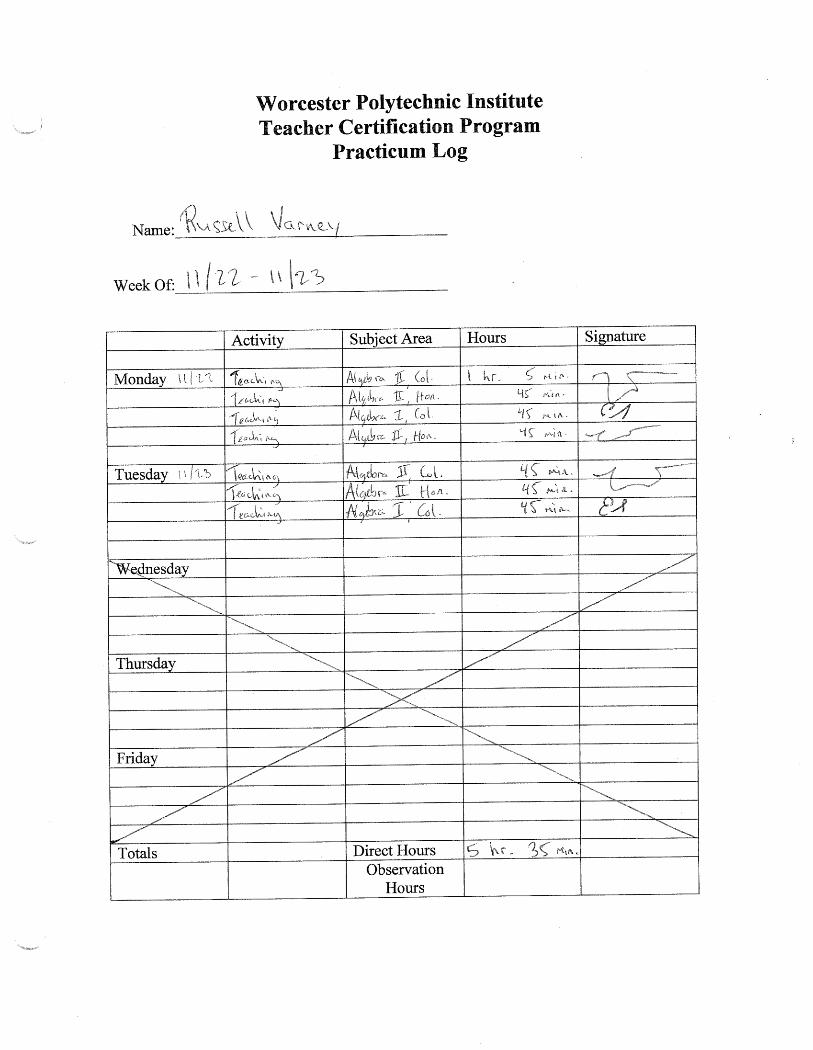
wpi teaching practicum
TRANSCRIPT
WPI Teaching Practicum
Interactive Qualifying Project
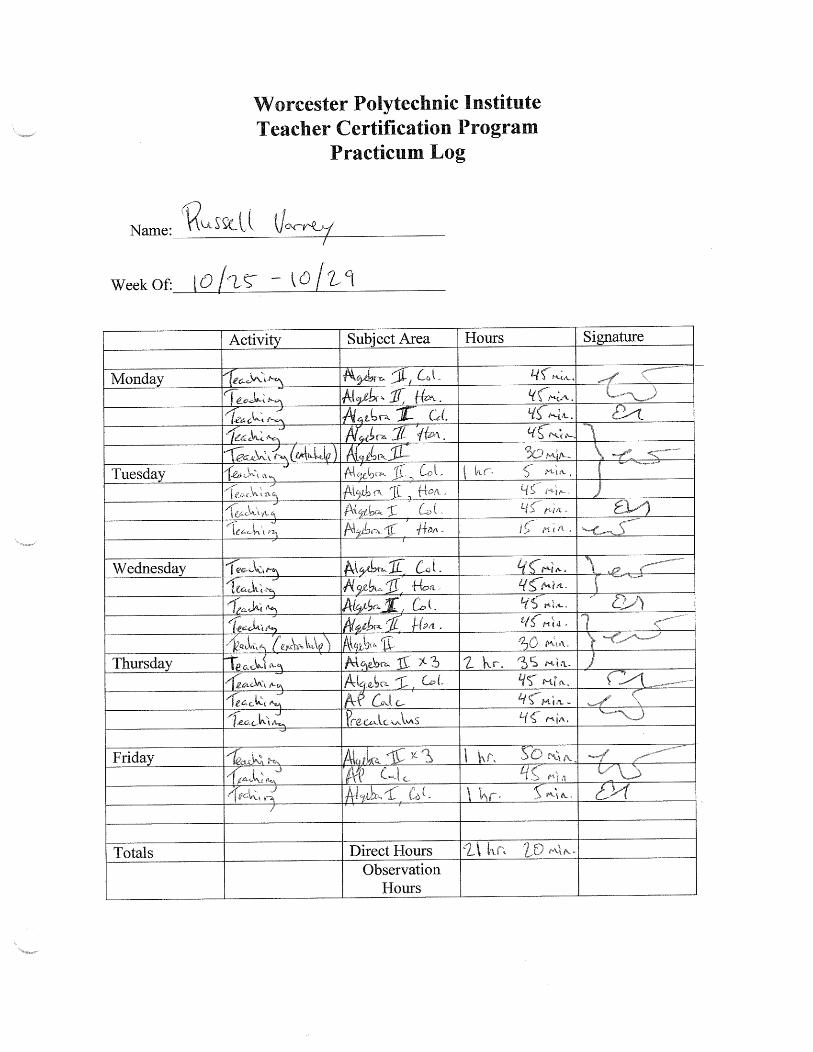
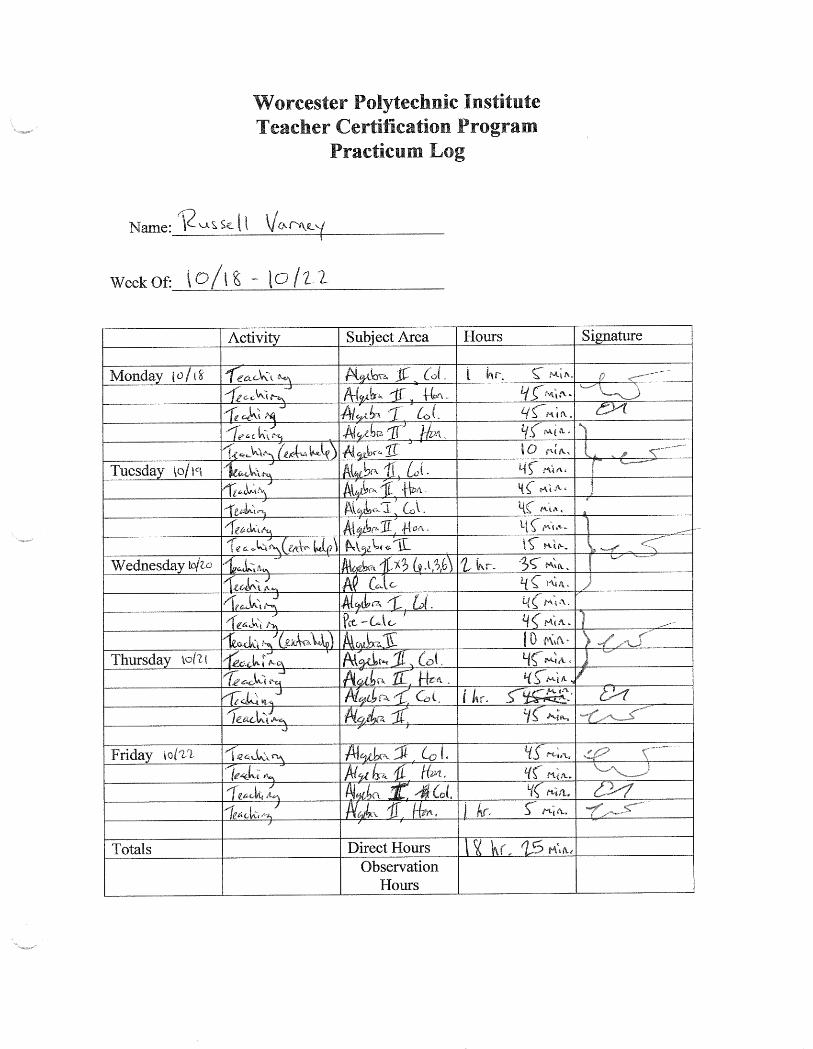
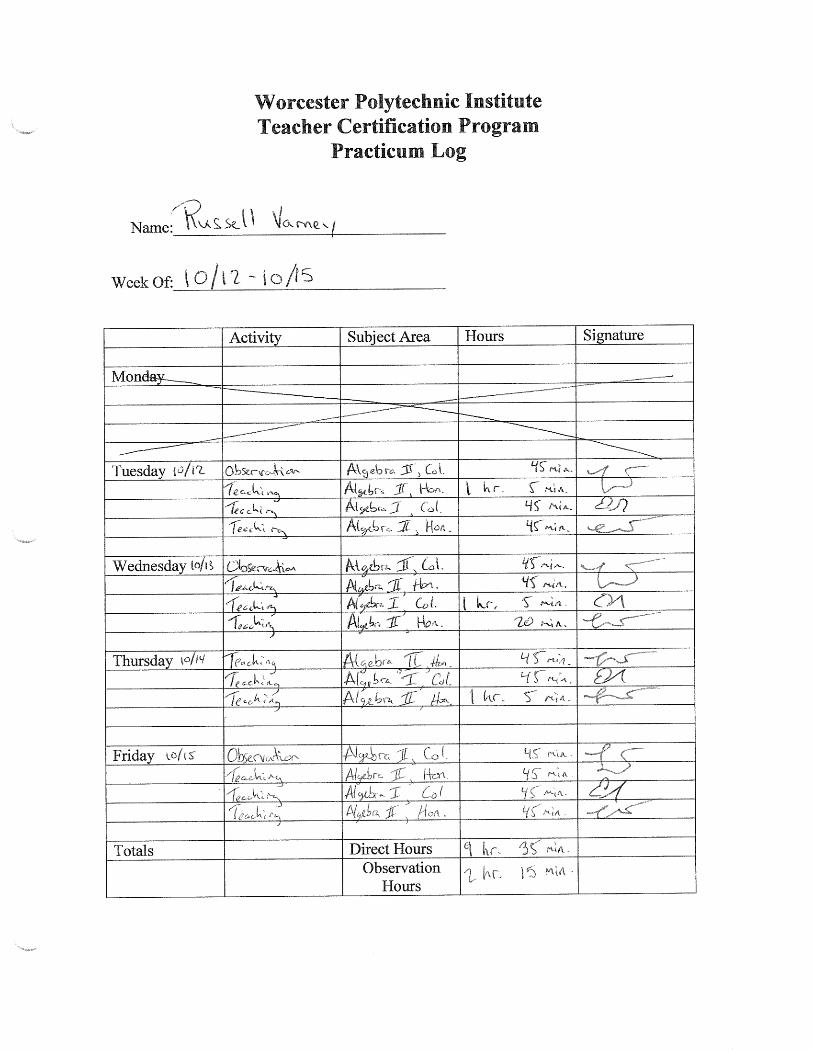
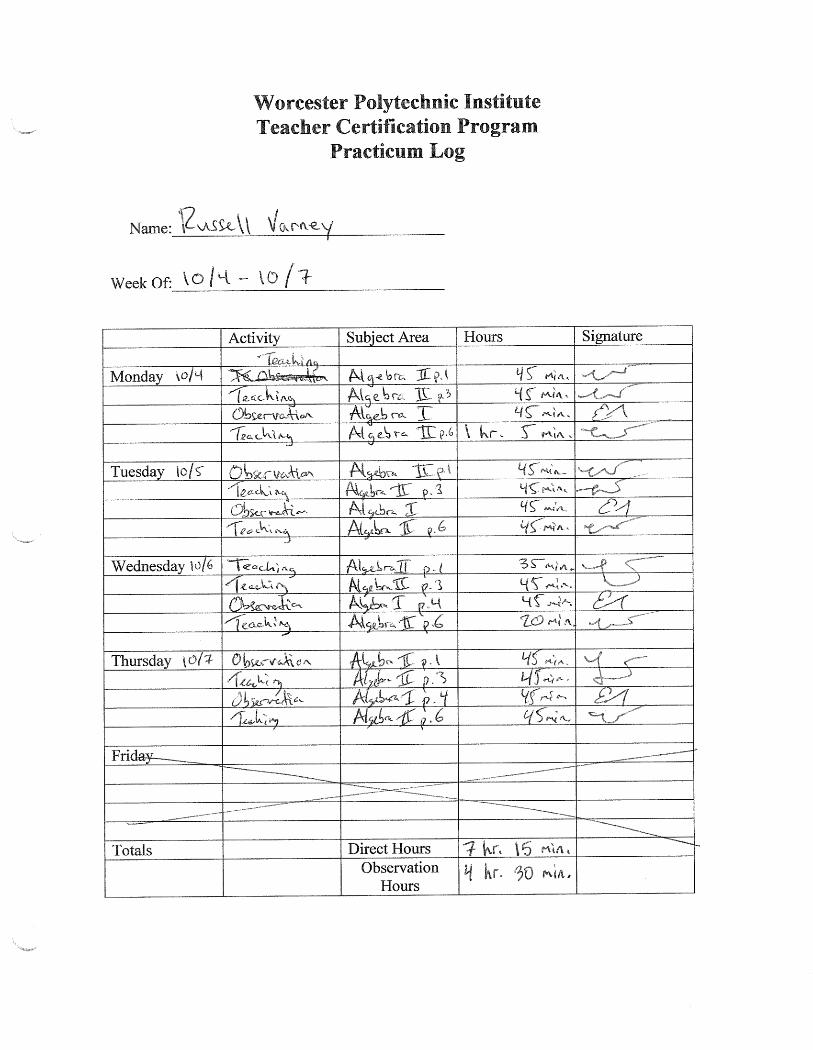
Russell Varney
Teaching Practicum Paper
Table of Contents Purpose of IQP Report .................................................................................................................................. 2
North High School ......................................................................................................................................... 3
Worcester Public Schools .......................................................................................................................... 3
Curriculum ................................................................................................................................................. 4
MCAS ......................................................................................................................................................... 4
Course Descriptions ...................................................................................................................................... 6
General Overview ..................................................................................................................................... 6
Algebra I .................................................................................................................................................... 7
Advanced Algebra ..................................................................................................................................... 8
Proceeding Mathematics Courses ............................................................................................................ 9
Course Materials ......................................................................................................................................... 10
Period 1: Advanced Algebra, College ...................................................................................................... 10
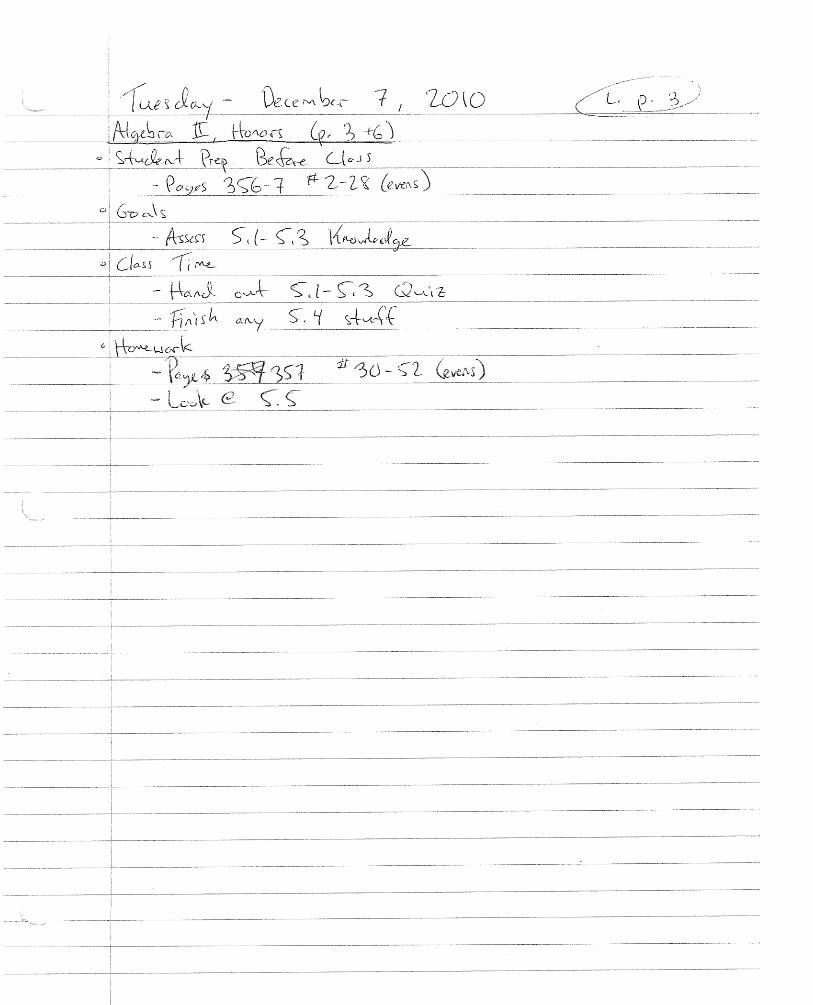
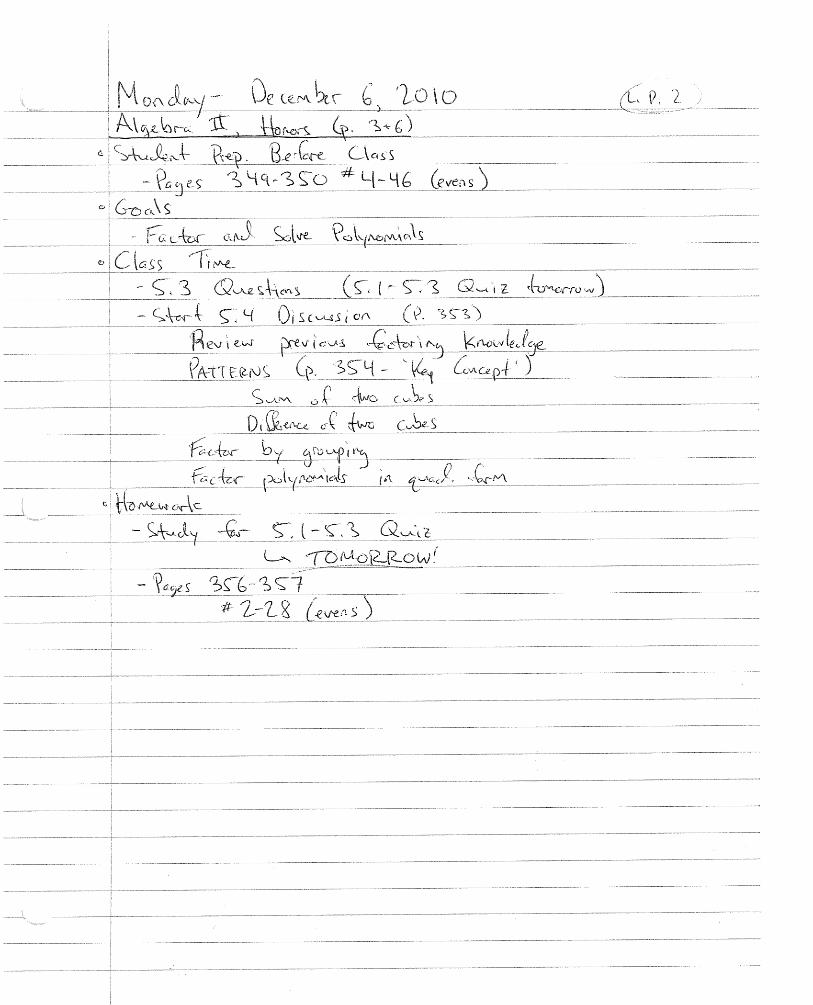
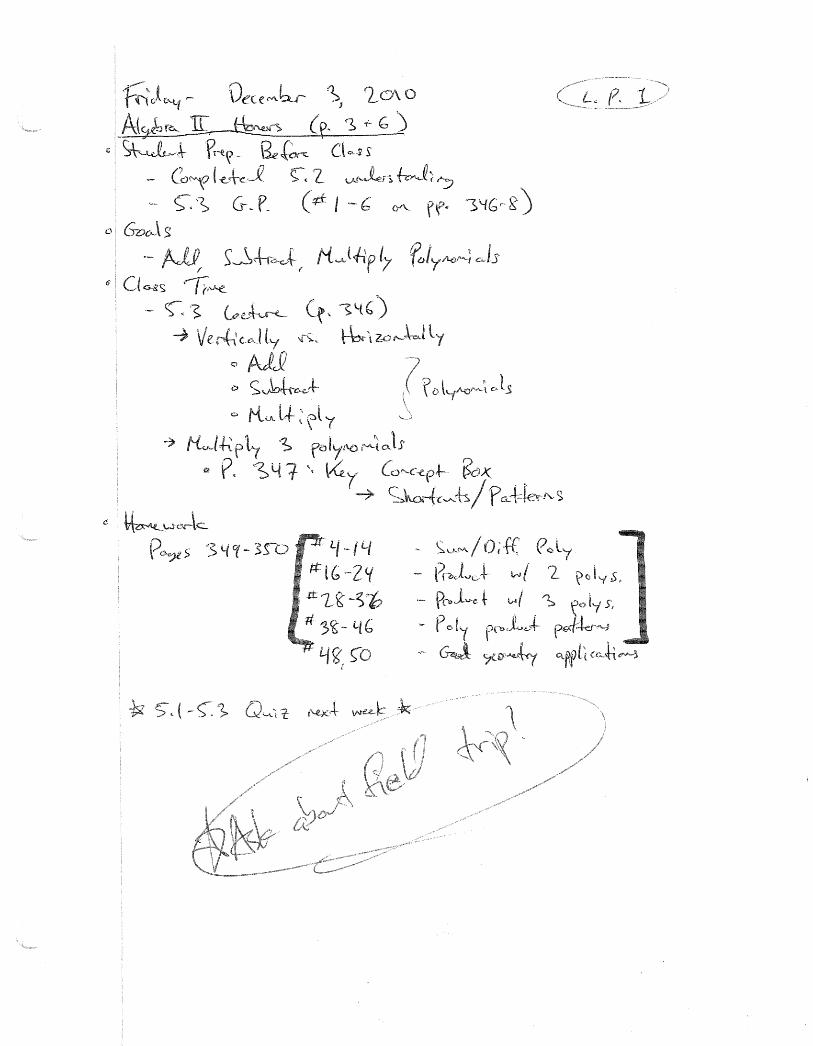
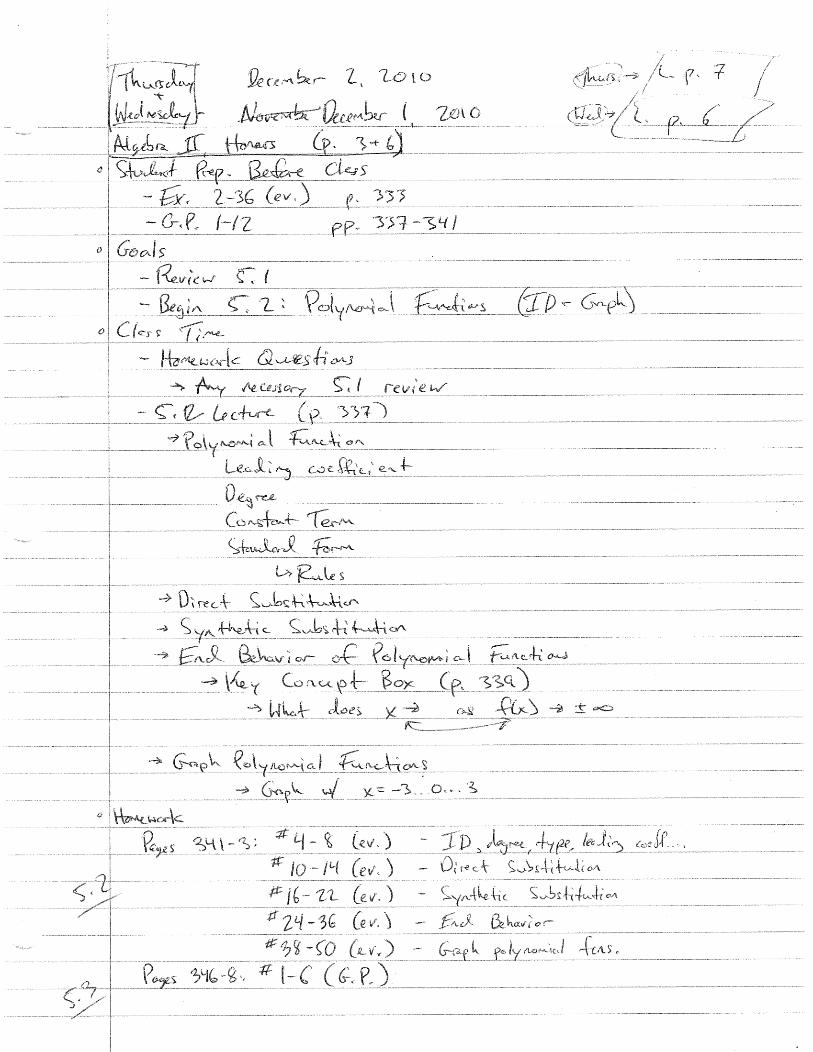
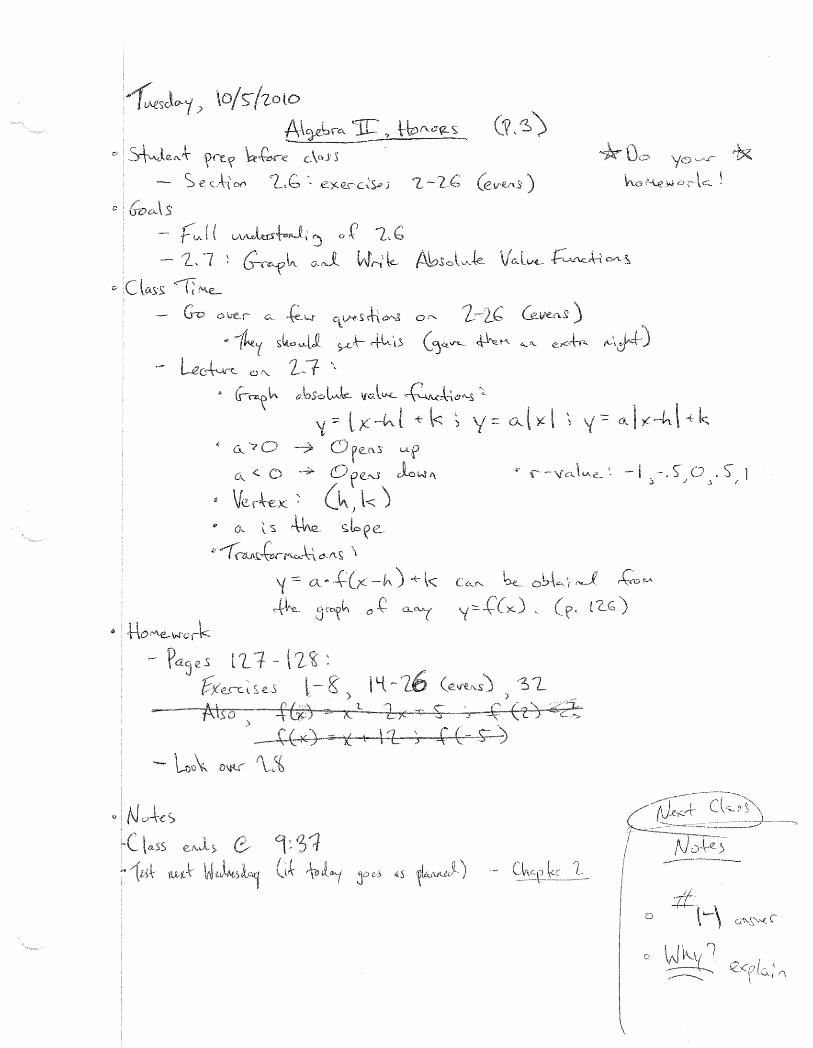
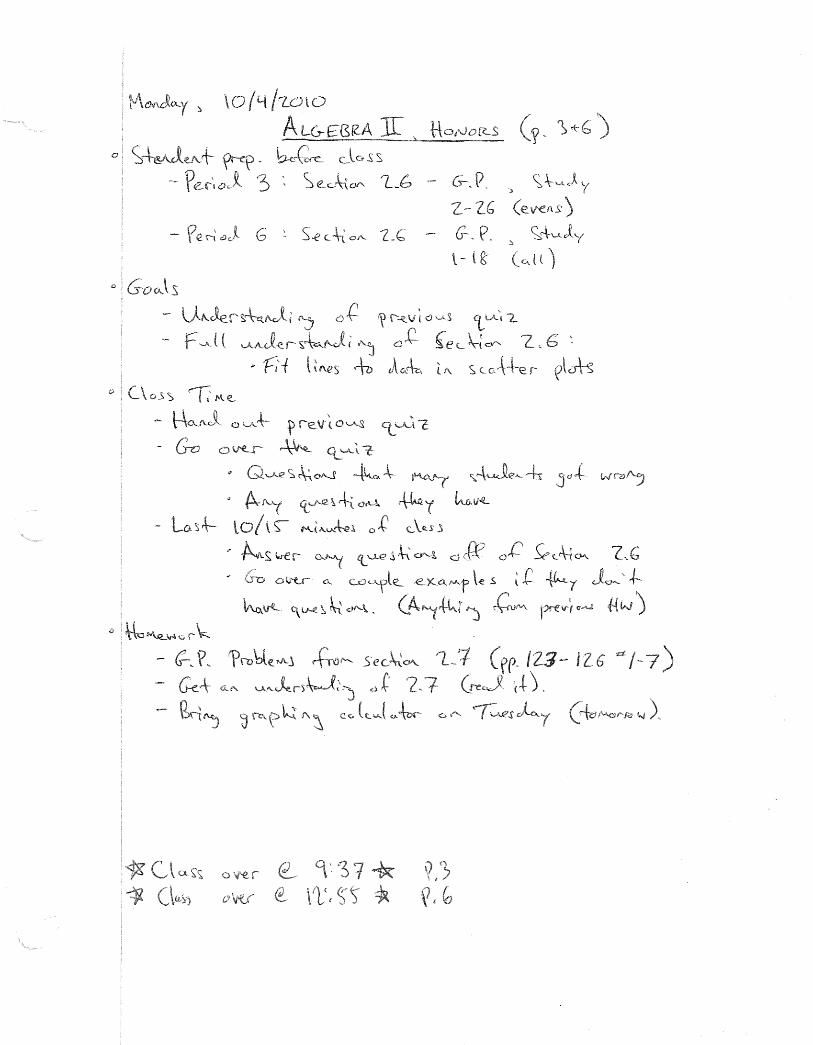
Period 3 and 6: Advanced Algebra, Honors ............................................................................................ 12
Period 4: Algebra I, College ..................................................................................................................... 14
The Students ............................................................................................................................................... 16
Period 1: Advanced Algebra, College ...................................................................................................... 16
Period 3: Advanced Algebra, Honors ...................................................................................................... 18
Period 4: Algebra I, College ..................................................................................................................... 19
Period 6: Advanced Algebra, Honors ...................................................................................................... 21
Classes Overall ........................................................................................................................................ 22
Assessment/MCAS Preparation .................................................................................................................. 24
College and Honors Advanced Algebra ................................................................................................... 24
College Algebra I ..................................................................................................................................... 26
Conclusion ................................................................................................................................................... 28
Works Cited ................................................................................................................................................. 30
Appendixes .................................................................................................................................................. 31
Purpose of IQP Report
1. It serves as a historical document with regard to the student's practicum
2. It demonstrates the student's understanding of the how the actual course(s) they are
involved in relate to and supports the Curriculum Frameworks
3. It demonstrates the student's ability to develop classroom materials consistent with the
Frameworks
4. It provides the student the opportunity to assess his or her classes so as to determine
the degree to which the Frameworks standards are being met
5. It provides the student with opportunity to provide evidence of effective classroom
management, promoting equity and meeting professional responsibilities.
6. It requires the students to reflect upon the connections between their experiences in
both the secondary education they are providing and the college education they are
simultaneously experiencing.
North High School
Worcester Public Schools North High School, or Worcester North, is one of the seven Worcester Public High Schools. Most
commonly known to the students of North High School are their rivals: Burncoat High School, Doherty
Memorial High School, and South High Community School. Claremont Academy, University Park Campus
School, and Worcester Technical High School are the other three schools that complete the Worcester
district’s population (School Fusion).
The School
North High School has been home to several Worcester County students since 1980. Best known
for its extracurricular activities, North High holds just over eleven hundred students. The school is
viewed as very run-down and in need of some improvement. That, along with its twentieth century
dynamics, is why a new building is in progress and is said to be finished within the next year or two.
Statistics have shown that Worcester North struggled with attendance as the 2007-2008 school year
progressed (School Fusion).
Demographics
There is very little continuity at Worcester High School. The majority of kids are Hispanic or
White/Caucasian, followed by African American and Asian or Pacific Islander. Although diversity is
common at Worcester North, wealth is not. Just over seventy five percent of the students are eligible for
free or reduced lunch. Eligibility for free and reduced lunch is based on family size and household
income. Teachers of North High also encounter students who have difficulty speaking English. With
around fourteen percent of the school’s students having limited proficiency in English, North High
School is forced to employ faculty members that can translate for students and their parents.
Furthermore, more than twenty two percent of students require special education (Worcester Public
Schools, 2010).
Curriculum There are several levels of courses in mathematics offered at North High School. The school
offers three levels of Algebra I, Geometry, and Algebra II as well as two levels of Advanced
Topology/Trigonometry and Topics in Algebra/Geometry. Furthermore, the students at Worcester North
have the opportunity to be challenged in Advanced Placement (AP) Courses such AP Calculus and AP
Statistics. Worcester North gives students a chance to take courses such as Pre-Calculus, College Level
Statistics, and Numeracy. Due to the high level of undereducated kids, North High is forced to add a
course called MCAS Math 1, as well. This class prepares students who have struggled with the MCAS in
the past to be better prepared for the test in the near future (Massachusetts Department of Elementary
and Secondary Education, 2008).
Overall, the intermediate level math courses are the most popular, by far. Thus, they do seem to
be lacking in the college-preparatory and honors level course attendance (School Fusion).
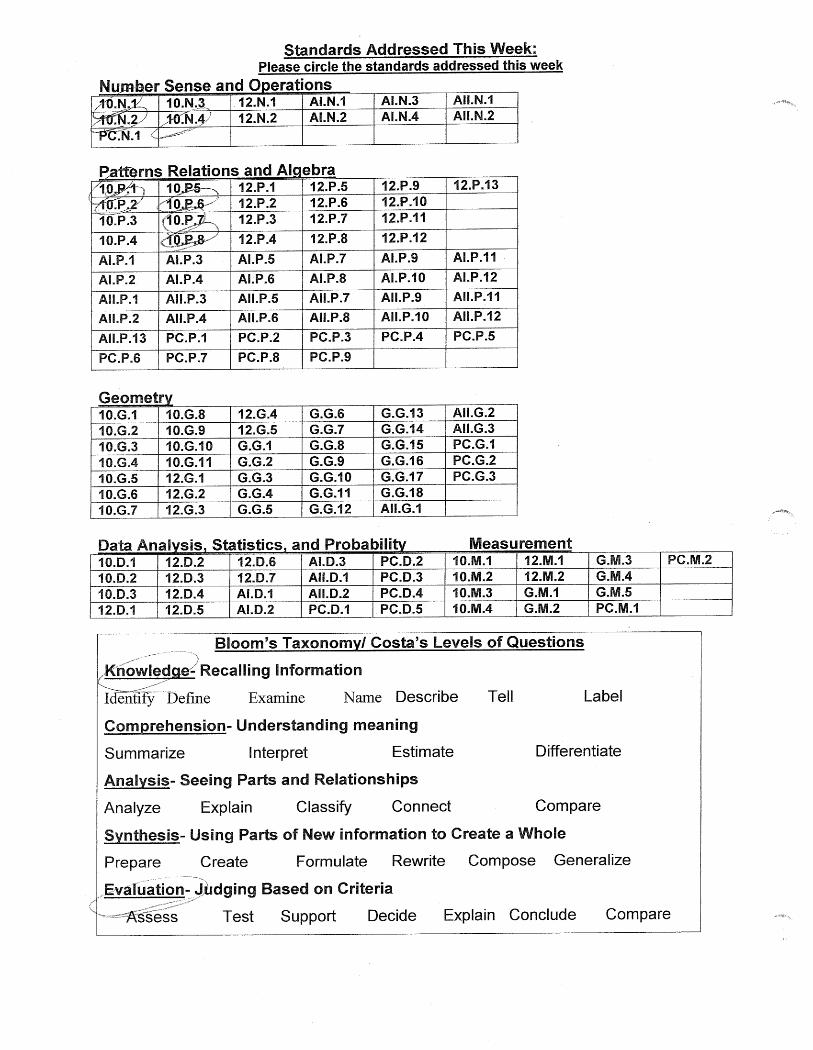
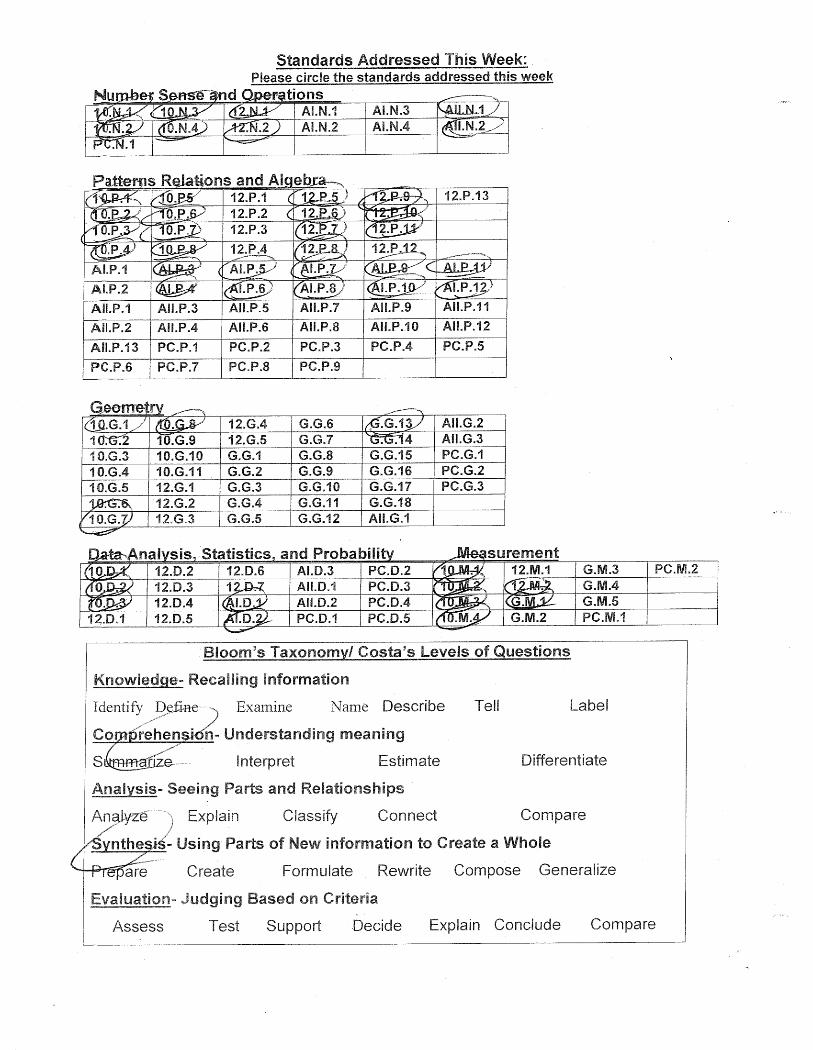
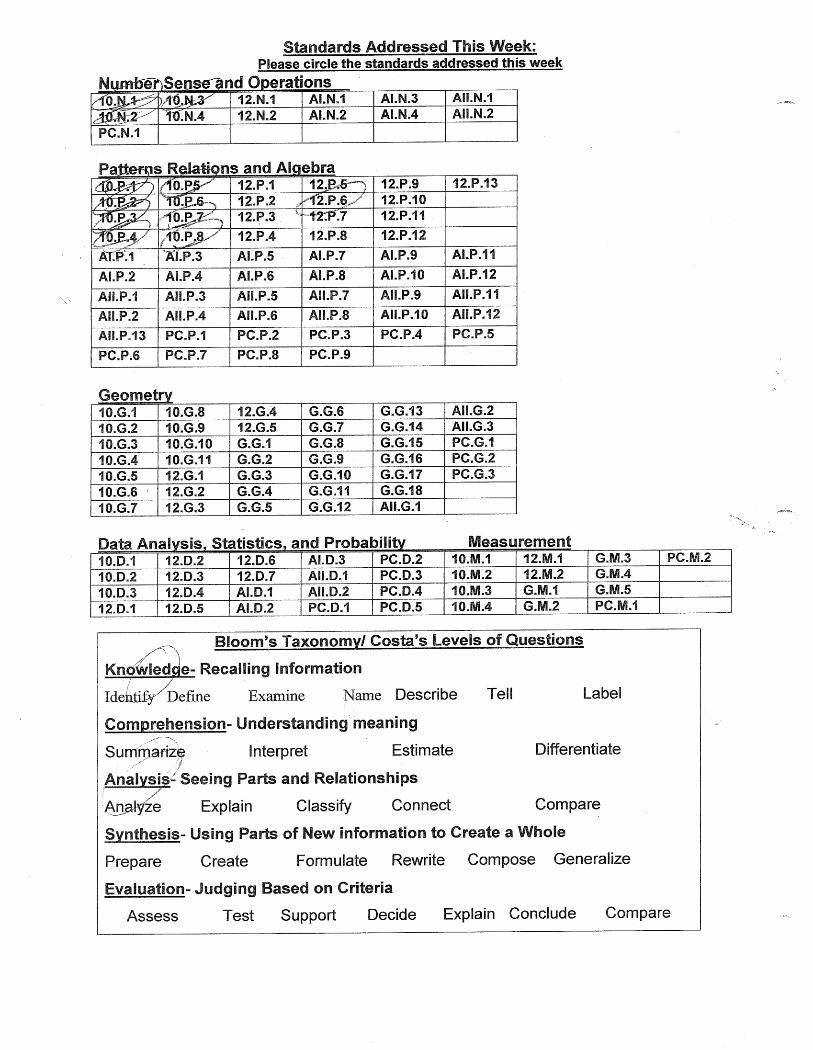
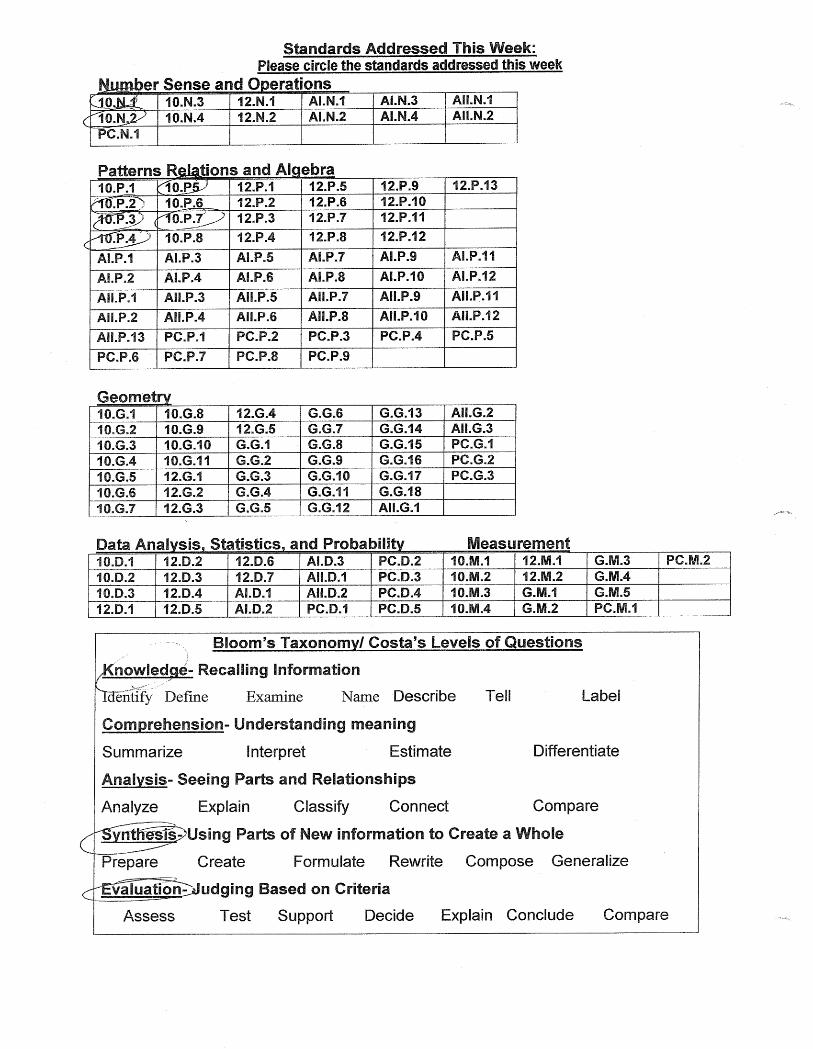
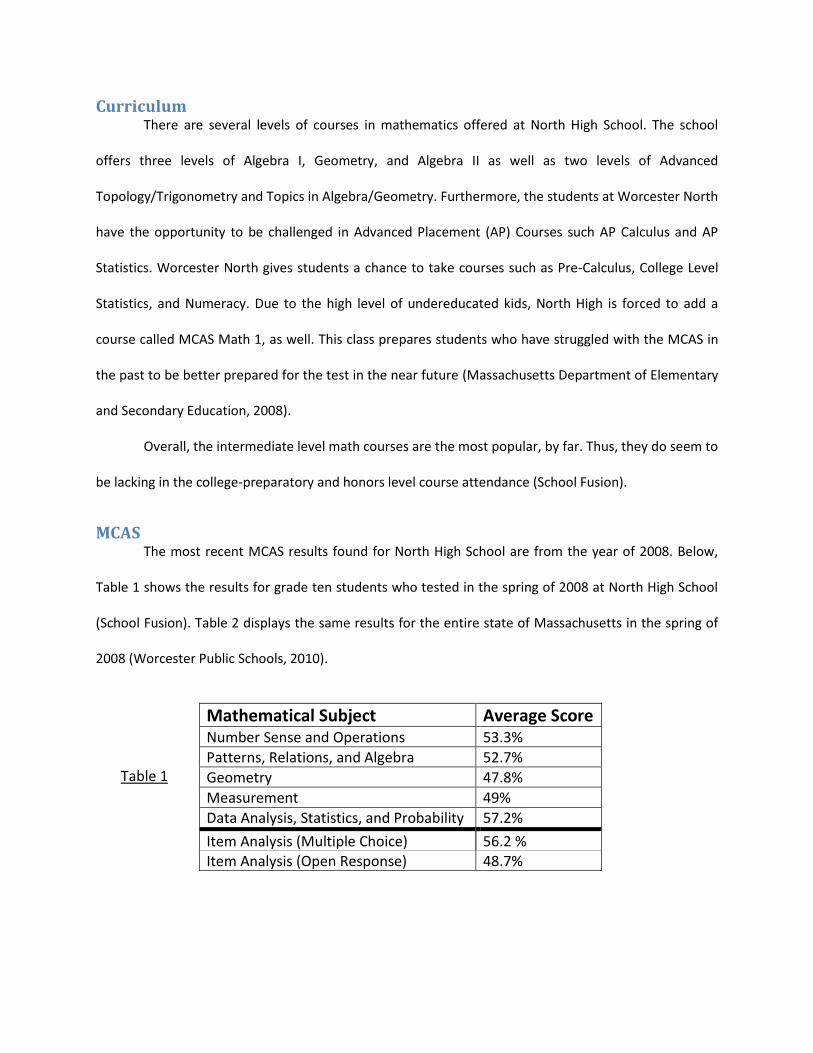
MCAS The most recent MCAS results found for North High School are from the year of 2008. Below,
Table 1 shows the results for grade ten students who tested in the spring of 2008 at North High School
(School Fusion). Table 2 displays the same results for the entire state of Massachusetts in the spring of
2008 (Worcester Public Schools, 2010).
Mathematical Subject Average Score Number Sense and Operations 53.3%
Patterns, Relations, and Algebra 52.7%
Geometry 47.8%
Measurement 49%
Data Analysis, Statistics, and Probability 57.2%
Item Analysis (Multiple Choice) 56.2 % Item Analysis (Open Response) 48.7%
Table 1
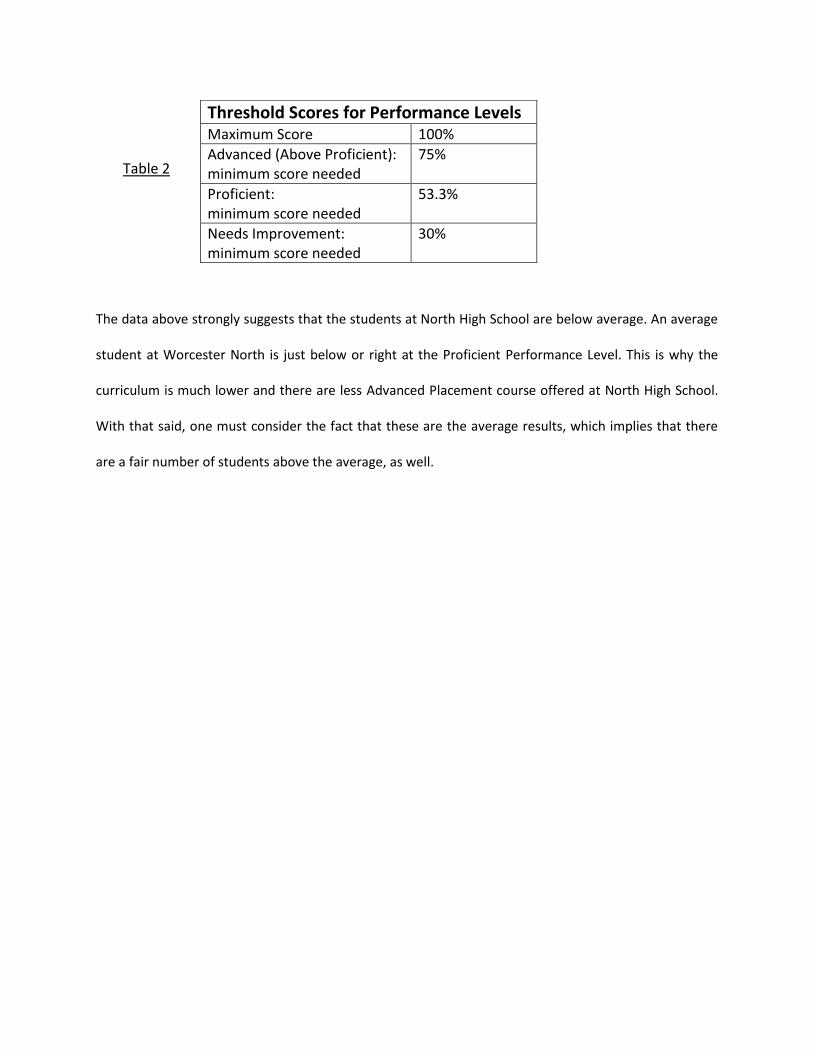
The data above strongly suggests that the students at North High School are below average. An average
student at Worcester North is just below or right at the Proficient Performance Level. This is why the
curriculum is much lower and there are less Advanced Placement course offered at North High School.
With that said, one must consider the fact that these are the average results, which implies that there
are a fair number of students above the average, as well.
Threshold Scores for Performance Levels Maximum Score 100%
Advanced (Above Proficient): minimum score needed
75%
Proficient: minimum score needed
53.3%
Needs Improvement: minimum score needed
30%
Table 2
Course Descriptions
General Overview
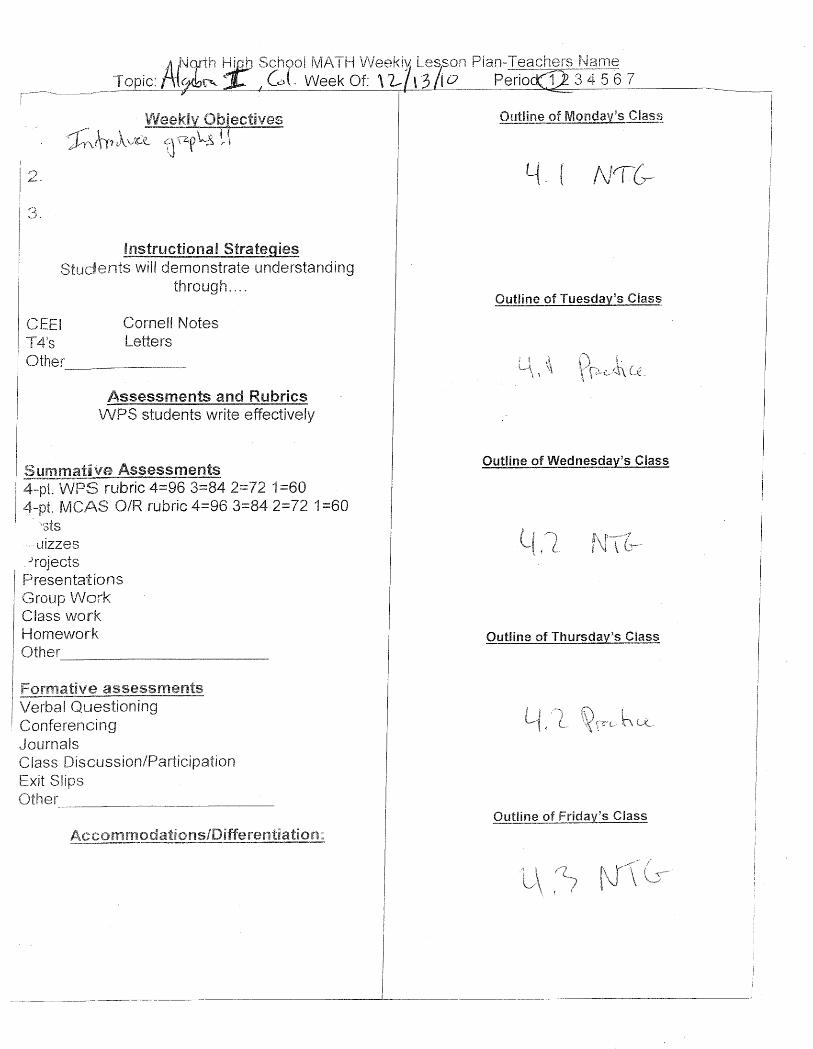
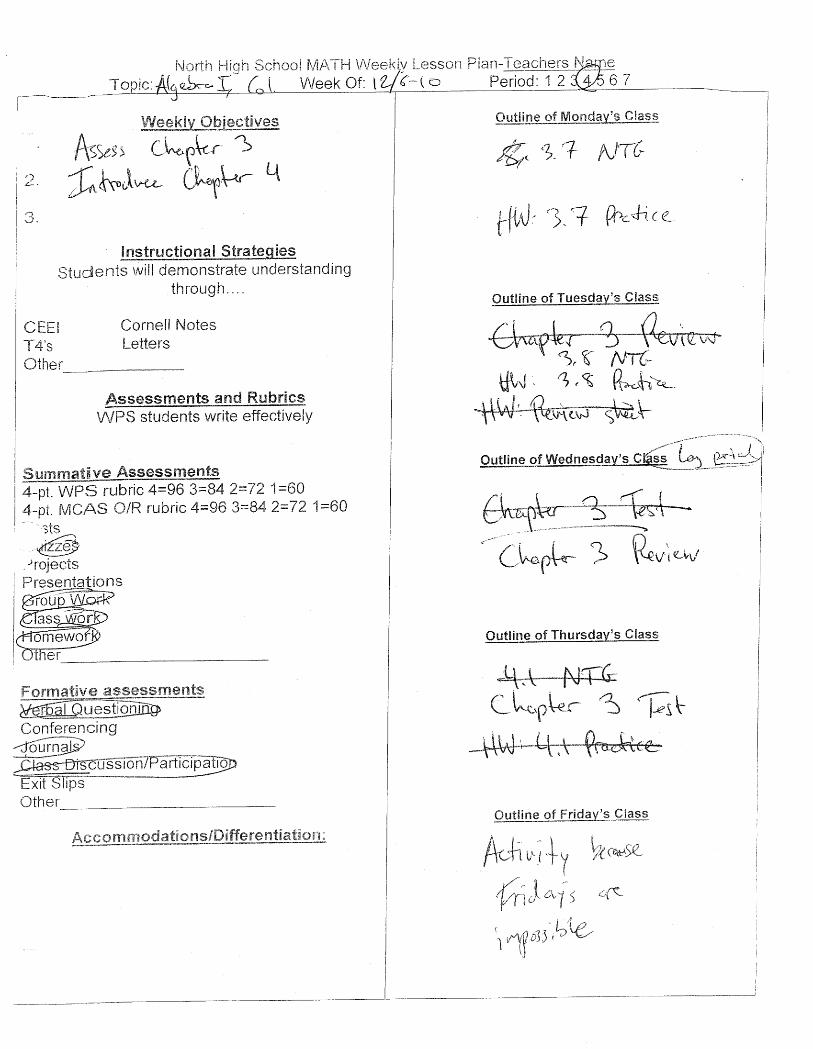
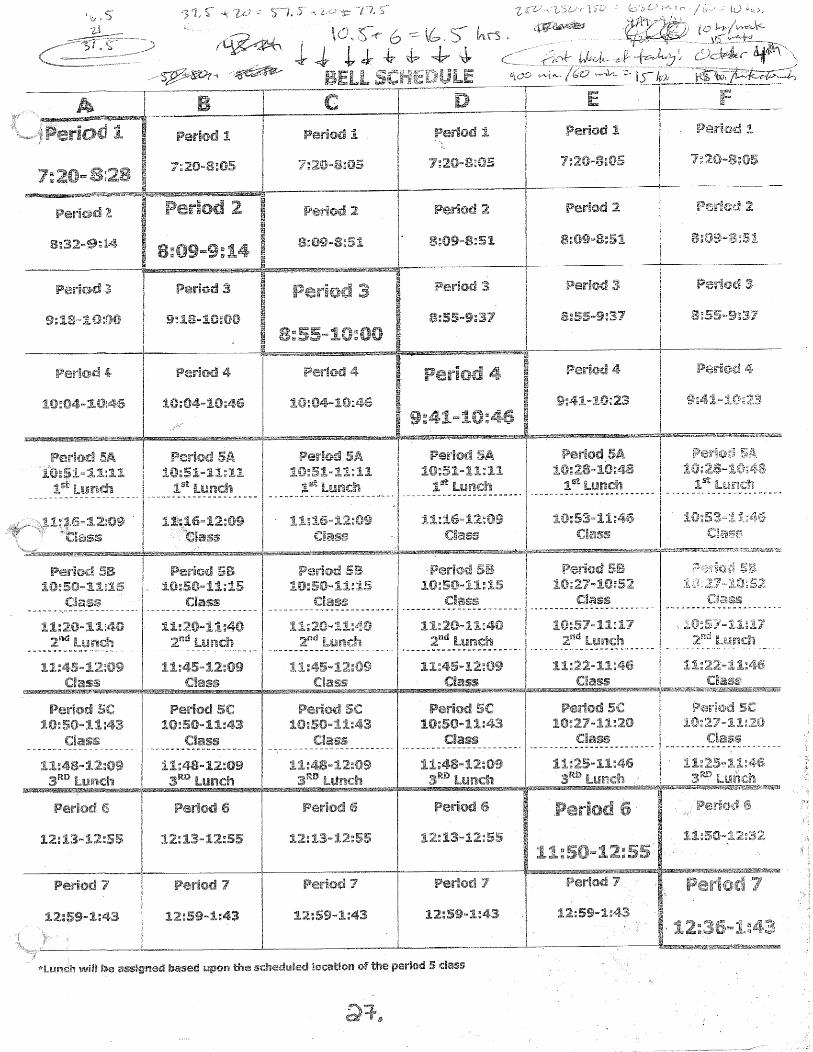
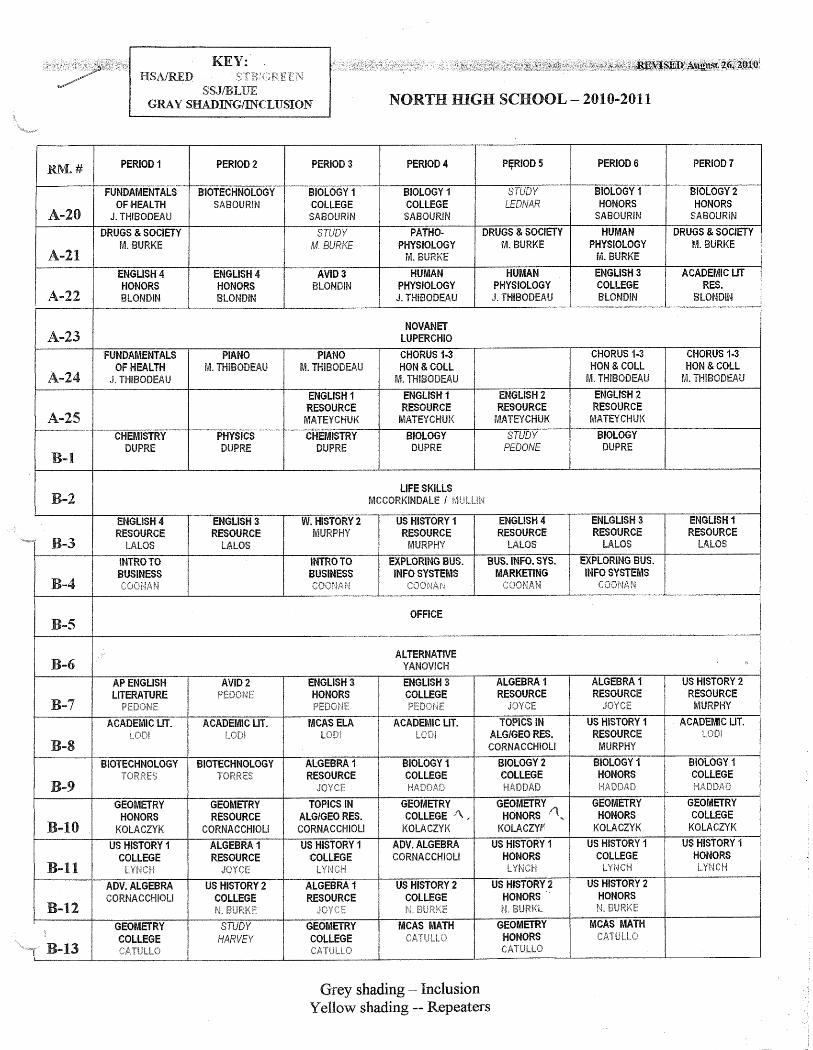
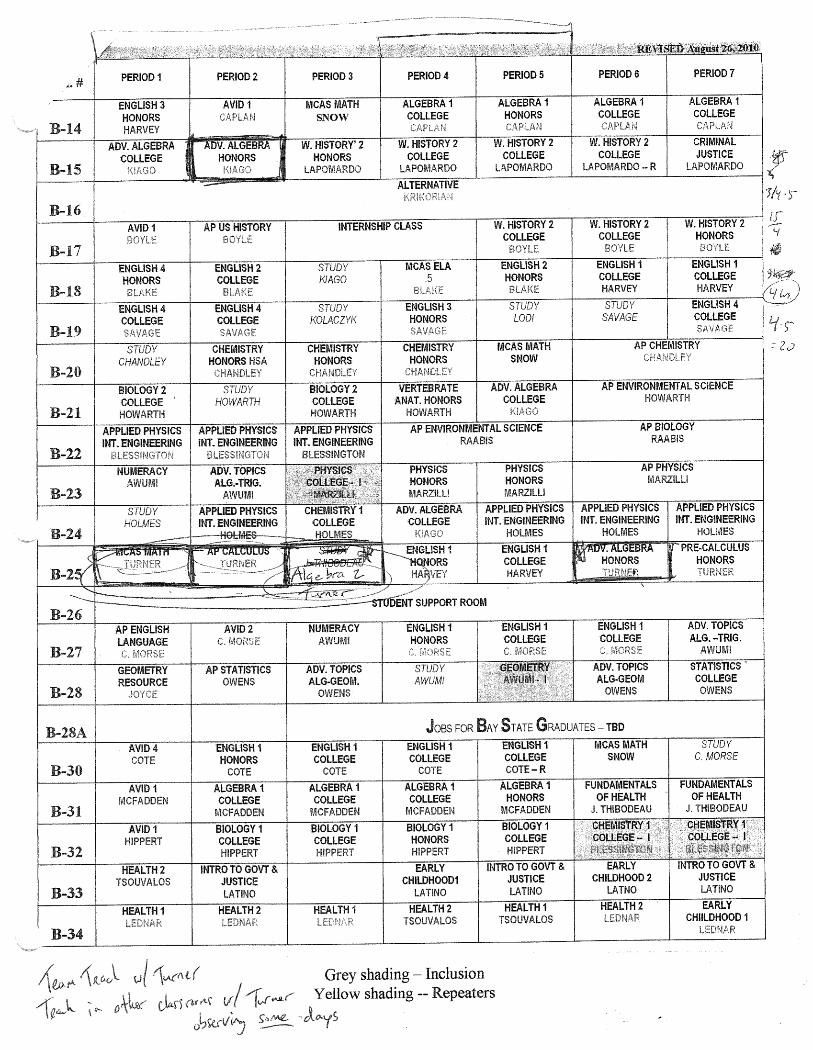
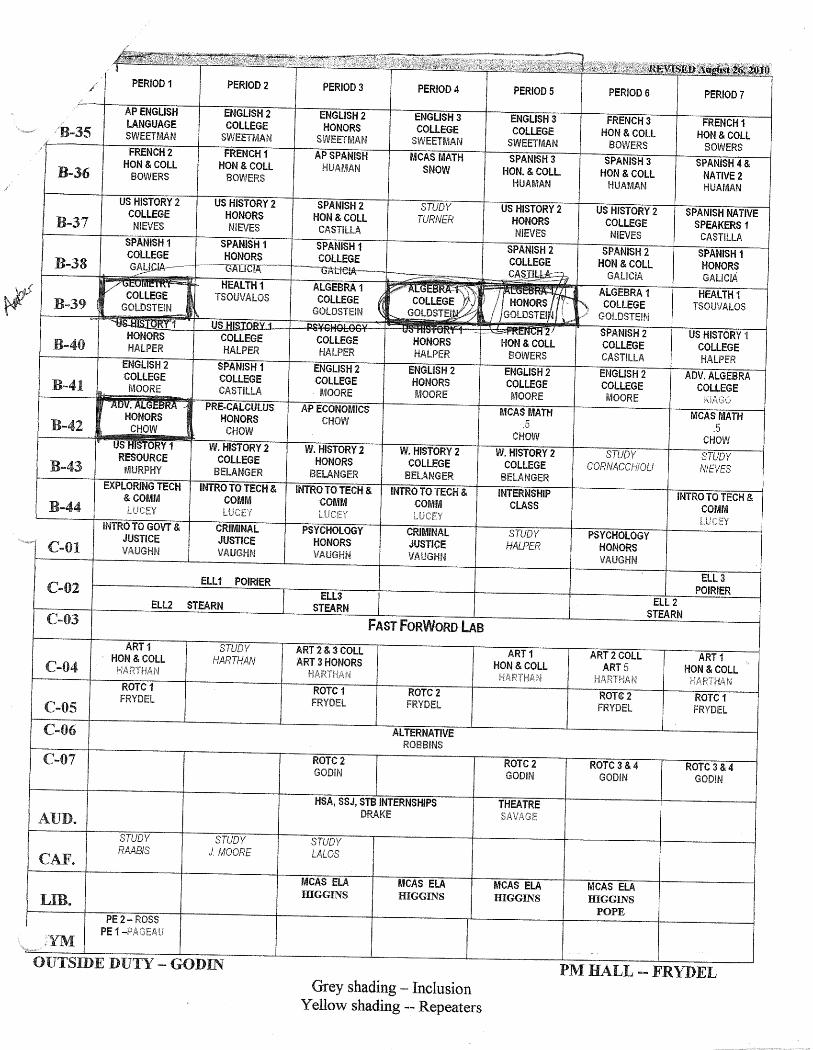
The structure of courses at North High School changed this past year (Appendix Q). Up until the
2010-2011 school-year, North used block scheduling. In block scheduling, courses are a semester long
and meet for over two hours. 2010 was the first year that North High changed to year-long courses that
meet for approximately an hour every day. This change allows for very little in-class discussion or hands-
on activities because of the short amount of time. It is a big adjustment for students and teachers. The
impact of this change is mentioned below when discussing each course.
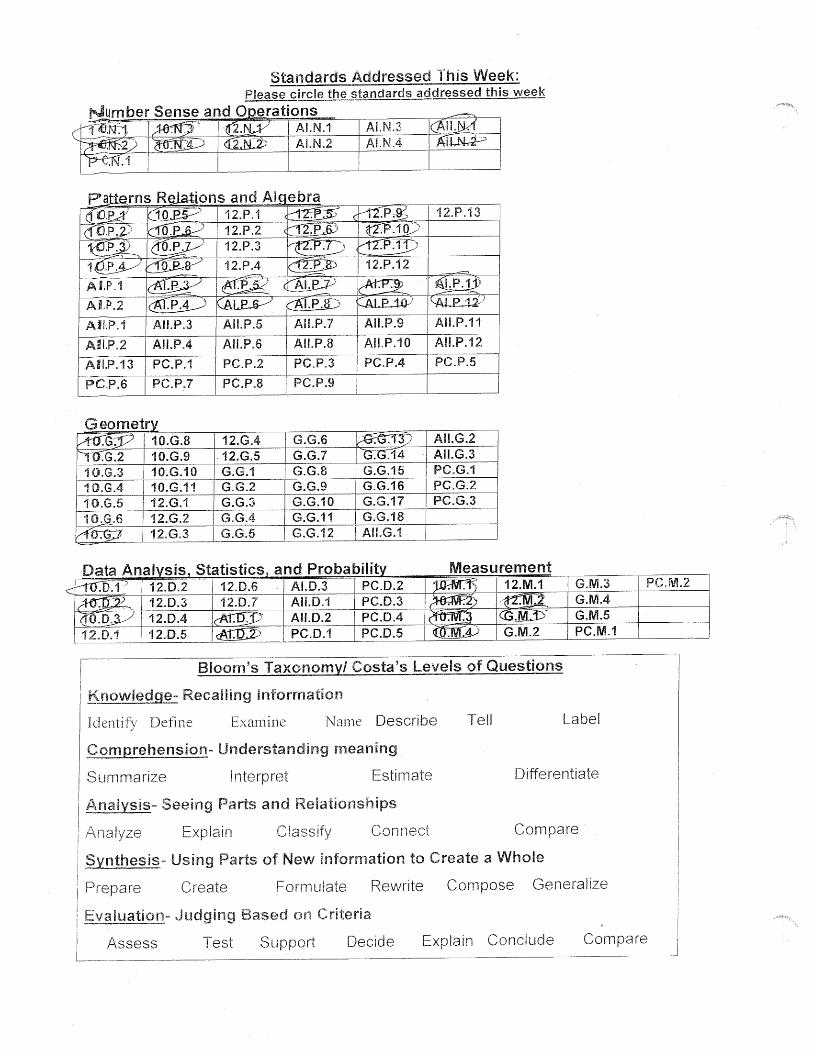
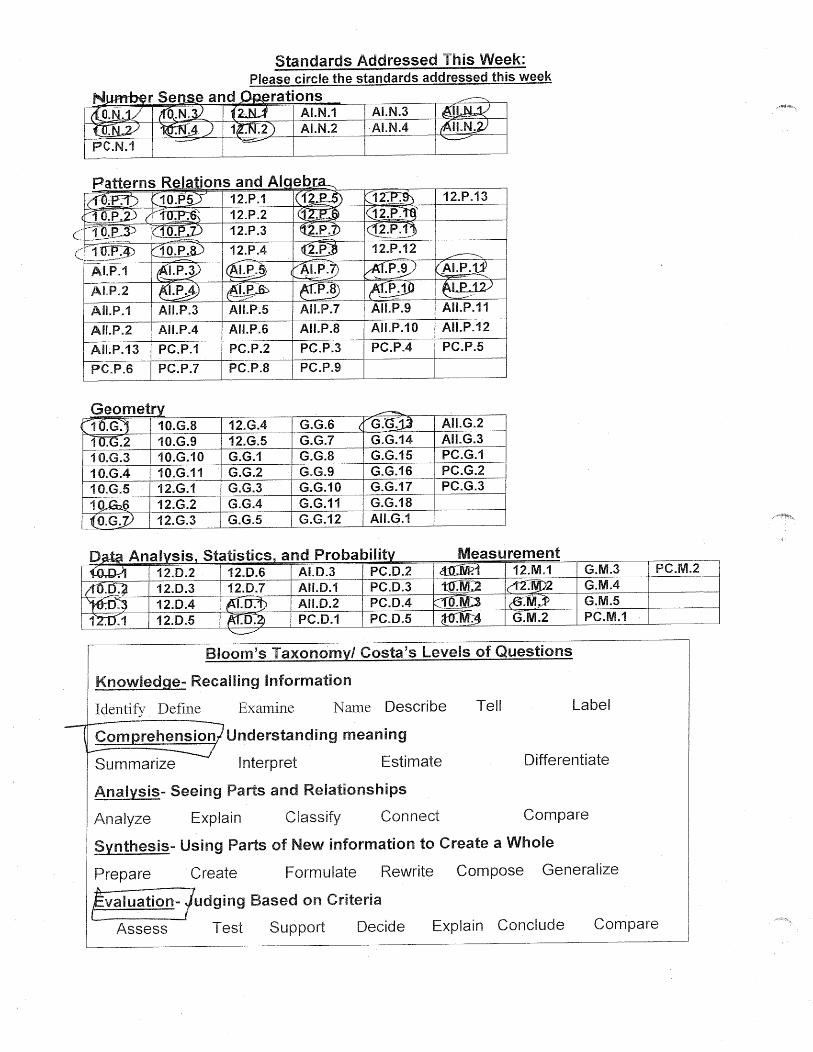
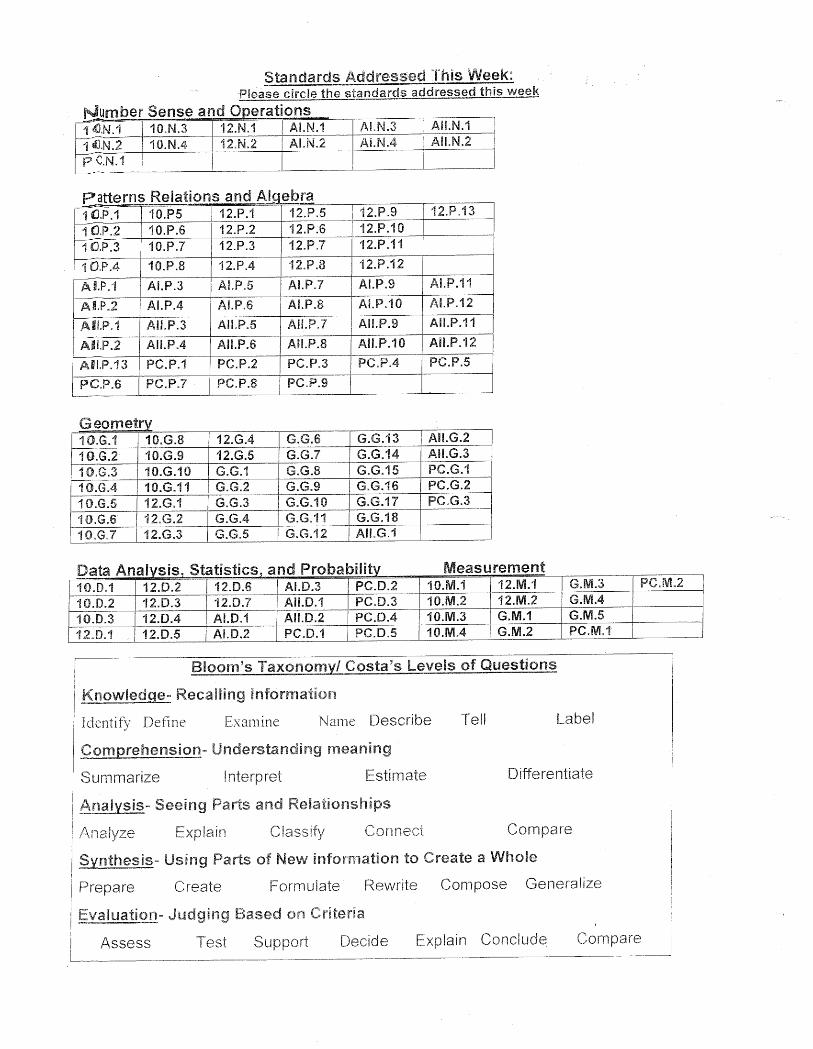
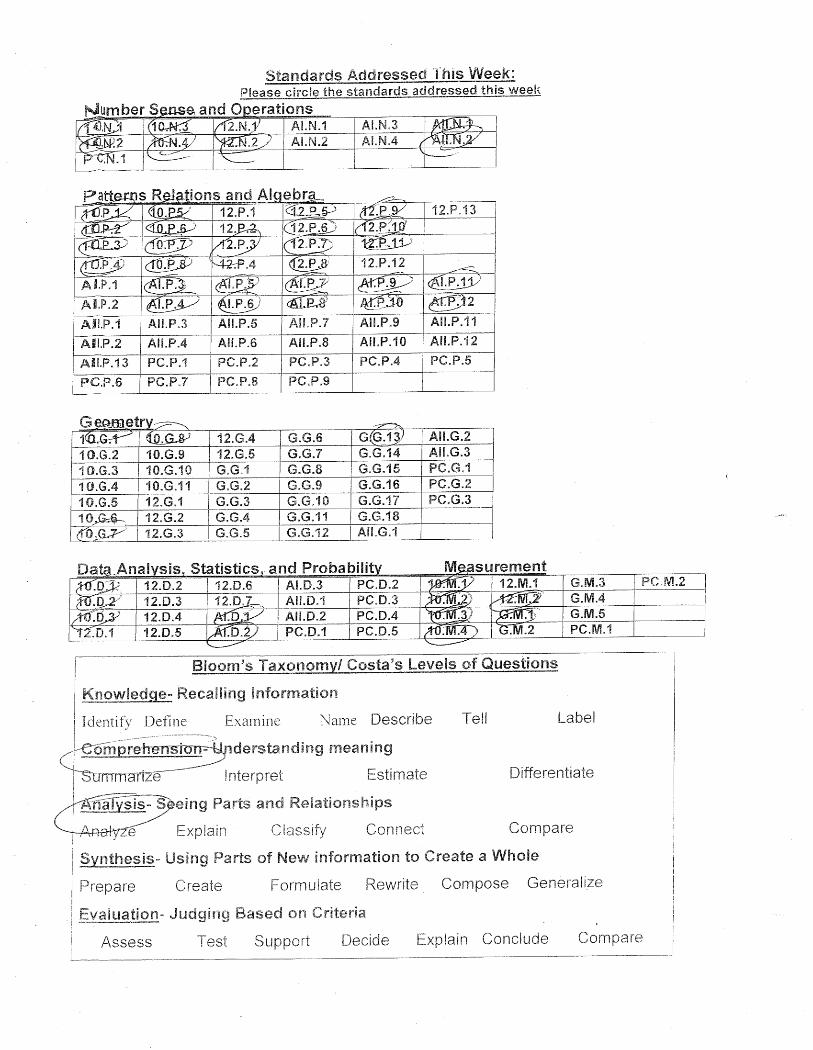
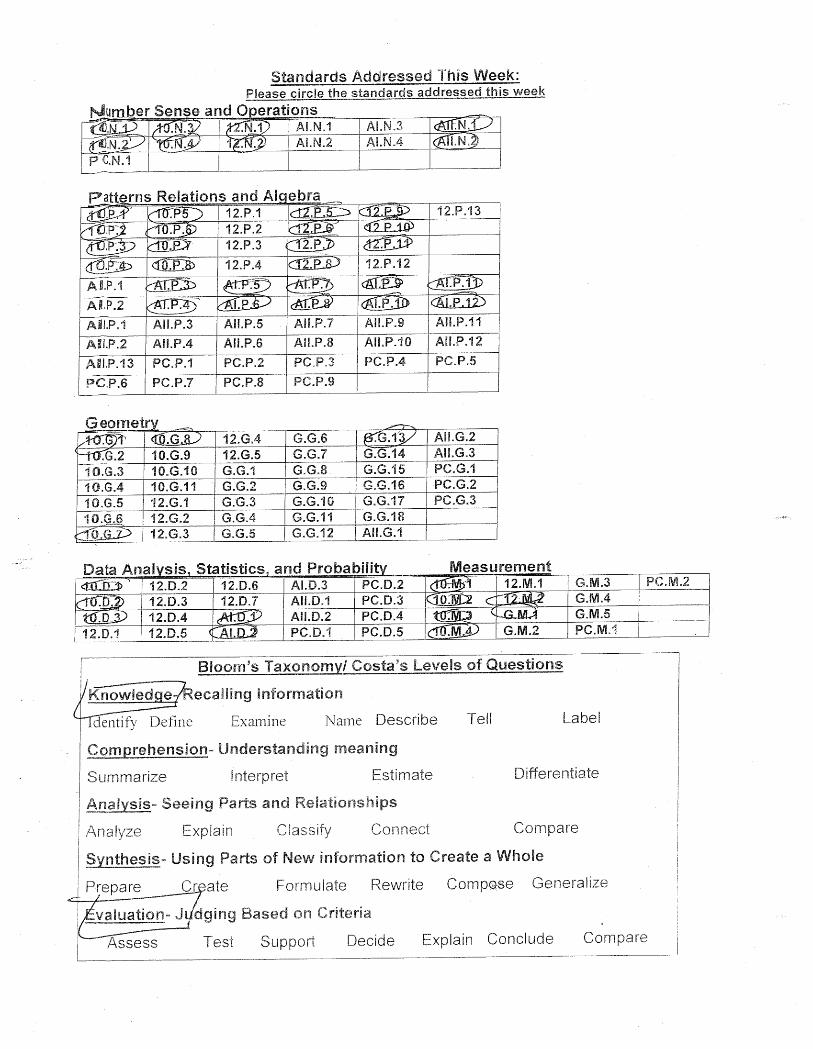
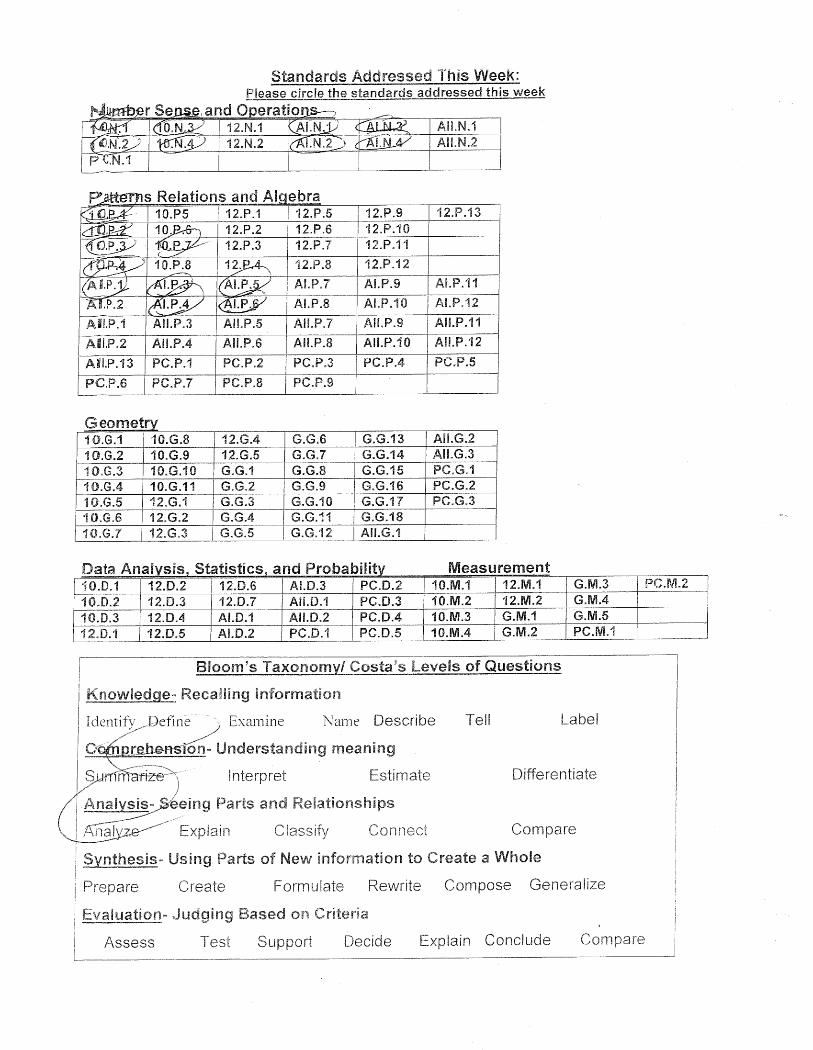
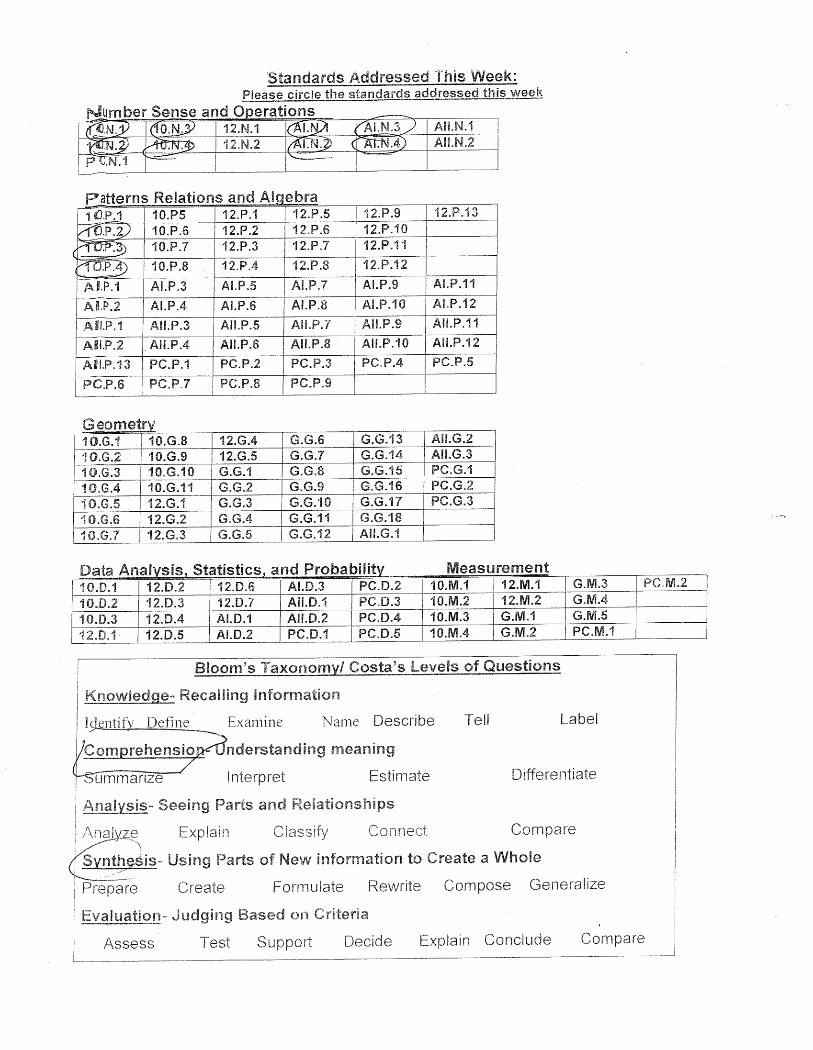
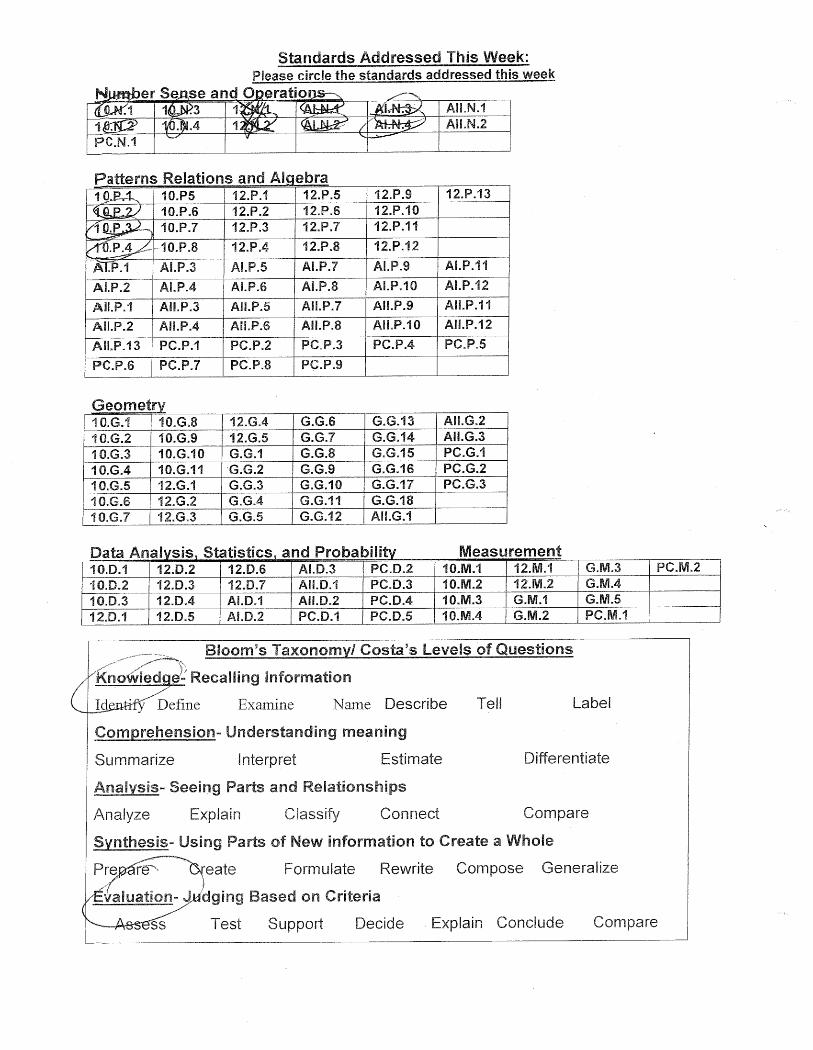
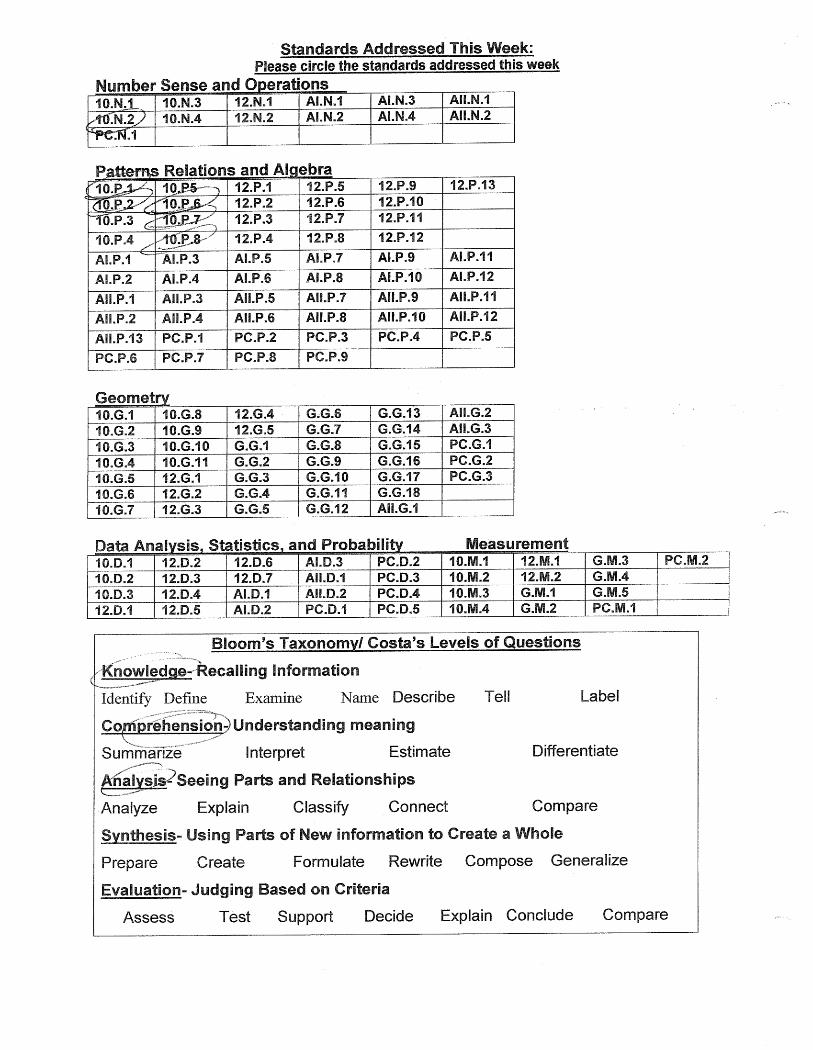
The Massachusetts State Frameworks describe the expectations for every teacher to follow in
three steps (Appendix F). I used these steps as a guideline when designing my courses (Appendix A: A,1).
First, teachers are expected to familiarize the students with the general concepts. This step requires an
ability to perform the basic idea using an example. Secondly, students are expected to be able to explain
their reasoning on how they arrived at their solution. This requires understanding beyond memorization
and calculation. Lastly, teachers must be assured that their students can make abstract or basic
connections with other topics in order to solve more complicated problems. This three-step concept is a
perfect preparation for the MCAS Test. A significant portion of the MCAS Test asks students to answer
open response questions which may require mastery in several concepts in order to answer a single
problem. (Appendix A: E,1)
North High School offers a very standard sequence of math courses. For most courses, there is a
higher level option, which is classified as “Honors”, and an average level option, which is classified as
“College”. This sequence consists of Algebra I, Geometry, Advanced Algebra, Pre-Calculus, and AP
Calculus and/or AP Statistics. The school also offers optional math courses that focus more specifically
on subjects such as Statistics, MCAS Math, Numeracy, and Trigonometry. The focus of this paper is
College Algebra I along with College and Honors Advanced Algebra.
Algebra I
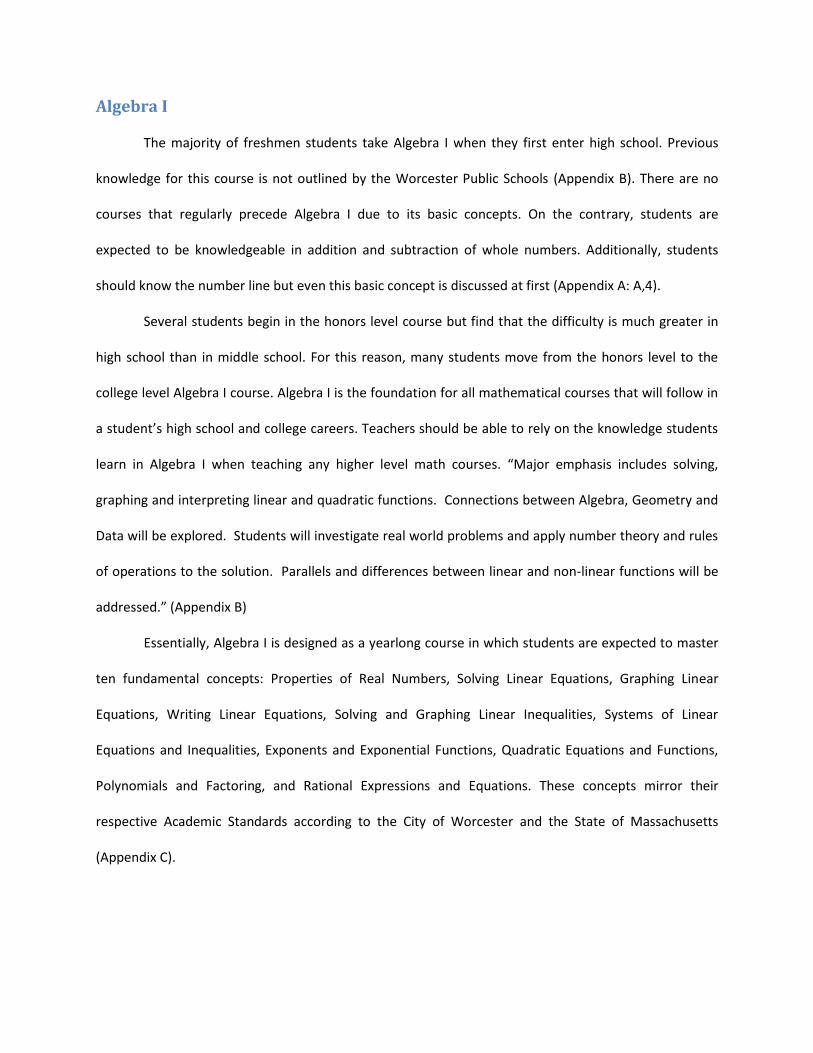
The majority of freshmen students take Algebra I when they first enter high school. Previous
knowledge for this course is not outlined by the Worcester Public Schools (Appendix B). There are no
courses that regularly precede Algebra I due to its basic concepts. On the contrary, students are
expected to be knowledgeable in addition and subtraction of whole numbers. Additionally, students
should know the number line but even this basic concept is discussed at first (Appendix A: A,4).
Several students begin in the honors level course but find that the difficulty is much greater in
high school than in middle school. For this reason, many students move from the honors level to the
college level Algebra I course. Algebra I is the foundation for all mathematical courses that will follow in
a student’s high school and college careers. Teachers should be able to rely on the knowledge students
learn in Algebra I when teaching any higher level math courses. “Major emphasis includes solving,
graphing and interpreting linear and quadratic functions. Connections between Algebra, Geometry and
Data will be explored. Students will investigate real world problems and apply number theory and rules
of operations to the solution. Parallels and differences between linear and non-linear functions will be
addressed.” (Appendix B)
Essentially, Algebra I is designed as a yearlong course in which students are expected to master
ten fundamental concepts: Properties of Real Numbers, Solving Linear Equations, Graphing Linear
Equations, Writing Linear Equations, Solving and Graphing Linear Inequalities, Systems of Linear
Equations and Inequalities, Exponents and Exponential Functions, Quadratic Equations and Functions,
Polynomials and Factoring, and Rational Expressions and Equations. These concepts mirror their
respective Academic Standards according to the City of Worcester and the State of Massachusetts
(Appendix C).
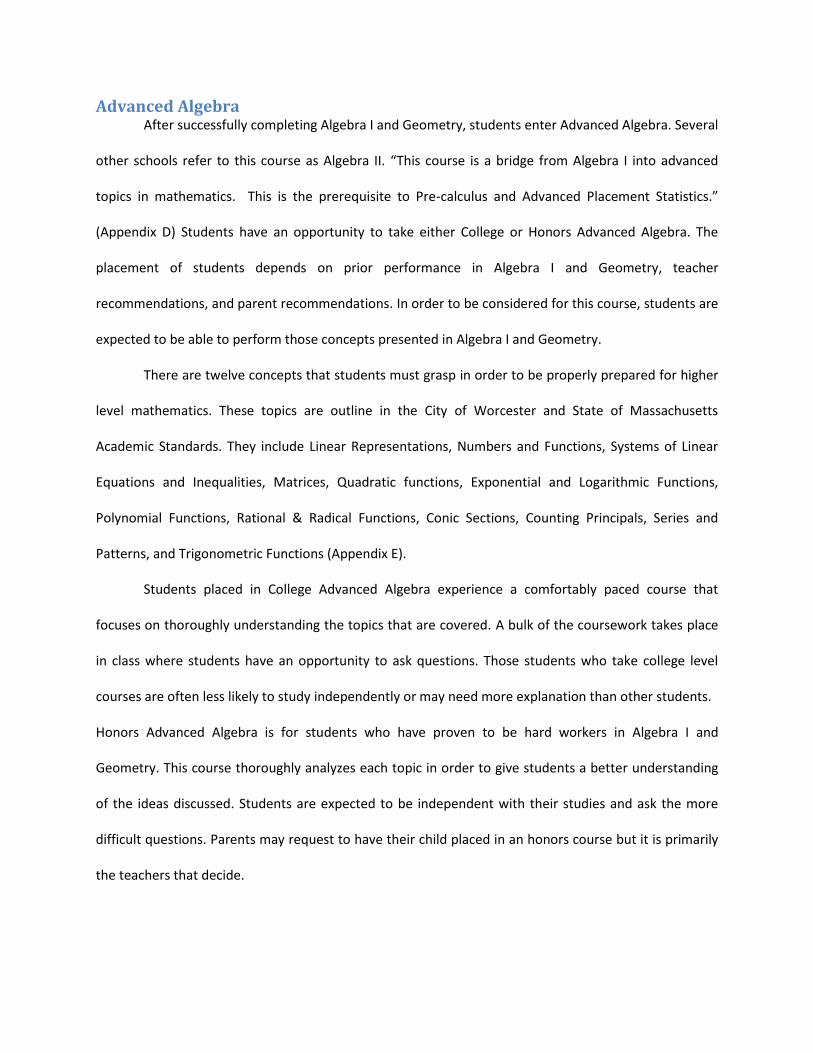
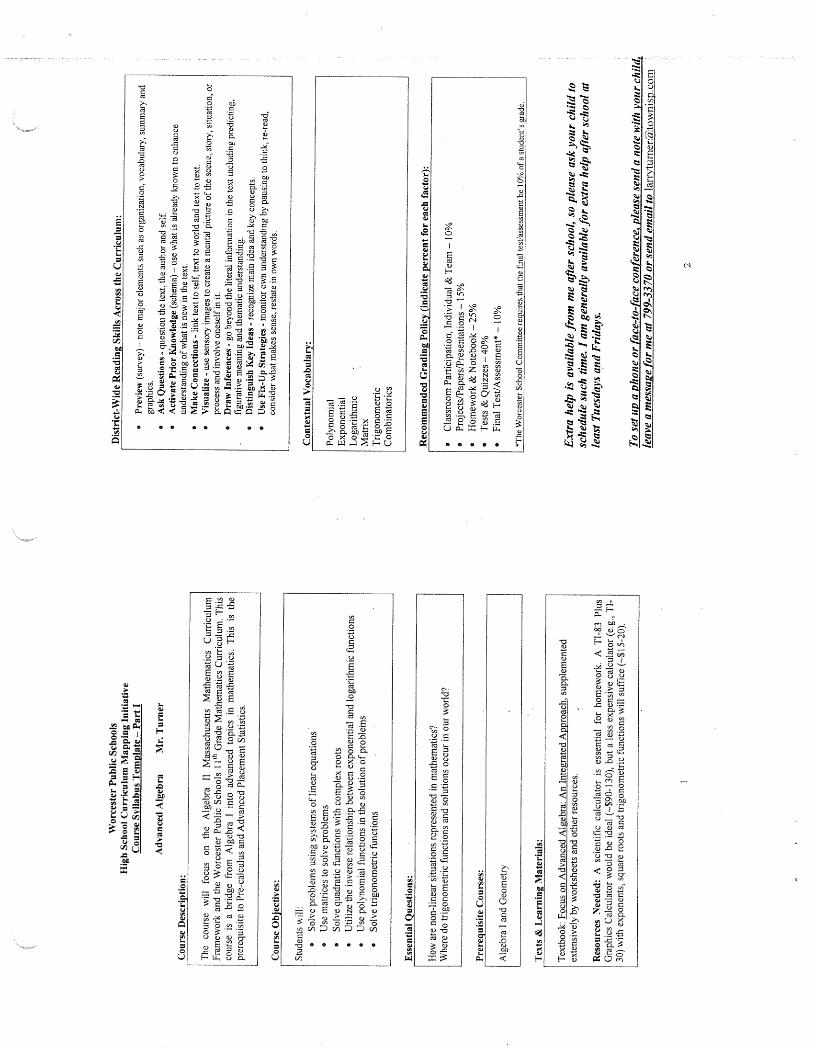
Advanced Algebra After successfully completing Algebra I and Geometry, students enter Advanced Algebra. Several
other schools refer to this course as Algebra II. “This course is a bridge from Algebra I into advanced
topics in mathematics. This is the prerequisite to Pre-calculus and Advanced Placement Statistics.”
(Appendix D) Students have an opportunity to take either College or Honors Advanced Algebra. The
placement of students depends on prior performance in Algebra I and Geometry, teacher
recommendations, and parent recommendations. In order to be considered for this course, students are
expected to be able to perform those concepts presented in Algebra I and Geometry.
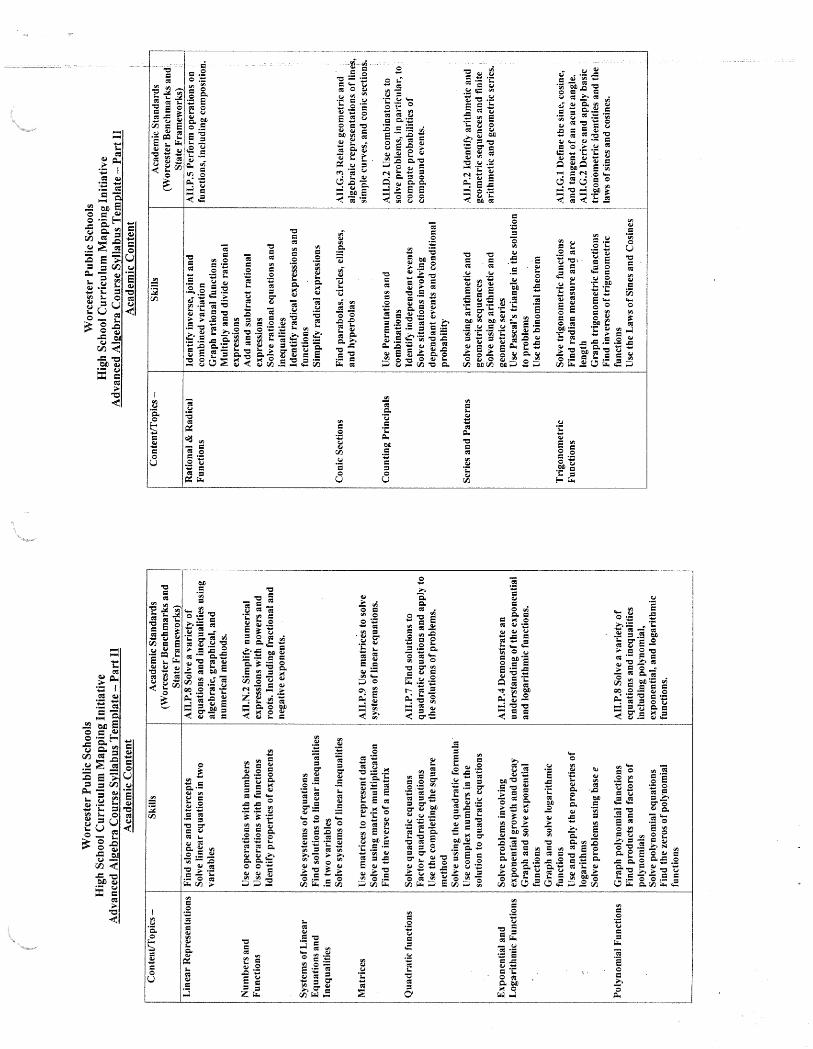
There are twelve concepts that students must grasp in order to be properly prepared for higher
level mathematics. These topics are outline in the City of Worcester and State of Massachusetts
Academic Standards. They include Linear Representations, Numbers and Functions, Systems of Linear
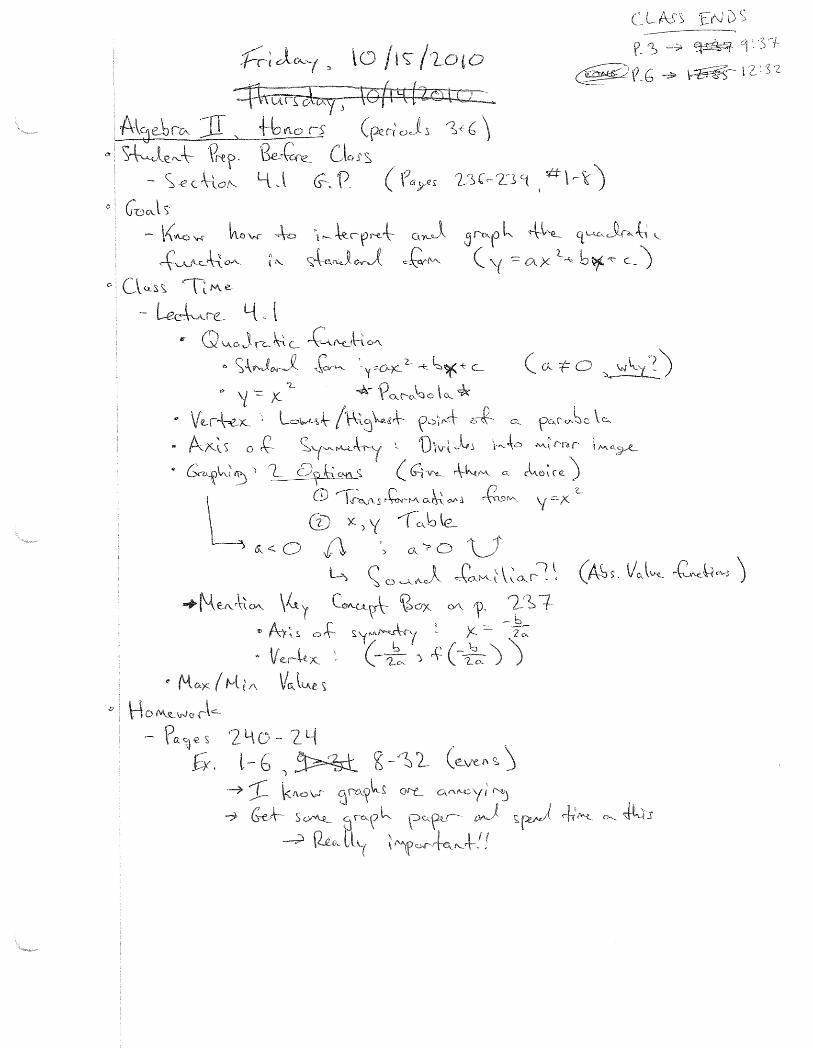
Equations and Inequalities, Matrices, Quadratic functions, Exponential and Logarithmic Functions,
Polynomial Functions, Rational & Radical Functions, Conic Sections, Counting Principals, Series and
Patterns, and Trigonometric Functions (Appendix E).
Students placed in College Advanced Algebra experience a comfortably paced course that
focuses on thoroughly understanding the topics that are covered. A bulk of the coursework takes place
in class where students have an opportunity to ask questions. Those students who take college level
courses are often less likely to study independently or may need more explanation than other students.
Honors Advanced Algebra is for students who have proven to be hard workers in Algebra I and
Geometry. This course thoroughly analyzes each topic in order to give students a better understanding
of the ideas discussed. Students are expected to be independent with their studies and ask the more
difficult questions. Parents may request to have their child placed in an honors course but it is primarily
the teachers that decide.
Proceeding Mathematics Courses Pre-Calculus, AP Statistics, and AP Calculus are courses that follow after a student completes the
basic courses discussed above. Pre-Calculus is designed to introduce students to concepts that will be
used constantly in higher level math courses. Of course, Algebra I, Geometry, Advanced Algebra
sequence is essential for success in this course. Seniors may take this as their final high school math
course. Some students may enroll in Pre-Calculus their junior year in order to prepare themselves for AP
Statistics or AP Calculus. In either case, it will prepare them for a faster-paced curriculum with a more
demanding work load. Furthermore, Advanced Placement (AP) courses, such as AP Calculus and AP
Statistics, are a great way to show a university or college that a student can perform at a higher level of
education.
Course Materials
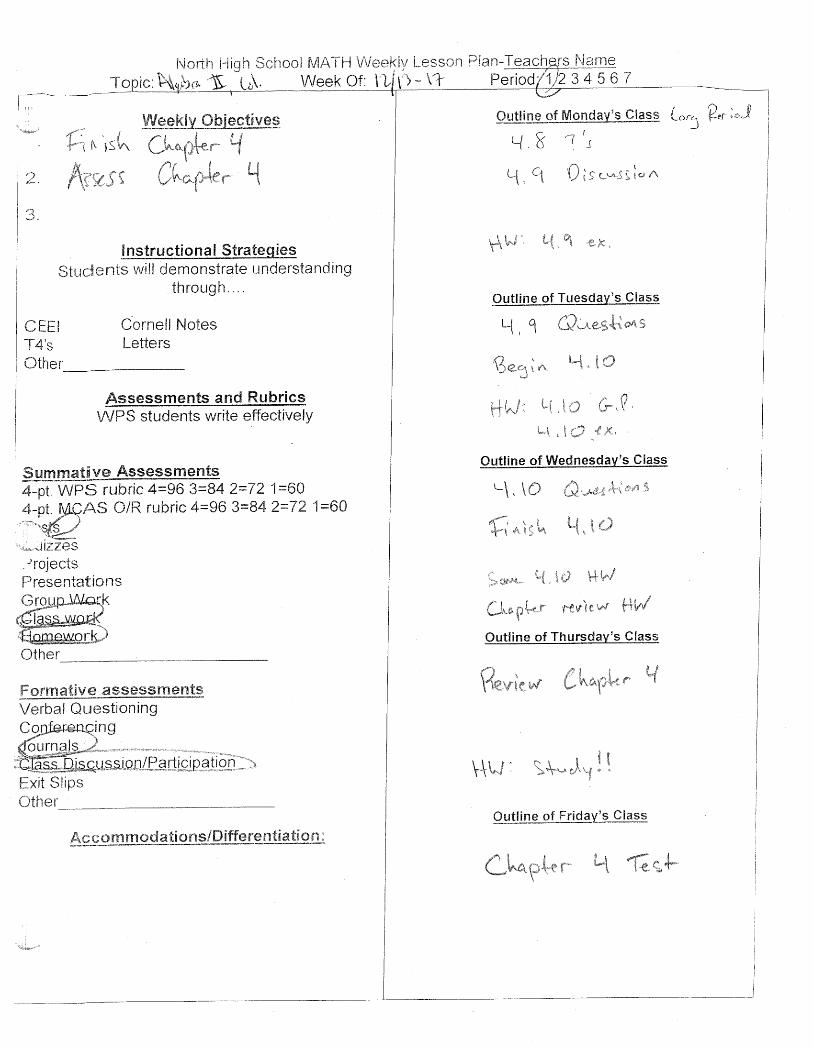
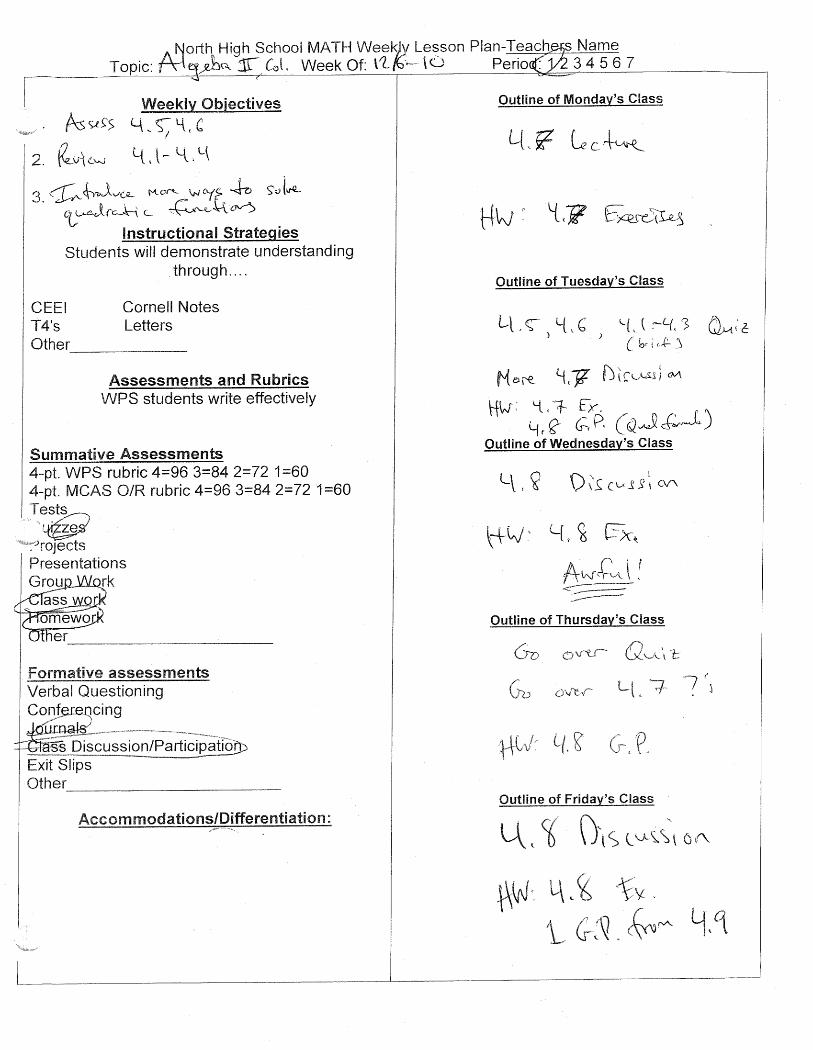
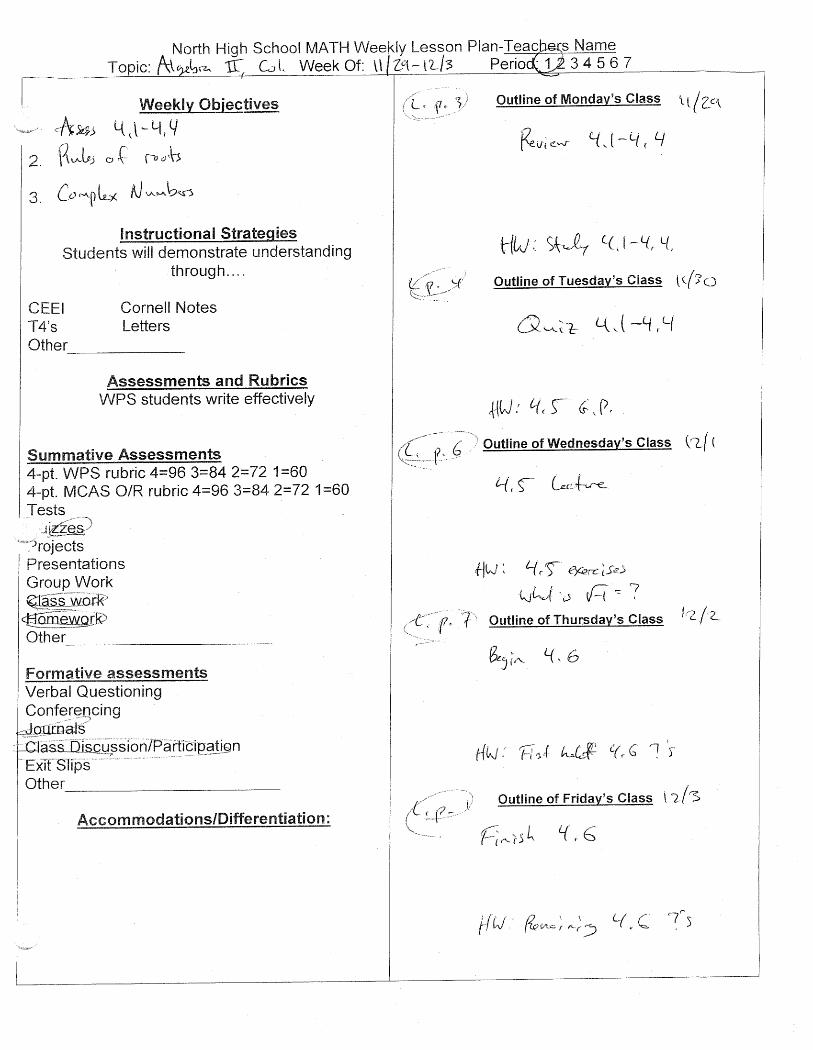
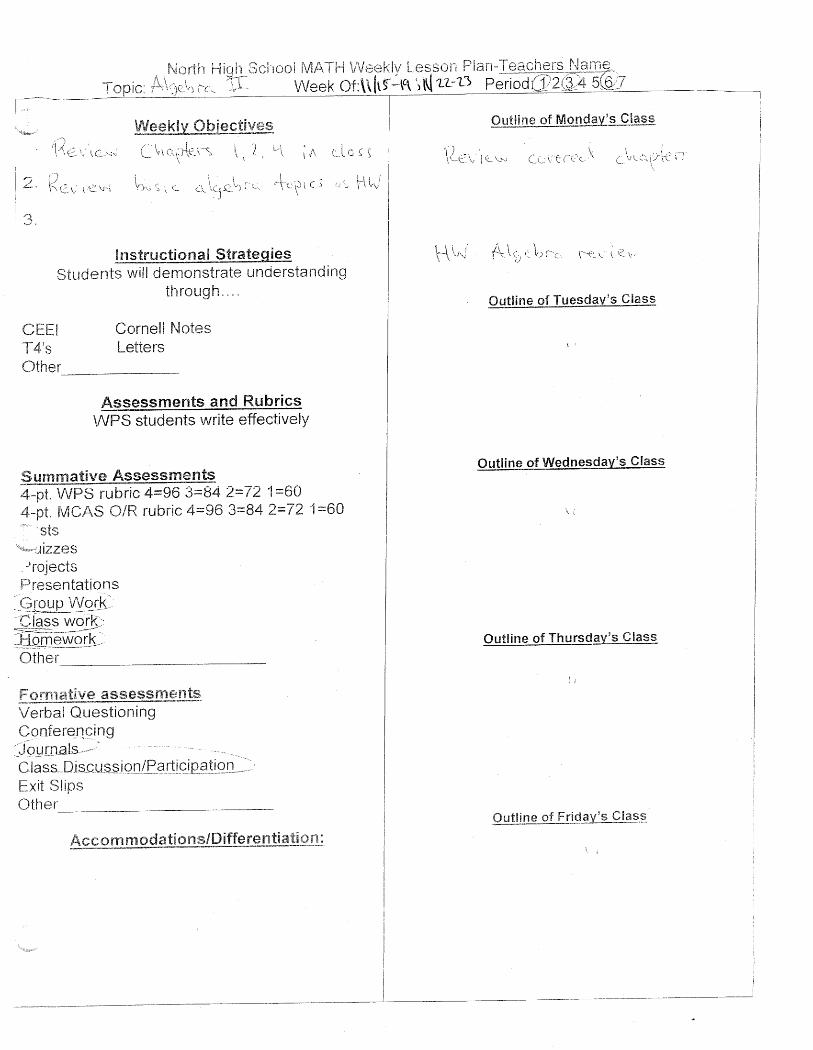
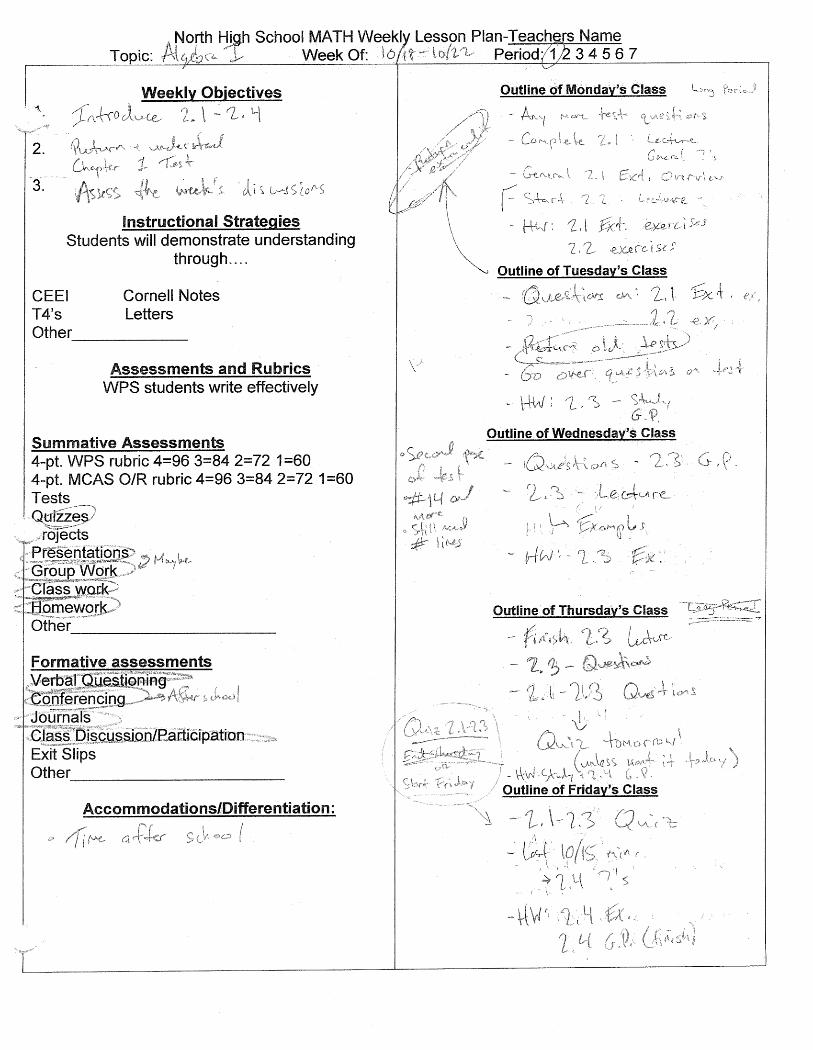
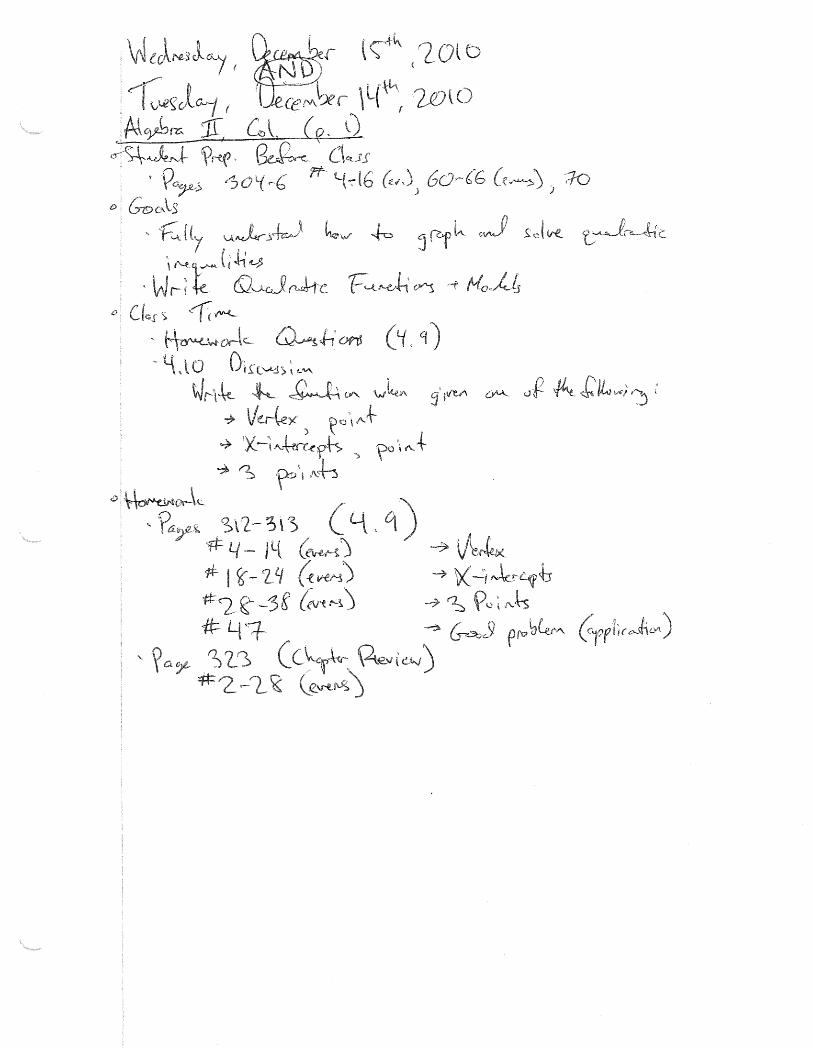
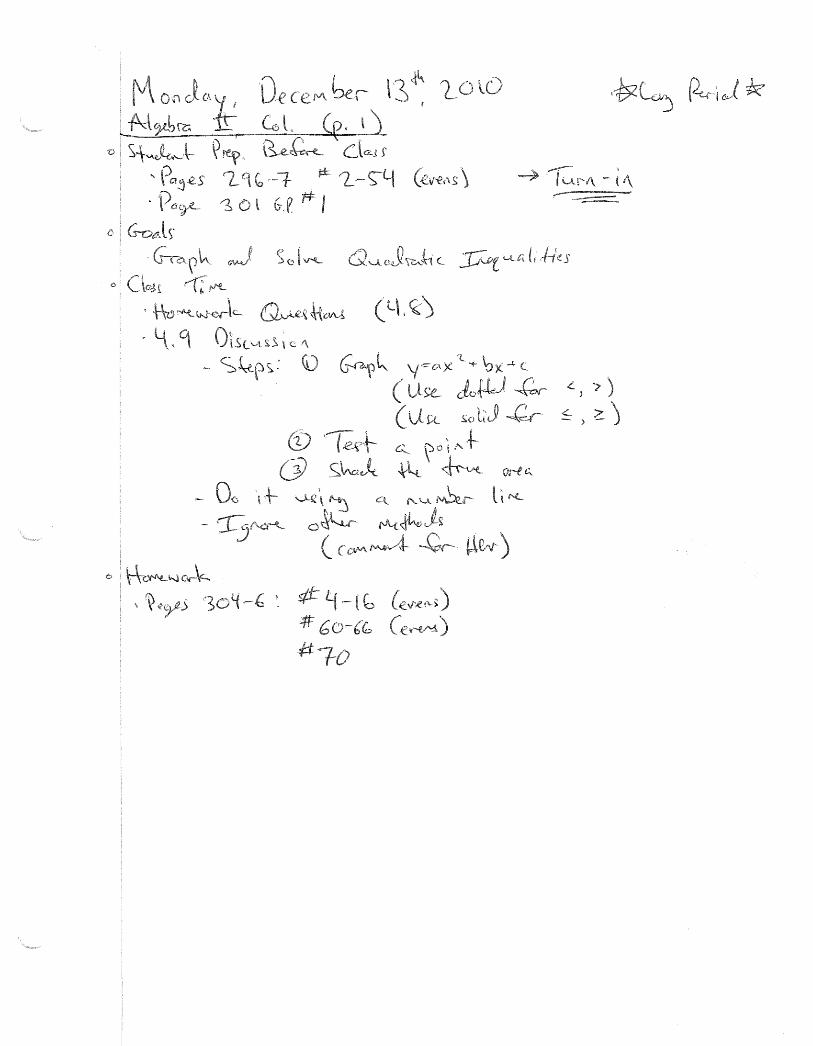
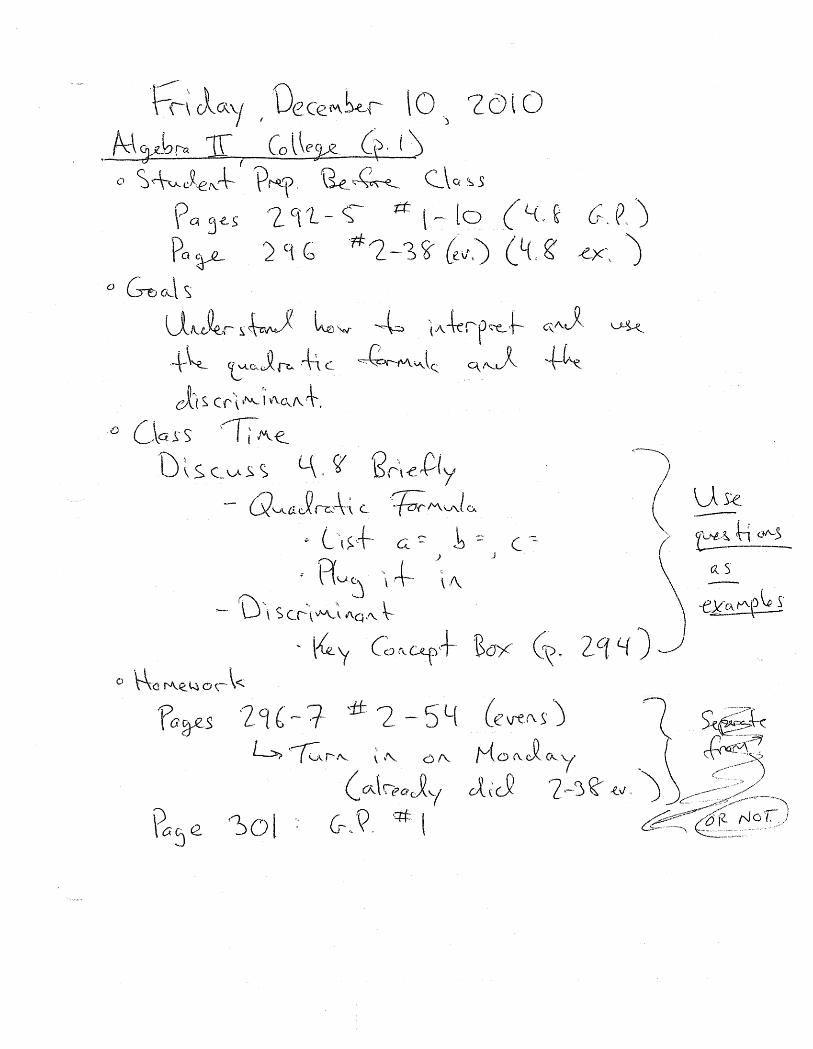
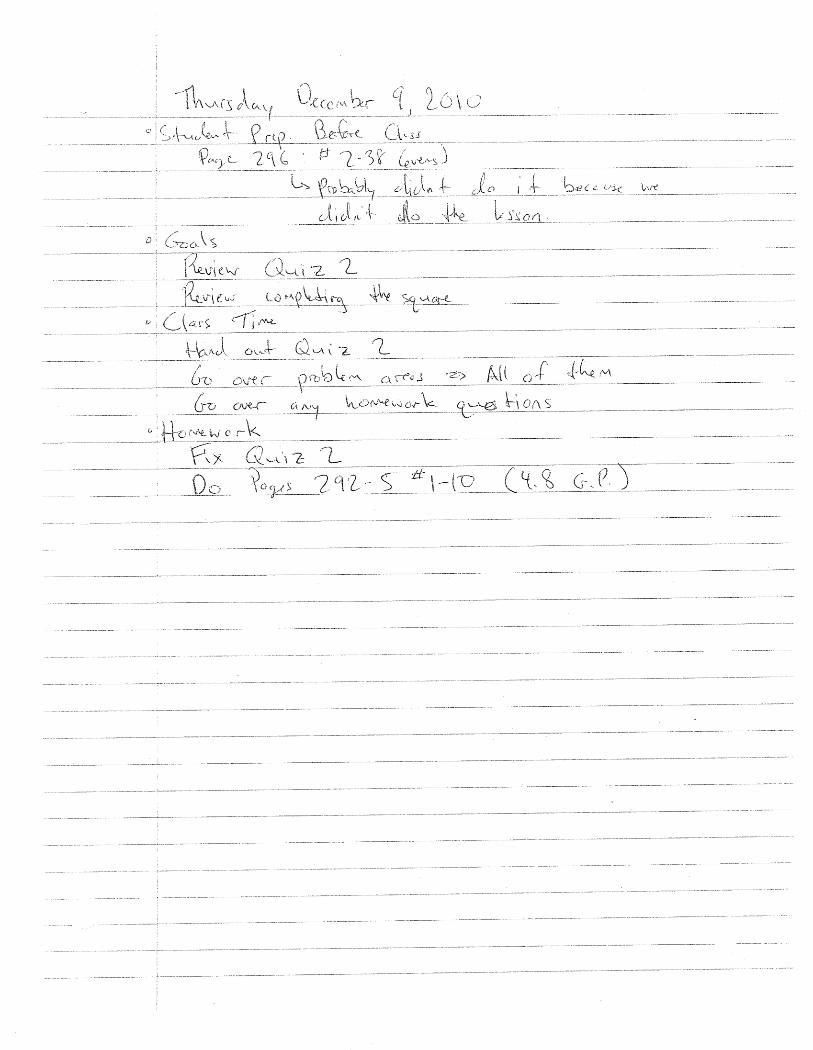
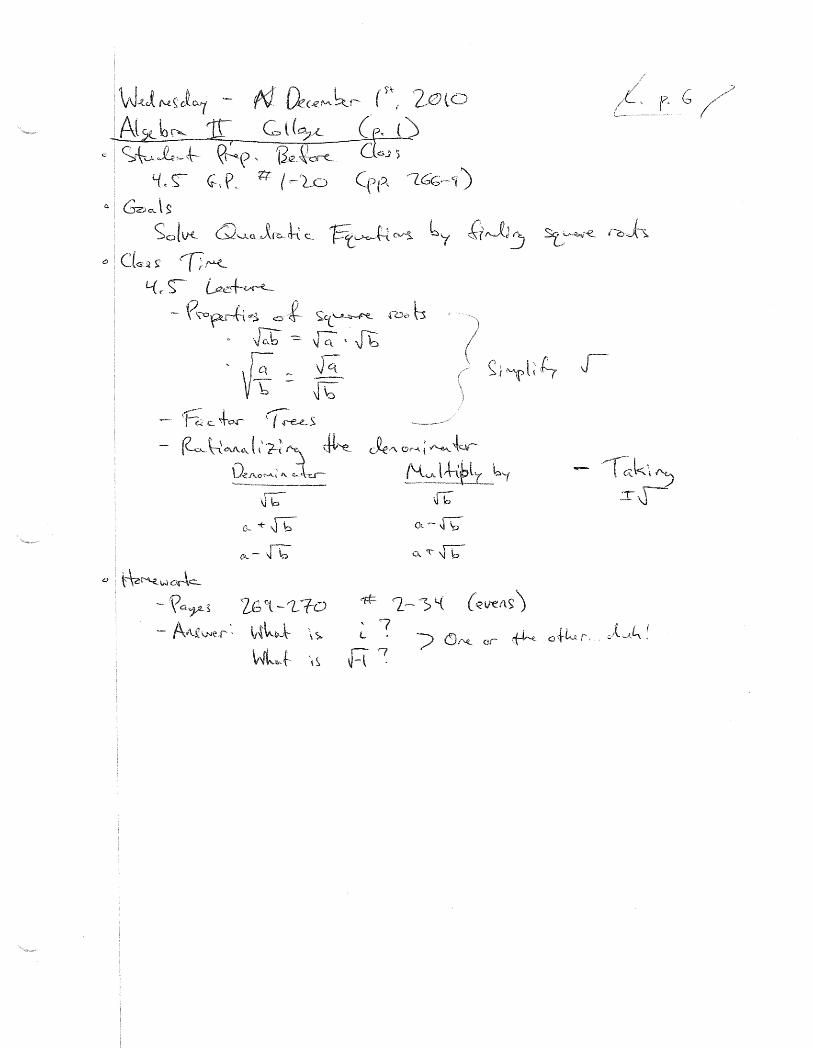
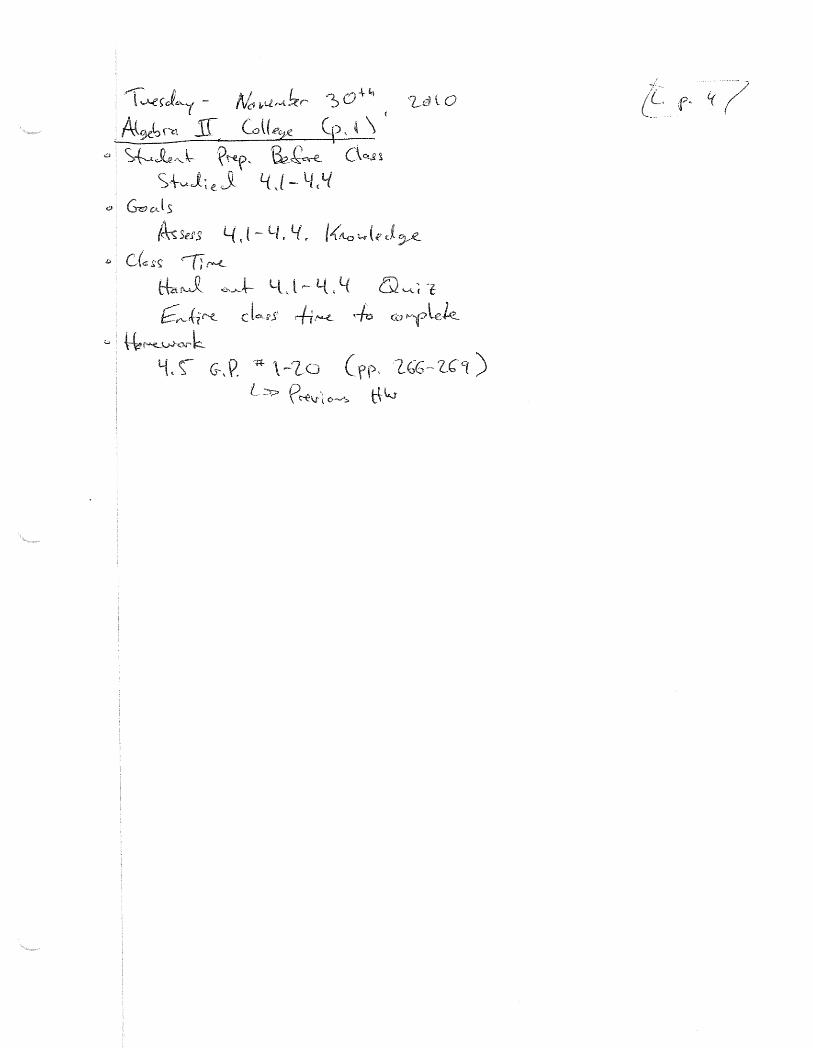
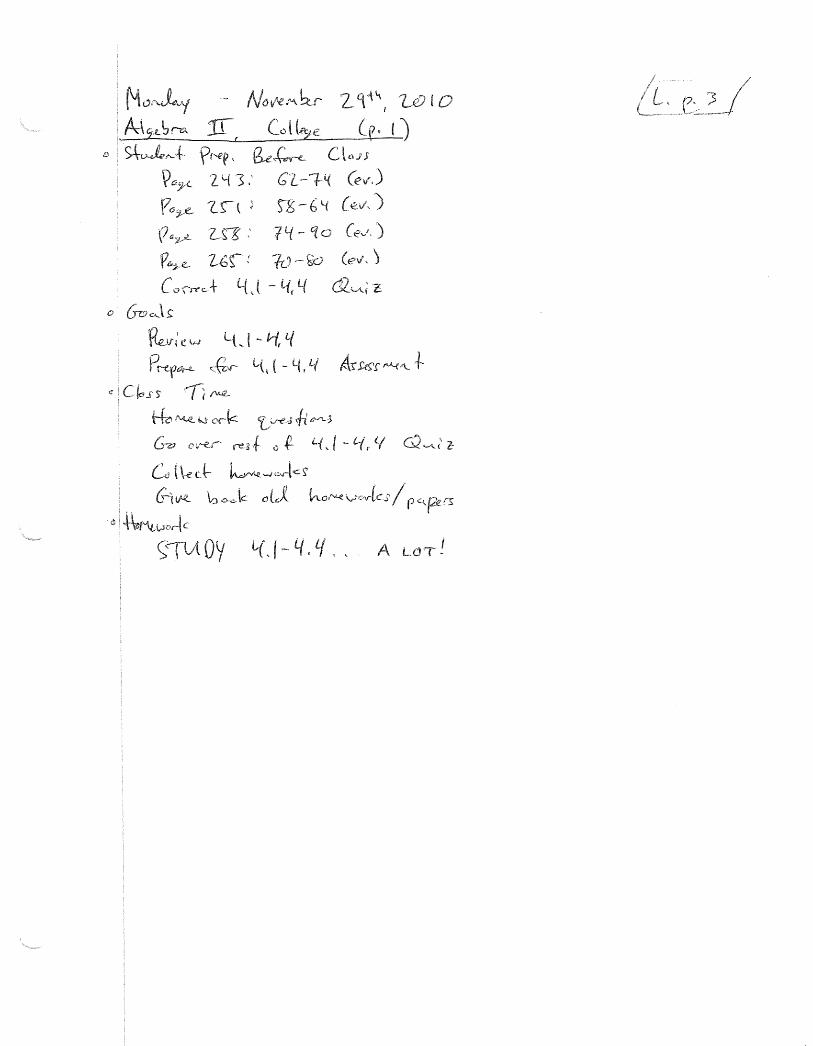
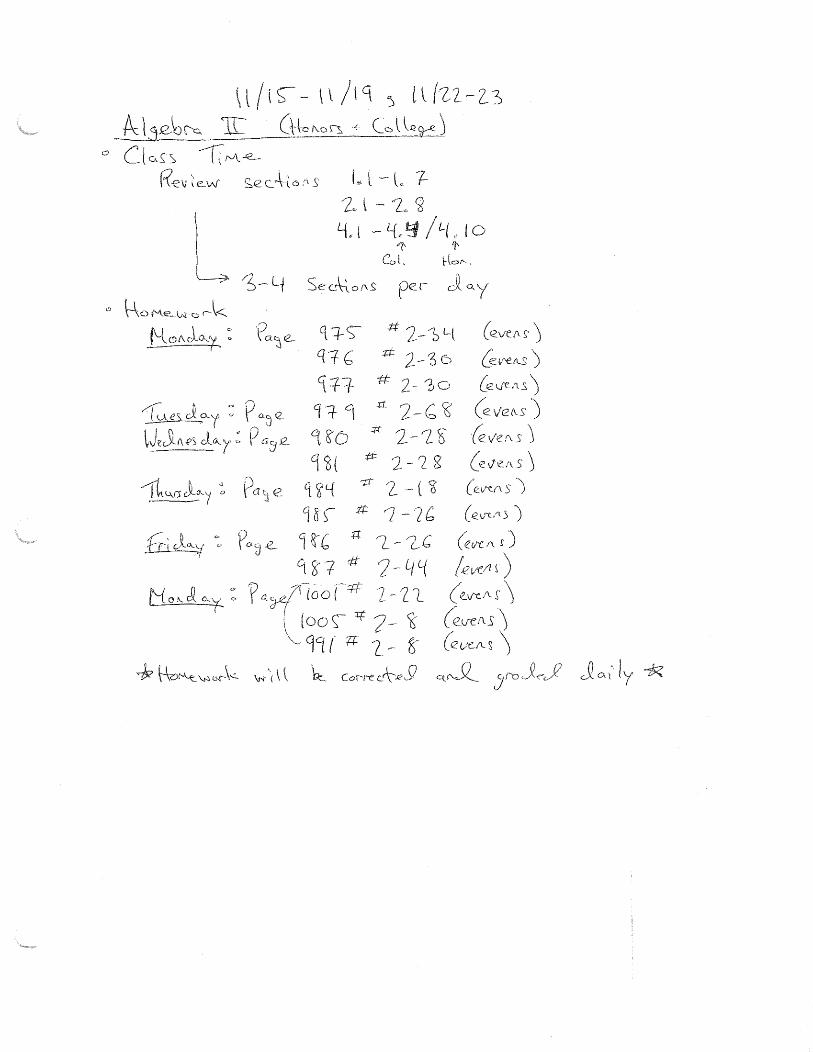
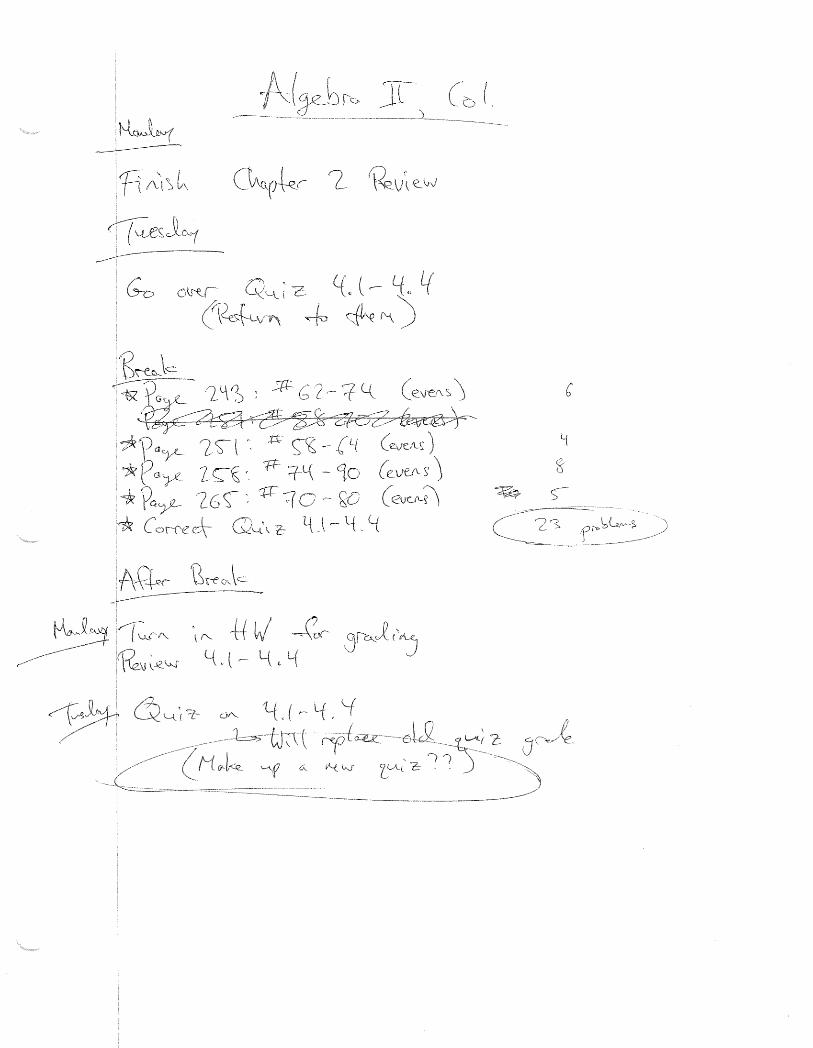
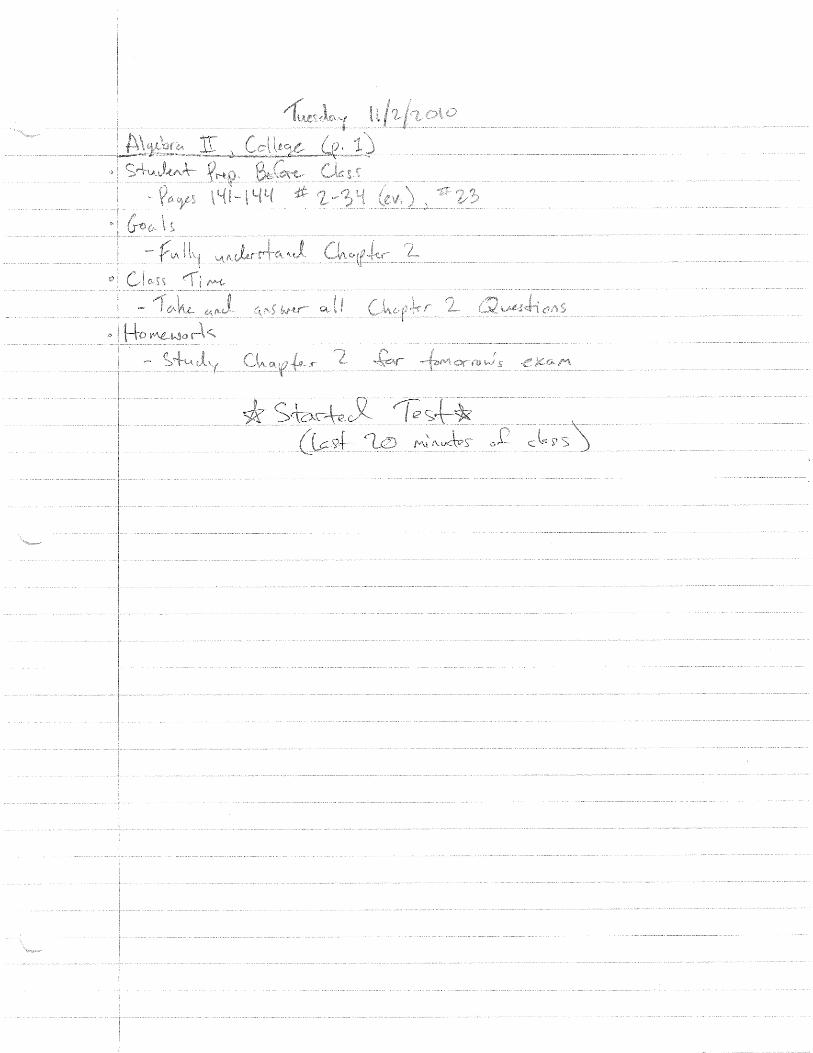
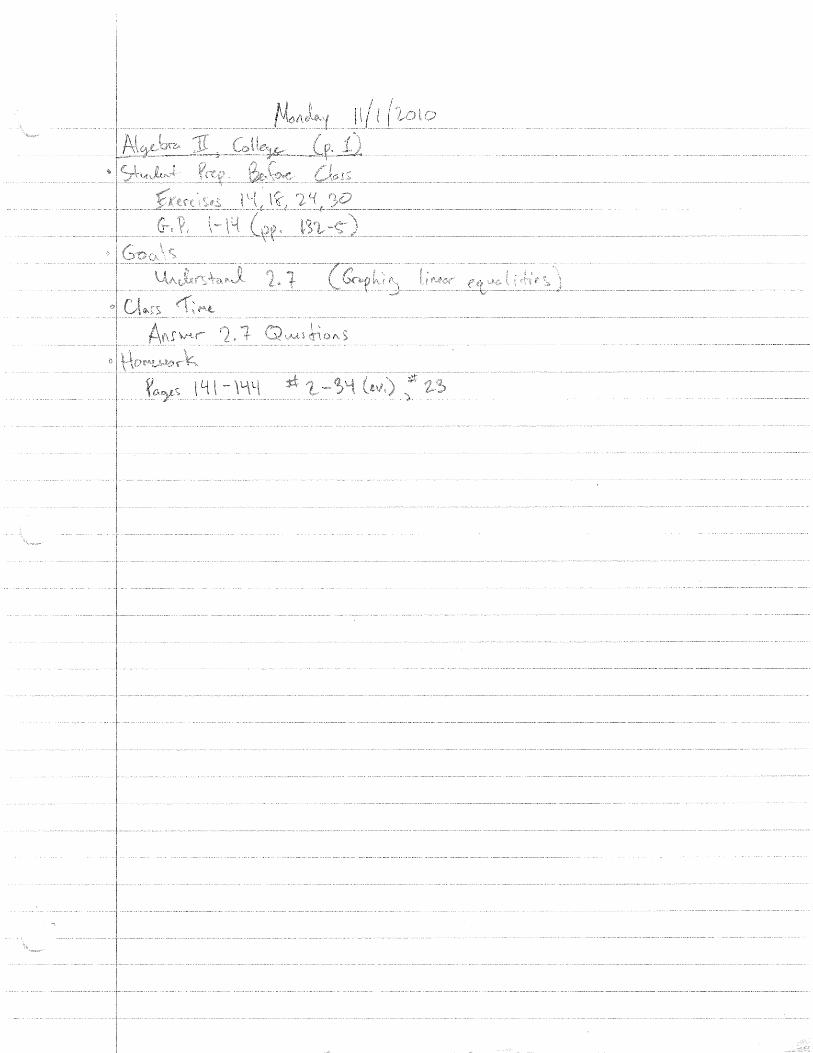
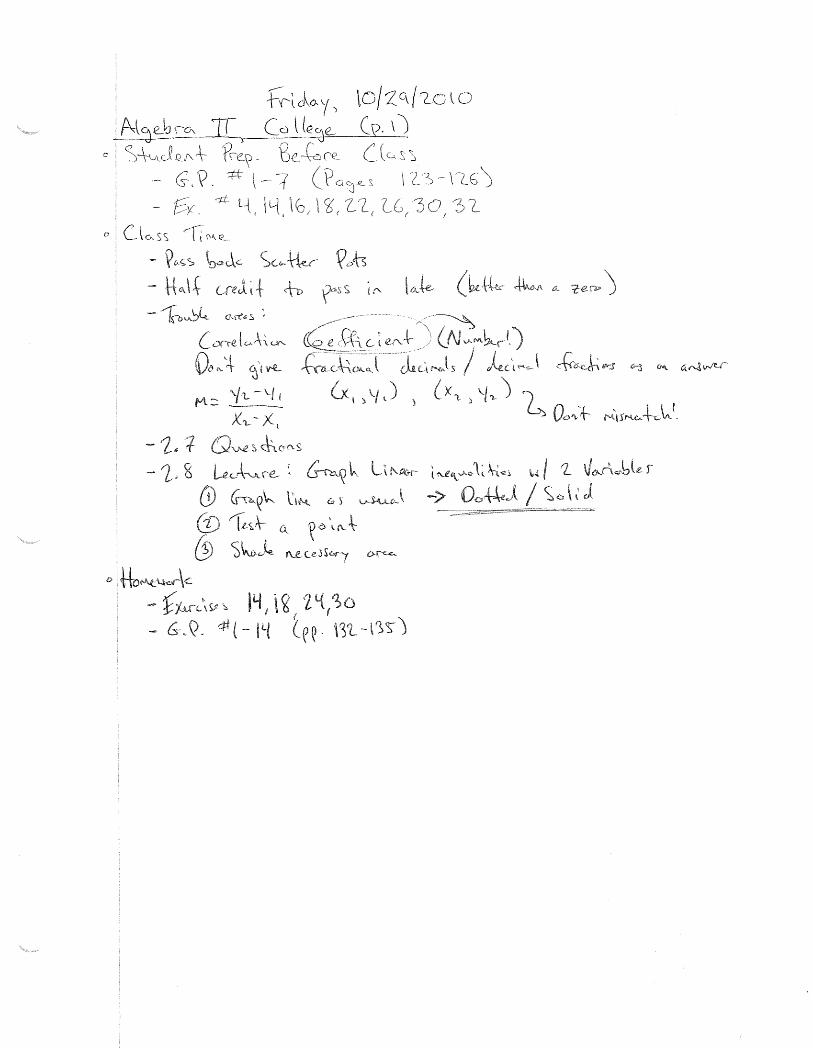
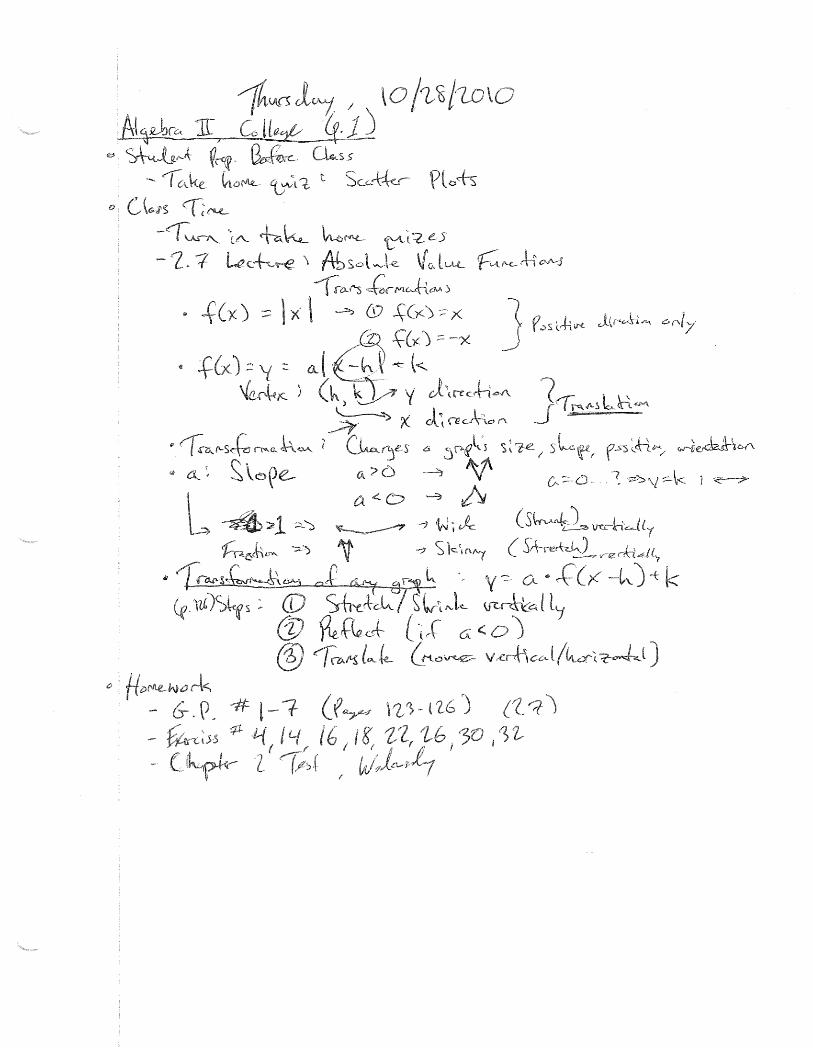
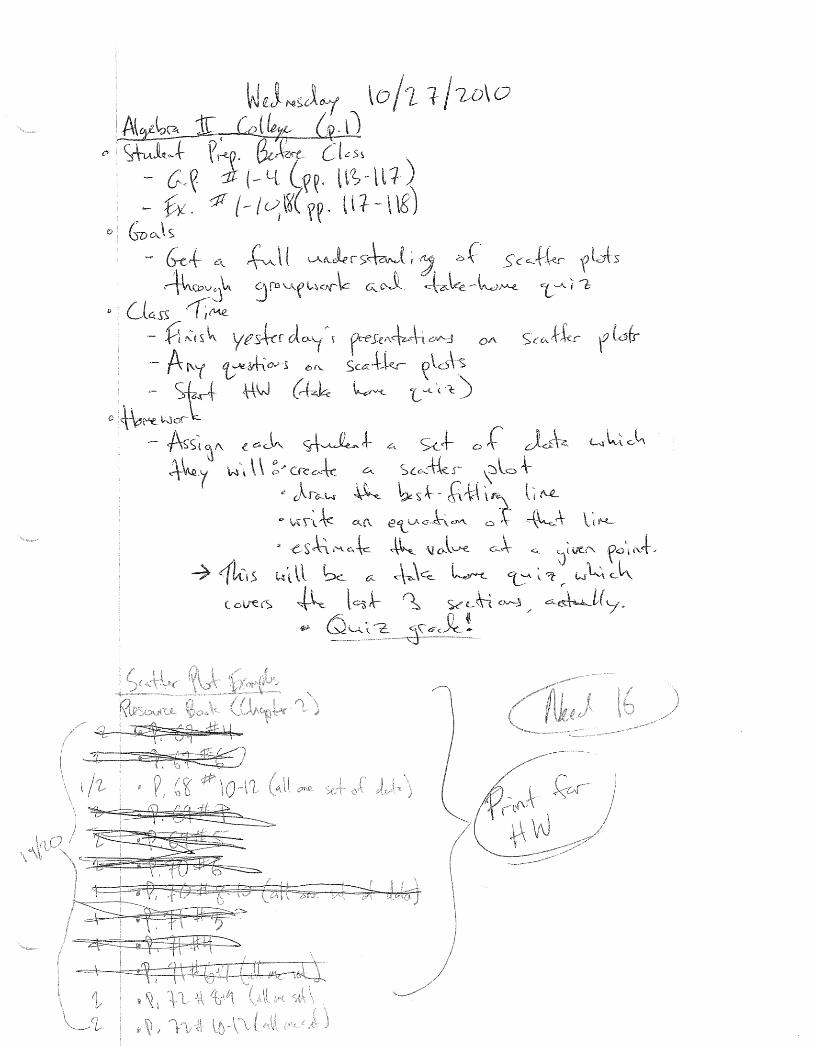
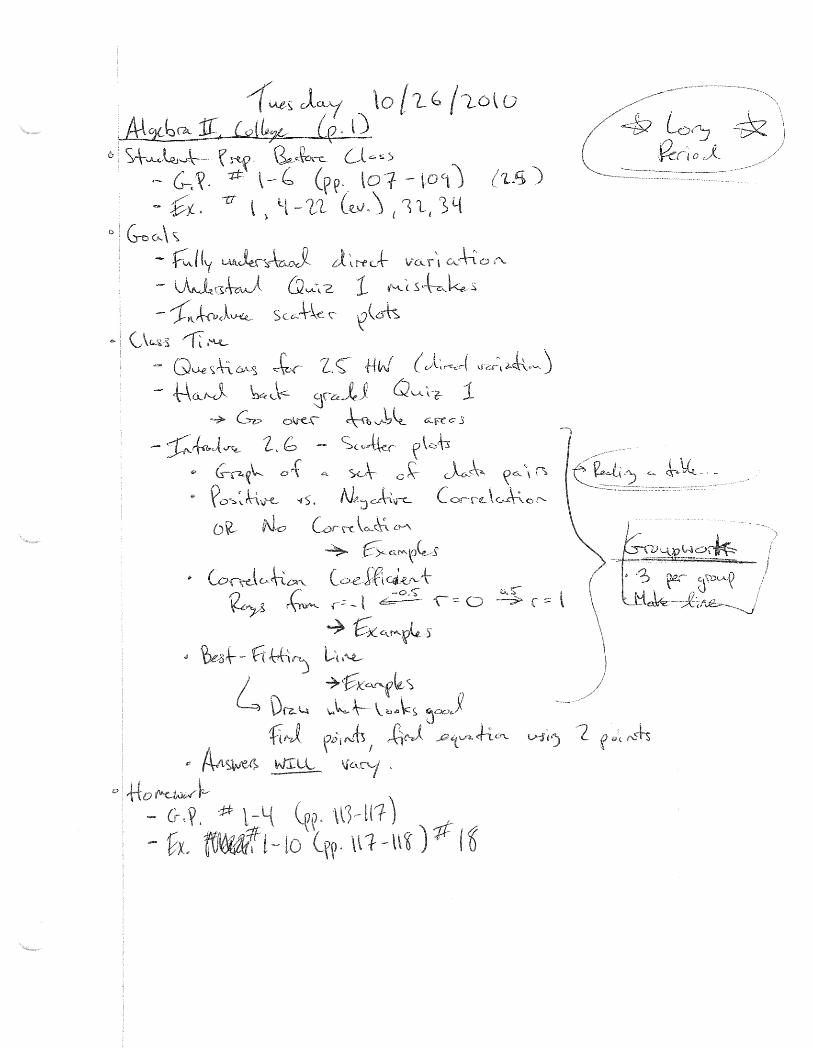
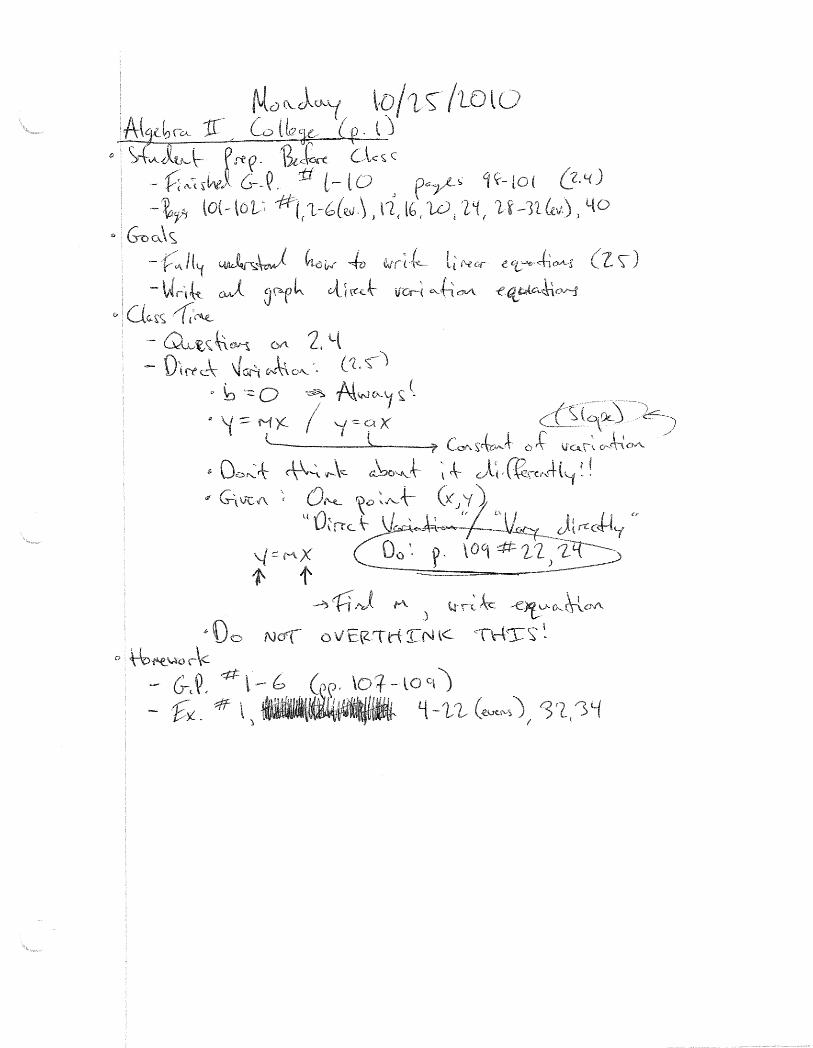
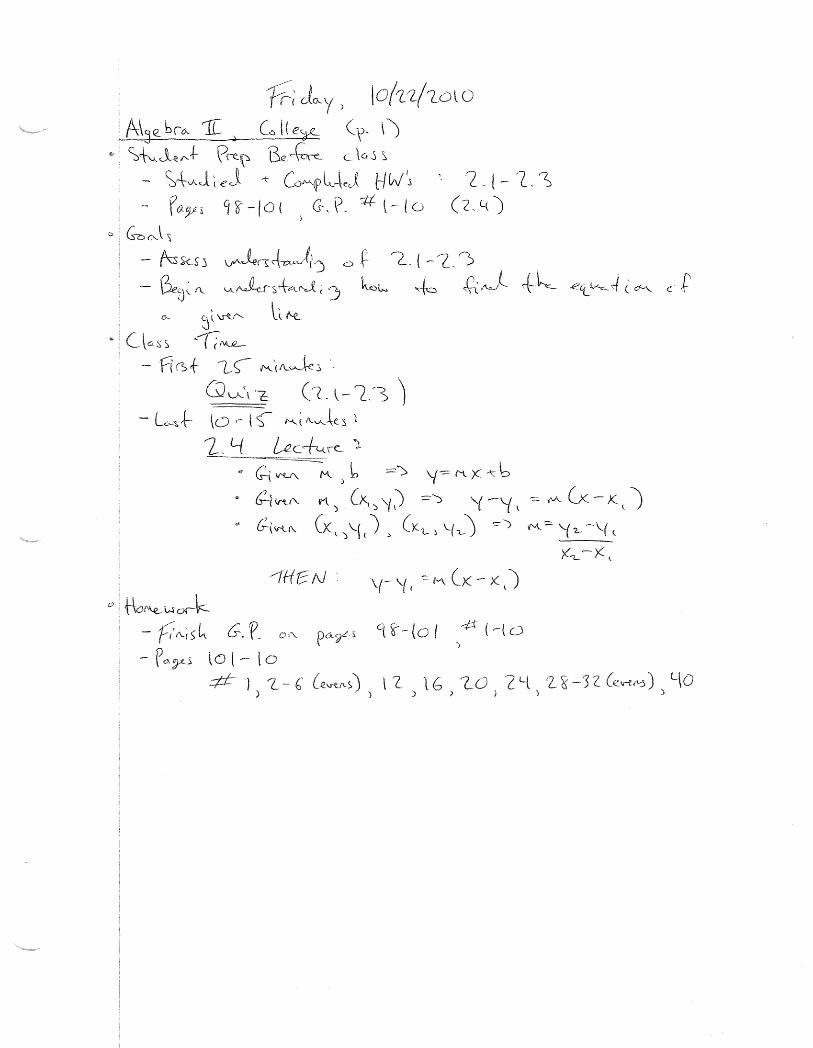
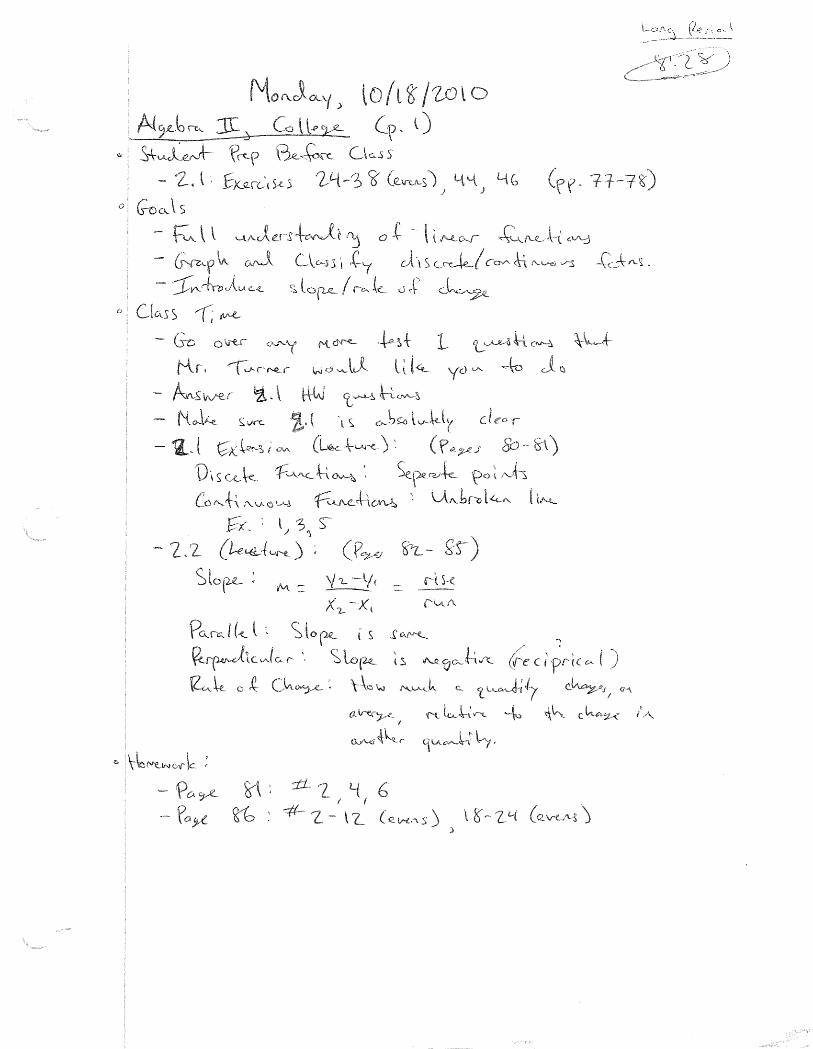
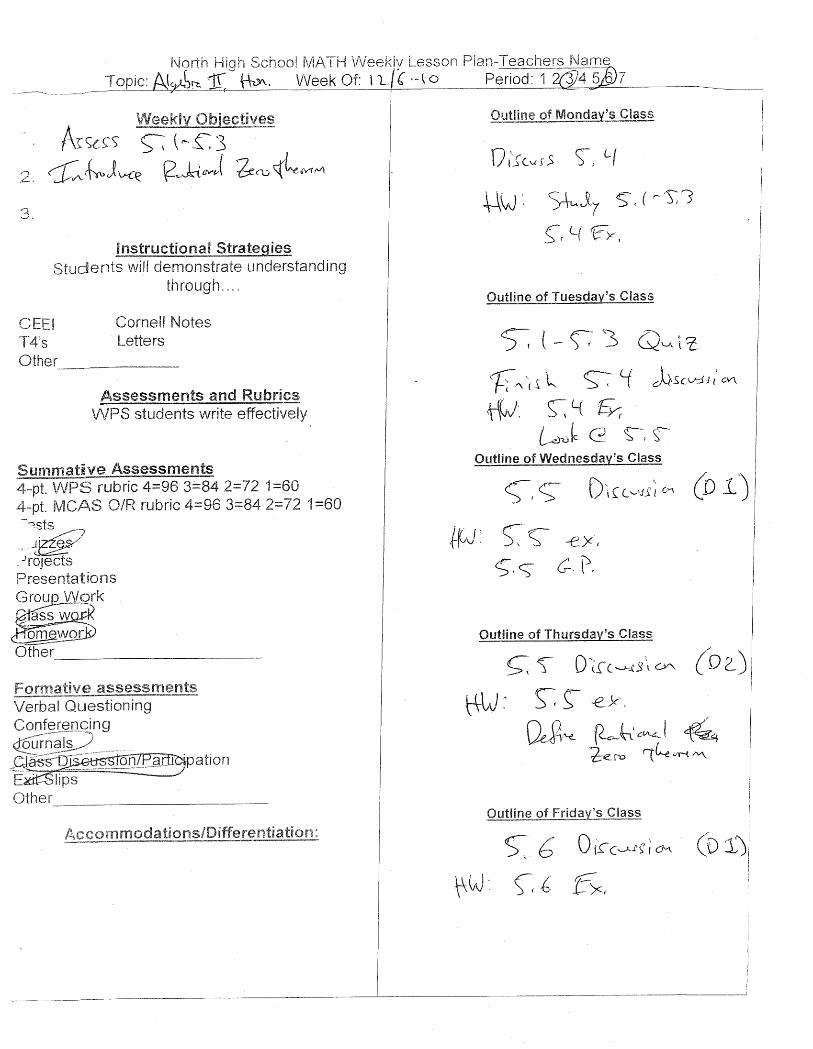
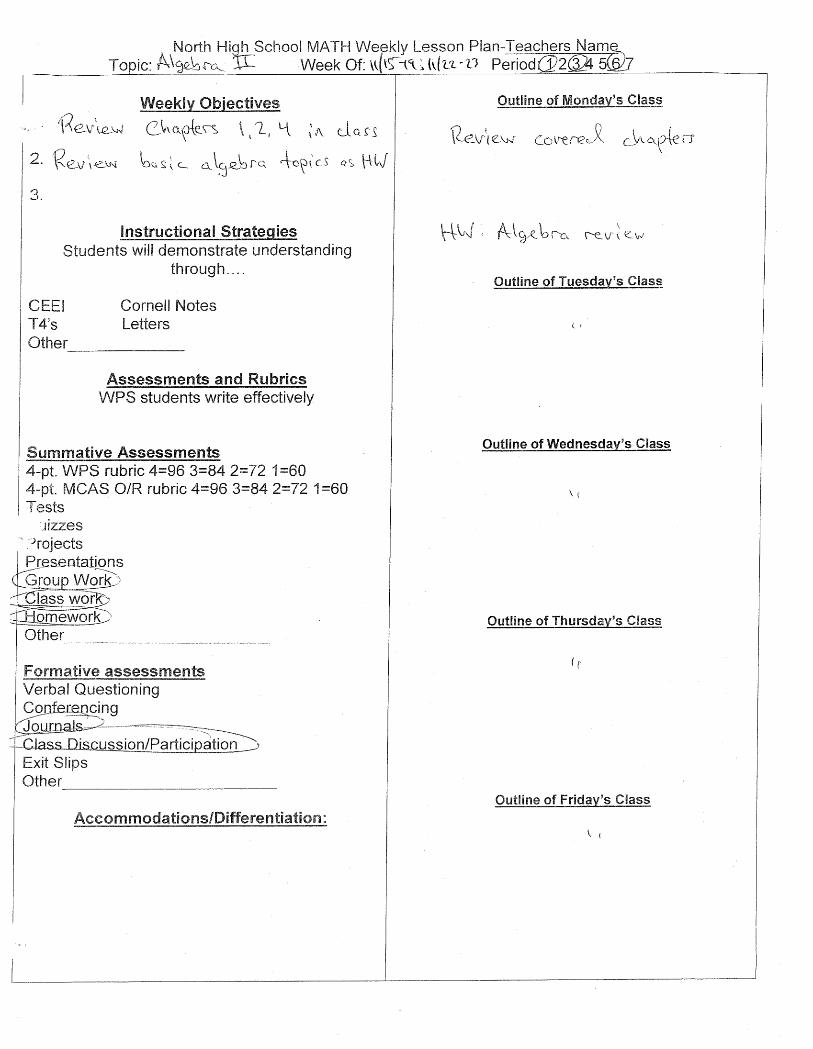
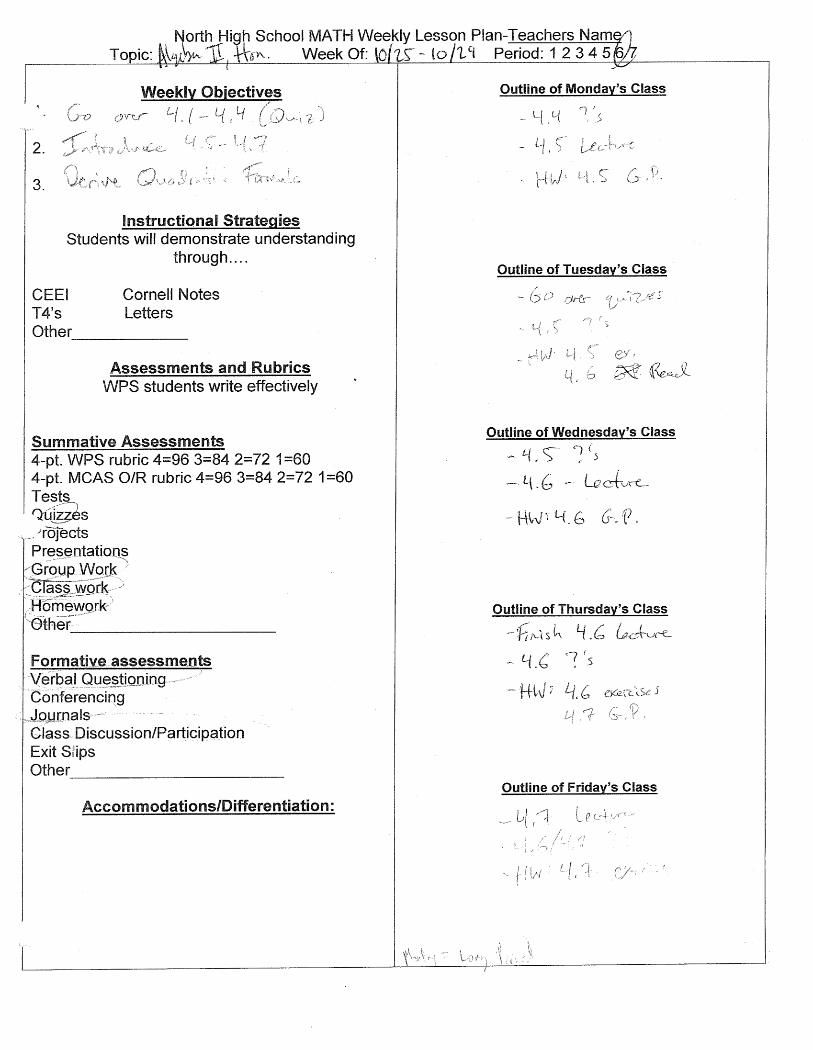
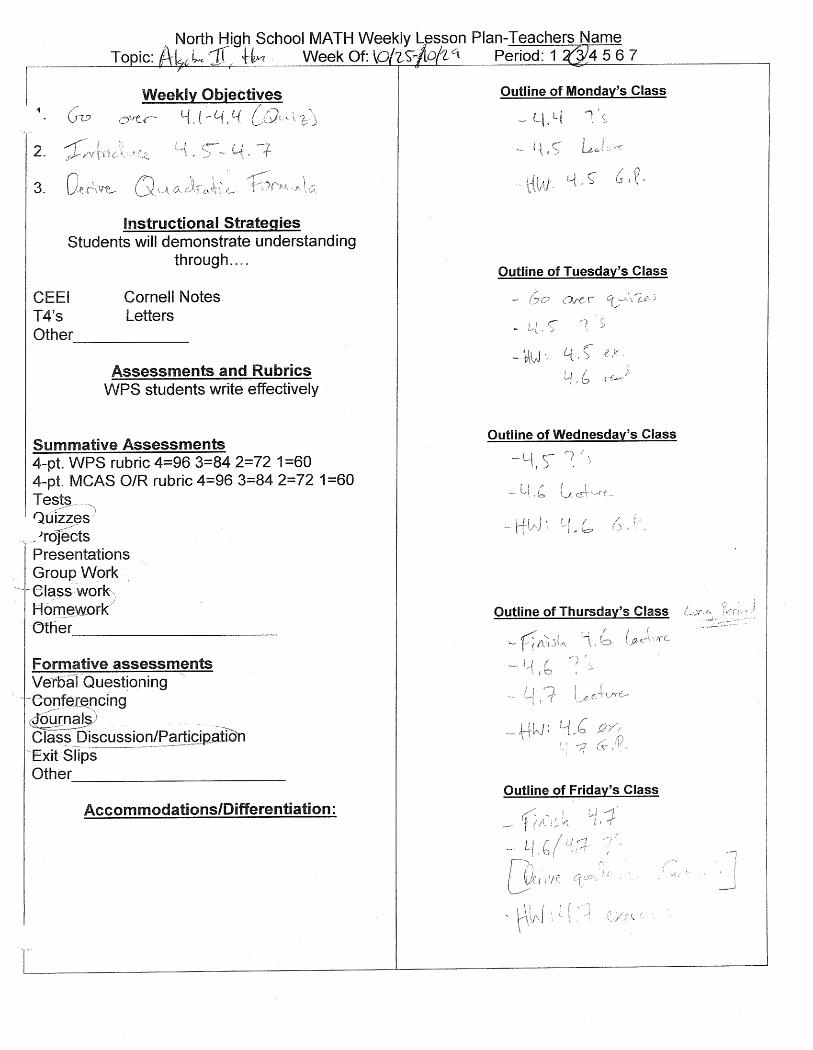
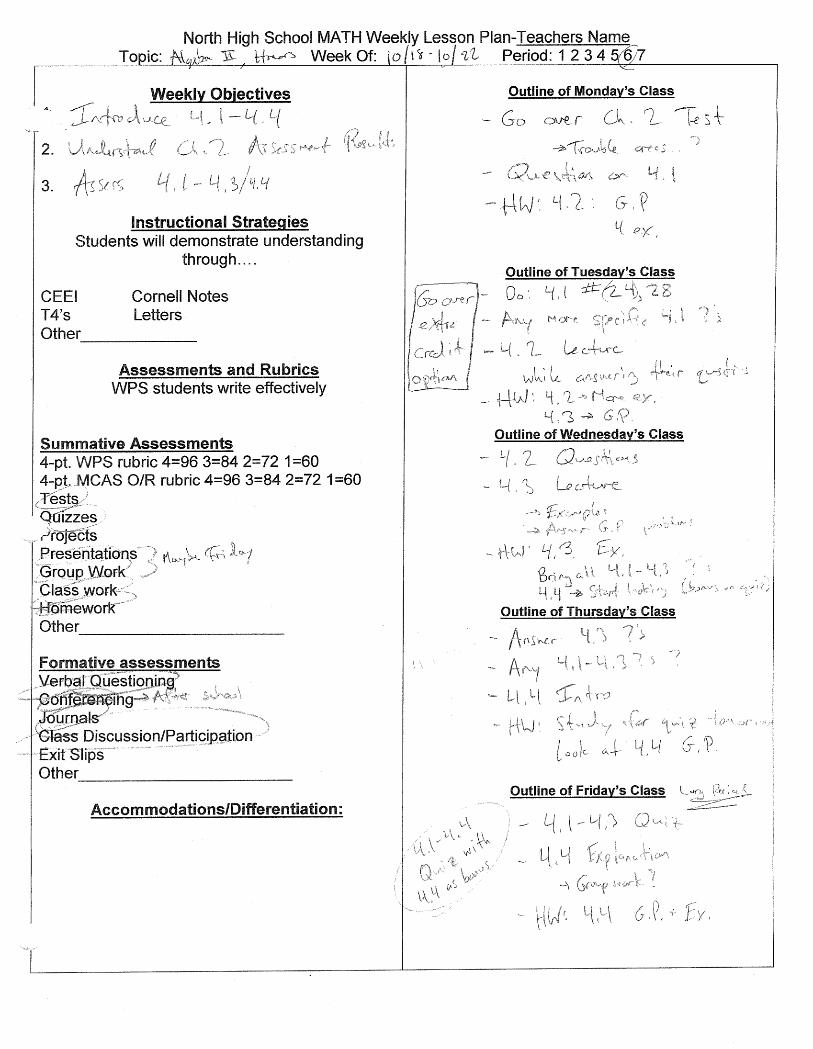
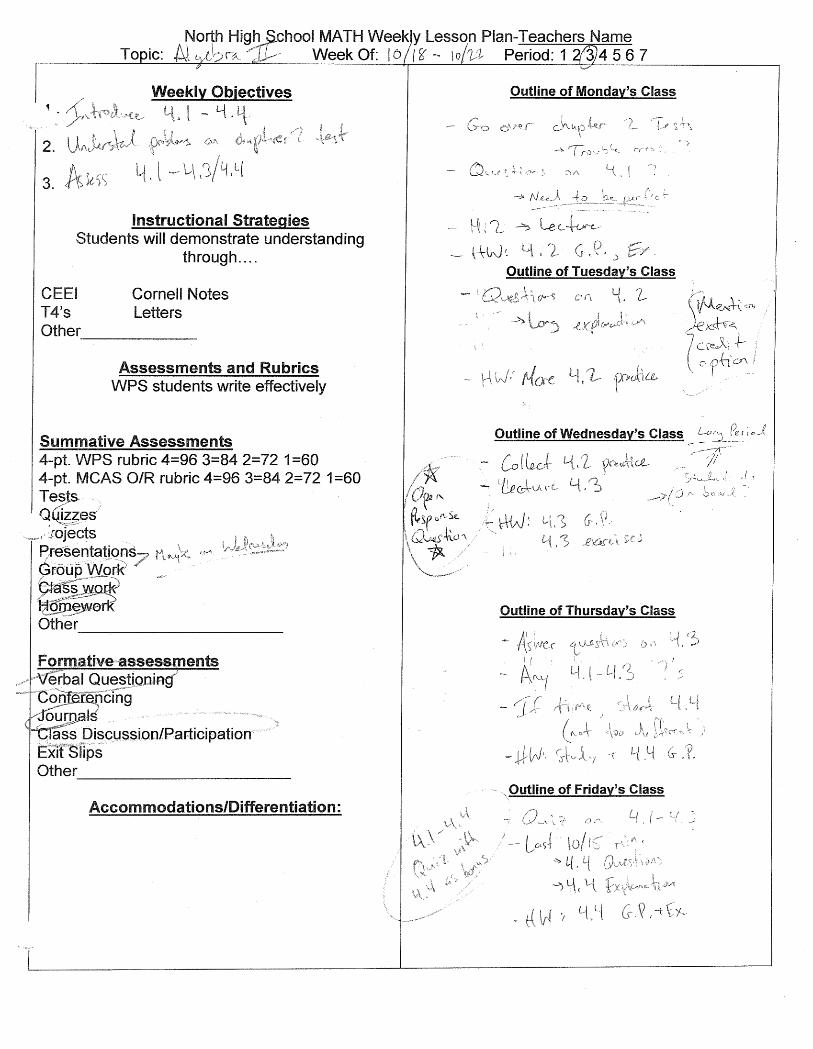
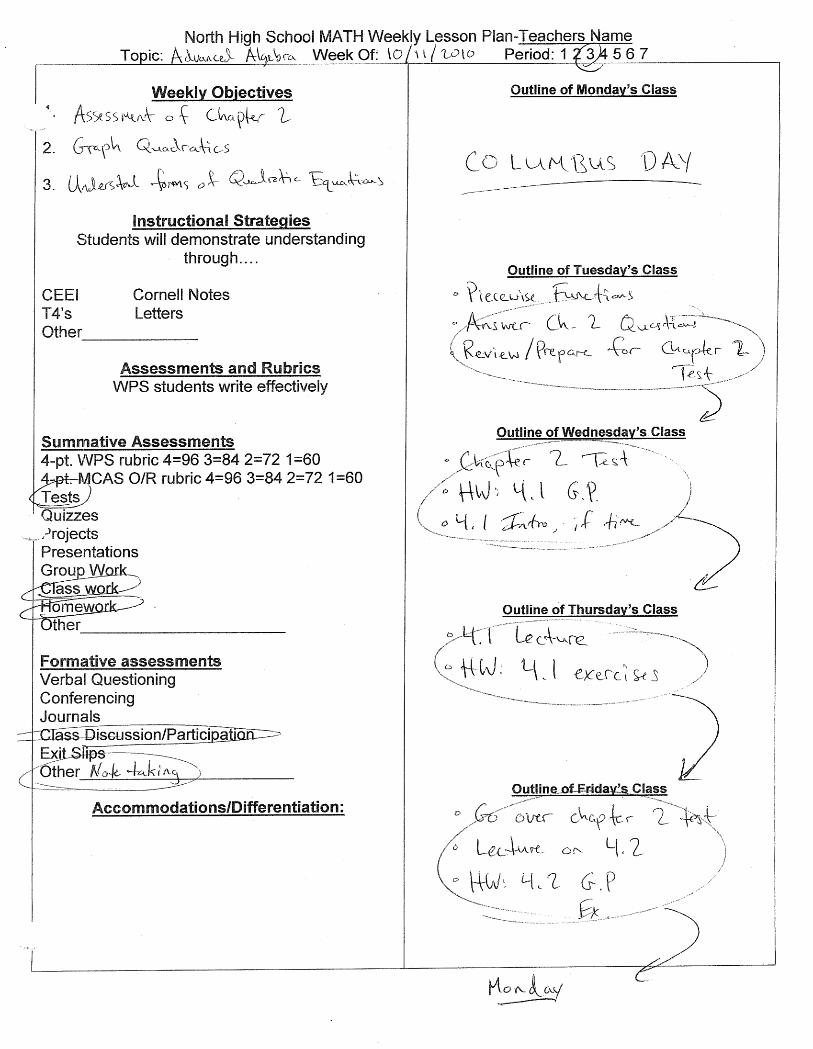
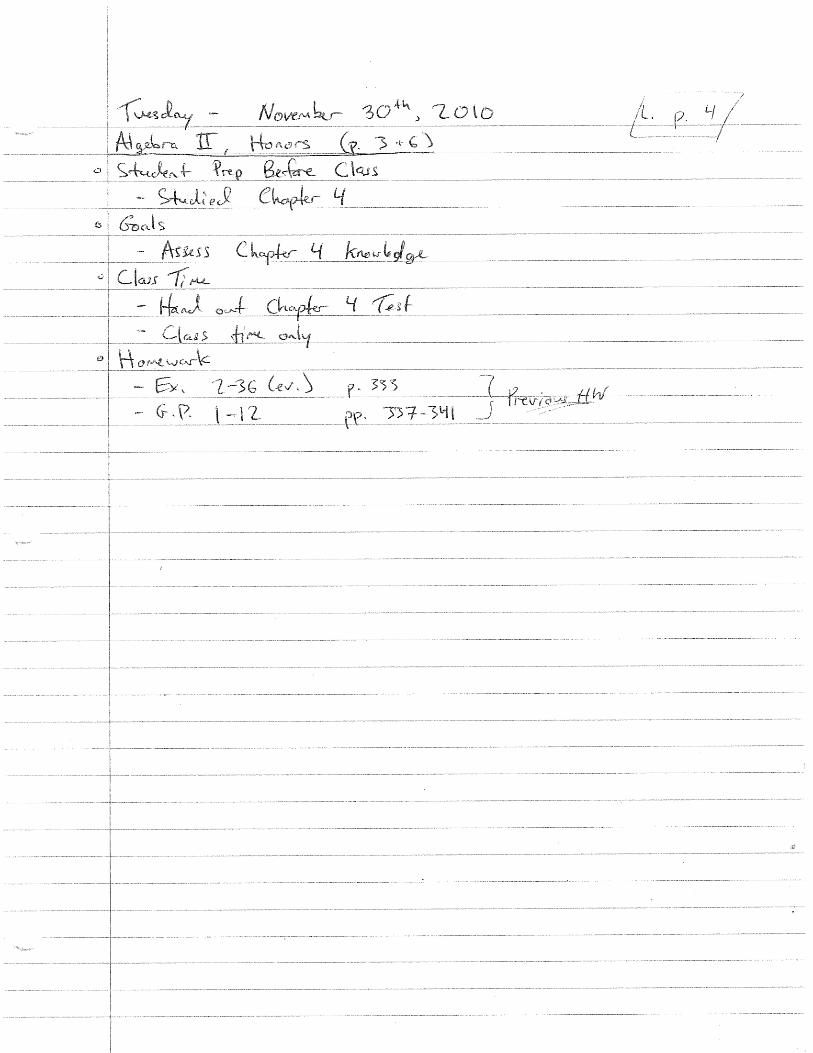
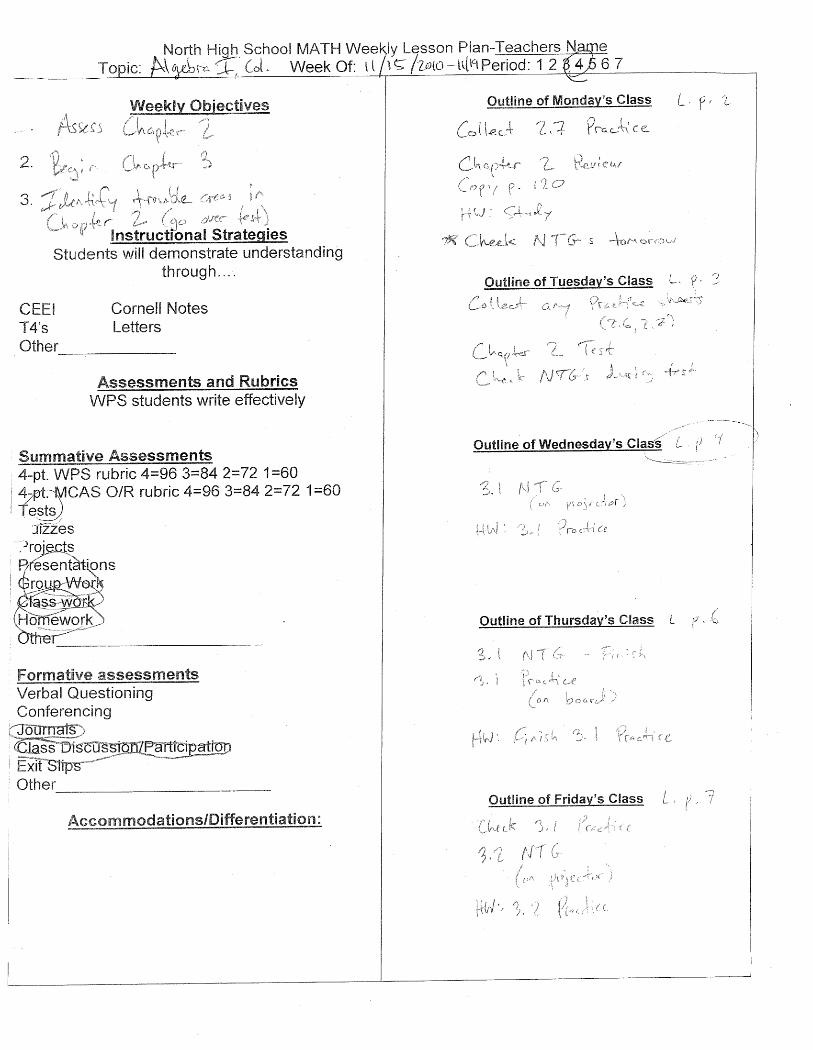
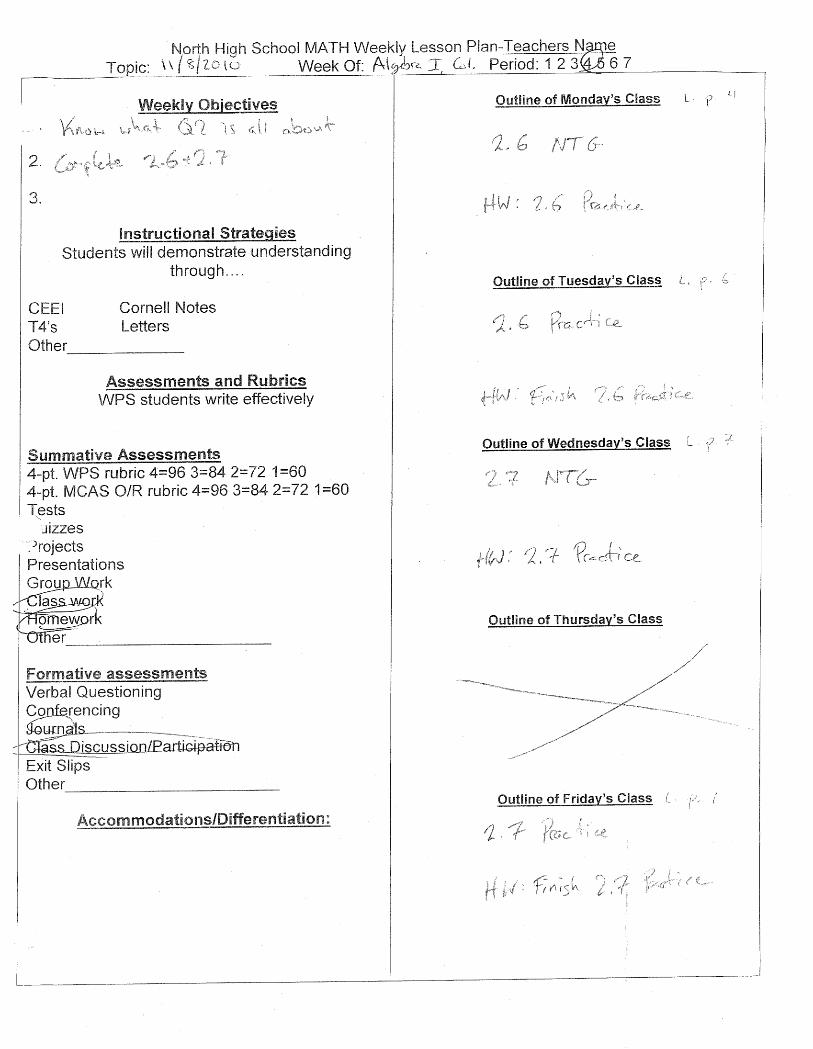
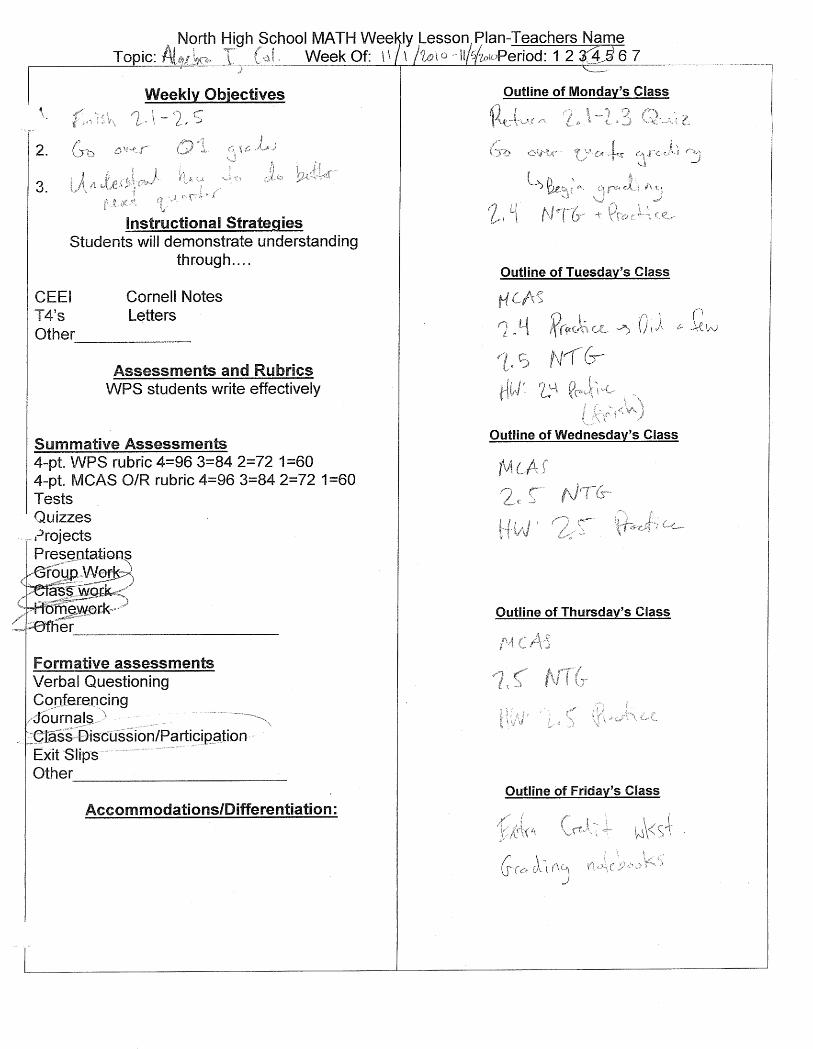
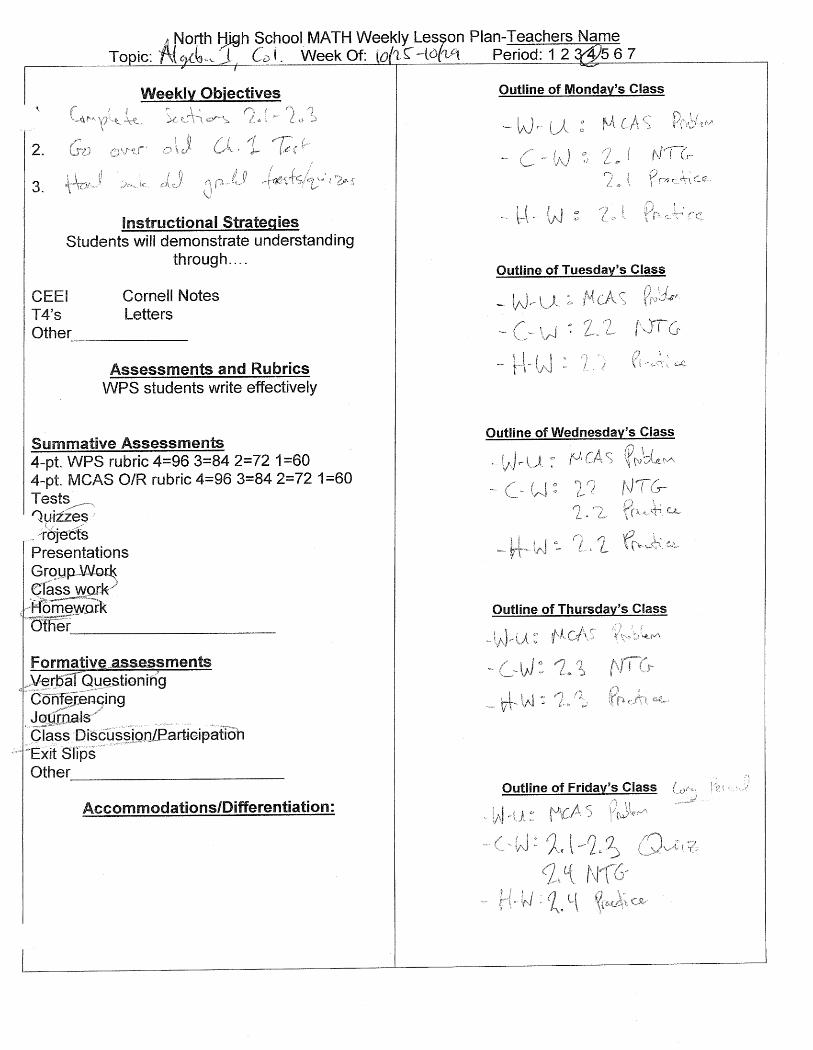
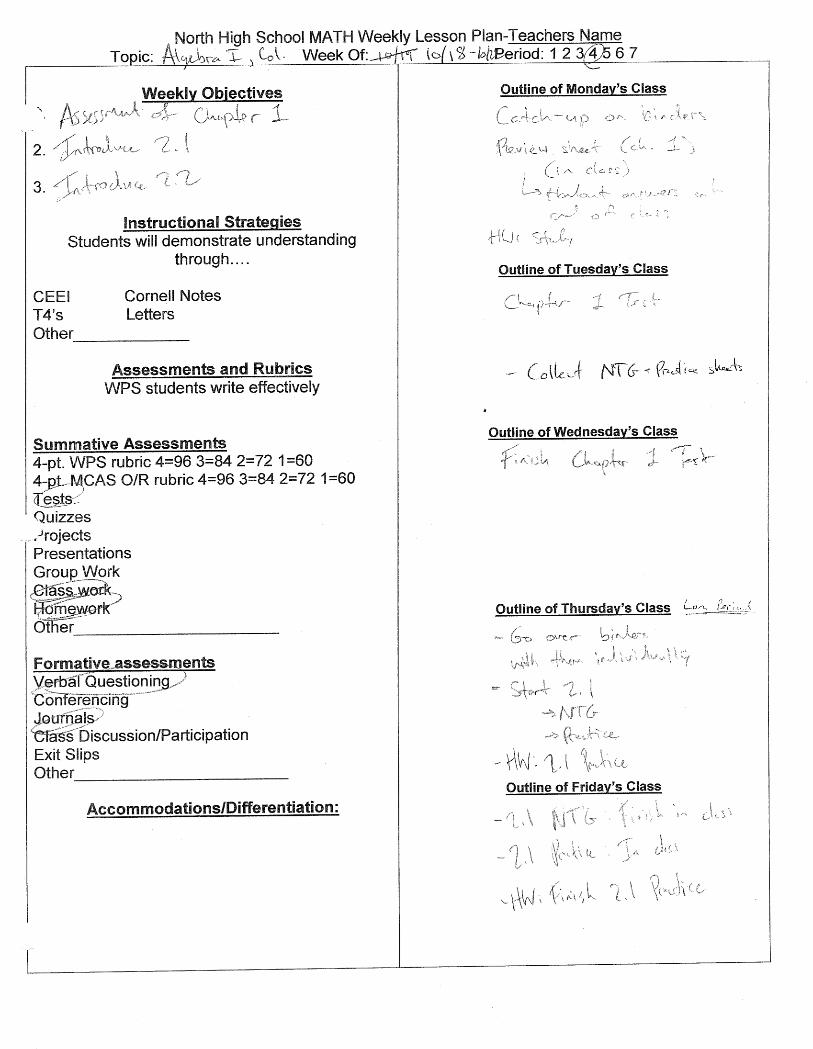
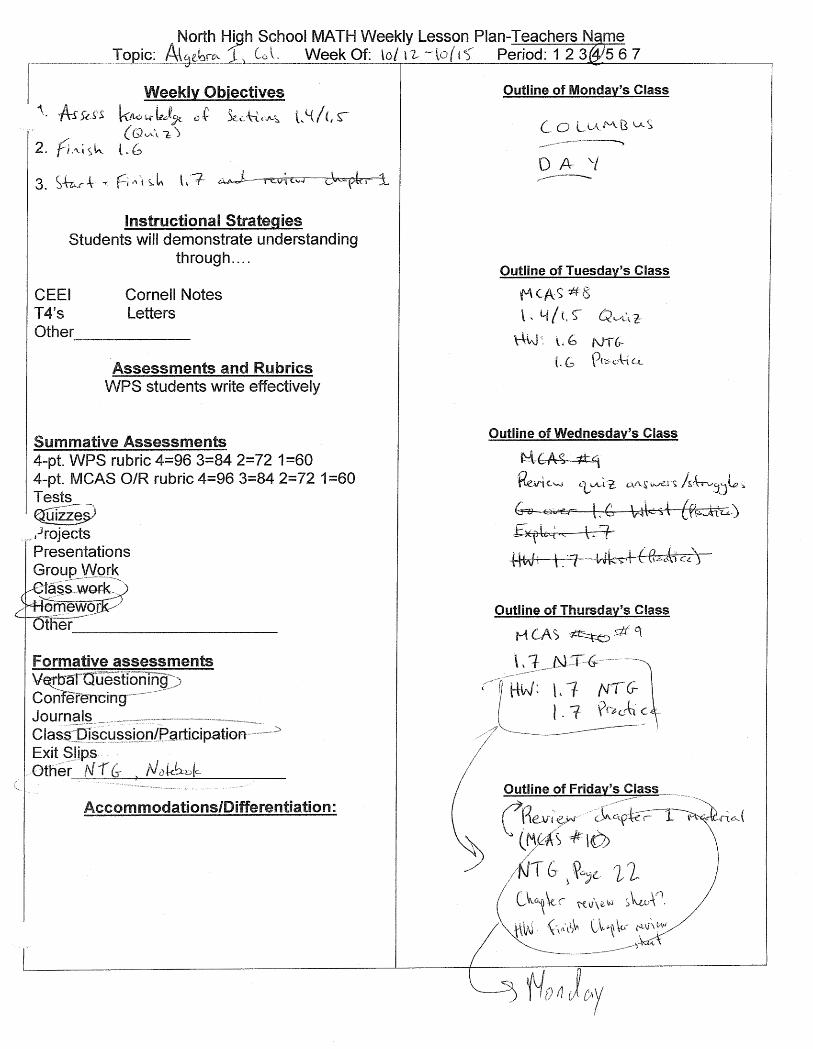
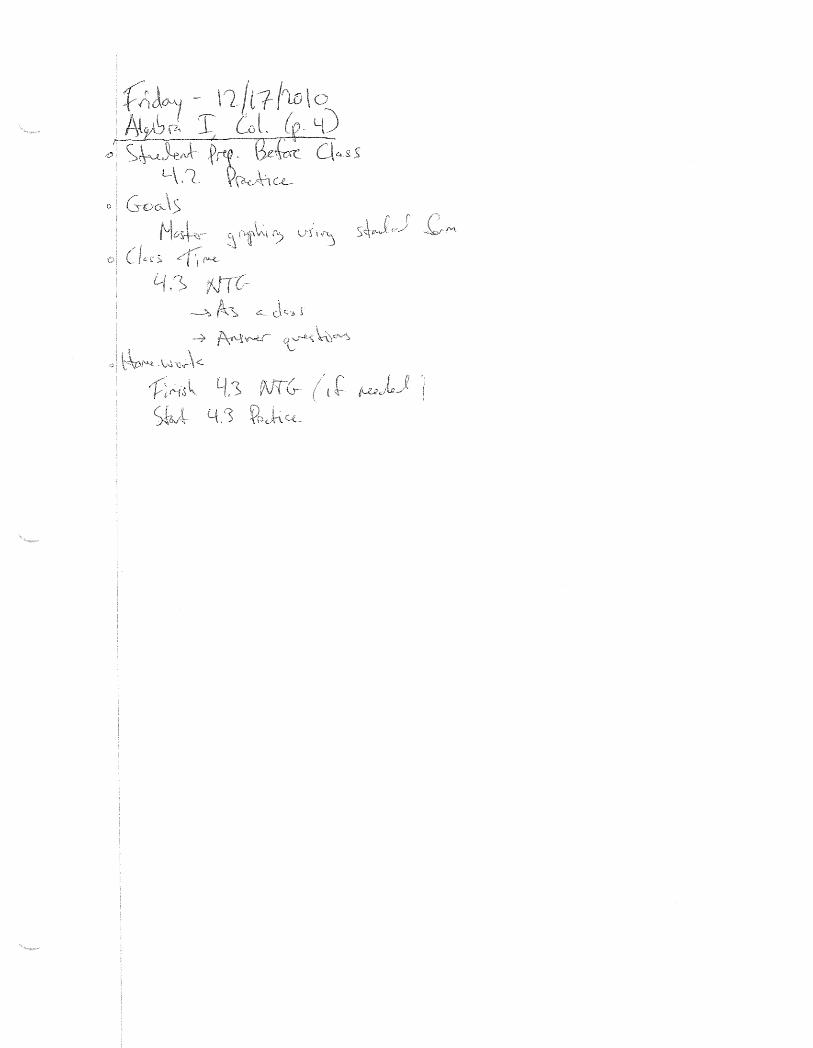
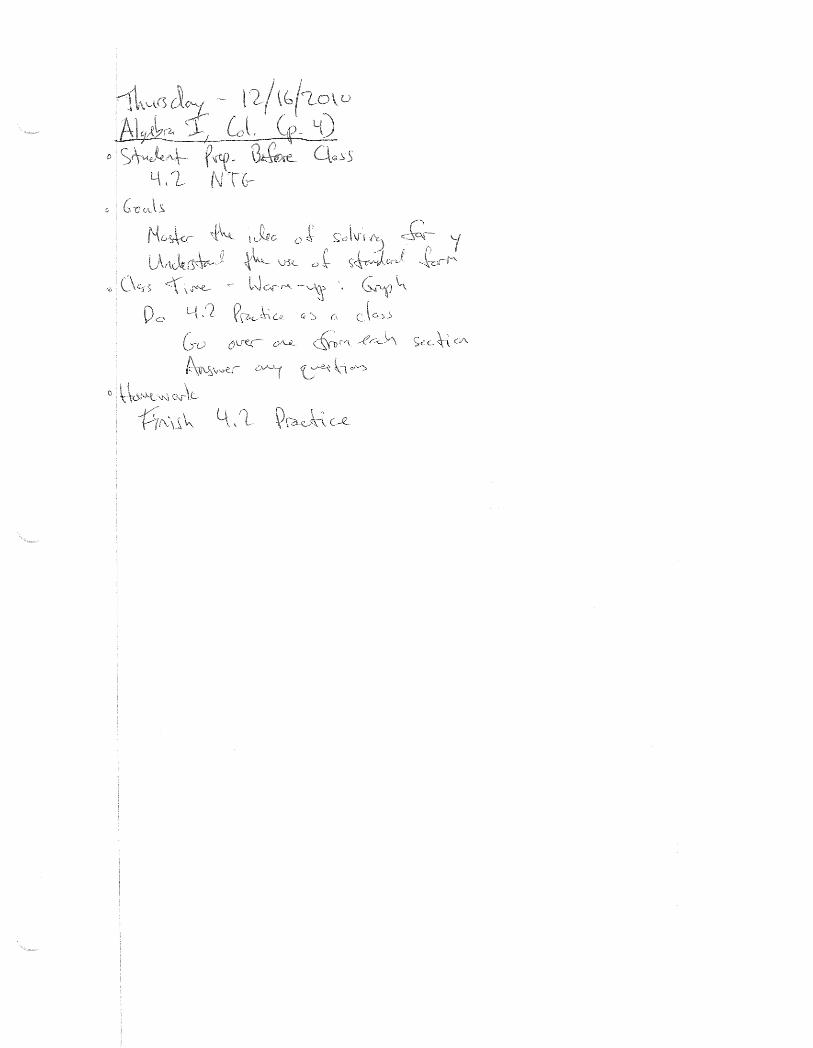
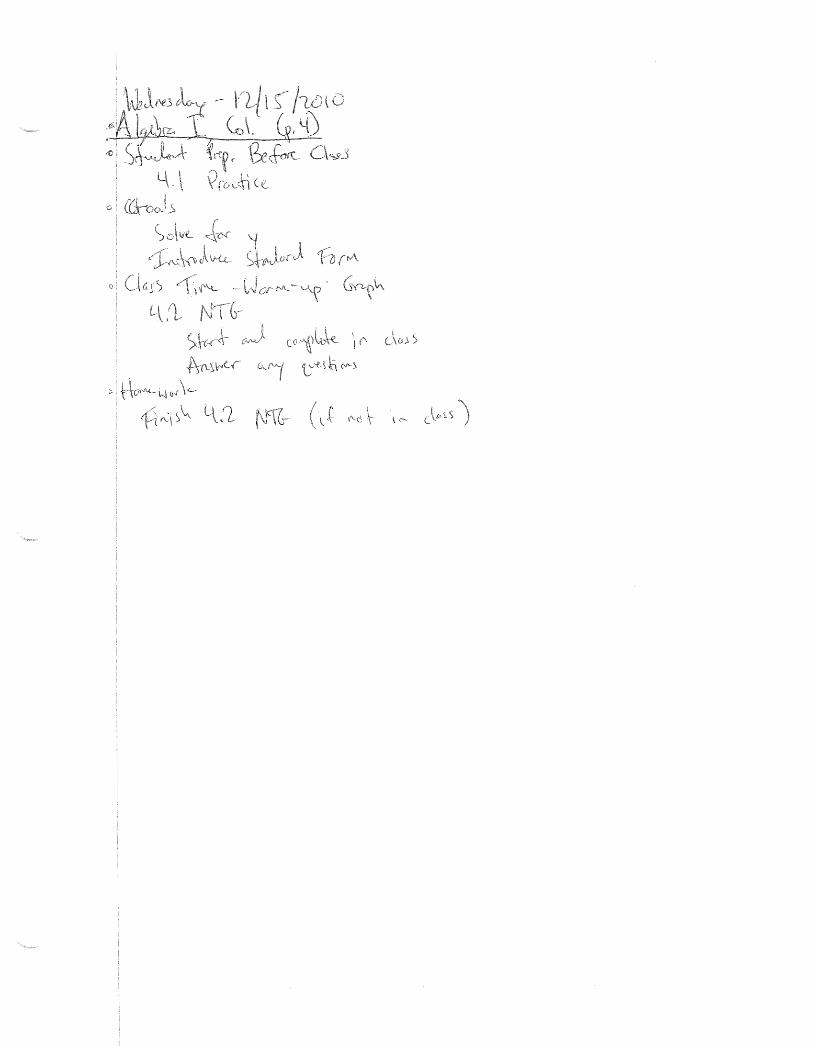
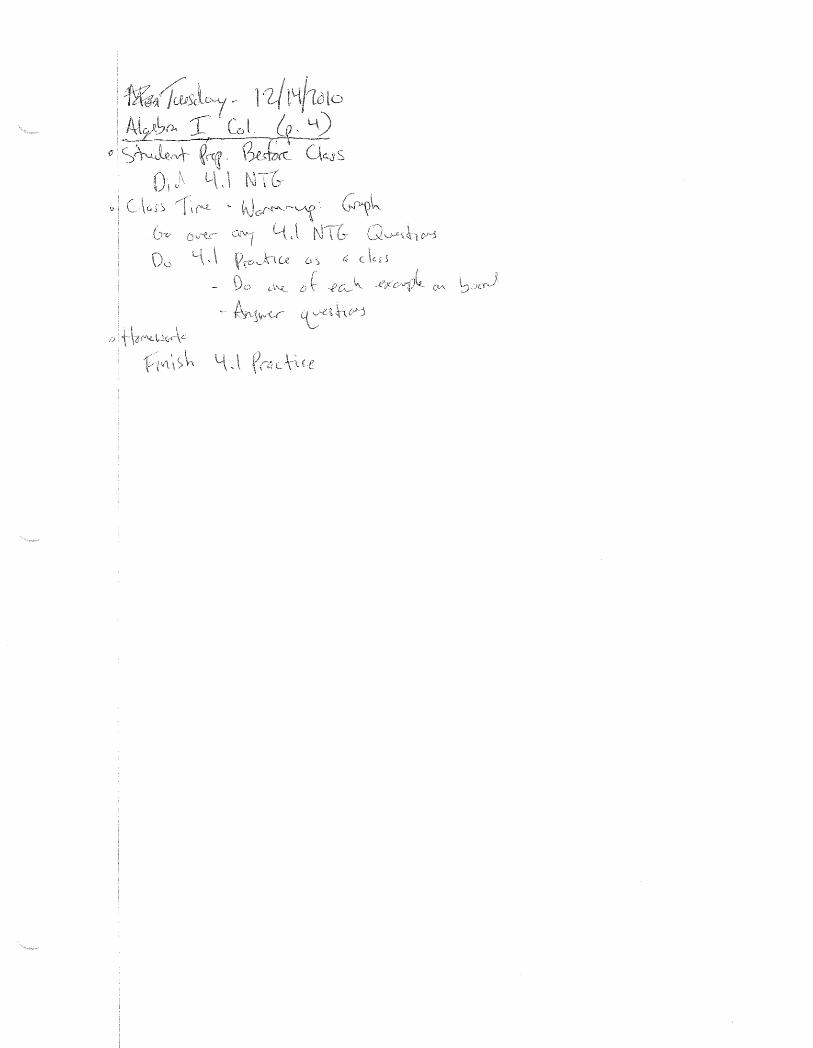
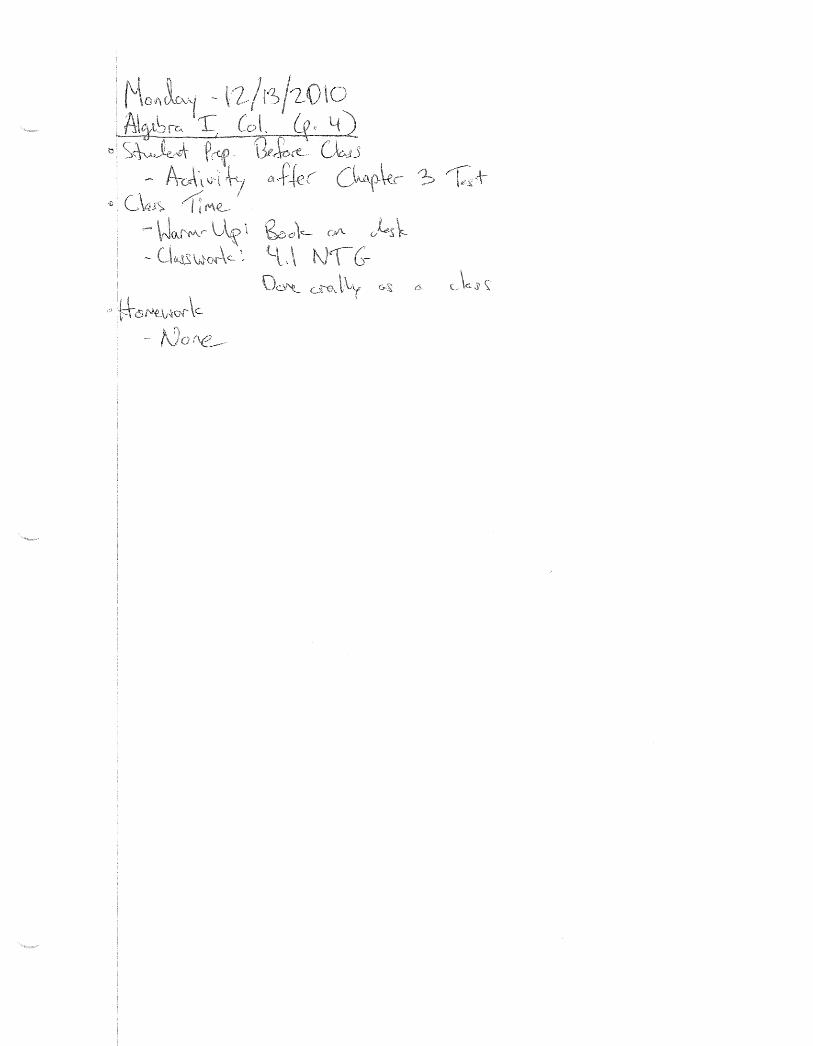
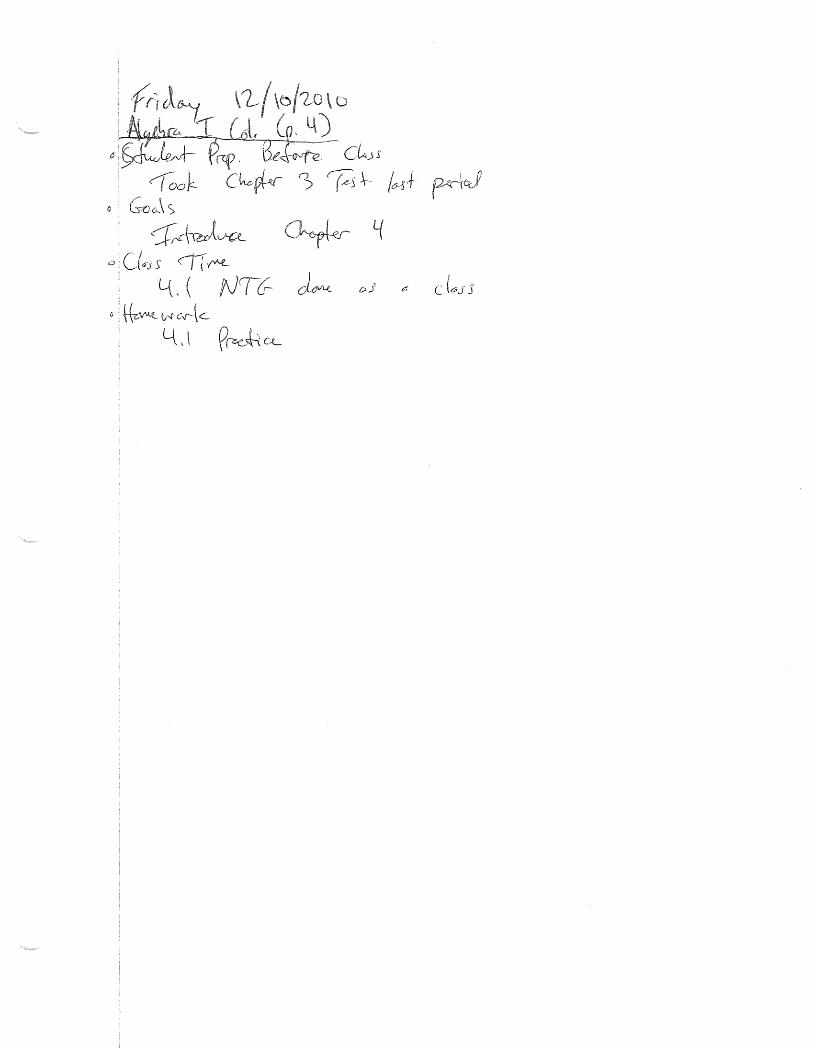
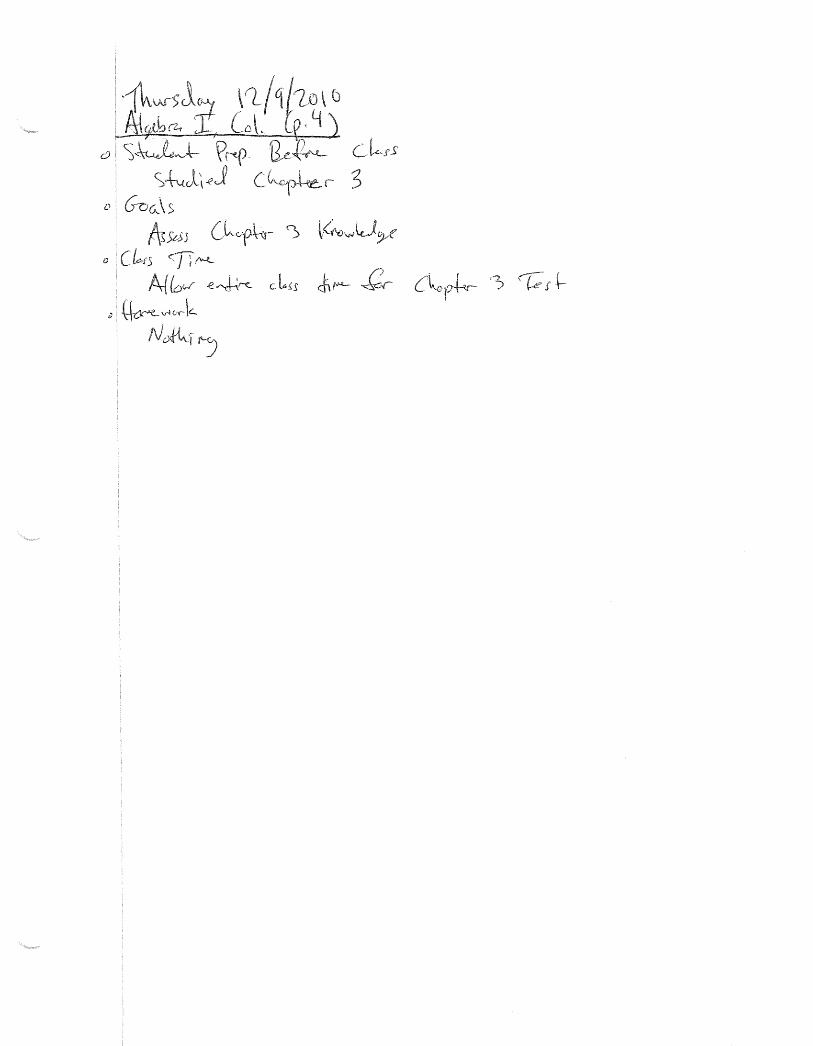
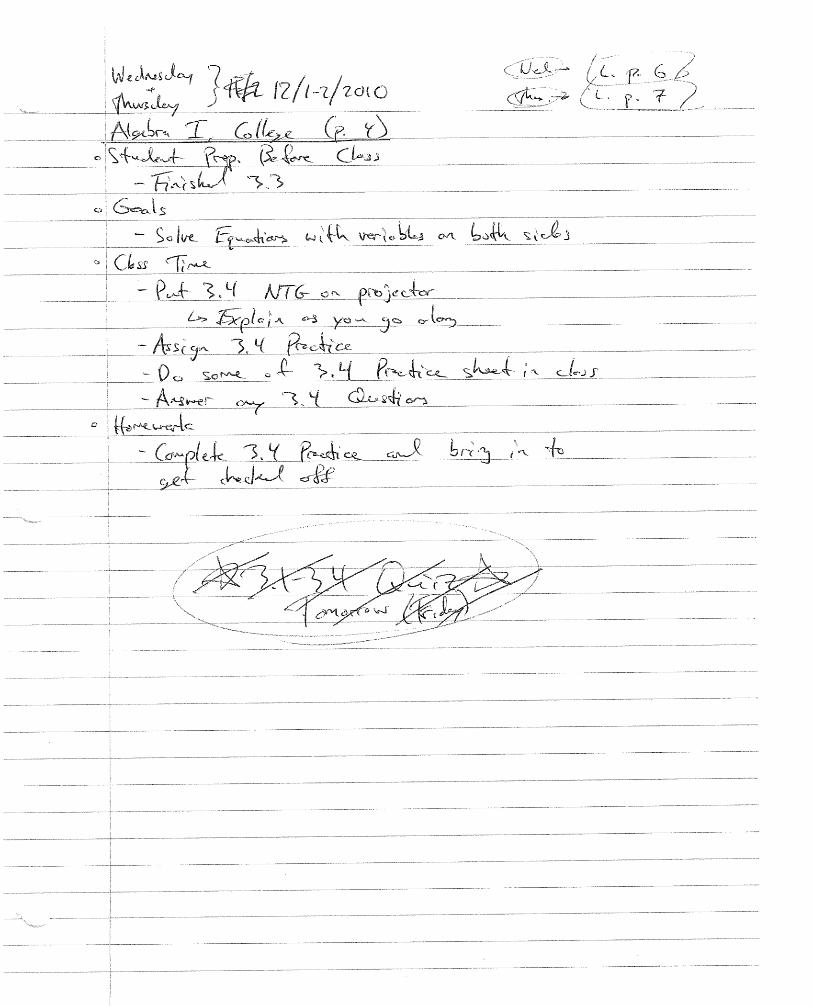
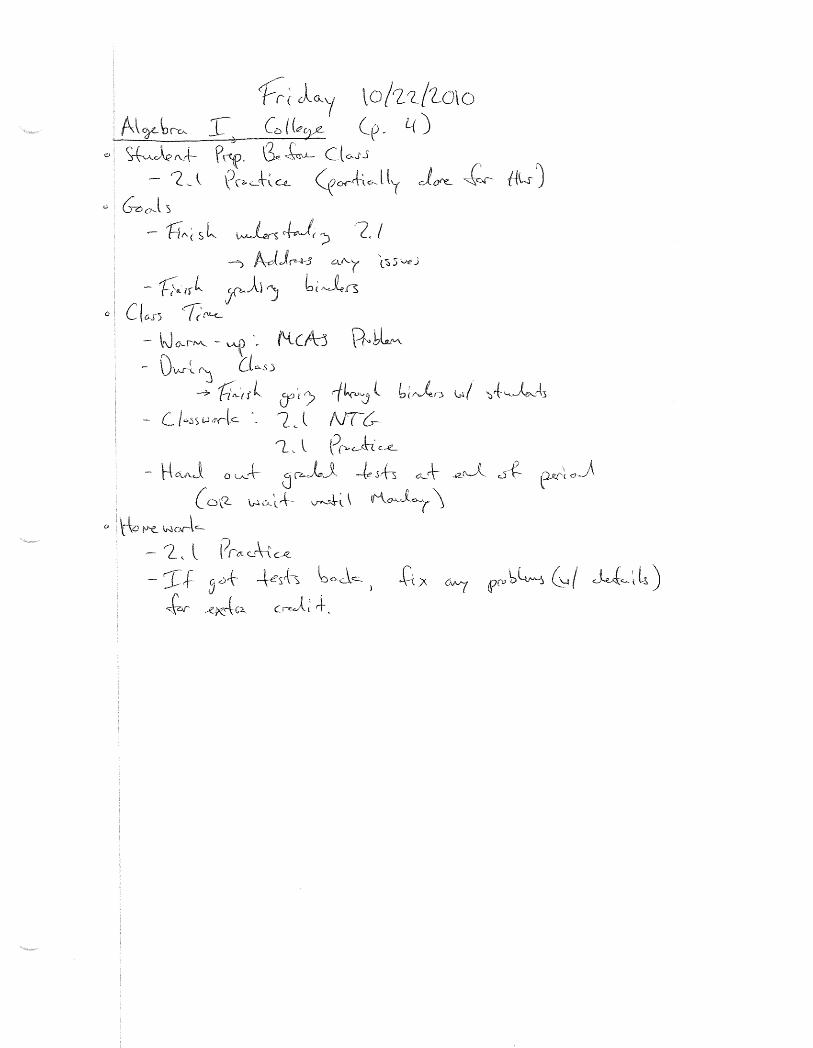
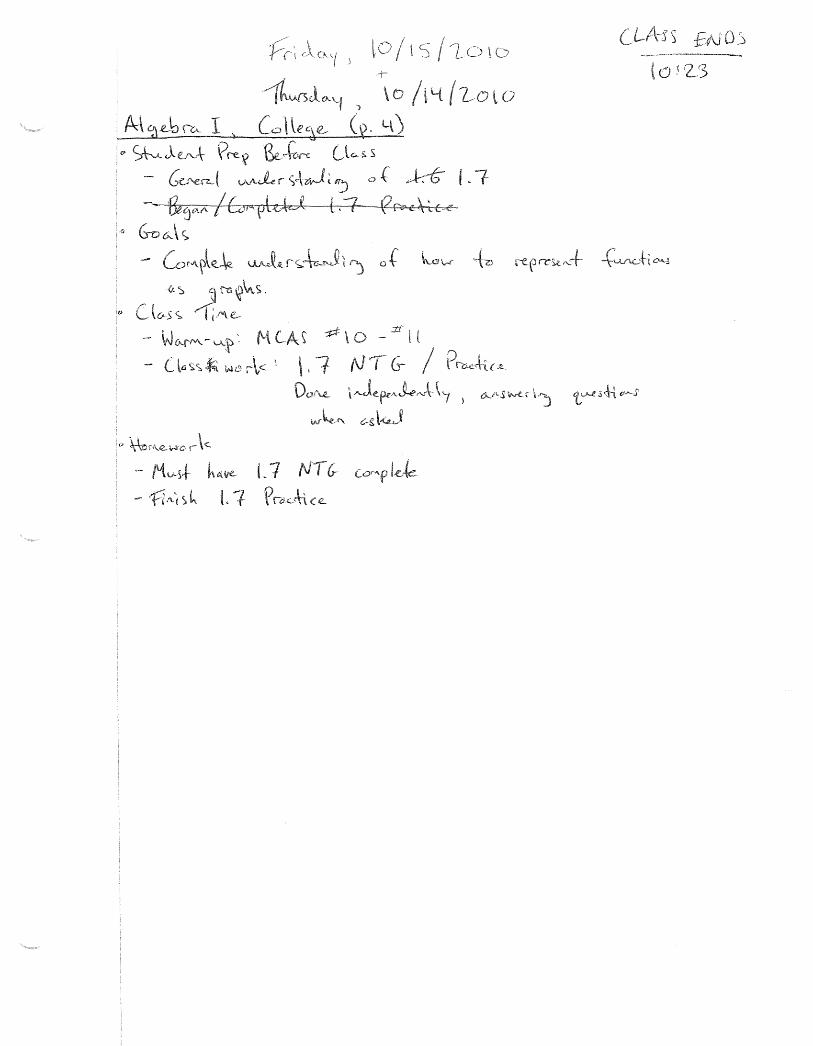
Period 1: Advanced Algebra, College College Advanced Algebra was a difficult course to teach due to the low level of effort and
preparedness from the students each day. For this reason, consistency was the most important part of
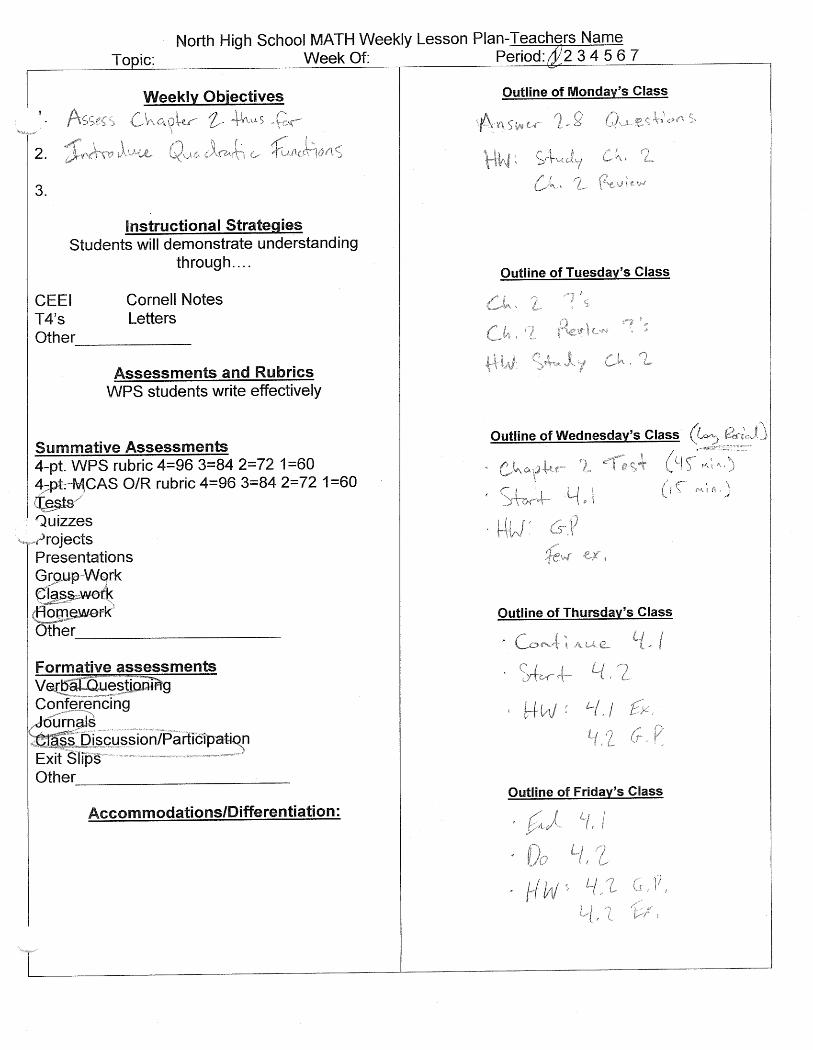
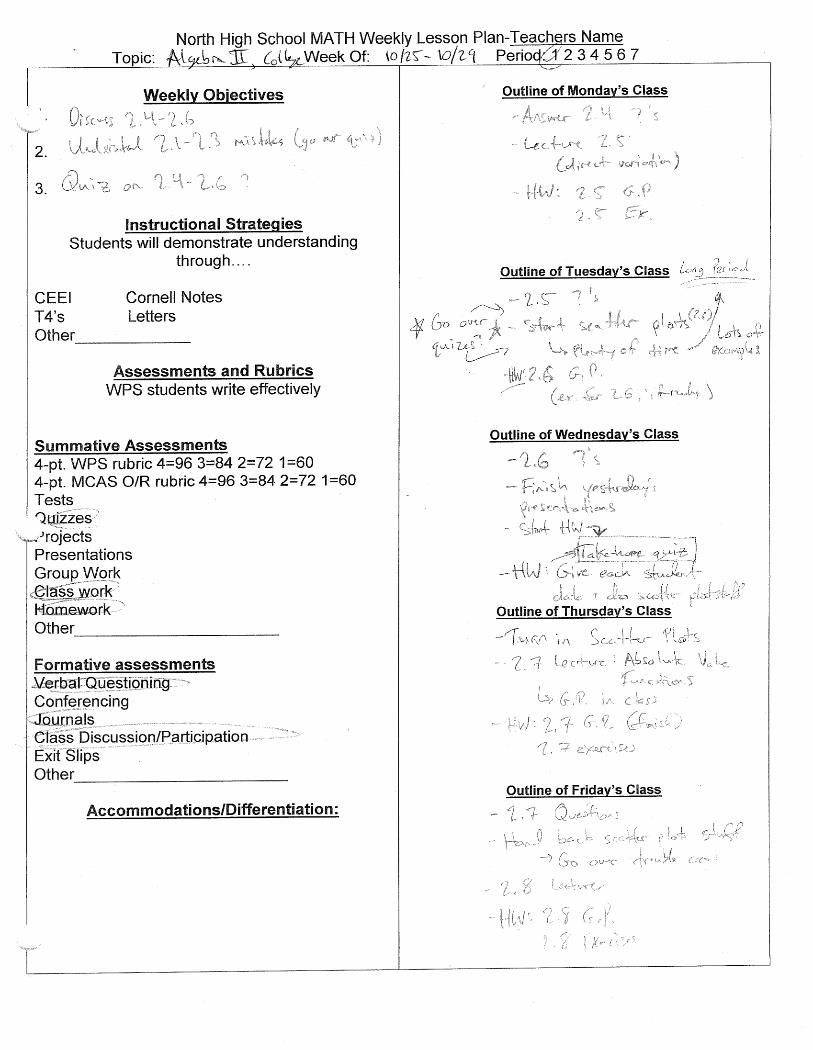
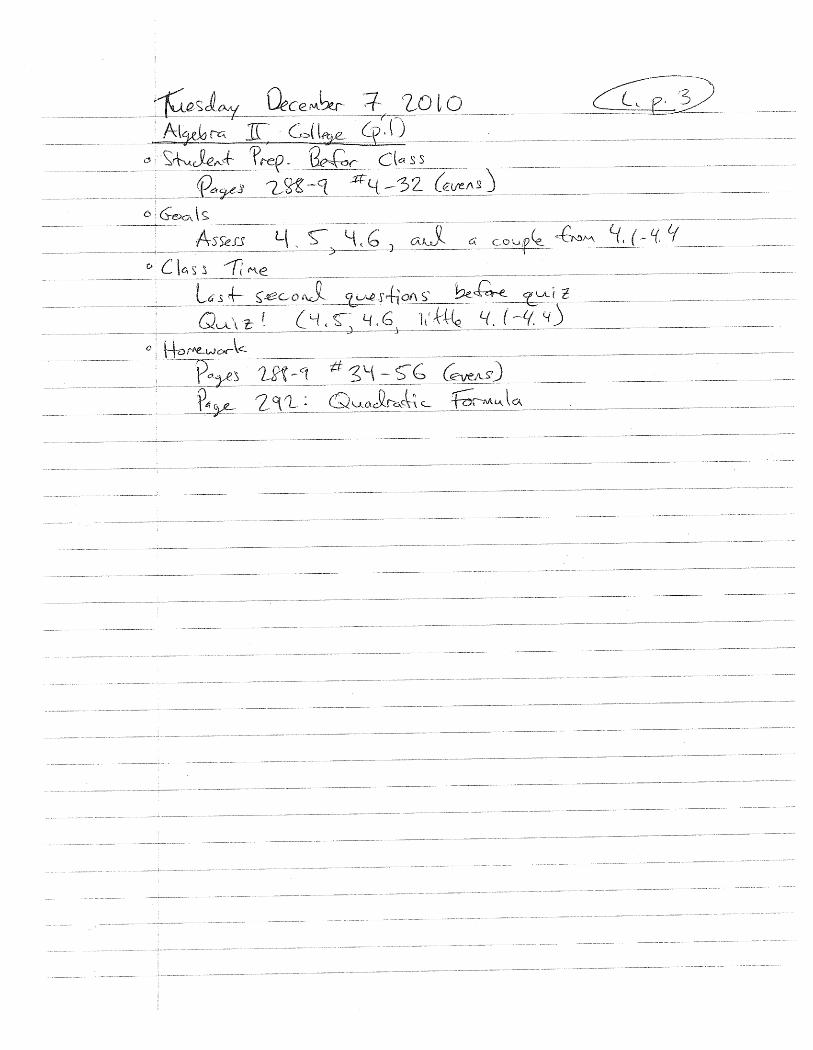
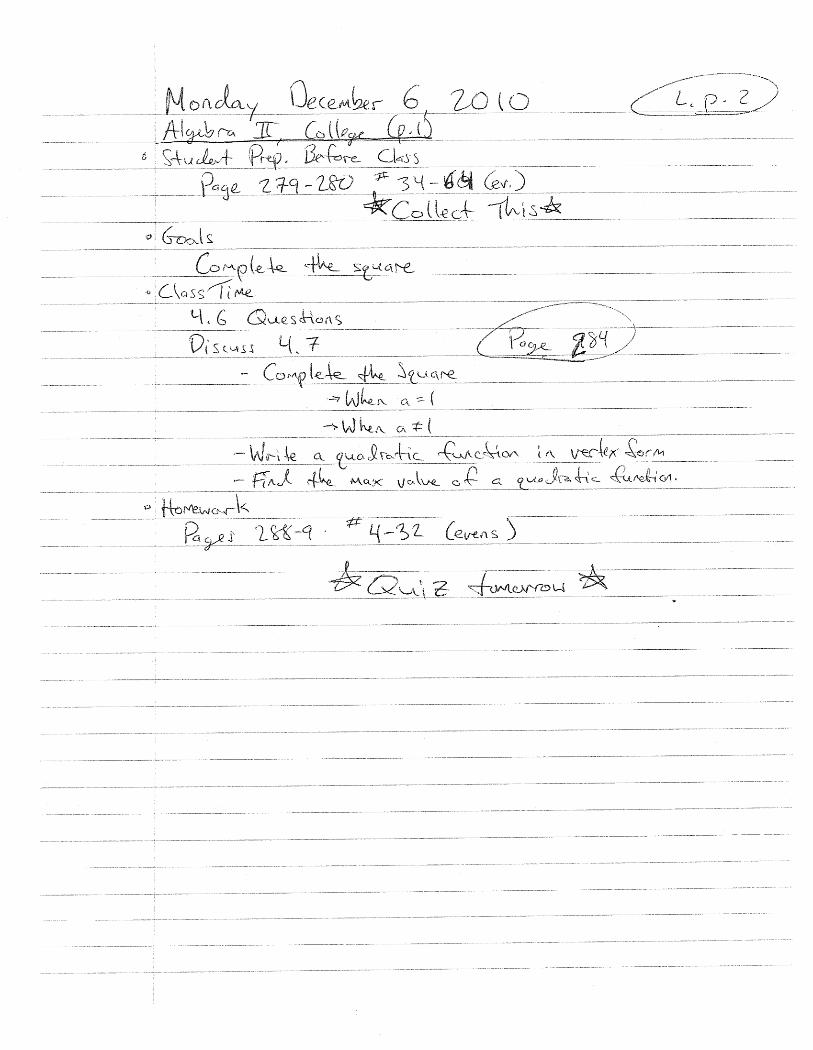
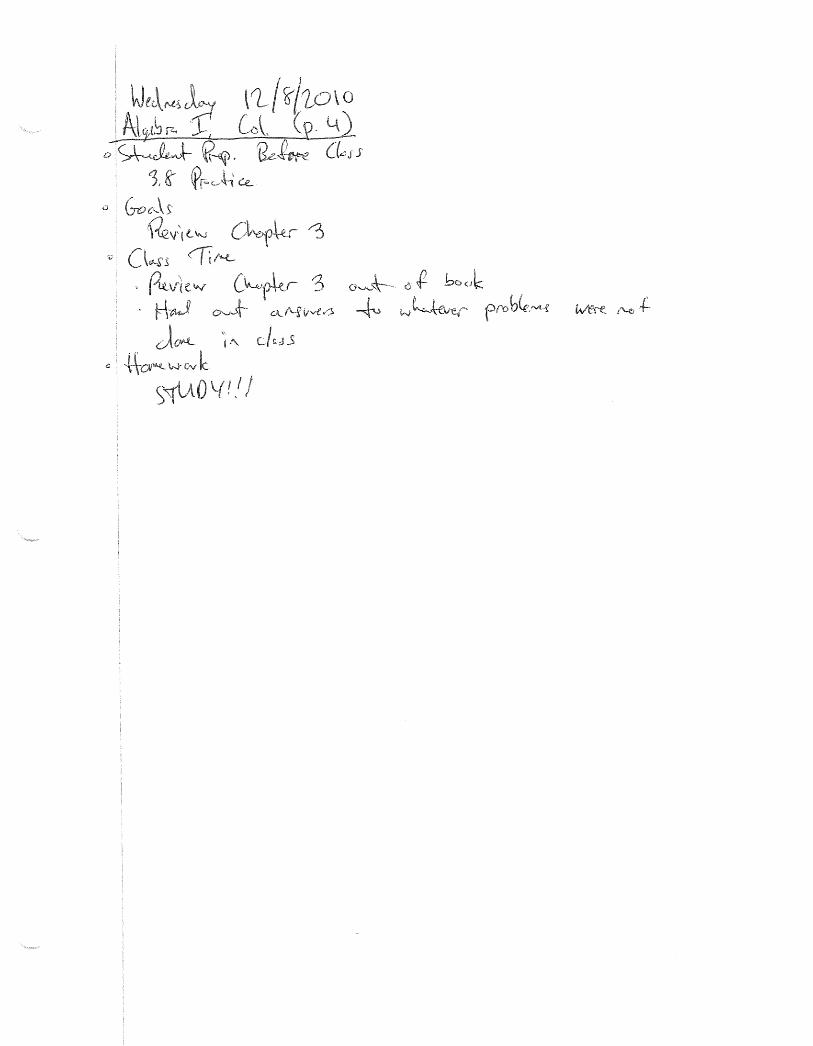
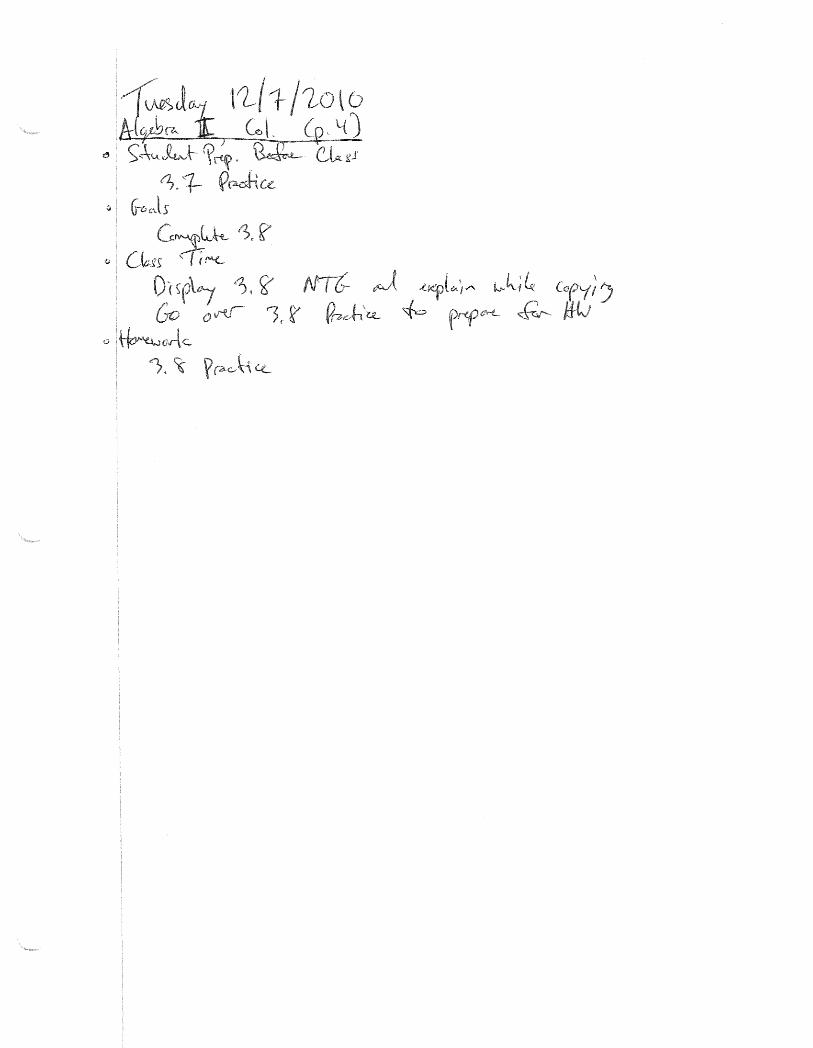
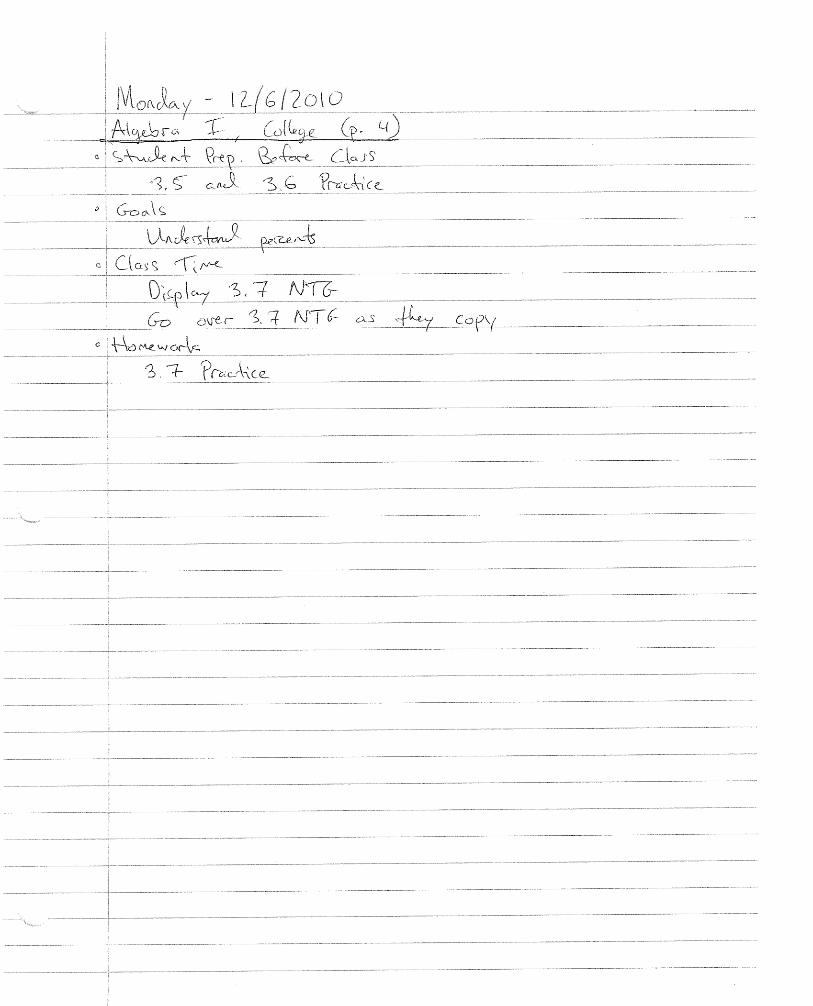
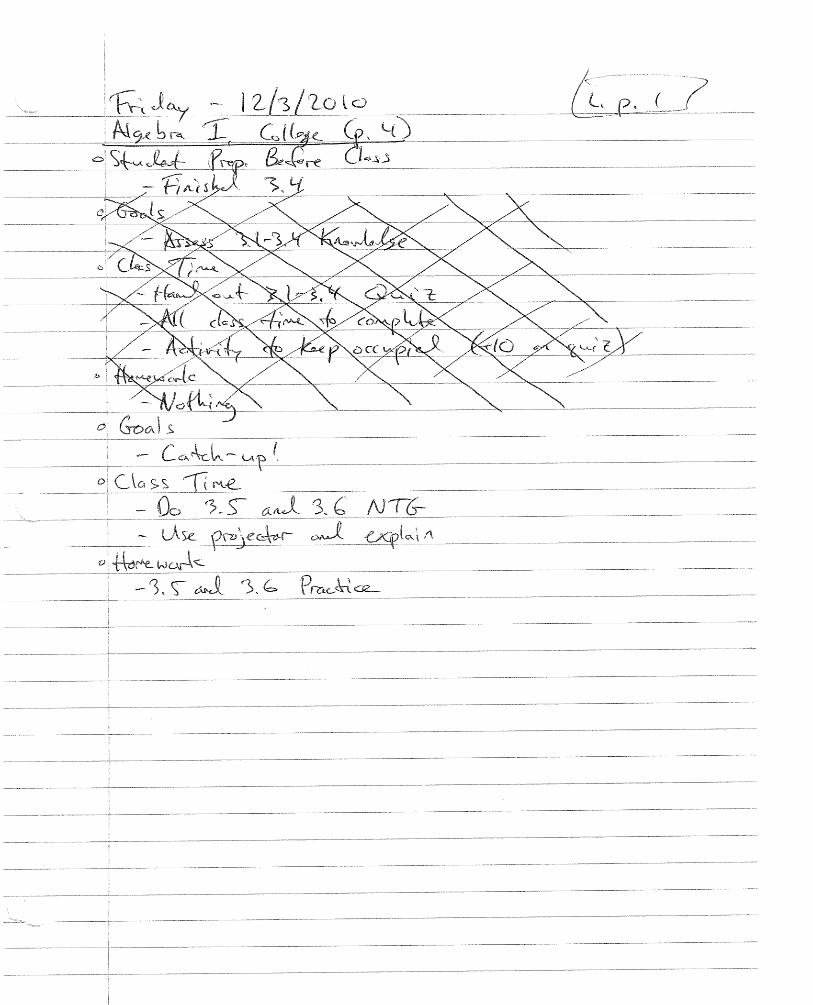
every class. Preparation consisted of having the entire week planned well in advance with daily agendas
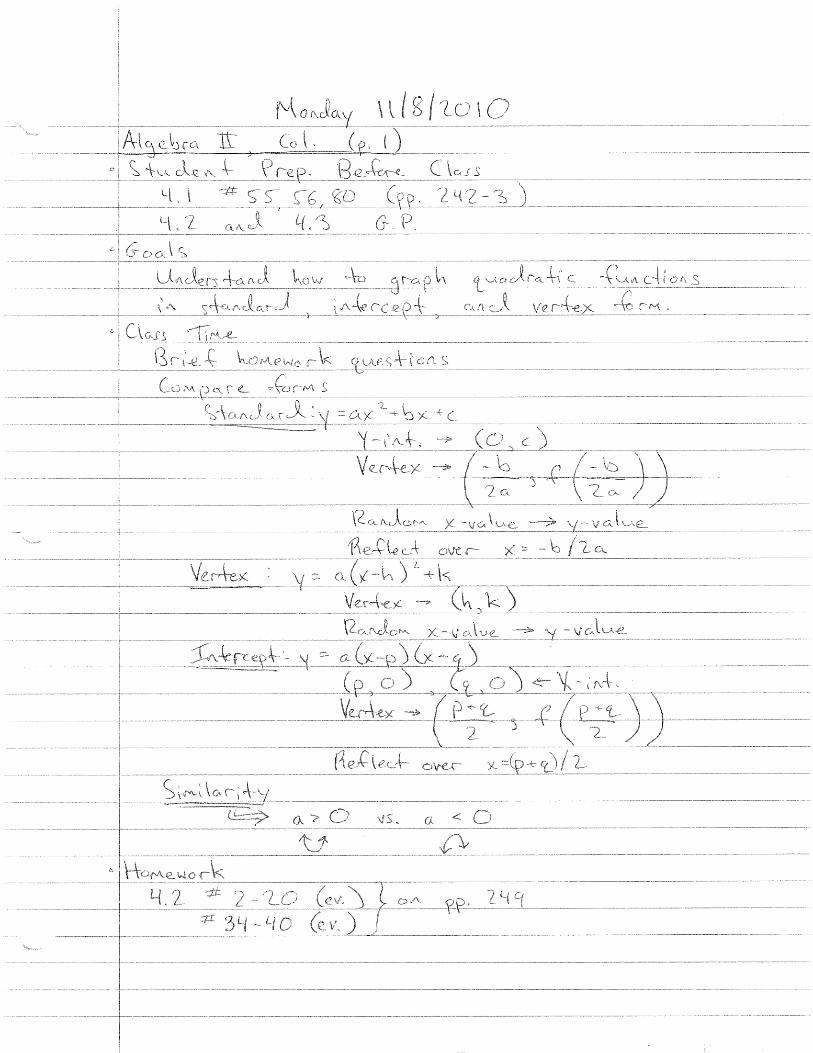
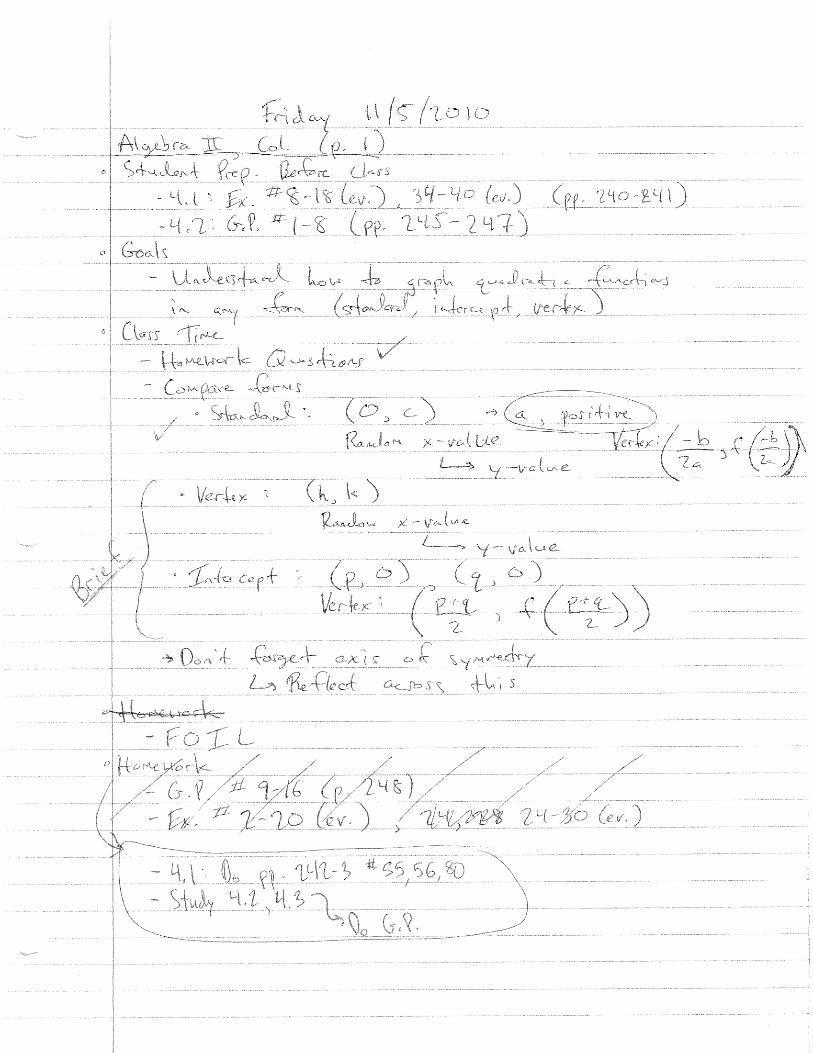
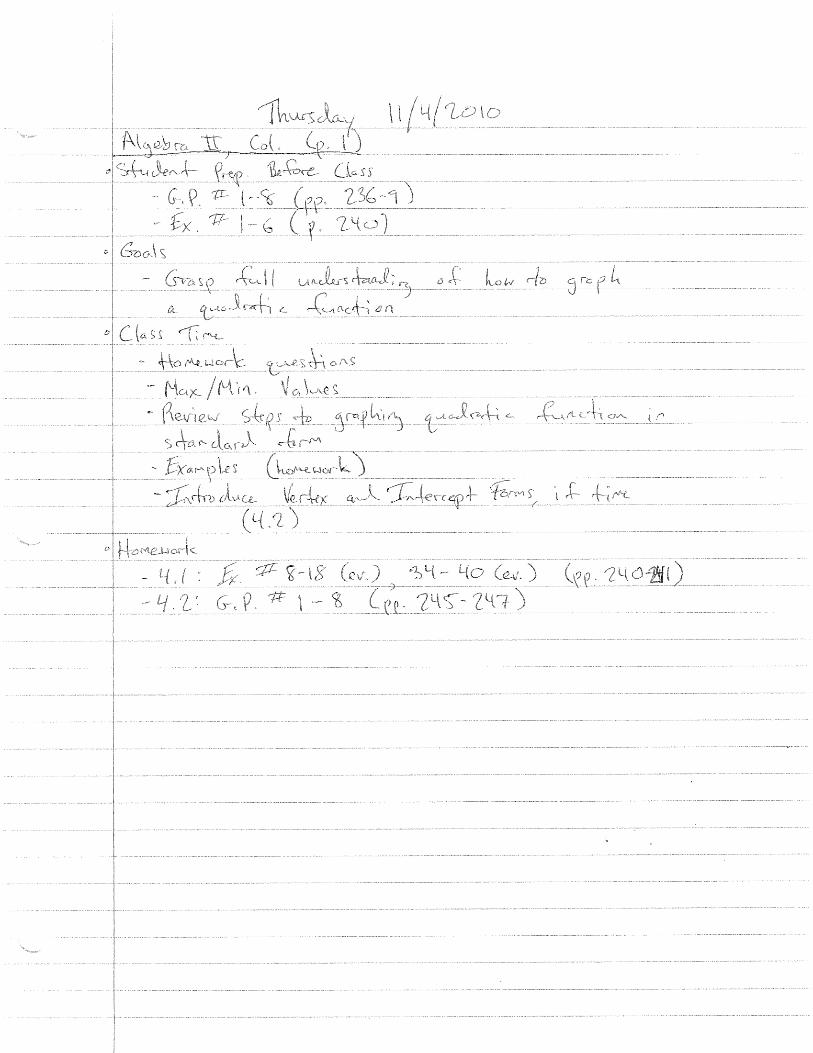
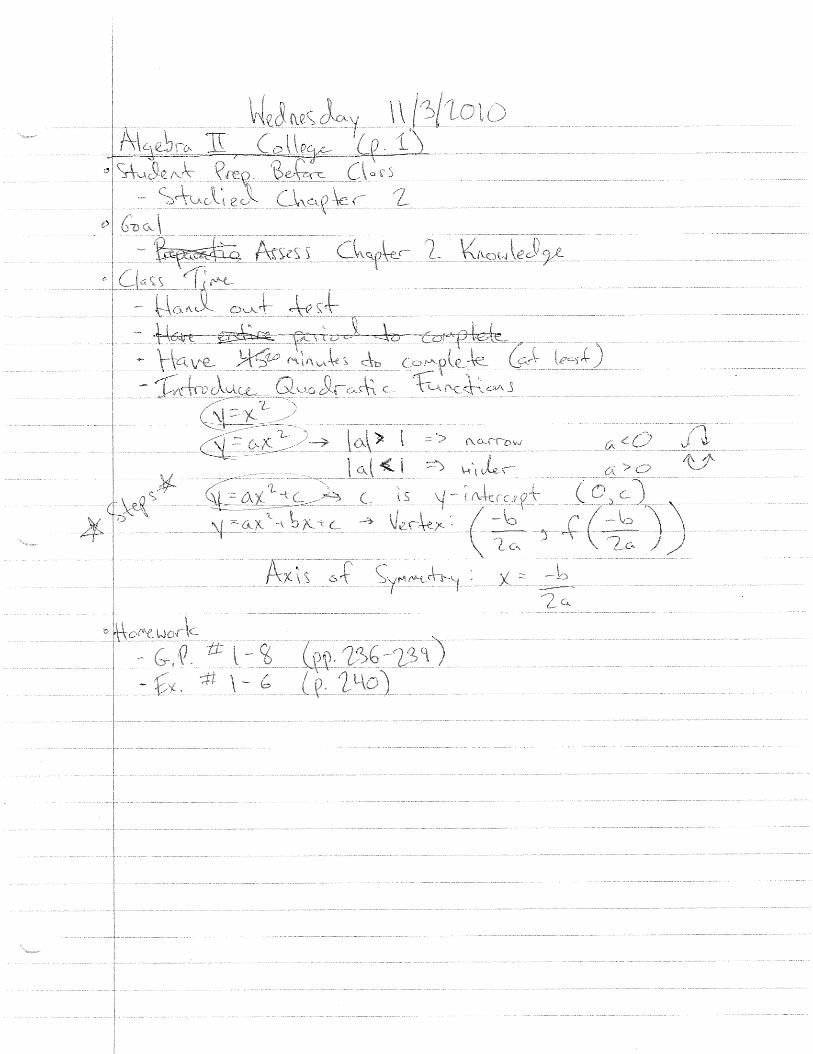
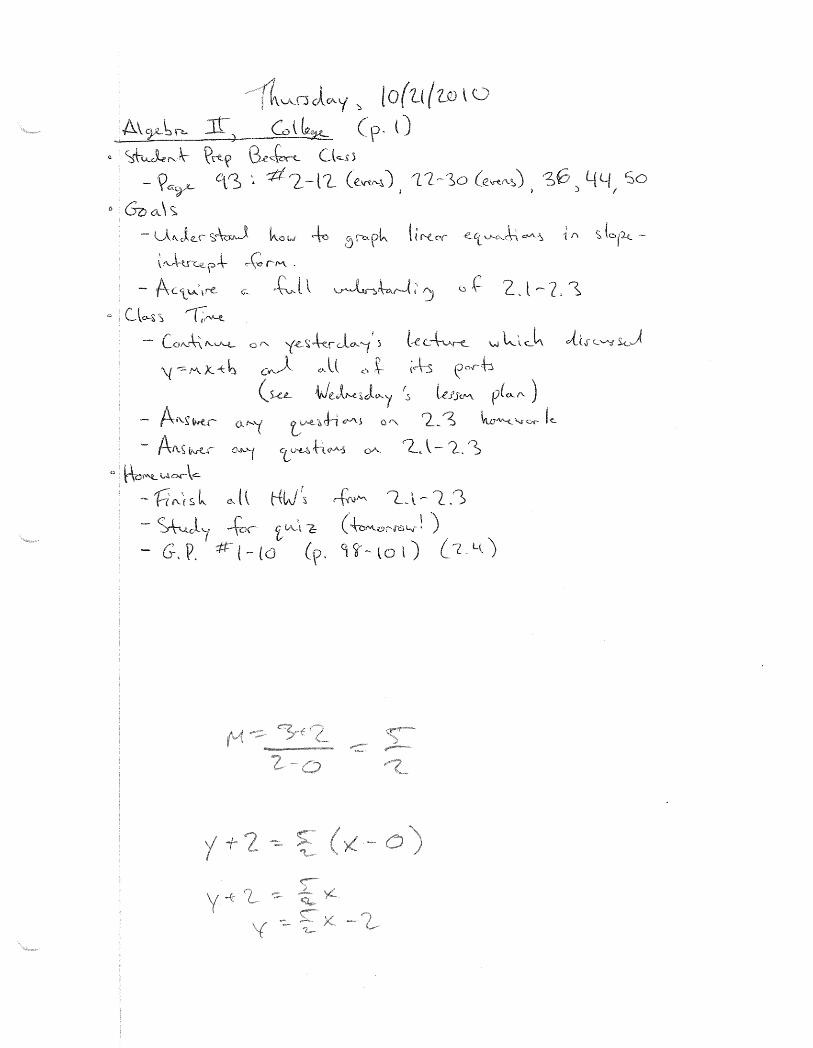
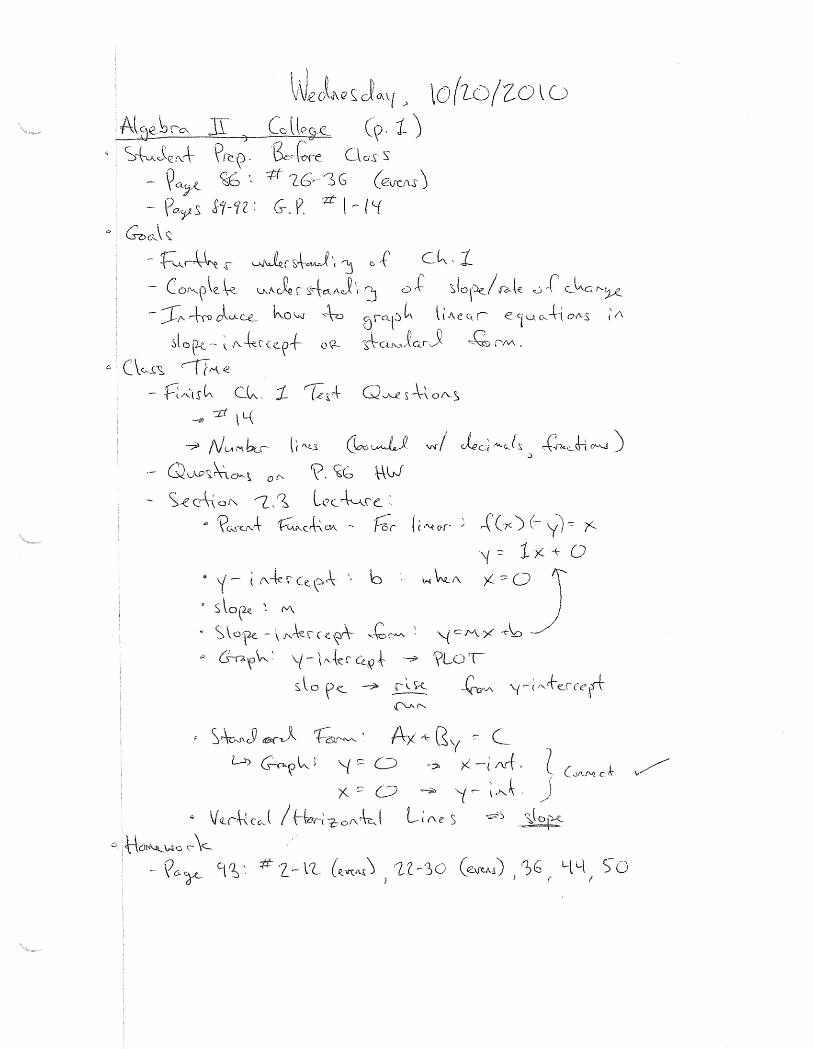
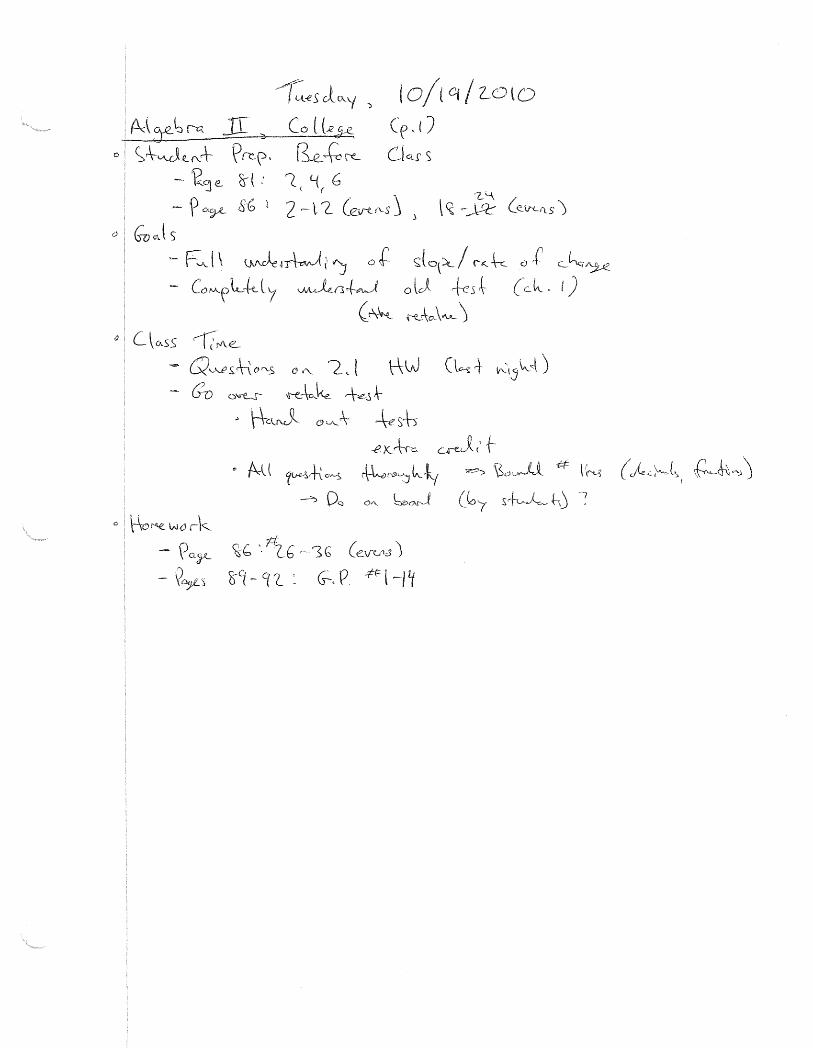
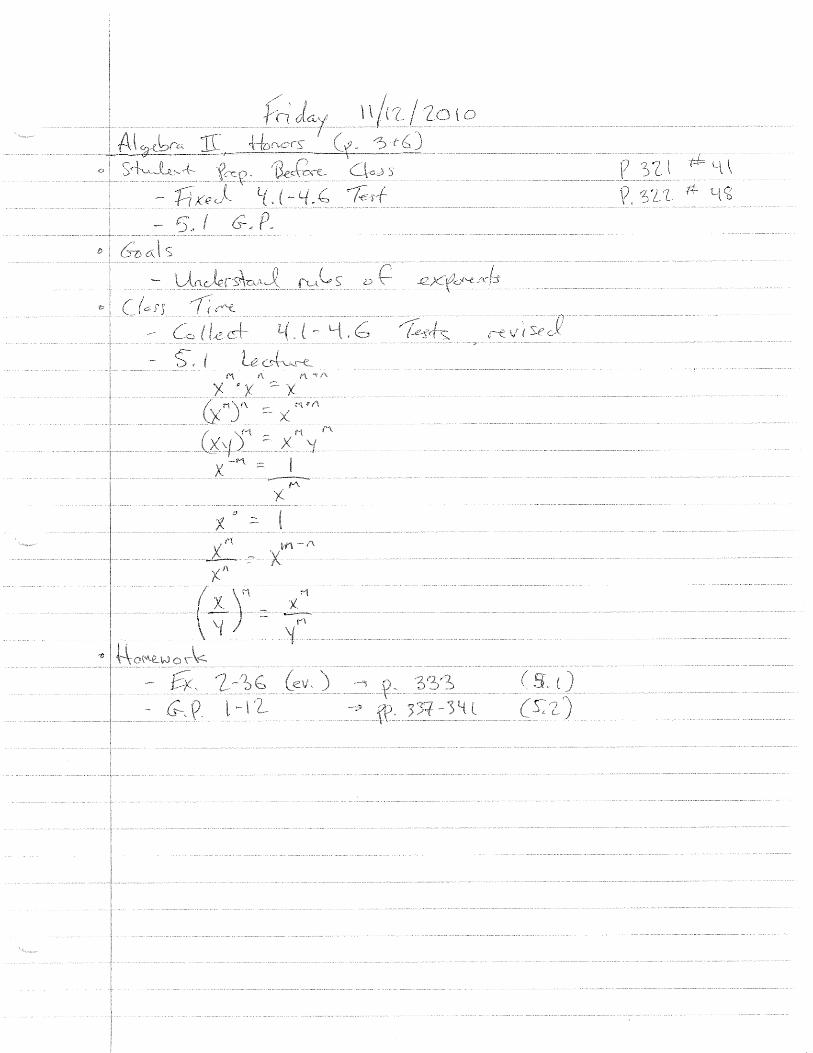
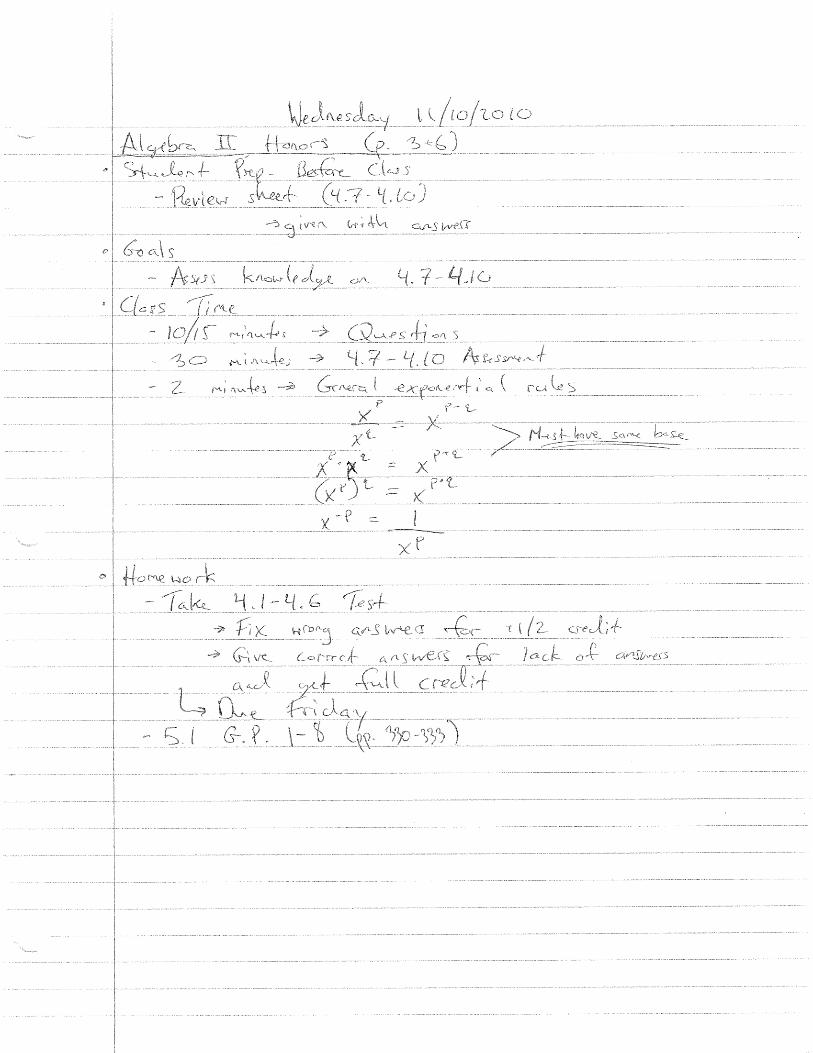
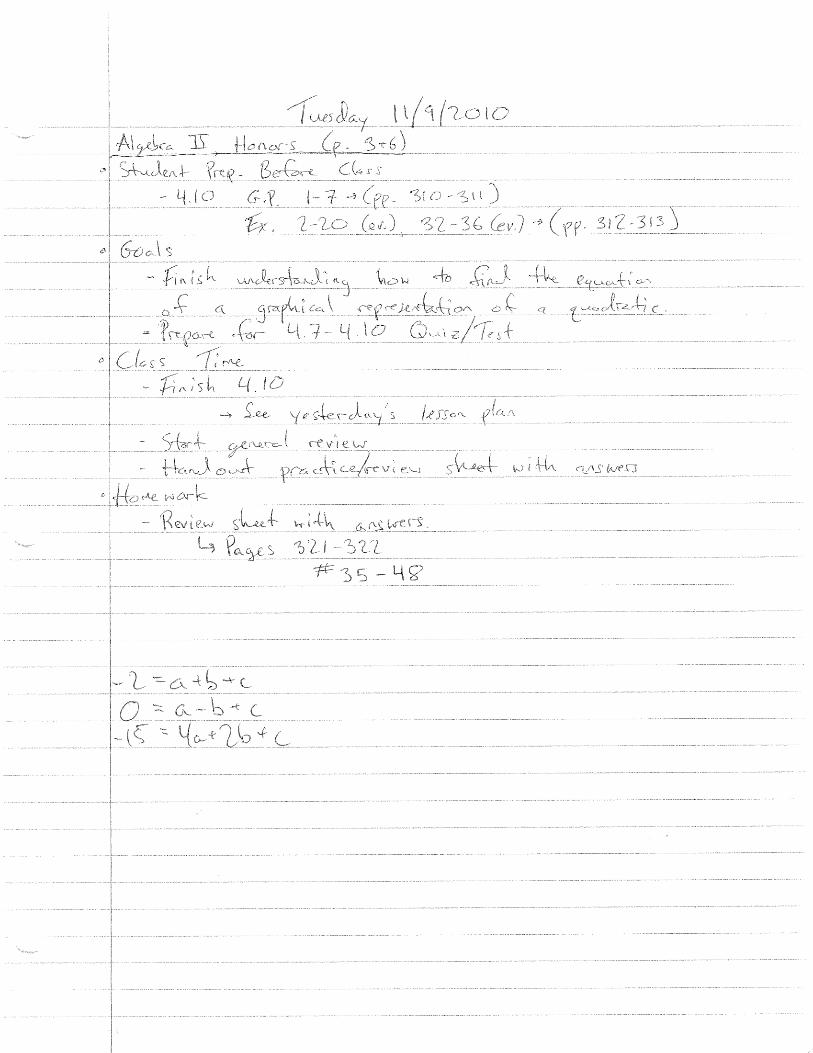
written on the board (Appendix G). Every daily agenda had objectives (Appendix A: B,1.i) and goals for
the day (Appendix A: A,5). Agendas also consisted of a briefing of the lesson plan for the day; random
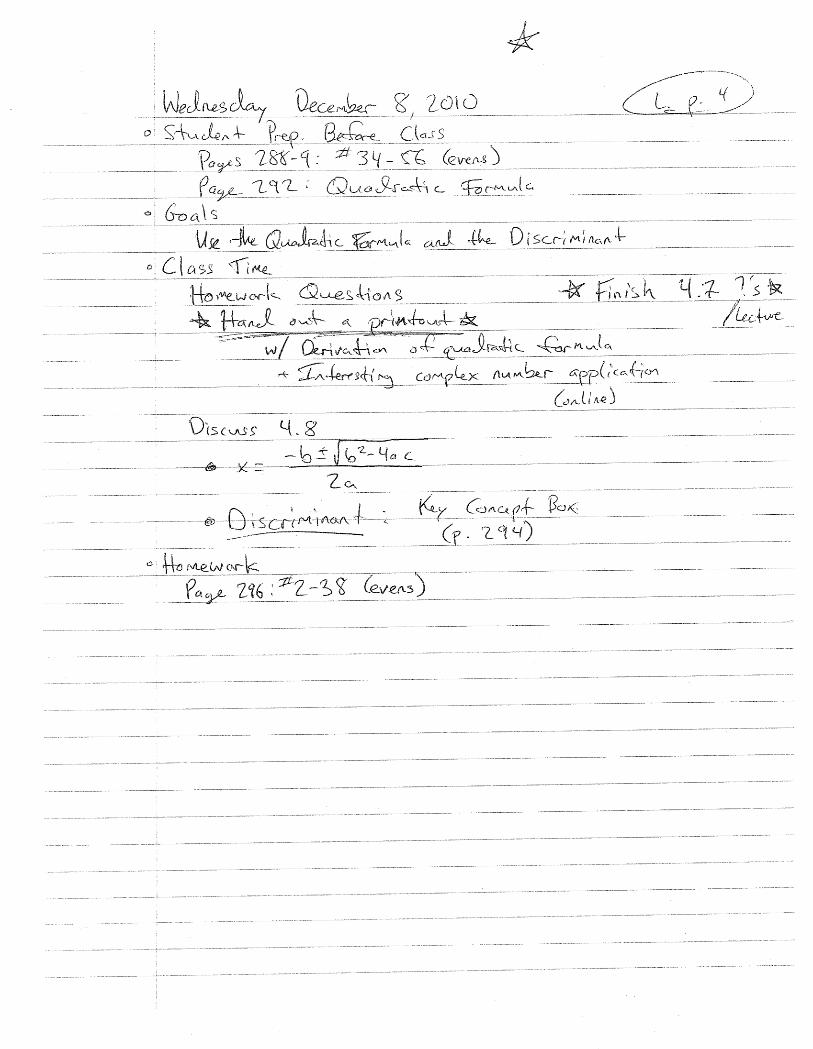
math question on board; questions on homework; daily lesson; and the night’s homework (Appendix H).
Random math questions were given out a few times a week in order to get the class settled and
thinking about different topics. Sometimes the question was related to the subject they were currently
studying in class. This way, I could see the students’ progress on the current topic. Other times, a
random math question would get the students thinking about other applications of math (Appendix A:
B,1.iii). Many times it would be a simple application problem but students rarely use applications
because everything is out of a textbook. This is very good practice for students because it they are all
interested in questions outside of the textbook (Appendix A: A,3).
The second part of the agenda each day was open for questions. These questions primarily
pertain to recent homework problems which were assigned previously. Students were encouraged to
ask questions and realize that no question was a stupid question (Appendix A: B,2.v). For this class, they
rarely preferred to write the solutions on the board. Thus, I would write the answers on the board half
the time and the other half would consist of students volunteering to present the answer. In both either
case, the answer was written on the board with details on how the solution was found. This allowed
students to show their knowledge, critique each other’s knowledge, and have the correct answers in
their notes for future studying.
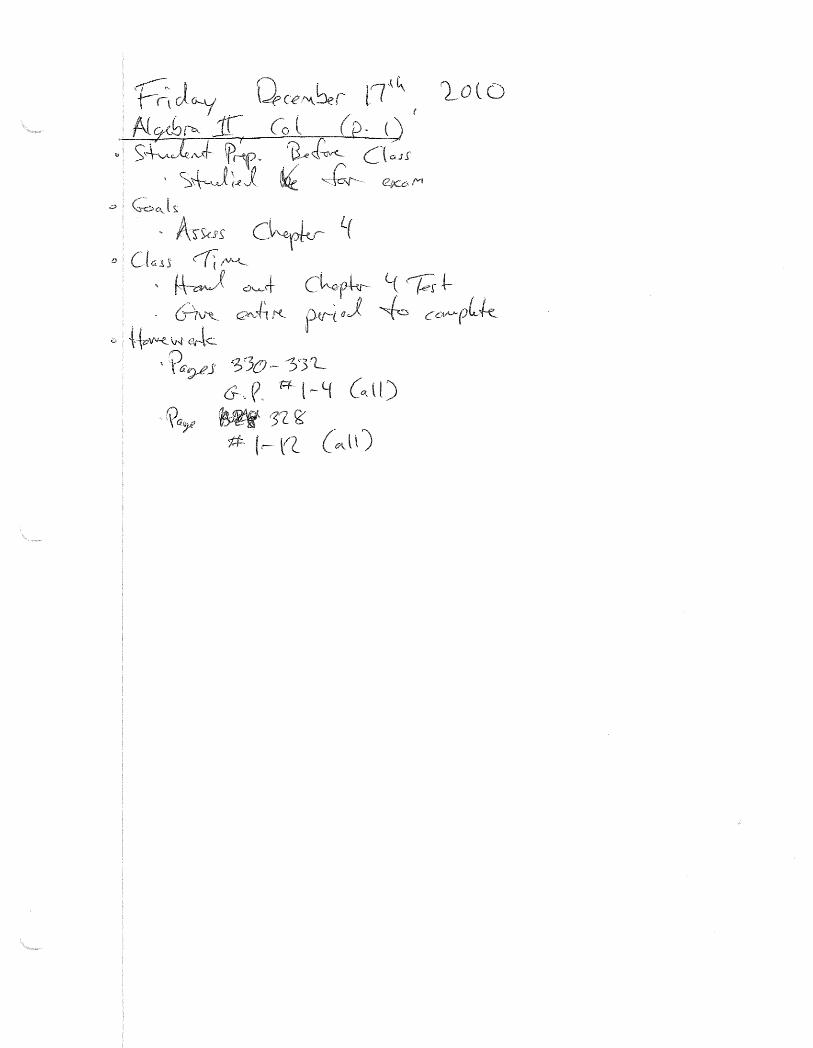
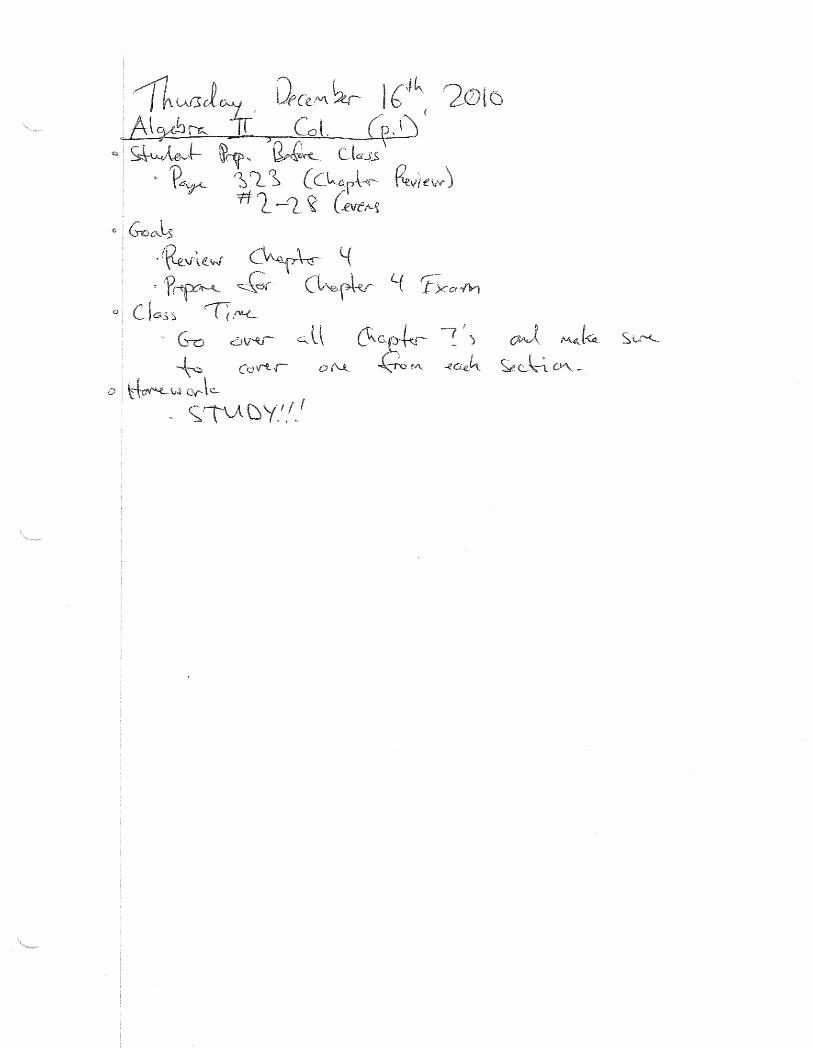
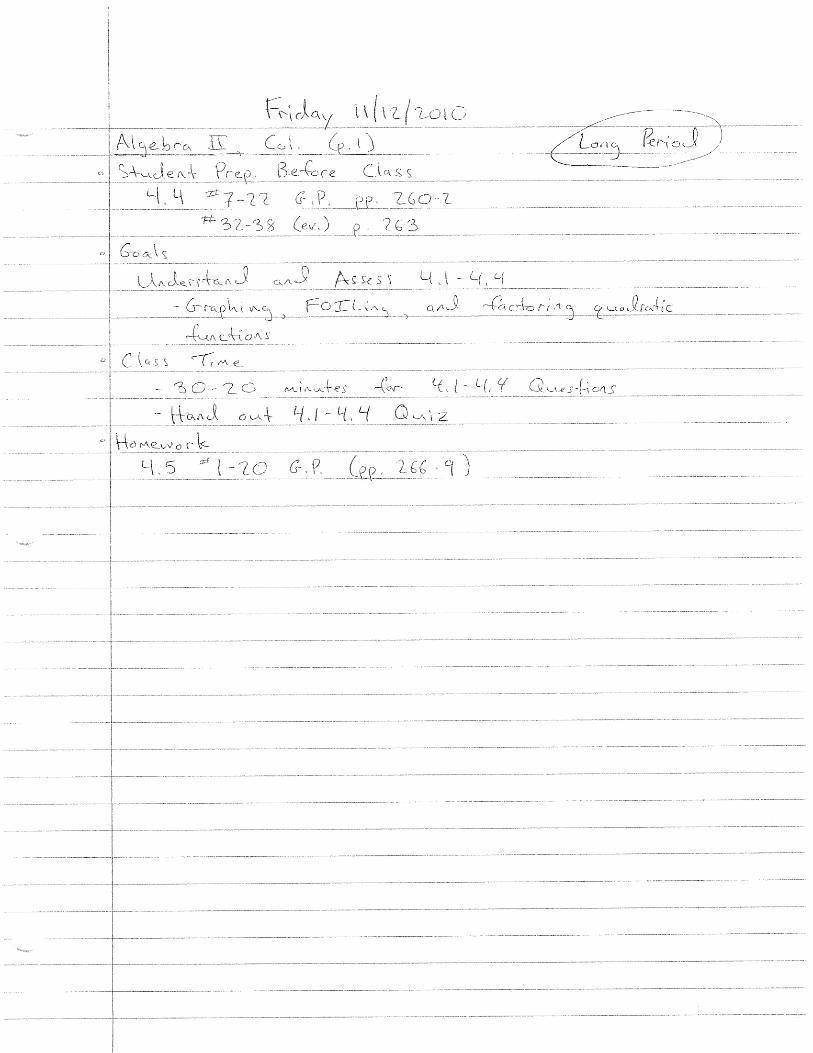
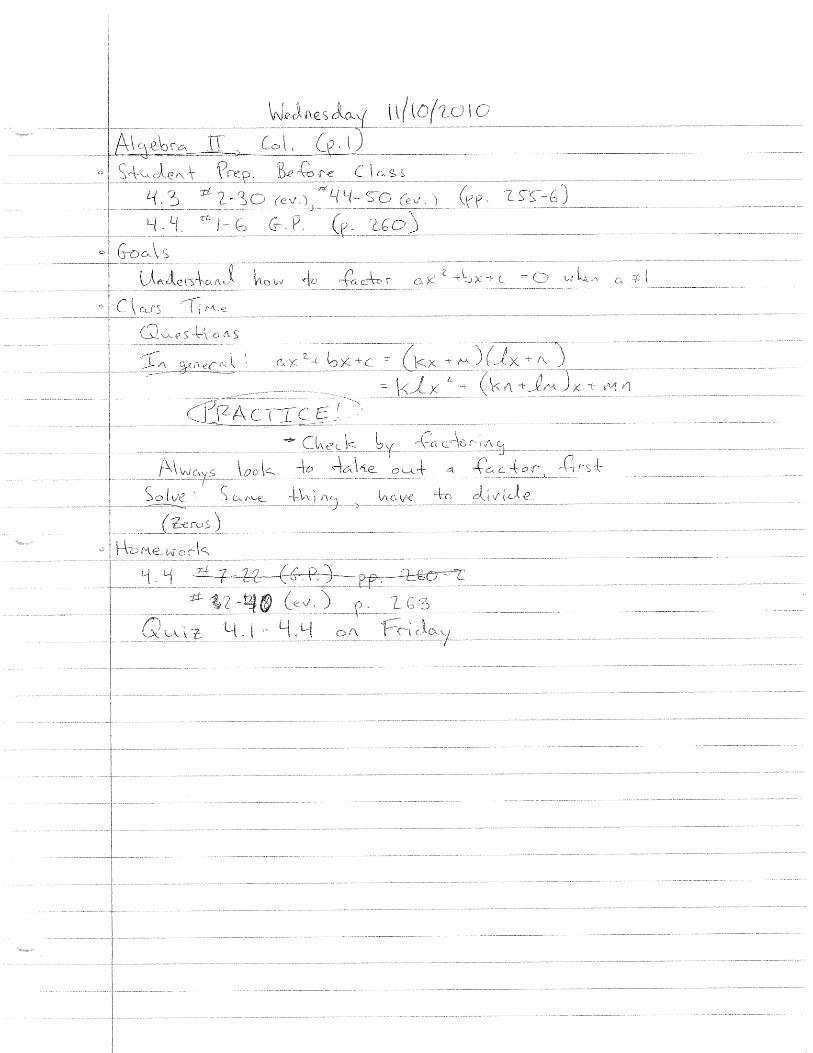
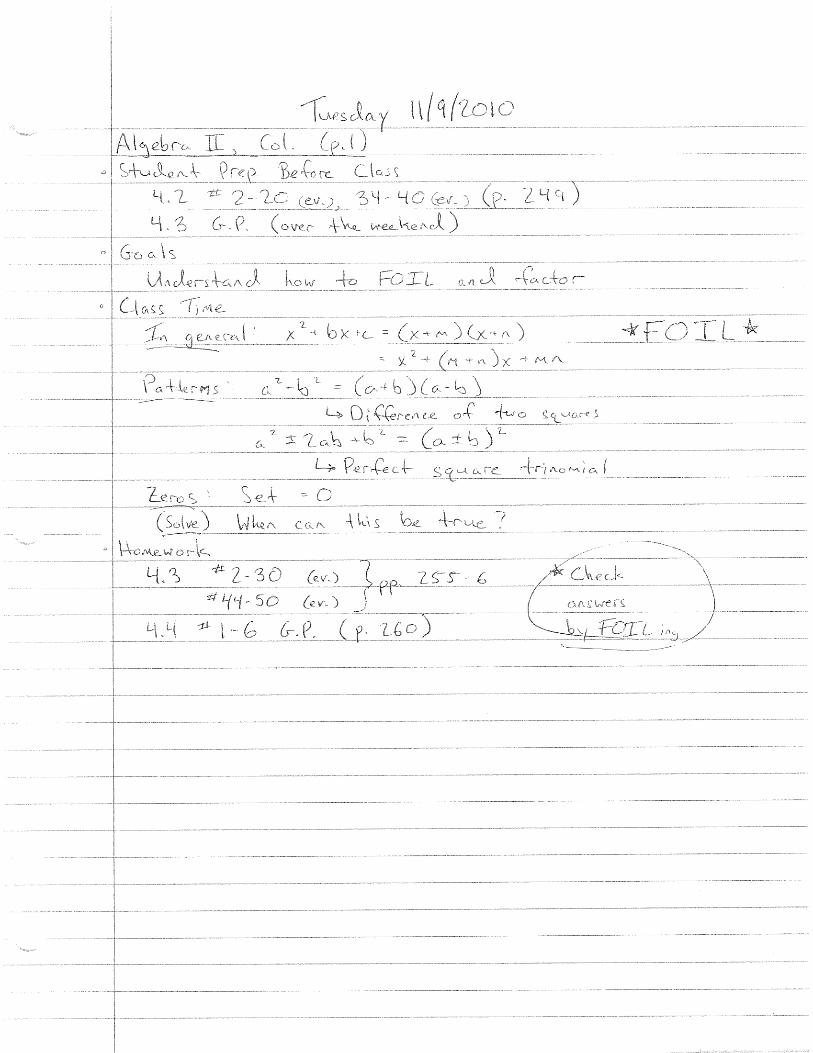
The majority of class time was dedicated to the daily lesson (Appendix H). One section was
covered over a span of one to two days, depending on the need for explanation. The lesson plan was
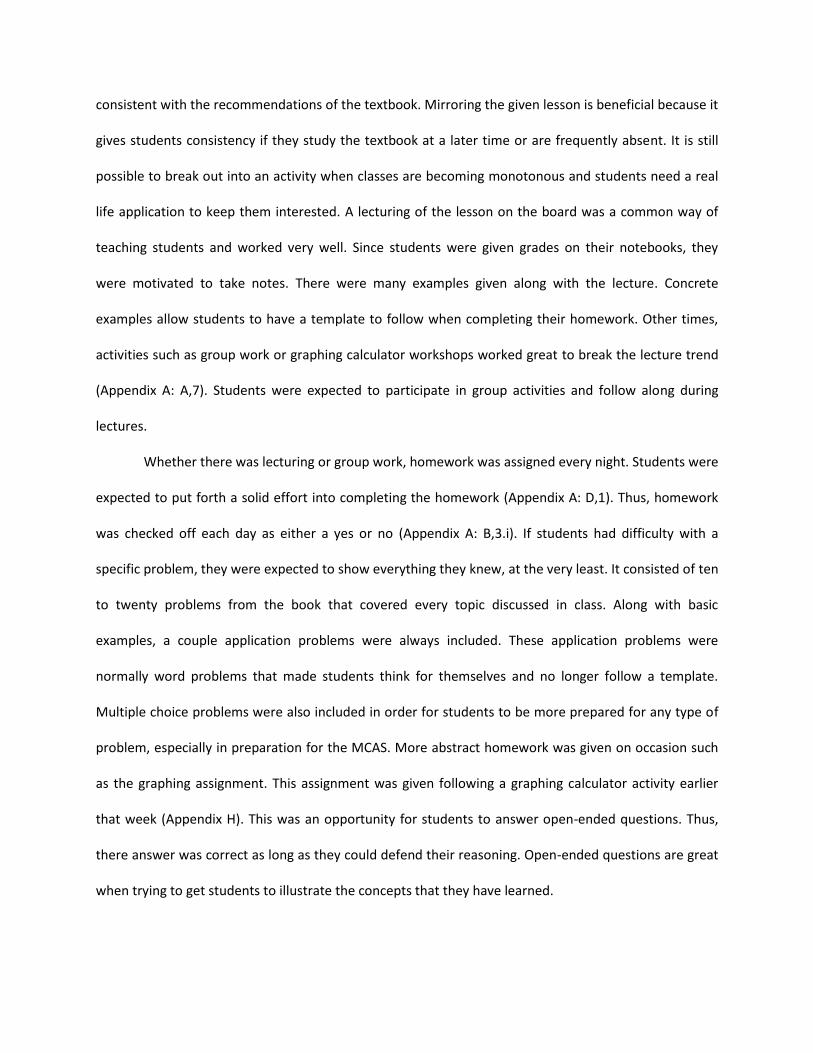
consistent with the recommendations of the textbook. Mirroring the given lesson is beneficial because it
gives students consistency if they study the textbook at a later time or are frequently absent. It is still
possible to break out into an activity when classes are becoming monotonous and students need a real
life application to keep them interested. A lecturing of the lesson on the board was a common way of
teaching students and worked very well. Since students were given grades on their notebooks, they
were motivated to take notes. There were many examples given along with the lecture. Concrete
examples allow students to have a template to follow when completing their homework. Other times,
activities such as group work or graphing calculator workshops worked great to break the lecture trend
(Appendix A: A,7). Students were expected to participate in group activities and follow along during
lectures.
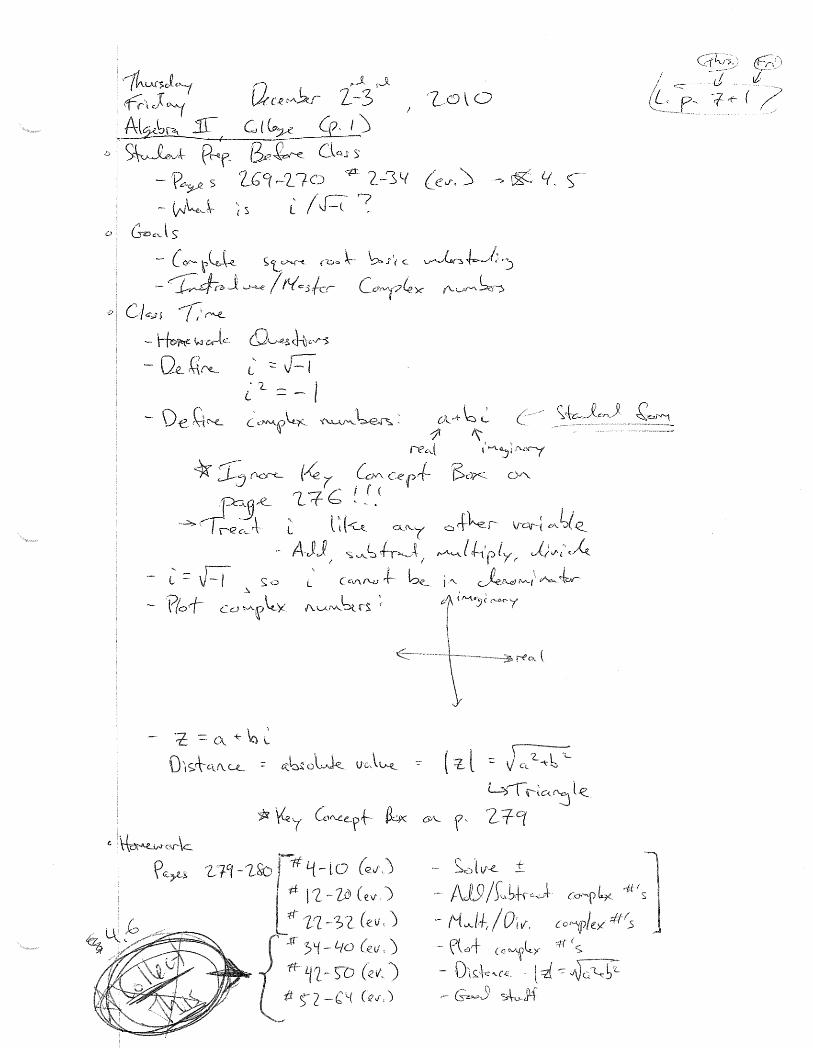
Whether there was lecturing or group work, homework was assigned every night. Students were
expected to put forth a solid effort into completing the homework (Appendix A: D,1). Thus, homework
was checked off each day as either a yes or no (Appendix A: B,3.i). If students had difficulty with a
specific problem, they were expected to show everything they knew, at the very least. It consisted of ten
to twenty problems from the book that covered every topic discussed in class. Along with basic
examples, a couple application problems were always included. These application problems were
normally word problems that made students think for themselves and no longer follow a template.
Multiple choice problems were also included in order for students to be more prepared for any type of
problem, especially in preparation for the MCAS. More abstract homework was given on occasion such
as the graphing assignment. This assignment was given following a graphing calculator activity earlier
that week (Appendix H). This was an opportunity for students to answer open-ended questions. Thus,
there answer was correct as long as they could defend their reasoning. Open-ended questions are great
when trying to get students to illustrate the concepts that they have learned.
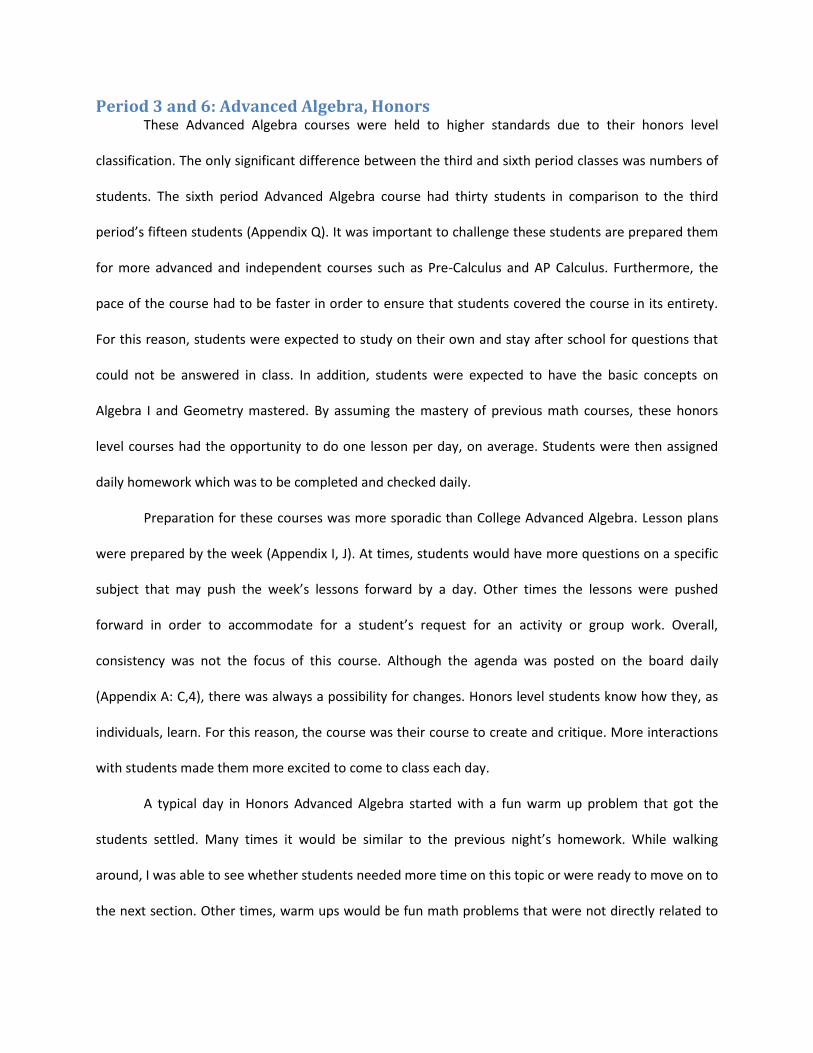
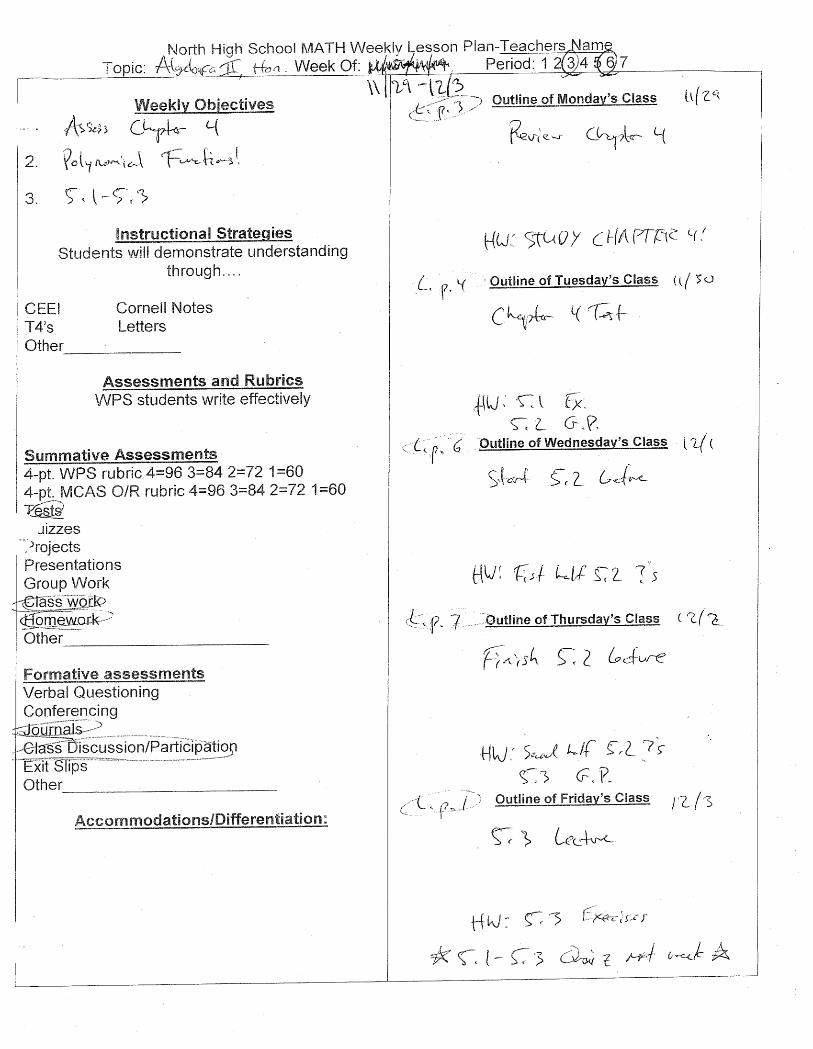
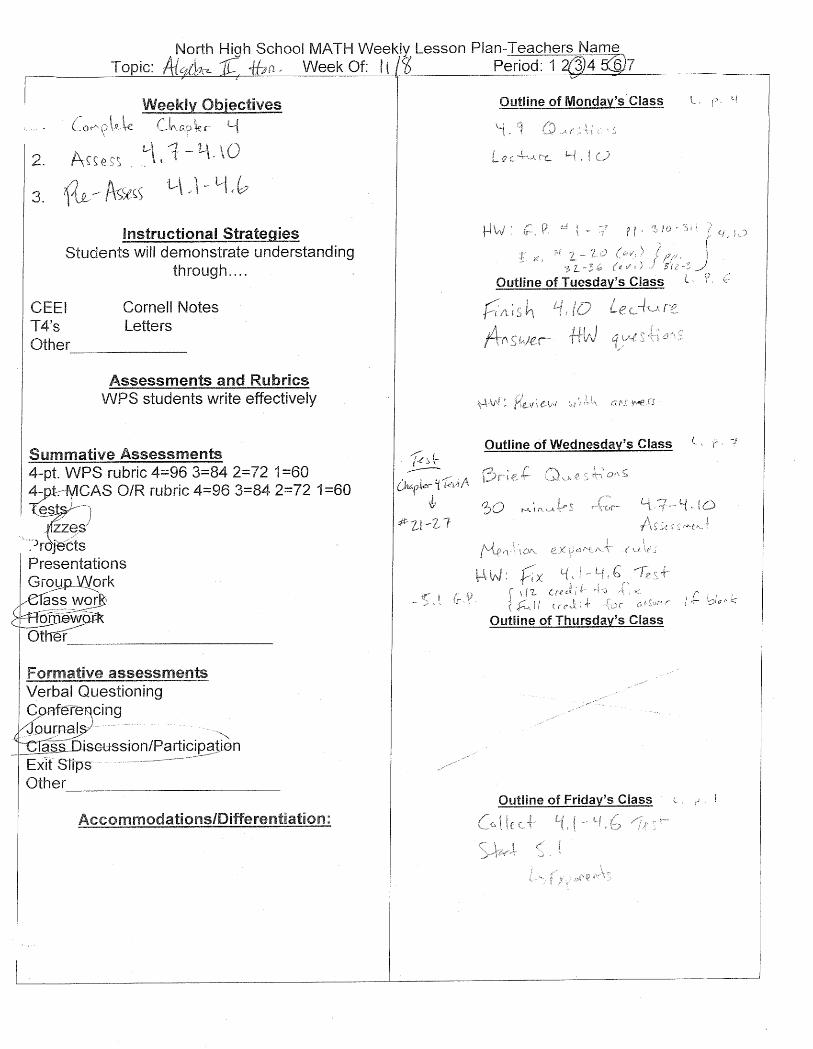
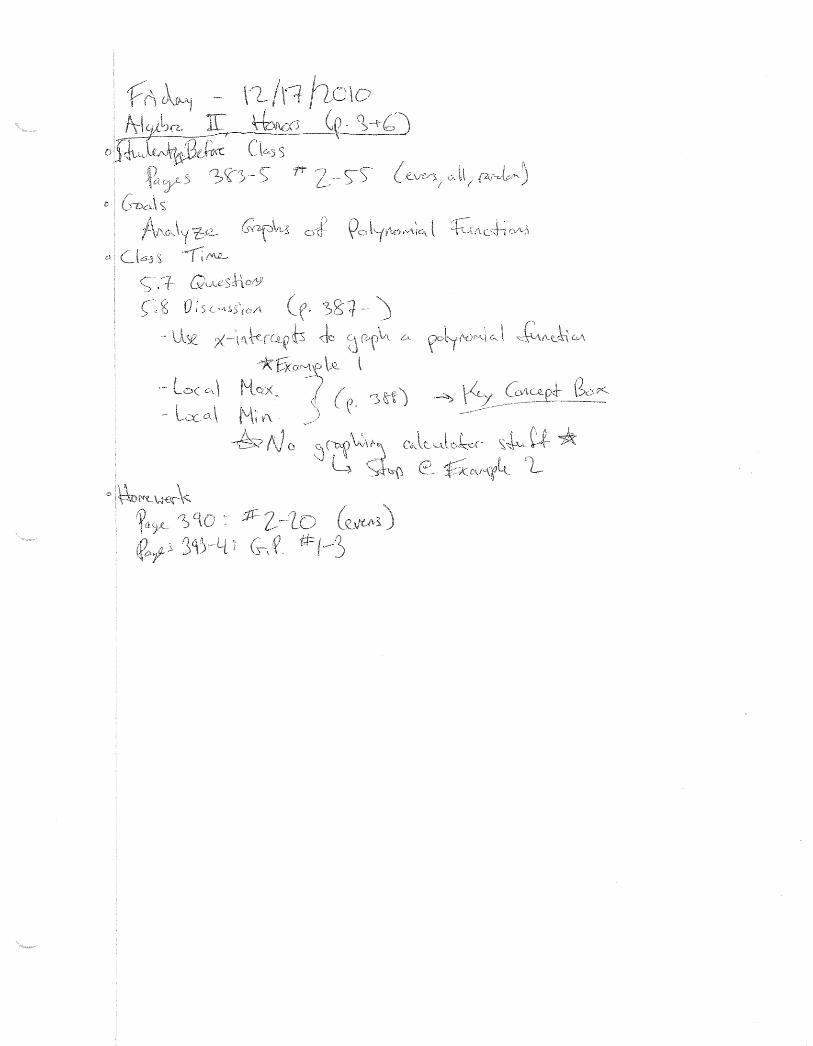
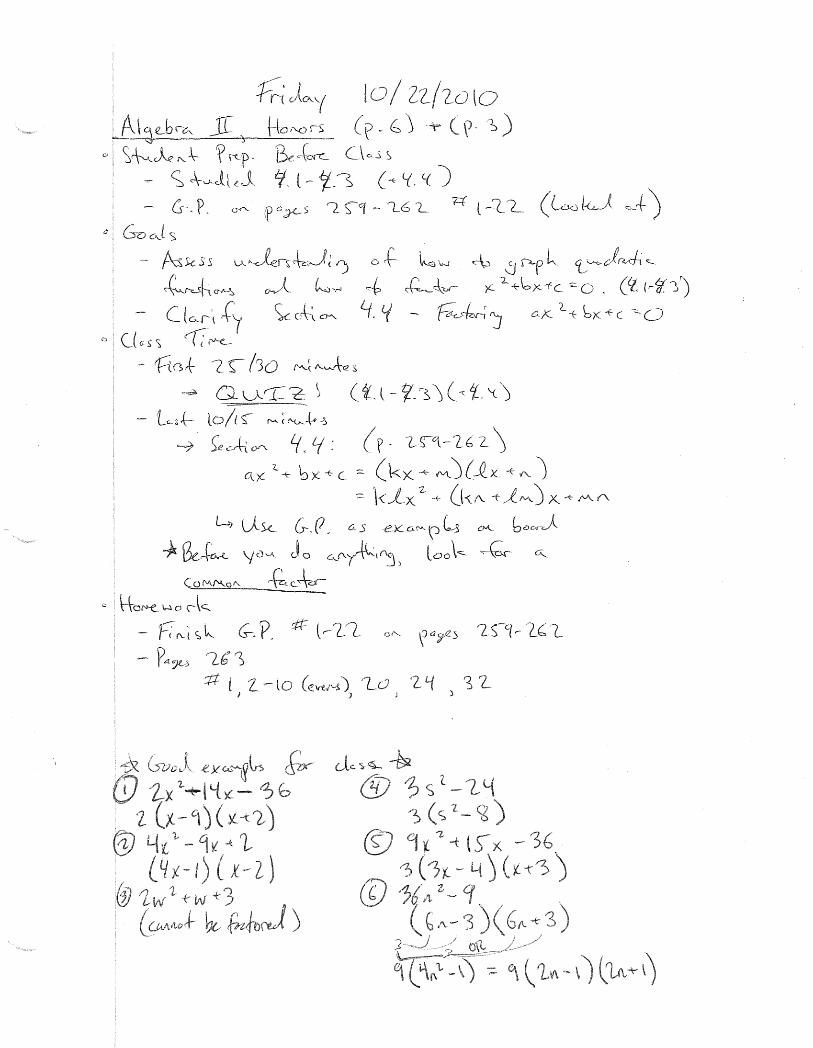
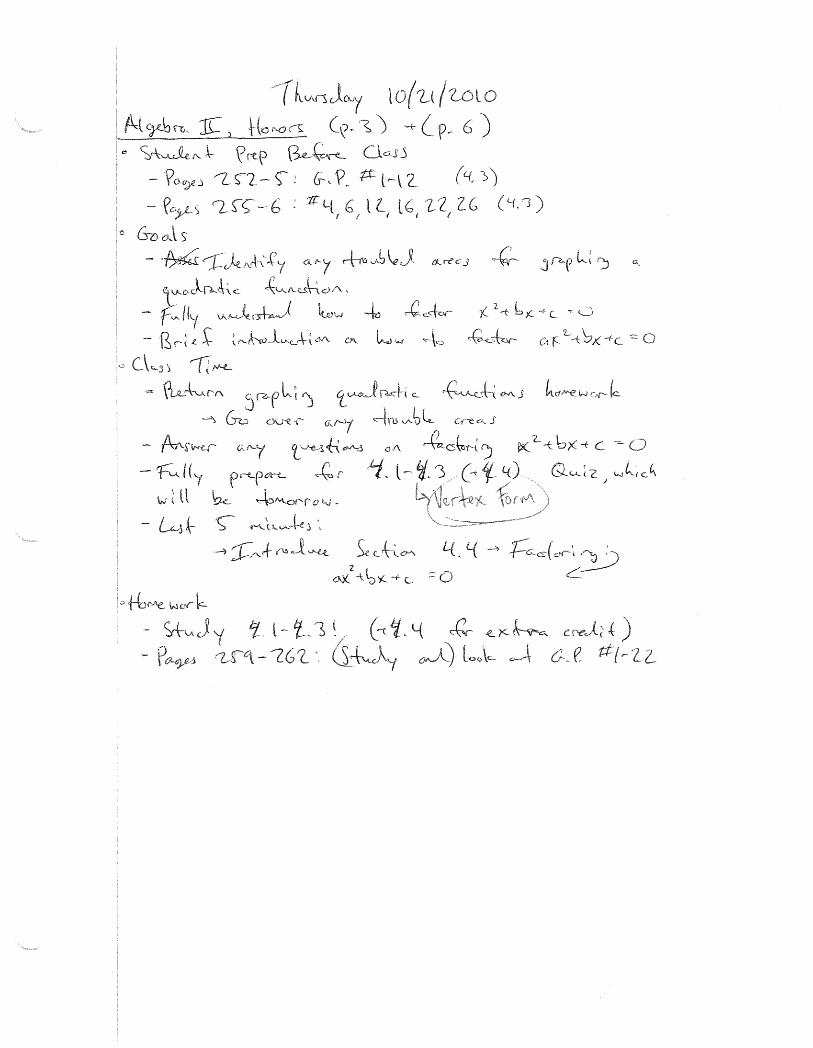
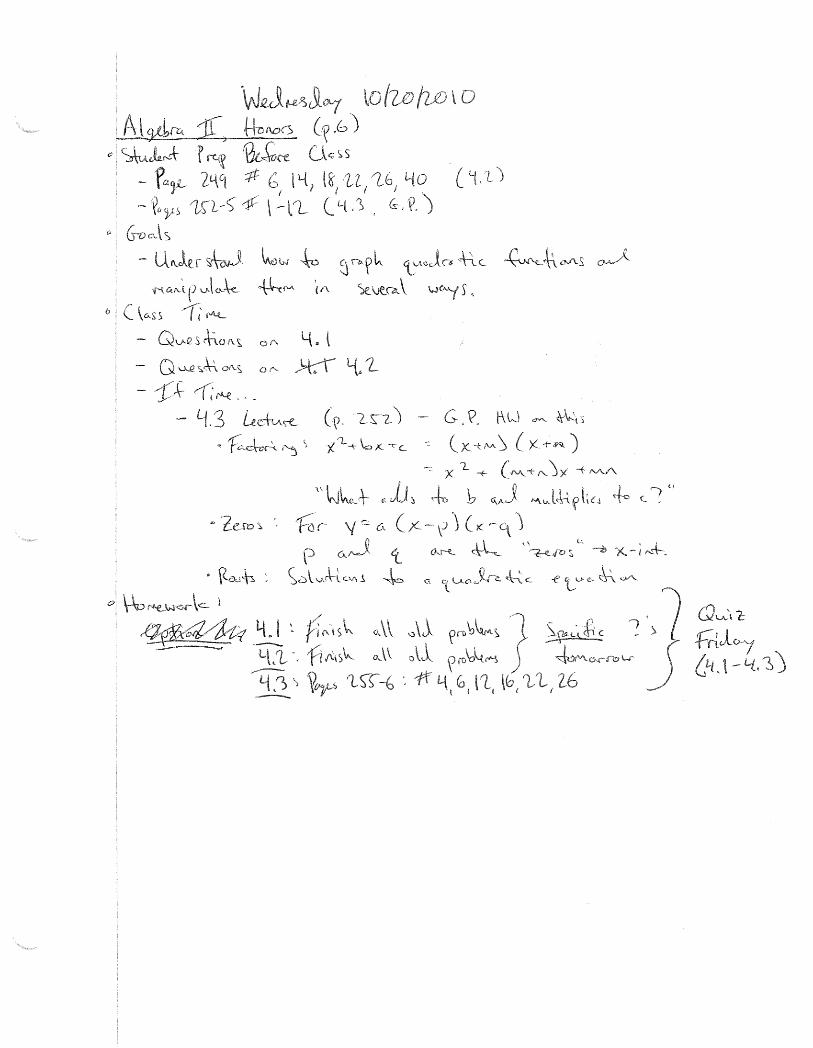
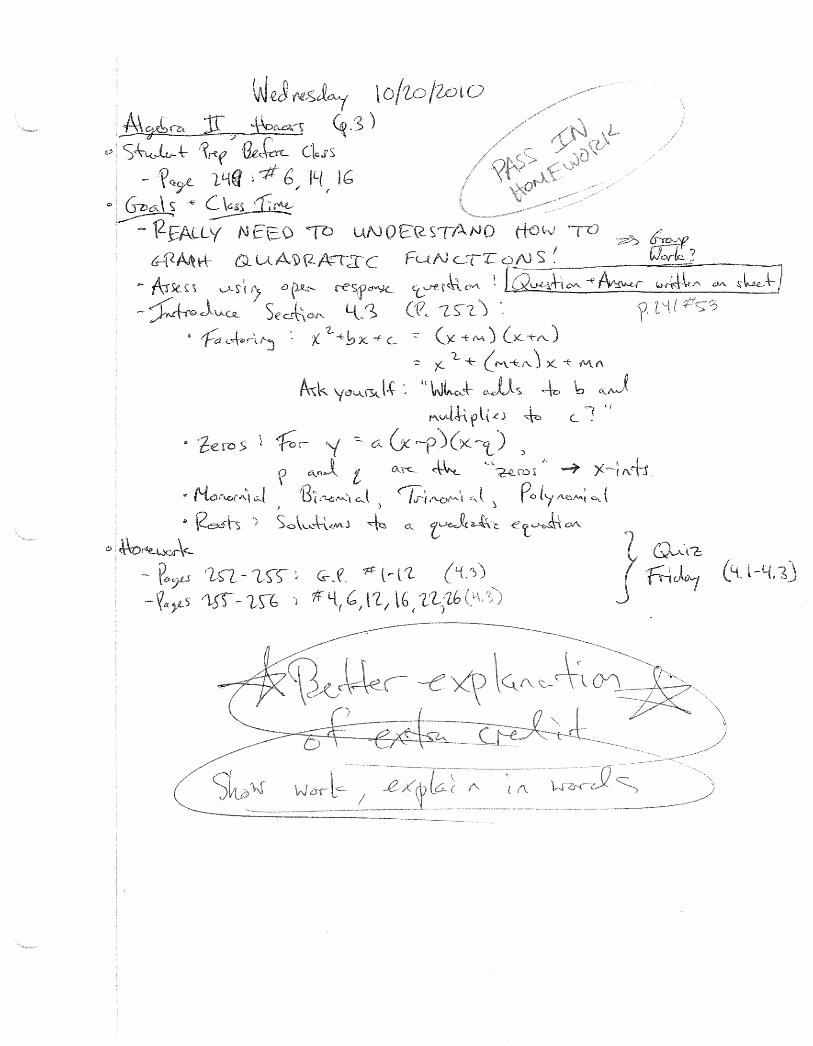
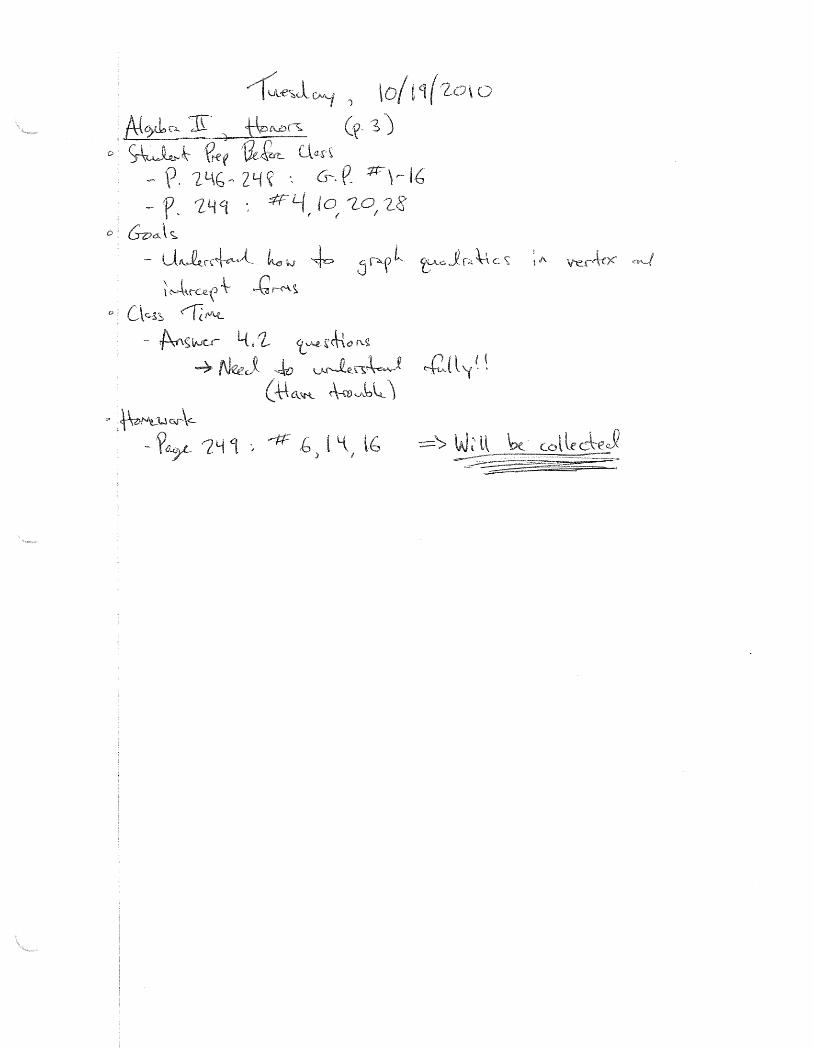
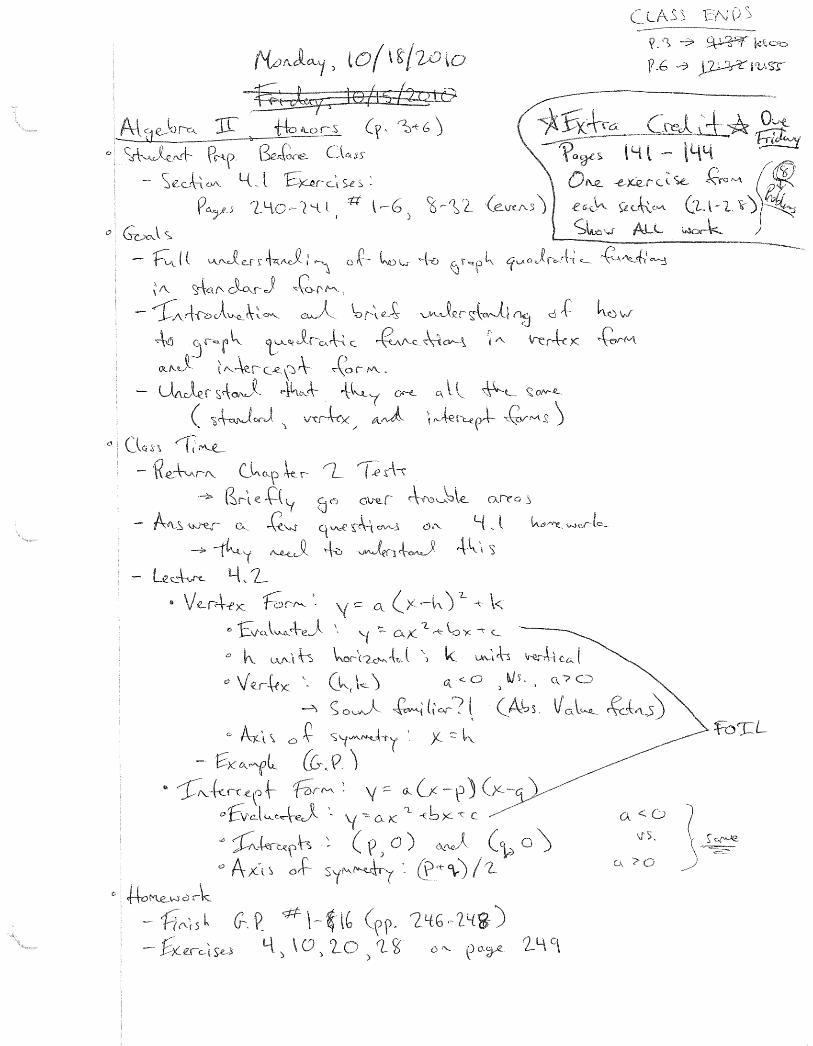
Period 3 and 6: Advanced Algebra, Honors These Advanced Algebra courses were held to higher standards due to their honors level
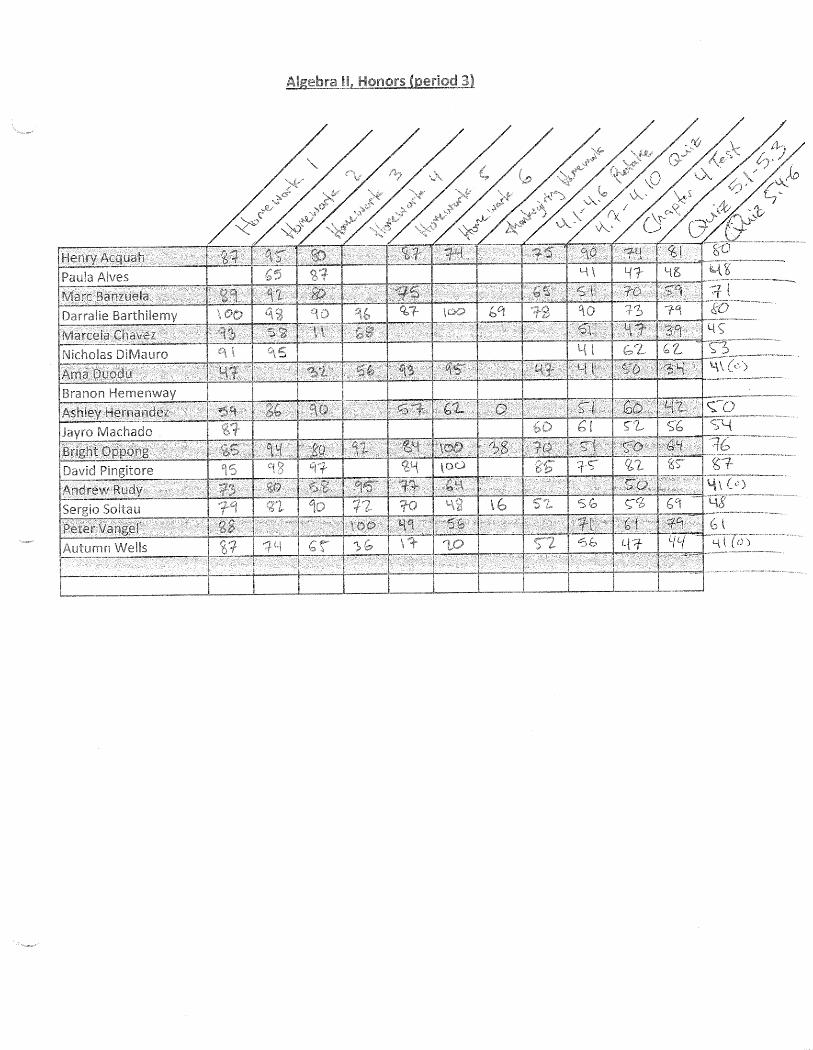
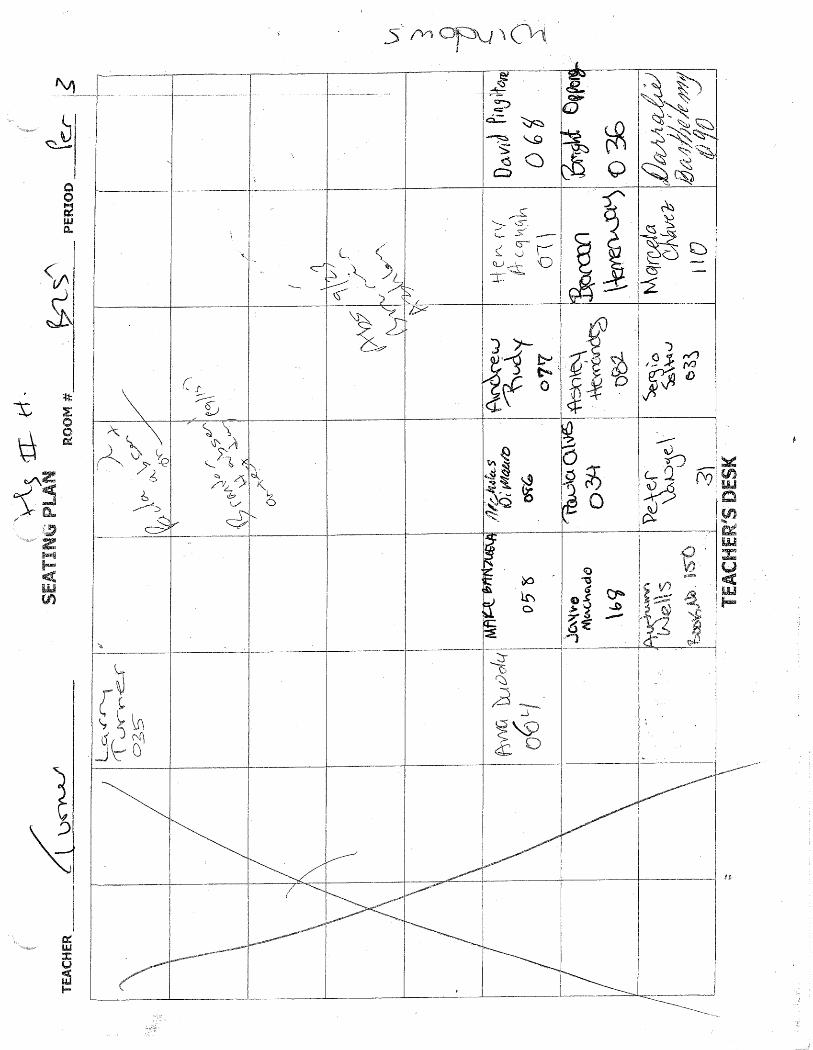
classification. The only significant difference between the third and sixth period classes was numbers of
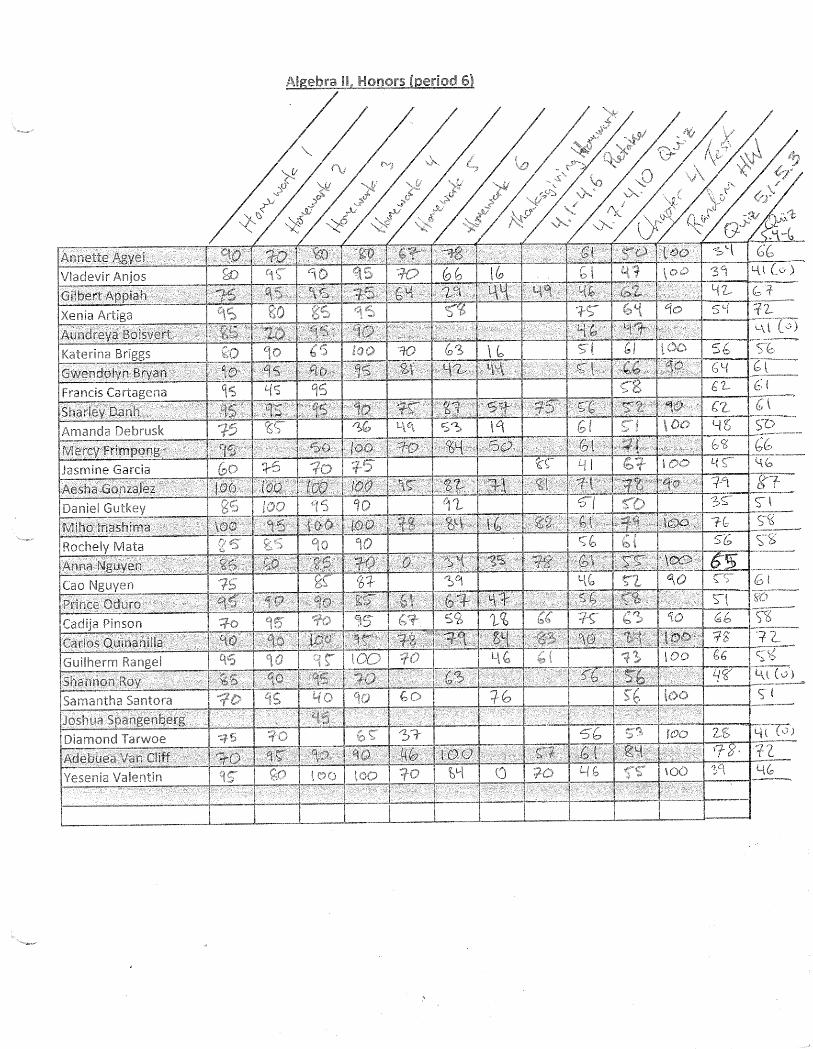
students. The sixth period Advanced Algebra course had thirty students in comparison to the third
period’s fifteen students (Appendix Q). It was important to challenge these students are prepared them
for more advanced and independent courses such as Pre-Calculus and AP Calculus. Furthermore, the
pace of the course had to be faster in order to ensure that students covered the course in its entirety.
For this reason, students were expected to study on their own and stay after school for questions that
could not be answered in class. In addition, students were expected to have the basic concepts on
Algebra I and Geometry mastered. By assuming the mastery of previous math courses, these honors
level courses had the opportunity to do one lesson per day, on average. Students were then assigned
daily homework which was to be completed and checked daily.
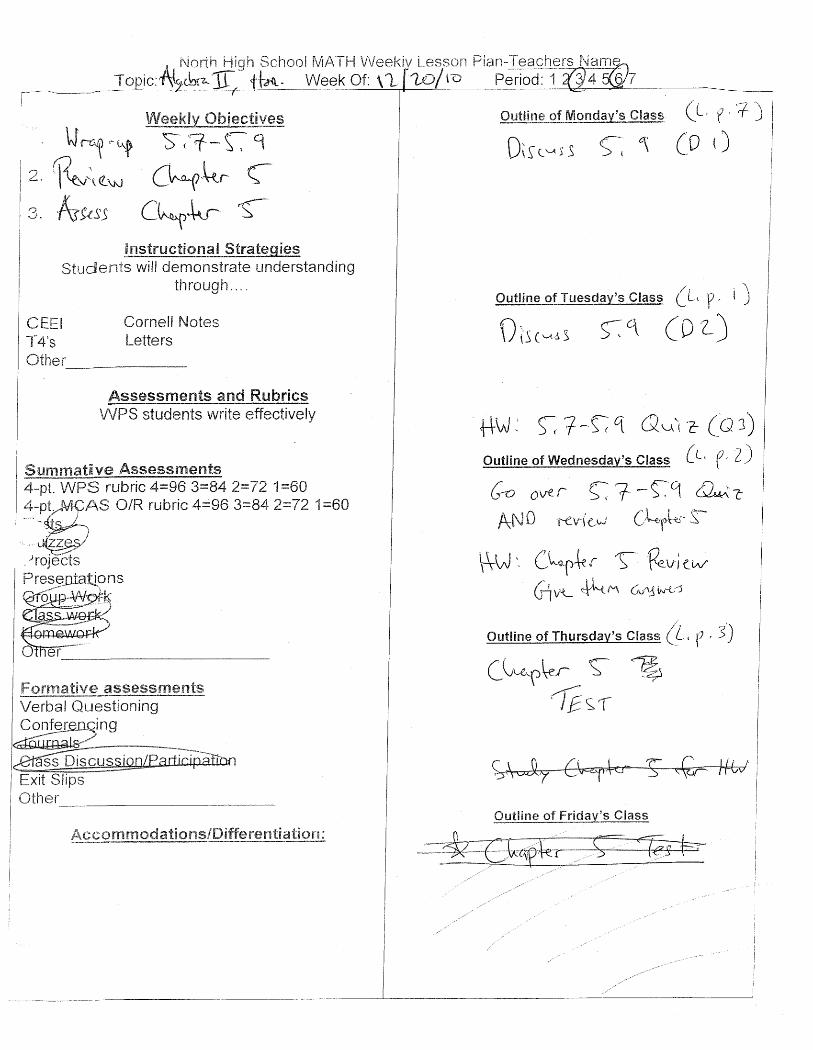
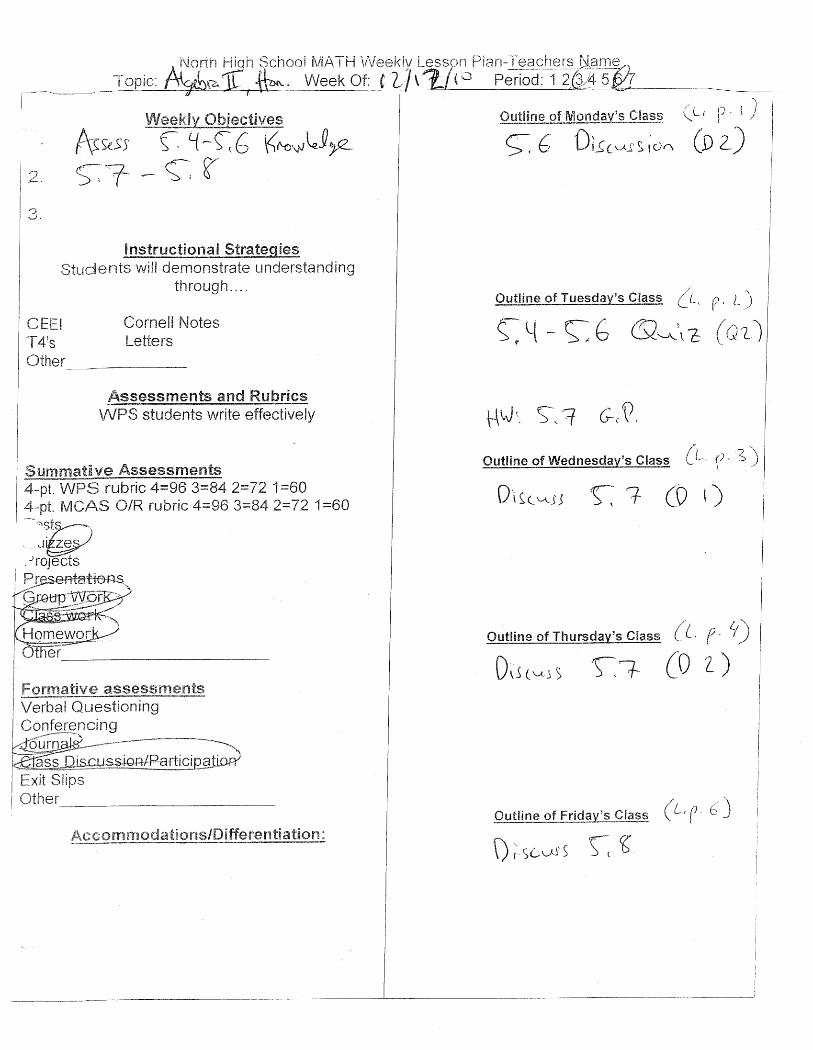
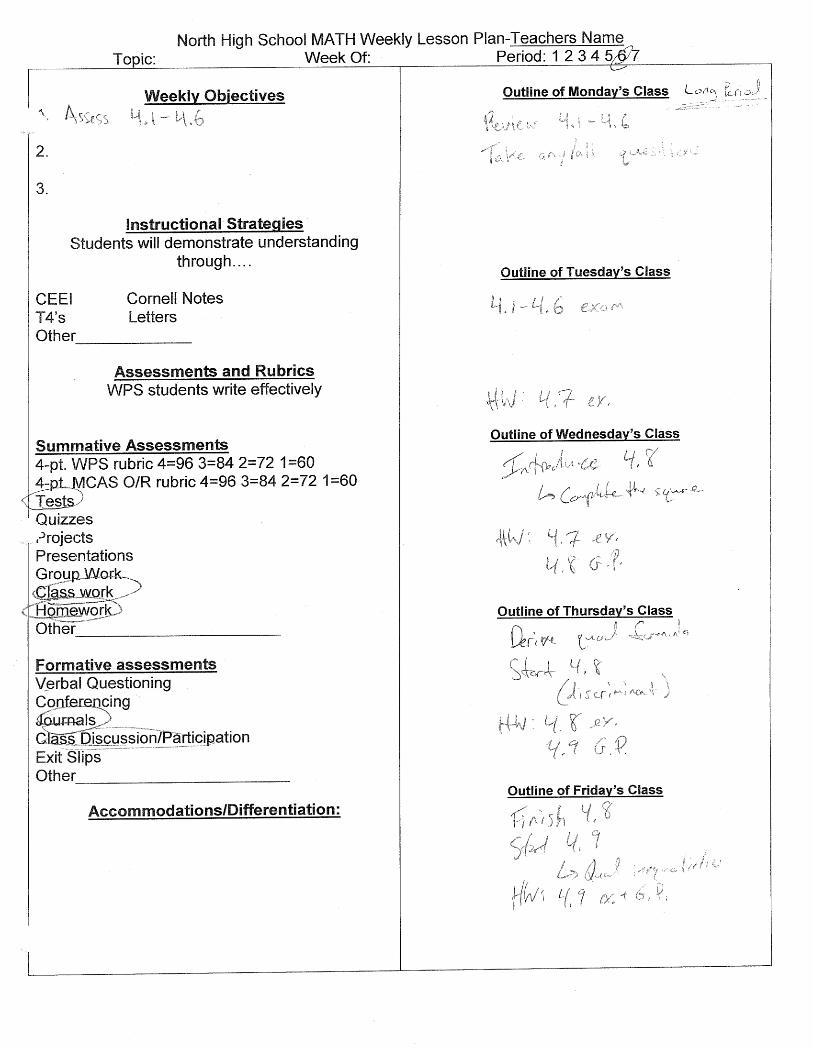
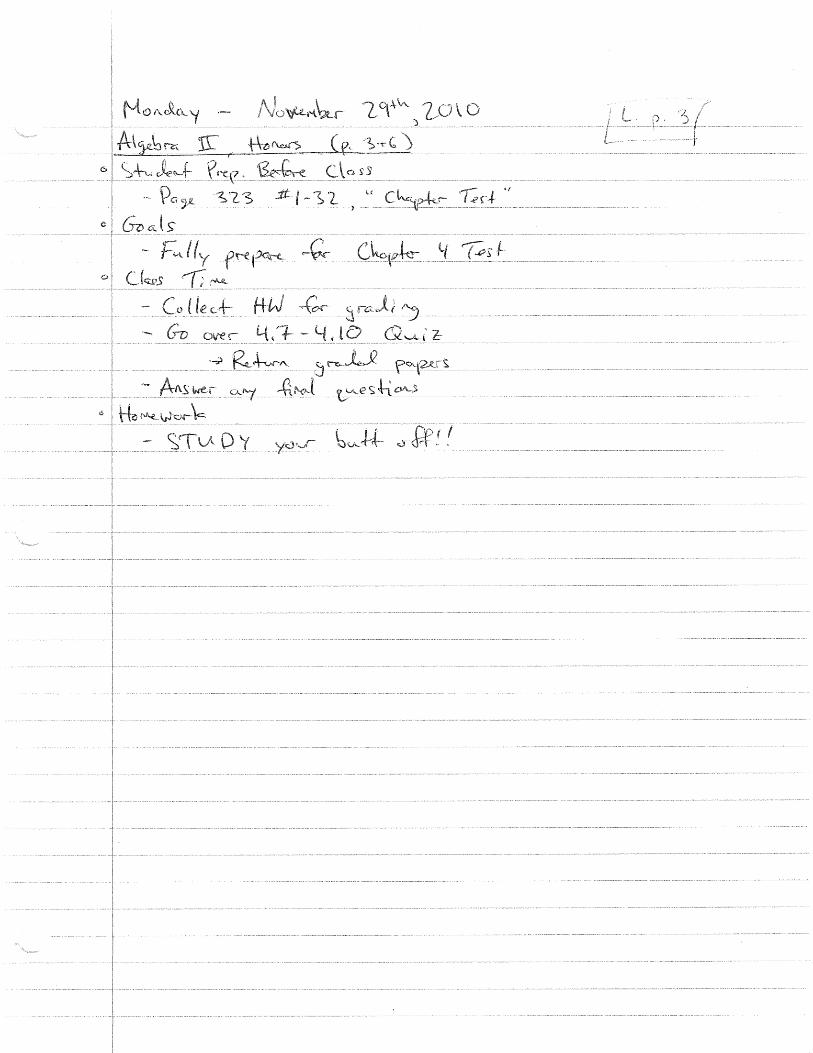
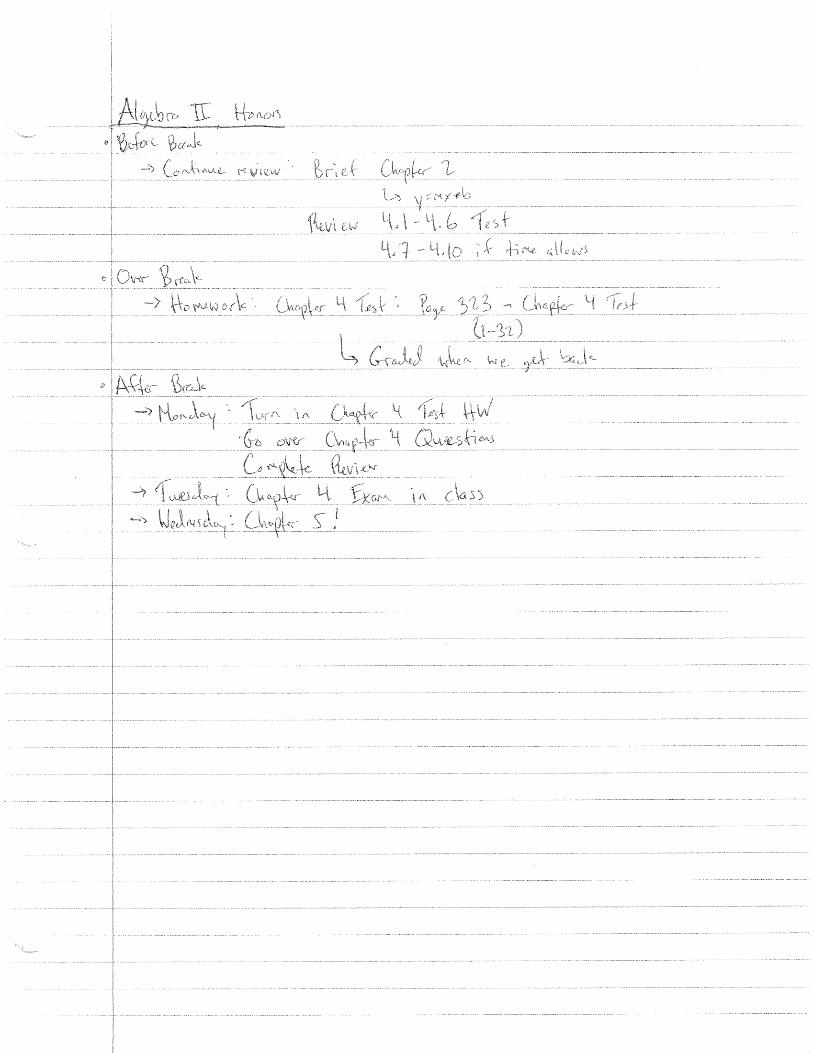
Preparation for these courses was more sporadic than College Advanced Algebra. Lesson plans
were prepared by the week (Appendix I, J). At times, students would have more questions on a specific
subject that may push the week’s lessons forward by a day. Other times the lessons were pushed
forward in order to accommodate for a student’s request for an activity or group work. Overall,
consistency was not the focus of this course. Although the agenda was posted on the board daily
(Appendix A: C,4), there was always a possibility for changes. Honors level students know how they, as
individuals, learn. For this reason, the course was their course to create and critique. More interactions
with students made them more excited to come to class each day.
A typical day in Honors Advanced Algebra started with a fun warm up problem that got the
students settled. Many times it would be similar to the previous night’s homework. While walking
around, I was able to see whether students needed more time on this topic or were ready to move on to
the next section. Other times, warm ups would be fun math problems that were not directly related to
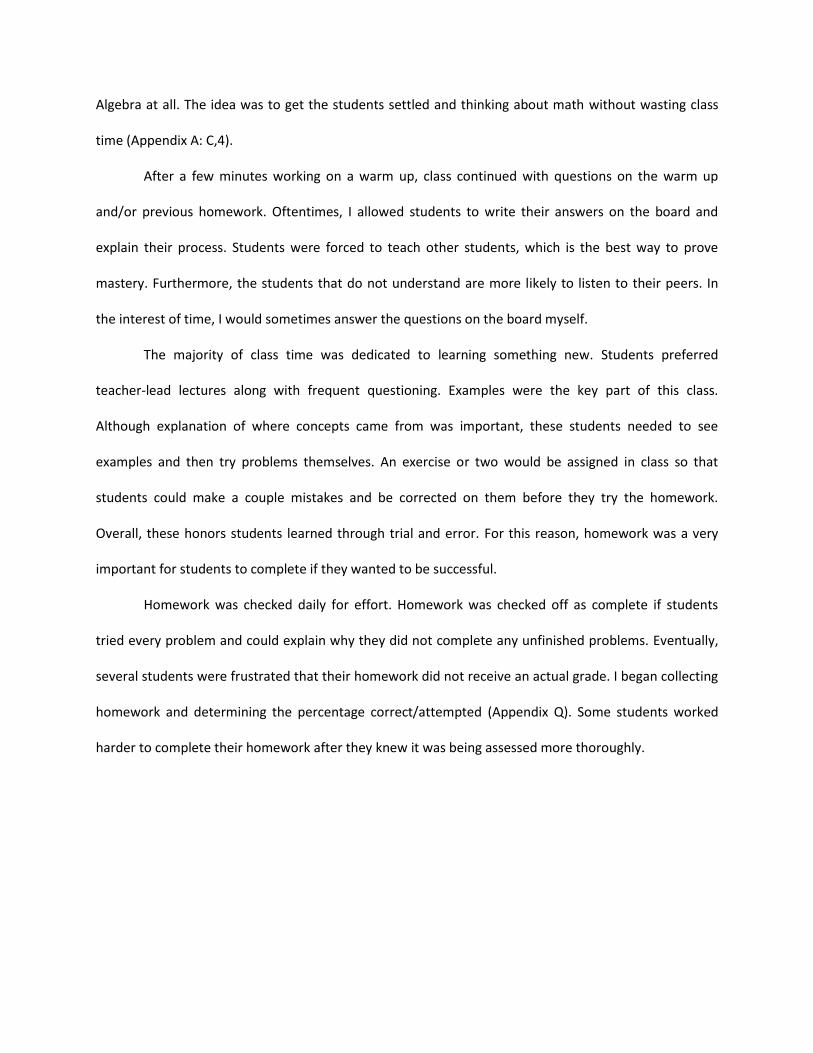
Algebra at all. The idea was to get the students settled and thinking about math without wasting class
time (Appendix A: C,4).
After a few minutes working on a warm up, class continued with questions on the warm up
and/or previous homework. Oftentimes, I allowed students to write their answers on the board and
explain their process. Students were forced to teach other students, which is the best way to prove
mastery. Furthermore, the students that do not understand are more likely to listen to their peers. In
the interest of time, I would sometimes answer the questions on the board myself.
The majority of class time was dedicated to learning something new. Students preferred
teacher-lead lectures along with frequent questioning. Examples were the key part of this class.
Although explanation of where concepts came from was important, these students needed to see
examples and then try problems themselves. An exercise or two would be assigned in class so that
students could make a couple mistakes and be corrected on them before they try the homework.
Overall, these honors students learned through trial and error. For this reason, homework was a very
important for students to complete if they wanted to be successful.
Homework was checked daily for effort. Homework was checked off as complete if students
tried every problem and could explain why they did not complete any unfinished problems. Eventually,
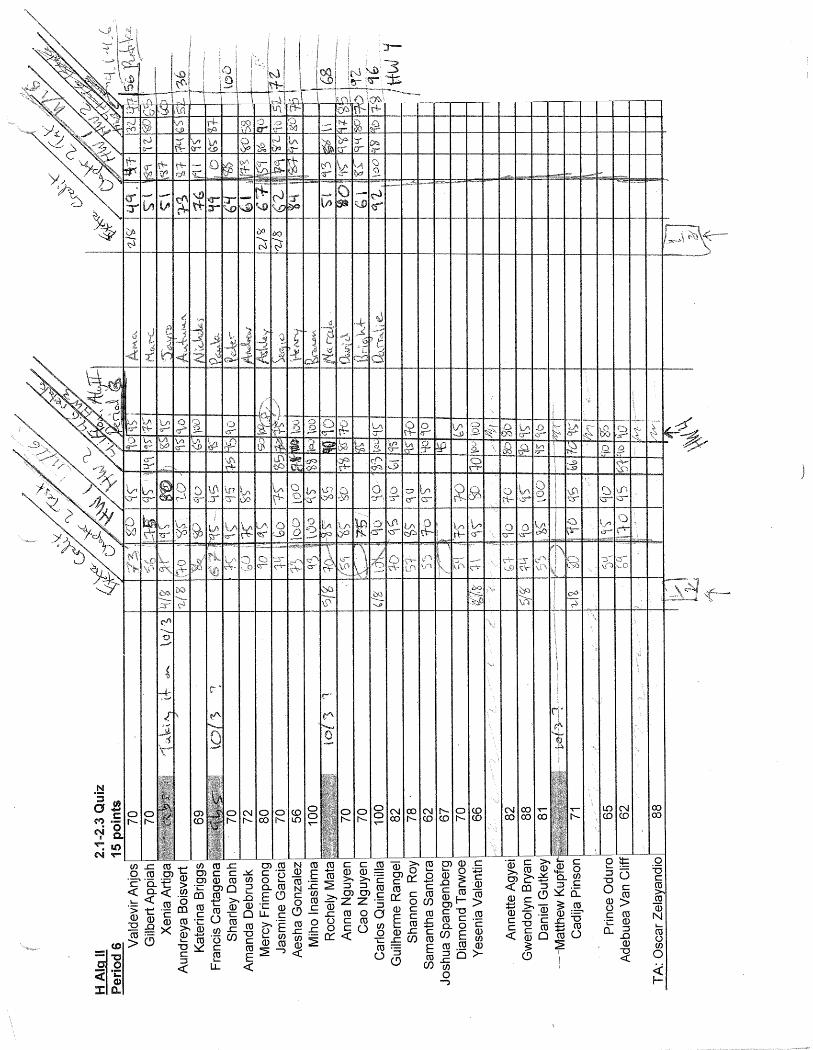
several students were frustrated that their homework did not receive an actual grade. I began collecting
homework and determining the percentage correct/attempted (Appendix Q). Some students worked
harder to complete their homework after they knew it was being assessed more thoroughly.
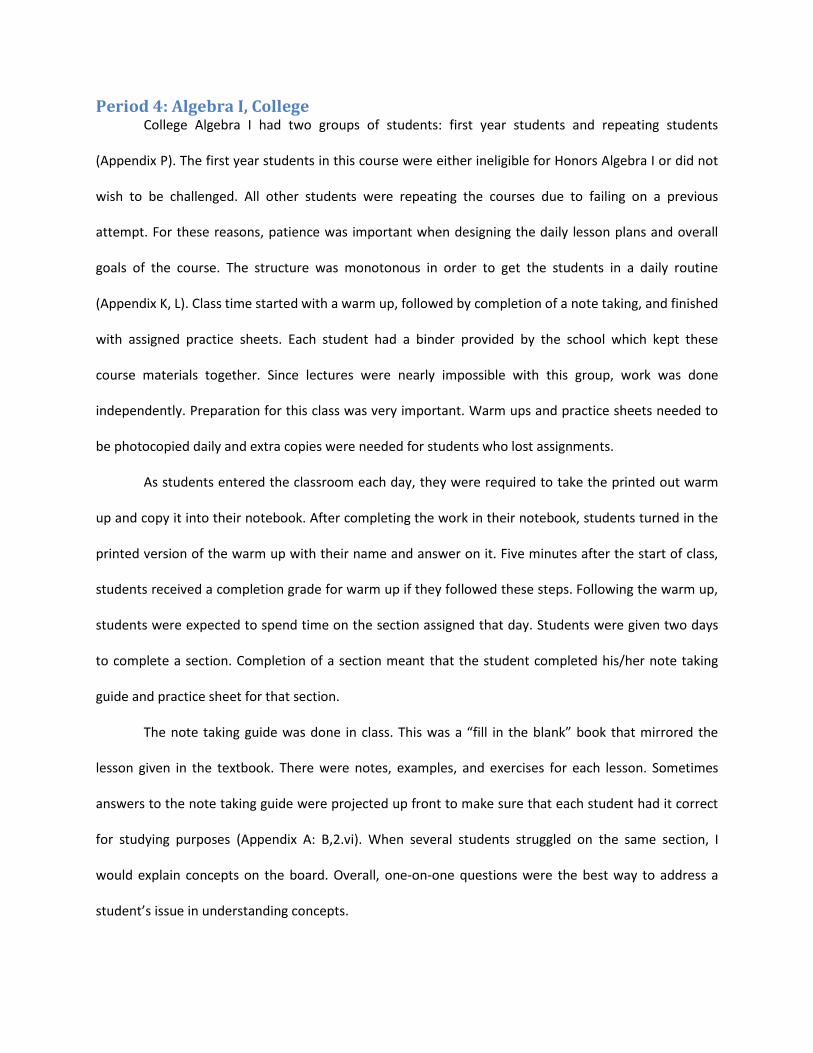
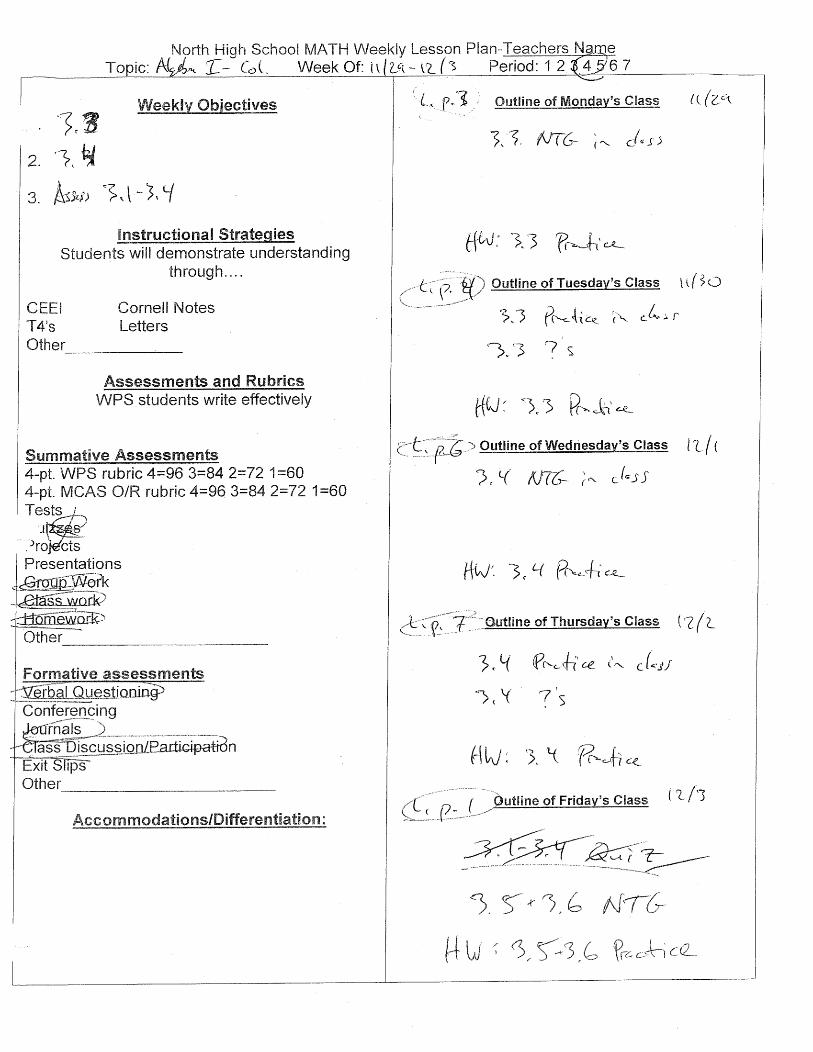
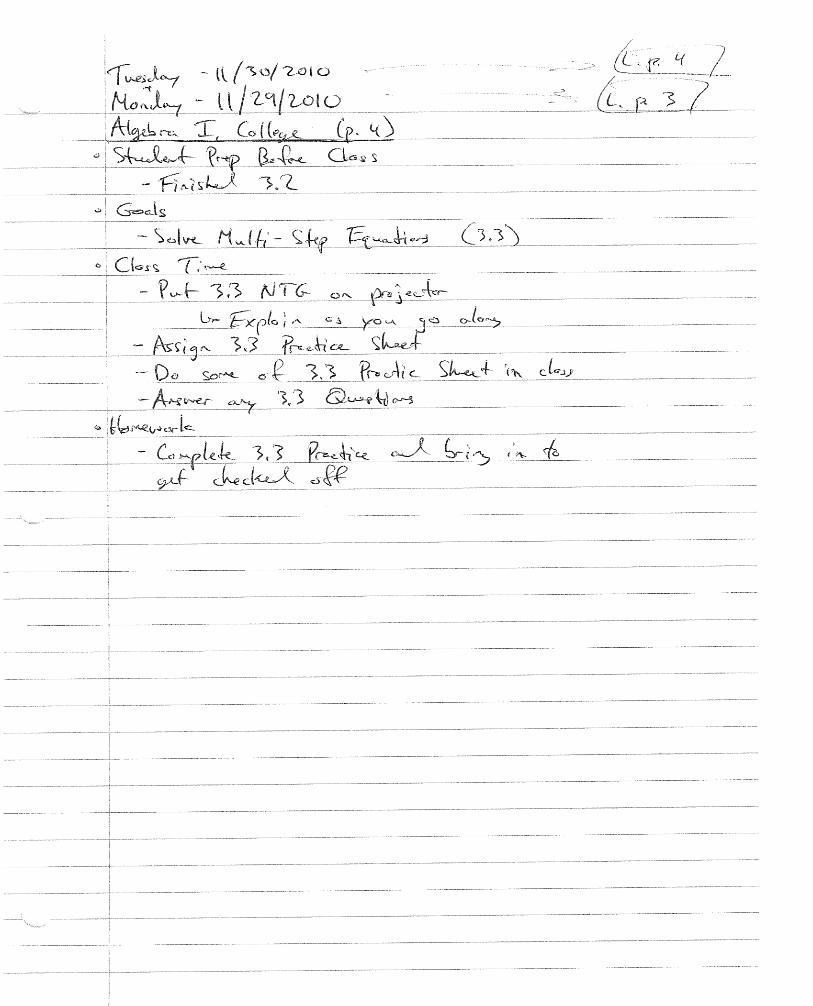
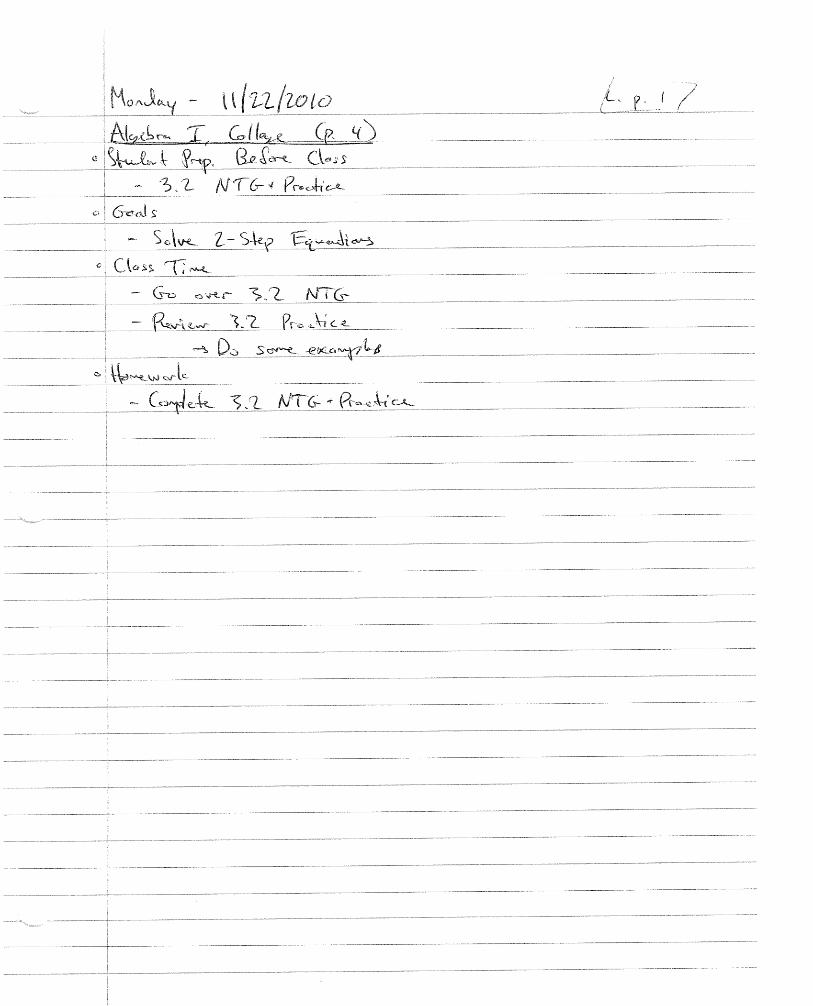
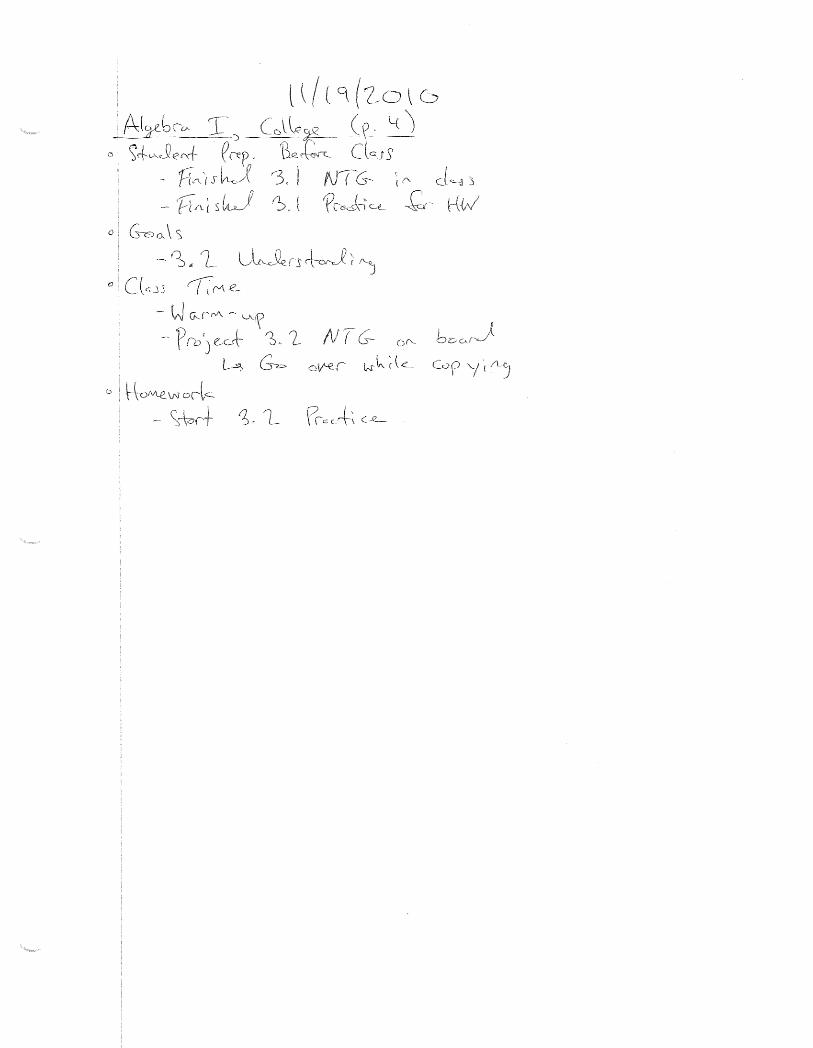
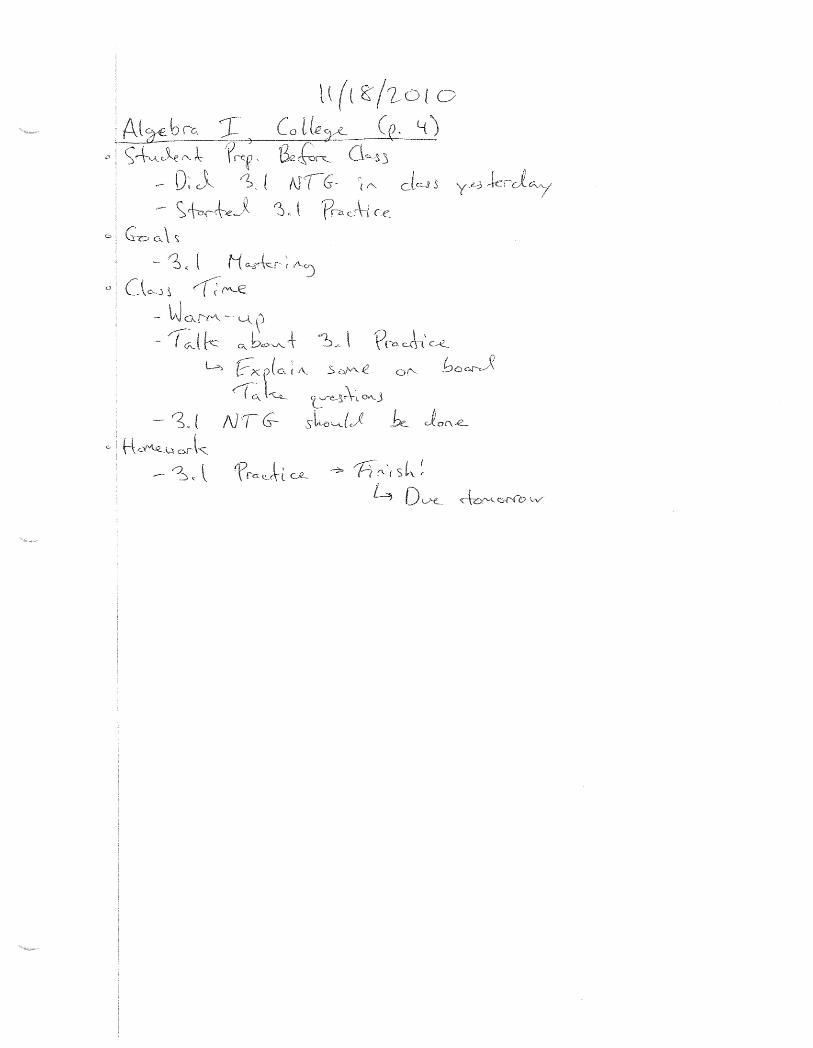
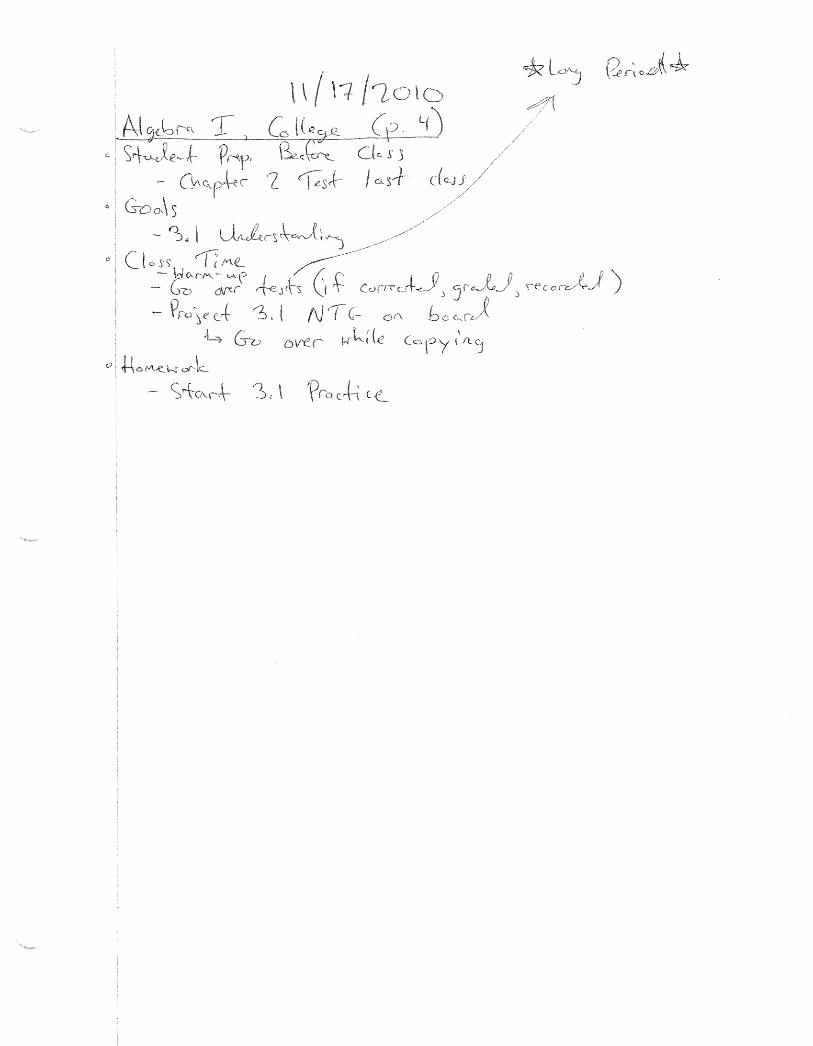
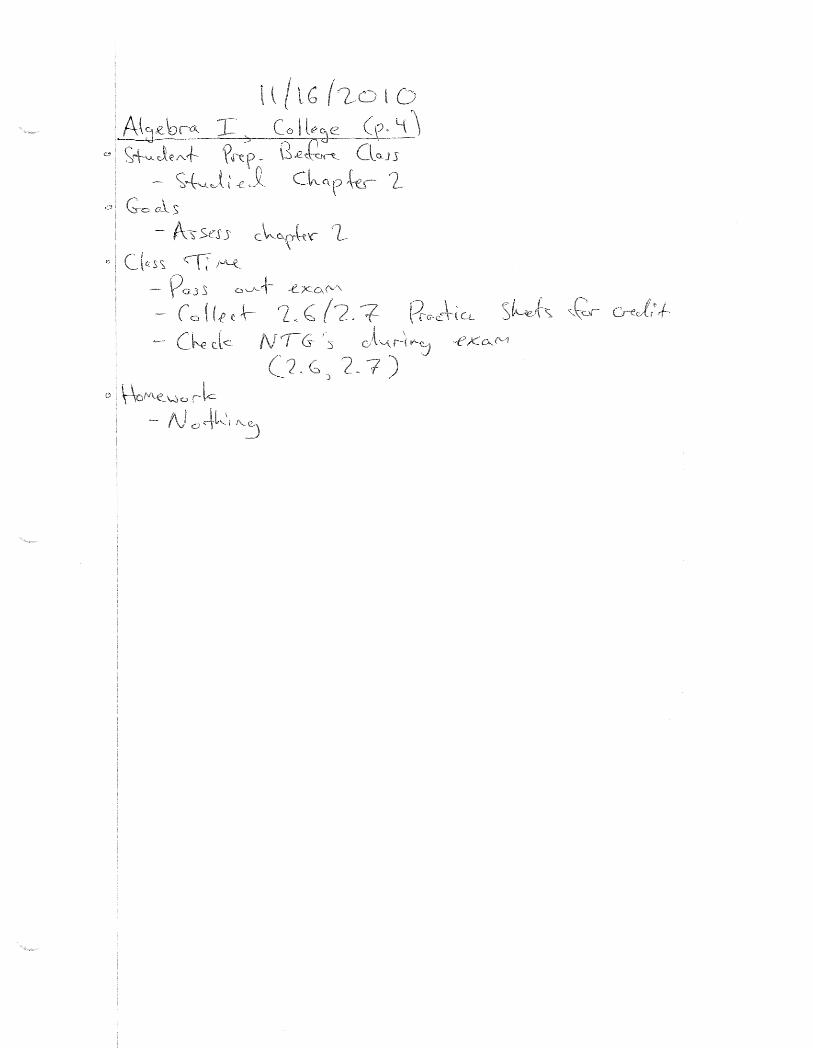
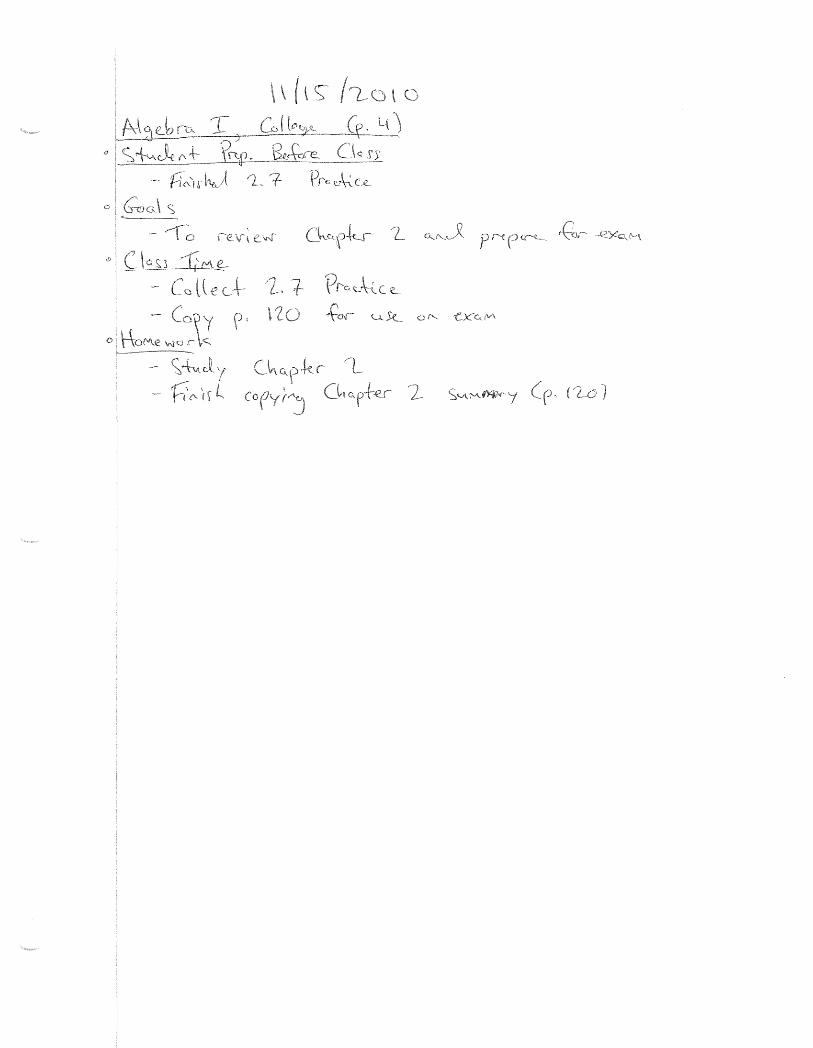
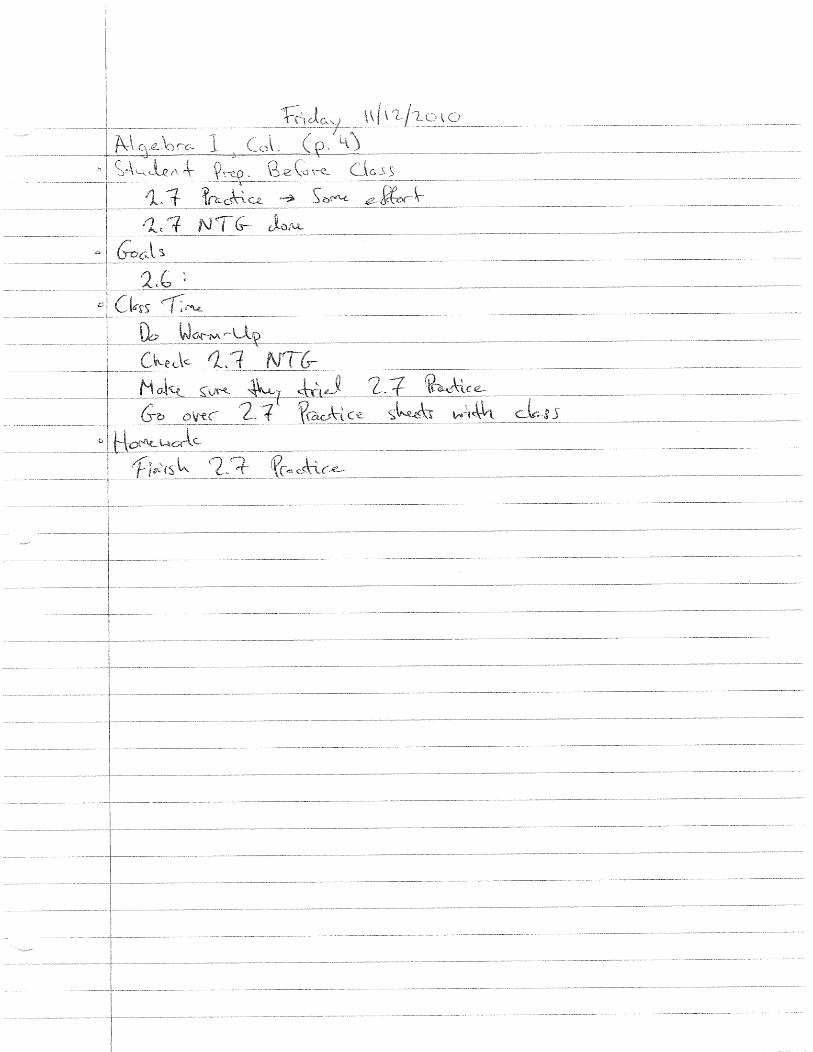
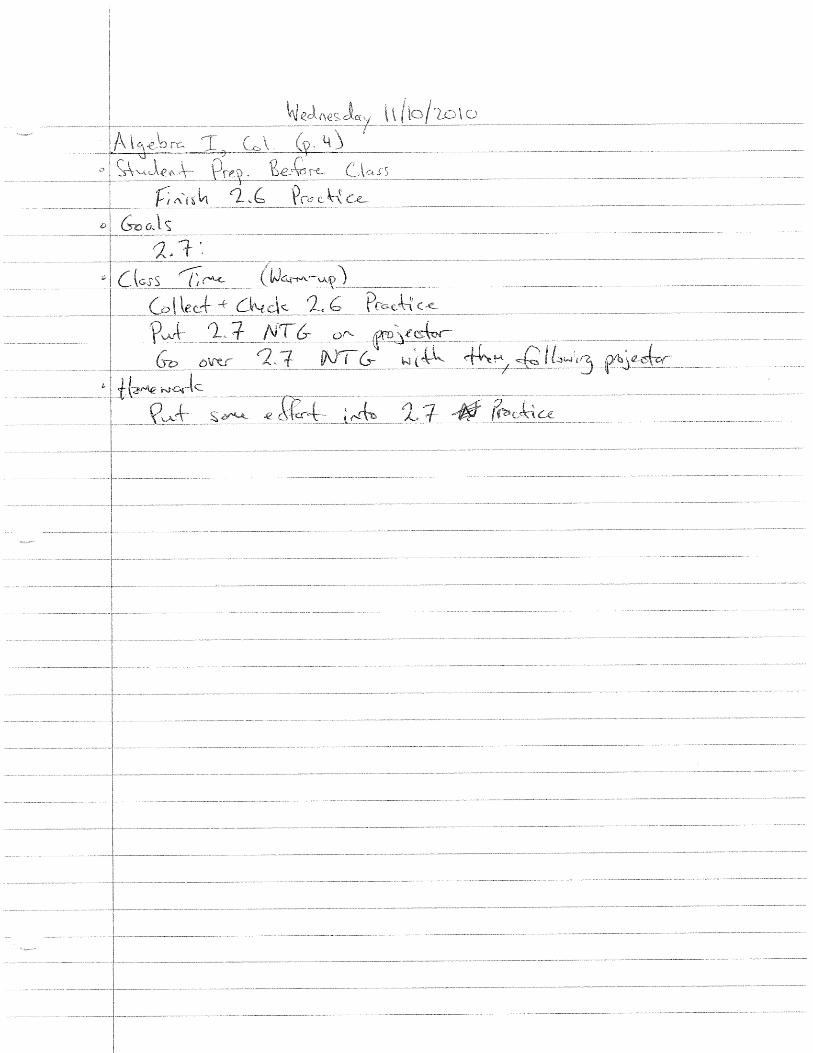
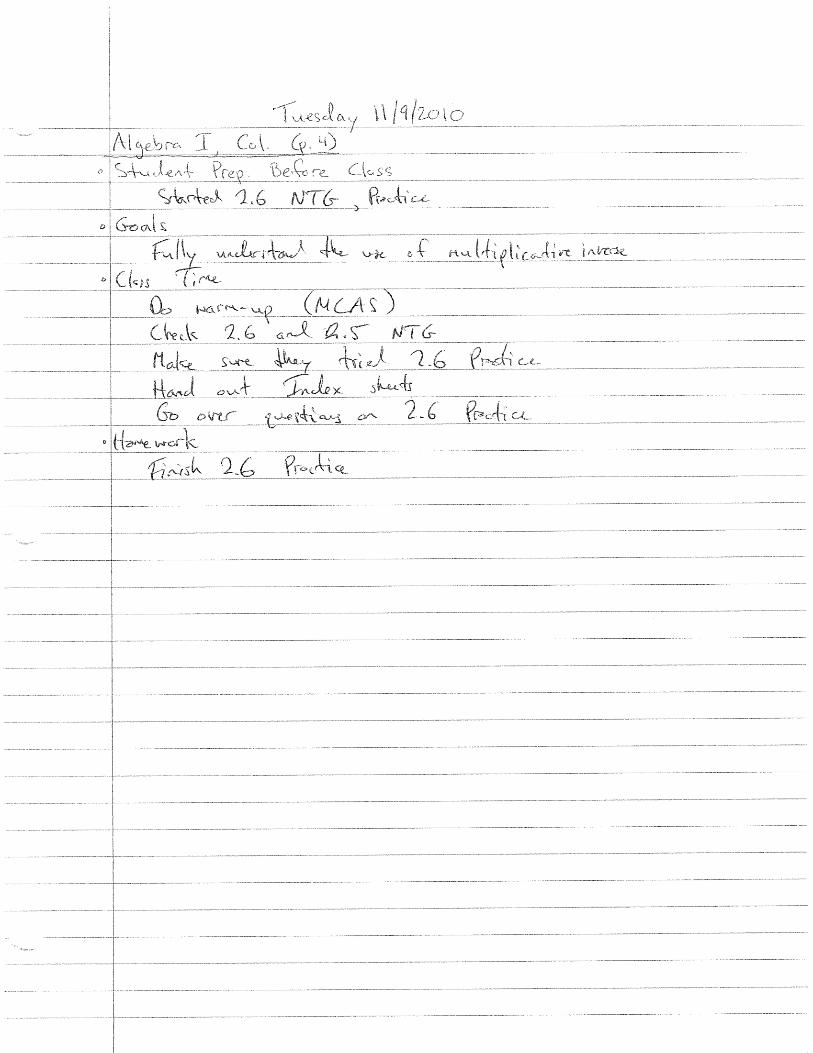
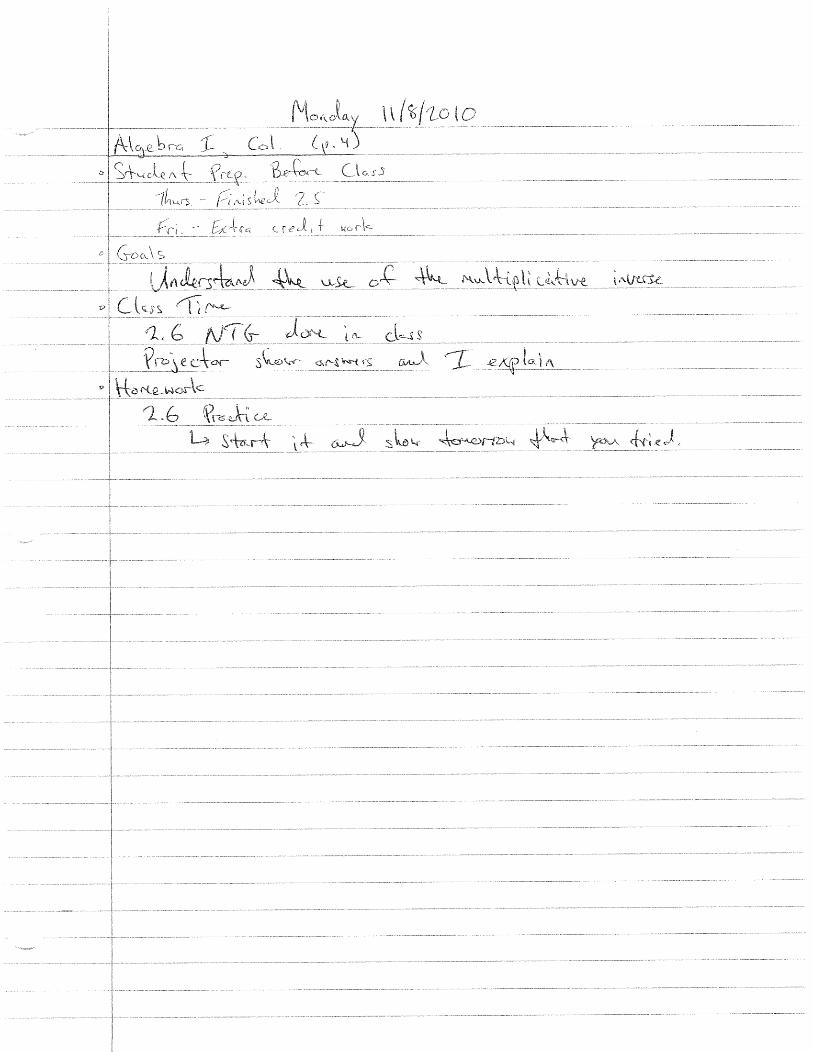
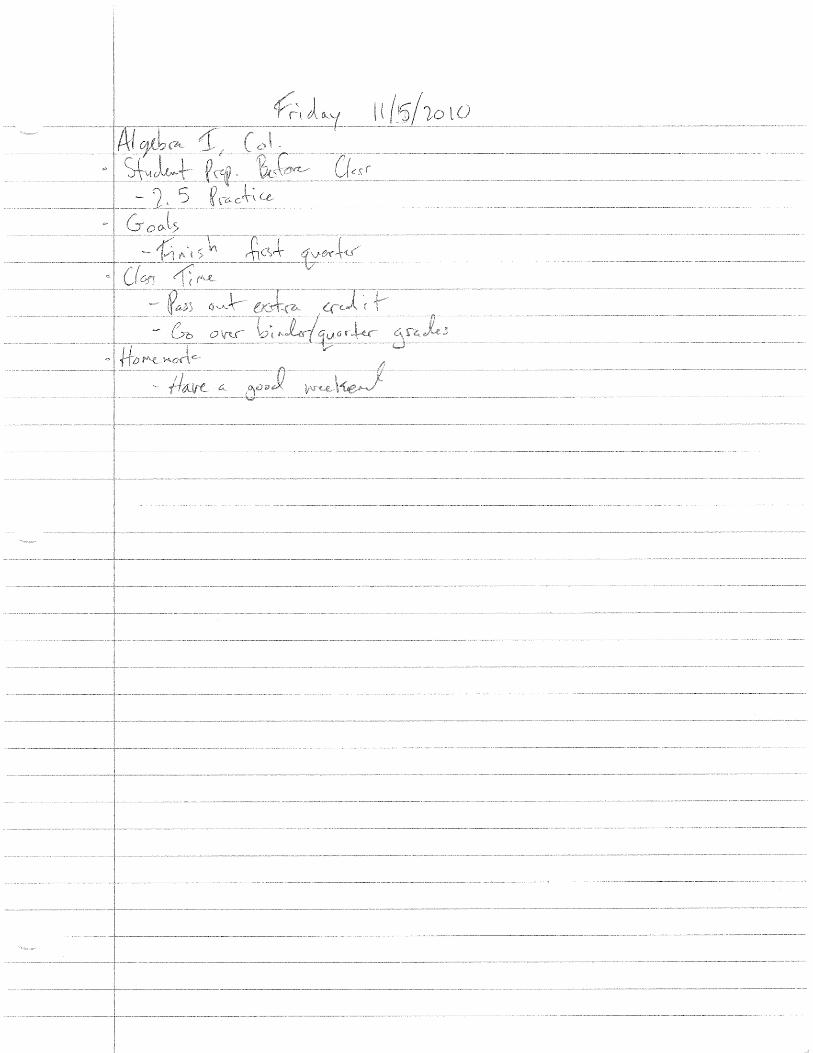
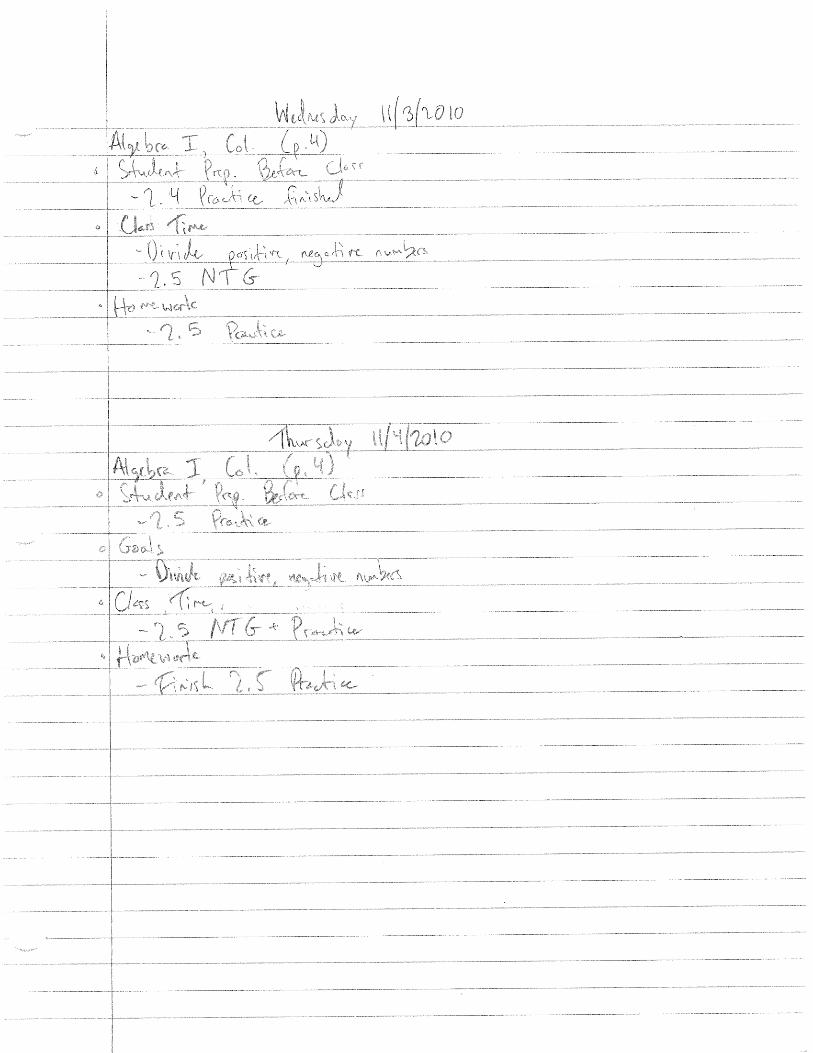
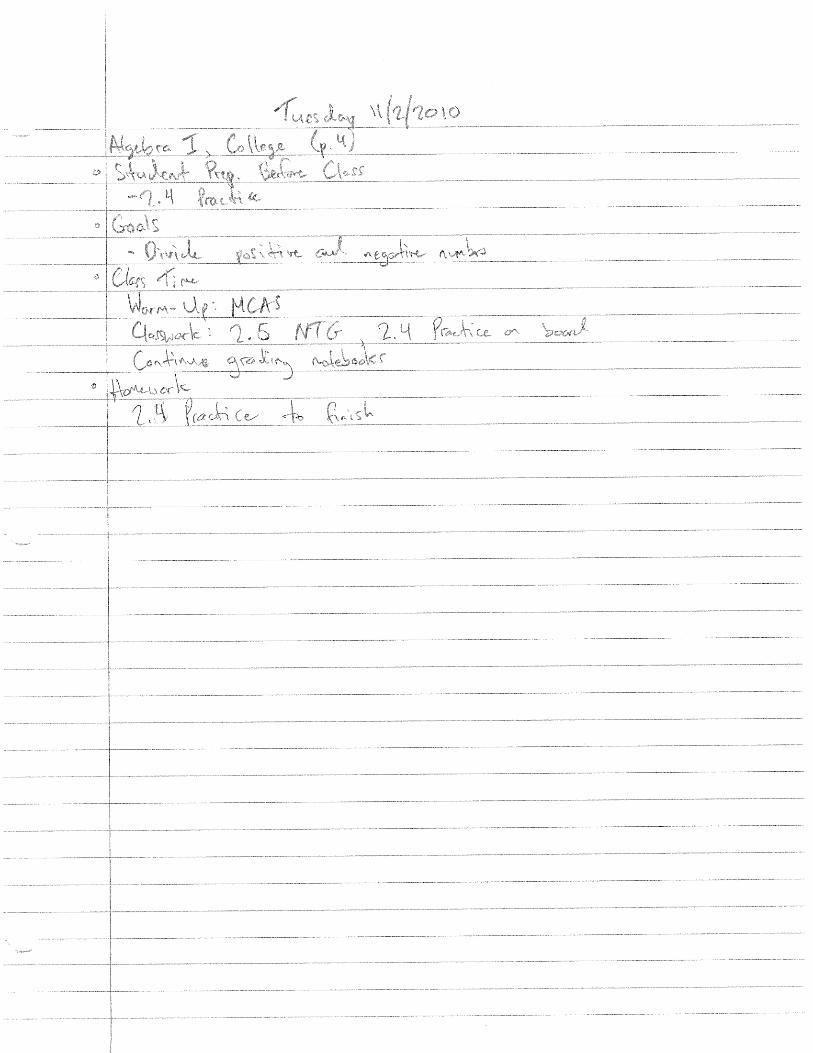
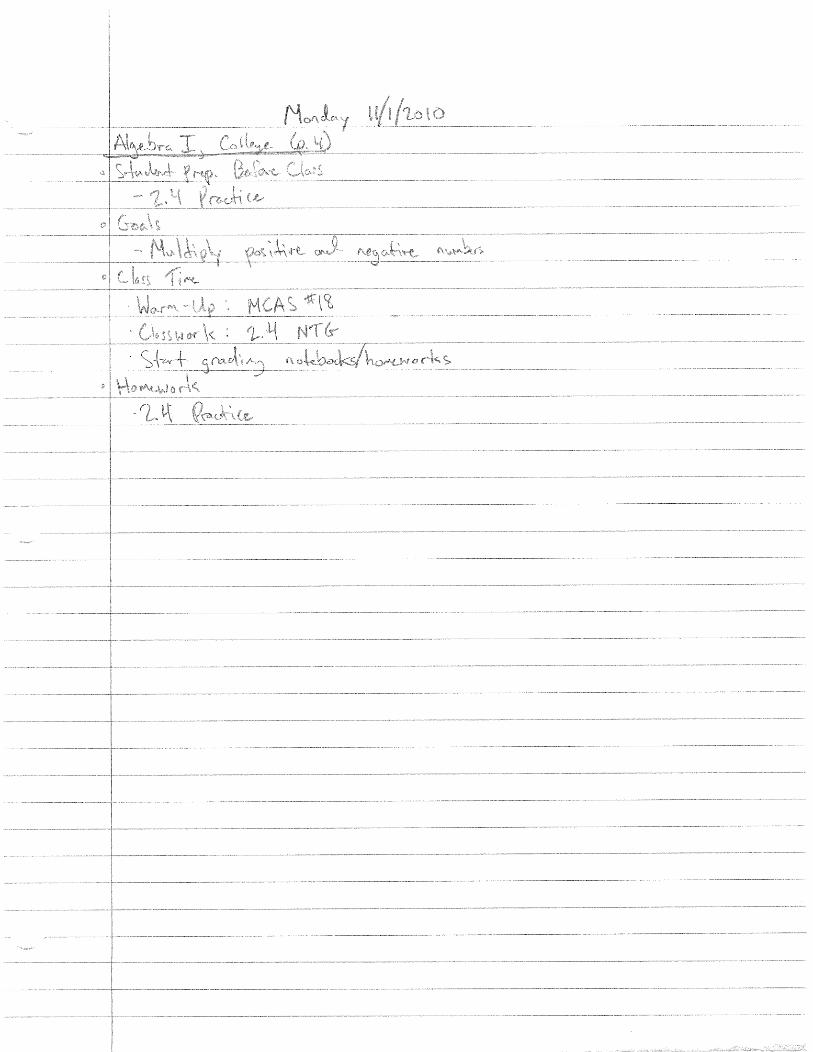
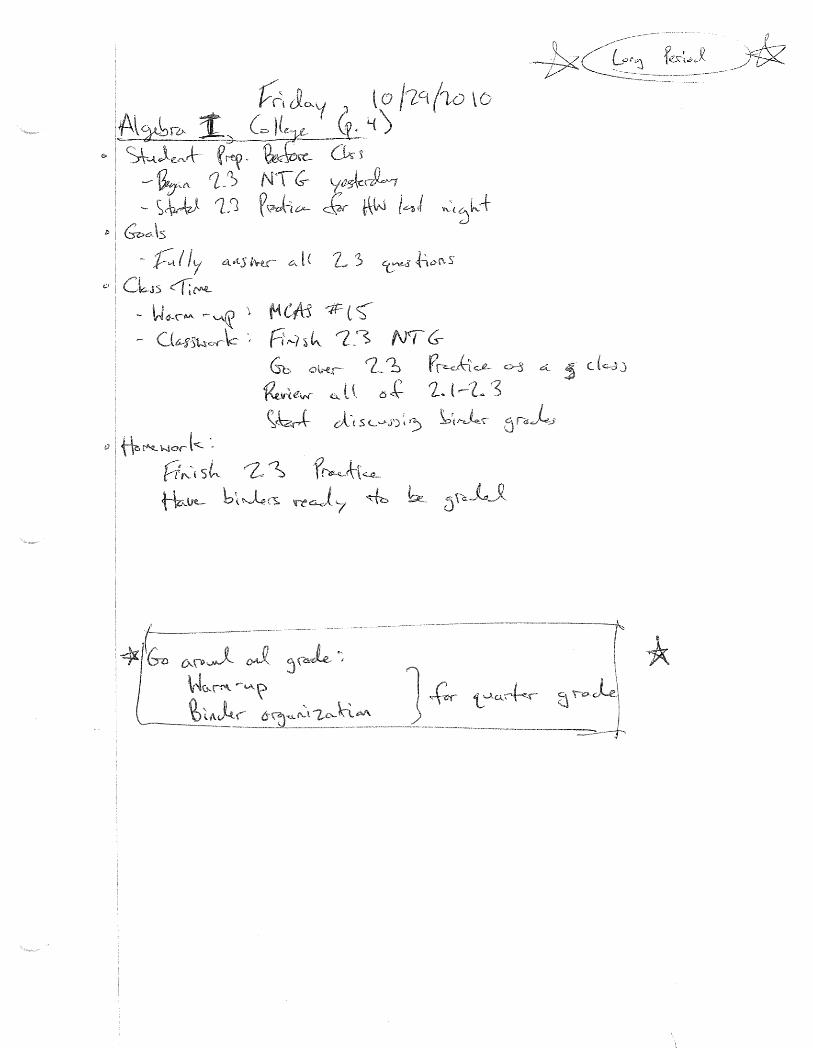
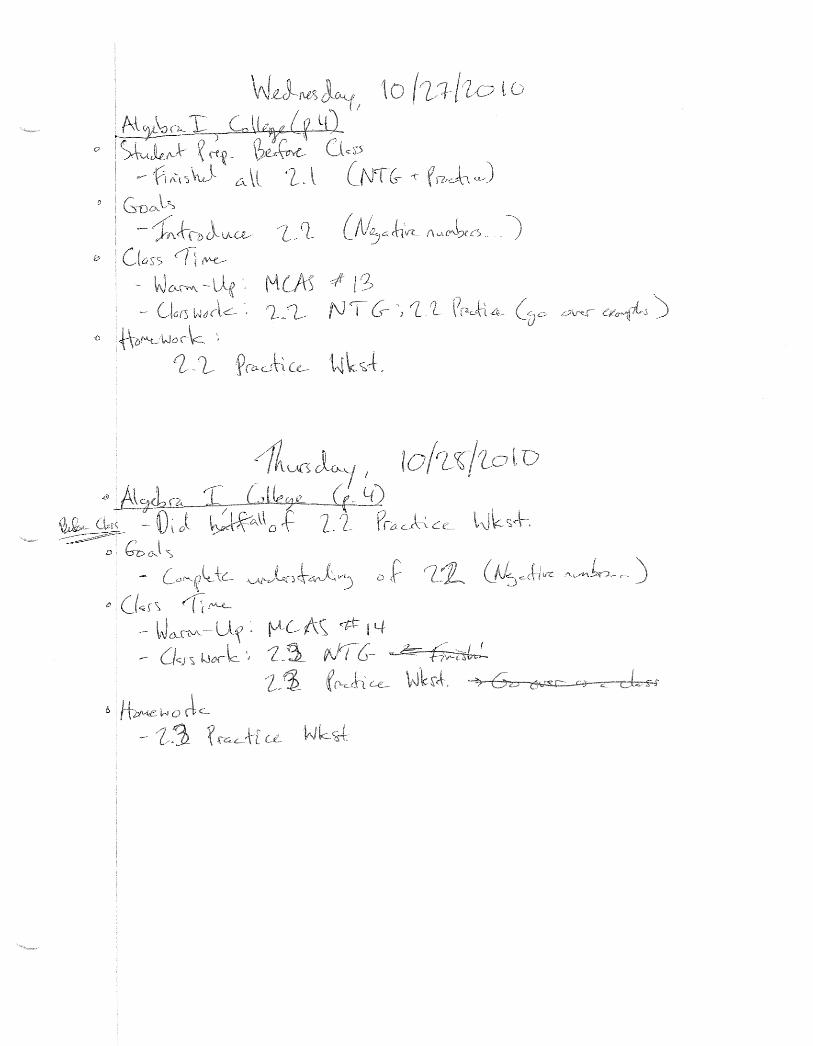
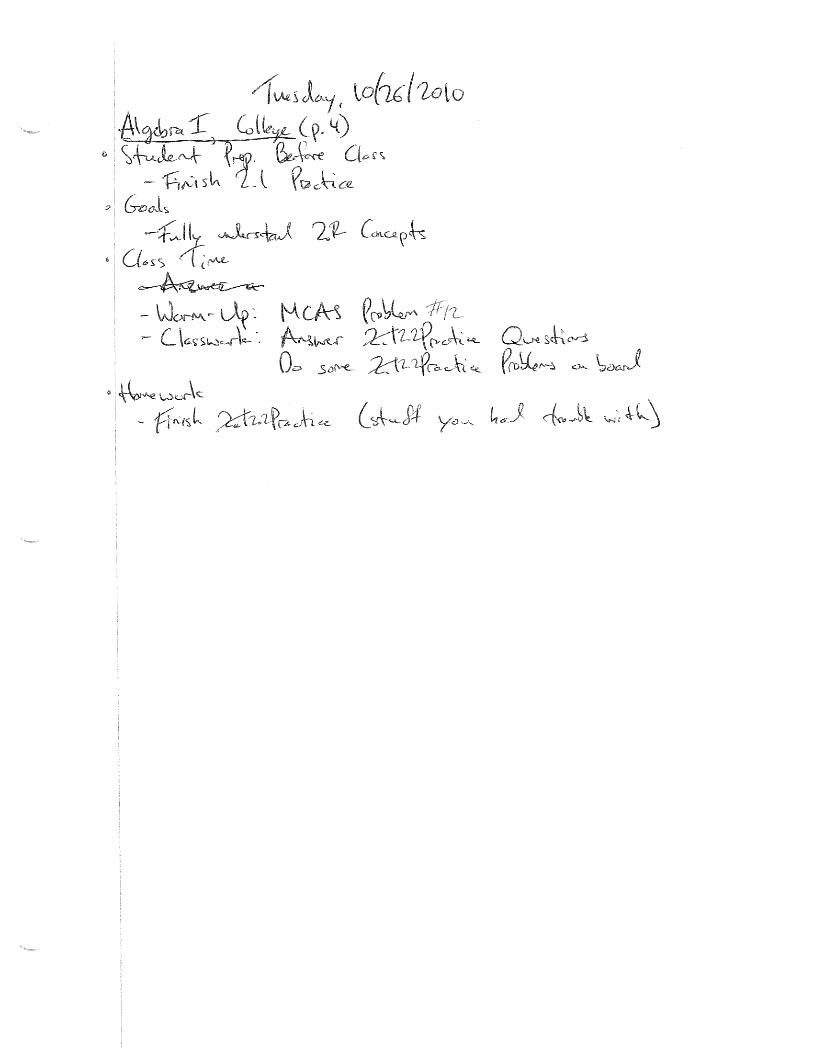
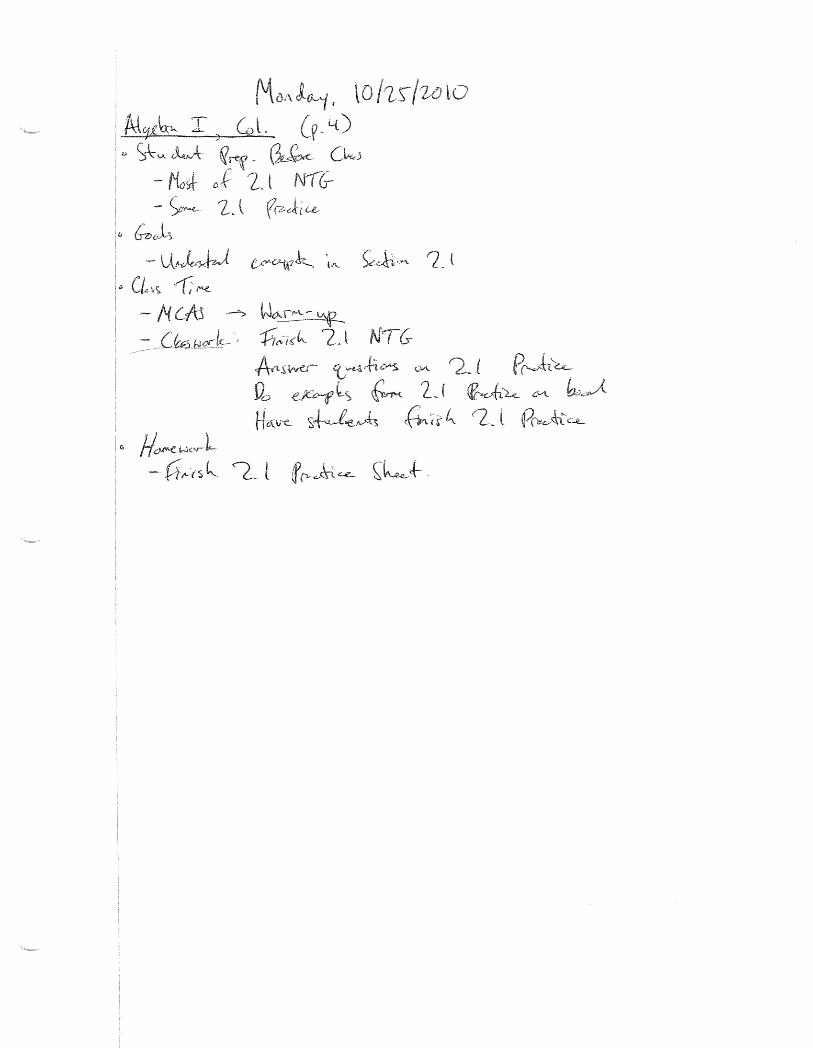
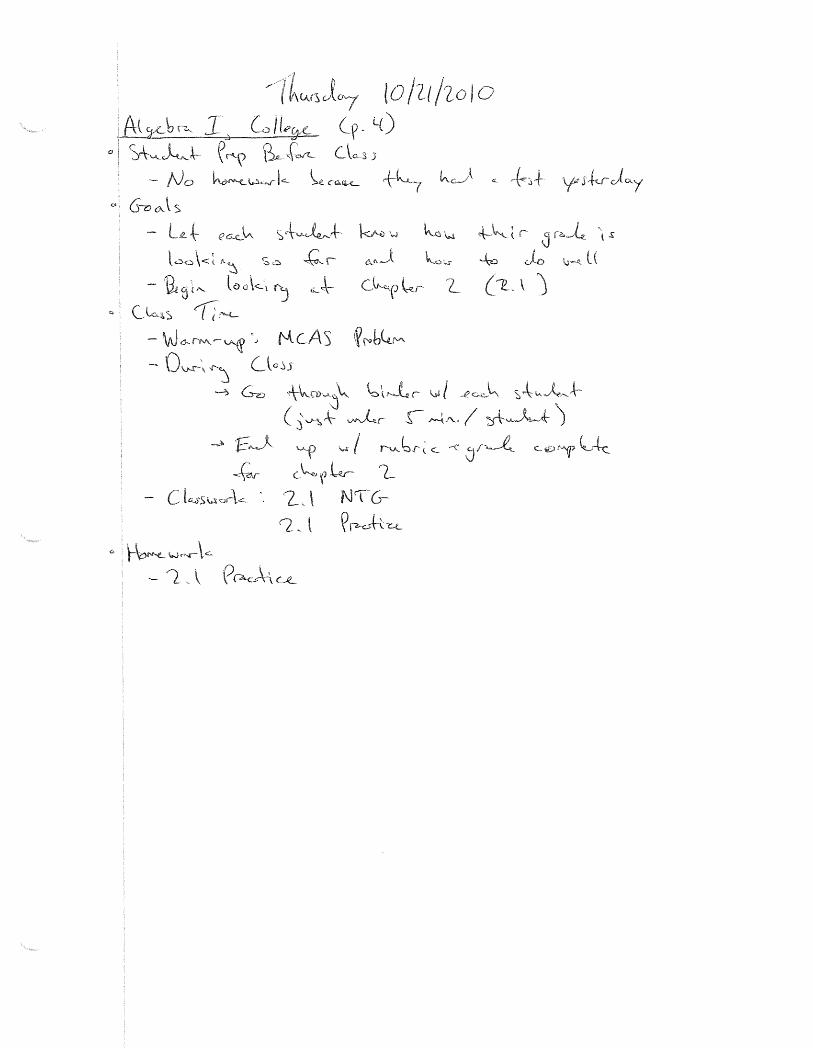
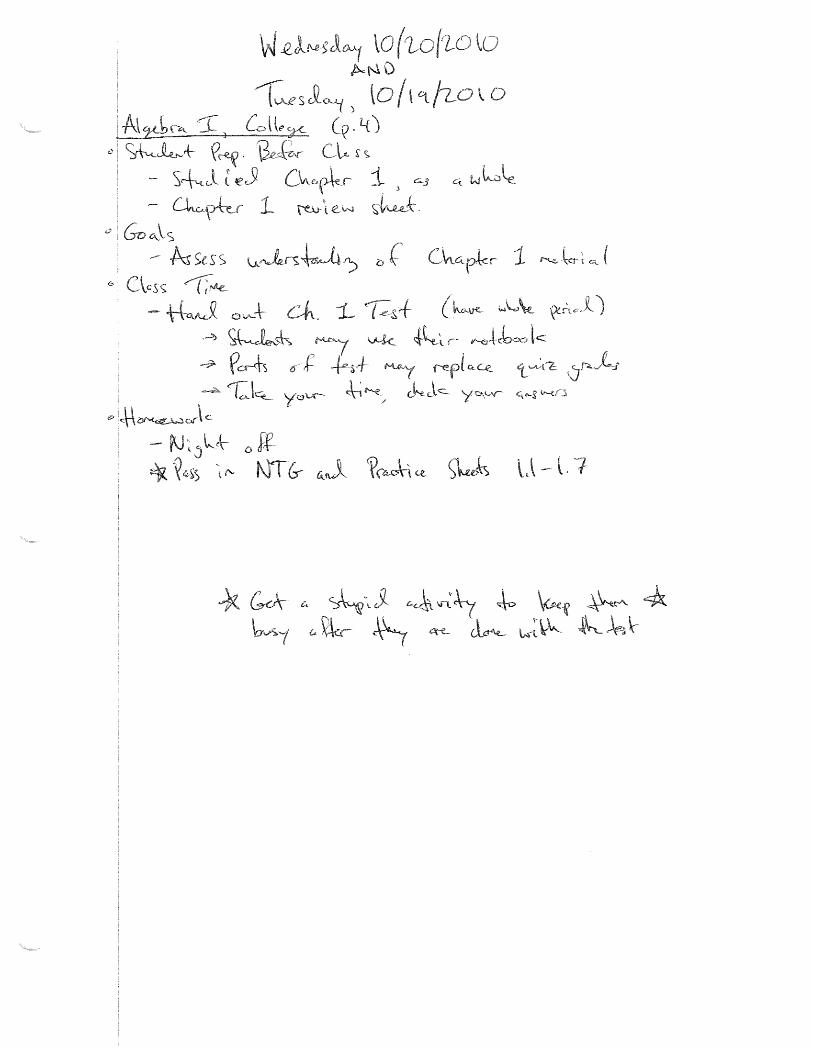
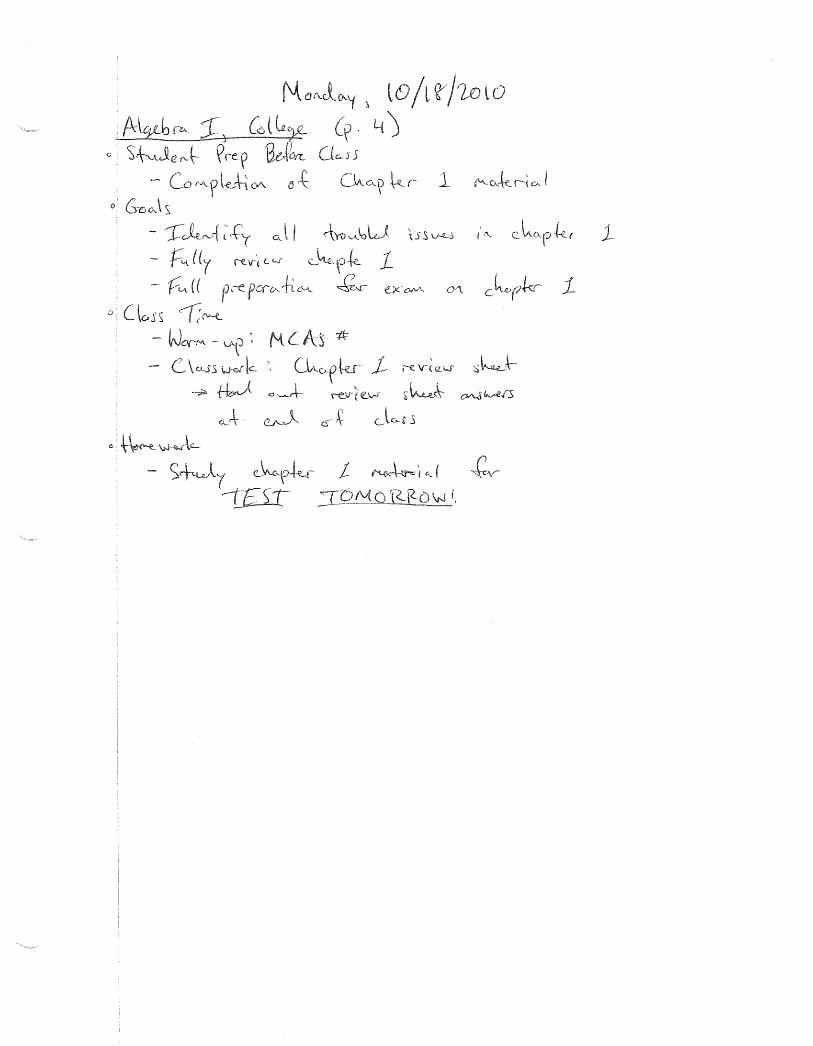
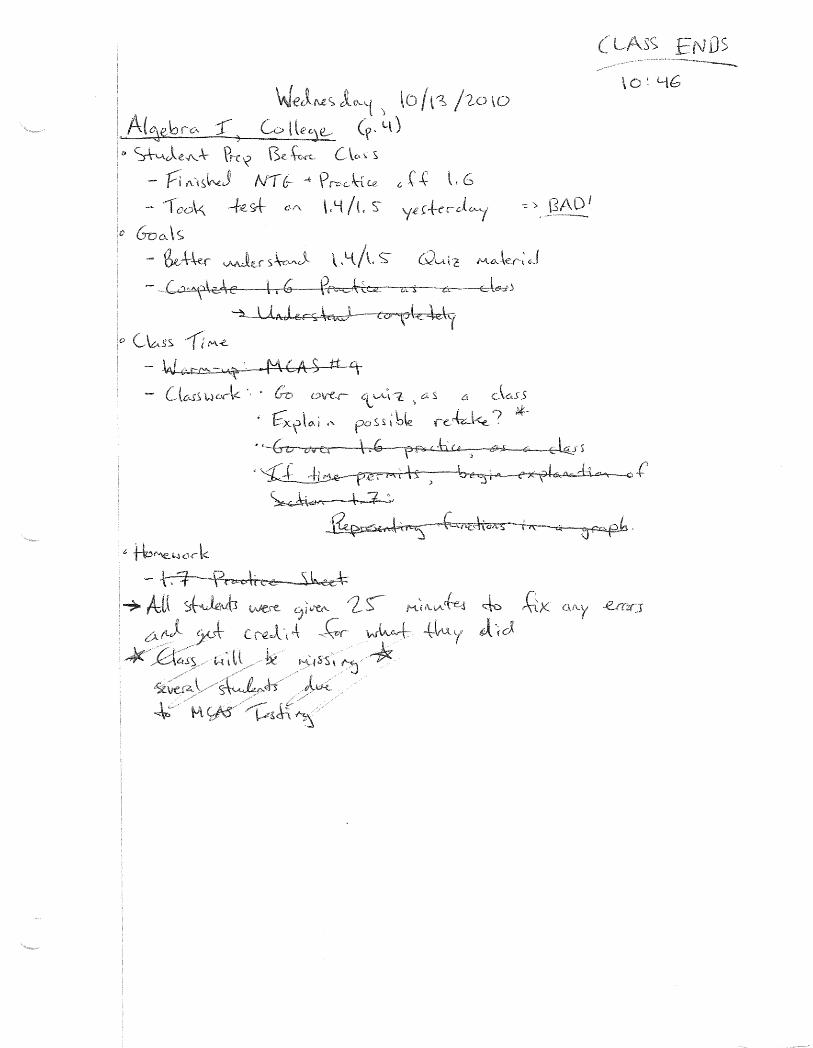
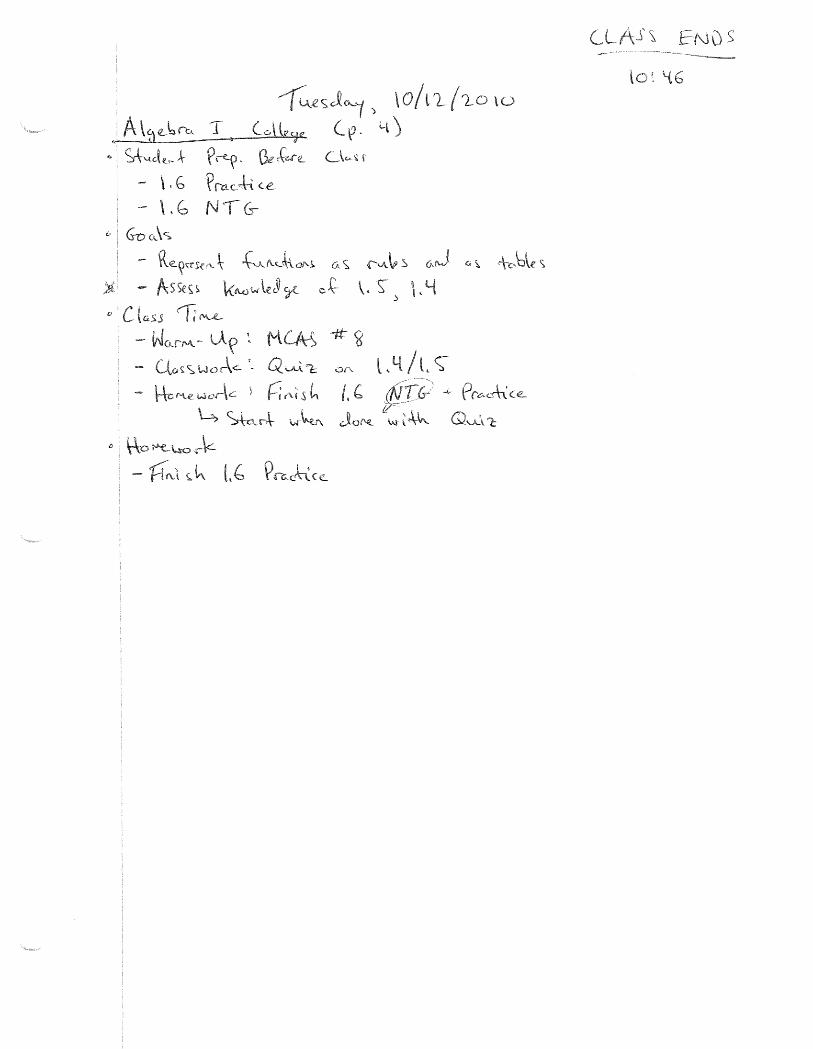
Period 4: Algebra I, College College Algebra I had two groups of students: first year students and repeating students
(Appendix P). The first year students in this course were either ineligible for Honors Algebra I or did not
wish to be challenged. All other students were repeating the courses due to failing on a previous
attempt. For these reasons, patience was important when designing the daily lesson plans and overall
goals of the course. The structure was monotonous in order to get the students in a daily routine
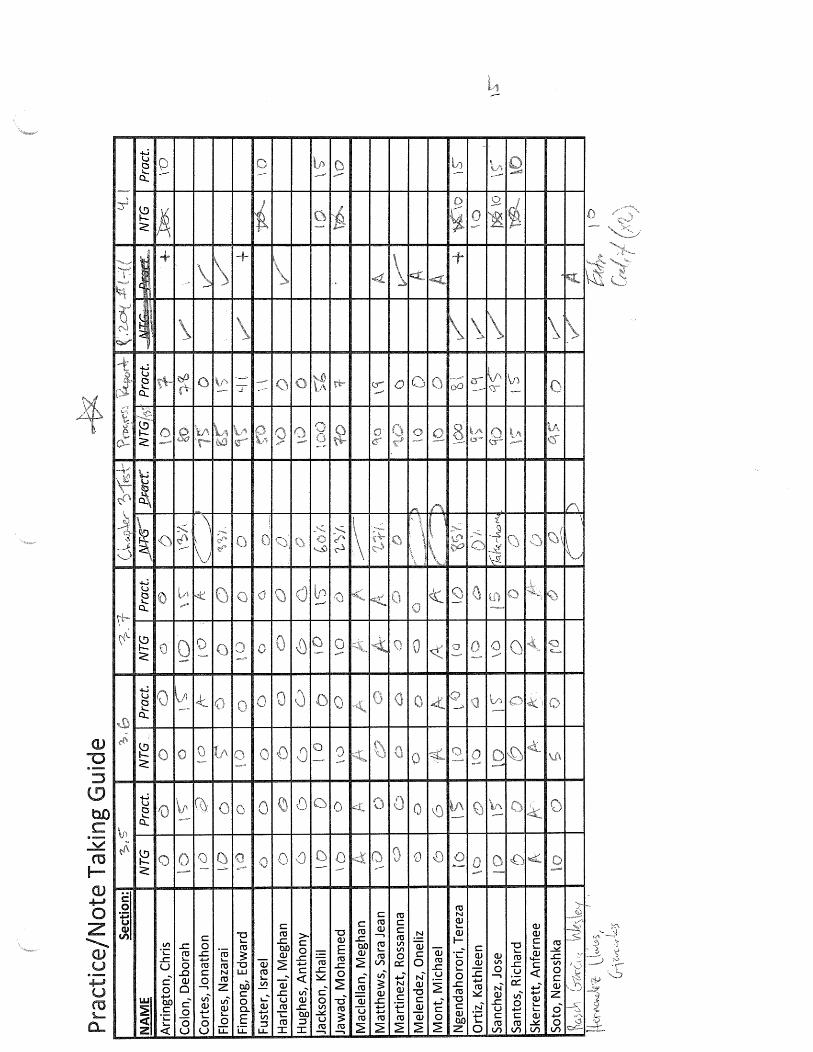
(Appendix K, L). Class time started with a warm up, followed by completion of a note taking, and finished
with assigned practice sheets. Each student had a binder provided by the school which kept these
course materials together. Since lectures were nearly impossible with this group, work was done
independently. Preparation for this class was very important. Warm ups and practice sheets needed to
be photocopied daily and extra copies were needed for students who lost assignments.
As students entered the classroom each day, they were required to take the printed out warm
up and copy it into their notebook. After completing the work in their notebook, students turned in the
printed version of the warm up with their name and answer on it. Five minutes after the start of class,
students received a completion grade for warm up if they followed these steps. Following the warm up,
students were expected to spend time on the section assigned that day. Students were given two days
to complete a section. Completion of a section meant that the student completed his/her note taking
guide and practice sheet for that section.
The note taking guide was done in class. This was a “fill in the blank” book that mirrored the
lesson given in the textbook. There were notes, examples, and exercises for each lesson. Sometimes
answers to the note taking guide were projected up front to make sure that each student had it correct
for studying purposes (Appendix A: B,2.vi). When several students struggled on the same section, I
would explain concepts on the board. Overall, one-on-one questions were the best way to address a
student’s issue in understanding concepts.
Practice sheets were to be completed as homework (Appendix O). The first page was basic
questions which mirrored examples given in the book and note taking guide. The second page had word
problems that challenged students to understand simple applications. All questions on the second page
ask students to explain their answer by showing their work. This made it obvious whether students
mastered the material or just followed an example. By having the section split up over two days,
students had time to attempt problems and then ask questions on the areas that caused them to
struggle.
The Students
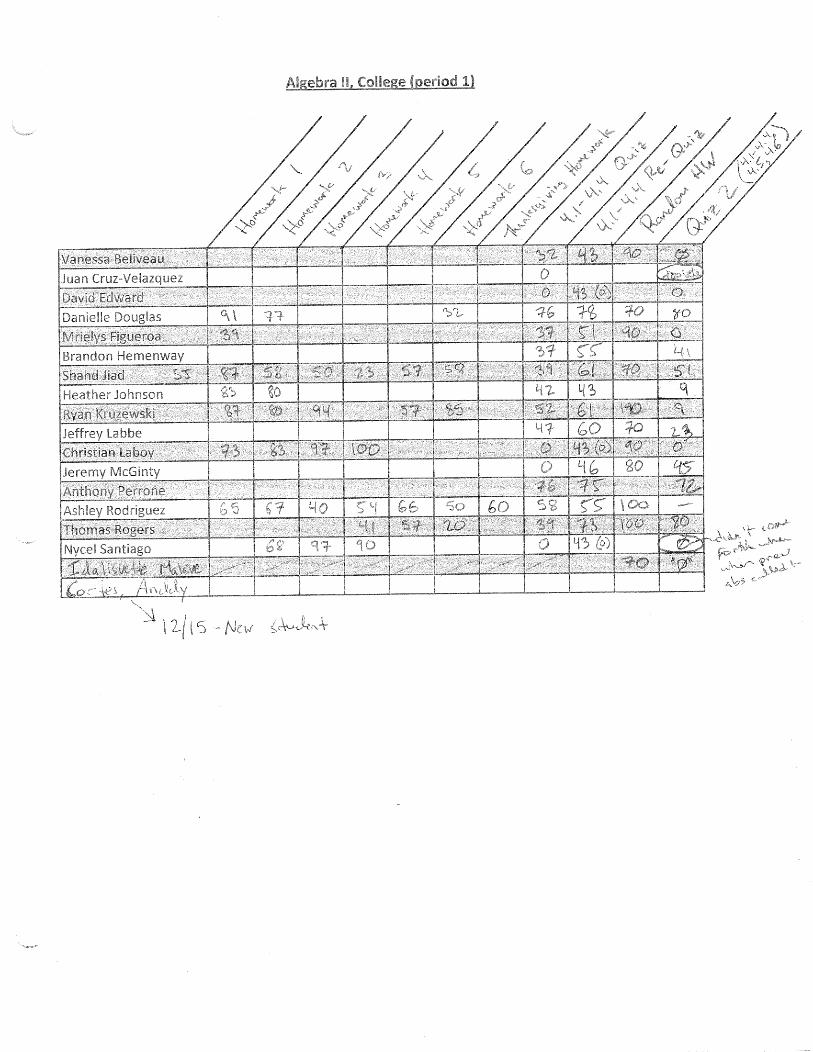
Period 1: Advanced Algebra, College College Advanced Algebra was the first class of the day for eighteen students (Appendix Q).
These eighteen students varied in their ability and effort. There was a solid group of students that put
forth enough effort to keep up with the course material; a group of trouble makers that were smart
enough to know the material but did not apply themselves; and stragglers that tried to sleep and/or
refused to pay attention every class.
The solid group of students was located in the center of the room and was always quiet during
lectures. They asked questions when confused and took notes otherwise. It was not hard to keep these
students on track. Homework was a separate issue, which was a struggle. Even the best students did not
do homework on a regular basis. Originally, homework was just a part of their notebook grade and was
not checked separately. This frustrated students because they felt that they were given nothing for their
effort. Explanation of how homework is practice for tests helped but grading their homework separately
became a worthwhile solution (Appendix A: A,2). Similarly, studying was not a norm in mathematics at
North High School. Students did not know how to study math. The idea of doing extra homework
problems without receiving credit was absurd. The lack of homework and studying made test grades
quite low. Aiding in the lazy mentality was the group of troublemakers.
There were three or four students that felt high school was unnecessary and grades were a joke.
They had the philosophy that it was “cool” to get the lowest grade on a test and you were a “nerd” if
you did well. This made other students embarrassed when they did well. I countered this issue by
writing notes on good test grades that mentioned there good performance. Two of the troublemakers
came late for class almost every day. This meant they missed about ten minutes of class time and
disturbed the class after they had finally settled down. Another member of this classification was
eighteen years old and had failed the course the year prior. I sent him to the office several times for
disturbing the classroom. Eventually, this was counterproductive so I made him sit in the front of the
classroom where his attention was focused towards me. I eventually found out that this student’s
parents were not supportive of him. He had a job that took up all of his time after school and he rarely
had any down time to do his homework. I talked to him and took this into consideration when assessing
him for the term.
The rest of the students in my period one class cannot be categorized. One student claimed he
had a learning disability and used it as an excuse during lectures and tests. During lectures, he would
start by taking notes and eventually fall asleep. Waking him was easy but keeping his attention towards
classwork was not. During tests, he would stare off into space for five to ten minutes before writing
anything. When he ran out of time, he claimed now enough time was allowed for the test. I tried to give
him extra time after class to finish tests or quizzes but his grade did not change. Another student
struggled with English making lectures useless to her. I solved this by meeting with her during my lunch
break almost every day. We went over the lesson and worked on a couple homework problems. She still
struggled but she always tried her hardest and asked a lot of questions. I tried to answer her questions
individually during class because to other students, the answers to her questions were obvious.
Overall, there was a pattern of learning styles. In order for these students to understand and try,
they needed applications. The best application was money. Anything associated with money made
perfect sense to these students (Appendix A: B,1.iv). Furthermore, group work was the solution to
getting all different types of students to work together. I learned this philosophy of group work from my
ID 3100 class at Worcester Polytechnic Institute (Appendix A: E,3). The course was taught by the
principal of the Massachusetts Academy of Math and Science. Some of my colleagues used the group
work and found it successful (Appendix A: E,4). This caused me to use it in the following manner once or
twice a week. I created groups of three or four that integrated students who rarely interacted with each
other. I gave them a few problems to work on as a group. If someone had a question, I asked someone
else in the group what the question was. This forced every student to problem solve on their own
without my help. When we returned to the lecture style class, every student knew a little more than
they did before the group activity (Appendix A: A,2). Class time was my primary focus because
homework problems were rarely completed by students. All of the practice had to be done in class.
Period 3: Advanced Algebra, Honors My Honors Advanced Algebra course that took place during period three was a very close group
of sixteen students (Appendix Q). They all knew each other and most of them were involved in
extracurricular activities. Those who were not involved elsewhere were even more interested in doing
well in the course. Both sets of students combined to make class time a very effective learning
environment. Whether I assigned group work, individual work, or board work they always put forth a
considerable amount of effort. Sadly, with a lack of effort on homework and studying, their grades did
not meet the expectations of an honors level course. Yet the potential was never lost with this crew.
Classroom management was very easy in this class. During lectures, students took notes and
frequently asked questions when concepts did not make sense. Eventually, several students realized
that notes were helpful but they knew they would not understand the material until they practiced.
Since students rarely did homework, I did many examples in class. Instead of doing five of the same
basic example, I made sure to cover each possible case that students may see in their homework and
quizzes/tests. By using class time in this manner, students would ask their questions in class and have a
template to follow when working on homework problems. If a homework problem did not look familiar,
they would rarely try it. Instead, they chose to come into class the next day stating that the homework
made little sense and was nothing like I taught the day before. This is why the questions section of my
daily lesson was so crucial. This process was also helpful because I allowed students to use their
notebooks on quizzes and tests. So even if they didn’t do their homework, their class notes were enough
to help them through the more difficult problems.
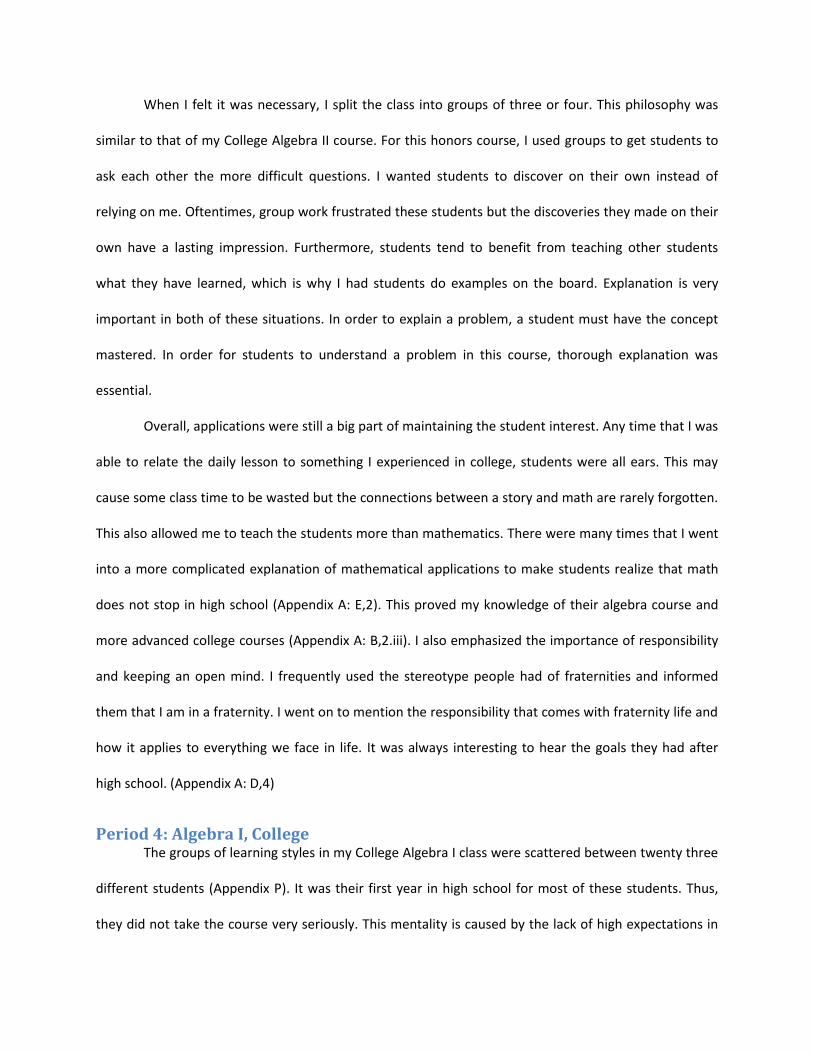
When I felt it was necessary, I split the class into groups of three or four. This philosophy was
similar to that of my College Algebra II course. For this honors course, I used groups to get students to
ask each other the more difficult questions. I wanted students to discover on their own instead of
relying on me. Oftentimes, group work frustrated these students but the discoveries they made on their
own have a lasting impression. Furthermore, students tend to benefit from teaching other students
what they have learned, which is why I had students do examples on the board. Explanation is very
important in both of these situations. In order to explain a problem, a student must have the concept
mastered. In order for students to understand a problem in this course, thorough explanation was
essential.
Overall, applications were still a big part of maintaining the student interest. Any time that I was
able to relate the daily lesson to something I experienced in college, students were all ears. This may
cause some class time to be wasted but the connections between a story and math are rarely forgotten.
This also allowed me to teach the students more than mathematics. There were many times that I went
into a more complicated explanation of mathematical applications to make students realize that math
does not stop in high school (Appendix A: E,2). This proved my knowledge of their algebra course and
more advanced college courses (Appendix A: B,2.iii). I also emphasized the importance of responsibility
and keeping an open mind. I frequently used the stereotype people had of fraternities and informed
them that I am in a fraternity. I went on to mention the responsibility that comes with fraternity life and
how it applies to everything we face in life. It was always interesting to hear the goals they had after
high school. (Appendix A: D,4)
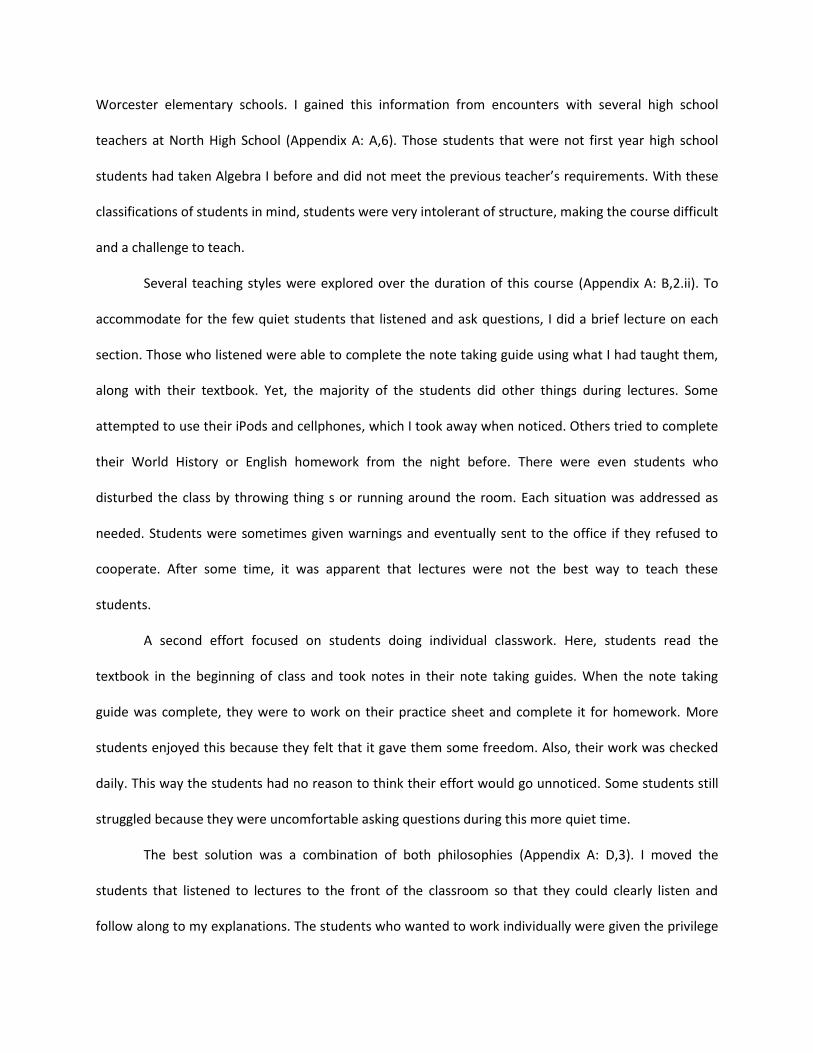
Period 4: Algebra I, College The groups of learning styles in my College Algebra I class were scattered between twenty three
different students (Appendix P). It was their first year in high school for most of these students. Thus,
they did not take the course very seriously. This mentality is caused by the lack of high expectations in
Worcester elementary schools. I gained this information from encounters with several high school
teachers at North High School (Appendix A: A,6). Those students that were not first year high school
students had taken Algebra I before and did not meet the previous teacher’s requirements. With these
classifications of students in mind, students were very intolerant of structure, making the course difficult
and a challenge to teach.
Several teaching styles were explored over the duration of this course (Appendix A: B,2.ii). To
accommodate for the few quiet students that listened and ask questions, I did a brief lecture on each
section. Those who listened were able to complete the note taking guide using what I had taught them,
along with their textbook. Yet, the majority of the students did other things during lectures. Some
attempted to use their iPods and cellphones, which I took away when noticed. Others tried to complete
their World History or English homework from the night before. There were even students who
disturbed the class by throwing thing s or running around the room. Each situation was addressed as
needed. Students were sometimes given warnings and eventually sent to the office if they refused to
cooperate. After some time, it was apparent that lectures were not the best way to teach these
students.
A second effort focused on students doing individual classwork. Here, students read the
textbook in the beginning of class and took notes in their note taking guides. When the note taking
guide was complete, they were to work on their practice sheet and complete it for homework. More
students enjoyed this because they felt that it gave them some freedom. Also, their work was checked
daily. This way the students had no reason to think their effort would go unnoticed. Some students still
struggled because they were uncomfortable asking questions during this more quiet time.
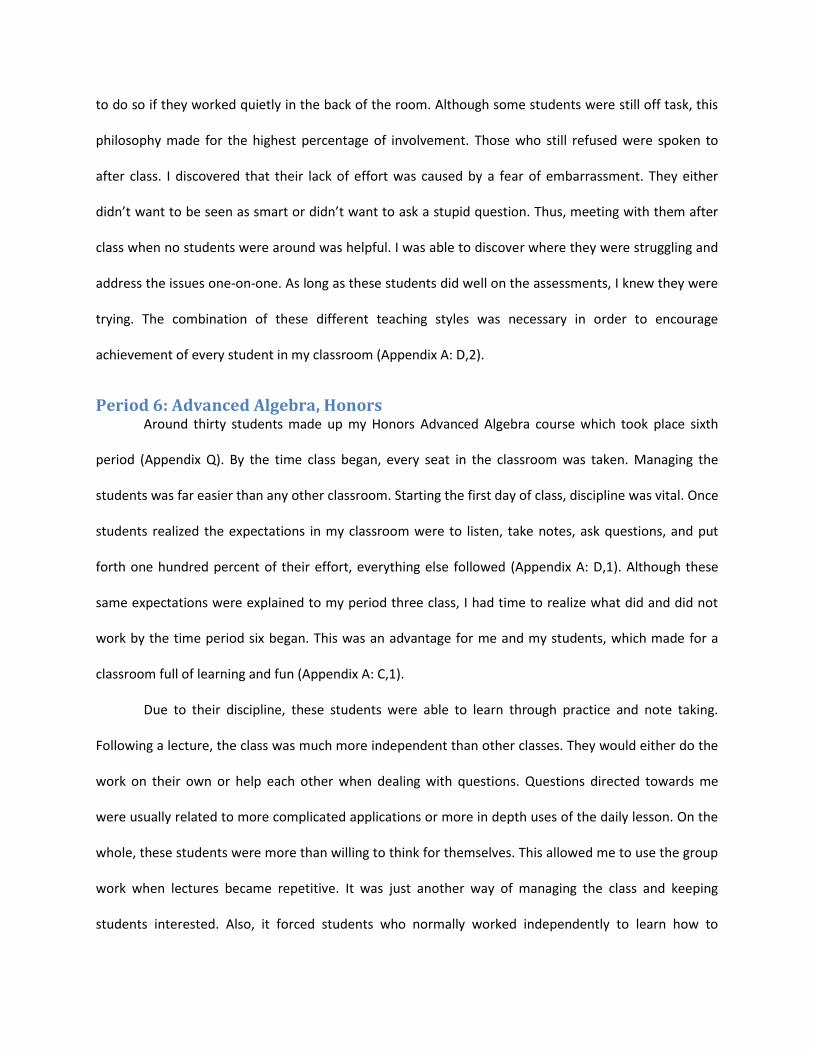
The best solution was a combination of both philosophies (Appendix A: D,3). I moved the
students that listened to lectures to the front of the classroom so that they could clearly listen and
follow along to my explanations. The students who wanted to work individually were given the privilege
to do so if they worked quietly in the back of the room. Although some students were still off task, this
philosophy made for the highest percentage of involvement. Those who still refused were spoken to
after class. I discovered that their lack of effort was caused by a fear of embarrassment. They either
didn’t want to be seen as smart or didn’t want to ask a stupid question. Thus, meeting with them after
class when no students were around was helpful. I was able to discover where they were struggling and
address the issues one-on-one. As long as these students did well on the assessments, I knew they were
trying. The combination of these different teaching styles was necessary in order to encourage
achievement of every student in my classroom (Appendix A: D,2).
Period 6: Advanced Algebra, Honors Around thirty students made up my Honors Advanced Algebra course which took place sixth
period (Appendix Q). By the time class began, every seat in the classroom was taken. Managing the
students was far easier than any other classroom. Starting the first day of class, discipline was vital. Once
students realized the expectations in my classroom were to listen, take notes, ask questions, and put
forth one hundred percent of their effort, everything else followed (Appendix A: D,1). Although these
same expectations were explained to my period three class, I had time to realize what did and did not
work by the time period six began. This was an advantage for me and my students, which made for a
classroom full of learning and fun (Appendix A: C,1).
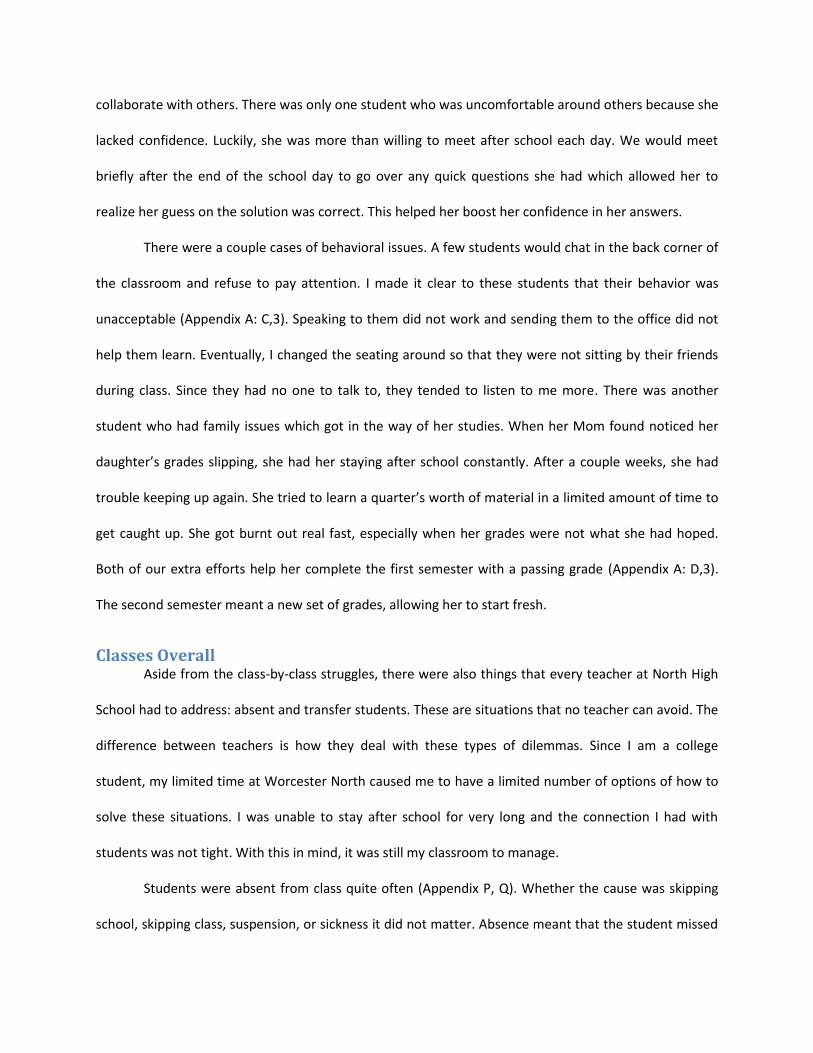
Due to their discipline, these students were able to learn through practice and note taking.
Following a lecture, the class was much more independent than other classes. They would either do the
work on their own or help each other when dealing with questions. Questions directed towards me
were usually related to more complicated applications or more in depth uses of the daily lesson. On the
whole, these students were more than willing to think for themselves. This allowed me to use the group
work when lectures became repetitive. It was just another way of managing the class and keeping
students interested. Also, it forced students who normally worked independently to learn how to
collaborate with others. There was only one student who was uncomfortable around others because she
lacked confidence. Luckily, she was more than willing to meet after school each day. We would meet
briefly after the end of the school day to go over any quick questions she had which allowed her to
realize her guess on the solution was correct. This helped her boost her confidence in her answers.
There were a couple cases of behavioral issues. A few students would chat in the back corner of
the classroom and refuse to pay attention. I made it clear to these students that their behavior was
unacceptable (Appendix A: C,3). Speaking to them did not work and sending them to the office did not
help them learn. Eventually, I changed the seating around so that they were not sitting by their friends
during class. Since they had no one to talk to, they tended to listen to me more. There was another
student who had family issues which got in the way of her studies. When her Mom found noticed her
daughter’s grades slipping, she had her staying after school constantly. After a couple weeks, she had
trouble keeping up again. She tried to learn a quarter’s worth of material in a limited amount of time to
get caught up. She got burnt out real fast, especially when her grades were not what she had hoped.
Both of our extra efforts help her complete the first semester with a passing grade (Appendix A: D,3).
The second semester meant a new set of grades, allowing her to start fresh.
Classes Overall Aside from the class-by-class struggles, there were also things that every teacher at North High
School had to address: absent and transfer students. These are situations that no teacher can avoid. The
difference between teachers is how they deal with these types of dilemmas. Since I am a college
student, my limited time at Worcester North caused me to have a limited number of options of how to
solve these situations. I was unable to stay after school for very long and the connection I had with
students was not tight. With this in mind, it was still my classroom to manage.
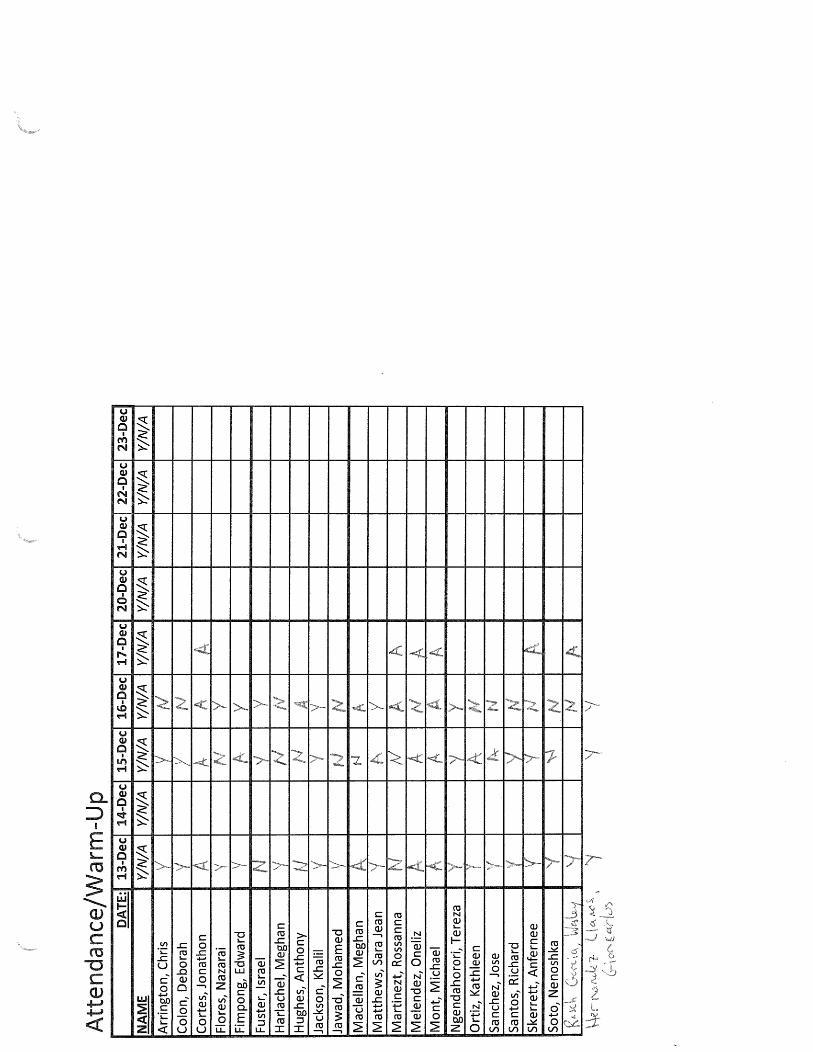
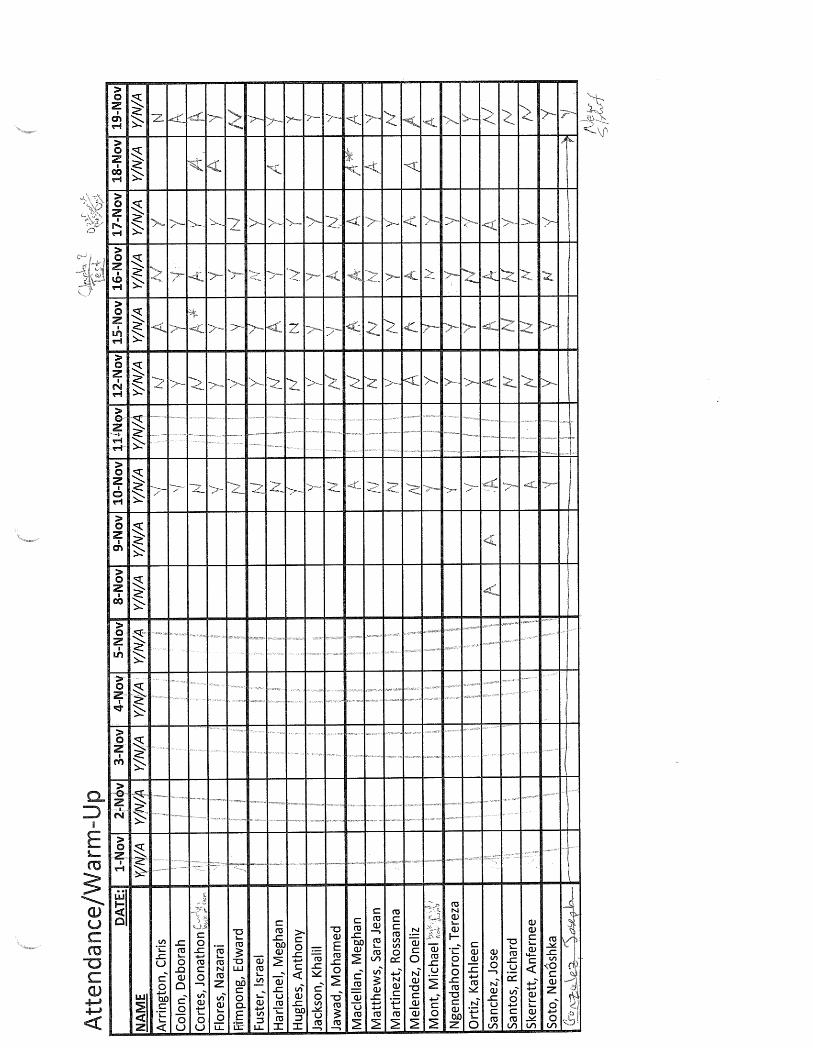
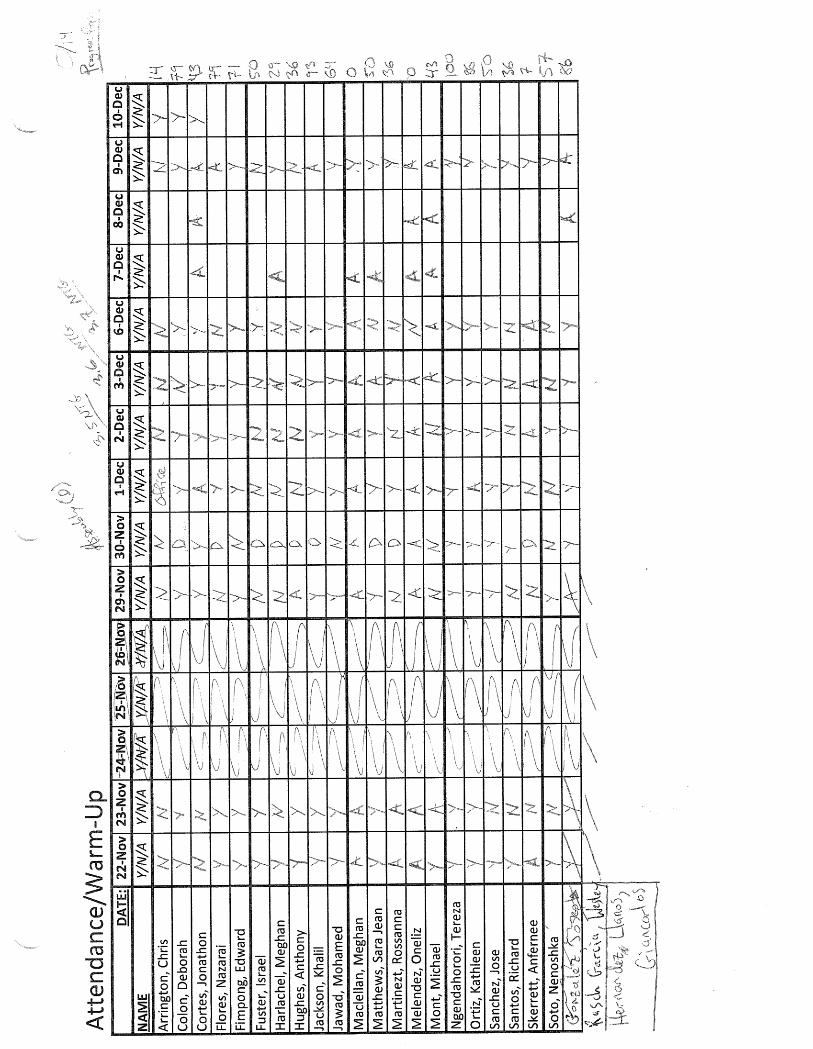
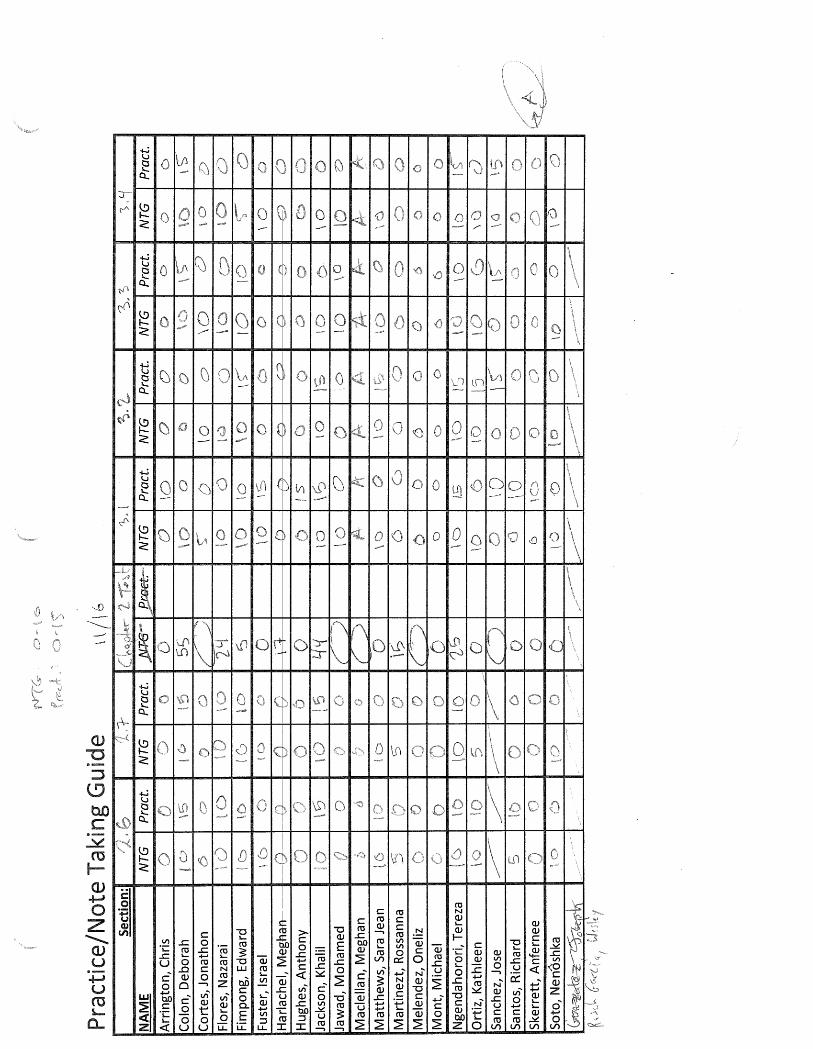
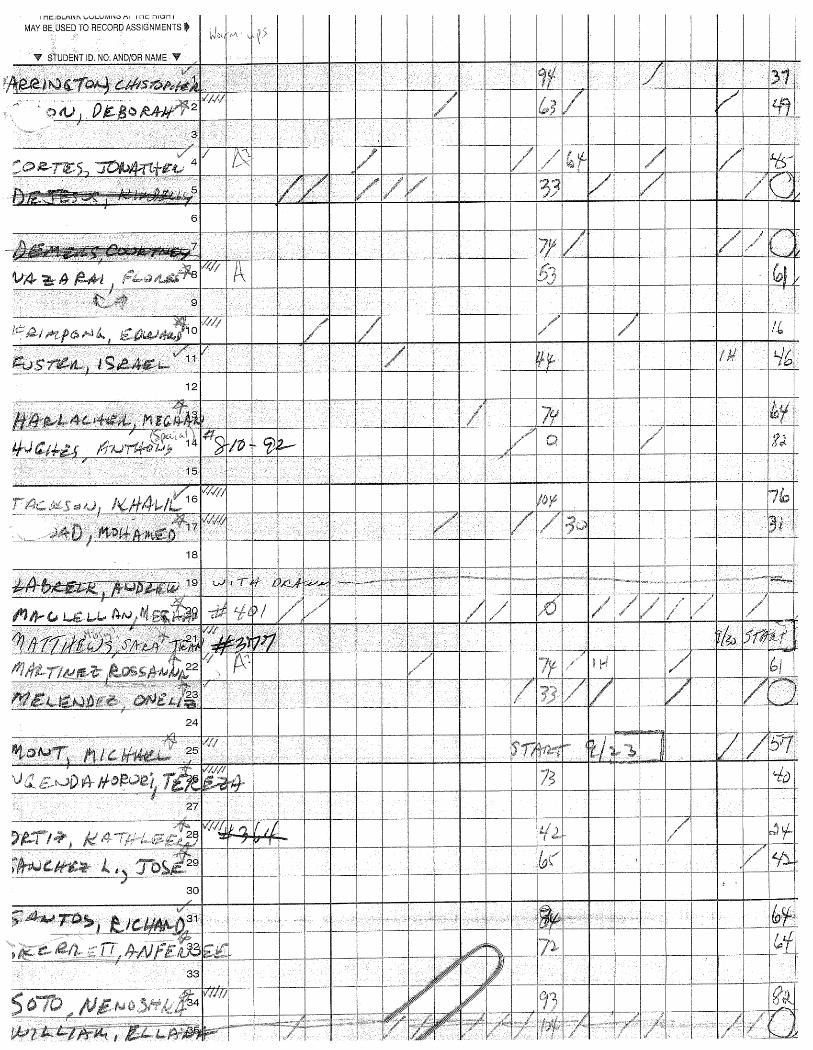
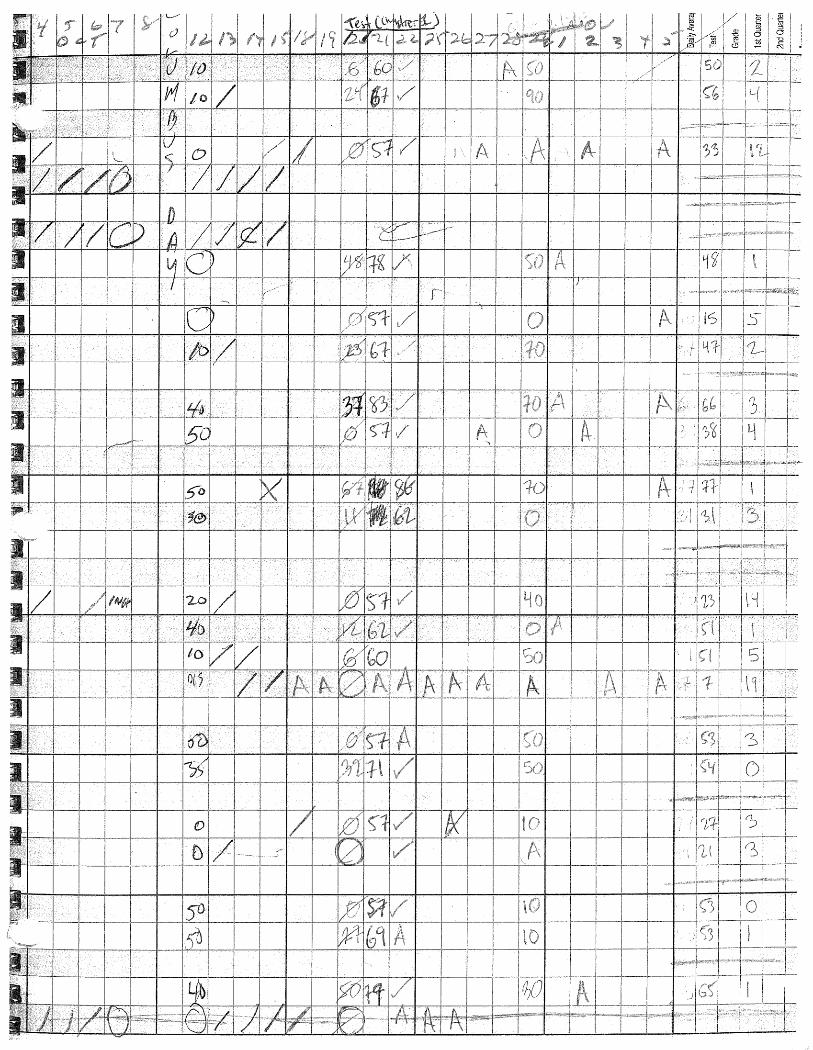
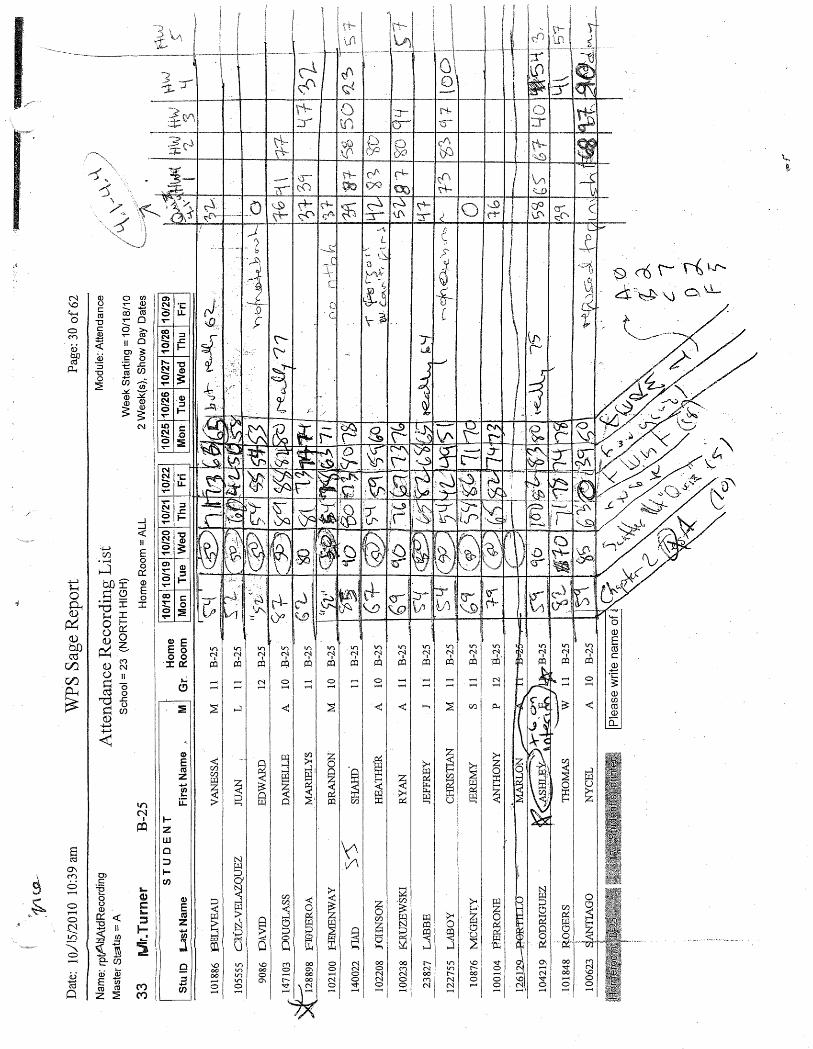
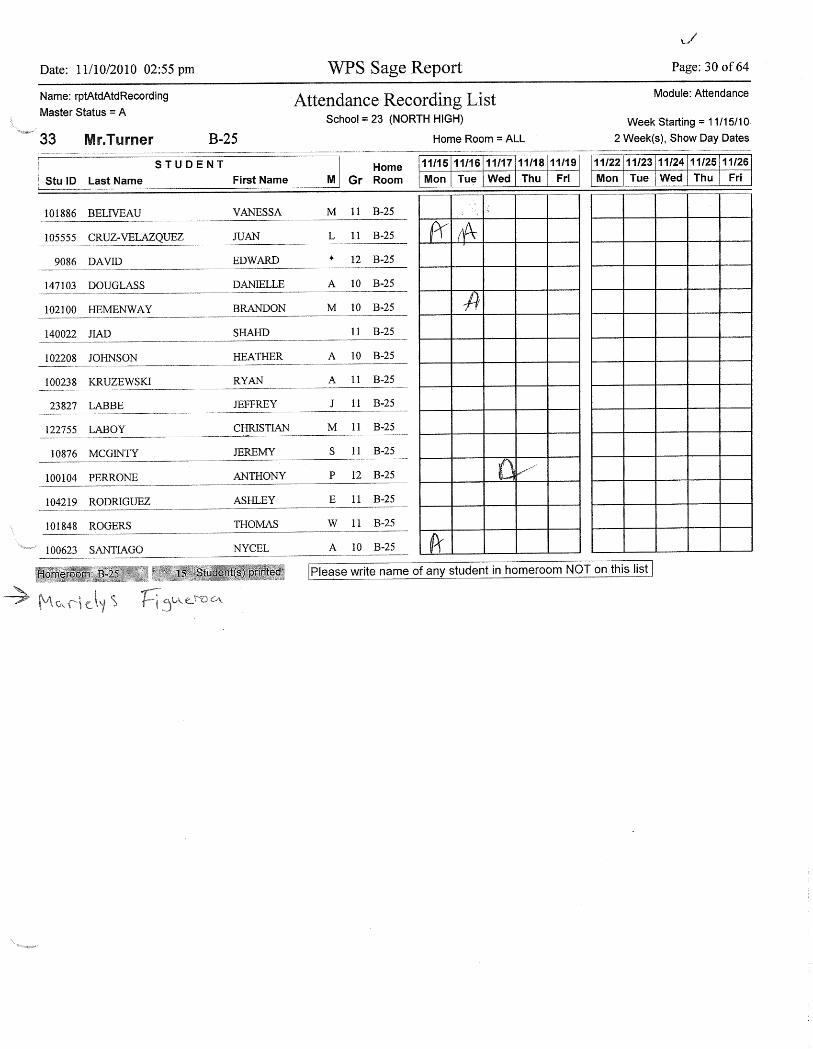
Students were absent from class quite often (Appendix P, Q). Whether the cause was skipping
school, skipping class, suspension, or sickness it did not matter. Absence meant that the student missed
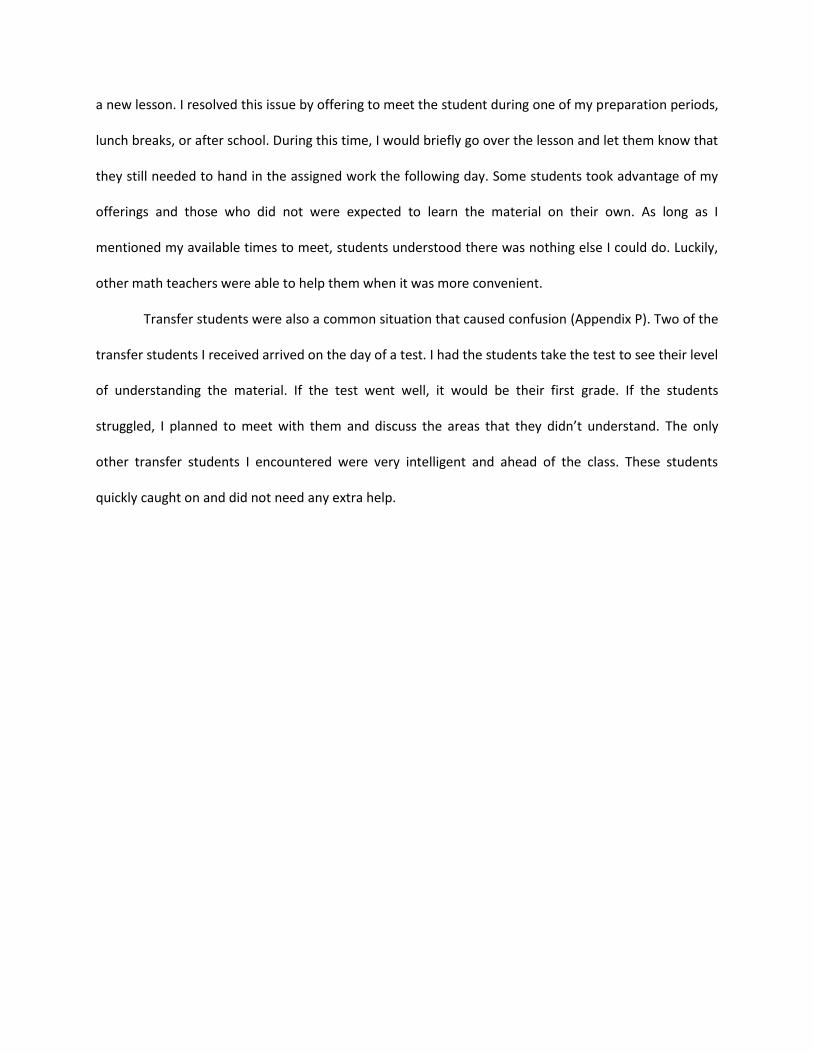
a new lesson. I resolved this issue by offering to meet the student during one of my preparation periods,
lunch breaks, or after school. During this time, I would briefly go over the lesson and let them know that
they still needed to hand in the assigned work the following day. Some students took advantage of my
offerings and those who did not were expected to learn the material on their own. As long as I
mentioned my available times to meet, students understood there was nothing else I could do. Luckily,
other math teachers were able to help them when it was more convenient.
Transfer students were also a common situation that caused confusion (Appendix P). Two of the
transfer students I received arrived on the day of a test. I had the students take the test to see their level
of understanding the material. If the test went well, it would be their first grade. If the students
struggled, I planned to meet with them and discuss the areas that they didn’t understand. The only
other transfer students I encountered were very intelligent and ahead of the class. These students
quickly caught on and did not need any extra help.
Assessment/MCAS Preparation
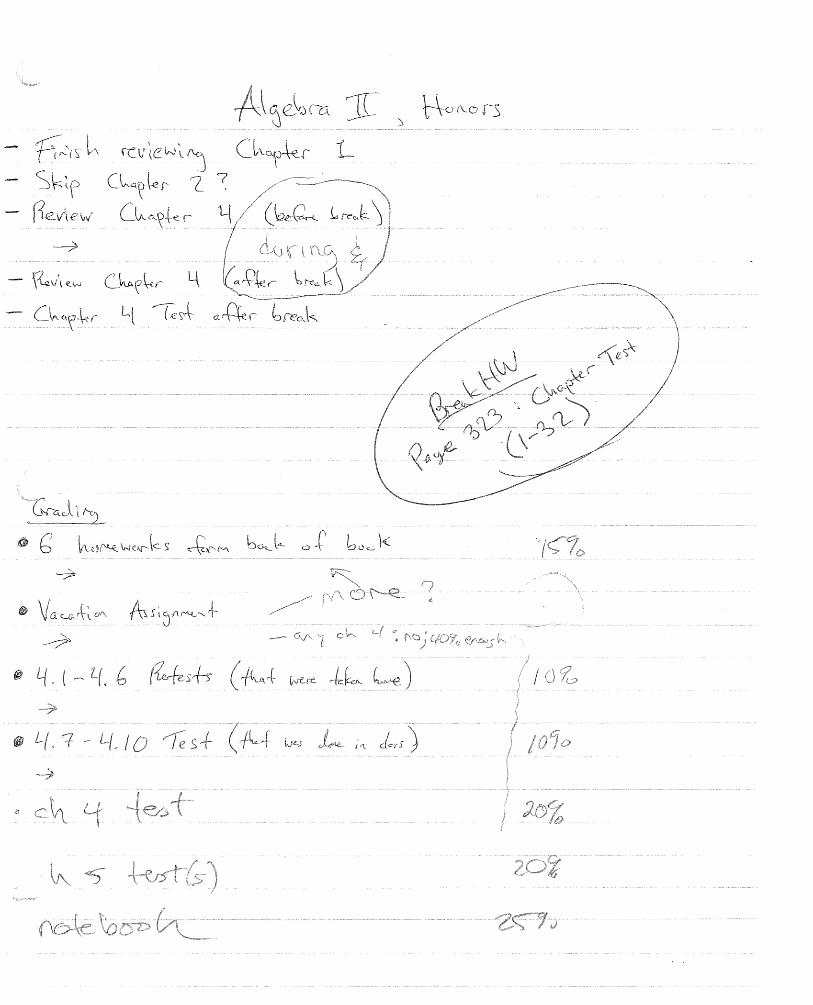
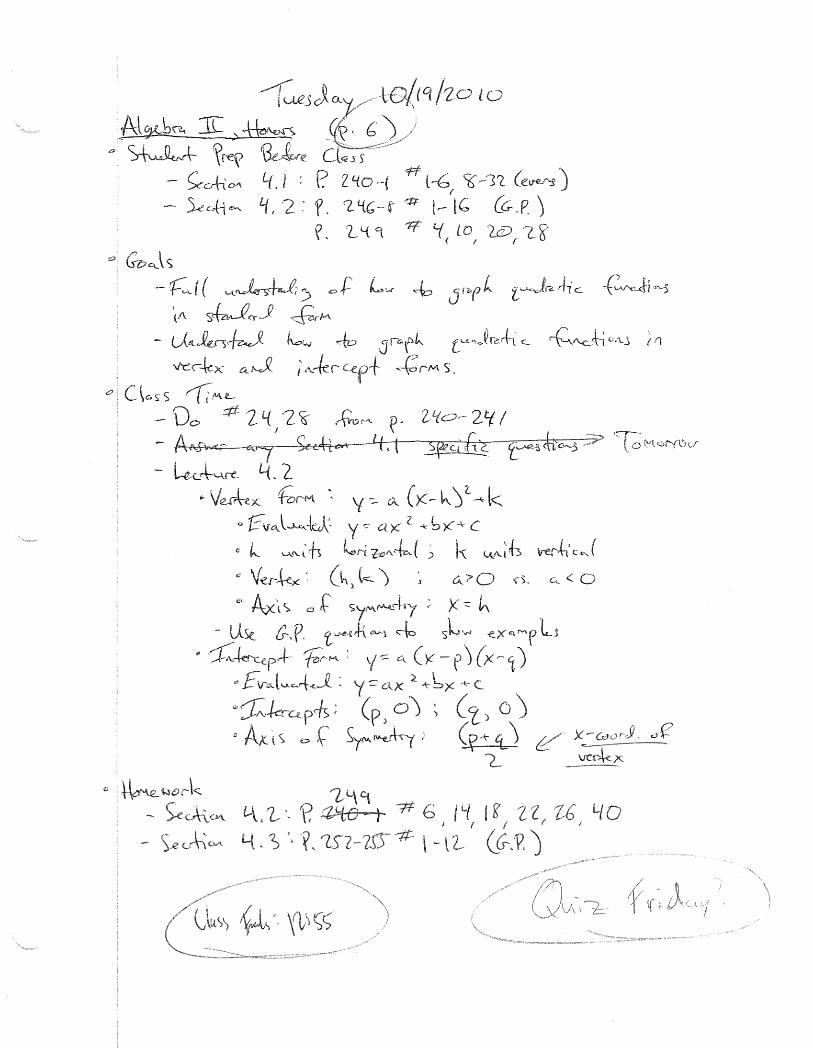
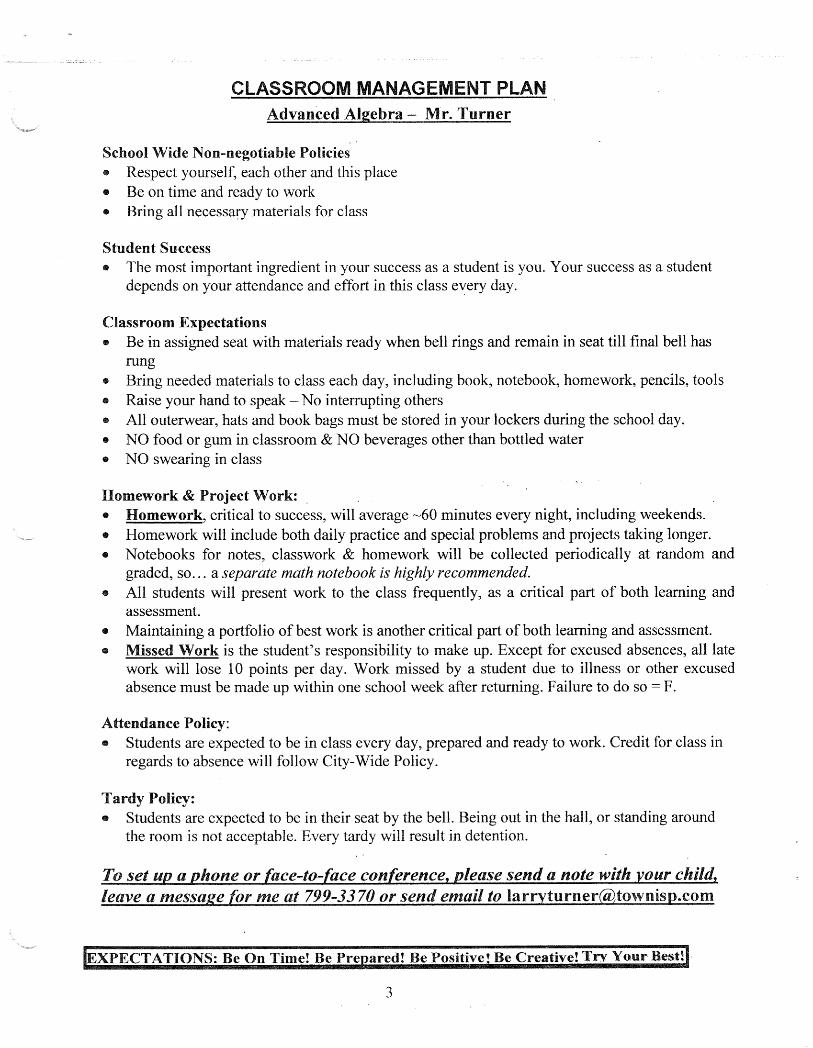
College and Honors Advanced Algebra All College and Honors Advanced Algebra courses had the same grading policy. As noted in the
syllabus given to every student and signed by every parent/guardian (Appendix A: E,5), students’ grades
were based on classroom participation (10%), presentations (15%), homework/notebook (25%),
tests/quizzes (40%), and final test/assessment (10%) (Appendix A: B,3.iii). This grading policy is the
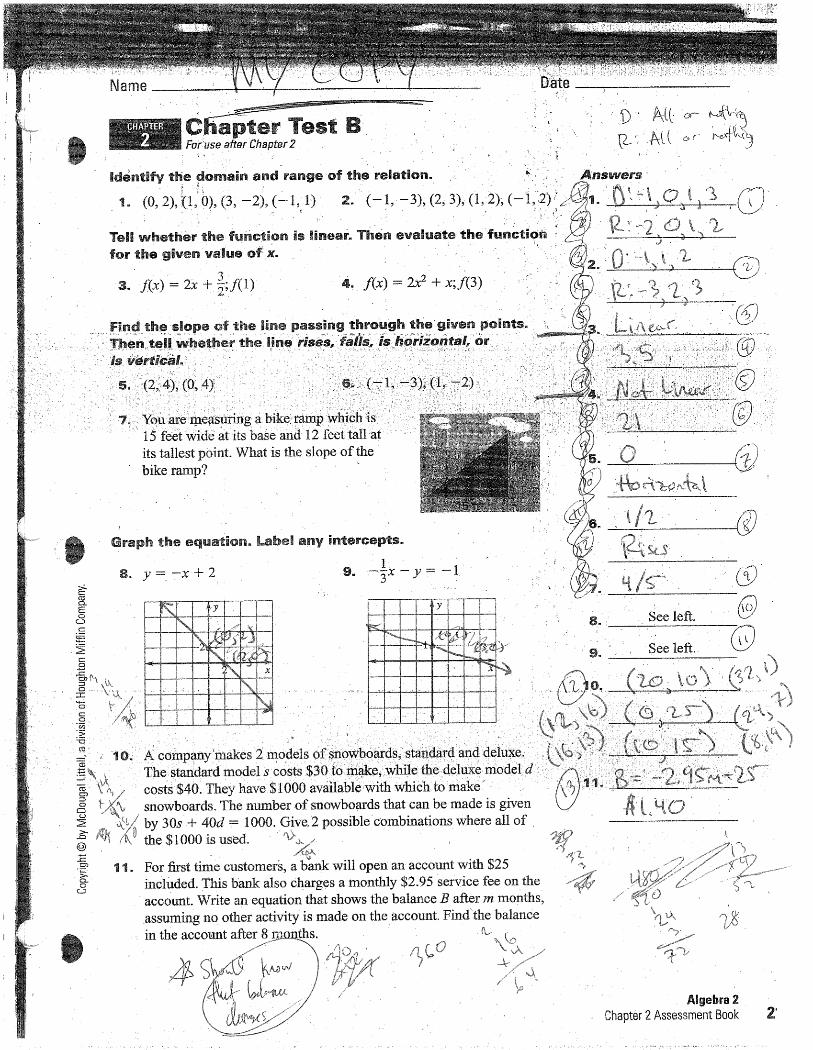
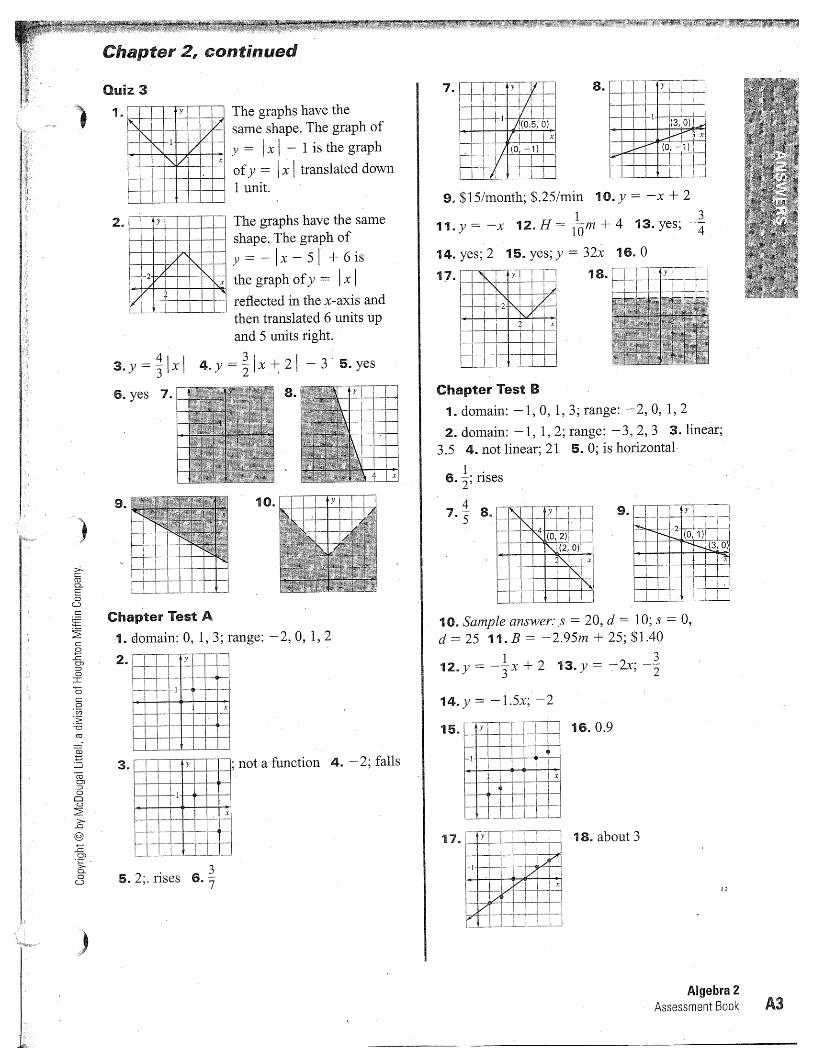
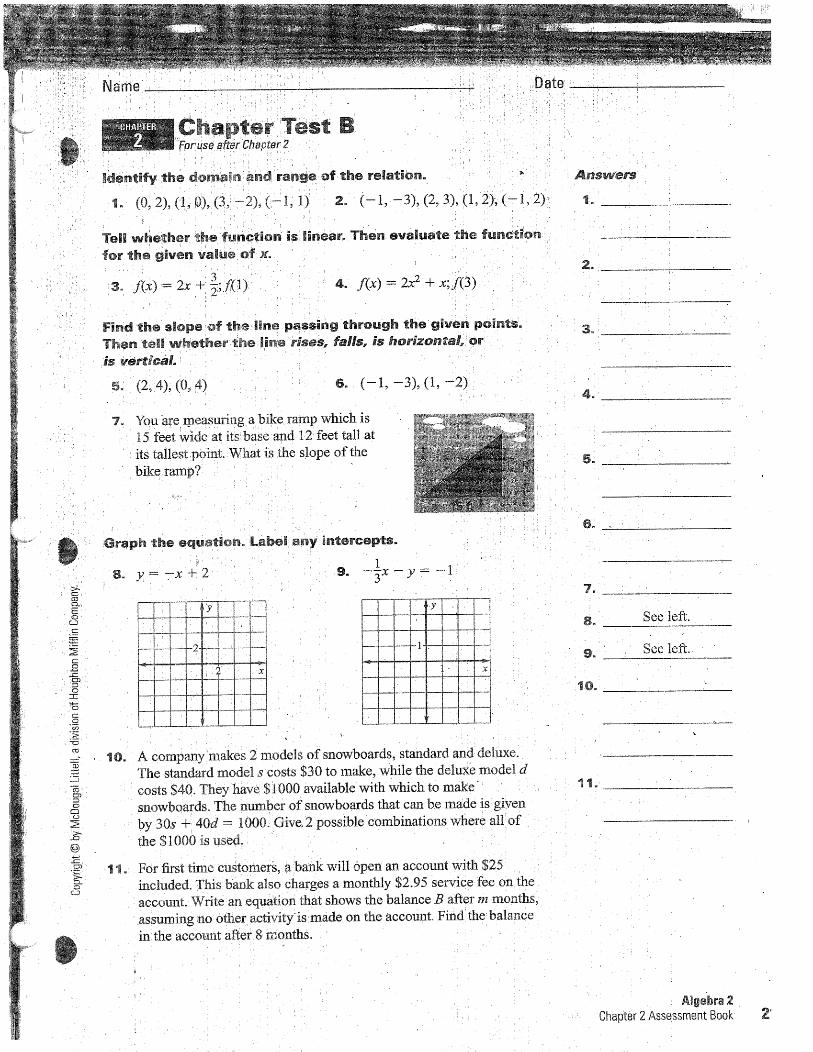
recommended format for all Worcester Public Schools (Appendix Q). It benefits students by giving them
a variety of ways to receive credit for their work (Appendix A: B,4.i). Furthermore, the logic of the
system is explained below. Within these given assignments, and also in addition, students were
consistently challenged with problems that prepared them for questions they may see in the MCAS.
Classroom participation is meant to be an easy contribution to each student’s final grade.
Students who frequently miss class have a possibility of not receiving the full ten points for their quarter
grade. Any student who could explain the cause of their absence and successfully make-up their work
would still be eligible for a full ten points. Students that disturb the classroom by talking out of turn or
often coming in late would lose points in this category. Likewise, students that fell asleep during class
lost the majority of their class participation credit.
Presentations are another form of classroom participation that has more of a focus. During
class, students are frequently asks to answer homework questions on the board to benefit their peers.
This is a great way for students to prove their knowledge that they have attained in the course.
Presentations after group work also counted towards a student’s presentation grade. Overall, students
had several chances over the months to present at some point. As long as a student attempted the
presentation and had proven some knowledge of the material, the majority of the fifteen points were
granted.
Although it was not the highest percentage of the grading policy, homework and note taking
had the biggest impact on a student’s grade. Students were expected to take notes every day during
class lectures. Furthermore, homework was to be done in the same notebook every night. Normally,
homework was problems out of the textbook referring to the appropriate chapter. Other times, an open
response question (Appendix A: B,2.iv) may be asked in order to prepare students for MCAS problems.
The book also prepared students for the MCAS by giving multiple choice exercises, which I frequently
assigned for that reason. When a test or quiz was assigned, students were allowed to use their
notebooks. As long as the student took accurate notes and completed his/her homework assignment,
including asking questions when unsure, his/her notebook was practically an answer sheet. Thus, the
reason for this grade was to encourage students to pay attention during class, along with practicing all
course material as much as possible.
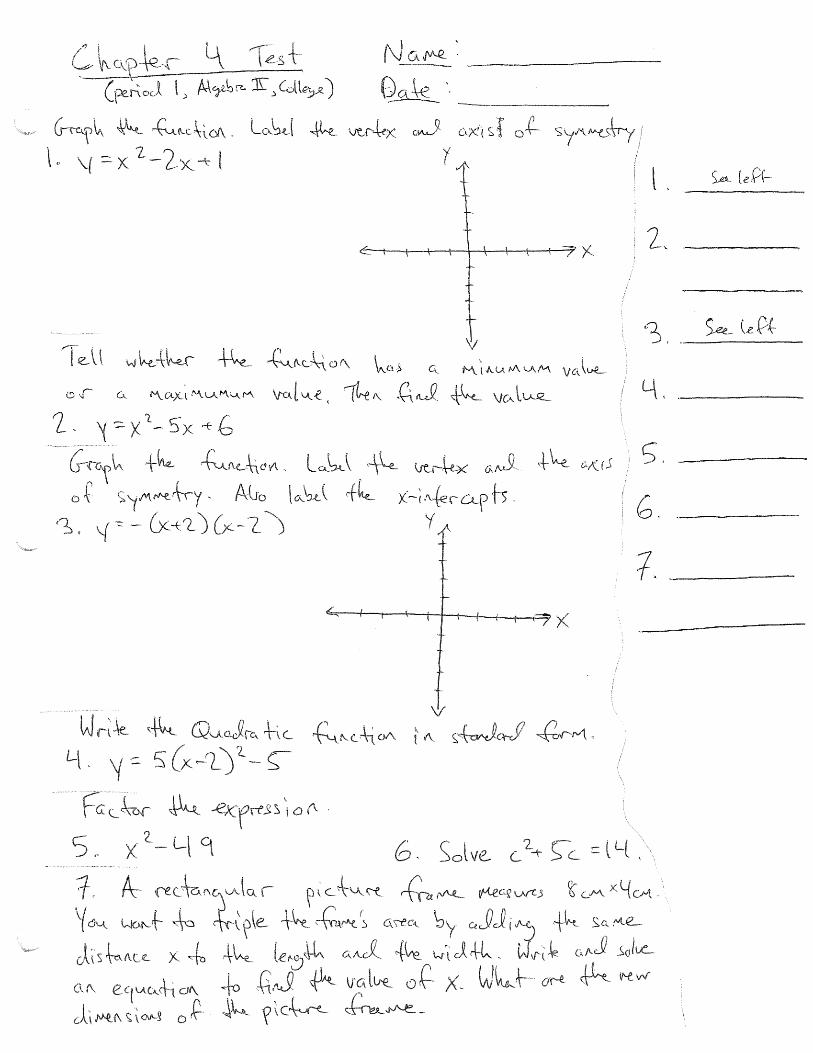
Finally, test and quizzes were assigned as the textbook recommended (Appendix M, N).
Normally, these test and quizzes were copied directly from the textbook unless I felt another form of
testing was more beneficial. For example, I assigned a take home test that was open-ended which tested
the students’ ability to create, record, and analyze a small set of data. Students were expected to defend
their answers in order to receive full credit. Open-ended problems are, once again, a great way for
students to prepare themselves for the MCAS. The standard quiz covered two or three sections and
were no more than ten questions. Tests covered entire chapters by taking a few questions from each
section. This philosophy was important to follow in order for students to show that they remember to
key parts of each lesson.
To encourage mastering of the material covered and meet Worcester School Committee
requirements, a final test was to be given at the end of the year (Appendix Q). During this test, students
are expected to exemplify understanding of all material covered in Advanced Algebra. This final is longer
for those in the honors level course and shorter for the college level course, depending on the amount
of material covered.
College Algebra I As mentioned earlier, College Algebra I was a very structured course that left little
independence for students. It was designed to show students how to succeed through note taking,
practice, and, most important, organization. For these reasons the grading policy was broking down into
five categories: binder (15%), warm-up (10%), note taking guide (15%), practice sheets (20%), and
quizzes/tests (40%) (Appendix A: B,3.iii). The percentage changed at times, depending on the outcome
of a student’s grade. Different students were strong in different areas and thus grading was done
accordingly (Appendix A: B,4.i). This break down of grading was provided to students during the middle
and end of each grading quarter. Students were told to grade themselves and then meet with me
individually to discuss my dis/agreements (Appendix A: B,3.ii).
At the beginning of the course, every student was provided with a one inch binder along with
warm-up, classwork, and homework indexes. Students were expected to bring their binder to class
every day and keep their indexes up to date. Index entries consisted of writing the date and the lesson
or activity that was done on that day. All work done in class and for homework was expected to be
three-hole punched and in its respective organized location in the binder. This binder was allowed to be
used as a resource during tests and quizzes periodically. At the end and middle of each quarter, students
presented there binder to me in order to receive this percentage of their grade. This binder also
provided a great, continuous portfolio for students that wished to present their achievements to school
personnel or parents/guardians (Appendix A: B,4.ii).
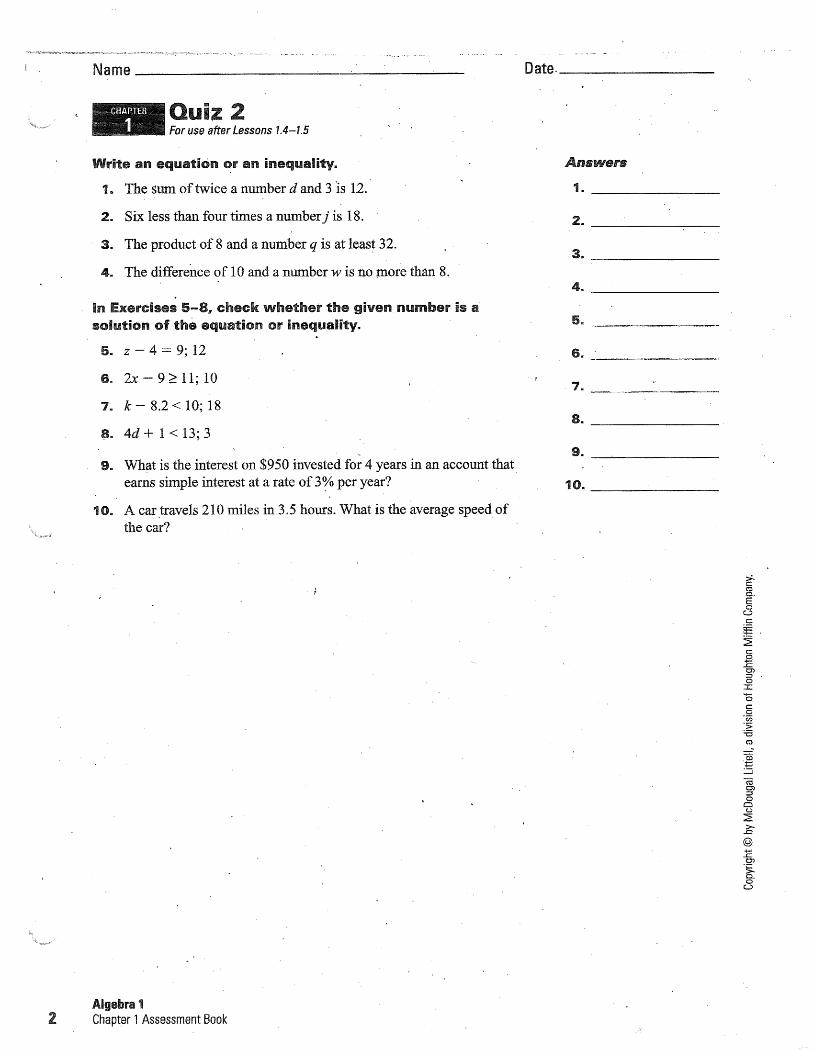
As described earlier, warm-ups were assigned at the beginning of class each day. This was a
math problem from the eighth or tenth grade MCAS. These problems were a great way to get the
students settled down as well as becoming familiar with problems they will see on the MCAS. In order to
receive full credit for a warm-up, a student was required to copy the printed warm-up question and
answer it in their binder. After completing the problem, they wrote down the answer on the warm-up
sheet and handed it in to me. A correct answer was not required for students to receive credit when
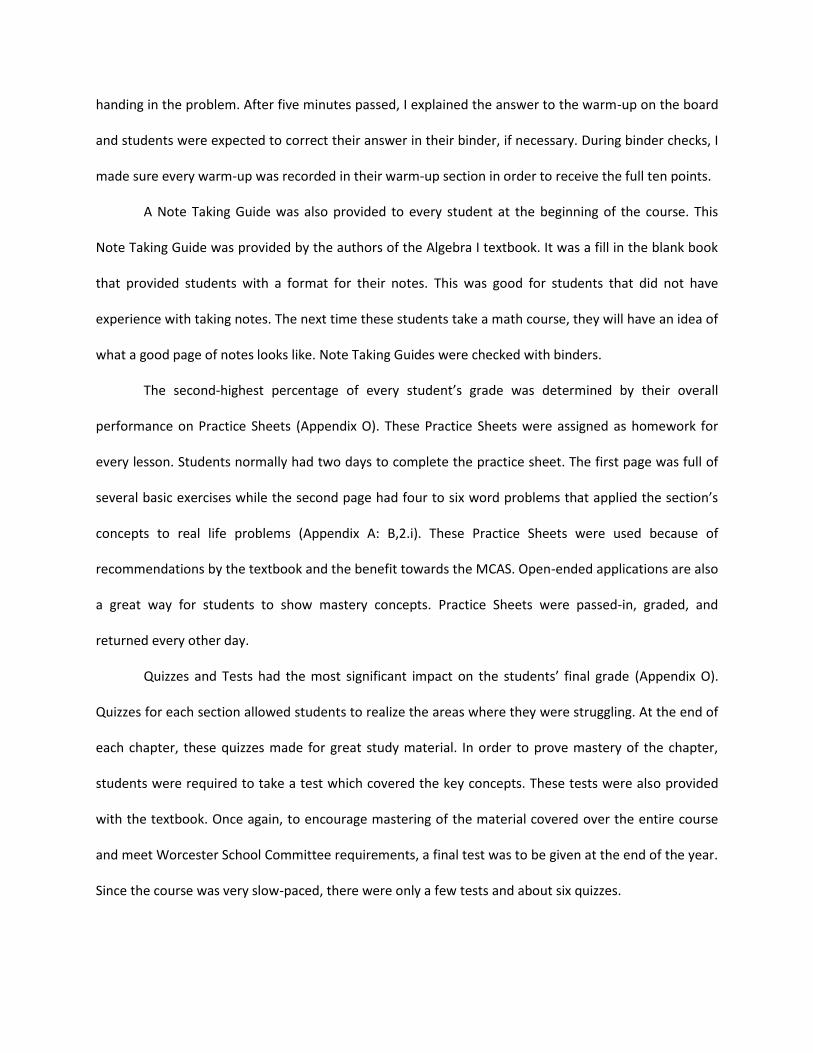
handing in the problem. After five minutes passed, I explained the answer to the warm-up on the board
and students were expected to correct their answer in their binder, if necessary. During binder checks, I
made sure every warm-up was recorded in their warm-up section in order to receive the full ten points.
A Note Taking Guide was also provided to every student at the beginning of the course. This
Note Taking Guide was provided by the authors of the Algebra I textbook. It was a fill in the blank book
that provided students with a format for their notes. This was good for students that did not have
experience with taking notes. The next time these students take a math course, they will have an idea of
what a good page of notes looks like. Note Taking Guides were checked with binders.
The second-highest percentage of every student’s grade was determined by their overall
performance on Practice Sheets (Appendix O). These Practice Sheets were assigned as homework for
every lesson. Students normally had two days to complete the practice sheet. The first page was full of
several basic exercises while the second page had four to six word problems that applied the section’s
concepts to real life problems (Appendix A: B,2.i). These Practice Sheets were used because of
recommendations by the textbook and the benefit towards the MCAS. Open-ended applications are also
a great way for students to show mastery concepts. Practice Sheets were passed-in, graded, and
returned every other day.
Quizzes and Tests had the most significant impact on the students’ final grade (Appendix O).
Quizzes for each section allowed students to realize the areas where they were struggling. At the end of
each chapter, these quizzes made for great study material. In order to prove mastery of the chapter,
students were required to take a test which covered the key concepts. These tests were also provided
with the textbook. Once again, to encourage mastering of the material covered over the entire course
and meet Worcester School Committee requirements, a final test was to be given at the end of the year.
Since the course was very slow-paced, there were only a few tests and about six quizzes.
Conclusion The four months spent at North High School as an Observer and Teacher opened my eyes and
made me grow as a person. The teachers were very accepting and helpful. I sensed the frustration in the
feelings of a few teachers due to the low expectations of the school. Yet every teacher was there to
change lives. Reflecting over the entire experience allows me to identify the areas of success and failure.
This will make my future teaching experiences even better for my students and me.
My success was in connecting with the students. Since I am only a few years older than many of
them, it was easy to relate our experiences. My young energy also allowed me to keep up with the
students’ energy levels. Furthermore, I had very little piety for the students that complained about the
amount of work they were given. I was in a similar situation three years ago and now I am in an even
busier lifestyle. These qualities allowed me to hold these students to much higher expectations than
they were accustomed. Sometimes they did not realize the amount of work they were doing because I
made class fun. As long as students tried, I was able to ease up and not yell. On the rare occasion that I
did yell, students took me seriously.
Of course, there were several more struggles than successes. Luckily, this experience has
allowed me to make mistakes and learn form them while I still have a safety net: my teaching mentor,
Mr. Turner. Mr. Turner observed me throughout my classes and pointed out my flaws. My flaws were
anything from standing in front of my writing at the whiteboard to wasting time in the beginning of the
course by not having a warm-up problem. As I fixed these flaws, classroom management became much
easier. Many of these solutions have become habits and will be remembered when I teach in the future.
Overall, Worcester North is a high need school that survives because of the patience that is so
apparent in character of every teacher. Patience is a virtue at North High because students are not held
to high expectations. Expectations of students are said every day during morning announcements but
not every teacher and administrator obeys. Inconsistency is noticed by the students which allow them to
take full advantage. The most important thing to do is to keep the expectations in the classroom

obvious. As long as these expectations are clear and consistent every day, students will learn to be
disciplined and success will follow. (Appendix A: E,6)
Works Cited Arena, F. E. (2006). Quadrant Office. Retrieved February 20, 2011, from Worcester Public Schools Web
site: http://quadrant-office.worcesterschools.org/ Massachusetts Department of Elementary and Secondary Education. (2008, August 14). Massachusetts
Comprehensive Assessment System: Threshold Scores of 2008 MCAS Tests. Retrieved September 5, 2010, from http://www.doe.mass.edu
School Fusion. (n.d.). North High School. Retrieved September 4, 2010, from SchoolFusion.com:
http://north.worcesterschools.org/ Worcester Public Schools. (2010). Worcester Public School High School Level Improvement Plan 2008-
2010 North High. Retrieved September 5, 2010, from http://north.worcesterschools.org Worcester Public Schools Syllabi. (n.d.). Retrieved February 20, 2011, from Worcester Public Schools:
http://math.worcesterschools.org

Appendixes
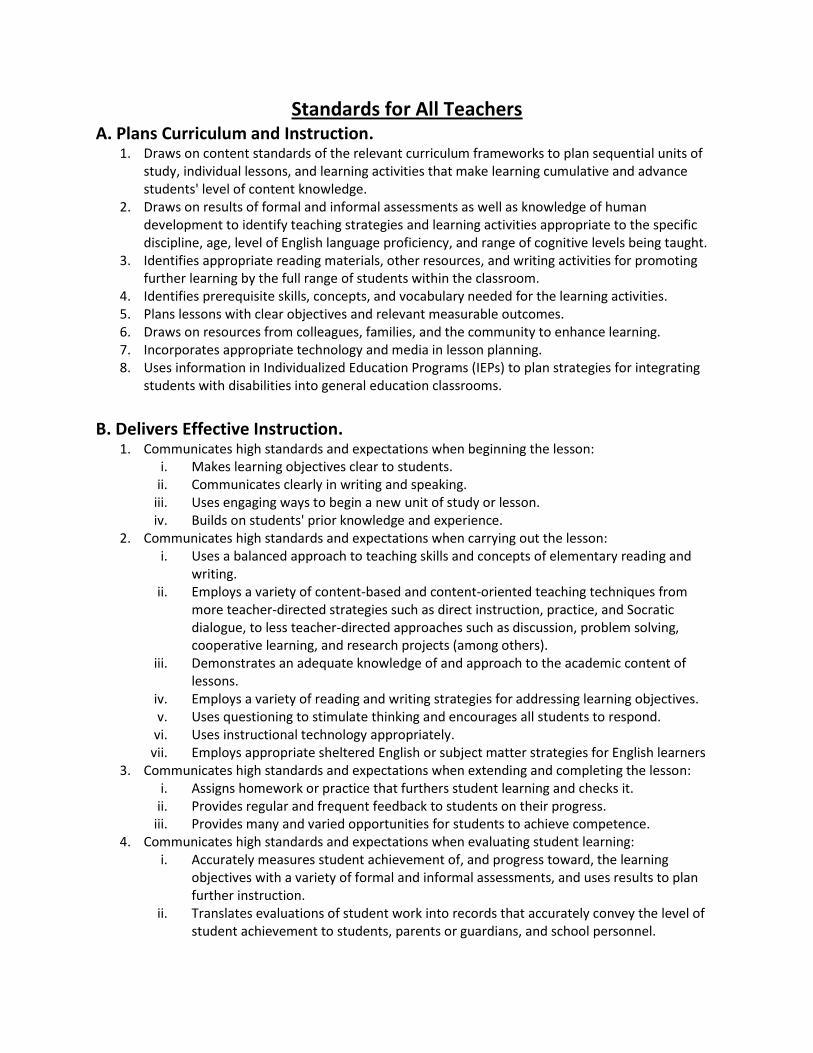
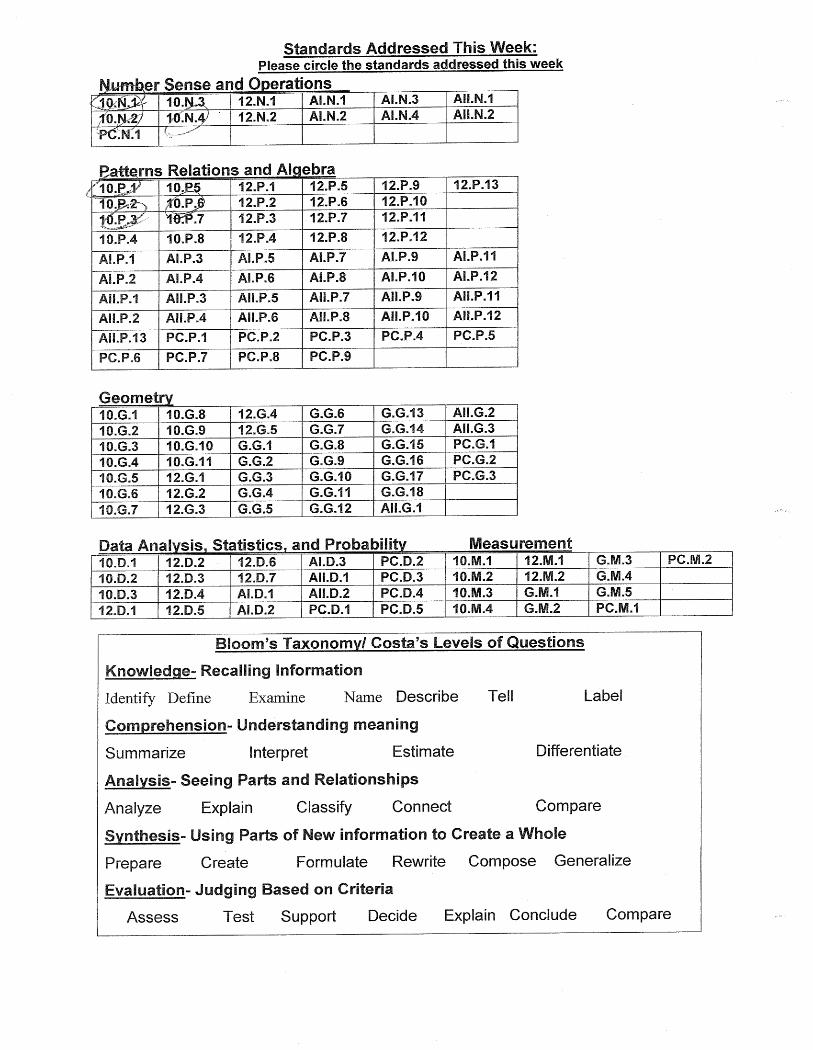
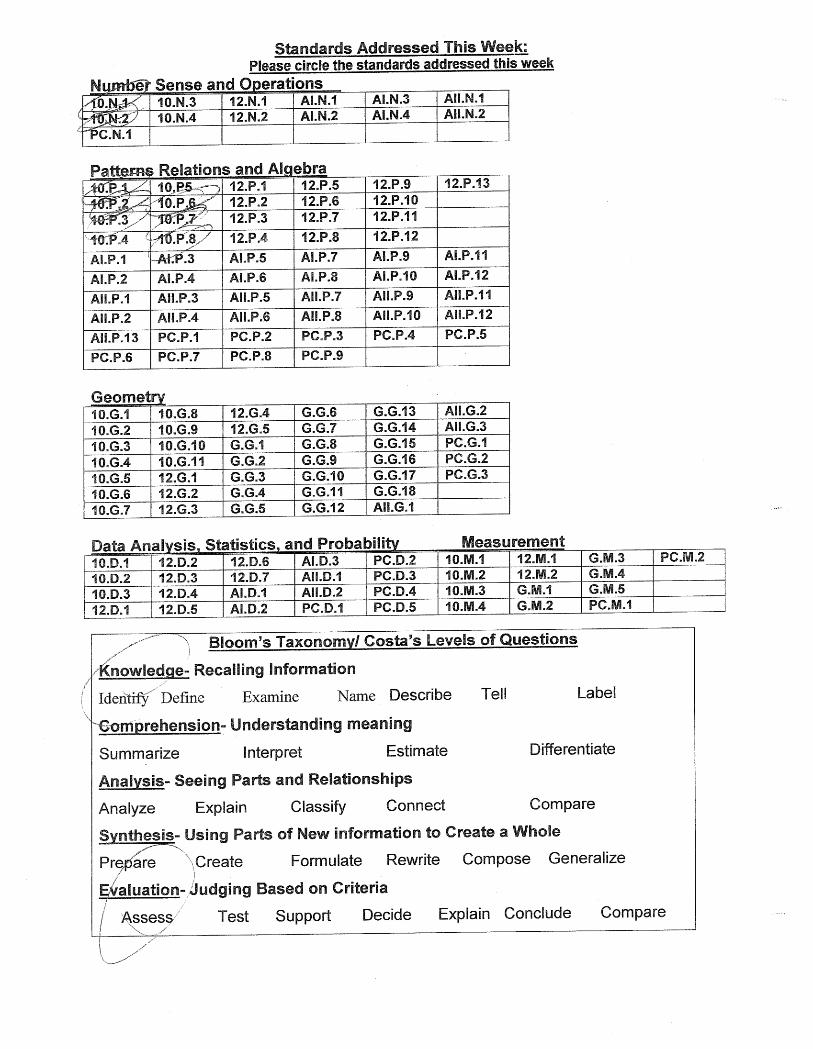
Standards for All Teachers A. Plans Curriculum and Instruction.
1. Draws on content standards of the relevant curriculum frameworks to plan sequential units of study, individual lessons, and learning activities that make learning cumulative and advance students' level of content knowledge.
2. Draws on results of formal and informal assessments as well as knowledge of human development to identify teaching strategies and learning activities appropriate to the specific discipline, age, level of English language proficiency, and range of cognitive levels being taught.
3. Identifies appropriate reading materials, other resources, and writing activities for promoting further learning by the full range of students within the classroom.
4. Identifies prerequisite skills, concepts, and vocabulary needed for the learning activities. 5. Plans lessons with clear objectives and relevant measurable outcomes. 6. Draws on resources from colleagues, families, and the community to enhance learning. 7. Incorporates appropriate technology and media in lesson planning. 8. Uses information in Individualized Education Programs (IEPs) to plan strategies for integrating
students with disabilities into general education classrooms.
B. Delivers Effective Instruction.
1. Communicates high standards and expectations when beginning the lesson: i. Makes learning objectives clear to students.
ii. Communicates clearly in writing and speaking. iii. Uses engaging ways to begin a new unit of study or lesson. iv. Builds on students' prior knowledge and experience.
2. Communicates high standards and expectations when carrying out the lesson: i. Uses a balanced approach to teaching skills and concepts of elementary reading and
writing. ii. Employs a variety of content-based and content-oriented teaching techniques from
more teacher-directed strategies such as direct instruction, practice, and Socratic dialogue, to less teacher-directed approaches such as discussion, problem solving, cooperative learning, and research projects (among others).
iii. Demonstrates an adequate knowledge of and approach to the academic content of lessons.
iv. Employs a variety of reading and writing strategies for addressing learning objectives. v. Uses questioning to stimulate thinking and encourages all students to respond.
vi. Uses instructional technology appropriately. vii. Employs appropriate sheltered English or subject matter strategies for English learners
3. Communicates high standards and expectations when extending and completing the lesson: i. Assigns homework or practice that furthers student learning and checks it.
ii. Provides regular and frequent feedback to students on their progress. iii. Provides many and varied opportunities for students to achieve competence.
4. Communicates high standards and expectations when evaluating student learning: i. Accurately measures student achievement of, and progress toward, the learning
objectives with a variety of formal and informal assessments, and uses results to plan further instruction.
ii. Translates evaluations of student work into records that accurately convey the level of student achievement to students, parents or guardians, and school personnel.
C. Manages Classroom Climate and Operation. 1. Creates an environment that is conducive to learning. 2. Creates a physical environment appropriate to a range of learning activities. 3. Maintains appropriate standards of behavior, mutual respect, and safety. 4. Manages classroom routines and procedures without loss of significant instructional time.
D. Promotes Equity.
1. Encourages all students to believe that effort is a key to achievement. 2. Works to promote achievement by all students without exception. 3. Assesses the significance of student differences in home experiences, background knowledge,
learning skills, learning pace, and proficiency in the English language for learning the curriculum at hand and uses professional judgment to determine if instructional adjustments are necessary.
4. Helps all students to understand American civic culture, its underlying ideals, founding political principles and political institutions, and to see themselves as members of a local, state, national, and international civic community.
E. Meets Professional Responsibilities.
1. Understands his or her legal and moral responsibilities. 2. Conveys knowledge of and enthusiasm for his/her academic discipline to students. 3. Maintains interest in current theory, research, and developments in the academic discipline and
exercises judgment in accepting implications or findings as valid for application in classroom practice.
4. Collaborates with colleagues to improve instruction, assessment, and student achievement. 5. Works actively to involve parents in their child's academic activities and performance, and
communicates clearly with them. 6. Reflects critically upon his or her teaching experience, identifies areas for further professional
development as part of a professional development plan that is linked to grade level, school, and district goals, and is receptive to suggestions for growth.
7. Understands legal and ethical issues as they apply to responsible and acceptable use of the Internet and other resources.
1
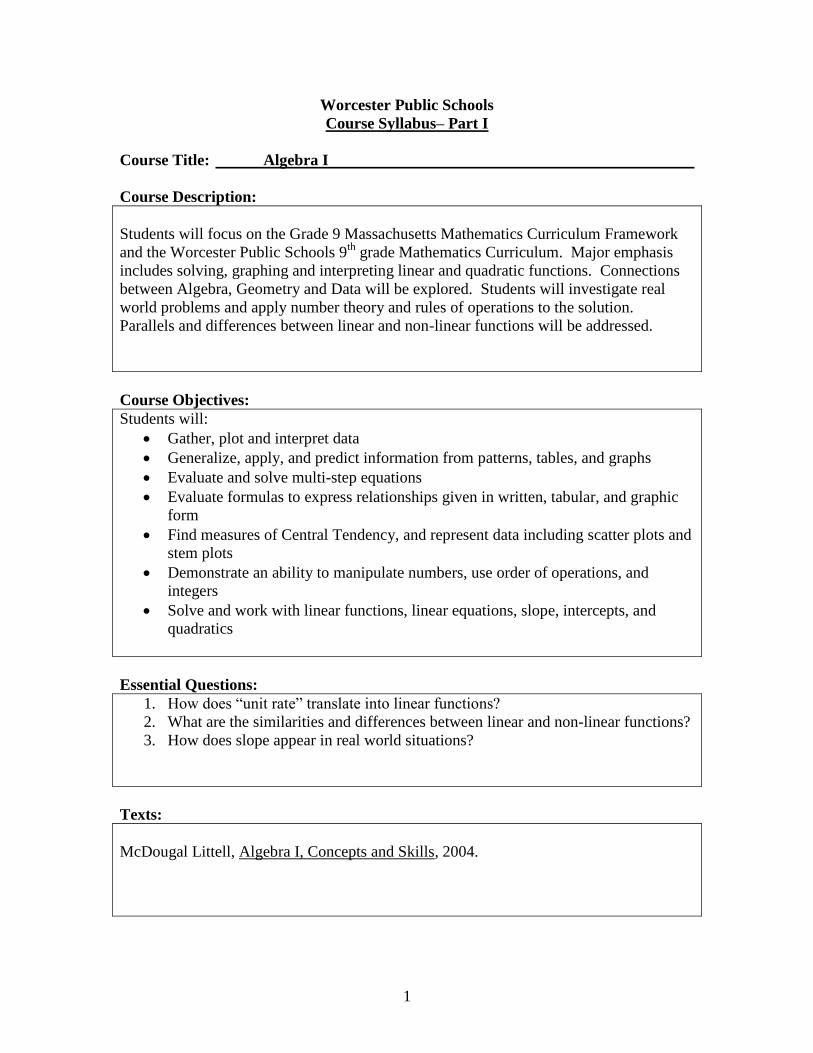
Worcester Public Schools
Course Syllabus– Part I
Course Title: Algebra I
Course Description:
Students will focus on the Grade 9 Massachusetts Mathematics Curriculum Framework
and the Worcester Public Schools 9th
grade Mathematics Curriculum. Major emphasis
includes solving, graphing and interpreting linear and quadratic functions. Connections
between Algebra, Geometry and Data will be explored. Students will investigate real
world problems and apply number theory and rules of operations to the solution.
Parallels and differences between linear and non-linear functions will be addressed.
Course Objectives:
Students will:
Gather, plot and interpret data
Generalize, apply, and predict information from patterns, tables, and graphs
Evaluate and solve multi-step equations
Evaluate formulas to express relationships given in written, tabular, and graphic
form
Find measures of Central Tendency, and represent data including scatter plots and
stem plots
Demonstrate an ability to manipulate numbers, use order of operations, and
integers
Solve and work with linear functions, linear equations, slope, intercepts, and
quadratics
Essential Questions:
1. How does “unit rate” translate into linear functions?
2. What are the similarities and differences between linear and non-linear functions?
3. How does slope appear in real world situations?
Texts:
McDougal Littell, Algebra I, Concepts and Skills, 2004.
2
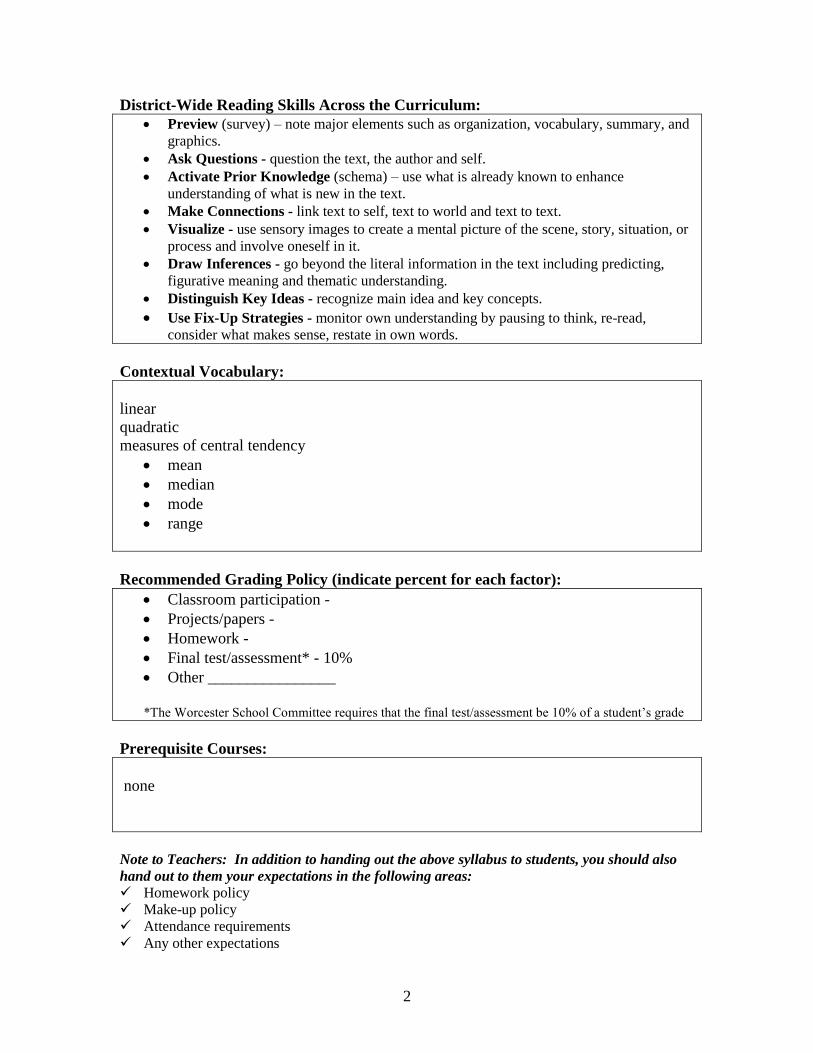
District-Wide Reading Skills Across the Curriculum:
Preview (survey) – note major elements such as organization, vocabulary, summary, and
graphics.
Ask Questions - question the text, the author and self.
Activate Prior Knowledge (schema) – use what is already known to enhance
understanding of what is new in the text.
Make Connections - link text to self, text to world and text to text.
Visualize - use sensory images to create a mental picture of the scene, story, situation, or
process and involve oneself in it.
Draw Inferences - go beyond the literal information in the text including predicting,
figurative meaning and thematic understanding.
Distinguish Key Ideas - recognize main idea and key concepts.
Use Fix-Up Strategies - monitor own understanding by pausing to think, re-read,
consider what makes sense, restate in own words.
Contextual Vocabulary:
linear
quadratic
measures of central tendency
mean
median
mode
range
Recommended Grading Policy (indicate percent for each factor):
Classroom participation -
Projects/papers -
Homework -
Final test/assessment* - 10%
Other ________________
*The Worcester School Committee requires that the final test/assessment be 10% of a student’s grade
Prerequisite Courses:
none
Note to Teachers: In addition to handing out the above syllabus to students, you should also
hand out to them your expectations in the following areas:
Homework policy
Make-up policy
Attendance requirements
Any other expectations
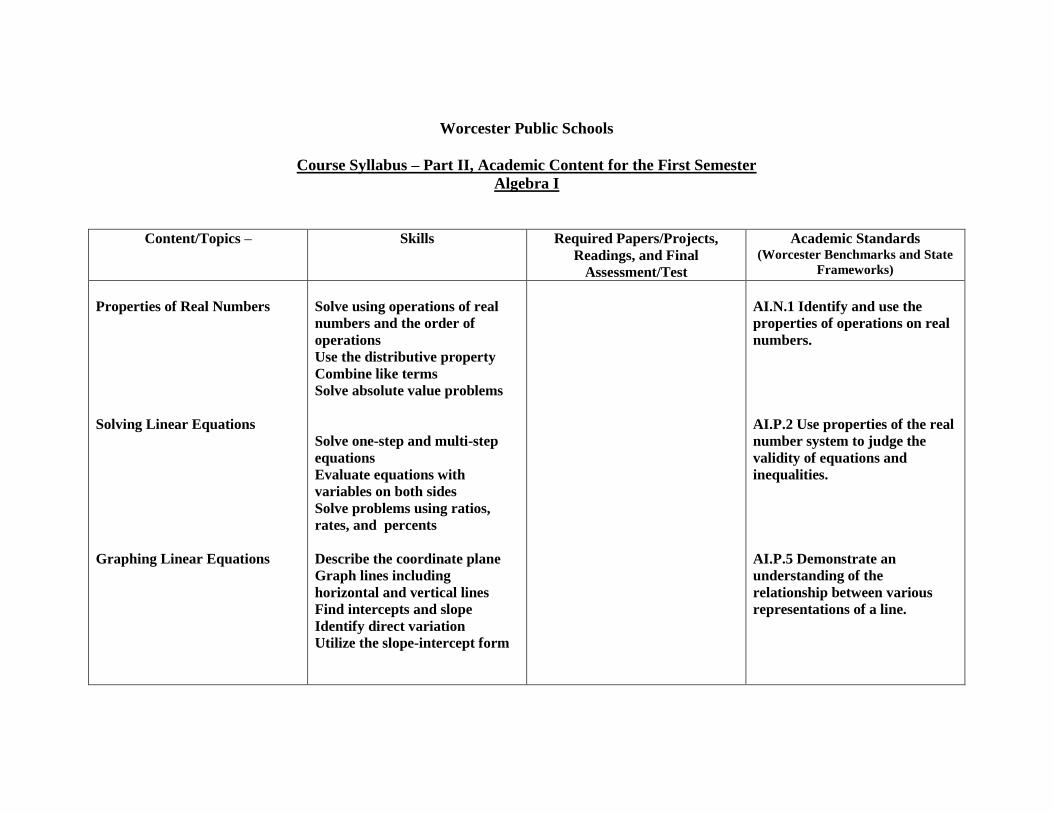
Worcester Public Schools
Course Syllabus – Part II, Academic Content for the First Semester
Algebra I
Content/Topics –
Skills Required Papers/Projects,
Readings, and Final
Assessment/Test
Academic Standards (Worcester Benchmarks and State
Frameworks)
Properties of Real Numbers
Solving Linear Equations
Graphing Linear Equations
Solve using operations of real
numbers and the order of
operations
Use the distributive property
Combine like terms
Solve absolute value problems
Solve one-step and multi-step
equations
Evaluate equations with
variables on both sides
Solve problems using ratios,
rates, and percents
Describe the coordinate plane
Graph lines including
horizontal and vertical lines
Find intercepts and slope
Identify direct variation
Utilize the slope-intercept form
AI.N.1 Identify and use the
properties of operations on real
numbers.
AI.P.2 Use properties of the real
number system to judge the
validity of equations and
inequalities.
AI.P.5 Demonstrate an
understanding of the
relationship between various
representations of a line.
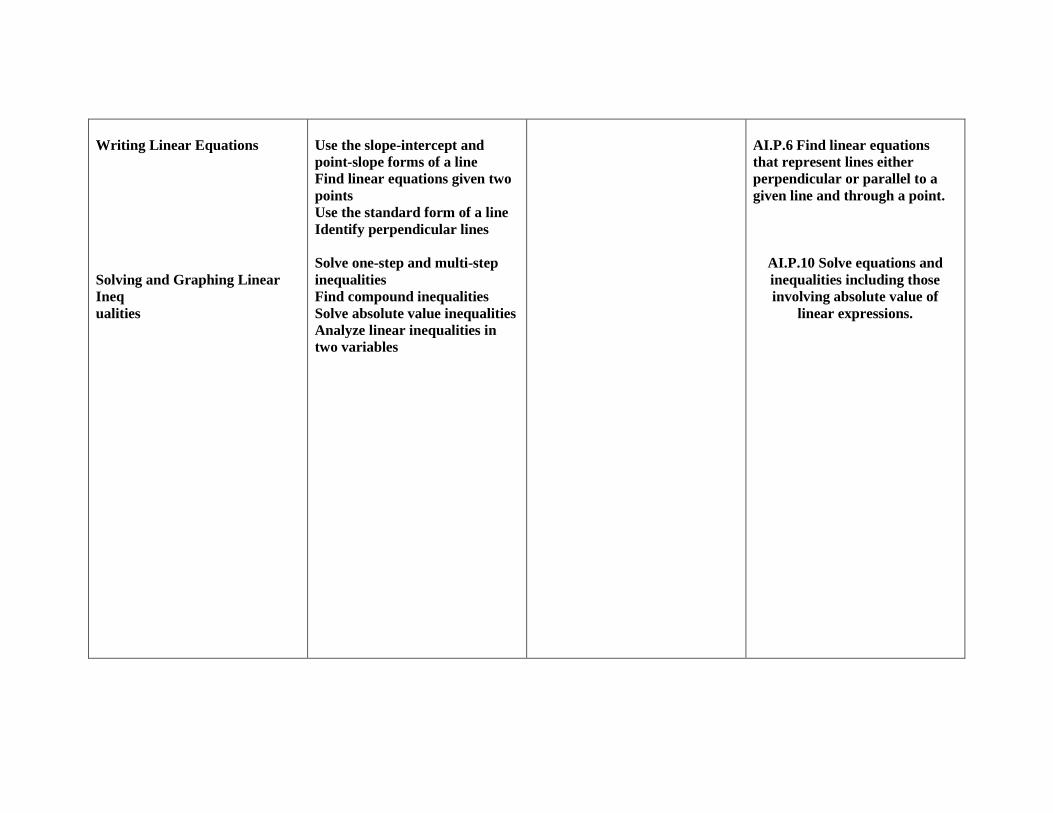
Writing Linear Equations
Solving and Graphing Linear
Ineq
ualities
Use the slope-intercept and
point-slope forms of a line
Find linear equations given two
points
Use the standard form of a line
Identify perpendicular lines
Solve one-step and multi-step
inequalities
Find compound inequalities
Solve absolute value inequalities
Analyze linear inequalities in
two variables
AI.P.6 Find linear equations
that represent lines either
perpendicular or parallel to a
given line and through a point.
AI.P.10 Solve equations and
inequalities including those
involving absolute value of
linear expressions.
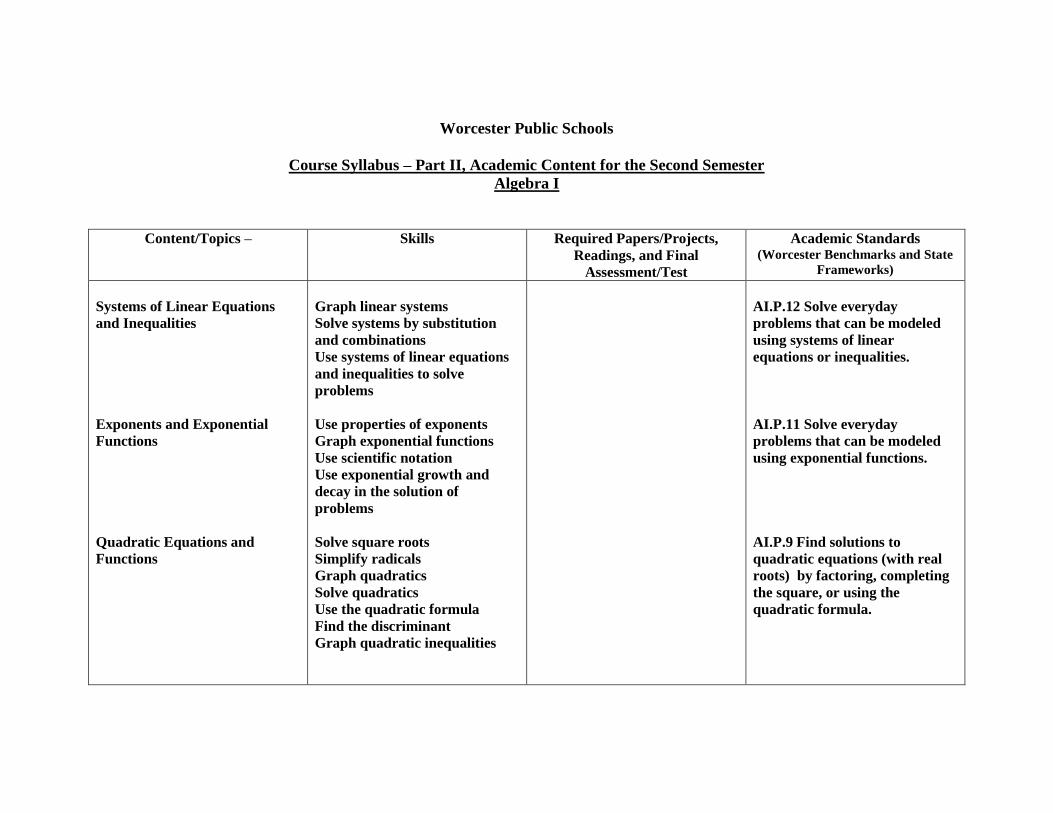
Worcester Public Schools
Course Syllabus – Part II, Academic Content for the Second Semester
Algebra I
Content/Topics –
Skills Required Papers/Projects,
Readings, and Final
Assessment/Test
Academic Standards (Worcester Benchmarks and State
Frameworks)
Systems of Linear Equations
and Inequalities
Exponents and Exponential
Functions
Quadratic Equations and
Functions
Graph linear systems
Solve systems by substitution
and combinations
Use systems of linear equations
and inequalities to solve
problems
Use properties of exponents
Graph exponential functions
Use scientific notation
Use exponential growth and
decay in the solution of
problems
Solve square roots
Simplify radicals
Graph quadratics
Solve quadratics
Use the quadratic formula
Find the discriminant
Graph quadratic inequalities
AI.P.12 Solve everyday
problems that can be modeled
using systems of linear
equations or inequalities.
AI.P.11 Solve everyday
problems that can be modeled
using exponential functions.
AI.P.9 Find solutions to
quadratic equations (with real
roots) by factoring, completing
the square, or using the
quadratic formula.
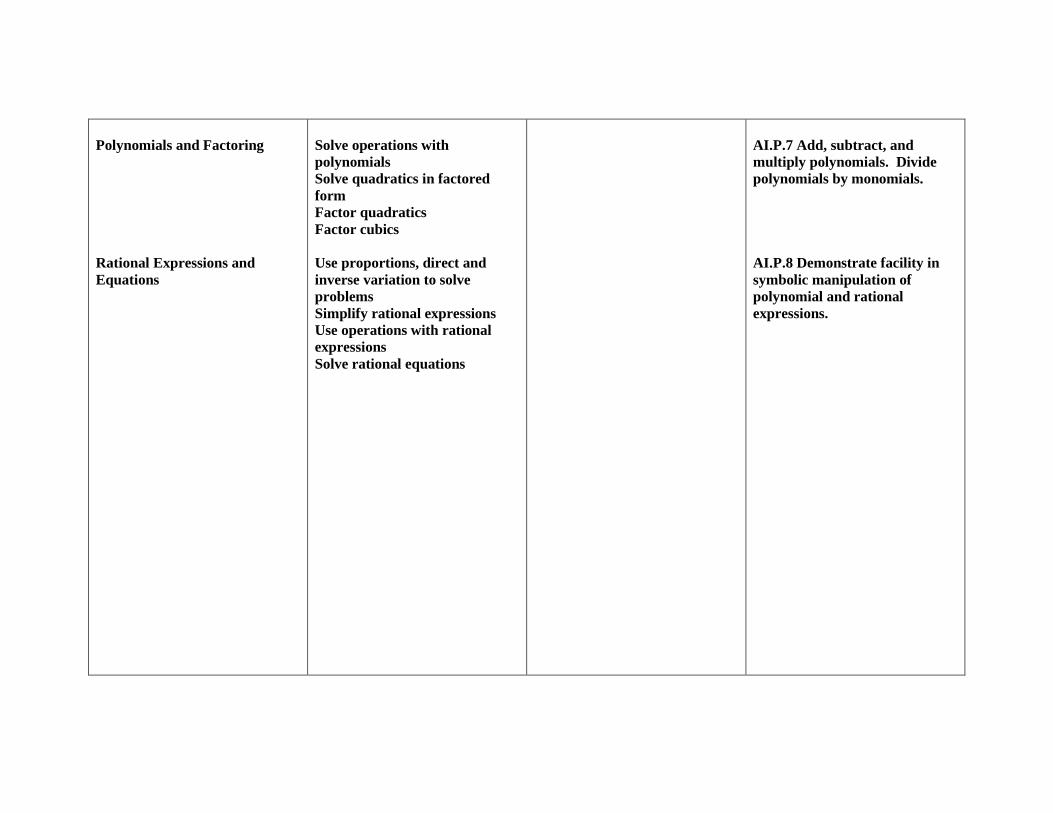
Polynomials and Factoring
Rational Expressions and
Equations
Solve operations with
polynomials
Solve quadratics in factored
form
Factor quadratics
Factor cubics
Use proportions, direct and
inverse variation to solve
problems
Simplify rational expressions
Use operations with rational
expressions
Solve rational equations
AI.P.7 Add, subtract, and
multiply polynomials. Divide
polynomials by monomials.
AI.P.8 Demonstrate facility in
symbolic manipulation of
polynomial and rational
expressions.
1
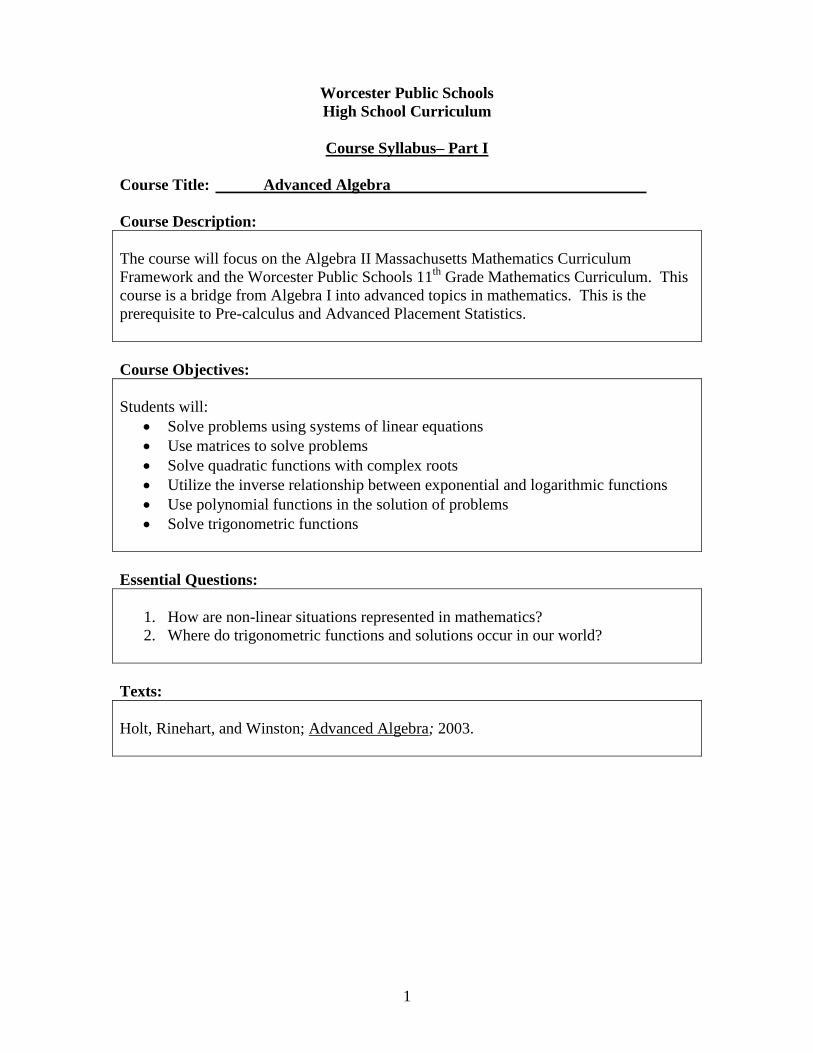
Worcester Public Schools
High School Curriculum
Course Syllabus– Part I
Course Title: Advanced Algebra
Course Description:
The course will focus on the Algebra II Massachusetts Mathematics Curriculum
Framework and the Worcester Public Schools 11th
Grade Mathematics Curriculum. This
course is a bridge from Algebra I into advanced topics in mathematics. This is the
prerequisite to Pre-calculus and Advanced Placement Statistics.
Course Objectives:
Students will:
Solve problems using systems of linear equations
Use matrices to solve problems
Solve quadratic functions with complex roots
Utilize the inverse relationship between exponential and logarithmic functions
Use polynomial functions in the solution of problems
Solve trigonometric functions
Essential Questions:
1. How are non-linear situations represented in mathematics?
2. Where do trigonometric functions and solutions occur in our world?
Texts:
Holt, Rinehart, and Winston; Advanced Algebra; 2003.
2
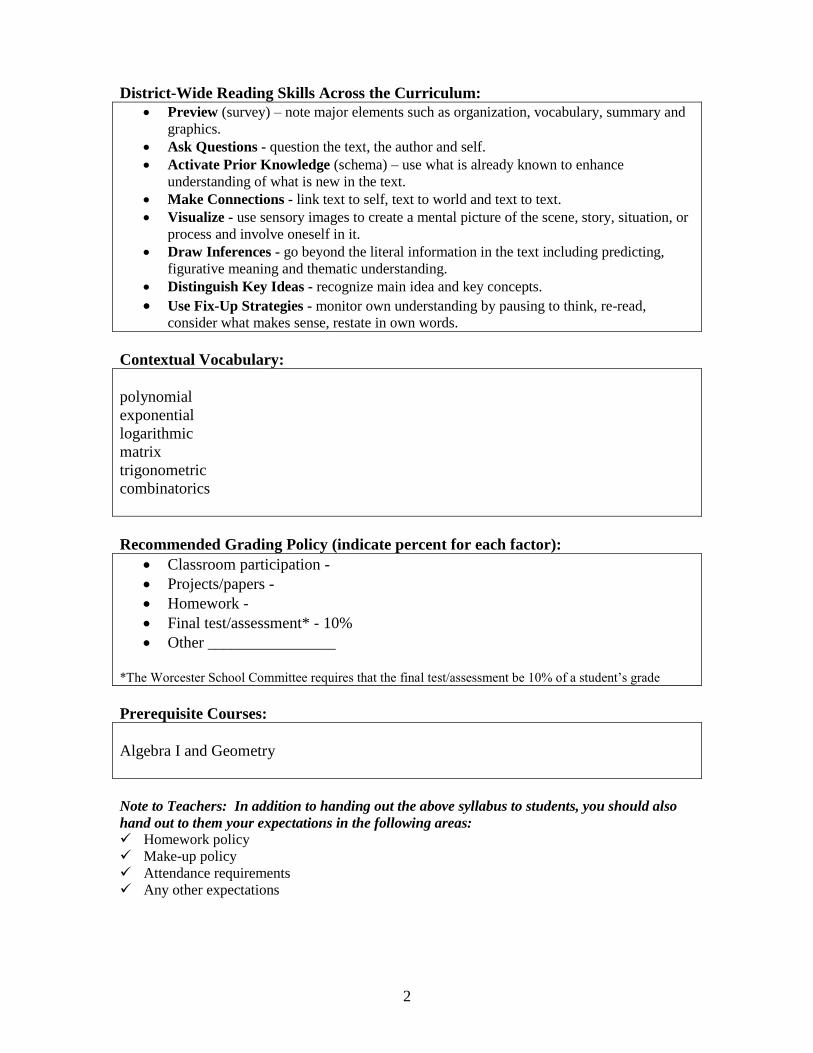
District-Wide Reading Skills Across the Curriculum:
Preview (survey) – note major elements such as organization, vocabulary, summary and
graphics.
Ask Questions - question the text, the author and self.
Activate Prior Knowledge (schema) – use what is already known to enhance
understanding of what is new in the text.
Make Connections - link text to self, text to world and text to text.
Visualize - use sensory images to create a mental picture of the scene, story, situation, or
process and involve oneself in it.
Draw Inferences - go beyond the literal information in the text including predicting,
figurative meaning and thematic understanding.
Distinguish Key Ideas - recognize main idea and key concepts.
Use Fix-Up Strategies - monitor own understanding by pausing to think, re-read,
consider what makes sense, restate in own words.
Contextual Vocabulary:
polynomial
exponential
logarithmic
matrix
trigonometric
combinatorics
Recommended Grading Policy (indicate percent for each factor):
Classroom participation -
Projects/papers -
Homework -
Final test/assessment* - 10%
Other ________________
*The Worcester School Committee requires that the final test/assessment be 10% of a student’s grade
Prerequisite Courses:
Algebra I and Geometry
Note to Teachers: In addition to handing out the above syllabus to students, you should also
hand out to them your expectations in the following areas:
Homework policy
Make-up policy
Attendance requirements
Any other expectations
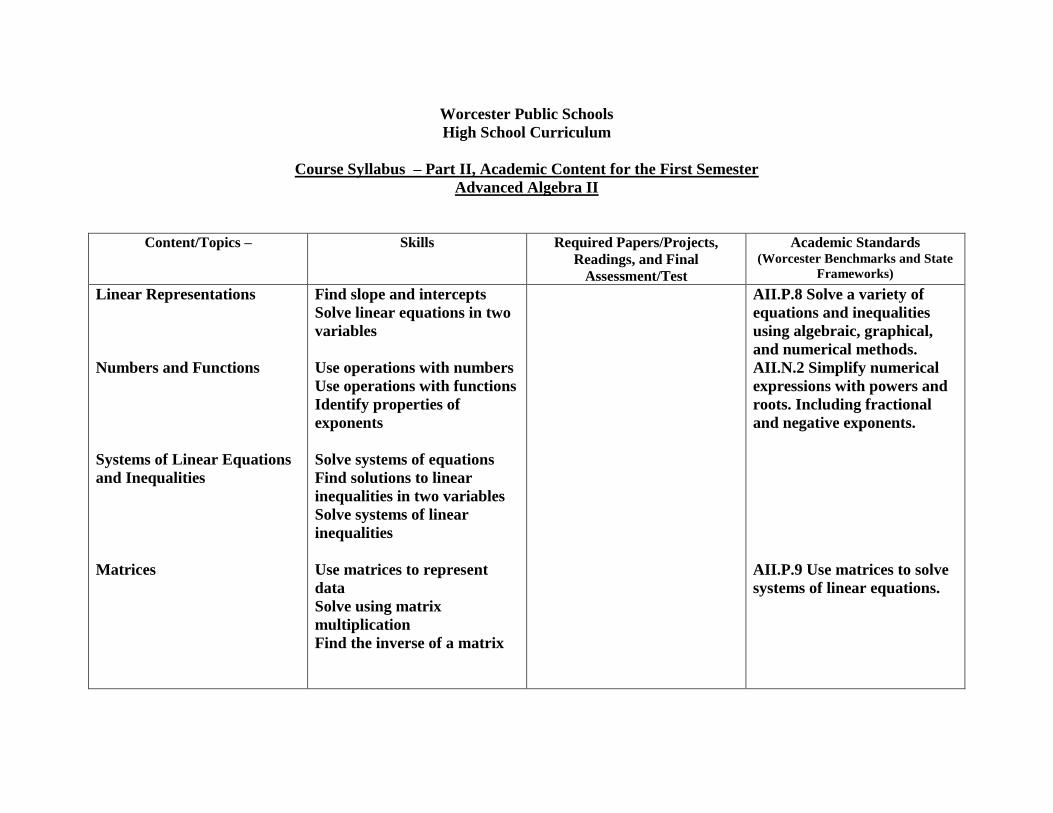
Worcester Public Schools
High School Curriculum
Course Syllabus – Part II, Academic Content for the First Semester
Advanced Algebra II
Content/Topics –
Skills Required Papers/Projects,
Readings, and Final
Assessment/Test
Academic Standards (Worcester Benchmarks and State
Frameworks)
Linear Representations
Numbers and Functions
Systems of Linear Equations
and Inequalities
Matrices
Find slope and intercepts
Solve linear equations in two
variables
Use operations with numbers
Use operations with functions
Identify properties of
exponents
Solve systems of equations
Find solutions to linear
inequalities in two variables
Solve systems of linear
inequalities
Use matrices to represent
data
Solve using matrix
multiplication
Find the inverse of a matrix
AII.P.8 Solve a variety of
equations and inequalities
using algebraic, graphical,
and numerical methods.
AII.N.2 Simplify numerical
expressions with powers and
roots. Including fractional
and negative exponents.
AII.P.9 Use matrices to solve
systems of linear equations.
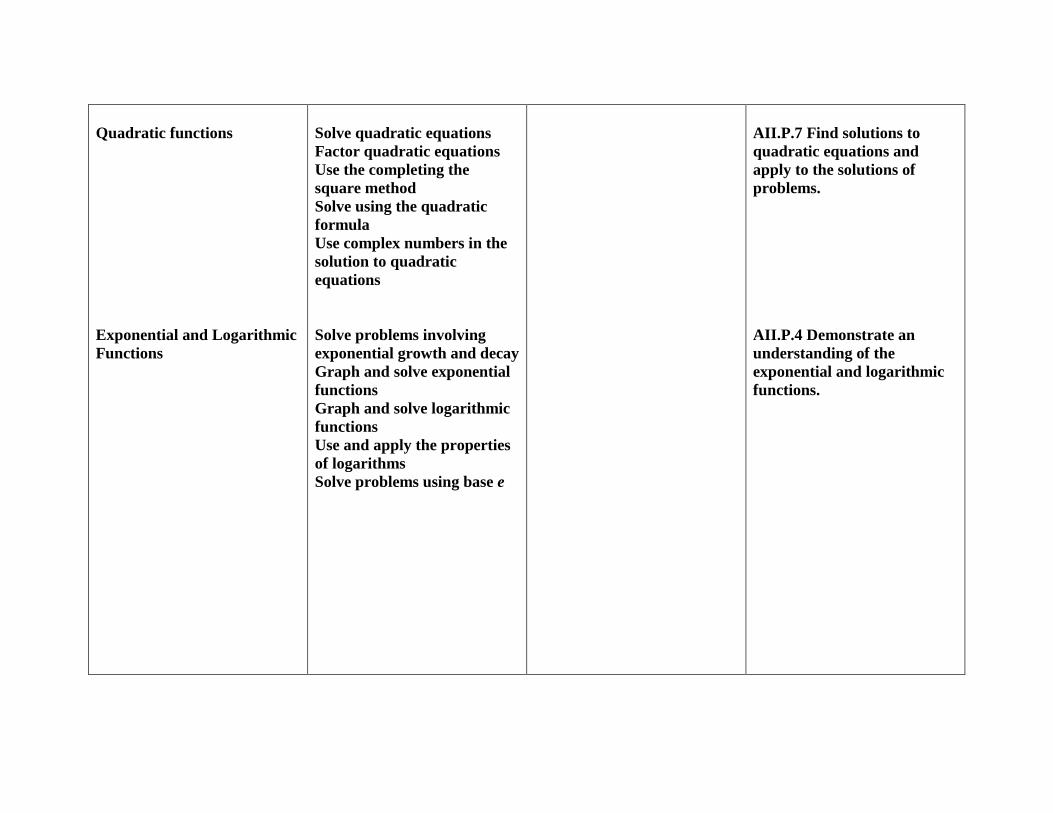
Quadratic functions
Exponential and Logarithmic
Functions
Solve quadratic equations
Factor quadratic equations
Use the completing the
square method
Solve using the quadratic
formula
Use complex numbers in the
solution to quadratic
equations
Solve problems involving
exponential growth and decay
Graph and solve exponential
functions
Graph and solve logarithmic
functions
Use and apply the properties
of logarithms
Solve problems using base e
AII.P.7 Find solutions to
quadratic equations and
apply to the solutions of
problems.
AII.P.4 Demonstrate an
understanding of the
exponential and logarithmic
functions.
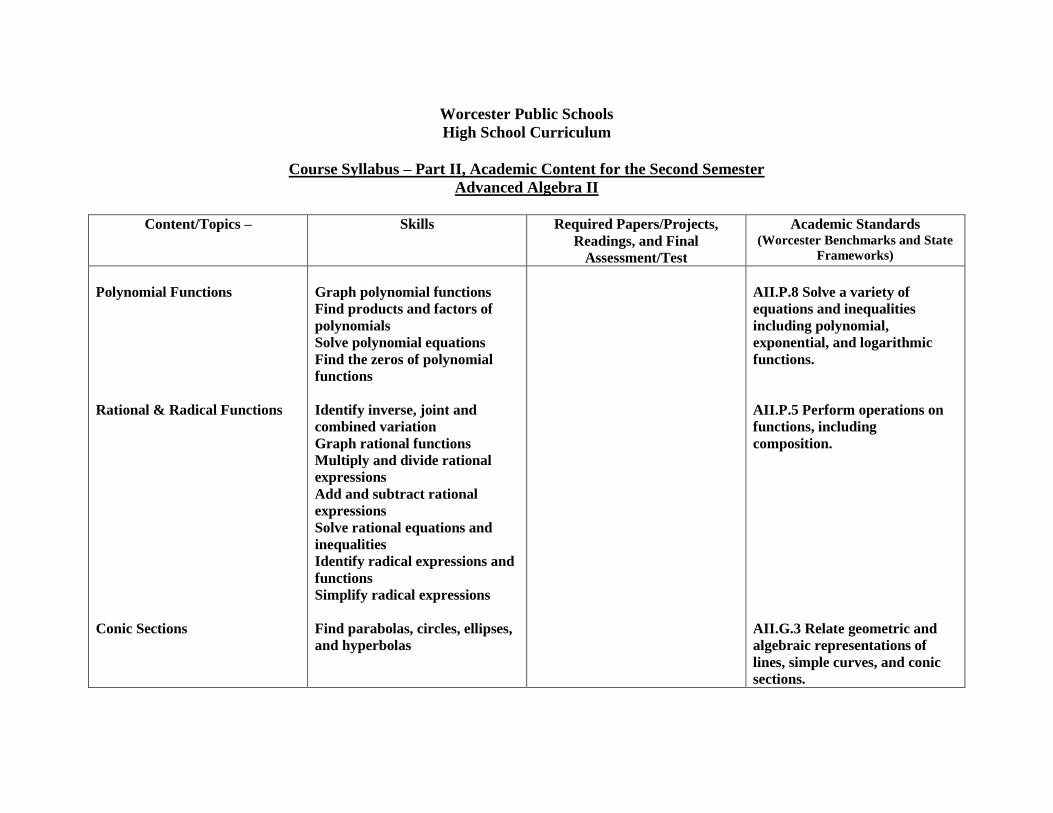
Worcester Public Schools
High School Curriculum
Course Syllabus – Part II, Academic Content for the Second Semester
Advanced Algebra II
Content/Topics –
Skills Required Papers/Projects,
Readings, and Final
Assessment/Test
Academic Standards (Worcester Benchmarks and State
Frameworks)
Polynomial Functions
Rational & Radical Functions
Conic Sections
Graph polynomial functions
Find products and factors of
polynomials
Solve polynomial equations
Find the zeros of polynomial
functions
Identify inverse, joint and
combined variation
Graph rational functions
Multiply and divide rational
expressions
Add and subtract rational
expressions
Solve rational equations and
inequalities
Identify radical expressions and
functions
Simplify radical expressions
Find parabolas, circles, ellipses,
and hyperbolas
AII.P.8 Solve a variety of
equations and inequalities
including polynomial,
exponential, and logarithmic
functions.
AII.P.5 Perform operations on
functions, including
composition.
AII.G.3 Relate geometric and
algebraic representations of
lines, simple curves, and conic
sections.
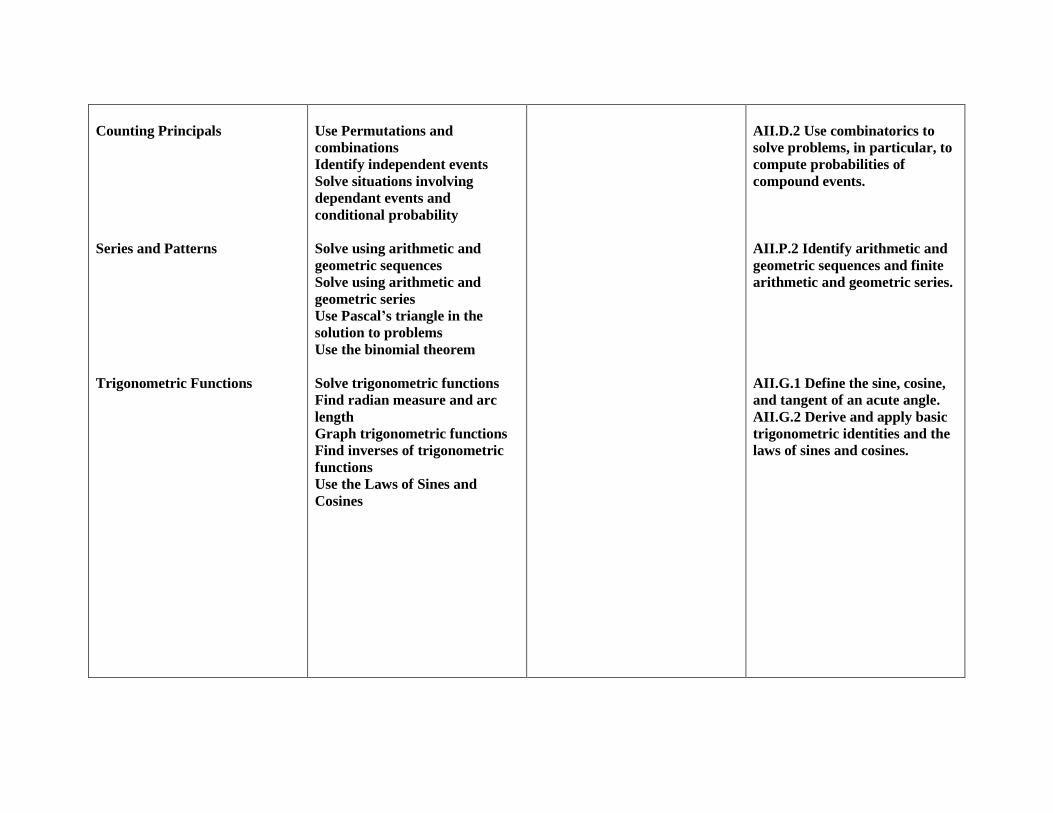
Counting Principals
Series and Patterns
Trigonometric Functions
Use Permutations and
combinations
Identify independent events
Solve situations involving
dependant events and
conditional probability
Solve using arithmetic and
geometric sequences
Solve using arithmetic and
geometric series
Use Pascal’s triangle in the
solution to problems
Use the binomial theorem
Solve trigonometric functions
Find radian measure and arc
length
Graph trigonometric functions
Find inverses of trigonometric
functions
Use the Laws of Sines and
Cosines
AII.D.2 Use combinatorics to
solve problems, in particular, to
compute probabilities of
compound events.
AII.P.2 Identify arithmetic and
geometric sequences and finite
arithmetic and geometric series.
AII.G.1 Define the sine, cosine,
and tangent of an acute angle.
AII.G.2 Derive and apply basic
trigonometric identities and the
laws of sines and cosines.
MASSACHUSETTS CURRICULUM
FRAMEWORK
FOR
MATHEMATICS Grades Pre-Kindergarten to 12
Incorporating the Common Core State Standards for Mathematics
Pre-publication edition
COPY EDITING IN PROGRESS
January 2011
2 Massachusetts Curriculum Framework for Mathematics January 2011
This document was prepared by the
Massachusetts Department of Elementary and Secondary Education
Mitchell D. Chester, Ed.D. Commissioner
Board of Elementary and Secondary Education Members
Ms. Maura Banta, Chair, Melrose
Ms. Harneen Chernow, Vice Chair Jamaica Plain
Dr. Vanessa Calderon-Rosado, Milton
Mr. Gerald Chertavian, Cambridge
Mr. Michael D’Ortenzio, Jr., Chair, Student Advisory Council, Wellesley
Ms. Beverly Holmes, Springfield
Dr. Jeffrey Howard, Reading
Ms. Ruth Kaplan, Brookline
Dr. James McDermott, Eastham
Dr. Dana Mohler-Faria, Bridgewater
Mr. Paul Reville, Secretary of Education, Worcester
Mitchell D. Chester, Ed.D., Commissioner and Secretary to the Board
The Common Core State Standards for Mathematics was adopted by the Massachusetts Board of Elementary and Secondary
Education on July 21, 2010. The Massachusetts pre-kindergarten standards in this framework were adopted by the Massachusetts
Board of Early Education and Care on December 14, 2010. The Massachusetts additional standards and features were adopted by the
Massachusetts Board of Elementary and Secondary Education on December 21, 2010.
The Massachusetts Department of Elementary and Secondary Education, an affirmative action employer, is committed to ensuring
that all of its programs and facilities are accessible to all members of the public.
We do not discriminate on the basis of age, color, disability, national origin, race, religion, sex or sexual orientation.
Inquiries regarding the Department’s compliance with Title IX and other civil rights laws may be directed to the
Human Resources Director, 75 Pleasant St., Malden, MA 02148 781-338-6105.
© 2010 Massachusetts Department of Elementary and Secondary Education
Permission is hereby granted to copy any or all parts of this document for non-commercial educational purposes. Please credit the
“Massachusetts Department of Elementary and Secondary Education.”
This document printed on recycled paper
Massachusetts Department of Elementary and Secondary Education
75 Pleasant Street, Malden, MA 02148-4906
Phone 781-338-3000 TTY: N.E.T. Relay 800-439-2370
www.doe.mass.edu
January 2011 Massachusetts Curriculum Framework for Mathematics Page 3
Massachusetts Department of Elementary and Secondary Education 75 Pleasant Street, Malden, Massachusetts 02148-4906 Telephone: (781) 338-3000
TTY: N.E.T. Relay 1-800-439-2370
December 2010
Dear Colleagues,
I am pleased to present to you the Massachusetts Curriculum Framework for Mathematics, Grades Pre-
Kindergarten to 12 adopted by the Board of Elementary and Secondary Education in December 2010. This
framework merges the Common Core State Standards for Mathematics with Massachusetts standards and
other features. These pre-kindergarten to grade 12 standards are based on research and effective practice and
will enable teachers and administrators to strengthen curriculum, instruction, and assessment.
In partnership with the Department of Early Education and Care (EEC), we added pre-kindergarten standards
that were collaboratively developed by early childhood educators from the Department of Elementary and
Secondary Education (ESE), EEC mathematics staff, and early childhood specialists across the state. The
pre-kindergarten standards were approved by the Board of Early Education and Care in December 2010.
These pre-kindergarten standards lay a strong necessary foundation for the kindergarten standards.
I am proud of the work that has been accomplished. The comments and suggestions received during the
revision process of the 2000 Mathematics Framework as well as comments on the Common Core State
Standards as they were being developed have strengthened this framework. I want to thank everyone who
worked with us to create challenging learning standards for Massachusetts students.
We will continue to work with schools and districts to implement the 2011 Massachusetts Curriculum
Framework for Mathematics over the next several years, and we encourage your comments as you use it. All
of the frameworks are subject to continuous review and improvement, for the benefit of the students of the
Commonwealth.
Thank you again for your ongoing support and for your commitment to achieving the goals of improved
student achievement for all students.
Sincerely,
Mitchell D. Chester, Ed.D.
Commissioner of Education
Mitchell D. Chester, Ed.D., Commissioner
4 Massachusetts Curriculum Framework for Mathematics January 2011
Acknowledgements for the Massachusetts Curriculum Framework for Mathematics
The 2011 Massachusetts Curriculum Framework for Mathematics is the result of the contributions of many
educators across the state. The Department of Elementary and Secondary Education wishes to thank all of
the Massachusetts groups that contributed to the development of these mathematics standards and all of the
individual teachers, administrators, mathematicians, mathematics education faculty, and parents who took
the time to provide thoughtful comments during the public comment periods.
Lead Writers, Common Core State Standards
Phil Daro, Senior Fellow, America's Choice
William McCallum, Ph.D., University Distinguished Professor and Head, Department of Mathematics, University of
Arizona; and Mathematics Consultant, Achieve
Jason Zimba, Ph.D., Professor of Physics and Mathematics, and the Center for the Advancement of Public Action,
Bennington College; and Co-founder, Student Achievement Partners
Lead Writers, Massachusetts Department of Elementary and Secondary Education,
2011 Massachusetts Curriculum Framework for Mathematics
Barbara Libby, Director, Office for Mathematics, Science and Technology/Engineering, member of the Common Core
State Standards for Mathematics Writing Group
Sharyn Sweeney, Mathematics Standards and Curriculum Coordinator, member of the Common Core State Standards
for Mathematics Writing Group
Kathleen Coleman, Writer Consultant, Coleman Educational Research, LLC
Massachusetts Contributors, 2008–2010
David Allen, High School Mathematics Teacher,
Lawrence Public Schools
Jennifer Beineke, Ph.D., Associate Professor of
Mathematics, Western New England College
Ann-Marie Belanger, Mathematics Teacher, Greater
New Bedford Regional Vocational Technical High
School
Kristine Blum, Sr. Education Manager, North Shore &
Merrimack Valley, Junior Achievement of Northern
New England
Margaret Brooks, Ph.D., Chair and Professor of
Economics, Bridgewater State University President,
Massachusetts Council on Economic Education
Kristine Chase, Elementary teacher, Duxbury Public
Schools
Andrew Chen, Ph.D., President, Edutron
Joshua Cohen, Ph.D., Research Associate Professor,
Tufts University School of Medicine
Anne Marie Condike, K–5 Mathematics Coordinator,
Westford Public Schools
Michael Coppolino, Middle School Mathematics
Teacher, Waltham Public Schools
Matthew Costa, K–12 Director Mathematics, Science,
and Technology, Revere Public Schools
Joyce Cutler, Ed.D., Associate Professor and
Mathematics Chair, Framingham State University
Valerie M. Daniel, Site Coordinator for the National
Center for Teacher Effectiveness and Mathematics
Coach, Boston Public Schools
Marie Enochty, Community Advocates for Young
Learners Institute
Marcia Ferris, Director, Massachusetts Association
for the Education of Young Children
Janet Forti, Middle School Mathematics Teacher,
Medford Public Schools
Thomas Fortmann, Former Member, Board of
Elementary and Secondary Education
Solomon Friedberg, Ph.D., Professor and Chair of
Mathematics, Boston College
Lynne Godfrey, Induction Director, Boston Teacher
Residency
Victoria Grisanti, Senior Manager, Community
Involvement, EMC2; Massachusetts Business Alliance
for Education representative
George (Scott) Guild, Director of Economic
Education, Federal Reserve Bank of Boston
Carol Hay, Professor and Chair of Mathematics,
Middlesex Community College
Douglas Holley, Director of Mathematics K–12,
Hingham Public Schools
Patricia Izzi, Mathematics Department Coordinator,
Attleboro High School
Steven Glenn Jackson, Ph.D., Associate Professor,
UMass Boston
January 2011 Massachusetts Curriculum Framework for Mathematics Page 5
Niaz Karim, Principal, Valmo Villages
Naseem Jaffer, Mathematics Coach Consultant
Dianne Kelly, Assistant Superintendent, Revere Public
Schools
Kelty Kelley, Early Childhood Coordinator, Canton
Public Schools
Joanna D. Krainski, Middle School Mathematics
Coordinator and Mathematics Teacher, Tewksbury
Public Schools
Raynold Lewis, Ph.D., Professor, Education
Chairperson, Worcester State University
Barbara Malkas, Deputy Superintendent of Schools,
Pittsfield Public Schools
Susan V. Mason, High School Mathematics Teacher,
Springfield Public Schools
Cathy McCulley, Elementary Teacher, North
Middlesex Regional School District
Lisa Mikus, Elementary Teacher, Newton Public
Schools
Vicki Milstein, Principal of Early Education,
Brookline Public Schools
Maura Murray, Ph.D., Associate Professor of
Mathematics, Salem State University
Gregory Nelson, Ph.D., Professor Elementary and
Early Childhood Education, Bridgewater State
University
Pendred Noyce, M.D., Trustee, Noyce Foundation
Leah Palmer, English Language Learner Teacher,
Wellesley Public Schools
Andrew Perry, Ph.D., Associate Professor of
Mathematics and Computer Science, Springfield
College
Katherine Richard, Associate Director of
Mathematics Programs, Lesley University
Daniel Rouse, Ed.D., Mathematics and Computer
Teacher, Dedham Public Schools
Linda Santry, (Retired) Coordinator of Mathematics
and Science, PreK–8, Brockton Public Schools
Jason Sachs, Director of Early Childhood, Boston
Public Schools
Elizabeth Schaper, Ed.D., Assistant Superintendent,
Tantasqua Regional/School Union 61 Districts
Wilfried Schmid, Ph.D., Dwight Parker Robinson
Professor of Mathematics, Harvard University
Denise Sessler, High School Mathematics Teacher,
Harwich High School
Glenn Stevens, Ph.D., Professor of Mathematics,
Boston University
Nancy Topping-Tailby, Executive Director,
Massachusetts Head Start Association
Elizabeth Walsh, Elementary Inclusion Teacher,
Wachusett Regional School District
Jillian Willey, Middle School Mathematics Teacher,
Boston Public Schools
Christopher Woodin, Mathematics Teacher and
Department Chair, Landmark School
Andi Wrenn, Member, Massachusetts Financial
Education Collaborative, K–16 Subcommittee
Department of Elementary and Secondary Education Staff
Alice Barton, Early Education Specialist
Emily Caille, Education Specialist
Haley Freeman, Mathematics Test Development
Specialist
Jacob Foster, Director of Science and
Technology/Engineering
Nyal Fuentes, Career and College Readiness Specialist
Simone Harvey, Mathematics Test Development
Specialist
Jennifer Hawkins, Administrator of Mathematics Test
Development
Mark Johnson, Former Director, Test Development
Carol Lach, Title IIB Coordinator
Life LeGeros, Director, Statewide Mathematics
Initiatives
Jeffrey Nellhaus, Deputy Commissioner
David Parker, Regional Support Manager
Stafford Peat, (Retired) Director, Office of Secondary
Support
Julia Phelps, Associate Commissioner, Curriculum
and Instruction Center
Meto Raha, Mathematics Targeted Assistance
Specialist
Donna Traynham, Education Specialist
Emily Veader, Mathematics Targeted Assistance
Specialist
Susan Wheltle, Director, Office of Humanities,
Literacy, Arts and Social Sciences
Department of Early Education and Care Staff
Sherri Killins, Commissioner
Phil Baimas, Director of Educator and Provider
Support
Katie DeVita, Educator Provider Support Specialist
6 Massachusetts Curriculum Framework for Mathematics January 2011
Introduction
Background
The Massachusetts Curriculum Framework for Mathematics builds on the Common Core State Standards
for Mathematics. The standards in this framework are the culmination of an extended, broad-based effort
to fulfill the charge issued by the states to create the next generation of pre-kindergarten–12 standards in
order to help ensure that all students are college and career ready in mathematics no later than the end of
high school.
In 2008 the Massachusetts Department of Elementary and Secondary Education convened a team of
educators to revise the existing Mathematics Curriculum Framework and, when the Council of Chief
State School Officers (CCSSO) and the National Governors Association Center for Best Practice (NGA)
began a multi-state standards development initiative in 2009, the two efforts merged. The standards in
this document draw on the most important international models as well as research and input from
numerous sources, including state departments of education, scholars, assessment developers,
professional organizations, educators from pre-kindergarten through college, and parents, students, and
other members of the public. In their design and content, refined through successive drafts and numerous
rounds of feedback, the Standards represent a synthesis of the best elements of standards-related work to
date and an important advance over that previous work.
As specified by CCSSO and NGA, the Standards are (1) research and evidence based, (2) aligned with
college and work expectations, (3) rigorous, and (4) internationally benchmarked. A particular standard
was included in the document only when the best available evidence indicated that its mastery was
essential for college and career readiness in a twenty-first-century, globally competitive society. The
standards are intended to be a living work: as new and better evidence emerges, the standards will be
revised accordingly.
Unique Massachusetts Standards and Features
Staff at the Massachusetts Department of Education worked closely with the Common Core writing team
to ensure that the resulting standards were comprehensive and organized in ways to make them useful for
teachers. In contrast to earlier Massachusetts Mathematics standards, these standards are written for
individual grades. To the Common Core K–12 standards we have added a select number of standards pre-
kindergarten–high school for further clarity and coherence. The Massachusetts additions are coded with
―MA‖ at the beginning of the standard.
Highlights of the 2011 Massachusetts Curriculum Framework for Mathematics
Grade-level content standards, pre-kindergarten to grade 8. Each grade level includes an
introduction and articulates a small number of critical mathematical areas that should be the focus
for this grade.
New to the 2011 Mathematics Framework are the Standards for Mathematical Practice that
describe mathematically proficient students and should be a part of the instructional program
along with the content standards.
The pre-kindergarten through grade 8 mathematics standards present a coherent progression and a
strong foundation that will prepare students for the 2011 Algebra I course. The new grade 8
mathematics standards are rigorous and include some standards that were covered in the 2000
Algebra I course. With this stronger middle school progression, students will need to progress
through the grades 6-8 standards in order to be prepared for the 2011 Algebra I course.
The High School Standards are presented by conceptual categories and in response to many
educators’ requests to provide models for how these standards can be configured into high school
courses, this framework also presents the high school standards by courses in two pathways: the
January 2011 Massachusetts Curriculum Framework for Mathematics Page 7
traditional pathway courses (Algebra I, Geometry, Algebra II) and the integrated pathway courses
(Mathematics I, II, and II). In addition, two advanced courses (Precalculus and Advanced
Quantitative Reasoning), developed by Massachusetts educators, are included.
Other features included in this document are revised Guiding Principles that show a strong
connection to the Mathematical Practices in the framework and an updated glossary of
mathematics terms that now includes graphics and tables of key mathematical rules, properties
and number sets.
Also included as Appendices are the following sections from the June 2010 Common Core State
Standards document: Applications of Common Core State Standards for English Language
Learners and Applications of Common Core State Standards for Students with Disabilities.
Toward Greater Focus and Coherence
For over a decade, research studies of mathematics education in high-performing countries have pointed
to the conclusion that the mathematics curriculum in the United States must become substantially more
focused and coherent in order to improve mathematics achievement in this country. To deliver on the
promise of common standards, the standards must address the problem of a curriculum that is ―a mile
wide and an inch deep.‖ These Standards are a substantial answer to that challenge and aim for clarity
and specificity.
William Schmidt and Richard Houang (2002) have said that content standards and curricula are coherent
if they are:
articulated over time as a sequence of topics and performances that are logical and reflect, where
appropriate, the sequential or hierarchical nature of the disciplinary content from which the subject matter
derives. That is, what and how students are taught should reflect not only the topics that fall within a
certain academic discipline, but also the key ideas that determine how knowledge is organized and
generated within that discipline. This implies that to be coherent, a set of content standards must evolve
from particulars (e.g., the meaning and operations of whole numbers, including simple math facts and
routine computational procedures associated with whole numbers and fractions) to deeper structures
inherent in the discipline. These deeper structures then serve as a means for connecting the particulars
(such as an understanding of the rational number system and its properties). (emphasis added)
The development of these Standards began with research-based learning progressions detailing what is
known today about how students’ mathematical knowledge, skill, and understanding develop over time.
The standards in this framework begin on page 15 with the eight Standards for Mathematical Practice.
8 Massachusetts Curriculum Framework for Mathematics January 2011
Guiding Principles for Mathematics Programs
The following principles are philosophical statements that underlie the mathematics content and
practice standards and resources in this curriculum framework. They should guide the construction
and evaluation of mathematics programs in the schools and the broader community.
Guiding Principle 1: Learning
Mathematical ideas should be explored in ways that stimulate curiosity, create enjoyment of
mathematics, and develop depth of understanding.
Students need to understand mathematics deeply and use it effectively. The standards of mathematical
practice describe ways in which students increasingly engage with the subject matter as they grow in
mathematical maturity and expertise through the elementary, middle, and high school years.
To achieve mathematical understanding, students should have a balance of mathematical procedures and
conceptual understanding. Students should be actively engaged in doing meaningful mathematics,
discussing mathematical ideas, and applying mathematics in interesting, thought-provoking situations.
Student understanding is further developed through ongoing reflection about cognitively demanding and
worthwhile tasks.
Tasks should be designed to challenge students in multiple ways. Short- and long-term investigations that
connect procedures and skills with conceptual understanding are integral components of an effective
mathematics program. Activities should build upon curiosity and prior knowledge, and enable students to
solve progressively deeper, broader, and more sophisticated problems. Mathematical tasks reflecting
sound and significant mathematics should generate active classroom talk, promote the development of
conjectures, and lead to an understanding of the necessity for mathematical reasoning.
Guiding Principle 2: Teaching
An effective mathematics program is based on a carefully designed set of content standards that are
clear and specific, focused, and articulated over time as a coherent sequence.
The sequence of topics and performances should be based on what is known about how students’
mathematical knowledge, skill, and understanding develop over time. What and how students are taught
should reflect not only the topics within mathematics but also the key ideas that determine how
knowledge is organized and generated within mathematics. Students should be asked to apply their
learning and to show their mathematical thinking and understanding by engaging in the first
Mathematical Practice, Making sense of problems and persevere in solving them. This requires teachers
who have a deep knowledge of mathematics as a discipline.
Mathematical problem solving is the hallmark of an effective mathematics program. Skill in
mathematical problem solving requires practice with a variety of mathematical problems as well as a firm
grasp of mathematical techniques and their underlying principles. Armed with this deeper knowledge, the
student can then use mathematics in a flexible way to attack various problems and devise different ways
of solving any particular problem. Mathematical problem solving calls for reflective thinking, persistence,
learning from the ideas of others, and going back over one's own work with a critical eye. Students should
construct viable arguments and critique the reasoning of others, they analyze situations and justify their
conclusions and are able to communicate them to others and respond to the arguments of others. (See
Mathematical Practice 3, Construct viable arguments and critique reasoning of others.) Students at all
grades can listen or read the arguments of others and decide whether they make sense, and ask questions
to clarify or improve the arguments.
January 2011 Massachusetts Curriculum Framework for Mathematics Page 9
Mathematical problem solving provides students with experiences to develop other mathematical
practices. Success in solving mathematical problems helps to create an abiding interest in mathematics.
Students learn to model with mathematics, they learn to apply the mathematics that they know to solve
problems arising in everyday life, society, or the workplace. (See Mathematical Practice 4, Model with
mathematics.)
For a mathematics program to be effective, it must also be taught by knowledgeable teachers. According
to Liping Ma, ―The real mathematical thinking going on in a classroom, in fact, depends heavily on the
teacher's understanding of mathematics.‖1 A landmark study in 1996 found that students with initially
comparable academic achievement levels had vastly different academic outcomes when teachers’
knowledge of the subject matter differed.2
The message from the research is clear: having knowledgeable
teachers really does matter; teacher expertise in a subject drives student achievement. ―Improving
teachers’ content subject matter knowledge and improving students’ mathematics education are thus
interwoven and interdependent processes that must occur simultaneously.‖3
Guiding Principle 3: Technology
Technology is an essential tool that should be used strategically in mathematics education.
Technology enhances the mathematics curriculum in many ways. Tools such as measuring instruments,
manipulatives (such as base ten blocks and fraction pieces), scientific and graphing calculators, and
computers with appropriate software, if properly used, contribute to a rich learning environment for
developing and applying mathematical concepts. However, appropriate use of calculators is essential;
calculators should not be used as a replacement for basic understanding and skills. Elementary students
should learn how to perform the basic arithmetic operations independent of the use of a calculator.4
Although the use of a graphing calculator can help middle and secondary students to visualize properties
of functions and their graphs, graphing calculators should be used to enhance their understanding and
skills rather than replace them.
Teachers and students should consider the available tools when presenting or solving a problem. Student
should be familiar with tools appropriate for their grade level to be able to make sound decisions about
which of these tools would be helpful. (See Mathematical Practice 5, Use appropriate tools
strategically.)
Technology enables students to communicate ideas within the classroom or to search for information in
external databases such as the Internet, an important supplement to a school’s internal library resources.
Technology can be especially helpful in assisting students with special needs in regular and special
classrooms, at home, and in the community.
Technology changes what mathematics is to be learned and when and how it is learned. For example,
currently available technology provides a dynamic approach to such mathematical concepts as functions,
rates of change, geometry, and averages that was not possible in the past. Some mathematics becomes
more important because technology requires it, some becomes less important because technology replaces
it, and some becomes possible because technology allows it.
1 Ma, Lipping, Knowing and Teaching Elementary Mathematics, Mahwah, New Jersey: Lawrence Erlbaum Associ-
ates, 1999. 2 Milken, Lowell, A Matter of Quality: A Strategy for Answering the High Caliber of America’s Teachers, Santa
Monica, California: Milken Family Foundation, 1999. 3 Ma, p. 147.
4 National Center for Education Statistics, Pursuing Excellence: A Study of U.S. Fourth-Grade Mathematics and
Science Achievement in International Context. Accessed June 2000.
10 Massachusetts Curriculum Framework for Mathematics January 2011
Guiding Principle 4: Equity
All students should have a high quality mathematics program that prepares them for college and a
career.
All Massachusetts students should have high quality mathematics programs that meet the goals and
expectations of these standards and address students’ individual interests and talents. The standards
provide clear signposts along the way to the goal of college and career readiness for all students. The
standards provide for a broad range of students, from those requiring tutorial support to those with talent
in mathematics. To promote achievement of these standards, teachers should encourage classroom talk,
reflection, use of multiple problem solving strategies, and a positive disposition toward mathematics.
They should have high expectations for all students. At every level of the education system, teachers
should act on the belief that every child should learn challenging mathematics. Teachers and guidance
personnel should advise students and parents about why it is important to take advanced courses in
mathematics and how this will prepare students for success in college and the workplace.
All students should have the benefit of quality instructional materials, good libraries, and adequate
technology. All students must have the opportunity to learn and meet the same high standards. In order to
meet the needs of the greatest range of students, mathematics programs should provide the necessary
intervention and support for those students who are below- or above grade-level expectations. Practice
and enrichment should extend beyond the classroom. Tutorial sessions, mathematics clubs, competitions,
and apprenticeships are examples of mathematics activities that promote learning.
Because mathematics is the cornerstone of many disciplines, a comprehensive curriculum should include
applications to everyday life and modeling activities that demonstrate the connections among disciplines.
Schools should also provide opportunities for communicating with experts in applied fields to enhance
students’ knowledge of these connections.
An important part of preparing students for college and careers is to ensure that they have the necessary
mathematics and problem-solving skills to make sound financial decisions that they face in the world
every day, including setting up a bank account; understanding student loans; credit and debit; selecting
the best buy when shopping; choosing the most cost effective cell phone plan based on monthly usage;
and so on.
Guiding Principle 5: Literacy Across the Content Areas
An effective mathematics program builds upon and develops students’ literacy skills and
knowledge.
Reading, writing, and communication skills are necessary elements of learning and engaging in
mathematics, as well as in other content areas. Supporting the development of students’ literacy skills will
allow them to deepen their understanding of mathematics concepts and help them determine the meaning
of symbols, key terms, and mathematics phrases as well as develop reasoning skills that apply across the
disciplines. In reading, teachers should consistently support students’ ability to gain and deepen
understanding of concepts from written material by acquiring comprehension skills and strategies, as well
as specialized vocabulary and symbols. Mathematics classrooms should make use of a variety of text
materials and formats, including textbooks, math journals, contextual math problems, and data presented
in a variety of media.
In writing, teachers should consistently support students’ ability to reason and deepen understanding of
concepts and the ability to express them in a focused, precise, and convincing manner. Mathematics
classrooms should incorporate a variety of written assignments ranging from math journals to formal
written proofs.
In speaking and listening, teachers should provide students with opportunities for mathematical discourse,
to use precise language to convey ideas, to communicate a solution, and support an argument.
January 2011 Massachusetts Curriculum Framework for Mathematics Page 11
Guiding Principle 6: Assessment
Assessment of student learning in mathematics should take many forms to inform instruction and
learning.
A comprehensive assessment program is an integral component of an instructional program. It provides
students with frequent feedback on their performance, teachers with diagnostic tools for gauging
students’ depth of understanding of mathematical concepts and skills, parents with information about
their children’s performance in the context of program goals, and administrators with a means for
measuring student achievement.
Assessments take a variety of forms, require varying amounts of time, and address different aspects of
student learning. Having students ―think aloud‖ or talk through their solutions to problems permits
identification of gaps in knowledge and errors in reasoning. By observing students as they work, teachers
can gain insight into students’ abilities to apply appropriate mathematical concepts and skills, make
conjectures, and draw conclusions. Homework, mathematics journals, portfolios, oral performances, and
group projects offer additional means for capturing students’ thinking, knowledge of mathematics,
facility with the language of mathematics, and ability to communicate what they know to others. Tests
and quizzes assess knowledge of mathematical facts, operations, concepts, and skills and their efficient
application to problem solving. They can also pinpoint areas in need of more practice or teaching. Taken
together, the results of these different forms of assessment provide rich profiles of students’ achievements
in mathematics and serve as the basis for identifying curricula and instructional approaches to best
develop their talents.
Assessment should also be a major component of the learning process. As students help identify goals for
lessons or investigations, they gain greater awareness of what they need to learn and how they will
demonstrate that learning. Engaging students in this kind of goal-setting can help them reflect on their
own work, understand the standards to which they are held accountable, and take ownership of their
learning.
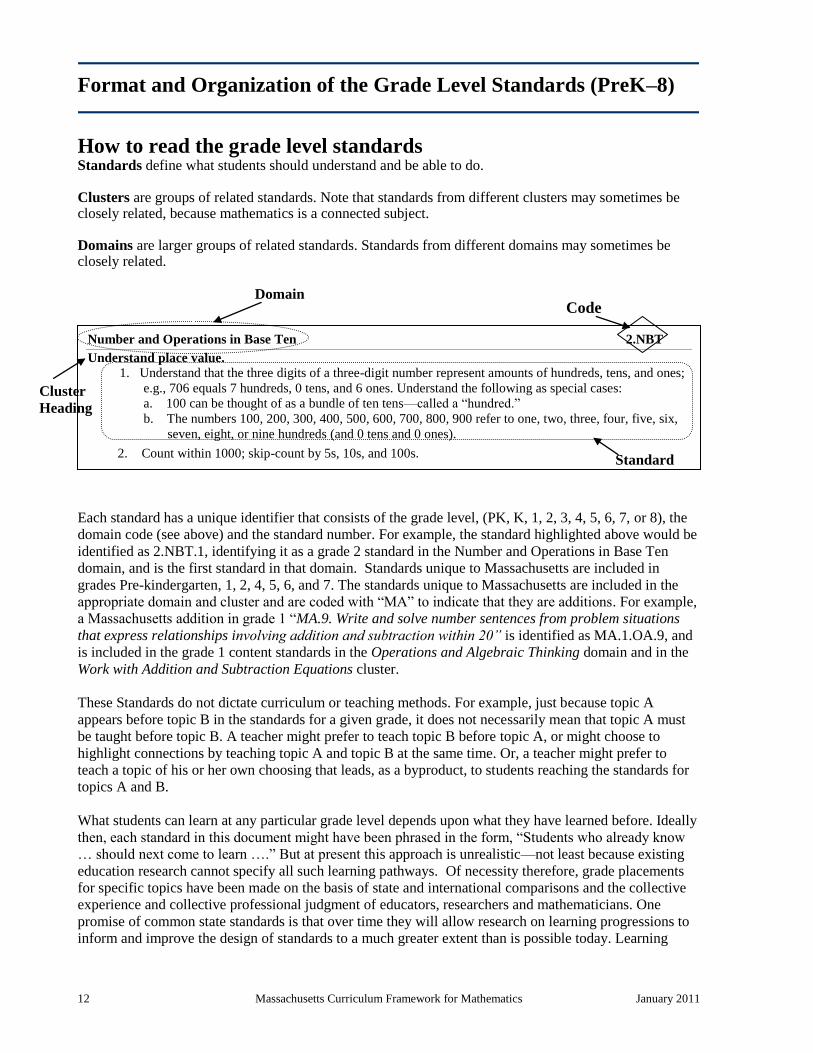
12 Massachusetts Curriculum Framework for Mathematics January 2011
Number and Operations in Base Ten 2.NBT
Understand place value.
1. Understand that the three digits of a three-digit number represent amounts of hundreds, tens, and ones;
e.g., 706 equals 7 hundreds, 0 tens, and 6 ones. Understand the following as special cases:
a. 100 can be thought of as a bundle of ten tens—called a ―hundred.‖
b. The numbers 100, 200, 300, 400, 500, 600, 700, 800, 900 refer to one, two, three, four, five, six,
seven, eight, or nine hundreds (and 0 tens and 0 ones).
2. Count within 1000; skip-count by 5s, 10s, and 100s.
Format and Organization of the Grade Level Standards (PreK–8)
How to read the grade level standards Standards define what students should understand and be able to do. Clusters are groups of related standards. Note that standards from different clusters may sometimes be closely related, because mathematics is a connected subject. Domains are larger groups of related standards. Standards from different domains may sometimes be closely related.
Each standard has a unique identifier that consists of the grade level, (PK, K, 1, 2, 3, 4, 5, 6, 7, or 8), the
domain code (see above) and the standard number. For example, the standard highlighted above would be
identified as 2.NBT.1, identifying it as a grade 2 standard in the Number and Operations in Base Ten
domain, and is the first standard in that domain. Standards unique to Massachusetts are included in
grades Pre-kindergarten, 1, 2, 4, 5, 6, and 7. The standards unique to Massachusetts are included in the
appropriate domain and cluster and are coded with ―MA‖ to indicate that they are additions. For example,
a Massachusetts addition in grade 1 ―MA.9. Write and solve number sentences from problem situations
that express relationships involving addition and subtraction within 20” is identified as MA.1.OA.9, and
is included in the grade 1 content standards in the Operations and Algebraic Thinking domain and in the
Work with Addition and Subtraction Equations cluster.
These Standards do not dictate curriculum or teaching methods. For example, just because topic A
appears before topic B in the standards for a given grade, it does not necessarily mean that topic A must
be taught before topic B. A teacher might prefer to teach topic B before topic A, or might choose to
highlight connections by teaching topic A and topic B at the same time. Or, a teacher might prefer to
teach a topic of his or her own choosing that leads, as a byproduct, to students reaching the standards for
topics A and B.
What students can learn at any particular grade level depends upon what they have learned before. Ideally
then, each standard in this document might have been phrased in the form, ―Students who already know
… should next come to learn ….‖ But at present this approach is unrealistic—not least because existing
education research cannot specify all such learning pathways. Of necessity therefore, grade placements
for specific topics have been made on the basis of state and international comparisons and the collective
experience and collective professional judgment of educators, researchers and mathematicians. One
promise of common state standards is that over time they will allow research on learning progressions to
inform and improve the design of standards to a much greater extent than is possible today. Learning
Domain
Standard
Cluster
Heading
Code

January 2011 Massachusetts Curriculum Framework for Mathematics Page 13
opportunities will continue to vary across schools and school systems, and educators should make every
effort to meet the needs of individual students based on their current understanding.
These Standards are not intended to be new names for old ways of doing business. They are a call to take
the next step. It is time for states to work together to build on lessons learned from two decades of
standards based reforms. It is time to recognize that standards are not just promises to our children, but
promises we intend to keep.
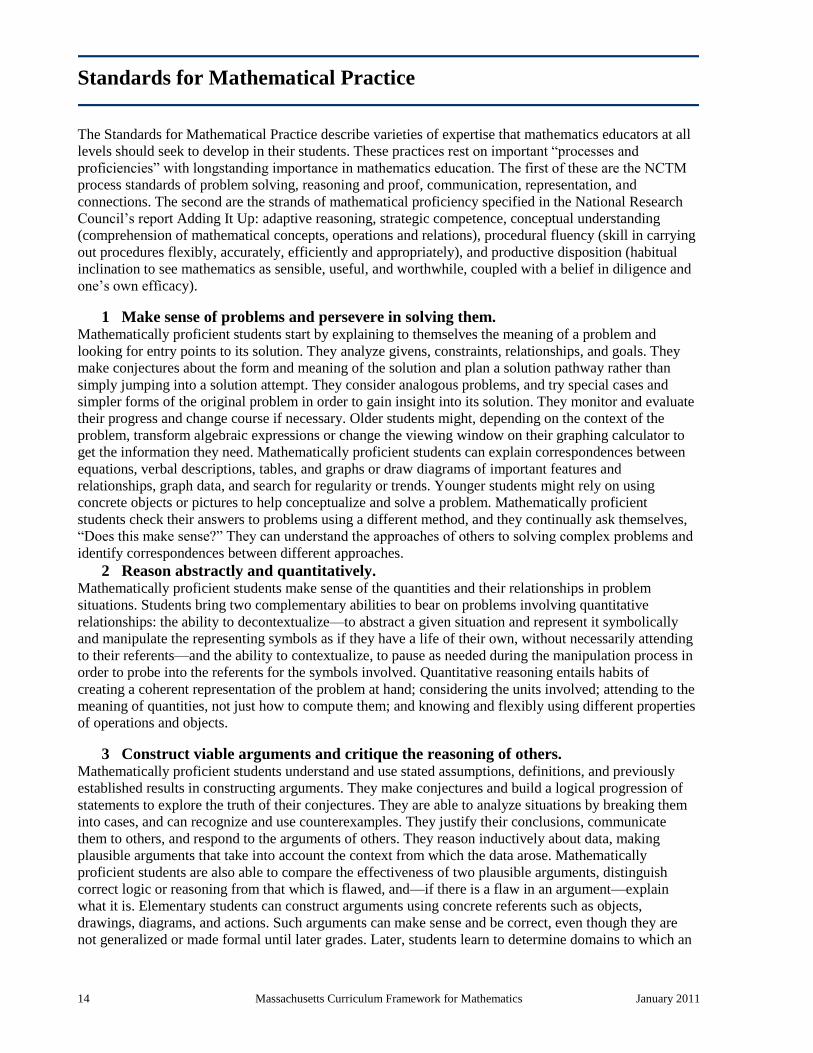
14 Massachusetts Curriculum Framework for Mathematics January 2011
Standards for Mathematical Practice
The Standards for Mathematical Practice describe varieties of expertise that mathematics educators at all
levels should seek to develop in their students. These practices rest on important ―processes and
proficiencies‖ with longstanding importance in mathematics education. The first of these are the NCTM
process standards of problem solving, reasoning and proof, communication, representation, and
connections. The second are the strands of mathematical proficiency specified in the National Research
Council’s report Adding It Up: adaptive reasoning, strategic competence, conceptual understanding
(comprehension of mathematical concepts, operations and relations), procedural fluency (skill in carrying
out procedures flexibly, accurately, efficiently and appropriately), and productive disposition (habitual
inclination to see mathematics as sensible, useful, and worthwhile, coupled with a belief in diligence and
one’s own efficacy).
1 Make sense of problems and persevere in solving them. Mathematically proficient students start by explaining to themselves the meaning of a problem and
looking for entry points to its solution. They analyze givens, constraints, relationships, and goals. They
make conjectures about the form and meaning of the solution and plan a solution pathway rather than
simply jumping into a solution attempt. They consider analogous problems, and try special cases and
simpler forms of the original problem in order to gain insight into its solution. They monitor and evaluate
their progress and change course if necessary. Older students might, depending on the context of the
problem, transform algebraic expressions or change the viewing window on their graphing calculator to
get the information they need. Mathematically proficient students can explain correspondences between
equations, verbal descriptions, tables, and graphs or draw diagrams of important features and
relationships, graph data, and search for regularity or trends. Younger students might rely on using
concrete objects or pictures to help conceptualize and solve a problem. Mathematically proficient
students check their answers to problems using a different method, and they continually ask themselves,
―Does this make sense?‖ They can understand the approaches of others to solving complex problems and
identify correspondences between different approaches.
2 Reason abstractly and quantitatively. Mathematically proficient students make sense of the quantities and their relationships in problem
situations. Students bring two complementary abilities to bear on problems involving quantitative
relationships: the ability to decontextualize—to abstract a given situation and represent it symbolically
and manipulate the representing symbols as if they have a life of their own, without necessarily attending
to their referents—and the ability to contextualize, to pause as needed during the manipulation process in
order to probe into the referents for the symbols involved. Quantitative reasoning entails habits of
creating a coherent representation of the problem at hand; considering the units involved; attending to the
meaning of quantities, not just how to compute them; and knowing and flexibly using different properties
of operations and objects.
3 Construct viable arguments and critique the reasoning of others. Mathematically proficient students understand and use stated assumptions, definitions, and previously
established results in constructing arguments. They make conjectures and build a logical progression of
statements to explore the truth of their conjectures. They are able to analyze situations by breaking them
into cases, and can recognize and use counterexamples. They justify their conclusions, communicate
them to others, and respond to the arguments of others. They reason inductively about data, making
plausible arguments that take into account the context from which the data arose. Mathematically
proficient students are also able to compare the effectiveness of two plausible arguments, distinguish
correct logic or reasoning from that which is flawed, and—if there is a flaw in an argument—explain
what it is. Elementary students can construct arguments using concrete referents such as objects,
drawings, diagrams, and actions. Such arguments can make sense and be correct, even though they are
not generalized or made formal until later grades. Later, students learn to determine domains to which an
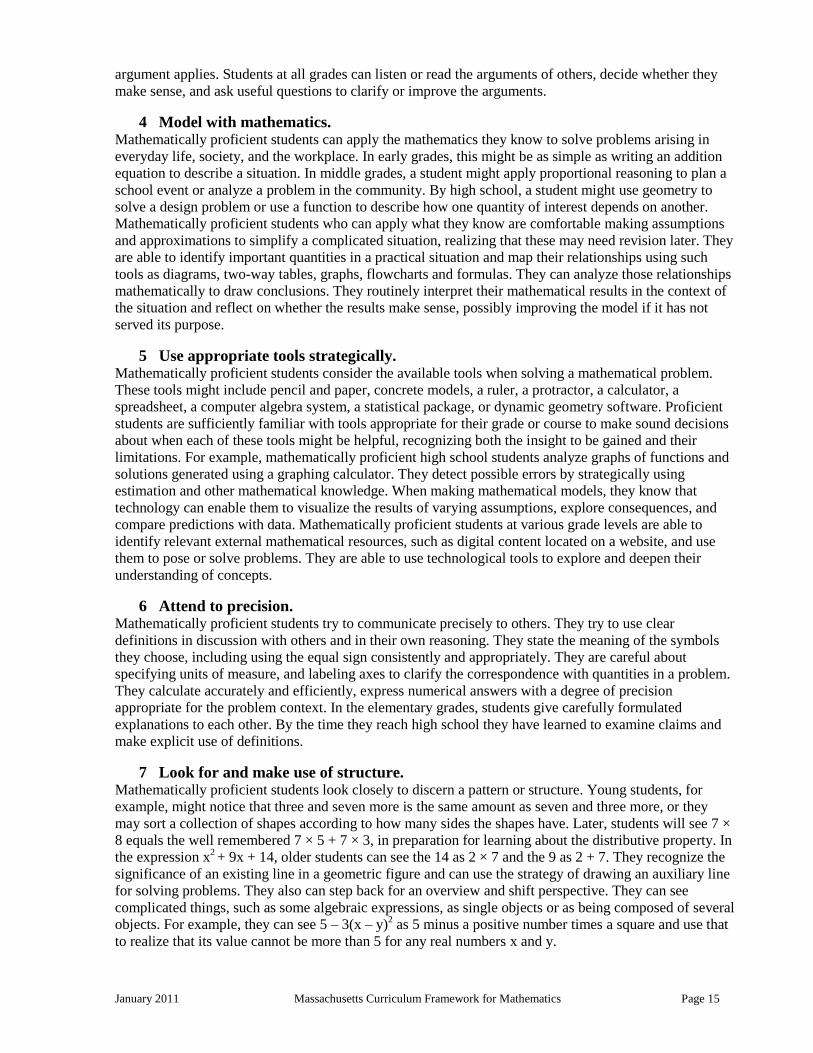
January 2011 Massachusetts Curriculum Framework for Mathematics Page 15
argument applies. Students at all grades can listen or read the arguments of others, decide whether they
make sense, and ask useful questions to clarify or improve the arguments.
4 Model with mathematics. Mathematically proficient students can apply the mathematics they know to solve problems arising in
everyday life, society, and the workplace. In early grades, this might be as simple as writing an addition
equation to describe a situation. In middle grades, a student might apply proportional reasoning to plan a
school event or analyze a problem in the community. By high school, a student might use geometry to
solve a design problem or use a function to describe how one quantity of interest depends on another.
Mathematically proficient students who can apply what they know are comfortable making assumptions
and approximations to simplify a complicated situation, realizing that these may need revision later. They
are able to identify important quantities in a practical situation and map their relationships using such
tools as diagrams, two-way tables, graphs, flowcharts and formulas. They can analyze those relationships
mathematically to draw conclusions. They routinely interpret their mathematical results in the context of
the situation and reflect on whether the results make sense, possibly improving the model if it has not
served its purpose.
5 Use appropriate tools strategically. Mathematically proficient students consider the available tools when solving a mathematical problem.
These tools might include pencil and paper, concrete models, a ruler, a protractor, a calculator, a
spreadsheet, a computer algebra system, a statistical package, or dynamic geometry software. Proficient
students are sufficiently familiar with tools appropriate for their grade or course to make sound decisions
about when each of these tools might be helpful, recognizing both the insight to be gained and their
limitations. For example, mathematically proficient high school students analyze graphs of functions and
solutions generated using a graphing calculator. They detect possible errors by strategically using
estimation and other mathematical knowledge. When making mathematical models, they know that
technology can enable them to visualize the results of varying assumptions, explore consequences, and
compare predictions with data. Mathematically proficient students at various grade levels are able to
identify relevant external mathematical resources, such as digital content located on a website, and use
them to pose or solve problems. They are able to use technological tools to explore and deepen their
understanding of concepts.
6 Attend to precision. Mathematically proficient students try to communicate precisely to others. They try to use clear
definitions in discussion with others and in their own reasoning. They state the meaning of the symbols
they choose, including using the equal sign consistently and appropriately. They are careful about
specifying units of measure, and labeling axes to clarify the correspondence with quantities in a problem.
They calculate accurately and efficiently, express numerical answers with a degree of precision
appropriate for the problem context. In the elementary grades, students give carefully formulated
explanations to each other. By the time they reach high school they have learned to examine claims and
make explicit use of definitions.
7 Look for and make use of structure. Mathematically proficient students look closely to discern a pattern or structure. Young students, for
example, might notice that three and seven more is the same amount as seven and three more, or they
may sort a collection of shapes according to how many sides the shapes have. Later, students will see 7 ×
8 equals the well remembered 7 × 5 + 7 × 3, in preparation for learning about the distributive property. In
the expression x2 + 9x + 14, older students can see the 14 as 2 × 7 and the 9 as 2 + 7. They recognize the
significance of an existing line in a geometric figure and can use the strategy of drawing an auxiliary line
for solving problems. They also can step back for an overview and shift perspective. They can see
complicated things, such as some algebraic expressions, as single objects or as being composed of several
objects. For example, they can see 5 – 3(x – y)2 as 5 minus a positive number times a square and use that
to realize that its value cannot be more than 5 for any real numbers x and y.
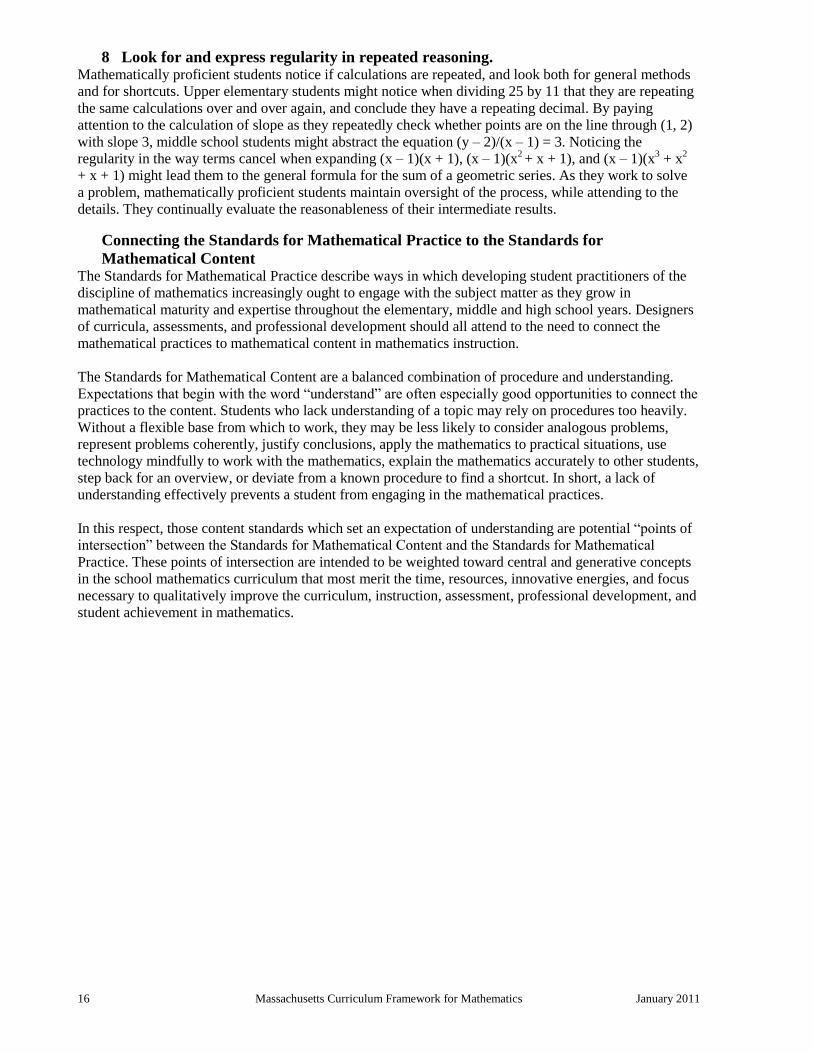
16 Massachusetts Curriculum Framework for Mathematics January 2011
8 Look for and express regularity in repeated reasoning. Mathematically proficient students notice if calculations are repeated, and look both for general methods
and for shortcuts. Upper elementary students might notice when dividing 25 by 11 that they are repeating
the same calculations over and over again, and conclude they have a repeating decimal. By paying
attention to the calculation of slope as they repeatedly check whether points are on the line through (1, 2)
with slope 3, middle school students might abstract the equation (y – 2)/(x – 1) = 3. Noticing the
regularity in the way terms cancel when expanding (x – 1)(x + 1), (x – 1)(x2 + x + 1), and (x – 1)(x
3 + x
2
+ x + 1) might lead them to the general formula for the sum of a geometric series. As they work to solve
a problem, mathematically proficient students maintain oversight of the process, while attending to the
details. They continually evaluate the reasonableness of their intermediate results.
Connecting the Standards for Mathematical Practice to the Standards for
Mathematical Content The Standards for Mathematical Practice describe ways in which developing student practitioners of the
discipline of mathematics increasingly ought to engage with the subject matter as they grow in
mathematical maturity and expertise throughout the elementary, middle and high school years. Designers
of curricula, assessments, and professional development should all attend to the need to connect the
mathematical practices to mathematical content in mathematics instruction.
The Standards for Mathematical Content are a balanced combination of procedure and understanding.
Expectations that begin with the word ―understand‖ are often especially good opportunities to connect the
practices to the content. Students who lack understanding of a topic may rely on procedures too heavily.
Without a flexible base from which to work, they may be less likely to consider analogous problems,
represent problems coherently, justify conclusions, apply the mathematics to practical situations, use
technology mindfully to work with the mathematics, explain the mathematics accurately to other students,
step back for an overview, or deviate from a known procedure to find a shortcut. In short, a lack of
understanding effectively prevents a student from engaging in the mathematical practices.
In this respect, those content standards which set an expectation of understanding are potential ―points of
intersection‖ between the Standards for Mathematical Content and the Standards for Mathematical
Practice. These points of intersection are intended to be weighted toward central and generative concepts
in the school mathematics curriculum that most merit the time, resources, innovative energies, and focus
necessary to qualitatively improve the curriculum, instruction, assessment, professional development, and
student achievement in mathematics.
January 2011 Massachusetts Curriculum Framework for Mathematics Page 17
Pre-Kindergarten
The preschool/pre-kindergarten population includes children between at least 2 years, 9 months until they
are kindergarten eligible. A majority attend programs in diverse settings––community-based early care
and education centers, family child care, Head Start, and public preschools. Some children do not attend
any formal program. These standards apply to children who are at the end of that age group, meaning
older four- and younger five-year olds.
In this age group, foundations of mathematical understanding are formed out of children’s experiences
with real objects and materials. The standards can be promoted through play and exploration activities,
and embedded in almost all daily activities. They should not be limited to ―math time.‖ These
mathematics standards correspond with the learning activities in the Massachusetts Guidelines for
Preschool Learning Experiences (2003). The standards should be considered guideposts to facilitate
young children’s underlying mathematical understanding.
In preschool or pre-kindergarten, activity time should focus on two critical areas: (1) developing an
understanding of whole numbers to 10, including concepts of one-to-one correspondence, counting,
cardinality (the number of items in a set), and comparison; (2) recognizing two-dimensional shapes,
describing spatial relationships, and sorting and classifying objects by one or more attributes. Relatively
more learning time should be devoted to developing children’s sense of number as quantity than to other
mathematics topics.
(1) These young children begin counting and quantifying numbers up to 10. Children begin with
oral counting and recognition of numerals and word names for numbers. Experience with
counting naturally leads to quantification. Children count objects and learn that the sizes,
shapes, positions, or purposes of objects do not affect the total number of objects in the
group. One-to-one correspondence with its matching of elements between the sets, provides
the foundation for the comparison of groups and the development of comparative language
such as, more than, less than, and equal to.
(2) Young children explore shapes and the relationships among them. They identify the attributes
of different shapes including the length, area, weight by using vocabulary such as: long,
short, tall, heavy, light, big, small, wide, narrow. They compare objects using comparative
language such as: longer/shorter, same length, heavier/lighter. They explore and create 2-
and 3-dimensional shapes by using various manipulative and play materials such as: popsicle
sticks, blocks, pipe cleaners, and pattern blocks. They sort, categorize, and classify objects
and identify basic 2-dimensional shapes using the appropriate language.
The Standards for Mathematical Practice complement the content standards at each grade level so that
students increasingly engage with the subject matter as they grow in mathematical maturity and expertise.
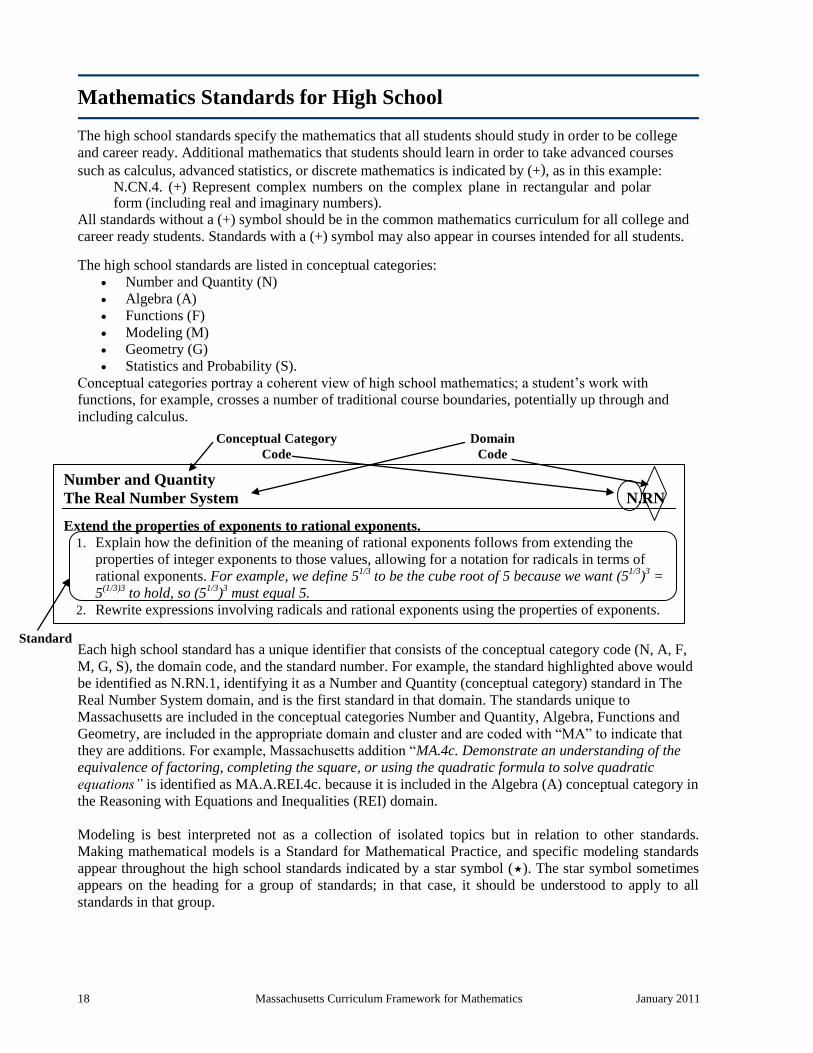
18 Massachusetts Curriculum Framework for Mathematics January 2011
Number and Quantity
The Real Number System N.RN
Extend the properties of exponents to rational exponents.
1. Explain how the definition of the meaning of rational exponents follows from extending the
properties of integer exponents to those values, allowing for a notation for radicals in terms of
rational exponents. For example, we define 51/3
to be the cube root of 5 because we want (51/3
)3 =
5(1/3)3
to hold, so (51/3
)3 must equal 5.
2. Rewrite expressions involving radicals and rational exponents using the properties of exponents.
Mathematics Standards for High School
The high school standards specify the mathematics that all students should study in order to be college
and career ready. Additional mathematics that students should learn in order to take advanced courses
such as calculus, advanced statistics, or discrete mathematics is indicated by (+), as in this example: N.CN.4. (+) Represent complex numbers on the complex plane in rectangular and polar form (including real and imaginary numbers).
All standards without a (+) symbol should be in the common mathematics curriculum for all college and
career ready students. Standards with a (+) symbol may also appear in courses intended for all students.
The high school standards are listed in conceptual categories:
Number and Quantity (N)
Algebra (A)
Functions (F)
Modeling (M)
Geometry (G)
Statistics and Probability (S).
Conceptual categories portray a coherent view of high school mathematics; a student’s work with
functions, for example, crosses a number of traditional course boundaries, potentially up through and
including calculus.
Each high school standard has a unique identifier that consists of the conceptual category code (N, A, F,
M, G, S), the domain code, and the standard number. For example, the standard highlighted above would
be identified as N.RN.1, identifying it as a Number and Quantity (conceptual category) standard in The
Real Number System domain, and is the first standard in that domain. The standards unique to
Massachusetts are included in the conceptual categories Number and Quantity, Algebra, Functions and
Geometry, are included in the appropriate domain and cluster and are coded with ―MA‖ to indicate that
they are additions. For example, Massachusetts addition ―MA.4c. Demonstrate an understanding of the
equivalence of factoring, completing the square, or using the quadratic formula to solve quadratic
equations” is identified as MA.A.REI.4c. because it is included in the Algebra (A) conceptual category in
the Reasoning with Equations and Inequalities (REI) domain.
Modeling is best interpreted not as a collection of isolated topics but in relation to other standards.
Making mathematical models is a Standard for Mathematical Practice, and specific modeling standards
appear throughout the high school standards indicated by a star symbol (). The star symbol sometimes
appears on the heading for a group of standards; in that case, it should be understood to apply to all
standards in that group.
Conceptual Category
Code
Domain
Code
Standard
January 2011 Massachusetts Curriculum Framework for Mathematics Page 19
Conceptual Category: Number and Quantity
Numbers and Number Systems. During the years from kindergarten to eighth grade, students must
repeatedly extend their conception of number. At first, ―number‖ means ―counting number‖: 1, 2, 3…. Soon
after that, 0 is used to represent ―none‖ and the whole numbers are formed by the counting numbers together
with zero. The next extension is fractions. At first, fractions are barely numbers and tied strongly to pictorial
representations. Yet by the time students understand division of fractions, they have a strong concept of
fractions as numbers and have connected them, via their decimal representations, with the base-ten system
used to represent the whole numbers. During middle school, fractions are augmented by negative fractions to
form the rational numbers. In Grade 8, students extend this system once more, augmenting the rational
numbers with the irrational numbers to form the real numbers. In high school, students will be exposed to yet
another extension of number, when the real numbers are augmented by the imaginary numbers to form the
complex numbers. (See Illustration 1 in Glossary.)
With each extension of number, the meanings of addition, subtraction, multiplication, and division are
extended. In each new number system—integers, rational numbers, real numbers, and complex numbers—
the four operations stay the same in two important ways: They have the commutative, associative, and
distributive properties and their new meanings are consistent with their previous meanings.
Extending the properties of whole-number exponents leads to new and productive notation. For example,
properties of whole-number exponents suggest that (51/3
)3 should be 5
(1/3)·3 = 5
1 = 5 and that 5
1/3 should be the
cube root of 5.
Calculators, spreadsheets, and computer algebra systems can provide ways for students to become better
acquainted with these new number systems and their notation. They can be used to generate data for
numerical experiments, to help understand the workings of matrix, vector, and complex number algebra, and
to experiment with non-integer exponents.
Quantities. In real-world problems, the answers are usually not numbers but quantities: numbers with units,
which involves measurement. In their work in measurement up through Grade 8, students primarily measure
commonly used attributes such as length, area, and volume. In high school, students encounter a wider
variety of units in modeling, e.g., acceleration, currency conversions, derived quantities such as person-hours
and heating degree days, social science rates such as per-capita income, and rates in everyday life such as
points scored per game or batting averages. They also encounter novel situations in which they themselves
must conceive the attributes of interest. For example, to find a good measure of overall highway safety, they
might propose measures such as fatalities per year, fatalities per year per driver, or fatalities per vehicle-mile
traveled. Such a conceptual process is sometimes called quantification. Quantification is important for
science, as when surface area suddenly ―stands out‖ as an important variable in evaporation. Quantification
is also important for companies, which must conceptualize relevant attributes and create or choose suitable
measures for them.
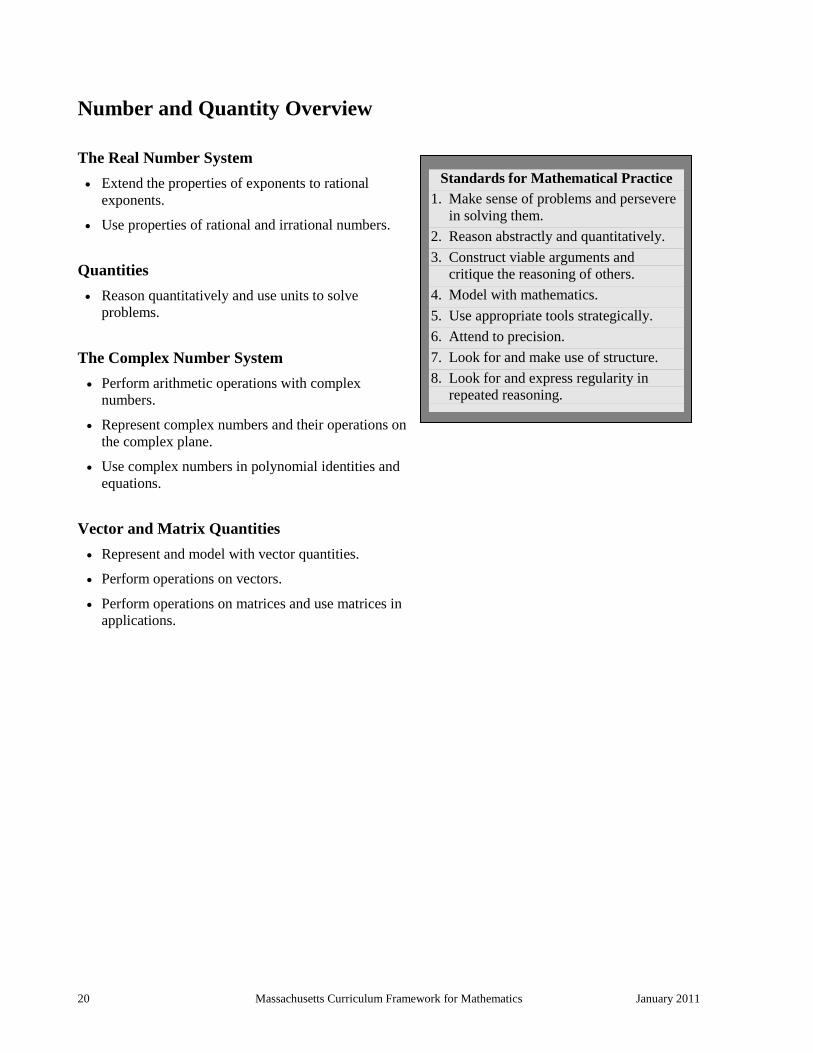
20 Massachusetts Curriculum Framework for Mathematics January 2011
Number and Quantity Overview
The Real Number System
Extend the properties of exponents to rational
exponents.
Use properties of rational and irrational numbers.
Quantities
Reason quantitatively and use units to solve
problems.
The Complex Number System
Perform arithmetic operations with complex
numbers.
Represent complex numbers and their operations on
the complex plane.
Use complex numbers in polynomial identities and
equations.
Vector and Matrix Quantities
Represent and model with vector quantities.
Perform operations on vectors.
Perform operations on matrices and use matrices in
applications.
Standards for Mathematical Practice
1. Make sense of problems and persevere
in solving them.
2. Reason abstractly and quantitatively.
3. Construct viable arguments and
critique the reasoning of others.
4. Model with mathematics.
5. Use appropriate tools strategically.
6. Attend to precision.
7. Look for and make use of structure.
8. Look for and express regularity in
repeated reasoning.
January 2011 Massachusetts Curriculum Framework for Mathematics Page 21
Number and Quantity
The Real Number System N.RN
Extend the properties of exponents to rational exponents.
1. Explain how the definition of the meaning of rational exponents follows from extending the properties
of integer exponents to those values, allowing for a notation for radicals in terms of rational exponents.
For example, we define 51/3
to be the cube root of 5 because we want (51/3
)3 = 5
(1/3)3 to hold, so (5
1/3)
3
must equal 5.
2. Rewrite expressions involving radicals and rational exponents using the properties of exponents.
Use properties of rational and irrational numbers.
3. Explain why the sum or product of two rational numbers are rational; that the sum of a rational number
and an irrational number is irrational; and that the product of a nonzero rational number and an
irrational number is irrational.
Quantities N.Q
Reason quantitatively and use units to solve problems.
1. Use units as a way to understand problems and to guide the solution of multi-step problems; choose and
interpret units consistently in formulas; choose and interpret the scale and the origin in graphs and data
displays.
2. Define appropriate quantities for the purpose of descriptive modeling.
3. Choose a level of accuracy appropriate to limitations on measurement when reporting quantities.
MA.3a. Describe the effects of approximate error in measurement and rounding on measurements and
on computed values from measurements. Identify significant figures in recorded measures and
computed values based on the context given and the precision of the tools used to measure.
The Complex Number System N.CN
Perform arithmetic operations with complex numbers.
1. Know there is a complex number i such that i2 = −1, and every complex number has the form a + bi
with a and b real.
2. Use the relation i2 = –1 and the commutative, associative, and distributive properties to add, subtract,
and multiply complex numbers.
3. (+) Find the conjugate of a complex number; use conjugates to find moduli and quotients of complex
numbers.
Represent complex numbers and their operations on the complex plane.
4. (+) Represent complex numbers on the complex plane in rectangular and polar form (including real and
imaginary numbers), and explain why the rectangular and polar forms of a given complex number
represent the same number.
5. (+) Represent addition, subtraction, multiplication, and conjugation of complex numbers geometrically
on the complex plane; use properties of this representation for computation. For example, 331 i = 8
because i31 has modulus 2 and argument 120°.
6. (+) Calculate the distance between numbers in the complex plane as the modulus of the difference, and
the midpoint of a segment as the average of the numbers at its endpoints.
Use complex numbers in polynomial identities and equations.
7. Solve quadratic equations with real coefficients that have complex solutions.
8. (+) Extend polynomial identities to the complex numbers. For example, rewrite x2 + 4 as
(x + 2i)(x – 2i).
Specific modeling standards appear throughout the high school standards indicated by a star symbol (). The star
symbol appearing on the cluster heading should be understood to indicate that all standards in that cluster are modeling
standards.
22 Massachusetts Curriculum Framework for Mathematics January 2011
9. (+) Know the Fundamental Theorem of Algebra; show that it is true for quadratic polynomials.
Vector and Matrix Quantities N.VM
Represent and model with vector quantities.
1. (+) Recognize vector quantities as having both magnitude and direction. Represent vector quantities by
directed line segments, and use appropriate symbols for vectors and their magnitudes (e.g., v, |v|, ||v||, v).
2. (+) Find the components of a vector by subtracting the coordinates of an initial point from the
coordinates of a terminal point.
3. (+) Solve problems involving velocity and other quantities that can be represented by vectors.
Perform operations on vectors.
4. (+) Add and subtract vectors.
a. Add vectors end-to-end, component-wise, and by the parallelogram rule. Understand that the
magnitude of a sum of two vectors is typically not the sum of the magnitudes.
b. Given two vectors in magnitude and direction form, determine the magnitude and direction of their
sum.
c. Understand vector subtraction v – w as v + (–w), where –w is the additive inverse of w, with the
same magnitude as w and pointing in the opposite direction. Represent vector subtraction
graphically by connecting the tips in the appropriate order, and perform vector subtraction
component-wise.
5. (+) Multiply a vector by a scalar.
a. Represent scalar multiplication graphically by scaling vectors and possibly reversing their
direction; perform scalar multiplication component-wise, e.g., as c(vx, vy) = (cvx, cvy).
b. Compute the magnitude of a scalar multiple cv using ||cv|| = |c|v. Compute the direction of cv
knowing that when |c|v ≠ 0, the direction of cv is either along v (for c > 0) or against v (for c < 0).
Perform operations on matrices and use matrices in applications.
6. (+) Use matrices to represent and manipulate data, e.g., to represent payoffs or incidence relationships
in a network.
7. (+) Multiply matrices by scalars to produce new matrices, e.g., as when all of the payoffs in a game are
doubled.
8. (+) Add, subtract, and multiply matrices of appropriate dimensions.
9. (+) Understand that, unlike multiplication of numbers, matrix multiplication for square matrices is not a
commutative operation, but still satisfies the associative and distributive properties.
10. (+) Understand that the zero and identity matrices play a role in matrix addition and multiplication
similar to the role of 0 and 1 in the real numbers. The determinant of a square matrix is nonzero if and
only if the matrix has a multiplicative inverse.
11. (+) Multiply a vector (regarded as a matrix with one column) by a matrix of suitable dimensions to
produce another vector. Work with matrices as transformations of vectors.
12. (+) Work with 2 2 matrices as transformations of the plane, and interpret the absolute value of the
determinant in terms of area.
January 2011 Massachusetts Curriculum Framework for Mathematics Page 23
Conceptual Category: Algebra
Expressions. An expression is a record of a computation with numbers, symbols that represent numbers,
arithmetic operations, exponentiation, and, at more advanced levels, the operation of evaluating a function.
Conventions about the use of parentheses and the order of operations assure that each expression is
unambiguous. Creating an expression that describes a computation involving a general quantity requires the
ability to express the computation in general terms, abstracting from specific instances.
Reading an expression with comprehension involves analysis of its underlying structure. This may suggest a
different but equivalent way of writing the expression that exhibits some different aspect of its meaning. For
example, p + 0.05p can be interpreted as the addition of a 5% tax to a price p. Rewriting p + 0.05p as 1.05p
shows that adding a tax is the same as multiplying the price by a constant factor.
Algebraic manipulations are governed by the properties of operations and exponents, and the conventions of
algebraic notation. At times, an expression is the result of applying operations to simpler expressions. For
example, p + 0.05p is the sum of the simpler expressions p and 0.05p. Viewing an expression as the result of
operation on simpler expressions can sometimes clarify its underlying structure.
A spreadsheet or a computer algebra system (CAS) can be used to experiment with algebraic expressions,
perform complicated algebraic manipulations, and understand how algebraic manipulations behave.
Equations and inequalities. An equation is a statement of equality between two expressions, often viewed
as a question asking for which values of the variables the expressions on either side are in fact equal. These
values are the solutions to the equation. An identity, in contrast, is true for all values of the variables;
identities are often developed by rewriting an expression in an equivalent form.
The solutions of an equation in one variable form a set of numbers; the solutions of an equation in two
variables form a set of ordered pairs of numbers, which can be plotted in the coordinate plane. Two or more
equations and/or inequalities form a system. A solution for such a system must satisfy every equation and
inequality in the system.
An equation can often be solved by successively deducing from it one or more simpler equations. For
example, one can add the same constant to both sides without changing the solutions, but squaring both sides
might lead to extraneous solutions. Strategic competence in solving includes looking ahead for productive
manipulations and anticipating the nature and number of solutions.
Some equations have no solutions in a given number system, but have a solution in a larger system. For
example, the solution of x + 1 = 0 is an integer, not a whole number; the solution of 2x + 1 = 0 is a rational
number, not an integer; the solutions of x2 – 2 = 0 are real numbers, not rational numbers; and the solutions
of x2 + 2 = 0 are complex numbers, not real numbers.
The same solution techniques used to solve equations can be used to rearrange formulas. For example, the
formula for the area of a trapezoid, A = ((b1+b2)/2)h, can be solved for h using the same deductive process.
Inequalities can be solved by reasoning about the properties of inequality. Many, but not all, of the properties
of equality continue to hold for inequalities and can be useful in solving them.
Connections to Functions and Modeling. Expressions can define functions, and equivalent expressions
define the same function. Asking when two functions have the same value for the same input leads to an
equation; graphing the two functions allows for finding approximate solutions of the equation. Converting a
verbal description to an equation, inequality, or system of these is an essential skill in modeling.
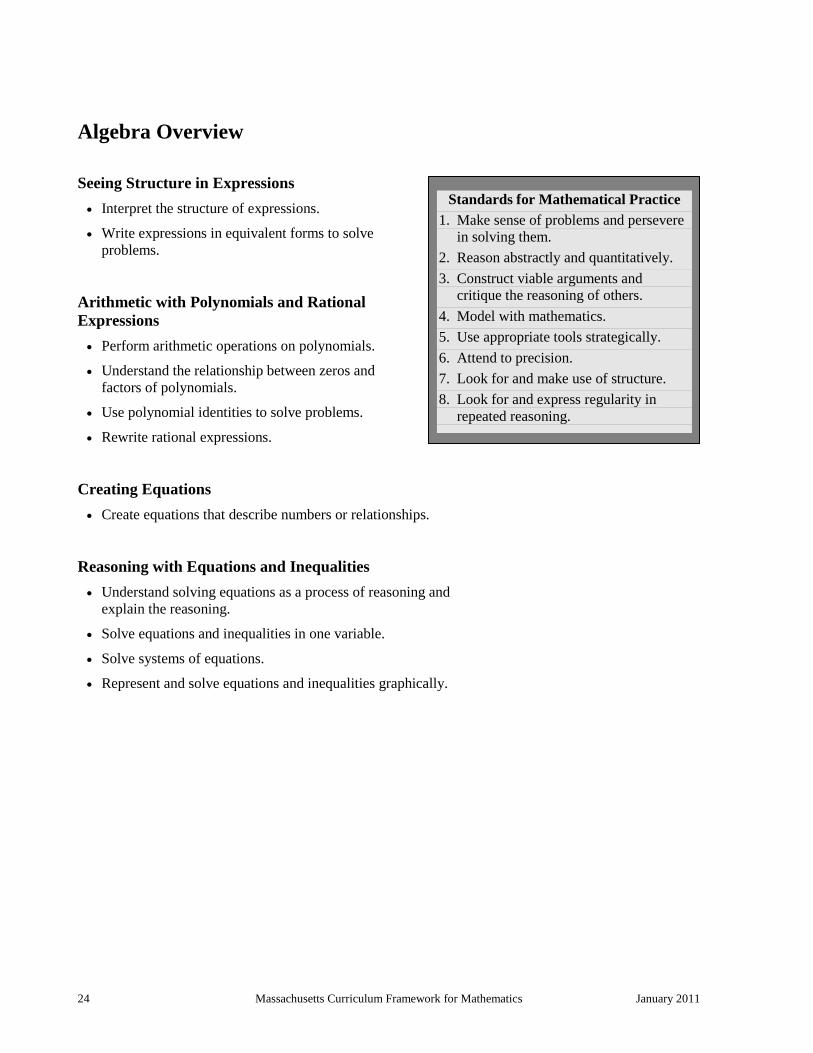
24 Massachusetts Curriculum Framework for Mathematics January 2011
Algebra Overview
Seeing Structure in Expressions
Interpret the structure of expressions.
Write expressions in equivalent forms to solve
problems.
Arithmetic with Polynomials and Rational
Expressions
Perform arithmetic operations on polynomials.
Understand the relationship between zeros and
factors of polynomials.
Use polynomial identities to solve problems.
Rewrite rational expressions.
Creating Equations
Create equations that describe numbers or relationships.
Reasoning with Equations and Inequalities
Understand solving equations as a process of reasoning and
explain the reasoning.
Solve equations and inequalities in one variable.
Solve systems of equations.
Represent and solve equations and inequalities graphically.
Standards for Mathematical Practice
1. Make sense of problems and persevere
in solving them.
2. Reason abstractly and quantitatively.
3. Construct viable arguments and
critique the reasoning of others.
4. Model with mathematics.
5. Use appropriate tools strategically.
6. Attend to precision.
7. Look for and make use of structure.
8. Look for and express regularity in
repeated reasoning.
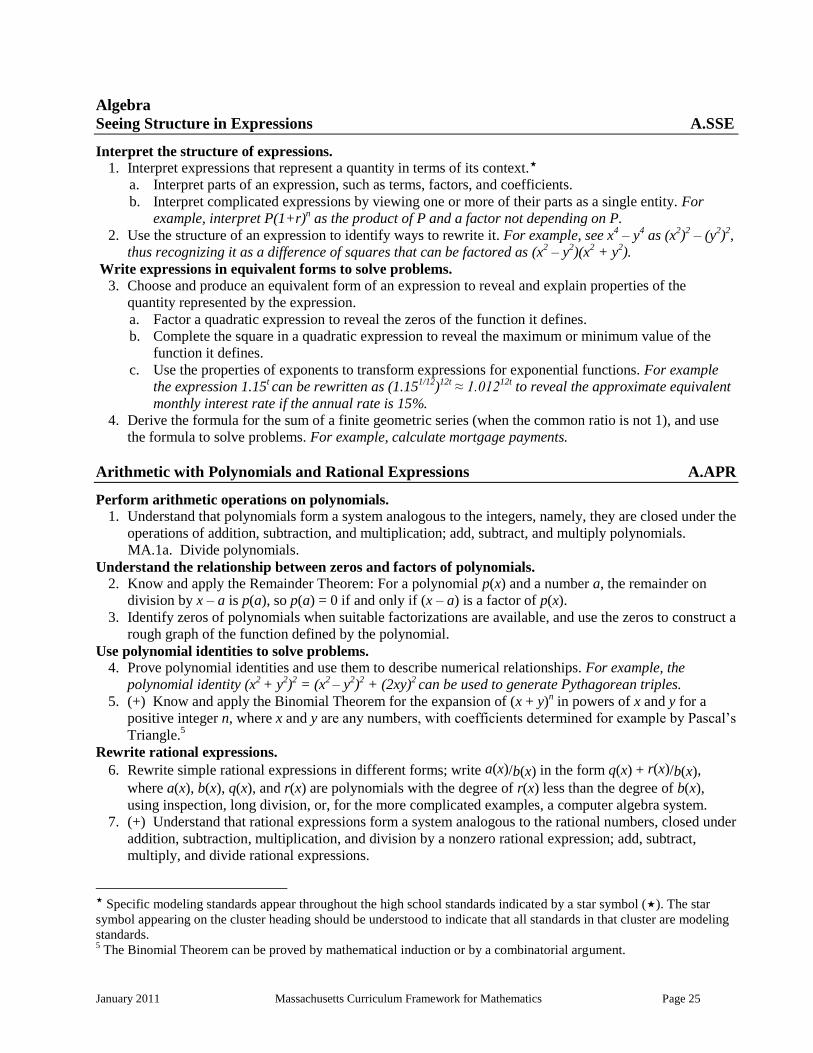
January 2011 Massachusetts Curriculum Framework for Mathematics Page 25
Algebra
Seeing Structure in Expressions A.SSE
Interpret the structure of expressions.
1. Interpret expressions that represent a quantity in terms of its context.
a. Interpret parts of an expression, such as terms, factors, and coefficients.
b. Interpret complicated expressions by viewing one or more of their parts as a single entity. For
example, interpret P(1+r)n as the product of P and a factor not depending on P.
2. Use the structure of an expression to identify ways to rewrite it. For example, see x4 – y
4 as (x
2)
2 – (y
2)
2,
thus recognizing it as a difference of squares that can be factored as (x2 – y
2)(x
2 + y
2).
Write expressions in equivalent forms to solve problems.
3. Choose and produce an equivalent form of an expression to reveal and explain properties of the
quantity represented by the expression.
a. Factor a quadratic expression to reveal the zeros of the function it defines.
b. Complete the square in a quadratic expression to reveal the maximum or minimum value of the
function it defines.
c. Use the properties of exponents to transform expressions for exponential functions. For example
the expression 1.15t can be rewritten as (1.15
1/12)
12t ≈ 1.012
12t to reveal the approximate equivalent
monthly interest rate if the annual rate is 15%.
4. Derive the formula for the sum of a finite geometric series (when the common ratio is not 1), and use
the formula to solve problems. For example, calculate mortgage payments.
Arithmetic with Polynomials and Rational Expressions A.APR
Perform arithmetic operations on polynomials.
1. Understand that polynomials form a system analogous to the integers, namely, they are closed under the
operations of addition, subtraction, and multiplication; add, subtract, and multiply polynomials.
MA.1a. Divide polynomials.
Understand the relationship between zeros and factors of polynomials.
2. Know and apply the Remainder Theorem: For a polynomial p(x) and a number a, the remainder on
division by x – a is p(a), so p(a) = 0 if and only if (x – a) is a factor of p(x).
3. Identify zeros of polynomials when suitable factorizations are available, and use the zeros to construct a
rough graph of the function defined by the polynomial.
Use polynomial identities to solve problems.
4. Prove polynomial identities and use them to describe numerical relationships. For example, the
polynomial identity (x2 + y
2)
2 = (x
2 – y
2)
2 + (2xy)
2 can be used to generate Pythagorean triples.
5. (+) Know and apply the Binomial Theorem for the expansion of (x + y)n in powers of x and y for a
positive integer n, where x and y are any numbers, with coefficients determined for example by Pascal’s
Triangle.5
Rewrite rational expressions.
6. Rewrite simple rational expressions in different forms; write a(x)/b(x) in the form q(x) + r(x)/b(x),
where a(x), b(x), q(x), and r(x) are polynomials with the degree of r(x) less than the degree of b(x),
using inspection, long division, or, for the more complicated examples, a computer algebra system.
7. (+) Understand that rational expressions form a system analogous to the rational numbers, closed under
addition, subtraction, multiplication, and division by a nonzero rational expression; add, subtract,
multiply, and divide rational expressions.
Specific modeling standards appear throughout the high school standards indicated by a star symbol (). The star
symbol appearing on the cluster heading should be understood to indicate that all standards in that cluster are modeling
standards. 5 The Binomial Theorem can be proved by mathematical induction or by a combinatorial argument.
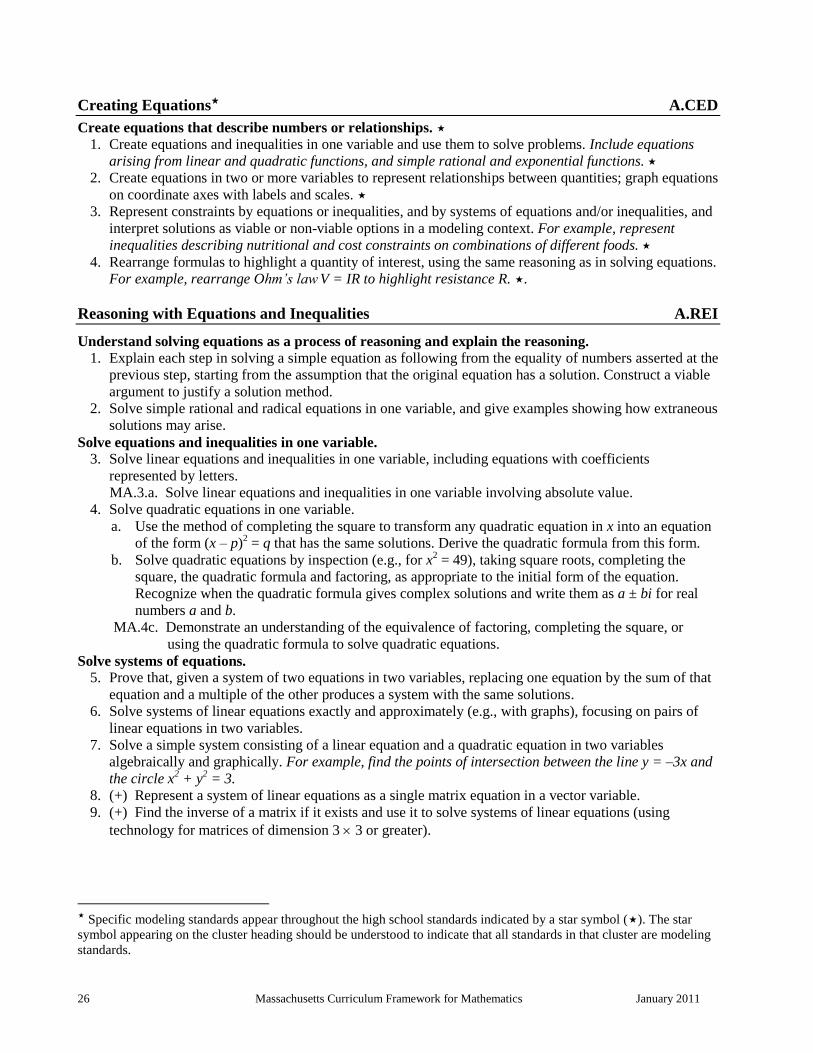
26 Massachusetts Curriculum Framework for Mathematics January 2011
Creating Equations A.CED
Create equations that describe numbers or relationships.
1. Create equations and inequalities in one variable and use them to solve problems. Include equations
arising from linear and quadratic functions, and simple rational and exponential functions.
2. Create equations in two or more variables to represent relationships between quantities; graph equations
on coordinate axes with labels and scales.
3. Represent constraints by equations or inequalities, and by systems of equations and/or inequalities, and
interpret solutions as viable or non-viable options in a modeling context. For example, represent
inequalities describing nutritional and cost constraints on combinations of different foods.
4. Rearrange formulas to highlight a quantity of interest, using the same reasoning as in solving equations.
For example, rearrange Ohm’s law V = IR to highlight resistance R. .
Reasoning with Equations and Inequalities A.REI
Understand solving equations as a process of reasoning and explain the reasoning.
1. Explain each step in solving a simple equation as following from the equality of numbers asserted at the
previous step, starting from the assumption that the original equation has a solution. Construct a viable
argument to justify a solution method.
2. Solve simple rational and radical equations in one variable, and give examples showing how extraneous
solutions may arise.
Solve equations and inequalities in one variable.
3. Solve linear equations and inequalities in one variable, including equations with coefficients
represented by letters.
MA.3.a. Solve linear equations and inequalities in one variable involving absolute value.
4. Solve quadratic equations in one variable.
a. Use the method of completing the square to transform any quadratic equation in x into an equation
of the form (x – p)2 = q that has the same solutions. Derive the quadratic formula from this form.
b. Solve quadratic equations by inspection (e.g., for x2 = 49), taking square roots, completing the
square, the quadratic formula and factoring, as appropriate to the initial form of the equation.
Recognize when the quadratic formula gives complex solutions and write them as a ± bi for real
numbers a and b.
MA.4c. Demonstrate an understanding of the equivalence of factoring, completing the square, or
using the quadratic formula to solve quadratic equations.
Solve systems of equations.
5. Prove that, given a system of two equations in two variables, replacing one equation by the sum of that
equation and a multiple of the other produces a system with the same solutions.
6. Solve systems of linear equations exactly and approximately (e.g., with graphs), focusing on pairs of
linear equations in two variables.
7. Solve a simple system consisting of a linear equation and a quadratic equation in two variables
algebraically and graphically. For example, find the points of intersection between the line y = –3x and
the circle x2 + y
2 = 3.
8. (+) Represent a system of linear equations as a single matrix equation in a vector variable.
9. (+) Find the inverse of a matrix if it exists and use it to solve systems of linear equations (using
technology for matrices of dimension 3 3 or greater).
Specific modeling standards appear throughout the high school standards indicated by a star symbol (). The star
symbol appearing on the cluster heading should be understood to indicate that all standards in that cluster are modeling
standards.
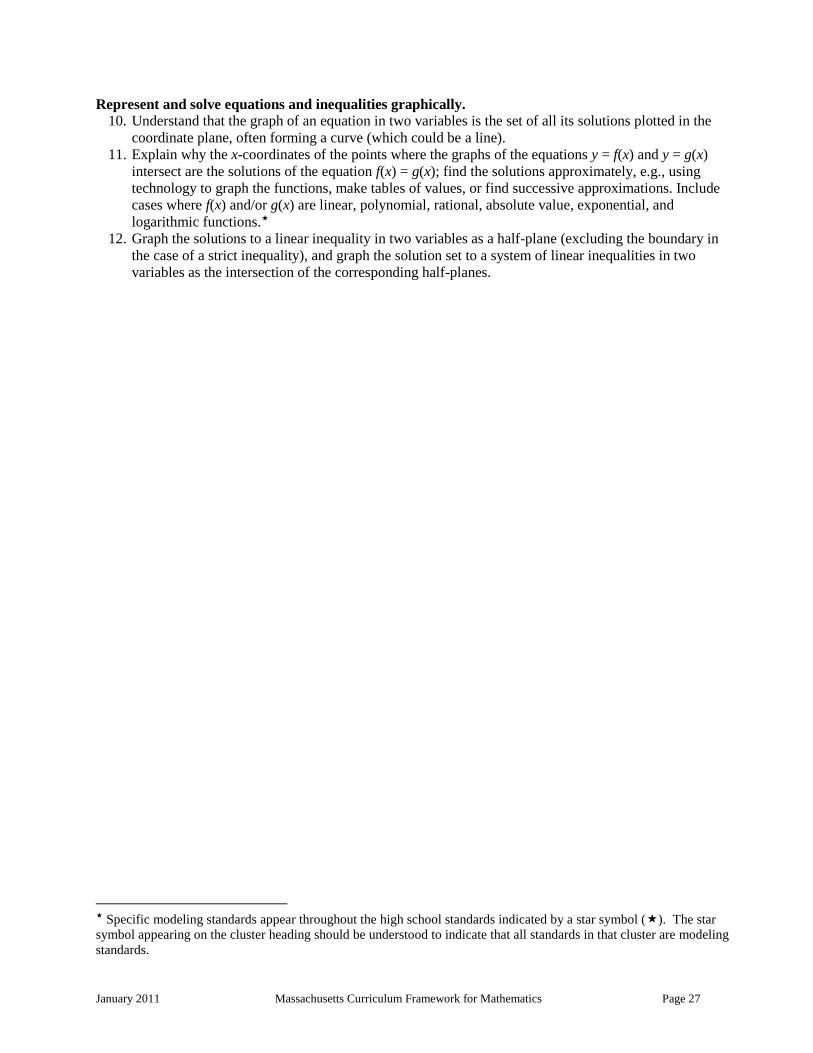
January 2011 Massachusetts Curriculum Framework for Mathematics Page 27
Represent and solve equations and inequalities graphically.
10. Understand that the graph of an equation in two variables is the set of all its solutions plotted in the
coordinate plane, often forming a curve (which could be a line).
11. Explain why the x-coordinates of the points where the graphs of the equations y = f(x) and y = g(x)
intersect are the solutions of the equation f(x) = g(x); find the solutions approximately, e.g., using
technology to graph the functions, make tables of values, or find successive approximations. Include
cases where f(x) and/or g(x) are linear, polynomial, rational, absolute value, exponential, and
logarithmic functions.
12. Graph the solutions to a linear inequality in two variables as a half-plane (excluding the boundary in
the case of a strict inequality), and graph the solution set to a system of linear inequalities in two
variables as the intersection of the corresponding half-planes.
Specific modeling standards appear throughout the high school standards indicated by a star symbol (). The star
symbol appearing on the cluster heading should be understood to indicate that all standards in that cluster are modeling
standards.
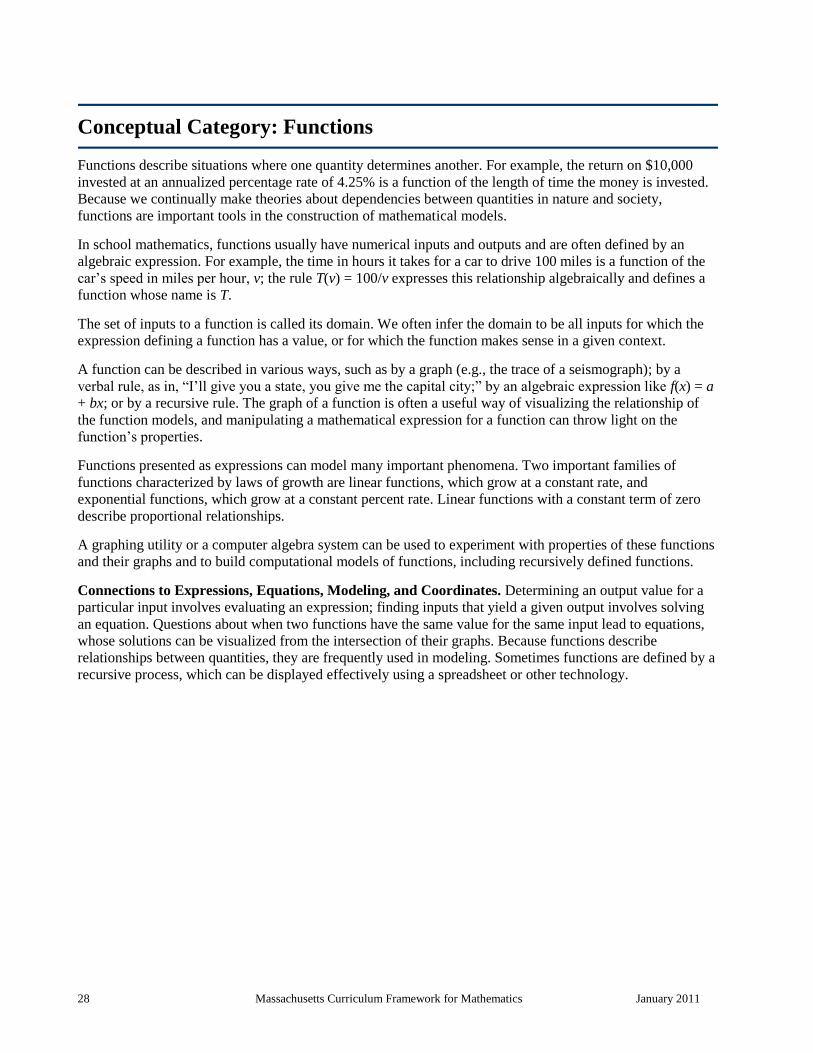
28 Massachusetts Curriculum Framework for Mathematics January 2011
Conceptual Category: Functions
Functions describe situations where one quantity determines another. For example, the return on $10,000
invested at an annualized percentage rate of 4.25% is a function of the length of time the money is invested.
Because we continually make theories about dependencies between quantities in nature and society,
functions are important tools in the construction of mathematical models.
In school mathematics, functions usually have numerical inputs and outputs and are often defined by an
algebraic expression. For example, the time in hours it takes for a car to drive 100 miles is a function of the
car’s speed in miles per hour, v; the rule T(v) = 100/v expresses this relationship algebraically and defines a
function whose name is T.
The set of inputs to a function is called its domain. We often infer the domain to be all inputs for which the
expression defining a function has a value, or for which the function makes sense in a given context.
A function can be described in various ways, such as by a graph (e.g., the trace of a seismograph); by a
verbal rule, as in, ―I’ll give you a state, you give me the capital city;‖ by an algebraic expression like f(x) = a
+ bx; or by a recursive rule. The graph of a function is often a useful way of visualizing the relationship of
the function models, and manipulating a mathematical expression for a function can throw light on the
function’s properties.
Functions presented as expressions can model many important phenomena. Two important families of
functions characterized by laws of growth are linear functions, which grow at a constant rate, and
exponential functions, which grow at a constant percent rate. Linear functions with a constant term of zero
describe proportional relationships.
A graphing utility or a computer algebra system can be used to experiment with properties of these functions
and their graphs and to build computational models of functions, including recursively defined functions.
Connections to Expressions, Equations, Modeling, and Coordinates. Determining an output value for a
particular input involves evaluating an expression; finding inputs that yield a given output involves solving
an equation. Questions about when two functions have the same value for the same input lead to equations,
whose solutions can be visualized from the intersection of their graphs. Because functions describe
relationships between quantities, they are frequently used in modeling. Sometimes functions are defined by a
recursive process, which can be displayed effectively using a spreadsheet or other technology.
January 2011 Massachusetts Curriculum Framework for Mathematics Page 29
Functions Overview
Interpreting Functions
Understand the concept of a function and use function
notation.
Interpret functions that arise in applications in terms of
the context.
Analyze functions using different representations.
Building Functions
Build a function that models a relationship between
two quantities.
Build new functions from existing functions.
Linear, Quadratic, and Exponential Models
Construct and compare linear, quadratic, and
exponential models and solve problems.
Interpret expressions for functions in terms of the situation
they model.
Trigonometric Functions
Extend the domain of trigonometric functions using the
unit circle.
Model periodic phenomena with trigonometric functions.
Prove and apply trigonometric identities.
Standards for Mathematical Practice
1. Make sense of problems and persevere
in solving them.
2. Reason abstractly and quantitatively.
3. Construct viable arguments and
critique the reasoning of others.
4. Model with mathematics.
5. Use appropriate tools strategically.
6. Attend to precision.
7. Look for and make use of structure.
8. Look for and express regularity in
repeated reasoning.
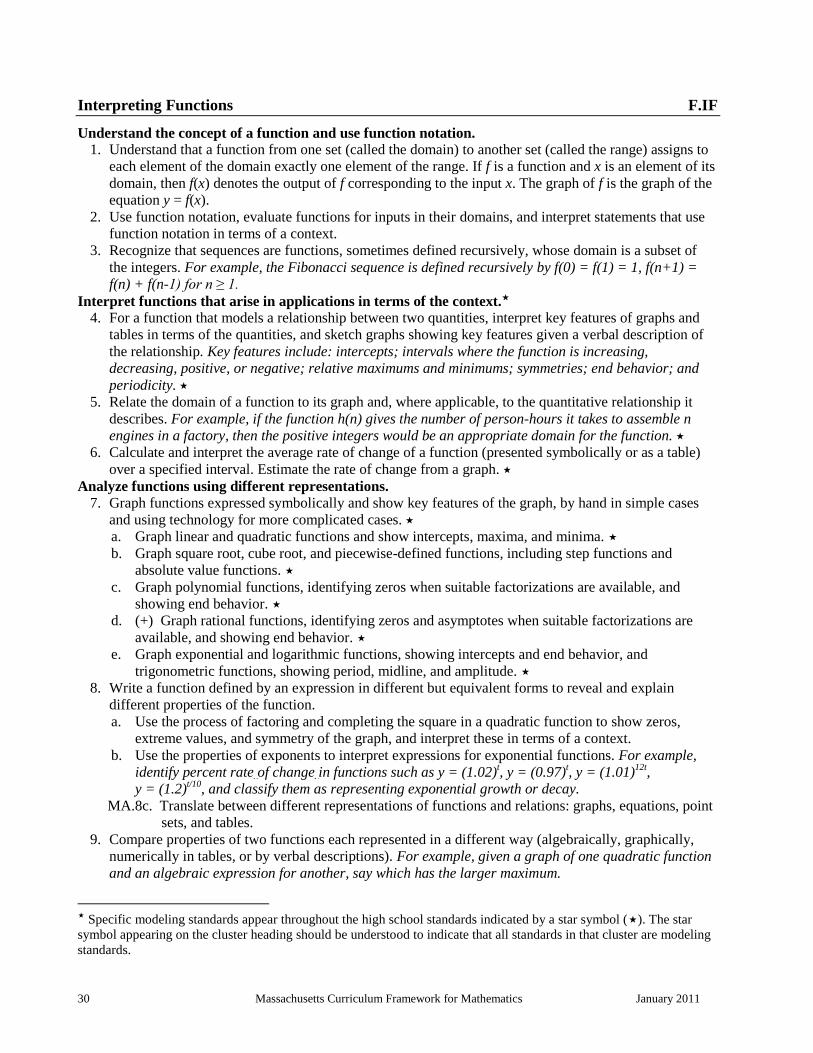
30 Massachusetts Curriculum Framework for Mathematics January 2011
Interpreting Functions F.IF
Understand the concept of a function and use function notation.
1. Understand that a function from one set (called the domain) to another set (called the range) assigns to
each element of the domain exactly one element of the range. If f is a function and x is an element of its
domain, then f(x) denotes the output of f corresponding to the input x. The graph of f is the graph of the
equation y = f(x).
2. Use function notation, evaluate functions for inputs in their domains, and interpret statements that use
function notation in terms of a context.
3. Recognize that sequences are functions, sometimes defined recursively, whose domain is a subset of
the integers. For example, the Fibonacci sequence is defined recursively by f(0) = f(1) = 1, f(n+1) =
f(n) + f(n-1) for n ≥ 1.
Interpret functions that arise in applications in terms of the context.
4. For a function that models a relationship between two quantities, interpret key features of graphs and
tables in terms of the quantities, and sketch graphs showing key features given a verbal description of
the relationship. Key features include: intercepts; intervals where the function is increasing,
decreasing, positive, or negative; relative maximums and minimums; symmetries; end behavior; and
periodicity.
5. Relate the domain of a function to its graph and, where applicable, to the quantitative relationship it
describes. For example, if the function h(n) gives the number of person-hours it takes to assemble n
engines in a factory, then the positive integers would be an appropriate domain for the function.
6. Calculate and interpret the average rate of change of a function (presented symbolically or as a table)
over a specified interval. Estimate the rate of change from a graph.
Analyze functions using different representations.
7. Graph functions expressed symbolically and show key features of the graph, by hand in simple cases
and using technology for more complicated cases.
a. Graph linear and quadratic functions and show intercepts, maxima, and minima.
b. Graph square root, cube root, and piecewise-defined functions, including step functions and
absolute value functions.
c. Graph polynomial functions, identifying zeros when suitable factorizations are available, and
showing end behavior.
d. (+) Graph rational functions, identifying zeros and asymptotes when suitable factorizations are
available, and showing end behavior.
e. Graph exponential and logarithmic functions, showing intercepts and end behavior, and
trigonometric functions, showing period, midline, and amplitude.
8. Write a function defined by an expression in different but equivalent forms to reveal and explain
different properties of the function.
a. Use the process of factoring and completing the square in a quadratic function to show zeros,
extreme values, and symmetry of the graph, and interpret these in terms of a context.
b. Use the properties of exponents to interpret expressions for exponential functions. For example,
identify percent rate of change in functions such as y = (1.02)t, y = (0.97)
t, y = (1.01)
12t,
y = (1.2)t/10
, and classify them as representing exponential growth or decay.
MA.8c. Translate between different representations of functions and relations: graphs, equations, point
sets, and tables.
9. Compare properties of two functions each represented in a different way (algebraically, graphically,
numerically in tables, or by verbal descriptions). For example, given a graph of one quadratic function
and an algebraic expression for another, say which has the larger maximum.
Specific modeling standards appear throughout the high school standards indicated by a star symbol (). The star
symbol appearing on the cluster heading should be understood to indicate that all standards in that cluster are modeling
standards.
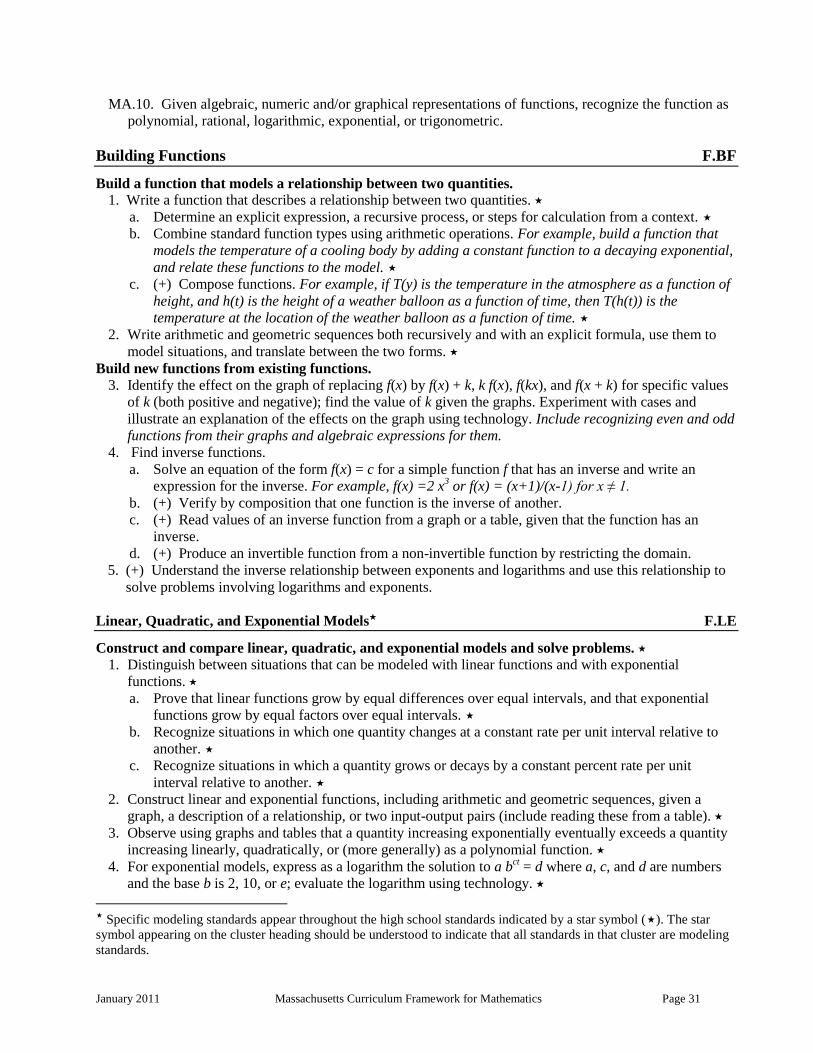
January 2011 Massachusetts Curriculum Framework for Mathematics Page 31
MA.10. Given algebraic, numeric and/or graphical representations of functions, recognize the function as
polynomial, rational, logarithmic, exponential, or trigonometric.
Building Functions F.BF
Build a function that models a relationship between two quantities.
1. Write a function that describes a relationship between two quantities.
a. Determine an explicit expression, a recursive process, or steps for calculation from a context.
b. Combine standard function types using arithmetic operations. For example, build a function that
models the temperature of a cooling body by adding a constant function to a decaying exponential,
and relate these functions to the model.
c. (+) Compose functions. For example, if T(y) is the temperature in the atmosphere as a function of
height, and h(t) is the height of a weather balloon as a function of time, then T(h(t)) is the
temperature at the location of the weather balloon as a function of time.
2. Write arithmetic and geometric sequences both recursively and with an explicit formula, use them to
model situations, and translate between the two forms.
Build new functions from existing functions.
3. Identify the effect on the graph of replacing f(x) by f(x) + k, k f(x), f(kx), and f(x + k) for specific values
of k (both positive and negative); find the value of k given the graphs. Experiment with cases and
illustrate an explanation of the effects on the graph using technology. Include recognizing even and odd
functions from their graphs and algebraic expressions for them.
4. Find inverse functions.
a. Solve an equation of the form f(x) = c for a simple function f that has an inverse and write an
expression for the inverse. For example, f(x) =2 x3 or f(x) = (x+1)/(x-1) for x ≠ 1.
b. (+) Verify by composition that one function is the inverse of another.
c. (+) Read values of an inverse function from a graph or a table, given that the function has an
inverse.
d. (+) Produce an invertible function from a non-invertible function by restricting the domain.
5. (+) Understand the inverse relationship between exponents and logarithms and use this relationship to
solve problems involving logarithms and exponents.
Linear, Quadratic, and Exponential Models F.LE
Construct and compare linear, quadratic, and exponential models and solve problems.
1. Distinguish between situations that can be modeled with linear functions and with exponential
functions.
a. Prove that linear functions grow by equal differences over equal intervals, and that exponential
functions grow by equal factors over equal intervals.
b. Recognize situations in which one quantity changes at a constant rate per unit interval relative to
another.
c. Recognize situations in which a quantity grows or decays by a constant percent rate per unit
interval relative to another.
2. Construct linear and exponential functions, including arithmetic and geometric sequences, given a
graph, a description of a relationship, or two input-output pairs (include reading these from a table).
3. Observe using graphs and tables that a quantity increasing exponentially eventually exceeds a quantity
increasing linearly, quadratically, or (more generally) as a polynomial function.
4. For exponential models, express as a logarithm the solution to a bct = d where a, c, and d are numbers
and the base b is 2, 10, or e; evaluate the logarithm using technology.
Specific modeling standards appear throughout the high school standards indicated by a star symbol (). The star
symbol appearing on the cluster heading should be understood to indicate that all standards in that cluster are modeling
standards.
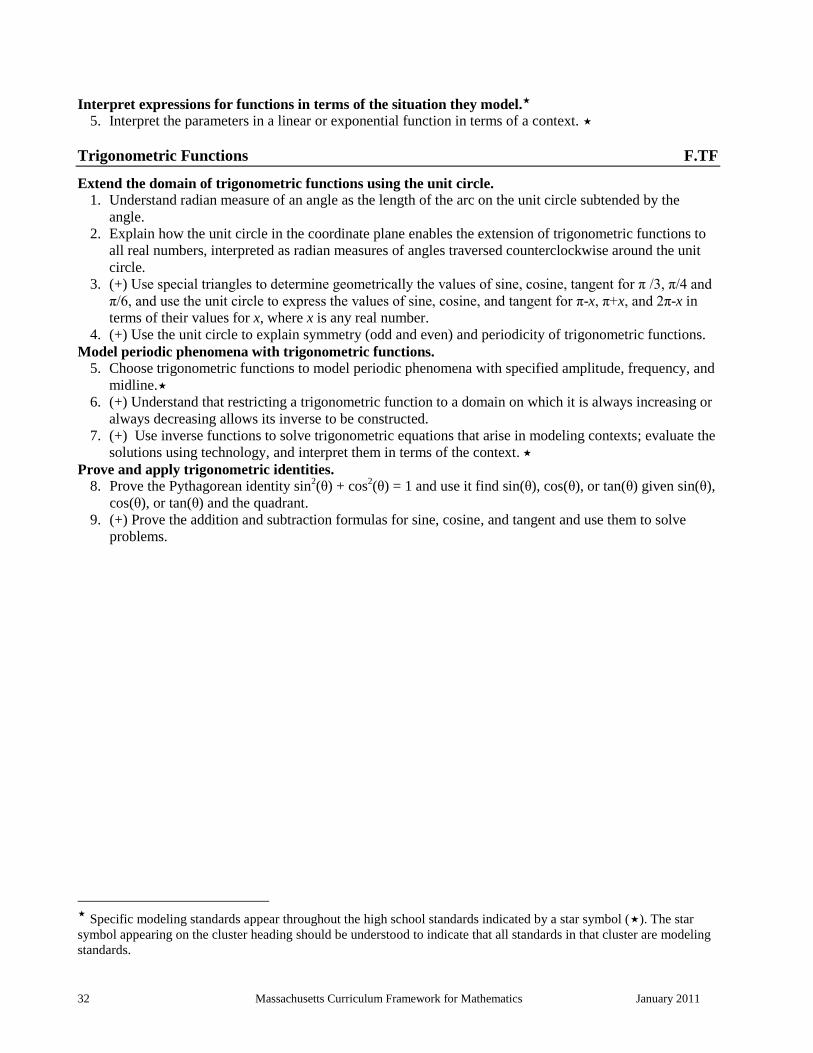
32 Massachusetts Curriculum Framework for Mathematics January 2011
Interpret expressions for functions in terms of the situation they model.
5. Interpret the parameters in a linear or exponential function in terms of a context.
Trigonometric Functions F.TF
Extend the domain of trigonometric functions using the unit circle.
1. Understand radian measure of an angle as the length of the arc on the unit circle subtended by the
angle.
2. Explain how the unit circle in the coordinate plane enables the extension of trigonometric functions to
all real numbers, interpreted as radian measures of angles traversed counterclockwise around the unit
circle.
3. (+) Use special triangles to determine geometrically the values of sine, cosine, tangent for π /3, π/4 and
π/6, and use the unit circle to express the values of sine, cosine, and tangent for π-x, π+x, and 2π-x in
terms of their values for x, where x is any real number.
4. (+) Use the unit circle to explain symmetry (odd and even) and periodicity of trigonometric functions.
Model periodic phenomena with trigonometric functions.
5. Choose trigonometric functions to model periodic phenomena with specified amplitude, frequency, and
midline.
6. (+) Understand that restricting a trigonometric function to a domain on which it is always increasing or
always decreasing allows its inverse to be constructed.
7. (+) Use inverse functions to solve trigonometric equations that arise in modeling contexts; evaluate the
solutions using technology, and interpret them in terms of the context.
Prove and apply trigonometric identities.
8. Prove the Pythagorean identity sin2(θ) + cos
2(θ) = 1 and use it find sin(θ), cos(θ), or tan(θ) given sin(θ),
cos(θ), or tan(θ) and the quadrant.
9. (+) Prove the addition and subtraction formulas for sine, cosine, and tangent and use them to solve
problems.
Specific modeling standards appear throughout the high school standards indicated by a star symbol (). The star
symbol appearing on the cluster heading should be understood to indicate that all standards in that cluster are modeling
standards.
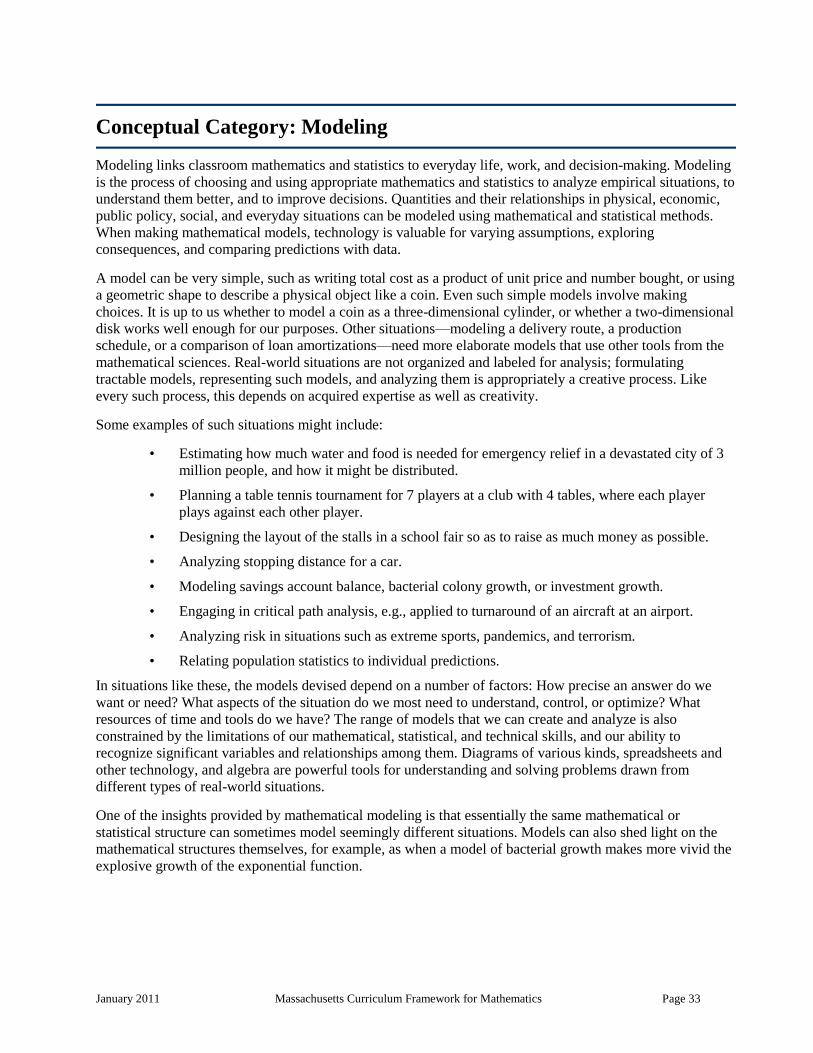
January 2011 Massachusetts Curriculum Framework for Mathematics Page 33
Conceptual Category: Modeling
Modeling links classroom mathematics and statistics to everyday life, work, and decision-making. Modeling
is the process of choosing and using appropriate mathematics and statistics to analyze empirical situations, to
understand them better, and to improve decisions. Quantities and their relationships in physical, economic,
public policy, social, and everyday situations can be modeled using mathematical and statistical methods.
When making mathematical models, technology is valuable for varying assumptions, exploring
consequences, and comparing predictions with data.
A model can be very simple, such as writing total cost as a product of unit price and number bought, or using
a geometric shape to describe a physical object like a coin. Even such simple models involve making
choices. It is up to us whether to model a coin as a three-dimensional cylinder, or whether a two-dimensional
disk works well enough for our purposes. Other situations—modeling a delivery route, a production
schedule, or a comparison of loan amortizations—need more elaborate models that use other tools from the
mathematical sciences. Real-world situations are not organized and labeled for analysis; formulating
tractable models, representing such models, and analyzing them is appropriately a creative process. Like
every such process, this depends on acquired expertise as well as creativity.
Some examples of such situations might include:
• Estimating how much water and food is needed for emergency relief in a devastated city of 3
million people, and how it might be distributed.
• Planning a table tennis tournament for 7 players at a club with 4 tables, where each player
plays against each other player.
• Designing the layout of the stalls in a school fair so as to raise as much money as possible.
• Analyzing stopping distance for a car.
• Modeling savings account balance, bacterial colony growth, or investment growth.
• Engaging in critical path analysis, e.g., applied to turnaround of an aircraft at an airport.
• Analyzing risk in situations such as extreme sports, pandemics, and terrorism.
• Relating population statistics to individual predictions.
In situations like these, the models devised depend on a number of factors: How precise an answer do we
want or need? What aspects of the situation do we most need to understand, control, or optimize? What
resources of time and tools do we have? The range of models that we can create and analyze is also
constrained by the limitations of our mathematical, statistical, and technical skills, and our ability to
recognize significant variables and relationships among them. Diagrams of various kinds, spreadsheets and
other technology, and algebra are powerful tools for understanding and solving problems drawn from
different types of real-world situations.
One of the insights provided by mathematical modeling is that essentially the same mathematical or
statistical structure can sometimes model seemingly different situations. Models can also shed light on the
mathematical structures themselves, for example, as when a model of bacterial growth makes more vivid the
explosive growth of the exponential function.
34 Massachusetts Curriculum Framework for Mathematics January 2011
The basic modeling cycle is summarized in the diagram. It involves (1) identifying variables in the situation
and selecting those that represent essential features, (2) formulating a model by creating and selecting
geometric, graphical, tabular, algebraic, or statistical representations that describe relationships between the
variables, (3) analyzing and performing operations on these relationships to draw conclusions, (4)
interpreting the results of the mathematics in terms of the original situation, (5) validating the conclusions by
comparing them with the situation, and then either improving the model or, if it is acceptable, (6) reporting
on the conclusions and the reasoning behind them. Choices, assumptions, and approximations are present
throughout this cycle.
In descriptive modeling, a model simply describes the phenomena or summarizes them in a compact form.
Graphs of observations are a familiar descriptive model—for example, graphs of global temperature and
atmospheric CO2 over time.
Analytic modeling seeks to explain data on the basis of deeper theoretical ideas, albeit with parameters that
are empirically based; for example, exponential growth of bacterial colonies (until cut-off mechanisms such
as pollution or starvation intervene) follows from a constant reproduction rate. Functions are an important
tool for analyzing such problems.
Graphing utilities, spreadsheets, computer algebra systems, and dynamic geometry software are powerful
tools that can be used to model purely mathematical phenomena (e.g., the behavior of polynomials) as well
as physical phenomena.
Modeling Standards Modeling is best interpreted not as a collection of isolated topics but rather in relation
to other standards. Making mathematical models is a Standard for Mathematical Practice, and specific
modeling standards appear throughout the high school standards indicated by a star symbol ().
January 2011 Massachusetts Curriculum Framework for Mathematics Page 35
Conceptual Category: Geometry
An understanding of the attributes and relationships of geometric objects can be applied in diverse
contexts—interpreting a schematic drawing, estimating the amount of wood needed to frame a sloping roof,
rendering computer graphics, or designing a sewing pattern for the most efficient use of material.
Although there are many types of geometry, school mathematics is devoted primarily to plane Euclidean
geometry, studied both synthetically (without coordinates) and analytically (with coordinates). Euclidean
geometry is characterized most importantly by the Parallel Postulate that through a point not on a given line
there is exactly one parallel line. (Spherical geometry, in contrast, has no parallel lines.)
During high school, students begin to formalize their geometry experiences from elementary and middle
school, using more precise definitions and developing careful proofs. Later in college some students develop
Euclidean and other geometries carefully from a small set of axioms.
The concepts of congruence, similarity, and symmetry can be understood from the perspective of geometric
transformation. Fundamental are the rigid motions: translations, rotations, reflections, and combinations of
these, all of which are here assumed to preserve distance and angles (and therefore shapes generally).
Reflections and rotations each explain a particular type of symmetry, and the symmetries of an object offer
insight into its attributes—as when the reflective symmetry of an isosceles triangle assures that its base
angles are congruent.
In the approach taken here, two geometric figures are defined to be congruent if there is a sequence of rigid
motions that carries one onto the other. This is the principle of superposition. For triangles, congruence
means the equality of all corresponding pairs of sides and all corresponding pairs of angles. During the
middle grades, through experiences drawing triangles from given conditions, students notice ways to specify
enough measures in a triangle to ensure that all triangles drawn with those measures are congruent. Once
these triangle congruence criteria (ASA, SAS, and SSS) are established using rigid motions, they can be used
to prove theorems about triangles, quadrilaterals, and other geometric figures.
Similarity transformations (rigid motions followed by dilations) define similarity in the same way that rigid
motions define congruence, thereby formalizing the similarity ideas of ―same shape‖ and ―scale factor‖
developed in the middle grades. These transformations lead to the criterion for triangle similarity that two
pairs of corresponding angles are congruent.
The definitions of sine, cosine, and tangent for acute angles are founded on right triangles and similarity,
and, with the Pythagorean Theorem, are fundamental in many real-world and theoretical situations. The
Pythagorean Theorem is generalized to non-right triangles by the Law of Cosines. Together, the Laws of
Sines and Cosines embody the triangle congruence criteria for the cases where three pieces of information
suffice to completely solve a triangle. Furthermore, these laws yield two possible solutions in the ambiguous
case, illustrating that Side-Side-Angle is not a congruence criterion.
Analytic geometry connects algebra and geometry, resulting in powerful methods of analysis and problem
solving. Just as the number line associates numbers with locations in one dimension, a pair of perpendicular
axes associates pairs of numbers with locations in two dimensions. This correspondence between numerical
coordinates and geometric points allows methods from algebra to be applied to geometry and vice versa. The
solution set of an equation becomes a geometric curve, making visualization a tool for doing and
understanding algebra. Geometric shapes can be described by equations, making algebraic manipulation into
a tool for geometric understanding, modeling, and proof. Geometric transformations of the graphs of
equations correspond to algebraic changes in their equations.
36 Massachusetts Curriculum Framework for Mathematics January 2011
Dynamic geometry environments provide students with experimental and modeling tools that allow them to
investigate geometric phenomena in much the same way as computer algebra systems allow them to
experiment with algebraic phenomena.
Connections to Equations. The correspondence between numerical coordinates and geometric points allows
methods from algebra to be applied to geometry and vice versa. The solution set of an equation becomes a
geometric curve, making visualization a tool for doing and understanding algebra. Geometric shapes can be
described by equations, making algebraic manipulation into a tool for geometric understanding, modeling,
and proof.
January 2011 Massachusetts Curriculum Framework for Mathematics Page 37
Geometry Overview Congruence
Experiment with transformations in the plane.
Understand congruence in terms of rigid motions.
Prove geometric theorems.
Make geometric constructions.
Similarity, Right Triangles, and Trigonometry
Understand similarity in terms of similarity
transformations.
Prove theorems involving similarity.
Define trigonometric ratios and solve problems
involving right triangles.
Apply trigonometry to general triangles.
Circles
Understand and apply theorems about circles.
Find arc lengths and areas of sectors of circles.
Expressing Geometric Properties with Equations
Translate between the geometric description and the equation
for a conic section.
Use coordinates to prove simple geometric theorems
algebraically.
Geometric Measurement and Dimension
Explain volume formulas and use them to solve problems.
Visualize relationships between two-dimensional and three-
dimensional objects.
Modeling with Geometry
Apply geometric concepts in modeling situations.
Standards for Mathematical Practice
1. Make sense of problems and persevere
in solving them.
2. Reason abstractly and quantitatively.
3. Construct viable arguments and
critique the reasoning of others.
4. Model with mathematics.
5. Use appropriate tools strategically.
6. Attend to precision.
7. Look for and make use of structure.
8. Look for and express regularity in
repeated reasoning.
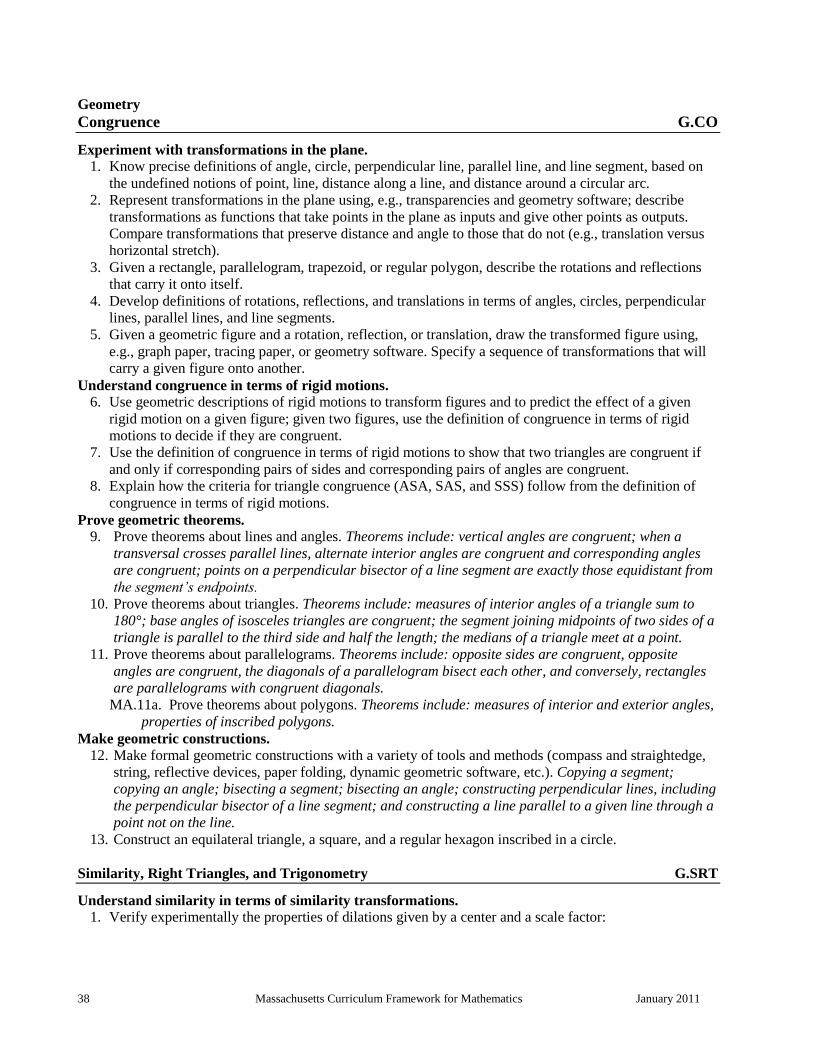
38 Massachusetts Curriculum Framework for Mathematics January 2011
Geometry
Congruence G.CO
Experiment with transformations in the plane.
1. Know precise definitions of angle, circle, perpendicular line, parallel line, and line segment, based on
the undefined notions of point, line, distance along a line, and distance around a circular arc.
2. Represent transformations in the plane using, e.g., transparencies and geometry software; describe
transformations as functions that take points in the plane as inputs and give other points as outputs.
Compare transformations that preserve distance and angle to those that do not (e.g., translation versus
horizontal stretch).
3. Given a rectangle, parallelogram, trapezoid, or regular polygon, describe the rotations and reflections
that carry it onto itself.
4. Develop definitions of rotations, reflections, and translations in terms of angles, circles, perpendicular
lines, parallel lines, and line segments.
5. Given a geometric figure and a rotation, reflection, or translation, draw the transformed figure using,
e.g., graph paper, tracing paper, or geometry software. Specify a sequence of transformations that will
carry a given figure onto another.
Understand congruence in terms of rigid motions.
6. Use geometric descriptions of rigid motions to transform figures and to predict the effect of a given
rigid motion on a given figure; given two figures, use the definition of congruence in terms of rigid
motions to decide if they are congruent.
7. Use the definition of congruence in terms of rigid motions to show that two triangles are congruent if
and only if corresponding pairs of sides and corresponding pairs of angles are congruent.
8. Explain how the criteria for triangle congruence (ASA, SAS, and SSS) follow from the definition of
congruence in terms of rigid motions.
Prove geometric theorems.
9. Prove theorems about lines and angles. Theorems include: vertical angles are congruent; when a
transversal crosses parallel lines, alternate interior angles are congruent and corresponding angles
are congruent; points on a perpendicular bisector of a line segment are exactly those equidistant from
the segment’s endpoints.
10. Prove theorems about triangles. Theorems include: measures of interior angles of a triangle sum to
180°; base angles of isosceles triangles are congruent; the segment joining midpoints of two sides of a
triangle is parallel to the third side and half the length; the medians of a triangle meet at a point.
11. Prove theorems about parallelograms. Theorems include: opposite sides are congruent, opposite
angles are congruent, the diagonals of a parallelogram bisect each other, and conversely, rectangles
are parallelograms with congruent diagonals.
MA.11a. Prove theorems about polygons. Theorems include: measures of interior and exterior angles,
properties of inscribed polygons.
Make geometric constructions.
12. Make formal geometric constructions with a variety of tools and methods (compass and straightedge,
string, reflective devices, paper folding, dynamic geometric software, etc.). Copying a segment;
copying an angle; bisecting a segment; bisecting an angle; constructing perpendicular lines, including
the perpendicular bisector of a line segment; and constructing a line parallel to a given line through a
point not on the line.
13. Construct an equilateral triangle, a square, and a regular hexagon inscribed in a circle.
Similarity, Right Triangles, and Trigonometry G.SRT
Understand similarity in terms of similarity transformations.
1. Verify experimentally the properties of dilations given by a center and a scale factor:
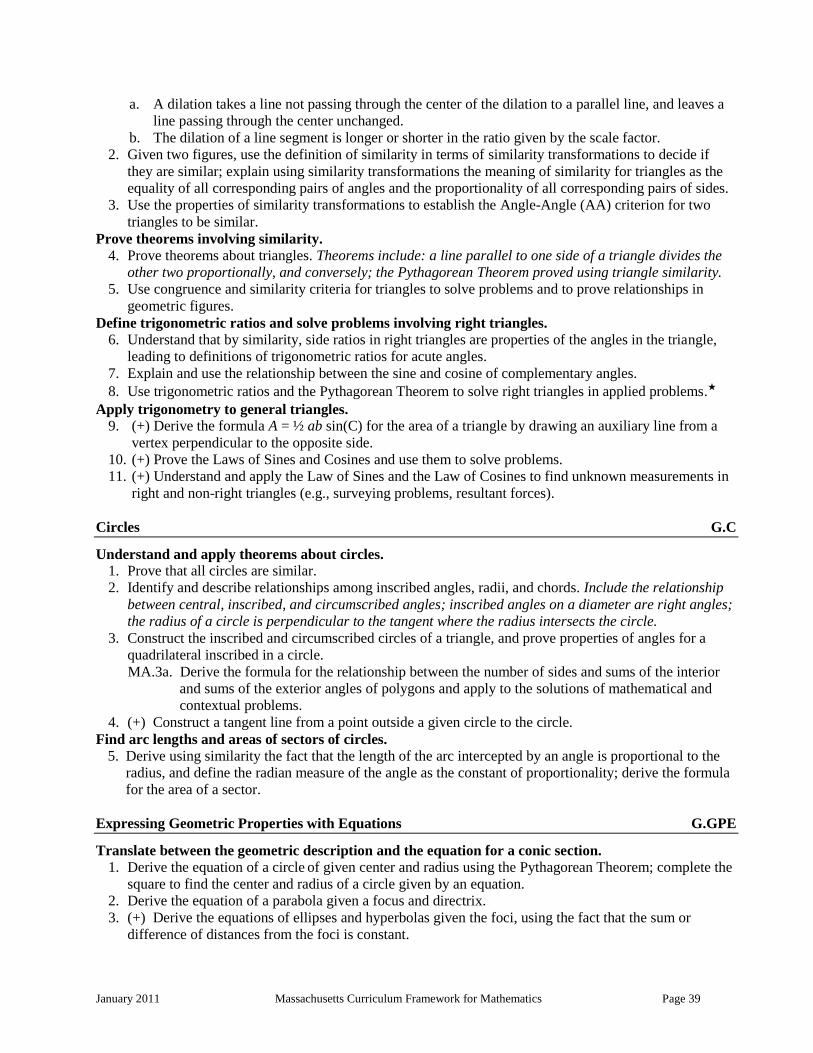
January 2011 Massachusetts Curriculum Framework for Mathematics Page 39
a. A dilation takes a line not passing through the center of the dilation to a parallel line, and leaves a
line passing through the center unchanged.
b. The dilation of a line segment is longer or shorter in the ratio given by the scale factor.
2. Given two figures, use the definition of similarity in terms of similarity transformations to decide if
they are similar; explain using similarity transformations the meaning of similarity for triangles as the
equality of all corresponding pairs of angles and the proportionality of all corresponding pairs of sides.
3. Use the properties of similarity transformations to establish the Angle-Angle (AA) criterion for two
triangles to be similar.
Prove theorems involving similarity.
4. Prove theorems about triangles. Theorems include: a line parallel to one side of a triangle divides the
other two proportionally, and conversely; the Pythagorean Theorem proved using triangle similarity.
5. Use congruence and similarity criteria for triangles to solve problems and to prove relationships in
geometric figures.
Define trigonometric ratios and solve problems involving right triangles.
6. Understand that by similarity, side ratios in right triangles are properties of the angles in the triangle,
leading to definitions of trigonometric ratios for acute angles.
7. Explain and use the relationship between the sine and cosine of complementary angles.
8. Use trigonometric ratios and the Pythagorean Theorem to solve right triangles in applied problems.★
Apply trigonometry to general triangles.
9. (+) Derive the formula A = ½ ab sin(C) for the area of a triangle by drawing an auxiliary line from a
vertex perpendicular to the opposite side.
10. (+) Prove the Laws of Sines and Cosines and use them to solve problems.
11. (+) Understand and apply the Law of Sines and the Law of Cosines to find unknown measurements in
right and non-right triangles (e.g., surveying problems, resultant forces).
Circles G.C
Understand and apply theorems about circles.
1. Prove that all circles are similar.
2. Identify and describe relationships among inscribed angles, radii, and chords. Include the relationship
between central, inscribed, and circumscribed angles; inscribed angles on a diameter are right angles;
the radius of a circle is perpendicular to the tangent where the radius intersects the circle.
3. Construct the inscribed and circumscribed circles of a triangle, and prove properties of angles for a
quadrilateral inscribed in a circle.
MA.3a. Derive the formula for the relationship between the number of sides and sums of the interior
and sums of the exterior angles of polygons and apply to the solutions of mathematical and
contextual problems.
4. (+) Construct a tangent line from a point outside a given circle to the circle.
Find arc lengths and areas of sectors of circles.
5. Derive using similarity the fact that the length of the arc intercepted by an angle is proportional to the
radius, and define the radian measure of the angle as the constant of proportionality; derive the formula
for the area of a sector.
Expressing Geometric Properties with Equations G.GPE
Translate between the geometric description and the equation for a conic section. 1. Derive the equation of a circle of given center and radius using the Pythagorean Theorem; complete the
square to find the center and radius of a circle given by an equation.
2. Derive the equation of a parabola given a focus and directrix.
3. (+) Derive the equations of ellipses and hyperbolas given the foci, using the fact that the sum or
difference of distances from the foci is constant.

40 Massachusetts Curriculum Framework for Mathematics January 2011
MA.3a (+) Use equations and graphs of conic sections to model real-world problems.
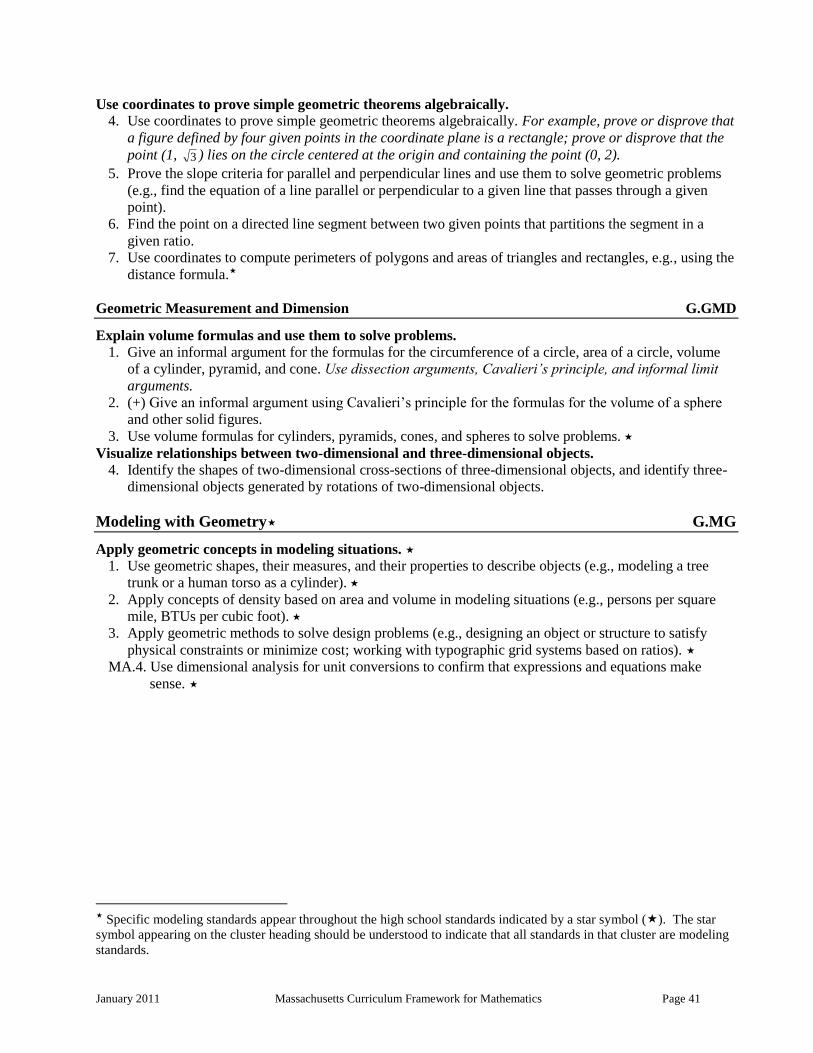
January 2011 Massachusetts Curriculum Framework for Mathematics Page 41
Use coordinates to prove simple geometric theorems algebraically.
4. Use coordinates to prove simple geometric theorems algebraically. For example, prove or disprove that
a figure defined by four given points in the coordinate plane is a rectangle; prove or disprove that the
point (1, 3 ) lies on the circle centered at the origin and containing the point (0, 2).
5. Prove the slope criteria for parallel and perpendicular lines and use them to solve geometric problems
(e.g., find the equation of a line parallel or perpendicular to a given line that passes through a given
point).
6. Find the point on a directed line segment between two given points that partitions the segment in a
given ratio.
7. Use coordinates to compute perimeters of polygons and areas of triangles and rectangles, e.g., using the
distance formula.
Geometric Measurement and Dimension G.GMD
Explain volume formulas and use them to solve problems.
1. Give an informal argument for the formulas for the circumference of a circle, area of a circle, volume
of a cylinder, pyramid, and cone. Use dissection arguments, Cavalieri’s principle, and informal limit
arguments.
2. (+) Give an informal argument using Cavalieri’s principle for the formulas for the volume of a sphere
and other solid figures.
3. Use volume formulas for cylinders, pyramids, cones, and spheres to solve problems.
Visualize relationships between two-dimensional and three-dimensional objects.
4. Identify the shapes of two-dimensional cross-sections of three-dimensional objects, and identify three-
dimensional objects generated by rotations of two-dimensional objects.
Modeling with Geometry G.MG
Apply geometric concepts in modeling situations.
1. Use geometric shapes, their measures, and their properties to describe objects (e.g., modeling a tree
trunk or a human torso as a cylinder).
2. Apply concepts of density based on area and volume in modeling situations (e.g., persons per square
mile, BTUs per cubic foot).
3. Apply geometric methods to solve design problems (e.g., designing an object or structure to satisfy
physical constraints or minimize cost; working with typographic grid systems based on ratios).
MA.4. Use dimensional analysis for unit conversions to confirm that expressions and equations make
sense.
Specific modeling standards appear throughout the high school standards indicated by a star symbol (). The star
symbol appearing on the cluster heading should be understood to indicate that all standards in that cluster are modeling
standards.
42 Massachusetts Curriculum Framework for Mathematics January 2011
Conceptual Category: Statistics and Probability
Decisions or predictions are often based on data—numbers in context. These decisions or predictions would
be easy if the data always sent a clear message, but the message is often obscured by variability. Statistics
provides tools for describing variability in data and for making informed decisions that take it into account.
Data are gathered, displayed, summarized, examined, and interpreted to discover patterns and deviations
from patterns. Quantitative data can be described in terms of key characteristics: measures of shape, center,
and spread. The shape of a data distribution might be described as symmetric, skewed, flat, or bell shaped,
and it might be summarized by a statistic measuring center (such as mean or median) and a statistic
measuring spread (such as standard deviation or interquartile range). Different distributions can be compared
numerically using these statistics or compared visually using plots. Knowledge of center and spread are not
enough to describe a distribution. Which statistics to compare, which plots to use, and what the results of a
comparison might mean, depend on the question to be investigated and the real-world actions to be taken.
Randomization has two important uses in drawing statistical conclusions. First, collecting data from a
random sample of a population makes it possible to draw valid conclusions about the whole population,
taking variability into account. Second, randomly assigning individuals to different treatments allows a fair
comparison of the effectiveness of those treatments. A statistically significant outcome is one that is unlikely
to be due to chance alone, and this can be evaluated only under the condition of randomness. The conditions
under which data are collected are important in drawing conclusions from the data; in critically reviewing
uses of statistics in public media and other reports, it is important to consider the study design, how the data
were gathered, and the analyses employed as well as the data summaries and the conclusions drawn.
Random processes can be described mathematically by using a probability model: a list or description of the
possible outcomes (the sample space), each of which is assigned a probability. In situations such as flipping
a coin, rolling a number cube, or drawing a card, it might be reasonable to assume various outcomes are
equally likely. In a probability model, sample points represent outcomes and combine to make up events;
probabilities of events can be computed by applying the Addition and Multiplication Rules. Interpreting
these probabilities relies on an understanding of independence and conditional probability, which can be
approached through the analysis of two-way tables.
Technology plays an important role in statistics and probability by making it possible to generate plots,
regression functions, and correlation coefficients, and to simulate many possible outcomes in a short amount
of time.
Connections to Functions and Modeling. Functions may be used to describe data; if the data suggest a
linear relationship, the relationship can be modeled with a regression line, and its strength and direction can
be expressed through a correlation coefficient.
Specific modeling standards appear throughout the high school standards indicated by a star symbol (). The star
symbol appearing on the cluster heading should be understood to indicate that all standards in that cluster are modeling
standards.
January 2011 Massachusetts Curriculum Framework for Mathematics Page 43
Statistics and Probability Overview
Interpreting Categorical and Quantitative Data
Summarize, represent, and interpret data on a single
count or measurement variable.
Summarize, represent, and interpret data on two
categorical and quantitative variables.
Interpret linear models.
Making Inferences and Justifying Conclusions
Understand and evaluate random processes underlying
statistical experiments.
Make inferences and justify conclusions from sample
surveys, experiments and observational studies.
Conditional Probability and the Rules of Probability
Understand independence and conditional probability and use
them to interpret data.
Use the rules of probability to compute probabilities of
compound events in a uniform probability model.
Using Probability to Make Decisions
Calculate expected values and use them to solve problems.
Use probability to evaluate outcomes of decisions.
Standards for Mathematical Practice
1. Make sense of problems and persevere
in solving them.
2. Reason abstractly and quantitatively.
3. Construct viable arguments and
critique the reasoning of others.
4. Model with mathematics.
5. Use appropriate tools strategically.
6. Attend to precision.
7. Look for and make use of structure.
8. Look for and express regularity in
repeated reasoning.
44 Massachusetts Curriculum Framework for Mathematics January 2011
Statistics and Probability
Interpreting Categorical and Quantitative Data S.ID
Summarize, represent, and interpret data on a single count or measurement variable.
1. Represent data with plots on the real number line (dot plots, histograms, and box plots).
2. Use statistics appropriate to the shape of the data distribution to compare center (median, mean) and
spread (interquartile range, standard deviation) of two or more different data sets.
3. Interpret differences in shape, center, and spread in the context of the data sets, accounting for possible
effects of extreme data points (outliers).
4. Use the mean and standard deviation of a data set to fit it to a normal distribution and to estimate
population percentages. Recognize that there are data sets for which such a procedure is not
appropriate. Use calculators, spreadsheets, and tables to estimate areas under the normal curve.
Summarize, represent, and interpret data on two categorical and quantitative variables. 5. Summarize categorical data for two categories in two-way frequency tables. Interpret relative
frequencies in the context of the data (including joint, marginal, and conditional relative frequencies).
Recognize possible associations and trends in the data.
6. Represent data on two quantitative variables on a scatter plot, and describe how the variables are
related.
a. Fit a function to the data; use functions fitted to data to solve problems in the context of the data.
Use given functions or choose a function suggested by the context. Emphasize linear, quadratic,
and exponential models.
b. Informally assess the fit of a function by plotting and analyzing residuals.
c. Fit a linear function for a scatter plot that suggests a linear association.
Interpret linear models.
7. Interpret the slope (rate of change) and the intercept (constant term) of a linear model in the context of
the data.
8. Compute (using technology) and interpret the correlation coefficient of a linear fit.
9. Distinguish between correlation and causation.
Making Inferences and Justifying Conclusions S.IC
Understand and evaluate random processes underlying statistical experiments. 1. Understand statistics as a process for making inferences to be made about population parameters based
on a random sample from that population.
2. Decide if a specified model is consistent with results from a given data-generating process, e.g., using
simulation. For example, a model says a spinning coin falls heads up with probability 0.5. Would a
result of 5 tails in a row cause you to question the model?
Make inferences and justify conclusions from sample surveys, experiments, and observational
studies. 3. Recognize the purposes of and differences among sample surveys, experiments, and observational
studies; explain how randomization relates to each.
4. Use data from a sample survey to estimate a population mean or proportion; develop a margin of error
through the use of simulation models for random sampling.
5. Use data from a randomized experiment to compare two treatments; use simulations to decide if
differences between parameters are significant.
6. Evaluate reports based on data.
Specific modeling standards appear throughout the high school standards indicated by a star symbol (). The star
symbol appearing on the cluster heading should be understood to indicate that all standards in that cluster are modeling
standards.
January 2011 Massachusetts Curriculum Framework for Mathematics Page 45
Conditional Probability and the Rules of Probability S.CP
Understand independence and conditional probability and use them to interpret data. 1. Describe events as subsets of a sample space (the set of outcomes) using characteristics (or categories)
of the outcomes, or as unions, intersections, or complements of other events (―or,‖ ―and,‖ ―not‖).
2. Understand that two events A and B are independent if the probability of A and B occurring together is
the product of their probabilities, and use this characterization to determine if they are independent.
3. Understand the conditional probability of A given B as P(A and B)/P(B), and interpret independence of
A and B as saying that the conditional probability of A given B is the same as the probability of A, and
the conditional probability of B given A is the same as the probability of B.
4. Construct and interpret two-way frequency tables of data when two categories are associated with each
object being classified. Use the two-way table as a sample space to decide if events are independent and
to approximate conditional probabilities. For example, collect data from a random sample of students
in your school on their favorite subject among math, science, and English. Estimate the probability that
a randomly selected student from your school will favor science given that the student is in tenth grade.
Do the same for other subjects and compare the results.
5. Recognize and explain the concepts of conditional probability and independence in everyday language
and everyday situations. For example, compare the chance of having lung cancer if you are a smoker
with the chance of being a smoker if you have lung cancer.
Use the rules of probability to compute probabilities of compound events in a uniform probability
model. 6. Find the conditional probability of A given B as the fraction of B’s outcomes that also belong to A, and
interpret the answer in terms of the model.
7. Apply the Addition Rule, P(A or B) = P(A) + P(B) – P(A and B), and interpret the answer in terms of
the model.
8. (+) Apply the general Multiplication Rule in a uniform probability model,
P(A and B) = P(A)P(B|A) = P(B)P(A|B), and interpret the answer in terms of the model.
9. (+) Use permutations and combinations to compute probabilities of compound events and solve
problems.
Using Probability to Make Decisions S.MD
Calculate expected values and use them to solve problems. 1. (+) Define a random variable for a quantity of interest by assigning a numerical value to each event in a
sample space; graph the corresponding probability distribution using the same graphical displays as for
data distributions.
2. (+) Calculate the expected value of a random variable; interpret it as the mean of the probability
distribution.
3. (+) Develop a probability distribution for a random variable defined for a sample space in which
theoretical probabilities can be calculated; find the expected value. For example, find the theoretical
probability distribution for the number of correct answers obtained by guessing on all five questions of
a multiple-choice test where each question has four choices, and find the expected grade under various
grading schemes.
4. (+) Develop a probability distribution for a random variable defined for a sample space in which
probabilities are assigned empirically; find the expected value. For example, find a current data
distribution on the number of TV sets per household in the United States, and calculate the expected
Specific modeling standards appear throughout the high school standards indicated by a star symbol (). The star
symbol appearing on the cluster heading should be understood to indicate that all standards in that cluster are modeling
standards.
46 Massachusetts Curriculum Framework for Mathematics January 2011
number of sets per household. How many TV sets would you expect to find in 100 randomly selected
households?
Use probability to evaluate outcomes of decisions. 5. (+) Weigh the possible outcomes of a decision by assigning probabilities to payoff values and finding
expected values.
a. Find the expected payoff for a game of chance. For example, find the expected winnings from a
state lottery ticket or a game at a fast-food restaurant.
b. Evaluate and compare strategies on the basis of expected values. For example, compare a high-
deductible versus a low-deductible automobile insurance policy using various, but reasonable,
chances of having a minor or a major accident.
6. (+) Use probabilities to make fair decisions (e.g., drawing by lots, using a random number generator).
7. (+) Analyze decisions and strategies using probability concepts (e.g., product testing, medical testing,
pulling [out] a hockey goalie at the end of a game).
Massachusetts Curriculum Framework for Mathematics Page 47 of 104 Draft for Board November 12, 2010
High School Model Pathways and Courses
Transition from Grade 8 to Algebra I or Mathematics I The pre-kindergarten to grade 8 standards present a coherent progression of concepts and skills that will
prepare students for Algebra I or Mathematics I. Students will need to master the grades 6-8 standards in
order to be prepared for the model Algebra I or Mathematics I course presented in this document. Some
students may master the 2011 grade 8 standards earlier than grade 8 which would enable these students to
take the model high school Algebra I or Mathematics I course in grade 8.
The 2011 grade 8 standards are rigorous and students are expected to learn about linear relationships and
equations, to begin the study of functions and compare rational and irrational numbers. In addition, the
statistics presented in the grade 8 standards are more sophisticated and include connecting linear relations
with the representation of bivariate data. The model Algebra I and Mathematics I courses progress from
these concepts and skills and focus on quadratic and exponential functions. Thus, the 2011 model Algebra I
course is a more advanced course than the Algebra I course identified in our 2000 framework. Likewise, the
Mathematics I course is also designed to follow the more rigorous 2011 grade 8 standards.
Development of High School Model Pathways and Courses6
The 2011 grades 9–12 high school mathematics standards presented by conceptual categories provide
guidance on what students are expected to learn in order to be prepared for college and careers. These
standards do not indicate the sequence of high school courses. In Massachusetts we received requests for
additional guidance about how these 9–12 standards might be configured into model high school courses and
represent a smooth transition from the grades prek-8 standards.
Achieve (in partnership with the Common Core writing team) convened a group of experts, including state
mathematics experts, teachers, mathematics faculty from two and four year institutions, mathematics teacher
educators, and workforce representatives to develop Model Course Pathways in Mathematics based on the
Common Core State Standards that would reflect a logical progression from the pre-K–8 standards. The
Pathways, Traditional (Algebra I, Geometry, and Algebra II) and Integrated (Mathematics I, Mathematics II,
and Mathematics III), are presented in the June 2010 Common Core State Standards for Mathematics
Appendix A: Designing High School Mathematics Courses Based on the Common Core State Standards for
Mathematics.
The Department of Elementary and Secondary Education convened high school teachers, higher education
faculty, and business leaders to review the two model pathways and related courses, and create additional
model courses for students to enter after completing either pathway. The resulting Pathways and courses
were presented to the Board of Elementary and Secondary Education as the model courses to be included in
the 2011 Massachusetts Mathematics Curriculum Framework.
The Pathways
All of the high school content standards (originally presented by conceptual categories) that specify the
mathematics all students should study for college and career readiness7 are included in appropriate locations
within the three courses of both Pathways. Students completing the three courses that comprise the
Traditional Pathway or the three courses that comprise the Integrated Pathway are prepared for additional
courses in higher level math comprised of the (+) standards. There are two such advanced model courses
defined in this document: Precalculus and Advanced Quantitative Reasoning.
6 Adapted from the Common Core State Standards for Mathematics and Appendix A: Designing High School Courses
based on the Common Core State Standards for Mathematics 7 In select cases (+) standards are included in Pathway model courses to maintain mathematical coherence.
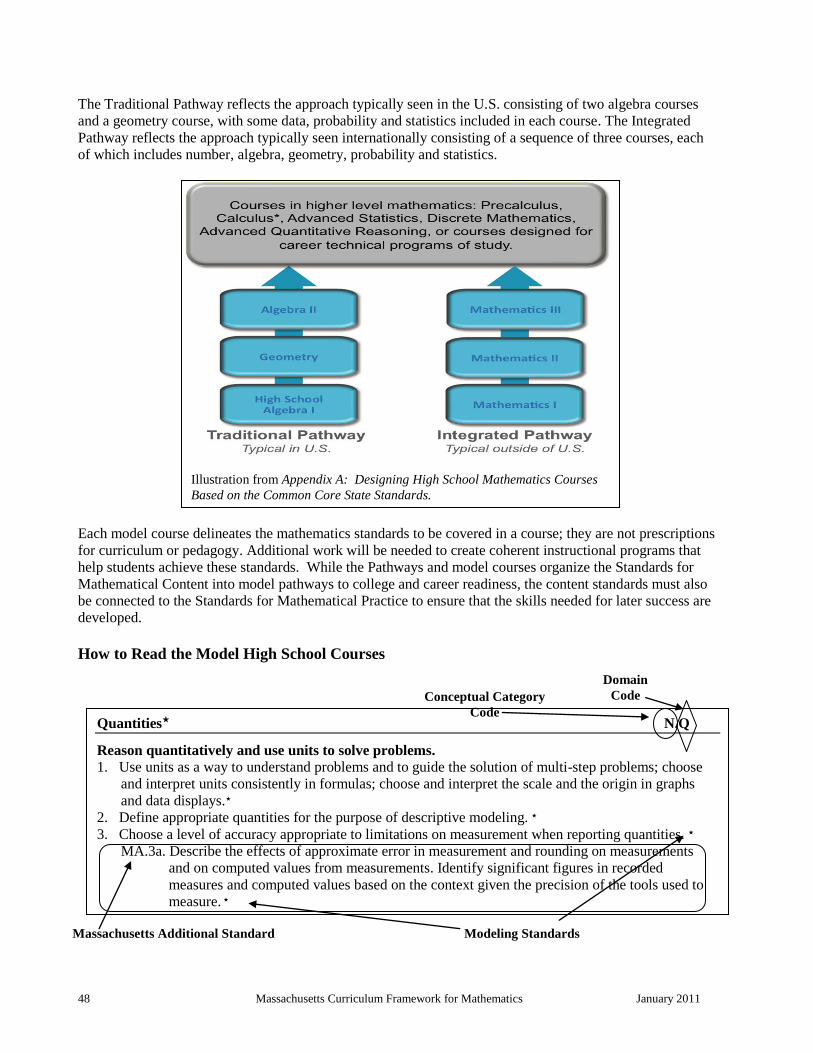
48 Massachusetts Curriculum Framework for Mathematics January 2011
The Traditional Pathway reflects the approach typically seen in the U.S. consisting of two algebra courses
and a geometry course, with some data, probability and statistics included in each course. The Integrated
Pathway reflects the approach typically seen internationally consisting of a sequence of three courses, each
of which includes number, algebra, geometry, probability and statistics.
Each model course delineates the mathematics standards to be covered in a course; they are not prescriptions
for curriculum or pedagogy. Additional work will be needed to create coherent instructional programs that
help students achieve these standards. While the Pathways and model courses organize the Standards for
Mathematical Content into model pathways to college and career readiness, the content standards must also
be connected to the Standards for Mathematical Practice to ensure that the skills needed for later success are
developed.
How to Read the Model High School Courses
Illustration from Appendix A: Designing High School Mathematics Courses
Based on the Common Core State Standards.
Quantities N.Q
Reason quantitatively and use units to solve problems.
1. Use units as a way to understand problems and to guide the solution of multi-step problems; choose
and interpret units consistently in formulas; choose and interpret the scale and the origin in graphs
and data displays.
2. Define appropriate quantities for the purpose of descriptive modeling.
3. Choose a level of accuracy appropriate to limitations on measurement when reporting quantities.
MA.3a. Describe the effects of approximate error in measurement and rounding on measurements
and on computed values from measurements. Identify significant figures in recorded
measures and computed values based on the context given the precision of the tools used to
measure.
Conceptual Category
Code
Domain
Code
Massachusetts Additional Standard Modeling Standards
Massachusetts Curriculum Framework for Mathematics Page 49 of 104 Draft for Board November 12, 2010
The unique identifier for the standards containing the conceptual category code, the domain code, and stand-
ard number will continue to be used to code standards as they appear in the model courses. The specific
modeling standards will be identified with the star symbol ()
The format of the model courses follows that of the pre-K – 8 grade-level standards. Each course begins
with an introduction that describes the critical areas, and an overview that identifies the conceptual
categories, domains, and cluster headings of the standards in the course. The introduction, domain and
cluster headings help to illustrate the relationships between the standards, and are integral parts of the course.
Footnotes
It is important to note that some standards are repeated in two or more courses within a Pathway. Footnotes
have been included in the courses in order to clarify what aspect(s) of a standard is appropriate for each
course. The footnotes are an important part of the standards for each course. For example, ―N.RN.1 Explain
how the definition of the meaning of rational exponents follows from extending the properties of integer
exponents to those values, allowing for a notation for radicals in terms of rational exponents‖ is included in
the Algebra I and Algebra II courses. The footnote in Algebra I, ―Introduce rational exponents for square and
cube roots in Algebra I and expand to include other rational exponents in Algebra II‖ indicates that rational
exponents should be limited to square and cube roots. The footnote in Algebra II, ―Expand understanding of
rational exponents to all uses‖ indicates that other applications of rational exponents should be included in
Algebra II.
Importance of Modeling in High School
Modeling (indicated by a in the standards) is defined as both a conceptual category for high school
mathematics and a mathematical practice and is an important avenue for motivating students to study
mathematics, for building their understanding of mathematics, and for preparing them for future success.
Development of the pathways into instructional programs will require careful attention to modeling and the
mathematical practices. Assessments based on these pathways should reflect both the content and standards
for mathematical practice.
50 Massachusetts Curriculum Framework for Mathematics January 2011
Traditional Pathway
Model Course: High School Algebra I8
The fundamental purpose of Algebra I is to formalize and extend the mathematics that students learned in the
middle grades. The course contains standards from the High School Conceptual Categories, each of which
were written to encompass the scope of content and skills to be addressed throughout grades 9–12 not in any
single course. Therefore, the full standard is presented in each model course, with clarifying footnotes as
needed to limit the scope of the standard and indicate what is appropriate for study in a particular course. For
example, the scope of Algebra I is limited to linear, quadratic, and exponential expressions and functions as
well as some work with absolute value, step, and functions that are piecewise-defined; therefore, although a
standard may include references to logarithms or trigonometry, those functions are not be included in the
work of Algebra I students, rather they will be addressed in Algebra II. Reminders of this limitation are
included as footnotes where appropriate in the Algebra I standards.
Algebra I has four critical areas that deepen and extend understanding of linear and exponential relationships
by contrasting them with each other and by applying linear models to data that exhibit a linear trend.
Students engage in methods for analyzing, solving and using quadratic functions. The Standards for
Mathematical Practice apply throughout the course and, together with the content standards, prescribe that
students experience mathematics as a coherent, useful, and logical subject that makes use of their ability to
make sense of problem situations.
(1) By the end of eighth grade, students have learned to solve linear equations in one variable and
have applied graphical and algebraic methods to analyze and solve systems of linear equations in
two variables. In this course students analyze and explain the process of solving an equation and
justify the process used in solving a system of equations. Students develop fluency writing,
interpreting, and translating between various forms of linear equations and inequalities, and
using them to solve problems. They master the solution of linear equations and apply related
solution techniques and the laws of exponents to the creation and solution of simple exponential
equations.
(2) In earlier grades, students define, evaluate, and compare functions, and use them to model
relationships between quantities. Students will learn function notation and develop the concepts
of domain and range. They focus on linear, quadratic, and exponential functions, including
sequences, and also explore absolute value, step, and piecewise-defined functions; they interpret
functions given graphically, numerically, symbolically, and verbally, translate between
representations, and understand the limitations of various representations. Students build on and
extend their understanding of integer exponents to consider exponential functions. They
compare and contrast linear and exponential functions, distinguishing between additive and
multiplicative change. Students explore systems of equations and inequalities, and they find and
interpret their solutions. They interpret arithmetic sequences as linear functions and geometric
sequences as exponential functions.
(3) Students extend the laws of exponents to rational exponents involving square and cube roots and apply this new understanding of number; they strengthen their ability to see structure in and create quadratic and exponential expressions. They create and solve equations, inequalities, and systems of equations involving quadratic expressions. Students become facile with algebraic manipulation, including rearranging and collecting terms, factoring, identifying and canceling
8 Adapted from the Common Core State Standards for Mathematics and Appendix A: Designing High School Courses
based on the Common Core State Standards for Mathematics
Massachusetts Curriculum Framework for Mathematics Page 51 of 104 Draft for Board November 12, 2010
common factors in rational expressions. Students consider quadratic functions, comparing the key characteristics of quadratic functions to those of linear and exponential functions. They select from among these functions to model phenomena. Students learn to anticipate the graph of a quadratic function by interpreting various forms of quadratic expressions. In particular, they identify the real solutions of a quadratic equation as the zeros of a related quadratic function. Students expand their experience with functions to include more specialized functions—absolute value, step, and those that are piecewise-defined.
(4) Building upon prior students’ prior experiences with data, students explore a more formal means
of assessing how a model fits data. Students use regression techniques to describe approximately
linear relationships between quantities. They use graphical representations and knowledge of the
context to make judgments about the appropriateness of linear models. With linear models, they
look at residuals to analyze the goodness of fit.
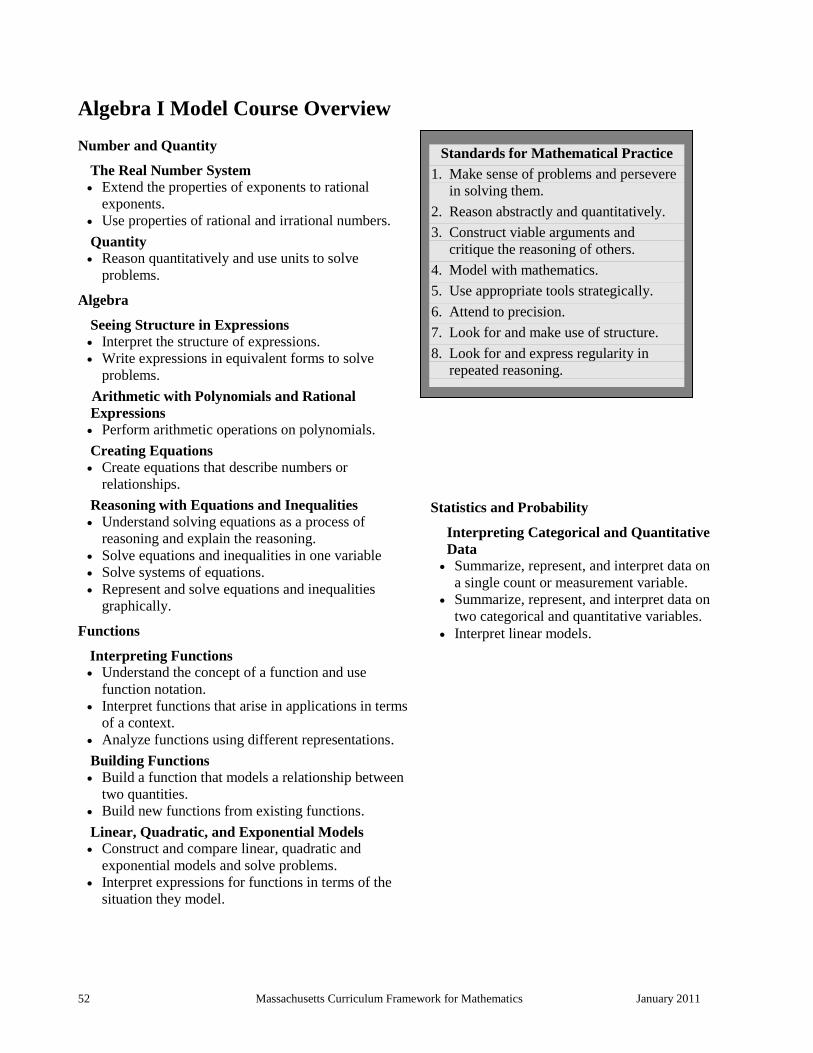
52 Massachusetts Curriculum Framework for Mathematics January 2011
Algebra I Model Course Overview
Number and Quantity
The Real Number System
Extend the properties of exponents to rational
exponents.
Use properties of rational and irrational numbers.
Quantity
Reason quantitatively and use units to solve
problems.
Algebra
Seeing Structure in Expressions
Interpret the structure of expressions.
Write expressions in equivalent forms to solve
problems.
Arithmetic with Polynomials and Rational
Expressions
Perform arithmetic operations on polynomials.
Creating Equations
Create equations that describe numbers or
relationships.
Reasoning with Equations and Inequalities
Understand solving equations as a process of
reasoning and explain the reasoning.
Solve equations and inequalities in one variable
Solve systems of equations.
Represent and solve equations and inequalities
graphically.
Functions
Interpreting Functions
Understand the concept of a function and use
function notation.
Interpret functions that arise in applications in terms
of a context.
Analyze functions using different representations.
Building Functions
Build a function that models a relationship between
two quantities.
Build new functions from existing functions.
Linear, Quadratic, and Exponential Models
Construct and compare linear, quadratic and
exponential models and solve problems.
Interpret expressions for functions in terms of the
situation they model.
Statistics and Probability
Interpreting Categorical and Quantitative
Data Summarize, represent, and interpret data on
a single count or measurement variable.
Summarize, represent, and interpret data on
two categorical and quantitative variables.
Interpret linear models.
Standards for Mathematical Practice
1. Make sense of problems and persevere
in solving them.
2. Reason abstractly and quantitatively.
3. Construct viable arguments and
critique the reasoning of others.
4. Model with mathematics.
5. Use appropriate tools strategically.
6. Attend to precision.
7. Look for and make use of structure.
8. Look for and express regularity in
repeated reasoning.
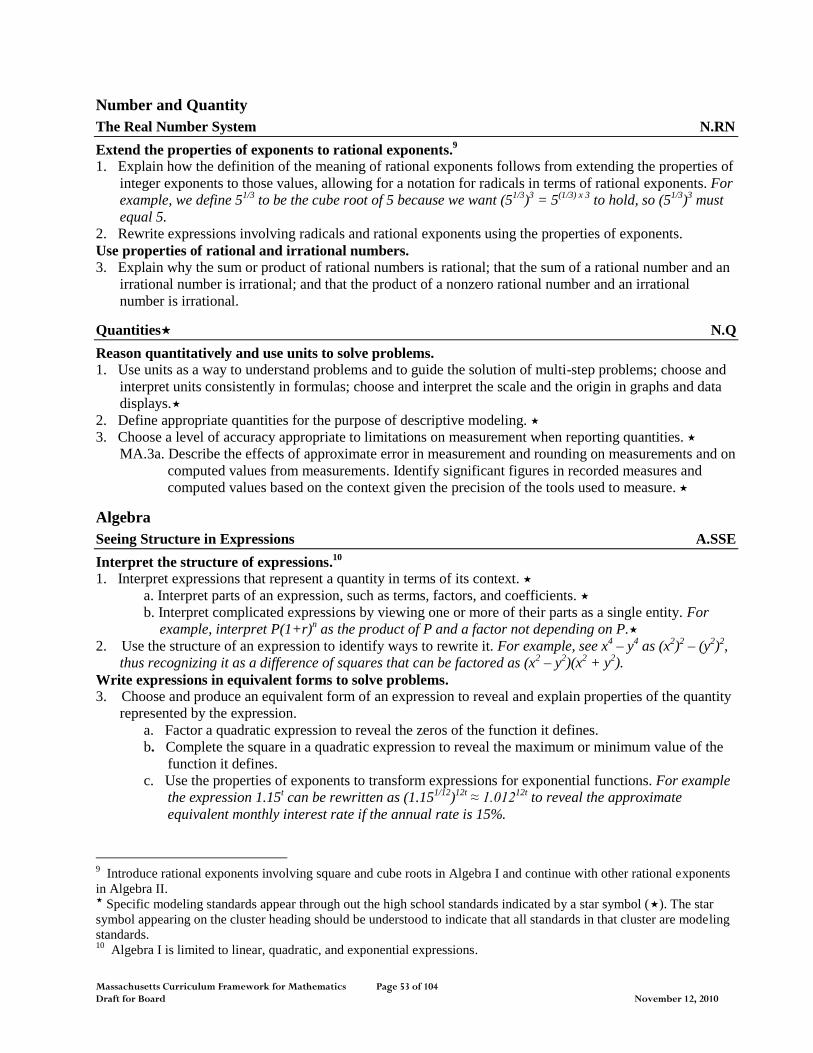
Massachusetts Curriculum Framework for Mathematics Page 53 of 104 Draft for Board November 12, 2010
Number and Quantity
The Real Number System N.RN
Extend the properties of exponents to rational exponents.9
1. Explain how the definition of the meaning of rational exponents follows from extending the properties of
integer exponents to those values, allowing for a notation for radicals in terms of rational exponents. For
example, we define 51/3
to be the cube root of 5 because we want (51/3
)3 = 5
(1/3) x 3 to hold, so (5
1/3)
3 must
equal 5.
2. Rewrite expressions involving radicals and rational exponents using the properties of exponents.
Use properties of rational and irrational numbers.
3. Explain why the sum or product of rational numbers is rational; that the sum of a rational number and an
irrational number is irrational; and that the product of a nonzero rational number and an irrational
number is irrational.
Quantities N.Q
Reason quantitatively and use units to solve problems.
1. Use units as a way to understand problems and to guide the solution of multi-step problems; choose and
interpret units consistently in formulas; choose and interpret the scale and the origin in graphs and data
displays.
2. Define appropriate quantities for the purpose of descriptive modeling.
3. Choose a level of accuracy appropriate to limitations on measurement when reporting quantities.
MA.3a. Describe the effects of approximate error in measurement and rounding on measurements and on
computed values from measurements. Identify significant figures in recorded measures and
computed values based on the context given the precision of the tools used to measure.
Algebra
Seeing Structure in Expressions A.SSE
Interpret the structure of expressions.10
1. Interpret expressions that represent a quantity in terms of its context.
a. Interpret parts of an expression, such as terms, factors, and coefficients.
b. Interpret complicated expressions by viewing one or more of their parts as a single entity. For
example, interpret P(1+r)n as the product of P and a factor not depending on P.
2. Use the structure of an expression to identify ways to rewrite it. For example, see x4 – y
4 as (x
2)
2 – (y
2)
2,
thus recognizing it as a difference of squares that can be factored as (x2 – y
2)(x
2 + y
2).
Write expressions in equivalent forms to solve problems.
3. Choose and produce an equivalent form of an expression to reveal and explain properties of the quantity
represented by the expression.
a. Factor a quadratic expression to reveal the zeros of the function it defines.
b. Complete the square in a quadratic expression to reveal the maximum or minimum value of the
function it defines.
c. Use the properties of exponents to transform expressions for exponential functions. For example
the expression 1.15t can be rewritten as (1.15
1/12)
12t ≈ 1.012
12t to reveal the approximate
equivalent monthly interest rate if the annual rate is 15%.
9 Introduce rational exponents involving square and cube roots in Algebra I and continue with other rational exponents
in Algebra II. Specific modeling standards appear through out the high school standards indicated by a star symbol (). The star
symbol appearing on the cluster heading should be understood to indicate that all standards in that cluster are modeling
standards. 10
Algebra I is limited to linear, quadratic, and exponential expressions.
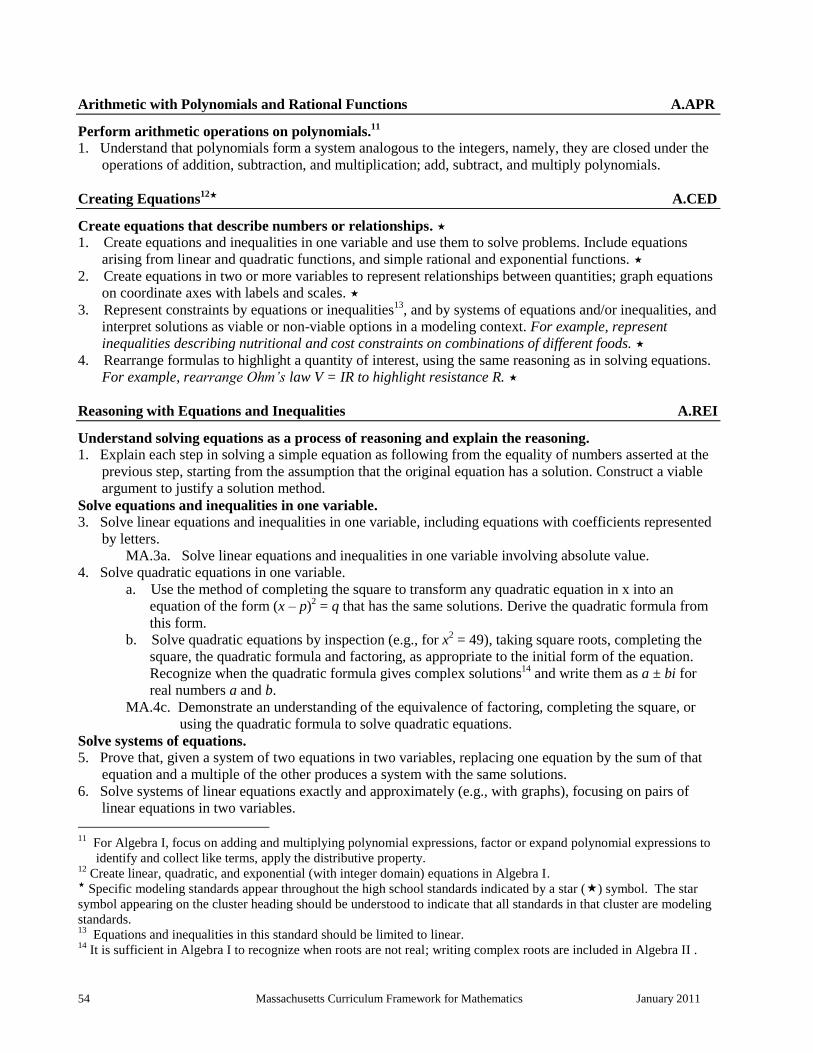
54 Massachusetts Curriculum Framework for Mathematics January 2011
Arithmetic with Polynomials and Rational Functions A.APR
Perform arithmetic operations on polynomials.11
1. Understand that polynomials form a system analogous to the integers, namely, they are closed under the
operations of addition, subtraction, and multiplication; add, subtract, and multiply polynomials.
Creating Equations12 A.CED
Create equations that describe numbers or relationships.
1. Create equations and inequalities in one variable and use them to solve problems. Include equations
arising from linear and quadratic functions, and simple rational and exponential functions.
2. Create equations in two or more variables to represent relationships between quantities; graph equations
on coordinate axes with labels and scales.
3. Represent constraints by equations or inequalities13
, and by systems of equations and/or inequalities, and
interpret solutions as viable or non-viable options in a modeling context. For example, represent
inequalities describing nutritional and cost constraints on combinations of different foods.
4. Rearrange formulas to highlight a quantity of interest, using the same reasoning as in solving equations.
For example, rearrange Ohm’s law V = IR to highlight resistance R.
Reasoning with Equations and Inequalities A.REI
Understand solving equations as a process of reasoning and explain the reasoning.
1. Explain each step in solving a simple equation as following from the equality of numbers asserted at the
previous step, starting from the assumption that the original equation has a solution. Construct a viable
argument to justify a solution method.
Solve equations and inequalities in one variable.
3. Solve linear equations and inequalities in one variable, including equations with coefficients represented
by letters.
MA.3a. Solve linear equations and inequalities in one variable involving absolute value.
4. Solve quadratic equations in one variable.
a. Use the method of completing the square to transform any quadratic equation in x into an
equation of the form (x – p)2 = q that has the same solutions. Derive the quadratic formula from
this form.
b. Solve quadratic equations by inspection (e.g., for x2 = 49), taking square roots, completing the
square, the quadratic formula and factoring, as appropriate to the initial form of the equation.
Recognize when the quadratic formula gives complex solutions14
and write them as a ± bi for
real numbers a and b.
MA.4c. Demonstrate an understanding of the equivalence of factoring, completing the square, or
using the quadratic formula to solve quadratic equations.
Solve systems of equations.
5. Prove that, given a system of two equations in two variables, replacing one equation by the sum of that
equation and a multiple of the other produces a system with the same solutions.
6. Solve systems of linear equations exactly and approximately (e.g., with graphs), focusing on pairs of
linear equations in two variables.
11
For Algebra I, focus on adding and multiplying polynomial expressions, factor or expand polynomial expressions to
identify and collect like terms, apply the distributive property. 12
Create linear, quadratic, and exponential (with integer domain) equations in Algebra I. Specific modeling standards appear throughout the high school standards indicated by a star () symbol. The star
symbol appearing on the cluster heading should be understood to indicate that all standards in that cluster are modeling
standards. 13
Equations and inequalities in this standard should be limited to linear. 14
It is sufficient in Algebra I to recognize when roots are not real; writing complex roots are included in Algebra II .
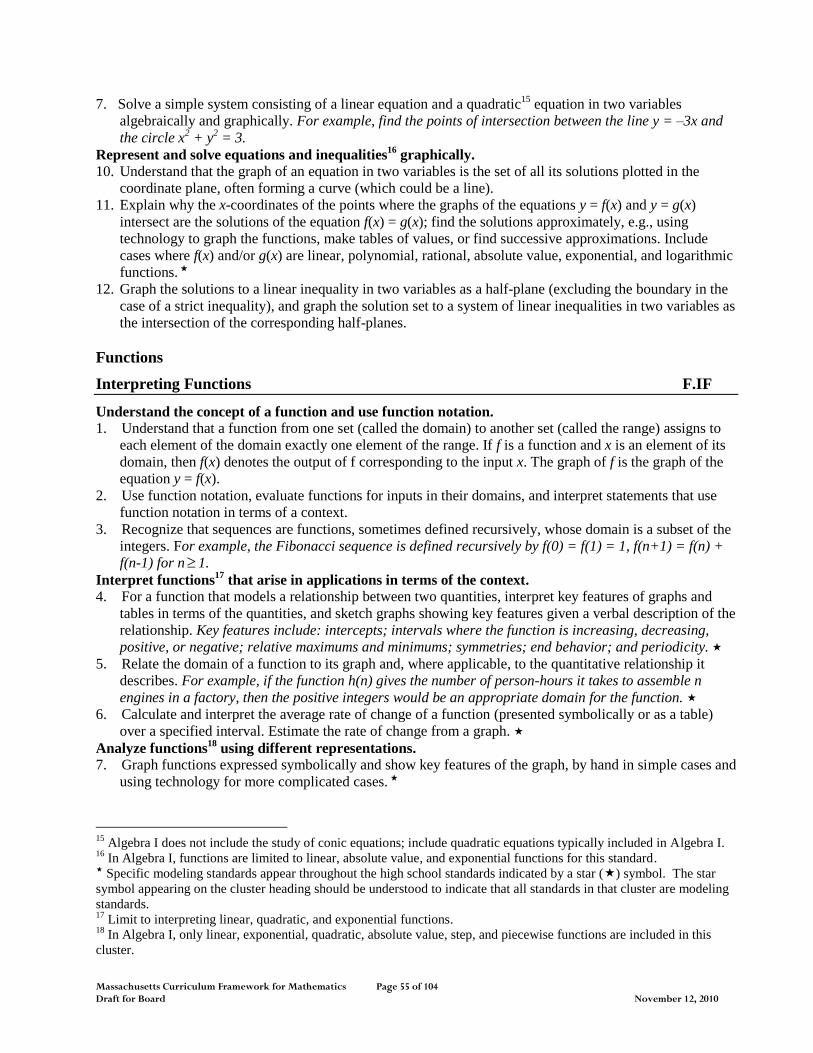
Massachusetts Curriculum Framework for Mathematics Page 55 of 104 Draft for Board November 12, 2010
7. Solve a simple system consisting of a linear equation and a quadratic15
equation in two variables
algebraically and graphically. For example, find the points of intersection between the line y = –3x and
the circle x2 + y
2 = 3.
Represent and solve equations and inequalities16
graphically.
10. Understand that the graph of an equation in two variables is the set of all its solutions plotted in the
coordinate plane, often forming a curve (which could be a line).
11. Explain why the x-coordinates of the points where the graphs of the equations y = f(x) and y = g(x)
intersect are the solutions of the equation f(x) = g(x); find the solutions approximately, e.g., using
technology to graph the functions, make tables of values, or find successive approximations. Include
cases where f(x) and/or g(x) are linear, polynomial, rational, absolute value, exponential, and logarithmic
functions.
12. Graph the solutions to a linear inequality in two variables as a half-plane (excluding the boundary in the
case of a strict inequality), and graph the solution set to a system of linear inequalities in two variables as
the intersection of the corresponding half-planes.
Functions
Interpreting Functions F.IF
Understand the concept of a function and use function notation.
1. Understand that a function from one set (called the domain) to another set (called the range) assigns to
each element of the domain exactly one element of the range. If f is a function and x is an element of its
domain, then f(x) denotes the output of f corresponding to the input x. The graph of f is the graph of the
equation y = f(x).
2. Use function notation, evaluate functions for inputs in their domains, and interpret statements that use
function notation in terms of a context.
3. Recognize that sequences are functions, sometimes defined recursively, whose domain is a subset of the
integers. For example, the Fibonacci sequence is defined recursively by f(0) = f(1) = 1, f(n+1) = f(n) +
f(n-1) for n 1.
Interpret functions17
that arise in applications in terms of the context.
4. For a function that models a relationship between two quantities, interpret key features of graphs and
tables in terms of the quantities, and sketch graphs showing key features given a verbal description of the
relationship. Key features include: intercepts; intervals where the function is increasing, decreasing,
positive, or negative; relative maximums and minimums; symmetries; end behavior; and periodicity.
5. Relate the domain of a function to its graph and, where applicable, to the quantitative relationship it
describes. For example, if the function h(n) gives the number of person-hours it takes to assemble n
engines in a factory, then the positive integers would be an appropriate domain for the function.
6. Calculate and interpret the average rate of change of a function (presented symbolically or as a table)
over a specified interval. Estimate the rate of change from a graph.
Analyze functions18
using different representations.
7. Graph functions expressed symbolically and show key features of the graph, by hand in simple cases and
using technology for more complicated cases.
15
Algebra I does not include the study of conic equations; include quadratic equations typically included in Algebra I. 16
In Algebra I, functions are limited to linear, absolute value, and exponential functions for this standard. Specific modeling standards appear throughout the high school standards indicated by a star () symbol. The star
symbol appearing on the cluster heading should be understood to indicate that all standards in that cluster are modeling
standards. 17
Limit to interpreting linear, quadratic, and exponential functions. 18
In Algebra I, only linear, exponential, quadratic, absolute value, step, and piecewise functions are included in this
cluster.
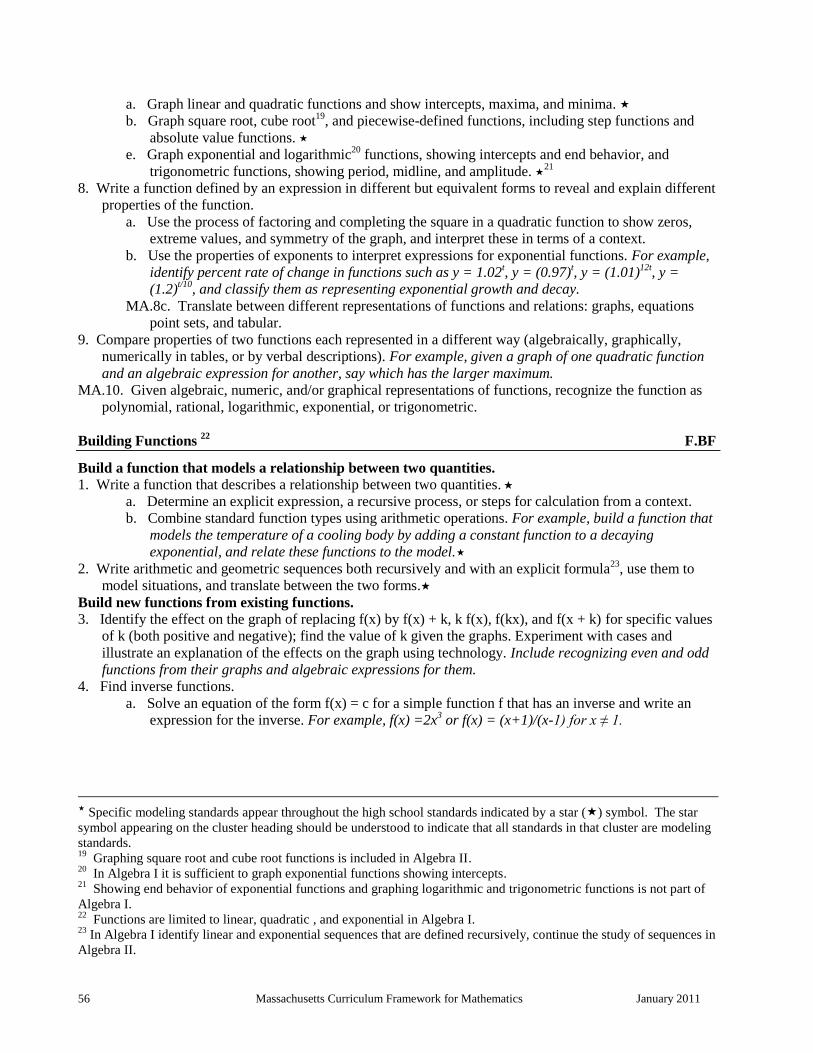
56 Massachusetts Curriculum Framework for Mathematics January 2011
a. Graph linear and quadratic functions and show intercepts, maxima, and minima.
b. Graph square root, cube root19
, and piecewise-defined functions, including step functions and
absolute value functions.
e. Graph exponential and logarithmic20
functions, showing intercepts and end behavior, and
trigonometric functions, showing period, midline, and amplitude. 21
8. Write a function defined by an expression in different but equivalent forms to reveal and explain different
properties of the function.
a. Use the process of factoring and completing the square in a quadratic function to show zeros,
extreme values, and symmetry of the graph, and interpret these in terms of a context.
b. Use the properties of exponents to interpret expressions for exponential functions. For example,
identify percent rate of change in functions such as y = 1.02t, y = (0.97)
t, y = (1.01)
12t, y =
(1.2)t/10
, and classify them as representing exponential growth and decay.
MA.8c. Translate between different representations of functions and relations: graphs, equations
point sets, and tabular.
9. Compare properties of two functions each represented in a different way (algebraically, graphically,
numerically in tables, or by verbal descriptions). For example, given a graph of one quadratic function
and an algebraic expression for another, say which has the larger maximum.
MA.10. Given algebraic, numeric, and/or graphical representations of functions, recognize the function as
polynomial, rational, logarithmic, exponential, or trigonometric.
Building Functions 22
F.BF
Build a function that models a relationship between two quantities.
1. Write a function that describes a relationship between two quantities.
a. Determine an explicit expression, a recursive process, or steps for calculation from a context.
b. Combine standard function types using arithmetic operations. For example, build a function that
models the temperature of a cooling body by adding a constant function to a decaying
exponential, and relate these functions to the model.
2. Write arithmetic and geometric sequences both recursively and with an explicit formula23
, use them to
model situations, and translate between the two forms.
Build new functions from existing functions.
3. Identify the effect on the graph of replacing f(x) by f(x) + k, k f(x), f(kx), and f(x + k) for specific values
of k (both positive and negative); find the value of k given the graphs. Experiment with cases and
illustrate an explanation of the effects on the graph using technology. Include recognizing even and odd
functions from their graphs and algebraic expressions for them.
4. Find inverse functions.
a. Solve an equation of the form f(x) = c for a simple function f that has an inverse and write an
expression for the inverse. For example, f(x) =2x3 or f(x) = (x+1)/(x-1) for x ≠ 1.
Specific modeling standards appear throughout the high school standards indicated by a star () symbol. The star
symbol appearing on the cluster heading should be understood to indicate that all standards in that cluster are modeling
standards. 19
Graphing square root and cube root functions is included in Algebra II. 20
In Algebra I it is sufficient to graph exponential functions showing intercepts. 21
Showing end behavior of exponential functions and graphing logarithmic and trigonometric functions is not part of
Algebra I. 22
Functions are limited to linear, quadratic , and exponential in Algebra I. 23
In Algebra I identify linear and exponential sequences that are defined recursively, continue the study of sequences in
Algebra II.
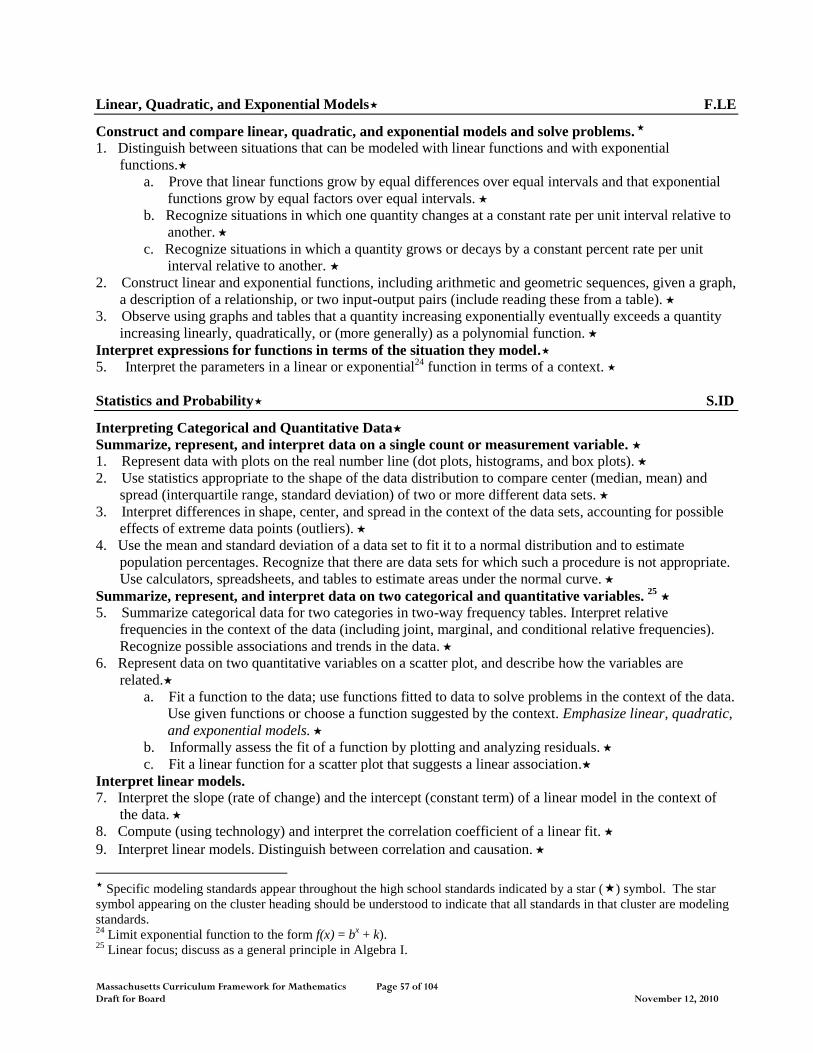
Massachusetts Curriculum Framework for Mathematics Page 57 of 104 Draft for Board November 12, 2010
Linear, Quadratic, and Exponential Models F.LE
Construct and compare linear, quadratic, and exponential models and solve problems.
1. Distinguish between situations that can be modeled with linear functions and with exponential
functions.
a. Prove that linear functions grow by equal differences over equal intervals and that exponential
functions grow by equal factors over equal intervals.
b. Recognize situations in which one quantity changes at a constant rate per unit interval relative to
another.
c. Recognize situations in which a quantity grows or decays by a constant percent rate per unit
interval relative to another.
2. Construct linear and exponential functions, including arithmetic and geometric sequences, given a graph,
a description of a relationship, or two input-output pairs (include reading these from a table).
3. Observe using graphs and tables that a quantity increasing exponentially eventually exceeds a quantity
increasing linearly, quadratically, or (more generally) as a polynomial function.
Interpret expressions for functions in terms of the situation they model.
5. Interpret the parameters in a linear or exponential24
function in terms of a context.
Statistics and Probability S.ID
Interpreting Categorical and Quantitative Data
Summarize, represent, and interpret data on a single count or measurement variable.
1. Represent data with plots on the real number line (dot plots, histograms, and box plots).
2. Use statistics appropriate to the shape of the data distribution to compare center (median, mean) and
spread (interquartile range, standard deviation) of two or more different data sets.
3. Interpret differences in shape, center, and spread in the context of the data sets, accounting for possible
effects of extreme data points (outliers).
4. Use the mean and standard deviation of a data set to fit it to a normal distribution and to estimate
population percentages. Recognize that there are data sets for which such a procedure is not appropriate.
Use calculators, spreadsheets, and tables to estimate areas under the normal curve.
Summarize, represent, and interpret data on two categorical and quantitative variables. 25
5. Summarize categorical data for two categories in two-way frequency tables. Interpret relative
frequencies in the context of the data (including joint, marginal, and conditional relative frequencies).
Recognize possible associations and trends in the data.
6. Represent data on two quantitative variables on a scatter plot, and describe how the variables are
related.
a. Fit a function to the data; use functions fitted to data to solve problems in the context of the data.
Use given functions or choose a function suggested by the context. Emphasize linear, quadratic,
and exponential models.
b. Informally assess the fit of a function by plotting and analyzing residuals.
c. Fit a linear function for a scatter plot that suggests a linear association.
Interpret linear models.
7. Interpret the slope (rate of change) and the intercept (constant term) of a linear model in the context of
the data.
8. Compute (using technology) and interpret the correlation coefficient of a linear fit.
9. Interpret linear models. Distinguish between correlation and causation.
Specific modeling standards appear throughout the high school standards indicated by a star () symbol. The star
symbol appearing on the cluster heading should be understood to indicate that all standards in that cluster are modeling
standards. 24
Limit exponential function to the form f(x) = bx + k).
25 Linear focus; discuss as a general principle in Algebra I.
58 Massachusetts Curriculum Framework for Mathematics January 2011
Traditional Pathway
Model Course: Geometry26
The fundamental purpose of the Geometry course is to formalize and extend students’ geometric experiences
from the middle grades. Students explore more complex geometric situations and deepen their explanations
of geometric relationships, presenting and hearing formal mathematical arguments. Important differences
exist between this Geometry course and the historical approach taken in Geometry classes. For example,
transformations are emphasized in this course. Close attention should be paid to the introductory content for
the Geometry conceptual category found on page 84. The Standards for Mathematical Practice apply
throughout this course and, together with the content standards, prescribe that students experience
mathematics as a coherent, useful, and logical subject that makes use of their ability to make sense of
problem situations. The critical areas are as follows:
(1) Students have prior experience with drawing triangles based on given measurements, performing
rigid motions including translations, reflections, and rotations, and have used these to develop
notions about what it means for two objects to be congruent. In this course, students establish
triangle congruence criteria, based on analyses of rigid motions and formal constructions. They
use triangle congruence as a familiar foundation for the development of formal proof. Students
prove theorems—using a variety of formats including deductive and inductive reasoning and
proof by contradiction—and solve problems about triangles, quadrilaterals, and other polygons.
They apply reasoning to complete geometric constructions and explain why they work.
(2) Students apply their earlier experience with dilations and proportional reasoning to build a
formal understanding of similarity. They identify criteria for similarity of triangles, use
similarity to solve problems, and apply similarity in right triangles to understand right triangle
trigonometry, with particular attention to special right triangles and the Pythagorean theorem.
Students develop the Laws of Sines and Cosines in order to find missing measures of general
(not necessarily right) triangles, building on students’ work with quadratic equations done in the
first course. They are able to distinguish whether three given measures (angles or sides) define 0,
1, 2, or infinitely many triangles.
(3) Students’ experience with three-dimensional objects is extended to include informal
explanations of circumference, area, and volume formulas. Additionally, students apply their
knowledge of two-dimensional shapes to consider the shapes of cross-sections and the result of
rotating a two-dimensional object about a line.
(4) Building on their work with the Pythagorean theorem in 8th grade to find distances, students use
the rectangular coordinate system to verify geometric relationships, including properties of
special triangles and quadrilaterals and slopes of parallel and perpendicular lines, which relates
back to work done in the first course. Students continue their study of quadratics by connecting
the geometric and algebraic definitions of the parabola.
(5) Students prove basic theorems about circles, with particular attention to perpendicularity and
inscribed angles, in order to see symmetry in circles and as an application of triangle congruence
criteria. They study relationships among segments on chords, secants, and tangents as an
application of similarity. In the Cartesian coordinate system, students use the distance formula to
write the equation of a circle when given the radius and the coordinates of its center. Given an
equation of a circle, they draw the graph in the coordinate plane, and apply techniques for
26
Adapted from Appendix A: Designing High School Mathematics Course Based on the Common Core State
Standards, http://www.corestandards.org/the-standards
Massachusetts Curriculum Framework for Mathematics Page 59 of 104 Draft for Board November 12, 2010
solving quadratic equations, which relates back to work done in the first course, to determine
intersections between lines and circles or parabolas and between two circles.
(6) Building on probability concepts that began in the middle grades, students use the languages of
set theory to expand their ability to compute and interpret theoretical and experimental
probabilities for compound events, attending to mutually exclusive events, independent events,
and conditional probability. Students should make use of geometric probability models wherever
possible. They use probability to make informed decisions.
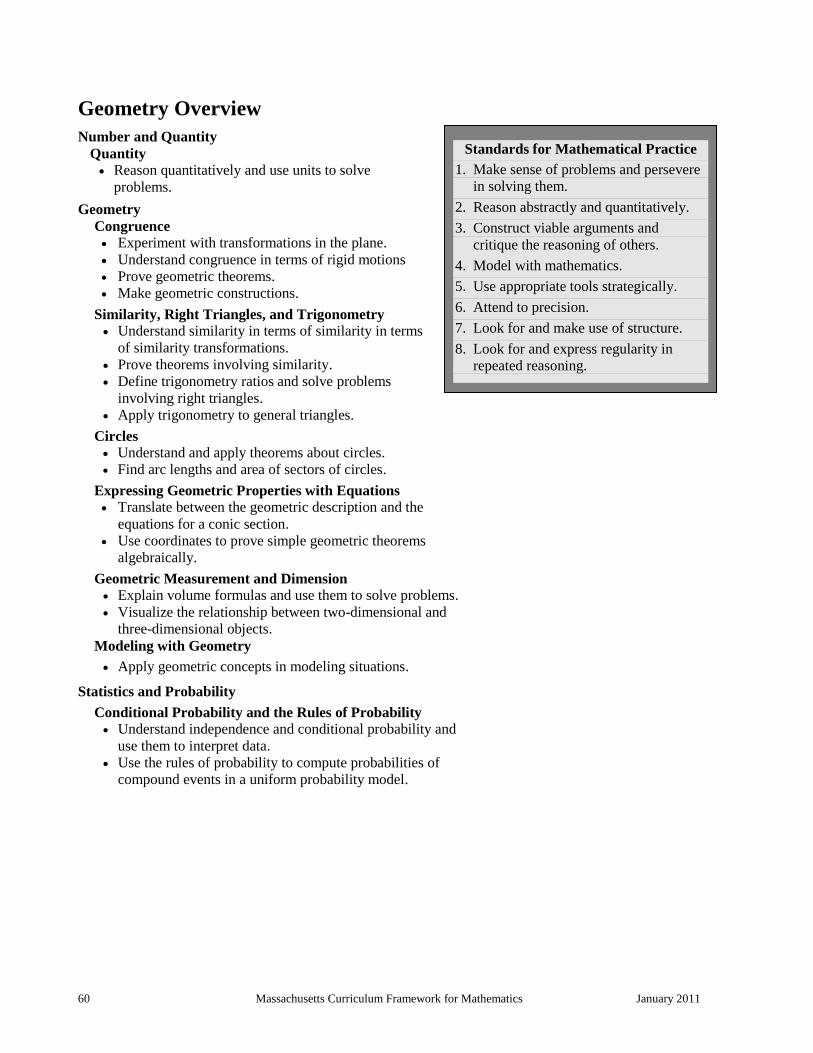
60 Massachusetts Curriculum Framework for Mathematics January 2011
Geometry Overview
Number and Quantity
Quantity
Reason quantitatively and use units to solve
problems.
Geometry
Congruence
Experiment with transformations in the plane.
Understand congruence in terms of rigid motions
Prove geometric theorems.
Make geometric constructions.
Similarity, Right Triangles, and Trigonometry
Understand similarity in terms of similarity in terms
of similarity transformations.
Prove theorems involving similarity.
Define trigonometry ratios and solve problems
involving right triangles.
Apply trigonometry to general triangles.
Circles
Understand and apply theorems about circles.
Find arc lengths and area of sectors of circles.
Expressing Geometric Properties with Equations
Translate between the geometric description and the
equations for a conic section.
Use coordinates to prove simple geometric theorems
algebraically.
Geometric Measurement and Dimension
Explain volume formulas and use them to solve problems.
Visualize the relationship between two-dimensional and
three-dimensional objects.
Modeling with Geometry
Apply geometric concepts in modeling situations.
Statistics and Probability
Conditional Probability and the Rules of Probability
Understand independence and conditional probability and
use them to interpret data.
Use the rules of probability to compute probabilities of
compound events in a uniform probability model.
Standards for Mathematical Practice
1. Make sense of problems and persevere
in solving them.
2. Reason abstractly and quantitatively.
3. Construct viable arguments and
critique the reasoning of others.
4. Model with mathematics.
5. Use appropriate tools strategically.
6. Attend to precision.
7. Look for and make use of structure.
8. Look for and express regularity in
repeated reasoning.
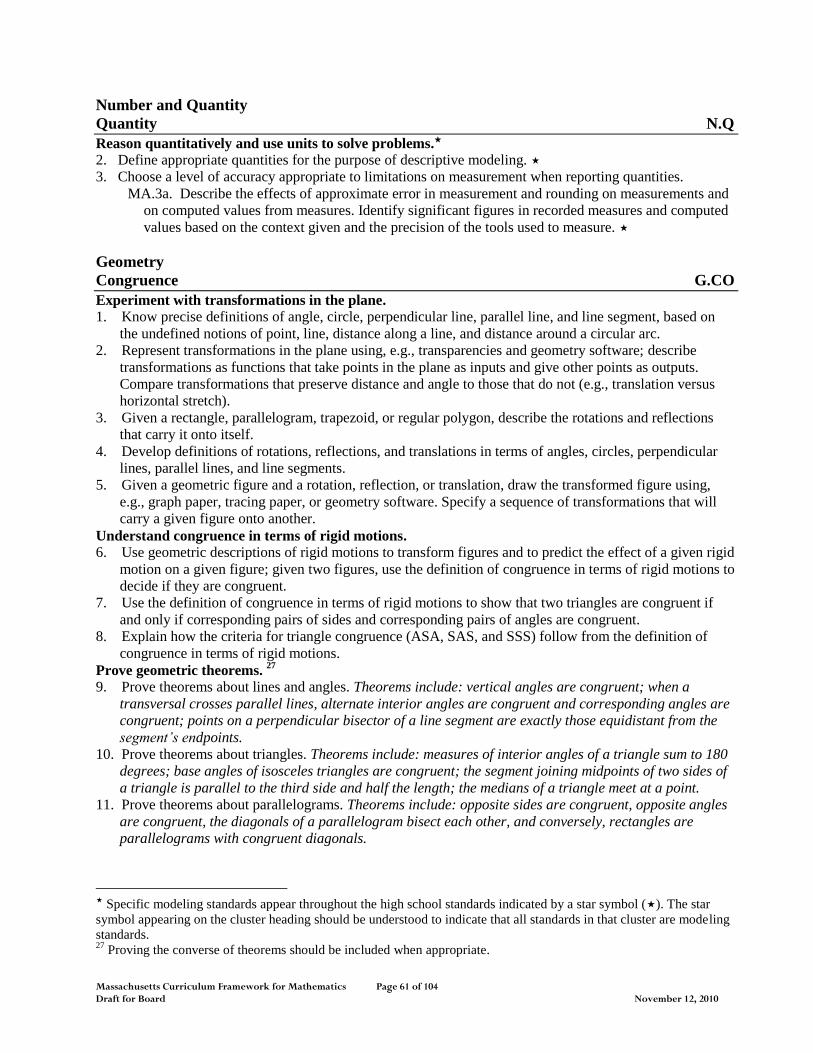
Massachusetts Curriculum Framework for Mathematics Page 61 of 104 Draft for Board November 12, 2010
Number and Quantity
Quantity N.Q
Reason quantitatively and use units to solve problems.
2. Define appropriate quantities for the purpose of descriptive modeling.
3. Choose a level of accuracy appropriate to limitations on measurement when reporting quantities.
MA.3a. Describe the effects of approximate error in measurement and rounding on measurements and
on computed values from measures. Identify significant figures in recorded measures and computed
values based on the context given and the precision of the tools used to measure.
Geometry
Congruence G.CO
Experiment with transformations in the plane.
1. Know precise definitions of angle, circle, perpendicular line, parallel line, and line segment, based on
the undefined notions of point, line, distance along a line, and distance around a circular arc.
2. Represent transformations in the plane using, e.g., transparencies and geometry software; describe
transformations as functions that take points in the plane as inputs and give other points as outputs.
Compare transformations that preserve distance and angle to those that do not (e.g., translation versus
horizontal stretch).
3. Given a rectangle, parallelogram, trapezoid, or regular polygon, describe the rotations and reflections
that carry it onto itself.
4. Develop definitions of rotations, reflections, and translations in terms of angles, circles, perpendicular
lines, parallel lines, and line segments.
5. Given a geometric figure and a rotation, reflection, or translation, draw the transformed figure using,
e.g., graph paper, tracing paper, or geometry software. Specify a sequence of transformations that will
carry a given figure onto another.
Understand congruence in terms of rigid motions.
6. Use geometric descriptions of rigid motions to transform figures and to predict the effect of a given rigid
motion on a given figure; given two figures, use the definition of congruence in terms of rigid motions to
decide if they are congruent.
7. Use the definition of congruence in terms of rigid motions to show that two triangles are congruent if
and only if corresponding pairs of sides and corresponding pairs of angles are congruent.
8. Explain how the criteria for triangle congruence (ASA, SAS, and SSS) follow from the definition of
congruence in terms of rigid motions.
Prove geometric theorems. 27
9. Prove theorems about lines and angles. Theorems include: vertical angles are congruent; when a
transversal crosses parallel lines, alternate interior angles are congruent and corresponding angles are
congruent; points on a perpendicular bisector of a line segment are exactly those equidistant from the
segment’s endpoints.
10. Prove theorems about triangles. Theorems include: measures of interior angles of a triangle sum to 180
degrees; base angles of isosceles triangles are congruent; the segment joining midpoints of two sides of
a triangle is parallel to the third side and half the length; the medians of a triangle meet at a point.
11. Prove theorems about parallelograms. Theorems include: opposite sides are congruent, opposite angles
are congruent, the diagonals of a parallelogram bisect each other, and conversely, rectangles are
parallelograms with congruent diagonals.
Specific modeling standards appear throughout the high school standards indicated by a star symbol (). The star
symbol appearing on the cluster heading should be understood to indicate that all standards in that cluster are modeling
standards. 27
Proving the converse of theorems should be included when appropriate.
62 Massachusetts Curriculum Framework for Mathematics January 2011
MA.11a. Prove theorems about polygons. Theorems include: measures of interior and exterior angles,
properties of inscribed polygons.
Make geometric constructions.
12. Make formal geometric constructions with a variety of tools and methods (compass and straightedge,
string, reflective devices, paper folding, dynamic geometric software, etc.). Copying a segment; copying
an angle; bisecting a segment; bisecting an angle; constructing perpendicular lines, including the
perpendicular bisector of a line segment; and constructing a line parallel to a given line through a point
not on the line.
13. Construct an equilateral triangle, a square, and a regular hexagon inscribed in a circle.
Similarity, Right Triangles, and Trigonometry G.SRT
Understand similarity in terms of similarity transformations.
1. Verify experimentally the properties of dilations given by a center and a scale factor:
a. A dilation takes a line not passing through the center of the dilation to a parallel line, and leaves a
line passing through the center unchanged.
b. The dilation of a line segment is longer or shorter in the ratio given by the scale factor.
2. Given two figures, use the definition of similarity in terms of similarity transformations to decide if they
are similar; explain using similarity transformations the meaning of similarity for triangles as the
equality of all corresponding pairs of angles and the proportionality of all corresponding pairs of sides.
3. Use the properties of similarity transformations to establish the Angle-Angle criterion (AA) for two
triangles to be similar.
Prove theorems involving similarity.
4. Prove theorems about triangles. Theorems include: a line parallel to one side of a triangle divides the
other two proportionally, and conversely; the Pythagorean Theorem proved using triangle similarity.
5. Use congruence and similarity criteria for triangles to solve problems and to prove relationships in
geometric figures.
Define trigonometric ratios and solve problems involving right triangles.
6. Understand that by similarity, side ratios in right triangles are properties of the angles in the triangle,
leading to definitions of trigonometric ratios for acute angles.
7. Explain and use the relationship between the sine and cosine of complementary angles.
8. Use trigonometric ratios and the Pythagorean Theorem to solve right triangles in applied problems.
Apply trigonometry to general triangles.
9. (+) Derive the formula A = (1/2)ab sin(C) for the area of a triangle by drawing an auxiliary line from a
vertex perpendicular to the opposite side.
10. (+) Prove the Laws of Sines and Cosines and use them to solve problems.
11. (+) Understand and apply the Law of Sines and the Law of Cosines to find unknown measurements in
right and non-right triangles (e.g., surveying problems, resultant forces).
Circles G.C
Understand and apply theorems about circles.
1. Prove that all circles are similar.
2. Identify and describe relationships among inscribed angles, radii, and chords. Include the relationship
between central, inscribed, and circumscribed angles; inscribed angles on a diameter are right angles;
the radius of a circle is perpendicular to the tangent where the radius intersects the circle.
3. Construct the inscribed and circumscribed circles of a triangle, and prove properties of angles for a
quadrilateral inscribed in a circle.
MA.3a. Derive the formula for the relationship between the number of sides and sums of the interior
and sums of the exterior angles of polygons and apply to the solutions of mathematical and
contextual problems.
Massachusetts Curriculum Framework for Mathematics Page 63 of 104 Draft for Board November 12, 2010
4. (+) Construct a tangent line from a point outside a given circle to the circle.
Find arc lengths and areas of sectors of circles.
5. Derive using similarity the fact that the length of the arc intercepted by an angle is proportional to the
radius, and define the radian measure of the angle as the constant of proportionality; derive the formula
for the area of a sector.
Expressing Geometric Properties with Equations G.GPE
Translate between the geometric description and the equation for a conic section.
1. Derive the equation of a circle of given center and radius using the Pythagorean Theorem; complete the
square to find the center and radius of a circle given by an equation.
2. Derive the equation of a parabola given a focus and a directrix.
Use coordinates to prove simple geometric theorems algebraically.
4. Use coordinates to prove simple geometric theorems algebraically. For example, prove or disprove that
a figure defined by four given points in the coordinate plane is a rectangle; prove or disprove that the
point (1, 3 ) lies on the circle centered at the origin and containing the point (0, 2).
5. Prove the slope criteria for parallel and perpendicular lines and use them to solve geometric problems
(e.g., find the equation of a line parallel or perpendicular to a given line that passes through a given
point).
6. Find the point on a directed line segment between two given points that partitions the segment in a given
ratio.
7. Use coordinates to compute perimeters of polygons and areas of triangles and rectangles, e.g., using the
distance formula.
Geometric Measurement and Dimension G.GMD
Explain volume formulas and use them to solve problems.
1. Give an informal argument for the formulas for the circumference of a circle, area of a circle, volume of
a cylinder, pyramid, and cone. Use dissection arguments, Cavalieri’s principle, and informal limit
arguments.
2. (+) Give an informal argument using Cavalieri’s principle for the formulas for the volume of a sphere
and other solid figures.
3. Use volume formulas28
for cylinders, pyramids, cones, and spheres to solve problems.
Visualize relationships between two-dimensional and three-dimensional objects.
4. Identify the shapes of two-dimensional cross-sections of three-dimensional objects, and identify three-
dimensional objects generated by rotations of two-dimensional objects.
Modeling with Geometry G.MG
Apply geometric concepts in modeling situations.
1. Use geometric shapes, their measures, and their properties to describe objects (e.g., modeling a tree trunk
or a human torso as a cylinder).
2. Apply concepts of density based on area and volume in modeling situations (e.g., persons per square
mile, BTUs per cubic foot).
3. Apply geometric methods to solve design problems (e.g., designing an object or structure to satisfy
physical constraints or minimize cost; working with typographic grid systems based on ratios).
MA.4. Use dimensional analysis for unit conversion to confirm that expressions and equations make sense.
Specific modeling standards appear throughout the high school standards indicated by a star symbol (). The star
symbol appearing on the cluster heading should be understood to indicate that all standards in that cluster are modeling
standards. 28
Note: MA 2011 grade 8 requires that students know volume formulas for cylinders, cones and spheres.
64 Massachusetts Curriculum Framework for Mathematics January 2011
Statistics and Probability
Conditional Probability and the Rules of Probability S.CP
Understand independence and conditional probability and use them to interpret data.29
1. Describe events as subsets of a sample space (the set of outcomes) using characteristics (or categories) of
the outcomes, or as unions, intersections, or complements of other events (―or,‖ ―and,‖ ―not‖).
2. Understand that two events A and B are independent if the probability of A and B occurring together is
the product of their probabilities, and use this characterization to determine if they are independent.
3. Understand the conditional probability of A given B as P(A and B)/P(B), and interpret independence of A
and B as saying that the conditional probability of A given B is the same as the probability of A, and the
conditional probability of B given A is the same as the probability of B.
4. Construct and interpret two-way frequency tables of data when two categories are associated with each
object being classified. Use the two-way table as a sample space to decide if events are independent and
to approximate conditional probabilities. For example, collect data from a random sample of students in
your school on their favorite subject among math, science, and English. Estimate the probability that a
randomly selected student from your school will favor science given that the student is in tenth grade.
Do the same for other subjects and compare the results.
5. Recognize and explain the concepts of conditional probability and independence in everyday language
and everyday situations. For example, compare the chance of having lung cancer if you are a smoker
with the chance of being a smoker if you have lung cancer.
Use the rules of probability to compute probabilities of compound events in a uniform probability
model.30
6. Find the conditional probability of A given B as the fraction of B’s outcomes that also belong to A, and
interpret the answer in terms of the model.
7. Apply the Addition Rule, P(A or B) = P(A) + P(B) – P(A and B), and interpret the answer in terms of the
model.
8. (+) Apply the general Multiplication Rule in a uniform probability model, P(A and B) = P(A)P(B|A) =
P(B)P(A|B), and interpret the answer in terms of the model.
9. (+) Use permutations and combinations to compute probabilities of compound events and solve
problems.
Specific modeling standards appear through out the high school standards indicated by a star symbol (). The star
symbol appearing on the cluster heading should be understood to indicate that all standards in that cluster are modeling
standards. 29
Link to data from simulations or experiments. 30
Introductory only
Massachusetts Curriculum Framework for Mathematics Page 65 of 104 Draft for Board November 12, 2010
Traditional Pathway
Model Course: Algebra II31
Building on their work with linear, quadratic, and exponential functions, students extend their repertoire of
functions to include logarithmic, polynomial, rational, and radical functions. The course contains standards
from the High School Conceptual Categories, each of which were written to encompass the scope of content
and skills to be addressed throughout grades 9–12 not in any single course. Therefore, the full standard is
presented in each model course, with clarifying footnotes as needed to limit the scope of the standard and
indicate what is appropriate for study in a particular course. Standards that were limited in Algebra I, no
longer have those restrictions in Algebra II. Students work closely with the expressions that define the
functions, are facile with algebraic manipulations of expressions, and continue to expand and hone their
abilities to model situations and to solve equations, including solving quadratic equations over the set of
complex numbers and solving exponential equations using the properties of logarithms. The Standards for
Mathematical Practice apply throughout this course and, together with the content standards, prescribe that
students experience mathematics as a coherent, useful, and logical subject that makes use of their ability to
make sense of problem situations. The critical areas for this course are as follows:
(1) A central theme is that the arithmetic of rational expressions is governed by the same rules as the
arithmetic of rational numbers. Students explore the structural similarities between the system
of polynomials and the system of integers. They draw on analogies between polynomial
arithmetic and base-ten computation, focusing on properties of operations, particularly the
distributive property. Connections are made between multiplication of polynomials with
multiplication of multi-digit integers, and division of polynomials with long division of integers.
Students identify zeros of polynomials, including complex zeros of quadratic polynomials, and
make connections between zeros of polynomials and solutions of polynomial equations. The
Fundamental Theorem of Algebra is examined.
(2) Building on their previous work with functions, and on their work with trigonometric ratios and
circles in Geometry, students now use the coordinate plane to extend trigonometry to model
periodic phenomena.
(3) Students synthesize and generalize what they have learned about a variety of function families.
They extend their work with exponential functions to include solving exponential equations with
logarithms. They explore the effects of transformations on graphs of diverse functions, including
functions arising in an application, in order to abstract the general principle that transformations
on a graph always have the same effect regardless of the type of the underlying function. They
identify appropriate types of functions to model a situation, they adjust parameters to improve
the model, and they compare models by analyzing appropriateness of fit and making judgments
about the domain over which a model is a good fit. The description of modeling as ―the process
of choosing and using mathematics and statistics to analyze empirical situations, to understand
them better, and to make decisions‖ is at the heart of this unit. The narrative discussion and
diagram of the modeling cycle should be considered when knowledge of functions, statistics,
and geometry is applied in a modeling context.
(4) Students see how the visual displays and summary statistics they learned in earlier grades relate
to different types of data and to probability distributions. They identify different ways of
collecting data— including sample surveys, experiments, and simulations—and the role that
randomness and careful design play in the conclusions that can be drawn.
31
Adapted from Appendix A: Designing High School Mathematics Course Based on the Common Core State
Standards, http://www.corestandards.org/the-standards
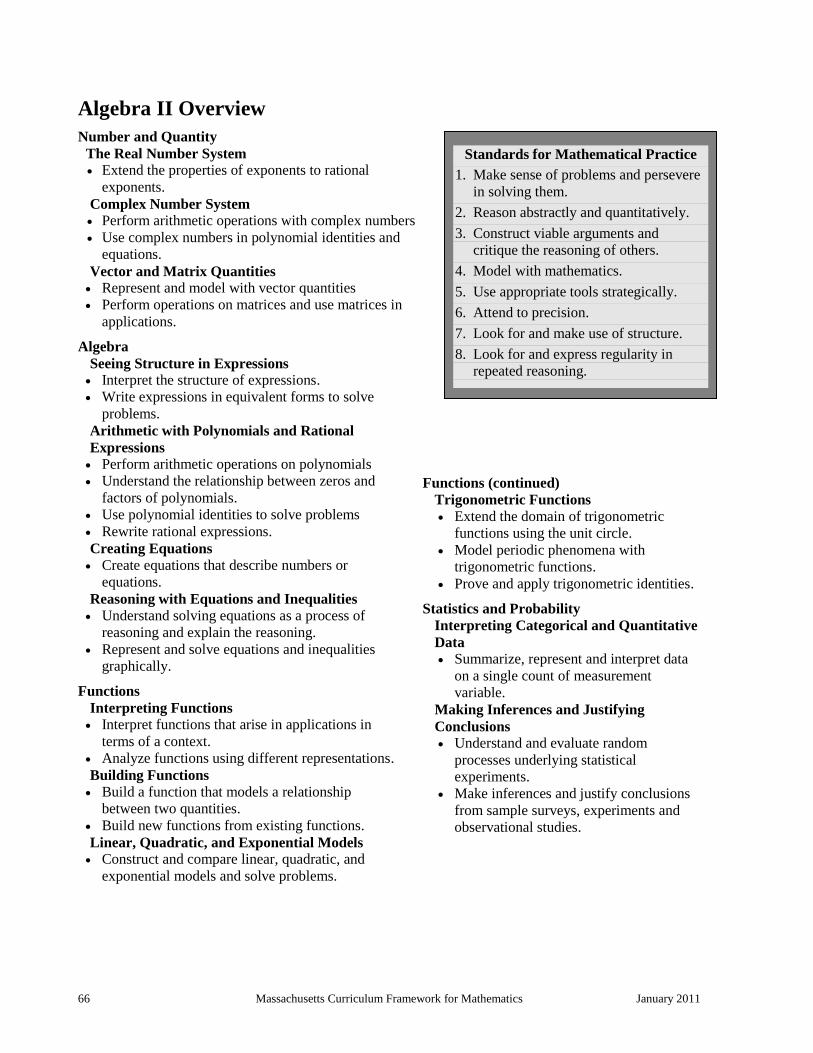
66 Massachusetts Curriculum Framework for Mathematics January 2011
Algebra II Overview
Number and Quantity
The Real Number System
Extend the properties of exponents to rational
exponents.
Complex Number System
Perform arithmetic operations with complex numbers
Use complex numbers in polynomial identities and
equations.
Vector and Matrix Quantities
Represent and model with vector quantities
Perform operations on matrices and use matrices in
applications.
Algebra
Seeing Structure in Expressions
Interpret the structure of expressions.
Write expressions in equivalent forms to solve
problems.
Arithmetic with Polynomials and Rational
Expressions
Perform arithmetic operations on polynomials
Understand the relationship between zeros and
factors of polynomials.
Use polynomial identities to solve problems
Rewrite rational expressions.
Creating Equations
Create equations that describe numbers or
equations.
Reasoning with Equations and Inequalities
Understand solving equations as a process of
reasoning and explain the reasoning.
Represent and solve equations and inequalities
graphically.
Functions
Interpreting Functions
Interpret functions that arise in applications in
terms of a context.
Analyze functions using different representations.
Building Functions
Build a function that models a relationship
between two quantities.
Build new functions from existing functions.
Linear, Quadratic, and Exponential Models
Construct and compare linear, quadratic, and
exponential models and solve problems.
Functions (continued)
Trigonometric Functions
Extend the domain of trigonometric
functions using the unit circle.
Model periodic phenomena with
trigonometric functions.
Prove and apply trigonometric identities.
Statistics and Probability
Interpreting Categorical and Quantitative
Data
Summarize, represent and interpret data
on a single count of measurement
variable.
Making Inferences and Justifying
Conclusions
Understand and evaluate random
processes underlying statistical
experiments.
Make inferences and justify conclusions
from sample surveys, experiments and
observational studies.
Standards for Mathematical Practice
1. Make sense of problems and persevere
in solving them.
2. Reason abstractly and quantitatively.
3. Construct viable arguments and
critique the reasoning of others.
4. Model with mathematics.
5. Use appropriate tools strategically.
6. Attend to precision.
7. Look for and make use of structure.
8. Look for and express regularity in
repeated reasoning.
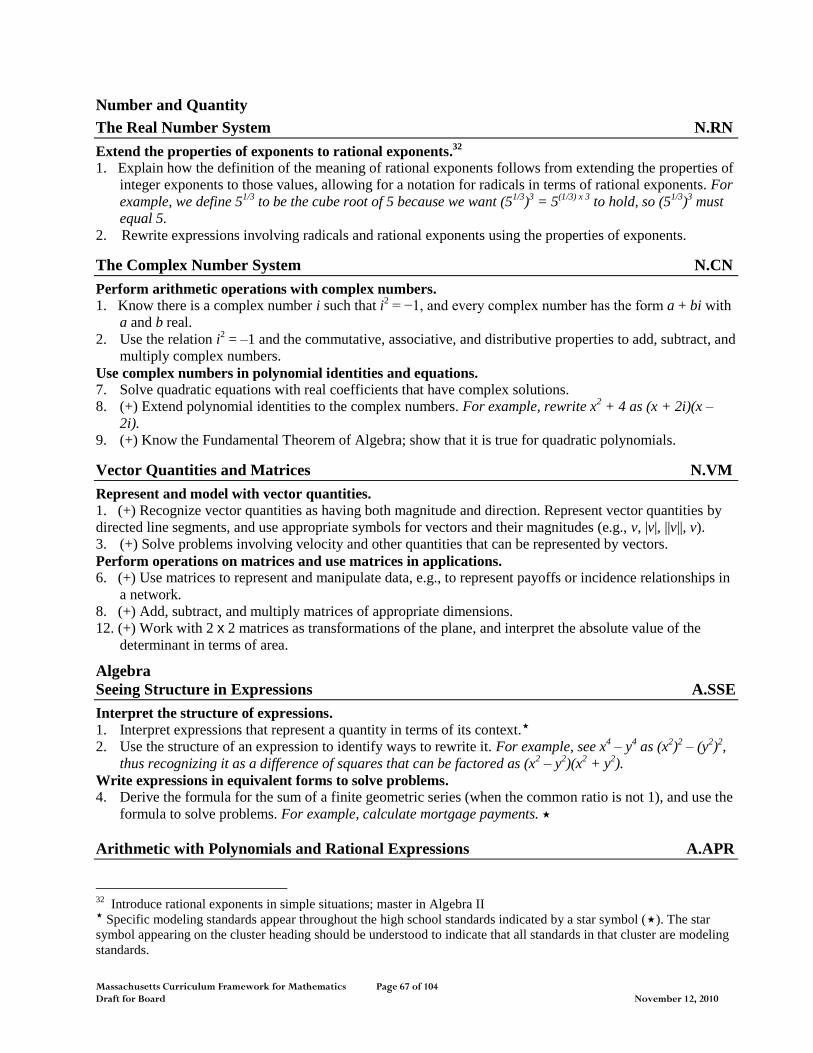
Massachusetts Curriculum Framework for Mathematics Page 67 of 104 Draft for Board November 12, 2010
Number and Quantity
The Real Number System N.RN
Extend the properties of exponents to rational exponents.32
1. Explain how the definition of the meaning of rational exponents follows from extending the properties of
integer exponents to those values, allowing for a notation for radicals in terms of rational exponents. For
example, we define 51/3
to be the cube root of 5 because we want (51/3
)3 = 5
(1/3) x 3 to hold, so (5
1/3)
3 must
equal 5.
2. Rewrite expressions involving radicals and rational exponents using the properties of exponents.
The Complex Number System N.CN
Perform arithmetic operations with complex numbers.
1. Know there is a complex number i such that i2 = −1, and every complex number has the form a + bi with
a and b real.
2. Use the relation i2 = –1 and the commutative, associative, and distributive properties to add, subtract, and
multiply complex numbers.
Use complex numbers in polynomial identities and equations.
7. Solve quadratic equations with real coefficients that have complex solutions.
8. (+) Extend polynomial identities to the complex numbers. For example, rewrite x2 + 4 as (x + 2i)(x –
2i).
9. (+) Know the Fundamental Theorem of Algebra; show that it is true for quadratic polynomials.
Vector Quantities and Matrices N.VM
Represent and model with vector quantities.
1. (+) Recognize vector quantities as having both magnitude and direction. Represent vector quantities by
directed line segments, and use appropriate symbols for vectors and their magnitudes (e.g., v, |v|, ||v||, v).
3. (+) Solve problems involving velocity and other quantities that can be represented by vectors.
Perform operations on matrices and use matrices in applications.
6. (+) Use matrices to represent and manipulate data, e.g., to represent payoffs or incidence relationships in
a network.
8. (+) Add, subtract, and multiply matrices of appropriate dimensions.
12. (+) Work with 2 x 2 matrices as transformations of the plane, and interpret the absolute value of the
determinant in terms of area.
Algebra
Seeing Structure in Expressions A.SSE
Interpret the structure of expressions.
1. Interpret expressions that represent a quantity in terms of its context.
2. Use the structure of an expression to identify ways to rewrite it. For example, see x4 – y
4 as (x
2)
2 – (y
2)
2,
thus recognizing it as a difference of squares that can be factored as (x2 – y
2)(x
2 + y
2).
Write expressions in equivalent forms to solve problems.
4. Derive the formula for the sum of a finite geometric series (when the common ratio is not 1), and use the
formula to solve problems. For example, calculate mortgage payments.
Arithmetic with Polynomials and Rational Expressions A.APR
32
Introduce rational exponents in simple situations; master in Algebra II Specific modeling standards appear throughout the high school standards indicated by a star symbol (). The star
symbol appearing on the cluster heading should be understood to indicate that all standards in that cluster are modeling
standards.
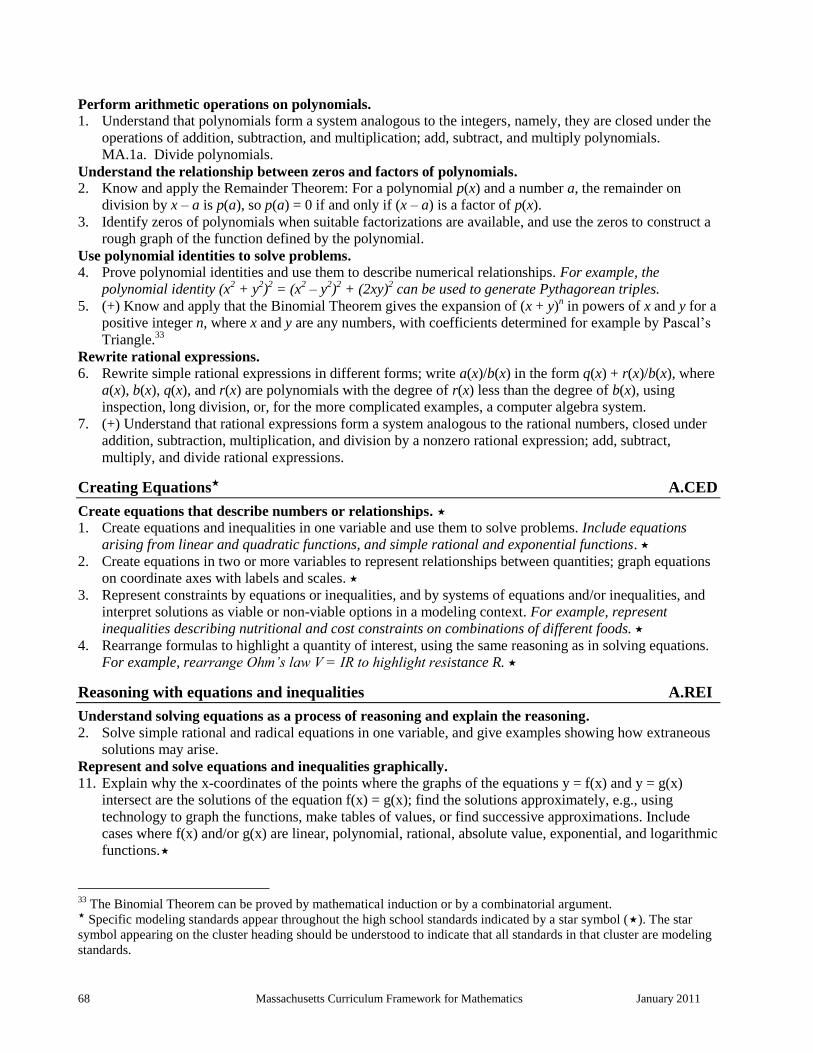
68 Massachusetts Curriculum Framework for Mathematics January 2011
Perform arithmetic operations on polynomials.
1. Understand that polynomials form a system analogous to the integers, namely, they are closed under the
operations of addition, subtraction, and multiplication; add, subtract, and multiply polynomials.
MA.1a. Divide polynomials.
Understand the relationship between zeros and factors of polynomials.
2. Know and apply the Remainder Theorem: For a polynomial p(x) and a number a, the remainder on
division by x – a is p(a), so p(a) = 0 if and only if (x – a) is a factor of p(x).
3. Identify zeros of polynomials when suitable factorizations are available, and use the zeros to construct a
rough graph of the function defined by the polynomial.
Use polynomial identities to solve problems.
4. Prove polynomial identities and use them to describe numerical relationships. For example, the
polynomial identity (x2 + y
2)
2 = (x
2 – y
2)
2 + (2xy)
2 can be used to generate Pythagorean triples.
5. (+) Know and apply that the Binomial Theorem gives the expansion of (x + y)n in powers of x and y for a
positive integer n, where x and y are any numbers, with coefficients determined for example by Pascal’s
Triangle.33
Rewrite rational expressions.
6. Rewrite simple rational expressions in different forms; write a(x)/b(x) in the form q(x) + r(x)/b(x), where
a(x), b(x), q(x), and r(x) are polynomials with the degree of r(x) less than the degree of b(x), using
inspection, long division, or, for the more complicated examples, a computer algebra system.
7. (+) Understand that rational expressions form a system analogous to the rational numbers, closed under
addition, subtraction, multiplication, and division by a nonzero rational expression; add, subtract,
multiply, and divide rational expressions.
Creating Equations A.CED
Create equations that describe numbers or relationships.
1. Create equations and inequalities in one variable and use them to solve problems. Include equations
arising from linear and quadratic functions, and simple rational and exponential functions.
2. Create equations in two or more variables to represent relationships between quantities; graph equations
on coordinate axes with labels and scales.
3. Represent constraints by equations or inequalities, and by systems of equations and/or inequalities, and
interpret solutions as viable or non-viable options in a modeling context. For example, represent
inequalities describing nutritional and cost constraints on combinations of different foods.
4. Rearrange formulas to highlight a quantity of interest, using the same reasoning as in solving equations.
For example, rearrange Ohm’s law V = IR to highlight resistance R.
Reasoning with equations and inequalities A.REI
Understand solving equations as a process of reasoning and explain the reasoning.
2. Solve simple rational and radical equations in one variable, and give examples showing how extraneous
solutions may arise.
Represent and solve equations and inequalities graphically.
11. Explain why the x-coordinates of the points where the graphs of the equations y = f(x) and y = g(x)
intersect are the solutions of the equation f(x) = g(x); find the solutions approximately, e.g., using
technology to graph the functions, make tables of values, or find successive approximations. Include
cases where f(x) and/or g(x) are linear, polynomial, rational, absolute value, exponential, and logarithmic
functions.
33
The Binomial Theorem can be proved by mathematical induction or by a combinatorial argument. Specific modeling standards appear throughout the high school standards indicated by a star symbol (). The star
symbol appearing on the cluster heading should be understood to indicate that all standards in that cluster are modeling
standards.
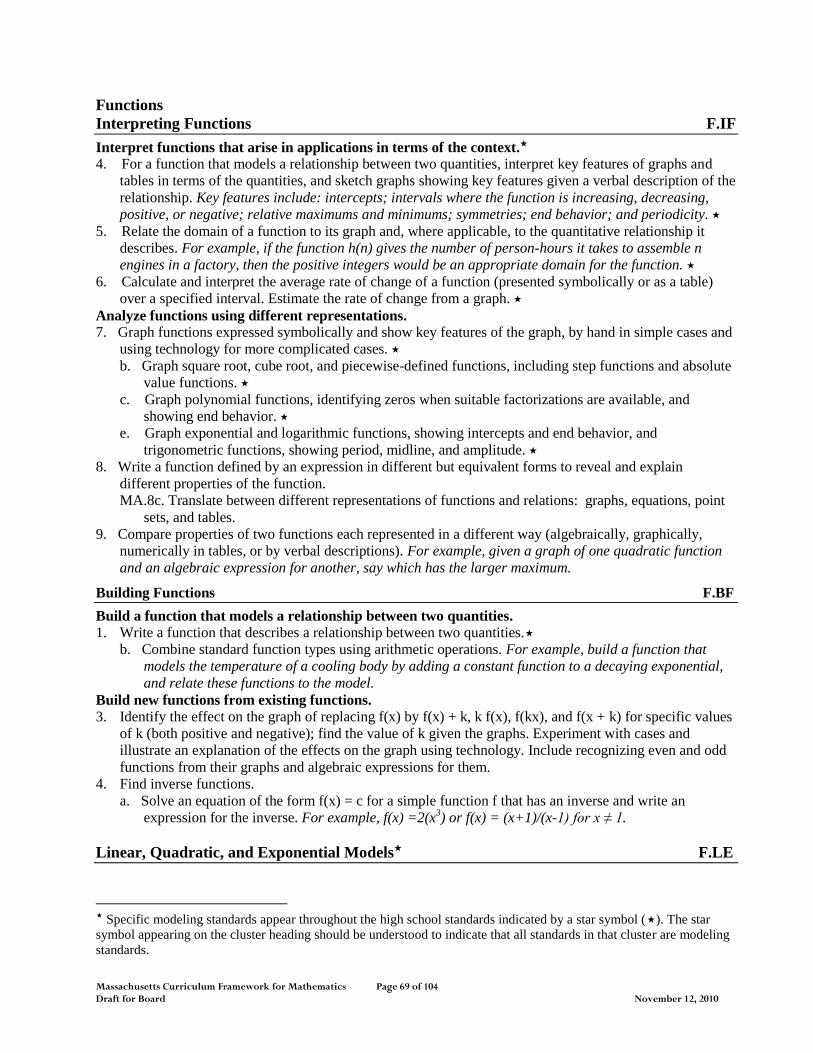
Massachusetts Curriculum Framework for Mathematics Page 69 of 104 Draft for Board November 12, 2010
Functions
Interpreting Functions F.IF
Interpret functions that arise in applications in terms of the context.
4. For a function that models a relationship between two quantities, interpret key features of graphs and
tables in terms of the quantities, and sketch graphs showing key features given a verbal description of the
relationship. Key features include: intercepts; intervals where the function is increasing, decreasing,
positive, or negative; relative maximums and minimums; symmetries; end behavior; and periodicity.
5. Relate the domain of a function to its graph and, where applicable, to the quantitative relationship it
describes. For example, if the function h(n) gives the number of person-hours it takes to assemble n
engines in a factory, then the positive integers would be an appropriate domain for the function.
6. Calculate and interpret the average rate of change of a function (presented symbolically or as a table)
over a specified interval. Estimate the rate of change from a graph.
Analyze functions using different representations.
7. Graph functions expressed symbolically and show key features of the graph, by hand in simple cases and
using technology for more complicated cases.
b. Graph square root, cube root, and piecewise-defined functions, including step functions and absolute
value functions.
c. Graph polynomial functions, identifying zeros when suitable factorizations are available, and
showing end behavior.
e. Graph exponential and logarithmic functions, showing intercepts and end behavior, and
trigonometric functions, showing period, midline, and amplitude.
8. Write a function defined by an expression in different but equivalent forms to reveal and explain
different properties of the function.
MA.8c. Translate between different representations of functions and relations: graphs, equations, point
sets, and tables.
9. Compare properties of two functions each represented in a different way (algebraically, graphically,
numerically in tables, or by verbal descriptions). For example, given a graph of one quadratic function
and an algebraic expression for another, say which has the larger maximum.
Building Functions F.BF
Build a function that models a relationship between two quantities.
1. Write a function that describes a relationship between two quantities.
b. Combine standard function types using arithmetic operations. For example, build a function that
models the temperature of a cooling body by adding a constant function to a decaying exponential,
and relate these functions to the model.
Build new functions from existing functions.
3. Identify the effect on the graph of replacing f(x) by f(x) + k, k f(x), f(kx), and f(x + k) for specific values
of k (both positive and negative); find the value of k given the graphs. Experiment with cases and
illustrate an explanation of the effects on the graph using technology. Include recognizing even and odd
functions from their graphs and algebraic expressions for them.
4. Find inverse functions.
a. Solve an equation of the form f(x) = c for a simple function f that has an inverse and write an
expression for the inverse. For example, f(x) =2(x3) or f(x) = (x+1)/(x-1) for x ≠ 1.
Linear, Quadratic, and Exponential Models F.LE
Specific modeling standards appear throughout the high school standards indicated by a star symbol (). The star
symbol appearing on the cluster heading should be understood to indicate that all standards in that cluster are modeling
standards.
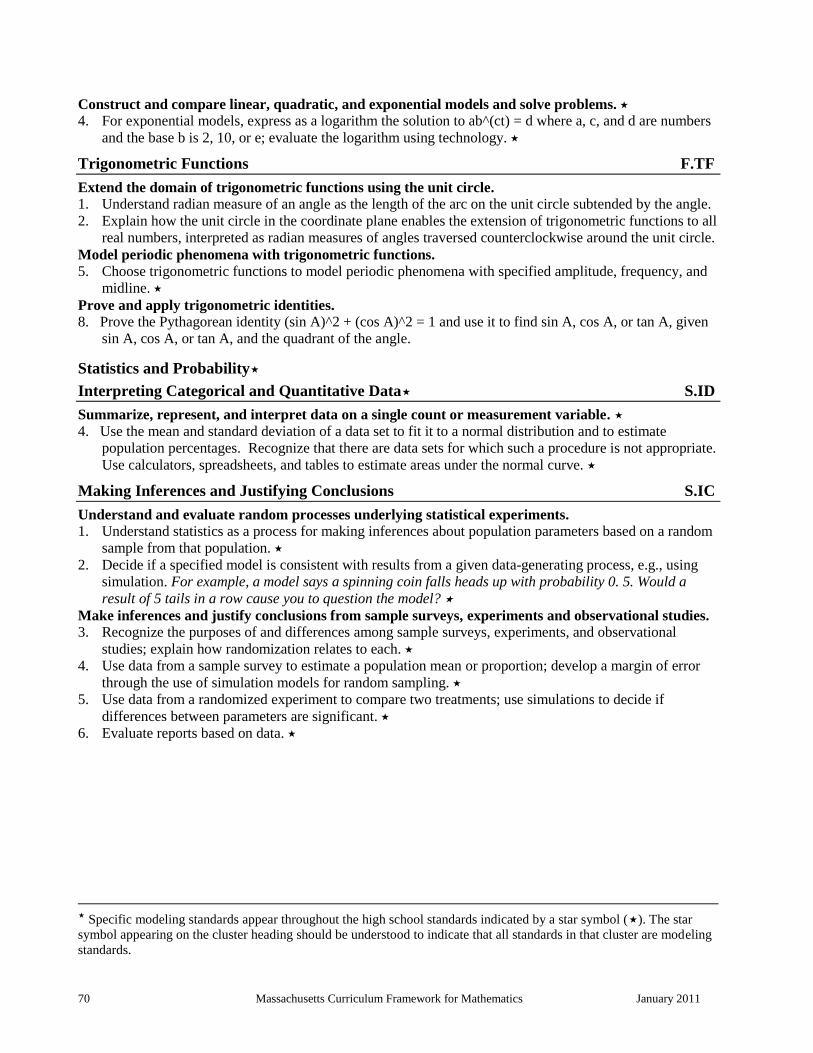
70 Massachusetts Curriculum Framework for Mathematics January 2011
Construct and compare linear, quadratic, and exponential models and solve problems.
4. For exponential models, express as a logarithm the solution to ab^(ct) = d where a, c, and d are numbers
and the base b is 2, 10, or e; evaluate the logarithm using technology.
Trigonometric Functions F.TF
Extend the domain of trigonometric functions using the unit circle.
1. Understand radian measure of an angle as the length of the arc on the unit circle subtended by the angle.
2. Explain how the unit circle in the coordinate plane enables the extension of trigonometric functions to all
real numbers, interpreted as radian measures of angles traversed counterclockwise around the unit circle.
Model periodic phenomena with trigonometric functions.
5. Choose trigonometric functions to model periodic phenomena with specified amplitude, frequency, and
midline.
Prove and apply trigonometric identities.
8. Prove the Pythagorean identity (sin A)^2 + (cos A)^2 = 1 and use it to find sin A, cos A, or tan A, given
sin A, cos A, or tan A, and the quadrant of the angle.
Statistics and Probability
Interpreting Categorical and Quantitative Data S.ID
Summarize, represent, and interpret data on a single count or measurement variable.
4. Use the mean and standard deviation of a data set to fit it to a normal distribution and to estimate
population percentages. Recognize that there are data sets for which such a procedure is not appropriate.
Use calculators, spreadsheets, and tables to estimate areas under the normal curve.
Making Inferences and Justifying Conclusions S.IC
Understand and evaluate random processes underlying statistical experiments.
1. Understand statistics as a process for making inferences about population parameters based on a random
sample from that population.
2. Decide if a specified model is consistent with results from a given data-generating process, e.g., using
simulation. For example, a model says a spinning coin falls heads up with probability 0. 5. Would a
result of 5 tails in a row cause you to question the model?
Make inferences and justify conclusions from sample surveys, experiments and observational studies.
3. Recognize the purposes of and differences among sample surveys, experiments, and observational
studies; explain how randomization relates to each.
4. Use data from a sample survey to estimate a population mean or proportion; develop a margin of error
through the use of simulation models for random sampling.
5. Use data from a randomized experiment to compare two treatments; use simulations to decide if
differences between parameters are significant.
6. Evaluate reports based on data.
Specific modeling standards appear throughout the high school standards indicated by a star symbol (). The star
symbol appearing on the cluster heading should be understood to indicate that all standards in that cluster are modeling
standards.
Massachusetts Curriculum Framework for Mathematics Page 71 of 104 Draft for Board November 12, 2010
Integrated Pathway
Model Course: Mathematics I34
The fundamental purpose of Mathematics I is to formalize and extend the mathematics that students learned
in the middle grades. The course contains standards from the High School Conceptual Categories, each of
which were written to encompass the scope of content and skills to be addressed throughout grades 9–12 not
in any single course. Therefore, the full standard is presented in each model course, with clarifying footnotes
as needed to limit the scope of the standard and indicate what is appropriate for study in a particular course.
For example, the scope of Mathematics I is limited to linear and exponential expressions and functions as
well as some work with absolute value, step, and functions that are piecewise-defined; therefore, although a
standard may include references to quadratic, logarithmic or trigonometric functions, those functions should
not be included in the work of Mathematics I students, rather they will be addressed in Mathematics II or III.
The critical areas deepen and extend understanding of linear relationships, in part by contrasting them with
exponential phenomena, and in part by applying linear models to data that exhibit a linear trend.
Mathematics 1 uses properties and theorems involving congruent figures to deepen and extend understanding
of geometric knowledge from prior grades. The course ties together the algebraic and geometric ideas
studied. The Standards for Mathematical Practice apply throughout each course and, together with the
content standards, prescribe that students experience mathematics as a coherent, useful, and logical subject
that makes use of their ability to make sense of problem situations.
(1) By the end of eighth grade students have had a variety of experiences working with expressions
and creating equations. Students become facile with algebraic manipulation in much the same
way that they are facile with numerical manipulation. Algebraic facility includes rearranging and
collecting terms, factoring, identifying and canceling common factors in rational expressions and
applying properties of exponents. Students continue this work by using quantities to model and
analyze situations, to interpret expressions, and by creating equations to describe situations.
(2) In earlier grades, students define, evaluate, and compare functions, and use them to model
relationships between quantities. Students will learn function notation and develop the concepts
of domain and range. They move beyond viewing functions as processes that take inputs and
yield outputs and start viewing functions as objects in their own right. They explore many
examples of functions, including sequences; they interpret functions given graphically,
numerically, symbolically, and verbally, translate between representations, and understand the
limitations of various representations. They work with functions given by graphs and tables,
keeping in mind that, depending upon the context, these representations are likely to be
approximate and incomplete. Their work includes functions that can be described or
approximated by formulas as well as those that cannot. When functions describe relationships
between quantities arising from a context, students reason with the units in which those
quantities are measured. Students build on and informally extend their understanding of integer
exponents to consider exponential functions. They compare and contrast linear and exponential
functions, distinguishing between additive and multiplicative change. They interpret arithmetic
sequences as linear functions and geometric sequences as exponential functions.
(3) By the end of eighth grade, students have learned to solve linear equations in one variable and
have applied graphical and algebraic methods to analyze and solve systems of linear equations in
two variables. Building on these earlier experiences, students analyze and explain the process of
34
Adapted from Appendix A: Designing High School Mathematics Course Based on the Common Core State
Standards, http://www.corestandards.org/the-standards
72 Massachusetts Curriculum Framework for Mathematics January 2011
solving an equation and to justify the process used in solving a system of equations. Students
develop fluency writing, interpreting, and translating between various forms of linear equations
and inequalities, and using them to solve problems. They master the solution of linear equations
and apply related solution techniques and the laws of exponents to the creation and solution of
simple exponential equations. Students explore systems of equations and inequalities, and they
find and interpret their solutions. All of this work is grounded on understanding quantities and
on relationships between them.
(4) Students’ prior experiences with data Is the basis for with the more formal means of assessing
how a model fits data. Students use regression techniques to describe approximately linear
relationships between quantities. They use graphical representations and knowledge of the
context to make judgments about the appropriateness of linear models. With linear models, they
look at residuals to analyze the goodness of fit.
(5) In previous grades, students were asked to draw triangles based on given measurements. They
also have prior experience with rigid motions: translations, reflections, and rotations and have
used these to develop notions about what it means for two objects to be congruent. Students
establish triangle congruence criteria, based on analyses of rigid motions and formal
constructions. They solve problems about triangles, quadrilaterals, and other polygons. They
apply reasoning to complete geometric constructions and explain why they work.
(6) Building on their work with the Pythagorean Theorem in 8th grade to find distances, students
use a rectangular coordinate system to verify geometric relationships, including properties of
special triangles and quadrilaterals and slopes of parallel and perpendicular lines.
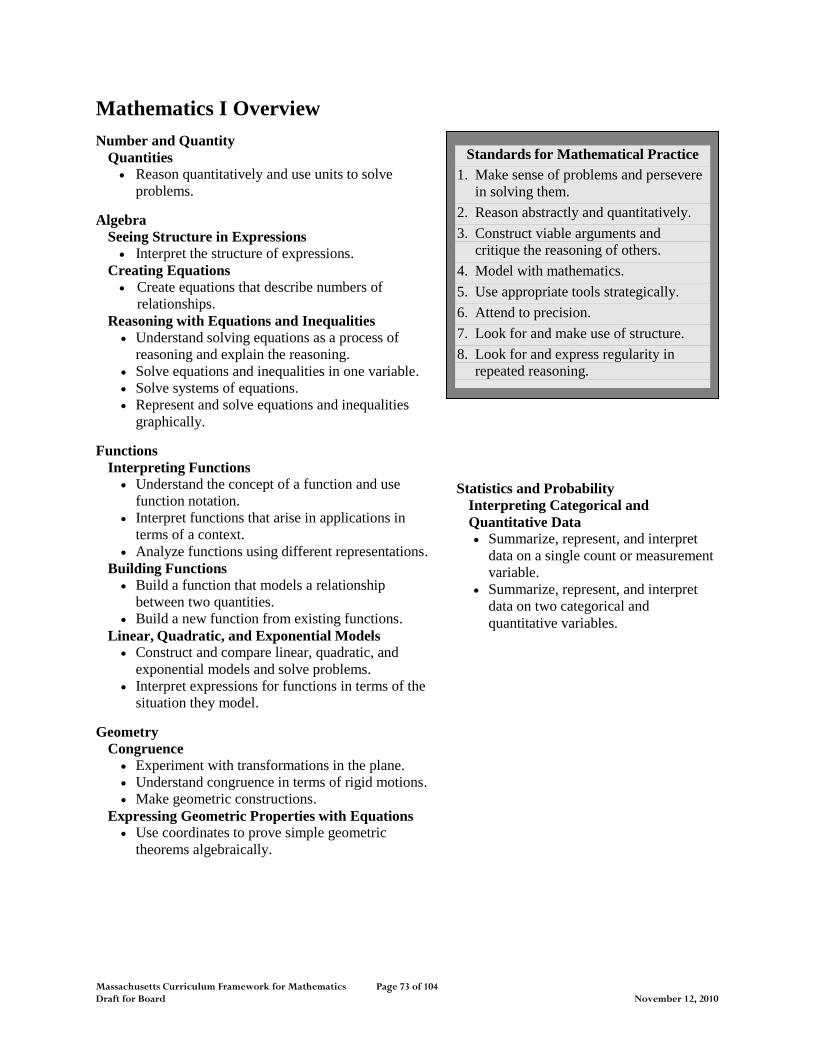
Massachusetts Curriculum Framework for Mathematics Page 73 of 104 Draft for Board November 12, 2010
Mathematics I Overview
Number and Quantity
Quantities
Reason quantitatively and use units to solve
problems.
Algebra
Seeing Structure in Expressions
Interpret the structure of expressions.
Creating Equations
Create equations that describe numbers of
relationships.
Reasoning with Equations and Inequalities
Understand solving equations as a process of
reasoning and explain the reasoning.
Solve equations and inequalities in one variable.
Solve systems of equations.
Represent and solve equations and inequalities
graphically.
Functions
Interpreting Functions
Understand the concept of a function and use
function notation.
Interpret functions that arise in applications in
terms of a context.
Analyze functions using different representations.
Building Functions
Build a function that models a relationship
between two quantities.
Build a new function from existing functions.
Linear, Quadratic, and Exponential Models
Construct and compare linear, quadratic, and
exponential models and solve problems.
Interpret expressions for functions in terms of the
situation they model.
Geometry
Congruence
Experiment with transformations in the plane.
Understand congruence in terms of rigid motions.
Make geometric constructions.
Expressing Geometric Properties with Equations
Use coordinates to prove simple geometric
theorems algebraically.
Statistics and Probability
Interpreting Categorical and
Quantitative Data
Summarize, represent, and interpret
data on a single count or measurement
variable.
Summarize, represent, and interpret
data on two categorical and
quantitative variables.
Standards for Mathematical Practice
1. Make sense of problems and persevere
in solving them.
2. Reason abstractly and quantitatively.
3. Construct viable arguments and
critique the reasoning of others.
4. Model with mathematics.
5. Use appropriate tools strategically.
6. Attend to precision.
7. Look for and make use of structure.
8. Look for and express regularity in
repeated reasoning.
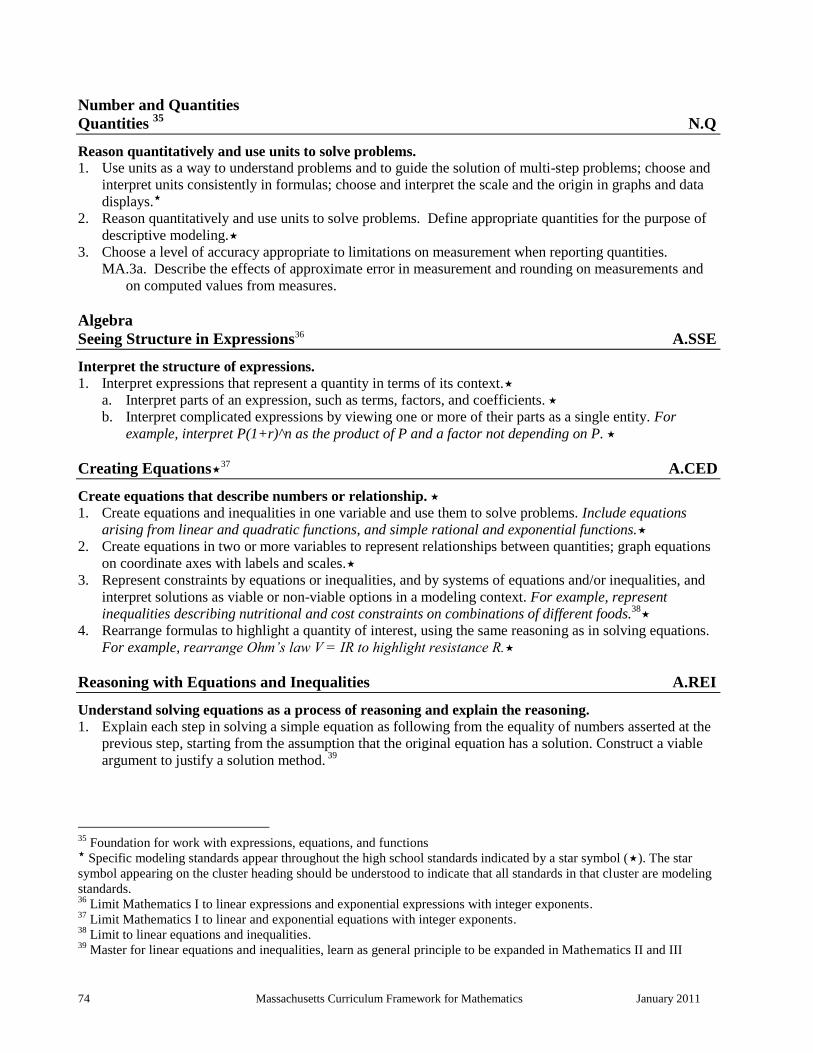
74 Massachusetts Curriculum Framework for Mathematics January 2011
Number and Quantities
Quantities 35
N.Q
Reason quantitatively and use units to solve problems.
1. Use units as a way to understand problems and to guide the solution of multi-step problems; choose and
interpret units consistently in formulas; choose and interpret the scale and the origin in graphs and data
displays.
2. Reason quantitatively and use units to solve problems. Define appropriate quantities for the purpose of
descriptive modeling.
3. Choose a level of accuracy appropriate to limitations on measurement when reporting quantities.
MA.3a. Describe the effects of approximate error in measurement and rounding on measurements and
on computed values from measures.
Algebra
Seeing Structure in Expressions36 A.SSE
Interpret the structure of expressions.
1. Interpret expressions that represent a quantity in terms of its context.
a. Interpret parts of an expression, such as terms, factors, and coefficients.
b. Interpret complicated expressions by viewing one or more of their parts as a single entity. For
example, interpret P(1+r)^n as the product of P and a factor not depending on P.
Creating Equations37 A.CED
Create equations that describe numbers or relationship.
1. Create equations and inequalities in one variable and use them to solve problems. Include equations
arising from linear and quadratic functions, and simple rational and exponential functions.
2. Create equations in two or more variables to represent relationships between quantities; graph equations
on coordinate axes with labels and scales.
3. Represent constraints by equations or inequalities, and by systems of equations and/or inequalities, and
interpret solutions as viable or non-viable options in a modeling context. For example, represent
inequalities describing nutritional and cost constraints on combinations of different foods.38
4. Rearrange formulas to highlight a quantity of interest, using the same reasoning as in solving equations.
For example, rearrange Ohm’s law V = IR to highlight resistance R.
Reasoning with Equations and Inequalities A.REI
Understand solving equations as a process of reasoning and explain the reasoning.
1. Explain each step in solving a simple equation as following from the equality of numbers asserted at the
previous step, starting from the assumption that the original equation has a solution. Construct a viable
argument to justify a solution method. 39
35
Foundation for work with expressions, equations, and functions Specific modeling standards appear throughout the high school standards indicated by a star symbol (). The star
symbol appearing on the cluster heading should be understood to indicate that all standards in that cluster are modeling
standards. 36
Limit Mathematics I to linear expressions and exponential expressions with integer exponents. 37
Limit Mathematics I to linear and exponential equations with integer exponents. 38
Limit to linear equations and inequalities. 39
Master for linear equations and inequalities, learn as general principle to be expanded in Mathematics II and III
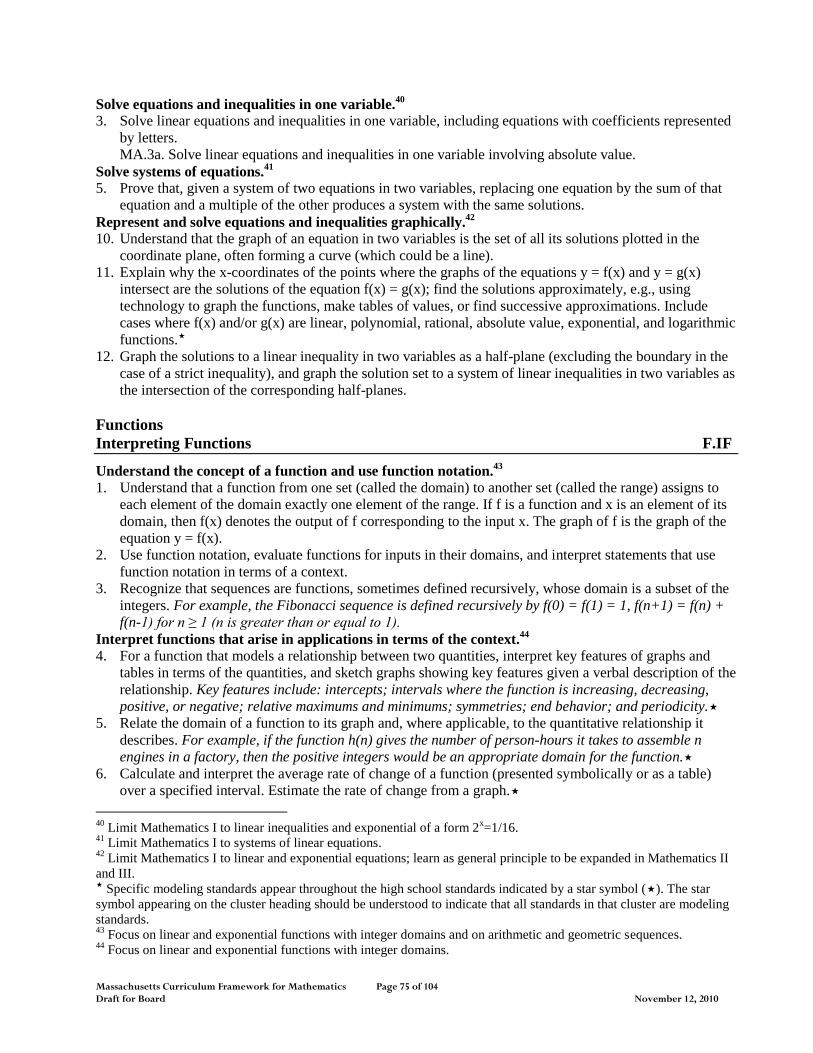
Massachusetts Curriculum Framework for Mathematics Page 75 of 104 Draft for Board November 12, 2010
Solve equations and inequalities in one variable.40
3. Solve linear equations and inequalities in one variable, including equations with coefficients represented
by letters.
MA.3a. Solve linear equations and inequalities in one variable involving absolute value.
Solve systems of equations.41
5. Prove that, given a system of two equations in two variables, replacing one equation by the sum of that
equation and a multiple of the other produces a system with the same solutions.
Represent and solve equations and inequalities graphically.42
10. Understand that the graph of an equation in two variables is the set of all its solutions plotted in the
coordinate plane, often forming a curve (which could be a line).
11. Explain why the x-coordinates of the points where the graphs of the equations y = f(x) and y = g(x)
intersect are the solutions of the equation f(x) = g(x); find the solutions approximately, e.g., using
technology to graph the functions, make tables of values, or find successive approximations. Include
cases where f(x) and/or g(x) are linear, polynomial, rational, absolute value, exponential, and logarithmic
functions.
12. Graph the solutions to a linear inequality in two variables as a half-plane (excluding the boundary in the
case of a strict inequality), and graph the solution set to a system of linear inequalities in two variables as
the intersection of the corresponding half-planes.
Functions
Interpreting Functions F.IF
Understand the concept of a function and use function notation.43
1. Understand that a function from one set (called the domain) to another set (called the range) assigns to
each element of the domain exactly one element of the range. If f is a function and x is an element of its
domain, then f(x) denotes the output of f corresponding to the input x. The graph of f is the graph of the
equation y = f(x).
2. Use function notation, evaluate functions for inputs in their domains, and interpret statements that use
function notation in terms of a context.
3. Recognize that sequences are functions, sometimes defined recursively, whose domain is a subset of the
integers. For example, the Fibonacci sequence is defined recursively by f(0) = f(1) = 1, f(n+1) = f(n) +
f(n-1) for n ≥ 1 (n is greater than or equal to 1).
Interpret functions that arise in applications in terms of the context.44
4. For a function that models a relationship between two quantities, interpret key features of graphs and
tables in terms of the quantities, and sketch graphs showing key features given a verbal description of the
relationship. Key features include: intercepts; intervals where the function is increasing, decreasing,
positive, or negative; relative maximums and minimums; symmetries; end behavior; and periodicity.
5. Relate the domain of a function to its graph and, where applicable, to the quantitative relationship it
describes. For example, if the function h(n) gives the number of person-hours it takes to assemble n
engines in a factory, then the positive integers would be an appropriate domain for the function.
6. Calculate and interpret the average rate of change of a function (presented symbolically or as a table)
over a specified interval. Estimate the rate of change from a graph.
40
Limit Mathematics I to linear inequalities and exponential of a form 2x=1/16.
41 Limit Mathematics I to systems of linear equations.
42 Limit Mathematics I to linear and exponential equations; learn as general principle to be expanded in Mathematics II
and III. Specific modeling standards appear throughout the high school standards indicated by a star symbol (). The star
symbol appearing on the cluster heading should be understood to indicate that all standards in that cluster are modeling
standards. 43
Focus on linear and exponential functions with integer domains and on arithmetic and geometric sequences. 44
Focus on linear and exponential functions with integer domains.
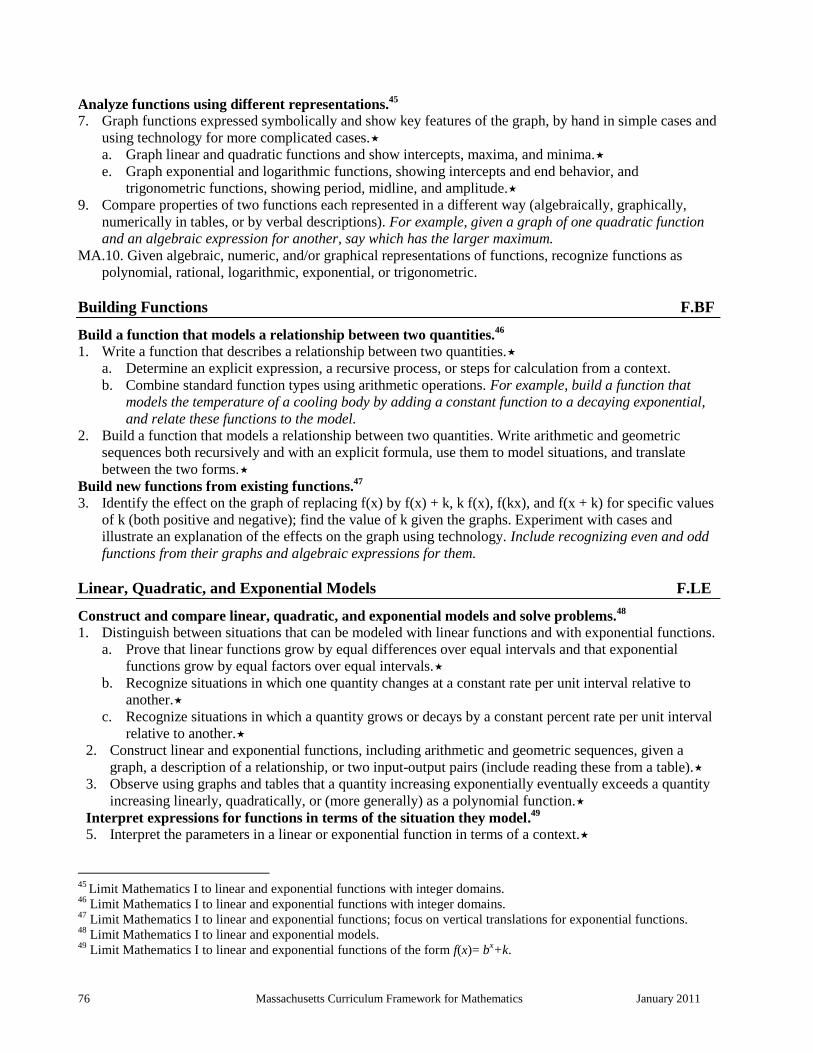
76 Massachusetts Curriculum Framework for Mathematics January 2011
Analyze functions using different representations.45
7. Graph functions expressed symbolically and show key features of the graph, by hand in simple cases and
using technology for more complicated cases.
a. Graph linear and quadratic functions and show intercepts, maxima, and minima.
e. Graph exponential and logarithmic functions, showing intercepts and end behavior, and
trigonometric functions, showing period, midline, and amplitude.
9. Compare properties of two functions each represented in a different way (algebraically, graphically,
numerically in tables, or by verbal descriptions). For example, given a graph of one quadratic function
and an algebraic expression for another, say which has the larger maximum.
MA.10. Given algebraic, numeric, and/or graphical representations of functions, recognize functions as
polynomial, rational, logarithmic, exponential, or trigonometric.
Building Functions F.BF
Build a function that models a relationship between two quantities.46
1. Write a function that describes a relationship between two quantities.
a. Determine an explicit expression, a recursive process, or steps for calculation from a context.
b. Combine standard function types using arithmetic operations. For example, build a function that
models the temperature of a cooling body by adding a constant function to a decaying exponential,
and relate these functions to the model.
2. Build a function that models a relationship between two quantities. Write arithmetic and geometric
sequences both recursively and with an explicit formula, use them to model situations, and translate
between the two forms.
Build new functions from existing functions.47
3. Identify the effect on the graph of replacing f(x) by f(x) + k, k f(x), f(kx), and f(x + k) for specific values
of k (both positive and negative); find the value of k given the graphs. Experiment with cases and
illustrate an explanation of the effects on the graph using technology. Include recognizing even and odd
functions from their graphs and algebraic expressions for them.
Linear, Quadratic, and Exponential Models F.LE
Construct and compare linear, quadratic, and exponential models and solve problems.48
1. Distinguish between situations that can be modeled with linear functions and with exponential functions.
a. Prove that linear functions grow by equal differences over equal intervals and that exponential
functions grow by equal factors over equal intervals.
b. Recognize situations in which one quantity changes at a constant rate per unit interval relative to
another.
c. Recognize situations in which a quantity grows or decays by a constant percent rate per unit interval
relative to another.
2. Construct linear and exponential functions, including arithmetic and geometric sequences, given a
graph, a description of a relationship, or two input-output pairs (include reading these from a table).
3. Observe using graphs and tables that a quantity increasing exponentially eventually exceeds a quantity
increasing linearly, quadratically, or (more generally) as a polynomial function.
Interpret expressions for functions in terms of the situation they model.49
5. Interpret the parameters in a linear or exponential function in terms of a context.
45
Limit Mathematics I to linear and exponential functions with integer domains. 46
Limit Mathematics I to linear and exponential functions with integer domains. 47
Limit Mathematics I to linear and exponential functions; focus on vertical translations for exponential functions. 48
Limit Mathematics I to linear and exponential models. 49
Limit Mathematics I to linear and exponential functions of the form f(x)= bx+k.
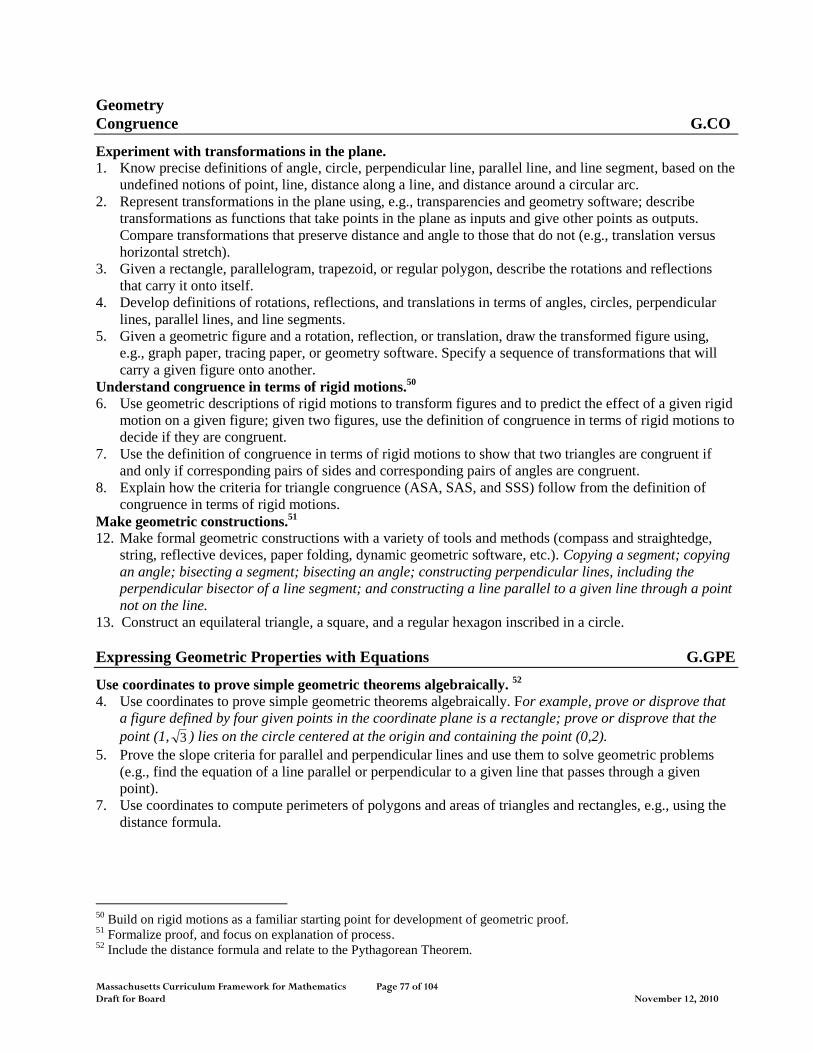
Massachusetts Curriculum Framework for Mathematics Page 77 of 104 Draft for Board November 12, 2010
Geometry
Congruence G.CO
Experiment with transformations in the plane.
1. Know precise definitions of angle, circle, perpendicular line, parallel line, and line segment, based on the
undefined notions of point, line, distance along a line, and distance around a circular arc.
2. Represent transformations in the plane using, e.g., transparencies and geometry software; describe
transformations as functions that take points in the plane as inputs and give other points as outputs.
Compare transformations that preserve distance and angle to those that do not (e.g., translation versus
horizontal stretch).
3. Given a rectangle, parallelogram, trapezoid, or regular polygon, describe the rotations and reflections
that carry it onto itself.
4. Develop definitions of rotations, reflections, and translations in terms of angles, circles, perpendicular
lines, parallel lines, and line segments.
5. Given a geometric figure and a rotation, reflection, or translation, draw the transformed figure using,
e.g., graph paper, tracing paper, or geometry software. Specify a sequence of transformations that will
carry a given figure onto another.
Understand congruence in terms of rigid motions.50
6. Use geometric descriptions of rigid motions to transform figures and to predict the effect of a given rigid
motion on a given figure; given two figures, use the definition of congruence in terms of rigid motions to
decide if they are congruent.
7. Use the definition of congruence in terms of rigid motions to show that two triangles are congruent if
and only if corresponding pairs of sides and corresponding pairs of angles are congruent.
8. Explain how the criteria for triangle congruence (ASA, SAS, and SSS) follow from the definition of
congruence in terms of rigid motions.
Make geometric constructions.51
12. Make formal geometric constructions with a variety of tools and methods (compass and straightedge,
string, reflective devices, paper folding, dynamic geometric software, etc.). Copying a segment; copying
an angle; bisecting a segment; bisecting an angle; constructing perpendicular lines, including the
perpendicular bisector of a line segment; and constructing a line parallel to a given line through a point
not on the line.
13. Construct an equilateral triangle, a square, and a regular hexagon inscribed in a circle.
Expressing Geometric Properties with Equations G.GPE
Use coordinates to prove simple geometric theorems algebraically. 52
4. Use coordinates to prove simple geometric theorems algebraically. For example, prove or disprove that
a figure defined by four given points in the coordinate plane is a rectangle; prove or disprove that the
point (1, 3 ) lies on the circle centered at the origin and containing the point (0,2).
5. Prove the slope criteria for parallel and perpendicular lines and use them to solve geometric problems
(e.g., find the equation of a line parallel or perpendicular to a given line that passes through a given
point).
7. Use coordinates to compute perimeters of polygons and areas of triangles and rectangles, e.g., using the
distance formula.
50
Build on rigid motions as a familiar starting point for development of geometric proof.
51 Formalize proof, and focus on explanation of process.
52 Include the distance formula and relate to the Pythagorean Theorem.
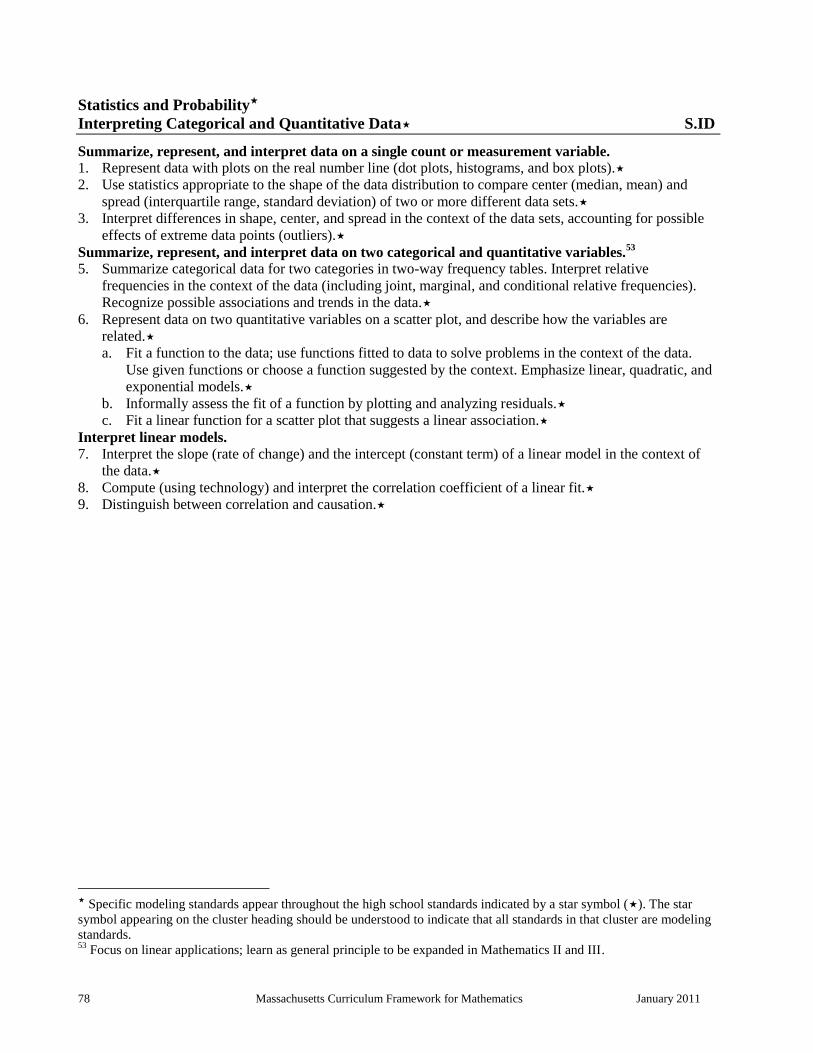
78 Massachusetts Curriculum Framework for Mathematics January 2011
Statistics and Probability
Interpreting Categorical and Quantitative Data S.ID
Summarize, represent, and interpret data on a single count or measurement variable.
1. Represent data with plots on the real number line (dot plots, histograms, and box plots).
2. Use statistics appropriate to the shape of the data distribution to compare center (median, mean) and
spread (interquartile range, standard deviation) of two or more different data sets.
3. Interpret differences in shape, center, and spread in the context of the data sets, accounting for possible
effects of extreme data points (outliers).
Summarize, represent, and interpret data on two categorical and quantitative variables.53
5. Summarize categorical data for two categories in two-way frequency tables. Interpret relative
frequencies in the context of the data (including joint, marginal, and conditional relative frequencies).
Recognize possible associations and trends in the data.
6. Represent data on two quantitative variables on a scatter plot, and describe how the variables are
related.
a. Fit a function to the data; use functions fitted to data to solve problems in the context of the data.
Use given functions or choose a function suggested by the context. Emphasize linear, quadratic, and
exponential models.
b. Informally assess the fit of a function by plotting and analyzing residuals.
c. Fit a linear function for a scatter plot that suggests a linear association.
Interpret linear models.
7. Interpret the slope (rate of change) and the intercept (constant term) of a linear model in the context of
the data.
8. Compute (using technology) and interpret the correlation coefficient of a linear fit.
9. Distinguish between correlation and causation.
Specific modeling standards appear throughout the high school standards indicated by a star symbol (). The star
symbol appearing on the cluster heading should be understood to indicate that all standards in that cluster are modeling
standards. 53
Focus on linear applications; learn as general principle to be expanded in Mathematics II and III.
Massachusetts Curriculum Framework for Mathematics Page 79 of 104 Draft for Board November 12, 2010
Integrated Pathway
Model Course: Mathematics II54
The focus of Mathematics II is on quadratic expressions, equations, and functions; comparing their
characteristics and behavior to those of linear and exponential relationships from Mathematics I as organized
into 5 critical areas. The course contains standards from the High School Conceptual Categories, each of
which were written to encompass the scope of content and skills to be addressed throughout grades 9–12 not
in any single course. Therefore, the full standard is presented in each model course, with clarifying footnotes
as needed to limit the scope of the standard and indicate what is appropriate for study in a particular course.
For example, the scope of Mathematics II is limited to quadratic expressions and functions as well as some
work with absolute value, step, and functions that are piecewise-defined; therefore, although a standard may
include references to logarithms or trigonometry, those functions should not be included in the work of
Mathematics II students, rather they will be addressed in Mathematics III.
(1) Students extend the laws of exponents to rational exponents and explore distinctions between
rational and irrational numbers by considering their decimal representations. Students learn that
when quadratic equations do not have real solutions the number system must be extended so that
solutions exist, analogous to the way in which extending the whole numbers to the negative
numbers allows x+1 = 0 to have a solution. Students explore relationships between number
systems: whole numbers, integers, rational numbers, real numbers, and complex numbers. The
guiding principle is that equations with no solutions in one number system may have solutions in
a larger number system.
(2) Students consider quadratic functions, comparing the key characteristics of quadratic functions
to those of linear and exponential functions. They select from among these functions to model
phenomena. Students learn to anticipate the graph of a quadratic function by interpreting various
forms of quadratic expressions. In particular, they identify the real solutions of a quadratic
equation as the zeros of a related quadratic function. When quadratic equations do not have real
solutions, students learn that that the graph of the related quadratic function does not cross the
horizontal axis. They expand their experience with functions to include more specialized
functions—absolute value, step, and those that are piecewise-defined.
(3) Students begin by focusing on the structure of expressions, rewriting expressions to clarify and
reveal aspects of the relationship they represent. They create and solve equations, inequalities,
and systems of equations involving exponential and quadratic expressions.
(4) Building on probability concepts that began in the middle grades, students use the languages of
set theory to expand their ability to compute and interpret theoretical and experimental
probabilities for compound events, attending to mutually exclusive events, independent events,
and conditional probability. Students should make use of geometric probability models wherever
possible. They use probability to make informed decisions.
(5) Students apply their earlier experience with dilations and proportional reasoning to build a
formal understanding of similarity. They identify criteria for similarity of triangles, use
similarity to solve problems, and apply similarity in right triangles to understand right triangle
trigonometry, with particular attention to special right triangles and the Pythagorean Theorem.
Students develop facility with geometric proof. They use what they know about congruence and
similarity to prove theorems involving lines, angles, triangles, and other polygons. They explore
a variety of formats for writing proofs.
54
Adapted from Appendix A: Designing High School Mathematics Course Based on the Common Core State
Standards, http://www.corestandards.org/the-standards
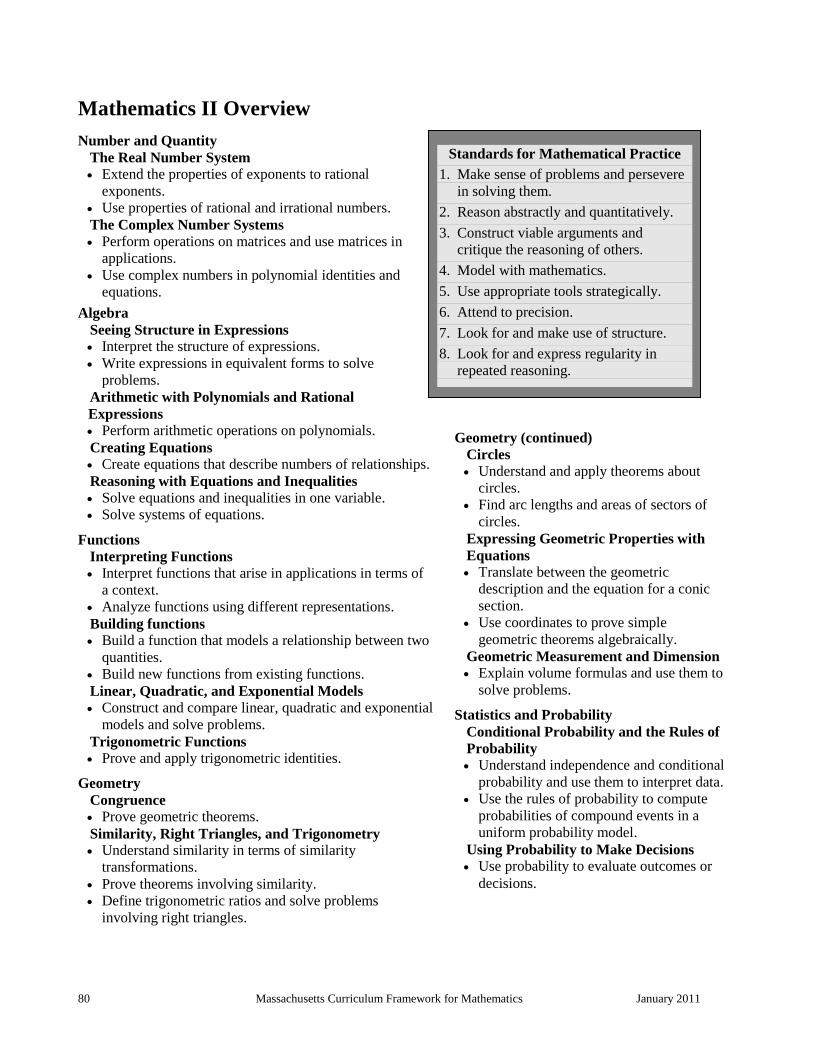
80 Massachusetts Curriculum Framework for Mathematics January 2011
Mathematics II Overview
Number and Quantity
The Real Number System
Extend the properties of exponents to rational
exponents.
Use properties of rational and irrational numbers.
The Complex Number Systems
Perform operations on matrices and use matrices in
applications.
Use complex numbers in polynomial identities and
equations.
Algebra
Seeing Structure in Expressions
Interpret the structure of expressions.
Write expressions in equivalent forms to solve
problems.
Arithmetic with Polynomials and Rational
Expressions
Perform arithmetic operations on polynomials.
Creating Equations
Create equations that describe numbers of relationships.
Reasoning with Equations and Inequalities
Solve equations and inequalities in one variable.
Solve systems of equations.
Functions
Interpreting Functions
Interpret functions that arise in applications in terms of
a context.
Analyze functions using different representations.
Building functions
Build a function that models a relationship between two
quantities.
Build new functions from existing functions.
Linear, Quadratic, and Exponential Models
Construct and compare linear, quadratic and exponential
models and solve problems.
Trigonometric Functions
Prove and apply trigonometric identities.
Geometry
Congruence
Prove geometric theorems.
Similarity, Right Triangles, and Trigonometry
Understand similarity in terms of similarity
transformations.
Prove theorems involving similarity.
Define trigonometric ratios and solve problems
involving right triangles.
Geometry (continued)
Circles
Understand and apply theorems about
circles.
Find arc lengths and areas of sectors of
circles.
Expressing Geometric Properties with
Equations
Translate between the geometric
description and the equation for a conic
section.
Use coordinates to prove simple
geometric theorems algebraically.
Geometric Measurement and Dimension
Explain volume formulas and use them to
solve problems.
Statistics and Probability
Conditional Probability and the Rules of
Probability
Understand independence and conditional
probability and use them to interpret data.
Use the rules of probability to compute
probabilities of compound events in a
uniform probability model.
Using Probability to Make Decisions
Use probability to evaluate outcomes or
decisions.
Standards for Mathematical Practice
1. Make sense of problems and persevere
in solving them.
2. Reason abstractly and quantitatively.
3. Construct viable arguments and
critique the reasoning of others.
4. Model with mathematics.
5. Use appropriate tools strategically.
6. Attend to precision.
7. Look for and make use of structure.
8. Look for and express regularity in
repeated reasoning.
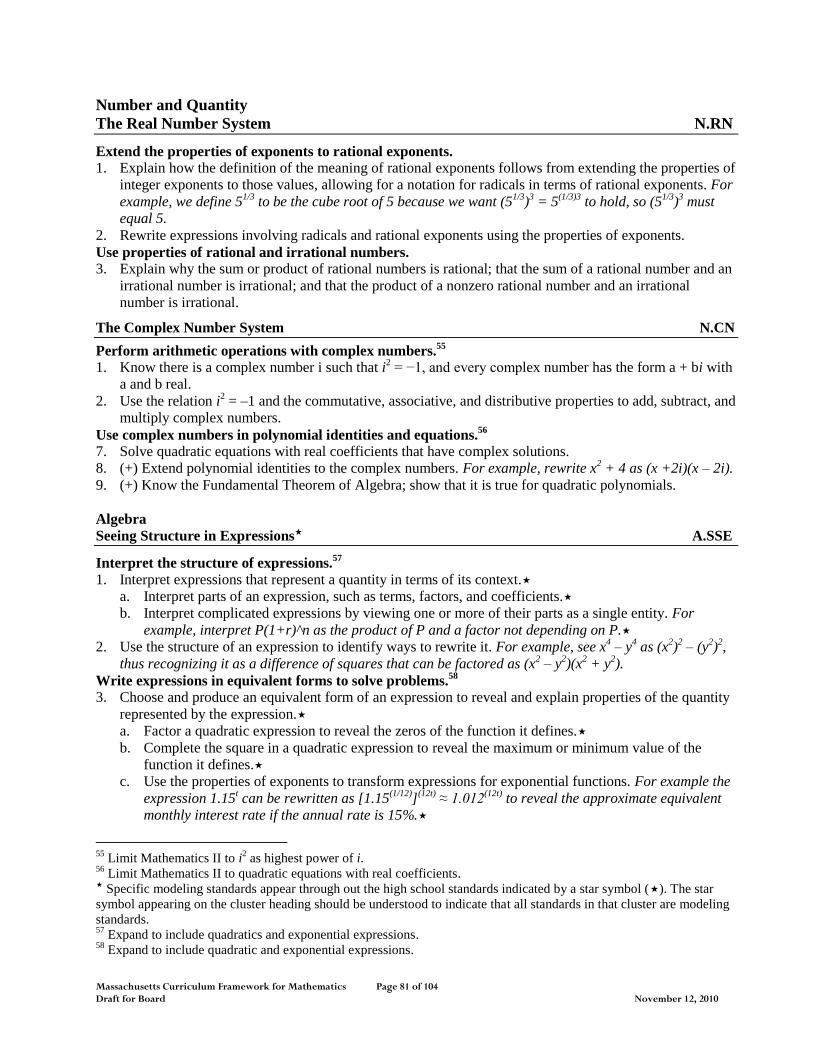
Massachusetts Curriculum Framework for Mathematics Page 81 of 104 Draft for Board November 12, 2010
Number and Quantity
The Real Number System N.RN
Extend the properties of exponents to rational exponents.
1. Explain how the definition of the meaning of rational exponents follows from extending the properties of
integer exponents to those values, allowing for a notation for radicals in terms of rational exponents. For
example, we define 51/3
to be the cube root of 5 because we want (51/3
)3 = 5
(1/3)3 to hold, so (5
1/3)
3 must
equal 5.
2. Rewrite expressions involving radicals and rational exponents using the properties of exponents.
Use properties of rational and irrational numbers.
3. Explain why the sum or product of rational numbers is rational; that the sum of a rational number and an
irrational number is irrational; and that the product of a nonzero rational number and an irrational
number is irrational.
The Complex Number System N.CN
Perform arithmetic operations with complex numbers.55
1. Know there is a complex number i such that i2 = −1, and every complex number has the form a + bi with
a and b real.
2. Use the relation i2 = –1 and the commutative, associative, and distributive properties to add, subtract, and
multiply complex numbers.
Use complex numbers in polynomial identities and equations.56
7. Solve quadratic equations with real coefficients that have complex solutions.
8. (+) Extend polynomial identities to the complex numbers. For example, rewrite x2 + 4 as (x +2i)(x – 2i).
9. (+) Know the Fundamental Theorem of Algebra; show that it is true for quadratic polynomials.
Algebra
Seeing Structure in Expressions A.SSE
Interpret the structure of expressions.57
1. Interpret expressions that represent a quantity in terms of its context.
a. Interpret parts of an expression, such as terms, factors, and coefficients.
b. Interpret complicated expressions by viewing one or more of their parts as a single entity. For
example, interpret P(1+r)^n as the product of P and a factor not depending on P.
2. Use the structure of an expression to identify ways to rewrite it. For example, see x4 – y
4 as (x
2)
2 – (y
2)
2,
thus recognizing it as a difference of squares that can be factored as (x2 – y
2)(x
2 + y
2).
Write expressions in equivalent forms to solve problems.58
3. Choose and produce an equivalent form of an expression to reveal and explain properties of the quantity
represented by the expression.
a. Factor a quadratic expression to reveal the zeros of the function it defines.
b. Complete the square in a quadratic expression to reveal the maximum or minimum value of the
function it defines.
c. Use the properties of exponents to transform expressions for exponential functions. For example the
expression 1.15t can be rewritten as [1.15
(1/12)]
(12t) ≈ 1.012
(12t) to reveal the approximate equivalent
monthly interest rate if the annual rate is 15%.
55
Limit Mathematics II to i2 as highest power of i.
56 Limit Mathematics II to quadratic equations with real coefficients.
Specific modeling standards appear through out the high school standards indicated by a star symbol (). The star
symbol appearing on the cluster heading should be understood to indicate that all standards in that cluster are modeling
standards. 57
Expand to include quadratics and exponential expressions. 58
Expand to include quadratic and exponential expressions.
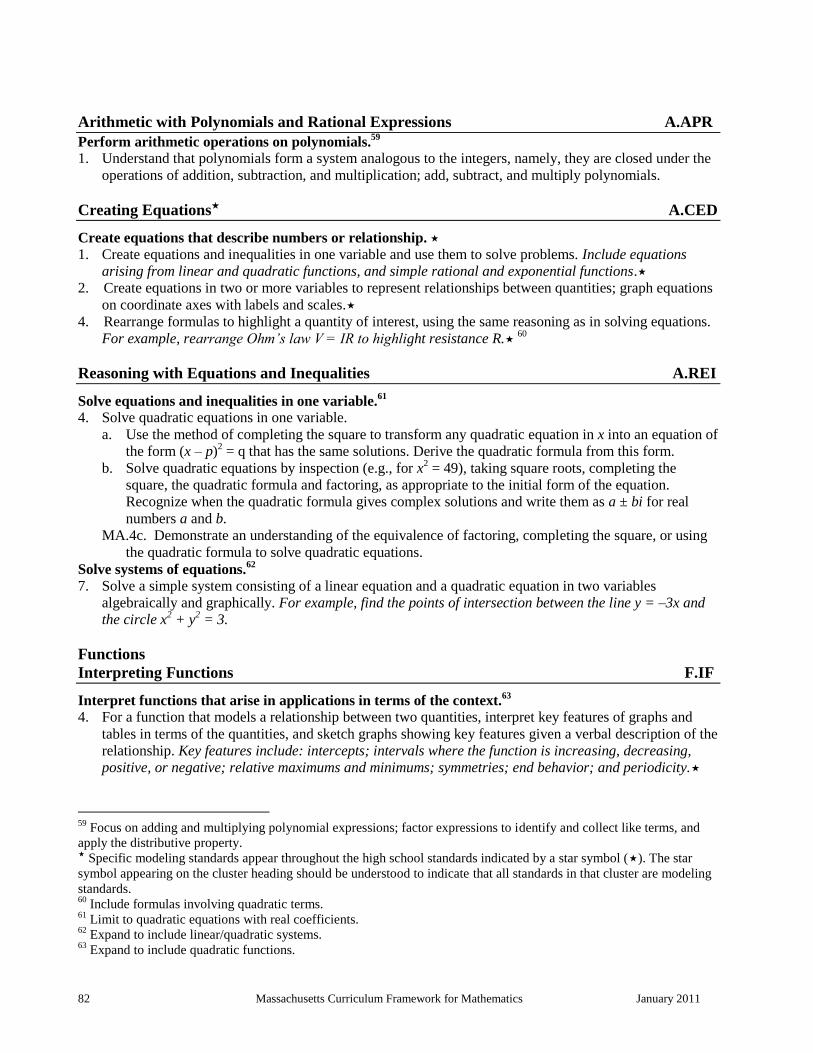
82 Massachusetts Curriculum Framework for Mathematics January 2011
Arithmetic with Polynomials and Rational Expressions A.APR
Perform arithmetic operations on polynomials.59
1. Understand that polynomials form a system analogous to the integers, namely, they are closed under the
operations of addition, subtraction, and multiplication; add, subtract, and multiply polynomials.
Creating Equations A.CED
Create equations that describe numbers or relationship.
1. Create equations and inequalities in one variable and use them to solve problems. Include equations
arising from linear and quadratic functions, and simple rational and exponential functions.
2. Create equations in two or more variables to represent relationships between quantities; graph equations
on coordinate axes with labels and scales.
4. Rearrange formulas to highlight a quantity of interest, using the same reasoning as in solving equations.
For example, rearrange Ohm’s law V = IR to highlight resistance R. 60
Reasoning with Equations and Inequalities A.REI
Solve equations and inequalities in one variable.61
4. Solve quadratic equations in one variable.
a. Use the method of completing the square to transform any quadratic equation in x into an equation of
the form (x – p)2 = q that has the same solutions. Derive the quadratic formula from this form.
b. Solve quadratic equations by inspection (e.g., for x2 = 49), taking square roots, completing the
square, the quadratic formula and factoring, as appropriate to the initial form of the equation.
Recognize when the quadratic formula gives complex solutions and write them as a ± bi for real
numbers a and b.
MA.4c. Demonstrate an understanding of the equivalence of factoring, completing the square, or using
the quadratic formula to solve quadratic equations.
Solve systems of equations.62
7. Solve a simple system consisting of a linear equation and a quadratic equation in two variables
algebraically and graphically. For example, find the points of intersection between the line y = –3x and
the circle x2 + y
2 = 3.
Functions
Interpreting Functions F.IF
Interpret functions that arise in applications in terms of the context.63
4. For a function that models a relationship between two quantities, interpret key features of graphs and
tables in terms of the quantities, and sketch graphs showing key features given a verbal description of the
relationship. Key features include: intercepts; intervals where the function is increasing, decreasing,
positive, or negative; relative maximums and minimums; symmetries; end behavior; and periodicity.
59
Focus on adding and multiplying polynomial expressions; factor expressions to identify and collect like terms, and
apply the distributive property. Specific modeling standards appear throughout the high school standards indicated by a star symbol (). The star
symbol appearing on the cluster heading should be understood to indicate that all standards in that cluster are modeling
standards. 60
Include formulas involving quadratic terms. 61
Limit to quadratic equations with real coefficients. 62
Expand to include linear/quadratic systems. 63
Expand to include quadratic functions.
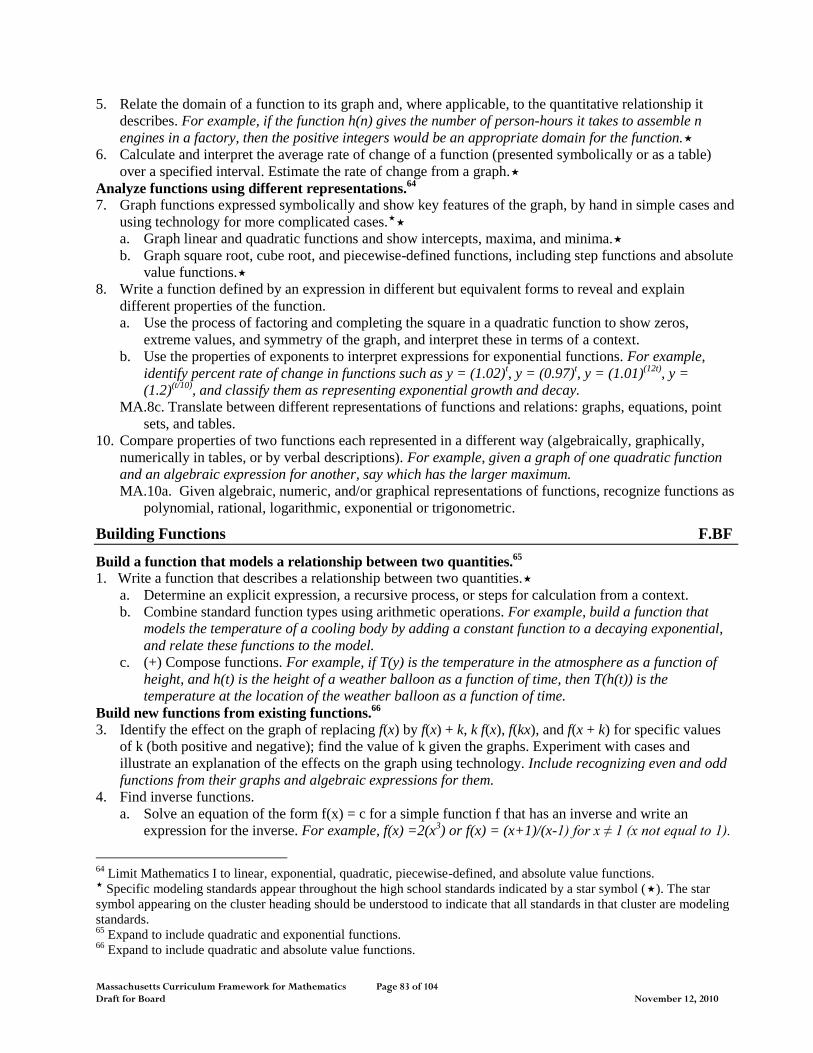
Massachusetts Curriculum Framework for Mathematics Page 83 of 104 Draft for Board November 12, 2010
5. Relate the domain of a function to its graph and, where applicable, to the quantitative relationship it
describes. For example, if the function h(n) gives the number of person-hours it takes to assemble n
engines in a factory, then the positive integers would be an appropriate domain for the function.
6. Calculate and interpret the average rate of change of a function (presented symbolically or as a table)
over a specified interval. Estimate the rate of change from a graph.
Analyze functions using different representations.64
7. Graph functions expressed symbolically and show key features of the graph, by hand in simple cases and
using technology for more complicated cases.
a. Graph linear and quadratic functions and show intercepts, maxima, and minima.
b. Graph square root, cube root, and piecewise-defined functions, including step functions and absolute
value functions.
8. Write a function defined by an expression in different but equivalent forms to reveal and explain
different properties of the function.
a. Use the process of factoring and completing the square in a quadratic function to show zeros,
extreme values, and symmetry of the graph, and interpret these in terms of a context.
b. Use the properties of exponents to interpret expressions for exponential functions. For example,
identify percent rate of change in functions such as y = (1.02)t, y = (0.97)
t, y = (1.01)
(12t), y =
(1.2)(t/10)
, and classify them as representing exponential growth and decay.
MA.8c. Translate between different representations of functions and relations: graphs, equations, point
sets, and tables.
10. Compare properties of two functions each represented in a different way (algebraically, graphically,
numerically in tables, or by verbal descriptions). For example, given a graph of one quadratic function
and an algebraic expression for another, say which has the larger maximum.
MA.10a. Given algebraic, numeric, and/or graphical representations of functions, recognize functions as
polynomial, rational, logarithmic, exponential or trigonometric.
Building Functions F.BF
Build a function that models a relationship between two quantities.65
1. Write a function that describes a relationship between two quantities.
a. Determine an explicit expression, a recursive process, or steps for calculation from a context.
b. Combine standard function types using arithmetic operations. For example, build a function that
models the temperature of a cooling body by adding a constant function to a decaying exponential,
and relate these functions to the model.
c. (+) Compose functions. For example, if T(y) is the temperature in the atmosphere as a function of
height, and h(t) is the height of a weather balloon as a function of time, then T(h(t)) is the
temperature at the location of the weather balloon as a function of time.
Build new functions from existing functions.66
3. Identify the effect on the graph of replacing f(x) by f(x) + k, k f(x), f(kx), and f(x + k) for specific values
of k (both positive and negative); find the value of k given the graphs. Experiment with cases and
illustrate an explanation of the effects on the graph using technology. Include recognizing even and odd
functions from their graphs and algebraic expressions for them.
4. Find inverse functions.
a. Solve an equation of the form f(x) = c for a simple function f that has an inverse and write an
expression for the inverse. For example, f(x) =2(x3) or f(x) = (x+1)/(x-1) for x ≠ 1 (x not equal to 1).
64
Limit Mathematics I to linear, exponential, quadratic, piecewise-defined, and absolute value functions. Specific modeling standards appear throughout the high school standards indicated by a star symbol (). The star
symbol appearing on the cluster heading should be understood to indicate that all standards in that cluster are modeling
standards. 65
Expand to include quadratic and exponential functions. 66
Expand to include quadratic and absolute value functions.
84 Massachusetts Curriculum Framework for Mathematics January 2011
Linear, Quadratic, and Exponential Models F.LE
Construct and compare linear, quadratic, and exponential models and solve problems.
3. Observe using graphs and tables that a quantity increasing exponentially eventually exceeds a quantity
increasing linearly, quadratically, or (more generally) as a polynomial function.
Trigonometric Functions F.TF
Prove and apply trigonometric identities.
8. Prove the Pythagorean identity (sin A)2 + (cos A)
2 = 1 and use it to find sin A, cos A, or tan A, given sin
A, cos A, or tan A, and the quadrant of the angle.
Geometry
Congruence G.CO
Prove geometric theorems.67
9. Prove theorems about lines and angles. Theorems include: vertical angles are congruent; when a
transversal crosses parallel lines, alternate interior angles are congruent and corresponding angles are
congruent; points on a perpendicular bisector of a line segment are exactly those equidistant from the
segment’s endpoints.
10. Prove theorems about triangles. Theorems include: measures of interior angles of a triangle sum to 180
degrees; base angles of isosceles triangles are congruent; the segment joining midpoints of two sides of
a triangle is parallel to the third side and half the length; the medians of a triangle meet at a point.
11. Prove theorems about parallelograms. Theorems include: opposite sides are congruent, opposite angles
are congruent, the diagonals of a parallelogram bisect each other, and conversely, rectangles are
parallelograms with congruent diagonals.
MA.11a. Prove theorems about polygons. Theorems include: measures of interior and exterior angels,
properties of inscribed polygons.
Similarity, Right Triangles, and Trigonometry G.SRT
Understand similarity in terms of similarity transformations.
1. Verify experimentally the properties of dilations given by a center and a scale factor:
a. A dilation takes a line not passing through the center of the dilation to a parallel line, and leaves a
line passing through the center unchanged.
b. The dilation of a line segment is longer or shorter in the ratio given by the scale factor.
2. Given two figures, use the definition of similarity in terms of similarity transformations to decide if they
are similar; explain using similarity transformations the meaning of similarity for triangles as the
equality of all corresponding pairs of angles and the proportionality of all corresponding pairs of sides.
3. Use the properties of similarity transformations to establish the AA criterion for two triangles to be
similar.
Prove theorems involving similarity.68
4. Prove theorems about triangles. Theorems include: a line parallel to one side of a triangle divides the
other two proportionally, and conversely; the Pythagorean Theorem proved using triangle similarity.
Specific modeling standards appear throughout the high school standards indicated by a star symbol (). The star
symbol appearing on the cluster heading should be understood to indicate that all standards in that cluster are modeling
standards. 67
Focus on validity underlying reasoning and use a variety of ways of writing proofs 68
Focus on validity underlying reasoning and use a variety of ways of writing proofs
Massachusetts Curriculum Framework for Mathematics Page 85 of 104 Draft for Board November 12, 2010
5. Use congruence and similarity criteria for triangles to solve problems and to prove relationships in
geometric figures.
Define trigonometric ratios and solve problems involving right triangles.
6. Understand that by similarity, side ratios in right triangles are properties of the angles in the triangle,
leading to definitions of trigonometric ratios for acute angles.
7. Explain and use the relationship between the sine and cosine of complementary angles.
8. Use trigonometric ratios and the Pythagorean Theorem to solve right triangles in applied problems.
Circles G.C
Understand and apply theorems about circles.
1. Prove that all circles are similar.
2. Identify and describe relationships among inscribed angles, radii, and chords. Include the relationship
between central, inscribed, and circumscribed angles; inscribed angles on a diameter are right angles; the
radius of a circle is perpendicular to the tangent where the radius intersects the circle.
3. Construct the inscribed and circumscribed circles of a triangle, and prove properties of angles for a
quadrilateral inscribed in a circle.
MA.3a. Derive the formula for the relationship between the number of sides and the sums of the interior
and the sums of the exterior angles of polygons and apply to the solutions of mathematical and
contextual problems.
4. (+) Construct a tangent line from a point outside a given circle to the circle.
Find arc lengths and areas of sectors of circles.
5. Derive using similarity the fact that the length of the arc intercepted by an angle is proportional to the
radius, and define the radian measure of the angle as the constant of proportionality; derive the formula
for the area of a sector.69
Expressing Geometric Properties with Equations G.GPE
Translate between the geometric description and the equation for a conic section.
1. Derive the equation of a circle of given center and radius using the Pythagorean Theorem; complete the
square to find the center and radius of a circle given by an equation.
2. Derive the equation of a parabola given a focus and directrix.
Use coordinates to prove simple geometric theorems algebraically.
4. Use coordinates to prove simple geometric theorems algebraically. For example, prove or disprove that
a figure defined by four given points in the coordinate plane is a rectangle; prove or disprove that the
point (1, 3 ) lies on the circle centered at the origin and containing the point (0, 2). 70
6. Find the point on a directed line segment between two given points that partitions the segment in a given
ratio.
Geometric Measurement with Dimension G.GMD
Explain volume formulas and use them to solve problems.
1. Give an informal argument for the formulas for the circumference of a circle, area of a circle, volume of
a cylinder, pyramid, and cone. Use dissection arguments, Cavalieri’s principle, and informal limit
arguments.
3. Use volume formulas for cylinders, pyramids, cones, and spheres to solve problems.
Statistics and Probability
69
Limit Mathematics II use of radian to unit of measure 70
Include simple circle theorems
86 Massachusetts Curriculum Framework for Mathematics January 2011
Conditional Probability and the Rules of Probability S.CP
Understand independence and conditional probability and use them to interpret data.71
1. Describe events as subsets of a sample space (the set of outcomes) using characteristics (or categories) of
the outcomes, or as unions, intersections, or complements of other events (―or,‖ ―and,‖ ―not‖).
2. Understand that two events A and B are independent if the probability of A and B occurring together is
the product of their probabilities, and use this characterization to determine if they are independent.
3. Understand the conditional probability of A given B as P(A and B)/P(B), and interpret independence of A
and B as saying that the conditional probability of A given B is the same as the probability of A, and the
conditional probability of B given A is the same as the probability of B.
4. Construct and interpret two-way frequency tables of data when two categories are associated with each
object being classified. Use the two-way table as a sample space to decide if events are independent and
to approximate conditional probabilities. For example, collect data from a random sample of students in
your school on their favorite subject among math, science, and English. Estimate the probability that a
randomly selected student from your school will favor science given that the student is in tenth grade.
Do the same for other subjects and compare the results.
5. Recognize and explain the concepts of conditional probability and independence in everyday language
and everyday situations. For example, compare the chance of having lung cancer if you are a smoker
with the chance of being a smoker if you have lung cancer.
Use the rules of probability to compute probabilities of compound events in a uniform probability
model.
6. Find the conditional probability of A given B as the fraction of B’s outcomes that also belong to A, and
interpret the answer in terms of the model.
7. Apply the Addition Rule, P(A or B) = P(A) + P(B) – P(A and B), and interpret the answer in terms of the
model.
8. (+) Apply the general Multiplication Rule in a uniform probability model,
P(A and B) = [P(A)]x[P(B|A)] =[P(B)]x[P(A|B)], and interpret the answer in terms of the model.
9. (+) Use permutations and combinations to compute probabilities of compound events and solve
problems.
Using Probability to Make Decisions S.MD
Use probability to evaluate outcomes of decisions.72
6. (+) Use probabilities to make fair decision (e.g., drawing by lots, using a random number generator).
7. (+) Analyze decisions and strategies using probability concepts (e.g., product testing, medical testing,
pulling [out] a hockey goalie at the end of a game).
Specific modeling standards appear throughout the high school standards indicated by a star symbol (). The star
symbol appearing on the cluster heading should be understood to indicate that all standards in that cluster are modeling
standards. 71
Link to data from simulations and/or experiments. 72
Introductory only; apply counting rules.
Massachusetts Curriculum Framework for Mathematics Page 87 of 104 Draft for Board November 12, 2010
Integrated Pathway
Model Course: Mathematics III73
It is in Mathematics III that students pull together and apply the accumulation of learning that they have from
their previous courses, with content grouped into four critical areas. The course contains standards from the
High School Conceptual Categories, each of which were written to encompass the scope of content and skills
to be addressed throughout grades 9–12 not in any single course. Therefore, the full standard is presented in
each model course, with clarifying footnotes as needed to limit the scope of the standard and indicate what is
appropriate for study in a particular course. Standards that were limited in Mathematics I and Mathematics
II, no longer have those restrictions in Mathematics III. Students apply methods from probability and
statistics to draw inferences and conclusions from data. Students expand their repertoire of functions to
include polynomial, rational, and radical functions74
. They expand their study of right triangle trigonometry
to include general triangles. And, finally, students bring together all of their experience with functions and
geometry to create models and solve contextual problems. The Standards for Mathematical Practice apply
throughout each course and, together with the content standards, prescribe that students experience
mathematics as a coherent, useful, and logical subject that makes use of their ability to make sense of
problem situations.
(1) Students see how the visual displays and summary statistics they learned in earlier grades relate
to different types of data and to probability distributions. They identify different ways of
collecting data— including sample surveys, experiments, and simulations—and the role that
randomness and careful design play in the conclusions that can be drawn.
(2) The structural similarities between the system of polynomials and the system of integers are
developed. Students draw on analogies between polynomial arithmetic and base-ten
computation, focusing on properties of operations, particularly the distributive property.
Students connect multiplication of polynomials with multiplication of multi-digit integers, and
division of polynomials with long division of integers. Students identify zeros of polynomials
and make connections between zeros of polynomials and solutions of polynomial equations.
Rational numbers extend the arithmetic of integers by allowing division by all numbers except 0.
Similarly, rational expressions extend the arithmetic of polynomials by allowing division by all
polynomials except the zero polynomial. A central theme is that the arithmetic of rational
expressions is governed by the same rules as the arithmetic of rational numbers. This critical
area also includes and exploration of the Fundamental Theorem of Algebra
(3) Students develop the Laws of Sines and Cosines in order to find missing measures of general
(not necessarily right) triangles. They are able to distinguish whether three given measures
(angles or sides) define 0, 1, 2, or infinitely many triangles. This discussion of general triangles
open up the idea of trigonometry applied beyond the right triangle—that is, at least to obtuse
angles. Students build on this idea to develop the notion of radian measure for angles and extend
the domain of the trigonometric functions to all real numbers. They apply this knowledge to
model simple periodic phenomena.
73
Adapted from Appendix A: Designing High School Mathematics Course Based on the Common Core State
Standards, http://www.corestandards.org/the-standards 74
In this course, rational functions are limited to those whose numerators are of degree at most 1 and denominators are
of degree at most 2; radical functions are limited to square roots or cube roots of at most quadratic polynomials.
88 Massachusetts Curriculum Framework for Mathematics January 2011
(4) Students synthesize and generalize what they have learned about a variety of function families.
They extend their work with exponential functions to include solving exponential equations with
logarithms. They explore the effects of transformations on graphs of diverse functions, including
functions arising in an application, in order to abstract the general principle that transformations
on a graph always have the same effect regardless of the type of the underlying functions. They
identify appropriate types of functions to model a situation, they adjust parameters to improve
the model, and they compare models by analyzing appropriateness of fit and making judgments
about the domain over which a model is a good fit. The description of modeling as ―the process
of choosing and using mathematics and statistics to analyze empirical situations, to understand
them better, and to make decisions‖ is at the heart of this unit. The narrative discussion and
diagram of the modeling cycle should be considered when knowledge of functions, statistics,
and geometry is applied in a modeling context.
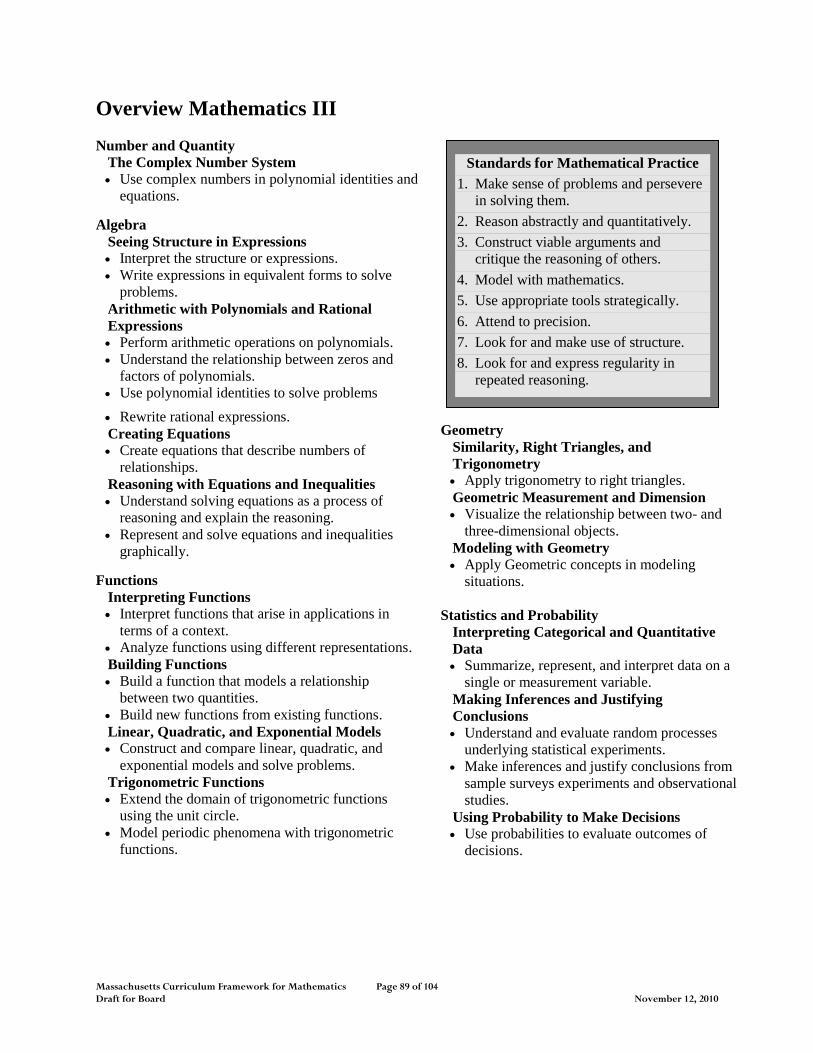
Massachusetts Curriculum Framework for Mathematics Page 89 of 104 Draft for Board November 12, 2010
Overview Mathematics III
Number and Quantity
The Complex Number System
Use complex numbers in polynomial identities and
equations.
Algebra
Seeing Structure in Expressions
Interpret the structure or expressions.
Write expressions in equivalent forms to solve
problems.
Arithmetic with Polynomials and Rational
Expressions
Perform arithmetic operations on polynomials.
Understand the relationship between zeros and
factors of polynomials.
Use polynomial identities to solve problems
Rewrite rational expressions.
Creating Equations
Create equations that describe numbers of
relationships.
Reasoning with Equations and Inequalities
Understand solving equations as a process of
reasoning and explain the reasoning.
Represent and solve equations and inequalities
graphically.
Functions
Interpreting Functions
Interpret functions that arise in applications in
terms of a context.
Analyze functions using different representations.
Building Functions
Build a function that models a relationship
between two quantities.
Build new functions from existing functions.
Linear, Quadratic, and Exponential Models
Construct and compare linear, quadratic, and
exponential models and solve problems.
Trigonometric Functions
Extend the domain of trigonometric functions
using the unit circle.
Model periodic phenomena with trigonometric
functions.
Geometry
Similarity, Right Triangles, and
Trigonometry
Apply trigonometry to right triangles.
Geometric Measurement and Dimension
Visualize the relationship between two- and
three-dimensional objects.
Modeling with Geometry
Apply Geometric concepts in modeling
situations.
Statistics and Probability
Interpreting Categorical and Quantitative
Data
Summarize, represent, and interpret data on a
single or measurement variable.
Making Inferences and Justifying
Conclusions
Understand and evaluate random processes
underlying statistical experiments.
Make inferences and justify conclusions from
sample surveys experiments and observational
studies.
Using Probability to Make Decisions
Use probabilities to evaluate outcomes of
decisions.
Standards for Mathematical Practice
1. Make sense of problems and persevere
in solving them.
2. Reason abstractly and quantitatively.
3. Construct viable arguments and
critique the reasoning of others.
4. Model with mathematics.
5. Use appropriate tools strategically.
6. Attend to precision.
7. Look for and make use of structure.
8. Look for and express regularity in
repeated reasoning.
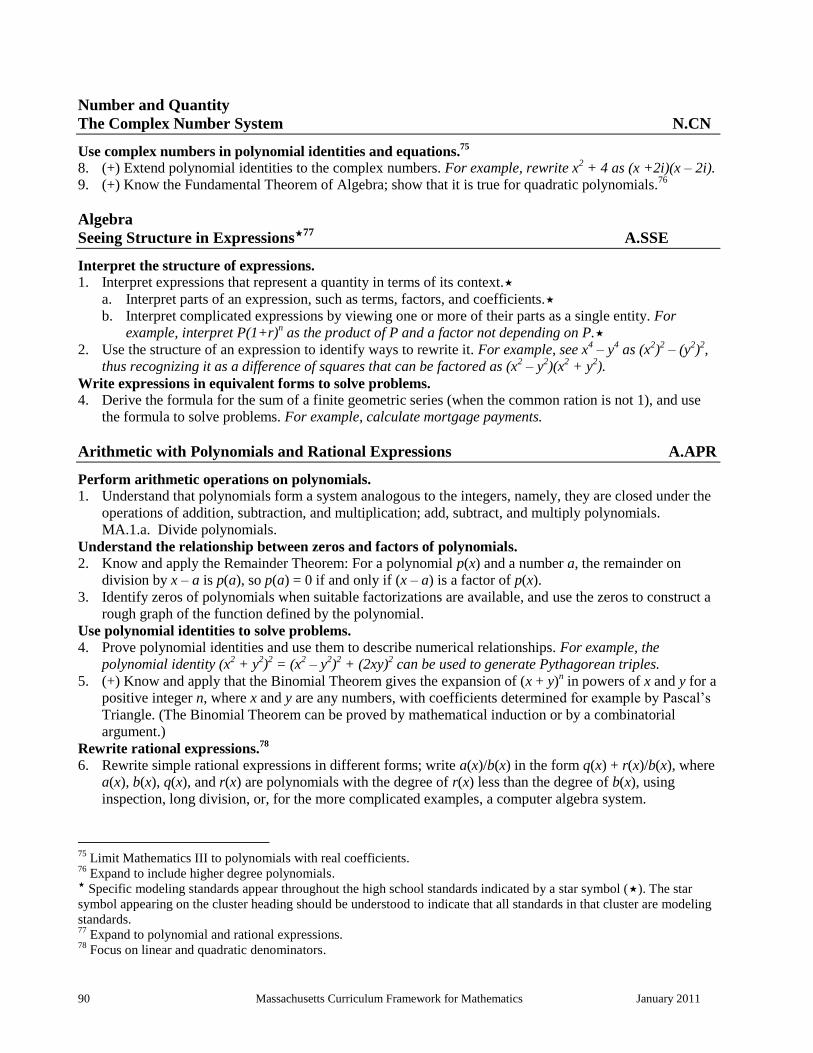
90 Massachusetts Curriculum Framework for Mathematics January 2011
Number and Quantity
The Complex Number System N.CN
Use complex numbers in polynomial identities and equations.75
8. (+) Extend polynomial identities to the complex numbers. For example, rewrite x2 + 4 as (x +2i)(x – 2i).
9. (+) Know the Fundamental Theorem of Algebra; show that it is true for quadratic polynomials.76
Algebra
Seeing Structure in Expressions77
A.SSE
Interpret the structure of expressions.
1. Interpret expressions that represent a quantity in terms of its context.
a. Interpret parts of an expression, such as terms, factors, and coefficients.
b. Interpret complicated expressions by viewing one or more of their parts as a single entity. For
example, interpret P(1+r)n as the product of P and a factor not depending on P.
2. Use the structure of an expression to identify ways to rewrite it. For example, see x4 – y
4 as (x
2)
2 – (y
2)
2,
thus recognizing it as a difference of squares that can be factored as (x2 – y
2)(x
2 + y
2).
Write expressions in equivalent forms to solve problems.
4. Derive the formula for the sum of a finite geometric series (when the common ration is not 1), and use
the formula to solve problems. For example, calculate mortgage payments.
Arithmetic with Polynomials and Rational Expressions A.APR
Perform arithmetic operations on polynomials.
1. Understand that polynomials form a system analogous to the integers, namely, they are closed under the
operations of addition, subtraction, and multiplication; add, subtract, and multiply polynomials.
MA.1.a. Divide polynomials.
Understand the relationship between zeros and factors of polynomials.
2. Know and apply the Remainder Theorem: For a polynomial p(x) and a number a, the remainder on
division by x – a is p(a), so p(a) = 0 if and only if (x – a) is a factor of p(x).
3. Identify zeros of polynomials when suitable factorizations are available, and use the zeros to construct a
rough graph of the function defined by the polynomial.
Use polynomial identities to solve problems.
4. Prove polynomial identities and use them to describe numerical relationships. For example, the
polynomial identity (x2 + y
2)
2 = (x
2 – y
2)
2 + (2xy)
2 can be used to generate Pythagorean triples.
5. (+) Know and apply that the Binomial Theorem gives the expansion of (x + y)n in powers of x and y for a
positive integer n, where x and y are any numbers, with coefficients determined for example by Pascal’s
Triangle. (The Binomial Theorem can be proved by mathematical induction or by a combinatorial
argument.)
Rewrite rational expressions.78
6. Rewrite simple rational expressions in different forms; write a(x)/b(x) in the form q(x) + r(x)/b(x), where
a(x), b(x), q(x), and r(x) are polynomials with the degree of r(x) less than the degree of b(x), using
inspection, long division, or, for the more complicated examples, a computer algebra system.
75
Limit Mathematics III to polynomials with real coefficients. 76
Expand to include higher degree polynomials. Specific modeling standards appear throughout the high school standards indicated by a star symbol (). The star
symbol appearing on the cluster heading should be understood to indicate that all standards in that cluster are modeling
standards. 77
Expand to polynomial and rational expressions. 78
Focus on linear and quadratic denominators.
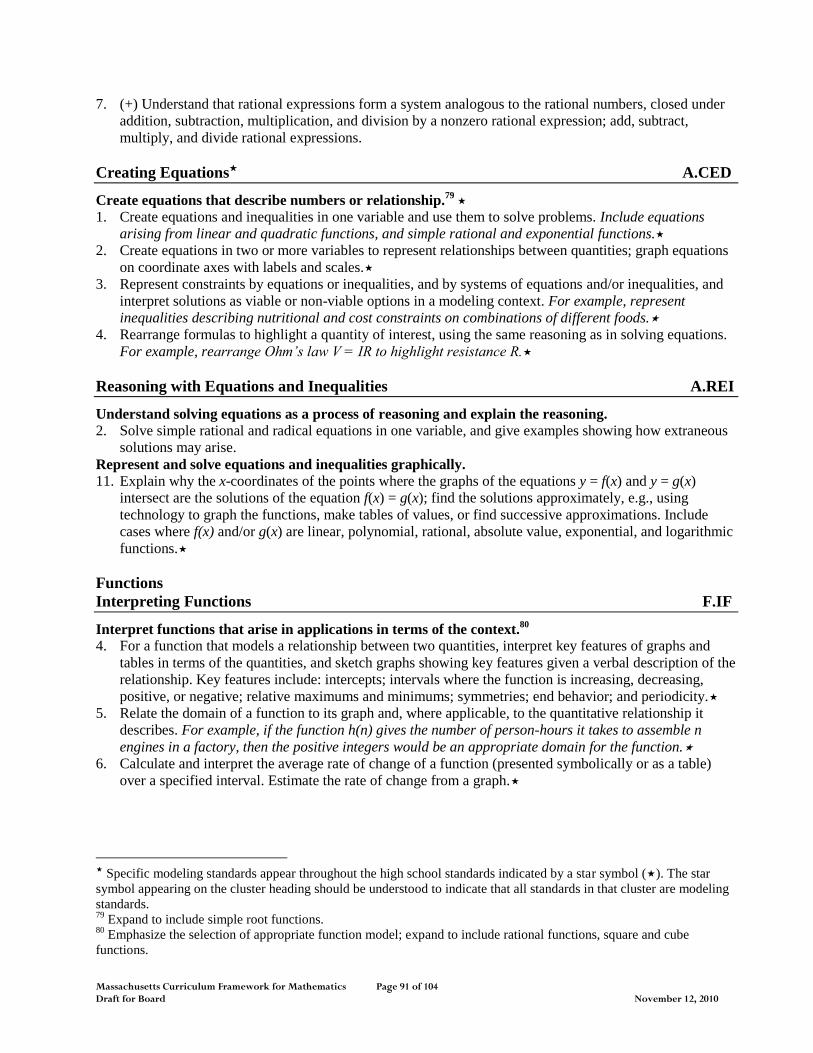
Massachusetts Curriculum Framework for Mathematics Page 91 of 104 Draft for Board November 12, 2010
7. (+) Understand that rational expressions form a system analogous to the rational numbers, closed under
addition, subtraction, multiplication, and division by a nonzero rational expression; add, subtract,
multiply, and divide rational expressions.
Creating Equations A.CED
Create equations that describe numbers or relationship.79
1. Create equations and inequalities in one variable and use them to solve problems. Include equations
arising from linear and quadratic functions, and simple rational and exponential functions.
2. Create equations in two or more variables to represent relationships between quantities; graph equations
on coordinate axes with labels and scales.
3. Represent constraints by equations or inequalities, and by systems of equations and/or inequalities, and
interpret solutions as viable or non-viable options in a modeling context. For example, represent
inequalities describing nutritional and cost constraints on combinations of different foods.
4. Rearrange formulas to highlight a quantity of interest, using the same reasoning as in solving equations.
For example, rearrange Ohm’s law V = IR to highlight resistance R.
Reasoning with Equations and Inequalities A.REI
Understand solving equations as a process of reasoning and explain the reasoning.
2. Solve simple rational and radical equations in one variable, and give examples showing how extraneous
solutions may arise.
Represent and solve equations and inequalities graphically.
11. Explain why the x-coordinates of the points where the graphs of the equations y = f(x) and y = g(x)
intersect are the solutions of the equation f(x) = g(x); find the solutions approximately, e.g., using
technology to graph the functions, make tables of values, or find successive approximations. Include
cases where f(x) and/or g(x) are linear, polynomial, rational, absolute value, exponential, and logarithmic
functions.
Functions
Interpreting Functions F.IF
Interpret functions that arise in applications in terms of the context.80
4. For a function that models a relationship between two quantities, interpret key features of graphs and
tables in terms of the quantities, and sketch graphs showing key features given a verbal description of the
relationship. Key features include: intercepts; intervals where the function is increasing, decreasing,
positive, or negative; relative maximums and minimums; symmetries; end behavior; and periodicity.
5. Relate the domain of a function to its graph and, where applicable, to the quantitative relationship it
describes. For example, if the function h(n) gives the number of person-hours it takes to assemble n
engines in a factory, then the positive integers would be an appropriate domain for the function.
6. Calculate and interpret the average rate of change of a function (presented symbolically or as a table)
over a specified interval. Estimate the rate of change from a graph.
Specific modeling standards appear throughout the high school standards indicated by a star symbol (). The star
symbol appearing on the cluster heading should be understood to indicate that all standards in that cluster are modeling
standards. 79
Expand to include simple root functions. 80
Emphasize the selection of appropriate function model; expand to include rational functions, square and cube
functions.
92 Massachusetts Curriculum Framework for Mathematics January 2011
Analyze functions using different representations.81
7. Graph functions expressed symbolically and show key features of the graph, by hand in simple cases and
using technology for more complicated cases.
b. Graph square root, cube root, and piecewise-defined functions, including step functions and absolute
value functions.
c. Graph polynomial functions, identifying zeros when suitable factorizations are available, and
showing end behavior.
e. Graph exponential and logarithmic functions, showing intercepts and end behavior, and
trigonometric functions, showing period, midline, and amplitude.
8. Write a function defined by an expression in different but equivalent forms to reveal and explain
different properties of the function.
a. Use the process of factoring and completing the square in a quadratic function to show zeros,
extreme values, and symmetry of the graph, and interpret these in terms of a context.
b. Use the properties of exponents to interpret expressions for exponential functions. For example,
identify percent rate of change in functions such as y = (1.02)t, y = (0.97)
t, y = (1.01)
(12t),
y = (1.2) (t/10)
, and classify them as representing exponential growth and decay.
MA.8c. Translate between different representations of functions and relations: graphs, equations, point
sets, and tables.
9. Compare properties of two functions each represented in a different way (algebraically, graphically,
numerically in tables, or by verbal descriptions). For example, given a graph of one quadratic function
and an algebraic expression for another, say which has the larger maximum.
Building Functions F.BF
Build a function that models a relationship between two quantities.
1. Write a function that describes a relationship between two quantities.
b. Combine standard function types using arithmetic operations. For example, build a function that
models the temperature of a cooling body by adding a constant function to a decaying exponential,
and relate these functions to the model.
Build new functions from existing functions.82
3. Identify the effect on the graph of replacing f(x) by f(x) + k, k f(x), f(kx), and f(x + k) for specific values
of k (both positive and negative); find the value of k given the graphs. Experiment with cases and
illustrate an explanation of the effects on the graph using technology. Include recognizing even and odd
functions from their graphs and algebraic expressions for them.
4. Find inverse functions.
a. Solve an equation of the form f(x) = c for a simple function f that has an inverse and write an
expression for the inverse. For example, f(x) =2(x3) or f(x) = (x+1)/(x-1) for x ≠ 1 (x not equal to 1).
Linear, Quadratic, and Exponential Models F.LE
Construct and compare linear, quadratic, and exponential models and solve problems.83
4. For exponential models, express as a logarithm the solution to ab(ct)
= d where a, c, and d are numbers
and the base b is 2, 10, or e; evaluate the logarithm using technology.
81
Expand to include rational and radical functions; focus on using key features to guide selection of appropriate type of
function model. Specific modeling standards appear throughout the high school standards indicated by a star symbol (). The star
symbol appearing on the cluster heading should be understood to indicate that all standards in that cluster are modeling
standards. 82
Expand to include simple radical, rational and exponential functions; emphasize common effect of each transfor-
mation across function types. 83
Only include logarithms as solutions of exponential functions.
Massachusetts Curriculum Framework for Mathematics Page 93 of 104 Draft for Board November 12, 2010
Trigonometric Functions F.TF
Extend the domain of trigonometric functions using the unit circle.
1. Understand radian measure of an angle as the length of the arc on the unit circle subtended by the angle.
2. Explain how the unit circle in the coordinate plane enables the extension of trigonometric functions to all
real numbers, interpreted as radian measures of angles traversed counterclockwise around the unit circle.
Model periodic phenomena with trigonometric functions.
5. Choose trigonometric functions to model periodic phenomena with specified amplitude, frequency, and
midline.
Geometry
Similarity, Right Triangles, and Trigonometry G.SRT
Apply trigonometry to general triangles.
9. (+) Derive the formula A = (1/2)ab sin(C) for the area of a triangle by drawing an auxiliary line from a
vertex perpendicular to the opposite side.
10. (+) Prove the Laws of Sines and Cosines and use them to solve problems.
11. (+) Apply trigonometry to general triangles. Understand and apply the Law of Sines and the Law of
Cosines to find unknown measurements in right and non-right triangles (e.g., surveying problems,
resultant forces).
Geometric Measurement and Dimension G.GMD
Visualize relationships between two-dimensional and three-dimensional objects.
4. Identify the shapes of two-dimensional cross-sections of three-dimensional objects, and identify three-
dimensional objects generated by rotations of two-dimensional objects.
Modeling with Geometry G.MG
Apply geometric concepts in modeling situations.
1. Use geometric shapes, their measures, and their properties to describe objects (e.g., modeling a tree trunk
or a human torso as a cylinder).
2. Apply concepts of density based on area and volume in modeling situations (e.g., persons per square
mile, BTUs per cubic foot).
3. Apply geometric methods to solve design problems (e.g., designing an object or structure to satisfy
physical constraints or minimize cost; working with typographic grid systems based on ratios).
MA.4. Use dimensional analysis for unit conversion to confirm that expressions and equations make sense.
Statistics and Probability
Interpreting Categorical and Quantitative Data S.ID
Summarize, represent, and interpret data on a single count or measurement variable.
4. Use the mean and standard deviation of a data set to fit it to a normal distribution and to estimate
population percentages. Recognize that there are data sets for which such a procedure is not appropriate.
Use calculators, spreadsheets, and tables to estimate areas under the normal curve.
Specific modeling standards appear throughout the high school standards indicated by a star symbol (). The star
symbol appearing on the cluster heading should be understood to indicate that all standards in that cluster are modeling
standards.
94 Massachusetts Curriculum Framework for Mathematics January 2011
Making Inferences and Justifying Conclusions S.IC
Understand and evaluate random processes underlying statistical experiments.
1. Understand statistics as a process for making inferences about population parameters based on a random
sample from that population.
2. Decide if a specified model is consistent with results from a given data-generating process, e.g., using
simulation. For example, a model says a spinning coin falls heads up with probability 0. 5. Would a
result of 5 tails in a row cause you to question the model.
Make inferences and justify conclusions from sample surveys, experiments, and observational studies.
3. Recognize the purposes of and differences among sample surveys, experiments, and observational
studies; explain how randomization relates to each.
4. Use data from a sample survey to estimate a population mean or proportion; develop a margin of error
through the use of simulation models for random sampling.
5. Use data from a randomized experiment to compare two treatments; use simulations to decide if
differences between parameters are significant.
6. Evaluate reports based on data.
Using Probability to Make Decisions S.MD
Use probability to evaluate outcomes of decisions.
6. (+) Use probabilities to make fair decisions (e.g., drawing by lots, using a random number generator).
7. (+) Analyze decisions and strategies using probability concepts (e.g., product testing, medical testing,
pulling [out] a hockey goalie at the end of a game).
Massachusetts Curriculum Framework for Mathematics Page 95 of 104 Draft for Board November 12, 2010
Advanced Model Course: Precalculus
Precalculus combines the trigonometric, geometric, and algebraic techniques needed to prepare students for
the study of calculus and strengthens their conceptual understanding of problems and mathematical
reasoning in solving problems. Facility with these topics is especially important for students intending to
study calculus, physics and other sciences, and engineering in college. As with the other courses, the
Standards for Mathematical Practice apply throughout this course, and together with the content standards,
prescribe that students experience mathematics as a coherent, useful, and logical subject that makes use of
their ability to make sense of problem situations.
(1) Students continue their work with complex numbers. They perform arithmetic operations with
complex numbers and represent them and the operations on the complex plane. The student will
investigate and identify the characteristics of the graphs of polar equations, using graphing
utilities. This will include classification of polar equations, the effects of changes in the
parameters in polar equations, conversion of complex numbers from rectangular form to polar
form and vice versa, and the intersection of the graphs of polar equations.
(2) Students expand their understanding of functions to include logarithmic and trigonometric
functions. The student will investigate and identify the characteristics of exponential and
logarithmic functions in order to graph these functions and solve equations and practical
problems. This will include the role of e, natural and common logarithms, laws of exponents and
logarithms, and the solution of logarithmic and exponential equations. They model periodic
phenomena with trigonometric functions and prove trigonometric identities. Other trigonometric
topics include reviewing unit circle trigonometry, proving trigonometric identities, solving
trigonometric equations and graphing trigonometric functions.
(3) Students will investigate and identify the characteristics of polynomial and rational functions
and use these to sketch the graphs of the functions. They will determine zeros, upper and lower
bounds, y-intercepts, symmetry, asymptotes, intervals for which the function is increasing or
decreasing, and maximum or minimum points. Students translate between the geometric
description and equation of conic sections. They deepen their understanding of the Fundamental
Theorem of Algebra.
(4) Students will perform operations with vectors in the coordinate plane and solve practical
problems using vectors. This will include the following topics: operations of addition,
subtraction, scalar multiplication, and inner (dot) product; norm of a vector; unit vector;
graphing; properties; simple proofs; complex numbers (as vectors); and perpendicular
components.
96 Massachusetts Curriculum Framework for Mathematics January 2011
Precalculus Overview Number and Quantity
The Complex Number System
Perform arithmetic operations with complex
numbers.
Represent complex numbers and their operations on
the complex plane.
Use complex numbers in polynomial identities and
equations.
Vector and Matrix Quantities
Represent and model with vector quantities.
Perform operations on vectors.
Perform operations on matrices and use matrices in
applications.
Algebra
Arithmetic with Polynomials and Rational
Expressions
Use polynomial identities to solve problems
Rewrite rational expressions.
Reasoning with Equations and Inequalities
Solve systems of equations.
Functions
Interpreting Functions
Analyze functions using different representations.
Building Functions
Build a function that models a relationship between
two quantities.
Build a new function from existing functions.
Trigonometric Functions
Extend the domain of trigonometric functions using
the unit circle.
Model periodic phenomena with trigonometric
functions.
Prove and apply trigonometric identities.
Geometry
Similarity, Right Triangles, and Trigonometry
Apply trigonometry to general triangles.
Circles
Understand and apply theorems about circles.
Expressing Geometric Properties with Equations
Translate between the geometric description and
the equations for a conic section.
Geometric Measurement and Dimension
Explain volume formulas and use them to solve
problems.
Visualize relationships between two- and three-
dimensional objects.
Standards for Mathematical Practice
1. Make sense of problems and persevere
in solving them.
2. Reason abstractly and quantitatively.
3. Construct viable arguments and
critique the reasoning of others.
4. Model with mathematics.
5. Use appropriate tools strategically.
6. Attend to precision.
7. Look for and make use of structure.
8. Look for and express regularity in
repeated reasoning.
Massachusetts Curriculum Framework for Mathematics Page 97 of 104 Draft for Board November 12, 2010
Number and Quantity
The Complex Number System N.CN
Perform arithmetic operations with complex numbers.
3. (+) Find the conjugate of a complex number; use conjugates to find moduli and quotients of complex
numbers.
Represent complex numbers and their operations on the complex plane.
4. (+) Represent complex numbers on the complex plane in rectangular and polar form (including real and
imaginary numbers), and explain why the rectangular and polar forms of a given complex numbers
represent the same number.
5. (+) Represent addition, subtraction, multiplication, and conjugation of complex numbers geometrically
on the complex plane; use properties of this representation for computation. For example, 8313
i has
modulus 2 and argument 120o.
6. (+) Calculate the distance between numbers in the complex plane as the modulus of the difference, and
the midpoint of a segment as the average of the numbers at its endpoints.
Use complex numbers in polynomial identities and equations.
8. (+) Extend polynomial identities to the complex numbers. For example, rewrite x2 + 4 as (x + 2i)(x –
2i).
9. (+) Know the Fundamental Theorem of Algebra; show that it is true for quadratic polynomials.
Vector Quantities and Matrices N.VM
Represent and model with vector quantities.
1. (+) Recognize vector quantities as having both magnitude and direction. Represent vector quantities by
directed line segments, and use appropriate symbols for vectors and their magnitudes (e.g., v, |v|, ||v||, v).
2. (+) Find the components of a vector by subtracting the coordinates of an initial point from the
coordinates of a terminal point.
3. (+) Solve problems involving velocity and the other quantities that can be represented by vectors.
Perform operations on vectors.
4. (+) Add and subtract vectors.
a. (+) Add vectors end-to-end, component-wise, and by the parallelogram rule. Understand that the
magnitude of a sum of two vectors is typically no the sum of the magnitudes.
b. (+) Given two vectors in magnitude and direction form, determine the magnitude and direction of
their sum.
c. (+) Understand vector subtraction v – w as v + (–w), where (–w) is the additive inverse of w, with
the same magnitude as w and pointing in the opposite direction. Represent vector subtraction
graphically by connecting the tips in the appropriate order, and perform vector subtraction
component-wise.
5. (+) Multiply a vector by a scalar.
a. (+) Represent scalar multiplication graphically by scaling vectors and possibly reversing their
direction; perform scalar vectors and possibly reversing their direction; perform scalar multiplication
component-wise, e.g., as c(vx,vy) = (cvx, cvy).
b. (+) Compute the magnitude of a scalar multiple cv using ||cv|| = |c|v. Compute the direction of cv
knowing that when |c|v 0, the direction of cv is either along v (for c > 0) or against v (for c < 0).
Perform operations on matrices and use matrices in applications.
6. (+) Use matrices to represent and manipulate data, e.g., to represent payoffs or incidence relationships in
a network.
7. (+) Multiply matrices by scalars to produce new matrices, e.g., as when all of the payoffs in a game are
doubled.
8. (+) Add, subtract, and multiply matrices of appropriate dimensions.
98 Massachusetts Curriculum Framework for Mathematics January 2011
9. (+) Understand that, unlike multiplication of numbers, matrix multiplication for square matrices is not a
commutative operation, but still satisfies the associative and distributive properties.
10. (+) Understand that the zero and identity matrices play a role in matrix addition and multiplication
similar to the role of 0 and 1 in the real numbers. The determinant of a square matrix is nonzero if and
only if the matrix has a multiplicative inverse.
11. (+) Multiply a vector (regarded as a matrix with one column) by a matrix of suitable dimensions to
produce another vector. Work with matrices as transformations of vectors.
12. (+) Work with 2 x 2 matrices as transformations of the plane, and interpret the absolute value of the
determinate in terms of area.
Algebra
Arithmetic with polynomials and rational expressions A.APR
Use polynomial identities to solve problems.
5. (+) Know and apply the Binomial Theorem for the expansion of (x + y)n in powers of x and y for a
positive integer n, where x and y are any numbers, with coefficients determined, for example, by Pascal’s
Triangle.84
Rewrite rational expressions.
6. Rewrite simple rational expressions in different forms; write a(x)/b(x) in the form q(x) + r(x)/b(x), where
a(x), b(x), q(x), and r(x) are polynomials with the degree of r(x) less than the degree of b(x), using
inspection, long division, or, for the more complicated examples, a computer algebra system.
7. (+) Understand that rational expressions form a system analogous to the rational numbers, closed under
addition, subtraction, multiplication, and division by a nonzero rational expression; add, subtract,
multiply, and divide rational expressions.
Reasoning with Equations and Inequalities A.REI
Solve systems of equations.
8. (+) Represent a system of linear equations as a single matrix equation in a vector variable.
9. (+) Find the inverse of a matrix if it exists and use it to solve systems of linear equations (using
technology for matrices of dimension 3 × 3 or greater).
Functions
Interpreting Functions F.IF
Analyze functions using different representations.
7. (+) Graph functions expressed symbolically and show key features of the graph, by hand in simple cases
and using technology for more complicated cases.
d. (+) Graph rational functions, identifying zeros when suitable factorizations are available, and
showing end behavior.
Building Functions F.BF
Build a function that models a relationship between two quantities.
1. Write a function that describes a relationship between two quantities.
c. (+) Compose functions. For example, if T(y) is the temperature in the atmosphere as a function of
height, and h(t) is the height of a weather balloon as a function of time, then T(h(t)) is the
temperature at the location of the weather balloon as the function of time.
Build new functions from existing functions.
4. Find inverse functions.
84
The Binomial Theorem can be proved by mathematical induction or by a combinatorial argument.
Massachusetts Curriculum Framework for Mathematics Page 99 of 104 Draft for Board November 12, 2010
b. (+) Verify by composition that one function is the inverse of another.
c. (+) Read values of an inverse function from a graph or a table, given that the function has an inverse.
d. (+) Produce an invertible function from a non-invertible function by restricting the domain.
5. (+) Understand the inverse relationship between exponents and logarithms and use this relationship to
solve problems involving logarithms and exponents.
Trigonometric Functions F.TF
Extend the domain of trigonometric functions using the unit circle.
3. (+) Use special triangles to determine geometrically the values of sine, cosine, tangent for /3, /4 and
/6, and use the unit circle to express the values of sine, cosines, and tangent for x, +x, and 2-x in
terms of their values for x, where x is any real number.
4. (+) Use the unit circle to explain symmetry (odd and even) and periodicity of trigonometric functions.
Model periodic phenomena with trigonometric functions.
6. (+) Understand that restricting a trigonometric function to a domain on which it is always increasing or
always decreasing allows its inverse to be constructed.
7. (+) Use inverse functions to solve trigonometric equations that arise in modeling contexts; evaluate the
solutions using technology, and interpret them in terms of the context.
Prove and apply trigonometric identities.
9. (+) Prove the addition and subtraction formulas for sine, cosine, and tangent and use them to solve
problems.
Geometry
Similarity, right triangles, and trigonometry G.SRT
Apply trigonometry to general triangles.
9. (+) Derive the formula A = ½ ab sin(C) for the area of a triangle by drawing an auxiliary line form a
vertex perpendicular to the opposite side.
10. (+) prove the Laws of Sines and Cosines and use them to solve problems.
11. (+) Understand and apply the Laws of Sines and Cosines to find unknown measurements in right and
non-right triangles, e.g., surveying problems, resultant forces.
Circles G.C
Understand and apply theorems about circles.
4. (+) Construct a tangent line from a point outside a given circle to the circle.
Expressing Geometric Properties with Equations G.GPE
Translate between the geometric description and the equation for a conic section.
3. (+) Derive the equations of ellipses and hyperbolas given the foci, using the fact that the sum of
difference of distances from the foci is constant.
MA.3a. (+) Use equations and graphs of conic sections to model real-world problems.
Geometric Measurement and Dimension G.GMD
Explain volume formulas and use them to solve problems.
2. (+) Give an informal argument using Cavalieri’s Principle for the formulas for the volume of a sphere
and other solid figures.
Visualize relationships between two-dimensional and three-dimensional objects.
4. Identify the shapes of two-dimensional cross-sections of three-dimensional objects, and identify three-
dimensional objects generated by rotations of two-dimensional objects.
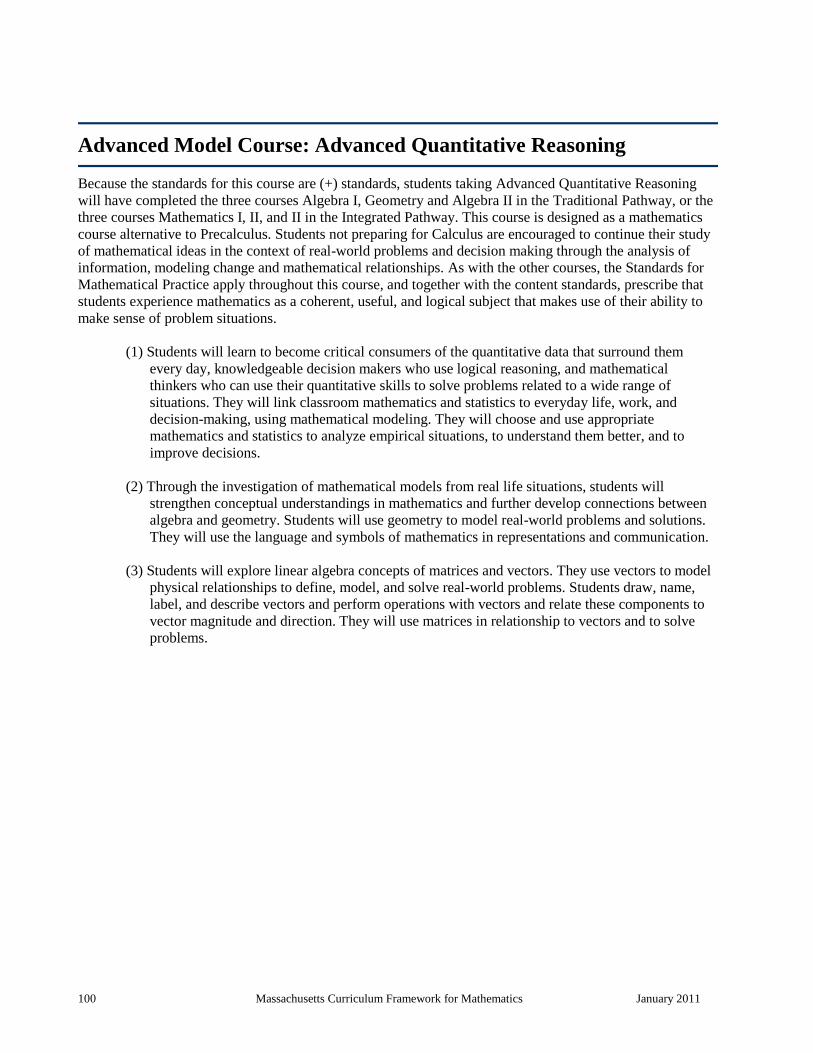
100 Massachusetts Curriculum Framework for Mathematics January 2011
Advanced Model Course: Advanced Quantitative Reasoning
Because the standards for this course are (+) standards, students taking Advanced Quantitative Reasoning
will have completed the three courses Algebra I, Geometry and Algebra II in the Traditional Pathway, or the
three courses Mathematics I, II, and II in the Integrated Pathway. This course is designed as a mathematics
course alternative to Precalculus. Students not preparing for Calculus are encouraged to continue their study
of mathematical ideas in the context of real-world problems and decision making through the analysis of
information, modeling change and mathematical relationships. As with the other courses, the Standards for
Mathematical Practice apply throughout this course, and together with the content standards, prescribe that
students experience mathematics as a coherent, useful, and logical subject that makes use of their ability to
make sense of problem situations.
(1) Students will learn to become critical consumers of the quantitative data that surround them
every day, knowledgeable decision makers who use logical reasoning, and mathematical
thinkers who can use their quantitative skills to solve problems related to a wide range of
situations. They will link classroom mathematics and statistics to everyday life, work, and
decision-making, using mathematical modeling. They will choose and use appropriate
mathematics and statistics to analyze empirical situations, to understand them better, and to
improve decisions.
(2) Through the investigation of mathematical models from real life situations, students will
strengthen conceptual understandings in mathematics and further develop connections between
algebra and geometry. Students will use geometry to model real-world problems and solutions.
They will use the language and symbols of mathematics in representations and communication.
(3) Students will explore linear algebra concepts of matrices and vectors. They use vectors to model
physical relationships to define, model, and solve real-world problems. Students draw, name,
label, and describe vectors and perform operations with vectors and relate these components to
vector magnitude and direction. They will use matrices in relationship to vectors and to solve
problems.
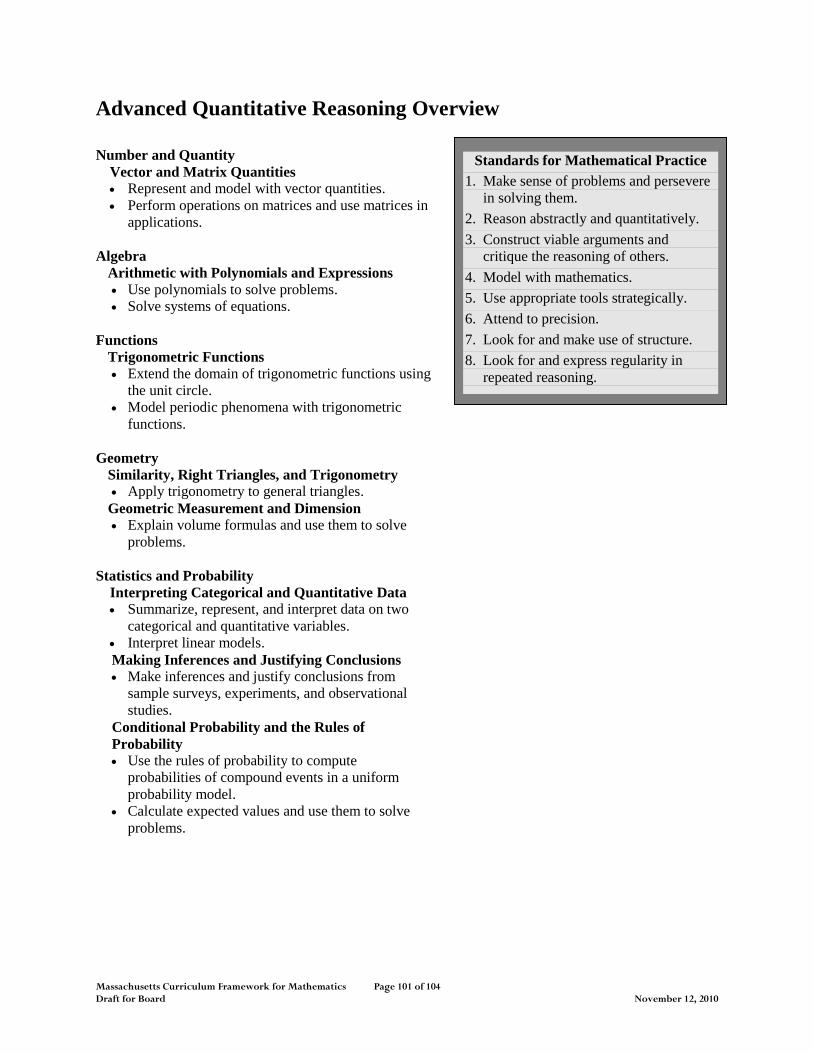
Massachusetts Curriculum Framework for Mathematics Page 101 of 104 Draft for Board November 12, 2010
Advanced Quantitative Reasoning Overview
Number and Quantity
Vector and Matrix Quantities
Represent and model with vector quantities.
Perform operations on matrices and use matrices in
applications.
Algebra
Arithmetic with Polynomials and Expressions
Use polynomials to solve problems.
Solve systems of equations.
Functions
Trigonometric Functions
Extend the domain of trigonometric functions using
the unit circle.
Model periodic phenomena with trigonometric
functions.
Geometry
Similarity, Right Triangles, and Trigonometry
Apply trigonometry to general triangles.
Geometric Measurement and Dimension
Explain volume formulas and use them to solve
problems.
Statistics and Probability
Interpreting Categorical and Quantitative Data Summarize, represent, and interpret data on two
categorical and quantitative variables.
Interpret linear models.
Making Inferences and Justifying Conclusions
Make inferences and justify conclusions from
sample surveys, experiments, and observational
studies.
Conditional Probability and the Rules of
Probability
Use the rules of probability to compute
probabilities of compound events in a uniform
probability model.
Calculate expected values and use them to solve
problems.
Standards for Mathematical Practice
1. Make sense of problems and persevere
in solving them.
2. Reason abstractly and quantitatively.
3. Construct viable arguments and
critique the reasoning of others.
4. Model with mathematics.
5. Use appropriate tools strategically.
6. Attend to precision.
7. Look for and make use of structure.
8. Look for and express regularity in
repeated reasoning.
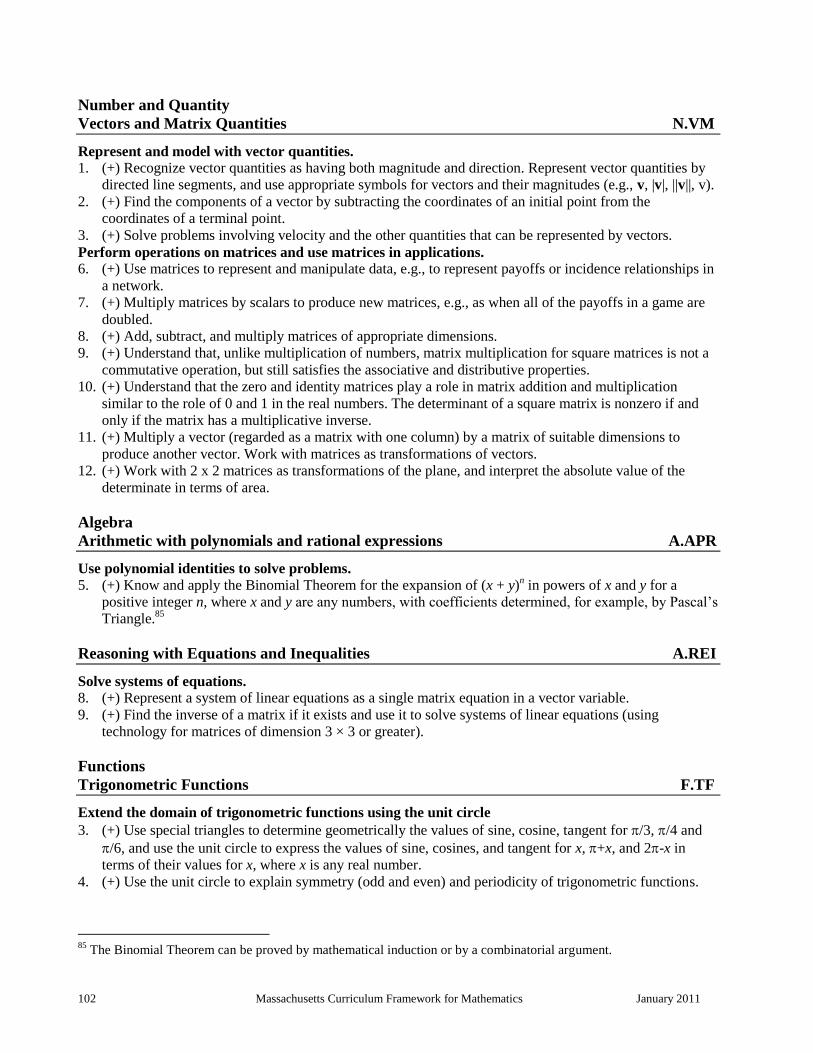
102 Massachusetts Curriculum Framework for Mathematics January 2011
Number and Quantity
Vectors and Matrix Quantities N.VM
Represent and model with vector quantities.
1. (+) Recognize vector quantities as having both magnitude and direction. Represent vector quantities by
directed line segments, and use appropriate symbols for vectors and their magnitudes (e.g., v, |v|, ||v||, v).
2. (+) Find the components of a vector by subtracting the coordinates of an initial point from the
coordinates of a terminal point.
3. (+) Solve problems involving velocity and the other quantities that can be represented by vectors.
Perform operations on matrices and use matrices in applications.
6. (+) Use matrices to represent and manipulate data, e.g., to represent payoffs or incidence relationships in
a network.
7. (+) Multiply matrices by scalars to produce new matrices, e.g., as when all of the payoffs in a game are
doubled.
8. (+) Add, subtract, and multiply matrices of appropriate dimensions.
9. (+) Understand that, unlike multiplication of numbers, matrix multiplication for square matrices is not a
commutative operation, but still satisfies the associative and distributive properties.
10. (+) Understand that the zero and identity matrices play a role in matrix addition and multiplication
similar to the role of 0 and 1 in the real numbers. The determinant of a square matrix is nonzero if and
only if the matrix has a multiplicative inverse.
11. (+) Multiply a vector (regarded as a matrix with one column) by a matrix of suitable dimensions to
produce another vector. Work with matrices as transformations of vectors.
12. (+) Work with 2 x 2 matrices as transformations of the plane, and interpret the absolute value of the
determinate in terms of area.
Algebra
Arithmetic with polynomials and rational expressions A.APR
Use polynomial identities to solve problems.
5. (+) Know and apply the Binomial Theorem for the expansion of (x + y)n in powers of x and y for a
positive integer n, where x and y are any numbers, with coefficients determined, for example, by Pascal’s
Triangle.85
Reasoning with Equations and Inequalities A.REI
Solve systems of equations.
8. (+) Represent a system of linear equations as a single matrix equation in a vector variable.
9. (+) Find the inverse of a matrix if it exists and use it to solve systems of linear equations (using
technology for matrices of dimension 3 × 3 or greater).
Functions
Trigonometric Functions F.TF
Extend the domain of trigonometric functions using the unit circle
3. (+) Use special triangles to determine geometrically the values of sine, cosine, tangent for /3, /4 and
/6, and use the unit circle to express the values of sine, cosines, and tangent for x, +x, and 2-x in
terms of their values for x, where x is any real number.
4. (+) Use the unit circle to explain symmetry (odd and even) and periodicity of trigonometric functions.
85
The Binomial Theorem can be proved by mathematical induction or by a combinatorial argument.
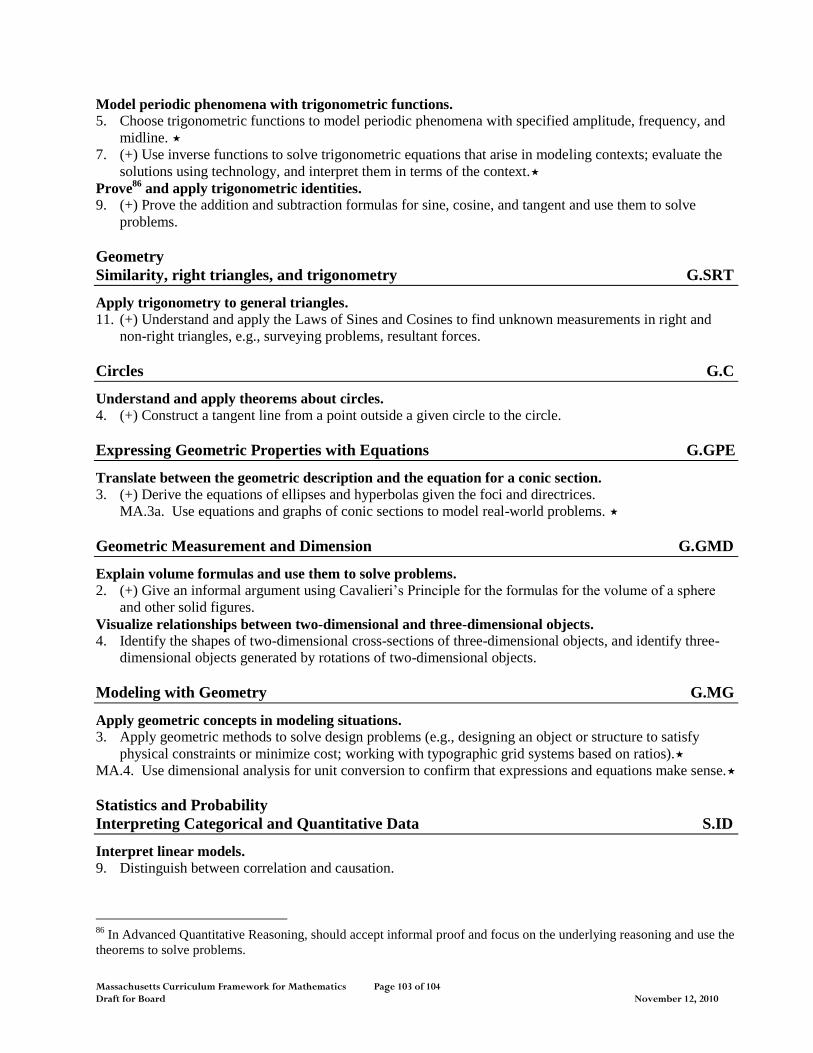
Massachusetts Curriculum Framework for Mathematics Page 103 of 104 Draft for Board November 12, 2010
Model periodic phenomena with trigonometric functions.
5. Choose trigonometric functions to model periodic phenomena with specified amplitude, frequency, and
midline.
7. (+) Use inverse functions to solve trigonometric equations that arise in modeling contexts; evaluate the
solutions using technology, and interpret them in terms of the context.
Prove86
and apply trigonometric identities.
9. (+) Prove the addition and subtraction formulas for sine, cosine, and tangent and use them to solve
problems.
Geometry
Similarity, right triangles, and trigonometry G.SRT
Apply trigonometry to general triangles.
11. (+) Understand and apply the Laws of Sines and Cosines to find unknown measurements in right and
non-right triangles, e.g., surveying problems, resultant forces.
Circles G.C
Understand and apply theorems about circles.
4. (+) Construct a tangent line from a point outside a given circle to the circle.
Expressing Geometric Properties with Equations G.GPE
Translate between the geometric description and the equation for a conic section.
3. (+) Derive the equations of ellipses and hyperbolas given the foci and directrices.
MA.3a. Use equations and graphs of conic sections to model real-world problems.
Geometric Measurement and Dimension G.GMD
Explain volume formulas and use them to solve problems.
2. (+) Give an informal argument using Cavalieri’s Principle for the formulas for the volume of a sphere
and other solid figures.
Visualize relationships between two-dimensional and three-dimensional objects.
4. Identify the shapes of two-dimensional cross-sections of three-dimensional objects, and identify three-
dimensional objects generated by rotations of two-dimensional objects.
Modeling with Geometry G.MG
Apply geometric concepts in modeling situations.
3. Apply geometric methods to solve design problems (e.g., designing an object or structure to satisfy
physical constraints or minimize cost; working with typographic grid systems based on ratios).
MA.4. Use dimensional analysis for unit conversion to confirm that expressions and equations make sense.
Statistics and Probability
Interpreting Categorical and Quantitative Data S.ID
Interpret linear models.
9. Distinguish between correlation and causation.
86
In Advanced Quantitative Reasoning, should accept informal proof and focus on the underlying reasoning and use the
theorems to solve problems.
104 Massachusetts Curriculum Framework for Mathematics January 2011
Making Inferences and Justifying Conclusions S.IC
Make inferences and justify conclusions from sample surveys, experiments, and observational studies.
4. Use data from a sample survey to estimate a population mean or proportion; develop margin of error
through the use of simulation models for random sampling.
5. Use data from a randomized experiment to compare two treatments; sue simulations to decide if
differences between parameters are significant.
6. Evaluate reports based on data.
Conditional Probability and the Rules of Probability S.CP
Use the rules of probability to compute probabilities of compound events in a uniform probability
model.
8. (+) Apply the general Multiplication Rule in a uniform probability model,
P(A and B) = P(A) P(BA) = P(B) P(AB), and interpret the answer in terms of the model.
9. (+) Use permutations and combinations to compute probabilities of compound events and solve
problems.
Using Probability to Make Decisions S.MD
Calculate expected values and use them to solve problems.
1. (+) Define a random variable for a quantity of interest by assigning a numerical value to each event in a
sample space; graph the corresponding probability distribution using the same graphical displays as for
data distributions.
2. (+) Calculate the expected value of a random variable; interpret it as the mean of the probability
distribution.
3. (+) Develop a probability distribution for a random variable defined for a sample space in which
theoretical probabilities can be calculated; find the expected value. For example, find the theoretical
probability distribution for the number of correct answers obtained by guessing on all five questions of a
multiple-choice test where each question has four choices, and find the expected grade under various
grading schemes.
4. (+) Develop a probability distribution for a random variable defined for a sample space in which
probabilities are assigned empirically; find the expected value. For example, find a current data
distribution on the number of TV sets per household in the United States, and calculate the expected
number of sets per household. How many TV sets would you expect to find in 100 randomly selected
households?
Use probability to evaluate outcomes of decisions.
5. (+) Weigh the possible outcomes of a decision by assigning probabilities to payoff values and finding
expected values.
a. (+) Find the expected payoff for a game of chance. For example, find the expected winnings from a
state lottery ticket or a game at a fast-food restaurant.
b. (+) Evaluate and compare strategies on the basis of expected values. For example, compare a high-
deductible versus a low-deductible automobile insurance policy using various, but reasonable,
chances of having a minor or a major accident.
6. (+) Use probabilities to make fair decisions (e.g., drawing by lots, using a random number generator).
7. (+) Analyze decisions and strategies using probability concepts (e.g., product testing, medical testing,
pulling [out] a hockey goalie at the end of a game).