working mode and physical activity as factors determining
TRANSCRIPT
�����������������
Citation: Lipert, A.; Musiał, K.;
Rasmus, P. Working Mode and
Physical Activity as Factors
Determining Stress and Sleep
Quality during COVID-19
Pandemic Lockdown in Poland. Life
2022, 12, 28. https://doi.org/
10.3390/life12010028
Academic Editors: Nicola Smania,
Nicola Valè and Maamer Slimani
Received: 3 November 2021
Accepted: 21 December 2021
Published: 24 December 2021
Publisher’s Note: MDPI stays neutral
with regard to jurisdictional claims in
published maps and institutional affil-
iations.
Copyright: © 2021 by the authors.
Licensee MDPI, Basel, Switzerland.
This article is an open access article
distributed under the terms and
conditions of the Creative Commons
Attribution (CC BY) license (https://
creativecommons.org/licenses/by/
4.0/).
life
Article
Working Mode and Physical Activity as Factors DeterminingStress and Sleep Quality during COVID-19 PandemicLockdown in Poland
Anna Lipert 1,* , Kamila Musiał 1 and Paweł Rasmus 2
1 Department of Sports Medicine, Medical University of Lodz, 92-213 Lodz, Poland;[email protected]
2 Department of Medical Psychology, Medical University of Lodz, 90-131 Lodz, Poland;[email protected]
* Correspondence: [email protected]
Abstract: The coronavirus pandemic and related government restrictions have a significant impacton peoples’ everyday functioning and working, which influences their physical and mental health.The aim of the study was to examine the associations between stress and sleep quality of people ofdifferent working modes: working in the workplace (WP), working remotely (RW), and nonworking(NW) in relation to their physical activity (PA) during COVID-19 pandemic lockdown in Poland.It was an online survey performed during governmental lockdown in April 2020. The data werecollected form 1959 adults using International Physical Activity Questionnaire—Short Form (IPAQ-SF), Pittsburgh Sleep Quality Index (PSQI), and Perceived Stress Scale (PSS). The conducted analysisincluded t-Student test, analysis of variance (ANOVA), and mediation analysis (MANOVA). Amoderate level of stress was reported in 57% of participants, and 34% of them reported a high stresslevel. Poor sleep quality was reported in 64% of participants. Total PA performed daily was, onaverage, 184.8 ± 170.5 min/day for WP, 120.6 ± 124.4 min/day for RW, and 124.6 ± 114.7 min/dayfor NW (p < 0.001). There was a relationship observed between the stress and sleep quality vs.PA habit and working mode, with p < 0.05. Being physically active can be beneficial to perceiveless stress and sleep disturbances influencing sleep quality, especially in remotely or nonworkingpeople. Planning future pandemic restrictions, the policymakers should be aware of the appropriateguidelines of work planning and PA recommendations for people of different working modes.
Keywords: working mode; exercise; quality of sleep; health; COVID-19; stress
1. Introduction
In 2019, the global coronavirus pandemic started, which required the introduction ofmany government restrictions that significantly influenced everyday life of people. Therehave also been significant changes to the way people work, which has largely been transferredto their homes [1]. The home has become not only a place of silence and relaxation, but,above all, a place of work, especially for white-collar professionals from sectors includinggovernment, consulting, academia, accountancy, business, and executive management, etc. [2].The change of the work organization from those in the workplace to the remote ones is linkedwith many life and work challenges [3], but, during the pandemic time, a key factor is toavoid the spread of the disease [4]. Unfortunately, if employees were not able to performtheir official duties remotely due to the specificity of their work, e.g., blue-collar workersor service workers, it very often resulted in the loss of their jobs [5]. Opportunity of workimproves quality of life, mental health, and is a vehicle for improving social inclusion andcommunity tenure [6]. Therefore, a sudden job loss or long-term sick leave are stressors thataffect mental health in both men and women [7]. Job insecurity due to restrictions during thecoronavirus pandemic has triggered the development of many diseases around Europeancountries, especially those related to mental health, such as post-traumatic disorders, high
Life 2022, 12, 28. https://doi.org/10.3390/life12010028 https://www.mdpi.com/journal/life
Life 2022, 12, 28 2 of 15
stress level, depression, or anxiety [8,9]. Those mental disorders, especially stress, are includedinto risk factors for sleep deprivation and poor quality of sleep [10]. Good quality of sleepand adequate sleep duration necessary for good health of adults 18–60 years of age meanssleeping for 7 to 9 h in a 24-h period [11]. For young adults and people with illnesses, moreappropriate is sleeping even more than 9 h per night [11]. During the COVID-19 pandemic,a high widespread presence of sleep disturbances was noticed, affecting 40% of the generalpopulation and those working in the health care sector [9,12].
The World Health Organization (WHO) has presented a series of recommendationsfor physical activity to reduce the health consequences of the COVID-19 pandemic [9]. Itis evidenced that physical activity (PA) is crucial to maintain general health and so-calledwell-being by lowering levels of stress, anxiety, and depressed mood [13]. Meta-analyticevidence demonstrates that PA, regardless of the time during the day when it is performedor its intensity, helps to improve sleep quality [14]. Even 10 minutes of moderate intensitywalking can improve mood [15] and 10 to 20-min PA bouts lead to cognition improvement [14].Therefore, even during obligatory social isolation and restrictions of maintaining physicaldistance, when the previous places for physical activities were no longer accessible, peoplewere encouraged to perform the most simple activities possible to be performed at home. Ifstaying at home was obligatory, simple staircases could serve as a place to perform the simplestphysical activity of low intensity. Depending on how fast you go up the stairs, this is a goodcardiovascular exercise [16]. The number of publications examining the influence of COVID-19pandemic governmental restrictions on health, both mental and physical, is still increasing.Studies can be found reporting the implications on emotional and social functioning [17] or theincrease in mental health disorders and suicidal incidents [18]. Moreover, some studies can befound presenting the relationship between anxiety, self-efficacy, and stress with the quality ofsleep and social support among the population of medical workers or desk workers [19–21].Studies show that the risk factors of mental health disorders during the pandemic are sex,age, economic status, employment status (student or worker), and relationship status [22,23].However, to our knowledge, there are no studies analyzing the relationship between physicalactivity, stress, and quality of sleep of the general population during pandemic lockdownand its relation to working mode. Therefore, the aim of the current study was to evaluatethe associations between stress and quality of sleep of people of different working modes inrelation to their physical activity during the COVID-19 pandemic in Poland. We hypothesizethat the working mode performed during pandemic lockdown, along with the physical activityhabit, may be of importance in the perceived stress and the obtained quality of sleep obtained.
2. Materials and Methods2.1. Study Design and Data Collection
The study data were obtained from the 1959 adult respondents at the age of 18 yearsand over. An anonymous online survey was designed using Google Forms and the linkwas distributed by social media, such as Facebook or Twitter. Moreover, the survey wasdistributed through communicational tools, such as Messenger, WhatsApp, or email. Fur-thermore, the most popular influencers were invited to the study to encourage participationin the survey. After activating the link to the survey questions, there was a content inform-ing that the study was fully voluntary, anonymous, and unpaid. Due to the anonymity ofthe questionnaire and the fact that its completion was equivalent to agreeing to participatein the study, the relevant University Human Ethics Committee decided to exempt it from itsapproval. The research was performed between 1 and 14 April 2020 during governmentallockdown. The study meets the relevant standards of the journal.
The presented study is a further analysis from data previously published [24], whichwere focused on the general population without taking into account the working modeperformed during the pandemic lockdown.
The governmental lockdown restrictions in the country during the time of the studyrequired keeping a minimum 2 m personal distance, and there were travel restrictions limitingthe amount of people in public transport. Traveling was allowed only for essential workers
Life 2022, 12, 28 3 of 15
or services, such as medical or healthcare. People were not allowed to leave their place ofresidence, except in necessary situations, such as getting to work or necessary shopping.Children and adolescents were not allowed to leave the house without the supervision of anadult. Any form of public gathering was also prohibited. There were designated special hoursbetween 10 and 12 a.m. for seniors in the shops, so any person below 65 years was not allowedto enter. All the services, such as restaurants and bars, hotels, parks, hairdressers, and beautystudios, were closed. There was only an online learning allowed at schools and universities.
2.2. Measurement Instruments
To obtain the socio-demographic data and relevant information most influencing thephysical activity, quality of sleep, and perceived stress, a self-made questionnaire was designed.
International Physical Activity Questionnaire—Short Form (IPAQ-SF) was used to col-lect information about the physical activity performed during the last typical week [25,26].The questionnaire concerns physical activity of three different intensities: low physical activ-ity in the form of walking (WPA = 3.3 METs), moderate physical activity (MPA = 4.0 METs),and vigorous physical activity (VPA = 8.0 metabolic equivalent (METs)) and across a setof domains, such as work-related activities, transport-related activities, leisure time, anddomestic and gardening (yard) activities. The final results were calculated according to theIPAQ scoring protocol guideline [26,27] and presented as the total minutes of PA per day.
Pittsburgh Sleep Quality Index (PSQI) was used to collect the data related to the qualityand patterns of sleep over the last month. The questionnaire is designed to measure sevencomponents: subjective sleep quality, sleep latency and its duration, habitual efficiencyof sleep, sleep disturbances, sleeping medication usage, and daytime dysfunction, andis able to differentiate “poor” from “good” quality of sleep. The results are presented inpoints and, if the final score is “5” or greater, it is indicated with poor sleep quality. Studiesconducted on various populations have shown the strong reliability and validity of PSQI,which suggests that this tool fulfils its intended utility [28].
Perceived Stress Scale (PSS) [29,30] was used to collect the data about the perceivedstress during the last month. The PSS was originally developed in 1983 and, since then,it has been a validated stress assessment tool. The results are presented in points, whichcan range from 0 to 40. Higher scores indicate higher perceived stress. The ranges are asfollows: 0–13 points means a low level of stress (LLS); 14–26 points means a moderate levelof stress (MLS), and 27–40 points means a high level stress (HLS).
All of the measurement instruments were translated into Polish and pretested to checkif the questions were well understood in the mother tongue. Moreover, after the questionswere posted on Google Forms, it was checked whether the link was working properly andthat it was possible to provide full answers. Only then was the link distributed through thepreviously described channels.
2.3. Statistical Analysis
All the statistics were performed using Statistical version 13.1 software (StatSoft).When the Shapiro–Wilk test revealed that the variables had a normal distribution andthere was a homogeneity of variances, the differences were analyzed using t-Student testfor two quantitative variables or ANOVA for more than two variables. The moderationanalysis of variance (MANOVA) was also performed to observe the relationship betweenthe stress and sleep results vs. the type of working mode and the habit of undertaking PA.Mann–Whitney test was used if the variables were not normally distributed. The resultswere presented as mean scores and standard deviations. All the differences at the level ofp < 0.05 were accepted as statistically significant.
3. Results3.1. Characteristics of the Participants
The socio-demographic characteristics of the study participants are presented inTable 1. The study participants were divided into three groups according to the working
Life 2022, 12, 28 4 of 15
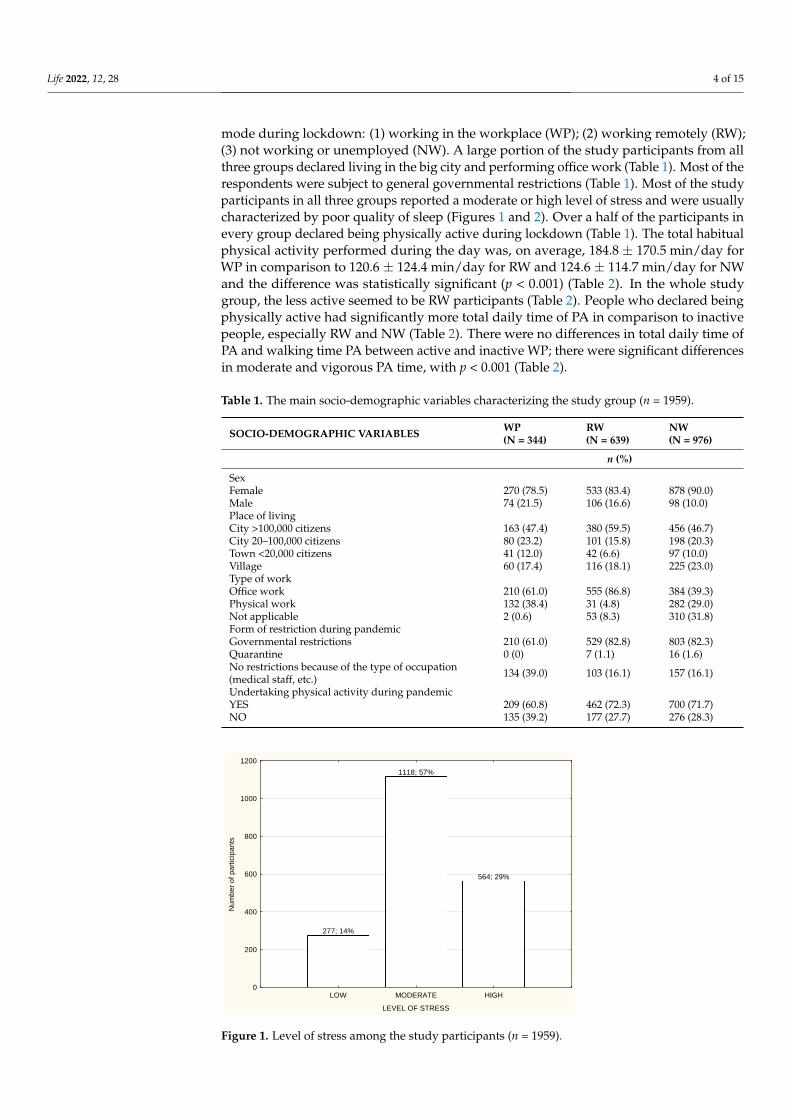
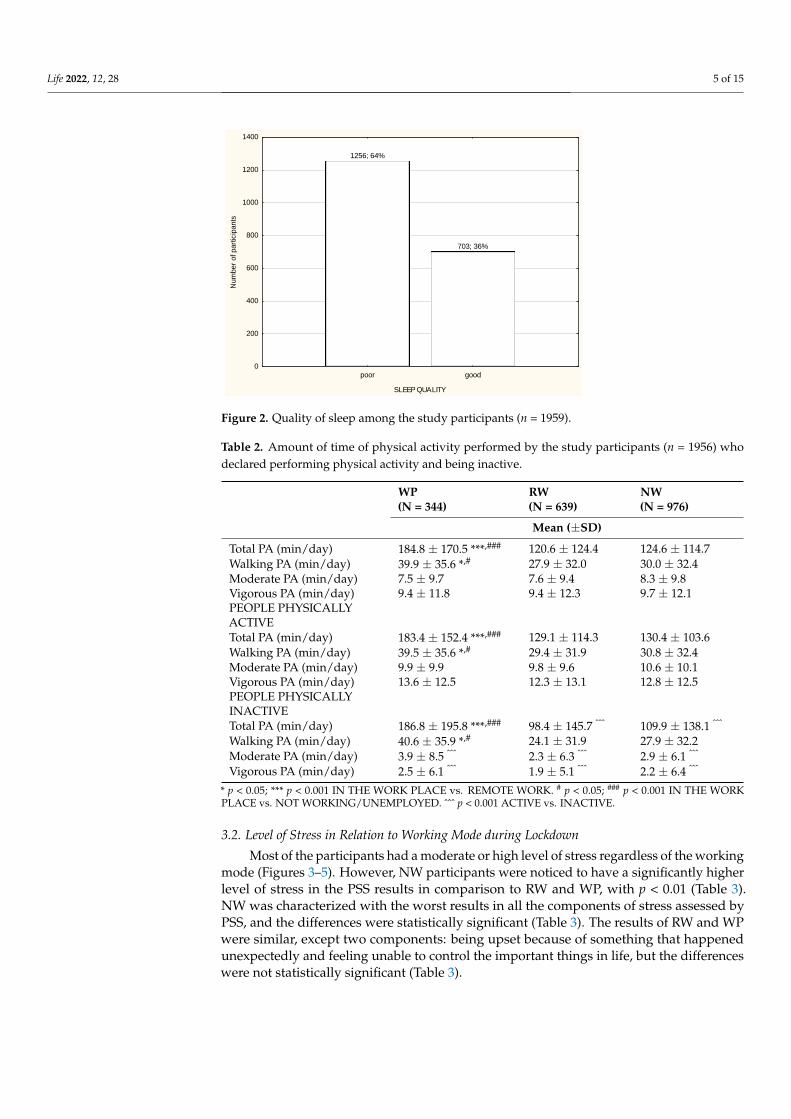
mode during lockdown: (1) working in the workplace (WP); (2) working remotely (RW);(3) not working or unemployed (NW). A large portion of the study participants from allthree groups declared living in the big city and performing office work (Table 1). Most of therespondents were subject to general governmental restrictions (Table 1). Most of the studyparticipants in all three groups reported a moderate or high level of stress and were usuallycharacterized by poor quality of sleep (Figures 1 and 2). Over a half of the participants inevery group declared being physically active during lockdown (Table 1). The total habitualphysical activity performed during the day was, on average, 184.8 ± 170.5 min/day forWP in comparison to 120.6 ± 124.4 min/day for RW and 124.6 ± 114.7 min/day for NWand the difference was statistically significant (p < 0.001) (Table 2). In the whole studygroup, the less active seemed to be RW participants (Table 2). People who declared beingphysically active had significantly more total daily time of PA in comparison to inactivepeople, especially RW and NW (Table 2). There were no differences in total daily time ofPA and walking time PA between active and inactive WP; there were significant differencesin moderate and vigorous PA time, with p < 0.001 (Table 2).
Table 1. The main socio-demographic variables characterizing the study group (n = 1959).
SOCIO-DEMOGRAPHIC VARIABLES WP(N = 344)
RW(N = 639)
NW(N = 976)
n (%)
SexFemale 270 (78.5) 533 (83.4) 878 (90.0)Male 74 (21.5) 106 (16.6) 98 (10.0)Place of livingCity >100,000 citizens 163 (47.4) 380 (59.5) 456 (46.7)City 20–100,000 citizens 80 (23.2) 101 (15.8) 198 (20.3)Town <20,000 citizens 41 (12.0) 42 (6.6) 97 (10.0)Village 60 (17.4) 116 (18.1) 225 (23.0)Type of workOffice work 210 (61.0) 555 (86.8) 384 (39.3)Physical work 132 (38.4) 31 (4.8) 282 (29.0)Not applicable 2 (0.6) 53 (8.3) 310 (31.8)Form of restriction during pandemicGovernmental restrictions 210 (61.0) 529 (82.8) 803 (82.3)Quarantine 0 (0) 7 (1.1) 16 (1.6)No restrictions because of the type of occupation(medical staff, etc.) 134 (39.0) 103 (16.1) 157 (16.1)
Undertaking physical activity during pandemicYES 209 (60.8) 462 (72.3) 700 (71.7)NO 135 (39.2) 177 (27.7) 276 (28.3)
Life 2021, 11, x FOR PEER REVIEW 5 of 17
No 135 (39.2) 177 (27.7) 276 (28.3)
277; 14%
1118; 57%
564; 29%
LOW MODERATE HIGH
LEVEL OF STRESS
0
200
400
600
800
1000
1200
Nu
mb
er
of
pa
rtic
ipa
nts
Figure 1. Level of stress among the study participants (n = 1959).
1256; 64%
703; 36%
poor good
SLEEP QUALITY
0
200
400
600
800
1000
1200
1400
Num
ber
of part
icip
ants
Figure 2. Quality of sleep among the study participants (n = 1959).
Table 2. Amount of time of physical activity performed by the study participants (n = 1956) who
declared performing physical activity and being inactive.
WP
(n = 344)
RW
(n = 639)
NW
(n = 976)
Mean (±SD)
Total PA (min/day) 184.8 ± 170.5 ***,### 120.6 ± 124.4 124.6 ± 114.7
Walking PA (min/day) 39.9 ± 35.6 *,# 27.9 ± 32.0 30.0 ± 32.4
Moderate PA (min/day) 7.5 ± 9.7 7.6 ± 9.4 8.3 ± 9.8
Vigorous PA (min/day) 9.4 ± 11.8 9.4 ± 12.3 9.7 ± 12.1
PEOPLE PHYSICALLY
ACTIVE
Total PA (min/day) 183.4 ± 152.4 ***,### 129.1 ± 114.3 130.4 ± 103.6
Walking PA (min/day) 39.5 ± 35.6 *,# 29.4 ± 31.9 30.8 ± 32.4
Moderate PA (min/day) 9.9 ± 9.9 9.8 ± 9.6 10.6 ± 10.1
Figure 1. Level of stress among the study participants (n = 1959).
Life 2022, 12, 28 5 of 15
Life 2021, 11, x FOR PEER REVIEW 5 of 17
No 135 (39.2) 177 (27.7) 276 (28.3)
277; 14%
1118; 57%
564; 29%
LOW MODERATE HIGH
LEVEL OF STRESS
0
200
400
600
800
1000
1200
Nu
mb
er
of
pa
rtic
ipa
nts
Figure 1. Level of stress among the study participants (n = 1959).
1256; 64%
703; 36%
poor good
SLEEP QUALITY
0
200
400
600
800
1000
1200
1400
Num
ber
of part
icip
ants
Figure 2. Quality of sleep among the study participants (n = 1959).
Table 2. Amount of time of physical activity performed by the study participants (n = 1956) who
declared performing physical activity and being inactive.
WP
(n = 344)
RW
(n = 639)
NW
(n = 976)
Mean (±SD)
Total PA (min/day) 184.8 ± 170.5 ***,### 120.6 ± 124.4 124.6 ± 114.7
Walking PA (min/day) 39.9 ± 35.6 *,# 27.9 ± 32.0 30.0 ± 32.4
Moderate PA (min/day) 7.5 ± 9.7 7.6 ± 9.4 8.3 ± 9.8
Vigorous PA (min/day) 9.4 ± 11.8 9.4 ± 12.3 9.7 ± 12.1
PEOPLE PHYSICALLY
ACTIVE
Total PA (min/day) 183.4 ± 152.4 ***,### 129.1 ± 114.3 130.4 ± 103.6
Walking PA (min/day) 39.5 ± 35.6 *,# 29.4 ± 31.9 30.8 ± 32.4
Moderate PA (min/day) 9.9 ± 9.9 9.8 ± 9.6 10.6 ± 10.1
Figure 2. Quality of sleep among the study participants (n = 1959).
Table 2. Amount of time of physical activity performed by the study participants (n = 1956) whodeclared performing physical activity and being inactive.
WP(N = 344)
RW(N = 639)
NW(N = 976)
Mean (±SD)
Total PA (min/day) 184.8 ± 170.5 ***,### 120.6 ± 124.4 124.6 ± 114.7Walking PA (min/day) 39.9 ± 35.6 *,# 27.9 ± 32.0 30.0 ± 32.4Moderate PA (min/day) 7.5 ± 9.7 7.6 ± 9.4 8.3 ± 9.8Vigorous PA (min/day) 9.4 ± 11.8 9.4 ± 12.3 9.7 ± 12.1PEOPLE PHYSICALLYACTIVETotal PA (min/day) 183.4 ± 152.4 ***,### 129.1 ± 114.3 130.4 ± 103.6Walking PA (min/day) 39.5 ± 35.6 *,# 29.4 ± 31.9 30.8 ± 32.4Moderate PA (min/day) 9.9 ± 9.9 9.8 ± 9.6 10.6 ± 10.1Vigorous PA (min/day) 13.6 ± 12.5 12.3 ± 13.1 12.8 ± 12.5PEOPLE PHYSICALLYINACTIVETotal PA (min/day) 186.8 ± 195.8 ***,### 98.4 ± 145.7 ˆˆˆ 109.9 ± 138.1 ˆˆˆ
Walking PA (min/day) 40.6 ± 35.9 *,# 24.1 ± 31.9 27.9 ± 32.2Moderate PA (min/day) 3.9 ± 8.5 ˆˆˆ 2.3 ± 6.3 ˆˆˆ 2.9 ± 6.1 ˆˆˆ
Vigorous PA (min/day) 2.5 ± 6.1 ˆˆˆ 1.9 ± 5.1 ˆˆˆ 2.2 ± 6.4 ˆˆˆ
* p < 0.05; *** p < 0.001 IN THE WORK PLACE vs. REMOTE WORK. # p < 0.05; ### p < 0.001 IN THE WORKPLACE vs. NOT WORKING/UNEMPLOYED. ˆˆˆ p < 0.001 ACTIVE vs. INACTIVE.
3.2. Level of Stress in Relation to Working Mode during Lockdown
Most of the participants had a moderate or high level of stress regardless of the workingmode (Figures 3–5). However, NW participants were noticed to have a significantly higherlevel of stress in the PSS results in comparison to RW and WP, with p < 0.01 (Table 3).NW was characterized with the worst results in all the components of stress assessed byPSS, and the differences were statistically significant (Table 3). The results of RW and WPwere similar, except two components: being upset because of something that happenedunexpectedly and feeling unable to control the important things in life, but the differenceswere not statistically significant (Table 3).

Life 2022, 12, 28 6 of 15
Life 2021, 11, x FOR PEER REVIEW 6 of 17
Vigorous PA (min/day) 13.6 ± 12.5 12.3 ± 13.1 12.8 ± 12.5
PEOPLE PHYSICALLY
INACTIVE
Total PA (min/day) 186.8 ± 195.8 ***,### 98.4 ± 145.7 ^^^ 109.9 ± 138.1 ^^^
Walking PA (min/day) 40.6 ± 35.9 *,# 24.1 ± 31.9 27.9 ± 32.2
Moderate PA (min/day) 3.9 ± 8.5 ^^^ 2.3 ± 6.3 ^^^ 2.9 ± 6.1 ^^^
Vigorous PA (min/day) 2.5 ± 6.1 ^^^ 1.9 ± 5.1 ^^^ 2.2 ± 6.4 ^^^
* p < 0.05; ** p < 0.01; *** p < 0.001 IN THE WORK PLACE vs. REMOTE WORK. # p < 0.05; ## p < 0.01; ### p < 0.001 IN THE WORK PLACE vs. NOT WORKING/UNEMPLOYED. ^ p < 0.05; ^^ p < 0.01;
^^^ p < 0.001 ACTIVE vs. INACTIVE.
3.2. Level of Stress in Relation to Working Mode during Lockdown
Most of the participants had a moderate or high level of stress regardless of the work-
ing mode (Figures 3–5). However, NW participants were noticed to have a significantly
higher level of stress in the PSS results in comparison to RW and WP, with p < 0.01 (Table
3). NW was characterized with the worst results in all the components of stress assessed
by PSS, and the differences were statistically significant (Table 3). The results of RW and
WP were similar, except two components: being upset because of something that hap-
pened unexpectedly and feeling unable to control the important things in life, but the dif-
ferences were not statistically significant (Table 3).
NW
131; 13%
514; 53%
331; 34%
LOW MODERATE HIGH
LEVEL OF STRESS
0
100
200
300
400
500
600
Num
ber
of
part
icip
an
ts
Figure 3. Level of stress among the nonworking participants (n = 1959). Figure 3. Level of stress among the nonworking participants (n = 1959).
Life 2021, 11, x FOR PEER REVIEW 7 of 17
RW
99; 15%
389; 61%
151; 24%
LOW MODERATE HIGH
LEVEL OF STRESS
0
50
100
150
200
250
300
350
400
450
Num
ber
of part
icip
ants
Figure 4. Level of stress among the participants working remotely (n = 1959).
WP
47; 14%
215; 63%
82; 24%
LOW MODERATE HIGH
LEVEL OF STRESS
0
20
40
60
80
100
120
140
160
180
200
220
240
Nu
mb
er
of p
art
icip
an
ts
Figure 5. Level of stress among the participants working in the workplace (n = 1959).
Table 3. Level of stress (mean ± SD) estimated by the Perceived Stress Scale (PSS).
WP
(n = 344)
RW
(n = 639)
NW
(n = 976)
Mean (±SD)
Overall level of stress
(Perceived Stress Scale; PSS)
(AU)
21.5 ± 7.1 21.5 ± 7.2 22.6 ± 7.5 **,##
1. Been upset because of
something that happened
unexpectedly (AU)
2.3 ± 1.0 2.1 ± 1.0 2.2 ± 1.0 *
2. Felt that you were unable to
control the important things in
your life (AU)
1.9 ± 1.1 2.1 ± 1.1 2.2 ± 1.2 *,###
3. Felt nervous and “stressed”
(AU) 2.4 ± 1.0 2.4 ± 1.0 2.5 ± 1.0
Figure 4. Level of stress among the participants working remotely (n = 1959).
Life 2021, 11, x FOR PEER REVIEW 7 of 17
RW
99; 15%
389; 61%
151; 24%
LOW MODERATE HIGH
LEVEL OF STRESS
0
50
100
150
200
250
300
350
400
450
Num
ber
of part
icip
ants
Figure 4. Level of stress among the participants working remotely (n = 1959).
WP
47; 14%
215; 63%
82; 24%
LOW MODERATE HIGH
LEVEL OF STRESS
0
20
40
60
80
100
120
140
160
180
200
220
240
Nu
mb
er
of p
art
icip
an
ts
Figure 5. Level of stress among the participants working in the workplace (n = 1959).
Table 3. Level of stress (mean ± SD) estimated by the Perceived Stress Scale (PSS).
WP
(n = 344)
RW
(n = 639)
NW
(n = 976)
Mean (±SD)
Overall level of stress
(Perceived Stress Scale; PSS)
(AU)
21.5 ± 7.1 21.5 ± 7.2 22.6 ± 7.5 **,##
1. Been upset because of
something that happened
unexpectedly (AU)
2.3 ± 1.0 2.1 ± 1.0 2.2 ± 1.0 *
2. Felt that you were unable to
control the important things in
your life (AU)
1.9 ± 1.1 2.1 ± 1.1 2.2 ± 1.2 *,###
3. Felt nervous and “stressed”
(AU) 2.4 ± 1.0 2.4 ± 1.0 2.5 ± 1.0
Figure 5. Level of stress among the participants working in the workplace (n = 1959).
Life 2022, 12, 28 7 of 15
Table 3. Level of stress (mean ± SD) estimated by the Perceived Stress Scale (PSS).
WP(N = 344)
RW(N = 639)
NW(N = 976)
Mean (±SD)
Overall level of stress (Perceived Stress Scale; PSS)(AU) 21.5 ± 7.1 21.5 ± 7.2 22.6 ± 7.5 **,##
1. Been upset because of something that happenedunexpectedly (AU) 2.3 ± 1.0 2.1 ± 1.0 2.2 ± 1.0 *
2. Felt that you were unable to control theimportant things in your life (AU) 1.9 ± 1.1 2.1 ± 1.1 2.2 ± 1.2 *,###
3. Felt nervous and “stressed” (AU) 2.4 ± 1.0 2.4 ± 1.0 2.5 ± 1.04. Felt confident about your ability to handle yourpersonal problems (AU) 2.0 ± 1.0 2.0 ± 1.0 2.2 ± 1.0 ***,##
5. Felt that things were going your way (AU) 2.3 ± 0.9 2.3 ± 0.9 2.5 ± 0.9 ***,##
6. Found that you could not cope with all the thingsthat you had to do (AU) 1.8 ± 1.0 1.8 ± 1.1 2.0 ± 1.1 **,##
7. Been able to control irritations in your life (AU) 1.9 ± 0.9 1.9 ± 1.0 2.0 ± 1.0 *8. Felt that you were on top of things (AU) 2.8 ± 0.9 2.8 ± 1.0 2.9 ± 1.0 *9. Been angered because of things that were outsideof your control (AU) 2.1 ± 1.1 2.2 ± 1.1 2.2 ± 1.1 #
10. Felt difficulties were piling up so high that youcould not overcome them (AU) 1.7 ± 1.2 1.7 ± 1.2 1.9 ± 1.2 ***,##
* p < 0.05; ** p < 0.01; *** p < 0.001 WR vs. NW. # p < 0.05; ## p < 0.01; ### p < 0.001 WP vs. NW. AU: arbitrary units.
3.3. Quality of Sleep in Relation to Working Mode during Lockdown
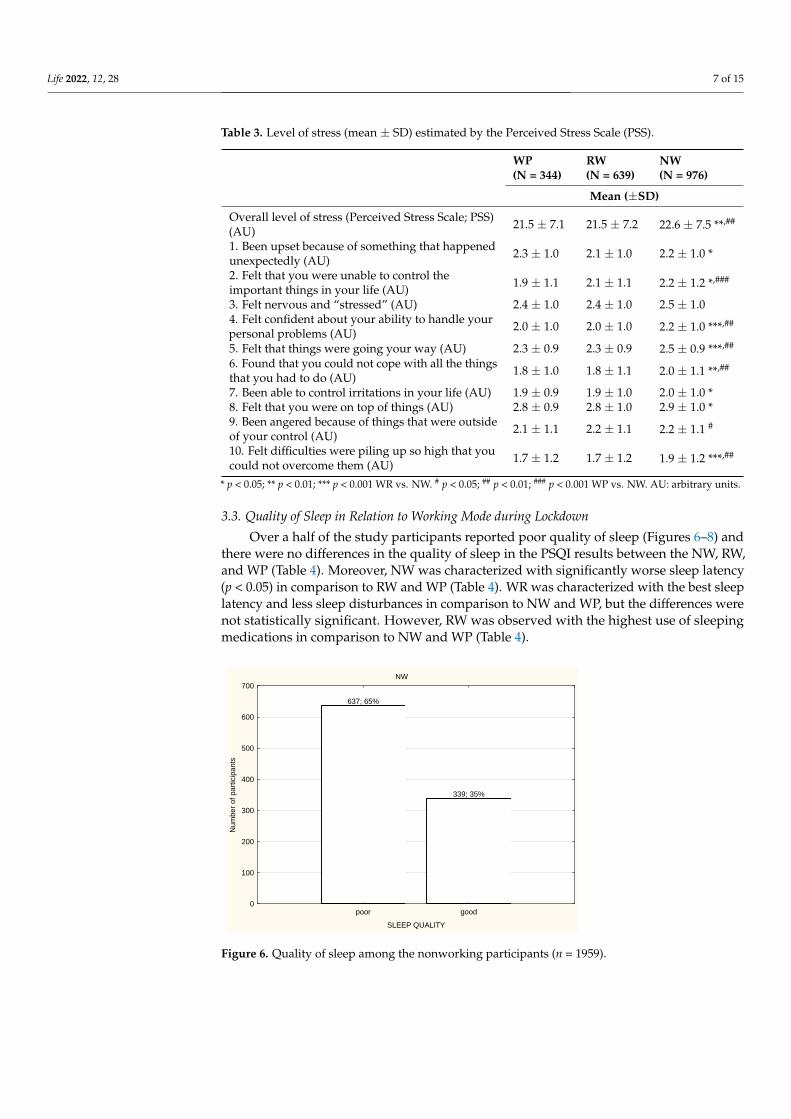
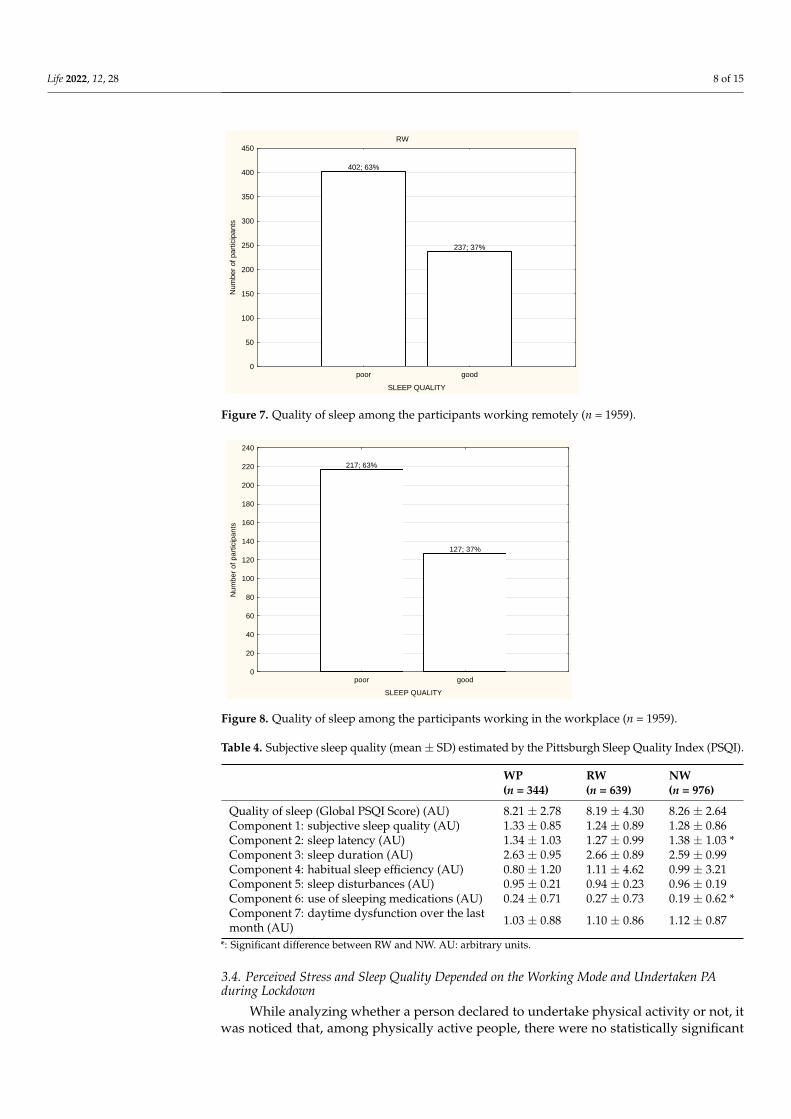
Over a half of the study participants reported poor quality of sleep (Figures 6–8) andthere were no differences in the quality of sleep in the PSQI results between the NW, RW,and WP (Table 4). Moreover, NW was characterized with significantly worse sleep latency(p < 0.05) in comparison to RW and WP (Table 4). WR was characterized with the best sleeplatency and less sleep disturbances in comparison to NW and WP, but the differences werenot statistically significant. However, RW was observed with the highest use of sleepingmedications in comparison to NW and WP (Table 4).
Life 2021, 11, x FOR PEER REVIEW 8 of 17
4. Felt confident about your
ability to handle your personal
problems (AU)
2.0 ± 1.0 2.0 ± 1.0 2.2 ± 1.0 ***,##
5. Felt that things were going
your way (AU) 2.3 ± 0.9 2.3 ± 0.9 2.5 ± 0.9 ***,##
6. Found that you could not
cope with all the things that
you had to do (AU)
1.8 ± 1.0 1.8 ± 1.1 2.0 ± 1.1 **,##
7. Been able to control
irritations in your life (AU) 1.9 ± 0.9 1.9 ± 1.0 2.0 ± 1.0 *
8. Felt that you were on top of
things (AU) 2.8 ± 0.9 2.8 ± 1.0 2.9 ± 1.0 *
9. Been angered because of
things that were outside of
your control (AU)
2.1 ± 1.1 2.2 ± 1.1 2.2 ± 1.1 #
10. Felt difficulties were piling
up so high that you could not
overcome them (AU)
1.7 ± 1.2 1.7 ± 1.2 1.9 ± 1.2 ***,##
* p < 0.05; ** p < 0.01; *** p < 0.001 WR vs. NW. # p < 0.05; ## p < 0.01; ### p < 0.001 WP vs. NW. AU:
arbitrary units.
3.3. Quality of Sleep in Relation to Working Mode during Lockdown
Over a half of the study participants reported poor quality of sleep (Figures 6–8) and
there were no differences in the quality of sleep in the PSQI results between the NW, RW,
and WP (Table 4). Moreover, NW was characterized with significantly worse sleep latency
(p < 0.05) in comparison to RW and WP (Table 4). WR was characterized with the best
sleep latency and less sleep disturbances in comparison to NW and WP, but the differ-
ences were not statistically significant. However, RW was observed with the highest use
of sleeping medications in comparison to NW and WP (Table 4).
NW
637; 65%
339; 35%
poor good
SLEEP QUALITY
0
100
200
300
400
500
600
700
Num
ber
of part
icip
ants
Figure 6. Quality of sleep among the nonworking participants (n = 1959). Figure 6. Quality of sleep among the nonworking participants (n = 1959).
Life 2022, 12, 28 8 of 15Life 2021, 11, x FOR PEER REVIEW 9 of 17
RW
402; 63%
237; 37%
poor good
SLEEP QUALITY
0
50
100
150
200
250
300
350
400
450
Num
ber
of
part
icip
ants
Figure 7. Quality of sleep among the participants working remotely (n = 1959).
217; 63%
127; 37%
poor good
SLEEP QUALITY
0
20
40
60
80
100
120
140
160
180
200
220
240
Nu
mb
er
of
pa
rtic
ipa
nts
Figure 8. Quality of sleep among the participants working in the workplace (n = 1959).
Table 4. Subjective sleep quality (mean ± SD) estimated by the Pittsburgh Sleep Quality Index
(PSQI).
WP
(n = 344)
RW
(n = 639)
NW
(n = 976)
Quality of sleep (Global
PSQI Score) (AU) 8.21 ± 2.78 8.19 ± 4.30 8.26 ± 2.64
Component 1: subjective
sleep quality (AU) 1.33 ± 0.85 1.24 ± 0.89 1.28 ± 0.86
Component 2: sleep latency
(AU) 1.34 ± 1.03 1.27 ± 0.99 1.38 ± 1.03 *
Component 3: sleep
duration (AU) 2.63 ± 0.95 2.66 ± 0.89 2.59 ± 0.99
Component 4: habitual
sleep efficiency (AU) 0.80 ± 1.20 1.11 ± 4.62 0.99 ± 3.21
Component 5: sleep
disturbances (AU) 0.95 ± 0.21 0.94 ± 0.23 0.96 ± 0.19
Figure 7. Quality of sleep among the participants working remotely (n = 1959).
Life 2021, 11, x FOR PEER REVIEW 9 of 17
RW
402; 63%
237; 37%
poor good
SLEEP QUALITY
0
50
100
150
200
250
300
350
400
450
Num
ber
of
part
icip
ants
Figure 7. Quality of sleep among the participants working remotely (n = 1959).
217; 63%
127; 37%
poor good
SLEEP QUALITY
0
20
40
60
80
100
120
140
160
180
200
220
240
Nu
mb
er
of
pa
rtic
ipa
nts
Figure 8. Quality of sleep among the participants working in the workplace (n = 1959).
Table 4. Subjective sleep quality (mean ± SD) estimated by the Pittsburgh Sleep Quality Index
(PSQI).
WP
(n = 344)
RW
(n = 639)
NW
(n = 976)
Quality of sleep (Global
PSQI Score) (AU) 8.21 ± 2.78 8.19 ± 4.30 8.26 ± 2.64
Component 1: subjective
sleep quality (AU) 1.33 ± 0.85 1.24 ± 0.89 1.28 ± 0.86
Component 2: sleep latency
(AU) 1.34 ± 1.03 1.27 ± 0.99 1.38 ± 1.03 *
Component 3: sleep
duration (AU) 2.63 ± 0.95 2.66 ± 0.89 2.59 ± 0.99
Component 4: habitual
sleep efficiency (AU) 0.80 ± 1.20 1.11 ± 4.62 0.99 ± 3.21
Component 5: sleep
disturbances (AU) 0.95 ± 0.21 0.94 ± 0.23 0.96 ± 0.19
Figure 8. Quality of sleep among the participants working in the workplace (n = 1959).
Table 4. Subjective sleep quality (mean ± SD) estimated by the Pittsburgh Sleep Quality Index (PSQI).
WP(n = 344)
RW(n = 639)
NW(n = 976)
Quality of sleep (Global PSQI Score) (AU) 8.21 ± 2.78 8.19 ± 4.30 8.26 ± 2.64Component 1: subjective sleep quality (AU) 1.33 ± 0.85 1.24 ± 0.89 1.28 ± 0.86Component 2: sleep latency (AU) 1.34 ± 1.03 1.27 ± 0.99 1.38 ± 1.03 *Component 3: sleep duration (AU) 2.63 ± 0.95 2.66 ± 0.89 2.59 ± 0.99Component 4: habitual sleep efficiency (AU) 0.80 ± 1.20 1.11 ± 4.62 0.99 ± 3.21Component 5: sleep disturbances (AU) 0.95 ± 0.21 0.94 ± 0.23 0.96 ± 0.19Component 6: use of sleeping medications (AU) 0.24 ± 0.71 0.27 ± 0.73 0.19 ± 0.62 *Component 7: daytime dysfunction over the lastmonth (AU) 1.03 ± 0.88 1.10 ± 0.86 1.12 ± 0.87
*: Significant difference between RW and NW. AU: arbitrary units.
3.4. Perceived Stress and Sleep Quality Depended on the Working Mode and Undertaken PAduring Lockdown
While analyzing whether a person declared to undertake physical activity or not, itwas noticed that, among physically active people, there were no statistically significant
Life 2022, 12, 28 9 of 15
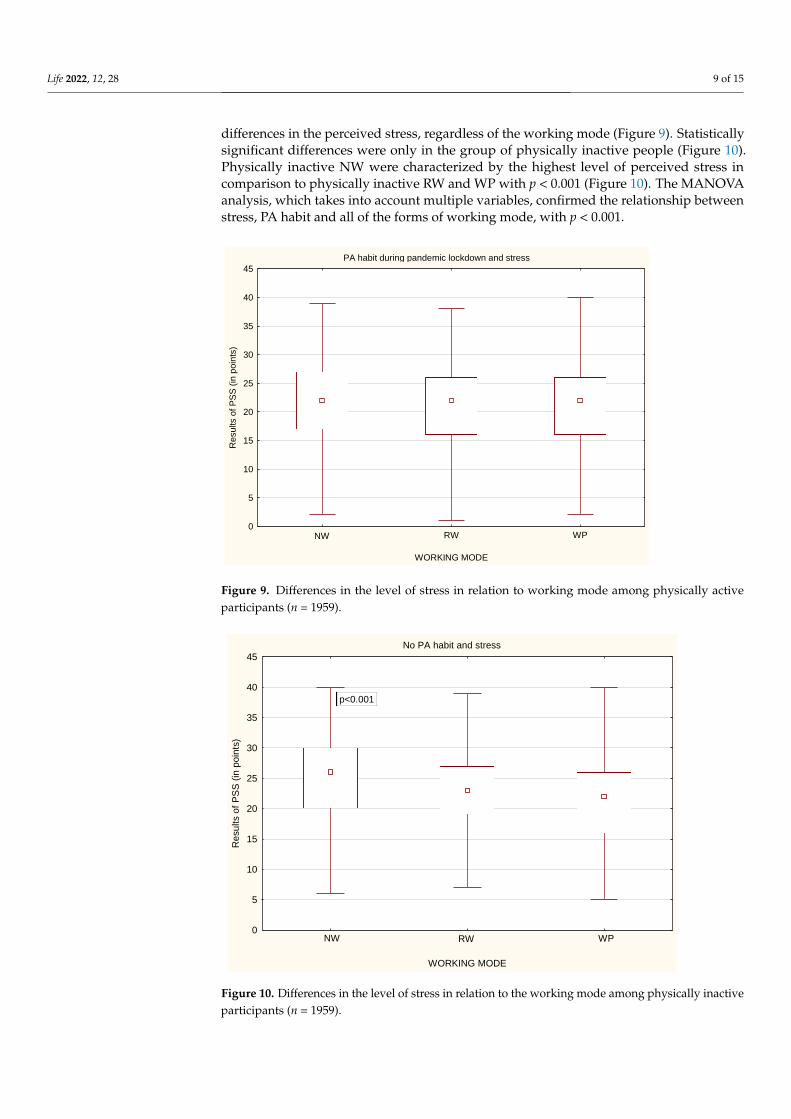
differences in the perceived stress, regardless of the working mode (Figure 9). Statisticallysignificant differences were only in the group of physically inactive people (Figure 10).Physically inactive NW were characterized by the highest level of perceived stress incomparison to physically inactive RW and WP with p < 0.001 (Figure 10). The MANOVAanalysis, which takes into account multiple variables, confirmed the relationship betweenstress, PA habit and all of the forms of working mode, with p < 0.001.
Life 2021, 11, x FOR PEER REVIEW 10 of 17
Component 6: use of
sleeping medications (AU) 0.24 ± 0.71 0.27 ± 0.73 0.19 ± 0.62 *
Component 7: daytime
dysfunction over the last
month (AU)
1.03 ± 0.88 1.10 ± 0.86 1.12 ± 0.87
*: Significant difference between RW and NW. AU: arbitrary units.
3.4. Perceived Stress and Sleep Quality Depended on the Working Mode and Undertaken PA
during Lockdown
While analyzing whether a person declared to undertake physical activity or not, it
was noticed that, among physically active people, there were no statistically significant
differences in the perceived stress, regardless of the working mode (Figure 9). Statistically
significant differences were only in the group of physically inactive people (Figure 10).
Physically inactive NW were characterized by the highest level of perceived stress in com-
parison to physically inactive RW and WP with p < 0.001 (Figure 10). The MANOVA anal-
ysis, which takes into account multiple variables, confirmed the relationship between
stress, PA habit and all of the forms of working mode, with p < 0.001.
PA habit during pandemic lockdown and stress
WORKING MODE
0
5
10
15
20
25
30
35
40
45
Resu
lts o
f P
SS
(in
poin
ts)
NW RW WP
Figure 9. Differences in the level of stress in relation to working mode among physically active par-
ticipants (n = 1959).
Figure 9. Differences in the level of stress in relation to working mode among physically activeparticipants (n = 1959).
Life 2021, 11, x FOR PEER REVIEW 11 of 17
No PA habit and stress
WORKING MODE
0
5
10
15
20
25
30
35
40
45
Re
su
lts o
f P
SS
(in
po
ints
)
p<0.001
NW RW WP
Figure 10. Differences in the level of stress in relation to the working mode among physically inac-
tive participants (n = 1959).
Similarly to stress level, while analyzing whether a person declared to undertake
physical activity or not, it was noticed that, among physically active people, there were
no statistically significant differences in the quality of sleep, regardless of the working
mode (Figure 11). Statistically significant differences were only in the group of physically
inactive people (Figure 12). Physically inactive NW were characterized by poorer quality
of sleep in the PSQI results in comparison to physically inactive RW and WP with p < 0.05
(Figure 12). The MANOVA analysis confirmed the relationship between stress, PA habit,
and remote work (p < 0.05) or nonworking people (p < 0.01) (Table 5).
Figure 10. Differences in the level of stress in relation to the working mode among physically inactiveparticipants (n = 1959).

Life 2022, 12, 28 10 of 15
Similarly to stress level, while analyzing whether a person declared to undertakephysical activity or not, it was noticed that, among physically active people, there were nostatistically significant differences in the quality of sleep, regardless of the working mode(Figure 11). Statistically significant differences were only in the group of physically inactivepeople (Figure 12). Physically inactive NW were characterized by poorer quality of sleep inthe PSQI results in comparison to physically inactive RW and WP with p < 0.05 (Figure 12).The MANOVA analysis confirmed the relationship between stress, PA habit, and remotework (p < 0.05) or nonworking people (p < 0.01) (Table 5).
Life 2021, 11, x FOR PEER REVIEW 12 of 17
PA habit and sleep
WORKING MODE
0
2
4
6
8
10
12
14
16
18
Re
su
lts o
f P
SQ
I (in
po
ints
)
NW RW WP
Figure 11. Differences in the quality of sleep in relation to the working mode among physically
active participants (n = 1959).
No PA habit and sleep
WORKING MODE
0
2
4
6
8
10
12
14
16
18
Re
su
lts o
f P
SQ
I (i
n p
oin
ts)
p<0.05
NW RW WP
Figure 12. Differences in the quality of sleep in relation to the working mode among physically
inactive participants (n = 1959).
Table 5. ANOVA/MANOVA analysis results.
Type III Sum Of Squares df Mean Square F p Value
Figure 11. Differences in the quality of sleep in relation to the working mode among physically activeparticipants (n = 1959).
Life 2021, 11, x FOR PEER REVIEW 12 of 17
PA habit and sleep
WORKING MODE
0
2
4
6
8
10
12
14
16
18
Re
su
lts o
f P
SQ
I (in
po
ints
)
NW RW WP
Figure 11. Differences in the quality of sleep in relation to the working mode among physically
active participants (n = 1959).
No PA habit and sleep
WORKING MODE
0
2
4
6
8
10
12
14
16
18
Re
su
lts o
f P
SQ
I (i
n p
oin
ts)
p<0.05
NW RW WP
Figure 12. Differences in the quality of sleep in relation to the working mode among physically
inactive participants (n = 1959).
Table 5. ANOVA/MANOVA analysis results.
Type III Sum Of Squares df Mean Square F p Value
Figure 12. Differences in the quality of sleep in relation to the working mode among physicallyinactive participants (n = 1959).

Life 2022, 12, 28 11 of 15
Table 5. ANOVA/MANOVA analysis results.
Type III Sum of Squares df Mean Square F p Value
STRESS(Intercept) 705,269.9 1 705,269.9 13,242.12 0.000000Work 989.5 2 494.7 9.29 0.000097PA 639.1 1 639.1 12.00 0.000544Work × PA 389.4 2 194.7 3.66 0.026026Error 104,016.0 1953 53.3SLEEP(Intercept) 99,053.36 1 99,053.36 9196.543 0.000000Work 13.58 2 6.79 0.630 0.532591PA 49.88 1 49.88 4.632 0.031512Work × PA 41.36 2 20.68 1.920 0.146880Error 21,002.90 1950 10.77
4. Discussion
The COVID-19 pandemic caused a lot of changes in the working mode of many people.Some of them lost their job or were forced to change it, but a lot of people changed theorganization of work from being in the workplace to remote work at home. Differentworking modes, the coexisting pandemic situation, and obligatory isolation were notneutral for physical and mental health and can be a reason for serious mental disorders [31],and even suicidal thoughts [18].
The aim of the study was to examine the associations between stress and qualityof sleep in relation to physical activity performed by people of working modes duringCOVID-19 pandemic lockdown in Poland.
In the present study, a high level of stress was significantly noticed more often in unem-ployed people in comparison to employed people. A systematic review also confirms that,during the pandemic, a depression risk factor is observed more often among unemployedpeople [32]. People who are employed were usually characterized with moderate stresslevel. The reason for that difference may be due to the fact that the unemployed peoplespent more time on reading newspapers, watching TV, or listening to the radio, so themedia channels that were delivering huge amounts of information about the current worldepidemiological situation could increase fear, anxiety, and, thus, the level of stress. This, inconjunction with the governmental restrictions prohibiting leaving the place of residence,limited social contact with people and general disturbance of everyday life could influenceboth stress level and sleep quality, especially those unemployed. Moreover, unemployedpeople had to be financially dependent on other people (relatives; friends) and, therefore,they may not receive adequate medical care in the event of an infection of COVID-19. Alldescribed factors are thought to negatively affect mental health [33]. Employed peoplecould feel more safety during possible COVID-19 infection due to the possession of healthinsurance; additionally, people working in the workplace had more social contact withother workmates, a very important aspect in decreasing stress. People who had to changetheir working mode from work in the workplace to remote work reported perceiving morestress; they were characterized with “work-life balance” (WLB) disorder and a decrease inwork satisfaction, [34]. To reduce the stress level, an increase in alcohol consumption wasobserved, together with other addictive substances, which also had a negative impact onphysical and mental health [5,35].
The difficulty in achieving “work-life balance” by remotely working people was alsoobserved in the previous study [34] before the pandemic [6]. Therefore, it is recommendedthat people working remotely should have some separate rules organizing their work andlife to achieve WLB [36].
The pandemic situation was also responsible for sleep disturbances, such as fallingasleep unintentionally, difficulties falling/staying asleep, and later bedtime, often usingsleep medication [35]. Our study showed that sleep quality was poor among both em-ployed and unemployed people. Indeed, there were no significant differences between
Life 2022, 12, 28 12 of 15
unemployed–employed people and remotely working–working in the workplace people.Other study confirmed that, despite the fact that people sleep longer and spend more timein bed during pandemic lockdown than before the COVID-19 pandemic, their sleep qualitydecreases [37,38].
Governmental restrictions modifying the everyday life of people limited access to theroutine classes and sport facilities, decreasing the general PA level. What was also visiblein the present study was people who were unemployed but physically active had bettersleep quality than those who were unemployed and physically inactive.
Employed people working in the workplace spent statistically significantly more timeon physical activity in comparison to people with remote work and unemployed people. Itwas also connected with the fact that people working in the workplace had to spend sometime on travel to the job destination. If the work was close enough to home that it allowsyou to travel along the way, it gave them the additional option of undertaking PA.
The results of the present study showed that lower stress level was observed amongunemployed people who declared to be physically active in comparison to those who werephysically inactive. On the other side, the research shows that that the high stress levelcould be a cause of low PA because of the lack of interest and motivation [39]. There area lot of advantages of regular PA and its link with mental health improvement duringisolation [40,41]; during the pandemic, the most important seems to be to decrease the riskor mellow the course of infection and immunology system improvement [42], rather thanmaintaining PA in the community.
The employers should provide mental support for their employees [20], with specialattention paid to the psychological help, especially among the healthcare providers. It wasshown that healthcare professionals who were closely working with COVID-19-positivepeople were noticed to have an increased stress level and decreased sleep quality [14,19].Moreover, they reported anxieties and depression [43].
The main strength of the study is its large sample. Next, the study was performedduring a special time of pandemic lockdown, which made it possible to analyze people’sbehavior and well-being at that particular time. Further, the data were collected usinginternationally recognized and validated tools. Moreover, the online form of the studymade it possible to provide access to many people during pandemic lockdown.
However, some limitations of the study should be emphasized. Firstly, it was a surveystudy using questionnaires, so the results are more subjective and may be underestimatedor overestimated by the answers of the respondents. It is usually recommended that astudy in the form of interview with the questionnaire is conducted in the presence ofan investigator who can sometimes help clarify the question. Unfortunately, during thepandemic lockdown, the access and direct contact with people was very reduced. Secondly,in the study group, there is a fairly large advantage of women over men. Probably, this isdue to the fact that, in surveys, especially those online, it is noticed that women participatemuch more often rather than men.
To summarize, the pandemic lockdown caused people to feel a lot of stress andsignificantly worsened their quality of sleep, regardless of the working mode. However,being unemployed was associated with a greater risk of experiencing a lot of stress andsleep disturbance. It was also noted that physical activity, even at home during a lockdown,can help reduce stress and, consequently, improve the quality of sleep, which was especiallyvisible among the unemployed. Maintaining the possibility of active work in any form,remotely or in the workplace, and undertaking physical activity translate into a reductionin stress and improve the quality of sleep. The presented conclusions should be bornein mind when there is another need to introduce such large restrictions in the everydayfunctioning of people.
Practical Implications
The study could be a recommendation for employers, informing what type of workshould be implemented for their employee during pandemic time to maintain mental

Life 2022, 12, 28 13 of 15
health, which is linked with quality of work. The study results should be valuable forhospital authorities to reduce the mental health burden of healthcare workers associatedwith COVID-19.
5. Conclusions
During pandemic lockdown, people were overstressed and had a poor quality of sleep.However, regardless of the working mode, people who had the opportunity to stay profes-sionally active perceived less stress than nonworking people. However, being physicallyactive can be beneficial to perceiving less stress and sleep disturbances influencing sleepquality, especially among remotely working and nonworking people. Planning futurepandemic restrictions, the policymakers should be aware of designing the appropriateguidelines of work planning and physical activity recommendations regarding the differentworking modes.
Author Contributions: Conceptualization, A.L.; methodology, A.L. and P.R.; software, A.L.; valida-tion, A.L.; formal analysis, A.L.; investigation, A.L., K.M., and P.R.; resources, A.L., P.R., and K.M.;data curation, A.L. and K.M.; writing—original draft preparation, A.L. and K.M.; writing—reviewand editing, A.L. and P.R.; visualization, A.L.; supervision, A.L.; project administration, A.L.; fundingacquisition, P.R. All authors have read and agreed to the published version of the manuscript.
Funding: This research received no external funding.
Institutional Review Board Statement: Completing the questionnaire was anonymous and equiv-alent to agreeing to participate in the study, so the relevant University Human Ethics Committeedecided to exempt it from its approval.
Informed Consent Statement: Completing the questionnaire was equivalent to agreeing to partici-pate in the study.
Data Availability Statement: The datasets used and/or analyzed during the current study areavailable from the corresponding author on reasonable request.
Conflicts of Interest: The authors declare no conflict of interest.
References1. Oakman, J.; Kinsman, N.; Stuckey, R.; Graham, M.; Weale, V. A rapid review of mental and physical health effects of working at
home: How do we optimise health? BMC Public Health 2020, 20, 1825. [CrossRef]2. Shimazu, A.; Nakata, A.; Nagata, T.; Arakawa, Y.; Kuroda, S.; Inamizu, N.; Yamamoto, I. Psychosocial impact of COVID-19 for
general workers. J. Occup. Health 2020, 62, e12132. [CrossRef]3. Wang, B.; Liu, Y.; Qian, J.; Parker, S.K. Achieving Effective Remote Working During the COVID-19 Pandemic: A Work Design
Perspective. Appl. Psychol. 2020, 70, 16–59. [CrossRef]4. Galanti, T.; Guidetti, G.; Mazzei, E.; Zappalà, S.; Toscano, F. Work From Home During the COVID-19 Outbreak: The Impact on
Employees’ Remote Work Productivity, Engagement, and Stress. J. Occup. Environ. Med. 2021, 63, e426–e432. [CrossRef]5. Wenham, C.; Smith, J.; Morgan, R. COVID-19: The gendered impacts of the outbreak. Lancet 2020, 395, 846–848. [CrossRef]6. Norström, F.; Virtanen, P.; Hammarström, A.; Gustafsson, P.E.; Janlert, U. How does unemployment affect self-assessed health? A
systematic review focusing on subgroup effects. BMC Public Health 2014, 14, 1310. [CrossRef]7. Thomas, C.; Benzeval, M.; Stansfeld, S.A. Employment transitions and mental health: An analysis from the British household
panel survey. J. Epidemiol. Community Health 2005, 59, 243–249. [CrossRef] [PubMed]8. Rossi, R.; Socci, V.; Talevi, D.; Mensi, S.; Niolu, C.; Pacitti, F.; Di Marco, A.; Rossi, A.; Siracusano, A.; Di Lorenzo, G. COVID-19
Pandemic and Lockdown Measures Impact on Mental Health Among the General Population in Italy. Front. Psychiatry 2020, 11,790. [CrossRef]
9. Silva Moreira, P.; Ferreira, S.; Couto, B.; Machado-Sousa, M.; Fernández, M.; Raposo-Lima, C.; Sousa, N.; Picó-Pérez, M.; Morgado,P. Protective Elements of Mental Health Status during the COVID-19 Outbreak in the Portuguese Population. Int. J. Environ. Res.Public Health 2021, 18, 1910. [CrossRef] [PubMed]
10. Garbarino, S.; Magnavita, N. Sleep problems are a strong predictor of stress-related metabolic changes in police officers. Aprospective study. PLoS ONE 2019, 14, e0224259. [CrossRef] [PubMed]
11. Watson, N.F.; Badr, M.S.; Belenky, G.; Bliwise, D.L.; Buxton, O.; Buysse, D.; Dinges, D.F.; Gangwisch, J.; Grandner, M.A.; Kushida,C.; et al. Recommended Amount of Sleep for a Healthy Adult: A Joint Consensus Statement of the American Academy of SleepMedicine and Sleep Research Society. Sleep 2015, 38, 843–844. [CrossRef] [PubMed]
Life 2022, 12, 28 14 of 15
12. Jahrami, H.; BaHammam, A.S.; Bragazzi, N.L.; Saif, Z.; Faris, M.; Vitiello, M.V. Sleep problems during the COVID-19 pandemicby population: A systematic review and meta-analysis. J. Clin. Sleep Med. 2021, 17, 299–313. [CrossRef]
13. Stanton, R.; To, Q.G.; Khalesi, S.; Williams, S.L.; Alley, S.J.; Thwaite, T.L.; Fenning, A.S.; Vandelanotte, C. Depression, Anxiety andStress during COVID-19: Associations with Changes in Physical Activity, Sleep, Tobacco and Alcohol Use in Australian Adults.Int. J. Environ. Res. Public Health 2020, 17, 4065. [CrossRef] [PubMed]
14. Piercy, K.L.; Troiano, R.P.; Ballard, R.M.; Carlson, S.A.; Fulton, J.E.; Galuska, D.A.; George, S.M.; Olson, R.D. The Physical ActivityGuidelines for Americans. JAMA 2018, 320, 2020–2028. [CrossRef]
15. Crush, E.A.; Frith, E.; Loprinzi, P.D. Experimental effects of acute exercise duration and exercise recovery on mood state. J. Affect.Disord. 2018, 229, 282–287. [CrossRef] [PubMed]
16. Füzéki, E.; Groneberg, D.A.; Banzer, W. Physical activity during COVID-19 induced lockdown: Recommendations. J. Occup. Med.Toxicol. 2020, 15, 25. [CrossRef]
17. Pfefferbaum, B.; North, C.S. Mental Health and the COVID-19 Pandemic. N. Engl. J. Med. 2020, 383, 510–512. [CrossRef]18. Gunnell, D.; Appleby, L.; Arensman, E.; Hawton, K.; John, A.; Kapur, N.; Khan, M.; O’Connor, R.C.; Pirkis, J. Suicide risk and
prevention during the COVID-19 pandemic. Lancet Psychiatry 2020, 7, 468–471. [CrossRef]19. Xiao, H.; Zhang, Y.; Kong, D.; Li, S.; Yang, N. The Effects of Social Support on Sleep Quality of Medical Staff Treating Patients
with Coronavirus Disease 2019 (COVID-19) in January and February 2020 in China. Med. Sci. Monit. 2020, 26, e923549. [CrossRef][PubMed]
20. Barone Gibbs, B.; Kline, C.E.; Huber, K.A.; Paley, J.L.; Perera, S. COVID-19 shelter-at-home and work, lifestyle and well-being indesk workers. Occup. Med. 2021, 71, 86–94. [CrossRef] [PubMed]
21. Mattila, E.; Peltokoski, J.; Neva, M.H.; Kaunonen, M.; Helminen, M.; Parkkila, A.K. COVID-19: Anxiety among hospital staff andassociated factors. Ann. Med. 2021, 53, 237–246. [CrossRef] [PubMed]
22. Marelli, S.; Castelnuovo, A.; Somma, A.; Castronovo, V.; Mombelli, S.; Bottoni, D.; Leitner, C.; Fossati, A.; Ferini-Strambi, L. Impactof COVID-19 lockdown on sleep quality in university students and administration staff. J. Neurol. 2021, 268, 8–15. [CrossRef]
23. Rodríguez, S.; Valle, A.; Piñeiro, I.; González-Suárez, R.; Díaz, F.M.; Vieites, T. COVID-19 Lockdown: Key Factors in Citizens’Stress. Front. Psychol. 2021, 12, 666891. [CrossRef] [PubMed]
24. Lipert, A.; Kozłowski, R.; Timler, D.; Marczak, M.; Musiał, K.; Rasmus, P.; Kamecka, K.; Jegier, A. Physical Activity as a Predictorof the Level of Stress and Quality of Sleep during COVID-19 Lockdown. Int. J. Environ. Res. Public Health 2021, 18, 5811.[CrossRef] [PubMed]
25. Bergier, J.; Kapka-Skrzypczak, L.; Bilinski, P.; Paprzycki, P.; Wojtyła, A. Physical activity of Polish adolescents and young adultsaccording to IPAQ: A population based study. Ann. Agric. Environ. Med. 2012, 19, 109–115. [PubMed]
26. Ainsworth, B.E.H.W.; Herrmann, S.D.; Meckes, N.; Bassett, D.R., Jr.; Tudor-Locke, C.; Greer, J.L.; Vezina, J.; Whitt-Glover, M.C.;Leon, A.S. The compendium of physical activities: A second update of codes and MET values. Med. Sci. Sports Exerc. 2011, 43,1575–1581. [CrossRef] [PubMed]
27. International Physical Activity Questionnaire. Cultural Adaptation. Available online: https://lcbc-uio.github.io/Questionnaires/articles/ipaq.html (accessed on 15 February 2021).
28. Mollayeva, T.; Thurairajah, P.; Burton, K.; Mollayeva, S.; Shapiro, C.M.; Colantonio, A. The Pittsburgh sleep quality index as ascreening tool for sleep dysfunction in clinical and non-clinical samples: A systematic review and meta-analysis. Sleep Med. Rev.2016, 25, 52–73. [CrossRef] [PubMed]
29. Klein, E.M.; Brähler, E.; Dreier, M.; Reinecke, L.; Müller, K.W.; Schmutzer, G.; Wölfling, K.; Beutel, M.E. The German version ofthe Perceived Stress Scale—Psychometric characteristics in a representative German community sample. BMC Psychiatry 2016, 16,159. [CrossRef]
30. Baik, S.H.; Fox, R.S.; Mills, S.D.; Roesch, S.C.; Sadler, G.R.; Klonoff, E.A.; Malcarne, V.L. Reliability and validity of the PerceivedStress Scale-10 in Hispanic Americans with English or Spanish language preference. J. Health Psychol. 2019, 24, 628–639. [CrossRef]
31. Caroppo, E.; Mazza, M.; Sannella, A.; Marano, G.; Avallone, C.; Claro, A.E.; Janiri, D.; Moccia, L.; Janiri, L.; Sani, G. Will NothingBe the Same Again?: Changes in Lifestyle during COVID-19 Pandemic and Consequences on Mental Health. Int. J. Environ. Res.Public Health 2021, 18, 8433. [CrossRef]
32. Xiong, J.; Lipsitz, O.; Nasri, F.; Lui, L.M.W.; Gill, H.; Phan, L.; Chen-Li, D.; Iacobucci, M.; Ho, R.; Majeed, A.; et al. Impactof COVID-19 pandemic on mental health in the general population: A systematic review. J. Affect. Disord. 2020, 277, 55–64.[CrossRef] [PubMed]
33. Petitta, L.; Probst, T.M.; Ghezzi, V.; Barbaranelli, C. Economic stress, emotional contagion and safety outcomes: A cross-countrystudy. Work 2020, 66, 421–435. [CrossRef] [PubMed]
34. Sandoval-Reyes, J.; Idrovo-Carlier, S.; Duque-Oliva, E.J. Remote Work, Work Stress, and Work-Life during Pandemic Times: ALatin America Situation. Int. J. Environ. Res. Public Health 2021, 18, 7069. [CrossRef] [PubMed]
35. Pérez-Carbonell, L.; Meurling, I.J.; Wassermann, D.; Wassermann, D.; Gnoni, V.; Leschziner, G.; Weighall, A.; Ellis, J.; Durrant, S.;Hare, A.; et al. Impact of the novel coronavirus (COVID-19) pandemic on sleep. J. Thorac Dis. 2020, 12 (Suppl. 2), S163–S175.[CrossRef] [PubMed]
36. Lopez-Leon, S.; Forero, D.A.; Ruiz-Díaz, P. Recommendations for working from home during the COVID-19 pandemic (andbeyond). Work 2020, 66, 371–375. [CrossRef]
Life 2022, 12, 28 15 of 15
37. Cellini, N.; Canale, N.; Mioni, G.; Costa, S. Changes in sleep pattern, sense of time and digital media use during COVID-19lockdown in Italy. J. Sleep Res. 2020, 29, e13074. [CrossRef]
38. Huang, Y.; Zhao, N. Generalized anxiety disorder, depressive symptoms and sleep quality during COVID-19 outbreak in China:A web-based cross-sectional survey. Psychiatry Res. 2020, 288, 112954. [CrossRef]
39. Stults-Kolehmainen, M.A.; Sinha, R. The effects of stress on physical activity and exercise. Sports Med. 2014, 44, 81–121. [CrossRef]40. Fletcher, G.F.; Landolfo, C.; Niebauer, J.; Ozemek, C.; Arena, R.; Lavie, C.J. Promoting Physical Activity and Exercise: JACC
Health Promotion Series. J. Am. Coll Cardiol. 2018, 72, 1622–1639. [CrossRef]41. Dominski, F.H.; Brandt, R. Do the benefits of exercise in indoor and outdoor environments during the COVID-19 pandemic
outweigh the risks of infection? Sport Sci. Health 2020, 16, 583–588. [CrossRef]42. Global Recommendations on Physical Activity for Health. 2011. Available online: https://www.who.int/dietphysicalactivity/
global-PA-recs-2010.pdf (accessed on 15 September 2021).43. Hassamal, S.; Dong, F.; Lee, C.; Ogunyemi, D.; Neeki, M.M. The Psychological Impact of COVID-19 on Hospital Staff. West. J.
Emerg. Med. 2021, 22, 346–352. [CrossRef] [PubMed]