woodfuels use for sustainable energy infrastructures’ materialization
TRANSCRIPT

In: Global Environmental Policies ISBN: 978-1-60876-204-0
Editors: R. Cancilla and M. Gargano, pp. 59-79 © 2010 Nova Science Publishers, Inc.
Chapter 3
WOODFUELS USE FOR SUSTAINABLE ENERGY
INFRASTRUCTURES’ MATERIALIZATION
Grigorios L. Kyriakopoulos*1, Konstantinos G. Kolovos*2
and Miltiadis S. Chalikias*3
1 National Technical University of Athens, School of Electrical and Computer
Engineering, Electric Power Division, Photometry Laboratory,
Athens, Greece 2 School of Pedagogical & Technological Educational (A.S.PE.T.E.),
Department of Civil and Construction Engineering Technology Teachers,
Αthens, Greece 3 Technological Institute of Piraeus,
Department of Business Administration,
Egaleo, Greece
ABSTRACT
The issue of the introduction of new environmental friendly and economical fuels to
the everyday energy-consuming human activities is controversial and imperative. The
recent European legislation, relative to the introduction of biofuels at local and national
levels, is conformed to the above direction. Additionally, the above proposal
implementation would be successfully materialized by exploiting the Renewable Energy
Sources, which are abundant in the Greek context. The present study is driven to the
wider implementation of biofuels, by applying High-Heating-Valued woodfuels that are
mainly cultivated in the Northern Greece context. The examined parameters include the
―High Heating Values‖, the densities, the annual total production and the annual
proportional allocation of the available woodfuels. Specifically, the examined woodfuel
* Corresponding author: Grigorios L. Kyriakopoulos, Dr. Chemical Engineer, National Technical University of
Athens, School of Electrical and Computer Engineering, Electric Power Division, Photometry Laboratory, 9
Heroon Polytechniou St., 157 80 Athens, Greece, Tel.: +30 210 7723506 E-mails: [email protected] ,
[email protected] * Tel.: +30 210 2896739, E-mail: [email protected]
* Tel.: +30 210 5381275, E-mail: [email protected]
The exclusive license for this PDF is limited to personal printing only. No part of this digital document may be reproduced, stored in a retrieval system or transmitted commercially in any form or by any means. The publisher has taken reasonable care in the preparation of this digital document, but makes no expressed or implied warranty of any kind and assumes no responsibility for any errors or omissions. No liability is assumed for incidental or consequential damages in connection with or arising out of information contained herein. This digital document is sold with the clear understanding that the publisher is not engaged in rendering legal, medical or any other professional services.

Grigorios L. Kyriakopoulos, Konstantinos G. Kolovos et al. 60
types are abundant both in the Northern Greek region, as well as in the nearby Balkan
regions – due to the proximity of their geo morphological and climatic conditions. The
study has focused on the Greek woodfuel production over the examined period 2004 –
2007, whereas the experimental process is adjusted to the qualitative woodfuels
information gathering from the nearby Balkan countries, through potential Scenarios
implementation. The outcoming results are supported by the investigation of the relevant
energy demand among the proposed projects, thus resulting in the projects‘
materialization via the optimum environmental, economic and socioeconomic conditions‘
evaluation. Especially, the main environmental conditions of energy production and
distribution include the presentation of the main categories of impact of pollution in local,
regional and global levels. Furthermore, the economic conditions include the description
of the dominated streams of financial costs and benefits which form the cornerstone of
each energy project economic evaluation. The economic consideration includes the
investigation of key-role of economic factors, such as the net present value (NPV), the
opportunity costs, the internal rate of return (IRR) and the externalities, supporting the
final decision of any future energy project‘s proposal. Finally, the critical comparison
between the above environmental, economic and socioeconomic parameters reveals the
significant determining parameters of the scenarios prosperity and profitability.
Keywords: Biofuels, Biomass, Renewable Energy Sources, Energy Project, Environmental
Sustainability, Financial Feasibility, Knowledge Management, Woodfuel.
1. INTRODUCTION
Nowadays, finding the appropriate knowledge material for economic growth is highly
supported through web data mining, Resource-Based View (RBV), Capability Life Cycle
(CLC) and Information Communication Technology (ICT) techniques. In order to combine
data from various heterogeneous sources, software agents have to understand the semantics of
the sources, since the source modeling is manual. Nevertheless, as the large number of
sources comes online, it is impractical to expect users to continue modeling them by hand.
Other difficulties facing the web users (individuals, managers, SME representatives) are the
language and cultural differences as well as the adaptation to heterogeneous web sources [1-
5].
Typical indicative examples of Knowledge Management utilization for specific
educational and social frameworks have been reported in the literature. Especially,
Knowledge Management was evaluated in the Australia Public Service [6], in strengthening
African universities strategic role [7], in Intellectual Capital statements to Asia and Europe
[8], in the cost-effective University – Industry interactions [9]. Furthermore, in the literature it
has been reported the analysis of knowledge-creating learning processes, such as the
Socialisation Externalisation Combination and Internalisation (SECI) modes, empirically
supported by pedagogical research [10].
Additionally, among the competitive strategies in global forestry industries, four elements
of evolution are especially important to understanding the functionality of their processes
[11]. Firstly, the firms are analysed from a variety of national contexts. This makes the
comparisons relevant, from the point of view that the nationality of the firms may explain
differences in performance and strategy. Secondly, the firms are operated with different

Woodfuels Use for Sustainable Energy Infrastructures‘ Materialization 61
governance structures. In particular, typical analysis includes the publicly traded, family
owned and state owned firms as well as cooperatives. Specific investigation focuses on how
the ownership structure is manifested in strategic actions. Third, appropriate study is made for
the firm-specific strategy profiles. Thus, the study results in new information on how firms
compete vis-à-vis industry trends and what reciprocal effects this has on performance. Fourth,
and perhaps most important, it is essential the study of the path dependent strategic processes
leading to success and failure of firms, thus seeing the performance outcomes as a function of
firms‘ history and current competitive and institutional environment.
Generally, there is a growing market for forest by-products as raw materials for energy.
High fossil fuel prices together with new energy and environmental policies are making
woodfuel an essential ingredient of energy policy in both developed and developing countries.
In developed countries, it is likely that the use of woodfuel for energy will continue to increase
if fossil fuel prices continue to rise. More generally, the use of biofuels, including those based on
wood and on agricultural products, will likely continue to increase, including their use for motor
vehicles. Sawmills and pulp and paper industries benefit by becoming energy producers. With
ever higher fuel prices, there will be even more pressure on forests and trees outside forests to
provide energy in the poorest countries [12].
Most biofuels are used for residential cooking and heating, mainly in Africa, Asia and
Latin America. For example, almost 90% of the wood removals in Africa are used for fuel. In
countries participating in the Organization for Economic Co-operation and Development
(OECD), such as Austria, Finland, Germany and Sweden, biofuels are increasingly used for the
production of electricity, attracting huge investments in wood-energy industries [13]. In the
United States, about 3% of energy demands are supplied by biomass. Much of this is
accounted for by the paper and pulp industry, which burns large quantities of woodfuel and
paper milling wastes to supply energy for its needs. Other substantial consumers of biomass
include households that burn woodfuel as a primary source of heat (about 5% fall into this
category and another 20% represent the occasionally burned woodfuel in a stove or fireplace),
commercial industries and establishments that burn woodfuel as a source of energy (in some
cases, simply for space-heating purposes) and waste-to-energy facilities, that burn municipal
solid waste. Outlook studies by the International Energy Agency (IEA) indicate that
renewable energy sources will continue to increase their market shares in the energy mix [13].
While heating and cooking will remain the principal uses for woodfuel and charcoal in
developing countries, the use of solid biofuels for the production of electricity is expected to
triple by 2030 [13].
Europe has achieved sustainable forest management. Despite its high population density,
roughly 30% of Europe‘s land area is covered by forests and these remain a key ecosystem
for biodiversity [14]. Natural forests, those unaffected by humans, often contain a diverse
range of both tree and non-tree species, but virtually all forests in Europe have experienced
more or less strong anthropogenic influences throughout history. Nonetheless all forests, even
monoculture plantations, are reservoirs of biodiversity. Forest area is increasing in most
European countries, and the positive trends exceed the negative [15]. Forest institutions are
strong, and changes in forest policies and institutions are largely positive. The Ministerial
Conference on the Protection of Forests in Europe (MCPFE) is the strongest regional political
mechanism to address forest issues in the world. However, there are a number of areas of
concern. Employment in the forest sector continues to decline, and the forest sector‘s
contribution to the economy is declining, in comparison to that of many other agricultural

Grigorios L. Kyriakopoulos, Konstantinos G. Kolovos et al. 62
sectors. Forests remain vulnerable to disturbances that are likely to increase if the global climate
continues to change as many experts predict. Countries with economies in transition are
striving to improve support and guidance to owners of newly privatized forests.
While concentrate the presentation of the cultivated forests situation in the Balkan
countries, the study is focused on a variety of fields such as forest area, forest biomass,
production, trade and consumption of woodfuel and sawnwood exhibits. Nevertheless, there
exist moderate differentiations, due to the non-uniformity of the geographical morphology of
each country and colonization – divergence in financial forest policy and population‘s variety,
in terms of socioeconomic background. In tables 1 and 2 the relevant literature data,
concerning the situation in Balkan countries for the years 2004 and 2005, is depicted [12, 15].
In the Greek context, the relevant literature [16 – 20] is particularly focuses on the poplar
cultivation in Northern Greece. Specifically, the poplar production and utilization is mainly
examined, due to the locally high wood production capacity, the poplar shorten growth time
and its high volume of industrial wood production. Additionally, a national policy proposal
that would encourages sustainable poplar cultivation and production, is also presented in the
above literature. In the Greek woodfuel production, sessile oak, white poplar and chestnut tree
are the main forest species with mean production coverage over than 60% of the total
woodfuel production. Data are available for the period 2004 – 2007 [16 – 20] and according
to the relevant literature [21 – 25], the above forest species are characterized by advantageous
mean High Heating Values (HHV), in the range of 17100 – 19500 kJ/kg. These HHV values
depend on the geographical zone and the growth season for each forest species, thus consist a
promising woodfuel material for alternative energy production.
The present study aims at revealing the importance of access and use of technical
knowledge in the contemporary scientific sector of Renewable Sources utilization in a
sustainable current and future Environment. The purpose of this paper is to combine an
―inferior‖ and ―underestimated‖ material, such as agricultural biomass raw byproducts to a
prominent, vital and added-value material. The bridging between the terms: ―inferior‖ and
―superior‖, ―underestimated‖ and ―valuable‖ is the accumulating knowledge of agricultural
byproducts properties, depicting in the RETScreen software construction and framework.
Particularly, this work investigates the possibility of replacing conventional heating
resources (such as electricity and diesel fuel) for domestic space heating purposes in a
woodfuel production Greek origin, by using Greek woodfuel biomass. Furthermore, the
optimization of the collected data is accomplished through the use of the RETScreen
International software [26] and the evaluation of the projects is materialized, in terms of their
environmental sustainability and financial feasibility. Finally, the social cohesion is
determined as the total balance, by offsetting on the one hand the opening new jobs and the
support to the local agricultural economies, following by diminishing the energy dependence
from fossil fuels and on the other hand the substantial restriction of vital agricultural products
– initially aiming at humans feeding – for biofuels production.

Table 1. Forest area, forest biomass and carbon
for the year 2005, in the Balkan countries [12, 15]
Country Forest area
Forest biomass and carbon
Biomassb Biomassb
Total foresta % of land
area
Area per
capita
Forest
plantations
Per
hectare Total
Per
hectare Total
(103 ha) (%) (ha) (103 ha) (t/ha) (106 t) (t/ha) (106 t)
Albania 794.0 29.0 0.2 88.0 129.7 103.0 65.0 52.0
Bosnia and Herzegovina 2185.0 43.1 0.6 142.0 160.6 351.0 81.0 176.0
Bulgaria 3625.0 32.8 0.5 – 145.4 527.0 73.0 263.0
Croatia 2135.0 38.2 0.5 61.0 179.9 384.0 90.0 192.0
Greece 3752.0 29.1 0.3 134.0 31.2 117.0 16.0 59.0
Republic of Moldova 329.0 10.0 0.1 1.0 79.0 26.0 40.0 13.0
Romania 6370.0 27.7 0.3 149.0 177.9 1133.0 89.0 567.0
Serbia and Montenegro 2694.0 26.4 0.3 39.0 115.8 312.0 58.0 156.0
Slovenia 1264.0 62.8 0.6 0.0 232.6 294.0 116.0 147.0
The former Yugoslav Republic of
Macedonia 906.0 35.8 0.4 30.0 45.3 41.0 22.0 20.0
a ―Total forest‖ includes forest plantations.
b ―Biomass‖ includes above– and below–ground biomass and dead wood.
c ―Carbon in biomass‖ excludes carbon in dead wood, litter and soil.

Table 2. Production, trade and consumption of woodfuel and
sawnwood for the year 2004, in the Balkan countries [12, 15]
Country
Woodfuel Sawnwood
(103 m3) (103 m3)
Production Imports Exports Consumption Production Imports Exports Consumption
Albania 221.0 0.0 56.0 165.0 97.0 24.0 21.0 99.0
Bosnia and Herzegovina 1310.0 1.0 194.0 1116.0 1319.0 13.0 1175.0 157.0
Bulgaria 2187.0 0.0 29.0 2158.0 332.0 7.0 273.0 66.0
Croatia 954.0 2.0 151.0 805.0 582.0 338.0 355.0 565.0
Greece 1057.0 371.0 15.0 1412.0 191.0 918.0 18.0 1091.0
Republic of Moldova 30.0 2.0 0.0 32.0 5.0 110.0 0.0 115.0
Romania 3015.0 0.0 72.0 2943.0 4588.0 21.0 2840.0 1769.0
Serbia and Montenegro 2097.0 2.0 5.0 2094.0 575.0 396.0 175.0 796.0
Slovenia 725.0 11.0 79.0 657.0 461.0 224.0 411.0 274.0
The former Yugoslav
Republic of Macedonia 705.0 0.0 3.0 702.0 28.0 108.0 2.0 134.0

Woodfuels Use for Sustainable Energy Infrastructures‘ Materialization 65
2. EXPERIMENTAL
2.1. Application of the Retscreen International Software
The RETScreen International software is developed by the Renewable Energy
Deployment Initiative (REDI) sponsored by the Natural Resources of Canada (NRCan), since
a literature review and Web search revealed eliminated readily available models, that were
well adapted to the modeling of domestic energy consumption [26]. RETScreen was designed
to overcome certain obstacles to the rapid evaluation of renewable sources of energy. These
include limited consumer knowledge of and experience with renewable energy, the
unreliability of previous renewable energy systems, compared to highly evolved conventional
heating technologies, the high cost of these novel technologies, the low cost of heating and
cooling compared to the initial cost of constructing a new building and the unwillingness of
homeowners to consider non-monetary values, such as environmental impacts.
Another advantage of using the RETScreen software is its effectiveness to provide a
rough and costless initial estimation of domestic energy infrastructures. For example, the fuel
costs used by the model include a realistic assessment of all costs incurred in the production
and transportation of the fuel and in the disposal of the wastes. Throughout the RETScreen
software analysis, each of the examined phases of fuels life cycle would have to be modelled
independently, and reliable data would have to be collected for each phase. Therefore, by
applying the proposed software, the prohibitively expensive and time-consuming process of a
more detailed project planning can be avoided.
2.2. Parameters of the Energy Projects
The projects examined in the present paper are focused on the effectiveness of woodfuel
biomass sources, to determine whether they represented viable sources of heating energy in
the Greek context. In particular, the present analysis is focused on the partial replacement of
the conventional energy grid of equally electricity and diesel fuels with biomass fuel. The
proposed biomass fuel is High Heating Value (HHV) woodfuel, cultivated in the Northern
Greece context and the energy projects refer to 6 building clusters of 700 m2, in total. The
determined study parameters, are for two ambient temperatures (-8 and 10°C) and for two
percentages, used to define the proportion of total energy consumption used to heat domestic
water (10 and 20%). The densities and the High Heating Values (HHV) of the Northern
Greek woodfuel types used in the present study are given in table 3 [21 – 25]. The examined
woodfuel production was based for the year 2004, since the evaluation of the relevant input
data, which are depicted in table 4, revealed no remarkable fluctuation of Greek woodfuels
production over years. The densities and the High Heating Values (HHV) of the Northern
Greek woodfuel types used in the present study are given in table 4 [21 – 25].

Grigorios L. Kyriakopoulos, Konstantinos G. Kolovos et al. 66
Table 3. Annual woodfuels production in the Greek context
Year (% participation) 2004
(examined year)
2005 2006 2007
Woodfuel Type
(annual production in m3)
Common Fir 20696 (4.6) 13790 (2.9) 13651 (3.1) 4210 (0.8)
Common Spruce 0 (0.0) 0 (0.0) 0 (0.0) 0 (0.0)
Aleppo Pine 18898 (4.2) 20873 (4.4) 27994 (6.3) 79507 (15.3)
Common Beech 126776 (28.0) 139738 (29.7) 140781 (31.7) 163882 (31.6)
Sessile Oak 282213 (62.2) 293599 (62.4) 258230 (58.2) 267444 (51.6)
White Poplar 4224 (0.9) 1504 (0.3) 2341 (0.5) 1995 (0.4)
Chestnut Tree 714 (0.2) 1297 (0.3) 1056 (0.2) 1736 (0.3)
Total (%) 453521 (100.0) 470801 (100.0) 444053 (100.0) 518774 (100.0)
Table 4. Densities, High Heating Values (HHV) and energy production
of the woodfuel types profile in the Greek context [21 – 25]
Woodfuel Type Density (t/m3) HHV (kJ/t) Energy production for the year 2004 (MJ)
Common Fir 0.53 21.08 231,2
Common Spruce 0.45 20.70 0,0
Aleppo Pine 0.45 21.62 183,9
Common Beech 0.80 17.87 1812,7
Sessile Oak 0.75 17.47 3697,3
White Poplar 0.40 19.50 32,9
Chestnut Tree 0.65 17.13 8,0
Total 5965,9
2.3. Retscreen Software Characteristics
The RETScreen software includes illustrations of the heating load, the power supply
infrastructures, the energy model (here, using renewable biomass fuels to replace the
conventional energy sources of electricity and diesel), and the cost analysis. The program‘s
output includes an illustration of the emissions of greenhouse-effect gases (GHG) and
financial results, including the after-tax Internal Rate of Return and Return on Investment
(IRR and ROI) and the Net Present Value (NPV) of the application, based on data supplied by
the user. Tables 5 – 9 present the data used in the present analysis.
Table 5. Heating load and application network
Parameter Input value
Building clusters 6
Total building area of the clusters (m2) 700
Conventional heating fuel types Electricity and #2 diesel
Design supply temperature (°C) 95
Design return temperature (°C) 65
Temperature differential (°C) 30
Oversizing of the main pipe network (%) 20
Total length of pipe in the main distribution line (m) 100
Total length of pipe in the secondary distribution line (m) 210

Woodfuels Use for Sustainable Energy Infrastructures‘ Materialization 67
Table 6. Energy model for the proposed application
Type of biomass fuel Woodfuel (HHV)
Building clusters 6
Total length of pipe (m) 310
Boiler capacity (kW) 2
Moisture content of fresh biomass (%) 30
"As fired" heating value of the biomass (MJ/t) 13096
Capacity of backup heating system (kW) 95
Seasonal efficiency of boiler (%) 80
Table 7. Analysis of the application costs. The parentheses contain the proportional
percentage of the corresponding total application cost.
Parameters/Costs Initial costs
Renewable Energy Equipment (€) 2420 (3.1)
Balance of Plant (€) 64597 (82.9)
Miscellaneous (€) 10902 (14.0)
Initial costs – Total 77918 (100.0)
Annual costs (Credits)
O&M cost (€) 15280 (90.2 – 90.7)
Fuel / electricity (€) 1571 (9.3 – 9.8)
Annual costs – Total 16851 (100.0)
Periodic costs
Refractory insulation (€) 1000
Table 8. Analysis of Greenhouse Gases (GHGs) effect
Base Case Heating System (Reference: electricity and diesel)
Building Cluster 1 2 3 4 5 6
Fuel type Electricity Electricity Electricity #2 diesel #2 diesel #2 diesel
CO2 emission factor (kg/GJ) 293.8 293.8 293.8 74.1 74.1 74.1
CH4 emission factor (kg/GJ) 0.0062 0.0062 0.0062 0.0020 0.0020 0.0020
N2O emission factor (kg/GJ) 0.0093 0.0093 0.0093 0.0020 0.0020 0.0020
GHG emission factor
(tCO2/MWh)
1.781 1.336 1.187 1.794 1.495 1.346
GHG emission factor
(tCO2/MWh)
Heating energy mix
1.592
Proposed Case Heating System (Mitigation)
Biomass type Woodfuel
Temperature, domestic hot water (%) -8°C, 10% -8°C, 20% 10°C, 10% 10°C, 20%
CO2 emission factor (kg/GJ) 0 0 0 0
CH4 emission factor (kg/GJ) 0.0320 0.0320 0.0320 0.0320
N2O emission factor (kg/GJ) 0.0040 0.0040 0.0040 0.0040
GHG emission factor (tCO2/MWh) 0.010 0.010 0.010 0.010
GHG emission factor (tCO2/MWh)
Heating energy mix
1.261 1.214 1.261 1.284
Net annual GHG emission reduction (tCO2) 24.7 31.1 52.1 55.4

Grigorios L. Kyriakopoulos, Konstantinos G. Kolovos et al. 68
Table 9. Financial and environmental feasibility
of the use of biomass (woodfuel)
Percentage of energy used to heat domestic
water
10% 20%
Tenvironment (°C) -8 10 -8 10
GHG emission reduction cost after income tax
analysis (€/tCO2)
-137 -656 -176 -702
Simple payback (years) 4.6 0.7 3.3 0.6
Years-to-positive cash flow 5.5 1.2 4.2 1.0
IRR and ROI (after tax, %) 18.3 85.6 23.4 95.3
NPV (€) 30664 310382 49677 353207
Retail price of electricity (€/kWh) 0.15
Annual increase in cost of electricity (%) 3
Inflation rate (%) 2
Discount rate (%) 10
Project life (years) 25
3. EVALUATION OF THE PROJECTS
3.1. Environmental Evaluation of the Projects
According to the environmental specifications of the projects, it is assumed that
conventional space heating is achieved with electricity and diesel fuels and it would be
partially displaced with biofuel produced by woodfuel biomass. GHG emission factor
decreased at about 21% when using the biomass fuel, instead of the conventional fuels.
Additionally, the projects constructed in the low outside temperature of -8°C, were proved
slightly more advantageous to diminish the GHGs emission factor, towards the high outside
temperature of 10°C. Furthermore, the annual reduction in GHG emission, in terms of tCO2,
ranged from 6 – 26% and the transition from 10% to 20% in the proportion of energy used for
domestic hot water is proved 4 times more advantageous at low outside temperature (-8°C)
compared to that of high outside temperature (10°C). The above results are presented in table
10. Nevertheless, the most environmentally promising project was that of outside temperature
of 10°C and the energy percentage for domestic hot water of 20%, as it is depicted in the table
8.
Table 10. Environmental assessment of the project
Type of fuel Electricity & Diesel mix compared to Biomass
Temperature, domestic hot water (%) -8°C, 10% -8°C, 20% 10°C, 10% 10°C,
20%
Reduction (%) in GHG emission factor (biomass
compared with conventional fuels)
20.79 23.74 20.79 19.35
Reduction (%) in annual GHG emission (tCO2) if
heating energy of domestic water increases from
10% to 20% of the total energy
25.91 6.33

Woodfuels Use for Sustainable Energy Infrastructures‘ Materialization 69
3.2. Financial Evaluation of the Projects
3.2.1. Financial Considerations of Energy Projects Prior to the outcoming results evaluation of the present study, it is worthy to note the
dominated economic tools of energy projects, by briefly providing the relevant terminology.
Therefore:
Equity is an ownership right or risk interest in an enterprise.
Payback period is the time taken for a project to recover its initial investment in
monetary terms.
Internal rate of return (IRR) is a discounted measure of project worth. The discount rate
that just makes the net present worth of the incremental net benefit stream, or incremental
cash flow, equals to zero.
Net Present Value (NPV) is the sum of discounted future benefits and costs at a stated
rate of discount. NPV is an absolute measure of project merit.
Opportunity cost is the value lost by using something in one application rather than
another. The opportunity cost of employing a worker in a project is the loss of net output that
worker would have produced elsewhere. The concept of opportunity cost is the cornerstone of
benefit-cost analysis.
In the electrical power industry, there is usually great pressure to start publicly owned
projects as soon as possible. However, a project should not be started unless the evaluator is
certain that the project will have a positive Net Present Value (NPV). Even then, it may not
be the optimum time to start the project. Assessing the effect of delaying the project has to be
undertaken to evaluate whether a possible NPV will be better slightly into the future. If a
future NPV is possible, then the project has to be executed at the year that provides the
highest NPV.
Usually, a project should be executed when the first year net benefits exceed opportunity
cost of the investment, i.e the discount rate times the project cost. Therefore, since the NPV is
positive at a discount rate equal to the opportunity cost of capital, the firm will proceed with
this investment. In contrast, if a delay causes a rise in the cost of the project, in real terms, this
should be taken into consideration [27].
3.2.2. Financial Outcomes of the Projects The Net Present Value (NPV) for all the biomass projects was positive. Nevertheless, the
economic results of the examined projects indicated that the most advantageous project is that
of outside temperature of 10°C and the energy percentage for domestic hot water of 20%.
Specifically, in comparison to all other scenarios, the above project is:
• about 12 – 91% higher NPV
• about 17 – 670% faster in terms of simple payback
• about 20 – 450% faster in terms of ‗years to positive cash flow‘ and
• about 10 – 81% higher in terms of after-tax IRR and ROI values.
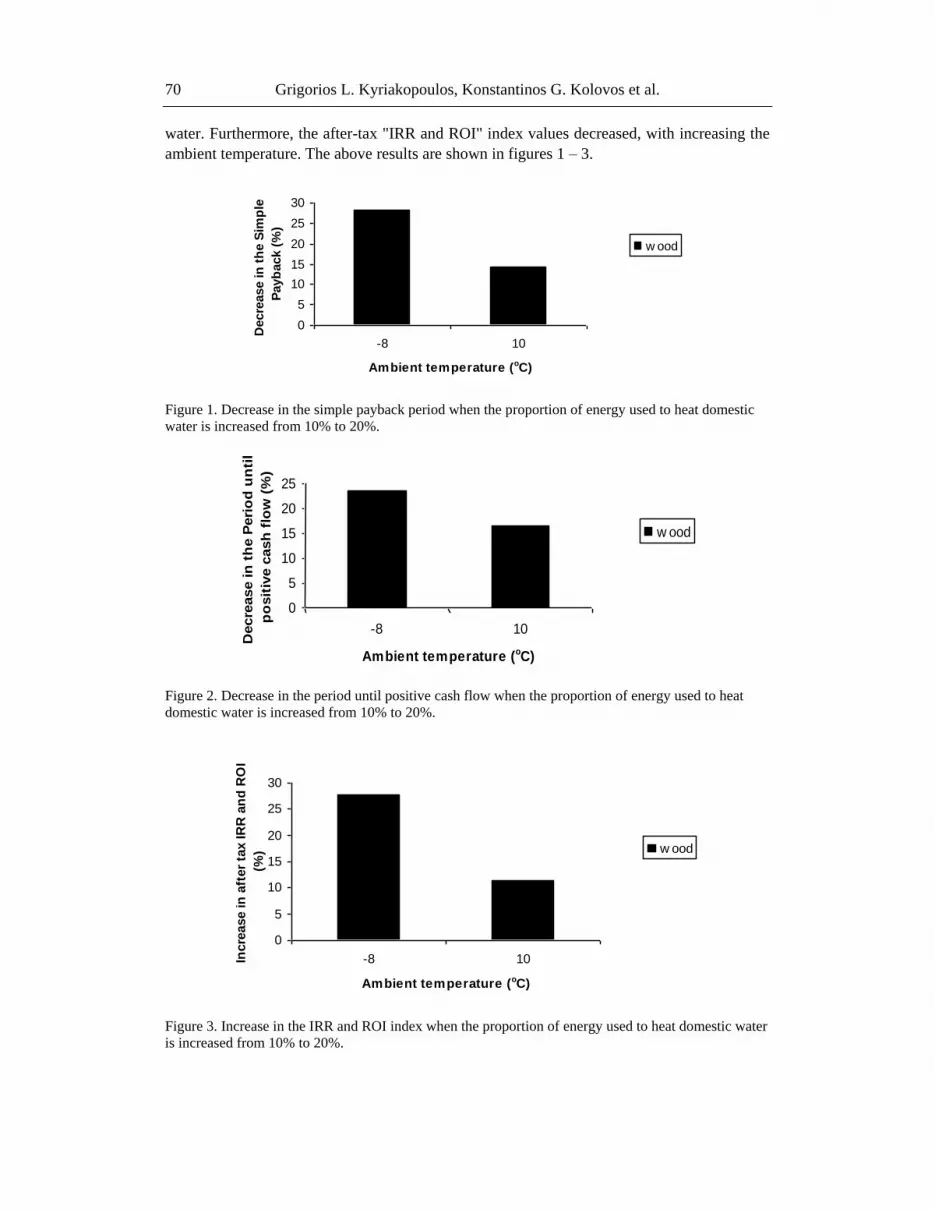
The simple payback and the period until positive cash flow parameters increased as the
ambient temperature increased, at both levels of energy consumption for heating domestic
Grigorios L. Kyriakopoulos, Konstantinos G. Kolovos et al. 70
water. Furthermore, the after-tax "IRR and ROI" index values decreased, with increasing the
ambient temperature. The above results are shown in figures 1 – 3.
0
5
10
15
20
25
30
-8 10
Ambient temperature (oC)
Decre
ase in
th
e S
imp
le
Payb
ack (
%)
w ood
Figure 1. Decrease in the simple payback period when the proportion of energy used to heat domestic
water is increased from 10% to 20%.
0
5
10
15
20
25
-8 10
Ambient temperature (oC)
Decre
ase in
th
e P
eri
od
un
til
po
sit
ive c
ash
flo
w (
%)
w ood
Figure 2. Decrease in the period until positive cash flow when the proportion of energy used to heat
domestic water is increased from 10% to 20%.
0
5
10
15
20
25
30
-8 10
Ambient temperature (oC)
Incre
ase in
aft
er
tax IR
R a
nd
RO
I
(%) w ood
Figure 3. Increase in the IRR and ROI index when the proportion of energy used to heat domestic water
is increased from 10% to 20%.

Woodfuels Use for Sustainable Energy Infrastructures‘ Materialization 71
4. THE GREEK AND THE WOODFUEL IMPORTS FROM THE NEARBY
BALKAN COUNTRIES SCENARIOS
According to the above results, the most unfavourable and the most favourable projects –
in terms of outside temperature, proportion of total energy used in domestic hot water – are: (-
8°C, 10%) and (10°C, 20%), respectively. Therefore, in order to investigate the relevant
significance of each of the above experimental parameters to the sustainability of each
proposed project, the proposed scenarios are based on the imports of woodfuel materials from
the nearby Balkan countries. In these scenarios, the main hypotheses of the above woodfuel
entrance to the Greek context are:
1. The geographical proximity of the woodfuel country producer to the proposed
infrastructure of biofuels consumer (village) of the Greek context. This hypothesis is
set for the unavoidable cost of cultivation and transportation elimination purposes.
2. The additional import biomass has been accrued to the existing Greek woodfuels
production, not replacing it.
3. Additionally, for comparison purposes, an assumption was made that the types of
wood production and distribution is exact the same both in the Greek context and the
Balkan countries, from which the biomass is imported. Therefore, in the present
study the examined woodfuels production is restricted to only three woodfuel types,
common for both the Greek context and the nearby Balkan countries: Common
Beech, Aleppo Pine and Common Fir. The selection of the specific three woodfuel
types was focused on two main characteristics: Firstly, the three examined woodfuel
types are the most commonly existing in both the Greek and the nearby Balkan
countries regions, due to only moderate differentiations of their geomorphological
and climatic conditions. Secondly, the woodfuel production of the three examined
woodfuel types exceeds of the 60% of the total Greek woodfuel production, thus
allowing reliable outcomes to be evaluated. Therefore, the available agricultural area
for woodfuels‘ production is allocated only among the above three wood types. This
area ―expansion‖ results in the energy capacity increase by a factor of 2.73
comparing to the existing energy capacity of the woodfuels production in the Greek
context.
4. Furthermore, for comparison reasons, the following parameters such as: total
domestic heating area of the village, outside temperature and the proportion of used
energy for domestic hot water and the rest of the input data in the tables 4 – 6, remain
intact.
5. The examined Greek woodfuel production was investigated at the year 2007, since
the outcoming results should be effectively compared to the above outcomes, thus
revealing the trend of the evaluated parameters over time.
5. TWO DIFFERENT SCENARIOS PRESENTATION
The specific structure of the present analysis is based on the influential investigation of
the accrued imported biomass to the existing Greek infrastructure outcomes, in environmental

Grigorios L. Kyriakopoulos, Konstantinos G. Kolovos et al. 72
and economic terms. Therefore, this implementation is further examined through the
following scenarios:
Scenario 1: The additional woodfuel biomass of the three dominated import woodfuel
types: Common Beech, Aleppo Pine and Common Fir is allocated in the exact same
proportion, as in the three relevant biomass sources of the Greek context. Therefore, the
relative (among the three) woodfuels‘ allocation is: 76%, 12% and 12% proportional
contribution for: Common Beech, Aleppo Pine and Common Fir, respectively. According to
the above Scenario 1, the boiler capacity based on the Greek woodfuel production is 2.5 kW,
therefore, the final biomass and consequently biofuels production of this production,
incorporating the import woodfuel quantities will be doubled to 5 kW. This means that the in
the ―Energy model for the proposed application‖ (table 6) the boiler capacity is over doubled,
from 2 to 5 kW.
Scenario 2: The three woodfuel types‘ allocation is as follows: 50%, 25% and 25%
proportional contribution for: Common Beech, Aleppo Pine and Common Fir respectively.
The proposed contribution selection is realistic, since it is relevant to the effective future and
sustainable depiction of forest cultivation production, in both the Northern Greece and the
nearby Balkan countries. According to the above Scenario 2, the boiler capacity based on the
Greek woodfuel production is 3 kW, therefore, the final biomass and consequently biofuels
production of this production, incorporating the import woodfuel quantities will be doubled to
6 kW. This means that in the ―Energy model for the proposed application‖ (table 6) the boiler
capacity is tripled, from 2 to 6 kW.
The distinct characteristic of each of the above Scenarios is the different proportional
allocation of the woodfuel production and the consequently power variation to the boiler
capacity. Therefore, both Scenarios which are based on the reallocation of each of the above
scenarios, is applied twice: (a) in the unfavourable and (b) in the favourable experimental
conditions of the above study: (-8°C, 10%) and (10°C, 20%), respectively. The actual
woodfuel and energy production of the examined woodfuel types, for the year 2007, is
presented in table 11.
Table 11. Actual woodfuel and energy production
of the examined woodfuel types for the year 2007
Woodfuels
Production and Energy Annual production
(in m3, % percentage) Energy (MJ)
Woodfuel Type
Sessile Oak 267444 (98.6) 3503.8
White Poplar 1995 (0.7) 15.6
Chestnut Tree 1736 (0.6) 19.3
Total (%) 271175 (100.0) 3538.7

Table 12. Financial and environmental feasibility of the Scenarios
Scenarios Scenario 1 Scenario 2 Un-favourable
project
Favourable
project
Experimental Conditions -8°C 10% 10°C 20% -8°C 10% 10°C 20% -8°C
10%
10°C
20%
Net annual GHG emission reduction
(tCO2) 41.9 83.4 47.3 90.2 24.7 55.4
GHG emission reduction cost after
income tax analysis (€/tCO2) -79 -466 -69 -430 -137 -702
Simple payback (years) 4.7 0.6 4.8 0.6 4.6 0.6
Years-to-positive cash flow 5.6 1.1 5.6 1.1 5.5 1.0
IRR and ROI (after tax, %) 18 93.8 17.9 93.4 18.3 95.3
NPV (€) 29977 352510 29752 352295 30664 353207
Retail price of electricity (€/kWh) 0.15
Annual increase in cost of electricity
(%) 3
Inflation rate (%) 2
Discount rate (%) 10
Project life (years) 25

Grigorios L. Kyriakopoulos, Konstantinos G. Kolovos et al. 74
Table 13. Environmental evaluation of the Scenarios
Type of fuel Woodfuel
Scenarios Transition
(initial-final situation)
Scenario 1 –
Scenario 2
Scenario 1 –
Scenario 2
Unfavourable –
Favourable
project
Experimental parameters -8°C, 10% 10°C, 20% (-8°C, 10%) –
(10°C, 20%)
Reduction (%) in net annual GHG
emission (tCO2) for the examined
Scenarios
12.89 8.15 124.29
Increase (%) in GHG emission
reduction cost after income tax analysis
(€/tCO2) for the examined Scenarios
12.66 7.73 412.41
5.1. Environmental Evaluation of the Scenarios
According to the environmental specifications of the alternative Scenarios, it is assumed
that in terms of: ―Net annual GHG emission reduction (tCO2)‖ the proposed Scenarios are in
favour of the existing projects (described in sections 2 and 3), since the relevant GHG
emission reduction is almost doubled than the unfavourable and favourable projects
(described in sections 2 and 3). Additionally in terms of: ―GHG emission reduction cost after
income tax analysis (€/tCO2)‖, the relevant results are very promising, since a decrease of
about a half is achieved compared to the corresponding results of the two unfavourable and
favourable projects. Furthermore, comparing the outcoming results between the Scenarios 1
and 2 it is proved that the transition to higher outside temperatures and proportional
percentage of energy used for domestic hot water, provide more satisfying environmental
results – in absolute experimental values. The above evaluation is depicted in the table 12.
Nevertheless, comparing the transition from Scenario 1 to Scenario 2 outcomes in relative
experimental values (percentage change (%), from the initial situation), the above
environmental optimization is more effectively achieved (about two times better) at lower
outside temperature (-8oC) and proportion of energy to domestic hot water (10%). The above
evaluation is depicted in the table 13.
5.2. Financial Evaluation of the Scenarios
5.2.1. General Financial Consideration In the electrical power industry, calculation of benefits is not easy. A new power station
would normally not only increase production, but also contribute towards reduction of the
overall system cost of generation. It may also reduce system losses and delay the
implementation of some projects for network strengthening. Certain projects are redundant
and are made necessary by the need to ensure security of supply. Rural electrification is
normally a source of financial loss, but has significant economic benefits. Some
improvements in power stations – like inhibition of emissions – incur high investment, reduce
electrical energy output energy output and efficiency, and yet have sound economical (even
environmental) benefits [27].

Woodfuels Use for Sustainable Energy Infrastructures‘ Materialization 75
While focusing on the main tools for the most projects‘ economic evaluation, financing is
done by a combination of equity and loans. The investor is interested to know the IRR of the
project and the return of equity. In calculating the return on the equity, the amount of loan
servicing (interest on the loan and loan repayments) has to appear as cash expenses and
deducted in the appropriate years from the current income stream. Simultaneously, the
amount of loan has to be deducted from the project cost. Thus, the costs, benefits and net
benefits will represent those accruing to the equity only. The IRR calculated will be the rate
of return on the equity. It has to be compared with the opportunity cost of the capital, i.e. the
return that this equity capital can obtain in the best alternative investment. The investor would
undertake the project only if the internal rate of return on the equity in this project is higher
than the opportunity cost [27].
Conclusively, the guiding principle for project evaluation is the maximization of NPV
while utilizing, as a discount rate, the opportunity cost of capital. The IRR is not the only
criterion for evaluating projects for investment decisions. NPV with a proper discount rate
(reflecting the true opportunity cost of capital) is a criterion. With limited budgeting, a
benefit/cost ratio has to be calculated to assist in prioritizing projects [27].
Another crucial determining parameter for the financial evaluation of the examined
projects is the externalities. Externalities are not easy to define and are very difficult to
quantify. Their identification and attempt at quantification is an important part of the job of a
skilled project evaluator. Some externalities are positive. In the electricity supply industry
they may be in the form of technology advancement, export promotion, job creation and
training. Examples of negative externalities include detrimental environmental impacts and
congestion [27].
Most large projects in the electrical power industry have externalities, with both
environmental and financial impacts. These range from minor visual impact and landscaping
problems in small transmission and distribution projects to very serious pollution problems,
as in low-quality coal power station. A main externality aspect of a project in the electricity
supply industry is the system linkage of projects. System linkages are external to the project
itself, but are internal to the electricity supply industry as a whole; therefore they cannot be
treated as a true externality. They should be taken into consideration in all financial and
economic evaluation of projects [27].
5.2.2. Financial Evaluation of the Scenarios The Net Present Value (NPV) for all the alternative Scenarios was positive. Nevertheless,
it is worthy to note that the favoured Scenarios in all the economic parameters of NPV,
simple payback, years to positive cash flow and after-tax IRR and ROI values, are those of
higher outside temperatures (10°C) and proportional percentage of energy used for domestic
hot water (20%). Additionally, there seemed a remarkable uniformity of the outcoming
economic results among the groups of the satisfying and unsatisfying Scenarios. The above
results are shown in figures 4 – 6.

Grigorios L. Kyriakopoulos, Konstantinos G. Kolovos et al. 76
0123456
Scenario
1: -8C, 1
0%
Scenario
2: -8C, 1
0%
Scenario
1: 10C, 2
0%
Scenario
2: 10C, 2
0%
Unfavourable project
Favourable project
Experimental parameters
Sim
ple
payb
ack (
years
)
Alternative Scenarios
Figure 4. Simple payback period of the alternative Scenarios.
0123456
Scenario 1: -8
C, 10%
Scenario 2: -8
C, 10%
Scenario 1: 1
0C, 20%
Scenario 2: 1
0C, 20%
Unfavourable project
Favourable project
Experimental parameters
Years
to
po
sit
ive c
ash
flo
w
Alternative Scenarios
Figure 5. Years to positive cash flow of the alternative Scenarios.
020406080
100120
Scenario 1: -8
C, 10%
Scenario 2: -8
C, 10%
Scenario 1: 1
0C, 20%
Scenario 2: 1
0C, 20%
Unfavourable project
Favourable project
Experimental parameters
Aft
er
tax I
RR
an
d R
OI
(%)
Alternative Scenarios
Figure 6. After tax IRR and ROI of the alternative Scenarios.

Woodfuels Use for Sustainable Energy Infrastructures‘ Materialization 77
6. CONCLUSION
Projects are carried out because they are needed, they are the least-cost solution and they
are profitable. It is now becoming increasingly necessary not only to weigh the benefits of the
investments through a cost-benefit analysis, but also to carry out financial profitability
projections. The traditional cost-benefit analysis of projects is used to assess their
acceptability to utilities, governments, investment bankers and development funds. There are
several ways of assessing whether the project is worth undertaking. The most useful of these
are:
a. computing the internal rate of return
b. evaluating the net present value of the project
c. calculating the benefit/cost ratio
d. other criteria (such as payback period and profit/investment ratio)
The above criteria, expect for the last, involve discounting.
In residential urban environments, as well as in cases of blocks of flats, the determining
factors of environmental and socioeconomic infrastructures‘ evaluation are: the greenhouse
gas emission factor values of the same ranking, the infrastructures‘ simplicity and the
necessary modification costs of the existing household infrastructures to successfully
introduction of biomass biofuels. It is apparent that the above parameters will affect the
infrastructures‘ economy of scale.
In suburban and rural regions, the dominated parameters to successful introduction of the
biomass biofuels to the local way of citizens‘ life are: the proximity of the source, the
convenient household space expansion to effective heating applications and the prohibitive
cost of implementing alternative potential infrastructure works, such as natural gas network.
According to externalities importance to the above examined projects, it is significantly
priority the attempt to quantify them and include their values in the projects‘ costs and
benefits. Where it is difficult to quantify them, which is a common phenomenon, they should
be cited in the project economical evaluation and they may affect the choice of the least-cost
solution.
The evaluation of the examined environmental and economic conditions of the proposed
scenarios of the present study, revealed that it is necessary the co-evaluation of all the
parameters that are related to the projects materialization, at the reference years. Additionally,
between the economic and the environmental conditions examined, the latter take an
advantage over the former, since the successful projects‘ implementation is highly depending
on the outside environmental conditions, than the narrow-fluctuated boiler power capacity
design. According to the applicable experimental procedure, the optimum conditions were
achieved at the lower temperature and the lower proportion of total energy, used in domestic
hot water at the year 2007: -8°C and 10%, respectively. Furthermore, the characteristics of
abundance of wood production and the High Heating Values of the Greek context, supporting
by the imported wood biomass from the nearby Balkan countries, are the dominated
parameters for future research. Further investigation should be focused onto this particular
type of biomass utilization. Finally, the overall success of the biofuels entrance will be highly
supported by the political initiatives for protective environmental legislation and subsidies

Grigorios L. Kyriakopoulos, Konstantinos G. Kolovos et al. 78
towards the promotion and use of renewable fuels, besides the social acceptance towards the
biofuels introduction to the everyday life of the citizens.
REFERENCES
[1] Lerman, K.; Plangprasopchock, A.; Knoblock, C.A. Semantic labeling of online
information sources. International Journal on Semantic Web and Information Systems,
2007, 3(3), pp. 36-56.
[2] Chung, H.; Lieberman, H. GlobalMind Automated analysis of cultural contexts with
multicultural. International Journal on Semantic Web and Information Systems, 2007,
3(1), pp. 65-95.
[3] Kaykova, O.; Khriyenko, O.; Kovtun, D.; Naumenko, A.; Terziyan, V.; Zharko, A.
General adaption framework: Enabling interoperability fro industrial web resources.
International Journal on Semantic Web and Information Systems, 2005, 1(3), pp. 31-63.
[4] Markellou, P.; Rigou, M.; Tsakalidis, A.; Sirmakessis, S. Shaping online learning
communities and the way adaptiveness adds to the picture. International Journal of
knowledge and Learning, 2005, 1(1/2), pp. 80-95.
[5] Hodgkinson-Williams, C.; Sieborger, I.; Terzoli, A. Enabling and constraining ICT
practice in secondary schools: case studies in South Africa. International Journal of
knowledge and Learning, 2005, 3(2/3), pp. 171-190.
[6] Martin, B. Knowledge management and the Australian Public Service: some lessons
learned. International Journal of knowledge and Learning, 2005, 1(1/2), pp. 146-158.
[7] Ahmed, A.; Newton, D.J. Strenghtening African universities‘ strategic role in
knowledge and technology development: policies and practice from Sudan.
International Journal of Learning and Intellectual Capital, 2005, 2(1), pp. 66-80.
[8] Ordonez de Pablos, P. Intellectual capital statements: what pioneering firms from Asia
and Europe are doing now. International Journal of knowledge and Learning, 2005,
1(3), pp. 249-268.
[9] Chakrabarti, A.K.; Santoro, M.D. Building social capital and learning environment in
university-industry relationships. International Journal of Learning and Intellectual
Capital, 2004, 1(1), pp. 19-36.
[10] Naeve, A.; Yli-Luoma, P.; Kravcik M.; Lytras, M.D. A modelling approach to study
learning processes with a focus on knowledge creation. International Journal of
Technology Enhanced Learning, 2008, 1(1/2), pp. 1-34.
[11] Juha-Antti Lamberg; Juha Näsi; Jari Ojala; Pasi Sajasalo, 2006, Chapter 1 in: The
Evolution of Competitive Strategies in Global Forestry Industries: Comparative
Perspectives, Springer editions, pp. 1–29.
[12] Food and Agriculture Organization of the United Nations, 2007, State of the World’s
Forests. 2007. Rome, Italy.
[13] International Energy Agency, 2005, IEA World Energy Outlook. 2005. Paris, France.
[14] United Nations Economic Commission for Europe/Food and Agriculture Organization
of the United Nations, 2005, European Forest Sector Outlook Study. 1960-2000-2020
Main Report. Geneva, Switzerland.

Woodfuels Use for Sustainable Energy Infrastructures‘ Materialization 79
[15] European Environment Agency, 2006, How much bioenergy can Europe produce
without harming the environment?. European Environment Agency Report No 7/2006,
Copenhagen, Denmark.
[16] Arabatzis, G. The individual and social characteristics of poplar investors-cultivators
and the factors that affect the size of poplar plantations according to the EU Regulation
2080/92. Agricultural Economics Review, 2008, 9(2), pp. 86-95.
[17] Arabatzis, G.; Christopoulou, O.; Soutsas, K. The EEC Regulation 2080/92 about forest
measures in agriculture: The case of poplar plantations in Greece. International Journal
of Ecodynamics, 2006, 1(3), pp. 245-257.
[18] Arabatzis, G. The development of Greek forestry in the framework of European Union
policies. Journal of Environmental Protection and Ecology. (forthcoming).
[19] Arabatzis, G.; Soutsas, K.; Goupos, Ch. Socio-economic impacts of afforestation and
reforestation in Europe. Review of Economic Science. (forthcoming).
[20] Koutroumanidis, Th.; Zafeiriou, E.; Arabatzis, G. Asymmetry in price transmission
between the producer and the consumer prices in the wood sector and the role of
imports: The case of Greece. Forest Policy and Economics, 2009, 11(1), pp. 56-64.
[21] Núñez-Regueira, L.; Rodríguez-Anón, J.A.; Proupín-Castiñeiras, J. Design of risk index
maps as a tool to prevent forest fires in the humid Atlantic zone of Galicia (NW Spain).
Thermochimica Acta, 2003, 399, pp. 31–42.
[22] Liodakis, S.; Kakardakis, T. Measuring the relative particle foliar combustibility of
WUI forest species located near Athens. Journal of Thermal Analysis and Calorimetry,
2008, 93(2), 627–635.
[23] Núñez-Regueira, L.; Rodríguez-Anón, J.A.; Proupín-Castiñeiras, J. Calorific Values
and Flammability of Forest species in Galicia. Continental high mountainous and
humid Atlantic zones. Bioresource Technology, 1997, 61, 111–119.
[24] Khalil, R.A.; Mészáros, E.; Grønli, M.G.; Várhegyi, G., Thermal analysis of energy
crops Part I: The applicability of a macro-thermobalance for biomass studies. Journal of
Analytical and Applied Pyrolysis, 2008, 81, 52–59.
[25] Ince, P.J. Estimating effective heating value of wood or bark fuels at various moisture
contents, General technical report FPL 13, 1977, U.S. Department of Agriculture,
Madison, USA.
[26] NRCan 2005. RETScreen International calculating tool: ‗BIOH3‘ supplied with the
latest information of August 2005. Natural Resources Canada, CANMET Energy
Diversification Research Laboratory (CEDRL). http://www.retscreen.net/
ang/d_o_view.php
[27] Hisham Khatib Economic Evaluation of Projects in the Electricity Supply Industry. IEE
Power & Energy Series 44, 2003, The Institution of Electrical Engineers publication,
London, UK, 216 pp.