women's empowerment in agriculture, production diversity, and nutrition: evidence from nepal
TRANSCRIPT

IFPRI Discussion Paper 01313
December 2013
Women’s Empowerment in Agriculture, Production Diversity, and Nutrition
Evidence from Nepal
Hazel Jean L. Malapit
Suneetha Kadiyala
Agnes R. Quisumbing
Kenda Cunningham
Parul Tyagi
Poverty, Health, and Nutrition Division

INTERNATIONAL FOOD POLICY RESEARCH INSTITUTE
The International Food Policy Research Institute (IFPRI), established in 1975, provides evidence-based policy solutions to sustainably end hunger and malnutrition and reduce poverty. The Institute conducts research, communicates results, optimizes partnerships, and builds capacity to ensure sustainable food production, promote healthy food systems, improve markets and trade, transform agriculture, build resilience, and strengthen institutions and governance. Gender is considered in all of the Institute’s work. IFPRI collaborates with partners around the world, including development implementers, public institutions, the private sector, and farmers’ organizations, to ensure that local, national, regional, and global food policies are based on evidence. IFPRI is a member of the CGIAR Consortium.
AUTHORS Hazel Jean L. Malapit ([email protected]) is a research coordinator in the Poverty, Health, and Nutrition Division of the International Food Policy Research Institute (IFPRI), Washington, DC. Suneetha Kadiyala ([email protected]) is a senior lecturer in the Leverhulme Centre for Integrative Research on Agriculture and Health at the London School of Hygiene and Tropical Medicine. Agnes R. Quisumbing ([email protected]) is a senior research fellow in the Poverty, Health, and Nutrition Division of IFPRI, Washington, DC.
Kenda Cunningham ([email protected]) is a PhD candidate in the Department of Population Studies, Faculty of Epidemiology at the London School of Hygiene and Tropical Medicine. Parul Tyagi ([email protected]) is a research analyst in the Poverty, Health, and Nutrition Division of IFPRI, New Delhi.
Notices 1. IFPRI Discussion Papers contain preliminary material and research results. They have been peer reviewed, but have not been subject to a formal external review via IFPRI’s Publications Review Committee. They are circulated in order to stimulate discussion and critical comment; any opinions expressed are those of the author(s) and do not necessarily reflect the policies or opinions of IFPRI. 2 The boundaries and names shown and the designations used on the map(s) herein do not imply official endorsement or acceptance by the International Food Policy Research Institute (IFPRI) or its partners and contributors.
Copyright 2013 International Food Policy Research Institute. All rights reserved. Sections of this material may be reproduced for personal and not-for-profit use without the express written permission of but with acknowledgment to IFPRI. To reproduce the material contained herein for profit or commercial use requires express written permission. To obtain permission, contact the Communications Division at [email protected].

Contents
Abstract v
Acknowledgments vi
1. Introduction 1
2. Conceptual Framework 3
3. Context and Data 6
4. Empirical Specification 12
5. Results 17
References 32
iii

Tables
2.1 The five domains of empowerment in the Women’s Empowerment in Agriculture Index 5
3.1 Household characteristics of Suaahara sample (2012) in comparison to Living Standards Measurement Study (LSMS) rural sample (2010/2011) 8
3.2 Maternal and child nutritional status and infant and young child feeding practices among samples from Suaahara, 2012; rural Nepal Demographic and Health Surveys (NDHS), 2011; and Living Standards Measurement Study (LSMS), 2010/2011 9
3.3 Percentage of agricultural production consumed, sold, and stored 11
4.1 Key study variables 15
5.1 Summary of coefficient estimates: Production diversity, women’s empowerment, and mother’s dietary diversity 18
5.2 Summary of coefficient estimates: Production diversity, women’s empowerment, and mother’s BMI 19
5.3 Summary of coefficient estimates: Production diversity, women’s empowerment, and children’s dietary diversity 22
5.4 Summary of coefficient estimates: Production diversity, women’s empowerment, and children’s weight-for-age z-score 25
5.5 Summary of coefficient estimates: Production diversity, women’s empowerment, and children’s weight-for-height z-score 27
5.6 Summary of coefficient estimates: Production diversity, women’s empowerment, and children’s height-for-age z-score 29
Figures
3.1 Suaahara baseline survey districts in Nepal 7
3.2 Contribution of each of the five domains to women’s disempowerment 10
3.3 Contribution of each of the 10 indicators to women’s disempowerment 10
iv

ABSTRACT
With the increasing recognition that agricultural growth and development do not necessarily translate into improved nutrition outcomes, policymakers are increasingly grappling with how to design and implement agricultural policies and programs that can also achieve nutritional objectives. Agriculture has direct links to nutrition in that it provides a source of food and nutrients and a broad-based source of income, as well as directly influencing food prices. Gender roles mediate these linkages, particularly in relation to increased food availability and increased income. Thus, one possible pathway through which agricultural development could improve health and nutrition outcomes is by considering gender roles and gender equity in agriculture. Using household survey data from Nepal, we investigate the impact of women’s empowerment in agriculture and production diversity on dietary diversity and anthropometric outcomes of mothers and children. Production diversity is positively associated with mothers’ dietary diversity and body mass index. Production diversity is positively associated with dietary diversity for children under two and predicts weight-for-age (WAZ), weight-for-height (WHZ), and height-for-age (HAZ) z-scores of children over two years of age. Indicators of empowerment are significantly associated with maternal outcomes but have a variable effect on child outcomes. Women’s autonomy in production and hours worked improve maternal and children’s dietary diversity and child HAZ.
Keywords: women’s empowerment, agriculture, gender, nutrition, Nepal, South Asia
v

ACKNOWLEDGMENTS
The authors are grateful to Suaahara (funded by the United States Agency for International Development [USAID] and managed by Save the Children–Nepal) for funding the survey, and to New Era for its able data collection effort. Suaahara/USAID also provided funding for Kenda Cunningham’s research time. Research funding for Hazel Malapit and Agnes Quisumbing was provided by USAID under Feed the Future, the US government’s global hunger and food security initiative, through its partnership with IFPRI on the Women’s Empowerment in Agriculture Index. Funding for Suneetha Kadiyala and Parul Tyagi’s time for data analysis writing was provided by Leveraging Agriculture for Nutrition in South Asia (LANSA), an international research program consortium made possible by a grant from the UK government. Suman Chakrabarti and Wahid Quabili from IFPRI provided excellent research assistance. The authors also wish to thank Benjamin Davis, the participants of the Farm Production and Nutrition Workshop, and others who have provided valuable comments and suggestions.
vi
1. INTRODUCTION
Broad-based agricultural growth has been shown to be effective in reducing poverty. However, increases in agricultural productivity do not translate directly into improved health and nutrition outcomes. A broad body of literature demonstrates that the linkages between agriculture, health, and nutrition are dynamic and multifaceted (Gillespie 2001; Headey 2012; Hoddinott 2011). Production-oriented projects that ignore the nutritional quality of food produced, potential trade-offs between crops for food and other uses, the health impacts of pesticide exposure and zoonotic diseases, and a range of other health and nutrition outcomes stand to have little—potentially even negative—impact on the well-being of the rural poor. With the increasing recognition that agricultural growth and development do not necessarily translate into improved nutrition outcomes, policymakers are increasingly grappling with how to design and implement agricultural policies and programs that can also achieve nutritional objectives.
Agriculture has direct links to nutrition in that it provides a source of food and nutrients and a broad-based source of income, as well as directly influencing food prices. Arimond, Hawkes, et al. (2010) have identified five pathways through which agricultural interventions can affect nutrition: increased food for own consumption, increased income, reductions in market prices, shifts in preferences, and shifts in control of resources within households. Gender roles have a substantial influence across all five pathways, particularly in relation to increased food availability and increased income. Thus, another possible pathway through which agricultural development could improve health and nutrition outcomes is by considering gender roles and gender equity in agriculture (Meinzen-Dick et al. 2012). Gillespie, Harris, and Kadiyala (2012) highlight the role of the gender division of labor in agriculture, which influences the amount of time women have to take care of themselves and young children; the intrahousehold allocation of food, which affects women’s nutritional status with its intergenerational effects on nutrition outcomes; and women’s power in decisionmaking, which influences whether gains in income translate into nutritional improvements.
This paper attempts to examine two linkages between agriculture and nutrition, using a survey of 4,080 households from 16 districts across the three agroecological zones in Nepal in 2012. More specifically, the paper aims to (1) examine the extent to which production diversity influences maternal and child nutrition in rural Nepali households and (2) investigate the relationship between key indicators of women’s empowerment and mother and child nutrition, taking into account the potential endogeneity of both empowerment and production diversity.
We use a newly developed index, the Women’s Empowerment in Agriculture Index (WEAI) and its component indicators (Alkire et al. 2013), to assess the extent of women’s empowerment in agriculture, diagnose areas where gaps in empowerment exist, and examine the extent to which improvements in the underlying indicators in these areas can improve dietary diversity and nutritional outcomes in rural Nepal. The WEAI is a survey-based index that uses individual-level data collected from primary male and female respondents within the same households and is similar in construction to the Alkire-Foster group of multidimensional poverty indexes (Alkire and Foster 2011a, 2011b). By using the aggregate measure of women’s empowerment and focusing on indicators in the dimensions in which women are most disempowered, we may be better able to identify areas for policy intervention to improve maternal and child nutrition.
Our results show that production diversity improves mothers’ dietary diversity and body mass index (BMI), but its impact on child outcomes is mediated by the child’s age. Production diversity is positively associated with dietary diversity for children under two and predicts weight-for-age (WAZ), weight-for-height (WHZ), and height-for-age (HAZ) z-scores for children over two years of age. These impacts on children over two years of age are consistent with the biological growth process and patterns of growth faltering in children. Indicators of empowerment are significantly associated with maternal outcomes but have a variable effect on child outcomes. Women’s autonomy in production and hours worked improve maternal and children’s dietary diversity and HAZ. The positive and highly significant correlation between women’s autonomy in agricultural production and nearly all maternal and child
1

outcomes is consistent with bargaining models that suggest that individuals who have greater decisionmaking power in the household receive a larger share of the benefits from household resources, including nutritious food. We also find that the number of hours worked by a woman in both paid and unpaid tasks contributes to improved diets and nutrition in her household, though not necessarily her own nutritional status. This finding points to the ambiguity of women’s workload as an indicator of women’s empowerment. While the WEAI assumes that excessive time spent by women in unpaid and paid tasks is disempowering (Alkire et al. 2013), leaving little time to care for themselves and their children, there may also be a counteracting income effect associated with working longer hours, resulting in additional resources available for improving both maternal and child nutrition.
Overall, our findings suggest that different dimensions of women’s empowerment may have different impacts on women and children’s diet and nutrition outcomes, and that improved nutrition is not necessarily correlated with being empowered in all the domains of empowerment, consistent with other findings in the empowerment literature (Kabeer 1999).
2

2. CONCEPTUAL FRAMEWORK
Linkages between Empowerment, Production, and Nutrition The rationale for considering women’s empowerment in agriculture as a determinant of food and nutrition security is rooted in a body of empirical evidence that demonstrates the ways in which women are essential to improvements in household agricultural productivity, food security, and nutrition security. Considerable evidence exists that households do not act in a unitary manner when making decisions or allocating resources (Alderman et al. 1995; Haddad, Hoddinott, and Alderman 1997). This means that men and women within households do not always have the same preferences nor pool their resources. The nonpooling of agricultural resources within the household creates a gender gap in control of agricultural inputs, which has important implications for productivity. Several empirical studies have found that redistributing inputs between men and women in the household has the potential to increase productivity (Udry et al. 1995; Peterman, Behrman, and Quisumbing 2010; Kilic, Palacios-Lopez, and Goldstein 2013). There also is a link between women’s control of resources and allocation of resources to food, although most empirical studies supporting this claim come from Africa south of the Sahara. For example, for Côte d’Ivoire, Hoddinott and Haddad (1995) and Duflo and Udry (2004) find that increasing women’s share of cash income significantly increases the share of household budget allocated to food. Doss (2006) shows that in Ghana, women’s share of assets, particularly farmland, significantly increases food expenditure budget shares. In Bangladesh, greater empowerment of women, also measured using the WEAI, has been found to increase per adult-equivalent calorie availability and dietary diversity (Sraboni et al. 2013).
Links between greater control of resources by women and child outcomes have also been verified in both observational and experimental studies (see Quisumbing [2003] for reviews of the former, and a systematic review by Yoong, Rabinovich, and Diepeveen [2012] for the latter). An expanded version of the 1990 UNICEF framework illustrates how several types of maternal resources may operate as key determinants of child nutritional status by influencing care practices such as feeding small children (UNICEF 1990; Engle, Menon, and Haddad 1997). In addition to noting the importance of caregiver education, physical health, and mental health, this framework notes the importance of women’s status by including the domains of maternal autonomy and control of household resources, workload and time availability, and social support networks (see Cunningham, Ferguson, et al. [2013] for a review of evidence from South Asia). However, these linkages are complex, and directions of impact between empowerment and nutrition outcomes are ambiguous. It is possible, for example, that increased empowerment enables women to allocate more of the family’s resources to food, and to different types of food. Women’s participation in paid and unpaid work, often viewed as a measure of empowerment, may also increase the resources available to the family through an income effect, but could also mean greater time away from the home and less time to devote to childcare.
Part of this ambiguity arises because empowerment is often not well defined, and what is perceived as empowerment is context specific. While increased mobility outside the home is often viewed as a measure of empowerment in Western contexts, in cultures that value female seclusion, such as in South Asia, and where labor market opportunities available to women consist of low-wage work, women themselves may seek to withdraw from the labor market as their families become wealthier. Kabeer (1999) argues that indicators of women’s empowerment must be sensitive to the ways in which context shapes processes of empowerment, as well as to whether women are empowered in the specific roles that they play (as mothers and/or as wives or partners) in these particular contexts.
For agricultural households, production diversity may have a direct influence on nutrition, not only through incomes generated from agricultural production but also through the possibility of home consumption. If households consume a large share of the food products that they produce, greater diversity in agricultural production may increase the availability of different types of food for household consumption, in turn improving dietary quality among household members and reducing the incidence of stunting, wasting, and underweight. Various studies (for example, Arimond, Wiesmann, et al. [2010] and
3

resources cited therein) have documented associations between dietary diversity indicators and micronutrient intakes or adequacy in developing countries.
Measuring Empowerment Using the WEAI Although linkages between increasing resources controlled by women and nutrition have been established, the linkages between women’s empowerment and nutrition have been more difficult to quantify owing to the difficulty of measuring empowerment. Kabeer (1999) defines empowerment as expanding people’s ability to make strategic life choices, particularly in contexts in which this ability had been denied to them. In Kabeer’s definition, the ability to exercise choice encompasses three dimensions: resources, agency, and achievements (well-being outcomes). The WEAI focuses on the agency aspect, that is, input in decisionmaking, rather than on the value of income and other assets or on achievements such as educational levels or nutritional status. The WEAI also differs from measures of empowerment derived from nationally representative surveys such as some demographic and health surveys (DHS), because these are based on questions about decisionmaking within the household that are typically confined to the domestic sphere and do not encompass decisions in the productive and economic spheres. Neither do most surveys have identical questions for men and women (Alkire et al. 2013). Lastly, the WEAI captures control over resources or agency within the agricultural sector, which is the primary source of livelihood in developing countries and is not covered by existing indexes.
The WEAI is an aggregate index, reported at the country or regional level, based on individual-level data on men and women within the same households. The two sub-indexes of the WEAI are (1) the five domains of women’s empowerment (5DE) and (2) gender parity (the Gender Parity Index [GPI]).1 The 5DE sub-index measures how empowered women are, capturing the roles and extent of women’s engagement in the agricultural sector in five domains: (1) decisions over agricultural production, (2) access to and decisionmaking power over productive resources, (3) control over use of income, (4) leadership in the community, and (5) time use. It assesses the degree to which women are empowered in these domains, and for those who are not empowered, the percentage of domains in which they are empowered.2 These domains are constructed using 10 indicators, defined in Table 2.1. The GPI reflects the percentage of women who are as empowered as the men in their households. For those households that have not achieved gender parity, the GPI shows the empowerment gap that needs to be closed for women to reach the same level of empowerment as men. The aggregate index shows the degree to which women are empowered in their households and communities and the degree of inequality between women and men in their households. Details regarding the construction and validation of the index can be found in Alkire et al. (2013); in this paper, we use the aggregate women’s 5DE score and its component indicators as our measure of women’s empowerment.3
1 This description draws from Alkire et al. (2013). 2 Empowerment within a domain means that the person has adequate achievements or has achieved adequacy for that
domain. 3 Note that out of the 4,080 households in the Suaahara sample, only 1,005 households have complete information on the
WEAI module for both male and female respondents. This is consistent with the extensive migration patterns of men in Nepal, as documented in the Nepal Demographic and Health Survey (NDHS) 2011 (Nepal, MOHP et al. 2012).
4

Table 2.1 The five domains of empowerment in the Women’s Empowerment in Agriculture Index Domain Indicator Definition of indicator Weight Production Input in productive decisions Sole or joint decisionmaking over food and cash-crop
farming, livestock, and fisheries 1/10
Autonomy in production Autonomy in agricultural production (for example, what inputs to buy, what crops to grow, what livestock to raise, and so on) (reflects the extent to which the respondent’s motivation for decisionmaking reflects his or her values rather than a desire to please others or avoid harm)
1/10
Resources Ownership of assets Sole or joint ownership of major household assets 1/15
Purchase, sale, or transfer of assets
Whether the respondent participates in decisions to buy, sell, or transfer his or her owned assets
1/15
Access to and decisions on credit
Access to and participation in decisionmaking concerning credit
1/15
Income Control over use of income Sole or joint control over income and expenditures 1/5
Leadership Group member Whether the respondent is an active member in at least one economic or social group (for example, agricultural marketing, credit, water users’ groups)
1/10
Speaking in public Whether the respondent is comfortable speaking in public concerning various issues such as intervening in a family dispute, ensuring proper payment of wages for public work programs, and so on
1/10
Time Workload Allocation of time to productive and domestic tasks 1/10
Leisure Satisfaction with the available time for leisure activities 1/10
Source: Alkire et al. (2013).
5

3. CONTEXT AND DATA
Country Context and Survey Design In the last decade Nepal has seen an impressive reduction in undernutrition among children under five years of age. Between 2001 and 2011, the Nepal Demographic and Health Surveys (NDHS) show that the rate of child stunting (low HAZ) declined by 16 percentage points and underweight (low WAZ) declined by 14 percentage points, while the rate of wasting (low WHZ) remained stagnant (Nepal, MOHP et al. 2012). But current rates of undernutrition still remain high: 41 percent of children are stunted, 29 percent are underweight, and 11 percent are wasted (Nepal, MOHP et al. 2012), with substantial regional variations. Kathmandu’s child stunting rate is about 31 percent, whereas in Humla, a far western district, stunting reaches 72 percent. Although 53 percent of children under five years of age in the mountains compared to 37 percent in the terai (the flat region), absolute numbers of stunted children are higher in the terai, where more than 50 percent of Nepalis live, compared to the less than 10 percent of the population residing in the mountains. Socioeconomic, demographic, cultural, gender, and ethnicity/caste factors also generate stark contrasts among different population subgroups’ health and nutritional outcomes. Dalits and other socially excluded ethnic and religious groups face unique disadvantages (Nepal, MOHP et al. 2012; Nepal Global Health Initiative Strategy 2010; Joshi et al. 2012; Nepal, National Planning Commission 2012; USAID Feed the Future 2010).
Challenges to attaining food and nutrition security in Nepal are diverse and include poverty, the recently ended civil war, limited arable land, and seasonal fluctuations in yields, as well as lack of access to social services, poor sanitation and hygiene practices, and suboptimal infant and young child feeding practices (Joshi et al. 2012; Nyyssölä 2007; Smith et al. 2003; USAID Feed the Future 2011; Haddad et al. 1996). Furthermore, the Asian enigma, the case in which economic growth is not followed by expected reductions in child undernutrition, postulates that women’s low social status may be a key contributor to undernutrition among women and children in Asia (Ramalingaswami, Jonsson, and Rohde 1996).
To investigate linkages among women’s empowerment, production diversity, and nutrition outcomes, we use data from a baseline survey conducted as a part of the evaluation of Suaahara, a USAID-funded multisectoral program in Nepal aiming to improve the nutritional status among children under two years of age and their mothers, over a period of five years from 2011 to 2016 (Cunningham, Kadiyala, et al. 2013). A total of 4,080 households with children under five years of age in 240 rural wards (the lowest administrative unit in Nepal) were surveyed, across the three agroecological zones of mountains, hills, and terai. A map of the survey area is found in Figure 3.1.4 Data collection occurred from mid-June through early October 2012, which was the middle of the rainy season. This seasonality is important to note given that agricultural production, food consumption patterns, and nutritional outcomes vary seasonally, making the results perhaps not generalizable to other seasons.
4 The 16 baseline survey districts included 8 intervention districts where Suaahara planned to implement programs and 8 matched comparison districts. The matching was based primarily on the following characteristics: agroecology/topography, Human Development Index ranking, size of landholdings, proportion of total population under two years of age, level of poverty, percentage of population that is marginalized, and radio ownership. The district matching was performed in consultation with the Suaahara team, the data collection firm (New Era), and other individuals and institutions affiliated with Suaahara or working on health and nutrition research in Nepal (Cunningham, Kadiyala, et al. 2013).
6

Figure 3.1 Suaahara baseline survey districts in Nepal
Source: Cunningham, Kadiyala, et al. (2013).
This survey included four different questionnaires: (1) a mothers’ questionnaire with the mother of the index child as the respondent; (2) a men’s questionnaire for the husband of the mother of the index child, or another major household decisionmaker when the husband was unavailable; (3) a questionnaire for a group of community leaders per ward; and (4) a questionnaire to be administered to one frontline health worker, a female community health volunteer, per ward.
The mothers’ questionnaire covered a broad range of issues related to determinants of maternal and child health and nutrition, as well as household food security and empowerment in agriculture. This part of the survey also involved taking anthropometric measurements and drawing blood to measure the hemoglobin status of children and the mother of the index child in the household. If available, the grandmother of the index child was also asked a short series of questions focusing on her perceptions of maternal and child health and nutrition. The male questionnaire covered household demographics and socioeconomics, as well as agricultural practices and empowerment in agriculture. The community leaders were interviewed as a group about ward access to key facilities and health and agricultural staff, migration patterns, livelihoods and poverty, social capital, leadership in the community, economic events, and local prices (Cunningham, Kadiyala, et al. 2013).
To measure women’s empowerment in agriculture, we administered the WEAI questionnaire developed by Alkire et al. (2013) and piloted in Bangladesh, Uganda, and Guatemala. Unlike the approach used in the WEAI pilot studies, where the self-identified primary male and primary female decisionmakers were chosen as respondents to the WEAI module, the Suaahara dataset collected the information from the mother of the index child and from her husband (or another male primary decisionmaker, if the husband was unavailable). Throughout this paper, we will refer to women’s empowerment and mothers’ empowerment interchangeably.
7

Sample Characteristics Tables 3.1 and 3.2 compare characteristics of the Suaahara sample with those from the rural sample of two nationally representative surveys, the 2011 NDHS and the 2010–2011 Living Standards Measurement Study (LSMS). The demographic and agricultural characteristics of the Suaahara sample households suggest a lower socioeconomic level than the rural LSMS sample (Table 3.1). Suaahara households are larger and a higher proportion are female-headed. Close to 100 percent (98.3 percent) of agricultural households in the Suaahara sample had land, compared to 84.7 percent in the LSMS sample, but the Suaahara sample cultivated smaller landholdings, on average (0.4 hectares compared to 0.7 hectares). A fifth of the Suaahara households and more than half of rural LSMS households had access to irrigation. Slightly more than 40 percent of households in the Suaahara sample received remittances, compared to 58.2 percent nationally, but the Suaahara sample households received substantially larger average remittances, possibly owing to these remittances coming from international rather than domestic migrants (Table 3.2).
Table 3.1 Household characteristics of Suaahara sample (2012) in comparison to Living Standards Measurement Study (LSMS) rural sample (2010/2011)
Characteristics Suaahara* 2012
LSMS** 2010/2011
% % Population characteristics Average household size 5.7 5.0 Proportion of female-headed households 33.8 26.5 Sex ratio (males per 100 females) 90.2 84.6 Agriculture and land Agricultural households with landa 98.3 84.7 Percentage of land irrigated 20.4 53.3 Average size of agricultural land (in hectares) 0.4 0.7 Percentage of holdings operating less than 0.5 hectares 74.2 51.2 Employment and remittances Percentage employedb 88.9 82.1 Percentage employed in agriculture (wage and self-employment) 67.1 70.5 Percentage of households receiving remittances 41.3 58.2 Average amount of remittances per recipient household (NRs) 96,526 70,759 Share of remittances received by households from other countries
87.9 41.7
Sources: *Authors’ calculations and **Central Bureau of Statistics (2012). Notes: a The Suaahara definition is based on the percentage of households surveyed that owned land, while the LSMS
definition is based on the percentage of all households that are agricultural households and own land. b The Suaahara definition is based on the employment status of the household head. The LSMS definition is based on all household members aged five years and older and is based on whether the individual has been employed for at least one hour in the previous seven days, has a job attachment if temporarily absent from work, or is available to work if work could be found.
Forty percent of children under five years of age in the Suaahara sample were stunted and 12 percent wasted, similar to the national average from the NDHS (Table 3.2), but underweight prevalence and anemia prevalence were higher in the Suaahara sample than in the NDHS sample. Underweight and anemia prevalence of nonpregnant mothers in the Suaahara sample was also higher than comparable figures in the NDHS sample. While a lower proportion of mothers in the Suaahara sample followed optimal breastfeeding practices relative to the national (rural) NDHS average, a slightly higher proportion
8

of mothers in the Suaahara sample reported introducing complementary foods at the right time and feeding foods from at least four food groups to children between 6 and 23.9 months of age. However, a slightly lower proportion of children within that age group seemed to receive meals at the minimum frequency or be fed iron-rich foods compared to children of that age in the rural NDHS sample.
Table 3.2 Maternal and child nutritional status and infant and young child feeding practices among samples from Suaahara, 2012; rural Nepal Demographic and Health Surveys (NDHS), 2011; and Living Standards Measurement Study (LSMS), 2010/2011
Indicators Suaahara* 2012
NDHS** 2011
LSMS*** 2010/2011
% % %
Child nutritional status
Children 0–59.9 months of age wasted 12 11 14
Children 0–59.9 months of age underweight 35 29 33
Children 6–59.9 months of age anemic 52 46
Mothers’ nutritional status
Nonpregnant mothers underweight 24 18
Nonpregnant mothers anemic 42 35
Infant and young child feeding (IYCF) practices
Mothers initiate breastfeeding within one hour of birth 39 45
Mothers exclusively breastfeed children 0–5.9 months of age 49 70 77
Mothers introduce solid and semisolid foods to children 6–7.9 months of age
73 66
Mothers feed children 6–23.9 months of age from at least 4 food groups 46 30
Mothers feed children 6–23.9 months of age the minimum meal frequency recommended
72 79
Mothers feed iron-rich foods to children 6–23.9 months of age 20 24
Sources: *Authors’ calculations, **Nepal, MOHP et al. (2012), and ***Central Bureau of Statistics (2012).
Women’s Empowerment in Agriculture in Nepal How empowered are Nepali women in agriculture? From the Suaahara baseline survey, we use five alternative measures to assess women’s empowerment. First, we use the female respondent’s individual-level 5DE empowerment profile or score, which is the weighted average of the 10 indicators in Table 2.1. The average 5DE score is 0.59, indicating a much lower level of empowerment in agriculture for Nepali women compared with women in Bangladesh (0.746), Guatemala (0.69), and Uganda (0.789) WEAI pilot areas (Alkire et al. 2013). Next, we use the findings from the WEAI diagnostics to identify the key dimensions on which to focus our analysis. The contributions of the five domains and the 10 indicators to women’s disempowerment in the Nepali Suaahara sample are presented in Figures 3.2 and 3.3, respectively. Figure 3.2 shows that the domains of leadership, production, resources, time, and income, in descending order, contribute the most to women’s disempowerment. At the indicator level, the indicators “group membership”, “control over use of income”, “autonomy in production”, and “workload” represent the largest contributions to women’s disempowerment.
9

Figure 3.2 Contribution of each of the five domains to women’s disempowerment
Source: Authors’ calculations.
Figure 3.3 Contribution of each of the 10 indicators to women’s disempowerment
Source: Authors’ calculations.
20.5
19.4
17.7
23.5
18.9 Production
Resources
Income
Leadership
Time
3.9
16.6
2.4
6.3
10.7
17.7
18.5
5
14.6
4.3 Input into production decisions
Autonomy in production
Asset ownership
Rights over assets
Access to and decisions on credit
Control over use of income
Group membership
Speaking in public confidence
Workload
Leisure
10
Although the WEAI was formulated to be an additive and decomposable index, similar to the Alkire-Foster family of multidimensional indexes (Alkire and Foster 2011a, 2011b), one cannot predict with certainty that empowerment in one domain (or sufficiency in an indicator) necessarily contributes to higher empowerment in aggregate. This is because of the very context-specific nature of gender relations. Moreover, each of the indicators is likely to be affected by different determinants (for example, factors that affect investment in social capital and community leadership may be different from those affecting autonomy in agricultural decisions), which makes finding instruments for the aggregate empowerment score challenging. That is, it may be more feasible to find valid instruments for the component indicators because they are confined to specific spheres of women’s empowerment, but more difficult to find instruments for the aggregate empowerment score.
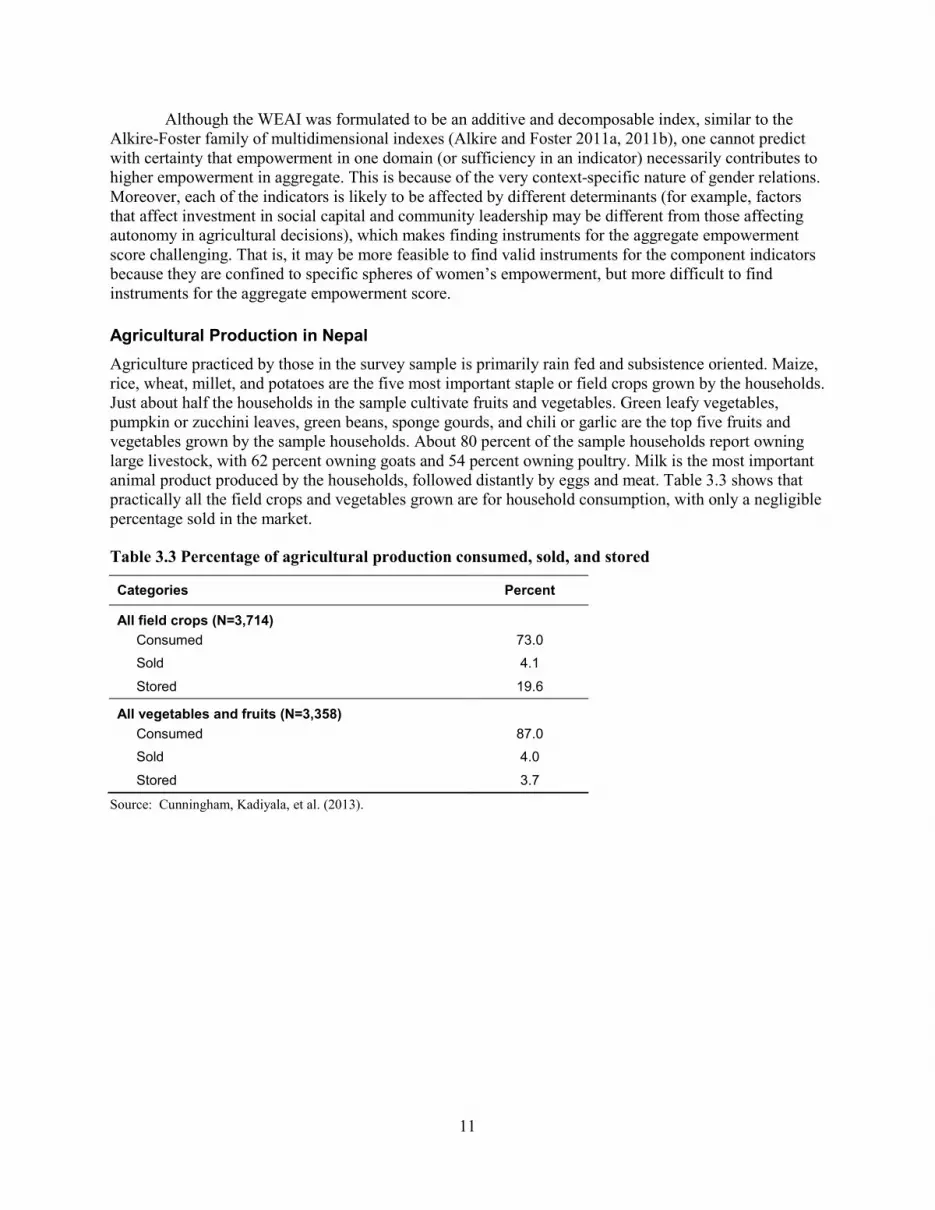
Agricultural Production in Nepal Agriculture practiced by those in the survey sample is primarily rain fed and subsistence oriented. Maize, rice, wheat, millet, and potatoes are the five most important staple or field crops grown by the households. Just about half the households in the sample cultivate fruits and vegetables. Green leafy vegetables, pumpkin or zucchini leaves, green beans, sponge gourds, and chili or garlic are the top five fruits and vegetables grown by the sample households. About 80 percent of the sample households report owning large livestock, with 62 percent owning goats and 54 percent owning poultry. Milk is the most important animal product produced by the households, followed distantly by eggs and meat. Table 3.3 shows that practically all the field crops and vegetables grown are for household consumption, with only a negligible percentage sold in the market.
Table 3.3 Percentage of agricultural production consumed, sold, and stored
Categories Percent
All field crops (N=3,714) Consumed 73.0
Sold 4.1
Stored 19.6
All vegetables and fruits (N=3,358) Consumed 87.0
Sold 4.0
Stored 3.7
Source: Cunningham, Kadiyala, et al. (2013).
11

4. EMPIRICAL SPECIFICATION
Nutritional status is determined by a complex interaction between individual dietary intake (quantity and quality) and health status, which is in turn determined by household food security, caring capacity and childcare practices, and access to adequate health services and sanitation (UNICEF 1990). In this paper, we hypothesize that production diversity and women’s empowerment affect dietary practices (for example, quality and quantity of diets consumed) and nutrition status.
Given that a majority of the Nepali households in our sample consume rather than sell what they produce (see Table 3.3), we expect that mothers and children in households that produce a larger variety of agricultural products are also more likely to consume diverse diets. Dietary diversity, the most widely used measure of diet quality, has been associated with nutrient adequacy among both children and women (Torheim et al. 2004; Arimond et al. 2010) and child anthropometry (Arimond and Ruel 2004). Similarly, we hypothesize that women who are empowered in agriculture are able to make key decisions that allow them to ensure their own and their children’s dietary diversity and nutritional status.
For simplicity, we denote the nutrition practice and outcome vector as the vector N, which comprises practices P and outcomes O. To investigate the relationships between nutrition practices (P), nutrition status (O), women’s empowerment in agriculture, and diversity in agricultural production we estimate the following:
N (P, O) = b0 + b1 empowerment + b2 production diversity + b3 I + b4 H + e, (1)
where I is a vector of individual characteristics, H is a vector of household characteristics, b0 , b1 , b2 , b3 , and b4 are parameters to be estimated, and e is an error term. Our key coefficients of interest are b1 and b2, which capture how women’s empowerment and production diversity, respectively, are correlated with the nutrition practice or outcome, controlling for a conventional set of observable individual and household characteristics. We expect that both women’s empowerment and production diversity predict (1) maternal dietary diversity, (2) children’s dietary diversity, (3) maternal BMI, and (4) children’s anthropometry (HAZ, WHZ, and WAZ).
For child-level nutrition practices and anthropometry, pooling all the children under five years old in the same regression assumes that women’s empowerment and production diversity is correlated with the dietary diversity and nutritional status of both older (over two years of age) and younger (under two years of age) children in the same way. It is now well known that the earlier and longer children are exposed to optimal conditions and behaviors, the more likely they are to be well nourished, especially in terms of linear growth. The first 1,000 days (that is, from conception to two years old) are now widely recognized as the period during which the greatest benefit from nutrition interventions could be accrued. Because this is a window of opportunity for targeting nutrition interventions, identifying the differential impacts of intervening variables on children depending on child age would help target interventions better. Therefore, the age at which assessments are made matters for the interpretation of findings, as well as for programmatic recommendations. For example, for children in the age group under two years of age, low HAZ probably reflects a continuing process of growth faltering, and for children over two years of age, it reflects a state of having faltered growth. To test whether women’s empowerment and production diversity have differential effects on children by age group, we include a dummy variable for children under two years old (= 1 if under two) and also interact this dummy variable with the empowerment variable and production diversity variable. The resulting equation to be estimated for child-level nutrition outcomes (OC) is given by:
12

OC = b0 + b1 empowerment + b2 production diversity + b3 under2 + b4 (empowerment × under2) + b5 (production diversity × under2) + b4 I + b5 H + ν, (2)
where bj is the parameters to be estimated and ν is an error term. For children over two years old, the relationship between women’s empowerment and the nutrition outcome is given by b1, and the relationship between production diversity and the nutrition outcome is given by b2. For children under two years old, the coefficient of interest is now (b1 + b4) for women’s empowerment and (b2 + b5) for production diversity. Equation (2) also nests the test of the difference between the coefficients for older and younger children, which is represented by b3 and b4. If b3 (or b4) is significantly different from zero, then this suggests that the empowerment (or production diversity) coefficients for older and younger children are not equal.
One possible source of bias in our analysis is the endogeneity of the empowerment and production diversity measures, both of which may be affected by the same factors that influence dietary diversity and nutrition status. To deal with this issue, we use standard instrumental variables (IV) techniques to identify different causal pathways affecting women’s empowerment in agriculture and diversity in production.
To identify women’s empowerment, we use instruments that capture various aspects of gender norms and the relative status of men and women in the Nepali context. These include (1) the proportion of sons out of the total number of children and (2) the cluster-level distance to markets. The proportion of sons can reflect a mother’s relative status if there is a social preference for sons, which is typical in South Asia (Das Gupta et al. 2003; Priya et al. 2012), while distance to market may reflect the intensity of a woman’s work burden at home, the woman’s degree of isolation within the community, and whether local norms on female mobility are binding.
Because agricultural production in Nepal is strongly determined by biophysical characteristics associated with specific agroecological zones, we use long-run district-level climate averages for the period 1981–2010 to identify production diversity.5 These include the natural log of (1) mean annual rainfall, (2) maximum temperature, and (3) minimum temperature.
Outcome Variables Maternal Dietary Diversity: Mothers’ diet quality was measured using the Individual Dietary Diversity Score (Swindale and Bilinsky 2006). Using prompts, mothers were asked to describe everything that they had eaten or drunk the previous day, or the day before that if the previous day was an unusual day for any reason, regardless of whether food was consumed in the home or outside. After probing to obtain the dietary recall for the entire 24 hours, enumerators recorded each item and then specifically asked whether items not mentioned were consumed. Using the 24-hour dietary recall data from mothers, we computed individual dietary diversity scores for mothers based on their consumption of nine food groups: starchy staples; beans, legumes, and nuts; dark green leafy vegetables; vitamin A–rich fruits, vegetables, and tubers; other fruits and vegetables; milk and milk products; eggs; fish; and meat (Arimond, Wiesmann, et al. 2010).
Children’s Dietary Diversity: We also conducted a similar 24-hour recall asking the mother or primary caretaker of the child in the previous 24 hours to recall the diet of the child. Dietary diversity of children 6–59 months of age is measured as the number of food groups consumed in the last 24 hours out of seven food groups. Food consumption was grouped into grains (cereals and tubers); pulses (legumes and nuts); vitamin A–rich fruits and vegetables; other fruits and vegetables; dairy; eggs; and all flesh foods, including meat, fish, and poultry. For all dietary data, we followed World Health Organization (WHO) guidelines (WHO 2010) as closely as possible in categorizing local foods into the appropriate
5 We purchased climate data from the Nepal Department of Hydrology and Meteorology, which is part of the Government of Nepal’s Ministry of Science, Technology and Environment, www.dhm.gov.np/.
13

categories and consulted multiple Nepali and international agricultural and nutrition experts regarding items that were not easily classifiable.
Maternal BMI: Women’s weight and height measurements are used to derive their BMI, expressed as weight in kilograms divided by height in meters squared (kg/m2).
Child Anthropometry: The enumerators measured weight and height or length and obtained information on the age of the child in months for all children under five years of age. Each child’s anthropometric measurements were compared to the 2006 WHO child growth standards reference for his or her age and sex to compute HAZ, WAZ, and weight-for-height [WHZ] z-scores (WHO 2006).
Key Independent Variables Agricultural Production Diversity: Our indicator for production diversity is the production diversity index, defined as the number of food groups produced by the household, parallel to the nine food groups used for measuring maternal dietary diversity using 24-hour recall (see above).
Women’s Empowerment in Agriculture Index: Consistent with the use of the WEAI as a diagnostic tool for identifying areas of disempowerment for policy intervention (Alkire et al. 2013), we use the underlying data that were used to construct the four indicators in which disempowerment was greatest to represent empowerment in these domains. We use each alternative empowerment indicator in turn as an explanatory variable to see how these key domains of empowerment correlate with nutrition practices and outcomes. For each dependent variable, we estimate five alternative specifications:
• Model 1: Aggregate empowerment score – The empowerment score of the primary female respondent, equal to the weighted average of achievements in the 10 indicators if the respondent is disempowered, and equal to 1 if the individual is empowered.
• Model 2: Group membership – The number of community social groups in which the respondent is an active member.
• Model 3: Control over use of income – The number of household agricultural and nonagricultural activities in which the respondent has some input in income decisions or feels she can make decisions.
• Model 4: Autonomy in production – The respondent’s average Relative Autonomy Index 6 score over various activities linked to household agricultural production.
• Model 5: Workload – The total time spent by the respondent in market (paid) and nonmarket (unpaid) activities, including domestic chores and caring for children and the elderly. The first four measures are defined as increasing in empowerment, so higher numbers imply
greater empowerment. The workload indicator, in contrast, may be nonlinear in empowerment—initially increasing in empowerment up to a certain critical threshold beyond which additional time spent may reflect time poverty and be disempowering rather than empowering. By construction, the workload indicator enters the WEAI negatively, that is, a woman who is overburdened by paid and unpaid work is considered to be disempowered (Alkire et al. 2013). For the purpose of this paper, we restrict the sample to 2,783 households that have complete WEAI data for the female respondent.
Means and standard deviations of the dependent variables and other independent variables are presented in Table 4.1. Child characteristics include a dummy variable for whether the child is a girl, a dummy for whether the child is under two years old, and the age and age squared of the child to capture nonlinear trends in age. Mother’s characteristics include age and age squared, completed years of formal schooling, and height. Household characteristics include a dummy for whether both male and female decisionmakers are present, log of household size, dependency ratio (the household members under 15
6 The Relative Autonomy Index is a measure of autonomy that reflects a person’s ability to act on what he or she values and probes the person’s own understanding of the situation and how he or she balances different motivations (Alkire 2007). The Relative Autonomy Index used in the WEAI adapts the measure of autonomy developed by psychologists and others working in self-determination theory (see Chirkov, Ryan, and Deci 2011).
14

and over 64 as a proportion of those of working age [ages 15–64]), socioeconomic status index (measured using principal components analysis of assets and housing characteristics), dummies for middle caste and lower (Dalit) caste (with high caste as the excluded category), whether the household belongs to a Suaahara intervention community, and dummies for the mountain and hill zones (with the lowland terai as the excluded category). Climate variables include the log differences between 2011 annual rainfall, maximum temperature, and minimum temperature and their respective long-run (1981–2010) averages. We can interpret these climate variables as (approximately) the percentage deviation of current (2011) rainfall levels (or temperature high/low) from their long-run normal levels.
Table 4.1 Key study variables Variable Observations Mean Standard
deviation Minimum Maximum
Dependent variables Child outcomes Height-for-age z-score
4,029
-1.73
1.23
-5.0
4 Weight-for-height z-score 4,036 -0.88 1.03 -4.7 4 Weight-for-age z-score 4,067 -1.61 1.05 -4.9 4 Diet diversity score (7 food groups) Mother outcomes
3,695 3.55 1.11 0.0 7
Diet diversity score (9 food groups) 4,080 6.27 1.73 0.0 12 Body mass index Production diversity variable
4,078 20.58 2.83 0.0 34
Production diversity index (9 food groups) 4,080 4.01 1.79 0 8 Women’s empowerment variables Women’s aggregate empowerment score 2,783 0.59 0.21 -0.0 1 Number of groups in which respondent is active member
3,847 0.25 0.64 0.0 7
Control over income 4,071 2.20 1.46 0.0 9 Autonomy in agricultural decisionmaking 2,954 0.24 1.47 -9.0 7 Hours spent in paid and unpaid work Instruments
4,080 10.88 3.03 0.0 20
Mother’s ratio of sons to total number of children
4,080 0.48 0.37 0.0 1
Distance to market (in kilometers) 4,029 12.65 16.33 0.0 100 Log of mean annual rainfall (1981–2010) 4,080 7.48 0.37 5.9 8 Log of average maximum temperature (1981–2010)
4,080 3.28 0.13 3.0 3
Log of average minimum temperature (1981–2010)
4,080 2.62 0.33 1.6 3
Son ratio x child under 2 4,080 0.21 0.35 0.0 1 Distance to market x child under 2 4,029 5.24 11.72 0.0 100 Mean annual rainfall x child under 2 4,080 3.28 3.72 0.0 8 Average maximum temperature x child under 2
4,080 1.44 1.63 0.0 3
Average minimum temperature x child under 2 Controls Child characteristics
4,080 1.15 1.32 0.0 3
Under 2 years old dummy 4,080 0.44 0.50 0.0 1 Girl dummy 4,080 0.48 0.50 0.0 1 Age (in months) 4,080 28.26 16.67 -0.0 60 Age squared 4,080 1,076.46 1,013.85 0.0 3,604
15

Table 4.1 Continued Variable Observations Mean Standard
deviation Minimum Maximum
Mother characteristics Age 4,080 26.87 6.11 15.0 52 Age squared 4,080 759.28 362.64 225.0 2,704 Height 4,078 151.73 5.60 133.0 186 Completed formal schooling (years) Household characteristics
4,078 4.51 4.45 0.0 22
Dual-adult household dummy 4,080 0.25 0.43 0.0 1 Log of household size 4,080 1.84 0.34 1.1 3 Household dependency ratio 4,080 1.34 0.99 0.1 7 Socioeconomic status index 4,030 0.00 0.91 -1.8 4 Middle caste dummy 4,065 0.33 0.47 0.0 1 Lower caste (Dalit) dummy 4,065 0.19 0.39 0.0 1 Intervention group dummy 4,080 0.50 0.50 0.0 1 Mountain area dummy 4,080 0.25 0.43 0.0 1 Hill area dummy 4,080 0.50 0.50 0.0 1 Central development zone dummy 4,080 0.19 0.39 0.0 1 Western development zone dummy Climate variables
4,080 0.56 0.50 0.0 1
% deviation of 2011 annual rainfall from long-run mean
4,080 -0.02 0.14 -0.7 0
% deviation of 2011 minimum temperature from long-run mean
4,080 -0.01 0.04 -0.2 0
% deviation of 2011 maximum temperature from long-run mean
4,080 -0.00 0.02 -0.1 0
Source: Authors’ calculations.
16

5. RESULTS
Maternal Dietary Diversity and Body Mass Index Tables 5.1 and 5.2 present selected ordinary least squares (OLS) and IV estimates of the impact of production diversity (measured using the nine-item production diversity index) and measures of women’s empowerment on mothers’ dietary diversity and BMI, respectively. Full OLS and IV results are available from the authors upon request.
Production diversity emerges as an important determinant of maternal dietary diversity across most specifications, using both OLS and IV techniques (Table 5.1). The two exceptions are the IV regressions with autonomy in agricultural decisions and workload as the women’s empowerment indicators, where production diversity is only weakly significant (at 10 percent) in the OLS regression and insignificant in the IV regression.
The challenges of instrumenting a composite indicator of women’s empowerment emerge in this set of regressions on maternal dietary diversity. In the specification with the women’s aggregate empowerment score, the Hansen J statistic leads us to reject the null hypothesis that the instruments are valid—that is, that they are correctly excluded from the estimated equation. We therefore take the results for the aggregate empowerment score with caution. However, we accept the null hypothesis of valid instruments when we use individual indicators of empowerment. Moreover, for all specifications, F-tests on the excluded instruments lead us to reject the null that their coefficients are equal to zero, and the endogeneity test of the regressors also confirms that the women’s empowerment indicators and production diversity should be treated as endogenous.
Control over income weakly affects maternal dietary diversity in the OLS specification but loses significance once the endogeneity of this variable is taken into account. Autonomy in agricultural decisions and hours spent in paid and unpaid work, however, emerge as positive and significant factors increasing maternal dietary diversity in the IV regressions.7 Note that these are the specifications in which production diversity is not significant, which may imply that once endogeneity of autonomy in agricultural decisions or mothers’ hours spent working are taken into account, their effects may swamp the effects of having a more diversified production portfolio.
7 While we reject the null of underidentification, concluding that the excluded instruments are correlated with the endogenous regressors, we still face the issue of weak instruments—the weak-identification F-statistics are lower than the Stock and Yogo (2005) critical values in all specifications.
17

Table 5.1 Summary of coefficient estimates: Production diversity, women’s empowerment, and mother’s dietary diversity
Mother’s dietary diversity
Model 1: Women’s
empowerment score
Model 2: Group
membership
Model 3: Control over
income
Model 4: Autonomy in agricultural
decisions Model 5: Workload
OLS IV OLS IV OLS IV OLS IV OLS IV Production diversity index 0.036* 0.691*** 0.036* 1.242*** 0.035* 1.191*** 0.035* 0.164 0.035* 0.309
(0.021) (0.142) (0.021) (0.353) (0.021) (0.422) (0.021) (0.273) (0.021) (0.207)
Women’s empowerment indicators Empowerment score of woman 0.107 0.769
(0.148) (0.901)
Number of groups in which respondent is active member
0.004 0.198
(0.047) (0.688)
Control over income
0.035* 0.097
(0.021) (0.268)
Autonomy in agricultural decisionmaking
-0.008 1.104**
(0.020) (0.446)
Hours spent in paid and unpaid work
0.005 0.463***
(0.011) (0.140)
Number of observations 2,745 2,709 2,745 2,745 2,745 2,745 2,742 2,706 2,745 2,709 Hansen’s J statistic, Ho: instruments are valid
19.307
3.417
3.529
5.568
3.753
p-value
0.000
0.181
0.171
0.135
0.153 Kleibergen-Paap LM test statistic Ho: equation underidentified 71.197
18.580
12.442
9.180
22.554
p-value
0.000
0.000
0.006
0.057
0.000
18

Table 5.1 Continued
Mother’s dietary diversity
Model 1: Women’s
empowerment score
Model 2: Group
membership
Model 3: Control over
income
Model 4: Autonomy in agricultural
decisions Model 5: Workload
OLS IV OLS IV OLS IV OLS IV OLS IV Kleibergen-Paap Wald weak-instrument F-statistic
15.245 4.447 2.936 1.779 5.579
Anderson-Rubin Wald test (p-value) 0.000 0.000 0.000 0.000 0.000
Anderson-Rubin chi-square test (p-value) 0.000 0.000 0.000 0.000 0.000
Source: Authors’ estimates using the 2012 Nepal Suaahara baseline data. Notes: OLS = ordinary least squares; IV = instrumental variables; Robust standard errors in parentheses; *** p<0.01, ** p<0.05, * p<0.1. Excluded instruments for production
diversity in all models are the log of long-run mean rainfall, log of long-run mean maximum temperature, and log of long-run mean minimum temperature. Excluded instruments for empowerment indicators in Models 1 and 4: son ratio and distance to market. Excluded instruments in Models 2 and 3: son ratio. Excluded instrument in Model 5: distance to market. Controls include mother’s age, age squared, height, and years of formal schooling completed; whether the household is a dual-adult household; log of household size; household dependency ratio; socioeconomic status index; middle caste dummy; lower caste dummy; intervention group dummy; dummies for agroecological and development zone; and climate variables (log of percent deviation of 2011 rainfall from long-run mean, log of percent deviation of 2011 average minimum temperature from long-run mean, and log of percent deviation of 2011 average maximum temperature from long-run mean).
Table 5.2 Summary of coefficient estimates: Production diversity, women’s empowerment, and mother’s BMI
Mother’s BMI
Model 1: Women’s
empowerment score
Model 2: Group
membership
Model 3: Control
over income
Model 4: Autonomy in agricultural
decisions Model 5: Workload
OLS IV OLS IV OLS IV OLS IV OLS IV
Production diversity index -0.036 0.411* -0.037 0.166 -0.037 0.372* -0.034 0.418 -0.029 0.305
(0.038) (0.212) (0.038) (0.228) (0.038) (0.207) (0.039) (0.330) (0.038) (0.252)
Women’s empowerment indicators Empowerment score of woman 0.634** 2.836**
(0.261) (1.257)
Number of groups in which respondent is active member
0.123 1.519**
(0.084) (0.690)
19

Table 5.2 Continued
Mother’s BMI
Model 1: Women’s
empowerment score
Model 2: Group
membership
Model 3: Control over
income
Model 4: Autonomy in agricultural
decisions Model 5: Workload
OLS IV OLS IV OLS IV OLS IV OLS IV
Control over income
0.039 0.445**
(0.038) (0.175)
Autonomy in agricultural decisionmaking
0.036 -0.217
(0.035) (0.522)
Hours spent in paid and unpaid work
-0.055*** 0.012
(0.018) (0.171)
Number of observations 2,745 2,709 2,745 2,709 2,745 2,709 2,742 2,706 2,745 2,709 Hansen’s J statistic, Ho: instruments are valid
3.268
2.813
1.663
8.082
8.520
p-value
0.352
0.421
0.645
0.044
0.036
Kleibergen-Paap LM test statistic Ho: equation underidentified
71.197
34.929
85.042
9.180
23.069
p-value
0.000
0.000
0.000
0.057
0.000 Kleibergen-Paap Wald weak-instrument F-statistic 15.245 7.342 17.895 1.779 4.570 Anderson-Rubin Wald test (p-value) 0.037 0.037 0.037 0.037 0.037 Anderson-Rubin chi-square test (p-value) 0.035 0.035 0.035 0.035 0.035
Source: Authors’ estimates using the 2012 Nepal Suaahara baseline data. Notes: BMI = body mass index; OLS = ordinary least squares; IV = instrumental variables; Robust standard errors in parentheses; *** p<0.01, ** p<0.05, * p<0.1. Excluded
instruments for production diversity in all models are the log of mean rainfall, log of mean maximum temperature, and log of mean minimum temperature. Excluded instruments for empowerment indicators in all models: son ratio and distance to market. Controls include mother’s age, age squared, height, and years of formal schooling completed; whether the household is a dual-adult household; log of household size; household dependency ratio; socioeconomic status index; middle caste dummy; lower caste dummy; intervention group dummy; dummies for agroecological and development zone; and climate variables (log of percent deviation of 2011 rainfall from long-run mean, log of percent deviation of 2011 average minimum temperature from long-run mean, and log of percent deviation of 2011 average maximum temperature from long-run mean).
20

Table 5.2 presents similar regressions for maternal BMI. In contrast to the dietary diversity regressions, the women’s aggregate empowerment score and indicators for social capital (group membership) and control over income emerge as significant in the IV regressions.8 Production diversity is significant only in the specifications with the aggregate women’s empowerment score and control of income. Taken together, these results suggest that different aspects of women’s empowerment may be at play in determining dietary diversity and BMI. Autonomy in agricultural production and women’s work in unpaid and paid activities are positively associated with maternal dietary diversity, perhaps because they more directly influence the range of food that is available to the household, particularly in this setting where households are less dependent on the market for food. This is consistent with the positive and significant coefficients of production diversity in the dietary diversity regression in most specifications. In contrast, women’s empowerment across all domains, ability to participate actively in groups (a measure of community leadership and social capital), and control of income are positively correlated with maternal BMI, but production diversity is no longer significant across all specifications—it is significant only in the IV regressions using the aggregate empowerment score and control of income. The indicators of group membership and control over use of income reflect a woman’s engagement in her community and her ability to decide how household income is allocated. These results suggest that for production diversity to be translated into women’s nutritional status, women must be able to control income or be empowered in other domains.9
Child Dietary Diversity and Anthropometric Outcomes Tables 5.3 to 5.6 present selected OLS and IV coefficients in regressions on children’s dietary diversity, WAZ, WHZ, and HAZ, respectively.
Because children’s dietary patterns may vary depending on child age, and because the period between birth and 24 months is a critical period for child growth and development, we introduce an additional interaction term for the child being under two years of age. IV diagnostics suggest that the instruments are correctly excluded from the estimating equations only in the specification using autonomy in agricultural decisions and workload, so we discuss IV results only for these specifications, and OLS for others (Table 5.3).10 Unlike the results for mothers, production diversity does not emerge as a consistent predictor of children’s dietary diversity in any of the specifications. However, in preferred OLS regressions using group membership, autonomy in agricultural decisions, and control over income as indicators of women’s empowerment, there are indications that production diversity improves dietary diversity among children under two years of age (OLS coefficients significant at 10 percent level). The coefficient on the aggregate women’s empowerment score and its interaction with the under-two dummy is insignificant in the (preferred) OLS specification. Both autonomy in agricultural decisions and hours spent in paid and unpaid work are positively correlated with child dietary diversity in the IV regressions, but these variables do not have a differential impact on children under two.
8 IV diagnostics for these variables perform reasonably well; we conclude that the instruments are valid and that the regressions are identified. In the aggregate empowerment score and control over income regressions, the F-statistic for the weak instruments test exceeds the Stock and Yogo (2005) critical value of 13.97 (two endogenous regressors, five instruments) with a maximal bias relative to OLS of 5 percent; however, the F-statistic for the group membership regression only exceeds the critical value of 5.19, suggesting a maximal bias of 20 percent relative to OLS.
9 In all specifications for maternal BMI, the F-tests of excluded instruments lead us to reject the null that they are insignificant. We also reject the null hypothesis that the endogenous regressors are exogenous, with the exception of the specification with autonomy in agricultural decisions, where the p-value of the test for exogeneity is 0.15. This suggests that in this particular specification, one can take the autonomy variable as exogenous. However, the OLS coefficient is not significant.
10 We are also unable to reject the null hypotheses that the endogenous regressors are exogenous in the specifications using group membership and control over income, so we prefer the OLS specifications in these two cases.
21

Table 5.3 Summary of coefficient estimates: Production diversity, women’s empowerment, and children’s dietary diversity
Children’s dietary diversity
Variable
Model 1: Women’s
empowerment score
Model 2: Group
membership
Model 3: Control over
income
Model 4: Autonomy in agricultural
decisions Model 5: Workload
OLS IV OLS IV OLS IV OLS IV OLS IV
Production diversity index 0.027 0.045 0.027 0.098 0.027 -0.017 0.029 -0.023 0.030 -0.009
(0.018) (0.096) (0.018) (0.165) (0.018) (0.154) (0.019) (0.136) (0.019) (0.151)
Whether child is under 2 0.028 0.260* 0.028 -0.042 0.027 0.181 0.024 0.165 0.022 0.245
(0.029) (0.157) (0.029) (0.217) (0.029) (0.139) (0.030) (0.132) (0.029) (0.321) Production diversity x child under 2 0.319 -1.460 0.285* 0.259 0.306* 0.536 0.289* -0.281 0.077 0.454
(0.207) (1.282) (0.161) (0.837) (0.176) (1.356) (0.164) (0.592) (0.223) (0.919) Women’s empowerment indicators Empowerment score of woman 0.159 -1.179*
(0.126) (0.707) Empowerment score x child under 2 -0.077 1.190
(0.204) (1.226)
Number of groups in which respondent is active member 0.033 -0.045
(0.036) (0.316)
Number of groups x child under 2 -0.051 1.243*
(0.073) (0.734)
Control over income 0.012 0.179
(0.017) (0.193) Control over income x child under 2 -0.015 -0.460
(0.031) (0.546)
Autonomy in agricultural decisionmaking 0.014 0.460**
(0.018) (0.218)
22

Table 5.3 Continued
Children’s dietary diversity
Variable
Model 1: Women’s
empowerment score
Model 2: Group
membership
Model 3: Control over
income
Model 4: Autonomy in agricultural
decisions Model 5: Workload
OLS IV OLS IV OLS IV OLS IV OLS IV
Autonomy x child under 2 -0.022 -0.227
(0.030) (0.139)
Hours spent in paid and unpaid work -0.012 0.210*
(0.009) (0.123)
Hours worked x child under 2 0.020 -0.106
(0.015) (0.177)
Number of observations 2,452 2,419 2,452 2,452 2,452 2,452 2,449 2,416 2,452 2,419 Hansen’s J statistic, Ho: instruments are valid 16.071 15.217 18.886 0.686 1.590
p-value 0.013 0.004 0.001 0.953 0.811 Kleibergen-Paap LM test statistic Ho: equation underidentified 37.882 23.648 8.359 15.749 11.814
p-value 0.000 0.000 0.138 0.008 0.037 Kleibergen-Paap Wald weak-instrument F-statistic 3.847 2.853 1.028 1.889 1.476
Anderson-Rubin Wald test (p-value) 0.002 0.002 0.002 0.051 0.046
Anderson-Rubin chi-square test (p-value) 0.001 0.001 0.001 0.047 0.043
Source: Authors’ estimates using the 2012 Nepal Suaahara baseline data. Notes: OLS = ordinary least squares; IV = instrumental variables; Robust standard errors in parentheses; *** p<0.01, ** p<0.05, * p<0.1. Excluded instruments are: (1) for
production diversity: the log of mean rainfall, log of mean maximum temperature, and log of mean minimum temperature; (2) for empowerment indicators in Models 1 and 4: son ratio and distance to market; (3) for empowerment indicators in Models 2 and 3: son ratio and log of mean rainfall; and (4) for empowerment indicators in Model 5: distance to market. Instruments for interactions of production diversity and empowerment with child under 2 are the instruments for each variable multiplied by the child under 2 dummy variable. Control variables are identical to those in the mother’s regression, plus a dummy for a child under 2, a girl child dummy, age in months, and age squared.
23

Addressing the endogeneity of women’s empowerment measures is more difficult with the child anthropometry regressions because, conceptually speaking, it is harder to find factors that affect maternal empowerment that do not directly affect child nutritional status. In the regressions for WAZ (a composite indicator of nutritional status reflecting both long-term and short-term components) and WHZ (a measure of short-term nutritional status), for example (Tables 5.4 and 5.5), we reject the null hypothesis that the instruments are uncorrelated with the error term and are correctly excluded from the estimated equation. In the WAZ regression in particular, we are unable to reject the null hypotheses that the production diversity and women’s empowerment indicators are exogenous, so OLS is our preferred specification.
In the WAZ and WHZ regressions (Table 5.4 and 5.5, respectively), a more diverse production portfolio is associated with neither children’s WAZ nor WHZ. But the interaction of the production diversity variable with children under two is significant and negative, indicating that the association between production diversity and these anthropometric indicators is mediated through the age of the child: for children over two years of age (the excluded group), production diversity positively predicts WAZ and WHZ.
In the preferred OLS specification, control of income and autonomy of agricultural decisionmaking are positively associated with children’s WAZ. Although IV regressions suggest that the number of hours worked is positively associated with WAZ overall and negatively associated with WAZ for children under two years of age, these results should be taken with caution because they are not robust to changes in estimation method—they are insignificant in the preferred OLS specification (Table 5.4).
The only empowerment indicator that is significant in the WHZ regressions is the number of hours spent in paid and unpaid work, which has a positive effect on WHZ overall but a negative effect on WHZ for children under two (Table 5.5). Although this result should be taken with caution, given the generally unsatisfactory performance of the IV regressions for WHZ in general,11 it potentially points to an income effect of women’s work that may affect short-term nutritional status positively but may also have negative implications for younger children.
Finally, in the regression for HAZ (Table 5.6), an indicator of long-term nutritional status, the performance of the instruments is weak, with the exception of autonomy in agricultural decisions and workload as empowerment indicators.12 So we primarily rely on the (preferred) OLS estimates to interpret the results. As in the case of WAZ and WHZ, the association between production diversity and HAZ appears to be mediated through the age of the child, with production diversity positively predicting HAZ for children over two years of age in all the models. Control over income (in the preferred OLS regression) and women having more autonomy in agricultural decisions and expending more hours in paid and unpaid work (in the preferred IV estimations) are positively correlated with higher HAZ for children.
11 We cannot reject the null hypotheses that the excluded instruments should be excluded from the regressions in all the specifications for WHZ, and we also only weakly reject the null hypothesis that the endogenous regressors are exogenous in the specifications with the overall women’s empowerment score and autonomy in agricultural decisions.
12 The Hansen J statistics lead us to reject the null hypothesis that the instruments are correctly excluded from the regressions in the specifications with the overall women’s empowerment score, group membership, and control of income.
24

Table 5.4 Summary of coefficient estimates: Production diversity, women’s empowerment, and children’s weight-for-age z-score
Weight-for-age z-score
Variable
Model 1: Women’s
empowerment score
Model 2: Group
membership
Model 3: Control over
income
Model 4: Autonomy in agricultural
decisions Model 5: Workload OLS IV OLS IV OLS IV OLS IV OLS IV
Production diversity index 0.010 0.028 0.011 0.143 0.011 0.046 0.013 -0.105 0.014 -0.170
(0.017) (0.079) (0.017) (0.090) (0.017) (0.079) (0.017) (0.122) (0.017) (0.148)
Whether child is under 2 0.010 0.124 0.009 -0.157 0.009 0.098 0.010 -0.049 0.004 0.414
(0.024) (0.120) (0.024) (0.143) (0.024) (0.115) (0.024) (0.121) (0.024) (0.272)
Production diversity x child under 2 -0.407** -1.941* -0.324** 0.175 -0.253* -1.570** -0.319** 0.027 -0.506*** 1.090
(0.166) (1.029) (0.132) (0.571) (0.142) (0.758) (0.132) (0.549) (0.181) (0.795) Women’s empowerment indicators Empowerment score of woman -0.031 -0.821
(0.113) (0.647) Empowerment score x child under 2 0.150 1.936*
(0.172) (1.081)
Number of groups in which respondent is active member 0.012 0.023 (0.033) (0.257)
Number of groups x child under 2 0.040 1.045**
(0.062) (0.493)
Control over income 0.027* -0.078
(0.016) (0.089) Control over income x child under 2 -0.029 0.437**
(0.025) (0.202)
Autonomy in agricultural decisionmaking 0.028* 0.514**
(0.016) (0.222) Autonomy x child under 2 0.023 -0.110
(0.025) (0.138)
Hours spent in paid and unpaid work -0.011 0.257**
(0.008) (0.117)
25

Table 5.4 Continued
Weight-for-age z-score
Variable
Model 1: Women’s
empowerment score
Model 2: Group
membership
Model 3: Control over
income
Model 4: Autonomy in agricultural
decisions Model 5: Workload OLS IV OLS IV OLS IV OLS IV OLS IV
Hours worked x child under 2 0.019 -0.288*
(0.012) (0.148)
Number of observations 2,738 2,702 2,738 2,702 2,738 2,702 2,735 2,699 2,738 2,702 Hansen’s J statistic, Ho: instruments are valid 26.271 20.408 20.013 17.692 20.194
p-value 0.000 0.002 0.003 0.007 0.003 Kleibergen-Paap LM test statistic Ho: equation underidentified 64.233 23.814 45.045 11.817 15.350
p-value 0.000 0.001 0.000 0.107 0.032 Kleibergen-Paap Wald weak-instrument F-statistic 6.487 2.422 4.593 1.151 1.535
Anderson-Rubin Wald test (p-value) 0.000 0.000 0.000 0.000 0.000 Anderson-Rubin chi-square test (p-value) 0.000 0.000 0.000 0.000 0.000
Source: Authors’ estimates using the 2012 Nepal Suaahara baseline data. Notes: OLS = ordinary least squares; IV = instrumental variables; Robust standard errors in parentheses; *** p<0.01, ** p<0.05, * p<0.1. Excluded instruments are: (1) for
production diversity: the log of mean rainfall, log of mean maximum temperature, and log of mean minimum temperature; (2) for empowerment indicators in Models 1, 2, 4, and 5: son ratio and distance to market; and (3) for empowerment indicators in Model 3: son ratio. Instruments for interactions of production diversity and empowerment with child under 2 are the instruments for each variable multiplied by the child under 2 dummy variable. Control variables are identical to those in the mother’s regression, plus a dummy for a child under 2, a girl child dummy, age in months, and age squared.
26

Table 5.5 Summary of coefficient estimates: Production diversity, women’s empowerment, and children’s weight-for-height z-score
Weight-for-height z-score
Variable Model 1: Women’s
empowerment score
Model 2: Group
membership
Model 3: Control over
income
Model 4: Autonomy in
agricultural decisions Model 5: Workload OLS IV OLS IV OLS IV OLS IV OLS IV
Production diversity index 0.013 0.057 0.013 0.023 0.013 0.014 0.014 -0.016 0.014 -0.143
(0.018) (0.085) (0.018) (0.170) (0.018) (0.156) (0.018) (0.115) (0.018) (0.167)
Whether child is under 2 0.022 0.276** 0.022 0.373* 0.022 0.324*** 0.024 0.202* 0.018 0.758**
(0.026) (0.136) (0.026) (0.225) (0.026) (0.123) (0.026) (0.113) (0.026) (0.365)
Production diversity x child under 2 -0.338* -1.900 -0.385*** -1.959** -0.321** -1.853 -0.377*** -1.136** -0.517*** 0.168
(0.185) (1.184) (0.141) (0.855) (0.151) (1.588) (0.141) (0.515) (0.188) (0.936) Women’s empowerment indicators Empowerment score of woman -0.128 0.319
(0.126) (0.705) Empowerment score x child under 2 -0.053 0.743
(0.193) (1.215)
Number of groups in which respondent is active member 0.006 0.522 (0.033) (0.332)
Number of groups x child under 2 0.075 0.230
(0.064) (0.767)
Control over income 0.014 0.123
(0.018) (0.259) Control over income x child under 2 -0.023 0.078
(0.028) (0.690)
Autonomy in agricultural decisionmaking 0.016 0.236
(0.017) (0.213) Autonomy x child under 2 0.024 0.041
(0.027) (0.134)
Hours spent in paid and unpaid work -0.002 0.232*
(0.008) (0.137)
27

Table 5.5 Continued
Weight-for-height z-score
Variable Model 1: Women’s
empowerment score
Model 2: Group
membership
Model 3: Control over
income
Model 4: Autonomy in
agricultural decisions Model 5: Workload OLS IV OLS IV OLS IV OLS IV OLS IV
Hours worked x child under 2 0.014 -0.338*
(0.013) (0.192)
Number of observations 2,718 2,682 2,718 2,718 2,718 2,718 2,715 2,679 2,718 2,682
Hansen’s J statistic, Ho: instruments are valid 20.538 13.979 16.433 15.546 8.151
p-value 0.002 0.007 0.002 0.004 0.086 Kleibergen-Paap LM test statistic Ho: equation underidentified 64.069 14.250 5.901 9.549 13.722
p-value 0.000 0.014 0.316 0.089 0.017 Kleibergen-Paap Wald weak-instrument F-statistic 6.461 1.785 0.728 1.155 1.723
Anderson-Rubin Wald test (p-value) 0.001 0.000 0.000 0.002 0.002 Anderson-Rubin chi-square test (p-value) 0.001 0.000 0.000 0.002 0.002
Source: Authors’ estimates using the 2012 Nepal Suaahara baseline data. Notes: OLS = ordinary least squares; IV = instrumental variables; Robust standard errors in parentheses; *** p<0.01, ** p<0.05, * p<0.1. Excluded instruments are: (1) for
production diversity: the log of mean rainfall, log of mean maximum temperature, and log of mean minimum temperature; (2) for empowerment indicators in Model 1: son ratio and distance to market; (3) for empowerment indicators in Models 2 and 3: son ratio; and (4) for empowerment indicators in Models 4 and 5: distance to market. Instruments for interactions of production diversity and empowerment with child under 2 are the instruments for each variable multiplied by the child under 2 dummy variable. Control variables are identical to those in the mother’s regression, plus a dummy for a child under 2, a girl child dummy, age in months, and age squared.
28

Table 5.6 Summary of coefficient estimates: Production diversity, women’s empowerment, and children’s height-for-age z-score
Height-for-age z-score
Variable
Model 1: Women’s
empowerment score
Model 2: Group
membership
Model 3: Control over
income
Model 4: Autonomy in agricultural
decisions Model 5: Workload OLS IV OLS IV OLS IV OLS IV OLS IV
Production diversity index 0.002 0.040 0.002 0.257** 0.002 0.292* 0.005 -0.105 0.007 -0.116
(0.019) (0.092) (0.019) (0.101) (0.019) (0.174) (0.019) (0.148) (0.020) (0.170)
Whether child is under 2 -0.001 -0.103 -0.002 -0.402*** -0.002 -0.125 -0.002 -0.254* -0.011 0.015
(0.026) (0.133) (0.026) (0.147) (0.026) (0.139) (0.026) (0.146) (0.026) (0.301)
Production diversity x child under 2 -0.526*** -0.916 -0.427*** 1.118* -0.343** 1.178 -0.421*** 0.788 -0.741*** 1.570*
(0.187) (1.104) (0.149) (0.586) (0.158) (1.639) (0.149) (0.663) (0.197) (0.929) Women’s empowerment indicators Empowerment score of woman 0.070 -2.002***
(0.126) (0.760) Empowerment score x child under 2 0.169 1.570
(0.184) (1.110)
Number of groups in which respondent is active member -0.002 -0.604**
(0.039) (0.302) Number of groups x child under 2 0.013 0.900*
(0.072) (0.524)
Control over income 0.037** -0.021
(0.018) (0.282) Control over income x child under 2 -0.038 -0.522
(0.028) (0.751)
Autonomy in agricultural decisionmaking 0.030 0.644**
(0.019) (0.264) Autonomy x child under 2 0.010 -0.152
(0.028) (0.157)
Hours spent in paid and unpaid work -0.020** 0.297**
(0.009) (0.138)
29

Table 5.6 Continued
Height-for-age z-score
Variable
Model 1: Women’s
empowerment score
Model 2: Group
membership
Model 3: Control over
income
Model 4: Autonomy in agricultural
decisions Model 5: Workload OLS IV OLS IV OLS IV OLS IV OLS IV
Hours worked x child under 2 0.031** -0.195
(0.013) (0.171)
Number of observations 2716 2680 2716 2680 2716 2716 2713 2677 2716 2680 Hansen’s J statistic, Ho: instruments are valid 11.059 11.763 10.900 4.740 7.305
p-value 0.087 0.067 0.028 0.578 0.294 Kleibergen-Paap LM test statistic Ho: equation underidentified 62.749 23.458 5.680 11.806 13.974
p-value 0.000 0.001 0.339 0.107 0.052 Kleibergen-Paap Wald weak-instrument F-statistic 6.329 2.390 0.700 1.151 1.398
Anderson-Rubin Wald test (p-value) 0.005 0.005 0.003 0.005 0.005 Anderson-Rubin chi-square test (p-value) 0.005 0.005 0.003 0.005 0.005
Source: Authors’ estimates using the 2012 Nepal Suaahara baseline data. Notes: OLS = ordinary least squares; IV = instrumental variables; Robust standard errors in parentheses; *** p<0.01, ** p<0.05, * p<0.1. Excluded instruments are: (1) for
production diversity: the log of mean rainfall, log of mean maximum temperature, and log of mean minimum temperature and (2) for empowerment indicators in all models: son ratio and distance to market. Instruments for interactions of production diversity and empowerment with child under 2 are the instruments for each variable multiplied by the child under 2 dummy variable. Control variables are identical to those in the mother’s regression, plus a dummy for a child under 2, a girl child dummy, age in months, and age squared.
30

Discussion and Policy Implications Our results suggest that production diversity at the household level plays an important role in determining maternal nutrition outcomes: mothers’ dietary diversity and BMI. The effects of production diversity on children’s nutrition outcomes appear to be mediated through the age of the child. We find that production diversity is positively associated with dietary diversity for children under two and predicts WAZ, WHZ, and HAZ for children over two years of age.
Different dimensions of women’s empowerment also appear to have different effects on dietary diversity and nutritional status for both mothers and children. Autonomy in agricultural production decisions emerges as a key determinant of almost all mother and child outcomes, with the exception of maternal BMI. The number of hours in paid and unpaid work is also positively associated with maternal dietary diversity, children’s dietary diversity, and children’s WHZ and HAZ. Control of income is important as a determinant of maternal BMI and child’s WAZ, while group membership is positively associated with maternal BMI.
The highly significant and positive association between women’s autonomy in agricultural production and almost all maternal and child outcomes is consistent with bargaining models that suggest that individuals who have greater decisionmaking power in the household receive a larger share of the benefits from household resources, including nutritious food. The positive impact of hours worked also points to the possibility that an income effect may be associated with improved dietary diversity among both mothers and children, and with nutritional outcomes for children but not for mothers. However, the results for hours worked also point to the ambiguity of women’s workload as an indicator of women’s empowerment. By construction, the WEAI treats excessive work by women, defined as spending more than 10.5 hours per day in paid and unpaid activities, as a sign of disempowerment. However, our regressions suggest that the number of hours worked by a woman in both paid and unpaid tasks contributes to improved diets and nutrition status for her children, though not necessarily her own nutrition status. Workload thus emerges as something similar to a double-edged sword: does the income derived from work make additional resources available for improving both maternal and child nutrition, or do mothers voluntarily work more hours to improve their families’ nutrition, but at the expense of their own empowerment and nutrition?
Overall, our results also suggest that the domains of empowerment that are significant for women and children’s diet and nutrition outcomes may not always overlap. This suggests that improved nutrition is not necessarily correlated with being empowered in all the domains of empowerment and that different domains may have different impacts on nutrition, consistent with other findings in the empowerment literature (Kabeer 1999). For maternal BMI, overall empowerment, engagement in the community, and control of income emerge as important, whereas empowerment related to autonomy in production and the mother’s workload are determinants of her own dietary diversity. It is also noteworthy that autonomy in production and, to a lesser extent, workload emerge consistently as a determinant of child nutrition, across several outcomes.
Measures of autonomy have recently been attracting attention as another way to conceptualize empowerment (Ryan and Deci 2000, 2011; Vaz et al. 2013). In this particular example, the autonomy indicator measures the extent to which a woman’s motivation for her behavior in agricultural decisionmaking is fairly autonomous as opposed to somewhat controlled and is also related to her psychological well-being. Thus, interventions to increase women’s agency and capability to make decisions in agriculture may not only provide another opportunity to engage them more visibly in agriculture, an area where they have traditionally been undercounted (FAO 2011), but also work to improve child nutrition as well as their own well-being.
31

REFERENCES
Alderman, H., P. A. Chiappori, L. Haddad, J. Hoddinott, and R. Kanbur. 1995. “Unitary versus Collective Models of the Household: Is It Time to Shift the Burden of Proof?” World Bank Research Observer 10 (1): 1–19.
Alkire, S. 2007. “Measuring Agency: Issues and Possibilities.” Indian Journal of Human Development 1 (1): 169–178.
Alkire, S., and J. Foster. 2011a. “Counting and Multidimensional Poverty Measurement. Journal of Public Economics 95 (7/8): 476–487.
________. 2011b. “Understandings and Misunderstandings of Multidimensional Poverty Measurement.” Journal of Economic Inequality 9: 289–314.
Alkire, S., R. Meinzen-Dick, A. Peterman, A. R. Quisumbing, G. Seymour, and A. Vaz. 2013. “The Women’s Empowerment in Agriculture Index.” World Development 52: 71–91.
Arimond, M., and M. T. Ruel. 2004. “Dietary Diversity Is Associated with Child Nutritional Status: Evidence from 11 Demographic and Health Surveys.” Journal of Nutrition 134: 2579–2585.
Arimond, M., C. Hawkes, M. T. Ruel, Z. Sifri, P. R. Berti, J. L. Leroy, J. Low, L. R. Brown, and E. A. Frongillo. 2010. “Agricultural Interventions and Nutrition: Lessons from the Past and New Evidence.” In Combating Micronutrient Deficiencies: Food-Based Approaches, edited by B. Thompson and L. Amoroso, 41–75. Rome: Food and Agriculture Organization of the United Nations and CAB International.
Arimond, M., D. Wiesmann, E. Becquey, A. Carriquiry, M. C. Daniels, M. Deitchler, N. Fanou-Fogny, et al. 2010. “Simple Food Group Diversity Indicators Predict Micronutrient Adequacy of Women’s Diets in 5 Diverse, Resource-Poor Settings.” Journal of Nutrition 140 (11): 2059S–2069S.
Central Bureau of Statistics. 2012. Nepal Living Standards Survey 2010/11, Third Round (NLSS-III). Kathmandu, Nepal: National Planning Commission Secretariat.
Chirkov, V., R. M. Ryan, and E. L. Deci. 2011. Human Autonomy in Cross-Cultural Context: Perspectives on the Psychology of Agency, Freedom, and Wellbeing (Cross-Cultural Advancements in Positive Psychology). Dordrecht, the Netherlands: Springer.
Cunningham, K., E. Ferguson, R. Uauy, R. and M. T. Ruel. 2013. “Women’s Empowerment and Child Nutritional Status in South Asia: a Critical Synthesis of the Literature,” Unpublished manuscript.
Cunningham, K., S. Kadiyala, S. Chakrabarti, H. J. Malapit, P. Menon, K. Singh, P. Tyagi, et al. 2013. Suaahara Baseline Survey Report. Washington, DC: International Food Policy Research Institute.
Das Gupta, M., J. Zhenghwa, L. Bohua, X. Zhenming, W. Chung, and B. Hwa-Ok. 2003. “Why Is Son Preference So Persistent in East and South Asia? A Cross-Country Study of China, India and the Republic of Korea.” Journal of Development Studies 40 (2): 153–187.
Doss, C. R. 2006. “The Effects of Intrahousehold Property Ownership on Expenditure Patterns in Ghana.” Journal of African Economies 15 (1): 149–180.
Duflo, E., and C. Udry. 2004. Intrahousehold Resource Allocation in Côte d’Ivoire: Social Norms, Separate Accounts and Consumption Choices. Working Paper No. w10498. Cambridge, MA, US: National Bureau of Economic Research.
Engle, P. L., P. Menon, and L. Haddad. 1997. Care and Nutrition: Concepts and Measurement. Washington, DC: International Food Policy Research Institute.
FAO (Food and Agriculture Organization of the United Nations). 2011. The State of Food and Agriculture 2010–2011. Women in Agriculture: Closing the Gender Gap for Development. Rome: Food and Agriculture Organization of the United Nations.
Gillespie, S. 2001. “Health and Nutrition.” In Empowering Women to Achieve Food Security, Brief 8, edited by A. Quisumbing and R. Meinzen-Dick. Washington, DC: International Food Policy Research Institute.
32

Gillespie, S., J. Harris, and S. Kadiyala. 2012. The Agriculture-Nutrition Disconnect in India: What Do We Know? IFPRI Discussion Paper No. 1187. Washington, DC: International Food Policy Research Institute.
Haddad, L., J. Hoddinott, and H. Alderman. 1997. Intrahousehold Resource Allocation in Developing Countries: Methods, Models, and Policy. Baltimore: Johns Hopkins University Press.
Haddad, L., C. Peña, C. Nishida, and S. Street. 1996. Food Security and Nutrition Implications of Intrahousehold Bias: A Review of Literature. FCND Discussion Paper 19. Washington, DC: International Food Policy Research Institute.
Headey, D. D. 2012. “Developmental Drivers of Nutritional Change: A Cross-Country Analysis.” World Development 42: 76–88.
Hoddinott, J. 2011. “Agriculture, Health, and Nutrition: Toward Conceptualizing the Linkages.” In 2020 Conference: Leveraging Agriculture for Improving Nutrition and Health. Washington, DC: International Food Policy Research Institute.
Hoddinott, J., and L. Haddad. 1995. “Does Female Income Share Influence Household Expenditures? Evidence from Côte d’Ivoire.” Oxford Bulletin of Economics and Statistics 57 (1): 77–96.
Joshi, N., K. E. Agho, M. J. Dibley, U. Senarath, and K. Tiwari. 2012. “Determinants of Inappropriate Complementary Feeding Practices in Young Children in Nepal: Secondary Data Analysis of Demographic and Health Survey 2006.” Maternal and Child Nutrition 8 (Suppl 1): 45–59.
Kabeer N. 1999. “Resources, Agency, Achievements: Reflections on the Measurement of Women’s Empowerment.” Development and Change 30 (3): 435–464.
Kilic, T., A. Palacios-Lopez, and M. Goldstein. 2013. Caught in a Productivity Trap: A Distributional Perspective on Gender Differences in Malawian Agriculture. World Bank Policy Research Working Paper 6381. Washington, DC: World Bank.
Meinzen-Dick, R., J. Behrman, P. Menon, and A. Quisumbing. 2012. “Gender: A Key Dimension Linking Agricultural Programs to Improved Nutrition and Health.” In Reshaping Agriculture for Nutrition and Health, edited by S. Fan and R. Pandya-Lorch, 135–144. Washington, DC: International Food Policy Research Institute.
Nepal Global Health Initiative Strategy. 2010. www.ghi.gov/whereWeWork/docs/NepalStrategy.pdf.
Nepal, MOHP (Ministry of Health and Population); New ERA; and ICF International Inc. 2012. Nepal Demographic and Health Survey (NDHS) 2011. Kathmandu, Nepal: MOHP, New ERA, and ICF International.
Nepal, National Planning Commission. 2012. Multi-sectoral Nutrition Plan. Vol. I, 1–97. Kathmandu, Nepal: National Planning Commission.
Nyyssölä, M. 2007. Women’s Status and Children’s Food Security in Nepal. WIDER Research Paper Vol. 2007/84. Helsinki, Finland: United Nations University, World Institute for Development Economics Research (UNU-WIDER).
Peterman, A., J. Behrman, and A. Quisumbing. 2010. A Review of Empirical Evidence on Gender Differences in Nonland Agricultural Inputs, Technology, and Services in Developing Countries. IFPRI Discussion Paper 975. Washington, DC: International Food Policy Research Institute.
Priya, N., G. Abhishek, V. Ravi, H. K. Thu, P. Mahesh, L. T. Giang, T. Jyotsna, et al. 2012. Study on Gender, Masculinity and Son Preference in Nepal and Vietnam. New Delhi: International Center for Research on Women.
Quisumbing, A. R. 2003. Household Decisions, Gender, and Development: A Synthesis of Recent Research. Washington, DC: International Food Policy Research Institute.
Ramalingaswami, V., U. Jonsson, and J. Rohde. 1996. “Commentary: The Asian Enigma.” In The Progress of Nations 1996. New York: United Nations Children’s Fund.
33

Ryan, R. M., and E. L. Deci. 2000. “Self-Determination Theory and the Facilitation of Intrinsic Motivation, Social Development, and Wellbeing.” American Psychologist 55 (1): 68–78.
________. 2011. “A Self-Determination Theory Perspective on Social, Institutional, Cultural, and Economic Supports for Autonomy and Their Importance for Wellbeing.” In Human Autonomy in Cross-Cultural Context: Perspectives on the Psychology of Agency, Freedom, and Wellbeing, edited by V. I. Chirkov, R. M. Ryan, and K. M. Sheldon, 45–64. Dordrecht, the Netherlands: Springer.
Smith, L. C., U. Ramakrishnan, A. Ndiaye, L. J. Haddad, and R. Martorell. 2003. The Importance of Women’s Status for Child Nutrition in Developing Countries. IFPRI Research Report 131. Washington, DC: International Food Policy Research Institute.
Sraboni, E., H. J. Malapit, A. Quisumbing, and A. Ahmed. 2013. “Women’s Empowerment in Agriculture: What Role for Food Security in Bangladesh?” Paper prepared for the ICAS VI conference, Rio de Janeiro, Brazil, October.
Stock, J. H., and M. Yogo. 2005. “Testing for Weak Instruments in Linear IV Regression.” In Identification and Inference for Econometric Models: Essays in Honor of Thomas Rothenberg, edited by D. W. K. Andrews and J. H. Stock, 80–108. Cambridge, UK: Cambridge University Press. Working paper version: NBER Technical Working Paper 284. www.nber.org/papers/T0284.
Swindale, A., and P. Bilinsky. 2006. Household Dietary Diversity Score (HDDS) for Measurement of Household Food Access: Indicator Guide (v.2). Washington, DC: Food and Nutrition Technical Assistance Project, Academy for Educational Development.
Torheim, L. E., F. Ouattara, M. M. Diarra, F. D. Thiam, I. Barikmo, A. Hatløy, and A. Oshaug. 2004. “Nutrient Adequacy and Dietary Diversity in Rural Mali: Association and Determinants.” European Journal of Clinical Nutrition 58: 594–604.
Udry, C., J. Hoddinott, H. Alderman, and L. Haddad. 1995. “Gender Differentials in Farm Productivity: Implications for Household Efficiency and Agricultural Policy.” Food Policy 20 (5): 407–423.
UNICEF (United Nations Children’s Fund). 1990. Strategy for Improved Nutrition of Women and Children in Developing Countries. New York: UNICEF.
USAID (United States Agency for International Development) Feed the Future. 2010. Feed the Future Nepal FY 2010 Implementation Plan. Washington, DC: USAID Feed the Future.
________. 2011. Nepal FY 2011–2015 Multi-Year Strategy Development. Washington, DC: USAID Feed the Future.
Vaz, A., S. Alkire, A. Quisumbing, and E. Sraboni. 2013. “Measuring Autonomy: Evidence from Bangladesh.” Unpublished manuscript, Oxford Poverty & Human Development Initiative.
WHO (World Health Organization) Multicentre Growth Reference Study Group. 2006. WHO Child Growth Standards: Length/height-for-age, weight-for-age, weight-for-length, weight-for-height and body mass index-for-age: Methods and development. Geneva: World Health Organization.
WHO. 2010. “The WHO Child Growth Standards.” www.who.int/childgrowth/standards/en/.
Yoong J., L. Rabinovich, and S. Diepeveen. 2012. The Impact of Economic Resource Transfers to Women versus Men: A Systematic Review. Technical report. London: EPPI-Centre, Social Science Research Unit, Institute of Education, University of London.
34


RECENT IFPRI DISCUSSION PAPERS
For earlier discussion papers, please go to www.ifpri.org/pubs/pubs.htm#dp. All discussion papers can be downloaded free of charge.
1312. Don’t tell on me: Experimental evidence of asymmetric information in transnational households. Kate Ambler, 2013.
1311. Can dairy value-chain projects change gender norms in rural Bangladesh?: Impacts on assets, gender norms, and time use. Agnes R. Quisumbing, Shalini D. Roy, Jemimah Njuki, Kakuly Tanvin, and Elizabeth Waithanji, 2013.
1310. Can government-allocated land contribute to food security?: Intrahousehold analysis of West Bengal’s microplot allocation program. Florence Santos, Diana Fletschner, Vivien Savath, and Amber Peterman, 2013.
1309. The National Health Insurance Scheme in Ghana: Implementation challenges and proposed solutions. Gissele Gajate-Garrido and Rebecca Owusua, 2013.
1308. Gender inequalities in ownership and control of land in Africa: Myths versus reality. Cheryl Doss, Chiara Kovarik, Amber Peterman, Agnes R. Quisumbing, Mara van den Bold, 2013.
1307. Farmer preferences for drought tolerance in hybrid versus inbred rice: Evidence from Bihar, India. Patrick S. Ward, David L. Ortega, David J. Spielman, Vartika Singh, 2013.
1306. Borrowing from the insurer: An empirical analysis of demand and impact of insurance in China. Yanyan Liu, Kevin Chen, Ruth Hill, and Chengwei Xiao, 2013.
1305. Organizational partnerships for food policy research impact: A review of what works. Athur Mabiso, Teunis Van Rheenen, and Jenna Ferguson, 2013.
1304. Fertilizer in Ethiopia: An assessment of policies, value chain, and profitability. Shahidur Rashid, Nigussie Tefera, Nicholas Minot, and Gezahengn Ayele, 2013.
1303. The global landscape of poverty, food insecurity, and malnutrition and implications for agricultural development strategies. Derek Headey, 2013.
1302. Leveling with friends: Social networks and Indian farmers’ demand for agricultural custom hire services. Nicolas Magnan, David J. Spielman, Travis J. Lybbert, and Kajal Gulati, 2013.
1301. Assessing the potential and policy alternatives for achieving rice competitiveness and growth in Nigeria. Michael Johnson, Hiroyuki Takeshima, and Kwabena Gyimah-Brempong, 2013.
1300. Revisiting agricultural input and farm support subsidies in Africa —The case of Ghana: lessons from four large government programs (mechanization, fertilizer, block farms, and marketing). Samuel Benin, Michael Johnson, Emmanuel Abokyi, Gerald Ahorbo, Kipo Jimah, Gamel Nasser, Victor Owusu, Joe Taabazuing, and Albert Tenga, 2013.
1299. The operational evidence base for delivering direct nutrition interventions in India: A desk review. Rasmi Avula, Suneetha Kadiyala, Kavita Singh, and Purnima Menon, 2013.
1298. Rethinking the measurement of undernutrition in a broader health context: Should we look at possible causes or actual effects? Alexander J. Stein, 2013.
1297. Women’s empowerment in agriculture: What role for food security in Bangladesh?. Esha Sraboni, Hazel J. Malapit, Agnes R. Quisumbing, and Akhter U. Ahmed, 2013.
1296. Sustainability of EU food safety certification: A survival analysis of firm decisions. Catherine Ragasa, Suzanne Thornsbury, and Satish Joshi, 2013.
1295. Efficiency and productivity differential effects of land certification program in Ethiopia: Quasi-experimental evidence from Tigray. Hosaena Ghebru Hagos and Stein Holden, 2013.
1294. Women’s empowerment and nutrition: An evidence review. Mara van den Bold, Agnes R. Quisumbing, and Stuart Gillespie, 2013.
1293. An evaluation of poverty prevalence in China: New evidence from four recent surveys. Chunni Zhang, Qi Xu, Xiang Zhou, Xiaobo Zhang, and Yu Xie, 2013.
1292. Cost-benefit analysis of the African risk capacity facility. Daniel J. Clarke and Ruth Vargas Hill, 2013.
1291. Agricultural mechanization patterns in Nigeria: Insights from farm household typology and agricultural household model simulation. Hiroyuki Takeshima, Alejandro Nin Pratt, Xinshen Diao, 2013.

INTERNATIONAL FOOD POLICY RESEARCH INSTITUTE
www.ifpri.org
IFPRI HEADQUARTERS 2033 K Street, NW Washington, DC 20006-1002 USA Tel.: +1-202-862-5600 Fax: +1-202-467-4439 Email: [email protected]
0