wolf creek, responses 30 - nuclear regulatory commission
TRANSCRIPT
30. Additional details regarding thedetailed assessment ofimpingement currently beingprepared by WCNOC staff (as citedin Enclosure 3 to WM 06-0046,November 17, 2006).
Aquatic Ecology Page 2 of 3
* Drawings and a detailed description of the circulating water system/service watersystem/essential service water system.
- Discharge Monitoring Reports for the last 12 month period.
- Whole effluent toxicity testing documentation or reports conducted at the facility (and asspecified in the facilities National Pollutant Discharge Elimination Systems [NPDES]permit).
• Item D.21 of the Facilities NPDES permit states that information required by the 316(b)Phase II regulations shall be submitted to Kansas Department of Heath & Environment(KDHE) in accordance with the dates indicated in the Phase II regulations. Pleasedescribe the steps conducted to date by WCNOC to comply with this permit requirementand provide any data collected to date in support of this submission.
" Current and historic flow records for the Neosho River.
" A statement is made in the 5th paragraph of Enclosure 2 to WM 06-0046 (November 17,2006) that the state of Kansas has not required entrainment monitoring and will notrequire it for the 316(b) determination. Please provide documentation from KDHEregarding this issue.
- Larval fish monitoring data as described in Paragraph 6 of Enclosure 2 to WM 06-0046(November 17, 2006).
- If available, information on the location of the spawning areas for the various fish
species in CCL.
• Bathymetric map of CCL.
" Available information regarding the initial stocking of CCL and subsequent stockingefforts.
" Available information regarding trends in the Neosho River fish populations.
" As discussed in Enclosure 1 to WM 06-0046 (November 17, 2006), please provide anyinformation available regarding WCNOC's stakeholder participation in the WatershedRestoration and Protection Strategy.
- Additional details regarding the detailed assessment of impingement currently beingprepared by WCNOC staff (as cited in Enclosure 3 to WM 06-0046, November 17,2006).
- Possible cold shock impacts to gizzard shad is mentioned in Section 2.2 of the ER(WCGS, 1990). If there have been any incidents of cold shock to gizzard shad or otherfish, please provide supporting data.
- Within Section 2.2 of the ER, it is noted that WCNOC develops annual fisherymonitoring reports and management plans. Please have available the most recentpublication of each of these reports.
Draft
V
WOLF CREEK GENERATING STATION
WOLF CREEK COOLING IMPOUNDMENT
CLEAN WATER ACT 316(b) - COOLING WATER INTAKE STRUCTURES
COMPREHENSIVE DEMONSTRATION STUDY
Prepared by:
Supervisor RegulatorySupport Approval:
Manager Regulatory AffairsApproval:
,- I j:j-S=L,-Ralph Logsdon Dan Haines
Bob Hammond Date
Kevin Moles Date
Executive Summary
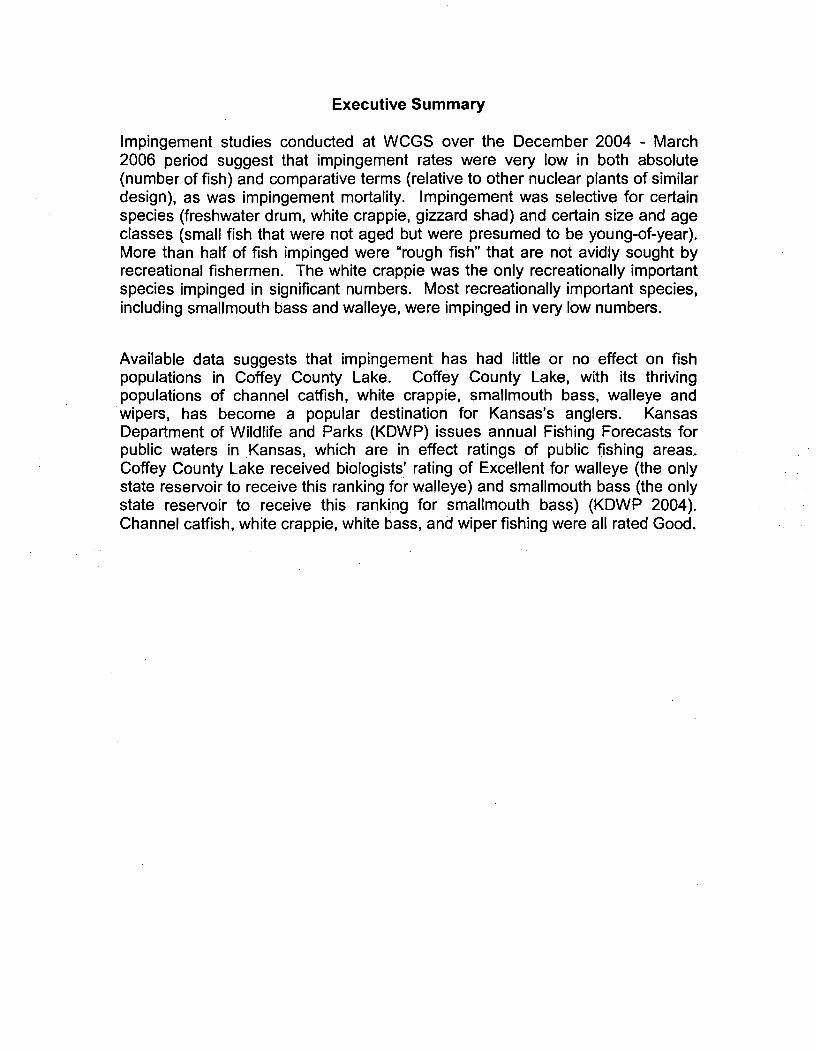
Impingement studies conducted at WCGS over the December 2004 - March2006 period suggest that impingement rates were very low in both absolute(number of fish) and comparative terms (relative to other nuclear plants of similardesign), as was impingement mortality. Impingement was selective for certainspecies (freshwater drum, white crappie, gizzard shad) and certain size and ageclasses (small fish that were not aged but were presumed to be young-of-year).More than half of fish impinged were "rough fish" that are not avidly sought byrecreational fishermen. The white crappie was the only recreationally importantspecies impinged in significant numbers. Most recreationally important species,including smallmouth bass and walleye, were impinged in very low numbers.
Available data suggests that impingement has had little or no effect on fishpopulations in Coffey County Lake. Coffey County Lake, with its thrivingpopulations of channel catfish, white crappie, smallmouth bass, walleye andwipers, has become a popular destination for Kansas's anglers. KansasDepartment of Wildlife and Parks (KDWP) issues annual Fishing Forecasts forpublic waters in Kansas, which are in effect ratings of public fishing areas,.Coffey County Lake received biologists' rating of Excellent for walleye (the onlystate reservoir to receive this ranking for walleye) and smallmouth bass (the onlystate reservoir to receive this ranking for smallmouth bass) (KDWP 2004).Channel catfish, white crappie, white bass, and wiper fishing were all rated Good.
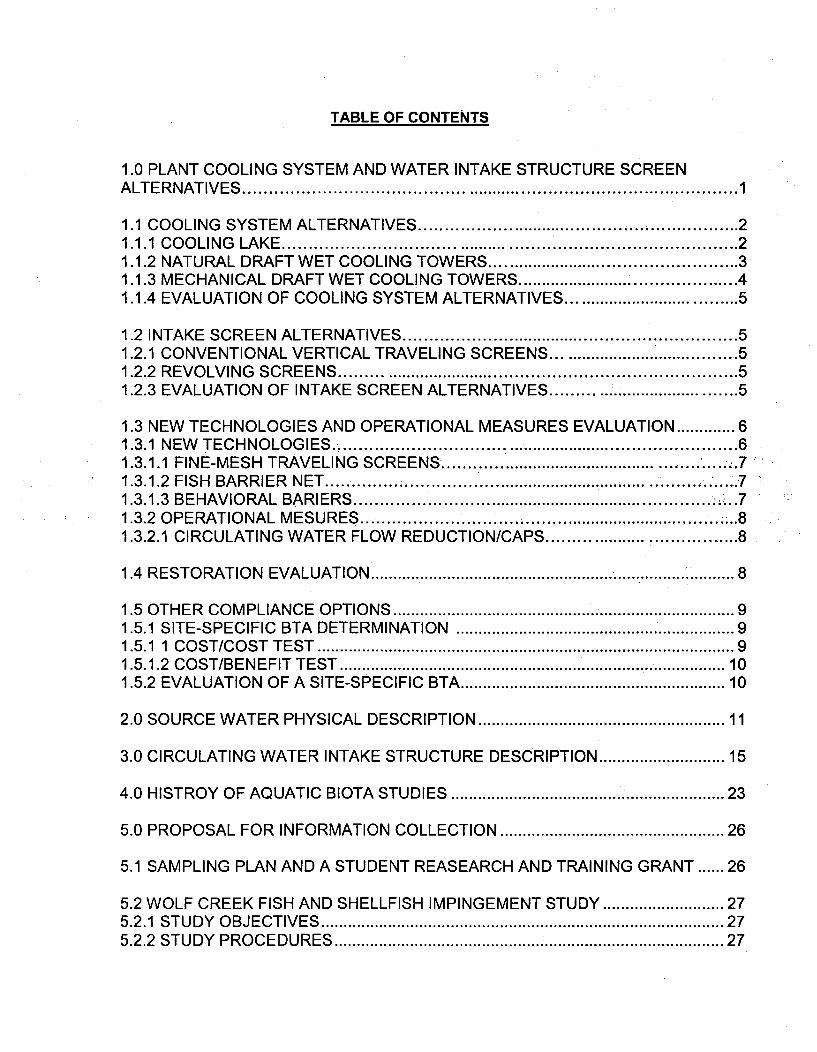
TABLE OF CONTENTS
1.0 PLANT COOLING SYSTEM AND WATER INTAKE STRUCTURE SCREENA LTER NATIV ES ........................................................................................... 1
1.1 COOLING SYSTEM ALTERNATIVES ................................ 21.1.1 C O O LIN G LA K E ...................................................................................... 21.1.2 NATURAL DRAFT WET COOLING TOWERS ............................................. 31.1.3 MECHANICAL DRAFT WET COOLING TOWERS ...................... 41.1.4 EVALUATION OF COOLING SYSTEM ALTERNATIVES .................................. 5
1.2 INTAKE SCREEN ALTERNATIVES .................................. 51.2.1 CONVENTIONAL VERTICAL TRAVELING SCREENS ................................... 51.2.2 REVOLVING SCREENS .......................................................................... 51.2.3 EVALUATION OF INTAKE SCREEN ALTERNATIVES ................................. 5
1.3 NEW TECHNOLOGIES AND OPERATIONAL MEASURES EVALUATION ...... 61.3.1 NEW TECHNO LO G IES -, ..... I ......................... ................... ........................... 61.3.1.1 FINE-MESH TRAVELING SCREENS................. ... ..... ............... 71.3.1.2 FISH BARRIER NET ............................ ............ ........ 71.3.1.3 BEHAVIO RAL BARIERS ........................................................................ .71.3.2 OPERA TIONAL MESURES ............................ I .......................................... 81.3.2.1 CIRCULATING WATER FLOW REDUCTION/CAPS ................................. 8
1.4 RESTORATION EVALUATION ..................................... 8
1.5 OTHER COMPLIANCE OPTIONS ........................................................................ 91.5.1 SITE-SPECIFIC BTA DETERMINATION ......................................................... 91.5.1 1 CO ST/CO ST TEST ......................................................................................... 91.5.1.2 COST/BENEFIT TEST ........................................ 101.5.2 EVALUATION OF A SITE-SPECIFIC BTA ....................................................... 10
2.0 SOURCE WATER PHYSICAL DESCRIPTION .................................................... 11
3.0 CIRCULATING WATER INTAKE STRUCTURE DESCRIPTION ......................... 15
4.0 HISTROY OF AQUATIC BIOTA STUDIES ............................ 23
5.0 PROPOSAL FOR INFORMATION COLLECTION ............................................. 26
5.1 SAMPLING PLAN AND A STUDENT REASEARCH AND TRAINING GRANT ...... 26
5.2 WOLF CREEK FISH AND SHELLFISH IMPINGEMENT STUDY ....................... 275.2.1 STUDY O BJECTIVES ..................................................................................... 275.2.2 STUDY PROCEDURES ............................................... I ................... ................. 27
6.0 IMPINGEMENT MORTALITY CHARACTERIZATION STUDY ........................... 29
7.0 RESTORATION PLAN .......................................... 29
8.0 VERIFICATION MONITORING PLAN ................................................................. 30
9.0 CWIS IMPINGEMENT 316(B) DETERMINATION ....................... 31
9.1 IMPACT OF FISH AND SHELLFISH RESOURCES FROM IMPINGEMENT ....... 319.1.1 ASSESSMENT ............................ ..... 339 .1.2 R E S U LT S ............................................................................................................. 34
9.2 IMPINGEMENT AT WCGS RELATIVE TO CCL FISHERY .. ............... 369.2.1 IM PO RTANT SPECIES ................................................................................... 36
9.3 IMPINGEMENT AT WCGS COMPARAED TO SIMILAR PLANTS ..................... 40
10.0 C O N C LUS IO N ................................................................................................. 41
11.0 LITERATURE CITED .............................. ............................... .... . ... . 50
FIGURES
Figure 2-1 50-M ILE VIVINITY MAP ............................................................. .................. 12Figure 2-2 6-M ILE VIVINITY MAP ............................................................................ 13Figure 2-3 SITE-BOUNDARY MAP .......................................................................... 14
DRAWINGS
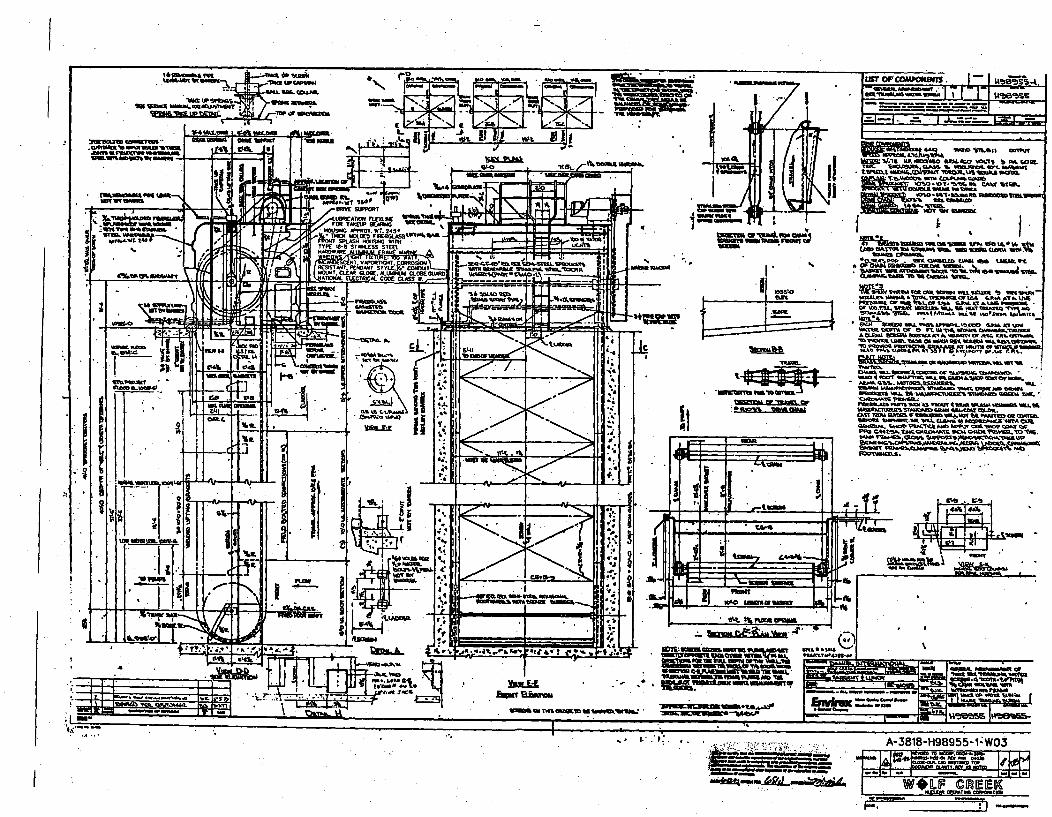
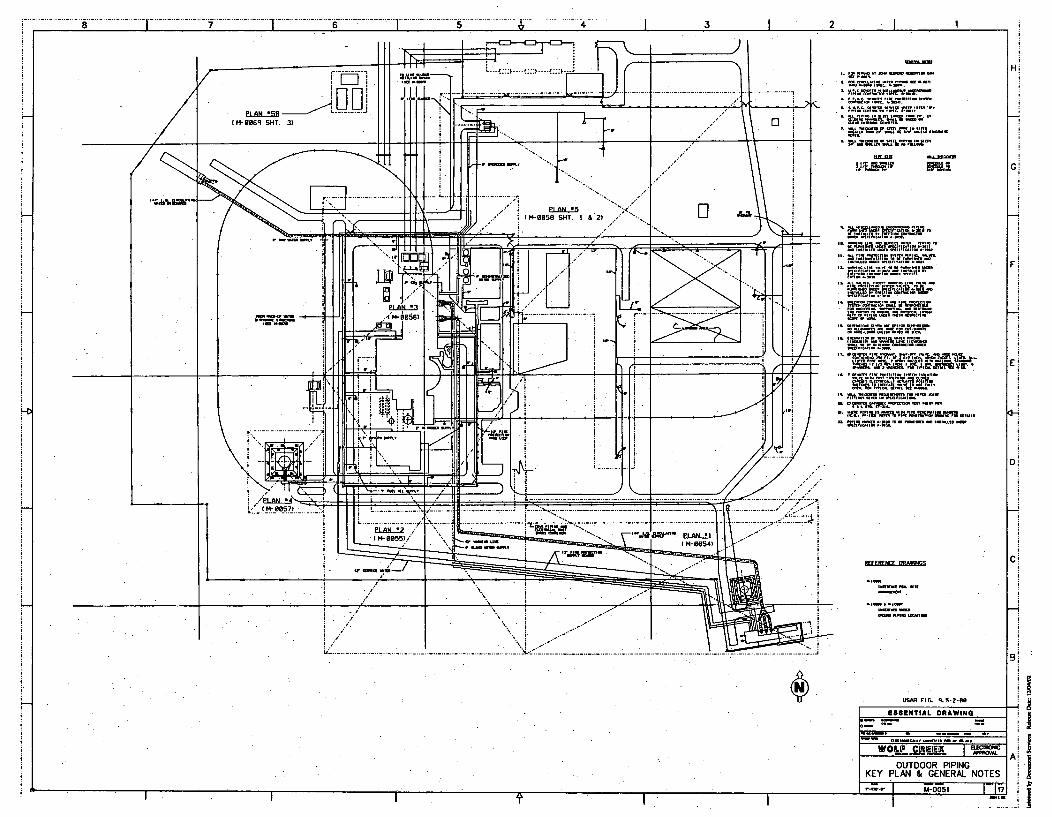
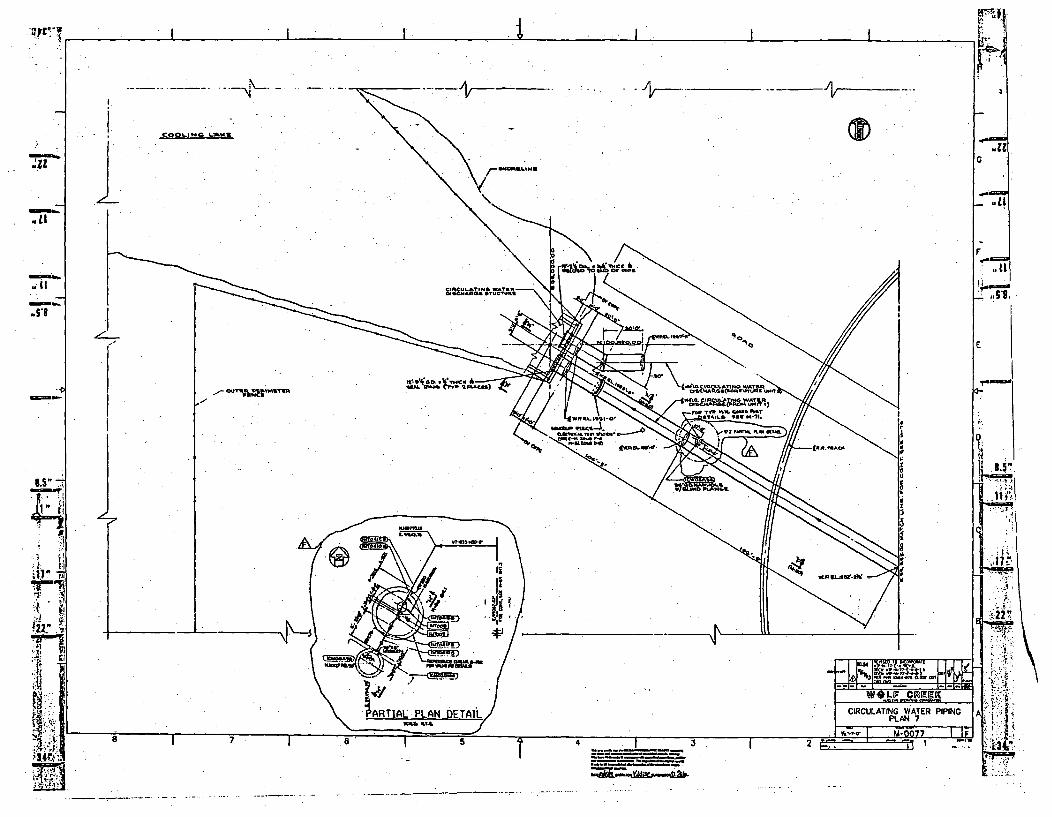
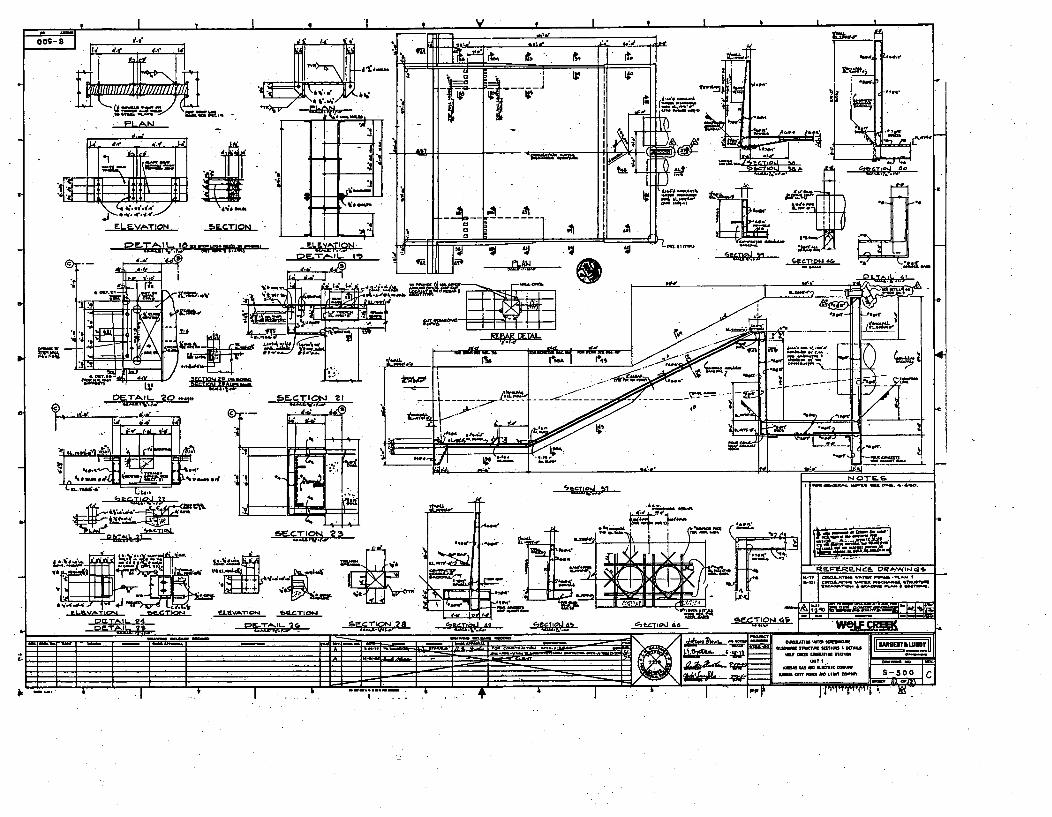
CIRCULATING WATER SCREENHOUSE DRAWING (2) .................................... 17 & 18CIRCULATING WATER SCREEHOUSE TRAVELING SCREENS DRAWING ...... 19CIRCULATING WATER UNDERGROUND PIPING DRAWING (2) ..................... 20 & 21CIRCULATING WATER DISCHARGE PIPING DRAWING ..................................... 22
TABLES
STOCKING RECORD OF COFFEY COUNTY LAKE ............................................... 25
APPENDICES
APPENDIX A RAW IMPINGEMENT DATA
APPENDIX B 2006 FISHERY MONITORING REPORT AND 2007 PLAN
APPENDIX C BIOLOGICAL CONTROL OF GIZZARD SHAD AT A NUCLEARPOWER PLANT
APPENDIX D EPA REGION VII POLICY ON GIZZARD SHAD
APPENDIX E CORRESPONDENCE AND TELEPHONE CALL RECORDCONCERNING COFFEY COUNTY LAKE AND FISHERY
APPENDIX F MAKEUP WATER SCREENHOUSE EPA PHASE II 316(b)DETERMINATION

Comprehensive Demonstration Study
1.0 Plant Cooling System and Water Intake Structure Screen Alternatives
In selecting a nuclear power plant site, it is necessary to determine what heatdissipation or cooling system is to be incorporated in the overall design. Thecooling system to be used is a primary determinant of the size and character ofthe site required for the plant.
In Kansas, particularly in the southeastern region, the limited availability ofcooling water and the requirement to optimize water resource conservation andmanagement are overriding considerations leading to the selection of the plantsite. Natural stream flows in the region tend to be low during the summer and fallmonths and during periods of drought. Normal stream flows are periodicallyinadequate to supply makeup for a power-plant cooling system and the powerplants must be sited on or in proximity to an existing reservoir, or on a reservoirthat has been constructed to provide cooling water for the plant.
Therefore, long-range water resources planning and wisest possible use andconservation of available water resources are absolutely necessary in. thedevelopment of new generating capacity. Each of the alternative cooling systemdiscussed below offers somewhat different advantages and disadvantages with -
the respect to the requirements for effective water resource management.
The second major consideration in. the selection of the alternative coolingsystems is the reliability and maintenance problems of the system in questionu,:No matter how effective a design might be in its net consumptive use of water,the system is not a valid alternative if it is not highly reliable for the operation of abase load nuclear power generating station. Systems that require additionalroutine maintenance or periodic heavy maintenance may cause disruption ofpower generation and cutback of power delivery, key factors in the question ofsystem reliability.
The third criterion to be considered in the selection of the cooling system is cost.An economic comparison of the alternative cooling system involves estimation ofdifferences in the construction costs (for example, initial costs of equipment andland acquisition for the cooling facilities), and operating cost (for example,maintenance, fuel costs, net send-out capabilities, makeup and water treatmentcosts).
To enable a direct comparison between the alternative cooling system, the WolfCreek site has been assumed to be the location for all the systems. In this way,secondary variables such as pipeline and transmission line distances and accessroutes for road and railroad transportation are kept constant, along with othersite-sensitive environmental characteristics not inherently related to the type ofcooling system used.
1
1.1 Cooling System Alternatives
The heat dissipation system is an integral part of the power generating stationand is designed to dissipate or transfer wasted thermal energy to theenvironment. Even under ideal conditions, no thermodynamic process canconvert more than 60 percent of a fuel's thermal energy into mechanical energyused to power the electrical generators. The total amount of heat or thermalenergy that is released and the amount of heat that must be dissipated throughthe cooling system are functions of the type, size, and efficiency of the plant.
The nuclear steam supply system (NSSS) chosen for Wolf Creek has a full loadthermal output equivalent to 3,425 Mwt. Approximately 67 percent of the heatgenerated will be rejected or dissipated to the environment. To accomplish thisheat transfer, the required circulating water flow through the condenser will be1,225 cubic feet per second (cfs) at a temperature rise of 30.4' F at full load(Sargent & Lundy, 1974). The principal types of cooling systems currently beingused or planned for power generating stations include:
1. Cooling lake;2. Mechanical draft wet cooling tower:,3. Natural draft wet cooling:towers.,..ý
1.1.1 Cooling Lake
The' surface of alcooling lake dissipates waste heat to the atmosphere by fourheat transfer mechanisms: Evaporation, ,40 percent; radiation, 30 percent;conduction, 25 percent; and advection, 5 percent; all working as functions ofclimatic conditions (Koflat, 1971). Thus, the lake depends upon naturalconditions and phenomena to remove heat transferred to it by the circulation ofcooling lake water through the condensers. The size of the lake required isdetermined by such criteria as local climatic conditions, heat load, and effectivecooling area of the lake.
The cooling lake system alternative is an off-stream cooling water impoundmentcreated by damming Wolf Creek, a minor tributary of the Neosho River. Theplant draws circulating water fro the cooling lake, passes it through thecondensers, where it picks up heat, and returns it to the lake. The circulatingwater intake and discharge structure are separated by sufficient distance andbaffle dikes to avoid recirculating of the warm water directly back to thecondenser. Most of the water required both for the original filling and the makeupwater requirements of the lake arrive by pipeline from John Redmond Reservoiron the Neosho River. The remaining small portion of the water requirementscomes from Wolf Creek.
A lake surface of about 2,630 acres would be required to meet the temperaturelimitations of the condenser. However, during drought conditions equivalent to
one occurrence of a 5-year duration in 50 years, the makeup water from JohnRedmond Reservoir (JRR) would be limited to an average of 40 cfs to meet thewater quality flows in the Neosho River. With makeup limited to an average rateof 40 cfs, a lake with a 5,960-acre surface area would be required to provide forthe 2,630-acre surface area after maximum drawdown.
A significant advantage of the cooling lake system as compared with thealternative is that, except for the circulating water pumps, no additionalequipment is necessary for plant operation. Plant reliability is not jeopardized bythe possible mechanical failure of cooling tower fans as in the case with coolingtower systems. In addition, plant maintenance costs and spare parts inventoriesfor cooling lake systems are lower than with other systems. The major costassociated with this system is the construction of the retaining dam, the intakeand discharge structures, and the water diversion and return pipelines required tomaintain necessary water level and water quality.
Note: By definition, Wolf Creek's cooling lake system can be also considered asa "recirculating water" system as water from Coffey County Lake (also known asWolf Creek Lake) is pumped through the plant condensers for the purpose ofremoving waste heat, passed ,through a cooling; device (lake) for the purpose of,removing such, heatý from -the water and then passed again through• the-,;condensers (40 CFR Part 423.11 (h)).
1.1.2 Natural Draft Wet Cooling Towers
A wet cooling. tower system is a direct contact evaporative cooling device.-Circulating water from the condenser is cascaded down through the tower,passing over baffle plates, which break the flow into drops. Air is drawn acrossthe baffle plates, cooling the water by evaporation. The cooled water is thenpumped back through the condenser. The required airflow is created by eitherby fans (mechanical draft) or by a tall shell in which the heated air rises (naturaldraft) because of the chimney effect (Parker and Krenkel, 1969).
The volume of airflow and the cooing efficiency of a natural draft lower dependson the temperature differences betweens the air in the shell and the ambient air.Higher effluent air temperature are normally encountered in natural draft towersthan in mechanical draft towers, and natural draft towers are not generallyconsidered suitable for hot climates in which the air density and humiditydifferences between inside and outside would at times be too small to achievethe minimum required air flow and rate of evaporation of the circulating coolingwater (National Academy of Engineering, 1972).
Inherently, these conditions tend to reduce the cooling efficiency of a natural draftcooling tower during the hotter, drier months of the year. For example,meteorological data for the southeastern Kansas region indicate that, on theaverage, a wet-bulb temperature of 750 F would be exceeded at least 10 percent
of the time. At such conditions of temperature and humidity, cooling efficiencywould drop far below acceptable levels. Because of these atmosphericconditions, the natural draft wet cooling system was not considered practical andwas discarded from further consideration.
1.1.3 Mechanical Draft Wet Cooling Towers
In considering mechanical draft cooling towers, it was concluded that the induceddraft tower would be preferable to the forced draft type, because higherefficiencies are achievable with the former.
Of the cooling tower options, the mechanically induced draft wet tower appearsmost viable for the plant operation. However, this alternative would have as higha total water consumption as the cooling lake system and, subsequently, wouldrequire a storage lake of at least as great an area as the cooling lake system toprovide for storage of makeup water during drought conditions equivalent to oneoccurrence of 5-year duration in 50 years. The lake is required because themaximum water rate demand during summer drought conditions may exceed theaverage rate of availability (40 cfs) from JRR. Therefore, the wet cooling towersystem also requires stored water at. Wolf Creek-for: use as makeup to thecooling towers to replace water lost by evaporation and blowdown. The location.of the Wolf Creek storage lake, makeup water source, and the conveyance ofblowdown water to the Neosho River for this alternative would be similar to thatof the cooling lake system descdbed~above.
Water treatment requirements are also an important consideration in the analysisof cooling tower operation. Biocide treatment of the circulating water is requiredin all cooling systems to prevent the growth of biological organisms (slimes) inthe cooling system. However, cooling towers with considerable water surfaceexposed to air and sunlight may require additional biocide treatment to controlthe growth of algae. For the control of metal corrosion and scaling, coolingtowers system may require additional chemical treatment, depending on thequality of the circulating water and the particular materials used in the tower andrelated construction and equipment.
Because the wet cooling tower requires a storage lake with as much heatdissipating surface as the cooling lake system, there seems no reason to use thewet cooling tower. Particularly, the wet cooling water system is less attractive onthe basis of costs and reliability when compared with the cooling lake systembecause there would be added capital costs, higher operating cost, and otherpenalties. There would be power penalties as well, because of additionalauxiliary machinery power requirements. Added maintenance associated withthe cooling tower is also a concern. Routine maintenance would be required onthe cooling tower fans, gear reducers, drive shafts, motors, water pumps, valves,piping and headers, and other mechanical components. Maintenance would alsobe required on such components as louvers and fill material, in addition to the
maintenance of a storage lake and pumping facilities similar to the ones requiredfor a cooling lake system.
1.1.4 Evaluation of Cooling System Alternatives
Through careful consideration of the basic characteristics of each of the coolingsystem alternatives described above, it was determined that only the cooling lakesystem would be considered in the design of Wolf Creek Generating Station.
The environmental impact, economic and reliability considerations associatedwith these alternatives indicate that the cooling tower alternatives would causemore depletion of available natural resources by using such resources for theconstruction of towers, basins, piping, and associated electrical and mechanicalequipment. In addition, the cooling tower options would require the highestmanpower expenditure during construction and would result in the poorestutilization of fuel resources. Also, the cooling lake system would be the mostdesirable system from an aesthetic standpoint. Therefore, the cooling lakealternative conclusively offers significant environmental advantages over both ofthe cooling tower options (WCGS-ER, 1974).
1.2 Intake Screen Alternatives
1.2.1 Conventional Vertical Traveling Screens
The conventional vertically rotating single entry band type screen is the most-common mechanically operated screen in U.S. power plant intakes. It performs-efficiently over a long service life and requires relatively little operational andmaintenance attention. It is applicable to almost all water screening situationsand adapts easily to changing water levels. At present there is no provisions forreturning fish greater then 100 mm in size that survive impingement to thecooling lake.
1.2.2 Revolving Screens
Three major types of revolving screens were considered: vertical revolving drumscreens; horizontal revolving drum screens; and revolving disk screens.Revolving drum screen provide the possibility of returning fish to the body ofwater. But in the case of CCL, this would not be effective since there is no flowto carry the fish away. Revolving disk screens offer no advantage over othercommon screens for fish protection, while requiring a very large screen structureto limit approach velocities to species of fish apt to being impinged.
1.2.3 Evaluation of Intake Screen Alternatives
Regardless of the alternative being selected, the intake velocity will be limited to1.0 ft/sec at low water level. The sustained swimming speed of the adult species
of fish expected to inhabit the lake is sufficient to minimize involuntaryimpingement at water velocities to or less than 1.0 ft/sec. Phytoplankton,zooplankton, juvenile fish, and fish eggs will undoubtedly be subject to passagethrough the circulating water intake structure. The alternative structures aresimilar in terms of potential effects to biota and thus comparisons are notwarranted.
The conventional vertical traveling screen was selected as the type of screeningmechanism to be use at the CWIS (WCGS-ER, 1974). Further discussion onthe CWIS screening system is described in Section 3.0.
Note: The Makeup Water Screenhouse (MUSH) on the Neosho River is used onoccasion to add water to Coffey County Lake (CCL). Coffey County Lake wasconstructed as a cooling lake for the WCGS and is considered a Water of theState. The transfer of water from the Neosho River to CCL is a transfer from aWater of the State to another Water of the State. This is a water transfer and nota direct use of water by WCGS. At this time water transfers are not covered byNPDES permitting, and therefore exempt from 316(b) coverage (USEPA, 2006).See Appendix F for more detailed information.
1.3 New Technologies and Operational Measures Evaluations
The Environmental Protection Agency (EPA) 316(b) Phase II regulations, [40CFR 125.95(b)(l)(i)] requires that the 316(b) determination include a descriptionof technologies and operational measures, which will be evaluated further todetermine feasibility of implementation and" effectiveness in meeting impingementstandards. Several technologies and measures have been developed/conductedand have proven effective, in certain circumstances, in reducing impingement atvarious CWIS. The feasibility of implementation and the performance of suchtechnologies and operational measures are highly site-specific. The design andcapacity of the existing CWIS, as well as source waterbody physical andbiological characteristics, including additional power requirements and loss ingenerating capacity and unit availability will determine which technologies and/oroperational measures are practical for implementation and effective in reducingimpingement at WCGS.
1.3.1 New Technologies
A screening of technologies has been conducted to determine whichtechnologies offer the greatest potential for application at WCGS and thereforewould warrant further evaluation. Technologies have been screened based uponfeasibility for implementation, biological effectiveness (i.e., ability to achievereductions in impingement mortality), and cost of implementation (includingcapital, installation, and annual operations and maintenance costs).
Based upon the results of the technology screening process discussed above,the following is a list of technologies evaluated to reduce impingement andachieve a performance standard, in whole or in part, for reduction inimpingement. Following is a list of those technologies:
1. Fine-mesh traveling screens2. Fish barrier net; and3. Behavioral barriers.
1.3.1.1 Fine-Mesh Traveling Screens
Fine-mesh traveling screens require an approach velocity no greater than 0.5 ft/sto handle the higher potential clogging rate, which would be inherent with thefiner mesh-screening medium. This technology is not viable for WCGS intakesystem due to high screen flow velocities of the existing system. Furtherevaluation of this technology is not warranted.
1.3.1.2 Fish Barrier Net
A fish net barrier is a mesh curtain installed in the waterbody in front of CWIS.All flow to the intake passes through the net so all-aquatic life forms of a certainsize are blocked from entering the intake. The net barrier is sized large enoughto have very low approach and through net velocities f 0.1 ft/s of less to precludeimpingement of juvenile fish with limited swimming ability. The mesh size mustbe large enough to preclude fouling during normal station operation while atthesame time small enough to effectively block passage of organisms into theintake.. These conditions typically limit the mesh size such that adult and apercentage of juvenile fish can be blocked.
A typical design-loading rate for fish barrier nets is 20-gpm ft2 . Therefore, abarrier net to handle the CWIS flow would require a net area of approximately7,200 ft2 for WCGS CWIS (based upon existing facility design capacity).Maintaining such a fish barrier net in the open lake moored around the existingintake is not practical and would be an operational and mechanical nightmare toupkeep. Further evaluation of this technology is not warranted.
1.3.1.3 Behavioral Barriers
A behavioral barrier relies on avoidance or attraction responses of the targetaquatic organism to a specific stimulus to reduce the potential of impingement.Most of the stimuli tested to date are intended to repulse the organism from thevicinity of the intake structure. Nearly all the behavioral barrier technologies areconsidered to be experimental or limited in effectiveness to a single targetspecies. Further evaluation of this technology is not warranted.
None of the above listed technologies would further limit the limited amount ofimpingement seen at WCGS as determined by the impingement monitoring,result analysis and conclusions drawn in Sections 9.0 and 10.0 but thesetechnologies would in turn be impractical as to capital, operational andmaintenance cost.
1.3.2 Operational Measures
Only one operational measure has proven effective in reducing impingement atthe CWIS and that is by reducing the flow through the CWIS.
1.3.2.1 Circulating Water Flow Reduction/Caps
Circulating water flow caps are an operational control measure which wouldinclude administratively limiting the total withdrawal of cooling water from CCL toan agreed upon value. The flow reduction may be schedules for periods of theyear when impingement are highest to achieve a greater reduction toimpingement.
There. are two reasons why this operational measure, will not work. First; theimpingement rate for any particular time or month during the year, was not-high;.;enoughý to warrant this type of. operational control to reduce impingement.;Secondly, nuclear power plant do not run effectively by having to reduce powergeneration because of reduce flows through the CWIS. Nuclear power plant,.,cannotibe operated as peaking units.:.
Note: In Section 1.0 of this position paper the architect/contactor during theconstruction of WCGS used the best technology and operational measuresavailable at that time. There was no requirement to perform an impingementstudy at WCGS. KDHE position as indicated in a letter sent by M.W. Gray,Director, Division of Environment, dated February 21, 1975, to M. Miller (KGE)stated "It is in our opinion (KDHE) that Kansas Gas and Electric Company shallnot be held responsible for the loss of fish in the lake due to cold shock kill,impingement, or entrainment". A copy of this letter can be found in Appendix E.
1.4 Restoration Evaluation
The EPA 316(b) Phase II regulation [40 CFR 125.95(b)(I)(i)] allows considerationof restoration measures as one of the options that may be implemented, eitheralone or in combination with technology and/or operational measures, to achieveperformance standards for reduction of impingement. Facilities may proposerestoration measures that will result in an increase in the number of fish andshellfish in the waterbody that would be similar to those achieved with meetingperformance standards through the implementation of technologies and/oroperational measures. A further look at restoration as a tool to offsetimpingement rates can be found in Section 7.0.
1.5 Other Compliance Options
One additional compliance alternative that WCGS may pursue includes a site-specific determination of best technology available (BTA). The site-specificdetermination option would be undertaken only in the event the implementationof some combination of an intake technology, operation change or restoration issignificantly greater in cost than anticipated by EPA at this time.
1.5.1 Site-Specific BTA Determination
The intent of the WCGS approach to compliance is to meet the impingementperformance standard established by the EPA when the new rule waspromulgated. However, WCGS also recognizes that if the cost of reaching thesegoals cannot reasonably be achieved that the EPA 316(b) Phase II regulationallows a somewhat lower impingement standard. Specifically the new rule wouldallow WCGS to demonstrate that WCGS is eligible for site-specific determinationof BTA to minimize impingement if WCGS has selected, installed, and properlyoperating and maintaining measures that the director has determined to be theBTA to •minimize. adverse. environmental .-impact of. WCGS cooling water-operations.This compliance alternative allows WCGS to request a site-specific determinationof BTA for minimizing impingement if WCGS can demonstrate that the cost forcompliance- with, the new rule are significantly greater than those considered byEPA in the development of the new Irule. (cost/cost test) or that the costs::-associated with compliance are.. significantly greater than the benefits(cost/benefit test) that would accrue to the environment.
1.5.1. 1 Cost/Cost Test
If WCGS chooses to seek a site-specific determination of BTA, a cost/cost testhas to be performed to compare the cost of implementing options to achieve fullcompliance with the 316(b) Phase II standards to costs estimated by the EPA forthe WCGS facility for achieving full compliance. In the 316(b) Phase II rule, theEPA has assumed that the WCGS facility has already meet the performancestandards based on existing technologies and measures already in place.Therefore EPA has projected zero compliance cost for the WCGS facility(Federal Register, Vol. 69 - 7/9/2004, page 41678 - see Facility ID# DUT1 105).
One thing that has not been fully resolved by EPA is what constitutes "significant"compared to zero dollars that the EPA projected for WCGS. Any cost associatedwith power reduction or plant shutdown (> $100,00/day) to make changes plusthe cost of those changes to the CWIS or traveling screens will fall upward intothe significant range even though "significant" has not been defined.
1.5.1.2 Cost/Benefit Test
A cost/benefit test may also be performed for WCGS to compare the total costsof achieving compliance with the environmental benefits through implementationof the required technologies, operational, and/or restoration measures. Costsare the sum of direct costs and indirect costs of any intake, operational, and/orrestoration mitigation actions. Direct costs include the costs of implementingcompliance alternatives, including capital, O&M, and lost generation revenue dueto extended outages. Indirect costs include any costs associated withimpairments of higher energy prices, and negative ecological effects of themitigation actions on the waterbody.
The benefits arise from reducing impingement by the full amount of the 316(b)Phase II rule's performance standard relative to baseline conditions. Theeconomic benefits of reduction in impingement have been specified by the EPAin its evaluation of the national benefits of the rule. The classes of benefitsidentified by EPA in its assessments include direct use benefits (e.g., those formcommercial and recreational fishing), indirect use benefits (e.g., increased forageorganisms), and existence, or passive use benefits (e.g., improved biodiversity).
Restoration is a component of the cost/benefit approach.:. The: ability of-:a-;:,,.-.-,-restoration project(s) to generate benefits. to. offset impingement must, bedemonstrated. This requires a method that can. be used to, quantify restorationbenefits in a; manner comparable to impingement effects in the ecosystem.WCGS..restoration method and measures are described in Appendix B. Kansas.,Department of Wildlife and Parks (KDWP), formerly known as Kansas Fish andGame Commission, have accepted this methodology, the use of CCL as afishery under a re-stocking program, being used by WCGS. KDWP's lettersasserting that CCL is a fishery can be found in Appendix E.
1.5.2 Evaluation of a Site-Specific BTA
None of these methods described in the above paragraphs are viable and a site-specific BTA is not sought along with the use of other technologies andoperational measures to meet compliance with the 316(b) Phase II rule. Arestoration measure is the only true alternative resource left for WCGS toimplement. WCGS use of a restoration measure is described in Section 7.0,Restoration Plan and will be use to offset impingement losses.
2.0 Source Water Physical Description
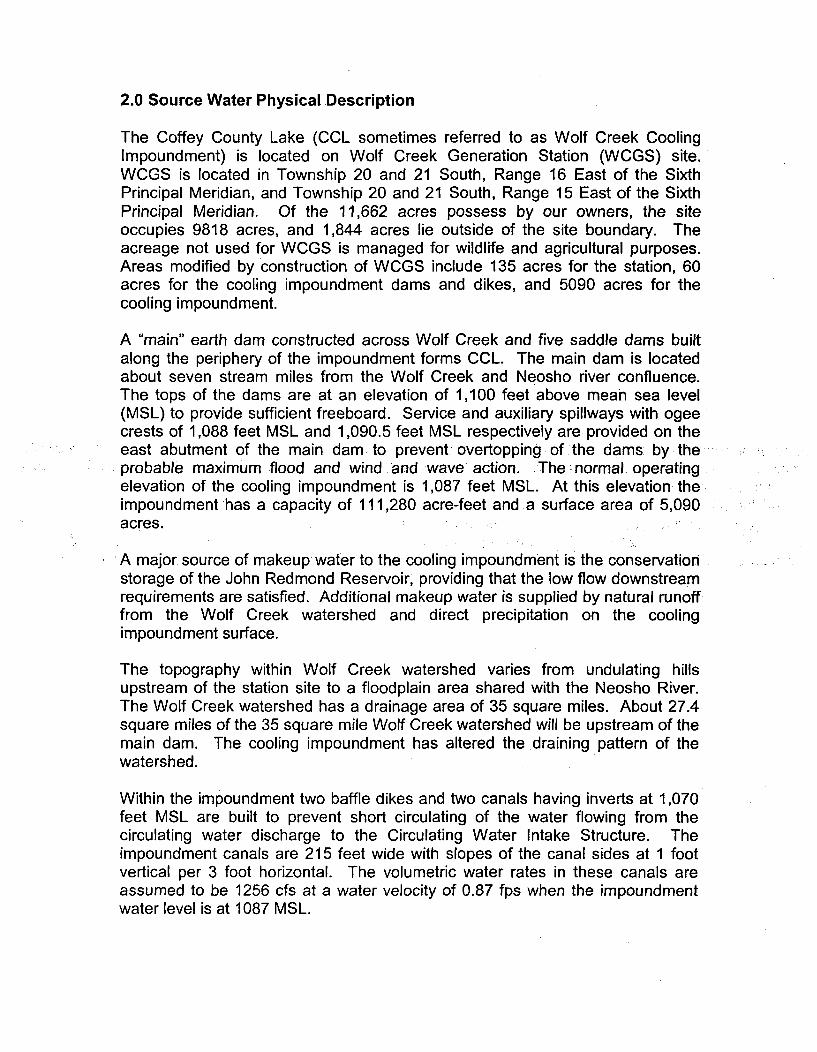
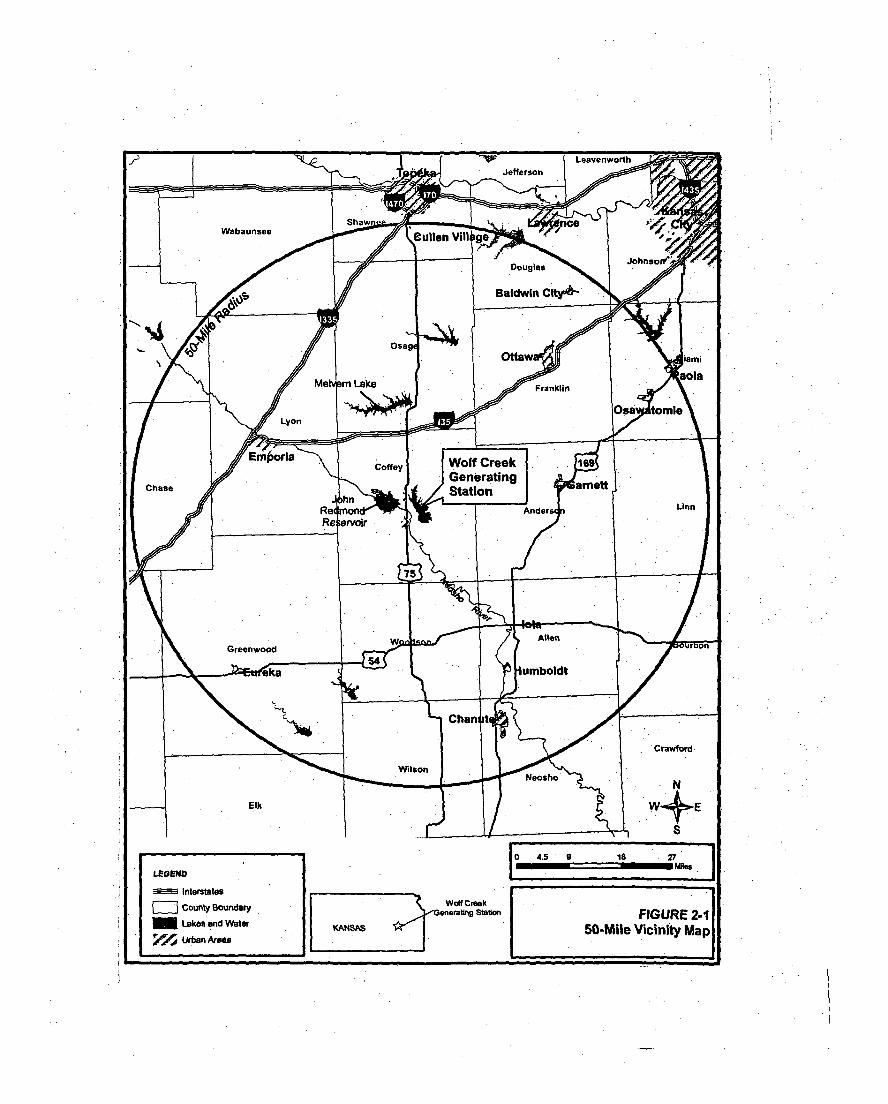
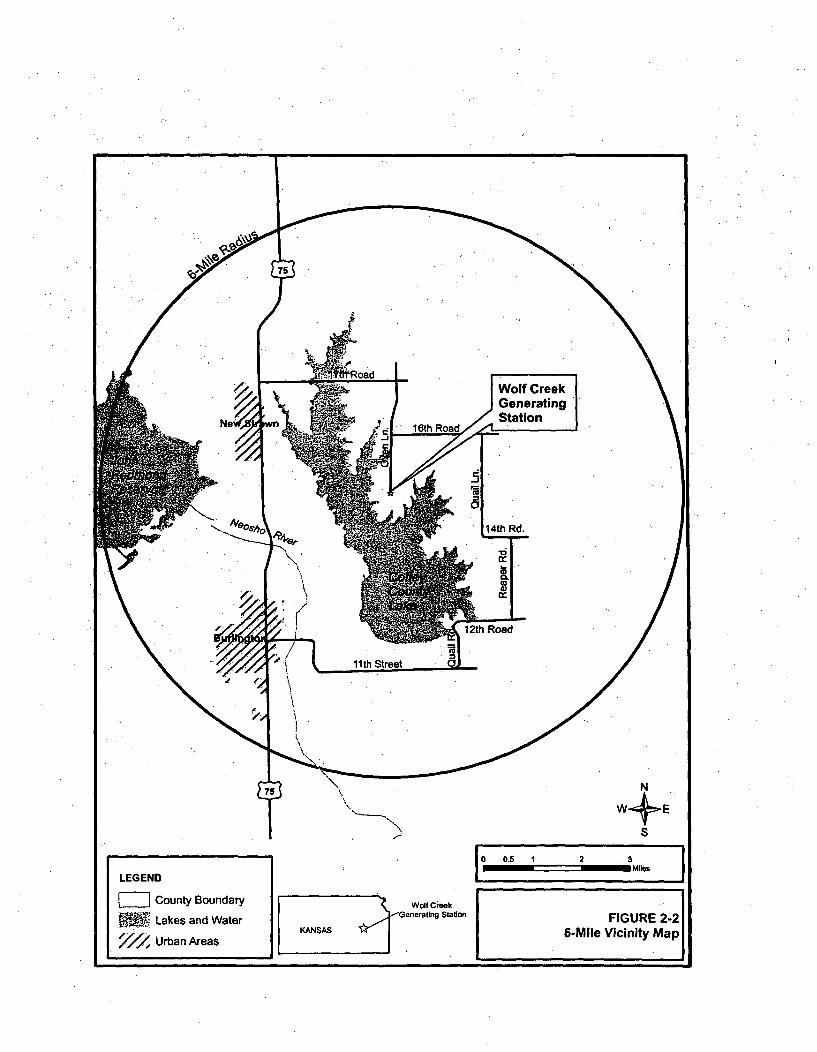
The Coffey County Lake (CCL sometimes referred to as Wolf Creek CoolingImpoundment) is located on Wolf Creek Generation Station (WCGS) site.WCGS is located in Township 20 and 21 South, Range 16 East of the SixthPrincipal Meridian, and Township 20 and 21 South, Range 15 East of the SixthPrincipal Meridian. Of the 11,662 acres possess by our owners, the siteoccupies 9818 acres, and 1,844 acres lie outside of the site boundary. Theacreage not used for WCGS is managed for wildlife and agricultural purposes.Areas modified by construction of WCGS include 135 acres for the station, 60acres for the cooling impoundment dams and dikes, and 5090 acres for thecooling impoundment.
A "main" earth dam constructed across Wolf Creek and five saddle dams builtalong the periphery of the impoundment forms CCL. The main dam is locatedabout seven stream miles from the Wolf Creek and Neosho river confluence.The tops of the dams are at an elevation of 1,100 feet above mean sea level(MSL) to provide sufficient freeboard. Service and auxiliary spillways with ogeecrests of 1,088 feet MSL and 1,090.5 feet MSL respectively are provided on theeast abutment of the main dam to prevent overtopping of the dams by theprobable maximum flood and wind and wave action. The ýnormal operatingelevation of the cooling impoundment is 1,087 feet MSL. At this elevation theimpoundment has a capacity of 111,280 acre-feet and a surface area of 5,090acres.
A major source of makeup water to the cooling impoundment is the conservationstorage of the John Redmond Reservoir, providing that the low flow downstreamrequirements are satisfied. Additional makeup water is supplied by natural runofffrom the Wolf Creek watershed and direct precipitation on the coolingimpoundment surface.
The topography within Wolf Creek watershed varies from undulating hillsupstream of the station site to a floodplain area shared with the Neosho River.The Wolf Creek watershed has a drainage area of 35 square miles. About 27.4square miles of the 35 square mile Wolf Creek watershed will be upstream of themain dam. The cooling impoundment has altered the draining pattern of thewatershed.
Within the impoundment two baffle dikes and two canals having inverts at 1,070feet MSL are built to prevent short circulating of the water flowing from thecirculating water discharge to the Circulating Water Intake Structure. Theimpoundment canals are 215 feet wide with slopes of the canal sides at 1 footvertical per 3 foot horizontal. The volumetric water rates in these canals areassumed to be 1256 cfs at a water velocity of 0.87 fps when the impoundmentwater level is at 1087 MSL.
.i
~' ,*
PC
N
S
0 0.5 1 2 .3Moes
LEGEND
SCounty Boundary
• Lakes and Water
%//• Urban Areas
|
Wolf Creek
Generating Station
KANSAS *
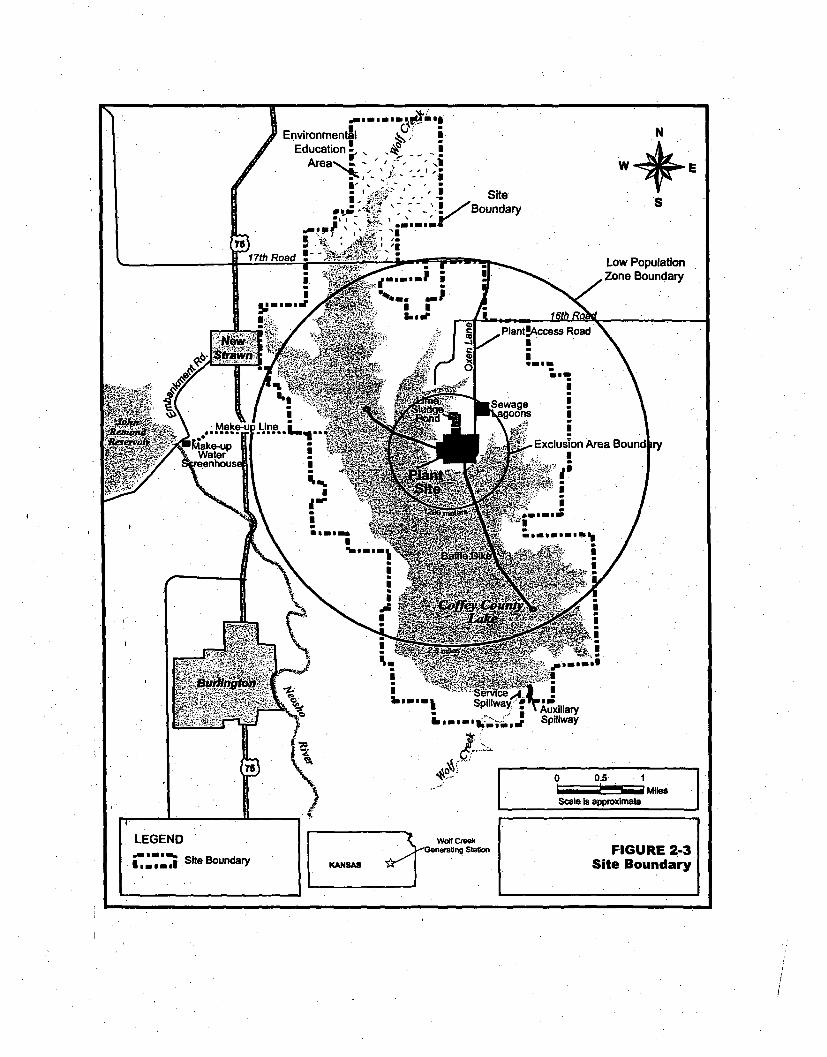
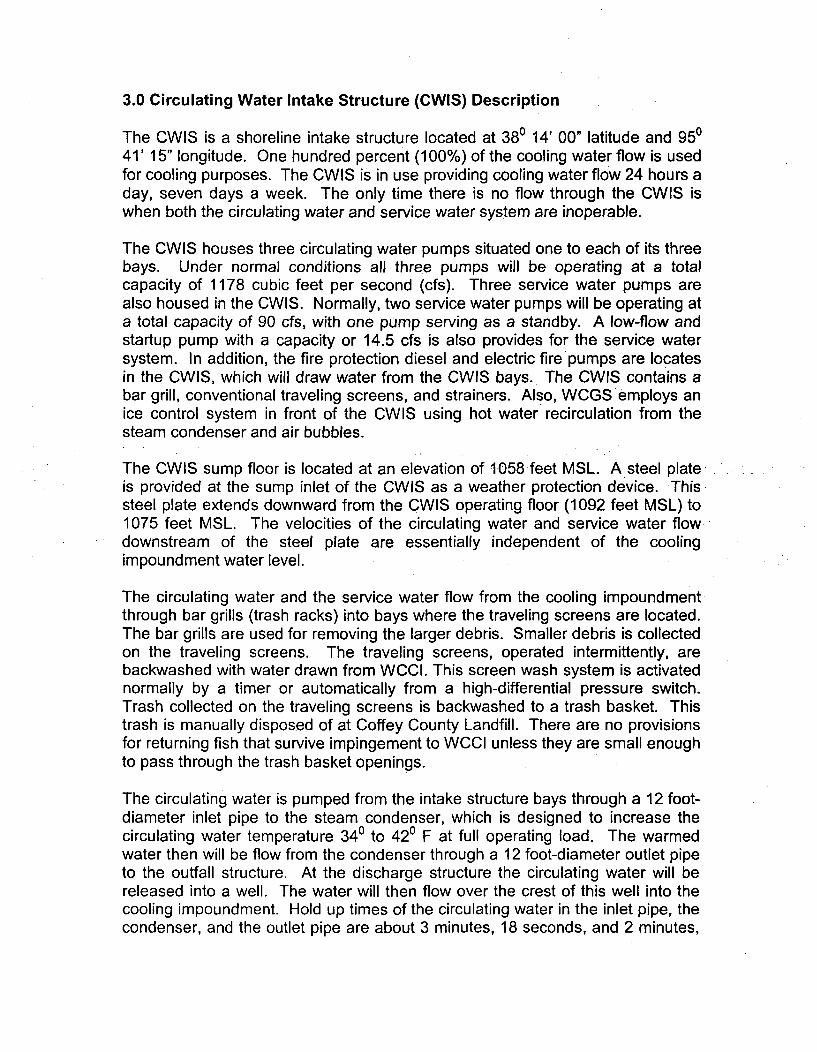
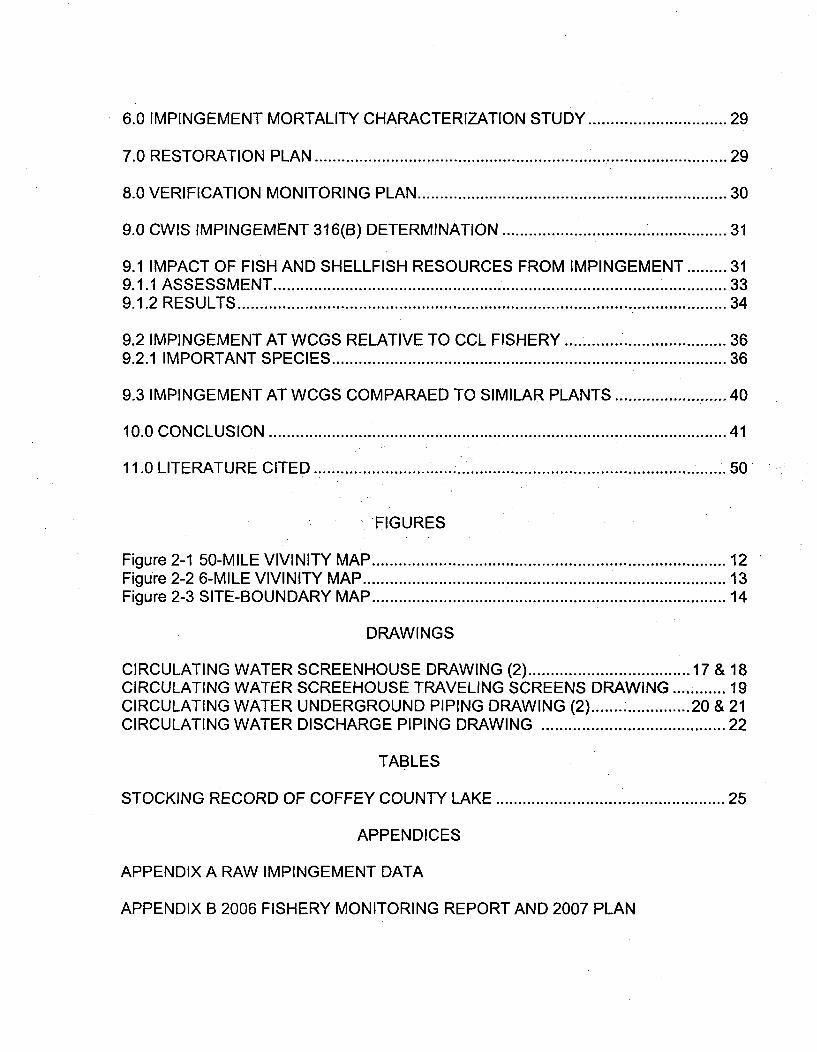
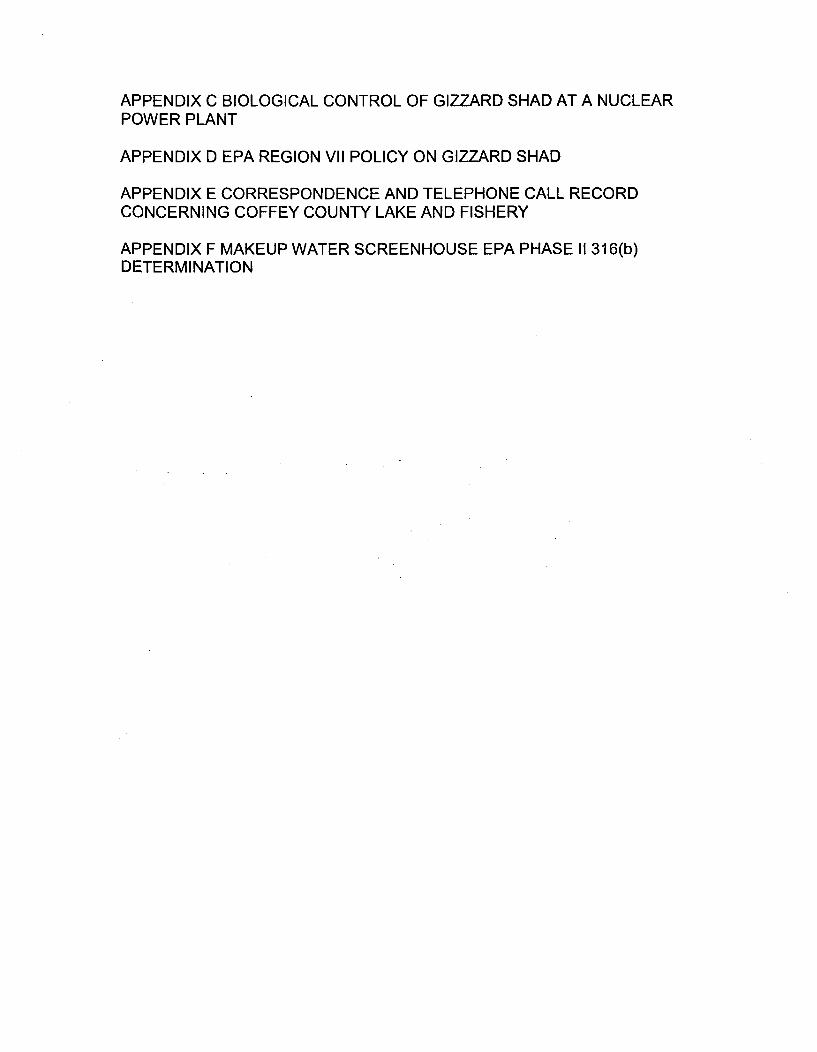
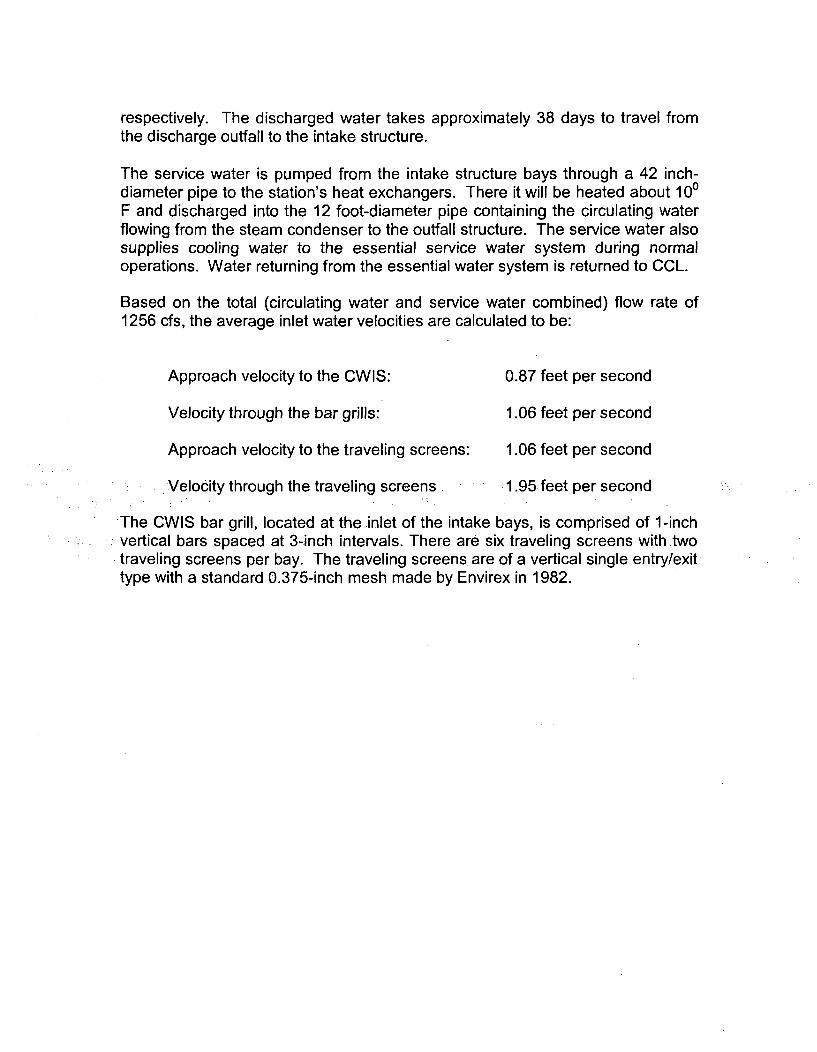
3.0 Circulating Water Intake Structure (CWIS) Description
The CWIS is a shoreline intake structure located at 380 14' 00" latitude and 95041' 15" longitude. One hundred percent (100%) of the cooling water flow is usedfor cooling purposes. The CWIS is in use providing cooling water flow 24 hours aday, seven days a week. The only time there is no flow through the CWlS iswhen both the circulating water and service water system are inoperable.
The CWlS houses three circulating water pumps situated one to each of its threebays. Under normal conditions all three pumps will be operating at a totalcapacity of 1178 cubic feet per second (cfs). Three service water pumps arealso housed in the CWIS. Normally, two service water pumps will be operating ata total capacity of 90 cfs, with one pump serving as a standby. A low-flow andstartup pump with a capacity or 14.5 cfs is also provides for the service watersystem. In addition, the fire protection diesel and electric fire pumps are locatesin the CWIS, which will draw water from the CWIS bays. The MWIS contains abar grill, conventional traveling screens, and strainers. Also, WCGS employs anice control system in front of the MWIS using hot water recirculation from thesteam condenser and air bubbles.
The CWIS sump floor is located at an elevation of 1058 feet MSL. A steel plateis provided at the sump inlet of the MWIS as a weather protection device. Thissteel plate extends downward from the CWlS operating floor (1092 feet MSL) to1075 feet MSL. The velocities of the circulating water and service water flowdownstream of the steel plate are essentially independent of the coolingimpoundment water level.
The circulating water and the service water flow from the cooling impoundmentthrough bar grills (trash racks) into bays where the traveling screens are located.The bar grills are used for removing the larger debris. Smaller debris is collectedon the traveling screens. The traveling screens, operated intermittently, arebackwashed with water drawn from WCCI. This screen wash system is activatednormally by a timer or automatically from a high-differential pressure switch.Trash collected on the traveling screens is backwashed to a trash basket. Thistrash is manually disposed of at Coffey County Landfill. There are no provisionsfor returning fish that survive impingement to WCCI unless they are small enoughto pass through the trash basket openings.
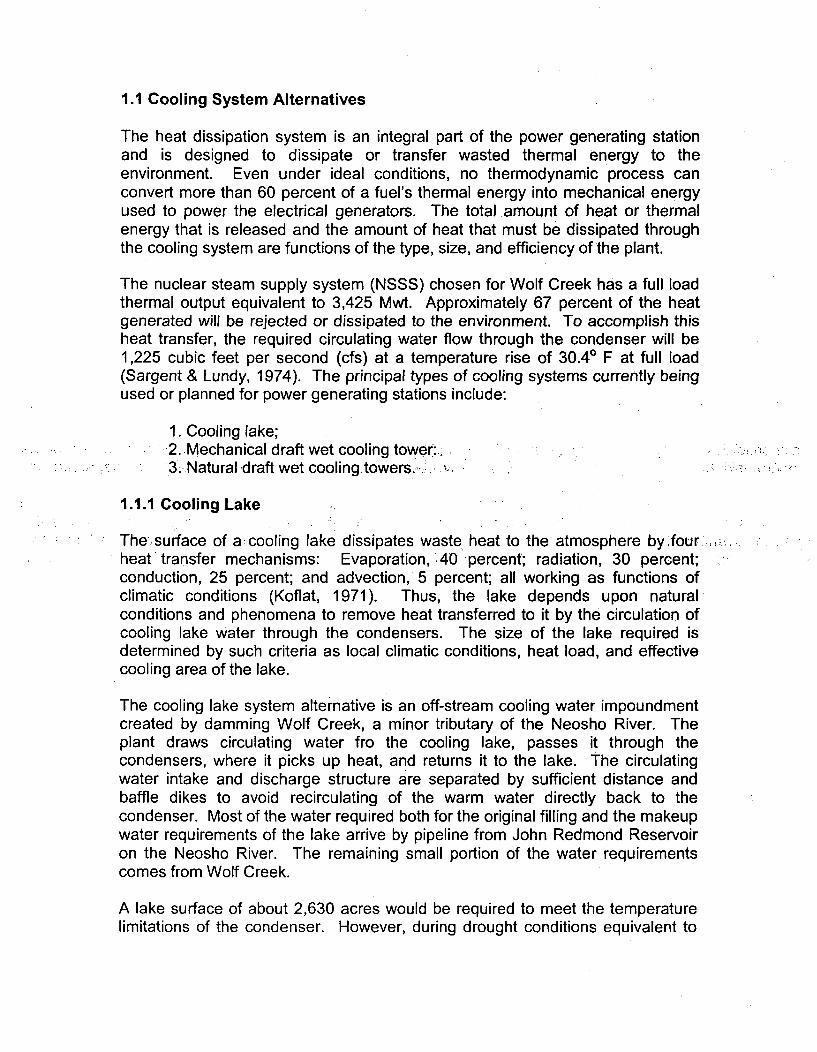
The circulating water is pumped from the intake structure bays through a 12 foot-diameter inlet pipe to the steam condenser, which is designed to increase thecirculating water temperature 340 to 420 F at full operating load. The warmedwater then will be flow from the condenser through a 12 foot-diameter outlet pipeto the outfall structure. At the discharge structure the circulating water will bereleased into a well. The water will then flow over the crest of this well into thecooling impoundment. Hold up times of the circulating water in the inlet pipe, thecondenser, and the outlet pipe are about 3 minutes, 18 seconds, and 2 minutes,
respectively. The discharged water takes approximately 38 days to travel fromthe discharge outfall to the intake structure.
The service water is pumped from the intake structure bays through a 42 inch-diameter pipe to the station's heat exchangers. There it will be heated about 100F and discharged into the 12 foot-diameter pipe containing the circulating waterflowing from the steam condenser to the outfall structure. The service water alsosupplies cooling water to the essential service water system during normaloperations. Water returning from the essential water system is returned to CCL.
Based on the total (circulating water and service water combined) flow rate of1256 cfs, the average inlet water velocities are calculated to be:
Approach velocity to the CWlS: 0.87 feet per second
Velocity through the bar grills: 1.06 feet per second
Approach velocity to the traveling screens: 1.06 feet per second
Velocity through the traveling screens 1.95 feet per second
The CWIS bar grill, located at the inlet of the intake bays, is comprised of 1-inchvertical bars spaced at 3-inch intervals. There are six traveling screens with twotraveling screens per bay. The traveling screens are of a vertical single entry/exittype with a standard 0.375-inch mesh made by Envirex in 1982.
8---- --- --- 6 -------------------- ---.-------- - - ---- w--- -r---. . .-- I ... .. 1.. . .. .
(b (1) 0~ C.) (_ ) G]
11ý
__ ------------ - ---- L------- ------------- --- -------- -- ----- i---------- --
an*I..
--.---- t0R!
7ýN
xx ! Xx x
.I.....
/ "I f
ROOF PLAN
i
Q. (
1]
!f'U_
--- -- -- -- --- -- -- - 7--- ---- ----- -.------- ------- ----- ------
.. .. .. .. a-- -- - -- -
YWa
2-
00~ -~
U...........
f .0
..00 . .. ... ...-
r - --- --------- --
* I!
~ ii
'0
_._o•:i PLAN Q EL. 1992'-0"F-t ....
Y-ý=
L-,.. UStO F[G. 18.4-1-@4
PLAN 0 EL. 1958' -0
NOTES
------- ----7 6 5 4 3 I 2 I I
8 7 6 5 4 3 2I, 'I ww
I I
H
t ,=-,'•'=•'--
F
SECTIONA-M
C,
B!
USAR FIG. 18.4-1-65
ESSENTIAL DRAWING
SG. RENTIAL DRAWING
WOL6F CREEK EM,401
CIRCULATING WATERSCREENHOUSE'-SECTIONS
.-- h 5 I113
A:!
1ý-i
lqILII•IIDl
UNWIMOT IK sm"MA UP
".0"AWANA. mmeo
I W4ft MALOM
am =PNW
C',
up
M Fft W"
"SINNUM
itW6 . .... C03
CAPVMA "ft-
WWWI
%ar lowAmm
%M-. Ell-W MWA
%Kamm OW
CVWWDWty
ORWE SUPPORT
UBRICATIOR FLEXMC Wes" "TOR TojMup BE~ wtomm- V
X. W' . 243- L"'.4T41M MOLDED rBERGLASS I.O.-A T"'A7 SPLASH HOUSM MTNTYPE 18-8 STA&LESS STEELHAWD.ARE R u
T X
QE9SrAM AHT STAR
mm"GUARD cc) -MCC c
I--T
vu -
i =c-=47=-,a.~as
q i m I
US OIFluiýiitt.
LI
\II
.I
SIMAX069M
TWINTIP41
'! •mi •
"-,I -
O4 Wl
IT 7.
ti I II1Z
II
9.1
Mmom1
W&FULI41
104a
Imuam
we;
U'T
I NB
V4MI
I
V-7
I jL-
dF
SI-.
itU
a.
4.4.1.*1
li.II
tI.~i~ a
-4- .4
4.'
1*'
-4
*4.
J-c
TaRmmMI
L
"A5 AlU4I IAO VOCXI t, dH SOUL
1010t w~ .OV-I.%1W ASW %Uel.
(~ ~~m~t fty.4~se . A% % oV.Ad.
ONWO.W Muewft Ie). %A HGKTiTaO~viifll& TiAL. m t~~.*14 l'd e C
tior
C AWI TWA 1110 t0164 lUll~~~86s flflilde"% amWML- l
!
1~~~
p
mad. 460-4.WI'..I> I I
i:ii=ii LI
-U;
- *-.ii i'~ji *8
I~ d *, r ~.
%4Ia.aa. 'I
i1W~I~00. ~
ca%.-AA. ('I
- ZMLILI. S
[.jLuumWe
A - ,;7:-.:-z:--.--.-.---4. - ~r'~~rr~Tr
- -u-u T** i
* ~ ~* U.
* 9~ me-iOu. 05046114. ~4
- I-rn
.
*I IX I :~I, -J
- lb
14te
Flow1fAlI pIk
.II.I.
1in.
wwammmomme 4dmmeurhI1.IWWM
J. - WT.fl1.WWeW~i.ilg
I-I
a.
-'---I-a---
A-3818-H98955-1 W03
WLiP CRIEIEK
...............8 7 -I. -- ------- --- ----5 ... 4 3 2
(M4-0069 SHT. :3)
IM?.---f::I fi
................................ . ..............
.' I. liii 11111 I ."
--- ------------
'I
11----;El0 At--
I
LaPLAN -It 1.
I M-8058 S34T. I & 2
I "',-
- -. ~ ,I
ta
L ....
Ii-- I --,3---
"I APO3~i
.,w C=m, mmmc
REFEENCT OAWNGS
EII I • il, I I I• I
'"'o"
6
....................
t . .... ...
,5"i
~J.-1--II
I
................ .. ..........................
............ ............---------- ----------- --
PLAN(M-0054)I EL55 i
C!
I I
- 3 -"*%
........................................................................ ..........................................................
USM FIG. IS-2-00
ESSENTIAL DRAWING
m-, - -.WOULML CL I aUlMNDM
OUTDOOR PIPINGKEY PLAN & GENERAL NOTES
M.-0051 -17
A'
IISKI
I . I V. I I
COOL3& "L~w
J FS*3~L11M
G
F
Eu
E
'77,T
A
3.-
ill" i
T.4t ARTIAL PLAN DETAI*L
1c" MA.
CIRCULATING WATER PIPINGPLAN 7
I I 0.6-I .
4 I 3.
I I *I 4 I
0., . ix* W
asaw
.' 4111 ~ECIN 21
lb "III r tM "1,- a'I .
A1*?
-- J I
- ~ ~ Aj ___
-=47
I - ,M IH 1 Q,0 * - _I.. . .
4-ecl L4.-
T v
MR, 74=
WE"
in-w
- - - - -- - - -
m O•A o b.-.-r.;&•7
rV-pull
9~. tu.-
F,
it
V...
W~L~I
4.g4
244 SF411_t4_4r
-- ~ ~ ~ ~ ~ ~ WA M~t. .n ,csmn.n
l-
ZiaMn tIWAL
II
V Jp1 n | ,7
V ... ..
. .I I.4. I . pw P . .
4.0 History of Aquatic Biota Studies
WCNOC conducted pre-operational (1973-1984) and operational (1985-1987)monitoring studies of Neosho River and Wolf Creek fish populations. Thesestudies were intended to establish baseline conditions with regard to NeoshoRiver and Wolf Creek fish populations and, later, to identify possible changes inthese populations associated with construction and operation of WCGS.
WCNOC surveys of the Neosho River (from John Redmond Reservoir tailwatersto below Wolf Creek) over the 1973-1987 period yielded 52 fish species, with 13species appearing in samples in every year. Electrofishing and seine data frompre-operational period (1977-1982) and an operational period (1985-1987) werepooled to examine species composition and relative abundance.
In all years, collections were dominated by Cyprinids (minnows and commoncarp) and Clupeids (gizzard shad). Cyprinids made up 61.2 percent of all fishcollected in the 1977-1982 pre-operational period and 73.0 percent of all fishcollected in the 1985-1987 operational period. Shad made up 16.4 percent offish collected in the pre-operational period and 16.8 percent of the fish collectedin the operational period. Comparisons of other groups (Ictalurids, Catastomids, .-,and Centrachids) showed relatively small shifts in the abundance between pre-operational and operational phases.
Having monitored Neosho River fishes from 1973 to 1987, WNCOC concludedthat construction of Coffey County Lake (CCL) and operation of WCGS had little.of no effect on Neosho River fishes. Changes, in relative abundance were seenbetween the years, but were relatively small and related to factors entirelyoutside of WCNOC's control. Weather, in particular, appeared to influence fishpopulations in the Neosho River downstream of John Redmond Reservoir.Rainfall up-river in the basin determined the volume of water releaseddownstream into the Neosho River. The amount (and timing) of water releaseddownstream affects reproductive success of species that spawn in the river,survival and growth of larval and juvenile fish, age and growth of adult fish,movement of all ages and stages of fish, and predator-prey relationships. All ofthese elements shape fish populations in the Neosho River in the vicinity ofWCGS.
Having established the WCGS was having little of no impact on the Neosho Riverfish populations, WCNOC shifted its focus in 1988 from the Neosho River toCCL. Just as significantly, WCNOC transitioned from monitoring fish populationsfor possible station-related changes to monitoring fish populations in order tomore effectively manage them. The primary fishery management goal in theyears after Coffey County lake filled (reached normal operating level in 1982)was gizzard shad control; specifically limiting numbers of young shad in the lakebecause they were vulnerable to cold shock. The concern was that cold-killedand cold-stunned gizzard shad could clog WCGS's intake screens. Sudden plant
shutdowns and cold shock are more of an issue at single unit nuclear plants, likeWCGS, than multiple-unit plants because there are no additional units tomoderate the sudden temperature change.
Before CCL reached full pool in 1982, WCGS embarked on an "aggressive"stocking program with the goal of establishing a fishery with a diversity ofpredators. Species stocked in smaller impoundments within basin to be floodedincluded largemouth bass, smallmouth bass, channel catfish, blue catfish,bluegill, black crappie, and walleye. Once filled, more of these species andwipers (stripped bass/white bass hybrids) were added. Gizzard shad larvae wereunavoidably introduced to the lake from the Neosho River when water waspumped to fill the lake. White bass and white crappie also appeared after thelake filled, and are presumed to have been introduced the same way. No fishingwas allowed in the lake in the 1980s, so there was no risk of sport fishpopulations being overfished. The ultimate goal was a "cropped" prey (gizzardshad) population with a relatively high proportion of larger, older, individuals andlow reproductive potential and a diverse, fast-growing community of predatorswith the ability to take different ages and sizes of shad occupying different partsof Coffey County Lake.
After the lke was opened to fishing (October 1996), gamefish populations :were:.::managed both to control shad and provide local and regional anglers with high-quality fishing. In June 1998, Coffey County assumed responsibility formanaging public use of the Wolf Creek Cooling Impoundment and changed thename of the lake to Coffey County Lake (CCL).
Coffey County Lake, with its thriving populations of channel catfish, whitecrappie, smallmouth bass, walleye and wipers, has become a popular destinationfor Kansas's anglers. WCNOC closely monitors fish populations in CCL in orderto draft annual fisheries management plans that will satisfy the complementarygoals of controlling gizzard shad numbers and maintaining healthy population ofgamefish. WCNOC uses a variety of gear types (e.g., electrofishing, fyke netting,gill netting, and seining) and sample CCL in systematic fashion to ensure thatspecies of interest are effectively sampled and sampling results area amenableto statistical analysis. Fish are collected in spring, summer, or fall, depending onthe species and its seasonal habitat preferences. Sampling is intended to gatherinformation on gizzard shad reproduction, survival, and abundance and predator(largemouth bass, smallmouth bass, white bass, wiper, and walleye) age andgrowth, condition, and abundance.
Having established population characteristics (size and age distribution, yearclass strength, actual and relative abundance) and compared population data toprevious years, WCNOC submit annual fisheries monitoring reports andmanagement recommendations to WCGS's Manager of Regulatory Affairs.These findings are also discussed with Kansas Department of Wildlife and Parksfishery biologist, who then draft regulations for CCL for WCNOC review. When
both organizations are satisfies with the proposed regulations, KDWP biologistsubmit these regulations to the Kansas Wildlife and Parks Commission, whichtypically approved them. Regulations approved by the Commission are adoptedand made enforceable by order of the Secretary of Wildlife and Parks.
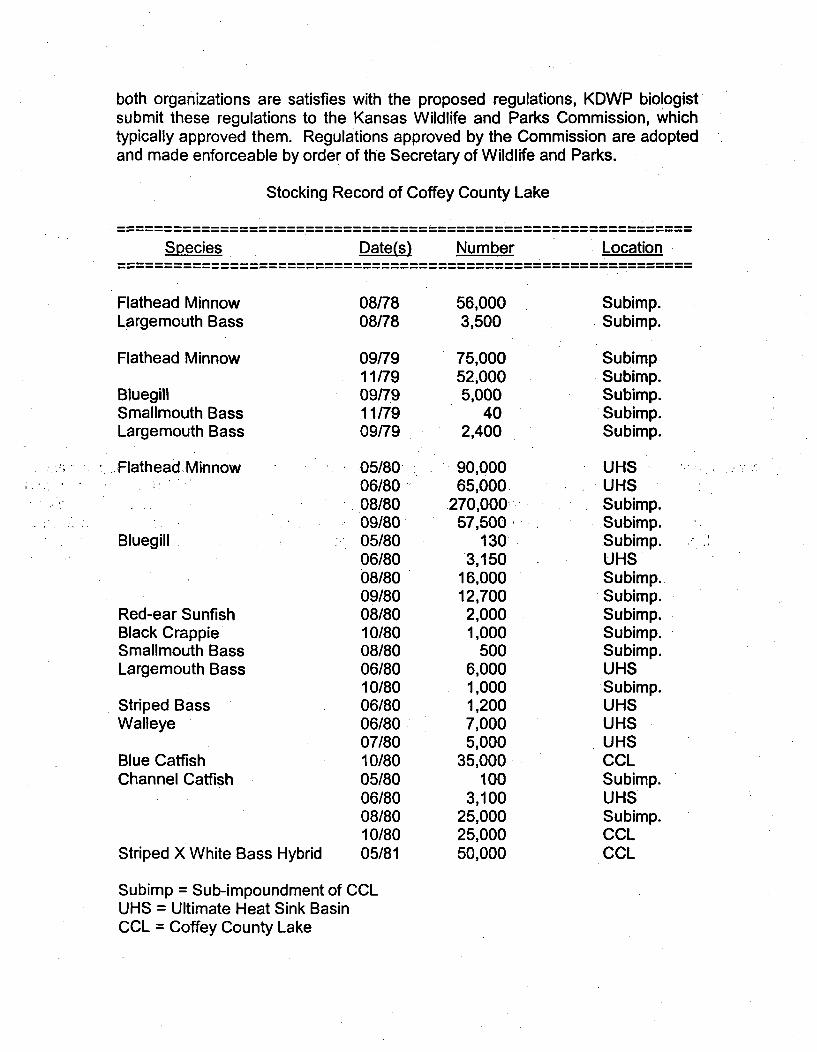
Stocking Record of Coffey County Lake
Species Date(s) Number Location
Flathead Minnow 08/78 56,000 Subimp.Largemouth Bass 08/78 3,500 Subimp.
Flathead Minnow 09/79 75,000 Subimp11/79 52,000 Subimp.
Bluegill 09/79 5,000 Subimp.Smallmouth Bass 11/79 40 Subimp.Largemouth Bass 09/79 2,400 Subimp.
Flathead Minnow
Bluegill
Red-ear SunfishBlack CrappieSmallmouth BassLargemouth Bass
Striped BassWalleye
Blue CatfishChannel Catfish
Striped X White Bass Hybrid
05/8006/8008/8009/8005/8006/8008/8009/8008/8010/8008/8006/8010/8006/8006/8007/8010/8005/8006/8008/8010/8005/81
90,00065,000
270,00057,500.'
1303,150
16,00012,7002,0001,000
5006,0001,0001,2007,0005,000
35,000100
3,10025,00025,00050,000
UHSUHSSubimp.Subimp.Subimp.UHSSubimp.Subimp.Subimp.Subimp.Subimp.UHSSubimp.UHSUHSUHSCCLSubimp.UHSSubimp.CCLCCL
Subimp = Sub-impoundment of CCLUHS = Ultimate Heat Sink BasinCCL = Coffey County Lake
5.0 Proposal for Information Collection
Development of a restoration plan is proposed by Wolf Creek Nuclear OperatingCorporation (WCNOC) to meet applicable Clean Water Act 316(b) requirements.WCNOC proposes to continue the current fishery management program thatmonitors and promotes relatively high predator species densities compatible withthe ecology of Coffey County Lake (CCL). High predator densities havediscouraged large concentration of small forage fish, primarily gizzard shad,which in turn has supported WCGS operation by keeping impingement rates low.The fishery also provides regional recreational benefits.
Fishery management has involved periodic stocking to support predator fishpopulations. The need for future stockings will be determined based on annualmonitoring data. Other restoration measures, such as habitat enhancement ornuisance species removal, will be considered as needed to support the currentfishery.
5.1 Sampling Plan and a Student Research and Training Grant
Wolf Creek Nuclear Operating. Corporation. (WCNOC) entered into a graduatelevel research project %with Pittsburgqi State. University to help quantify.environmental interfaces with Wolf Creek Generating Station (WCGS) operation.This partnership enhanced WCNOC's ability to address these issues in a costefficient manner. For the university, it helped prepare the students in a fieldWhere such skills will likely- be in demand in the utility industry. Theenvironmental interfaces that were researched'are industry wide issues, withmany utilities likely to contract with consultant firms, which will need biologists toconduct similar research.
For WCNOC, primary issues include recently promulgated Clean Water Act316(b) regulations, and station re-licensing issues with impingement andentrainment aspects of fish and aquatic organisms at the cooling water intake.Information on impingement and entrainment effects will also be useful for fisherymanagement considerations to maintain low gizzard shad -densities.Impingement refers to impacts to the environment due to larger fish and otherorganisms being trapped on the traveling screens, which is both a 316(b) and re-licensing issue. Entrainment refers to impacts due to smaller aquatic organismsbeing pumped through the plant, which is primarily a re-licensing issue. Note:For the purposes of this Comprehensive Demonstration Study (CDS) submittalonly impingement will be discussed. An entrainment study is not required for anintake structure on lake and reservoir.
The product desired from the graduate research will be to collect, analyze, andprepare a manuscript suitable for submittal to a peer-reviewed publication. Allresearch is to be conducted in an unbiased manner. WCNOC will reserve theright as a coauthor for any publication.
26
As required in 40 CFR 125.95(b)(3), the results of the impingement samplingprogram will be summarized in this submittal that will answer the followingenvironmental question:
What is the fish mortality rate due to impingement at WCGS? Thiswould include; fish density estimates by species in the intake areaof CCL, determination of fish numbers at the intake screens thatwere dead before being impinged on the screens, and annualimpingement rates sufficient to confidently extrapolate total plantimpacts to the fishery.
5.2 Wolf Creek Fish and Shellfish Impingement Study
5.2.1 Study Objectives
A. Determine fish community vulnerable to impingement
B. Determine impingement
C. Evaluate water quality
D. Evaluate the factors contributing to impingement
5.2.2 Study Procedures
A. In order to determine the fish community vulnerable to impingement:1. Existing WCNOC fish data will be used to establish historicaltrends for seasonal changes in:
a. species compositionb. relative abundancec. length frequency
2. Ongoing sampling by WCNOC along with some targeted effortsusing electro-fishing, trap-nets, gillnets and hydro-acoustics (ifpractical) will be used to establish current seasonal changes in theintake area.
B. In order to determine impingement rates:1. Screen-wash catch basket surveys will be conducted every eighthours for a 24-hour period on a monthly basis, with more frequentsurveys during peak impingement periods. Information collectedwill include:
a. species compositionb. length frequency
27
c. pre-impingement mortality
C. In order to evaluate water quality influences, measurements will betaken to determine:
1. DO profiles2. Temp profiles3. Turbidity
D. In order to evaluate the factors contributing to impingement:1. Vulnerable species composition, length frequencies, and densityestimates will be compared to:
a. time of yearb. time of dayc. dissolved oxygend. Water tempe. WCGS operating conditionsf. Screen-wash numberg. Screen-wash species compositionh. Screen-wash length frequenciesi. Natural mortality, as measured at screen-washj. Water clarityk. upstream temperaturehI. upstream dissolved oxygenm. upstream water clarityn. plant operating conditions
28
6.0 Impingement Mortality Characterization Study
Wolf Creek's quantitative impingement study is described below, and is designedto review fish impingement over the spring, summer, fall and winter periods.Precision and reliability of reduced sampling designs may be affected by thenumber of sampling days selected at various times of the year, particularly if theimpingement rates of individual fish species are of interest.
Intuitively, we suspect that impingement of key species in WCCI tends to behighest in the winter and lowest in the spring. Sampling may therefore be moreintense (2-3 days/month) during the key impingement months (December.-February), and less intensive during other seasons (1 day/month). This samplingdesign would allow about 15 days of sampling and ensure reasonable precisionand reliability. Sampling over a 24-hour period will measure any diurnal influenceto impingement. The research is scheduled for two years to account for anyweather variations.
7.0 Restoration Plan
Wolf Creek can use restoration measures when design and construction and/or"operational measures are. less: feasible, lest cost-effective or -lessenvironmentally desirable. Wolf Creek's restoration plan is basically a restockingprogram designed to maintain a desirable fishery in WCCI based on our annualfishery monitoring report (see Appendix A). The WCC1 restocking program wasinitiated in 1978 and continues today. The Environmental Management groupprepares the annual fishery monitoring report.
This report targets three issues that need to be addressed prior to restockingWCCI. They are; (1) young-of-year (YOY) gizzard shad changes, (2) adult shadand predator fish population dynamics, and (3) angler harvest impacts to thefishery.
First, knowledge of YOY shad production is important because these fish posethe most immediate impingement threat to plant operations. Identifyingincreases in YOY numbers before winter temperatures make them vulnerable toimpingement will allow operational preparations to compensate for the increasedrisk of impingement.
Second, the characteristics of the adult fish population provide long-term data toevaluate if YOY shad control benefits will continue. Higher numbers of shadgrowing to reproductive size is an indication that less predation is occurring.Likewise, fewer predator fish growing to reproductive size would indicatedeclining shad control capabilities. Increased predator fish health would alsoindicate this. Stocking recommendations also are derived from the adult fishcharacteristics
Lastly, the adult fishery monitoring will provide information on angler harvestimpacts to the fishery. Proper length limit recommendations can be derived fromthe monitoring data to ensure that public angler harvest and the plant's gizzardshad control efforts remain compatible. Creel census data collected by CoffeyCounty at the lake access park will be reviewed and compared with the otherfishery sampling data.
8.0 Verification Monitoring Plan
The purpose of the verification-monitoring program is to provide theEnvironmental Management group with information regarding the WCCI fishery.A variety of sampling gears are used to assess the condition of adult and juvenileclasses of both prey and predator species to provide information on potentialimpingement impacts to station operation. In addition, the methods employedwill assess the effects of station operation and angler harvest on the fishpopulations in WCCI.
An annual report, the Fishery Monitoring Report, detailing the fishery monitoring:.,activities and results are compiled.. Any trend's influence on the ability of the
fishery to control fish impingement events, which may affect WCGS operations,willi be identified. In addition, WCGS Operations will be notified, if necessary; of,the possibility of increased shad impingement that may be expected during thewinter. ý:Any adjustments to angling length and creel limits will be proposed.Recommendations that may include: increased monitoring or stocking needs will .be presented. A summary of the fishery monitoring activities will be completedby April of each year.
9.0 CWIS Impingement 316(b) Determination
Kansas Department of Health and Environment (KDHE), Bureau of Water(BOW), has not as of this time, made any Clean Water Act 316(b) determinationfor cooling water intake structures on either a river, lake or reservoir. Therecently renewed NPDES permit, February 1, 2005, for WCGS takes intoaccount the new EPA 316(b) Phase Ii regulations, 40 CFR Part 125.95 et seq.requirements for once-through cooling systems. The permit requires theapplicant to conduct a study of the cooling-water intake for potential adverseenvironmental impacts in accordance with Section 316(b) of the Clean Water Actand to submit to KDHE the required information by June 2008. Any requirementsresulting from the water intake study would be reflected in future NDPES permits.
9.1 Impact of Fish and Shellfish Resources from Impingement
Cooling Water Source
The Circulating Water System (CWS), Service Water System (SWS), and theEssential Service Water System (ESWS) at WCGS all draw from and dischargeto Coffey County Lake (CCL), formerly, known as the Wolf Creek Cooling Lake.
. CCL is located on the WCGS site; A ,main" earth dam constructed across Wolf:Creek and five saddle dams built along the- periphery of the impoundment formsCCL. The main dam is located about seven stream miles from the Wolf Creekand Neosho river confluence, The tops of the dams are at an elevation of 1,100feet above mean sea level (MSL),to provide sufficient freeboard. Service andauxiliary spillways with ogee crests of 1,088:feet MSL and 1,090.5 feet MSLrespectively are provided on the east abutment of the main dam to preventovertopping of the dams by the probable maximum flood and wind and waveaction. The normal operating elevation of the cooling impoundment is 1,087 feetMSL .At this elevation the impoundment has a capacity of 111,280 acre-feet anda surface area of 5,090 acres.
This 5,090-acre reservoir is designed to provide adequate cooling water to theplant during a one-in-fifty-year drought. To maintain the water level in the CCL, itis sometimes necessary to pump makeup water to the CCL from the NeoshoRiver, just below the John Redmond Reservoir dam.
Within the impoundment two baffle dikes and two canals having inverts at 1,070feet MSL were built to prevent short-circuiting of the water flowing from thecirculating water discharge to the Circulating Water Intake Structure. Theimpoundment canals are 215 feet wide with slopes of the canal sides at 1 footvertical per 3 foot horizontal. The volumetric water rates in these canals areassumed to be 1256 cfs at a water velocity of 0.87 fps when the impoundmentwater level is at 1087 MSL. WCGS cooling water system configuration isconsidered a once-through cooling water system. Figures 1, provides asimplified drawing of the cooling lake and John Redmond Reservoir System.
Circulating Water System
The Circulating Water Screenhouse (CWSH) is located in the southeast comer ofthe main plant area on the shore of the cooling lake. The screenhouse containsthe major equipment associated with the circulating water system (CWS) and theservice water system (SWS).
The CWS operates continuously during power generation, including startup andshutdown. Three one-third capacity motor-driven, vertical, wet-pit circulatingwater pumps pump the circulating water from the cooling lake to the maincondenser. They are designed to operate through the expected range of coolinglake levels. The heated water discharged from the condenser is returned to thecooling lake through a CWS discharge structure. The main circulating waterpipes from the circulating water screenhouse to the power block and from thepower block to the discharge structure have an inside diameter of 144 inches.
Freeze protection to prevent ice blockage at the circulating water screenhouse isaccomplished by a warming line that routes a portion of the circulating watercondenser discharge to the inlet of the screenhouse pump bays.
"The- SWS consists of three one-half capacity service water pumps and one lowflow and startup pump, traveling- screens and automatic backwash strainers, alllocated in the screenhouse. ,.During normal plant operation, the SWS suppliescooling water to the turbine plant auxiliary equipment, steam generator blowdownnonregenerative heat exchanger, and: CVCS chiller, as well as componentsserved by the ESWS. The service Water system is the normal water supply forthe Demineralized Water Makeup System.
The circulating water and the service water flow from the cooling impoundmentthrough bar grills (trash racks) into bays where the traveling screens are located.The bar grills are used for removing the larger debris. The CWIS bar grill,located at the inlet of the intake bays, is comprised of 1-inch vertical bars spacedat 3-inch intervals.
There are six traveling screens with two traveling screens per bay. The travelingscreens are of a vertical single entry/exit type with a standard 0.375-inch meshmade by Envirex in 1982. Smaller debris is collected on the traveling screens.The traveling water screens are operated as per system operating procedures.The traveling water screens can be rotated and backwashed, manually orautomatically, due to differential pressure across the screens. Debris isautomatically deposited in a basket for periodic removal by plant personnel.
The plant service water return discharges into the circulating water discharge.This discharge is directed to the station cooling lake. Each service water pump issized to deliver 25,000 gpm (-58 cfs) of service water at a discharge pressure ofapproximately 185 feet. Each circulating water pump has a design capacity of
167,000 gpm (-372 cfs) at a corresponding developed total head of 74 feet ofwater.
The CWIS sump floor is located at an elevation of 1058 feet MSL. A steel plate isprovided at the sump inlet of the CWIS as a weather protection device. Thissteel plate extends downward from the CWlS operating floor (1092 feet MSL) to1075 feet MSL. The velocities of the circulating water and service water flowdownstream of the steel plate are essentially independent of the coolingimpoundment water level.
Three pumps provide the design flow rate of approximately 500,000 gallons perminute when lake water temperatures are greater than 50 OF. Becausecondenser cooling is more efficient with colder intake water, only two pumps areoperated with a design flow of 365,000 gallons per minute when laketemperatures are below 50 OF. At these pumping rates, design flow across therotating screens at the point of impingement is less than 1.0 fps.
9.1.1 Assessment
Data from impingement surveys conducted monthly. at WCGS over theDecember 2004 through March 2006 period were used for this assessment. Afine-mesh (0.25 inch bar mesh) collection basket was placed in a catch basin to:collect all fish washed from traveling screens over a given 24-hour period. :Thebasket-was necessary because small fish are able to move through. the grate at •the base of the catch basin and re-enter the CCL.
Fish were removed from the basket every eight hours and identified, measured,and examined in order to ascertain their condition. Each fish was classified as"live," "recently dead," or "dead" based on its physical condition. All fishcategorized as "dead" based on examination were considered dead before theywere impinged on the traveling screens. These fish represented natural mortalityin CCL. Fish categorized as "recently dead" were assumed to have been alivewhen impinged, and died in the collection basket as a result of exposure andoxygen deprivation.
Because the traveling screen wash passes though a trash grating (with 1 inch by3.75 inch openings or 2.54 centimeters by 9.53 centimeters) at the point at whichit leaves the Circulating Water Screenhouse (CWSH) and flows into CCL, thefollowing assumptions were employed in extrapolating monthly and annual ratesof impingement mortality from basket surveys:
All fish greater than 100 mm total length (TL), no matter their condition inthe collection basket, would die under normal circumstances because theywould not likely pass through the openings in the trash grating.
All fish in the collection basket less than 100 mm TL categorized as "live"or "recently-dead" would, under normal circumstances, return to the CCLand survive.
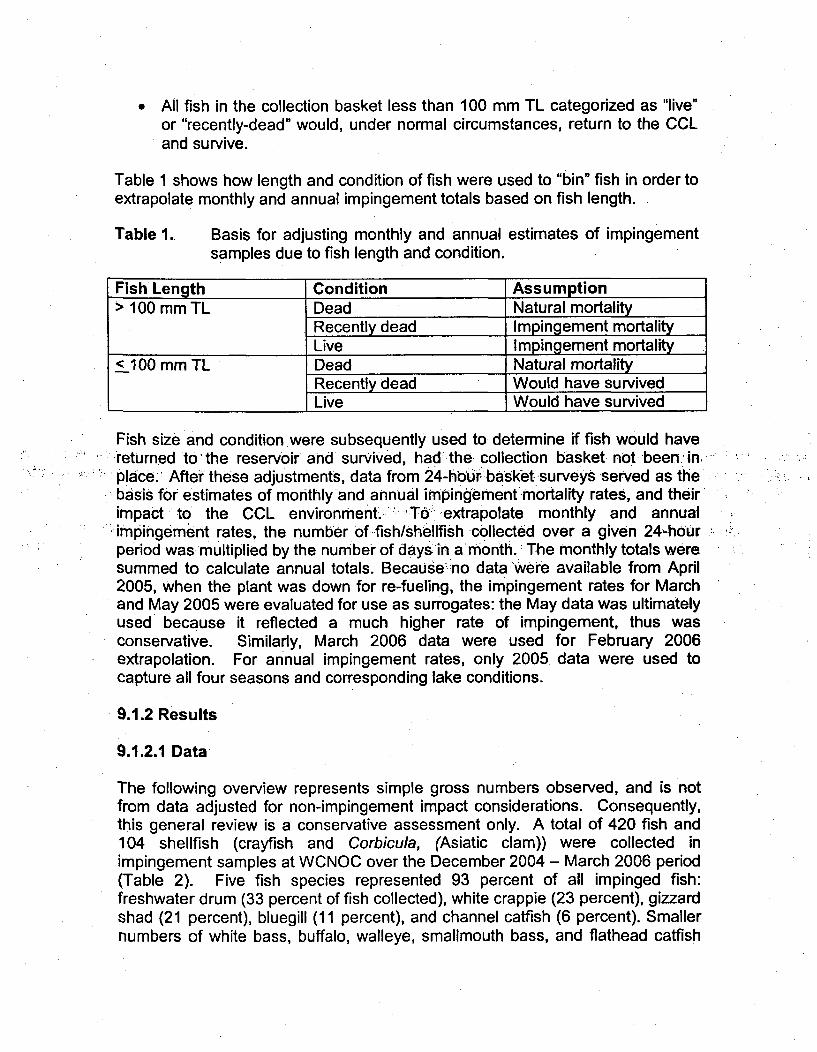
Table 1 shows how length and condition of fish were used to "bin" fish in order toextrapolate monthly and annual impingement totals based on fish length.
Table 1. Basis for adjusting monthly and annual estimates of impingementsamples due to fish length and condition.
Fish Length Condition Assumption> 100 mm TL Dead Natural mortality
Recently dead Impingement mortalityLive Impingement mortality
< 100 mm TL Dead Natural mortalityRecently dead Would have survivedLive Would have survived
Fish size and condition were subsequently used to determine if fish would have-returned to' the reservoir and survived, had the collection basket not been. in,place. After these adjustments, data from 24-ho'u`rbasket surveys served as thebasis for estimates of monthly'and annual impingementmortality rates, and theirimpact to the CCL environment. `T6-extrapolate monthly and annualimpingement rates, the number of fish/shellfish collected over a given 24 -hourperiod was multiplied by the number of daysin a month. The monthly totals weresummed to calculate annual totals. Because no data were available from April2005, when the plant was down for re-fueling, the impingement rates for Marchand May 2005 were evaluated for use as surrogates: the May data was ultimatelyused because it reflected a much higher rate of impingement, thus wasconservative. Similarly, March 2006 data were used for February 2006extrapolation. For annual impingement rates, only 2005. data were used tocapture all four seasons and corresponding lake conditions.
9.1.2 Results
9.1.2.1 Data
The following overview represents simple gross numbers observed, and is notfrom data adjusted for non-impingement impact considerations. Consequently,this general review is a conservative assessment only. A total of 420 fish and104 shellfish (crayfish and Corbicula, (Asiatic clam)) were collected inimpingement samples at WCNOC over the December 2004 - March 2006 period(Table 2). Five fish species represented 93 percent of all impinged fish:freshwater drum (33 percent of fish collected), white crappie (23 percent), gizzardshad (21 percent), bluegill (11 percent), and channel catfish (6 percent). Smallernumbers of white bass, buffalo, walleye, smallmouth bass, and flathead catfish
were also collected, but none of these species comprised more than four percentof the total. Eighty-seven Corbicula and 17 crayfish were also collected over the16-month period. Both operators of power plants and fish and game agenciesregard the non-native Corbicula as a nuisance species across the U.S. Thisspecies clogs power plant cooling water systems and out-competes anddisplaces native freshwater mussels. Any Corbicula losses at WCGS areregarded as beneficial. The small number of crayfish impinged (approximatelyone per day) is presumed to be less than the number consumed by a single,actively feeding adult smallmouth bass per day. Because all shellfish were smallenough, and were considered hardy, none were considered as impacted byimpingement.
Approximately 52 percent of all fish and shellfish impinged were found dead inthe collection basket. Gizzard shad, a species known to be fragile and subject towinter kills (Scott and Crossman 1973; Klemesrud 2003; Schoenung 2003),showed the highest mortality rate, 63 percent. Freshwater drum also showed afairly high rate of mortality, 58 percent. Mortality rates for bluegill, channel catfish,and white crappie were 48 percent, 46 percent, and 31 percent, respectively.Catfish species are exceedingly hardy and able to tolerate low levels of dissolvedoxygen (SRAC 1988; Smitherman and Dunham 1993; .Pennsylvania Angler &Boater 2001) so it is not surprising that they showed lower rates of mortality.-:!
9.11.2.2-Analysis
For actual impact, data were adjusted by removingthe fish justified as being non-impingement related, the daily ,(actual) impingement'rates of fish in Table 3yielded estimated monthly impingement rates ranging from 0 to 1,612.. A annualtotal of 957 fish and no shellfish were estimated to have died as a result of beingimpinged (Table 3). This corresponds to impingement mortality rates of 30.8percent for finfish and zero percent for shellfish. The highest rates ofimpingement were observed in late spring-early summer (May and June) and fall-early winter (November and December). Water temperatures in the 30s and low40s *F were generally associated with higher rates of impingement andimpingement mortality for all fish species, but trends were less than clear-cut.The lowest temperature observed over the 16-month period (37.5 °F in January2005) was associated with a fairly low impingement. Although no statistical testswere performed, there appeared to be no correlation between cooling waterwithdrawal rates and impingement mortality (Figure 1). Highest impingementrates were often associated with operation of two circulating water pumps; lowestimpingement rates were often associated with operation of three circulating waterpumps. This suggests that environmental factors influence impingement asmuch or more than operational factors. These environmental factors includemeteorology (frontal movement, specifically air temperature, wind speed, winddirection), water quality (water temperature, dissolved oxygen levels at depth),and biology (distribution and abundance of species that are vulnerable toimpingement, such as gizzard shad; overall health of the fish community; size
and age composition, as smaller fish are more vulnerable, relatively, than largerfish, which are stronger swimmers).
9.2 Impingement at WCGS Relative to CCL Fishery
9.2.1 Important Species in CCL
To determine the fishery's susceptibility to WCGS impingement impacts, a reviewof species present and those considered important for long term recreational andcommercial (industrial) value is necessary. Fish species present are common toreservoirs in Kansas (Cross and Collins 1995) and are listed in Table 4. Thepresent fishery reflects WCNOC management efforts to biologically controlimpingement rates by promoting predator species. This continuing effort wasundertaken to minimize impingement impact to the lake environment, and toprevent the economic and operational difficulties that could be caused byexcessive impingement, particularly gizzard shad. Problem impingement onintake screens can develop because gizzard shad have difficulty avoiding intakeflows when they naturally become weakened, and eventually die, as winter watertemperatures fall below approximately 40 °F (Bruce NGS 1977, Ontario Hydro•1977,-Olmstead and Clugston 1986,- White et al 1986).. Predator.(game) speciesthat are considered important at WCGS'-to control impingement include-species.,that are also important for recreational purposes, These include channel catfish,white bass, wiper hybrids, smallmouth bass, largemouth bass, white crappie, andwalleye (Tables 5 and 6). WCNOC's fishery management efforts revolve aroundeliminating excessive gizzard shad wintertime impingement events that canGreate.operational challenges to the circulating water,, screens. This effort hasbeen successful with shad densities kept low (Table 7). Still, shad are animportant forage species in CCL, and critical for the well being of predators in thelake. Reductions caused by natural predation, or other influences, such aswinter die-offs or WCGS impingement, cannot be greater than the population canrecover from. Extremely low shad densities would cause subsequent reduction inimportant predator species (Haines 2000). Consequently gizzard shad areconsidered an important species in CCL, and potential impacts fromimpingement must be balanced. There are no listed threatened or endangeredfish species known to be present in CCL, nor are any expected. For the purposeof this evaluation, the commercially important species are considered thoseimportant for electricity production at WCGS as explained above. Species usedfor the commercial food market include buffalo species and common carp.However, there is currently no plans to allow commercial harvest on CCL, thusthere should be no impingement impacts expected, and no further assessmentwill be needed. Additional details on CCL fishery can be found in WCGS'sAnnual Fishery Monitoring Report and Plans (WCNOC 2006).
9.2.1.1 Channel Catfish
As previously established, channel catfish are typically hardy, and all but one thatwere sampled were < 100 mm TL, and thus would have returned to CCL alive
(Table 3). For assessment purposes on an annual basis (2005 data), adjustedestimates indicate no mortality attributable to WCGS. Thus, impingementimpacts to the channel catfish population in CCL were consideredinconsequential.
9.2.1.2 White bass
White bass are common to reservoirs in Kansas, and can be highly productive(Colvin 1993). They are a pelagic (open water) species, highly mobile, and arecommon in the vicinity of the circulating water intake. This may tend to exposethem to impingement. This is reflected by the annual adjusted impingementestimate of 122 (Table 3), and these were all judged to be young-of-year fish.Based on annual catch frequencies, the white bass population in CCL hasremained relatively consistent, with normal fluctuation (Table 7). Extrapolatingtotal white bass densities in CCL to estimate impingement percentage was notpossible due to the passive sampling gear used (gill nets). Survival rates forCCL white bass were unavailable, but average survival in regional reservoirsranged from 21 to 52 percent and averaged 35 percent (Colvin 1993). Growthrates in CCL, as well as regionally (Colvin 1993), indicate that it would takeapproximately three years for white bass,to reach 12 inches (305 mm) TL, which.
.:.is the current minimum length for recreational harvest. Using average survivalofV:35 percent, the 122 white bass removed from the CCL population byimpingement would be 5.2 fish by the time they are available for harvest. Thiswould be from 0.3 to 1.4 percent of the annual recreational harvest from 1999through 2005 (Table 5). Because white bass are. highly productive, and the small,percentage of the fish made unavailable, impingement is judged to not pose a.threat to the fishery in CCL.
9.2.1.3 Wiper Hybrids, Smallmouth bass, and Largemouth Bass
Of the important predator species, there were no wiper hybrids or largemouthbass found in the impingement samples, and only one smallmouth bassobserved, which was judged as dead before being impinged (natural mortality).Fishery sampling by WCNOC indicates catch rates for these species to vary(Table 7). The wiper hybrids were hatchery spawned, and their densities werecontrolled by WCNOC stocking, which was based on shad control needs. Ashybrids, they have not reproduced sufficiently to maintain a population.Largemouth bass have experienced a long-term decline typical of agingreservoirs (Kimmel and Groeger 1986, Willis 1986). Because these specieswere not found in the catch basket, they are not considered to be adverselyimpacted by impingement.
9.2.1.4 White Crappie
White crappie is the game fish species with the highest adjusted annualimpingement estimate of 185 fish (Table 3). It is an important recreational
species, however, because of its current creel limit of only two fish per day, it isnot a species sought after for consumption. It is a species important for WCGS,though, because gizzard shad is major forage item (Cross and Collins 1995,Muoneke et al 1992). Most of the crappies impinged were slightly greater thanthe 100 mm TL used for data adjustment, and were young-of-year fish. O'Brienet al (1984) determined that crappie 80 to 170 mm TL were wholly pelagic.Smaller crappies have also been more often taken in open water than along theshoreline (Grinstead as cited in Carlander 1977). WCNOC observation alsoindicates such small crappie distribution in CCL. This would tend to explain thehigher impingement for white crappie. The fish would be in the deeper, openwater similar to that adjacent to the cooling water intake, and thus moresusceptible to impingement. Annual survival rates ranged from 23 to 29 percentfor three Kansas reservoirs after length limits were instituted (Mosher 2000), and46 percent for Lake Carl Blackwell in north-central Oklahoma (Muoneke 1992).Annual survival rates for CCL have not been calculated, however, it is believed tolikely be toward the higher range due to relatively larger, longer-lived crappiepresent. The current length limit before crappies are available for recreationalharvest is 14 inches (356 mm) TL, which is restrictive. Average growth rates forCCL crappies indicate that they typically reach the length limit at four years of
S•.age.. Applying the higher 46 perCent sUrvival'rate to the adjusted impinged :fish,yields reductions from 185 after year one, to 85-after year two, to 39-after yearthree, and to 18 after year four. Accordingly,' impingement would cause 18crappies to be unavailable for recreational harvest' This represents from 2.5.to9.8 percent of crappies harvested (Table 5). As stated eadier,:restrictive creel
, and.length limits suppress harvest rates for CCL crappies. A more applicableimpact comparison would be for recreational caught-and-released data, for which18 impinged fish represents from 0.2 to 0.4 percent of the annual recreationalcatch (Table 6). In summary, white crappie was shown to be relativelyvulnerable to impingement, and was the game species most impinged. Therelative percentage of crappie surviving to sizes available for recreational harvestwas higher than other CCL species. However, due to restrictive harvest limits,these percentages may be inflated. Percentages of the recreationally caught-and-released remained low. Consequently, impingement is not expected toadversely impact the CCL fishery, but this species may be more susceptible thanother species evaluated.
9.2.1.5 Walleye
Walleye is an important species both for WCGS operations and recreation.During the entire impingement sampling period, only one was consideredimpinged, and this extrapolates to 30 walleye per year (Table 3). Catch curveregressions for 2003 and 2004 indicate total annual survival estimates forwalleye of 41 and 17 percent, respectively. Averaging these yields a totalsurvival rate of 29 percent. At the current slot limit (18 to 26 inch protected) andat growth rates present in 2003 and 2004, the 30 walleye at 388 mm TL (lengthof impinged specimen) would remain available for recreational harvest for
approximately two years. Applying the 29 percent survival estimate, reductionsto the extrapolated 30 impinged walleye would be 21.3 fish the first year, and anadditional 6.2 fish the second year. This means that of the 30 impinged walleye,if similar impingement, survival, and growth continued annually, estimated annualloss to the recreational fishery would be 11.2 walleye (8.7 fish remaining afterfirst year, plus 2.5 remaining after second year). This represents <1.0 percent ofthe recreationally harvest annually (Table 5), and < 0.2 percent of the walleyecaught and released by anglers (Table 6). Because a passive gear type (gillnets) was used to monitor walleye in CCL, total lake population density could notbe estimated, only relative catch frequency changes (Table 7). Extrapolatingthese numbers based on one fish impinged is not statistically defensible, but itwill provide in this circumstance a relative measure to assess impacts to walleyein CCL. Because the percent removed from the population was very small, thereis no impingement impacts expected to the CCL walleye.
9.2.1.6 Gizzard Shad
Based on adjusted impingement data, gizzard shad represented the largestnumber of fish impinged on an annual basis (2005 data, Table 3). An adjustedtotal of 496 were considered impingement mortality during the sampling period.Using 2005 data as representative of annual mortality., the adjusted impingement:, ,.-mortality was 341 gizzard shad. An estimate of thetotal gizzard shad estimatefrom CCL could be derived from midsummer seine hauls from 1983 through 1997: (Haines 2000). Average density estimates in CCL of similar sized shad over the1983 through 1997 period were 3.005 million. Mortality attributable toimpingement represents 0.01 percent of this average'young-of-year populationestimate. Observed length of impinged shad would tend to further reduce anypotential impingement influences. Scale aging indicate that the larger adultbrood fish achieved first year growth to approximately 200 mm TL, which isabove normal growth (Haines2000). These fish were suspected to have beenspawned in the heated discharge from WCGS earlier than normal, and were ableto grow sufficiently to not be as susceptible to cold induced mortality (White et al1986), were too large for predators, and not as susceptible to impingement. Allshad in the impingement samples were smaller young-of-year (approximately100mm TL), and not as likely to survive in CCL to reach reproductive age. Thus,evidence shows that the sizes impinged would not be as likely to contribute on along-term basis to the CCL fishery. In summary, gizzard shad is considered oneof the most important species in CCL, and had the highest annual (2005)adjusted impingement rates. It was not considered impacted by impingementdue to the extremely low percentage removed from the estimated populationdensity. Shad age, growth and size distribution data also imply that the mostimportant shad to the predator fishery were the earlier spawned fish that wereable to recruit to reproductive sizes, and were not susceptible to impingement.Therefore, impingement at CCL does not appreciably impact gizzard shad.
9.2.1.7 Other Species
The remaining species were either considered as rough fish, or were infrequentlyfound in the impingement catch basket. Consequently, these were notconsidered as recreationally of commercially important species as they relate toCCL and impingement.
9.3 Impingement at WCGS Compared to Similar Plants
9.3.1 V.C. Summer Station (South Carolina)
VC Summer Nuclear Station (VCSNS), in South Carolina, may be the nuclearplant most similar to WCGS in terms of design and cooling system. Both plantsare single-unit Westinghouse PWRs with once-through cooling systems thatwithdraw and discharge to small cooling reservoirs. Coffey County Lake, at5,090 acres, is slightly smaller than Monticello Reservoir (6,500 acres). The316(b) Demonstration for VCSNS indicated that an estimated 85,000 fishweighing 515 kilograms were impinged annually, which amounted to less thanone percent of the reservoirs standing crop (Dames & Moore 1985). Highestrates of impingement were -observed. in -winter, when- large numbers of:-cold-..shocked gizzard shad were ýimpinged. More-than 80-percentof fish impinged. -,-
.:,"over the 12 months of the study (October 1983 through September 1984) were: .gizzard. shad. Other species commonly impinged were yellow perch, white,
.7 catfish, bluegill, and channel catfish. Based on these impingement rates, which.were approximately 20.times those seen at WCGS, the Dames & Moore 316(b).Demonstration concluded that "the number of fishes impinged by VCSNS appearsufficiently low so as to have minimal effect on the fish community." In April1985, the South Carolina Department of Health and Environmental Controldetermined that the "location, design, construction, and capacity of the VCSNScooling water intake structure reflects the best technology available forminimizing adverse environmental impact" (SCE&G 2002). This determinationhas been made a part of all NPDES permits issued since that time.
9.3.2 North Anna Power Station (Virginia)
North Anna Power Station, a two-unit Westinghouse plant near Mineral, Virginia,uses a once-through condenser cooling system that withdraws from anddischarges to Lake Anna, a 9,600 acre cooling reservoir. Virginia Powerconducted impingement studies over the 1978-1983 timeframe to characterizeimpingement and entrainment at the plant. The total number of fish in screenwash samples ranged from 11,063 (1983) to 148,995 (1979) per year, whichtranslated into impingement estimates of 45,591 and 583,530 fish, respectively.Sixty-one percent of fish impinged were gizzard shad, many of which were cold-stressed. Yellow perch (15.8 percent) and black crappie (15.7 percent) were theother species impinged in significant numbers. The authors of the NAPS 316(b)demonstration observed that total impingement and entrainment rates tended to
track with abundance of gizzard shad, and declined markedly as the gizzardshad became less numerous in collections.
10.0 Conclusion
Impingement studies conducted at WCGS over the December 2004 - March2006 period suggest that impingement rates were very low in both absolute(number of fish) and comparative terms (relative to other nuclear plants of similardesign), as was impingement mortality. Impingement was selective for certainspecies (freshwater drum, white crappie, gizzard shad) and certain size and ageclasses (small fish that were not aged but were presumed to be young-of-year).More than half of fish impinged were "rough fish" that are not avidly sought byrecreational fishermen. The white crappie was the only recreationally importantspecies impinged in significant numbers. Most recreationally important species,including smallmouth bass and walleye, were impinged in very low numbers.Available data suggests that impingement has had little or no effect on fishpopulations in Coffey County Lake. Coffey County Lake, with its thrivingpopulations of channel catfish, white crappie, smallmouth bass, walleye and
. wipers,',.has become a popular:. destination- for..-Kansas .anglers. .-Kansas:Department 7of Vildlife: and Parks, (KDWP) issues annual Fishing Forecasts forpublic -waters in Kansas, which are in:.effect ratingsof public fishing areas:
CoffeyCounty Lake received biologists' -rating of. Excellent for walleye. (the only. [
* statereservoir to receive this ranking for walleye) and smallmouth bass (the only:,;.: -state ý reservoir to receive this ranking for smallmouth bass): (KDWP-i 2004).'..'Channel-catfish, white crappie, white bass, andwiper fishing wereall rated Good..
Therefore, WCNOC concludes that impacts to fish and shellfish in the CoffeyCounty Lake from impingement are SMALL and that mitigative measures are notwarranted.
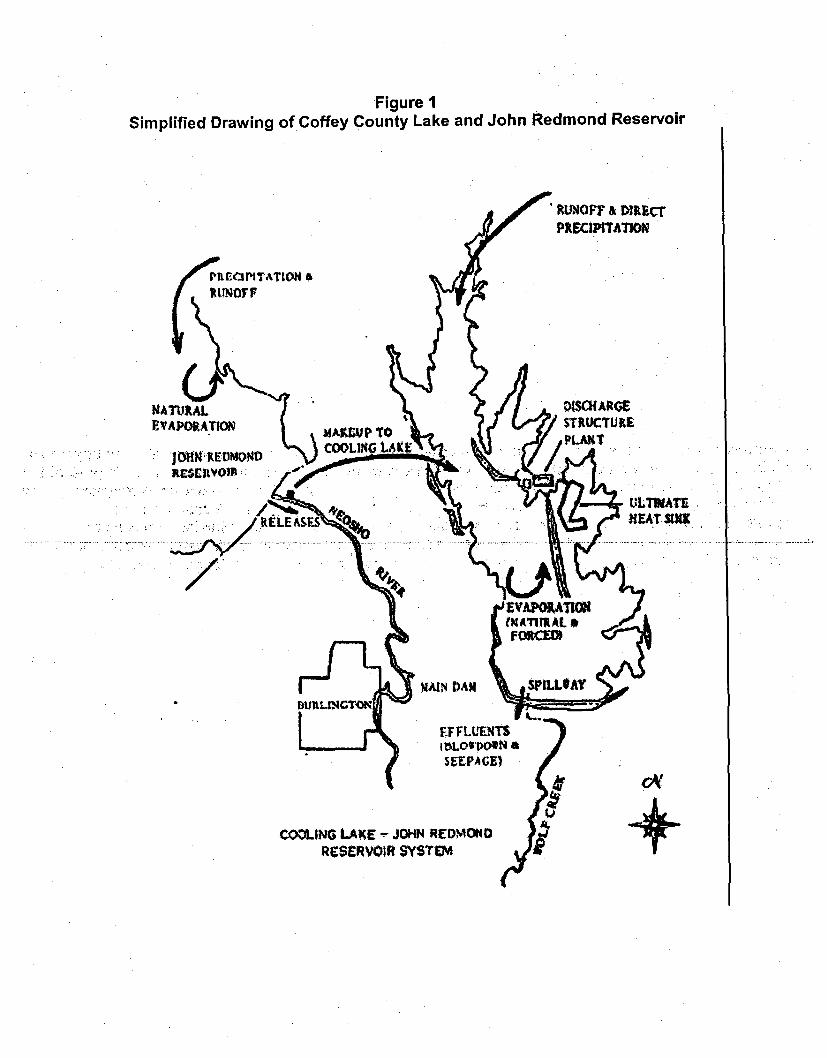
Figure 1Simplified Drawing of Coffey County Lake and John Redmond Reservoir
'RUXOFF & DIRRCTPRECIPITAT1O?
A
DMSOAIGE$TRUCTURE.E.VAPORATION
RjWIV011DM?4
ULTIMATEREAT SM(
FFFVLX~T-ILBLOWPOIN a3EEPAGE)
4vCOOLING LAME - J"Hf REDM4ON
RESERVOIR SYSTEM
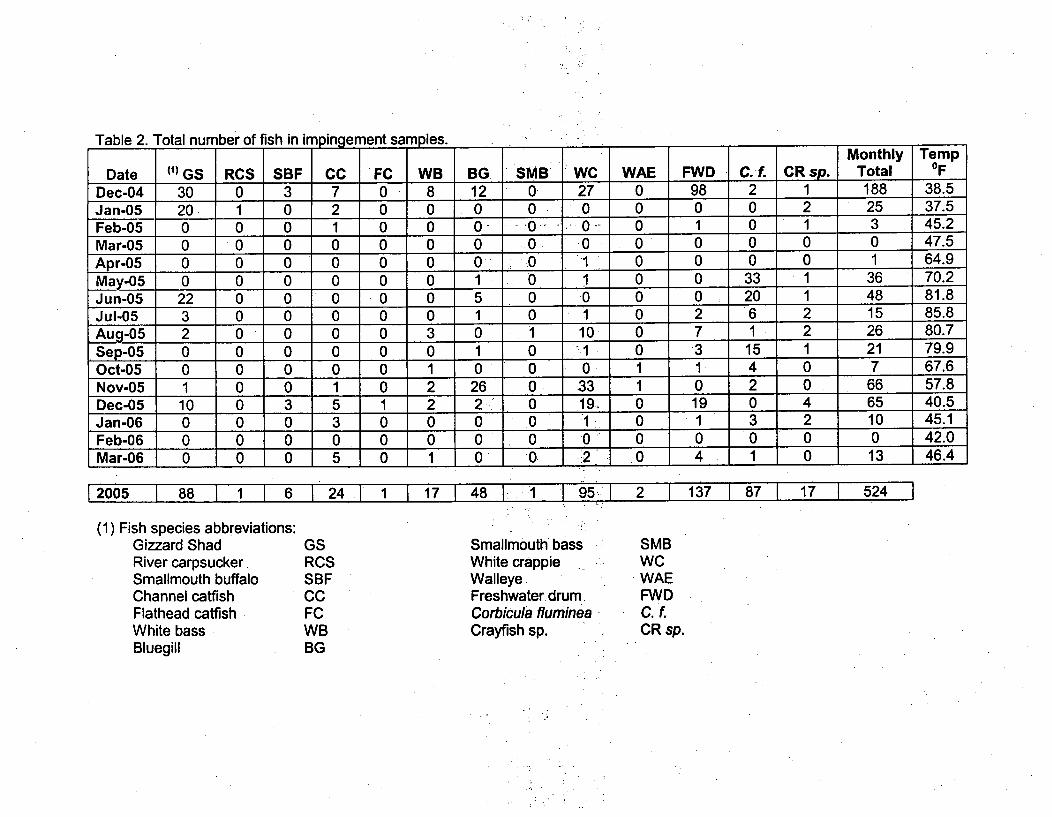
Table 2. Total number of fish in impingement sal -es.Monthly Temp
Date (1) GS RCS SBF CC FC WB BG SMB WC WAE FWD C. f. CR sp. Total OF
Dec-04 30 0 3 7 0 8 12 0 27 0 98 2 1 188 38.5
Jan-05 20 1 0 2 0 0 0 0 0 0 0 0 2 25 37.5
Feb-05 0 0 0 1 0 0 0- 0- 0 0 1 0 1 3 45.2
Mar-05 0 0 0 0 0 0 0 0 0 0 0 0 0 0 47.5
Apr-05 0 0 0 0 0 0 0 0 1 0 0 0 0 1 64.9
May-05 0 0 0 0 0 0 1 0 1 0 0 33 1 36 70.2
Jun-05 22 0 0 0 0 0 5 0 0 0 0 20 1 48 81.8
Jul-05 3 0 0 0 0 0 1 0 1 0 2 6 2 15 85.8
Aug-05 2 0 0 0 0 3 0 1 10 0 7 1 2 26 80.7
Sep-05 0 0 0 0 0 0 1 0 1 0 3 15 1 21 79.9
Oct-05 0 0 0 0 0 1 0 0 0 1 1 4 0 7 67.6Nov-05 1 0 0 1 0 2 26 0 33 1 0 2 0 66 57.8
Dec-05 10 0 3 5 1 2 2 0 19. 0 19 0 4 65 40.5Jan-06 0 0 0 3 0 0 0 0 1 0 1 3 2 10 45.1
Feb-06 0 0 0 0 0 0 0 0 0 0 0 0 0 0 42.0Mar-06 0 0 0 5 0 1 0 0 2 .0 4 1 0 13 46.4
2005 88 1 16 24 11 17 48 1 95 2 137 87 17 524
(1) Fish species abbreviations:Gizzard ShadRiver carpsuckerSmallmouth buffaloChannel catfishFlathead catfishWhite bassBluegill
GSRCSSBFCCFCWBBG
Smallmouth bassWhite crappie,WalleyeFreshwater drumCorbicula flumineaCrayfish sp.
SMBWCWAEFWDC.f.CR sp.
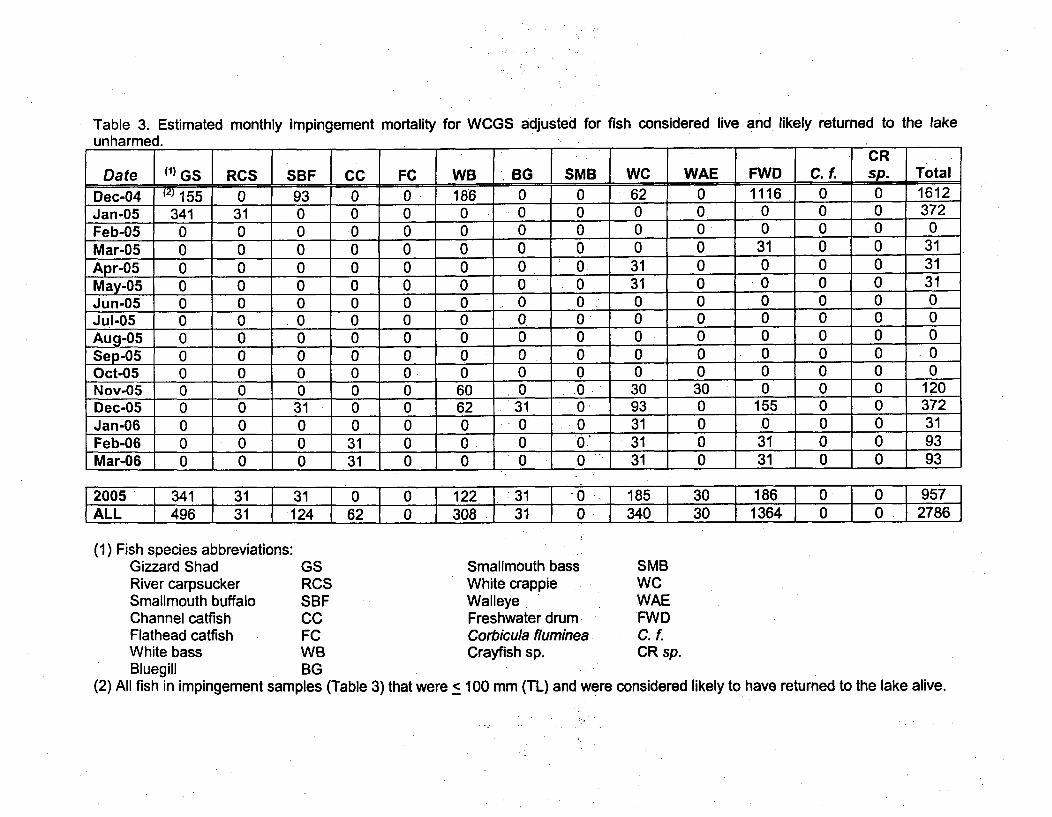
Table 3. Estimated monthly impingement mortality for WCGS adjusted for fish considered live and likely returned to the lakeunharmed.
Date (1) GS RCS SBF CC FC WB BG }SMB WC WAE FWD Cf. sp. Total
Dec-04 (21 155 0 93 0 0 186 0 0 62 0 1116 0 0 1612Jan-05 341 31 0 0 0 0 0 0 0 0 0 0 0 372Feb-05 0 0 0 •0 0 0 0 0 0 0 0 0 0 0Mar-05 0 0 0 0 0 0 0 0 0 0 31 0 0 31Apr-05 0 0 0 0 0 0 0 0 31 0 0 0 0 31May-05 0 0 0 0 0 0 0 0 31 0 0 0 0 31Jun-05 0 0 0 0 0 0 0 0 0 0 0 0 0 0Jul-05 0 0 0 0 0 0 0. 0 0 0 0 0 0 0Aug-05 0 0 0 0 0 0 0 0 0 0 0 0 0 0Sep-05 0 0 0 0 0 0 0 0 0 0 0 0 0 0Oct-05 0 0 0 0 0 0 0 0 0 0 0 0 0 0Nov-05 0 0 0 0 0 60 0 Q 30 30 0 0 0 120Dec-05 0 0 31 0 0 62 31 0- 93 0 155 0 0 372Jan-06 0 0 0 0 0 0 0 0 31 0 0 0 0 31Feb-06 0 0 0 31 0 0 0 0 31 0 31 0 0 93Mar-06 0 0 0 31 0 0 0 0- 31 0 31 0 0 93
L005 341 31 3110 0 3122 31 -0 185 30 16 0 0 29578ALL 496 31 124 62 0 3081311 013401 30 113641 0 0 2786
(1) Fish species abbreviations:Gizzard ShadRiver carpsuckerSmallmouth buffaloChannel catfishFlathead catfish
GSRCSSBFCCFC
Smallmouth bassWhite crappieWalleyeFreshwater drumCorbicula fluminea
SMBWCWAEFWDC.f.
White bass WB Crayfish sp. CR sp.Bluegill BG
(2) All fish in impingement samples (Table 3) that were < 100 mm (TL) and were considered likely to have returned to the lake alive.
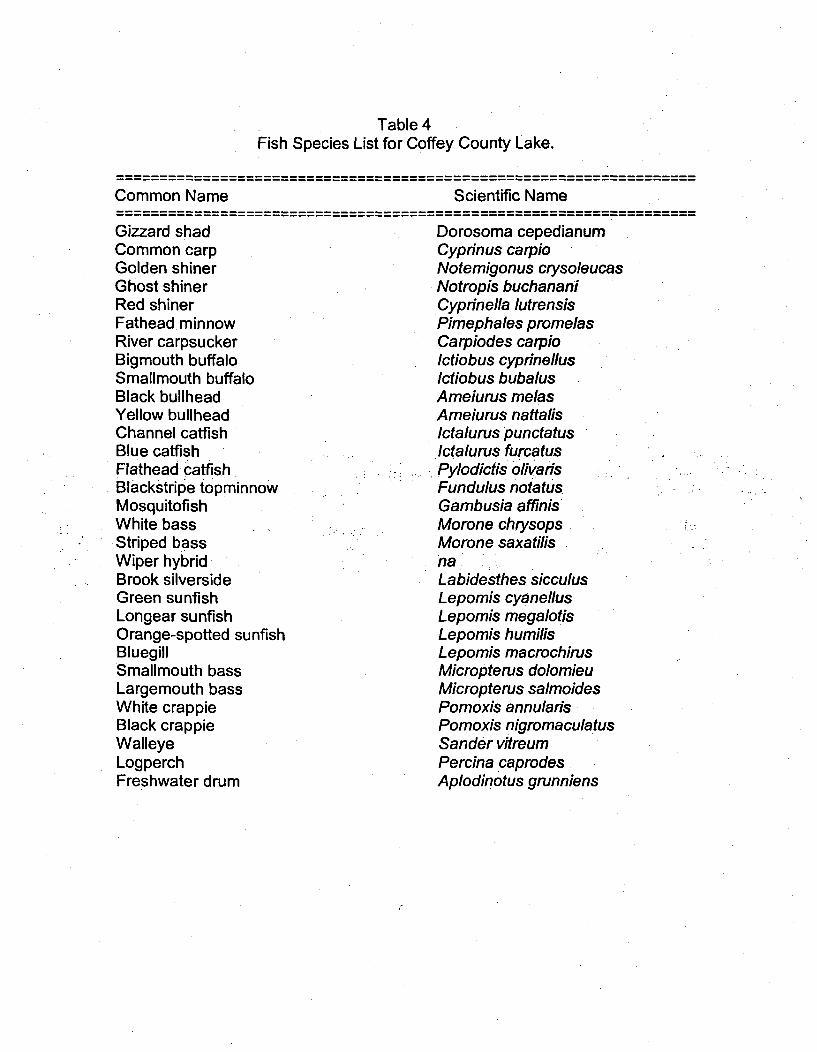
Table 4Fish Species List for Coffey County Lake.
Common Name Scientific Name
Gizzard shad Dorosoma cepedianumCommon carp Cyprinus carpioGolden shiner Notemigonus crysoleucasGhost shiner Notropis buchananiRed shiner Cyprinella lutrensisFathead minnow Pimephales promelasRiver carpsucker Carpiodes carpioBigmouth buffalo Ictiobus cyprinellusSmallmouth buffalo Ictiobus bubalusBlack bullhead Ameiurus melasYellow bullhead Ameiurus nattalisChannel catfish Ictalurus punctatusBlue catfish Ictalurus furcatusFlathead catfish Pylodictis olivarisBlackstripe topminnow Fundulus notatusMosquitofish Gambusia affinisWhite bass Morone chrysopsStriped bass Morone saxatilisWiper hybrid na :Brook silverside Labidesthes sicculusGreen sunfish Lepomis cyanellusLongear sunfish Lepomis megalotisOrange-spotted sunfish Lepomis humilisBluegill Lepomis macrochirusSmallmouth bass Micropterus dolomieuLargemouth bass Micropterus salmoidesWhite crappie Pomoxis annularisBlack crappie Pomoxis nigromaculatusWalleye Sander vitreumLogperch Percina caprodesFreshwater drum Aplodinotus grunniens
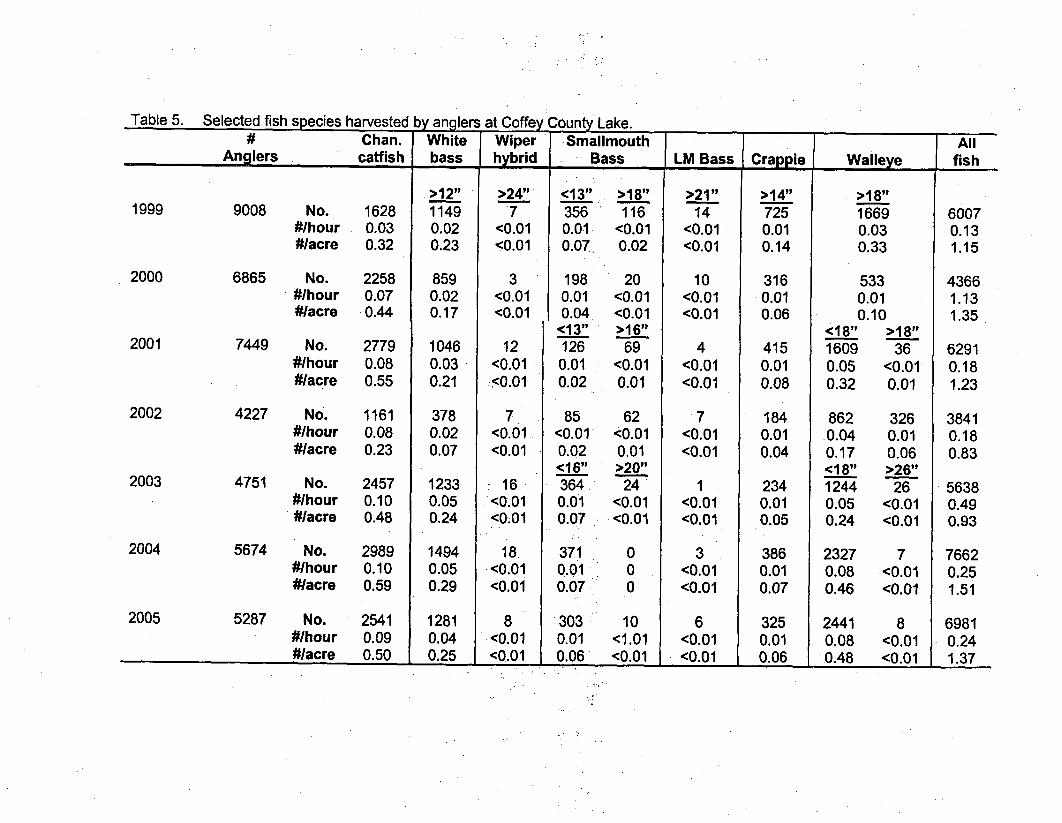
Table 5. Selected fish snecies harvested lyaner~q n't Cnf • niitv I nk•
Chan. White I Wiper Smallmouth I ] AllAnglers catfish I bass hybrid . Bass ass Crappie Walleye fish
1999 9008 No. 1628#Ihour 0.03#/acre 0.32
No. 2258#/hour 0.07#/acre 0.44
2000 6865
2001 7449 No. 2779#Ihour 0.08#Nacre 0.55
4227 No. 1161#/hour 0.08#/acre 0.23
>12"11490.020.23
8590.020.17
10460.030.21
3780.020.07
12330.050.24
14940.05
>24"17
<0.01<0.01
3<0.01<0.01
12<0.01.<0.01
7<0.01<0.01
.16<0.01<0.01
<13" >18"356 1160.01 <0.010.07 0.02
198 200.01 <0.010.04 <0.01
<13"_ >166"126 69
0.01 <0.010.02 0.01
85 62<0.01 <0.010.02 0.01<16" >20"364 240.01 <0.010.07 <0.01
>21"14
<0.01<0.01
2002
10<0.01<0.01
4<0.01<0.01
7<0.01<0.01
1<0.01<0.01
3<0.01<0.01
6<0.01<0.01
>14"7250.010.14
3160.010.06
4150.010.08
1840.010.04
2340.010.05
3860.010.07
3250.010.06
>18"16690.030.33
5330.010.10
<18" >18"1609 360.05 <0.010.32 0.01
862 3260.04 0.010.17 0.06<18"9 >26"1244 260.05 <0.010.24 <0.01
2327 70.08 <0.010.46 <0.01
2441 80.08 <0.010.48 <0.01
60070.131.15
43661.131.35
62910.181.23
38410.180.83
56380.490.93
76620.251.51
69810.241.37
2003 4751 No. 2457#1hour 0.10#Nacre 0.48
2004 5674 No. 2989#/hour 0.10#Iacre 0.59
5287 No. 2541#1hour 0.09#Nacre 0.50
18.<0.01
3710.01
000
2005
0.29
12810.040.25
<0.01 1 0.07
8<0.01<0.01
303 100.01 <1.010.06 <0.01I 0.25 I 1.37
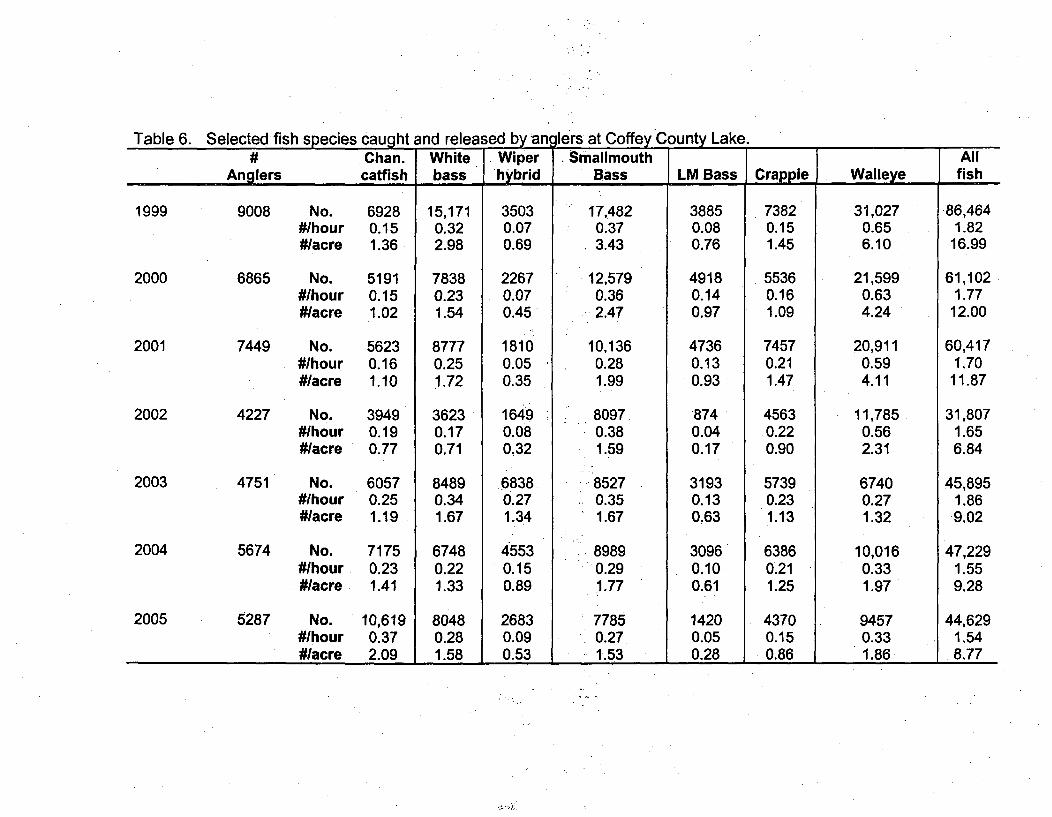
Table 6. Selected fish sDecies cauaht and released by anglers at Coffey County Lake.# Chan. White Wiper - Smallmouth All
Anglers catfish bass hybrid Bass LM Bass Crappie Walleye fish
1999 9008 No. 6928 15,171 3503 17,482 3885 7382 31,027 86,464#/hour 0.15 0.32 0.07 0.37 0.08 0.15 0.65 1.82#/acre 1.36 2.98 0.69 3.43 0.76 1.45 6.10 16.99
2000 6865 No. 5191 7838 2267 12,579 4918 5536 21,599 61,102#/hour 0.15 0.23 0.07 0.36 0.14 0.16 0.63 1.77#/acre 1.02 1.54 0.45 2.47 0.97 1.09 4.24 12.00
2001 7449 No. 5623 8777 1810 10,136 4736 7457 20,911 60,417#/hour 0.16 0.25 0.05 0.28 0.13 0.21 0.59 1.70#/acre 1.10 1.72 0.35 1.99 0.93 1.47 4.11 11.87
2002 4227 No. 3949 3623 1649 . 8097. 874 4563 11,785 31,807#/hour 0.19 0.17 0.08 0.38 0.04 .0.22 0.56 1.65#/acre 0.77 0.71 0.32 1.59 0.17 0.90 2.31 6.84
2003 4751 No. 6057 8489 6838 8527 3193 5739 6740 45,895#/hour 0.25 0.34 0.27 0.35 0.13 0.23 0.27 1.86#/acre 1.19 1.67 1.34 1.67 0,63 1.13 1.32 •9.02
2004 5674 No. 7175 6748 4553 8989 3096 6386 10,016 47,229#/hour 0.23 0.22 0.15 0.29 0.10 0,21 0.33 1.55#Iacre 1.41 1.33 0.89 1.77 0.61 1.25 1.97 9.28
2005 5287 No. 10,619 8048 2683 7785 1420 4370 9457 44,629#/hour 0.37 0.28 0.09 0.27. 0.05 0.15 0.33 1.54#/acre 2.09 1.58 0.53 1.53 0.28 0.86 1.86 8.77
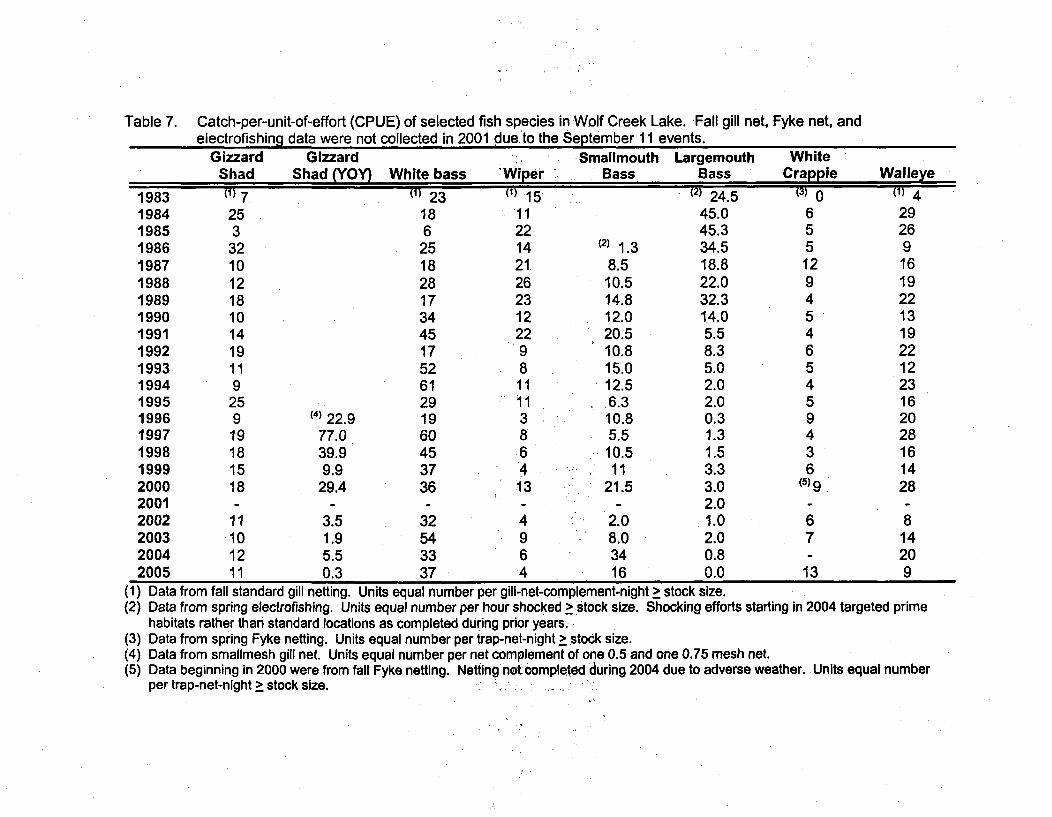
Table 7. Catch-per-unit-of-effort (CPUE) of selected fish species in Wolf Creek Lake. Fall gill net, Fyke net, andelectrofishinci data were not collected in 2001 due to the September 11 events.
Gizzard Gizzard Smallmouth Largemouth WhiteShad Shad (YOY) White bass -Wiper Bass Bass Crappie Walleye
1983 (1) T (1) 23 (1) 15 (2) 24.5 (3) 0 (1) 41984 25 18 11 45.0 6 291985 3 6 22 45.3 5 261986 32 25 14 (2) 1.3 34.5 5 91987 10 18 21 8.5 18.8 12 161988 12 28 26 10.5 22.0 9 191989 18 17 23 14.8 32.3 4 221990 10 34 12 12.0 14.0 5 131991 14 45 22 20.5 5.5 4 191992 19 17 9 10.8 8.3 6 221993 11 52 8 15.0 5.0 5 121994 9 61 11 12.5 2.0 4 231995 25 29 11 .6.3 2.0 5 161996 9 (4)22.9 19 3 10.8 0.3 9 201997 19 77.0 60 8 5.5 1.3 4 281998 18 39.9 45 6 10.5 1.5 3 161999 15 9.9 37 4 11 3.3 6 142000 18 29.4 36 13 21.5 3.0 (5) 9 282001 - - - - - 2.0 -2002 11 3.5 32 4 2.0 1.0 6 82003 10 1.9 54 9 8.0 2.0 7 142004 12 5.5 33 6 34 0.8 - 202005 11 0.3 37 4 16 0.0 13 9
(1) Data from fall standard gill netting. Units equal number per gill-net-complement-night > stock size.(2) Data from spring electrofishing. Units equal number per hour shocked > stock size. Shocking efforts starting in 2004 targeted prime
habitats rather than standard locations as completed during prior years.(3) Data from spring Fyke netting. Units equal number per trap-net-night > stock size.(4) Data from smalimesh gill net. Units equal number per net complement of one 0.5 and one 0.75 mesh net.(5) Data beginning in 2000 were from fall Fyke netting. Netting not Completed during 2004 due to adverse weather. Units equal number
per trap-net-night > stock size.
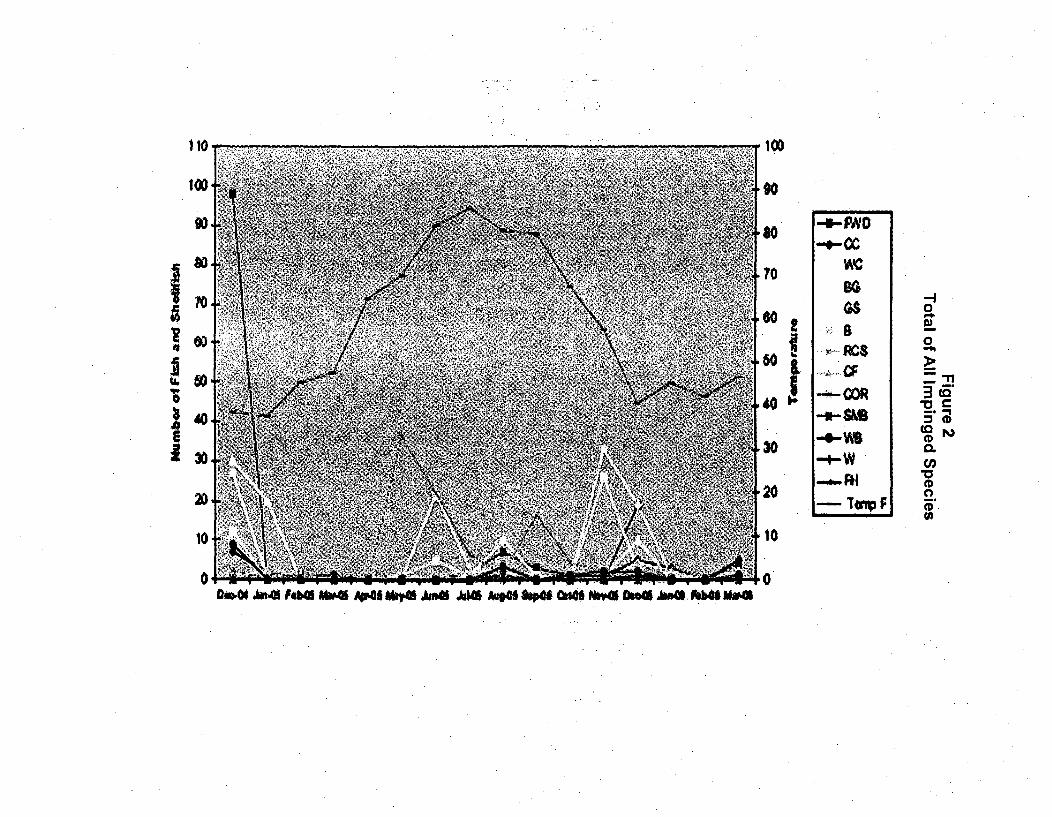
110. IO0
BG 0
-. )70
60.
.O,. 0
'.~CF
.D. 'Pr,4 g '
a01 13 -4-W * ,~r
br- m- tW F*b Mv ApiMS~ "bu A" AM Aog8 *SIW ~OSN *0.0 DN4 ObWN MOON
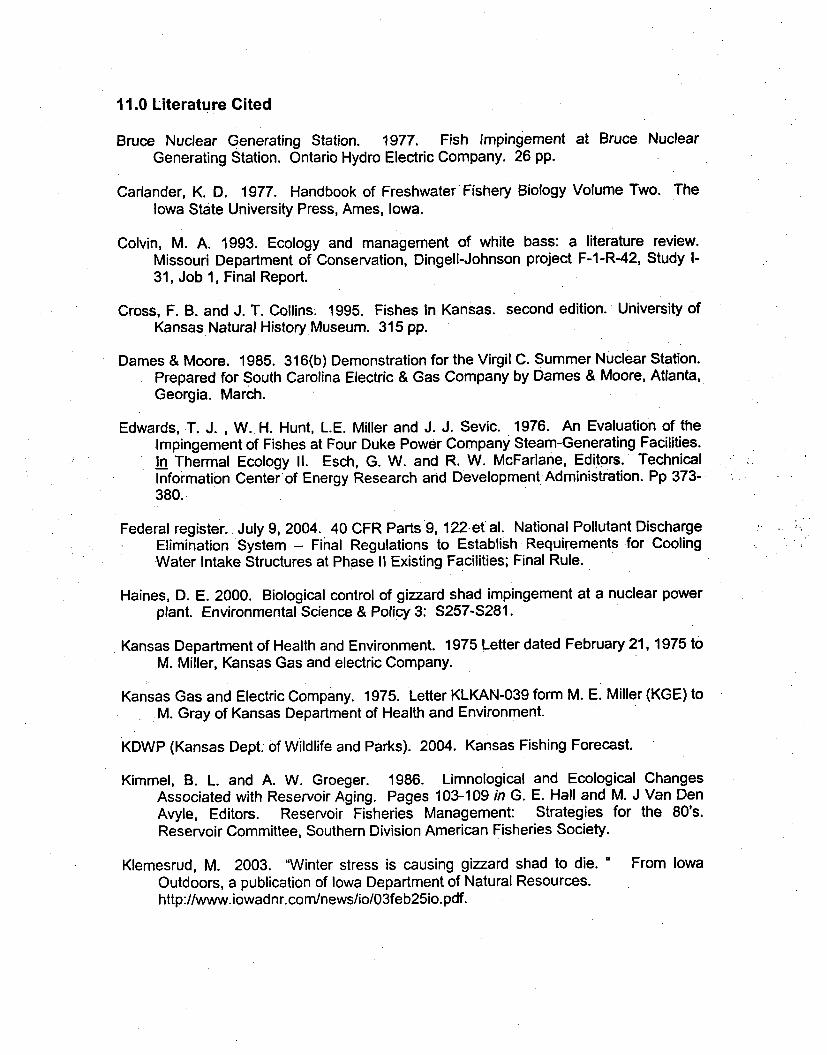
11.0 Literature Cited
Bruce Nuclear Generating Station. 1977. Fish Impingement at Bruce NuclearGenerating Station. Ontario Hydro Electric Company. 26 pp.
Carlander, K. D. 1977. Handbook of Freshwater Fishery Biology Volume Two. TheIowa State University Press, Ames, Iowa.
Colvin, M. A. 1993. Ecology and management of white bass: a literature review.Missouri Department of Conservation, Dingell-Johnson project F-1-R-42, Study I-31, Job 1, Final Report.
Cross, F. B. and J. T. Collins. 1995. Fishes In Kansas. second edition. University ofKansas Natural History Museum. 315 pp.
Dames & Moore. 1985. 316(b) Demonstration for the Virgil C. Summer Nuclear Station.Prepared for South Carolina Electric & Gas Company by Dames & Moore, Atlanta,Georgia. March.
Edwards, T. J. , W. H. Hunt, L.E. Miller and J. J. Sevic. 1976. An Evaluation of theImpingement of Fishes at Four Duke Power Company Steam-Generating Facilities.In Thermal Ecology II. Esch, G. W. and R. W. McFarlane, Editors. TechnicalInformation Center of Energy Research and Development Administration. Pp 373-380.
Federal register. July 9, 2004. 40 CFR Parts 9, 122et al. National Pollutant DischargeElimination System - Final Regulations to Establish Requirements for CoolingWater Intake Structures at Phase II Existing Facilities; Final Rule.
Haines, D. E. 2000. Biological control of gizzard shad impingement at a nuclear powerplant. Environmental Science & Policy 3: S257-S281.
Kansas Department of Health and Environment. 1975 Letter dated February 21, 1975 toM. Miller, Kansas Gas and electric Company.
Kansas Gas and Electric Company. 1975. Letter KLKAN-039 form M. E. Miller (KGE) to
M. Gray of Kansas Department of Health and Environment.
KDWP (Kansas Dept. of Wildlife and Parks). 2004. Kansas Fishing Forecast.
Kimmel, B. L. and A. W. Groeger. 1986. Limnological and Ecological ChangesAssociated with Reservoir Aging. Pages 103-109 in G. E. Hall and M. J Van DenAvyle, Editors. Reservoir Fisheries Management: Strategies for the 80's.Reservoir Committee, Southern Division American Fisheries Society.
Klemesrud, M. 2003. "Winter stress is causing gizzard shad to die. " From IowaOutdoors, a publication of Iowa Department of Natural Resources.http://www.iowadnr.com/news/io/03feb25io.pdf.
Mosher, T. D. 2000. Assessment of a 254-mm Minimum Length Limit for Crappie inThree Northeastern Kansas Reservoirs Final Report. Kansas Department ofWildlife and Parks. Federal Aid Project No. FW-9-12 and F-30-R-1.
Muoneke, M. I., C. C. Henry, and 0. E. Maughan. 1992. Population structure and-foodhabits of white crappie Pomoxis annualris Rafinesque in a turbid Oklahomareservoir. Journal of Fish Biology. Volume 1 Page 647 - October.
O'Brien W. J., B. Loveless, and D. Wright. 1984. Feeding Ecology of Young WhiteCrappie in a Kansas Reservoir. North American Journal of Fisheries Management;4: p 341-349.
Olmstead, L.L. and J.P. Clugston. 1986. Fishery Management in CoolingImpoundments in Reservoir Fisheries Management: Strategies for the 80's. G.Hall and M. Van Den Avyle, Editors. American Fisheries Society. Bethesda, MD.327 pp.
Ontario Hydro. 1977. Winter studies of gizzard shad at Lambto GS-1976-77. OntarioHydro Research Division Report. No. 77-400-K. 47pp.
Pennsylvania Angler & Boater. 2001. "The Basics of Water Pollution in Pennsylvania."http://www.fish.state.pa.us/anglerboater/2001/jf2001 /wpollbas.htm. Pennsylvania.Angler & Boater Magazine.. (online), a publication of the Pennsylvania Fish & Boat.Commission.
Schoenung, B. 2003. Fish and Wildlife Research and Management Notes. IndianaDepartment of Natural Resources, Division of Fish and Wildlife. Available online athttp://www.state.in.us/dnr/fishwild/publications/notes/boggs.htm.
Scott, W.B., and E. J. Crossman. 1973. Freshwater Fishes of Canada. Bulletin 184,Fisheries Research Board of Canada. Ottawa.
Smitherman, R.O., and R. A. Dunham. 1993. Relationships Among Cultured andNaturally Occurring Populations of Freshwater Catfish in the United States. In(Collie and McVey, Eds) Proceedings of the Twenty-Second U.S.-JapanAquaculture Panel Symposium, August 21-22, 1993, Homer, Alaska.
South Carolina Electric & Gas Company. 2002. Appendix E - Applicant'sEnvironmental Report, Operating License Renewal Stage, Virgil C. SummerNuclear Station. August.
United States Environmental Protection Agency (EPA). 2006. Letter dated November22, 2006, from J. Dunn (EPA) to J. Werner (KCPL)
United States Environmental Protection Agency (EPA). 2006. Letter dated November27, 2006, from J. Dunn (EPA) to S. Williams (IDNA)
United States Nuclear Regulatory Commission (NRC). 1975. Final EnvironmentalStatement (FES) for Wolf Creek Generating Station. NUREG-75/096
Virginia Power. 1985. Impingement and Entrainment Studies for North Anna PowerStation, 1978-1983. Prepared by Virginia Power Water Quality Department,Richmond.
WCNOC. 2006. 2005 Fishery Monitoring Report and 2006 Plan. Internal documents.
Wellborn, T. L. 1988. Channel Catfish: Life History and Biology. Southern RegionalAquaculture Center, Texas A&M University, College. Station, Texas. SRACPublication No. 180.
White, Andrew M., F. D. Moore, N. A. Alidridge, and D. M. Loucks. 1986. The Effects ofNatural Winter Stresses on the Mortality of the Eastern Gizzard Shad, Dorosomacepedianum, in Lake Erie. Environmental Resource Associates, Inc. and JohnCarrol University, for The Cleveland Electric Illuminating Company and The OhioEdison Company. 208 pp.
Willis, D. W. 1986. Review of Water Level Management on Kansas Reservoirs. Pages110-114 in G. E. Hall and M. J Van Den Avyle, Editors. Reservoir FisheriesManagement: Strategies for the 80's. Reservoir Committee, Southern DivisionAmerican Fisheries Society.

APPENDIX A
Raw Impingement Data
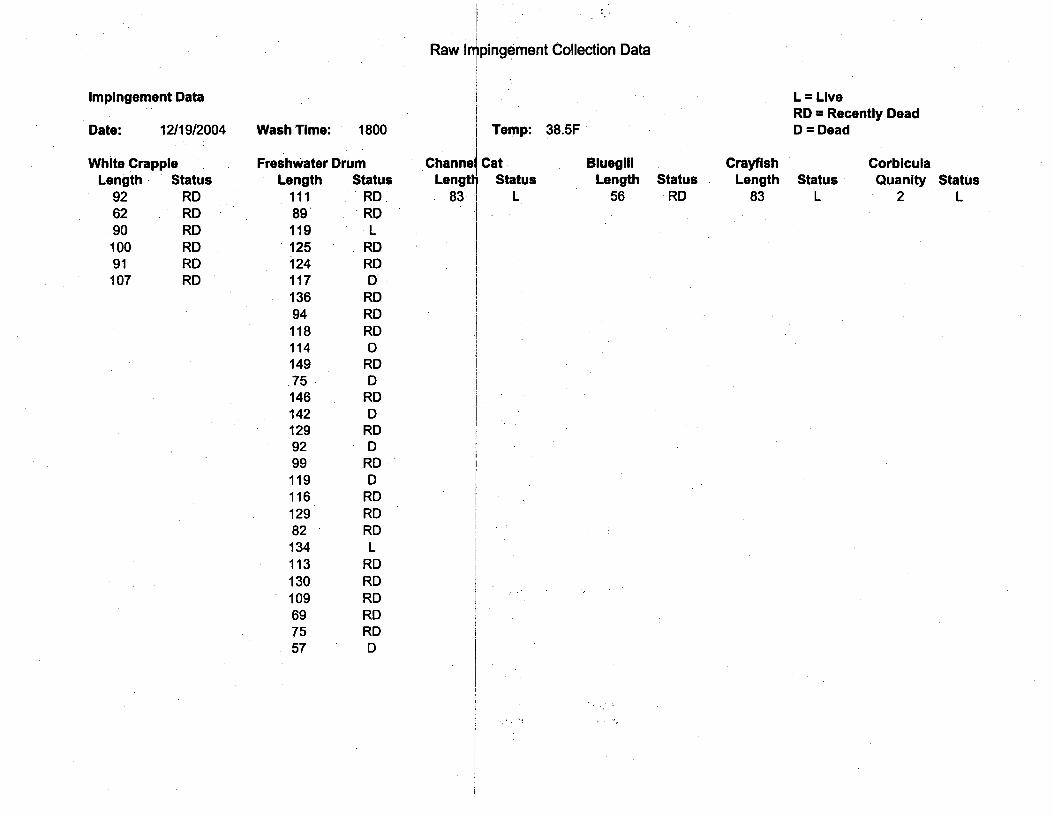
Raw lImpingement Collection Data
Impingement Data L = LiveRD = Recently DeadD = DeadDate: 12/19/2004 Wash Time: 1800 Temp: 38.5F
White CrappieLength Status
92 RD62 RD90 RD100 RD91 RD107 RD
Freshwater DrumLength Status
111 RD.89 RD119 .L125 RD124 RD117 D136 RD94 RD118 RD114 D149 RD.75 D146 RD142 D129 RD92 D99 RD119 D116 RD129 RD82 RD
134 L113 RD130 RD109 RD69 RD75 RD57 D
ChannelLengtt
.83
CatI Status
L
BluegillLength
56Status
RD
CrayfishLength
83Status
L
CorbiculaQuanity Status
2 L
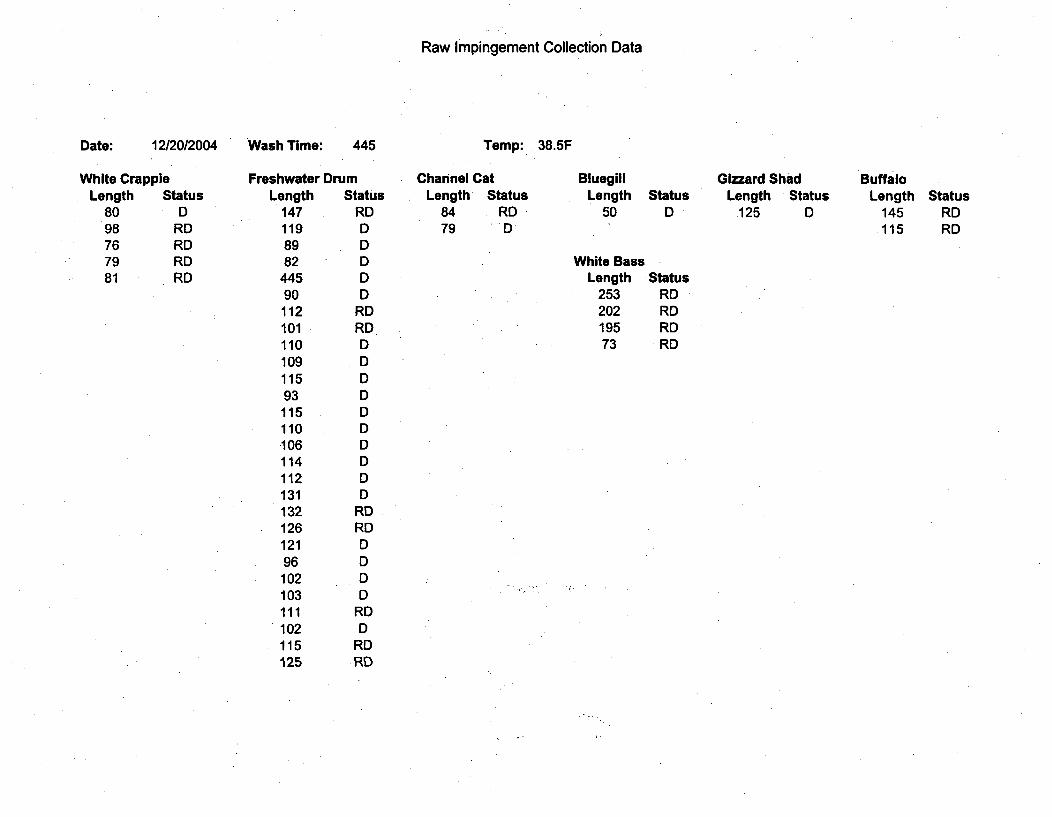
Raw Impingement Collection Data
Date: 12/20/2004 Wash Time: 445 Temp: 38.5F
White CrappieLength Status
80 D98 RD76 RD79 RD81 RD
Freshwater DrumLength Status
147 RD119 D89 D82 D
445 D90 D112 RD101 RD110 D109 D115 D93 D
115 D110 D106 D114 D112 D131 D132 RD126 RD121 D96 D102 D103 D111 RD102 D115 RD125 RD
Channel CatLength Status
84 RD79 D
BluegillLength
50Status
0
Gizzard ShadLength Status
.125 D
BuffaloLength Status
145 RD115 RD
White BassLength Status
253 RD202 RD195 RD73 RD
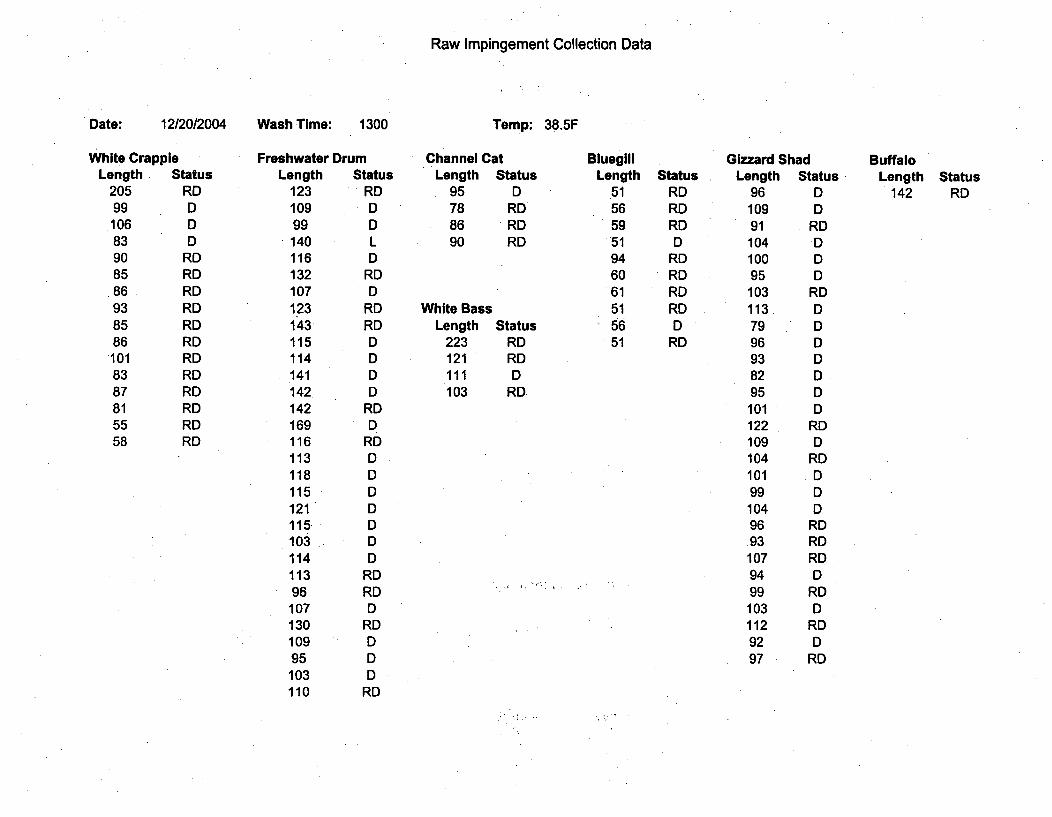
Raw Impingement Collection Data
Date: 12/20/2004 Wash Time: 1300 Temp: 38.5F
White CrappieLength Status
205 RD99 D
.106 D83 D90 RD85 RD
.86 RD93 RD85 RD86 RD101 RD83 RD87 RD81 RD55 RD58 RD
Freshwater DrumLength Status
123 RD109 D99 D
140 L116 D132 RD107 D123 RD143 RD115 D114 D141 D142 D142 RD169 D116 RD113 D118 D115 D121 D115 D103 D114 D113 RD96 RD
107 D130 RD109 D95 D103 D110 RD
Channel CatLength Status
95 D78 RD86 RD90 RD
BluegillLength
51565951946061515651
StatusRDRDRDD
RDRDRDRDD
RD
White BassLength Status
223 RD121 RD111 D103 RD
Gizzard ShadLength Status
96 D109 D91 RD104 D100 D95 D103 RD113 D79 D96 D93 D82 D95 D101 D122 RD109 D104 RD101 D99 D104 D96 RD93 RD
BuffaloLength Status
142 RD
10794991031129297
RDD
RDD
RDD
RD
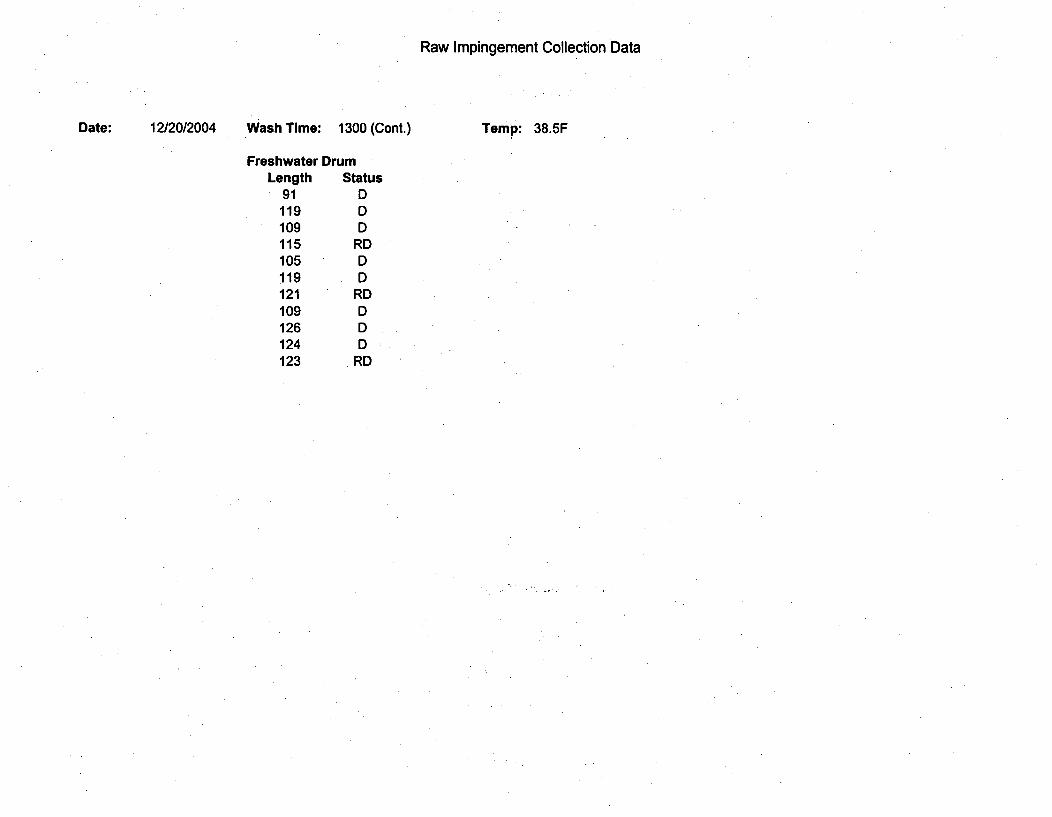
Raw Impingement Collection Data
Date: 12/20/2004 Wash Time: 1300 (Cont.) Temp: 38.5F
Freshwater DrumLength Status
91 D119 D109 D115 RD105 D119 D121 RD109 D126 D124 D123 RD
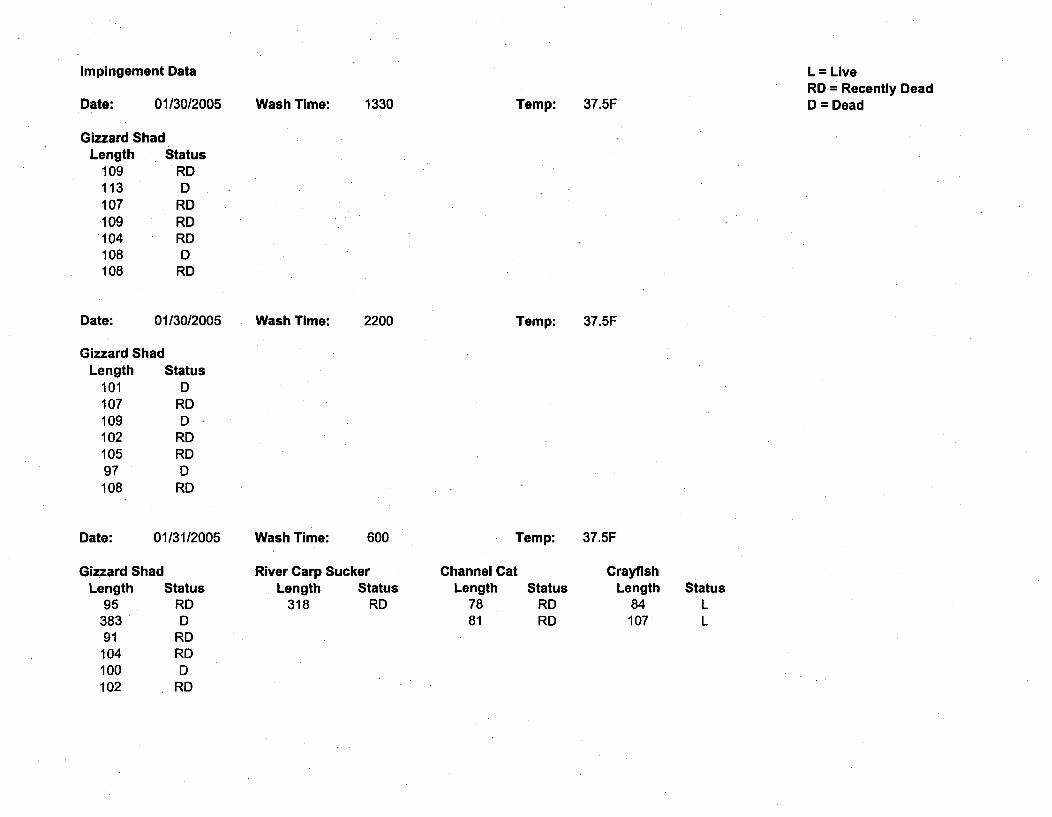
Impingement Data L = LiveRD = Recently DeadD = DeadDate: 01/30/2005 Wash Time: 1330 Temp: 37.5F
Gizzard ShadLength Status
109 RD113 D107 RD109 RD104 RD108 D108 RD
Date: 01/30/2005 Wash Time: 2200 Temp: 37.5F
Gizzard ShadLength Status
101 D107 RD109 D102 RD105 RD97 D108 RD
Date: 01/31/2005 Wash Time: 600 Temp: 37.5F
Gizzard ShadLength Status
95 RD383 D91 RD104 RD100 D102 RD
River Carp SuckerLength Status
318 RD
Channel CatLength Status
78 RD81 RD
CrayfishLength Status
84107
LL
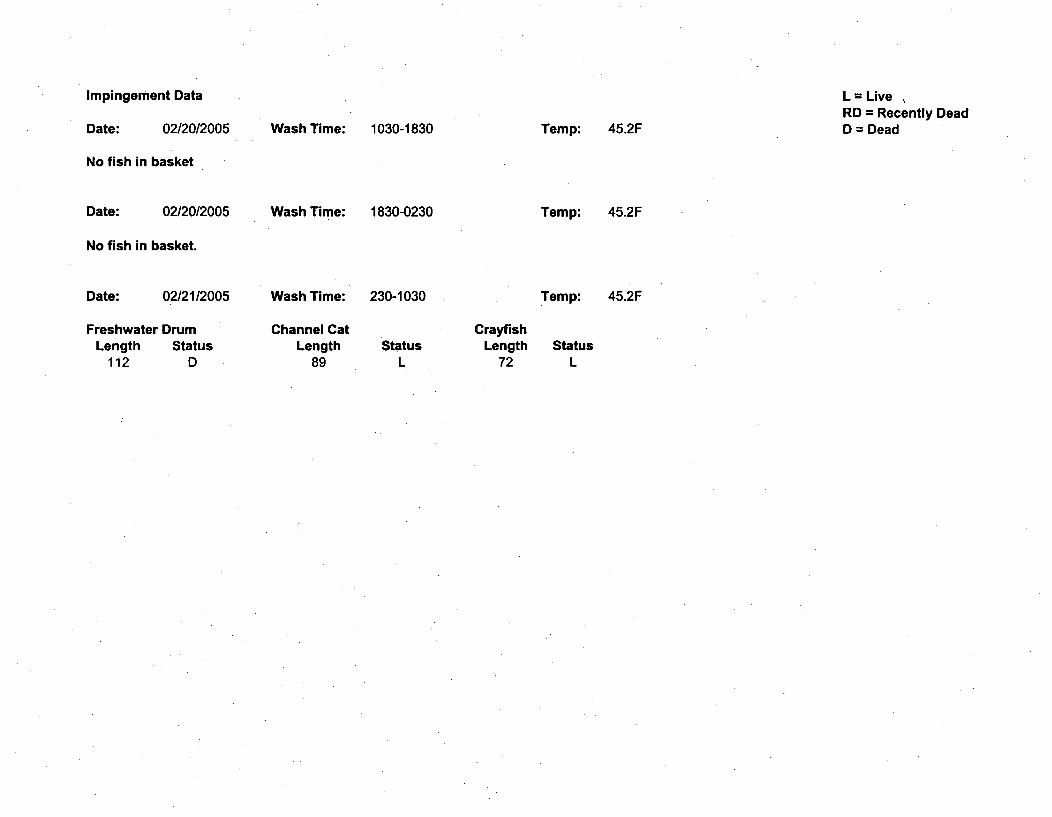
Impingement Data
Date: 02/20/2005
No fish in basket
Date: 02/20/2005
No fish in basket.
Date: 02/21/2005
Freshwater DrumLength Status
112 D
L =Live ,RD = Recently DeadD = DeadWash Time:
Wash Time:
Wash Time:
Channel CatLength
89
1030-1830
1830-0230
230-1030
StatusL
Temp: 45.2F
Temp: 45.2F
Temp: 45.2F
CrayfishLength Status
72 L
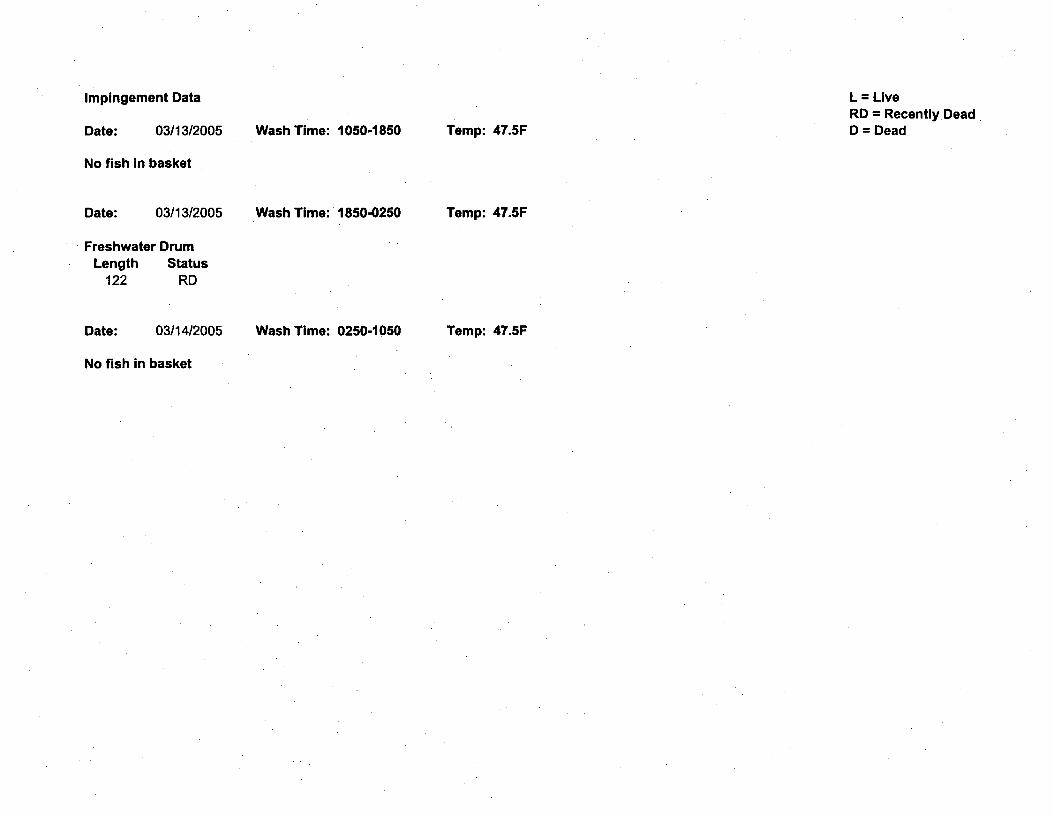
Impingement Data
Date: 03/13/2005
No fish in basket
Date: 03/13/2005
Freshwater DrumLength Status
122 RD
Date: 03/14/2005
No fish in basket
L = LiveRD = Recently.DeadD = DeadWash Time: 1050-1850
Wash Time: 1850-0250
Wash Time: 0250-1050
Temp: 47.5F
Temp: 47.5F
Temp: 47.5F
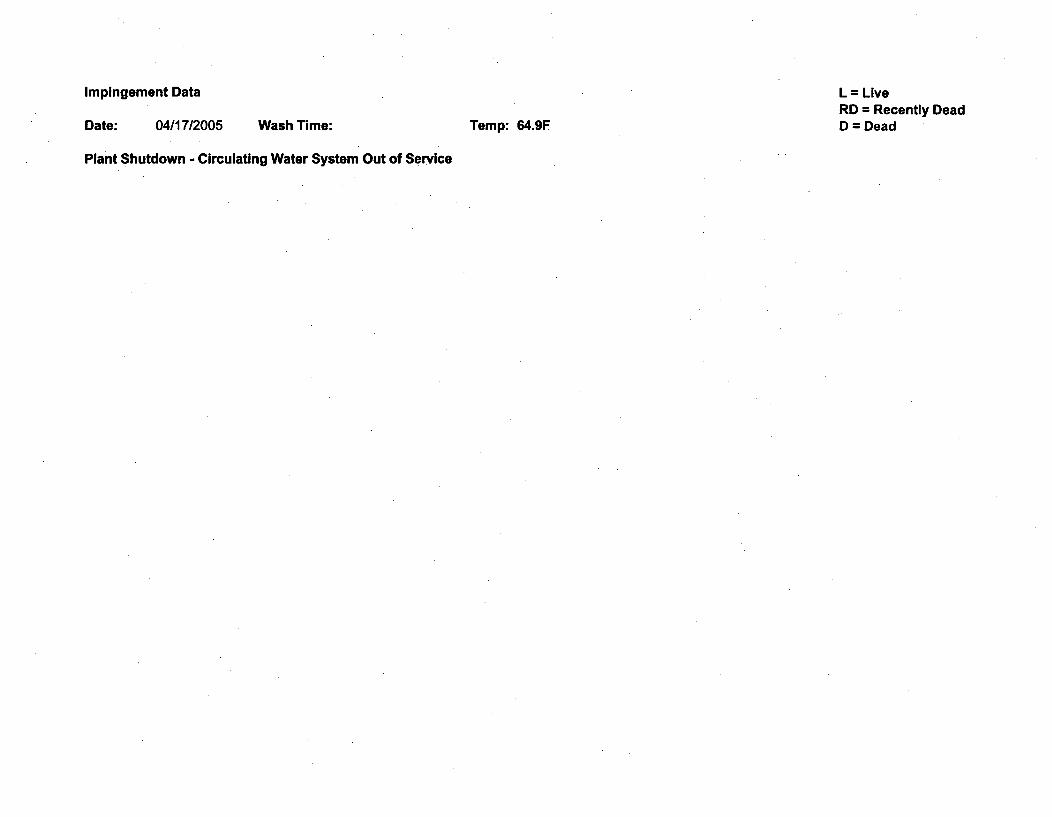
Impingement Data
Date: 04/17/2005 Wash Time:
Plant Shutdown - Circulating Water System Out of Service
L = LiveRD = Recently Dead
Temp: 64.9F D = Dead
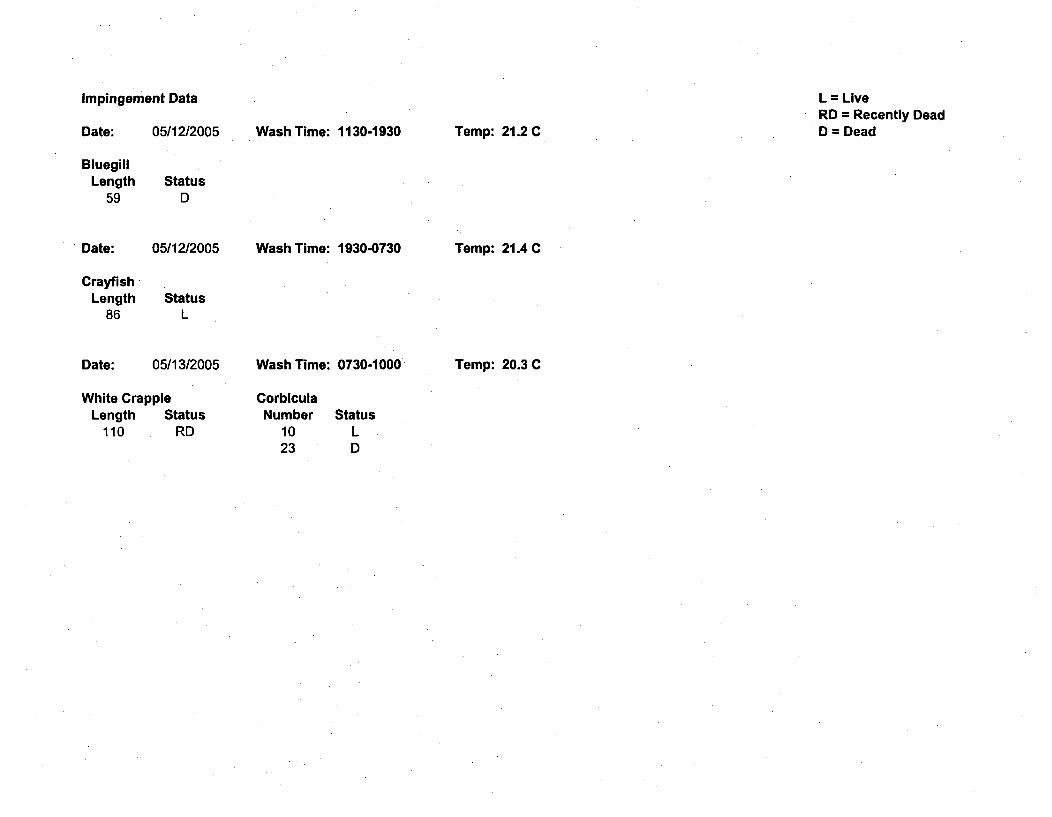
Impingement Data
Date: 05/12/2005
BluegillLength Status
59 D
L = LiveRD = Recently DeadD = DeadWash Time: 1130-1930
Wash Time: 1930-0730
Temp: 21.2 C
Date:
CrayfishLength
86
05/12/2005 Temp: 21.4 C
StatusL
Date: 05/13/2005
White CrappieLength Status
110 RD
Wash Time: 0730-1000
CorbiculaNumber Status
10 L23 D
Temp: 20.3 C
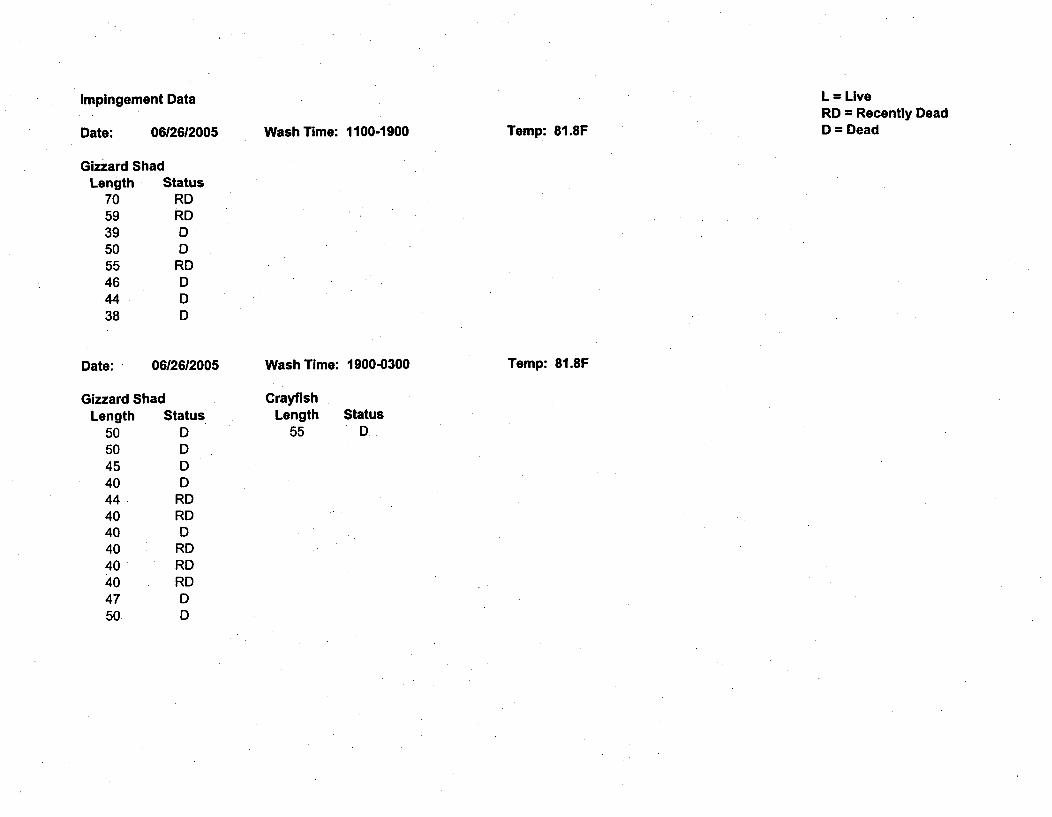
Impingement Data L = LiveRD = Recently DeadD = DeadDate: 06/26/2005 Wash Time: 1100-1900 Temp: 81.8F
Gizzard ShadLength Status
70 RD59 RD39 D50 D55 RD46 D
.44 D38 D
Date: 06126/2005
Gizzard ShadLength Status
50 D50 D45 D40 D44 RD40 RD40 D40 RD40 RD40 RD47 D50 D
Wash Time: 1900-0300 Temp: 81.8F
CrayfishLength
55Status
D
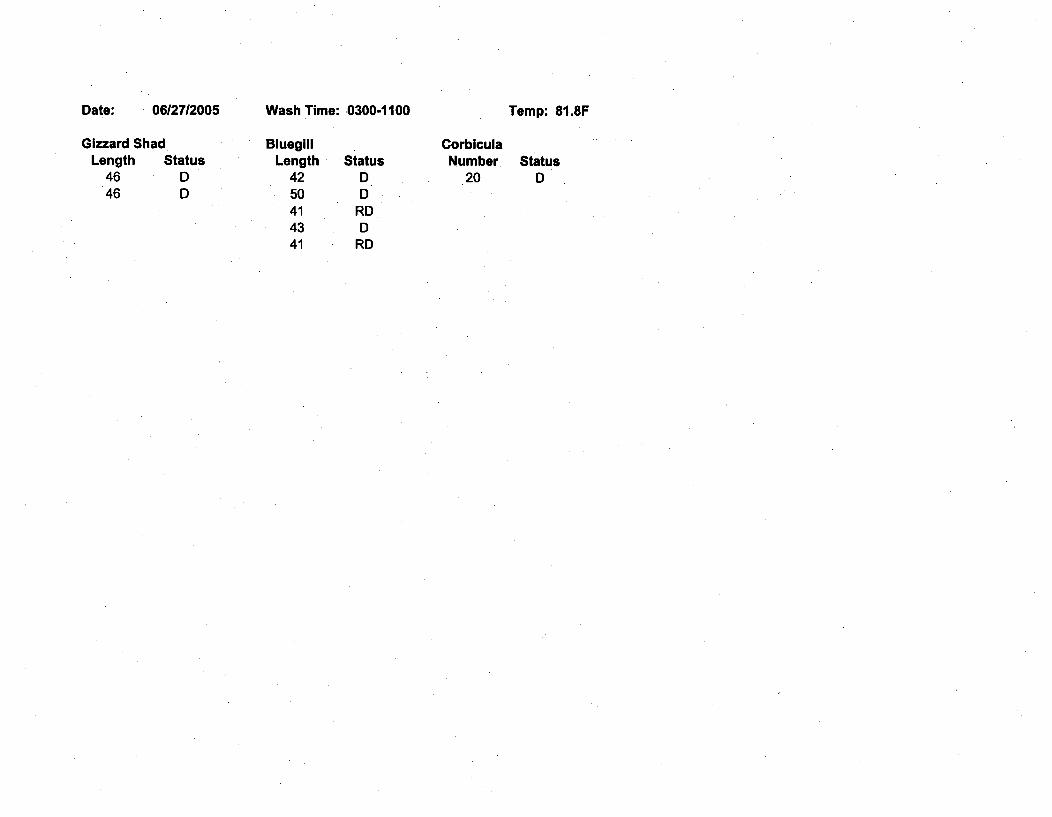
Date: 06/27/2005
Gizzard ShadLength Status
46 D46 D
Wash Time: 0300-1100 Temp: 81.8F
BluegillLength
4250414341
StatusDD
RDD
RD
CorbiculaNumber.
20Status
D
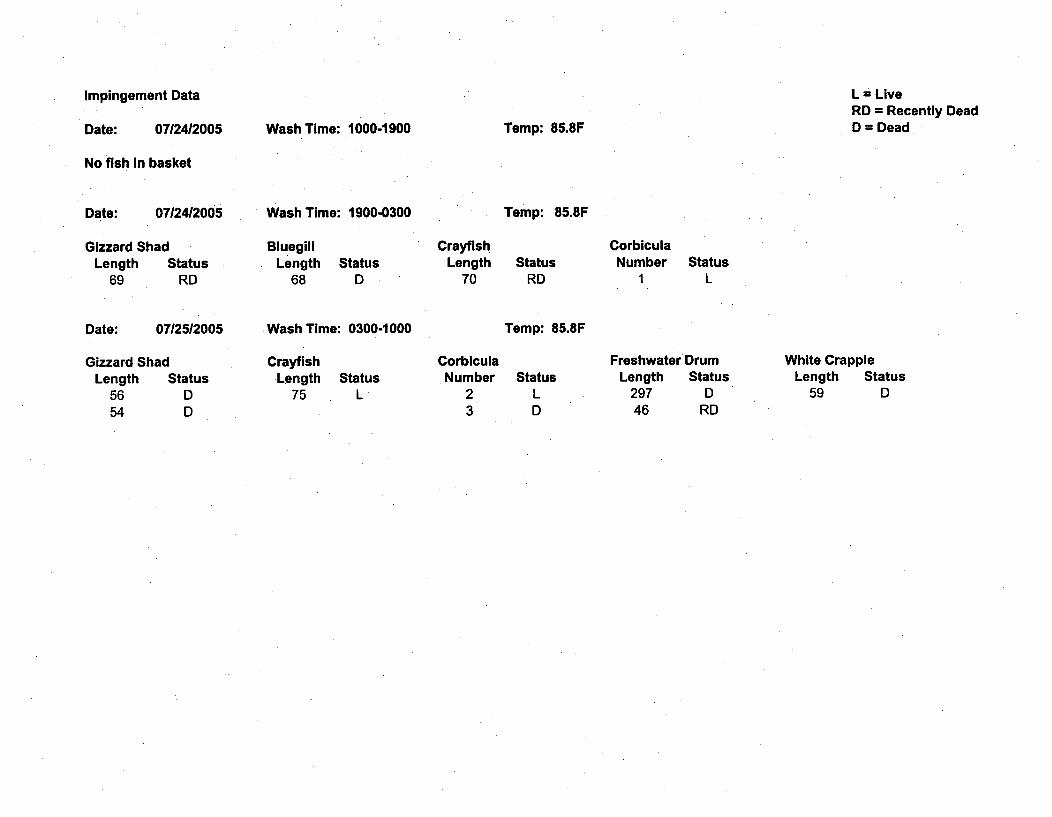
Impingement Data
Date: 07/24/2005
L = LiveRD = Recently DeadD = DeadWash Time: 1000-1900 Temp: 85.8F
No fish in basket
Date: 07124/2005 Wash Time: 1900-0300 Temp: 85.8F
Gizzard ShadLength Status
69 RD
BluegillLength
68Status
D
CrayfishLength
70
CorbiculaNumber StatusStatus
RD I L
Date: 07/25/2005 Wash Time: 0300-1000 Temp: 85.8F
Gizzard ShadLength Status
56 D54 D
CrayfishLength
75Status
L
CorbiculaNumber
23
StatusLD
Freshwater DrumLength Status
297 D46 RD
White CrappieLength Status
59 D
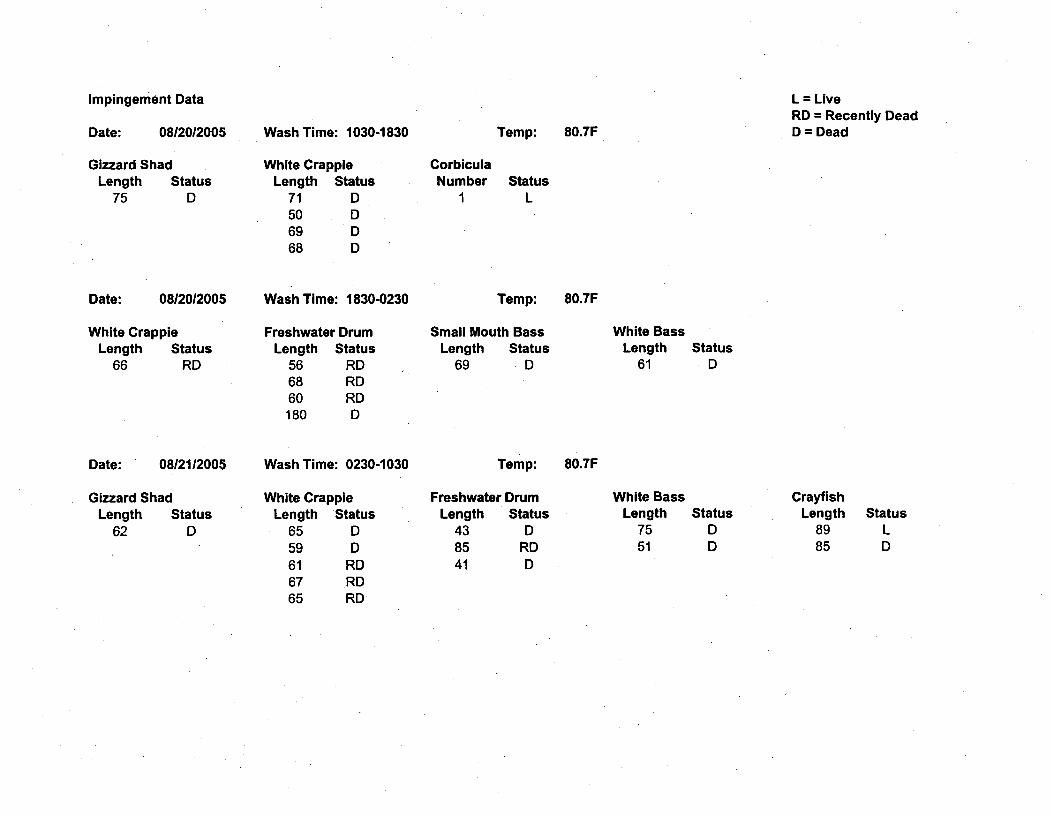
Impingement Data
Date: 08120/2005
Gizzard ShadLength Status
75 D
L = LiveRD = Recently DeadD = DeadWash Time: 1030-1830
White CrappieLength Status
71 D
Temp: 80.7F
CorbiculaNumber Status
1 L506968
DDD
Date: 08/20/2005
White CrappieLength Status
66 RD
Wash Time: 1830-0230 Temp: 80.7F
Freshwater DrumLength Status
56 RD68 RD60 RD180 D
Small Mouth BassLength Status
69 D
White BassLength Status
61 D
Date: 08/21/2005
Gizzard ShadLength Status
62 D
Wash Time: 0230-1030 Temp: 80.7F
White CrappieLength Status
65 D59 D61 RD67 RD65 RD
Freshwater DrumLength Status
43 D85 RD
White BassLength Status
75 D51 D
CrayfishLength Status
89 L85 D
41 D
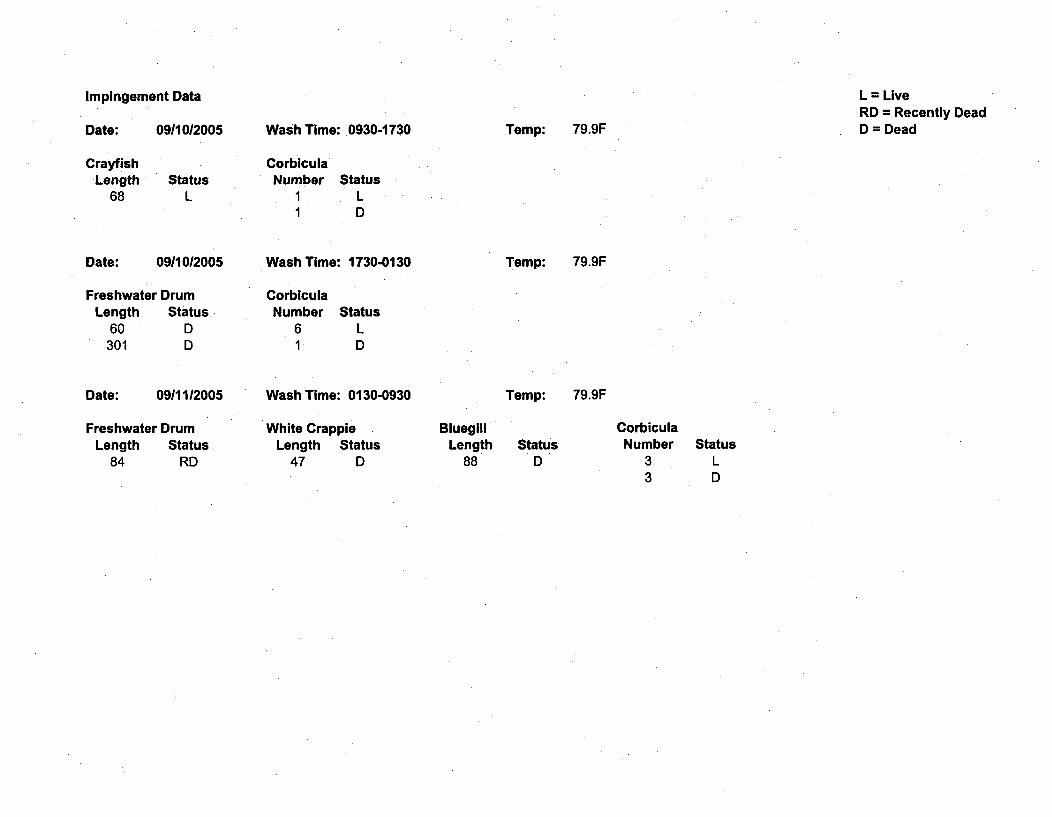
Impingement Data
Date: 09/10/2005
CrayfishLength Status
68 L
L = LiveRD = Recently DeadD = DeadWash Time: 0930-1730 Temp: 79.9F
CorbiculaNumber Status
11
LD
Date: 0911012005
Freshwater DrumLength Status
60 D301 D
Date: 09111/2005
Freshwater DrumLength Status
84 RD
Wash Time: 1730-0130 Temp: 79.9F
CorbiculaNumber Status
61
LD
Wash Time: 0130-0930 Temp: 79.9F
White CrappieLength Status
47 D
BluegillLength Status
88 D
CorbiculaNumber Status
3 L3 D
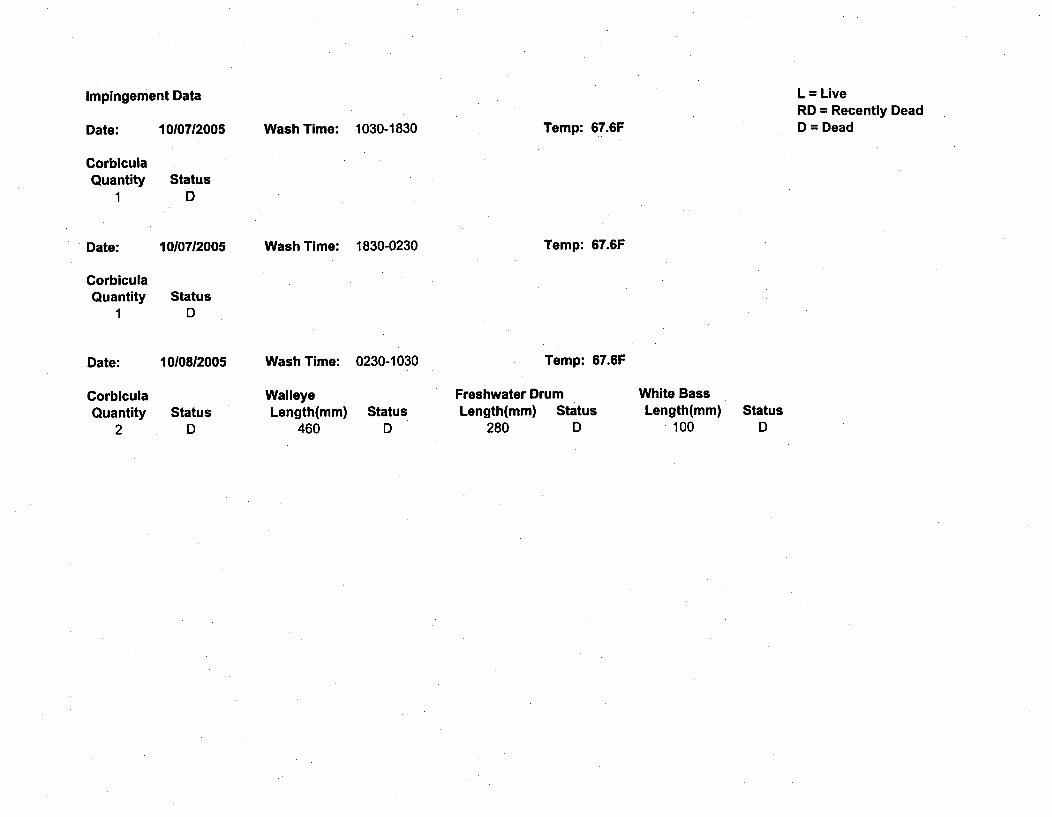
Impingement Data L = LiveRD = Recently DeadD = DeadDate:
CorbiculaQuantity
1
Date:
CorbiculaQuantity
1
10107/2005
StatusD
10/0712005
Wash Time: 1030-1830 Temp: 67.6F
Wash Time: 1830-0230 Temp: 67.6F
StatusD
Date: 10108/2005
CorbiculaQuantity
2
Wash Time: 0230-1030
WalleyeLength(mm) Status
460 DStatus
D
Freshwater DrumLength(mm) Status
280 D
Temp: 67.6F
White BassLength(mm)
. 100Status
D
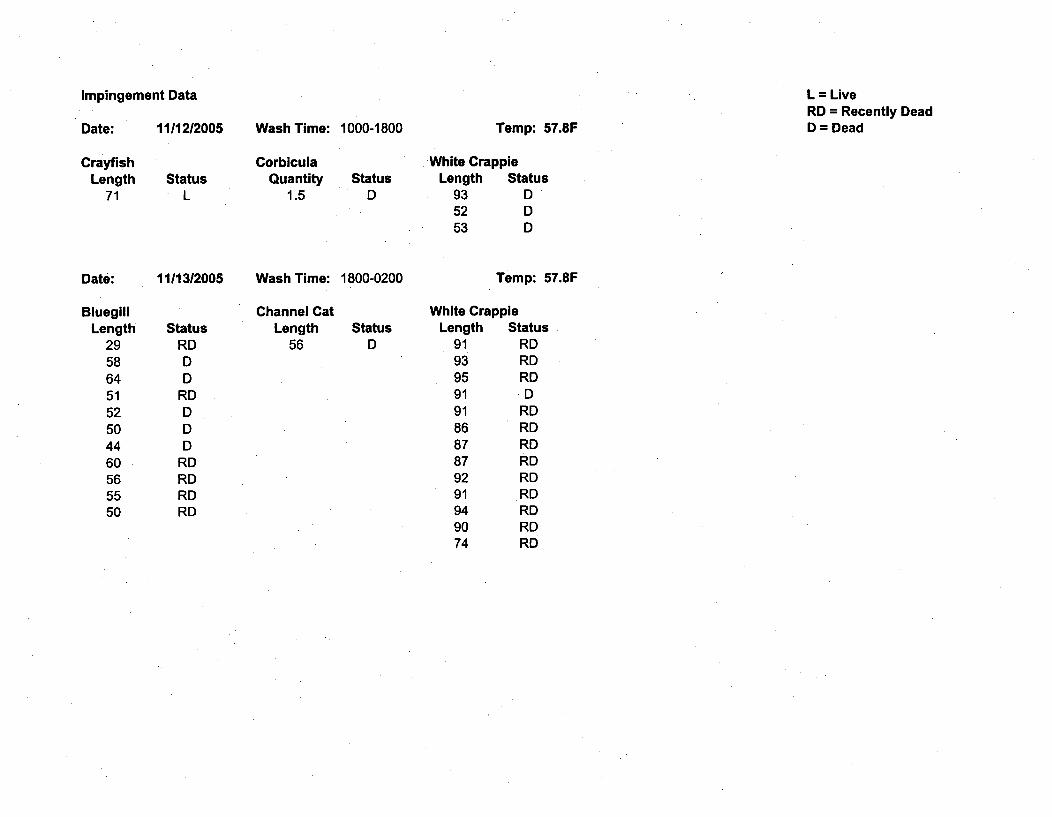
Impingement Data L = LiveRD = Recently Dead
Temp: 57.8F D = DeadDate: 11112/2005 Wash Time: 1000-1800
CrayfishLength
71Status
L
CorbiculaQuantity
1.5Status
D
White CrappieLength Status
93 D52 D53 D
Date: 1111312005 Wash Time: 1800-0200 Temp: 57.8F
BluegillLength
2958645152504460565550
StatusRDDD
RDDDD
RDRDRDRD
Channel CatLength
56Status
D
White CrappieLength Status
91 RD93 RD95 RD91 D91 RD86 RD87 RD87 RD9291949074
RDRDRDRDRD
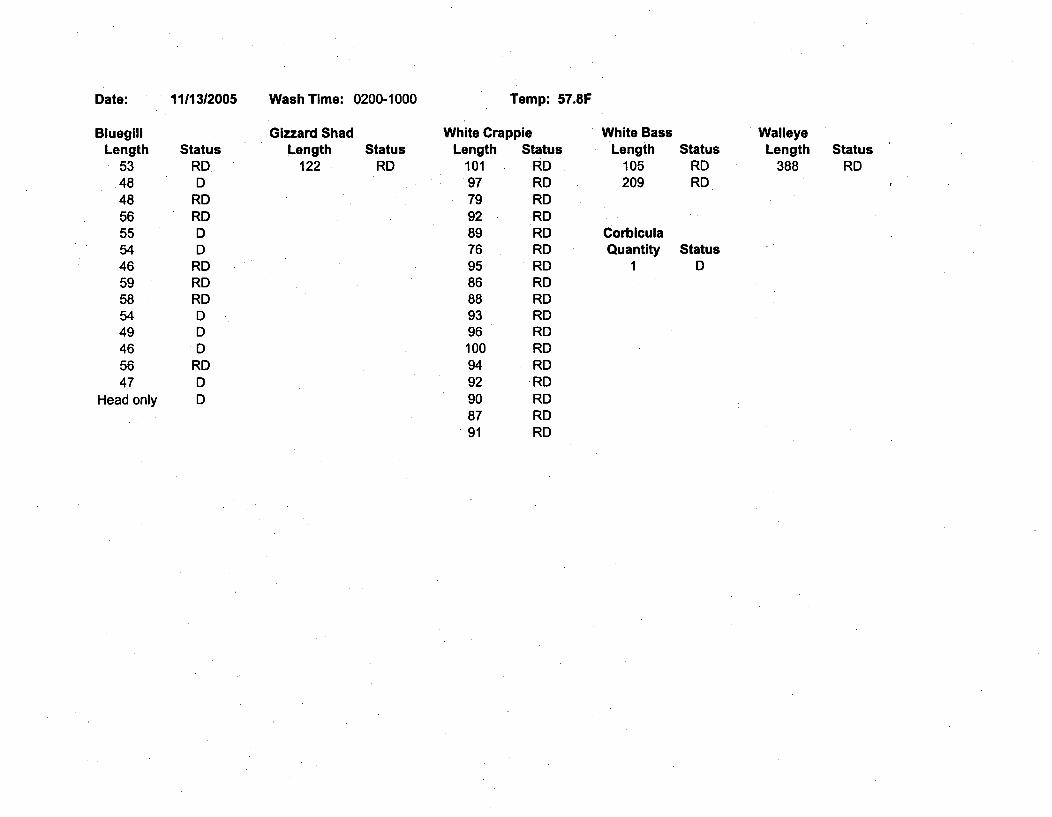
Date: 1111312005 Wash Time: 0200-1000 Temp: 57.81F
BluegillLength
53ý48485655544659585449465647
Head only
StatusRDD
RDRDDD
RDRDRDDDD
RDDD
Gizzard ShadLength
122Status
RD
White CrappieLength Status
101 RD97 RD79 RD92 RD89 RD76 RD95 RD86 RD88 RD93 RD96 RD100 RD94 RD92 RD90 RD87 RD91 RD
White BassLength
105209
CorbiculaQuantity
1
StatusRDRD
StatusD
WalleyeLength
388Status
RD
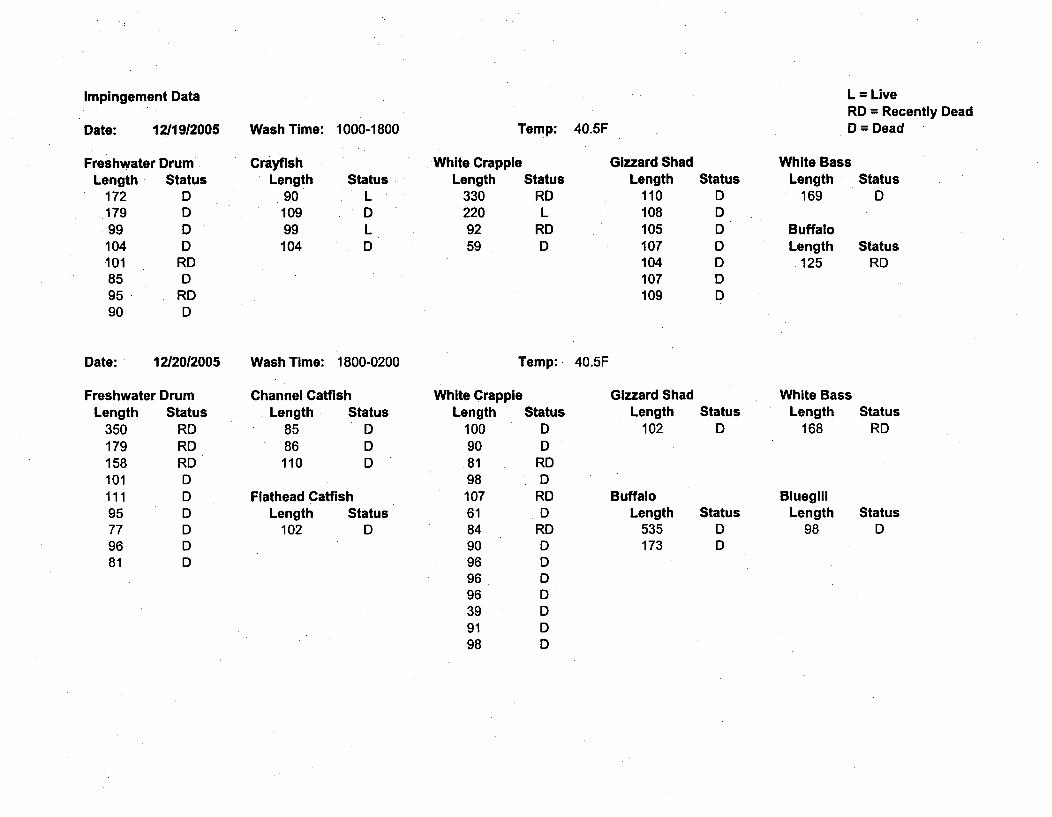
Impingement Data L = LiveRD = Recently DeadD = DeadDate: 12119/2005 Wash Time: 1000-1800 Temp: 40.5F
Freshwater DrumLength Status
172 D179 D99 D
104 D101 RD85 D95 RD90 D
CrayfishLength
9010999
104
StatusLDLD
White CrappieLength Status
330 RD220 L92 RD59 D
Gizzard ShadLength Status
110 D108 D105 D107 D104 D107 D109 D
White BassLength Status
169 D
BuffaloLength Status.125 RD
Date: 12/20/2005 Wash Time: 1800-0200 Temp: 40.5F
Freshwater DrumLength Status
350 RD179 RD158 RD101 D111 D95 D77 D96 D81 D
Channel CatfishLength Status
85 D86 D110 D
Flathead CatfishLength Status
102 D
White CrappieLength Status
100 D90 D
.81 RD98 D107 RD61 D84 RD90 D96 D96 D96 D39 D91 D.98 D
Gizzard ShadLength Status
102 D
BuffaloLength Status
535 D173 D
White BassLength Status
168 RD
BluegillLength Status
98 D
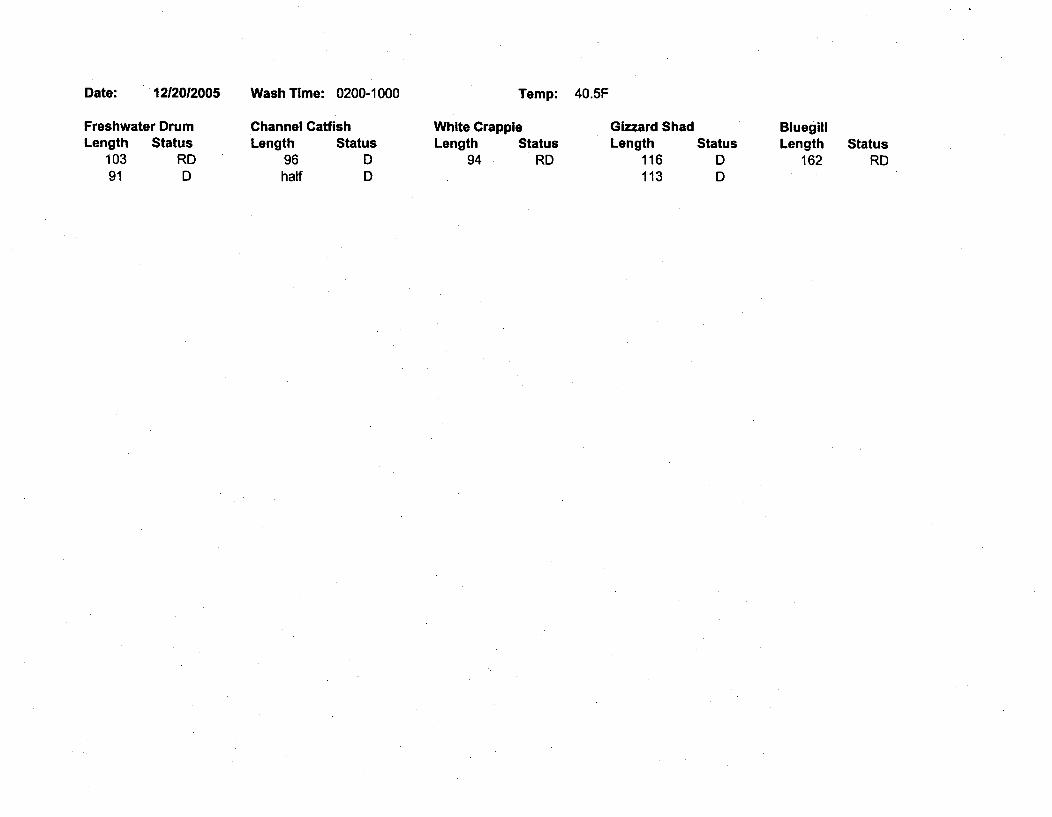
Date: 12/2012005 Wash Time: 0200-1000 Temp: 40.5F
Freshwater DrumLength Status
103 RD91 D
Channel CatfishLength Status
96 Dhalf D
White CrappieLength Status
94 RD
Gizzard ShadLength Status
116 D113 D
BluegillLength
162Status
RD
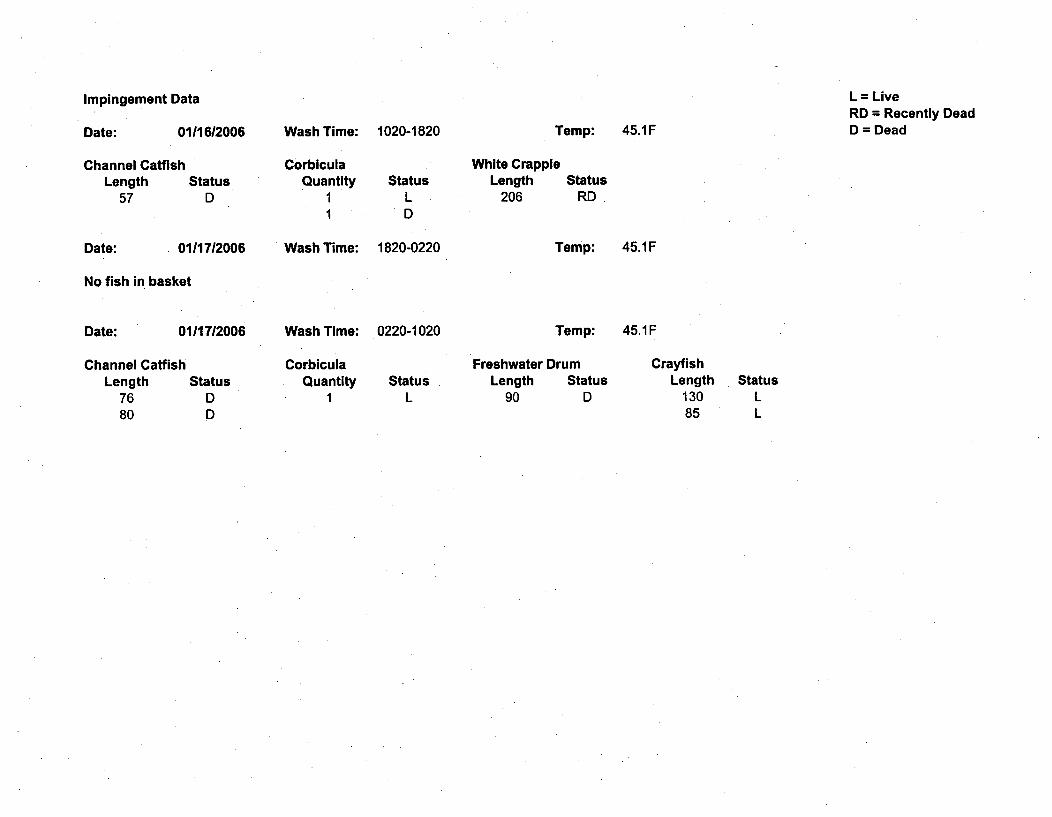
Impingement Data L = LiveRD = Recently DeadD = DeadDate: 01/1612006 Wash Time: 1020-1820 Temp: 45.1F
Channel CatfishLength Status
57 D
CorbiculaQuantity
11
StatusLD
White CrappieLength
206Status
RD
Date: 0111712006 Wash Time: 1820-0220 Temp: 45.1F
No fish in basket
Date: 01117/2006 Wash Time: 0220-1020 Temp: 45.1F
Channel CatfishLength Status
76 D80 D
CorbiculaQuantity
1Status
L
Freshwater DrumLength Status
90 D
CrayfishLength
13085
StatusLL
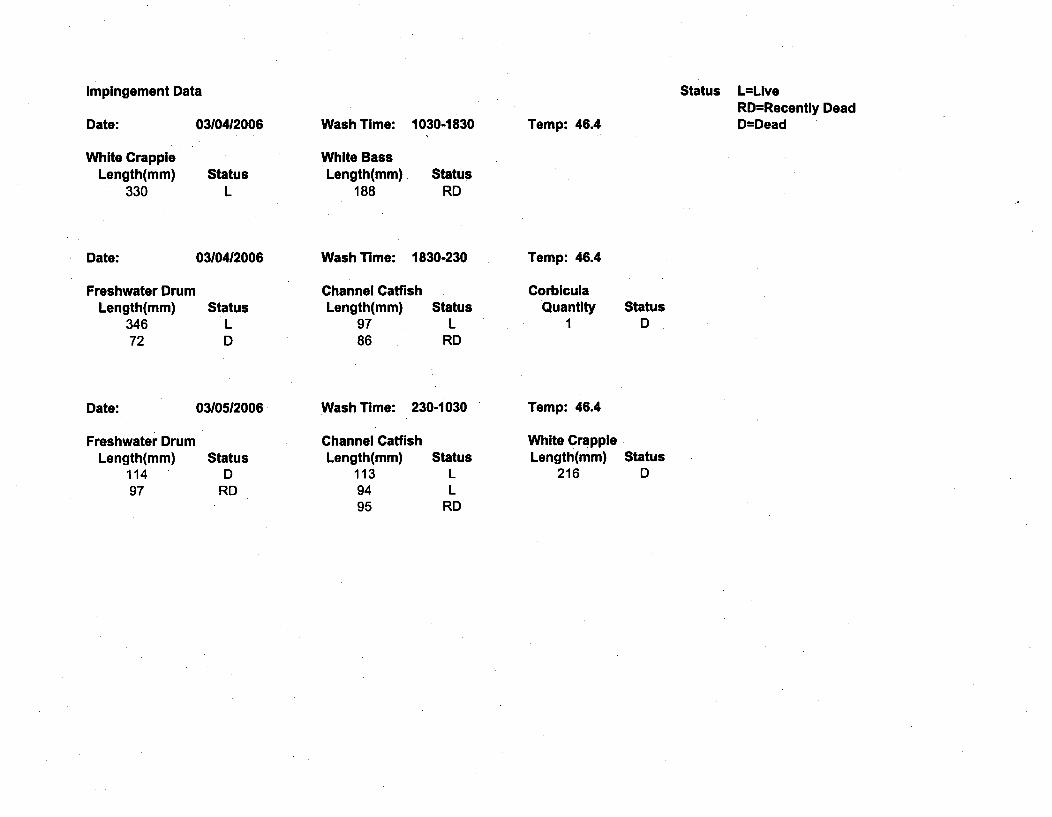
Impingement Data Status L=LiveRD=Recently DeadD=DeadDate: 03104/2006 Wash Time: 1030-1830 Temp: 46.4
White CrappieLength(mm)
330Status
L
White BassLength(mm)
188Status
RD
Date: 03/0412006 Wash Time: 1830-230
Freshwater DrumLength(mm)
34672
StatusLD
Channel CatfishLength(mm)
9786
Temp: 46.4
CorbiculaQuantity
IStatus
LRD
StatusD
Date: 03/05/2006 Wash Time: 230-1030
Freshwater DrumLength(mm)
11497
StatusD
RD
Channel CatfishLength(mm)
1139495
Temp: 46.4
White CrappieLength(mm)
216Status
LL
RD
StatusD
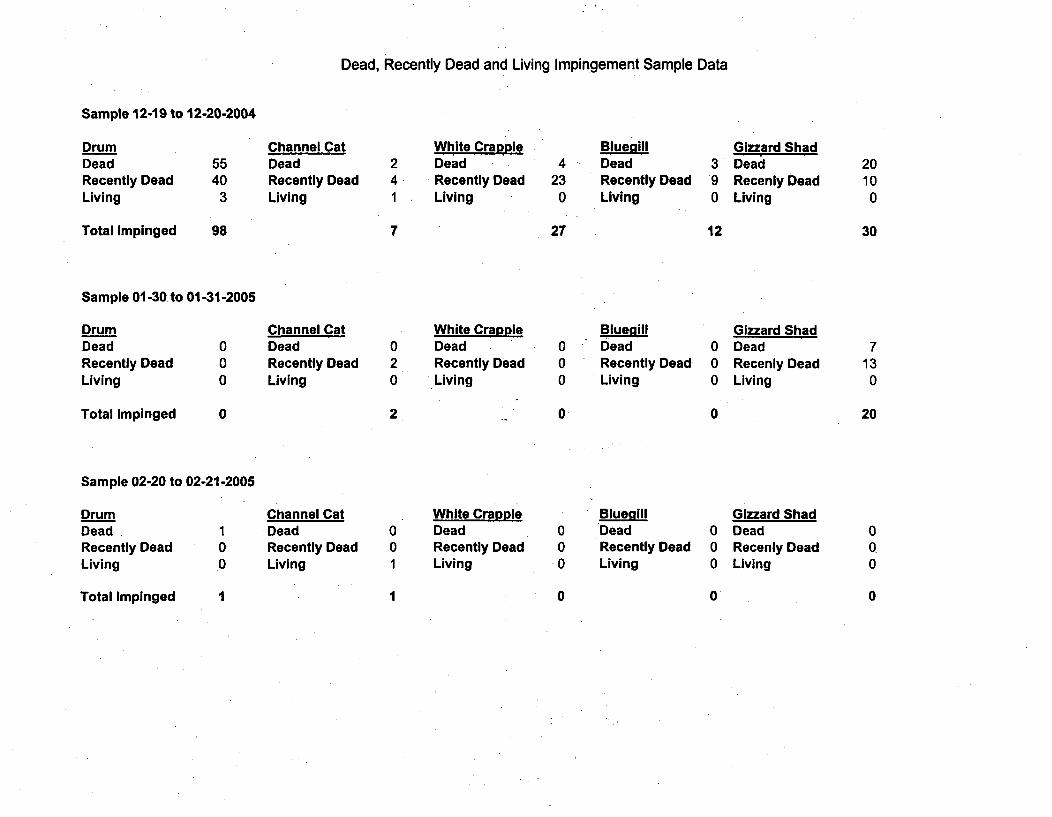
Dead, Recently Dead and Living Impingement Sample Data
Sample 12-19 to 12-20-2004
DrumDeadRecently DeadLiving
Total Impinged
5540
3
98
Channel CatDeadRecently DeadLiving
241
7
White CrappieDeadRecently DeadLiving
4230
27
BluegillDeadRecently DeadLiving
Gizzard Shad3 Dead9 Recenly Dead0 Living
20100
3012
Sample 01-30 to 01-31-2005
DrumDeadRecently DeadLiving
Total Impinged
000
0
Channel CatDeadRecently DeadLiving
020
2
White CrappieDeadRecently DeadLiving
000
BluegillDeadRecently DeadLiving
000
0
Gizzard ShadDeadRecenly DeadLiving
7130
200
Sample 02-20 to 02-21-2005
DrumDeadRecently DeadLiving
Channel Cat1 Dead0 Recently Dead0 Living
001
White CrappDeDeadRecently DeadLiving
000
BluegilllDeadRecently DeadLiving
000
Gizzard ShadDeadRecenly DeadLiving
000
Total Impinged I ToalImined I1 000 0 0
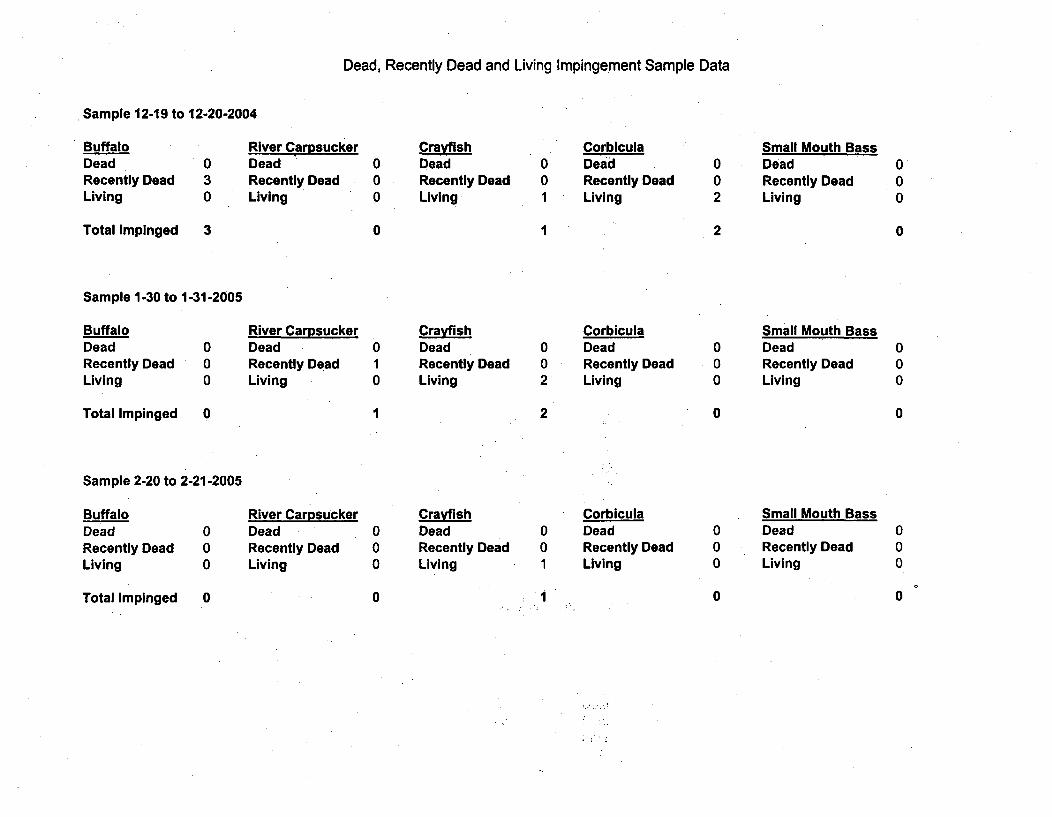
Dead, Recently Dead and Living Impingement Sample Data
Sample 12-19 to 12-20-2004
BuffaloDeadRecently DeadLiving
Total Impinged
030
3
River CarpsuckerDeadRecently DeadLiving
000
0
CrayfishDeadRecently DeadLiving
001
CorbiculaDeadRecently DeadLiving
002
2
Small Mouth BassDeadRecently DeadLiving
000
1 0
Sample 1-30 to 1-31-2005
BuffaloDeadRecently DeadLiving
000
River CarpsuckerDeadRecently DeadLiving
010
CrayfishDeadRecently DeadLiving
002
2
CorbiculaDeadRecently DeadLiving
000
0
Small Mouth BassDeadRecently DeadLiving
000
0Total Impinged 0
Sample 2-20 to 2-21-2005
I
BuffaloDeadRecently DeadLiving
000
River CarpsuckerDeadRecently DeadLiving
000
CrayfishDeadRecently DeadLiving
001
CorbiculaDeadRecently DeadLiving
000
Small Mouth BassDeadRecently DeadLiving
000
Total Impinged 0 Total Imige: 1 010 0
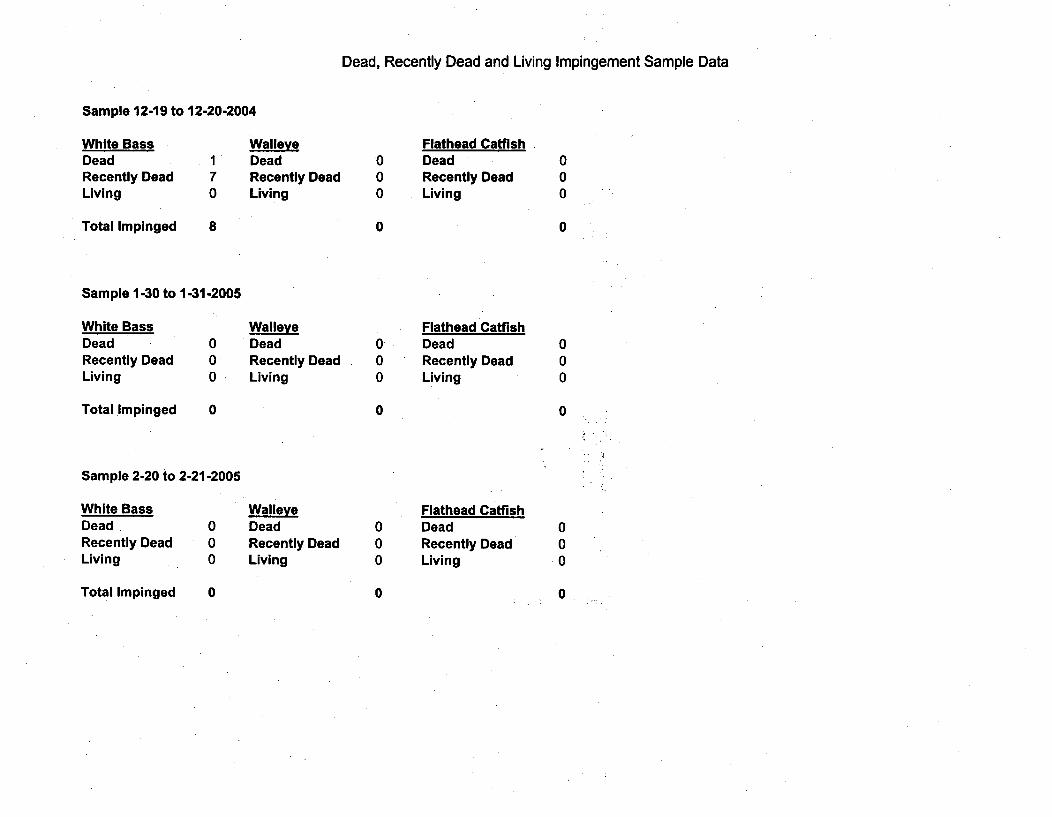
Dead, Recently Dead and Living Impingement Sample Data
Sample 12-19 to 12-20-2004
White BassDeadRecently DeadLiving
Total Impinged
170
8
WalleveDeadRecently DeadLiving
000
0
Flathead CatfishDeadRecently DeadLiving
000
0
Sample 1-30 to 1-31-2005
White BassDeadRecently DeadLiving
Total Impinged
000
0
WalleveDeadRecently DeadLiving
000
0
Flathead CatfishDeadRecently DeadLiving
000
0
Sample 2-20 to 2-21-2005
White BassDead.Recently DeadLiving
000
WalleyeDeadRecently DeadLiving
000
0
Flathead CatfishDeadRecently DeadLiving
000
0Total Impinged 0
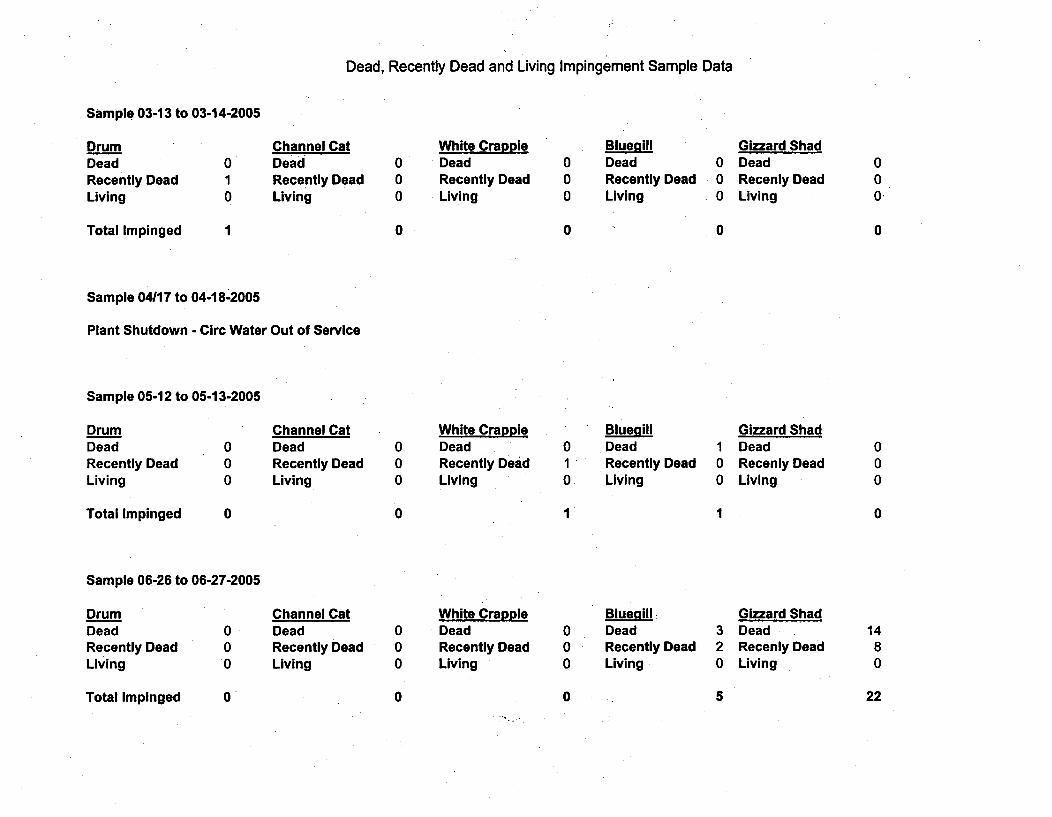
Dead, Recently Dead and Living Impingement Sample Data
Sample 03-13 to 03-14-2005
DrumDeadRecently DeadLiving
Total Impinged
010
Channel CatDeadRecently DeadLiving
000
0
White CrappleDeadRecently DeadLiving
000
0
BluegillDeadRecently DeadLiving
Gizzard Shad0 Dead0 Recenly Dead0 Living
000,
01 0
Sample 04117 to 04-18-2005
Plant Shutdown - Circ Water Out of Service
Sample 05-12 to 05-13-2005
DrumDeadRecently DeadLiving
Total Impinged
000
0
Channel CatDeadRecently DeadLiving
000
0
White CrappieDeadRecently DeadLiving
010
* BluegillDeadRecently DeadLiving
Gizzard Shad1 Dead0 Recenly Dead0 Living
000
01 I
Sample 06-26 to 06-27-2005
DrumDeadRecently DeadLiving
Channel Cat0 Dead0 Recently Dead0 Living
000
White CrappieDeadRecently DeadLiving
000
BlueaillDeadRecently DeadLiving
Gizzard Shad3 Dead2 Recenly Dead0 Living
1480
Total Impinged 0 0 0 5 22
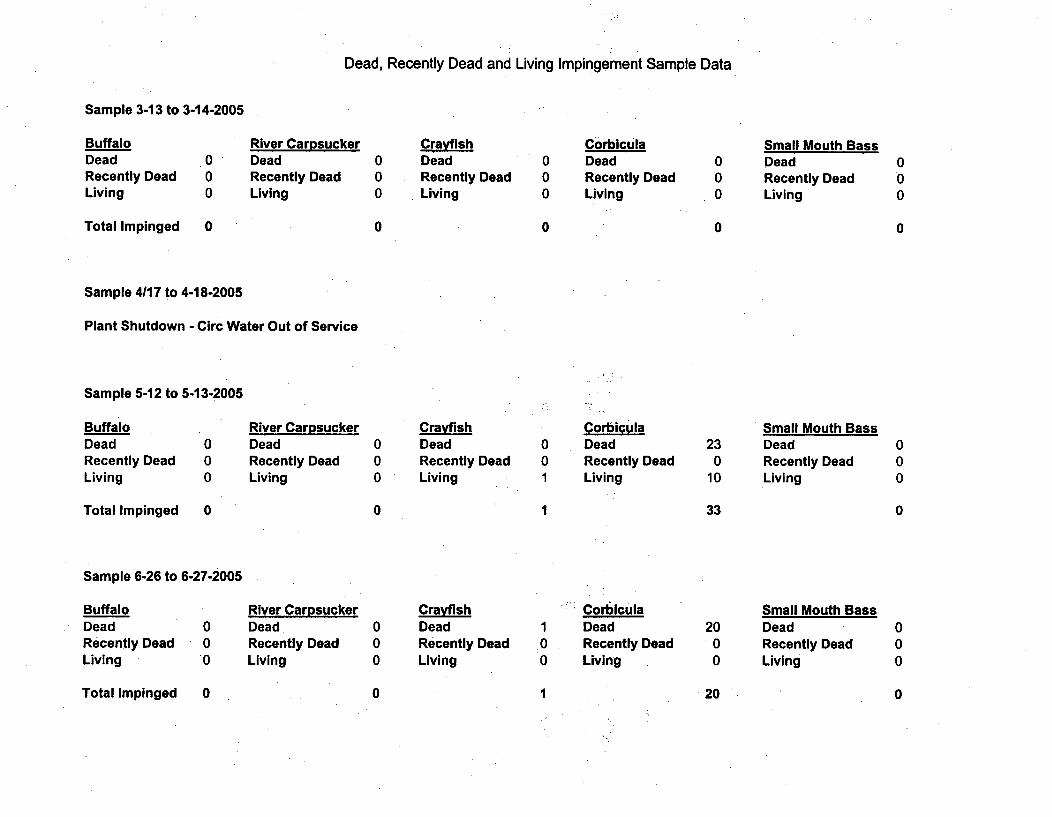
Dead, Recently Dead and Living Impingement Sample Data
Sample 3-13 to 3-14-2005
BuffaloDeadRecently DeadLiving
000
River CarpsuckerDeadRecently DeadLiving
000
0
CrayfishDeadRecently DeadLiving
000
0
CorbiculaDeadRecently DeadLiving
000
0
Small Mouth BassDeadRecently DeadLiving
000
0Total Impinged 0
Sample 4117 to 4-18-2005
Plant Shutdown - Circ Water Out of Service
Sample 5-12 to 5-13-2005
BuffaloDeadRecently DeadLiving
Total Impinged
000
0
River CarpsuckerDeadRecently DeadLiving
000
0
CrayfishDeadRecently DeadLiving
001
CorbiculaDeadRecently DeadLiving
230
10
33
Small Mouth BassDeadRecently DeadLiving
000
0I
Sample 6-26 to 6-27-2005
BuffaloDeadRecently DeadLiving
000
River CarpsuckerDeadRecently DeadLiving
000
CrayfishDeadRecently DeadLiving
100
CorbiculaDeadRecently DeadLiving
2000
Small Mouth BassDeadRecently DeadLiving
000
Total Impinged 0 0 1 20 0
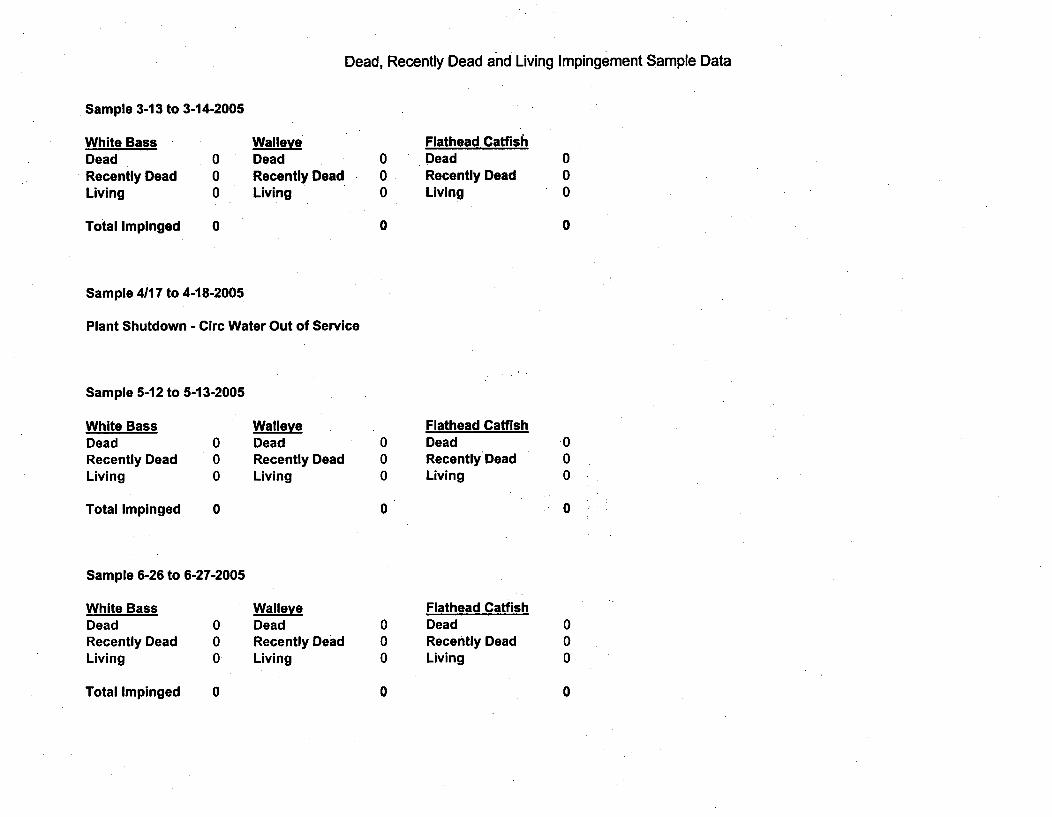
Dead, Recently Dead and Living Impingement Sample Data
Sample 3-13 to 3-14-2005
White BassDeadRecently DeadLiving
Total Impinged
000
0
WalleveDeadRecently DeadLiving
000
0
Flathead CatfishDeadRecently DeadLiving
000
0
Sample 4117 to 4-18-2005
Plant Shutdown - Circ Water Out of Service
Sample 5-12 to 5-13-2005
White BassDeadRecently DeadLiving
Total Impinged
000
0
WalleveDeadRecently DeadLiving
000
0
Flathead CatfishDeadRecently DeadLiving
000~
0
Sample 6-26 to 6-27-2005
White BassDeadRecently DeadLiving
000
WalleveDeadRecently DeadLiving
000
0
Flathead CatfishDeadRecently DeadLiving
000
0Total Impinged 0
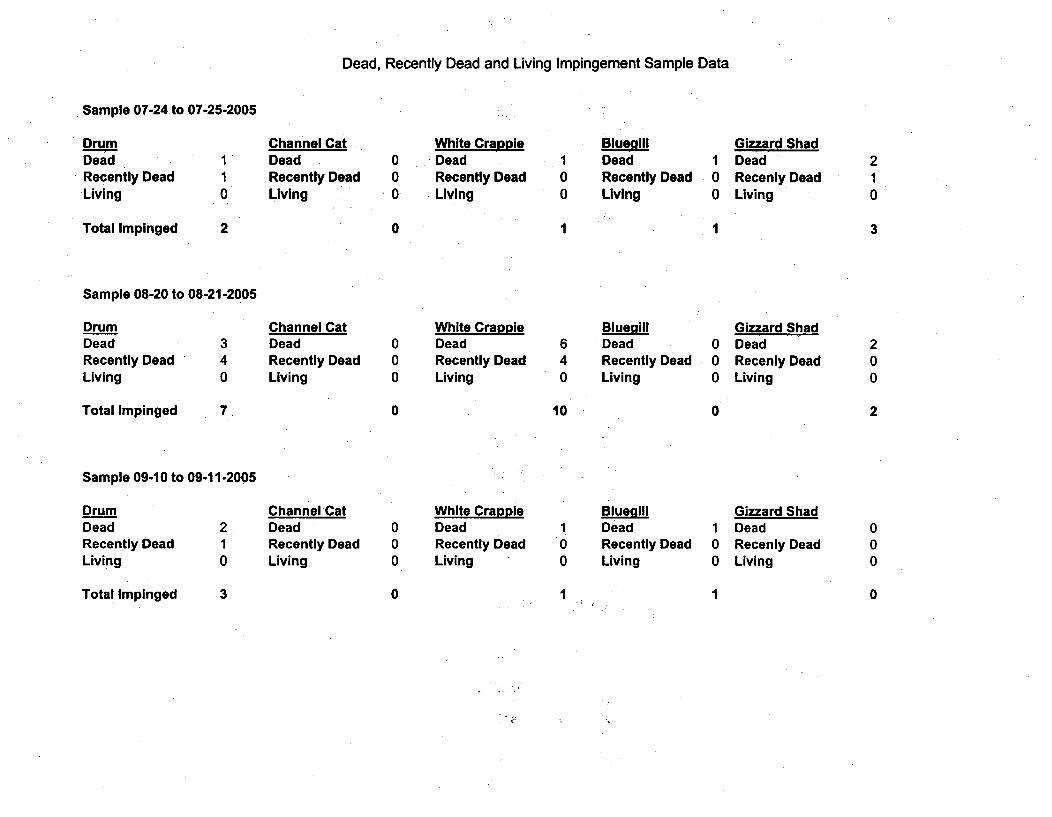
Dead, Recently Dead and Living Impingement Sample Data
Sample 07-24 to 07-25-2005
DrumDeadRecently Dead.Living
Total Impinged
Channel CatI Dead1 Recently Dead0 Living
000
0
White CrappleDeadRecently DeadLiving
100
1
Blusai~lDeadRecently DeadLiving
100
Gizzard ShadDeadRecenly DeadLiving
210
32 I
Sample 08-20 to 08-21-2005
DrumDeadRecently DeadLiving
Total Impinged
340
7
Channel CatDeadRecently DeadLiving
000
0
White CrappleDeadRecently DeadLiving
640
BluegillDeadRecently DeadLiving
000
0
Gizzard ShadDeadRecenly DeadLiving
200
210
Sample 09-10 to 09-11-2005
DrumDeadRecently DeadLiving
Total Impinged
Channel Cat2. Dead1 Recently Dead0 Living
000
0
White CrappleDeadRecently DeadLiving
100
I
BlueoillDeadRecently DeadLiving
100
Gizzard ShadDeadRecenly DeadLiving
000
03 I
L•
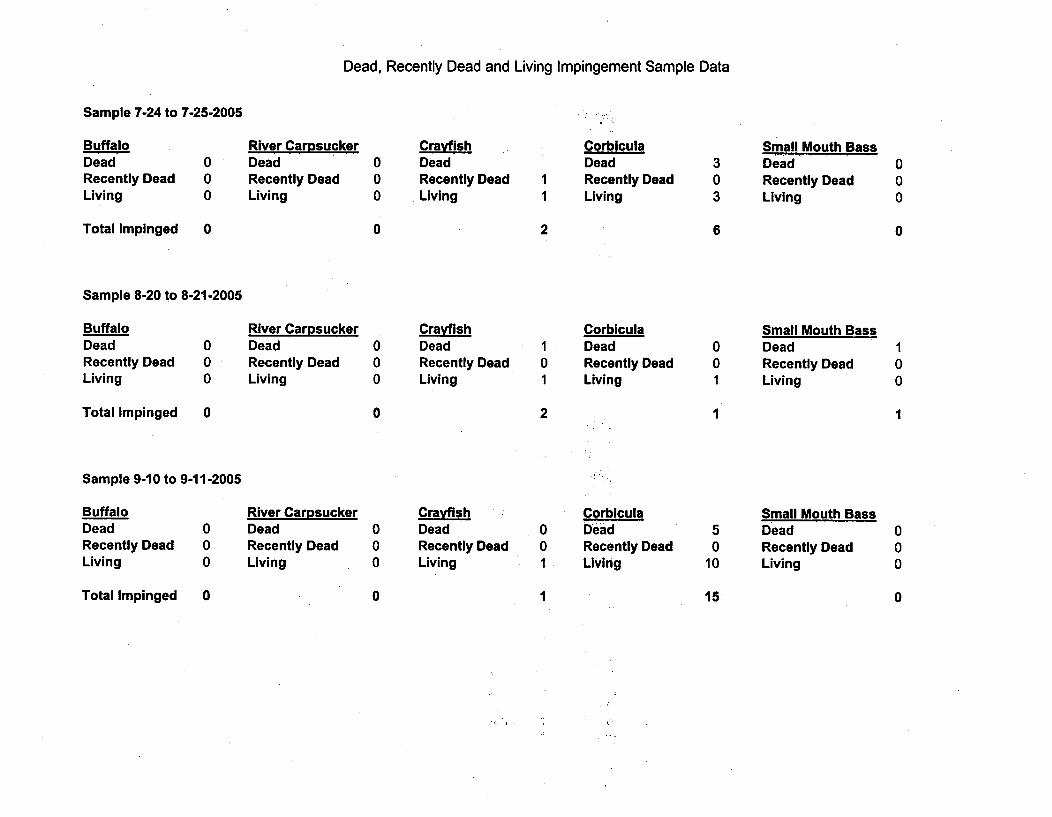
Dead, Recently Dead and Living Impingement Sample Data
Sample 7-24 to 7-25-2005
BuffaloDeadRecently DeadLiving
000
River CarpsuckerDeadRecently DeadLiving
000
0
CrayfishDeadRecently DeadLiving
CorbiculaDeadRecently DeadLiving
I1
303
6
Small Mouth BassDeadRecently DeadLiving
000
0Total Impinged 0
Sample 8-20 to 8-21-2005
2
BuffaloDeadRecently DeadLiving
000
River CarpsuckerDeadRecently DeadLiving
000
0
CrayfishDeadRecently DeadLiving
101
2
CorbiculaDeadRecently DeadLiving
001
Small Mouth BassDeadRecently DeadLiving
I00
1Total Impinged 0
Sample 9-10 to 9-11-2005
BuffaloDeadRecently DeadLiving
000
River CarpsuckerDeadRecently DeadLiving
000
CrayfishDeadRecently DeadLiving
001
CorbiculaDeadRecently DeadLiving
50
10
Small Mouth BassDeadRecently DeadLiving
000
Total Impinged 0 0 1 Totl mpige 0 115 0
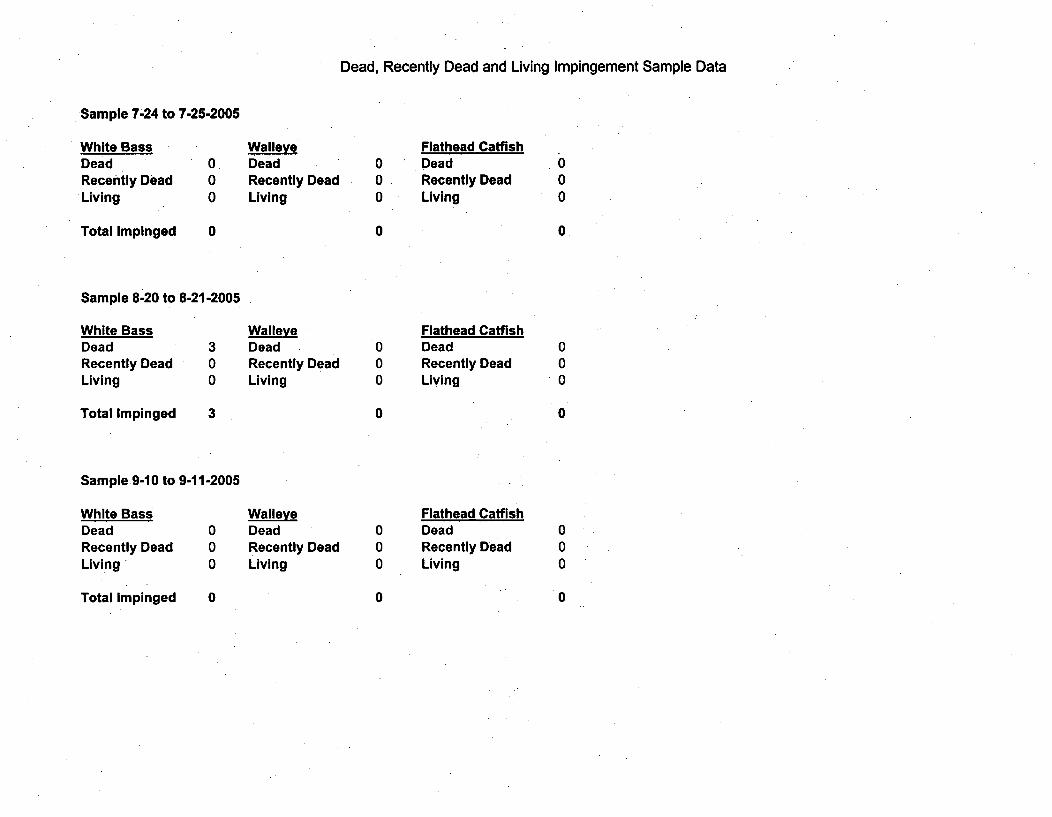
Dead, Recently Dead and Living Impingement Sample Data
Sample 7-24 to 7-25-2005
White BassDeadRecently DeadLiving
Total Impinged
000
0
WalleveDeadRecently DeadLiving
000
0
Flathead CatfishDeadRecently DeadLiving
000
0
Sample 8-20 to 8-21-2005
White BassDeadRecently DeadLiving
Total Impinged
300
3
WalleveDeadRecently DeadLiving
000
0
Flathead CatfishDeadRecently DeadLiving
000
0
Sample 9-10 to 9-11-2005
White BassDeadRecently DeadLiving
000
WalleveDeadRecently DeadLiving
000
0
Flathead CatfishDeadRecently DeadLiving
000
0Total Impinged 0
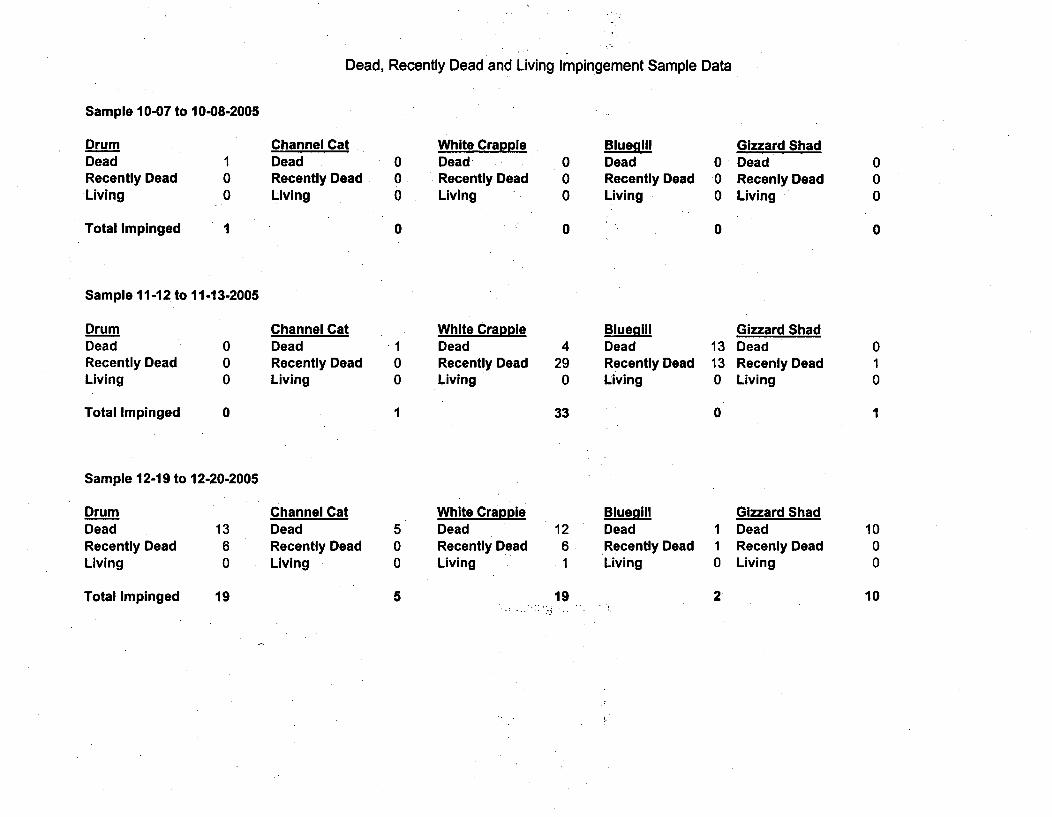
Dead, Recently Dead and Living Impingement Sample Data
Sample 10-07 to 10-08-2005
DrumDeadRecently DeadLiving
Total Impinged
Channel Cat1 Dead0 Recently Dead0 Living
000
0
White CrappleDeadRecently DeadLiving
000
0
BluegillDeadRecently DeadLiving
Gizzard Shad0 Dead0 Recenly Dead0 Living
000
0I 0
Sample 11-12 to 11-13-2005
DrumDeadRecently DeadLiving
Total Impinged
000
0
Channel CatDeadRecently DeadLiving
I00
1
White CrappieDeadRecently DeadLiving
429
0
33
BluegillDeadRecently DeadLiving
Gizzard Shad13 Dead13 Recenly Dead0 Living
010
0 I
Sample 12-19 to 12-20-2005
DrumDeadRecently DeadLiving
1360
Channel CatDeadRecently DeadLiving
500
White CrappieDeadRecently DeadLiving
1261
BluegillDeadRecently DeadLiving
010
Gizzard ShadDeadRecenly DeadLiving
1000
Total Impinged 19 ToalImined 195 19 212 10
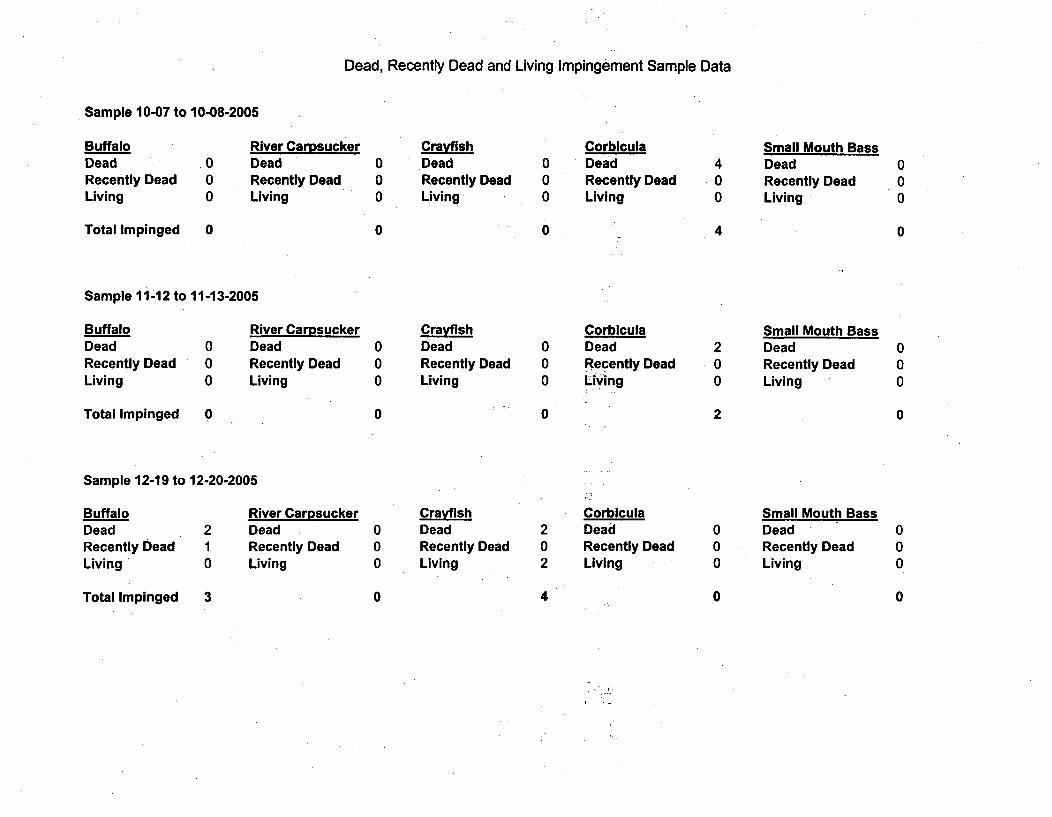
Dead, Recently Dead and Living Impingement Sample Data
Sample 10-07 to 10-08-2005
BuffaloDeadRecently DeadLiving
000
River CarpsuckerDeadRecently DeadLiving
000
0
CrayfishDeadRecently DeadLiving
000
0
CorbiculaDeadRecently DeadLiving
400
4
Small Mouth BassDeadRecently DeadLiving
000
0Total Impinged 0
Sample 11-12 to 11-13-2005
BuffaloDeadRecently DeadLiving
Total Impinged
000
0
River CarpsuckerDeadRecently DeadLiving
000
0
CrayfishDeadRecently DeadLiving
000
CorbiculaDeadRecently DeadLiving
200
2
Small Mouth BassDeadRecently DeadLiving
000
00
.Sample 12-19 to 12-20-2005
BuffaloDeadRecently DeadLiving
210
River CarpsuckerDeadRecently DeadLiving
000
CrayfishDeadRecently DeadLiving
202
CorbiculaDeadRecently DeadLiving
000
Small Mouth BassDeadRecently DeadLiving
000
Total Impinged 3 0 4 Totl mpige 3 40 0
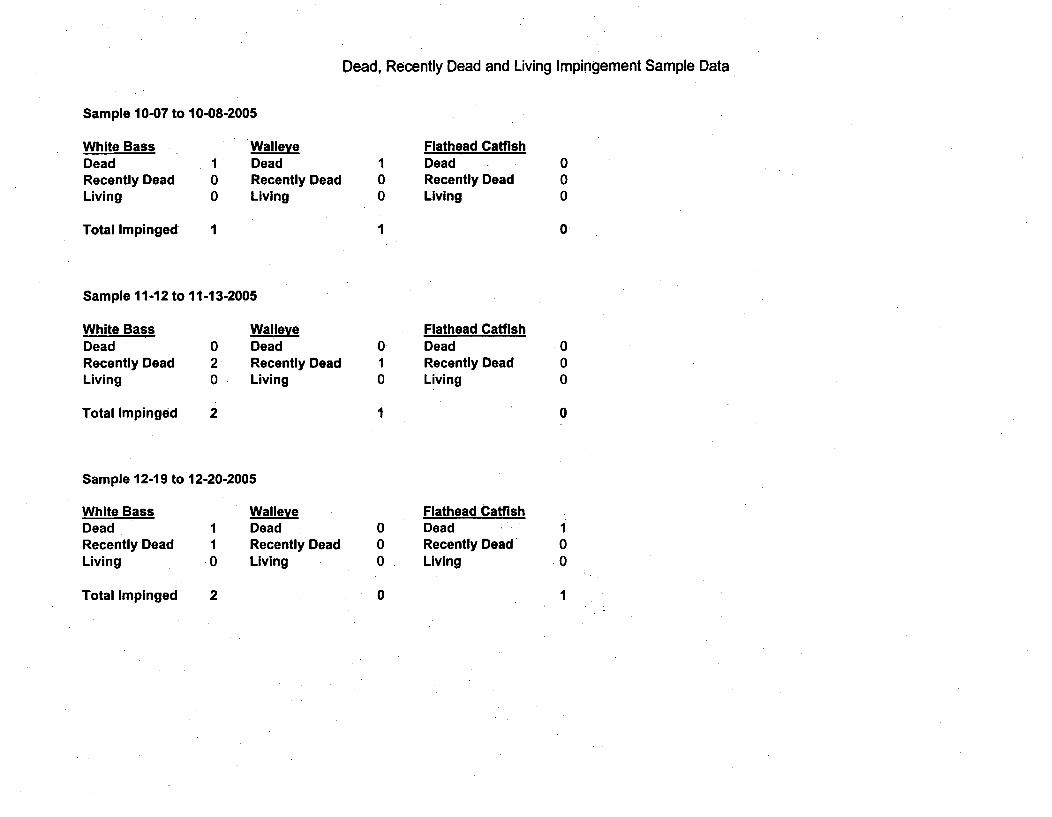
Dead, Recently Dead and Living Impingement Sample Data
Sample 10-07 to 10-08-2005
White BassDeadRecently DeadLiving
Total Impinged
100
WalleveDeadRecently DeadLiving
000
Flathead CatfishDeadRecently DeadLiving
000
01 1
Sample 11-12 to 11-13-2005
White BassDeadRecently DeadLiving
Total Impinged
020
2
WalleveDeadRecently DeadLiving
010
Flathead CatfishDeadRecently DeadLiving
000
0I
Sample 12-19 to 12-20-2005
White BassDeadRecently DeadLiving
Walleve1 DeadI Recently Dead0 Living
000
0
Flathead CatfishDeadRecently DeadLiving
100
1Total Impinged 2
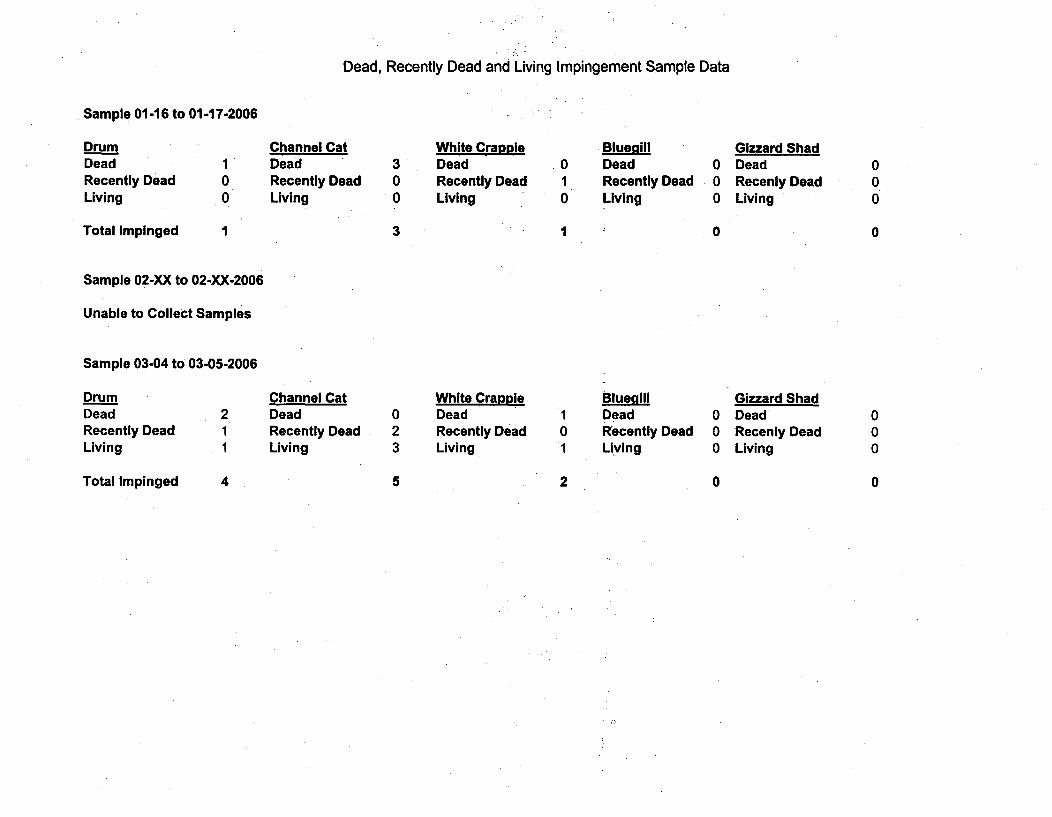
Dead, Recently Dead and Living Impingement Sample Data
.Sample 01-16 to 01 -17-2006
DrumDeadRecently DeadLiving
Total Impinged
100
Channel CatDeadRecently DeadLiving
300
3
White CrappieDeadRecently DeadLiving
010
1
BluenillDeadRecently DeadLiving
000
Gizzard ShadDeadRecenly DeadLiving
000
0I 0
Sample 02-XX to 02-XX-2006
Unable to Collect Samples
Sample 03-04 to 03-05-2006
DrumDeadRecently DeadLiving
Channel Cat2, Dead1 Recently Dead1 Living
023
White CrappleDeadRecently DeadLiving
101
B3luegillDeadRecently DeadLiving
000
Gizzard ShadDeadRecenly DeadLiving
000
Total Impinged 4 5 2 0 0
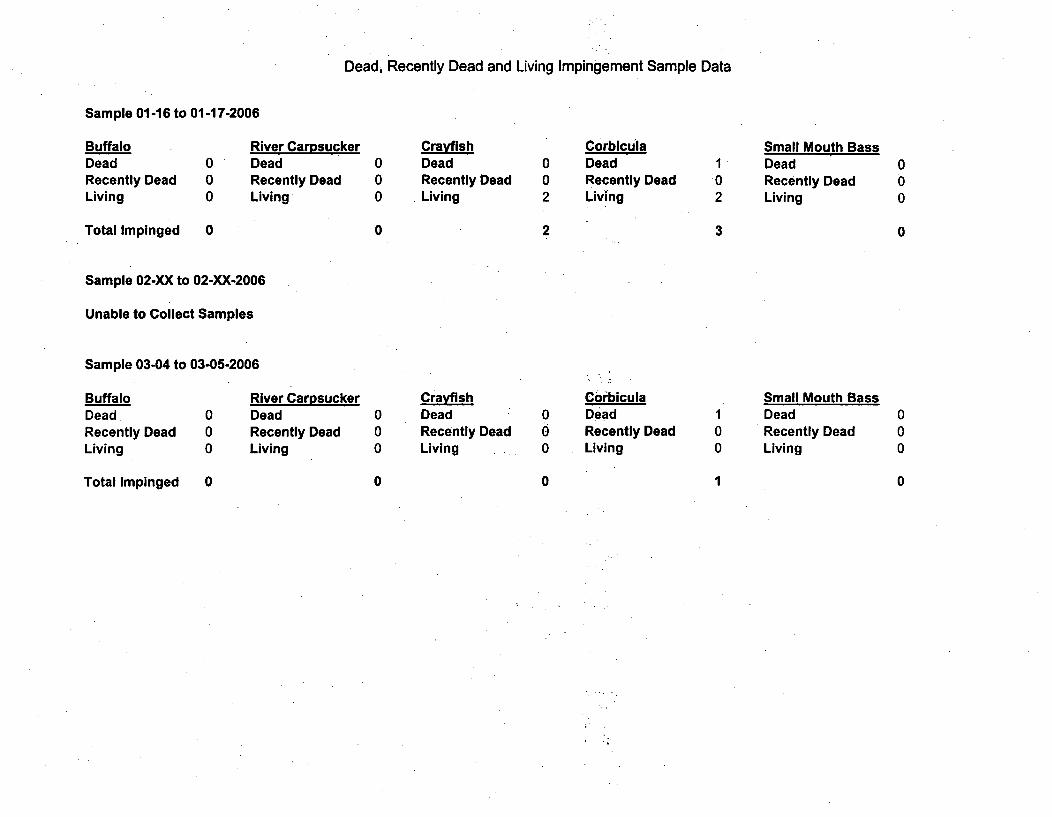
Dead, Recently Dead and Living Impingement Sample Data
Sample 01-16 to 01 -17-2006
BuffaloDeadRecently DeadLiving
000
River CarpsuckerDeadRecently DeadLiving
000
0
CrayfishDeadRecently DeadLiving
002
2
CorbiculaDeadRecently DeadLiving
102
3
Small Mouth BassDeadRecently DeadLiving
000
0Total Impinged 0
Sample 02-XX to 02-XX-2006
Unable to Collect Samples
Sample 03-04 to 03-05-2006
BuffaloDeadRecently DeadLiving
000
River CarpsuckerDeadRecently DeadLiving
000
CrayfishDeadRecently DeadLiving
000
CoibiculaDeadRecently DeadLiving
100
Small Mouth BassDeadRecently DeadLiving
000
Total Impinged 0 0 0 Totl mpige 0 01 0
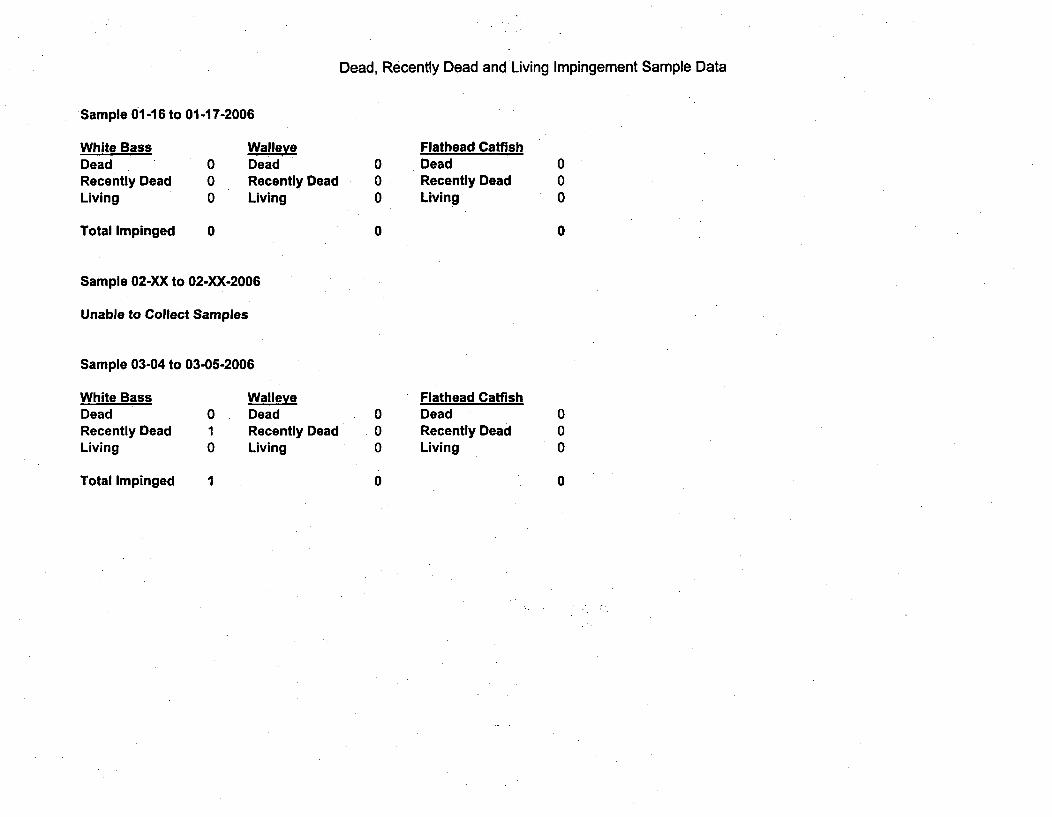
Dead, Recently Dead and Living Impingement Sample Data
Sample 01-16 to 01 -17-2006
White Bass WalleveDead 0 DeadRecently Dead 0 Recently DeadLiving 0 Living
Total Impinged 0
000
0
Flathead CatfishDeadRecently DeadLiving
000
0
Sample 02-XX to 02-XX-2006
Unable to Collect Samples
Sample 03-04 to 03-05-2006
White Bass WalleveDead 0 DeadRecently Dead 1 Recently DeadLiving 0 Living
Total Impinged I
000
0
Flathead CatfishDeadRecently DeadLiving
000
0
APPENDIX B
Coffey County Lake 2005 Fishery Monitoring Report
and
2006 Plan

AK
T
WOLF CREEK GENERATING STATION
Wolf Creek Lake
2005 FISHERY MONITORING REPORT AND 2006 PLAN
Prepared by:
Supervisor RegulatorySupport Approval:
Manager Regulatory AffairsApproval:
2/16/06Dan Haines Date
02/ 17/ 06Robert Hammond Date
evnMolese02/21/06Kevin Moles Date
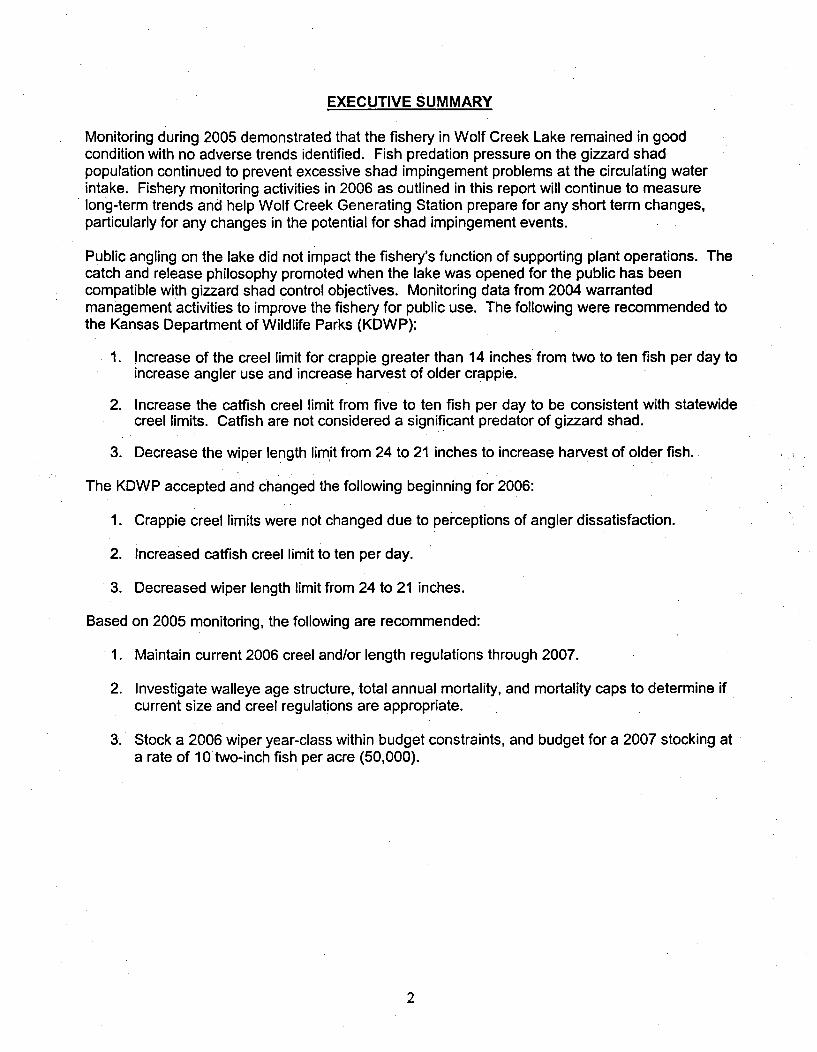
EXECUTIVE SUMMARY
Monitoring during 2005 demonstrated that the fishery in Wolf Creek Lake remained in goodcondition with no adverse trends identified. Fish predation pressure on the gizzard shadpopulation continued to prevent excessive shad impingement problems at the circulating waterintake. Fishery monitoring activities in 2006 as outlined in this report will continue to measurelong-term trends and help Wolf Creek Generating Station prepare for any short term changes,particularly for any changes in the potential for shad impingement events.
Public angling on the lake did not impact the fishery's function of supporting plant operations. Thecatch and release philosophy promoted when the lake was opened for the public has beencompatible with gizzard shad control objectives. Monitoring data from 2004 warrantedmanagement activities to improve the fishery for public use. The following were recommended tothe Kansas Department of Wildlife Parks (KDWP):
1. Increase of the creel limit for crappie greater than 14 inches from two to ten fish per day toincrease angler use and increase harvest of older crappie.
2. Increase the catfish creel limit from five to ten fish per day to be consistent with statewidecreel limits. Catfish are not considered a significant predator of gizzard shad.
3. Decrease the wiper length limit from 24 to 21 inches to increase harvest of older fish.
The KDWP accepted and changed the following beginning for 2006:
1. Crappie creel limits were not changed due to perceptions of angler dissatisfaction.
2. Increased catfish creel limit to ten per day.
3. Decreased wiper length limit from 24 to 21 inches.
Based on 2005 monitoring, the following are recommended:
1. Maintain current 2006 creel and/or length regulations through 2007.
2. Investigate walleye age structure, total annual mortality, and mortality caps to determine ifcurrent size and creel regulations are appropriate.
3. Stock a 2006 wiper year-class within budget constraints, and budget for a 2007 stocking ata rate of 10 two-inch fish per acre (50,000).
2

2005 FISHERY MONITORING REPORT AND 2006 PLAN
INTRODUCTION
This report presents the results of fishery monitoring activities on Wolf Creek Lake (WCL). Dataare summarized in table form to document long-term trends and demonstrates that the fishery hasfunctioned as desired through 2005. The goal is to increase public safety and plant operatingefficiency by reducing the potential for excessive gizzard shad young-of-year (YOY) impingementon the Circulating Water System intake screens. Shad impingement problems to date have notoccurred due largely to the characteristics of the current fishery.
Public' use of the fishery is also important to maintain community relations and local economicbenefits. Consequently, maintaining and/or enhancing public enjoyment of the fishery that iscompatible with the shad impingement control are other important goals of this program. Creeland length limits were determined jointly with the Kansas Department of Wildlife and Parks(KDWP). The catch-and-release strategy employed appears to have succeeded with nodetrimental changes to the fishery observed through 2005.
Fishery monitoring activities in 2006 will be similar to 2005 to maintain long-term trending. Short-term changes will also be detected to ensure WCGS can be prepared if impingement potentialincreases.
METHODS
The monitoring methods used during 2005 allowed for continued analyses of important long-termtrends. Gill netting was used at long-term sites on WCL (Figure 1). Spring electrofishing efforttargeted smallmouth and largemouth bass habitat by shocking in shoreline transects until aminimum number of fish or a designated length of shore was sampled. Small-mesh gill nettingreplaced shoreline seining in 1998 to better assess young-of-year (YOY) gizzard shad densitiesand recruitment (Boxrucker et al -1991). Important species to the fishery were targeted whenexpected to be efficiently sampled.
Sampling efforts are listed in Table 1. Fish sampled were weighed to the nearest gram, andmeasured (total length, TL) to the nearest millimeter. Proportional stock density (PSD, Anderson1980), incremental relative stock density (RSD, Gablehouse 1984), and relative weight (Wr, Wegeand Anderson 1978) were indices applied. Length-weight equations adopted by KDWP wereused.
The 2006 efforts will be completed as scheduled in Table 2. These efforts are the same as for2005. Anglers using the lake park report the number of fish caught and released, the number keptfor personal use, and angler satisfaction. These creel sheets are collected and tabulated byCoffey County. Data from the census sheets will be used to determine if harvest rates changedramatically and to measure angler success.
Increasing walleye size variability and maximum size is advantageous to diversified shad control,as well as angler compatibility and success. Consequently, walleye age structure, total annualmortality, and mortality caps will be determined using methods similar to Quist et. al. (2004). Thecurrent management objective is to produce larger walleye (>26 inches total length) byencouraging harvest of smaller walleye from a stable population with good recruitment, thusreducing intraspecific competition allowing surviving individuals to grow larger. A slot limitprohibiting harvest of fish between 18 and 26 inches was set to accomplish this. Assessingmortality caps will determine if walleye die of natural mortality before reaching 26 inches, if harvestof smaller individuals is necessary, if decreasing interspecific competition for available prey would
3
be effective, and if regulating length of harvest is applicable given current lake biology and anglerimpacts. University graduate students will be solicited and supported with research grant fundingto complete this task. Available scale and fishery data will be used.
RESULTS AND PLANS
The fishery in Wolf Creek Lake continued to function as desired. It exhibited signs of low preydensities, which is preferred to minimize fish impingement at the circulating -water intake. Thepotential for excessive gizzard shad impingement remained small due to relatively low YOYdensities going into the winter months. The shad appear to be limited by predation, as indicatedby the population indices of the predator species. Gizzard shad typically has been an importantforage species in most reservoirs (Carlander 1969, Pflieger 1975, Stein and Johnson 1987, Colvin1993). For shad to be compatible with WCGS operation, low YOY shad densities must bemaintained. Periodic recruitment of shad young to reproducing adults also must occur to maintainthe predators, which in turn control shad numbers. These conditions currently exist in WCL, andbenefit WCGS.
Catch densities of remained similar to past years for adult gizzard shad, white bass and wiper;,increased for white crappie, and decreased for smallmouth bass and walleye (Table 3). Falldensities of small gizzard shad remained low. Density changes for smallmouth bass is likely dueto sampling variation. Walleye changes may be due to sampling variation because catch densitieswere within past ranges. Increased angler harvest for two consecutive years may also havecontributed (Table 7)
Fish length frequencies in 2005, as shown by the PSD/RSD indices (Table 4), showed no majorchanges to past years, except for gizzard shad. A higher PSD indicates fewer shad recruiting tomid-size due in part to predation, and an older population existing. Continued recruitment andgrowth of important species were evident with most showing good percentages of mid-sizedindividuals (RSDS-Q, RSD Q-P, and RSD M-T size ranges). For wipers, the sizes increasedslightly showing continuing maturation of the latest 2001 year-class stocking. Because of this,budgeting for potential wiper stocking in 2006 is recommended to ensure continued presence.There was a small shift to larger walleye, possibly due to the current regulations, but this shift isnot definitive. Walleye research referenced earlier should determine any relationships.
Body conditions as indicated by Wr indices (Table 5) remained similar to past years for gizzardshad, smallmouth bass, and white crappie; increased for white bass, wiper; and decreased forwalleye. All species showed adequate body conditions to maintain their populations. Largeincreases or decreases in body condition were not evident for most species. The white bassincrease may be attributable to decreasing wiper competition, as the 2001 year-class matures.Overall, this indicates that no large changes in prey availability occurred, primarily gizzard shaddensities.
No detrimental impacts due to angler harvest of the predator populations controlling gizzard shadhave been observed. Harvest rates were slightly lower, but still similar for most species, exceptwalleye (Table 6 and 7). Harvest of walleye under 18 inches nearly doubled in 2004, and slightlymore in 2005. Because the population indices for catch frequency, length frequency, and bodyconditions remained similar to past years, influence by angler harvest was not apparent.
There are no fish creel and length limit changes recommended for 2007. The current smalimouthbass and walleye slot limits were imposed to increase body condition and growth. These limitsshould remain in effect until more data is collected to assess their impacts. The current minimumlength limit (12 inches) for white bass was set to protect younger wipers. Since a wiper year classstocking is planned for 2006 and 2007, the white bass minimum length should remain in effect.The crappie is an important littoral predator of gizzard shad in the absence of high largemouth
4
densities, so the minimum length limit (14 inches) was set to protect a majority of the largerindividuals. A large proportion of crappie were near the limit (PSD M-T of 28, Table 4),consequently the limit should remain the same.
PLAN RESULTS
To ensure continued WCGS support and public use, the fishery program will accomplish thefollowing:
1. Continue monitoring as outlined.
2. Maintain current 2006 creel and/or length regulations through 2007.
3. Investigate walleye age structure, total annual mortality, and mortality caps to determine ifcurrent size and creel regulations are appropriate.
4. Stock a 2006 wiper year-class within budget constraints, and budget for a 2007 stocking ata rate of 10 two-inch fish per acre (50,000).
5
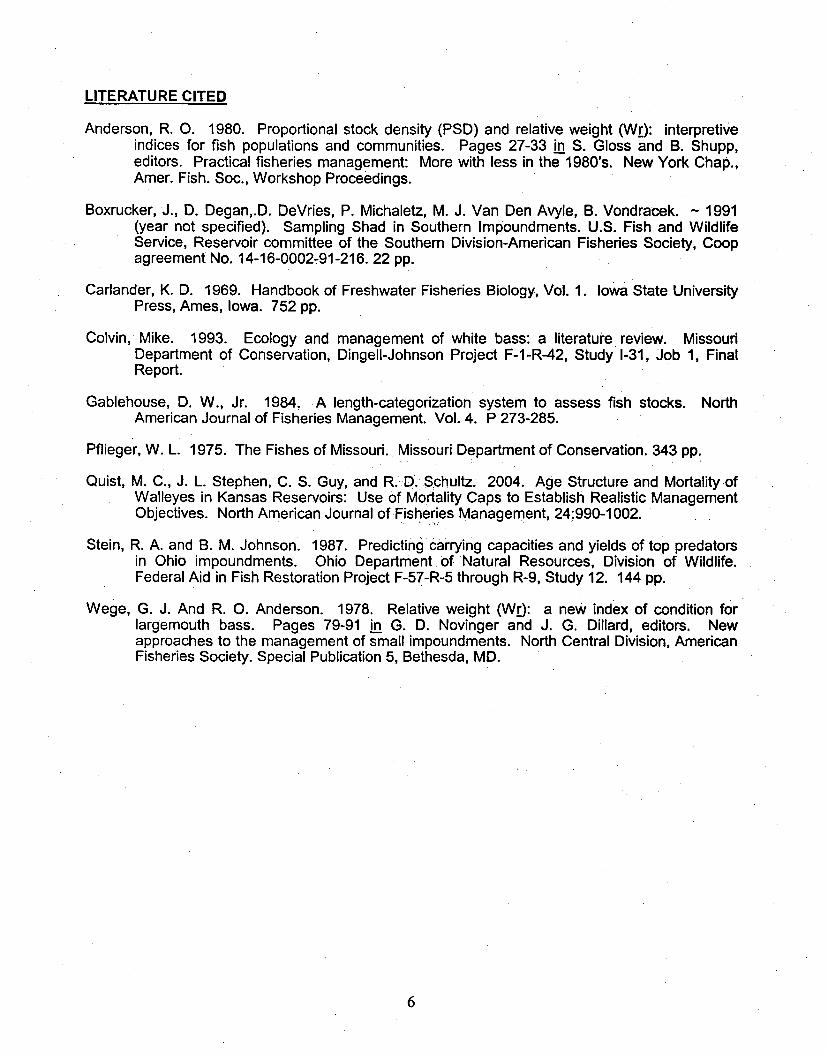
LITERATURE CITED
Anderson, R. 0. 1980. Proportional stock density (PSD) and relative weight (Wr): interpretiveindices for fish populations and communities. Pages 27-33 in S. Gloss and B. Shupp,editors. Practical fisheries management: More with less in the 1980's. New York Chap.,Amer. Fish. Soc., Workshop Proceedings.
Boxrucker, J., D. Degan,.D. DeVries, P. Michaletz, M. J. Van Den Avyle, B. Vondracek. ~ 1991(year not specified). Sampling Shad in Southern Impoundments. U.S. Fish and WildlifeService, Reservoir committee of the Southern Division-American Fisheries Society, Coopagreement No. 14-16-0002-91-216. 22 pp.
Carlander, K. D. 1969. Handbook of Freshwater Fisheries Biology, Vol. 1. Iowa State UniversityPress, Ames, Iowa. 752 pp.
Colvin, Mike. 1993. Ecology and management of white bass: a literature review. MissouriDepartment of Conservation, Dingell-Johnson Project F-1-R-42, Study 1-31, Job 1, FinalReport.
Gablehouse, D. W., Jr. 1984. A length-categorization system to assess fish stocks. NorthAmerican Journal of Fisheries Management. Vol. 4. P 273-285.
Pflieger, W. L. 1975. The Fishes of Missouri. Missouri Department of Conservation. 343 pp.
Quist, M. C., J. L. Stephen, C. S. Guy, and R. D. Schultz. 2004. Age Structure and Mortality ofWalleyes in Kansas Reservoirs: Use of Mortality Caps to Establish Realistic ManagementObjectives. North American Journal of Fisheries Management, 24:990-1002.
Stein, R. A. and B. M. Johnson. 1987. Predicting carrying capacities and yields of top predatorsin Ohio impoundments. Ohio Department of Natural Resources, Division of Wildlife.Federal Aid in Fish Restoration Project F-57-R-5 through R-9, Study 12. 144 pp.
Wege, G. J. And R. 0. Anderson. 1978. Relative weight (Wr): a new index of condition forlargemouth bass. Pages 79-91 in G. D. Novinger and J. G. Dillard, editors. Newapproaches to the management of small impoundments. North Central Division, AmericanFisheries Society. Special Publication 5, Bethesda, MD.
6
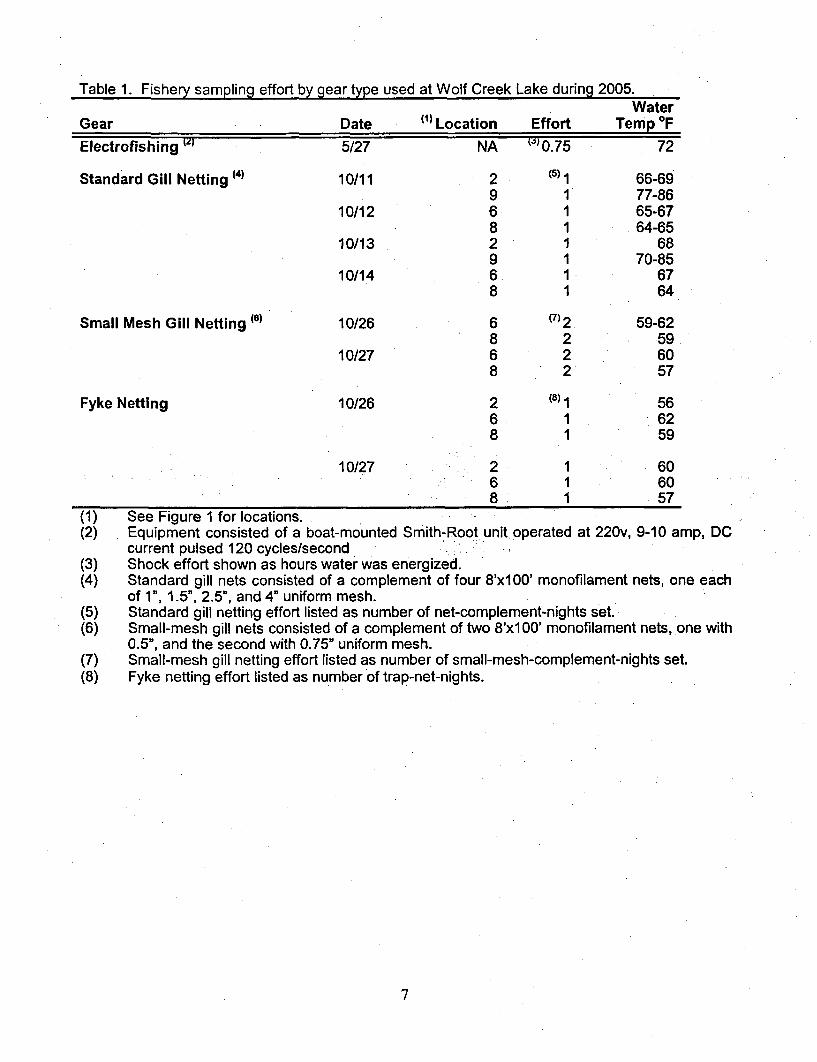
Table 1. Fishery sampling effort by gear type used at Wolf Creek Lake during 2005.Water
Gear Date (1) Location Effort Temp IF
Electrofishing 'z 5/27 NA (d0.75 72
Standard Gill Netting (4) 10/11 2 (5) 1 66-699 1 77-86
10/12 6 1 65-678 1 64-65
10/13 2 1 689 1 70-85
10/14 6 1 678 1 64
Small Mesh Gill Netting (6) 10/26 6 (7) 2 59-628 2 59
10/27 6 2 608 2 57
Fyke Netting 10/26 2 (8)1 566 1 628 1 59
10/27 2 1 606 1 608 1 57
(1) See Figure 1 for locations.(2) Equipment consisted of a boat-mounted Smith-Root unit operated at 220v, 9-10 amp, DC
current pulsed 120 cycles/second(3) Shock effort shown as hours water was energized.(4) Standard gill nets consisted of a complement of four 8'x100' monofilament nets, one each
of 1", 1.5", 2.5", and 4" uniform mesh.(5) Standard gill netting effort listed as number of net-complement-nights set.(6) Small-mesh gill nets consisted of a complement of two 8'xl 00' monofilament nets, one with
0.5", and the second with 0.75" uniform mesh.(7) Small-mesh gill netting effort listed as number of small-mesh-complement-nights set.(8) Fyke netting effort listed as number of trap-net-nights.
7

Table 2. Fish Sampling Schedule at Wolf Creek Lake during 2006.
1.
2.
3.
4.
5.
6.
7.
8.
Minimum Information Needed to AssessFishery
Gizzard shad recruitment through winter
White crappie population characteristics andhealthLargemouth bass population characteristics andhealthSmallmouth bass population characteristics andhealthWhite bass population characteristics and health
Wiper survival and health
Walleye population characteristics and health
Gizzard shad YOY reproduction and densitiesgoing into winter
Method Preferred TimeFrame
Electrofishing
Fyke netting/Gill nettingElectrofishing
Electrofishing
Gill netting
Gill netting
Gill netting
Small MeshGill Netting
April/May
October/November
April/May
April/May
October
October
October
September/October
8
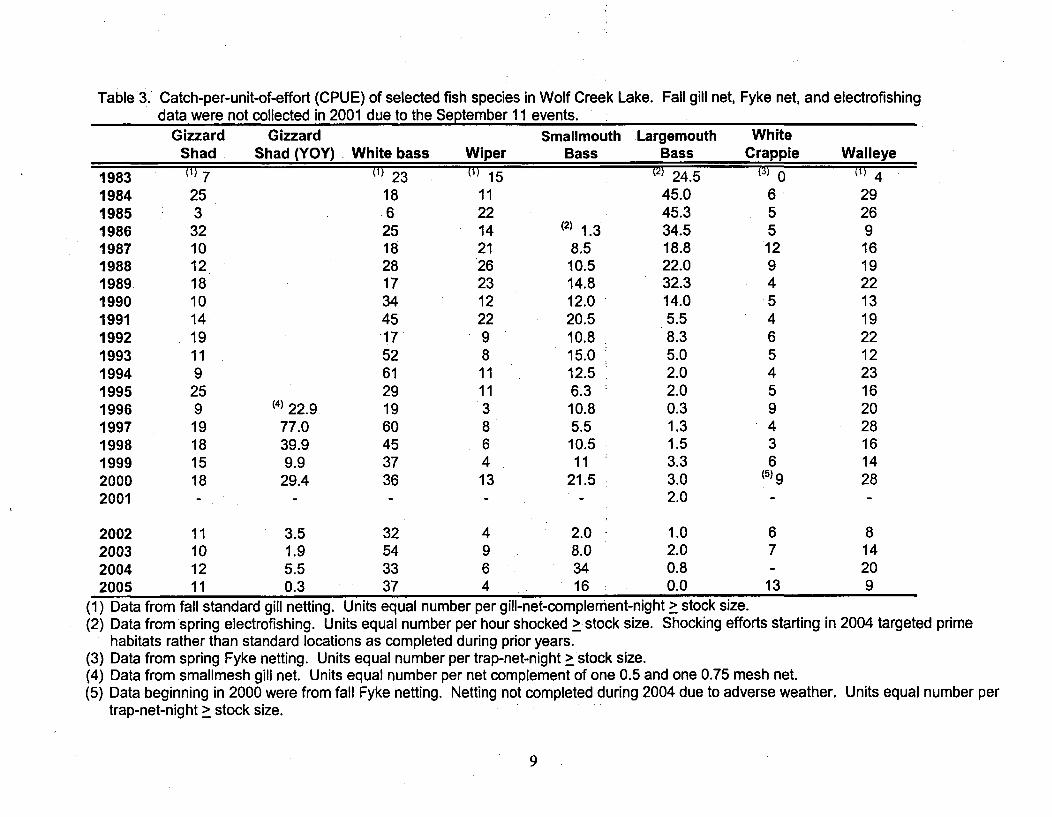
Table 3. Catch-per-unit-of-effort (CPUE) of selected fish species in Wolf Creek Lake. Fall gill net,data were not collected in 2001 due to the September 11 events.
Fyke net, and electrofishing
Gizzard Gizzard Smallmouth Largemouth WhiteShad Shad (YOY) White bass Wiper Bass Bass Crappie Walleye
1983 (1) 7 (1) 23 (1) 15 (2) 24.5 (3) 0 (1) 41984 25 18 11 45.0 6 291985 3 6 22 45.3 5 261986 32 25 14 (2) 1.3 34.5 5 91987 10 18 21 8.5 18.8 12 161988 12 28 26 10.5 22.0 9 191989 18 17 23 14.8 32.3 4 221990 10 34 12 12.0 14.0 5 131991 14 45 22 20.5 5.5 4 191992 19 17 9 10.8 8.3 6 221993 11 52 8 15.0: 5.0 5 121994 9 61 11 12.5 2.0 4 231995 25 29 11 6.3 2.0 5 161996 9 (4)22.9 19 3 10.8 0.3 9 201997 19 77.0 60 8 5.5 1.3 4 281998 18 39.9 45 6 10.5 1.5 3 161999 15 9.9 37 4 11 3.3 6 142000 18 29.4 36 13 21.5 3.0 (5)9 282001 - - - - - 2.0 - -
2002 11 3.5 32 4 2.0 1.0 6 82003 10 1.9 54 9 8.0 2.0 7 142004 12 5.5 33 6 34 0.8 - 202005 11 0.3 37 4 16 0.0 13 9
(1) Data from fall standard gill netting. Units equal number per gill-net-complement-night > stock size.(2) Data from spring electrofishing. Units equal number per hour shocked > stock size. Shocking efforts starting in 2004 targeted prime
habitats rather than standard locations as completed during prior years.(3) Data from spring Fyke netting. Units equal number per trap-net-night > stock size.(4) Data from smallmesh gill net. Units equal number per net complement of one 0.5 and one 0.75 mesh net.(5) Data beginning in 2000 were from fall Fyke netting. Netting not completed during 2004 due to adverse weather. Units equal number per
trap-net-night > stock size.
9
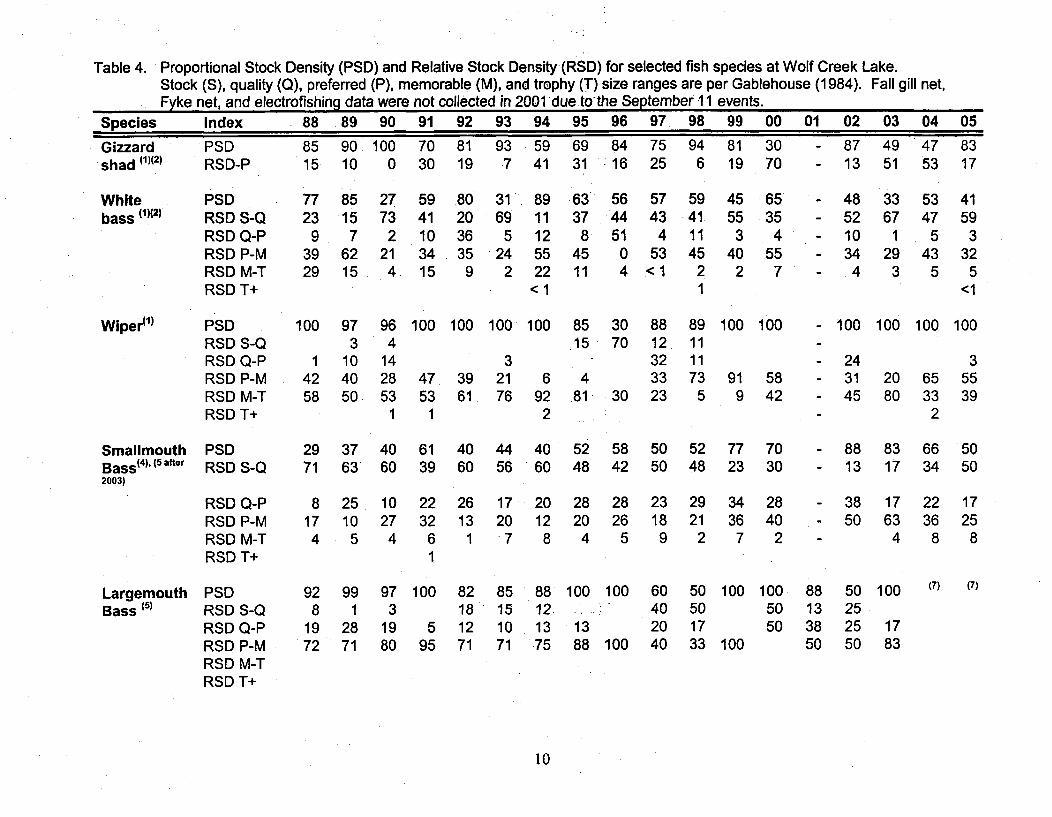
Table 4. Proportional Stock Density (PSD) and Relative Stock Density (RSD) for selected fish species at Wolf Creek Lake.Stock (S), quality (Q), preferred (P), memorable (M), and trophy (T) size ranges are per Gablehouse (1984). Fall gill net,Fyke net, and electrofishing data were not collected in 2001 due tothe September 11 events.
Species Index 88 89 90 91 92 93 94 95 96 97 98 99 00 01 02 03 04 05
Gizzardshad (1)(2)
Whitebass (1)(2)
Wiper(1 )
SmallmouthBass(4), (5 after
2003)
PSDRSD-P
PSDRSD S-QRSD Q-PRSD P-MRSD M-TRSD T+
PSDRSD S-QRSD Q-PRSD P-MRSD M-TRSD T+
PSDRSD S-Q
85 90. 100 70 81 93 59 69 84 75 94 81 3015 10 0 30 19 7 41 31 16 25 6 19 70
77 85 27 59 .80 31 89 63 56 57 59 45 6523 15 73 41 20 69 11 37 44 43 41 55 35
9 7 2 10 36 5 12 8 51 4 11 3 439 62 21 34 35. 24 55 45 0 53 45 40 5529 15 4 15 9 2 22 11 4 <1 2 2 7
<1 1
100 97 96 100 100 100 100 85 30 88 89 100 1003 4 .15 70 12. 11
1 10 14 3 32 1142 40 28 47 39 21 6 4 33 73 91 5858 50 53 53 61 76 92 81 30 23 5 9 42
1 1 2
29 37 40 61 40 44 40 52 58 50 52 77 7071 63 60 39 60 56 60 48 42 50 48 23 30
•8 25 10 22 26 17 20 28 28 23 29 34 2817 10 27 32 13 20 12 20 26 18 21 36 404 5 4 6 1 7 8 4 5 9 2 7 2
1
92 99 97 100 82 85 88 100 100 60 50 100 1008 1 3 18 15 12. 40 50 50
19 28 19 5 12 10 13 13 20 17 5072 71 80 95 71 71 75 88 100 40 33 100
- 87 49 47 83- 13 51 53 17
- 48 33 53 41- 52 67 47 59- 10 1 5 3- 34 29 43 32- .4 3 5 5
<1
- 100 100 100 100
- 24 3- 31 20 65 55- 45 80 33 39
2
- 88 83 66 50- 13 17 34 50
38 17 22 1750 63 36 25
4 8 8
RSD Q-PRSD P-MRSD M-TRSD T+
Largemouth PSDBass (5) RSD S-Q
RSD Q-PRSD P-MRSD M-TRSD T+
88 50 10013 2538 25 1750 50 83
(7) (7)
10
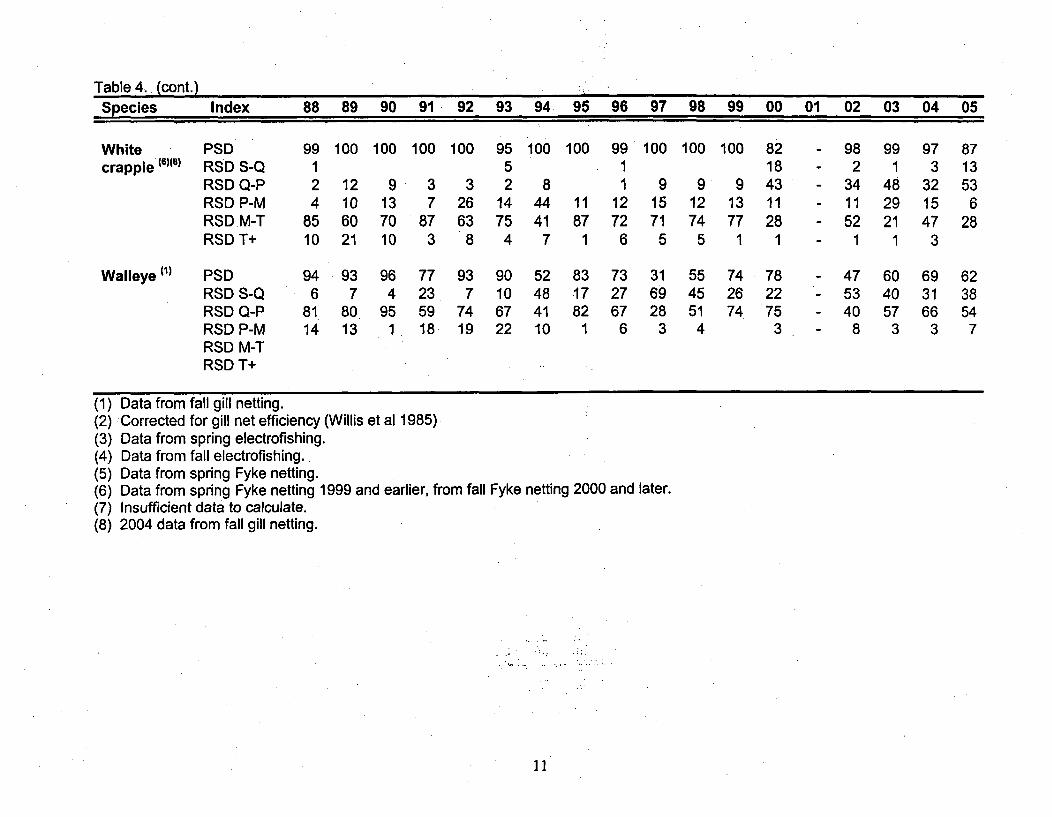
Table 4. (cont.)Species Index 88 89 90 91 92 93 94 95 96 97 98 99 00 01 02 03 04 05
White PSDcrappie (6)l5) RSD S-Q
RSD Q-PRSD P-MRSD M-TRSD T+
99 100 100 100 100 95 100 100 99 100 100 100 821 5 1 182 12 9 3 3 2 8 1 9 9 9 434 10 13 7 26 14 44 11 12 15 12 13 11
85 60 70 87 63 75 41 87 72 71 74 77 2810 21 10 3 8 4 7 1 6 5 5 1 1
94 93 96 77 93 90 52 83 73 31 55 74 786 7 4 23 7 10 48 17 27 69 45 26 22
81 80 95 59 74 67 41 82 67 28 51 74 7514 13 1 18 19 22 10 1 6 3 4 3
- 98 99 97 87- 2 1 3 13- 34 48 32 53- 11 29 15 6- 52 21 47 28- 1 1 3
- 47 60 69 62- 53 40 31 38- 40 57 66 54- 8 3 3 7
Walleye (1 PSDRSD S-QRSD Q-PRSD P-MRSD M-TRSD T+
(1) Data from fall gill netting.(2) Corrected for gill net efficiency (Willis et al 1985)(3) Data from spring electrofishing.(4) Data from fall electrofishing.(5) Data from spring Fyke netting.(6) Data from spring Fyke netting 1999 and earlier, from fall Fyke netting 2000 and later.(7) Insufficient data to calculate.(8) 2004 data from fall gill netting.
I1
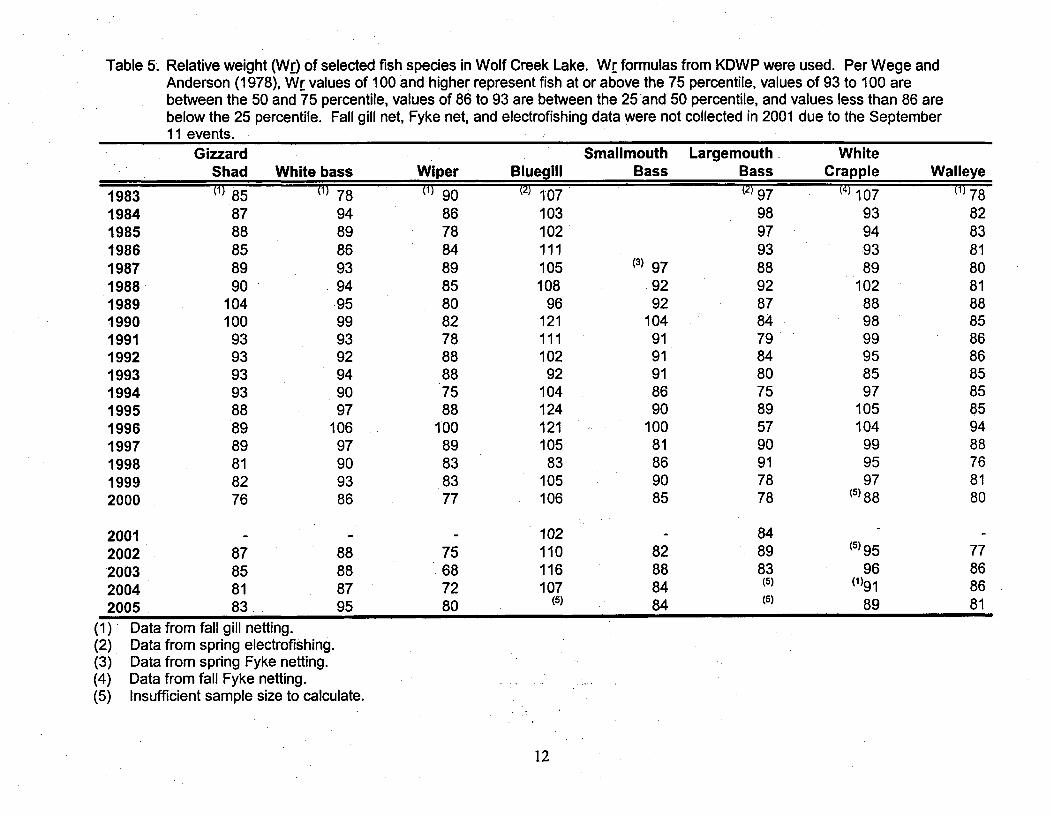
Table 5. Relative weight (Wr) of selected fish species in Wolf Creek Lake. Wr formulas from KDWP were used. Per Wege andAnderson (1978), Wr values of 100 and higher represent fish at or above the 75 percentile, values of 93 to 100 arebetween the 50 and 75 percentile, values of 86 to 93 are between the 25 and 50 percentile, and values less than 86 arebelow the 25 percentile. Fall gill net, Fyke net, and electrofishing data were not collected in 2001 due to the September11 events.
Gizzard ýSmallmouth Largemouth WhiteShad White bass Wiper Bluegill Bass Bass Crappie Walleye
1983 (1) 85 (1) 78 (1) 90 (2) 107 (2) 974) 107 (1)781984 87 94 86 103 98 93 821985 88 89 78 102 97 94 831986 85 86 84 111 93 93 811987 89 93 89 105 (3) 97 88 89 801988 90 94 85 108 .92 92 102 811989 104 95 80 96 92 87 88 881990 100 99 82 121 104 84 98 851991 93 93 78 111 91 79 99 861992 93 92 88 102 91 84 95 861993 93 94 88 92 91 80 85 851994 93 90 75 104 86 75 97 851995 88 97 88 124 90 89 105 851996 89 106 100 121 100 57 104 941997 89 97 89 105 81 90 99 881998 81 90 83 83 86 91 95 761999 82 93 83 105 90 78 97 812000 76 86 77 106 85 78 (5)88 80
2001 - - 102 - 84
2002 87 88 75 110 82 89 (5)95 77.2003 85 88 68 116 88 83 96 862004 81 87 72 107 84 (5) (1)91 862005 83 95 80 84 (5) 89 81
(1)(2)(3)(4)(5)
Data from fall gill netting.Data from spring electrofishing.Data from spring Fyke netting.Data from fall Fyke netting.Insufficient sample size to calculate.
12
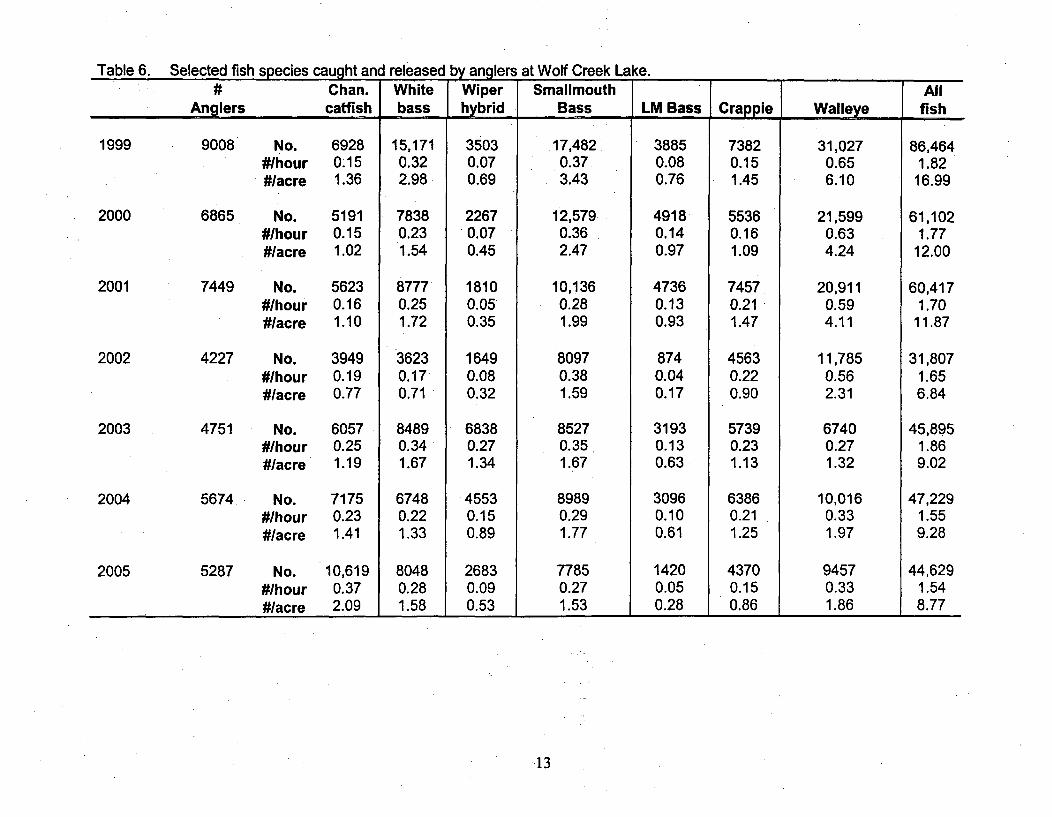
Table 6. Selected fish species caught and released by anqlers at Wolf Creek Lake.Chan. White Wiper Smallmouth All
Anglers catfish bass-. hybrid Bass J LM Bass Crappie Walleye fish
1999 9008
2000 6865
2001 7449
2002 4227
No.#/hour#/acre
No.#/hour#/acre
No.#Ihour#/acre
No.#/hour#/acre
No.#/hour#/acre
No.#/hour#/acre
No.#/hour#/acre
69280.151.36
51910.151.02
56230.161.10
39490.190.77
60570.251.19
71750.231.41
10,6190.372.09
15,1710.322.98
78380.231.54
87770.251.72
36230.170.71
84890.341.67
67480.221.33
80480.281.58
35030.070.69
22670.070.45
18100.050.35
16490.080.32
68380.271.34
4553
0.150.89
26830.090.53
17,4820.373.43
12,5790.362.47
10,1360.281.99
80970.381.59
85270.351.67
89890.291.77
77850.271.53
38850.080.76
49180.140.97
47360.130.93
8740.040.17
31930.130.63
30960.100.61
14200.050.28
73820.151.45
55360.161.09
74570.211.47
45630.220.90
57390.231.13
63860.211.25
43700.150.86
31,0270.656.10
21,5990.634.24
20,9110.594.11
11,7850.562.31
67400.271.32
10,0160.331.97
94570.331.86
86,4641.82
16.99
61,1021.77
12.00
60,4171.70
11.87
31,8071.656.84
45,8951.869.02
47,2291.559.28
44,6291.548.77
2003 4751
2004 5674
2005 5287
13
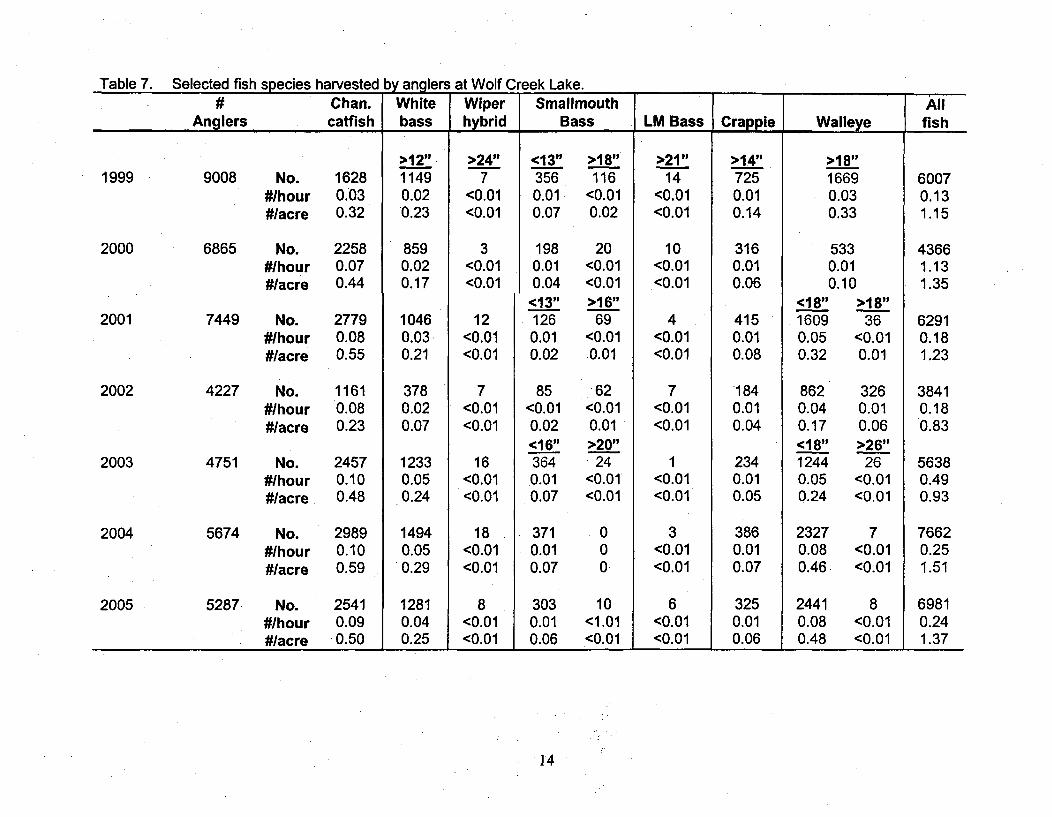
Table 7. Selected fish species harvested by anqlers at Wolf Creek Lake.Chan. White Wiper Smallmouth All
Anglers catfish bass hybrid Bass I LM Bass Crappie Walleye fish
1999 9008
6865
No. 1628#/hour 0.03#1acre 0.32
>12".11490.020.23
2000 No. 2258 I 859
2001
#/hour 0.07#/acre 0.44
7449 No. 2779#/hour 0.08#/acre 0.55
4227 No. 1161#/hour 0.08#/acre 0.23
2002
0.020.17
10460.030.21
3780.020.07
12330.050.24
14940.050.29
12810.040.25
>24"7
<0.01<0.01
3<0.01<0.01
12<0.01<0.01
7<0.01<0.01
16<0.01<0.01
18<0.01<0.01
8<0.01<0.01
<13"3560.010.07
1980.010.04
<13",1260.010.02
85<0.010.02<166"3640.01
0.07
3710.010.07
3030.010.06
>18"116
<0.010.02
20<0.01<0.01>16"
69<0.010.01
62
<0.010.01>20"
24<0.01<0.01
000
10<1.01<0.01
>21"14
<0.01<0.01
10<0.01<0.01
4<0.01<0.01
7<0.01<0.01
1<0.01<0.01
3<0.01<0.01
6<0.01<0.01
>14"7250.010.14
3160.010.06
4150.010.08
1840.010.04
2340.010.05
3860.010.07
3250.010.06
>18"16690.030.33
5330.010.10
<18" >18"1609 36
0.05 <0.010.32 0.01
862 3260.04 0.010.17 0.06<18" >26"1244 260.05 <0.010.24 <0.01
2327 70.08 <0.010.46 <0.01
2441 80.08 <0.010.48 <0.01
60070.131.15
43661.131.35
62910.181.23
38410.180.83
56380.490.93
76620.251.51
69810.241.37
2003 4751 No. 2457#/hour 0.10#/acre 0.48
2004 5674 No. 2989#/hour 0.10#/acre 0.59
5287 No. 2541#/hour 0.09#/acre 0.50
2005
14
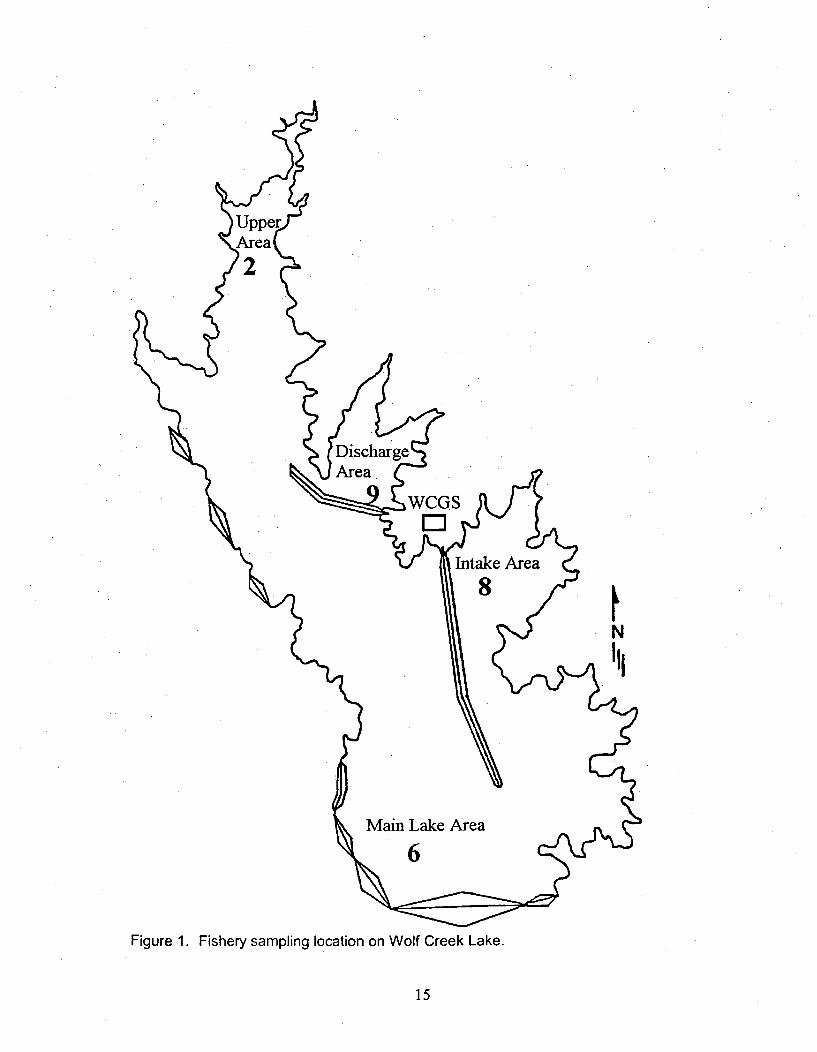
NIII
Main Lake Area6
Figure 1. Fishery sampling location on Wolf Creek Lake.
15

APPENDIX C
Biological Control Of Gizzard Shad Impingement At A Nuclear Power
EnvironmentalScience & Policy
www.elsevier.com/locate/envsciELSEVIER Environmental Science & Policy 3 (2000) S275-S28i
Biological control of gizzard shad impingement at a nuclearpower plant
Dan E. Haines*Wolf Creek Nuclear Operating Corporation, 1550 Oxen Lane, Burlington, KS 66839. USA
Abstract
Biological control of gizzard shad (Dorosoma cepedianum) using predator fish species was managed to reduce impingement oncooling water intake screens at Coffey County Lake (CCL), Kansas. Long term shad and predator proportional stock densities(PSD) and body conditions (Wr) were used to characterize this fishery. Comparisons were completed between the lake's primaryproductivity (mg/in 3 chlorophyll-a), catch-per-unit-effort (CPUE) of young-of-year (YOY) and adult gizzard shad, and bodyconditions of predator species. No relationships were found between the lake's productivity and gizzard shad densities indicatingthat other mechanisms control shad numbers, likely predation. Body conditions of the prevalent predator species in CCL werepositively compared with the previous year's production during a short-lived increase in shad densities. It is well documentedthat shad are an important food source for most predator species present in the lake. It is believed that the predator speciespresent played a significant role in reducing YOY shad densities each year. Body conditions of predators did not indicate asurplus of a primary prey species. High shad growth rates and PSD indices promote survival of sufficient shad to adults, thusmaking this fishery nearly self-sustaining, and beneficial for plant operation. © 2000 Elsevier Science Ltd. All rights reserved.
Keywords: Gizzard shad; Cooling lake; Impingement; Fishery; Predation; Biological control
1. Introduction
Excessive fish impingement on intake screens cancause costly equipment damage and power productiondelays. In the mid-west, gizzard shad (Dorosoma cepe-dianum) can produce large numbers of young andtypically reach high densities in impoundments (Pflie-ger, 1975; Willis and Jones, 1986; Dettmers and Stein,1991). Gizzard shad, especially the young-of-year(YOY), are susceptible to winter mortality, usually aswater temperatures fall below approximately 4°C(38°F) (Nebraska Public Power District (NPPD), 1985;Willis, 1987; Jester and Jensen, 1972). Impingementproblems on power plant intake screens developbecause these shad cannot avoid intake flows during
Tel.: + 1-316-364-8831, ext. 4672; fax: + 1-316-364-4154.E-mail address: [email protected] (D.E. Haines).
such natural winter die-offs (Olmstead and Clugston,1986; White et al., 1986).
Gizzard shad is also an important forage species inmost reservoirs (Pflieger, 1975; Carlander, 1969; Steinand Johnson, 1987; Colvin, 1993). Some predator in-fluences have been documented (Dettmers and Stein,1991), but typically shad have not been controlled bypredation (Putman and DeVries, 1994). It would be anobvious advantage in a power plant cooling lake, tohave predator species reduce gizzard shad YOY.abun-dance to densities low enough to prevent excessiveimpingement on intake screens, on an annual basis. Inaddition, adverse environmental, public relation, andregulatory impacts associated with large impingementevents could also be avoided.
In 1977, early during the construction of CCL, itwas expected that gizzard shad could not be excludedfrom, and would flourish in the lake. Consequently, anaggressive stocking program was completed, with thegoal of limiting winter survival of YOY gizzard shad.
1462-9011/00/$ - see front matter © 2000 Elsevier Science Ltd. All rights reserved.PII: S1462-9011(00)00067-8
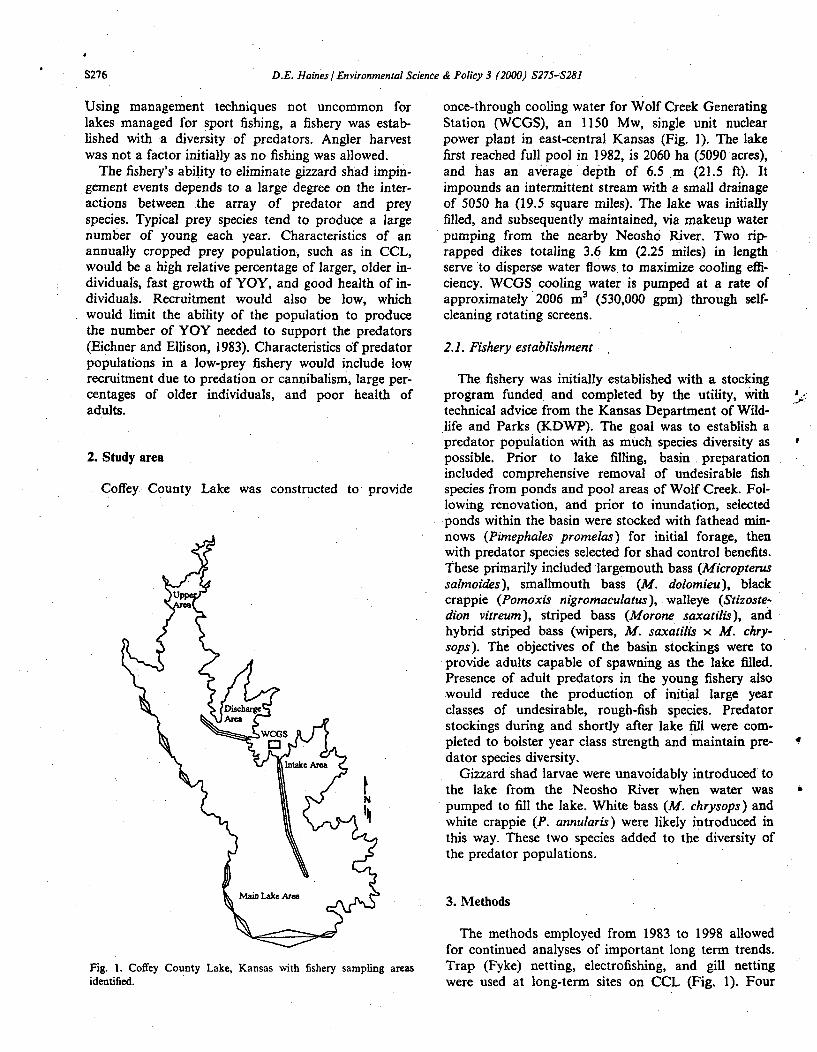
S276 D.E. Haines/ Environmental Science & Policy 3 (2000) S275-S281
Using management techniques not uncommon forlakes managed for sport fishing, a fishery was estab-lished with a diversity of predators. Angler harvestwas not a factor initially as no fishing was allowed.
The fishery's ability to eliminate gizzard shad impin-gement events depends to a large degree on the inter-actions between the array of predator and preyspecies. Typical prey species tend to produce a largenumber of young each year. Characteristics of anannually cropped prey population, such as in CCL,would be a high relative percentage of larger, older in-dividuals, fast growth of YOY, and good health of in-dividuals. Recruitment would also be low, whichwould limit the ability of the population to producethe number of YOY needed to support the predators(Eichner and Ellison, 1983). Characteristics of predatorpopulations in a low-prey fishery would include lowrecruitment due to predation or cannibalism, large per-centages of older individuals, and poor health ofadults.
2. Study area
Coffey County Lake was constructed to provide
once-through cooling water for Wolf Creek GeneratingStation (WCGS), an 1150 Mw, single unit nuclearpower plant in east-central Kansas (Fig. 1). The lakefirst reached full pool in 1982, is 2060 ha (5090 acres),and has an- average depth of 6.5 m (21.5 ft). Itimpounds an intermittent stream with a small drainageof 5050 ha (19.5 square miles). The lake was initiallyfilled, and subsequently maintained, via makeup waterpumping from the nearby Neosho River. Two rip-rapped dikes totaling 3.6 km (2.25 miles) in lengthserve to disperse water flows, to maximize cooling effi-ciency. WCGS cooling water is pumped at a rate ofapproximately 2006 m3 (530,000 gpm) through self-cleaning rotating screens.
2.1. Fishery establishment
The fishery was initially established with a stockingprogram funded and completed by the utility, withtechnical advice from the Kansas Department of Wild-life and Parks (KDWP). The goal was to establish apredator population with as much species diversity aspossible. Prior to lake filling, basin preparationincluded comprehensive removal of undesirable fishspecies from ponds and pool areas of Wolf Creek. Fol-lowing renovation, and prior to inundation, selectedponds within the basin were stocked with fathead min-nows (Pimephales promelas) for initial forage, thenwith predator species selected for shad control benefits.These primarily included largemouth bass (Micropterussalmoides), smallmouth bass (M. dolomieu), blackcrappie (Pomoxis nigromaculatus), walleye (Stizoste-.dion vitreum), striped bass (Morone saxatilis), andhybrid striped bass (wipers, M. saxatilis x M. chry-sops). The objectives of the basin stockings were toprovide adults capable of spawning as the lake filled.Presence of adult predators in the young fishery alsowould reduce the production of initial large yearclasses of undesirable, rough-fish species. Predatorstockings during and shortly after lake fill were com-pleted to bolster year class strength and maintain pre-dator species diversity.
Gizzard shad larvae were unavoidably introduced tothe lake from the Neosho River when water waspumped to fill the lake. White bass (M. chrysops) andwhite crappie (P. annularis) were likely introduced inthis way. These two species added to the diversity ofthe predator populations.
3. Methods
The methods employed from 1983 to 1998 allowedfor continued analyses of important long term trends.Trap (Fyke) netting, electrofishing, and gill nettingwere used at long-term sites on CCL (Fig. 1). Four
5'..
I.
4
I Q
Fig. 1. Coffey County Lake, Kansas with fishery sampling areasidentified.
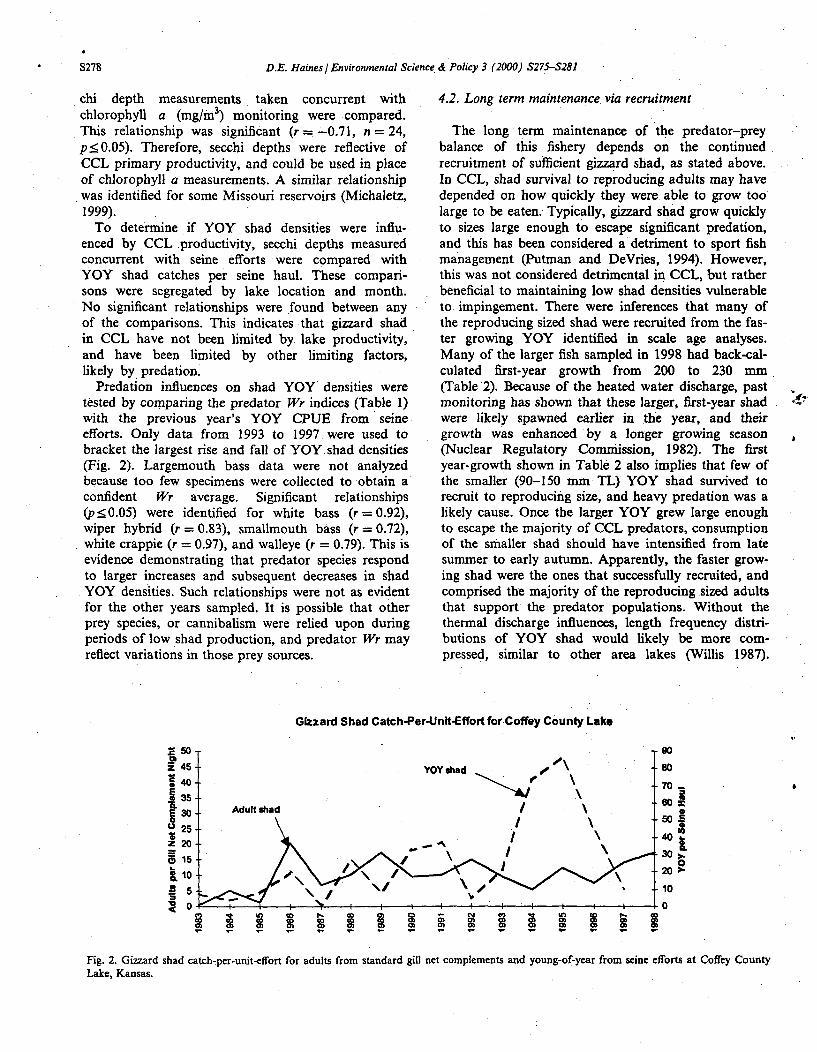
S278 D.E. Haines/ Environmental Science & Policy 3 (2000) S275-S281
chi depth measurements taken concurrent withchlorophyll a (mg/rn 3) monitoring were compared.This relationship was significant (r =- 0.71, n = 24,p:50.05). Therefore, secchi depths were reflective ofCCL primary productivity, and could be used in placeof chlorophyll a measurements. A similar relationshipwas identified for some Missouri reservoirs (Michaletz,1999).
To determine if YOY shad densities were influ-enced by CCL productivity, secchi depths measuredconcurrent with seine efforts were compared withYOY shad catches per seine haul. These compari-sons were segregated by lake location and month.No significant relationships were found between anyof the comparisons. This indicates that gizzard shadin CCL have not been limited by. lake productivity,and have been limited by other limiting factors,likely by predation.
Predation influences on shad YOY densities weretested by comparing the predator Wr indices (Table 1)with the previous year's YOY CPUE from seine•efforts. Only data from 1993 to 1997 were used tobracket the largest rise and fall of YOY shad densities(Fig. 2). Largemouth bass data were not analyzedbecause too few specimens were collected to obtain aconfident Wr average. Significant relationships(p:50.05) were identified for white bass (r = 0.92),wiper hybrid (r = 0.83), smallmouth bass (r = 0.72),white crappie (r = 0.97), and walleye (r = 0.79). This isevidence demonstrating that predator species respondto larger increases and subsequent decreases in shadYOY densities. Such relationships were not as evidentfor the other years sampled. It is possible that otherprey species, or cannibalism were relied upon duringperiods of low shad production, and predator Wr mayreflect variations in those prey sources.
4.2. Long term maintenance via recruitment
The long term maintenance of the predator-preybalance of this fishery depends on the continuedrecruitment of sufficient gizzard shad, as stated above.In CCL, shad survival to reproducing adults may havedepended on how quickly they were able to grow toolarge to be eaten. Typically, gizzard shad grow quicklyto sizes large enough to escape significant predation,and this has been considered a detriment to sport fishmanagement (Putman and DeVries, 1994). However,this was not considered detrimental in CCL, but ratherbeneficial to maintaining low shad densities vulnerableto impingement. There were inferences that many ofthe reproducing sized shad were recruited from the fas-ter growing YOY identified in scale age analyses.Many of the larger fish sampled in 1998 had back-cal-culated first-year growth from 200 to 230 mm(Table 2). Because of the heated water discharge, pastmonitoring has shown that these larger, first-year shadwere likely spawned earlier in the year, and theirgrowth was enhanced by a longer growing season.(Nuclear Regulatory Commission, 1982). The firstyear-growth shown in Table 2 also implies that few ofthe smaller (90-150 mm TL) YOY shad survived torecruit to reproducing size, and heavy predation was alikely cause. Once the larger YOY grew large enoughto escape the majority of CCL predators, consumptionof the smaller shad should have intensified from latesummer to early autumn. Apparently, the faster grow-ing shad were the ones that successfully recruited, andcomprised the majority of the reproducing sized adultsthat support the predator populations. Without thethermal discharge influences, length frequency distri-butions of YOY shad would likely be more com-pressed, similar to other area lakes (Willis 1987).
Gizzard Shad Catch-Per-Unit-Effort for Coffey County Lake
2 50
F 45
£40.~38
530
25
20
Adult shad
YOY shad -
/I
•I. \ I
gO80
70_
60z
50.S
40o,
30
10
0
Fig. 2. Gizzard shad catch7per-unit-effort for adults from standard gill net complements and young-of-year from seine efforts at Coffey CountyLake, Kansas.
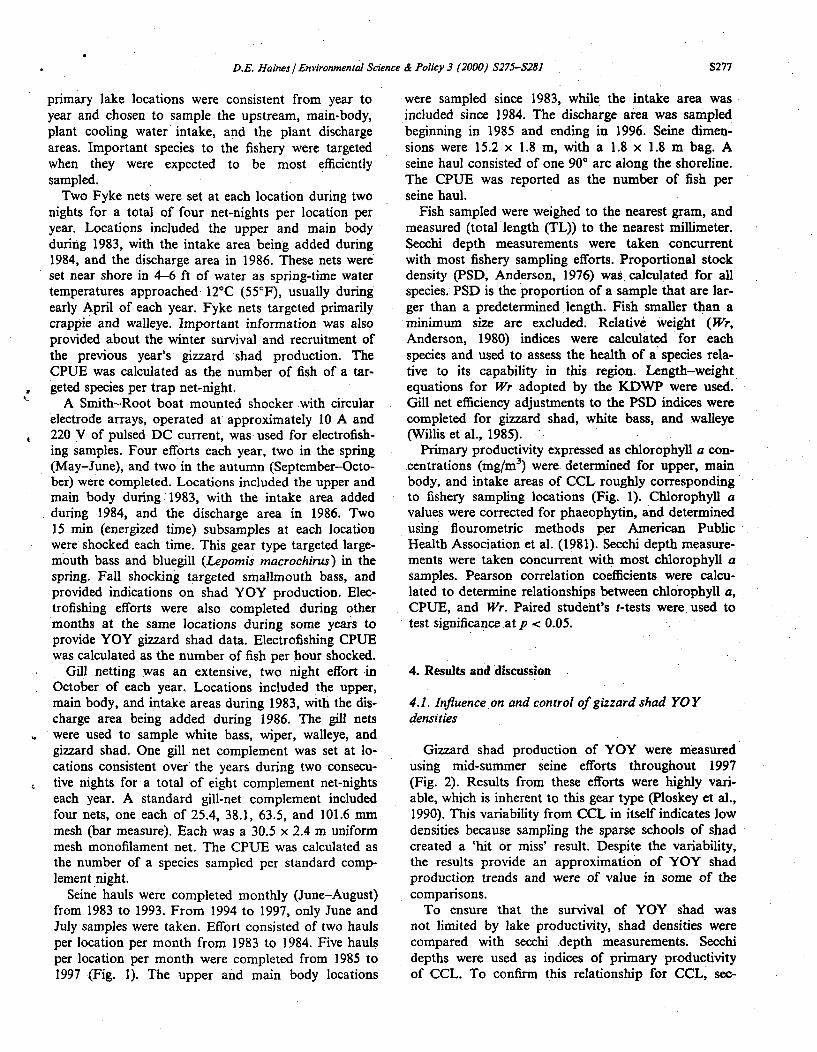
D.E. Haines / Environmental Science & Policy 3 (2000) S275-S281 S277
primary lake locations were consistent from year toyear and chosen to sample the upstream, main-body,plant cooling water intake, and the plant dischargeareas. Important species to the fishery were targetedwhen they were expected to be most efficientlysampled.
Two Fyke nets were set at each location during twonights for a total of four net-nights per location peryear. Locations included the upper and main bodyduring 1983, with the intake area being added during1984, and the discharge area in 1986. These nets wereset near shore .in 4-6 ft of water as spring-time watertemperatures approached 12°C (55°F), usually duringearly April of each year. Fyke nets targeted primarilycrappie and walleye. Important information was alsoprovided about the winter survival and recruitment ofthe previous year's gizzard shad production. TheCPUE was calculated as the number of fish of a tar-geted species per trap net-night.
A Smith-Root boat mounted shocker with circularelectrode arrays, operated at approximately 10 A and220 V of pulsed DC current, was used for electrofish-ing samples. Four efforts each year, two in the spring(May-June), and two in the autumn (September-Octo-ber) were completed. Locations included the upper andmain body during 1983, with the intake area addedduring 1984, and the discharge area in 1986. Two15 min (energized time) subsamples at each locationwere shocked each time. This gear type targeted large-mouth bass and bluegill (Lepomis macrochirus) in thespring. Fall shocking targeted smallmouth bass, andprovided indications on shad YOY production. Elec-trofishing efforts were also completed during othermonths at the same locations during some years toprovide YOY gizzard shad data. Electrofishing CPUEwas calculated as the number of fish per hour shocked.
Gill netting was an extensive, two night effort inOctober of each year. Locations included the upper,main body, and intake areas during 1983, with the dis-charge area being added during 1986. The gill netswere used to sample white bass, wiper, walleye, andgizzard shad. One gill net complement was set at lo-cations consistent over the years during two consecu-tive nights for a total of eight complement net-nightseach year. A standard gill-net complement includedfour nets, one each of 25.4, 38.1, 63.5, and 101.6 mmnmesh (bar measure). Each was a 30.5 x 2.4 m uniformmesh monofilament net. The CPUE was calculated asthe number of a species sampled per standard comp-lement night.
Seine hauls were completed monthly (June-August)from 1983 to 1993. From 1994 to 1997, only June andJuly samples were taken. Effort consisted of two haulsper location per month from 1983 to 1984. Five haulsper location per month were completed from 1985 to1997 (Fig. 1). The upper and main body locations
.were sampled since 1983, while the intake area wasincluded since 1984. The discharge area was sampledbeginning in 1985 and ending in 1996. Seine dimen-sions were 15.2 x 1.8 m, with a 1.8 x 1.8 m bag. Aseine haul consisted of one 90° arc along the shoreline.The CPUE was reported as the number of fish perseine haul.
Fish sampled were weighed to the nearest gram, andmeasured (total length (TL)) to the nearest millimeter.Secchi depth measurements were taken concurrentwith most fishery sampling efforts. Proportional stockdensity (PSD, Anderson, 1976) was calculated for allspecies. PSD is the proportion of a sample that are lar-ger than a predetermined length. Fish smaller than aminimum size are excluded. Relative weight (Wr,Anderson, 1980) indices were calculated for eachspecies and used to assess the health of a species rela-tive to its capability in this region. Length-weightequations for Wr adopted by the KDWP were used.Gill net efficiency adjustments to the PSD indices werecompleted for gizzard shad, white bass, and walleye(Willis et al., 1985).Primary productivity expressed as chlorophyll a con-centrations (mg/n 3) were. determined for upper, mainbody, and intake areas of CCL roughly correspondingto fishery sampling locations (Fig. 1). Chlorophyll avalues were corrected for phaeophytin, and determinedusing flourometric methods per American PublicHealth Association et al. (1981). Secchi depth measure-ments were taken concurrent with most chlorophyll asamples. Pearson correlation coefficients were calcu-lated to determine relationships between chlorophyll a,CPUE, and Wr. Paired student's t-tests were, used totest significance at p < 0.05.
4. Results and discussion
4.1. Influence on and control of gizzard shad YO Ydensities
Gizzard shad production of YOY were measuredusing mid-summer seine efforts throughout 1997(Fig. 2). Results from these efforts were highly vari-able, which is inherent to this gear type (Ploskey et al.,1990). This variability from CCL in itself indicates lowdensities because sampling the sparse schools of shadcreated a 'hit or miss' result. Despite the variability,the results provide an approximation of YOY shadproduction trends and were of value in some of thecomparisons.
To ensure that the survival of YOY shad wasnot limited by lake productivity, shad densities werecompared with secchi depth measurements. Secchidepths were used as indices of primary productivityof CCL. To confirm this relationship for CCL, sec-
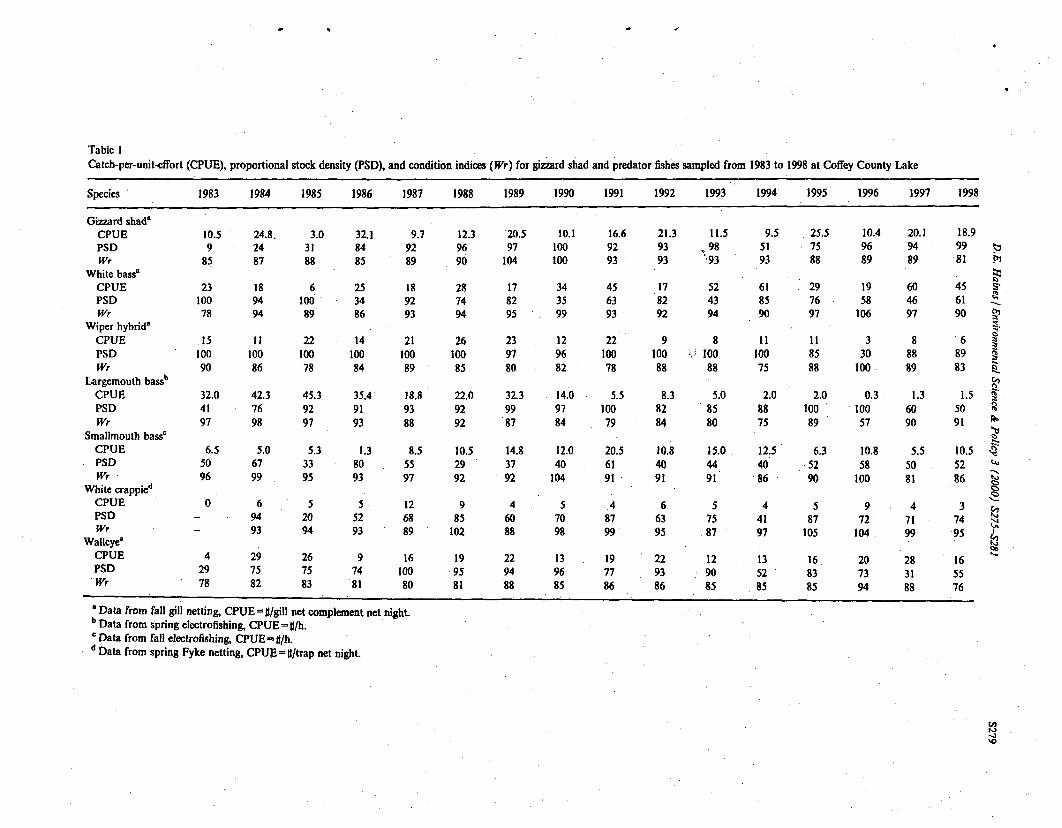
Table ICatch-per-unit-effort (CPUE), proportional stock density (PSD), and condition indices (Wr) for gizzard shad and predator fishes sampled from 1983 to 1998 at Coffey County Lake
Species 1983 1984 1985 1986 1987 1988 1989 1990 1991 1992 1993 1994 1995 1996 1997 1998
Gizzard shad"CPUEPSDWr
White bassaCPUEPSDWr
Wiper hybrid'CPUEPSDWr
Largemouth bassb
CPUEPSDWr
Smallmouth basseCPUEPSDWr
White crappieCPUEPSDWr
Walleye8
CPUEPSDWr
10.5 24.8. 3.0 32.19 24 31 84
85 87 88 85
9.7 12.3 20.5 10.1 16.6 21.3 11.5
92 96 97 100 92 93 _98
89 90 104 100 93 93 93
2310078
.15
10090
.189494
1i10086
6100
89
2210078
253486
189293
287494
178295
239780
343599
456393
178292
524394
5 25.5 10.4 20.1 18.9
75 96 94 99
88 89 89 81 .i
29 19 60 45 S"
76 58 46 61
97 106 97 90 ;;
11 3 8 6
85 30 88 89
88 100 89 83
14 21 26
100 100 10084 89 85
12 22 9 8 11
96 100 100 100 100
82 78 88 88 75
32.0 42.3 45.3 .35.4 18.8 22.0 32.3 14.0 5.5
41 76 92 91 93 92 99 97 100
97 98 97 93 88 92 87 84 79
8.3 5.082 8584 80
2.08875
6.5 5.0 5.3 1.3 8.5 10.5 14.8 12.0 20.5 10.8 15.0 12.5
50 67 33 80 55 29 37 40 61 40 44 40
96 99 95 93 97 92 92 104 91 91 91 86
2.0 0.3 1.3 1.5 "
100 100 60 5089 57 90 91
6.3 10.8 5.5 10.5 ~•
.52 58 50 52
90 100 81 86
5 9 4 3
87 72 71 74
105 104 99 95
16 20 28 16
83 73 31 5585 94 88 76
0 6- . 94- 93
52094
267583
5 . 12
52 6893 89
985
102
19
.95
81
46088
229488
57098
139685
.48799
197786
66395
57587
44197
135285
42978
297582
97481
1610080
22 1293 90
86 85
8Data from fall gill netting, CPUE = It/gill net complement net night.b Data from spring electrofishing, CPUE = 0t/h.C'Data from fall electrofishing, CPUE = I/h.d Data from spring Fyke netting, CPUE = #t/trap net night.
cjo
'q0
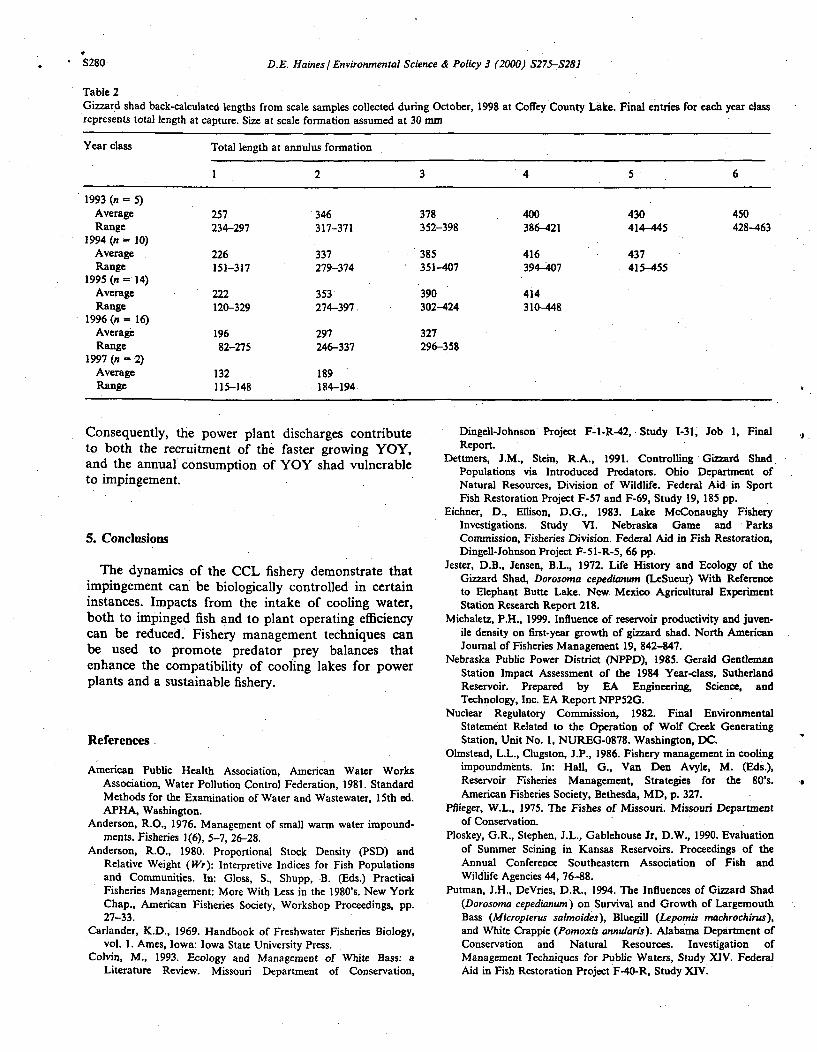
S280 D.E. Haines / Environmental Science & Policy 3 (2000) S275-S281
Table 2Gizzard shad back-calculated lengths from scale samples collected during October, 1998 at Coffey County Lake. Final entries for each year classrepresents total length at capture. Size at scale formation assumed at 30 mm
Year class Total length at annulus formation
1 2 3 4 5 6
1993 (n 5)Average 257 346 378 400 430 450Range 234-297 317-371 352-398 386-421 414-445 428-463
1994 (n = 10)Average 226 337 385 416 437Range 151-317 279-374 351-407 394-407 415-455
1995 (n = 14)Average 222 353 390 414Range 120-329 274-397 302-424 310-448
1996 (n = 16)Average 196 297 327Range 82-275 246-337 296-358
1997 (n = 2)Average 132 189Range 115-148 184-194
Consequently, the power plant discharges contributeto both the recruitment of the faster growing YOY,and the annual consumption of YOY shad vulnerableto impingement.
5. Conclusions
The dynamics of the CCL fishery demonstrate thatimpingement can be biologically controlled in certaininstances. Impacts from the intake of cooling water,both to impinged fish and to plant operating efficiencycan be reduced. Fishery management techniques canbe used to promote predator prey balances thatenhance the compatibility of cooling lakes for powerplants and a sustainable fishery.
References
American Public Health Association, American Water WorksAssociation, Water Pollution Control Federation, 1981. StandardMethods for the Examination of Water and Wastewater, 15th ed.APHA, Washington.
Anderson, R.O., 1976. Management of small warm water impound-ments. Fisheries 1(6), 5-7, 26-28.
Anderson, R.O., 1980. Proportional Stock Density (PSD) andRelative Weight (Wr): Interpretive Indices for Fish Populationsand Communities. In: Gloss, S., Shupp, B. (Eds.) PracticalFisheries Management: More With Less in the 1980's. New YorkChap., American Fisheries Society, Workshop Proceedings, pp.27-33.
Carlander, K.D., 1969. Handbook of Freshwater Fisheries Biology,vol. 1. Ames, Iowa: Iowa State University Press.
Colvin, M., 1993. Ecology and Management of White Bass: aLiterature Review. Missouri Department of Conservation,
Dingell-Johnson Project F-I-R-42, Study 1-31, Job 1, FinalReport.
Dettmers, J.M., Stein, R.A., 1991. Controlling Gizzard ShadPopulations via Introduced Predators. Ohio Department ofNatural Resources, Division of Wildlife. Federal Aid in SportFish Restoration Project F-57 and F-69, Study 19, 185 pp.
Eichner, D., Ellison, D.G., 1983. Lake McConaughy FisheryInvestigations. Study VI. Nebraska Game and ParksCommission, Fisheries Division. Federal Aid in Fish Restoration,Dingell-Johnson Project F-51-R-5, 66 pp.
Jester, D.B., Jensen, B.L., 1972. Life History and Ecology of theGizzard Shad, Dorosoma cepedianum (LeSueur) With Referenceto Elephant Butte Lake. New Mexico Agricultural ExperimentStation Research Report 218.
Michaletz, P.H., 1999. Influence of reservoir productivity and juven-ile density on first-year growth of gizzard shad, North AmericanJournal of Fisheries Management 19, 842-847.
Nebraska Public Power District (NPPD), 1985. Gerald GentlemanStation Impact Assessment of the 1984 Year-class, SutherlandReservoir. Prepared by EA Engineering, Science, andTechnology, Inc. EA Report NPP52G.
Nuclear Regulatory Commission, 1982. Final EnvironmentalStatement Related to the Operation of Wolf Creek GeneratingStation, Unit No. 1, NUREG-0878. Washington, DC.
Olmstead, L.L., Clugston, J.P., 1986. Fishery management in coolingimpoundments. In: Hall, G., Van Den Avyle, M. (Eds.),Reservoir Fisheries Management, Strategies for the 80's.American Fisheries Society, Bethesda, MD, p. 327.
Pflieger, W.L., 1975. The Fishes of Missouri. Missouri Departmentof Conservation.
Ploskey, G.R., Stephen, J.L., Gablehouse Jr, D.W., 1990. Evaluationof Summer Seining in Kansas Reservoirs. Proceedings of theAnnual Conference Southeastern Association of Fish andWildlife Agencies 44, 76-88.
Putman, J.H., DeVries, D.R., 1994. The Influences of Gizzard Shad(Dorosoma cepedianum) on Survival and Growth of LargemouthBass (Micropterus salmoides), Bluegill (Lepomis machrochirus),and White Crappie (Pomoxis annularis). Alabama Department ofConservation and Natural Resources. Investigation ofManagement Techniques for Public Waters, Study XIV. FederalAid in Fish Restoration Project F-40-R, Study XIV.
8
D.E. Haines/ Environmental Science & Policy 3 (2000) S275-S281 S281
Stein, R.A., Johnson, B.M., 1987. Predicting Carrying Capacitiesand Yields of Top Predators in Ohio Impoundments. OhioDepartment of Natural Resources, Division of Wildlife. FederalAid in Fish Restoration Project F-57-R-5 through R-9, Study 12,144 pp.
White, A.M., Moore, F.D., Alldridge, N.A., Loucks, D.M., 1986.The Effects of Natural Winter Stresses on the Mortality of theEastern Gizzard Shad, Dorosoma cepedianwn, in Lake Erie. TheCleveland Electric Illuminating Company and The Ohio EdisonCompany, Cleveland, Ohio. Environmental Resource Associates,Inc. and John Carrol University. Report 78. 208 pp.
Willis, D.W., 1987. Reproduction and recruitment of gizzard shad inKansas reservoirs. North American Journal of FisheriesManagement 7, 71-80.
Willis, D.W., Jones, L.D., 1986. Fish standing crops in wooded and
nonwooded coves of Kansas reservoirs. North American Journalof Fisheries Management 6, 393-425.
Willis, D.W., McCloskey, K.D., Gablehouse Jr, D.W., 1985.Calculation of stock density indices based on adjustments for gillnet mesh size efficiency. North American Journal of FisheriesManagement 5, 126-137.
Dan E. Haines received a BSc degree from Emporia State University,Emporia, Kansas and a MSc degree from Emporia State Universityin Environmental Biology. He has been employed as an Environmen-tal Biologist at Wolf Creek Nuclear Operating Corporation since1983. Responsibilities include natural resource and fishery manage-ment of the cooling lake to support operation of the electric generat-ing plant.

APPENDIX D
EPA Region VII Policy on Gizzard Shad
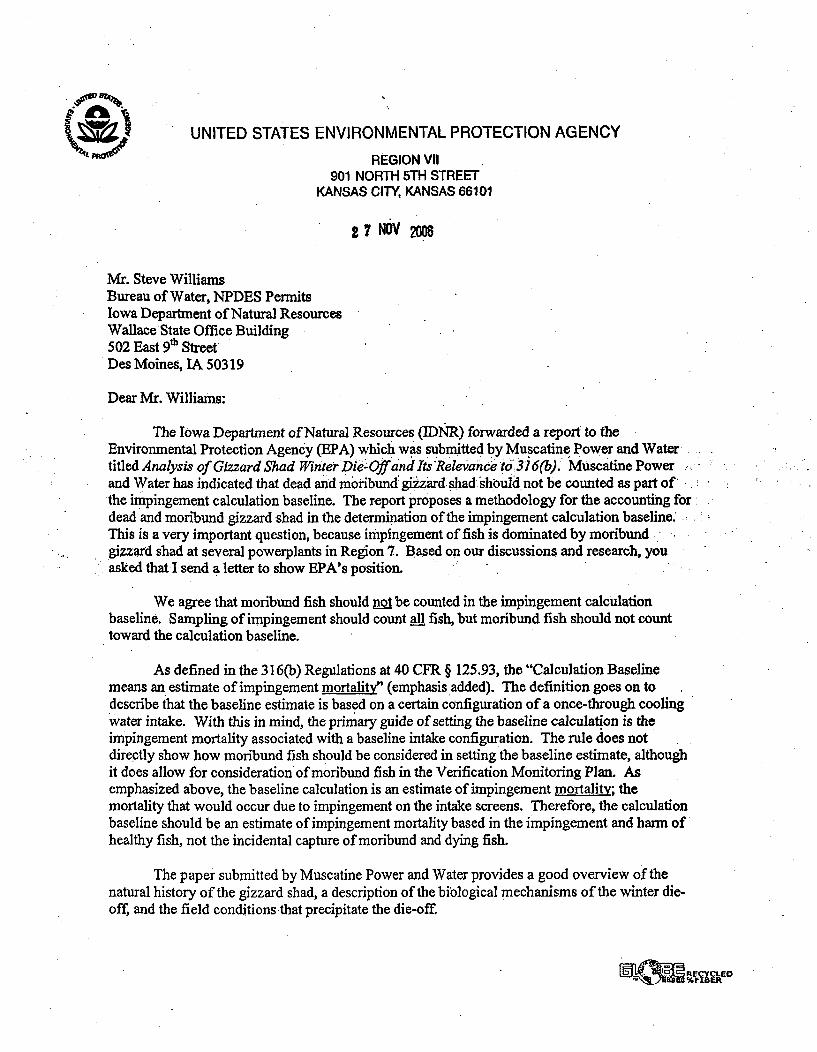
UNITED STATES ENVIRONMENTAL PROTECTION AGENCY
REGION VII901 NORTH 5TH STREET
KANSAS CITY, KANSAS 66101
7 NOV 20
Mr. Steve WilliamsBureau of Water, NPDES PermitsIowa Department of Natural ResourcesWallace'State Office Building502 East 9t" StreetDes Moines, IA 50319
Dear Mr. Williams:
The Iowa Department of Natural Resources (IDNR) forwarded a report to theEnvironmental Protection Agency (EPA) which was submitted by Muscatine Power and Watertitled Analysis of Gizzard Shad Winter Die-Off and Its iRelevance to 376(b). Muscatine Powerand Water has indicated that dead and moribund gizzard shad shbuld not be counted as part ofthe impingement calculation baseline. The report proposes a methodology for the accounting for.dead and moribund gizzard shad in the determination of the impingement calculation baseline...This is a very important question, because impingement offish is dominated by moribund , •gizzard shad at several powerplants in Region 7. Based on our discussions and research, youasked that I send a letter to show EPA's position.
We agree that moribund fish should not be counted in the impingement calculationbaseline. Sampling of impingement should count all fish, but moribund fish should not counttoward the calculation baseline.
As defined in the 316(b) Regulations at 40 CFR § 125.93, the "Calculation Baselinemeans an estimate of impingement mortality' (emphasis added). The definition goes on todescribe that the baseline estimate is based on a certain configuration of a once-through coolingwater intake. With this in mind, the primary guide of setting the baseline calculation is theimpingement mortality associated with a baseline intake configuration. The rule does notdirectly show how moribund fish should be considered in setting the baseline estimate, althoughit does allow for consideration of moribund fish in the Verification Monitoring Plan. Asemphasized above, the baseline calculation is an estimate of impingement mortality; themortality that would occur due to impingement on the intake screens. Therefore, the calculationbaseline should be an estimate of impingement mortality based in the impingement and harm ofhealthy fish, not the incidental capture of moribund and dying fish.
The paper submitted by Muscatine Power and Water provides a good overview of thenatural history of the gizzard shad, a description of the biological mechanisms of the winter die-off, and the field conditions that precipitate the die-off.
RECYCLEDRftWFIBER
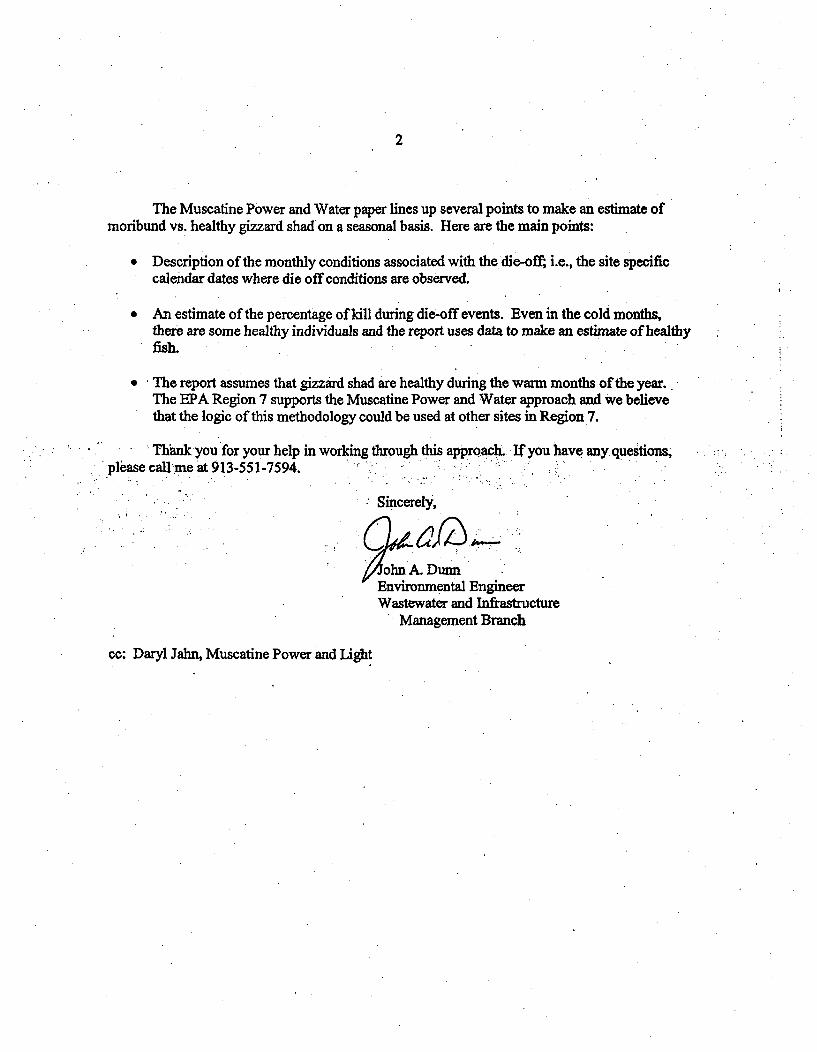
2
The Muscatine Power and Water paper lines up several points to make an estimate ofmoribund vs. healthy gizzard shad on a seasonal basis. Here are the main points:
Description of the monthly conditions associated with the. die-off; i.e., the site specificcalendar dates where die off conditions are observed.
An estimate of the percentage of kill during die-off events. Even in the cold months,there are some healthy individuals and the report uses data to make an estimate of healthyfish.
* The report assumes that gizzard shad are healthy during the warm months of the year.The EPA Region 7 supports the Muscatine Power and Water approach and we believethat the logic of this methodology could be used at other sites in Region 7.
Thank you for your help in workingthrough this approach. If you have any questions,ple•ase call'me at 913-551-7594.
Sincerely,
Environmental EngineerWastewater and Infrastructure
Management Branch
cc: Daryl Jahn, Muscatine Power and Light
t
August 9, 2006
Mr. Daryl K. JahnEnvironmental SpecialistMuscatine Power and Water3205 Cedar StreetMuscatine, Iowa 52761-2204
Dear Mr. Jahn:
HDRILMS is pleased to submit the final version of the report that describes thewinter die-off of gizzard shad in the more northerly portions of its geographicalrange. This is an annual phenomenon. which often strains the capability of watertraveling screens :when large numbers of dead and dying shad are brought in .through the intake structures: of electric.generating facilities.
The relevance of these dead and dying fish to the determination of the calculationbaseline in the Section 316(b) Phase II Rule is not addressed in the Rule which setsforth a Performance Standard for reduction of 'impingement mortality of fish on thetraveling screens. The key'term is impingement mortality which should not applyto fish that are dead or irreversibly dying before they reach the traveling screens.
We are confidant that the information put forth in this report will be considered bythe Iowa DNR as it deliberates this issue.
If you have any questions, please do not hesitate to contact me after my return fromvacation on August 22, 2006.
Very truly yours,
Bruce L. Lippincott, Ph.D.Manager Mid West Operations
HDR ILMS 10207 Lucas Road Phone. 18151334.9511HDR Engineerinlg. IJe. Woostock it I0090-7445 Fax: 18)5 334-,514
I w .hdrirkc.cm
Analysis of Gizzard Shad Winter Die-Off and Its Relevance to 316(b)
Prepared for
Muscatine Power and Water3205 Cedar Street
Muscatine, Iowa 52761
August 2006HDRNLMS
10207 Lucas RoadWoodstock, Illinois 60098
I
Table of Contents
1 Introduction ..................................................................................................... 11.1 Background .............................................................................................................. 11.2 Question .......................................................................................................... 11.3 O bjective .................................................................................................................. 2
2 Gizzard Shad Range Extension and Winter Mortality ............................................... 23 Synopsis of Physiological and Biochemical Studies on Gizzard Shad Collected Duringthe Winter Season ................................................ 3
3.1 Use of Total Lipids as Energy Source ................................................................. 4.3.2 Effects of Starvation on Lipid Reserves, Serum Glucose, and Total Serum Protein4
3.3 Cystolic Lactate Dehydrogenase ........................................................................ 53.4 Serum and Brain Glucose .................................................................................... 53.5 Cholesterol ....................................................... ...................................................... 63.6 Summary .......................................................................................... .......... .. 7
3.6.1 Total Lipids ................................................................................................... 73.6.2 Cystolic Lactate Dehydrogenase ................................................................. 73.6.3 Serum and Brain Glucose .................................. 83.6.4 Cholesterol ............................................ 8
4 Quad Cities Nuclear Generating Station Intake Studies ..................... 85. Impingement Data Collected During Winter 2005/2006 .................. ................... 106. Relevance to 316b Phase l ..l..... ................ .. ; .................................. 197. Recom edindations..................................... ................. ........................................... 198. References .. . .. ......................................... ......................... 20
Analysis of Gizzard Shad Winter Die-Off and Its Relevance to 316(b)
Analysis of Gizzard Shad Winter Die-Off and Its Relevance To316(b)
1 Introduction
1.1 Background
Following several years of discussion, review, and revision by both regulators and the regulatedcommunity, USEPA published the Clean Water Act, Section 316(b) Phase II Rule on July 9,2004. This rule is directed primarily at existing electric generating facilities with the objective ofreducing the numbers of fish and shellfish that are removed from the source water body by theCooling Water Intake System (CWIS) through impingement on the traveling water screens and/orentrainment of early life stages in the cooling water stream.
The Rule defines Performance Standards to be met for both impingement and entrainment,criteria for qualifying for each standard, a roadmap by which to navigate through the process,generic groupings of compliance measures that are to be considered, economic valuations, and ageneral. instruction directed at monitoring effectiveness of compliance measures selected. TheRule is. clear that all facilities must comply with the impingement standard but some areexempted from the entrainment standard.
Central to the Rule is the determination of the calculation baseline which estimates the numbers' "of organisms that are impinged and/or entrained. This is the set of numbers against which thePerformance Standard is measured and influences compliance measures selected to satisfy the'Performance Standard. Nearly all affected facilities have needed to conduct impingement studies(and some have needed to conduct entrainment studies) to provide current data for determinationof the calculation baseline.
The Rule and the text which surrounds it are silent on one aspect of counting impinged fish forcomputation of the calculation baseline; namely, the treatment of fish that are dead or moribundbefore they reach the traveling water screens during periods of winter die off. (Moribund fish arementioned in the verification monitoring section of the Rule but only to the extent that they willneed to be addressed at that time.) By its silence, the Rule infers that this decision is to be madeby state Directors, who are defined in the Rule. It appears, then, that each state will need todecide how to treat these fish within the context of the Rule. More specifically, decisions need tobe made about the treatment of gizzard shad in those states that are located within the northernportion of this species' geographical range and that experience large, natural winter die off ofgizzard shad on an annual basis.
1.2 Question
The salient question is: Should dead and moribund gizzard shad be counted in determination ofthe impingement calculation baseline?
HIDR/LMSAugust 2006
Analysis of Gizzard Shad Winter Die-Off and Its Relevance to 316(b)
The simplest answer is "yes;" but that contradicts the intent of the Rule which is to reduce thenumbers of live fish lost to the environment through compliance with the Performance Standardusing one or several compliance measures. That is, mortality caused by impingement is to bereduced by at least 80% and there is no benefit to be gained by including already dead ormoribund gizzard shad in the computations. Assigning some calculated monetary value to fishthat have already died or are close to death is a questionable exercise that places an undue burdenon the applicant. A more practical response is "no" in those cases where a large portion of thetotal annual impingement, either by numbers or by weight, is composed of gizzard shad and mostof them are collected in a moribund state during the cold weather period between November 1and March 31.
The latter response needs to be supported by scientific data that documents the percentages ofhealthy, dead, and moribund gizzard shad that are found in the vicinity of the CWIS travelingscreens during the winter months and provision of physiological information that explains colddeath in this species and its irreversible path in moribund specimens.
1.3 Objective
The objective of this "white paper" is to provide scientific information that can be used in thedecision-making process to answer .the question. This will include a.brief history of the northerly .
.range extension of gizzard shad and observations on winter behayior,.-results of a winter study -conducted at an electric generating station located on the Mississippi River which documents .percentages of healthy, dead, and moribund gizzard shad collected before the trash racks,. and a:'.synopsis of critical physiological and biochemical pathways that. are disrupted by cold ambient'water temperatures leading to death in this more southerly species.
2 Gizzard Shad Range Extension and Winter Mortality
Gizzard shad, Dorosoma cepedianum, is a southerly species that began to radiate northwardsometime after 1820 when it was first reported in the Ohio River near Cincinnati (Kirtland,1844). The species continued to migrate northward through the remainder of the 1800's; and by1900 had reached Lake Erie and southern Lake Michigan (Miller, 1960). During the second halfof the 20'h Century, gizzard shad were reported from the Upper Great Lakes (Scott and Crossman,1973; Becker, 1983) and Eddy and Underhill (1974) reported a collection being made during thedecade of the 1960's in the Minnesota portion of the Upper Mississippi River.
Concurrent with this range extension, gizzard shad populations in established areas began toexplode during the 1950's. This trend continued for a period of over 30 years and continuestoday. A number of authors have suggested possible reasons for this range extension andpopulation explosion including increased phytoplankton availability (Trautman, 1956), increasedspawning habitat (Bodola, 1955), a decreased number of predators (White et al., 1975), increasedareas of thermal discharge (Becker, 1983), and a documented warming trend between 1950 and1980 (Assel, 1980). While it is difficult to separate these factors, White et al. (1986) suggest thatthe warming trend was a central cause. The warming that is attributed to the greenhouse gassescontinues to contribute to the success of this species widely in range extension and populationnumbers. On a more local level, warm water discharges provide winter sanctuaries that sheltergizzard shad during the cold weather period which allows them to survive to the followingseason.
2FDR/ILMSAugust 2006
Analysis of Gizzard Shad Winter Die-Off and Its Relevance to 316(b)
Numerous authors have reported periodic die off of this species that occurs always during thewinter. Kirtland (1844) reported heavy winter kills in the Ohio River and White et al. (1986)described the winter kills as often being massive and population dependent. Most authors notedthat the die offs occurred in December during periods of rapidly declining temperatures. Thiswas observed annually in Crab Orchard Lake in southern Illinois (Wehr, 1976).
However, rapid temperature declines were not the only phenomenon observed to be associatedwith the die offs. Heidinger (1983) indicated that winds that cause turnover at 40 C contribute tothe die off in lakes suggesting that this may be a tipping point temperature. Walberg (1964)reported that 100% of the 0+ age class of gizzard shad died after ice covered a South Dakota Lakefor more than 103 days. Not all authors agree on specific temperatures at which these fishbecome disoriented and die and recovery has been observed following exposure to lowtemperatures for short periods of time (Neumann et al., 1977). All this suggests that severaltemperature parameters work in concert to cause death. In addition to rapid temperature declines,low temperatures and duration of the low temperature period both play a role in the wintermortality.
The last parameter that appears to play a role in winter mortality is size of the individual fish(Heidinger, 1983; Mayhew, 1983). Most observers have noted that the smaller individuals diefirst in the earlier part of the winter and.the larger individuals die later in the season. This has'been doc'umnted byý Trauan (1981) w ho -re - nr gizzard shad inLake Erie ranged in size fromr 64 to'10 mm in length in Novemnbe but ranged from 100 to 230'm mmin length by annulus formation in the Spring. Caroots (1976) showed that Lake Erie gizzardshad&YOY.imeasured from 30 to 160 mm in October but from 95 to 165 mm by about the first of-April.' Wbile acclimation may play some role in these observations, it does not fully explain he :observatiorns., Furthermore, this is essentially a no growth period for these fish. -These datasuggest. that high mortality issiize selective and that YOY gizzard shad are especially vulnerable'to winter mortality.
All authors report that, after May 1, mortality rates in the gizzard shad populations return tonormal levels.
Information presented in this section has been observed over a long period of time and leads totwo questions. First, what causes such large numbers of gizzard shad, particularly YOY shad, todie during the cold weather period? Second, what percentage of gizzard shad coming into CWISare healthy during the winter months?
3 Synopsis of Physiological and Biochemical Studies on Gizzard ShadCollected During the Winter Season
White et al. (1986) conducted the seminal study that investigated many physiological andbiochemical pathways in YOY gizzard shad during the winter period to determine why and howthese fish die. They determined from literature that the YOY size range for Lake Erie gizzardshad was 40-160 mm SL which, using information presented in Carlander (1969), converts to arange of approximately 50-210 mm TL.
It is not the intent of this synopsis to summarize each pathway investigated; but rather, to presentinformation concerning those that are most critical to death of individual shad. These include:
3BDR/LMSAugust 2006
Analysis of Gizzard Shad Winter Die-Off and Its Relevance to 316(b)
* Use of Total Lipids as Energy Source* Effects of Starvation on Lipid Reserves, Serum Glucose, and Total Serum Protein* Cystolic Lactate Dehydrogenase* Serum and Brain Glucose* Cholesterol
3.1 Use of Total Lipids as Energy Source
Cold-blooded organisms survive winter in one of three ways. One is to cease feeding and becometotally inactive. A second is to remain active and feed opportunistically and the third is to ceasefeeding but remain somewhat active. In all three survival mechanisms, lipids are used as energysources with some catalysis of other tissues as emergency sources of energy when lipids aredepleted. These other tissues are quickly regenerated when ambient temperatures begin to rise inthe spring.
Gizzard shad is a species that appears to use the third survival strategy, i.e. it remains active untiltemperatures approach freezing but discontinues feeding when water temperatures reachapproximately 11 C (Bodola, 1966). White et al. (1986) reported that total lipid content ingizzard shad taken from Lake Erie during the October-November period ranged from 23 to 41% 1/of dry weight but that this percentage did'not: decrease over the winter and the total lipid content '
actuallyincreased slightly by March 1 which was contrary to the survival strategy.
A time series experiment. was then designed to sample gizzard shad bi-weekly throughout thefollowing winter season to identify thewater temperature at which lipid utilization ceases and theresults indicated that, when water temperatures are below 8° C, lipids are no longer utilized forenergy. The result is that gizzard shad, particularly YOY shad, begin to .starve in spite of.relatively high lipid reserves. Liver and muscle glycogens are quickly exhausted and this isfollowed by tissue catalysis to provide energy. Liver tissue is broken down first and isaccompanied by loss of liver functions including elimination of ammonia, breakdown ofbilirubin, and red blood cell lysis. By the end of winter, the liver is not recognizable and the totalphysiologic failure of individuals causes continuous mortality throughout the winter season. Thiscatalysis is not reversible following long periods of cold weather.
Small YOY shad were observed dying in November before water temperatures declined below 80C and assays of these fish revealed that they had no lipids stored. It was concluded that they werehatched late in the season and food was used entirely for growth with very little being convertedto lipids.
3.2 Effects of Starvation on Lipid Reserves, Serum Glucose, and TotalSerum Protein
White et al. (1986) designed a series of laboratory experiments to determine whether gizzard shadutilize lipids at water temperatures greater than 110 C when they are starved. Results of thesetests showed that that death occurred daily after about 22 days of starvation at room temperatures(20-220 C). Fish were randomly selected throughout the experiments and assayed. Data from onesuch experiment showed that serum glucose declined by 29.3%, total serum protein by 21.6%,and lipids by 37.9%, while serum ammonia remained essentially constant. In a separate
4HDR/LMSAugust 2006
Analysis of Gizzard Shad Winter Die-Off and Its Relevance to 316(b)
progressed. This baseline ranged from 35 to 40 mg/dl and concentrations measured during thewinter months continually rose and reached levels that were about 10 times those of the activefeeding periods. These high levels were indicative of some physiologic failure and the authorsinvestigated and dismissed several possible causes including adrenal collapse, which controlscatabolism of muscle tissue to serve as an energy substrate, and starvation. As theysystematically tested possible failures, it became evident that increased serum glucose levels wereindicative of cell membrane transport failures, i.e. substances were not being diffused either in orout of cells and glucose was building up as a result. Cell membranes had become rigid at lowerwater temperatures.
Of all the body tissues, those of the central nervous system, including the brain, are the mostdemanding for a steady supply of energy. Due to loss of permeability of the membranes, thesecells, particularly brain cells, are deprived of this energy supply. If this occurs rapidly, then thebrain loses its ability to function which is manifested in loss of locomotion function and quicklythereafter by loss of equilibrium. Individuals are observed to be swimming erratically and/or ontheir sides. This is often followed by a comatose condition.
Is this loss of locomotion and equilibrium attributed to a hyperglycemic or a hypoglycemiccondition? Unfortunately, both conditions manifest in similar observable behavior and theinvestigators found that both existed during different die-offs. Therefore, the condition isattributable to a difference in concentrations across the membranes rather than either too much or'too:little glucose in the brain. This suggests membrane failure orutheilSS ofmembrane fluidity..
Thermal .shock that may be experienced by shad swimming init and out of thermally enhanced:`areas would result in a hyperglycemic condition. Because the hypoglycemic condition was also,documented, the authors concluded that die-offs are not caused by thermal shock.,
Combining the observations of substantial increases in serum glu•ose with a hypoglycemiccondition in the brain indicates that shad attempt to compensate the loss of membrane fluidity ortransport by increasing concentrations outside the brain cells. This is the physiologic failure thatleads to erratic swimming and the comatose condition which is quickly followed by death.
3.5 Cholesterol
The basic premise of functionality of biological membranes is the ability to maintain a constantfluidity, irrespective of temperature. This fluidity is a function of the types of lipid molecules inthe membrane and can be tested by measuring the cholesterol content of the serum and cellmembranes, with higher, relatively constant levels being associated with individuals that areadapted and survive the winter. Conversely, individuals that exhibit low serum cholesterolconcentrations at any given time during the winter are at greatest risk of dying. This, coupledwith shad having the greatest degree of liver degeneration, provides the best predictor of risk ofdeath.
Shad assayed for serum cholesterol throughout the winter including prior to, during, andfollowing die off events indicated that those which died had lower serum cholesterolconcentrations than those that survived. Because serum cholesterol levels are not quicklymodified, it is possible to predict which subsets of the population are at risk by knowing theserum cholesterol concentrations.
6HDR/LMSAugust 2006
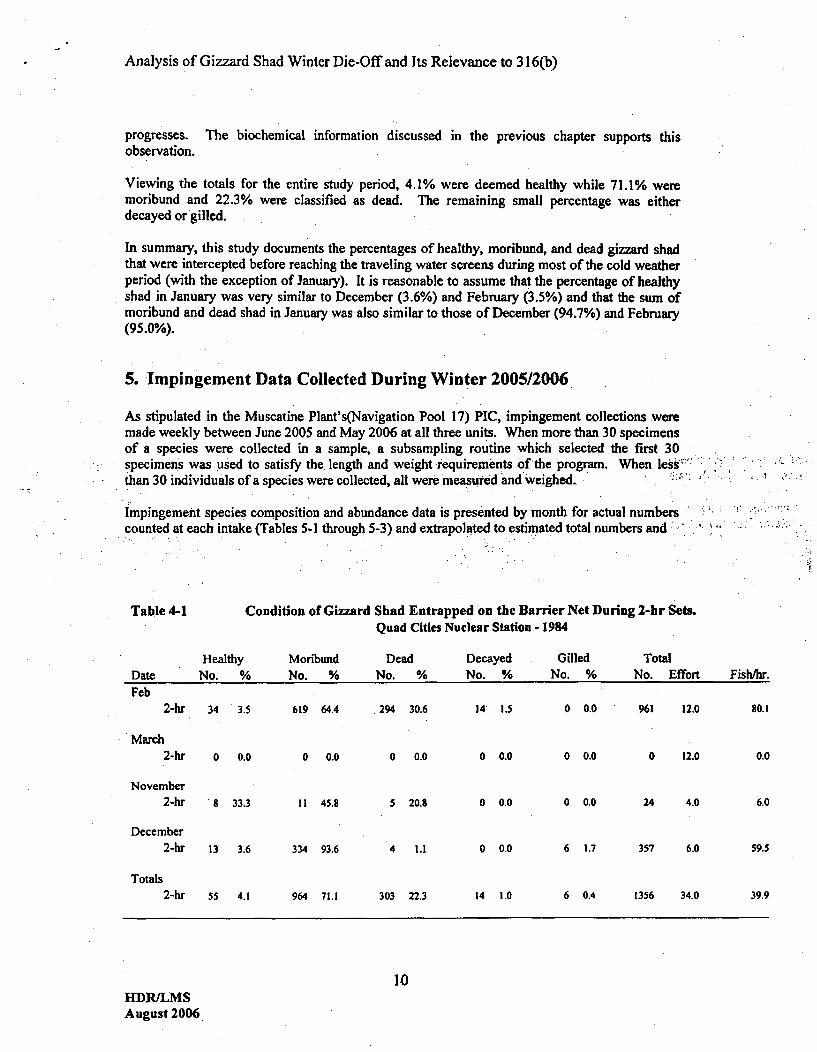
Analysis of Gizzard Shad Winter Die-Off and Its Relevance to 316(b)
progresses. The biochemical information discussed in the previous chapter supports thisobservation.
Viewing the totals for the entire study period, 4.1% were deemed healthy while 71.1% weremoribund and 22.3% were classified as dead. The remaining small percentage was eitherdecayed or gilled.
In summary, this study documents the percentages of healthy, moribund, and dead gizzard shadthat were intercepted before reaching the traveling water screens during most of the cold weatherperiod (with the exception of January). It is reasonable to assume that the percentage of healthyshad in January was very similar to December (3.6%) and February (3.5%) and that the sum ofmoribund and dead shad in January was also similar to those of December (94.7%) and February(95.0%).
5. Impingement Data Collected During Winter 2005/2006
As stipulated ,in the Muscatine Plant's(Navigation Pool 17) PIC, impingement collections weremade weekly between June 2005 and May 2006 at all three units. When more than 30 specimensof a species were collected in a sample, a subsampling routine which selected the first 30specimens was used to satisfy the length and weight requirements of the program. When lesk''."than 30 individuals of a species were collected, all were measured and weighed.
Impingement species composition and abundance data is presented by month for actual numbers.counted at each intake (Tables 5-1 through 5-3) and extrapolated to estimated total numbers and
Table 4-1 Condition of Gizzard Shad Entrapped on the Barrier Net During 2-hr Sets.Quad Cities Nuclear Station - 1984
Healthy MoribundNo. % No. %
DeadNo.
Decayed% No. %
Gilled TotalNo. % No. EffortDate Fish/hr.
Feb2-hr 34 3.5 619 64.4
March2-hr 0 o.0 0 0.0
Novei
Decen
Totals
mber2-hr 8 33.3 11 45.8
nber
2-hr 13 3.6 334 93.6
2-hr 55 4.1 964 71.1
294 30.6
0 0.0
5 20.8
4 1.1
303 22.3
14 1.5
o 0.o
0 0.0
0 0.0
14 1.0
0 0.0
0 0.0
0 0.0
6 1.7
6 0.4
0 12.0
24 4.0
961 12.0 80.1
0.0
6.0
357 6.0 59.5
1356 34.0 39.9
10MDR/LMS
August 2006
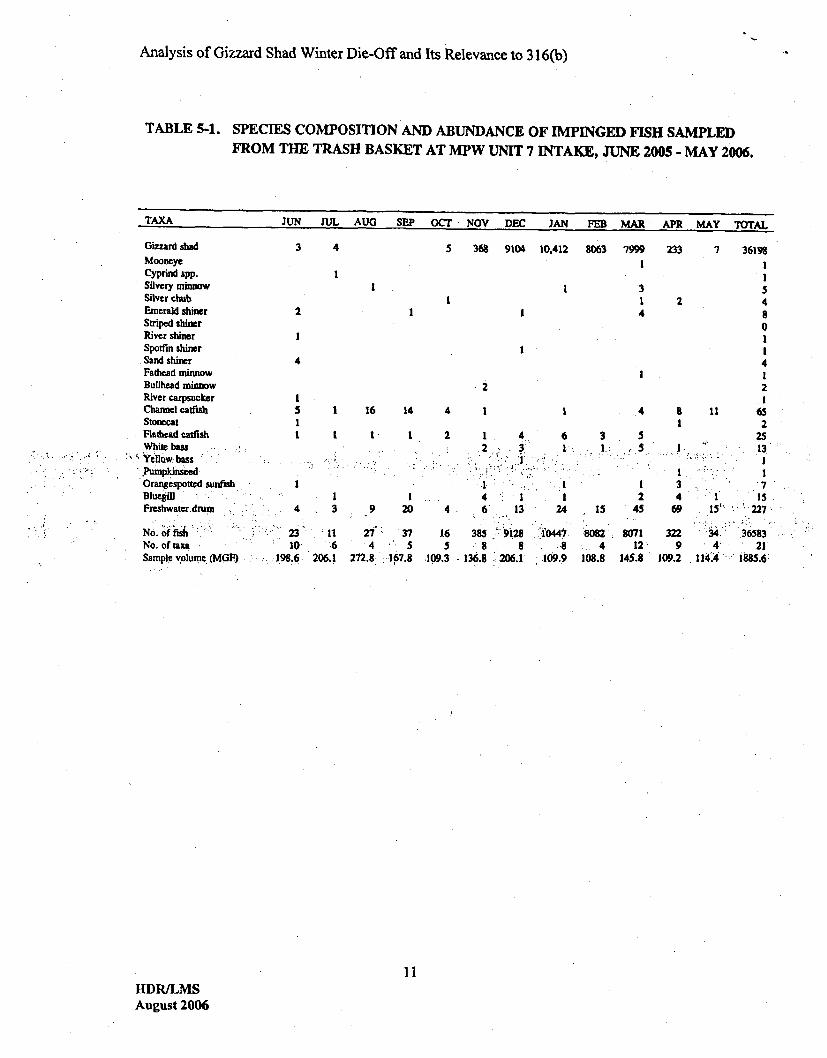
Analysis of Gizzard Shad Winter Die-Off and Its Relevance to 316(b)
TABLE 5-1. SPECIES COMPOSITION AND ABUNDANCE OF IMPINGED FISH SAMPLEDFROM THE TRASH BASKET AT MPW UNIT 7 INTAKE, JUNE 2005 - MAY 2006.
TAXA JUN JUL AUG SEP OCT NOV DEC JAN FEB MAR APR MAY TOTAL
Gizzard shadMooneyeCyprind spp.Silvery mimnwSihvr cihbEmerald shinerStriped shinerRiver shinerSpotfin shinerSand shinerFadicad minnowBullhead minnowRiver caxpsuckerChannel catfishStonecatFlathezad catfishWhite bassYellow bass..PumpkinseedOrangespotted sunfishBluegil •Freshwater.dnrm
N o. o f fi "i .
No. of axaaSampe volume (MGF)
3 4
1
5 368 9104 10,412 8063 7999 2331
I 1I
3I4
22
i
4
S
1t
I I
I
I2
7 36198
1i5
48011
41
2
11 632
25
.13
71 15
15 - 227
134-' 365834: 21
114ý.4 - i885.6!
1 16 14 4 1 I
I t 1 2 1 4.2 3
6I/
4 8
3 5I: .-S I
1 32 4
5 45 69
1 I4 3 9 20
23 11 271'- 3710 ;6 4 S'" 5
98.61 206.1 272.8. 167.8
.. . 4 1
4 6 13
16 385 :"i28
3 .8 28.109,3.- 136.8 206.1
I
24
,10441
10 9.9
*80824108.8
807112
145.8
3229
109.2
11HDR/LMSAugust 2006
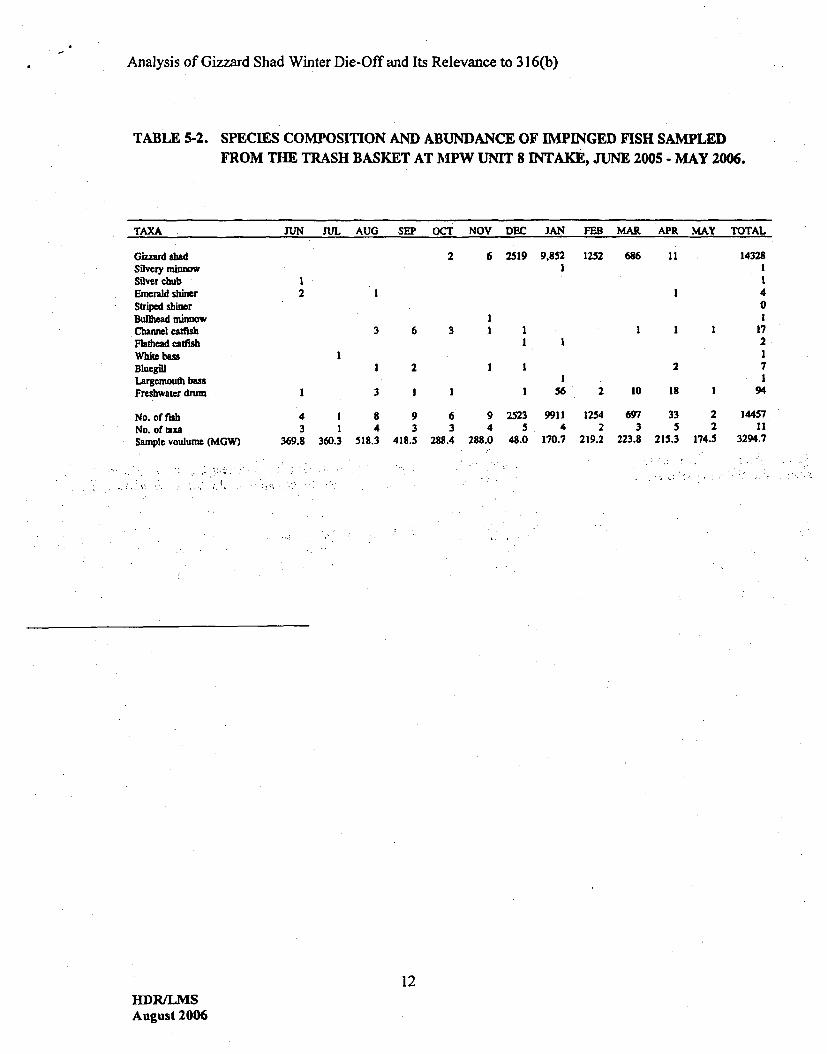
Analysis of Gizzard Shad Winter Die-Off and Its Relevance to 316(b)
TABLE 5-2. SPECIES COMPOSITION AND ABUNDANCE OF IMPINGED FISH SAMPLEDFROM THE TRASH BASKET AT MPW UNIT 8 INTAKE, JUNE 2005 - MAY 2006.
TAXA JUN JUL AUG SEP OCT NOV DEC JAN FEB MAR APR MAY TOTAL
Gizzard shadSilvery minnowSilver chubEmerald shinerStriped shinerBtullhead minnowChanne cwAf*shFlathcad catfishWhite bassBluegillLargemouth bassFreshwater drum
2 6 2519 9,852 1252 686 11
12
143281t
40
I I
13 6 3 1 1 1 1 17
211
I
I I1 2 2 7i
94I 3 1 1 1 56 2 10 18
No. of fishNo. of taxaSample voulume (MOW)
4 I 8 9 63 1 4 3 3
369.8 360.3 518.3 418.5 288.4
9 2523 9911 1254 697 33 2 144574 5 4 2 3 5 2 11
288.0 48.0 170.7 219.2 223.8 215.3 174.5 3294.7
12HIDR/LMSAugust 2006
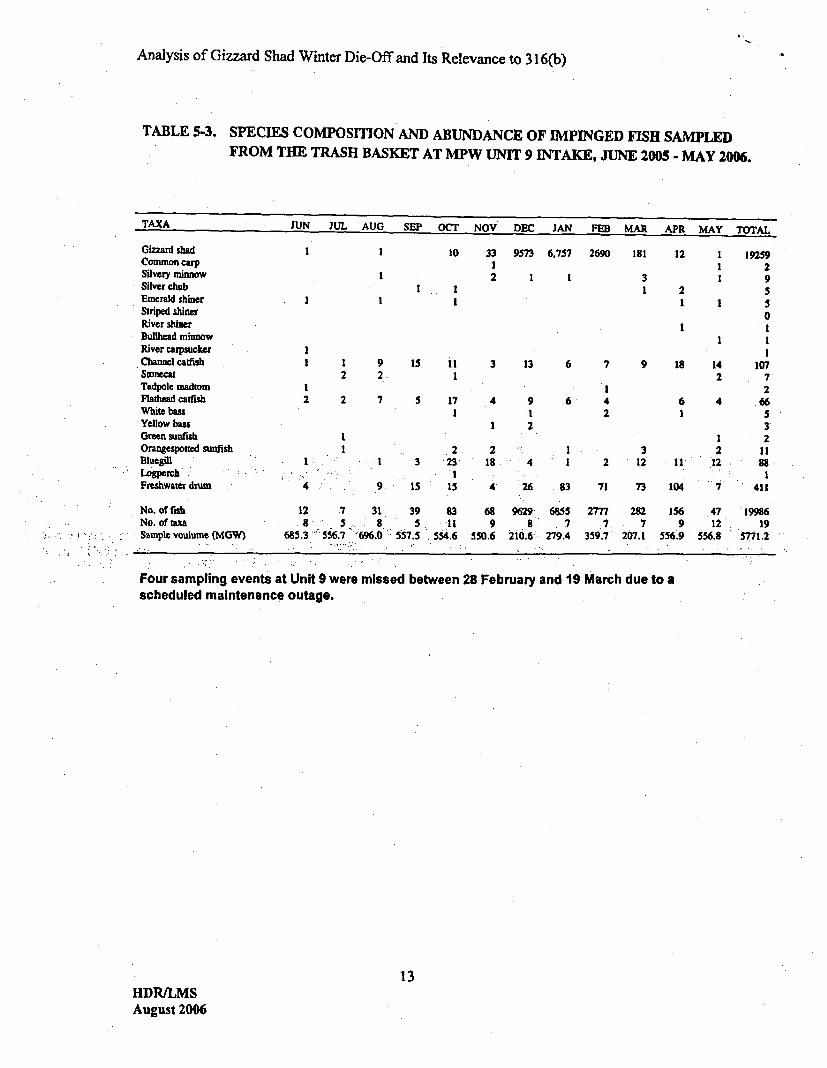
Analysis of Gizzard Shad Winter Die-Off and Its Relevance to 316(b)
TABLE 5-3. SPECIES COMPOSITION AND ABUNDANCE OF IMPINGED FISH SAMPLEDFROM THE TRASH BASKET AT MPW UNIT 9 INTAKE, JUNE 2005 - MAY 2006.
TAXA JU.N JUlL AUGA S1P IV'T hNr-¶ VN'e I:m A W
IZZO Ml F.D iVIJ J~iL% MAl T TOAL
Gizzard shadCommon carpSilvery minnowSilver chubEmerald shinerStriped shinerRiver shinerBullhead minnowRiver carpsuckerChannel catfishStonecatTadpole madtormFladtead caffishWhite bauYellow bassGreen sunfishOrangesponed sunfishBluegillLogperchFreshwater drum
No. of fishNo. of t•aSample voulume (MGW)
1
I
i
1
I
10 33 9573 6.757 2690 18112 1 .I 3
1
12 1 192591 21 9
2 5I 1 5
0
I 1
I1 1
1!
!2
1 9 15 112 2. 1
2 7 5 17.1
3 13 6 7 9 18 14 1072 7
1 24 9 6 4 6 4 .66
1 2 1 51 2 3
!1
1
4
1 22. 2 1 3 2 11
•1 3 '23' 18 4 1 *2 12 11 12 88
9 15 15 4 26 83 71 73 104 17 41
12 7 31 39 83 68 9629 6855 2777 282 156 47 199868 5 8 5 11 9 8. 7 7 7 9 12' 19
685.3 556.7 696.0. 557.5 554.6 550.6 210.6' 279.4 359.7 207.1 556.9 556.8 '5771.2
Four sampling events at Unit 9 were missed between 28 February and 19 March due to a
scheduled maintenance outage.
13HDR/LMSAugust 2006
Analysis of Gizzard Shad Winter Die-Off and Its Relevance to 316(b)
weights for the year based on intake flow (Tables 5-4 through 5-6). Lengths are presented as alength frequency table (5-7) that begins with June 2005 and extends through May 2006 andcombines all the fish measured at the three units. This is intended to aid the reader in followingthe 2005 year class through the winter season.
Inspection of Tables 5-1 through 5-3 shows the expected pattern of low gizzard shadimpingement from June through the October/November period followed by dramatic increases ofshad impingement during the December through March period. Based on information gatheredfrom the literature, discussion of the breakdown of biochemical pathways and enzymes, andresults of the winter study at the Quad Cities Nuclear Station on Pool 14 of the Mississippi River,it is reasonable to conclude that the preponderance of these shad were either dead or moribund atthe time they were impinged during these winter months. Tables 5-4 through 5-6 show that shadimpinged during the cold weather months comprised in excess of 95% of the total annualimpingement collection of all species by both numbers and weight at each intake.
Investigators have determined that most of the winter mortality occurs in YOY gizzard shad.White et al. (1986) defined YOY shad is those between 40 and 160 mm SL which converts toabout 52 to 210 mm TL. Table 5-7 presents length frequency data (TL) by size category. Themajority of the fish that were measured were within this YOY range and as the season progressedthe mean size of the fish increased. This is consistent with the observation that smallerindividuals have smaller livers and die earlier in the winter as a result of liver failure,.Conversely, larger individuals die later in the winter. because they have larger livers to provide.energy for a longer period of time'.
This information supports the observation that gizzard shad in Iowa are living in the northerlyportion of their geographical range and die off in great numbers when water temperatures declinefirst below 80 C.
White et al. (1986) concluded that winter mortality is high, natural (particularly YOY), and iscaused by the failure of the species to adapt to long-term cold stress in the northerly portions ofits geographical range. Impingement during this winter period is composed largely (>95%) ofshad that have died from long-term cold stress and other natural causes prior to being impinged.
14HDR/LMSAugust 2006
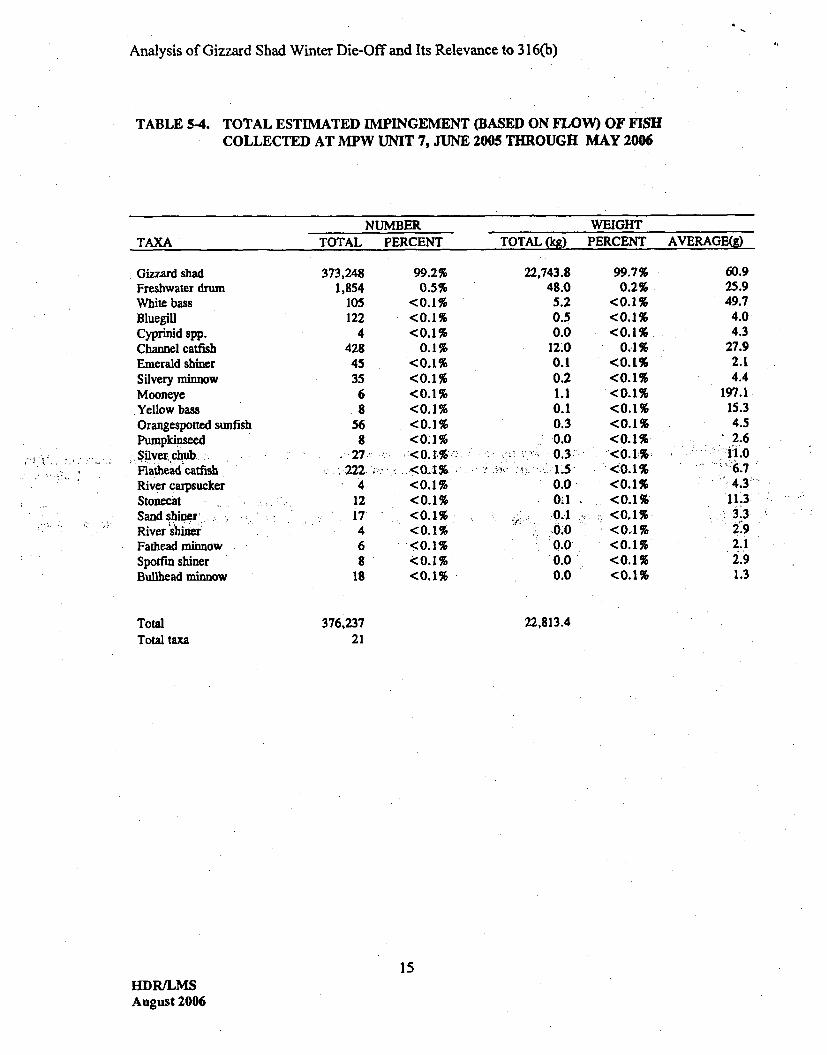
Analysis of Gizzard Shad Winter Die-Off and Its Relevance to 316(b)
TABLE 5-4. TOTAL ESTIMATED IMPINGEMENT (BASED ON FLOW) OF FISHCOLLECTED AT MPW UNIT 7, JUNE 2005 THROUGH MAY 2006
NUMBER WEIGHTTAXA TOTAL PERCENT TOTAL (kg) PERCENT AVERAGE(g)
Gizzard shadFreshwater drumWhite bassBluegillCyprinid spp.Channel catfishEmerald shinerSilvery minnowMooneyeYellow bassOrangespotted sunfishPumpkinseedSiver, chub
.- Flathead catfishRiver carpsuckerStonecatSand shinerRiver shinerFathead minnowSpotfin shinerBullhead minnow
TotalTotal taxa
373,248.1,854
105122
4428
453568
568
27222.
12i7468
18
99.2%0.5%
<0.1%<0.1%<0.1%
0.1%<0.1%<0.1%<0.1%<0.1%<0.1%<0.1%<0.1%<0.. 1%<0.1%<0.1%<0.1%<0.1%<0.1%<0.1%<0.1%
22,743.848.05.20.50.0
12.00.10.21.10.10.30.00.3
• . •,• : • .,_,1.5 :
0.0
• ' 0:01 ...
0.00.00.0
99.7%0.2%
<0.1%<0.1%<0.1%
0.1%<0.1%<0.1%<0.1%<0.1%<0.1%<0.1%<0.1.%<0.1%<0.1%<0.1%<0,1%<0.1%<0.1%<0.1%<0.1%
60.925.949.74.04.3
27.92.14.4
197.115.34.52.6
1i.06.74.3
11.3
2.9'2.1
2.91.3
376,23721
22,813.4
15HDR/LMSAugust 2006
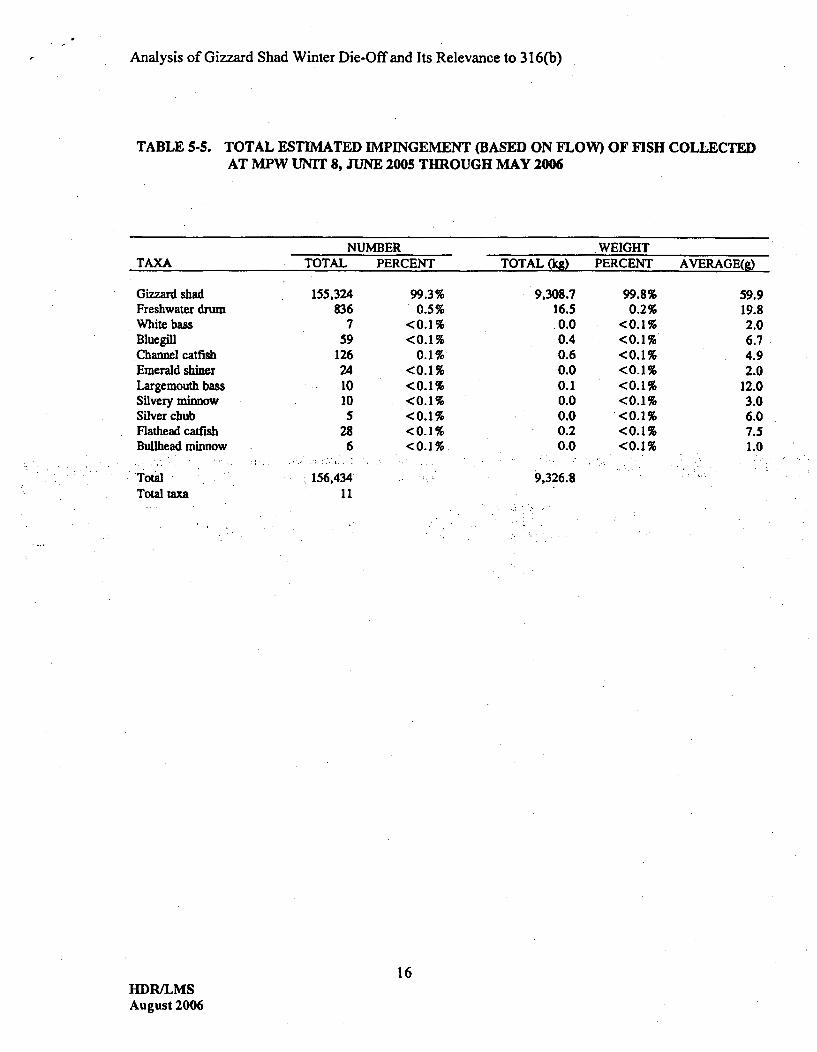
Analysis of Gizzard Shad Winter Die-Off and Its Relevance to 316(b)
TABLE 5-5. TOTAL ESTIMATED IMPINGEMENT (BASED ON FLOW) OF FISH COLLECTEDAT MPW UNIT 8, JUNE 2005 THROUGH MAY 2006
NUMBER WEIGHTTAXA TOTAL PERCENT TOTAL (kg) PERCENT AVERAGE(g)
Gizzard shadFreshwater drumWhite bassBluegill.Channel catfishEmerald shinerLargemouth bassSilvery minnowSilver chubFlathead catfishBullhead minnow
TotalTotal taxa
155,324836
759
1262410105
286
156,43411
99.3%0.5%
<0.1%<0.1%
0.1%<0.1%<0.1%<0.1%<0.1%<0.1%<0.1%
9,308.716.5.0.00.40.60.00.10.00.00.20.0
9,326.8
99.8%0.2%
<0.1%<0.1%<0.1%<0.1%<0.1%<0.1%<0.1%<0.1%<0.1%
59.919.82.06.74.92.0
12.03.06.07.51.0
16HDR/LMSAugust 2006
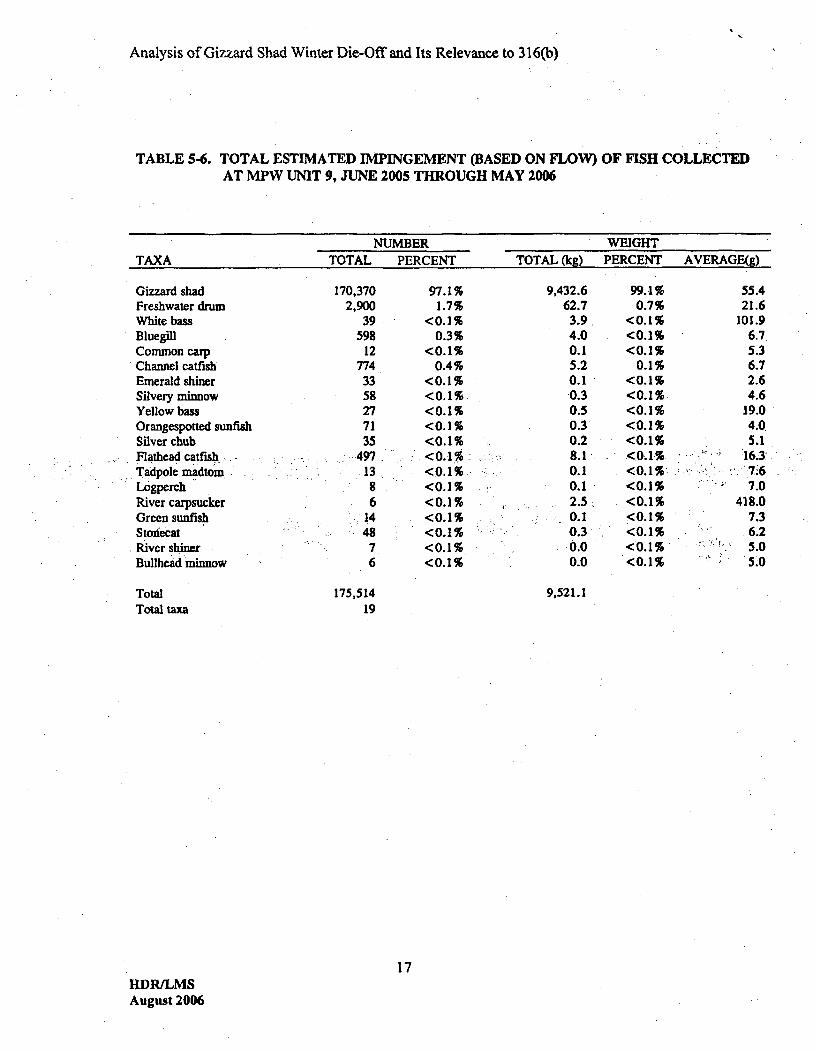
Analysis of Gizzard Shad Winter Die-Off and Its Relevance to 316(b)
TABLE 5-6. TOTAL ESTIMATED IMPINGEMENT (BASED ON FLOW) OF FISH COLLECTEDAT MPW UNIT 9, JUNE 2005 THROUGH MAY 2006
NUMBER WEIGHTTAXA TOTAL PERCENT TOTAL (kg) PERCENT AVERAGE(g)
Gizzard shadFreshwater drumWhite bassBluegillCommon carpChannel catfishEmerald shinerSilvery minnowYellow bassOrangespotted sunfishSilver chubFlathead catfish.. .Tadpole madtom.LogperchRiver carpsuckerGreen sunfishStonecatRiver shinerBullhead minnow
TotalTotal taxa
170,3702,900
39598
12774
3358277135
.497
138
6144876
175,51419
97.1%1.7%
<0.1%0.3%
<0.1%0.4%
<0.1%<0.1%<0.1%<0.1%<0.1%<0.1%<0.1%<0.1%
<0.1%<0.1%<0.1%<0.1%<0.1%
9,432.662.73.94.00.15.20.10.30.50.30.28.10.10.12.50.10.30.0
~0.0
99.1%0.7%
<0.1%<0.1%<0.1%
0.1%<0.1%<0.1%<0.1%<0.1%<0.1%<0.1%<0.1%:<0.1%<0.1%<0.1%<0.1%<0.1%<0.1%
55.421.6
101.96.75.36.72.64.6
19.04.0.5.1
16.37.67.0
418.07.3
... 6.2
5.05.0
9,521.1
17HDR/LMSAugust 2006
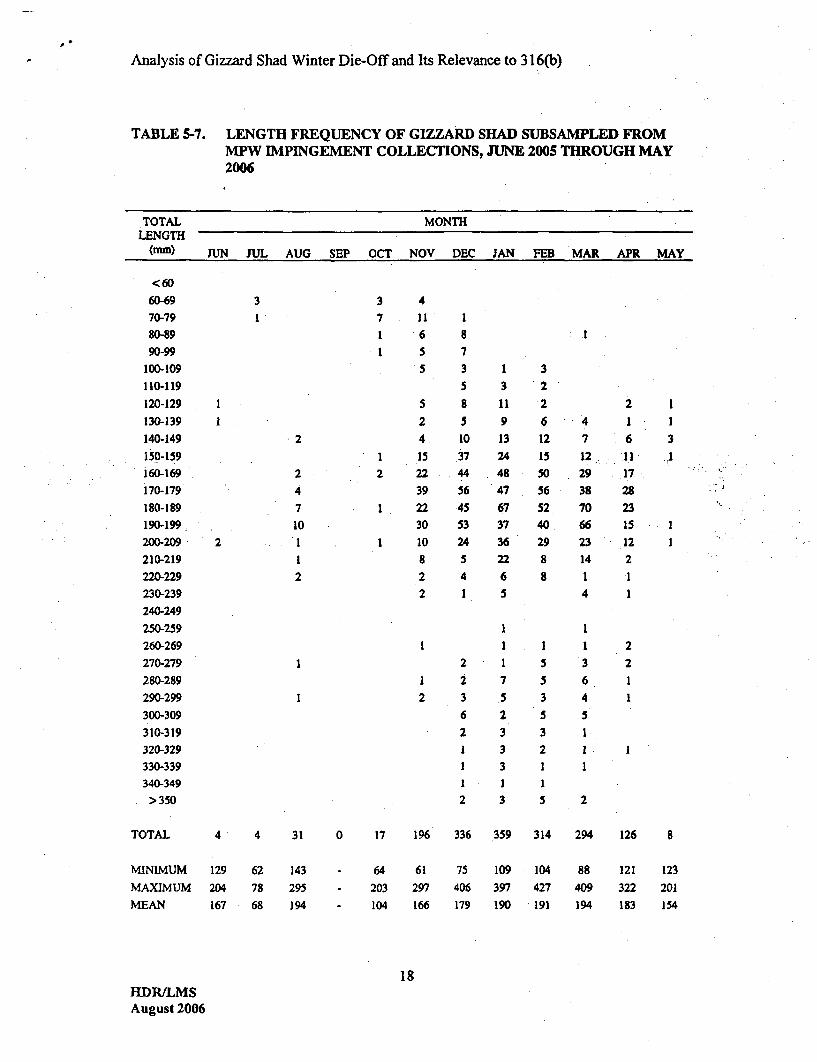
Analysis of Gizzard Shad Winter Die-Off and Its Relevance to 316(b)
TABLE 5-7. LENGTH FREQUENCY OF GIZZARD SHAD SUBSAMPLED FROMMPW IMPINGEMENT COLLECTIONS, JUNE 2005 THROUGH MAY2006
TOTAL MONTHLENGTH
(mm) JUN JUL AUG SEP OCT NOV DEC JAN FEB MAR APR MAY
<6060-69 3 3 4
70-79 1 7 11 180-89 . 6 890-99 5 5 7
100-109 "5 3 1 3.110-119 5 3 2
120-129 1 5 8 11 2 2 1
130-139 1 2 5 9 6 4 1 1
140-149 2 4. 10 13 12 7 6 3150-159 1 15 37 24 15 12.._ 11 .1160-169 2 2 22 44 48 50 29 _17.,170-179 4 39 56 47 56 38 28180-189 7 1 22 45 67 52 70 23
190-199. 10 30 53 37 40 66 15 1200-209 2 1 10 24 36 29 23 12 1
210-219 1 8 5 22 8 14 2220-229 2 2 "4 6 8 1 1
230-239 2 1 5 4 1
240-249
250-259 1 1260-269 1 1 1 1 2
270-279 1 2 1 5 3 2
280-289 1 2 7 5 6 1
290-299 1 2 3 .5 3 4 1
300-309 6 2 5 5
310-319 2 3 3 1320-329 1 3 2 1 1330-339 1 .3 1 1340-349 1 1 1> 350 2 3 5 2
TOTAL 4 4 31 0 17 196 336 359 314 294 126 8
MINIMUM 129 62 143 64 61 75 109 104 88 121 123
MAXIMUM 204 78 295 - 203 297 406 397 427 409 322 201MEAN 167 68 194 - 104 166 179 190 191 194 183 154
18HDR/LMSAugust 2006
Analysis of Gizzard Shad Winter Die-Off and Its Relevance to 316(b)
6. Relevance to 316b Phase II
The impingement performance standard set forth in the Phase H Rule states that impingementmortality must be reduced or offset by a minimum of 80% of the calculation baseline. A numberof operational and technological measures are available to accomplish this reduction, along withpossible restoration measures should they survive the court challenge.
One technological measure is a class of technologies that return fish alive to the source waterbody. Returning fish that were dead or moribund before being impinged returns energy to thewaterway system but has no bearing on reducing impingement mortality as stipulated in the Rule,i.e. the intended benefit is not available at the beginning of the process; and, therefore, can not beaccomplished.
Similarly, implementing operational measures to reduce impingement based on these numbers ofdead/dying fish also will not accomplish the intended goal of the Rule to reduce impingementmortality.
Designing restoration programs to offset losses of fish that are dead or moribund would place anundue financial burden on the applicant by necessarily over-designing the restoration program toaccount for dead and dying fish that were merely removed from the waterway much the same as avacuum cleaner does -its job. Besides, restoration should offset mortality losses that result from:impingement.
The question then becomes how to best approach integrating this information into eitherdetermining .thei'calculation baseline or satisfying the performance standard, the :objective ofwhich is to reduce impingement mortality. .
7. Recommendations
There may be different approaches to answering the question; but the most direct and simplest isto eliminate dead and moribund gizzard shad collected during the winter months from thecalculation baseline. Recognizing that not all gizzard shad die during the winter, it isrecommended that 4% of the numbers impinged during the November through March period beconsidered alive and healthy (the average for this period in the Quad Cities Station study); andtherefore, included in the calculation baseline for a.generating facility.
Although a late season hatch may die off during late October, it is recommended that all shadimpinged from April through October be included in the calculation baseline.
This approach includes those portions of the gizzard shad population which are truly at risk toimpingement mortality without inflating the calculation baseline with irrelevant dead or moribundshad whose mortality is attributed to natural causes induced by long-term cold stress.
The State of Illinois which shares a common border with Iowa along the Mississippi River istaking this approach.
19HDR/LMSAugust 2006
0Analysis of Gizzard Shad Winter Die-Off and Its Relevance to 316(b)
8. References Cited
Assel, Raymond A. 1980. Maximum freezing degree-days as a winter severity index for the
Great Lakes, 1897-1977. Monthly Weather Review, 108:1440.
Becker, G.C. 1983. Fishes, of Wisconsin. Univ. of Wisc. Press. Madison, Wisc. Pp. 273-277.
Bodola, A. 1955. Life history of the gizzard shad, Dorosoma cepedianum (LaSeuer) in WesternLake Erie. PhD Dissertation, Ohio State University. Columbus, Ohio.
Bodola, A. 1966. Life history of the gizzard shad, Dorosoma cepedianurn (LaSeuer) in WesternLake Erie. US Fish Wildl. Serv. Bull. 65(2):391.
Carlander, K.D. 1969. Handbook of freshwater fishery biology. Vol. 1. The Iowa StateUniversity Press. Ames, Iowa. pp. 82-89.
Caroots, M.S. 1976. A study of the Eastern Gizzard Shad, Dorosoma cepedianum, from LakeErie. MS Thesis, John Carroll University. University Heights, Ohio.
Eddy, S. and J. Underhill. 1974. Northern Fishes. University of Minnesota Press. Minneapolis,MN. P. 147.
Heidinger, Roy C. 1983. Life history of the gizzard shad and threadfin shad as it relates to theecology of small lakes fisheries. Proc. Of Small Lakes Management Workshop - Pros andCons of Shad. Iowa Conservation Commission and Sport Fishery Institue, Des Moines, Iowa.198 pp.
Kirtland, J.P. 1844. Descriptions of fishes of Lake Erie, the Ohio River and its tributaries.Article 7. Boston Journal of Natural History, No. 4. p. 23 1.
Lawler, Matusky & Skelly Engineers. 1985. Quad Cities Aquatic Program, 1984 Annual Report.Submitted to Commonwealth Edison Company, Chicago, IL.
Mayhew, J. 1983. Proc. Of Small Lakes Management Workshop - Pros and Cons of Shad. IowaConservation Commission and Sport Fishery Institue, Des Moines, Iowa. 198 pp.
Miller, R.R. 1960. Systematics and biology of the gizzard shad, (Dorosoma cepedianum), andrelated fishes. Fishery Bull., US Fish Wildi Serv. 60:371.
Neumann, David A., W.J. Wachter, E.L. Melisky and D.G. Bardarik. 1977. Filed and laboratoryassessment of factors affecting the occurrence and distribution of gizzard shad (Dorosomacepedianum) at Front Street Steam Electric Generating Station, Erie, Pennsylvania.Pennsylvania Electric Company.
Scott, W.B. and E.J. Crossman. 1973. Freshwater Fishes of Canada. Fish Res. Bd. Canada,Ottawa. Bulletin No. 184. pp. 133-137.
20HDRfLMSAugust 2006
Analysis of Gizzard Shad Winter Die-Off and Its Relevance to 316(b)
Trautman, M.B. 1956. The Fishes of Ohio. Ohio State University Press. Columbus, Ohio.p. 182.
1981. The Fishes of Ohio. Ohio State University Press. Columbus, Ohio. p.201-204.
Walburg, C. 1964. Fish population studies,Lewis and Clark Lake, Missouri River, 1956-1962.Spec. Sci. Rpt., US Fish WildI. Serv. No. 482: 1-27.
Wehr, Larry W. 1976. Osmotic variation of serum of gizzard shad, Dorosoma cepedianum, inrelation to seasonal temperature changes. PhD Dissertation, Southern Illinois University.Carbondale, IL.
White, A.M., M.B. Trautman, EJ. Foell, M.P. Kelty and R. Gaby. 1975. Water Quality BaselineAssessment for the Cleveland Area - Lake Erie. Vol. IH. The fishes of the Clevelandmetropolitan area including the Lake Erie shoreline. USEPA Report: EPA-905n5-001.
White, A.M., F.D. Moore, N.A. Alldridge and D.M. Loucks. 1986. The Effects of NaturalWinter Stresses on the Mortality of the Eastern Gizzard Shad, Dorosoma cepedianum, in LakeErie. Submitted to The Cleveland Electric Illuminating Company, Cleveland, Ohio and TheOhio Edison Company, Akron, Ohio. 209 pp.
21HDR/LMSAugust 2006

APPENDIX E
Correspondence and Telephone Call Records ConcerningCoffey County Lake and Fisheries
W1 LF CREEKNUCLEAR OPERATING CORPORATION
Kevin J. MolesManager Regulatory Affairs
JAN 1720RA 07-0004
Kansas Department of Health and EnvironmentBureau of Water - Industrial Programs.1000 SW Jackson St., Suite 420Topeka, Kansas 66612-1367
Attention: Mr. Eric Staab
Reference: Letter from E. C. Staab (KDHE) dated 11/22/06 to J. E. Werner(KCPL) confirming makeup to La Cygne Lake from the. Maraisdes Cygnes River constitutes a water transfer..
Subject: Request for a letter from KDHE confirming makeup from the
...... : . Neosho River to Coffey County Lake is a water transfer.
Dear Mr. Staab:
Based on a conversation with Ralph Logsdon on January 9, 2007, Wolf Creek. Nuclear.Operating .C0poration (WCNOC) requests a letter confirming Kansas. Department of Health-t.and Environment's (KDHE)positionon water. transfers.
The Wolf Creek Generating Station (WCGS) Makeup Water Screenhouse (MUSH). on theNeosho River is used on occasion to add water to Coffey County Lake (CCL). Although CoffeyCounty Lake was constructed as a cooling lake for the WCGS it is considered a Water of theState. The pumping of water from the Neosho River to CCL is a transfer from a Water: of the.State to another Water of the State. Therefore, this -is actually a water transfer -and not-considered a direct use of water by WCGS. .
WCNOC understands that water. transfers are not governed by. NPDES .permitting, andtherefore exempt from the requirements of 316(b). WCNOC is requesting written confirmation -of this position similar to that sent to Kansas City Power and Light in the reference. If you haveany questions regarding this request, please contact Mr. Ralph Logsdon at. (620):364-8831.,extension 4730.
Sincerely,
Kevin J. Moles
KJM/rll
cc: Don Carlson/KDHE-BOW
P.O. Box 411 / Burlington, KS 66839 / Phone: (620) 364-8831An Equal Opportunity Employer M/F/HC/VET
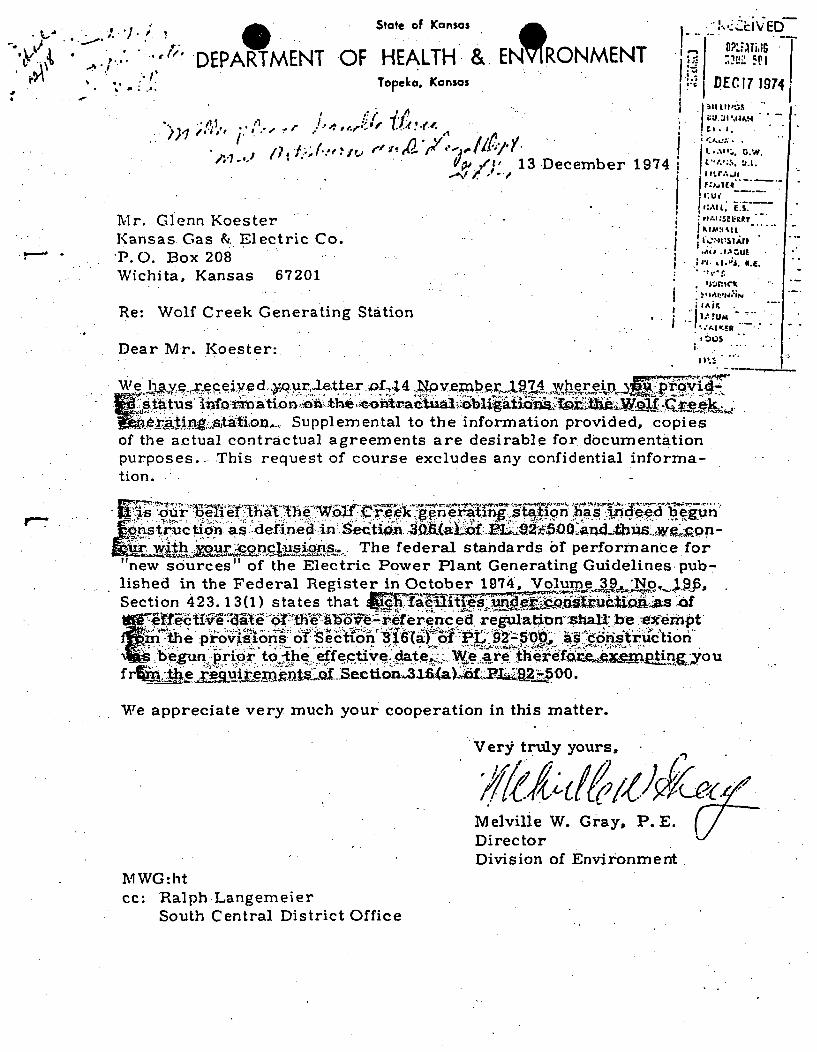
:. ~- 'State of Kansas lV .CIED.. ; ' DEPARTMENT OF HEALTH& E IRONMENT , V:'.,i IG.To ka. Kansas I,
• .-. ' - " I - -l " 1 "II/ ;Ki" ., D E .. -• It I . I"
4/;13 December 1974
_-V,& /.1 -10
Mr. Glenn Koester :"'L -
Kansas Gas & Electric Co. "P. 0. Box 208 -.. .. ".E. "Wichita, Kansas 67201
Re: Wolf Creek Generating'Station i i.
Dear Mr. Koester:
We lye.ece[veed,.yx.urlNetter.•f,4.pvexber. -..74 wherein 1• o4-.status inorain-~te~n~ad~i _W~t .1iW1
•.er.in.g+..stion.- Supplemental to the information provided, copiesof the actual contractual agreements are desirable for documentationpurposes... This request of course- excludes any confidential informa-tion..
* l~j•:s o~ur :•ef+ enar..the ~Wo ire --generating,. .s.t n as .•ns t:u ctiogn as .defi~nefi in .Sec~tio . Xat .3PLO•i.••:2•-O ) an& 4 wls.,,epn a-
hn The federal standards bf performance for"new sources" of the Electric Power Plant Generating Guidelines, pub-lished in the Federal Register in October 1974, Volume 3+9.+'No. 196,Section 423.13(1) states that ; Wfil•piji ox f
~t~Ct~d Thb~b~ -ef r-c ed regWlatinn' zhall. bre -e~r pt"
r:the provx.s.ions o ection 316 (a " -9 , .as .oiitrtuc tionegun.-prir to A ecve e.. .. W.e. are ere.. hrt0A i&o7.u
We appreciate very much your cooperation in this matter.
Very truly yours,
Melville W. Gray, P. E.DirectorDivision of Environment
TO WG: htcc: Ralph.Langemeier
South Central District Office
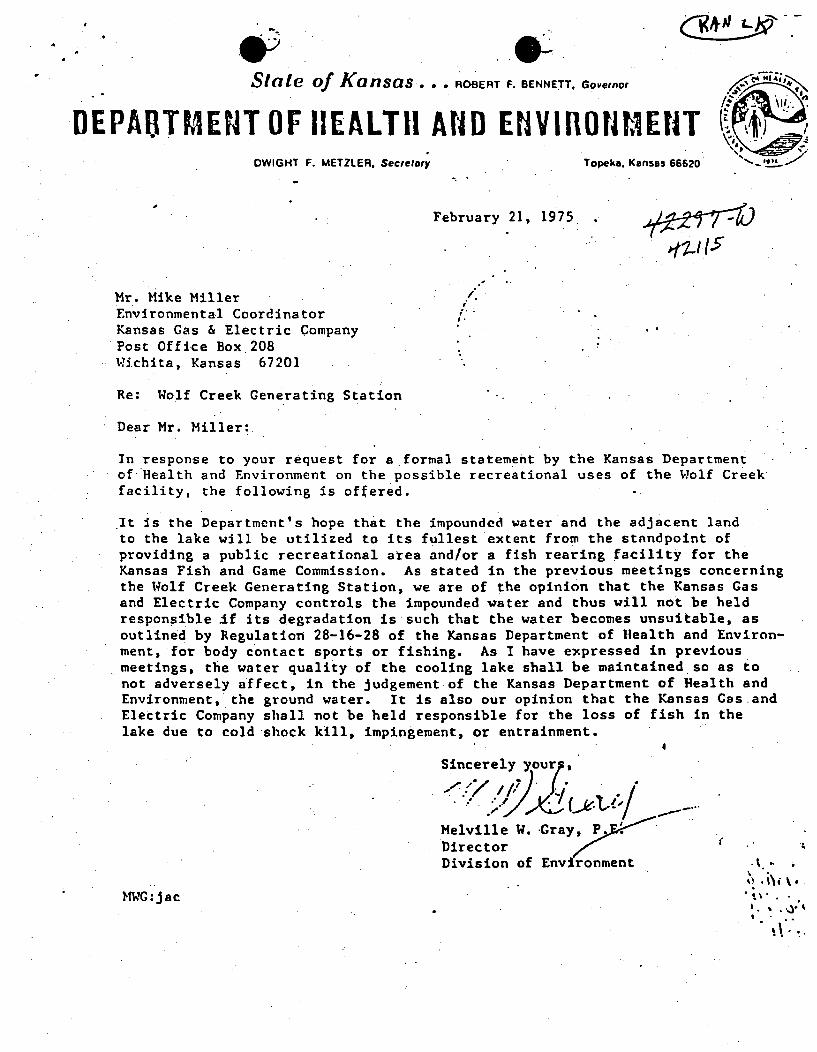
Slate of Kansas... ROBERT F. SENNETT. Governor
DEPAITMENT OF HEALTH ArD ENVIRIONfMEIITDWIGHT F. METZLER. Secretary Topeka. Kansas 66620 ' -""
• February 21, 1975.
Mr. Mike Miller /Environmental Coordinator ,.Kansas Gas & Electric CompanyPost Office Box. 208Wichita, Kansas 67201
Re: Wolf Creek Generating Station
Dear Mr. Miller:
In •response to your request for a formal statement by the Kansas Departmentof *Health and Environment on the possible recreational uses of the Wolf Creek,facility, the following is offered.
It is the Department's hope that the impounded water and the adjacent landto the lake will be utilized to its fullest extent from the standpoint ofproviding a public recreational area and/or a fish rearing facility for theKansas Fish and Game Commission. As stated in the previous meetings concerningthe Wolf Creek Generating Station, we are of the opinion that the Kansas Gasand Electric Company controls the impounded water and thus will not be heldresponsible If its degradation is such that the water becomes unsuitable, asoutlined by Regulation 28-16-28 of the Kansas Department of Health and Environ-ment, for body contact sports or fishing. As I have expressed in previousmeetings, the water quality of the cooling lake shall be maintained so as tonot adversely affect, in the judgement of the Kansas Department of Health andEnvironment, the ground water. It is also our opinion that the Kansas Gas andElectric Company shall not be held responsible for the loss of fish in thelake due to cold shock kill, impingement, or entrainment.
4
Sincerely your,: " "
Melville W. -Gray, P.DirectorDivision of Environment
, '; .ij.MWG:jac ';." • •
'- I.'o.
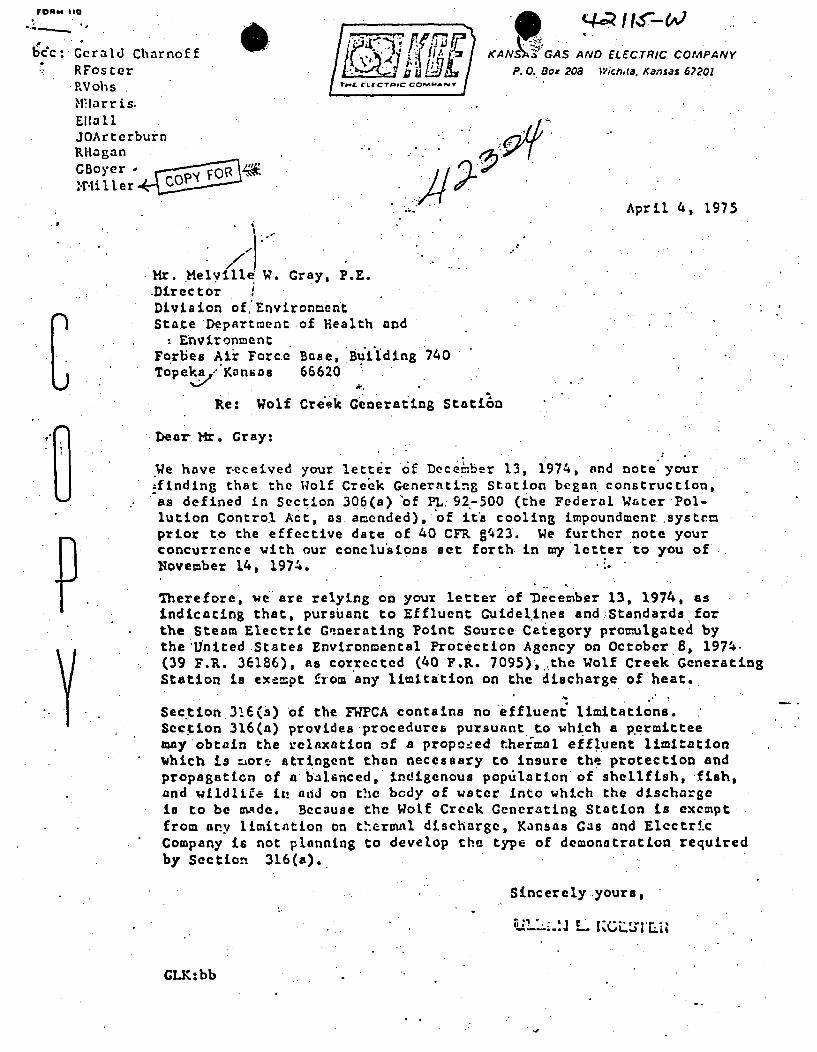
rUUM iUS
bc- Gerald Charnoff I KANS GAS AND ELECTRIC COMPANY
* RFosrer P.o. Box 208 Witcha. Kansas 62201
P.V ohs LY
'.larr is.Ella 11JOArterburn .Rl-lagan
GBoy.erv O
April 4, 1975
M r. .Mel.'4E W . Cray , P.E. "'
.Director,.Division of. EnvironmentState Department of Health and
Environment6 Forbes Air Forc.e" Base, Building 740Topek•.a Kansas 66620
Re: Wolf Cre'k Generating Station
Dear Hr. Gray:
We have r-eceived your letter of Decem.ber 13, 1974, and note your--finding that the Wolf Creek Generating Station began. construction,.8as defined in Section 306(a) of PL. 92.-500 (the Federal Water Pol-lution Control Act, as amended), of its cooling impoundment systemprior t~o the effective date of 40 CFR 1423. We further note yourconcurrence with our conclu'sions set forth in my letter to you ofNovember 14, 1974.
Therefore, we"are relying onyour letter *of *ecember 13, 1974, asindicating that, pursuant to Effluent Guidelines and Standards for
the Steam Electric Generating Point Source Category promulgated bythe'United States Environmental Protection Agency on OctoberS, 1974-(39 F.R. 36186), as corrected (40 F.R. 7095),..the Wolf Creek GeneratingStation is exe-.pt from any limitation on the discharge of heat.
Sec*tion 316(s) of the FWPCA contains no effluent limitations.Section 316(a) provides procedures pursuant to which a p.ermitteemay'obtain the relaxation of a propozed therfmal effluent limitation*which is :aore stringent than necessary to insure the protection and
propagation Iof abba].anced, indigenous poptilation of shellfish, fish,and wildlife in and on the body of water into which the discharge
in to be made. Because the Wolf Creek Generating Station is exempt...
from any limitation on thermal discharge, Kansas Gas and Electric
Company is not planning to develop the type of demonltratyon requiredby Section 316(a).
~Sincerely yours,
11-.'. L. NGLM~i-L
CLK:bb
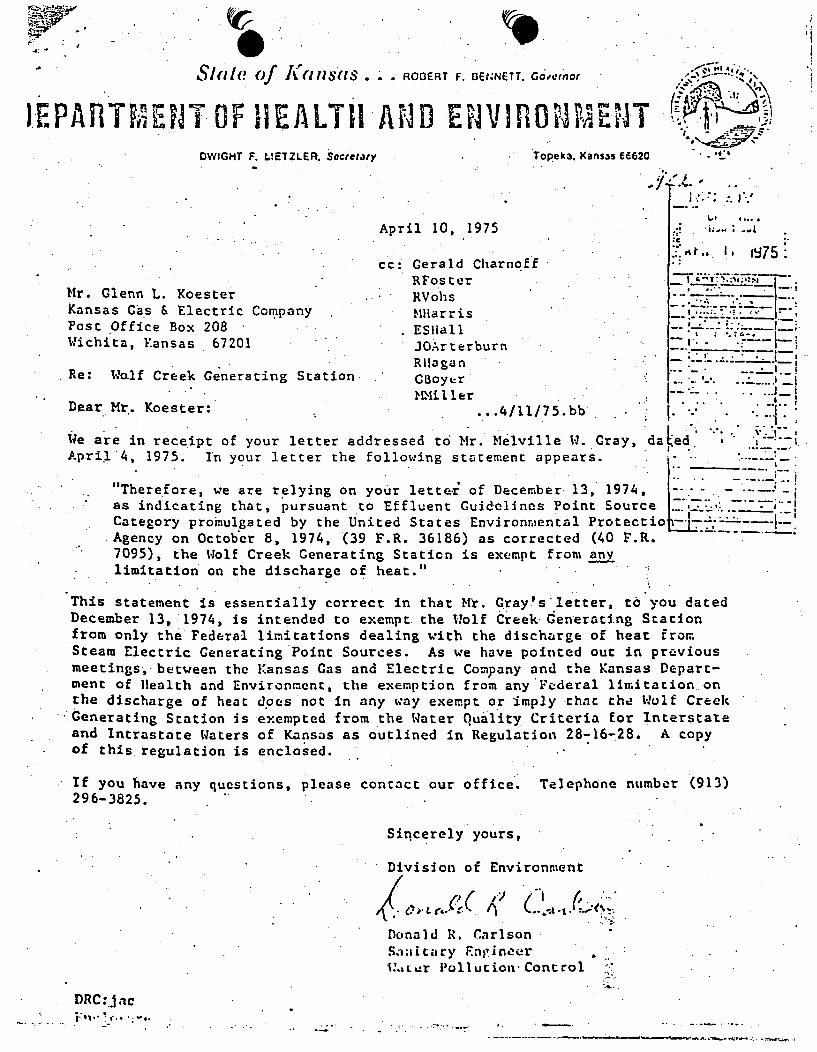
-Slate of Kanlsa .. .1 ROBERT F. BEN~NETT. Governor
)EPAlTM H~T. OF HEALTH A H D U ~V I RONhE "NTDWIGHT F. L#ETZLER. Secretary Topeka. Kansas 66620
(A1~1!175
April 10, 1975
cc: Gerald CharnoffRFoster '
Mr. Glenn L. Koester RVohsKansas Gas & Electric Company ilarris
Post Office Box 208 . ESl1all .-. _:
Wichita, Kansas 6720.1 JOArterburn j -..
RilaganRe: Wolf Creek Generating Station GUoytr : ....-...- _ i_'--.--.. .til 11eDear Mr.. Koester: .... 4/i1/75.bb . . -.
We are in receipt of your letter addressed to Mr. Melville W. Gray, da -ed ,April 4, 1975. In your letter the following statement appears.
"Therefore, we are relying on your lette-r of December 13, 1974, - -.as indicating that, pursuant to Effluent Guidelines Point Source ,_ -----Category promulgated by the United States Environmental Protectio -*.---------
Agency on Octob'er 8, 1974, (39 F.R. 36186) as corrected (40 F.R.7095), the Wolf Creek Generating Station is exempt from anylimitation on the discharge of heat.".
This statement is essentially correct in that Mr. Gray's'letter, tb you datedDecember 13, 1974, is intended to exempt. the Wolf Creek Generating Stationfrom only the Federal limitations dealing with the discharge of heat fromSteam Electric Generating Point Sources. As we have pointed out in previousmeetings, between the Kansas Gas and Electric Company and the Kansas Depart-ment of Health and Environment, the exemption from any Federal limitation-onthe discharge of heat does not in any way exempt or imply that the Wolf Creek
• Generating Station is exempted from the Water Quality Criteria for Interstateand Intrastate Waters of Kansas as outlined in Regulation 28-16-28. A copyof this regulation is enclosed.
If you have any questions, please contact our office. Telephone number (913)296-3825.
Sincerely yours,
Division of Environment
' .]
Donald R. CarlsonSaaitary EngineerI.,r..±r 'ollution. Control ".
DRC:.jacF1~*t.
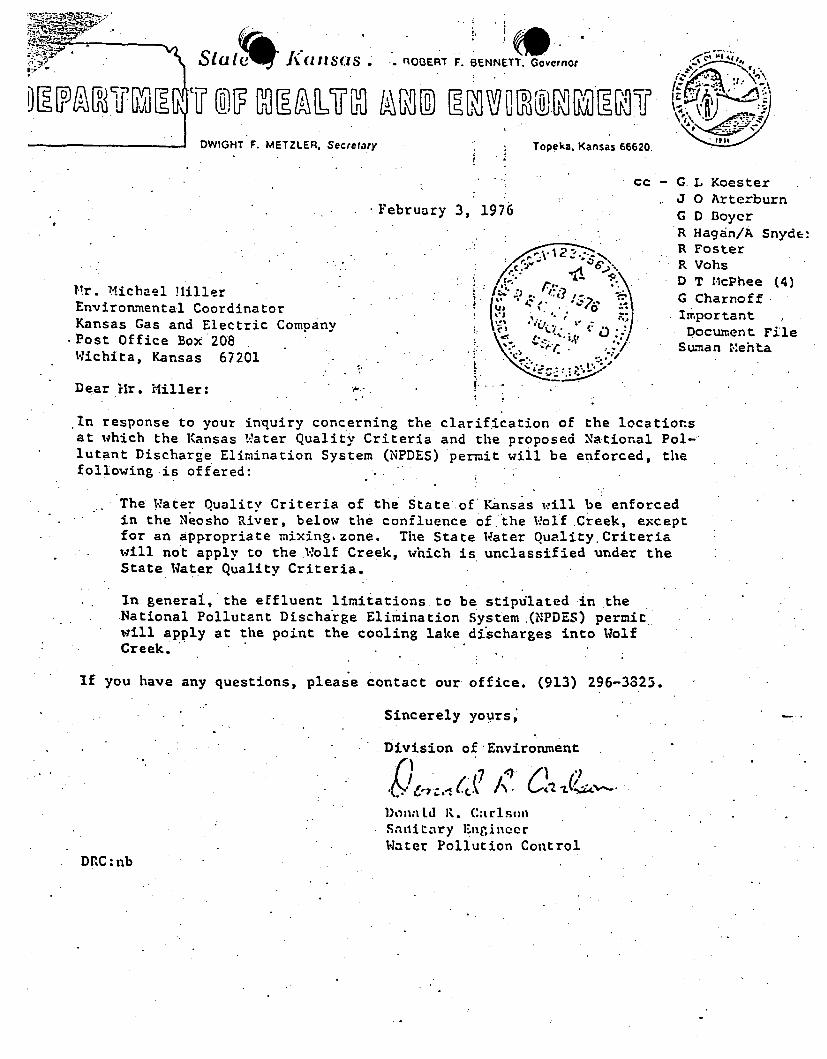
'~~C 41Z4.
L•a' LS l Kansais. . noj3ERT F. BENNETT, Governor
DWIGHT F. METZLER. Secretary Topeka. Kansas 66620.
cC - G L KoesterJ 0 Arterburn
F.ebruary 3, 1976 G D Boycr
R Hagan/A Snyde:R Foster
.. R VohsD T McPhee (4)
Mr. Michael Miller G.ChanoffEnviro rn.mental Coor di a o u . • • -- G Charnoff •
...Cdinator ".' ImportantKansas Gas and Electric Company /.DounC) .t File
-Post Office Box 208 / Document File
W ichita , Kansas 67201 • m". . ,.e.'
Dear Hr. Miller: '..
In response to your inquiry concerning the clarifcation of the locationsat which the Kansas .ater Quality Criteria and the proposed National Pol-lutant Discharge Elimination System (NPDES) permit will be enforced, thefollowing is offered:
The Water Quality Criteria of the State of Kansas will be enforcedin the Neosho River, below the confluence of the W.olf Creek, exceptfor an appropriate mixing-.zone. The State Water Quality.Criteriawill not apply to the Wolf Creek, which is unclassified under theState Water Quality Criteria.
In general, the effluent limitations to be stipxilated in theNational Pollutant Discha'rge Elimination System .(NPDES) permit
will apply at the point the cooling lake di'scharges into WolfCreek.
If you have any questions, please contact our office. (913) 296-3825.
Sincerely yours'
' Division of Environment
Donn td R. Carlson
Snailary EnginoerWater Pollution Control
DRC: nb
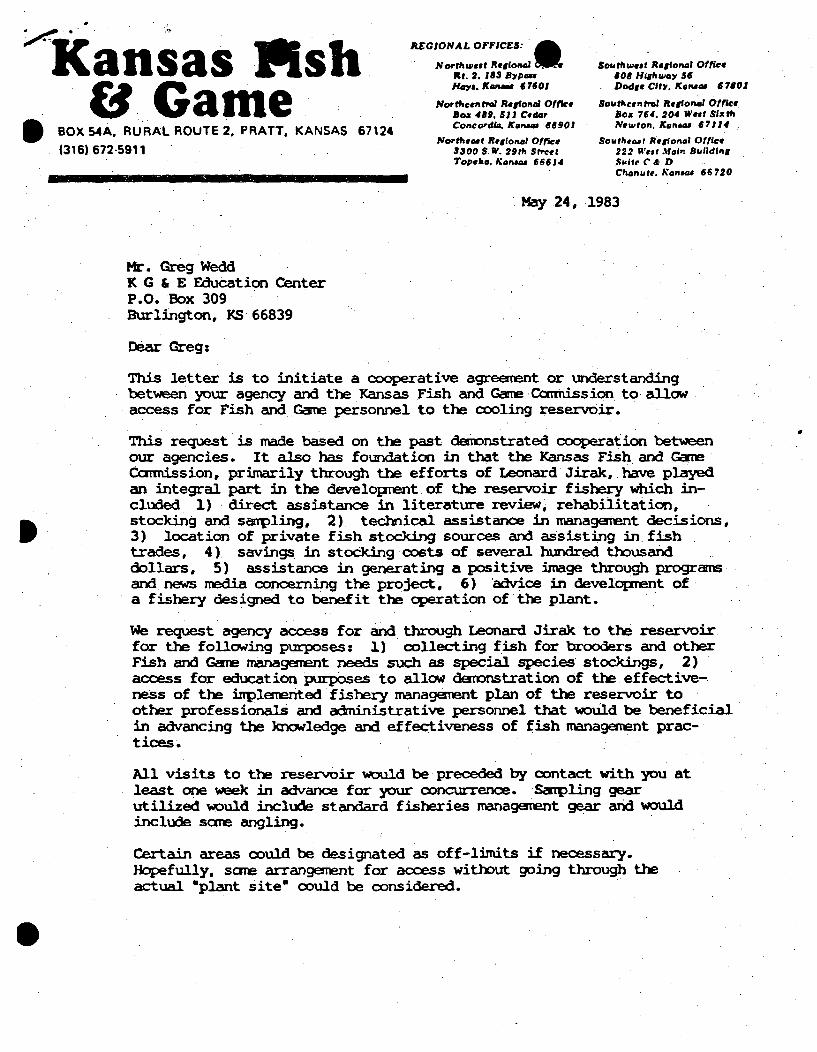
REGIONAL OFFICES:K a n sas P ISPfNorthwest Regional Southwest Regional Office
Ri. 2. 183 Bypass 808 Highway 36Ga 6Dodge City. Kansas 67801
Northcentral Regional Office Southcentral Regional OfficeBX GBtO 489. 53J Cedar Box 764. 204 West Sixth
BOX 54A. RURAL ROUTE 2. PRATT. KANSAS 67124 Concordia. Kansas 66901 Newton, Kansas 67114
- Northeast Regional Office Southeast RAegional Office(316) 6725911 3300 S W. 29th Street 222 West Mtai Building
Topeka. Kansas 66614 Suite C & D__....._C hanute. Kansas 66720
May 24, 1983
Mt. Greg WeddK G & E Education CenterP.O. Box 309Burlington, KS 66839
Dear Greg:
This letter is to initiate a cooperative agreement or understandingbetween your agency and the Kansas Fish and Game Cam-ission to allowaccess for Fish and aGme personnel to the cooling reservoir.
This request is made based on the past demonstrated cooperation betweenour agencies. It also has foundation in that the Kansas Fish and GameCcmission, primarily through the efforts of Leonard Jirak, have playedan integral part in the development of the reservoir fishery which in-cluded 1) direct assistance in literature review, rehabilitation,stocking and sanpling, 2) technical assistance in management decisions,I 3) location of private fish stocking sources and assisting in. fishtrades, 4). savings in stocking costs of several hundred thousanddollars, 5) assistance in generating a positive image through programsand news media concerning the project, 6) advice in developmlent ofa fishery designed to benefit the operation of the plant.
We request agency access for and through Leonard Jirak to the reservoirfor the following purposes: 1) collecting fish for brooders and otherFish and Game management needs such as special species stockings, 2)access for education p'urposes to allow demonstration of the. effective-ness of the ibplemented fishery management plan of the reservoir toother professionals and administrative personnel that would be beneficialin advancing the knowledge and effectiveness of fish management prac-tices.
All visits to the reservoir would be preceded by contact with you atleast one week in advance for your concurrence. Sampling gearutilized would include standard fisheries management gear and wouldinclude same angling.
Certain areas could be designated as off-limits if necessary.Hopefully, saoe arrangement for access without going through theactual "plant site" could be considered.
I
To: Greg WeddFran: Bruce TaggartMay 24, 1983Page 2, continued
The entire management concept for the current existing fishery wasbased on our recaomendations from years of management experience.We feel the request for. our agency's access will enable us to buildon that management experience.
We appreciate your cooperation and consideration on this request.Please advise us as soon as possible of yo-r decision.
Sincerel,
SNce Tag"rRegional Fisheries SupervisorSoutheast Region,
BT/kg
Kansas tishBO Game
BOX 54A, RURAL ROUTE 2, PRATT, KANSAS 67124
"(316) 672-5911
REGIONAL OFFICES:@
Northwest Regional OfficeRt. 2, 183 BypassHays, Kansas 17601
Northcentral Regional OfficeBox 489, 511 CedarConcordia, Kansas 66901
Northeast Regional Office3300 S.W. 29th StreetTopeka, Kansas 66614
September 10, 1984
Southwest Regional Office808 Highway 56Dodge City. Kansas 67801
Southcentral Regional OfficeBox 764, 204 West SixthNewton, Kansas 67114
Southeast Regional Office222 West Main BuildingSuite C & DChanute, Kansas 66720
Mr. Greg WeddKG&E Education CenterP.O. Box 309Burlington, KS 66839
Dear Greg:
By way of this letter. w6;-ie reqUsng pe sion to collect 2,000 adultlargemouth bass and:.500.:adult- smallmoxuth bass fran. your cooling reservoir.
In order to collect tbd~e fish efficiently, w6ewuldlike to bring in ourthree electrofishing boatsaInd a •hatchyi• týuck to haul fish. We wouldalso appreciate.your participationo ond your,ýlectrofishing equipment, how-ever, this 'is not- a p'reequisit- for our n
We would request to collect these fish during a, two-week period fromOctober !•thro g-.October• 198 i !!• in'O. .oghO 14 Depending upon our success, we may need
to return in April of 1985 -to colec additional fish.
Please advise.u as soon as possible'on your consideration of this request.Thanks.
Sinceey
Leonard JirakDistrict:.Fisheries Biologist. ;N Strawn District Office
LJ/kg
cc:. Bruce Taggart
Kansas lish&B Game
BOX 54A, RURAL ROUTE 2, PRATT, KANSAS 67124
(316) 672-5911
REGIONAL OFFICES:
Northwest Regional officeRt. 2, 183 BypassHays, Kansas 67601
Northcentral Regional Office*Box 489, 511 CedarConcordia, Kansas 66901
Northeast Regional Office3300 S.W. 29th StreetTopeka, Kansas 666'14
4;O75-4
Southwest Regional Office808 Highway 56Dodge City, Kansas 67801
Southcentral Regional OfficeBox 764i 204 West SixthNewton. -Kansas 67114
Southeast Regional Office222 West Main BuildingSuite C & DChanute, Kansas 66720
October 15, 1984
Greg WeddEnvironmental BiologistWolf Creek Power PlantBox 444Lebo,. KS 66856 - .
Dear Greg:
I want this.lettei to expresso.. r appreciation for Kansas Gasand Electric CarPany, s: coopef'ation: and, assistance in obtainingthe 655 .adult black bass-frd. your dooling resevoir last Friday.
Fish and Game staff inolved were not 0only:,irressed with thelake and its fishp..opulation, ',but- also. the very efficient andhardworking Kansas Gas and%El•ctric Caopany staff.
This. type of project persoifies the type of cooperation thathas existed betwenour agencies on fish management activitieson your inpoudent In omy opinion, the sportfish population
in the reservoir now. ist•t•hte e in the state. Kansas Gas andElectric Ccmpany has.- indeed :done -an: extremely cammhdable job onthe fishery.Once again,. thanks, for thefish and the good help.
Sincerely,.
Regional Fisheries SupervisorSoutheast Region
BT/kgcc: Jim Beam
Leonard Jirak
Kansas Ash& -Game
BOX 54A, RURAL ROUTE 2, PRATT, KANSAS 67124
(316) 672-5911
REGIONAL OFFICES:
Northwest Regional OfficeRt. 2, 183 BypassHays, Kansas 7601
Northcentral Regional OfficeBox 489, 511 CedarConcordia, Kansas 66901
Northeast Regional Office3300 S.W. 29th StreetTopeka, Kansas 66614
Southwest Regional Office808 Highway 56Dodge City, Kansas 67801
Southcentral Regional OfficeBox 764, 204 West SixthNewton, Kansas 67114
Southeast.Regional Office222 West Main Building.Suite C & DChanute, Kansas 66720
April 29, 1985
Greg WeddP.O. Box 444Lebo, KS 66856
Dear Greg:-
This letter is:to acknowledge and. thank you for your assistancein obtaining: blac, crappe br ish for'our hatchery needs at
Farlington. Once again•o•ur' .assistance very much appreciated.
sihncerely,
'Bruce Taggart• " , .~ýegional Fisheries Supervisor
Bouteast Region
BT/kgf
REGIONAL OFFICES:
&a hNorthwest Regional Office Southwest Regional OfficeK Rt. 2,183 Bypass 808 Highway 56G aeHays, Kansas1 7601 Dodge City, Kansas 67801
Northcentral Regional Office Southcentral Regional Officee G an e Box 489, 511 Cedar Box 764, 204 West Sixth
BOX 54A, RURAL ROUTE 2, PRATT, KANSAS 67124 Concordia, Kansas 66901 Newton, Kansas 67114
Northeast Regional Office Southeast Regional Office(316) 672-5911 3300 S.W. 29th Street 222 West Main Building.
Topeka, Kansas 66614 Suite C & DChanute, Kansas 66720
June 13, 1985
Mr. Greg WeddEnvironmental SectionKansas Gas & Electric CorpanyWolf Creek Generating Station
.Box 444Lebo, .KS 66856
Dear Greg: -
The fishery in the Wolf Creek C•o'olgReservoJir•has developed as plannedand even better thanh'expectedý.'-,. The Kansas Gas and Electric Company staffis to be coamended -for-their concern and response 'in,.developing the reser-voir resource to its fullest-potenital.'.": The original plan was to build ahigh density predator fish poPuiationi to, control rough fish and gizzardshad densitie3s. -ýTh•s•:is' recisel.y-.what. c-i:tan place., The plan alsocalled for us6eof the "sportfish -,.for rilod stock'in other, state waters andhas~he au.",ocrrd. byth public forthis has also o-,ccurred. The.. lake wads -,also' to -be ue ytepbi ofishing ifI NiRC.and KG&E regulations y 'ould allow it.
The survival and the subse quentdensity of prdacious fish has been ex-tremely high and initial groýwh was excelient. and has remained good.
The fishery has-a now reached, apopuaton:.:nsity and biomass where sanetype of major harvest would ..be:: beneficial..,The lake has been full forfour years and .thebiaas of the sportfish population has reached or isnear its peak. At the same time the lake's 'carrying capacity is mostlikely declining....
It is my concern that these f sh".hav:reached. a critical bicomass that theaquatic system will now be hard pressed .to maintain. Growth of inter-mediate size and smaller gamefish has, slowed and will become severelydepressed. I expect that the body condition of all but the very largestpredacious fish will decline noticeably by late sumner. Considering thedecreased body condition and high density there is a strong potentialfor winter stress, disease transmission, and significant fish mortality.
This is a problem that is poorly documented in any literature. Thisproblem is rare because very few fisheries managers have been successfulin producing such a high biomass of sportfish. Most that have, intendedthe fishery for public use and angler harvest has prevented the fishpopulation from reaching the proportions of the standing crop at WolfCreek. Those that have not allowed public utilization most likely did notexpend the effort to have a quality fishery as you have.
To: Greg WeddFran: Leonard JirakJune 13, 1985Page 2, continued
The potential problem that exists needs to be anticipated in time to re-medy the situation. Once a massive die off is observed, little can bedone to change the situation. As in most animal populations the endresult is a lower population than would have occurred if •moderate removalhad occurred.
The action necessary is much like the initiation of the pre-inpoundmentmanagement program where problems were circumvented and management strategieswere desighed to take advantage of opportunities as they became available.
I suggest that the fish population be monitored closely over the nextseveral months to observe if this problem continues to develop, and thatremedial action be taken before a very valuable resource is lost. Ifthe Kansas Fish and Game Cammrission can be of any assistance, please feelfree to request our help.
Sincerely,
Leonard JirakDistrict Fisheries BiologistNew Strawn District Office
LJ/kg
cc: Bruce Taggart
Kansas Pish&,..GameBOX 54A, RURAL ROUTE 2. PRATT, KANSAS 67124
(316) 672-5911
REGIONAL. OFFICES: 0Northwest Regional Office
Rt. 2, 183 BypassHays, Kansas 67601
Northcentral Regional OfficeBox 489, 511 Cedar.Concordla, Kansas 66901
Northeast Regional Office3300 S.W. 29th StreetTopeka, Kansas 66614
Southwest Regional Office808 Highway 56Dodge City, Kansas 67801
Southcentral Regional OfficeBox 764. 204 West SixthNewton..Kansas 67114
Southeast Regional Office222 West Main BuildingSuite C & D1Chanute, Kansas 66720
September Us, 1985
Greg WeddP.O. Box 444Lebo, KS 66856
Dear Greg:
We would like to electrofish *and transport fish fromn your lake onthe 19th and 20th -of .ptember, ..1985. We have- aneed for 1,000largemouth bass adults,'. 200 ;.-,s iuth bass adults, 1,000 wipers,200• black crappie,, and 200 wte crappie. If we are unsuccessfulor incarpleteý-iini.our.results, we" would also: like to try. again inOctober afteýr it coo-ls off.. T hanks for your consideration of thisrequest.
/ ,< . •i•-::: . ......... .. . .
Bruce TaggartRegional, Fisheries SupervisorSoutheast Region
BT/kg
Kansas Ash& Game
BOX 54A, RURAL ROUTE 2. PRATT, KANSAS 67124
(316) 672-5911
REGIONAL OFFICES:
Northwest Regional OfficeRt. 2, 183 BypassHays, Kansas 7601
Northcentral Regional OfficeBox 489, 511 CedarConcordia, Kansas 66901
Northeast Regional Office3300 S.W. 29th StreetTopeka, Kansas 66614
Southwest Regional Office808 Highway 56Dodge City, Kansas 67801
Southcentral Regional OfficeBox 764, 204 West SixthNewton, Kansas 67114
Southeast Regional Office
222 West Main Building.Suite C & DChanute, Kansas 66720
February 1:7, 1986
.Greg WeddWolf Creek Educational CenterBox 309Burlington,. KS 66839
Dear Greg:
We would like to."obt aintwelve ý(12) large feemale and.four (4) male striped
bass frar your .lake the last week of April....;'These fish will be spawned
for striped bass production in Kansas. Please let me know if this can be
worked in. T-hanks.--'.-..
Sincerely
Bru Supervisor
Regiona Fisheries SupervisorSoutheast Region
BT/kg
cc: Leonard Jirak,
Kansas IshB Game
BOX54A, RURAL.ROUTE 2, PRATT, KANSAS 67124
(316) 672-5911
REGIONAL OFFICES: 0
Northwest Regional OfficeRt. 2, 183 BypassHays, Kansas 67601
Northcentral Regional OfficeBox 489, 511 Cedar,Concordia, Kansas 66901
Northeast Regional Office3300 S.W. 29th StreetTopeka, Kansas 66614
Southwest Regional Office* 808 Highway 56
Dodge City. Kansas 67801
Southcentral Regional OfficeBox 764," 204 West SixthNewton, Kansas 67114
Southeast Regional Office222 West Main BuildingSuite C & DChanute, Kansas 66720
March 27, 1986
Greg WeddWolf Creek Educational CenterBox 309Burlington, KS 66839
Gregg:
Thank you for your assistance in obtaining largemouth bass franWolf Creek. We stocked 455.largemouth that averaged two pounds-each. The following, is. a, b own 1. of where the fish went:
Montg :yStat'e- Fishing LeLa .-150Neosho State Fi6hingLake - 250-Neosho Rearing Pond ., 55
The fish in: the Neosho Rearing .Pond will be used to evaluate mor-tality and survivors will be stocked at the Mined Land WildlifeArea..-
Sincerely,
Bruce Taggart• Regional Fisheries Supervisor
Southeast Region
BT/kg
Kansas FishWSOUTHEAST REGIONAL OFFICE
222 W. MAIN BLDG. SUITE C&D, CHANUTE, KS 66720 (316) 431-0380
W--
March 23, 1987
REC24••'7.
Greg WeddWolf Creek Educational CenterBox 309Burlington, KS 66839
Dear Gregg:
Thank you for *your assistance in obtaining fish fromThe following is a breakdown of where the fish went:
Date Location
2-25-87 MLWAMLWAFarlington
3-5-87. NOSLNOSLWOSLBig HillPonds
Species
LM BWipersStripers
Number
3663321
Wolf Creek.
Size
2-7 1 bs.3 lb. ave.5 lbs. ave.
C CATLM BLM B
LM B
1159
135
117
2-10 lbs.2 lb. ave.2 lb. ave.
2 lb. ave.
All of the stripers died at Farlington. It is believed that haulingstripers and largemouth together from where they were collectedto the hatchery truck caused the mortalityy. In the future,striper brooders will be moved independently. The 'only otherfish loss was about six largemouth bass.
Sorry for the delay in getting this information to you.
Sincerely,
Bru eRegional Fisheries SupervisorSoutheast Region
BT/kgcc: Steve Mense
Leonard JirakRob Friggeri
EQUAL OPPORTUNITY EMPLOYER
Kansas FishS2SOUTH EAST REGIONAL OFFICEe 222 W. MAIN BLDG. SUITE C&D, CHANUTE, KS 66720 (316) 431-0380
June 24, 1987
Greg Wedd and StaffWolf Creek Education CenterBox 309Burlington, KS 66839
Dear Gregg and Staff:
We commend your effort in helping supply quality fish for the JohnRedmond Kid's Fishing Derby. It has become a huge success mainlydue to the qualiity of fishing experienced by those young childrenthat participate.
Most of the fish in the ponda big thanks from the Kansasfishing kids.
were provided from W.C.G.S. Again,Fish & Game Commission and all the
Sinc (pl
Leonna JirakDistrict Fisheries BiologistNew Strawn, KS 66839
i/kg
cc: Bruce Taggart
EQUAL OPPORTUNITY EMPLOYER
I!I1E REGION 5 OFFICEP.O. Box 777
Chanute, KS 66720316-431-0380Equal Cpportunity Employer
WILDLIFE.4:PARKS
I qc1 77!
April 1, 1997
qr1.7~ 6Brad LovelessWn7f rreek Lake% Leonard Jirak540 16th Road NWHartford, Ks. 66854
Brad,
On behalf of Public Wholesale Water Supply District #11 and theanglers of southeast Kansas, I would like to whole-heartedly thankyou for permitting us to collect smallmouth bass adults from WolfCreek Lake for stocking into the recently constructed Bo~ne eqkLake (540 acres). Hopefully these fish will soon sprovide an exciting sportfishery in two years when the lake opensto fishing.
Leonard was able to collect a total of 40 fish ranging in size from8-15 inches. The fish hauled very well and looked to be inexcellent condition when stocked into Bone Creek.Lake.
Again, thanks for providing us with these fish. Anglers shouldreap the benefits of your generosity for many years to come.
Sincerely,
Rob Frigg,ý Y
Dist. Fisheries BiologistPittsburg(!
KANSAS OUTDOORS "America's Best Kept Secret"
Kansas Ash.&,.GameBOX 54A, RURAL ROUTE 2. PRATT, KANSAS 67124
(316) 672-5911
REGIONAL OFFICES:
Northwest Regional OfficeRt. 2, 183 BypassHays, Kansas 67601
Northcentral Regional OfficeBox 489. 511 CedarConcordia, Kansas 66901
Northeast Regional Office3300 S.W. 29th StreetTopeka, Kansas 66614
Southwest Regional Office808 Highway 66Dodge City, Kansas 67801
Southcentral Regional OfficeBox 764; 204 West SixthNewton, Kansas 67114
Southeast Regional Office.222 West Main BuildingSuite C & D
Chanute, Kansas 66720
New Strawn
February 23,1988
Mr. Greg Wedd
Environmental Section
Kansas Gas & Electric CompanyWolf Creek Generating StationBox 44Lebo, KS 66856
....~ ~ ~~~. ;.>i./::./ ....:..............Dear Greg;
Following our,. discussion 'on moving fish from Wolf Creek to our publicfishing lakes I. have compiled. the ýfollowing list:
Montgomery SFLý 250 La,.Irg'emouth ~bas'sWoodson SFL 250 argemou th-bass
Strewn CityiLake 50 i-Largemouth bass
50 wipero25 large channel' cat.
Lairds Pond......... 50 wipers100..channe1-cat
The largemouth need-to be a minimum of 12 inches to be in the protected
size range..The wipers:. and- channel catfish can be any size with the largercatfish going :toStrawn city lake. We would be ready to move these fish at yourconvenience. Thanks in Advance!
inc rely
Leonard Ji akDistrict Fisheries Biologist
STATE OF KANSAS
* 7 -. DEPARTMENTuOF WILDLIFE & PARKS -
MoundCity District OfficeCourthouse. 315 MainMound City, KS 66056
PH: 913.795.2218 FAX: 913.795.2889
To: Wolf Creek Nuclear Operating StationDanWtlliamson, Environmental SectionBurlington, KS
From: Don George Ž-,Fisheries BiologistKS. Dept. Of Wildlife & Parks315 Main
.Mound City, KS. 66056
Date: 04-15-1998
Dear Mr. Wiliamson:I am requesting permission to obtain up to 75 smallmouth bass adults from Wolf Creek Reservoir.This mission will be conducted by Leonard Jirah and I will assist. It is my goal to obtain thissample before these fish spawn. The smallmouth bass collected will be placed into LaCygneReservoir to compliment the stocking that occurred in 1997. Thanks for your assistance with thisproject.
IMA~t; REGION 2 OFFICE3300 SW 29THTOPEKA, KS 66614.4(913) 273-674066614
Equal Opportunity Employer
WILDLIFE•::PARKS
Richard Sanders2512 Cimarron Dr.Lawrence, KS. 66046
January 22, 1991
Brad LovelessWolf Creek Nuclear Operating Corp.P.O. Box 411Burlington, KS 66839
Dear Brad,
Your cooperation in supplying fishes for the Topeka Boat Show madethe display tank a success. Species and numbers of fishes displayedincluded:
I. Morone spp. -82. Drum -1
3. Bluegill'- I4. Black Crappie - 15. Walleye - 66. Flathead Catfish - 37. Channel Catfish - 38. Smallmouth Bass - 59. Largemouth Bass - 15
Thanks, for your assistance.
Sincerely,
Richard Sanders
cc: Steve Hawks
KANSAS OUTDOORS "America's Best Kept Secret"
K3A REGION 2 OFFICE 'K• 3300 SW 29TH
TOPEKA, KS 66614-2053(913) 273-6740 " MAR 21993 iEqual Opportunity Employer .
itl•,'- . :-' I
'ARKS Richard Sanders
2512 Cimarron DriveLawrence, KS 66046
February 26, 1993
Brad LovelessWolf Creek Nuclear Operation. CorporationP.O. 411Burlington, KS 66839•
Dear Brad,
Thanks, for allowing Kansas Department of Wildlife &.Parks tocollect display fish from Wolf Creek for use at the Topeka Boat.and Outdoor Show. Dan put us on the fish right away and we got agood representation of Kansas sportfish. The display was a hitwith the public. If my memory is correct, the following fishwere used in the display:
Species Number
Largemouth Bass 13Smallmouth Basss 5Wiper 5White Bass 2Blue Catfish 1Flathead Catfish 1Common Carp 2Smallmouth Buffalo 1Bigmouth Buffalo 1
Again, thanks for your cooperation.
Sincerely,
Richard Sanders
cc: Leonard JirakSteve Hawks
KANSAS OUTDOORS "America's Best Kept Secret"
STATE OF KANSAS 93- o/ 29Y01
Joan FinneyGovernor
DEPARTMENT OF WILDLIFE & PARKS
OPERATIONS OFFICERt. 2, Box 54A
Pratt, KS 67124 - 9599(316) 672-5911 / FAX (316) 672-6020
Theodore D. EnsleySecretary
Brad LovelessSupervisor, Environmental Management
Wolf Creek Nuclear Operating Corp.P.O. Box 411Burlington, KS 66839
August 31, 1993
Dear Mr. Loveless,
The recent flooding appears to have had a detrimental affect on the Department's walleye managementprograms. Our biologists have reported that Glen Elder and Lovewell reservoirs, our primary sources forwalleye egg collection, have experienced severe losses of adult fish.
Complicating the situation is the fact that many other State Fishing Lakes and federal reservoirs also lostwalleye. This will result in sharply increased stocking requests to rebuild these populations.
We would like to explore the possibility of collecting walleye eggs from the Wolf Creek Cooling Lake nextspring. Our biologists would capture walleye using modified fyke nets, strip the eggs, and then release the
fish. The eggs would then be transported to our Milford Hatchery for production of stockable fry.
Department policy has been to stock fry back into lakes where egg taking occurred to insure we have nonegative impact on donor lakes' recruitment. We would gladly set aside a portion of the fry produced forreturnto Wolf Creek.
The Department and the anglers of Kansas would be grateful to Western Resources for considering thisrequest Please contact me if you have any questions.
Sincerely,
Douglas D. Nygren
Fisheries Management Liaison
xc: Joe Kramer Jim Beam
Steve Adams Leonard JirakLarry Tiemann
VftI..4LF CREEKNUCLEAR OPERATING COROA(O
Warren B. Wood August 10, 1995Generl CounW wWl Secretary
GC 95-0132File No. 40.004.01
Kansas Department of Wildlife and ParksRoute 2, Box 54APratt, Kansas 67124-9599
Attention: Mr. Doug Nygren:
Subject: Proposed Wolf Creek Lake Angling Regulations
Dear Mr. Nygren:
Wolf Creek Nuclear Operating Corporation (WCNOC) proposes that the angling regulations thatappear on Exhibit 1 attached to this letter be adopted by the Kansas Department of Wildlife andParks (KDWP) beginning in 1996 for Wolf Creek Lake. These regulations were designed byWCNOC and KDWP biological staff with the primary goal of preserving the existing fishery.This fishery supports power plant operation by biologically controlling excessive numbers of
. gizzard shad in the cooling lake. The proposed regulations will also allow for a small amount ofharvest from a primarily catch-and-release fishery that many anglers can enjoy for a long time.
We look forward to working with KDWP to provide this recreational opportunity to the generalpublic. If you have any questions on the proposed regulations, please feel free to contact BradLoveless (316) 364-8831 extension 4530.
Very truly yours,
Warren B. Wood
WBWrjaf
cc: Leonard Jirak (KDWP)James Cambell (Coffey County Attorney)
P.O. Box 411 / Burlington. KS 66839 / Phone: (316) 364-4105
An Equal Opportunity Employer M/FIHCNET
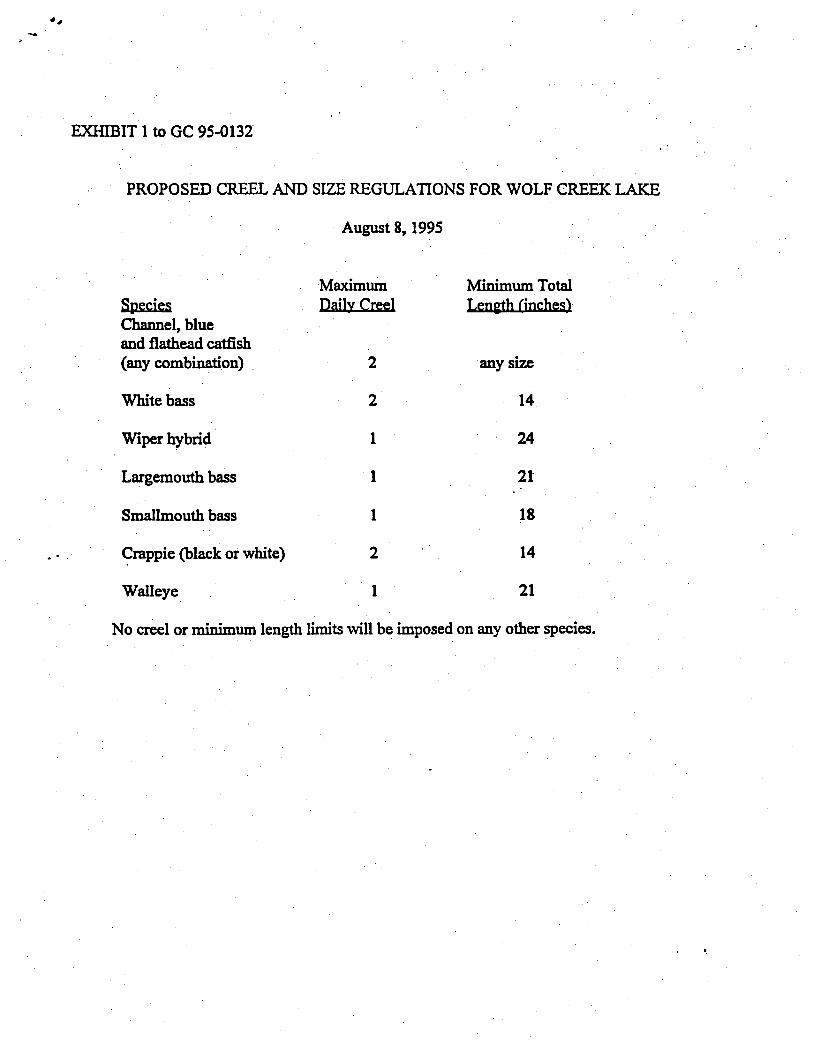
EXHIBIT I to GC 95-0132
PROPOSED CREEL AND SIZE REGULATIONS FOR WOLF CREEK LAKE
August 8, 1995
Maximum Minimum Total
Channel, blueand flathead catfish(any combination) 2 any size
White bass 2 14
Wiper hybrid 1 24
Largemouth bass 1 21
Smallmouth bass 1 18
Crappie (black or white) 2 14
Walleye 21
No creel or minimum length limits will be imposed on any other species.
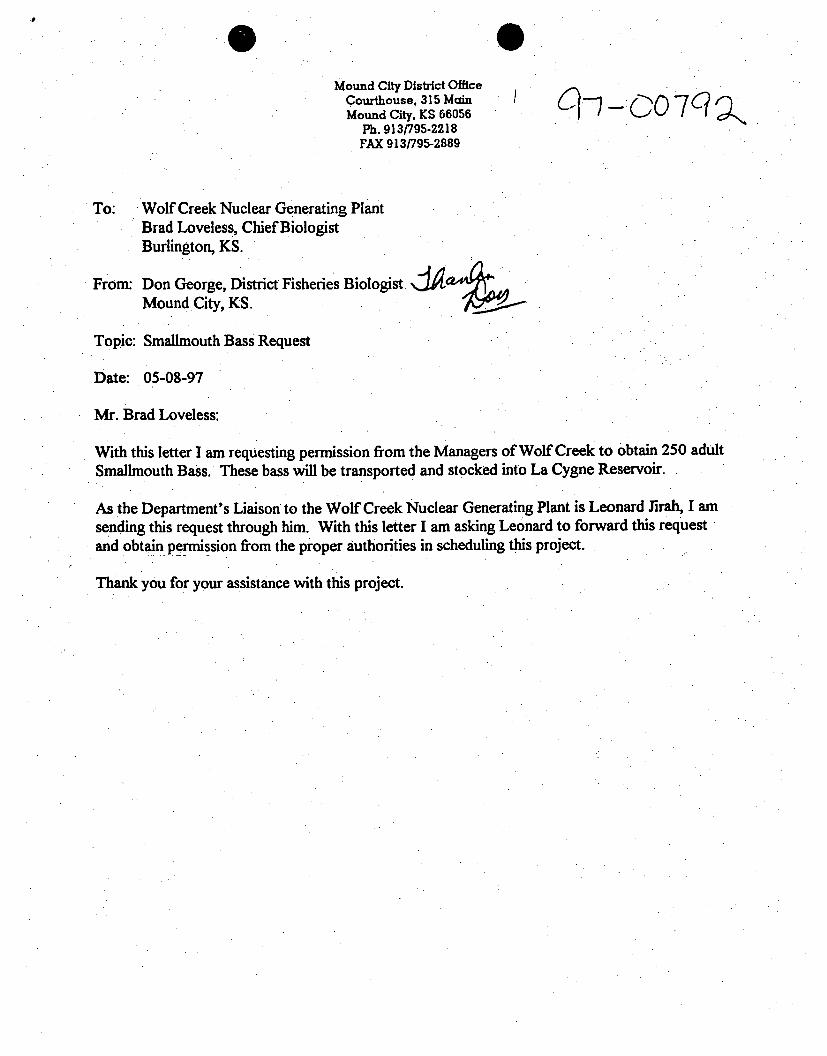
Mound City District OfficeCourthouse, 315 Main -
Mound City. KS 66056Ph. 913/795-2218FAX 913/795-2889
To: Wolf Creek Nuclear Generating PlantBrad Loveless, Chief BiologistBurlington, KS.
From: Don George, District Fisheries Biologist.Mound. City, KS.
Topic: Smallmouth Bass Request
Date: 05-08-97
Mr. Brad Loveless:
With this letter I am requesting permission from the Managers of Wolf Creek to obtain 250 adultSmallmouth Bass. These bass will be transported and stocked into La Cygne Reservoir.
As the Department's Liaison to the Wolf Creek Nuclear Generating Plant is Leonard 'irah, I amsending this request through him. With this letter I am asking Leonard to forward this requestand obtain permission from the proper authorities in scheduling this project.
Thank you for your assistance with this project.
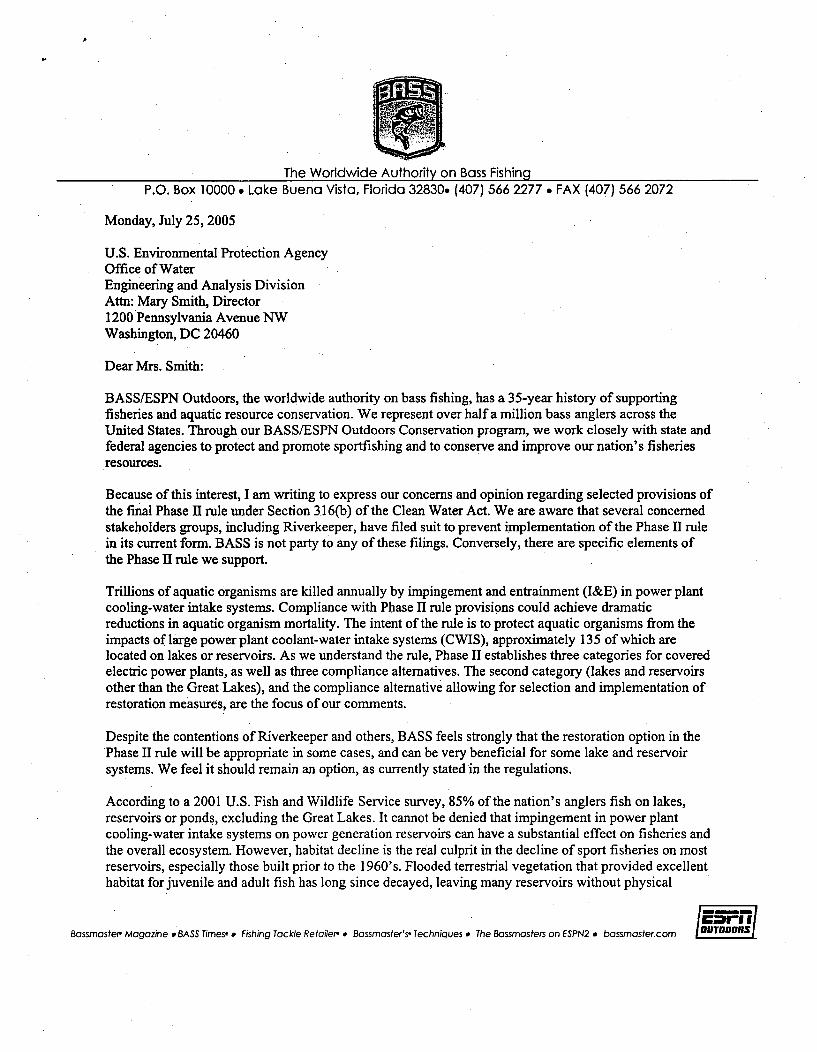
The Worldwide Authority on Bass FishingP.O. Box 10000 e Lake Buena Vista, Florida 32830. (407) 566 2277 * FAX (407) 566 2072
Monday, July 25, 2005
U.S. Environmental Protection AgencyOffice of WaterEngineering and Analysis DivisionAttn: Mary Smith, Director1200 Pennsylvania Avenue NWWashington, DC 20460
Dear Mrs. Smith:
BASS/ESPN Outdoors, the worldwide authority on bass fishing, has a 35-year history of supportingfisheries and aquatic resource conservation. We represent over half a million bass anglers across theUnited States. Through our BASS/ESPN Outdoors Conservation program, we work closely with state andfederal agencies to protect and promote sportfishing and to conserve and improve our nation's fisheriesresources.
Because of this interest, I am writing to express our concerns and opinion regarding selected provisions ofthe final Phase II rule under Section 316(b) of the Clean Water Act. We are aware that several concernedstakeholders groups, including Riverkeeper, have filed suit to prevent implementation of the Phase II rulein its current form. BASS is not party to any of these filings. Conversely, there are specific elements ofthe Phase H1 rule we support.
Trillions of aquatic organisms are killed annually by impingement and entrainment (I&E) in power plantcooling-water intake systems. Compliance with Phase H rule provisions could achieve dramaticreductions in aquatic organism mortality. The intent of the rule is to protect aquatic organisms from theimpacts of large power plant coolant-water intake systems (CWIS), approximately 135 of which arelocated on lakes or reservoirs. As we understand the rule, Phase II establishes three categories for coveredelectric power plants, as well as three compliance alternatives. The second category (lakes and reservoirsother than the Great Lakes), and the compliance alternative allowing for selection and implementation ofrestoration measures, are the focus of our comments.
Despite the contentions of Riverkeeper and others, BASS feels strongly that the restoration option in thePhase II rule will be appropriate in some cases, and can be very beneficial for some lake and reservoirsystems. We feel it should remain an option, as currently stated in the regulations.
According to a 2001 U.S. Fish and Wildlife Service survey, 85% of the nation's anglers fish on lakes,reservoirs or ponds, excluding the Great Lakes. It cannot be denied that impingement in power plantcooling-water intake systems on power generation reservoirs can have a substantial effect on fisheries andthe overall ecosystem. However, habitat decline is the real culprit in the decline of sport fisheries on mostreservoirs, especially those built prior to the 1960's. Flooded terrestrial vegetation that provided excellenthabitat for juvenile and adult fish has long since decayed, leaving many reservoirs without physical
Bassmoster Magazine *BASS Times- * Fishing Tackle Retailer' * Bassmaster's' Techniques • The Bassmasters on ESPN2 o bassmaster.com
habitat. On these reservoirs, with the exception of high water years that flood terrestrial vegetation, thereis little or no cover for young fish to use to escape from predators, resulting in low recruitment. Otherreservoirs have become overrun with aquatic nuisance vegetation, impacting all recreational uses.
States lack the money or resources to implement massive habitat restoration efforts on these largewaterbodies. Federal agencies responsible for many of these reservoirs receive little funding to enhancerecreational fishing. Hydropower, navigation and flood control receive priority.
BASS feels that all alternatives need to be available to mitigate for the impacts of power plants.Restoration should be available as a compliance alternative, especially if there are not readily availabletechnological or operational fixes. Using habitat restoration as a compliance alternative will yield netbenefits to the fishery resource, increasing survival of spawned fish, leading to increased recruitment,which essentially contributes to replacing organisms lost by impingement. Indirect benefits of habitatrestoration can include increased fishable areas; improved angling success; added habitat for waterfowl,birds and other animals; and improved water quality and aesthetics. Habitat restoration can providebenefits in perpetuity, with decreasing cost to the utility over time.
In many cases, restoration will be a better option than actually reducing impingement mortality. Mostreservoir fisheries have evolved under the influence of these power generation facilities. Your ownestimates are that 98% of the fish affected by facilities in inland waters are non-game species. Often theseare species whose impingement numbers are low in relation to their overall population size. While manyare important forage species, they are species having typically high reproductive rates, and theirabundance is generally limited by other factors such as habitat availability. In some cases, natural andother mortality actually exceeds impingement mortality. In one study of two Texas reservoirs, the numberof fish consumed by cormorants exceeded the number of fish impinged by power plants [PBS&J. 2003.Comprehensive Aquatic Surveys ofBraunig and Calaveras Lakes Data Report. Prepared for City PublicService of San Antonio].
The need to revitalize habitat on aging reservoirs is an overwhelming problem. If restoration remains acompliance alternative in both Phase II and Phase III rules, the potential outcome could be millions ofdollars for aquatic habitat restoration. This would represent only a fraction of the costs of retrofitting orchanging operational practices. Without the restoration alternative, consumers will likely absorb theexpense of modifications that have no measurable benefit to reservoir fisheries.
Loss of fish habitat across the nation is recognized as a critical issue for fish and wildlife managers. Losthabitat undermines the health and productivity of aquatic systems and dependant fish populations.Declining fish habitat also diminishes aesthetic and angling opportunities, undermining the ability ofstates to deliver quality public outdoor recreational opportunities. In recognition of this, in 2003 theInternational Association of Fish and Wildlife Agencies committed to taking a leadership role in thedevelopment of a National Fish Habitat Initiative (NFHIl), modeled after the highly successful NorthAmerican Waterfowl Management Plan. BASS is proud to serve as a member of the NFHI PartnershipCouncil, working to develop a comprehensive national strategy to conserve and enhance fish habitat. Wefeel that all options for enhancing fishery resources need to be available as part of this national strategy,including a restoration alternative for I&E impacts.
Thank you for the opportunity to comment. If you would like further discussion, I can be reached [email protected], or 334-551-2422.
Sincerely,/s/NOREEN K. CLOUGHConservation DirectorBASS/ESPN Outdoors
Logsdon Ralph L
From: Williamson Daniel LSent: Thursday, July 28, 2005 2:53 PMTo: Hammond Robert ACc: Haines Daniel E; Logsdon Ralph LSubject: Support for 316(b) Restoration
FYI. Published in the July 25, 2005 EEl EnviroWeek newsletter.
Mary T. Smith EPA 316(b) LetterOn July 7, Noreen Clough, Conservation Director for BASS/ESPN Outdoors (The Worldwide Authority onBass Fishing) sent Mary Smith, Director, Engineering and Analysis Division, EPA Office of Water and lead HQ316(b) contact a letter (see below) stating that despite the contentions of Riverkeeper and others, BASS feelsstrongly that the restoration option in the Phase II rule will be appropriate in some cases, and can be verybeneficial for some lake and reservoir systems. BASS feels it should remain an option, as currently stated inthe regulations.
MaryTSmithEPA3161tr._BASS.pdf
1
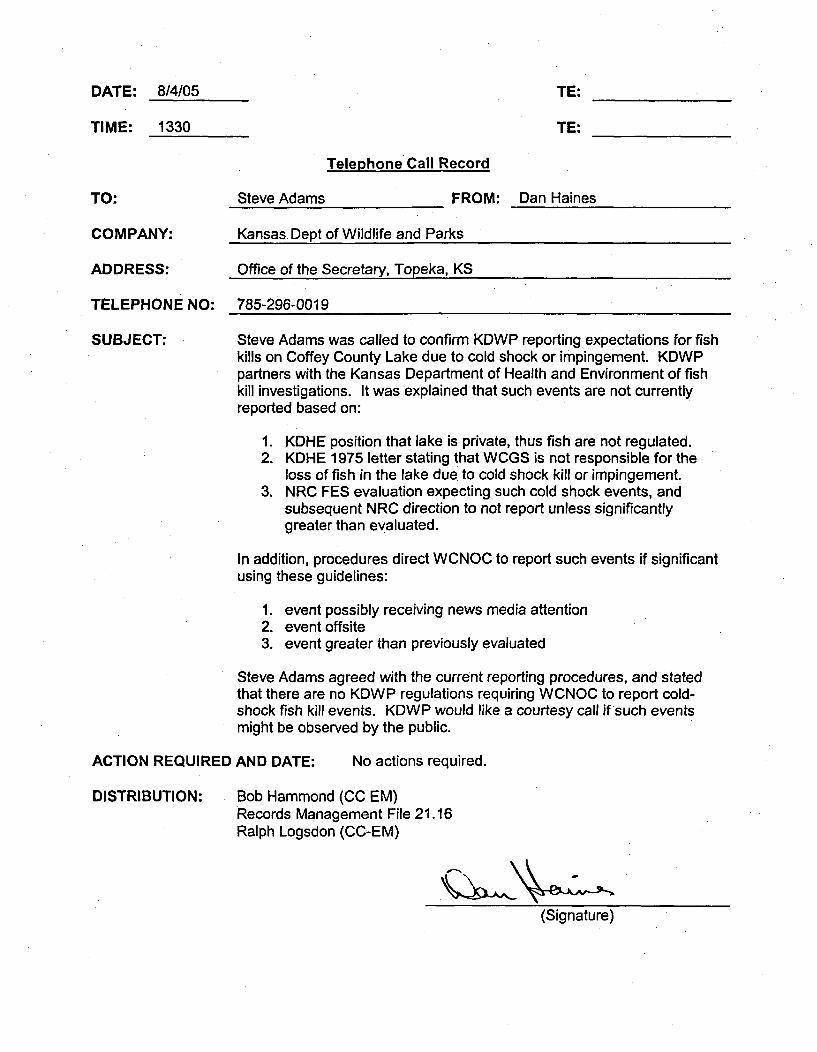
DATE: 8/4/05
TIME: 1330
TE:
TE:
Telephone Call Record
TO: Steve Adams FROM: Dan Haines
COMPANY:
ADDRESS:
TELEPHONE NO:
SUBJECT:
Kansas Dept of Wildlife and Parks
Office of the Secretary, Topeka, KS
785-296-0019
Steve Adams was called to confirm KDWP reporting, expectations for fishkills on Coffey County Lake due to cold shock or impingement. KDWPpartners with the Kansas Department of Health and Environment of fishkill investigations. It was explained that such events are not currentlyreported based on:
1. KDHE position that lake is private, thus fish are not regulated.2. KDHE 1975 letter stating that WCGS is not responsible for the
loss of fish in the lake due to cold shock kill or impingement.3. NRC FES evaluation expecting such cold shock events, and
subsequent NRC direction to not report unless significantlygreater than evaluated.
In addition, procedures direct WCNOC to report such events if significantusing these guidelines:
1. event possibly receiving news media attention2. event offsite3. event greater than previously evaluated
Steve Adams agreed with the current reporting procedures, and statedthat there are no KDWP regulations requiring WCNOC to report cold-shock fish kill events. KDWP would like a courtesy call if such eventsmight be observed by the public.
ACTION REQUIRED AND DATE: No actions required.
DISTRIBUTION: Bob Hammond (CC EM)Records Management File 21.16Ralph Logsdon (CC-EM)
(Signature)
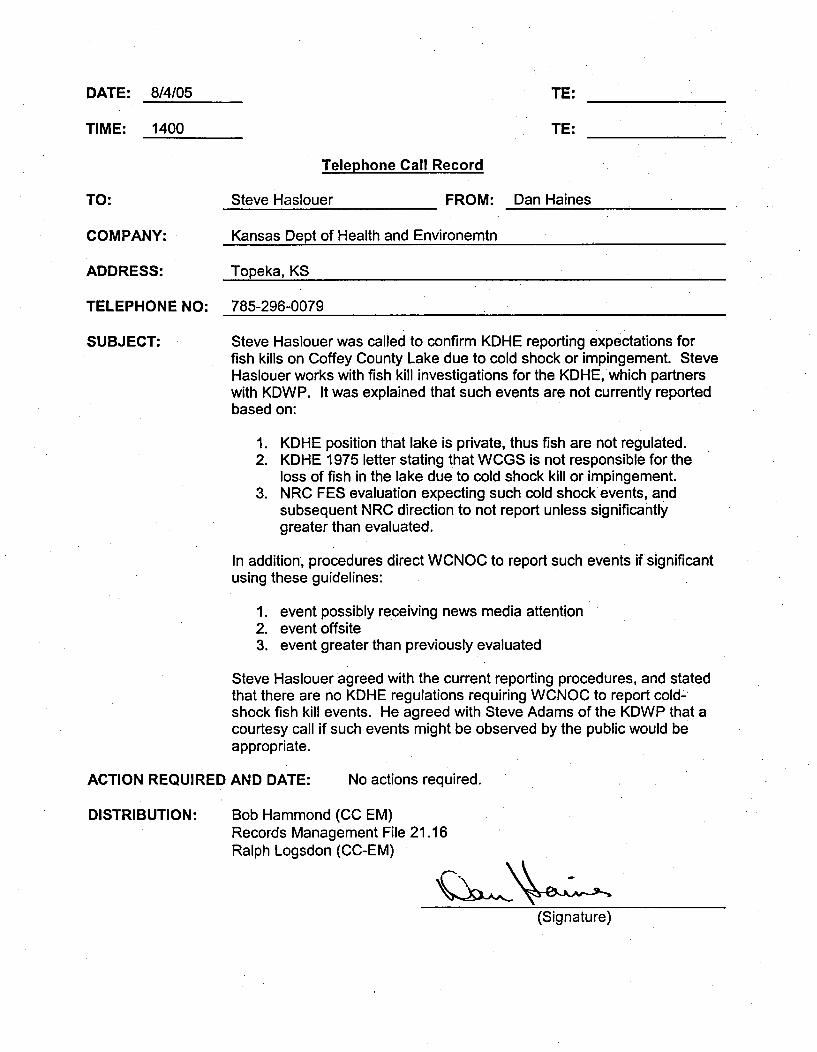
DATE: 8/4/05
TIME: 1400
TE:
TE:
Telephone Call Record
TO: Steve Haslouer FROM: Dan Haines
COMPANY:
ADDRESS:
Kansas Dept of Health and Environemtn
Topeka, KS
TELEPHONE NO: 785-296-0079
SUBJECT: Steve Haslouer was called to confirm KDHE reporting expectations forfish kills on Coffey County Lake due to cold shock or impingement. SteveHaslouer works with fish kill investigations for the KDHE, which partnerswith KDWP. It was explained that such events are not currently reportedbased on:
1. KDHE position that lake is private, thus fish are not regulated.2. KDHE 1975 letter stating that WCGS is not responsible for the
loss of fish in the lake due to cold shock kill or impingement.3. NRC FES evaluation expecting such cold shock events, and
subsequent NRC direction to not report unless significantlygreater than evaluated.
In addition, procedures direct WCNOC to report such events if significantusing these guidelines:
1.2.3.
event possibly receiving news media attentionevent offsiteevent greater than previously evaluated
Steve Haslouer agreed with the current reporting procedures, and statedthat there are no KDHE regulations requiring WCNOC to report cold-
shock fish kill events. He agreed with Steve Adams of the KDWP that acourtesy call if such events might be observed by the public would beappropriate.
ACTION REQUIRED AND DATE: No actions required.
DISTRIBUTION: Bob Hammond (CC EM)Records Management File 21.16Ralph Logsdon (CC-EM)
(Signature)

APPENDIX F
MAKEUP WATER SCREENHOUSE 316(b) DETERMINATION
oK-oooSS
KANSAS Kathleen Sebelius, GovernorRoderick L. Bremby, Secretary
DEPARTMENT OF HEALTHAND ENVIRONMENT www.kdheks.gov
January 23, 2007
Mr. Kevin J. MolesWolf Creek Nuclear Operating CorporationP.O. Box 411Burlington, KS 66839
RE: Wolf Creek Generating Station (WCGS) 316(b) Water Transfer Information
NPDES Permit No. I-NE07-PO02
Dear Mr. Moles:
KDHE has reviewed the letter dated January 17,2007 regarding the referenced facility. KDHEconcurs with WCGS's finding that the intake on John Redmond Reservoir constitutes a water transfer andnot a direct use of water by the power plant. As such, the John Redmond Reservoir intakes are not coolingwater intakes subject to 316(b).
If you have any questions in regard to this issue, please feel free to call me at (785) 296-4347.
Sincerely,
ECS:espc:
Eric C. Staab, P.E.Industrial Programs. Section
Bureau of Water
Northeast District Office
Ralph Logsdon, WCGS
John Dunn, EPA Region VII
KDHE, BOW, IPS
CURTIS STATE OFFICE BUILDING, 1000'SW JACKSON ST., STE. 420, TOPEKA, KS 66612-1367
Voice 785-296-5545 Fax 785-296-5509
WES'F:CREEK1NUCLEAR OPERATING CORPORATION
Kevin J. MolesManager Regulatory Affairs
JAN 17 200RA 07-0004
Kansas Department of Health and EnvironmentBureau of Water - Industrial Programs-.1000 SW Jackson St., Suite 420Topeka, Kansas 66612-1367
Attention: Mr. Eric Staab
Reference: Letter from E. C. Staab (KDHE) dated 11/22/06. to.J. E. Wemer(KCPL) confirming makeup to La Cygne Lake from the. Maraisdes Cygnes River constitutes a water transfer.
Subject: Request fora letter from KDHE confirming makeup from. the
Neosho River to Coffey County Lake is a water transfer;
Dear Mr. Staab:
Based: on. a conversation with Ralph 'Logsdon on January 9, 2007, Wolf Creek. Nuclear.Operating. Corporation (WCNOC) requests a letter confirming. Kansas. Department of .Health...and Environment's (KDHE) position on water. transfers.
The Wolf Creek Generating Station (WCGS) Makeup Water Screenhouse (MUSH) on theNeosho River is used on occasion to add water to Coffey County Lake (CCL). Although CoffeyCounty Lake was constructed as a cooling lake for the WCGS it is considered a Water of theState. The pumping of water from the Neosho River to CCL is a transfer from a Water: of the.State to another Water of the State. Therefore, this -is actually a water transfer -and notconsidered a direct use of water by WCGS.
WCNOC understands that water transfers are not govemed -by NPDES -permitting, andtherefore exempt from the requirements of 316(b).- WCNOC is requesting written confirmation •of this position similar to that sent to Kansas City Power and Light in the reference. If you-have .any questions regarding this request, please contact Mr. Ralph Logsdon at.. (620) 364-8831.,extension 4730.
Sincerely,
Kevin J. Moles
KJM/rll
cc: Don Carlson/KDHE-BOW
P.O. Box 411 / Burlington, KS 66839 I Phone: (620) 364-8831An Equal Opportunity Employer M/F/HC/VET
KANSASRODERICK L. BREMBY, SECRETARY KATHLEEN SEBELIUS, GOVERNOR
DEPARTMENT OF HEALTH AND ENVIRONMENT
November 22, 2006
Mr. Joseph E. WernerKCP&LP.O. Box 418679Kansas City, MO 64141-9679
RE: LaCygne 316(b) Proposal InformationNPDES Permit No. I-MC18-POOI
Dear Mr. Werner:
KDHE has reviewed the Proposal for Information Collection (PIC) dated March 31, 2006 for thereferenced facility and the Errata transmitted by letter dated.October 16,2006. Additional clarifications areincluded KCP & L's letter to EPA dated October 18, 2006 and EPA's response dated November 15,2006...
KDHE concurs with EPA's finding that the intake on the Marais des Cygnes River constitutes awater transfer and not a direct use of water by the power plant.. As such, the Marais des Cygnes Riverintakes are not cooling water intakes subject to 316(b).
KDHE approves the errata modifying the original PIC. KDHE understands that KCP & L hasproceeded with implementation of the PIC. However, the issue of how the sampling data will be used todevelop the calculation baseline and demonstrate impingement mortality reduction remains somewhat unclear.This issue in part remains unresolved in EPA guidance on the subject. It is anticipated that this issue will beresolved as data is generated, evaluated and presented as part of the Comprehensive Demonstration Study.Once KCP & L resolves the issue of how the sampling data will be calculated to demonstrate compliance,the PIC will be approved.
If you have any questions in regard to this issue, please feel free to call me at (785) 296-4347.
Sinc erely, "
Eric C. Staab, P.E.
Industrial Programs Section
Bureau of Water
ECS:espc: Northeast District Office
John Dunn, EPA Region VIIKDHE, BOW, IPS
DIVISION OF ENVIRONMENTBureau of Water - Industrial Programs Section
CURTIS STATE OFFICE BUILDING, 1000 SW JACKSON ST., STE 420, TOPEKA, KS 66612-1367Voice 785-296-5545 Fax 785-296-0086 http://www.kdhe.state.ks.us
low UNITED STATES ENVIRONMENTAL PROTECTION AGENCYREGION VII
901 NORTH 5TH STREETKANSAS CITY, KANSAS 66101
5 NOV 200
Mr. Joseph E. Werner
Senior Environmental BiologistKansas City Power and LightP.O. Box 418679Kansas City, MO 64141-9679
Dear Mr. Werner:
In your letter, dated October 18, 2006, you requested clarification on the applicability ofthe Phase 11316(b) regulations to a water intake on the Marais des Cygne River. The KansasDepartment of Health and Environment (KDHE) is the permitting authority for the NationalPollutant Discharge Elimination (NPDES) permit program in the state of Kansas. I did. someregulatory research and discussed my findings with Eric Staab with K.DHE. The KDHE agreeswith the finding that I am sharing in this letter.
The intake on the Marais des Cygne River is used on occasion to add water to La CygneLake. The La Cygne Lake was constructed as a cooling lake for the La Cygne GeneratingStation and is a Water of the State. The KCPL provided basic data on the operation of the riverintake and asserted that the intake was a water usage commensurate with a closed-cycle system,and therefore, exempt from 316(b) coverage.
The transfer of water from the Marais des Cygne River to La Cygne Lake is a transferfrom a Water of the State to another Water of the State. This is a water transfer and not a directuse of water by the powerplant. At this time, water transfers are not covered by NPDESpermitting. Recently, EPA public noticed a rulemaking which confirmed that NPDESregulations would not apply to water transfers. The public comment period has closed and therule is expected to be finalized in early 2007.
La Cygne Lake is a Water of the State, so the 316(b) rules still apply to the cooling waterintake for the La Cygne powerplant.
..... If you have questions, please callne at 913:55-7.594, 9... ...... ........
Sinc ely,
hnA. DunnEr Environmental EngineerWastewater and Infrastructure
Management Branch
cc; Eric Staab, KDHE" .JECVCLER
MB FIBER
October 18, 2006
John DunnU.S. Environmental Protection Agency, Region VII901 North Fifth StreetKansas City, KS 66101
RE: Clean Water Act 316(b) "Proposal for Information Collection"Kansas City Power & Light La Cygne Generating StationLa Cygne, Kansas
Dear Mr. Dunn:
To aid in your evaluation of Kansas City Power and Light's request to have the Maraisdes Cygne River intake exempt from Section 316(b) requirements, the followingadditional information including historical data on withdrawals and river flows isprovided, as you requested.
The La Cygne Generating.Station uses La Cygne Lake as the source and receiver ofonce-through condenser cooling water. Sometimes, water outputs from the lake exceedwater inputs. To maintain the water level in La Cygne Lake for normal plant operations,recreational use, and fish and wildlife habitat, water is occasionally pumped from theMarais des Cygne River to La Cygne Lake. If flow in the Marais des Cygnes River willnot support pumping,, then assurance releases are requested. This withdrawal issupported by the purchase of assurance storage space in Melvern and Pomona lakes.Withdrawal rates range from approximately 25.8 MGD with one pump to approximately38.7 MGD for two pumps. Historic water withdrawal rates, as reported to the KansasDepartment of Agriculture, Division of Water Resources, from the Marais des CygnesRiver were evaluated for the period of 2002 through 2005. Daily river flow data from theU.S. Geological Survey river gaging station 06915800 Marais des Cygnes River at LaCygne, Kansas were obtained for the same period. This gaging station is located whereState Highway 152 crosses the Marais des Cygnes River just west of La Cygne andapproximately 5.7 river miles upstream of the La Cygne Lake intake (Figure 1).
Monthly withdrawals from the Marais des Cygne River ranged from 0 to 1,122.41million gallons (MG) (Figure 2a) and averaged 207.44 MG. No withdrawals occurred in31 of the 48 months during this period. Concurrently, monthly flows in the Marais desCygnes River ranged from 1,162 to 274,014 MG (Figure 2b) and averaged 31,368 MG.Over the period of record, total flow in the river was 1,505,650 MG and total withdrawalwas 9,957 MG or 0.66 percent of the river's flow.
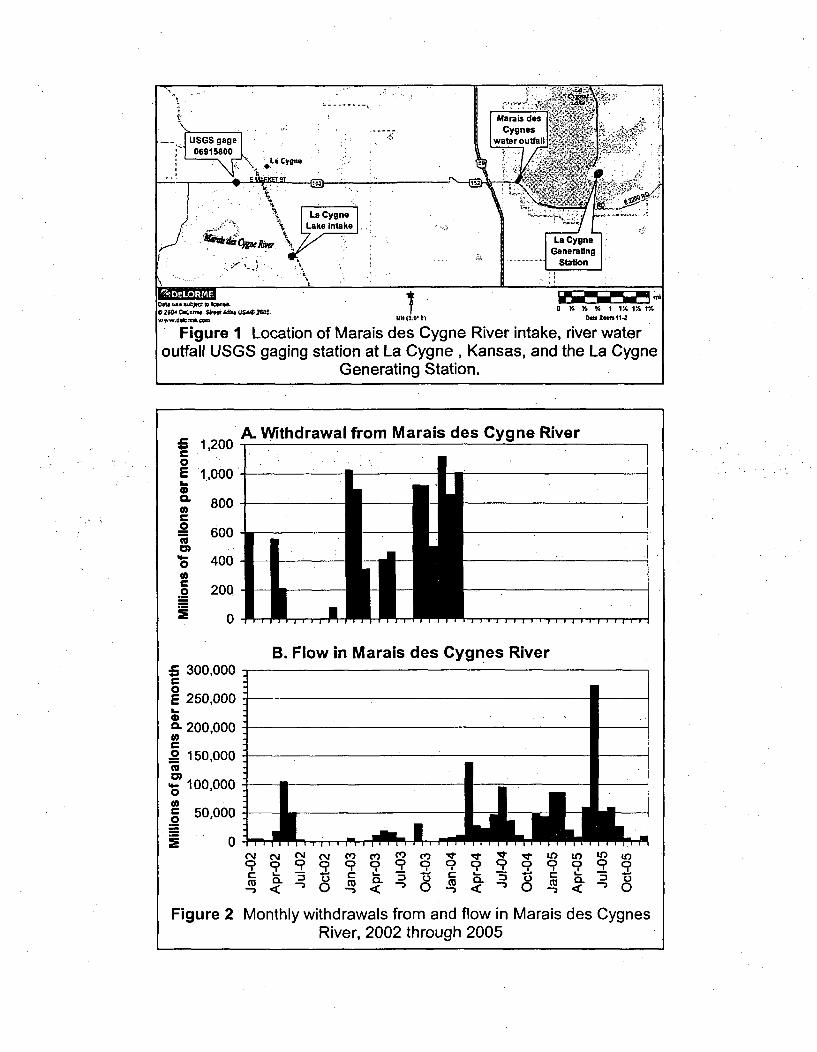
A- Withdrfawal from Marais des Cvnne River5 1,200c0E 1,ooo0=* 800"
600W
6 400
o 200
0 0
.... j• .........
300,0000E 250,000i_
L 200,0000-.2150,000
0, 5 100,000
0 S50,000
S 0
B. Flow in Marais des Cygnes River
"V N " " M M MV MV '0 V~* Vq V~ W to U) to
c 75
Figure 2 Monthly withdrawals from and flow in Marais des CygnesRiver, 2002 through 2005
The design intake rate for the cooling water intake at the La Cygne Generating Station is1,186 million gallons per day. This daily cooling water intake rate is slightly greaterthan the maximum monthly withdrawal rate from the Marais des Cygne River recordedduring 2002 through 2005 (1,122.41 MG). The maximum monthly river withdrawal rateis 3.2 percent of the monthly design cooling water intake rate (1,186 X 30 = 35,580 MG).The average Marais des Cygne River monthly withdrawal rate (207.44 MG) is only 0.6percent of the open-cycle cooling withdrawal rate. The relative amount of waterwithdrawn for closed-cycle cooling (i.e., cooling towers) is typically about 5 percent ofthat used for open-cycle (i.e., once-through) cooling. Even at the maximum rate,therefore, the withdrawal rate by Marais des Cygne River intake is commensurate with atypical closed-cycle cooling system. As such, the Marais des Cygne River intakecomplies with Section 316(b) performance standards at 40 CFR 125.94(a)(1)(i) andshould be exempt from the Section 316(b) Comprehensive Demonstration Study.
As we have previously discussed, we also wish EPA Region VII to consider the fact thatthe Marais des Cygne River intake is part of a water transfer system and that the watertransfer system was not a point source of pollution. As such, the water transfer systemand the intake are not subject to the National Discharge Pollutant Elimination System(NPDES). Because Section 316(b) regulations are administered under the NPDES, theMarais des Cygne River intake cannot be considered subject to the Section 316(b)regulations.
I hope you will find this information useful in evaluating our request to have the Mariasdes Cygne River intake exempt from Section 316(b) requirements. Please call me at 816-654-1741 if you have any additional questions regarding this request. I look forward toyour decision.
Sincerely,KANSAS CITY POWER & LIGHT
Joseph E. WernerSenior Environmental Biologist
Cc: Chris Dubinick (KCP&L)Greg Howick (Bums and McDonnell)
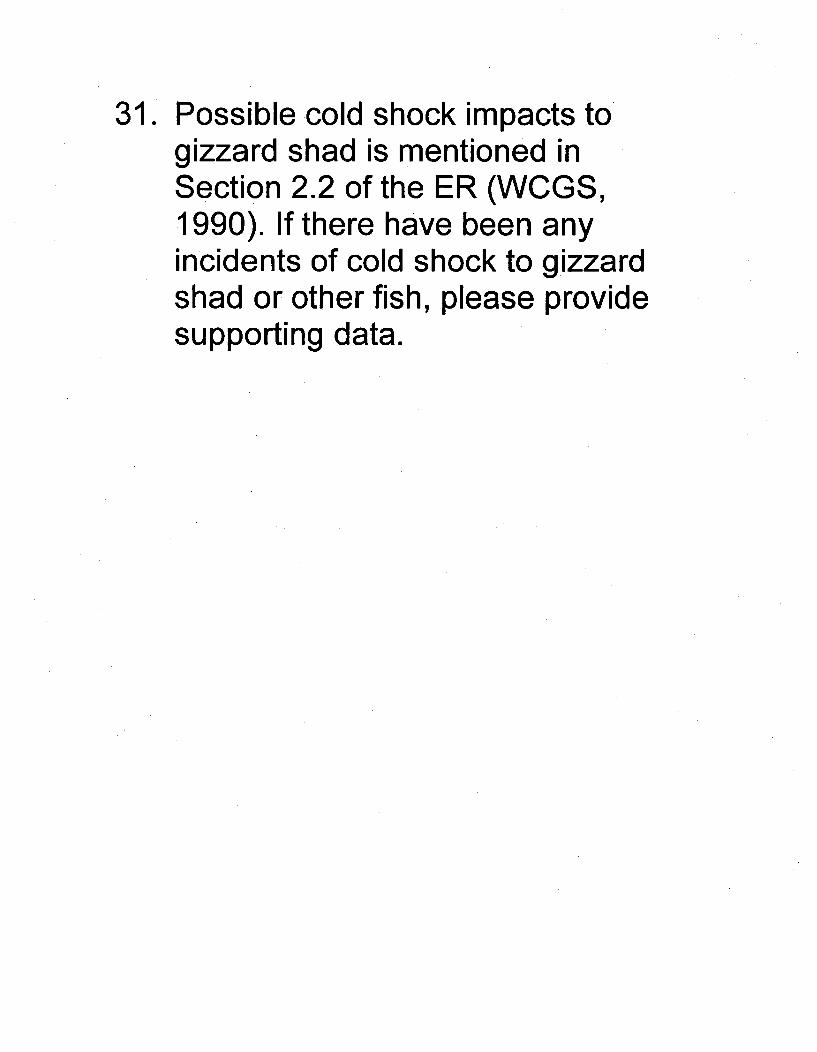
31. Possible cold shock impacts togizzard shad is mentioned inSection 2.2 of the ER (WCGS,1990). If there have been anyincidents of cold shock to gizzardshad or other fish, please providesupporting data.
Aquatic Ecology Page 2 of 3
* Drawings and a detailed description of the circulating water system/service watersystem/essential service water system.
" Discharge Monitoring Reports for the last 12 month period.
" Whole effluent toxicity testing documentation or reports conducted at the facility (and asspecified in the facilities National Pollutant Discharge Elimination Systems [NPDES]permit).
- Item D.21 of the Facilities NPDES permit states that information required by the 316(b)Phase II regulations shall be submitted to Kansas Department of Heath & Environment.(KDHE) in accordance with the dates indicated in the Phase II regulations. Pleasedescribe the steps conducted to date by WCNOC to comply with this permit requirementand provide any data collected to date in support of this submission.
" Current and historic flow records for the Neosho River.
* A statement is made in the 5th paragraph of Enclosure 2 to WM 06-0046 (November 17,2006) that the state of Kansas has not required entrainment monitoring and will notrequire it for the 316(b) determination. Please provide documentation from KDHEregarding this issue.
* Larval fish monitoring data as described in Paragraph 6 of Enclosure 2 to WM 06-0046(November 17, 2006).
- If available, information on the location of the spawning areas for the various fish
species in CCL.
* Bathymetric map of CCL.
" Available information regarding the initial stocking of CCL and subsequent stockingefforts.
• Available information regarding trends in the Neosho River fish populations.
• As discussed in Enclosure 1 to WM 06-0046 (November 17, 2006); please provide anyinformation available regarding WCNOC's stakeholder participation in the WatershedRestoration and Protection Strategy.
- Additional details regarding the detailed assessment of impingement currently beingprepared by WCNOC staff (as cited in Enclosure 3 to WM 06-0046, November 17,2006).
- Possible cold shock impacts to gizzard shad is mentioned in Section 2.2 of the ER(WCGS, 1990). If there have been any incidents of cold shock to gizzard shad or otherfish, please provide supporting data.
- Within Section 2.2 of the ER, it is noted that WCNOC develops annual fisherymonitoring reports and management plans. Please have available the most recentpublication of each of these reports.
Aquatic Ecology
Audit Needs request #63
"A mention is made in Section 2.2 of the ER (WCGS, 1990) of possible coldshock impacts to gizzard shad. Have there been any incidents of cold shock togizzard shad or other fish? If so, please provide supporting data."
The reference to possible cold shock impacts to gizzard shad as it relates to Section 2.2of the ER is unclear. The citation "WCGS 1990" could not be found in Section 2.2 of theER. There is inference in Section 2.2 of the ER (Operating License Renewal Stage) togizzard shad's vulnerability to cold shock (second complete paragraph on page 4 of 52).The inference relates to the natural mortality of gizzard shad to wintertime watertemperatures, the increased potential for impingement this may cause on the circulatingwater intake screens, and the associated operational challenges such impingement maycause.
In the circulating water discharge area of Coffey County Lake (CCL), which is influencedby thermal discharges, cold shock potential is present. This is most likely during colderwinter periods when fish are attracted into that portion of the lake. After plant shutdownsduring such times, thermal discharges stopped, which can subject fishes to potentialrapid decreases in water temperature, and cause cold shock mortality.
Such plant shutdowns have occurred during cold-water temperatures since Wolf CreekGenerating Station (WCGS) operation began. Not all resulted in cold shock mortality tofish. Each incidence of cold shock mortality that has occurred was evaluated todetermine if the event was greater than expected in the original licensing evaluation (seeFinal Environmental Statement related to the Operation of WCGS, NUREG-0878).Reviews of such evaluations were provided in the Annual Environmental OperatingReports required by Environmental Protection Plan, Appendix B to the Facility OperatingLicense.
There have been seven fish kill events attributable to cold shock influences betweenSeptember 1985 and January 2007. Copies of WCGS internal evaluations of theseevents are attached as supporting data for cold shock effects to gizzard shad and otherfish during each incident. None were considered to have greater impacts to the CCLfishery than previously evaluated.
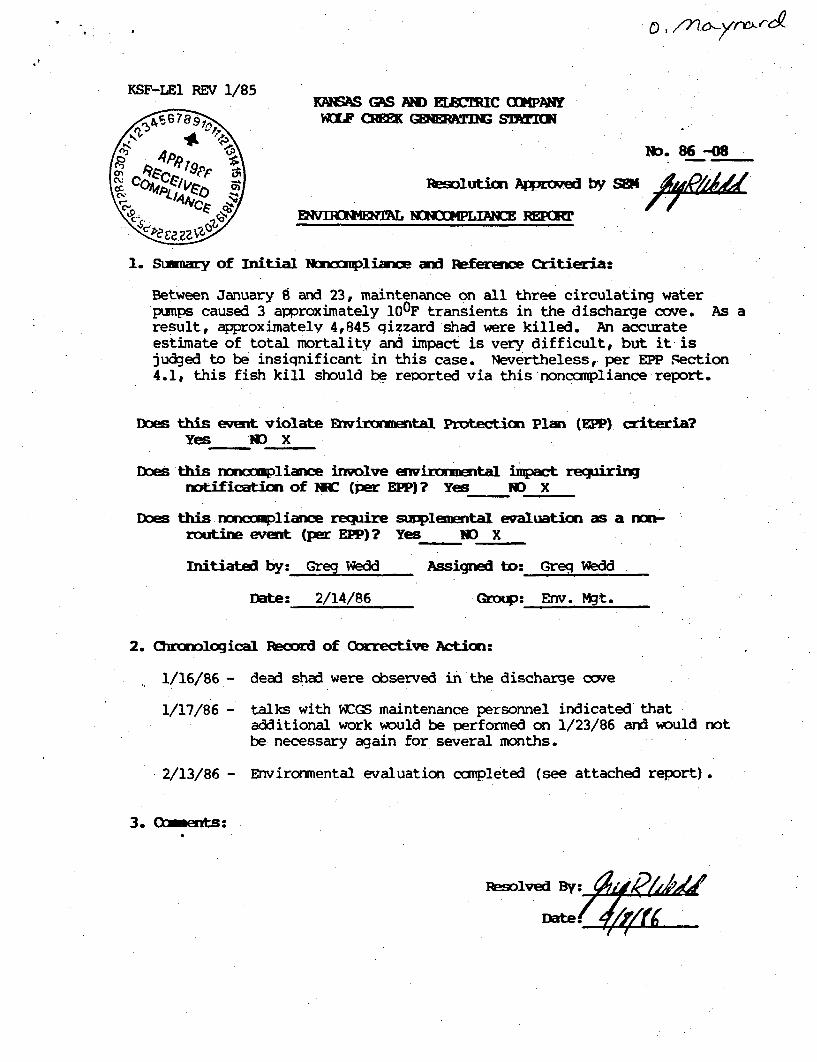
0~ /71O)ffV~kV'c~
KSF-LEl REV 1/85KANSAS GAS AND EEECTRIC COMPANY
WOLF QSK ~TDI
MD. 86 -08
Peslutian Appfyd by SE24
EN D * i N NONOOwMPLI C RmEPOR
1. Sumnary of Initial Norxrmpliance and Ieference Critieria:
Between January 8 and 23, maintenance on all three circulating waterpumps caused 3 approximately 10 0 F transients in the discharge cove. As aresult, approximately 4,845 qizzard shad were killed. An accurateestimate of total mortality and impact is very difficult, but it isjudged to be insiqnificant in this case. Nevertheless, per EPP Section4.1, this fish kill should be reported via this noncompliance report.
Does this event violate Environmental Protection Plan (EPP), criteria?Yes D X_
Dom n this fcn uplinwof involve evirnmesntal impat reqiriMrvtfi~icnof NBC (per EPP)? Yes NO) X
Does this nrncxmpliance requireruieevent (per EPP)?
Initiated by: Greg Wed
Date: 2/14/86
supplenental evaluation a a non-Yes ND X
Assigned to: Greq w%1d
GroI: Env. Mgt.
2. Chrm-logical Record of 0orrective Action:
1/16/86 -
1/17/86 -
2/13/86 -
dead shad were observed in the discharge cove
talks with WCGS maintenance personnel indicated thatadditional work would be performed on 1/23/86 and would notbe necessary again for several months.
Envirormental evaluation campleted (see attached report).
3. Comments:
esolved
D~te7
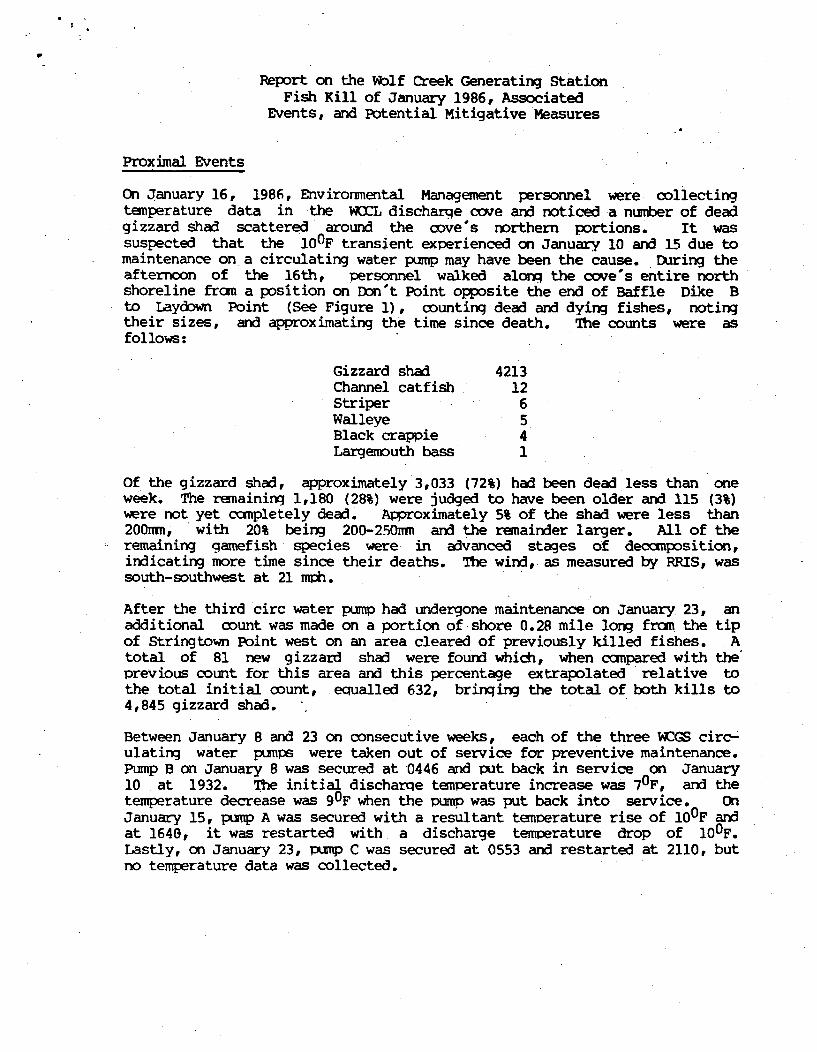
Report on the Wolf Creek Generating StationFish Kill of January 1986, Associated
Events, and Potential Mitigative Measures
Proximal Events
On January 16, 1986, Environmental Management personnel were collectingtemperature data in the WOCL discharge cove and noticed a number of deadgizzard shad scattered around the cove's northern portions. It wassuspected that the 100 F transient experienced on January 10 and 15 due tomaintenance on a circulating water pump may have been the cause. During theafternoon of the 16th, personnel walked along the cove's entire northshoreline from a position on Don't Point opposite the end of Baffle Dike Bto Laydown Point (See Figure 1), counting dead and dying fishes, notingtheir sizes, and approximating the time since death. The counts were asfollows:
Gizzard shad 4213Channel catfish 12Striper 6Walleye 5Black crappie 4Largemouth bass 1
Of the gizzard shad, approximately 3,033 (72%) had been dead less than oneweek. The remaining 1,180 (28%) were judged to have been older and 115 (3%)were not yet completely dead. Approximately 5% of the shad were less than200mn, with 20% being 200-250mm and the remainder larger. All of theremaining gamefish species were in advanced stages of decomposition,indicating more time since their deaths. The wind, as measured by RRIS, wassouth-southwest at 21 mph.
After the third circ water pump had undergone maintenance on January 23, anadditional count was made on a portion of shore 0.28 mile long from the tipof Stringtown Point west on an area cleared of previously killed fishes. Atotal of 81 new gizzard shad were found which, when compared with the'previous count for this area and this percentage extrapolated relative tothe total initial count, equalled 632, bringing the total of both kills to4,845 gizzard shad.
Between January 8 and 23 on consecutive weeks, each of the three WCGS circ-ulating water pumps were taken out of service for preventive maintenance.Pump B on January 8 was secured at 0446 and put back in service on January10 at 1932. The initial discharqe temperature increase was 70 F, and thetemperature decrease was 90 F when the pump was put back into service. OnJanuary 15, pump A was secured with a resultant temperature rise of 100 F andat 1640, it was restarted with a discharge temperature drop of 100 F.Lastly, on January 23, pump C was secured at 0553 and restarted at 2110, butno temperature data was collected.
Page 2
Environmental/Chemical Parameters
Wintertime attraction of fishes to heated discharges has been oftendocunented and was predicted to occur in the W1CL discharge cove KG&E 1981,NRC 1975, NRC 1985. Significant mortality was expected due to cold shock inthe event of a midwinter plant trip (Appendix B of the Wolf Creek operatingLicense), and is assumed that the potential for mortality due to smalltransients from operations such as pump maintenance was included in thisassessment. Gizzard shad have been shown to undergo loss of equilibrium ordeath at drops of 20 C (Agersborq 1930) and 11-13 1/2 0 C (Cox and Coutant1976). Marked temperature rises, although to a lesser degree, have alsobeen shown to cause mortality (review in Prosser and Brown 1961).Interestingly, Aqersborg (1930) noted of heat-shocked fish:
"Fish dying in this way remained for many days without decomposing,even when kept in the laboratory with ordinary room temperature,indicating, it seems, that a certain deqree of coagulation of theprotoplasm had. taken place just prior to death. Rigor uotis wasmuch more vigorous in such fish than in individuals caught aliveand left to die on land. In the latter, decomposition was veryevident on the second day."
This tends to weaken our field estimates of time-since-death, so we placelittle confidence in them.
The loss of equilibrium stage is particularly important in a discussionabout gizzard shad because lab studies indicate that it is very seldcm thatshad fully recover once this stage is reached (Cox and Coutant 1975). In alake situation such as at Wolf Creek, the probability of being washedonshore or to a zone of even colder water is high, further reducing survivalchances. Additionally, fish floating aimlessly due to cold shock have beendocumented to have a higher risk of being preyed upon (Coutant et al. 1974,Coutant et al. 1976, Wolters and Coutant 1976). Warmwater discharges havebeen often documented as winter predator attractors (Ash et al. 1974, Glassand Maughan 1985) and Wolf Creek's has concentrated larqemouth bass and allMorone species since mid-December (KG&E in prep.). Hence, an abundance ofpredators, particularly largemouth bass and striped X white bass hybrids,exists in the discharge cove.
Another environmental consideration in this assessment must be naturalmortality of shad in the discharge cove. Rouqhly 2f% of largemouth basselectroshocked behind the discharge wingwalls had bulging bellies and/or afish tail prortruding from their mouths (KG&E, in prep.) Almost withoutexception, those prey checked were gizzard shad. January largemouth basspopulati.on estimates for the immediate discharge, using the Petersen method(Everhart and Youngs 1981), were 3968 + 237,134 and 4650 + 267,676. Whilethe value of estimates with such wide Zonfidence intervals is limited, theaverage of these two numbers was used for our projections. If 4,300largemouth bass is assumed to be the population size and 20% of these weretypically full, approximately 860 bass were full at any given time. Datafran Molnar and Tolg (1962) indicated that at January dischargetemperatures, largemouth bass would digest shad-sized prey at a rate of 1per 24 hours, or a total of 860 would have been removed per day.
Page 3
Unusually warm temneratures in January were due to consistently southerlywinds. Environmental Management records indicate south-southeast to south-southwest winds throughout the weeks when pump maintenance was beingperformed. Consequently, deposition of dead fishes was considered mostprobable on the north shore of the discharge cove, where counts were made.
Environmental Impact
The total of 4,845 gizzard shad counted on the discharge cove shorelineduring the final two weeks of January pump maintenance is not a large numberby fishery management standards (Bruce NGS 1977, Ecological Analysts 1983).Winterkills of much larger maqnitude are commonplace in the midwest (Bodola1966) and seldom of concern. Based on the projection of gizzard shadpredation in the discharqe cove, the magnitude of the documented winterkillwould be exceeded in 6 days. Therefore, while the ocmbination of plant-induced, shad mortality and predation may have long-term detrimental effectson the WCCL fishery, the magnitude of the documented winterkill is believedto be the smaller camponent of this impact.
Mitigation
Measures to mitigate subsequent gizzard shad winterkills could includeefforts to reduce both the frequency of maintenance and the magnitude ofresultant transients. The need for frequent maintenance on circulatingwater pumps will decline drastically in the future due to changes in upkeepand an increase in preventative maintenance (T. Deddens, pers. comm.). Thusmaintenance will be more often performed at times of our choosing whenimpacts are least likely, such as late spring through early fall. Second,varying power level while turning pumps on or off could decrease cold andheat shock mortality by reducing the magnitude of temperature changes, butcoordination of plant systems to achieve this would be very difficult andthe benefits realized would likely be small. Thus, increasing pump'reliability, a course of action already begun, is viewed as the mostpromising mitigative measure.
Conclusion
In Wolf Creek as in many midwestern reservoirs, the gizzard shad is theprimary forage species for predatory gamefishes. But, due to their prolificnature (Cross and Colins 1975), ability to reproduce successfully withrelatively few adults (Anderson 1973), common, massive winterkills (BruceNGS 1978, Ecological Analysts 1983), and their high, natural mortality inWCCL due to discharge cove predation, this thermally-induced fish kill isjudged to be insignificant to the WCCL fishery and specifically to itsgizzard shad population.
Signature: A,, pl" _Date:
Agersborg, H. P. K., 1930. Influence of Temperature on Fish. Ecology1i:136-144.
Anderson, R. 0., 1973. Axplication of theory and research to manaqemdnt ofwarmwater fish populations. Trans. Am. Fish. Soc. 101(1):164-171.
Ash, G. R., N. E. Chymko, and D. N. Gallup, 1974. Fish kill due to a "cold-shock" in Lake Wabanun, Alberta. J. Fish. Res. Board Can. 31:1822-1824.
Bodola,,A., 1966. Life history of the gizzard shad, Dorosoma cepedianum(LeSeur), in Western Lake Erie. U.S. Fish and Wildl. Serv. FishBul.65(2) :391-425.
Bruce Nuclear Generating Station, 1977. Fish Impingement at Bruce N. G. S.Ontario Hydro, Ontario, Canada.
Coutant, C. C., H. M. Ducharme, and J. R. Fisher, JR., 1974. Effects ofcold-shock on vulnerability of juvenile channel catfish (Ictaluruspunctatus) and largemouth bass (Micropterus salmoides) to predation. J.tfsh Res. Board Con. 31:351-354.
Coutant, C. C., D. K. Cox, and K. W. Moored, Jr., 1976. Futher studies ofcold-shock effects on susceptibility of young channel catfish topredation in Thermal Ecology II, G. W. Esch and R. W. McFarlane, eds.
Cox, D. K. and C. C. Coutant, 1976. Acute cold-shock vesistance of gizzardshad in Thermal Ecology II, G. W. Esch and R. W. McFarlane, eds.
Cross, F. B. and J. T. Collins, 1975. Fishes of Kansas. Univ. of Kansas,189 pp.
Deddens, T., personal communication. Maintenance contractor, Wolf CreekGenerating Station.
Ecological Analysts, 1983. Gerald Gentleman Station Imoact Assessment ofthe 1982 Fisheries Year-Class, Sutherland Reservoir, Report to NebraskaPublic Power District, Columbus.
Everhart, W. H. and W. D. Youngs, 1975. Principles of Fishery Science, 2nded. Cornell University Press, Ithaca an 9 pp.
Glass, R. D. and 0. Eugene Maughan, 1985. Concentrated harvest of stripedbass X white bass hybrids near a heated water outlet. N. Am. J. Fish.Man. 5:105-107.
Jester, D. B. and B. L. Jensen, 1972. Life history and ecology of thegizzard shad, Dorosama cepedianum, with reference to Elephant Butle Lake.New Mexico State Univ. Aqric. Exper. Station. Res. Rep. 218. 57 pp.
Kansas Gas and Electric, 1981. Wolf Creek Generating Station EnvironmentalReport (Operating License Stage). Wichita, Kansas. 2 vols.
Kansas Gas and Electric, in preparation. Wolf Creek Generating StationFishery Monitoring Report for 1985. Wichita, Kansas.
Molnar, G. and I. Tolg, 1962. Relation between water temperature andgastric digestion of largemouth bass(Micropterus salmoides). J. Fish.Res. Board Can. 19:1005-1012.
Nuclear Regulatory Commission, 1975. Wolf Creek Generating Station FinalEnvironmental Statement (construction Phase). Washington, D.C.
Nuclear Regulatory Commission, 1985.Operating License NPF-32, Appendix
Prosser, C. L. and F. A. Brown, 1961.Saunders Co., Phila. 888 rp.
Wolf Creek Generating StationB. Washington, D.C.
Ccmparative Animal Physiology, W. B.
Wolters, W. R. and C.- C. Coutant, 1976. The effect of cold-shock on thevulnerability of young bluegill to predation in Thermal Ecology ILI, G. W.Esch and R. W. McFarlane, eds.
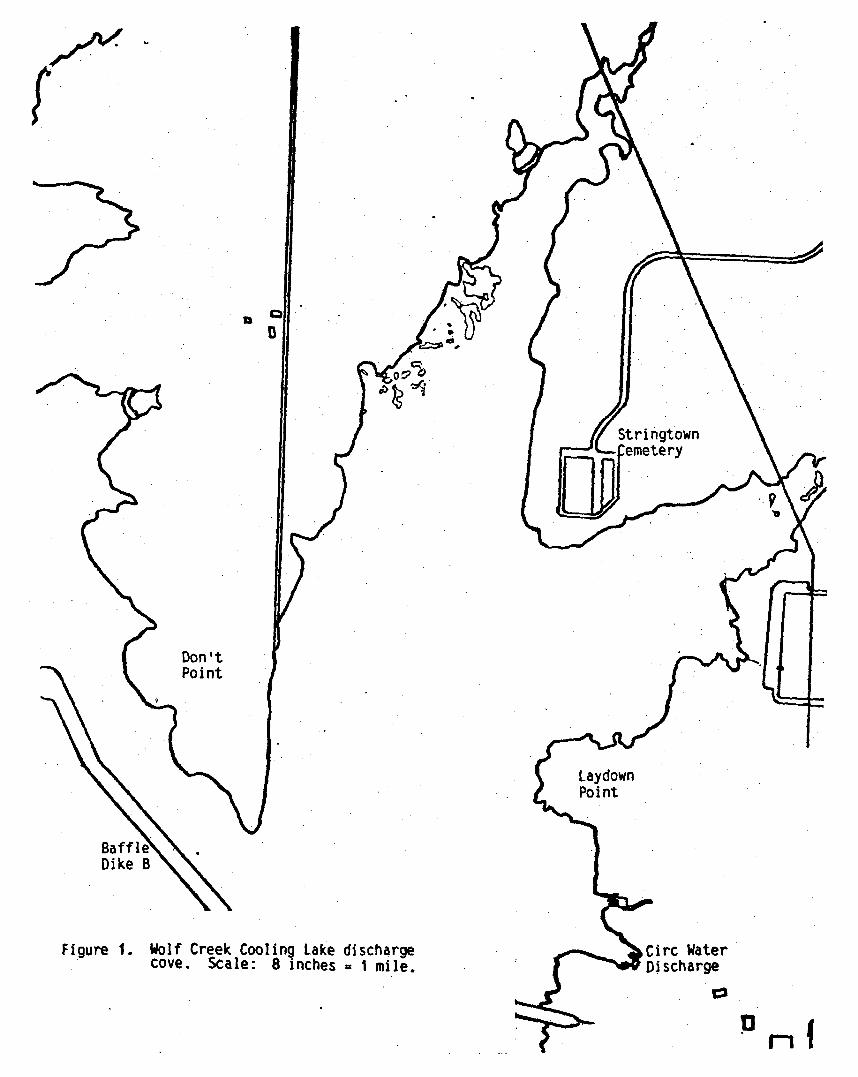
a
Don'tPoint
Dike B
Figure 1. Wolf Creek Cooling Lake discharge
cove. Scale: 8 inches = I mile.
Circ WaterDischarge
0
j] M I
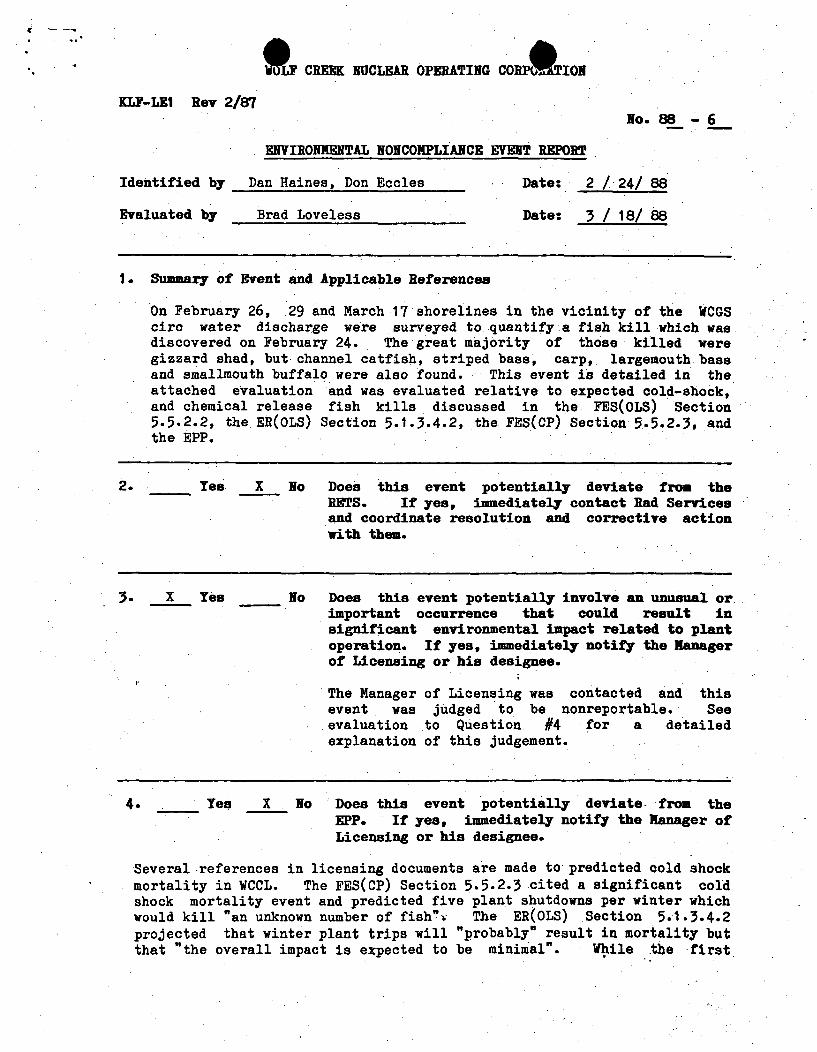
O CREEK NUCLEAR OPERATING COBPU IOI
KLF-LE1 Rev 2/87No. 88 - 6
ENVIRONMENTAL NONCOMPLIANCE EVENT REPORT
Identified by Dan Haines, Don Eccles Date: 2 /24/ 88
Date: 3 / 18/ 88Evaluated by Brad Loveless
1. Summary of Event and Applicable References
On February 26, 29 and March 17 shorelines in the vicinity of the WCGScirc water discharge were surveyed to quantify a fish kill which wasdiscovered on February 24. The great majority of those killed weregizzard shad, but channel catfish, striped bass, carp, largemouth bassand smallmouth buffalo were also found. This event is detailed in theattached evaluation and was evaluated relative to expected cold-shock,and chemical release fish kills discussed in the FES(OLS) Section5.5.2.2, the ER(OLS) Section 5.1.3.4.2, the FES(CP) Section 5.5.2.3, andthe EPP.
2. Yes X No Does this event potentially deviate from theRETS. If yes, immediately contact Rad Servicesand coordinate resolution and corrective actionwith them.
3. X Yes No Does this event potentially involve an unusual orimportant occurrence that could result insignificant environmental impact related to plantoperation. If yes, immediately notify the Managerof Licensing or his designee.
The Manager of Licensing was contacted and thisevent was judged to be nonreportable. Seeevaluation to Question #4 for a detailedexplanation of this judgement.
4. Yes X No Does thisEPP. IfLicensing
event potentially deviate from theyes, immediately notify the Manager ofor his designee.
Several references in licensing documents are made to predicted cold shockmortality in WCCL. The FES(CP) Section 5.5.2.3 cited a significant coldshock mortality event and predicted five plant shutdowns per winter whichwould kill "an unknown number of fish"v The ER(OLS) Section 5.1.3.4.2projected that winter plant trips will "probably" result in mortality butthat "the overall impact is expected to be minimal". Wh.ile the first
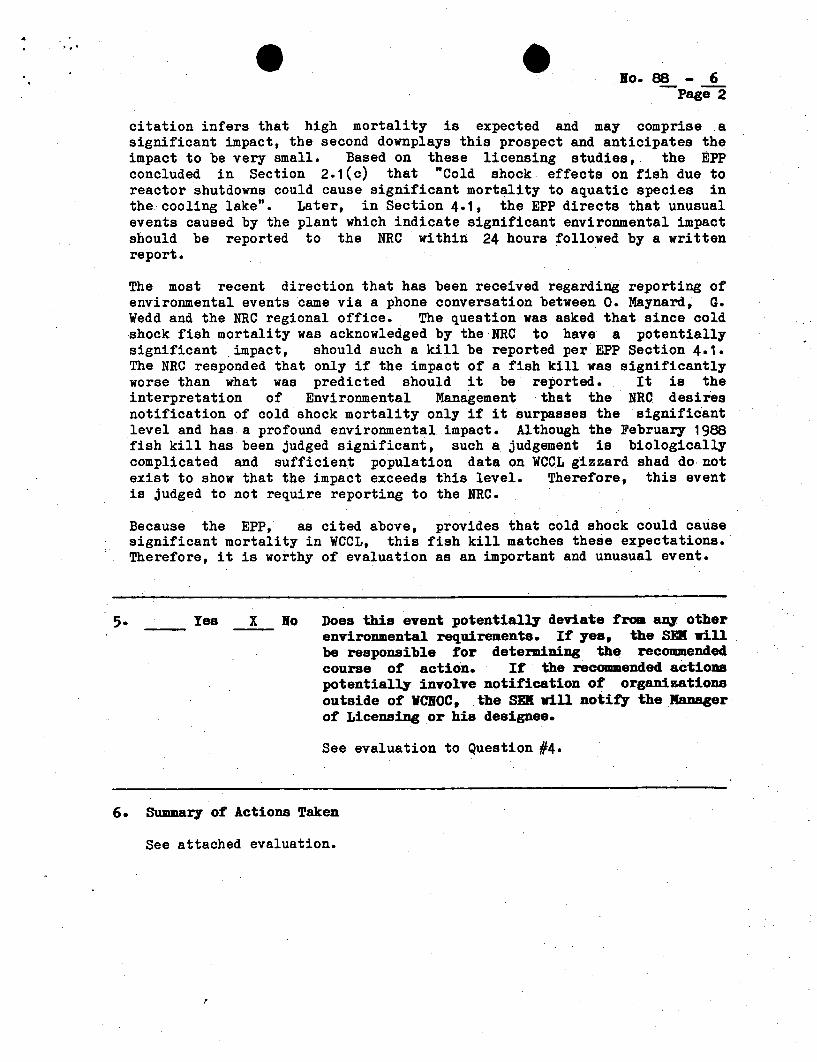
No. 88 - 6Page 2
citation infers that high mortality is expected and may comprise asignificant impact, the second downplays this prospect and anticipates theimpact to be very small. Based on these licensing studies, the EPpconcluded in Section 2.1(c) that "Cold shock effects on fish due toreactor shutdowns could cause significant mortality to aquatic species inthe cooling lake". Later, in Section 4.1, the EPP directs that unusualevents caused by the plant which indicate significant environmental impactshould be reported to the NRC within 24 hours followed by a writtenreport.
The most recent direction that has been received regarding reporting ofenvironmental events came via a phone conversation between 0. Maynard, G.Wedd and the NRC regional office. The question was asked that since coldshock fish mortality was acknowledged by the NRC to have a potentiallysignificant impact, should such a kill be reported per EPP Section 4.1.The NRC responded that only if the impact of a fish kill was significantlyworse than what was predicted should it be reported. It is theinterpretation of Environmental Management that the NRC desiresnotification of cold shock mortality only if it surpasses the significantlevel and has a profound environmental impact. Although the February 1988fish kill has been judged significant, such a judgement is biologicallycomplicated and sufficient population data on WCCL gizzard shad do notexist to show that the impact exceeds this level. Therefore, this eventis judged to not require reporting to the NRC.
Because the EPP, as cited above, provides that cold shock could causesignificant mortality in WCCL, this fish kill matches these expectations.Therefore, it is worthy of evaluation as an important and unusual event.
5-. Yes X No Does this event potentially deviate from any otherenvironmental requirements. If yes, the SEX willbe responsible for determining the recommendedcourse of action. If the recommended actionspotentially involve notification of organizationsoutside of VCNOC, the SEN will notify the Managerof Licensing or his designee.
See evaluation to Question #4.
6. Summary of Actions Taken
See attached evaluation.
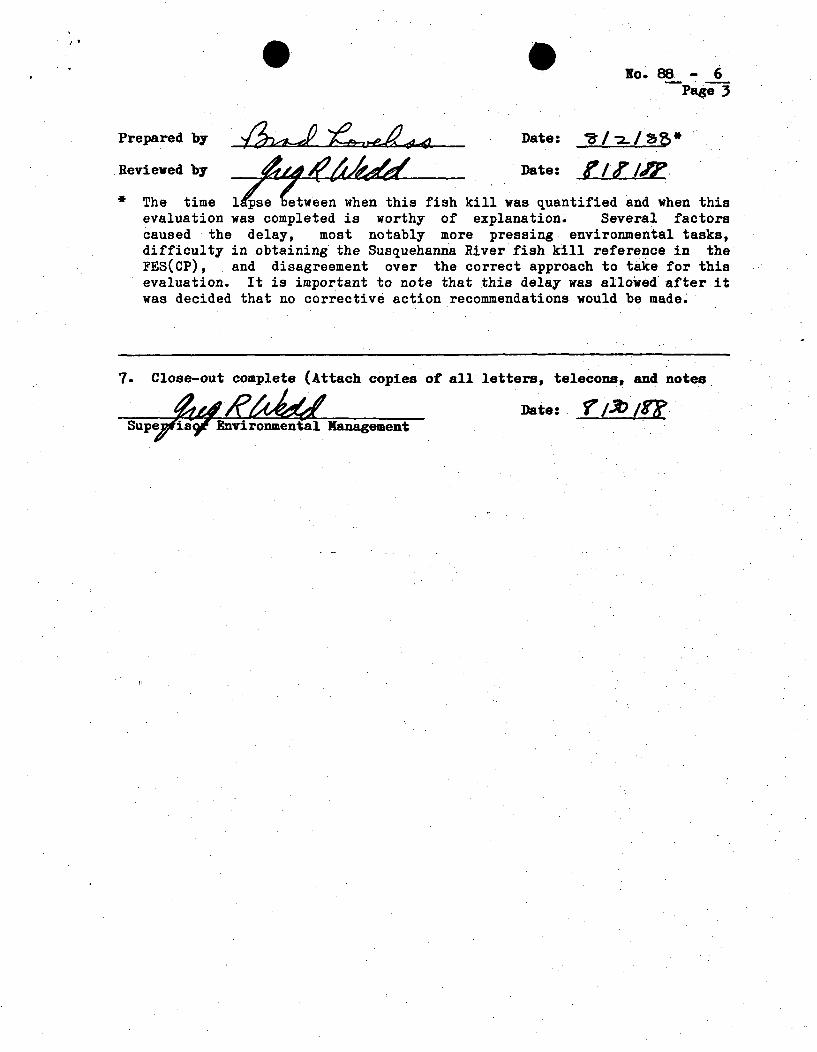
No. 88 -6
Prepared by Date: / ?i
Reviewed by Date:
The time 1Ipse etwee is fish kill was quantified and when thisevaluation was completed is worthy of explanation. Several. factorscaused the delay, most notably more pressing environmental tasks,difficulty in obtaining the Susquehanna River fish kill reference in theFES(CP), and disagreement over the correct approach to take for thisevaluation. It is important to note that this delay was allowed after itwas decided that no corrective action recommendations would be made.
7. Close-out complete (Attach copies of all letters, telecons, and notes
Date:. ____Supe~isv RnvironCenta Management
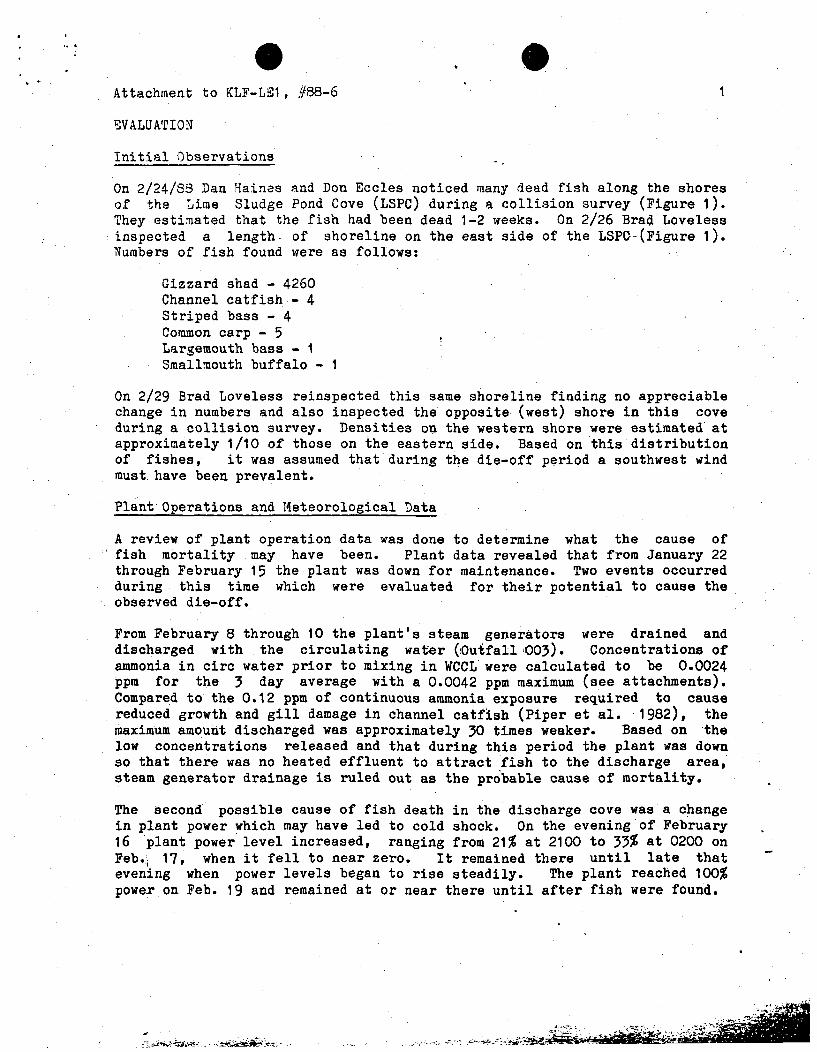
Attachment to KLF-L1I, #88-6 1
EVALUATION
Initial Observations
On 2/24/83 Dan Haines and Don Eccles noticed many dead fish along the shoresof the Lime Sludge Pond Cove (LSPC) during a collision survey (Figure 1).They estimated that the fish had been dead 1-2 weeks. On 2/26 Brad Lovelessinspected a length- of shoreline on the east side of the LSPQ-(Figure 1).Numbers of fish found were as follows:
Gizzard shad - 4260Channel catfish - 4Striped bass - 4Common carp - 5Largemouth bass - ISmallmouth buffalo - 1
On 2/29 Brad Loveless reinspected this same shoreline finding no appreciablechange in numbers and also inspected the opposite (west) shore in this coveduring a collision survey. Densities on the western shore were estimated atapproximately 1/10 of those on the eastern side. Based on this distributionof fishes, it was assumed that during the die-off period a southwest windmust have been prevalent.
Plant Operations and Meteorological Data
A review of plant operation data was done to determine what the cause offish mortality may have been. Plant data revealed that from January 22through February 15 the plant was down for maintenance. Two events occurredduring this time which were evaluated for their potential to cause theobserved die-off.
From February 8 through 10 the plant's steam generators were drained anddischarged with the circulating water (Outfall 003). Concentrations ofammonia in circ water prior to mixing in WCCL were calculated to be 0.0024ppm for the 3 day average with a 0.0042 ppm maximum (see attachments).Compared to the 0.12 ppm of continuous ammonia exposure required to causereduced growth and gill damage in channel catfish (Piper et al. 1982), themaximum amount discharged was approximately 30 times weaker. Based on thelow concentrations released and that during this period the plant was downso that there was no heated effluent to attract fish to the discharge area,steam generator drainage is ruled out as the probable cause of mortality.
The second possible cause of fish death in the discharge cove was a changein plant power which may have led to cold shock. On the evening of February16 plant power level increased, ranging from 21% at 2100 to 33% at 0200 onFeb., 17, when it fell to near zero. It remained there until late thatevening when power levels began to rise steadily. The plant reached 100%power on Feb. 19 and remained at or near there until after fish were found.
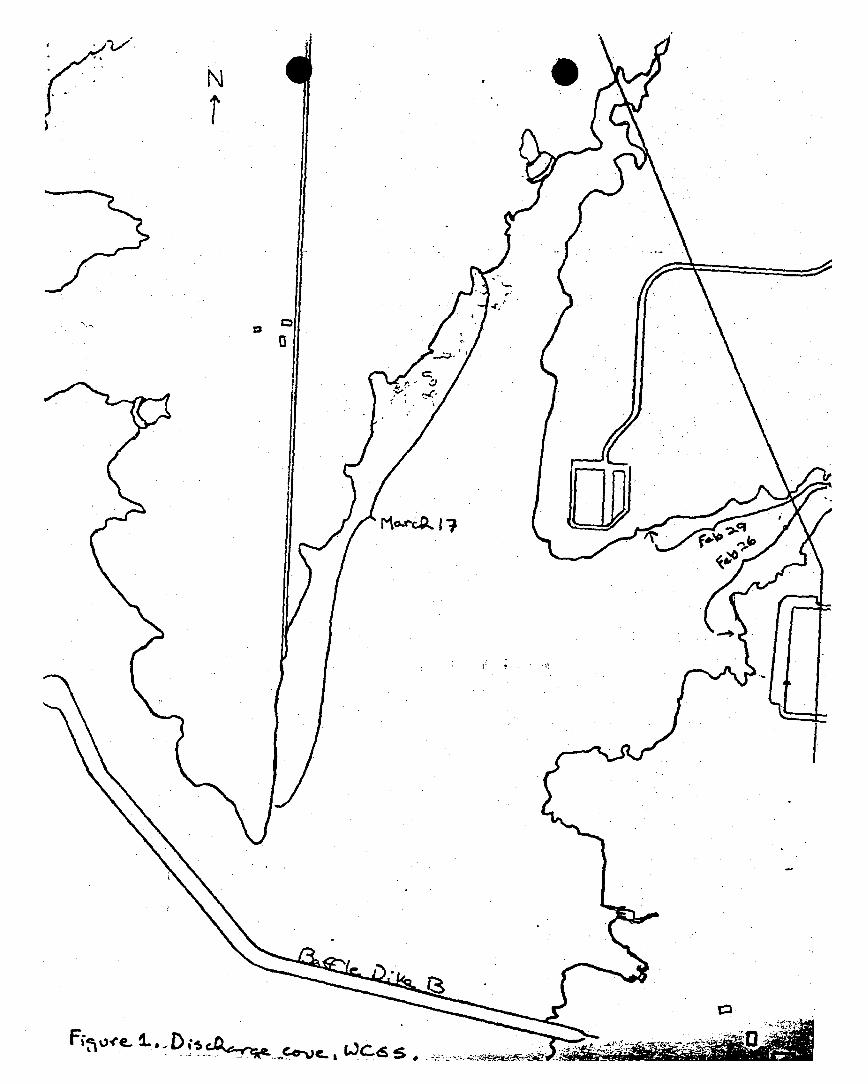
N
0
R~,f D isS
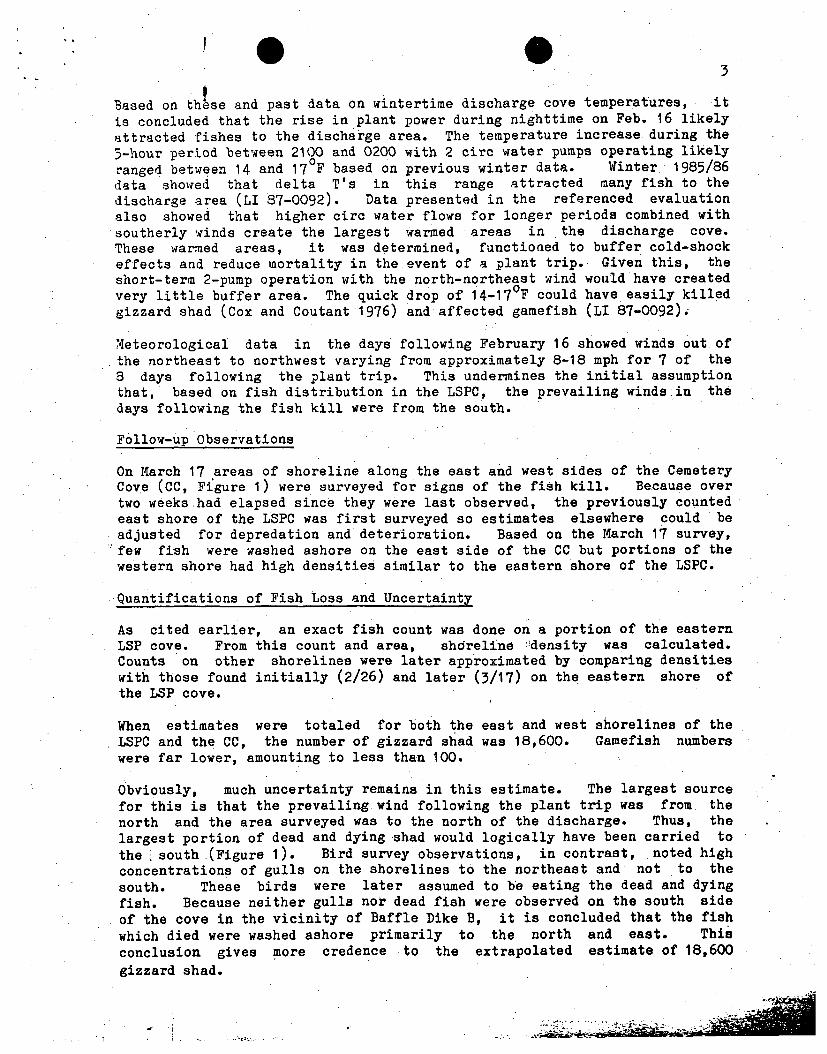
3
Based on these and past data on wintertime discharge cove temperatures, itis concluded that the rise in plant power during nighttime on Feb. 16 likelyattracted fishes to the discharge area. The temperature increase during the3-hour period between 2100 and 0200 with 2 circ water pumps operating likelyranged between 14 and 170F based on previous winter data. Winter 1985/86data showed that delta T's in this range attracted many fish to thedischarge area (LI 87-0092). Data presented in the referenced evaluationalso showed that higher circ water flows for longer periods combined withsoutherly winds create the largest warmed areas in the discharge cove.These warmed areas, it was determined, functioned to buffer cold-shockeffects and reduce mortality in the event of a plant trip. Given this, theshort-term 2-pump operation with the north-northeast wind would have createdvery little buffer area. The quick drop of 14-17OF could have easily killedgizzard shad (Cox and Coutant 1976) and affected gamefish (LI 87-0092)i
Meteorological data in the days following February 16 showed winds out ofthe northeast to northwest varying from approximately 8-18 mph for 7 of the8 days following the plant trip. This undermines the initial assumptionthat, based on fish distribution in the LSPC, the prevailing winds in thedays following the fish kill were from the south.
Follow-up Observations
On March 17 areas of shoreline along the east and west sides of the CemeteryCove (CC, Figure 1) were surveyed for signs of the fish kill. Because overtwo weeks had elapsed since they were last observed, the previously countedeast shore of the LSPC was first surveyed so estimates elsewhere could beadjusted for depredation and deterioration. Based on the March 17 survey,few fish were washed ashore on the east side of the CC but portions of thewestern shore had high densities similar to the eastern shore of the LSPC.
Quantifications of Fish toss and Uncertainty
As cited earlier, an exact fish count was done on a portion of the easternLSP cove. From this count and area, shoreline ;density was calculated.Counts on other shorelines were later approximated by comparing densitieswith those found initially (2/26) and later (3/17) on the eastern shore ofthe LSP cove.
When estimates were totaled for both the east and west shorelines of theLSPC and the CC, the number of gizzard shad was 18,600. Gamefish numberswere far lower, amounting to less than 100.
Obviously, much uncertainty remains in this estimate. The largest sourcefor this is that the prevailing wind following the plant trip was from thenorth and the area surveyed was to the north of the discharge. Thus, thelargest portion of dead and dying shad would logically have been carried tothe, south (Figure 1). Bird survey observations, in contrast, noted highconcentrations of gulls on the shorelines to the northeast and not to thesouth. These birds were later assumed to be eating the dead and dyingfish. Because neither gulls nor dead fish were observed on the south sideof the cove in the vicinity of Baffle Dike B, it is concluded that the fishwhich died were washed ashore primarily to the north and east. Thisconclusion gives more credence to the extrapolated estimate of 18,600gizzard shad.
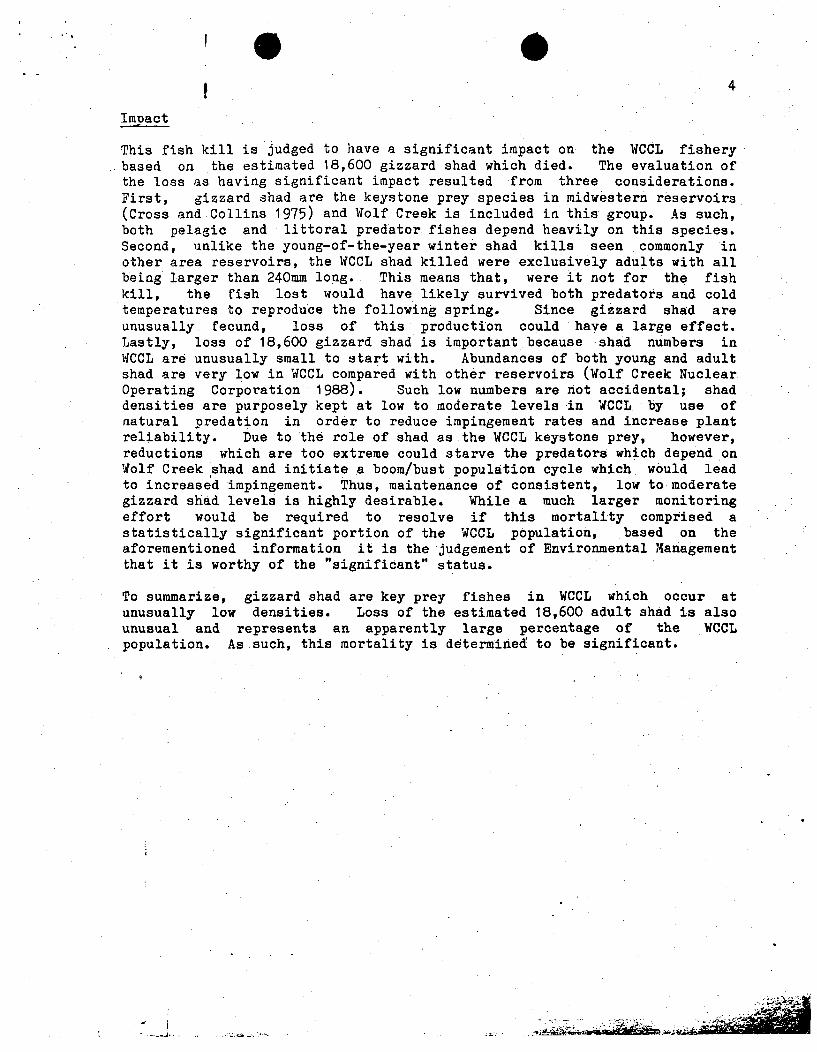
4
Impact
This fish kill is judged to have a significant impact on the WCCL fisherybased on the estimated 18,600 gizzard shad which died. The evaluation ofthe loss as having significant impact resulted from three considerations.First, gizzard shad are the keystone prey species in midwestern reservoirs(Cross and Collins 1975) and Wolf Creek is included in this group. As such,both pelagic and littoral predator fishes depend heavily on this species.Second, unlike the young-of-the-year winter shad kills seen commonly inother area reservoirs, the WCCL shad killed were exclusively adults with allbeing larger than 240mm long. This means that, were it not for the fishkill, the fish lost would have likely survived both predators and coldtemperatures to reproduce the following spring. Since gizzard shad areunusually fecund, loss of this production could have a large effect.Lastly, loss of 18,600 gizzard shad is important because shad numbers inWCCL are unusually small to start with. Abundances of both young and adultshad are very low in WCCL compared with other reservoirs (Wolf Creek Nuclear.Operating Corporation 1988). Such low numbers are not accidental; shaddensities are purposely kept at low to moderate levels in WCCL by use ofnatural predation in order to reduce impingement rates and increase plantreliability. Due to the role of shad as the WCCL keystone prey, however,reductions which are too extreme could starve the predators which depend onWolf Creek shad and initiate a boom/bust population cycle which. would leadto increased impingement. Thus, maintenance of consistent, low to moderategizzard shad levels is highly desirable. While a much larger monitoringeffort would be required to resolve if this mortality comprised astatistically significant portion of the WCCL population, based on theaforementioned information it is the judgement of Environmental Managementthat it is worthy of the "significant" status.
To summarize, gizzard shad are key prey fishes in WCCL which occur atunusually low densities. Loss of the estimated 18,600 adult shad is alsounusual and represents an apparently large percentage of the WCCLpopulation. As such, this mortality is determined to be significant.
5
Citation
Cross, F. B. and J. T. Collins. 1975. Fishes in Kansas. University ofKansas Publications, Lawrence. 189 pp.
Piper, R. G., I. B. McElwain, L. E. Orme, J. P. McCraren, L. G. Fowler andJ. R. Leonard. 1982. '-'ish Hatchery Management. United States Fish andWildlife Service, Washington, D. C. 517 pp.
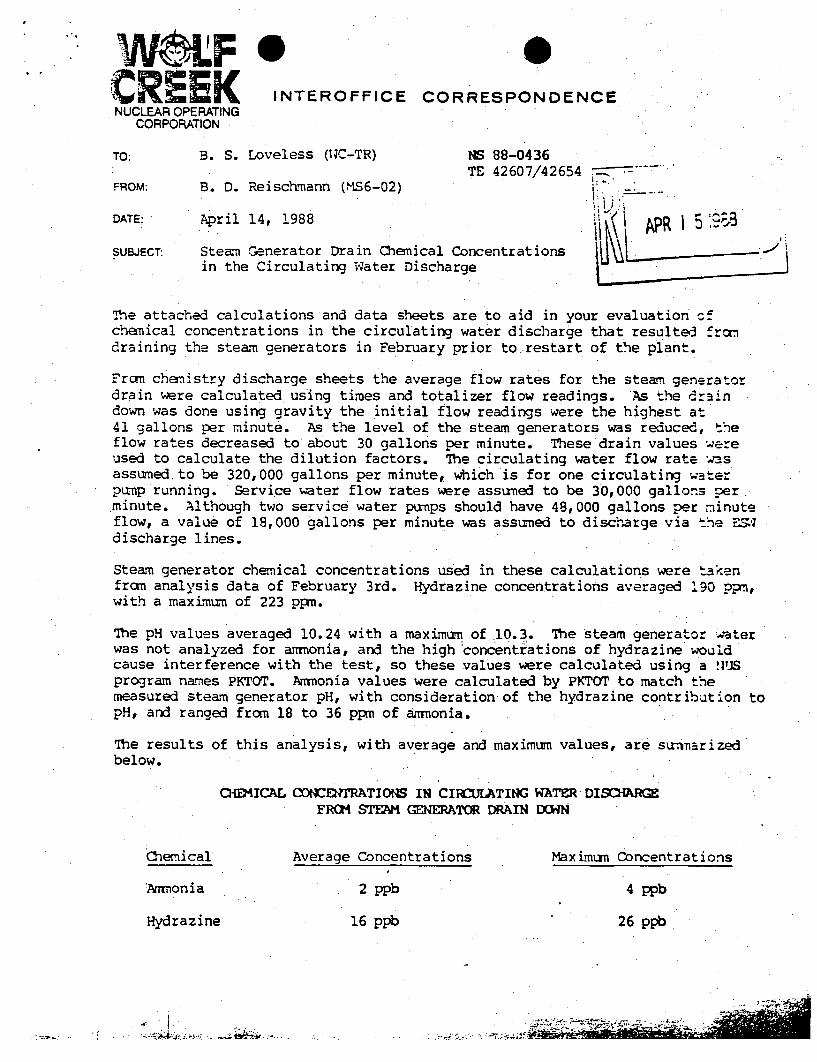
MMLFCREEK, INTEROFFICENUCLEAR OPERATING
CORPORATION
0CORRESPONDENCE
TO:
FROM:
DATE:
B. S. Loveless (I;C-TR)
B. D. Reischrnann (MS6-02)
April 14, 1988
NS 88-0436TE 42607/42654
I A' PR>ncentrations - ite
SUBJECT: Steam Generator Drain Chemical Ccin the Circulating W..ater Discharc
The attached calculations and data sheets are to aid in your evaluation 5fchemical concentrations in the circulating water discharge that resulted fromdraining the steam generators in February prior to restart of the plant,
From chemistry discharge sheets the average flow rates for the steam generatordrain were calculated using times and totalizer flow readings. As the draindown was done using gravity the initial flow readings were the highest at41 gallons per minute. As the level of the steam generators was reduced, theflow rates decreased to about 30 gallons per minute. These drain values wereused to calculate the dilution factors. The circulating water flow rate wasassumed.to be 320,000 gallons per minute, which is for one circulating water.pumnp running. Service 6ater flow rates were assumed to be 30,000 gallons per,.minute. Although two service water pumps should have 48,000 gallons per minuteflow, a value of 18,000 gallons per minute was assumed to discharge via the E91discharge lines.
Steam generator chemical concentrations used in these calculations were takenfrom analysis data of February 3rd. Hydrazine concentrations averaged 190 ppm,with a maximum of 223 ppm.
The pH values averaged 10.24 with a maximum, of 10.3. The steam generator --4terwas not analyzed for ammonia, and the high concentrations of hydrazine wouldcause interference with the test, so these values were calculated using a !VISprogram names PKTOT. Amionia values were calculated by PKTOT to match the,measured steam generator pH, with consideration of the hydrazine contribution topH, and ranged from 18 to 36 ppm of ammonia.
The results of this analysis, with average and maximum values, are su, narizedbelow.
CHEMICAL COWErRATIONS IN CIRCULATING WATER DISCHARGEFROM STEAM GENERAOR DRAIN D(WN
Chemical
Ammon ia
Hydrazine
Average Concentrations Maximum Concentrations
2 ppb
16 ppb
1 4 ppb
26 ppb
K .~:--. r~.- ý X "I
Page TwoNS 88-043(3April 14, 1983
9
If more. information is required on this project please contact me.
BDR,,bjh
/)~t
Attachments
cc: R. L. L~ogsdon (CC-.CH), %</a
L. K. Loney (IMS6-02), w/a
C. A. Swartzendruber (MS6-02),
w/a
J. D. Ziesenis (WC-CH), w/a
Records Managenent (WC-MS), w/a
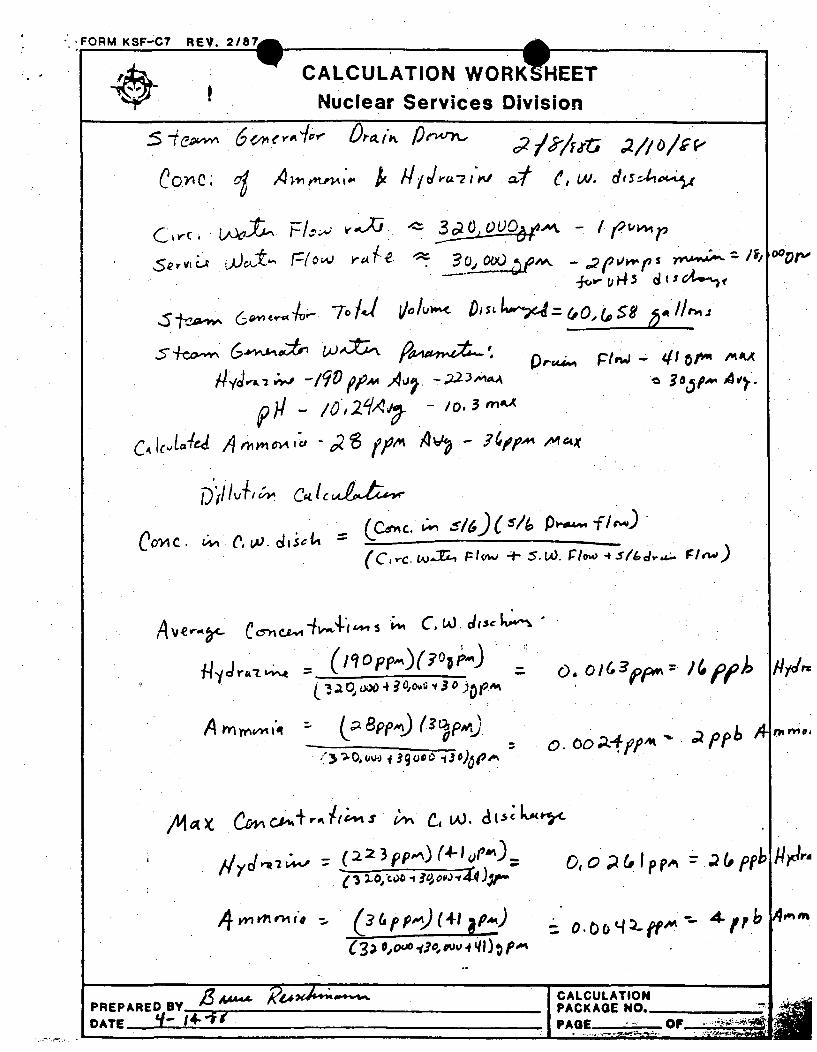
,FORM KSF-C7 REV. 2/87
-~ CAL.CULATION WORKYHEET1Nuclear Services Division
6 rev V-p-~ pnrn .2/?/Fri5 .21101,Fk
0 o1 e; A ,.ti~.' ic A//dhccZI,4., ~27~ (~ 44,1.
CV*c, - F/.:ý.ýý r--Z 3~OVV%(.M. -
s~t~w~ ~ 7 6/ 1 o41~ -" D)SLLw-x4=&Q(,t5y_5/ri
ýoor-
- -0,2tA,- - /0. 3 m"
D ',J,,,.: •" tl A q'
C, I&A.4ej A.4 . -, " 4- t
)I / ./J-,,ýý C~( (CLJJALti')4
Co" c. - L , w. dItcLi (CC C.&c , SM.. )fcn / P5 -- -f/, .)
( C, -C . •,.• tow W ,, - . POW •71:a, ,. -,
A ve UC,nC , iv•V 'ý , 'o.-5 ; CW.J di ,, ,'-%Jram- ... ,;e. = (nope)? ov ,",
LO.•ao, oo.io,o.a., 3 o.)De.,cX Opj~i~~ ~4po%
A rnm, , - (y 8p~it~) (~pA~Uo. ooe, 2fp " Ipp6 A-I ,,,V
/4,x X C&qC%+rth" 600h w JS Co u",I.
-7(223epp,)(4-10 eMY..= ('.3 2 €O,~)O p .V4,)_+1
' 03; ,000, y.a , r.,, .4 qI ), #,,
&,O~(iIppA
- ~ 4jpb
ýdl
I'fi
APREPARED BYDATE _,M. 19
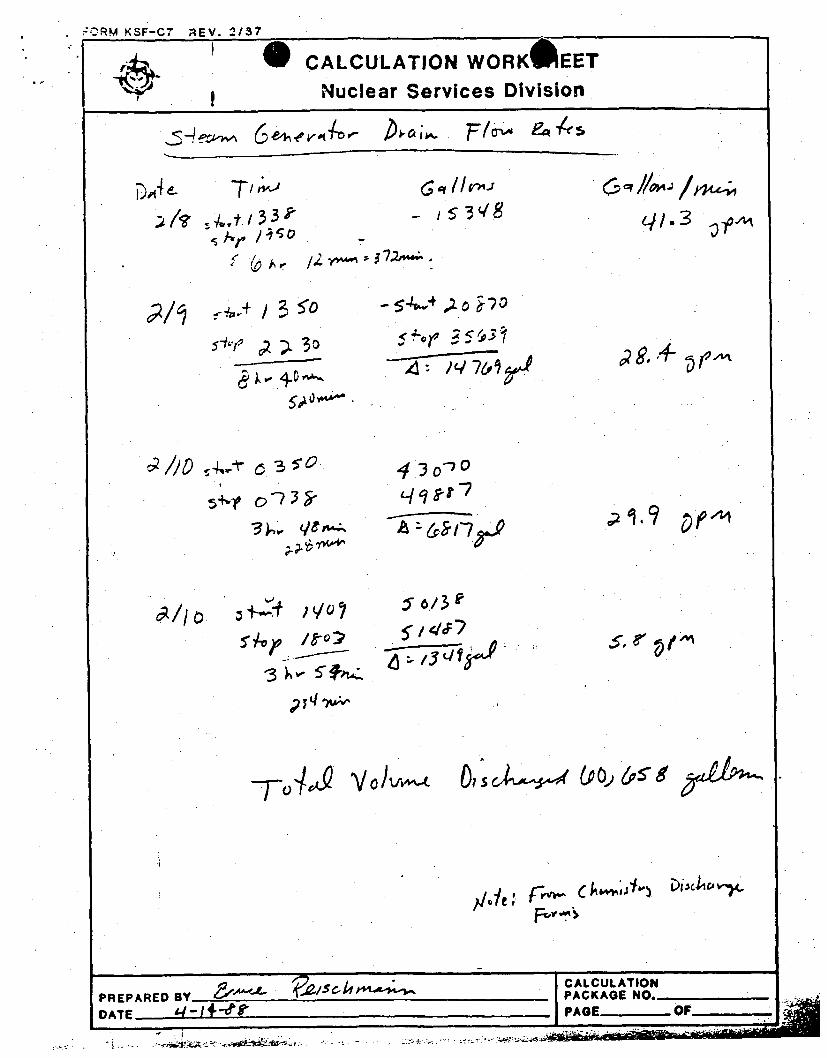
-'RM KSF-C7 REV. 2/37
*0 CALCULATION WORKOEET
Nuclear Services Division
54~~v w -e V 'tD~ k F/0''e~
GS iy10 /,•/'• 5)441./33I-)*7/,,I;O .
/3•0.. ,-÷ t5 '
-4: q 7& 1
~/~o ~4~A
~
~v f~2LS )~~- :s-f~~~
430-70qqil 7
A r7rf
.704J.,V 0 ) vw-t LI
gd: Fr~ v-qýV~id tcv~
PREPARED By .DATE i/-Id-g'fr
CALCULATIONPACKAGE NO..PAGE OF
---. 4
J .. mm
U -

I.
1
.. ,H 3
- ~ *
I.•
9-
35..
p.
I . .*.
4
5A4
vt-
5A, C
I. . . . . . --
* ~:- .2~-4..:- .i~
34.A~Jc7.4. . . ."- ~.-..
*1m *2
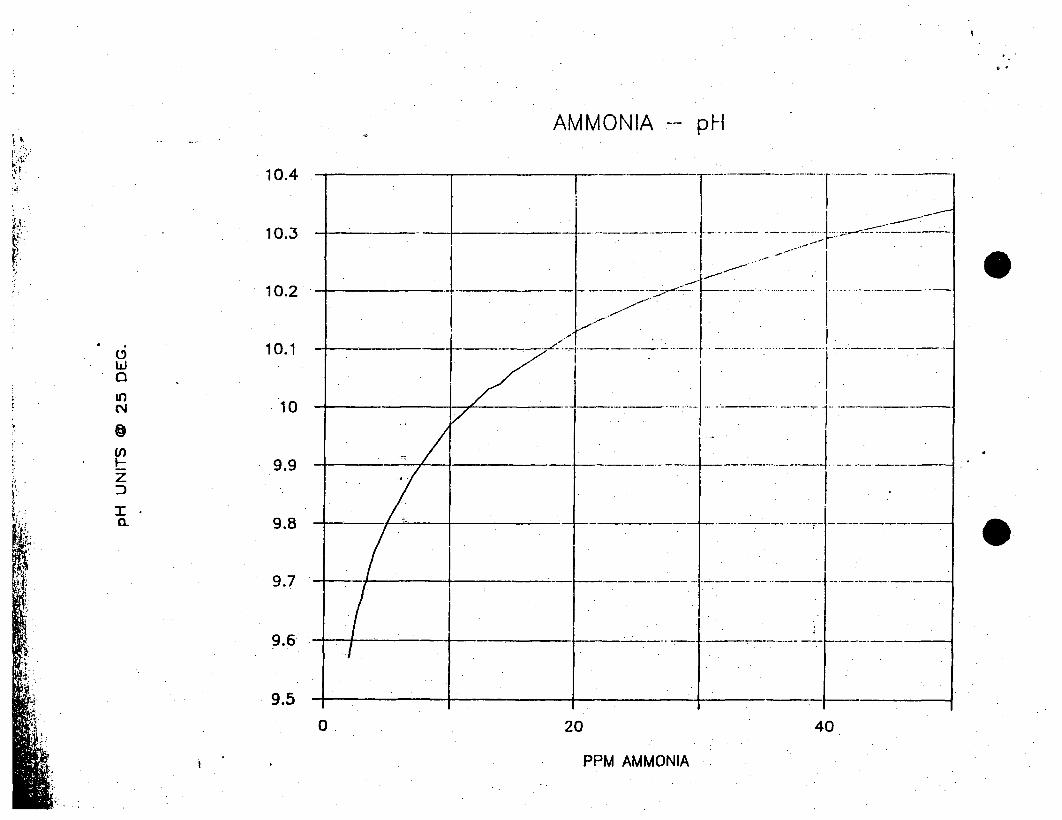
AMMONIA -- pH
10.4
6 ~~~~10.3 __
_
<,1
10•s
hi
0U,
I9.
- 9.6a.9.8
-
-- _ __
_
9.7 -__ _ _
9.540 . 20 40
i PPM AMMONIA
.W6LFCREEKNUCLEAR OPERATING
CORPORATION
INTEROFFICE CORRESPOND!
TO: G. R. Wedd (WC-TR) LI 88-0399
FROM: 0. L. Maynard (WC-LI)
DATE: August 29, 1988
SUBJECT: Environmental Noncompliance Event Report #88-6
The purpose of this letter is to document the reportability determinationassociated with the subject report. This letter, along with the attachedjustification, should be included with the record copy of EnvironmentalNoncompliance Event Report #88-6.
My evaluation of the subject report concluded that. the event is notreportable pursuant to the EPP. The attachment provides the justificationand rationale for this conclusion.
OLM/jad
Attachment
cc: B. S. Loveless (WC-TR), w/aRecords Management (WC-MS), w/a
Attachment to LI 88 9Page 1 of 3
REPORTABILITY DETERMINATIONFOR
ENVIRONMENT.NONCOMPLIANCE EVENT REPORT 88-6
As a result of a recent cold shock mortality event at Wolf Creek, anEnvironmental Noncompliance Event Report was initiated in accordance withKP-LE-2202 to document and control the evaluation of the event. TheEnvironmental Biologist identified that the event could potentially bereportable as an unusual or important occurrence relative to theEnvironmental Protection Plan. The Manager of Licensing was subsequentlycontacted in accordance with KP-LE-2202 to determine whether or not theevent was reportable to the Nuclear Regulatory Commission. The Manager ofLicensing reviewed the event report, Licensing documents, and regulations inorder to determine reportability. The evaluation concluded that the eventdid not constitute a noncompliance and the event was not reportable pursuantto NRC requirements.
Evaluation
Noncompliance
Environmental Management procedure. KP-LE-2202 defines an EnvironmentalNoncompliance as "an event or occurrence that results in an environmentalcondition which deviates form the project environmental requirements". Thefollowing documents were reviewed to determine the project environmentalrequirements relative to cold shock mortality in Wolf Creek Cooling Lake:
- WCGS Environmental Report
- NUREG-75/096 "Final Environmental -Statement related to theconstruction of Wolf Creek Generating Station"
- WCGS Environmental Report OLS
- NUREG 0878 "Final Environmental Statement related to the operationof Wolf Creek Generating Station"
- Letter KMLNRC 84-210 dated December 3, 1984 from G. L. Koester toH. R. Denton which transmitted the proposed Environmental ProtectionPlan
- WCGS Operating License NPF-42
All of the above Licensing documents provide a consistent position relativeto cold shock mortality. The Wolf Creek documents and correspondenceidentify the fact that plant transients during the winter months will likelyresult in a significant number of fish killed but large mortality will notresult in significant impact to the environment.
Attachment to LI 88& 9Page 2 of 3
The NRC documents and correspondence acknowledge the cold shock mortalityand agree that it would not have a significant impact on the environment.
During the review of the above documents,, there were no environmentalrequirements identified from which this event deviates. Therefore, thisevaluation concluded that the event did not constitute an "EnvironmentalNoncompliance" as defined in KP-LE-2202.
It should be noted that although this event did not appear to be an"Environmental Noncompliance", the Environmental Noncompliance Event Reportis an appropriate mechanism for documenting the event and the associatedevaluation.
Reportability
Although the above evaluation concluded that the event did not constitute anoncompliance, the event was evaluated for reportability relative toEnvironmental Protection Plan (EPP) section 4.1 Again, the same Licensingdocuments and correspondence were reviewed to determine the regulatoryrequirements and overall environmental significance relative to the subjectevent. For convenience EPP section 4.1 is provided below:
4.1 Unusual or Important Environmental Events
Any occurrence of an unusual or important event that indicates orcould result in significant environmental impact casually related toplant operation shall be recorded and promptly reported to the NRCwithin 24 hours followed by a written report per Subsection 5.4.2.The following are examples: excessive bird impaction events, onsiteplant or animal disease out breaks, mortality or unusual occurrence ofany species protected by the Endangered Species Act of 1973, fishkills, increase in nuisance organizms or conditions, and unanticipatedor emergency discharge of waste water or chemical substances.
No routine monitoring programs are required to implement thiscondition.
The question of which fish kills are reportable and which ones are not hasbeen raised in the past. Since there were differing interpretations of thereportability requirements relative to fish kills, a telephone conferencewas held with the NRC Project Manager (Paul O'Connor) and an. NRCEnvironmental reviewer in 1987 to discuss the reporting requirements. TheNRC's interest in having events reported is to be made aware of any unusualor important environmental occurrence relating to plant operation that couldhave a significant environmental impact that had not been reviewed orconsidered as part of the licensing process. Therefore, fish killsresulting from thermal shock would not be reportable as long as the eventwas limited to the Wolf Creek Cooling Lake and did not involve anyendangered species. However, fish kills of even small magnitude on theNeosho River, Wolf Creek, or John Redmond would be reportable. Thisdifferentation is made because the NRC concluded that cold shock mortalitywas acceptable in part because it would be limited to the cooling lake.

Attachment to LI 880 9Page 3 of 3
In considering the reportability relative to EPP section 4.1 it iS importantto consider several factors. Wolf Creek Cooling Lake was constructed by theproject for the sole purpose of providing cooling for the plant. Thefishery has been developed to enhance, plant availability by minimizingimpingment potential. While cold shock mortality could potentially alterthe fishery in the cooling lake, it will not adversely impact any of thepublic or other surrounding waters and fisheries. Therefore, a significantcold shock mortality in Wolf Creek Cooling Lake does not result in apotentially significant environmental impact unless it impacts other bodiesof-water or endangered species.
In conclusion, this evaluation determined that the subject event was notreportable for the following reasons:.
- The event was limited to WCCL, and
- The event was within the scope of what had been previously reviewedand found environmentally acceptable in the Licensing process, and
- No endangered species were involved.
This evaluation is consistent with the guidance obtained from the NRC onprevious occurrences.
0 0WOLF CREU• NUCLEAR OPERATING CORPORATION
Inl-LuI Rev 2187No. 8_9_. 2
ENVIRONMENTAL NONCGMPLIANCE EVENT REPORT
Identified by Brad Loveless Date: 2 1 2 89
Date: 2 1 7 89Evaluated by Brad Loveless
1. Summary of Event and Applicable.References
On Feb. 2, 1989 at 1321 the plant tripped from 100X power. Before andafter the trip, two circ water pumps were running leading to a delta Tof aproximately 38 F. Previously and for the next two days, the windwas strong (10-20 mph) and from due north. On the third day, wind beganto shift slightly to the west and by the fourth day, it was from 3000.Temperatures during these days ranged from -10OF to 200F. On Feb.3 inthe evening WCGS began to ascend in power, returning to 100 power onFeb. 4. On the day after the trip, Feb. 3, morning and afternoon fishcounts were done. At these times wind and wave action made observationsdifficult, but estimates of approximately 500 shad and very few otherspecies were made based on visible fish washed up on Baffle Dike B. OnFeb. 6 at 1000 a follow-up survey was done. Estimates of 400 conmmoncarp, 100 smallmouth buffalo and 1200-3000 gizzard shad were made. Allcarp and buffalo were found on the west leg of the dike with all shadfound on the eastern leg. Additionally, approximately ten walleye werekilled and washed up on the baffle dike during this time. Observationswere still difficult due to heavy ice cover. Our observations indicatedthat very few fish had been scavenged up until our Feb. 6 survey and dueto the strong north winds, we believe that nearly all fish killed by thefalling temperatures were blown onto the north side of Baffle Dike B.
•2. Yes X No Does this event potentially deviate from theRETS. If yes, Immediately contact Rad Servicesand coordinate resolution and corrective actionVith them.
3. Yes X No Does this event potentially involve an unusual or
important occurrence that could result insignificant enviromoental impact related to plantoperation. If yes, Immediately notify the Managerof Licensing or his designee.
Letter LI 88-0399 from 0. Maynard to G. Weddprovides a determination that fish kills in WCCLdue to thermal shock are neither reportable nor dothey constitute an environmental noncompliance.
4. Yes X No Does this event potentially deviate from theEPP. If yes, immediately notify the Manager ofLicensing or his designee.
6
Page 2 No. 89 -2
5. Yes X No Does this event potentially deviate fro any otherenvironmental requirements. If yes, the SE1 willbe responsible for. determining the recomendedcourse of action. If the recommended actionspotentially involve notification of organizationsoutside of VCNOC, the SE1 will notify the Managerof Licensing or his designee.
6. Summary of Actions Taken
Prepared by 7_ / A P- . .d Date: .2-3.1 .L
Reviewed by 49 ; 4/1'44ý" Date: _ _10 _ q
7. Close-out complete (Attach copies of all letters, telecons, and notes
Supervi r vironmental ManagementDate: cltO ic;"
W6 °LFCREEKNUCLEAR OPERATING
CORPORATION
INTEROFFICE CORRESPONDI
TO: G. R. Wedd (WC-TR) LI 88-0399
FROM: 0. L. Maynard (WC-LI)
DATE: August 29, 1988
SUBJECT: Environmental Noncompliance Event Report #88-6.
The purpose of this letter is to document the reportabilityassociated with the subject report. This letter, along withjustification, should be included with the record copy ofNoncompliance Event Report #88-6.
determinationthe attachedEnvironmental
My evaluation of the subject report concluded that the event is notreportable pursuant to the EPP. The attachment provides the, justificationand rationale .for this conclusion.
OLM/j ad
Attachment
cc: B. S. Loveless (WC-TR), w/aRecords Management (WC-MS) wv/a
Attachment to LI 88 9Page 1 of 3
REPORTAB ILITY DETERMINATIONFOR
ENVIRONMENT NONCOMPLIANCE EVENT REPORT 88-6
As a result of a recent cold shock mortality event at Wolf Creek, anEnvironmental Noncompliance Event Report was initiated in accordance withKP-LE-2202 to document and control the evaluation of the event. TheEnvironmental Biologist identified that the event could potentially bereportable as an unusual or important occurrence relative to theEnvironmental Protection Plan. The Manager of Licensing was subsequentlycontacted in accordance with KP-LE-2202 to determine whether or not theevent was reportable to the Nuclear Regulatory Commission. The Manager ofLicensing reviewed the event report, Licensing documents, and regulations inorder to determine reportability. The evaluation concluded that the eventdid not constitute a noncompliance and the event was not reportable pursuantto NRC requirements.
Evaluation
Nonc omjliance
Environmental Management procedure KP-LE-2202 defines an EnvironmentalNoncompliance as "an event or occurrence that results in an environmentalcondition which deviates form the project environmental requirements". Thefollowing documents were reviewed to determine the project environmentalrequirements relative to cold shock mortality in Wolf Creek Cooling Lake:
- WCGS Environmental Report
- NUREG-75/096 "Final Environmental Statement related to theconstruction of Wolf Creek Generating Station"
- WCGS Environmental Report OLS
- NUREG 0878 "Final Environmental Statement related to the operationof Wolf Creek Generating Station"
- Letter KMLNRC 84-210 dated December 3, 1984 from G. L. Koester toH. R. Denton which transmitted the proposed Environmental ProtectionPlan
- W.CGS Operating License NPF-42
All of the above Licensing documents provide a consistent position relativeto cold shock mortality. The Wolf Creek documents and correspondenceidentify the fact that plant transients during the winter months will likelyresult in a significant number of fish killed but large mortality will notresult in significant impact to the environment.
* Attachment to LI 84 99Page 2 of 3
The NRC documents and correspondence acknowledge the cold shock mortalityand agree that it would not have a significant impact on the environment.
During the review of the above documents, there were no environmentalrequirements identified from which this event deviates. Therefore, thisevaluation concluded that the event did not constitute an "EnvironmentalNoncompliance" as defined in KP-LE-2202.
It should be noted that although this event did not appear to be an"Environmental Noncompliance", the Environmental Noncompliance Event Reportis an appropriate mechanism for documenting the event and the associated
evaluation.
Reportabilit"
Although the above evaluation concluded that the event did not constitute anoncompliance, the event was evaluated for reportability relative, toEnvironmental Protection Plan (EPP) section 4.1 Again, the same Licensingdocuments and correspondence were reviewed to determine the regulatoryrequirements and overall environmental significance relative to the subjectevent. For convenience EPP section 4.1 is provided below:
4.1 Unusual or Important Environmental Events
Any occurrence of an unusual or important event that indicates orcould result in significant environmental impact casually related toplant operation shall be recorded and promptly reported to the. NRCwithin 24 hours followed by a written report per Subsection 5.4.2..The following are examples: excessive bird impaction events, onsiteplant or animal disease out breaks, mortality or unusual, occurrence ofany species protected by the Endangered Species Act of 1973, fishkills, increase in nuisance organizms or conditions, and unanticipatedor emergency discharge of waste water :or chemical substances.
No routine monitoring programs are required to implement thiscondition.
The question of which fish kills are reportable and which ones are not hasbeen raised in the past. Since there were differing interpretations of thereportability requirements relative to fish kills, a telephone conferencewas held with the NRC Project Manager (Paul O'Connor) and an NRCEnvironmental reviewer in 1987 to discuss the reporting requirements. TheNRC's interest in having events reported is to be made aware of any unusualor important environmental occurrence relating to plant operation that couldhave a significant environmental impact that had not been reviewed orconsidered as part of the licensing process. Therefore, fish killsresulting from thermal shock would not be reportable as long as the eventwas limited to the Wolf Creek Cooling Lake and did not involve anyendangered species. However, fish kills of even small magnitude on theNeosho River, Wolf Creek, or John Redmond would be reportable. Thisdifferentation is made because the NRC concluded that cold shock mortalitywas acceptable in part because it would be limited to the cooling lake.
Attachment to LI 80 99* • Page 3 of 3
In considering the reportability relative to EPP section 4.1 it is importantto consider several factors. Wolf Creek Cooling Lake was constructed by theproject for the sole purpose of providing cooling for the plant. Thefishery has been developed to enhance plant availability by minimizingimpingment potential. While cold shock mortality could potentially alterthe fishery in the cooling lake, it will not adversely impact any of thepublic or other surrounding waters and fisheries. Therefore, a significantcold shock mortality in Wolf Creek Cooling Lake does not result in apotentially significant environmental impact unless it impacts other bodiesof water or endangered species.
In conclusion, this evaluation determined that the subject event was not
reportable for the following reasons:
- The event was limited to WCCL, and
- The event was within the scope of what had been previously reviewed
and found environmentally acceptable in the Licensing process, and
-No endangered species were involved.
This evaluation is consistent with the guidance obtained from the NRC onprevious occurrences.
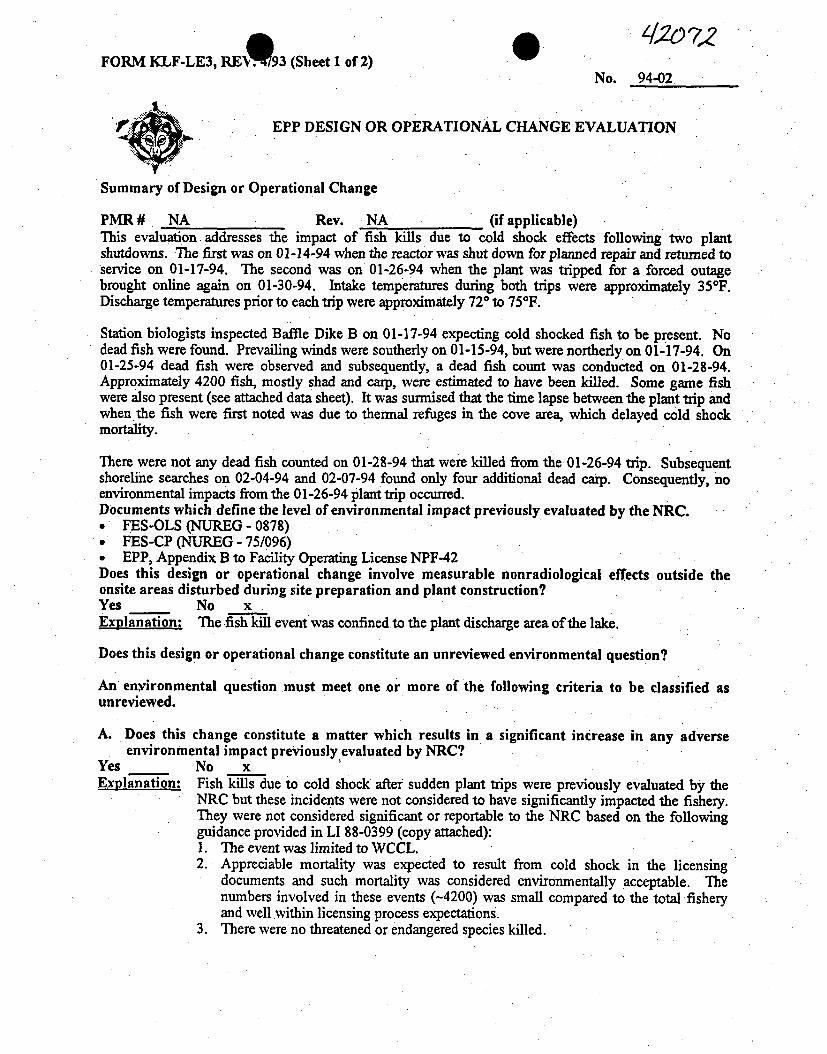
FORM KLF-LE3, REM.93 (Sheet 1 of 2)No. 94-02
EPP DESIGN OR OPERATIONAL CHANGE EVALUATION
Summary of Design or Operational Change
PMR # NA Rev. NA (if applicable)This evaluation addresses the impact of fish kills due to cold shock effects following two plantshutdowns. The first was on 01-14-94 when the reactor was shut down for planned repair and returned toservice on 01-17-94. The second was on 01-26-94 when the plant was tripped for a forced outagebrought online again on 01-30-94. Intake temperatures during both trips were approximately 35°F.Discharge temperatures prior to each trip were approximately 720 to 75°F.
Station biologists inspected Baffle Dike B on 01-17-94 expecting cold shocked fish to be present. Nodead fish were found. Prevailing winds were southerly on 01-15-94, but were northerly on 01-17-94. On01-25-94 dead fish were observed and subsequently, a dead fish count was conducted on 01-28-94.Approximately 4200 fish, mostly shad and carp, were estimated to have been killed. Some game fishwere also present (see attached data sheet). It was surmised that the time lapse between the plant trip andwhen the fish were first noted was due to thermal refuges in the cove area, which delayed cold shockmortality.
There were not any dead fish counted on 01-28-94 that were killed from the 01-26-94 trip. Subsequentshoreline searches on 02-04-94 and 02-07-94 found only four additional dead carp. Consequently, noenvironmental impacts from the 0 1-26-94 plant trip occurred.Documents which define the level of environmental impact previously evaluated by the NRC.* FES-OLS (NUREG - 0878)* FES-CP (NUREG - 75/096)* EPP, Appendix B to Facility Operating License NPF-42Does this design or operational change involve measurable nonradiological effects outside theonsite areas disturbed during site preparation and plant construction?Yes No xExplanation: The fish kill event was confined to the plant discharge area of the lake.
Does this design or operational change constitute an unreviewed environmental question?
An enironmental question must meet one or more of the following criteria to be classified asunreviewed.
A. Does this change constitute a matter which results in a significant increase in any adverseenvironmental impact previously evaluated by NRC?
Yes No xExplanation: Fish kills due to cold shock after sudden plant trips were previously evaluated by the
NRC but these incidents were not considered to have significantly impacted the fishery.They were not considered significant or reportable to the NRC based on the followingguidance provided in LI 88-0399 (copy attached):1. The event was limited to WCCL.2. Appreciable mortality was expected to result from cold shock in the licensing
documents and such mortality was considered environmentally acceptable. Thenumbers involved in these events (-4200) was small compared to the total fisheryand well within licensing process expectations.
3. There were no threatened or endangered species killed.
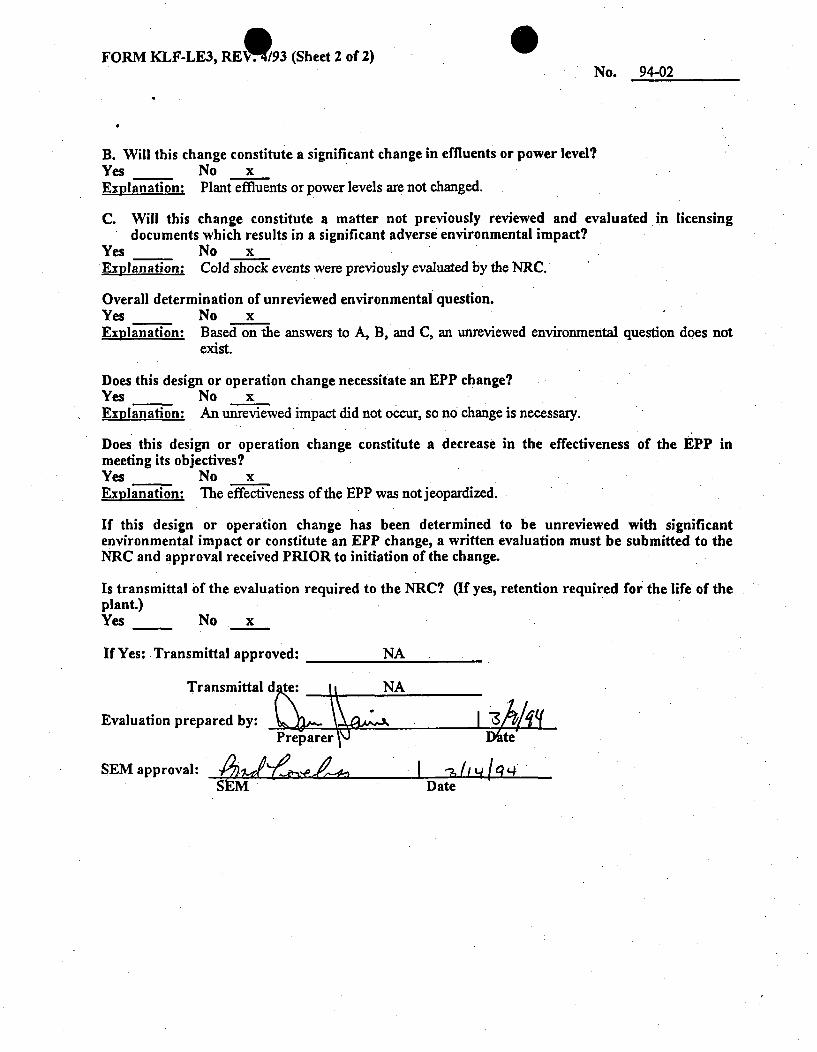
FORM KLF-LE3, RE.*/93 (Sheet 2 of 2)No. 94-02
B. Will this change constitute a significant change in effluents or power level?Yes No xExplanation: Plant effluents or power levels are not changed.
C. Will this change constitute a matter not previously reviewed and evaluated in licensingdocuments which results in a significant adverse environmental impact?
Yes No xExplanation: Cold shock events were previously evaluated by the NRC.
Overall determination of unreviewed environmental question.Yes No xExplanation: Based on the answers to A, B, and C, an unreviewed enviromnental question does not
exist.
Does this design or operation change necessitate an EPP change?Yes No xExplanation: An unreviewed impact did not occur, so no change is necessary.
Does this design or operation change constitute a decrease in the effectiveness of the EPP inmeeting its objectives?Yes No xExplanation: The effectiveness of the EPP was notjeopardized.
If this design or operation change has been determined to be unreviewed with significantenvironmental impact or constitute an EPP change, a written evaluation must be submitted to theNRC and approval received PRIOR to initiation of the change.
Is transmittal of the evaluation required to the NRC? (If yes, retention required for the life of theplant.)Yes No x
If Yes: Transmittal approved: NA
Transmittal d t NA
Evaluation prepared by: Jear A lf qIte"/Preparer J\ Dfite'
SEM approval: . -[i4[qSEM Date
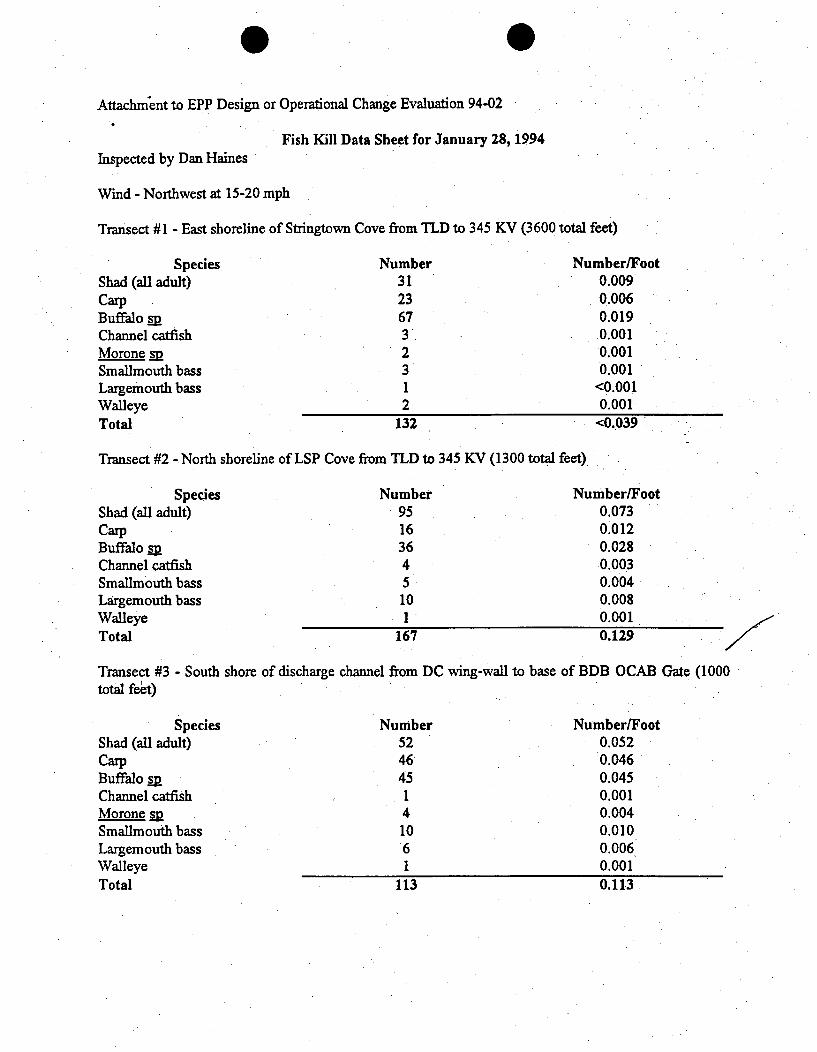
Attachmnent to EPP Design or Operational Change Evaluation 94-02
Fish Kill Data Sheet for January 28, 1994Inspected by Dan Haines
Wind - Northwest at 15-20 mph
Transect #1 - East shoreline of Stringtown Cove from TLD to 345 KV (3600 total feet)
SpeciesShad (all adult)CarpBuffalo sDChannel catfishMorone g2Smanlmouth bassLargemouth bassWalleyeTotal
Number31236732
312
Number/Foot0.0090.0060.0190.0010.0010.001
<0.0010.001
<0.039132
Transect #2 - North shoreline of LSP Cove from TLD to 345 KV (1300 total feet)
SpeciesShad (all adult)CarpBuffalo g2Channel catfishSmallmouth bassLargemouth bassWalleyeTotal
Number95163645101
167
Number/Foot0.0730.0120.0280.0030.0040.0080.0010.129
Transect #3 - South shore of discharge channel from DC wing-wall to base of BDB OCAB Gate (1000total feet)
SpeciesShad (all adult)CarpBuffalo s2Channel catfishMorone spSmallmouth bassLargemouth bassWalleyeTotal
Number5246451
41061
113
Number/Foot0.0520.0460.0450.0010.0040.0100.0060.0010.113
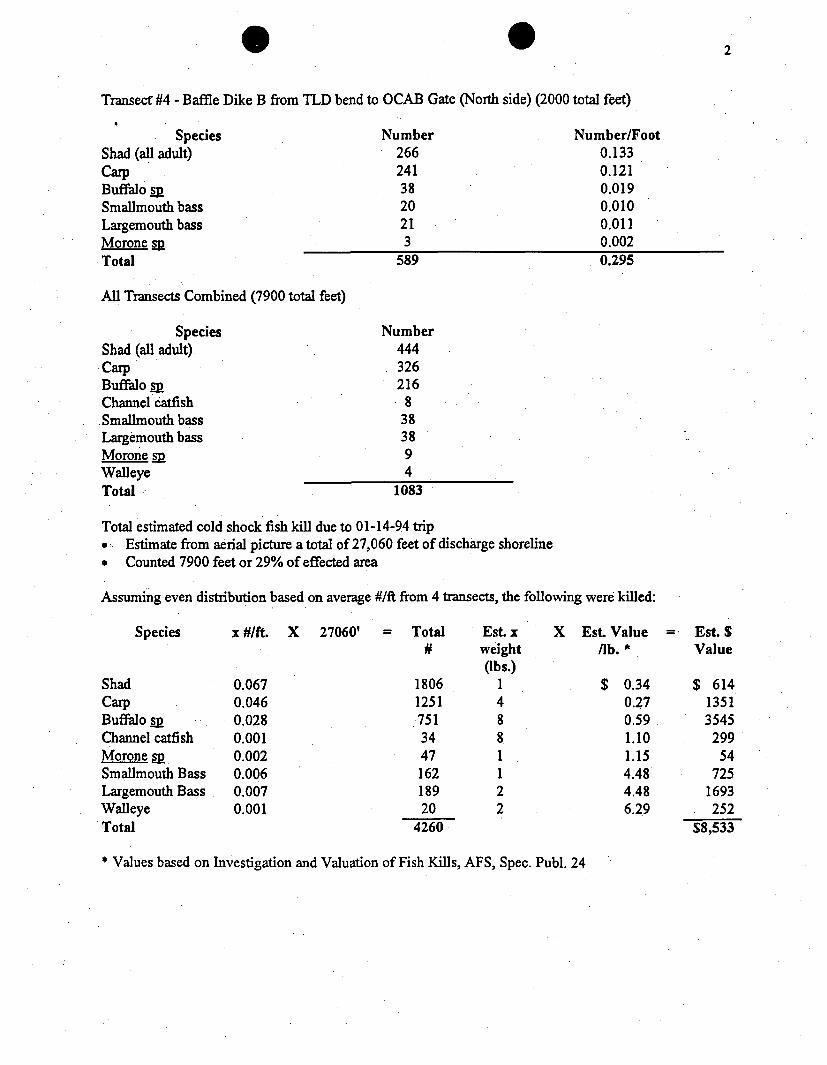
2
Transect #4 - Baffle Dike B from TLD bend to OCAB Gate (North side) (2000 total feet)
SpeciesShad (all adult)CarpBuffalo VSmallmouth bassLargemouth bassMorone _MTotal
Number2662413820213
589
Number/Foot0.1330.1210.0190.0100.0110.0020.295
All Transects Combined (7900 total feet)
SpeciesShad (all adult)CarpBuffalo -MChannel catfishSmallmouth bassLargemouth bassMorone _MWalleyeTotal
Number444326216
8383894
1083
Total estimated cold shock fish kill due to 01-14-94 trip* Estimate from aerial picture a total of 27,060 feet of discharge shoreline* Counted 7900 feet or 29% of effected area
Assuming even distribution based on average #/ft from 4 transects, the following were killed:
Species
ShadCarpBuffalo 9 .Channel catfishMorone sRSmallmouth BassLargemouth BassWalleyeTotal
x #/ft. X 27060' = Total Est. xN weight
0.0670.0460.0280.0010.0020.0060.0070.001
18061251751344716218920
4260
(bs.)148811
22
X Est. Value/lb. *
$ 0.340.270.591.101.154.484.486.29
Est. $Value
$ 61413513545
29954
7251693
252$8,533
* Values based on Investigation and Valuation of Fish Kills, AFS, Spec. Publ. 24
WA4LF'CREEKNUCLEAR OPERATING
CORPORATION
INTEROFFICE COR
G. R. Wedd (WC-TR)TO:LI 88-0399
0. L. Maynard (WC-LI)-"
DATE: August 29, 1988
SUBJECT: Environmental Noncompliance Fvent Repor• #83-5
The purpose of this letter is to document the reportability
associated with the.subject report. This- letter, along with
justification, should be included with.the record copy of
Noncompliance Event Report #88-6.
determinationthe attachedEnvironmental
"y evaluation of. the subject report -.concluded that. the event is.. not
reportable pursuant to the EPP. -The attachment provides the..justification
and rattionale for this conclusion.
OLM/jad
Attachment
cc: B.- S. Loveless (WC-TR), w/a..Records Management (WC-MS), w/a
V
Attachment to LI -0399Pagel1 of 3
REPORTABILITY DETERMINATIONFOR
ENVIRONMENT NONCOMPLIANCE EVENT REPORT 88-6
As a result of a. recent cold. shock mortality event at Wolf Creek,. anEnvironmental Noncompliance Event Report was -initiated in accordance with
KP-LE-2202 to document and control the evaluation of the event. Thet. Environmental Biologist identified that the event could potentially bereportable as an unusual or important occurrence relative to the
Environmental Protection Plan. The Manager of Licensing was subsequentlycontacted in accordance- with KP-LE-2202 to determine whether or not.theeven: vas reportablse to Nhe .uclear egulat~ry Commissi-n. The Manager of
Licensing reviewed the event report, Licensing. documents, and regulations inorder to determine reportability. The evaluation concluded that the eventdid not constitute a noncompliance and the event was not reportable pursuant"'
..to NRC..requirements.
. Evaluation
Environmental Management . procedure KP-LE-2202 defines an .. EnvironmentalNoncompliance as "an event or occurrence that results in an environmentalcondition which deviates form the project environmental requirements". Thefollowing documents were reviewed to determine the project environmentalrequirements relative to cold shock mortality in Wolf Creek Cooling Lake:
- WCGS Environmental Report
- NUREG-75/096 "Final Environmental Statement related to theconstruction of Wolf Creek Generating Station"
- WCGS Environmental Report OLS
- NUREG 0878 "Final Environmental Statement related to the operationof Wolf Creek Generating Station"
- Letter KMLNRC 84-210 dated December 3, 1984 from G. L. Koester to
H. R. Denton which transmitted the proposed Environmental ProtectionPlan.
- WCCS Operating License NPF-42
All of the above Licensing documents provide a consistent position relativeto cold shock mortality. The Wolf Creek documents and correspondenceident'ify the' fact that plant transients during the winter months will likelyresult in a significant number of fish killed but large mortality will notresult in significant impact to the environment.
Attachment to LI 0399Page 2 of .3
The NRC documents and correspondence acknowledge the cold shock mortalityand agree that it would not have a significant impac-t on the environment.
During the review of therequirements identified fromevaluation concluded thatNoncompliance" as defined in
above documents, there were no environmentalwhich this event deviates. Therefore,, thisthe event did not constitute an "EnvironmentalKP-LE-2202.
It should be .noted that although this event did not appear to be an"Environmental Noncompliance", the Environmental Noncompliance Event Reportis an appropriate mechanism for documenting the event and the associatede'ia1.at •n.'.".
Re__rtabilit_
Although the above evaluation concluded that the event did not constitute anoncompliance,, the event was evaluated for reportability relative toEnvironmental Protection Plan (EPP) section 4.1 Again, the same Licensingdocuments and. correspondence were reviewed . to determine the regulatory
--requirements and overall environmental significance relative to the subject'event. For convenience EPP section 4.1 is provided below:
4.1 Unusual or Important Environmental Events".
Any occurrence of an unusual or important event that indicates orcould result in significant environmental impact casu.ualyLj.jated toplant operation shall be recorded and promptly reported "to t~e NRCwithin 24 hours followed' by a written report per. Subsection 5.4.2.The following are examples: excessive bird impaction events, onsiteplant or animal disease, out breaks, mortality or unusual occurrence ofany species protected by the Endangered-Species Act of 1973, fishkills, increase in nuisance organizms or conditions, and unanticipatedor emergency discharge of waste water or chemical substances.
No routine monitoring programs are required to implementcondition.
this
The question of which fish kills are reportable and which ones are not has-been raised in the past. Since there were differing interpretations of the
-:'reportability requirements relative to fish kills, a telephone conferencewas held with the NRC Project Manager (Paul O'Connor) and an NRCEnvironmental reviewer in 1987 to discuss the reporting requirements. TheNRC's interest in having events reported is to be made aware of any unusualor important environmental occurrence relating.to plant operation that couldhave a significant environmental impact that had not been reviewed orconsidered as part of the licensing process. Therefore, fish killsresulting from thermal shock would not be reportable as long as the eventwas limited to the Wolf Creek Cooling Lake and did not involve any
.endangered species. However, fish kills of even small magnitude on theNeosho River, Wolf Creek, or John Redmond would be reportable. Thisdifferentation is made because the NRC concluded that cold shock mortalitywas acceptable in part because it would be limited to the cooling lake.
* Attachment to L1 0399Page 3 of 3
In considering the reportability relative to EPP section 4.1 it is importantto consider several factors. Wolf Creek Cooling Lake. was constructed by theproject for the sole purpose of providing cooling for the plant. Thefishery has been developed to enhance- plant availability by minimizingimpingment potential. While cold shock mortality could potentially alterthe fishery in the cooling lake, it will not adversely impact any of thepublic or other surrounding waters and fisheries. Therefore, a significantcold shock mortality in Wolf Creek Cooling Lake does not result in apotentially significant environmental impact unless 1itjmpacts other bodiesof water or endangered species.
In conclusion, this evaluation determined that the subject event was notreportable for the following reasons:
- The event was limited to WCCL, and
- The event was- within the scope of what had been previously reviewedand found environmentally, acceptable in the Licensing process, and
- No endangered. species were involved.
This evaluation is consistent with the guidance obtained fr'om the NRC onprevious occurrences.
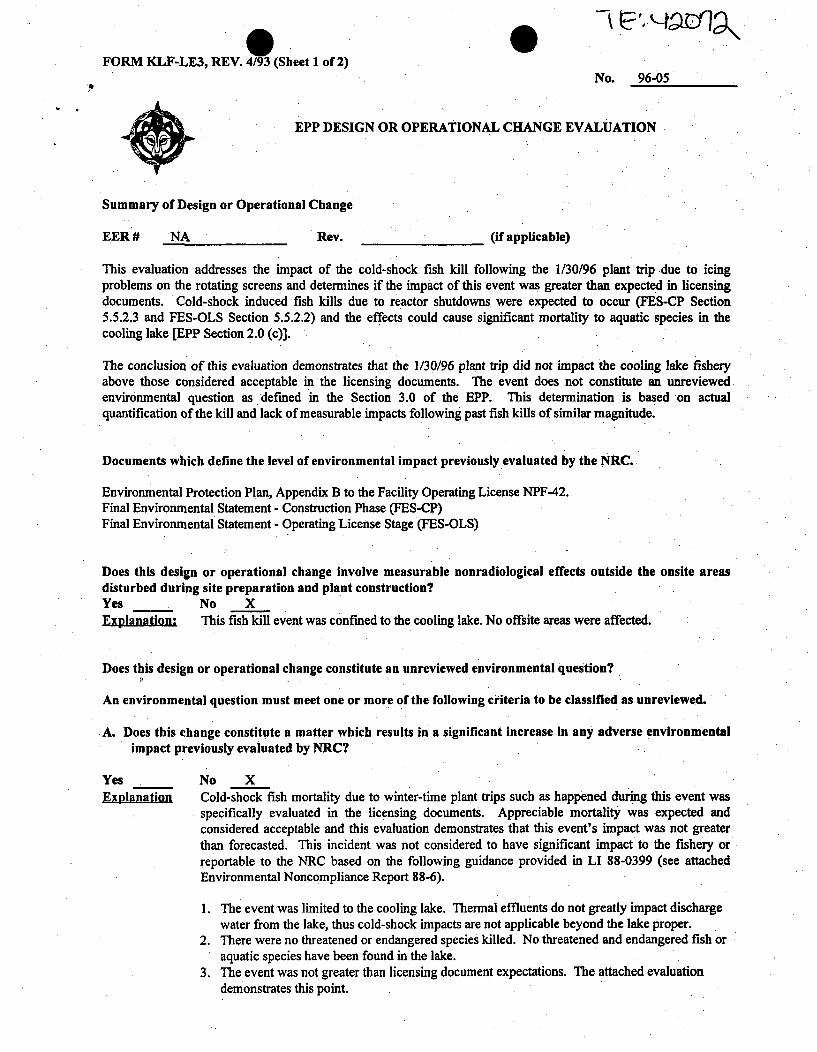
0FORM KLF-LE3, REV. 4/93 (Sheet 1 of 2) 0
No. 96-05ft
EPP DESIGN OR OPERATIONAL CHANGE EVALUATION
Summary of Design or Operational Change
EER# NA Rev. (if applicable)
This evaluation addresses the impact of the cold-shock fish kill following the 1/30/96 plant trip due to icingproblems on the rotating screens and determines if the impact of this event was greater than expected in licensingdocuments. Cold-shock induced fish kills due to reactor shutdowns were expected to occur (FES-CP Section5.5.2.3 and FES-OLS Section 5.5.2.2) and the effects could cause significant mortality to aquatic species in thecooling lake [EPP Section 2.0 (c)].
The conclusion of this evaluation demonstrates that the 1/30/96 plant trip did not impact the cooling lake fisheryabove those considered acceptable in the licensing documents. The event does not constitute an unreviewedenvironmental question as defined in the Section 3.0 of the EPP. This determination is based on actualquantification of the kill and lack of measurable impacts following past fish kills of similar magnitude.
Documents which define the level of environmental impact previously evaluated by the NRC.
Environmental Protection Plan, Appendix B to the Facility Operating License NPF-42.Final Environmental Statement - Construction Phase (FES-CP)Final Environmental Statement - Operating License Stage (FES-OLS)
Does this design or operational change involve measurable nonradiological effects outside the onsite areasdisturbed during site preparation and plant construction?Yes No XExplanations This fish kill event was confined to the cooling lake. No offsite areas were affected.
Does this design or operational change constitute an unreviewed environmental question?
An environmental question must meet one or more of the following criteria to be classified as unreviewed.
A. Does this change constitute a matter which results in a significant increase in any adverse environmentalimpact previously evaluated by NRC?
Yes.Explnatio
No XCold-shock fish mortality due to winter-time plant trips such as happened during this event wasspecifically evaluated in the licensing documents. Appreciable mortality was expected andconsidered acceptable and this evaluation demonstrates that this event's impact was not greaterthan forecasted. This incident was not considered to have significant impact to the fishery orreportable to the NRC based on the following guidance provided in LI 88-0399 (see attachedEnvironmental Noncompliance Report 88-6).
1. The event was limited to the cooling lake. Thermal effluents do not greatly impact dischargewater from the lake, thus cold-shock impacts are not applicable beyond the lake proper.
2. There were no threatened or endangered species killed. No threatened and endangered fish oraquatic species have been found in the lake.
3. The event was not greater than licensing document expectations. The attached evaluationdemonstrates this point.
FORM KLF-LE3, REV. 4/93 (Sheet 2 of 2)No. 96-05
B. Will this change constitute a significant change in effluents or power level?Yes No XExplanation: This event does not involve plant effluent of power level changes.
C. Will this change constitute a matter not previously reviewed and evaluated in licensing documents whichresults in a significant adverse environmental impact?
Yes No XExplanation: Fish kill events were previously evaluated. See answer to question A.
Overall determination of unreviewed environmental question.Yes No XExplanation: This event does not represent an increase to previously evaluated fish kill impacts, changes to
plant effluents or power levels, nor does it constitute a matter not previously reviewed. Anunreviewed environmental question does not exist.
Does this design or operation change necessitate an EPP change?Yes No XExpanation No changes are needed.
Does this design or operation change constitute a decrease in the effectiveness of the EPP in meeting itsobjectives?Yes No XExplanation: No changes occurred that would decrease the effectiveness of the EPP.
If this design or operation change has been determined to be unreviewed with significant environmentalimpact or constitute an EPP change, a written evaluation must be submitted to the NRC and approvalreceived PRIOR to initiation of the change.
Is transmittal of the evaluation required to the NRC? (If yes, retention required for the life of the plant.)Yes No X
If Yes: Transmittal approved:N/A
I ransmiua, dae:I
Evaluation prepare d by: Dan Haines [email protected]/10/96
Preparer Date
SEM approval: DaeSEM Date
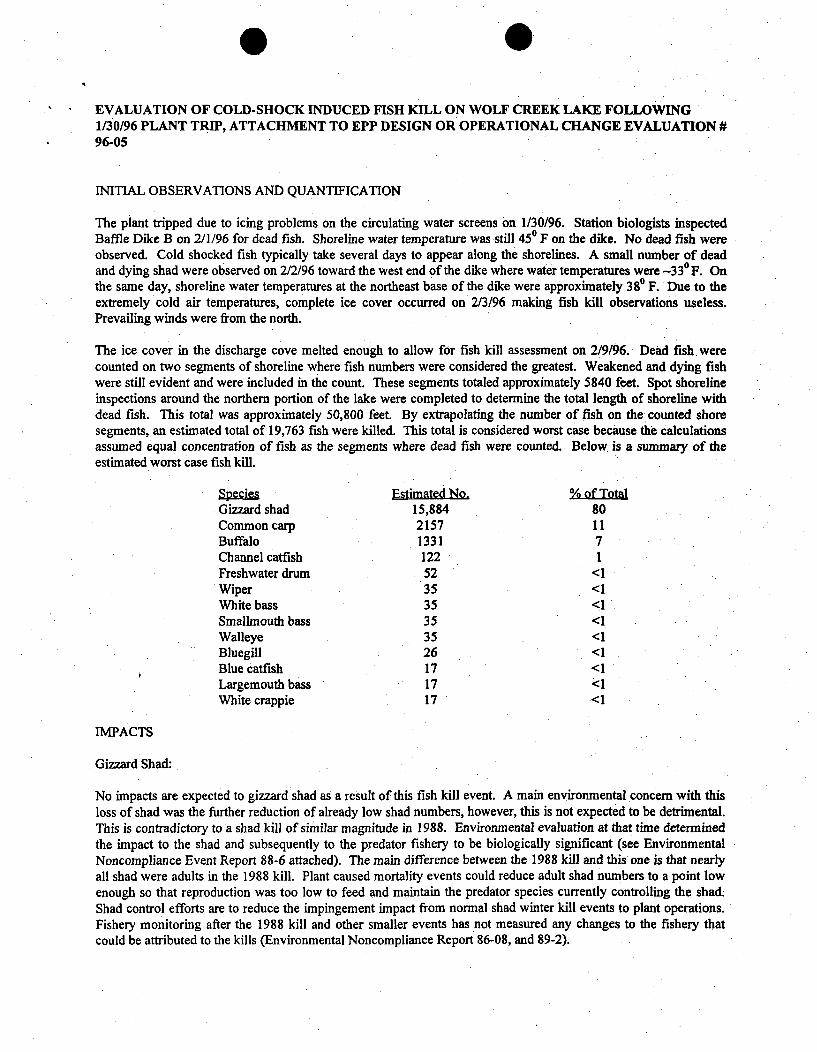
0 0
EVALUATION OF COLD-SHOCK INDUCED FISH KILL ON WOLF CREEK LAKE FOLLOWING1/30/96 PLANT TRIP, ATTACHMENT TO EPP DESIGN OR OPERATIONAL CHANGE EVALUATION #96-05
INITIAL OBSERVATIONS AND QUANTIFICATION
The plant tripped due to icing problems on the circulating water screens on 1/30/96. Station biologists inspectedBaffle Dike B on 2/1/96 for dead fish. Shoreline water temperature was still 450 F on the dike. No dead fish wereobserved. Cold shocked fish typically take several days to appear along the shorelines. A small number of deadand dying shad were observed on 2/2/96 toward the west end of the dike where water temperatures were -330 F. Onthe same day, shoreline water temperatures at the northeast base of the dike were approximately 380 F. Due to theextremely cold air temperatures, complete ice cover occurred on 2/3/96 making fish kill observations useless.Prevailing winds were from the north.
The ice cover in the discharge cove melted enough to allow for fish kill assessment on 2/9/96. Dead fish. werecounted on two segments of shoreline where fish numbers were considered the greatest. Weakened and dying fishwere still evident and were included in the count. These segments totaled approximately 5840 feet. Spot shorelineinspections around the northern portion of the lake were completed to determine the total length of shoreline withdead fish. This total was approximately 50,800 feet. By extrapolating the number of fish on the counted shoresegments, an estimated total of 19,763 fish were killed. This total is considered worst case because the calculationsassumed equal concentration of fish as the segments where dead fish were counted. Below is a summary of theestimated worst case fish kill.
EtiN. % of TolGizzard shad 15,884 80Common carp 2157 11Buffalo 1331 7Channel catfish 122 1Freshwater drum 52 <1Wiper 35 <1White bass 35 <1Smallmouth bass 35 <1Walleye 35 <1Bluegill 26 <1Blue catfish 17 <1Largemouth bass 17 <1White crappie 17 <1
IMPACTS
Gizzard Shad:
No impacts are expected to gizzard shad as a result of this fish kill event. A main environmental concern with thisloss of shad was the further reduction of already low shad numbers, however, this is not expected to be detrimental.This is contradictory to a shad kill of similar magnitude in 1988. Environmental evaluation at that time determinedthe impact to the shad and subsequently to the predator fishery to be biologically significant (see EnvironmentalNoncompliance Event Report 88-6 attached). The main difference between the 1988 kill and this one is that nearlyall shad were adults in the 1988 kill. Plant caused mortality events could reduce adult shad numbers to a point lowenough so that reproduction was too low to feed and maintain the predator species currently controlling the shad.Shad control efforts are to reduce the impingement impact from normal shad winter kill events to plant operations.Fishery monitoring after the 1988 kill and other smaller events has not measured any changes to the fishery thatcould be attributed to the kills (Environmental Noncompliance Report 86-08, and 89-2).
0 0
Roughfish:
No impacts to the fishery are expected to result from the number of roughfish killed. Common carp, buffalo(mostly smallmouth), and freshwater drum made up approximately 18% of the fish killed. These species are notpreferred sportfish nor do they help appreciably with reducing shad numbers. The combined total of 3540represents less than I fish per acre (5090 acres of lake).
Gamefish:
Less than two percent of the fish killed were game fish. This number is small when compared to the entire lakepopulation and is not considered detrimental.
CONCLUSION
A large number of shad were killed by the cold shock event, but based on past monitoring after similar cold shockevents, detrimental impacts are not expected. The number of other species killed was small when compare to theentire lake population. Because measurable impacts to the fishery are not expected, no increase to previouslyevaluated impacts due to cold-shock mortality occurred.
quLF CREEK NUCLEAR OPERATING CORPb. ATION
KLF-LE1 Rev 2/87No.* 88 - 6
ENVIRONMENTAL NONCOMPLIANCE EVENT REPORT
Identified by Dan Haines, Don Eccles Date: 2 / 24/ 88
Date: 3 / 18/ 88Evaluated by Brad Loveless
1. Summary of Event and Applicable References
On Februjary 26. 29 and Mprnh 17 shnrelines in the vitcinitv nf lýe WenScirc water discharge were surveyed to quantify a fish kill, which wasdiscovered on February 24. The great majority of those killed weregizzard shad, but channel catfish, striped bass, carp, largemouth bassand smallmouth buffalo were also found. This event is detailed in theattached evaluation and was evaluated relative to expected cold-shock,and chemical release fish kills discussed in the FES(OLS) Section5.5.2.2, the ER(OLS) Section 5.1.3.4.2, the FES(CP) Section 5.5.2.3, andthe EPP.
2. Yes X No Does this event potentially deviate from theRETS. If yes, immediately contact Rad Servicesand coordinate resolution and corrective actionvith them.
3- X Yes No Does this event potentially involve an unusual orimportant occurrence that could result insignificant environmental impact related to plantoperation. If yes, immediately notify the Managerof Licensing or his designee.
The Manager of Licensing was contacted and thisevent was judged to be nonreportable. Seeevaluation to Question #4 for a detailedexplanation of this judgement.
.4. Yes X No Does thisEPP. IfLicensing
event potentially deviate, from theyes,- immediately notify the Manager ofor his designee.
Several references in licensing documents are made to predicted cold shockmortality in WCCL. The FES(CP) Section 5.5.2.3 cited a significant coldshock mortality event and predicted five plant shutdowns per winter whichwould kill "an unknown number of fish". The ER(OLS) Section 5.1.3.4.2projected that winter plant trips will "probably" result in mortality butthat "the overall impact is expected to be minimal". While the first
* • _• .
No. 88 - 6Page 2
citation infers that high mortality is expected and may comprise asignificant impact, the second downplays this prospect and anticipates theimpact to be very small. Based. on these licensing studies, the EPPconcluded in Section 2.1(c) that "Cold shock effects on fish. due toreactor shutdowns could cause significant mortality to aquatic species inthe cooling lake". Later, in Section 4.1, the EPP directs that'unusualevents caused by the plant which indicate significant environmental impactshould be reported to the NRC within 24 hours followed by a writtenreport.
The most recent direction that has been received regarding reporting ofenvironmental events came via a phone conversation between 0. Maynard, G.
shock fish mortality was acknowledged by the NRC to have a potentiallysignificant impact, should such a kill be reported per EPP Section 4.1.The NRC responded that only if the impact of a fish kill was significantlyworse than what was predicted should it be reported. It is theinterpretation of Environmental Management that the NRC desiresnotification of cold shock mortality only if it surpasses the significantlevel and has a profound environmental impact.. Although the February 1988fish kill has been judged significant, such a judgement is biologicallycomplicated and sufficient population data on WCCL gizzard shad do notexist to show that the impact exceeds this level. Therefore, this eventis judged to not require reporting to the NRC.
Because the EPP, as cited above, provides that cold shok could caus,:5'significant mortality in WCCL, this fish kill matches these expectations.Therefore, it is worthy of evaluation as an important and unusual event.. -,
5-. Yes X No Does this event potentially deviate from any otherenvironmental requirements. If yes, the SE, will-be responsible for determining the recommendedcourse of action. If the recommended actionspotentially involve notification of organizationsoutside of WCNOC, the SEN will notify the Managerof Licensing or his designee.
See evaluation to Question #4-
6. Summary of Actions Taken
See attached evaluation.
No. 88 - 6Page 3
Prepared by ____________Date:
Reviewed by Date: i/r/Zo.'17p/s e-• n wh en -th is"i kil
The time pse wee is fish kill was quantified and when thisevaluation was completed is worthy of explanation. Several factorscaused the delay, most notably more pressing environmental tasks,difficulty in obtaining the Susquehanna River fish kill reference in theFES(CP), and disagreement over the correct approach to take for thisevaluation. It is important to note that this delay was allowed after itwas decided that no corrective action recommendations would be made.
7. Close-out complete (Attach copies of all letters, telecons, and notes
Date:iro___
Attachment to KLF-LEI , #88-6 1
WvALUATION
Initial Observations
On 2/24/83 Dan Haines and Don Eccles noticed many dead fish along the shoresof the ime Sludge Pond Cove (LSPC).during a collision survey (Figure 1).They estimated that the fish had been dead 1-2 weeks. On 2/26 Brad Lovelessinspected a length. of shoreline on the east side of the LSPO.(Figure 1).'lumbers of fish founid were as follows:
Gizzard shad - 4260Channel catfish - 4
Common carp 5Largemouth bass - ISmallmouth buffalo - 1
On 2/29 Brad Loveless reinspected this same shoreline finding no appreciablechange in numbers and also inspected the opposite (west) shore in this coveduring a collision survey. Densities on the western shore were estimated atapproximately 1/10 of those on the eastern side, Based on this distributionof fishes, it was assumed that during the die-off period a southwest windmust have been prevalent.
Plant Operations and Meteorological Data
A review of plant operation data was done to determine what the cause offish mortality may have been. Plant data revealed that from January 22through February 15 the plant was down for maintenance. Two events occurredduring this time which were evaluated for their potential to cause theobserved die-off.
From February 8 through 10 the plant's steam generators were drained anddischarged with the circulating water (-utfall0O03). Concentrations ofammonia in circ water prior to mixing in WCCL were calculated to be 0.0024ppm for the 3 day average with a 0.0042 ppm maximum (see attachments).Compared to the 0.12 ppm of continuous ammonia exposure required to causereduced growth and gill damage in channel catfish (Piper et al. 1982), themaximum amount discharged was approximately 30 times weaker. Based on thelow concentrations released and that during this period the plant was downso that there was no heated effluent to attract fish to the discharge area,steam generator drainage is ruled out as the probable cause of mortality.
The second possible cause of fish death in the discharge cove was a changein plant power which may have led to cold shock. On the evening of February16 plant power level increased, ranging from 21% at 2100 to 3.3% at 0200 onFeb.1 17, when it fell to near zero. It remained there until late thatevening when power levels began to rise steadily. The plant reached 100%power on Feb. 19 and remained at or near there until after fish were found.
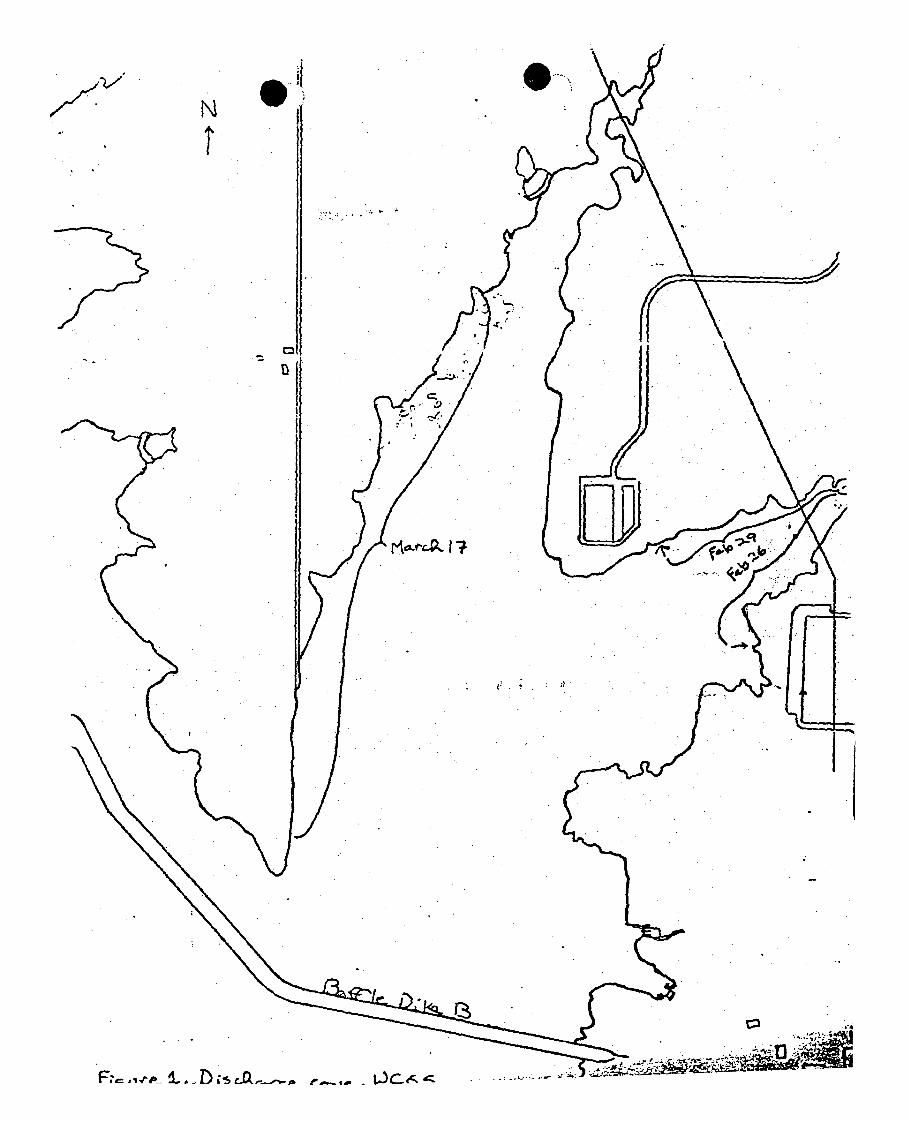
Ii
N1'
e. . OCA,--
3
Based on thse and past data on wintertime discharge cove temperatures, itis concluded that the rise in plant power during nighttime on Feb. 16 likelyattracted fishes to the discharge area. The temperature increase during the5-hour period between 2100 and 0200 with 2 circ water pumps operating likelyranged between 14 and 17 0 F based on previous winter data. Winter 1985/86data showed that delta T's in this range attracted many fish to thedischarge area (LI 37-0092). Data presented in the referenced evaluationalso showed that higher circ water flows for longer periods combined withsoutherly winds create the largest warmed areas in the discharge cove.These warmed areas, it was determined, functioned to buffer cold-shockeffects and reduce mortality in the event of a plant trip. Given this, theshort-term 2-pump operation with the north-northeast wind would have createdvery little buffer area. The quick drop of 14-17 0 F could have easily killed
izzar"! 6C vox ann CoutaxIt i97b) ann affected gamefish kLI 87-0092).
Meteorological data in the days following February 16 showed winds out ofthe northeast to northwest varying from approximately 8-18 mph for 7 of the8 days following the plant trip. This undermines the initial assumptionthat, based on fish distribution in the LSPC, the prevailing winds.in thedays following the fish kill were from the south.
Follow-up Observations
On March 17 areas of shoreline along the east and west sides of the CemeteryCove (CC, Figure 1) were surveyed for signs of the fish kill. Because overtw9 weeks had elapsed since they were last observed, the previously countedeast shore of the tSPC was first surveyed so estimates elsewhere could be..adjusted for depredation and deterioration. Based on the March i7 survey,few fish were washed ashore on the east side of the CC but portions of thewestern shore had high densities similar to the eastern shore of the LSPC.
Quantifications of Fish Loss and. Uncertainty
As cited earlier, an exact fish count was done on a portion of the easternLSP cove. From this count and area, shoreline "density was calculated.Counts on other shorelines were later approximated by comparing densitieswith those found initially (2/26) and later (3/17) on the eastern shore ofthe LSP cove..
When estimates were totaled for both the east and west shorelines of theLSPC and the CC, the number of gizzard shad was 18,600. Gamefish. numberswere far lower, amounting to less than 100.
Obviously, much uncertainty remains in this estimate. The largest sourcefor this is that the prevailing wind following the plant trip was from thenorth and the area surveyed was to the north of the discharge. Thus, thelargest portion of dead and dying shad would logically have been carried tothe , south (Figure I). Bird survey observations, in contrast, noted highconcentrations of gulls on the shorelines to the northeast and not to thesouth. These birds were later assumed to be eating the dead and dyingfish. Because neither gulls nor dead fish were observed on the south sideof the cove in the vicinity of Baffle Dike B, it is concluded that the fishwhich died were washed ashore primarily to the north and east. Thisconclusion gives more credence to the extrapolated estimate of 18,600gizzard shad.
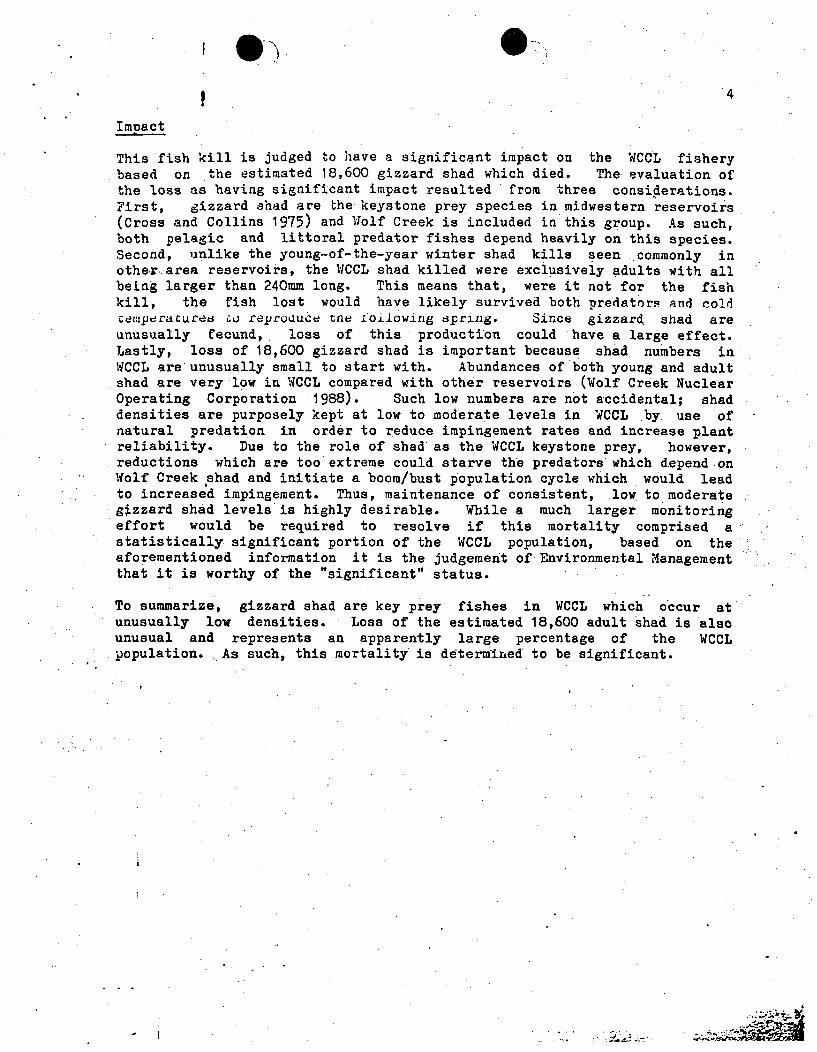
4
ImtactThis fish kill is judged to have a significant impact on the WCCL fishery
based on the estimated 18,600 gizzard shad which died. The evaluation ofthe loss as having significant impact resulted from three considerations.First, gizzard shad are the keystone prey species in midwestern reservoirs(Cross and Collins 1975) and Wolf Creek is included in this group. As such,both pelagic and littoral predator fishes depend heavily on this species.,Second, unlike the young-of-the-year winter shad kills seen commonly in
other..area reservoirs, the WCCL shad killed were exclusively adults with allbeing larger than 240mm long. This means that, were it not for the fishkill, the fish lost would have likely survived both predators qnd coldceuiperacures W reproauce tne foiLowing spring. Since gizzard shad areunusually fecund, loss of this production could have a large effect.Lastly, loss of 18,600 gizzard shad is important because shad numbers inWCCL are unusually small to start with. Abundances of both young and adultshad are very low in WCCL compared with other reservoirs (Wolf Creek NuclearOperating Corporation 1988). Such low numbers are not accidental; shaddensities are purposely kept at low to moderate levels in WCCL by use ofnatural predation in order to reduce impingement rates and increase plantreliability. Due to the role of shad as the WCCL keystone prey, however,reductions which are too extreme could starve the predators which depend onWolf Creek shad and initiate a boom/bust population cycle which would leadto increased impingement. Thus, maintenance of consistent, low to moderategizzard shad levels is highly desirable. While a much larger monitoringeffort would be required to resolve if this mortality comprised astatistically significant portion of the WCCL population, based on theaforementioned information it is the judgement of Environmental Managementthat it is worthy of the "significant" status.
To summarize, gizzard shad are key prey fishes in WCCL which occur atunusually low densities. Loss of the estimated 18,600 adult Shad is alsounusual and represents an apparently large percentage of the WCCLpopulation ... As such, this mortality is determined to be significant.
- . ;, * .•.A•. 4•~ : ',-*
0)5
Citation
Cross, F. B. and J. T. Collins. 1975. Fishes in Kansas. University ofKansas Publications, Lawrence. 189 pp.
Piper, R. G., I. B. McElwain, L. E. Orme, J. P. McCraren, L. G. Fowler andJ. R. Leonard. 1982. 7ish Hatchery Management. United States Fish andWildlife Service, Washington, D. C. 517 pp.
J:
... A -.
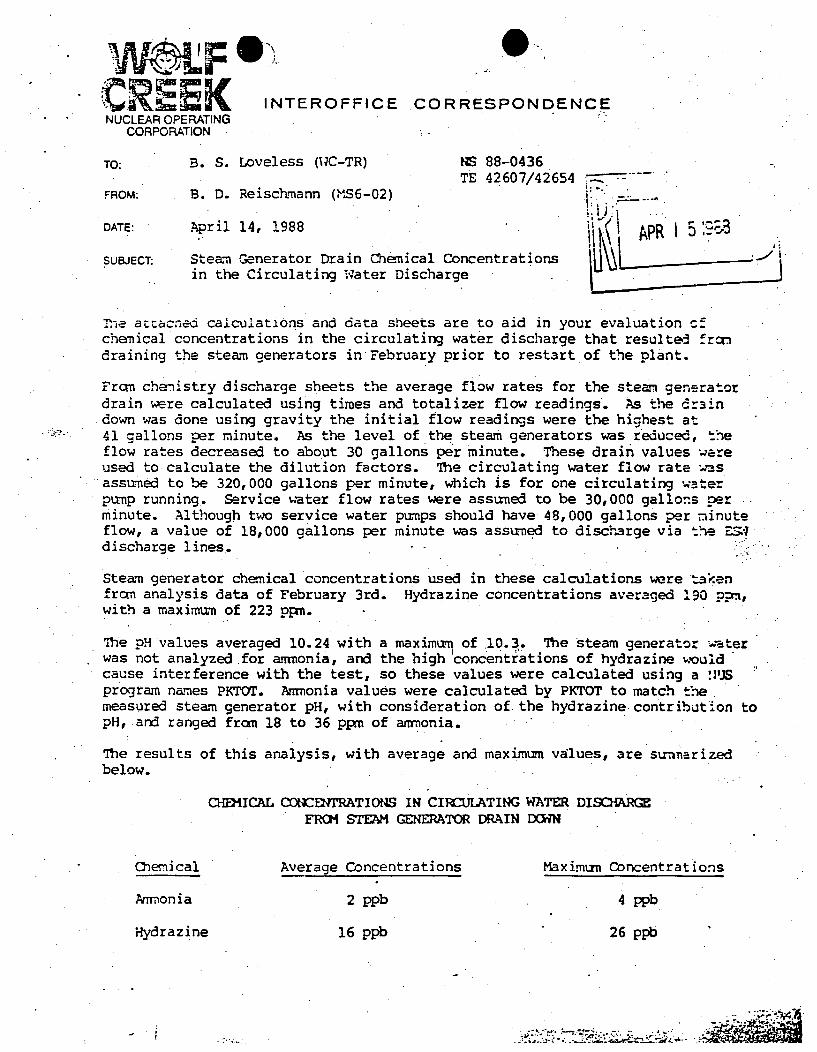
INTEROFFICENUCLEAR OPERATING
CORPORATION
CORRESPONDENCE
TO:
FROM:
DATE:
B. S. Loveless (I;C-TR)
B. D. Reischmann (M"S6-02)
April 14, 1988
HS 88-0436TE 42607/42654
* ,IAPR 1 -:3
,ncentrations;e
SUBJECT: Steam Generator Drain Chemical Ccin the Circulating W.ater Discharc
The attach-ed calculations and data sheets are to aid in your evaluation cfchemical concentrations in the circulating water discharge that resulted fromdraining the steam generators in February prior to restart of the plant.
From chemistry discharge sheets the average flow rates for the steam generatordrain were calculated using times and totalizer flow readings. As the dr3indown was done using gravity the initial flow readings were the highest at
-. 41 gallons per minute. As the level of the steam generators was reduced, theflow rates decreased to about 30 gallons per minute. These drain values we•eused to calculate the dilution factors. The circulating water flow rate w•sassumed to be 320,000 gallons per minute, which is for one circulating waterpump running. Service water flow rates were assumed to be 30,000 gallons perminute. Although two service water pumps should have 48,000 gallons per minuteflow, a value of 18,000 gallons per minute was assumed to discharge via the ESIdischarge lines.
Steam generator chemical concentrations used in these calculations were takenfrom analysis data of February 3rd. Hydrazine concentrations averaged 190 pp.,with a maximum of 223 ppm.
The pH values averaged 10.24 with a maximum of .10.3. The steam generator WEterwas not analyzed for ammonia, and the high concentriations of hydrazine wouldcause interference with the test, so these values were calculated using a TSprogram names PKTrOT. Annmonia values were calculated by PKTOT to match themeasured steam generator pH, with consideration of the hydrazine contribution topH, and ranged from 18 to 36 ppm of ammonia.
The results of this analysis, with average and maximum values, are stxnnaarizedbelow.
CHEMICAL CONCEMRATIONS IN CIRCULATING WATER DISCHARGEFRCM STEAM GENERATOR DRAIN DCWN
Chemical
Anmonia
Hydrazine
Average Concentrations Maximum Concentrations
2 ppb
16 ppb
4 ppb
26 ppb
- ~ ~
Page TwoNS 88-0436April 14, 2988
If -more information is requirej on this project please. contact me.
BDR;"bjh
Attac1hents
cc: R. L. Lrogsdon (WC-CH), w/a
C. A. 5wartzendruber (MS6-02), w/aJ. D. Ziesenis (WC-CH), w/aRecords "4anagement (,IC-,MS), w/a
I
Z
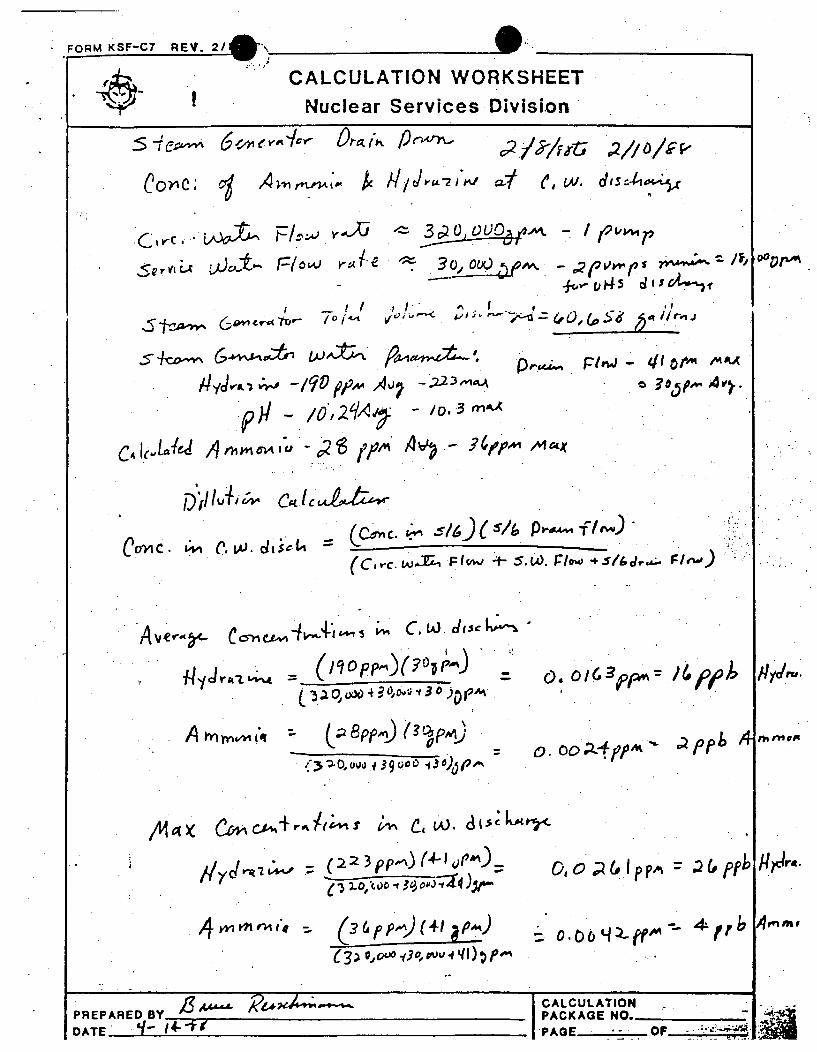
FORM KSF-C7 REV. 21/•"'.
-- 7, ...;CALCULATION WORKSHEET
Nuclear Services Division
5 -,,cr-
eOY'C;
iýý e yoq 4ay, D),tz ih P c2
Allm fn J*Utlu k gjdb1"-21'W at
(', Ld. , -
e,'C,-C. LV&,A^)At ZOJ~ 4~---3-•VO- OIjI% -
30 reeooDrp.
I - ~f -. :1
/4ydalrk -Ix ; o ,, ' -. t22 $4
/-* 21A.1r"
0rccA ~fV1~4J' 4'or"' i~~AA~
1 1I ...U
DsIIIu1tje~a
CC-ýic. &./)S~P4%fCoa.(C, C. LA4A~-¶ F10W j- +5 5.uO. Plow.. *Sf6jra. Flew
A vvc C "4 C" 'r.
0 ( 4 Opp-)(?t 3 ) 0.01/6 3p~ 4,, I giciru.
A t,I 39VIp i3)O~ 0. o~ooeL.fpi'
Sppt, ,,. ni r" oi'
Al40' C&~CA~~b r. /f-4S £ C4d WA. 8 (.$c- kx e7 ,
( 2 23~p-~)544~4'ML0 ~-~"'~
0,o a
: o.0o q:L• 4-" It
/lc)r4
/14 kvlmn¶'. (3'pP&( q 8 1)
PREPARED BY K -DATE q- j4- I CALCULATION
PACKAGE NO.PAGE _. OP -" .
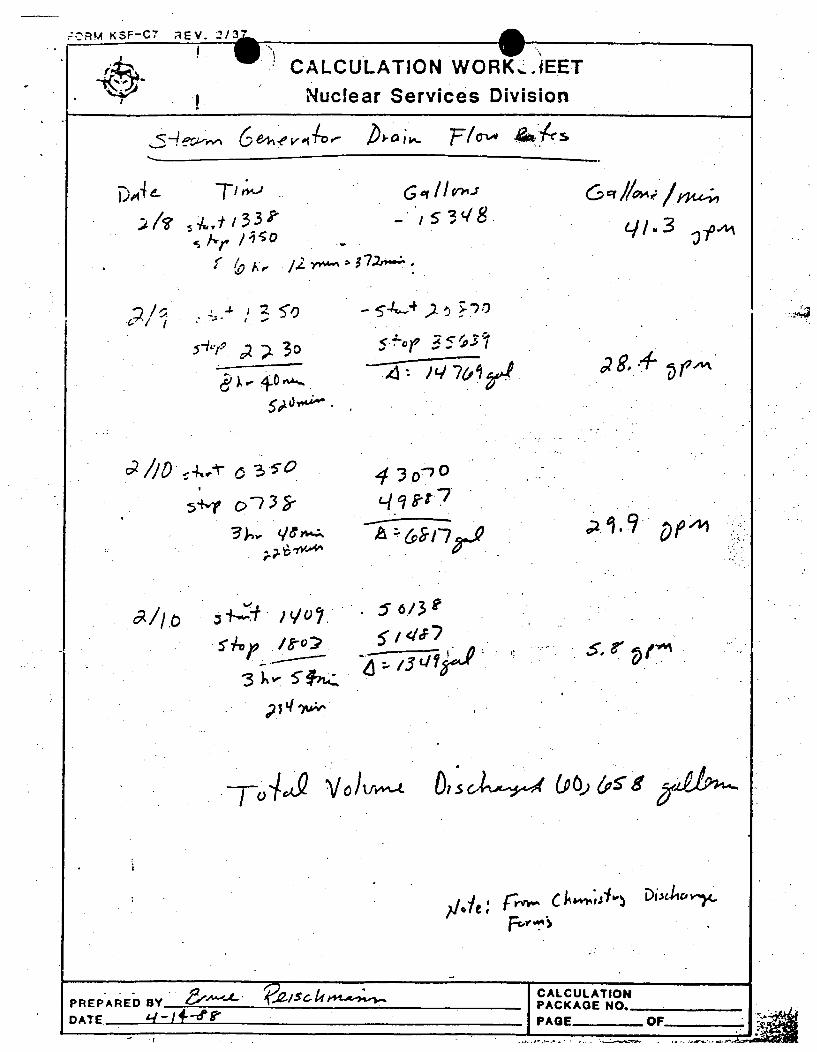
R-_-,. KSF-C7 REV. 2/A,_
C cALCULATION WORK,.1EET
Nuclear Services Division
D~ie- Tit'-J-.
//04.ý /
a llo :4A,- /2rro-k•-t -3 3 -
ho
SNO..,
cI//O •.1 • •.o5•i c .7ro
#. ...
.. 2 9 .v¢,
- 5 .47 2 7 - 0
431-" 70 •
61-./ r'
... 4 :: ;. ''•"
4l 3"/ ,-l -,
g,• -.+ Dr,,A,
$9.9 ~fA1
(Ao)&~g ~4'k~
.he: frvv- C A,4-;Sb.. riA,,,...,,.
PREP ARED BY C"a' l"
DATE 4-+ I CALCULATIONPACKAGE NO._PAGE_ OF_ _
m
I
44vH3
wl.
3$..
- ~ .2 .2
~2t
. itt.
....................................

I
i 4 . - it
35..r
I..
* i. . . .- - . .
*1 . ... .. :.- . . .
I,
A
..-.... .
c
'-A-...
... '...•..
°,
.5
- - - 2 Jr. - .1'r
.. ~. * . * >1 .. * *
- - ~.... ... " . , t. , '..-
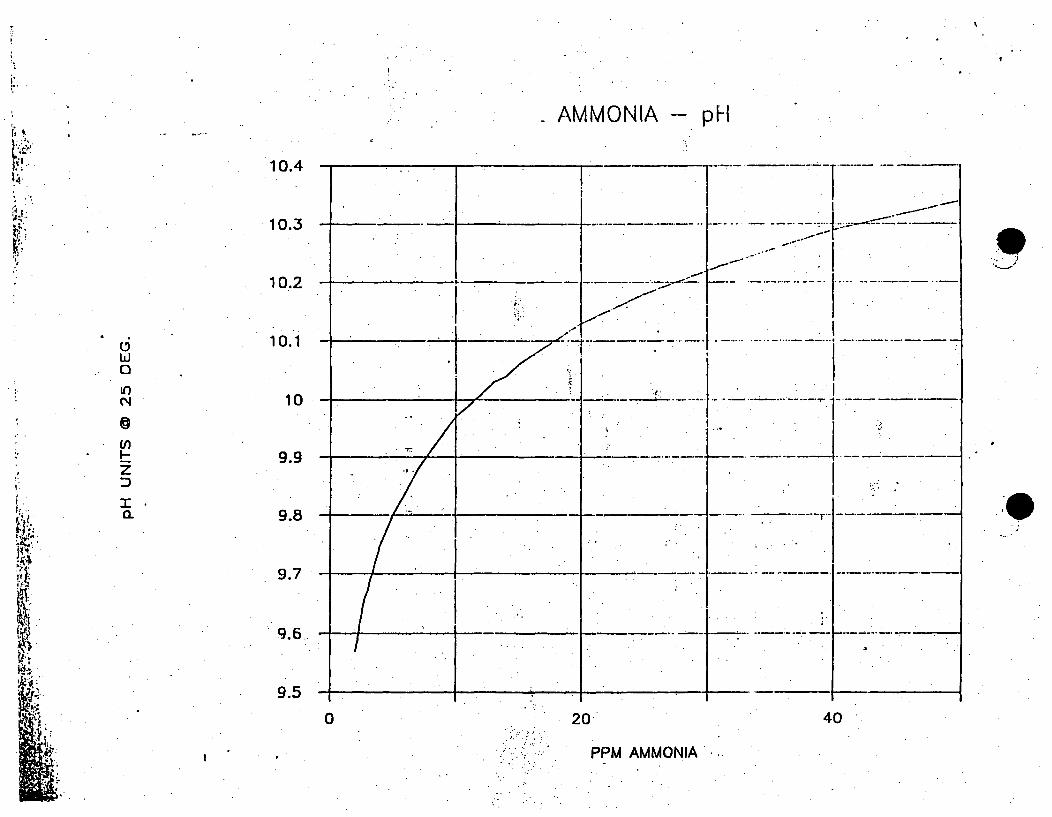
AMMONIA -- pH
10.4
10.3
10.2
10.1
10
CLi
10
(4
9.9
9.8
9.7
9.6
9.5
0 20 40.
PPM AMMONIA •
0 ..
' .W6LF•..CREEKNUCLEAR OPERATING
CORPORATION
INTEROFFICE CORRESPOND
TO: G. R. Wedd (WC-TR) LI 88-0399
FROM: 0. L. Maynard (WC-LI)
DATE: August 29, 1988
SUBJECT: Environmental Noncompliance Event Report #88-6
The purpose of this letter is to document the reportability determinationassociated with the subject report. This letter, along with the attachedjustification, should be included with the record copy of Environmental.....Noncompliance Event Report #88-6.
My evaluation of the subject report concluded that, the event is. notreportable pursuant to the EPP. The attachment providesithe justificationand rationale for this conclusion.
OLM/j ad
Attachment
. cc: B. S. Loveless (WC-.TR), w/aRecords Management (WC-MS), w/a
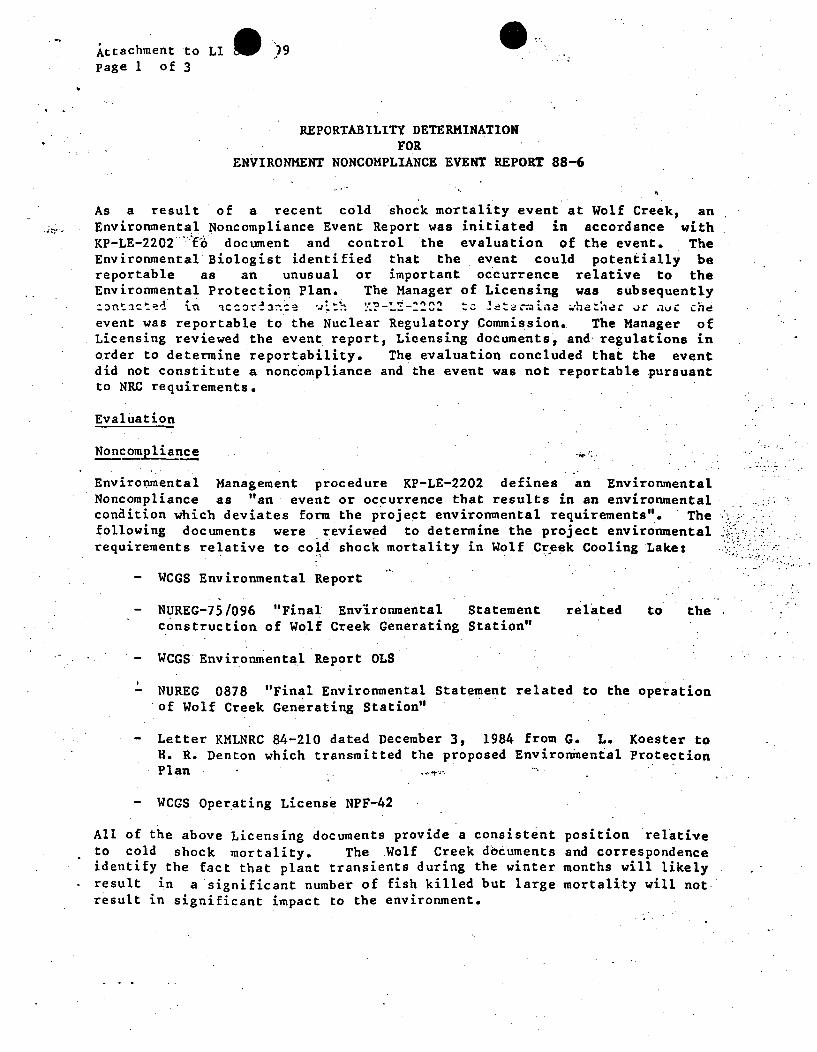
Attachment to LIpage 1 of 3
REPORTABILITY DETERMINATIONFOR
ENVIRONMENT NONCOMPLIANCE EVENT REPORT 88-6
As a result of a recent cold shock mortality event at Wolf Creek, anEnvironmental Noncompliance Event Report was initiated in accordance withKP-LE-2202 to document and control the evaluation of the event. TheEnvironmental Biologist identified that the event could potentially bereportable as an unusual or important occurrence relative to theEnvironmental Protection Plan. The Manager of Licensing was subsequently:ontacted in accor-an:e "ih --c ..etr-ae what'her )r a.c cheevent was reportable to the Nuclear Regulatory Commission, The Manager ofLicensing reviewed the event report, Licensing documents, and regulations inorder to determine reportability. The evaluation concluded that the eventdid not constitute a noncompliance and the event was not reportable pursuantto NRC requirements.
Evaluation
Nonclompiiance
Environmental Management procedure KP-LE-2202 defines an EnvironmentalNoncompliance as "an event or occurrence that results in an environmentalconaition which deviates form the project environmental requirements". Thefollowing documents were reviewed to determine the project environmentalrequirements relative to cold shock mortality in Wolf Creek Cooling Lake:
- WCGS Environmental Report
- NUREG-75/096 "Final Environmental Statementconstruction of Wolf Creek Generating Station"
related to the
" WCGS Environmental Report OLS
I'm NUREG 0878 "Final Environmental Statement related to the operation
*of Wolf Creek Generating Station"
- Letter KMLNRC 84-210 dated December 3, 1984 from G. L. Koester toH. R. Denton which transmitted the proposed Environmental ProtectionPlan
- WCGS Operating License NPF-42
All of the above Licensing documents provide a consistent position relativeto cold shock mortality. The Wolf Creek d6cuments and correspondenceidentify the fact that plant transients during the winter months will likelyresult in a significant number of fish killed but large mortality will notresult in significant impact to the environment.
Attachment to LI .39page 3 of3
In considering the reportability relative to EPP section 4.1 it is important
to consider several factors. Wolf Creek Cooling Lake was constructed by the
project, for the sole purpose of providing cooling for the plant. The
fishery has been developed to enhance plant availability by minimizing
impingment potential. While cold shock mortality could potentially' alter
the fishery in the cooling lake, it will not adversely impact any of the
public or other surrounding waters and fisheries. Therefore, a significant
cold shock mortality in Wolf Creek Cooling Lake does not result in a
potentially significant-environmental impact unless it impacts other bodies
of water or endangered species.
in conclusina, Cnis evaiuacion Jecennined chac the subject event was not
reportable for the following reasons:
- The event was limited to WCCL, and
The event was within the scope of what had been previously reviewed
and found environmentally acceptable in the Licensing process, and
- No endangered species were involved.
This evaluation is consistent with the guidance obtained -from the NRC on
previous occurrences.
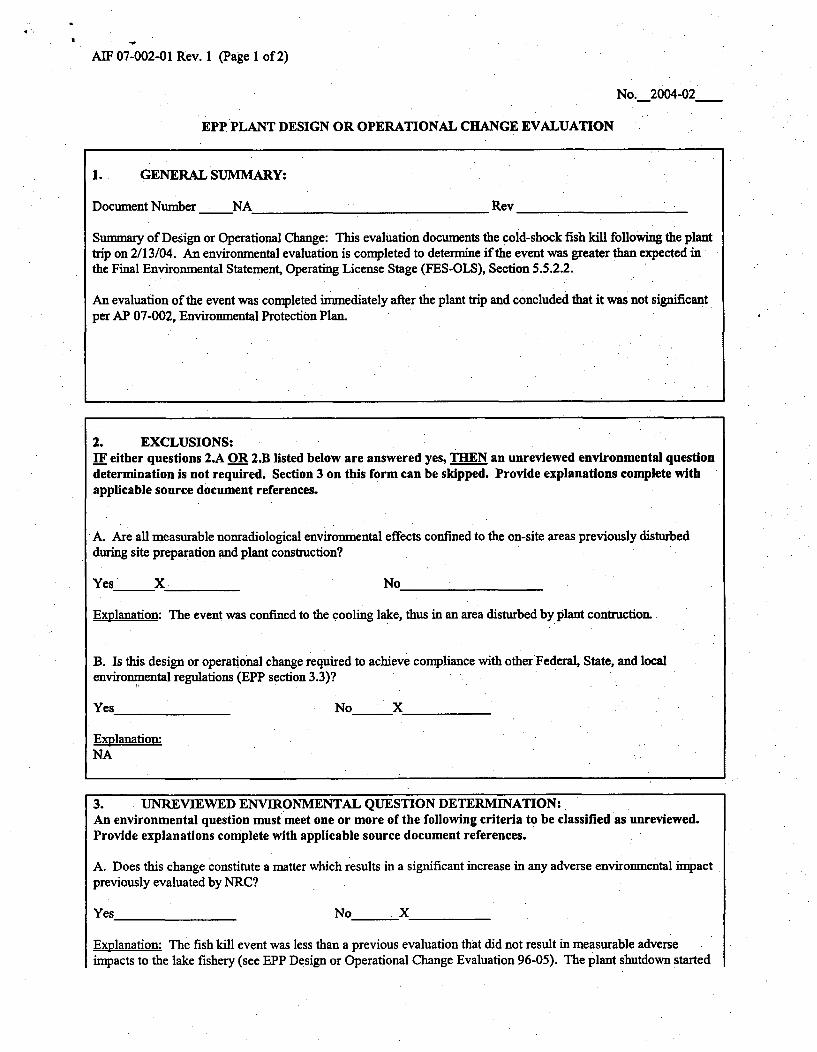
AIF 07-002-01 Rev. 1 (Page 1 of 2)
No._2004-02
EPP PLANT DESIGN OR OPERATIONAL CHANGE EVALUATION
1. GENERAL SUMMARY:
Document Number NA Rev
Summary of Design or Operational Change: This evaluation documents the cold-shock fish kill following the planttrip on 2/13/04. An environmental evaluation is completed to determine if the event was greater than expected inthe Final Environmental Statement, Operating License Stage (FES-OLS), Section 5.5.2.2.
An evaluation of the event was completed immediately after the plant trip and concluded that it was not significantper AP 07-002, Environmental Protection Plan.
2. EXCLUSIONS:IF either questions 2.A OR 2.B listed below are answered yes, THEN an unreviewed environmental questiondetermination is not required. Section 3 on this form can be skipped. Provide explanations complete withapplicable source document references.
A. Are all measurable nonradiological environmental effects confined to the on-site areas previously disturbedduring site preparation and plant construction?
Yes X No
Explanation: The event was confined to the cooling lake, thus in an area disturbed by plant contruction.
B. Is this design or operational change required to achieve compliance with other Federal, State, and localenvironmental regulations (EPP section 3.3)?
Yes
Explanation:NA
No X
3. UNREVIEWED ENVIRONMENTAL QUESTION DETERMINATION:An environmental question must meet one or more of the following criteria to be classified as unreviewed.Provide explanations complete with applicable source document references.
A. Does this change constitute a matter which results in a significant increase in any adverse environmental impactpreviously evaluated by NRC?
Yes No . X
Explanation: The fish kill event was less than a previous evaluation that did not result in measurable adverseimpacts to the lake fishery (see EPP Design or Operational Change Evaluation 96-05). The plant shutdown started
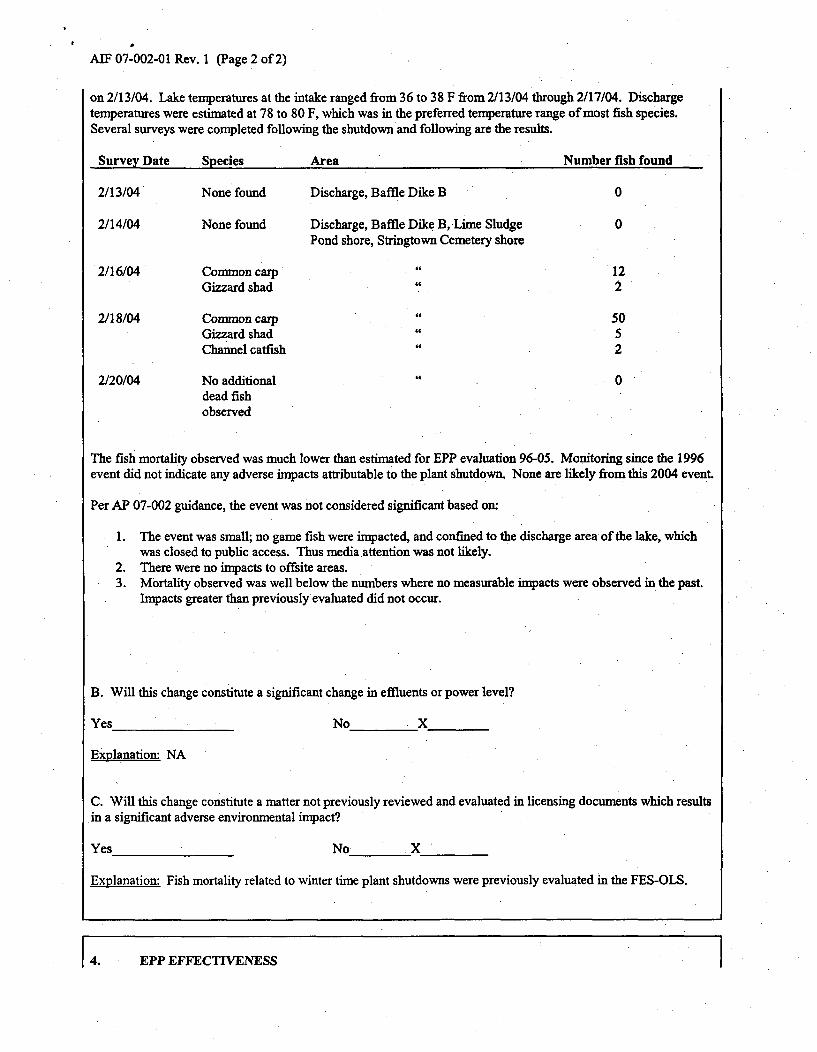
AIF 07-002-01 Rev. 1 (Page 2 of 2)
on 2/13/04. Lake temperatures at the intake ranged from 36 to 38 F from 2/13/04 through 2/17/04. Dischargetemperatures were estimated at 78 to 80 F, which was in the preferred temperature range of most fish species.Several surveys were completed following the shutdown and following are the results.
Survey Date Species Area Number fish found
2/13/04 None found Discharge, Baffle Dike B 0
2/14/04 None found Discharge, Baffle Dike B, Lime Sludge 0Pond shore, Stringtown Cemetery shore
2/16/04 Common carp 12Gizzard shad 2
2/18/04 Common carp 50Gizzard shad 5Channel catfish 2
2/20/04 No additional 0dead fishobserved
The fish mortality observed was much lower than estimated for EPP evaluation 96-05. Monitoring since the 1996
event did not indicate any adverse impacts attributable to the plant shutdown. None are likely from this 2004 event.
Per AP 07-002 guidance, the event was not considered significant based on:
1. The event was small; no game fish were impacted, and confined to the discharge area of the lake, whichwas closed to public access. Thus media attention was not likely.
2. There were no impacts to offsite areas.3. Mortality observed was well below the numbers where no measurable impacts were observed in the past.
Impacts greater than previously evaluated did not occur.
B. Will this change constitute a significant change in effluents or power level?
Yes No X
Explanation: NA
C. Will this change constitute a matter not previously reviewed and evaluated in licensing documents which results
.in a significant adverse environmental impact?
Yes No X
Explanation: Fish mortality related to winter time plant shutdowns were previously evaluated in the FES-OLS.
4. EPP EFFECTIVENESS
AIF 07-002-01 Rev. 1 (Page 3 of 2)
Does this design or operational change constitute a decrease in the effectiveness of the EPP in meeting itsobjectives?
Yes No X
Explanation:
5. EPP CHANGE
Does this design or operational change necessitate an EPP change?
Yes No X
Explanation:
If this design or operational change has been determined to be unreviewed with significant environmental impact,reducing the effectiveness of the EPP, or constitute an EPP change, a written evaluation must be submitted to theNRC and approval received PRIOR to initiation of the change. Submittals shall be in accordance with AP 26A-004and AP 26B-001.
Evaluation prepared by: 8/9/04Preparer Date
,--E# IJL-S=L-Supervisory approval: 8/9/04
Supervisor Date
Manager approval:Manager Date
(Manager approval required only if the design or operational change involves an unreviewed environmentalquestion, reduces the effectiveness of the EPP, or requires an EPP change.)
33. Section 2.5 of the ER (WCGS,1980) describes the Topeka shiner,Neosho madtom, and Neoshomucket mussel. Please haveavailable any records of thesespecies being collected inimpingement and entrainmentsampling.
Aquatic EcologyP Page 3 of 3
* Section 2.5 of the ER (WCGS, 1980) describes the Topeka shiner, Neosho madtom,and Neosho mucket mussel. Please have available any records of these species beingcollected in impingement and entrainment sampling.
Information on the source of water for the Sharpe Generating Station mentioned inSection 2.12 of the ER (WCGS, 1980).
- Information on potential riparian/wetland communities in the project area, including
along the transmission line.
* Information on any microbiological monitoring program, including any recent data.
" Section 6.2 of the ER (WCGS, 1980) notes that routine mitigation and monitoringprograms are conducted, including effluent chemistry monitoring and water quality andfishery monitoring of CCL. Please provide at a minimum the most recent set of thesedata.
* A description, including volumes, chemical, and radiological characteristics, of all solid,liquid, aqueous, and gaseous waste streams generated by the facility. Includeinformation on whether waste streams are disposed at off-site locations, or released toland, air, or water bodies on-site.
IA

Question 64. Section 2.5 of the ER (WCGS, 2006) describes the Topeka shiner,Neosho madtom, and Neosho mucket mussel. Are there any records of thesespecies being collected in the impingement and entrainment sampling?
Due to the unique habitat the Neosho madtom inhabits (I.e., riffles), madtoms arenot found in lakes or reservoirs. In addition, there has been no record of any ofthe above-described species being collected in WCGS impingement andentrainment studies.
KANSAS GAS AND ELECTRIC COMPANY
WOLF CREEK GENERATING STATION
MAKEUP SCREENHOUSE IMPINGEMENT MONITORING REPORT
NOVEMBER, 1980 - OCTOBER, 1981
ACCEPTED:-.Raymod F. Lewis, Jr.
Supervisor Radiological/Environmental Assessment
APPROVED: 1.4FGreg R. Wedd
Supervisornvironmental Assessment
A ,~ar AT.ý S chreibe" " Mark A'. SchreibetEnvironmental Biologist
.... ;. x•: •;//Stephen M. Williams
Environmental Technician
ii
TABLE OF CONTENTS
Page
List of Tables . . ...... ........... . .. iii
List of Figures .............. iv
INTRODUCTION ...... . . ...... 1.
METHODS . . . . . . . . . . . . . . . . . . 3
RESULTS AND DISCUSSION . . . . . . ... . . . 9
SUM4MARY . . . . . . . . . . . . . . . . . . 43
Literature Cited . . . . . . . . . . . . . . 45
Appendices
. . . . 46
.. .1 60
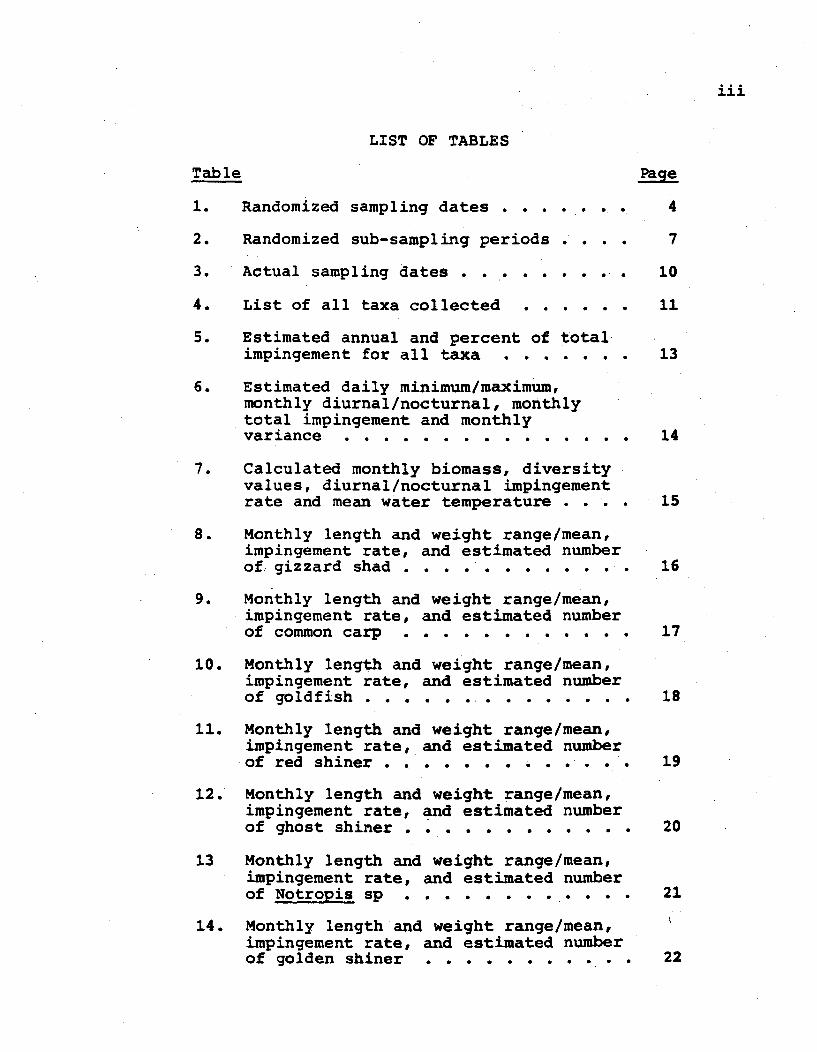
iii
LIST OF TABLES
Table Page
1. Randomized sampling dates . . . .... 4
2. Randomized sub-sampling periods . . . 7
3. Actual sampling dates . 10
4. List of all taxa collected . . . . . . 11
5. Estimated annual and percent of totalimpingement for all taxa . . . . . . . 13
6. Estimated daily minimum/maximum,monthly diurnal/nocturnal, monthlytotal impingement and monthlyvariance . . . .* . . . . . . . . . . . 14
7. Calculated monthly biomass, diversityvalues, diurnal/nocturnal impingementrate and mean water temperature . . . . 15
B. Monthly length and weight range/mean,impingement rate, and estimated numberof. gizzard shad . . . . .o .. . .0. 16
9. Monthly length and weight range/mean,impingement rate, and estimated numberof common carp .. .. . . . . . .. 17
10. Monthly length and weight range/mean,impingement rate, and estimated numberof goldfish .. ............. 18
11. Monthly length and weight range/mean,impingement rate, and estimated numberof red shiner . . .0 0 0 0 . 0 0 19
12. Monthly length and weight range/mean,impingement rate, and estimated numberof ghost shiner o . . . . . .. o . . . 20
13 Monthly length and weight range/mean,impingement rate, and estimated numberof Notropis sp . . . . . . . ... . . 21
14. Monthly length and weight range/mean,impingement rate, and estimated numberof golden shiner . . o . ..o. . o . o 22
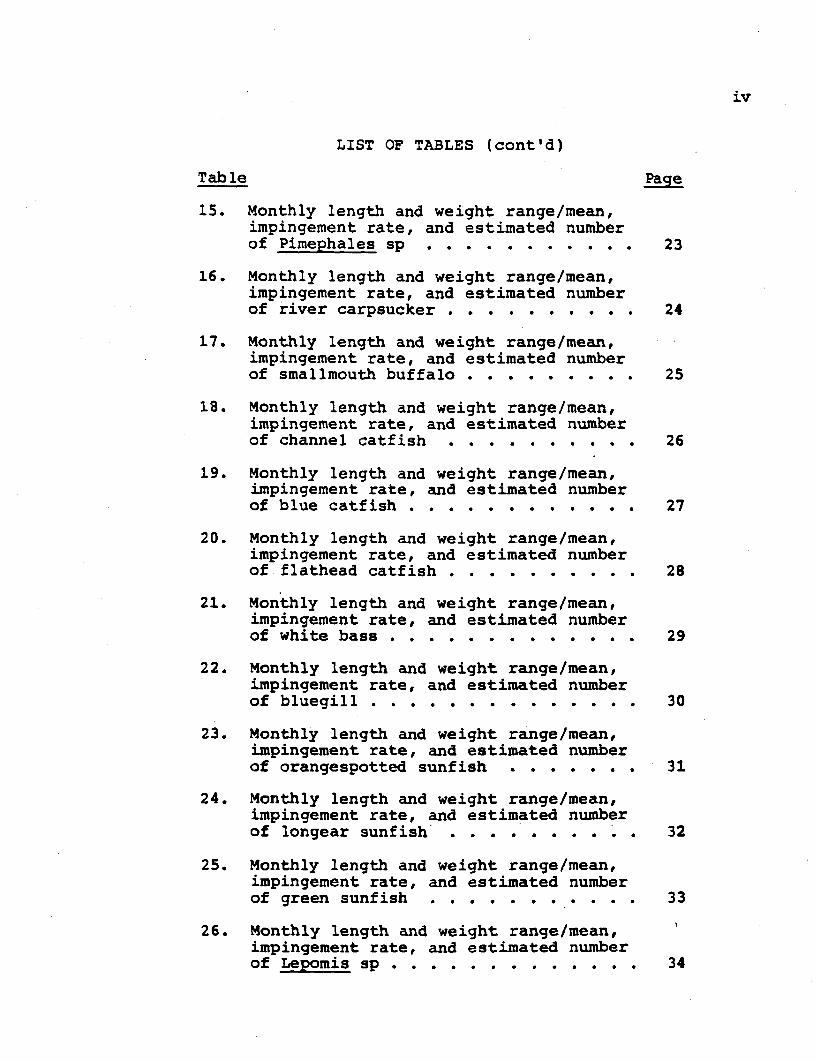
iv
LIST OF TABLES (cont'd)
Table Page
15. Monthly length and weight range/mean,impingement rate, and estimated numberof Pimephales sp .... .... ... 23
16. Monthly length and weight range/mean,impingement rate, and estimated numberof river carpsucker . . . . . . . . . . 24
17. Monthly length and weight range/mean,impingement rate, and estimated numberof smallmouth buffalo . . . . . . . . . 25
18. Monthly length and weight range/mean,impingement rate, and estimated numberof channel catfish .*. . . . . . . . . 26
19. Monthly length and weight range/mean,impingement rate, and estimated numberof blue catfish. . .. . . . . . . .. 27
20. Monthly length and weight range/mean,impingement rate, and estimated numberof flathead catfish .*. . . . . . . . . 28
21. Monthly length and weight range/mean,impingement rate, and estimated numberof white bass. . . .. . . . . . . . . 29
22. Monthly length and weight range/mean,impingement rate, and estimated numberof bluegill. . . . . . . . . . . . . . 30
23. Monthly length and weight range/mean,impingement rate, and estimated numberof orangespotted sunfish . . . . . . . 31
24. Monthly length and weight range/mean,impingement rate, and estimated numberof longear sunfish 32
25. Monthly length and weight range/mean,impingement rate, and estimated numberof green sunfish . . . . . . . . .. . 33
26. Monthly length and weight range/mean,impingement rate, and estimated numberof Lepomis sp . . . . . . . . . . . . . 34
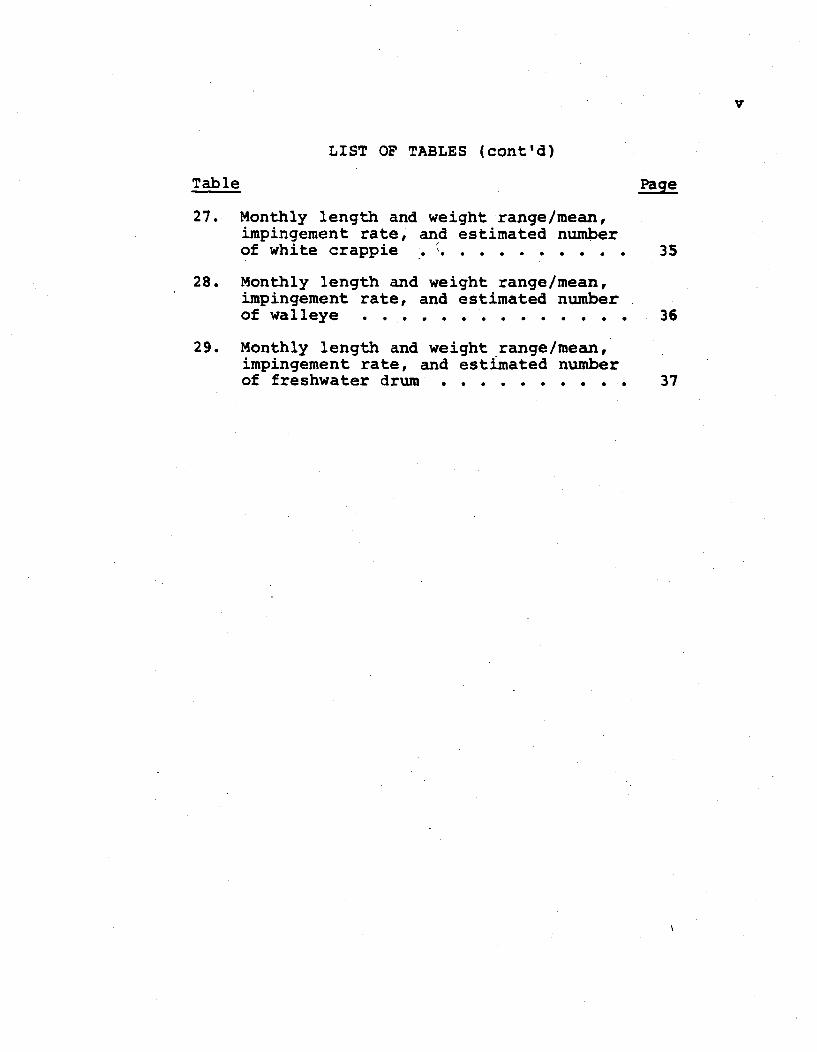
V
LIST OF TABLES (cont'd)
Table Page
27. Monthly length and weight range/mean,impingement rate, and estimated numberof white crappie . .. .. .. ..... 3S
28. Monthly length and weight range/mean,impingement rate, and estimated numberof walleye . . . . . . . . . 36
29. Monthly length and weight range/mean,impingement rate, and estimated numberof freshwater drum . . . . . . .... 37
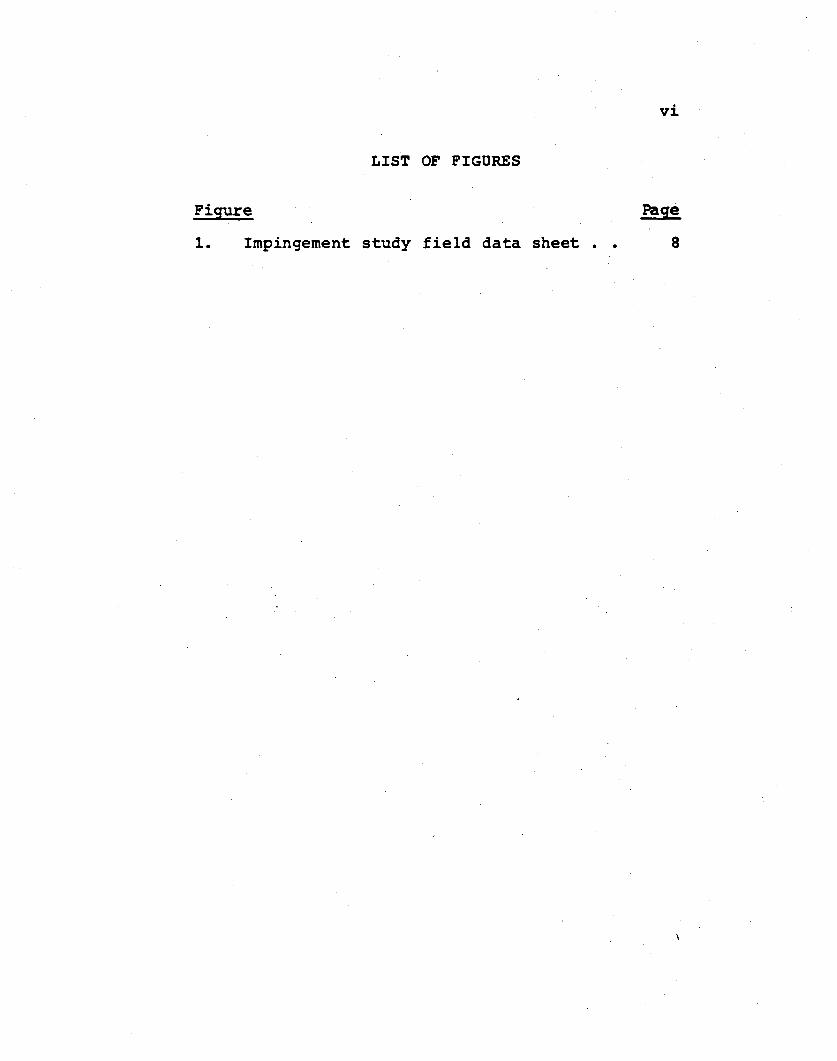
vi
LIST OF FIGURES
Figure
1. Impingement study field data sheet .
Page
8
INTRODUCT ION
A permit for the construction of Wolf Creek Generating
Station, Unit No. 1 (WCGS) was issued to Kansas Gas and
Electric Company (KG&E) and Kansas City Power and Light Com-
pany (KCPL) in 1977. As a condition to issuance of the per-
mit [Item 3.f.(2)], the Nuclear Regulatory Commission (NRC)
established a requirement that KG&E/KCPL monitor the impinge-
ment of fish during the lake-filling phase of construction.
This report presents the results of a one-year impinge-
ment study which fulfills the NRC requirement outlined in
Section 6.1.3.2 of the Final Environmental Statement (FES),
NUREG-75/096. The objective of this study was to document
species composition and abundance, size distribution and
seasonality of fish impinged at the, WCGS Makeup Water
Screenhouse (MUSH) located in the tailwaters of John Redmond
Reservoir (JRR).
The MUSH is situated on the east side of the Neosho
River downstream of JRR dam. The MUSH houses three pumps,
each with a maximum capacity of approximately 38,000 gallons
per minute (gpm). Trash bar grills and 0.375 inch mesh ver-
tical traveling screens are placed in front of each pump.
The screen wash system is activated manually, by a timer or
automatically from a high differential pressure switch. In-
take velocities at the MUSH are quite low with calculated
2
velocities at the traveling screens ranging from 0.19 to
0.57 feet per second (fps) at 1007.5 MSL.
An intake channel supplies makeup water to the screen
house during normal flow conditions. During low flow con-
ditions, the channel deadends at the MUSH. However, when
moderate to high flow exists, the channel is contiguous with
the river. A more detailed description of the JRR discharge
system and the MUSH can be found in the WCGS Environmental
Report - Operating License Stage (ER/OLS), Section 3.4.3.1.
METHODS
The study was initiated in November 1980 and continued
through October 1981. Sampling frequency followed the
schedule specified by the NRC in the FES and was as follows:
two 12-hour screen counts twice weekly from April to July
and twice monthly from August to March; one screen count for
the period beginning at 0800 and ending at 2000; the other
for the period beginning at 2000 and ending at 0800 the
following day. Traveling screens were washed starting about
30 minutes before the beginning and end of a sample period.
All debris and fish washed from the screen were collected in
an aluminum basket or nylon bag net. The mesh size of both
collection devices was 0.375 inch.
A program was written to permit the random choice of
sampling dates within intervals specified by the NRC. A
Hewlett-Packard Model 41-C calculator was programmed and
sampling dates recorded as they were produced. The random-
ized schedule of sampling dates is given in Table 1. The
schedule of dates produced was utilized as a rigid schedule
throughout the study. Impingement was monitored on any
scheduled day when makeup pumps were operating. If MUSH
pumps were not in operation on a scheduled sampling date,
that sampling effort was dropped from the study. In August,
one exception to this system occurred due to erratic' pumping.
In this case, a single additional sampling date was incor-
porated into the study to replace the missed dates.
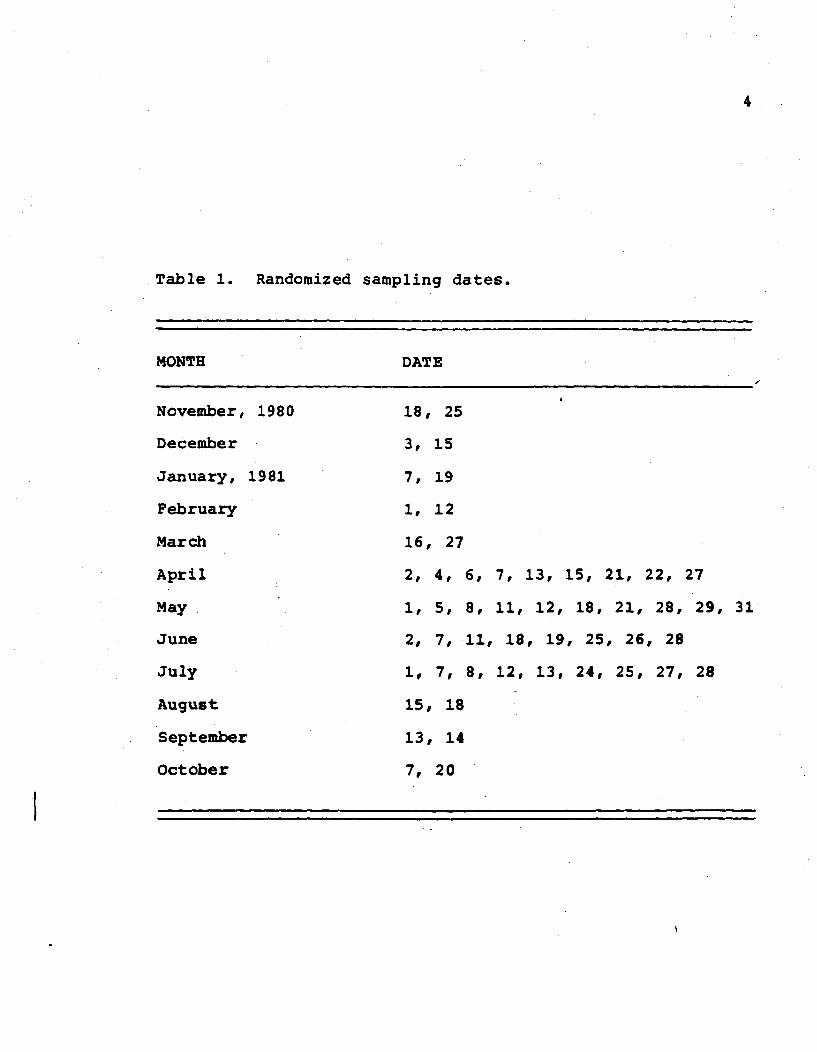
4
Table 1. Randomized sampling dates.
MONTE DATE
November, 1980 18, 25
December 3, 15
January, 1981 7, 19
February 1, 12
March 16, 27
April 2, 4, 6, 7, 13, 15, 21, 22, 27
May 1, 5, 8, 11, 12, 18, 21, 28, 29, 31
June 2, 7, 11, 18, 19, 25, 26, 28
July 1, 7, 8, 12, 13, 24, 25, 27, 28
August 15, 18
September 13, 14
October 7, 20
I
5
Fish collected during a 12-hour period were enumerated
by species, making a full count of those species represented
by 30 individuals or less. If the total number of a given
species (N) was over 30 but less than 100, 50 percent of the
group or a minimum of 30 individuals were processed. If N
was greater than 100, 30 fish plus one percent of N-100 were
processed.
This system was used during the initial portion of the
study, however, an alternative method was utilized when it
became apparent that this method required the handling of
excessive numbers of fish. Effective February 1, 1981, the
system for enumeration of collected fish was changed to
require full enumeration of those species represented by 25
individuals or less. If the actual or calculated total
number of a given species (N) was greater than 25, an addi-
tional one percent of the total (N) were processed, up to a
maximum of 40 fish.
Throughout the study, when species were present in num-
bers greater than 100 individuals, the number and weight of
the individuals of that species in the representative sub-
sample was recorded. These values were then compared with
the total weight of all the individuals of that species in
the sample to permit extrapolation of the total number.
Extremely high impingement rates were encountered on
February 1, 1981, and forced the reduction of the 12-hour
collection period to four 10-minute subsamples within each
12-hour period. Times for these subsamples were selected
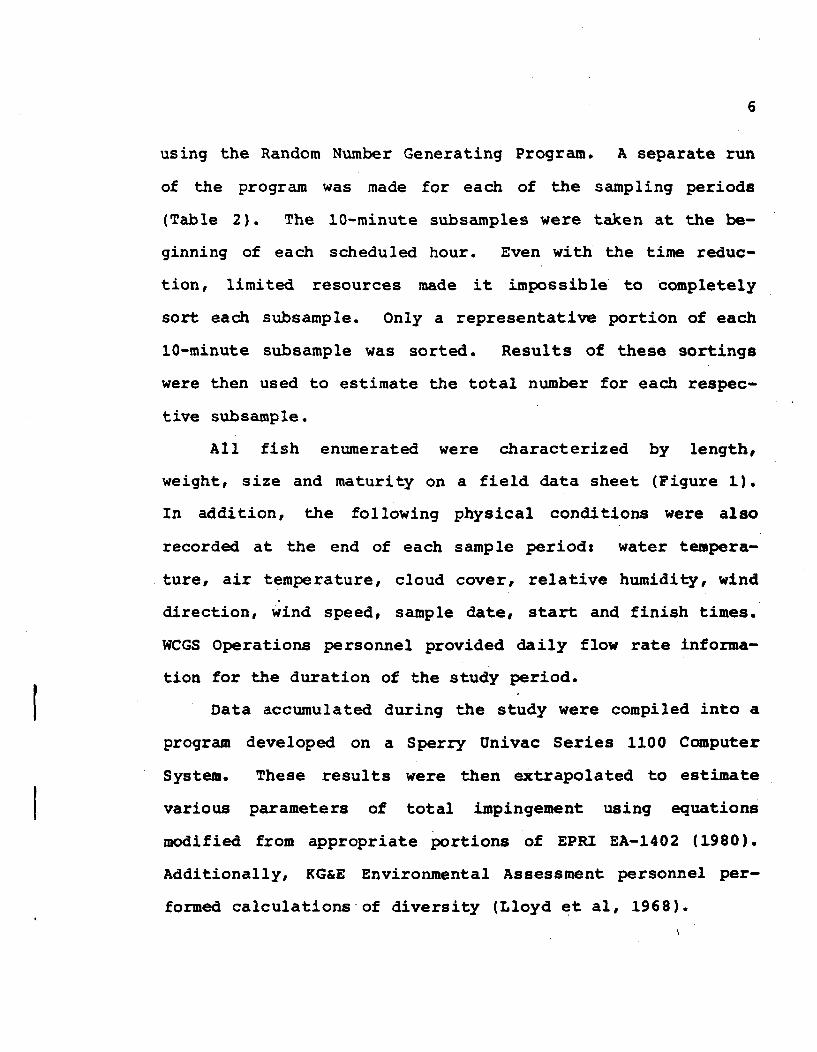
6
using the Random Number Generating Program. A separate run
of the program was made for each of the sampling periods
(Table 2). The 10-minute subsamples were taken at the be-
ginning of each scheduled hour. Even with the time reduc-
tion, limited resources made it impossible to completely
sort each subsample. Only a representative portion of each
10-minute subsample was sorted. Results of these sortings
were then used to estimate the total number for each respec-
tive subsample.
All fish enumerated were characterized by length,
weight, size and maturity on a field data sheet (Figure 1).
In addition, the following physical conditions were also
recorded at the end of each sample period: water tempera-
ture, air temperature, cloud cover, relative humidity, wind
direction, wind speed, sample date, start and finish times.
WCGS Operations personnel provided daily flow rate informa-
tion for the duration of the study period.
Data accumulated during the study were compiled into a
program developed on a Sperry Univac Series 1100 Computer
System. These results were then extrapolated to estimate
various parameters of total impingement using equations
modified from appropriate portions of EPRI EA-1402 (1980).
Additionally, KG&E Environmental Assessment personnel per-
formed calculations-of diversity (Lloyd et al, 1968).
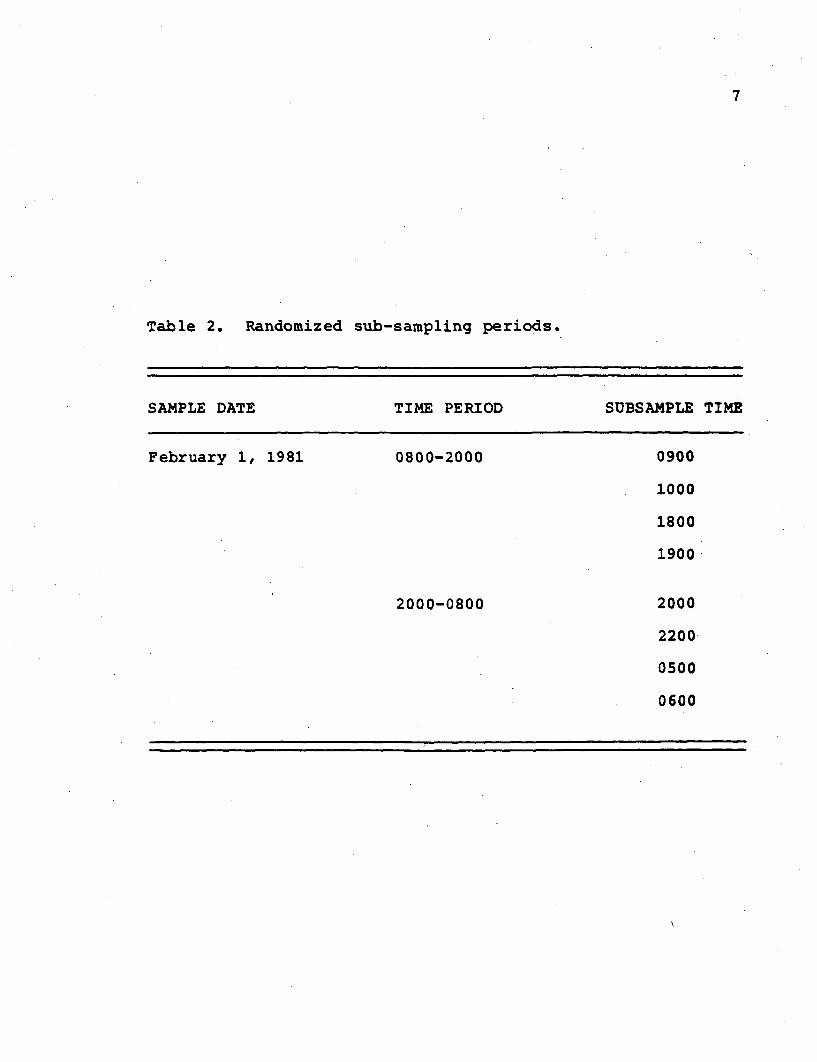
7
Table 2. Randomized sub-sampling periods.
SAMPLE DATE TIME PERIOD SUBSAMPLE TIME
February 1, 1981 0800-2000 0900
1000
1800
1900
2000-0800 2000
2200
0500
0600
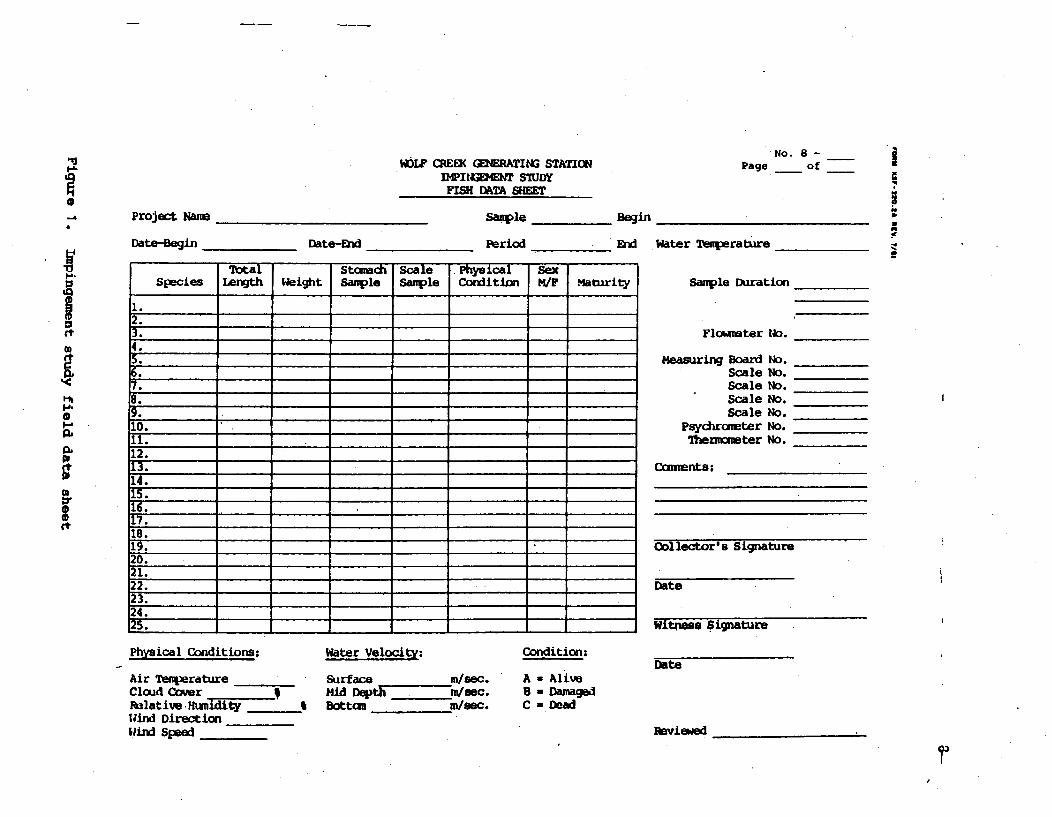
"'3g.4.
'I-4
4
.1,~.d.
so
ICt
ca
I-tbp.1.
001
01
00Ct
WOLF M•EEIK GMRATING STATIONDIPINGDO SIUDY
FISH DATA SHEET
No. 8 -Page _ of I
i#4
UU
Project Name
Date-Beqin
Sample
Period
Begin
End Water TemperatureDate-End
Total Stomach Scale Physical SexSpecies Length Weight Sampile Sample Cordition M/F Maturity
2.3.
4.S.
!7.
9.
10.11.12.13.
14.15.16.
18.19.
20.21.22.23.24.25.
Sample Duration
Flowmeter No.
Measuring Board No.Scale No.Scale No.Scale No.Scale No.
Psychrometer No.Thenzmo"ter No.
Camments _
Collector's Signature
Date
Witness Signature
DatePhysical Conditions:
Air TemperatureCloud CoverRalative. Hum iityWhind DirectionWiind Speed
Water Velocity:
Surface m/sec.Mid Deptnh n/ec.Bottcm m/sec.
Condition:
A = AliveB = DamagedC a DOaW
Reviewed
RESULTS AND DISCUSSION
Monitoring Schedule
Impingement at the MUSH was monitored when makeup
pumping to WCCL was occurring according to the schedule in
Table 1. However, shut-downs of MUSH pumping occurred
perodically and sampling was not performed during these
periods. Intermittent pumping resulted in deletion of a
single monitoring date in both January and February. Pump-
ing was stopped to permit modification/maintenance of the
pump control system for a prolonged period in early spring
from April 1 to May 21. This resulted in a total of 15
sampling dates being dropped from the study. Additionally,
.Ln August intermittent pumping caused both scheduled dates
to be missed. In this case, a single sampling date was
added to the study on a non-random basis. This was done to
provide data for a month when significant pumping occurred
that otherwise would not have been included in the study.
Impingement was monitored at the MUSH on a total of 33
dates. A list of actual dates sampled for the study appears
in Table 3.
General
A total of 19 species representing 15 genera and eight
families were collected during this study (Table 4). The
calculated estimate of the total impingment for the study
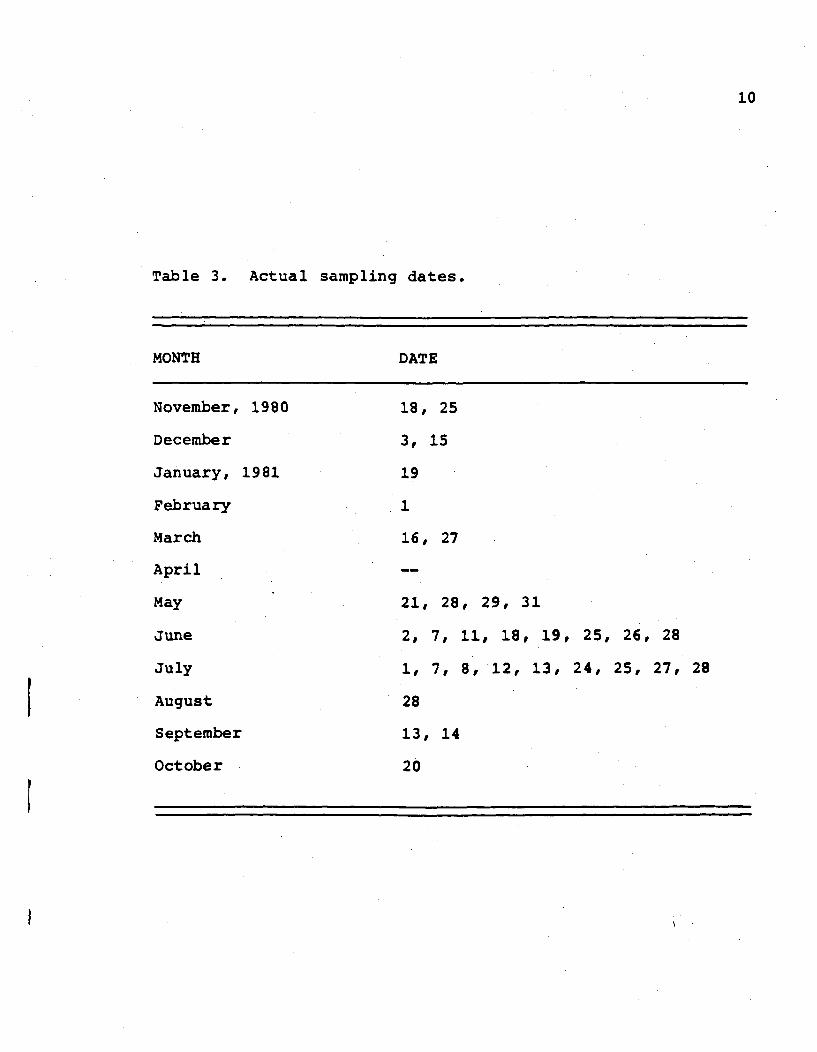
10
Table 3. Actual sampling dates.
MONTH DATE
November, 1980
December
January, 1981
February
March
April
May
June
July
August
September
October
18, 25
3, 15
19
1
16, 27
21, 28, 29, 31
2, 7, 11, 18, 19, 25, 26, 28
1, 7, 8, 12, 13, 24, 25, 27, 28
28
13, 14
20
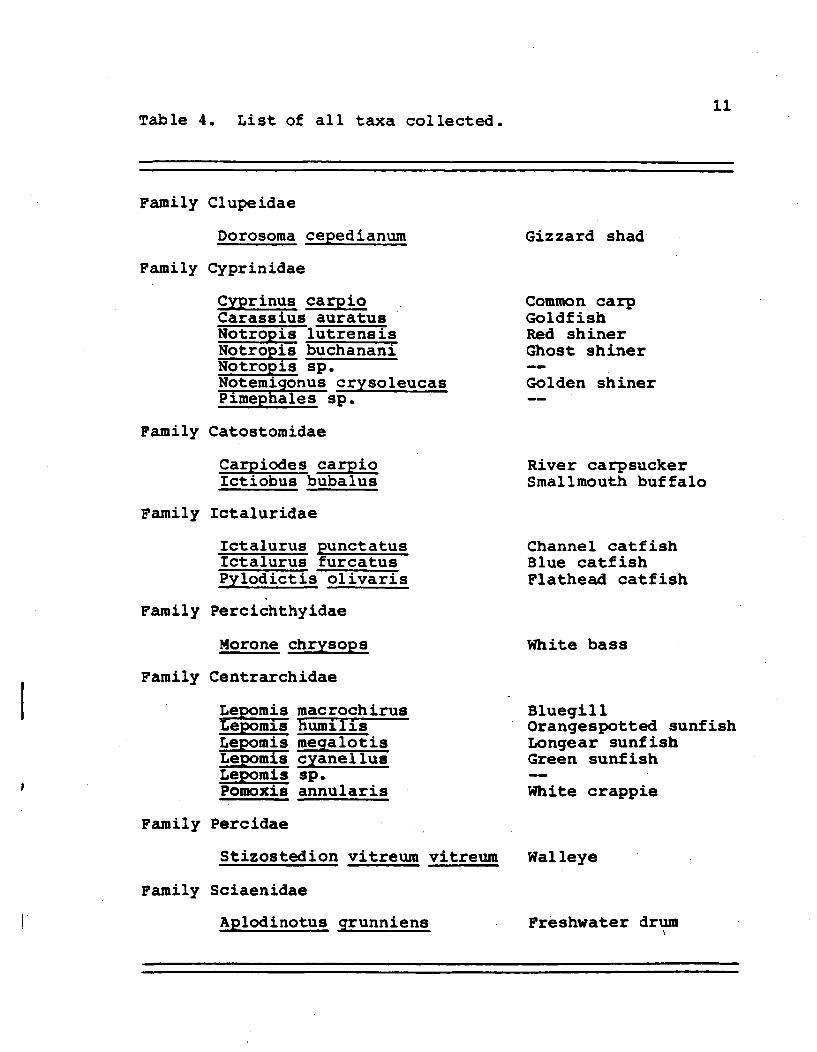
11Table 4. List of all taxa collected.
Family Clupeidae
Dorosoma cepedianum Gizzard shad
Family Cyprinidae
Cyprinus carpioCarassius auratusNotropis lutrensisNotropis buchananiNotropis sp.Notemigonus crysoleucasPimephales sp.
Common carpGoldfishRed shinerGhost shiner
Golden shiner
Family Catostomidae
Carpiodes carpioIctiobus bubalus
River carpsuckerSmallmouth buffalo
Family Ictaluridae
Ictalurus punctatusIctalurus furcatusPylodictis olivaris
Channel catfishBlue catfishFlathead catfish
Family Percichthyidae
Morone chrysops White bass
Family Centrarchidae
Lepomis macrochirusLepomis humilisLepomis megalotisLepomis cyanellusLepomis sp.Pomoxis annularis
BluegillOrangespotted sunfishLongear sunfishGreen sunfish
White crappie
Family Percidae
Stizostedion vitreum vitreum
Family Sciaenidae
Aplodinotus grunniens
Walleye
Freshwater drum
12
period was 105,465,103 fish. The weight of these individ-
uals was estimated through calculations to be 1,403,086
kilograms.
The estimated annual impingement and percent of total
impingement is presented in Table 5 for all taxa. Daily
minimum/maximum, monthly diurnal/nocturnal, estimated month-
ly total impingement and monthly variance appear in Table 6.
Daily minimum/maximum values were derived either from actual
24-hour sample results or from mean daily impingement num-
bers calculated from estimated monthly impingement. Table 7
presents monthly biomass estimates, diversity values,
diurnal/nocturnal/total impingement rates by volume and mean
water temperature values. The ranges and means of length/
weight, as well as impingement rate and estimated number
impinged is presented for each taxa on a monthly basis in
Tables 8 - 29. Length frequency distribution for impinged
fish is presented by month in Appendix I for all taxa.
Observations on maturity of impinged fish are presented by
month, along with estimates of numbers within each maturity
classification in Appendix II.
Impingement at the MUSH exhibited a high degree of
variability seasonally in terms of numbers and species com-
position. Monthly impingement was highest during the winter
months with an estimated peak of 80,139,235 fish in February
(Table 6). Monthly variance seemed to generally correlate
to impingement with the highest values occurring in the
winter months and the lowest in the summer. Values for
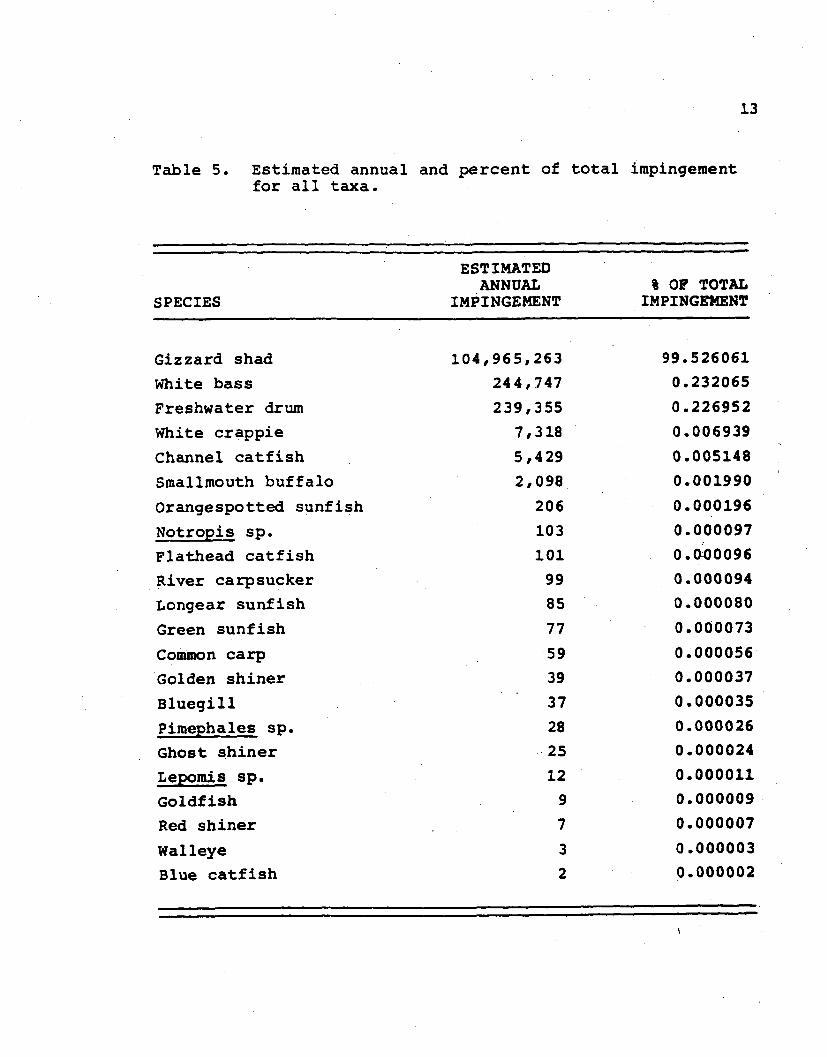
13
Table 5. Estimated annual and percent of total impingementfor all taxa.
ESTIMATEDANNUAL % OF TOTAL
SPECIES IMPINGEMENT IMPINGEMENT
Gizzard shad
White bass
Freshwater drum
White crappie
Channel catfish
Smallmouth buffalo
Orangespotted sunfish
Notropis sp.
Flathead catfish
River carpsucker
Longear sunfish
Green sunfish
Common carp
Golden shiner
Bluegill
Pimephales sp.
Ghost shiner
Lepomis sp.
Goldfish
Red shiner
Walleye
Blue catfish
104,965,263244,747
239,355
7,318
5,429
2,098
206
103
101
99
85
77
59
39
37
28
25
12
9
7
3
2
99.5260610.232065
0.226952
0.006939
0.005148
0.001990
0.000196
0.000097
0.0o0096
0.000094
0.000080
0.000073
0.000056
0.000037
0.000035
0.000026
0.000024
0.000011
0.000009
0.000007
0.000003
0.000002
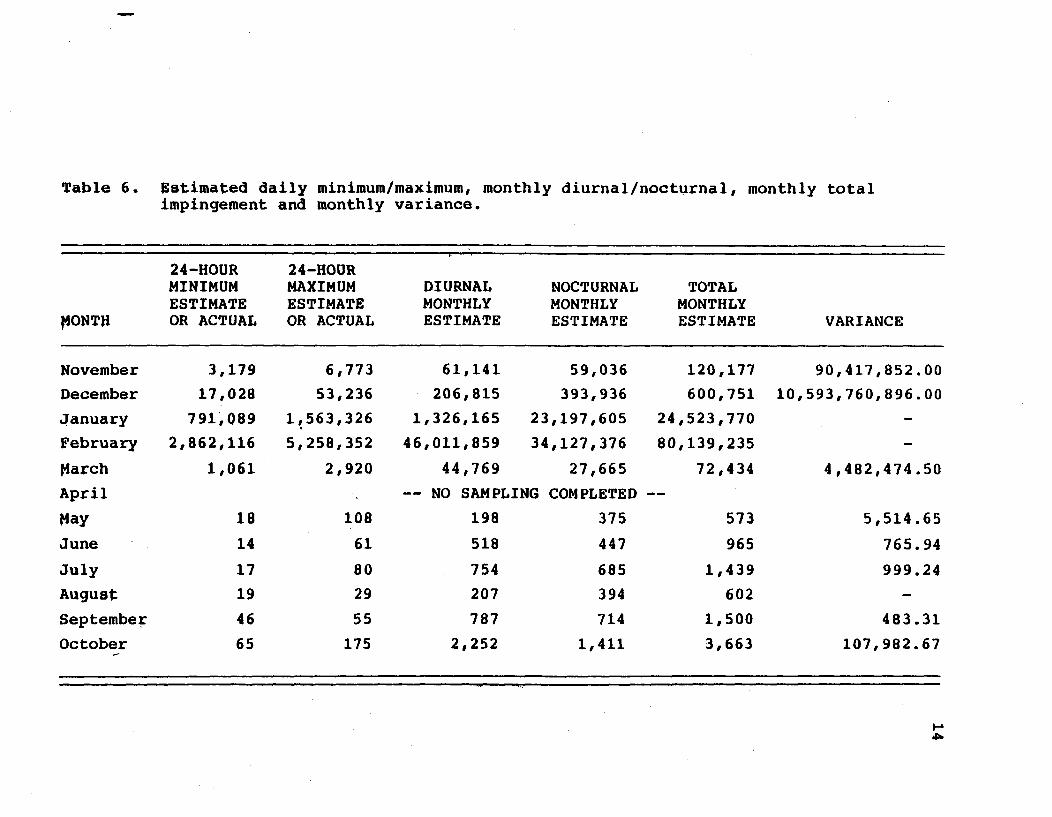
Table 6. Estimated daily minimum/maximum, monthly diurnal/nocturnal, monthly totalimpingement and monthly variance.
24-HOUR 24-HOURMINIMUM MAXIMUM DIURNAL NOCTURNAL TOTALESTIMATE ESTIMATE MONTHLY MONTHLY MONTHLY
MONTH OR ACTUAL OR ACTUAL ESTIMATE ESTIMATE ESTIMATE VARIANCE
November 3,179 6,773 61,141 59,036 120,177 90,417,852.00
December 17,028 53,236 206,815 393,936 600,751 10,593,760,896.00
January 791,089 1,563,326 1,326,165 23,197,605 24,523,770
February 2,862,116 5,258,352 46,011,859 34,127,376 80,139,235
March 1,061 2,920 44,769 27,665 72,434 4,482,474.50
April -- NO SAMPLING COMPLETED --
May 18 108 198 375 573 5,514.65
June 14 61 518 447 965 765.94
July 17 80 754 685 1,439 999.24
August 19 29 207 394 602 -
September 46 55 787 714 1,500 483.31
October 65 175 2,252 1,411 3,663 107,982.67
H~
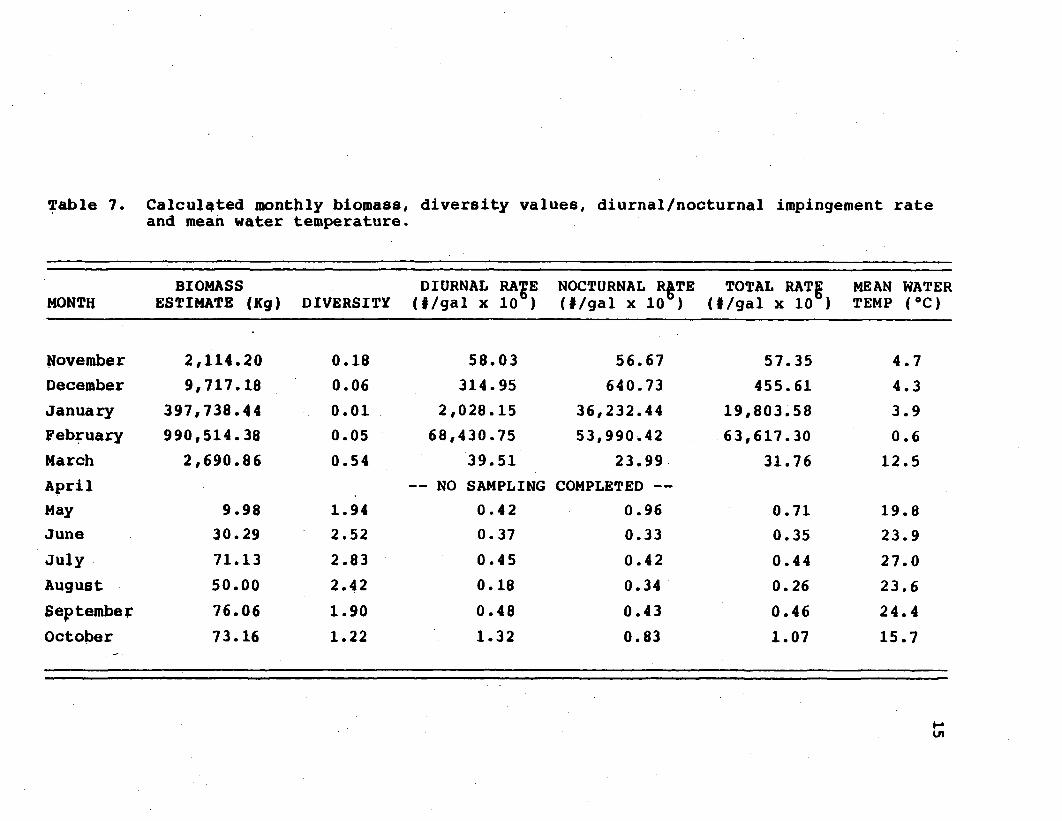
Table 7. Calculated monthly biomass, diversity values, diurnal/nocturnal impingement rateand mean water temperature.
BIOMASS DIURNAL RAWE NOCTURNAL R§TE TOTAL RATE MEAN WATERMONTH ESTIMATE (Kg) DIVERSITY (#/gal x 10-} (#/gal x 10 ) (#/gal x 10 ) TEMP (*C)
November 2,114.20 0.18 58.03 56.67 57.35 4.7
December 9,717.18 0.06 314.95 640.73 455.61 4.3
January 397,738.44 0.01 2,028.15 36,232.44 19,803.58 3.9
February 990,514.38 0.05 68,430.75 53,990.42 63,617.30 0.6
March 2,690.86 0.54 39.51 23.99 31.76 12.5
April -- NO SAMPLING COMPLETED --
May 9.98 1.94 0.42 0.96 0.71 19.8
June 30.29 2.52 0.37 0.33 0.35 23.9
July 71.13 2.83 0.45 0.42 0.44 27.0
August 50.00 2.42 0.18 0.34 0.26 23.6
September 76.06 1.90 0.48 0.43 0.46 24.4
October 73.16 1.22 1.32 0.83 1.07 15.7
U1
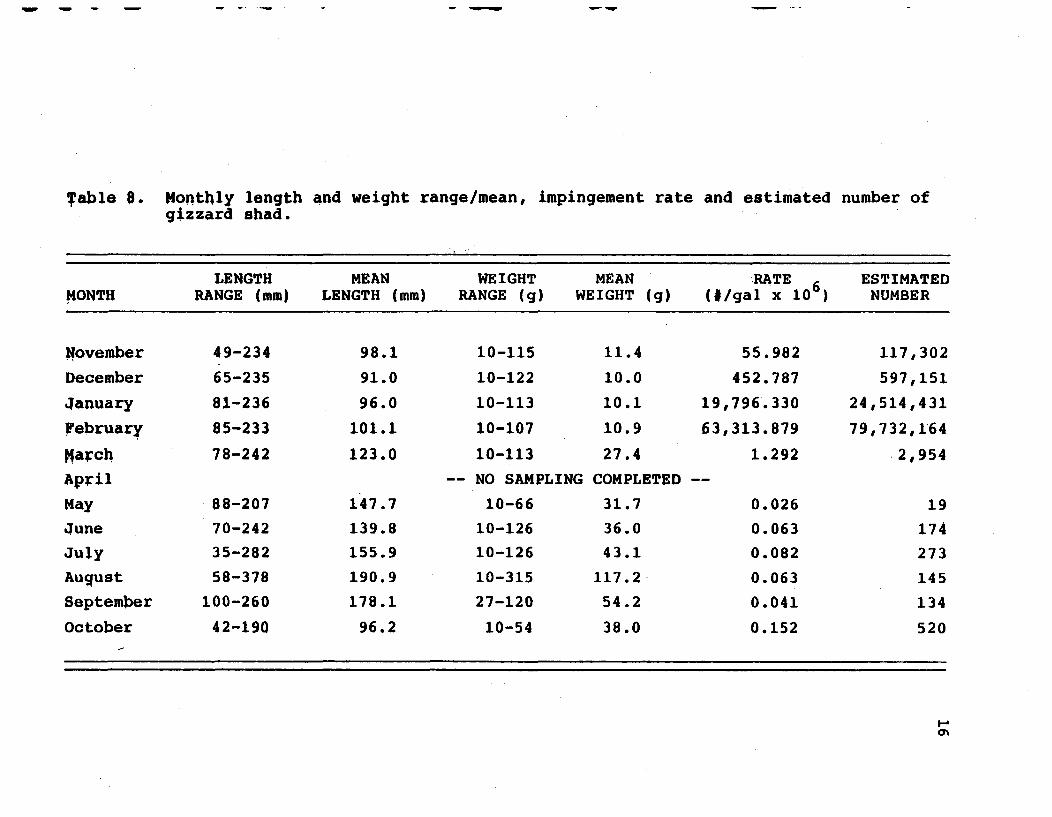
w - - -
Table 8. Monthly length and weight range/mean, impingement rate and estimated number ofgizzard shad.
LENGTH MEAN WEIGHT MEAN RATE 6 ESTIMATEDMONTH RANGE (mm) LENGTH (mm) RANGE (g) WEIGHT (g) (#/gal x 10 ) NUMBER
November 49-234 98.1 10-115 11.4 55.982 117,302
December 65-235 91.0 10-122 10.0 452.787 597,151
January 81-236 96.0 10-113 10.1 19,796.330 24,514,431
february 85-233 101.1 10-107 10.9 63,313.879 79,732,164
fjarch 78-242 123.0 10-113 27.4 1.292 .2,954
April -- NO SAMPLING COMPLETED --
May 88-207 147.7 10-66 31.7 0.026 19June 70-242 139.8 10-126 36.0 0.063 174
July 35-282 155.9 10-126 43.1 0.082 273August 58-378 190.9 10-315 117.2- 0.063 145
September 100-260 178.1 27-120 54.2 0.041 134
October 42-190 96.2 10-54 38.0 0.152 520
I-a
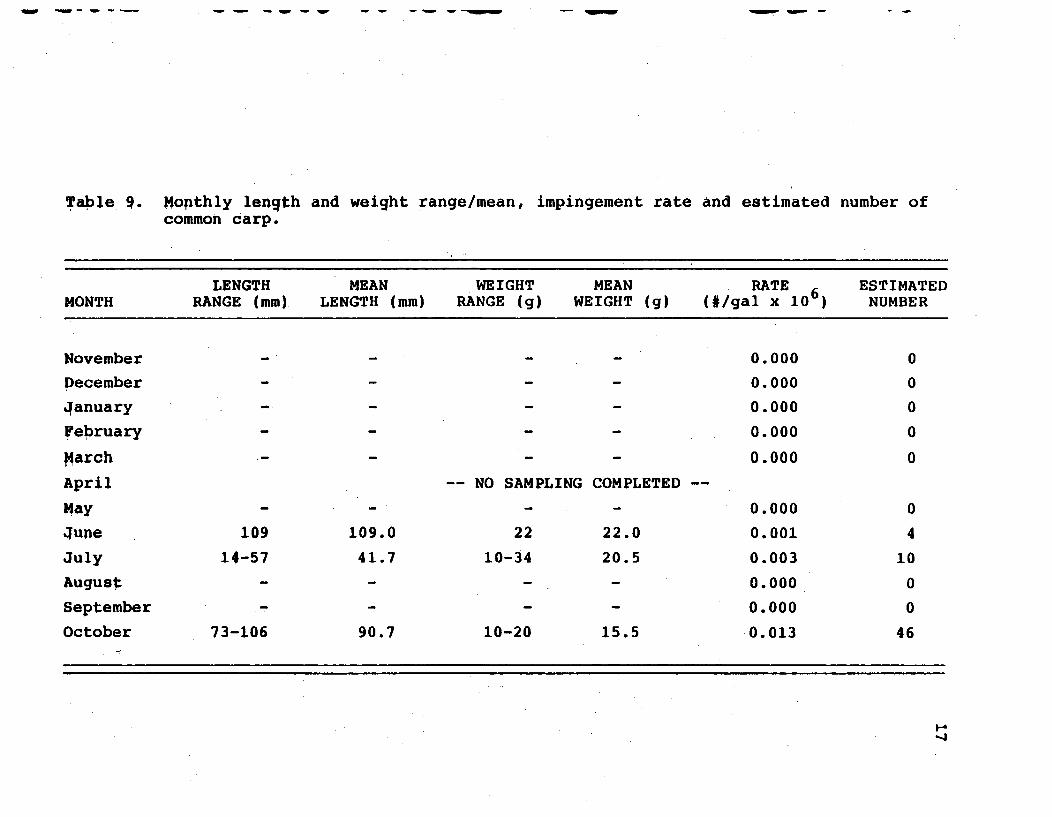
w *~- - - - MW - qW - __
Table 9. Monthly length and weight range/mean, impingement rate and estimated number ofcommon carp.
LENGTH MEAN WEIGHT MEAN RATE ESTIMATEDMONTH RANGE (mm) LENGTH (mm) RANGE (g) WEIGHT (g) (#/gal x 106) NUMBER
November .... 0.000 0
December .... 0.000 0
January ..... 0.000 0
February ..... 0.000 0
March ..... 0.000 0
April -- NO SAMPLING COMPLETED --
May .-.. 0.000 0
June 109 109.0 22 22.0 0.001 4
July 14-57 41.7 10-34 20.5 0.003 10
August - - -. 0.000 0
September , - - - 0.000 0
October 73-106 90.7 10-20 15.5 0.013 46
-4

Table 10. Monthly length and weight range/mean, impingement rate and estimated number ofgoldfish.
LENGTH MEAN WEIGHT MEAN RATE 6 ESTIMATEDMONTH RANGE (mm) LENGTH (mm) RANGE (g) WEIGHT (g) (#/gal x 10% NUMBER
November .... 0.000 0
December .... 0.000 0
January .... 0.000 0
February - - - - 0.000 0
March .... 0.000 0
April -- NO SAMPLING COMPLETED --
May 157 157.0 46 46.0 0.003 2
June 110 110.0 16 16.0 0.001 4
July 130 130.0 36 36.0 0.001 3
August - - - - 0.000 0
September - - 0.000 0
October - - 0.000 0
Go
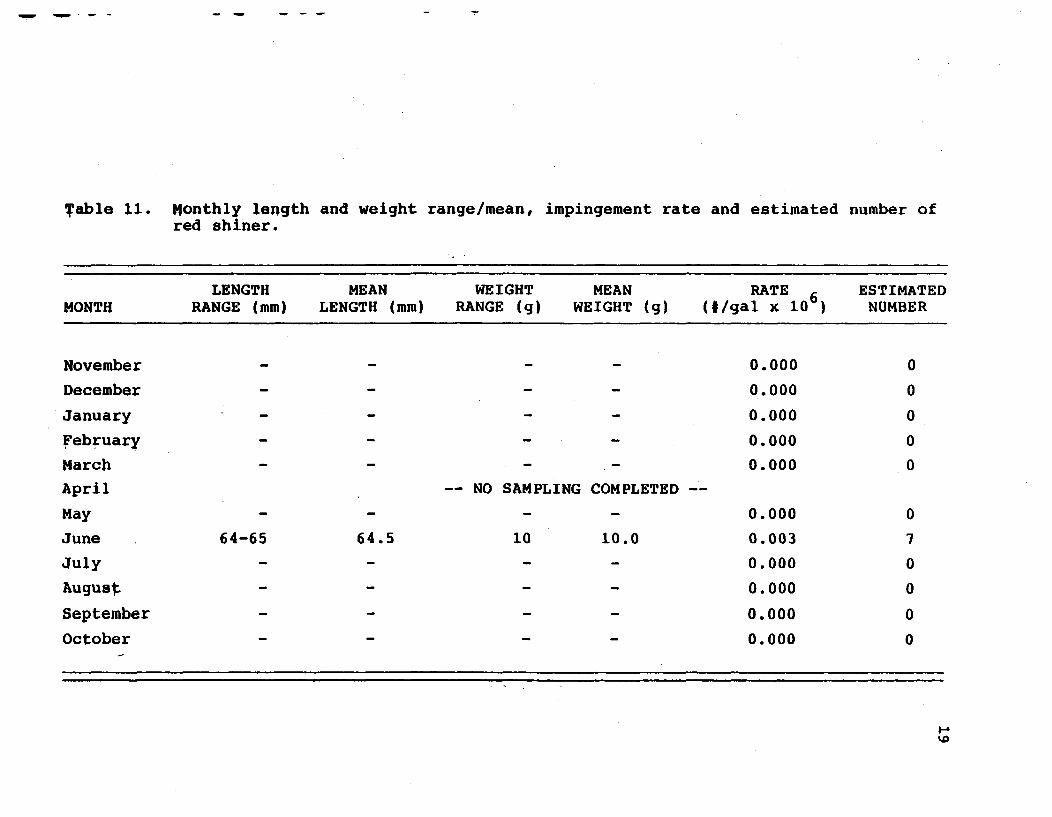
- - - - -
Table 11. M4onthly length and weight range/mean, impingement rate and estimated number ofred shiner.
LENGTH MEAN WEIGHT MEAN RATE 6 ESTIMATEDMONTH RANGE (mm) LENGTH (mm) RANGE (g) WEIGHT (g) (#/gal x 10 ) NUMBER
November .... 0.000 0
December .... 0.000 0
January .... 0.000 0
February .... 0.000 0
March .... 0.000 0April -- NO SAMPLING COMPLETED --
May - - - 0.000 0
June 64-65 64.5 10 10.0 0.003 7
July - - - - 0.000 0
August - - - - 0.000 0
September - - - - 0.000 0
October - - - - 0.000 0
I-'
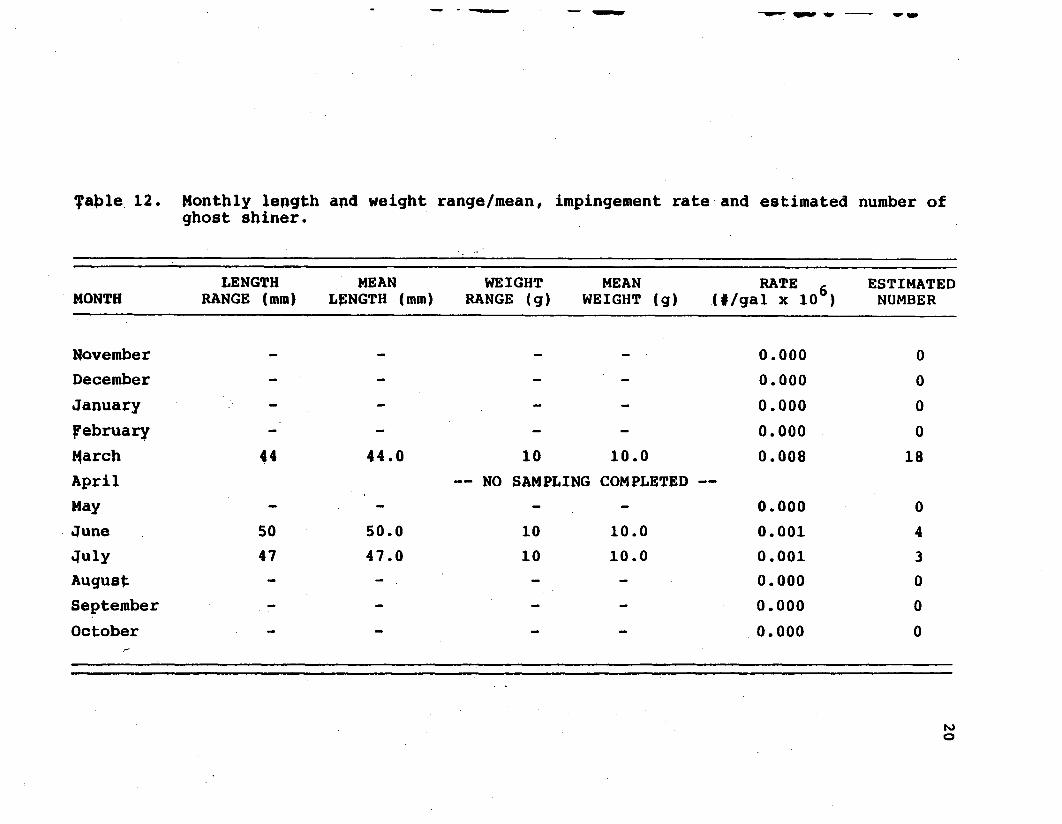
- NNO -w-, w "r - w
Table 12. Monthly length and weight range/mean, impingement rate and estimated number ofghost shiner.
LENGTH MEAN WEIGHT MEAN RATE 6 ESTIMATEDMONTH RANGE (mm) LENGTH (mm) RANGE (g) WEIGHT (g) (#/gal x 10 ) NUMBER
November .... 0.000 0
December .... 0.000 0
January .... 0.000 0
february ..... 0.000 0
March 44 44.0 10 10.0 0.008 18
April -- NO SAMPLING COMPLETED --
May - - - 0.000 0
June 50 50.0 10 10.0 0.001 4
July 47 47.0 10 10.0 0.001 3
August - - - 0.000 0
September - - - - 0.000 0
October .... 0.000 0
0

!qble 14. Monthly length and weight range/mean, impingement rate and estimated number ofNotropis sp.
LENGTH MEAN WEIGHT MEAN RATE 6 ESTIMATEDMONTH RANGE (mm) LENGTH (mm) RANGE (g) WEIGHT (g) (#/gal x 106) NUMBER
November - - - - 0.000 0
December 37 37.0 10 10.0 0.008 9
January .... 0.000 0
February ..... 0.000 0
March 36-43 39.3 10 10.0 0.024 55
April -- NO SAMPLING COMPLETED --
May - - - 0.000 0
June 45-55 50.0 10 10.0 0.003 7
July 44-53 49.7 10 10.0 0.003 10August 63 63.0 10 10.0 0.009 21
September - - - - 0.000 0
October .... 0.000 .0
I-a
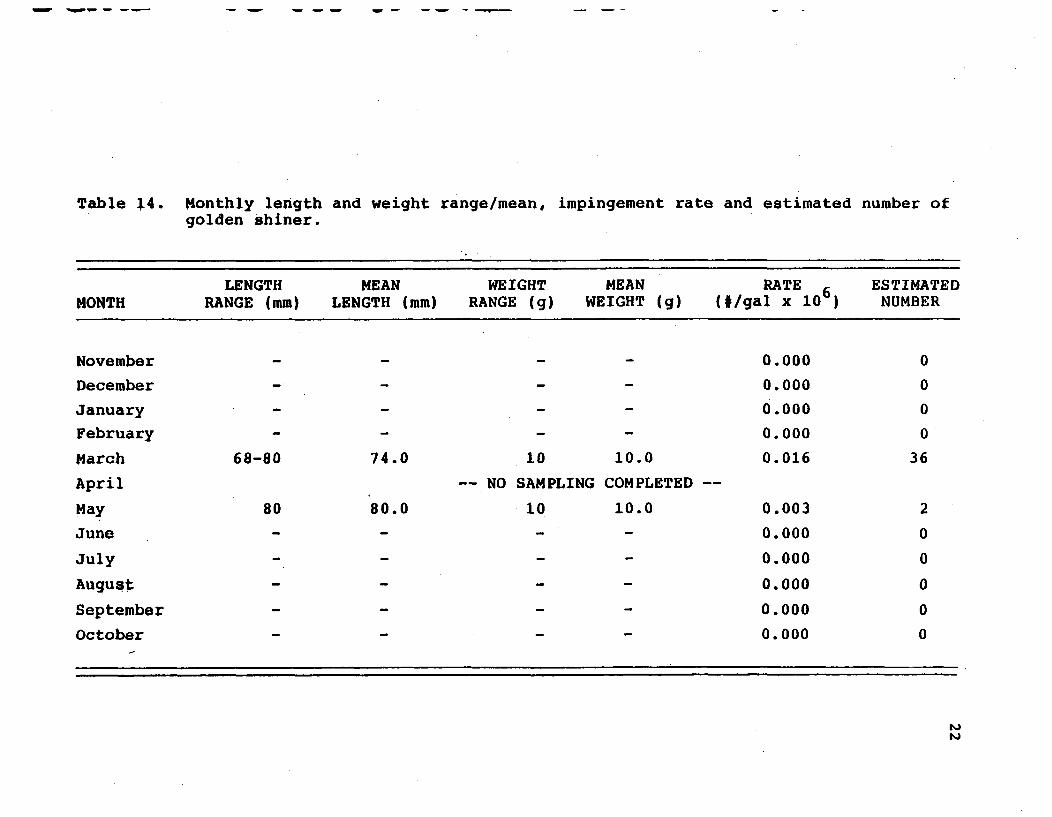
1010ý ."W- - - - w - -- - w - n - - - - - -
Table 14. Monthly length and weight range/mean, impingement rate and estimated number ofgolden shiner.
LENGTH MEAN WEIGHT MEAN RATE 6 ESTIMATEDMONTH RANGE (mm) LENGTH (mm) RANGE (g) WEIGHT (g) (#/gal x 10 NUMBER
November .- 0.000 0
December - - 0.000 0
January .- 0.000 0
February .- - 0.000 0
March 68-80 74.0 10 10.0 0.016 36
April -- NO SAMPLING COMPLETED --
May 80 80.0 10 10.0 0.003 2
June .... 0.000 0
July ... 0.000 0
August ... 0.000 0
September ... 0.000 0
October .... 0.000 0
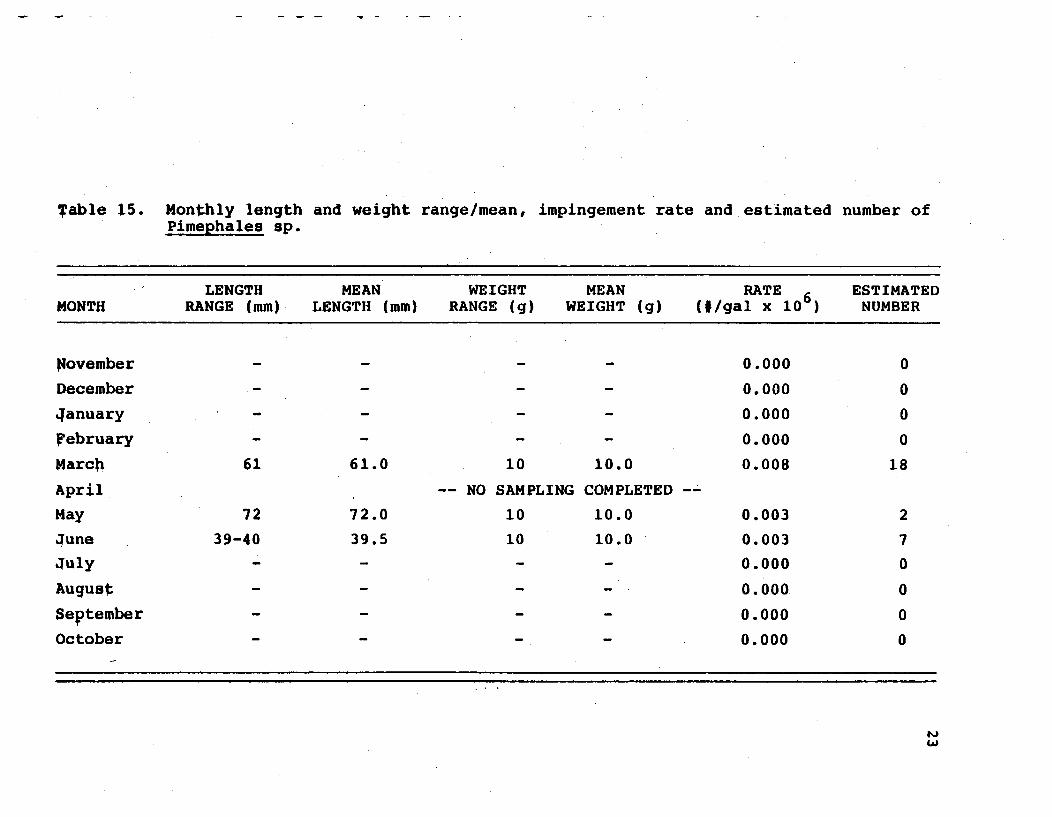
Table 15. Monthly length and weight range/mean, impingement rate and estimated number ofPimephales sp.
LENGTH MEAN WEIGHT MEAN RATE 6 ESTIMATEDMONTH RANGE (mm) LENGTH (mm) RANGE (g) WEIGHT (g) (#/gal x 10 NUMBER
November .- 0.000 0
December .- 0.000 0
January .- 0.000 0
february - - - - 0.000 0
March 61 61.0 .10 10.0 0.008 18
April -- NO SAMPLING COMPLETED -"
May 72 72.0 10 10.0 0.003 2
June 39-40 39.5 10 10.0 0.003 7
July - - - - 0.000 0
August - -. 0.000 0
September - - 0.000 0
October - - 0.000 0
wU
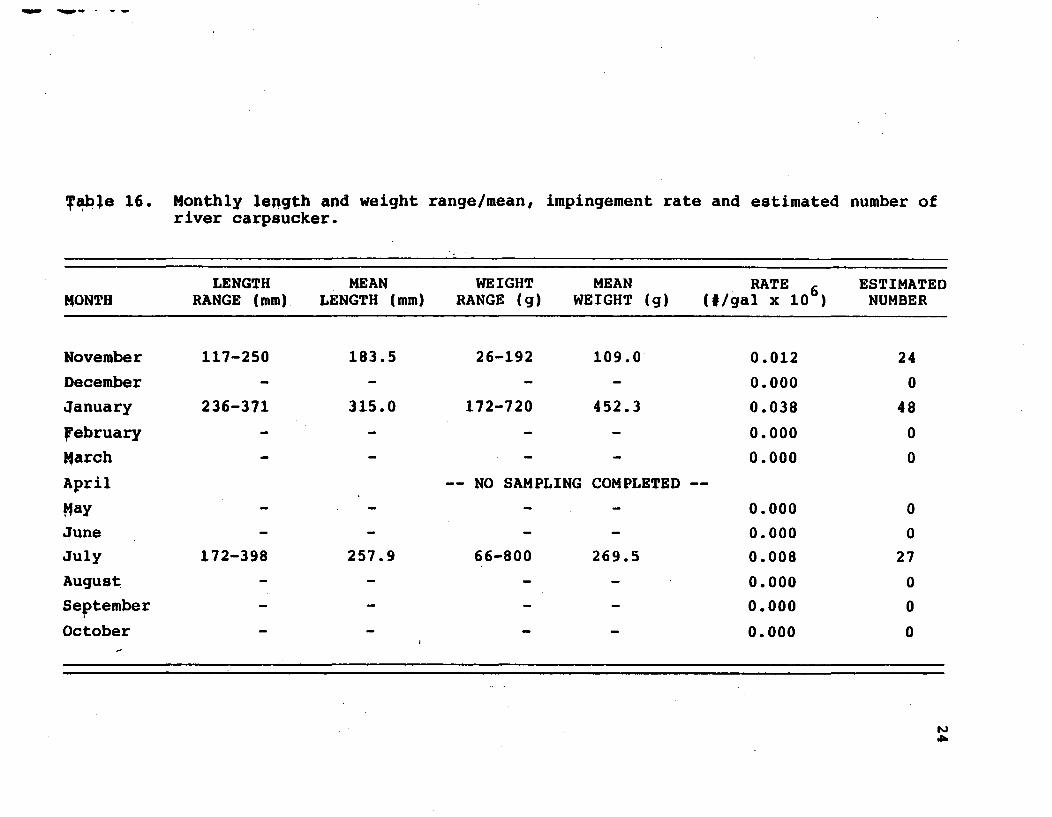
.ow -W - - - -
Table 16. Monthly length and weight range/mean, impingement rate and estimated number ofriver carpsucker.
LENGTH MEAN WEIGHT MEAN RATE 6 ESTIMATEDMONTH RANGE (mm) LENGTH (mm) RANGE (g) WEIGHT (g) (#/gal x 10-) NUMBER
November 117-250 183.5 26-192 109.0 0.012 24
December - - - - 0.000 0
January 236-371 315.0 172-720 452.3 0.038 48
Yebruary - - - - 0.000 0
March .... 0.000 0
April -- NO SAMPLING COMPLETED --
May .... 0.000 0
June .- - 0.000 0
July 172-398 257.9 66-800 269.5 0.008 27
August - - - - 0.000 0
September .... 0.000 0
October .... 0.000 0
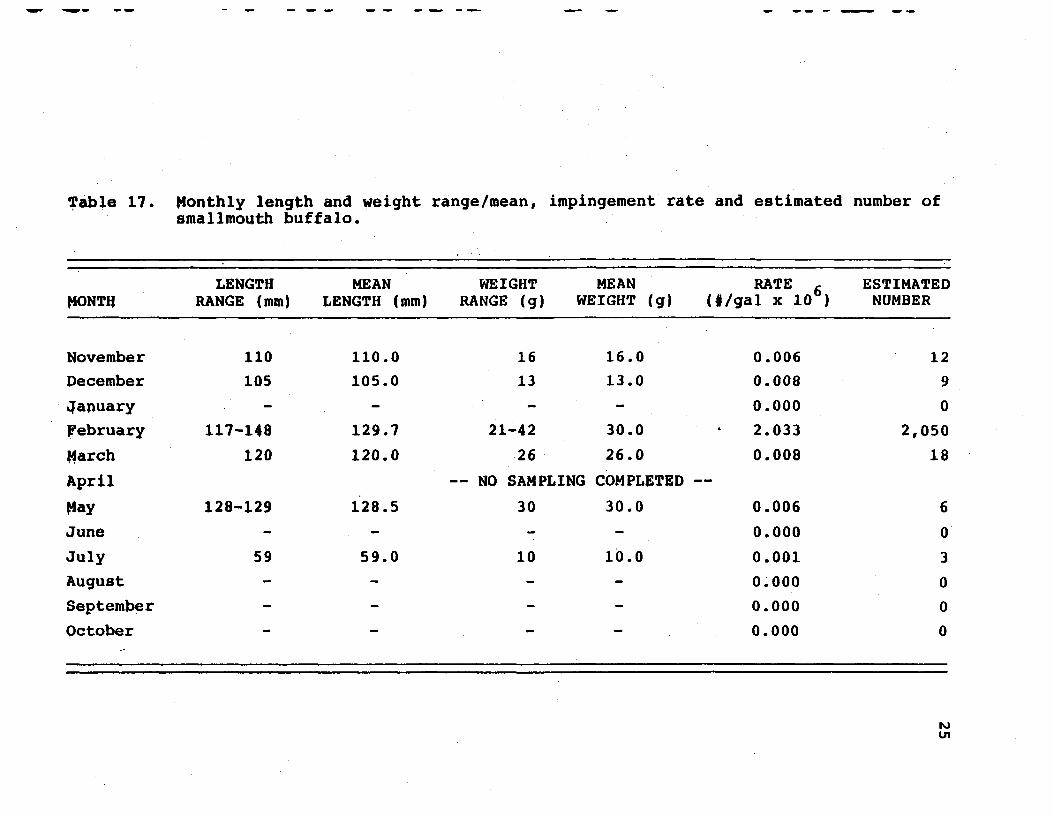
q1NW -Mý- - -
Table 17. Monthly length and weight range/mean, impingement rate and estimated number ofsmallmouth buffalo.
LENGTH MEAN WEIGHT MEAN RATE 6 ESTIMATEDMONTH RANGE (mm) LENGTH (mm) RANGE (g) WEIGHT (g) (#/gal x 10 ) NUMBER
November 110 110.0 16 16.0 0.006 12
December 105 105.0 13 13.0 0.008 9
qanuary .... 0.000 0
february 117-148 129.7 21-42 30.0 2.033 2,050
March 120 120.0 26 26.0 0.008 18
April -- NO SAMPLING COMPLETED -
May 128-129 128.5 30 30.0 0.006 6
June - - - 0.000 0
July 59 59.0 10 10.0 0.001 3
August - - - - 0.000 0
September .... 0.000 0
October .... 0.000 0
U'

". -W W W -
Table 18.. Monthly length and weight range/mean, impingement rate and estimated number ofchannel catfish.
LENGTH MEAN WEIGHT MEAN RATE 6 ESTIMATEDMONTH RANGE (mm) LENGTH (mm) RANGE (g) WEIGHT (g) (#/gal x 10 ) NUMBER
November 44-264 136.1 10-100 31.8 0.150 314
December 77-220 161.9 10-75 38.1 0.0.98 124
January 5.8-167 101.0 10-34 12.4 0.127 168
February 86-125 101.3 10-19 11.3 2.033 2,050
March 58-465 91.2 10-710 88.9 0.917 2,092
April -- NO SAMPLING COMPLETED
May 77-218 117.9 10-65 15.9 0.247 196
june 80-290 136.9 10-211 37.4 0.024 68
July 35-345 145.2 10-170 41.6 0.011 37
August 53-220 146.2 10-75 38.2 0.054 124
September 64-197 118.0 10-63 28.4 0.032 104
October 53-218 107.9 10-106 39.8 0.045 153
at
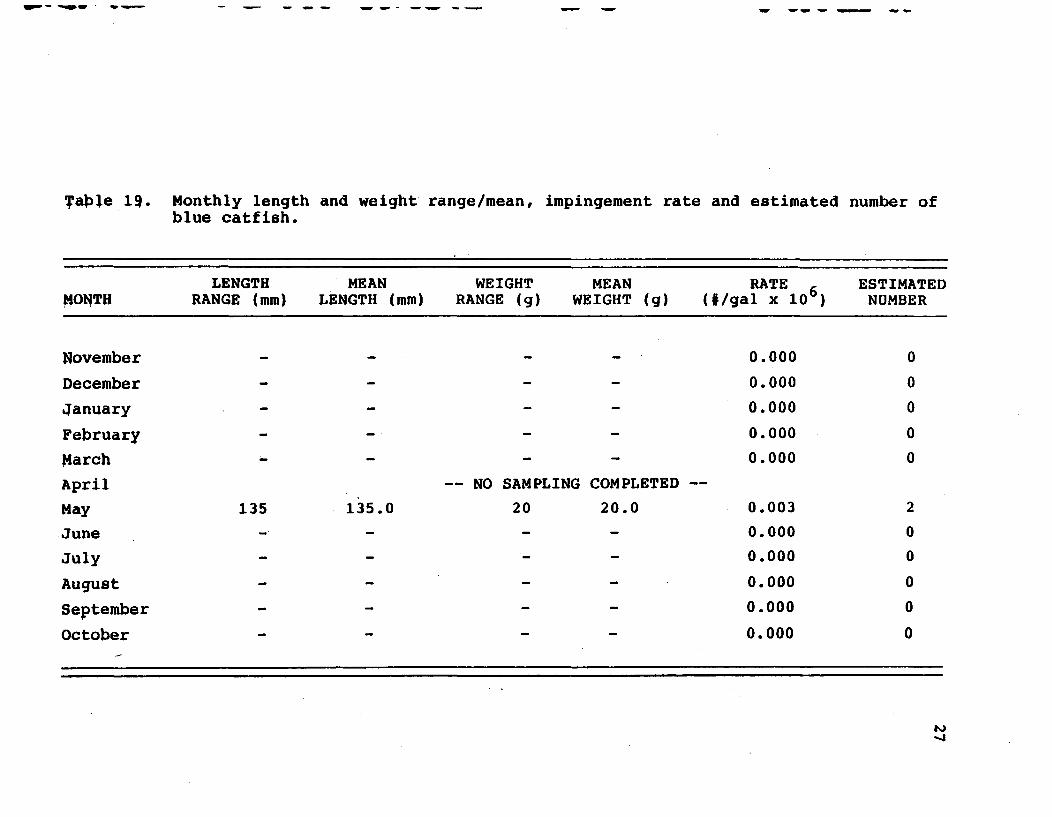
W- -mw w- - ---
Table 19. Monthly length and weight range/mean, impingement rate and estimated number ofblue catfish.
LENGTH MEAN WEIGHT MEAN RATE 6 ESTIMATEDMONTH RANGE (mm) LENGTH (mm) RANGE (g) WEIGHT (g) (#/gal x 106) NUMBER
November .... 0.000 0
December .- 0.000 0
January .- 0.000 0
February .- 0.000 0
March .- 0.000 0
April -- NO SAMPLING COMPLETED --
May 135 135.0 20 20.0 0.003 2
June - - - - 0.000 0
July - - - - 0.000 0
August - - 0.000 0
September - - 0.000 0
October - -- - 0.000 0
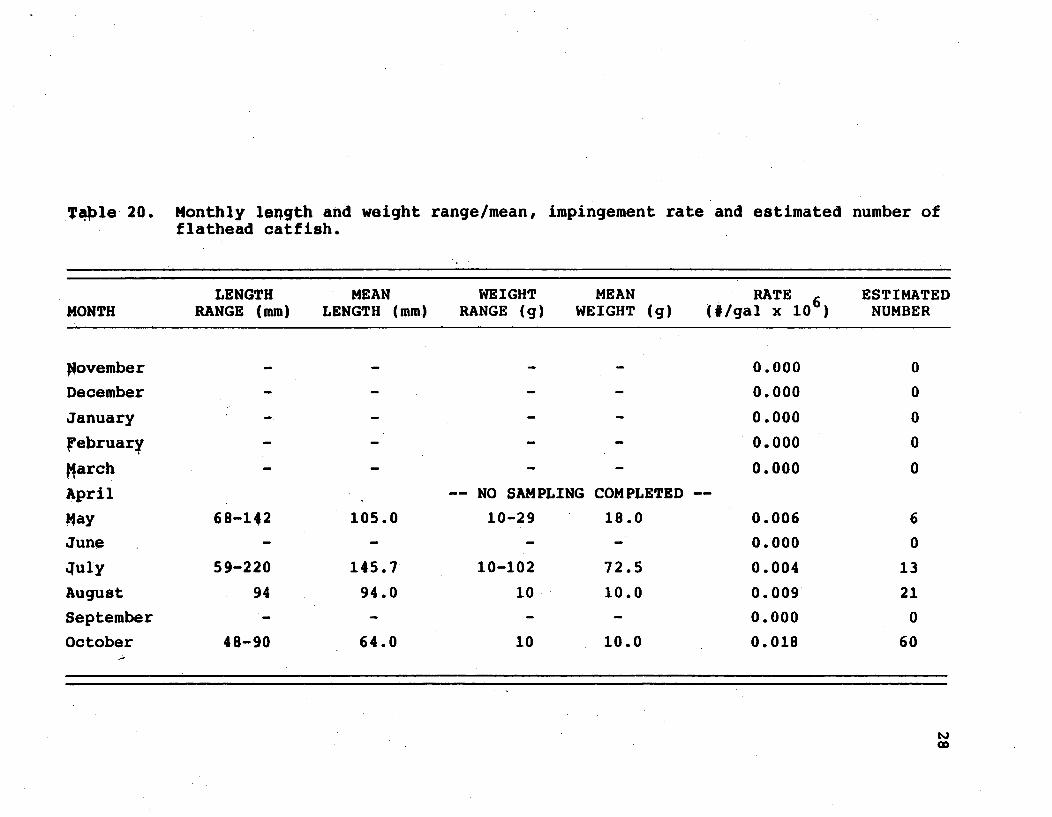
Table 20. Monthly length and weight range/mean, impingement rate and estimated number offlathead catfish.
LENGTH MEAN WEIGHT MEAN RATE 6 ESTIMATEDMONTH RANGE (mm) LENGTH (mm) RANGE (g) WEIGHT (g) (#/gal x 106) NUMBER
povember .... 0.000 0
December .... 0.000 0
January ..... 0.000 0
February .... 0.000 0
March .... 0.000 0
April -- NO SAMPLING COMPLETED --
14ay 68-142 105.0 10-29 18.0 0.006 6
June - - - 0.000 0
duly 59-220 145.7 10-102 72.5 0.004 13August 94 94.0 10 10.0 0.009 21
September - - - - 0.000 0
October 48-90 64.0 10 10.0 0.018 60
I~J
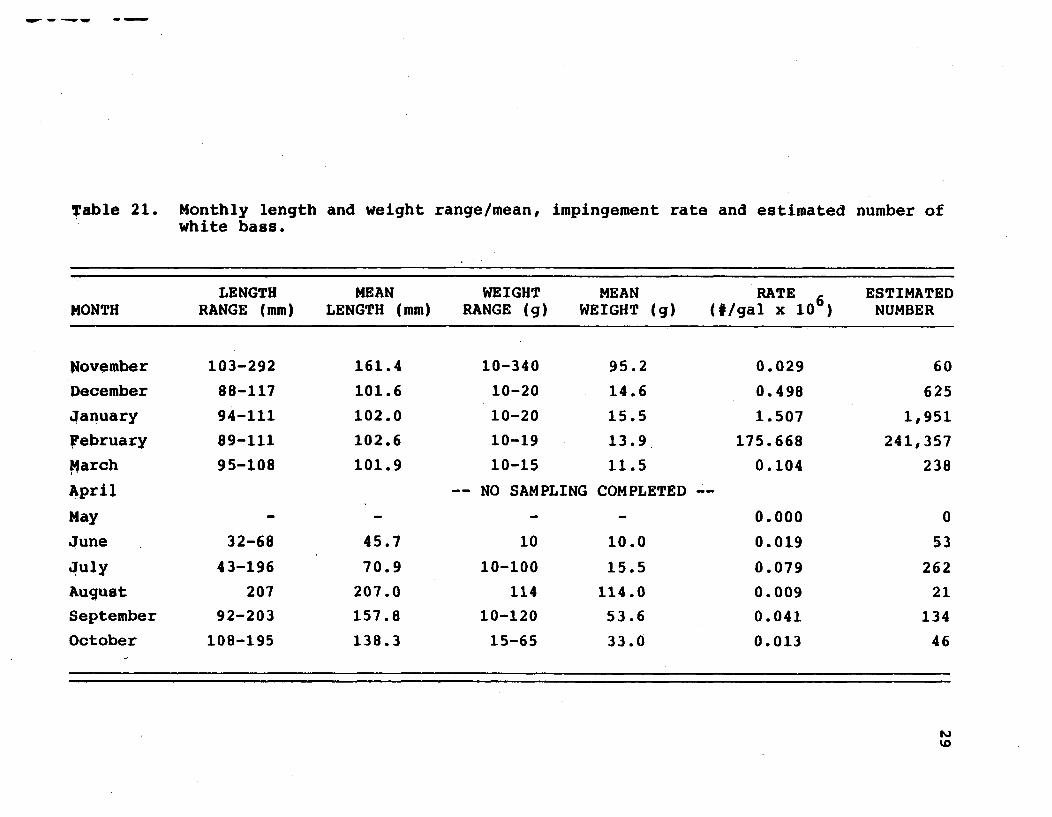
r- -- w --
Table 21. Monthly length and weight range/mean, impingement rate and estimated number ofwhite bass.
LENGTH MEAN WEIGHT MEAN RATE 6 ESTIMATEDMONTH RANGE (mm) LENGTH (mm) RANGE (g) WEIGHT (g) (#/gal x 10 ) NUMBER
November 103-292 161.4 10-340 95.2 0.029 60
December 88-117 101.6 10-20 14.6 0.498 625
January 94-111 102.0 10-20 15.5 1.507 1,951
February 89-111 102.6 10-19 13.9 175.668 241,357
,4arch 95-108 101.9 10-15 11.5 0.104 238
April -- NO SAMPLING COMPLETED
May - - - - 0.000 0
June 32-68 45.7 10 10.0 0.019 53
July 43-196 70.9 10-100 15.5 0.079 262
August 207 207.0 114 114.0 0.009 21
September 92-203 157.8 10-120 53.6 0.041 134
October 108-195 138.3 15-65 33.0 0.013 46
qko
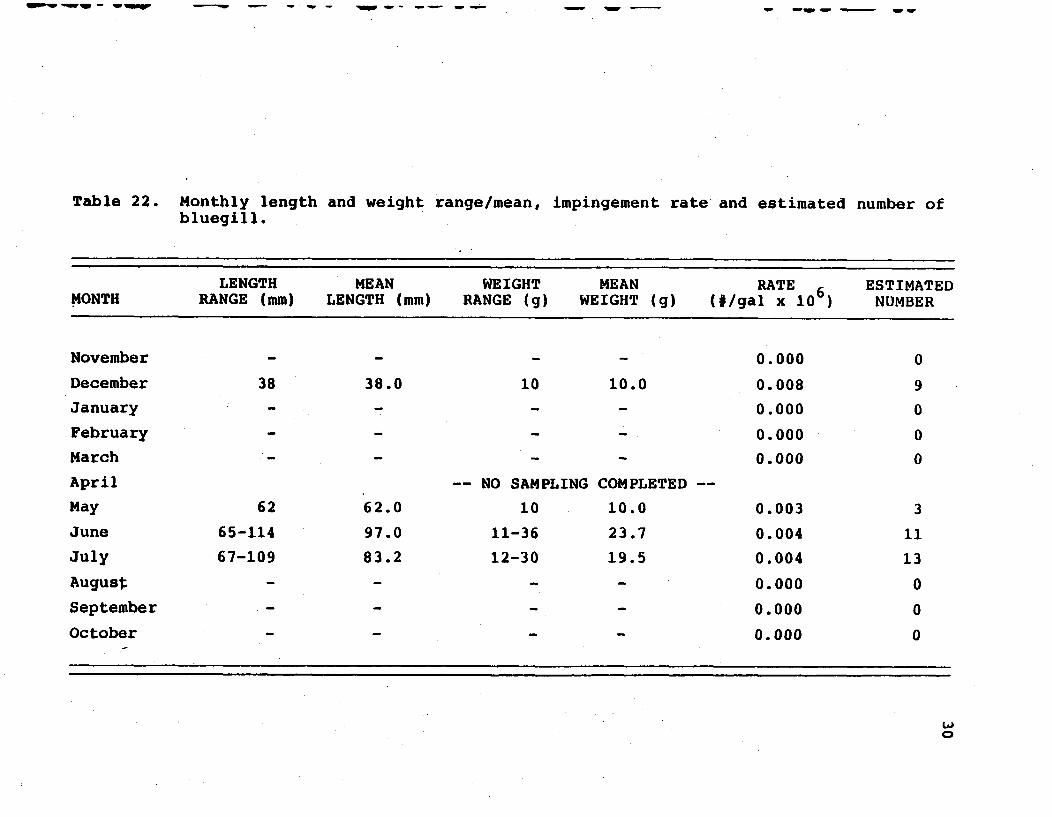
Iwo--w -- Nwqw - W mupw ~w ~ - w - -w - - - - - - - 'WW -w ~- • -M ý W W
Table 22. Monthly length and weight range/mean, impingement rate and estimated number ofbluegill.
LENGTH MEAN WEIGHT MEAN RATE 6 ESTIMATEDMONTH RANGE (mm) LENGTH (mm) RANGE (g) WEIGHT (g) (#/gal x 10 NUMBER
November - - - 0.000 0
December 38 38.0 10 10.0 0.008 9
January .... 0.000 0
February .... 0.000 0
March .... 0.000 0
April -- NO SAMPLING COMPLETED --
May 62 62.0 10 10.0 0.003 3
June 65-114 97.0 11-36 23.7 0.004 11
July 67-109 83.2 12-30 19.5 0.004 13
August - - - 0.000 0
September 0.000 0
October 0.000 0
L.J0
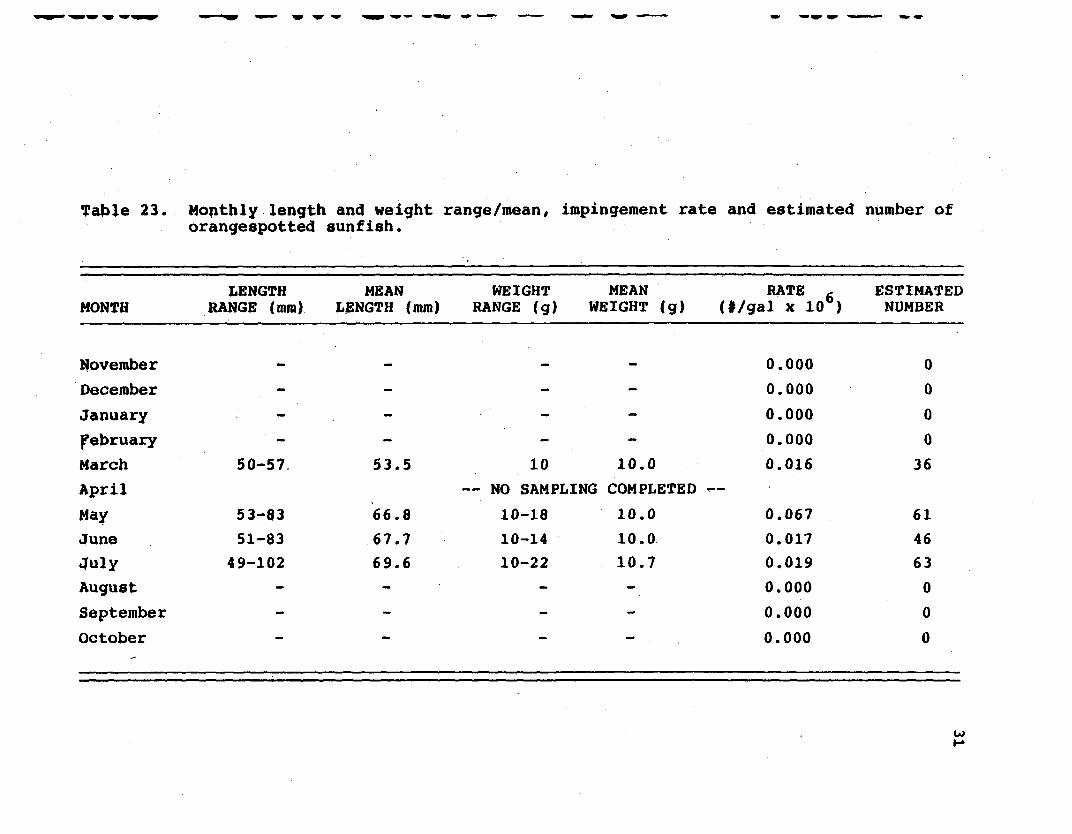
WWFW I-%WqW 1W "WqxMW -a-q "-- WW - W 1W W " - - w - -W AW - -w - -ý -M. 4W - ý "r
Table 23. Monthly length and weight range/mean, impingement rate and estimated number oforangespotted sunfish.
LENGTH MEAN WEIGHT MEAN RATE 6 ESTIMATEDMONTH RANGE (mm) LENGTH (mm) RANGE (g) WEIGHT (g) (#/gal x 10 ) NUMBER
November .... 0.000 0December ... 0.000 0January ... 0.000 0February ... 0.000 0March 50-57. 53.5 10 10.0 0.016 36April -- NO SAMPLING COMPLETED --
May 53-83 66.8 10-18 10.0 0.067 61June 51-83 67.7 10-14 10.0 0.017 46July 49-102 69.6 10-22 10.7 0.019 63August - - - 0.000 0September
0.000 0October
0.000 0
I-A

1W- W - W - -
Table 24. Monthly length and weight range/mean, impingement rate and estimated number oflongear sunfish.
LENGTH MEAN WEIGHT MEAN RATE 6 ESTIMATEDMONTH RANGE (mm) LENGTH (mm) RANGE (g) WEIGHT (g) (#/gal x 10 NUMBER
November - - - - 0.000 0
December .... 0.000 0
January - - - 0.000 0
february .... 0.000 0
March - - - - 0.000 0
April -- NO SAMPLING COMPLETED --
May - - - 0.000 0
June 55-97 71.3 10-21 13.0 0.009 25
July 64-135 84.3 10-70 18.1 0.018 60
August - - - 0.000 0
September - - - 0.000 0
October - - - 0.000 0
L.
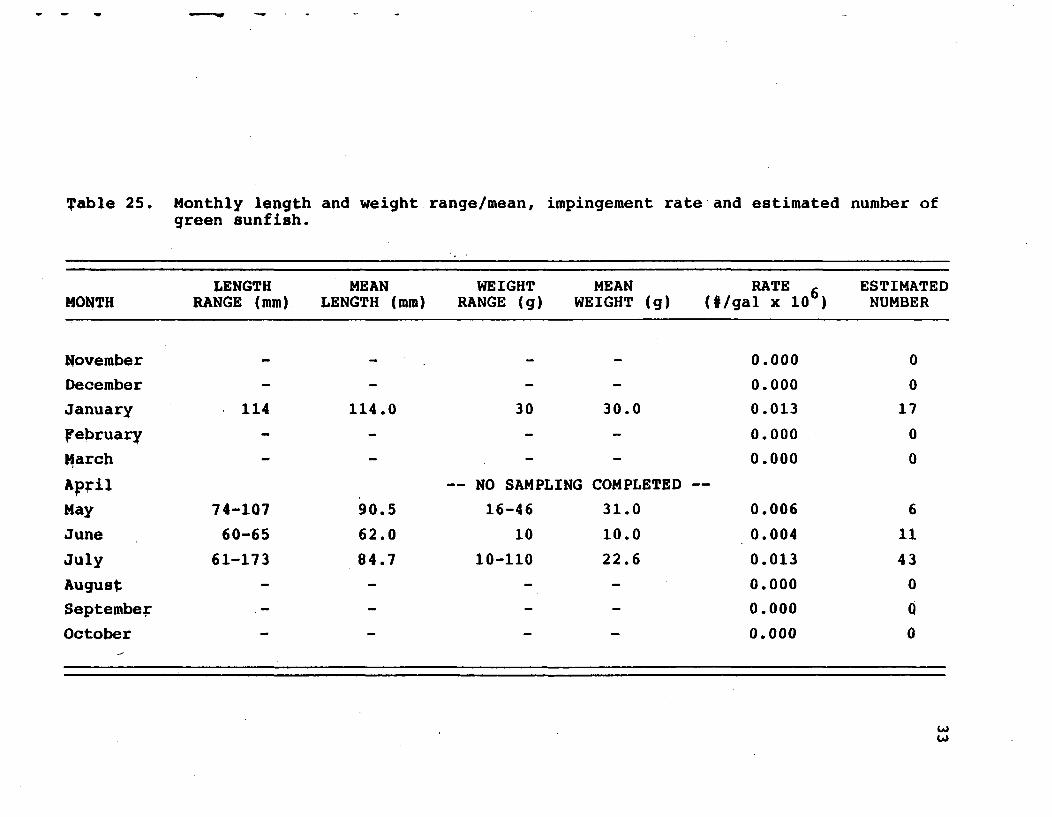
Table 25. Monthly length and weight range/mean, impingement rate and estimated number ofgreen sunfish.
LENGTH MEAN WEIGHT MEAN RATE 6 ESTIMATEDMONTH RANGE (mm) LENGTH (mm) RANGE (g) WEIGHT (g) (#/gal x 10 ) NUMBER
November .... 0.000 0
December - - - - 0.000 0
January 114 114.0 30 30.0 0.013 17
February - - - - 0.000 0
March ..... 0.000 0
April -- NO SAMPLING COMPLETED --
May 74-107 90.5 16-46 31.0 0.006 6
June 60-65 62.0 10 10.0 0.004 11
July 61-173 84.7 10-110 22.6 0.013 43
August - -. 0.000 0
September -- 0.000 0
October - 0.000 0
LAI
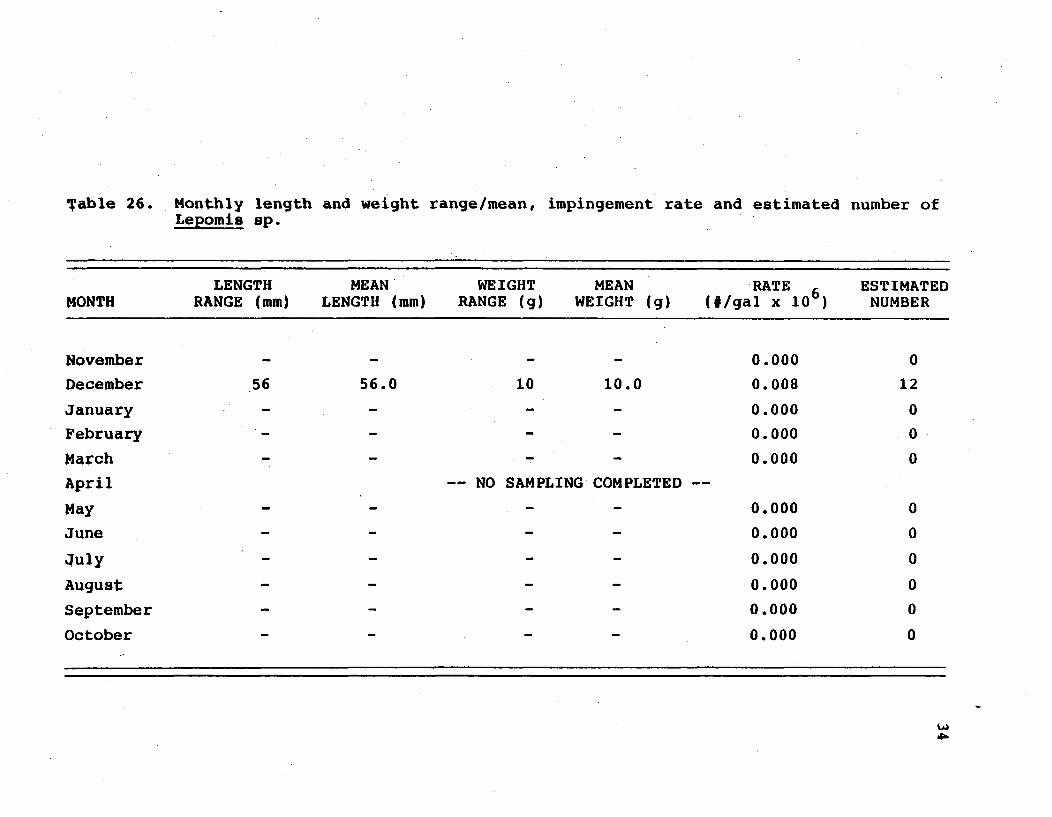
Table 26. Monthly length and weight range/mean, impingement rate and estimated number ofLepomis sp.
LENGTH MEAN WEIGHT MEAN RATE 6 ESTIMATEDMONTH RANGE (mm) LENGTH (mm) RANGE (g) WEIGHT (g) (#/gal x 10 NUMBER
November - - - - 0.000 0
December 56 56.0 10 10.0 0.008 12
January .... 0.000 0
February .... 0.000 0
March - , - 0.000 0
April -- NO SAMPLING COMPLETED --
May .... 0.000 0
June . 0.000 0
July .- 0.000 0
August .- 0.000 0
September .- 0.000 0
October 0.000 0
'4
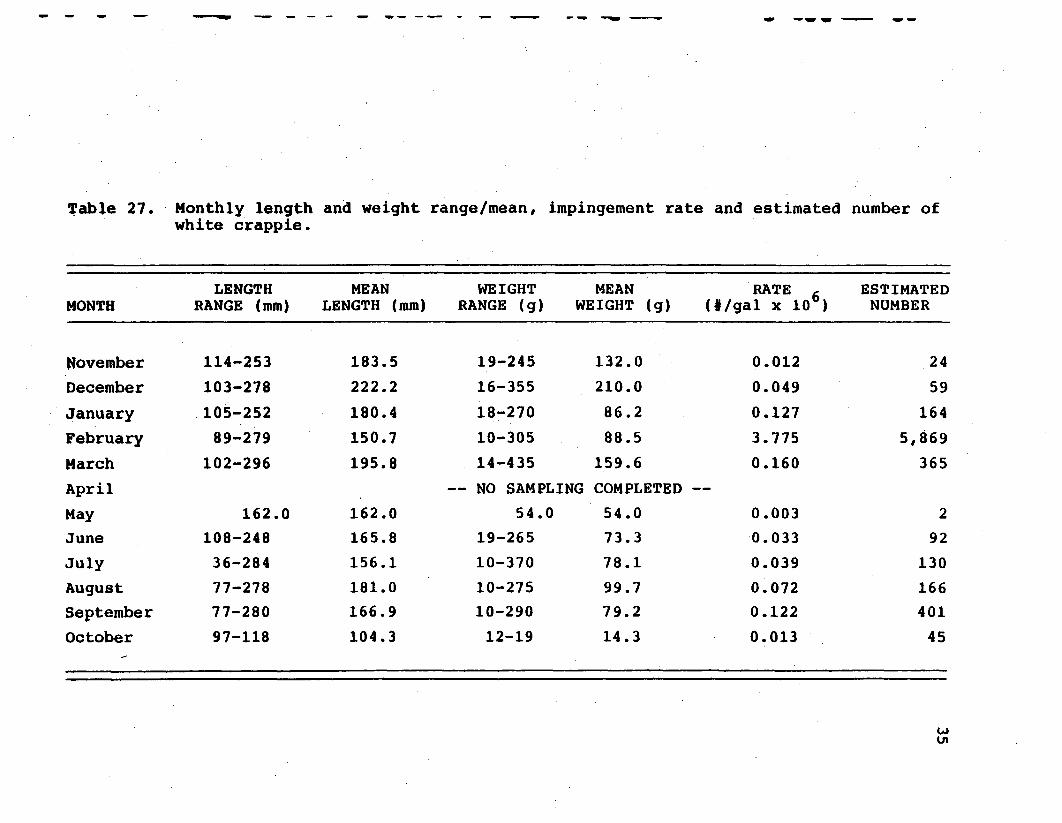
m w - - - - - - -- - - - -w - qup -Wr qW -
Table 27. Monthly length and weight range/mean, impingement rate and estimated number ofwhite crappie.
LENGTH MEAN WEIGHT MEAN RATE 6 ESTIMATEDMONTH RANGE (mm) LENGTH (mm) RANGE (g) WEIGHT (g) (#/gal x 10 ) NUMBER
November 114-253 183.5 19-245 132.0 0.012 24
December 103-278 222.2 16-355 210.0 0.049 59
January 105-252 180.4 18-270 86.2 0.127 164
February 89-279 150.7 10-305 88.5 3.775 5,869
March 102-296 195.8 14-435 159.6 0.160 365
April -- NO SAMPLING COMPLETED --
May 162.0 162.0 54.0 54.0 0.003 2
June 108-248 165.8 19-265 73.3 0.033 92
July 36-284 156.1 10-370 78.1 0.039 130
August 77-278 181.0 10-275 99.7 0.072 166
September 77-280 166.9 10-290 79.2 0.122 401
October 97-118 104.3 12-19 14.3 0.013 45
Ln
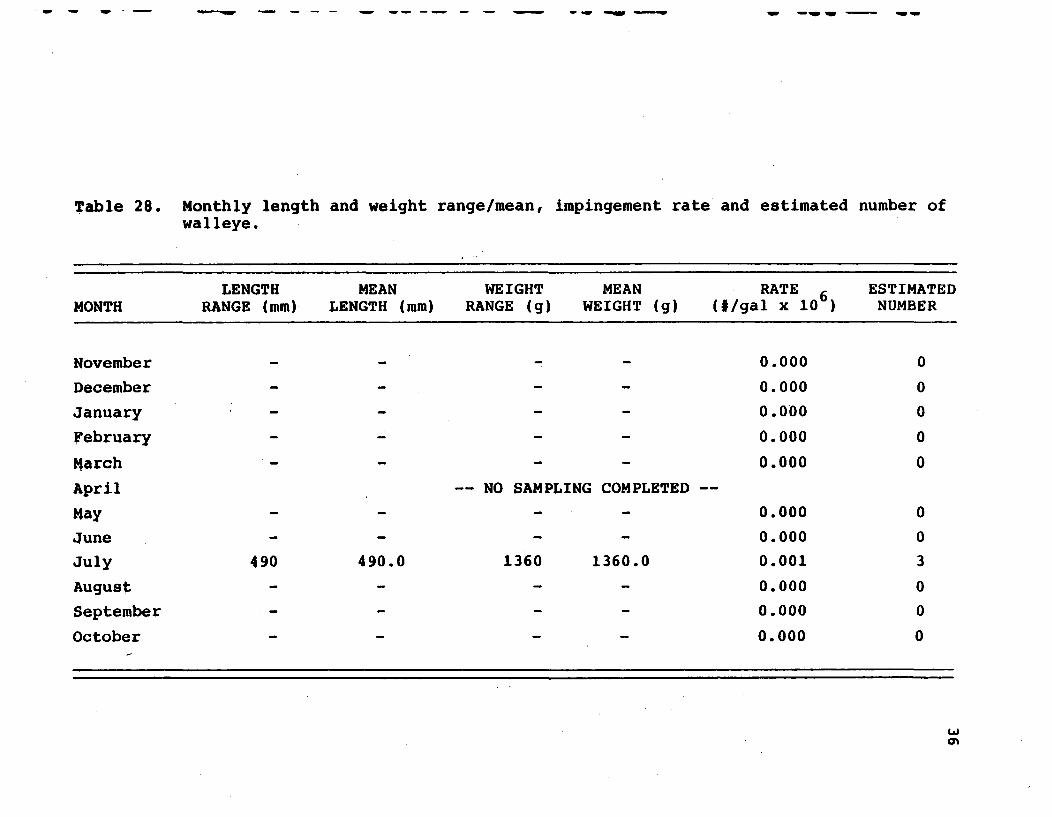
- - - - w '- - - - - - - w - - w -w w -ý -qw 4W - -Wý
Table 28. Monthly length and weight range/mean, impingement rate and estimated number ofwalleye.
LENGTH MEAN WEIGHT MEAN RATE 6 ESTIMATEDMONTH RANGE (mm) LENGTH (mm) RANGE (g) WEIGHT (g) (#/gal x 10 ) NUMBER
November - - , - 0.000 0
December .- - 0.000 0
January .- - 0.000 0
February - - - 0.000 0
March - - - 0.000 0
April -- NO SAMPLING COMPLETED --
May - - - - 0.000 0
June .- - 0.000 0
July 490 490.0 1360 1360.0 0.001 3
August - - - - 0.000 0
September .... 0.000 0
October .... 0.000 0
wO•h
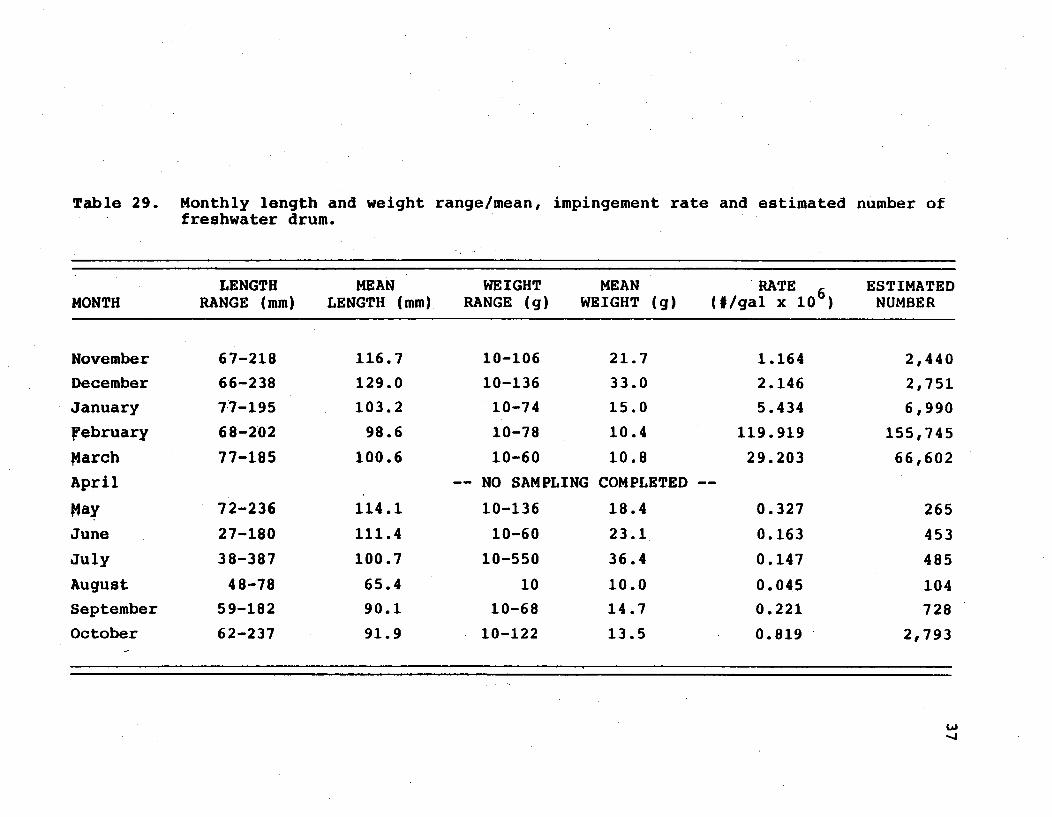
Table 29. Monthly length and weight range/mean, impingement rate and estimated number offreshwater drum.
LENGTH MEAN WEIGHT MEAN RATE 6 ESTIMATEDMONTH RANGE (mm) LENGTH (mm) RANGE (g) WEIGHT (g) (#/gal x 10 ) NUMBER
November 67-218 116.7 10-106 21.7 1.164 2,440
December 66-238 129.0 10-136 33.0 2.146 2,751
January 7.7-195 103.2 10-74 15.0 5.434 6,990
February 68-202 98.6 10-78 10.4 119.919 155,745
March 77-185 100.6 10-60 10.8 29.203 66,602
April -- NO SAMPLING COMPLETED --
May 72-236 114.1 10-136 18.4 0.327 265
June 27-180 111.4 10-60 23.1. 0.163 453
July 38-387 100.7 10-550 36.4 0.147 485
August 48-78 65.4 10 10.0 0.04.5 104
September 59-182 90.1 10-68 14.7 0.221 728
October 62-237 91.9 10-122 13.5 0.819 2,793
-4
38
January, February, and September were not available since
sampling occurred on only one date in each of these months.
Impingement was not consistently higher during either diur-
nal or nocturnal periods throughout the study. Diversity
values were highest during the mid-summer months, peaking.
in July at 2.83 while the lowest value, 0.01, occurred in
January (Table 7). A discussion of various parameters as
they relate to the taxa collected plus the mechanisms
affecting impingement follows for each family occurring in
the study.
Clupeidae
This family was represented by only the gizzard shad,
which comprised over 99.5% of the total impingement during
the study. Length-frequency data indicated that over 90% of
gizzard shad processed during the study were less than
125 mm total length (TL). The data would therefore indicate
that these fish fall within the average first year growth
for mid-western gizzard shad (Purkett, 1958). The rate of
impingement indicates that the largest numbers of young-of-
the-year (YOY) gizzard shad were impinged during the winter
(Table 8).
Impingement of gizzard shad increased from December
through February, peaking at over 63,000 fish per million
gallons. On several occasions during this period, substan-
tial numbers of YOY gizzard shad were observed being swept
through the JRR gates and out of the stilling basin's low
39
flow channel. These fish were unable to maintain their
orientation in the current and appeared to be in a stressed
condition.
When monitoring resumed in May, the rate of gizzard
shad impingement had dropped to its lowest rate observed
during the study. Although gizzard shad continued to be
impinged throughout the remainder of the study, their rates
were similar to other species.
Cyprinidae
During the study, several members of this family were
impinged including common carp, goldfish, red shiner, ghost
shiner, golden shiner, Notropis sp. and Pimephales sp. As
a family, cyprinid taxa comprised a minor portion of the
total impingement.
Only two members of this family, Notropis sp. and
golden shiner, were impinged at a rate exceeding 0.015 fishIper million gallons (Tables 9 - 15). Notropis sp. and
golden shiner impingement both peaked in March at 0.024 and
0.016 fish per million gallons, respectively. Common carp
were never a large component of sampled daily impingement.
They occurred in June, July and October, peaking in October
at a rate of 0.013 fish per million gallons.
Catostomidae
Two species of this family, river carpsucker and small-
mouth buffalo, were collected during the study (Tables 16 -I
40
17). River carpsucker were not a major component of total
impingement but smallmouth buffalo were the sixth most com-
mon taxa impinged during the study (Table 5). Despite the
number six ranking, total smallmouth buffalo impingement
was calculated to be only slightly over 2,000 fish for the
entire study period.
Ictaluridae
Channel catfish, blue catfish and flathead catfish
represented this family during the study. Channel catfish"
occurred consistently throughout the study. This species
ranked fifth in total impingement with a calculated estimate
of 5,429 fish (Table 5). Throughout the study the majority
of channel catfish impinged were less than 150 mm TL al-
though individuals up to 465 mm were collected in March
(Table 18). Monthly mean lengths of impinged channel cat-
fish never exceeded 162 mm throughout the study.
Only one blue catfish was processed during collections
at the MUSH. This individual, was 135 mm in length and was
collected in May (Table 19). The collection of this indi-
vidual coincided with the harvesting of a Kansas Fish and
Game Commission (KF&G) rearing pond which contained blue
catfish and drained into the Neosho River. This individual
was within the size range of fish harvested from this pond
and probably escaped during draining operations.
Flathead catfish occurred during the summer months but
were never numerous (Table 20). October was the peak month
41
for impingement of this species with a calculated total of
60 individuals.
Percichthyidae
Only one member of this family, white bass, occurred
during the study. Although this species was the second most
commonly impinged taxa, it comprised less than 0.25% of
total impingement (Table 5). Throughout the study white
bass impingement was confined to early age groups with the
monthly average length never exceeding 210 mm TL (Table 21).
Over 98% of total white bass impingement occurred in
February and during that month their mean length was approx-
imately 102 mm.
Centrarchidae
The six taxa of this family which occurred during
the study were bluegill, orangespotted sunfish, longear sun-
fish, green sunfish, Lepomis sp. and white crappie. Of
these taxa, only white crappie ranked in the top six in
terms of total impingement, ranking number four (Table 5).
Mature white crappie in ripe condition were impinged during
March but comprised only 5% of all crappie processed for
that month (Appendix II). Other members of the sunfish
family were observed in spawning condition. Bluegill,
orangespotted sunfish, longear sunfish and green sunfish
were impinged in ripe and running ripe condition. These
spawning individuals comprised significant portions of
42
impingement for their respective species. However, none of
these species ranked high in terms of total impingement.
Percidae
Impingement of this family was limited to one species,
the walleye. Only one individual was collected during
sampling and the total annual walleye impingement was cal-
culated to be three fish (Table 28).
Sciaenidae
The only member of this family impinged was the fresh-
water drum. Although freshwater drum ranked third in
impingement, they comprised slightly less than 0.25% of the
total catch (Table 5). This species was impinged throughout
the study with peak numbers occurring in February. The
monthly mean length ranged from 65 to 129 mm (TL) and
monthly mean weights never exceeded 37 grams (Table 29).
Additionally, over 98% of all drum which could be sexed were
classified as immature (Appendix II).
SUMMARY
Data collected during monitoring at the MUSH reveals
a pattern typical of impingement at many other facilities
(Edwards et al, 1976: Freeman and Sharma, 1977). This
pattern shows impingement dominated by the major clupeid
species present, peaking during winter months and composed
of young-of-the-year (YOY) fish, with sportfish occurring
at low rates.
Throughout the study gizzard shad were the dominant
component of impinged fish, comprising over 99% of the
calculated total. Field observations plus impingement study
data supports a hypothesis that during peak impingement,
shad were being discharged from JRR in a stressed condition
and were unable to avoid the low intake velocities present
at the MUSH.
Gizzard shad, along with white bass and freshwater
drum, comprised more than 99.9% of total impingement. Peak
impingement for all three of these taxa occurred during
January and February and was predominantly YOY fish.
Neither blue sucker (Cycleptus elongatus) or Neosho
madtom (Noturus placidus) individuals were impinged during
the study. No impingement of Neosho madtoms was expected
since this species has not been collected during prolonged
monitoring in the area of the MUSH. Additionally, no other
rare, threatened or endangered species were impinged at the
MUSH.
44
The data compiled and circumstances observed during the
monitoring period indicate that a worst case situation has
been monitored. Low rainfall resulted in discharge rates
from JRR which were low enough to consistently isolate the
intake channel from the Neosho River throughout late 1980
and early 1981. Additionally, lake filling activities
necessitated maximum pumping efforts throughout the study.
These factors combined to cause the high impingement ob-
served during the winter months.
Normal rainfall patterns will typically provide more
favorable flow conditions and completion of lakefill will
substantially reduce demands for makeup water. The combin-
ation of these circumstances will ameliorate the contri-
butory factors of the observed impingement thereby moderat-
ing long-term impingement at the MUSH.
LITERATURE CITED
Edwards, T. J., W. H. Hunt, L. E. Miller and J. J. Sevic.
1976. An evaluation of the impingement of fishes at
four Duke Power Company steam-generating facilities.
in Thermal Ecology II. Esch, G. W. and R. W. McFarlane,
Editors. Technical Information Center of Energy Re-
search and Development Administration. pp. 373-380.
Electric Power Research Institute. 1980. Methodology for
assessing population and ecosystem level effects re-
lated to intake of cooling waters. Electric Power
Research Institute Report EA-1402 Volume 1, 370 pp.
Freeman, R. F. III and R. K. Sharma. 1977. Survey of fish
impingement at power plants in the United States; Vol-
ume II. Argonne National Lab. ES-56. 328 pp.
Lloyd, M., J. H. Zar and J. R. Karr. 1968. On the calcula-
tion of information-theoretical measures of diversity.
Am. Midl. Nat. 79(2):257-272.
Purkett, C. A., Jr. 1958. Growth rates of Missouri stream
fishes. Mo. Cons. Comm., D-J Ser. No. 1, 46 pp.
United States Nuclear Regulatory Commission, Final Environ-
mental Statement for Wolf Creek Generating Station.
1975. NUREG-75/096.

APPENDIX I
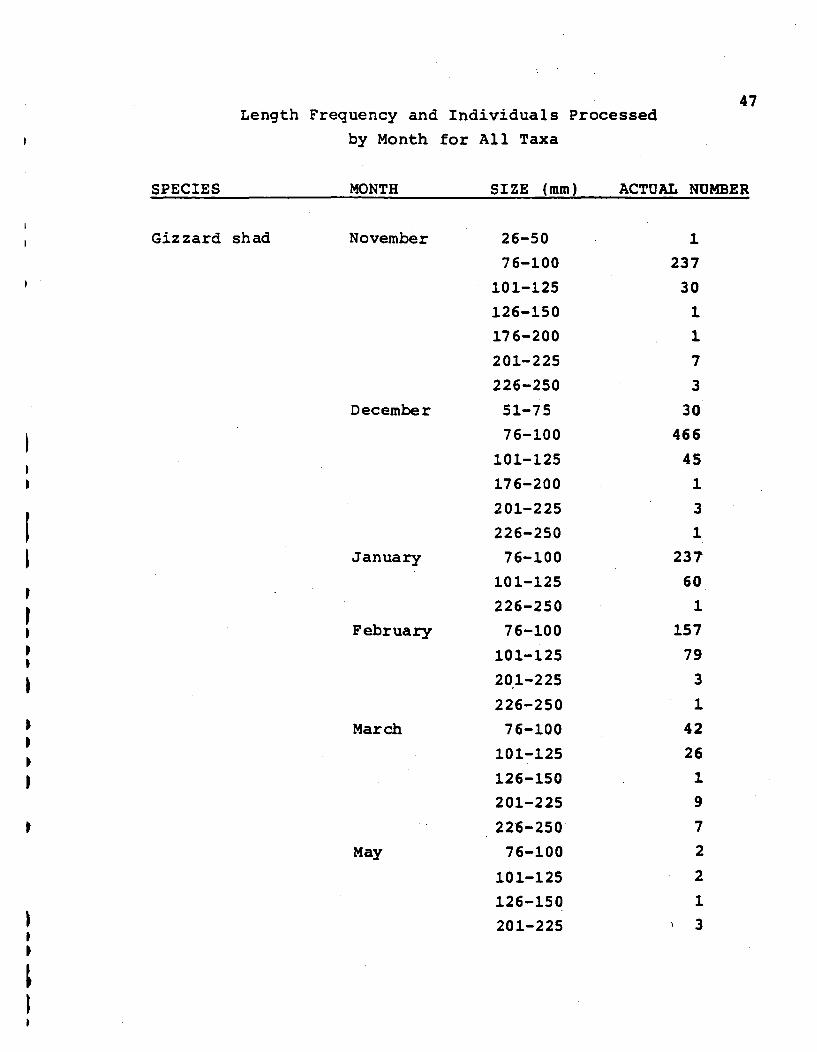
47Length Frequency and Individuals Processed
by Month for All Taxa
SPECIES MONTH SIZE (mm) ACTUAL NUMBER
Gizzard shad November
December
January
February
March
May
26-50
76-100
101-125
126-150
176-200
201-225
226-250
51-7 5
76-100
101-125
176-200
201-225
226-250
76-100
101-125
226-250
76-100
101-125
201-225
226-250
76-100
101-125
126-150
201-225
226-250
76-100
101-125
126-150
201-225
1
237
30
1
1
7
3
30
466
45
1
3
1
237
60
1
157
79
31.
42
26
1
9
7
2
2
1
3
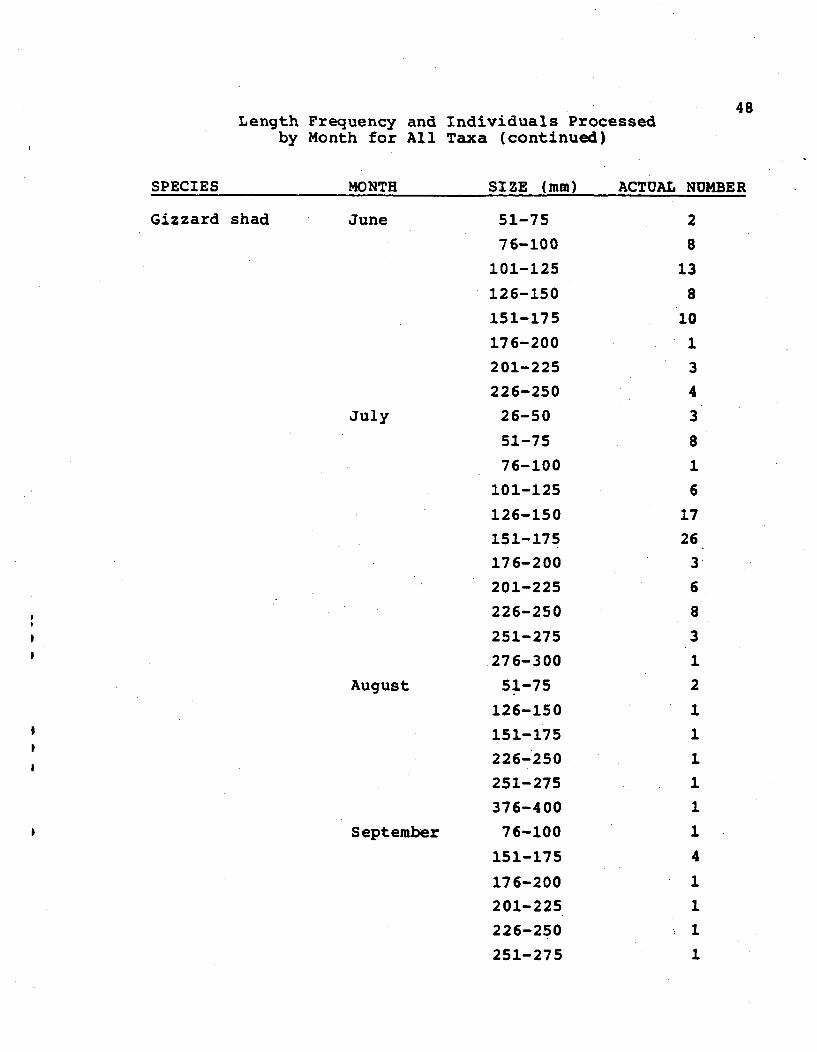
48Length Frequency and Individuals Processed
by Month for All Taxa (continued)
SPECIES MONTH SIZE (mm) ACTUAL NUMBER
Gizzard shad June
July
August
September
51-75
76-100
101-125
126-150
151-175
176-200
201-225
226-250
26-50
51-75
76-100
101-125
126-150
151-175
176-200
201-225
226-250
251-27527 6-3 00
51-75
126-150
151-175
226-250
251-275
376-400
76-100
151-175
176-200
201-225
226-250
251-275
2
8
13
8
101
3
4
3
8
1
6
17
26
34
68
3
1
2
1
1
1
1
1
1
4
1
1
1
1
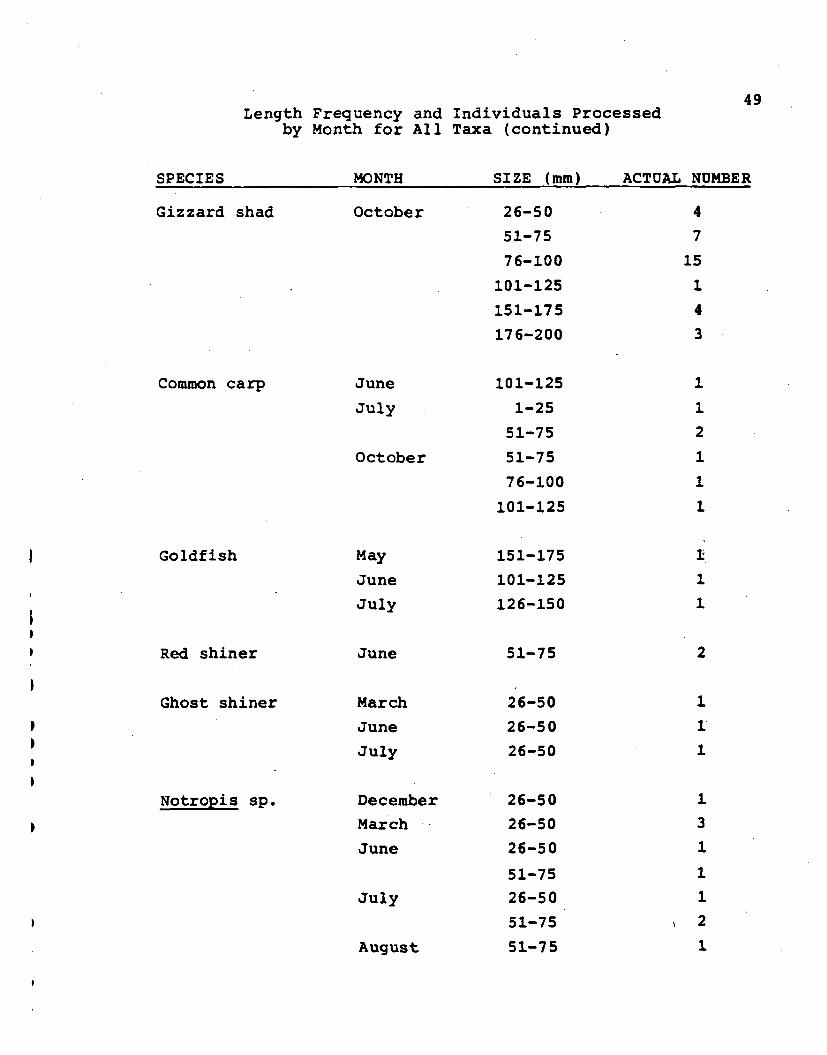
49Length Frequency and Individuals Processed
by Month for All Taxa (continued)
SPECIES MONTH SIZE (mm) ACTUAL NUMBER
Gizzard shad October
Common carp June
July
October
26-50
51-75
76-100
101-125
151-175
176-200
101-125
1-25
51-75
51-75
76-100
101-125
151-175
101-125
126-150
51-75
26-50
26-50
26-50
Goldfish
4
715
1
4
3
Red shiner
Ghost shiner
May
June
July
June
March
June
July
112
1
1
1
1
1
1
2
1
Notropis sp. December
March
June
26-50
26-50
26-50
51-75
26-50
51-75
51-75
1
3
1
11
1
July
August
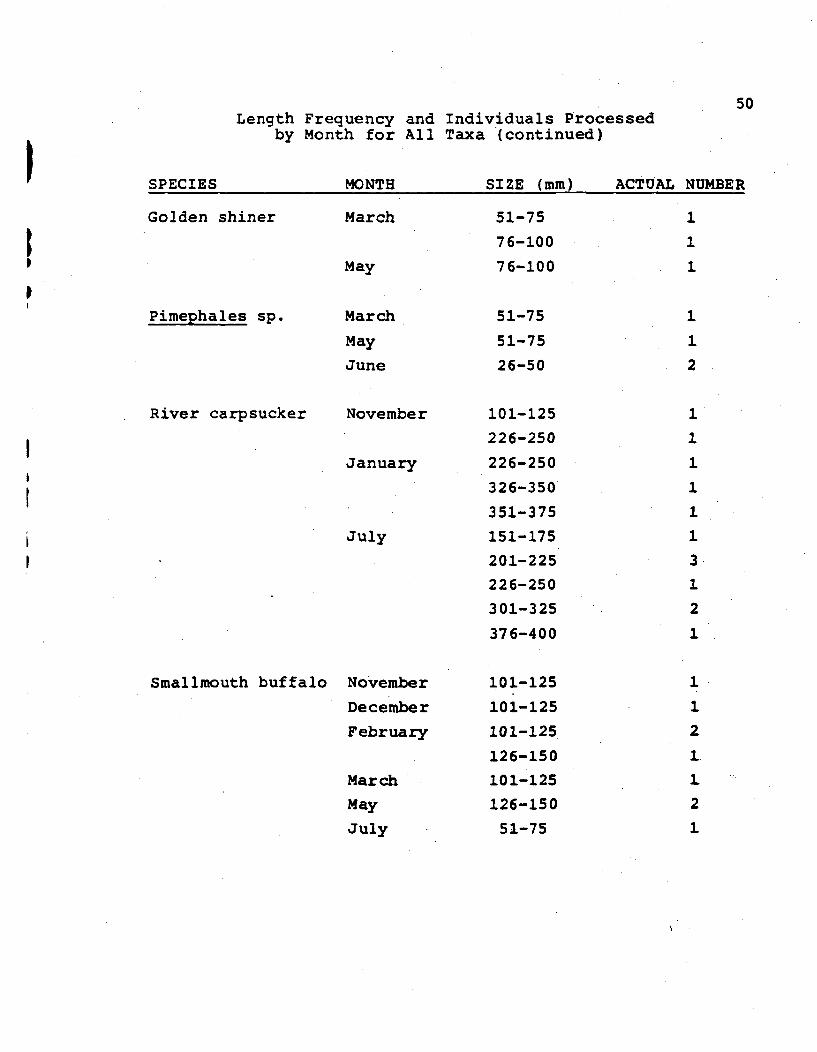
50Length Frequency and Individuals Processed
by Month for All Taxa (continued)
SPECIES MONTH SIZE (mm) ACTUAL NUMBER
Golden shiner
Pimephales sp.
March
May
March
May
June
River carpsucker November
January
July
Smallmouth buffalo November
December
February
March
May
July
51-75
76-100
76-100
51-75
51-75
26-50
101-125
226-250
226-250
326-350
351-375
151-175
201-225
226-250
301-325
376-400
101-125
101-125
101-125
126-150
101-125
126-150
51-75
1
1
1
111
312
1
11
1
1
1
2
11
2
11~2
1
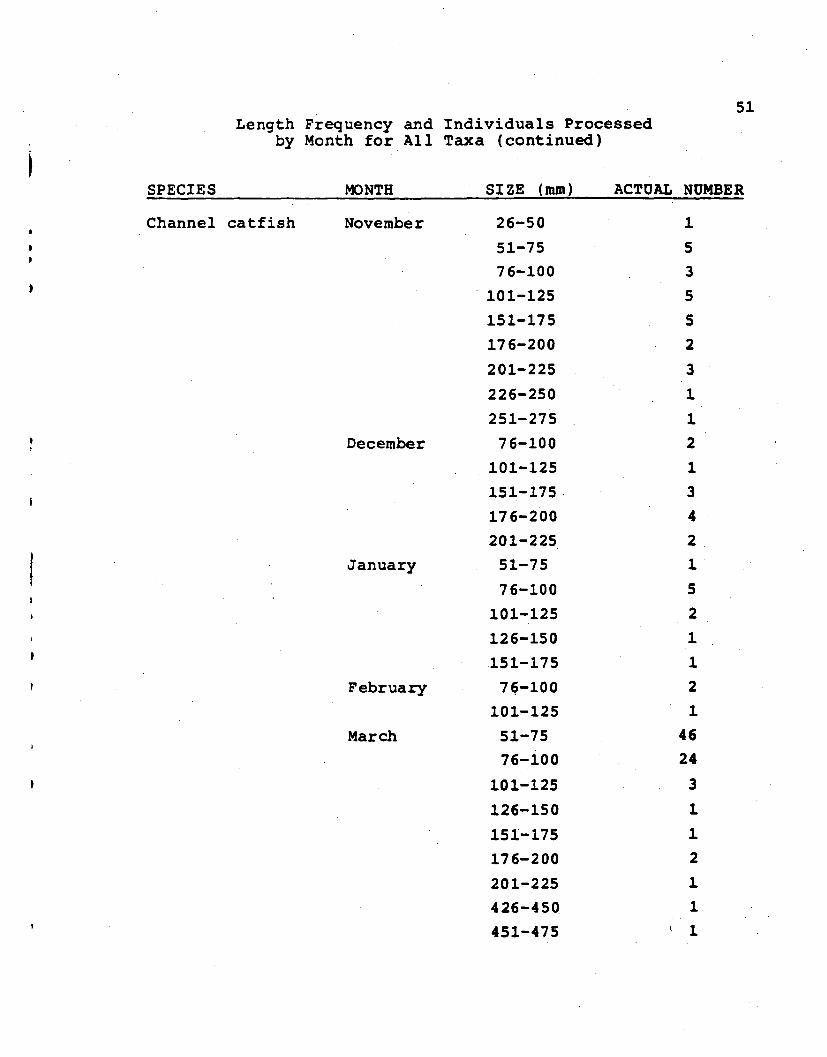
51Length Frequency and Individuals Processed
by Month for All Taxa (continued)
SPECIES MONTH SIZE (mm) ACTUAL NUMBER
Channel catfish November
December
January
February
March
26-50
51-75
76-100
101-125
151-175
176-200
201-225
226-250
251-275
76-100
101-125
151-175
176-200
201-225
51-75
76-100
101-125
126-150151-175
76-100
101-125
51-75
76-100
101-125
126-150
151-175
176-200
201-225
426-450
451-475
1
5
35
5
2
3
1
12
1
3
4
2
1
5
2
1
12
1
46
24
3
11
2
1
1
1
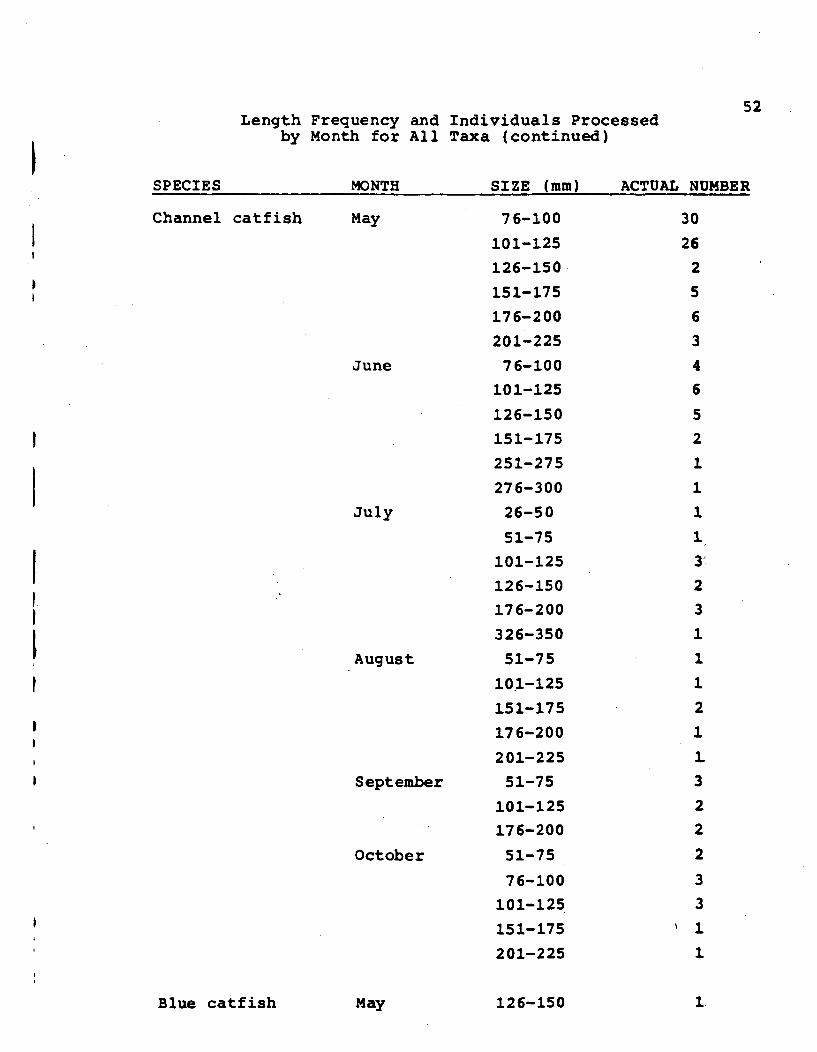
52Length Frequency and Individuals Processed
by Month for All Taxa (continued)
SPECIES MONTH SIZE (mm) ACTUAL NUMBER
Channel catfish May
June
I
July
I
76-100
101-125
126-150
151-175
176-200
201-225
76-100
101-125
126-150
151-175
251-275
276-300
26-50
51-75
101-125
126-150
176-200
326-350
51-75
101-125
151-175
176-200
201-225
51-75
101-125
176-200
51-75
76-100
101-125
151-175
201-225
30
26
2
5
6
3
4
6
5
21
1
1
I
3.
2
3
1
1
1
2
3
3
22
2
3
31I
1.
August
September
October
Blue catfish May 126-150 1
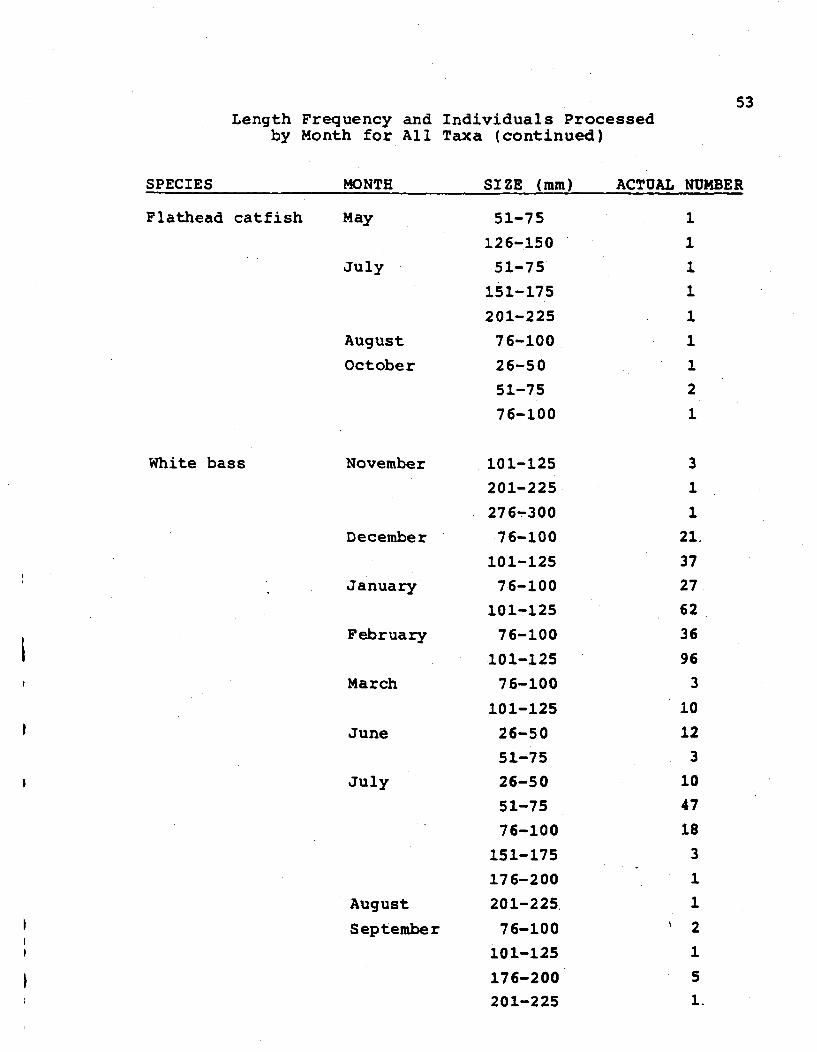
53Length Frequency and Individuals Processed
by Month for All Taxa (continued)
SPECIES MONTH SIZE (mm) ACTUAL NUMBER
Flathead catfish May
July
August
October
White bass November
December
January
February
March
June
July
August
September
51-75
126-150
51-75
151-175
201-225
76-100
26-50
51-75
76-100
101-125
201-225
276-300.76-100
101-125
76-100
101-125
76-100
101-125
76-100
101-125
26-50
51-75
26-50
51-75
76-100
151-175
176-200
201-225,
76-100
101-125
176-200
201-225
31
1
21.
37
27.
62
36
96
3
10
12
3
10
47
18
3
1
1
2
1
5
I.
1
11
1
1
1
12
1
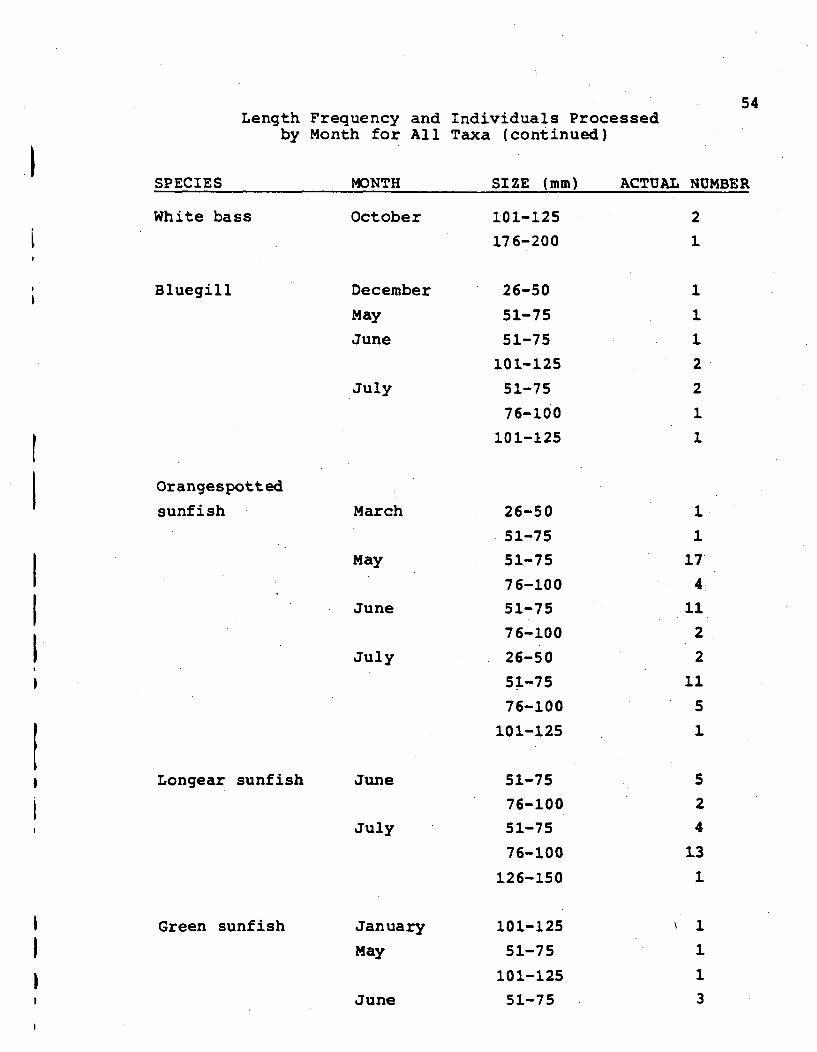
54Length Frequency and Individuals Processed
by Month for All Taxa (continued)
SPECIES MONTH SIZE (mm) ACTUAL NUMBER
White bass October
Bluegill December
May
June
101-125
176-200
26-50
51-75
51-75
101-125
51-75
76-100
101-125
21
1
1
1
22
11
July
Orangespotted
sunfish
IIII
II
March
May
June
July
June
26-50
51-75
51-75
76-100
51-75
76-100
26-50
51-75
76-100
101-125
51-75
76-100
51-75
76-100
126-150
101-125
51-75
101-125
51-75
11
17
4
11
2
2
11
5
i
5
2
4
13
1
Longear sunfish
July
iII
Green sunfish January
May
11
1
3June
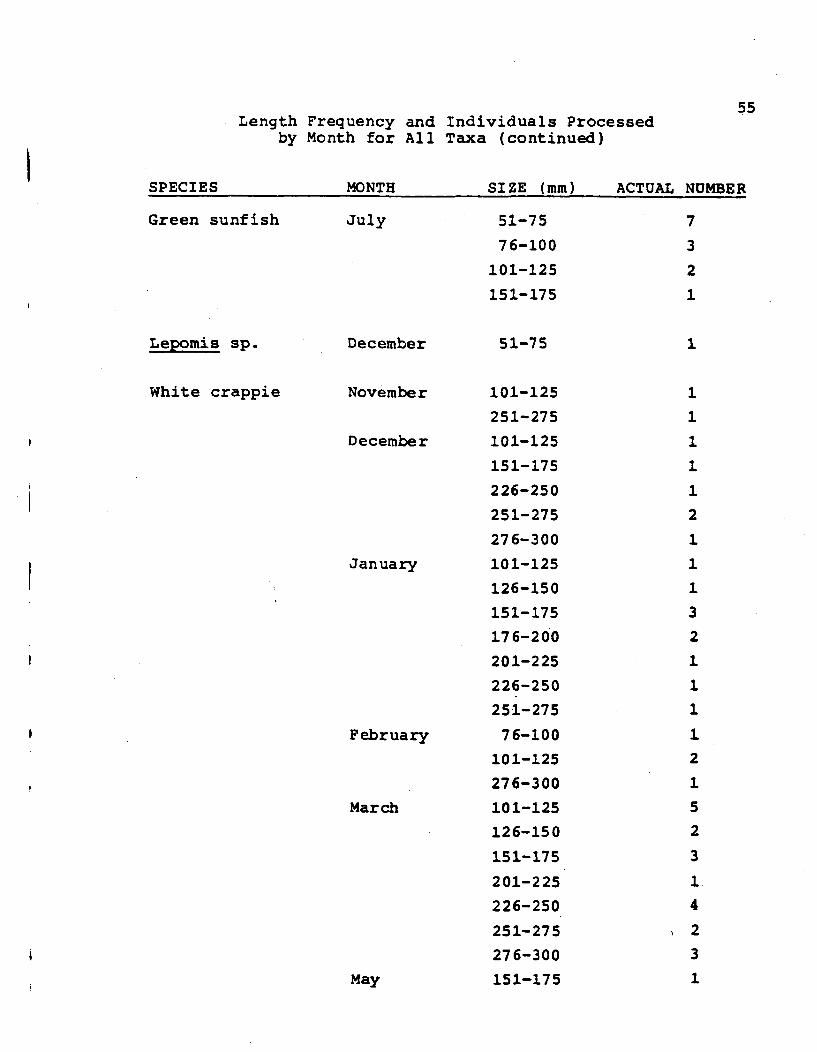
55Length Frequency and Individuals Processed
by Month for All Taxa (continued)
SPECIES MONTH SIZE (mm) ACTUAL NUMBER
Green sunfish July 51-75
76-100
101-125
151-175
7
3
21
1Lepomis sp.
White crappie
December
November
December
January
February
March
May
51-75
101-125
251-275
101-125
151-175
226-250
251-275
276-300
101-125
126-150
151-175
176-2 00
201-225
226-250
251-275
76-100
101-125
276-300
101-125
126-150
151-175
201-225
226-250
251-275
276-300
151-175
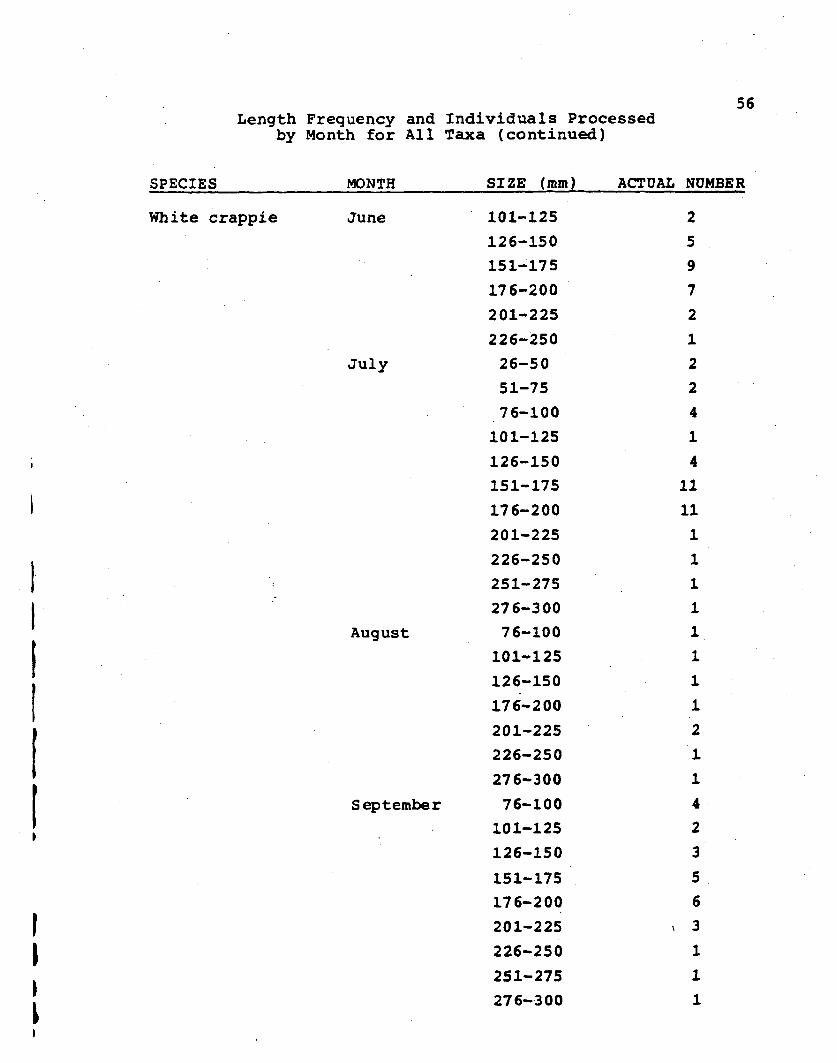
56Length Frequency and Individuals Processedby Month for All Taxa (continued)
SPECIES MONTH SIZE (mm) ACTUAL NUMBER
White crappie June
July
August
September
101-125
126-150
151-175
176-200
201-225
226-250
26-50
51-75
76-100
101-125
126-150
151-175
176-200
201-225
226-250
251-275
276-300
76-100
101-125
126-150
176-200
201-225
226-250
276-300
76-100
101-125
126-150
151-175
176-200
201-225
226-250
251-275
276-300
2
5
9
7
2
1
2
2
4
1
411
11
1
1
1
1
1
1
11
21.
1
42
3
5
63
1
1
1
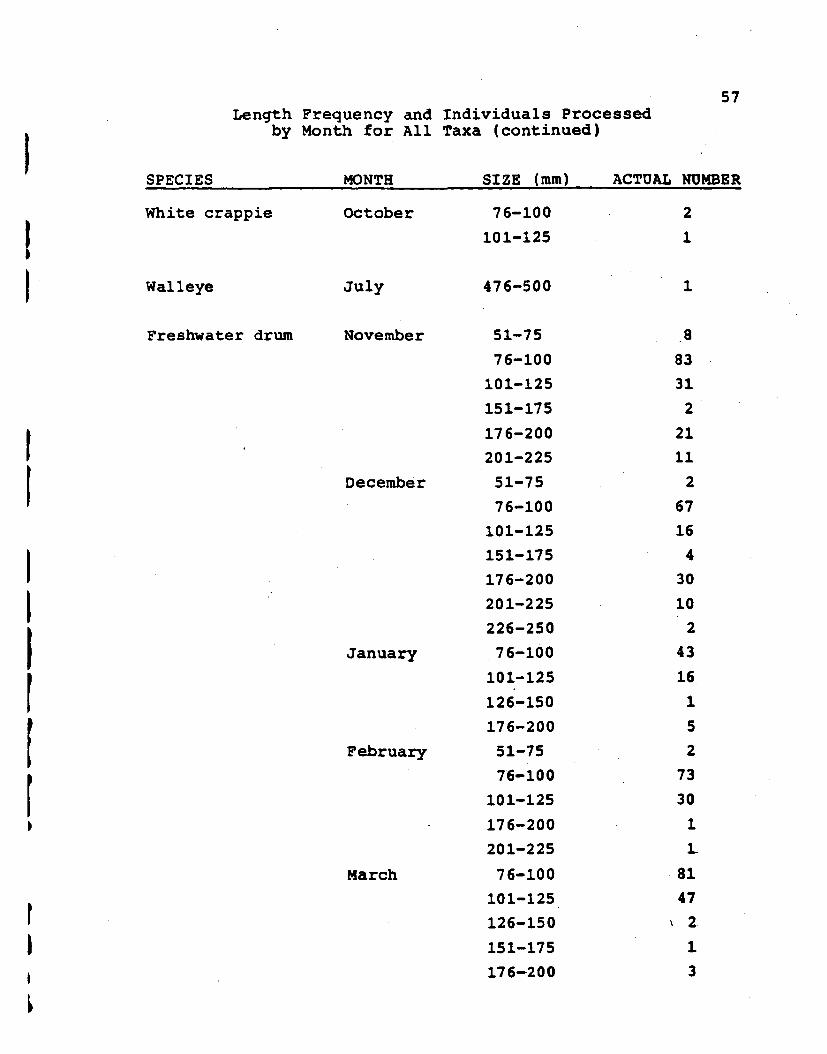
57Length Frequency and Individuals Processed
by Month for All Taxa (continued)
SPECIES MONTH SIZE (mm) ACTUAL NUMBER
White crappie October
Wal leye July
Freshwater drum November
December
January
February
March
76-100
101-125
476-500
51-75
76-100
101-125
151-175
176-200
201-225
51-75
76-100
101-125
151-175
176-200
201-225
226-250
76-100
101-125
126-150
176-200
51-75
76-100
101-125
176-200
201-225
76-100
101-125
126-150
151-175
176-200
883
31
2
21
11
2
67
16
4
30
102
43
16
1
5
2
73
30
1
1~
81
47
23
21
1.
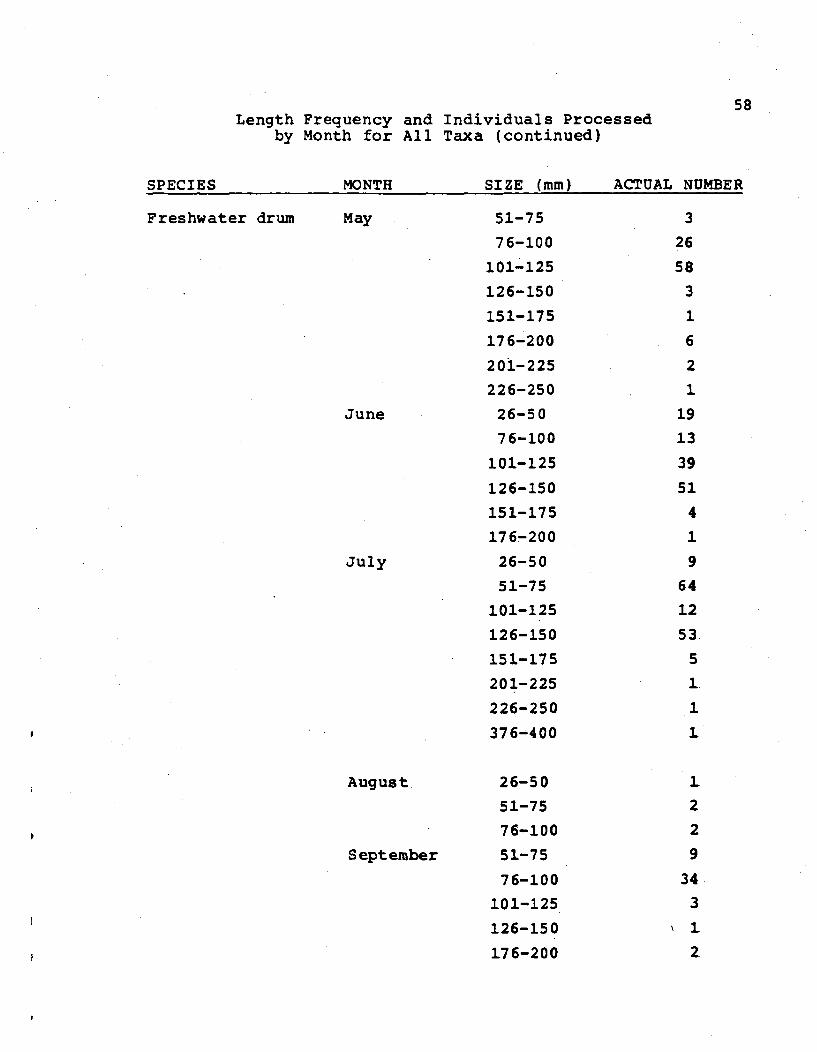
58Length Frequency and Individuals Processed
by Month for All Taxa (continued)
SPECIES MONTH SIZE (mm) ACTUAL NUMBER
Freshwater drum May
June
July
August
September
51-75
76-100
101-125
126-150
151-175
176-200
201-225
226-250
26-50
76-100
101-125
126-150
151-175
176-200
26-50
51-75
101-125
126-150
151-175
201-225
226-250
376-400
26-50
51-75
76-100
51-75
76-100
101-125
126-150
176-200
3
26
58
3
1
6
2
1
19
13
39
51
4
1
9
64
12
53
51
1
2
2
9
34
3
12-
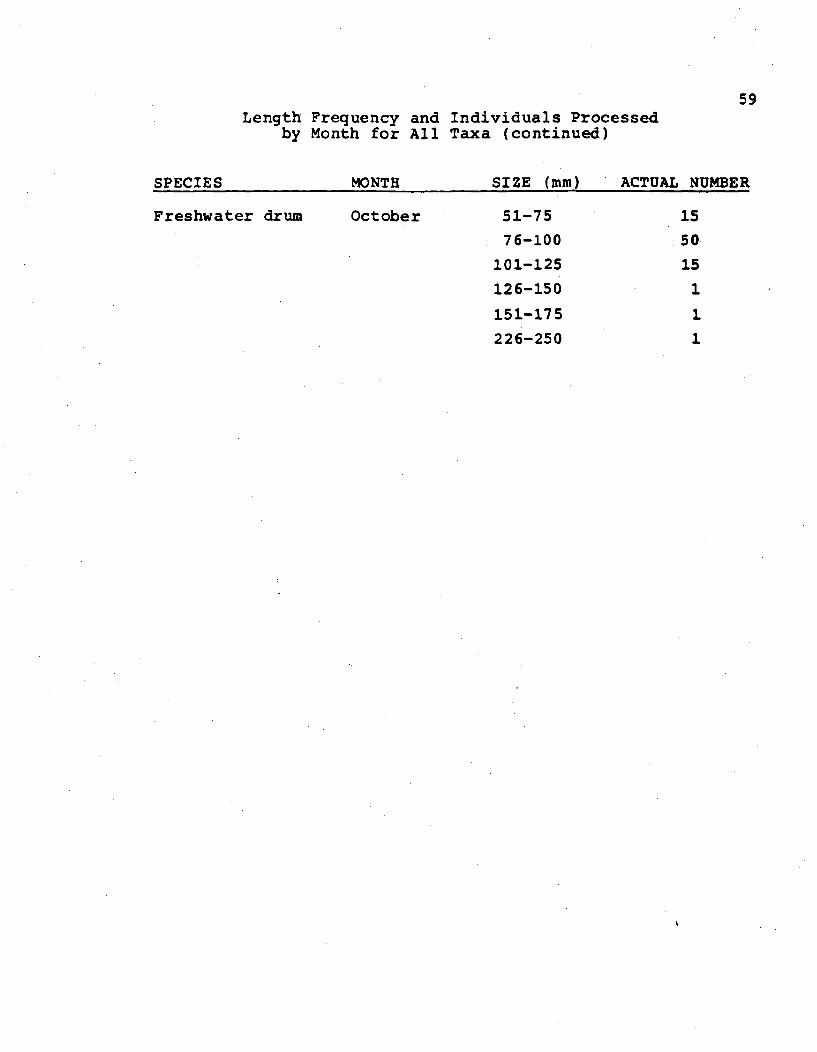
59Length Frequency and Individuals Processed
by Month for All Taxa (continued)
SPECIES MONTH SIZE (mm) ACTUAL NUMBER
Freshwater drum October 51-75
76-100
101-125
126-150
151-175
226-250
15
50
151
1
1

APPENDIX II
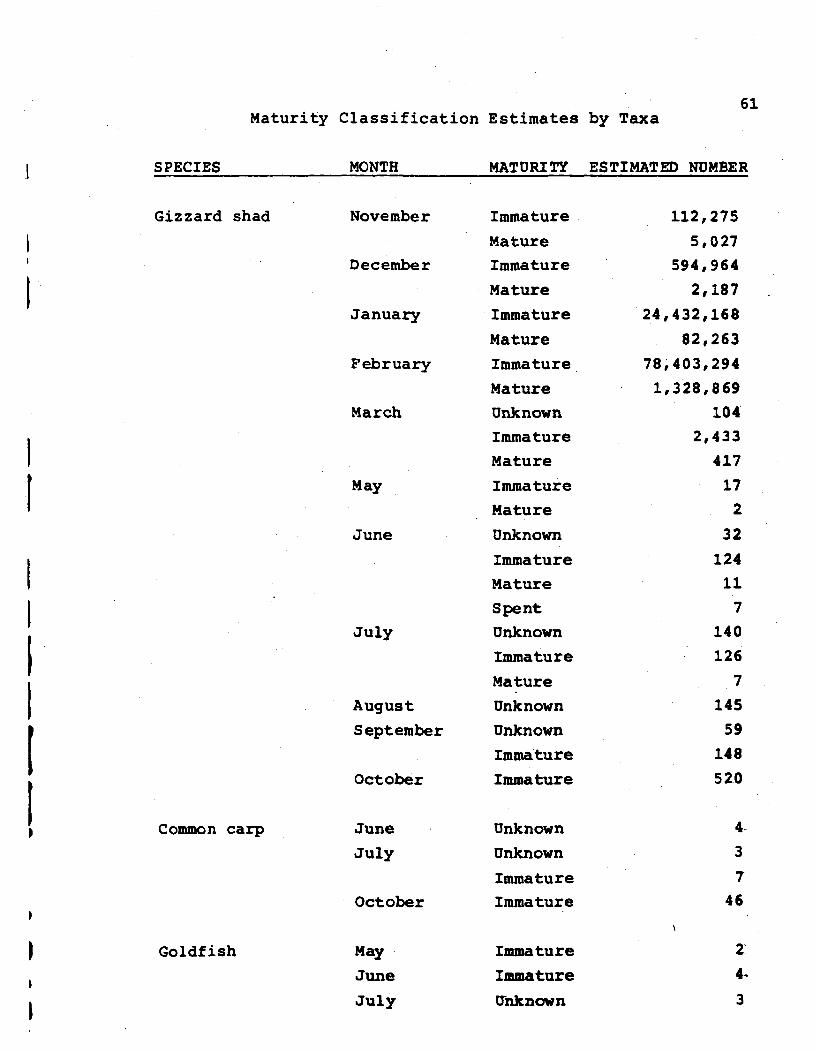
61Maturity Classification Estimates by Taxa
SPECIES MONTH MATURITY ESTIMATED NUMBER
Gizzard shad November
December
January
February
March
May
June
July
August
September
October
Immature
MatureImmature
MatureImmature
Mature
Immature
MatureUnknownImmatureMature
Immature
Mature
Unknown
Immature
MatureSpentUnknown
Immature
Mature
UnknownUnknown
Immature
Immature
Unknown
Unknown
ImmatureImmature
Immature
Immature
Unknown
112,275
5,027
594,964
2,187
24,432,168
82,263
78,403,294
1,328,869
104
2,433
417
17
2
32
124
11
7
140
126
7
145
59
148
520
Common carp June
July
October
May
June
July
4.
3
7
46
Goldf ish 2
4-
3
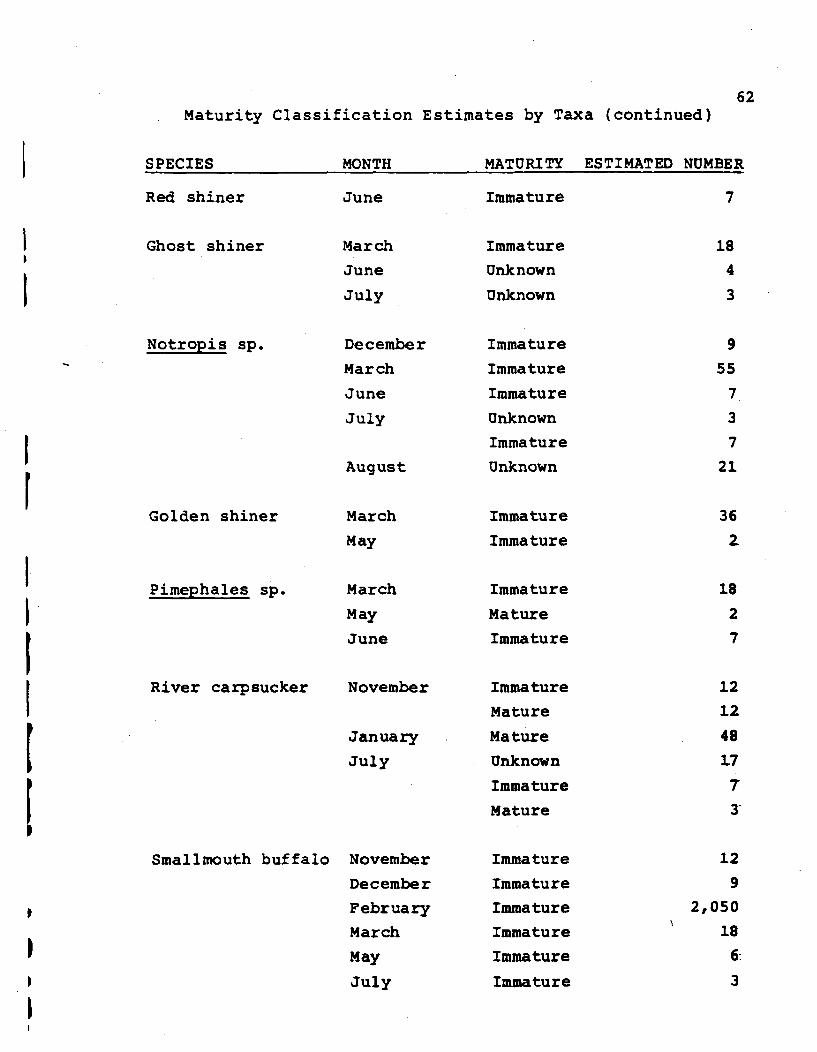
62Maturity Classification Estimates by Taxa (continued)
SPECIES MONTH MATURITY ESTIMATED NUMBER
Red shiner
Ghost shiner
June
March
June
July
Notropis sp. December
March
June
July
Golden shiner
Pimephales sp.
August
March
May
March
May
June
Immature
Immature
Unknown
Unknown
Immature
Immature
Immature
Unknown
Immature
Unknown
Immature
Immature
Immature
Mature
Immature
Immature
Mature
Mature
Unknown
Immature
Mature
Immature
Immature
Immature
Immature
Immature
Immature
7
18
4
3
9
55
7
3
7
21
36
2
18
2
7
12
12
48
17
7-
3
River carpsucker November
January
July
Smallmouth buffalo November
December
February
March
May
July
12
9
2,050
18
6-
3
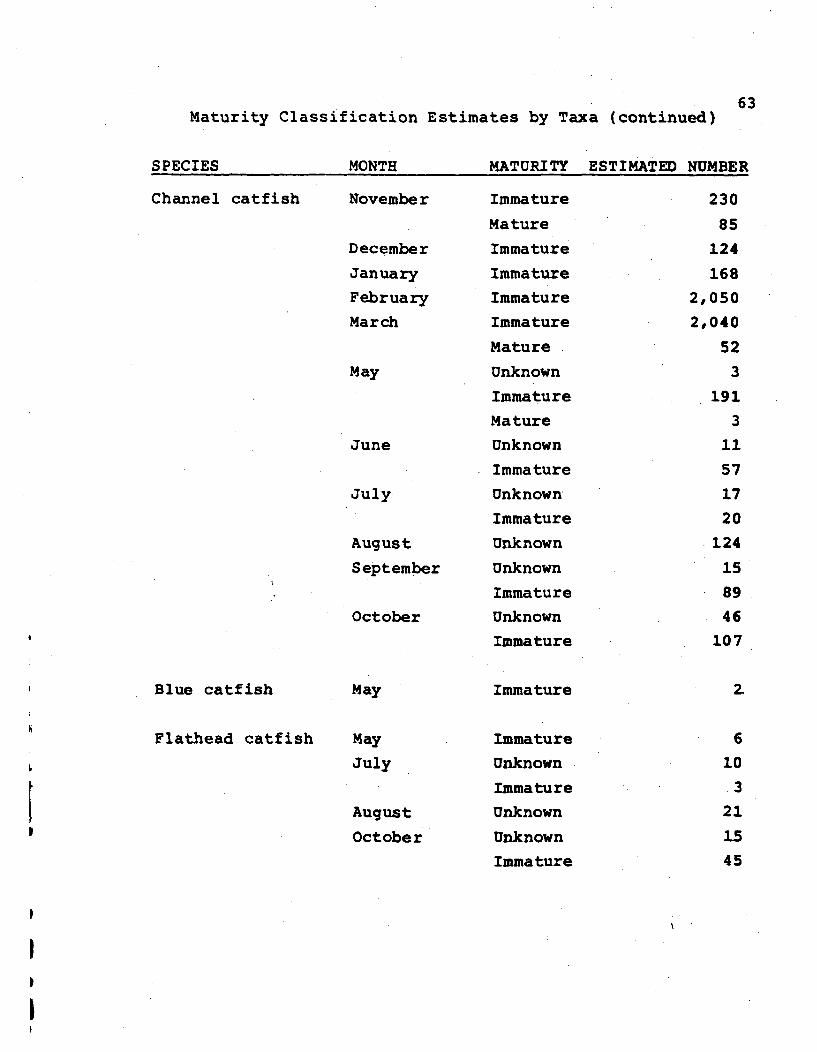
63Maturity Classification Estimates by Taxa (continued)
SPECIES MONTH MATURITY ESTIMATED NUMBER
Channel catfish November
December
January
February
March
May
June
July
August
September
October
Immature
Mature
Immature
Immature
Immature
Immature
Mature
Unknown
ImmatureMature
Unknown
Immature
Unknown
Immature
Unknown
Unknown
ImmatureUnknown
Immature
Immature
ImmatureUnknown
ImmatureUnknown
UnknownImmature
230
85
124
168
2,050
2,040
52
3
191
3
11
57
17
20
124
15
89
46
107
Blue catfish
Flathead catfish
May
May
July
August
October
2
6
10•3
21
1545
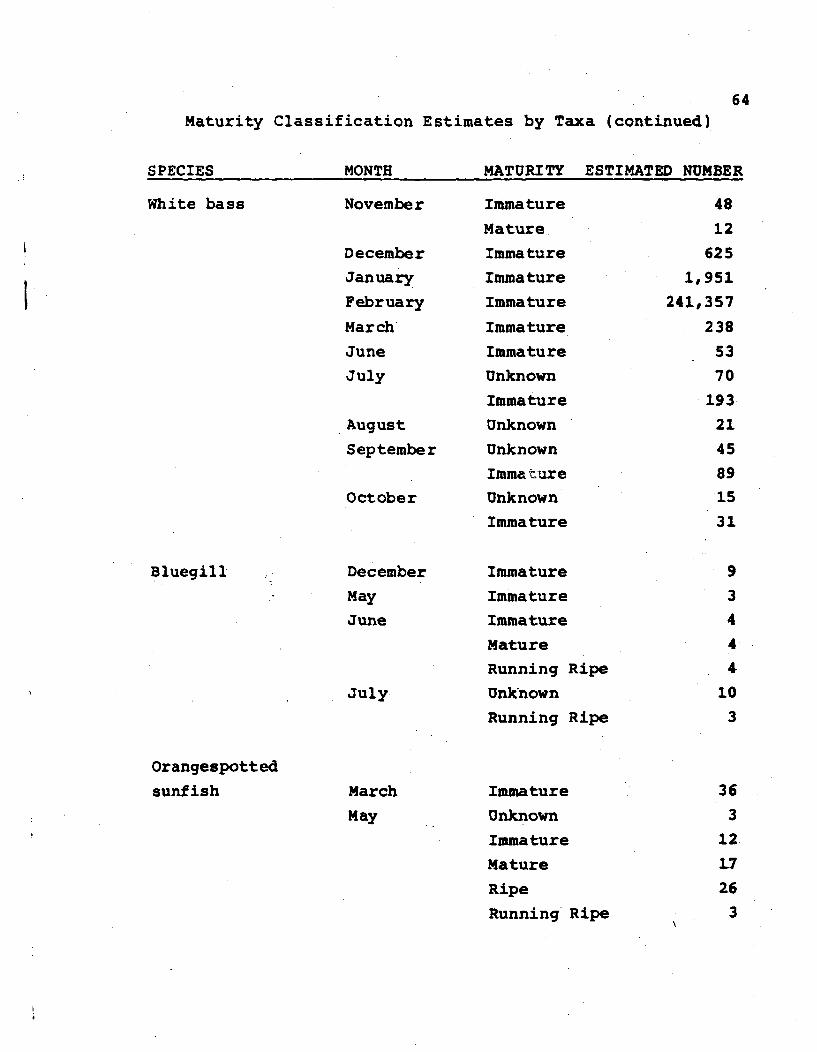
64Maturity Classification Estimates by Taxa (continued)
SPECIES MONTH MATURITY ESTIMATED NUMBER
White bass November
December
January
February
March
June
July
August
September
October
Immature
MatureImmature
Immature
Immature
Immature
ImmatureUnknown
ImmatureUnknown
Unknown
ImmatureUnknown
Immature
48
12
625
1,951
241,357
238
53
70193.
21
458915
31
Bluegill December
May
June
Immature
Immature
Immature
MatureRunning Ripe
UnknownRunning Ripe
934
4
4
10
3July
Orangespotted
sunfish March
May
Immature
Unknown
Immature
Mature
RipeRunning Ripe
36
312
1726
3
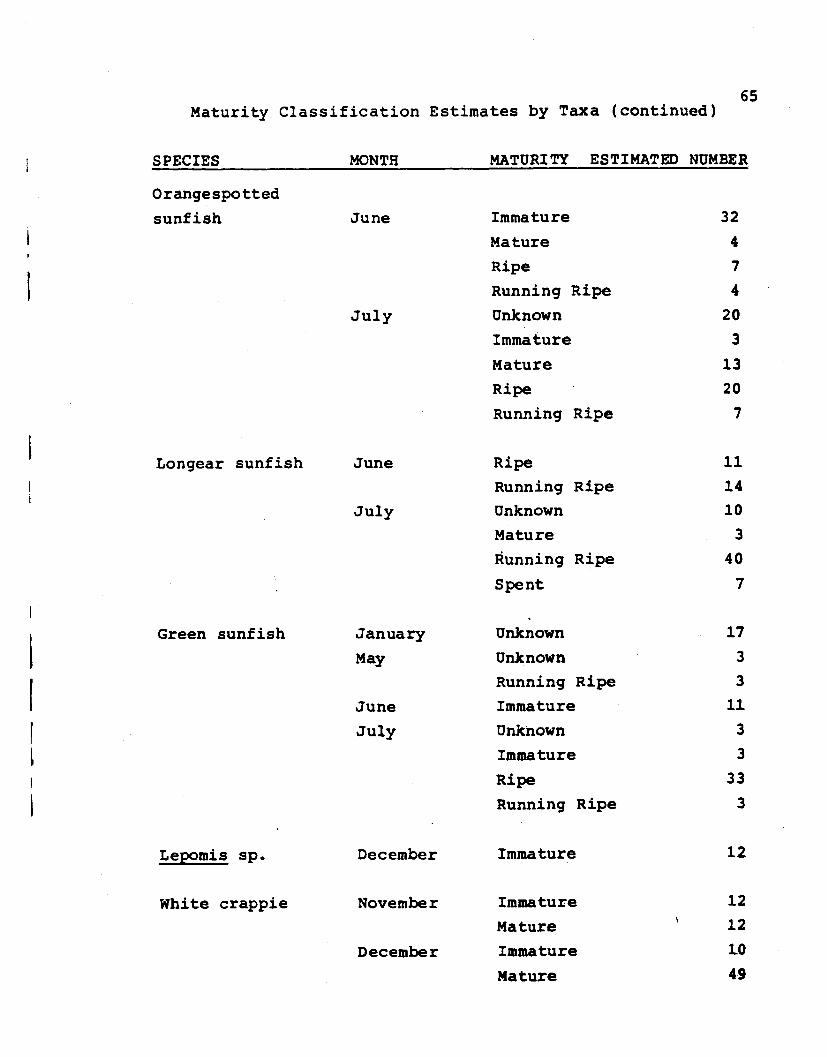
65Maturity Classification Estimates by Taxa (continued)
SPECIES MONTH MATURITY ESTIMATED NUMBER
Orangespotted
sunfish June
July
Longear sunfish June
July
Immature
Mature
Ripe
Running Ripe
UnknownImmature
Mature
Ripe
Running Ripe
Ripe
Running RipeUnknown
MatureRunning Ripe
Spent
Unknown
Unknown
Running RipeImmature
Unknown
Immature
Ripe
Running Ripe
Immature
32
4
7
4
20
3
13
20
7
11
14
10
3
40
7
17
3
3
11
3
3
33
3
Green sunfish January
May
JuneJuly
Lepomis sp.
White crappie
December
November
December
Immature
Mature
Immature
Mature
12
12
12
1049
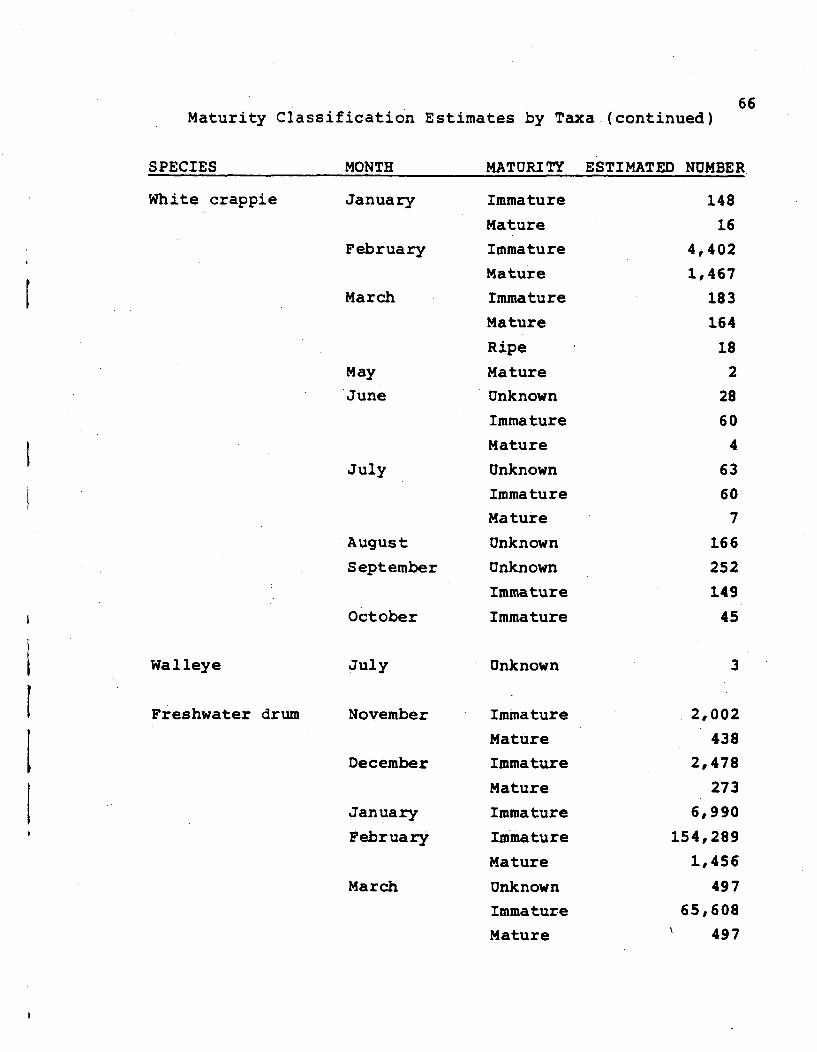
66Maturity Classification Estimates by Taxa (continued)
SPECIES MONTH MATURITY ESTIMATED NUMBER
White crappie January
February
March
May
June
July
August
September
October
Immature
Mature
Immature
Mature
Immature
Mature
Ripe
MatureUnknown
Immature
Mature
Unknown
ImmatureMature
Unknown
Unknown
Immature
Immature
Unknown
Immature
MatureImmature
MatureImmature
Immature
Mature
UnknownImmature
Mature
148
16
4,402
1,467
183
164
18
2
28
60
4
63
60
7
166
252
149
45
Wal leye July 3
Freshwater drum November
December
January
February
March
2,002
438
2,478
273
6,990
154,289
1,456
497
65,608
497
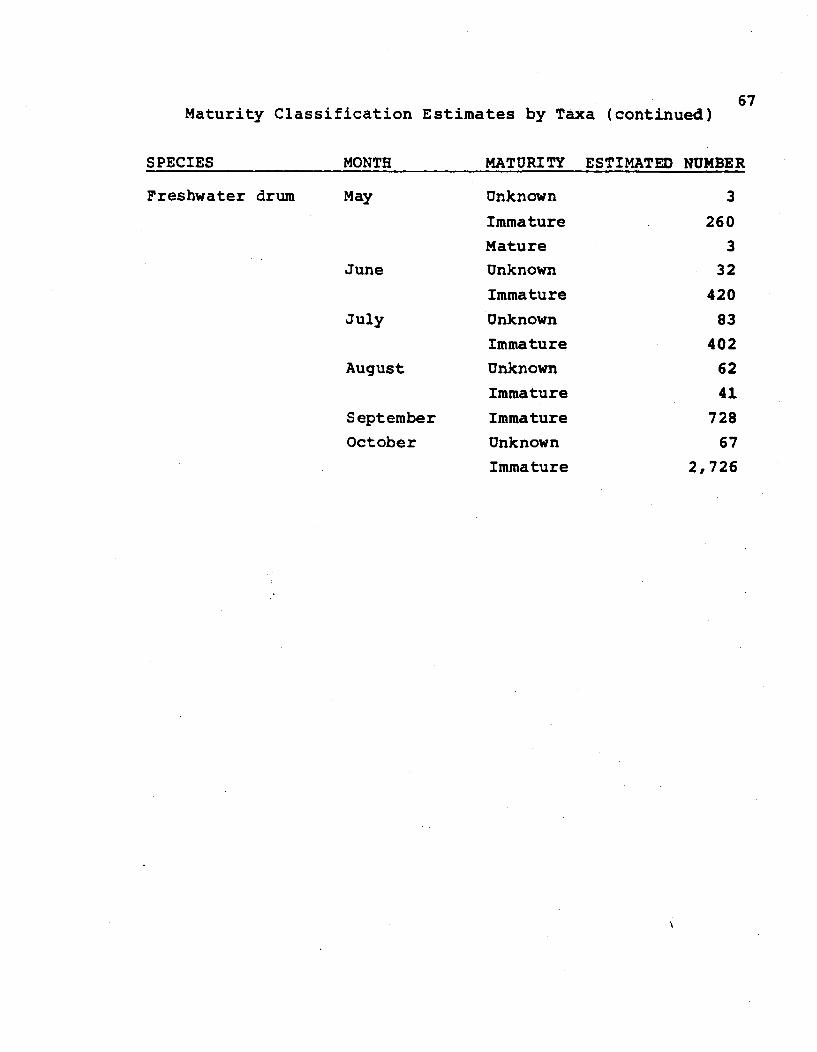
67Maturity Classification Estimates by Taxa (continued)
SPECIES MONTH MATURITY ESTIMATED NUMBER
Freshwater drum May
June
July
August
September
October
Unknown
Immature
Mature
Unknown
Immature
Unknown
Immature
Unknown
Immature
Immature
Unknown
Immature
3
260
3
32
420
83
402
62
41
728
67
2,726
38. A description, including volumes,chemical, and radiologicalcharacteristics, of all solid, liquid,aqueous, and gaseous wastestreams generated by the facility.Include information on whetherwaste streams are disposed at off-site locations, or released to land,air, or water bodies on-site.
Aquatic Ecology Page 3 of 3
- Section 2.5 of the ER (WCGS, 1980) describes the Topeka shiner, Neosho madtom,and Neosho mucket mussel. Please have available any records of these species beingcollected in impingement and entrainment sampling.
* Information on the source of water for the Sharpe Generating Station mentioned in.Section 2.12 of the.ER (WCGS, 1980).
- Information on potential riparian/wetland communities in the project area, including
along the transmission line.
" Information on any microbiological monitoring program, including any recent data.
" Section 6.2 of the ER (WCGS, 1980) notes that routine mitigation and monitoringprograms are conducted, including effluent chemistry monitoring and water quality andfishery monitoring of CCL. Please provide at a minimum the most recent set of thesedata.
- A description, including volumes, chemical, and radiological characteristics, of all solid,liquid, aqueous, and gaseous waste streams generated by the facility. Includeinformation on whether waste streams are disposed at off-site locations, or released toland, air, or water bodies on-site..
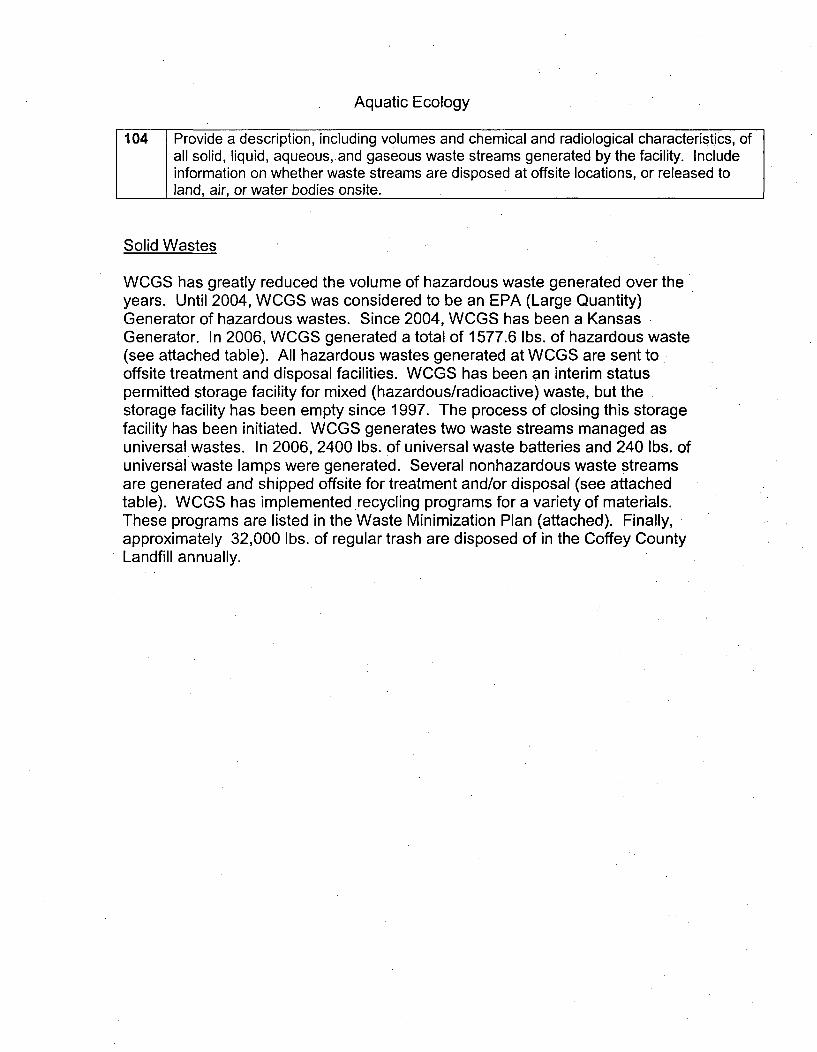
Aquatic Ecology
104 Provide a description, including volumes and chemical and radiological characteristics, ofall solid, liquid, aqueous,.and gaseous waste streams generated by the facility. Includeinformation on whether waste streams are disposed at offsite locations, or released toland, air, or water bodies onsite.
Solid Wastes
WCGS has greatly reduced the volume of hazardous waste generated over theyears. Until 2004, WCGS was considered to be an EPA (Large Quantity)Generator of hazardous wastes. Since 2004, WCGS has been a KansasGenerator. In 2006, WCGS generated a total of 1577.6 lbs. of hazardous waste(see attached table). All hazardous wastes generated at WCGS are sent tooffsite treatment and disposal facilities. WCGS has been an interim statuspermitted storage facility for mixed (hazardous/radioactive) waste, but thestorage facility has been empty since 1997. The process of closing this storagefacility has been initiated. WCGS generates two waste streams managed asuniversal wastes. In 2006, 2400 lbs. of universal waste batteries and 240 lbs. ofuniversal waste lamps were generated. Several nonhazardous waste streamsare generated and shipped offsite for treatment and/or disposal (see attachedtable). WCGS has implemented recycling programs for a variety of materials.These programs are listed in the Waste Minimization Plan (attached). Finally,approximately 32,000 lbs. of regular trash are disposed of in the Coffey CountyLandfill annually.
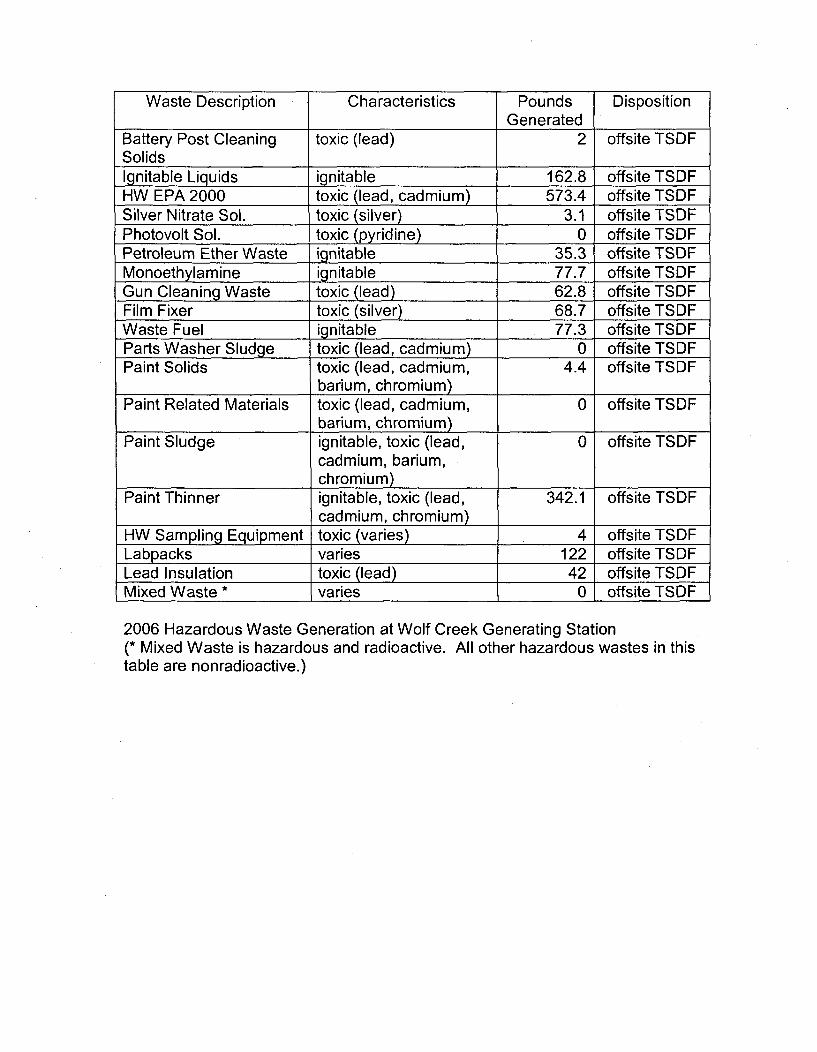
Waste Description Characteristics Pounds DispositionGenerated
Battery Post Cleaning toxic (lead) 2 offsite TSDFSolidsIgnitable Liquids ignitable 162.8 offsite TSDFHW EPA 2000 toxic (lead, cadmium) 573.4 offsite TSDFSilver Nitrate Sol. toxic (silver) 3.1 offsite TSDFPhotovolt Sol. toxic (pyridine) 0 offsite TSDFPetroleum Ether Waste ignitable 35.3 offsite TSDFMonoethylamine ignitable 77.7 offsite TSDFGun Cleaning Waste toxic (lead) 62.8 offsite TSDFFilm Fixer toxic (silver) 68.7 offsite TSDFWaste Fuel ignitable 77.3 offsite TSDFParts Washer Sludge toxic (lead, cadmium) 0 offsite TSDFPaint Solids toxic (lead, cadmium, 4.4 offsite TSDF
barium, chromium)Paint Related Materials toxic (lead, cadmium, 0 offsite TSDF
barium, chromium)Paint Sludge ignitable, toxic (lead, 0 offsite TSDF
cadmium, barium,chromium)
Paint Thinner ignitable, toxic (lead, 342.1 offsite TSDFcadmium, chromium)
HW Sampling Equipment toxic (varies) 4 offsite TSDFLabpacks varies 122 offsite TSDFLead Insulation toxic (lead) 42 offsite TSDFMixed Waste * varies 0 offsite TSDF
2006 Hazardous Waste Generation at Wolf Creek Generating Station(* Mixed Waste is hazardous and radioactive. All other hazardous wastes in thistable are nonradioactive.)
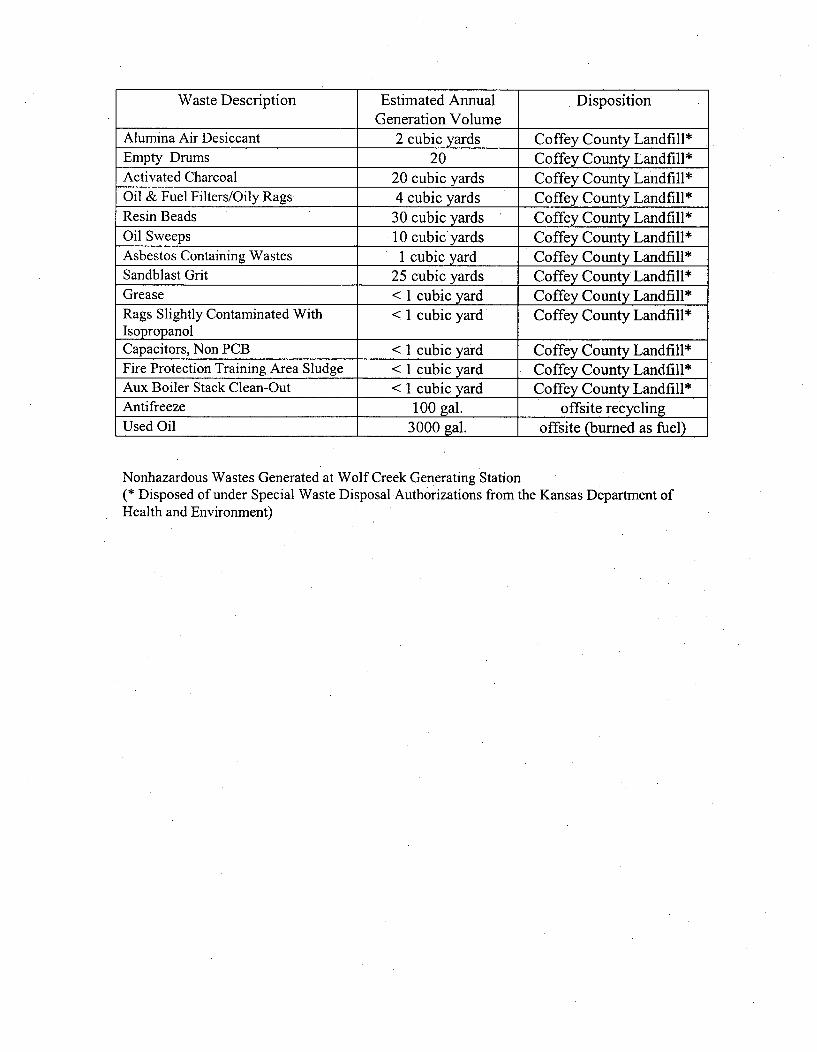
Waste Description Estimated Annual DispositionGeneration Volume
Alumina Air Desiccant 2 cubic yards Coffey County Landfill*Empty Drums 20 Coffey County Landfill*Activated Charcoal 20 cubic yards Coffey County Landfill*Oil & Fuel Filters/Oily Rags 4 cubic yards Coffey County Landfill*Resin Beads 30 cubic yards Coffey County Landfill*Oil Sweeps 10 cubicyards Coffey County Landfill*Asbestos Containing Wastes 1 cubic yard Coffey County Landfill*Sandblast Grit 25 cubic yards Coffey County Landfill*Grease < 1 cubic yard Coffey County Landfill*Rags Slightly Contaminated With < 1 cubic yard Coffey County Landfill*IsopropanolCapacitors, Non PCB < 1 cubic yard Coffey County Landfill*Fire Protection Training Area Sludge < 1 cubic yard Coffey County Landfill*Aux Boiler Stack Clean-Out < 1 cubic yard Coffey County Landfill*Antifreeze 100 gal. offsite recyclingUsed Oil 3000 gal. offsite (burned as fuel)
Nonhazardous Wastes Generated at Wolf Creek Generating Station(* Disposed of under Special Waste Disposal Authorizations from the Kansas Department ofHealth and Environment)
AGE.D
0'&/02/200,5
DOCUMENT CONTROL NUMBER
WCEM-04-010
Document Control Revision
I
WOLF CREEK NUCLEAR OPERATING CORPORATION
WASTE MINIMIZATION PLAN
Rev. 06/2005 I
for K. Moles 6/24/2005
APPROVED:Manager Regulatory Affairs Date
RELEASE DATE: T % J -; '-5
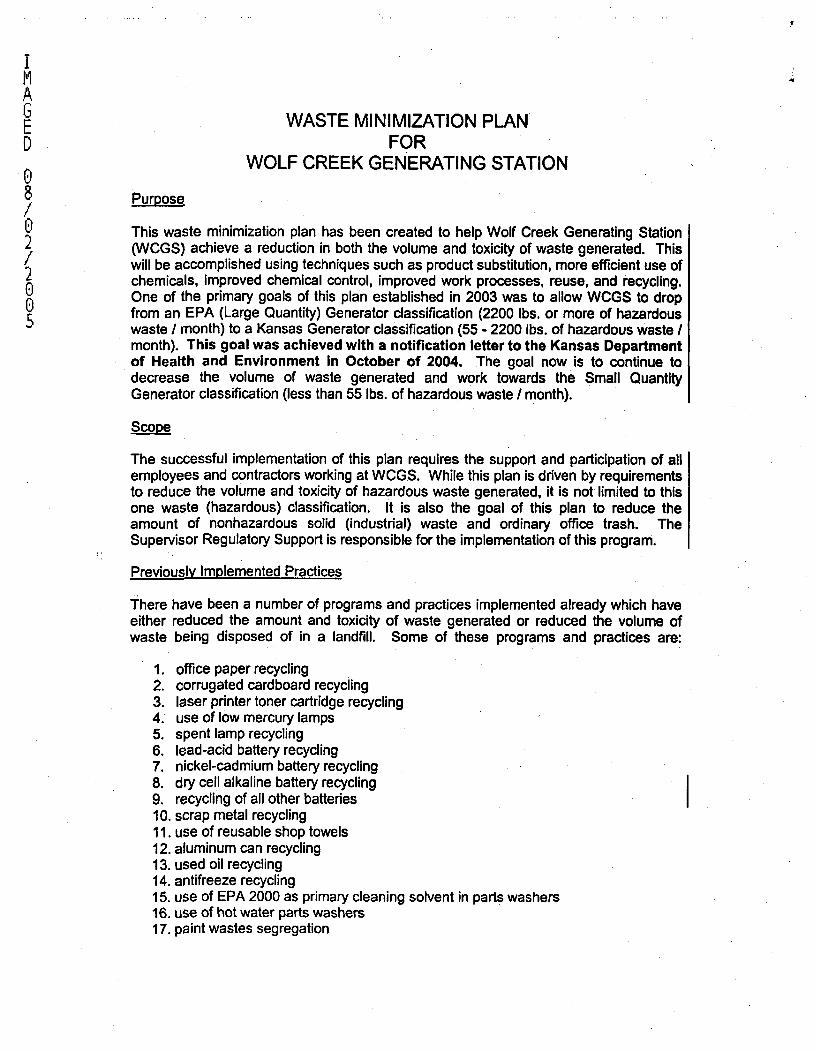
E_ WASTE MINIMIZATION PLAND FOR
cWOLF CREEK GENERATING STATION~Purpose
/
This waste minimization plan has been created to help Wolf Creek Generating Station2 (WCGS) achieve a reduction in both the volume and toxicity of waste generated. This
will be accomplished using techniques such as product substitution, more efficient use of2 chemicals, improved chemical control, improved work processes, reuse, and recycling.0 One of the primary goals of this plan established in 2003 was to allow WCGS to drop0 from an EPA (Large Quantity) Generator classification (2200 lbs. or more of hazardous
waste / month) to a Kansas Generator classification (55 - 2200 lbs. of hazardous waste /month). This goal was achieved with a notification letter to the Kansas Departmentof Health and Environment in October of 2004. The goal now is to continue todecrease the volume of waste generated and work towards the Small QuantityGenerator classification (less than 55 lbs. of hazardous waste I month).
ScoDe
The successful implementation of this plan requires the support and participation of allemployees and contractors working at WCGS. While this plan is driven by requirementsto reduce the volume and toxicity of hazardous waste generated, it is not limited to thisone waste (hazardous) classification. It is also the goal of this plan to reduce theamount of nonhazardous solid (industrial) waste and ordinary office trash. TheSupervisor Regulatory Support is responsible for the implementation of this program.
Previously Implemented Practices
There have been a number of programs and practices implemented already which haveeither reduced the amount and toxicity of waste generated or reduced the volume ofwaste being disposed of in a landfill. Some of these programs and practices are:
1. office paper recycling2. corrugated cardboard recycling3. laser printer toner cartridge recycling4. use of low mercury lamps5. spent lamp recycling6. lead-acid battery recycling7. nickel-cadmium battery recycling8. dry cell alkaline battery recycling9. recycling of all other batteries10. scrap metal recycling11. use of reusable shop towels12. aluminum can recycling13. used oil recycling14. antifreeze recycling15. use of EPA 2000 as primary cleaning solvent in parts washers16. use of hot water parts washers17. paint wastes segregation
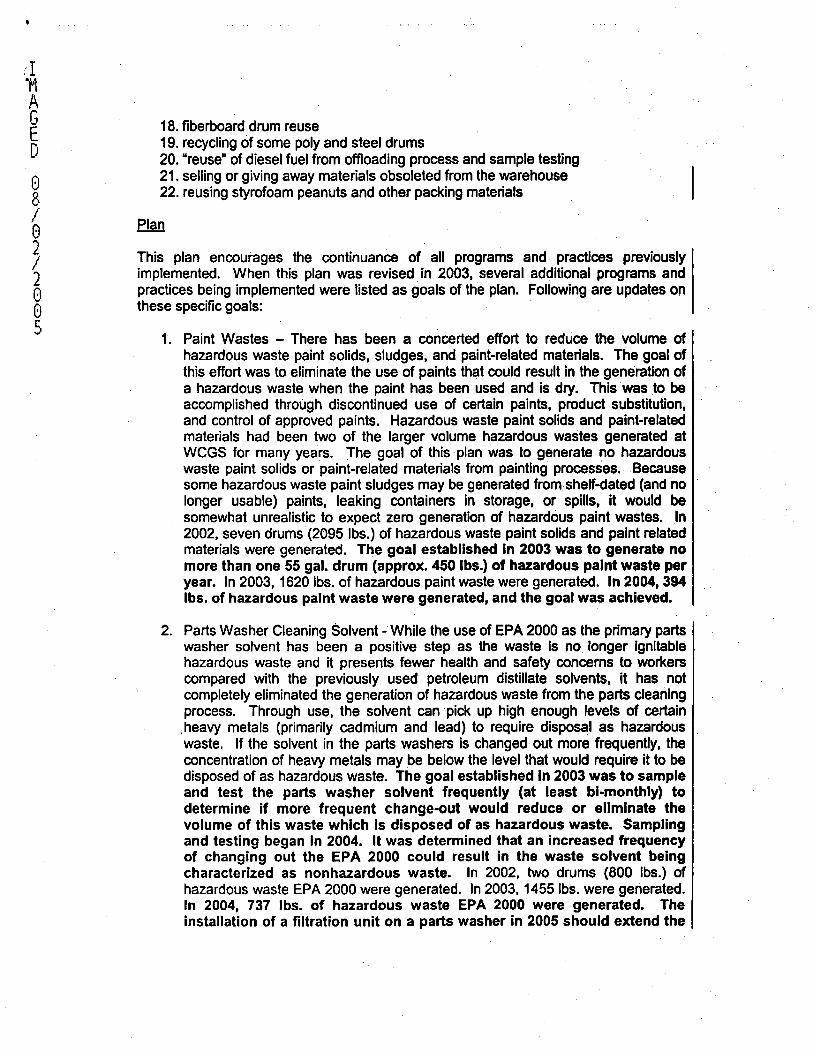
:1AE 18. fiberboard drum reuseE 19. recycling of some poly and steel drums
20. "reuse" of diesel fuel from offloading process and sample testing21. selling or giving away materials obsoleted from the warehouse22. reusing styrofoam peanuts and other packing materials
Plan
2 This plan encourages the continuance of all programs and practices previously2 implemented. When this plan was revised in 2003, several additional programs ando• practices being implemented were listed as goals of the plan. Following are updates ono these specific goals:
5 1. Paint Wastes - There has been a concerted effort to reduce the volume ofhazardous waste paint solids, sludges, and paint-related materials. The goal ofthis effort was to eliminate the use of paints that could result in the generation ofa hazardous waste when the paint has been used and is dry. This was to beaccomplished through discontinued use of certain paints, product substitution,and control of approved paints. Hazardous waste paint solids and paint-relatedmaterials had been two of the larger volume hazardous wastes generated atWCGS for many years. The goal of this plan was to generate no hazardouswaste paint solids or paint-related materials from painting processes. Becausesome hazardous waste paint sludges may be generated from shelf-dated (and nolonger usable) paints, leaking containers in storage, or spills, it would besomewhat unrealistic to expect zero generation of hazardous paint wastes. In2002, seven drums (2095 lbs.) of hazardous waste paint solids and paint relatedmaterials were generated. The goal established In 2003 was to generate nomore than one 55 gal. drum (approx. 450 lbs.) of hazardous paint waste peryear. In 2003, 1620 lbs. of hazardous paint waste were generated. In 2004, 394lbs. of hazardous paint. waste were generated, and the goal was achieved.
2. Parts Washer Cleaning Solvent - While the use of EPA 2000 as the primary partswasher solvent has been a positive step as the waste is no longer ignitablehazardous waste and it presents fewer health and safety concerns to workerscompared with the previously used petroleum distillate solvents, it has notcompletely eliminated the generation of hazardous waste from the parts cleaningprocess. Through use, the solvent can pick up high enough levels of certain
.heavy metals (primarily cadmium and lead) to require disposal as hazardouswaste. If the solvent in the parts washers is changed out more frequently, theconcentration of heavy metals may be below the level that would require it to bedisposed of as hazardous waste. The goal established In 2003 was to sampleand test the parts washer solvent frequently (at least bi-monthly) todetermine if more frequent change-out would reduce or eliminate thevolume of this waste which is disposed of as hazardous waste. Samplingand testing began in 2004. It was determined that an increased frequencyof changing out the EPA 2000 could result in the waste solvent beingcharacterized as nonhazardous waste. In 2002, two drums (800 lbs.) ofhazardous waste EPA 2000 were generated. In 2003, 1455 lbs. were generated.In 2004, 737 lbs. of hazardous waste EPA 2000 were generated. Theinstallation of a filtration unit on a parts washer in 2005 should extend the
b life of the EPA 2000 and further reduce the possibility of the waste solventE being characterized as hazardous waste.DI
0 3. Diesel Fuel - Because of its flashpoint, diesel fuel which was disposed of hadbeen managed as hazardous waste. One source of diesel fuel which was being
/ managed that way was the fuel drawn from the storage and day tanks by
Operations to inspect for the presence of water. This is clean diesel fuel, andthere was no good reason why it should be managed as waste. Operations and
2/ Administrative Services implemented a program for accumulating it as clean2 diesel and using it as fuel in vehicles or equipment. In 2002, approximately 11502~ lbs. of diesel fuel from this source were disposed of as hazardous waste. The
goal established in 2003 was to completely eliminate this as a waste0 stream. This goal has been achieved, and no waste diesel fuel has been
generated from this process since 2003.
4. Batteries - Recycling programs had been in place for lead-acid and nickel-cadmium batteries for many years. Although not requiring management as ahazardous waste, a large number of dry cell alkaline batteries had been disposedof as office trash. A small number of other types of batteries are also likely beingdisposed of in the trash. The goal established in 2003 was to implement arecycling program for dry cell alkaline batteries and for as many othertypes of batteries as is possible. This goal was achieved In October of2003.
Opportunities exist for WCGS to find other businesses that may reuse or recyclematerials that would otherwise be disposed of as waste. Several material and wasteexchanges can now be accessed via the internet. Inventory control can also play asignificant role in waste reduction. A significant amount of both hazardous andnonhazardous waste has been generated in the past by the disposal of shelf-dated orobsoleted products. Supply Chain Services is now pursuing other options beforedetermining that materials should, as a last resort, be disposed of as waste.
The use of products that will not produce a hazardous waste can contribute greatly tothe reduction in the volume of hazardous waste generated. There are also moreopportunities for recycling additional types of wastes and spent products.
In order to heighten employees' awareness of the need for waste minimization and toencourage individuals to actively support the effort, a program has been implemented tosolicit minimization ideas and reward employees for those ideas which are implemented.While all ideas which are implemented will earn the originator a reward, those whichresult in more significant reductions will earn the originator a more significant reward.
Monthly hazardous waste generation volume will continue to be tracked. Performanceindicators will be utilized to track both monthly hazardous waste generation and totalcumulative quantities of hazardous waste.
This waste minimization plan should be revised annually to reflect accomplishments andupdate goals.
kA37
631
/
WrLF CREEK'NUCLEAR OPERATING CORPORATION k•OI~OI7
Kevin J. MolesManager Regulatory Affairs .APR3O02001i
RA 04-0036
U: S. Nuclear Regulatory CommissionATTN: Document Control DeskWashington, DC 20555
-Subject: Docket No. 50-482: Wolf Creek Generating Station Annual RadioactiveEffluent Release Report - Report 27
Gentlemen:
. This letter transmits the enclosed Wolf Creek Generating Station (WCGS) Annual RadioactiveEffluent Relea'e Report. The report covers the period from January 1, 2003, throughDecember 31, 2003. It is being submitted pursuant to Section 5.6.3 of the WCGS TechnicalSpecifications. Three attachments are included as part of this report. Attachments I, II; and IIIare revised procedures required to be submitted with this report: AP 07B-003, "Offsite DoseCalculation Manual,' AP 07B-004, "OffsIte Dose Calculation Manual (RadiologicalEnvironmental Monitoring Program),* and AP 31A-100, "Solid Radwaste Process ControlProgram.'
No commitments are identified in this correspondence. If you have any questions concerningthis matter, please contact me at (620) 364-4126, or Mr. William Muilenburg at (620) 364-8831,ext. 4511.
KJM/rlg
Enclosure
cc: J. N. Donohew (NRC), w/eD. N. Graves (NRC), wleB. S. Mallett (NRC), wleSenior Resident Inspector (NRC), wle
P.O. Box 411 I Burlington, KS 668391 Phone: (620) 364-8831An Equal Opporiunity Employer M/F/HC!VET
P
Wolf Creek Nuclear Operating Corporation
..X Wolf Creek Generating Station
Docket No: 50-4,82Facility Operating License No: .NPF-42
Ahnual Radloactive Effluent Release. Report
Report No. 27,
Reportirig Period: Janury 1, 2003 Dbcbmbe" 31, 2003

"2 of.40
Table of Contents
Executive Summary 4"'P Section I*8q Report of 2003 Radioactive Effluents: Liquid 8
2003 Liquid Effluents 102003 Liquid Cumulative Dose Summary?- Table 1 122003 Liquid Curriulative Dose Summary - Table 2 13Report of 2003 Radioactive Effluents: Airborne 142003 Gaseous Effluents 16
p 2003 Gaseous Cumulative Dose Summary - Table I 182003 Gaseous Cumulative Dose Summary - Table 2 19Section I1 20Offsite Dose Calculation Manual Limits 20Effluent Concentration Limits (ECLs) 20Average Energy 21Measurements and Approximations of Total Radioactivity (Liquid and 21Gaseous Waste' Effluents)Batch Releases 23Continuous Releases 23Doses to a Member of the Public from Activities Inside the Site
S, Boundary 23.Additional. Information 232003.Effluent Concentration Limits 26
' 2003 Solid Waste Shipments 27Irradiated Fuel Shipments .28Section 111 29•Meteorological Data - Hours At Each Wind Speed and Direction 29"Section IV 38
" Unplanned or Abnormal Releases '38Offsite Dose Calculation Manual 38Major Changes to Liquid, Solid, or Gaseous Radioactive WasteTreatment Systems 38Land Use Census 39Radwaste Shipments 39Inoperability of Effluent Monitoring Instrumentation 39Storage Tanks 39,
J •D- 3 of 40
' Table of Contents
Attachment I - WCGS Procedure AP 07B-003, Revision 4, "Offsite Dose Calculation Manual"Attachment II - WCGS Procedure AP 07B-004, Revision 5, "Offsite Dose Calculation Manual(Radiological Environmental Monitoring Program)"Attachment III - WCGS Procedure AP 31A-100, Revision 4, "Solid Radwaste Process ControlProgram'. ,
0T
* II
I. I . .
4 of 40
IT1 •EXECUTIVE SUMMARY
This Annual Radioactive Effluent Release Report (Report # 27) documents the quantities of liquid* and gaseous effluents and solid waste released by the Wolf Creek Generating Station (WCGS)
P from January 1, 2003, through December 31, 2003. The format and content of this report are inaccordance with Regulatory Guide 1.21, Revision 1, "Measuring, Evaluation; and ReportingRadioactivity in Solid Wastes and Releases of Radioactive Materials in Liquid and GaseousEffluents from Light-Water-Cooled Nuclear Power Plants.". Sections I; II, I1l, and IV of this reportprovide information required by NRC Regulatory Guide 1.21 and Section 7.2 of AP 076-003,"Offsite Dose Calculation Manual" (ODCM).
Section I --- Section I contains in detail the quantities of radioactive liquid and gaseous effluentsand cumulative dose summaries for 2003, tabulated for' each quarter and for yearly totals.,Specific ODCM effluent limits and dose limits are also listed in Section I, along with thepercentage of the effluent limits actually released, and the percentages of, the dose limit actuallyreceived. No effluent or dose limits were exceeded during 2003.
An elevated release pathway does not exist at WCGS. All airborne releases are considered to beground levelreleases. The gaseous pathway dose determination is met by the WCGS ODCMmethodology of assigning all gaseous pathways to a hypothetical individual residing at thehighest annual X/Q and D/Q location, as specified in the ODCM. This results in a conservativeestimate of dose to a member of the public, rather than determining each pathway dose for eachrelease condition. A conservative error of thirty percent has been estimated in the effluent data.As stated above, no ODCM dose limits were exceeded in 2003.
Section II Section II includes supplemental information on continuous and batch releases,calculated doses, and solid waste disposal. There were 87 gaseous batch releases in 2003versus 77 in 2002. There were 76 liquid batch releases in 2003 versus 71 In 2002. WCGSreleased 0.020 curies in liquid releases during 2003 versus 0.018 curies in 2002, excluding gasand tritium. Continuous release pathways remained the same as previous years and allcontinuous releases were monitored. There was a missed surveillance as a result of a valvemisalignment on the sample isolation valve for Gas Decay Tank #3. The event is furtherdiscussed in the Performance Improvement Request (PIR) report information.
The report contains information on the following PIRs.
PIR 2003-0173 - On 1-29-2003 the Balance of Plant Operator (BOP) in the Control Room takinglog readings noted that monitor GHRE-10A was in accident isolation which switches samplesuction from room air rather than the Radwaste Vent effluent stream. The sampling as requiredby ODCM Table 3-2 was not met for 6.5 hours since the sample air was coming from room air.
PIR 2003-0529 - Support Engineering incorrectly reported a previous flow rate of 4627 cfm forthe containment mini-purge unit as the current flow to Operations and Chemistry. The correctcurrent flow should have been reported as 4260 cfm.
PIR 2003-0848 - During the channel calibration portion of STS IC-474B, "Channel CalibrationUnit Ventilation System Radiation Monitor GTRE21B," it was discovered that the pumpdiaphragm had a hole in it. The sample air passing by the detector was diluted due to the pumpdiaphragm hole being upstream of the pump and the detector being downstream of the pump. Itis unknown how long the hole in the pump diaphragm was present before being discovered.
4 5 of40
PIR 2003-1882 - Waste Gas Decay Tank (WGDT) #3 decreased in pressure and WGDT #8increased in pressure during a Volume Control Tank (VCT) Purge. The purge was secured and
all reach rod valves that could cause a decrease in pressure in the gas decay tanks were verifiedclosed. Work Order 03-25.3.665 was generated to replace the relief valve.
PIR 2003-2158 - On 7-17-2003 the "A waste gas compre~ssor moisture separator tank reliefvalve was being replaced. When the relief valve flange was broken loose water commencedspraying from the flange area. The flange bolts were retightened. This relief valve discharges
S.into WGDT #8 that contained - 5 psig pressure. WGDT #8 Oressure decreased -'0.4 psig during, this. evolution.
PIR 2003-2580- Containment Atmosphere Monitors GTRE31 and GTRE32 were 6hanged 8-29-.• ,2003. The particulate filters were discolored. Gamma scans performed on the filters indicated
no gamma activity. The discoloration of the filters. ist not indicative of Reactor Coplant System(RCS) leakage. The filters. were sent off for boron and iron analysis and the results wereinconclusive.
PIR 2003-2805 - The sample isolation valve for WGDT #3 was found in the open position by aChemistry technician on 9-22-2003. The. chemistry technicign was performing STS CH-009,Waste Gas Decay Tank Curie Content Surveillance. The last sample from WGDT #3 taken forSTS CH-009 was on 9-5-2003. After WGDT #3 was sampled, a curie content sample wasobtained from WGDT #8 the same day. It is probable that the sample obtained for WGDT #8 on9-5-2003 was not representative of what was in that tank, buf rather a composite of WGDT #3and WGDT #8 since the sample isolation valve for WGDT. #3 was still in the open position.. Oncethe sample isolation, valve for WGDT #3 was closed the total ctrie content surveillance for WGDT#8 was completed. The cornseqpence of thevalve alignmentis'a missed siurveillance.
PIR 2003-3555 - The low setpoint for WGDT permit 2003165 was incorrect.. The correct setpointto use was 7.97E+02 p.Ci/sec, but 8.83E+02 pCi/sec. was recorded. The calculated low setpointwas 7.97E+02 pCi/sec. The low setpoint for the Radwaste Vent was 8.83E+02 pCi/sec. Therelease was performed using a less conservative setpoint, but the low setpoint was notcompromised due to the built-in conservatism of the setpoint calculation.
PIR 2003-3591 - The, high setpoint for containment purge permit 2003178 for GTRE-22 and.GTRE-33.was recorded as 1.02E-02 pCi/cc and the correct setpoint should have been recordedasi. 1.OOE-02 pCi/cc. This incorrect setp6int could have prevented the Control Room fromreceiving the Hi-Hi Process Radiation Alarm prior, to the ESFAS (Engineering Safety FeatureActuation System) isolating the containment purge. The low setpoint was not jeopardized duringthe release.
Section III - Section III documents WCGS meteorological data for wind speed, wind direction,and atmospheric stability. WCGS did not meet the Regulatory Guide 1.23, "MeteorologicalPrograms in Support of Nuclear Power Plants' requirement for having at least 90%meteorological data recovery for 2003. PIR 2004-0620 has been written to address this and theresolution will be presented in the 2005 Annual Report.
6 of 40
Section IV - Section IV documents unplanned and abnormal releases, changes to radwastetreatment systems, land use census, monitoring instruments, radwaste shipments,.and storagetank quantities. PIR 2003-2158 documents the decrease of -0.4 psig in WGDT #8 during an
* evolution to replace the "A" waste gas compressor moisture separator tank relief valve. Watersprayed out when the flange was loosened causing the decrease in pressure. The subsequentincrease in the GHRE-IOB monitor reading was determined to. be from Chemistry samplingactivities. There was no uncontrolled or unmonitored release in either circumstance. No ODCMlimits were exceeded.
No changes or events occurred on the land use census, monitoring instruments, radwasteshipments, and storage units.
Q
7 of 40
ATTACHMENTS
Attachment I-AP 07B-003, revision 4, "Offsite Dose Calculition Manual"Attachment 11-AP 078-004, revision 5, 'Offsite 'Dose Calculation Manual (RadiologicalEnvironmental Monitoring Program)'Attachment III-AP 31A-1 00, revision 4, "Solid Radwaste Process Control Program'
p -• I.
0W'"
• °
0°
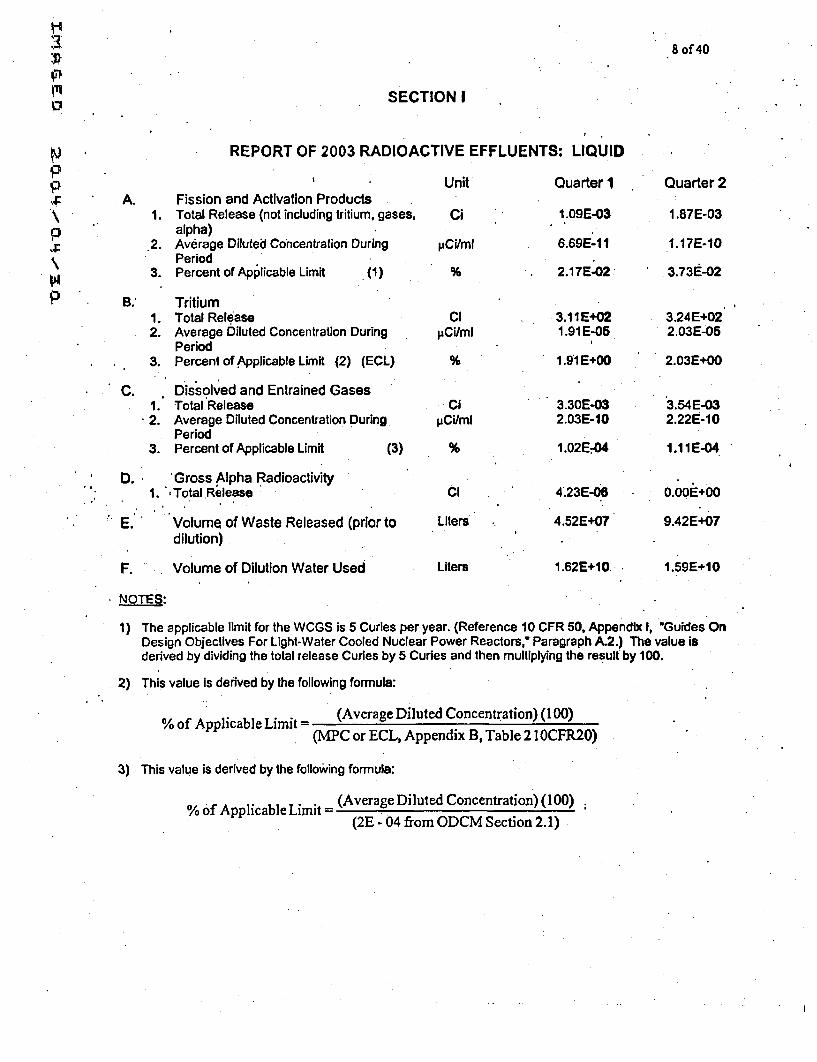
.4
38 of 40
SECTION I
REPORT OF 2003 RADIOACTIVE EFFLUENTS: LIQUID
PX
UnitA. Fission and Activation Products
1. Total Release (not including tritium, gases,alpha)
.2. Average Diluted Concentration DuringPeriod
3. Percent of Applicable Limit (1)
B.' Tritium1. Total Release2. Average Diluted Concentration During
Period3. Percent of Applicable Limit (2) (ECL)
Ci
pCi/mi
CiCi/ml
Quarter 1
1.09E-03
6.69E-1 I
2.17E-02
3.11E+021.91 E-05
1.91 E+00
3.30E-032.03E-10
1.02E.-04
4.23E-06
4.52E+07
1.62E+10
Quarter 2
1.87E-03
1.17E-10
3.73E-02
3.24E+02
2.03E-05
2.03E+00
C. Dissolved and Entrained Gases1. Total Release2. Average Diluted Concentration During.
Period3. Percent of Applicable Limit
I CipCi/ml
'3) %
D. 'Gross Alpha Radioactivity1. Total Release
E. Volume of Waste Released (prior to
dilution)
F. Volume of Dilution Water Used
3.54E-032.228-1 0
1.11E-04.
0.OOEO00
9.42E+07
1 .59E+10
Cl
Liters
Liters
NOTES:
1) The applicable limit for the WCGS is 5 Curies per year. (Reference 10 CFR 50, Appendix I, "Guides OnDesign Objectives For Light-Water Cooled Nuclear Power Reactors,* Paragraph A.2.) The value isderived by dividing the total release Curies by 5 Curies and then multiplying the result by 100.
2) This value Is derived by the following formula:
(Average Diluted Concentration) (100)% of Applicable Limit=
(MPC or ECL, Appendix B, Table 2 10CFR20)
3) This value is derived by the following formula:
So'f Applicable Limit= (Average Diluted Concentration) (100)(2E - 04 from ODCM Section 2.1)
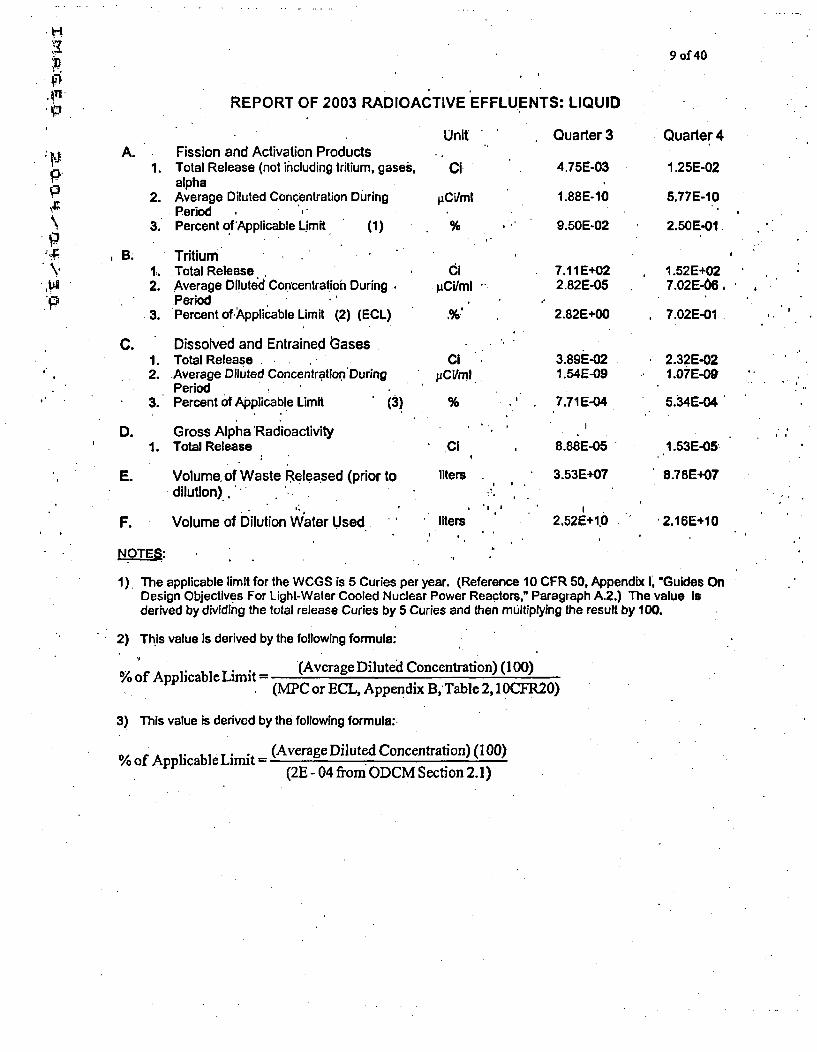
P
X
9 of 40
REPORT OF 2003 RADIOAC
A. Fission and Activation Products1. Total Release (not including tritium, gases,
alpha2. Average Diluted Concentration During
Period , ,3. Percent of'Applicable Limit (1)
B. Tritium•1. Total Release2. Average Diluted Concentration During
Period•3. Percent of-Applicable Limit (2) (ECL)
C. Dissolved and Entrained Oases1. Total Release2. Average Diluted Concentratlon'During
Period3.' Percent of Applicable Limit (3)
D. Gross Alpha 'Radioactivity1. Total Release
E. Volume, of Waste Released (prior todilution)
F. Volume of Dilution Water Used.
;TIVE EFFLUENTS: LIQUID
Unit *Quarter 3
Ci. 4.75E-03
PjCVmI 1.88E-10
% , 9.50E-02
CliCVml.
ClPCVml
Cl
liters
liters
7.11 E+022.82E-05
2.82E+00
3.89E-021.54E-09
*7.71 E-04
8.88E-05
*3.53E+07
2.52E+1,0
Quarter 4
1.25E-02
5.77E-10
2.50E-01,
1 .52E+027.02E-066
*7.02E-01
*2.32E-02
5.34E-04
I .53E-05-
8.78E+07,
* 2.16E+10
= !
NOTE.T:
1). The applicable limit for the WCGS is 5 Curies per year. (Reference 10 CFR 50, Appendix I, "Guides OnDesign Objectives For Light-Water Cooled Nuclear Power Reactors," Paragraph A.2.) The value Isderived by dividing the total release Curies by 5 Curies and then multiplying the result by 100.
2) This value is derived by the following formula:
% of Applicable Limit = (Average Diluted Concentration) (100)
(MPC or ECL, Appendix B,Table 2,10CFR20)
3) This value is derived by the following formula:.
(Average Diluted Concentration) (100)(2E - 04 from ODCM Section 2.1)
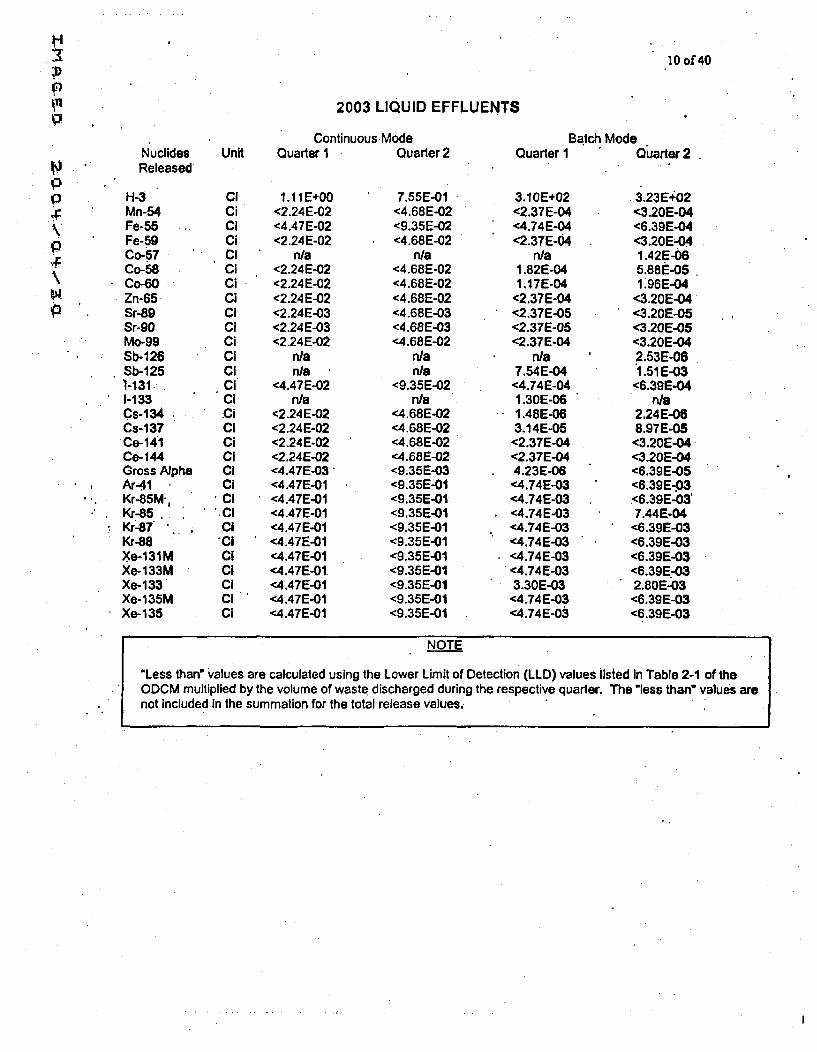
P7P1
10 of 40
2003 LIQUID EFFLUENTS
Continuous ModeN'uclidesReleased
H-3Mn-54Fe-55Fe-59Co-57Co-58Co-60Zn-65Sr-89Sr-90Mo-99Sb-126Sb-1251-131..1-133Cs-134Cs-137Ce-141Ce-144Gross AlphaAr4l 1Kr-85M1,Kr-85Kr87"'Kr-88Xe-131MXe-133MXe-133Xe-135MXe-135
Unit Quarter I
ClCiClCiCiCiCiCiClC'CiCiCiCiCiClCiCiClClCi
* Ci'.Ci
C1'CiCiClCiCiCi
1.111E+00<2.24E-02<4.47E-02<2.24E-02
I n/a<2.24E-02<2.24E-02<2.24E-02<2.24E-03<2.24E-03<2.24E-02
n/an/a
<4.47E-02n/a
<2.24E-02<2.24E-02<2.24E-02<2.24E-02<4.47E-03<4.47E-01<4.7E-01<4.47E-01<4.47E-01<4.47E-01<4.47E-01<4.47E-01,<4.47E-01<4.47E-01<4.47E-01
Quarter 2
7.55E-01<4.68E-02<9.35E-02<4.68E-02
n/a<4 .68E-02<4.68E-02<4.68E-02<4 .68E-03<4 .68E-03<4 .68E-02
n/an/a
<9.35E-02n/e
<4.68E-02<4.68E-02<4.68E-02<4.68E-02<9.35E-03<9.35E-01<9.35E-01<9.35E-O1<9.35E-01<9.35E-01<9.35E-01<9.35E-01<9.35E-01<9.35E-01<9.35E-01
BaQuarter 1
3.10E+02<2.37E-04<4.74E-04<2.37E-04
n/a1.82E-041.17E-04
<2.37E-04<2.37E-05<2.37E-05<2.37E-04
rna7.54E-04
<4.74E-041.30E-061.48E-063.14E-05
<2.37E-04<2.37E-044.23E-06<4.74E-03<4.74E-03<4.74E-03<4.74E-03<4.74E-03<4.74E-03<4.74 E-033.30E-03<4.74E-03<4.74E-03
3.23E402<3.20E-04<6.3 9E-04<3.20E-04.1 .42E-665.88t-05I :96E-04
<3.20E-04<3.20E-05<3.20E-05<3.20E-042.53E-061.51 E-03
<6.39E-04n/a
2.24E-068.97E-05
<3.20E-04<3.20E-04<c6.39E-05<6.39E-.03
* <6.39E-03'7.44E-04
<6.39E-03* <6.39E-03
<6.39E-03<6.39E-032.B0E-03
<6.39E-03<6.39E-03
itch ModeC)uarter 2
NOTE
"Less than' values are calculated using the Lower Limit of Detection (LLD) values listed in Table 2-1 of theODCM multiplied by the volume of waste discharged during the respective quarter. The "less than" values arenot included in the summation for the total release values.
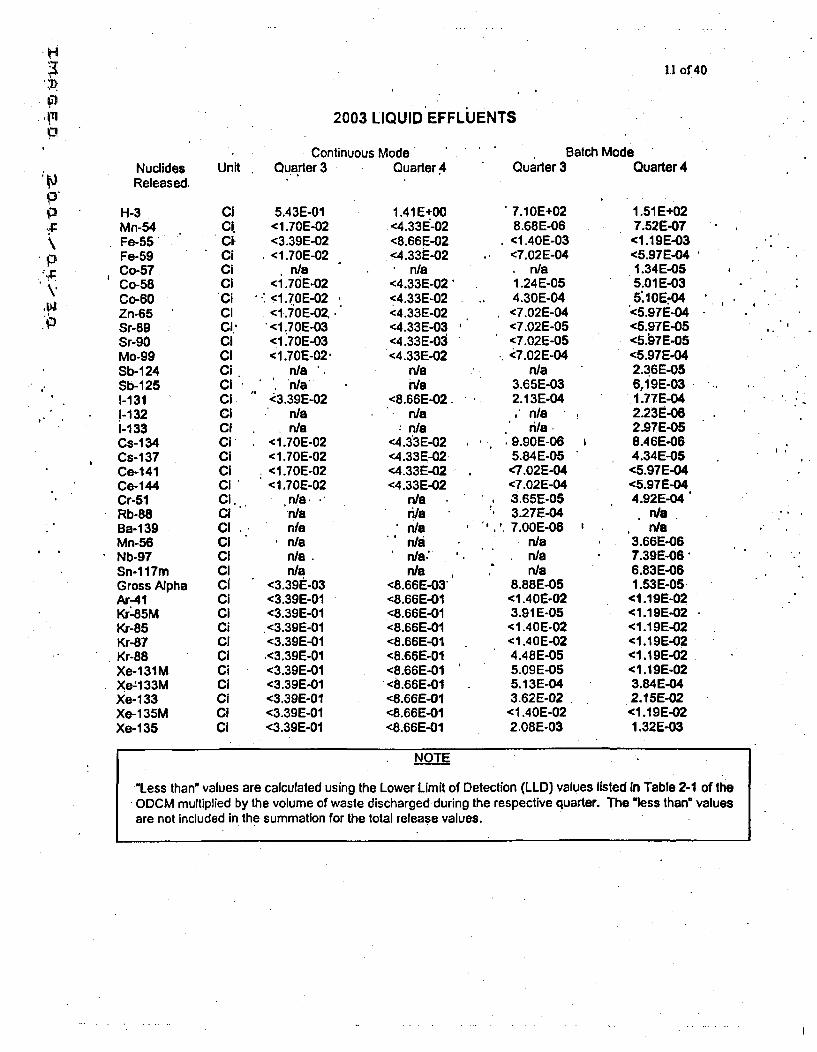
0- 1.1 of 40
2003 LIQUID EFFLUENTS
X.P
NuclidesReleased.
H-3Mn-54Fe-55Fe-59Co-57Co-58Co-60Zn-65Sr-89Sr-g0Mo-99Sb-124Sb-1251-1311-1321-133Cs-1 34Cs-137Ce-141Ce-144Cr-51Rb-88Ba-1 39Mn-56Nb-97Sn-1 17mGross AlphaAr41Kr-85MKr-85Kr-87Kr-88Xe-131M
eXi133MXe- 133Xe-135MXe- 135
Unit
ClCkCi.CiCiCl'Ci
CiCi:CiCiCiCICiCiClCICiCiCiCl.C0ClClCiCIcfCiCICiClCiCiClCiCiCl
Continuous ModeQuarter 3
5.43E-01<1.70E-02<3.39E-02
, <1.70E-02n/a
<1.70E-02-;1.70E-02<1 .70E-02,,
'<1.70E-03<1.70E-03<1.70E-02'
n/a.n/a
-<3.39E-02n/an/a
<1.70E-02<1.70E-02<1.70E-02<1.70E-02
n•a.'n/a
n/an/an/an/a
<3.39E-03<3.39E-01<3.39E-01
.<3.39E-01<3.39E-01.<3.39E-01<3.39E-01<3.39E-01<3.39E-01<3.39E-01<3.39E-01
Quarter 4
1.41 E+00<4.33E-02<8.66E-02<4.33E-02
n/a<4.33E-02'<4.33E-02<4.33E-02<4.33E-03<4.33E-03<4.33E-02
n/an/a
<8.66E-02.Idan/a
<4.3"3E-02<4.33E-02.<4.33E-02<4.33E-02
n/ari/a
'n/ia
* n/a:•n/a
<8.66E-03-<8.66E-O1<8.66E-01<8.66E-O1<8.66E-01<8.66E-01<8.66E-01<8.66E-01<8.66E-01<8.66E-O1<8.66E-01
Quarter 33atch Mode
Quarter 4
* 7.1OE+028.68E-06<1.40E-03<7.02E-04
n/a1.24E-054.30E-04<7.02E-04<7.02E-05<7.02E-054 .,7.02E-04
n/a3.65E-032.13E-04
n/ari/a,
* . 9.90E-065.84E-05
, '7.02E-04<7.02E-043.65E-053.27E-04
' "'.* 7.OOE-06n/an/a
S In/a8.88E-05<1 .40E-023.91 E-05<I.40E-02<I.40E-024.48E-055.09E-055.13E-043.62E-02
<1.40E-022.08E-03
1.51 E+027.52E-07
<1.19E-03<5.97E-04.1.34E-055.01 E-035'.imoE4
<5.97E-04<5.97E-05<5k9E-05<5.97 E-04
* 2.36E-056 ̀A9E-031 .77E-042.23t-062-97E-058.46E-0B4.34E-05<5.97E-04<5'c.97E-044.92E-04
n/aI., n/a
* 3.66E-067.39E-06~6.83E-06I1.53E-05<1 .19E-02<1.19E-02<1.19E-02<1.19E.02ci .19E-02<1 .19E-023.84E-042.1 5E-02<1.19E-021 .32E-03
NOTE
"Less than" values are calcutated using the Lower Limit of Detection (LLD) values listed In Table 2-1 of the
ODCM multiplied by the volume of waste discharged during the respective quarter. The "less than" valuesare not included in the summation for the total release values.
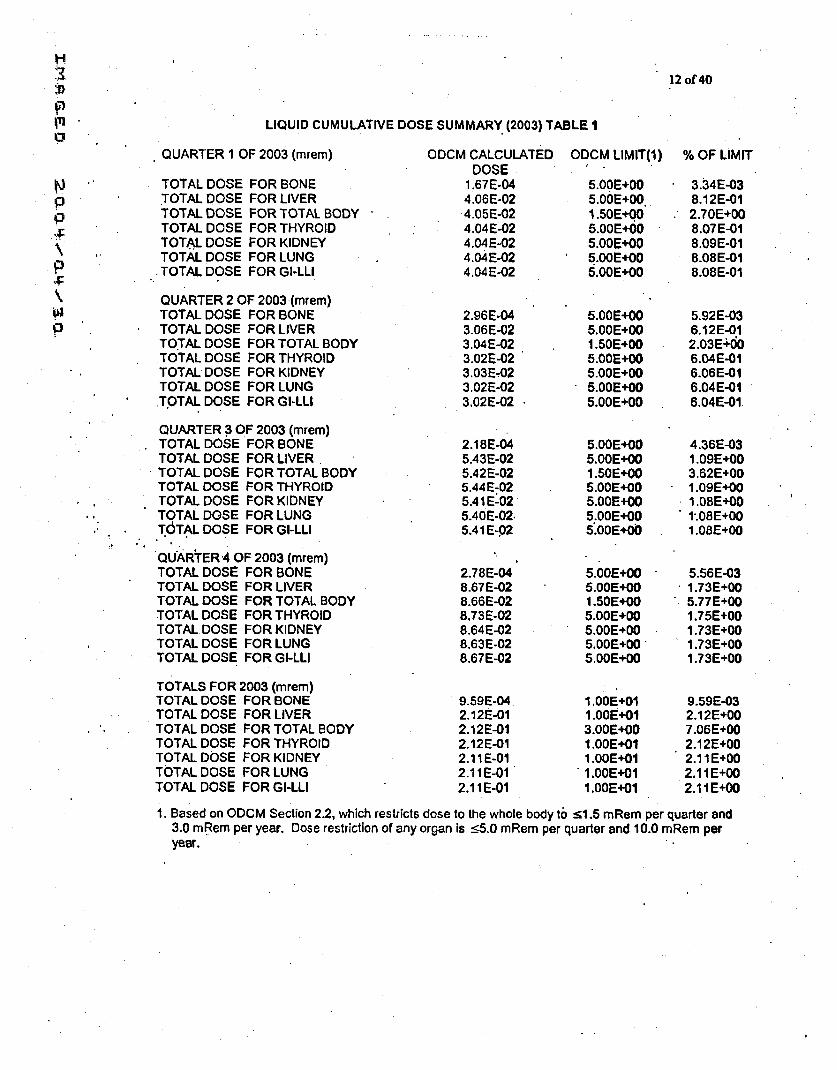
12 of 40
LIQUID CUMULATIVE DOSE SUMMARY (2003) TABLE I
QUARTER 1 OF 2003 (mrem)
P
P
TOTAL DOSETOTAL DOSETOTAL DOSETOTAL DOSETOTAL DOSETOTAL DOSETOTAL DOSE
FOR BONEFOR LIVERFOR TOTAL BODYFOR THYROIDFOR KIDNEYFOR LUNGFOR GI-LLI
ODCM CALCULATEDDOSE
1.67E-044.06E-024.05E-024.04E-024.04E-024.04E-024.04E-02
2.96E-043.06E-023.04E-023.02E-023.03E-023.02E-023.02E-02
ODCM LIMIT(1)
5.OOE+DO5.06E+DOi .50E+OO5.00E+61)5.OOE+OO5.OOE+0O5.OOE+0O
5.00 E+OO5.OOE+D0I .50E+DO5.OOE+OO5.OOE+0O
*5.001E+005.00E+00
QUARTER 2 OF 2003 (mrem)TOTAL DOSE FOR BONETOTAL DOSE FOR LIVERTOTAL DOSE FOR TOTAL BODYTOTAL DOSE FOR THYROIDTOTAL DOSE FOR KIDNEYTOTAL DOSE FOR LUNGTOTAL DOSE FOR GI-LLI
QUARTER 3 OF 2003 (mrem)TOTAL DOSE FOR BONETOTAL DOSE FOR LIVERTOTAL DOSE FOR TOTAL BODYTOTAL DOSE FOR THYROIDTOTAL DOSE FOR KIDNEYTOTAL DOSE FOR LUNGT6TAL DOSE FOR GI-LLI
QUARtER.4 OF 2003 (mrem)TOTAL DOSE FOR BONETOTAL DOSE FOR LIVERTOTAL DOSE FOR TOTAL BODYTOTAL DOSE FOR THYROIDTOTAL DOSE FOR KIDNEYTOTAL DOSE FOR LUNGTOTAL DOSE FOR GI-LLI
TOTALS FOR 2003 (mrem)TOTAL DOSE FOR BONETOTAL DOSE FOR LIVERTOTAL DOSE FOR TOTAL BODYTOTAL DOSE FOR THYROIDTOTAL DOSE FOR KIDNEYTOTAL DOSE FOR LUNGTOTAL DOSE FOR GI-LLI
2.18E-045.43E-025.42E-025.44E-025.41E-025.40E-02.5.41 E-02
2.78E-048.67E-028.66E-028.73E-028.64E-028.63E-028.67E-02
9.59E-042.12E-012.12E-012.12E-012.11 E-012.11E-012.11E-01
5.OOE+OO
1 .50E+005.00E4-005.001E+005 OOE+005.00E+06
5.0OE+005.OOE+0O11.50E+005.OOE+0O5.00E+005.OOE+0O,5.00E+00
1 .OOE+0II .OOE+013.OOE+OO1 .0OE+011 .00E+011 .O0E+01I .0OE+01
% OF LIMIT
3.34E-038.12E-012.7OE+008.07E-018.09E-018.08E-018.08E-01
5.92E-036.12E-012.03E-OI-6.04E-016.06E-016.04E-016.04E-01
4.36E-031.09E+003.62E+001.09E+001.0BE+00t1.08E+001.08E+00
5.56E-031.73E+00
"•5.77E+00
1.75E+001.73E+001.73E+001.73E+00
9.59E-032.12E+007.06E+002.12E+002.11 E+002.11 E+002.11E+00
1. Based on ODCM Section 2.2, which restricts dose to the whole body to :10.5 mRem per quarter and
3.0 mRem per year. Dose restriction of any organ is _<5.0 mRem per quarter and 10.0 mRem per
year.
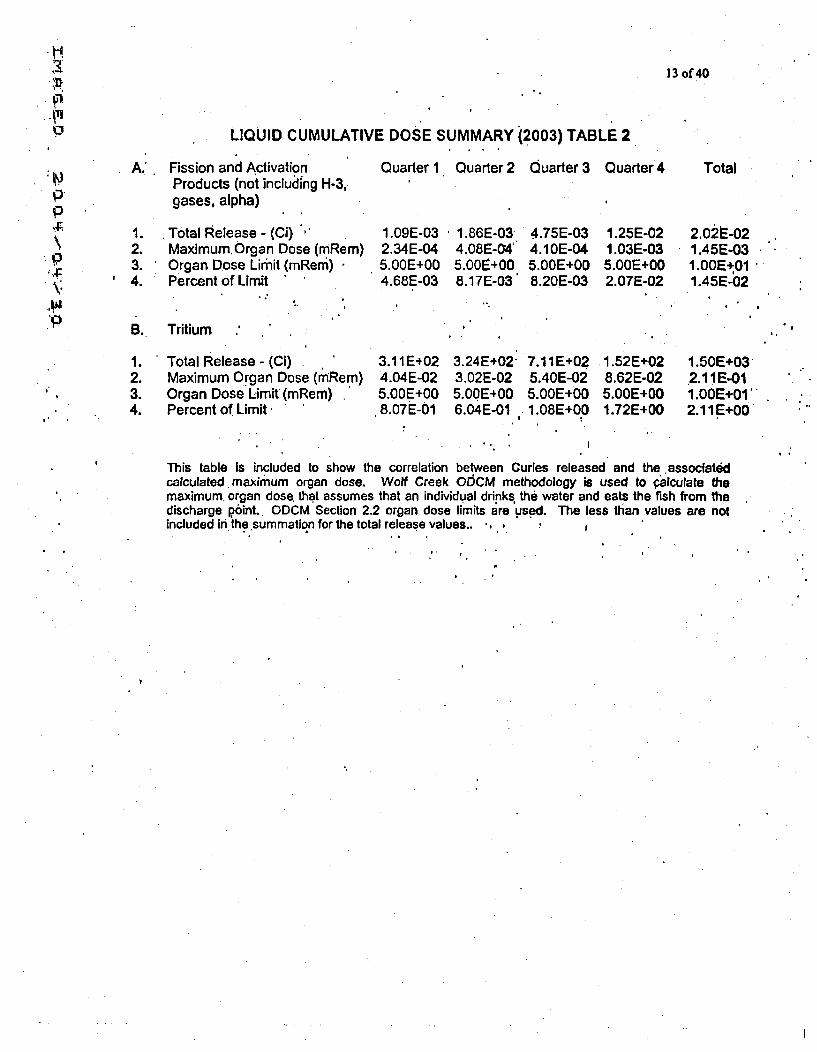
'3)
pp'4;
.9
13 of 40
LIQUID CUMULATIVE DOSE SUMMARY (2003) TABLE 2
A. Fission and ActivationProducts (not including H-3,gases, alpha)
Total Release - (Ci)Maximum, Organ Dose (mRem)Organ Dose Limit (mRemr) •Percent of Limit
Quarter 1 Quarter2 Quarter 3 Quarter4
1.2.3.4.
B.
1.2.3.4.
1.09E-032.34E-045.OOE+004.68E-03
*1.86E-03-4 .OBE-04'5.005+008.17E-03
4.75E-034.1IOE-045.OOE+0O8.20E-03
1.25E-021.03E-035.OOE+0O2.07E-02
Total
2.02.-021.45E-031.00E+011.45E-02
Tritium
Total Release - (Ci)Maximum Organ Dose (rnRem)Organ Dose Limit (mRem)Percent of Limit.
3.11E+024.04E-025.OOE+00
.8.07E-01
3.24E+02-3.02E-025.OQE+006.04E-01
7.I11E+025.40E-025.OOE+001.08E+O0!
1.52E+028.62E-025.OOE+001.72E+00
1 .50E+03.2.11IE-01I .OOE+0I2.11 E+i00
This table Is included to show the correlation between Curies released and the .associatedcalculated maximum organ dose. Wolf Creek 06CM methodology is used to calculate themaximum, organ dose. that assumes that an individual drinks the water and eats the fish from thedischarge point. ODCM Section 2.2 organ dose limits are used. The less than values are notincluded in the summation for the total release values.. ,
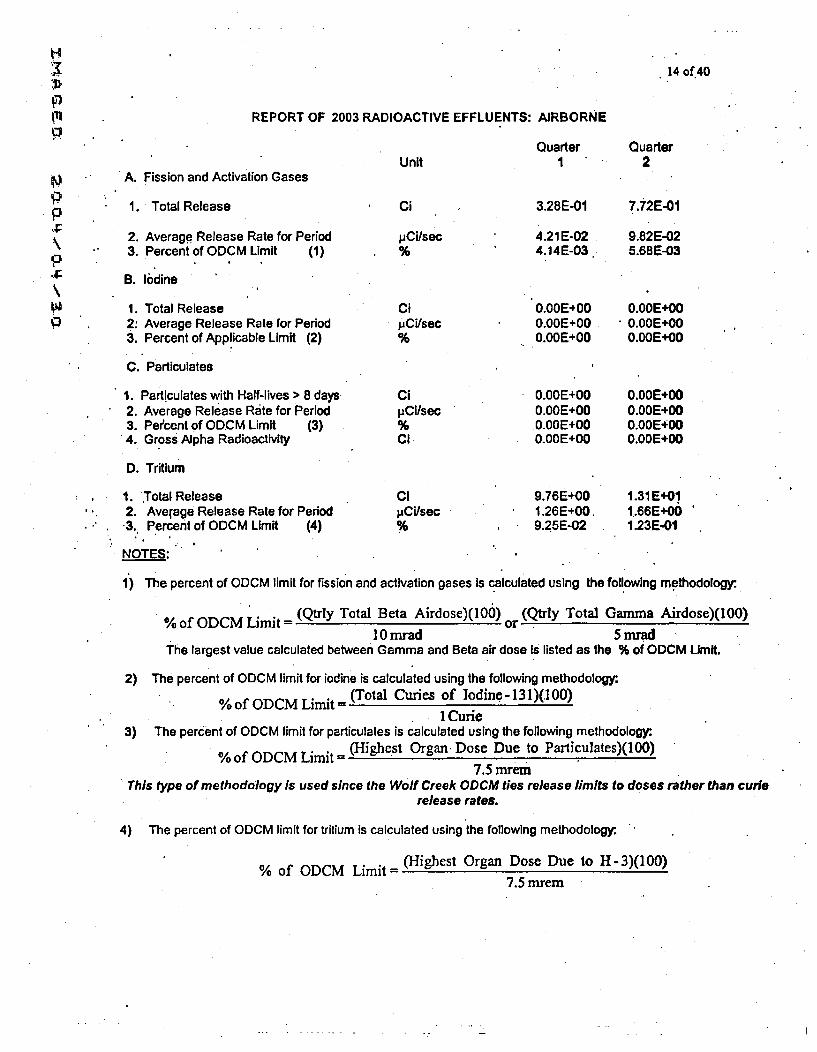
14 of 40
. REPORT OF 2003 RADIOACTIVE EFFLUENTS: AIRBORNE
Quarter QuarterUnit 1 2
A. Fission and Activation Gases
1. Total Release Ci 3.28E-01 7.72E-01
2. Average Release Rate for Period pCi/sec 4.21 E-02 9.82E-023. Percent of ODCM Limit (1) % 4.14E-03. 5.68E-03,0B. Iodine
1. Total Release Cl O.OOE.00 0.OOE+O0P3 . 2: Average Release Rate for Period pCi/sec 0.OOE+00 0.00E+00
3. Percent of Applicable Limit (2) % 0.OOE+00 O.OOE+00
C. Particulates
1. Particulates with Half-lives > 8 days Ci O.OOE+00 0.OOE+002. Average Release Rate for Period pCi/sec 0.OOE+00 0.OOE+003. Percent of ODCM Limit (3) % 0.0E+0 0.00E+0O04. Gross Alpha Radioactivity Cl O.OOE+00 0.OOE.00
D. Tritium
1. Total Release Cl 9.76E+O0 1.31 E+01
2. Average Release Rate for Period PCi/sec 1.26E+00. 1..66E+0O•3. Percent of ODCM Limit (4) % 9.25E-02 1.23E-01
NOTES:
1) The percent of ODCM limit for fission and activation gases Is calculated using the following methodology:.
% of ODCM Limit (Qtrly Total Beta Airdose)(100) or (Qtrly Total Gamma Airdose)(100)10 mrad 5mrad
The largest value calculated between Gamma and Beta air dose is listed as the % of ODCM Limit.
2) The percent of ODCM limit for iodine is calculated using the following methodology:S % of ODCM Limit - (Total Curies of Iodine - 131)(100)
I Curie3) The percent of ODCM limit for particulates is calculated using the following methodology:.
% of ODCM Limit - (Highest Organ Dose Due to Particulates)(100)
7.5 mremThis type of methodology Is used since the Wolf Creek ODCM ties release limits to doses rather than curie
release rates.
4) The percent of ODCM limit for tritium is calculated using the following methodology.
% of ODCM Limit= (Highest Organ Dose Due to H-3)(100)7.5 mrem
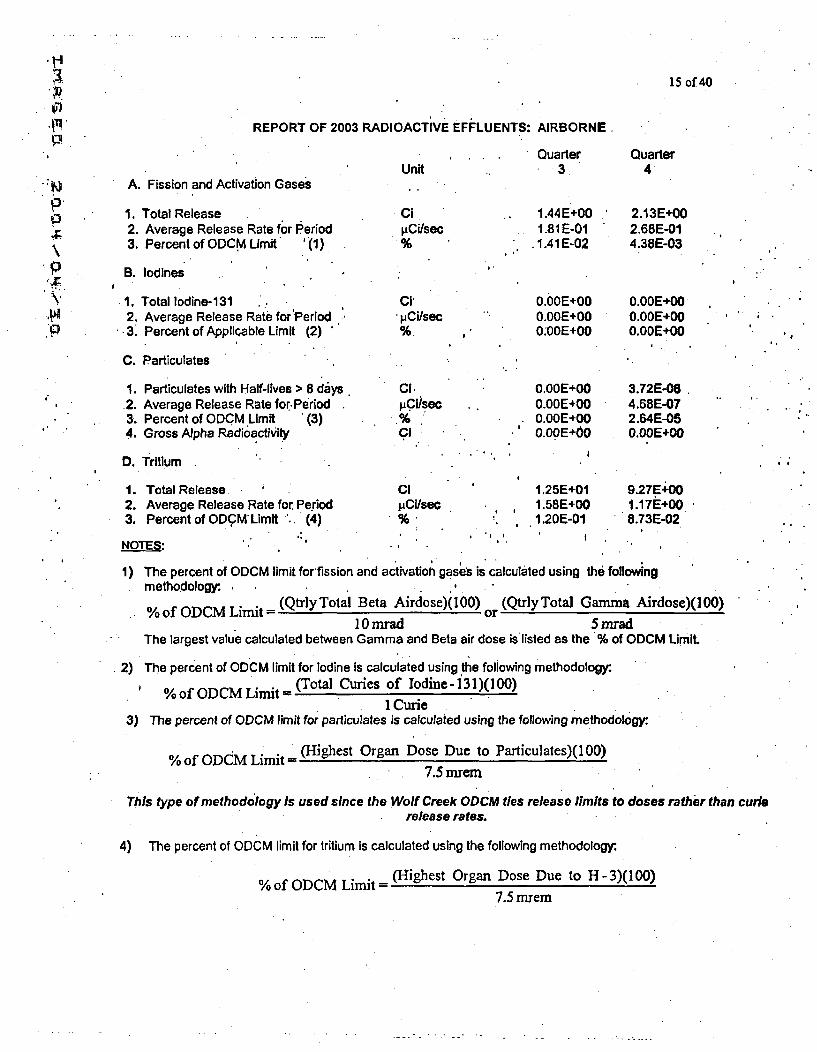
P,'P
pxQ
15 of 40
REPORT OF 2003 RADIOACTIVE EFFLUENTS: AIRBORNE
A. Fission and Activation Gases
1. Total Release2. Average Release Rate for Period3. Percent of ODCM Limit '.()
B. lodines
1. Total Iodine-1312. Average Release Rate for;Period
.•3. Percent of Applicable Limit (2)
C. Particulates
1. Particulates with Half-lives > 8 days.2. Average Release Rate for Period3. Percent of ODCM Limit '(3)4. Gross Alpha Radioactivily
D. Tritium
1. Total Release2. Average Release Rate for. Period3. Percent of ODCM Limit .. (4)
NOTES:
Unit
CipCi/sec
CilpCi/sec
Ci.
PCI/sec
Cl
.. Quarter3
1.44E+001.81 E-01. 1.41E-02
0.OOE+O0O.OOE+00SO.OOE+O0
0.OOE+O00.00E4000.OOE+O00.OOE+60
Quarter4+
2.13E+002.68E-014.38E-03
0.001E+000.0012÷00O.OOE+00
3.72E-0.4.68E-072.64E-050.60E+O0
ClpCi/seC
1.25E+011.58E+00
i 1.20E-01
9.27E-O01.17E+008.73E-02
1) The percent of ODCM limit forfission and activatioh gases is calculated using th efollowingmethodology:. ,
O/0 A OrhCM Timit (QtrlyTotal Beta Airdose)(100) nr (QtrlyTotal Gamma Airdose)(100)10 mrad 5 mrad
The largest value calculated between Gamma and Beta air dose is'listed as the % of ODCM LimiL
2) The percent of ODCM limit for Iodine Is calculated using the following methodology:.%of ODCM .Limit= (Total .Curies of Iodine-131)(100)
1 Curie3) The percent of ODCM limit for particulates is calculated using the following methodology:.
% of ODCM Limit= (Highest Organ Dose Due to Particulates)(100)7.5 mrem
This type of methodology Is used since the Wolf Creek ODCM ties release limits to doses rather than cuderelease rates.
4) The percent of 00CM limit for tritium is calculated using the following methodology:.
% of ODCM Limit = (Highest Organ Dose Due to H-3)(100)7.5 nuem
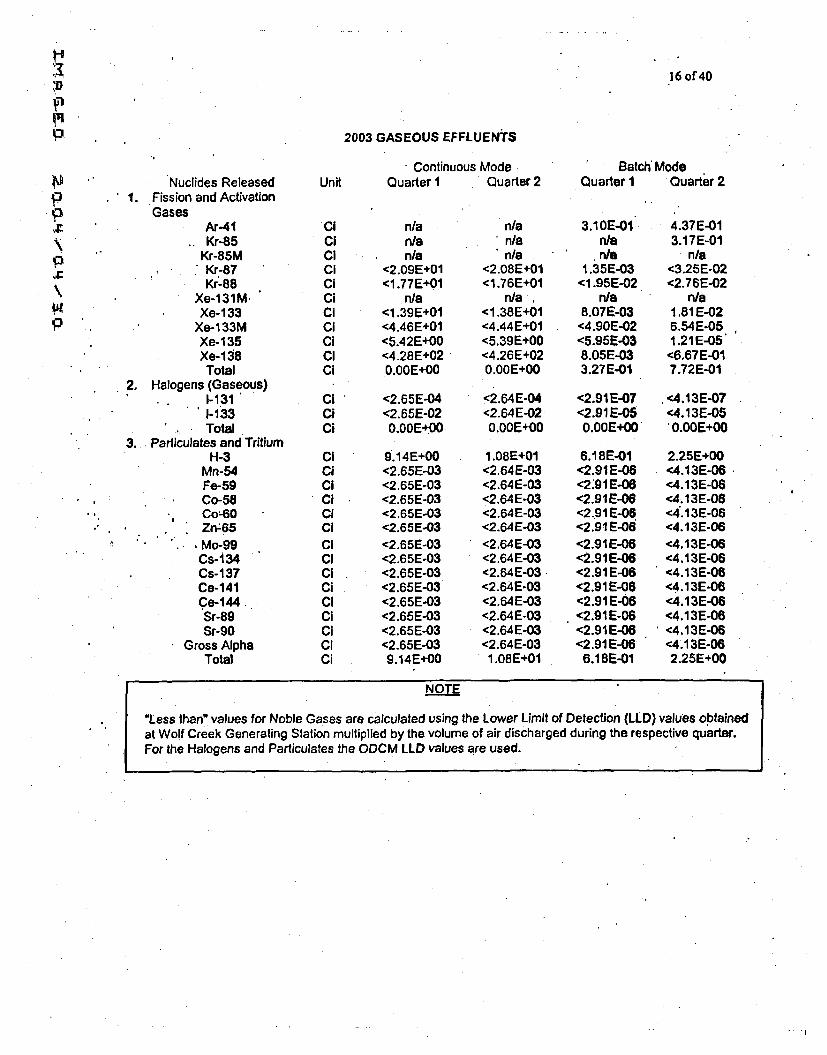
IID0
16 of 40
2003 GASEOUS EFFLUENTS
. Continuous Mode Batch ModeQuarter I Quarter 2Nuclides Released
1. Fission and ActivationGases
Ar-41Kr-85
Kr-85M* "Kr-87
Kr-88Xe-131M,Xe-133
Xe-1 33MXe-135Xe-138Total
2. Halogens (Gaseous)1-1311-133Total
3. Particulates and TritiumH-3
Mn-54Fe-59
, Co-58CoL-60Zn-A65
Unit
ClCiCiCiCiCiCiClCiClCi
CiCiCi
CiCiCiCiCiCiCiClCiCiClCiCiClCi
Quarter I
n/an/an/a
<2.09E+01<1.77E+01
n/a<1.39E+01<4.46E+01<5.42E+00<4.28E+020.00E+00
<2.65E-04<2.65E-02O.00E+00
9.14E+00<2.65E-03<2.65E-03<2.65E-03<2.65E-03<2.65E-03<2.65E-03<2.65E-03<2.65E-03<2.65E-03<2.65E-03<2.65E-03<2.65E-03<2.65E-039.14E+00
Quarter 2
n/an/an/a
<2.08E+01<1.76E+01
n/a ,<1.38E+01<4.44E+01<5.39E+00<4.26E+020.OOE+00
<2.64E-04<2.64E-020.OOE+00
1.08E+01<2.64E-03<2.64E-03<2.64E-03<2.64E-03<2.64E-03<2.64E-03<2.64E-03<2.64E-03<2.64E-03<2.64E-03<2.64E-03<2.64E-03<2.64E-031.08E+01
3.1OE-01n/an/a
1.35E-03<1.95E-02
n/a8.07E-03
<4.90E-;02<5.95E-038.05E-033.27E-01
<2.91 E-07<2.91 E-050.OOE+00
6.18E-01<2.91E-06<2.'91 E-06<2.91E-06<2.91 E-06<2.9.1 E-08<2.91 E-06<2.91 E-06<2.91 E-06<2.91 E-06<2.91 E-06<2.91 E-06<2.91 E-06<2.91 E-066.18E-01
4.37E-013.17E-01
n/a<3.25E-02<2.76E-02
n/a1.81 E-026.54E-051.21E-05
<6.67E-017.72E-01
* <4.13E-07<4.13E-05* 0.00E+00
2.25E+00<4.13E-06<4.13E-06<4.13E-08<4.13E-06<4.13E-06<4.13E-06<4.13E-06<4.13E-06<4.13E-06<4.13E-06<4.13E-06<4.13E-06<4.13E-062.25E+00
" Mo-99Cs-i34Cs- 137Ce-141Ce-144Sr-89Sr-90
Gross AlphaTotal
NOTE
"Less than* values for Noble Gases are calculated using the Lower Limit of Detection (LLD) values obtainedat Wolf Creek Generating Station multiplied by the volume of air discharged during the respective quarter.For the Halogens and Particulates the ODCM LLD values are used.
. . .I
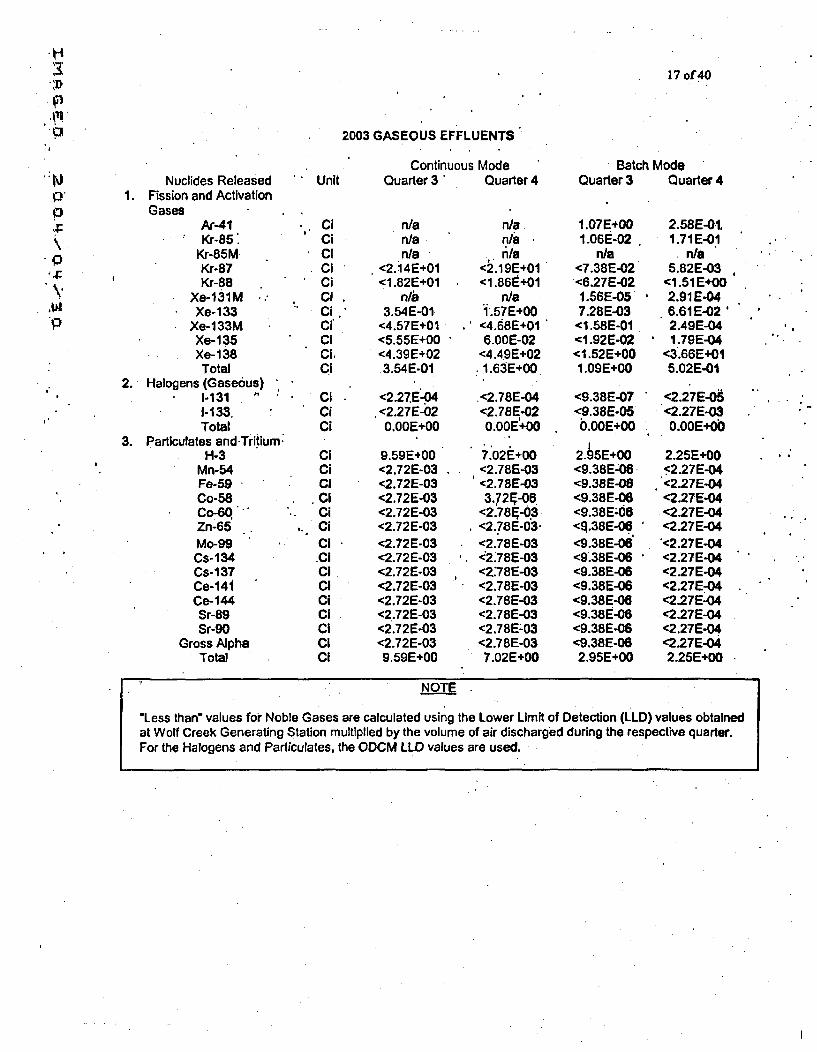
i-I
,~'I1.
0p4:
P
17 of 40
2003 GASEOUS EFFLUENTS"
Continuous Mode Batch ModeQuarter 3 Quarter 4Nuclides Released Unit
1. Fission and ActivationGases
Ar-41 CiKr-85' Ci
Kr-85M CiKr-87 CiKr-88 Ci
Xe-131M .." ClXe-133 Ci
Xe-133M Ci,Xe-135 CiXe-138 Ci,Total Ci
2. Halogens (Gaseous)1-131 Ci1-133. CiTotal Ci
3. Particulates and Triiium:H-3 Ci
Mn-54 CiFe-59 ClCo-58. CiCo-60 " CiZn-65 . . CiMo-99 ClCs-134 ClCs-137 CiCe-141 CiCe-144 CiSr-89 CiSr-90 Cl
Gross Alpha Ci. Total Ci
Quarter 3'
n/an/an/a
<2.14E+01<1.82E+01
3.54E-01<4.57E+01<5.55E+00<4.39E+023.54E-01
<2.27E-04<2.27E-020.OOE+00
9.59E+00<2.72E-03<2.72E-03<2.72E-03<2.72E-03<2.72E-03<2.72E-03<2.72E-03<2.72E-03<2.72E-03<2.72E-03<2.72E-03<2.72E-03<2.72E-039.59E+00
Quarter 4
n/an/arnla
<2.19E+01<1.861t+01
n/a1-.57E.00<4.68E+016.OOE-02
<4.49E+021 ! .63E+00
.<2.78E-04<2.78E-020.006+00
7.02E+00<2.78E-03<2.78E-033.724-06
<2.78E-03<2.78E-03,<2.78E-03, 2.78E-03<2:78E-03<2.78E-03<2.78E-03<2.78E-03<2.78E-03<2.78E-037.02E+00
1.07E+001.06t-02
n/a<7.38E-02<6.27E-021.56E-057.28E-03
<1.58E-01<1.92E-02<1.52E+001.09E+00
<9.38E-07<9.38E-050.00E+00
2.95E+00<9.38&-06<9.38E-08<9.38E-06<9.38E-&6<Q.38E-06<9.38E-06<9,38E-06<9.38E-06<9.38E-06<9.38E-06<9.38E-08<9.38E-06<9.38E-062.95E+00
2.58E-01.1.71 E-01.n/a
5.82E-03<1.51 E+002.91 E-046.61E-022.49E-041.79E-04
<3.66E+015.02E-01
<2.27E-05<2.27E-030.00E-+O
2.25E+00-<2.27E-04<2.27E-04<2.27E-04<2.27E-04<2.27E-04<2.27E-04<2.27E-04<2.27E-04<2.27E-04<2.27E-04<2.27E-04<2.27E-04<2.27E-042.25E+00
I
NOTE
*Less than" values for Noble Gases are calculated using the Lower Limit of Detection (LLD) values obtainedat Wolf Creek Generating Station multiplied by the volume of air discharged during the respective quarter.For the Halogens and Particulates. the ODCM LLD values are used.
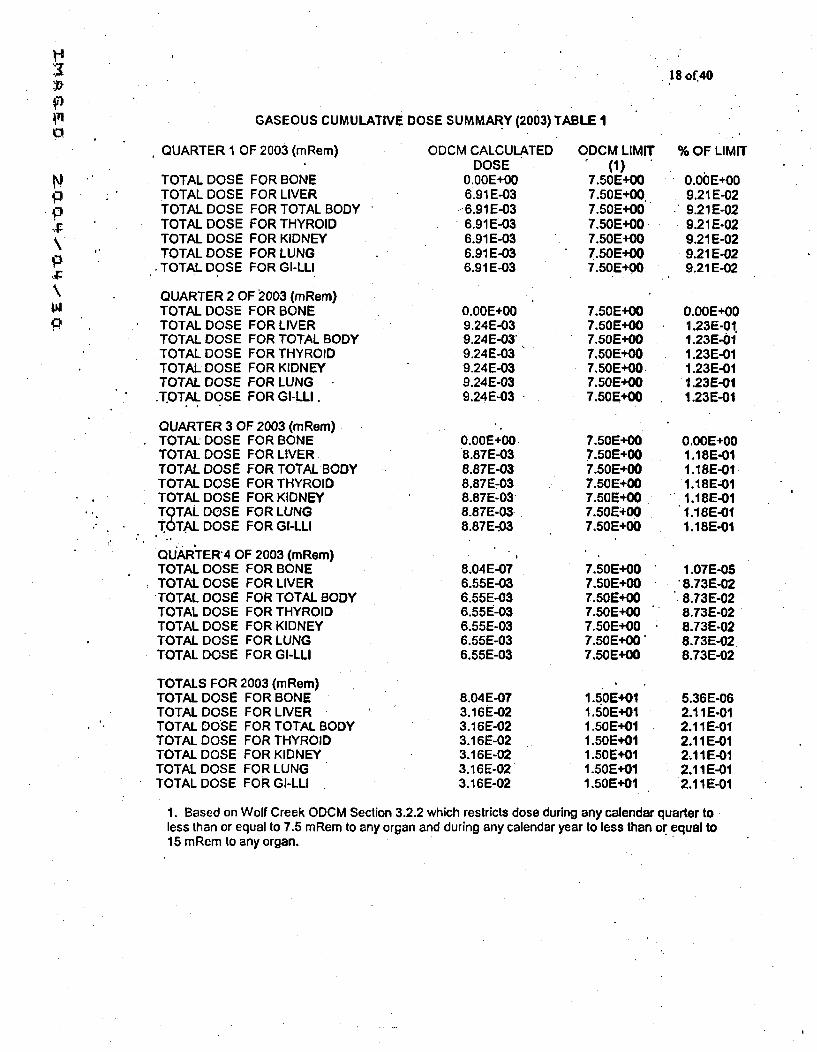
'-I3
'7)~1~
0
pp4:
p4:
wP
18 of.40
GASEOUS CUMULATIVE DOSE SUMMARY (2003) TABLE I
QUARTER I OF 2003 (mRem)
TOTAL DOSETOTAL DOSETOTAL DOSETOTAL DOSETOTAL DOSETOTAL DOSETOTAL DOSE
FOR BONEFOR LIVERFOR TOTAL BODYFOR THYROIDFOR KIDNEYFOR LUNGFOR GI-LLI
ODCM CALCULATEDDOSE
O.00E+006.91 E-036.91 E-036.91 E-036.91 E-036.91 E-036.91 E-03
0.OOE+009.24E-039.24E-03'9.24E-039.24E-039.24E-039.24E-03
QUARTER 2 OF 2003 (mRem)TOTAL DOSE FOR BONETOTAL DOSE FOR LIVERTOTAL DOSE FOR TOTAL BODYTOTAL DOSE FOR THYROIDTOTAL DOSE FOR KIDNEYTOTAL DOSE FOR LUNG
.TOTAL DOSE FOR GI-LLI.
QUARTER 3 OF 2003 (mRem)TOTAL DOSE FOR BONETOTAL DOSE FOR LIVERTOTAL DOSE FOR TOTAL BODYTOTAL DOSE FOR THYROIDTOTAL DOSE FOR KIDNEYTDTAL DOSE FOR LUNGTOTAL DOSE FOR GI-LLI
QUARTER4 OF 2003 (mRem)TOTAL DOSE FOR BONETOTAL DOSE FOR LIVERTOTAL DOSE FOR TOTAL BODYTOTAL DOSE FOR THYROIDTOTAL DOSE FOR KIDNEYTOTAL DOSE FOR LUNGTOTAL DOSE FOR GI-LLI
TOTALS FOR 2003 (mRem)TOTAL DOSE FOR BONETOTAL DOSE FOR LIVERTOTAL DOSE FOR TOTAL BODYTOTAL DOSE FOR THYROIDTOTAL DOSE FOR KIDNEYTOTAL.DOSE FOR LUNGTOTAL DOSE FOR GI-LLI
0.00E+008.87E-038.87E-038.87E7038.87E-038.87E-03.8.87E-03
8.04E-076.55E-036.55E-036.55E-036.55E-036.55E-036.55E-03
8.04E-073.16E-023.16E-023.16E-023.16E-023.16E-023.16E-02
ODCM LIMIT75(1)7.50E+007.50E+007.50E+007.50E+007.50E+007.50E+007.50E+00
7.50E+007.50E+007,50E+007.50E+007.50E+007.50E+007.50E+00
7.50E+007.50E+007.50E+007.50E+007.50E+007.50E+607.50E+00
7.50E+007.50E+007.50E+007.50E+007.50E+007.50E+007.50E+00
1.560E+011.50E+011.50E+011.50E+011.50E+011.50E+011 .50E+01
% OF LIMIT
O.OOE+009.21 E-029.21E-029.21 E-029.21 E-029.21 E-029.21 E-02
O.OOE+001.23E-011.23E-011.23E-011.23E-011.23E-011.23E-01
0.OOE+001.18E-011.18E-011.18E•1I1,18E-01
S1.18E-011.18E-01
1.07E-05* 8.73E-028.73E-028.73E-028.73E-028.73E-028.73E-02
5.36E-062.11 E-012.11E-012411 E-012A11E-012.11E-012.11 E-01
1. Based on Wolf Creek ODCM Section 3.2.2 which restricts dose during any calendar quarter toless than or equal to 7.5 mRem to any organ and during any calendar year to less than or equal to15 mRem to any organ.
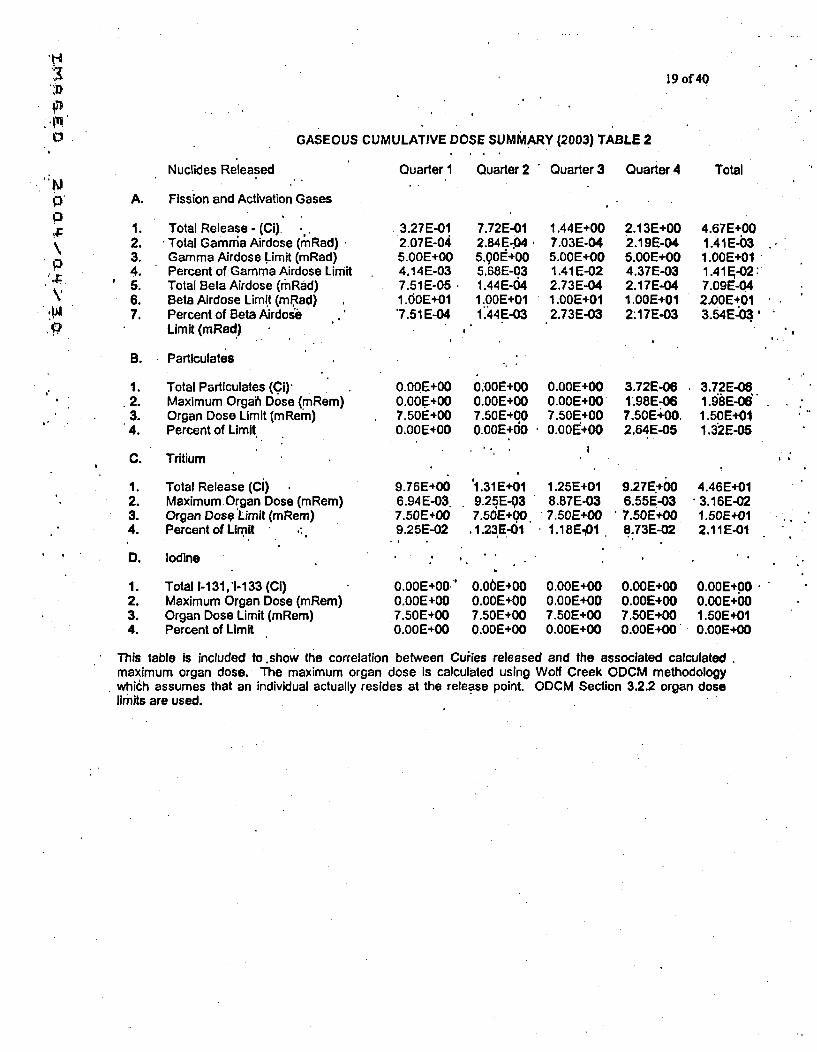
*131
p0
pp
19 of 40
GASEOUS CUMULATIVE DOSE SUMMARY (2003) TABLE 2
Nuclides Released Quarter 1 Quarter 2 ' Quarter 3
A. Fission and Activation Gases
1.2.3.4.5.6.7.
Total Release - (Ci).Total Gamnia Airdose (mnRad)Gamma Airdose Limit (mRad)Percent of Gamma Airdose LimitTotal Beta Airdose (MrRad)Beta Airdose Limit (mlad)Percent of Beta AirdoseLimit (mRad)
3.27E-012.07E-045.OOE+004.14 E-037.51 E-05•1.OOE+01"7.51E-04
7.72E-012.84E-.045.90E+005.68E-031.44E-641.00E+011.44E-03
1.44E+007.03E-045.OOE+0O1.41 E-022.73E-041.OOE+012.73E-03
Quarter 4
2.13E+002.19E-045.OOE+004.37E-032.17E-041.00E+012.17E-03
Total
4.67E+001.41E-031.00E+011.41 E-02:7.09E-042.00E+013.54E-b03
B. Particulates
1.2.3.4.
Total Particulates (Ci)-Maximum Orgah Dose (tmRem)Organ Dose Limit (mRem)Percent of Limit
C. Tritium
1.2.3.4.
D.
1.2.3.4.
Total Release (Ci)Maximum Organ Dose (mRem)Organ Dosq Limit (mRem)Percent of Limit - ,
O.OQE+00O.OOE+O07.50L+00O.00E+O0
9.76E+006.94 E-03.7.50 E+009.25E-02
0.0OE+00.0.00E4007.50E+000.OOE+00
O.'OOE+00O.012+O007 .50E+000.00E+60
Iodine
0.00E+000.00E+007.50E+00O.OOEf+00
'1.31 E+019.25E-937.50E+00.1.23E-01
0.00E+000.OOE+0O7.50E+000.00E+00
1.25E+018.87E-037.50E+001.18E101
0.00E+00o.00E+007.50E+000.OOE+00
3.72E-061.98E-067.50E+00.2.64E-05
9.27E.+006.55E-037.50E+008.73E-02
0.00E+000.00E+007.50E+000.00E+00
4.46E+013.16E-021.50E+012.11E-01
* 3.72E-081.98E-06"1.50E+011.3'2E-05
Total 1-131,'1-133 (CI)Maximum Organ Dose (mRem)Organ Dose Limit (mRem)Percent of Limit
0.00E+000.00E+001.50E+010.00E+00
This table Is included to .show the correlation between Curies released and the associated calculatedmaximum organ dose. The maximum organ dose is calculated using Wolf Creek ODCM methodologywhich assumes that an individual actually resides at the release point. ODCM Section 3.2.2 organ doselimits are used.
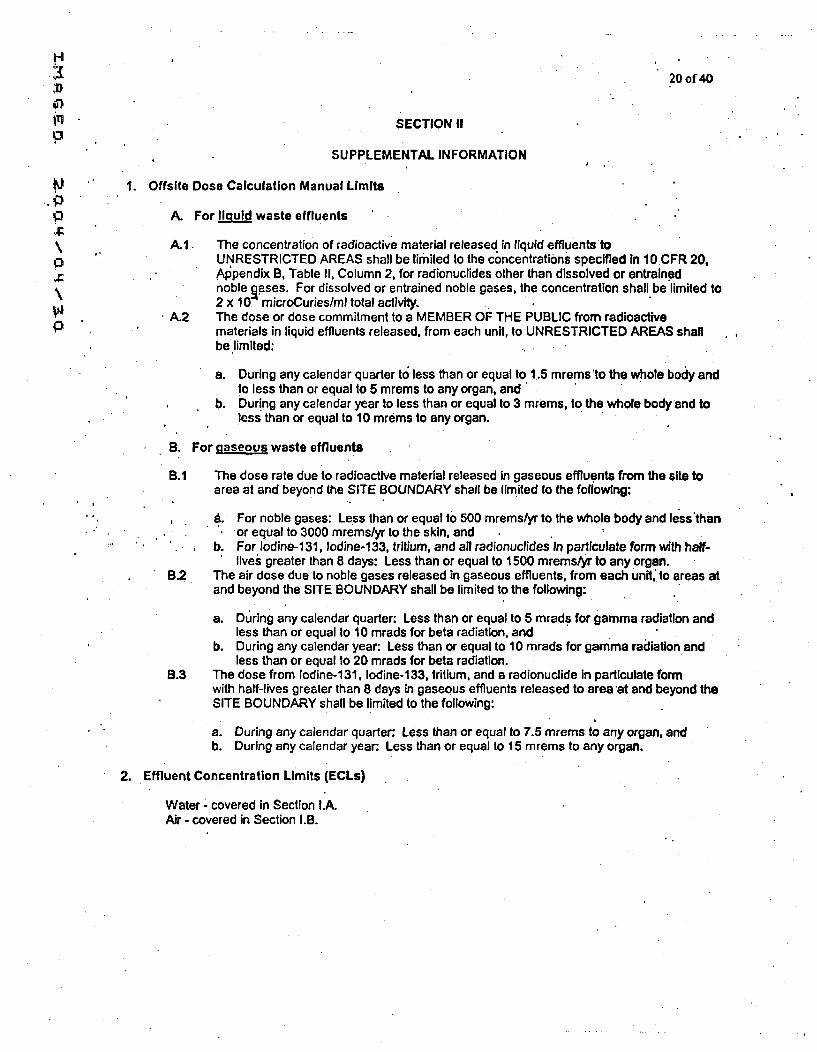
H3 20 of 40
SECTION IIpSUPPLEMENTAL INFORMATION
1. Offsite Dose Calculation Manual Limits
A. For i9ud waste effluents
A.1. The concentration of radioactive material released in liquid effluents toUNRESTRICTED AREAS shall be limited to the concentrations specified In 10 CFR 20,
. Appendix B, Table 11, Column 2, for radionuclides other than dissolved or entrainednoble Rases. For dissolved or entrained noble gases, the concentration shall be limited to
A.2 2 x 10 microCuries/ml total activity.•A.2 The dose or dose commitment to a MEMBER OF THE PUBLIC from radioactive
P materials in liquid effluents released, from each unit, to UNRESTRICTED AREAS shallbe limited:
a. During any calendar quarter to less than or equal to 1.5 mrems 'to the whole body andto less than or equal to 5 mrems to any organ, and
b. During any calendar year to less than or equal to 3 mrems, to the whole body and toless than or equal to 10 mrems to any organ.
B. For gaseous waste effluents
B.1 The dose rate due to radioactive material released in gaseous effluents from the site toarea at and beyond the SITE BOUNDARY shall be limited to the followfng:
, . For noble gases: Less than or equal to 500 mrems/yr to the whole body and less'than-or equal to 3000 mremslyr to the skin, and
*. ,b. For Iodine-131, Iodine-133, tritium, and all radionuclides in particulate form with half-livei greater than 8 days: Less than or equal to 1500 mrems/yr to any organ.
B.2 The air dose due to noble gases released in gaseous effluents, from each unit, to areas atand beyond the SITE BOUNDARY shall be limited to the following:
a. During any calendar quarter: Less than or equal to 5 mrads for gamma radiation andless than or equal to 10 mrads for beta radiation, and
b. During any calendar year: Less than or equal to 10 mrads for gamma radiation andless than or equal to 20 mrads for beta radiation.
B.3 The dose from Iodine-131, Iodine-133, tritium, and a radionuclide in particulate formwith half-lives greater than 8 days in gaseous effluents released to area at and beyond theSITE BOUNDARY shall be limited to the following:
a. During any calendar quarter: Less than or equal to 7.5 mrems to any organ, and
b. During any calendar year: Less than or equal to 15 mrems to any organ.
2. Effluent Concentration Limits (ECLs)
Water - covered in Section I.A.Air - covered in Section I.B.
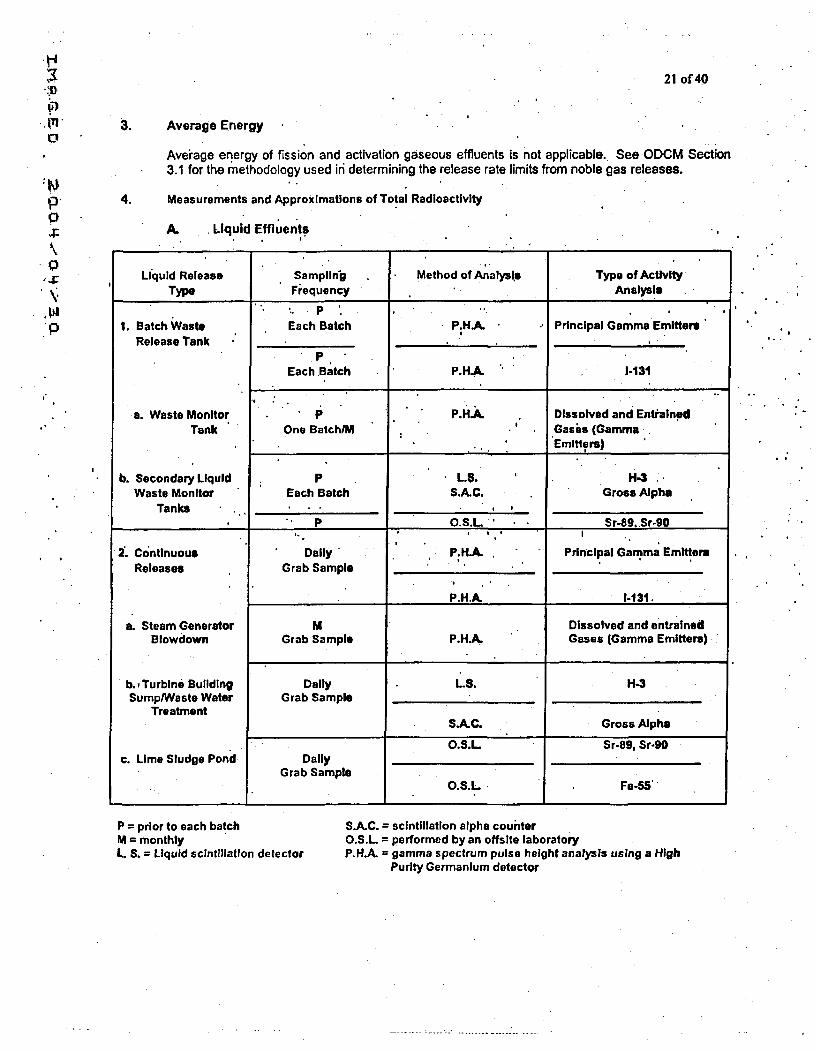
I~)* ~1i.0
p.04:
*0
3)1p
21 of 40
3. Average Energy
Average energy of fission and activation gaseous effluents is not applicable. See ODCM Section3.1 for the methodology used iri determining the release rate limits from noble gas releases.
4. Measurements and Approximations of Total Radioactivity
A. Liquid Effluents
Liquid Release Sampling Method of Analysis Type of ActivityType Frequency __Analysis
P*1. Batch Waste Each Batch P.HJA Principal Gamma Emitters
Release Tank
Each Batch P.H.A. 1-131
a. Waste Monitor P P.H•• Dissolved and Entaln.edTank One Batch/M :Gass (Gamma
Emitters)
b. Secondary Liquid P L.$. H-3Waste Monitor Each Batch S.A.C. Gross Alpha
Tanks .. _ _._• , ,P O.S.L' Sr-89,.Sr-90
S.i I
2. Continuous Daily - P.H.A. Principal Gamma EmittersReleases Grab Sample
P.H.A. 1-13t.
a. Steam Generator M Dissolved and entrainedBlowdown Grab Sample P.H.A, Gases (Gamma Emitters)
b.i Turblne Building Daily . L.S. H-3SumplWaste Water Grab Sample
TreatmentS.A.C. Gross Alpha
O.S.L Sr-89, Sr-90c. Lime Sludge Pond Daily
Grab SampleO.S.L Fe-55
• I
P = prior to each batchM = monthlyL. S. = Liquid scintillation detector
S.A.C. = scintillation alpha counterO.S.L = performed by an offslte laboratoryP.H.A. = gamma spectrum pulse height analysis using a High
Purity Germanium detector
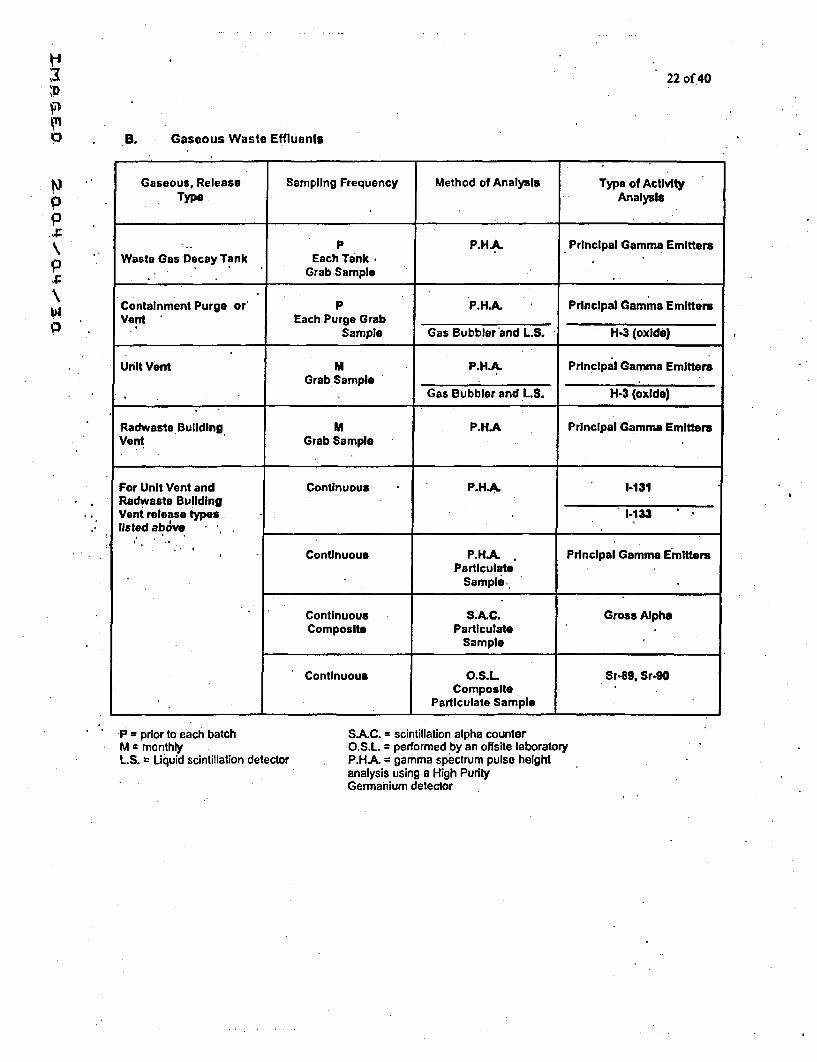
22 of 40
0 B. Gaseous Waste Effluents
Ip
P
Gaseous, Release Sampling Frequency Method of Analysis Type of ActivityType Analysis
. P P.HJ.A Principal Gamma EmittersWaste Gas Decay Tank Each Tank,
,, Grab Sample
Containment Purge or' P P.HJA Principal Gamma EmittersVent Each Purge Grab
Sample Gas Bubbler'and L.S. H-3 (oxide)
Unit Vent M P.HJ.A Principal Gamma EmittersGrab Sample
Gas Bubbler and L.S. H-3 (oxide)
Radwaste Building M P.HA Principal Gamma EmittersVent Grab Sample
For Unit Vent and Continuous P.H.A. 1-131Radwaste BuildingVent release types 1-133listed abvve ,__
Continuous P.H.A. Principal Gamma EmittersParticulate
Sample-.
Continuous S.A.C. Gross AlphaComposite Particulate
Sample
Continuous O.S.L Sr-89, Sr-90Composite
Particulate Sample
P = prior to each batchM monthlyL.S. = Liquid scintillation detector
SAC. = scintillation alpha counterOS.L. = performed by an offsite laboratoryP.HA = gamma spectrum pulse heightanalysis using a High PurityGermanium detector
23 of 40
.AIr 5. Batch Releases.
A batch release is the discontinuous release of gaseous or liquid effluents which takesplace over a finite period of time, usually hours or days.
There were 87 gaseous batch releases during the reporting period. The longest gaseous.o batch release lasted 9,795 minutes, while the shortest lasted 58 minutes. The average
release lasted 734 minutes with a total gaseous batch release time of 63,828 minutes.
, There we're 76'liquid batch .releases. during the reporting period. The longest liquid batchrelease lasted 382 minutes, while the shortest lasted 51 minutes. The average releaselasted 202 minutes with a total liquid batch release time of 15,350 minutes. ,
6. Continuous Releases
A contin'uous release is ,a release of gaseous or ..liquid effluent, which is essentiallyuninterrupted for extended periods during normal operation of the facility. Four. liquidrelease pathways Were designated as continuou's releases during this reporting -period:Steam Generator Blowdown, Turbine Building Sump, Waste Water Treatment, and LimeSludge Pond. Two gas release pathways were designated as continuous releases: UnitVent and Radwaste Building Vent.
7. Doses to a Member of the Public from Activities Inside the Site Boundary
Four activities by members of the public were considered in this evaluation: personnelmaking deliveries to the plant, workers at the Williarn Allen White Building located outsideof the restricted area, the use of the access road' sbuth 6f the Radwaste Building, andpublic use of the cooling lake during .times when fishing was allowed. 'The dose calculatedfor the maximum exposed individual for these four activities was as follows:
Plant Deliveries 3.41E-01 mRemWilliam Allen White Building Workers 7.86E-03 mRemAccess Road Users 3.49E-03 mRemLake Use 4.90E-02 mRem
The plant delivery calculations were based on'deliveries 3 hours per week for 50 weeksper year. The William Allen White Building occupancy was based on normal workinghours of 2000 per year. The usage factor. for the access road south of the RadwasteBuilding was 25 hours per year. The dose to fishermen on the lake was based upon 3528hours (12 hours a day for 294 days, based on the number of days that the lake was opento fisherman). Pathways used in the calculation were gaseous inhalation, submersion,and ground plane. All calculations were performed in accordance with the methodologyand parameters in the ODCM.
8. Additional InformationPIR 2003-0173 - On 1-29-03 the BOP Operator was taking log readings on the RM-11and noticed monitor GHRE-10A was in accident isolation mode so the monitor waspulling sample from room air rather than from the Radwaste Vent effluent stream. Themonitor was reset and flow was re-established through GHRE-10A. A review of the RM-11 showed that GHRE-10A went into the "purging" mode at 1-28-03/2129. I&Cpersonnel were performing STS SP-010B, Channel Operability Test, on GHRE-10B from1900 to -2300 on 1-28-03. The technicians were performing a database download on
24 of 40
I;)
•'1 GHRE-10B at a time when the detector counts were high. As part of the downloadingprocess the GHRE-10B software enables the detection circuitry. When the detectorcircuitry was enabled with existing high counts, the GHRE-10B signal was at a sufficientlevel to actuate the "alert" alarm. When GHRE-10B goes into "alert', GHRE-10A goes
* into "purge" mode. We did not have sampling as required by the ODCM Table 3-2 forP -6.5 hours when the sampling air was being pulled from room air.P
PIR 2003-0529 - The letter sent as a result of STS PE-003, Emergency Exhaust SystemFlow Rate and Combined Pressure Drop Test, contained incorrect flow rate data for the
P Coritainrrient Purge unit. It had a recorded value of 4627 cfm as opposed to the currentvalue of 4260 cfm. This incorrect flow rate was used in the low setpoint calculation forcontainment purge permit 2003030. The higher flow rate used In the calculation lent
* itself to a more conservative setpoint. The low setpoint used on the permit was 3.87E-050 uCi/cc based on 4627 cfm. The correct low setpoint would have been 4.23E-05 uCi/cc
using 4260 cfm.
PIR 2003-0848 - On 3-28-2003 during the channel calibration portion of STS IC-474B,Channel Calibration Unit Ventilation System Radiation Monitor GTRE21B, It was
dis&vered that the pump diaphragm had a hole in it. The last time a procedure wasperfoirmed that would have detected a hole in the pump diaphragm was 2-25-2003.Chemistry reads the flow from the local rotometer and this flow reading Is used in thecalculation that determines the total volume of sample that passed through the applicablefilter. The rotometer is on the discharge side of the pump and registers all flow passingthrough it, including any dilution air. It is unknown when the hole in the diaphragmP developed..
'PIR 2003-1882 - On June 23, 2003 following a VCT purge and hydrogen recombining to
GDT #3' it was noted that-the pressure in GDT #8 increased and the pressure in GDT #3decreased. The pressure in GDT #3 was 13 psig and the pressure In GDT #8 was 1.8psig at 0830/6-23-2003. Once the waste gas system was secured readings were takenon the eight gas decay tanks and monitored during the shift. The readings remainedstable and at 0600/6-24-2003 the reading was 11.4 psig on GDT #3 and 3.6 psig on GDT#8. It was determined that the waste gas compressor relief valve could have caused theincrease in GDT #8 and the decrease in GDT #3. Work Order 03-253665 was generatedto investigate a potential hardware failure of the waste gas compressor relief valve.Troubleshooting determined the moisture separator tank relief valve for "A" compressorwas intermittently leaking by based on gas decay tank pressure changes and the reliefvalve was changed.
PIR 2003-2580 - Containment Atmosphere filters were changed on GTRE31 andGTRE32 on 8-29-2003. The particulate filters were discolored with a "dirty tan' color. Agamma scan was performed on the particulate filter from GTRE-31 and there was noactivity detected. Filters discolored with rust or boric acid may be an indication of RCSleakage. The discoloration on the filters is not indicative of RCS leakage. The unittripped on 8-18-2003. On 8-23-2003 the unit reduced power to 80%. These eventscould have contributed to the color on the filters as well. The filters were sent to SherryLaboratories for iron and boron analysis so a baseline could be established. We are tocomplete 3 months of baseline sampling during routine operation and then performperiodic analysis to ensure the baseline hasn't changed. We didn't use the filters fromthe outage as a part of our baseline study so this PIR is still open. The conclusion will beincluded in the 2005 Annual Radioactive Effluent Report.
25 of 40
O PIR 2003-2805 On 9-22-2003 a chemistry technician 'found the sample isolation valveopen for Gas Decay Tank #3. This tank was last sampled 9-5-2003. Gas Decay Tank#8 was sampled following the sample for Gas Decay Tank #3 that was taken earlier inthe day. The sample for Gas Decay Tank #8 may not have been a representative
' sample since the isolation valve for Gas Decay Tank #3 was still open. TheP consequence of this' valve misalignment is a missed Technical Requirements Manual
, surveillance. Technical Surveillance Requirement 3.10.3.1 is "required once per 7 daysduring addition of radioactive material to the tank, AID once within 7 days following
Qaddition of radioactive material to the tank". Upon 6iscovery both WGDT #3 and #8 were. ' sampled, analyzed and the curie content for-each tank was determined. This missed
surveillance is .not :.reportable in the' form of a...Reportability Evaluation' Request 'orLicensee Event Report.
PPIR 2003-3555 - Gas Decay Tank Release permit 2603165 was issued with an incorrectlow setpoint. The low setpoint is calculated using AIF 07B-022-07, Skin Dose Rate, andAIF 07B-022-08, Whole Body Dose Rate. The lower of the two values calculated .is the
" . setpoint selected• .If the calculated low setpoint is greater than the RWV (RadwasteVent) low. setpoint, then the low setpoint on the GDT,. permit is set equal to the lowsetpoint on the RWV permit. If the calculated low setpoint is lower than the RWV lowsetpoint, than the calculated setpoint is used. The .clculated low setpoint was 7.97E+02pCi/sec. The low setpoint on the RWV permit was 8.83E+02 pCi/sec. The correct lowsetpoint to use .on the permit was 7.97E+02 pCi/sec, but 8.83E+02 pCi/sec was recordedon the permit. The'release was performed with a less conservative setpoint, but the lowsetpoint Was not compromised due to the built-in conSerVatism of the setpoint calculation.An expected monitor response is calculated which cpnsiders the rale of the release. Thecalculated monitor response is thendoubled and this'is the value that.is compared to thelow setpoint If the expected monitor response indicates the low. setpoint could beexceeded, then the expected monitor response cal.tulation is performed again using alower release rate to ensure the low setpoint is not breached. The expected monItorresponse on the permit was 7.81E+01 pCi/sec, and the monitor reading during therelease was 2.98E+01 pCi/sec.
PIR 2003-3591 - Containment Purge Permit 2003178 had an incorrect value for the highsetpoint for GTRE-22 and GTRE-33, Containment Air monitors. The setpoint on thepermit was recorded as 1.02E-02 pCi/cc and the setpoint should have been recorded as1.001E-02 pCi/cc. The use of the Incorrect setpoint was discovered after the releaseoccurred by the technician who retrieved the permit from the control room. Monitorsetpoints are used to ensure compliance with 10CFR20. The ESFAS actually controlsthe actuation of a containment purge isolation signal, therefore the radiation monitor, viathe ESFAS, would have terminated the purge prior to exceeding any 10 CFR dose limits.
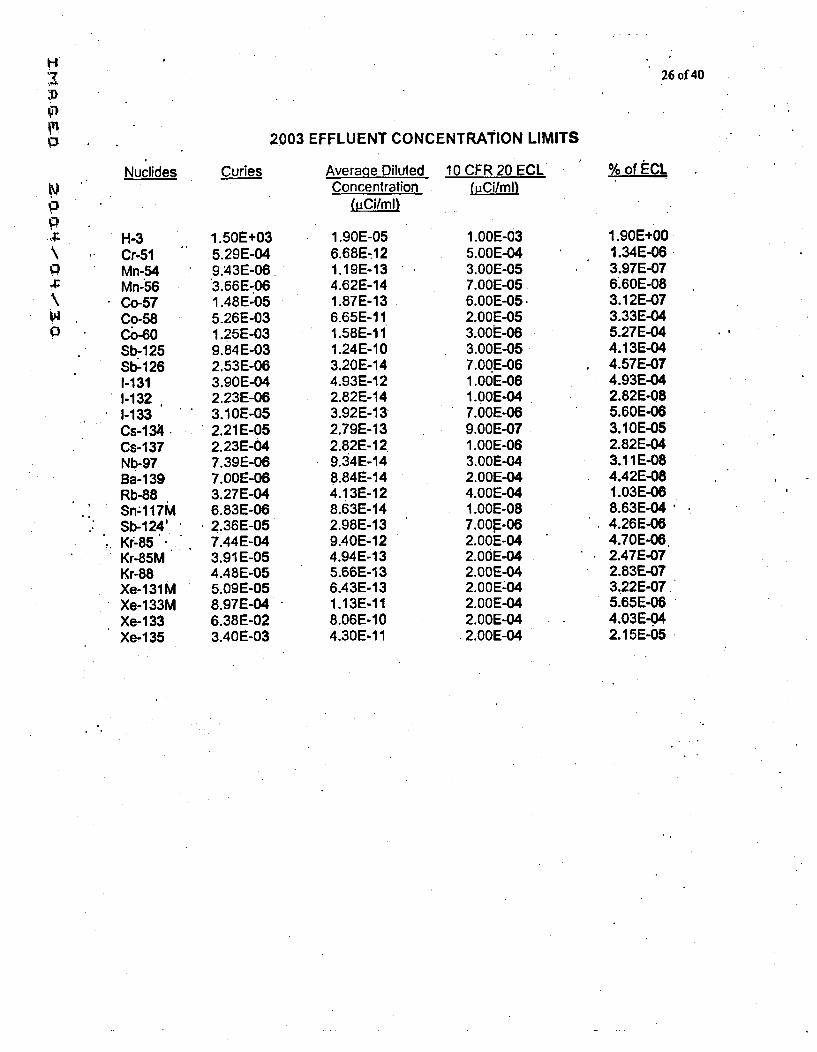
N'7'-4
p~1I
pp
p4:
0
26 of 40
2003 EFFLUENT CONCENTRATION LIMITS
Nuclides
H-3Cr-51Mn-54Mn-56Co-57Co-58Co-60Sb-125Sb-1261-1311-1321-133Cs-134Cs-137Nb-97Ba-139Rb-88Sn-117MSb-124'Kr-85Kr-85MKr-88Xe-131MXe-133MXe-1 33Xe-1 35
Curies
1.50E+035.29E-049.43E-063.66E-061.48E-055.26E-031.25E-039.84E-032.53E-063.90E-042.23E-063.1OE-052.21 E-052.23E-047.39E-067.OOE-063.27E-046.83E-062.36E-057.44E-043.91 E-054.48E-055.09E-058.97E-046.38E-023.40E-03
Average DilutedConcentration
1.90E-056.68E-1121.19E-134.62E-141.87E-136.65E-111.58E-1 11.24E-103.20E-144.93E-122.82E-143.92E-1 32.79E-132.82E-129.34E-148.84E-144.13E-128.63E-142.98E-1 39.40E-124.94E-1 35.66E-136.43E-131.13E-118.06E-1 04.30E-11
10 CFR 20 ECL(Pcilml)
1.OOE-035.OOE-043.00E-057.OOE-056.00E-05.2.00E-053.00E-063.OOE-057.OOE-061.OOE-061.00E-047.OOE-069.OOE-071.00E-063.OOE-042.OOE-044.00E-041.00E-087.00E-062.OOE-042.00E-042.00E-042.00E:042.00E-042.OOE-042.O0E-04
% of ECL
1.90E+001.34E-063.97E-076.60E-083.12E-073.33E-045.27E-044.13E-044.57E-074.93E-042.82E-Q85.60E-063.10E-052.82E-043.11E-084.42E-081.03E-068.63E-044.26E-064.70E-06.2.47E-072.83E-073.22E-075.65E-064.03E-042.15E-05
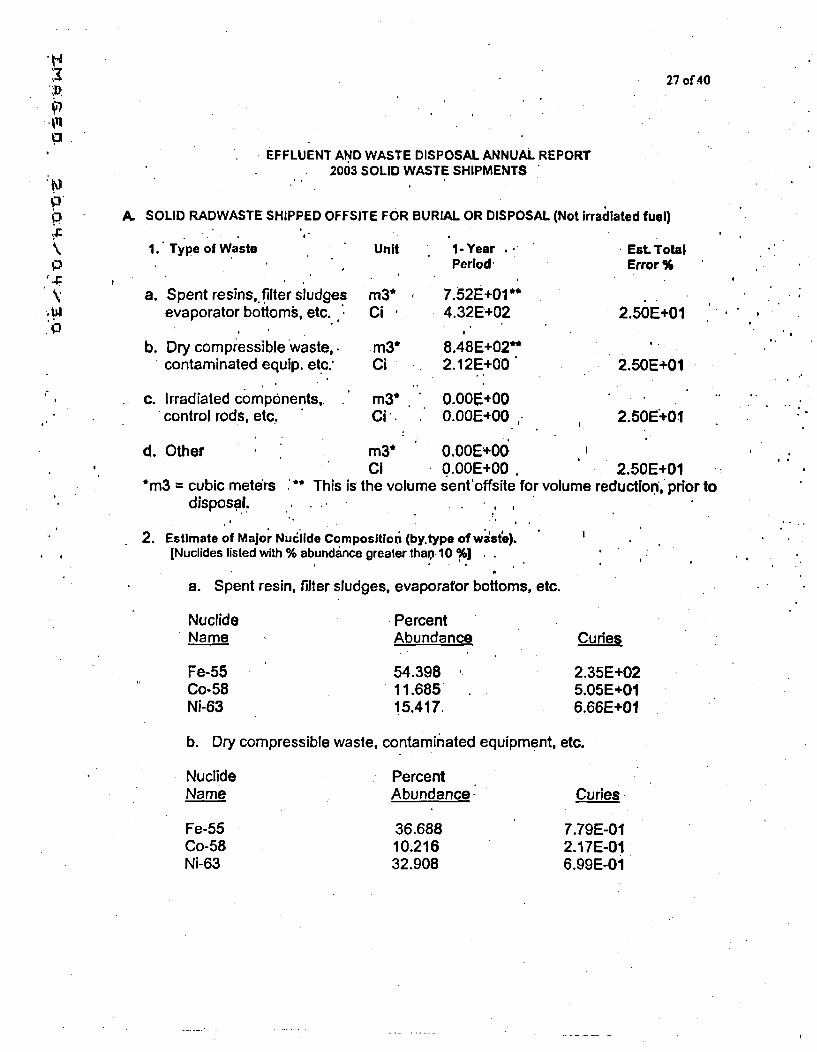
i-I27 of 40
0p
0I.;
.0
EFFLUENT AND WASTE DISPOSAL ANNUAL REPORT
2003 SOLID WASTE SHIPMENTS
A. SOLID RADWASTE SHIPPED OFFSITE FOR BURIAL OR DISPOSAL (Not irradiated fuel)
1., Type of Waste
a. Spent resins,.filter sludgesevaporator bottoms, etc.
b. Dry compressiblewaste,.contaminated equip. etc.
c. Irradiated components,.control rods, etc.
Unit 1-YearPeriod-
m3* 7.52E+01*Ci 4.32E+02
m3* 8.48E+02*Ci 2.12E+00
m3* O.OOE+00Ci. . O.OOE+00
•Est. TotalError %
2.50E+01
2.50E+01
2.50E+01
d. Other m3* O.OOE+00Ci O.OOE+00 , 2.50E+01
*m3 = cubic meters ** This is the volume sent'offsite for volume reductio n, prior todisposal. , .
2. Estimate of Major Nuciide Composition (by.type of waste).
[Nuclides listed with % abundance greater tharn 10 %]
a. Spent resin, filter sludges, evaporator bottoms, etc.
NuclideName
Fe-55Co-58Ni-63
PercentAbundance
54.39811.68515.417.
Curies
2.35E+025.05E+016.66E+01
b. Dry compressible waste, contaminated equipment, etc.
NuclideName
Fe-55Co-58Ni-63
PercentAbundance.
36.68810.21632.908
Curies
7.79E-012.17E-016.99E-01
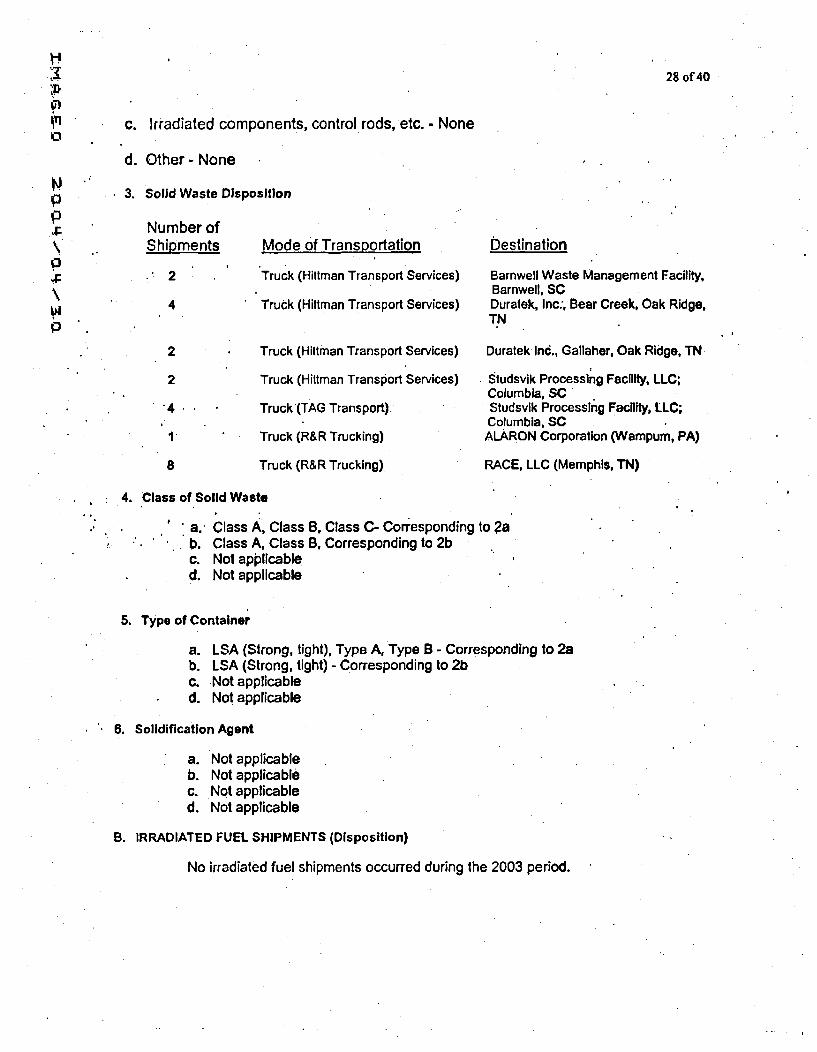
AT
28 of 40
c. Irradiated components, control rods, etc. - None
~3.pp
p
p.
d. Other- None
* 3. Solid Waste Dis
Number ofShipments
. 2
*4
2
2
84
8
position
Mode of Transportation
Truck (Hittman Transport Services)
Truck (Hittman Transport Services)
Truck (Hitlman Transport Services)
Truck (Hittman Transport Services)
Truck (TAG Transport).
Truck (R&R Trucking)
Truck (R&R Trucking)
Destination
Barnwell Waste Management Facility,Barnwell, SCDuratek, Inc., Bear Creek, Oak Ridge,TN
Duratek Inc., Gallaher, Oak Ridge, TN
Studsvik Processing Facility, LLC;Columbia, SCStudsvik Processing Facility, LLC;Columbia, SCALARON Corporation (Wampum, PA)
RACE, LLC (Memphis, TN)
4. Class of Solid Waste
a. Class A, Class B, Class C- Corresponding to 2a". Class A, Class B, Corresponding to 2bc. Not applicable,c. Not applicable
5. Type of Container
a. LSA (Strong, tight), Type A, Type B - Corresponding to 2ab. LSA (Strong, tight) - Corresponding to 2bc. Not applicabled. Not applicable
6. Solidification Agent
a. Not applicableb. Not applicablec. Not applicabled. Not applicable
B. IRRADIATED FUEL SHIPMENTS (Disposition)
No irradiated fuel shipments occurred during the 2003 period.
29 of.40
SECTION III
HOURS AT'EACH WIND SPEED AND DIRECTION
This section documents VYCGS meteorological data for wind speed, wind direction, and.atmospheric stability.
The meteorological data supplied in the following tables covers the period from January 1, 2003,'through December 31,.2003, and indicates the number of hours at each wind speed and directionfor each stability class. All gasedus releases at the WCGS are ground level releases. (Wolf
.P Creek Station did not meet Re'gulatory Guide 1.23 requirement for having at least 90%meteorological data recovery for 2003. PIR 2004-0620 has been written and the resolution willbe presented in the 2005 Annual Report.)
A Meteorological Professor at the University of Kansas established the first set of criteria* that.isused to determine data 'availability and. verification. This verification takes a look at allinstruments on the tower and compares the instruments. against one another to verify- aparameter that is outside the normal meteorological parameters for this part of Kansas. Thesoftware then flags 'all paramet ers in that 15-minute pe6riod as bad data. Bad data is then.accumulated assuming all parameters were unavailable. This method also flags data as badanytime the communication link to the plant computer' is down or the plant computer is down.This method is conservative and may flag data as bad evert though the required Reg. Guide 1.23instruments are .stillavailable. Data availabilityusing this r'iethod.is 84.4%.
, I
A review of the data from the instruments reveal that approximately 12% of the missirg/bad datais from data that. was either 0, or the data did not change from one 15 minute average 'to theother. This is due to either instrument malfunction or the computer or computer link/modembeing down. The Meteorological Tower Instruments will be replaced in 2004 and the problem ofunresponsive instruments and the computer being down will be eliminated, or greatly reduced.Therefore, it is reasonable assurance that when the new instruments get installed that the dataavailability will be greater than 90%. The data availability for the Meteorological Data for the year2003 is 84.4%.
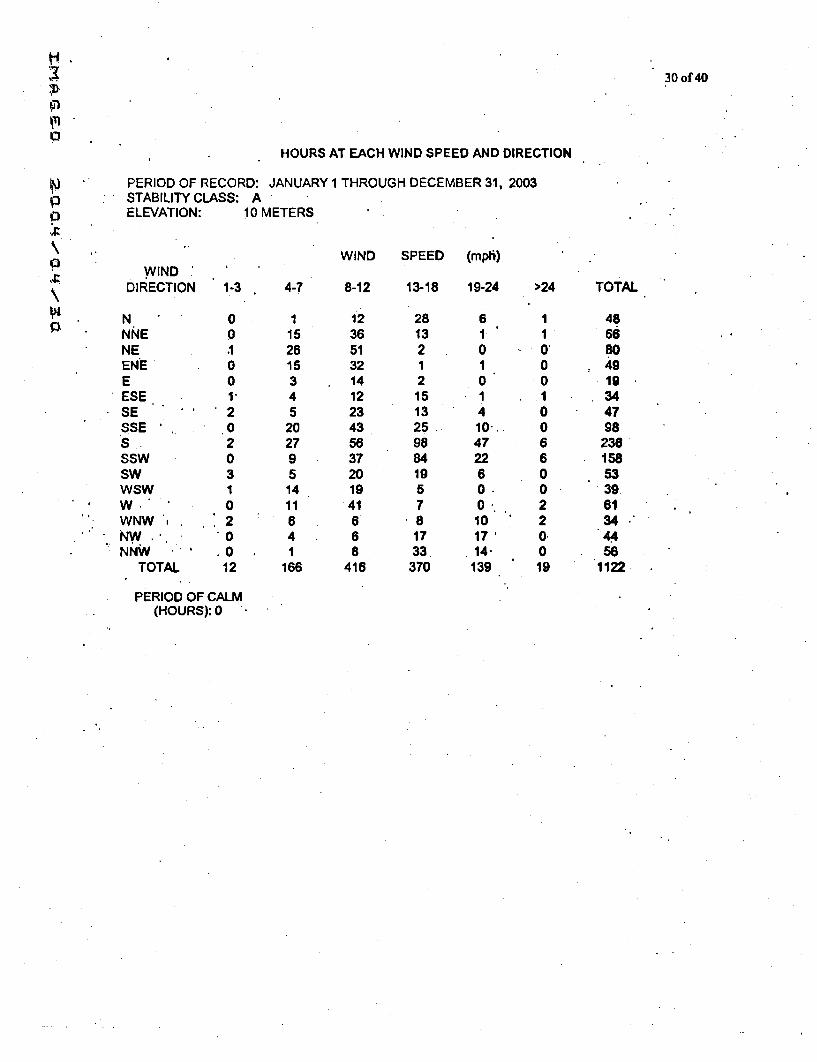
30 of 40
HOURS AT EACH WIND SPEED AND DIRECTION
,PERIOD OF RECORD: JANUARY 1 THROUGH DECEMBER 31, 2003rp STABILITY CLASS: A
ELEVATION: 10 METERS
WIND SPEED (mph)WIND
DIRECTION 1-3 4-7 8-12 13-18 19-24 >24 TOTAL
N 0 1 12 28 6 1 48NNE 0 15 36 13 1 1 66NE .1 26 51 2 0 0, 80ENE 0 15 32 1 1 0 : 49E 0 3 14 2 0 0 19ESE 1 4 12 15 1 1 34SE 2 5 23 13 4 0 47SSE 0 20 43 25 10-.. 0 98S. 2 27 56 98 47 6 236SSW 0 9 37 84 22 6 158SW 3 5 20 19 6 0 53WSW 1 14 19 5 0 0 39
' W 0 11 41 7 0 2 61WNW ' .2 8 6 8 10 2 34"NW 0 4 6 17 17' 0. 44NNW .0 1 8 33. 14- 0 58
TOTAL 12 166 418 370 139 19 1122
PERIOD OF CALM•. (HOURS): 0
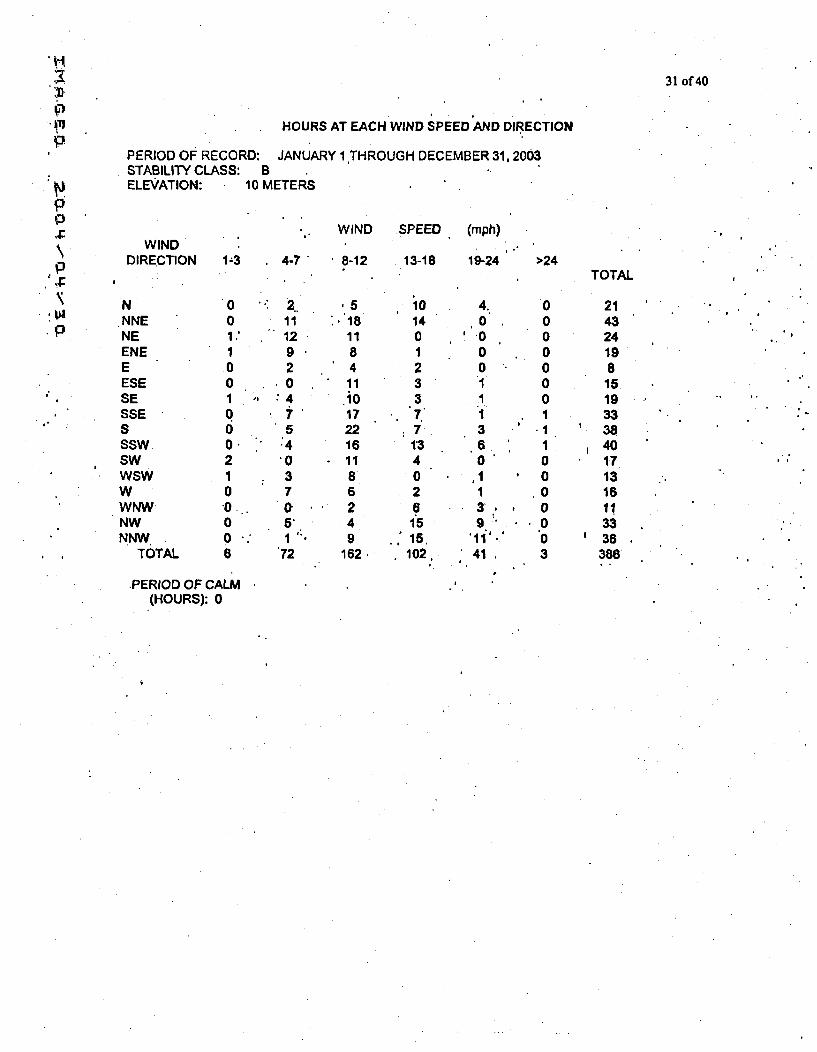
* N
P
P
P
31 of 40
HOURS AT EACH WIND SPEED AND DIRECTION
PERIOD OF RECORD: JANUARY 1,THROUGH DECEMBER 31,2003STABILITY CLASS: BELEVATION: 10 METERS
WINDDIRECTION
NNNENEENEEESESESSESSSWSWWSWWWNWNWNNW
TOTAL
WIND
1'3 4-7 8-12
SPEED (mph)
13-18 19-24
'001.*
I
00I
00
21
0
00..6
11
12920
:4
5.4"0
S3
7
5'
72
,5. '18
118
4* 11
.i0172216
*118
6249
162
140I
233
* 7.7
134026
1515.102,
4.0
00*"
'I
11
36,
.0*
3'
41
>24
0000000
01.I
00.0000
3
TOTAL
214324198
15
1933384017131611
3338
386
.PERIOD OF CALM(HOURS): 0
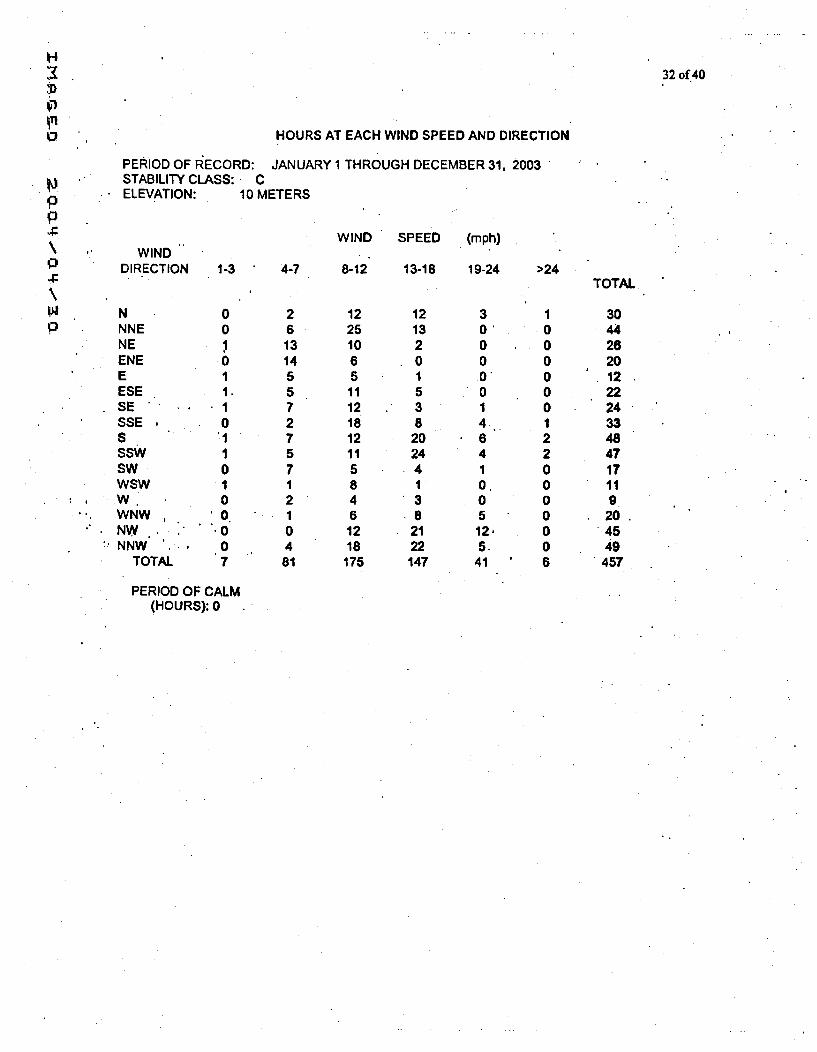
32 of 40
0 HOURS AT EACH WIND SPEED AND DIRECTION
PERIOD OF IRECORD: JANUARY 1 THROUGH DECEMBER 31, 2003STABILITY CLASS: CELEVATION: 10 METERS
WIND SPEED (mph)WIND
DIRECTION 1-3 4-7 8-12 13-18 19-24 >24TOTAL
N 0 2 12 12 3 1 30. NNE 0 6 25 13 0, 0 44
NE 1 13 10 2 0 0 26ENE 0 14 6 0 0 0 20E 1 5 5 1 0 0 12ESE 1. 5 11 5 0 0 22SE . 1 7 12 3 1 0 24SSE . 0 2 18 8 4. 1 33S 1 7 12 20 6 2 48SSW 1 5 11 24 4 2 47SW 0 7 5 4 1 0 17WSW 1 1 8 1 0. 0 11W 0 2 4 3 0 0 9WNW 0. 1 6 8 5 0 20.
' NW. .0 0 12 21 12. 0 45NNW '.., 0 4 18 22 5. 0 49
TOTAL 7 81 175 147 41 6 457
PERIOD OF CALM(HOURS): 0
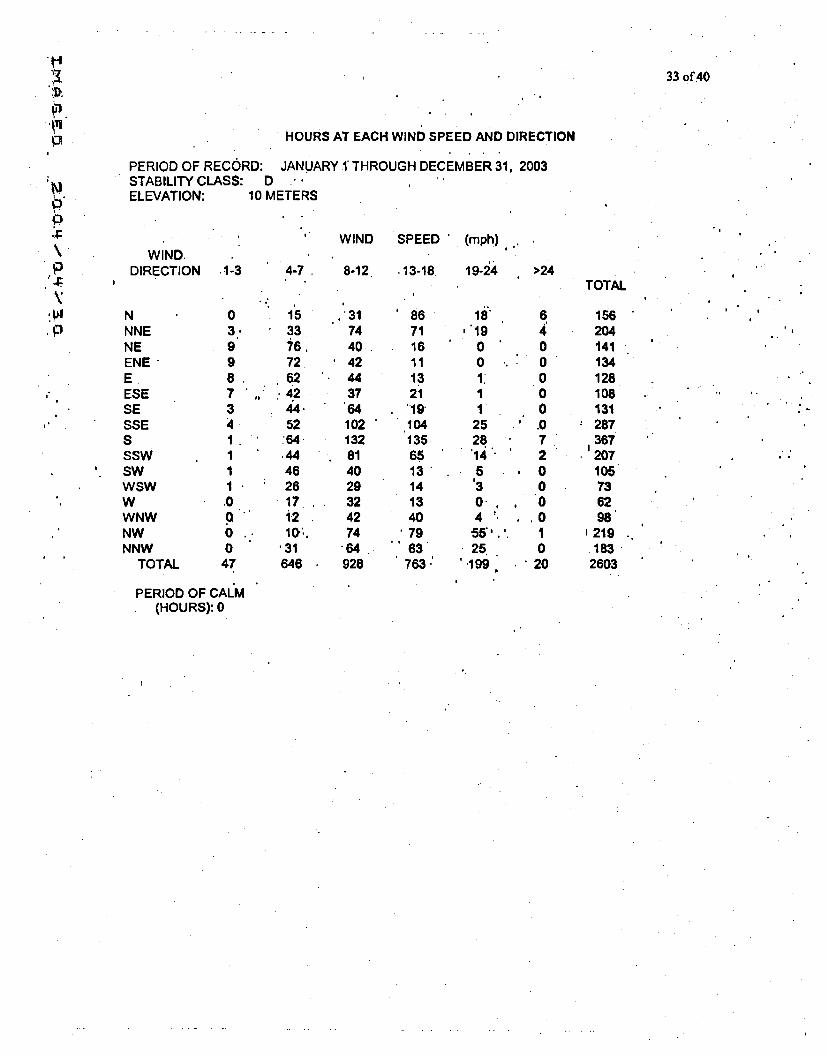
A.n
Mpp
.P
33 of 40
HOURS AT EACH WIND SPEED AND DIRECTION
PERIOD OF RECORD: JANUARY 1 THROUGH DECEMBER 31, 2003STABILITY CLASS: DELEVATION: 10 METERS
WIND.DIRECTION
NNNENEENEEESESESSESSSWSWWSWWWNWNWNNW
TOTAL
WIND SPEED (mph)
.1-3
03'998,
73
1.
1*
,0
04.0
47
4-7 , 8-12. .13-18 19-24 >24
153376,72624244.52
.64
.44462617i2
'31646
.,31744042
.443764102132814029324274
-64
928
* 867116111321.."19.
10413565131413407963'
763"
18"" 6''19 4
0 00... 01, 01 01 0
25 .' .028 7'14 25 ,03 00. , 04 . .,0
*55"'' 125. 0
'.199 . 20
TOTAL
156204141134128108131287367207105736298
1219183
2603
PERIOD OF CALM(HOURS): 0
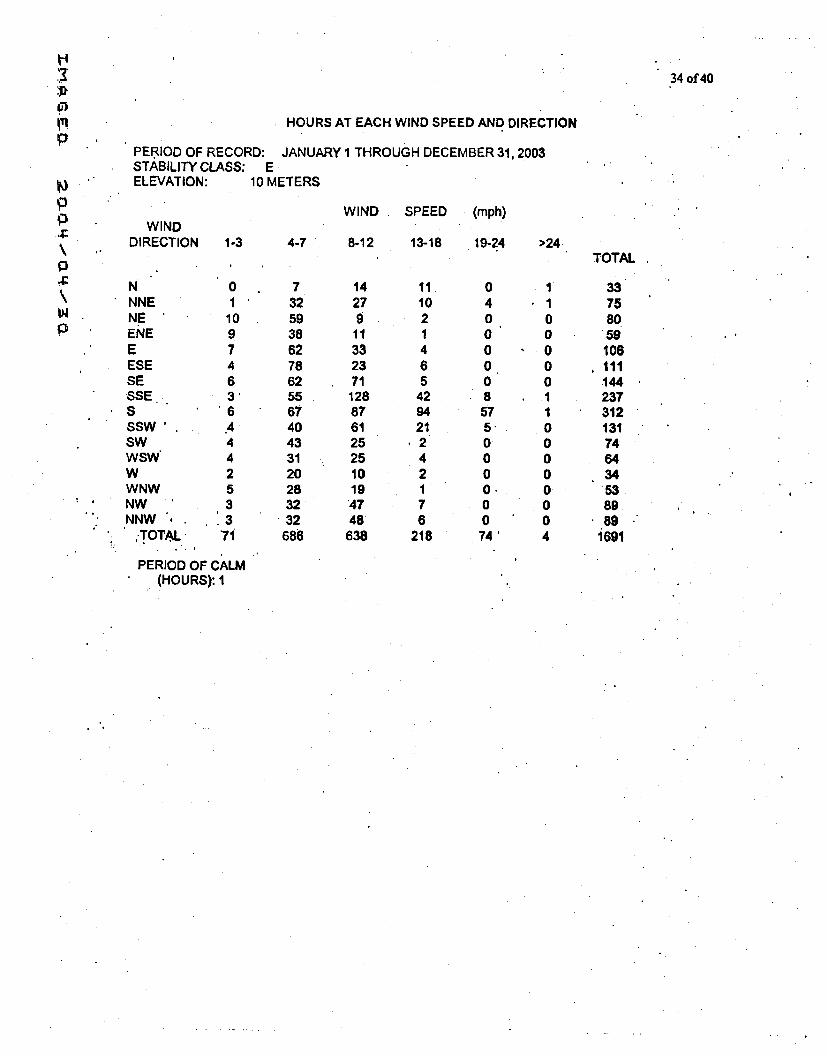
34 of 40
- HOURS AT EACH WIND SPEED AND DIRECTIONp,
PERIOD OF RECORD: JANUARY 1 THROUGH DECEMBER 31, 2003STABILITY CLASS: EELEVATION: 10 METERS
WINDWIND SPEED (mph)O WIND
DIRECTION 1-3 4-7 8-12 13-18 19-24 >24.TOTAL
N 0 7 14 11. 0 1 33*NNE 1 32 27 10 4 1 75
w. NE 10 59 9 2 0 0 80P ENE 9 38 11 1 0 0 59
E 7 62 33 4 0 0 108ESE 4 78 23 6 0 0 ,111SE 6 62 71 5 0 0 144SSE 3' 55 128 42 8 1 237S *6 67 87 94 57 1 312SSW . .4 40 61 21 5. 0 131SW 4 43 25 .2 0 0 74WSW 4 31 25 4 0 0 64W 2 20 10 2 0 0 34WNW 5 28 19 1 0. 0 53
' NW 3 32 47 7 0 0 89NNW . .13 32 48 6 0 0 89
• .-TOTAL 71 686 638 218 74' 4 1691
PERIOD OF CALM(HOURS): I
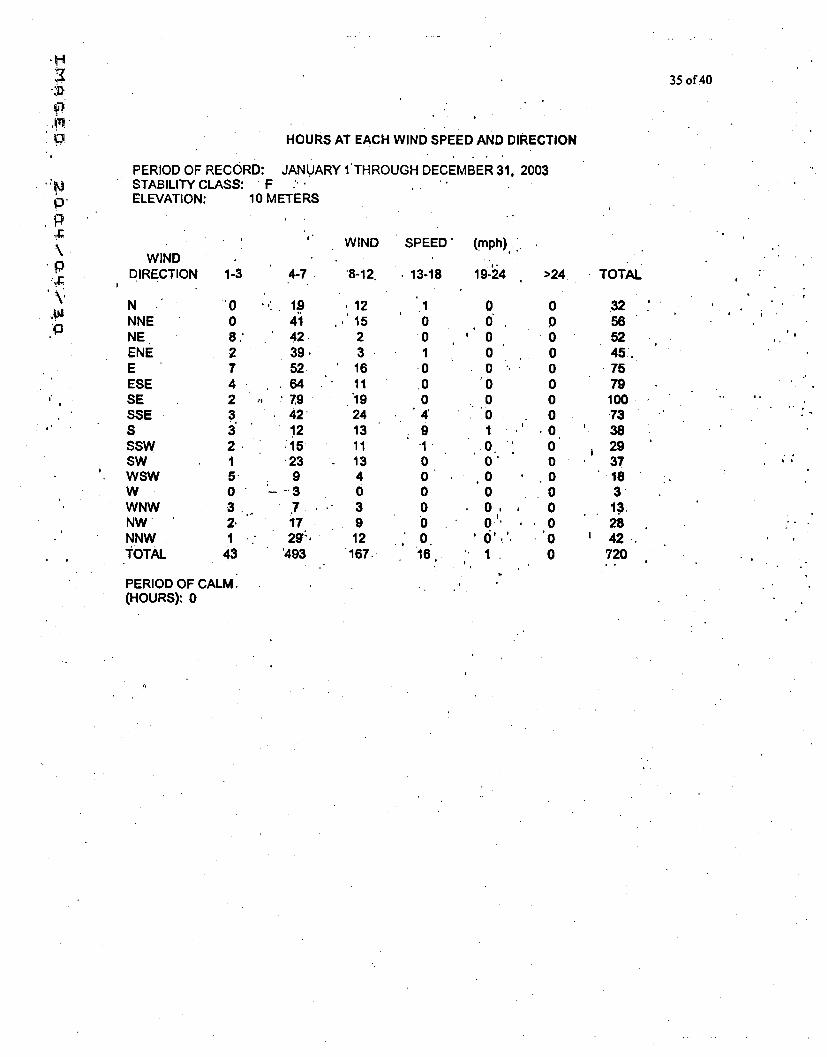
35 of 40
Ac
HOURS AT EACH WIND SPEED AND DIRECTION
PERIOD OF RECORD: JANUARY f'THROUGH DECEMBER 31. 2003STABILITY CLASS: " FELEVATION: 10 METERS
WINDDIRECTION
NNNENEENEEESESESSESSSWSWWSWWWNWNWNNWTOTAL
WIND SPEED' (mph),
1-3 4-7 '8-12. 13-18 19-24 >24 TOTAL
10 190 418.' 422 39.7 524 642 793 42'3 122 151 235- 90 ..- 33 .7.2- 171 .1 29--
43 '493
,12, 15
231611
.1924131113403912
167.
0.00.I0004'
.9
00000
'0.16,
060,00
"000
0,
0,0
0
0
" 1.,
00000000
*000000
.000
32 '565245..75791007338293718313.2842-
720
I . :
PERIOD OF CALM.(HOURS): 0
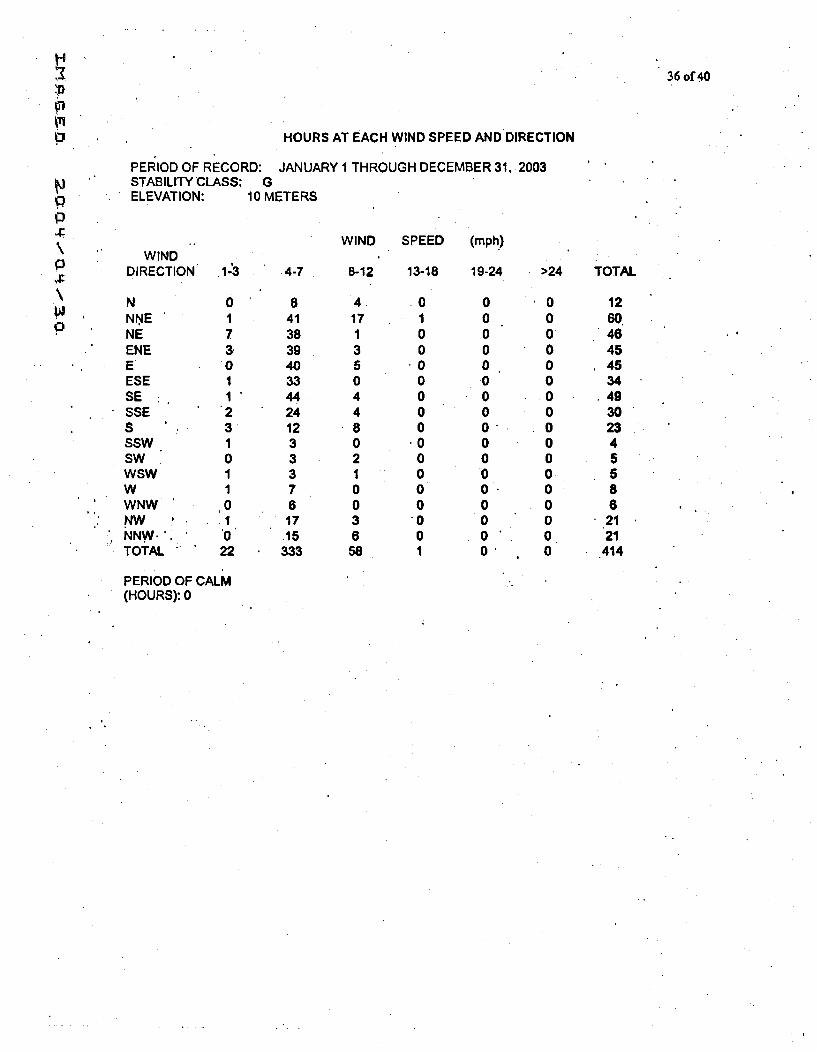
36 of40
a HOURS AT EACH WIND SPEED AND DIRECTION
PERIOD OF RECORD: JANUARY 1 THROUGH DECEMBER 31, 2003*11 STABILITY CLASS: G
, .ELEVATION: 10 METERS0
WIND WIND SPEED (mph)\ WIND
DIRECTION .1-3 4-7 8-12 13-18 19-24 >24 TOTAL
N 0 8 4. 0 0 0 12
W. NNE 1 41 17 1 0 0 60.
NE 7 38 1 0 0 0 46ENE 3, 39 3 0 0 0 45E 0 40 5 0 0 0 45ESE 1 33 0 0 0 0 34SE 1 44 4 0 0 0 .49SSE 2 24 4 0 0 0 30S . 3 12 8 0 0• 0 23SSW 1 3 0 0 0 0 4SW 0 3 2 0 0 0 5WSW 1 3 1 .0 0 0 5W 1 7 0 0 0 0 8WNW 0 6 0 0 0 0 aNW 1 17 3 "0 0 0 21NNW- 0 .15 6 0 0 0. 21TOTAL 22 333 58 1 0, 0 .414
PERIOD OF CALM(HOURS): 0
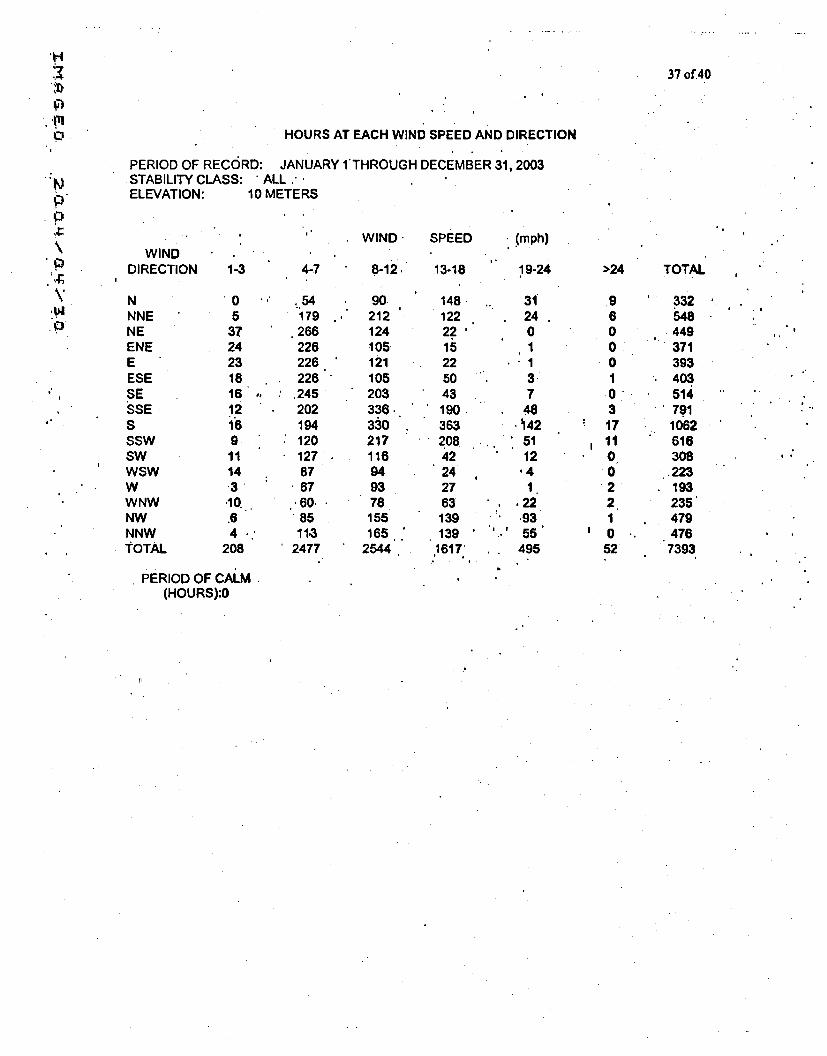
37 of 40
q7)111p
P0
HOURS AT EACH WIND SPEED AND DIRECTION
PERIOD OF RECORD: JANUARY 1'THROUGH DECEMBER 31, 2003STABILITY CLASS: 'ALL.-*ELEVATION:
WINDDIRECTION
10 METERS
WIND SPEED (mph)
1-3 4-7 8-12. 13-18
NNNE
0 NE
ENEEESESESSE
* S
SSWSWWSWWWNWNWNNWTOTAL
0 .,.545 179
37 26624 22623 22618 22616 .24512 202is 1949. 12011 12714 873. 67
.10. 60.6 854 . 113
208 2477
90., 212
124105121105203336..3302171169493781551652544
1481222215225043190363
S2.0842242763139139
1617'
19-24
312401
"1
37
.48'142
*51
12.4
1.
.. 22.93
".9 55495
>24
9600010317110022
5052
TOTAL
332548449371393403.5147911062616308
.. 223193235'4794767393
PERIOD OF CALM(HOURS):0
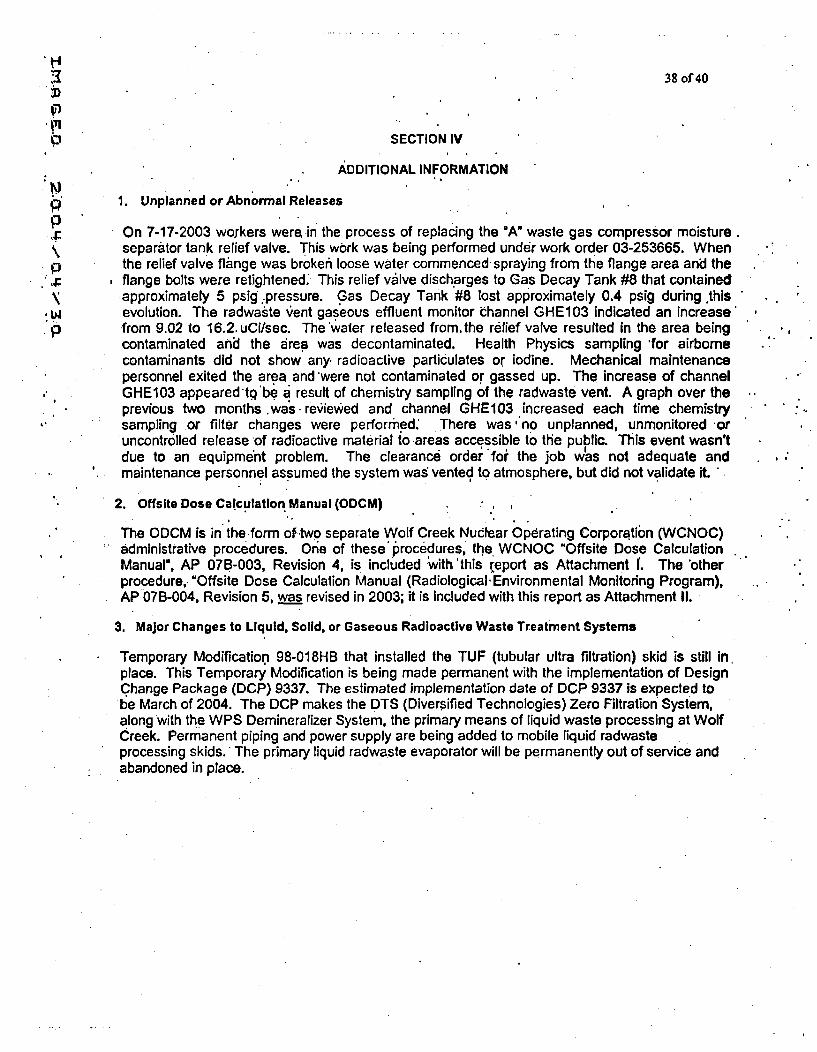
38 of 40
a SECTION IV
ADDITIONAL INFORMATION
p. 1. Unplanned or Abnormal ReleasesP
On 7-17-2003 workers were in the process of replacing the "A" waste gas compressor moisture.separator tank relief valve. This work was being performed under work order 03-253665. When
P the relief valve flange was brokern loose water commenced- spraying from the flange area and theflange bolts were retightened• This relief valve discharges to Gas Decay Tank #8 that containedapproximately 5 psig.pressure. Gas Decay Tank #8 lost approximately 0.4 psig during.thisevolution. The radwaste vent gaseous effluent monitor channel GHE103 indicated an increase'
p from 9.02 to 16.2. uCVsec. The'water released from, the relief valve resulted in the area beingcontaminated and the area was decontaminated. Health Physics sampling 'for airbornecontaminants did not show any. radioactive particulates or iodine. Mechanical maintenancepersonnel exited the area and'were not contaminated or gassed up. The increase of channelGHE103 appearedtQ'be. a result of chemistry sampling of the radwaste vent. A graph over theprevious two months was reviewved and channel GHE103 increased each time chemistrysampling or filter changes were performed. There was' no unplanned, unmonitored *oruncontrolled release of radioactive material to areas accessible to the public. This event wasn'tdue to an equipment problem. The clearance order fo" the job was not adequate and
S '. maintenance personnel assumed the system was; vented to atmosphere, but did not validate it.
2. Offsite Dose Calculation Manual (ODCM) . •
The ODCM is in the form of two separate Wolf Creek Nuclear Operating Corpora.tibn (WCNOC)administrative procedures. One of these* Iroce'dures, the, WCNOC "Offsite Dose CalculationManual", AP 07B-003, Revision 4, is included •Nith 'this report as Attachment I. The 'otherprocedure, "Offsite Dose Calculation Manual (Radiological- Environmental Monitoring Program),AP 078-004, Revision 5, was revised in 2003; it is included with this report as Attachment I1.
3. Major Changes to Liquid, Solid, or Gaseous Radioactive Waste Treatment Systems
Temporary Modificatioin 98-018HB that installed the TUF (tubular ultra filtration) skid is still In.place. This Temporary Modification is being made permanent with the implementation of DesignChange Package (DCP) 9337. The estimated implementation date of DCP 9337 is expected tobe March of 2004. The DCP makes the DTS (Diversified Technologies) Zero Filtration System,along with the WPS Demineralizer System, the primary means of liquid waste processing at WolfCreek. Permanent piping and power supply are being added to mobile liquid radwasteprocessing skids. The primary liquid radwaste evaporator will be permanently out of service andabandoned in place.
3 39 of 40
4. Land Use Census
No new locations for dose calculation were identified during this report period.
S5. Radwaste Shipments
IX Twenty-three shipments of radioactive waste occurred during this report period. Section Ii,Subsection 3, of this report contains specific details regarding each shipment's mode of
p) transportation and destination.
6. Inoperability of Effluent Monitoring Instrumentation
, No events occurred that violated ODCM Requirements Tables 2-2 and 3-2, liquid or gaseouseffluent monitoring instrumentation.
7. Storage Tanks
'At no time during the year 2003 was there an event that led to liquid holdup tanks or gas storagetanks, exceeding the limits of Technical Requirements Manual Sections 3.10.1 or 3.10.3.Technical Specification requirements for the program' are now covered by TechnicalRequirements Manual Section 3.10, "Explosive Gas and Storage Tank Radioactivity Monitoring.*
h'd /-9/ 7IMAGED
0
CI
00
W4jLF CREEK'NUCLEAR OPERATING CORPORATION
Kevin J. MolesManager Regulatory Affairs
April 29, 2005RA 05-0039
U. S. Nuclear Regulatory CommissionATTN: Document Control DeskWashington, DC 20555
Subject: Docket No. 50-482: Wolf Creek Generating Station Annual RadioactiveEffluent Release Report - Report 28
Gentlemen:
This letter transmits the enclosed Wolf Creek Generating Station (WCGS) Annual RadioactiveEffluent Release Report. The report covers the period from January 1, 2004, throughDecember 31, 2004. It is being submitted pursuant to Section 5.6.3 of the WCGS TechnicalSpecifications. Included as part of the report are copies of revised procedures required to besubmitted with this report. Procedures AP 07B-003, "Offsite Dose Calculation Manual," AP07B-004, "Offsite Dose Calculation Manual (Radiological Environmental Monitoring Program),"and AP 31A-100, "Solid Radwaste Process Control Program." are included as Attachments I, II,and III to the report.
No commitments are identified in this correspondence. If you have any questions concerningthis matter, please contact me at (620) 364-4126, or Ms. Diane Hooper at (620) 364-4041.
KJM/rIg
Enclosure
cc: J. N. Donohew (NRC), wleD. N. Graves (NRC), w/eB. S. Mallett (NRC), w/eSenior Resident Inspector (NRC), w/e
P.O. Box 411 / Burlington. KS 66839 / Phone: (620) 364-8831An Equal Opportunity Employer MIF/HCNET
A.
UED
Ci
LWolf Creek Nuclear Operating Corporation
CI Wolf Creek Generating Station
Docket No: 50-482Facility Operating License No: NPF-42
Annual Radioactive Effluent Release Report
Report No.28
Reporting Period: January 1, 2004 - December 31, 2004
I2 of 40
E Table of Contents
Page
E
Executive Summary 4Section I 8
4 Report of 2004 Radioactive Effluents: Liquid 82004 Liquid Effluents 102004 Liquid Cumulative Dose Summary -Table 1. 122004 Liquid Cumulative Dose Summary - Table 2 13
• Report of 2004 Radioactive Effluents: Airborne 142004 Gaseous Effluents 162004 Gaseous Cumulative Dose Summary - Table 1 1B2004 Gaseous Cumulative Dose Summary - Table 2 19Section II 20Off site Dose Calculation Manual Limits 20Effluent Concentration Limits (ECLs) 20Average Energy 21Measurements and Approximations of Total Radioactivity (Liquid and 21Gaseous Effluents)Batch Releases 23Continuous Releases 23Doses to a Member of the Public from Activities Inside the SiteBoundary 23Additional Information 232004 Effluent Concentration Limits 272004 Solid Waste Shipments 28Irradiated Fuel Shipments 29Section III 30Meteorological Data - Hours At Each Wind Speed and Direction 30Section IV 39Unplanned or Abnormal Releases 39Offsite Dose Calculation Manual 39Major Changes to Liquid, Solid, or Gaseous Radioactive Waste 39TreatmentTreatment Systems 39Land Use Census 39Radwaste Shipments 39Inoperability of Effluent Monitoring Instrumentation 39Storage Tanks 39
IA
3 of 40
-E Table of Contents
- Attachment I - WCGS Procedure AP 07B-003, Revision 5, "Offsite Dose Calculation Manual"
* Attachment II - WCGS Procedure AP 07B-004, Revision 8, "Offsite Dose Calculation ManualGR
(Radiological Environmental Monitoring Program)"Attachment III - WCGS Procedure AP 31A-100, Revision 5, "Solid Radwaste Process Control4 Program"
2
0C
I(I!4 of 40
A.
E EXECUTIVE SUMMARYD
[I This Annual Radioactive Effluent Release Report (Report # 28) documents the quantities of liquidV
and gaseous effluents and solid waste released by Wolf Creek Generating Station (WCGS) fromJanuary 1, 2004 through December 31, 2004. The format and content of this report are in
C1 accordance with Regulatory Guide 1.21, Revision 1, "Measuring, Evaluation, and ReportingRadioactivity in Solid Wastes and Releases of Radioactive Materials in Liquid and GaseousEffluents from Light-Water-Cooled Nuclear Power Plants." Sections I, II, I1l, and IV of this reportprovide information required by NRC Regulatory Guide 1.21 and Section 7.2 of AP 07B-003,"Offsite Dose Calculation Manual" (ODCM).
Section I - Section I contains, in detail, the quantities of radioactive liquid and gaseous effluentsand cumulative dose summaries for 2004, tabulated for each quarter and for yearly totals.Specific ODCM effluent limits and dose limits are also listed in Section I, along with thepercentage of the effluent limits actually released and the percentages of the dose limit actuallyreceived. No effluent or dose limits were exceeded during 2004.
An elevated release pathway does not exist at WCGS. All airborne releases are considered to beground level releases. The gaseous pathway dose determination is met by the WCGS ODCMmethodology of assigning all gaseous pathways to a hypothetical individual residing at thehighest annual X/Q and D/Q location, as specified in the ODCM. This results in a conservativeestimate of dose to a member of the public, rather than determining each pathway dose for eachrelease condition. A conservative error of thirty percent has been estimated in the effluent data.As stated above, no ODCM dose limits were exceeded in 2004.
Section II - Section II includes supplemental information on continuous and batch releases,calculated doses, and solid waste disposal. There were 67 gaseous batch releases in 2004versus 87 in 2003. There were 58 liquid batch releases in 2004 versus 76 in 2003. WCGSreleased 0.019 curies in liquid releases during 2004 versus 0.020 curies in 2003, excluding gasand tritium. Continuous release pathways remained the same as previous years and allcontinuous releases were monitored.
The report contains information on the following Performance Improvement Requests (PIRs):
PIR 2003-2580 - This PIR is being included as a follow-up from the 2004 Annual Report.Baseline results were sent to engineering for evaluation. Engineering made a request foradditional blank filters to be sent off for comparison. The results of those filters showed that theestablishment of a baseline was not feasible.
PIR 2003-3253 - This PIR is being included due to an omission from the 2004 Annual Report.On 10-29-03, a Turbine Building Sump composite was prepared and analyzed based oncalculations performed on the excel spreadsheet, AIF 07B-020-02. The calculations wereperformed incorrectly due to a change in daylight savings time not being included.
PIR 2004-0037 - Weekly composites for both Waste Water Treatment and Turbine BuildirigSump were completed without all required samples. Both instances resulted in improperlyperformed Offsite Dose Calculation Manual surveillances.
PIR 2004-0620 - The MET tower did not meet the 90% data recovery availability for 2003required by Reg Guide 1.23, "Meteorological Programs in Support of Nuclear Power Plants."Actual availability was 84.4%. Instrumentation has been replaced to improve availability,
I,M. 5 of 40
GED PIR 2004-1096 - On April 16, 2004, while recircing Waste Gas Decay Tank #6, the tank pressure
C! was noticed to be decreasing by Operations. After investigating, it was determined that thepressure loss was accounted for by an increase in Gas Decay Tank #8.
PIR 2004-1235 - During the Quick Hit Assessment (04-153) of high ammonia chemistry, it wasdiscussed that there was no clear determination on the effect of the ZERO system if highconcentrations of ETA water are found to be leaking into the Dirty Radwaste System (DRW) fromthe Blowdown system.
! PIR 2004-1287 - While preparing a liquid release permit for Waste Monitor Tank A (THB07A) onCMay 6, 2004, it was discovered that radiation monitor HBRE-18 was inoperable. Chemistry had
not been notified of the monitor inoperability. The Offsite Dose Calculation Manual requires atleast two independent samples be analyzed and at least two qualified individuals verify releaserates and valve lineup with an inoperable monitor.
PIR 2004-1410 - The ODCM contains a statement that information contained in appendix B ofattachment A is "proprietary information provided by SAL." This is a concern because the NuclearRegulatory Commission (NRC) cannot put information identified as proprietary in the publicdomain, and they cannot withhold the information without the appropriate documentationdescribing what is proprietary and why.
PIR 2004-2087 - On August 13, 2004, the channel checks for radiation monitors GTRE-31 andGTRE-32 were not performed as required by Surveillance Requirements between 1100 and 1900hours. This is considered a missed surveillance in accordance with Surveillance Requirement3.0.3.
PIR 2004-3146 - A Steam Generator Blowdown composite sample was not obtained within thenecessary time, including the 25% grace period. The composite sample is required by AP 07B-003, Offsite Dose Calculation Manual. The result was a missed ODCM surveillance.
PIR 2004-3374 - The Effluent Management Software (EMS) used for performing Offsite DoseCalculation Manual required effluent release permit calculations was found to be inoperable onDecember 12, 2004. The Information Services help desk was contacted to resolve the problem,but due to the software age, lack of IS knowledge and no support system set up for immediatevendor assistance, the problems have yet to be resolved.
Section III --- Section III documents WCGS meteorological data for wind speed, wind direction,and atmospheric stability. At the time of this report, MET data was not made available.
6 of 40,'-
ESection IV --- Section IV documents unplanned and abnormal releases, changes to radwastetreatment systems, land use census, monitoring instruments, radwaste shipments, and storagetank quantities. There were no unplanned or abnormal releases that occurred in 2004.
. No changes to events occurred on the land use census, monito ring instruments, radwasteshipments, and storage units.
'IIt
7 of 4O
A-
ED ATTACHMENTS
0 Attachment
I - AP 07B-003, revision 5, "Offsite Dose Calculation Manual"
Attachment II - AP 07B-004, revision 8, "Offsite Dose Calculation Manual (Radiological
I Environmental
Monitoring Program)"
A Attachment
III - AP 31A-1 00, revision 5, "Solid Radwaste Process Control Program"
4
II0
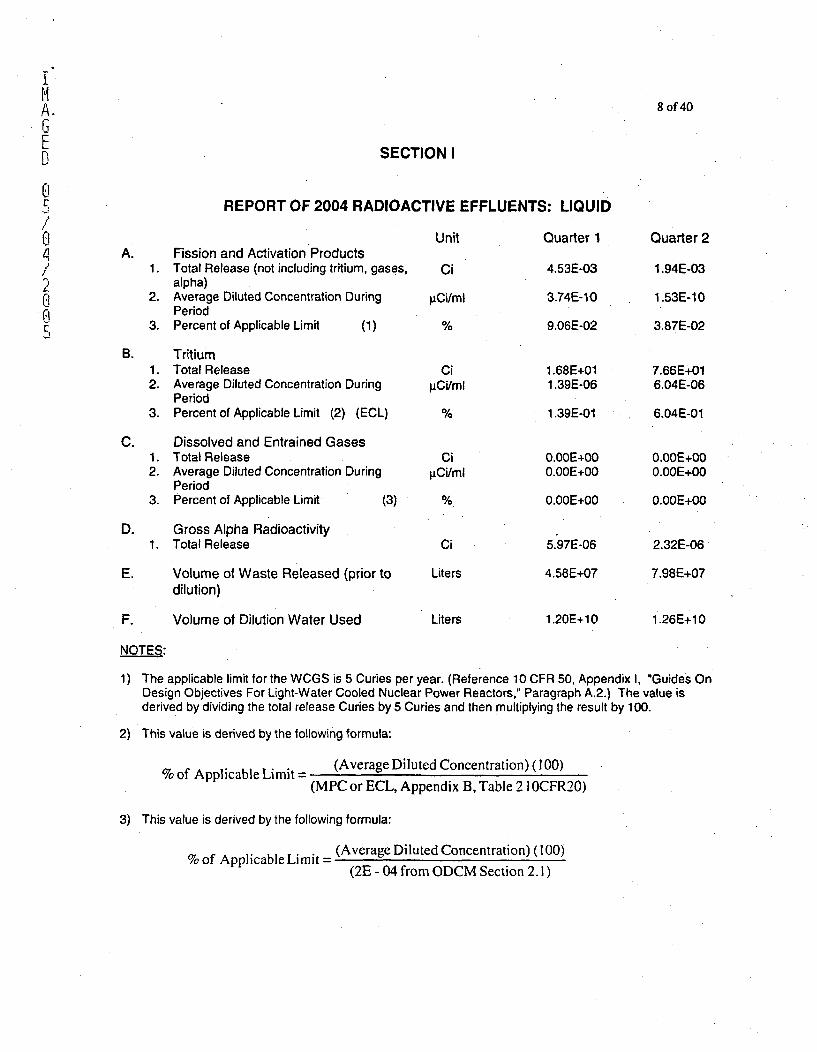
,iii
A. 8 of 40
EE SECTION I
REPORT OF 2004 RADIOACTIVE EFFLUENTS: LIQUID
Unit Quarter I Quarter 24 A. Fission and Activation Products
1. Total Release (not including tritium, gases, Ci 4.53E-03 1.94E-032 alpha)
2. Average Diluted Concentration During piCi/ml 3.74E-10 1.53E-10r. Period
3. Percent of Applicable Limit (1) % 9.06E-02 3.87E-02
B. Tritium1. Total Release Ci 1.68E+01 7.66E+012. Average Diluted Concentration During gICvml 1.39E-06 6.04E-06
Period3. Percent of Applicable Limit (2) (ECL) % 1.39E-01 6.04E-01
C. Dissolved and Entrained Gases1. Total Release Ci O.OOE+00 0.00E+002. Average Diluted Concentration During ACi/ml 0.OOE+00 0.OOE+00
Period3. Percent of Applicable Limit (3) % O.OOE+00 0.OOE+O0
D. Gross Alpha Radioactivity1. Total Release Ci 5.97E-06 2.32E-06
E. Volume of Waste Released (prior to Liters 4.58E+07 7.98E+07
dilution)
F. Volume of Dilution Water Used Liters 1.20E+10 1.26E+10
NOTES:
1) The applicable limit for the WCGS is 5 Curies per year. (Reference 10 CFR 50, Appendix I, 'Guides OnDesign Objectives For Light-Water Cooled Nuclear Power Reactors," Paragraph A.2.) The value isderived by dividing the total release Curies by 5 Curies and then multiplying the result by 100.
2) This value is derived by the following formula:
% of Applicable Limit = (Average Diluted Concentration) (100)(MPC or ECL, Appendix B, Table 2 1OCFR20)
3) This value is derived by the following formula:
% of Applicable Limit = (Average Diluted Concentration) (100)(2E - 04 from ODCM Section 2. 1)
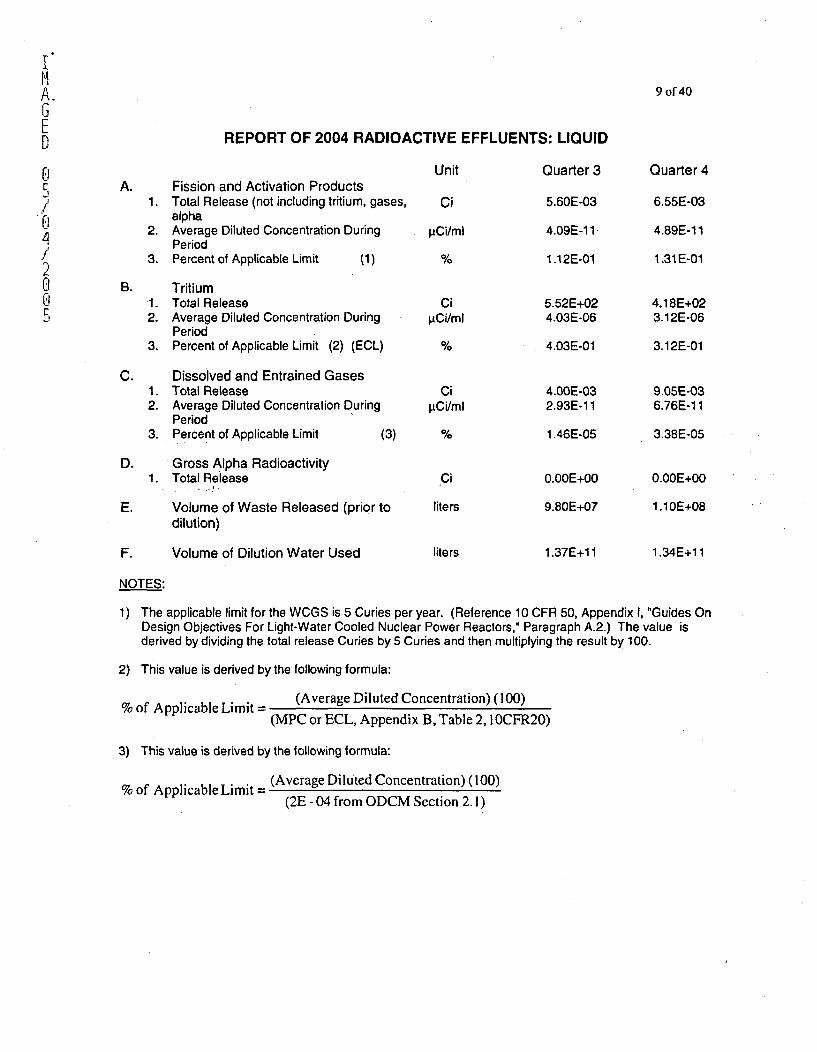
ill
GEU
0
/U
/
UU
9 of 40
REPORT OF 2004 RADIW
A. Fission and Activation Products1. Total Release (not including tritium, gases,
alpha2. Average Diluted Concentration During
Period3. Percent of Applicable Limit (1)
B. Tritium1. Total Release2. Average Diluted Concentration During
Period3. Percent of Applicable Limit (2) (ECL)
C. Dissolved and Entrained Gases1. Total Release2. Average Diluted Concentration During
Period3. Percent of Applicable Limit (3)
D. Gross Alpha Radioactivity1. Total Release
E. Volume of Waste Released (prior todilution)
CTIVE EFFLUENTS: LIQUID
Unit Quarter 3
Ci 5.60E-03
ACi/ml 4.09E-1 1
% 1.12E-01
CilaCi/ml
CiuiCi/ml
5.52E+024.03E-06
4.03E-01
4-GOE-032.93E-1 1
1 .46E-05
0.OOE+00
9.80E+07
Quarter 4
6.55E-03
4.89E-1 1
1.31 E-01
4.18E+023.12E-06
3.12E-01
9.05E-036.76E-1 1
3.38E-05
0.OOE+00
1.10E+08
Ci
liters
F. Volume of Dilution Water Used liters 1.37E+1 1 1.34E+1 1
NOTES:
1) The applicable limit for the WCGS is 5 Curies per year. (Reference 10 CFR 50, Appendix I, "Guides OnDesign Objectives For Light-Water Cooled Nuclear Power Reactors," Paragraph A.2.) The value isderived by dividing the total release Curies by 5 Curies and then multiplying the result by 100.
2) This value is derived by the following formula:
% of Applicable Limit = (Average Diluted Concentration) (100)(MPC or ECL, Appendix B, Table 2, 1 OCFR20)
3) This value is derived by the following formula:
%of Applicable Limit= (Average Diluted Concentration) (100)
(2E -04 from ODCM Section 2. 1)
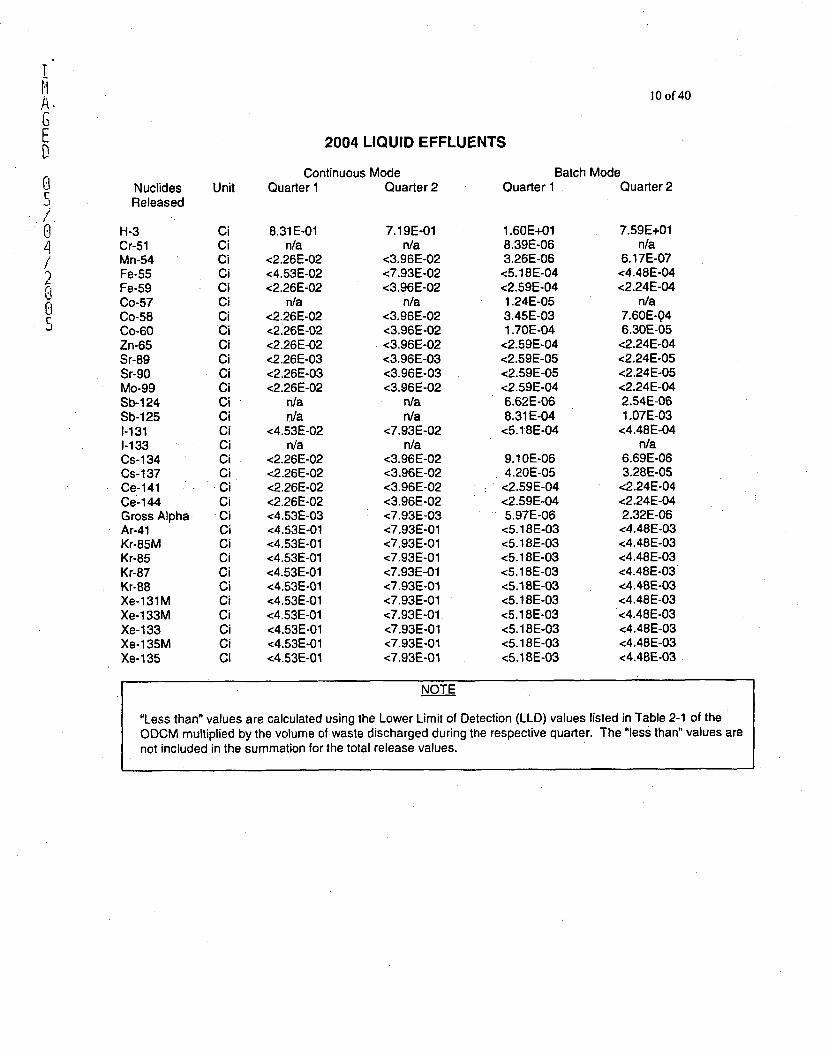
I.. 10 of 40
A.GE 2004 LIQUID EFFLUENTS
Continuous Mode Batch Mode(3 Nuclides Unit Quarter 1 Quarter 2 Quarter 1 Quarter 2cReleased
(3 H-3 Ci 8.31 E-01 7.19E-01 1.60E+01 7.59E+014 Cr-51 Ci n/a n/a 8.39E-06 n/a
Mn-54 Ci <2.26E-02 <3.96E-02 3.26E-06 6.17E-072 Fe-55 Ci <4.53E-02 <7.93E-02 <5.18E-04 <4.48E-04C1 Fe-59 Ci <2.26E-02 <3.96E-02 <2.59E-04 <2.24E-040 Co-57 Ci n/a n/a 1.24E-05 n/a
Co-58 Ci <2.26E-02 <3.96E-02 3.45E-03 7.60E-04Co-60 Ci <2.26E-02 <3.96E-02 1.70E-04 6.30E-05Zn-65 Ci <2.26E-02 <3.96E-02 <2.59E-04 <2.24E-04Sr-89 Ci <2.26E-03 <3.96E-03 <2.59E-05 <2.24E-05Sr-90 Ci <2.26E-03 <3.96E-03 <2.59E-05 <2.24E-05Mo-99 Ci <2.26E-02 <3.96E-02 <2.59E-04 <2.24E-04Sb-124 Ci n/a n/a 6.62E-06 2.54E-06Sb-125 Ci n/a n/a 8.31 E-04 1.07E-031-131 Ci <4.53E-02 <7.93E-02 <5.18E-04 <4.48E-041-133 Ci n/a n/a n/aCs-134 Ci <2.26E-02 <3.96E-02 9.1OE-06 6.69E-06Cs-137 Ci <2.26E-02 <3.96E-02 4.20E-05 3.28E-05Ce-141 • Ci <2.26E-02 <3.96E-02 <2.59E-04 <2.24E-04Ce-144 Ci <2.26E-02 <3.96E-02 <2.59E-04 <2.24E-04Gross Alpha Ci <4.53E-03 <7.93E-03 5.97E-06 2.32E-06Ar-41 Ci <4.53E-01 <7.93E-01 <5.18E-03 <4.48E-03Kr-85M Ci <4.53E-01 <7.93E-01 <5.18E-03 <4.48E-03Kr-85 Ci <4.53E-01 <7.93E-01 <5.18E-03 <4.48E-03Kr-87 Ci <4.53E-01 <7.93E-01 <5.18E-03 <4.48E-03Kr-88 Ci <4.53E-01 <7.93E-01 <5.1 8E-03 <4.48E-03Xe-131M Ci <4.53E-01 <7.93E-01 <5.18E-03 <4.48E-03Xe-133M Ci <4.53E-01 <7.93E-01 <5.18E-03 <4.48E-03Xe-133 Ci <4.53E-01 <7.93E-01 <5.18E-03 <4.48E-03Xe-1 35M Ci <4.53E-01 <7.93E-01 <5.1 8E-03 <4.48E-03Xe-135 Ci <4.53E-01 <7.93E-01 <5.18E-03 <4.48E-03
NOTE
"Less than" values are calculated using the Lower Limit of Detection (LLD) values listed in Table 2-1 of theODCM multiplied by the volume o1 waste discharged during the respective quarter. The "less than" values arenot included in the summation for the total release values.
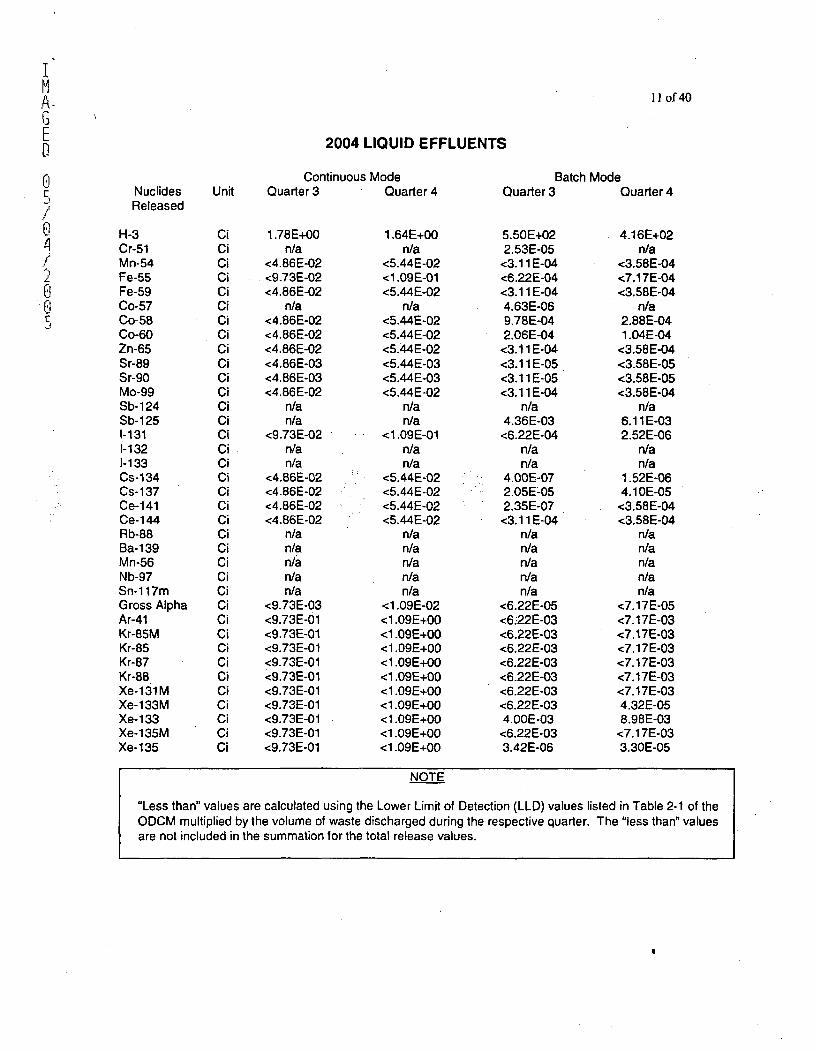
I
Ep
0
U
1I of*40
2004 LIQUID EFFLUENTS
ntinuous ModeQuarter 4
Batch ModeNuclidesReleased
H-3Cr-51Mn-54Fe-55Fe-59Co-57Co-58Co-60Zn-65Sr-89Sr-90Mo-99Sb-124Sb-1251-1311-1321-133Cs-134Cs-137Ce-141Ce-144Rb-88Ba-139Mn-56Nb-97Sn-1 17mGross AlphaAr-41Kr-85MKr-85Kr-87Kr-88Xe-131MXe-133MXe-133Xe-135MXe-135
Unit Quarter 3
1.78E+00n/a
<4.86E-02<9.73E-02<4.86E-02
n/a<4.86E-02<4.86E-02<4.86E-02<4.86E-03<4.86E-03<4.86E-02
n/an/a
<9.73E-02n/an/a
<4.86E-02<4.86E-02<4.86E-02<4.86E-02
n/an/an/an/an/a
<9.73E-03<9.73E-01<9.73E-01<9.73E-01<9.73E-01<9.73E-01<9.73E-01<9.73E-01<9.73E-01<9.73E-01<9.73E-01
1.64E+00n/a
<5.44E-02<1.09E-01<5.44E-02
n/a<5.44E-02<5.44E-02<5.44E-02<5.44E-03<5.44E-03<5.44E-02
n/an/a
<1.09E-01n/an/a
<5.44E-02<5.44E-02<5.44E-02<5.44E-02
n/an/an/an/an/a
<1.09E-02<1.09E+00<1.09E+00<1.09E+00<1.09E+00<1.09E+00<1.09E+00<1.09E+00<1.09E+00<1.09E+00<1.09E+00
Quarter 3
5.50E+022.53E-05
<3.11 E-04<6.22E-04<3.11 E-044.63E-069.78E-042.06E-04
<3.11 E-04<3.11 E-05<3.1 1 E-05<3.11 E-04
n/a4.36E-03<6.22E-04
n/an/a
4.OOE-072.05E-052.35E-07<3.11 E-04
n/an/an/an/an/a
<6.22E-05<6.22E-03<6.22E-03<6.22E-03<6.22E-03<6.22E-03<6.22E-03<6.22E-034.OOE-03<6.22E-033.42E-06
Quarter 4
4.16E+02n/a
<3.58E-04<7.17E-04<3.58E-04
n/a2.88E-041.04E-04
<3.58E-04<3.58E-05<3.58E-05<3.58E-04
n/a6.11 E-032.52E-06
n/an/a
1.52E-064.1 OE-05<3.58E-04<3.58E-04
n/an/an/an/an/a
<7.17E-05<7.17E-03<7.17E-03<7.17E-03<7.17E-03<7.17E-03<7.17E-034.32E-058.98E-03
<7.17E-033.30E-05
NOTE
"Less than" values are calculated using the Lower Limit of Detection (LLD) values listed in Table 2-1 of theODCM multiplied by the volume of waste discharged during the respective quarter. The "less than" valuesare not included in the summation for the total release values.
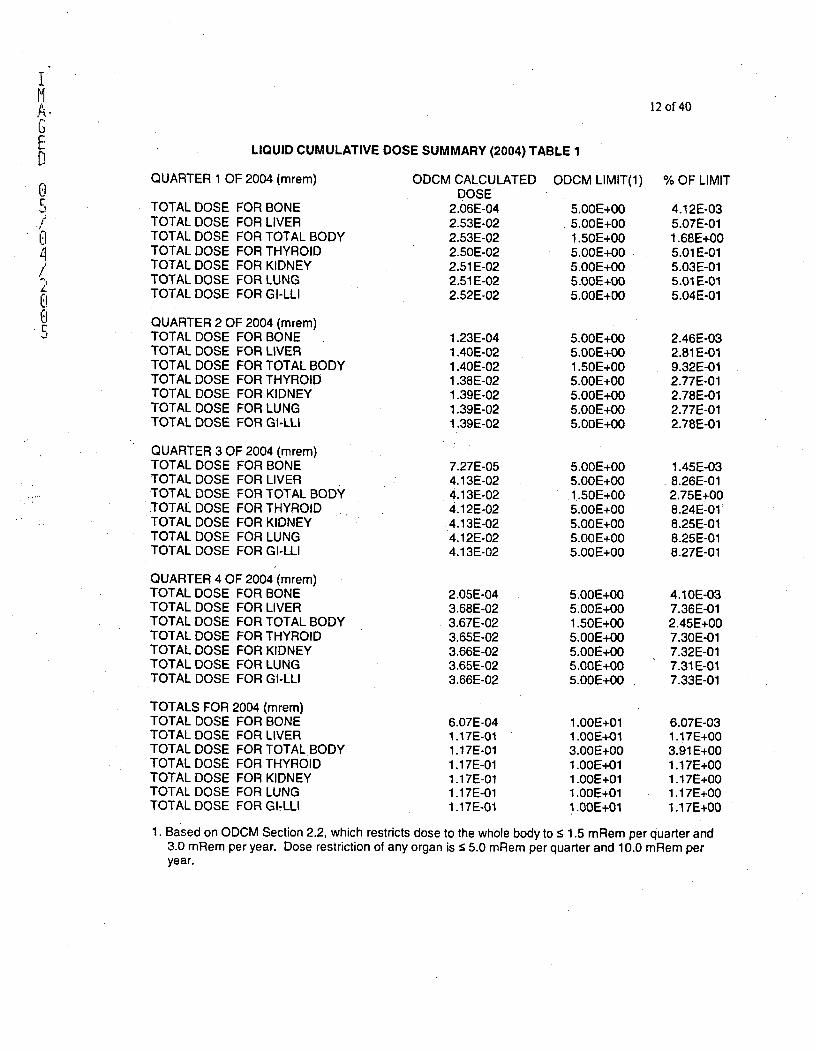
A.GED
CI
010
12 of 40
LIQUID CUMULATIVE DOSE SUMMARY (2004) TABLE 1
QUARTER 1 OF 2004 (mrem)
TOTAL DOSETOTAL DOSETOTAL DOSETOTAL DOSETOTAL DOSETOTAL DOSETOTAL DOSE
FOR BONEFOR LIVERFOR TOTAL BODYFOR THYROIDFOR KIDNEYFOR LUNGFOR GI-LLI
ODCM CALCULATEDDOSE
2.06E-042.53E-022.53E-022.50E-022.51 E-022.51 E-022.52E-02
1.23E-041.40E-021.40E-021.38E-021.39E-021.39E-021.39E-02
ODCM LIMIT(l)
5.OOE+005.00E+001.50E+005.00E+005.OOE+005.OOE+005.OOE+00
5.OOE+005.OOE+001.50E+005.OOE+005.OOE+005.OOE+005.00E+00
QUARTER 2 OF 2004 (mrem)TOTAL DOSE FOR BONETOTAL DOSE FOR LIVERTOTAL DOSE FOR TOTAL BODYTOTAL DOSE FOR THYROIDTOTAL DOSE FOR KIDNEYTOTAL DOSE FOR LUNGTOTAL DOSE FOR GI-LLI
QUARTER 3 OF 2004 (mrem)TOTAL DOSE FOR BONETOTAL DOSE FOR LIVERTOTAL DOSE FOR TOTAL BODY
.TOTAL DOSE FOR THYROIDTOTAL DOSE FOR KIDNEYTOTAL DOSE FOR LUNGTOTAL DOSE FOR GI-LLI
QUARTER 4 OF 2004 (mrem)TOTAL DOSE FOR BONETOTAL DOSE FOR LIVERTOTAL DOSE FOR TOTAL BODYTOTAL DOSE FOR THYROIDTOTAL DOSE FOR KIDNEYTOTAL DOSE FOR LUNGTOTAL DOSE FOR GI-LLI
TOTALS FOR 2004 (mrem)TOTAL DOSE FOR BONETOTAL DOSE FOR LIVERTOTAL DOSE FOR TOTAL BODYTOTAL DOSE FOR THYROIDTOTAL DOSE FOR KIDNEYTOTAL DOSE FOR LUNGTOTAL DOSE FOR GI-LLI
7.27E-054.13E-024.13E-024.12E-024.13E-024.12E-024.1 3E-02
2.05E-043.68E-023.67E-023,65E-023,66E-023.65E-023.66E-02
6.07E-041.17E-011.17E-011.1 7E-011.17E-011.17E-011.17E-01
5.OOE+005.OOE+001.50E+005.OOE+005.OOE+005.00E+005.OOE+O0
5.OOE+005.OOE+001.50E+005.OOE+005.00E+005.00E+005.00E+00
1.OOE+011.00E+O13.00E+001.00E+011.OOE+011.00E+011.OOE+01
% OF LIMIT
4.12E-035.07E-011.68E+005.01 E-015.03E-015.01 E-015.04E-01
2.46E-032.81 E-019.32E-012.77E-012.78E-012.77E-012.78E-01
1.45E-038.26E-012.75E+008.24E-01:8.25E-018.25E-018.27E-01
4.1OE-037.36E-012.45E+007.30E-017.32E-017.31 E-017.33E-01
6.07E-031.17E+003.91 E+001.17E+001.17E+001.17E+001.17E+00
1. Based on ODCM Section 2.2, which restricts dose to the whole body to s 1.5 mRem per quarter and3.0 mRem per year. Dose restriction of any organ is -- 5.0 mRem per quarter and 10.0 mRem peryear.
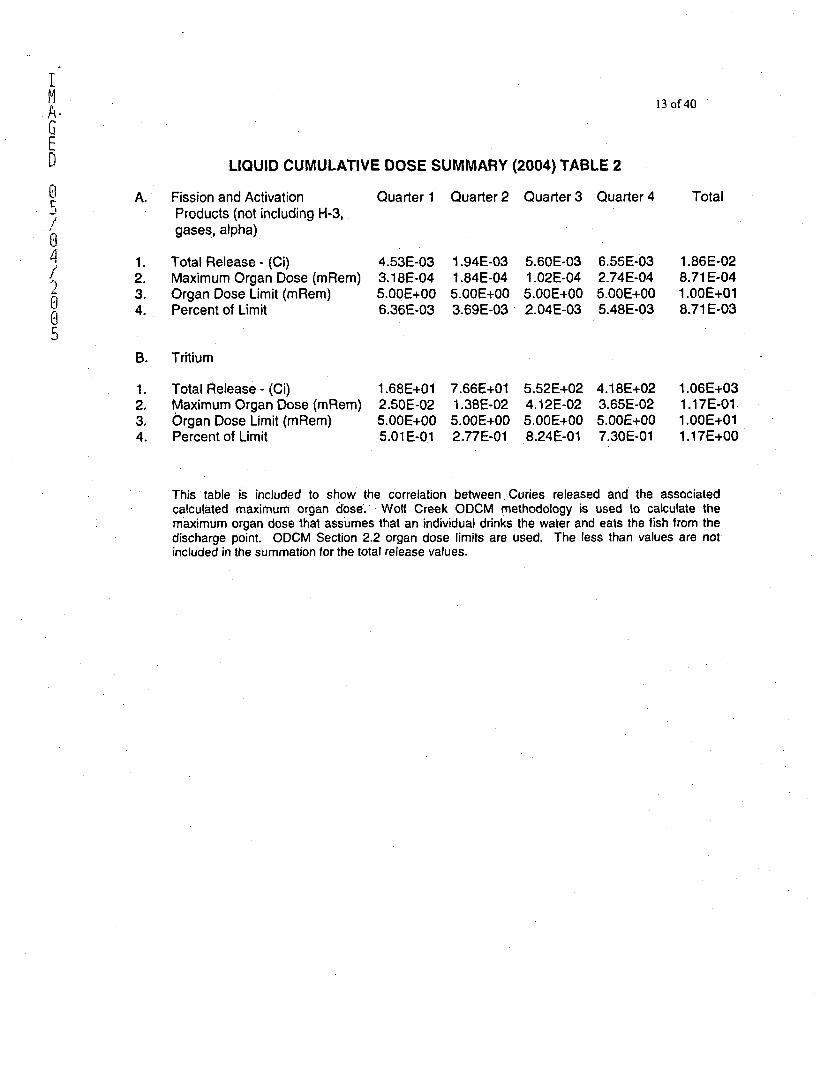
13 of 40A.
E[) LIQUID CUMULATIVE DOSE SUMMARY (2004) TABLE 2
U A. Fission and Activation Quarter I Quarter 2 Quarter 3 Quarter 4 TotalProducts (not including H-3,gases, alpha)
1. Total Release - (Ci) 4.53E-03 1.94E-03 5.60E-03 6.55E-03 1.86E-02/ 2. Maximum Organ Dose (mRem) 3.18E-04 1.84E-04 1.02E-04 2.74E-04 8.71 E-04L 3. Organ Dose Limit (mRem) 5.00E+00 5.OOE+00 5.OOE+00 5.OOE+00 1.00E+01
4. Percent of Limit 6.36E-03 3.69E-03, 2.04E-03 5.48E-03 8.71 E-03j
B. Tritium
1. Total Release - (Ci) 1.68E+01 7.66E+01 5.52E+02 4.18E+02 1.06E+032. Maximum Organ Dose (mRem) 2.50E-02 1.38E-02 4.12E-02 3.65E-02 1.17E-013. Organ Dose Limit (mRem) 5.OOE+00 5.OOE+00 5.OOE+00 5.OOE+00 1.OOE+014. Percent of Limit 5.01 E-01 2.77E-01 8.24E-01 7.30E-01 1.17E+00
This table is included to show the correlation between ,Curies released and the associatedcalculated maximum organ dose'. Wolf Creek ODCM methodology is used to calculate themaximum organ dose that assumes that an individual drinks the water and eats the fish from thedischarge point. ODCM Section 2.2 organ dose limits are used. The less than values are notincluded in the summation for the total release values.
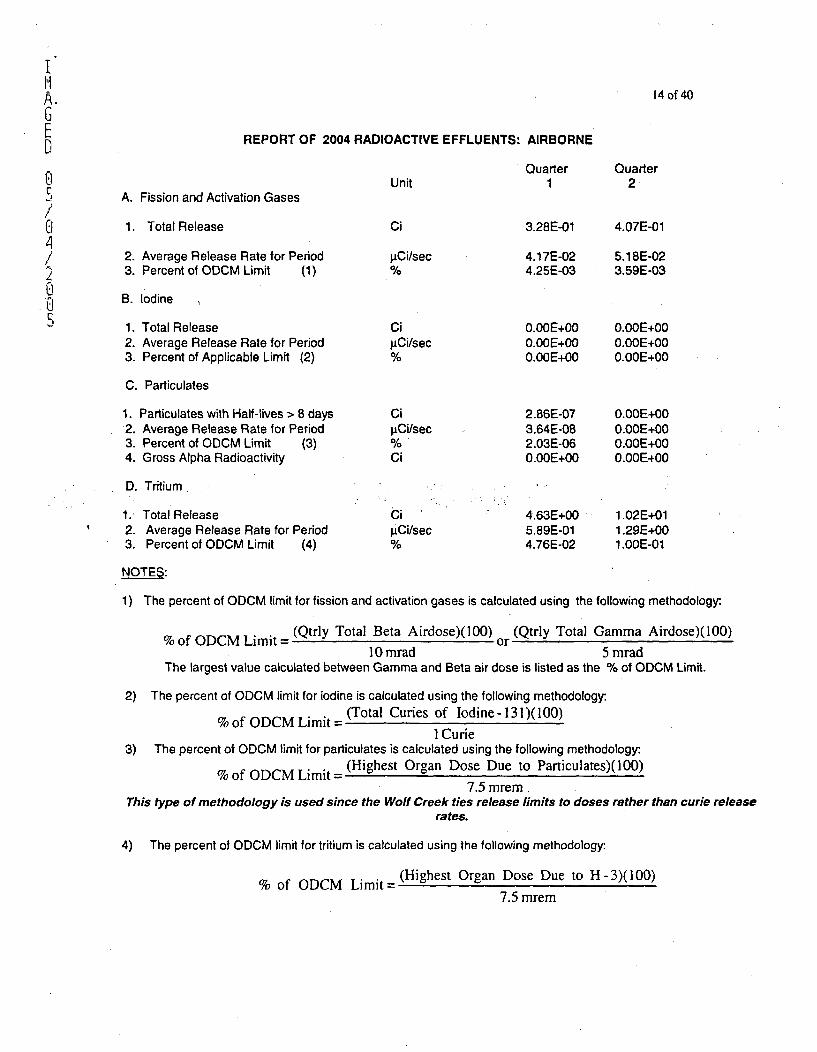
IA. 14 of 40GF REPORT OF 2004 RADIOACTIVE EFFLUENTS: AIRBORNE
Quarter QuarterO Unit 1 2
A. Fission and Activation Gases
0 1. Total Release Ci 3.28E-01 4.07E-01
2. Average Release Rate for Period pCi/sec 4.17E-02 5.18E-023. Percent of ODCM Limit (1) % 4.25E-03 3.59E-03
b-? B. Iodine
1 . Total Release Ci O.OOE+00 O.OOE+002. Average Release Rate for Period pCilsec O.OOE+00 O.OOE+003. Percent of Applicable Limit (2) % O.OOE+00 O.OOE+00
C. Particulates
1. Particulates with Half-lives > 8 days Ci 2.86E-07 O.OOE+002. Average Release Rate for Period pCi/sec 3.64E-08 O.OOE+003. Percent of ODCM Limit (3) % 2.03E-06 O.OOE+004. Gross Alpha Radioactivity Ci O.OOE+00 O.OOE+00
D. Tritium
1., Total Release Ci 4.63E+00 1.02E+012. Average Release Rate for Period p.Ci/sec 5.89E-01 1.29E+003. Percent of ODCM Limit (4) % 4.76E-02 1.00E-01
NOTES:
1) The percent of ODCM limit for fission and activation gases is calculated using the following methodology:.
% of ODCM Limit = (Qtrly Total Beta Airdose)(100) or (Qtrly Total Gamma Airdose)(100)10 mrad 5 mrad
The largest value calculated between Gamma and Beta air dose is listed as the % of ODCM Limit.
2) The percent of ODCM limit for iodine is calculated using the following methodology:
% of ODCM Limit= (Total Curies of Iodine- 131)(100)] Curie
3) The percent of ODCM limit for particulates is calculated using the following methodology:.
%of ODCM Limit= (Highest Organ Dose Due to Particulates)(100)7.5 mrem.
This type of methodology is used since the Wolf Creek ties release limits to doses rather than curie releaserates.
4) The percent of ODCM limit for tritium is calculated using the following methodology:.
% of ODCM Limit= (Highest Organ Dose Due to H-3)(100)7.5 mrem
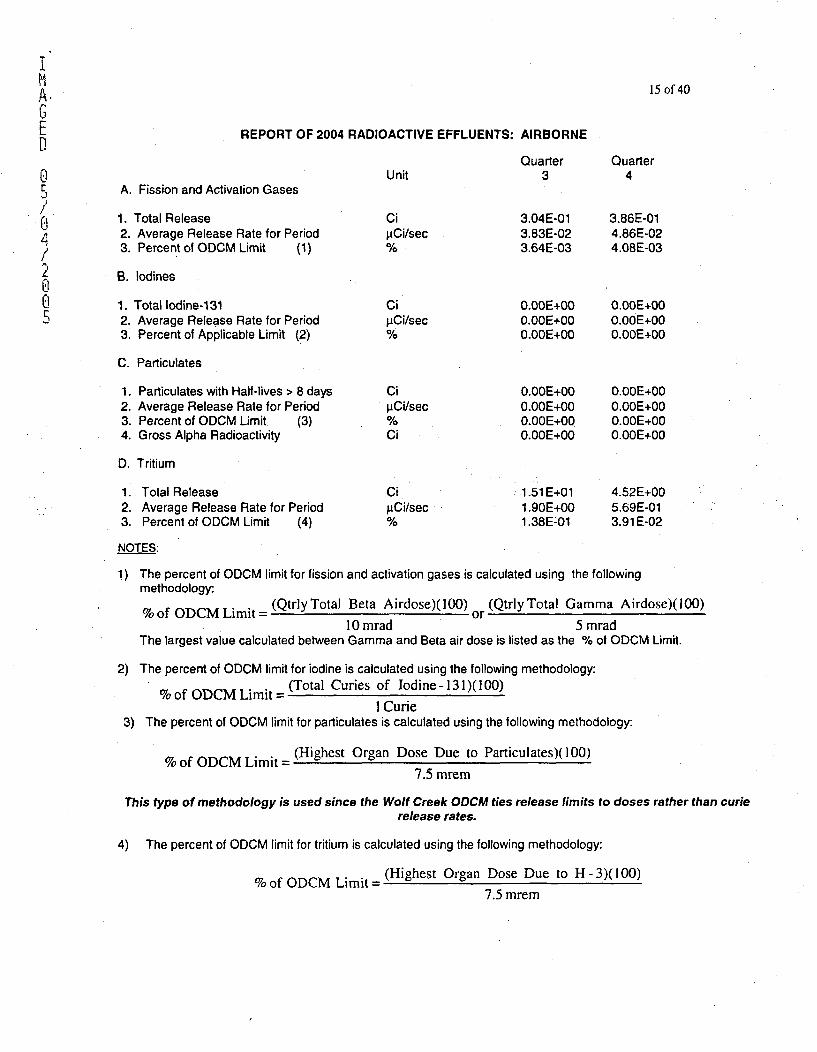
IA 15 of 40
GE REPORT OF 2004 RADIOACTIVE EFFLUENTS: AIRBORNED
Quarter Quarter0 Unit 3 4
A. Fission and Activation Gases
1. Total Release Ci 3.04E-01 3.86E-012. Average Release Rate for Period pCi/sec 3.83E-02 4.86E-023. Percent of ODCM Limit (1) % 3.64E-03 4.08E-03
B. lodines
- 1. Total Iodine-131 Ci 0.OOE+O0 O.OOE+002. Average Release Rate for Period piCi/sec O.OOE+00 O.OOE+003. Percent of Applicable Limit (2) % O.OOE+00 O.OOE+00
C. Particulates
1. Particulates with Half-lives > 8 days Ci 0.O0E+00 O.OOE+002. Average Release Rate for Period piCi/sec 0.OOE+00 0.OOE+003. Percent of ODCM Limit (3) % O.OOE+00 O.OOE+004. Gross Alpha Radioactivity Ci 0.OOE+00 O.OOE+00
D. Tritium
1.. Total Release Ci 1.51E+01 4.52E+002. Average Release Rate for Period pCi/sec 1.90E+00 5.69E-013. Percent of ODCM Limit (4) % 1.38E:01 3.91 E-02
NOTES:
1) The percent of ODCM limit for fission and activation gases is calculated using the followingmethodology.%of ODCM Limit= (Qtrly Total Beta Airdose)(100) (Qtrly Total Gamma Airdose)(100)
orl0 mrad 5 mrad
The largest value calculated between Gamma and Beta air dose is listed as the % of ODCM Limit.
2) The percent of ODCM limit for iodine is calculated using the following methodology:
% of ODCM Limit= (Total Curies of Iodine- 131)(100)1 Curie
3) The percent of ODCM limit for particulates is calculated using the following methodology:
% of ODCM Limit = (Highest Organ Dose Due to Particulates)( 100)
7.5 mrem
This type of methodology is used since the Wolf Creek ODCM ties release limits to doses rather than curierelease rates.
4) The percent of ODCM limit for tritium is calculated using the following methodology:
%of ODCM Limit= (Highest Organ Dose Due to H-3)(100)7.5 mrem
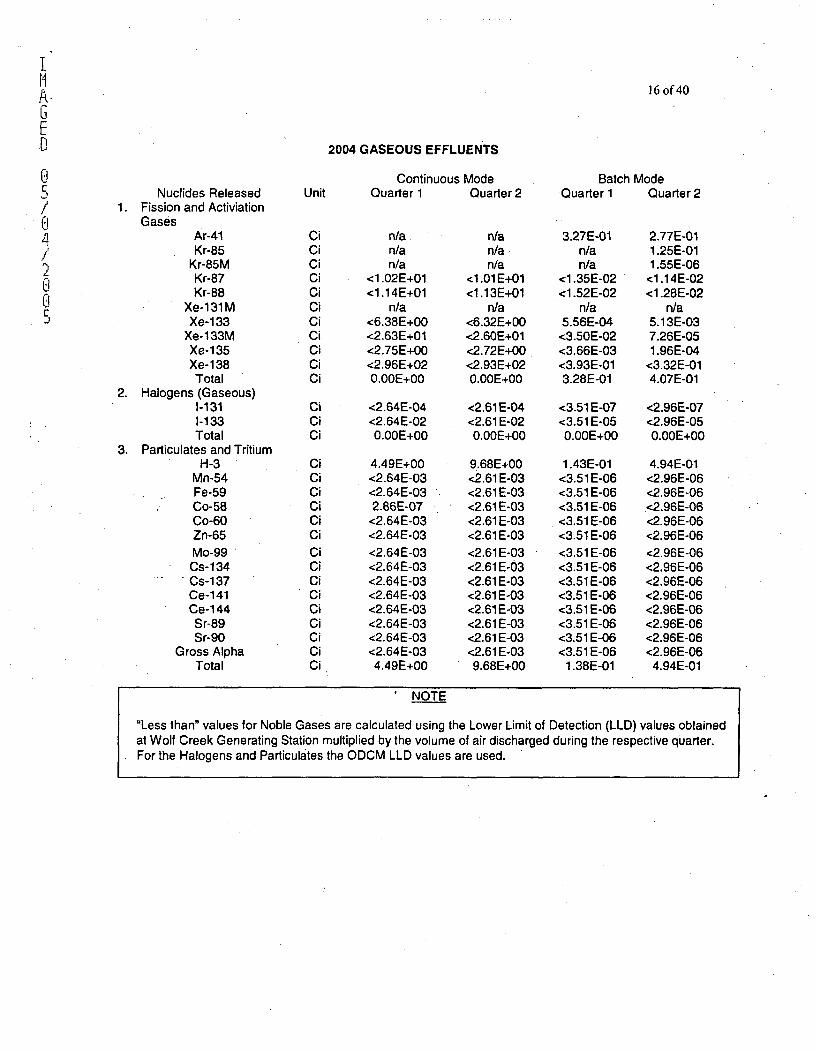
16 of 40
E0 2004 GASEOUS EFFLUENTS
Continuous Mode Batch ModeNuclides Released Unit Quarter 1 Quarter 2 Quarter 1 Quarter 2
1. Fission and Activiation(i Gases
Ar-41 Ci n/a n/a 3.27E-01 2.77E-01/ Kr-85 Ci n/a n/a n/a 1.25E-01
Kr-85M Ci n/a n/a n/a 1.55E-06Kr-87 Ci <1.02E+01 <1.01E+01 <1.35E-02 <1.14E-02Kr-88 Ci <1.14E+01 <1.13E+01 <1.52E-02 <1.28E-02
U Xe-131M Ci n/a n/a n/a n/aXe-133 Ci <6.38E+00 <6.32E+00 5.56E-04 5.13E-03
Xe-133M Ci <2.63E+01 <2.60E+01 <3.50E-02 7.26E-05Xe-135 Ci <2.75E+00 <2.72E+00 <3.66E-03 1.96E-04Xe-138 Ci <2.96E+02 <2.93E+02 <3.93E-01 <3.32E-01Total Ci O.OOE+00 O.OOE+00 3.28E-01 4.07E-01
2. Halogens (Gaseous)1-131 Ci <2.64E-04 <2.61 E-04 <3.51 E-07 <2.96E-071-133 Ci <2.64E-02 <2.61 E-02 <3.51 E-05 <2.96E-05Total Ci O.OOE+00 O.OOE+00 O.OOE+00 O.OOE+00
3. Particulates and TritiumH-3 Ci 4.49E+00 9.68E+00 1.43E-01 4.94E-01
Mn-54 Ci <2.64E-03 <2.61 E-03 <3.51 E-06 <2.96E-06Fe-59 Ci <2.64E-03 <2.61 E-03 <3.51 E-06 <2.96E-06Co-58 Ci 2.86E-07 <2.61 E-03 <3.51 E-06 <2.96E-06Co-60 Ci <2.64E-03 <2.61 E-03 <3.51 E-06 <2.96E-06Zn-65 Ci <2.64E-03 <2.61E-03 <3,51E-06 <2.96E-06Mo-99 Ci <2.64E-03 <2.61 E-03 <3,51 E-06 <2.96E-06Cs-134 Ci <2.64E-03 <2.61 E-03 <3.51 E-06 <2.96E-06Cs-1 37 Ci <2.64E-03 <2.61 E-03 <3.51 E-06 <2.96E-06Ce-141 Ci <2.64E-03 <2.61 E-03 <3.51 E-06 <2.96E-06Ce-144 Ci <2.64E-03 <2.61E-03 <3.51 E-06 <2.96E-06Sr-89 Ci <2.64E-03 <2.61E-03 <3.51E-06 <2.96E-06Sr-90 Ci <2.64E-03 <2.61E-03 <3.51E-06 <2.96E-06
Gross Alpha Ci <2.64E-03 <2.61 E-03 <3.51 E-06 <2.96E-06Total Ci 4.49E+00 9.68E+00 1.38E-01 4.94E-01
I NOTE
"Less than" values for Noble Gases are calculated using the Lower Limit of Detection (LLD) values obtainedat Wolf Creek Generating Station multiplied by the volume of air discharged during the respective quarter.For the Halogens and Particulates the ODCM LLD values are used.
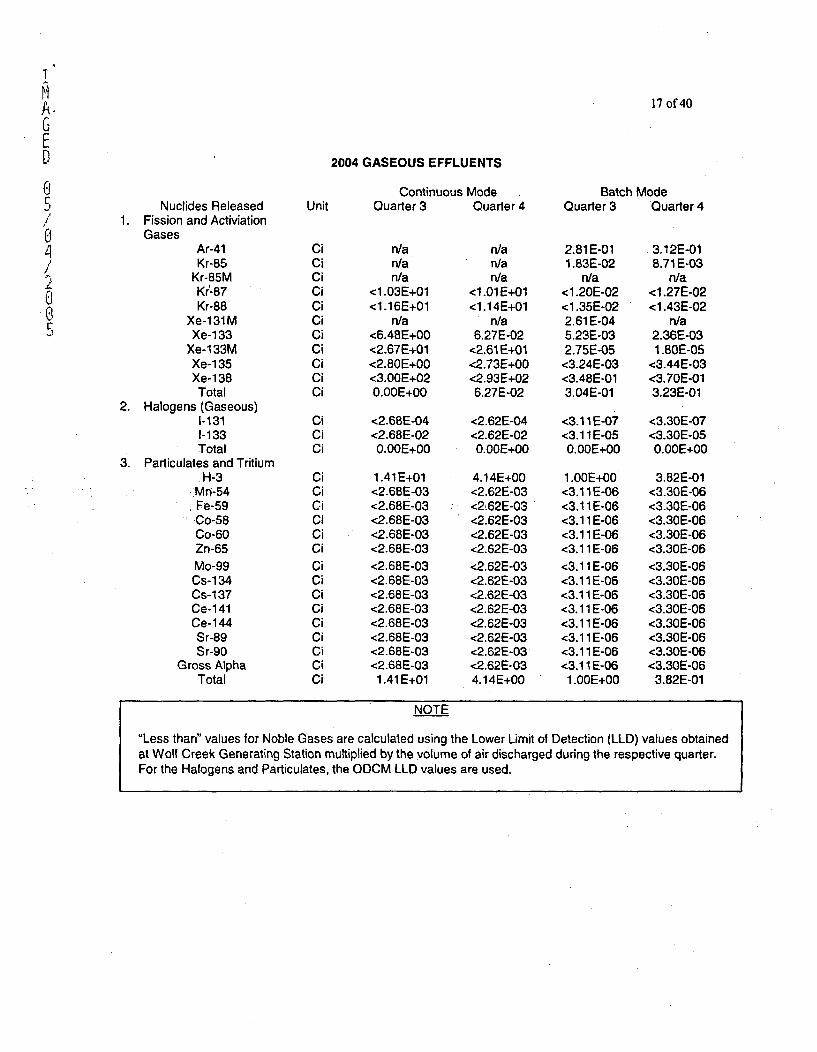
I17 of 4OA.
GEE 2004 GASEOUS EFFLUENTS
O Continuous Mode Batch ModeNuclides Released Unit Quarter 3 Quarter 4 Quarter 3 Quarter 4
1. Fission and ActiviationCi Gases
Ar-41 Ci n/a n/a 2.81 E-01 3.12E-01Kr-85 Ci n/a n/a 1.83E-02 8.71 E-03
Kr-85M Ci n/a n/a n/a n/a2 Kr'-87 Ci <1.03E+01 <1.01 E+01 <1.20E-02 <1.27E-02Kr-88 Ci <1.16E+01 <1.14E+01 <1.35E-02 <1.43E-02
0 Xe-131M Ci n/a n/a 2.61E-04 n/aXe-1 33 Ci <6.48E+00 6.27E-02 5.23E-03 2.36E-03
Xe-133M Ci <2.67E+01 <2.61 E+01 2.75E-05 1.80E-05Xe-1 35 Ci <2.80E+00 <2.73E+00 <3.24E-03 <3.44E-03Xe-1 38 Ci <3.OOE+02 <2.93E+02 <3.48E-01 <3.70E-01Total Ci 0.00E+00 6.27E-02 3.04E-01 3.23E-01
2. Halogens (Gaseous)1-131 Ci <2.68E-04 <2.62E-04 <3.11 E-07 <3.30E-07
.1-133 Ci <2.68E-02 <2.62E-02 <3.11E-05 <3.30E-05
.Total Ci 0.00E+00 0.00E+00 0.00E+00 0.00E+003. Particulates and Tritium
H-3 Ci 1.41E+01 4.14E+00 1.00E+00 3.82E-01Mn-54 Ci <2.6BE-03 <2.62E-03 <3.11 E-06 <3.30E-06Fe-59 Ci <2.68E-03 <2..62E-03 <3.11E-06 <3.30E-06Co-58 Ci <2.68E-03 <2.62E-03 <3.11E-06 <3.30E-06Co-60 Ci <2.68E-03 <2.62E-03 <3.11E-06 <3.30E-06Zn-65 Ci <2.68E-03 <2.62E-03 <3.11E-06 <3.30E-06Mo-99 Ci <2.68E-03 <2.62E-03 <3.11E-06 <3.30E-06Cs-134 Ci <2.68E-03 <2.62E-03 <3.11E-06 <3.30E-06Cs-137 Ci <2.68E-03 <2.62E-03 <3.11E-06 <3.30E-06Ce-1 41 Ci <2.68E-03 <2.62E-03 <3.11E-06 <3.30E-06Ce-144 Ci <2.68E-03 <2.62E-03 <3.11E-06 <3.30E-06Sr-89 Ci <2.68E-03 <2.62E-03 <3.11E-06 <3.30E-06Sr-90 Ci <2.68E-03 <2.62E-03 <3.11 E-06 <3.30E-06
Gross Alpha Ci <2.68E-03 <2.62E-03 <3.11 E-06 <3.30E-06Total Ci 1.41 E+01 4.14E+00 1.00E+00 3.82E-01
NOTE
"Less than" values for Noble Gases are calculated using the Lower Limit of Detection (LLD) values obtained
at Wolf Creek Generating Station multiplied by the volume of air discharged during the respective quarter.For the Halogens and Particulates, the ODCM LLD values are used.
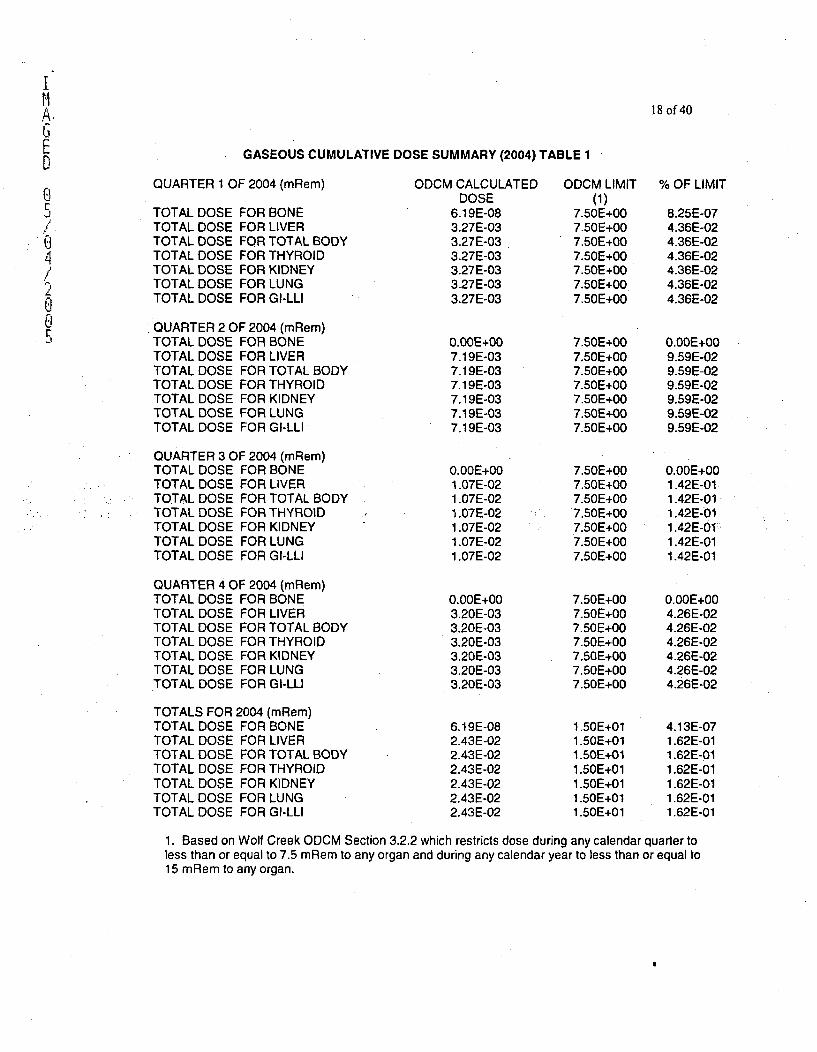
IIiA.GEU
0
0.e1/
0
18 of 40
GASEOUS CUMULATIVE DOSE SUMMARY (2004) TABLE 1
QUARTER 1 OF 2004 (mRem)
TOTAL DOSETOTAL DOSETOTAL DOSETOTAL DOSETOTAL DOSETOTAL DOSETOTAL DOSE
FOR BONEFOR LIVERFOR TOTAL BODYFOR THYROIDFOR KIDNEYFOR LUNGFOR GI-LLI
ODCM CALCULATEDDOSE
6.19E-083.27E-033.27E-033.27E-033.27E-033.27E-033.27E-03
0.OOE+007.19E-037.19E-037.19E-037.19E-037.19E-037.19E-03
ODCM LIMIT(1)
7.50E+007.50E+007.50E+007.50E+007.50E+007.50E+007.50E+00
7.50E+007.50E+007.50E+007.50E+007.50E+007.50E+007.50E+00
QUARTER 2 OF 2004 (mRem)TOTAL DOSE FOR BONETOTAL DOSE FOR LIVERTOTAL DOSE FOR TOTAL BODYTOTAL DOSE FOR THYROIDTOTAL DOSE FOR KIDNEYTOTAL DOSE FOR LUNGTOTAL DOSE FOR GI-LLI
QUARTER 3 OF 2004 (mRem)TOTAL DOSE FOR BONETOTAL DOSE FOR LIVERTOTAL DOSE FOR TOTAL BODYTOTAL DOSE FOR THYROIDTOTAL DOSE FOR KIDNEYTOTAL DOSE FOR LUNGTOTAL DOSE FOR GI-LLI
QUARTER 4 OF 2004 (mRem)TOTAL DOSE FOR BONETOTAL DOSE FOR LIVERTOTAL DOSE FOR TOTAL BODYTOTAL DOSE FOR THYROIDTOTAL DOSE FOR KIDNEYTOTAL DOSE FOR LUNGTOTAL DOSE FOR GI-LLI
TOTALS FOR 2004 (mRem)TOTAL DOSE FOR BONETOTAL DOSE FOR LIVERTOTAL DOSE FOR TOTAL BODYTOTAL DOSE FOR THYROIDTOTAL DOSE FOR KIDNEYTOTAL DOSE FOR LUNGTOTAL DOSE FOR GI-LLI
0.OOE+001.07E-021.07E-021.07E-021 .07E-021.07E-021.07E-02
0.OOE+003.20E-033.20E-033.20E-033.20E-033.20E-033.20E-03
6.19E-082.43E-022.43E-022.43E-022.43E-022.43E-022.43E-02
7.50E+007.50E+007.50E+007.50E+007.50E+007.50E+007.50E+00
7.50E+007.50E+007.50E+007.50E+007.50E+007.50E+007.50E+00
1.50E+011.50E+011.50E+011.50E+011.50E+011.50E+011.50E+01
% OF LIMIT
8.25E-074.36E-024.36E-024.36E-024.36E-024.36E-024.36E-02
0.OOE+009.59E-029.59E-029.59E-029.59E-029.59E-029.59E-02
O.OOE+001.42E-011.42E-011.42E-011.42E-011.42E-011.42E-01
0.OOE+004.26E-024.26E-024.26E-024.26E-024.26E-024.26E-02
4.13E-071.62E-011.62E-011.62E-011.62E-011.62E-011.62E-01
1. Based on Wolf Creek ODCM Section 3.2.2 which restricts dose during any calendar quarter toless than or equal to 7.5 mRem to any organ and during any calendar year to less than or equal to15 mRem to any organ.
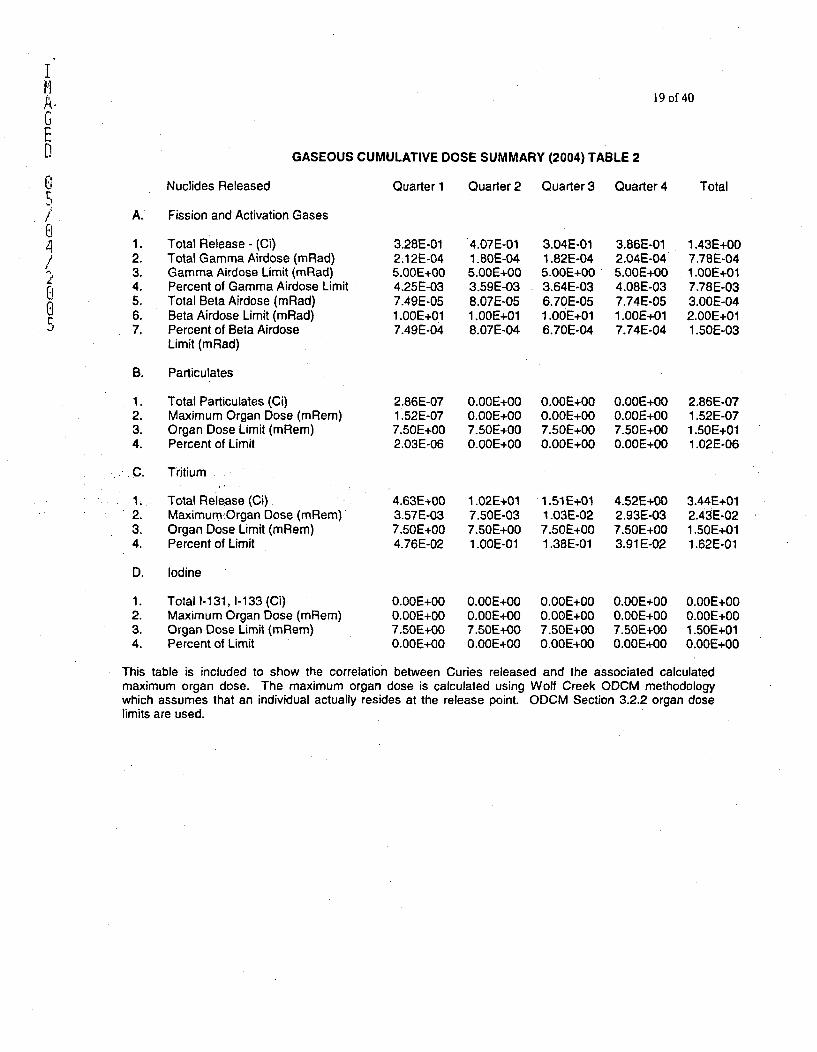
IA. 19 of 40
GE[] GASEOUS CUMULATIVE DOSE SUMMARY (2004) TABLE 2
U Nuclides Released Quarter 1 Quarter 2 Quarter 3 Quarter 4 Total
/ A. Fission and Activation Gases
,4 1. Total Release - (Ci) 3.28E-01 4.07E-01 3.04E-01 3.86E-01 1.43E+00/ 2. Total Gamma Airdose (mRad) 2.12E-04 1.80E-04 1.82E-04 2.04E-04 7.78E-04
3. Gamma Airdose Limit (mRad) 5.OOE+00 5.00E+00 5.00E+00 5.OOE+00 1.OOE+01o 4. Percent of Gamma Airdose Limit 4.25E-03 3.59E-03 3.64E-03 4.08E-03 7.78E-03o 5, Total Beta Airdose (mRad) 7.49E-05 8.07E-05 6.70E-05 7.74E-05 3.OOE-046. Beta Airdose Limit (mRad) 1.OOE+01 1.OOE+01 1.00E+01 1.OOE+01 2.OOE+01
- 7. Percent of Beta Airdose 7.49E-04 8.07E-04 6.70E-04 7.74E-04 1.50E-03Limit (mRad)
B. Particulates
1. Total Particulates (Ci) 2.86E-07 0.OOE+00 0.00E+00 0.OOE+00 2.86E.072. Maximum Organ Dose (mRem) 1.52E-07 0.OOE+00 O.OOE+00 0.OOE+00 1.52E-073. Organ Dose Limit (mRem) 7.50E+00 7.50E+00 7.50E+00 7.50E+00 1.50E+014. Percent of Limit 2.03E-06 0.OOE+00 O.OOE+00 0.OOE+00 1.02E-06
-C. Tritium
1. Total Release (Ci). 4.63E+00 1.02E+01 1.51 E+01 4.52E+00 3.44E+012. MaximumýOrgan Dose (mRem) 3.57E-03 7.50E-03 1.03E-02 2.93E-03 2.43E-023. Organ Dose Limit (mRem) 7.50E+00 7.50E+00 7.50E+00 7.50E+00 1.50E+014. Percent of Limit 4.76E-02 1.OOE-01 1.38E-01 3.91 E-02 1.62E-01
D. Iodine
1. Total 1-131, 1-133 (Ci) 0.OOE+00 0.OOE+00 0.OOE+00 0.OOE+00 0.OOE+002. Maximum Organ Dose (mRem) 0.00E+00 0.00E+00 0.OOE+00 0.OOE+00 0.OOE+003. Organ Dose Limit (mRem) 7.50E+00 7.50E÷00 7.50E+00 7.50E+00 1.50E+014. Percent of Limit 0.OOE+00 0.OOE+00 O.OOE+00 0.OOE+00 0.OOE+00
This table is included to show the correlation between Curies released and the associated calculatedmaximum organ dose. The maximum organ dose is calculated using Wolf Creek ODCM methodologywhich assumes that an individual actually resides at the release point. ODCM Section 3.2.2 organ doselimits are used.
I" 20 of 40
E SECTION IIDSUPPLEMENTAL INFORMATION
1. Offsite Dose Calculation Manual Limits
WA. For liqUid waste effluents
A.1 The concentration of radioactive material released in liquid effluents toUNRESTRICTED AREAS shall be limited to the concentrations specified in 10 CFR 20,Appendix B, Table II, Column 2, for radionuclides other than dissolved or entrainednoble rases. For dissolved or entrained noble gases, the concentration shall be limited to2 x 10Y microCuries/ml total activity.
A.2 The dose or dose commitment to a MEMBER OF THE PUBLIC from radioactivematerials in liquid effluents released, from each unit, to UNRESTRICTED AREAS shallbe limited:
a. During any calendar quarter to less than or equal to 1.5 mrems to the whole body andto less than or equal to 5 mrems to any organ, and
b. During any calendar year to less than or equal to 3 mrems, to the whole body and toless than or equal to 10 mrems to any organ.
B. For gaseous waste effluents
B.1 The dose rate due to radioactive material released in gaseous effluents from the site toarea at and beyond the SITE BOUNDARY shall be limited to the following:
a. For noble gases: Less than or equal to 500 mrems/yr to the whole body and less thanor equal to 3000 mrems/yr to the skin, and
b. For Iodine-i131, Iodine-133, tritium, and all radionuclides in particulate form with half-lives greater than 8 days: Less than or equal to 1500 mrems/yr to any organ.
B.2 The air dose due to noble gases released in gaseous effluents, from each unit, to areas atand beyond the SITE BOUNDARY shall be limited to the following:
a. During any calendar quarter: Less than or equal to 5 mrads for gamma radiation andless than or equal to 10 mrads for beta radiation, and
b. During any calendar year. Less than or equal to 10 mrads for gamma radiation andless than or equal to 20 mrads for beta radiation.
B.3 The dose from Iodine-131, Iodine-133, tritium, and a radionuclide in particulate formwith half-lives greater than 8 days in gaseous effluents released to area at and beyond theSITE BOUNDARY shall be limited to the following:
a. During any calendar quarter: Less than or equal to 7.5 mrems to any organ, and
b. During any calendar year. Less than or equal to 15 mrems to any organ.
2. Effluent Concentration Limits (ECLs)
Water - covered in Section I.A.Air - covered in Section I.B.
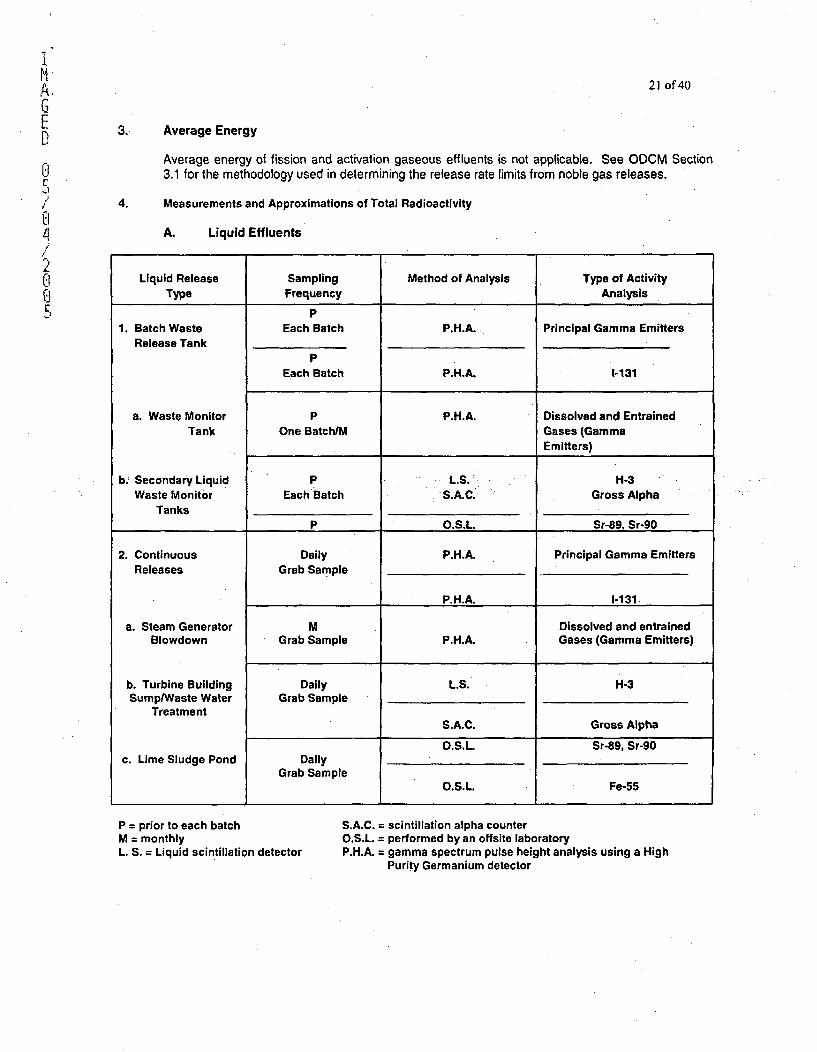
A.
ED
C
2i
0:
21 of 40
3. Average Energy
Average energy of fission and activation gaseous effluents is not applicable. See ODCM Section3.1 for the methodology used in determining the release rate limits from noble gas releases.
4. Measurements and Approximations of Total Radioactivity
A. Liquid Effluents.
Liquid Release Sampling Method of Analysis Type of ActivityType Frequency Analysis
P1. Batch Waste Each Batch P.H.A. Principal Gamma Emitters
Release Tank
PEach Batch P.H.A. 1-131
a. Waste Monitor P P.H.A. Dissolved and EntrainedTank One Batch/M Gases (Gamma
Emitters)
b. Secondary Liquid P L.S. H-3Waste Monitor Each Batch S.A.C. Gross Alpha
TanksP O.S.L. Sr-89. Sr-90
2. Continuous Daily P.H.A. Principal Gamma EmittersReleases Grab Sample
P.H.A. 1-131
a. Steam Generator M Dissolved and entrainedBlowdown Grab Sample P.H.A. Gases (Gamma Emitters)
b. Turbine Building Daily L.S. H-3SumplWaste Water Grab Sample
TreatmentS.A.C. Gross Alpha
O.S.L. Sr-89, Sr-90c. Lime Sludge Pond Daily
Grab SampleO.S.L. Fe-55
P = prior to each batchM = monthlyL. S. = Liquid scintillation detector
S.A.C. = scintillation alpha counterO.S.L. = performed by an offsite laboratoryP.H.A. = gamma spectrum pulse height analysis using a High
Purity Germanium detector
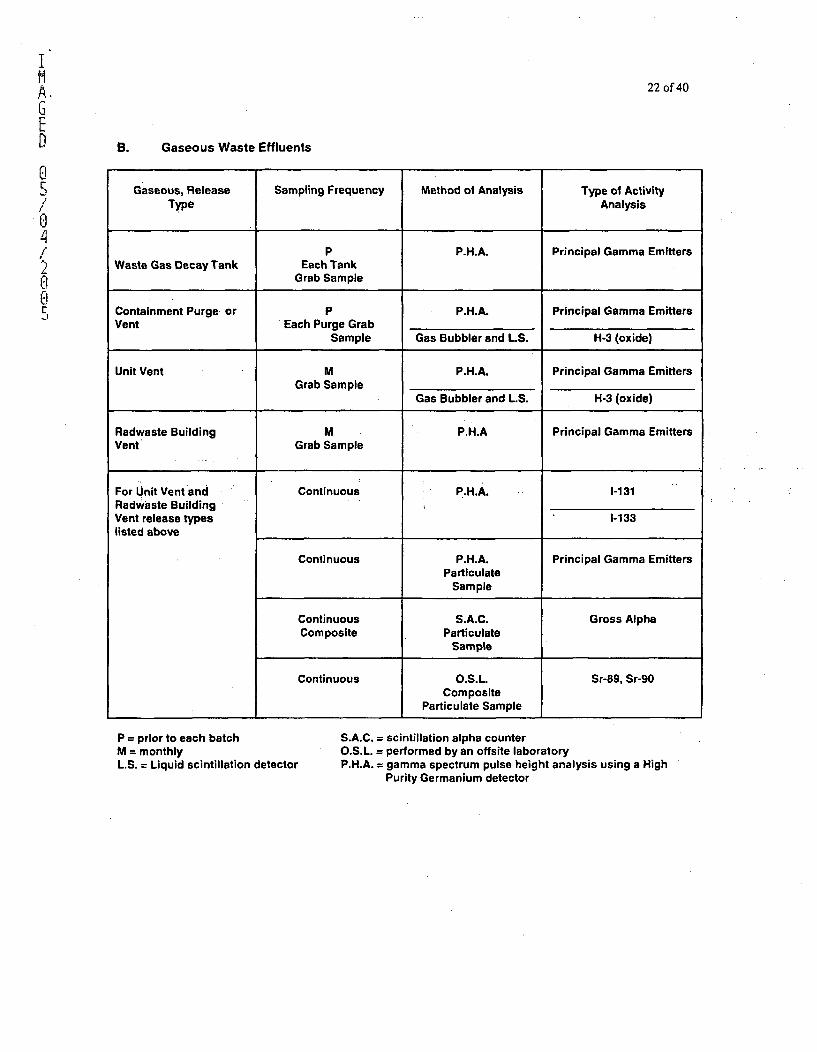
A~.
GE
0
0
22 of 40
B. Gaseous Waste Effluents
Gaseous, Release Sampling Frequency Method of Analysis Type of ActivityType Analysis
P P.H.A. Principal Gamma EmittersWaste Gas Decay Tank Each Tank
Grab Sample
Containment Purge or P P.H.A. Principal Gamma EmittersVent Each Purge Grab
Sample Gas Bubbler and L.S. H-3 (oxide)
Unit Vent M P.H.A. Principal Gamma EmittersGrab Sample
Gas Bubbler and L.S. H-3 (oxide)
Radwaste Building M P.H.A Principal Gamma EmittersVent Grab Sample
For Unit Vent and Continuous P.H.A. 1-131Radwaste BuildingVent release types 1-133listed above
Continuous P.H.A. Principal Gamma EmittersParticulate
Sample
Continuous S.A.C. Gross AlphaComposite Particulate
Sample
Continuous O.S.L. Sr-89, Sr-90Composite
Particulate Sample
P = prior to each batchM = monthlyL.S. = Liquid scintillation detector
S.A.C. = scintillation alpha counterO.S.L. = performed by an offsite laboratoryP.H.A. = gamma spectrum pulse height analysis using a High
Purity Germanium detector
IiA. 23 of 40GE 5. Batch ReleasesD
A batch release is the discontinuous release of gaseous or liquid effluents which takesplace over a finite period of time; usually hours or days.
There were 67 gaseous batch releases during the reporting period. The longest gaseousU batch release lasted 522 minutes, while the shortest lasted 42 minutes. The average
release lasted 178 minutes with a total gaseous batch release time of 11,899 minutes./
There were 58 liquid batch releases during the reporting period. The longest liquid batchC_1 release lasted 265 minutes, while the shortest lasted 29 minutes. The average releaseUlasted 156 minutes with a total liquid batch release time of 8,981 minutes.
6. Continuous Releases
A continuous release is a release of gaseous or liquid effluent, which is essentiallyuninterrupted for extended periods during normal operation of the facility. Four liquidrelease pathways were designated as continuous releases during this reporting period:Steam Generator Blowdown, Turbine Building Sump, Waste Water Treatment, and LimeSludge Pond. Two gas release pathways were designated as continuous releases: UnitVent and Radwaste Building Vent.
7. Doses to a Member of the Public from Activities Inside the Site Boundary
Four activities by members of the public were considered in this evaluation: personnelmaking deliveries to the plant, workers at the William Allen White Building located outsideof the restricted area, the use of the access road south of the Radwaste Building, andpublic use of the cooling lake during times when fishing was allowed. The dose calculatedfor the maximum exposed individual for these four activities was as follows:
Plant Deliveries 2.63E-01 mRemWilliam Allen White Building Workers 5.91 E-03 mRemAccess Road Users 2.69E-03 mRemLake Use 3.66E-02 mRem
The plant delivery calculations were based on deliveries 3 hours per week for 50 weeksper year. The William Allen White Building occupancy was based on normal workinghours of 2000 per year. The usage factor for the access road south of the RadwasteBuilding was 25 hours per year. The dose to fishermen on the lake was based upon 3840hours (12 hours a day for 320 days, based on the number of days that the lake was opento fisherman). Pathways used in the calculation were gaseous inhalation, submersion,and ground plane. All calculations were performed in accordance with the methodologyand parameters in the ODCM.
8. Additional Information
PIR 2003-2580 - This PIR is being included as a follow-up from the 2004 AnnualReport. Several months' filters were sent to Sherry Laboratories for vendor analysis ofboron and iron to establish a baseline for results. All results were sent to engineering forevaluation. At the request of engineering, several new filters, all from different lots, weresent to the vendor for comparison. Following the return of these results from the vendor,engineering determined that the establishment of a baseline for boron and iron on sample
IA. 24 of 4O
GE filters was not feasible. Engineering recommended that the iron and/or boron content ofD exposed radiation monitor filters not be used as a first indication for RCS leakage.
0! Instead, isotopic analyses should be used, considering both total activity and isotopespresent. Changes were made to chemistry procedures AP 02-002, ChemistrySurveillance Program, and AP 02-003, Chemistry Specification Manual, to providenecessary guidance to ensure any potential RCS leakage be quickly assessed.
/1 PIR 2003-3253 - This PIR is being included due to an omission from the 2004 Annual2Report. On 10-29-03, a Turbine Building Sump composite was prepared and analyzed2j based on calculations performed on excel spreadsheet, AIF 07B-020-02. The
01 spreadsheet did not account for the hour gain due to daylight savings time andincorrectly calculated the discharge volume. The composite volume for the TurbineBuilding Sump was corrected for the end of daylight savings time, and other compositeswere reviewed to ensure the program error did not occur with them. Not including the60-minute difference had virtually no impact, as there was an insignificant difference(<0.5%) in the volume used for the total composite volume. A change was made tochemistry procedure Al 07B-020, Instructions for Composite Preparation, informing theuser that daylight savings corrections need to be performed manually.
PIR 2004-0037 - For the week of 11-5 through 11-11-03, the Turbine Building Sump(TBS) weekly composite did not contain a required sample. For the week of 11-12through 11-18-03, the Waste Water Treatment (WWT) weekly composite did not containa required sample. Both instances resulted in improperly performed Offsite DoseCalculation Manual (ODCM) surveillances. Both instances happened during RefuelingOutage 13. The TBS miss occurred due to' miscommunication about the ucomposite•week". Discussions between technicians resulted in the daily composite, pulled 11-5-03, not being added to the weekly composite. The review of appropriate paperwork wasdone improperly and that daily composite remained on the shelf. The omission wasquestioned but not resolved. The WWT miss also occurred due to miscommunicationbetween Chemistry and Operations, as well as within Chemistry itself. A sample of the Bbasin was pulled 11-11-03 and saved for composite. That basin was held for three daysprior to release due to a circ water outage. There was confusion between groups as towhich basin had actually been sampled, and information about that was apparentlyrecorded incorrectly. The result was that the composite for B basin, pulled 11-11 andreleased 11-14-03, was not included in the weekly composite. The volumes for bothweekly composites were corrected and corresponding release permits edited to correctdischarge volumes and total curies released. Several procedure changes were made toaddress daily compositing, defining the composite week, and changing the compositereview and verification process. In addition, the problems and resolutions identified inthis PIR were reviewed with all technicians face to face.
PIR 2004-0620 - The MET tower did not meet the 90% data recovery availability for2003 required by Reg Guide 1.23, "Meteorological Programs in Support of NuclearPower Plants." The actual availability was 84.4 %. The lower availability was due toinstrument malfunction or the computer or computer link/modem being unavailable. Achange package (09882) was implemented to replace instrumentation on the MET tower.Meteorological instrumentation was replaced by mid-August 2004 to improve availability.
2004-1096 - On April 16, 2004, while recircing Waste Gas Decay Tank (WGDT) #6, thetank pressure was noticed to be decreasing by Operations. After investigating, it wasdetermined that the pressure loss was accounted for by an increase in WGDT #8. The
II25 of 40A.
GE result of the pressure transfer did not affect any ongoing operations. DuringEl troubleshooting, it was determined that HA V-1032F, Compensating Seal Make-up Valve
o solenoid, was not operating properly. That valve was replaced, tested, and foundoperating properly. However, a pressure change between #6 and #8 was still observed.It was then determined that the transfer appeared to be a result of the Waste Gas
* Compressor B moisture separator relief valve leaking by the valve seat, which may have0] been a result of the previously bad solenoid valve. A workorder was issued to replace
the moisture separator relief.
2004-1235 - During the Quick Hit Assessment (04-153) of high ammonia chemistry, itwas discussed that there was no clear determination on the effect of the ZERO system ifhigh concentrations of ethanolamine (ETA) water are found to be leaking into the DirtyRadwaste System (DRW) from the Blowdown system. Discussions were held withDiversified Technologies Services (DTS) chemical engineer, who was contacted foradvice on processing liquid waste containing ammonia and/or ETA. The DTS position isthat the SRO unit will reject the ETA, which will result in this chemical being concentratedin the reject waste stream. It will then be concentrated as a dry solid waste in the DrumDryer prior to disposal. ETA concentrations should not impact the existing liquid wasteprocessing systems.
2004-1287 - While preparing a liquid release permit for Waste Monitor Tank A (THB07A)on May 6, 2004, it was discovered that radiation monitor HBRE-18 was inoperable.
...Chemistry had not been notified of the monitor inoperability. The ODCM requires at leasttwo independent samples be analyzed and at least two qualified individuals verify releaserates and valve lineup with an inoperable monitor. In addition Chemistry is required toinitiate APF 02-007-01, HBRE-18 Operability. The inoperability was due to a loss ofcommunication between the RM1 1 and HBRE-18. Upon investigation, it was reportedthat the monitor was functioning properly locally. Due to the fact that it was operatinglocally and there was no release actually in progress, the Control Room Supervisor didnot consider the monitor inoperable and no actions were taken. After furtherinvestigation, it was recognized that notification should have been made. Themiscommunication resulted in unnecessary delays in permit preparation and additionalunscheduled work for Chemistry.
2004-1410 - The ODCM, submitted as an attachment to the 2003 Annual EffluentReport, contains a statement that information contained in appendix B of attachment A is"proprietary information provided by SAL." This is a concern because the NuclearRegulatory Commission (NRC) cannot put information identified as proprietary in thepublic domain, and they cannot withhold the information without the appropriatedocumentation describing what is proprietary and why. This phrase has been included inthe ODCM since revision 0 was released because the ODCM receives its own review aspart of revision process and is only an attachment to the report. The statement is notappropriate and there is no concern with prior submittals, but the NRC requested that the2004 report be corrected so it can be handled properly. Following investigation, itappeared that the statement may have been inappropriately "cut and pasted" along withthe data in this appendix but is not proprietary to SAL. The conclusion was that thestatement could be removed without violating any agreement or rights of SAL. AP 07B-003, ODCM, was revised to remove the "proprietary information" label from thedocument. It was released 9-29-04. In addition, letter RA 04-0119 was submitted to theNRC on 10-13-04 to provide them with the revised version of the Annual Reportcontaining the revised ODCM.
I(I' A, 26 of 40
GED 2004-2087 - On August 13, 2004, the channel checks for Containment Atmosphere
radiation monitors GTRE-31 and GTRE-32 were not performed as required bySurveillance Requirements between 1100 and 1900 hours. This is considered to be amissed surveillance in accordance with Surveillance Requirement (SR) 3.0.3. The
* ~. previous check had been completed satisfactorily at 0449. The subsequent check,4 completed at 2206. As allowed by SR 3.0.3, the surveillance was performed
satisfactorily within 24 hours of the missed surveillance. A review of historical data forboth monitors indicated that both channels remained operable during the time of the
o missed surveillance.
C2004-3146 - On November 23, 2004, a Steam Generator Blowdown composite sample
was not obtained within the necessary time, including the 25% grace period. Thecomposite sample is required by AP 07B-003, ODCM. The sample on 11-22 wasobtained at 0805. The sample on 11-23 was not obtained until 1455, after promptingfrom the Control Room. Based on the grace period allowance, the sample was requiredby 1405. The result was a missed ODCM surveillance. The consequences of this wereminor due to the fact that the daily sample composite represents a larger volume that willbe reflected when included in the weekly composite.
2004-3374 - The Effluent Management Software (EMS) used for performing ODCMrequired effluent release permit. calculations was found to be inoperable on December12, 2004. The Information Services'help desk was contacted to resolve the problem, butdue to the software age, lack. of IS knowledge :and no support system set up forimmediate vendor assistance, the problems were slow to be resolved. Data had notbeen backed up on EMS since 11-23, so reentering all of the permit data would havebeen required prior to performing additional release calculations. The evolution wasexpected to take between 12 and 14 hours for entry and verification. Fortunately, thesystem recovered long enough to perform a backup. EMS had to be accessed on abackup server, designed for testing/development not production. The consequences ofnot having EMS accessible to perform release calculations were missing ODCM requiredsurveillances and potentially causing containment pressure to exceed TechnicalSpecification limits. This malfunction happened previously in 2003. Backups are beingperformed on a weekly basis. A purchase requisition has been issued to establish anannual maintenance agreement with Computer Associates, the database support vendor.In addition, a request for funding new software has been approved for 2005.
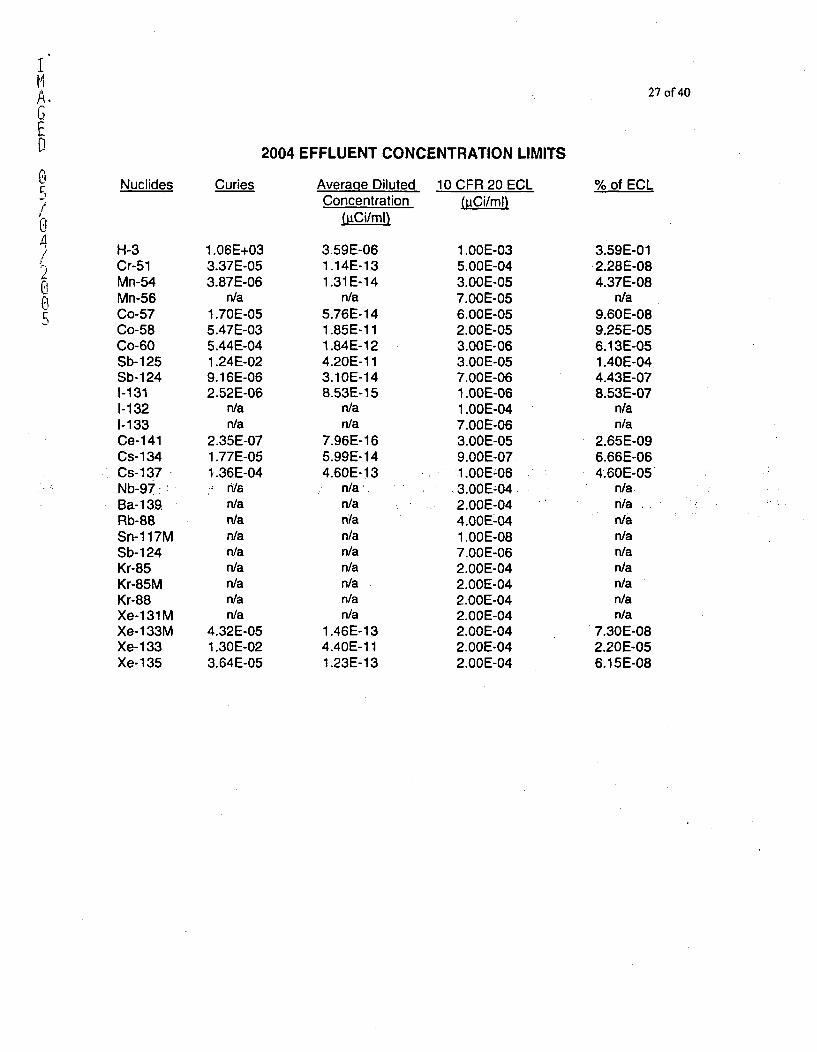
A.C,
EDru
5uI
c-
0i
27 of 40
2004 EFFLUENT CONCENTRATION LIMITS
Nuclides
H-3Cr-51Mn-54Mn-56Co-57Co-58Co-60Sb-125Sb-1241-1311-1321-133Ce-141Cs-134Cs-137Nb-97.ýBa-13.9.Rb-88Sn-i 17MSb- 124Kr-85Kr-85MKr-88Xe-131MXe- 133MXe-133Xe-135
Curies
1.06E+033.37E-053.87E-06
n/a1.70E-055.47E-035.44E-041.24E-029.16E-062.52E-06
n/an/a
2.35E-071.77E-051-.36E-04
n/an/a
n/an/an/an/an/an/an/a
4.32E-051.30E-023.64E-05
Average DilutedConcentration
(gCi/ml)
3.59E-061.14E-131.31E-14
n/a5.76E- 141.85E-111.84E-124.20E-113.10E-148.53E-1 5
n/an/a
7.96E-165.99E-144.60E-13
n/an/an/an/an/an/an/an/an/a
1.46E-134.40E-111.23E-13
10 CFR 20 ECL(klCi/mI)
1.OOE-035.OOE-043.OOE-057.OOE-056.OOE-052.OOE-053.OOE-063.OOE-057.OOE-061.OOE-061.OOE-047.OOE-063.OOE-059.OOE-071.OOE-063.00&E042.0OE-044.00E-041.OOE-087.OOE-062.OOE-042.OOE-042.OOE-042.OOE-042.OOE-042.00E-042.OOE-04
% of ECL
3.59E-012.28E-084.37E-08
n/a9.60E-089.25E-056.13E-051.40E-044.43E-078.53E-07
n/an/a
2.65E-096.66E-064.60E-05
n/an/an/an/an/an/an/an/an/a
7.30E-082.20E-056.15E-08
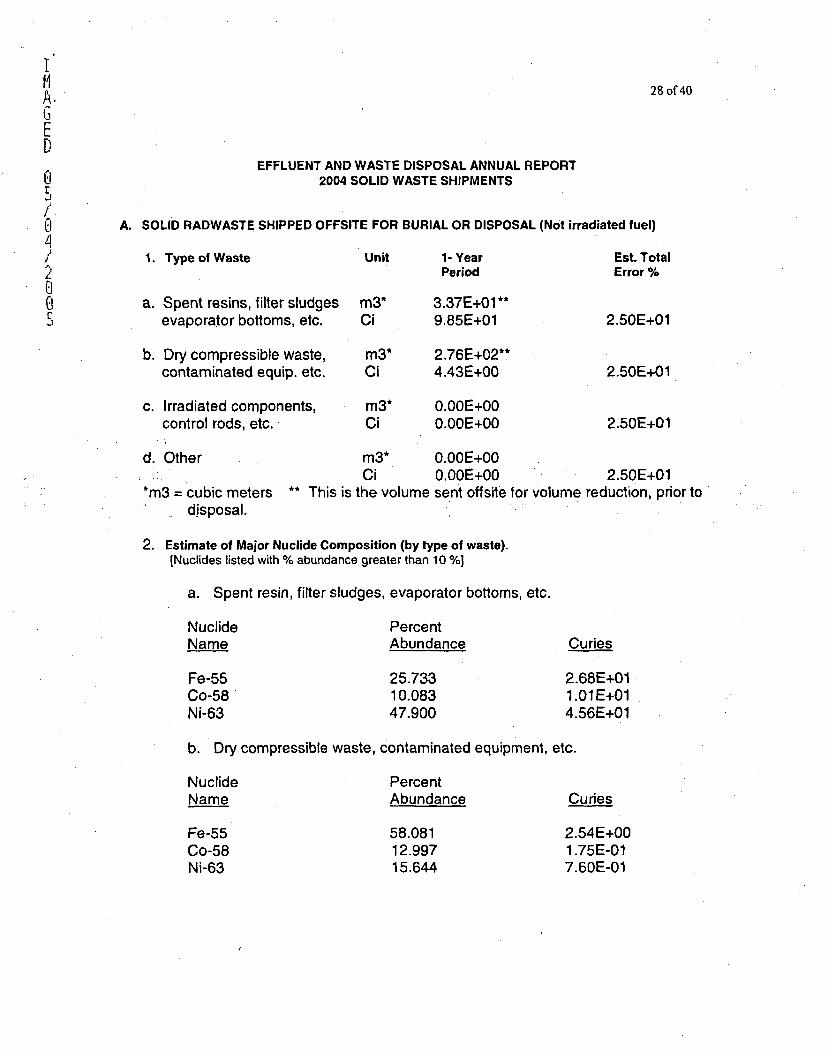
I11A.GED
j
AI
2iG.
28 of 40
EFFLUENT AND WASTE DISPOSAL ANNUAL REPORT2004 SOLID WASTE SHIPMENTS
A. SOLID RADWASTE SHIPPED OFFSITE FOR BURIAL OR DISPOSAL (Not irradiated fuel)
1. Type of Waste
a. Spent resins, filter sludgesevaporator bottoms, etc.
b. Dry compressible waste,contaminated equip. etc.
c. Irradiated components,control rods, etc.:
Unit
m3*Ci
m3*Ci
m3*Ci
1- YearPeriod
3.37E+01 **
9.85E+01
2.76E+02**4.43E+00
O.OOE+000.OOE+00
Est. TotalError %
2.50E+01
2.50E+01
2.50E+01
d. Other
*m3 = cubic meters
disposal.
m3* 0.OOE+00Ci 0.00E+00 2.50E+01
This is the volume sent offsite for volume reduction, prior to
2. Estimate of Major Nuclide Composition (by type of waste).(Nuclides listed with % abundance greater than 10 %0
a. Spent resin, filter sludges, evaporator bottoms, etc.
NuclideName
Fe-55Co-58Ni-63
PercentAbundance
25.73310.08347.900
Curies
2.68E+011.01 E+014.56E+01
b. Dry compressible waste, contaminated equipment, etc.
NuclideName
Fe-55Co-58Ni-63
PercentAbundance
58.08112.99715.644
Curies
2.54E+001.75E-017.60E-01
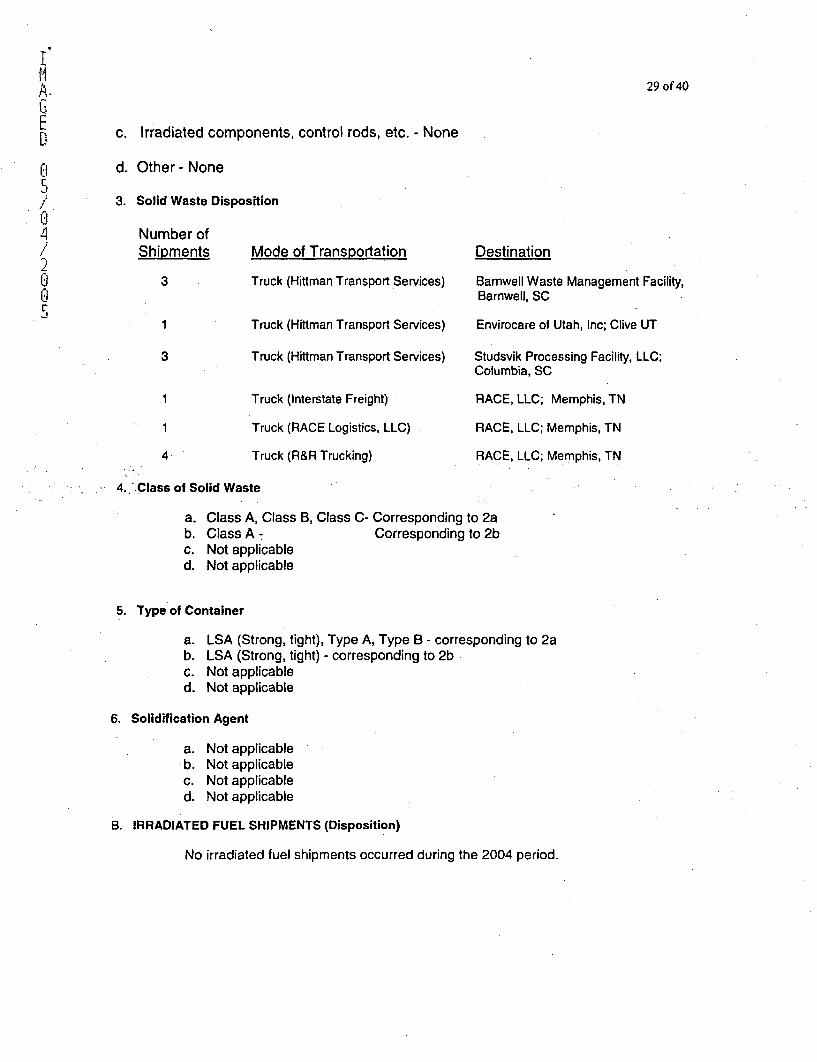
A.GEFG]C~
29 of 40
c. Irradiated components, control rods, etc. - None
d. Other-None
3. Solid Waste Disposition
Number ofShipments
3
1
3
4
Mode of Transportation
Truck (Hittman Transport Services)
Truck (Hittman Transport Services)
Truck (Hittman Transport Services)
Truck (Interstate Freight)
Truck (RACE Logistics, LLC)
Truck (R&R Trucking)
Destination
Barnwell Waste Management Facility,Barnwell, SC
Envirocare of Utah, Inc; Clive UT
Studsvik Processing Facility, LLC;Columbia, SC
RACE, LLC; Memphis, TN
RACE, LLC; Memphis, TN
RACE, LLC; Memphis, TN
* 4. "Class of Solid Waste
a. Class A, Class B, Class C- Corresponding to 2ab. Class A - Corresponding to 2bc. Not applicabled. Not applicable
5. Type of Container
a. LSA (Strong, tight), Type A, Type B - corresponding to 2ab. LSA (Strong, tight) - corresponding to 2bc. Not applicabled. Not applicable
6. Solidification Agent
a. Not applicableb. Not applicablec. Not applicabled. Not applicable
B. IRRADIATED FUEL SHIPMENTS (Disposition)
No irradiated fuel shipments occurred during the 2004 period.
I30 of 40A
EO •SECTION III
O! HOURS AT EACH WIND SPEED AND DIRECTIONJ/ ,04 This section documents WCGS meteorological data for wind speed, wind direction, and/ atmospheric stability.2o The meteorological data supplied in the following tables covers the period from January 1, 2004,0 through December 31, 2004, and indicates the number of hours at each wind speed and direction
for each stability class. All gaseous releases at the WCGS are ground level releases. (WolfCreek Station did not meet Regulatory Guide 1.23 requirement for having at least 90%meteorological data recovery for 2004. As identified in PIR 2004-0620 problems withinstrumentation or computer link were the cause of this problem and resulted in the replacementof the meteorological tower instruments.
A Meteorological Professor at the University of Kansas helped to establish the first set of criteriathat is used to determine data availability and verification. This verification takes a look at therequired instruments on the tower and compares the instrument output (meteorological value)against one another and against a set of criteria for the particular parameter being measured.This method also flags data as bad anytime the communication link to the plant computer isdown or the plant computer is down. This method is conservative and may flag data as badeven though the required Reg. Guide 1.23 instruments are still available. Data availability usingthis method is 85.2%, for the year 2004.
The Meteorological Tower Instruments were replaced in 2004 and the problem of unresponsiveinstruments and the computer being down have been greatly reduced. Since the newinstruments were installed data availability has been meeting the 90% availability requirement.The data availability for the Meteorological Data for the year 2004 as stated above is 85.2%. Partof the unavailability for the year 2004 came from the time that it took to replace the instrumentsthat were causing the system downtime. Wolf Creek Engineering change package 09882updated the meteorological instrumentation (over 230 hours). It was recognized that the towerwould be out of service while this replacement was ongoing and during this time back-up, handinstruments were available (if needed by the E-Plan) but these instruments are not credited forcollection of meteorological data. It is expected that the meteorological tower data will beconsiderably more reliable from this point forward due to the installation of the replacementinstrumentation and the fact that the key parameters have "back-up" instruments installed withthe replacements.
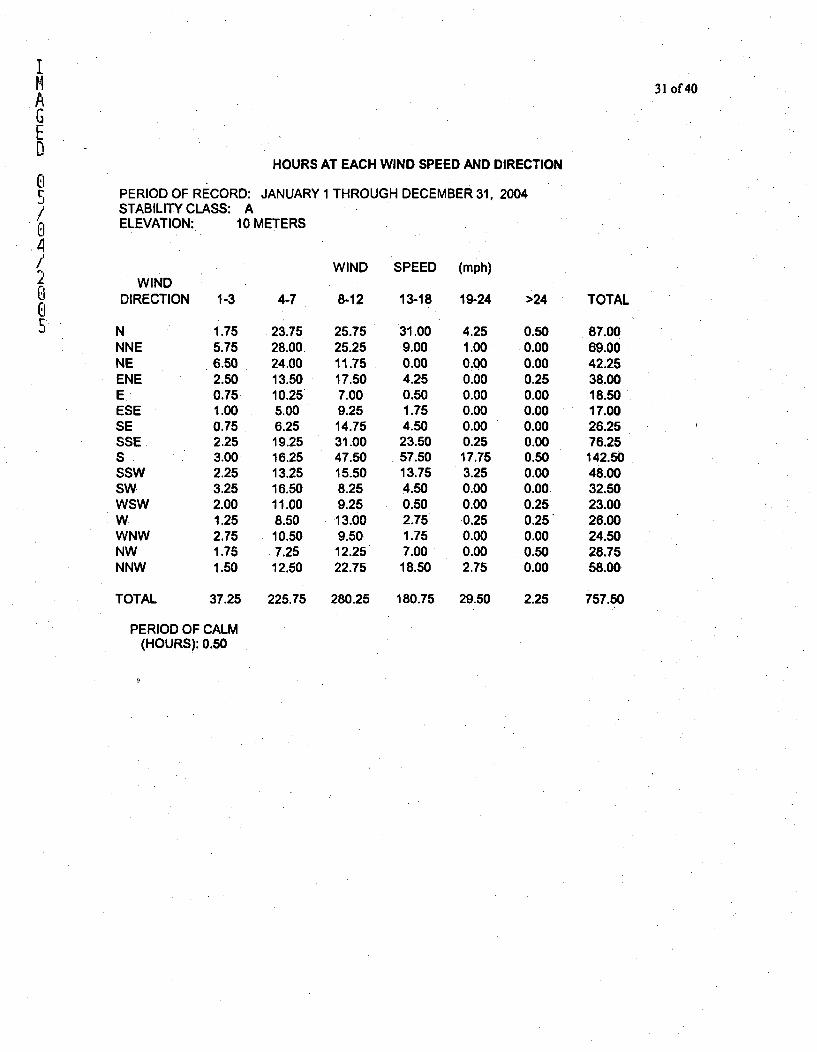
IM 31 of 40AGED
HOURS AT EACH WIND SPEED AND DIRECTION0r PERIOD OF RECORD: JANUARY 1 THROUGH DECEMBER 31, 2004/ STABILITY CLASS: A0 ELEVATION: 10 METERS
WIND SPEED (mph)LWIND
DIRECTION 1-3 4-7 8-12 13-18 19-24 >24 TOTAL0N 1.75 23.75 25.75 31.00 4.25 0.50 87.00NNE 5.75 28.00. 25.25 9.00 1.00 0.00 69.00NE 6.50 24.00 11.75 0.00 0.00 0.00 42.25ENE 2.50 13.50 17.50 4.25 0.00 0.25 38.00E 0.75 10.25 7.00 0.50 0.00 0.00 18.50ESE 1.00 5.00 9.25 1.75 0.00 0.00 17.00SE 0.75 6.25 14.75 4.50 0.00 0.00 26.25SSE 2.25 19.25 31.00 23.50 0.25 0.00 76.25S 3.00 16.25 47.50 57.50 17.75 0.50 142.50SSW 2.25 13.25 15.50 13.75 3.25 0.00 48.00SW 3.25 16.50 8.25 4.50 0.00 0.00 32.50WSW 2.00 11.00 9.25 0.50 0.00 0.25 23.00W 1.25 8.50 13.00 2.75 0.25 0.25 26.00WNW 2.75 10.50 9.50 1.75 0.00 0.00 24.50NW 1.75 7.25 12.25 7.00 0.00 0.50 28.75NNW 1.50 12.50 22.75 18.50 2.75 0.00 58.00
TOTAL 37.25 225.75 280.25 180.75 29.50 2.25 757.50
PERIOD OF CALM(HOURS): 0.50
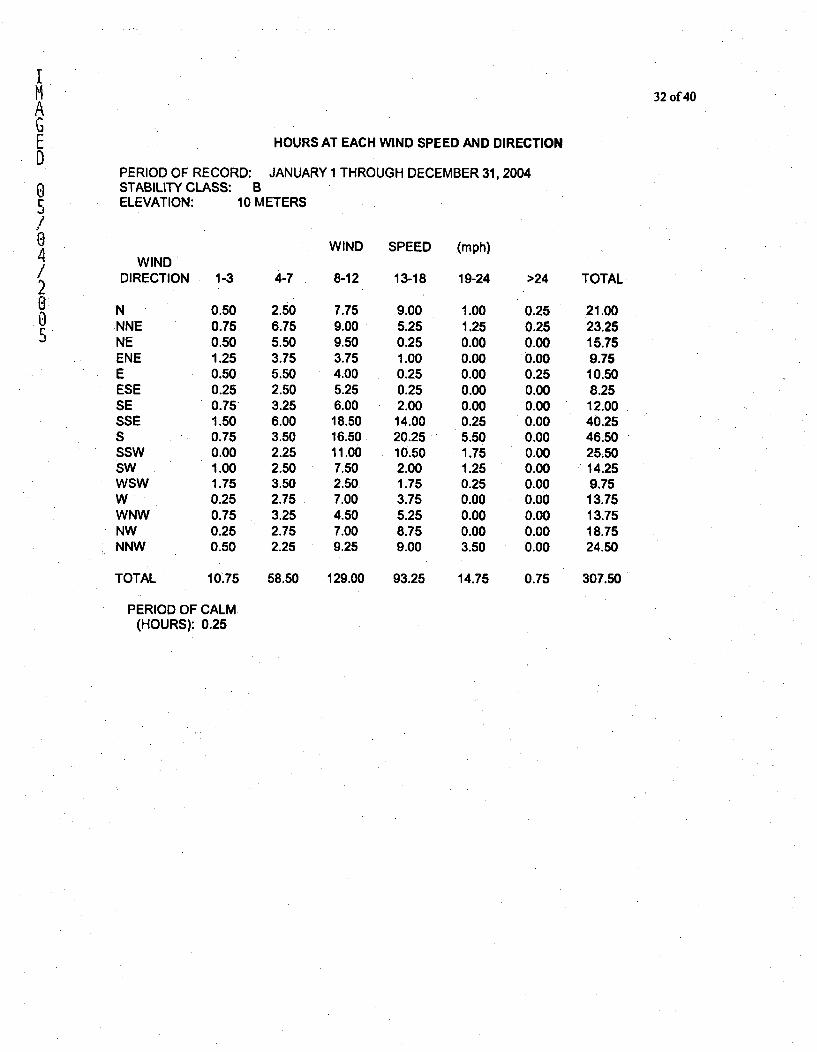
IMAGED
r
04/2005
32 of 40
HOURS AT EACH WIND SPEED AND DIRECTION
PERIOD OF RECORD: JANUARY 1 THROUGH DECEMBER 31, 2004STABILITY CLASS: BELEVATION: 10 METERS
WINDWIND SPEED (mph)
8-12 13-18 19-24 >24 TOTALDIRECTION 1-3
NNNENEENEEESESESSESSSWSWWSWWWNWNWNNW
TOTAL
0.500.750.501.250.500.250.751.500.750.001.001.750.250.750.250.50
4-7
2.506.755.503.755.502.503.256.003.502.252.503.502.753.252.752.25
7.759.009.503.754.005.256.00
18.5016.5011.007.502.507.004.507.009.25
9.005.250.251.000.250.252.0014.0020.2510.502.001.753.755.258.759.00
1.001.250.000.000.000.000.000.255.501.751.250.250.000.000.003.50
0.250.250.000.000.250.000.000.000.000.000.000.000.000.000.000.00
21.0023.2515.759.7510.508.2512.0040.2546.5025.5014.259.7513.7513.7518.7524.50
10.75 58.50 129.00 93.25 14.75 0.75 307.50
PERIOD OF CALM(HOURS): 0.25
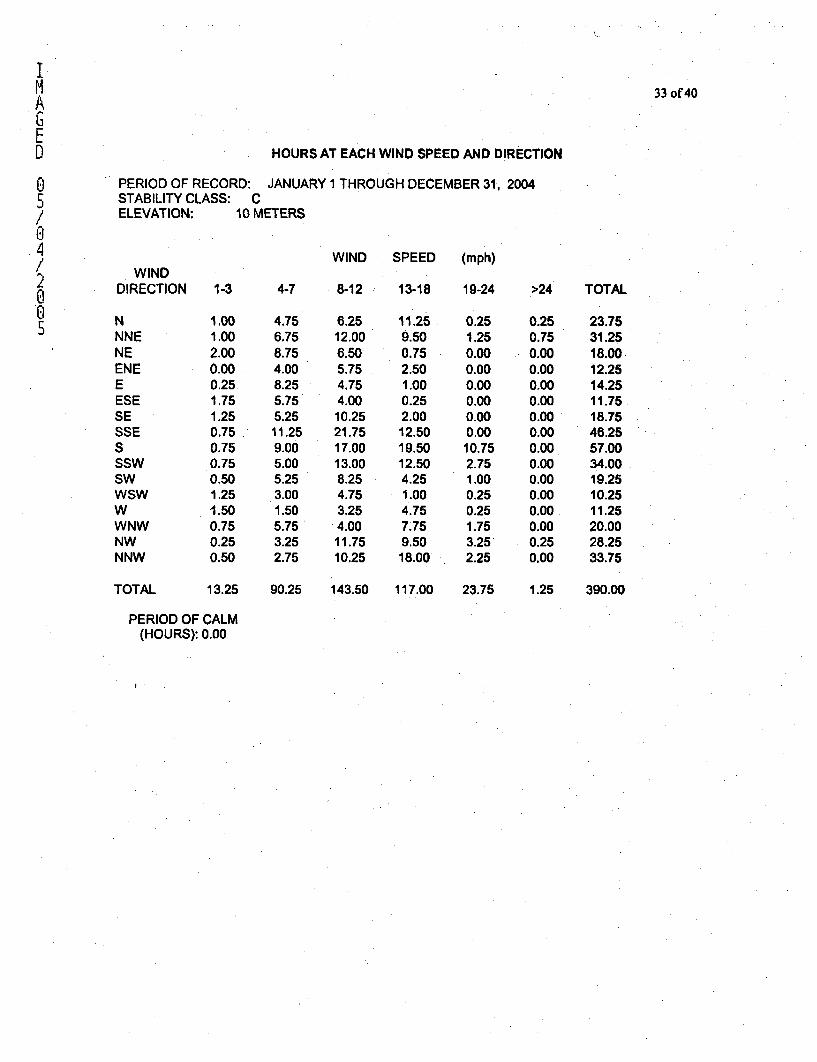
MAGED
05/'04/2005
33 of 40
HOURS AT EACH WIND SPEED AND DIRECTION
PERIOD OF RECORD: JANUARY 1 THROUGH DECEMBER 31, 2004STABILITY CLASS: CELEVATION: 10 METERS
WINDDIRECTION 1-3 4-7
WIND SPEED (mph)
8-12 13-18 19-24 >24 TOTAL
NNNENEENEEESESESSESSSWSWWSWWWNWNWNNW
TOTAL
1.001.002.000.000.251.751.250.750.750.750.501.251.500.750.250.50
4.756.758.754.008.255.755.2511.259.005.005.253.001.505.753.252.75
6.2512.006.505.754.754.0010.2521.7517.0013.008.254.753.254.0011.7510.25
11.259.500.752.501.000.252.0012.5019.5012.504.251.004.757.759.5018.00
0.251.250.000.000.000.000.00
0.0010.752.751.000.250.251.753.252.25
0.250.750.000.000.000.000.000.000.000.000.000.000.000.000.250.00
23.7531.2518.0012.2514.2511.7518.7546.2557.0034.0019.2510.2511.2520.0028.2533.75
13.25 90.25 143.50 117.00 23.75 1.25 390.00
PERIOD OF CALM(HOURS): 0.00
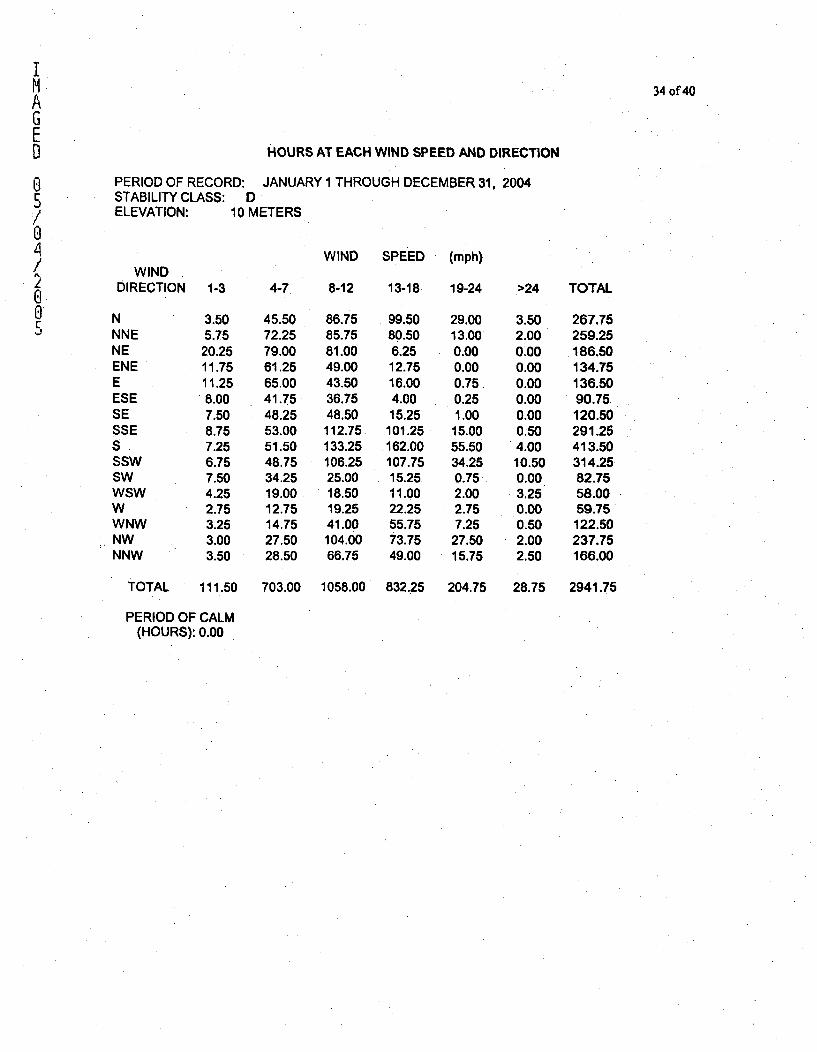
34 of 40
0
/0
/20aC'3
HOURS AT EACH WIND SPEED AND DIRECTION
PERIOD OF RECORD: JANUARY 1 THROUGH DECEMBER 31, 2004STABILITY CLASS: DELEVATION: 10 METERS
WINDDIRECTION
NNNENEENEEESESESSESSSWSWWSWWWNWNWNNW
1-3
WIND SPEED (mph)
8-12 13-18 19-244-7
3.50 45.50 86.75 99.50 29.005.75 72.25 85.75 80.50 13.0020.25 79.00 81.00 6.25 0.0011.75 61.25 49.00 12.75 0.0011.25 65.00 43.50 16.00 0.758.00 41.75 36.75 4.00 0.257.50 48.25 48.50 15.25 1.008.75 53.00 112.75 101.25 15.007.25 51.50 133.25 162.00 55.506.75 48.75 106.25 107.75 34.257.50 34.25 25.00 15.25 0.754.25 19.00 18.50 11.00 2.002.75 12.75 19.25 22.25 2.753.25 14.75 41.00 55.75 7.253.00 27.50 104.00 73.75 27.503.50 28.50 66.75 49.00 15.75
>24 TOTAL
3.50 267.752.00 259.250.00 186.500.00 134.750.00 136.500.00 90.750.00 120.500.50 291.254.00 413.5010.50 314.250.00 82.753.25 58.000.00 59.750.50 122.502.00 237.752.50 166.00
28.75 2941.75TOTAL 111.50 703.00 1058.00 832.25 204.75
PERIOD OF CALM(HOURS): 0.00
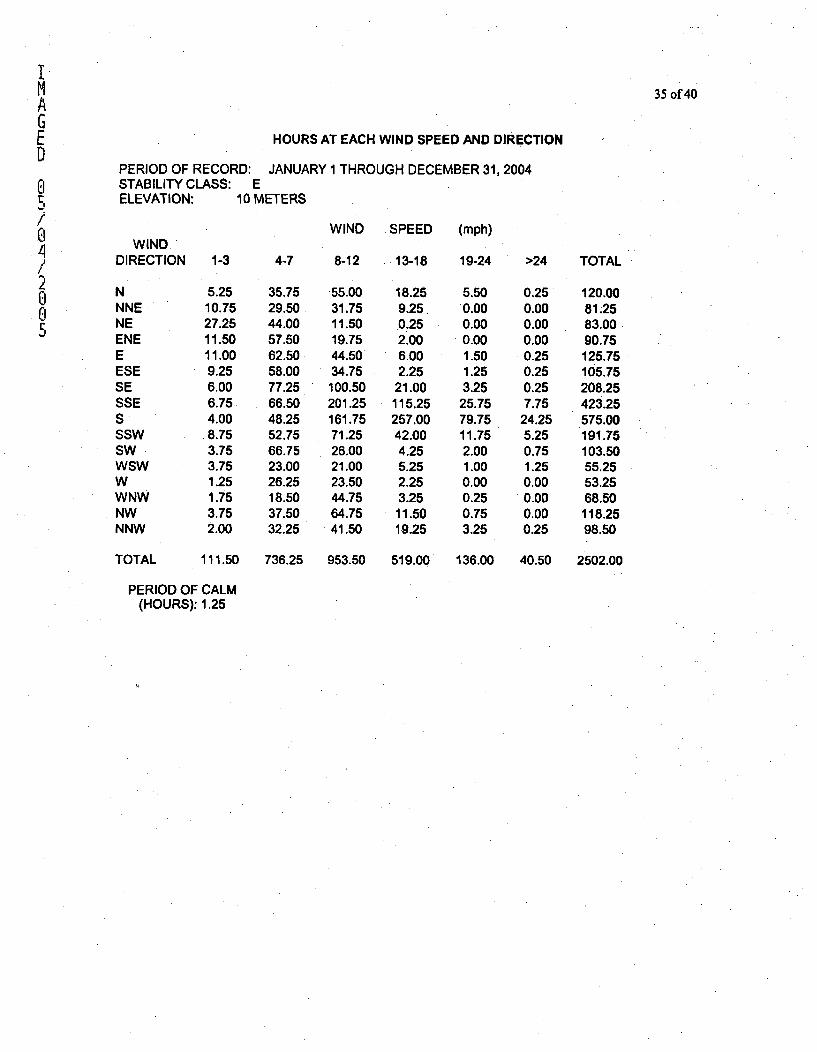
IMAGED
0
/0
/200J
35 of 40
HOURS AT EACH WIND SPEED AND DIRECTION
PERIOD OF RECORD: JANUARY 1 THROUGH DECEMBER 31, 2004STABILITY CLASS: EELEVATION: 10 METERS
WIND SPEED (mph)WIND
DIRECTION 1-3
N 5.25NNE 10.75NE 27.25ENE 11.50E 11.00ESE 9.25SE 6.00SSE 6.75S 4.00SSW 8.75SW 3.75WSW 3.75W 1.25WNW 1.75NW 3.75NNW 2.00
4-7 8-12 13-18 19-24 >24 TOTAL
35.75 55.00 18.2529.50 31.75 9.25.44.00 11.50 0.2557.50 19.75 2.0062.50 44.50 6.0058.00 34.75 2.2577.25 100.50 21.0066.50 201.25 115.2548.25 161.75 257.0052.75 71.25 42.0066.75 26.00 4.2523.00 21.00 5.2526.25 23.50 2.2518.50 44.75 3.2537.50 64.75 11.5032.25 41.50 19.25
5.500.000.000.001.501.253.2525.7579.7511.752.001.000.000.250.753.25
0.25 120.000.00 81.250.00 83.000.00 90.75
.0.25 125.750.25 105.750.25 208.257.75 423.25
24.25 575.005.25 191.750.75 103.501.25 55.250.00 53.250.00 68.500.00 118.250.25 98.50
TOTAL 111.50 736.25 953.50 519.00 136.00 40.50 2502.00
PERIOD OF CALM(HOURS): 1.25
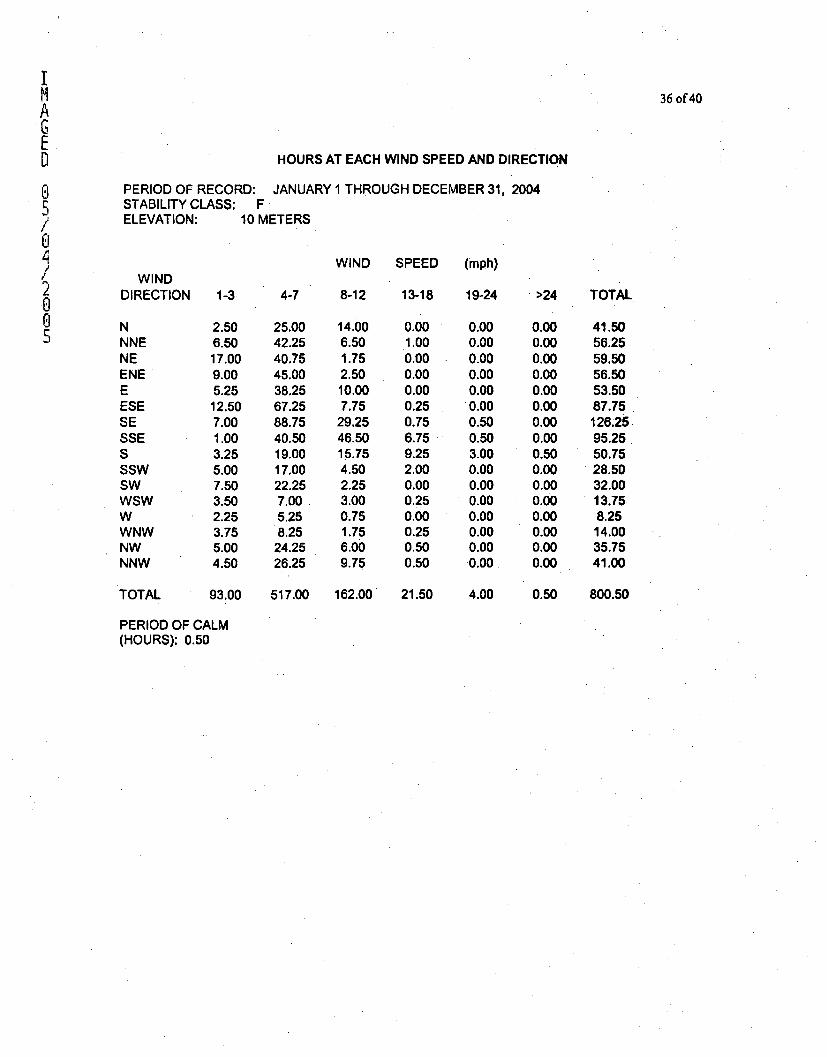
IMAGE0
/2
0CJ
36 of 40
HOURS AT EACH WIND SPEED AND DIRECTION
PERIOD OF RECORD: JANUARY 1 THROUGH DECEMBER 31, 2004STABILITY CLASS: FELEVATION: 10 METERS
WIND SPEED (mph)WIND
DIRECTION
NNNENEENEEESESESSESSSWSWWSWWWNWNWNNW
1-3
2.506.5017.009.005.25
12.507.001.003.255.007.503.502.253.755.004.50
4-7 8-12 13-18 19-24 >24 TOTAL
25.0042.2540.7545.0038.2567.2588.7540.5019.0017.0022.257.005.258.2524.2526.25
14.006.501.752.5010.007.75
29.2546.5015.754.502.253.000.751.756.009.75
0.001.000.000.000.00
0.250.756.759.252.000.000.250.000.250.500.50
0.000.000.000.000.000.000.500.503.000.000.000.000.000.000.000.00
0.000.000.000.000.000.000.000.000.500.000.000.000.000.000.000.00
41.5056.2559.5056.5053.5087.75126.2595.2550.7528.5032.0013.758.2514.0035.7541.00
TOTAL 93.00 517.00 162.00 21.50 4.00 0.50 800.50
PERIOD OF CALM(HOURS): 0.50
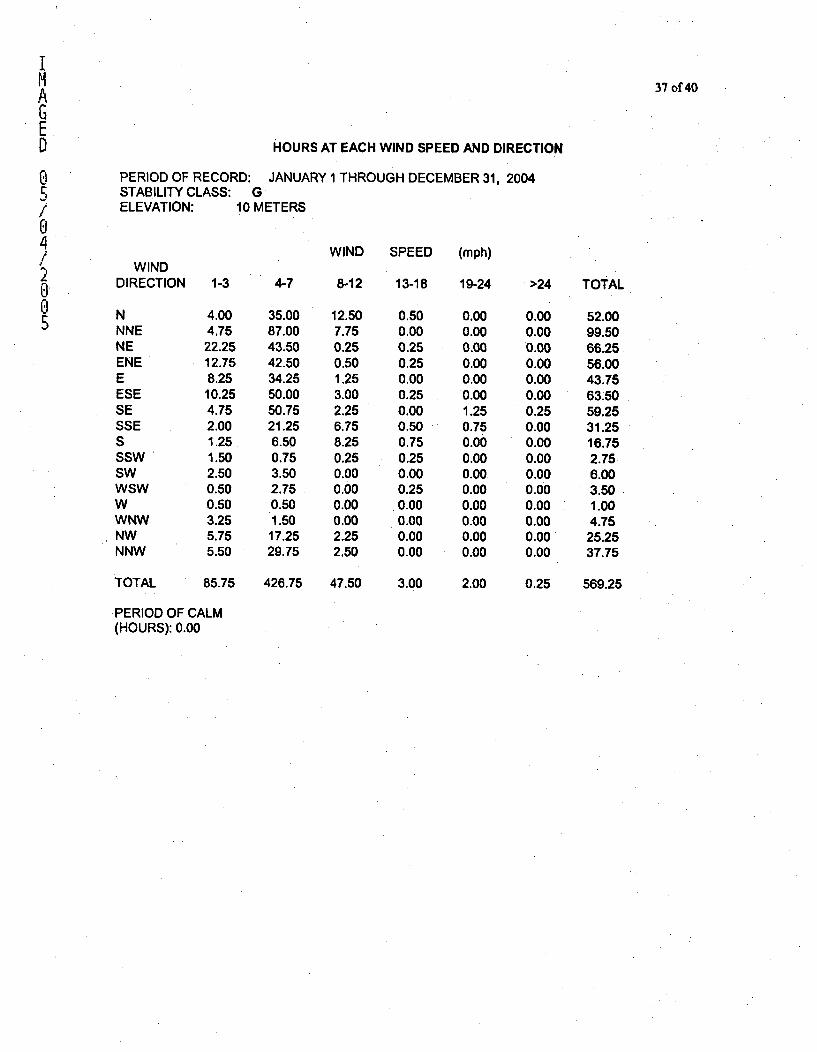
MAGED
05/0
/20
5
37 of 40
HOURS AT EACH WIND SPEED AND DIRECTION
PERIOD OF RECORD: JANUARY 1 THROUGH DECEMBER 31, 2004STABILITY CLASS: GELEVATION: 10 METERS
WINDDIRECTION 1-3
WIND SPEED (mph)
4-7 8-12 13-18 19-24 >24 TOTAL
NNNENEENEEESESESSESSSWSWWSWWWNWNWNNW
TOTAL
4.004.7522.2512.758.2510.254.752.001.251.502.500.500.503.255.755.50
35.0087.0043.5042.5034.2550.0050.7521.256.500.753.502.750.501.5017.2529.75
12.507.750.250.501.253.002.256.758.250.250.000.000.000.002.252.50
0.500.000.250.250.000.250.000.500.750.250.000.250.000.000.000.00
0.000.000.000.000.000.001.250.750.000.000.000.000.000.000.000.00
0.000.000.000.000.000.000.250.000.000.000.000.000.000.000.000.00
52.0099.5066.2556.0043.7563.5059.2531.2516.752.756.003.501.004.75
25.2537.75
85.75 426.75 47.50 ' 3.00 2.00 0.25 569.25
PERIOD OF CALM(HOURS): 0.00
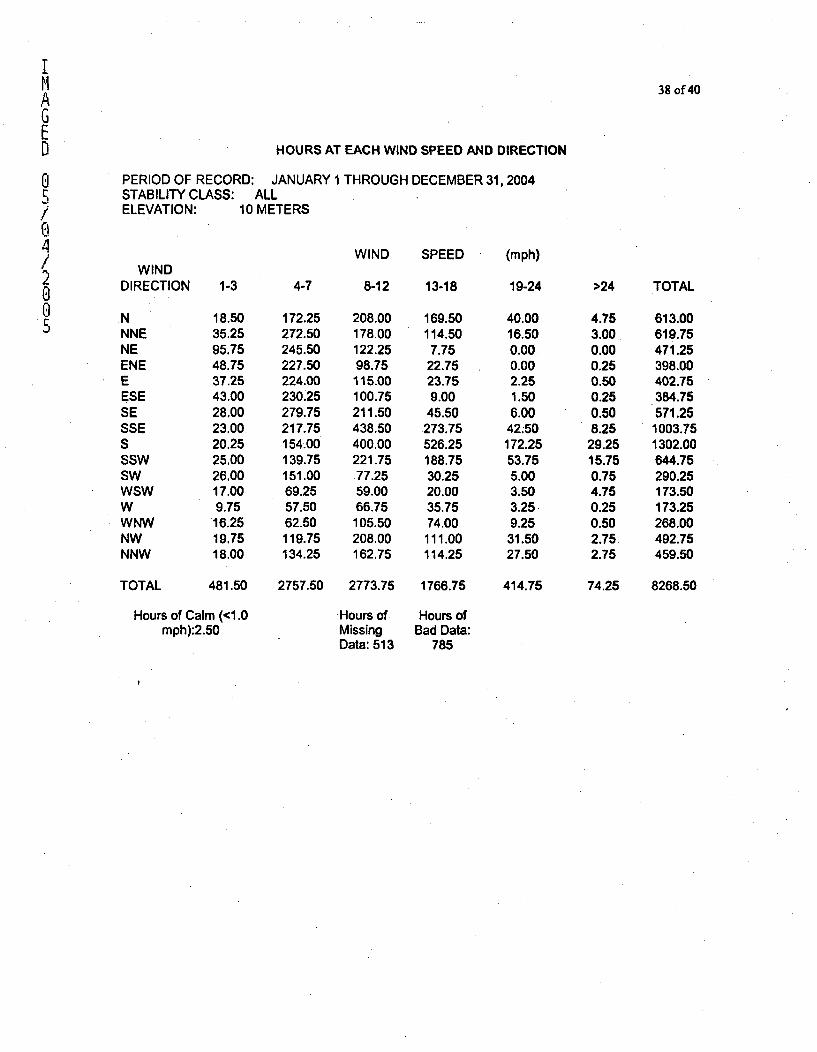
I
38 of 40ACEO HOURS AT EACH WIND SPEED AND DIRECTION
O PERIOD OF RECORD: JANUARY 1 THROUGH DECEMBER 31,2004STABILITY CLASS: ALL
/ ELEVATION: 10 METERS
WIND SPEED (mph)
2 WINDo DIRECTION 1-3 4-7 8-12 13-18 19-24 >24 TOTAL
N 18.50 172.25 208.00 169.50 40.00 4.75 613.005 NNE 35.25 272.50 178.00 114.50 16.50 3.00 619.75
NE 95.75 245.50 122.25 7.75 0.00 0.00 471.25ENE 48.75 227.50 98.75 22.75 0.00 0.25 398.00E 37.25 224.00 115.00 23.75 2.25 0.50 402.75ESE 43.00 230.25 100.75 9.00 1.50 0.25 384.75SE 28.00 279.75 211.50 45.50 6.00 0.50 571.25SSE 23.00 217.75 438.50 273.75 42.50 8.25 1003.75S 20.25 154.00 400.00 526.25 172.25 29.25 1302.00SSW 25.00 139.75 221.75 188.75 53.75 15.75 644.75SW 26.00 151.00 77.25 30.25 5.00 0.75 290.25WSW 17.00 69.25 59.00 20.00 3.50 4.75 173.50W 9.75 57.50 66.75 35.75 3.25 0.25 173.25WNW 16.25 62.50 105.50 74.00 9.25 0.50 268.00NW 19.75 119.75 208.00 111.00 31.50 2.75 492.75NNW 18.00 134.25 162.75 114.25 27.50 2.75 459.50
TOTAL 481.50 2757.50 2773.75 1766.75 414.75 74.25 8268.50
Hours of Calm (<1.0 Hours of Hours ofmph):2.50 Missing Bad Data:
Data: 513 785
III 39 of 40G
SECTION IV
O ADDITIONAL INFORMATION5/ 1. Unplanned or Abnormal Releases04 There were no unplanned or abnormal releases that occurred in 2004./
2. Offsite Dose Calculation Manual (ODCM)
o The ODCM is in the form of two separate Wolf Creek Nuclear Operating Corporation (WCNOC)5 administrative procedures. One of these procedures, the WCNOC "Offsite Dose Calculation
Manual", AP 07B-003, Revision 5, is included with this report as Attachment I. The otherprocedure, "Offsite Dose Calculation Manual (Radiological Environmental Monitoring Program),AP 07B-004, Revision 8, is included with this report as Attachment I1.
3. Major Changes to Liquid, Solid, or Gaseous Radioactive Waste Treatment Systems
Temporary Modification 04-002HB is in the design process as a result of CCP 9337modifications. Previous changes to the Zero Filtration System in Radwaste resulted in possibleline overpressure problems to the Drum Dryer, as well as drain problems from the sample sink.After further testing, it was determined that over pressurization was not a problem; however,changes are being made to allow for the use of a TMP that will throttle flow to the Drum DryerHoldup Tank to monitor the system pressure. To address the drain problems from the samplesink, a new vent line will be installed to the SRO (Spiral Reverse Osmosis unit) so that the SROsample line will no longer be used as a continuous process vent. This should improve thefunctioning of the sample sink drain by reducing the flow into the sink.
4. Land Use Census
No new locations for dose calculation were identified during this report period.
5. Radwaste Shipments
Twelve shipments of radioactive waste occurred during this report period. Section II, Subsection3, of this report contains specific details regarding each shipment's mode of transportation anddestination.
6. Inoperability of Effluent Monitoring Instrumentation
No events occurred that violated ODCM Requirements Tables 2-2 and 3-2, liquid or gaseouseffluent monitoring instrumentation.
7. Storage Tanks
At no time during the year 2004 was there an event that lead to liquid holdup tanks or gasstorage tanks exceeding the limits of Technical Requirements Manual Sections 3.10.1 or 3.10.3.Technical Specification requirements for the program are now covered by TechnicalRequirements Manual Section 3.10, "Explosive Gas and Storage Tank Radioactivity Monitoring."
a
W(LF CREEK'NUCLEAR OPERATING CORPORATION
0/
Kevin J. Moles8 Manager Regulatory Affairs April 27, 2006/,2O RA 06-00670
'6 U. S. Nuclear Regulatory CommissionATTN: Document Control DeskWashington, DC 20555
Subject: Docket No. 50-482: Wolf Creek Generating Station Annual RadioactiveEffluent Release Report - Report 29
Gentlemen:
This letter transmits the enclosed Wolf Creek Generating Station (WCGS) Annual RadioactiveEffluent Release Report. The report covers the period from January 1, 2005, throughDecember 31, 2005. It is being submitted pursuant to Section 5.6.3 of the WCGS TechnicalSpecifications. Included as part of the report are copies of revised procedures required to besubmitted with this report. Procedures AP 07B-003, "Offsite Dose Calculation Manual," AP07B-004, "Offsite Dose Calculation Manual (Radiological Environmental Monitoring Program),"and AP 31A-100, "Solid Radwaste Process Control Program." are included as Attachments 1, 11,and III to the report.
No commitments are identified in this correspondence. If you have any questions concerningthis matter, please contact me at (620) 364-4126, or Ms. Diane Hooper at (620) 364-4041.
Sincerely,
Kevin J. Mol
KJM/rlt
Enclosure
cc: J. N. Donohew (NRC), w/eW. B. Jones (NRC), w/eB. S. Mallett (NRC), w/eSenior Resident Inspector (NRC), w/e
P.O. Box 411 'Burlington. KS 66839 / Phone: (620) 364-8831An Equal Oppor!unity Employer M,F "CNVET
IMA
D
04/2
Wolf Creek Nuclear Operating Corporation20 0 Wolf Creek Generating Station
6
Docket No: 50-482Facility Operating License No: NPF-42
Annual Radioactive Effluent Release Report
Report No. 29
Reporting Period: January 1,2005 - December 31, 2005

I
A 2 of36
V Table of Contents
Paaqe4/ Executive Summary 4
Section 1 ,68 Report of 2005 Radioactive Effluents: Liquid 6
2005 Liquid Effluents 82005 Liquid Cumulative Dose Summary - Table 1 10
U 2005 Liquid Cumulative Dose Summary - Table 2 11, Report of 2005 Radioactive Effluents: Airborne 12b 2005 Gaseous Effluents 14
2005 Gaseous Cumulative Dose Summary -. Table 1 162005 Gaseous Cumulative Dose Summary - Table 2 17Section II 18Offsite Dose Calculation Manual Limits 18Effluent Concentration Limits (ECLs) 18Average Energy 19Measurements and Approximations of Total Radioactivity (Liquid and 19Gaseous Effluents)Batch Releases 21Continuous Releases 21Doses to a Member of the Public from Activities Inside the SiteBoundary 21Additional Information 222005 Effluent Concentration Limits 232005 Solid Waste Shipments 24Irradiated Fuel Shipments 25Section III 26Meteorological Data - Hours At Each Wind Speed and Direction 26Section IV 35Unplanned or Abnormal Releases 35Off site Dose Calculation Manual 35Major Changes to Liquid, Solid, or Gaseous Radioactive WasteTreatment Systems 35Land Use Census 35Radwaste Shipments 35Inoperability of Effluent Monitoring Instrumentation 35Storage Tanks 35Attachments 36
I3 of 36
D Table of Contents
AAttachment I - WCGS Procedure AP 07B-003, Revision 5, "Offsite Dose Calculation Manual"/ Attachment II - WCGS Procedure AP 07B-004, Revision 10, "Offsite Dose Calculation Manual(Radiological Environmental Monitoring Program)"
8 Attachment III - WCGS Procedure AP 31A-100, Revision 5, "Solid Radwaste Process Control/ Program"
0
6
I4 of 36
bE
EXECUTIVE SUMMARY
04 This Annual Radioactive Effluent Release Report (Report # 29) documents the quantities of liquid
and gaseous effluents and solid waste released by Wolf Creek Generating Station (WCGS) fromJanuary 1, 2005 through December 31, 2005. The format and content of this report are inaccordance with Regulatory Guide 1.21, Revision 1, "Measuring, Evaluation, and ReportingRadioactivity in Solid Wastes and Releases of Radioactive Materials in Liquid and GaseousEffluents from Light-Water-Cooled Nuclear Power Plants.! Sections I, II, Ill, and IV of this report
19 provide information required by NRC Regulatory Guide 1.21 and Section 7.2 of AP 07B-003,o "Offsite Dose Calculation Manual" (ODCM).6
Section I --- Section I contains, in detail, the quantities of radioactive liquid and gaseous effluentsand cumulative dose summaries for 2005, tabulated for each quarter and for yearly totals.Specific ODCM effluent limits and dose limits are also listed in Section I, along with thepercentage of the effluent limits actually released and the percentages of the dose limit actuallyreceived. No effluent or dose limits were exceeded during 2005.
An elevated release pathway does not exist at WCGS. All airborne releases are considered to beground level releases. The gaseous pathway dose determination is met by the WCGS ODCMmethodology of assigning all gaseous pathways to a hypothetical individual residing :at thehighest annual X/Q and D/Q location, as specified in the ODCM. This results in a conservativeestimate of dose to a member of the public, rather than determining each pathway dose: for eachrelease condition. A conservative error of thirty percent has been estimated in the effluent data..As stated above, no ODCM dose limits were exceeded in 2005.
Section II --- Section II includes supplemental information on continuous and batch releases,calculated doses, and solid waste disposal. There were 72 gaseous batch releases in 2005versus 67 in 2004. There were 62 liquid batch releases in 2005 versus 58 in 2004. WCGSreleased 0.014 curies in liquid releases during 2005 versus 0.019 cures in 2004, excluding gasand tritium. Continuous release pathways remained the same as previous years and allcontinuous releases were monitored.
The report contains information on the following Performance Improvement Request (PIR):
PIR 2005-1836 - While performing a Volume Control Tank (VCT) purge to Gas Decay Tank #3(GDT), a leak was identified on a moisture separator pressure switch (HAPS1035B). The leakresulted in an unplanned, monitored release.
Section III --- Section III documents WCGS meteorological data for wind speed, wind direction,and atmospheric stability.
Section IV - Section IV documents unplanned and abnormal releases, changes to radwastetreatment systems, land use census, monitoring instruments, radwaste shipments, and storagetank quantities. There was one unplanned, monitored release in 2005.
No changes to events occurred on the land use census, monitoring instruments, radwasteshipments, and storage units.
I
A 5 of 36GED
ATTACHMENTS
Attachment I - AP 071-003, revision 5, "Offsite Dose Calculation Manual"Attachment I1 - AP 078-004, revision 10, "Offsite Dose Calculation Manual (RadiologicalEnvironmental Monitoring Program)"
/ Attachment III - AP 31A-100, revision 5, "Solid Radwaste Process Control Program"/20
6
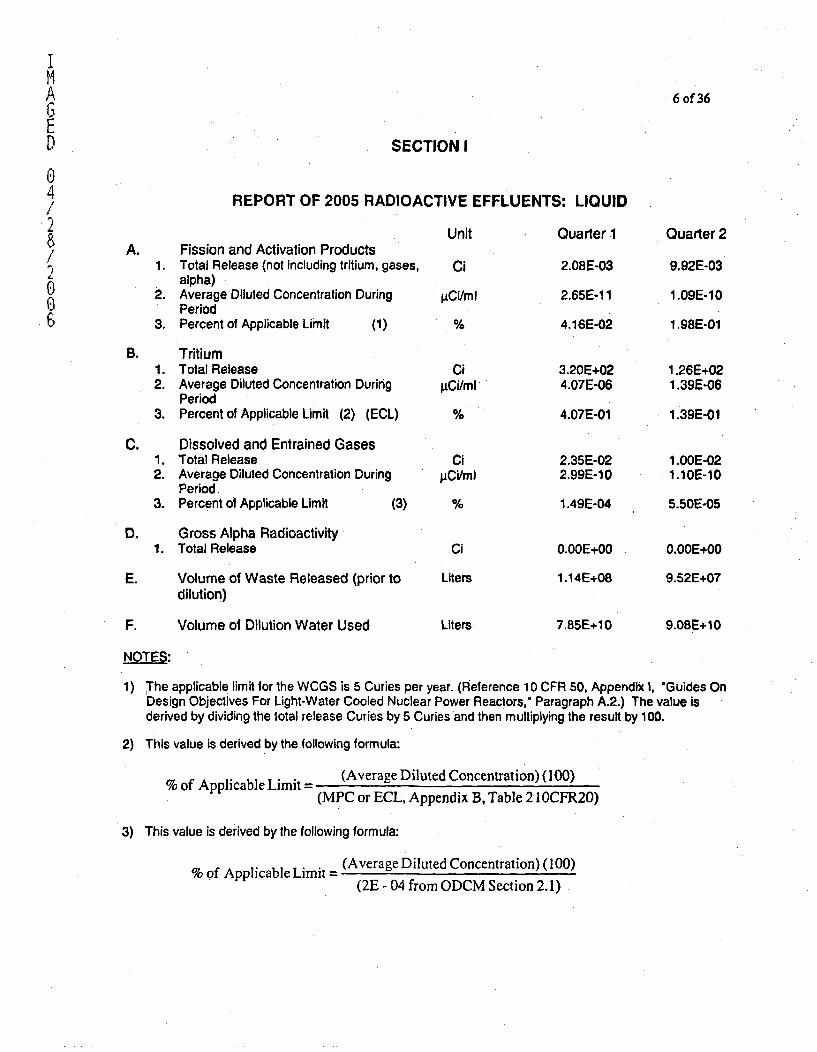
I
A 6 of 36
.Ep SECTION I0
$ REPORT OF 2005 RADIOACTIVE EFFLUENTS: LIQUID/
Unit Quarter 1 Quarter 2A. Fission and Activation Products
1. Total Release (not including tritium, gases, Ci 2.08E-03 9.92E-03alpha)
2. Average Diluted Concentration During VCi/ml 2.65E-1 1 1.09E-10(;-• Period
3. Percent of Applicable Limit (1) % 4.16E-02 1.98E-01
B. Tritium1. Total Release Ci 3.20E+02 1.26E+022. Average Diluted Concentration During gCi/ml 4.07E-06 1.39E-06
Period3. Percent of Applicable Limit (2) (ECL) % 4.07E-01 1.39E-01
C. Dissolved and Entrained Gases1. Total Release Ci 2.35E-02 1.OOE-022. Average Diluted Concentration During ACi/ml 2.99E-10 1.10E-10
Period3. Percent of Applicable Limit (3) % 1.49E-04 5.50E-05
D. Gross Alpha Radioactivity1. Total Release Ci 0.OOE+00 0.00E+00
E. Volume of Waste Released (prior to Liters 1.14E+08 9.52E+07dilution)
F. Volume of Dilution Water Used Liters 7.85E+10 9.08E+10
NOTES:
1) The applicable limit for the WCGS is 5 Curies per year. (Reference 10 CFR 50, Appendix I, "Guides OnDesign Objectives For Light-Water Cooled Nuclear Power Reactors," Paragraph A.2.) The value isderived by dividing the total release Curies by 5 Curies and then multiplying the result by 100.
2) This value is derived by the following formula:
% of Applicable Limit = (Average Diluted Concentration) (100)(MPC or ECL, Appendix B, Table 2 1OCFR20)
3) This value is derived by the following formula:
% of Applicable Limit = (Average Diluted Concentration) (100)(2E - 04 from ODCM Section 2.1)
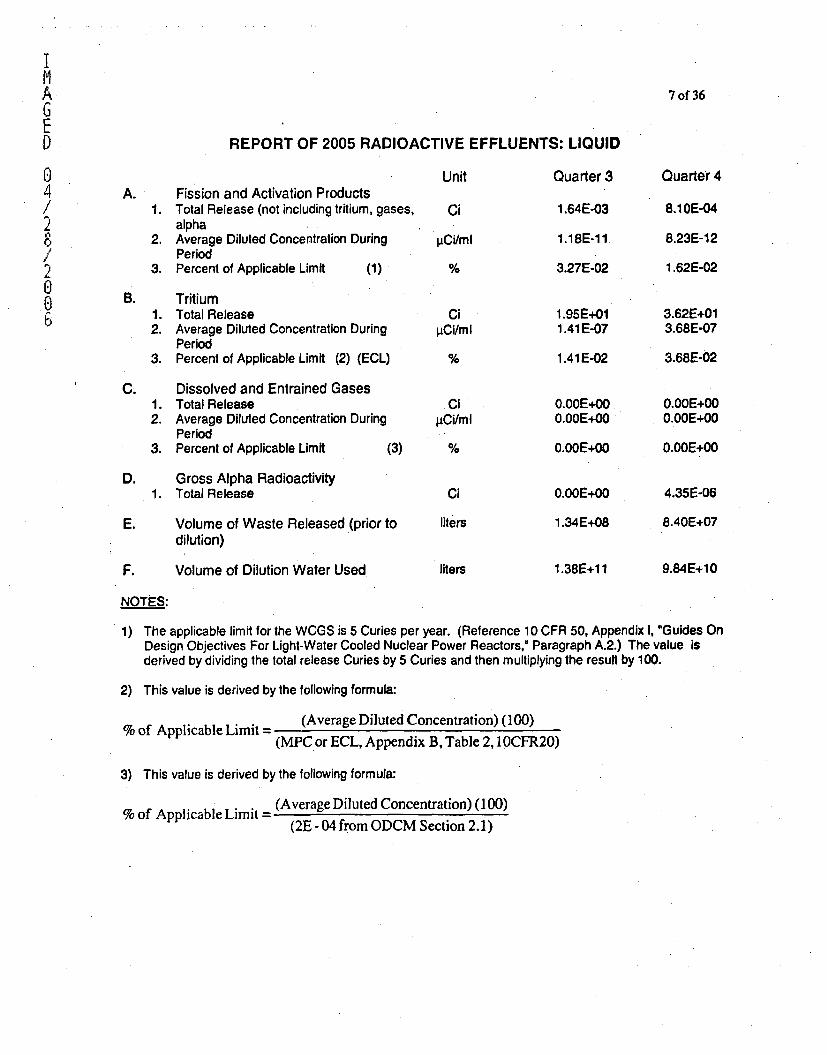
IN
ED
04
/2
0.0b^
7 of 36
REPORT OF 2005 RADIO?
A. Fission and Activation Products1. Total Release (not including tritium, gases,
alpha2. Average Diluted Concentration During
Period3. Percent of Applicable Limit (1)
B. Tritium1. Total Release2. Average Diluted Concentration During
Period3. Percent of Applicable Limit (2) (ECL)
C. Dissolved and Entrained Gases1. Total Release2. Average Diluted Concentration During
Period3. Percent of Applicable Limit (3)
D. Gross Alpha Radioactivity1. Total Release
E. Volume of Waste Released (prior todilution)
CTIVE EFFLUENTS: LIQUID
Unit Quarter 3
Ci 1.64E-03
Rui/ml 1.18E-11.
% 3.27E-02
Cij•Ci/ml
CiVICi/ml
1.95E+011.41 E-07
1.41 E-02
0.OOE+000.00E+00
0.OOE+00
0.OOE+00
1.34E+08
Quarter 4
8.1 OE-04
8.23E-12
1.62E-02
3.62E+013.68E-07
3.68E-02
0.00E+000.OOE+00
0.OOE+00
4.35E-06
8.40E+07
Ci
liters
F. Volume of Dilution Water Used liters 1.38E+11 9.84E+10
NOTES:
1) The applicable limit for the WCGS is 5 Curies per year. (Reference 10 CFR 50, Appendix I, "Guides OnDesign Objectives For Light-Water Cooled Nuclear Power Reactors," Paragraph A.2.) The value isderived by dividing the total release Curies by 5 Curies and then multiplying the result by 100.
2) This value is derived by the following formula:
(Average Diluted Concentration) (100)(MPC or ECL, Appendix B, Table 2,1 OCFR20)
3) This value is derived by the following formula:
(Average Diluted Concentration) (100)% of Applicable Limit = (2E -04 from ODCM Section 2.1)
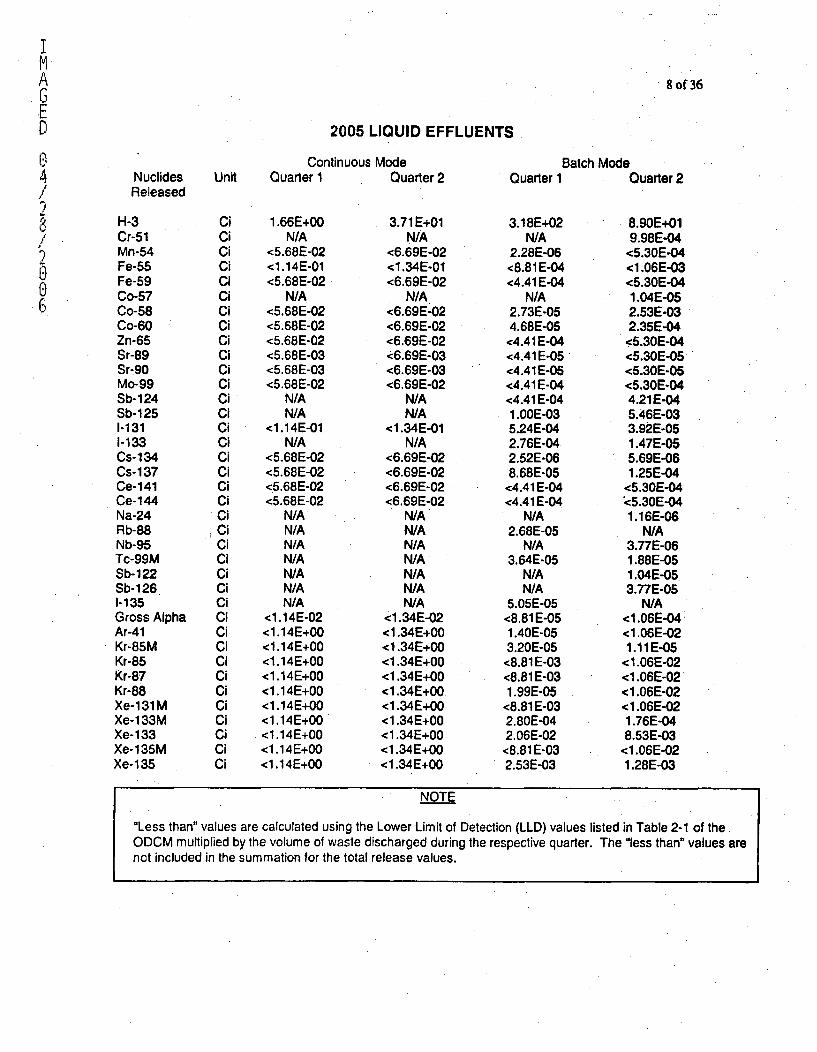
I
A 8 of 36GE) 2005 LIQUID EFFLUENTS
0 Continuous Mode Batch Mode4 Nuclides Unit Quarter I Quarter 2 Quarter 1 Quarter 2
Released
1H-3 Ci 1.66E+00 3.71 E+01 3.18E+02 8.90E+01Cr-51 Ci N/A N/A N/A 9.98E-04Mn-54 Ci <5.68E-02 <6.69E-02 2.28E-06 <5.30E-04Fe-55 Ci <1.14E-01 <1.34E-01 <8.81E-04 <1.06E-03Fe-59 Ci <5.68E-02 <6.69E-02 <4.41 E-04 <5.30E-04Co-57 Ci N/A N/A N/A 1.04E-05
6 Co-58 Ci <5.68E-02 <6.69E-02 2.73E-05 2.53E-03Co-60 Ci <5.68E-02 <6.69E-02 4.68E-05 2.35E-04Zn-65 Ci <5.68E-02 <6.69E-02 <4.41 E-04 <5.30E-04Sr-89 Ci <5.68E-03 46.69E-03 <4.41 E-05 <5.30E-05Sr-90 Ci <5.68E-03 <6.69E-03 <4.41E-05 <5.30E-05Mo-99 Ci <5.68E-02 <6.69E-02 <4.41E-04 <5.30E-04Sb-124 Ci N/A N/A <4.41 E-04 4.21 E-04Sb-125 Ci N/A N/A 1.OOE-03 5.46E-031-131 Ci <1.14E-01 <1.34E-01 5.24E-04 3.92E-05I1-133 Ci N/A N/A 2.76E-04 1.47E-05Cs-134 Ci <5.68E-02 <6.69E-02 2.52E-06 5.69E-06Cs-137 Ci <5.68E-02 <6.69E-02 8.68E-05 1.25E-04Ce-141 Ci <5.68E-02 <6.69E-02 <4.41 E-04 <5.30E-04Ce-144 Ci <5.68E-02 <6.69E-02 <4.41E-04 k5.30E-04Na-24 Ci N/A N/A N/A 1.16E-06Rb-88 Ci N/A N/A 2.68E-05 N/ANb-95 Ci N/A N/A N/A 3.77E-06Tc-99M Ci N/A N/A 3.64E-05 1.88E-05Sb-122 Ci N/A N/A N/A 1.04E-05Sb-126 Ci N/A N/A N/A 3.77E-051-135 Ci N/A N/A 5.05E-05 N/AGross Alpha Ci <1.14E-02 <1.34E-02 <8.81E-05 <1.06E-04Ar-41 Ci <1.14E+00 <1.34E+00 1.40E-05 <1.06E-02Kr-85M Ci <1.14E+00 <1.34E+00 3.20E-05 1.11E-05Kr-85 Ci <1.14E+00 <1.34E+00 <8.81E-03 <1.06E-02Kr-87 Ci <1.14E+00 <1.34E+00 <8.81E-03 <1.06E-02Kr-88 Ci <1.14E+00 <1.34E+00 1.99E-05 <1.06E-02Xe-131M Ci <1.14E+00 <1.34E+00 <8.81E-03 <1.06E-02Xe-133M Ci < 1.14E+00 <1.34E+00 2.80E-04 1.76E-04Xe-133 Ci <1.14E+00 <1.34E+00 2.06E-02 8.53E-03Xe-135M Ci <1.14E+00 <1.34E+00 <8.81E-03 <1.06E-02Xe-135 Ci <1.14E+00 <1.34EE+00 2.53E-03 1.28E-03
NOTE
"Less than" values are calculated using the Lower Limit of Detection (LLD) values listed in Table 2-1 of theODCM multiplied by the volume of waste discharged during the respective quarter. The "less than" values arenot included in the summation for the total release values.
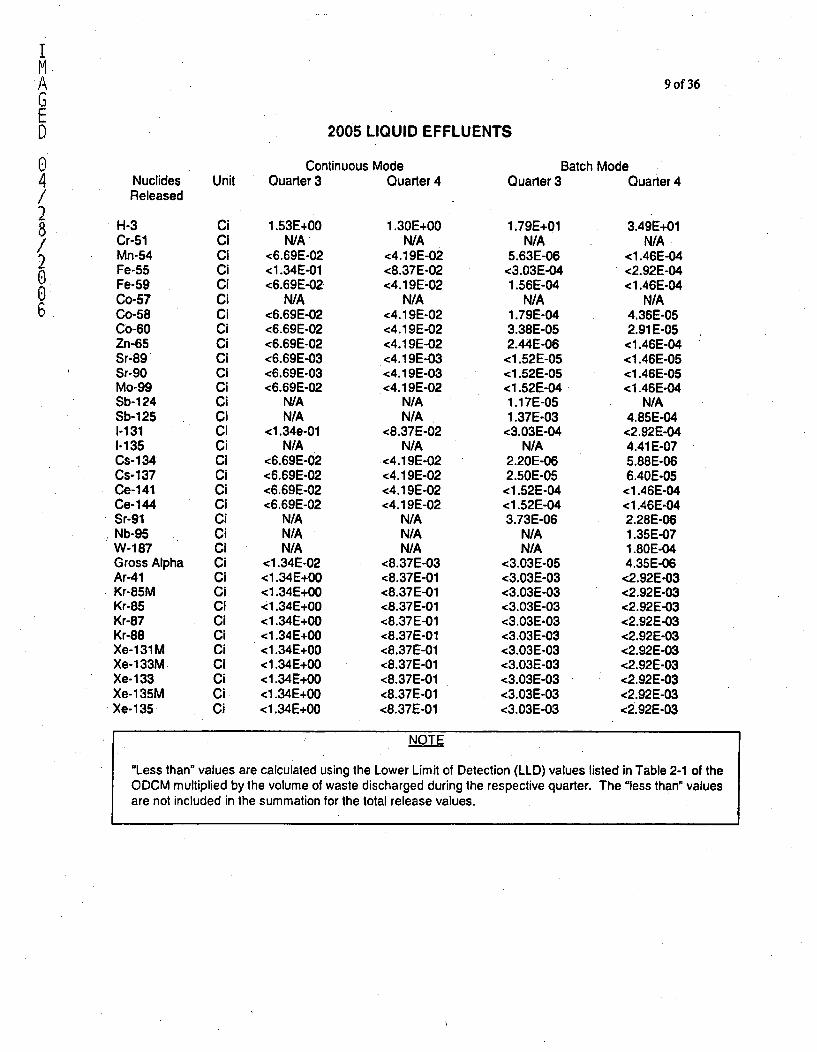
I, 9 9of 36
E2005 LIQUID EFFLUENTS
O Continuous Mode Batch Mode4 Nuclides Unit Quarter 3 Quarter 4 Quarter 3 Quarter 4/ Released28 H-3 Ci 1.53E+00 1.30E+00 1.79E+01 3.49E+01/ Cr-51 Ci N/A N/A N/A N/A
Mn-54 Ci <6.69E-02 <4.19E-02 5.63E-06 <1.46E-042 Fe-55 Ci <1.34E-01 <8.37E-02 <3.03E-04 <2.92E-04Fe-59 Ci <6.69E-02 <4.19E-02 1.56E-04 <1.46E-04
U Co-57 Ci N/A N/A N/A N/A6 Co-58 Ci <6.69E-02 <4.19E-02 1.79E-04 4.36E-05
Co-60 Ci <6.69E-02 <4.19E-02 3.38E-05 2.91E-05Zn-65 Ci <6.69E-02 <4.19E-02 2.44E-06 <1.46E-04Sr-89 Cl <6.69E-03 <4.19E-03 <1.52E-05 <1.46E-05Sr-90 Ci <6.69E-03 <4.19E-03 <1.52E-05 <1.46E-05Mo-99 Ci <6.69E-02 <4.19E-02 <1.52E-04 <1.46E-04Sb-124 Ci N/A N/A 1.17E-05 N/ASb-125 Cl N/A N/A 1.37E-03 4.85E-041-131 Ci <1.34e-01 <8.37E-02 <3.03E-04 <2.92E-041-135 Ci N/A N/A N/A 4.41 E-07Cs-134 Ci <6.69E-02 <4.19E-02 2.20E-06 5.88E-06Cs-137 Ci <6.69E-02 <4.19E-02 2.50E-05 6.40E-05Ce-141 Ci <6.69E-02 <4.19E-02 <1.52E-04 <1.46E-04Ce-144 Ci <6.69E-02 <4.19E-02 <1.52E-04 <1.46E-04Sr-91 Ci N/A N/A 3.73E-06 2.28E-06Nb-95 Ci N/A N/A N/A 1.35E-07W-187 Ci N/A N/A N/A 1.80E-04Gross Alpha Ci <1.34E-02 <8.37E-03 <3.03E-05 4.35E-06Ar-41 Ci <1.34E+00 <8.37E-01 <3.03E-03 <2.92E-03Kr-85M Ci <1.34E+00 <8.37E-01 <3.03E-03 <2.92E-03Kr-85 Cl <1.34E+00 <8.37E-01 <3.03E-03 <2.92E-03Kr-87 Ci <1.34E+00 <8.37E-01 <3.03E-03 <2.92E-03Kr-88 Ci <1.34E+00 <8.37E-01 <3.03E-03 <2.92E-03Xe-1i31M Ci <1.34E+00 <8.37E-01 <3.03E-03 <2.92E-03Xe-1i33M Ci <1.34E+00 <8.37E-01 <3.03E-03 <2.92E-03Xe-133 Ci <1.34E+00 <8.37E-01 <3.03E-03 <2.92E-03Xe-135M Ci <1.34E+00 <8.37E-01 <3.03E-03 <2.92E-03Xe-135 Ci <1.34E+00 <8.37E-01 <3.03E-03 <2M92E-03
NOTE
" "Less than" values are calculated using the Lower Limit of Detection (LLD) values listed in Table 2-1 of theODCM multiplied by the volume of waste discharged during the respective quarter. The "less than" valuesare not included in the summation for the total release values.
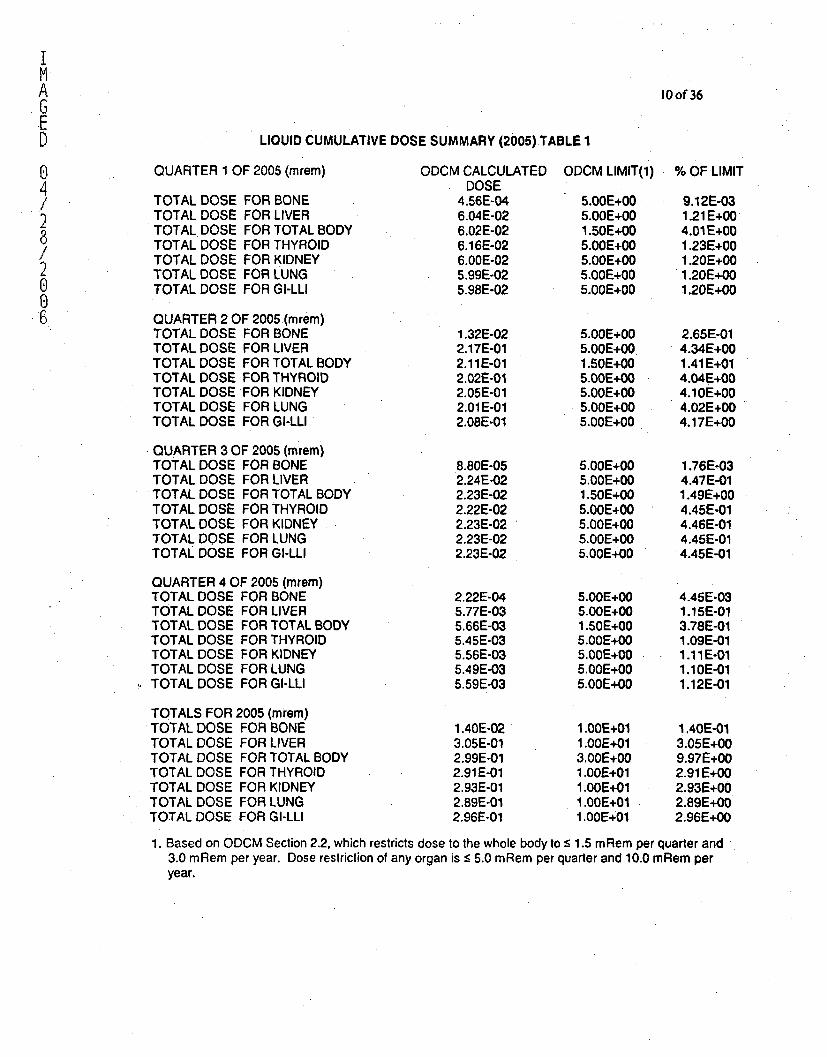
IMAG.ED
64
/
/
206
10 of 36
LIOUID CUMULATIVE DOSE SUMMARY (2005) TABLE 1
QUARTER 1 OF 2005 (mrem)
TOTAL DOSETOTAL DOSETOTAL. DOSETOTAL DOSETOTAL DOSETOTAL DOSETOTAL DOSE
FOR BONEFOR LIVERFOR TOTAL BODYFOR THYROIDFOR KIDNEYFOR LUNGFOR GI-LLI
ODCM CALCULATEDDOSE
4.56E-046.04E-026.02E-026.16E-026.OOE-025.99E-025.98E-02
1.32E-022.17E-012.11E-012.02E-012.05E-012.01E-012.08E-01
ODCM LIMIT(l)
5.OOE+005.OOE+001.50E+005.OOE+005.OOE+005.00E+005.OOE+00
5.00E+005.OOE+001.50E+O05.OOE+005.OOE+0O5.OOE+005.00E+00
QUARTER 2 OF 2005 (mrem)TOTAL DOSE FOR BONETOTAL DOSE FOR LIVERTOTAL DOSE FOR TOTAL BODYTOTAL DOSE FOR THYROIDTOTAL DOSE FOR KIDNEYTOTAL DOSE FOR LUNGTOTAL DOSE FOR GI-LLI
QUARTER 3 OF 2005 (mrem)TOTAL DOSE FOR BONETOTAL DOSE FOR LIVERTOTAL DOSE FOR TOTAL BODYTOTAL DOSE FOR THYROIDTOTAL DOSE FOR KIDNEYTOTAL DOSE FOR LUNGTOTAL DOSE FOR GI-LLI
QUARTER 4 OF 2005 (mreom)TOTAL DOSE FOR BONETOTAL DOSE FOR LIVERTOTAL DOSE FOR TOTAL BODYTOTAL DOSE FOR THYROIDTOTAL DOSE FOR KIDNEYTOTAL DOSE FOR LUNGTOTAL DOSE FOR GI-LLI
TOTALS FOR 2005 (mrem)TOTAL DOSE FOR BONETOTAL DOSE FOR LIVERTOTAL DOSE FOR TOTAL BODYTOTAL DOSE FOR THYROIDTOTAL DOSE FOR KIDNEYTOTAL DOSE FOR LUNGTOTAL DOSE FOR GI-LLI
8.80E-052.24E-022.23E-022.22E-022.23E-022.23E-022.23E-02
2.22E-045.77E-035.66E-035.45E-035.56E-035.49E-035.59E-03
1.40E-023.05E-012.99E-012.91 E-012.93E-012.89E-012.96E-01
5.00E+005.OOE+001.50E+005.00E+005.OOE+005.00E+005.OOE+O0
5.OOE+005.OOE+001.50E+005.00E+005.OOE+005.00E+005.00E+00
1.00E+011 .00E+013.OOE+001.00E+011 .00E+011.00E+011.OOE+01
% OF LIMIT
9.12E-031.21 E+004.01 E+001.23E+001.20E+001.20E+001.20E+00
2.65E-014.34E+001.41 E+014.04E+004.1 OE+O04.02E+004.17E+00
1.76E-034.47E-O11.49E+004.45E-014.46E-014.45E-014.45E-01
4.45E-031.15E-013.78E-011.09E-011.11E-011.10E-011.12E-01
1.40E-013.05E+009.97E+002.91 E+002.93E+002.89E+002.96E+00
1. Based on ODCM Section 2.2, which restricts dose to the whole body to < 1.5 mRem per quarter and
3.0 mRem per year. Dose restriction of any organ is < 5.0 mRem per quarter and 10.0 mRem per
year.
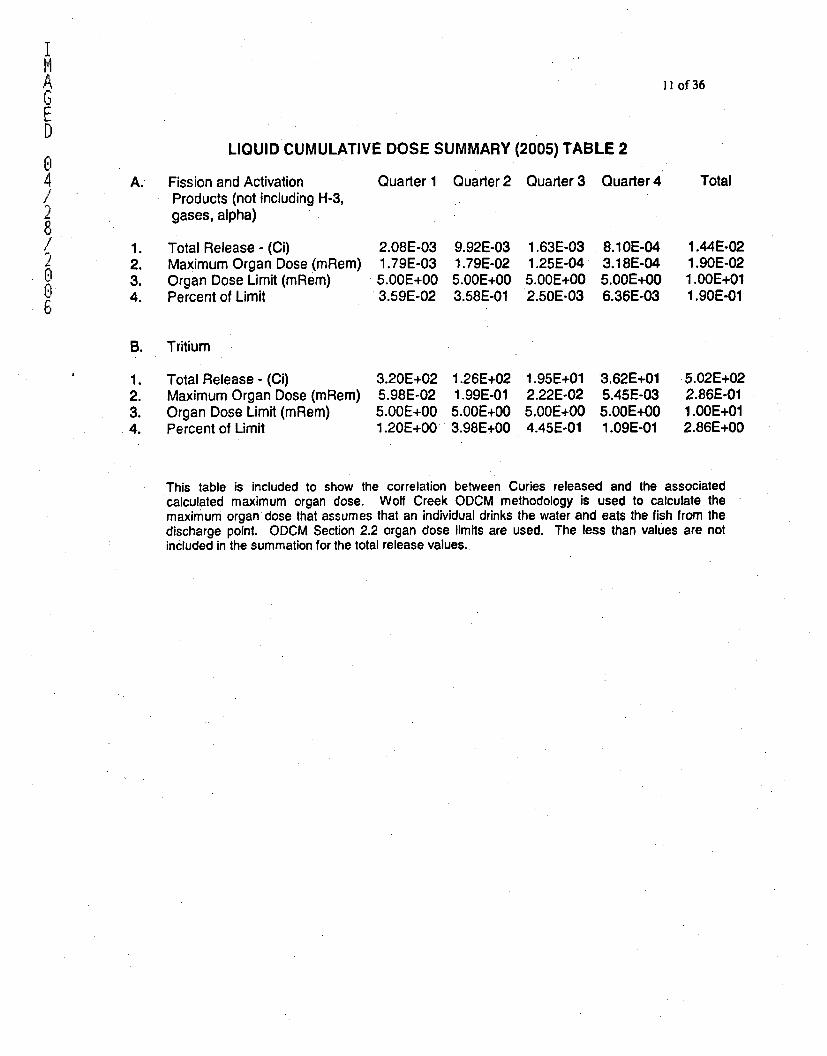
II of 36
GED
LIQUID CUMULATIVE DOSE SUMMARY (2005) TABLE 2
4 A. Fission and Activation Quarter 1 Quarter 2 Quarter 3 Quarter 4 Total/1 Products (not including H-3,
gases, alpha)0
/ 1. Total Release - (Ci) 2.08E-03 9.92E-03 1.63E-03 8.10E-04 1.44E-022 2. Maximum Organ Dose (mRem) 1.79E-03 1.79E-02 1.25E-04 3.18E-04 1.90E-02O 3. Organ Dose Limit (mRem) 5.00E+00 5.OOE+00 5.OOE+00 5.00E+00 1.00E+01o 4. Percent of Limit 3.59E-02 3.58E-01 2.50E-03 6.36E-03 1.90E-016
B. Tritium
1. Total Release - (Ci) 3.20E+02 1.26E+02 1.95E+01 3.62E+01 5.02E+022. Maximum Organ Dose (mRem) 5.98E-02 1.99E-01 2.22E-02 5.45E-03 2.86E-013. Organ Dose Limit (mRem) 5.OOE+00 5.OOE+00 5.OOE+00 5.OOE+00 1.00E+01
•4. Percent of Limit 1.20E+00 3.98E+00 4.45E-01 1.09E-01 2.86E+00
This table is included to show the correlation between Curies released and the associatedcalculated maximum organ dose. Wolf Creek ODCM methodology is used to calculate themaximum organ dose that assumes that an individual drinks the water and eats the fish from thedischarge point. ODCM Section 2.2 organ dose limits are used. The less than values are notincluded in the summation for the total release values.
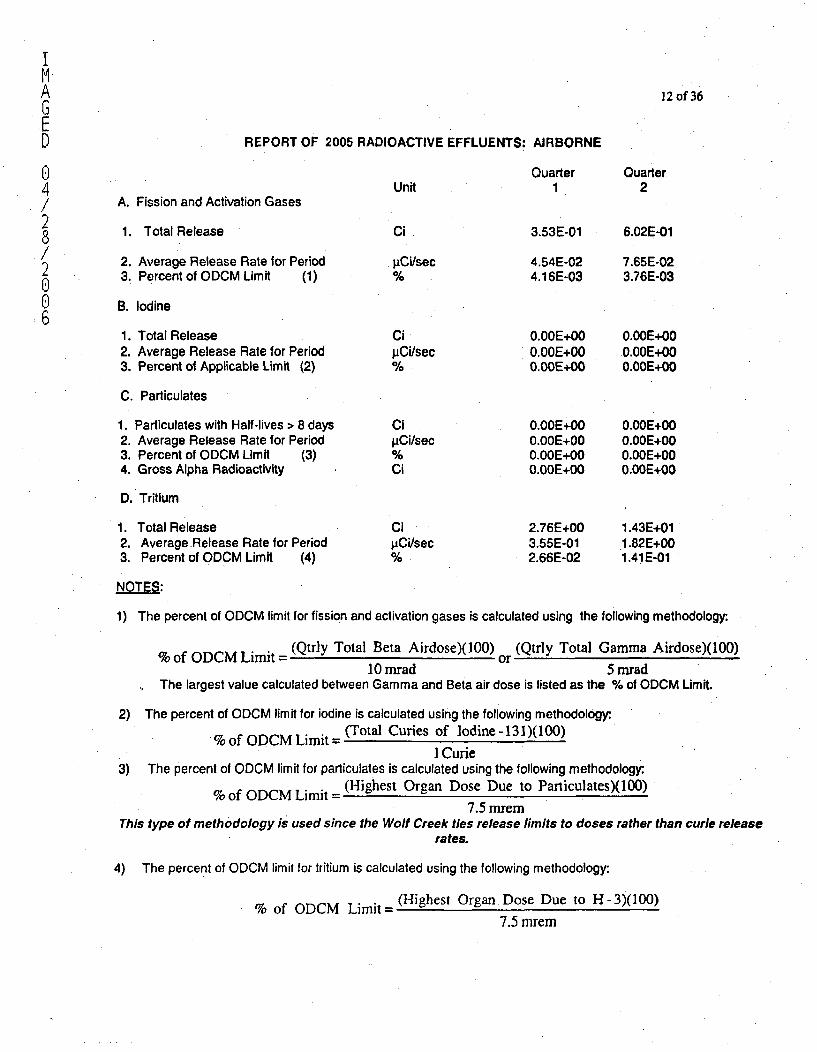
IHA 12 of 36G.ED REPORT OF 2005 RADIOACTIVE EFFLUENTS: AIRBORNE
o Quarter Quarter4 Unit 1 2
/ A. Fission and Activation Gases
21. Total Release Ci 3.53E-01 6.02E-01
/-2. Average Release Rate for Period pCi/sec 4.54E-02 7.65E-02
2 3. Percent of ODCM Limit (1) % 4.16E-03 3.76E-03
o B. Iodine
1. Total Release Ci 0.OOE+00 O.OOE+002. Average Release Rate for Period jpCi/sec 0.OOE+00 O.OOE+003. Percent of Applicable Limit (2) % 0.OOE+00 0.OOE+00
C. Particulates
1. Particulates with Half-lives > 8 days Ci 0.00E+40 0.OOE+002. Average Release Rate for Period PCi/sec 0.OOE+00 0.OOE+O03. Percent of ODCM Limit (3) % 0.OOE+00 O.OOE+O04. Gross Alpha Radioactivity Ci O.OOE+00 O.OOE+00
D. Tritium
1. Total Release Cl 2.76E+00 1.43E+012. Average Release Rate for Period pCi/sec 3.55E-01 1.82E+003. Percent of ODCM Limit (4) % 2.66E-02 1.41 E-01
NOTES:
1) The percent of ODCM limit for fission and activation gases is calculated using the following methodology:.
% of ODCM Limit (Qtrly Total Beta Airdose)(100) or (Qtrly Total Gamma Airdose)(100)10 mrad 5 mrad
The largest value calculated between Gamma and Beta air dose is listed as the % of ODCM Limit.
2) The percent of ODCM limit for iodine is calculated using the following methodology:
% of ODCM Limit = (Total Curies of Iodine -131)(100)I Curie
3) The percent of ODCM limit for particulates is calculated using the following methodology:.
%of ODCM Limit = (Highest Organ Dose Due to Particulates)(100)7.5 mrem
This type of methodology is used since the Wolf Creek ties release limits to doses rather than curie releaserates.
4) The percent of ODCM limit for tritium is calculated using the following methodology:
% of ODCM Limit = (Highest Organ. Dose Due to H - 3)(100)7.5 mrem
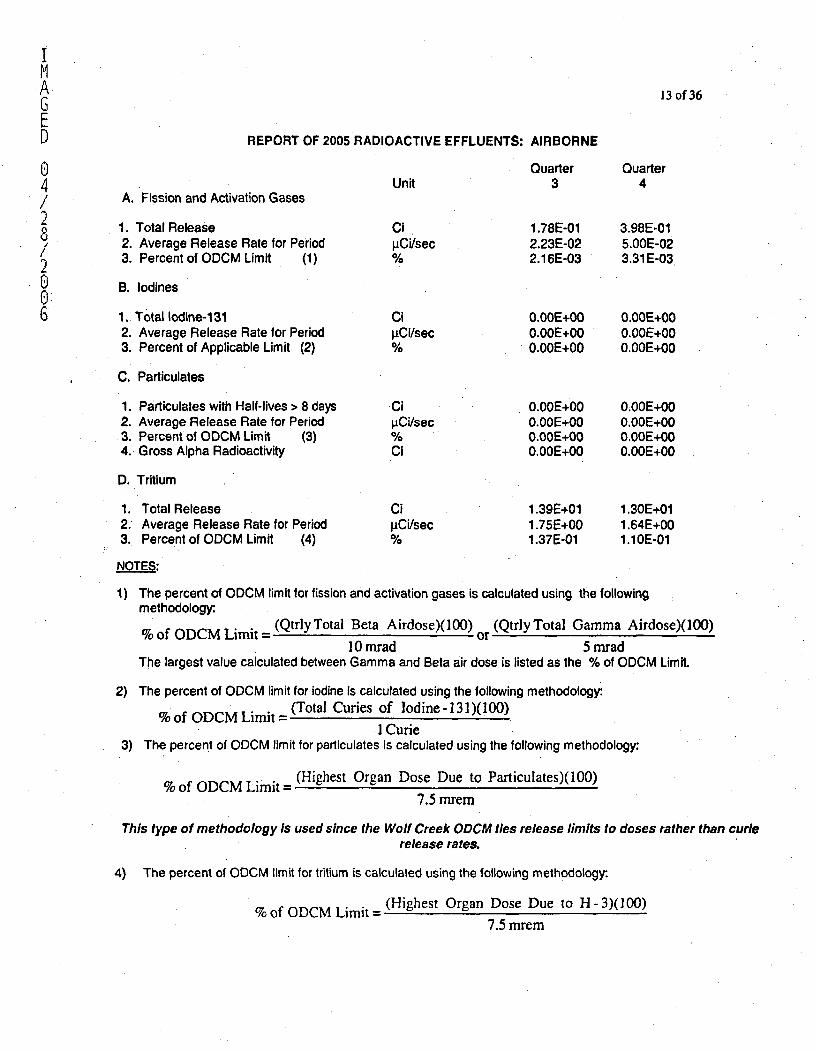
I.
13 of 366ED REPORT OF 2005 RADIOACTIVE EFFLUENTS: AIRBORNE
O Quarter Quarter4Unit 3 4
/ A. Fission and Activation Gases
21. Total Release Ci 1.78E-01 3.98E-012. Average Release Rate for Period piCi/sec 2.23E-02 5.00E-023. Percent of ODCM Limit (1) % 2.16E-03 3.31E-03
0 B. lodines06 1. Total Iodine-131 Ci 0.OOE+00 0.OOE+00
2. Average Release Rate for Period ipCi/sec 0.OOE+00 O.OOE+003. Percent of Applicable Limit (2) % 0.00E+00 0.OOE+00
C. Particulates
1. Particulates with Half-lives > 8 days Cl O.OOE+00 0.OOE+002. Average Release Rate for Period f.Ci/sec 0.OOE+00 O.OOE+003. Percent of ODCM Limit (3) % O.OOE+00 0.OOE+004. Gross Alpha Radioactivity Ci O.OOE+00 O.OOE+00
D. Tritium
1. Total Release Ci 1.39E+01 1.30E+012. Average Release Rate for Period pCi/sec 1.75E+00 1.64E+003. Percent of ODCM Limit (4) % 1.37E-01 1.10E-01
NOTES:
1) The percent of ODCM limit for fission and activation gases is calculated using the followingmethodology:% of ODCM Limit = (Qtrly Total Beta Airdose)(100)or (Qtrly Total Gamma Airdose)(100)
10 mrad 5 mradThe largest value calculated between Gamma and Beta air dose is listed as the % of ODCM Limit.
2) The percent of ODCM limit for iodine is calculated using the following methodology.(Total Curies of Iodine-131)(l00)% of ODCM Limit =
I Curie3) The percent of ODCM limit for particulates is calculated using the following methodology:
% of ODCM Limit = (Highest Organ Dose Due to Particulates)(100)7.5 mrem
This type of methodology is used since the Wolf Creek ODCM ties release limits to doses rather than curierelease rates.
4) The percent of ODCM limit for tritium is calculated using the following methodology.
% of ODCM Limit = (Highest Organ Dose Due to H - 3)(100)
7.5 mrem
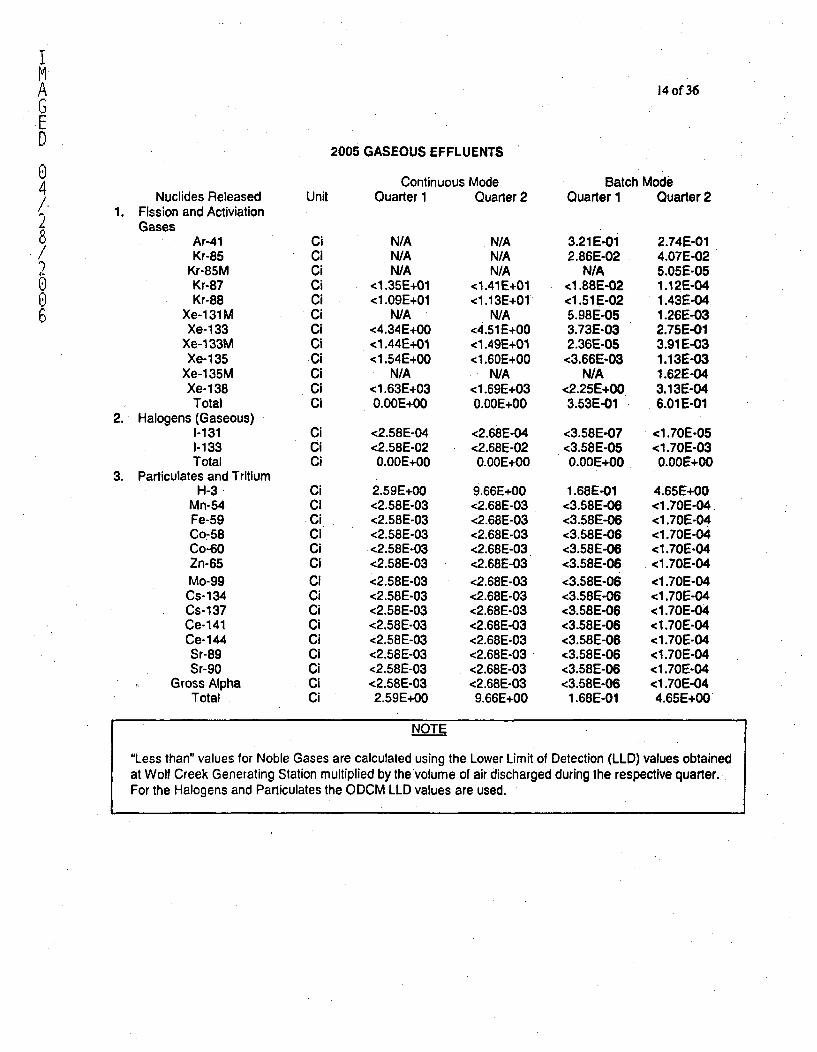
I
14 of36GE
2005 GASEOUS EFFLUENTS
Continuous Mode Batch Mode
Nuclides Released Unit Quarter 1 Quarter 2 Quarter 1 Quarter 21. Fission and Activiation
GasesAr-41 Ci N/A N/A 3.21 E-01 2.74E-01Kr-85 Ci N/A N/A 2.86E-02 4.07E-02
Kr-85M Ci N/A N/A N/A 5.05E-05' Kr-87 Ci <1.35E+01 <1.41E+01 <1.88E-02 1.12E-040 Kr-88 Ci <1.09E+01 <1.13E+01 <11.51E-02 1.43E-046 Xe-131M Ci N/A N/A 5.98E-05 1.26E-03
Xe-133 Ci <4.34E+00 <4.51E+00 3.73E-03 2.75E-01Xe-1 33M Ci <1.44E+01 <1.49E+01 2.36E-05 3.91 E-03Xe-135 Ci <1.54E+00 <1.60E+00 <3.66E-03 1.13E-03
Xe-1 35M Ci N/A N/A N/A 1.62E-04Xe-138 Ci <1.63E+03 <1.69E+03 <2.25E+00 3.13E-04Total Ci 0.00E+00 0.OOE+00 3.53E-01 6.01 E-01
2. Halogens (Gaseous)1-131 Ci <2.58E-04 <2.68E-04 <3.58E-07 <1 .70E-051-133 Ci <2.58E-02 <2.68E-02 <3.58E-05 <1.70E-03Total Ci 0.OOE+00 O.OOE+00 0.OOE+00 , .00E+00
3. Particulates and TritiumH-3 Ci 2.59E+00 9.66E+00 1.68E-01 4.65E+00
Mn-54 Ci <2.58E-03 <2.68E-03 <3.58E-06 <1.70E-04Fe-59 Ci <2.58E-03 <2.68E-03 <3.58E-06 <1.70E-04Co-58 Ci <2.58E-03 <2.68E-03 <3.58E-06 <1.70E-04Co-60 Ci <2.58E-03 <2.68E-03. <3.58E-06 <1 .70E-04Zn-65 Ci <2.58E-03 <2.68E-03 <3.58E-06 <1 .70E-04Mo-99 Ci <2.58E&03 <2.68E-03 <3.58E-06 <1.70E-04Cs-134 Ci <2.58E-03 <2.68E-03 <3.58E-06 <1.70E-04Cs-137 Ci <2.58E-03 <2.68E-03 <3.58E-06 <1.70E-04Ce-141 Ci <2.58E-03 <2.68E-03 <3.58E-06 <1.70E-04Ce-144 Ci <2.58E-03 <2.68E-03 <3.58E-06 <1.70E-04Sr-89 Ci <2.58E-03 <2.68E-03 <3.58E-06 <1.70E-04Sr-90 Ci <2.58E-03 <2.68E-03 <3.58E-06 <1.70E-04
Gross Alpha Ci <2.58E-03 <2.68E-03 <3.58E-06 <1.70E-04Total Ci 2.59E+00 9.66E+00 1.68E-01 4.65E+00
NOTE
"Less than" values for Noble Gases are calculated using the Lower Limit of Detection (LLD) values obtainedat Wolf Creek Generating Station multiplied by the volume of air discharged during the respective quarter.For the Halogens and Particulates the ODCM LLD values are used.
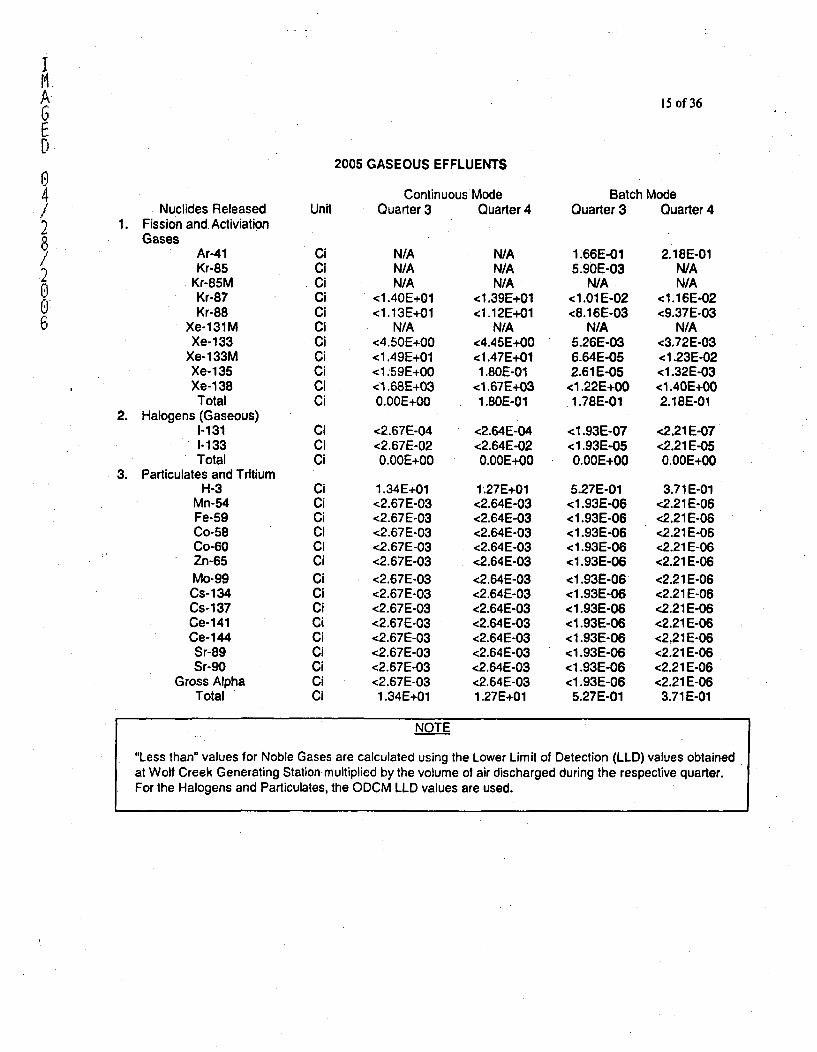
IHA 15 of 36
2005 GASEOUS EFFLUENTS
4 Continuous Mode Batch ModeNuclides Released Unit Quarter 3 Quarter 4 Quarter 3 Quarter 4
2 1. Fission and Activiation8 • .GasesG Ar-41 Ci N/A N/A 1 .66E-01 2.18E-01Kr-85 Ci N/A N/A 5.90E-03 N/A
Kr-85M Ci N/A N/A N/A N/AKr-87 Ci <1.40E+01 <1.39E+01 <1.01 E-02 <1.16E-02U Kr-88 Ci <1.13E+01 -1.12E+01 <8.16E-03 <9.37E-03
6 Xe-131M Ci N/A N/A N/A N/AXe-133 Ci <4.50E+00 <4.45E+00 5.26E-03 <3.72E-03
Xe-133M Ci <1.49E+01 <1.47E+01 6.64E-05 <1.23E-02Xe-135 Ci <1:59E+00 1.80E-01 2.61E-05 <1.32E-03Xe-138 Ci <1.68E+03 <1.67E+03 <1.22E+00 <1.40E+00Total Ci 0.OOE+00 1.80E-01 1.78E-01 2.18E-01
2. Halogens (Gaseous)1-131 Ci <2.67E-04 <2.64E-04 <1.93E-07 <2.21E-071-133 Ci <2.67E-02 <2.64E-02 <1.93E-05 <2.21 E-05Total Ci O.OOE+00 O.OOE+00 O.OOE+00 O.OOE+00
3. Particulates and TritiumH-3 Ci 1.34E+01 1.27E+01 5.27E-01 3.71E-01
Mn-54 Ci <2.67E-03 <2.64E-03 <1.93E-06 <2.21E-06Fe-59 Ci <2.67E-03 <2.64E-03 <1.93E-06 <2.21 E-06Co-58 Ci <2.67E-03 <2.64E-03 <1.93E-06 <2.21E-06Co-60 Ci <2.67E-03 <2.64E-03 <1.93E-06 <2.21 E-06Zn-65 Ci <2.67E-03 <2.64E-03 <1.93E-06 <2.21 E-06Mo-99 Ci <2.67E-03 <2.64E-03 <1.93E-06 <2.21 E-06Cs-134 Ci <2.67E-03 <2.64E-03 <1.93E-06 <2.21E-06Cs-1 37 Ci <2.67E-03 <2.64E-03 <1.93E-06 <2.21 E-06Ce-141 Ci <2.67E-03 <2.64E-03 <1.93E-06 <2.21E-06Ce-144 Ci <2.67E-03 <2.64E-03 <1.93E-06 <2.21E-06Sr-89 Ci <2.67E-03 <2.64E-03 <1.93E-06 <2.21 E-06Sr-90 Ci <2.67E-03 <2.64E-03 <1.93E-06 <2.21 E-06
Gross Alpha Ci <2.67E-03 <2.64E-03 <1.93E-06 <2.21 E-06Total Ci 1.34E+01 1.27E+01 5.27E-01 3.71 E-01
NOTE
"Less than" values for Noble Gases are calculated using the Lower Limit of Detection (LLD) values obtainedat Wolf Creek Generating Station multiplied by the volume of air discharged during the respective quarter.For the Halogens and Particulates, the ODCM LLD values are used.
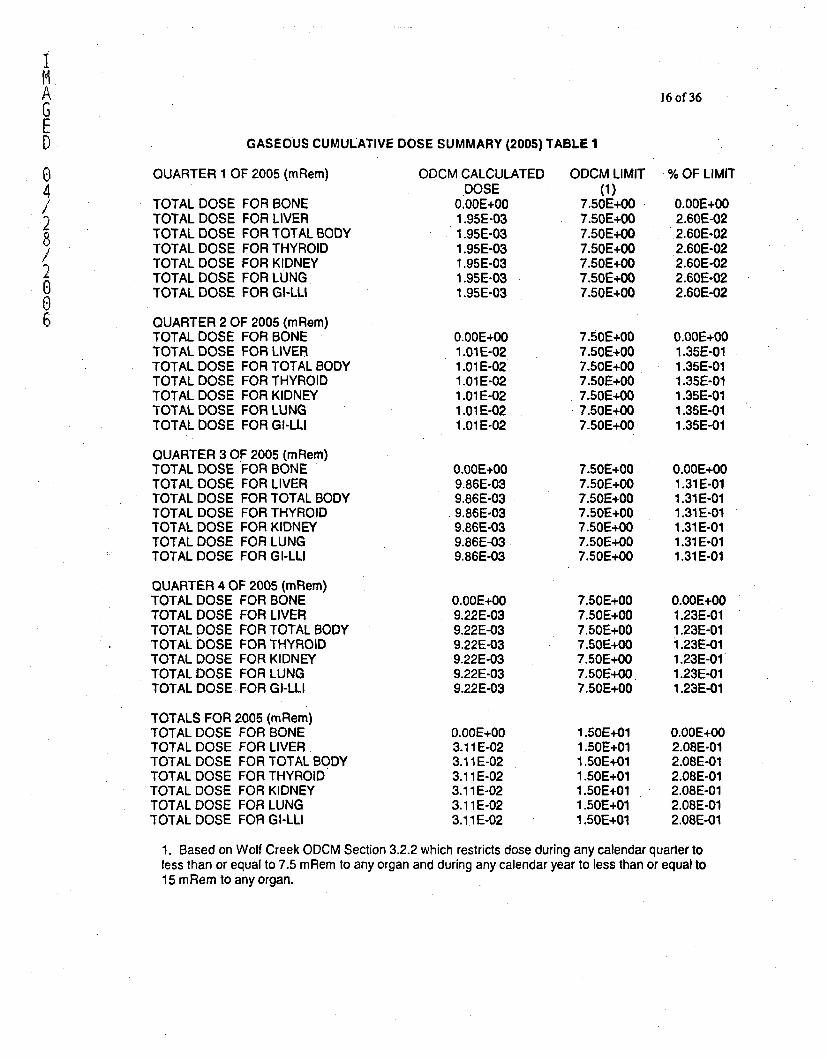
MAGED
04/
8/4.0
6
16 of 36
GASEOUS CUMULATIVE DOSE SUMMARY (2005) TABLE I
QUARTER 1 OF 2005 (mRem)
TOTAL DOSETOTAL DOSETOTAL DOSETOTAL DOSETOTAL DOSETOTAL DOSETOTAL DOSE
FOR BONEFOR LIVERFOR TOTAL BODYFOR THYROIDFOR KIDNEYFOR LUNGFOR GI-LLI
ODCM CALCULATEDDOSE
0.OOE+001.95E-031.95E-031.95E-031.95E-031.95E-031.95E-03
O.OOE+001.01 E-021.01 E-021.01 E-021.01 E-021.01 E-021.01 E-02
QUARTER 2 OF 2005 (mRem)TOTAL DOSE FOR BONETOTAL DOSE FOR LIVERTOTAL DOSE FOR TOTAL BODYTOTAL DOSE FOR THYROIDTOTAL DOSE FOR KIDNEYTOTAL DOSE FOR LUNGTOTAL DOSE FOR GI-LLI
QUARTER 3 OF 2005 (mRem)TOTAL DOSE FOR BONETOTAL DOSE FOR LIVERTOTAL DOSE FOR TOTAL BODYTOTAL DOSE FOR THYROIDTOTAL DOSE FOR KIDNEYTOTAL DOSE FOR LUNGTOTAL DOSE FOR GI-LLI
QUARTER 4 OF 2005 (mRem)TOTAL DOSE FOR BONETOTAL DOSE FOR LIVERTOTAL DOSE FOR TOTAL BODYTOTAL DOSE FOR THYROIDTOTAL DOSE FOR KIDNEYTOTAL DOSE FOR LUNGTOTAL DOSE FOR GI-LLI
TOTALS FOR 2005 (mRem)TOTAL DOSE FOR BONETOTAL DOSE FOR LIVER.TOTAL DOSE FOR TOTAL BODYTOTAL DOSE FOR THYROIDTOTAL DOSE FOR KIDNEYTOTAL DOSE FOR LUNGTOTAL DOSE FOR GI-LLI
0.OOE+009.86E-039-86E-03.9.86E-039.86E-039.86E-039.86E-03
0.OOE+009.22E-039.22E-039.22 E-039.22E-039.22E-039.22E-03
0.OOE+003.11 E-023.11IE-023.11 E-023.11 E-023.11 E-023.11 E-02
ODCM LIMIT(1)
7.50E+007.50E+007.50E+007.50E+007.50E+007.50E+007.50E+00
7.50E+007.50E+007.50E+0O7.50E+007.50E+007.50E+007.50E+00
7.50E+007.50E+007.50E+007.50E+007.50E+007.50E+007.50E+00
7.50E+007.50E+007.50E+007.50E+007.50E+007.50E+007.50E+00
1.50E+011.50E+011 ,50E+011.50E+011.50E+011.50E+011.50E+01
% OF LIMIT
O.OOE+002.60E-022.60E-022.60E-022.60E-022.60E-022.60E-02
O.OOE+O01.35E-011.35E-011.35E-011.35E-011,35E-011.35E-01
O.OOE+O01.31 E-011.31 E-011.31E-011.31E-011.31 E-011.31 E-01
O.OOE+0O1.23E-011.23E-011.23E-011.23E-011.23E-011.23E-01
O.OOE+002.08E-012.08E-012.08E-012.08E-012.08E-012.08E-01
1. Based on Wolf Creek ODCM Section 3.2.2 which restricts dose during any calendar quarter to
less than or equal to 7.5 mRem to any organ and during any calendar year to less than or equal to
15 mRem to any organ.
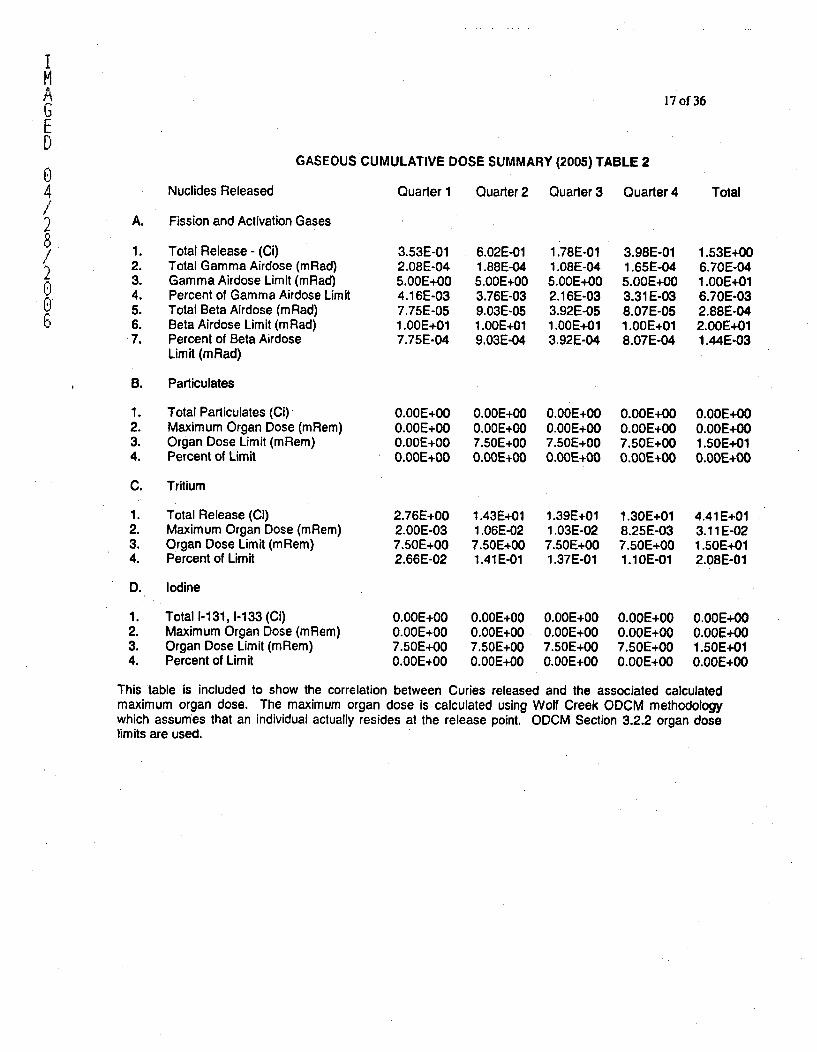
I
A 17of36GED
GASEOUS CUMULATIVE DOSE SUMMARY (2005) TABLE 204 Nuclides Released Quarter 1 Quarter 2 Quarter 3 Quarter 4 Total
A. Fission and Activation Gases8/ 1. Total Release - (Ci) 3.53E-01 6.02E-01 1.78E-01 3.98E-01 1.53E+00
2. Total Gamma Airdose (mRad) 2.08E-04 1.88E-04 1.08E-04 1.65E-04 6.70E-043. Gamma Airdose Limit (mRad) 5.OOE+00 5.00E+00 5.OOE+00 5.OOE+O0 1.00E+014. Percent of Gamma Airdose Limit 4.16E-03 3.76E-03 2.16E-03 3.31 E-03 6.70E-03
0 5. Total Beta Airdose (mRad) 7.75E-05 9.03E-05 3.92E-05 8.07E-05 2.88E-04b 6. Beta Airdose Limit (mRad) 1.OOE+01 1.OOE+01 1.OOE+01 1.OOE+01 2.OOE+01
7. Percent of Beta Airdose 7.75E-04 9.03E-04 3.92E-04 8.07E-04 1.44E-03Limit (mRad)
B. Particulates
1. Total Particulates (Ci) O.OOE+00 O.OOE+00 O.OOE+00 O.OOE+00 O.OOE+002. Maximum Organ Dose (mRem) O.OOE+00 O.OOE+00 0.00E+00 O.OOE+00 O.OOE+003. Organ Dose Limit (mRem) O.OOE+00 7.50E+00 7.50E+00 7.50E+00 1.50E+014. Percent of Limit O.OOE+00 O.OOE+00 O.OOE+00 O.OOE+00 O.OOE+00
C. Tritium
1. Total Release (Ci) 2.76E+00 1.43E+01 1.39E+01 1.30E+01 4.41 E+012. Maximum Organ Dose (mRem) 2.00E-03 1.06E-02 1.03E-02 8.25E-03 3.11 E-023. Organ Dose Limit (mRem) 7.50E+00 7.50E+00 7.50E+00 7.50E+00 1.50E+014. Percent of Limit 2.66E-02 1.41E-01 1.37E-01 1.10E-01 2.08E-01
D. Iodine
1. Total 1-131,1-133 (Ci) O.OOE+00 O.OOE+00 O.OOE+00 O.OOE+00 O.OOE+O02. Maximum Organ Dose (mRem) O.OOE+00 O.OOE+00 O.OOE+00 O.OOE+00 O.OOE+O03. Organ Dose Limit (mRem) 7.50E+00 7.50E+00 7.50E+00 7.50E+00 1.50E+014. Percent of Limit O.OOE+00 O.OOE+00 O.OOE+00 O.OOE+00 O.OOE+00
This table is included to show the correlation between Curies released and the associated calculatedmaximum organ dose. The maximum organ dose is calculated using Wolf Creek ODCM methodologywhich assumes that an individual actually resides at the release point. ODCM Section 3.2.2 organ doselimits are used.
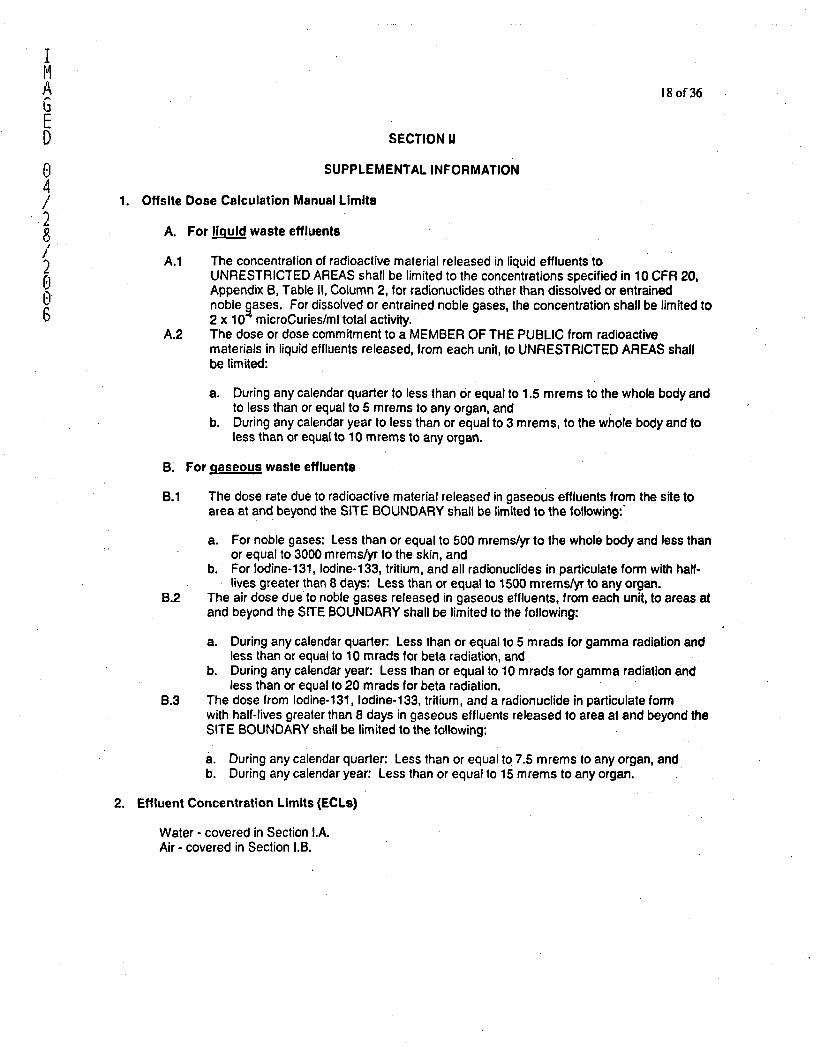
I
A18 of36GED. SECTION II
CI SUPPLEMENTAL INFORMATION4/ 1. Offsite Dose Calculation Manual Limits
A. For li!qud waste effluents
/ A.1 The concentration of radioactive material released in liquid effluents toUNRESTRICTED AREAS shall be limited to the concentrations specified in 10 CFR 20,
0 Appendix B, Table II, Column 2, for radionuclides other than dissolved or entrainednoble pases. For dissolved or entrained noble gases, the concentration shall be limited to
& 2 x 10 microCuries/ml total activity.A.2 The dose or dose commitment to a MEMBER OF THE PUBLIC from radioactive
materials in liquid effluents released, from each unit, to UNRESTRICTED AREAS shallbe limited:
a. During any calendar quarter to less than or equal to 1.5 mrems to the whole body andto less than or equal to 5 mrems to any organ, and
b. During any calendar year to less than or equal to 3 mrems, to the whole body and toless than or equal to 10 mrems to any organ.
B. For gaseous waste effluents
B.1 The dose rate due to radioactive material released in gaseous effluents from the site toarea at and beyond the SITE BOUNDARY shall be limited to the following:"
a. For noble gases: Less than or equal to 500 mrems/yr to the whole body and less thanor equal to 3000 mrems/yr to the skin, and
b. For lodine-131, Iodine-1 33, tritium, and all radionuclides in particulate form with half-lives greater than 8 days: Less than or equal to 1500 mrems/yr to any organ.
B.2 The air dose due to noble gases released in gaseous effluents, from each unit, to areas atand beyond the SITE BOUNDARY shall be limited to the following:
a. During any calendar quarter: Less than or equal to 5 mrads for gamma radiation andless than or equal to 10 mrads for beta radiation, and
b. During any calendar year: Less than or equal to 10 mrads for gamma radiation andless than or equal to 20 mrads for beta radiation.
B.3 The dose from Iodine-131, Iodine-133, tritium, and a radionuclide in particulate formwith half-lives greater than 8 days in gaseous effluents released to area at and beyond theSITE BOUNDARY shall be limited to the following:
a. During any calendar quarter: Less than or equal to 7.5 mrems to any organ, andb. During any calendar year: Less than or equal to 15 mrems to any organ.
2. Effluent Concentration Limits (ECLs)
Water - covered in Section I.A.Air - covered in Section I.B.
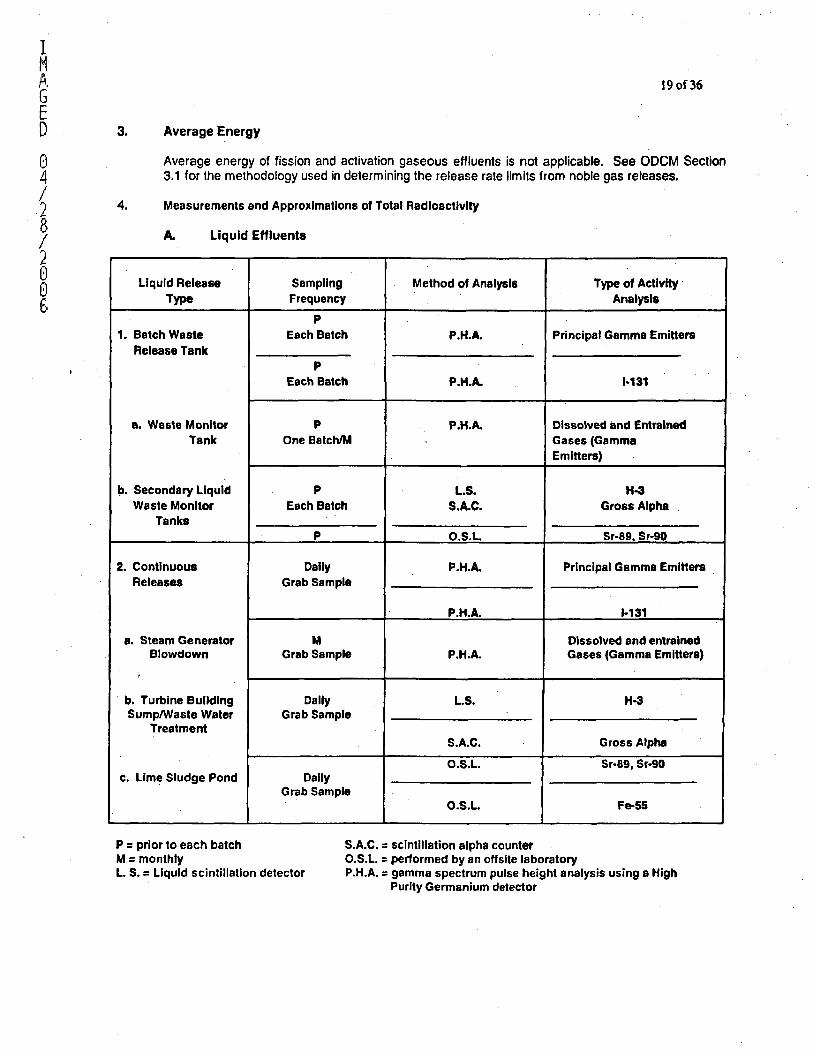
Iii.
6
04/.9
/
006
19 of 36
3. Average Energy
Average energy of fission and activation gaseous effluents is not applicable. See ODCM Section3.1 for the methodology used in determining the release rate limits from noble gas releases.
4. Measurements and Approximations of Total Radioactivity
A. Liquid Effluents
Liquid Release Sampling Method of Analysis Type of ActivityType Frequency Analysis
P1. Batch Waste Each Batch P.H.A. Principal Gamma Emitters
Release TankP
Each Batch P.H.A. 1-131
a. Waste Monitor P P.H.A. Dissolved and EntrainedTank One Batch/M Gases (Gamma
Emitters)
b. Secondary Liquid P L.S. H-3Waste Monitor Each Batch S.A.C. Gross Alpha
TanksP O.S.L Sr-89. Sr-90
2. Continuous Daily P.H.A. Principal Gamma EmittersReleases Grab Sample
P.H.A. 1-131
a. Steam Generator M Dissolved and entrainedBlowdown Grab Sample P.H.A. Gases (Gamma Emitters)
b. Turbine Building Daily L.S. H-3Sump/Waste Water Grab Sample
TreatmentS.A.C. Gross Alpha
O.S.L. Sr-69, Sr-90c. Lime Sludge Pond Daily
Grab SampleO.SL.L Fe-55
P = prior to each batchM monthlyL. S. = Liquid scintillation detector
S.A.C. = scintillation alpha counterO.S.L. = performed by an offsite laboratoryP.H.A. = gamma spectrum pulse height analysis using a High
Purity Germanium detector
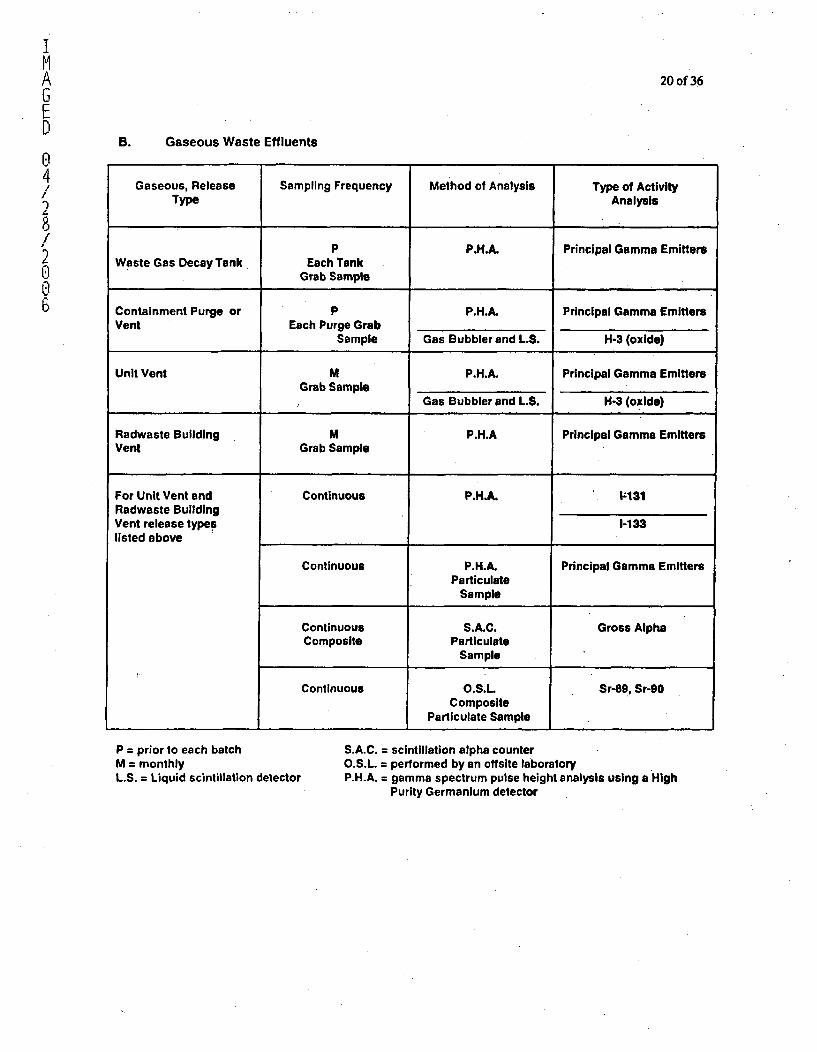
IHAGEDI
04!
8/2.006
20 of 36
B. Gaseous Waste Effluents
Gaseous, Release Sampling Frequency Method of Analysis Type of ActivityType Analysis
P P.H.A. Principal Gamma EmittersWaste Gas Decay Tank Each Tank
Grab Sample
Containment Purge or P P.H.A. Principal Gamma EmittersVent Each Purge Grab
Sample Gas Bubbler and L.S. H-3 (oxide)
Unit Vent M P.H.A. Principal Gamma EmittersGrab Sample
Gas Bubbler and L.S. H-3 (oxide)
Radwaste Building M P.H.A Principal Gamma EmittersVent Grab Sample
For Unit Vent and Continuous P.H.A. 1i131Radwaste BuildingVent release types 1-133listed above
Continuous P.H.A. Principal Gamma EmittersParticulate
Sample
Continuous S.A.C. Gross AlphaComposite Particulate
Sample
Continuous O.S.L. Sr-89, Sr-90Composite
Particulate Sample
P = prior to each batchM = monthlyL.S. = Liquid scintillation detector
S.A.C. = scintillation alpha counterO.S.L. = performed by an offsite laboratoryP.H.A. = gamma spectrum pulse height analysis using a High
Purity Germanium detector
I
A 21 of 36GED 5. Batch Releases
0 A batch release is the discontinuous release of gaseous or liquid effluents which takes4 place over a finite period of time; usually hours or days.
There were 72 gaseous batch releases during the reporting period. The longest gaseous8batch release lasted 9777 minutes, while the shortest lasted 75 minutes. The average
release lasted 538 minutes with a total gaseous batch release time of 45,683 minutes.2o There were 62 liquid batch releases during the reporting period. The longest liquid batch0" release lasted 375 minutes, while the shortest lasted 30 minutes. The average releaseb lasted 156 minutes with a total liquid batch release time of 10,545 minutes.
6. Continuous Releases
A continuous release is a release of gaseous or liquid effluent, which is essentiallyuninterrupted for extended periods during normal operation of the facility. Four liquidrelease pathways were designated as continuous releases during this reporting period:Steam Generator Blowdown, Turbine Building Sump, Waste Water Treatment, and LimeSludge Pond. Two gas release pathways were designated as continuous releases: UnitVent and Radwaste Building Vent.
7. Doses to a Member of the Public from Activities Inside the Site Boundary
Four activities by members of the public were considered in this evaluation: personnelmaking deliveries to the plant, workers at the William Allen White Building located outsideof the protected area boundary, the use of the access road south of the RadwasteBuilding, and public use of the cooling lake during times when fishing-was-allowed. Thedose calculated for the maximum exposed individual for these four activities was asfollows:
Plant Deliveries 3.36E-01 mRemWilliam Allen White Building Workers 7.42E-03 mRemAccess Road Users 3.54E-03 mRemLake Use 4.57E-02 mRem
The plant delivery calculations were based on deliveries 3 hours per week for 50 weeksper year. The William Allen White Building occupancy was based on normal workinghours of 2000 per year. The usage factor for the access road south of the RadwasteBuilding was 25 hours per year. The dose to fishermen on the lake was based upon 4356hours (12 hours a day for 363 days, based on the number of days that the lake was opento fisherman). Pathways used in the calculation were gaseous inhalation, submersion,and ground plane. All calculations were performed in accordance with the methodologyand parameters in the ODCM.
I
A 22 of 36GED
8. Additional Information04 PIR 2005-1836 - While performing a Volume Control Tank (VCT) purge to Gas Decayi/ Tank #3 (GDT), a leak was identified on a Swagelok fitting on a moisture separator2 pressure switch (HAPS1035B). During the VCT purge, the Radwaste Treatment Systems
Operator noticed a significant drop in pressure. The purge was secured and the system/ lineup verified, with no deficiencies found. The leak was found to be at a fitting on
HAPS1035B, which allowed an unexpected pressure loss from GDT #3, from 21 psig to0 6.8 psig over a time period of 94 minutes. Work Request 05-050478 was written. The0 leak resulted in an unplanned, monitored release of noble gases from the RadwasteS Building Vent. No ODCM limits were exceeded. An estimated 6.22E-03 curies were
released.
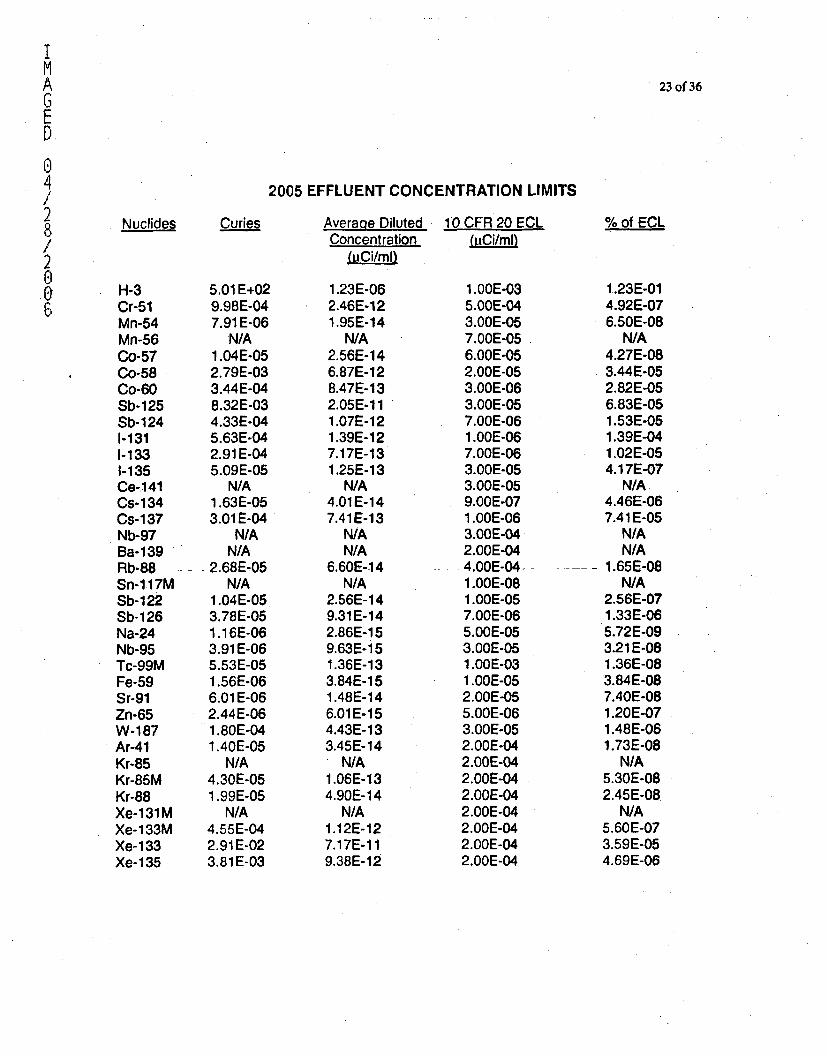
IMAGE
0
/
063
23 of 36
2005 EFFLUENT CONCENTRATION LIMITS
Nuclides
H-3Cr-51Mn-54Mn-56Co-57Co-58Co-60Sb-125Sb-1241-1311-1331-135Ce-141Cs-134Cs-i 37Nb-97Ba-139Rb-88Sn-i 17MSb-122Sb-126Na-24Nb-95Tc-99MFe-59Sr-91Zn-65W-187Ar-41Kr-85Kr-85MKr-88Xe-1 31MXe-133MXe-133Xe-135
Curies
5.01 E+029.98E-047.91 E-06
N/A1.04E-052.79E-033.44E-048.32E-034.33E-045.63E-042.91 E-045.09E-05
N/A1.63E-053.01 E-04
N/AN/A
2.68E-05N/A
1.04E-053.78E-051.16E-063.91 E-065.53E-051.56E-066.01 E-062.44E-061.80E-041.40E-05
N/A4.30E-051.99E-05
N/A4.55E-042.91 E-023.81 E-03
Average DilutedConcentration
(uCi/ml)
1.23E-062.46E-121.95E-14
N/A2.56E-146.87E-128.47E-132.05E-1 11.07E-121.39E-127.17E-131.25E-1 3
N/A4.01E-147.41E-13
N/AN/A
6.60E-1 4N/A
2.56E-149.31E-142.86E-1 59.63E-151.36E-133.84E- 151.48E-146.01E-154.43E-133.45E-14
N/A1.06E-134.90E-14
N/A1.12E-127.17E-1 19.38E-12
10 CFR 20 ECL(uCi/ml)
1.OOE-035.OOE-043.OOE-057.OOE-056.OOE-052.OOE-053.OOE-063.OOE-057.OOE-061.OOE-067.OOE-063.OOE-053.OOE-059.OOE-071.OOE-063.OOE-042.OOE-041.OOE-081.OOE-057.OOE-065.OOE-053.OOE-051.OOE-031.OOE-052.OOE-055.OOE-063.OOE-052.OOE-042.OOE-042.OOE-042.OOE-042.00E-042.OOE-042.OOE-042.OOE-04
% of ECL
1.23E-014.92E-076.50E-08
N/A4.27E-083.44E-052.82E-056.83E-051.53E-051.39E-041.02E-054.17E-07
N/A.4.46E-067.41 E-05
N/AN/A
1.65E-08N/A
2.56E-071.33E-065.72E-093.21 E-081.36E-083.84E-087.40E-081.20E-071.48E-061.73E-08
N/A5.30E-082.45E-08
N/A5.60E-073.59E-054.69E-06
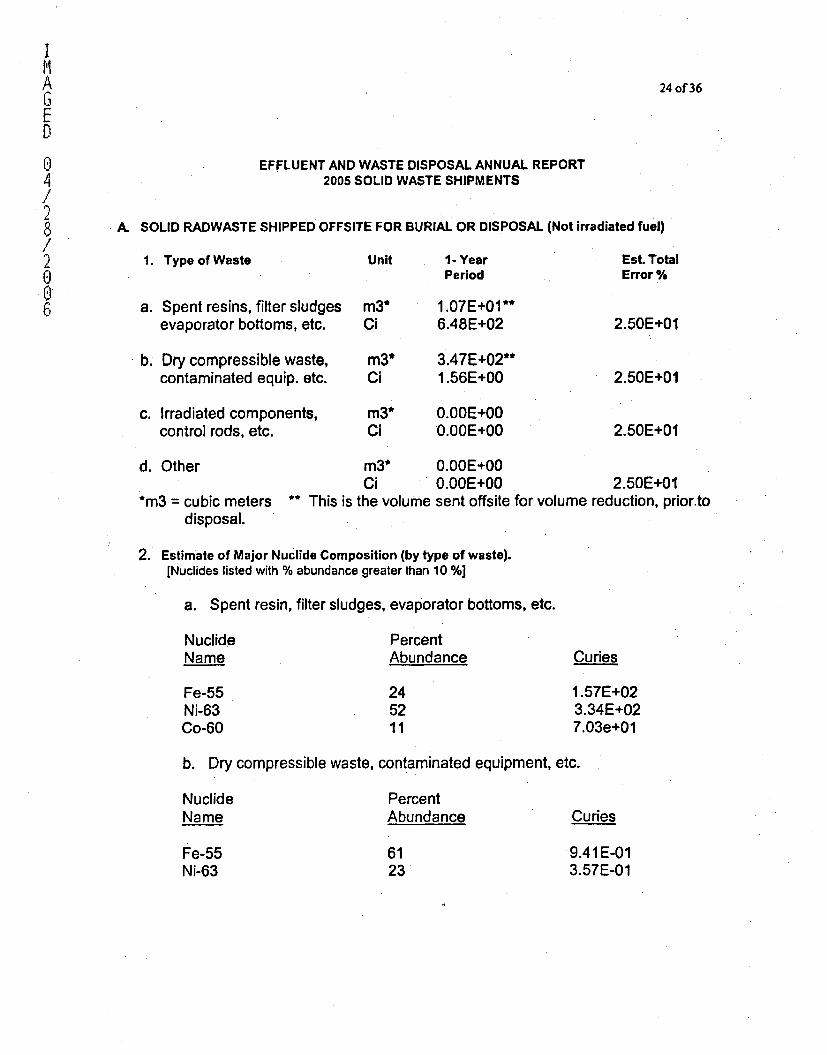
IMA 24 of 36ED
O EFFLUENT AND WASTE DISPOSAL ANNUAL REPORT4 2005 SOLID WASTE SHIPMENTS
A. SOLID RADWASTE SHIPPED OFFSITE FOR BURIAL OR DISPOSAL (Not irradiated fuel)/1. Type of Waste Unit 1- Year Est. Total
O Period Error %
a. Spent resins, filter sludges m3* 1.07E+01**evaporator bottoms, etc. Ci 6.48E+02 2.50E+01
b. Dry compressible waste, m3* 3.47E+02**contaminated equip. etc. Ci 1.56E+00 2.50E+01
c. Irradiated components, m3* O.OOE+00control rods, etc. Ci O.OOE+00 2.50E+01
d. Other m3* O.OOE+00Ci O.OOE+00 2.50E+01
*m3 = cubic meters This is the volume sent offsite for volume reduction, prior.todisposal.
2. Estimate of Major Nuclide Composition (by type of waste).[Nuclides listed with % abundance greater than 10 %]
a. Spent resin, filter sludges, evaporator bottoms, etc.
Nuclide PercentName Abundance Curies
Fe-55 24 1.57E+02Ni-63 52 3.34E+02Co-60 11 7.03e+01
b. Dry compressible waste, contaminated equipment, etc.
Nuclide PercentName Abundance Curies
Fe-55 61 9.41E-01Ni-63 23 3.57E-01
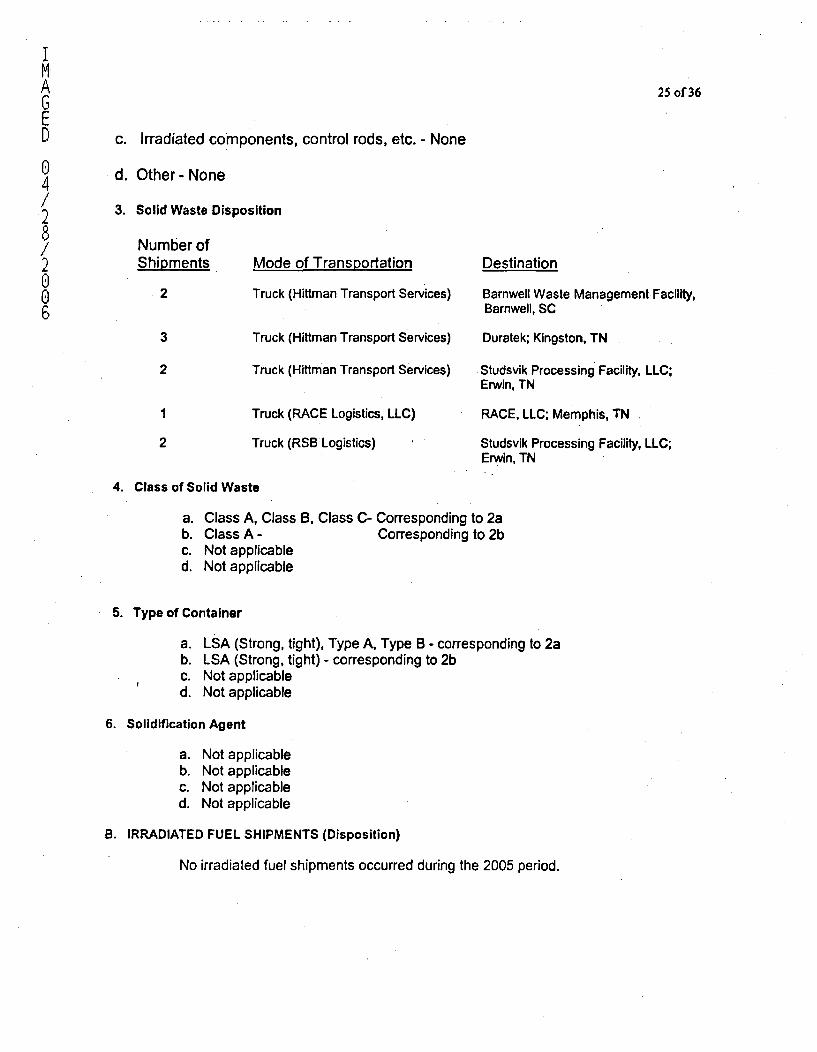
IMAGE[)
04/2.V/2.006
25 of 36
c. Irradiated components, control rods, etc. - None
d. Other- None
3. Solid Waste Disposition
Number ofShipments Mode of Transportation
2 Truck (Hittman Transport Services)
3 Truck (Hittman Transport Services)
2 Truck (Hittman Transport Services)
1 Truck (RACE Logistics, LLC)
2 Truck (RSB Logistics) I
Destination
Barnwell Waste Management Facility,Barnwell, SC
Duratek; Kingston, TN
•Studsvik Processing Facility, LLC;Erwin, TN
RACE, LLC; Memphis, TN
Studsvik Processing Facility, LLC;Erwin, TN
4. Class of Solid Waste
a. Class A, Class B, Class C- Corresponding to 2ab. Class A - Corresponding to 2bc. Not applicabled. Not applicable
5. Type of Container
a. LSA (Strong, tight), Type A, Type B - corresponding to 2ab. LSA (Strong, tight) - corresponding to 2bc. Not applicabled. Not applicable
6. Solidification Agent
a. Not applicableb. Not applicablec. Not applicabled. Not applicable
B. IRRADIATED FUEL SHIPMENTS (Disposition)
No irradiated fuel shipments occurred during the 2005 period.
IMA 26 of 36.G•ED SECTION III
0 HOURS AT EACH WIND SPEED AND DIRECTION4
2This section documents WCGS meteorological data for wind speed, wind direction, and
/ atmospheric stability.
The meteorological data supplied in the following tables covers the period from January 1, 2005,0 through December 31, 2005, and indicates the number of hours at each wind speed and directionfor each stability class. All gaseous releases at the WCGS are ground level releases.
Wolf Creek Station did meet Regulatory Guide 1.23 requirement for data recovery and had a90.58% meteorological data recovery for 2005.
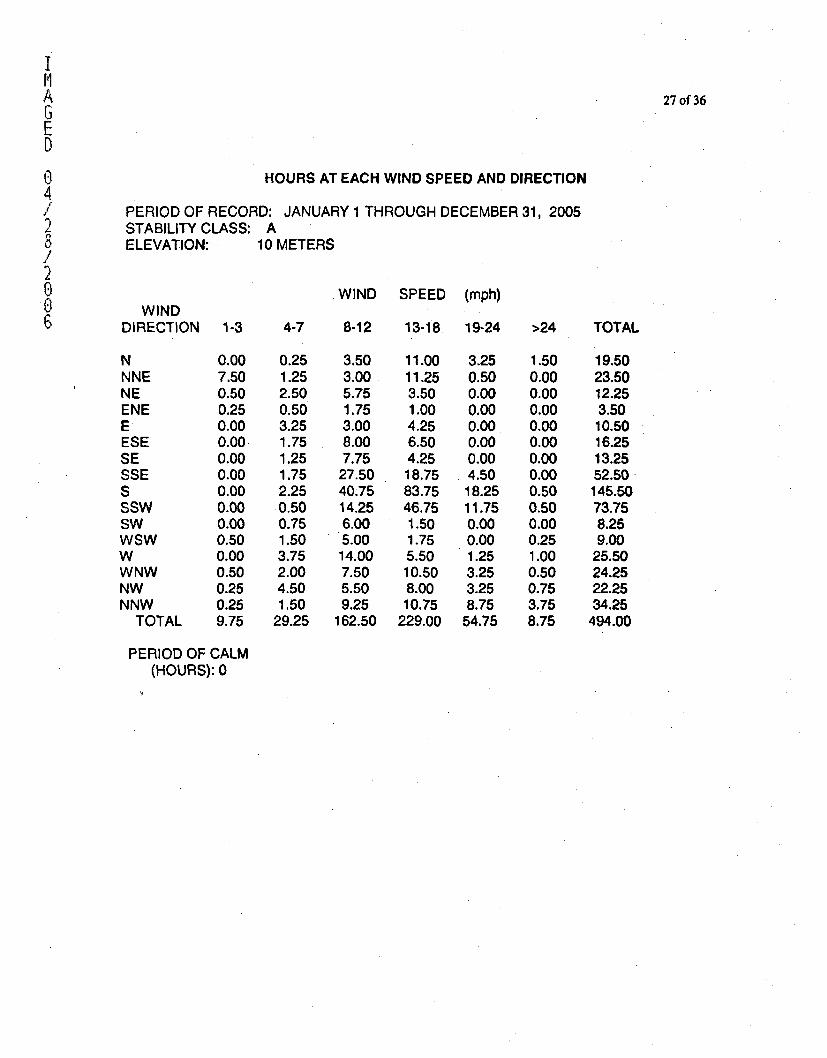
I
AbED
04./
2A
0I2006
27 of 36
HOURS AT EACH WIND SPEED AND DIRECTION
PERIOD OF RECORD: JANUARY 1 THROUGH DECEMBER 31, 2005STABILITY CLASS: AELEVATION: 10 METERS
WINDDIRECTION 1-3
N 0.00NNE 7.50NE 0.50ENE 0.25E 0.00ESE 0.00SE 0.00SSE 0.00S 0.00SSW 0.00SW 0.00WSW 0.50W 0.00WNW 0.50NW 0.25NNW 0.25
TOTAL 9.75
PERIOD OF CALM(HOURS): 0
4-7
0.251.252.500.503.251.751.251.752.250.500.751.503.752.004.501.50
29.25
WIND SPEED (mph)
8-12 13-18, 19-24
3.50 11.00 3.253.00 11.25 0.505.75 3.50 0.001.75 1.00 0.003.00 4.25 0.008.00 6.50 0.007.75 4.25 0.0027.50 18.75 4.5040.75 83.75 18.2514.25 46.75 11.756.00 1.50 0.005.00 1.75 0.0014.00 5.50 1.257.50 10.50 3.255.50 8.00 3.259.25 10.75 8.75
1.62.50 229.00 54.75
>24
1.500.000.000.000.000.000.000.000.500.500.000.251.000.500.753.758.75
TOTAL
19.5023.5012.253.5010.5016.2513.2552.50145.5073.758.259.00
25.5024.2522.2534.25
494.00

I
A 28 of 36GED HOURS AT EACH WIND SPEED AND DIRECTION
PERIOD OF RECORD: JANUARY 1 THROUGH DECEMBER 31,20054 STABILITY CLASS: B
ELEVATION: 10 METERS2
WIND SPEED (mph)WIND
DIRECTION 1-3 4-7 8-12 13-18 19-24 >24O TOTAL6
N 1.00 2.75 10.25 10.25 3.75 0.50 28.50NNE 0.25 2.50 6.75 8.75 0.75 0.00 19.00NE 0.50 3.00 5.25 1.75 0.25 0.00 10.75ENE 0.00 3.75 2.50 0.50 0.00 0.00 6.75E 0.00 21.50 4.75 0.75 0.50 0.50 28.00ESE 0.00 1.25 3.50 2.50 0.00 0.00 7.25SE 0.00 2.00 10.25 1.75 0.25 0.00 14.25SSE 0.25 5.25 12.25 5.50 2.00 0.00 25.25S 0.00 5.50 24.75 20.50 8.75 0.25 59.75SSW 0.25 3.00 18.25 23.75 4.00 0.50 49.75SW 0.00 1.75 8.25 0.25 0.25 0.00 10.50.WSW 1.25 3.50 3.75 0.25 0.00 0.75 9.50W 0.50 3.75 8.75 3.25 0.25 1.75 18.25WNW 0.50 3.75 7.50 2.00 0.75 1.25 15.75NW 0.50 5.00 7.25 9.25 2.25 0.50 24.75NNW 0.50 3.00 6.50 8.75 6.25 1.25 26.25
TOTAL 4.50 71.25 140.50 99.75 30.00 7.25 354.25
PERIOD OF CALM(HOURS): 0
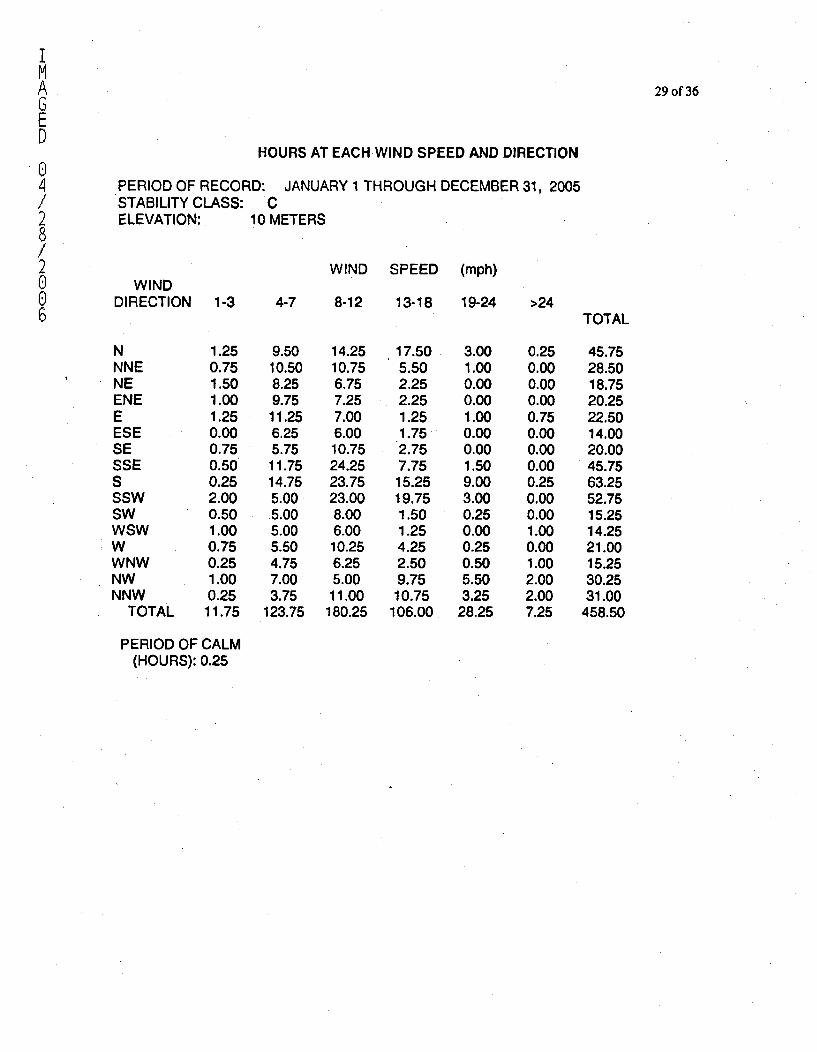
IMA 29 of 36GED
HOURS AT EACH WIND SPEED AND DIRECTION04 PERIOD OF RECORD: JANUARY 1 THROUGH DECEMBER 31, 2005/ STABILITY CLASS: C2 ELEVATION: 10 METERS8/2 WIND SPEED (mph)o WIND0 DIRECTION 1-3 4-7 8-12 13-18 19-24 >246 TOTAL
N 1.25 9.50 14.25 17.50 3.00 0.25 45.75NNE 0.75 10.50 10.75 5.50 1.00 0.00 28.50NE 1.50 8.25 6.75 2.25 0.00 0.00 18.75ENE 1.00 9.75 7.25 2.25 0.00 0.00 20.25E 1.25 11.25 7.00 1.25 1.00 0.75 22.50ESE 0.00 6.25 6.00 1.75 0.00 0.00 14.00SE 0.75 5.75 10.75 2.75 0.00 0.00 20.00SSE 0.50 11.75 24.25 7.75 1.50 0.00 45.75S 0.25 14.75 23.75 15.25 9.00 0.25 63.25SSW 2.00 5.00 23.00 19.75 3.00 0.00 52.75SW 0.50 5.00 8.00 1.50 0.25 0.00 15.25WSW 1.00 5.00 6.00 1.25 0.00 1.00 14.25W 0.75 5.50 10.25 4.25 0.25 0.00 21.00WNW 0.25 4.75 6.25 2.50 0.50 1.00 15.25NW 1.00 7.00 5.00 9.75 5.50 2.00 30.25NNW 0.25 3.75 11.00 10.75 3.25 2.00 31.00
TOTAL 11.75 123.75 180.25 106.00 28.25 7.25 458.50
PERIOD OF CALM(HOURS): 0.25
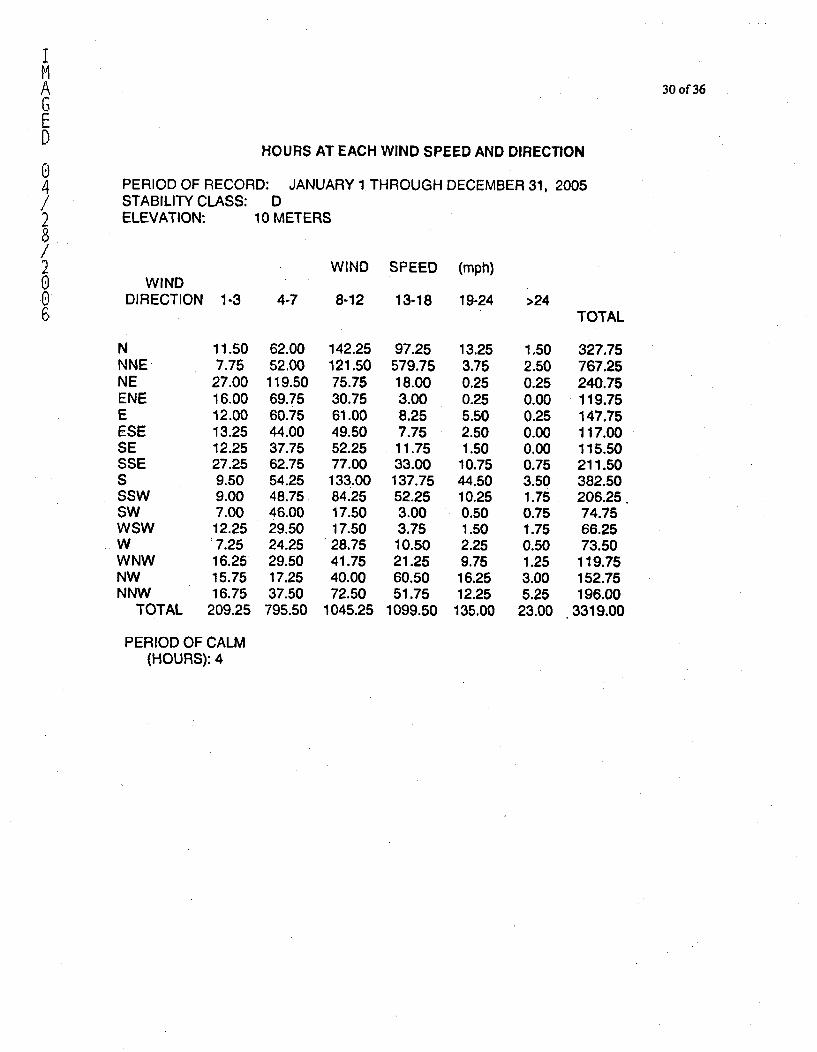
IIiA
D
4
006
30 of 36
HOURS AT EACH WIND SPEED AND DIRECTION
PERIOD OF RECORD: JANUARY 1 THROUGH DECEMBER 31, 2005STABILITY CLASS: DELEVATION: 10 METERS
WIND SPEED (mph)WIND
DIRECTION 1-3 4-7 8-12 13-18 19-24 >24TOTAL
NNNENEENEEESESESSESSSWSWWSWWWNWNWNNW
TOTAL
11.50 62.00 142.25 97.25 13.257.75 52.00 121.50 579.75 3.75
27.00 119.50 75.75 18.00 0.2516.00 69.75 30.75 3.00 0.2512.00 60.75 61.00 8.25 5.5013.25 44.00 49.50 7.75 2.5012.25 37.75 52.25 11.75 1.5027.25 62.75 77.00 33.00 10.759.50 54.25 133.00 137.75 44.509.00 48.75 84.25 52.25 10.257.00 46.00 17.50 3.00 0.5012.25 29.50 17.50 3.75 1.50:7.25 24.25 '28.75 10.50 2.2516.25 29.50 41.75 21.25 9.7515.75 17.25 40.00 60.50 16.2516.75 37.50 72.50 51.75 12.25
209.25 795.50 1045.25 1099.50 135.00
1.50 327.752.50 767.250.25 240.750.00 119.750.25 147.750.00 117.000.00 115.500.75 211.503.50 382.501.75 206.25.0.75 74.751.75 66.250.50 73.501.25 119.753.00 152.755.25 196.00
23.00 .3319.00
PERIOD OF CALM(HOURS): 4
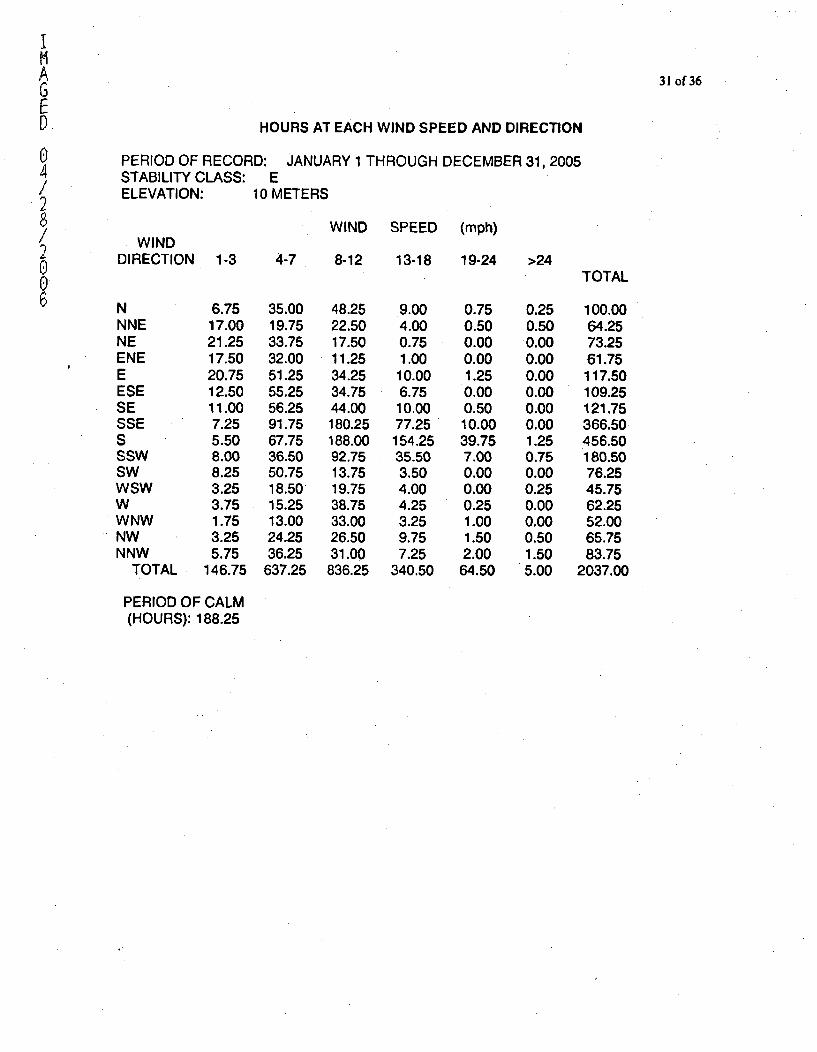
iiAG
[)
04/2
2006
31 of 36
HOURS AT EACH WIND SPEED AND DIRECTION
PERIOD OF RECORD: JANUARY 1 THROUGH DECEMBER 31,2005STABILITY CLASS: EELEVATION: 10 METERS
WINDDIRECTION 1-3 4-7
WIND SPEED (mph)
8-12 13-18 19-24 >24
NNNENEENEEESESESSESSSWSWWSWWWNWNWNNW
TOTAL
6.75 35.00 48.2517.00 19.75 22.5021.25 33.75 17.5017.50 32.00 11.2520.75 51.25 34.2512.50 55.25 34.7511.00 56.25 44.007.25 91.75 180.255.50 67.75 188.008.00 36.50 92.758.25 50.75 13.753.25 18.50 19.753.75 15.25 38.751.75 13.00 33.003.25 24.25 26.505.75 36.25 31.00
146.75 637.25 836.25
9.004.000.751.00
10.006.75
10.0077.25
154.2535.503.504.004.253.259.757.25
340.50
0.750.500.000.001.250.000.5010.0039.757.000.000.000.251.001.502.0064.50
0.250.500.000.000.000.000.000.001.250.750.000.250.000.000.501.505.00
TOTAL
100.0064.2573.2561.75
117.50109.25121.75366.50456.50180.5076.2545.7562.2552.0065.7583.75
2037.00
PERIOD OF CALM(HOURS): 188.25
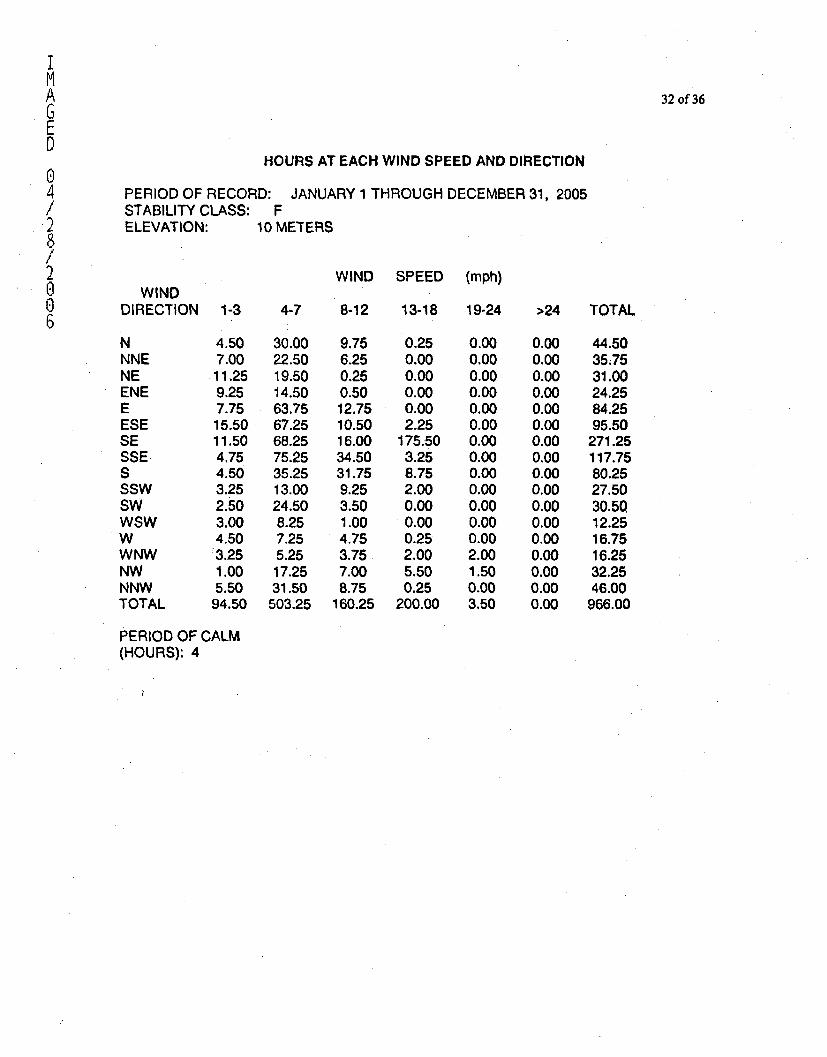
I
A 32 of 36GED
HOURS AT EACH WIND SPEED AND DIRECTION04 PERIOD OF RECORD: JANUARY 1 THROUGH DECEMBER 31, 2005
/ STABILITY CLASS: FELEVATION: 10 METERS
/2 WIND SPEED (mph)O WINDo DIRECTION 1-3 4-7 8-12 13-18 19-24 >24 TOTAL6
N 4.50 30.00 9.75 0.25 0.00 0.00 44.50NNE 7.00 22.50 6.25 0.00 0.00 0.00 35.75NE 11.25 19.50 0.25 0.00 0.00 0.00 31.00ENE 9.25 14.50 0.50 0.00 0.00 0.00 24.25E 7.75 63.75 12.75 0.00 0.00 0.00 84.25ESE 15.50 67.25 10.50 2.25 0.00 0.00 95.50SE 11.50 68.25 16.00 175.50 0.00 0.00 271.25SSE 4.75 75.25 34.50 3.25 0.00 0.00 117.75S 4.50 35.25 31.75 8.75 0.00 0.00 80.25SSW 3.25 13.00 9.25 2.00 0.00 0.00 27.50SW 2.50 24.50 3.50 0.00 0.00 0.00 30.50QWSW 3.00 8.25 1.00 0.00 0.00 0.00 12.25W 4.50 7.25 4.75 0.25 0.00 0.00 16.75WNW 3.25 5.25 3.75 2.00 2.00 0.00 16.25NW 1.00 17.25 7.00 5.50 1.50 0.00 32.25NNW 5.50 31.50 8.75 0.25 0.00 0.00 46.00TOTAL 94.50 503.25 160.25 200.00 3.50 0.00 966.00
PERIOD OF CALM(HOURS): 4
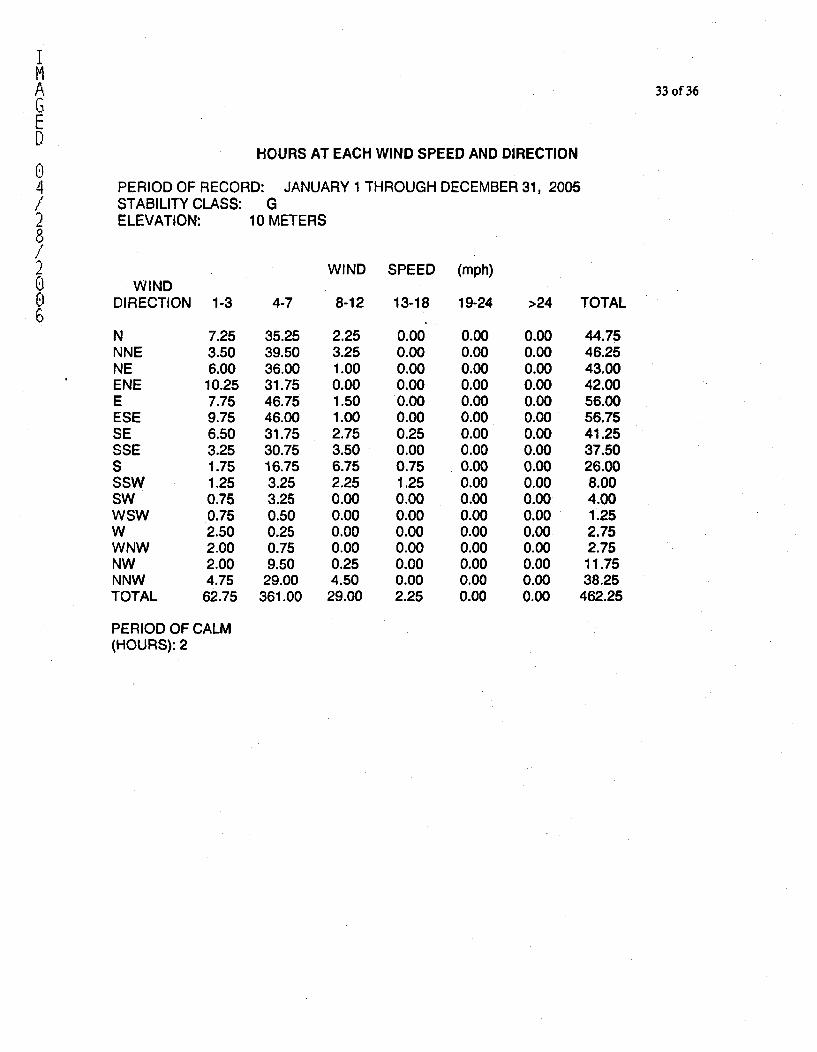
IMA 33 of 36GED
HOURS AT EACH WIND SPEED AND DIRECTION04 PERIOD OF RECORD: JANUARY 1 THROUGH DECEMBER 31, 2005/ STABILITY CLASS: G2 ELEVATION: 10 METERS0/
2 WIND SPEED (mph)WIND
DIRECTION 1-3 4-7 8-12 13-18 19-24 >24 TOTAL
N 7.25 35.25 2.25 0.00 0.00 0.00 44.75NNE 3.50 39.50 3.25 0.00 0.00 0.00 46.25NE 6.00 36.00 1.00 0.00 0.00 0.00 43.00ENE 10.25 31.75 0.00 0.00 0.00 0.00 42.00E 7.75 46.75 1.50 0.00 0.00 0.00 56.00ESE 9.75 46.00 1.00 0.00 0.00 0.00 56.75SE 6.50 31.75 2.75 0.25 0.00 0.00 41.25SSE 3.25 30.75 3.50 0.00 0.00 0.00 37.50S 1.75 16.75 6.75 0.75 0.00 0.00 26.00SSW 1.25 3.25 2.25 1.25 0.00 0.00 8.00SW 0.75 3.25 0.00 0.00 0.00 0.00 4.00WSW 0.75 0.50 0.00 0.00 0.00 0.00 1.25W 2.50 0.25 0.00 0.00 0.00 0.00 2.75WNW 2.00 0.75 0.00 0.00 0.00 0.00 2.75NW 2.00 9.50 0.25 0.00 0.00 0.00 11.75NNW 4.75 29.00 4.50 0.00 0.00 0.00 38.25TOTAL 62.75 361.00 29.00 2.25 0.00 0.00 462.25
PERIOD OF CALM(HOURS): 2
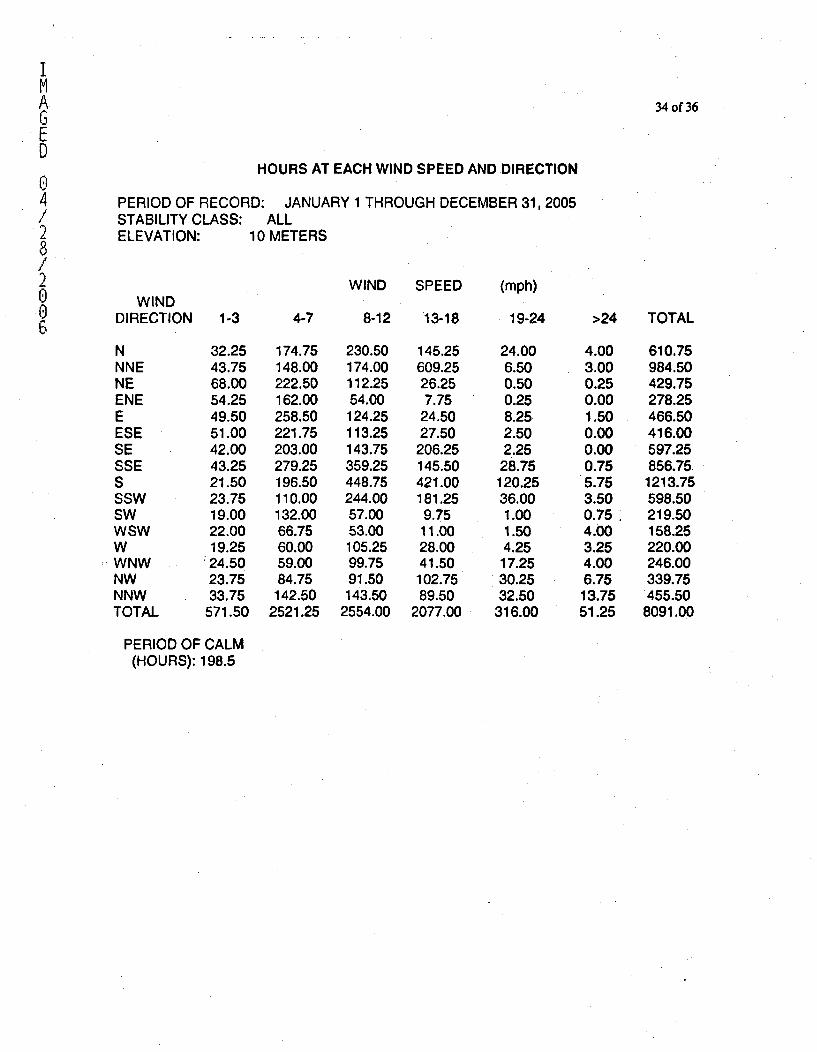
I11
bED
04/
/
/
2U06
34 of 36
HOURS AT EACH WIND SPEED AND DIRECTION
PERIOD OF RECORD: JANUARY 1 THROUGH DECEMBER 31, 2005STABILITY CLASS: ALLELEVATION: 10 METERS
WINDDIRECTION
WIND SPEED
8-12 13-18
NNNENEENEEESESESSESSSWSWWSWWWNWNWNNWTOTAL
1-3
32.2543.7568.0054.2549.5051.0042.0043.2521.5023.7519.0022.0019.25
:24.5023.7533.75
571.50
4-7
174.75148.00222.50162.00258.50221.75203.00279.25196.50110.00132.0066.7560.0059.0084.75
142.502521.25
230.50174.00112.2554.00124.25113.25143.75359.25448.75244.0057.0053.00105.2599.7591.50143.50
2554.00
145.25609.2526.257.75
24.5027.50
206.25145.50421.00181.259.75
11.0028.0041.50
102.7589.50
2077.00
(Mph)
19-24
24.006.500.500.258.252.502.25
28.75120.2536.001.001.504.25
17.2530.2532.50
316.00
>24 TOTAL
4.003.000.250.001.50~0.000.000.755.753.500.754.003.254.006.7513.7551.25
610.75984.50429.75278.25466.50416.00597.25856.75
1213.75598.50219.50158.25220.00246.00339.75455.508091.00
PERIOD OF CALM(HOURS): 198.5
I
35 of 36ED
SECTION IV
4, ADDITIONAL INFORMATION
2p 1. Unplanned or Abnormal Releases/
One unplanned, monitored release occurred in 2005. See Section II, Additional Information.
o 2. Offsite Dose Calculation Manual (ODCM)
The ODCM is in the form of two separate Wolf Creek Nuclear Operating Corporation (WCNOC)
administrative procedures. One of these procedures, the WCNOC "Offsite Dose CalculationManual", AP 07B-003, Revision 5, is included with this report as Attachment i. The otherprocedure, "Offsite Dose Calculation Manual (Radiological Environmental Monitoring Program),AP 07B-004, Revision 10, is included with this report as Attachment II.
3. Major Changes to Liquid, Solid, or Gaseous Radioactive Waste Treatment Systems
There were no major changes to any of the radioactive waste treatment systems in 2005.
4. Land Use Census
No new locations for dose calculation were identified during this report period.
5. Radwaste Shipments
Twelve shipments of radioactive waste occurred during this report period. Section II, Subsection3, of this report contains specific details regarding each shipment's mode of transportation anddestination.
6. Inoperability of Effluent Monitoring Instrumentation
No events occurred that violated ODCM Requirements Tables 2-2 and 3-2, liquid or gaseouseffluent monitoring instrumentation.
7. Storage Tanks
At no time during the year 2005 was there an event that led to liquid holdup tanks or gas storagetanks exceeding the limits of Technical Requirements Manual Sections 3.10.1 or 3.10.3.Technical Specification requirements for the program are now covered by TechnicalRequirements Manual Section 3.10, "Explosive Gas and Storage Tank Radioactivity Monitoring."