willingness to pay for air quality improvements in klang valley malaysia
TRANSCRIPT

Willingness to Pay for Air Quality Improvement in Sofia, Bulgaria
Hua Wang
Development Research Group, World Bank
Dale Whittington
University of North Carolina at Chapel Hill
Corresponding address: Dr. Hua Wang, The World Bank, MC2-626, 1818 H St., N.W.,
Washington, DC 20433, USA. Tel: 202-473-3255; Fax: 202-522-3230; Email:

2
ABSTRACT
This paper reports a survey study of willingness to pay for air quality improvement in Sofia,
Bulgaria. The stochastic payment card approach, which asks respondents the likelihood that
she would agree to pay a series of prices, was employed to estimate individuals’
willingness-to-pay distributions. The results show that people in Sofia were willing to pay up
to about 4.2% of their income for an air quality improvement program. Income elasticity of
willingness-to-pay for air quality improvement was about 27%. The traditional, referendum
contingent valuation approach was also employed for the purpose of comparison. The
empirical results show that the referendum approach produces a much higher estimation of
willingness to pay than the stochastic payment card approach.

3
Willingness to Pay for Air Quality Improvement in Sofia, Bulgaria
I. Introduction
A number of empirical studies have suggested that, rather than having a single point
economic value, respondents in Contingent Valuation (CV) studies may instead have a range of
economic values in their mind or a valuation distribution (e.g., Cameron and Quiggin, 1994;
DuBourg et al., 1994). This notion has been directly incorporated into several CV surveys that
explicitly acknowledge that respondents may face uncertainties in answering valuation questions.
For example, Li and Mattsson (1995) assumed that respondents had incomplete knowledge
about their true valuation of a commodity and might give wrong answers in dichotomous CV
surveys. After they answered the valuation question, respondents were asked a follow-up
question to measure their confidence in their CV answer. This was used to characterize the
degree of preference uncertainty. Ready et al. (1995) acknowledged that respondents might
have difficulty in resolving ambivalent information presented in CV studies, so they offered
respondents the opportunity to express the intensity of their preferences. This enabled the
authors to estimate “regions of ambivalence” for their respondents. Welsh and Bishop (1993)
and Welsh and Poe (1998) presented a multiple bounded discrete choice (MBDC) approach
that asked respondents certainty intensity questions over a range of price thresholds. Their
question format is also consistent with the assumption that CV respondents may have a
distribution or range of possible values.
Wang (1997a & 1997b) has argued that uncertainty is an inherent characteristic of
people’s economic valuation process for both market and non-market commodities, and can
never be fully resolved. He explicitly discussed the concept of an individual’s valuation
distribution, and proposed a random valuation model for treating “don’t know” responses in
dichotomous CV surveys, and a stochastic payment card approach to estimate individuals'
valuation distributions. In this stochastic payment card approach, the enumerator presents the
respondent with a payment card and asks her the likelihood that she would agree to pay a series
of prices. By assuming (1) that the likelihood of a “yes” answer to the valuation question is the

4
probability of an increase in the individual’s utility, and (2) a specific functional form for the
individual’s valuation distribution, each individual’s valuation distribution can be estimated.
This paper presents an empirical study of people’s willingness to pay (WTP) for an air
pollution control program conducted in Sofia, Bulgaria. Two surveys were conducted in Sofia:
one using the stochastic payment card and the other a referendum CV question. The CV
scenario presented to the two groups of respondents was the same. The study thus provides a
comparison of estimated WTP using the stochastic payment card and the traditional referendum
contingent valuation approaches. The results show that the traditional referendum approach
gave much higher estimates of individuals’ WTP than the stochastic payment card approach.
The paper is organized as follows. The next, second section briefly reviews the
stochastic approach of an individual’s valuation. Section III presents the empirical study
conducted in Sofia. Further discussion of the stochastic valuation and referendum approaches is
provided in Section IV.
II. The Stochastic Valuation Approach
It has been argued that uncertainty is an inherent characteristic of people's economic
valuation process for both market and non-market commodities and can never be fully resolved,
and that an individual's valuation should be characterized as a random variable with an
associated distribution (Wang, 1997a &b). Wang notes that there are several sources of
uncertainty associated with an individual’s valuation process for nonmarket goods and services.
First, uncertainty may exist with respect to the commodity in question. The quality of a good or
service such as air quality improvement has numerous attributes. Air quality improvements can
be approximately described in terms of changes in the concentrations of a specified number of
pollutants, but strictly speaking, it is not practically possible to give a complete description of an
air quality change. Quantitative measures are typically presented for mean or peak values of
concentrations of selected pollutants.
Second, even if the quality change could be completely known, an individual may be still
uncertain about how to use the good or service in question. For example, an individual may

5
wonder what the quality change means to him, e.g., what is the health effect of the air quality
change? What are the savings in terms of reduced medical care costs associated with this air
quality change?
Third, uncertainty exists in markets. The value to an individual of a commodity is
influenced by prices of both substitute and complementary goods or services. In the air quality
valuation example, future medical care costs and the prices of air pollution control technologies
are directly related to an individual’s value of an air quality change and are somewhat unknown
to the individual.
Fourth, uncertainty may also exist with respect to an individual’s own characteristics and
preferences. Individuals are sometimes uncertain about their future income. Furthermore,
people’s tastes may change over time due to learning or other experiences. In the context of
contingent valuation surveys, because of the hypothetical nature of the valuation task, individuals
may face other uncertain factors, such as the terms of provision of a public good.
The notion that an individual’s value of a good or service is stochastic, and is best
characterized as a random variable with an associated a valuation distribution, is consistent with
daily observations on the ways people talk about their willingness to pay for a commodity.
Many people use two ways to express their willingness to pay for a good. One is to say that
they are willing to pay about X dollars, which may be interpreted as the mean value of a
valuation distribution; the other is by giving a range from Y to Z dollars, which can also be
interpreted as information about a valuation distribution.
A general valuation framework under uncertainty can be described as follows. Let the
value of an individual’s utility function at a status quo level of environmental quality, E0, be:
V0= V(Y, P, E0, Z, ε1) (1)
where Y is income; P is a price vector; Z is a vector of socioeconomic variables; and ε1
represents uncertain factors which are not reflected in Y, P, E0, and Z. When the level of
environmental quality improves from E0 to E1, and the individual’s utility changes to V1 = V(Y,

6
P, E1, Z, ε1). Assume that an individual is willing to pay up to an amount of WTP for the
change in environmental quality, such that :
V0 (Y-WTP, P, E1, Z, ε1) = V0 (Y, P, E0, Z, ε1) (2)
Solving for WTP yields …
WTP = WTP(Y, P, E0, E1, Z, ε1) = E[WTP] + ε2 (3)
where E[.] is an expectation transformation, and ε2 is the random term of the individual’s
economic value WTP. One would expect that this random variable ε2 should be different for
different individuals.
To measure individuals' valuation distributions, Wang (1997b) proposes a new value
elicitation format termed the stochastic payment card approach. An example is presented in
Figure 1, which is similar to the multiple bounded dichotomous choice model employed by
Welsh and Bishop (1993), except that in Figure 1, numeric likelihood values are presented with
verbal likelihood references. Respondents are directly asked how likely they would be to agree
to pay certain amounts of money for the commodity. A card showing different prices is
presented to respondents and they are asked how likely they would be to agree to pay each of
the amounts shown. Respondents are asked to select a number as the likelihood or probability
that they would agree to pay a specific price. If the respondent answers a series of such
questions, a likelihood matrix can then be observed. Results from the fields of experimental
psychology and decision analysis (Wallsten et al., 1983 & 1995; Clemen, 1990) have shown
that people use subjective probabilities in their daily lives and that a person can express a
likelihood value either verbally or numerically. However, some individuals will interpret
language differently than the numerical values; many people find numbers too abstract to use in
expressing likelihood values.1 Therefore, in the design of the stochastic payment card,
1 It is possible that introducing uncertainty explicitly in the CV questions could create confusion for therespondent rather than enabling a respondent to give a more complete valuation response. This concern is

7
respondents are provided with both numbers and words so that they more easily express
themselves.
The likelihood matrix obtained with the stochastic payment card approach provides
probabilities of an individual saying “yes” to referendum questions with different payments. This
likelihood matrix can be interpreted as a record of the individual’s cumulative valuation
distribution function (CDF). As in dichotomous-choice contingent valuation studies where
different prices are presented to different split-samples of respondents, the probability that a
utility maximizer, with a cumulative valuation distribution function F(.), would accept the offer
presented in this dichotomous choice question (or vote for the proposal) would be,
Pr(yes) = Pr {V(Y-t, P, E1, Z, ε) > V(Y, P, E0, Z, ε) } (4)
= Pr {V(Y-t, P, E1, Z, ε) > V(Y-WTP, P, E1, Z, ε) }
= Pr {WTP >t}
= 1- F(t)
where again V is an indirect utility function; Y is income; P is a price vector; Z is a vector of
individual’s socioeconomic characteristics; E0 is the initial environmental quality, which would be
improved to E1 if the air quality management plan is implemented; t is the price offered to obtain
the environmental quality change; and WTP is the individual’s value for the certain change. The
likelihood matrix obtained with the stochastic payment card is a record of an individual's
probabilities of accepting different proffered payments.
The cumulative valuation distribution function F(.), the valuation probability density
function, the mean and the variance of the probability function can be estimated with the
likelihood matrix data. The estimation of the valuation distribution is straight forward. From (4),
we have Pij = 1-Fi(tj), where Pij is individual i's probability (the number circled by respondent i
on the stochastic payment card) of voting for the referendum at the jth payment point tj; Fi(.) is
the person i's CDF. By assuming a specific functional form for Fi(.), standard statistical
especially pertinent in countries where people do not have a long experience with democratic votingprocedures, such as Bulgaria. However, the results of our case study and the findings of Welsh and Poe

8
software can be used to estimate the parameters in Fi(.), and the mean µi and standard variance
σi of individual i’s valuation distribution. For example, if a normal distribution is assumed for
F(.), we have,
( )
Piti
ti Pi
= −−
= + −−
1
11
Φ
Φ
( )µ
σµ σ
(5)
With a set of ti’s and Pi’s, a simple regression can be used to estimate µ and σ.
For cases where numeric likelihood values cannot be obtained for estimating a valuation
distribution, it might be possible to estimate an upper bound, a lower bound, and a mean value
with some reasonable assumptions about the meaning of the verbal likelihood data. An estimate
of the upper bound of an individual’s valuation range is the lowest price where a respondent
gives a “definitely no (0%)” answer. Likewise, the lower bound of an individual’s valuation
range can be found at the highest price where a respondent gives a “definitely yes (100%)”
answer. The mean of a valuation distribution can be obtained from prices where a respondent
says “not sure (50%).”
III. Sofia Air Valuation Study
Study Design
In October 1995, we conducted a CV survey in Sofia, Bulgaria, to estimate
households’ willingness to pay for air quality improvement. The purpose of the CV survey
included: 1) to estimate people’s willingness to pay for air quality improvement in Sofia,
Bulgaria; 2) implement the stochastic payment card value elicitation procedure; and 2) to
compare the stochastic payment card approach with the conventional referendum CV
approach. The CV scenario section of the household questionnaire had five parts: (1)
Background: Current Air Quality Conditions in Sofia; (2) A Description of an Air Pollution
(1998) would appear to indicate that this threat is perhaps not as serious as one might fear.

9
Clean-up Plan; (3) Consequences of the Air Pollution Clean-up Plan; (4) Costs of the Air
Pollution Clean-up Plan; and (5) Valuation Question(s). Respondents were also asked
questions about their socioeconomic characteristics, environmental attitudes and perceptions,
and reactions to the air quality improvement program.
The study design is summarized in Figure 2. A stratified random sample of households
was drawn from neighborhoods throughout the city. The response rate was about 60%, and
reflects some suspicion that people in Sofia feel when a stranger comes to their home and
requests an interview. Five hundred and fourteen in-person interviews were completed with
household heads or their spouses. The sample was first split into two approximately equal parts.
Two hundred and forty three interviews were completed with respondents who received a
survey instrument with a standard referendum CV question (Version A). Five different
referendum prices were used (100, 300, 500, 1000, 2000 levas2 per month); there were thus
five split-samples of approximately 48 respondents each. These prices represent from 1% to
18% of the mean household income of the respondents.
The remaining 271 respondents received a stochastic payment card (Version B). These
respondents were subdivided into two groups: B1 (n = 135) and B2 (n = 136). Respondents in
Group B1 received a standard stochastic payment card with the full set of eight prices (25, 50,
100, 300, 500, 1000, 2000, 3000 levas per month); respondents in group B2 received a
truncated stochastic payment card with five prices (100, 300, 500, 1000, 2000 levas per
month). Respondents who received versions B1 and B2 were given numeric likelihood values
of 0% (“Definitely no”); 25% (“Probably no”); 50% (“Not sure”); 75% (“Probably yes”), and
100% (“Definitely yes”) to indicate the probability that they would pay the specified prices.
Specifically, respondents were asked the following willingness-to-pay question in
conjunction with the stochastic payment card:
I (the enumerator) want you (the respondent) to suppose that the people of Sofia had an
opportunity to vote for this (air quality improvement) plan. If the majority of people voted for the plan, the
plan would go into effect and every household would have to pay. If the majority of people voted against
the plan, no one would have to pay and air pollution would stay as it is now.
2 In October, 1995, US$1 = 68 levas.

10
Now, I want you to tell me how likely you would be to vote for the air quality improvement plan in
Sofia, if your monthly expenses for transport, electricity, etc. would increase in different amounts. In other
words, I want to know how likely it would be that you would vote for the air quality clean-up plan if it would
cost your household different monthly amounts.
There are no right or wrong answers; we really want to know how you would vote on this proposal.
If the number indicated in the left column (monthly price in leva) were the increase in your monthly
expenses for the implementation of the air pollution clean-up plan, how likely is it you would vote for the
plan?
Results of Analysis
Overview
Table 1 presents the socioeconomic and demographic information on respondents who
received both Version A and Version B questionnaires. As hoped, there are no statistically
significant differences in these two subsets of sample respondents for any of the socioeconomic
or demographic variables.
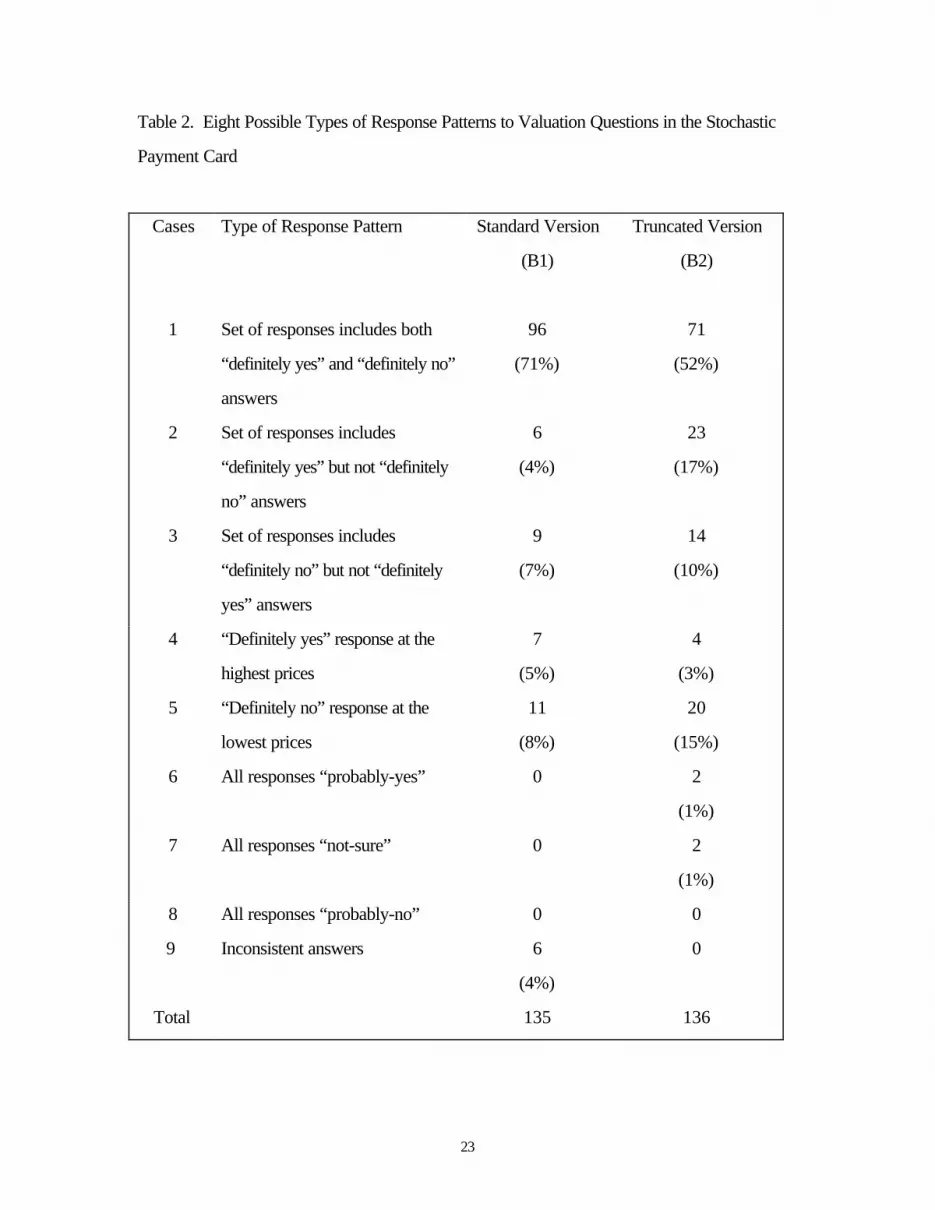
Table 2 presents eight possible types of response patterns that respondents could give
to the questions on the stochastic payment card, and the percentage of sample respondents in
each. For the standard version of the payment card, 71% of respondents gave answers that
suggest the individuals’ WTP ranges were covered by the payment card,3 while 11% of
respondents had WTP ranges that were partially covered by the card. Thirteen percent of
respondents’ WTP ranges were not covered by the card (or these respondents were unwilling
to reveal their WTP ranges). Valuation distributions could not be estimated for these
respondents.
Table 3 summarizes the answers of respondents who received the referendum valuation
question (Version A). Of the 243 referendum interviews, 216 yes/no/not-sure answers were
recorded and could be used for further analyses (27 respondents did not answer the valuation
question). As expected, as the price of the air quality improvement plan increased, the
3 There were six observations for which respondents gave answers with a higher probability of voting forthe proposal at a higher price. We considered these to be enumerator mistakes and deleted them from thesample for purposes of analysis.

11
percentage of respondents in each split-sample that rejected the plan (i.e., that refused to pay)
increased.
Estimation of Individuals’ Valuation Distributions
Valuation functions were calculated for 219 respondents in the group B subsample
(Cases 1, 2, and 3 in Table 2); the mean and the variance of these valuation functions were
estimated using the approach described in Section II. Valuation distribution functions could not
be estimated for the 46 respondents with Case 4-8 response patterns (17 percent of the total
number of 271 respondents that received either the B1 or B2 version of the questionnaire). The
inability of the stochastic payment card elicitation approach to handle these cases could pose a
serious threat to the validity and usefulness of the method if the excluded respondents are
systematically different from respondents who give Case 1-3 response patterns. However, no
systematic difference between these two groups was found in this study.4
In calculations of mean values and variances of individuals’ valuation distributions,
values of 0.005 and 0.995 were used in the regressions instead of 0 and 1 for probability Pi.
Assuming the individuals’ valuation functions are all normally distributed,5 the mean values of µ
and σ are 508 and 159 levas respectively (Table 4) 6. The average of the standard variance of
the mean WTP estimation is 73 levas, and the average standard error of the standard variance
estimation is 51 levas.
Econometric Analysis of Individuals’ Valuation Distributions
4 However, the average value of the mean WTPs of the sample does change somewhat if responses forcases 4 and 5 are included with reasonable assumptions on the WTP values. For example, if one assumes aWTP of 3000 levas for those respondents who gave all “definitely yes” answers and a WTP of 25 levas forthose giving all “definitely no” answers, then the sample mean WTP would be 602 levas rather than 508levas. We do not feel that there are strong reasons for treating cases 4 and 5 as protest bids. In futurestudies, we intend to expand the price range of the payment card.5 In fact, there is no reason to suppose that each individual in the sample has the same functional form forhis valuation function; we make this assumption for simplicity.

12
Assuming individuals’ valuation distributions have the same functional form,7 the
calculated mean WTP and standard variances vary across respondents in systematic ways.
Figure 3 shows how the mean WTP values and the standard variances of the valuation
distributions for Group B1 respondents vary with household income. As expected, respondents
with higher household incomes have higher mean WTP’s and larger variances.
Table 5 presents the results of three econometric models that attempt to explain
differences across respondents in their mean WTP and the standard variance associated with
their valuation distributions. Both the household income and the education of respondents had
significant effects on respondents’ willingness to pay for the air pollution clean-up plan, with
expected, positive signs. The elasticity of mean WTP with respect to income is about 0.27.
Older respondents and women had lower WTP. However, the models show that people with
higher uncertainty about their future income would be willing to pay more for the air pollution
clean-up plan.
There are also several significant variables in the second model in Table 5 that explain
differences in the estimated variances of individuals’ valuation functions, i.e., the variance of an
individual’s valuation distribution is correlated with individuals’ socioeconomic and demographic
status. Men have larger variances of their valuation distributions than women; respondents with
higher uncertainties about their future income had larger variances in their valuation distribution.
Truncation also had a significant effect, indicating that respondents’ answers are sensitive to the
payment card design.
The same variables were generally statistically significant in both the mean value and
variance models. A regression of log(σ/µ) against other exogenous variables showed that the
variable MALE was positive and statistically significant. Men thus have a wider variance of
WTP than women, even when the mean WTP’s are the same. The variable UNCERT has the
expected positive sign but is not statistically significant.
6 The average value of those prices corresponding to the indifferent (50%) responses is about 473 levaswhich is very close to the value estimated by modeling the individuals’ valuation distributions.7 The results with the normal distribution assumption were used in the econometric analyses.

13
Comparison with the Referendum Approach
After deleting observations with missing values, 194 interviews were available to
estimate probit models explaining the determinants of respondents’ answers to the referendum
CV question (Version A). The modeling results are provided in Table 6. These results are
used to estimate mean WTP values for the Group A sample. There were 49 “not sure” (“Don’t
know” or DK) answers to the referendum questions given by Group A respondents. Two
methods were used for analyzing these data: 1) treating DK as “no”; 2) the threshold approach
developed by Wang (1997a). The two methods gave consistent results.
The results of these probit models indicated that the price offered to respondents had a
strong negative effect on the likelihood that a respondent would accept the air quality
improvement plan. Income and education have significant, positive effects on the likelihood of
voting for the air quality improvement plan; age has a significant, negative effect. Contrary to
expectations, respondents who have a respiratory disease or who live in a household in which a
family member has a respiratory disease were less likely to vote for the air quality improvement
plan. Female respondents were more likely to give a “not sure” answer.
Using these estimated probit model results, the mean WTP for the sample was
calculated. When the DK responses were treated as “no’s,” the mean WTP for the Group A
respondents was 1430.8 Other ways of handling the DK responses resulted in higher mean
WTP estimates. The lowest mean WTP estimated with the referendum CV data is almost three
times the highest mean WTP calculated using the data from the stochastic payment card (508
levas per month; Table 4)
This difference in the estimated mean WTP between the Group A and Group B
respondents could be a result of several factors because the analyses with the data from the
stochastic valuation approach and the referendum question are based on different theoretical
assumptions and different procedures for handling “problematic” responses. To isolate the
effect of the two elicitation procedures on the estimated mean WTP, we conducted additional
analyses in which we treated the data obtained from the stochastic payment card at a specific
8 The estimated model was used to calculate the WTP for each respondent in the sample; 1430 levas is themean of these values.

14
price as if it were the individual’s answer to a single referendum question. A new data set was
thus constructed for Group B respondents by randomly assigning a price to each respondent.
In this way, we were able to use the answers from all of Group B respondents (except the six
with inconsistent responses). This new data set for the Group B respondents was then analyzed
in exactly the same way as the data set for the Group A respondents.
Six different ways were used to encode the likelihood answers from the stochastic
payment card as yes/no/not-sure answers in order to generate a referendum CV sample for the
WTP estimation for respondents in Group B:
(1) “definitely yes” answers in the stochastic payment card treated as “yes” in the
referendum model; “probably yes”, “not sure” and “probably no” treated as “don’t know’s”;
“definitely no” treated as “no”;
(2) “definitely yes” and “probably yes” answers in the stochastic payment card treated
as “yes” in the referendum model; “not sure” treated as “don’t know’s”; “probably no” and
“definitely no” treated as “no”;
(3) answers in the stochastic payment card simply treated as an ordered ranking;
(4) “definitely yes” answers in the stochastic payment card treated as “yes” in the
referendum model; all others treated as “no”;
(5) “definitely yes” and “probably yes” answers in the stochastic payment card treated
as “yes” in the referendum model; all others treated as “no”;
(6) “definitely yes” and “probably yes”, “not sure” answers in the stochastic payment
card treated as “yes” in the referendum model; all others treated as “no.”
Because the results for the Group B respondents depend upon the price a particular respondent
is assigned, we conducted a Monte Carlo analysis with different trial price assignments, and
calculated the sample mean WTP for each trial. For each of these six ways of converting
likelihood answers to a referendum format, 1000 trial price assignments to Group B
respondents were made. The sample mean WTP result presented for Group B respondents for

15
each way of converting likelihood answers from the stochastic payment card to a referendum
format is the mean of the 1000 trial price assignments.
Table 7 shows that the highest mean WTP obtained from the stochastic payment card
data is 523 levas, when “definitely yes,” “probably yes,” and “not sure” are all treated as “yes”
responses in a referendum model. This estimated mean WTP number is still much lower than
the lowest estimate obtained using the referendum value elicitation approach (1430 levas).9
This Monte Carlo analysis confirms that the difference in the mean WTP estimates obtained
from the stochastic payment card data and the referendum data is largely due to the elicitation
procedure itself, and not to the assumptions underlying the calculation procedures.
V. Discussion
The stochastic payment card approach presented in this paper is a preliminary,
exploratory attempt to collect data that can be used to estimate individuals’ valuation
distributions. It requires respondents to give subjective probabilities about whether a
hypothetical action would be taken. The approach assumes that the probability that a
respondent is going to take an action is the probability that respondent’s utility value increases.
This in turn is based on a rational choice assumption that individuals take actions when and only
when their utility values increase. The procedure proposed for estimating an individual’s
valuation distribution is simple and does not require the use of sophisticated econometric
models. However, the analyst must assume a functional form for individuals’ valuation
distribution functions. The evidence from our Sofia case study suggests that the mean value and
the variance of the valuation distributions are not very sensitive to specific functional form
assumed.
The stochastic payment card approach seems to have worked reasonably well in the
case study. At the lowest price all respondents would ideally choose “definitely yes,” and at the
9 The ordered probit modeling approach for the stochastic payment card data gives a sample mean WTPestimate of about 516 levas (Wang, 1997b).

16
highest price, all responses would be “definitely no” (assuming the survey designers succeed in
selecting low and high prices that bound all respondents’ valuation distribution functions). Eighty
two percent of respondents who received the full stochastic payment card (B1) gave “definitely
yes” answers to the lowest price offered (25 levas) and 88% gave “definitely no” answers to the
highest payment point (3000 levas). The results of the Sofia case study do indicate, however,
that respondents’ likelihood answers to questions on the stochastic payment card can be
affected by the way payment cards are designed.10 At a price of 100 levas (the lower end of
the truncated payment card), respondents were more likely to give positive answers if they
received the truncated payment card,11 suggesting that they interpreted that lowest price as an
indication that it was acceptable. One approach for dealing with this possible bias may be to
extend the range of prices presented on the stochastic payment card, possibly including zero as
the minimum price. Before we conducted the case study, we were concerned that respondents’
unfamiliarity with democratic voting processes in Bulgaria would affect people’s ability to
answer CV questions in general, and the stochastic payment card questions in particular.
However, based on our experience in Sofia during the fieldwork, we do not believe that this is a
serious threat to the validity of our results.
In the economic valuation literature, analysts have generally used the option price
approach to deal with the issue of uncertainty in future outcomes. This option price approach
assumes a single point value in an individual’s mind even when there exist obvious uncertainties.
An option price can be estimated with data collected by a traditional contingent valuation survey
with dichotomous choice valuation questions. The stochastic valuation approach, on the other
hand, does not assume that a respondent has a single point value for his maximum willingness to
pay, even for a market good. The Sofia air valuation study suggests that the single point value
assumption may be incorrect, because estimated variances of individuals’ valuation distributions
are correlated with uncertainty levels. The single value assumption would suggest that the
variances estimated are white noise.
10 An exponential increase of prices on the payment card could also have an effect on the valuationdistribution estimation. One consequence could be an overestimate of the correlation of variance and themean value of a valuation distribution.11 This is consistent with Rowe et al. (1996)’s findings (they did not find range and centering biases).

17
The valuation information obtained with the referendum elicitation procedure is
necessarily incomplete, a fact well recognized by CV practitioners. A yes/no answer only gives
information about one point on a valuation distribution function (with 0 or 1 representing a
probability that should often be a number between 0 and 1). Because a yes/no answer is quite
easy for respondents to offer (a positive side of the approach), such a yes/no answer might be
offered without respondents seriously considering the question. The stochastic payment card
approach attempts to obtain a more complete description of each individual’s preferences. It
focuses on measuring each individual's valuation intensity information; this information is
relatively complete compared to that obtained from a single dichotomous choice question. The
sample size required for a study using a stochastic payment card approach should thus be
smaller than for a conventional referendum CV study.
The stochastic payment card approach, however, requires respondents to give numeric
likelihood values; some respondents may have difficulty doing this. Significant confusion may be
induced in some respondents if a study is not well designed. Providing corresponding verbal or
visual aids may help respondents report likelihood values, but this may not solve the problem,
especially for illiterate respondents. More research is needed to assess the nature of subjective
probabilities that respondents give in CV interviews. However, as discussed in Section II of this
paper, even when the numerical likelihood information obtained is not sufficient to construct a
model to estimate an individual’s underlying valuation distribution, reasonable assumptions can
be made based on the verbal likelihood data to estimate an upper bound, a lower bound and a
mean value.
The traditional procedures used to implement the referendum CV approach are
problematic if one does not assume that an individual’s valuation is a single point estimate. The
error terms in the value estimation models proposed by Hanemann (1984) and Cameron (1989)
are assumed to be homogeneous over the population; according to the stochastic theory of
economic valuation they should be heterogeneous. The empirical study presented in this paper
shows that the traditional dichotomous choice CV gave an estimate of people’s WTP that was
2-3 times higher than the stochastic approach, despite the fact that the two approaches found

18
the same determinants of WTP. More research is warranted to better understand the reasons
for this difference.
Acknowledgements:
We would like to thank Dr. Dafina Gercheva for her guidance and advice on survey
design and implementation issues in Sofia, and Dr. David Guilkey for his many helpful
suggestions on the econometric analyses.

19
References
Cameron, T. A. 1988. “A New Paradigm for Valuing Non-market Goods Using
Referendum Data: Maximum Likelihood Estimation by Censored Logistic
Regression.” J of Envr. Econ. & Mngmnt. 15, 355-379.
Cameron, T.A. and Quiggin, J. 1994. "Estimation Using Contingent Valuation Data From:
A 'Dichotomous Choice with Follow-up' Questionnaire", J of Envr. Econ. & Mngmnt.
24, 218-234.
Clemen, Robert T., 1990, Making Hard Decisions, PWS-Kent Publishing Company,
Boston.
Desvousges, W.H. & Smith, Kerry. 1987. "Option Price Estimates for Water Quality
Improvements: A Contingent Valuation Study for the Monongahela River", J. Envr.
Econ. & Mngmnt, 14, 248-267.
DuBourg, W.R., M.W. Jones-Lee, and G. Loomies, 1994, “Imprecise Preferences and the
WTP-WTA Disparity,” J. Risk Uncertainty 9, 115-133 (1994).
Edwards, Steven. 1988. "Option Prices for Ground water Protection", J. Envr. Econ. &
Mngmnt, 15, 475-487.
Fischoff, Baruch, and Furby. 1988. “Measuring Values: A Conceptual Framework for
Interpreting Transactions with Special Reference to Contingent Valuation of Visibility.”
Journal of Risk and Uncertainty.” June. pp. 147-84.
Graham, Daniel A. 1981. "Cost - Benefit Analysis under Uncertainty", American
Economic Review. Vol 71, pp. 715-725.
Hanemann, W.M. 1984. "Welfare Evaluations in Contingent Valuation Experiments with
Discrete Responses", Amer. J. Agr. Econ. Vol. 66, pp. 332-341.
Li, Chuan-Zhong, Leif Mattsson. 1995. “Discrete Choice under Preference Uncertainty:
An Improved Model for Contingent Valuation”, J. of Envr. Econ. Mngmnt. 28,
256-269.
Mitchell, R.C. & Carson, R.T. 1989. Using Surveys to Value Public Goods: The
Contingent Valuation Method, Resources for the Future, Washington, D.C.

20
Ready, Richard C., Whitehead, John C. & Blomquist, Glenn C. 1995. "Contingent
Valuation When Respondents Are Ambivalent," J. of Envr. Econ. Mngmnt. 29,
181-196.
Rowe, Robert D., W. D. Schulze, & W. S. Breffle. 1996. “A Test for Payment Card
Biases”, J. Envr. Econ. Mngmnt. 31(2), 178-185.
Wang, Hua. 1997a. “Treatment of Don't-Know Responses in Contingent Valuation
Surveys: A Random Valuation Model”, J. of Envr. Econ. Mngmnt. 32, 219-232.
Wang, Hua. 1997b. Contingent Valuation of Environmental Resources: A Stochastic
Perspective, a Ph.D. Dissertation, Department of Environmental Sciences and
Engineering, School of Public Health, University of N. Carolina at Chapel Hill.
Wallsten, T.S. and D. V. Budescu, 1983, “Encoding subjective probabilities: A
psychological and psychometric review,” Management Science, 29 (2), 1983
Wallsten, T.S. and D. V. Budescu, 1995, “A review of human linguistic probability
processing: General principles and empirical evidence,” The Knowledge Engineering
Review, 10:1, 43-62, 1995
Welsh, M.P. and Bishop, R.C., 1993, “Multiple Bounded Discrete Choice Models,”
Western Regional Research Publication, W-33, Sixth Interim Report, 1993.
Welsh, M.P. and Poe, G.L., 1998, “Elicitation Effects in Contingent Valuation:
Comparison to a Multiple Bounded Discrete Choice Approach,” J. of Envr. Econ.
Mngmnt. 36, 170-185.

21
Figure 1. An Example of the Stochastic Payment Card Design
(Please circle one number for each payment)
How would you vote if the
passage of this envir. plan
meant your utility bill would Definitely Probably Not Probably Definitely
increase by $x per month Yes Yes Sure No No
for one year?
Price
0 1.0 0.9 0.8 0.7 0.6 0.5 0.4 0.3 0.2 0.1 0
2 1.0 0.9 0.8 0.7 0.6 0.5 0.4 0.3 0.2 0.1 0
4 1.0 0.9 0.8 0.7 0.6 0.5 0.4 0.3 0.2 0.1 0
6 1.0 0.9 0.8 0.7 0.6 0.5 0.4 0.3 0.2 0.1 0
8 1.0 0.9 0.8 0.7 0.6 0.5 0.4 0.3 0.2 0.1 0
10 1.0 0.9 0.8 0.7 0.6 0.5 0.4 0.3 0.2 0.1 0
12 1.0 0.9 0.8 0.7 0.6 0.5 0.4 0.3 0.2 0.1 0
....... ..........................................................................
100 1.0 0.9 0.8 0.7 0.6 0.5 0.4 0.3 0.2 0.1 0
_______________________________________________________________________________
Figure 2. Sofia Air Valuation Study Design
(Total Sample Size N=514)
Version B Version A( Stochastic Payment Card) (Referendum)
N=271 N=243
P100 N=47Version B1 Version B2 P300 N=54Standard Card Truncated Card P500 N=47N=135 N=136 P1000 N=42
P2000 N=53

22
Figure 3. Income vs Mean Value and StandardVariance of an Individual's WTP Distribution
0
200
400
600
800
1000
1200
<5000
5000-
9000
10000
11000-
14000
15000-
18000
20000
>20000
Income Group
WTPValue
mean-std varmean
mean+std var
Table 1: Description of Major Socioeconomic and Demographic Variables
VariableName
Description of Variables Mean Value(Std Dev) ofSample A
Mean Value(Std Dev) ofSample B
Price Hypothetical monthly cost in levas
INC Household monthly income in levas. 11,925(8,424)
12,925(10,908)
SCHOOL Number of years a respondent attended aschool.
13(2.3)
12(2.6)
MALE 1=the respondent is male; 0=otherwise. 0.37 0.47
AGE Age of a respondent. 46(14)
47(15)
MARRY 1=the respondent was married; 0=otherwise. 0.77 0.83RESP 1=there were respiratory diseases found in a
household; 0=otherwise.0.43 0.34
UNCERT 1=the respondent did not know how thehousehold income would change over the nextfive years; 0=otherwise.
0.18 0.18
No. of Obs. 243 245
23
Table 2. Eight Possible Types of Response Patterns to Valuation Questions in the Stochastic
Payment Card
Cases Type of Response Pattern Standard Version
(B1)
Truncated Version
(B2)
1 Set of responses includes both
“definitely yes” and “definitely no”
answers
96
(71%)
71
(52%)
2 Set of responses includes
“definitely yes” but not “definitely
no” answers
6
(4%)
23
(17%)
3 Set of responses includes
“definitely no” but not “definitely
yes” answers
9
(7%)
14
(10%)
4 “Definitely yes” response at the
highest prices
7
(5%)
4
(3%)
5 “Definitely no” response at the
lowest prices
11
(8%)
20
(15%)
6 All responses “probably-yes” 0 2
(1%)
7 All responses “not-sure” 0 2
(1%)
8 All responses “probably-no” 0 0
9 Inconsistent answers 6
(4%)
0
Total 135 136

24
Table 3: Percent of Respondents Giving Different Answers
to Referendum CV Questions by Price
Referendum Prices ( Levas/Month)
WTP
Answers
100 300 500 1000 2000
No 4 14 24 29 42
Not Sure 2 6 11 24 6
Yes 94 80 65 46 52
Table 4: Sample Means of Individuals’ Estimated Mean WTP and Standard Variance of WTP
DistributionParameters
NormalDistribution
Mean WTP’sMean 508Std. Dev. 458
Std Var of WTPMean 159Std. Dev. 135
Average R2 0.86

25
Table 5: Econometric Analyses of Individuals’ Valuation Distributions
Dependent
Variable: log(µ)
Dependent
Variable:
log(σ)
Dependent
Variable:
log(σ/µ)
Constant 3.4
(3.5)***
2.7
(2.4)**
-1.3
(-19.9)***
log(INC) 0.27
(2.64)***
0.21
(1.84)*
SCHOOL 0.07
(3.16)***
0.06
(2.31)**
MALE 0.36
(3.08)***
0.53
(3.96)***
0.16
(1.93)*
AGE -0.02
(-4.02)***
-0.02
(-3.81)***
RESP 0.24
(1.76)*
0.14
(1.59)
UNCERT 0.30
(2.02)**
0.44
(2.55)**
0.14
(1.24)
Shorter
Card
0.44
(3.96)***
0.39
(2.99)***
Adj-R2 0.27 0.23 0.02
N 198 198 198
***-Statistically significant at the 1% level
**-Statistically significant at the 5% level
*-Statistically significant at the 10% level

26
Table 6: Model Results for Referendum Data (Group A Respondents)
DataTreatment
Treating “not sure” as “no” Threshold Approach
Full Model ReducedForm
Full Model ReducedForm
PRICE -0.8e-3(-4.8)***
-0.8e-3(-4.8)***
0.8e-3(5.0)***
0.8e-3(5.3)***
Constant 2.6(3.1)***
1.6(3.2)***
2.8(3.5)***
1.9(3.9)***
INC 0.3e-4(1.9)**
0.2e-4(1.6)*
0.3e-4(2.0)**
0.2e-4(1.7)*
SCHOOL -0.1(-1.4)
-0.05(-1.1)
MALE 0.2(1.1)
0.1(0.5)
AGE -0.02(-2.0)**
-0.02(-1.9)*
-0.02(-2.4)**
-0.02(-2.3)**
MARRY -0.3(-1.0)
-0.3(-1.1)
RESP -0.4(-1.8)*
-0.4(-1.8)*
-0.4(-1.8)*
-0.4(-1.9)*
UNCERT 0.02(0.08)
0.02(0.06)
threshold:Constant 0.2
(4.1)***0.2(4.2)***
Male -0.1(-1.6)
-0.1(-1.7)*
Mean WTP 1429 1618Std Error ofMean WTP
212 200
Std Dev ofWTP
525 533
Sample Size 194 194
***-Statistically significant at the 1% level**-Statistically significant at the 5% level*-Statistically significant at the 10% level

27
Table 7: Estimation of WTP with Data from the Stochastic Payment Card, Using Traditional
Referendum Modeling Methods and Monte Carlo Simulation
Models I II III IV V VI
LikelihoodAnswerTreatment
DY asyes; PY,NS &PN asDK; DNas no
DY/PYas yes;NS asDK;DN/PNas no
5OrderedAnswers
DY asyes;others asno
DY/PYas yes;others asno
DY/PY/NS asyes;others asno
ModelingMethod
OrderedProbit
OrderedProbit
OrderedProbit
Probit Probit Probit
MeanWTP
354 392 360 14 267 523
Std. Dev.of WTP
63 61 64 138 74 62
N 265 265 265 265 265 265
DY = Definitely yes; PY = Probably yes; NS = Not sure; DK = Don’t Know;
PN = Probably no; DN = Definitely no