why knot calidris canutus take medium-sized macoma balthica when six prey species are available
TRANSCRIPT

Vol. 83: 113-128, 1992 1 1
MARINE ECOLOGY PROGRESS SERIES Mar. Ecol. Prog. Ser. i Published July 16
Why knot Calidris canutus take medium-sized Macoma balthica when six prey species are
available
Leo zwartsl, Anne-Marie ~ l o m e r t ~
' Rijkswaterstaat Flevoland, PO Box 600,8200 AP Lelystad, The Netherlands Zoological Laboratory, University of Groningen. PO Box 14.9750 AA Haren. The Netherlands
ABSTRACT: We quantified the prey selection and intake rate of a wading bird, knot CaLidns canutus, when 6 different, intertidal prey species, the mud snail Peringia ulvae and the bivalves Macorna balthica, Cerastoderma edule, Mya arenaria, Scrobicularia plana and Mytilus edulis, were abundant. Knot usually search for food by randomly probing into the mud. Prey selection may be described by 5 rules: (1) Prey are not ingestible by knot if the circumference is more than 30 mm. (2) Prey are not accessible to knot when they lie buried deeper than 2 to 3 cm. (3) The probability of a prey organism being detected depends on its surface area, measured in the horizontal plane. (4) Prey are ignored when they are unprofitable, i.e. when the rate of intake whlle handling the prey is below the current overall average intake rate during feeding. (5) Knot prefer thin-shelled to thick-shelled prey species, possibly because a high inorganic content has an inhibitory effect on the rate at which energy can be extracted from the food. The first rule of ingestion is set by the gape width, and is therefore invariable. The fraction of the prey which is accessible varies according to the probing depth of the bird. The lower size threshold of prey taken is determined by the profitability rule and so varies according to the current feeding rate of knot. Unfortunately for knot, the majority of the preferred thin-shelled prey live out of reach of the bill, whereas the thick-shelled species live at the surface. Medium-sized Macoma balthica is the best con~promise available in the 6-species mix.
INTRODUCTION
Worms, crabs and shrimps are the most important prey for the majority of the 14 wader species occurring on the intertidal areas in NW Europe (Cramp & Sim- mons 1983). Although bivalves form the bulk of the biomass of the macrozoobenthos living in the intertidal zone (Beukema 1976), only 2 waders, oystercatcher Haematopus ostralegus and knot Calidris canutus, are specialized to such a degree that they depend on bi- valves almost entirely. Oystercatchers take the larger bivalves, which they open by stabbing or forcing the bill between the valves, or by hammering a hole in the shell (Hulscher 1976, 1982, Goss-Custard & Durell 1988, Cayford & Goss-Custard 1990). In contrast, knot swallow bivalves and snails whole (Ehlert 1964, David- son 1971, Prater 1972, Goss-Custard et al. 1977b).
This paper considers why knot were observed to select some prey and not others from 6 potential prey species. Two species occur on the surface of the sub- strate, the mud snail Peringia ulvae and the mussel
Mytilus edulis. Another, the cockle Cerastoderma edule, is found just below the surface, and 3 species, the clams Macoma balthica, Mya arenaria and Scrobicularia plana, are buried several cm deep.
To understand prey selection by a predator, it is essential to know whether prey are detected but rejected or are simply inaccessible by virtue of their excessive depth below the surface. It is thus important to know which prey are actually available. Our first goal was therefore to test whether prey selection by knot could be explained simply by their rate of encounter with different kinds of prey. To determine the fraction available, 3 factors need investigation:
(1) Which prey are ingestible. Since knot eat prey whole, the width of their gape sets an upper limit to prey size. The prey species have different shapes, so the circumference of the shell, rather than its length, is Likely to form a measure of the upper size threshold of prey that can be swallowed.
(2) Which prey are accessible. Since knot probe some 3 cm into the mud and the prey remain immobile when
O Inter-Research 1992

114 Mar. Ecol Prog. Ser.
attacked, the proportion of prey living within reach of the bill can be determined exactly (Hulscher 1973, 1982, Goss-Custard et al. 1977a. Reading & McGrorty 1978, Zwarts & Wanink 1989).
(3) Which prey are detectable. Since knot locate their benthic prey by probing (Gerritsen et al. 1983), the probability of finding prey of different sizes was meas- ured using a modified version of the random touch model developed by Hulscher (1982) for touch-feeding oystercatchers.
When the prey selected differs from what would be expected on the basis of the density of accessible and detectable prey that could be swallowed, knot can be assumed to prefer some prey types to others. The possi- bility that such a selection could be predicted within the framework of an optimal foraging strategy was next investigated. This problem can conveniently be divided into 2 questions:
(4) Which prey are profitable. Since knot take one bivalve at a time, the time needed for handling one prey item can be measured. Optimal foraging theory predicts that prey sizes for which the intake rate during actuai handiing is 'Deiow the overaii average intake rate during feeding as a whole (Le, handling + search- ing measured over long intervals) have to be ignored in order to maximize intake rate (e.g. Hughes 1980).
When even prey which are both available and profit- able are ignored, a short-term strategy of maximizing gross intake rate may fail to explain the observed selection. And, since food must also be processed, the final question becomes (Sibly 1981):
(5) Which prey glve the highest rate of energy yield. Since knot ingest the shell of the molluscs, inorganic content of the food is extremely high. If the rate at which food can be processed limits the intake rate, knot may maximize their rate of energy gain by selecting prey with a lower inorganic content.
METHODS
Knot. Data were collected on the Wierumer flats along the Frisian coast in the eastern part of the Dutch Wadden Sea 153" 25' N, 6" 04' E; see Zwarts et al. 1992 (companion article)]. The majority of the knot arrive at the end of July and leave the area by mid-August en route to their African wintering areas (Boere & Smit 1980, Zwarts et al. 1992). Observations were made on 4 August 1983, when a flock of 30 knot fed within 20 to 30 m of the observation tower at Site M (see Fig. 2 in Zwarts et al. 1992) The knot fed on a plot that was situated 23 cm below mean sea level where the clay content ( < 2 {[m) in the upper 25 cm of the substrate was 4.8 % (Zwarts 1988). Individual knot were watched without interruption from the tower (height 6 m) for 3 h
before the flood tide covered the area. The birds were observed with a mirror ( X 40) and a zoom ( X 15 to 45) telescope. Prey size was estimated in 1/4 cm categories with reference to the bill length (3.5 cm). The handling time of each prey lifted to the surface was measured by digital stopwatch. The time spent searching and preen- ing was also noted. Faeces were collected from the area immediately after the observations had ended.
Prey taken by knot. Actual prey size was recon- structed from fragments found in the faeces and in 18 gizzards from knot collected on the island of Vheland (Dutch Wadden Sea) between 23 August and 24 October 1982. In bivalves, the relation between umbo width and shell length was used: as an example Macoma balthica is shown in Fig. 1. Body length of the ragworm Nerels diversicolor was estimated from jaw length (calibration curve in Zwarts & Esselink 1989). The length of Corophium volutatorwas derived from the relationship between the length of the second antennae and body length. The size of shore crabs Carcinus maenas was estimated from the relationship between carapace width and the size of the propodus of the p i l ~ c e ~ . iliiaci Peiifigia iiivae were measured direc:!y.
width of the top (mm)
Flg. 1 Macoma balthica. Length predicted from width of the umbo. The function is calculated for 24 means, weighted for
sample size
Prey available. Prey were divided into 1 mm size classes, and the density of each class was determined at the time the observations were made using a stand- ard sampling programme, 16 samples of 1/56 m* being taken (Zwarts 1988). The burying depth of the bivalves was measured using methods described in Zwarts & Wanink (1989).
The laboratory procedures for measuring the flesh weight of each mm class (ash-free dry weight, AFDW) are given in Zwarts (1991). The allometric relationships between AFDW and shell length in the 6 potential prey

Zwarts & Blomert: Why knot take A4acoma balthica 115
- Macoma balthica
y - 1 . 5 7 9 ~ + 0.458~2- 2 177 n-5442 2-24 mm
-
I I . I I I I I L
4 6 8 10 15 20
Mya arenaria
11.308 2-114 mm -
1 1 1 1 , 1 1 1 1 1 1
4 6 8 10 15 20 shell length (mm) shell length (mm) shell length (mm)
Fig. 2. Relations between dry weight of the cleaned shell (mg dry weight) and shell length (upper line), and between flesh weight (mg ash-free dry weight) and shell length (lower line), in 6 hard-shelled prey species. All data, except for Peringia ulvae, were collected in the study area in August; data were pooled for 11 yr of sampling (from Zwarts 1991 and unpubl.). Data for P ulvae were taken from Chambers & Milne (1979) and combined for May and November; a correction is made for the 3 % organic matter found in the shell (Dekker 1969), representing 10 to 15 % of the total organic mass Since the relation between ln(shel1 weight) and In(1ength) appeared to be concave in the bivalves, a polynomial line was fitted The functions were calculated for the means per each mm size class, weighted for the number of observations. All correlations were larger than 0.995. The furlctions clre indicated in the panels [ y = ln(mg) and X = ln(mm)], as well as the number of measurements and the range over which the regressions were
calculated
species (Fig. 2) are based on data collected in the study area in August, at the time the observations were made. No data for Peringia ulvae are available, so published values are used (Chambers & Milne 1979, Dekker 1979). Since knot swallow the shell, Fig. 2 also shows the relation between length and dry weight of the empty and cleaned shell. In order to be able also to measure food intake in terms of wet weight, samples of Macoma balthica, Cerastoderma edule and Mytilus
edulis were weighed immediately after being col- lected, without any surface water being removed. Table l gives the allometric relationships for wet weights. The percentage of water hardly differed among the 3 bivalve species. Normally, the proportion of water in marine benthos is around 78%, (authors' unpubl. data), but the 3 species in Table 1 had a much greater proportion: 91 to 93 % excluding the shell. The reason for this was that, when collected and so dis-

116 Mar Ecol. Prog. Ser. 83: 113-128, 1992
Table 1. Relations between total wet weight of 3 bivalve species, freshly taken from the substrate in September 1988. Since the relation between ln(we1ght) and ln(1ength) appeared to be concave in 2 of the 3 species, polynomial lines were fitted. The functions were calculated for the means per mm class, weighted for the number of observations; y = ln(mg) and X = ln(mm). Water content (+ SE) and fresh content are given as a percentage of the total wet weight, including the shell. Dry flesh content was not measured in the sample itself, but estimated from weight-length equations calculated for samples taken from the same area in the
same period
I Species Equation % Water % Flesh I Macoma balthica 298 0.998 y = 2.559 + 0.8032 - 0 . 7 4 3 ~ 54.12 -+ 0.24 Cerastoderma edule 320 0.999 y = -1.226 + 3 . 0 2 3 4 ~ 55.72 + 0.22 Mytilus edulis 173 0.998 y = 4.083 + 0.5262 - 0 . 6 4 2 ~ 51.90 + 0.21 5.0
turbed, the bivalves shut their valves firmly and enclosed some seawater. C. edule contained 1 . 5 ~ as much water relative to the amount of flesh as did Macoma balthica and Mytilus edulis. The salinity of the water in the shells was 27.5% (n = 3, SD = 0.2), similar to that in the surrounding water.
RESULTS
Gizzard analysis
Seven of the 18 gizzards contained no prey fragments. One contained 10 umbos of Macoma balthica, with an estimated shell length of 15 to 16 mm. Shell fragments of Cerastoderma edule (but no umbos) and 4 pincers of Carcinus maenas (estimated carapace width ca 8 mm) were found in another gizzard. The remaining 9 giz- zards held a total of 1022 Peringia ulvae. Though many were damaged, the shell length of 17 % and shell width of 44 O/O of the P. ulvae were determined (left inset in Fig. 3). Width was converted to shell length (right inset in Fig. 3). Larger snails were more often fragmented than small ones (Fig. 3), so it was difficult to quantify size selection. Prey length averaged 2.36 mm (SD = 0.60) in the subsample of specimens for which length could be measured directly. However, length was 2.86 mm (SD =
0.79) in the subsample for which only the width was intact. Most likely the average size for the entire sample was 3 mm or more, because the unmeasurable fractions were probably above average sizes. Though differences among shell lengths were small, the 3 estimates of shell length give values of average flesh weight of prey taken by knot which differ by 50 %, due to the fact that flesh weight allometrically relates to shell length with a power of 2.14 (Fig. 2).
Prey selection
According to our observations, not all prey taken from the mud were actually swallowed: 63 of the 84 Macoma
0 2 4 6 shell length (mm)
Fig. 3. Peringia ulvae. Size frequency distribution of 450 individuals found in 9 gizzards of knot Calidris canutus col- lected on Vlieland, Dutch Wadden Sea, during the period 15 August to 24 October 1982. Dark shading: snails for which length could be determined. Light shading: crushed snails for which width at the base, but not length, could be measured and for which length was derived from the relationship between width and length in undamaged snails (see right inset). Left inset shows that in more than half of the snails neither width nor length could be measured (100 % = 1022)
balthica brought to the surface were ingested, and only 1 in 4 of the Cerastoderma edule. Two shrimps Crangon crangon 5 cm long were handled for several seconds but finally not eaten. Rejection of the latter 2 prey species was unexpected as C. edule is a major prey elsewhere (Goss-Custard et al. 1977b, Boere & Smit 1980, Nehls

Zwarts & Blomert: Why k .not take Macoma balthica 113
1992) and faecal analysis showed that knot can feed on shrimps 43 to 63 mm long (authors' unpubl. data).
Both the field observations and faecal analysis indi- cate that Macoma balthica was the main prey and that Cerastoderma edule, Nereis diversicolor and Cor- ophium volutator were rarely taken (Table 2). Even though very few of the prey seen eaten were too small to identify, 360 mud snails Peringia ulvae (1 to 3 mm) and 6 very small bivalves (1 to 2 mm) were found in the faeces. However, all were intact and contained flesh, so they must have been accidentally scraped from the surface while the faeces were being collected.
Table 2. Calidris canutus. Prey taken by knot during 82 min (left column) and prey found in 20 faeces from the same individuals (right column), Wierumer flats, Dutch Wadden Sea, 4 August 1983. Among the prey taken, 3 were so small that the species could not be identified. The number of prey in the faeces was determined by counting unique fragments (jaws of the ragworm Nereis divers~color, second antennae of Corophium volutator, umbos of Macoma balthica and Ceras- toderma edule); since each animal has 2 such fragments, the numbers found were divided by 2. Anlmals accidentally
scraped from the surface are indicated in parentheses
No. prey No. prey in observed faeces
Macoma balthica > 9 mm 63 19 Cerastoderma edule 12 mm 1 0.5 Nereis diversicolor 1 0 5 Corophium volutator 3 0.5 Macoma balthica spat
1 . 3 (2 )
Cerastoderma edule spat (4) Peringja ulvae I (360)
One of the knot observed produced 15 faeces during 21 min of continuous observation. All but one of the intervals between faeces depositions varied between 58 and 88 S. The exception was 174 s long, suggesting that we missed one faecal packet during one interval. If so, knot produced one faecal packet per 80 S. Therefore the faeces that were collected reflected a period of 20 X 80 S, or 26 min, feeding. Since the total time spent watching the birds was 83 min, the number of prey seen taken should have been 83/26 or 3.2 times as large as the number found in the faeces, and this was indeed so (Table 2): in Macoma balthica the ratio was 3.3. Thus, faecal analysis confirmed the visual observations of prey selection.
Size selection
Estimates of prey size made by eye in the field suggested knot took Macoma balthica between 3/4 and 2 cm long, but faecal analysis showed that the size range was narrower (0.9 to 1.6 cm; Fig. 4 ) . It appears that the
I I I
5 10 15 20 shell length (mm)
R g . 4 . Macoma balthica. Size frequency d~stribution of prey taken by the same knot Calidris canutus according to (A) faecal analysis and (B) visual estimates in the field. Inset gives the function used to correct the visual estimates of prey size
observers overestimated the sizes of the larger prey and underestimated those of the smaller ones. In order to correct the visual estimates, a cumulative frequency distribution was made of the size classes found in the faeces. This allowed the average size of the 6 categories used for estimating prey size visually in the field to b e superimposed on the frequency distribution of the actual size classes taken (inset in Fig. 4). To increase the sample size for the smallest prey categories, the few prey classified in the field as 0.75, 1 or 1.25 cm long are combined for purposes of this study.
A quarter of all Macoma balthica handled by knot were not swallowed. Although occasionally small M. balthica were lost during handling, most rejections concerned large prey, refused after a 5 to 6 S frantic handling effort. The larger the prey, the more were rejected (Fig. 5A). Since half of the M. balthica 16 mm long were refused, specimens larger than this were clearly too large for knot. Knot handle M. balthica with a series of 'catch and throw movements' during which the food is transported up the bill (Gerritsen 1988). The larger the prey, the greater the number of catch and throw cycles required, and so handling time increased with prey size (Fig. 5B).
The profitability of each prey size, expressed as mg AFDW S-' handling, was calculated from the relation

118 Mar Ecol. Prog. Ser. 83: 113-128, 1992
PREY INGESTED
0 ' I I I
1'2 13 14 1'5 1'6 shell length (mm)
Fig. 5. Macoma ballhica. Handling of different sizes by knot Calidris canutus. (A) Percent prey lost or rejected. (B) Hand- ling time of prey swallowed by knot and lost or rejected. (C) Ash-free dry weight (AFDW) as determined in 1062 speci- mens collected, r = 0.999. (D) Profitablllty (mg AFDW S-'
handling) of prey swallowed. The upper line represents only the prey that were swallowed; the lower line reflects the profitability after taking into account the time lost during handling of rejected prey (see panel A ) , the intake rate (mg
AFDW S-') during feeding is indicated by grey shading
between prey size and handling time (Fig. 5B) and between prey size and AFDW (Fig 5C). As handling time increased disproportionally to the amount of flesh, the profitability decreased in the larger size classes (Fig. 5D). This decrease was even larger when the time lost in handling rejected prey finally was taken into account (Fig. 5D).
Intake rate
During 67 min of feeding, knot took 63 Macoma balthica, whose average weight was 39.6 mg AFDW
The contribution of the 3 other prey species to the total food intake was only 1 %. AFDW of the single 11 mm cockle taken was 16.2 mg, of the 3 Corophium volutator 3 X 0.4 mg, and of the single 4 cm ragworm 7.6 mg. The total intake rate was 0.63 mg S-' , excluding 18.8 % of the observation time spent preening, usually in short bouts. With this non-feeding time included, the overall intake rate decreased to 0.51 mg S-'.
Density of available prey
Though the knot fed in a rich area (Fig. 6), not all prey may have been available. Below we attempt to quantify which prey were actually available to knot.
P. ulvae 36300 m-2
4000 80000 0
0 5
M. balthica 8% m-2
40
I
shell length (mm)
Fig. 6. Densi.ty of each size class of the mud snail Peringia ulvae and 5 bivalve species (Macoma balthica, Cerastoderrna edule, Mya arenaria. Scrob~cularia plana, Mytilus edulis) on the site where knot fed. Note different vertical scales. Large C. edule (23 to 33 mm; 150 specimens m-'], Mya arenaria (23 to 41 mm; 21 m-2) and S. plana (38 to 43 mm; 21 m-') are not
shown. See Table 3 for total biomass m-2 of the 6 species
C. edule 200 - 1536 m-2
N E
- $160- a - - 0 L
$120-
5 - C
80 -
40 -
0 40 -
20 -
0
20 - S. plana 38 m-'
0 I A I -.- I

Zwarts & Blomert: Why knot take Macoma balthica 119
shell length (mm) shell length (mm) shell length (mm)
Fig. 7. (A) Shell width. (B) shell height and (C) shell circumference as a function of shell length in 5 bivalve species. Length, height and width were measured in 608 Macoma balthica (r = 0.984 and r = 0.993 for width vs length and height vs length, respectively), 400 Cerastoderma edule (r = 0.995, 0.998), 292 Mya arenaria (r = 0.995, 0.997), 347 Scrobicularia plana (r = 0.985, 0.993) and 304 Mytilus edulis (r = 0.995, 0.996). The circumference (panel C) is derived from the 'shape index', the ratio between the measured circumference and the sum of width and height. The shape index differed significantly in the 5 specles according to a l-way analysis of variance (n = 51, = 0.60, p <0.0001); the standard errors for the 5 species were less than 1 O/O of the average shape
index. In (C), the predicted critical upper size threshold for knot, based on knot eating M. balthica (o), is indicated by a bar
Ingestible prey
Though Macolna balthica between 3 and 21 mm were present (Fig. 6), no prey larger than 16 mm long were taken (Fig. 4). Since more than half of M. balthica 16 mm long were rejected (Fig. 5A), this is presumably the largest prey that is normally ingested. The same upper size limit was also found by Prater (1972), Goss- Custard et al. (1977b), Nehls (1992) and Piersma (pers. comm.). This limit is probably not determined by length per se, but by the combined effect of shell width and height. The 'catch and throw movement' made by knot handling a large shell (Gerritsen 1988) is intended to bring the prey with its longest axis parallel to the bill. Since the gape has to be stretched wide to allow a large, hard-shelled prey to be swallowed, the upper size limit is determined by the circumference of the shell in a plane perpendicular to the length axis.
These considerations of dimensions of course apply to all bivalves. In all species studied, a size-indepen- dent ratio was found, whereby the shell circumference of the prey was 1.5 to 1.6 times greater than the sum of its width and height. This shape index was lowest in Mytilus edulis (1.51; S E = 0.007, n = 11) and highest in Scrobicularia plana (1.62; SE = 0.01, n = 10) (see Fig. 7C). There was a very close relationship between shell length and shell width (Fig. ?A) and between shell length and shell height (Fig. ?B), so the circumference could be predicted accurately for each length class (Fig. ?C).
The circumference of 16 mm long Macoma balthica is 30.6 mm (Fig. ?C). Using the same value, all Ceras- toderma edule longer than 12 mm could not be ingested, whereas the predicted upper limits for the more slender Mya arenana, Scrobicularia plana and Mytilus edulis would be 17, 19 and 21 mm, respec- tively. Data to test the predicted upper size limits are scarce, but agree wlth these values. Knot rarely took C. edule longer than 10 mm (Goss-Custard et al. 1977b, Nehls 1992, Piersma pers. comm.), but did swallow prey 18 to 19 mm long among the more oblong M. edulis (Prater 1972, Piersma pers. comm.). Though length itself also might set a limit to the size of prey knot could swallow, there are no data available for this, so the circumference of 30.6 mm measured in Macoma balthica, is taken as the limit for all species. Even the largest Peringia ulvae (length 6 mm) remained far below this limit.
Accessible prey
All Peringia ulvae and mussels Mytilus edulis were considered accessible, as they live at the surface. The other 4 bivalve species occurred at various depths beneath the surface. Based on work done in the same locality (Zwarts & Wanink 1989), the proportion of the prey living in the upper 2 or 3 cm of the substrate is shown in Fig. 8.
Which prey would be within reach of a bill 35 mm

120 Mar Ecol. Prog Ser 83. 113-128, 1992
0 - 0
E 50 -
- OUT OF REACH
100-
shell length (mm)
Fig 8 Percentage per slze class of 4 blvalve specles llvlng In the upper 2 cm or upper 3 cm of the substrate, as a measure of the fraction of prey accessible to knot The data, collected In the study area, are based on Zwarts & Wanink (1989) and are from August for Macoma balthica and July to September for Cerastoderma edule and Mya arenana. Since small Scroblcularia plana rarely occurred m the study area during the years of sampling, the data are lumped for the entlre year and supplen~ented w t h depth measurements from LVales
(Hughes 1970)
long? Assuming that a knot needs ca 5 mm purchase on a shell of 10 mm or longer, the distance between the mud surface and the upper edge of the bivalve (bury~ng depth) would have to be less than 30 mm tor a knot to take a prey However, not all of this upper 30 mm would be fully exploited, as only some probes were made to the base of the bill The upper 10 to 20 mm must have been searched more thoroughly than the deeper layer Most probes of the closely related sanderling Cdlldris alba (bill length 26 to 27 mm) were 20 mm deep (Gerntsen & Meiboom 1986) and the probing depths of an oyster- catcher [b~ l l length 70 mm) averaged 40 mm (Wanink & Zwarts 1985) This suggests that prey living In the upper 2 cm (Fig 8) likely would be accessible to knot
LENGTH WIDTH HEIGHT
Cerastoderma edule 0680rO008 L W n-10
\
Mya arenarla 06€u_+0012 H W n-4
Flg 9 Surface area ( touch area') of 4 bivalve species, given as a functlon ot the Iatio of shell length and width, except in Mya arenaria for which shell height and width were used. Number of measurements and standard error of the ratios are given 'Touch area refers to the maximal surface area of b~valves buried In thelr natural position, measured in a horizontal
plane
Detectable prey
Taking into account the fraction of prey that is too large to be eaten or are living too far down to be reached. the density of the available prey in the study site is reduced from 2705 to 1412 bivalves m-'. But not all of these may be detectable, except perhaps Mytilus edulis, which is visible on the surface. The other bi- valves were found by probing vertically downward, in the same way oystercatchers search for Macoma balth- lca (Hulscher 1982). The probability of a prey being touched depends primarily on its surface area meas- ured In the horizontal plane. Hulscher (1982) measured this 'touch area' by photographing bivalves in their natural position from above, the mud having been carefully removed beforehand. Wanink & Zwarts (1985) measured 'touch area' in Scrobicularia plana, by determining the surface area left by prey pressed into modelling clay The latter technique was also used here The natural position of the bivalves in the sub- strate 1s shown in Fig. 9. Touch area was closely related to the product of shell width and shell length (Fig. 9); w ~ d t h and height were used in Mya arenaria, due to

Zwarts & Blomert: Why knot take Macoma balthica 121
their different position in the mud. The index was similar for different size classes; the standard errors were very small (Fig. 9).
Like oystercatchers (Hulscher 1982), sandpipers, such as knot, probe with an open bill, apparently to increase the effective touch area (Gerritsen & Meiboom 1986, Gerritsen 1988). The touch surface of a slightly E opened knot bill is about 3 X 7 mm (Gerritsen 1988, authors' unpubl. data). For simplicity, the prey is considered a circle (with radius r) and the (opened) bill a rectangle (with X and y as sides). The 'effective touch area ' , which equals the touch area of the prey enlarged by the surface area of the bill t ~ p , can then be expressed as a function of the 3 variables r, X and y (Habekotte 1987). Fig. 10 shows that the surface of the bill adds an important increment to the touch area, especially for 2 4 6 8 10 14 18 26 30
the smaller prey. shell length ( m m )
EFFECTIVE TOUCH AREA
Fig. 10. 'Effective touch area' of a bivalve as a function of the 'touch area' of the shell, enlarged by the surface of the bill tip. shown for 3 situations: zero, small and large touch area. For simplicity, touch area is shown as a circle. The surface of the tip of the 2 (opened) mandibles 1s indicated with a rectangle;
see text for further explanation
Since the touch area is a simple function of shell length and width or, in Mya arenana, shell width and height (Fig. g), the surface area can be calculated from the shell dimensions (Fig. 7A, B). The calculated surface is given in Fig. 11 as an allometnc function of length. The expected exponent of this equation would be 2 if the shape of the shell was the same in all size classes. In fact, the exponent is larger than 2, and greatest in Macoma balthica. The reason is that small bivalves are more slender than large ones, particularly in M, balthica. The data in Fig. 11 for M. balthica coincide well with those of Hulscher (1982), taking into account that his measure- ments are for more slender specimens (Hulscher pers.
Fig. 11. 'Touch area' of 4 bivalve species (Cerastoderma edule, Macoma balthica, Scrobicularia plana, Mya arenaria) as a function of shell length. Touch area is calculated from the same data used In Fig 7A, B. The relations between surface and d~mensions of the shells (Fig. 9) were used to calculate the regressions shown. The grey field shows the enlargement of the touch area for C. edule when the surface of the bill is taken into account: this gives the 'effective touch area' (see Fig. 10
and text for further explanation)
comm.), as were the data for Cerastoderma edule obtained by Hulscher (1976) and for Scrobicularia plana obta~ned by Wan~nk & Zwarts (1985).
To calculate the effective touch area, the touch area given in Fig. 11 was transformed to a circle to find the derived variable r. With r and bill dimensions X and y known, the touch area was converted into effective touch area. The calculated effective touch area is shown as a function of shell length for Cerastoderma edule in Fig. 11. The risk of prey being encountered by a probing knot increased 25-fold for all species within the range of size classes shown. The effective touch area is twice as large as the touch area for bivalves > 10 mm, but more than 20 times as large for bivalves 2 mm long. This confirms the importance of the large touch area of the bill tip itself.
Selection of available prey
In this section we derive the relative nsk of prey being taken by knot, according to the random touch model, but without ~Vytilus edulis and Peringia ulvae, which knot could locate visually. The total effective touch area of all benthic prey together is the product of effective touch area per size class (Fig. 11) and density per size class (Fig. 6). Assuming that during a probe a prey is either hit or missed completely, and that 2 prey are never hit in one probe, the bill must encounter a
122 Mar Ecol. Prog. Ser. 84: 1-8, 1992
prey 44 % of the times the knot is probing (no depth restriction). However, if it is assumed that the probing depth was only 2 cm (see Fig. 8), the percentage of hits decreases to 35 %. If the prey that are too large to be ingested are also excluded, the percentage is reduced to 15 %.
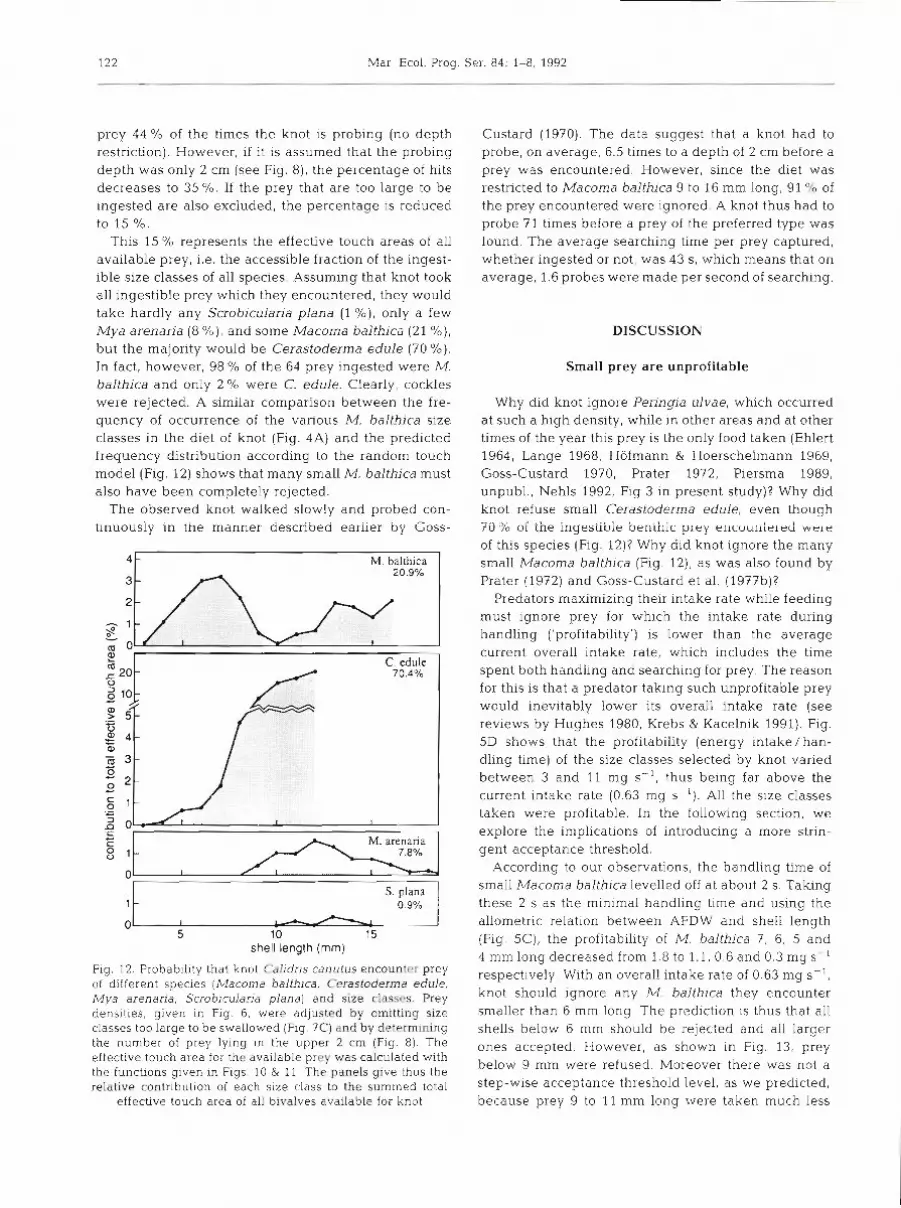
This 15 % represents the effective touch areas of all available prey, i.e. the accessible fraction of the ingest- ible size classes of all species. Assuming that knot took all ingestible prey which they encountered, they would take hardly any Scrohicularia plana (1 %) , only a few Mya arenaria (8 %) , and some Macoma balthica (21 %), but the majority would be Cerastoderma edule (70 %). In fact, however, 98 O/O of the 64 prey ingested were M. balthica and only 2 % were C. edule. Clearly, cockles were rejected. A similar comparison between the fre- quency of occurrence of the various M. balthica size classes in the diet of knot (Fig. 4A) and the predicted frequency distribution according to the random touch model (Fig. 12) shows that many small M, balthica must also have been completely rejected.
The observed knot walked slowly and probed con- hnuousiy In the manner described eariier by Goss-
4 1 M. balthica I
shell length (mm)
1
Fig. 12. Probability that knot Calidris canutus encounter prey of different species (Macoma balthlca, Cerastoderma edule, Mya arenaria, Scrobicularia plana) and size classes. Prey densities, given in Fig. 6, were adjusted by omitting size classes too large to be swallowed (Fig. ?C) and by determining the number of prey lying in the upper 2 cm (Fig. 8). The effective touch area for the available prey was calculated with the functions given In Figs. 10 & 11 The panels give thus the relative contribution of each size class to the summed total
effective touch area of all bivalves available for knot
S. plana - 0.9%
Custard (1970). The data suggest that a knot had to probe, on average, 6.5 times to a depth of 2 cm before a prey was encountered. However, since the diet was restricted to Macoma halthica 9 to 16 mm long, 91 % of the prey encountered were ignored. A knot thus had to probe 71 times before a prey of the preferred type was found. The average searching time per prey captured, whether ingested or not, was 43 S, which means that on average, 1.6 probes were made per second of searching.
0 I
5 10 15
DISCUSSION
Small prey are unprofitable
Why did knot ignore Peringia ulvae, which occurred at such a high density, while in other areas and at other times of the year this prey is the only food taken (Ehlert 1964, Lange 1968, Hofmann & Hoerschelmann 1969, Goss-Custard 1970, Prater 1972, Piersma 1989, unpubl., Nehls 1992, Fig 3 in present study)? Why did knot refuse small Cerastoderma edule, even though - ,. t u % of the ingestibie beniilic pley ellcuur~ie~eri wele of this species (Fig. 12)? Why did knot ignore the many small Macoma balthica (Fig. 12), as was also found by Prater (1972) and Goss-Custard et al. (1977b)?
Predators maximizing their intake rate while feeding must ignore prey for which the intake rate during handling ('profitability') is lower than the average current overall intake rate, which includes the time spent both handling and searching for prey. The reason for this is that a predator taklng such unprofitable prey would inevitably lower its overall intake rate (see reviews by Hughes 1980, Krebs & Kacelnik 1991). Fig. 5D shows that the profitability (energy ~n take /han- dling time) of the size classes selected by knot varied between 3 and 11 rng S-', thus being far above the current intake rate (0.63 mg S-'). All the size classes taken were profitable. In the following section, we explore the implications of introducing a more strin- gent acceptance threshold.
According to our observations, the handling time of small Macoma balthica levelled off at about 2 S. Taking these 2 S as the minimal handling time and using the allometric relation between AFDW and shell length (Flg. 5C) , the profitability of M. balthica 7 , 6, 5 and 4 mm long decreased from 1.8 to 1.1, 0.6 and 0.3 mg S-'
respectively. With an overall intake rate of 0.63 rng S-',
knot should ignore any M. balthica they encounter smaller than 6 mm long The prediction is thus that all shells below 6 mm should be rejected and all larger ones accepted. However, as shown in Fig. 13, prey below 9 mm were refused. Moreover there was not a step-wise acceptance threshold level, as we predicted, because prey 9 to 11 mm long were taken much less

Zwarts & Blomert: Why knot take Macoma balthica 123
shell length (mm)
Fig. 13. Selectivity of knot Calidris canutus feeding on Macoma balthica living in the upper 2 cm of the substrate The frequency distribution of the size classes taken by knot (Fig. 4A) was divided by the predicted frequency distribution on the basis of size and depth (Fig. 12, upper panel). The ratio was highest for prey of 15 mm; selection ratios for all other size classes are expressed relative to this maximum, set at
100 %
frequently than expected. By ignoring such profitable prey, knot would not maximize their intake rate. The effect on intake rate of ignoring profitable prey may be calculated, since encounter rate, A j , handling time, h,, and flesh weight, E,, are known for each size class i. The encounter rate, A, is the inverse of the searching time. Assuming that a knot made 1.6 probes S-', A, can be estimated from the random touch model (see Fig. 12). The 2 other variables were measured directly.
The overall intake rate, total energy E obtained in total time T, is calculated from a multi-species func- tional response equation (Charnov 1976) :
The intake rate was calculated assuming that (1) all Macoma balthica (size 9 to 16 mm) encountered were pulled to the surface, and (2) the proportion of prey lost or rejected was as observed in the field (Fig. 5A, accepting the proportion of the 12 mm size class as applying to all smaller prey). The change in intake rate when the acceptance threshold for prey size was varied is shown im Fig. 14. Clearly, it did not matter whether knot accepted all M. balthica larger than 3 mm or larger than 11 to 12 mm. The reason for this is that the profitability of the size classes around 6 mm long was close to the current intake rate.
The profitability rule also can be used to calculate the lower size threshold for other prey species. The relation between shell size and dry flesh weight is taken from Fig. 2. These data represent average weights in
lower size threshold (mm)
Fig. 14. Effect of a shift in the lower acceptance threshold on intake rate of knot Cahdris canutus whlle feeding. The calcu- lations are based upon 3 variables: encounter rate, handling time and weight of the prey of each size class; see text for further explanation. According to the prediction, prey smaller than 6 mm should be refused but, as shown, intake rate did not change much when the lower limit was several mm lower
or higher than this
August, calculated for a data set from 11 yr (Zwarts 1991); note that the body condition of Macoma balthica at Site M during the year of observation was 18% above this average (see Figs. 2 & 5C). Assuming that only a single size class 1s available for a given period, the rate at which prey must be taken to achieve an intake rate of 0.63 mg S-', as found in this study, can be calculated (Fig. 15). To achieve this rate, from 22 to 341 prey 1 mm long have to be taken per second, depend- ing on the prey species selected. This is quite impos- sible, however. A knot already requires 0.4 s to trans- port a small piece of flesh up the bill (Gerritsen 1988). Taking this as the absolute minimum, the lower limit of profitable prey is indicated in Fig. 15 (Threshold A). The resulting prediction is that all size classes below 3 or 4 mm would be ignored by knot. There are 3 reasons why this lower size threshold may, in fact, be higher. Firstly, if prey have to be extracted from the mud, a more realistic estimate of the shortest handling time may be 1 prey item per 2 S. The lower acceptance threshold must therefore be higher for the buried bival- ves (Threshold B in Fig. 15) than for prey found at the surface (Threshold A).
Secondly, the foregoing calculations assume that prey recognition is instantaneous once prey have been encountered, which only seems plausible if knot rely solely on visual cues. Since knot are touch-feeders (Gerntsen et al. 1983), they must take a certain amount of time to recognize prey types buried in the substrate, and this recognition time should be added to handling time (Hughes 1979). This would further reduce the

Mar. Ecol. Prog. Ser. 83: 113-128, 1992
LOWER SIZE THRESHOLD - - - - - - - A surfaceprey + B buried prey
I 1 I I I I l l l l l I I 1 1 2 3 4 5 6 7 8 9 1 0 1 2 1 4
shell length (mm)
profitability of all size classes, and would cause an upward shift in the lower acceptance threshold.
Thirdly, when only prey similar in size to the lower size thresholds are available, knot cannot lose time searching for them; they must handle prey ccntinu ously. This situation is rarely found. However Peringia ulvae occur at densities of several individuals ~ m ' ~ , one of the rare situations where it seems possible to feed on prey without spending time searching. The knot on Vlieland took P. ulvae 2 to 4 mm long (Fig. 3), as was also the case in Wash Bay, England (Goss- Custard et al. 1977b). P. ulvae of 2, 3 and 4 mm contain 0.12, 0.30 and 0.55 mg dry flesh, respectively (Fig. 2 ) . Assuming these snails are handled in 0.4 s, the highest possible intake rate would be 0.5, 0.8 or 1,4 mg s-', according to whether all the prey were 2, 3 or 4 mm long. In other words, knot should be able to reach the observed 0.6 mg s only if snails 3 mm and larger were taken. However, in the study area, most P. ulvae were less than 2 mm long (Fig. 6). This may explain why these extremely abundant and readily available prey were completely ignored. The knot on Vlieland took P. ulvae ca 3 mrn long, weighing 0.3 mg on average (Fig. 3). Two of these prey would have to be taken per second to achieve an intake rate similar to that of knot eating Macoma balthica. The rate at which knot take P. ulvae has been measured previously 980 snails were taken in a feeding period of 20 min (Swennen unpubl., cited in Glutz et al. 1975), or 1 prey per 1.2 s, meaning that an intake rate of 0.6 mg s might have been achieved if the snails were 4 mm long
Size classes of prey which are harvestable by knot
Fig. 16 summarizes, for each of the 6 prey species, the size classes that are most likely to be taken. The
Fig. 15. Maximum feeding rate (prey in summer condition swallowed s ' ; see Fig. 2) for 5 bivalve species (Mytilus edulis, Mya arenana, Scrobicularia plana, Macoma balthica, Cerastoderma edule) and Peringia ulvae, assuming that knot Calidris canutus eats prey of the same size class while its intake rate remains at a level of 0.63 mg s ' The graph shows that a knot has to take small prey at an improbably high rate to achieve this intake rate, The size thresholds reflect situations when prey can be ta- ken without spending time searching; the handling time is set at 0.4 s (Threshold A), thought to be the shortest handling time for prey taken from the sur- face, or 2 s (Threshold B), assumed to be the shor- test time needed to extract and ingest prey from the
mud (Threshold B)
P. ulvae M balthica C. edule M. arenaria S. plana M edulis
P. ulvae M. balthica C edule M. arenaria S. plana TOO DEEF
s?E%z% M edulis
I I I
I I I I I I
0 5 10 15 20 25 shell length (rnrn)
Fig. 16. Size classes of the 6 hard-shelled prey species (Perin- gia ulvae, Macoma balthica, Cerastoderma edule, Mya arenan'a, Scrobiculan'a plana, Mytilus edulis) which are ingestible by, accessible and presumably profitable to knot Calidris canutus (light shaded areas). Prey sizes are defined as harvestable when (1) they can be swallowed, (2 ) they lay within reach of the bill, and (3) their handling efficiency is higher than the average feeding rate (mg s i handling > mg s" ' feeding). As explained in the text, the thresholds are not to
be considered as fixed limits
biomass harvestable by knot is only a fraction of the total biomass, because the majority of the flesh is found in prey too large to be swallowed (Table 3). The upper threshold is set by gape width (size threshold) and, to a

Zwarts & Blomert: Why knot take Macoma balthica
Table 3. Total biomass of 6 potential prey species for knot Calidris c.anutus (g AFDW m-') in the study area (corresponding to data given in Fig. 6) and that of prey individuals too large, too deep or too small for knot (see Fig. 16). The remaining biomass is
harvestable for knot
Species Total biomass Too large Not too large, Too small Harvestable but too deep for knot for knot
Peringia ulvae 3.7 0 0 3.2 0.5 Cerastoderma edule 87.1 77.0 0 0.1 10.0 Macoma balthica 28.2 19.6 4.6 0.3 3.7 Scrobicularia plana 12.7 12.4 0.2 0 0.1 Mya arenaria 6.5 4.1 1.2 0 1.2 Mytilus edulis 0.4 0 0 0 0.4
Total 138.6 113.1 6.0 3.6 15.9
lesser degree, by bill length (depth threshold), and the lower size threshold is set by the speed at which prey may be handled (profitability threshold). The upper size threshold has been investigated in relation to gape width, but it is also conceivable that there is a size limit related to the ability to crush prey in the gizzard, as suggested for the purple sandpiper Calidris maritima (Summers et al. 1990). Work in progress (T. Piersma unpubl.) will show whether in knot the digestibility of prey decreases with size.
The upper size threshold is probably fixed for the most part. It should be noted, however, that the relation between shell circumference and shell length (Fig. 7C) may vary locally and geographically. Variation in shape has been attributed to age and density in Mytilus edulis (Seed 1968) and to growth rate and ambient salinity in Cerastodernia edule (Eisma 1963, Hancock 1967). Macorna balthica in the southern part of their range are more slender than those in the north (Beukema & Meehan 1985). The effect of this is that the critical length for knot varies by 2 to 3 mm.
Though knot do not take bivalves that live too deep, they can vary the depth to which they probe. Oyster- catchers probed more deeply when the density of prey within reach was low (Wanink & Zwarts 1985). The fraction of prey living in the upper 2 and 3 cm is given in Fig. 8 for our study site in late summer. Macoma balthica and Scrobicularia plana live much deeper in winter than in summer, with the proportion accessible to knot varying between 0 and 100 % (Reading & McGrorty 1978, Zwarts & Wanink 1989, Zwarts et al. 1992). There is no seasonal variation in the burying depth of Mya arenaria and Cerastoderrna edule (Zwarts & Wanink 1989).
In addition, according to the profitabhty rule, the lower size threshold should be variable, because it is closely linked to the current intake rate. When only the less profitable prey are available, the intake rate will inevitably decrease, so that the low-ranlung prey then become profitable (e.g. Zwarts & Drent 1981). Profita- bility will also depend on the condition of the prey.
Cayford & Goss-Custard (1990) have shown the impli- cations of variations in the condition of Mytilus edulis for size selection by oystercatchers. Similar variations in AFDW occur in Macorna balthica: individuals of similar size contain about 1.5 times as much flesh in May and June as in February and March. This seasonal variation is even larger in Cerastoderma edule (Zwarts 1991). Thus, the lower acceptance level should increase in winter as the condition of prey decreases. This is only true, however, if knot are able to maintain their intake rate at a constant level. The lower size threshold would not change if the intake rate decreased at the same rate as did prey condition.
Whether knot can survive on a lower intake rate depends on the available feeding time and on their energy requirements. The available feeding period does not vary much between intertidal areas used by knot, but the energy requirements do differ: when wintering in Africa, for example, energy requirements may be half those in NW Europe during a cold spell (Kersten & Piersma 1987, Piersma et al. 1991) or during the pre- migration period when knot are fattening up (Klaassen et al. 1990). The knot in the study area in late summer were on migration, so the high intake rate observed was probably required to enable them to accumulate body reserves. This would imply that the small prey ignored during this pre-migration period might be profitable under other circumstances, and so might be taken when knot require a lower daily food consumption. The aver- age intake rate of knot wintering in Africa was esti- mated to be about 0.37 mg S-' (Zwarts et al. 1990b), 40 % below the 0.63 mg S- ' found in this study. This may be one of the reasons why knot in Mauritania accept very small prey (Zwarts et al. 1990a).
Does a digestive bottleneck explain prey selection?
The rate of food processing in oystercatchers is con- strained by the capacity of the gut to digest food,

Mar. Ecol. Prog. Ser. 84: 1-8, 1992
Table 4. Rate at which 3 waders process their food in terms of mg total wet weight S-', mg dry weight S-' and mg dry flesh S-' The food composition is also given. 'Non-flesh' refers to Inorganic dry matter (shell, sand, salt). Knot fed on Macoma ballhlca, including the shell (present study). Whirnbrel took crabs of the genus Uca [the maximal processing rate is taken from Zwarts & Dirksen (1990) and the food composition from Zwarts & Blomert (1990)l; 30 "10 of the organic matter, found in the skeleton of the crab, was indigestible and therefore added to the non-flesh component. Oystercatchers ate only the flesh of mussels (Kersten &
Visser unpubl.)
Species Body weight Processing rate (mg S-') Food composit~on (%) (9) Wet Dry Dry flesh Water Non-flesh Flesh I 119 9.0 4.2 0.51 54 40 6
Whimbrel 4 13 11.1 2.8 1.0 7 5 16 9 Oystercatcher l 525 4.4 0.9 0.7 80 4 16
because, although they can ingest 100 mg wet weight S-', the gut processing rate is only 4.4 mg wet weight S-' (Kersten & Visser unpubl.). Thus, when the inges- tion rate over a long period exceeds 4.4 mg S-' diges- tive pauses are necessary to empty the digestive tract. Are there any reasons to believe that the rate of food intake of knot was also constrained by such a digestive bottleneck? When the preening periods are included as m,. pvssit;le digestive pciuses, the cverzll iritzke rcite - V V ~ S
1 prey item per 82 S. Knot produced 1 faecal packet per 80 s and the faeces contained, on average, 0.98 prey, which means that the defecation rate was 1 prey item per 78 S. This suggests that the observed ingestion rate was equal to the processing rate, as derived from the defecation rate, and that higher intake rates while feeding would not be possible, unless the birds were to take more digestive pauses (or increase their process- ing rate and probably decrease the digestibility of the food).
Knot ingested the wet flesh and shells along with the water included in the shells. Knot eating Macoma balthica ingested 54 O/O water, 6 % dry flesh and 40 % inorganic matter in the form of shell, salt and sand (Table 4). When the equation in Table 1 is used to convert the prey taken to total wet weight, knot appeared to have ingested and processed 9 mg wet weight S- ' (Table 4). M. Kersten & W. Visser (unpubl.) compared the weight of ingested food with the weight loss by defecation in oystercatchers. Behavioural obser- vations on whimbrels Numenius phaeopus showed that the intake rate, with digestive pauses included, level- led off above a certain value (Zwarts & Dirksen 1990). The data for these 3 wader species are not easy to compare, as the body weights vary between the species and their diet is completely different. Oystercatchers removed flesh from the sheII, so the food consisted mainly of water and the non-food ballast was low Whimbrels eating whole fiddler crabs Uca tangeri ingested a much higher proportion of non-food matter, although it was not as high as for knot eating M. balthica (Table 4 ) . Since a constant proportion of the
body in birds is allocated to the digestive tract, it would be expected that meal size is proportional to body weight (Calder 1974). However, the rate of food proces- sing must be proportional to the birds' requirement, i.e. (body eight)^'^ (Zwarts et al. 1990b). On this basis, the expected processing rate of knot would be 0.4 times that of oystercatcher and whimbrel. Whether the pro- cessing rate is expressed in terms of wet weight, total dry or flesh weigh+ l,..-' A." + +L.-:- C ,,,, ,L,uL L,es, ,ood 3: a rate much faster than 0.4 times the rate observed in the other 2 species (Table 4). The defecation rate observed in knot (one per 80 S) was indeed much faster than in oystercatchers, which produced one dropping per 10 min (M. Kersten & W. Visser unpubl.).
This comparison with the 2 other waders might sug- gest that knot are adapted to processing food having a low flesh content. However, when the processing rate is 9 mg wet weight S-' at maximum, a switch from Macoma balthica to Cerastoderma edule would lead to a great reduction in the yield, measured in terms of energy. Indeed, the ratio of shell weight to flesh in C. edule is nearly twice that in M. balthica (Fig. 17), and when calculated for wet weight the ratio is even more unfavourable (Table 1). C. edule is extremely unfavourable food in winter when the flesh content, relative to the total dry weight, is reduced to about 5 %, one third that in M, balthica during winter (Fig. 17)
Thin-shelled prey may therefore be preferred to thick-shelled species, because of the more favourable rate at which their energy can b e processed. Thus, deeply buned bivalves should be preferred to Cerasto- derma edule and Peringia ulvae, which live at or just below the surface. Indeed, just this was observed: Macoma balthica was preferred to C. edule (this study) and to P. ulvae (Prater 1972, Piersma 1989). Contrary to expectation, the shell weight of Mytilus edulis, which also lives on the surface, was actually lower than in these latter 2 species. Fig. 17 shows that the shel1:flesh ratio of M. edulis is just above those of the benthic species and two thirds that of the average value for C.

Zwarts & Blomert: Why k not take Macoma balthica 127 , JuNi A U 1 i"" S, plana
M. balthica l m M. aren'iuia m M. edulis
P. ulvae
C. edule I I I I I I I I
0 2 4 6 A I b h k ' rat10 shell weight / flesh weight
Fig 17. Ratio of shell weight (DW) and flesh welght (AFDW) for 5 bivalves (Scrobicularia plana, Macoma balthica, Mya arenaria, Mytilus edulis, Cerastoderma edule) 12 mm long and for Penngia ulvae 6 mm long. The August data are taken from Fig. 2. Also shown is the average ratio in June, when body condition peaks, and in March, when body weights are
at the lowest level (from Zwarts 1991 and unpubl.)
edu le , but in many areas, the flesh: weight ratio of M. edulis would resemble that of C. edule (Seed 1979, Fisher 1983, Bustnes & Erikstad 1990).
There is also variation in the shell weights of benthic species. The shell weights of Ceras tode rma e d u l e from brackish waters are only half of those of the same species in the Wadden Sea (Kristensen 1957, Eisma 1963, present study). The shells of M a c o m a bal th ica were thinnest in the sheltered areas near the shore, with the individuals further offshore being 1.5 times heavier (Kristensen 1957, Beukema 1980). Bonsdorff & Wenne (1989) found that the shells of individuals living in sand were 17 O/O heavier than those living in mud. Assuming that knot prefer thin-shelled bivalves, also within prey species, such variations in shell thickness may well influence the distribution of knot over the feeding areas. It is to be expected that knot feeding on M. balthica prefer sheltered, muddy areas along the shore, where the shells are thin. In fact, it was found that these areas were ignored (Zwarts et al. 1992), so other factors must also be involved.
A relatively thick shell is an obvious impediment to predators attempting to break it with their bill (Cayford & Goss-Custard 1990) or pincers (Boulding 1984), increasing the handling time and decreasing the value of the prey. Furthermore, a thick shell also makes prey less attractive to knot, and perhaps other predators which swallow prey whole, because it leads to a diges- tive bottleneck and so results in a reduction of process- ing rate.
Acknowledgements. We thank Piet Zegers, who allowed us to investigate the gizzards of knot, and Theunis Piersma, who encouraged us to write this paper We are grateful to Rudi Drent, John Goss-Custard and Theunis Plersma for helpful discussions and comments on the manuscript. Dick V~sser carefully prepared the figures.
LITERATURE CITED
Beukema, J . J. (1976). Blomass and species richness of the macrobenthic animals living on a tidal flat area in the Dutch Wadden Sea Neth J Sea Res. 10: 236-261
Beukema, J . J . (1980). Calcimass and carbonate production by molluscs on the tidal flats in the Dutch Wadden Sea: I. the tellinid bivalve Macoma balthica. Neth. J . Sea. Res. 14. 323-338
Beukema, J. J., Meehan, B. W (1985). Latitudinal variation in linear growth and other shell characteristics of Macoma balthica. Mar. Biol. 90 27-33
Boere, G. C., Smit, C. J. (1980). Knot (Calidrls canutus). In: Smit, C. J . , Wolff, W. J (eds.). Birds of the Wadden Sea. Balkema, Rotterdam, p. 136-145
Bonsdorff, E., Wenne, R. (1989). A comparison of condition indices of Macoma balthica (L.) from the northern and southern Baltic Sea. Neth. J. Sea Res. 23: 45-55
Boulding, E. G. (1984). Crab-resistant features of shells of burrowing bivalves: decreasing vulnerability by increas- ing handling time. J. exp mar. Biol. Ecol. 74: 201-223
Bustnes, J . O . , Erikstad, K. E. (1990). Size select~on of common n~ussels, Mytilus edulls, by common eiders, Somateria mollissima: energy maximization or shell weight minimi- zation? Can. J. 2001. 68: 2280-2283
Calder. W. A. I11 (1974). Consequence of body size for avian energetics. In: Paynter, R. A. (ed.). Avian energetics. Nut- tall Ornithological Club, Cambridge, MA. p. 86-151
Cayford, J . T., Goss-Custard, J . D. (1990). Seasonal changes in the size selection of mussels, Mytilus edulis, by oyster- catchers, Haematopus ostralegus: an optimality approach. Anim. Behav. 40- 609-624
Chambers, M. R., Milne, H. (1979). Seasonal variation in the condition of some intertidal invertebrates of the Ythan estuary, Scotland. Estuar coast. mar. Sci. 8: 411-419
Charnov, E. L. (1976). Optimal foraging: attack strategy of a mantid. Am. Nat. 110: 141-151
Cramp, S., Simmons. K. E. L. (eds.) (1983). The birds of the western Palaearctic, Vol. 111. Oxford University Press, Ox- ford
Davidson, P. E. (1971) Some foods taken by waders in Morecambe Bay, Lancashire. Bird Study 18. 137-186
Dekker, R. (1979). Numbers, growth, biomass and production of organic and calcareous matter of Hydrobia ulvae (Gas- tropoda: Prosobranchia) in the western Dutch Wadden Sea. Internal Report, Netherlands Institute for Sea Research, 1979-15, Texel
Ehlert, W (1964). Zur Okologie und Biologie der Ernahrung einiger Limikolen-Arten. J . Ornithol. 105. 1-53
Eisma, D. (1963). Shell-characteristics of Cardlum edule L. as indicator of salin~ty. Neth. J. Sea Res 2 493-540
Fisher, H. (1983). Shell weight as an independent variable in relation to cadmium content of molluscs. Mar. Ecol. Prog. Ser. 12: 59-75
Gerritsen, A. F. G. (1988). General and specific patterns in foraging acts of sandpipers (Calidris). In: Feeding techni- ques and the anatomy of the bill in sandpipers (Calidris). Thesis, University of Leiden, p. 91-137
Gerritsen, A. F. G., Heezik, Y M. van, Swennen, C. (1983). Chemoreception In two further Calidris species (C. maritima and C. canutus) with a cornpanson of the relative importance of chemoreception durlng foraging in Calidris species. Neth. J . Zool. 33: 485-496
Gerritsen, A. F. G., Meiboom, A. (1986). The role of touch in prey density estimation by Calidris alba. Neth. J . Zool. 36: 530-562
Glutz \Ion Blotzheim, U. N., Bauer, K M , Bezzel, E. (1975).

128 Mar. Ecol. Prog. Ser. 84: 1-8. 1992
Handbuch der Vogel Mitteleuropas, Band 6. Akademische Verlagsgesellschaft, Wiesbaden
Goss-Custard, J . D. (1970). Feeding dispersion in some over- wintering wading birds. In: Crook, J . H. (ed.) Social behaviour in birds and mammals. Academic Press. Lon- don. p. 3-35
Goss-Custard, J . D., Durell. S. E. A. le V. dit (1988). The effect of dominance and feeding method on the intake rates of oystercatchers, Haematopus ostralegus, feeding on mus- sels. J. Anim. Ecol. 57: 827-844
Goss-Custard, J. D., Jenyon, R. A., Jones, R. E. , Newbery, P. E , Williams, R. B. (1977a) The ecology of the Wash I1 Seasonal variation in the feeding conditions of wading birds (Charadrii). J. appl. Ecol. 14, 701-719
Goss-Custard, J . D., Jones, R. E., Newbery, P. E. (1977bl. The ecology of the Wash I. Distribution and diet of wading birds (Charadrii). J . appl. Ecol. 14: 681-700
Habekotte, B. (1987). Scholeksters e n slijkgapers. Student report. Zoological Laboratory, University of Groningen. Groningen
Hancock, D. A. (1967) Growth and mesh selection in the edible cockle (Cardium e d d e L.) J . appl. Ecol. 4: 137-157
H6frnanrl, H. , Huerscheimdnr~, H. (1969). Nahrunysunter- suchungen bei Limikolen durch Mageninhaltsanalysen. Corax 3: 7-22
Hughes, R. N. (1970). Population dynamics of the bivalve Scrobicularia plana (Da Costa) on an intertidal mud-flat in x--&L ,A,..,
W U L vvares. 2. Ai;im. ECG:. 39: 333-356 Hughes, R. N. (1979). Optimal diets under the energy maximi-
zation premise: the effects of recognition time and learn- ing. Am. Nat. 113: 209-221
Hughes, R . N. (1980). Optimal foraging theory in the marine context. Oceanogr. mar. Biol. A Rev. 18: 423-481
Hulscher, J . B. (1973). Burylng-depth and trematode infection in Macoma balthica. Neth J Sea Res. 6: 141-156
Hulscher, J . B. (1976). Localisation of cockles (Cardium edule L.) by the oystercatcher (Haematopus ostralegus L ) in darkness and daylight. Ardea 64: 292-310
Hulscher, J . B. (1982). The oystercatcher (Haernatopus ostrale- gus) a s a predator of the bivalve Macorna balthica in the Dutch Wadden Sea. Ardea 70: 89-152
Kersten, M,, Piersma, T (1987). High levels of energy expen- diture in shorebirds; metabolic adaptations to an energeti- cally expensive way of life. Ardea 75: 175-188
Klaassen, M. , Kersten, M. , Ens, B J. (1990). Energetic require- ments for maintenance and premigratory body mass gain of waders wintering in Africa. Ardea 78: 209-220
Krebs, J . R. , Kacelnik, A. (1991) Decision-making. In. Krebs, J. R. , Davies, N. B [eds ) Behavioural ecology an evolu- tionary approach. Blackwell Scientific Publications, Oxford, p. 105-136
Kristensen, 1. (1957). Differences in density and growth in a cockle population in the Dutch Wadden Sea. Archs. nerl. Zool. 12: 351-453
Lange. G. (1968). Uber Nahrung, Nahrungsaufnahme und Verdauungstrakt mitteleuropaischer Limikolen. Beitr Vogelkd. 13: 225-334
Nehls, G. (1992). Food selection of knots Calidris c a n u t u s ~ n the Wadden Sea: the importance of seasonal and annual varia- tion of food availability Wader Study Group Bull (in press)
Piersma, T (1989). Seasonal changes in, the food requirements of knots. Annual report 1988. Netherlands Institute for Sea Research, Texel, p. 22-23
This article was submitted to the editor
Piersma, T. , Drent, R . , Wiersma, P. (1991). Temperate versus tropical wintering in the world's northernmost breeder, the knot: metabolic scope and resource levels restrict sub- specific options. Acta XX Congressus Internationalis Ornithologici, Christchurch, p. 761-772
Prater, A. J . (1972). The ecology of Morecambe Bay 111. The food and feeding habits of knot (Calidris canutus L.) in Morecambe Bay. J. appl. Ecol. 9: 179-194
Reading, C. J . , McGrorty. S. (1978). Seasonal variation in the burying depth of Macoma balthica (L.) and its accessibility to wading birds. Estuar. coast mar. Sci. 6: 135-144
Seed, R. (1968). Factors influencing shell shape in the mussel lvlytilus edulis. J mar biol. Ass. U.K. 48: 561-584
Seed, R. (1979). Vanations In the shell-flesh relationships of Mytilus: the value of sea mussels as items of prey. Veliger 22: 219-221
Sibly, R. M. (1981). Strategies of digestion and defecation. In: Collins, C. R., Calow, P. (eds.) Physiological ecology. Blackwell, Oxford. p. 109-139
Summers, R. W., Smith, S. , Nicoll, M., Atkinson, N. K. (1990). Tidal and sexual differences in the diet of purple sandpip- ers Calidris maritima in Scotland. Bird Study 37: 187-194
Wdnink, J . , Zwarts, L. (1985). Dues an vptimdlly foraging oystercatcher obey the functional response? Oecologia 67 98-106
Zwarts, L. (1988). De bodemfauna van de Fries-Groningse waddenkust. Flevobericht 194. Rijksdienst voor de IJssel- m e i i p o l d ~ i j . Leiystad
Zwarts, L. (1991). Seasonal variation in body condition of the bivalves Macorna balthica, Scrobicularia plana, lMya arenaria and Cerastoderrna edule in the Dutch Wadden Sea. Neth. J . Sea Res. 28: 231-245
Zwarts, L., Blomert, A.-M. (1990). Selectivity of whimbrels feeding on fiddler crabs explained by component specific digestibilities. Ardea 78: 237-256
Zwarts, L., Blomert, A.-M , Ens, B. J . , Hupkes, R., van Spanle, T M. (1990a) Why do waders reach high feeding densities on the intertidal flats of the Banc d'Arguin, Mauritania? Ardea 78: 39-52
Zwarts, L., Blomert, A.-M., Hupkes, R. (1990b). Increase of feeding time in waders preparing for spring migration from the Banc d'Arguin. Mauritania. Ardea 78: 237-256
Zwarts, L., Blomert, A.-M., Wanink, J. H. (1992). Annual and seasonal variation in the food supply harvestable by knot Calidris canutus staging in the Wadden Sea in ldte sum- mer Mar. Ecol. Prog. Ser 83: 129-139
Zwarts, L., Dirksen, S (1990). Digestive bottleneck limits the increase in food intake of whimbrels preparing for spnng migration from the Banc d'Arguin, Mauritania Ardea 78: 257-278
Zwarts, L.. Drent, R. H. (1981). Prey depletion and the regula- tion of predator density: Oystercatchers (Haernatopus ostralegus) feeding on mussels (Mytilus edulis). In: Jones, N. V., Wolff, W. J . (eds.) Feeding and survival strategies of estuarine organisms. Plenum Press, New York, p. 193-216
Zwarts, L., Essel~nk, P (1989). Versatility of male curlews (Numenius arquata) preying upon Nerels dlvers~color~ deploying contrast~ny capture modes dependent on prey availability Mar Ecol. Prog. Ser. 56: 255-269
Zwarts, L., Wanink, J. (1989). Siphon size and burying depth in deposit- and suspension-feeding ben th~c bivalves. Mar. Biol. 100: 227-240
Manuscript first rr.ccived: October 14, 1991 Revised version accepted: April, 24, 1992