who reads research articles? an altmetrics analysis of mendeley user categories
TRANSCRIPT
1
Who Reads Research Articles? An Altmetrics Analysis
of Mendeley User Categories1
Ehsan Mohammadi
1, Mike Thelwall
1, Stefanie Haustein
2, Vincent Larivière
2,3
E-mail: [email protected]
1 Statistical Cybermetrics Research Group, Faculty of Science and Engineering, University of
Wolverhampton, Wulfruna Street, Wolverhampton WV1 1LY, UK.
2 École de bibliothéconomie et des sciences de l'information, Université de Montréal, C.P.
6128, Succ. Centre-Ville, Montréal, QC. H3C 3J7, Canada.
3 Observatoire des Sciences et des Technologies (OST), Centre Interuniversitaire de
Recherche sur la Science et la Technologie (CIRST), Université du Québec à Montréal,
CP 8888, Succ. Centre-Ville, Montréal, QC. H3C 3P8, Canada
Abstract
Little detailed information is known about who reads research articles and the contexts in
which research articles are read. Using data about people who register in Mendeley as
readers of articles, this paper explores different types of users of Clinical Medicine,
Engineering and Technology, Social Science, Physics and Chemistry papers inside and
outside academia. The majority of readers for all disciplines were PhD students,
postgraduates and postdocs but other types of academics were also represented. In
addition, many Clinical Medicine papers were read by medical professionals. The highest
correlations between citations and Mendeley readership counts were found for types of
users that often authored academic papers, except for associate professors in some sub-
disciplines. This suggests that Mendeley readership can reflect usage similar to traditional
citation impact, if the data is restricted to readers who are also authors, without the delay
of impact measured by citation counts. At the same time, Mendeley statistics can also
reveal the hidden impact of some research papers, such as educational value for non-
author users inside academia or the impact of research papers on practice for readers
outside academia.
Keyword: altmetrics, Mendeley, research impact, readership analysis, social
bookmarking
1 This is a preprint of an article to be published in the Journal of the Association for Information Science
and Technology © copyright 2014 John Wiley & Sons, Inc
2
Introduction
Since the 1960s, citations have been widely used in research evaluation and monitoring.
However, it is acknowledged that they alone cannot capture the full spectrum of research
impact (MacRoberts & MacRoberts, 1989; Kostoff, 1998). For example, uncited publications
may still be useful (Bornmann & Marx, in press) partly because many non-author
professionals also read research articles (Price & Gürsey, 1975; Tenopir & King, 2000). For
instance, practitioners, undergraduate students (Nicholas et al., 2005), the public (Kurtz &
Bollen, 2010) and lecturers use research publications for purposes such as teaching (Kousha
& Thelwall, 2008) or professional activities (Schloegl & Stock, 2004), including medical
practice (Bennett, Casebeer, Kristofco, & Strasser, 2004). Therefore, it is clear that the
impacts of research can go beyond knowledge advancement within science, and hence the
influence of research publications in social, economic, cultural and environmental contexts
needs to be identified (Bornmann, 2012; Thelwall, 2012) in research evaluation. In the same
way, the Higher Education Funding Council for England (HEFCE), in the new Research
Excellence Framework (REF) will consider all types of research impact outside academia
(HEFCE, 2011). Therefore, multiple indicators are needed (Martin, 1996) to measure the
wider influence of research publications. Measures derived from usage data have been
suggested (Bollen, Van De Sompel, Hagberg, & Chute, 2009) to capture broader research
impact but due to a lack of information about users of academic publications (Bollen &
Sompel, 2008; Haustein & Siebenlist, 2012) systematic investigations into the contexts where
research papers are used have not been conducted yet.
The engagement of researchers with different social web platforms provides a novel
opportunity to measure different types of research impact (Cronin, 2013a) and can help to
capture many kinds of non-scientific research impact (Bornmann, in press). In particular,
social web mentions of scientific publications can be retrieved from various platforms and are
often grouped under the umbrella term altmetrics (Priem, Piwowar, & Hemminger, 2012).
The academic social web site Mendeley is a platform for users to manage scholarly
references, create online profiles and communicate with peers. The numerous users (approx.
2.6 million in October 2013), large database, and open Applications Programming Interface
(API) of Mendeley are particularly useful for compiling usage indicators. In particular, the
fact that Mendeley provides the top 3 in terms of “academic status” of readers per document
makes it possible to identify the users of research publications by different types of
occupations and academic titles.
The first gap that this research tries to fill is to discover how diverse the readers of scholarly
papers are in Mendeley. Although several studies have found correlations between Mendeley
readership counts and citations (Li, Thelwall, & Giustini, 2012; Bar-Ilan, 2012; Mohammadi
& Thelwall, in press), the extent to which Mendeley readership counts actually measure
readership, and in how far they capture the same or a different impact than citations is still
not known. Thus, the current study aims to fill this gap by analysing the effect of academic
status on the correlations between citations and Mendeley readership counts.
3
Literature review
Social media and scientific publications
Informetrics is the study of any form of information with quantitative approaches (Tague-
Sutcliffe, 1992) including bibliometrics, scientometrics and citation analysis (Egghe &
Rousseau, 1990). Cybermetrics, on the other hand, is the study of electronic information on
the internet, using bibliometric methods (Björneborn, 2004). In the late 1990s, the web was
suggested to be a medium through which the diverse impacts of scholars could be identified
(Cronin, Snyder, Rosenbaum, Martinson, & Callahan, 1998). As a result of this and other
observations about the potential of the web for bibliometrics (e.g., Almind & Ingwersen,
1997), the new area of webometrics emerged a sub-area of cybermetrics and informetrics for
the study of web-based phenomena drawing upon bibliometric methods (Björneborn &
Ingwersen, 2004). Recently, with the advent of the social web, the new area of altmetrics
began. Altmetrics focuses on social web sites like Twitter, blogs, Wikipedia, Mendeley and
other social bookmarking tools and uses open APIs for data gathering (Priem, Taraborelli,
Groth, & Neylon, 2011). Like the web, social web platforms provide new opportunities to
measure scholarly communication (Priem, 2013) in both formal and informal contexts
(Cronin, 2013a). Rousseau and Ye (2013, p. 3289) believe that although the idea behind
altmetrics is valuable, the term is not appropriate. They suggested “influmetrics” instead, as
more explicitly a subdivision of webometrics. Similarly, Cronin (2013b, p.1523) argued that
“complementary” can be a better term rather than alternative in this context.
Early altmetrics research characterised social media data and its appropriateness for research
assessment. Social reference managers and social bookmarking tools such as Mendeley,
CiteUlike, and BibSonomy provide facilities for users to save, manage and share scientific
literature online. In addition, when users bookmark or save a record in their own social web
profile then a reader count or bookmark will be recorded on the website. These social
platforms thus provide opportunities to trace the global usage of scientific publications
(Haustein et al., 2010). Some studies have used reference managers and social bookmarking
websites to generate altmetrics. For example, several bookmarking-based metrics and some
traditional indicators have been compared for assessing physics journals (Haustein &
Siebenlist, 2011).
Priem, Piwowar and Hemminger (2012) explored a large sample of papers published by the
Public Library of Science (PLoS). Around 80% of the PLoS articles were covered by
Mendeley while 31% and 10% of these papers were bookmarked on CiteULike and
Delicious, respectively, although it is not completely fair to compare statistics between the
sites because they are used and record information in different ways. Around 10% to 12% of
the sample were tweeted or mentioned on Facebook and less than 10% of the papers were
cited in blogs or reviewed by Faculty of 1000 (F1000, now F1000Prime), a post-publication
review site for biomedical papers. Similarly, previous studies have reported that the coverage
of Mendeley is more extensive than that of CiteULike for a sample of articles published in
4
Science and Nature (Li et al., 2012) with similar results being found for publications in the
field of bibliometrics (Haustein et al., 2013). It has also been reported that Mendeley had the
highest coverage among other altmetrics resources for 20,000 random publications indexed in
WoS (Zahedi, Costsas, & Wouters, 2013). Furthermore, Mohammadi and Thelwall (in press)
found that 44% of Social Science articles and 13% of the Humanities papers from WoS in the
year 2008 were covered by Mendeley. In contrast, analysing the entire F1000 database,
Waltman and Costas (in press) discovered that as few as 2% of biomedicine articles were
reviewed by F1000 experts. Again, the figures are not directly comparable because F1000
articles are reviewed whereas Mendeley articles are only recorded in the site. A large-scale
study of PubMed articles in 11 social media resources (excluding Mendeley) reported that
less than 20% of the papers were covered by most of the resources (Thelwall, Haustein,
Larivière, & Sugimoto, 2013), with Twitter having the most extensive coverage at less than
10% for 2010 to 2012 PubMed articles and reviews (Haustein, Peters, Sugimoto, Thelwall, &
Larivière, in press). In another large-scale multidisciplinary study, Costas, Zahedi, and
Wouters, (2014) discovered that research papers had more coverage (13.3%) in Twitter than
in several other social websites, including Facebook walls, blogs, Twitter, Google+ and News
outlets. A later Mendeley analysis of the same set of 1.4 million PubMed papers reports that
66% had at least one Mendeley reader (Haustein et al., submitted). Results of a survey of
bibliometricians reported that most of them had LinkedIn profiles (68%) and around half had
Twitter accounts while 20% were users of Academia.edu, Mendeley, and ResearchGate
(Haustein et al., 2013).
For research evaluation purposes, the value of different social web data should be validated.
As a result, several studies have assessed the value of altmetrics-based indicators by
comparing them with traditional metrics. One study, for example, found that tweet mentions
of articles in a single open access online medical informatics journal could predict future
citations (Eysenbach, 2011). Similarly, Shema, Bar-Ilan, and Thelwall (in press) reported that
papers mentioned in science blogs received more citations later. Moderate correlations
between F1000 scores and citations have also been reported (Waltman & Costas, 2013; Li &
Thelwall, 2012) and F1000 scores are able to recognize the suitability of medical papers for
clinical practice better than citations (Mohammadi & Thelwall, 2013). Finding no
correlations between indicators derived from the academic social web site Academia.edu and
bibliometric indicators, Thelwall and Kousha (in press) concluded that the informal scholarly
communications in Academia.edu probably do not reflect traditional academic impact or
prestige. Significant positive correlations between bookmarking data from CiteUlike and
Mendeley and citations for a sample of articles published in Science and Nature provide
evidence that bookmarking data is a promising source for research evaluation (Li et al.,
2012). Nevertheless, based upon moderate correlations between Mendeley readership and
citation counts for articles, Bar-Ilan (2012), Haustein et al. (2013), Haustein et al. (submitted)
and Zahedi et al., (2013) all concluded that reading and citing are not similar scholarly
activities. Li and Thelwall (2012) found positive correlations between Mendeley readership
counts and bibliometric indicators for a sample of papers in the field of genomics and
genetics. In two large-scale studies, medium positive correlations between Mendeley
readership counts and citations were discovered for ten social science and humanities
5
disciplines (Mohammadi & Thelwall, in press) and PubMed papers (Haustein et al.,
submitted). Both studies concluded that readership and citations reflect different types of
research impact. To sum up, although many metrics derived from social media have been
shown to correlate with bibliometric indicators for some specific sets of articles, it is not clear
what kinds of research impact can be captured through the new indicators. Thus, new studies
are needed to investigate which kinds of research influence can be reflected by altmetrics.
Professions and Science
The responsibilities of different professions and the status of academics can both affect the
roles and contexts in which individuals use scholarly publications. For example, younger
researchers read more papers (Tenopir, King, Spencer, & Wu, 2009) and also cite more
resources in their publications (Pancheshnikov, 2007; Barnett & Fink, 2008; Larivière,
Sugimoto, & Bergeron, 2013) in comparison to senior researchers. Niu and Hemminger
(2012) found academic status to be an important issue in information seeking behaviour for
faculty members, students and staff at five US universities. Interviewing scholars in the field
of humanities, Ge (2010) revealed that PhD students and assistant professors use electronic
resources more than associate professors and professors. Jamali and Nicholas (2006) found
that PhD students browse electronic journals more than senior scholars in physics and
astronomy. Catalano (2013) concluded that although Masters and PhD students both use the
web for information searching, the latter believe that references provided by faculty members
are more reliable. Whitmire (2002) argued that the information seeking behaviour of
undergraduate students could be different from that of graduate students and faculty members
but they can have similar information seeking behaviour because some students used
resources suggested by faculty members more than other references (Korobili, Malliari, &
Zapounidou, 2011).
Outside academia, practitioners and developers use research publications in their daily
activities (Bollen & Van De Sompel, 2008) but the roles, tasks and the contexts in which they
use information can affect their information seeking behaviours (Leckie, Pettigrew, &
Sylvain, 1996). For example, a survey of non-author physicians in Canada discovered that
73% of the participants read journal articles (McAlister, Graham, Karr, & Laupacis, 1999).
Another study reported that journal articles were the most useful publication type to fulfil the
information needs of residents in a hospital (Schilling, Steiner, Lundahl, & Anderson, 2005).
The information seeking habits of engineers in different fields (Ellis & Haugan., 1997;
Kwasitsu, 2003; Freund, Toms, & Waterhouse, 2005; Taylor et al., 2010) have also been
examined. Personal communications with colleagues, internal documents, journal articles,
conference proceedings are all sources that engineers use to satisfy their information needs
(Hertzum & Pejtersen, 2000). In principle, due to the practical nature of these professions
they do not cite and may read less than university faculty members (Tenopir & King, 2000
cited by Tenopir, King, Clarke, Na, & Zhou, 2007). For instance, a survey of paediatricians at
the University of Tennessee revealed that they read journal articles for updating their
knowledge but read less than medical faculty members in the same organization (Tenopir et
al., 2007). In summary, there is evidence that some professions outside academia read
6
scientific articles and therefore the impact of these articles would not be fully reflected by
citations − but little is known about how the impact of publications on different professions
could be measured.
Research Questions
In order to holistically evaluate the use of research results, it is important to know who reads
academic articles and why (Thelwall, 2012). These issues have not been systematically
examined before, because of anonymity in usage data for electronic journals and because of
the lack of usage data for print journals. Although some studies have explored article
readership on a small scale (Niu & Hemminger, 2012; Hemminger, Lu, Vaughan, & Adams,
2007) there are no large-scale systematic studies of what types of people read scholarly
articles. This study partly fills this gap from a quantitative perspective by analysing the
statuses of readers (e.g., professors, PhD students, undergraduate students, non-academic
users) of research articles for several disciplines in Mendeley. Additionally, the effect of
users’ occupations on correlations between Mendeley readership counts and citations
investigated. The following research questions drive this study, focusing on several broad
areas of science.
1. What are the common types of readers for Clinical Medicine, Engineering and
Technology, Social Science, Physics and Chemistry research articles in Mendeley?
2. Does academic or professional status of readers in Mendeley affect the relationship
between Mendeley readership counts and citation counts?
Research method
Data collection
The Web of Science (WoS) was chosen as the source of lists of articles in academic journals.
The Observatoire des sciences et des technologies in-house version of the Thomson Reuters
databases was used. All bibliographic information and citation data for WoS journal articles
from 2008 was selected, excluding non-article document types, such as editorials and book
reviews. The citation data comes from the Science Citation Index Expanded (SCIE), the Arts
& Humanities Citation Index (AHCI) and the Social Science Citation Index (SSCI) in
December 2012. The year 2008 was chosen to allow all articles at least four years to receive
citations. For defining the main research disciplines and sub-disciplines, the US National
Science Foundation (NSF) classification was used. This classification is more suitable for this
study than the WoS classifications because each journal is assigned to only one NSF research
speciality or sub-discipline. The 22 most productive disciplines in terms of the number of
publications in the year 2008 were selected for the study from the broad NSF categories of
Clinical Medicine, Engineering and Technology, Social Science, Physics and Chemistry (see
Appendix 1). These disciplines include 44% of the journal articles from 2008 in the Thomson
Reuters databases used.
7
In the next step, using the Mendeley API, Mendeley readership counts for each selected WoS
article were automatically extracted with Webometric Analyst (lexiurl.wlv.ac.uk) relying on a
query based on the last name of the first author, publication year and title of the article.
Instead of relying on a document identifier such as DOI, which is often missing in the
Mendeley entries, this method increases recall by relying on three main metadata elements.
However, documents with at least one incorrect item of bibliographic information (e.g.,
author or year) were ignored to increase precision. As multiple copies of a paper could exist
in Mendeley, duplicate records were identified and removed based on WoS unique IDs. Out
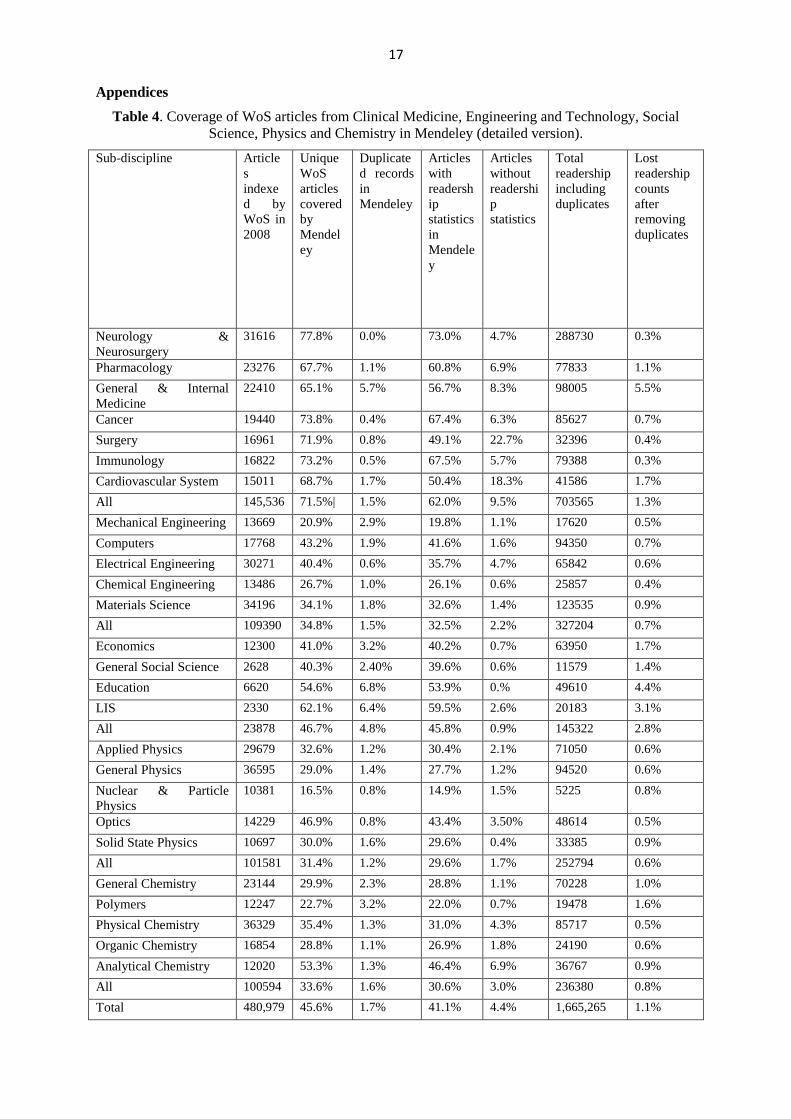
of 480,979 WoS articles for all disciplines, 219,326 (45.6%) were found in Mendeley and
3,745 were duplicates. Removing duplicates reduced the overall readership count by 1.1%
(see Table 4).
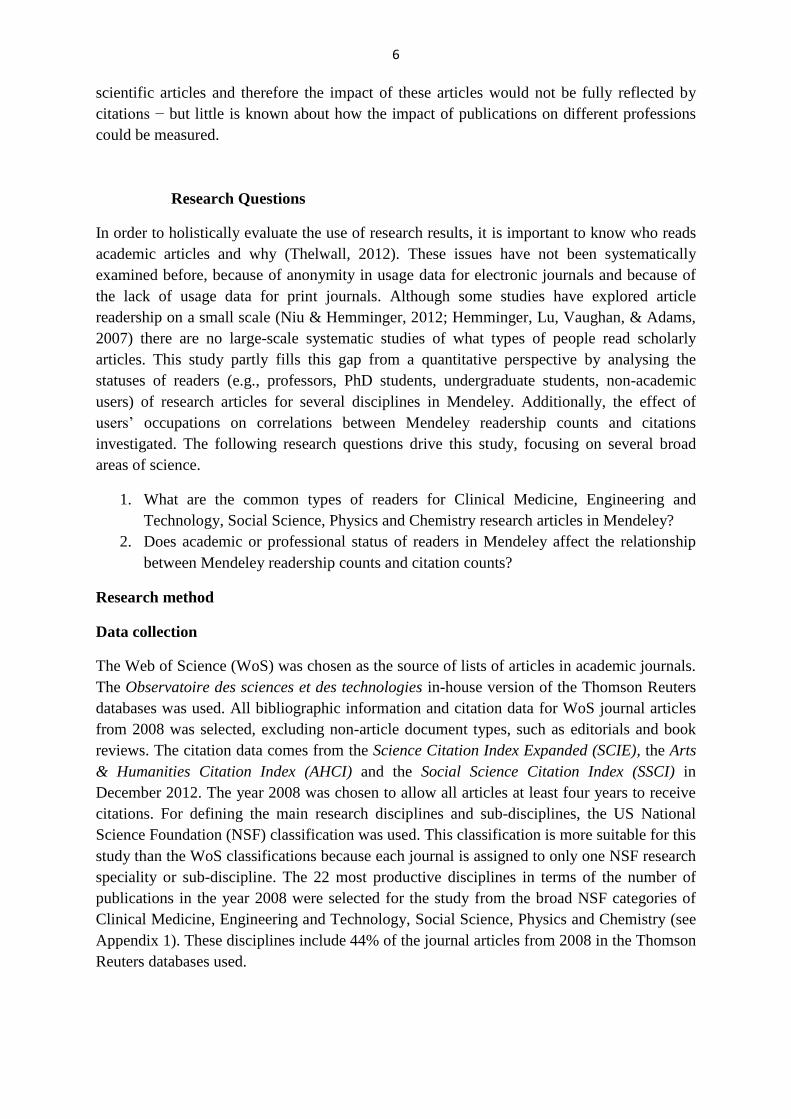
Mendeley coverage varied by discipline. Clinical Medicine articles had the highest coverage
in Mendeley (71.6% had a Mendeley record, see Table 1), while in Physics, Chemistry and
Engineering and Technology only about one third of the documents were saved in Mendeley.
Mendeley records with zero readers in the Mendeley database were disregarded. These
papers could have been added to Mendeley in several ways. For instance, Mendeley may
automatically add all articles from specific publishers. Moreover, some journals
administrators or researchers may add all their publications to Mendeley to publicise them.
Detailed information for articles with zero readers is listed in Table 1.As shown in Table 1,
41.1% of the WoS articles had Mendeley readership statistics. All of the 197,848 of the WoS
articles with Mendeley readership statistics from Clinical Medicine, Engineering and
Technology, Social Science, Physics and Chemistry were selected for further analysis (see
appendix, Table 4).
Table 1. Coverage of WoS articles from Clinical Medicine, Engineering and Technology, Social
Science, Physics and Chemistry in Mendeley.
Discipline Articles
indexed
by WoS
in 2008
Unique
WoS
articles
covered
by
Mendeley
Duplicate
WoS
records in
Mendeley
Articles
with
readership
statistics
in
Mendeley
Articles
without
readership
statistics
Clinical Medicine 145,536 71.6% 1.5% 62.1% 9.5%
Engineering and
Technology
109,390 34.8% 1.5% 32.6% 2.2%
Social Science 23,878 46.8% 4.8% 45.9% 0.9%
Physics 101,581 31.4% 1.2% 29.7% 1.8%
Chemistry 100,594 33.7% 1.7% 30.6% 3.1%
Total 480,979 45.6% 1.7% 41.1% 4.4%
8
Although the Mendeley API provides information related to the discipline, academic status
and country of readers for each record, it only reports percentages rather than raw data and
only gives information about the top three categories. For each article and each of the top
three readers’ occupations for that article, the percentage of readers with that occupation was
multiplied by the total number of readers of the article and divided by 100 to obtain the
estimated number of article readers from that occupation.
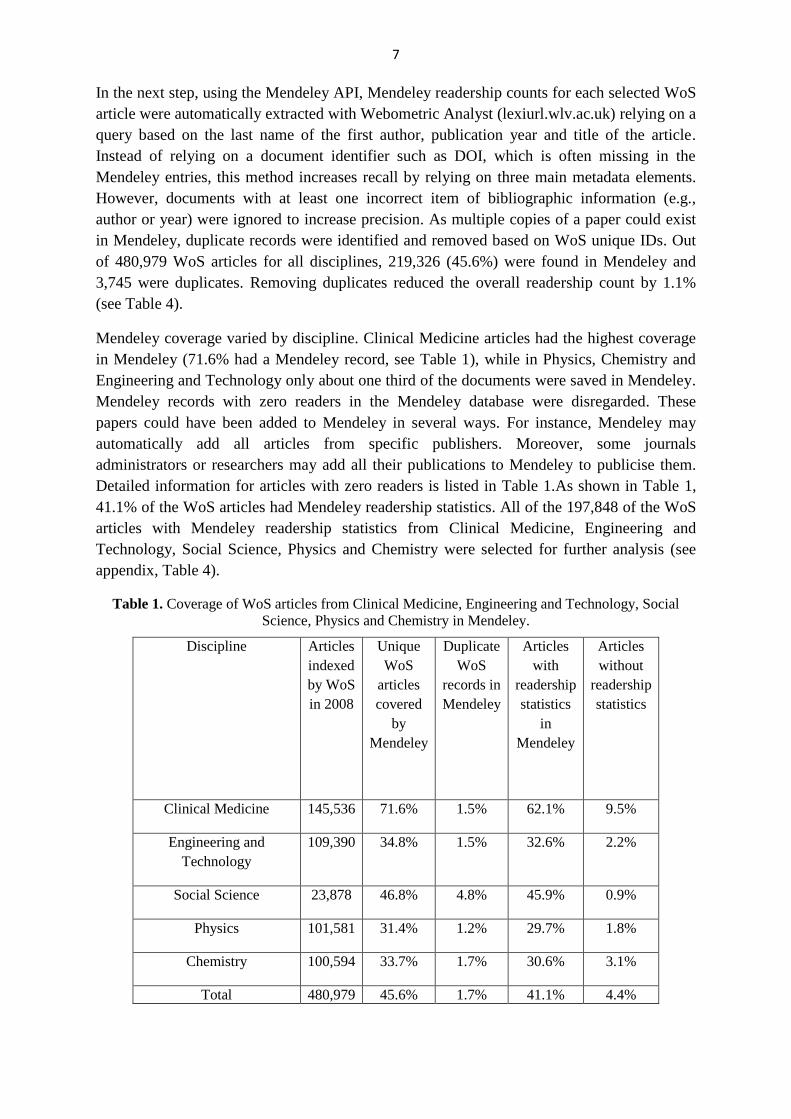
To understand how far the three most frequent statuses represented the entire readership of a
document, the sum of the (up to) three status percentages was subtracted from the total
readership counts to indicate the missing information per document. As shown in Table 2,
academic status information was not available for 27% of the total readership counts due to
the restrictions of the Mendeley API.
Table 2. Available and missing Mendeley user status information for readership counts for Clinical
Medicine, Engineering and Technology, Social Science, Physics and Chemistry via the Mendeley
API.
Discipline Total readership
counts
Readership counts
with status
information available
via the API for the
top 3 categories
Readership
counts without
status information
Clinical Medicine 699681 70.5% 29.4%
Engineering and
Technology
324624 75.2% 24.7%
Social Science 140952 69.0% 31.1%
Physics 251071 76.5% 23.4%
Chemistry 231313 76.9% 24.3%
Total 1647641 73.1% 27.0%
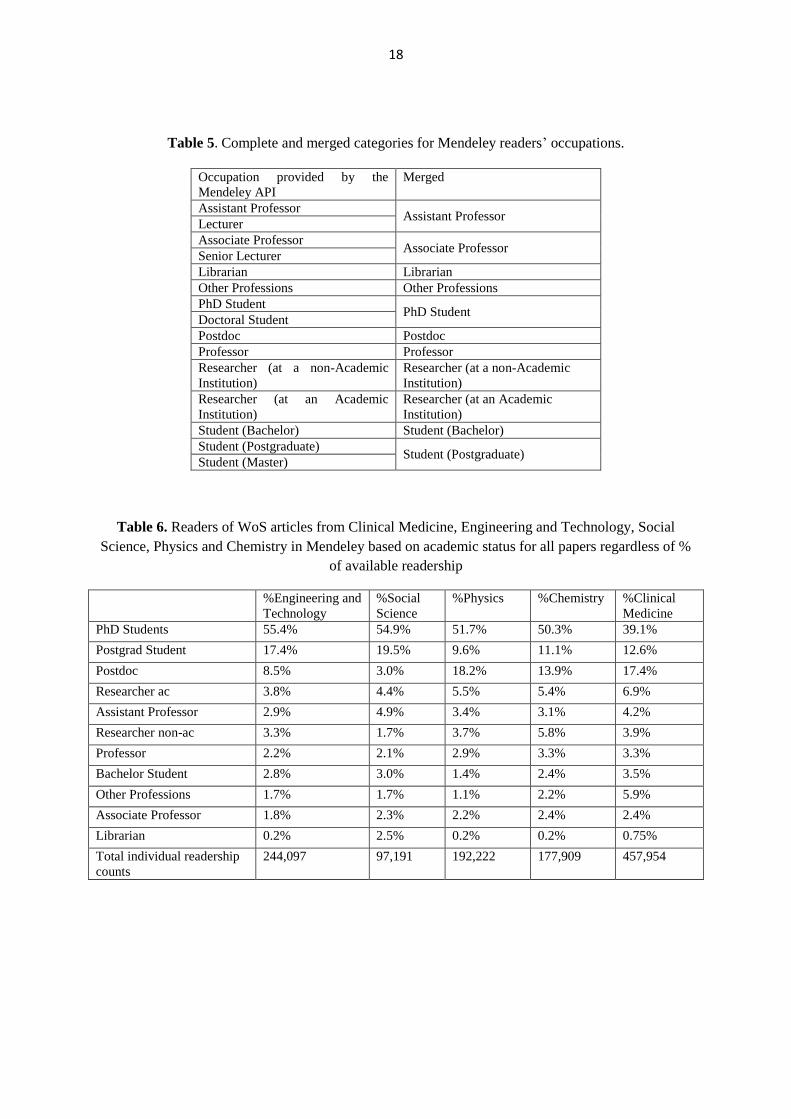
Some of the 15 occupational categories reported by Mendeley are similar and were merged
into a single category. For instance, postgraduate students and masters students were merged
into a single postgraduate student category (see appendix, Table 5).
Results
Readers and occupations
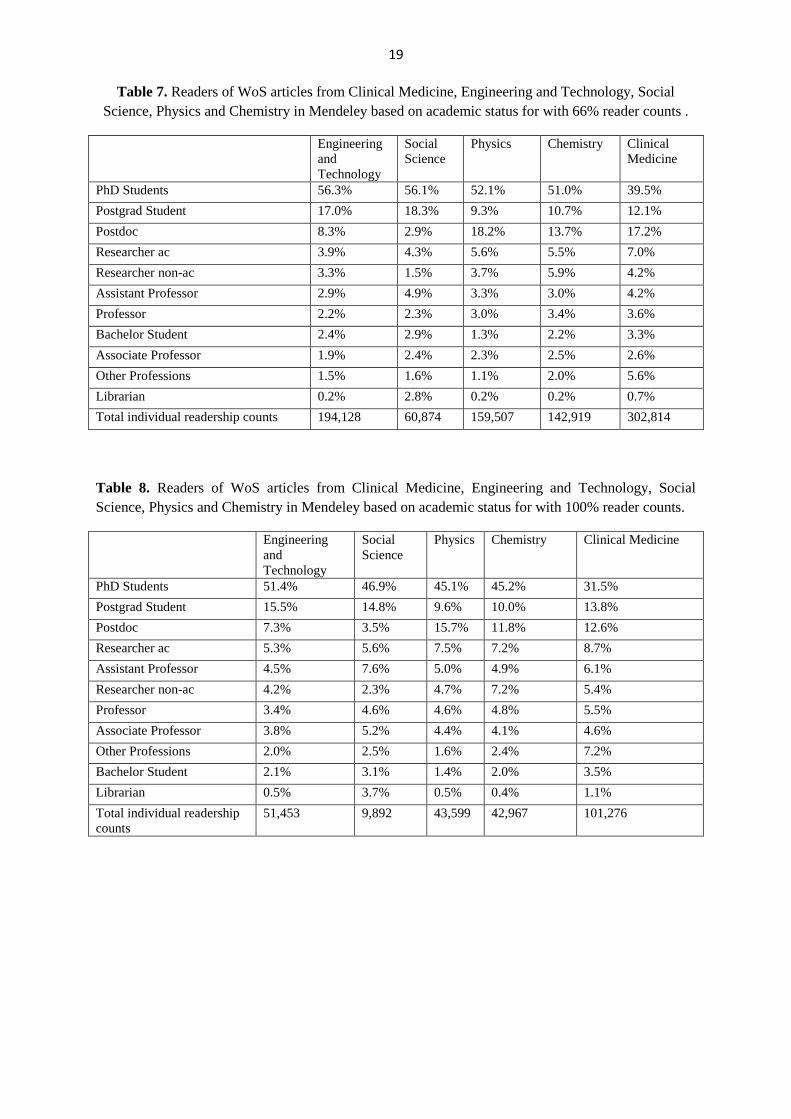
Because Mendeley only reports reader counts for the top 3 occupational categories for each
article and this biases the results so that they underestimate the percentages of categories
which frequently do not belong to the top 3, results are also provided for documents where
the top 3 categories made up 100% and at least 66% of all reader counts, respectively. As the
9
actual unbiased percentage of readers per status cannot be exactly determined based on the
data provided, the three values can thus be considered as estimates of actual values, where the
true figure lies somewhere between the three values for each occupation.
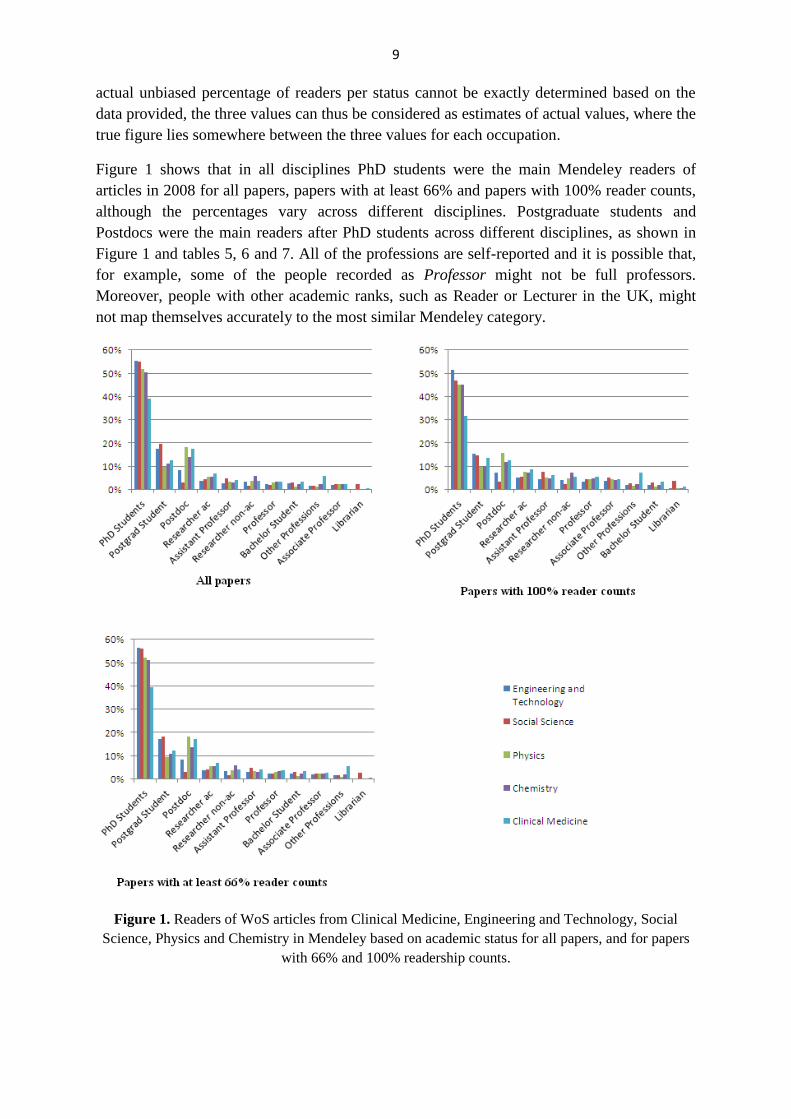
Figure 1 shows that in all disciplines PhD students were the main Mendeley readers of
articles in 2008 for all papers, papers with at least 66% and papers with 100% reader counts,
although the percentages vary across different disciplines. Postgraduate students and
Postdocs were the main readers after PhD students across different disciplines, as shown in
Figure 1 and tables 5, 6 and 7. All of the professions are self-reported and it is possible that,
for example, some of the people recorded as Professor might not be full professors.
Moreover, people with other academic ranks, such as Reader or Lecturer in the UK, might
not map themselves accurately to the most similar Mendeley category.
Figure 1. Readers of WoS articles from Clinical Medicine, Engineering and Technology, Social
Science, Physics and Chemistry in Mendeley based on academic status for all papers, and for papers
with 66% and 100% readership counts.
10
Among the selected disciplines, about 7.2%, 5.9% and 5.6% of the readers of Clinical
Medicine papers were from the Other Professions category for papers with 100%, all papers
and papers with 66% reader counts respectively.. Librarians were 3.7%, 2.8% and 2.5 % the
reported readers of social sciences articles but were the least common readers of papers in
other disciplines.
Correlations between Mendeley readership counts and citations based on users’ occupations
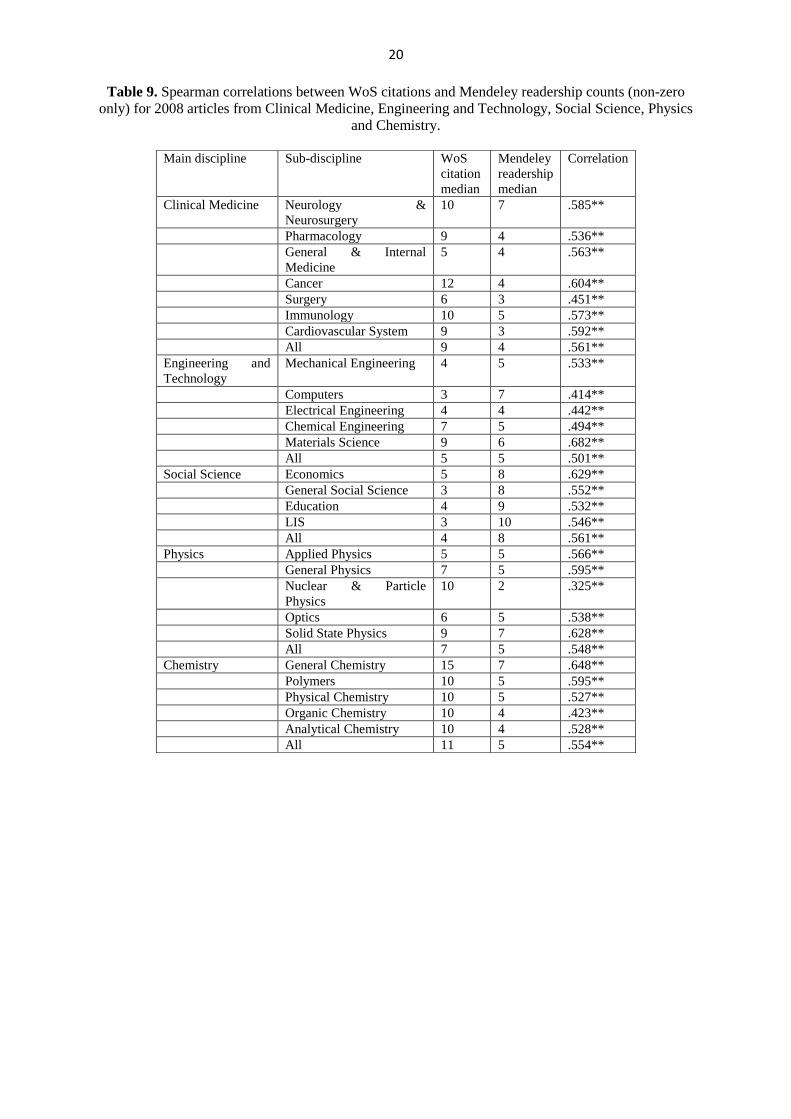
Spearman correlations were calculated for each sub-discipline between Mendeley readership
counts and citations for all articles with at least one reader in Mendeley. Values of r = 0.1+,
0.3+, and 0.5+ (whether positive or negative) were considered to be small, medium, and
large, respectively (Cohen, 1988), with medium and large correlations considered to be
substantial. There were statistically significant and substantial correlations between Mendeley
readership counts and citations for all five disciplines (Table 3, see also Table 9). The
correlations for all of the disciplines are similar but are highest in Clinical Medicine and
Social Science (r=.561).
In order to investigate the effect of non-read articles on correlations between Mendeley
readership counts and citations, the analysis was repeated but including articles with zero
readers (including articles that were in Mendeley but which were not found by the search
process). In other words, all articles not found in Mendeley were assumed to have zero
Mendeley readers. As shown in Table 3 the correlations between Mendeley readership counts
and citations are weaker for all examined disciplines. The median Mendeley readership
counts for all Social Science sub-disciplines are higher than their median citation counts and
the overall median Social Science Mendeley readership count is double the median Social
Science citation count (Table 3). The opposite is true for Physics, Chemistry and Clinical
medicine but there is equality in Engineering and Technology. If the dataset had included
articles with zero Mendeley readership counts, then the correlations would probably have
been weaker (Mohammadi & Thelwall, in press), as confirmed below.
Table 3. Spearman correlations between WoS citations and Mendeley readership counts (both zero
and non-zero) for 2008 articles.
**Significant at p=0.01
Main
disciplines
WoS citation median
non-zero only/ Both
zero and non-zero
Mendeley readership
median
non-zero/ Both zero and
non-zero
Spearman
correlation
non-zero/ Both
zero and non-zero
Clinical
Medicine
9
7
4
2
.561**
.463**
Engineering and
Technology
5
3
5
0
.501**
.327**
Social Science 4
2
8
0
.561**
.456**
Physics 7
4
5
0
.548**
.308**
Chemistry 11
6
5
0
.554**
.369**
11
As mentioned before, only the top three occupations for Mendeley readership counts are
available for each article. To partly overcome this limitation, correlations were calculated
between Mendeley readership counts and citations for several occupations for three datasets
based on the availability of readership data, including a) all articles, b) articles with at least
66% of reader occupations available, and c) articles with 100% of reader occupations
available. The correlations for all papers are presumably overestimates, especially for those
occupational categories that often do not belong to the top 3 reported ones. As the actual
unbiased correlation values cannot be computed, the three values are considered as estimates
where the 100% value reflects the lower bound of correlations.
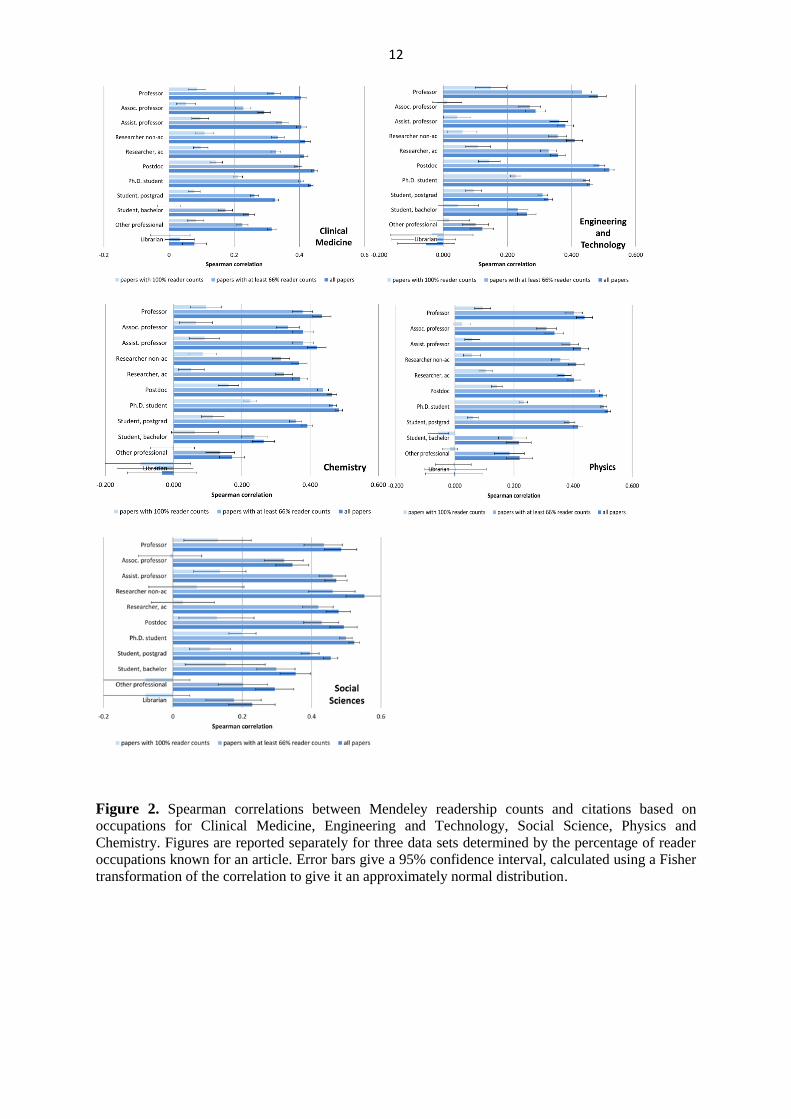
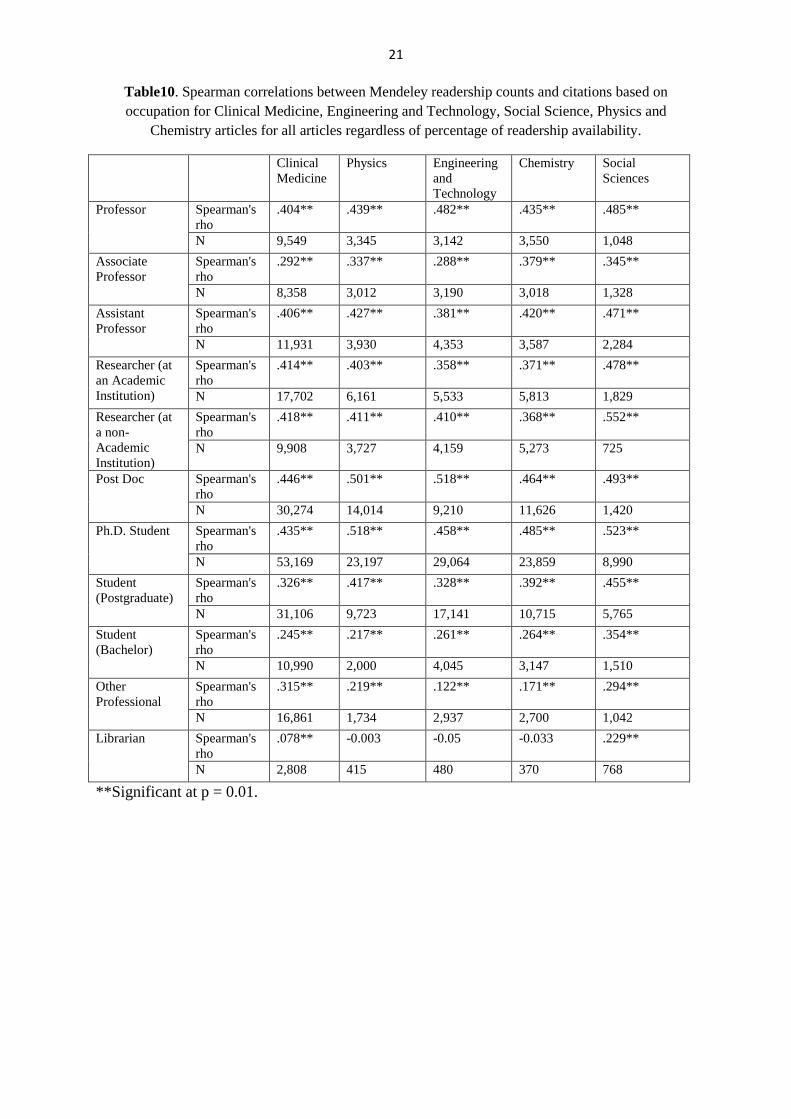
There are positive correlations between Mendeley readership counts and citations for almost
all the occupations, except librarians for some sub-disciplines, although the strengths of the
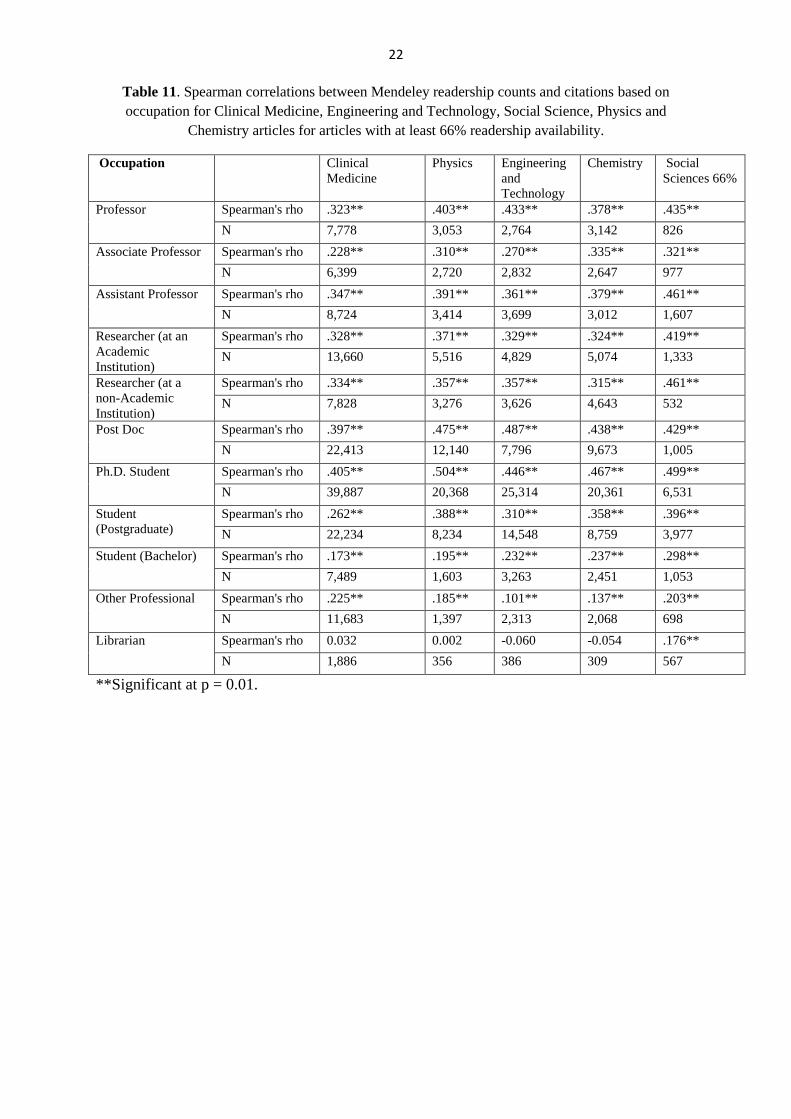
correlations vary by occupation across the research disciplines (Figure 2). As shown in Figure
2, the correlations decrease for records with 66% of the readership occupations available in
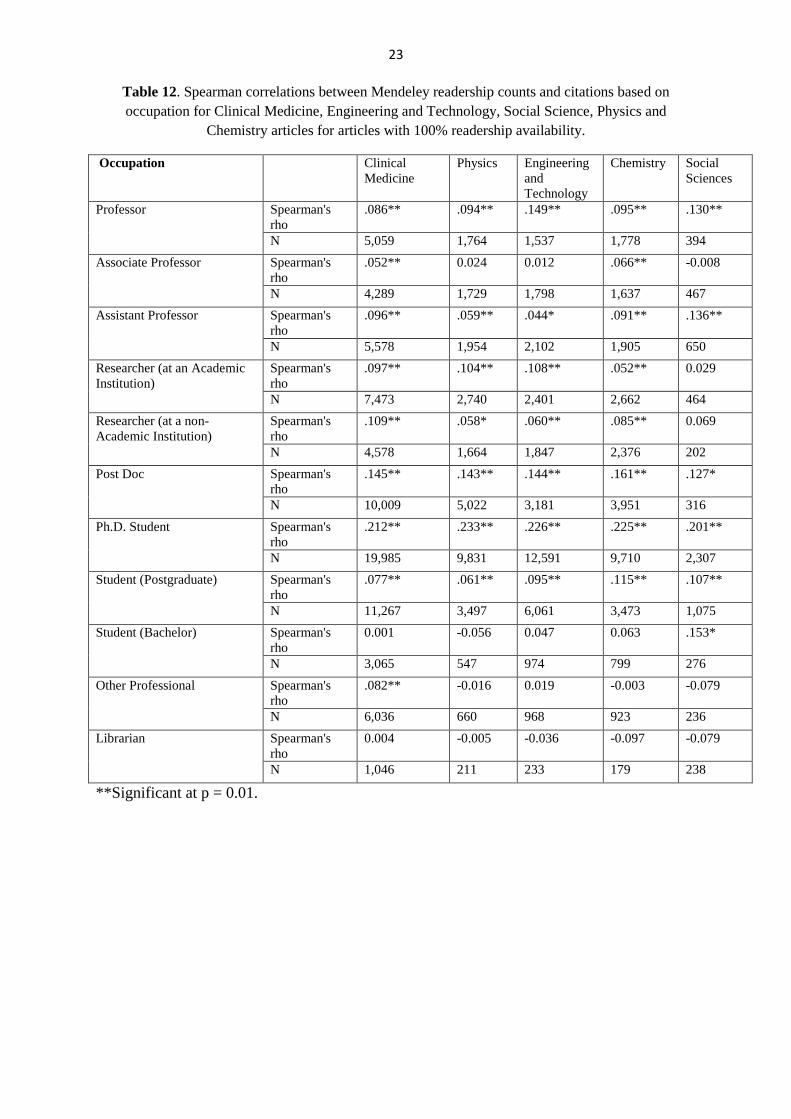
comparison to all articles and the correlations are smaller for records with 100% of the
readership occupations available in contrast to the sets of articles with at least 66% of the
readership occupations available. In other words, all correlations are lower for papers with
100% readership occupations available and the likely reason is that these papers are the least
cited papers with the lowest total number of readers and so the correlation test is less
powerful for them because the numbers are smaller. Generally, the highest correlations are
for full professors, assistant professors, postdocs and PhD students while the lowest
correlations are for undergraduates, other professions and librarians in all disciplines in all the
three datasets. The pattern of correlations for researchers at academic and non-academic
institutions is similar across the research areas for all the three datasets. However, the
differences between correlations for undergraduate and postgraduate students are noticeable
for all disciplines (see appendix, Tables 10, 11 and 12). The correlations between Mendeley
readership counts and citations for full professors, assistant professors, post docs and PhD
students, postgraduate students are substantial for all disciplines. As shown in Figure 2, the
correlations for undergraduates and other professions are small. Nevertheless, the correlations
for other professions are higher for Clinical Medicine among the other disciplines.
12
Figure 2. Spearman correlations between Mendeley readership counts and citations based on
occupations for Clinical Medicine, Engineering and Technology, Social Science, Physics and
Chemistry. Figures are reported separately for three data sets determined by the percentage of reader
occupations known for an article. Error bars give a 95% confidence interval, calculated using a Fisher
transformation of the correlation to give it an approximately normal distribution.
13
Discussion
Most readers of Clinical Medicine, Engineering and Technology, Social Science, Physics and
Chemistry papers in Mendeley are PhD students. Postgraduate students and postdoctoral
researchers are the two most common readers of papers in Mendeley across different
disciplines, after PhD students. Perhaps the most important reason is that Mendeley attracts
young researchers because they adapt to new technology better than older scholars. Another
possible explanation is that PhD students and postdoctoral researchers mainly research
whereas the other groups are likely to have more additional responsibilities. Also, PhD
students use more references in their publications than do faculty members (Larivière,
Sugimoto, & Bergeron, 2013). Additionally, PhD students and postdoctoral researchers mine
the literature more than senior researchers as they try to obtain comprehensive knowledge
about their research topics while older researchers are often co-authors (Gingras, Larivière,
Macaluso, & Robitaille, 2008) and thus probably have more supervisory roles in research
projects. Alternatively, younger researchers are more adaptable to novel ideas and read more
new publications, while senior scholars use older literature (Barnett & Fink, 2008).
Moreover, Mendeley is a new tool and senior researchers seem to avoid using most social
web services (Mas-Bleda, Thelwall, Kousha, & Aguillo, 2013) and may prefer to continue
with their existing referencing practices.
Postgraduates are also readers of many articles in almost all of the sub-disciplines. They are
not far behind PhD students in terms of using Mendeley. Additionally, whilst undergraduates
are Mendeley readers of scholarly articles, their scarcity compared to postgraduate and PhD
students could be because undergraduates tend to use reference materials and textbooks
(Jamali & Nicholas, 2006) rather than journal articles as the former provide their information
in a more convenient way (Fescemyer, 2000) or they do not yet know about reference
management software.
A noticeable percentage of Clinical Medicine papers were read by people who are apparently
not academics and this is an important issue because some articles could be useful in clinical
practice even if they are not cited in the literature (Jones, Donovan, & Hanney, 2012).
Moreover, a noticeable fraction of the social science papers , probably Library and
Information Science articles, had librarians as readers, which is consistent with results of
Schloegl and Stock (2004). Additionally, librarians bookmarked some Clinical Medicine
papers and this could be an indication of medical researchers engaging clinical librarians in
scholarly activities like systematic searching and information dissemination. The importance
of these kinds of scholarly activities by librarians has been mentioned before (Brettle &
Long, 2001).
There were substantial and positive correlations between Mendeley readership and citation
counts for all the studied sub-disciplines of Clinical Medicine, Engineering and Technology,
Social Science, Physics and Chemistry. These findings corroborate previous studies (Bar-
Ilan, 2012; Li et al., 2012; Mohammadi & Thelwall, in press) but stronger correlations were
found for this dataset. A probable likely reason for the increased correlation is that the
number of Mendeley users has increased over time, giving better raw readership data. As
reported above, the correlations vary across different sub-disciplines.
14
The median Mendeley readership counts for all Social Science and some Engineering and
Technology sub-disciplines are significantly higher than the median number of citations. The
results could be evidence that papers in these research areas were read by many people that
did not cite them, consistent with Social Science articles having many pure readers
(Armbruster, 2008) and Engineering and Technology papers being used in applied contexts.
Thus, it seems that Mendeley readership is able to provide evidence of using research articles
in contexts other than for their science contribution, at least for Social Science and some
applied sub-disciplines. Therefore, and since citation-based indicators are less effective for
Social Science research evaluation than for hard Sciences research evaluation (Nederhof,
2006), Mendeley readership could compliment citations for the evaluation of Social Science
articles. Moreover, it also could be used as a supplementary indicator to measure the impact
of some technological or medical papers in applied contexts, as citation analysis is more
useful for the assessment of theoretical research rather than applied research.
In response to the second research question, the findings indicate that there are positive
correlations between Mendeley readership and citations for all of the occupations, except
librarians, for all of the sub-disciplines examined. However, the highest correlations are for
users that are also authors, except for associate professors in some sub-disciplines. This
suggests that Mendeley readers with authorship roles probably reflect impact closer to
traditional citations in comparison to readership counts for non-author types of user and goes
some way towards validating Mendeley as an altmetric data source. Nevertheless, the
correlations for authors are not strong enough to claim that Mendeley readership counts and
citation counts are interchangeable. It is likely that academics use research articles in other
activities rather than citing, for example in their teaching. The lowest correlations were found
for undergraduates and non-academic users. This suggests that students often benefit from
articles that are not highly cited. Thus, Mendeley provides an opportunity to monitor impact
on students, which probably reflects the educational value of research articles. This would
only work for a small percentage of articles, however, since undergraduates are a small
minority of Mendeley users and their data is typically hidden by Mendeley as a side-effect of
reporting only the three most common types of user for each article. A logical consequence of
this is that low citations for undergraduate users may partly be an artefact of readership
counts for undergraduate only registering in the Mendeley API when undergraduate form a
disproportionately high proportion of an article’s readers. Similarly, non-academic readership
counts have among the lowest correlations with citation counts, suggesting that their
readership counts could also help to identify individual articles and types of article that are
valuable outside academia.
The results of this study are consistent with conclusions of Kurtz and Bollen (2010), which
were based on case studies (e.g. Rowlands & Nicholas, 2007; Bollen & Van De Sompel,
2008) using usage datasets that were mainly local (institutional), publisher dependent and not
publically-accessible, and therefore not practical for most researchers. Thus, this research
gives a practical solution with global usage data for multiple disciplines for the first time.
One of the limitations of this research is that the sample is restricted to journal articles while
users in particular occupations or disciplines may benefit more from other document types.
15
For example, engineers read relatively many conference articles in comparison to books and
journals (Niu & Hemminger, 2012). Based upon advanced Mendeley searches for WoS
journal articles from 2008, it seems that Mendeley has records for 837,958 journal articles
from 2008, although some of these records are likely to be duplicates and so the actual
number of journal articles in Mendeley is likely to be lower than this. . Within these articles,
788,260 (94%) had at least one Mendeley reader. The current study main sample includes the
197,848 WoS articles from 2008 from Clinical Medicine, Engineering and Technology,
Social Science, Physics and Chemistry with at least one Mendeley reader, which is about
25% of in the articles from 2008 with at least one Mendeley reader.
Another limitation is that it compares individual readership counts of each article with the
total citations received by an article instead of the unique number of citing authors. The latter
would involve author disambiguation, which was not feasible given the large amount of
citing papers. As mentioned above, data on readers’ occupations was only available for three
most common reader categories for each article, which resulted in losing around 27% of the
readership counts. A consequence of this is that numerically small groups of readers (e.g.,
associate professors, professors, undergraduates, librarians), may have lower correlations due
to underestimating their readership or only recording their readership values for articles for
which they formed a disproportionately large share of the readers. Perhaps most importantly,
the site Mendeley is perhaps most useful for those who will eventually cite an article and so
its readership counts seem likely to under-represent users who will never need to cite an
article, perhaps including disproportionately many practitioners. Hence Mendeley readership
statistics should not be taken as an unbiased reflection of an article’s readers.
Finally, from the perspective of using Mendeley as a data source for altmetrics, the biggest
limitation is that probably the users of Mendeley form a small and biased minority of the
readers of academic articles. In particular, assuming that Mendeley users tend to be younger
than typical article readers, Mendeley readership data could not be used to estimate the
proportions of readers of different types for articles. For example, although various types of
professor form less than 10% of the Mendeley readers of articles and various types of student
form 55%-77% (depending upon area), it is possible that professors are the majority readers
of articles but rarely join Mendeley. Nevertheless, it seems reasonable to compare the
proportions of Mendeley readers with different occupations between sets of articles in
Mendeley (e.g., Social Sciences vs. Clinical Medicine) to identify whether readership is
particularly high for one occupational group, even though the level of uptake of Mendeley
between different professions could also vary between discipline.
Conclusions
This study suggests that the Mendeley readership consists of many undergraduate and
postgraduate students, as well different groups of academics and non-academics. In other
words, the results show that Mendeley provides evidence that research articles are read by a
variety types of users inside and outside academia. A majority of Mendeley readers are PhD
students in Engineering and Technology, Social Science, Physics and Chemistry, with
faculty, perhaps surprisingly, being a minority in all cases. In terms of Mendeley readers
outside of higher education institutions, these appear to be a small minority, with Clinical
16
Medicine having 7.2 % from Other professions for papers with 100% readership counts.
Thus, Mendeley readership is able to capture a dimension of the impact of scientific
documents on various activities performed within the academic community – such as “plain
reading”, i.e., reading without subsequently citing, writing theses, doing assignments or
drafting research proposals but also provides a little evidence of their applied use by people
outside academia, such as medical doctors and surgeons.
Mendeley readership counts could perhaps supplement citation counts in the Social Sciences
and in some Engineering research areas in which citation counts are lower than Mendeley
readership counts. The variation in correlations between Mendeley readership counts and
citations received for different types of reader suggested that the meaning of Mendeley
readership counts depends upon the readers’ occupations. This implies that in some cases
Mendeley readership may reflect traditional citation impact but in other cases it may reflect
educational uses or impact on applied contexts. Therefore, Mendeley readership is a
promising data source that is different from both citations and raw usage data. However,
Mendeley is only one of many reference manager tools and other reference managers (e.g.
Endnote, RefWorks, Zotero) also have many users but their data are not publically available.
Thus, Mendeley seems to be the only choice to reveal aspects of the readership of research
articles. This could be particularly useful in disciplines for which citation-based indicators are
least reliable, such as the social sciences, arts and humanities, and perhaps also applied
research. Nevertheless, more qualitative research is needed to investigate why Mendeley
users register articles in order to find out how often adding a document to the Mendeley
library means that the document has been, or will be, read.
17
Appendices
Table 4. Coverage of WoS articles from Clinical Medicine, Engineering and Technology, Social
Science, Physics and Chemistry in Mendeley (detailed version).
Sub-discipline Article
s
indexe
d by
WoS in
2008
Unique
WoS
articles
covered
by
Mendel
ey
Duplicate
d records
in
Mendeley
Articles
with
readersh
ip
statistics
in
Mendele
y
Articles
without
readershi
p
statistics
Total
readership
including
duplicates
Lost
readership
counts
after
removing
duplicates
Neurology &
Neurosurgery
31616 77.8% 0.0% 73.0% 4.7% 288730 0.3%
Pharmacology 23276 67.7% 1.1% 60.8% 6.9% 77833 1.1%
General & Internal
Medicine
22410 65.1% 5.7% 56.7% 8.3% 98005 5.5%
Cancer 19440 73.8% 0.4% 67.4% 6.3% 85627 0.7%
Surgery 16961 71.9% 0.8% 49.1% 22.7% 32396 0.4%
Immunology 16822 73.2% 0.5% 67.5% 5.7% 79388 0.3%
Cardiovascular System 15011 68.7% 1.7% 50.4% 18.3% 41586 1.7%
All 145,536 71.5%| 1.5% 62.0% 9.5% 703565 1.3%
Mechanical Engineering 13669 20.9% 2.9% 19.8% 1.1% 17620 0.5%
Computers 17768 43.2% 1.9% 41.6% 1.6% 94350 0.7%
Electrical Engineering 30271 40.4% 0.6% 35.7% 4.7% 65842 0.6%
Chemical Engineering 13486 26.7% 1.0% 26.1% 0.6% 25857 0.4%
Materials Science 34196 34.1% 1.8% 32.6% 1.4% 123535 0.9%
All 109390 34.8% 1.5% 32.5% 2.2% 327204 0.7%
Economics 12300 41.0% 3.2% 40.2% 0.7% 63950 1.7%
General Social Science 2628 40.3% 2.40% 39.6% 0.6% 11579 1.4%
Education 6620 54.6% 6.8% 53.9% 0.% 49610 4.4%
LIS 2330 62.1% 6.4% 59.5% 2.6% 20183 3.1%
All 23878 46.7% 4.8% 45.8% 0.9% 145322 2.8%
Applied Physics 29679 32.6% 1.2% 30.4% 2.1% 71050 0.6%
General Physics 36595 29.0% 1.4% 27.7% 1.2% 94520 0.6%
Nuclear & Particle
Physics
10381 16.5% 0.8% 14.9% 1.5% 5225 0.8%
Optics 14229 46.9% 0.8% 43.4% 3.50% 48614 0.5%
Solid State Physics 10697 30.0% 1.6% 29.6% 0.4% 33385 0.9%
All 101581 31.4% 1.2% 29.6% 1.7% 252794 0.6%
General Chemistry 23144 29.9% 2.3% 28.8% 1.1% 70228 1.0%
Polymers 12247 22.7% 3.2% 22.0% 0.7% 19478 1.6%
Physical Chemistry 36329 35.4% 1.3% 31.0% 4.3% 85717 0.5%
Organic Chemistry 16854 28.8% 1.1% 26.9% 1.8% 24190 0.6%
Analytical Chemistry 12020 53.3% 1.3% 46.4% 6.9% 36767 0.9%
All 100594 33.6% 1.6% 30.6% 3.0% 236380 0.8%
Total 480,979 45.6% 1.7% 41.1% 4.4% 1,665,265 1.1%
18
Table 5. Complete and merged categories for Mendeley readers’ occupations.
Occupation provided by the
Mendeley API
Merged
Assistant Professor Assistant Professor
Lecturer
Associate Professor Associate Professor
Senior Lecturer
Librarian Librarian
Other Professions Other Professions
PhD Student PhD Student
Doctoral Student
Postdoc Postdoc
Professor Professor
Researcher (at a non-Academic
Institution)
Researcher (at a non-Academic
Institution)
Researcher (at an Academic
Institution)
Researcher (at an Academic
Institution)
Student (Bachelor) Student (Bachelor)
Student (Postgraduate) Student (Postgraduate)
Student (Master)
Table 6. Readers of WoS articles from Clinical Medicine, Engineering and Technology, Social
Science, Physics and Chemistry in Mendeley based on academic status for all papers regardless of %
of available readership
%Engineering and
Technology
%Social
Science
%Physics %Chemistry %Clinical
Medicine
PhD Students 55.4% 54.9% 51.7% 50.3% 39.1%
Postgrad Student 17.4% 19.5% 9.6% 11.1% 12.6%
Postdoc 8.5% 3.0% 18.2% 13.9% 17.4%
Researcher ac 3.8% 4.4% 5.5% 5.4% 6.9%
Assistant Professor 2.9% 4.9% 3.4% 3.1% 4.2%
Researcher non-ac 3.3% 1.7% 3.7% 5.8% 3.9%
Professor 2.2% 2.1% 2.9% 3.3% 3.3%
Bachelor Student 2.8% 3.0% 1.4% 2.4% 3.5%
Other Professions 1.7% 1.7% 1.1% 2.2% 5.9%
Associate Professor 1.8% 2.3% 2.2% 2.4% 2.4%
Librarian 0.2% 2.5% 0.2% 0.2% 0.75%
Total individual readership
counts
244,097 97,191 192,222 177,909 457,954
19
Table 7. Readers of WoS articles from Clinical Medicine, Engineering and Technology, Social
Science, Physics and Chemistry in Mendeley based on academic status for with 66% reader counts .
Engineering
and
Technology
Social
Science
Physics Chemistry Clinical
Medicine
PhD Students 56.3% 56.1% 52.1% 51.0% 39.5%
Postgrad Student 17.0% 18.3% 9.3% 10.7% 12.1%
Postdoc 8.3% 2.9% 18.2% 13.7% 17.2%
Researcher ac 3.9% 4.3% 5.6% 5.5% 7.0%
Researcher non-ac 3.3% 1.5% 3.7% 5.9% 4.2%
Assistant Professor 2.9% 4.9% 3.3% 3.0% 4.2%
Professor 2.2% 2.3% 3.0% 3.4% 3.6%
Bachelor Student 2.4% 2.9% 1.3% 2.2% 3.3%
Associate Professor 1.9% 2.4% 2.3% 2.5% 2.6%
Other Professions 1.5% 1.6% 1.1% 2.0% 5.6%
Librarian 0.2% 2.8% 0.2% 0.2% 0.7%
Total individual readership counts 194,128 60,874 159,507 142,919 302,814
Table 8. Readers of WoS articles from Clinical Medicine, Engineering and Technology, Social
Science, Physics and Chemistry in Mendeley based on academic status for with 100% reader counts.
Engineering
and
Technology
Social
Science
Physics Chemistry Clinical Medicine
PhD Students 51.4% 46.9% 45.1% 45.2% 31.5%
Postgrad Student 15.5% 14.8% 9.6% 10.0% 13.8%
Postdoc 7.3% 3.5% 15.7% 11.8% 12.6%
Researcher ac 5.3% 5.6% 7.5% 7.2% 8.7%
Assistant Professor 4.5% 7.6% 5.0% 4.9% 6.1%
Researcher non-ac 4.2% 2.3% 4.7% 7.2% 5.4%
Professor 3.4% 4.6% 4.6% 4.8% 5.5%
Associate Professor 3.8% 5.2% 4.4% 4.1% 4.6%
Other Professions 2.0% 2.5% 1.6% 2.4% 7.2%
Bachelor Student 2.1% 3.1% 1.4% 2.0% 3.5%
Librarian 0.5% 3.7% 0.5% 0.4% 1.1%
Total individual readership
counts
51,453 9,892 43,599 42,967 101,276
20
Table 9. Spearman correlations between WoS citations and Mendeley readership counts (non-zero
only) for 2008 articles from Clinical Medicine, Engineering and Technology, Social Science, Physics
and Chemistry.
Main discipline Sub-discipline WoS
citation
median
Mendeley
readership
median
Correlation
Clinical Medicine Neurology &
Neurosurgery
10 7 .585**
Pharmacology 9 4 .536**
General & Internal
Medicine
5 4 .563**
Cancer 12 4 .604**
Surgery 6 3 .451**
Immunology 10 5 .573**
Cardiovascular System 9 3 .592**
All 9 4 .561**
Engineering and
Technology
Mechanical Engineering 4 5 .533**
Computers 3 7 .414**
Electrical Engineering 4 4 .442**
Chemical Engineering 7 5 .494**
Materials Science 9 6 .682**
All 5 5 .501**
Social Science Economics 5 8 .629**
General Social Science 3 8 .552**
Education 4 9 .532**
LIS 3 10 .546**
All 4 8 .561**
Physics Applied Physics 5 5 .566**
General Physics 7 5 .595**
Nuclear & Particle
Physics
10 2 .325**
Optics 6 5 .538**
Solid State Physics 9 7 .628**
All 7 5 .548**
Chemistry General Chemistry 15 7 .648**
Polymers 10 5 .595**
Physical Chemistry 10 5 .527**
Organic Chemistry 10 4 .423**
Analytical Chemistry 10 4 .528**
All 11 5 .554**
21
Table10. Spearman correlations between Mendeley readership counts and citations based on
occupation for Clinical Medicine, Engineering and Technology, Social Science, Physics and
Chemistry articles for all articles regardless of percentage of readership availability.
Clinical
Medicine
Physics Engineering
and
Technology
Chemistry Social
Sciences
Professor Spearman's
rho
.404** .439** .482** .435** .485**
N 9,549 3,345 3,142 3,550 1,048
Associate
Professor
Spearman's
rho
.292** .337** .288** .379** .345**
N 8,358 3,012 3,190 3,018 1,328
Assistant
Professor
Spearman's
rho
.406** .427** .381** .420** .471**
N 11,931 3,930 4,353 3,587 2,284
Researcher (at
an Academic
Institution)
Spearman's
rho
.414** .403** .358** .371** .478**
N 17,702 6,161 5,533 5,813 1,829
Researcher (at
a non-
Academic
Institution)
Spearman's
rho
.418** .411** .410** .368** .552**
N 9,908 3,727 4,159 5,273 725
Post Doc Spearman's
rho
.446** .501** .518** .464** .493**
N 30,274 14,014 9,210 11,626 1,420
Ph.D. Student Spearman's
rho
.435** .518** .458** .485** .523**
N 53,169 23,197 29,064 23,859 8,990
Student
(Postgraduate)
Spearman's
rho
.326** .417** .328** .392** .455**
N 31,106 9,723 17,141 10,715 5,765
Student
(Bachelor)
Spearman's
rho
.245** .217** .261** .264** .354**
N 10,990 2,000 4,045 3,147 1,510
Other
Professional
Spearman's
rho
.315** .219** .122** .171** .294**
N 16,861 1,734 2,937 2,700 1,042
Librarian Spearman's
rho
.078** -0.003 -0.05 -0.033 .229**
N 2,808 415 480 370 768
**Significant at p = 0.01.
22
Table 11. Spearman correlations between Mendeley readership counts and citations based on
occupation for Clinical Medicine, Engineering and Technology, Social Science, Physics and
Chemistry articles for articles with at least 66% readership availability.
Occupation Clinical
Medicine
Physics Engineering
and
Technology
Chemistry Social
Sciences 66%
Professor Spearman's rho .323** .403** .433** .378** .435**
N 7,778 3,053 2,764 3,142 826
Associate Professor Spearman's rho .228** .310** .270** .335** .321**
N 6,399 2,720 2,832 2,647 977
Assistant Professor Spearman's rho .347** .391** .361** .379** .461**
N 8,724 3,414 3,699 3,012 1,607
Researcher (at an
Academic
Institution)
Spearman's rho .328** .371** .329** .324** .419**
N 13,660 5,516 4,829 5,074 1,333
Researcher (at a
non-Academic
Institution)
Spearman's rho .334** .357** .357** .315** .461**
N 7,828 3,276 3,626 4,643 532
Post Doc Spearman's rho .397** .475** .487** .438** .429**
N 22,413 12,140 7,796 9,673 1,005
Ph.D. Student Spearman's rho .405** .504** .446** .467** .499**
N 39,887 20,368 25,314 20,361 6,531
Student
(Postgraduate)
Spearman's rho .262** .388** .310** .358** .396**
N 22,234 8,234 14,548 8,759 3,977
Student (Bachelor) Spearman's rho .173** .195** .232** .237** .298**
N 7,489 1,603 3,263 2,451 1,053
Other Professional Spearman's rho .225** .185** .101** .137** .203**
N 11,683 1,397 2,313 2,068 698
Librarian Spearman's rho 0.032 0.002 -0.060 -0.054 .176**
N 1,886 356 386 309 567
**Significant at p = 0.01.
23
Table 12. Spearman correlations between Mendeley readership counts and citations based on
occupation for Clinical Medicine, Engineering and Technology, Social Science, Physics and
Chemistry articles for articles with 100% readership availability.
Occupation Clinical
Medicine
Physics Engineering
and
Technology
Chemistry Social
Sciences
Professor Spearman's
rho
.086** .094** .149** .095** .130**
N 5,059 1,764 1,537 1,778 394
Associate Professor Spearman's
rho
.052** 0.024 0.012 .066** -0.008
N 4,289 1,729 1,798 1,637 467
Assistant Professor Spearman's
rho
.096** .059** .044* .091** .136**
N 5,578 1,954 2,102 1,905 650
Researcher (at an Academic
Institution)
Spearman's
rho
.097** .104** .108** .052** 0.029
N 7,473 2,740 2,401 2,662 464
Researcher (at a non-
Academic Institution)
Spearman's
rho
.109** .058* .060** .085** 0.069
N 4,578 1,664 1,847 2,376 202
Post Doc Spearman's
rho
.145** .143** .144** .161** .127*
N 10,009 5,022 3,181 3,951 316
Ph.D. Student Spearman's
rho
.212** .233** .226** .225** .201**
N 19,985 9,831 12,591 9,710 2,307
Student (Postgraduate) Spearman's
rho
.077** .061** .095** .115** .107**
N 11,267 3,497 6,061 3,473 1,075
Student (Bachelor) Spearman's
rho
0.001 -0.056 0.047 0.063 .153*
N 3,065 547 974 799 276
Other Professional Spearman's
rho
.082** -0.016 0.019 -0.003 -0.079
N 6,036 660 968 923 236
Librarian Spearman's
rho
0.004 -0.005 -0.036 -0.097 -0.079
N 1,046 211 233 179 238
**Significant at p = 0.01.
24
References
Almind, T. C., & Ingwersen, P. (1997). Informetric analyses on the world wide web:
methodological approaches to ‘webometrics’. Journal of documentation, 53(4), 404-426.
Armbruster, C. (2008). Access, Usage and Citation Metrics: What Function for Digital Libraries and
Repositories in Research Evaluation? Available at SSRN 1088453
Bar-Ilan, J. (2012). JASIST 2001–2010. Bulletin of Association for Information Science and
Technology, 24–28.
Barnett, G. A., & Fink, E. L. (2008). Impact of the internet and scholar age distribution on academic
citation age. Journal of the American Society for Information Science and Technology, 59(4),
526–534.
Bennett, N. L., Casebeer, L. L., Kristofco, R. E., & Strasser, S. M. (2004). Physicians’ Internet
information-seeking behaviors. The Journal of continuing education in the health professions,
24(1), 31–8.
Bollen, J, & Sompel, H. V. (2008). Usage impact factor: The effects of sample characteristics on
usagebased impact metrics. Journal of the American Society for Information Science and
Technology, 59(1), 136–149.
Björneborn, L. (2004). Small-world link structures across an academic Web space: A library and
information science approach. Doctoral dissertation, Royal School of Library and Information
Science,Copenhagen,Denmark.
Björneborn, L., & Ingwersen, P. (2004). Toward a basic framework for webometrics. Journal of the
American Society for Information Science and Technology, 55(14), 1216–1227.
Bollen, Johan, & Van De Sompel, H. (2008). Usage Impact Factor: the effects of sample
characteristics on usage-based impact metrics. Journal of the American Society for Information
Science, 59(1), 13.
Bollen, Johan, Van De Sompel, H., Hagberg, A., & Chute, R. (2009). A principal component analysis
of 39 scientific impact measures. (T. Mailund, Ed.)PLoS ONE, 4(6), e6022.
Bornmann, L. (in press). Is there currently a scientific revolution in scientometrics? Journal of the
American Society for Information Science and Technology.
Bornmann, L. (2012). Measuring the societal impact of research: research is less and less assessed on
scientific impact alone--we should aim to quantify the increasingly important contributions of
science to society. EMBO reports, 13(8), 673–6.
Bornmann, L., & Marx, W. (in press). The Wisdom of Citing Scientists. Journal of the American
Society for Information Science and Technology.
Brettle, a J., & Long, a F. (2001). Comparison of bibliographic databases for information on the
rehabilitation of people with severe mental illness. Bulletin of the Medical Library Association,
89(4), 353–62.
25
Catalano, A. (2013). Patterns of graduate students’ information seeking behavior: a meta-synthesis of
the literature. Journal of Documentation (Vol. 69, pp. 243–274).
Cohen, J. (1988). Statistical power analysis for the behavioral sciences. (L. Erlbaum, Ed.)Statistical
Power Analysis for the Behavioral Sciences (Vol. 2nd, p. 567). Lawrence Erlbaum Associates.
Costas, R., Zahedi, Z., & Wouters, P. (2014). Do altmetrics correlate with citations? Extensive
comparison of altmetric indicators with citations from a multidisciplinary perspective. Arxiv
preprint arXiv: 1401.4321.
Cronin, B. (2013a). Metrics à la mode. Journal of the American Society for Information Science and
Technology, 64(6), 1091–1091.
Cronin, B. (2013b). The evolving indicator space (iSpace). Journal of the American Society for
Information Science and Technology, 64(8), 1523–1525.
Cronin, B., Snyder, H. W., Rosenbaum, H., Martinson, A., & Callahan, E. (1998). Invoked on the
Web. Journal of the American Society for Information Science, 49(14), 1319–1328.
Egghe, L., & Rousseau, R. (1990). Introduction to Informetrics: quantitative methods in library,
documentation and information science. Amsterdam: Elsevier Science Publishers.
Ellis, D., & Haugan., M. (1997). Modelling the information seeking patterns of engineers and research
scientists in an industrial environment. Journal of documentation, 4(53), 384–403.
Eysenbach, G. (2011). Correction: Can Tweets Predict Citations? Metrics of Social Impact Based on
Twitter and Correlation with Traditional Metrics of Scientific Impact. Journal of Medical
Internet Research, 13(4), e123.
Fescemyer, K. (2000). Information-seeking behavior of undergraduate geography students. Research
Strategies, 17(4), 307–317.
Freund, L., Toms, E. G., & Waterhouse, J. (2005). Modeling the Information Behaviour of Software
Engineers Using a Work - Task Framework. Proceedings of the American Society for
Information Science and Technology, 42(1).
Ge, X. (2010). Information-seeking behavior in the digital age: A multidisciplinary study of academic
researchers. College & Research Libraries, 435–455.
Gingras, Y., Larivière, V., Macaluso, B., & Robitaille, J.-P. (2008). The effects of aging on
researchers’ publication and citation patterns. PloS one, 3(12), e4048.
Haustein, S., Golov, E., & Luckanus, K., Reher, S. & Terliesner, J. (2010). Journal evaluation and
science 2.0: Using social bookmarks to analyze reader perception. Book of Abstracts of the 11th
International Conference on Science and Technology Indicators (pp. 117–119).
Haustein, S., Larivière, V., Thelwall, M., Amyot, D., & Peters, I. (submitted). Tweets vs. Mendeley
readers: How do these two social media metrics differ? IT – Information Technology.
Haustein, S., Peters, I., Bar-Ilan, J., Priem, J., Shema, H., & Terliesner, J. (2013). Coverage and
adoption of altmetrics sources in the bibliometric community. arXiv, 1–12.
26
Haustein, S., Peters, I., Thelwall, M., Sugimoto, C.R., Larivière, V. (in press) Tweeting biomedicine:
an analysis of tweets and citations in the biomedical literature. Journal of the American Society
for Information Science and Technology.
Haustein, S., & Siebenlist, T. (2011). Applying social bookmarking data to evaluate journal usage.
Journal of Informetrics, 5(3), 446–457.
HEFCE. (2011). Research Excellence Framework (Vol. 2011). Higher Education Funding Council for
England. Hemminger, B. M., Lu, D., Vaughan, K. T. L., & Adams, S. J. (2007). Information
seeking behavior of academic scientists. Journal of the American Society for Information
Science and Technology, 58(14), 2205–2225.
Hertzum, M., & Pejtersen, A. M. (2000). The information-seeking practices of engineers: searching
for documents as well as for people. Information Processing & Management, 36(5), 761–778.
Jamali, H. R., & Nicholas, D. (2006). Communication and information-seeking behavior of PhD
students in physicists and astronomy. Proceedings of the American Society for Information
Science and Technology, 43(1), 1–18.
Jones, T. H., Donovan, C., & Hanney, S. (2012). Tracing the wider impacts of biomedical research: a
literature search to develop a novel citation categorisation technique. Scientometrics, 1–10.
Korobili, S., Malliari, A., & Zapounidou, S. (2011). Factors that Influence Information-Seeking
Behavior: The Case of Greek Graduate Students. The Journal of Academic Librarianship, 37(2),
155–165.
Kostoff, R. (1998). The use and misuse of citation analysis in research evaluation. Scientometrics,
1(1), 27–43.
Kurtz, M., & Bollen, J. (2010). Usage bibliometrics. Annual Review of Information Science and
Technology, 44(1-64).
Kwasitsu, L. (2003). Information-seeking behavior of design , process , and manufacturing engineers.
Library & Information Science Research, 25(4), 459–476.
Larivière, V., Sugimoto, C. R., & Bergeron, P. (2013). In their own image? a comparison of doctoral
students’ and faculty members' referencing behavior. Journal of the American Society for
Information Science and Technology, 64(5), 1045–1054.
Leckie, G., Pettigrew, K., & Sylvain, C. (1996). Modeling the information seeking of professionals: a
general model derived from research on engineers, health care professionals, and lawyers. The
Library Quarterly.
Li, & Thelwall, M. (2012). F1000 , Mendeley and Traditional Bibliometric Indicators. 17th
International Conference on Science and Technology Indicators (Vol. 3, pp. 1–11).
Li, X., Thelwall, M., & Giustini, D. (2012). Validating online reference managers for scholarly impact
measurement. Scientometrics, 91(2), 461–471.
MacRoberts, M. H., & MacRoberts, B. R. (1989). Problems of citation analysis: A critical review.
Journal of the American Society for Information Science, 40(5), 342–349.
Martin, B. R. (1996). The use of multiple indicators in the assessment of basic research.
Scientometrics, 36(3), 343–362.
27
Mas Bleda, A., Thelwall, M., Kousha, K. & Aguillo, I. (2013). European highly cited scientists’
presence in the social web. In J. Gorraiz, E. Schiebel, C. Gumpenberger, M. Hörlesberger and H.
Moed (Eds.), 14th International Society of Scientometrics and Informetrics Conference (ISSI
2013), (pp. 98-109). Vienna: Austria.
McAlister, F. A., Graham, I., Karr, G. W., & Laupacis, A. (1999). Evidence-based medicine and the
practicing clinician. Journal of General Internal Medicine, 14(4), 236–242.
Mohammadi, E., & Thelwall, M. (in press). Mendeley readership altmetrics for the social sciences
and humanities: Research evaluation and knowledge flows. Journal of the American Society for
Information Science and Technology.
Mohammadi, E., & Thelwall, M. ( 2013). Assessing non-standard article impact using F1000 labels.
Scientometrics, 97(2) , 383-395 .
Nederhof. (2006). Bibliometric monitoring of research performance in the Social Sciences and the
Humanities: A Review. Scientometrics, 66(1), 81–100.
Nicholas, D., Huntington, P., Dobrowolski, T., Rowlands, I., Jamali M., H. R., & Polydoratou, P.
(2005). Revisiting “obsolescence” and journal article “decay” through usage data: an analysis of
digital journal use by year of publication. Information Processing & Management, 41(6), 1441–
1461.
Niu, X., & Hemminger, B. M. (2012). A study of factors that affect the information-seeking behavior
of academic scientists. Journal of the American Society for Information Science and Technology,
63(2), 336–353.
Pancheshnikov, Y. (2007). A Comparison of Literature Citations in Faculty Publications and Student
Theses as Indicators of Collection Use and a Background for Collection Management at a
University Library. The Journal of Academic Librarianship, 33(6), 674–683.
Piwowar, H. (2013). Altmetrics: Value all research products. Nature, 493(7431), 159–159.
Price, D., & Gürsey, S. (1975). Studies in Scientometrics I Transience and Continuance in Scientific
Authorship. Ciência da Informação.
Priem, J. (2013). Scholarship: Beyond the paper. Nature, 495(7442), 437–440. doi:10.1038/495437a
Priem, J., Piwowar, H. A., & Hemminger, B. M. (2012). Altmetrics in the wild: Using social media to
explore scholarly impact. Arxiv preprint arXiv:1203.4745.
Priem, Taraborelli, D., Groth, P., & Neylon, C. (2011). altmetrics: a manifesto. Retrieved from
http://altmetrics.org/manifesto
Rousseau, R., & Ye, F. (2013). A multi-metric approach for research evaluations. Chinese Science
Bulletin, 1–7.
Rowlands, I., & Nicholas, D. (2007). The missing link: journal usage metrics. Aslib Proceedings,
59(3), 222–228. Schilling, L. M., Steiner, J. F., Lundahl, K., & Anderson, R. J. (2005).
Residents’ patient-specific clinical questions: opportunities for evidence-based learning.
Academic medicine: journal of the Association of American Medical Colleges, 80(1), 51–6.
28
Schloegl, C., & Stock, W. G. (2004). Impact and relevance of LIS journals: A scientometric analysis
of international and German-language LIS journals - Citation analysis versus reader survey.
Journal of the American Society for Information Science and Technology, 55(13), 1155–1168.
Shema, H., Bar-Ilan, J., & Thelwall, M. (in press). Do blog citations correlate with a higher number of
future citations? Research blogs as a potential source for alternative metrics. Journal of the
American Society for Information Science and Technology.
Tague-Sutcliffe, J. (1992). An introduction to informetrics. Information Processing & Management,
28(1), 1–3.
Taylor, P., Aurisicchio, M., Bracewell, R., & Wallace, K. (2010). Journal of Engineering Design
Understanding how the information requests of aerospace engineering designers influence
information- seeking behaviour engineering designers influence information-seeking behaviour.
Journal of Engineering Design, 21(6), 707–730.
Tenopir, C., & King, D. W. (2000). Towards Electronic Journals: Realities for Scientists, Librarians,
and Publishers. Washington, D. C.: Special Libraries Association.
Tenopir, C., King, D. W., Clarke, M. T., Na, K., & Zhou, X. (2007). Journal reading patterns and
preferences of pediatricians. Journal of the Medical Library Association: JMLA, 95(1), 56–63.
Tenopir, C., King, D. W., Spencer, J., & Wu, L. (2009). Variations in article seeking and reading
patterns of academics: What makes a difference? Library & Information Science Research,
31(3), 139–148.
Thelwall, M. (2012). Journal impact evaluation: a webometric perspective. Scientometrics, 92(2),
429–441.
Thelwall, M., Haustein, S., Larivière, V., & Sugimoto, C. R. (2013). Do Altmetrics Work? Twitter
and Ten Other Social Web Services. PLoS ONE, 8(5), e64841.
Thelwall, M., & Kousha, K. (in press). Academia . edu: Social Network or Academic Network?
Journal of the American Society for Information Science and Technology.
Waltman, L., & Costas, R. (in press). F1000 recommendations as a Potentail New Data Source for
Research Evaluation: A comparison with citations, Journal of the American Society for
Information Science and Technology
Whitmire, E. (2002). Disciplinary differences and undergraduates’ information-seeking behavior.
Journal of the American Society for Information Science and Technology, 53(8), 631–638.
Zahedi, Z., Costsas, R., & Wouters, P. (2013). How well developed are Altmetrics? Cross-disciplinary
analysis of the presence of “alternative metrics” in scientific publications. 14th International
Society of Scientometrics and Informetrics Conference (ISSI) (pp. 876–884). Vienna: Austrian
Institute of Technology.