who is at risk for dyslexia? phonological processing in five-to seven-year-old dutch-speaking...
TRANSCRIPT

PLEASE SCROLL DOWN FOR ARTICLE
This article was downloaded by: [KU Leuven Biomedical Library]On: 25 January 2010Access details: Access Details: [subscription number 918011597]Publisher RoutledgeInforma Ltd Registered in England and Wales Registered Number: 1072954 Registered office: Mortimer House, 37-41 Mortimer Street, London W1T 3JH, UK
Scientific Studies of ReadingPublication details, including instructions for authors and subscription information:http://www.informaworld.com/smpp/title~content=t775653700
Who Is At Risk for Dyslexia? Phonological Processing in Five-to Seven-Year-Old Dutch-Speaking Children With SLIEllen Vandewalle a; Bart Boets a; Pol Ghesquière a; Inge Zink a
a Katholieke Universiteit Leuven,
Online publication date: 22 January 2010
To cite this Article Vandewalle, Ellen, Boets, Bart, Ghesquière, Pol and Zink, Inge(2010) 'Who Is At Risk for Dyslexia?Phonological Processing in Five-to Seven-Year-Old Dutch-Speaking Children With SLI', Scientific Studies of Reading, 14:1, 58 — 84To link to this Article: DOI: 10.1080/10888430903242035URL: http://dx.doi.org/10.1080/10888430903242035
Full terms and conditions of use: http://www.informaworld.com/terms-and-conditions-of-access.pdf
This article may be used for research, teaching and private study purposes. Any substantial orsystematic reproduction, re-distribution, re-selling, loan or sub-licensing, systematic supply ordistribution in any form to anyone is expressly forbidden.
The publisher does not give any warranty express or implied or make any representation that the contentswill be complete or accurate or up to date. The accuracy of any instructions, formulae and drug dosesshould be independently verified with primary sources. The publisher shall not be liable for any loss,actions, claims, proceedings, demand or costs or damages whatsoever or howsoever caused arising directlyor indirectly in connection with or arising out of the use of this material.
Who Is At Risk for Dyslexia?Phonological Processing in Five-
to Seven-Year-Old Dutch-SpeakingChildren With SLI
Ellen Vandewalle, Bart Boets, Pol Ghesquière, and Inge ZinkKatholieke Universiteit Leuven
A disproportionally high number of children with specific language impairment
(SLI) develop dyslexia. Yet it is hard to predict which individual child is at risk. This
article presents a longitudinal study of phonological and early literacy development
of 18 Dutch-speaking children with SLI, compared to 18 typically developing con-
trols over a period of 2 years. These matched pairs of children were followed from 1
year before until 1 year after the start of formal literacy instruction. Children with
SLI had problems with phonological awareness (PA) and verbal short-term memory
(vSTM) in kindergarten. PA and vSTM in kindergarten were not good predictors for
dyslexia in children with SLI, but rapid automatized naming (RAN) measured in kin-
dergarten was strongly correlated with reading and spelling in both groups. We can
infer that only SLI children who additionally failed on RAN in kindergarten devel-
oped reading and spelling problems at the end of Grade 1.
INTRODUCTION
Specific Language Impairment
Specific language impairment (SLI) is defined as a failure in spoken language
development occurring despite average or above-average nonverbal intelli-
gence; adequate hearing and vision; absence of neurological, physical, emo-
tional or social problems; and adequate opportunity to acquire spoken language
SCIENTIFIC STUDIES OF READING, 14(1), 58–84Copyright © 2010 Society for the Scientific Study of ReadingISSN: 1088-8438 print / 1532-799X onlineDOI: 10.1080/10888430903242035
Correspondence should be sent to Ellen Vandewalle, Katholieke Universiteit Leuven, ExpORL,
Department of Neurosciences, Herestraat 49 bus 721, Leuven, 3000, Belgium. E-mail: ellen.
Downloaded By: [KU Leuven Biomedical Library] At: 11:39 25 January 2010
skills (McArthur & Bishop, 2001). SLI is not a homogeneous disorder, but it in-
cludes children with varying profiles, arising from combinations of deficits in
particular areas of communication (phonology, morphology, syntax, semantics,
and pragmatics). Deficits in each area can include receptive and/or expressive
difficulties (e.g., Bishop & Leonard, 2000; Botting & Conti-Ramsden, 2004).
Comorbidity With Dyslexia
Dyslexia is frequently comorbid with SLI. Dyslexia is generally defined as a dis-
order characterized by severe reading and spelling difficulties that are persistent
and resistant to the usual didactic measures and remedial efforts. Data on the
prevalence of the comorbidity between SLI and dyslexia are inconsistent, vary-
ing from 12.5% to 85% (for an overview, see McArthur, Hogben, Edwards,
Heath, & Mengler, 2000). These different estimates relate to the definitions and
criteria used to diagnose SLI and dyslexia, the way of selecting participants, and
the age of the participants at the time of diagnosis. Catts, Adlof, Hogan, and
Weismer (2005) used precise selection criteria and found a rather limited but sta-
tistically significant overlap (17–33%) between SLI diagnosed in kindergarten
and dyslexia in later grades. Because comorbidity of SLI and dyslexia is clearly
above chance level, children with SLI seem to have an increased risk to develop
dyslexia. On average, children with SLI tend to score significantly poorer on
reading and spelling measures than typically developing controls (e.g., Ander-
son, Brown, & Tallal, 1993; Catts, 1993; Catts, Gillispie, Leonard, Kail, &
Miller, 2002; McArthur et al., 2000). Snowling, Bishop, and Stothard (2000) re-
ported that the number of SLI children with comorbid dyslexia may increase
with age.
The cause of this comorbidity is still under study, but a number of models
posit that the overlap between both disorders can be explained by problems in the
development of phonological skills (Bishop & Snowling, 2004; Catts et al.,
2005; Pennington & Bishop, 2009; Scarborough & Dobrich, 1990; Snowling et
al., 2000).
Causal Theories of Dyslexia
Problems with phonology (i.e. the representation and processing of speech
sounds) are widely accepted as a cause of dyslexia (for a review, see Snowling,
2000). Phonological deficits have been demonstrated in three broad areas
(Wagner & Torgesen, 1987): phonological awareness (PA; e.g., Liberman
& Shankweiler, 1985; Mann & Liberman, 1984), verbal short-term memory
(vSTM; e.g., Catts, 1989; Mann & Liberman, 1984) and retrieval of phono-
logical codes from long-term memory (rapid automatized naming [RAN];
e.g., Bowers & Swanson, 1991). Several prospective longitudinal studies
WHO IS AT RISK FOR DYSLEXIA 59
Downloaded By: [KU Leuven Biomedical Library] At: 11:39 25 January 2010

have suggested a causal link between sensitivity to the phonological structure
of words and later progress in reading acquisition (e.g., Bradley & Bryant,
1983; Wagner, Torgesen, & Rashotte, 1994), although this relation is probably
reciprocal (e.g., Morais, Cary, Alegria, & Bertelson, 1979; Torppa et al.,
2007).
The relation between RAN on one hand and PA and vSTM on the other hand
has been subject of an ongoing debate. According to the traditional view, slow
naming speed reflects a type of problem that is partially distinct from PA but still is
connected to a similar underlying deficit, that is, underspecified or immature pho-
nological representations (e.g., Pennington, Cardoso-Martins, Green, & Lefly,
2001; Wagner et al., 1994). According to others (e.g., Bowers & Ishaik, 2003;
Compton, De Fries, & Olson, 2001; Wolf & Bowers, 1999) RAN is a unique and
independent predictor for dyslexia besides the phonological deficit and can be in-
dependently affected and cause dyslexia. If both skills are affected, the child has a
so-called double deficit and his or her reading and spelling impairment will be
more severe (Wolf & Bowers, 1999).
PA, vSTM, RAN, and Their Role in Reading Development
in Children With SLI
Although many studies have investigated this relation, the precise link between
phonological skills and their predictive value for literacy development is not yet
clear. It is generally accepted that PA and RAN are good predictors for reading in
typically developing children (for a review, see Scarborough, 1998; Verhagen,
Aarnoutse, & van Leeuwe, 2008; Wolf, Bowers, & Biddle, 2000). PA tends to be
more important in the initial phases of reading development (for word-analytic de-
coding) and is more correlated with reading accuracy. RAN may be of greater im-
portance in the development of reading fluency (word-holistic recognition) and
reading comprehension and is better correlated with reading speed (Elbro &
Scarborough, 2004; van den Bos, Ruijssenaars, & Spelberg, 2008; van den Bos,
Zijlstra, & Spelberg, 2002). However, other language skills (e.g., general language
ability, expressive language, vocabulary) also have a predictive value for dyslexia
(Scarborough, 1998).
Although it is not sure whether these same skills predict dyslexia in children
with SLI, a number of SLI studies do retain the same predictors: PA, RAN, letter
knowledge, vocabulary, grammar skills, and nonverbal intelligence (Catts et al.,
2002; Elbro & Scarborough, 2004; Scarborough, 1998). Nonverbal intelligence
seems to have a protective influence on reading development, as SLI children with
high IQ can better compensate for their language problems (Snowling et al., 2000).
In Catts’s (1993) study, children with speech and/or language problems had signif-
icantly lower first- and second-grade reading scores than typically developing
controls. For these children, preschool measures of PA and RAN turned out to be
60 VANDEWALLE ET AL.
Downloaded By: [KU Leuven Biomedical Library] At: 11:39 25 January 2010
better predictors for word recognition in Grade 1 and Grade 2 than measures of re-
ceptive and expressive language ability. de Bree (2007) performed an extensive
study on phonological abilities of Dutch-speaking children at various younger
ages (1;6 to 5;0 years) and observed that, in comparison with a control group, both
children with SLI and children at family risk for dyslexia showed phonological
difficulties, but with different error patterns.
A number of studies compared child groups that were defined on a basis of pre-
senting oral language and literacy problems: an SLI group with normal literacy
(SLI-NL), a literacy-disabled SLI group (SLI-LD), a control group with normal
literacy (Control-NL), and a literacy-disabled control group (Control-LD). It is in-
teresting to investigate the potentially different performance of these four groups
on tests like PA, vSTM, and RAN, and their relation with reading skills.
On one hand, Catts et al. (2005) observed that the SLI-NL group had no or only
a mild deficit in PA and vSTM compared to a control group in Grade 4 and 8,
whereas the Control-LD group and the SLI-LD group had more problems with PA
and vSTM. Based on these results, the authors concluded that problems with PA
and vSTM are more closely associated with dyslexia than with SLI. Similar results
were obtained by Kelso, Fletcher, and Lee (2007) for SLI children between 7 and 9
years old.
On the other hand, some other studies (Bishop, McDonald, Bird, & Hayiou-
Thomas, 2009; Scheltinga, van der Leij, & van Beinum, 2003) found no relation
between PA and reading skills in children with SLI. In the study by Bishop et al.
(2009), the four groups were compared. At the age of 4 and 6 years, scores for PA
and vSTM were not significantly different for the SLI-NL group and the SLI-LD
group. Based on this result, the authors concluded that PA and vSTM are associ-
ated with oral language problems and are not typical for dyslexia. At the age of 9
years, the SLI-NL group outperformed the SLI-LD group and the control-LD
group for RAN, and their scores did not differ significantly from the control-NL
group. RAN measured at 9 years was the strongest predictor to divide the SLI
children in groups on a basis of literacy achievement. Hence, the authors con-
cluded that RAN is not related to oral language ability, but it is related to reading
ability. Apparently, good RAN-skills can be protective for reading development,
even when oral language skills are impaired. Unfortunately, in the study by
Bishop et al. (2009) RAN was not measured at 4 and 6 years of age, but it was
suggested to be a good predictor of early reading difficulties in children with lan-
guage impairment.
In line with the study by Bishop et al. (2009), Brizzolara et al. (2006) obtained
similar results in poor readers with and without a history of language delay. RAN
deficits were shared by most dyslexics (with and without a history of language im-
pairment), whereas PA and vSTM problems were mainly associated with a history
of language impairment. They concluded that in a language with a regular orthog-
raphy such as Italian, RAN, and not PA or vSTM, may represent the main cogni-
WHO IS AT RISK FOR DYSLEXIA 61
Downloaded By: [KU Leuven Biomedical Library] At: 11:39 25 January 2010

tive marker of developmental dyslexia. Studies by Raitano, Pennington, Tunick,
and Boada (2004) and Tunick (2004) indicate that RAN is relatively spared in chil-
dren with a speech sound disorder. In these studies good RAN skills seem to pro-
tect children with a speech sound disorder and a phonological deficit from devel-
oping dyslexia.
Need for More Longitudinal Research
Thus far it is not clear whether SLI children with normal literacy ability score
within normal range for PA and vSTM. Several studies postulate that an isolated
PA deficit will not necessarily cause dyslexia in children with SLI. Moreover, the
studies by Bishop et al. (2009) and Scheltinga et al. (2003) suggest that PA and
vSTM are not related to reading and spelling ability in children with SLI. There-
fore, it may be incorrect to assume that literacy predictors for children with SLI are
the same as those for the general population. Also the early role of RAN on the
reading development of children with SLI has to be further investigated, as good
RAN skills are hypothesized to be protective for reading development. In addition,
the influence of language transparency (McCardle, Scarborough, & Catts, 2001) is
unclear.
At present only a few longitudinal SLI studies started in kindergarten. Yet this
is the only way to ensure that the measured phonological and language abilities are
not influenced by reading and spelling ability. To enable early diagnosis, preven-
tion, and intervention, more longitudinal research with an extended set of variables
is needed to find reliable preschool predictors for later reading and spelling prob-
lems in children with SLI.
In the present study, tests of PA, vSTM, RAN, and letter knowledge were as-
sessed in SLI and control children in the last year of kindergarten (KG3), before
children received any formal reading and spelling instruction. After 1 year of liter-
acy instruction, at the end of Grade 1 (G1), a series of standardized reading and
spelling tasks was administered. Groups were compared on the phonological and
literacy measures, and the predictive value of the kindergarten measures toward
first-grade literacy development was analyzed.
METHOD
Participants
This 2-year study pertains to 36 children, aged between 4;9 years and 5;10 years
when the first tests were administered: 18 children (3 girls and 15 boys) with SLI
(the SLI group) and 18 matched typically developing children (3 girls and
15 boys) without language or articulation problems (the control group).
62 VANDEWALLE ET AL.
Downloaded By: [KU Leuven Biomedical Library] At: 11:39 25 January 2010

All children with SLI were born in 2000, attended the last year of regular kin-
dergarten at the beginning of the study (KG3) and were monolingual Dutch speak-
ers. They had no mental retardation, hearing loss, or any other known problem that
could explain their language impairment. Nonverbal IQ, verbal IQ, or total IQ
was above 85 on the Wechsler Preschool and Primary Scale of Intelligence–Re-
vised (Vander Steene & Bos, 1997), on the Snijders-Oomen Niet-verbale Intelli-
gentietest—Revisie (Snijders-Oomen Nonverbal Intelligence Test–Revised;
Snijders, Tellegen, & Laros, 1988) or on the Colombia Mental Maturity Scale
(Burgemeister, Blum, & Lorge, 1972). The SLI group was recruited by open
calls toward all speech and language therapists in the Dutch-speaking part of
Belgium. All children of the SLI group started language therapy before the age of
4;4 years because of severe language problems. At the start of therapy, children
scored below percentile 3 on at least one of the subtests of three standardized
Dutch language tests: Reynell Taalontwikkelingsschalen (Reynell Language De-
velopmental Scales; Schaerlaekens, Zink, & van Ommeslaeghe, 2003), Taaltests
voor Kinderen (Language Tests for Children; van Bon & Hoekstra, 1982), or
Schlichting Test voor Taalproductie (Schlichting Test for Language Production;
Schlichting, van Eldik, Spelberg, van der Meulen, & van der Meulen, 2003). To
ensure the persistence of the language problem, children had to score below per-
centile 10 on at least one of the subtests of these language tests at a second evalu-
ation after the age of 4;4 years. In addition to these language problems, some
children had concurrent articulation problems.
Children in the control group met the same selection criteria, with the restric-
tion that they did not show any speech or language difficulties (as confirmed by
their parents and teachers). For every individual child from the SLI group, the
best matching control child was selected based on five criteria: (a) educational
environment, that is, same class; (b) gender; (c) age; (d) nonverbal intelligence;
and (e) parental educational level. Nonverbal intelligence was assessed collec-
tively in the class, using an adapted version of the Raven Coloured Progressive
Matrices (Raven, Court, & Raven, 1984) and parental educational level was ob-
tained by a questionnaire completed by the parents. The parents indicated their
highest obtained qualification, which was transformed into a low, middle, or
high score.
Actually, 26 children with SLI were initially selected, but 1 child left the study
after kindergarten because the parents no longer wished to participate, and 7 chil-
dren did not move on to G1 of a regular primary school after KG3. Three of these 7
children repeated KG3, and 4 moved to a special school for children with language
and learning disabilities. Throughout the article we present only results for the two
groups of 18 matched children who attended G1 in a regular primary school, as
only for these children reading and spelling skills can be compared and relations
between KG3 measures and G1 literacy achievement can be calculated. Moreover,
these restricted groups turned out to be better matched than the original groups. In
WHO IS AT RISK FOR DYSLEXIA 63
Downloaded By: [KU Leuven Biomedical Library] At: 11:39 25 January 2010
footnote1 more details about the 7 SLI children not attending G1 after KG3 are pre-
sented, and relevant results of the original groups of 26 SLI children and their con-
trols are given in additional footnotes.
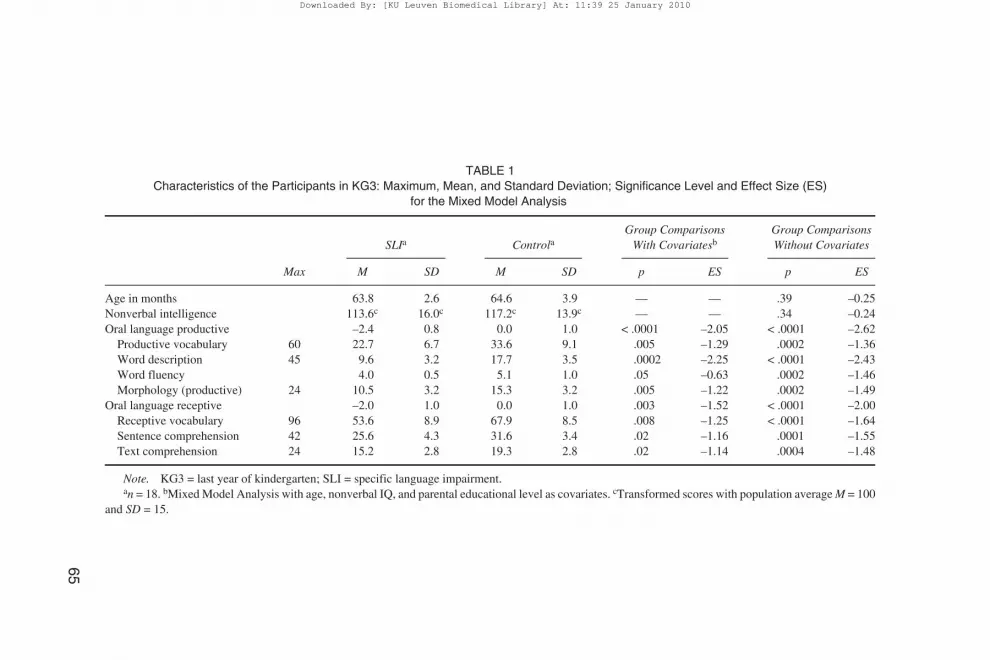
Descriptive statistics are displayed in Tables 1 and 2.2 Mixed model analyses
(MMA) showed that both groups had equivalent age and nonverbal intelligence (see Ta-
ble 1). Fisher’s Exact Tests revealed no significant group difference in the distribution of
the educational level of the mother, but there was a significant difference in the distribu-
tion of the educational level of the father (see Table 2). On all productive and receptive
oral language measures (for a description of the tests, see the Measures section), the
SLI group scored significantly poorer than the control group, even when covariates
were taken into account in the MMA (see Table 1). For articulation accuracy, control
children made few errors (with M = 43.7 close to the maximum score, SD = 0.6), but
the SLI group showed a large variation in articulation accuracy (M = 30.9, SD = 12.0).
In G1 oral language skills were reassessed with the same tasks. For all oral lan-
guage tasks, except sentence and text comprehension, the SLI group again scored
significantly lower than the control group. Repeated measures MMA were com-
puted with time (KG3 and G1) as within-subject variable, participant group as be-
tween-subject variable and with age, nonverbal intelligence and parental educa-
tional level as covariates. Significant group and time effects were present for all
tasks. The Group × Time interaction was only significant for the sentence compre-
hension task. Because all other interaction terms were nonsignificant, we can con-
clude that both groups made comparable progress on the oral language tasks. The
SLI group went through almost the same evolution as the control group, so there
was no recovery or increased delay of their language impairment.
Measures
Oral Language and Articulation Abilities
In KG3 and in G1 four tests of productive oral language, three tests of receptive
oral language, and an articulation test were administered.
64 VANDEWALLE ET AL.
1It is relevant to analyze the seven children with SLI that did not go to G1. Means for nonverbal IQ, oral
language, and all phonological tasks were lower for this group compared to the 18 SLI children who went on
to G1, but only the differences for nonverbal intelligence, rhyme production, nonword repetition, and the
vSTM composite score were significant. The decision to restart KG3 or move to a special school was jointly
taken by the parents and teachers at the end of KG3 and depended on different factors, like the presence of
emotional problems, doubts about cognitive skills, severe language, phonological and articulation prob-
lems, and personal factors. Hence, we can conclude that the 18 children with SLI who attended G1 are a
more homogeneous group than the initial group of 26 SLI children. This could be the reason why matching
correspondence for the restricted group of 18 pairs of children was better than for the 26 child pairs.2The results of the group comparisons of the 18 pairs of children for the kindergarten data presented
in Tables 1 and 2 are in line with results of the group comparisons for the original group of 2 × 26 SLI
and control children. Only on maternal educational level results were different: The original group of
26 SLI children did differ significantly from their 26 controls (p = .03).
Downloaded By: [KU Leuven Biomedical Library] At: 11:39 25 January 2010
65
TABLE 1
Characteristics of the Participants in KG3: Maximum, Mean, and Standard Deviation; Significance Level and Effect Size (ES)
for the Mixed Model Analysis
SLIa ControlaGroup Comparisons
With Covariatesb
Group Comparisons
Without Covariates
Max M SD M SD p ES p ES
Age in months 63.8 2.6 64.6 3.9 — — .39 –0.25
Nonverbal intelligence 113.6c 16.0c 117.2c 13.9c — — .34 –0.24
Oral language productive –2.4 0.8 0.0 1.0 < .0001 –2.05 < .0001 –2.62
Productive vocabulary 60 22.7 6.7 33.6 9.1 .005 –1.29 .0002 –1.36
Word description 45 9.6 3.2 17.7 3.5 .0002 –2.25 < .0001 –2.43
Word fluency 4.0 0.5 5.1 1.0 .05 –0.63 .0002 –1.46
Morphology (productive) 24 10.5 3.2 15.3 3.2 .005 –1.22 .0002 –1.49
Oral language receptive –2.0 1.0 0.0 1.0 .003 –1.52 < .0001 –2.00
Receptive vocabulary 96 53.6 8.9 67.9 8.5 .008 –1.25 < .0001 –1.64
Sentence comprehension 42 25.6 4.3 31.6 3.4 .02 –1.16 .0001 –1.55
Text comprehension 24 15.2 2.8 19.3 2.8 .02 –1.14 .0004 –1.48
Note. KG3 = last year of kindergarten; SLI = specific language impairment.an = 18. bMixed Model Analysis with age, nonverbal IQ, and parental educational level as covariates. cTransformed scores with population average M = 100
and SD = 15.
Downloaded By: [KU Leuven Biomedical Library] At: 11:39 25 January 2010

Productive oral language. The productive oral language test battery con-
sisted of a productive vocabulary test from the Taaltoets Allochtone Kinderen
(Language Test for Foreign Children; Verhoeven & Vermeer, 1986), a word de-
scription test and a productive morphology test (comprising plurals and past partici-
ples) from the Taaltoets Alle Kinderen (Language Test for All Children; Verhoeven &
Vermeer, 2001), and a newly designed word fluency test. This word fluency test
measured the speed at which the child was able to produce words belonging to one
semantic category (e.g., beverages, fruit, animals). This test was composed based on
the Individuele Taalniveautest voor Kleuters (Individual Language Level Test for
Children in Kindergarten; Dudal, 1999) and the subtest Ideeënproductie (Production
of Words) of the Revisie Amsterdamse Intelligentie Test (Revised Intelligence Test
developed in Amsterdam; Bleichrodt, Drenth, Zaal, & Resing, 1984). The child was
given 20 sec to produce as many words as possible from the given semantic cate-
gory. The score is then the average of the number of correct responses on all items.
Receptive oral language. The receptive oral language test battery consisted
of a receptive vocabulary test, a sentence comprehension, and a text comprehen-
sion task from the Taaltoets Alle Kinderen (Language Test for All Children;
Verhoeven & Vermeer, 2001).
Articulation accuracy. To assess articulation accuracy, two subtests of a
Dutch articulation test were administered (Speech Vision, 2000). These subtests
measured the pronunciation of two or three consonant clusters in words in initial or
final position. The child had to name the different pictures. A cluster was scored
incorrect if the child used substitutions or deletions of one or more sounds of the
consonant cluster.
66 VANDEWALLE ET AL.
TABLE 2
Characteristics of the Participants in KG3: Distribution of Parental
Educational Level in the SLI Group and the Control Group;
Significance Level for the Fisher’s Exact Test
SLIa ControlaGroup
Comparisons
Parental Educational Level Low Middle High Low Middle High p
Maternal educational level 3 11 4 2 5 11 .09
Paternal educational level 2 12 4 0 7 11 .02
Note. KG3 = last year of kindergarten; SLI = specific language impairment.
an = 18.
Downloaded By: [KU Leuven Biomedical Library] At: 11:39 25 January 2010
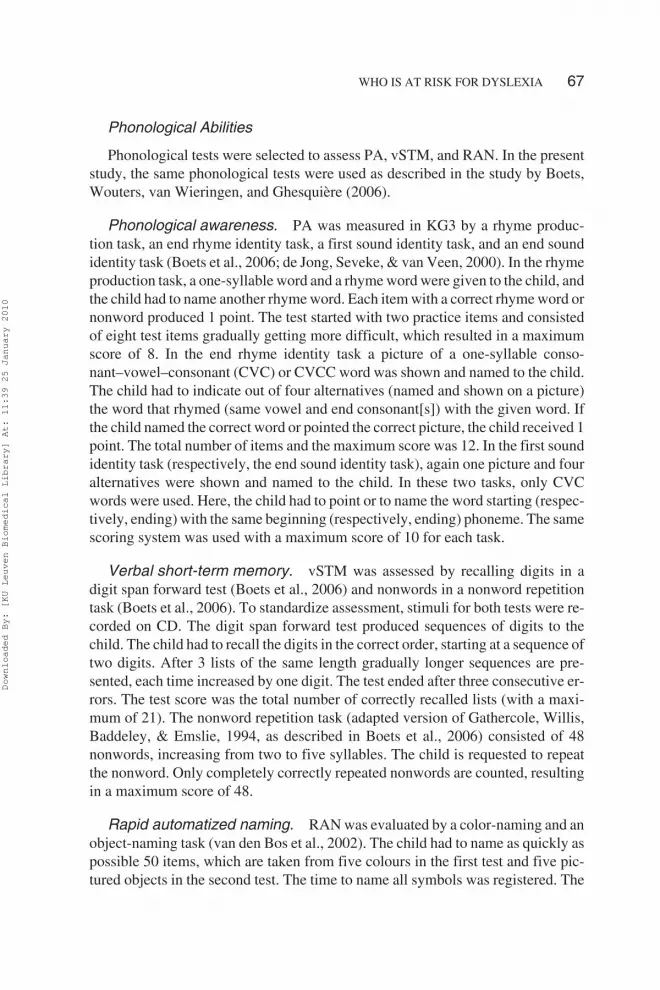
Phonological Abilities
Phonological tests were selected to assess PA, vSTM, and RAN. In the present
study, the same phonological tests were used as described in the study by Boets,
Wouters, van Wieringen, and Ghesquière (2006).
Phonological awareness. PA was measured in KG3 by a rhyme produc-
tion task, an end rhyme identity task, a first sound identity task, and an end sound
identity task (Boets et al., 2006; de Jong, Seveke, & van Veen, 2000). In the rhyme
production task, a one-syllable word and a rhyme word were given to the child, and
the child had to name another rhyme word. Each item with a correct rhyme word or
nonword produced 1 point. The test started with two practice items and consisted
of eight test items gradually getting more difficult, which resulted in a maximum
score of 8. In the end rhyme identity task a picture of a one-syllable conso-
nant–vowel–consonant (CVC) or CVCC word was shown and named to the child.
The child had to indicate out of four alternatives (named and shown on a picture)
the word that rhymed (same vowel and end consonant[s]) with the given word. If
the child named the correct word or pointed the correct picture, the child received 1
point. The total number of items and the maximum score was 12. In the first sound
identity task (respectively, the end sound identity task), again one picture and four
alternatives were shown and named to the child. In these two tasks, only CVC
words were used. Here, the child had to point or to name the word starting (respec-
tively, ending) with the same beginning (respectively, ending) phoneme. The same
scoring system was used with a maximum score of 10 for each task.
Verbal short-term memory. vSTM was assessed by recalling digits in a
digit span forward test (Boets et al., 2006) and nonwords in a nonword repetition
task (Boets et al., 2006). To standardize assessment, stimuli for both tests were re-
corded on CD. The digit span forward test produced sequences of digits to the
child. The child had to recall the digits in the correct order, starting at a sequence of
two digits. After 3 lists of the same length gradually longer sequences are pre-
sented, each time increased by one digit. The test ended after three consecutive er-
rors. The test score was the total number of correctly recalled lists (with a maxi-
mum of 21). The nonword repetition task (adapted version of Gathercole, Willis,
Baddeley, & Emslie, 1994, as described in Boets et al., 2006) consisted of 48
nonwords, increasing from two to five syllables. The child is requested to repeat
the nonword. Only completely correctly repeated nonwords are counted, resulting
in a maximum score of 48.
Rapid automatized naming. RAN was evaluated by a color-naming and an
object-naming task (van den Bos et al., 2002). The child had to name as quickly as
possible 50 items, which are taken from five colours in the first test and five pic-
tured objects in the second test. The time to name all symbols was registered. The
WHO IS AT RISK FOR DYSLEXIA 67
Downloaded By: [KU Leuven Biomedical Library] At: 11:39 25 January 2010
RAN-score is calculated as the number of symbols named per second. Thus, a
higher RAN-score corresponded to a higher naming speed.
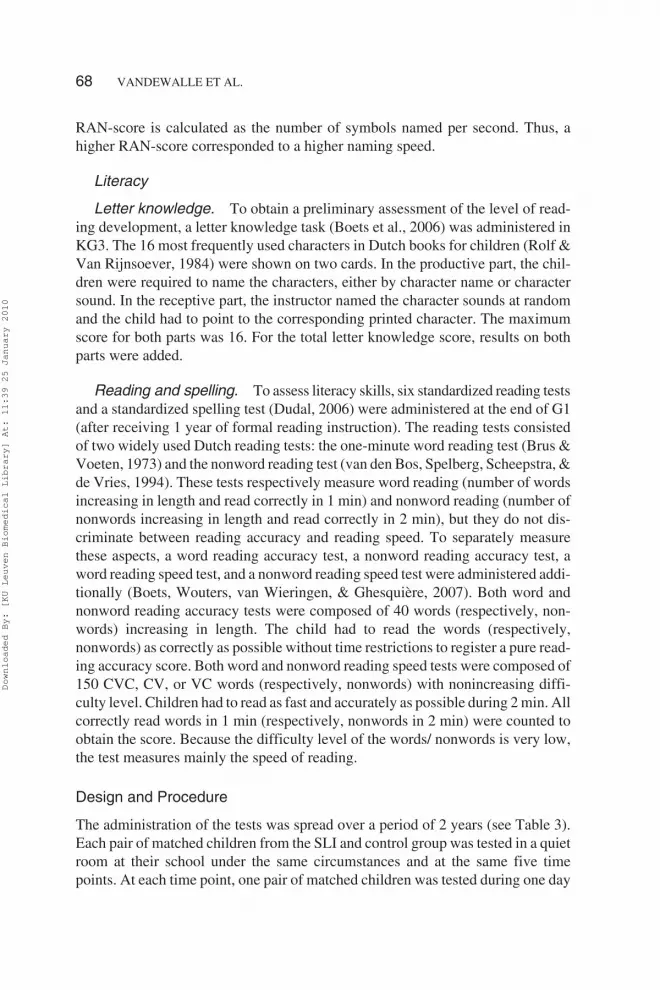
Literacy
Letter knowledge. To obtain a preliminary assessment of the level of read-
ing development, a letter knowledge task (Boets et al., 2006) was administered in
KG3. The 16 most frequently used characters in Dutch books for children (Rolf &
Van Rijnsoever, 1984) were shown on two cards. In the productive part, the chil-
dren were required to name the characters, either by character name or character
sound. In the receptive part, the instructor named the character sounds at random
and the child had to point to the corresponding printed character. The maximum
score for both parts was 16. For the total letter knowledge score, results on both
parts were added.
Reading and spelling. To assess literacy skills, six standardized reading tests
and a standardized spelling test (Dudal, 2006) were administered at the end of G1
(after receiving 1 year of formal reading instruction). The reading tests consisted
of two widely used Dutch reading tests: the one-minute word reading test (Brus &
Voeten, 1973) and the nonword reading test (van den Bos, Spelberg, Scheepstra, &
de Vries, 1994). These tests respectively measure word reading (number of words
increasing in length and read correctly in 1 min) and nonword reading (number of
nonwords increasing in length and read correctly in 2 min), but they do not dis-
criminate between reading accuracy and reading speed. To separately measure
these aspects, a word reading accuracy test, a nonword reading accuracy test, a
word reading speed test, and a nonword reading speed test were administered addi-
tionally (Boets, Wouters, van Wieringen, & Ghesquière, 2007). Both word and
nonword reading accuracy tests were composed of 40 words (respectively, non-
words) increasing in length. The child had to read the words (respectively,
nonwords) as correctly as possible without time restrictions to register a pure read-
ing accuracy score. Both word and nonword reading speed tests were composed of
150 CVC, CV, or VC words (respectively, nonwords) with nonincreasing diffi-
culty level. Children had to read as fast and accurately as possible during 2 min. All
correctly read words in 1 min (respectively, nonwords in 2 min) were counted to
obtain the score. Because the difficulty level of the words/ nonwords is very low,
the test measures mainly the speed of reading.
Design and Procedure
The administration of the tests was spread over a period of 2 years (see Table 3).
Each pair of matched children from the SLI and control group was tested in a quiet
room at their school under the same circumstances and at the same five time
points. At each time point, one pair of matched children was tested during one day
68 VANDEWALLE ET AL.
Downloaded By: [KU Leuven Biomedical Library] At: 11:39 25 January 2010

in three individual sessions of approximately 30 min. Tests were taken at three
time points when the children were attending KG3 (before learning to read and
write) and at two time points when they were attending G1 (when they started
learning to read and write). Data collection was carried out by four trained speech
and language therapists.
Data were analyzed in a clustered manner, comparing the SLI group with the
control group at the level of the matched individuals. MMA (Littell, Stroup, &
Freund, 2002; Verbeke & Lesaffre, 1997) was used with pair as a random variable
(1–18) and participant group (SLI group vs. control group) as the fixed be-
tween-subject variable. Age, nonverbal intelligence, and parental educational
level were included as fixed (co)variables. Because the incorporation of covariates
might obfuscate some effects, group comparisons without covariates are repre-
sented as well. Standardized mean differences were calculated as a measure of ef-
fect size for each MMA by dividing the difference between the least-squares
means by the pooled standard deviation of the dependent variable for that analysis
(Schagen & Elliott, 2004). As described by Cohen (1969), an effect size of 0.2 is
considered as small, whereas an effect size of 0.5 is called medium and an effect
size of 0.8 is called large. For the nonword repetition test and the verbal short-term
memory composite score, a statistical correction for articulation accuracy was ap-
plied. For letter knowledge, raw scores were log-transformed prior to MMA in or-
der to obtain a normal distribution.
Variables that were assumed to measure a common theoretical construct were
aggregated into composite scores. For the phonological measures, an exploratory
WHO IS AT RISK FOR DYSLEXIA 69
TABLE 3
Overview of the Test Period and Administered Tests
Year Test Period Administered Tests
KG3 4th–7th month Nonverbal IQ
Oral language part 1: productive vocabulary, sentence
comprehension, productive morphology
Articulation accuracy
6th–8th month PA
vSTM
RAN
Letter knowledge
8th–10th month Oral language part 2: word description, receptive vocabulary,
word fluency, text comprehension
G1 8th–10th month Oral language (part 1 and 2)
9th–10th month Reading
Spelling
Note. KG3 = last year of kindergarten; G1 = Grade 1; PA = phonological awareness; vSTM = ver-
bal short-term memory; RAN = rapid automatized naming.
Downloaded By: [KU Leuven Biomedical Library] At: 11:39 25 January 2010

factor analysis with varimax rotation retained four factors based on the Scree test.
Factor loadings of all phonological measures are presented in Table 4. The first
factor had heavy loadings of the nonword repetition task and the digit span and a
more modest loading of the first sound identity task. As a consequence, this factor
could be reliably labeled as the vSTM factor. The second factor was completely
determined by heavy loadings of both the color- and the object-RAN task, and as
such could be regarded as the RAN factor. The third factor was completely deter-
mined by heavy loadings of the rhyme production task and the end rhyme identity
task and hence represents PA at the rhyme level (PArhyme factor). Finally, the first
sound identity task and the end sound identity task loaded heavily on the fourth fac-
tor, namely, the PAphoneme factor. Consequently, composite scores for PArhyme,
PAphoneme, vSTM, and RAN were calculated by computing z scores for each task
and averaging the scores of the tests that determined the same underlying construct
(presented in bold in Table 4). In the same way, a composite score for the four ex-
pressive oral language tests and a composite score for the three receptive oral lan-
guage tests were calculated by averaging the z scores of the corresponding tests. All
composite scores were further standardized relative to the mean and standard devia-
tion of the control group (with M = 0 and SD = 1 for the control group).
Spearman correlation coefficients were calculated to analyze relationships be-
tween the kindergarten variables and G1 measures. To determine which children
have reading and spelling problems at the end of G1, a literacy composite score
was calculated averaging the standardized results (relative to normative data) of
all reading and spelling tests. A cut-off point of –1 SD on this literacy composite
score was taken as a criterion to delineate the literacy-delayed group. Another cri-
terion in order to define dyslexia is that the reading and spelling problems have to
70 VANDEWALLE ET AL.
TABLE 4
Factor Loadings of Exploratory Factor Analysis With Varimax Rotation
of All Phonological Measures in KG3
Factor 1
vSTM
Factor 2
RAN
Factor 3
PArhyme
Factor 4
PAphoneme
Rhyme production .10 .01 .92 .17
End rhyme identity .28 .24 .84 .11
First sound identity .56 –.14 .27 .65
End sound identity .12 .04 .13 .95
Nonword repetition .83 .20 .25 .20
Digit span .87 .23 .10 .10
RAN colors .17 .93 .07 –.01
RAN objects .16 .93 .13 –.01
Note. n = 36. KG3 = last year of kindergarten; vSTM = verbal short-term memory; RAN = rapid
automatized naming; PA = phonological awareness. Bold text indicates the dominant factor scores of
the phonological measures used in the composite scores.
Downloaded By: [KU Leuven Biomedical Library] At: 11:39 25 January 2010

be persistent and should be didactically resistant (Gersons-Wolfensberger &
Ruijssenaers, 1997). This additional criterion could not yet be verified in our
study, as children had only 1 year of formal reading instruction. Therefore, we do
not call the children scoring below –1 SD on the literacy composite score “dys-
lexic” or “literacy disabled” but “literacy delayed” (hence “LD” stands in the fur-
ther text for “literacy delayed”). The SLI-LD group was compared with the
SLI-NL group and the control-NL group using a clustered MMA design with pair
as random variable, participant group as fixed between-subject variable and with
the same covariates as mentioned above. All post hoc analyses were corrected for
multiple comparisons using the Tukey procedure (á = .05).
RESULTS
Data analyses are presented in function of their relevance to four research
questions.
1. Do Children With SLI Show More Problems With PA,
vSTM, RAN, and Letter Knowledge in KG3 Than Typically
Developing Children?
Descriptive statistics and MMA test statistics for these KG3 measures are displayed
in Table 5.3 MMA significance levels and effect sizes are presented for the group
comparisons with and without including covariates age, nonverbal intelligence, and
parental educational level. For PArhyme, PAphoneme, and vSTM tasks, the SLI
group scored lower than the control group, but not always significantly when
covariates were included. However, if we do not take into account the covariates, all
PArhyme, PAphoneme, and vSTM tasks show significant group differences. Effect
sizes (see Table 5) for PA and vSTM for both group comparisons were almost all
medium to large. Remarkable were the large standard deviations for both PA rhyme
tasks for the SLI group in comparison with the control group and a ceiling effect for
the rhyme production task for the control group, which are probably the reasons for
the nonsignificant p values for the MMA with covariates. For the two RAN tasks
and their composite score, no significant group differences were observed, with very
small effect sizes. Similar results were obtained when no covariates were taken into
account. For productive and receptive letter knowledge, the SLI group scored signif-
icantly lower than the control group with large effect sizes.
WHO IS AT RISK FOR DYSLEXIA 71
3The results of the phonological data presented in Table 5 are similar to the group comparisons of
the original 26 pairs of children. Only on four measures results of the MMA with covariates turned out
to be different: The original group of 26 SLI children did differ significantly from their 26 controls on
rhyme production (p = .007), end rhyme identity (p = .03), PArhyme composite score (p = .006), and
the digit span task (p = .005).
Downloaded By: [KU Leuven Biomedical Library] At: 11:39 25 January 2010

2. Do Children With SLI Show More Reading and Spelling
Problems at the End of G1 Than Typically Developing
Children?
At the end of G1, reading and spelling skills were assessed. In Table 6, maximum
scores, means, standard deviations, MMA significance levels, and effect sizes
with and without including covariates age, nonverbal intelligence, and parental ed-
ucational level are given for each test. It is evident that children from the SLI group
scored consistently lower on every literacy measure, but none of the group differ-
ences was statistically significant when covariates were included. Effect sizes in-
cluding covariates were very small, both for reading accuracy and reading speed.
However, MMA without covariates showed significant group differences and
large effect sizes for the word reading accuracy test and spelling test. The mean
reading and spelling scores of the control group were comparable to normative
72 VANDEWALLE ET AL.
TABLE 5
Scores for Phonological and Letter Knowledge Abilities in KG3: Maximum, Mean,
and Standard Deviation; Significance Level and Effect Size (ES)
for the Mixed Model Analysis
SLIa Controla
Group
Comparisons
With Covariatesb
Group
Comparisons
Without Covariates
Max M SD M SD p ES p ES
PArhyme composite –2.0 3.0 0.0 1.0 .20 –0.47 .01 –0.88
Rhyme production 8 6.4 2.3 7.7 0.8 .32 –0.37 .03 –0.70
End rhyme identity 12 7.9 3.6 10.4 1.5 .16 –0.49 .01 –0.89
PAphoneme composite –1.3 1.1 0.0 1.0 .03 –0.96 .002 –1.25
First sound identity 10 4.3 2.2 7.3 2.2 .01 –1.21 .0008 –1.37
End sound identity 10 4.1 2.5 6.1 2.2 .21 –0.50 .02 –0.83
vSTM composite –1.4 0.9 0.0 1.0 .04c –1.15c .0004 –1.46
Nonword repetition test 48 10.8 4.6 20.4 6.2 .04c –1.25c < .0001 –1.78
Digit span 21 6.2 1.8 7.8 1.7 .20 –0.51 .01 –0.91
RAN composite –0.5 1.1 0.0 1.0 .90 –0.05 .17 –0.48
RAN colors 0.6 0.2 0.7 0.2 .53 –0.25 .14 –0.52
RAN objects 0.6 0.2 0.7 0.1 .69 0.16 .25 –0.40
Letter knowledge 32 6.7 5.2 15.4 9.1 .02 –0.96 .0001 –1.27
Letter knowledge
productive
16 2.5 2.9 7.4 5.1 .02 –0.91 .0007 –1.12
Letter knowledge
receptive
16 4.2 2.7 8.1 4.3 .03 –0.85 .0005 –1.19
Note. KG3 = last year of kindergarten; SLI = specific language impairment; PA = phonological aware-
ness; vSTM = verbal short-term memory; RAN = rapid automatized naming.an = 18. bMixed Model Analysis with age, nonverbal IQ, and parental educational level as covariates.
cThese values were corrected for articulation accuracy.
Downloaded By: [KU Leuven Biomedical Library] At: 11:39 25 January 2010
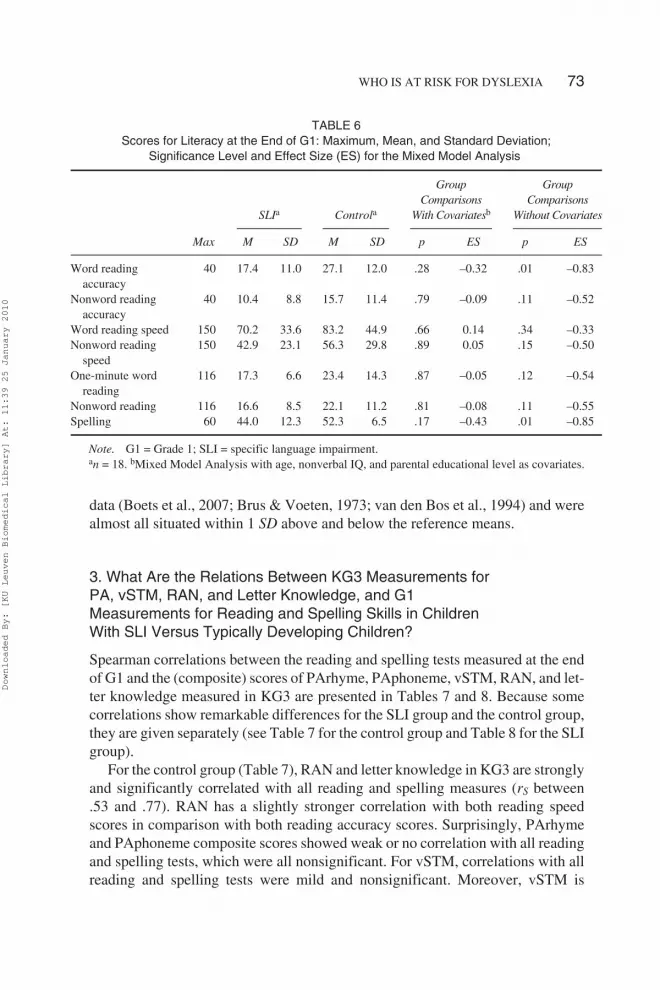
data (Boets et al., 2007; Brus & Voeten, 1973; van den Bos et al., 1994) and were
almost all situated within 1 SD above and below the reference means.
3. What Are the Relations Between KG3 Measurements for
PA, vSTM, RAN, and Letter Knowledge, and G1
Measurements for Reading and Spelling Skills in Children
With SLI Versus Typically Developing Children?
Spearman correlations between the reading and spelling tests measured at the end
of G1 and the (composite) scores of PArhyme, PAphoneme, vSTM, RAN, and let-
ter knowledge measured in KG3 are presented in Tables 7 and 8. Because some
correlations show remarkable differences for the SLI group and the control group,
they are given separately (see Table 7 for the control group and Table 8 for the SLI
group).
For the control group (Table 7), RAN and letter knowledge in KG3 are strongly
and significantly correlated with all reading and spelling measures (rS between
.53 and .77). RAN has a slightly stronger correlation with both reading speed
scores in comparison with both reading accuracy scores. Surprisingly, PArhyme
and PAphoneme composite scores showed weak or no correlation with all reading
and spelling tests, which were all nonsignificant. For vSTM, correlations with all
reading and spelling tests were mild and nonsignificant. Moreover, vSTM is
WHO IS AT RISK FOR DYSLEXIA 73
TABLE 6
Scores for Literacy at the End of G1: Maximum, Mean, and Standard Deviation;
Significance Level and Effect Size (ES) for the Mixed Model Analysis
SLIa Controla
Group
Comparisons
With Covariatesb
Group
Comparisons
Without Covariates
Max M SD M SD p ES p ES
Word reading
accuracy
40 17.4 11.0 27.1 12.0 .28 –0.32 .01 –0.83
Nonword reading
accuracy
40 10.4 8.8 15.7 11.4 .79 –0.09 .11 –0.52
Word reading speed 150 70.2 33.6 83.2 44.9 .66 0.14 .34 –0.33
Nonword reading
speed
150 42.9 23.1 56.3 29.8 .89 0.05 .15 –0.50
One-minute word
reading
116 17.3 6.6 23.4 14.3 .87 –0.05 .12 –0.54
Nonword reading 116 16.6 8.5 22.1 11.2 .81 –0.08 .11 –0.55
Spelling 60 44.0 12.3 52.3 6.5 .17 –0.43 .01 –0.85
Note. G1 = Grade 1; SLI = specific language impairment.an = 18. bMixed Model Analysis with age, nonverbal IQ, and parental educational level as covariates.
Downloaded By: [KU Leuven Biomedical Library] At: 11:39 25 January 2010
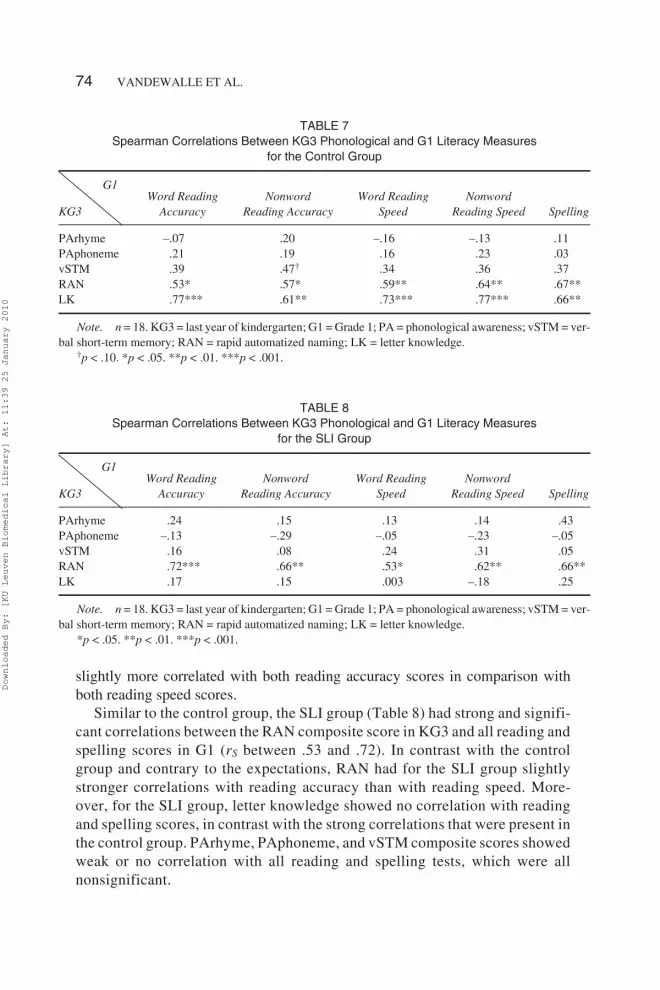
slightly more correlated with both reading accuracy scores in comparison with
both reading speed scores.
Similar to the control group, the SLI group (Table 8) had strong and signifi-
cant correlations between the RAN composite score in KG3 and all reading and
spelling scores in G1 (rS between .53 and .72). In contrast with the control
group and contrary to the expectations, RAN had for the SLI group slightly
stronger correlations with reading accuracy than with reading speed. More-
over, for the SLI group, letter knowledge showed no correlation with reading
and spelling scores, in contrast with the strong correlations that were present in
the control group. PArhyme, PAphoneme, and vSTM composite scores showed
weak or no correlation with all reading and spelling tests, which were all
nonsignificant.
74 VANDEWALLE ET AL.
TABLE 7
Spearman Correlations Between KG3 Phonological and G1 Literacy Measures
for the Control Group
G1
KG3
Word Reading
Accuracy
Nonword
Reading Accuracy
Word Reading
Speed
Nonword
Reading Speed Spelling
PArhyme –.07 .20 –.16 –.13 .11
PAphoneme .21 .19 .16 .23 .03
vSTM .39 .47† .34 .36 .37
RAN .53* .57* .59** .64** .67**
LK .77*** .61** .73*** .77*** .66**
Note. n = 18. KG3 = last year of kindergarten; G1 = Grade 1; PA = phonological awareness; vSTM = ver-
bal short-term memory; RAN = rapid automatized naming; LK = letter knowledge.†p < .10. *p < .05. **p < .01. ***p < .001.
TABLE 8
Spearman Correlations Between KG3 Phonological and G1 Literacy Measures
for the SLI Group
G1
KG3
Word Reading
Accuracy
Nonword
Reading Accuracy
Word Reading
Speed
Nonword
Reading Speed Spelling
PArhyme .24 .15 .13 .14 .43
PAphoneme –.13 –.29 –.05 –.23 –.05
vSTM .16 .08 .24 .31 .05
RAN .72*** .66** .53* .62** .66**
LK .17 .15 .003 –.18 .25
Note. n = 18. KG3 = last year of kindergarten; G1 = Grade 1; PA = phonological awareness; vSTM = ver-
bal short-term memory; RAN = rapid automatized naming; LK = letter knowledge.
*p < .05. **p < .01. ***p < .001.
Downloaded By: [KU Leuven Biomedical Library] At: 11:39 25 January 2010

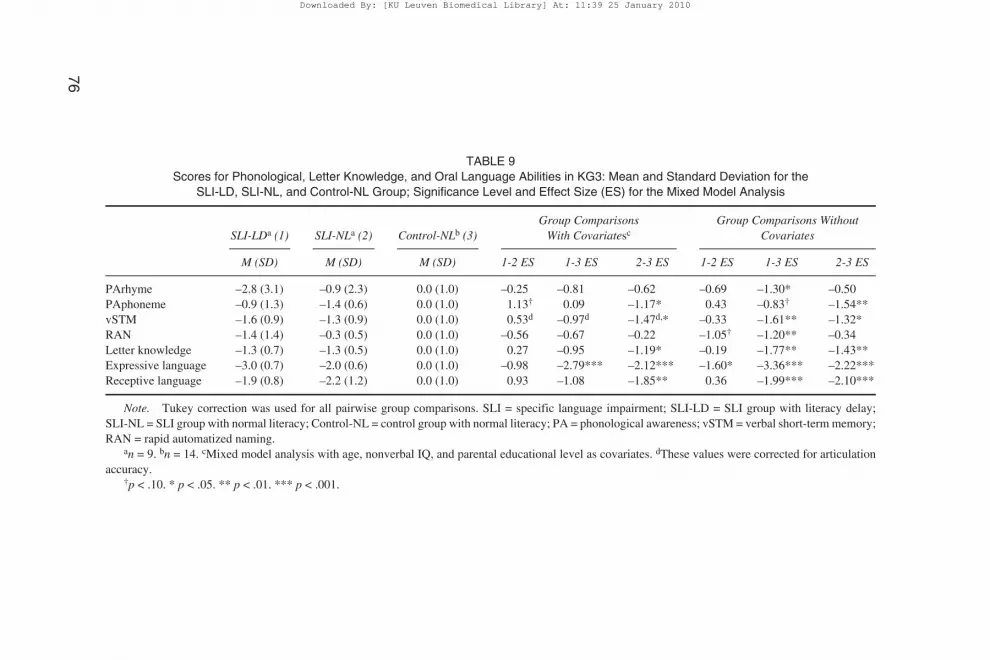
4. Do Children With SLI-LD Show More Problems With
PArhyme, PAphoneme, vSTM, RAN, and Letter Knowledge
Than SLI-NL Children or Control-NL Children?
Using a cut-off point of –1 SD on the literacy composite score based on reading
and spelling scores in G1, 9 of the 18 SLI children were literacy delayed (SLI-LD
group), whereas 4 of the 18 control children were literacy delayed (control-LD
group). In this manner, four groups were obtained: the SLI-NL group (n = 9), the
SLI-LD group (n = 9), the control-NL group (n = 14), and the control-LD group
(n = 4). Chi-square tests revealed that this group partitioning is close to signifi-
cance (p = .08). The last group will not be further analyzed because of its small
size.
Table 9 compares all composite scores measured at KG3 (PArhyme,
PAphoneme, vSTM, RAN, letter knowledge, expressive and receptive oral
language) for these three groups (SLI-LD, SLI-NL, control-NL). All means
and standard deviations shown in Table 9 were standardized relative to the
mean and standard deviation of the control-NL group (M = 0, SD = 1 for the
control-NL group). Effect sizes and significance levels of the group compari-
sons were presented with and without covariates (age, nonverbal IQ, and pa-
rental educational level). Given the rather small sample sizes, it should be
noted that the statistical power to discern significant group differences is rela-
tively small.
In KG3, both SLI groups (with and without literacy delay) had low scores for
PArhyme, PAphoneme, vSTM, and letter knowledge in comparison with the
control-NL group. Most of these group comparisons were significant with large
effect sizes when no covariates were taken into account. With covariates, how-
ever, fewer significant differences were retained. Remarkably, the SLI-NL
group scored even lower than the SLI-LD group for PAphoneme. The scores for
the three groups on the RAN tests showed a completely different pattern: the
SLI-NL group had similar scores as the control-NL group, but the SLI-LD group
scored lower compared to the SLI-NL group and control-NL group. These differ-
ences were not significant when covariates were taken into account but were
(close to) significant without covariates. The effect sizes for the comparison of
the SLI-LD group with the SLI-NL and control-NL groups were large, whereas
the effect size for the comparison of the SLI-NL group with the control-NL
group was small. For oral language in KG3, the SLI-LD and the SLI-NL group
had, as expected, lower scores than the control-NL group and most of these dif-
ferences were significant. Note that for expressive and receptive oral language
the SLI-LD and the SLI-NL group did not differ significantly when covariates
were taken into account. However, for expressive oral language, MMA without
covariates showed a significantly lower score for the SLI-LD group compared to
the SLI-NL group.
WHO IS AT RISK FOR DYSLEXIA 75
Downloaded By: [KU Leuven Biomedical Library] At: 11:39 25 January 2010
76
TABLE 9
Scores for Phonological, Letter Knowledge, and Oral Language Abilities in KG3: Mean and Standard Deviation for the
SLI-LD, SLI-NL, and Control-NL Group; Significance Level and Effect Size (ES) for the Mixed Model Analysis
SLI-LDa (1) SLI-NLa (2) Control-NLb (3)
Group Comparisons
With Covariatesc
Group Comparisons Without
Covariates
M (SD) M (SD) M (SD) 1-2 ES 1-3 ES 2-3 ES 1-2 ES 1-3 ES 2-3 ES
PArhyme –2.8 (3.1) –0.9 (2.3) 0.0 (1.0) –0.25 –0.81 –0.62 –0.69 –1.30* –0.50
PAphoneme –0.9 (1.3) –1.4 (0.6) 0.0 (1.0) 1.13† 0.09 –1.17* 0.43 –0.83† –1.54**
vSTM –1.6 (0.9) –1.3 (0.9) 0.0 (1.0) 0.53d –0.97d –1.47d,* –0.33 –1.61** –1.32*
RAN –1.4 (1.4) –0.3 (0.5) 0.0 (1.0) –0.56 –0.67 –0.22 –1.05† –1.20** –0.34
Letter knowledge –1.3 (0.7) –1.3 (0.5) 0.0 (1.0) 0.27 –0.95 –1.19* –0.19 –1.77** –1.43**
Expressive language –3.0 (0.7) –2.0 (0.6) 0.0 (1.0) –0.98 –2.79*** –2.12*** –1.60* –3.36*** –2.22***
Receptive language –1.9 (0.8) –2.2 (1.2) 0.0 (1.0) 0.93 –1.08 –1.85** 0.36 –1.99*** –2.10***
Note. Tukey correction was used for all pairwise group comparisons. SLI = specific language impairment; SLI-LD = SLI group with literacy delay;
SLI-NL = SLI group with normal literacy; Control-NL = control group with normal literacy; PA = phonological awareness; vSTM = verbal short-term memory;
RAN = rapid automatized naming.an = 9. bn = 14. cMixed model analysis with age, nonverbal IQ, and parental educational level as covariates. dThese values were corrected for articulation
accuracy.†p < .10. * p < .05. ** p < .01. *** p < .001.
Downloaded By: [KU Leuven Biomedical Library] At: 11:39 25 January 2010

DISCUSSION
This study focused on the role of preschool phonological skills (PA, vSTM, and
RAN) and letter knowledge in the development of reading and spelling problems
in children with SLI and allows us to draw some interesting conclusions.
RAN measured in KG3 was highly correlated with reading (both accuracy and
speed) and spelling at the end of G1 for children with SLI as well as for typically
developing children. Moreover, RAN scores measured in KG3 were lower for the
SLI group with literacy delay compared to the SLI group with normal literacy and
compared to normal reading controls. Based on these observations, RAN can be
regarded as a good preschool predictor for reading and spelling problems at the
end of G1 in children with SLI. This was already hypothesized by Bishop et al.
(2009) and is empirically confirmed in this study, consistent with the findings of
Catts (1993). A slightly stronger correlation between RAN and reading speed
compared to reading accuracy could be observed in the control group, but not in
the SLI group.
PA (at rhyme and phoneme level) and vSTM scores in KG3 were low for the
whole SLI group, not only for the SLI group with literacy delay. These skills did
not differentiate the SLI group with literacy delay and the SLI group with normal
literacy. Surprisingly, PA and vSTM seem to play a less important role for word
reading and spelling development in children with SLI, as PA and vSTM in KG3
did not correlate significantly with reading (both accuracy and speed) and spelling
in children with SLI. Part of this phenomenon can be due to the transparent orthog-
raphy of the language, which is confirmed by a similar lack of correlation between
PA scores and reading/spelling scores in the control group. An identical lack of
correlation in the SLI group was found in the study by Bishop et al. (2009) and in
the study by Scheltinga et al. (2003). Moreover, this result is consistent with the
finding of de Bree (2007) for vSTM, but contradicts with the study by Catts
(1993). Our results suggest that PA and vSTM in kindergarten do not predict read-
ing and spelling in children with SLI or in children in general, in an orthographi-
cally transparent language.
In the control group but not in the SLI group, good letter knowledge in KG3
was associated with better performance for reading and spelling at the end of G1.
Hence, letter knowledge does not seem to be a reliable predictor for reading and
spelling for children with SLI. This finding is in contrast with the results obtained
by Catts et al. (2002). There, letter knowledge was proposed to be a reliable predic-
tor for children with language impairments beside other predictors.
It is important to observe that these effects for RAN, PA, vSTM, and letter
knowledge are not influenced by the severity of the language problems, as the oral
language skills in SLI children with and without literacy problems were in general
not significantly different (although we have to be careful with this interpretation
because of the small sizes of the groups). Looking at expressive and receptive oral
WHO IS AT RISK FOR DYSLEXIA 77
Downloaded By: [KU Leuven Biomedical Library] At: 11:39 25 January 2010

language ability, it is interesting to observe that the SLI children with literacy
problems generally scored poorer than the SLI normal literacy group on expres-
sive but not on receptive oral language ability.
In summary, not all known predictors for reading and spelling problems in the
general population seem to predict reading and spelling problems in children with
SLI. In kindergarten, only RAN is able to predict reading and spelling ability at the
end of G1 for children with SLI. Not all children with SLI seem to have RAN prob-
lems (i.e., 4 of 18 in our study had a score below –1 SD in comparison with the con-
trol group, all from the SLI-LD group). On the other hand, most children with SLI
do have problems with phonological awareness (i.e., 13 of 18 in our study had a
score below –1 SD on PArhyme and/or PAphoneme, 6 belong to the SLI-LD
group) and problems with vSTM (i.e., 12 of 18 in our study, 6 belong to the
SLI-LD group). The PA and vSTM problems can be caused by oral language prob-
lems as mentioned by Bishop et al. (2009) as all but 1 of the 17 children with PA
and/or vSTM problems had an expressive language score lower than –1.6 SD in
comparison with the control group. Not all children with SLI do have an increased
risk for reading and spelling problems in G1. Based on these results, we can infer
that only the SLI subgroup with RAN problems on top of PA and vSTM problems
will develop reading and spelling problems in G1. In a similar vein, good RAN
skills can be seen as a protective factor against the development of reading and
spelling deficits (cf. Raitano et al., 2004; Tunick, 2004).
Surprisingly, in our study there was no significant difference in reading (both
for speed and accuracy and for words and nonwords) and spelling between the SLI
group and the control group at the end of G1 when covariates were taken into ac-
count. Moreover, effect sizes were very small and were not larger for reading
speed than for reading accuracy as one might have expected for a transparent lan-
guage. We initially expected a group difference based on three elements: first, the
relatively strong comorbidity between SLI and dyslexia; second, the observation
that children with SLI scored significantly lower on most of the tests for PA,
vSTM, and letter knowledge in KG3 in comparison with typically developing chil-
dren; and third, the widely established predictive relationship between PA, letter
knowledge, and reading development (e.g., Anderson et al., 1993; Catts, 1993;
Catts et al., 2002; McArthur et al., 2000). The fact that PA and vSTM problems in
KG3 did not cause literacy problems in G1 in this empirical study is in contradic-
tion with both the Double Deficit Hypothesis and the Single Deficit Hypothesis.
Although there is a lack of difference at the level of the group, among the 18 chil-
dren with SLI 9 had a literacy score lower than 1 SD at the end of G1. This preva-
lence value of 50% is rather high, which is partially due to the mild criterion but is
in line with the study of McArthur et al. (2000) where the same cut-off score of –1
SD was used. In addition, when no covariates were taken into account in the
MMA, a significant group difference was observed for the word reading accuracy
task and spelling task. Moreover, reading and spelling was measured in a very
78 VANDEWALLE ET AL.
Downloaded By: [KU Leuven Biomedical Library] At: 11:39 25 January 2010
early developmental stage where differences may not yet be very pronounced. In-
deed, the prevalence number of the comorbidity between SLI and dyslexia is sug-
gested to increase over time (Snowling et al., 2000).
Because the empirical data are limited to the Dutch language, one may think
that the conclusions about the small role of PA and the important role of RAN in
the development of reading in children with SLI may be restricted to transparent
languages. Indeed, it is generally acknowledged that in transparent languages such
as Dutch, the predictive role of PA may be less pronounced (Elbro & Scarborough,
2004) and RAN can play a more important role (Brizzolara et al., 2006; van den
Bos, 1998; Wimmer, 1993). However, as the conclusions of our study are consis-
tent with the conclusions of a study in English, a less transparent language (Bishop
et al., 2009), and a study in Italian, an even more transparent language than Dutch
(Brizzolara et al., 2006), the results of our study do not seem that language spe-
cific.
Although the conclusions of the studies by Catts et al. (2005) and Bishop et al.
(2009) may seem contradictory, after precise analysis and comparison with our
study, the results can be reconciled by considering the evolution of the variables
over time. In kindergarten, Grade 1 and Grade 2, PA and vSTM skills seem to be
weak in all SLI children, also in those with normal reading development, as all
three studies observed. In later reading development measured in Grade 4 and
Grade 8, both PA and vSTM improved for SLI children with normal reading but
remained weak in SLI children with dyslexia, as observed in the study by Catts et
al. (2005) and in line with some results for vSTM in the study by Bishop et al.
(2009) for children at the age of 9. Catts et al. (2005) offered two possible explana-
tions for this time-effect: It may reflect the reciprocal influence of reading on PA
or it may indicate that PA deficits are more stable over time in children with
dyslexia.
The number of children with SLI and the control group are rather small in this
study. However, the selection of both groups was done very carefully and both
groups were matched and analyzed while taking into account educational environ-
ment (same class), gender, age, nonverbal intelligence and parental educational
level. A very important element is that each pair of SLI and control child received
exactly the same instruction, which makes the comparisons for reading and spell-
ing ability highly reliable. Moreover, children of both groups were selected spread
over the whole Dutch part of Belgium (around 6 million inhabitants) and not only
those presented at one rehabilitation center. Most results of both the control and
the SLI group are also consistent with literature, indicating that they are represen-
tative for both populations.
Two critical elements regarding the group compositions in this study are the
persistence of the oral language problems for the SLI children and the representa-
tiveness of the control group. Language results of KG3 and G1 showed that the
SLI group had very low scores on almost any language aspect compared to the
WHO IS AT RISK FOR DYSLEXIA 79
Downloaded By: [KU Leuven Biomedical Library] At: 11:39 25 January 2010

control group. Although the SLI children were initially selected for scoring very
low on at least one language aspect, the whole SLI group had significantly lower
scores for almost all language aspects, even in G1. The language problems for the
SLI group seemed to be persistent, whereas the control group scored within nor-
mal ranges for oral language in KG3 and G1. Moreover, repeated measurements
showed that the evolution in oral language ability was similar for the SLI group
and control group, and the gap between both groups did not narrow despite the oral
language therapy that all SLI children received. Therefore, we can conclude that
the selection criteria for both groups were appropriate.
We conclude that preschool RAN measures appear to have an important role in
predicting the presence of reading and spelling problems among SLI children.
Therefore, further research is needed to analyze the underlying cognitive aspects
measured by RAN tests. Previous research has produced a number of possible cog-
nitive aspects as reviewed in Wolf and Bowers (2000), but no decisive conclusions
have been reached. Although degraded phonological representations often have
been mentioned, more recent studies hypothesize a disturbed access of phonologi-
cal codes (Ramus & Szenkovits, 2008) or a general deficit in the speed of process-
ing (Catts, Bridges, Little, & Tomblin, 2008). Another open question is whether
RAN can be considered as a part of phonology. In this respect, our study demon-
strates that RAN has a very different role than PA and vSTM for children with SLI.
In this study, only decoding skills and no reading comprehension skills have been
measured. Language impairment may have a stronger impact on reading compre-
hension than on single-word recognition as stated by Catts (1993) and Bishop et al.
(2009). It is intended to continue this longitudinal study to find out whether the
children with SLI will develop word recognition and spelling problems and/or
reading comprehension problems later on and which children with SLI will de-
velop these problems. This study has been performed in Dutch, a transparent lan-
guage for reading and spelling. Further longitudinal research in other languages
and with larger groups starting from kindergarten will also be necessary to gener-
alize these results for all children with SLI.
ACKNOWLEDGMENTS
The authors are grateful to Ester Dewaelheyns, Ellen De Wever, Indra Lens, Sarah
Saey, and Liesbet Schouwaerts for helping with the data collection. The authors
wish to acknowledge the rehabilitation centers, speech and language therapists,
and the Vlaamse Vereniging voor Logopedisten (VVL) [Flemish Union of Speech
and Language Therapists] for helping with the selection of the children with SLI,
and all the children, their parents, schools, and teachers for their commitment to
the study.
80 VANDEWALLE ET AL.
Downloaded By: [KU Leuven Biomedical Library] At: 11:39 25 January 2010
REFERENCES
Anderson, K. C., Brown, C. P., & Tallal, P. (1993). Developmental language disorders: Evidence for a
basic processing deficit. Current Opinion in Neurology & Neurosurgery, 6(1), 98–106.
Bishop, D. V. M., & Leonard, L. B. (2000). Speech and language impairments in children: Causes,
characteristics, intervention and outcome. Brighton, UK: Psychology Press.
Bishop, D. V. M., McDonald, D., Bird, S., & Hayiou-Thomas, M. E. (2009). Children who read words
accurately despite language impairment: Who are they and how do they do it? Child Development,
80(2), 593–605.
Bishop, D. V. M., & Snowling, M. J. (2004). Developmental dyslexia and specific language impair-
ment: Same or different? Psychological Bulletin, 130, 858–886.
Bleichrodt, N., Drenth, P. J. D., Zaal, J. N., & Resing, W. C. M. (1984). Revisie Amsterdamse Kinder
Intelligentietest [Revised Children Intelligence Test Developed in Amsterdam]. Lisse, the Nether-
lands: Swets & Zeitlinger.
Boets, B., Wouters, J., van Wieringen, A., & Ghesquière, P. (2006). Auditory temporal information
processing in preschool children at family risk for dyslexia: Relations with phonological abilities and
developing literacy skills. Brain and Language, 97, 64–79.
Boets, B., Wouters, J., van Wieringen, A., & Ghesquière, P. (2007). Auditory processing, speech per-
ception and phonological ability in pre-school children at high-risk for dyslexia: A longitudinal
study of the auditory temporal processing theory. Neuropsychologia, 45, 1608–1620.
Botting, N., & Conti-Ramsden, G. (2004). Characteristics of children with specific language impair-
ment. In L. Verhoeven & H. van Balkom (Eds.), Classification of developmental language disor-
ders: Theoretical issues and clinical implications (pp. 23–38). Mahwah, NJ: Erlbaum.
Bowers, P. G., & Ishaik, G. (2003). RAN’s contribution to understanding reading disabilities. In H. L.
Swanson, K. R. Harris, & S. Graham (Eds.), Handbook of learning disabilities (pp. 140–157). New
York: Guilford.
Bowers, P. G., & Swanson, L. B. (1991). Naming speed deficits in reading disability: Multiple mea-
sures of a singular process. Journal of Experimental Child Psychology, 51, 195–219.
Bradley, L., & Bryant, P. E. (1983). Categorizing sounds and learning to read: A causal connection. Na-
ture, 301, 419–421.
Brizzolara, D., Chilosi, A., Cipriani, P., Di Filippo, G., Gasperini, F., Mazzotti, S., et al. (2006). Do
phonological and rapid automatized naming deficits differentially affect dyslexic children with and
without a history of language delay? A study of Italian dyslexic children. Cognitive and Behavioral
Neurology, 19, 141–149.
Brus, B. T., & Voeten, M. J. (1973). Eén-minuut-test vorm A en B. Verantwoording en handleiding
[One-minute word reading test version A and B. Justification and manual]. Nijmegen, the Nether-
lands: Berkhout.
Burgemeister, B., Blum, L. H., & Lorge, I. (1972). Colombia Mental Maturity Scale (3rd ed.). New
York: Harcourt Brace.
Catts, H. W. (1989). Phonological processing deficits and reading disabilities. In A. G. Kahmi & H. W.
Catts (Eds.), Reading disabilities: A developmental language perspective (pp. 101–132). Boston:
Little Brown.
Catts, H. W. (1993). The relationship between speech-language impairments and reading disabilities.
Journal of Speech and Hearing Research, 36, 948–958.
Catts, H. W., Adlof, S. M., Hogan, T. P., & Weismer, S. E. (2005). Are specific language impair-
ment and dyslexia distinct disorders? Journal of Speech, Language, and Hearing Research, 48,
1378–1396.
Catts, H. W., Bridges, M. S., Little, T. D., & Tomblin, J. B. (2008). Reading achievement growth in
children with language impairments. Journal of Speech, Language and Hearing Research, 51,
1569–1579.
WHO IS AT RISK FOR DYSLEXIA 81
Downloaded By: [KU Leuven Biomedical Library] At: 11:39 25 January 2010
Catts, H. W., Gillispie, M., Leonard, L. B., Kail, R. V., & Miller, C. A. (2002). The role of speed of pro-
cessing, rapid naming, and phonological awareness in reading achievement. Journal of Learning
Disabilities, 35, 510–525.
Cohen, J. (1969). Statistical power analysis for the behavioral sciences. New York: Academic Press.
Compton, D. L., De Fries, J. C., & Olson, R. K. (2001). Are RAN- and phonological awareness-deficits
additive in children with reading disabilities? Dyslexia, 7, 125–149.
de Bree, E. (2007). Dyslexia and phonology: A study of the phonological abilities of Dutch children
at-risk of dyslexia. Unpublished doctoral dissertation, Universiteit Utrecht, Utrecht, the Netherlands.
de Jong, P. F., Seveke, M. J., & van Veen, M. (2000). Phonological sensitivity and the acquisition of
new words in children. Journal of Experimental Child Psychology, 76(4), 275–301.
Dudal, P. (1999). INTAK: Individuele taalniveautest voor kleuters [Individual language level test for
children in kindergarten]. Brussels, Belgium: VCLB Service.
Dudal, P. (2006). Leerlingvolgsysteem VCLB. Spelling: Toetsen 1-6. Basisboek en kopieerbundel
[Child follow-up system. Spelling tests for grade 1–6. Manual and copy-book]. Leuven, Belgium:
Garant.
Elbro, C., & Scarborough, H. S. (2004). Early identification. In T. Nunes & P. Bryant (Eds.), Handbook
of children’s literacy (pp. 339–359). Dordrecht, the Netherlands: Kluwer Academic.
Gathercole, S. E., Willis, C. S., Baddeley, A. D., & Emslie, H. (1994). The children’s test of nonword
repetition: A test of phonological working memory. Memory, 2(2), 103–127.
Gersons-Wolfensberger, D. J. M., & Ruijssenaers, W. A. J. J. M. (1997). Definition and treatment of
dyslexia: A report by the Committee on Dyslexia of the Health Council of the Netherlands. Journal
of Learning Disabilities, 30(2), 209–213.
Kelso, K., Fletcher, J., & Lee, P. (2007). Reading comprehension in children with specific language im-
pairment: An examination of two subgroups. International Journal of Language & Communication
disorders, 42, 39–57.
Liberman, I. Y., & Shankweiler, D. (1985). Phonology and the problems of learning to read and write.
Remedial and Special Education, 6, 8–17.
Littell, R. C., Stroup, W. W., & Freund, R. J. (2002). SAS for linear models (4th ed.). Cary, NC: SAS
Institute.
Mann, V. A., & Liberman, I. Y. (1984). Phonological awareness and verbal short-term memory: Can
they presage early reading problems? Journal of Learning Disabilities, 17, 592–599.
McArthur, G. M., & Bishop, D. V. M. (2001). Auditory perceptual processing in people with reading
and oral language impairments: Current issues and recommendations. Dyslexia, 7, 150–170.
McArthur, G. M., Hogben, J. H., Edwards, V. T., Heath, S. M., & Mengler, E. D. (2000). On the “spe-
cifics” of specific reading disability and specific language impairment. Journal of Child Psychology
and Psychiatry, 41, 869–874.
McCardle, P., Scarborough, H. S., & Catts, H. W. (2001). Predicting, explaining, and preventing chil-
dren’s reading difficulties. Learning Disabilities Research & Practice, 16, 230–239.
Morais, J., Carey, L., Alegria, J., & Bertelson, P. (1979). Does awareness of speech as a sequence of
phones arise spontaneously? Cognition, 7, 323–331.
Pennington, B. F., & Bishop, D. V. M. (2009). Relations among speech, language, and reading disor-
ders. Annual Review of Psychology, 60(7), 1–24.
Pennington, B. F., Cardoso-Martins, C., Green, P. A., & Lefly, D. L. (2001). Comparing the phonological
and double deficit hypotheses for developmental dyslexia. Reading and Writing, 14(7-8), 705–799.
Raitano, N. A., Pennington, B. F., Tunick, R. A., & Boada, R. (2004). Pre-literacy skills of subgroups
of children with speech sound disorders. Journal of Child Psychology and Psychiatry, 45, 821–835.
Ramus, F., & Szenkovits, G. (2008). What phonological deficit? The Quarterly Journal of Experimen-
tal Psychology, 61, 129–141.
Raven, J. C., Court, J. H., & Raven, J. (1984). Manual for Raven’s Progressive Matrices and Vocabu-
lary Scales. London: Lewis.
82 VANDEWALLE ET AL.
Downloaded By: [KU Leuven Biomedical Library] At: 11:39 25 January 2010
Rolf, P. C., & Van Rijnsoever, R. J. (1984). Positionele letter frekwenties van het Nederlands [Posi-
tional letter frequencies in Dutch]. Lisse, the Netherlands: Swets & Zeitlinger.
Scarborough, H. S. (1998). Early identification of children at risk for reading disabilities: Phonological
awareness and some other promising predictors. In P. J. Accardo, A. J. Capute, & B. K. Shapiro
(Eds.), Specific reading disability: A view of the spectrum (pp. 75–119). Timonium, MD: York.
Scarborough, H. S., & Dobrich, W. (1990). Development of children with early language delay. Jour-
nal of Speech and Hearing Research, 33, 70–83.
Schaerlaekens, A., Zink, I., & van Ommeslaeghe, K. (2003). Reynell Taalontwikkelingsschalen:
Handleiding, tweede versie [Reynell Language Developmental Scales: Manual, 2nd ed.]. Lisse, the
Netherlands: Swets & Zeitlinger.
Schagen, I., & Elliott, K. (2004). But what does it mean? The use of effect sizes in educational research.
London: National Foundation for Educational Research.
Scheltinga, F., van der Leij, A., & van Beinum, F. (2003). Importance of phonological skills and under-
lying processes to reading achievement. Proceedings of the Institute of Phonetic Sciences of the Uni-
versity of Amsterdam, The Netherlands, 25, 21–30.
Schlichting, J. E. P. T., van Eldik, M. C. M., Spelberg, H. C. L., van der Meulen, Sj., & van der Meulen,
B. F. (2003). Schlichting Test voor Taalproductie: Handleiding, derde gewijzigde druk [Schlichting
Test for Language Production: Manual, 3rd rev. ed.]. Lisse, the Netherlands: Swets & Zeitlinger.
Snijders, J. Th., Tellegen, P. J., & Laros, J. A. (1988). Snijders-Oomen niet-verbale intelligentietest
Son-R 5.5-17. Verantwoording en Handleiding [Snijders-Oomen nonverbal intelligence test—re-
vised version 5.5–17. Justification and manual]. Groningen, the Netherlands: Wolters-Noordhoff.
Snowling, M. J. (2000). Dyslexia (2nd ed.). Oxford, UK: Blackwell.
Snowling, M., Bishop, D. V. M., & Stothard, S. E. (2000). Is preschool language impairment a risk fac-
tor for dyslexia in adolescence? Journal of Child Psychology and Psychiatry, 41, 587–600.
Speech Vision v.z.w. (2000). Articulatie-OnderzoekTM Speech Vision [Dutch Articulation Test Speech
Vision]. Roeselare.
Torppa, M., Poikkeus, A.-M., Laakso, M.-L., Tolvanen, A., Leskinen, E., Leppänen, P. H. T., et al.
(2007). Modeling the early paths of phonological awareness and factors supporting its development
in children with and without familial risk of dyslexia. Scientific Studies of Reading, 11, 73–103.
Tunick, R. A. (2004). Cognitive overlap between reading disability and speech sound disorder: A test
of the severity hypothesis. Denver, CO: University of Denver.
van Bon, W. H. J., & Hoekstra, J. G. (1982). Taaltests voor Kinderen: Handleiding [Language Tests for
Children: Manual]. Lisse, the Netherlands: Swets & Zeitlinger.
van den Bos, K. (1998). IQ, phonological awareness, and continuous-naming speed related to Dutch
children’s performance on two word identification tests. Dyslexia, 4, 73–89.
van den Bos, K. P., Ruijssenaars, A. J. J. M., & Spelberg, H. C. L. (2008). De diagnose van dyslexie en
de ontwikkeling van woorden lezen [The diagnosis of dyslexia and the development of word read-
ing]. Tijdschrift voor Orthopedagogiek, 47, 325–338.
van den Bos, K. P., Spelberg, H. C. L., Scheepstra, A. J. M., & De Vries, J. R. (1994). De Klepel. Vorm
A en B. Een test voor de leesvaardigheid van pseudowoorden. Verantwoording, handleiding,
diagnostiek en behandeling [Klepel Test. Version A and B. A nonword reading test. Justification,
manual, diagnosis and treatment]. Nijmegen, the Netherlands: Berkhout.
van den Bos, K. P., Zijlstra, B. J. H., & Spelberg, H. C. (2002). Life-span data on continuous-naming speeds of
numbers, letters, colors, and pictured objects, and word-reading speed. Scientific Studies of Reading, 6, 25–49.
Vander Steene, G., & Bos, A. (1997). WPPSI-R, Wechler Preschool and Primary Scale of Intelligence.
Vlaams-Nederlandse aanpassing: Testinstructie [Flemish-Dutch adaptation. Test instruction]. Lisse,
the Netherlands: Swets & Zeitlinger.
Verbeke, G., & Lesaffre, E. (1997). The effect of misspecifying the random-effects distribution in
linear mixed models for longitudinal data. Computational Statistics and Data Analysis, 23,
541–556.
WHO IS AT RISK FOR DYSLEXIA 83
Downloaded By: [KU Leuven Biomedical Library] At: 11:39 25 January 2010

Verhagen, W., Aarnoutse, C., & van Leeuwe, J. (2008). Phonological awareness and naming speed in
the prediction of Dutch children’s word recognition. Scientific Studies of Reading, 12, 301–324.
Verhoeven, L., & Vermeer, A. (1986). Taaltoets Allochtone Kinderen: Diagnostische toets voor de
mondelinge vaardigheid Nederlands bij allochtone kinderen van 5-9 jaar (handleiding, toetsboeken,
scoreboeken) [Language Test for Foreign Children: Diagnostic test for the Dutch oral language
skills in foreign children from 5–9 years old (manual, test books, scoring forms)]. Zwijsen b.v.
Tilburg.
Verhoeven, L., & Vermeer, A. (2001). Taaltoets Alle Kinderen: Diagnostische toets voor de mon-
delinge vaardigheid Nederlands bij kinderen van groep 1 tot en met 4 (handleiding, toetsboeken,
scoreboeken) [Language Test for All Children: Diagnostic test for the Dutch oral language skills in
children from kindergarten till grade 2 (manual, test books, scoring forms)]. Arnhem, the Nether-
lands: Cito.
Wagner, R. K., & Torgesen, J. K. (1987). The nature of phonological processing and its causal role in
the acquisition of reading skills. Psychological Bulletin, 101, 192–212.
Wagner, R. K., Torgesen, J. K., & Rashotte, C. A. (1994). Development of reading-related phonologi-
cal processing abilities: New evidence of bidirectional causality from a latent variable longitudinal
study. Developmental Psychology, 30, 73–87.
Wimmer, H. (1993). Characteristics of developmental dyslexia in a regular writing system. Applied
Psycholinguistics, 14, 1–33.
Wolf, M., & Bowers, P. (1999). The “Double-Deficit Hypothesis” for the developmental dyslexias.
Journal of Educational Psychology, 91, 1–24.
Wolf, M., & Bowers, P. G. (2000). Naming-speed processes and developmental reading disabilities: An intro-
duction to the special issue on the double-deficit hypothesis. Journal of Learning Disabilities, 33, 322–324.
Wolf, M., Bowers, P. G., & Biddle, K. (2000). Naming-speed processes, timing, and reading: A con-
ceptual review. Journal of Learning Disabilities, 33, 387–407.
84 VANDEWALLE ET AL.
Downloaded By: [KU Leuven Biomedical Library] At: 11:39 25 January 2010