who are we trying to include? eight year demographic study reveals traits of transitioning young...
TRANSCRIPT
Who Are We Trying to Include?
Eight Year Demographic Study Reveals Traits of Transitioning Young Emirati Adults in a Rapidly Developing Society
Dr. Georgia DaleureSalman Alaskar Mohamed AlhashimiMohamed Alghazal Hamad ShaheenMohamed Jasim Musab IbrahimHumaid Binmasoud Mohamed Anwar
Sharjah Men’s Applied Research Team (SMART Club)
Emiratis must work and contribute back to the society in order to build and maintain a sustainable economy (UAE Vision 2021)
To develop successful education and training programs, the characteristics of those being educated and trained must be understood and accurately interpreted
The nature and context of the workplace that graduates will enter must be understood from its own historic and culture perspective
This study attempts to contribute toward that understanding
Inclusion --Holistic Sustainability
Sixth Annual GCES Symposium: Inclusion not Exclusion
April 2015 2
Participants were male and female Emirati students
from years 2004 to 2012 (with 2005 left out)
in two categories:first year of post-secondary education (PSE) total student population in alternate years
interpretations made with input from Emirati student researchers
About the Study
Sixth Annual GCES Symposium: Inclusion not Exclusion
April 2015 3
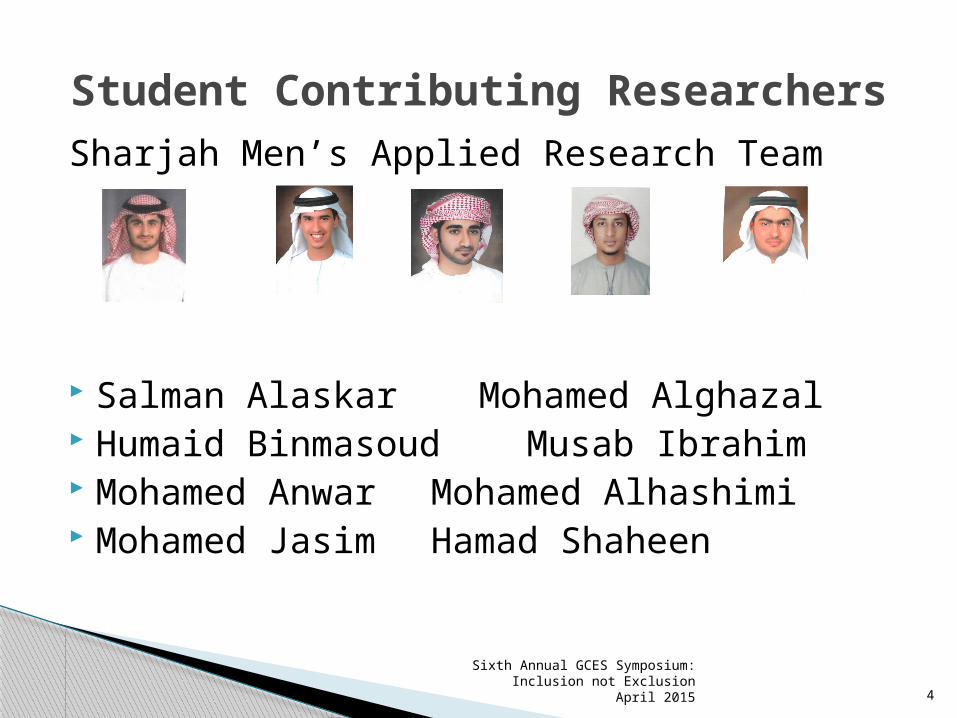
Sharjah Men’s Applied Research Team
Salman Alaskar Mohamed Alghazal Humaid Binmasoud Musab Ibrahim Mohamed Anwar Mohamed Alhashimi Mohamed Jasim Hamad Shaheen
Sixth Annual GCES Symposium: Inclusion not Exclusion
April 2015 4
Student Contributing Researchers
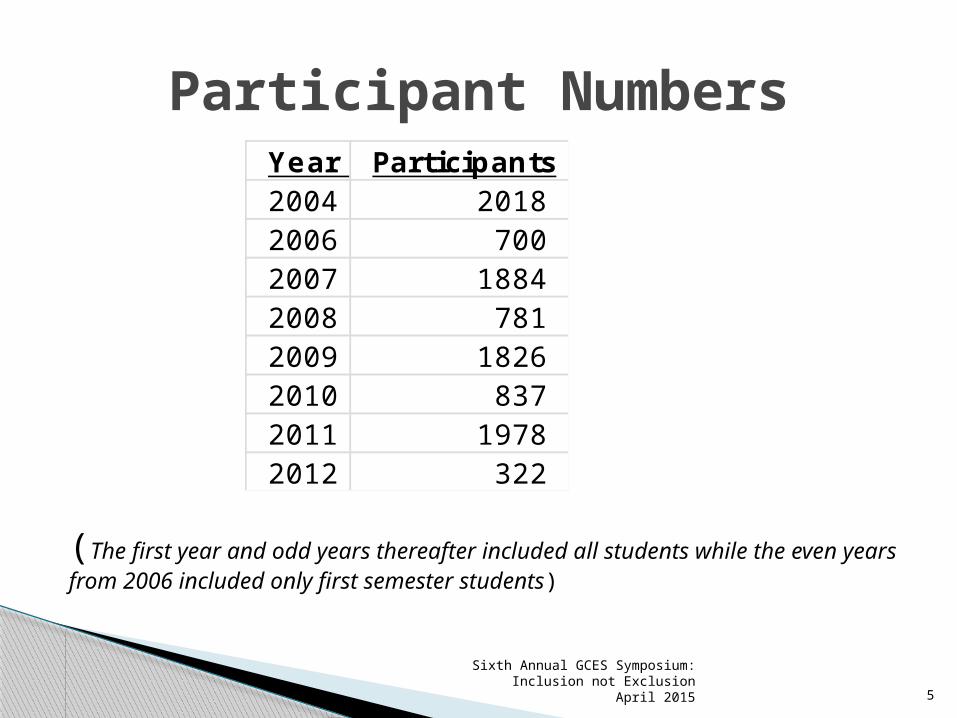
(The first year and odd years thereafter included all students while the even years from 2006 included only first semester students)
Participant NumbersYear Participants2004 20182006 7002007 18842008 7812009 18262010 8372011 19782012 322
Sixth Annual GCES Symposium: Inclusion not Exclusion
April 2015 5
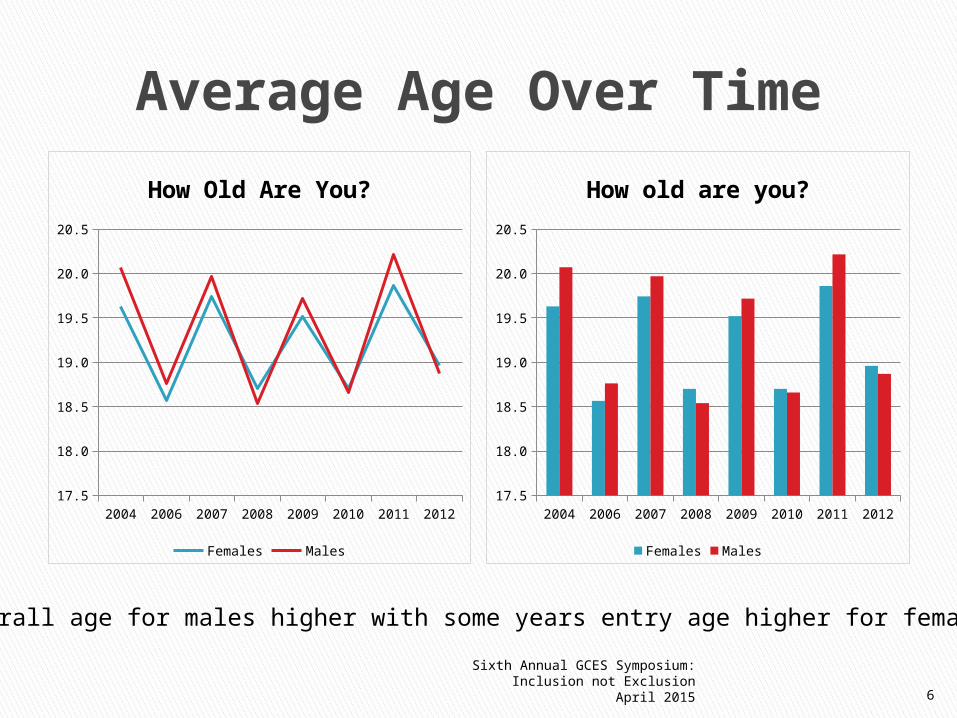
Average Age Over Time
2004 2006 2007 2008 2009 2010 2011 201217.5
18.0
18.5
19.0
19.5
20.0
20.5
How old are you?
Females Males
2004 2006 2007 2008 2009 2010 2011 201217.5
18.0
18.5
19.0
19.5
20.0
20.5
How Old Are You?
Females Males
Overall age for males higher with some years entry age higher for femalesSixth Annual GCES Symposium:
Inclusion not Exclusion April 2015 6
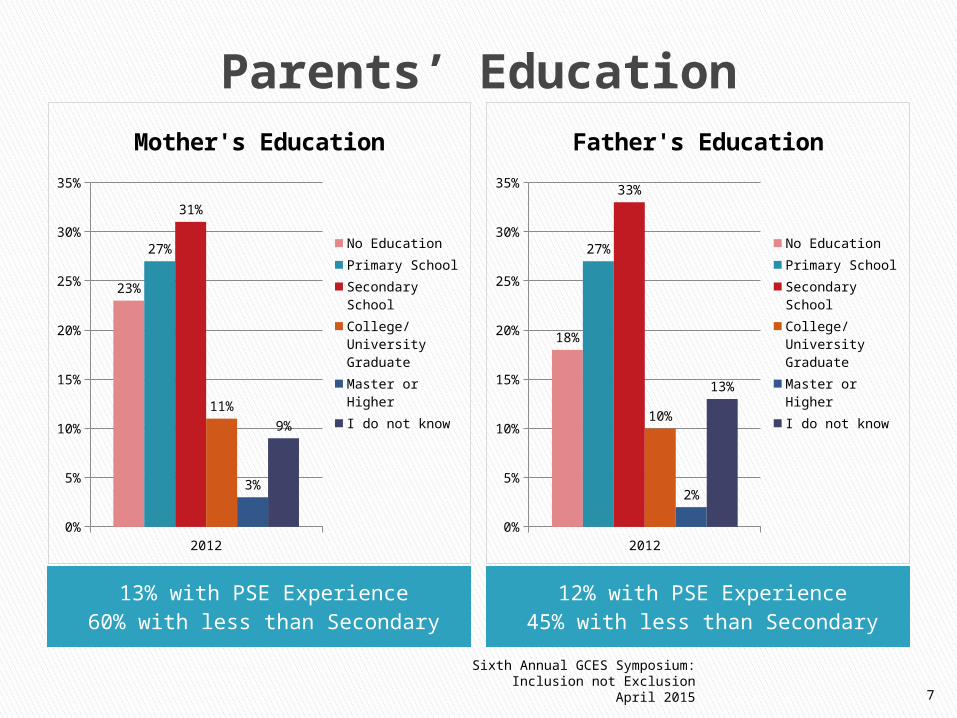
Parents’ Education
13% with PSE Experience60% with less than Secondary
12% with PSE Experience45% with less than Secondary
20120%
5%
10%
15%
20%
25%
30%
35%
23%
27%
31%
11%
3%
9%
Mother's Education
No EducationPrimary SchoolSecondary SchoolCollege/University GraduateMaster or HigherI do not know
20120%
5%
10%
15%
20%
25%
30%
35%
18%
27%
33%
10%
2%
13%
Father's Education
No EducationPrimary SchoolSecondary SchoolCollege/University GraduateMaster or HigherI do not know
Sixth Annual GCES Symposium: Inclusion not Exclusion
April 2015 7
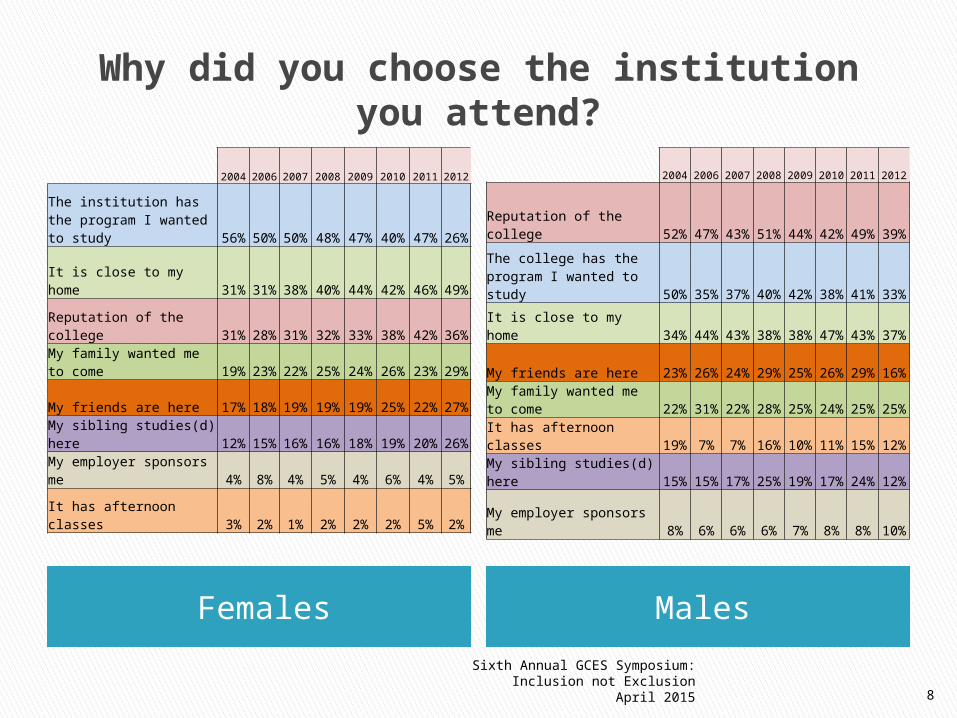
Why did you choose the institution you attend?
Females Males
2004 2006 2007 2008 2009 2010 2011 2012
The institution has the program I wanted to study 56% 50% 50% 48% 47% 40% 47% 26%
It is close to my home 31% 31% 38% 40% 44% 42% 46% 49%
Reputation of the college 31% 28% 31% 32% 33% 38% 42% 36%My family wanted me to come 19% 23% 22% 25% 24% 26% 23% 29%
My friends are here 17% 18% 19% 19% 19% 25% 22% 27%My sibling studies(d) here 12% 15% 16% 16% 18% 19% 20% 26%My employer sponsors me 4% 8% 4% 5% 4% 6% 4% 5%It has afternoon classes 3% 2% 1% 2% 2% 2% 5% 2%
2004 2006 2007 2008 2009 2010 2011 2012
Reputation of the college 52% 47% 43% 51% 44% 42% 49% 39%The college has the program I wanted to study 50% 35% 37% 40% 42% 38% 41% 33%It is close to my home 34% 44% 43% 38% 38% 47% 43% 37%
My friends are here 23% 26% 24% 29% 25% 26% 29% 16%My family wanted me to come 22% 31% 22% 28% 25% 24% 25% 25%It has afternoon classes 19% 7% 7% 16% 10% 11% 15% 12%My sibling studies(d) here 15% 15% 17% 25% 19% 17% 24% 12%
My employer sponsors me 8% 6% 6% 6% 7% 8% 8% 10%
Sixth Annual GCES Symposium: Inclusion not Exclusion
April 2015 8
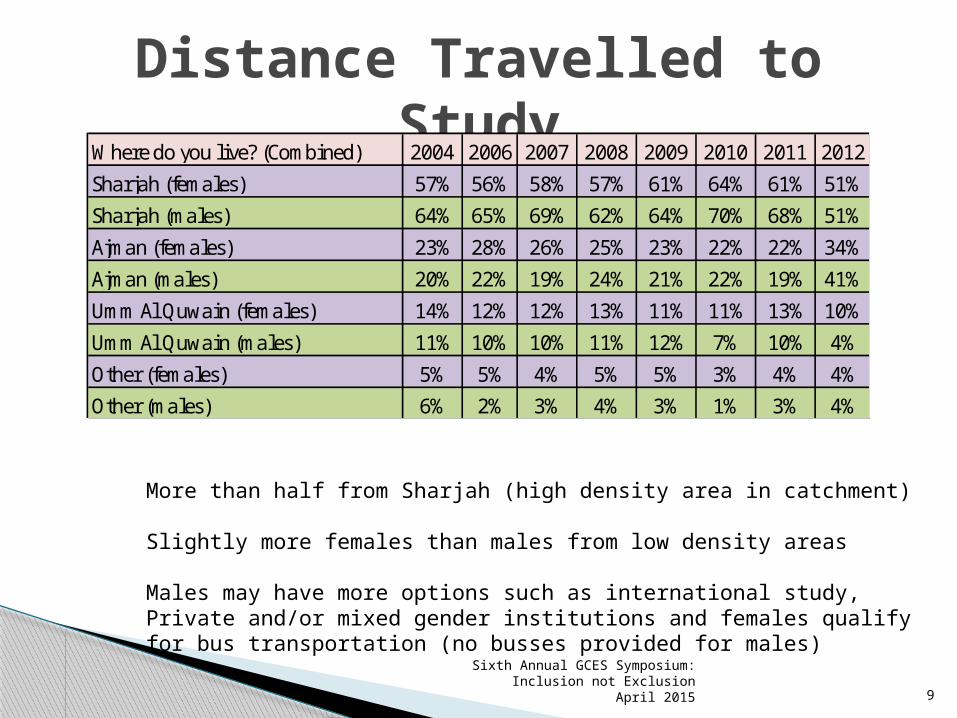
Distance Travelled to StudyW here do you live? (Combined) 2004 2006 2007 2008 2009 2010 2011 2012
Sharjah (females) 57% 56% 58% 57% 61% 64% 61% 51%Sharjah (males) 64% 65% 69% 62% 64% 70% 68% 51%Ajman (females) 23% 28% 26% 25% 23% 22% 22% 34%Ajman (males) 20% 22% 19% 24% 21% 22% 19% 41%Umm Al Quwain (females) 14% 12% 12% 13% 11% 11% 13% 10%Umm Al Quwain (males) 11% 10% 10% 11% 12% 7% 10% 4%Other (females) 5% 5% 4% 5% 5% 3% 4% 4%Other (males) 6% 2% 3% 4% 3% 1% 3% 4%
More than half from Sharjah (high density area in catchment)
Slightly more females than males from low density areas
Males may have more options such as international study,Private and/or mixed gender institutions and females qualify for bus transportation (no busses provided for males)
Sixth Annual GCES Symposium: Inclusion not Exclusion
April 2015 9
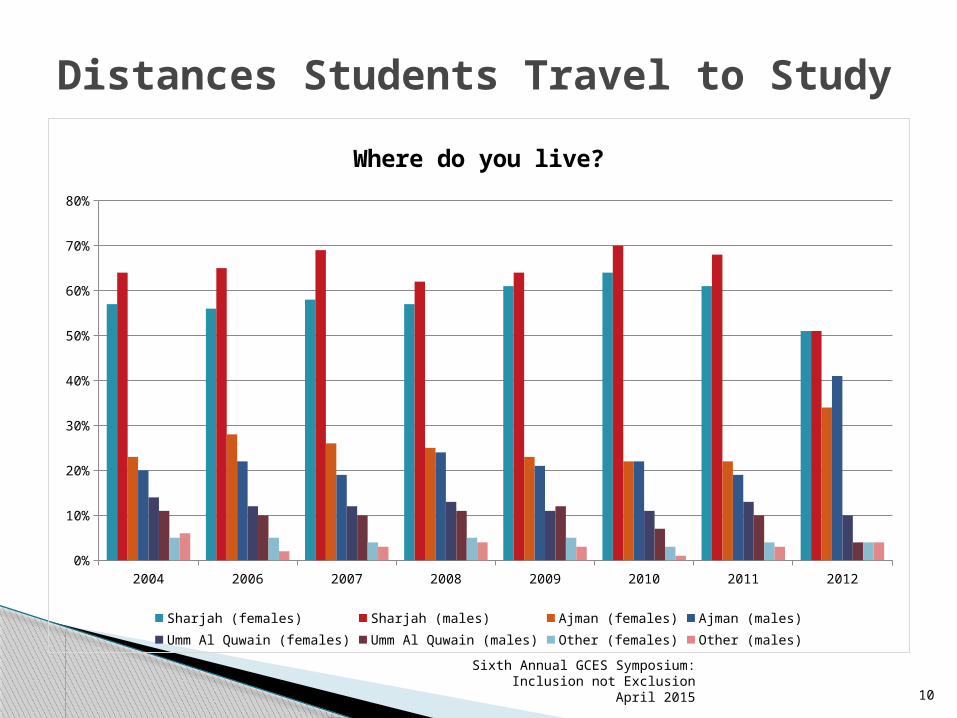
Distances Students Travel to Study
2004 2006 2007 2008 2009 2010 2011 20120%
10%
20%
30%
40%
50%
60%
70%
80%
Where do you live?
Sharjah (females) Sharjah (males) Ajman (females) Ajman (males)Umm Al Quwain (females) Umm Al Quwain (males) Other (females) Other (males)
Sixth Annual GCES Symposium: Inclusion not Exclusion
April 2015 10
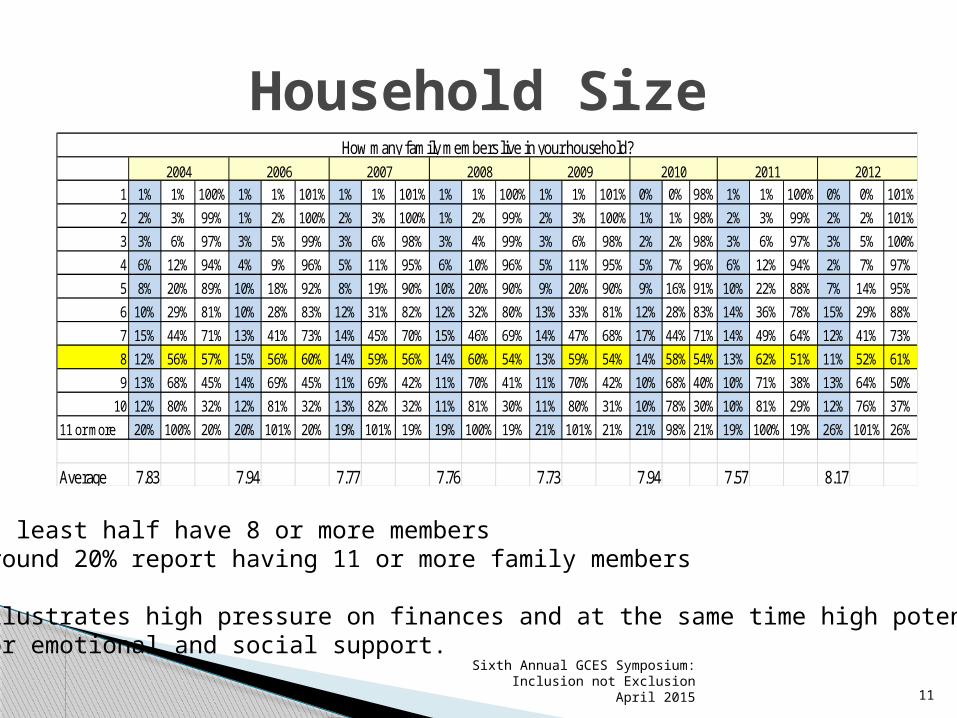
Household Size1 1% 1% 100% 1% 1% 101% 1% 1% 101% 1% 1% 100% 1% 1% 101% 0% 0% 98% 1% 1% 100% 0% 0% 101%2 2% 3% 99% 1% 2% 100% 2% 3% 100% 1% 2% 99% 2% 3% 100% 1% 1% 98% 2% 3% 99% 2% 2% 101%3 3% 6% 97% 3% 5% 99% 3% 6% 98% 3% 4% 99% 3% 6% 98% 2% 2% 98% 3% 6% 97% 3% 5% 100%4 6% 12% 94% 4% 9% 96% 5% 11% 95% 6% 10% 96% 5% 11% 95% 5% 7% 96% 6% 12% 94% 2% 7% 97%5 8% 20% 89% 10% 18% 92% 8% 19% 90% 10% 20% 90% 9% 20% 90% 9% 16% 91% 10% 22% 88% 7% 14% 95%6 10% 29% 81% 10% 28% 83% 12% 31% 82% 12% 32% 80% 13% 33% 81% 12% 28% 83% 14% 36% 78% 15% 29% 88%7 15% 44% 71% 13% 41% 73% 14% 45% 70% 15% 46% 69% 14% 47% 68% 17% 44% 71% 14% 49% 64% 12% 41% 73%8 12% 56% 57% 15% 56% 60% 14% 59% 56% 14% 60% 54% 13% 59% 54% 14% 58% 54% 13% 62% 51% 11% 52% 61%9 13% 68% 45% 14% 69% 45% 11% 69% 42% 11% 70% 41% 11% 70% 42% 10% 68% 40% 10% 71% 38% 13% 64% 50%10 12% 80% 32% 12% 81% 32% 13% 82% 32% 11% 81% 30% 11% 80% 31% 10% 78% 30% 10% 81% 29% 12% 76% 37%
11 or more 20% 100% 20% 20% 101% 20% 19% 101% 19% 19% 100% 19% 21% 101% 21% 21% 98% 21% 19% 100% 19% 26% 101% 26%
Average 7.83 7.94 7.77 7.76 7.73 7.94 7.57 8.17
2010 2011 2012How m any fam ily m em bers live in your household?
2004 2006 2007 2008 2009
At least half have 8 or more membersAround 20% report having 11 or more family members
Illustrates high pressure on finances and at the same time high potential for emotional and social support.
Sixth Annual GCES Symposium: Inclusion not Exclusion
April 2015 11
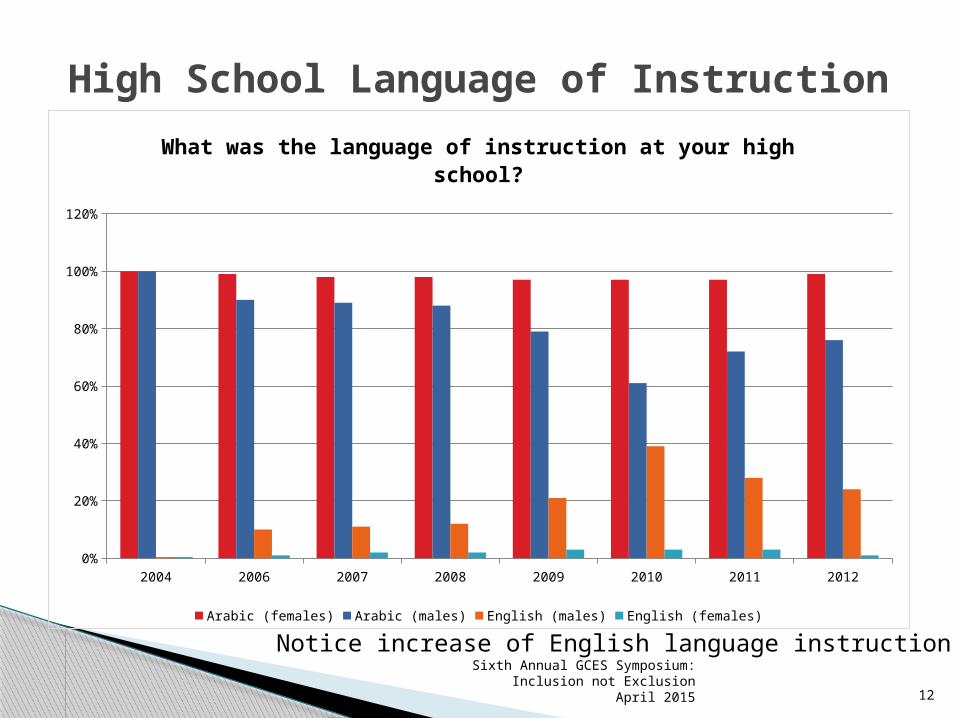
High School Language of Instruction
2004 2006 2007 2008 2009 2010 2011 20120%
20%
40%
60%
80%
100%
120%
What was the language of instruction at your high school?
Arabic (females) Arabic (males) English (males) English (females)
Sixth Annual GCES Symposium: Inclusion not Exclusion
April 2015 12
Notice increase of English language instruction
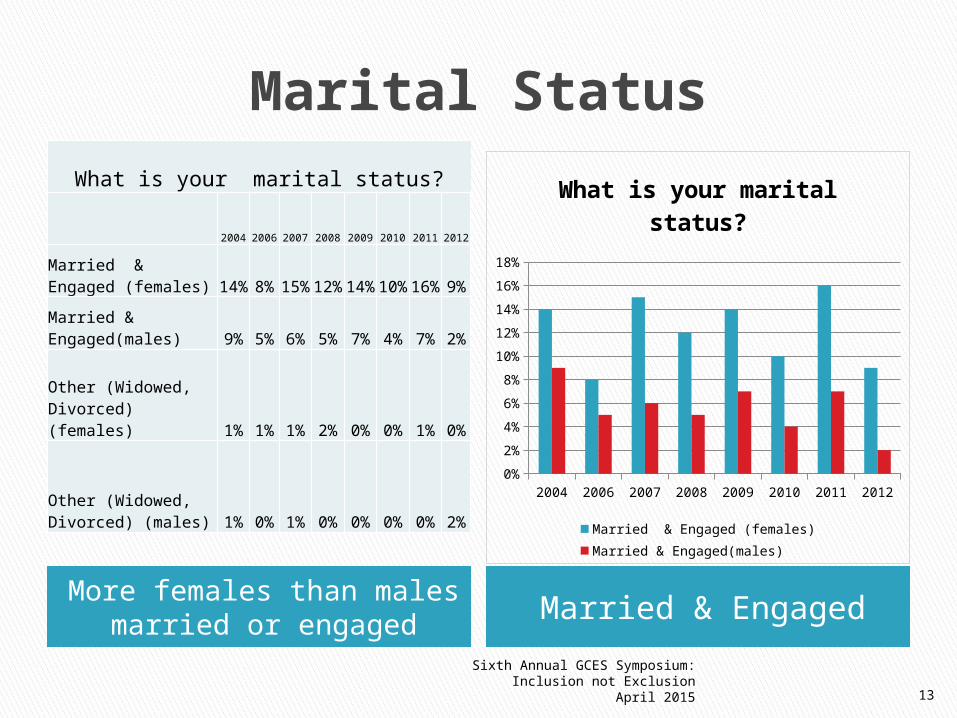
Marital Status
More females than males married or engaged Married & Engaged
What is your marital status?
2004 2006 2007 2008 2009 2010 2011 2012
Married & Engaged (females) 14% 8% 15% 12% 14% 10% 16% 9%Married & Engaged(males) 9% 5% 6% 5% 7% 4% 7% 2%
Other (Widowed, Divorced) (females) 1% 1% 1% 2% 0% 0% 1% 0%
Other (Widowed, Divorced) (males) 1% 0% 1% 0% 0% 0% 0% 2%
2004 2006 2007 2008 2009 2010 2011 20120%2%4%6%8%
10%12%14%16%18%
What is your marital status?
Married & Engaged (females)Married & Engaged(males)
Sixth Annual GCES Symposium: Inclusion not Exclusion
April 2015 13
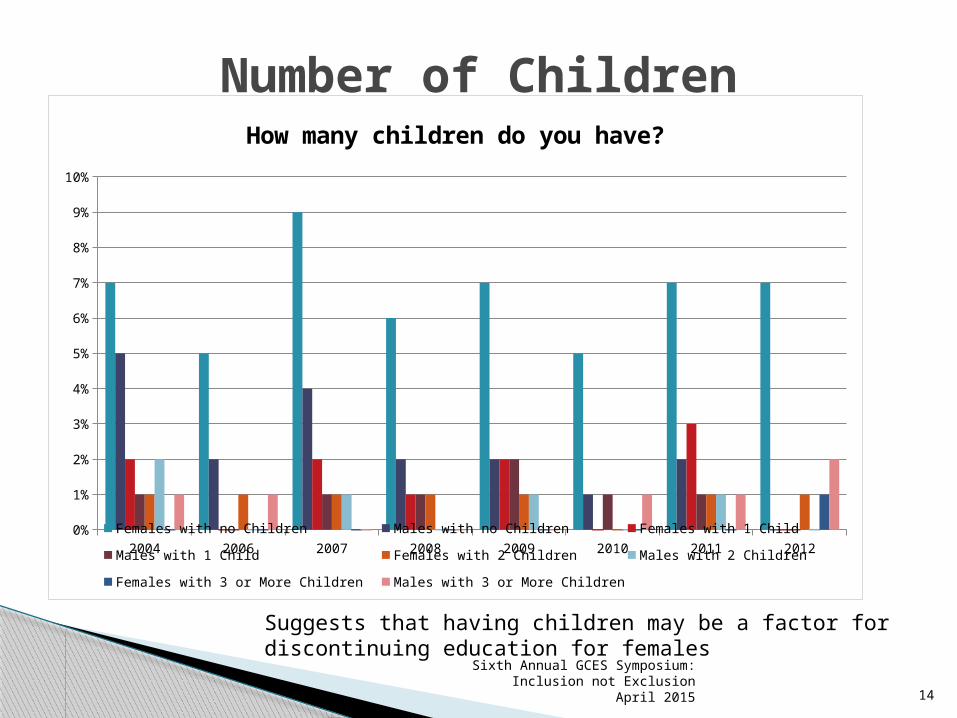
Number of Children
2004 2006 2007 2008 2009 2010 2011 20120%
1%
2%
3%
4%
5%
6%
7%
8%
9%
10%
How many children do you have?
Females with no Children Males with no Children Females with 1 ChildMales with 1 Child Females with 2 Children Males with 2 ChildrenFemales with 3 or More Children Males with 3 or More Children
Sixth Annual GCES Symposium: Inclusion not Exclusion
April 2015 14
Suggests that having children may be a factor for discontinuing education for females
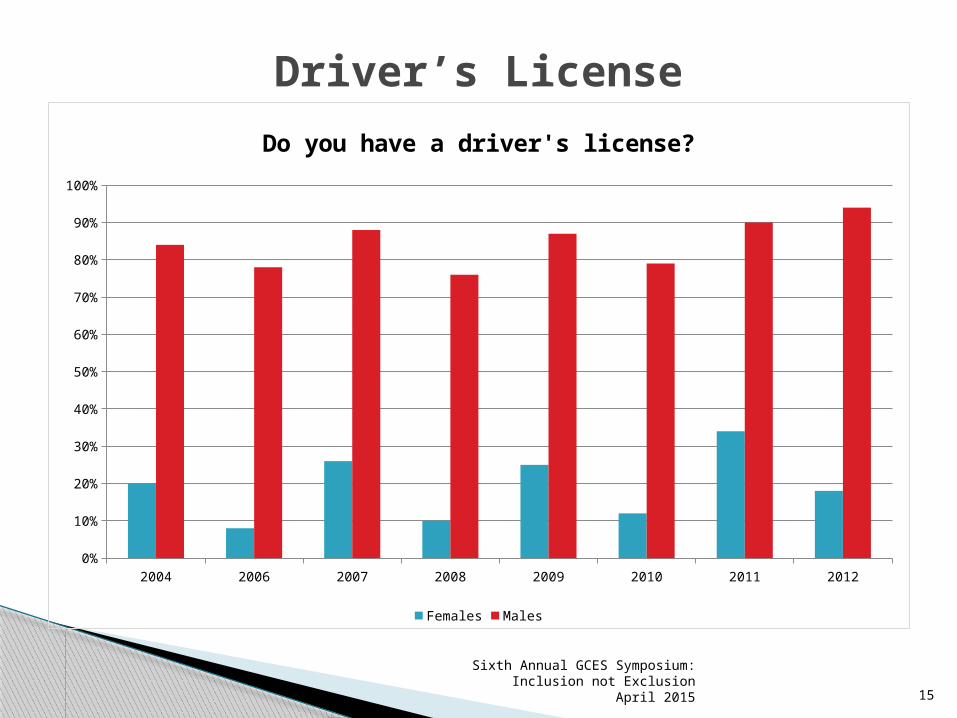
Driver’s License
2004 2006 2007 2008 2009 2010 2011 20120%
10%
20%
30%
40%
50%
60%
70%
80%
90%
100%
Do you have a driver's license?
Females Males
Sixth Annual GCES Symposium: Inclusion not Exclusion
April 2015 15
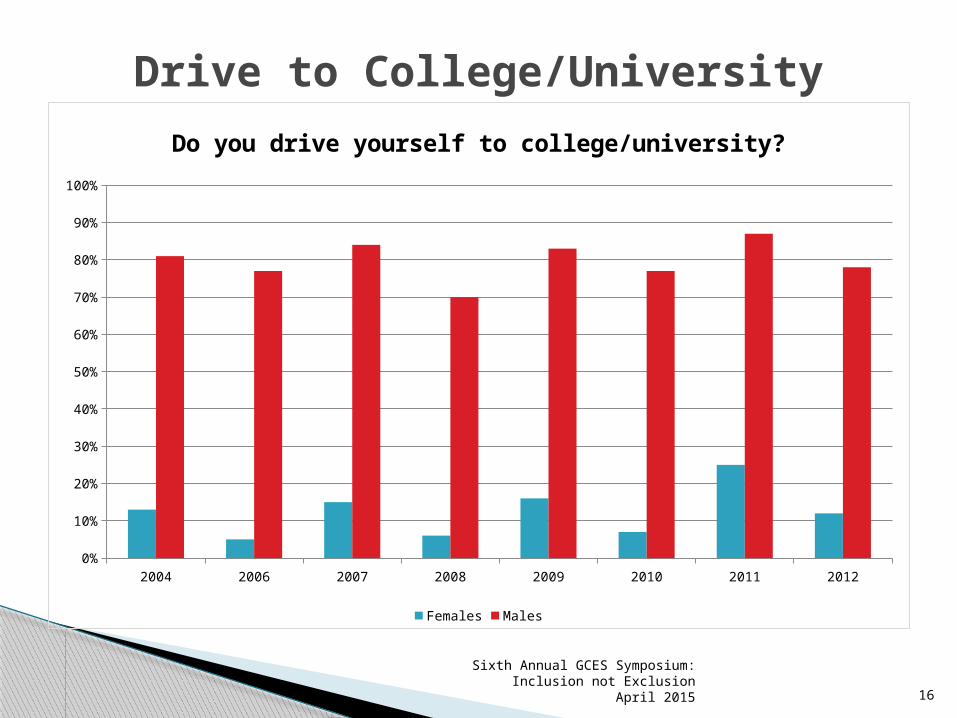
Drive to College/University
2004 2006 2007 2008 2009 2010 2011 20120%
10%
20%
30%
40%
50%
60%
70%
80%
90%
100%
Do you drive yourself to college/university?
Females Males
Sixth Annual GCES Symposium: Inclusion not Exclusion
April 2015 16
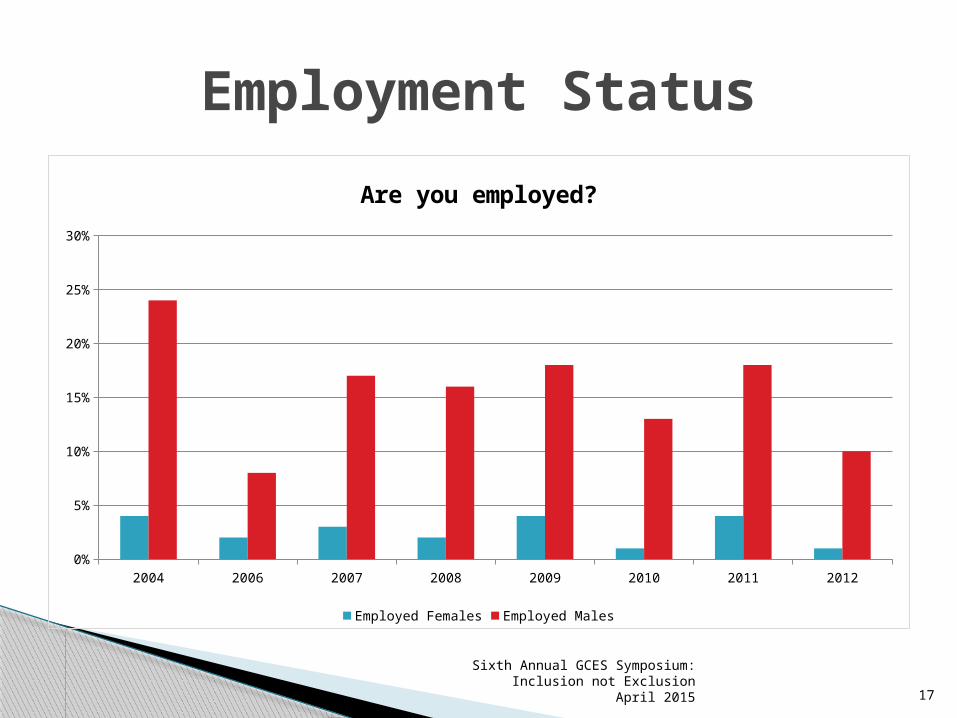
Employment Status
2004 2006 2007 2008 2009 2010 2011 20120%
5%
10%
15%
20%
25%
30%
Are you employed?
Employed Females Employed Males
Sixth Annual GCES Symposium: Inclusion not Exclusion
April 2015 17
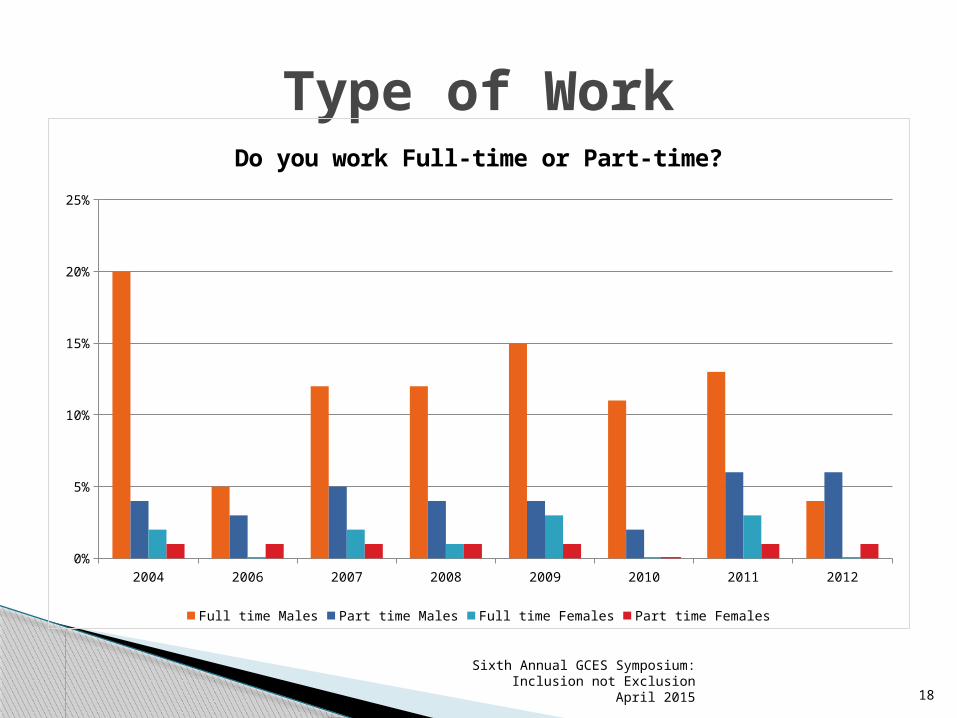
Type of Work
2004 2006 2007 2008 2009 2010 2011 20120%
5%
10%
15%
20%
25%
Do you work Full-time or Part-time?
Full time Males Part time Males Full time Females Part time Females
Sixth Annual GCES Symposium: Inclusion not Exclusion
April 2015 18
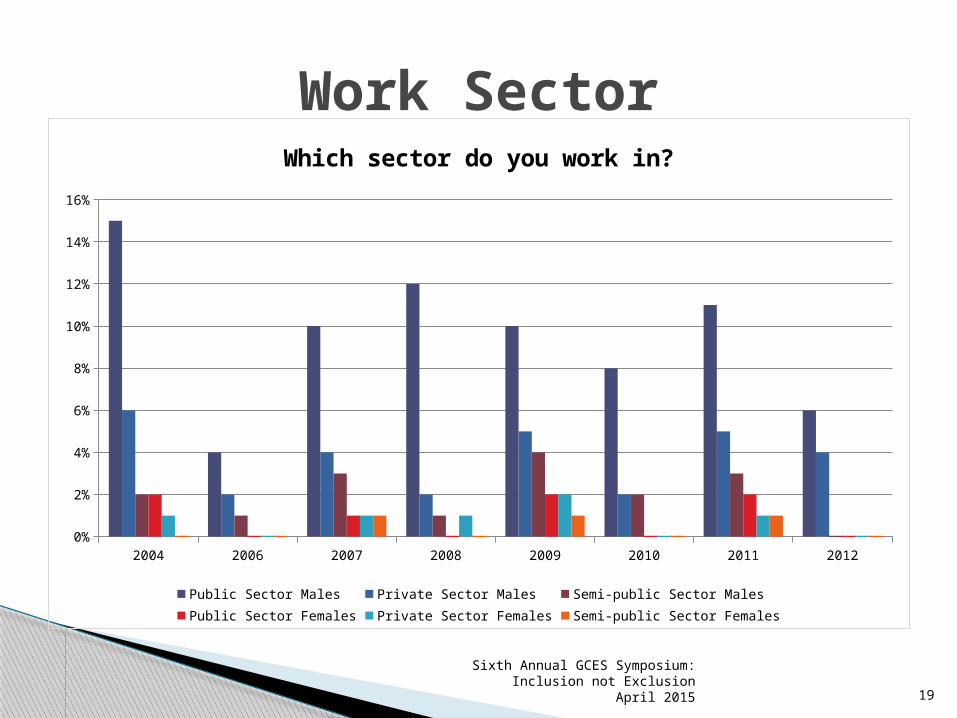
Work Sector
2004 2006 2007 2008 2009 2010 2011 20120%
2%
4%
6%
8%
10%
12%
14%
16%
Which sector do you work in?
Public Sector Males Private Sector Males Semi-public Sector MalesPublic Sector Females Private Sector Females Semi-public Sector Females
Sixth Annual GCES Symposium: Inclusion not Exclusion
April 2015 19
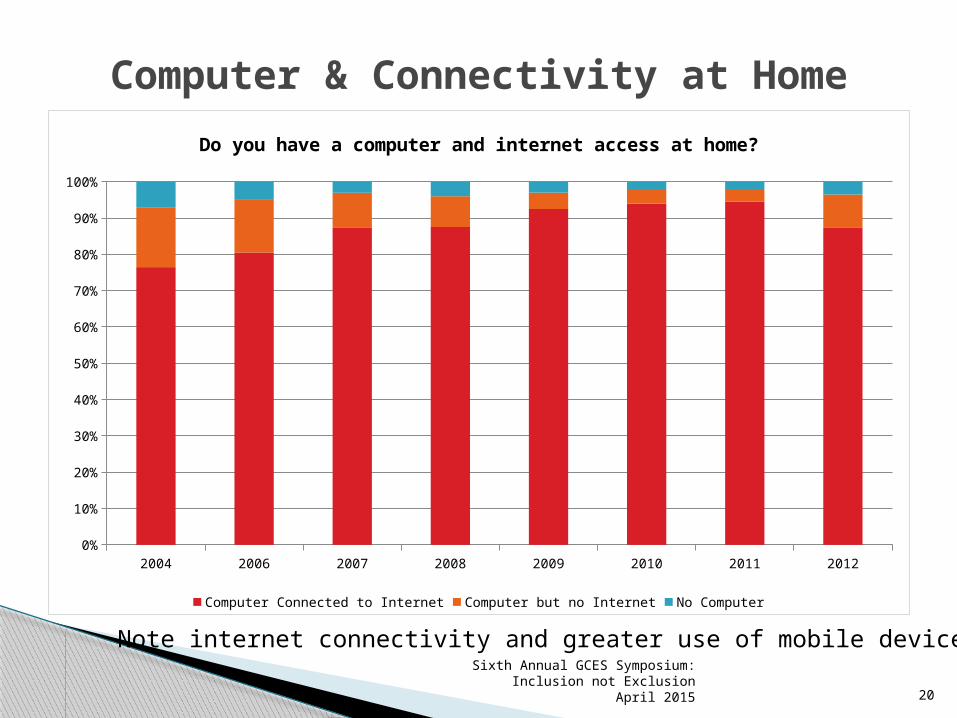
Computer & Connectivity at Home
2004 2006 2007 2008 2009 2010 2011 20120%
10%
20%
30%
40%
50%
60%
70%
80%
90%
100%
Do you have a computer and internet access at home?
Computer Connected to Internet Computer but no Internet No Computer
Sixth Annual GCES Symposium: Inclusion not Exclusion
April 2015 20
Note internet connectivity and greater use of mobile devices
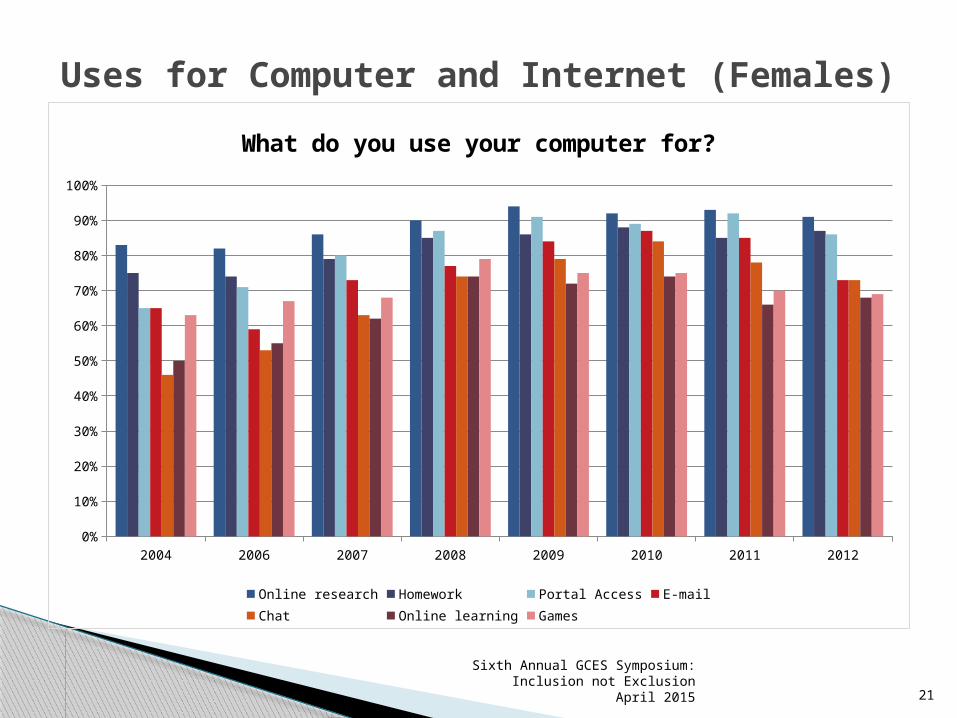
Uses for Computer and Internet (Females)
2004 2006 2007 2008 2009 2010 2011 20120%
10%
20%
30%
40%
50%
60%
70%
80%
90%
100%
What do you use your computer for?
Online research Homework Portal Access E-mailChat Online learning Games
Sixth Annual GCES Symposium: Inclusion not Exclusion
April 2015 21
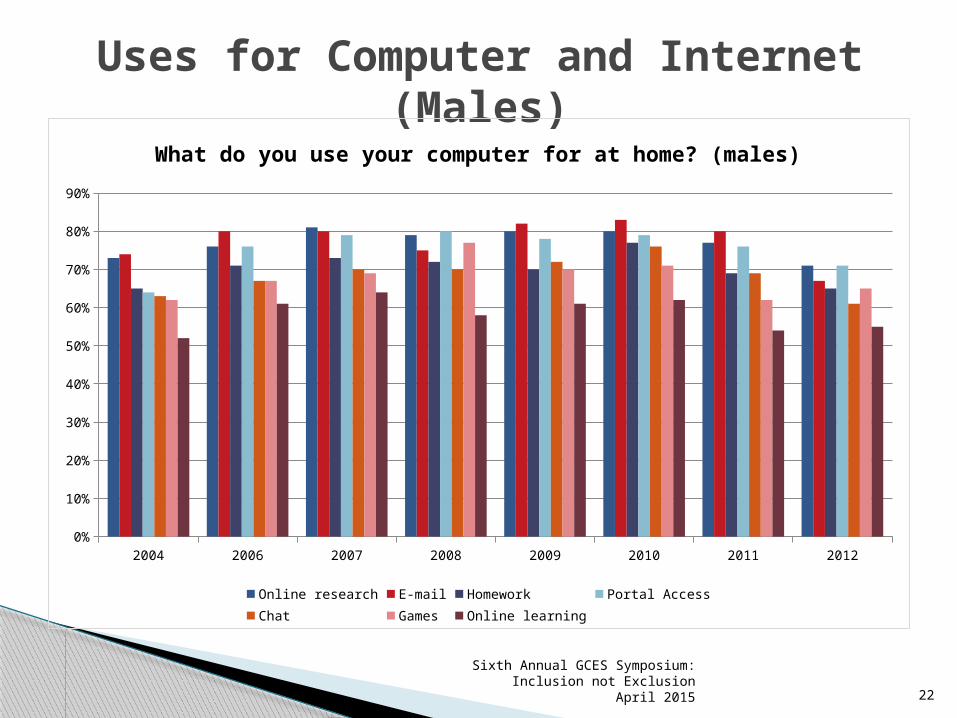
Uses for Computer and Internet (Males)
2004 2006 2007 2008 2009 2010 2011 20120%
10%
20%
30%
40%
50%
60%
70%
80%
90%
What do you use your computer for at home? (males)
Online research E-mail Homework Portal AccessChat Games Online learning
Sixth Annual GCES Symposium: Inclusion not Exclusion
April 2015 22
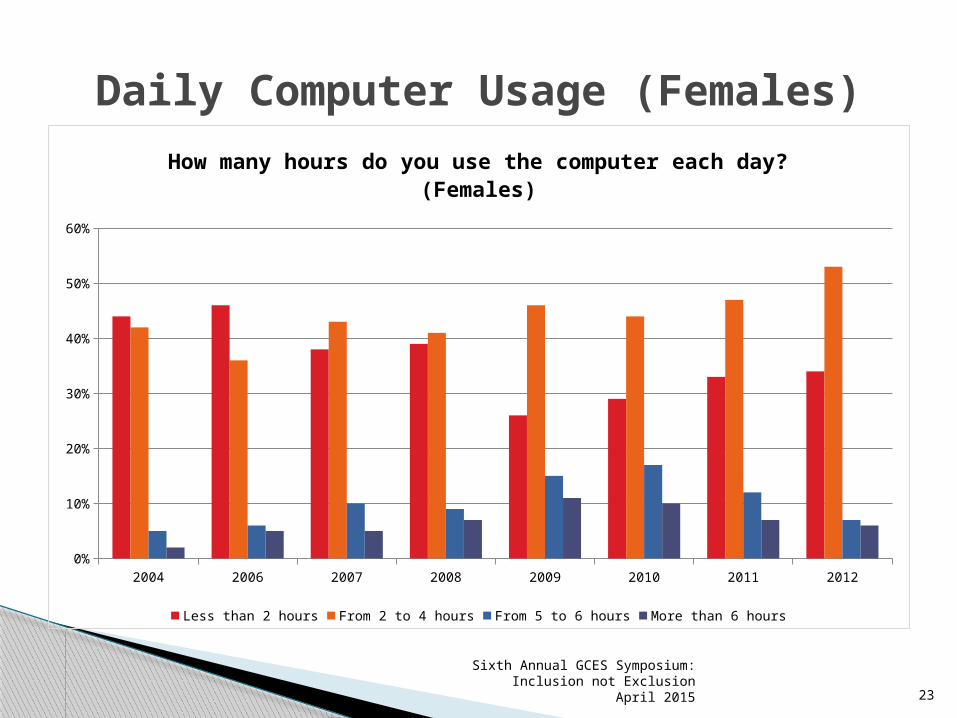
Daily Computer Usage (Females)
2004 2006 2007 2008 2009 2010 2011 20120%
10%
20%
30%
40%
50%
60%
How many hours do you use the computer each day? (Females)
Less than 2 hours From 2 to 4 hours From 5 to 6 hours More than 6 hours
Sixth Annual GCES Symposium: Inclusion not Exclusion
April 2015 23
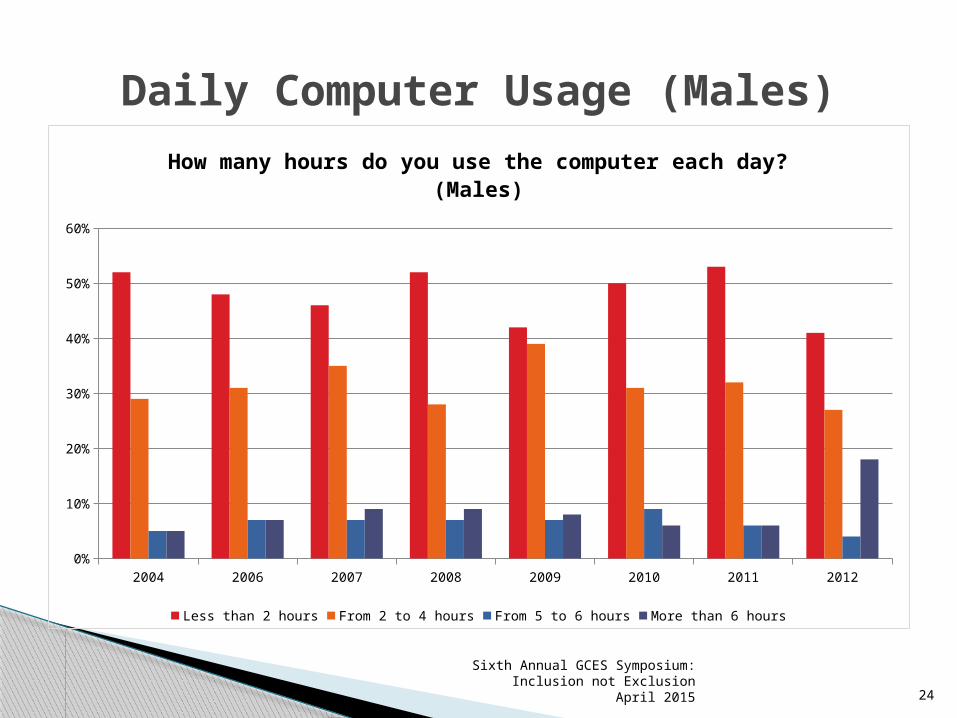
Daily Computer Usage (Males)
2004 2006 2007 2008 2009 2010 2011 20120%
10%
20%
30%
40%
50%
60%
How many hours do you use the computer each day? (Males)
Less than 2 hours From 2 to 4 hours From 5 to 6 hours More than 6 hours
Sixth Annual GCES Symposium: Inclusion not Exclusion
April 2015 24
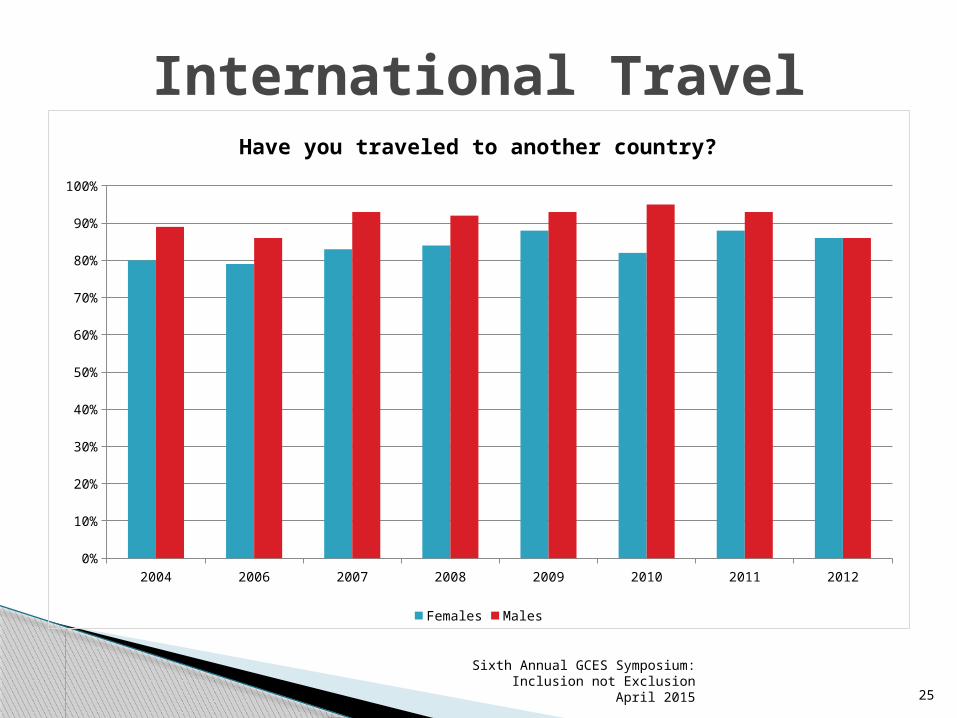
International Travel
2004 2006 2007 2008 2009 2010 2011 20120%
10%
20%
30%
40%
50%
60%
70%
80%
90%
100%
Have you traveled to another country?
Females Males
Sixth Annual GCES Symposium: Inclusion not Exclusion
April 2015 25
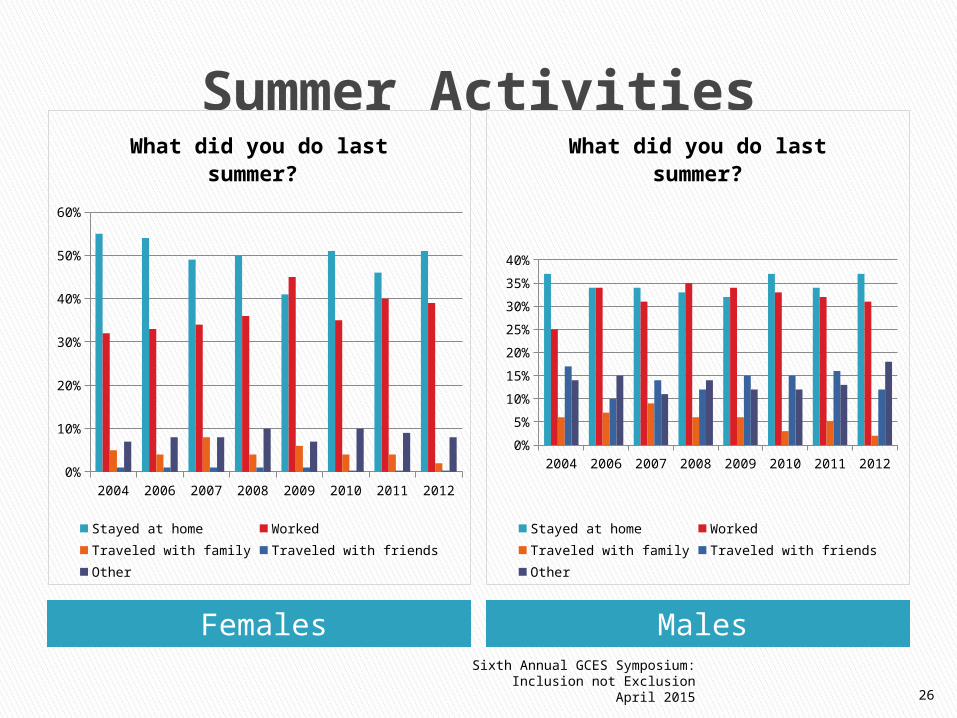
Summer Activities
Females Males
2004 2006 2007 2008 2009 2010 2011 20120%
10%
20%
30%
40%
50%
60%
What did you do last summer?
Stayed at home WorkedTraveled with family Traveled with friendsOther
2004 2006 2007 2008 2009 2010 2011 20120%5%10%15%20%25%30%35%40%
What did you do last summer?
Stayed at home WorkedTraveled with family Traveled with friendsOther
Sixth Annual GCES Symposium: Inclusion not Exclusion
April 2015 26
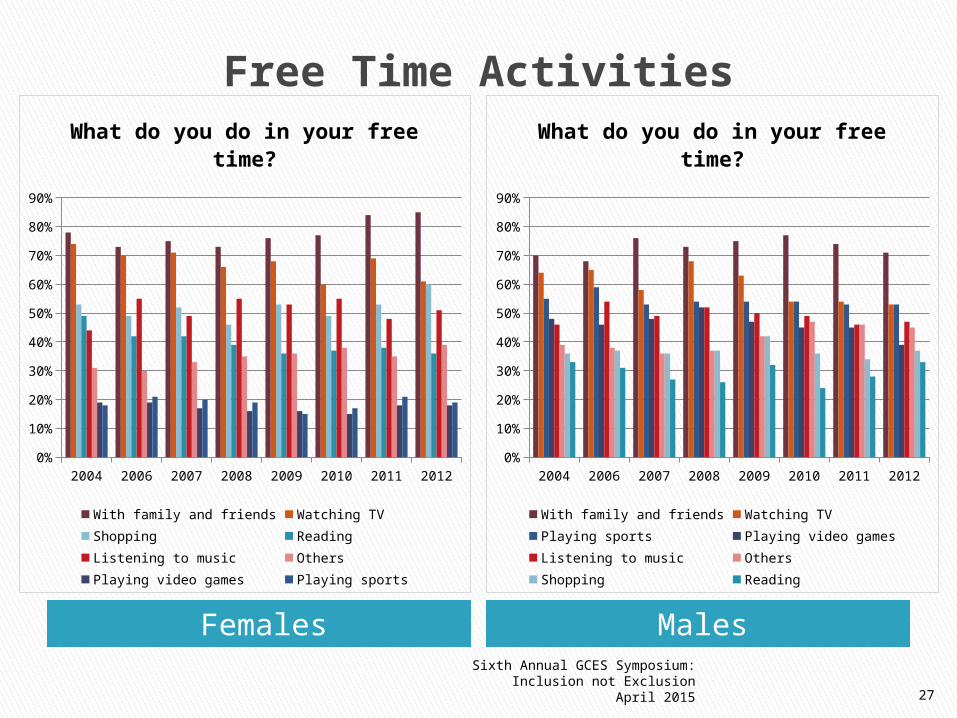
Free Time Activities
Females Males
2004 2006 2007 2008 2009 2010 2011 20120%
10%
20%
30%
40%
50%
60%
70%
80%
90%
What do you do in your free time?
With family and friends Watching TVShopping ReadingListening to music OthersPlaying video games Playing sports
2004 2006 2007 2008 2009 2010 2011 20120%
10%
20%
30%
40%
50%
60%
70%
80%
90%
What do you do in your free time?
With family and friends Watching TVPlaying sports Playing video gamesListening to music OthersShopping Reading
Sixth Annual GCES Symposium: Inclusion not Exclusion
April 2015 27
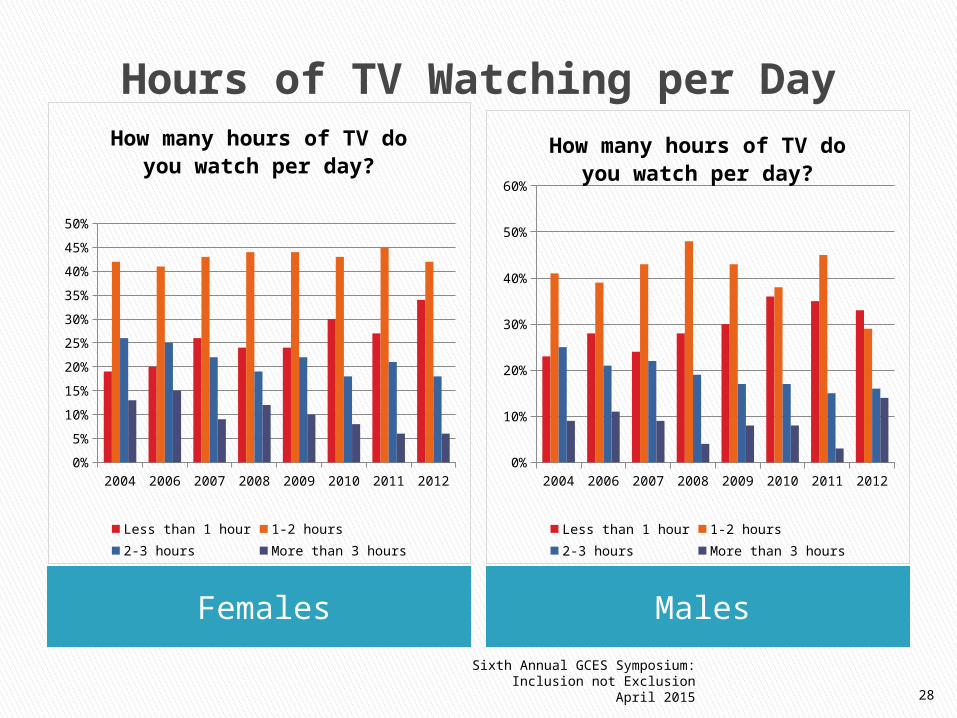
Hours of TV Watching per Day
Females Males
2004 2006 2007 2008 2009 2010 2011 20120%5%
10%15%20%25%30%35%40%45%50%
How many hours of TV do you watch per day?
Less than 1 hour 1-2 hours2-3 hours More than 3 hours
2004 2006 2007 2008 2009 2010 2011 20120%
10%
20%
30%
40%
50%
60%
How many hours of TV do you watch per day?
Less than 1 hour 1-2 hours2-3 hours More than 3 hours
Sixth Annual GCES Symposium: Inclusion not Exclusion
April 2015 28
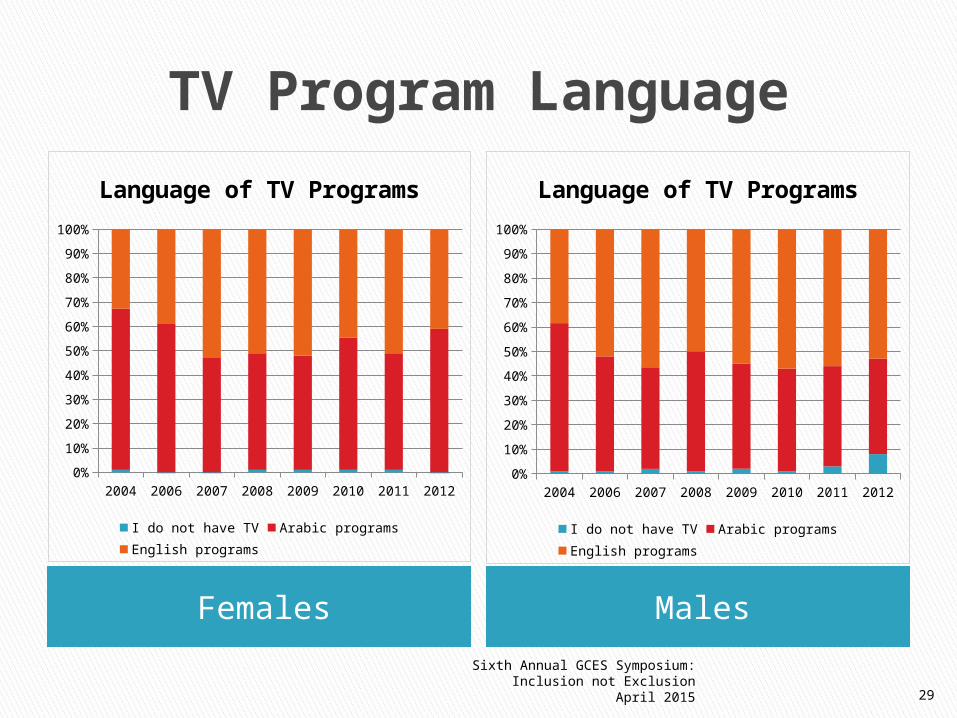
TV Program Language
Females Males
2004 2006 2007 2008 2009 2010 2011 20120%
10%20%30%40%50%60%70%80%90%
100%
Language of TV Programs
I do not have TV Arabic programsEnglish programs
2004 2006 2007 2008 2009 2010 2011 20120%10%20%30%40%50%60%70%80%90%
100%
Language of TV Programs
I do not have TV Arabic programsEnglish programs
Sixth Annual GCES Symposium: Inclusion not Exclusion
April 2015 29
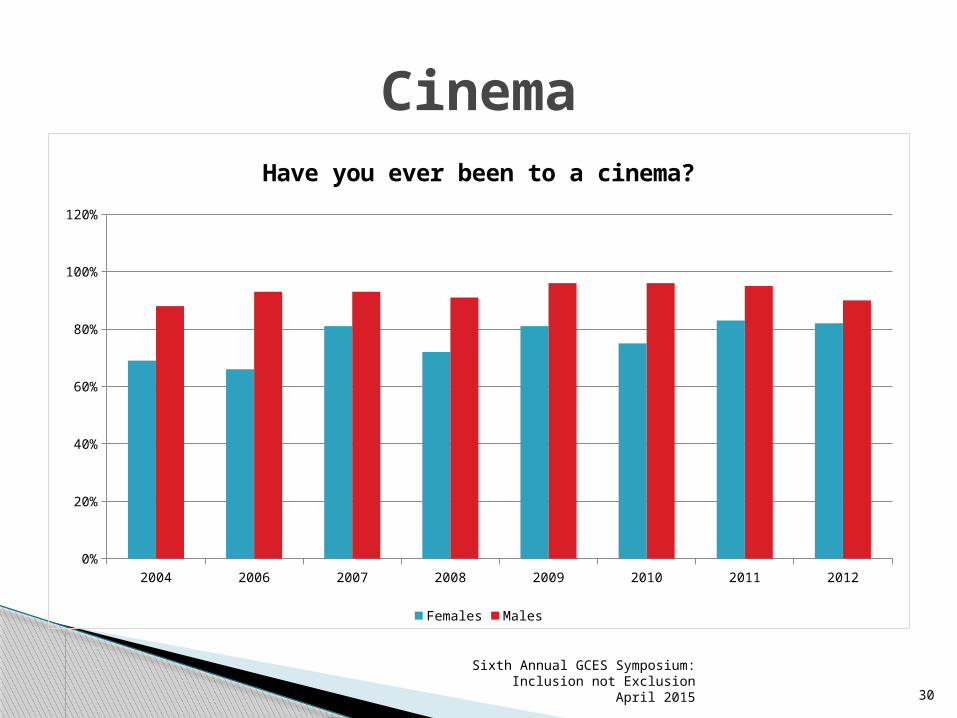
Cinema
2004 2006 2007 2008 2009 2010 2011 20120%
20%
40%
60%
80%
100%
120%
Have you ever been to a cinema?
Females Males
Sixth Annual GCES Symposium: Inclusion not Exclusion
April 2015 30
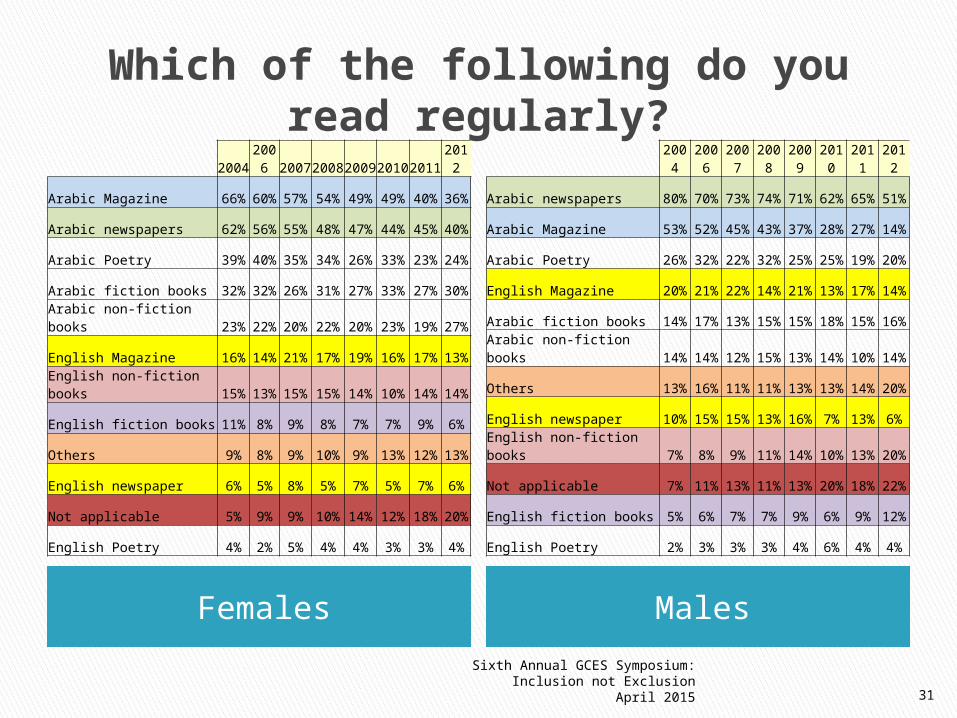
Which of the following do you read regularly?
Females Males
2004
2006
2007
2008
2009
2010
2011
2012
Arabic newspapers 80% 70% 73% 74% 71% 62% 65% 51%
Arabic Magazine 53% 52% 45% 43% 37% 28% 27% 14%
Arabic Poetry 26% 32% 22% 32% 25% 25% 19% 20%
English Magazine 20% 21% 22% 14% 21% 13% 17% 14%
Arabic fiction books 14% 17% 13% 15% 15% 18% 15% 16%Arabic non-fiction books 14% 14% 12% 15% 13% 14% 10% 14%
Others 13% 16% 11% 11% 13% 13% 14% 20%
English newspaper 10% 15% 15% 13% 16% 7% 13% 6%English non-fiction books 7% 8% 9% 11% 14% 10% 13% 20%
Not applicable 7% 11% 13% 11% 13% 20% 18% 22%
English fiction books 5% 6% 7% 7% 9% 6% 9% 12%
English Poetry 2% 3% 3% 3% 4% 6% 4% 4%
20042006 20072008200920102011
2012
Arabic Magazine 66% 60% 57% 54% 49% 49% 40% 36%
Arabic newspapers 62% 56% 55% 48% 47% 44% 45% 40%
Arabic Poetry 39% 40% 35% 34% 26% 33% 23% 24%
Arabic fiction books 32% 32% 26% 31% 27% 33% 27% 30%Arabic non-fiction books 23% 22% 20% 22% 20% 23% 19% 27%
English Magazine 16% 14% 21% 17% 19% 16% 17% 13%English non-fiction books 15% 13% 15% 15% 14% 10% 14% 14%
English fiction books 11% 8% 9% 8% 7% 7% 9% 6%
Others 9% 8% 9% 10% 9% 13% 12% 13%
English newspaper 6% 5% 8% 5% 7% 5% 7% 6%
Not applicable 5% 9% 9% 10% 14% 12% 18% 20%
English Poetry 4% 2% 5% 4% 4% 3% 3% 4%
Sixth Annual GCES Symposium: Inclusion not Exclusion
April 2015 31
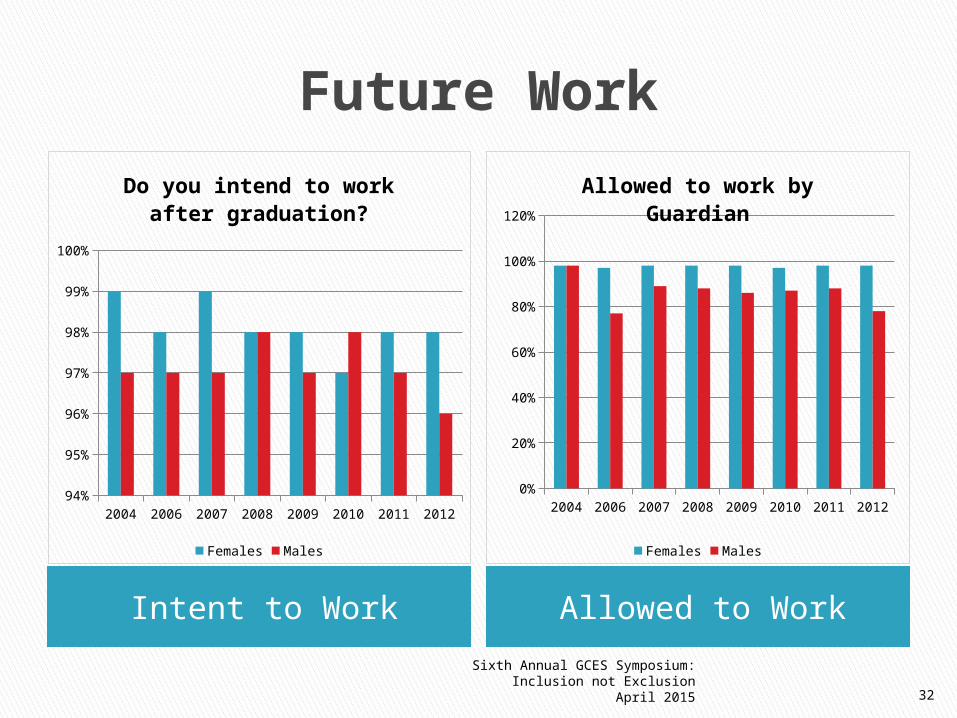
Future Work
Intent to Work Allowed to Work
2004 2006 2007 2008 2009 2010 2011 201294%
95%
96%
97%
98%
99%
100%
Do you intend to work after graduation?
Females Males
2004 2006 2007 2008 2009 2010 2011 20120%
20%
40%
60%
80%
100%
120%
Allowed to work by Guardian
Females Males
Sixth Annual GCES Symposium: Inclusion not Exclusion
April 2015 32
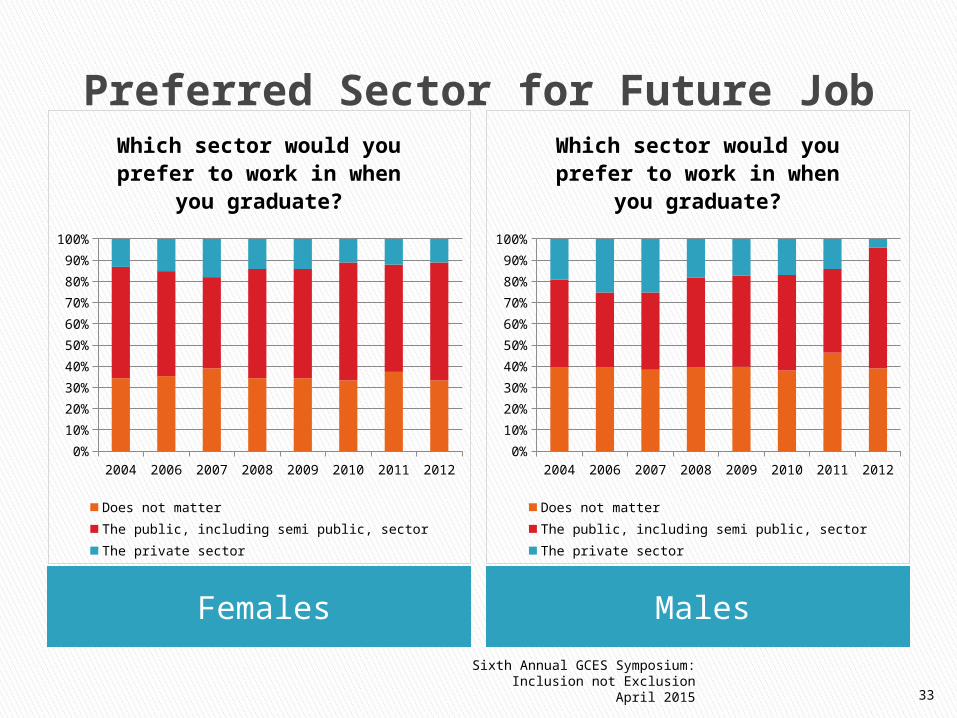
Preferred Sector for Future Job
Females Males
2004 2006 2007 2008 2009 2010 2011 20120%
10%20%30%40%50%60%70%80%90%
100%
Which sector would you prefer to work in when
you graduate?
Does not matterThe public, including semi public, sectorThe private sector
2004 2006 2007 2008 2009 2010 2011 20120%10%20%30%40%50%60%70%80%90%
100%
Which sector would you prefer to work in when
you graduate?
Does not matterThe public, including semi public, sectorThe private sector
Sixth Annual GCES Symposium: Inclusion not Exclusion
April 2015 33
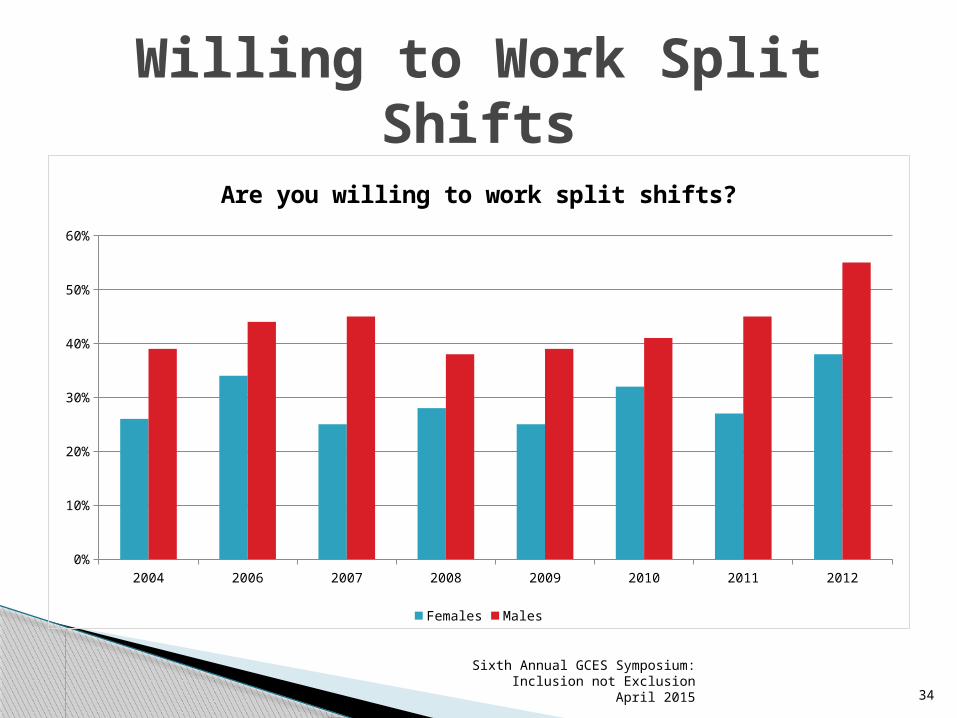
Willing to Work Split Shifts
2004 2006 2007 2008 2009 2010 2011 20120%
10%
20%
30%
40%
50%
60%
Are you willing to work split shifts?
Females Males
Sixth Annual GCES Symposium: Inclusion not Exclusion
April 2015 34
Young Emirati adults are often the first in their families to received PSE
Often high financial demand on family resources
More are returning to PSE after working Females are attending more than males but not necessarily completing (marriage and especially having children a factor for discontinuing)
More families are supporting their daughters to attend PSE
Sixth Annual GCES Symposium: Inclusion not Exclusion
April 2015 35
Summary
Emirati youth are becoming more technology savvy and using mobile devices more frequently
Access to internet with global social & e-media
Increasing working while studying, especially in the private sector mostly due to availability of jobs
Many hope to transition to public sector after graduation
Prefer straight shift for 8 hours in future work especially females (manage family responsibilities)
Sixth Annual GCES Symposium: Inclusion not Exclusion
April 2015 36
Summary