welfare analysis of the dominican republic-central america-united states free trade agreement: the...
TRANSCRIPT

PLEASE SCROLL DOWN FOR ARTICLE
This article was downloaded by: [Texas Technology University]On: 19 November 2008Access details: Access Details: [subscription number 788773086]Publisher RoutledgeInforma Ltd Registered in England and Wales Registered Number: 1072954 Registered office: Mortimer House,37-41 Mortimer Street, London W1T 3JH, UK
The International Trade JournalPublication details, including instructions for authors and subscription information:http://www.informaworld.com/smpp/title~content=t713772442
Welfare Analysis of the Dominican Republic-Central America-United StatesFree Trade Agreement: The Cotton Textile and Apparel IndustriesSuwen Pan a; Mark Welch b; Samarendu Mohanty a; Mohamadou Fadiga a; Don Ethridge a
a Department of Agricultural and Applied Economics, Texas Tech University, Lubbock, Texas, USA b
Department of Agricultural Economics, Texas A&M University, College Station, Texas, USA
Online Publication Date: 01 April 2008
To cite this Article Pan, Suwen, Welch, Mark, Mohanty, Samarendu, Fadiga, Mohamadou and Ethridge, Don(2008)'Welfare Analysis ofthe Dominican Republic-Central America-United States Free Trade Agreement: The Cotton Textile and Apparel Industries',TheInternational Trade Journal,22:2,188 — 217
To link to this Article: DOI: 10.1080/08853900801970585
URL: http://dx.doi.org/10.1080/08853900801970585
Full terms and conditions of use: http://www.informaworld.com/terms-and-conditions-of-access.pdf
This article may be used for research, teaching and private study purposes. Any substantial orsystematic reproduction, re-distribution, re-selling, loan or sub-licensing, systematic supply ordistribution in any form to anyone is expressly forbidden.
The publisher does not give any warranty express or implied or make any representation that the contentswill be complete or accurate or up to date. The accuracy of any instructions, formulae and drug dosesshould be independently verified with primary sources. The publisher shall not be liable for any loss,actions, claims, proceedings, demand or costs or damages whatsoever or howsoever caused arising directlyor indirectly in connection with or arising out of the use of this material.

WELFARE ANALYSIS OF THE
DOMINICAN REPUBLIC-
CENTRAL AMERICA-UNITED
STATES FREE TRADE
AGREEMENT: The Cotton Textile
and Apparel Industries
Suwen PanMark Welch
Samarendu MohantyMohamadou Fadiga
Don Ethridge
Suwen Pan is a Research Scientist in the Department ofAgricultural and Applied Economics, Texas Tech University,Lubbock, Texas.
Mark Welch is an Extension Economist in the Department ofAgricultural Economics, Texas A&M University, College Station,Texas.
Samarendu Mohanty is in the Department of Agricultural andApplied Economics, Texas Tech University, Lubbock, Texas.
Mohamadou Fadiga is in the Department of Agricultural andApplied Economics, Texas Tech University, Lubbock, Texas.
Don Ethridge is in the Department of Agricultural and AppliedEconomics, Texas Tech University, Lubbock, Texas.
THE INTERNATIONAL TRADE JOURNAL, Volume XXII, No. 2, April--June 2008 188ISSN: 0885-3908 print/1521-0545 online. DOI: 10.1080/08853900801970585
Downloaded By: [Texas Technology University] At: 18:45 19 November 2008

Economic health is one of the keys to a secure future for our
Caribbean Basin and to the neighbors there. . . . we’ve labored
long to develop an economic program that integrates trade, aid,
and investment---a program that represents a long-term commit-
ment to the countries of the Caribbean and Central America to
make use of the magic of the marketplace, the market of the
Americas, to earn their own way toward self-sustaining growth.
--President Ronald Reagan, February 24, 1982
This article studies the effects of the Dominican Republic-Central
America-United States Free Trade Agreement (US-CAFTA-DR)
on the world fiber market using a partial equilibrium modeling
approach. We find the effect of the agreement on the U.S. cotton
yarn and Caribbean cotton apparel industries to be positive while
the U.S. cotton apparel industry suffers significant losses. Cotton
apparel producers in the Caribbean region gain approximately
$80 million under US-CAFTA-DR while gains by the U.S. yarn
industry average about $120 million over current trade arrange-
ments. The U.S. cotton apparel industry loses about $40 million
per year under US-CAFTA-DR.
* * * * *
I. INTRODUCTION
As outlined by President Reagan above, the United States has long
been interested in promoting economic development in the Caribbean
region. The above remarks preceded the introduction of the Caribbean
Basin Initiative (CBI), a private sector initiative designed to expand
foreign and domestic investment to diversify and solidify the economies
of Central American and Caribbean countries. CBI has since become a
general term to refer to the official title of legislation enacting this
economic assistance package, the Caribbean Basin Economic
Recovery Act of 1983 (CBERA), as well as the Caribbean Basin
Pan et al.: Welfare Analysis . . . 189
Downloaded By: [Texas Technology University] At: 18:45 19 November 2008

Economic Recovery Expansion Act of 1990 (CBERA Expansion Act),
and the U.S.-Caribbean Basin Trade Partnership Act of 2000
(CBTPA). The impetus of these legislative acts was unilateral devel-
opment assistance by allowing certain exports from the Caribbean
region to enter the U.S. quota and duty free.
In 2004, the Bush administration successfully negotiated an
agreement with trade representatives of the governments of
Costa Rica, the Dominican Republic, El Salvador, Honduras,
Guatemala, and Nicaragua for a multilateral extension of CBI
known as the Dominican Republic-Central America-United States
Free Trade Agreement (US-CAFTA-DR).1 This agreement not
only makes permanent the preferential trade status afforded nations
under CBI (CBTPA was set to expire in 2008), it offered reciprocal
duty and quota free access for U.S. producers to the markets of
CAFTA countries. US-CAFTA-DR basically transforms CBI from
a unilateral trade agreement to a true Free Trade Agreement (FTA)
between the United States and nations in the Caribbean region in
the spirit of the North American Free Trade Agreement (NAFTA).
Part of U.S. motivation in seeking a reciprocal trade agreement
with Central American and Caribbean trading partners was to craft a
response to growing competition in the textile and apparel (T&A)
industries.2 In a quota-free world created by the Agreement on
Textiles and Clothing (ATC),3 the T&A industries of the United
States and the Region face increasing competition from such industry
giants as China. By building on competitive advantages in the area,
US-CAFTA-DR may be seen as an attempt of members to enlarge and
1The terms ‘‘Region’’ (following Gelb, 2005) and ‘‘CAFTA countries’’ will be used to refer tothe Central American countries and the Dominican Republic who have signed US-CAFTA-DR.
2For the purposes of this article, we follow Gelb (2005) by defining ‘‘textiles’’ as yarn or
fabric and sometimes end products such as bed linens, towels, window curtains, tarpaulin,
tents, etc. The term ‘‘apparel’’ refers to clothing, footwear excluded.3On January 1, 2005, The Agreement on Textiles and Clothing phased out all quotas
on imports of textiles and apparel from countries that are members of the World Trade
Organization (WTO).
190 THE INTERNATIONAL TRADE JOURNAL
Downloaded By: [Texas Technology University] At: 18:45 19 November 2008

strengthen the textile and clothing industry in the Western
Hemisphere. By strengthening the strategic partnership at the heart
of CBI, US-CAFTA-DR combines
. . . highly efficient U.S. cotton/yarn/textile manufacturing with U.S.
design/financing/ marketing industries and with Caribbean Basin
low-cost sewing/assembly operations. They are concerned that
without such a partnership, substantial parts of all these sectors
will move to low-cost and technically efficient Far East producers.
(U.S. Department of Commerce, 2006)
The viability of this industry may be based on the strong ties that
bind the cotton and textile industries of the United States to the
apparel industries of Central America and the Caribbean.
Dominican Republic-Central America-US Textile and
Apparel Industries
The apparel industries of Central America and the Caribbean
region are important customers for U.S. cotton and textile producers.
In 2005, the Region imported 233,000 bales of cotton (NCC, 2006).
But more important than a destination for cotton exports, CAFTA
countries are the most important customer of the U.S. textile industry.
Since 1998, cotton textile exports from the U.S. to the Region have
almost doubled. The Region currently accounts for 51 percent of all
cotton textile exports from the United States (see Figure I).
CAFTA countries continue to be significant suppliers of cot-
ton textile and apparel products to the U.S. market. Since 1998,
the Region has increased its cotton T&A exports to the United
States by 65% (see Figure II). However, U.S. imports of cotton
textile and apparel from China during the same time period have
increased by over 400 percent. Most of that gain occurred in 2005
with the expiration of textile quotas. The CAFTA countries saw
their market share drop from 30 percent in 2004 to 15 percent in
2005. China’s market share increased from 11 percent in 2004 to
19 percent in 2005 (ERS, 2006). It appears China has been able to
Pan et al.: Welfare Analysis . . . 191
Downloaded By: [Texas Technology University] At: 18:45 19 November 2008

capture a significant amount of market share in an environment of
free trade while CAFTA countries have seen theirs erode.
The implications of lost market share by Central American
and Caribbean T&A manufacturers have important consequences
for both U.S. and Regional producers. As Figures I and II show, the
U.S. and CAFTA textile industries are strongly interwoven. The
Region is both an important export and import market for the U.S.
cotton textile and apparel industries. The Trade Resource Center
(2005) estimates that the share of U.S. content in fabric imported
to the United States from CAFTA producers is 79 percent. This
compares to 37 percent U.S. content in imports from Mexico and
1 percent from China. If successful in staving off Chinese
competition in the cotton T&A industry, US-CAFTA-DR would
strengthen the U.S. textile industry by increasing its role as the
Figure 1U.S. Cotton Textile and Apparel (T&A) Exports,
Raw Fiber Equivalent
0
200,000
400,000
600,000
800,000
1,000,000
1,200,000
1,400,000
1,000 pounds
CAFTA-DR NAFTA ROW
1998 2005200420032002200120001999
Source: ERS
192 THE INTERNATIONAL TRADE JOURNAL
Downloaded By: [Texas Technology University] At: 18:45 19 November 2008

major cotton yarn and fabric supplier for the CAFTA countries.
Regional T&A producers would gain through increased shipments
of cotton apparel and textile products to the United States Cotton
producers in the United States would gain from increased mill
demand in both markets.
From CBI to US-CAFTA-DR4
Besides changing from a unilateral trade agreement (designed
to offer economic development assistance to Caribbean nations) to
a multilateral free trade agreement (offering reciprocal duty-free
Figure 2U.S. Cotton Textile and Apparel (T&A) Imports,
Raw Fiber Equivalent
0
500,000
1,000,000
1,500,000
2,000,000
2,500,000
1,000 pounds
China CAFTA-DR NAFTA
1998 2005200420032002200120001999
Source: ERS
4For a more complete comparison of the provisions of US-CAFTA-DR to CBTPA that
affect the apparel industry, see AAFA, 2005.
Pan et al.: Welfare Analysis . . . 193
Downloaded By: [Texas Technology University] At: 18:45 19 November 2008

market access for U.S. producers), US-CAFTA-DR contains other
changes significant to the T&A industries of all parties. Under
CBTPA (the latest legislative action of CBI), duty free access to
U.S. markets was allowed for textiles composed of yarn or fabrics
that originated in the U.S. Under US-CAFTA-DR, components of
a textile or apparel product can originate in the region, not only
the United States. Regional origination not only applies to other
CAFTA countries, but to NAFTA trading partners as well.
Additionally, a textile or apparel good that contains one or
more fibers, yarns, or fabrics considered to be in short supply in the
U.S. is treated as satisfying the origination criteria, regardless of
source (Gelb, 2005). Cotton exports to Central America will
become duty-free immediately; textile and apparel will be duty-
free immediately if they meet the Agreement’s rules of origin.
Other Studies
Several studies have evaluated US-CAFTA-DR and provided
estimates of its impact. An investigation requested by the U.S.
Trade Representative concluded that US-CAFTA-DR would
likely result in moderate increases in U.S. imports of textiles,
apparel, and footwear. Additionally, this report concluded that
US-CAFTA-DR would result in a small increase in U.S. exports to
the Caribbean region, so small that the impact on U.S. jobs or
output would be negligible (USITC, 2004; Gelb, 2005).
Brown, Kiyota, and Stern (2004) use a multi-sector/multi-
country general equilibrium model to estimate the effects of
trade negotiations and changes to trade policies. Their results
for the textile and apparel sectors show a greater impact than
the USITC report. Brown, Kiyota, and Stern find that under
US-CAFTA-DR, U.S. exports of textiles would increase 6 percent,
textile imports would increase 3 percent, and U.S. textile employ-
ment decline 0.34 percent (a loss of about 3,000 jobs). U.S. apparel
exports would increase by 12 percent, apparel imports increase by
194 THE INTERNATIONAL TRADE JOURNAL
Downloaded By: [Texas Technology University] At: 18:45 19 November 2008

7 percent, and apparel employment decrease by 1.6 percent (a loss
of 12,000 jobs). The impacts on the Central American and
Caribbean economies are much greater. US-CAFTA-DR would
result in a regional increase in textile exports of 53 percent, an
increase in textile imports of 26 percent, and an increase in textile
employment of 27 percent (47,887 additional jobs). In the apparel
sector, Regional exports increase by 70 percent, imports increase
by 18 percent, and apparel employment increases by 43 percent
(an increase of 225,091 jobs). The significance of these findings
should be considered with caution; Brown, Kiyota, and Stern used
a 1997 database and did not include the effects of CBTPA which
was enacted in 2000. A portion of the growth in textiles
and apparel must be accounted for by this legislation and not
US-CAFTA-DR alone. Thus, these findings likely overestimate
the effects of US-CAFTA-DR.
McMahon, Rosson, and Adcock (2005) estimate the effects of
US-CAFTA-DR on agricultural exports from the U.S. to Central
America and the Caribbean. For the U.S. cotton and related
industries, they find that total business activity would increase
by $77.5 million under US-CAFTA-DR compared to a scenario
without the agreement. US-CAFTA-DR is shown to boost the
value of raw cotton exports and labor income and employment
by approximately 32 percent.
Our study of CAFTA-DR takes a more integrated approach
than the studies cited above. We estimate the welfare changes of
the agreement by considering the cotton textile complex from raw
cotton trade to textiles to finished goods. By incorporating more
industry sectors, a more complete estimate of economic conse-
quences may be derived.
Objective of this Analysis
The purpose of this report is to assess the economic effects of
the Dominican Republic-Central America-United States Free
Pan et al.: Welfare Analysis . . . 195
Downloaded By: [Texas Technology University] At: 18:45 19 November 2008

Trade Agreement on world textile and cotton trade flows, prices,
and market equilibria. The analysis considers scenarios that repre-
sent those components of the agreement that directly affect the
cotton, textile, and apparel industries of the United States, the five
Central American countries, and the Dominican Republic. We
quantify the impact of textile and cotton markets on terms of
trade, trade flows between US-CAFTA-DR economies, and other
trading partners.
In this paper, we compare three scenarios for the cotton, yarn,
and apparel trades. First, a baseline is developed assuming trade
agreements and tariff schedules as they exist without US-CAFTA-
DR and without the current provisions of CBTPA (since it is set
for expiration in 2008). The second scenario is based on the
indefinite continuation of CBTPA but without the provisions of
US-CAFTA-DR. Finally, the third scenario is based on full imple-
mentation of US-CAFTA-DR.
US-CAFTA-DR calls for eventual duty-free, quota-free access
on essentially all products (FAS, 2005). In the analysis presented
here, we model the impact of the agreement via the elimination of
tariffs that are recognized in publicized trading schedules. No
attempt has been made to quantify the effects of non-tariff barriers
to trade (NTBs). Fisher (2006) points out that NTBs such as
quotas, technical barriers to trade, and a wide array of customs
and administrative practices and procedures may substantially
impair trade that is otherwise free of tariff restrictions. This is
particularly true of the textile and textile article industries.
However, the textile industries of the United States and the
Region have a long history of cooperation and collaboration.
Preferential trade agreements such as CBTPA have been
successful in
creating an environment in which businesses forge strategic partner-
ships in the increasingly complex regimen of textile and apparel
manufacturing. In a paradigm of coordination, components are
196 THE INTERNATIONAL TRADE JOURNAL
Downloaded By: [Texas Technology University] At: 18:45 19 November 2008

routinely produced in countries other than where the end product is
assembled, end products are produced mainly for export, and all are
in close touch with each other. (Gelb, 2005, p.2)
In addition, the US-CAFTA-DR accord contains special provi-
sions committing trading partners to ‘‘ . . . identify trade facilitat-
ing initiatives regarding standards, technical regulations, and
conformity assessment procedures that are appropriate for parti-
cular issues or sectors’’ (USTR, 2007). While recognizing that
NTBs may be significant barriers to trade in many cases, the
circumstances surrounding the textile trade between the U.S.
and the Region and the provisions of the agreement itself address
many of these issues. Therefore, NTBs were not modeled sepa-
rately in this analysis.5
The remainder of the article is organized as follows: the next
section provides a basic theoretical background for economic wel-
fare calculations; this is followed by a description of the data and
analytical methods used; next are the results of this analysis; and
finally a section of summary and conclusions.
II. THEORETICAL BASIS
Long standing economic theories of comparative advantage
provide the rationale for US-CAFTA-DR: the overall economic
welfare of a country can be improved by producing those goods at
which they are relatively more efficient and trade for the rest
(Hornbeck, 2006). It would then be expected that the welfare
gains from free trade outweigh the overall welfare lost by an
economy in which trade is restricted or distorted by tariffs or
quotas. The purpose of this section is to theoretically demonstrate
the net welfare gains and losses of two trading partners and two
5For more discussion on the modeling challenges and methodologies associated with
NTBs, see Fugazza and Maur, 2006.
Pan et al.: Welfare Analysis . . . 197
Downloaded By: [Texas Technology University] At: 18:45 19 November 2008
commodities (modeling one commodity at a time) with the
removal of trade restricting tariffs.
The simplified economic model presented here is constructed
to demonstrate changes in net social welfare. This is derived from
changes in consumer and producer surplus in the face of changing
product prices. The model also accounts for gains or losses in
government revenue associated with the imposition or removal of
tariffs that affect the general welfare of a society as well. We do not
model the raw cotton market here, but note that the demand for
cotton is derived from the demand for cotton yarn. Therefore,
increased demand by the yarn production sector will increase the
demand for cotton with the accordant welfare effects in this indus-
try sector.
The theoretical model is based on several assumptions. The
first assumption is that the trading policies of both nations affect
world prices in the textile and apparel markets. This assumption is
based on the relatively large market share that the CAFTA
countries in toto represent for U.S. exports of cotton textiles (51
percent). As cotton apparel exporters, CAFTA countries have
seen their market share decline, but still claim a 15 percent market
share, enough to be considered large for the purposes of this
analysis. Second, the United States is a net exporter of cotton
yarn while the Region is a net importer of cotton yarn. Third,
the United States has an excess demand for apparel that is in part
supplied by the CAFTA countries. Fourth, the US-CAFTA-DR
agreement would lower import prices relative to any applicable
tariffs or, conversely, prices would be higher in the absence of US-
CAFTA-DR due to the presence of import tariffs. Fifth, we treat
imports and domestically produced goods as perfect substitutes.
Sixth, we ignore distributional and political issues related to
government receipts in order to focus on the economic welfare
effects of changes in tariffs.
The results of the paper are derived using a standard partial
equilibrium comparative analysis in the Marshallian economic
198 THE INTERNATIONAL TRADE JOURNAL
Downloaded By: [Texas Technology University] At: 18:45 19 November 2008

surplus framework (see Currie, Martin, and Schmitz, 1971; Bale
and Greenshields, 1978; Bale and Lutz, 1981, for more detail).
Figure III presents the basic framework for the welfare analysis
under US-CAFTA-DR. The upper part of the figure represents the
yarn market. The United States exports yarn to Central American
and Caribbean markets that impose an import tariff. The lower
part of the figure represents the apparel market in which the
CAFTA countries export to the United States which is modeled
with an import tariff.
Pf represents the free trade price under US-CAFTA-DR both
for the yarn or apparel markets. Pi represents the domestic price
facing importers of the commodity while Px represents the prices
faced by exporters in the domestic market. Therefore, in the yarn
market Pi is the initial price position for yarn imports in the
Figure 3Conceptual Framework of Welfare Analysis
Yarn Market
Region US
ES
ED
Pf
Pi
Px
Pf
Pi
Px
a b ce f h
i j l mn o
Apparel Market
Region World Market US
ES
ED
IN O P Q
A B CE F
dg qp
MLJ DHG
World Market
Pan et al.: Welfare Analysis . . . 199
Downloaded By: [Texas Technology University] At: 18:45 19 November 2008

CAFTA countries. Px is the domestic yarn price in the
United States with import tariffs imposed by the Central American
and Caribbean countries. Pf is the resultant price in both the United
States and the Region with free trade.
The Yarn Market
The upper portion of Figure III shows the welfare effects of
US-CAFTA-DR on the cotton yarn market. The gain in consumer
surplus in Central America and the Dominican Republic with the
free trade agreement is represented by area aþ bþ cþ d. Producer
surplus is reduced in the same region area a. Government revenue
with the import tariff, area cþ g, is lost in free trade. In the United
States, the removal of the tariff increases the price level from Px to
Pf. Producer surplus increases by nþ o þ pþ q. Consumer surplus
in the United States is reduced by area n. Government revenue in
the U.S. is unaffected.
The Apparel Market
The lower portion of Figure III shows the welfare effects of
US-CAFTA-DR on the market for cotton apparel. The gain in
consumer surplus in the U.S. with removal of import tariffs is
given by area A þ B þ C þ D. The loss of producer surplus with
lower prices in the U.S. is area A. The U.S. government loses area
C þ G in revenue. In the Central American-Caribbean region,
higher prices with free trade results in increased producer surplus
of area N þ O þ P þ Q and a loss of consumer surplus of
area N.
Net Effects of Free Trade
In integrated markets such as the textile and apparel indus-
tries of the United States, Central America, and the Caribbean,
estimates of welfare effects of free trade in each country must
account for changes in both sectors. The net effect will be the
summation of separate effects modeled in Figure III. The basic
social welfare calculation is shown in Table I. We assume all
200 THE INTERNATIONAL TRADE JOURNAL
Downloaded By: [Texas Technology University] At: 18:45 19 November 2008

countries are only concerned with the welfare of their own citi-
zens and the fate of industries in their own nations. As demon-
strated here, the United States would be better off if US-CAFTA-
DR would open markets for U.S.-produced cotton yarn; the
CAFTA countries would be better off if the United States
would open its apparel market to them. Whether any or all of
the sovereign nations that negotiated this agreement sign or
decline depends on whether the Bc or Bu of Table I is negative
or positive. Estimates of welfare net effects may assist these
nations in deciding whether to keep old structures of protection
in place or abolish trade barriers and adopt US-CAFTA-DR.
Each nation will compare the payoffs of these two trade strategies
which can be measured by B’s, the dollar measures of the real
income changes associated with the movement between the equi-
librium situations because of relative price changes. US-CAFTA-
DR would be signed if the B’s are positive.
Table IWelfare Effects of US-CAFTA-DR
Central America andthe Dominican Republic
(the Region) United States
Yarn Sector
Consumer surplus
(apparel producers
in the Region)
a þ b þ c þ d �n
Producer surplus �a n þ o þ p þ q
Govt revenue �(c þ g) 0
Apparel Sector
Consumer surplus �N A þ B þ C þ D
Producer surplus N þ O þ P þ Q �A
Government revenue 0 �(C þ G)National Welfare BR ¼ a þ b þ c þ d þ N þ O
þ P þ Q� (a þ c þ g þ N)
BU ¼ n þ o þ p þ q þ A þ B
þ C þ D� (A þ C þ G)
Pan et al.: Welfare Analysis . . . 201
Downloaded By: [Texas Technology University] At: 18:45 19 November 2008

III. METHODS AND DATA
To provide an estimate of the welfare gains and losses of US-
CAFTA-DR, a partial equilibrium econometric model of the
world fiber market, developed by the Cotton Economic
Research Institute (CERI) at Texas Tech University, is used
(Pan et al., 2004). Some of the advantages of using partial
equilibrium as opposed to other methods include ease of model
building, fewer demands of theoretical assumptions and data,
and the allowance of more detail than general equilibrium mod-
els (Alvaro and Wailes, 2005). This model of the world fiber
market has been used to analyze such cases as the Brazilian
and West African complaints against U.S. farm policy in the
dispute panels of the World Trade Organization (Pan et al.,
2006), a comparison of U.S. farm policy and China’s tariff rate
quota system (Pan et al., 2005), the effect of revaluation of
China’s currency on world fiber markets (Pan et al., 2005), and
the effect of complete trade liberalization in the world cotton
market (Pan et al., 2006). Pan et al. (2004) provides complete
model explication. The model is also the basis of CERI’s annual
Global Cotton Outlook.
The model incorporates 25 major trading blocs reflecting
major participants in the world cotton trade (Pan et al.,
2004). As each country and region sets their tariff policies,
they can be expected to have some impact on the terms of
trade which they face. An outline of the trade flows for the
cotton, textile, and apparel industries of Central America and
the Dominican Republic is given in the Figure IV and the
major equations estimated are in Table II. Along with equa-
tions and parameter estimates (with standard errors in par-
entheses), Table II reports diagnostic statistics of the model.
In addition to the Durbin-Watson statistics, tests were con-
ducted to detect higher order correlation. No significant effects
were found.
202 THE INTERNATIONAL TRADE JOURNAL
Downloaded By: [Texas Technology University] At: 18:45 19 November 2008

Yarn and Fiber Supply Model
The domestic supply of yarn and fabric for the CAFTA textile
industry is shown as the sum of imports from the U.S. and the rest
of the world (ROW). We ignore the cotton sector in the model due
to little production and mill use in the CAFTA countries. Cotton
yarn and fabric imports from the U.S. increase as the U.S. cotton
textile price index increases and U.S. yarn price decreases
(Equation 1.1). Cotton yarn and fabric imports from other coun-
tries increase as the Chinese apparel price index increases, U.S.
cotton apparel price decreases, and the U.S. yarn price increases
(Equation 1.2).
Apparel Demand Model
A two-step procedure is used for estimating fiber demand
that connects textile output to yarn and fiber inputs. The
Figure 4Representation of US-CAFTA-DR model
Cotton yarn and fabric imports form theUNITED STATES
Cotton apparelCotton yarn and fabric imports from the ROW
Cotton imports Cotton yarn and fabric produced
Cotton apparel domestic use
Cotton apparel export to theUNITED STATES
Cotton apparel export to other countries
Apparel price index
Pan et al.: Welfare Analysis . . . 203
Downloaded By: [Texas Technology University] At: 18:45 19 November 2008

Table IIParameter Estimates of US-CAFTA-DR Fiber Model
Equations Parameters and Std Errors Adj. R2D-W
Statistics F-Statistics
(1.1) Cotton Yarn and FabricImports from United States
¼ �1083893 þ 11991*US cotton Textile price index-2347.46*US yarn price (581047) (6101.26) (1641.11)
0.98 2.52 284.29
þ 0.89*Lag(yarn and fabric import from US) (0.12)
(1.2) Cotton Yarn and FabricImports from ROW
¼ 907744 þ 3315.03*Chinese apparel price index�197.86*US cotton apparel (472228) (465.73) (58.03)
0.93 2.08 182.66
price index þ 119.95*US yarn price (146.45)
(1.3) Textile Domestic
Consumption Per Capita
¼ 1.11 þ 0.97*real GDP per capita -- 0.05
*CAFTA-DR Cotton apparel price (0.43) (0.38) (0.02)
0.76 2.54 14.95
þ 0.70*Lag(Textile Consumption/capita) (0.16)
(1.4) Cotton Apparel Exports ¼ 86876 þ 3645.67*US textile price index �20653
*CAFTA-DR apparel price (24714) (988.83) (6028)
0.96 2.30 355.96
þ 0.79*lag(Apparel Exports) (0.07)
(1.5) Cotton Yarn and
Fabric Share in total
Textile Fiber Consumption
¼ 1.48 �0.07*Textile output�0.003
*log(cotton apparel price) (0.42) (0.03) (0.0004)
�0.007*log(wool apparel price) þ 0.01
*log(polyester apparel price) (0.004) (0.004)
(1.6) Man-made FiberYarn and Fabric Share
in Total Textile Fiber
Consumption
¼ �0.60 þ 0.07* Textile output þ 0.01* log(cotton apparel price) (0.46) (0.03) (0.004)
þ 0.02* log(wool apparel price) �0.03* log(polyester apparel price) (0.01) (0.01)
204
Downloaded By: [Texas Technology University] At: 18:45 19 November 2008
first step involves the estimation of total domestic textile
production. In the second step, total domestic textile produc-
tion (total fiber demand) is allocated among the various
fibers. Thus, demand for each major fiber type (cotton and
man-made) can be estimated according to its utilization in
the textile production process.
Step 1. Total domestic textile demand is given by the follow-
ing formula:
Total Domestic Textile Demand
¼ Domestic Textile ConsumptionþApparel Exports
The model calculates per capita domestic textile consumption in
fiber equivalents as a function of per capita income and the
CAFTA cotton apparel price (Equation 1.3). Apparel exports
are estimated as a function of the U.S. textile price index and the
CAFTA apparel price (Equation 1.4).
Step 2. In the second step, total domestic textile produc-
tion is allocated among the various fibers (cotton and man-
made). Cotton’s share is shown to decrease as total textile
output increases, decreases as cotton apparel prices increase,
decreases as the price of wool apparel decreases, and increases
as polyester apparel prices increase (Equation 1.5). The share
of man-made fiber in total domestic consumption increases
with total output, increases with cotton apparel prices,
increases as wool apparel increases, and decreases as polyester
apparel prices increase (Equation 1.6). The apparel price is
solved endogenously by the balance in the cotton textile
market.
The historic and predicted macroeconomic variables (real
GDP, exchange rate, population, and GDP deflator) originate
from Global Insight and are shared by the Food and Agricultural
Policy Research Institute (FAPRI). Cotton production,
Pan et al.: Welfare Analysis . . . 205
Downloaded By: [Texas Technology University] At: 18:45 19 November 2008
consumption, ending stocks, imports, and export data are from
USDA Foreign Agriculture Service Production, Supply &
Distribution (PSD). Fiber mill consumption and man-made
fiber data are from FAO World Fiber Consumption Survey
(before 1994) and Fiber Organon (after 1994). Yarn and apparel
trade and the tariff rates are from World Integrated Trade
Solution Database, FTAA-ALCA database and Office of
Textiles and Apparel (OTEXA).
IV. SIMULATION RESULTS
Tables III through VII present the main findings of the
analysis. The baseline projection assumes all US-CAFTA-DR
countries impose the same tariff rates on cotton yarn imports
and cotton apparel imports as the goods from other countries
such as apparel imported from China. The perpetual extension of
current CBI legislation is shown by the scenario CBI. The effects
of reciprocal free trade between the United States, Central
America, and the Dominican Republic are measured in the US-
CAFTA-DR scenario. Policy effects (percentage change esti-
mates) of both alternative scenarios are compared to the
baseline.
Removing tariff rates on cotton yarn imports in the
Caribbean region shifts their yarn supply curve to the right.
The same supply effect is seen in the U.S. apparel market
when apparel import tariffs from the region are eliminated.
As Table III shows, yarn imports from the United States to
the Region would increase with US-CAFTA-DR by 0.42 percent
and decline to the Region from the rest of the world by 0.04
percent. With the trade agreement, cotton apparel imports from
the Region to the U.S. increase by an average 0.74 percent and
domestic textile consumption in the Region declines by an aver-
age 3.36%. All of the effects of US-CAFTA-DR magnify those of
CBI alone.
206 THE INTERNATIONAL TRADE JOURNAL
Downloaded By: [Texas Technology University] At: 18:45 19 November 2008

Table IIIEffects on Regional Textile Markets
2006/07 2007/08 2008/09 2009/10 2010/11 Average
(1000 MT)
Cotton yarn and fabric Import from US Baseline 601.67 603.22 636.95 666.35 694.87 640.61
CBI 0.11% 0.20% 0.27% 0.33% 0.38% 0.26%
US-CAFTA-DR 0.17% 0.33% 0.44% 0.54% 0.62% 0.42%
Cotton yarn and fabric import from ROW Baseline 177.82 148.18 139.37 128.08 116.40 141.97
CBI �0.02% �0.02% �0.02% �0.03% �0.03% �0.02%US-CAFTA-DR �0.03% �0.04% �0.04% �0.04% �0.05% �0.04%
Cotton Apparel export to US Baseline 743.99 708.97 673.46 652.86 611.28 678.11
CBI 0.19% 0.37% 0.53% 0.68% 0.84% 0.52%US-CAFTA-DR 0.27% 0.52% 0.75% 0.96% 1.19% 0.74%
Textile price Dollars per pound
Baseline 6.57 8.42 8.63 8.46 9.09 8.24CBI 6.84% 5.34% 5.21% 5.31% 4.94% 5.53%
US-CAFTA-DR 8.41% 6.55% 6.39% 6.50% 6.04% 6.78%
Domestic textile consumption per capita Kg per person
Baseline 2.91 3.19 3.55 3.91 3.91 3.49
CBI �1.69% �2.63% �3.09% �3.21% �3.19% �2.76%
US-CAFTA-DR �2.07% �3.23% �3.79% �3.93% �3.78% �3.36%
207
Downloaded By: [Texas Technology University] At: 18:45 19 November 2008

Welfare gains in the Region are reported in Table IV. Apparel
producers gain an average $408 million annually with the tariff
rate removed. However, Regional governments lose $291 million in
tariff collection revenue. Consumers in the Region lose $27 million
due to domestic cotton apparel price increases. The net gain of
nations in the Region with the trade agreement would be approxi-
mately $90 million annually (compared to no trade agreement
at all).
The effects of the agreement on the U.S. cotton sector are
presented in Table V. With increased cotton yarn exports to
the Region, U.S. cotton mill use increases by 0.16 percent and
U.S. cotton exports decline by 0.06 percent. The U.S. raw
cotton sector is not significantly affected by the trade agree-
ment with production basically unchanged and prices influ-
enced by less than ¼ cent per pound (0.04 percent). As
for the U.S. textile and apparel sector (Table VI), T&A prices
decrease an average 4.06 percent with the agreement due to
the 0.17 percent increase in cotton T&A imports. Domestic
cotton textile and apparel consumption in the U.S. increases
0.09 percent.
Welfare analysis of US-CAFTA-DR in the United States is
presented in Table VII. Cotton producers gain around $2.7 million
with small changes in the farm price and domestic cotton pro-
duction increases. Cotton yarn spinners in the U.S. gain around
$124 million over current CBI trade provisions with increased
exports to an expanding textile industry in the Region. However,
apparel producers lose around $40 million dollars with increased
competition for cotton apparel from the Region. The U.S.
government loses some import tariff revenue while increased
competition in the U.S. textile market with more imports from
the Region benefit U.S. consumers by about $6 million. The
net welfare gain in the U.S. totals $54 million annually with
US-CAFTA-DR over CBI and $135 million over no trade agree-
ment at all.
208 THE INTERNATIONAL TRADE JOURNAL
Downloaded By: [Texas Technology University] At: 18:45 19 November 2008

Table IVWelfare Effects on Region
2006/07 2007/08 2008/09 2009/10 2010/11 Average
(Million Dollars)
Producers CBI 342.75 337.90 329.47 324.99 313.89 329.80
US-CAFTA-DR 422.16 417.36 407.95 403.05 390.73 408.25
Government CBI �164.07 �166.99 �179.03 �190.17 �201.38 �180.33
US-CAFTA-DR �265.24 �270.12 �289.72 �307.87 �326.12 �291.81
Consumers CBI �30.09 �21.86 �19.16 �21.06 �20.96 �22.62
US-CAFTA-DR �36.77 �26.46 �23.00 �25.21 �26.78 �27.64
Total CBI 148.59 149.06 131.28 113.76 91.55 126.85US-CAFTA-DR 120.14 120.79 95.22 69.96 37.84 88.79
209
Downloaded By: [Texas Technology University] At: 18:45 19 November 2008
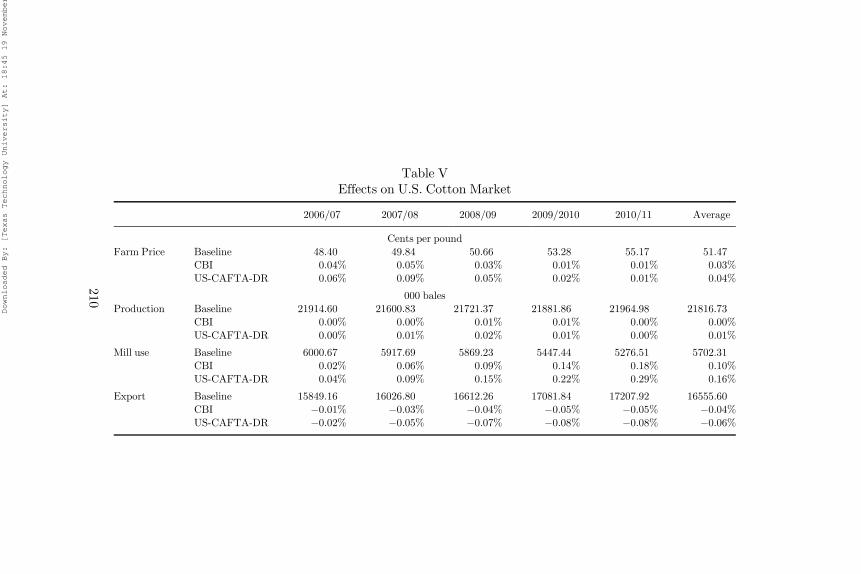
Table VEffects on U.S. Cotton Market
2006/07 2007/08 2008/09 2009/2010 2010/11 Average
Cents per pound
Farm Price Baseline 48.40 49.84 50.66 53.28 55.17 51.47CBI 0.04% 0.05% 0.03% 0.01% 0.01% 0.03%
US-CAFTA-DR 0.06% 0.09% 0.05% 0.02% 0.01% 0.04%
000 balesProduction Baseline 21914.60 21600.83 21721.37 21881.86 21964.98 21816.73
CBI 0.00% 0.00% 0.01% 0.01% 0.00% 0.00%
US-CAFTA-DR 0.00% 0.01% 0.02% 0.01% 0.00% 0.01%
Mill use Baseline 6000.67 5917.69 5869.23 5447.44 5276.51 5702.31
CBI 0.02% 0.06% 0.09% 0.14% 0.18% 0.10%
US-CAFTA-DR 0.04% 0.09% 0.15% 0.22% 0.29% 0.16%
Export Baseline 15849.16 16026.80 16612.26 17081.84 17207.92 16555.60
CBI �0.01% �0.03% �0.04% �0.05% �0.05% �0.04%
US-CAFTA-DR �0.02% �0.05% �0.07% �0.08% �0.08% �0.06%
210
Downloaded By: [Texas Technology University] At: 18:45 19 November 2008

Table VIEffects on U.S. Cotton Textile Market
2006/07 2007/08 2008/09 2009/10 2010/11 Average
Cotton Textile Price Dollars per PoundBaseline 12.97 12.94 13.48 13.76 13.80 13.39
CBI �1.12% �2.03% �2.67% �3.16% �3.57% �2.51%
US-CAFTA-DR �1.82% �3.27% �4.32% �5.11% �5.76% �4.06%
Cotton Textile Import Million poundsBaseline 8201.71 8272.79 8329.63 8554.43 8664.48 8404.61
CBI 0.04% 0.08% 0.11% 0.13% 0.15% 0.10%
US-CAFTA-DR 0.07% 0.13% 0.18% 0.22% 0.25% 0.17%Cotton Textile Consumption
Baseline 11082.03 11113.28 11146.86 11169.20 11197.20 11141.72
CBI 0.03% 0.05% 0.06% 0.07% 0.08% 0.06%
US-CAFTA-DR 0.04% 0.07% 0.10% 0.11% 0.13% 0.09%
211
Downloaded By: [Texas Technology University] At: 18:45 19 November 2008

Table VIIWelfare Effects on U.S. Cotton and Textile Sectors
2006/07 2007/08 2008/09 2009/10 2010/11 Average
Producers Million Dollars
Cotton producers CBI 1.87 3.00 1.97 1.07 0.70 1.72US-CAFTA-DR 3.03 4.86 3.21 1.65 0.81 2.71
Yarn Producers CBI 267.39 242.91 259.48 279.70 288.24 267.55
US-CAFTA-DR 383.88 355.62 380.80 410.10 425.04 391.09
Apparel Producers CBI �60.95 �61.58 �70.63 �77.31 �86.89 �71.47
US-CAFTA-DR �98.18 �103.04 �112.31 �115.18 �119.38 �109.62
Government
Cotton support saved CBI 0.11 0.22 0.29 0.30 0.29 0.24
US-CAFTA-DR 0.17 0.36 0.46 0.49 0.46 0.39
Textile tariff CBI �133.65 �127.21 �120.29 �116.00 �108.16 �121.06
US-CAFTA-DR �171.13 �163.08 �154.91 �150.17 �140.61 �155.98
Consumers CBI 1.58 2.85 3.93 4.76 5.39 3.70
US-CAFTA-DR 2.55 4.60 6.36 7.69 8.72 5.99
Total CBI 76.35 60.19 74.76 92.52 99.56 80.68US-CAFTA-DR 120.32 99.32 123.61 154.57 175.06 134.58
212
Downloaded By: [Texas Technology University] At: 18:45 19 November 2008

V. CONCLUSION
Most U.S. cotton producers, textile manufacturers, apparel
importers, and retailers support US-CAFTA-DR (Gelb, 2005).
Our findings provide validation for the economic benefits these
industry sectors would receive. However, US-CAFTA-DR faced
strong opposition in the United States from the American
Manufacturing Trade Action Coalition and the National
Textile Association. They feared that US-CAFTA-DR would
destroy tens of thousands of U.S. textile and apparel manufactur-
ing jobs (AMTAC, 2004). Our findings again concur: the eco-
nomic loss this industry has felt under CBI would expand with
US-CAFTA-DR.
Accounting for the gains and losses by different industry
groups cited above, US-CAFTA-DR is shown here to increase
the national economic welfare of both the United States and the
Central American/Caribbean region nations who have signed.
The total welfare gains of the cotton T&A sectors in these coun-
tries would reach around $165 million, with the United States
receiving a positive economic impact of $135 million and the
Region realizing a gain of $89 million.
Studies such as this can make an important contribution to the
ongoing debate in many political circles concerning the benefits of
free trade agreements. The official trade position of the United
States is one of open markets (USTR, 2006). Passage of US-
CAFTA-DR in the U.S. was seen as a signal of U.S. commitment
and leadership in the free trade agenda. Even so, the U.S. House of
Representatives approved US-CAFTA-DR by a single vote.
Clearly, there remains serious debate in the United States, a
champion of free trade agreements, over the net gains and losses
such agreements produce. While economic theory is clear in estab-
lishing the benefits of free trade, who wins and who loses have
important policy implications. ‘‘The essence of a free trade agree-
ment is to open up markets to greater access from partner
Pan et al.: Welfare Analysis . . . 213
Downloaded By: [Texas Technology University] At: 18:45 19 November 2008

countries’’ (Paggi et al., 2005, p. 138). But the closeness of the vote
approving CAFTA indicates that considerable doubt remains over
the benefits of free trade, especially important in continuing nego-
tiations of the WTO (Outlaw, 2005).
REFERENCES
Alvaro, D. M., and Wailes, E. J. General and Partial Equilibrium
Analysis of the Impact of the Central America Free Trade
Agreement on the U.S. Rice Sector. presented at the American
Agricultural Economics Association Annual Meeting,
Providence, Rhode Island, July 24--27, 2005.
American Apparel and Footwear Association (AAFA). U.S./Central
America-Dominican Republic Free Trade Agreement (CAFTA)
vs. Caribbean Basin Trade Partnership Act (CBTPA). April 22,
2005. Available online at http://www.apparelandfootwear.org/
data/caftacbtpaaafacomparison050422.pdf. Accessed April 13,
2006.
American Manufacturing Trade Action Coalition (AMTAC).
CAFTA Bad for U.S. Textile Industry and Workers, May 28,
2004. Available online at www.amtac.org. Accessed April 13, 2006.
Bale, M. D., and Greenshields, B. L. 1978. Japanese Agricultural
Distortions and Their Welfare Values. American Journal of
Agricultural Economics 60: 59--64.
Bale, M. D., and Lutz, E. 1981. Price Distortions in Agricultural
and Their Effects: An International Comparison. American
Journal of Agricultural Economics 63: 8--22.
Brown, D., Kiyota, K., and Stern, R. Computational Analysis of the
U.S. Bilateral Free Trade Agreements with Central America,
Australia, and Morocco. Working paper, Department of
Economics, University of Michigan, February 8, 2004.
Currie, M., Martin, J. A., and Schmitz, A. 1971. The Concept of
Economic Surplus and Its Use in Economic Analysis.
Economic Journal 81: 741--99.
214 THE INTERNATIONAL TRADE JOURNAL
Downloaded By: [Texas Technology University] At: 18:45 19 November 2008

Fisher, B. 2006. Preference Erosion, Government Revenues
and Non-Tariff Trade Barriers. The World Economy:
1377--1393.
Fugazza, M., and Maur, J.-C. Non-Tariff Barriers in a Non-Tariff
World. Paper prepared for the Trade Analysis Branch,
Division on International Trade in Goods and Services, and
Commodities, UNCTAD, Geneva, July 2006.
Gelb, B. A. DR-CAFTA, Textiles, and Apparel. CRS Report for
Congress RS22150, May 20, 2005.
Hornbeck, J.F. The Dominican Republic-Central America-United
States Free Trade Agreement (CAFTA-DR). CRS Report for
Congress RL31870, January 4, 2006.
McMahon, S., Posson, P., and Adcock, F. 2005. Potential
Economic Impact of the Central American Free Trade
Agreement-Dominican Republic on the United States.
Working paper, Center for North American Studies,
Department of Agricultural Economics, Texas A&M.
National Cotton Council (NCC). Cotton Crop Databases.
Available online at http://www.cotton.org/econ/cropinfo/
cropdata/index.cfm. Accessed April 20, 2006.
Outlaw, J. L. 2005. Washington Scene. Choices 20: 215--216.
Paggi, Mechel S., Kennedy, P. L., Yamazaki, F., and Josling,
T. 2005. Regional Trade Agreements and Implications for
US Agriculture: The Case of CAFTA-DR. Choices 20:
137--141.
Pan, S., Fadiga, M., Mohanty, S., and Welch, M. 2007a. Cotton in
a Free Trade World. Economic Inquiry 45: 188--197.
Pan, S., Mohanty, S., Ethridge, D., and Fadiga, M. 2006. The
Impacts of U.S. Cotton Programs on the World Market: An
Analysis of Brazilian and West and Central African WTO
Petitions. Journal of Cotton Science 10: 180--192.
Pan, S., Mohanty, S., Fadiga, M., and Ethridge, D. 2004.
Structural Models of the United States and the Rest-of-the-
World Natural Fiber Market, CER # 04--03, Cotton
Pan et al.: Welfare Analysis . . . 215
Downloaded By: [Texas Technology University] At: 18:45 19 November 2008

Economics Research Institute, Department of Agricultural
and Applied Economics, Texas Tech University.
Pan, S., Mohanty, S., Welch, M., Ethridge, D., and Fadiga, M. 2007b.
Effects of Chinese Currency Appreciation on the World Fiber
Markets. Contemporary Economic Policy 25: 185--205.
Pan, S., Welch, M., Mohanty, S., and Fadiga, M. 2005. Assessing
the Impacts of the Chinise TRQ System and U.S. Subsidies on
the World Cotton Market. The Estey Centre Journal of
International Law and Trade Policy 6: 251--273.
Reagan, R. Public Papers of Ronald Reagan. Remarks to the
Permanent Council of the Organization of American States
on the Caribbean Basin Initiative, 24 February 1982.
Available online at http://www.reagan.utexas.edu/archives/
speeches/1982/82feb.htm. Accessed September 27, 2005.
Trade Resource Center. DR-CAFTA and Textiles and Apparel.
Business Roundtable, 2005. Available online at http://trade.
businessroundtable.org/trade_2005/cafta_dr/textiles.html.
Accessed March 28, 2006.
U.S. Department of Agriculture, Economic Research Service (ERS).
Cotton and Wool Outlook Report, 2006. Available online at
http://usda.mannlib.cornell.edu/reports/erssor/field/cws-bb/.
Accessed April 13, 2006.
U.S. Department of Agriculture, Foreign Agricultural Service.
‘‘Central American-Dominican Republic-United States-Free
Trade Agreement’’. Overall Agriculture Fact Sheet, March 2005.
U.S. Department of Commerce, International Trade
Administration, Market Access and Compliance (MAC).
Available online at http://www.mac.doc.gov/CBI/WebMain/
intro.htm. Accessed April 7, 2006.
United States International Trade Commission (USITC). 2004.
U.S.-Central America-Dominican Republic Free Trade
Agreement: Potential Economywide and Selected Sectoral
Effects, (Investigation no. TA-2104-13, Publication 3717).
Washington, DC: USITC.
216 THE INTERNATIONAL TRADE JOURNAL
Downloaded By: [Texas Technology University] At: 18:45 19 November 2008

United States Trade Representative (USTR). Mission of the USTR.
Available online at http://www.ustr.gov/Who_We_Are/
Mission_of_the_USTR.html. Accessed April 25, 2006.
USTR. CAFTA-DR Final Text. Available online at http://www.
ustr.gov/Trade_Agreements/Regional/CAFTA/CAFTA-DR_
Final_Texts/Section_Index.html. Accessed October 10, 2007.
Pan et al.: Welfare Analysis . . . 217
Downloaded By: [Texas Technology University] At: 18:45 19 November 2008