we will look at two ways to identify outliers. the first of which
TRANSCRIPT
We will look at two ways to identify outliers. The first of which we will discuss now.
This method, which we will call the IQR method, is based upon the five‐number summary, in particular it uses the IQR and the 1st and 3rd quartiles, Q1 and Q3.
1
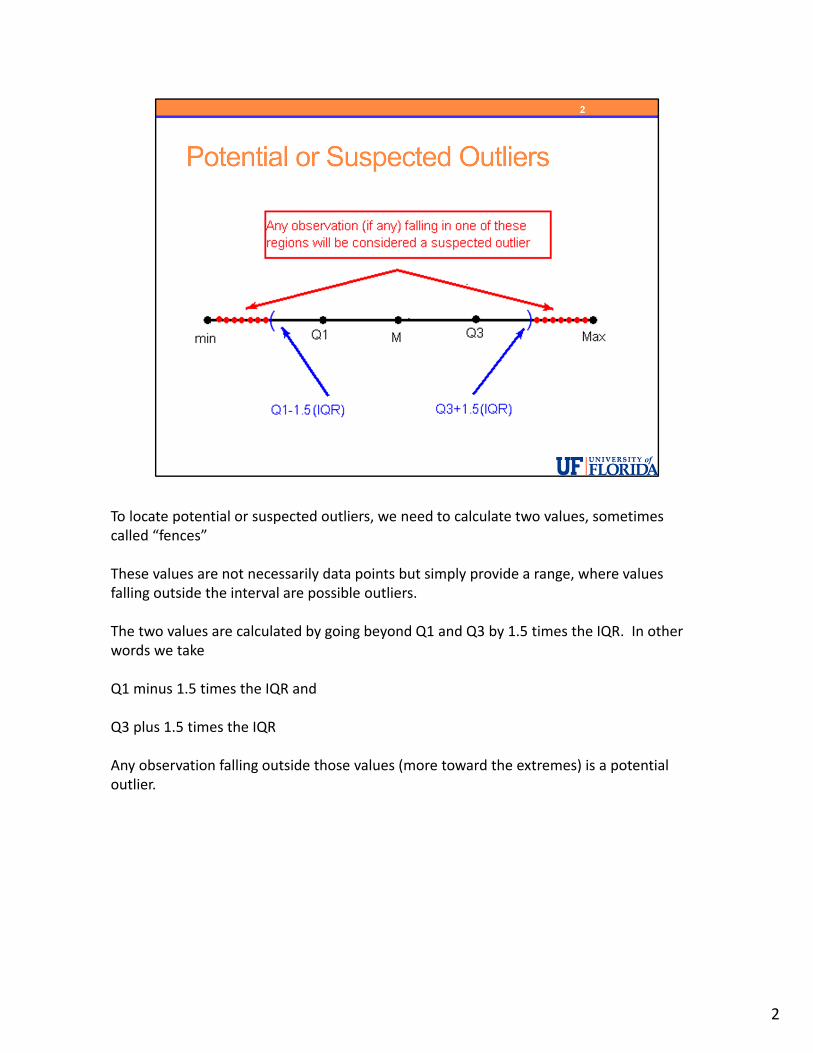
To locate potential or suspected outliers, we need to calculate two values, sometimes called “fences”
These values are not necessarily data points but simply provide a range, where values falling outside the interval are possible outliers.
The two values are calculated by going beyond Q1 and Q3 by 1.5 times the IQR. In other words we take
Q1 minus 1.5 times the IQR and
Q3 plus 1.5 times the IQR
Any observation falling outside those values (more toward the extremes) is a potential outlier.
2
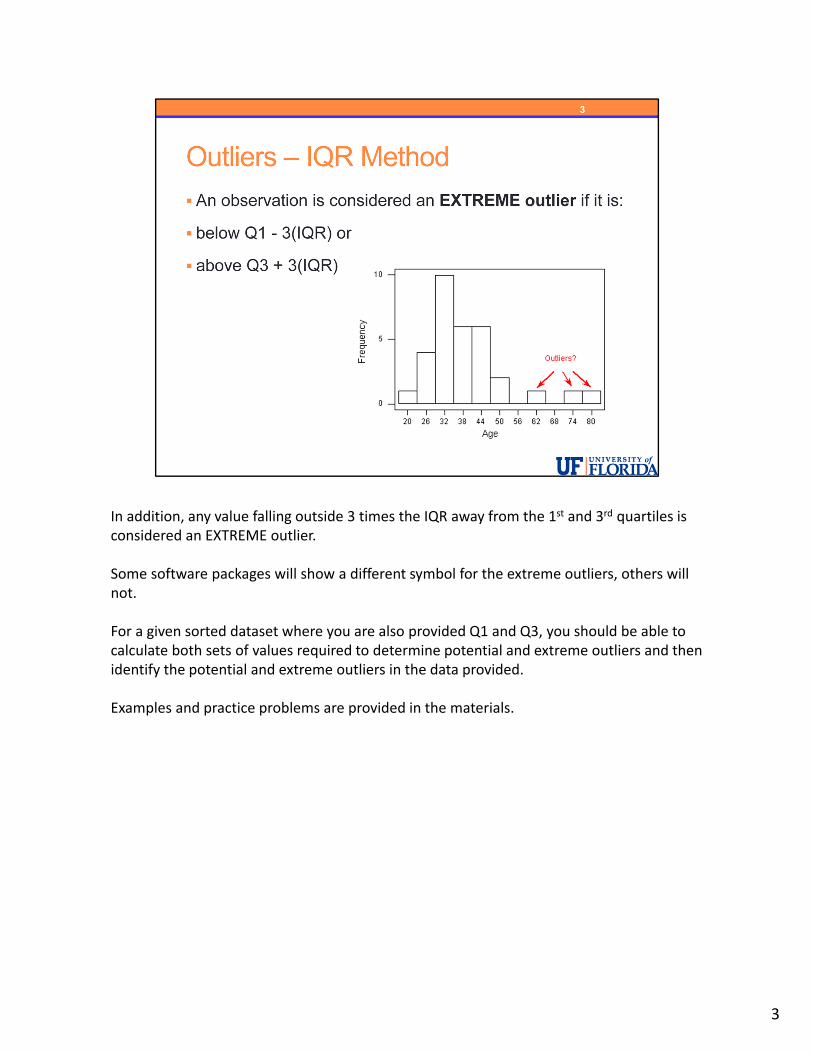
In addition, any value falling outside 3 times the IQR away from the 1st and 3rd quartiles is considered an EXTREME outlier.
Some software packages will show a different symbol for the extreme outliers, others will not.
For a given sorted dataset where you are also provided Q1 and Q3, you should be able to calculate both sets of values required to determine potential and extreme outliers and then identify the potential and extreme outliers in the data provided.
Examples and practice problems are provided in the materials.
3
If an outlier was produced by essentially the same process as the rest of data, and if such extremes are expected to eventually occur again, then the outlier contains something important and interesting about the process, and it should be kept in the data
4
If the outlier was produced under different conditions from the rest of the data (or by a different process), the outlier can be removed from the data if your goal is to investigate only the process that produced the rest of the data
5
An outlier which is a mistake (typo, measuring error), should be corrected if possible or else removed from the data before calculating summary statistics or making inferences from the data (and the reason for the mistake should be investigated)
6
Identifying outliers is an important component of describing the distribution of one quantitative variable.
Next, we will see that this process of identifying outliers is used when creating boxplots.
7