wdm/tdm pon bidirectional networks single-fiber/wavelength rsoa-based onus layer 1 / layer 2...
TRANSCRIPT

1
WDM/TDM PON Bidirectional Networks Single-Fiber/Wavelength RSOA-based ONUs Layer 1/2
Optimization
Author
Eduardo Tommy López Pastor
Advisors:
Josep Joan Prat Gomà
José Antonio Lázaro Villa
A thesis submitted in fulfillment for the degree of
Philosophy Doctor
At the
Optical Communications Group (GCO)
Signal Theory and Communications Department (TSC)
Barcelona, September 2013

2
The work described in this thesis was performed in the Optical Communications Group (GCO) at the
Signal Theory and Communications (TSC) department of the Universitat Politècnica de Catalunya (UPC)
/ Barcelona Tech. It was funded, in part, by the The Programme Alßan "high level scholarships of the
European Union to Latin America" and supported by the European Commission through the FP7 Projects
SARDANA and EURO-FOS.
.
Eduardo Tommy López Pastor
“WDM/TDM PON Bidirectional Networks Single-Fiber/Wavelength RSOA-based ONUs Layer 1/2
Optimization”
Subject Headings: Optical Fiber Communications
Copyright © 2013 by Eduardo Tommy López Pastor
All rights reserved. No part of this publication may be reproduced, stored in a retrieval system, or
transmitted in any form or by any means without the prior written consent of the author.
Printed in Barcelona, Spain.

3
To my Mother Mercedes
To my Children Otto, Deborah and Paulo
“Y dijo Dios: Sea la luz; y fue la luz.” Gn. 1:3

4
Abstract
This Thesis proposes the design and the optimization of a hybrid WDM/TDM PON at the L1 (PHY) and
L2 (MAC) layers, in terms of minimum deployment cost and enhanced performance for Greenfield NG-
PON. The particular case of RSOA-based ONUs and ODN using a single-fibre/single-wavelength is
deeply analysed.
In this WDM/TDM PON relevant parameters are optimized. Special attention has been given at the main
noise impairment in this type of networks: the Rayleigh Backscattering effect, which cannot be prevented.
To understand its behaviour and mitigate its effects, a novel mathematical model for the Rayleigh
Backscattering in burst mode transmission is presented for the first time. It model has been used to
optimize the WDM/TDM RSOA based PON.
Also, a cost-effective, simple design SCM WDM/TDM PON with rSOA-based ONU, was optimized and
implemented. This prototype was successfully tested showing high performance, robustness, versatility
and reliability. So, the system is able to give coverage up to 1280 users at 2.5 Gb/s / 1.25 Gb/s
downstream/upstream, over 20 Km, and being compatible with the GPON ITU-T recommendation.
This precedent has enabled the SARDANA network to extend the design, architecture and capabilities of
a WDM/TDM PON for a long reach metro-access network (100 km). A proposal for an agile
Transmission Convergence sub-layer is presented as another relevant contribution of this work. It is based
on the optimization of the standards GPON and XG-PON (for compatibility), but applied to a long reach
metro-access TDM/WDM PON rSOA-based network with higher client count.
Finally, a proposal of physical implementation for the SARDANA layer 2 and possible configurations for
SARDANA internetworking, with the metro network and core transport network, are presented.

5
Acknowledgments
First and foremost I want to thank God for each day of my life, for the opportunity to conduct my PhD
and for the people I was blessed to cross on my way during this part of my life.
Specially, I want to give prominence to my advisor Dr. Josep Prat for his friendship, his support, his
involvement in my welfare, his guidance in my PhD and in this work, and for having given to me the
opportunity to join the Optical Communications research group and to participate in international
projects, relevant congress, stays and different research activities. Furthermore, I would like to thank Dr.
Jose Antonio Lázaro for agreeing to be my co-advisor and for sharing his knowledge with me.
Thanks to the Tribunal of this Thesis; I am grateful to Dr. António Teixeira (IT-Aveiro University), Dra.
Carmen Mas (Technische Universität München - TUM) and Dr. Josep Segarra (UPC), thanks for given
relevance and prestige to this work.
This work and research contributions would not have been possible without the full support of my
colleagues and friends at the Optical Communications Group (GCO) at UPC. My special thanks to Victor
Polo for his genuine friendship, his personal support, his laboratory assistance and for sharing his
practical experience. In this work there are many of your contributions. In the same line, I would like to
thanks Bernhard Schrenk, Josep Maria Fabrega, Cristina Arellano, Francesc Bonada and Mireia Omella,
GCO old friends; I learned a lot working with them. Also, my thanks to Ivan Cano, Jeison Tabares and
the new colleagues in the group; and least but not last I send my gratitude to: Luis Velasco, Marc Ruiz,
Fernando Agraz, Alberto Castro, Pouria and others, for the good atmosphere they provided during the
many working hours.
I want to acknowledge Dr. Phillipe Chanclou from France Telecom/Orange and Mr. Risto Soila from
Tellabs Oy (Finland), for the support in the work stays due to SARDANA project.
Thanks to my teachers, especially to Dr. Gabriel Junyent and Dr. Jaume Comellas, and administrative
personal of the UPC, especially to Beni Vázquez (TSC-Doctorat), and Anna Fàbregas Punti and Lluïsa
Romanillos of the UPC International Affairs
Thanks to all my family for their love, encouragement and support. Especially thanks to my beloved
children, to my parents Mercedes and Juan, to my brothers Jaime, Carlos, Mario, Jorge and to my sister
Maria, and to Rocio Aliaga. A special thanks to my brother Mario, my uncle César and my grandmother
Juana for their material and spiritual support.

6
Thanks to my spiritual brothers and sisters of the Barcelona’s church and the CEPPEV.
Thanks to my English teacher and friend Sam Buxton and to my friend Francisca Torres (Paqui). Also,
thanks to my friends of the Penya del Barça.
This work was supported by the Programme ALBAN, the European Union Programme of High Level
Scholarships for Latin America, scholarship no. E05D056349BR. Also for financial assistance, I want to
express my thanks to several public projects and private contracts: SARDANA project and EuroFOS
networks of excellence project, from the European Commission (7th FP STREP projects); SCALING
international project contract (Tellabs Inc.), and the Spanish MICINN project TEC2008-01887 (TEYDE).
Thanks to all!!!

7
Table of Contents:
List of Figures .............................................................................................................................................. 14
List of Tables ............................................................................................................................................... 21
Abbreviations and Acronyms ..................................................................................................................... 23
Chapter 1 .................................................................................................................................................... 30
1. Introduction ...................................................................................................................................... 30
1.1. State-of-Art ................................................................................................................................... 32
1.1.1. Active vs. Passive Optical Networks ................................................................................... 32
1.1.2. Bidirectional Transmissions in PONs ................................................................................. 33
1.1.3. Access Networks: Architecture and Topologies ................................................................ 34
1.1.3.1. Point-to-Point Architecture ......................................................................................... 34
1.1.3.2. TDM-PON architecture ............................................................................................... 35
1.1.3.3. WDM-PON architecture .............................................................................................. 36
1.1.3.4. Hybrid WDM/TDM-PON architecture ...................................................................... 37
1.1.3.5. UDWDM-PON architecture ........................................................................................ 39
1.1.4. Reflective ONUs .................................................................................................................... 40
1.1.4.1. ONU based on a RSOA ................................................................................................ 40
1.1.4.2. RSOA basic characteristics ......................................................................................... 41
1.1.5. Rayleigh Backscattering (RB) ............................................................................................. 43
1.1.5.1. Backscatter Signal Analysis ......................................................................................... 43
1.1.6. PON and Next Generation PON (NG-PON) Standards .................................................... 46
1.1.6.1. FSAN XG-PON ITU-T G.987 Recommendation ....................................................... 48
1.1.6.2. IEEE 10G-EPON (802.3av) Recommendation .......................................................... 50
1.2. Thesis Outline ............................................................................................................................... 53
1.2.1. Objectives .............................................................................................................................. 53
1.2.2. Organization of this Thesis .................................................................................................. 54

8
Chapter 2 .................................................................................................................................................... 55
2. WDM and WDM/TDM–PON Network Optimization .................................................................. 55
2.1. Optimization of a rONU-based WDM-PONs in Rayleigh-limited by optimal ONU Gain and WDM position ........................................................................................................................................... 57
2.1.1. Rayleigh Backscattering Analysis in Upstream path ............................................................ 57
2.1.2. Rayleigh Backscattering Analysis for Downstream .............................................................. 60
2.1.3. Simulations performed ............................................................................................................. 60
2.1.4. Experimental Measures and Results ...................................................................................... 61
2.1.5. Conclusion ................................................................................................................................. 64
2.2. WDM/TDM PON architecture optimization ............................................................................. 65
2.2.1. Modulation Format definition ................................................................................................. 66
2.2.1.1. SCM Modulation Format .................................................................................................... 67
2.2.2. Computer Simulations ............................................................................................................. 69
2.2.2.1. OLT Schematic ..................................................................................................................... 69
2.2.2.2. ONU Schematic ..................................................................................................................... 71
2.2.2.3. Simulation results ................................................................................................................. 72
2.2.2.4. Pre-amplification at the OLT .............................................................................................. 74
2.2.2.5. Feeder fibre optimal length ................................................................................................. 75
2.2.3. RSOA: characterization and measurement ........................................................................... 75
2.2.3.1. RSOA characterization ........................................................................................................ 76
2.2.3.2. RSOA electrical bandwidth optimization........................................................................... 76
2.2.3.3. RSOA Measurements ........................................................................................................... 77
2.2.4. SCM-DPSK Optimization ....................................................................................................... 78
2.2.4.1. B2B full duplex measurements ............................................................................................ 78
2.2.5. System Optimization ................................................................................................................ 79
2.2.5.1. Simulations of Performance ................................................................................................ 80
2.2.5.2. RSOA: Continuous stream/ Burst Mode transmission ..................................................... 82
2.2.5.3. RSOA parameters as a function of Temperature .............................................................. 83
2.2.6. Final designs, implementation and results ............................................................................. 86
2.2.6.1. Back-to-back Reference ....................................................................................................... 87
2.2.6.2. SCM WDM/TDM PON testbed Prototype ......................................................................... 88
2.2.6.3. Setup (1)................................................................................................................................. 89
2.2.6.4. Setup (2)................................................................................................................................. 91
2.2.6.5. Setup (3)................................................................................................................................. 93
2.2.7. Conclusions ............................................................................................................................... 97
2.3. Final Conclusions ......................................................................................................................... 98

9
Chapter 3 .................................................................................................................................................... 99
3. TDM-PON RSOA-based ONU ........................................................................................................ 99
3.1. RB analysis in burst mode (BM) transmission ........................................................................ 100
RB analysis in BM transmission in a TDMA environment ............................................................ 101
3.1.1. Rayleigh backscattering from the ONU burst output power (RBu) .............................. 101
3.1.2. Rayleigh backscattering effect between ONUs ................................................................ 102
3.1.2.1. Rayleigh backscattering at the combiner output from “n” ONUs (RBoC) ............... 103
3.1.2.2. Rayleigh backscattering RBoC at the ONU input (RBoCO) ...................................... 106
3.1.2.3. Total Rayleigh backscattering at the ONU input (RBt) .............................................. 106
3.1.3. Numerical Analysis and Simulations ................................................................................ 106
3.1.4. Analysis of the critical cases due to RB impairments ...................................................... 107
3.1.5. Rayleigh reflected (RBr) .................................................................................................... 110
3.1.5.1. Rayleigh reflected from the ONU at the OLT input (RBrO) ..................................... 113
3.1.6. Total Rayleigh at the OLT input ....................................................................................... 114
3.1.7. Upstream optical Signal-to-Rayleigh Ratio (US-oSRR) .................................................. 114
3.1.8. Conclusions ......................................................................................................................... 116
3.2. TDM-PON rSOA-based ONU Network design and Optimization ........................................ 117
3.2.1. Analysis of the relevant parameters ................................................................................. 117
3.2.1.1. Extinction Ratio .............................................................................................................. 117
3.2.1.2. RSOA electro-optical modulation ................................................................................. 118
3.2.1.3. Carrier level Recovery ................................................................................................... 118
3.2.1.4. Rayleigh Backscattering impairment ........................................................................... 118
3.2.1.5. ONU splitting factor ....................................................................................................... 119
3.2.2. Scenario and Network Topology ....................................................................................... 119
3.2.3. TDM-PON rSOA-based ONU optimization .................................................................... 120
3.2.3.1. DS direction flux ............................................................................................................. 120
3.2.3.2. US direction flux ............................................................................................................. 120
3.2.4. TDM-PON RSOA-based ONU Evaluation ...................................................................... 122
3.2.4.1. Experimental setup ......................................................................................................... 122
3.2.4.2. Experimental Evaluation ............................................................................................... 123
3.2.5. Conclusions ......................................................................................................................... 127
Chapter 4 .................................................................................................................................................. 128
4 WDM/TDM-PON SARDANA Network ....................................................................................... 128
4.1 Network Architecture ............................................................................................................ 129
4.1.1 SARDANA Wavelength Allocation ............................................................................... 131

10
4.2 SARDANA subsystems .......................................................................................................... 131
4.3 Optical Network Unit (ONU) Subsystem ............................................................................. 132
4.3.1 ONU subsystem RSOA based ........................................................................................ 133
4.3.2 Downstream cancellation requirement ......................................................................... 134
4.3.2.1 A Basic Downstream Cancellation ................................................................................ 134
4.3.2.2 Upstream BER with/without downstream cancellation .............................................. 135
4.3.3 Optical network tests ...................................................................................................... 137
4.3.3.1 Back-to-back Downstream Sensitivity tests ................................................................. 137
4.3.3.2 Back-to-back Upstream Sensitivity test ........................................................................ 137
4.3.4 SARDANA ONU Layer 1 Prototype ............................................................................. 138
4.3.4.1 ONU-RX section ............................................................................................................. 138
4.3.4.2 ONU-TX section ............................................................................................................. 138
4.3.4.3 Optical Coupler .............................................................................................................. 140
4.3.4.4 SARDANA ONU Layer 1 Assembly ............................................................................. 140
4.4 Central Office (CO) ................................................................................................................ 142
4.5 OLT Subsystem ...................................................................................................................... 142
4.5.1 OLT optical Transmitter ............................................................................................... 143
4.5.1.1 Dithering for Rayleigh Backscattering Mitigation ...................................................... 144
4.5.1.2 Optical Source ................................................................................................................. 144
4.5.1.3 Optical Modulator and Stabilization Circuit ............................................................... 145
4.5.1.4 RF Data Interface ........................................................................................................... 146
4.5.2 OLT optical receiver ...................................................................................................... 146
4.5.3 Optical Amplification ..................................................................................................... 148
4.5.3.1 Pump generation ............................................................................................................. 149
4.5.4 OLT subsystem racks ..................................................................................................... 150
4.6 ODN (Optical Distribution Network) ................................................................................... 151
4.7 Remote Node (RN) .................................................................................................................. 152
4.7.1 SARDANA RN operation .............................................................................................. 153
4.8 SARDANA Test-bed ............................................................................................................... 154
4.8.1 SARDANA Network tests .............................................................................................. 157
4.8.2 SARDANA Field Trial ................................................................................................... 159
4.9 Energy efficiency .................................................................................................................... 161
4.10 Conclusion ............................................................................................................................... 163
Chapter 5 .................................................................................................................................................. 164
5.1. SARDANA NG-PON (SPON) Layer 2 ..................................................................................... 165

11
5.1.1. SARDANA NG-PON Layer Architecture ........................................................................ 166
5.1.1.1. SARDANA OLT layer Architecture ......................................................................... 166
5.1.1.2. SARDANA ONU layer Architecture ........................................................................ 167
5.1.2. SARDANA Transmission Convergence (STC) Design ................................................... 169
5.1.3. SARDANA TC Service Adaptation Sub-layer ................................................................. 170
5.1.3.1. SARDANA GEM (SGEM) Frame basic functions .................................................. 170
a) SGEM Header......................................................................................................................... 171
b) SGEM payload ........................................................................................................................ 173
5.1.4. SARDANA TC (STC) Framing Sub-layer ....................................................................... 174
5.1.4.1. SARDANA Downstream Frame ............................................................................... 174
a) STC frame header .................................................................................................................. 174
PLOAMd message in SARDANA ........................................................................................................ 174
Bandwidth map (BWmap) in SARDANA ........................................................................................... 175
b) STC Payload ........................................................................................................................... 177
5.1.4.2. SARDANA Upstream Frame .................................................................................... 177
a) STC burst header ................................................................................................................... 177
b) Upstream STC burst Payload ............................................................................................... 179
5.1.5. SARDANA TC - PHY Adaptation Sub-layer .................................................................. 180
5.1.5.1. DS PHY frame ............................................................................................................ 180
Physical Synchronization Block (PSBd) ............................................................................................. 181
Downstream PHY frame payload ..................................................................................................... 181
5.1.5.2. US PHY burst ............................................................................................................. 182
Upstream PHY burst payload ........................................................................................................... 182
Upstream Physical Synchronization Block (PSBu) ............................................................................ 182
Guard Time ....................................................................................................................................... 183
Preamble time .................................................................................................................................. 185
Delimiter time .................................................................................................................................. 185
Upstream Burst Size – Minimum and Maximum values .................................................................. 187
5.2. SARDANA Media Access Control Processes ........................................................................... 188
5.2.1. Timing relationships OLT-ONU in SARDANA network ............................................... 189
Quiet window (QW).......................................................................................................................... 189
5.2.2. RSOA-based ONU Starting, Initialization and Registration .......................................... 190
5.2.3. RSOA-based ONU upstream transmission timing .......................................................... 193
a) ONU response time .................................................................................................................. 193
b) ONU’s Equalization Delay (EqD) ............................................................................................... 194

12
5.2.4. Timing during ONU Serial Number Acquisition and Ranging ...................................... 194
a) Serial Number Acquisition process........................................................................................... 194
b) SARDANA quiet window calculation ........................................................................................ 197
c) Ranging Process ........................................................................................................................ 198
5.2.5. Optimization of the ONU activation process ................................................................... 199
5.2.6. Equalization Delay (EqD) Calculus .................................................................................. 205
5.2.7. Timing during the Operation State of the PON............................................................... 206
5.3. Conclusions ................................................................................................................................. 208
Chapter 6 .................................................................................................................................................. 209
6.1. SARDANA Layer 2 Implementation ........................................................................................ 210
6.1.1. FPGA clock frequency and data path definition ............................................................. 210
6.1.2. SARDANA sub-system prototyping ................................................................................. 211
6.1.2.1. Ethernet Interface Module ........................................................................................ 212
a) 10 GE SNI Interface ............................................................................................................... 212
b) 10/100/1000 Base-T UNI Interface ........................................................................................ 213
6.1.2.2. Optical interface module (TST 9061) ....................................................................... 214
6.1.3. OLT Layer 2 Prototyping .................................................................................................. 215
6.1.3.1. OLT STC TX .............................................................................................................. 215
6.1.3.2. OLT STC RX .............................................................................................................. 216
6.1.4. ONU Layer 2 Prototyping.................................................................................................. 217
6.1.4.1. ONU STC TX .............................................................................................................. 217
6.1.4.2. ONU STC RX .............................................................................................................. 218
6.1.5. Control of the SARDANA STC processes ........................................................................ 219
6.1.6. SARDANA Layer 2 system operation .............................................................................. 221
6.1.7. Interlayer encapsulation process in SARDANA .............................................................. 224
6.2. SARDANA Internetworking ..................................................................................................... 227
6.2.1. Ethernet frame over SGEM .............................................................................................. 228
6.2.2. Multi-Protocol Management (MPM) ................................................................................ 228
6.2.2.1. MPM processing ......................................................................................................... 228
6.2.2.2. MPM processing for IP over Ethernet services ....................................................... 230
6.2.3. Network interoperability across SARDANA ................................................................... 233
6.2.3.1. SARDANA interoperability at Layer 1 level ........................................................... 233
6.2.3.2. SARDANA interoperability at higher Layer level .................................................. 234
MPLS over SGEM.......................................................................................................................... 234
6.2.3.3. SARDANA capabilities for Core Network Services ................................................ 235

13
GMPLS transport over SARDANA.............................................................................................. 236
a) Internetworking at the SARDANA PHY level .................................................................... 237
b) Internetworking at the SARDANA L2/L3 Layer ................................................................ 237
6.3. Conclusions ................................................................................................................................. 239
Chapter 7 .................................................................................................................................................. 240
7.1. General Conclusions ................................................................................................................... 240
7.2. Future research........................................................................................................................... 243
Annex A .................................................................................................................................................... 244
A.1. XGTC layer structure ............................................................................................................ 244
A.2. XGTC layer procedures ......................................................................................................... 244
a) In the downstream direction ................................................................................................. 244
b) In the upstream direction ...................................................................................................... 245
A.3. Sub-Layers of the XGTC Layer ............................................................................................ 246
A.4. XGPON Management System ............................................................................................... 247
Annex B ..................................................................................................................................................... 249
B. Publication List and Research Activities ...................................................................................... 249
B.1. Publications in International, Peer-Reviewed Journals: .................................................... 249
B.2. Publications in Scientific Congresses: .................................................................................. 249
B.3. Books: ...................................................................................................................................... 251
B.4. Research Projects: .................................................................................................................. 251
Annex C ..................................................................................................................................................... 252
C. Biography ........................................................................................................................................ 252

14
List of Figures
Fig. 1. 1 - Bidirectional transmission schemas in ODN PONs: a) two-fibre, b) one-fibre, two-wavelength,
c) one-fibre, one-wavelength. .................................................................................................................... 33
Fig. 1. 2 - 10 Gb/s P2P Ethernet LAN-to-LAN connection based on XFP transceivers. ............................... 35
Fig. 1. 3 - A typical TDM GPON ITU-T 984.x network architecture (modified from [46]) ........................... 36
Fig. 1. 4 - A typical WDM PON network architecture. ................................................................................ 37
Fig. 1. 5 – A WDM/TDM PON architecture based on a WDM ring and a TDM tree. .................................. 38
Fig. 1. 6 – Scattering produced by a pulse P(r) in a single-mode fibre. ...................................................... 43
Fig. 1. 7 - Rayleigh Backscattering power as a function of the fibre length (experimental measures)...... 45
Fig. 1. 8 - A timeline of the evolution of the PON networks standards (modified from [46]). .................. 46
Fig. 1. 9 - Next-generation PON (NG-PON), and stages of the evolution. .................................................. 47
Fig. 1. 10 - Schematic of signal multiplexing in IEEE 10G-EPON [100]. ...................................................... 51
Fig. 1. 11 - Wavelength allocations of IEEE GE-PON, 10G-EPON, ITU-T G-PON and XG-PON, and SARDANA
network (modified from [100]). ................................................................................................................. 51
Fig. 2. 1 - Schematic of a plain WDM-PON with MUX at the fibre plant. ................................................... 57
Fig. 2. 2 - Theoretical C/S as a function of the feeder length for ONU gain of 10, 15 and 20 dB and for the
optimal gain (Eq.2.2 in 2.1), with α(dB)=0.2dB/Km, L1+ L2=50Km, A=5dB, and Optical Distribution
Network (ODN) total loss=15dB. ................................................................................................................ 58
Fig. 2. 3 - Optimal gain as function of the distance to different values of A. ............................................. 59
Fig. 2. 4 - Scenario for the downstream analysis........................................................................................ 60
Fig. 2. 5 – Crosstalk-to-Signal (C/S) simulation as a function of the MUX position for ONU gain of 10, 15
and 20 dB in downstream and upstream transmission. ............................................................................ 61
Fig. 2. 6 - Setup for the experimental measurements ............................................................................... 61
Fig. 2. 7 - BER measurements for 10, 15 and 20dB of ONU gain with the MUX a) at the OLT side. b) at the
ONU side c) at half way between OLT and ONU (Experimental and simulated curves). ........................... 62
Fig. 2. 8 - BER as a function of the MUX position to different ONU gain values (Simulations and
Experimental results). ................................................................................................................................ 63
Fig. 2. 9 - WDM/TDM PON reference architecture .................................................................................... 65
Fig. 2. 10 - Functional scheme of the WDM/TDM PON system proposed ................................................. 66
Fig. 2. 11 - Theoretical sensitivity for the proposed modulation formats ................................................. 68
Fig. 2. 12 -DPSK scheme for up-converting a differential pre-coded signal at the OLT side (left), and for
detecting such a signal at the ONU side after photo-detection (right). ..................................................... 68
Fig. 2. 13 - WDM-PON preliminary schema - Link in three stages ............................................................. 69
Fig. 2. 14 - VPI scheme of the OLT SCM System ......................................................................................... 70
Fig. 2. 15 - VPI scheme of the ONU reference system ............................................................................... 71

15
Fig. 2. 16 - RSOA functional model for this design (based on SOA Ideal Amplifier + EAM) ....................... 71
Fig. 2. 17 - VPI scheme of the SCM receiver ............................................................................................... 72
Fig. 2. 18 – Q-factor (dB) vs. OLT Input Power for different Rayleigh Backscattering coefficients in the
upstream path ............................................................................................................................................ 72
Fig. 2. 19 – Q-factor (dB) vs. OLT Input Power for different Rayleigh Backscattering coefficients in the
downstream path ....................................................................................................................................... 73
Fig. 2. 20 - Performance of the system without pre-Amp and with pre-Amp ........................................... 74
Fig. 2. 21 - Q-factor as a function of the WDM length fibre and the number of users to upstream and
downstream paths ..................................................................................................................................... 75
Fig. 2. 22 - Original Kamelian RSOA RF response: 600MHz of bandwidth at 6dB ...................................... 76
Fig. 2. 23 - PCB layout of the electrical equalization of the RSOA .............................................................. 76
Fig. 2. 24 - RSOA mounting ......................................................................................................................... 77
Fig. 2. 25 – Equalized Kamelian RSOA RF response for bias current of 90mA. The equalized response has
a 6dB bandwidth of about 1.7 GHz and a 10dB-bandwidth of about 2 GHz which allows for 2.5 Gb/s
transmission. .............................................................................................................................................. 77
Fig. 2. 26 - BER measures for different Bias current versus receiver power. ............................................. 78
Fig. 2. 27 - Experimental setup for single fibre B2B full-duplex measurements. ....................................... 79
Fig. 2. 28 – Sensitivity results for the B2B full duplex SCM system. ........................................................... 79
Fig. 2. 29 - Functional diagram of the new proposed model (to see Fig. 2.10) .......................................... 80
Fig. 2. 30 - VPI schematic of the new proposed model .............................................................................. 80
Fig. 2. 31 - Q-factor versus number of users in the upstream path. .......................................................... 81
Fig. 2. 32 – Q-factor for different ONU Extinction Ratio and RSOA Gain ................................................... 81
Fig. 2. 33 - RSOA eye in continuous stream at 1.25Gps, bias of 70mA, modulation of 2 Vpp and input
signal of -15dBm. ........................................................................................................................................ 82
Fig. 2. 34 - Overview of frame in Burst Mode of the RSOA and Eye generated at a bit rate of 1.25Gbps,
bias of 70mA, modulation of 2 Vpp and input signal of -15dBm. .............................................................. 82
Fig. 2. 35 - Kamelian RSOA Amplified Spontaneous Emission versus temperature @1550nm for Bias
current of 70mA. ........................................................................................................................................ 83
Fig. 2. 36 - Kamelian RSOA Gain and ER versus ambience temperature for optical Pin=-20dBm and Bias
current =70mA with 20dBm sinusoidal RF modulation at 500MHz. .......................................................... 83
Fig. 2. 37 - RSOA OSNR and Noise Figure versus ambience temperature for optical Pin=-20dBm and for
Bias current =70mA with 20dBm sinusoidal RF modulation at 500MHz. .................................................. 84
Fig. 2. 38 - a) ASE response of the Kamelian 2nd
generation RSOA. b) Gain and output power versus the
optical input power. ................................................................................................................................... 87
Fig. 2. 39 – Prototype implementation of our SCM WDM/TDM PON at the GCO-UPC laboratory ........... 88
Fig. 2. 40 - Scheme of the 25km+1x8splitter+2km bidirectional single fibre setup (1).............................. 89
Fig. 2. 41 - Scheme of the 16km+1x40 AWG+2km+1x4 splitter+2km bidirectional single fibre setup (2). 91
Fig. 2. 42 - Scheme of two fibres (16km) +1x40 AWG+2km+1x4splitter+2km bidirectional single fibre .. 93
Fig. 2. 43 - a) Downstream and b) Upstream sensitivity curves for the three PON scenarios ................... 96

16
Fig. 3. 1 - TDM-PON scenario with different Rayleigh backscattering impairments ................................ 101
Fig. 3. 2 – Rayleigh accumulation process at the combiner output from “n” ONUs ................................ 103
Fig. 3. 3 - Rayleigh power accumulation at the combiner output due to the burst signal from different
ONUs affecting other ONUs (e.g. case of 32 ONUs) ................................................................................. 104
Fig. 3. 4 - Rayleigh Backscattering and power level at the combiner output and ONU input calculated for
2 up to 64 ONUs considering symmetric bandwidth allocation............................................................... 107
Fig. 3. 5 – Scenario of analysis of critical values to total RB at the ONU 2 input as a function of different
ONU 2 nominal power output and asymmetric burst length .................................................................. 107
Fig. 3. 6 – Total RB at the ONU 2 input as a function of different ONU 2 nominal output power and
asymmetric burst length .......................................................................................................................... 108
Fig. 3. 7 – DS optical Signal-to-Rayleigh Ratio (DS-oSRR) at different asymmetrical duty cycles
(ONU1/ONU2) and different ONU2 nominal output power .................................................................... 109
Fig. 3. 8 - ONU burst length divided into “n” parts for calculating the Rayleigh reflected and the
influences of the RBu and RBoCO ............................................................................................................ 111
Fig. 3. 9 - RBr total at the ONU input and RBr as a function of the impact of the G•RBu and G•RBoCO 113
Fig. 3. 10 - Rayleigh reflected values at the OLT input (RBrO) and at the ONU output (RBr) from 2 up to
64 ONUs, considering the same ONU gain for all ONUs. ......................................................................... 114
Fig. 3. 11 – US-oSRR and total Rayleigh at the OLT input and the contributions from RBc and RBrO ..... 115
Fig. 3. 12 – Optical Signal-to-Rayleigh Ratio (oSRR) as a function of the Extinction Ratio for different BER
values. ....................................................................................................................................................... 117
Fig. 3. 13 - RSOA optical output power for different injection bias current and optical carrier input
power. ...................................................................................................................................................... 118
Fig. 3. 14 – Rayleigh penalty at the reception in upstream and downstream transmission. ................... 119
Fig. 3. 15 – The WDM/TDM PON network and the TDM tree section with the OLT on the place of the RN.
.................................................................................................................................................................. 119
Fig. 3. 16 - Optimization flux diagram for a TDM-PON rONU with FEC to BER 5E-4. ............................... 121
Fig. 3. 17 - Experimental Setup block diagram ......................................................................................... 122
Fig. 3. 18 - The SARDANA testbed and practical implementation for experimental evaluation.............. 123
Fig. 3. 19 - DS power budget and US-oSRR tolerances for RSOA gain=21dB and ONU coupling factor
90/10 and 80/20, with BER 5E-4. ............................................................................................................. 124
Fig. 3. 20 - Maximum data users in rONU-based PON: B2B transmission and US burst using DS
remodulation with/without DS cancellation ............................................................................................ 125
Fig. 3. 21 - DS-oSRR and US-oSRR values for 16 and 32 users with ONU splitting loss 90/10 and 80/20,
and feeder fibre of 15 km and 10 km. ...................................................................................................... 126
Fig. 4. 1 – Architecture model and main characteristics of the SARDANA network. ............................... 130
Fig. 4. 2 - SARDANA wavelength allocation plan ...................................................................................... 131
Fig. 4. 3 - SARDANA ONU basically architecture showing Layer 1 and Layer 2 ........................................ 133

17
Fig. 4. 4 - ONU-TX blocks diagram detail .................................................................................................. 133
Fig. 4. 5 - Block scheme of the ONU with downstream cancellation circuit ............................................ 135
Fig. 4. 6 - Scheme of the upstream sensitivity measures versus Downstream ER ................................... 135
Fig. 4. 7 – a) Upstream Sensitivity curves for remodulated upstream transmission, with and without
cancellation. b) Upstream eye diagram @2.5Gbps for ER (DS) =3dB without DS cancellation. c) with DS
cancellation. ............................................................................................................................................. 136
Fig. 4. 8 - Scheme for the downstream sensitivity measure and BER-Sensitivity for DS-ER of 10, 4 and
3dB............................................................................................................................................................ 137
Fig. 4. 9 - Scheme and sensitivity measure of the Upstream Back-to-back. ............................................ 137
Fig. 4. 10 – ONU-RX implementation: APD Fujitsu-RX with the Limiting Amplifier. ................................ 138
Fig. 4. 11 – ONU-TX system board. ........................................................................................................... 139
Fig. 4. 12 - ONU module front-end. .......................................................................................................... 140
Fig. 4. 13 - Blocks of the ONU Layer 1 prototype module. ....................................................................... 141
Fig. 4. 14 - SARDANA rack with two ONU prototypes: ONU layer 2 (above) and opto-electrical ONUs layer
1 (middle) subsystem ............................................................................................................................... 142
Fig. 4. 15 – General Scheme of the layer 1/2 SARDANA OLT ................................................................... 142
Fig. 4. 16 – Block diagram of the SARDANA OLT transmission ................................................................. 143
Fig. 4. 17 - Integration of: a) Dithering circuitry for delivering a dithering signal to the DFB laser diode; (b)
DFB laser diode board; (c) and Current driver and temperature controller for the laser diode. ............ 144
Fig. 4. 18 -Dependence of the emission wavelength on the temperature. ............................................. 145
Fig. 4. 19 – a) Long-term measurements of the transmitted optical power over 12 hours for a stabilized
modulator. b) Electro-optical response of the optical modulator. The 3dB bandwidth is 10.2 GHz. ...... 146
Fig. 4. 20 - OLT AC RX schematic diagram blocks. .................................................................................... 147
Fig. 4. 21 - Hybrid amplifier design and prototype................................................................................... 149
Fig. 4. 22 - Internal scheme of the fibre based pump source for remotely pumped amplification and
SARDANA prototype fibre laser pump source.......................................................................................... 149
Fig. 4. 23 - Remote Amplification System at the SARDANA Central Office .............................................. 150
Fig. 4. 24 - OLT racks: The 2100mm rack is equipped with the Service switch, two OLT Layer 2 sub-racks,
four OLT transmitter assemblies, two DWDM multiplexer/demultiplexer pairs for East and West ring
segments, protection and monitoring assembly, and fibre connect. ...................................................... 150
Fig. 4. 25 – SARDANA metro-access Optical Distribution Network .......................................................... 151
Fig. 4. 26 - Remote Node a) basic structure and b) physical implementation ......................................... 153
Fig. 4. 27 – Basic operation of a SARDANA Remote Node ....................................................................... 154
Fig. 4. 28 - SARDANA testbed scheme (left), demo setup, downstream east spectrum, burst mode
upstream frame, DS and US eyes (right). ................................................................................................. 155
Fig. 4. 29 - SARDANA testbed implementation for the demo. ................................................................. 156
Fig. 4. 30 - Network setup for SARDANA demonstrator tests in Helsinki-Finland. .................................. 158
Fig. 4. 31 – a) Field trial network scheme, b) Detail of the Imaging Lab and Orange Lab connection, and c)
Lannion ring map (in yellow). ................................................................................................................... 159

18
Fig. 4. 32 - Performances of the systems transported in the SARDANA test-bed .................................... 161
Fig. 4. 33 - Results on the consumption per user and Gbit as a function of the number of ONUs per
Central Office, for the uplink limitation of 100 and 320 Gbit/s. .............................................................. 162
Fig. 5. 1 - SARDANA MAC architecture layer 2 overview ......................................................................... 165
Fig. 5. 2 - SARDANA NG-PON system architecture ................................................................................... 166
Fig. 5. 3 - SARDANA OLT system architecture on the OSI network reference model .............................. 167
Fig. 5. 4 - SARDANA ONU system architecture on the OSI network reference model ............................. 168
Fig. 5. 5 - Service Adaptation Sub-layer and SGEM framing..................................................................... 170
Fig. 5. 6 - GPON GEM frame and the new formats for the 10 Gbit/s GEM frames from FSAN and
SARDANA. ................................................................................................................................................. 171
Fig. 5. 7 - Encapsulation process in the SARDANA framing sub-layer ...................................................... 174
Fig. 5. 8 - Downstream frame header and changes respect to GPON and XGPON .................................. 175
Fig. 5. 9 - BWmap structure in STC ........................................................................................................... 176
Fig. 5. 10 - Upstream burst structures in XGTC, and changes for SARDANA TC ....................................... 179
Fig. 5. 11 - Encapsulation process in the SARDANA PHY adaptation sub-layer ....................................... 180
Fig. 5. 12 - Downstream PHY frame structure at the SARDANA TC layer ................................................. 181
Fig. 5. 13 – Downstream PHY frame with payload and physical synchronization block (PSBd) .............. 182
Fig. 5. 14 – Upstream PHY frame and PHY bursts .................................................................................... 183
Fig. 5. 15 – Guard Time, Preamble and Delimiter structure in SARDANA networks ................................ 183
Fig. 5. 16 – Phase shifting between DS Signal and US signal reflected .................................................... 184
Fig. 5. 17 - RSOA response time: initialization and additional delays due to associated circuitry (tRSOAon
≈ 10 ns, in 2ns/div). .................................................................................................................................. 185
Fig. 5. 18 – SARDANA Upstream Physical Synchronization Block (PSBu) definition values and OLT
Receiver Timing setup (adapted from [150]) ........................................................................................... 187
Fig. 5. 19 – US Burst with a PSBu of 128 ns .............................................................................................. 187
Fig. 5. 20 - Media access control based on bandwidth map allocation for two ONUs ............................ 189
Fig. 5. 21 – ONU synchronization state machine (modified from G.987.3_F10.3). ................................. 191
Fig. 5. 22 – ONU Activation processes flow .............................................................................................. 192
Fig. 5. 23 - ONU transmission timing diagram .......................................................................................... 193
Fig. 5. 24 - SARDANA ODN maximal distance: Lmin+Dmax ≈ 100 km ..................................................... 195
Fig. 5. 25 - Timing during ONU Serial Number Acquisition ...................................................................... 196
Fig. 5. 26 - ONU initialization values in SARDANA network ..................................................................... 198
Fig. 5. 27 – Message exchange optimization on the ONU activation process in SARDANA network. ..... 200
Fig. 5. 28 - Optimization sequence of the ONU activation process in SARDANA network ...................... 201
Fig. 5. 29 – Practical values from the optimization on the ONU activation process in SARDANA network
.................................................................................................................................................................. 202

19
Fig. 5. 30 - ONU activation process: XG-PON and SARDANA without/with optimization. ....................... 203
Fig. 5. 31 - A comparative between SARDANA and XG-PON for the ONU initialization process. ............ 204
Fig. 5. 32 - Equalization delay calculation during SN process................................................................... 205
Fig. 5. 33 - Maximum EqD value for the Dmax=20 km on the SARDANA network. ................................. 206
Fig. 5. 34 - Timing during the Operation State ......................................................................................... 207
Fig. 6. 1 - Two-stages SerDes implementation for the 32-bit SARDANA data path (modified from [174])
.................................................................................................................................................................. 211
Fig. 6. 2 - OLT/ONU prototype base board based on FPGA Altera Stratix IV GX ...................................... 212
Fig. 6. 3 - Ethernet interface modules for SNI a) HSMC CX4 Adapter Board b) HSMC board based on XAUI
interface connects with Altera Stratix IV FPGA Development Kit. ........................................................... 213
Fig. 6. 4 - Ethernet interface modules for UNI: HSMC 4-Ports 10/100/1000Base-T RJ-45 port Adapter
Board ........................................................................................................................................................ 213
Fig. 6. 5 - Optical HSMC module board (TST9061) for the OLT and ONU assemblies. ............................. 214
Fig. 6. 6 - Optical interface module (TST9061), connected on the MAC base board Altera Stratix IV GX 214
Fig. 6. 7 – Block diagram of the SARDANA OLT Layer1/Layer 2 implementation .................................... 215
Fig. 6. 8 – OLT Layer 1/Layer 2 implementation based on Altera Stratix IV FPGA GX card module pictorial
diagram. The Interfaces through Ethernet CX4 adapter and Optics Interface TST9061, as well as the CPC
control unit and the OLT Optics Assembly are shown. ............................................................................ 216
Fig. 6. 9 - SARDANA ONU Layer1/Layer 2 and FPGA implementation ..................................................... 217
Fig. 6. 10 –The ONU Layer 1/Layer 2 implementation pictorial diagram, based on Altera Stratix IV FPGA
GX card module. Interfaces through Ethernet 10/100/1000 Base-T adapter and Optics Interface
TST9061, as well as the CPC control unit and the ONU optics assembly ................................................. 218
Fig. 6. 11 - SARDANA demonstrator network for Management & Control test....................................... 219
Fig. 6. 12 - SARDANA network system: MAC and PHY implementation .................................................. 222
Fig. 6. 13 – SARDANA Layer 2 B2B setup used at the Tellabs OY (Espoo-Finland) for OMC/Ethernet and
CLI/Telnet tests. ........................................................................................................................................ 223
Fig. 6. 14 - Interlayer encapsulation in the SARDANA Network Downstream process ............................ 225
Fig. 6. 15 - Ethernet frame mapping into SGEM payload (modified from G.987.3_F9-5) ........................ 228
Fig. 6. 16 - Encapsulation between layers based on the OSI model and MPM processes. ...................... 229
Fig. 6. 17 - IP header format ..................................................................................................................... 230
Fig. 6. 18 – IP header mapping from Ethernet frame for multi-protocol management in SARDANA
metro/access network ............................................................................................................................. 231
Fig. 6. 19 – MPM mapped of the IP/Ethernet headers (from Ethernet frame), on the SGEM frame. ..... 232
Fig. 6. 20 – SARDANA – XGPON (or GPON/GE-PON) interoperability PHY layer processes, for
interconnection through a SARDANA remote node (RN). ....................................................................... 233
Fig. 6. 21 – MPLS packet mapping into XGEM frame ............................................................................... 235

20
Fig. 6. 22 - SARDANA metro MPLS point-to-point transmission and overlay capacities for the GMPLS
Transport Network ................................................................................................................................... 236
Fig. 6. 23 – Internetworking between a GMPLS network and an IP network by SARDANA tunnelling
capabilities. ............................................................................................................................................... 238
Fig. A. 1 - Downstream SDU mapping at the XGTC layer (Modified from G.987.3_F6-1) ........................ 245
Fig. A. 2 -Upstream SDU mapping at the XGTC layer (Modified from G.987.3_F6-2) .............................. 246
Fig. A. 3 - The XGTC information flow (Modified from G.987.3_F6-3) ..................................................... 248

21
List of Tables Table 1. 1 - RSOA parameter performances as a function of the optical input power and bias current
values (modified from [35]). ....................................................................................................................... 42
Table 1. 2 - Contents of the XG-PON G.987.x Recommendations ............................................................. 48
Table 1. 3 - Layered structure of XG-PON .................................................................................................. 49
Table 2. 1 - Bandwidth limits for different sub-carrier modulations ......................................................... 67
Table 2. 2 - Sensitivity values for Pe = 10-10
and Pe = 10-4
. ......................................................................... 68
Table 2. 3 - Power Loss at ODN .................................................................................................................. 69
Table 2. 4 – Simulation results for SCM WDM/TDM PON in the upstream path ...................................... 73
Table 2. 5 – Simulation results for SCM WDM/TDM PON in the downstream path .................................. 74
Table 2. 6 - Operation points for several ambience temperature environments at worst polarization case
and most critical carrier wavelength (1560nm). ........................................................................................ 85
Table 2. 7 - Complete detail of the measurements for several scenarios and features of the SCM
WDM/TDM PON prototype @1550nm &25ºC .......................................................................................... 86
Table 2. 8 - B2B Sensitivity ......................................................................................................................... 87
Table 2. 9 - Range of suitable OLT output powers and corresponding power budgets for a 25km+1x8
splitter+2km single fibre with a 70/30 splitter at ONU .............................................................................. 90
Table 2. 10 - Range of suitable OLT output powers and corresponding power budgets for a 16km+1x40
AWG+2km +1x4splitter+2km single fibre with a 70/30 coupler at ONU. .................................................. 92
Table 2. 11 - Range of OLT output powers and corresponding power budgets for a double-fibre (16km)
+1x40 AWG+2km +1x32 splitter+2km single fibre with its more appropriate coupler at ONU................. 94
Table 2. 12 - Range of OLT output powers and corresponding power budgets for a double- fibre (16km)
+1x40AWG+2km +1x32 splitter+2km single fibre with a 70/30 coupler at ONU. ..................................... 94
Table 2. 13 - Range of OLT output powers and corresponding power budgets for a double-fibre (16km)
+1x40 AWG+2km +1x32 splitter+2km single fibre with 80/20 coupler at ONU. ....................................... 95
Table 3. 1 - RSOA-based ONU and GPON/XGPON ONU comparative ...................................................... 126
Table 4. 1 - Requirements for the SARDANA ONU RSOA based. ............................................................. 134
Table 4. 2 - Upstream Sensitivity vs. Downstream ER .............................................................................. 136
Table 4. 3 – ONU RX section input/output values .................................................................................... 138
Table 4. 4 – ONU TX section input/output values .................................................................................... 139
Table 4. 5 - ONU Layer 1 optical input/output characteristics ................................................................. 141
Table 4. 6 - ONU Layer 1 electrical input/output characteristics ............................................................. 141
Table 4. 7 - Zenko LT-05B95B-XFPGXreceiver optical and electrical specification .................................. 147

22
Table 4. 8 - Technical Specification of the high power amplifier ............................................................. 148
Table 4. 9 - Comparison of the performances .......................................................................................... 148
Table 4. 10 - Service Scenarios for SARDANA ........................................................................................... 152
Table 4. 11 – SARDANA’s performance in terms of ring length, maximum number of ONUs and down/up
bit rates. ................................................................................................................................................... 160
Table 5. 1 - PLOAM message structure .................................................................................................... 175
Table 5. 2 – PLOAM-L field code ............................................................................................................... 176
Table 5. 3 – PLOAM status and DBRu status information code ............................................................... 178
Table 5. 4 - Probability of a severely errored burst as a function of delimiter length [125] .................... 186
Table 5. 5 - Burst mode overhead time recommended allocation for OLT functions.............................. 186
Table 5. 6 - Minimum and Maximum Size values for the burst of an US transmission ........................... 188
Table 5. 7 - Serial_Number_ONU PLOAMu message ............................................................................... 195
Table 5. 8 - SN PLOAM burst response time from an ONU ...................................................................... 195
Table 5. 9 – Quiet Window and QW offset comparative values between XG-PON and SARDANA ......... 204
Table 6. 1 – Partial list of IP protocol numbers used in the Protocol field. .............................................. 231

23
Abbreviations and Acronyms
10G-EPON 10 Gigabit-EPON
A&D Add and Drop Filter
AES Advanced Encryption Standard
Alloc-ID Allocation ID
AN Access Network
APC Angled Physical Contact (Connector)
APD Avalanche Photo-Diode
APON Asynchronous Passive Optical Network
AO Allocation Overhead
ASE Amplified Spontaneous Emission
ASK Amplitude Shift Keying
ATM Asynchronous Transfer Mode
AWG Arrayed Waveguide Grating
B Rayleigh Backscattering Coefficient
B2B Back-to-Back
BE Burst Enable
BER Bit-error ratio
BERT BER Tester
BIP Bit-Interleaved Parity
BM Burst Mode
BPF Band Pass Filter
B-PON Broadband Passive Optical Network
BPSK Binary Phase Shift Keying
BW Bandwidth
BWmap Bandwidth map
CAPEX capital expenditures
CID Consecutive identical digits
CLI Command Line Interface
CLR Clock Recovery
CM Continuous Mode
C/M Control and Management
CML Current Mode Logic
CO Central Office
CPC Control PC
CPE Customer Premises Equipment
CRC Cyclic Redundancy Check

24
C/S Crosstalk-to-Signal ratio
CSMA/CD Carrier Sense Multiple Access with Collision Detection
CW Continuous Wavelength
dB Decibel
DBA Dynamic Bandwidth Assignment
DBRu Dynamic Bandwidth Report upstream
DD Direct Detection
DCF Dispersion Compensating Fibre
DFB Distributed Feedback
DFE Decision Feedback Equalizer
DG Dying Gasp
DHCP Dynamic Host Configuration Protocol
DPSK Differential Phase Shift Keying
DS Downstream
DSC Downstream Cancellation
DSL Digital Subscriber Line
DWDM Dense Wavelength Division Multiplexing
EAM Electro-Absorption Modulator
EDF Erbium-Doped Fibre
EDFA Erbium-Doped Fibre Amplifier
EFM Ethernet in the First Mile
EMS Element Management System
E/O Electro/Optical
EPON Ethernet Passive Optical Network
EQ Equalizer
EqD Equalization Delay
ER Extinction Ratio
FEC Forward Error Correction
FEC Forwarding Equivalence Class (MPLS)
FFE Feed Forward Equalizer
FP Fabry-Perot
FPGA Field-Programmable Gate Array
FSAN Full Service Access Network
FSK Frequency Shift Keying
FTTx Fibre to the x (B – building, business; H – home; C – cabinet, curb)
FWI Forced Wake-Up Indication
FWM Four-Wave Mixing
Gb/s Gigabit per second
Gbps Gigabit per second
GEM G-PON encapsulation method
GHz Giga Hertz

25
GCO Optical Communications Group
GMPLS Generalized Multi Protocol Label Switching
GPON Gigabit-capable passive optical network
GTC G-PON transmission convergence
H Header
HDTV High Definition TV
HEC Header Error Control
HSMC High Speed Mezzanine Connector
IANA Internet Assigned Numbers Authority
ICMP Internet Control Message Protocol
ID Identifier
IEEE Institute of Electrical and Electronics Engineers
IL Insertion Losses
IM Intensity Modulation
IM/DD Intensity Modulation / Direct Detection
IP Internet Protocol
IPTV Internet Protocol TV
ISI Inter-Symbolic Interference
ISC Interface Switching Capability
ITU International Telecommunications Union
LAN Local Area Network
LD Laser Diode
LED Light Emitting Diode
LER Label Edge Router
LF Last Fragment
LO Local Oscillator
LOS Loss of signal
LPF Low Pass Filter
LSC Lambda Switch Capable
LT Line Termination
LVDS Low-Voltage Differential Signalling
LVPECL Low-voltage positive emitter-coupled logic
MAC Medium Access Control
MAN Metropolitan Access Network
MIB Management Information Base
MLSE Maximum Likelihood Sequence Estimation
MPLS Multi Protocol Label Switching
MPM Multi-Protocol Management
MUX Multiplexer
MZM Mach-Zehnder Modulator
NA Numerical Aperture

26
NF Noise Figure
NGN Next Generation Network
NGA Next Generation Access
NG-PON Next-Generation PON
NMS Network Management System
NRZ Non-Return-to-Zero (line code)
NT Network Termination
OAM Operation, Administration and Maintenance
OAN Optical Access Network
ODN Optical Distribution Network
OEO Optical-Electronic-Optical (conversion)
OFDM Orthogonal Frequency Division Multiplexing
OLT Optical Line Terminal
OMCC ONU Management and Control Channel
OMCI ONU Management and Control Interface
ONT Optical Network Terminal
ONU Optical Network Unit
OOK On-Off Keying
OPEX Operational Expenditure
ORL Optical Return Loss
OSA Optical Spectrum Analyzer
OSI Open System Interconnection
OSNR Optical Signal-to-Noise Ratio
OSRR Optical Signal-to- Rayleigh Ratio
OTDR Optical Time-Domain Reflectometer
OXC Optical Cross Connect
P Parity
P2MP Point-to-MultiPoint
P2P Point-to-Point
PC Polarization Controller
PC Physical Contact (connector fibre)
PCB Printed Circuit Board
PDH Plesiochronous Digital Hierarchy
PDL Polarization Dependent Loss
PDU Protocol Data Unit
PHY Physical Interface
PLI Payload Length Indicator
PLOAM Physical layer operations, administration and maintenance
PMD Physical Medium Dependent
PMD Polarisation Mode Dispersion
PON Passive optical network

27
POTS Plain old telephone service
PPG Pulse pattern generator
PPPoE Point-to-Point Protocol over Ethernet
PRBS Pseudo-Random Bit Sequence
PSB Physical Synchronization Block
PSK Phase Shift Keying
PSN Packet switched network
PT Payload Type
PTI Payload Type Indicator
QAM Quadrature Amplitude Modulation
QoS Quality of service
QPSK Quadrature phase shift keying
QW Quiet Window
R Responsivity of the photodiode
RB Rayleigh backscattering
RBc Rayleigh backscattering from carrier signal
RBoC Rayleigh backscattering at the Combiner output
RBoC Rayleigh backscattering from the Combiner output at the ONU input
RBr Rayleigh backscattering reflected
RBrO Rayleigh backscattering reflected at the OLT input
RBu Rayleigh backscattering from upstream signal
RBt Total Rayleigh backscattering
RE Reach extender
REAM Reflective electro absorption modulator
RL return loss
RN Remote node
RF Radio Frequency
RFC Request-for-Comments
RSOA Reflective semiconductor optical amplifier
RGC RSOA Gain Control
RS Reed-Solomon
RTCP RTP Control Protocol
RTD Round-Trip Delay
RTP Real-time Transport Protocol
RX Receiver
RZ Return to zero
S Scattering coefficient
SC Subscriber Connector
SCM Sub-Carrier Modulation
SDH Synchronous Digital Hierarchy
SDU Service Data Unit

28
SERDES SERialization/DESerealization
SFC Super Frame Counter
SFP Small Form-factor Pluggable (transceiver)
SGEM SARDANA GEM
SIP Session Initiation Protocol
SLA Service Level Agreement
SMA Sub-Miniature version A (connector)
SN Service node
SN Sequence Number
SN Serial Number
SNI Service node interface
SNMP Simple Network Management Protocol
SNR Signal to noise ratio
SOA Semiconductor optical amplifier
SONETSynchronous Optical Network
SR Status Reporting
SSB Single side band
STB Set-Top Box
STC SARDANA Transmission Convergence
SXGPON SARDANA XG-PON
TBD To be defined
TC Transmission Convergence
T-CONT Transmission container
TCP Transmission Control Protocol
TDM Time division multiplexing
TDMA Time-Division Multiple Access
TEC Temperature Controller
TIA Trans-Impedance Amplifier
TM Traffic monitoring
ToS Type-of-Service
TX Transmitter
U User plane
UDP User Datagram Protocol
UDWDM Ultra-Dense WDM
UNI User network interface
US Upstream
VLAN Virtual Local Area Network
VOA Variable Optical Attenuator
VoD Video-on-Demand
VoIP Voice over IP
VPI Virtual Photonics Inc.

29
VPN Virtual Private Network
WBS Wavelength Broadcast and Select
WDM Wavelength division multiplexing
WR Wavelength Routed
WS Wavelength Splitting
XAUI 10 Gigabit Attachment Unit Interface
XFP 10-Gigabit Small Form Factor Pluggable
XGEM XG-PON Encapsulation Method
XG-PON 10-Gigabit passive optical network, G.987 series
XTC XGPON Transmission Convergence (or XGTC)

30
Chapter 1
1. Introduction
A passive optical network (PON) access features a point-to-multi-point (P2MP) architecture to provide
broadband traffic to final users. The P2MP architecture has become the most popular solution for FTTH
network deployment among service providers and telecom operators. In this process, GPON and EPON
standards have guided the development and implementation of the PON in the last decade.
However, with the growing popularity of bandwidth demanding services such as HDTV, Video-on-
Demand (VoD), and video-conferencing applications, there is an increasing demand on broadband access,
and operators expect more from PON networks.
Solutions have been presented for FSAN and IEEE standardization groups through, XG-PON [1] and
10G-EPON [2] respectively, to improve bandwidth. Nevertheless, other requirement that includes long
reach and service support capabilities, as well as cost-effective architectures, enhanced performance of
access nodes and improved bandwidth assignments need to be satisfied. Also, PON deployments have
been aiming to combine the capacity of metro and access networks in the last mile of the Internet service
provisioning.
Although great efforts have been made by research groups on dense technologies (OFDM [3-9],
UDWDM [10-12], coherent transmission [13-16], etc.), these are not yet mature, and are not

31
standardized. This is a key issue to decision making for the telecom industry. A powerful alternative is the
optimization over existing PON networks.
An optimization process is a measurable improvement of a process or system. In that direction, a redesign
and optimization of the access network technologies, its architecture, access control, bandwidth
management and latency requirements, and devices and infrastructures, in terms of minimum deployment
cost for greenfield PON, is a good alternative.
In this sense, WDM-PON architecture, often seen as the next generation trend, when combined with time
division multiplexing (TDM) techniques, in a hybrid WDM/TDM, is a beneficial solution due to their
high capacity. To maintain the cost-effectiveness of PONs, reflective network units such as reflective
semiconductor optical amplifiers (RSOA) at the customer premises are a suitable approach. However, due
to the bidirectional nature, degradations from physical effects like Rayleigh backscattering between the
optical line terminal (OLT) and the optical network unit (ONU) arise and lead to decreased performance.
To mitigate these penalties and offer higher performance over a cheaper and faster broadband access
solution, different optimization processes, at Layer 1 (PHY) and Layer 2 (MAC), are presented in this
work.

32
1.1. State-of-Art
1.1.1. Active vs. Passive Optical Networks
In general, there are two important types of architectures that make fibre-to-the-home (FTTH) broadband
implementation: active optical networks (AONs) and passive optical networks (PONs). Each has
advantages and disadvantages as compared to the other.
Active optical access networks uses electrically powered switching equipment, such as a router or a
switch aggregator and take advantage of repeaters based on O/E/O regenerators for reach extension to
have additional intelligence located closer to the subscriber that can reduce latency, flexibly add
bandwidth, isolate faults, switch, schedule and queue traffic— and maximize bandwidth utilization
between the switch aggregator and central office [17-20].
On the other hand, a passive optical network does not include electrically powered switching equipment
and no active components are deployed in the optical distribution network, this is between the operator
and the final user [21-23]. Instead, it uses optical splitters to separate and collect optical signals as they
move through the network. In this way, economic advantages deriving from maintenance of active
devices can be obtained as they are situated either at the CO of the provider, principally, or at the
customer premises. So, PON networks are gaining interest from network providers and researchers.
Here, the trade-off is one additional active or powered expensive element versus a passive power splitter
with an inherently lower failure rate and economically feasible but no ability to isolate faults, switch local
traffic or provision narrow transmissions [20]. However, these functionalities can be implemented in the
PON on the layer 2 in the OLT at the Central Office.
So, due to a major advantage and great interest, this Thesis is focused only in PON networks.
A hybrid access network between AONs and PONs, where the fibre plant is in principle subject to passive
components but contains service nodes referred to as local exchanges, where electrically powered
equipment such as amplifiers, are also implemented [24-29]. For this thesis they are, strictly speaking, not
passive, although the absence of higher layer functionality in these network nodes.

33
1.1.2. Bidirectional Transmissions in PONs
In FTTH PON technologies the infrastructure of the Optical Distribution Network (ODN) is a critical
constraint when deploying the access network. The target for novel designs is a function of scalability
(number of users, bit rate and coverage) and implementation cost per subscriber. In this scenario,
bidirectional single-fibre/single wavelength transmission is the most cost-effective proposal in terms of
CAPEX.
In general, for bidirectional transmission, different criteria for its implementation must be taken into
account. Fig. 1.1 shows the basic implementation options.
An ODN based on two-fibre implementation, consisting in one fibre for each direction is shown in Fig.
1.1a. This ODN structure is adopted for most of the actual commercial technologies for PONs, due to that
optical components employed at the OLT and ONU are less restrictive and inexpensive laser or even LED
sources can be employed achieving correct transmission results, despite this is not a cost-effective ODN
architecture. Other advantage of this type of implementation is that signal impairments caused by back-
reflected light can be eliminated with the appropriate use of optical isolators.
A more efficient solution for ODN implementation is single-fibre transmission because only half of the
amount of fibre is necessary; as well, the cost for connectors, splices and other network components
decrease.
Fig. 1. 1 - Bidirectional transmission schemas in ODN PONs: a) two-fibre, b) one-fibre, two-wavelength, c) one-
fibre, one-wavelength.
Transmission over a single fibre can be implemented using two implementations. The simplest is to
transmit bidirectional data using different wavelengths, as shown in Fig. 1.1b. This implementation
requires optical sources of different wavelength as well as optical filters to divide uplink and downlink
channels. Thus, the signals do not interfere with each other, as they are carried in separated frequencies
[30].
OLTSNI
OLT ONUSNI UNI
ONUUNI
OLT ONUSNI UNI
λ
λ
λ1
λ2
λ1
λ1
Optical Distribution Network
a) two-fibre
b) one-fibre, two-wavelength
c) one-fibre, one-wavelength

34
The second implementation consists in using the same wavelength in both directions, as shown in Fig.
1.1c. It allows spatial economy in WDM systems where the number of wavelength is limited. With
bidirectional signalling, the total aggregate data throughput can be doubled because downstream and
upstream traffic can occur at the same wavelength. This implementation is preferred from the perspective
of hardware efficiency, latency, network integrity, network management and reduction of costs for fibres
and components [31].
However, coherent crosstalk due to Rayleigh backscattering and reflections, present in this type of
implementation, needs to be mitigated, as well as new ONU TX/RX designs are required.
1.1.3. Access Networks: Architecture and Topologies
1.1.3.1. Point-to-Point Architecture
In Point-to-point (P2P) access networks there is a dedicated fibre span between each OLT and ONU as a
basis to implement its ODN and it do not distribute the signal via a splitter. In this network, no
infrastructure is shared (as in the fibre plant as at the central office). It typically utilizes one or two
wavelengths for half or full-duplex bidirectional data transmission for the end-user, allows thereby high
transmission capacities operating in continuous mode with simple transmitters and receivers, as it is the
case in optical intensity modulation/direct detection (IM/DD) transmission systems. However, such
solutions are not considered to be cost-efficient for access.
A commercial development is based on Ethernet Point-to-Point fibre optic networks. This systems use
standard Ethernet technology for transmitting services to the end subscriber. Commonly available
components (switches and routers with optical interfaces), can therefore be used for the subscriber as CPE
(Customer Premises Equipment).
By using dedicated fibre optics to the subscriber, bandwidth can be customised. In this aspect, P2P
architecture is superior to the PON’s P2MP architecture. Just by adding boards, subscribers can obtain an
upgrade, without the network architecture or the service of other subscribers having to be changed.
Physical interface with symmetrical bandwidths of 1000 Mbps, SFP transceivers (1 Gbps) and XFP (10
Gbps) are standard. In particular, 10 Giga-Ethernet P2P uses IEEE802.3ae standard transmission
interfaces. Fig. 1.2 shows a 10 Gbps P2P Ethernet connection, based on 802.3ae for using XFP
transceivers.
However, software can of course adjust the bandwidth actually supplied to below the physical bandwidth
to suit each customer.
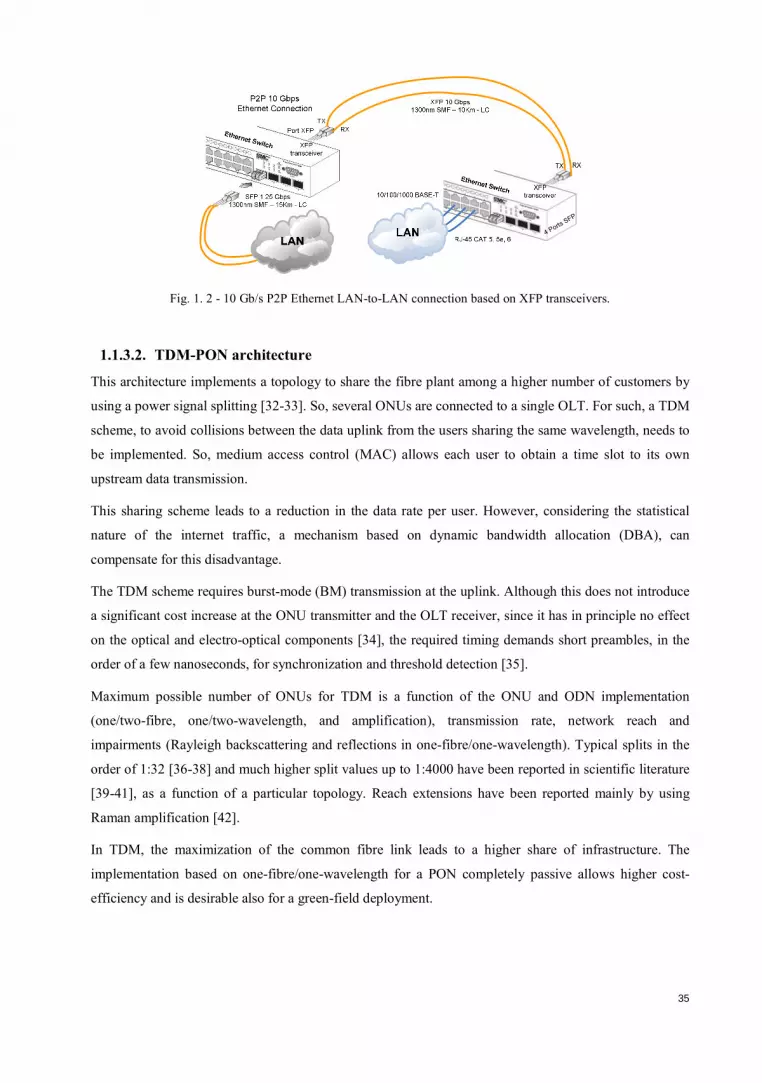
35
Fig. 1. 2 - 10 Gb/s P2P Ethernet LAN-to-LAN connection based on XFP transceivers.
1.1.3.2. TDM-PON architecture
This architecture implements a topology to share the fibre plant among a higher number of customers by
using a power signal splitting [32-33]. So, several ONUs are connected to a single OLT. For such, a TDM
scheme, to avoid collisions between the data uplink from the users sharing the same wavelength, needs to
be implemented. So, medium access control (MAC) allows each user to obtain a time slot to its own
upstream data transmission.
This sharing scheme leads to a reduction in the data rate per user. However, considering the statistical
nature of the internet traffic, a mechanism based on dynamic bandwidth allocation (DBA), can
compensate for this disadvantage.
The TDM scheme requires burst-mode (BM) transmission at the uplink. Although this does not introduce
a significant cost increase at the ONU transmitter and the OLT receiver, since it has in principle no effect
on the optical and electro-optical components [34], the required timing demands short preambles, in the
order of a few nanoseconds, for synchronization and threshold detection [35].
Maximum possible number of ONUs for TDM is a function of the ONU and ODN implementation
(one/two-fibre, one/two-wavelength, and amplification), transmission rate, network reach and
impairments (Rayleigh backscattering and reflections in one-fibre/one-wavelength). Typical splits in the
order of 1:32 [36-38] and much higher split values up to 1:4000 have been reported in scientific literature
[39-41], as a function of a particular topology. Reach extensions have been reported mainly by using
Raman amplification [42].
In TDM, the maximization of the common fibre link leads to a higher share of infrastructure. The
implementation based on one-fibre/one-wavelength for a PON completely passive allows higher cost-
efficiency and is desirable also for a green-field deployment.
4 Ports
SFP

36
Standards (ITU-T -G.984 for GPON or Ethernet 802.3 EPON) have been established for key parameters
of TDM PON systems. Fig. 1.3 shows a typical TDM PON network architecture based on ITU-T 984.x
GPON.
Fig. 1. 3 - A typical TDM GPON ITU-T 984.x network architecture (modified from [46])
1.1.3.3. WDM-PON architecture
Wavelength Division Multiplexing (WDM) PON provides an independent wavelength channel to each
user in each communication direction while the fibre architecture is shared. It therefore combines the
fibre efficiency of a TDM-PON with the powerful features of P2P connectivity. Fig. 1.4 shows a typical
WDM PON network architecture.
WDM PON is currently an emerging FTTH technology and vendor-specific in its implementation at the
optical layer. A major advantage is the long reach that WDM PON offers, and so it is mostly used today
in backhaul scenarios to serve base stations, OLTs, or other aggregation devices. WDM architecture, as
TDM, allows to share common infrastructure between multiple users, but multiplexing in the optical
frequency domain based on a WDM multiplexer [43,31]. The WDM-PON increases the spectral
efficiency of the access network by taking advantage of the high optical bandwidth of optical fibres.
The continuous mode (CM) data transmission can accommodate high guaranteed data rates up to 10
Gbps, without the introduction of additional intelligence in the MAC layer, due to the exclusive
wavelength channel of each user.
Typical customer densities are 40 per employed waveband, while up to 3 wavebands in S-band, C-band
and L-band could be effectively used to maintain low optical losses in the ODN.
Nowadays, the granularity of commercial components for WDM multiplexers is limited, so that a fine
channel grid that provides a larger number of wavelengths per waveband cannot be achieved. Typical
1490 nm
1310 nm
1555 nm
Downstream
TDM
ONU2
ONU32
1:32 couplerOLT Video
Data
E1/T1/Telephony
Data
ONU1
E1/DS1/Telephony
POTS
VOIP
TDMA
Upstream
RF Video Overlay

37
channel spacing is 100 GHz, but is still expected to decrease which is also confirmed by research, where a
spacing of down to few GHz for using UDWDM has been demonstrated [44-45].
In turn, a larger number of data channels would also require powerful and electrically powered optical
amplifiers that are placed inside the ODN, since Raman amplification or remotely pumped EDFs at the
common trunk span are not able to provide significant gain for a dense comb of data signals [35].
WDM PON architectures are being developed by many companies but no standards exist for them yet.
However, FSAN launched the NGPON2 recommendations mid-2012 that has WDM PON, i.e. a lambda
pair-per-user, considered as an option. It is important to note that FSAN advanced XPON to NGPON2 by
adding more wavelength channels into the network. In that sense, the migration path to more capacity in
access is surely based on WDM. Most systems have 100 or 200 GHz channel spacing and have several
tens of nm between upstream and downstream channel clusters.
Fig. 1. 4 - A typical WDM PON network architecture.
1.1.3.4. Hybrid WDM/TDM-PON architecture
Hybrid PON architecture maximizes the customer density by incorporating WDM and TDM techniques.
Different hybrid WDM/TDM PON architectures are proposed in the literature [6-49,51-56,33]. A set of
wavelengths is thereby fed together via a common, and in general, long trunk or ring segment, and a
WDM demultiplexer then spreads the single data channels towards a bunch of TDM trees, each of them
containing a feeder fibre, a power splitter and a short drop fibre. In this way, the multiplexing factors of
WDM and TDM segment are multiplied and a high number of customers can be served by the operator. A
hybrid PON can be seen as an overlay of TDM-PONs, whose trunk segment is partially shared over a
single fibre span.
Some types of hybrid PONs, as the wavelength broadcast and select (WBS-PON), uses passive power
splitters to broadcast all the wavelengths to all the users, and leave it to the MAC layer to schedule time
slots as well as wavelengths for different users. It requires tunability at the ONU.
Other architecture, named wavelength splitting (WS-PON), uses a combination of a wavelength splitter
(arrayed waveguide grating, AWG) and a power splitter to share each wavelength among multiple ONUs
using TDM. It requires low-cost fixed wavelength transceivers at the ONU. However, the ONU becomes
Service
Provider
GbE
Network
10GbE
Network
WDMNetworkUNI
UNI
XFP
SFP
User 1
User 32
Central
Office
feeder
drop
OLT Mux
ONU1
ONUn
DeMux
ONU2
ONU3

38
coloured. Though this architecture significantly improves the power budget, it reduces the overall
flexibility available in the WBS PON. The other architecture, the wavelength routed (WR-PON) uses a
combination of power splitters and optical switches to switch any wavelength to any TDM PON [52-53].
The WR PON significantly improves upon the data security compared to the WBS PON while keeping
the flexibility of dynamically switching wavelengths from one TDM PON to another (contrary to the
fixed wavelength allocation scheme of the WS PON). However, the WR PON introduces active
equipment in the remote node and the combination of flexibility and security comes at the expense of
power budget and cost [54]. Other hybrid WDM/TDM PON architectures that use wavelength selective
switches at the remote node to improve flexibility, data security and power budget, is shown in [55].
In the SARDANA network [56], the most interesting state-of-the-art hybrid WDM/TDM NG-PON
demonstration, a number of 1024 users can be served at 2.5 or 10 Gb/s, guarantying a bandwidth between
100 Mb/s and 1Gb/s per user, at distances over 60-100 km with proper power budget balance, splitting
ratio and number of wavelengths.
This network offers a Ring+Tree topology. The access trees length is up to 20 km, inherited from current
PON standards, while the ring length may span longer distances towards a metropolitan coverage. This
architecture is compatible with a colourless design of the ONU, and also with pure WDM-PON, operating
as a resilient TDM over WDM overlay. This network will be presented in chapter 4. Fig. 1.5 shows a
hybrid WDM/TDM PON architecture based on a WDM ring and a TDM tree, as used in SARDANA
project [51].
Fig. 1. 5 – A WDM/TDM PON architecture based on a WDM ring and a TDM tree.
The junction between the WDM and the TDM segment is often used to incorporate some network
intelligence or means of amplification. While in networks that contain electrically powered equipment
these so-called remote nodes include routers [57] or protocol terminators [58], the SARDANA network,
the SUCCESS network and other approaches provide optical amplification by remotely pumping rare-
earth doped fibres [46-47].
WDM/TDM PON architecture is a principal candidate to be the paradigm of the NG-PON2.

39
1.1.3.5. UDWDM-PON architecture
WDM-PONs with ultra-dense wavelength allocation is an emerging type of access network that allows
increasing the customer density of the PON and avoids narrow-band classical WDM multiplexers, by
placing passive splitters as signal distribution elements, as it is the case in TDM-PONs, and in turn
coherent detection to overcome the introduced high loss budget of the network [59]. Thus, UDWDM
increments the spectral efficiency with respect to current optical access systems (TDM and WDM) that
make poor use of the transmission capacity of optical fibre.
Ultra dense WDM (UDWDM) technology requires an array of discrete lasers or multi-frequency sources
with extreme wavelength stability. So, the large number of individual transmitters and receivers that are
required at the OLT demands progress in photonic large-scale integration. Also, a broad homogenous
gain of the erbium doped fibre (EDF) is the main problem to overcome in EDF based optical comb
sources [60-63].
Coherent detection of a specific data channel requires a tuneable laser source [64] at the ONU and is in
principle contradictory to cost-effective mass deployment. However, progress has been made on the
development of lower cost tuneable lasers that can be also used for data modulation at bit rates up to 2.5
Gbps [65].
A typical data rate would be 1 Gbps that is compatible with a channel spacing of 3 GHz [36], but
sustained symmetric data rates, from 1 to 10 Gbit/s per user, is a target [47]. This would assure a
customer density of 1000 users or more on a single fibre, however, with the restriction of having a limited
maximum data rate for which no simple upgrade path is given. Also, to send ~1000 wavelengths to all
users is questionable from the viewpoint of energy efficiency [35]. In addition, the reception sensitivity
has to be very low to avoid nonlinear effects at the feeder fibre close to the OLT where many wavelengths
are present with too high overall optical power.
It is an ideal system to consolidate different network technologies, a view backed by many Fixed Network
Operators and Mobile Network Operators.

40
1.1.4. Reflective ONUs
Cost-effective solutions must be developed to be able to offer future-proof NG-PON service broadband
connections to end users at a reasonable cost. A key element for such purpose is the Optical Network Unit
(ONU) at the Customer Premises, having a direct impact on the cost of service by user. Thus, simple
ONU needs to be designed. Reflective ONU is the principal candidate for this target.
The integration of the reflective modulators with optical amplifiers is a promising solution for the ONU
[66-68]. Centralized light control and wavelength management (at the OLT) and colourless operation
(WDM-capable) can be obtained by means of reflective ONUs. It avoids laser source at the ONU and
associated circuitry (stabilization and provisioning circuitry), for re-using downstream wavelength,
implementing a cost-effective system.
Also, this system allows bidirectional transmission by using single-fibre/single-wavelength transmission,
in order to reduce network size and connection complexity of the outside plant [69], reducing cost and
simplifying the ODN design.
In a reflective ONU, the electrical upstream data re-modulates the optical downstream signal on this
wavelength at the same time, performing wavelength reuse. This process can be achieved either by using
orthogonal modulation formats for DS/US with frequency or phase shift keying (FSK, PSK) or by
suppression of the amplitude shift keyed (ASK) downstream pattern before the optical carrier is again
modulated with ASK upstream data [35].
Extensive research work has been focusing on reflective ONUs [70-77]. So, the reflective semiconductor
optical amplifier (RSOA), the reflective electro-absorption modulator (REAM) or integrated versions of
SOA and REAM, are promising candidates for this purpose.
1.1.4.1. ONU based on a RSOA
The earliest use of a laser amplifier for modulation in local access is reported in [78-79]. A reflector
amplifier is introduced for modulation, and its amplifying and reflecting characteristics were analysed.
Upstream modulation systems are reported in [80-81]. In [82], the capability of a SOA operating as a
photo-detector was verified.
An electro-optic transceiver based on a single Reflective Semiconductor Optical Amplifier (RSOA), used
as Optical Network Unit, appears as a potential cost effective solution for a FTTH passive optical
platform with bidirectional operation along single fibre outside plant. It performs modulation and
detection operations at the bit rate 2.5 Gb/s (upstream modulation) and 10 Gb/s (downstream detection)
[51], performing the loss budget that are proposed in GPON [83].
Upstream transmitters at 10 Gb/s were finally found with the help of SOA/REAMs [84-85] or spectrally
compressed modulation formats such as duobinary [86] or quaternary amplitude modulation [87].

41
However, the RSOA-based transmitters suffered from strong performance degradation. So, it is just
suitable for a low loss Budget [35].
Incoming light is modulated by the RSOA injection current carrying the upstream user data and amplified
before being transmitted. RSOA also acts as a photo-detector by sensing the voltage variation of the
electrode. This ONU design is wavelength independent (colourless), allowing an easier design of the rest
of the system.
RSOA is implemented within the Indium-Phosphide semiconductor material system. These III-V
semiconductor components provide a by far smaller form-factor and are therefore in course of the
miniaturization of future customer premises equipment (CPE) [35]. However, parasitic side effects during
modulation, such as chirp and the limited electro-optical bandwidth, penalize the data transmission. It is
therefore often required to compensate these unwanted effects by additional electronic means like passive
or adaptive electronic equalization.
1.1.4.2. RSOA basic characteristics
Gain and Noise Figure (NF)
In a RSOA, with a redesign of its back-facet towards a retro-reflector, the gain and noise emission is
different with respect to a normal SOA. A moderate gain is expected to be obtained with a lower bias
current due to the fact that the signal passes the active region twice. On the other hand, the effect of gain
saturation will therefore approach at lower values of input power. The RSOA has a higher noise figure
due to its retro-reflective design. For a low input power of -30 dBm and a bias current of 100 mA, the NF
would be about 3 dB higher than the optimum working point of the SOA, where a NF of 7.5 dB can be
obtained for the same bias current but an input power of -5 dBm [35].
Electro-Optical Modulation Bandwidth
Limitations are given by the electro-optical (E/O) response of the RSOA semiconductor, which will
prevent to reach high modulation data rates [106].
The electro-optical response of the SOA depends on the chosen point of operation [88], for which
stringent limitations for the applied modulation can be imposed. Next to the physical processes inside the
semiconductor material that are related with the applied bias current and optical signal input of the SOA,
also the packaging of the device has to be taken into account. In addition, the electrical interface of the
bias electrode will introduce a natural low-pass transfer function for the electrical signal [89]. Typically,
commercial SOA devices are not intended to be primarily used as intensity modulator so that the bonding
interface inside the package is not optimized for high modulation bandwidths.

42
Chirp
The intensity modulation process carried for the RSOA, for modulation of the injected bias current, leads
also to modulation of the optical frequency due to band filling effects. The introduced phase modulation
for the signals that are originally intended to be purely intensity modulated, can lead to problems.
Thus, chirping during modulation introduces, together with a dispersive transmission link, penalties for
the reception, especially for modulation with large extinction ratios [90]. A possibility to reduce this
unwanted effect is to apply a holding beam that maintains the separation of the quasi-Fermi levels and
prevents therefore chirping [35].
Dependence on Bias Current and Optical Input Power
The performance of operation of RSOA depends on the bias current and the optical input power, which
define the bias point. Different applications such as modulation or amplification will exploit different
performance in terms of gain, NF, or modulation bandwidth in different operation values. Table 1.1, from
[35] summarizes RSOA parameter performances as a function of the optical input power and bias current
values.
Table 1. 1 - RSOA parameter performances as a function of the optical input power and bias current values
(modified from [35]).
RSOA
Optical Input Power
Low
Pin < -15 dBm
Medium
-15 dBm< Pin < -5 dBm
High (saturation)
Pin > -5 dBm
bias current
High
High gain and NF for
very low input powers,
good modulation ER
for long devices, capable to modulate the
optical phase
Gain decreases due to
saturation but low NF,
good modulation bandwidth for short devices
Low gain, NF increases
with input power level,
large modulation
bandwidth for short
devices
Medium
Moderate gain,
moderate-high NF,
modulation bandwidth
reduced
Moderate gain and NF
Low gain, higher NF,
good modulation
bandwidth for short
devices
Low
quite low gain, higher NF,
low modulation
bandwidth
Low gain, high NF,
low modulation bandwidth No gain, high NF

43
1.1.5. Rayleigh Backscattering (RB)
As we have seen, to maintain the cost-effectiveness of PONs, reflective network units such as RSOA at
the customer premises with single-fibre/single-wavelength ODN are a suitable approach. However, due to
the bidirectional nature, its network configuration suffer from additional penalties associated with discrete
back-reflections from connectors and Rayleigh backscattering (especially with ONUs RSOA-based which
amplify these effects). Although connector reflections can be sufficiently reduced using appropriately
designed connectors (by employing elements with low return loss and APC connectors or fibre splices)
[70,91], RB remains principal noise impairment in this type of networks.
RB is an inherent effect of the fibre and cannot be prevented. Due to the irregular amorphous structure of
the glass and microscopic defects (much smaller than the wavelength of the light), light is diffusely
scattered into the fibre. A fraction of the light is back scattered towards the transmitter. It overlaps with
data signal sent from the opposite direction and induces crosstalk between these two counter-propagating
waves [92]. RB cannot be eliminated due to its random nature, but can be mitigated by reducing overlap
between upstream and downstream optical spectra.
1.1.5.1. Backscatter Signal Analysis
The light travelling along a fibre with the distance exhibits an exponentially decreasing power level. The
power transmission relation between fibre incident light (Po) and transmitted power (P(r)) at a distance r
is (α is the attenuation coefficient):
���� � �� � ��� The scattered power dPRB, at the position r within an infinitesimal small interval dr is proportional to the
pulse power P(r). This is shown in Fig. 1.6.
�� � � � � ������
Fig. 1. 6 – Scattering produced by a pulse P(r) in a single-mode fibre.
With k = S·αs , αs is the scattering coefficient (~ λ-4) and S (backscattering capture coefficient) is the
fraction of the light scattered in all directions that is captured and guided back to emitter.
� � ����� �� � 1�
Optical
Transmitterw
L
dr
Po
t=0 P(r)=Po·e-a·r
RB
Fibre section
r

44
With NA: fibre’s numerical aperture; n0: refractive index of the fibre core; and “m” depends on the
refractive index profile (4.55 for single mode fibre [93]).
Summing up the light power backscattered from infinitesimal short intervals dr from the whole pulse w,
and by considering that part of the signal power returns (Po·e-2αr) [50], it yields:
� ���� � � � ��� ����������
The total RB of a fibre with length L, if excited by a continuous wave signal, can be obtained integrating
PRB for small pulse widths over the total length of the fibre.
� ���� � � � ��������
� � ��� �� � ���������
� � ��� ��2 � � �1 ! ������ If we define B=Rayleigh Backscattering Coefficient,
" � � ��2 � then: � ���� � �� � " � �1 ! ������
…(1.1)
Fig. 1.7 shows experimental measures of Rayleigh Backscattering power as a function of the fibre length
(incident light power = 0 dBm). With increase of the fibre length, the interference level of RB also
increases and converges, after about 20 km, asymptotically to a maximum value. This value depends on
the transmission wavelength. For 1550 nm single-mode fibre it is about 34.5 dB below the fibre input
power, as demonstrated experimentally in [70].
The critical distinction of RB noise is that it is coloured while ASE and electrical noise (i.e. thermal and
shot noise) are white. RB analyses vary significantly depending on whether the RB overlaps in frequency
with the signal or if the RB is separated in frequency from the signal. Worst case overlapping RB noise
will be called coherent RB crosstalk, while partially overlapping RB noise will be called incoherent RB
crosstalk. Coherent crosstalk does not imply that the signal and noise fields are mutually coherent but
rather that they share a common carrier frequency. The phase of the RB field and signal field are always
statistically independent in practical situations and thus interference cross-terms average to zero [31].

Fig. 1. 7 - Rayleigh Backscattering power as a function of the fibre length (experimental measures).
Thus, the degradation is stronger if signals coming from different directions fall into the same wavelength
range, so that the differential frequency of two optical frequencies (∆fopt) can temporarily fall within the
electrical receiver bandwidth, leading to additional coherent crosstalk. An expression for
photocurrent, according to the square-law characteristic of the photodiode, when signal power P
crosstalk Pc(t) overlap, is shown in equation 1.2 (polarisation is not considered).
With:
R: responsivity of the photodiode.
∆fopt(t): time-dependent differential frequency of signal and crosstalk.
∆φopt(t): time-dependent optical phase difference.
Coherent crosstalk can have much stronger effect than incoherent crosstalk due to the Ps(t) · Pc(t) product
(with Ps(t) >> Pc(t)). Coherent crosstalk is only relevant if the difference frequency of the optical carriers
is within the detection bandwidth.
In chapter 2 and chapter 3 expressions for the Rayleigh backscattering effects in WDM and TDM
networks, continuous mode and burst mode transmission, will be deduced.
-50
-48
-46
-44
-42
-40
-38
-36
-34
0 5 10 15 20 25 30
Series1
L--> ∞RB=-34.5 dBm
Fibre Length (km)
PRB(dBm)
Detected
Signal
Incoherent
Crosstalk Coherent
Crosstalk

46
1.1.6. PON and Next Generation PON (NG-PON) Standards
Current PON technology is a powerful option for deep-fibre broadband access. Serious efforts to
standardize and develop this technology have steadily extended the feature set of PON to make the
technology more flexible in terms of deployment and services.
The five major PON standards are BPON (ITU-T G.983 - broadband PON, currently only of historical
interest), GPON (ITU-T G.984) [83], EPON (802.3ah) [94], 10GE-PON (802.3av) [2] and XGPON
(G.987) [1]. Fig. 1.8 shows a timeline of the evolution of standards for PON networks [95]. Also,
demonstration field trial from SARDANA, a European NG-PON project (presented in chapter 4), are
indicated in this timeline.
Fig. 1. 8 - A timeline of the evolution of the PON networks standards (modified from [46]).
BPON, its successor GPON and XGPON are ITU-T recommendations sponsored by FSAN, a vendor and
operator committee. EPON is an IEEE option developed by the IEEE Ethernet in the First Mile (EFM)
initiative. The IEEE 10G EPON Study Group was established in March 2006 and it has produced the
standard named “802.3av-2009 IEEE Standard for Information Technology - Part 3: (CSMA/CD) Access
Method and Physical Layer Specifications Amendment 1: Physical Layer Specifications and Management
Parameters for 10 Gb/s Passive Optical Networks”. It was approved in September 2009 and publicised in
October 30, 2009.
The FSAN NGA work group has been formed to study the evolution of optical access systems beyond
GPON. A first product is 10 Gigabit-capable Passive Optical Network (XG-PON) 987.x standard (2010).
As much as possible, this Recommendation maintains characteristics from BPON and GPON. This is to
promote backward compatibility with existing Optical Distribution Networks (ODN) that complies with
those recommendations. Furthermore, this recommendation provides a mechanism that enables seamless
subscriber migration from GPON and E-PON to XG–PON using WDM defined in the G.984 series.
There are two flavours of XG-PONs based on the upstream line rate: XG-PON1 featuring a 2.5Gbit/s
upstream path and XG-PON2 featuring a 10Gbit/s one. The initial phase of this specification only
addresses XG-PON1. XG-PON2 will be addressed at later phase when the technology becomes more
mature.
G.984.5 published
G.984.1, G.984.3G.984.4 Rev2 published
G.984.2 amd2, G.984.6 published
1995 2000
FSANfounded
‘98 ‘02 ‘04 ‘05 ‘06‘01
BPON (ITU G.983.1)
published BPON OMCI
(G.983.2) published
IEEEEPONbegins
FSAN begins GPON
‘03
BPON OMCI
(G.983.2) Revised
GPON OMCI (G.984.4) published
GPON TC (G.984.3) published
IEEE 802.3ah (EPON) published
FSAN begins NG-PON
‘07
IEEE begins 10GEPON
‘08
IEEE 802.3av (10GE-PON) published
‘09
XGPON TC (G.987)
published
2010
begins SARDANA project
SARDANA project finished
SARDANA field Trials
2013
NG-PON 2?

47
In parallel the research community are reporting various future developments of optical access technology
(e.g. WDM, increased reach/split, bit rates, number of users, backward-compatible with old PON or even
IEEE 10GE-PON), to a next generation access system. The next-generation PON (NG-PON) defines two
stages of evolution: NG-PON1 and NG-PON2, as shown in Fig. 1.9.
Fig. 1. 9 - Next-generation PON (NG-PON), and stages of the evolution.
NG-PON1 is compatible with GPON deployments in accordance with G.984.5. Compatibility with a
GPON reach extender is also expected. XG-PON1 is the principal exponent of this stage, which supports
data rates of 10 Gbps downstream and 2.5 Gbps upstream. A symmetric system, which supports 10Gbps
in downstream and upstream (XG-PON2) and WDM option to overlay PONs and P2P connections on the
same fibre infrastructure in G.984.5 enhancement bands are hoped.
ITU-T has not constrained NG-PON 2 by the GPON ODN, recognizing that G.984 definitions will not be
suitable forever and new developments will obviate the need for backward compatibility. It is anticipated
that NG-PON 2 products will be available around 2015. NG-PON 2 may use a new fibre network,
introducing in particular the ability to use ultra-dense wavelength-division multiplexing (UDWDM)
splitters instead of power splitters to separate users via different wavelengths on the same ODN. A bridge
NG-PON architecture between NG-PON 1 and NG-PON 2 is SARDANA network.
SARDANA is a novel FTTH hybrid architecture for Next Generation WDM/TDM-PON, with new
functionality and extended performances: Resilience (against fibre cut), extended reach (100Km) and
number of homes (>1000), full compatibility with 10G XG-PON, truly passive, better fibre utilization and
smooth scalability. It is a transparent solution to metro-access network convergence. This network will be
analysed in chapter 4.
2008 2010 ~2015
Power splitter deployed for Giga PON(no replacement / no addition)
Splitter for NG-PON2(power splitter or something new)
G-PON
1G-EPON
WDM option to enable to P2Poverlay/multiple
XGPONs
“Coexistence ” enables gradual migration in the same ODN.
NG-PON2
E.g. Higher-rate TDM,DWDM, CDM,
OFDM, etc.
NG-PON1 incl.
long-reach optionCap
acity
XG-PON(Up: 2.5G or 10G, Down: 10G)
Component R&D to enable NG-PON2

48
1.1.6.1. FSAN XG-PON ITU-T G.987 Recommendation
10-Gigabit Capable Passive Optical Network (XG-PON) is a PON system supporting nominal
transmission rates on the order of 10 Gb/s (XG-PON1: 10 Gb/s / 2.5 Gb/s, XG-PON2: 10 Gb/s / 10 Gb/s),
and implementing the suite of protocols specified in the ITU-T G.987 series of Recommendations. XG-
PON is a sub-class of NG-PON1 [1].
The ITU-T G.987 Recommendation for XG-PON is formed by four technical documents. Titles and
contents of these recommendations are summarized in Table 1.2.
Table 1. 2 - Contents of the XG-PON G.987.x Recommendations
Rec. Title Content
G.987.1
[1]
XG-PON: General requirements General requirements for services, interfaces to other systems,
scalability (distance, split ratio, etc.), in order to guide the
physical layer and transmission convergence layer
specifications. Smooth migration from the Gigabit-class PON
is one of the important targets as well and the maximum loss
budget, as a function of the existing ODN. Also includes the
system and operational requirements to meet the needs of
business and residential applications.
G.987.2
[96]
XG-PON: Physical Media
Dependent (PMD) layer
specification
Describes a flexible optical fibre access networks capable of
supporting the bandwidth requirements of business and
residential services with asymmetrical nominal line rate 10 /
2.5 Gb/s in downstream / upstream direction. Describes the
physical layer requirements and specifications for the PMD
layer: optical parameter specifications of transmitted and
received signals between OLT and ONU as well as optical-path
characteristics between OLT and ONU. The same allocation as
IEEE 10G-EPON has been selected (i.e., 1260–1280 nm
upstream and 1575–1580 nm downstream), so that the optical
components can be common with IEEE 10G-EPON ones and
smooth migration from the Gigabit-class PON is ensured.
G.987.3
[97]
XGPON Transmission
Convergence (TC) layer
specification
Describes the layered structures of the XG-PON transmission
convergence layer. It specifies the XG-PON Encapsulation
Method (XGEM), the framing sub-layer (downstream frame
and upstream burst formats) and the PHY adaptation sub-layer,
including FEC and scrambling. The TDMA function for
controlling upstream signal timeslots, the function for
activating ONUs, the function for encrypting downstream
signals, and timing aspects are also presented. The XGTC layer
extends the GTC frame structure to 4-byte word boundaries.
G.987.4
[98]
XG-PON: ONU management and
control interface specification
(OMCI)
Specifications of protocol and message formats of management
information base (MIB) for managing/controlling XG-PON
ONUs. Because many G-PON OMCI definitions can be
applied to XG-PON, generalizing OMCI to various PON
systems is introduced [100].
Layered structure of XG-PON optical network
The two layers considered in XG-PON are the physical medium dependent layer and the XGTC layer
(also named XTC layer). It is shown in Table 1.3 [1].

49
Table 1. 3 - Layered structure of XG-PON
Path Layer Transmission Medium Layer (with OAM functions)
XGTC layer Adaptation XGEM encapsulation PON Transmission
DBA XGEM port BW allocation QoS handling & T-CONT management Privacy and security Frame alignment Ranging Burst synchronization Bit/Byte synchronization
Physical medium layer E/O adaptation Wavelength Division Multiplexing Fibre connection
The XGTC layer is divided into PON transmission and adaptation sub-layers, which correspond to the
Transmission Convergence sub-layer of the X-GEM conveying various data types. The PON transmission
sub-layer terminates the required transmission function on the ODN. The PON-specific functions are
terminated by the PON transmission sub-layer, and it is not seen from the adaptation sub-layer. The
XGTC layer will be analysed in chapter 5.
Physical layer Requirements
XG-PON architecture is based on a single fibre transmission using fibre types described in ITU-T G.652.
To achieve a low cost implementation of such a compatibility feature, the retained wavelengths are:
• for the upstream "O- Band" ranging from 1260 to 1280nm,
• for the downstream "1577nm" ranging from 1575 to 1580nm.
In the optical power budget, co-existence of GPON and XG-PON on an ODN featuring class B+ [99]
optical budget is the nominal requirement. With the additional loss introduced by the new architecture,
two "Nominal" power budget classes have been selected: Nominal1 (29dB) and Nominal2 (31dB) at BER
of 1E-12. In addition, co-existence of Gigabit PON and XG-PON on an ODN featuring C+ optical budget
drives the extended power budget requirement, allowing for an additional split in the ODN with
appropriate margins, or alternatively an increase in the supported system reach.
By considering split ratios, as many network operators have constructed their ODN infrastructure with
1:32 to 1:64 split for GPONs; 1:64 split (subject to the overall loss budget) is the minimum requirement
for XG–PON to allow coexistence.
Also, ITU-T G.987 introduces the concept of fibre distance and maximum differential fibre distance. XG-
PON1 must support the maximum fibre distance of at least 20 km. In addition, XG-PON1 TC layer needs
to support the maximum fibre distance of 60 km. XG-PON1TC layer also needs to support the maximum
differential fibre distance of up to 40 km.
System level requirements are also considered. Power saving in telecommunication network systems has
become an increasingly important concern in the interest of reducing operators’ OPEX and reducing the

50
network contribution to greenhouse emission gasses. The primary objective of the power saving function
in access networks is to keep providing the lifeline service(s). Full service mode, dozing mode, and sleep
mode are the options that can offer various levels of power saving during the normal mode of operation.
In addition, when the mains outage happens, power shedding should be activated for the power saving
capability [1].
Also, the XG-PON OLT support DBA for the efficient sharing of upstream bandwidth among the
connected ONUs and the traffic-bearing entities within the individual ONUs based on the dynamic
indication of their activity. The dynamic activity indication can be based on the following two methods:
• Status reporting (SR) DBA employs the explicit buffer occupancy reports that are solicited by the
OLT and submitted by the ONUs in response (DBRu field into upstream burst header);
• Traffic monitoring (TM) DBA employs OLT’s observation of the actual traffic amount in
comparison with the allocated upstream transmission opportunities.
It is outside the scope of the requirement specification to define which specific methods have to be
supported and the DBA scheme to be implemented.
In this work, a special interest is for ITU-T 987.3 FSAN recommendation. It is present in Annex A and is
discussed in Chapters 5 and 6.
1.1.6.2. IEEE 10G-EPON (802.3av) Recommendation
The IEEE 10G EPON Study Group has produced the standard 802.3av-2009 IEEE Standard that defines
the access method and Physical Layer Specifications and Management Parameters for 10 Gb/s Passive
Optical Networks [2].
MAC layer and above layers have been actualized to accommodate the new physical layer specifications
as well as to achieve a smooth system upgrade. For this, the following three types of ONUs can coexist in
the same PON.
1) Symmetric 10Gb/s / 10Gb/s Downstream / Upstream,
2) Asymmetric 10Gb/s / 1Gb/s Downstream / Upstream,
3) GE-PON 1Gb/s / 1Gb/s Downstream / Upstream.
Fig. 1.10 shows the connectivity scheme for these three types of configurations. In downstream, 10G/1G
signals are transmitted in different wavelength bands (1575–1580 nm for 10 Gb/s and 1480–1500 nm for
1 Gb/s) from the OLT. The ONU selects one signal by using wavelength-division multiplexing (WDM).
In upstream, 10G/1G signals are transmitted within the same/overlapped wavelength band (1260–1280
nm for 10 Gb/s and 1260–1360 for 1 Gb/s) from the ONUs, but the upstream signal from each ONU is
transmitted so as to arrive at the OLT at a different timing from those of the others under the OLT’s
control using TDMA. To receive consecutive upstream signals having different speeds (i.e., 1G or 10G)

51
and different powers from each other, a dual-rate burst receiver is necessary in OLT. The 10G-EPON
standard includes the dual-rate receiver implementation [100].
Fig. 1. 10 - Schematic of signal multiplexing in IEEE 10G-EPON [100].
The wavelength allocations of GE-PON [94], asymmetric 10G-EPON, and symmetric 10G-EPON are
presented in Fig. 1.11. Wavelength allocations of GPON and XG-PON, by compatibility, and SARDANA
network, by comparison considerations, are also shown.
Fig. 1. 11 - Wavelength allocations of IEEE GE-PON, 10G-EPON, ITU-T G-PON and XG-PON, and SARDANA
network (modified from [100]).
US
US
1250 1300 1350 1500 1550 1600
US
US
US
DS
DS
DS
DS
DS
Video
Overlay
DS/US DS/US
IEEE GE-PON
IEEE 10G-EPON
Asymmetric
IEEE 10G-EPON
Symmetric
ITU-T G-PON
ITU-T XG-PON
SARDANA
C-band L-band (optional
extension)
Wavelength (nm)

52
Fig. 1.11 shows wavelength allocation compatibility between symmetric 10G-EPON and XG-PON for
downstream and upstream. In the case of SARDANA network, because it uses wavelength re-use (send
and receive in the same wavelength), downstream and upstream share the same wavelength for operation,
usually a channel into the C-band (1530 – 1565 nm), and this band it does not compatible with the
standards. However, L-band is provided as an optional extension in SARDANA. In this band some
compatibility between 10 G-EPON, XG-PON and SARDANA (only in downstream) is possible.
10G-EPON uses a high-gain forward error correction (FEC) code, Reed-Solomon (255, 223), to make
possible low-cost optical transceiver modules. Aside from the physical layer specifications, specifications
for achieving the following features are included in the standard.
So, different of GE-PON, which was a fixed value, adjustable laser on/off time is considered in multipoint
MAC control (MPMC), to allow flexible system operation matched to the performances of the lasers
transmitting the upstream burst signals
Also, extended MAC control frames to allow various MAC-control implementations that are not defined
in IEEE standard 802.3 to accommodate various system requirements flexibly; and activation of a ranging
window for each upstream speed in MPMC to allow the coexistence of the three types of ONUs and
discrimination between GE-PON and asymmetric 10G-EPON from the same 1G upstream frame.
Dynamic bandwidth allocation (DBA) algorithm is out of the scope of the standard.

53
1.2. Thesis Outline
1.2.1. Objectives
The general objective of this thesis is to design and to optimize a WDM/TDM PON bidirectional single-
fibre/single-wavelength RSOA-based ONU network, at PHY and MAC layers, as an alternative of
reliable, cost-effective deployment and faster broadband access solution for greenfield PON.
The specific objectives of this thesis are the following:
1) To do, for the first time, a deep analysis of the Rayleigh backscattering in burst mode
transmission to obtain mathematical expressions to understand its behavior and to apply
techniques to mitigate their effects.
2) To optimize a WDM-PON RSOA-based ONU network by analyzing the RB behavior and by
demonstrating that the Rayleigh substantially varies depending on the position of the distribution
element. This optimization process can be used efficiently to minimize the RB effect in the next
generation WDM access networks.
3) To design and optimize a TDM-PON RSOA-based ONU Single-fibre/wavelength network, to
obtain the maximum number of user over the standard length (20 km), focusing on the best
tradeoff between the most critical parameters.
4) To design and optimize a WDM/TDM PON with ONU rSOA and SCM modulation based. The
target is to obtain a cost-effective, simple and with full service coverage network (up to 1280
users), at 2.5 Gb/s / 1.25 Gb/s downstream/upstream, over 20 Km, and being compatible with the
GPON ITU-T recommendation.
5) To extend the design, architecture and capabilities of a WDM/TDM PON RSOA-based for a long
reach metro-access network at the layer 2 level. A proposal of Transmission Convergence sub-
layer (OSI model layer 2), is a relevant objective of this work. It is based on the optimization of
the standards GPON and XG-PON (for compatibility), but applied to SARDANA network or
similar metro-access networks. A proposal for physical implementation of this layer is also
presented.
6) To establish the connectivity requirements and possible configurations for SARDANA
internetworking in the context of broadband access, metro and transport network level, by
empowering Transmission Convergence (TC) layer functionalities.

54
1.2.2. Organization of this Thesis
This work is organized as follows.
Chapter 2 introduces some practical optimization aspects for a WDM-PON network, related with the
WDM multiplexer position, the Rayleigh backscattering and RSOA gain, to go to deeper analysis of a
WDM/TDM PON SCM–based and its optimization.
Chapter 3 presents a Rayleigh backscattering analysis in burst mode transmission for a TDM-PON
network. Based on this analysis a TDM-PON rSOA-based ONU network is designed and optimized.
Chapter 4 focuses in SARDANA network, a Metro-Access WDM-TDM NG-PON network. Physical
layer characteristics and field trial are shown.
Chapter 5 presents a new proposal for Transmission Convergence (TC) layer of SARDANA network,
compatible with TC of XG-PON. This novel TC allows SARDANA to deploy internetworking functions.
An agile ONU activation process by simplification of the ranging state is also shown. Although
SARDANA is long reach (up to 100 km), this optimization improves a 44% the performance with respect
to XG-PON (20 km).
Chapter 6 shows a physical implementation for the STC SARDANA architecture over the SXGPON
original draft. OLT/ONU prototypes and suitable interfaces for interconnection with higher layer clients
and OLT/ONU optical assemblies at the PHY layer are deployable. Also, connectivity requirements and
possible configurations for SARDANA internetworking with other communications systems, in the
context of broadband access, are proposed. Different internetworking services can be implemented at the
PHY level, at the metro network level or at core transport network level.
Finally, in Chapter 7, conclusions of this work and future research are presented.

55
Chapter 2
2. WDM and WDM/TDM–PON Network Optimization
The existing recommendations and standards for PONs, as the IEEE 803.2ah Ethernet Passive Optical
Network (EPON), the IEEE 803.2av 10-Gigabit Ethernet Passive Optical Network (10G-EPON), the
ITU-T G.984 Gigabit-capable Passive Optical Network (GPON) and the ITU-T G.987 10 Gigabit-capable
Passive Optical Network (XGPON), are based in TDM technology, offering different degrees of service
and network performance.
A particular PON architecture still in research, where different wavelengths are used in order to increase
the number of channels by means of wavelength division multiplexing (WDM) technology is called
WDM-PON.
The upgrade of PONs with WDM technology requires the controlled generation of different wavelength
for transmission. This can be readily done at the OLT, but can be a major problem at the ONUs, because
of the wavelength stability required and the inventory complexity to supply a different DFB laser at each
customer. A possible solution is the use of a tuneable laser at the ONU, but its control is complex and its
cost is still too high. In consequence, the best realistic option is the reflective ONU with centralized
seeding light at the Optical Line Terminal (OLT) [82], as the best cost-effective potential solution. This
avoids the use of any wavelength generation at ONU and is suited for bidirectional single-fibre access,
simplifying the fibre plant. Also, it implements a cost effective NG-PON network by the use of a single-

56
fibre for both, upstream and downstream transmission, and uniform and wavelength independent
components at the ONU (colourless) for a transparent WDM-PON scenario. Reflective SOAs (RSOAs)
are promising devices to implement such reflective ONUs, because their simultaneous amplification,
detection and modulation capabilities. However, Rayleigh backscattering arises as the dominant
impairment in this type of implementation respect to others interferences [74].
In this first section the penalties in the upstream and downstream paths in WDM-PON networks due to
RB signals are analysed with respect to the relevant design parameters and to optimize the system by
establishing the most adequate location of the distribution element, considering the optimum ONU gain
on each case.
Furthermore, advances in WDM photonics and in electronics may provide scalability from commercial
FTTH TDM PON infrastructures. A combination of TDM and WDM technologies in the Optical
Distribution Network (ODN) would allow increasing the number of ONUs served. These latter’s
technologies are part of the next generation of PON networks (NG-PON). Thus, in the second section of
this chapter, a WDM/TDM PON system with reflective ONU was designed, simulated, optimized,
implemented and tested.
Characterization of the device parameters and impairment effects, in order to establish the elements most
suitable were analytically modeled. Definition of the best modulation formats for the prototype was
established. Several advanced techniques have been proposed and tested by means of simulations.
Functional and electrical/optical schemes and mathematical analysis, in bidirectional transmission, were
obtained. Results are shown in terms of power budget, splitting ratio, up/down tradeoff, and power values
in key points of the system.
This prototype was successfully tested showing high performance, robustness, versatility and reliability.
So, the system is able to give coverage up to 1280 users (32 users/wavelength * 40 wavelengths) at 20
Km of fibre length, at 2.5 Gb/s in downstream and 1.25 Gb/s in upstream.
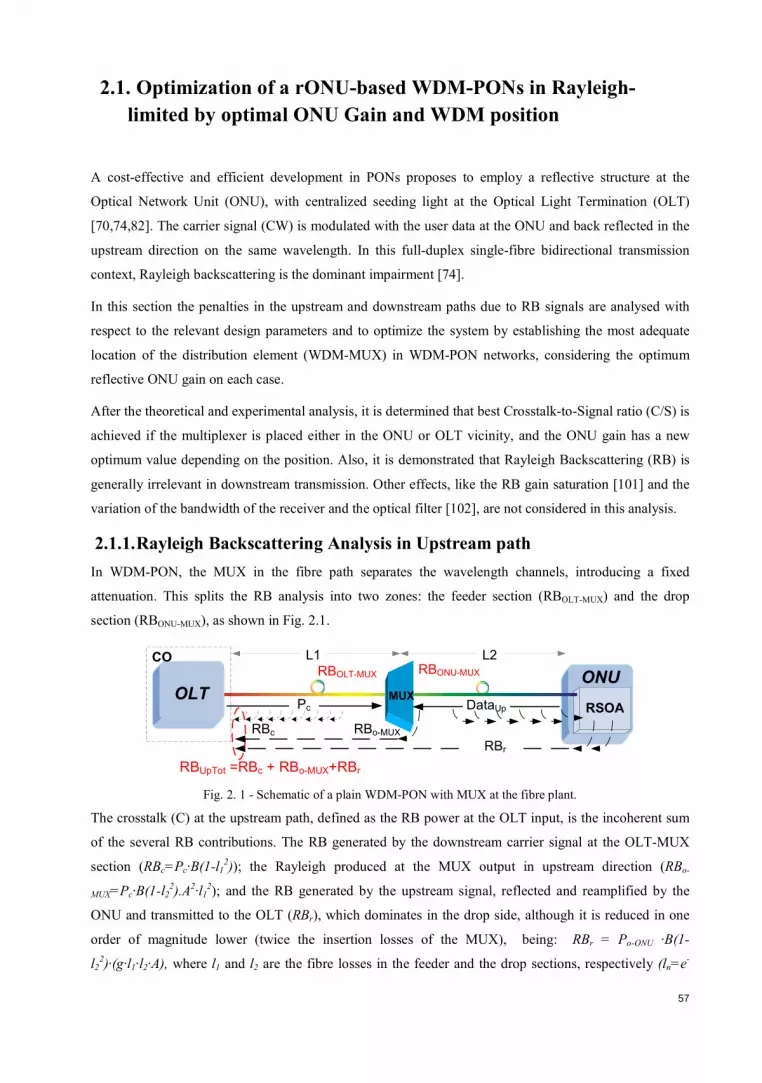
57
2.1. Optimization of a rONU-based WDM-PONs in Rayleigh-limited by optimal ONU Gain and WDM position
A cost-effective and efficient development in PONs proposes to employ a reflective structure at the
Optical Network Unit (ONU), with centralized seeding light at the Optical Light Termination (OLT)
[70,74,82]. The carrier signal (CW) is modulated with the user data at the ONU and back reflected in the
upstream direction on the same wavelength. In this full-duplex single-fibre bidirectional transmission
context, Rayleigh backscattering is the dominant impairment [74].
In this section the penalties in the upstream and downstream paths due to RB signals are analysed with
respect to the relevant design parameters and to optimize the system by establishing the most adequate
location of the distribution element (WDM-MUX) in WDM-PON networks, considering the optimum
reflective ONU gain on each case.
After the theoretical and experimental analysis, it is determined that best Crosstalk-to-Signal ratio (C/S) is
achieved if the multiplexer is placed either in the ONU or OLT vicinity, and the ONU gain has a new
optimum value depending on the position. Also, it is demonstrated that Rayleigh Backscattering (RB) is
generally irrelevant in downstream transmission. Other effects, like the RB gain saturation [101] and the
variation of the bandwidth of the receiver and the optical filter [102], are not considered in this analysis.
2.1.1. Rayleigh Backscattering Analysis in Upstream path
In WDM-PON, the MUX in the fibre path separates the wavelength channels, introducing a fixed
attenuation. This splits the RB analysis into two zones: the feeder section (RBOLT-MUX) and the drop
section (RBONU-MUX), as shown in Fig. 2.1.
Fig. 2. 1 - Schematic of a plain WDM-PON with MUX at the fibre plant.
The crosstalk (C) at the upstream path, defined as the RB power at the OLT input, is the incoherent sum
of the several RB contributions. The RB generated by the downstream carrier signal at the OLT-MUX
section (RBc=Pc·B(1-l12)); the Rayleigh produced at the MUX output in upstream direction (RBo-
MUX=Pc·B(1-l22).A2·l1
2); and the RB generated by the upstream signal, reflected and reamplified by the
ONU and transmitted to the OLT (RBr), which dominates in the drop side, although it is reduced in one
order of magnitude lower (twice the insertion losses of the MUX), being: RBr = Po-ONU ·B(1-
l22)·(g·l1·l2·A), where l1 and l2 are the fibre losses in the feeder and the drop sections, respectively (ln=e
-
RBo-MUX
L1 L2
OLT
CO
ONU
RSOADataUp
RBc
RBUpTot =RBc + RBo-MUX+RBr
RBOLT-MUX RBONU-MUX
RBr
MUXPc
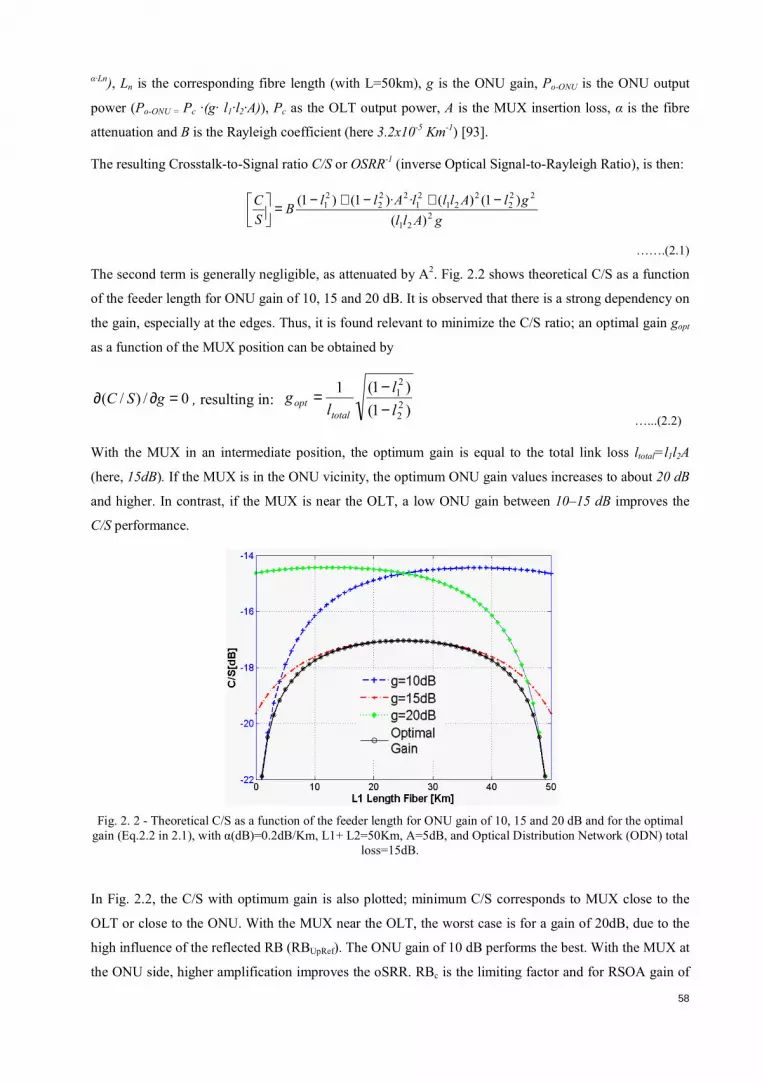
58
α·Ln), Ln is the corresponding fibre length (with L=50km), g is the ONU gain, Po-ONU is the ONU output
power (Po-ONU = Pc ·(g· l1·l2·A)), Pc as the OLT output power, A is the MUX insertion loss, α is the fibre
attenuation and B is the Rayleigh coefficient (here 3.2x10⁻⁵ Km-1) [93].
The resulting Crosstalk-to-Signal ratio C/S or OSRR-1 (inverse Optical Signal-to-Rayleigh Ratio), is then:
gAll
glAlllAllB
S
C2
21
222
221
21
222
21
)(
)1()(·)·1()1( −+−+−=
…….(2.1)
The second term is generally negligible, as attenuated by A2. Fig. 2.2 shows theoretical C/S as a function
of the feeder length for ONU gain of 10, 15 and 20 dB. It is observed that there is a strong dependency on
the gain, especially at the edges. Thus, it is found relevant to minimize the C/S ratio; an optimal gain gopt
as a function of the MUX position can be obtained by
, resulting in: )1(
)1(122
21
l
l
lg
total
opt −−=
…...(2.2)
With the MUX in an intermediate position, the optimum gain is equal to the total link loss ltotal=l1l2A
(here, 15dB). If the MUX is in the ONU vicinity, the optimum ONU gain values increases to about 20 dB
and higher. In contrast, if the MUX is near the OLT, a low ONU gain between 10–15 dB improves the
C/S performance.
Fig. 2. 2 - Theoretical C/S as a function of the feeder length for ONU gain of 10, 15 and 20 dB and for the optimal
gain (Eq.2.2 in 2.1), with α(dB)=0.2dB/Km, L1+ L2=50Km, A=5dB, and Optical Distribution Network (ODN) total
loss=15dB.
In Fig. 2.2, the C/S with optimum gain is also plotted; minimum C/S corresponds to MUX close to the
OLT or close to the ONU. With the MUX near the OLT, the worst case is for a gain of 20dB, due to the
high influence of the reflected RB (RBUpRef). The ONU gain of 10 dB performs the best. With the MUX at
the ONU side, higher amplification improves the oSRR. RBc is the limiting factor and for RSOA gain of
( / ) / 0C S g∂ ∂ =

59
10dB the upstream signal would be weak. The RBUpRef is not relevant in this case due to the double
attenuation at the ODN. For the MUX located in the middle of the link, RB generation is relevant in both
sections because the 25km of fibre on each side. RBc is the most relevant for low ONU gain while
RBUpRef is for high gain. In this case, the best scenario is the ONU gain equal to the link loss with the
MUX in the middle of the link, as then the sum of the main two RB contributions is minimum.
It is preferred the MUX close to the ONU as for this case, the optimal gain is higher than the link losses,
providing a valuable power margin. Also, the use of a unique fibre carrying all wavelengths near to the
ONU premises is more cost-effective.
Fig. 2.3 plots the optimal gain vs. MUX position for different MUX loss (A) values. We observe a wide
range around the intermediate position where the optimum value is about the link loss. At the edges, the
performances improve, although the behaviour gets rather critical with the gain selection. The worst
positions for the MUX as a function of the gain are obtained differentiating equation 2.1 and equalizing it
to 0:
LgA
Ll
SC +⋅
⋅=⇒=∂
∂)
1ln(
4
10
)/(221
1 α
……..(2.3)
For g=10, 15, and 20dB, maximal C/S are found in L1=37.5 km, 25 km and 12.5 km respectively. It is
somehow remarkable that a gain equal to the total link loss (15dB) is optimum at the intermediate position
but, at the same time, the intermediate position is slightly the worst for this gain.
Fig. 2. 3 - Optimal gain as function of the distance to different values of A.
Also, Fig 2.3 shows that with the MUX near the ONU, optimal gain would be higher to overcome MUX
losses and reach the OLT with the best oSRR, by considering that, in this case, RBc is most relevant.
On the other hand, with the MUX near the OLT, optimal gain would be lower to avoid a large RBUpRef,
the RB most relevant in this case, not just by feeder fibre > 20km, but also for lower MUX losses.
8
10
12
14
16
18
20
22
0 10 20 30 40 50
Opt
imal
Gai
n (d
B)
L1 Length Fiber (Km)
A=3dBA=4dBA=5dBA=6dBA=7dBA=8dB
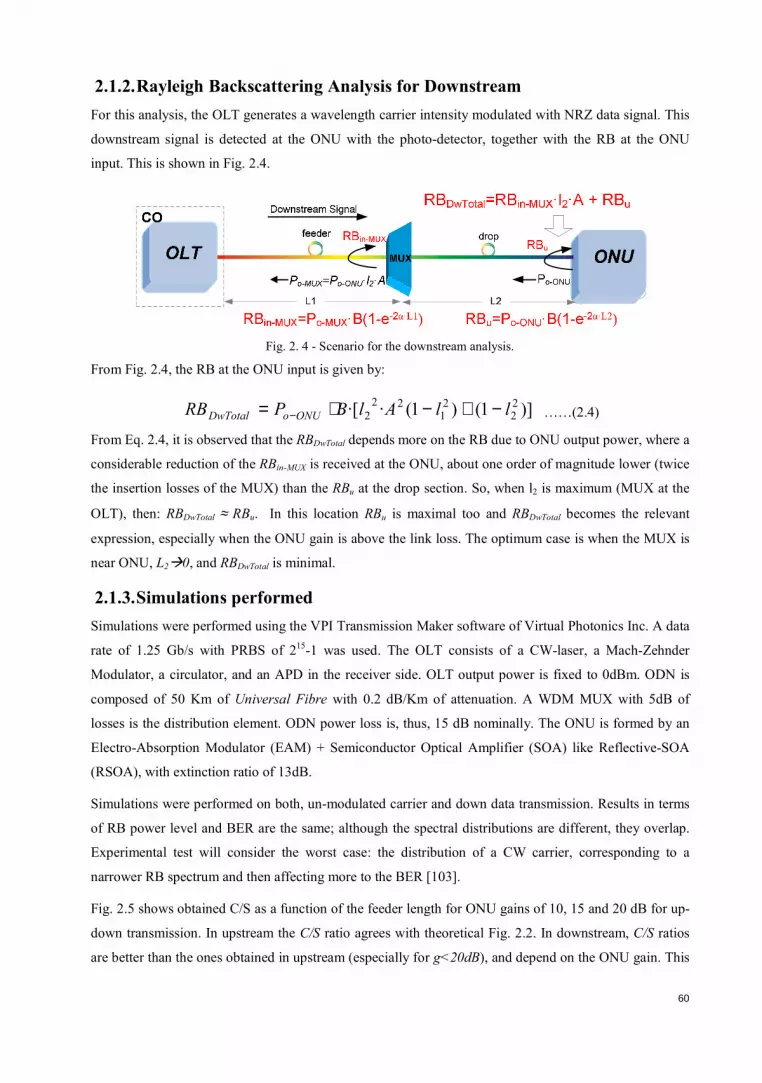
60
2.1.2. Rayleigh Backscattering Analysis for Downstream
For this analysis, the OLT generates a wavelength carrier intensity modulated with NRZ data signal. This
downstream signal is detected at the ONU with the photo-detector, together with the RB at the ONU
input. This is shown in Fig. 2.4.
Fig. 2. 4 - Scenario for the downstream analysis.
From Fig. 2.4, the RB at the ONU input is given by:
)]1()1(··[ 22
21
22
2 llAlBPRB ONUoDwTotal −+−⋅= − ……(2.4)
From Eq. 2.4, it is observed that the RBDwTotal depends more on the RB due to ONU output power, where a
considerable reduction of the RBin-MUX is received at the ONU, about one order of magnitude lower (twice
the insertion losses of the MUX) than the RBu at the drop section. So, when l2 is maximum (MUX at the
OLT), then: RBDwTotal ≈ RBu. In this location RBu is maximal too and RBDwTotal becomes the relevant
expression, especially when the ONU gain is above the link loss. The optimum case is when the MUX is
near ONU, L2�0, and RBDwTotal is minimal.
2.1.3. Simulations performed
Simulations were performed using the VPI Transmission Maker software of Virtual Photonics Inc. A data
rate of 1.25 Gb/s with PRBS of 215-1 was used. The OLT consists of a CW-laser, a Mach-Zehnder
Modulator, a circulator, and an APD in the receiver side. OLT output power is fixed to 0dBm. ODN is
composed of 50 Km of Universal Fibre with 0.2 dB/Km of attenuation. A WDM MUX with 5dB of
losses is the distribution element. ODN power loss is, thus, 15 dB nominally. The ONU is formed by an
Electro-Absorption Modulator (EAM) + Semiconductor Optical Amplifier (SOA) like Reflective-SOA
(RSOA), with extinction ratio of 13dB.
Simulations were performed on both, un-modulated carrier and down data transmission. Results in terms
of RB power level and BER are the same; although the spectral distributions are different, they overlap.
Experimental test will consider the worst case: the distribution of a CW carrier, corresponding to a
narrower RB spectrum and then affecting more to the BER [103].
Fig. 2.5 shows obtained C/S as a function of the feeder length for ONU gains of 10, 15 and 20 dB for up-
down transmission. In upstream the C/S ratio agrees with theoretical Fig. 2.2. In downstream, C/S ratios
are better than the ones obtained in upstream (especially for g<20dB), and depend on the ONU gain. This

61
dependence does not affect the BER performance that remains well below by several orders of
magnitude. Also, it is observed that the best position for the MUX is near ONU. These results
demonstrate that the RB power in downstream is negligible, and only becomes relevant when the ONU
gain is above the ODN losses with the MUX positioned furthest from the ONU, as also will be shown in
Fig. 2.8.
Fig. 2. 5 – Crosstalk-to-Signal (C/S) simulation as a function of the MUX position for ONU gain of 10, 15 and 20
dB in downstream and upstream transmission.
2.1.4. Experimental Measures and Results
Fig. 2.6 shows the experimental setup. At the OLT, a tunable laser was used to feed the ONU at 1550.14
nm, matching the MUX channel. The power applied to the feeder fibre was 0 dBm. The upstream
reception was carried out by an APD (sensitivity of -22.5dBm for BER=10-10). An optical filter (BW
34.5GHz) was introduced before the photo-detection. A variable attenuator was used to obtain the
sensitivity curve (Fig. 2.7). The link was formed by two fibre sections of 25 km (total attenuation =-
10dB). A MUX with 5 dB insertion loss was employed.
Fig. 2. 6 - Setup for the experimental measurements
The ONU was formed by a Kamelian RSOA 18-TO-37-08, directly modulated with the upstream data at
1.25Gbit/s, (PRBS 215-1, ER= 11 dB). The RSOA gain values (10, 15 and 20 dB) were characterized as a
function of the bias current (34, 45 and 80 mA).
-28
-26
-24
-22
-20
-18
-16
-14
0 10 20 30 40 50
C/S
(dB
)
L1 length fiber (Km)
g=10dB Up g=10dB Dw
g=15dB Up g=15dB Dw
g=20dB Up g=20dB Dw
OLT ONU

62
Several measurements were carried out for different MUX positions: at the OLT side (L1= 0km, L2=
50km); at the ONU premises (L1= 50 km, L2= 0 km); and at half-way of the link (L1=25 km, L2=25km).
Back-to-back was performed too (Fig. 2.7). These experimental measurements are compared to the
simulation results in Fig. 2.7, performed in the same power and conditions, based in GPON standard,
providing similar results.
With the MUX near the OLT, the ONU gain of 10 dB performs the best (2.2 dB penalty), while the worst
case is for a gain of 20dB, with a BER = 10-8 error floor. This result is due to the high influence of the
RBUpRef at the ONU.
At the ONU side, higher amplification improves the system. The penalty for G=20dB is 1.5dB. In this
case, there is an error floor in the order of BER=10-7 for the lowest gain (10dB), since RBc is the limiting
factor and the upstream signal is weak. The reflected RB is not relevant due to the double attenuation by
the MUX and the feeder fibre.
Fig. 2. 7 - BER measurements for 10, 15 and 20dB of ONU gain with the MUX a) at the OLT side. b) at the ONU
side c) at half way between OLT and ONU (Experimental and simulated curves).
1.E-12
1.E-10
1.E-08
1.E-06
1.E-04
1.E-02
-28 -26 -24 -22 -20 -18 -16
BER a)
1.E-12
1.E-10
1.E-08
1.E-06
1.E-04
1.E-02
-28 -26 -24 -22 -20 -18
BER b)
1.E-12
1.E-10
1.E-08
1.E-06
1.E-04
1.E-02
-28 -26 -24 -22 -20 -18 -16 -14
BER G=10dB-ExpG=15dB-ExpG=20dB-ExpG=10dB-SimG=15dB-SimG=20dB-SimB2B
c)

63
For the MUX located in the middle of the link, performances are, in general, worse; because the 25km of
fibre on each side are long enough for the RB generation in both sections. RBc is the most relevant for low
ONU gain while RBUpRef is for high gain. In this case, the ONU gain equal to the link loss is the best
(penalty of 3.9dB).
The BER in upstream and downstream for different values of ONU gain is also shown in Fig. 2.8
(simulation/experimental). We observe that at any position of the MUX, with an ONU gain recovering the
ODN loss (15dB), the BER performance is always better than 10-10, at the RX sensitivity specified.
However, for low or high gain values (e.g. 10 dB and 20 dB, respectively), it is possible to be below the
required BER only if selecting the MUX location properly. For a ONUgain=20 dB, it is better to place the
MUX within 10 km from the ONU, since longer drop fibre will highly increase C/S. Gain values smaller
than 10dB are not recommendable because of the receiver noise. For the input powers received at the
RSOA (≈ -15dBm), no significant gain saturation of the RSOA is observed, that could potentially reduce
the crosstalk [101,103].
The upstream BER curves follow the same tendency as the simulation; some differences are due to the
limited RX sensitivity, to the difficulty measuring BER values better than 10-12 during real tests, and also
to the simulation model where only RB noise was taken into account. Fig. 2.8 also includes the results
from BER simulations in downstream.
Fig. 2. 8 - BER as a function of the MUX position to different ONU gain values (Simulations and Experimental
results).
1.E-34
1.E-30
1.E-26
1.E-22
1.E-18
1.E-14
1.E-10
1.E-06
0 10 20 30 40 50
BE
R
L1 length fiber (Km)
g=10dB-Up-Sim g=10dB-Up-Exp g=10dB-Dw-Sim
g=15dB-Up-Sim g=15dB-Up-Exp g=15dB-Dw-Sim
g=20dB-Up-Sim g=20dB-Up-Exp g=20dB-Dw-Sim
ONUOLT

64
2.1.5. Conclusion
We demonstrated that the Rayleigh crosstalk signals substantially vary depending on the position of the
distribution element, since they are determined by the length of the fibre and by the ONU gain applied.
Although, in a real-world deployment, the position of the distribution element is usually determined by
more practical considerations, like the cost, the physical distribution of the customers, etc; this study
provides relevant information in terms of transmission optimization in WDM-PON. The results reveal
that the best performance can be achieved if the distribution element is placed either in the ONU or OLT
vicinity, at the expense, in such cases, that the ONU gain takes a new optimum depending on that exact
position. Please, note that this conclusion are not expandable to other ODN structure, as TDM, because
other RB expressions arises as a function of the particular parameters of this architecture: wavelength
sharing, burst mode transmission, higher splitting losses, different power and position of each ONU, etc,
as will be analyzed in the next chapter.
Also, these results demonstrated that the downstream RB power is generally irrelevant for the data
transmission. These results can be used efficiently to minimize the RB effect in the next generation WDM
access networks.

65
2.2. WDM/TDM PON architecture optimization A combination of TDM and WDM technologies in the Optical Distribution Network (ODN) would allow
increasing the system capacity. In this context, a new WDM/TDM PON architecture with bidirectional
operation along single-fibre/single wavelength is proposed, aiming to reach a greater number of users or a
higher range in a way cost effective by using reflective ONUs.
This section describes this architecture as a part of the project “Scaling PON systems beyond current
standards” developed by UPC-Optical Communications Group and Tellabs Inc (USA). It had as main
goal the design and implementation of the best WDM/TDM-PON ONUs based on RSOA. Optimization
processes were done. For such effect, a series of tasks were developed and are presented.
Fig. 2.9 shows the proposed architecture over the PON reference system, considering the fundamental
impairments present in a WDM-PON.
Fig. 2. 9 - WDM/TDM PON reference architecture
This approach was tested and optimized over the reference architecture [83,104] at bit rates of 2.5/1.25
Gbit/s, and considering the fundamental impairments present in the WDM-PON, like reflections,
Rayleigh backscattering, ASE noise, APD noise, ONU noise accumulation, WDM multiplexer optical
response, burst transient response, non-linearity, etc.
The characterization of the device parameters and impairment effects in order to establish the elements
most suitable to next implementation were done: APD detectors, extinction ratios, BER/Q factors, and
Rayleigh backscattering were analytically modelled. The modulation formats most suitable for this
architecture were defined.
Our first WDM/TDM PON model proposed, according to the ITU-T nomenclature, is shown in the Fig.
2.10.

66
Fig. 2. 10 - Functional scheme of the WDM/TDM PON system proposed
ONU: Optical Network Unit
ODN: Optical Distribution Network
OLT: Optical Line Termination
WDM: Wavelength Division Multiplex Module
AF: Adaptation Function (Sometimes, it may be included in the ONU.)
SNI: Service Node Interface
UNI: User Network Interface
S: Point on the optical fibre just after the OLT (Downstream)/ONU (Upstream) optical connection point
R: Point on the optical fibre just before the ONU (Downstream)/OLT (Upstream) optical connection point
2.2.1. Modulation Format definition
One great challenge in WDM-PONs is the transmitter at the ONU, which must have a wavelength that is
precisely aligned with specifically allocated WDM grid wavelength. A cost-effective solution would
ideally employ the same components in each ONU, which should thus be independent of the wavelength
(“colourless”) assigned by the network. Optical carriers are distributed from head-end office to different
ONUs to produce the upstream signals. Re-modulation of downstream signal to generate upstream signal
further reduces the cost by wavelength reuse [105-106].
However, as both downstream (DS) and upstream (US) share the same wavelength, they may easily suffer
from crosstalk, which has to be minimized. So, it is very important that modulation formats of the DS and
US signals should be carefully defined.
Several re-modulation schemes have been proposed, using both DS and US on-off keying (OOK) [107].
For such, the extinction ratio of the downstream signal had to be small enough to minimize the residual
modulation present at the upstream signal, but large enough for correct detection at the ONU. Substantial
efforts have been done to develop wavelength re-modulated WDM-PON technology including non-
return-to-zero (NRZ) coding with RSOA [108]. The NRZ coding requires amplitude compression of
downstream signal with gain saturated RSOA. NRZ pulse shape-defined formats have generally narrower
spectrum than RZ pulse shape-defined formats. A modulation format for the downstream, without
substantial increase in the hardware complexity, is Intensity Modulation with reduced extinction ratio
[82].

67
As an alternative, the downstream data can be modulated with a modulation format constant in amplitude,
such as frequency shift keying (FSK) or phase shift keying (PSK), whereas ASK is used for the upstream
data. The advanced modulation formats: differential phase-shift keying (DPSK) [106] or quaternary
DPSK (QDPSK) [109] could be exploited for the downstream signal to tackle the problem of reduced
extinction ratio of the downstream signal. Moreover, in optically amplified systems, DPSK requires
nearly 3 dB lower SNR than OOK formats, enabling extended reach. DPSK erasure and orthogonal
DPSK/intensity modulation (IM) scheme for virtual private network has also been proposed [110]. In
[111], the re-modulation scheme using DPSK modulation format in both downstream and upstream
signals for “colourless” dense (DWDM) PONs are proposed and demonstrated.
Another solution is to use sub-carrier multiplexing (SCM) in the electrical domain carrying uplink and
downlink in different RF sub-carrier. Thus, signals are spectrally separated and do not interfere with each
other. Here, we analyze this SCM-IM modulation format [111-113], because it does not require extra
optical devices.
2.2.1.1. SCM Modulation Format
In PON networks different modulation schemes for down/up transmission have been demonstrated
[82,114-117]. However, these methods may not be cost-effective due to the components needed for the
modulation and detection of these signals. A more cost-effective solution is the use of a sub-carrier
multiplexing (SCM) technique with direct modulation [118-119].
Optical sub-carrier multiplexing (SCM) is a scheme where multiple signals are multiplexed in the
radiofrequency (RF) domain and transmitted by a single wavelength. A significant advantage of SCM is
that microwave devices are more mature than optical devices in terms of stability, frequency selectivity
and coherent detection, and more advanced modulation formats can be applied easily.
A summary of the total required bandwidth needed at the ONU receiver for each proposed modulation for
2.5 Gb/s, can be found on Table 2.1. According to that table, the more efficient are multi-level PSK.
However, they are the more complex to be implemented.
Table 2. 1 - Bandwidth limits for different sub-carrier modulations
Modulation
Format
Double-sided
modulation bandwidth
Sub-carrier
frequency
Minimum photo-detector
bandwidth
SCM-DPSK 3.75 GHz 5 GHz 7.5 GHz
SCM-BPSK 3.75 GHz 5 GHz 7.5 GHz
SCM-QPSK 1.875 GHz 2.5 GHz 4.375 GHz
SCM-DQPSK 1.875 GHz 2.5 GHz 4.375 GHz

68
The theoretical sensitivity, in order to define the modulation format most adequate for our system is
shown in Fig. 2.11. Error probability (Pe) for several modulation formats are obtained from [120]. For
DPSK SCM modulation the Error probability is given for:
Pe=0.5·e-OSNR
Fig. 2. 11 - Theoretical sensitivity for the proposed modulation formats
The main sensitivity values found are shown in Table 2.
Table 2. 2 - Sensitivity values for Pe = 10-10 and Pe = 10
-4.
Sensitivity (Pe 10-10) Sensitivity (Pe 10
-4)
IM 2.5 Gbps (ITU-T) -27 dBm -29.3 dBm
SCM-BPSK -26.7 dBm -28.9 dBm
SCM-DPSK -26.6 dBm -28.8 dBm
SCM-QPSK -26.8 dBm -29.1 dBm
SCM-DQPSK -25.5 dBm -27.8 dBm
SCM DPSK is the most simple and low-cost for implementing, since there is no need for electrical phase-
locking. It will be the modulation format used for the implementation of our SCM-WDM/TDM PON
system. Simplified electrical scheme for the DPSK is shown in Fig. 2.12.
Fig. 2. 12 -DPSK scheme for up-converting a differential pre-coded signal at the OLT side (left), and for detecting
such a signal at the ONU side after photo-detection (right).
-14
-12
-10
-8
-6
-4
-2
0
-35 -33 -31 -29 -27 -25
Input power (dBm)
log(
BE
R)
IM (ITU-T ref.) SCM-BPSK SCM-DPSK SCM-QPSK SCM-DQPSK
Tb
Mixer
Local
Oscillator LPFBPF
Mixerfrom
Photodetectorto
Modulator
DPSK
Transmiter
DPSK
Receiver
DataData

SCM has been limited to 1.25 Gbps downstream up to now, with the electrical schemes not optimized
[111-113].
2.2.2. Computer Simulations
Computer simulation of the full system using Virtual Photonics Inc. (VPI) Transmission Maker was done.
A definition of the WDM/TDM-PON network reference scenario in terms of schematic, components and
main requirements have been established.
A preliminary approach is shown in Fig. 2.13 at 2.5/1.25 Gbit/s bit rates. Here, the ONU and OLT are
represented as VPI's galaxies. In these simulations are considered the fundamental impairments present in
the WDM/TDM PON (reflections, Rayleigh backscattering, ASE noise, APD noise, WDM multiplexer
optical response, non-linearity’s). In this first stage, the bidirectional transmission link is divided in three
parts: WDM feeder fibre, TDM feeder fibre and Drop fibre.
Fig. 2. 13 - WDM-PON preliminary schema - Link in three stages
In this design, the power budget at the ODN is detailed in Table 2.3.
Table 2. 3 - Power Loss at ODN
Power Budget at ODN
Element Insertion Loss Comment
Fiber Length 5.0 dB 20 Km x 0.25dB/Km
AWG 4.0 dB
Coupler 3.2 dB (-3.2 dB by 2 n̂ ONUs)
Total 12.2 dB
2.2.2.1. OLT Schematic
The downstream data signal is modulated on a RF sub-carrier by using SCM-DPSK modulation. An
electrical oscillator, running at 5 GHz, is used. Two band-pass 4th-order Bessel filters, centred at 5 GHz
and 3.75 GHz bandwidth, are placed at both, the transmitter and receiver sides.
The resultant signal modulates an optical carrier via a MZM. The Extinction Ratio at the OLT is set
OLT
EXTERNAL PLANT
WDM feeder TDM feeder Drop fibre
ONU
L1 L2

Fig. 2. 14 - VPI scheme of the OLT SCM System
OLT Characteristics values:
TX:
• ER-OLT=8.4dB
• Power output= 0dBm
• SCM-TX:
o Output BW = 1.5*Bit Rate Default
o Carrier Frequency = 5GHz.
• Loss at the OLT-TX = Loss Modulation + IL (AWG) + IL (Circulator)
RX:
• APD Receiver (OLT) with Thermal Noise= 28.835E-12 A/Hz1/2, responsivity = 0.7 A/W and
Avalanche Multiplication = 6.0.
• Loss at the OLT-RX = IL (AWG) + IL (Circulator) = 4dB + 1.5dB = 5.5dB.

2.2.2.2. ONU Schematic
ONU VPI scheme, shown in Fig. 2.15, include the SCM-RX and a RSOA galaxies.
Fig. 2. 15 - VPI scheme of the ONU reference system
RSOA VPI Model
The RSOA was modeled in VPI software as a functional Block instead of a sample module (described by
a physical model of the device). The difficulties to manipulate some parameters directly (Noise Figure,
Extinction Ratio and Chirp) and the computation time, was determining for not using the full
VPI model.
Thus, RSOA was emulated with an Ideal Amplifier (Gain and Noise Figure parameters) and an Electro
Absorption Modulator (EAM), characterized by the bias, chirp and ER (through the modulation index)
This RSOA functional model is shown in Fig. 2.16. The ONU extinction ratio is setting in 13 dB
(modulation index = 0.95).
Pin-ONU
Pout-ONU
BER-DOWN
Q-DOWN
RSOA
Coupler
SCM-RX
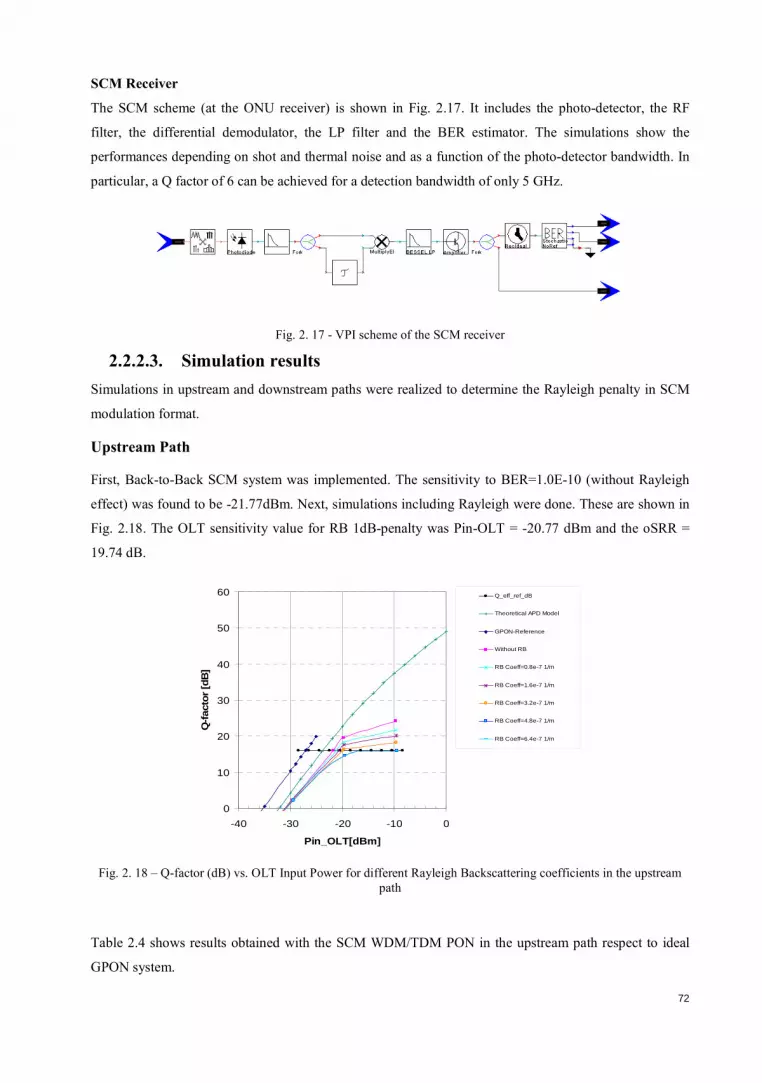
72
SCM Receiver
The SCM scheme (at the ONU receiver) is shown in Fig. 2.17. It includes the photo-detector, the RF
filter, the differential demodulator, the LP filter and the BER estimator. The simulations show the
performances depending on shot and thermal noise and as a function of the photo-detector bandwidth. In
particular, a Q factor of 6 can be achieved for a detection bandwidth of only 5 GHz.
Fig. 2. 17 - VPI scheme of the SCM receiver
2.2.2.3. Simulation results
Simulations in upstream and downstream paths were realized to determine the Rayleigh penalty in SCM
modulation format.
Upstream Path
First, Back-to-Back SCM system was implemented. The sensitivity to BER=1.0E-10 (without Rayleigh
effect) was found to be -21.77dBm. Next, simulations including Rayleigh were done. These are shown in
Fig. 2.18. The OLT sensitivity value for RB 1dB-penalty was Pin-OLT = -20.77 dBm and the oSRR =
19.74 dB.
Fig. 2. 18 – Q-factor (dB) vs. OLT Input Power for different Rayleigh Backscattering coefficients in the upstream
path
Table 2.4 shows results obtained with the SCM WDM/TDM PON in the upstream path respect to ideal
GPON system.
0
10
20
30
40
50
60
-40 -30 -20 -10 0
Pin_OLT[dBm]
Q-fa
ctor
[dB
]
Q_eff_ref_dB
Theoretical APD Model
GPON-Reference
Without RB
RB Coeff=0.8e-7 1/m
RB Coeff=1.6e-7 1/m
RB Coeff=3.2e-7 1/m
RB Coeff=4.8e-7 1/m
RB Coeff=6.4e-7 1/m

73
Table 2. 4 – Simulation results for SCM WDM/TDM PON in the upstream path
Modulation
Format SCM/IM
GPON
Reference System
Bit Rate 2.5/1.25 Gb/s 2.5/1.25 Gb/s
ER (dB)
OLT 8.4 dB OLT >10
ONU 13 dB ONU >10
Sensitivity without RB (dBm) -27.3 dBm -28 dBm
Sensitivity with RB (dBm) -26.32 dBm --
oSRR (dB) (1dB-penalty)
Robustness 19.74 dB --
Penalty over reference 0.68 dB 0
Downstream Path
Back-to-Back was implemented. The sensitivity to BER=1.0E-10 (without RB effect) was -21.26dBm.
Next, simulations including Rayleigh were done. The sensitivity value for RB 1dB-penalty was -20.26
dBm and the oSRR was 21.11 dB, as shown in Fig. 2.19.
Fig. 2. 19 – Q-factor (dB) vs. OLT Input Power for different Rayleigh Backscattering coefficients in the downstream
path
Table 2.5 shows results obtained respect to ideal GPON system.
0
10
20
30
40
50
60
-40 -30 -20 -10 0
Q-f
acto
r [dB
]
Pin_ONU[dBm]
Q_eff_ref_dB
Theoretical APD Model
GPON-Reference
Without RB
RB Coeff=1.6e-9 1/m
RB Coeff=1.6e-8 1/m
RB Coeff=1.6e-7 1/m
RB Coeff=3.2e-7 1/m
RB Coeff=4.8e-7 1/m
RB Coeff=6.4e-7 1/m
RB Coeff=8.0e-7 1/m
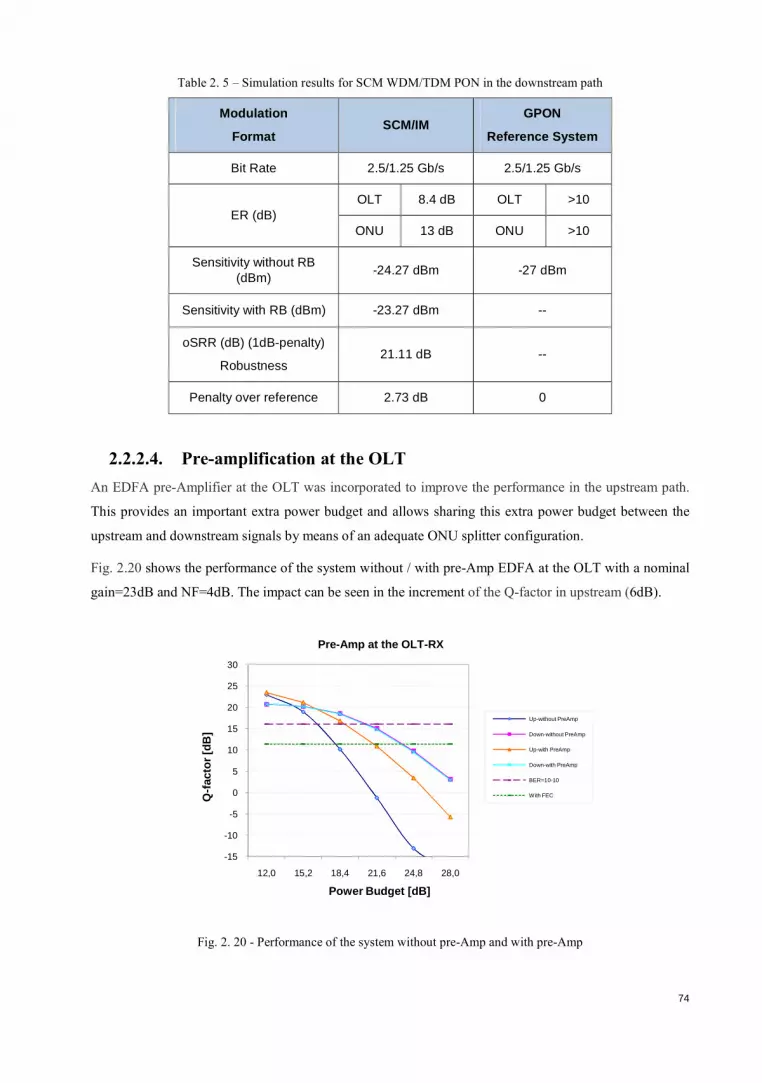
74
Table 2. 5 – Simulation results for SCM WDM/TDM PON in the downstream path
Modulation
Format SCM/IM
GPON
Reference System
Bit Rate 2.5/1.25 Gb/s 2.5/1.25 Gb/s
ER (dB) OLT 8.4 dB OLT >10
ONU 13 dB ONU >10
Sensitivity without RB (dBm)
-24.27 dBm -27 dBm
Sensitivity with RB (dBm) -23.27 dBm --
oSRR (dB) (1dB-penalty)
Robustness 21.11 dB --
Penalty over reference 2.73 dB 0
2.2.2.4. Pre-amplification at the OLT
An EDFA pre-Amplifier at the OLT was incorporated to improve the performance in the upstream path.
This provides an important extra power budget and allows sharing this extra power budget between the
upstream and downstream signals by means of an adequate ONU splitter configuration.
Fig. 2.20 shows the performance of the system without / with pre-Amp EDFA at the OLT with a nominal
gain=23dB and NF=4dB. The impact can be seen in the increment of the Q-factor in upstream (6dB).
Fig. 2. 20 - Performance of the system without pre-Amp and with pre-Amp
-15
-10
-5
0
5
10
15
20
25
30
12,0 15,2 18,4 21,6 24,8 28,0
Q-f
acto
r [dB
]
Power Budget [dB]
Pre-Amp at the OLT-RX
Up-without PreAmp
Down-without PreAmp
Up-with PreAmp
Down-with PreAmp
BER=10-10
With FEC

75
In this configuration, a power budget of 18.4 dB is obtained for the sensitivity value (BER=1x10⁻¹⁰).
However, only 8 users per wavelength could be served (up to 16 users by using FEC).
2.2.2.5. Feeder fibre optimal length
The most adequate feeder fibre length configuration, for an ODN of 20 Km, was evaluated as a function
of the system performance (Q-factor, BER).
By establishing a drop fibre length of 1 Km and varying the lengths of the WDM (L1) and TDM (L2)
fibre sections simultaneously (to see Fig. 2.13), we obtained the values shown in Fig. 2.21, for upstream
and downstream path, as a function of the number of ONUs to be served. Simulations were done by
considering chromatic dispersion (1.6e-6 s/m2) and Rayleigh (with RB Coefficient=1.6e-8 dB·m
-1)
impairments.
Fig. 2. 21 - Q-factor as a function of the WDM length fibre and the number of users to upstream and downstream
paths
The results show that for shorter lengths of the WDM fibre section, the performance in the path upstream
will be better. Thus, with L1 = 1 Km and L2 =18 Km up to 16 users could be served. These results are
expected from crosstalk effect produced by Rayleigh. So, if L1 section is longer, the crosstalk effect will
be more degrading.
In the Downstream path the variation of the lengths for the L1 y L2 is irrelevant. Here, in the best one of
the cases, a maximum of 8 users could be served (16 with FEC).
2.2.3. RSOA: characterization and measurement
Characterization and measurements were done for a RSOA low cost from Kamelian, with nominal 18dB
gain, implemented by a long SOA cavity (600 um).
Upstream Path
-5
0
5
10
15
20
25
0 8 16 24 32 40 48 56 64
Users
Q-f
acto
r [d
B]
L1=17Km
L1=15Km
L1=13Km
L1=11Km
L1=9Km
L1=7Km
L1=5Km
L1=3Km
L1=1Km
Sensitivity
FEC - 10-4
Downstream Path
-5
0
5
10
15
20
25
0 8 16 24 32 40 48 56 64
Users
Q-f
acto
r [d
B]
L1=17Km
L1=15Km
L1=13Km
L1=11Km
L1=9Km
L1=7Km
L1=5Km
L1=3Km
L1=1Km
Sensitivity
FEC - 10-4

76
RSOA Provider: Kamelian
Part RSOA-18-TO-C-FA
Serial Number 29-06-0301146132
Description 18 dB Gain, TOCAN package, C-band
2.2.3.1. RSOA characterization
Original RSOA RF response is shown in Fig. 2.22. This has a 6dB bandwidth of about 600MHz, and it
shows a quasi-lineal decreasing slope RF response dropping from the low frequencies, which limits for
1.25 Gbps bit rate transmission. Here, an impedance adapter was used for maximum power transfer (50
Ohms).
Fig. 2. 22 - Original Kamelian RSOA RF response: 600MHz of bandwidth at 6dB
2.2.3.2. RSOA electrical bandwidth optimization
To increase the device bandwidth and to optimize the RF response, the RSOA has been electrically
equalized with a simple RC filter (43 ohm in parallel with a 5.1pF capacitor), in order to improve its
electrical bandwidth. The scheme of the equalizer mounted in the first electrical prototype is shown in
Fig. 2.23.
Fig. 2. 23 - PCB layout of the electrical equalization of the RSOA
0 500 1000 1500 2000 2500 3000-20
-15
-10
-5
0
5
Frequency [MHz]
[dB
]
Rsoa Kamelian RF Response

77
The board is a standard 1.6 mm fibre glass board and the width of the micro-strip path is 2.87 mm in
order to adapt de transmission line from the RF input to the RSOA Anode (Pin 1) to 50 ohm. Anode pin
has been taken to 2mm length for RF efficiency. Cathode and case pins from the RSOA are ground
connected. This new circuit allows basing current to the RSOA. Fig. 2.24 shows a picture of this first
prototype.
Fig. 2. 24 - RSOA mounting
In Fig. 2.25, the electrical bandwidth of the equalized RSOA is shown. The electrical equalizer produces
a signal pre-distortion compensating the low bandwidth limitations of the device. For using the
equalization circuit, the 6dB electrical bandwidth has been increased from 0.6 GHz to 1.75 GHz, and will
allow using the RSOA device for bit rate transmission even higher than the 1.25 Gbps standard. The
bandwidth enhancement is obtained paying the cost of electrical losses and additional power consumption
at the RF electrical input what will force to the use of a powerful electrical driver.
Fig. 2. 25 – Equalized Kamelian RSOA RF response for bias current of 90mA. The equalized response has a 6dB
bandwidth of about 1.7 GHz and a 10dB-bandwidth of about 2 GHz which allows for 2.5 Gb/s transmission.
2.2.3.3. RSOA Measurements
Fig. 2.26 shows BER measurements at 1.25 Gbps as a function of the RSOA optical input power (-20
dBm), with a 200 GHz Optical Filter. It can be concluded that an increase of the bias current demands to
increase the modulation deep to keep almost the same BER. On the other hand, the transmission can even
0 500 1000 1500 2000 2500 3000-14
-12
-10
-8
-6
-4
-2
0
2
4
Frequency (MHz)
Fre
quen
cy R
espo
nse
(dB
)
EQualized Kamelian RSOA (Bias =90mA)
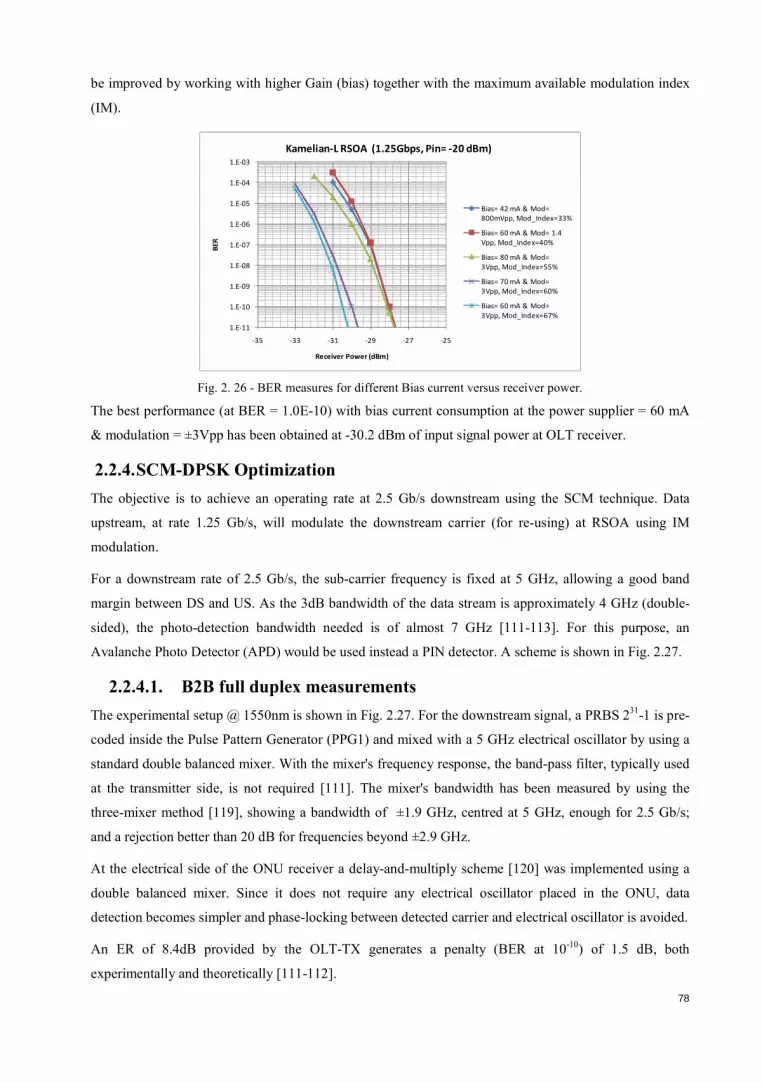
78
be improved by working with higher Gain (bias) together with the maximum available modulation index
(IM).
Fig. 2. 26 - BER measures for different Bias current versus receiver power.
The best performance (at BER = 1.0E-10) with bias current consumption at the power supplier = 60 mA
& modulation = ±3Vpp has been obtained at -30.2 dBm of input signal power at OLT receiver.
2.2.4. SCM-DPSK Optimization
The objective is to achieve an operating rate at 2.5 Gb/s downstream using the SCM technique. Data
upstream, at rate 1.25 Gb/s, will modulate the downstream carrier (for re-using) at RSOA using IM
modulation.
For a downstream rate of 2.5 Gb/s, the sub-carrier frequency is fixed at 5 GHz, allowing a good band
margin between DS and US. As the 3dB bandwidth of the data stream is approximately 4 GHz (double-
sided), the photo-detection bandwidth needed is of almost 7 GHz [111-113]. For this purpose, an
Avalanche Photo Detector (APD) would be used instead a PIN detector. A scheme is shown in Fig. 2.27.
2.2.4.1. B2B full duplex measurements
The experimental setup @ 1550nm is shown in Fig. 2.27. For the downstream signal, a PRBS 231-1 is pre-
coded inside the Pulse Pattern Generator (PPG1) and mixed with a 5 GHz electrical oscillator by using a
standard double balanced mixer. With the mixer's frequency response, the band-pass filter, typically used
at the transmitter side, is not required [111]. The mixer's bandwidth has been measured by using the
three-mixer method [119], showing a bandwidth of ±1.9 GHz, centred at 5 GHz, enough for 2.5 Gb/s;
and a rejection better than 20 dB for frequencies beyond ±2.9 GHz.
At the electrical side of the ONU receiver a delay-and-multiply scheme [120] was implemented using a
double balanced mixer. Since it does not require any electrical oscillator placed in the ONU, data
detection becomes simpler and phase-locking between detected carrier and electrical oscillator is avoided.
An ER of 8.4dB provided by the OLT-TX generates a penalty (BER at 10-10) of 1.5 dB, both
experimentally and theoretically [111-112].
1.E-11
1.E-10
1.E-09
1.E-08
1.E-07
1.E-06
1.E-05
1.E-04
1.E-03
-35 -33 -31 -29 -27 -25
BE
R
Receiver Power (dBm)
Kamelian-L RSOA (1.25Gbps, Pin= -20 dBm)
Bias= 42 mA & Mod=
800mVpp, Mod_Index=33%
Bias= 60 mA & Mod= 1.4
Vpp, Mod_Index=40%
Bias= 80 mA & Mod=
3Vpp, Mod_Index=55%
Bias= 70 mA & Mod=
3Vpp, Mod_Index=60%
Bias= 60 mA & Mod=
3Vpp, Mod_Index=67%

79
Fig. 2. 27 - Experimental setup for single fibre B2B full-duplex measurements.
Initially an ONU splitting ratio of 50:50 (-3dB) was used. For the upstream signal at 1.25 Gb/s, a PRBS
length of 231-1, by means of a pattern generator (PPG2), was used. The RSOA gain was of 17 dB. At the
OLT side, a low pass filter was placed after photo-detection, in order to properly reject re-modulation
noise from downstream signal. The sensitivity is shown in Fig. 2.28. For the downstream (BER 10-10) -
23.4 dBm was achieved. For the upstream, -22.6 dBm was obtained.
Fig. 2. 28 – Sensitivity results for the B2B full duplex SCM system.
In the Fig. 2.28, because the Variable Optical Attenuator (VOA) is placed in between OLT and ONU
(attenuating both ONU output power and RSOA input power), OSNR is more degraded at the ONU
output and the upstream curve shows that special shape.
2.2.5. System Optimization
Initial design proposed has a strong limitation in the number of users to be served. An optimization of the
system is necessary. Thus, a new model based on a reconfiguration of the WDM feeder, now two-fiber
based, is proposed. In this way, we expect counterattacking the RB effect, our principal impairment. Fig.
2.29 shows the functional diagram for this new model, according to ITU-T nomenclature.
RSOA
Am
p
Am
p
Splitter
3dB
ONU Delay
Mixer
Electrical
Oscillator
Am
pPPG1
Laser @1550nm
APD
LPF
BER2
PPG2
APD
ζ
LPF
BER1
Am
p
VOA
Splitter
6dB
4th order
Bessel
4th order
Bessel
OLT

80
Fig. 2. 29 - Functional diagram of the new proposed model (to see Fig. 2.10)
By considering that this two-fibre model is the most suitable solution to the implementation of our project
prototype, optimization of the parameters for this model was done via VPI simulations.
With two-fibre at the feeder section, RB is not critical and OLT output power could be incremented to
improve the power budget. In such case, non-linearity would be considered.
VPI Schematic
Fig. 2.30 shows the VPI schematic of the new proposed model. Now, two fibres are used between the
OLT and AWG (NR1). Although, two AWGs are shown (by convenience), these simulate the effect of
only one AWG.
Fig. 2. 30 - VPI schematic of the new proposed model
2.2.5.1. Simulations of Performance
Fig. 2.31 shows Q-factor vs. number of users in the upstream path. A sensitivity increment of the OLT
receiver due at the reduction of the RB effect is shown. Thus, up to 32 users is possible with
configurations WDM feeder (L1) / TDM feeder (L2) from 17/2 to 9/10 km. By applying FEC is possible
to achieve up to 64 users, with configurations L1/L2 from 17/2 to 13/6 Km.

81
Fig. 2. 31 - Q-factor versus number of users in the upstream path.
In the downstream path new configuration to improve the quality of signal has not effect. Furthermore,
because a power budget increment in the US path and the use of the pre-amplifier at the OLT, a de-
balanced between US and DS is produced. A trade-off adjustment will be done in the coupler
(splitter/combiner) at the ONU.
Extinction Ratio and RSOA gain
Simulation tests with non-linear effects and Rayleigh were done. The typical dispersion coefficient of
16us/m2 for SSMF has been used. SPM, XPM and FWM were included. Fig. 2.32 shows the measured
BER (20 log Q) versus the OLT input power for different ER (8.5, 10 and 13 dB) and RSOA Gain (14, 17
and 20 dB), to 16, 32 and 64 users/wavelength. A bigger ER and an adapted Gain at the ONU offers best
performance. Thus, with an ER=13dB and a Gain=20dB is possible to reach the optimal value of 32
users/wavelength (up to 64 users/wavelength with FEC).
Fig. 2. 32 – Q-factor for different ONU Extinction Ratio and RSOA Gain
Upstream Path
-5
0
5
10
15
20
25
0 8 16 24 32 40 48 56 64
UsersQ
-fac
tor [
dB]
L1=17Km
L1=15Km
L1=13Km
L1=11Km
L1=9Km
L1=7Km
L1=5Km
L1=3Km
L1=1Km
Sensitivity
FEC - 10-4
ER(dB) and RSOA Gain (dB)
0.0
5.0
10.0
15.0
20.0
25.0
-50 -48 -46 -44 -42 -40 -38 -36 -34 -32 -30
OLT Power Input (dBm)
20lo
g(Q
)
ER=8.5, G=14
ER=8.5, G=17
ER=8.5, G=20
ER=10, G=14
ER=10, G=17
ER=10, G=20
ER=13, G=14
ER=13, G=17
ER=13, G=20
(BER=1E-10)
FEC (BER=1E-4)
32 Users
16 Users
64 Users
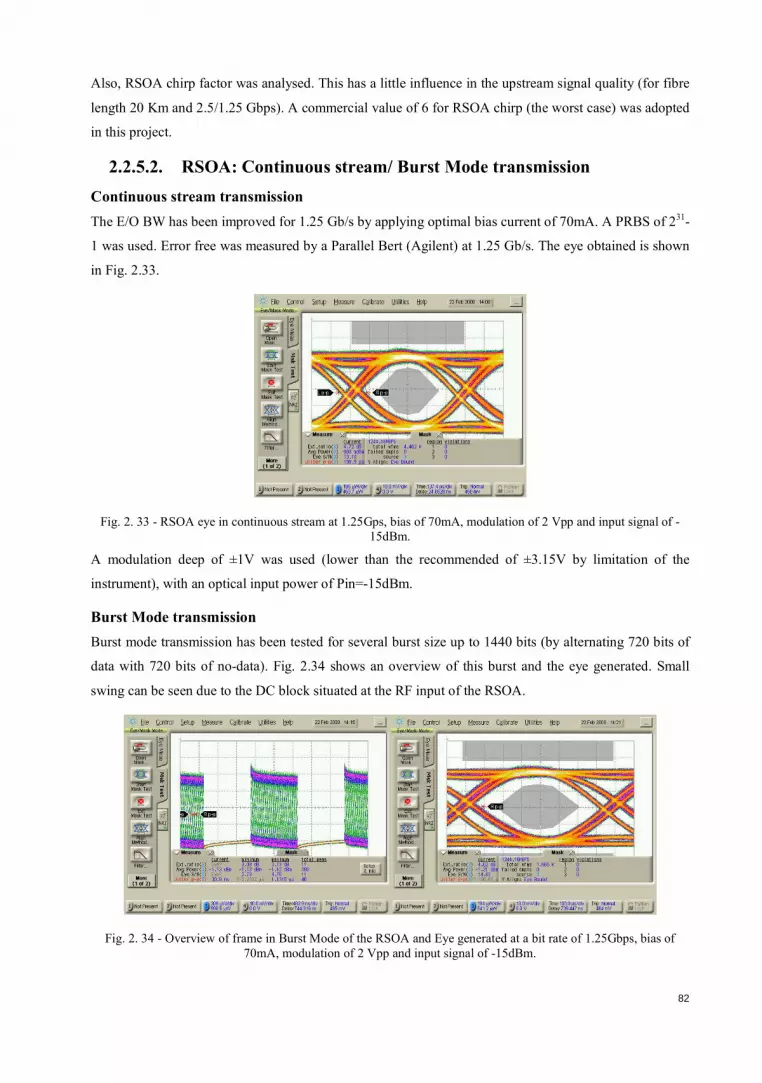
82
Also, RSOA chirp factor was analysed. This has a little influence in the upstream signal quality (for fibre
length 20 Km and 2.5/1.25 Gbps). A commercial value of 6 for RSOA chirp (the worst case) was adopted
in this project.
2.2.5.2. RSOA: Continuous stream/ Burst Mode transmission
Continuous stream transmission
The E/O BW has been improved for 1.25 Gb/s by applying optimal bias current of 70mA. A PRBS of 231-
1 was used. Error free was measured by a Parallel Bert (Agilent) at 1.25 Gb/s. The eye obtained is shown
in Fig. 2.33.
Fig. 2. 33 - RSOA eye in continuous stream at 1.25Gps, bias of 70mA, modulation of 2 Vpp and input signal of -
15dBm.
A modulation deep of ±1V was used (lower than the recommended of ±3.15V by limitation of the
instrument), with an optical input power of Pin=-15dBm.
Burst Mode transmission
Burst mode transmission has been tested for several burst size up to 1440 bits (by alternating 720 bits of
data with 720 bits of no-data). Fig. 2.34 shows an overview of this burst and the eye generated. Small
swing can be seen due to the DC block situated at the RF input of the RSOA.
Fig. 2. 34 - Overview of frame in Burst Mode of the RSOA and Eye generated at a bit rate of 1.25Gbps, bias of
70mA, modulation of 2 Vpp and input signal of -15dBm.

83
2.2.5.3. RSOA parameters as a function of Temperature
Optical gain, extinction ratio (ER), optical signal to noise ratio (OSNR) and Noise Figure (NF) has been
analysed as function of the temperature. As can be seen in Fig. 2.35 (ASE curves), the optical efficiency
drops with temperature. Reducing the temperature to less than 25ºC the efficiency can be increased.
Fig. 2. 35 - Kamelian RSOA Amplified Spontaneous Emission versus temperature @1550nm for Bias current of
70mA.
The optical gain drops similarly with temperature in the whole C-Band. Reducing the temperature to less
than 25ºC, the gain can be increased as can be seen in Fig. 2.36(a). The ER exhibits its maximum around
25ºC and drops when temperature moves away to the edges, increasing or decreasing. That behaviour is
quite similar in the whole C-Band. The available temperature range, keeping ER>9, goes from 25ºC to
40ºC as can be seen in Fig. 2.36(b).
(a) (b)
Fig. 2. 36 - Kamelian RSOA Gain and ER versus ambience temperature for optical Pin=-20dBm and Bias current
=70mA with 20dBm sinusoidal RF modulation at 500MHz.
The best OSNR trade-off into the whole C-Band is between 25º to 40 ºC. Out of that range, the OSNR
drops when wavelength and temperature decrease. But it becomes even worse when temperature
increases, as can be seen in Fig. 2.37(a). Similarly to the OSNR, the optimum NF is 25º to 40ºC
temperature range, as shown in Fig. 2.37(b).
-50
-44
-38
-32
-26
-20
-14
-8
-2
4
1,400 1,425 1,450 1,474 1,499 1,524 1,549 1,573 1,598 1,623 1,648 1,673 1,697
Op
tica
l P
ow
er
(dB
m)
Wavelength (nm)
Kamelian RSOA ASE
13ºC
17ºC
30ºC
40ºC
55ºC
10
12
14
16
18
20
22
24
0 10 20 30 40 50 60
Ga
in (
dB
)
Temperature (ºC)
Gain
1530nm
1550nm
1560nm
5
7
9
11
13
15
0 10 20 30 40 50 60
ER
(d
B)
Temperature (ºC)
Extinction Ratio
1530nm
1550nm
1560nm

84
Fig. (a) Fig. (b)
Fig. 2. 37 - RSOA OSNR and Noise Figure versus ambience temperature for optical Pin=-20dBm and for Bias
current =70mA with 20dBm sinusoidal RF modulation at 500MHz.
As a conclusion, the Kamelian RSOA has found suitable to optical data transmission at 1.25Gb/s at 25ºC
at the established working point (Bias current = 70mA with 20 dBm of RF modulation = ±63mA). But
satisfying the Gain, ER, OSNR, and NF requirements (Gain>18, ER>9) into the whole C-Band demands
to keep the un-cooled RSOA device in an environment with temperature stabilized around 25ºC, because
the Gain and ER parameters, and the electro-optical efficiency performance highly drops with
temperature (gain reduces about 10 dB).
Several scenarios can be considered: to place the RSOA device at the user ‘home’, or RSOA into a
temperature stabilized cabinet, with heat-sink and air renewing systems.
At 50ºC ambience temperature, to achieve optical output power in the range of -3 to 0 dBm, it is
necessary to reduce the optical input requirements to ≥ -15dBm. The best operation point (for the worst
polarization case and the most critical carrier wavelength of 1560nm) is for Bias current of 90 mA, that
allows achieving optical gain around 12 dB at that extreme temperatures. For bias currents higher than
90mA, the temperature of the device also increases leading to gain reduction and optical output power
dropping.
The ER drop at extreme temperatures of 50ºC and also 0ºC can be easily improved increasing the data
modulation deep to values around 22dBm (±80mA).
In Table 2.6, a summary of the electrical and optical conditions, regarding the operation point versus
temperature, is presented. All data are considered for the worst polarization case at the wavelength of
1560nm which presents the worst RSOA optical performance. It is expected that the RSOA will work
better for lower wavelengths, in the range from 1530 to 1550 nm.
25
26
27
28
29
0 10 20 30 40 50 60
OS
NR
(d
B)
Temperature (ºC)
OSNR
1530nm
1550nm
1560nm
8
9
10
11
12
13
14
0 10 20 30 40 50 60
NF
(dB
)
Temperature (ºC)
Noise Figure1530nm
1550nm
1560nm

85
Table 2. 6 - Operation points for several ambience temperature environments at worst polarization case and most
critical carrier wavelength (1560nm).
Temperature 10ºC 25ºC 50ºC
Bias current 70mA 70mA 70-90 mA
RF deep modulation 22 dBm (±80mA) 20 dBm (±60mA) 22 dBm (±80mA)
Optical Input Power ≥ -20 dBm ≥ -20 dBm ≥ -15dBm
Optical Gain ≥ 18 dB ≥ 16 dB ≥ 11 dB
Optical Output Power ≥ -3 dBm ≥ -3 dBm ≥ -3 dBm
Extinction Ratio ≥ 9 dB ≥ 9 dB ≥ 9 dB
OSNR > 27 dB > 27 dB > 32 dB
Noise Figure < 11 dB < 11 dB < 11 dB
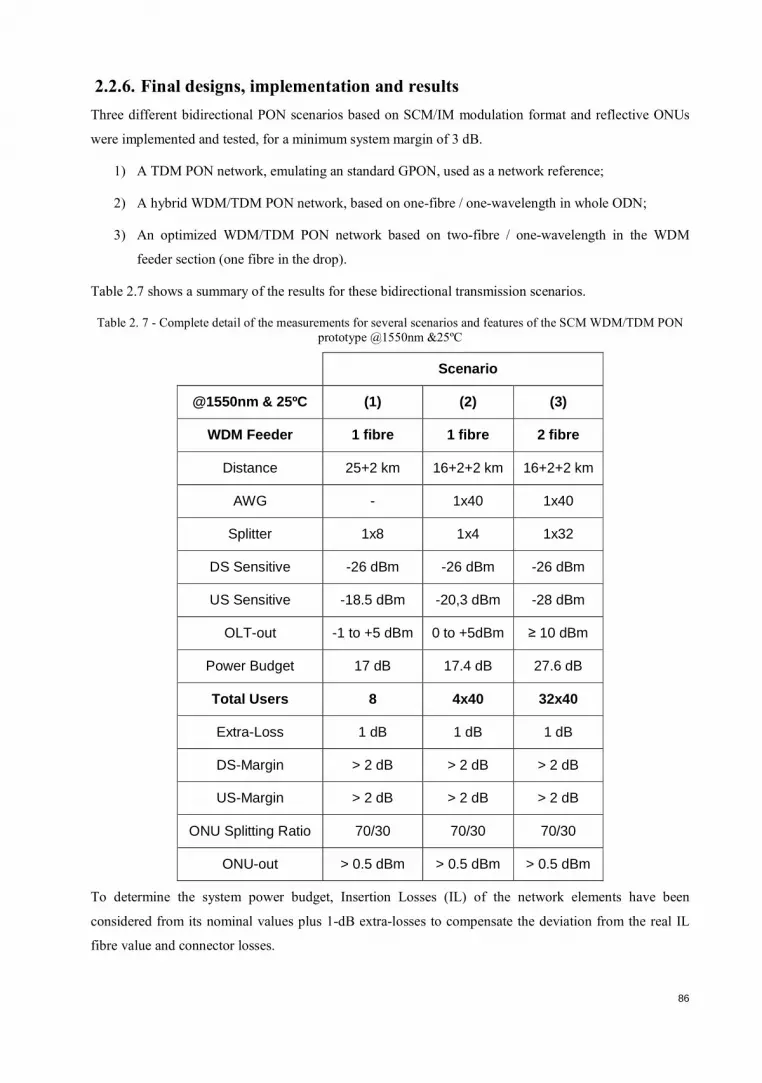
86
2.2.6. Final designs, implementation and results
Three different bidirectional PON scenarios based on SCM/IM modulation format and reflective ONUs
were implemented and tested, for a minimum system margin of 3 dB.
1) A TDM PON network, emulating an standard GPON, used as a network reference;
2) A hybrid WDM/TDM PON network, based on one-fibre / one-wavelength in whole ODN;
3) An optimized WDM/TDM PON network based on two-fibre / one-wavelength in the WDM
feeder section (one fibre in the drop).
Table 2.7 shows a summary of the results for these bidirectional transmission scenarios.
Table 2. 7 - Complete detail of the measurements for several scenarios and features of the SCM WDM/TDM PON
prototype @1550nm &25ºC
Scenario
@1550nm & 25ºC (1) (2) (3)
WDM Feeder 1 fibre 1 fibre 2 fibre
Distance 25+2 km 16+2+2 km 16+2+2 km
AWG - 1x40 1x40
Splitter 1x8 1x4 1x32
DS Sensitive -26 dBm -26 dBm -26 dBm
US Sensitive -18.5 dBm -20,3 dBm -28 dBm
OLT-out -1 to +5 dBm 0 to +5dBm ≥ 10 dBm
Power Budget 17 dB 17.4 dB 27.6 dB
Total Users 8 4x40 32x40
Extra-Loss 1 dB 1 dB 1 dB
DS-Margin > 2 dB > 2 dB > 2 dB
US-Margin > 2 dB > 2 dB > 2 dB
ONU Splitting Ratio 70/30 70/30 70/30
ONU-out > 0.5 dBm > 0.5 dBm > 0.5 dBm
To determine the system power budget, Insertion Losses (IL) of the network elements have been
considered from its nominal values plus 1-dB extra-losses to compensate the deviation from the real IL
fibre value and connector losses.

87
In the (1) and (2) scenarios, bidirectional transmission over one single fibre is deployed, so the upstream
sensitivities are limited from the Rayleigh backscattering interference, specially RBc, which forces to
have the OLT output power controlled, so as to maintain the fibre standard length (20km).
Scenario (3) deploys double fibre in the WDM feeder network avoiding Rayleigh backscattering which
saves the OLT from the output power limits and allows achieving higher power budgets.
Into the OLT will be necessary to use an AWG to distribute each wavelength to its appropriate TDM tree.
This will produce extra losses which can be compensated by using an EDFA pre-amplifier at the input of
the AWG multiplexer.
2.2.6.1. Back-to-back Reference
The TX & RX back-to-back sensitivity has been measured for downstream and upstream @1550nm to
have the limits of the operation. This is summarized in Table 2.8.
• 2.5Gbps-B2B downstream sensitivity (PRBS-31 & BER= 10-10) of -26.5dBm at the APD input
(Fujitsu FRM5N143DS) which is almost the limit of the APD.
• 1.25Gbps-B2B upstream sensitivity (PRBS-31 & BER= 10-10) of -27dBm at the APD input (ZENKO
LT-XXB7/46B).
Table 2. 8 - B2B Sensitivity
Sensitivity
@ 1x10⁻¹⁰
Downstream
(APD input)
Upstream
(APD input)
Upstream
(1.25G standard APD input)
B2B -26.5 -27 -28
The gain performance of the RSOA @1550nm&25ºC is shown in Fig. 2.38.
Fig. 2. 38 - a) ASE response of the Kamelian 2nd generation RSOA. b) Gain and output power versus the optical
input power.
-10
-5
0
5
10
15
20
25
30
-30-25-20-15-10
Ou
tpu
t p
ow
er
(dB
m)
& O
pti
cal G
ain
(d
B)
Optical Input Power (dBm)
Kamelian RSOA 2a Generation
RSOA Gain

The scenarios to be considered require 3 principal restrictions to be fulfilled:
1) To have an OSRR > 15dB, which is the measured value for SCM modulation for bidirectional
transmission over one single fibre.
2) In agreement with the RSOA penalties table versus wavelength, every scenario will be forced to have a
power margin of at least 2dB to allow the optical transmission in the whole C-band for a devic
temperature range going from 10ºC to 30ºC.
3) ONU output has to be higher than 0.5dBm.
Theoretically, because of the unbalanced sensitivities values for the RSOA and the ONU-APD, when
looking for the best power budget it leads to the use of a 70/30 coupler ratio, with 70% output connected
to the RSOA.
2.2.6.2. SCM WDM/TDM PON testbed Prototype
Fig. 2.39 shows the SCM WDM/TDM PON testbed prototype implemented at the UPC-GCO laboratory.
Fig. 2. 39 – Prototype implementation of our SCM WDM/TDM PON at the GCO-UPC laboratory
ONU
RRSSOOAA
APD
SSCCMM--RRXX
AAPPDD
OLT
EEDDFFAA
SSCCMM--TTXX
ODN
TTDDMM
CCOOUUPPLLEERR
AAWWGG MMZZMM
CCIIRRCCUULLAATTOORR
OONNUU
SSPPLLIITTTTEERR
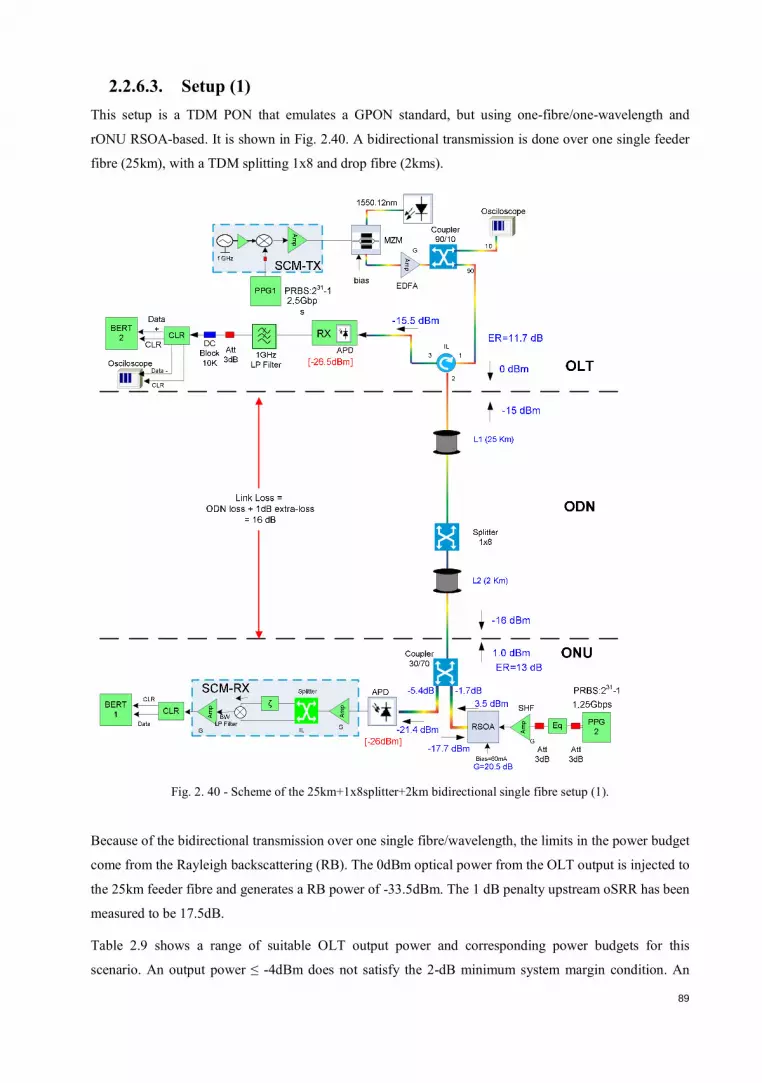
89
2.2.6.3. Setup (1)
This setup is a TDM PON that emulates a GPON standard, but using one-fibre/one-wavelength and
rONU RSOA-based. It is shown in Fig. 2.40. A bidirectional transmission is done over one single feeder
fibre (25km), with a TDM splitting 1x8 and drop fibre (2kms).
Fig. 2. 40 - Scheme of the 25km+1x8splitter+2km bidirectional single fibre setup (1).
Because of the bidirectional transmission over one single fibre/wavelength, the limits in the power budget
come from the Rayleigh backscattering (RB). The 0dBm optical power from the OLT output is injected to
the 25km feeder fibre and generates a RB power of -33.5dBm. The 1 dB penalty upstream oSRR has been
measured to be 17.5dB.
Table 2.9 shows a range of suitable OLT output power and corresponding power budgets for this
scenario. An output power ≤ -4dBm does not satisfy the 2-dB minimum system margin condition. An

90
output power ≤ -1dBm forces the ONU output to be lower than 0.5dBm, while a power higher than 6dBm
does not satisfy the upstream OSRR≥ 15dB requirement for this SCM modulation.
Table 2. 9 - Range of suitable OLT output powers and corresponding power budgets for a 25km+1x8 splitter+2km
single fibre with a 70/30 splitter at ONU
OLT out (dBm)
OSRR (dB)
Link Loss
(dB) Power Budget
(dB) DS-Margin
(dB) US-Margin
(dB) ONU-out (dBm)
6 14.4 OSRR<15dB
5 15.3 16 21.3 9.6 5.3 3.5
0 18.5 16 19.5 4.6 3.5 1.8
-1 19 16 19 3.6 3 0.5
-2 20.1 16 18.4 2.6 2.4 -0.1
-5 20.3 < DS-Sensitiv
Upstream and downstream curves were measured. For a BER 1.0E-10, upstream sensitivity was -18.4
dBm, while for downstream the sensitivity was -20.1 dBm. These results are shown in Fig. 2.43.
With these results, downstream power budget was 19.4 dB (system margin = 3.4 dB), whereas the
upstream power budget was 20.1 dB (system margin = 4.1 dB).
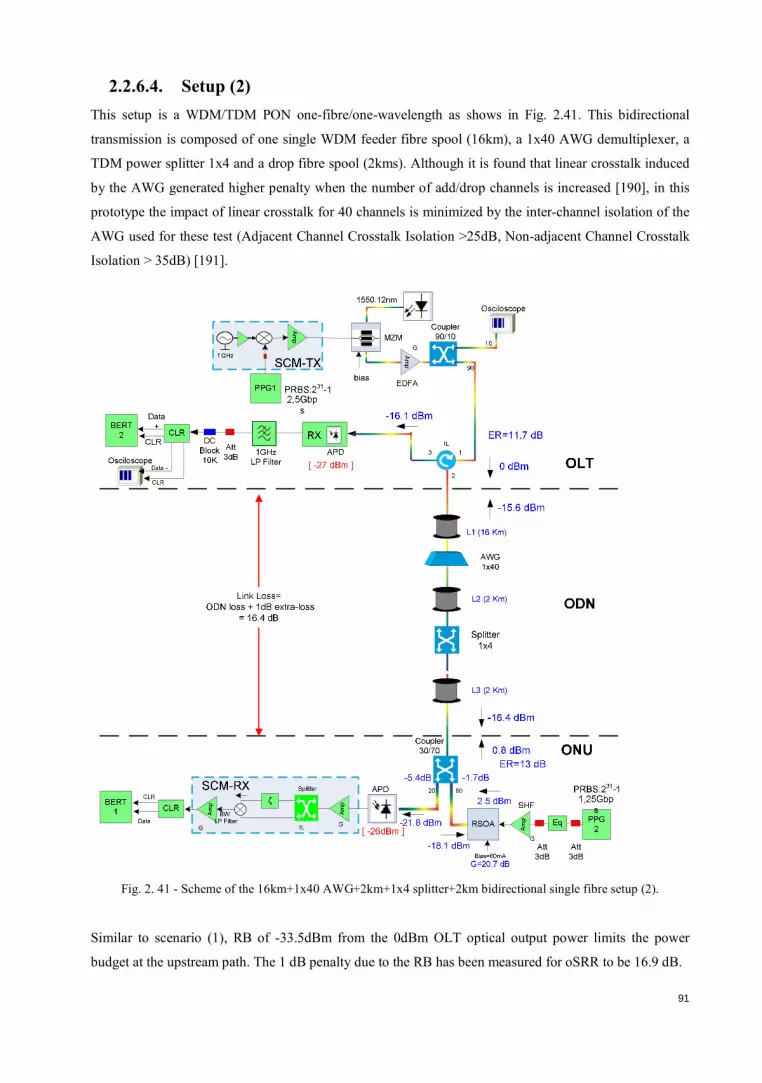
91
2.2.6.4. Setup (2)
This setup is a WDM/TDM PON one-fibre/one-wavelength as shows in Fig. 2.41. This bidirectional
transmission is composed of one single WDM feeder fibre spool (16km), a 1x40 AWG demultiplexer, a
TDM power splitter 1x4 and a drop fibre spool (2kms). Although it is found that linear crosstalk induced
by the AWG generated higher penalty when the number of add/drop channels is increased [190], in this
prototype the impact of linear crosstalk for 40 channels is minimized by the inter-channel isolation of the
AWG used for these test (Adjacent Channel Crosstalk Isolation >25dB, Non-adjacent Channel Crosstalk
Isolation > 35dB) [191].
Fig. 2. 41 - Scheme of the 16km+1x40 AWG+2km+1x4 splitter+2km bidirectional single fibre setup (2).
Similar to scenario (1), RB of -33.5dBm from the 0dBm OLT optical output power limits the power
budget at the upstream path. The 1 dB penalty due to the RB has been measured for oSRR to be 16.9 dB.

92
The upstream sensitivity (BER=10-10) has been measured to be OLTin= -19dBm, while the downstream
sensitivity was -20.6dBm. This is shown in Fig. 2.43.
The downstream power budget for this scenario with OLT output power of 0dBm was 20.6dB (system
margin of 4.2dB), whereas the upstream power budget was 19.8dB (system margin of 3.4dB). This
scenario offers the specific WDM functionality with the AWG 1x40 by reducing the splitter ratio to 1x4.
This deployment allows up to 4x40 = 160 users.
The suitable OLT output range goes from 0 to 5dBm. An OLT output power lower than 0dBm does not
satisfy the ONU output power (higher than 0.5dBm) condition, while an output power higher than 5dBm
does not satisfy the upstream OSRR> 15dB requirement for this SCM modulation. This is shown in Table
2.10.
Table 2. 10 - Range of suitable OLT output powers and corresponding power budgets for a 16km+1x40 AWG+2km
+1x4splitter+2km single fibre with a 70/30 coupler at ONU.
OLT out (dBm)
OSRR (dB)
Link Loss
(dB) Power Budget (dB)
DS-Margin (dB)
US-Margin (dB)
ONU-out (dBm)
6 14.7 OSRR<15dB
5 15.5 16.4 23 9.2 6.6 2.7
0 18.6 16.4 20.6 4.2 4.7 0.8
-1 19.1 16.4 19.6 3.2 4.2 0.3
-2 19.5 16.4 18.6 2.2 3.6 -0.3
-3 19.8 16.4 17.6 1.2 2.9 -1
-5 20.3 < DS-Sensitiv

93
2.2.6.5. Setup (3)
An optimized bidirectional transmission WDM/TDM PON over two fibres in the WDM feeder fibre
spool (16km), with 1x40 AWG demultiplexer, TDM feeder fibre spool (2Km), TDM power splitting
1x32 and one single drop fibre spool (2kms) is shown in Fig. 2.42.
Fig. 2. 42 - Scheme of two fibres (16km) +1x40 AWG+2km+1x4splitter+2km bidirectional single fibre
Two-fibre in the WDM feeder section reduce dramatically the RB effect over the upstream path and it is
negligible. This allows increasing the OLT output power. So it is possible to exit from the OLT even with
more than 10dBm. These conditions improve the power budget of the system. Thus, up to 40x32 users
(1280 users) can be covered.
PRBS:231-1
AWG 1x40
L2 (2 Km)
IL=5 dB
ODN
L1 (16 Km)
ONU
OLT
LP Filter
Splitter1x32
Link-Loss = ODN loss + 1dB extra-loss
=26.6 dB
Coupler30/70
DC Block10K
Att3dB
OsciloscopeData -
CLR
L3 (2 Km)
10 dBm
-16.6 dBm
APD
MZM
biasEDFA
3
G
PPG1
Am
p
f GHz
SCM-TX
2,5GbpsPRBS:231-1
RX
Coupler90/10
90
10
Osciloscope1550.12nm
Am
p
BERT2 CLR
Data +
CLR ER=11.7 dB
[ -28 dBm ]
Am
p
Am
p ?
SCM-RX Splitter
ILGG
BERT1 BW
LP Filter PPG2
RSOA
1,25Gbps
G=20.7dB
Am
p
G
APD
Eq
-5.4dB
CLR
Data
CLR
Bias=60mA
SHF
-1.7dB
[-26dBm]-18.3 dBm
2.5 dBm
0.8 dBm
Att3dB
Att3dB
-25.8 dBm
1 GHzLPF
ER=13dB
-22 dBm
Amp

94
In this scenario, the total link loss was 26.6 dB. An optical pre-amplifier was incorporated at the upstream
detection, since there was no RB limitation and OLT costs are shared among all users of the network.
Table 2.11 details the network performance for several OLT output powers. An OLT output power of
10dBm allows a splitting ratio of 1x32, while accomplishing the imposed initial conditions regarding
oSRR, power margin and ONU output.
When the OLT output power is reduced, both the power budget and the splitting ratio must be reduced
and the required ONU output condition is not satisfied.
Table 2. 11 - Range of OLT output powers and corresponding power budgets for a double-fibre (16km) +1x40
AWG+2km +1x32 splitter+2km single fibre with its more appropriate coupler at ONU.
OLT out (dBm)
Link Loss (dB)
Power Budget (dB)
Splitting Ratio
Coupler Ratio
DS-Margin (dB)
US-Margin (dB)
ONUout (dBm)
0 dBm 20.1 dB 22.8 8 50/50 2.7 3.7 -4.1
5 dBm 23.3 dB 26.8 16 60/40 3.5 3.6 -1.1
5 dBm 23.3 dB 25.6 16 70/30 2.3 4.4 -0.3
10 dBm 26.6 dB 28.8 32 70/30 4 2.2 0.8
10 dBm 26.6 dB 28.8 32 80/20 2.2 3 1.5
For this 10dBm OLT output operation point, we have chosen the 70/30 coupling even that the required
conditions are accomplished also with the 80/20 coupler ratio configuration, as it can be seen in Tables
2.12 and 2.13.
Table 2. 12 - Range of OLT output powers and corresponding power budgets for a double- fibre (16km)
+1x40AWG+2km +1x32 splitter+2km single fibre with a 70/30 coupler at ONU.
OLT out (dBm)
Link Loss (dB)
Power Budget (dB)
Coupler Ratio
DS-Margin (dB)
US-Margin (dB)
ONU-out (dBm)
9 26.6 dB 28.2 70/30 3 1.7 0.2
10 26.6 dB 28.8 70/30 4 2.2 0.8
12 26.6 dB 29.7 70/30 6 3.1 1.7
15 26.6 dB 30.7 70/30 9 4.1 2.7

95
Table 2. 13 - Range of OLT output powers and corresponding power budgets for a double-fibre (16km) +1x40
AWG+2km +1x32 splitter+2km single fibre with 80/20 coupler at ONU.
OLT out (dBm)
Link Loss (dB)
Power Budget (dB)
Coupler Ratio
DS-Margin (dB)
US-Margin (dB)
ONU-out (dBm)
9 26.6 27.8 80/20 1.2 2.4 1
10 26.6 28.8 80/20 2.2 3 1.5
12 26.6 30.4 80/20 4.2 3.8 2.4
15 26.6 31.3 80/20 7.2 4.7 3.3
Suitable OLT output powers keeping this performance are for values higher than 10dBm. The power
budgets with OLT output power ≥ 10dBm are better than 28dB, but these output powers could cause
interferences by nonlinear effects.

96
The upstream sensitivity curves (BER=10-10) has been measured to be OLTin = -28.8dBm. The
downstream sensitivity was -19.6dBm. This is shown in Fig. 2.43. Thus, a symmetrical power budget of
29.6 dB (system margin of 4 dB) was achieved.
Fig. 2. 43 - a) Downstream and b) Upstream sensitivity curves for the three PON scenarios

97
2.2.7. Conclusions
A SCM WDM/TDM PON system with a reflective-SOA ONU was designed, simulated, optimized,
implemented and tested.
A SCM (sub-carrier multiplexing) modulation format was used. Data downstream was modulated in
DPSK over an electrical sub-carrier at 5 GHz, to leave spectral space to the IM (intensity modulation)
base-band upstream, over the same wavelength, for full duplex operation over the same fibre and same
wavelength.
The measurement, modelling and characterization of commercial RSOAs and the list of design
parameters, impairment effects and design relations was experimentally performed in order to define the
elements and characteristics of the reflective ONU. The evaluation of the RSOA to be used for the
colourless ONU was undertaken. Low cost RSOA exhibits a limited RF response which could highly
limit the transmission bit rate. A best RF response, by optimum impedance adaptation and electronic
equalization, to increase the device bandwidth was done. The best transmission operation point in the low
range of the C-band is for bias current 70mA and amplitude modulation ±60mA.
Evolution schemes, as a function of new requirements, were a characteristic in this process. The
possibility to include a pre-amplification at the OLT and the determination of the lengths of the feeder
fibre section were evaluated. It was assessed that the bidirectional crosstalk (Rayleigh backscattering)
limits single-fibre transmission at 20 Km and restricts the OLT output power as a function of the
upstream oSRR.
Thus, initial designs proposed had a strong limitation in the power budget and in consequence in the
amount of users to be served (max. 8 users). By considering power budget differences between upstream
and downstream paths, two parameters: OLT output power and ONU coupler splitting ratio, become
important optimization elements in order to find the best upstream/downstream trade-off.
To overcome these limitations, a new design based in two fibers in the WDM feeder section was adopted
and implemented. This design was successfully tested showing high performance, robustness, versatility
and reliability. So, the system is able to give coverage up to 32 users per wavelength at 20 Km of fibre
length, power budget of 28dB, compatible with the ITU-T G.984.2B+ G-PON system recommendation
deployments, but for a total of 1280 users, at 2.5 Gb/s in downstream and 1.25 Gb/s in upstream.
This system is intended to take place in the access network as a solution within the frame of the next
generation optical access network scaling from current GPON systems.

98
2.3. Final Conclusions
In WDM-PON and hybrid WDM/TDM PON networks different parameters are susceptible to be
optimized to obtain a better performance of the system.
In that sense, the first part of this section provides relevant information in terms of transmission
optimization in WDM-PON. Thus, although in practical deployments the position of the distribution
element (in this case, a DEMUX in a WDM PON) is usually determined by different considerations (cost,
distribution of the customers, business opportunity, etc.), our work and its results show that best
performance can be achieved if such distribution element is placed either in the ONU or OLT vicinity, by
demonstrating that the Rayleigh substantially varies depending on the position of that distribution
element, since they are determined by the fibre length and by the ONU gain applied. In such cases, the
ONU gain takes a new optimum depending on that exact position. These results can be used efficiently to
minimize the RB effect in the next generation WDM access networks.
In the second part of this chapter, a SCM WDM/TDM PON system with a colourless ONU rSOA based,
cost-effective, simple design and full service coverage, was designed, simulated, optimized and
implemented.
Considering upstream/downstream power budget differences, several parameters (OLT output power,
ONU splitting ratio, ERs, feeder fibre length, RSOA gain, modulation formats, etc.), become important
optimization elements in order to find the best upstream/downstream trade-off.
The initial designs proposed had a strong limitation in the power budget (only 8 users to be served). To
overcome these limitations, a design based in two fibres in the WDM feeder section was adopted and
implemented. This prototype was successfully tested showing high performance, robustness, versatility
and reliability. So, the system is able to give coverage up to 1280 users at 20 Km, at 2.5 Gb/s in
downstream and 1.25 Gb/s in upstream, and being compatible with the GPON ITU-T recommendation.

99
Chapter 3
3. TDM-PON RSOA-based ONU
In the implementation of practical next-generation PON (NG-PON) the most critical issue is how to
realize low cost transmitters at subscriber ends [82]. The use of a reflective structure at the ONU (rONU)
is a suitable approach cost/effective compared with the DFB laser-based typical ITU-standard ONU
[83,104]. A rONU may consist of a reflective semiconductor optical amplifier (RSOA), a loop comprising
an optical amplifier and an external modulator, or a self-injected FP laser [74]. In particular, the use of a
RSOA-based ONU allows simultaneous re-modulation capabilities and broadband amplification,
colourless operation, integration, CAPEX/OPEX reduction and wavelength reuse [7,51, 121-123],
freeing-up wavelength spectrum for future extension. However, due to single fibre/wavelength scenario,
Rayleigh backscattering (RB) is the dominant impairment with downstream/upstream optical signal-to-
rayleigh ratio (oSRR) critical relation.
In this chapter, the design of a Single- Fibre/Single-Wavelength TDM-PON rSOA-based ONU, in burst
mode operation, is theoretical and experimentally discussed. Impairments from Rayleigh Backscattering
are analysed and modelled, and optimal TDM-PON design values are presented in order to reach the
maximum number of users for efficient exploitation.

100
3.1. RB analysis in burst mode (BM) transmission
Rayleigh analysis in Burst Mode shows especial characteristics due mainly to the short time duration of
the data signal that it originates and the burst power. In this chapter, special attention is for the burst
signal from a reflective ONU.
By considering a burst signal generated at the ONU travelling along a fibre, this signal exhibits an
exponentially decreasing power level with the distance (and the propagation time). The power relation
between the nominal ONU output power and transmitted power over the fibre after a time “t” is:
P(t)=P0·e-α·Vg·t
(3.1)
With: α=0.046 km-1, the single-mode fibre attenuation (0.2 dB/km), Vg≈2.0x10⁵ km/s, the group velocity
in the fibre.
For this burst signal, the scattered power dPrb(t) at the time t within an infinitesimal time interval dt is
proportional to the burst power P(t).
dPrb(t)=k·P(t) dt
(3.2)
where k=S·αs·Vg, with S=1x10⁻³, the fraction of the light scattered in back direction [93,25]; and with
αs = 3.2x10⁻² [km-1], the Rayleigh scattering loss.
Thus, from (3.1) and (3.2), summing up the light power backscattered from infinitesimal short time
intervals dt from the whole burst, yields:
��#�$� � � � � ��$��$%&'()*�
��#�$� � � � �� � ���+,�%�$%&'()*� - ��#�$� � � ��2 � � ���1 ! ���+,�%&'()*�
By considering B=Rayleigh Backscattering Coefficient (from Chapter 1), " � .�)�� , then, ��#�$� � �� � " � �1 ! ����01�$23�4$� (3.3)
For example, for a rONU output power of 0 dBm, with B=34.6 dB, the RB power generated for a burst
time tburst = 10 us is -42.3 dBm, and for a tburst = 1 us is -52 dBm. Then, the backscattered power is
proportional to the duration of the burst.

101
RB analysis in BM transmission in a TDMA environment
A particular relevant scenario, a TDM-PON section (it forms part of a WDM/TDM PON overlay, as seen
in chapter 2), full-duplex single-fibre/single-wavelength bidirectional transmission with burst mode
upstream signal and reflective ONU with wavelength-reuse, is shown in Fig. 3.1.
Fig. 3. 1 - TDM-PON scenario with different Rayleigh backscattering impairments
Here, all ONUs are served by the same OLT and are using the same wavelength. Also, the ONU burst
time is associated with an upstream frame (in ITU-T FSAN it is 125us [124-125]) that transport all
contributions from different ONUs.
Different RB power values can be found as a function of the analysis point into ODN. These will be
described below.
3.1.1. Rayleigh backscattering from the ONU burst output power (RBu)
By considering this Rayleigh is generated by the upstream burst signal from the ONU, it will be named
RBu (Rayleigh Backscattering from upstream burst signal).
In the environment of a TDMA (it characteristic of an upstream transmission), and considering a static
bandwidth assignment access for all ONUs, a good practical approximation to obtain the RBu is
considering the ONU output power (Po) value as a function of its burst time into the upstream total frame
shared by all ONUs. So, [71]:
Po burst(dBm) = Po (dBm) – (10·Log (Nº ONUs)) (dB)
……..…(3.4)
where Po burst is inversely proportional to the number of ONUs, i.e., the burst power contribution from an
ONU, relative to its nominal power, will be a function of the ONUs sharing the same UP frame (125us).
For a TDMA based on a dynamic bandwidth assignment (DBA), the ONU burst output power (Po)
depends on the burst time into the upstream total frame. In such condition, an approximation to obtain the
RBu is obtained by considering [126]:
Po burst(dBm) =Po(dBm) + 10·Log (% burst time) (dB)

102
……..…(3.5)
Where “% burst time” is the percentage of time of burst assigned by the MAC at the OLT (through the
bandwidth map scheme), for this ONU into the upstream frame (125us).
For instance, by considering ONU nominal output power Po=0 dBm and 32 ONUs, from (3.4) Po burst = -15
dBm. Now, if we consider that the burst time percentage is 3.125% (equivalent to one ONU in a PON
with 32 ONUs), from (3.5) Po burst = -15 dBm.
Thus, a good approximation to obtain the RBu is:
RBu= P0 burst·B·(1-e-2·α·Lburst
)
……..…(3.6)
Nevertheless, the Lburst is usually as long as Ldrop (a small burst of 10 us has a length of 2 km), then a most
practical expression for the RBu is:
RBu= P0 burst·B·(1-e-2·α·Ldrop
)
……..…(3.7)
When the burst become smaller relative to drop fibre (for example, in a static allocation for 32 ONUs
(3.9us for each ONU), or only ONU signalling transmission - header transmission), in these cases eq. 3.6
is the most adequate.
In eq. (3.7) is considered only the drop fibre length instead the total fibre length, because in the ODN
TDM-PON (feeder fibre + splitter/combiner + drop fibre, as shown in Fig. 1), the Rayleigh contributions
at the ONU input beyond of the splitter/combiner are negligible due to higher splitter losses [123].
Unlike from eq. (3.3), that describes the Rayleigh effect for a burst signal from a general way, eqs. (3.6)
and (3.7) are defined for a practical shared environment, such as a TDMA. Also, these expressions are
described as a function of the fibre length (the burst time is implicit into the Po burst expression).
Furthermore, by considering that:
�� � 5 �� #6��%789 :789 ;
and that Ldrop=Vg·tburst, then eqs (3.3) and (3.7) come to be equivalent.
3.1.2. Rayleigh backscattering effect between ONUs
Although the drop section isolates each ONU (this fibre section is not shared), an undesirable effect due
to the Rayleigh backscattering accumulated at the combiner output from the burst power from other
ONU’s can affect the downstream data signal arriving at an ONU. This phenomenon, that causes
crosstalk among ONUs, will be discussed below. Here, the combiner is the part of the coupler device
view in upstream direction, and combines all the burst from the ONUs to form the upstream frame (Fig.
3.1).

3.1.2.1. Rayleigh backscattering at the combiner output from “n” ONUs (RBoC)
In this section, the Rayleigh backscattering at the combiner output (“B” point in Fig. 3.1), from “n” ONUs
is analysed. Fig. 3.2 shows a scenario of “n” ONUs transmitting bursts (in sequential way) on a GPON
frame of 125us. When an ONU is in on-state during a determined time, others ONUs are in off
However, their bursts (transmitted when they were in on-state) have produced Rayleigh that is
accumulated at the combiner output. This Rayleigh (RBoC) is added with the RBu at the ONU input and
affects the downstream signal.
Fig. 3. 2 – Rayleigh accumulation process at the combiner output from “n” ONUs
Considering an initial state (t1=0), and from the ONU1, the Rayleigh produced by the burst of this ONU
at the combiner output in the instant t2 will be [126]:
……..…(
with:
RBoCn: Rayleigh power at the combiner output from the ONU “n” (here, n=1)
PoC: Combiner output power, where PoC=Po-ONU – (lcoupler+ldrop)
Lbn: Burst length from the ONU n (fibre length occupied in the burst duration)
)·(1(·))·(1(·)1(··(2·2·2·2·2
331323 bbbbb LL
oCLL
oCL
oCoC eeBPeeBPeBPRB+−−−−− −+−+−= ααααα
)1(· 1·2
1bL
oCoC eBPRBα−−=
))·(1(·)1(· 212 ·2·2·22
bbb LLoC
LoCoC eeBPeBPRB
ααα −−− −+−=
g
drop
v
Ltt =− 12
1t 2t
g
drop
bbbonforONUmv
Ltttt ·2321 +++=−onforONUmt −
a
b
c

104
Now, considering the Rayleigh accumulation for two ONUs (at “b” step), and assuming that drop length
(Ldrop) is the same for all ONUs:
<"�=� � ��=� � " � �1 ! ����&>� ? ��=; � " � �1 ! ����&@� � �����&>� and for three ONUs, as shown in “c” and in Fig. 3.3:
<"�=A � ��=A � " � �1 ! ����&B� ? ��=� � " � �1 ! ����&>� � �����&B� ? ��=;� "�1 ! ����&@� � ������&>C�&B��
Fig. 3. 3 - Rayleigh power accumulation at the combiner output due to the burst signal from different ONUs
affecting other ONUs (e.g. case of 32 ONUs)
By considering that ONU “m” is in on-state transmission in this moment, this Rayleigh arrives to this
ONU after a time given by:
1 2 32·
drop
forONUm b b b
g
Lt t t t
v= + + +
In general, for n ONUs transmitting in their allocated burst time (as shown in Fig. 3.2):
<"�=: � " � D��=:�1 ! ����&E� ? ��=:;�1 ! ����&�EF@�� � �����&E�? ��=:��1 ! ����&�EF>�� � G�����&EC�&�EF@��H ? ��=:A�1 ! ����&�EFB��� G�����&EC�&�EF@�C�&�EF>��H ? I … . . ?��=;�1 ! ����&@�� G�����&EC�&�EF@�C�&�EF>�CI�&>�HL ……..…(3.9)
Let us now consider a static bandwidth allocation from the OLT MAC for analysing the impact of eq.
(3.9). Then Lbn is of the same length for all n ONUs, and then Lbn=Lb. Also, considering n ONUs
transmitting at the same power:
<"�=: � ��= � "D�1 ! ����&E� ? �1 ! ����&�EF@�� � �����&E� ? �1 ! ����&�EF>��� G�����&EC�&�EF@��H ? �1 ! ����&�EFB�� � G�����&EC�&�EF@�C�&�EF>��H? I … . . ?�1 ! ����&@� � G�����&EC�&�EF@�C�&�EF>�CI�&>�HL Thus, the Rayleigh at the output of the combiner from n ONUs from the 125us upstream frame is:
<"�=: � ��= � "�1 ! ����&� � �1 ? �����&� ? �������&� ? I … . . G����:;���&H)
))·(1(·))·(1(·)1(·2·2·2·2·2·2
3bbbbb LL
oC
LL
oC
L
oCoC eeBPeeBPeBPRBααααα −−−−− −+−+−=
)1(··2
1bL
oCoC eBPRBα−−= )·(·
· dropL
C elα−
L_b(n

105
This process is cyclic. Thus, in the following GPON time slots, other contributions from these ONUs also
should be considered. Therefore, for “N” burst contributions from these n ONUs transmitting at the same
power, burst time and drop length, the Rayleigh at the coupler output is:
<"�=8 � ��= � "�1 ! ����&� � M5�����N;���&�8NO; P
……..…(3.10)
The “real” limit for “N” is given by Lfeeder, with Lfeeder = N·tburst·Vg
Adapting eq. (3.10) to the geometric series, when N �∞, this expression converge to
;;QF>�R& , due to ����& S 1 so,
<"�=8 � ��= � "�1 ! ����&� � T 11 ! ����&U
Then, for this special case, the Rayleigh accumulated by N bursts (with N�∞) from “n” ONUs, when the
feeder fibre is infinitely long, approximates to:
<"�=8 V ��= � " ……..…(3.11)
i.e., for the conditions assumed, the Rayleigh RBoC has a dependency with the combiner output power (as
a function of the combiner losses), as B (backscattering coefficient) is constant (B = 34.8E-5 ≈ -34.6 dB).
Where,
��=��"�� � �W=��"�� ! XY��"� ……..…(3.12)
By considering n = number of ONUs (n is a power of 2 for practical reasons).
lc: coupler loss, XY � 3 � [\] �:�[\] � �" ? �^_�44 X`44, ……..…(3.13)
and excess loss≈1 dB.
PiC: coupler input power, �W= � ��789 � ���a(bc ……..…(3.14)
A good practical approach to accumulated Rayleigh (<"�=:� from (3.10), by considering that multiples burst had been transmitted and the burst length from each ONUs had occupied the feeder fibre would be:
<"�=: � ��= � "�1 ! ����&� � M5�����:;���& �d:O; P
<"�=: � ��= � "�1 ! ����&� � �1 ? �����&� ? �������&� ? I … . . G����:;���&H
≈G1 ! ����effaf(H
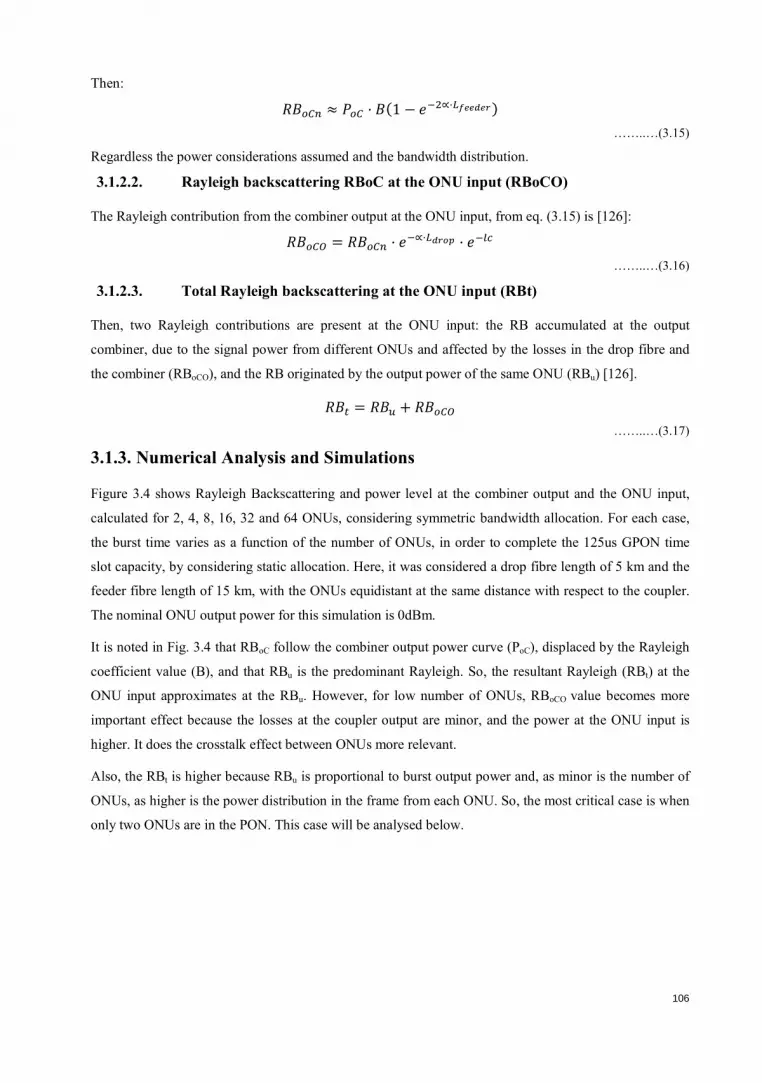
106
Then: <"�=: V ��= � "�1 ! ����effaf( � ……..…(3.15)
Regardless the power considerations assumed and the bandwidth distribution.
3.1.2.2. Rayleigh backscattering RBoC at the ONU input (RBoCO)
The Rayleigh contribution from the combiner output at the ONU input, from eq. (3.15) is [126]: <"�=7 � <"�=: � ���a(bc � �gY ……..…(3.16)
3.1.2.3. Total Rayleigh backscattering at the ONU input (RBt)
Then, two Rayleigh contributions are present at the ONU input: the RB accumulated at the output
combiner, due to the signal power from different ONUs and affected by the losses in the drop fibre and
the combiner (RBoCO), and the RB originated by the output power of the same ONU (RBu) [126].
<"% � <"6 ? <"�=7 ……..…(3.17)
3.1.3. Numerical Analysis and Simulations
Figure 3.4 shows Rayleigh Backscattering and power level at the combiner output and the ONU input,
calculated for 2, 4, 8, 16, 32 and 64 ONUs, considering symmetric bandwidth allocation. For each case,
the burst time varies as a function of the number of ONUs, in order to complete the 125us GPON time
slot capacity, by considering static allocation. Here, it was considered a drop fibre length of 5 km and the
feeder fibre length of 15 km, with the ONUs equidistant at the same distance with respect to the coupler.
The nominal ONU output power for this simulation is 0dBm.
It is noted in Fig. 3.4 that RBoC follow the combiner output power curve (PoC), displaced by the Rayleigh
coefficient value (B), and that RBu is the predominant Rayleigh. So, the resultant Rayleigh (RBt) at the
ONU input approximates at the RBu. However, for low number of ONUs, RBoCO value becomes more
important effect because the losses at the coupler output are minor, and the power at the ONU input is
higher. It does the crosstalk effect between ONUs more relevant.
Also, the RBt is higher because RBu is proportional to burst output power and, as minor is the number of
ONUs, as higher is the power distribution in the frame from each ONU. So, the most critical case is when
only two ONUs are in the PON. This case will be analysed below.
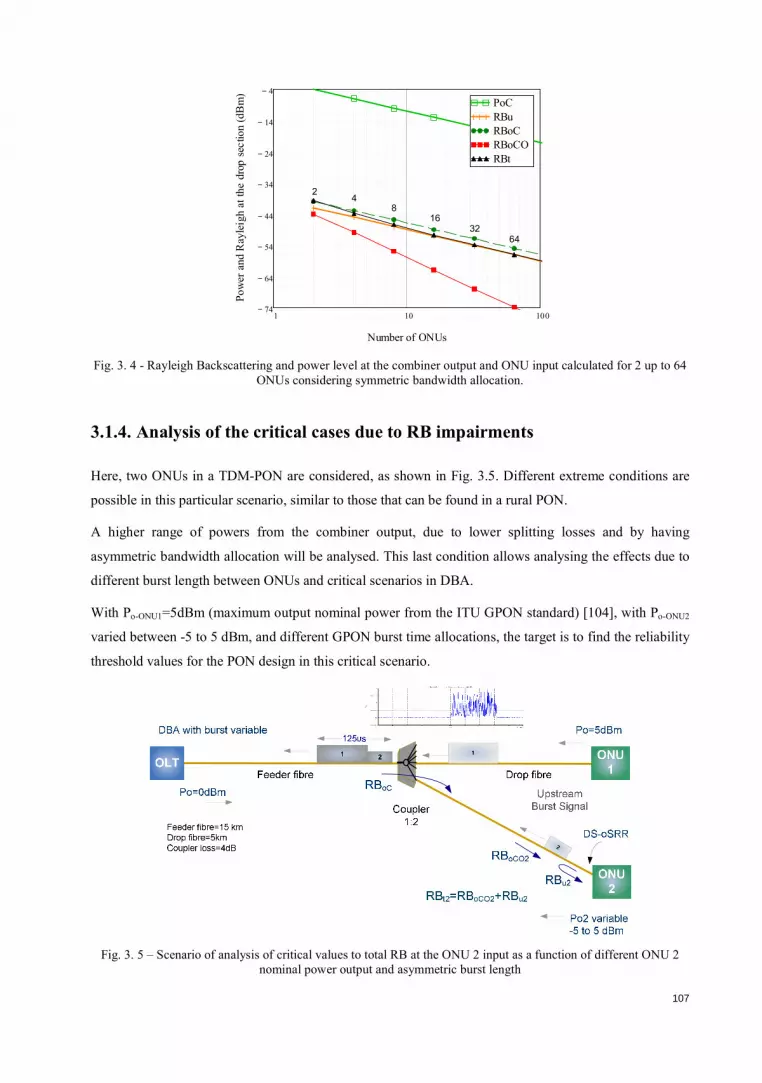
107
Fig. 3. 4 - Rayleigh Backscattering and power level at the combiner output and ONU input calculated for 2 up to 64
ONUs considering symmetric bandwidth allocation.
3.1.4. Analysis of the critical cases due to RB impairments
Here, two ONUs in a TDM-PON are considered, as shown in Fig. 3.5. Different extreme conditions are
possible in this particular scenario, similar to those that can be found in a rural PON.
A higher range of powers from the combiner output, due to lower splitting losses and by having
asymmetric bandwidth allocation will be analysed. This last condition allows analysing the effects due to
different burst length between ONUs and critical scenarios in DBA.
With Po-ONU1=5dBm (maximum output nominal power from the ITU GPON standard) [104], with Po-ONU2
varied between -5 to 5 dBm, and different GPON burst time allocations, the target is to find the reliability
threshold values for the PON design in this critical scenario.
Fig. 3. 5 – Scenario of analysis of critical values to total RB at the ONU 2 input as a function of different ONU 2
nominal power output and asymmetric burst length
1 10 10074−
64−
54−
44−
34−
24−
14−
4−PoC
RBu
RBoC
RBoCO
RBt
Number of ONUs
Power and Rayleigh at the drop section (dBm)
24
816
3264

108
A symmetrical allocation ONU1/ONU2 50%/50% is used to start. It is used as a reference to observe the
RB effect due to different powers between ONUs, as shown in Fig. 3.6. On this first insight, the RBoC at
the ONU 2 (RBoCO2) is predominant over the RBt at the ONU 2 (RBt2) when Po-ONU1 is at least twice time
the Po-ONU2. This is also facilitated by the lower combiner losses (4 dB, by using eq. (13)). Otherwise,
RBu2 would increase strongly the RBt.
However, an asymmetrical allocation, by using ONU1/ONU2 80%/20%, combined with the different
powers between these ONUs, it originates that RBoCO2 > RBu for all the output power values of the
ONU 2 considered in the simulation (from -5 to 5 dBm). Despite this fact, the total Rayleigh affecting the
ONU 2 is not greater than the obtained in a symmetrical allocation, due to lower impact of RBu2, because
the lower duty cycle (20%).
Fig. 3. 6 – Total RB at the ONU 2 input as a function of different ONU 2 nominal output power and asymmetric
burst length
From these results we can infer (by extrapolation) that asymmetrical bandwidth values with ONU1 <
ONU2 will affect more the total Rayleigh at the ONU 2 due to the greater impact of the RBu.
Fig. 3.7 continues with this analysis and justifies at the last asseveration. The downstream optical Signal-
to-Rayleigh ratio (oSRR) is shown to different asymmetrical duty cycles between the ONU1 and the
ONU2, and different ONU 2 nominal output power. Here, OLT output power is fixed at 0 dBm and ODN
loss=8dB.
5− 4− 3− 2− 1− 0 1 2 3 4 554−
52−
50−
48−
46−
44−
42−
40−
38−
36−
34−
RBoC (80/20)
RBoCO2 (80/20)
RBu2 (80/20)
RBt (80/20)
RBoC (50/50)
RBoCO2 (50/50)
RBu2 (50/50)
RBt (50/50)
ONU 2 output nominal power (dBm)
Rayleigh Backscattering at ONU 2 input (dBm)
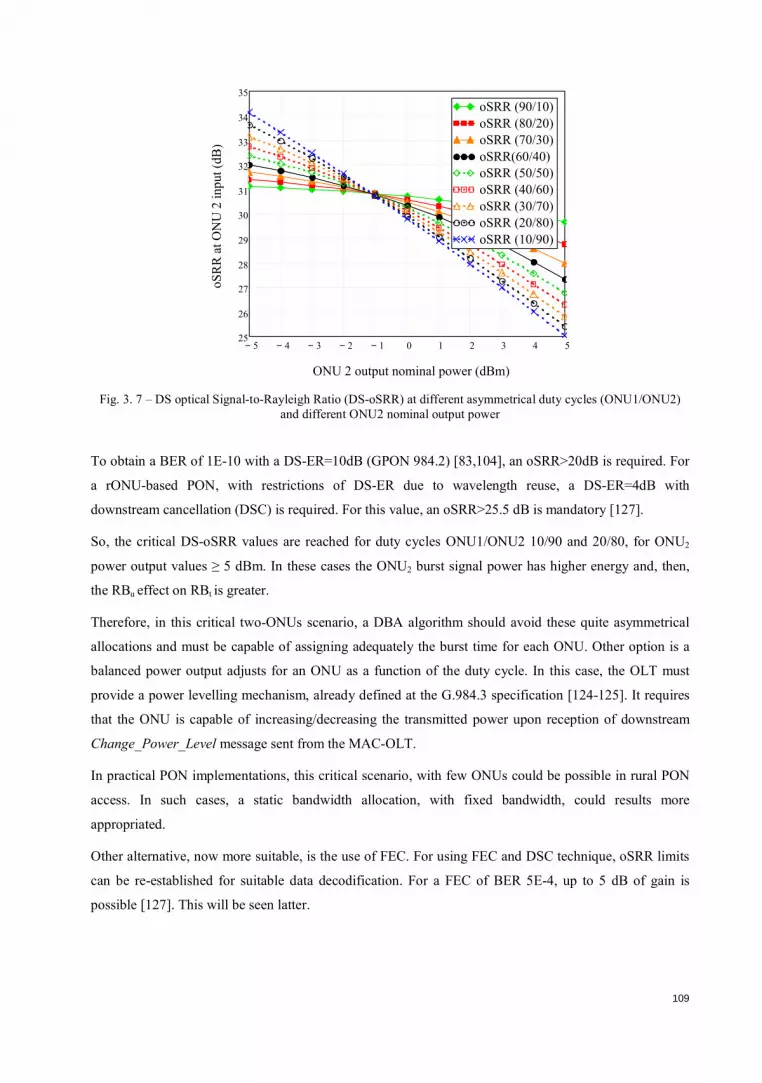
109
Fig. 3. 7 – DS optical Signal-to-Rayleigh Ratio (DS-oSRR) at different asymmetrical duty cycles (ONU1/ONU2)
and different ONU2 nominal output power
To obtain a BER of 1E-10 with a DS-ER=10dB (GPON 984.2) [83,104], an oSRR>20dB is required. For
a rONU-based PON, with restrictions of DS-ER due to wavelength reuse, a DS-ER=4dB with
downstream cancellation (DSC) is required. For this value, an oSRR>25.5 dB is mandatory [127].
So, the critical DS-oSRR values are reached for duty cycles ONU1/ONU2 10/90 and 20/80, for ONU2
power output values ≥ 5 dBm. In these cases the ONU2 burst signal power has higher energy and, then,
the RBu effect on RBt is greater.
Therefore, in this critical two-ONUs scenario, a DBA algorithm should avoid these quite asymmetrical
allocations and must be capable of assigning adequately the burst time for each ONU. Other option is a
balanced power output adjusts for an ONU as a function of the duty cycle. In this case, the OLT must
provide a power levelling mechanism, already defined at the G.984.3 specification [124-125]. It requires
that the ONU is capable of increasing/decreasing the transmitted power upon reception of downstream
Change_Power_Level message sent from the MAC-OLT.
In practical PON implementations, this critical scenario, with few ONUs could be possible in rural PON
access. In such cases, a static bandwidth allocation, with fixed bandwidth, could results more
appropriated.
Other alternative, now more suitable, is the use of FEC. For using FEC and DSC technique, oSRR limits
can be re-established for suitable data decodification. For a FEC of BER 5E-4, up to 5 dB of gain is
possible [127]. This will be seen latter.
5− 4− 3− 2− 1− 0 1 2 3 4 525
26
27
28
29
30
31
32
33
34
35
oSRR (90/10)
oSRR (80/20)
oSRR (70/30)
oSRR(60/40)
oSRR (50/50)
oSRR (40/60)
oSRR (30/70)
oSRR (20/80)
oSRR (10/90)
ONU 2 output nominal power (dBm)
oSRR at ONU 2 input (dB)

110
3.1.5. Rayleigh reflected (RBr)
In a PON rONU-based, Rayleigh contributions at the ONU input are remodulated, reamplified, reflected
and transmitted in upstream direction, added coherently at the signal data burst. Rayleigh reflected is
possible only when t=tRSOA on. In other case, RBr is negligible (ideally RBr=0, with ER=∞). When
RSOAoff-state, the upstream signal and the Rayleigh reflected are upstream propagated with loss given by e-
α·Ldrop.
Two important parameters in RBr are the ONU gain and the burst length from this ONU. Here, ONU gain
(G) is expressed by:
G = ONUinput power + RSOAgain+ ONUlosses
With: RSOAgain, the gain of the Reflective SOA inside the ONU, and the losses inside the ONU, where
ONUlosses = 2·ONUsplitting + Otherlosses.
To obtain an expression for the impact of the ONU burst length, it is divided into “n” parts of length ∆L,
as shown in Fig. 3.8. The Rayleigh reflected is calculated by steps, in order to examine, also, the Rayleigh
effects from other ONUs.
Upstream burst length (Lb) from the ONUk is partitioned in “n” parts. So, Lb=n·∆Lb.
The Rayleigh from this ∆Lburst from eq. (3.6) is given by:
<"6 � �`#6��% � "�1 ! ���∆�&'()*�
The accumulated Rayleigh is given in eq. (3.10), and the accumulated Rayleigh at the coupler output
reaching the ONUk (RBoCOk) is given in eq. (3.16).
In the time t=t1, the Rayleigh reflected by the RSOA of the ONUk is:
RBr(t1)= Po-burst·B(1-e-2α·∆Lb
)·G + G·RBoCOk
In t=t2:
RBr(t2)= (RBr-t1+Po-burst)·G·B(1-e-2α·2∆Lb)+ G·RBoCOk
In t=t3:
RBr(t3)= (RBr-t2+Po-burst)·G·B·(1-e-2α·3∆Lb)+ G·RBoCOk
In t=t4:
RBr(t4)= (RBr-t3+Po-burst)·G·B·(1-e-2α·4∆Lb) + G·RBoCOk
In general, for t=tn=tRSOA-off , with Lb=Vg·tn=n·∆Lb
RBr(tn)=(RBr(t(n-1))+Po-burst)·G·B·(1-e-2α·n∆Lb) + G·RBoCOk
Now, developing each of these expressions by searching a compact expression for this Rayleigh:
In t=t1:
RBr(t1)= Po-burst·B(1-e-2α·∆Lb)·G + RBoCOk·G
In t=t2:

111
RBr(t2)= Po-burst·G2·B2(1-e-2α·∆Lb)·(1-e-2α·2∆Lb)+ RBoCOk·G
2· B(1-e-2α·2∆Lb)+ (Po-burst·G·B(1-e-2α·2∆Lb)+ G·RBoCOk
In t=t3:
RBr(t3)= (Po-burst·G3·B3(1-e-2α·∆Lb)·(1-e-2α·2∆Lb) ·(1-e-2α·3∆Lb) + RBoCOk·G
3· B2(1-e-2α·2∆Lb) ·(1-e-2α·3∆Lb) + (Po-
burst·G2·B2(1-e-2α·2∆Lb) ·(1-e-2α·3∆Lb) + G2·B·RBoCOk ·(1-e
-2α·3∆Lb) +(Po-burst·G·B(1-e-2α·3∆Lb) + G·RBoCOk
In t=t4:
RBr(t4)= Po-burst·G4·B
4(1-e
-2α·∆Lb)·(1-e
-2α·2∆Lb)·(1-e
-2α·3∆Lb)·(1-e
-2α·4∆Lb) + Po-burst·G
3·B
3(1-e
-2α·2∆Lb) ·(1-e
-
2α·3∆Lb)·(1-e
-2α·4∆Lb) +Po-burst·G
2·B
2(1-e
-2α·3∆Lb)·(1-e
-2α·4∆Lb) +Po-burst·G·B·(1-e
-2α·4∆Lb) + RBoCOk·G
4· B
3(1-e
-
2α·2∆Lb)·(1-e-2α·3∆Lb)·(1-e-2α·4∆Lb) + RBoCOk·G3·B2·(1-e-2α·3∆Lb)·(1-e-2α·4∆Lb) + RBoCOk·G
2·B· (1-e-2α·4∆Lb) +
RBoCOk ·G
Fig. 3. 8 - ONU burst length divided into “n” parts for calculating the Rayleigh reflected and the influences of the
RBu and RBoCO
1tbL∆
2tbL∆2
3tbL∆3
ntbb LLn =∆
)1(··2 bL
burstuk eBPoRB∆−−= α
dropL
coCNoCNk elRBRB·
··α−=
])()[1(·1
)·1·(2·2 ∑=
−−−−=N
n
LnLoCoCN
bb eeBPRBαα
cl
cl
cl
cl

112
Now, considering the m-th divisions of the burst (in t=tm):
<"��%�i�� � ��jklmn o�p � "�iD1 ! q����:�∆�&�Li:O; ? �p � "�i;D1 ! q����:�∆�& �Li
:O�? �p � "�i�D1 ! q����:�∆�& �Li
:OA ? �p � "�iAD1 ! q����:�∆�&�Li:Or … s
? p � <"�=7N o�p � "�i;D1 ! qG���:�∆�&HLi:O� ? �p � "�i�D1 ! qG���:�∆�& HLi
:OA? �p � "�iAD1 ! qG���:�∆�&HLi
:Or … s
Finally, the compact expression for the Rayleigh reflected, resulting for the “m” time divisions of the
burst length (Lb) is:
<"��%t� � ��#6��% � o5�p � "�i�:;�D1 ! q����N�∆�&�LiNO:
i:O; s ? p � <"�=7N
� �5�p � "�i:D1 ! q G���N�∆�&HLiNO:C;
i:O; �
……..…(3.18)
Eq. (3.18) allows calculating the RBr in a determined instant of the burst time, as a function of the
contribution from “m” elements of the burst length. As a consequence, this expression evidences that the
RBr value depends strongly on the burst length as of the ONU gain.
Fig. 3.9 shows RBr total at the ONU input from eq. (3.15) and RBr as a function of the impact of the
G·RBu (1st term of the eq. 3.18) and G·RBoCO (2
nd term of the eq. 3.18), for a PON system with 2 up to 64
ONUs. It is observed that RBu has more influence at the total RBr due to its higher power. So, a good
practical approximation to RBr calculation from an ONU can be straightforward obtained from the
Rayleigh contributions at the ONU input (RBu + RBoCO), reamplified by the ONU gain (G). So:
RBr= (RBu + RBoCO)·G

113
Fig. 3. 9 - RBr total at the ONU input and RBr as a function of the impact of the G•RBu and G•RBoCO
Also, from this Fig. 3.9, RBr is critical when ONU numbers < 4, due to the fact that the burst power that
originates the RBu has more energy as it has more bandwidth into the upstream frame.
3.1.5.1. Rayleigh reflected from the ONU at the OLT input (RBrO)
Considering the Rayleigh reflected from the ONUk
<"�N � <"%N � pN
With<"%N � <"6N ? <"�=7N, the total Rayleigh at the ONUk, and Gk is the ONUk gain This Rayleigh, after being attenuated at the drop section, is combined at the coupler with the RBrN-1 from
all “N-1” ONUs in the PON. The resultant Rayleigh is affected by the ODN losses together with the
upstream data frame, before arriving at the OLT. An expression for the RBr at the OLT input (RBrO) is
shown in eq. (3.19).
<"�7 � �5 <"�N � ���a(bc� � ���effaf( � �Y8
NO;
….(3.19)
Fig. 3.10 shows the Rayleigh reflected values at the OLT input (RBrO) and the Rayleigh reflected values
at the ONU output (RBr) from 2 up to 64 ONUs, by assuming that ONU gain is the same for all ONUs.
As the number of ONUs in the PON increases, as the sum of the RBr powers from all ONUs at the
coupler, it overpass the ODN losses.
2
4
8
16
32
64
1 10 10060−
54−
48−
42−
36−
30−
24−
18−
RBr due to RBu
RBr due to RBoCO
RBr total
ONU numbers
RB reflected at ONU output (dBm)

114
Fig. 3. 10 - Rayleigh reflected values at the OLT input (RBrO) and at the ONU output (RBr) from 2 up to 64 ONUs,
considering the same ONU gain for all ONUs.
3.1.6. Total Rayleigh at the OLT input
At the OLT input two Rayleigh impairments are present: RB due to OLT output power (RBc) and
Rayleigh reflected from the ONUs (RBrO). So:
RBOLT=RBc+RBrO
….(3.20)
RBc is obtained from eq. (1.1) (Chapter 1) [70,74]. It is determinant in the calculus of the OLT output
power and the upstream power budget in the PON design and establishes the US-oSRR thresholds.
3.1.7. Upstream optical Signal-to-Rayleigh Ratio (US-oSRR)
An expression to calculate of the US-oSRR is given for the eq. (3.21) [70]:
US-oSRR=OLTinput/RBOLT
….….(3.21)
With RBOLT defined in eq. (3.20). OLT input power can be given by:
OLTinput = ONUout · ODNlosses
….….(3.22)
With ODNlosses, the losses in the optical distribution network:
uv�g���Q� � ���a(bc � �gY � ���effaf( ….….(3.23)
and with the combiner losses defined in eq. (3.13).
2
4
8
16
32
64
1 10 10050−
46−
42−
38−
34−
30−
26−
22−
18−
RBr at the OLT input
RBr at the ONU output
ONU numbers
RB reflected at the OLT(dBm)
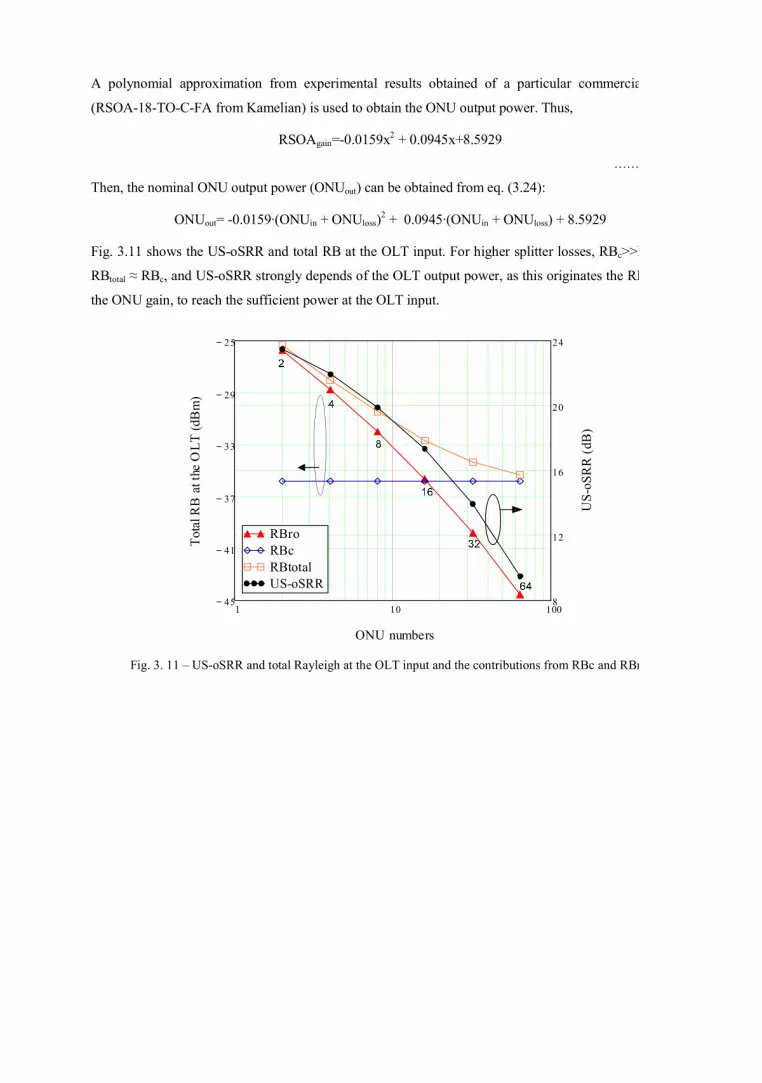
A polynomial approximation from experimental results obtained of a particular commercial RSOA
(RSOA-18-TO-C-FA from Kamelian) is used to obtain the ONU output power. Thus,
RSOAgain=-0.0159x2 + 0.0945x+8.5929
………..(
Then, the nominal ONU output power (ONUout) can be obtained from eq. (3.24):
ONUout= -0.0159·(ONUin + ONUloss)2 + 0.0945·(ONUin + ONUloss) + 8.5929
Fig. 3.11 shows the US-oSRR and total RB at the OLT input. For higher splitter losses, RBc>>RB
RBtotal ≈ RBc, and US-oSRR strongly depends of the OLT output power, as this originates the RB
the ONU gain, to reach the sufficient power at the OLT input.
Fig. 3. 11 – US-oSRR and total Rayleigh at the OLT input and the contributions from RBc and RBrO
1 10 10045−
41−
37−
33−
29−
25−
8
12
16
20
24
RBro
RBc
RBtotal
US-oSRR
ONU numbers
Total RB at the OLT (dBm)
US-oSRR (dB)

116
3.1.8. Conclusions
A deeper analysis for Rayleigh Backscattering effect in burst mode transmission was done. From this
analysis, equations for Rayleigh backscattering from the ONU burst output power (RBu), Rayleigh
backscattering at the combiner output (RBoC), RBoC at the ONU input (RBoCO), Rayleigh
backscattering reflected (RBr) and RBr at the OLT input (RBrO) were deterministically formulated to
determine their behavior, effects and dependences.
Critical cases are present in downstream transmission for configurations with lower ONU numbers due to
a higher energy concentration in the upstream burst and lower tree losses and the resulting Rayleigh.
So, the resultant Rayleigh (RBt) at the ONU input approximates at the RBu. However, for low number of
ONUs, RBoCO value becomes more important effect because the losses at the coupler output are minor,
and the Rayleigh power at the ONU input is higher. It does the crosstalk effect between ONUs more
relevant. Then, the most critical case, only two ONUs in the PON, was analysed.
Asymmetrical allocations for this scenario were studied. By using ONU1/ONU2 80%/20%, and different
powers between these ONUs originates that RBoCO2 >RBu. Despite this fact, the total Rayleigh
affecting the ONU 2 is not greater than the symmetrical allocation, due to lower impact of RBu. For
asymmetrical bandwidth, now with ONU1 < ONU2, the total Rayleigh at the ONU 2 will be higher due to
the greater impact of the RBu.
When compared with GPON (BER of 1E-10 with a DS-ER=10dB) where an oSRR>20dB is required, a
rONU-based PON, with restrictions of DS-ER (4dB) due to wavelength reuse, an oSRR>25.5 dB is
mandatory. So, critical DS-oSRR values are reached for duty cycles ONU1/ONU2 10/90 and 20/80, for
ONU2 power output values ≥ 5 dBm. Therefore, in this critical two-ONUs scenario, a DBA algorithm
should avoid these quite asymmetrical allocations and must be capable of assigning adequately the burst
time for each ONU.
In practical PON implementations, this critical scenario, with few ONUs could be possible in rural PON
access. In such cases, a static bandwidth allocation, with fixed bandwidth, could results more
appropriated than DBA techniques, so as to establish a fixed burst length and power transmission that
does not generates crosstalk to other ONUs sharing the same wavelength.

117
3.2. TDM-PON rSOA-based ONU Network design and
Optimization
In this section, the design of a Single-Wavelength/Fiber TDM-PON rSOA-based ONU in burst operation
is discussed and optimized to reach the best exploitation point, and up to 32 ONUs are demonstrated, by
selecting adequately the power outputs and the tradeoff between DS power budget and US-oSRR.
3.2.1. Analysis of the relevant parameters
3.2.1.1. Extinction Ratio
DS signal with ER > 5 dB would be difficult to be data-cleaned before being directly IM data
remodulated at RSOA-based ONUs. Reduction of DS Extinction Ratio (ER) is required to achieve good
enough feed-forward cancellation. The optimum DS-ER to keep minimized DS-residual during its space
bits for US remodulation is a tradeoff: too low DS-ERs result in an unacceptable high penalty for its
detection, while a too high ER degrades the US performance [122].
BER dependency of ER and oSRR (@ 1dB penalty) has been experimentally measured on the TDM
section of the SARDANA network (as will be seen in chapter 5), through a B2B connection [127], and
the results are shown in Fig. 3.12. The lower ERs, the higher are the oSRR requirement. So, for BER of
1E-9 with a DS-ER=10dB (GPON 984.2) [83,104], an oSRR>20dB is required, whilst for a DS-ER=4dB,
an oSRR>25dB is mandatory. This fact will limit dramatically the maximum splitting ratio and the power
budget of the system.
Fig. 3. 12 – Optical Signal-to-Rayleigh Ratio (oSRR) as a function of the Extinction Ratio for different BER values.
However, Fig. 3.12 also shows that is possible to achieve an oSRR optimal value by using FEC to BER
5E-4and DSC technique. So, oSRR limits are established for suitable data decodification: DS-
oSRRlimit≥20 dB and US-oSRRlimit≥14.5 dB, with US-ER=9dB to fulfill the required power budget.
10
12
14
16
18
20
22
24
26
28
3 4 5 6 7 8 9 10 11 12 13 14 15
OS
RR
(d
B)
Extinction Ratio (dB)
BER=1E-3
BER=5E-4
BER=1E-6
BER=1E-9
RSOA's wavelength
reuse domain
with DS
cancellation
without DS
cancellation

118
3.2.1.2. RSOA electro-optical modulation
RSOA operation, presented in Fig. 3.13, shows the available electro-optical modulation range for
different RSOA optical carrier input powers and injection bias currents. It is observed that for bias current
< 80mA the output is quite linear, and it becomes saturated for higher bias current. The best BER
performance has been obtained with bias current =60 mA and modulation = ± 3 Vpp. These best tradeoff
values allow a modulation index ≈70%, with an US-ER > 9dB.
Fig. 3. 13 - RSOA optical output power for different injection bias current and optical carrier input power.
3.2.1.3. Carrier level Recovery
Also, because of the direct US remodulation on the same DS stream, carrier level recovery techniques had
been required to erase the DS pattern [128-130]. As carrier recovery by gain saturation requires the high
injection power, insufficient in PONs with high tree loss, an additional feed-forward cancellation circuit
[121] has been used. This consists of an electrical delay (∆τ) for fine tuning of the path lengths, a
derivative filter (DF) and RF amplifier combinatory to subtract the inverted DS information.
3.2.1.4. Rayleigh Backscattering impairment
As was analysed in previous section, Rayleigh penalizes at oSRR. Fig. 3.14 presents details of the
Rayleigh penalty and shows how the upstream signal is over penalized, while the downstream remains
less sensitive to Rayleigh, basically because of burst signal generates less Rayleigh.
For example, when the OLT output is 0dB, the ODN fibre length is 20 km (RBc = 34.6 dBm, ODN fibre
losses -4 dB), and the ODN splitting ratio is 1:32 (-16 dB power losses), the oSRR is of only 14.6 dB, if
considering an ONU gain of 20 dB (upstream signal power at the OLT input is -20 dBm). This value
highly penalizes the reception.
0
0.5
1
1.5
2
2.5
3
3.5
4
4.5
20 40 60 80 100
Sig
na
l O
utp
ut
Po
we
r (m
W)
Bias Current (mA)
Pin= -5 dBm
Pin= -10 dBm
Pin= -15 dBm
Pin= -20 dBm
Pin= -25 dBm
Pin= -30 dBm

119
Fig. 3. 14 – Rayleigh penalty at the reception in upstream and downstream transmission.
3.2.1.5. ONU splitting factor
The splitting inside the ONU splits input optical power to the RSOA to be remodulated, and to the APD
for downstream detection.
Due to downstream remains less sensitivity to Rayleigh, ONU output power must be a maximum to avoid
upstream Rayleigh penalties, so as much power reaches the RSOA much better. The idea is to give more
than 50% to RSOA whilst the remaining power is enough to the APD to detect.
ONU splitting factor is a key parameter to matching downstream power budget and upstream oSRR
critical trade-off.
3.2.2. Scenario and Network Topology
The TDM setup with single-fibre/wavelength scenario is based on SARDANA PON tree section
[51,123], and is shown in Fig. 3.15. This implements colourless reflective-ONUs based on RSOA and
burst mode US operation. To emulate a common TDM-PON [104], an OLT from central office (CO) is
placed in the site of the remote node (RN). This configuration is fully compatible with other TDM tree
topologies. The ODN is fixed in 20 km (standard reach) @2.5/1.25Gbps and operates at 1552.52 nm.
Each ONU transmits burst carried on 125us GPON US frames. Here, a static bandwidth assignment is
considered for simplicity. So, duty cycles are in correspondence with the ODN splitting ratio.
Fig. 3. 15 – The WDM/TDM PON network and the TDM tree section with the OLT on the place of the RN.
Upstream Rayleigh-backscatteringDownstream Rayleigh-backscattering

120
3.2.3. TDM-PON rSOA-based ONU optimization
The target is to analyze and optimize the TDM-PON rONU to obtain the best power budget and higher
users’ number.
Optimization Flux Diagram
Fig. 3.16 shows an optimization’s flux diagram of this PON with decision blocks, dependence processes
between blocks and expressions for DS continuous /US burst signal and RB impairments [70,123].
Because of the single-fiber/single-wavelength PON configuration, RB will be present as the most relevant
optical impairment both in continuous mode as in burst mode. As a consequence, relevant decision blocks
are the DS-oSRR and the US-oSRR.
3.2.3.1. DS direction flux
In DS direction, the CW OLT output power is evaluated as a function of the length feeder fibre and the
RBc power that it produces. So, a block decision does a test of the US-oSRR level for such power signal
and power impairment. If this level is lower than an oSRR threshold (US-oSRR<z), OLT output power
must be adjusted.
At the ONU input, other block decision compares for a suitable DS-oSRR level based on the DS signal
reaching the ONU and the RBu as a function of the ONU output power. In general, due to higher number
of ONUs (and higher tree losses), the DS signal power at ONU tends to be low. However, smaller burst
from the ONU originates low transmitted power. So, RBu has low effect on this ONU, consequently DS-
oSRR is not generally limiting. In the case that DS-oSRR is lower than a target level (DS-oSRR<y), the
ODN coupler must be adjusted for a smaller ONU numbers in the PON.
In the RX device, if the RX sensitivity is sufficiently tolerant at the actual input level or the minimum
BER is not reached yet, it is possible to adjust the ONU splitting ratio to favor the ONU TX section.
3.2.3.2. US direction flux
In US direction, a RSOA gain decision block establishes an operational limit for the system. So, RSOA
gain ≥ budget loss + ONU loss satisfies the system requirements; otherwise, US-oSRR will be critic due
to a lower US reach level because high tree losses and, also, a high RBc value, as a function of the CW
OLT output power. In this last case, RSOA parameters would be adjusted, or considered to change the
device to other with more gain. It still, if minimum US-oSRR is not reached, the ODN coupler must be
adjusted for a smaller ONU numbers in the PON.
In general, combining ONU splitting factor and RSOA gain a suitable combinations can be obtained.
RSOA gain and the more unbalanced coupling always improve the tolerance margin for the Power
Budget and oSRR. 80/20% becomes the most useful (better than 90/10%) because the more unbalanced
coupling the more coupling total losses which penalizes the receiver.

121
Fig. 3. 16 - Optimization flux diagram for a TDM-PON rONU with FEC to BER 5E-4.

122
3.2.4. TDM-PON RSOA-based ONU Evaluation
3.2.4.1. Experimental setup
Experimental setup is based on tree section of the SARDANA metro-access network @2.5/1.25 Gbps
rates, as shown in Fig. 3.17. The simplest implementation case, and the most critical, is with two ONUs
(ONU2 is used as dummy). Also, it provides the contribution of the all remaining ONUs.
Each ONU transmits data burst into 125us GPON upstream frame, with duty cycles of 50%, 25% and so
on, up to 3.125%, in correspondence with the emulated ODN splitting ratio (1x2 to 1x32 respectively).
Fresnel back-reflections have been avoided by using angled connectors.
Fig. 3. 17 - Experimental Setup block diagram
At the OLT, TX transmits at 2.5 Gbits suitable for give a higher power values excursion for the test
proposes (up to 5dB optical power by an EDFA optical booster amplifier with a 100G ASE filter). The
Receiver has an EDFA preamp allowing for receiver sensitivities around -30dBm. So, the OLT fulfils the
requirements of the GPON 984.2 B+ [104].
Each ONU consists in a RSOA device with 15dB to 21dB gain, and APD receiver with sensitivity of -
30dBm @10Gbps and an optical splitter to share input power towards RSOA and APD simultaneously. In
TX, a system with DS cancellation allows the RSOA maximal reuse of the DS wavelength. ONU
transmits a 1.25Gbp/s Burst mode as standard GPON.
At the ODN, drop fibre (from 5 to 10 each) and feeder fibre (from 15 to 10 km), in order to have a fibre
link of 20km, as a GPON standard, are the data transmission paths. A two-port splitter/combiner (-4dB)
plus a digital attenuator allow emulating different tree losses as a function of the ONU numbers in the
PON. The SARDANA testbed and practical implementation is shown in Fig. 3.18.

123
Fig. 3. 18 - The SARDANA testbed and practical implementation for experimental evaluation
3.2.4.2. Experimental Evaluation
Bidirectional transmission with RSOA-ONU in burst mode with US direct remodulation with/ without
DS cancellation was measured. The appropriate balance between the DS signal output power and the
ONU gain, and on the other hand, the power budget and the power loss, as a function of the DS/US oSRR
boundaries are necessary to reach the best PON’s operating point. Increasing the users’ number -
proportionally with the splitter losses- the DS signal power and the US-oSRR level decrease. When the
OLT power increases DS power budget improves, but the RBc limits the US-oSRR.
On the other hand, the ONU output value increases the US-oSRR but depends directly on the RSOA gain
and the ONU losses. So, the best operating point is a tradeoff of good tolerance for the DS power budget
and the US-oSRR together.
Fig. 3.19 shows results obtained experimentally for the tolerance margin (dB) matching Downstream
power budget and Upstream oSRR, as a function of the OLT output power, other critical parameter
because RBc, as a key parameter to choose the coupling factor. The best value is for higher tolerance
margins. Both are for a RSOA gain of 21dB. Splitting factor into ONU for 80%/20% and 90%/10% (90%
of power goes to the RSOA to be remodulated whilst 10% power is for data detection) are tested.
OLT output power values are considered into the ITU GPON range [124-125]. Critical 16 and 32 ONUs
scenarios are evaluated.

124
Fig. 3. 19 - DS power budget and US-oSRR tolerances for RSOA gain=21dB and ONU coupling factor 90/10 and
80/20, with BER 5E-4.
The coupling factor at the ONU input to feed the RSOA unit and the RX confirms to be an important
parameter to take the best profit of the received power. For a splitting of 80/20, the results are in
agreement with [126] and the best tradeoffs DS power budget / US-oSRR are to OLT output power values
between 0 and –3 dBm.
For the coupling factor 90/10, where the maximum splitting ratio depends on the ONU photo-detector
sensitivity, the best tradeoff is for values between 0 and 3 dBm. Here, it is possible to superimpose the
undesirable RBc with a higher upstream power from the higher ONU gain.
Now, PON performances using RSOAs with nominal G=16dB and 21dB are analyzed experimentally and
optimized to obtain the maximum number of users (Fig. 3.20). An OLT output power 0 dBm allows the
RSOA gain matching the ODN power budget.
The DS power budget -at the APD RX- has a higher dependency with the RX/TX splitting ratio 90/10
into the ONU. Fig. 3.20 shows that up to 32 users are possible with nominal 21 dB ONU gain. The DS
cancellation is adjusted to 1dB maximum penalty. Auxiliar lines (dashed lines), showing the number of
users were experimentally obtained relative to B2B measurements.
-5
-3
-1
1
3
5
7
9
11
-5 -4 -3 -2 -1 0 1 2 3 4 5
32 ONUs, DS Budget, 90/10
16 ONUs, DS Budget, 90/10
32 ONUs, DS Budget, 80/20
16 ONUs, DS Budget, 80/20
32 ONUs, US-oSRR, 90/10
16 ONUs, US-oSRR, 90/10
32 ONUs, US-oSRR, 80/20
16 ONUs, US-oSRR, 80/20
OLT output power (dBm)
DS power Budget and US-oSRR tolerances (dB)

125
Fig. 3. 20 - Maximum data users in rONU-based PON: B2B transmission and US burst using DS remodulation
with/without DS cancellation
The US-oSRR value is penalized for higher tree losses and as a function of the Po-OLT (because of the
RBc). The key parameter to save US-oSRR penalty depends on the ONU gain as RSOA gain > Budget
Loss + ONU Loss. RSOA gain=16dB allows for 16 users PON with Power-Tolerance>5dB, while RSOA
gain=21dB reaches up to 32 users with Power-Tolerance>0.5dB.
A sensitivity improvement > 2 dB is reached by using Downstream Cancellation.
An ODN (20km) redistribution (by feeder fiber reduction while the drop fiber increases), avoids for high
RBc values by improving the US-oSRR tolerance, as shown in Fig. 3.21. RSOA gain=21dB on 10km
feeder with 10km drop increases Power-budget-tolerance to >1.5dB for up to 32 users, while DS-oSRR is
always into the tolerable range, US-oSRR requires 90/10 coupling into ONU.
-10
-9
-8
-7
-6
-5
-4
-3
-30 -25 -20 -15 -10
B2B_carrier_G21dB
wDSC_burst_G21dB
woDSC_burst_G21dB
wDSC_burst_G16dB
woDSC_burst_G16dB
OLT input power (dBm)
Log
(BE
R)
OLT input power (dBm)
Log
(BE
R)
OLT input power (dBm)
Log
(BE
R)
OLT input power (dBm)
Log
(BE
R)
128users
64users
32users
16users
8users
256users

126
Fig. 3. 21 - DS-oSRR and US-oSRR values for 16 and 32 users with ONU splitting loss 90/10 and 80/20, and feeder
fibre of 15 km and 10 km.
Some important design parameter values in TDM-PON RSOA-based ONU are compared with ONUs
based on ITU standards GPON G.984.2 ONU [104] and XGPON G.987.2 [83]. Table 3.1 shows this
comparative.
Table 3. 1 - RSOA-based ONU and GPON/XGPON ONU comparative
ONU type DS-ER
(dB)
Loss
Budget
(dB)
Phy
Reach
(km)
Optical
Splitter
Optical
Budget
(dB)
BER
DS
Ref.
RX
Sensitivity
(at BER level)
Path
Penalty
(dB)
λ
used
Bit Rate
(DS/US)
(Gbit/s)
GPON ONU
(G.984.2 B+) >10 28 20 1:32 13-28 1E-10 -27 dBm 0.5 2 2.5/1.25
RSOA-based ONU
(SARDANA) <5 28 20 1:32 13-28
5E-4
(FEC) -30 dBm 0.5 1 2.5/1.25
XGPON ONU
(G.987.2) >8.2
N1: 29
N2: 31 20 1:64
N1: 14-29
N2: 16-31
1E-3
(FEC) -28 dBm 1 2
10/2.5
10/10
From Table 3.1, RSOA-based ONU take advantage over the ITU-standards (GPON and XGPON) in the
re-use of the wavelength and colourless capacity. It gives the potential for transparent Metro-access
interoperability without Electro-optical conversion (with low cost ONUs) at the cost of fewer users
(1x32). It would be possible to reach up to 64 splitting with powerful RSOAs with Gain>25dB and high
sensitivity APDs (better than -30dBm). Also, free-up spectrum, for future expansion, and reduce
CAPEX/OPEX is obtained.
Furthermore, the lower optical powers can be considered as a green factor because of the energy saving.
18
22
26
30
34
38
14
16
18
20
22
16 24 32
ONUs' Number
US
oSRR
(dB)
US oSRR min (BER 5E-4)
DS oSRR min (BER 5E-4)
DS
oSRR
(dB)

127
3.2.5. Conclusions
In this section, a TDM-PON rSOA-based ONU Network design and Optimization, looking for colorless,
low cost, single-fibre with wavelength reuse and truly passive, was presented.
In this network, the number of users and the network coverage determine the power budget. Although it
could be managed by injecting more power from the TX, it introduces the Rayleigh backscattering which
penalizes the oSRR. Then, RB limits the OLT output power and so, limits the power budget. As a
consequence, and to compensate these limitations, high ONU gain is required. Other critical parameter is
the DS-ER, reduced to allow wavelength reuse by carrier level recovery.
In the upstream direction, the difficult are for scenarios with 32/64 ONUs, due to higher tree losses.
Single-fiber/wavelength reflective PON has been optimized focusing on the best tradeoff between ODN
power budget and US-oSRR. RSOA gain and ONU splitting factor are the key parameter. By using FEC
to BER 5E-4, optimal DS cancellation, RSOA gain=21dB, the appropriate OLT output power between 0
to 3 dBm and 90/10 ONU splitting ratio, up to 32 users can be reached.
For using FEC and DSC technique, oSRR limits can be re-established for suitable data decodification.
For a FEC of BER 5E-4, up to 5 dB of gain is possible.
This TDM-PON rSOA-based ONU design takes advantage over the ITU-standards in the re-use of the
wavelength and colourless capacity with low cost ONUs. The lower optical powers can be considered as a
green factor because of the energy saving. A handicap in our design, with respect to expensive dual band
XGPON/GPON ITU design, is the RB that limits the maximum power budget.

128
Chapter 4
4 WDM/TDM-PON SARDANA Network
Current development on new FTTH network architectures and technologies aim at enabling universal
communications with a substantial increase in terms of bidirectional capacity, connected users and
distance reach, as well as incorporating enhanced security, scalability, service integration and other key
functionalities. With this aim, recent proposals for next generation FTTH, in the so-called NGA-
NGPON2, intensify the use of the WDM dimension to extend the performances of PONs.
SARDANA constitutes a new network model into the NGPON2. It stands for “Scalable Advanced Ring-
based passive Dense Access Network Architecture” [82,131]. SARDANA implements a hybrid
WDM/TDM-PON and consists of the organization of the optical distribution network as the TDM access
trees passively connected, through a cascadeable passive add&drop Remote Nodes, with a WDM
bidirectional ring. The proposed Ring + Trees topology can be considered as an evolution towards an
integrated Metro-Access network, covering similar geographical area, users and services, but
concentrating electronic equipment at an unique site (the Central Office), and implementing an all-optical
passive alternative, operating as a resilient TDM-over-WDM overlay, by optimizing and extending the
capabilities and performance of the WDM/TDM network presented in chapter 2. This can constitute a
transparent passive approach of what is today known as metro-access convergence.
This FP7 European project was development between January 2008 and December 2010 and was
composed by 7 pre-eminent institutions (industries and research centres): Universitat Politècnica de
Catalunya (UPC-Spain), France Telecom (FT/Orange-France), Tellabs (Finland), Intracom (Greece),

129
Instituto de Telecomunicaçoes (IT-Portugal), ISCOM (Italy) and AIT (Greece) [51]. SARDANA is an
approach to demonstrate how the huge bandwidth available through the fibre access can be exploited in
an extended, cost efficient and reliable manner. SARDANA, following the acronym, features:
- Scalable: SARDANA is able to serve up to 1024 users with symmetrical 100-1000 Mbit/s per user,
spread along distances up to 100 km, at 10Gbit/s, in a flexible way. This one order of magnitude increase
in every of these features provides a virtually unlimited broadband access for all. Since operators face a
high degree of uncertainty at this level (take rates, user demands, etc) and the necessity of deferring the
investments, incremental scalability has become a major objective. SARDANA is capable of continuous
growth of the network, as new users get connected, providing continuous branching in physical, time and
wavelength domains, at longer distances in new areas, and as higher bandwidth is demanded.
- Advanced: to reach the project goals, a series of innovations are proposed and implemented:
• Adoption, adaptation and optimization of new opto-electronic technologies, like reflective
semiconductor optical amplifier, remotely pumped fibre amplification, wavelength shifting, etc.
• Signal processing and communication techniques, like orthogonal optical modulation formats to
reuse the same wavelength in down- and up-stream, non-linear electronic equalization of the
different optical impairments present, hybrid domain signal multiplexing (wavelength and time
domain, routing the optical packets without collisions or extra delays).
- Ring-based passive: the network topology is hybrid with a central WDM ring and TDM single-fibre
trees to the homes. Strict passiveness is preserved in the fibre plant, to simplify the deployment and
maintenance of the network.
- Dense Access Network Architecture: related to the concept of the user density in an area; it can range
from a rural scenario (long reach) to an urban scenario with several thousand homes, all optically
interconnected from one wide ring through the trees.
4.1 Network Architecture
SARDANA implements an alternative NG-PON architecture consisting of the organization of the optical
distribution network (ODN) as a WDM bidirectional ring and TDM access trees, interconnected by means
of cascadable optical passive add&drop remote nodes (RN), as shown in Fig. 4.1.
The ring + tree topology is an evolution from the conventional Metro and Access networks connected by
O/E/O equipment at the interfaces between the OLTs and the Metro network nodes. SARDANA
implements an integrated Metro-Access network, covering similar geographical area, users and services,
but concentrating electronic equipment at a unique CO, and implementing an all-optical passive
alternative, operating as a resilient TDM over WDM overlay. Depending on the scenario, the ring + tree
mixed topology optimizes the usage of the fibre infrastructure in the ODN, and also offers enhanced
scalability and flexible distribution, as new RNs can be installed.

130
Fig. 4. 1 – Architecture model and main characteristics of the SARDANA network.
The ring topology provides resilience capability and distributed add&drop with a minimal number of
links, being the most common topology in metropolitan networks. With the proper design of the Remote
Nodes (RN), there are two possible OLT-ONU paths; in case of a fibre failure, the data links are
reconfigured and restored, with centralized optical switching at the OLT.
The project mainly was focused on the physical layer, specifically on the optical and electro-optical
subsystems, trying to be highly transparent to the protocol, coding and bit rate of existing PON standards.
However, a specification for SARDANA Transmission Convergence, compatible with NG-PON is
proposed and discussed in chapter 5.
The ITU-T GPON standard was taken as the reference point, this being also the most stringent in
specifications. By means of optical transponders, the adaptation of standard PON systems to SARDANA
was performed, incorporating the new functionalities. Therefore, SARDANA can be regarded as a new
transparent optical layer operating at the wavelength domain transparently, that act as traffic collector of
existing access systems, and using the existing metro/access optical passive infrastructure. The
corresponding multi-operability model in terms of OLT and ONU interfaces is shown in chapter 6. Here,
for the full network demonstration, a 10G/2.5G MAC, based on FPGA, in line with xGPON GTC (ITU-T
G.987) standard, has been developed and demonstrated, together with conventional LAN and MAN
communications, supporting advanced new broadband multimedia services.
CO
RN1 RN2
RNi
RNj
RNN RNN-1
ON ONU
ON ONU
1:K
ON ONU
ON ONU
1:K
ON ONU
1:K
ON ONU
ON ONU
1:K RSOA
ONU
λD m+1,…, λD2N
WDM RING
TDM TREE
λD1,…, λDm
Downstream Signals
Upstream Signals
λU 1,…, λUm
λU m+1,…, λU2N
Bidirectional Transmission
WDM Metro ring : Resilience (up to 1.2Tbit/s)
Passive Remote Nodes (RN):– Cascadable Add&Drop– 2-to-1 fibre interface– Remotely pumped (from CO)
optical amplification by EDFs
– Athermal splitters and fixed filters
CO (OLT):– Centralizes the light generation and control– Stack of lasers serving TDM trees– Standard G/E-PON equipment adapted to SARDANA
ONU colourless:– Reflective– Single fibre &
wavelength
TDM tree Access1:32 coupler

131
4.1.1 SARDANA Wavelength Allocation
SARDANA uses the wavelength band between 1530nm and 1565nm (C-band), with optional extension to
1565-1625 nm (L-band). This wavelength plan is well above the GPON up/down wavelengths, (1490nm
DS, 1310nm US) [132], and compatible, in L-band, only in downstream, with XG-PON1 (1575-1580nm
DS, 1260-1280nm US) [133]. A key difference is of course that in this band, SARDANA uses DWDM
with strict wavelengths generation (centralized at OLT) aligned with the ITU Grid. This implies that
SARDANA should allow DS XGPON1 wavelengths, but US signals should be converted at US
XGPON1 wavelengths at the OLT. In the GPON case, wavelengths have to be converted to the
SARDANA wavelengths.
Also, SARDANA opts for not supporting the Video Overlay Service (that was defined at 1550-1560 nm),
due to it overlaps with the DWDM C-band, and would require too stringent optical filters to combine
both. Besides, the video overlay downstream signal, intrinsically an analogue sub-carrier multiplex
(SCM), requires a very high SNR to be provided to the user for an acceptable quality (about 20dB higher
than the digital signal); this facts limits the overall power budged and produces inter-service crosstalk.
Nowadays, the VoIP and IPTV are much advanced and cleaner solution to be integrated in the IP PON
stream. Thus, the interoperability with a video service operator is via an IP connection, with a specified
SLA.
Fig. 4.2 shows wavelength plan for SARDANA. Wavelengths for the pump generation for remote
amplification, OTDR monitoring and control are shown too.
Fig. 4. 2 - SARDANA wavelength allocation plan
4.2 SARDANA subsystems
The implementation of the network subsystems: colourless Optical Network Unit (ONU), Optical Line
Terminal (OLT) at the Central Office (CO), the Optical Distribution Network (ODN) and the passive
Remote Node (RN), covered a number of technical challenges. Along the project, although several
solutions have been investigated, the decision on the selected one for network demonstration was made
on the basis of cost and robustness, leaving more complex advanced solutions for parallel research.
14
60
14
70
14
80
14
90
15
00
15
10
15
20
15
30
15
40
15
50
15
60
15
70
15
80
15
90
16
00
16
10
16
20
16
30
16
40
16
50
16
60
16
70
DS/US SARDANA
Pump SARDANA
OTDR monitoring
Supervisory/Control

132
4.3 Optical Network Unit (ONU) Subsystem
A key requirement of the ONU was to be colourless and to reuse the DS wavelength, in full-duplex
operation compatible with xPON. A reflective-ONU based on RSOA has been taken as preferred option
because its simplicity and colourlessness. However, it can rise up serious impairments operating in full-
duplex with wavelength reuse, as seen in chapters 2 and 3. To overcome the bandwidth, noise and
crosstalk limitations, a complete study of the possible optical modulation formats were made and several
compensating techniques were developed:
- Reduced-ER downstream with feed-forward cancellation at ONU [134]
- Wavelength dithering to reduce Rayleigh backscattering and reflections [135]
- Upstream chirped-managed RSOA with offset-filtering, reaching 10G operation [136]
- Adaptive electronic equalization, using MLSE and DFE/FFE at 10G [136-137]
- Integrated colourless optical FSK demodulation with a SOA/REAM [138].
- Wavelength shifting at ONU for reduction of Rayleigh scattering [139]
- Other modulation formats tested like SCM [111-113], SSB and homodyne PSK [131] are kept as longer
term research.
The ONU subsystem of the SARDANA includes the electro-optical ones for the ONU optical interfaces
(ONU layer 1) and for the ONU MAC (ONU layer 2). This section presents the architecture and the
specification of the components used in the ONU layer 1. SARDANA ONU layer 2 will be shown in
chapters 5 and 6.
The ONU input/output PON interface is a single optical fibre with bidirectional transmission over the
same wavelength of the PON. Its opto-electrical subsystems are based on an APD optical receiver that
detects the 10Gbps downstream signal and an optical transmitter that emits upstream on the same
wavelength, but at 2.5Gbps, for using a 600MHz bandwidth RSOA, with bandwidth enhancement to
achieve 2.5Gbps transmission, as seen in chapter 2.
A commercial ONU alternative, based on low cost tuneable laser from Pirelli and a Luminent APD
receiver was also considered. However, by considering a cost-efficient bidirectional data transmission and
focusing on strategies for the implementation of full-duplex data delivery by using foremost the simple
ASK modulation format, reflective-ONU optical transceiver RSOA-based was taken as the preferred
option, although it raised extra significant impairments in full-duplex transmission with wavelength reuse,
specially Rayleigh backscattering impairment [25,74,93,141-146]. To overcome some limitations of the
RSOA when used as an ONU (bandwidth, noise and crosstalk limitations), several compensating
techniques as downstream ER cancellation, upstream chirped-managed offset-filtering wavelength
dithering and adaptive electronic equalization were implemented [35,70-71,126,135].

133
4.3.1 ONU subsystem RSOA based
The opto-electrical ONU based on a RSOA enables bidirectional transmission over a single fibre with the
same wavelength. The upstream transmission rate was established to be 2.5Gbps in burst mode in order to
be TDM compatible as required in the tree part of the SARDANA PON network. A basic scheme of the
ONU subsystem layer 1 is shown in Fig. 4.3. The ONU-TX is a RSOA device, which is upstream re-
modulated while the arriving downstream signal is partially erased by means of a downstream
cancellation circuit. The ONU-RX consists of a 10G APD photo-detector with TIA.
Fig. 4. 3 - SARDANA ONU basically architecture showing Layer 1 and Layer 2
Fig. 4.4 shows block diagram of the ONU-TX section. TX section requires 3 electrical inputs: the BE
signal to activate the transmission at every burst and inject the bias current to the RSOA electro-optical
device; the 2.5 Gbps differential upstream data; and the downstream cancellation signal coming from the
ONU-RX.
Fig. 4. 4 - ONU-TX blocks diagram detail
The main requirements of these subsystems are listed in Table 4.1.

134
Table 4. 1 - Requirements for the SARDANA ONU RSOA based.
Input Optical Power > -15 dBm
Input DS ER 3 - 4 dB
Nominal RX Bit Rate 10 Gbit/s
RX Sensitivity < -17 dBm
RX electrical Output CML levels >350mVpp (AC-coupling)
Output Optical Power < -2 dBm
Output ER > 6 dB
Optical Gain > 15 dB
TX electrical inputs CML > 350 mVpp
Burst-Enable input 0.5 (OFF)/2.5 (ON)
Nominal TX Bit Rate 2.5 Gbit/s
4.3.2 Downstream cancellation requirement
The re-use of a single wavelength for full-duplex transmission guarantees low CapEx since no extra
amplifiers for a second optical carrier have to be used and the fibre plant can be shared among a higher
number of users due to a higher spectral efficiency. However, the signal to be re-used requires a process
of reconditioning.
For the RSOA, the re-modulation of the downstream signal provides a 3 level upstream signal, which
reduces the upstream eye and makes the transmission more sensitive to impairments like noise and
distortion. The RSOA partially cancels that downstream data intrinsically thanks to the gain saturation of
a SOA. In order to achieve a clearest upstream transmission, electrical and optical techniques for
downstream cancellation from the most basically and cheapest, as counter injecting the same downstream
signal in opposed phase, to advanced techniques can be implemented, differentiating in their performance
and induced complexity [35].
4.3.2.1 A Basic Downstream Cancellation
The RSOA signal was optically delayed to synchronize the DS received data with the electrical data
modulation at the RSOA. A longer optical path in the RSOA way allows to achieve the required delay to
quasi suppress the downstream remaining signal. Fig. 4.5 shows the ONU block diagram with DS
suppression.

135
Fig. 4. 5 - Block scheme of the ONU with downstream cancellation circuit
4.3.2.2 Upstream BER with/without downstream cancellation
Testbed scheme to measure US sensitivity vs. DS ER, by using re-modulated upstream transmission, with
and without downstream cancellation, is presented in Fig. 4.6. The PON data transmission was emulated
with two PRBS generators, one for the DS at 10Gbps DFB-MZM-TX and other for the US at 2.5Gbps.
ER-DS was fixed to 3dB, while ER-US was 6dB. RSOA optical gain was of 14dB. At the OLT sub-
system, an ASE rejection filter was used to adjust the optical input power to a 20GHz receiver. Sensitivity
curves are shown in Fig. 4.7a.
Fig. 4. 6 - Scheme of the upstream sensitivity measures versus Downstream ER
This shows that for appropriate error free upstream operation, the DS cancellation is required; otherwise
there is not error-free upstream transmission.
Fig. 4.7b and 4.7c show the transmitter US eye without and with DS cancellation. Due to the remaining
DS signal, the US data becomes nearly closed eye. By using DS cancellation, upstream signal eye
becomes open allowing for error free data detection.
The RSOA re-modulation tries to erase the 10 Gbit/s downstream signals; it cannot be done perfectly
because the RSOA-TX has a bandwidth of only 1.8 GHz and upstream sensitivity decreases with
downstream ER. So there is a key trade-off on the downstream ER.
RSOA
APD
Coupler
TST
9061
Interface
SARDANA
Transmission
Convergence
(STC)
FPGA-based
SARDANA Layer 2
DS Data RX
US Data TX
Burst Enable
ONU
LP filter
10 Gbps
2.5 Gbps
Peltier
Termistor
TEC
Bias
Circuit
Equalizer
Equalizer
Clock
Recovery
ER
monitor
Decision
Downstream
Cancellation
Circuit
Delay
SARDANA Layer 1
Delay
ER monitor

Fig. 4. 7 – a) Upstream Sensitivity curves for remodulated upstream transmission, with and without cancellation. b)
Upstream eye diagram @2.5Gbps for ER (DS) =3dB without DS cancellation. c) with DS cancellation.
The sensitivity with ER=4dB was between -26 and -29 dBm, as shown in Table 4.2.
Table 4. 2 - Upstream Sensitivity vs. Downstream ER
Upstream BER
Upstream Sensitivity
ER=3dB ER=4dB ER=4.5dB ER=5dB
1E-10 -26.9 -26.3 Floor (1E-08) Floor (1E-06)
1E-06 -29.2 -29 -28.5 -28.2
The optimum DS cancellation signal at the ONU-TX input was found to be around 30mVpp. The ONU
TX Data input amplitude was Vpp CML standard 400mVpp single ended (800mVpp differential) & DS
cancellation signal. Downstream ER higher than 4dB do not allowed for error free transmission.
1.E-11
1.E-10
1.E-09
1.E-08
1.E-07
1.E-06
1.E-05
1.E-04
1.E-03
1.E-02
-40 -35 -30 -25 -20 -15 -10
Up
str
ea
m B
ER
RX-OLT Sensitivity (dBm)
Upstream BitErrorRatio vs Downstream Cancellation
OLT= Carrier &
RSOA Pin=-
15dBm
OLT= Carrier &
RSOA Pin=-
16dBm
OLT-
TX=10Gbps, ER=3
dB, & Rsoa Pin=-
16dBm
OLT-TX=10Gbps +
DS
Cancellation, &
Rsoa Pin=-16dBm
a)
b)
c)

137
4.3.3 Optical network tests
Full characterization of ONU required back-to-back downstream and upstream sensitivity test over
SARDANA with the ER limitation imposed for the bidirectional transmission over the same wavelength.
4.3.3.1 Back-to-back Downstream Sensitivity tests
A downstream signal with ER = 3 to 4 dB was used. Fig. 4.8 shows the scheme and values for the
downstream sensitivity measure.
Fig. 4. 8 - Scheme for the downstream sensitivity measure and BER-Sensitivity for DS-ER of 10, 4 and 3dB.
The obtained sensitivities were -25.3, -20.6 and 17 dBm, for ER of 10, 4 and 3dB, respectively. As can be
seen, the penalty due to the ER reduction from ER=10 to ER=3dB was around 8 dB, while it was around
5dB for ER=4dB. APD multiplication factor was adjusted to M=8, with a bias voltage of 21.1V,
providing proper bandwidth, gain and sensitivity.
4.3.3.2 Back-to-back Upstream Sensitivity test
An external optical source was used to generate the ER=3dB 10Gbps DS signal to be in the same
conditions as the real US and DS bidirectional operation in SARDANA network. Fig. 4.9 shows the block
diagram for the US B2B sensitivity measure and the upstream sensitivity curves (without EDFA
preamplifier at the OLT-RX).
Fig. 4. 9 - Scheme and sensitivity measure of the Upstream Back-to-back.
Because the tested RSOA gain was of 14dB, in order to have 0dBm at the RSOA output, the
recommended input power to the ONU would be of -12dBm to compensate 2dB input coupler loss. Can
be observed that for an optical power at the ONU input of -14 dBm the upstream sensitivity was about -
17dBm, while increasing the ONU input power in 2 dB the sensitivity improves also in 2dB.
1.E-11
1.E-10
1.E-09
1.E-08
1.E-07
1.E-06
1.E-05
1.E-04
1.E-03
-32 -30 -28 -26 -24 -22 -20 -18 -16
BE
R
Pin [dBm]
ER=10
ER=4
ER=3

138
4.3.4 SARDANA ONU Layer 1 Prototype
The ONU Layer 1 Prototype was mainly composed by an ONU-RX system, an ONU-TX system, an
optical coupler and a DS cancellation circuit.
4.3.4.1 ONU-RX section
The ONU-RX section was based on a FRM5N Fujitsu APD receiver + 10Gbps limiting amplifier (based
on a MAX3945). Fig. 4.10 shows a layout of the 10G opto-electrical receiver at the ONU.
Fig. 4. 10 – ONU-RX implementation: APD Fujitsu-RX with the Limiting Amplifier.
Table 4.3 shows the min/max and typical values of the input/output at the RX section of the SARDANA
ONU.
Table 4. 3 – ONU RX section input/output values
Label Name Connector Minimum Values
Typical values
Maximum Values
APD IN Optical Input SC/PC -21dBm -17dBm -5dBm
DS Out DS cancellation SMA 10mVpp 20mVpp 30mVpp
Data Out(+) DS-RXsignal(+) SMA 400mVpp
Data Out(-) DS-RX signal(-) SMA 400mVpp
4.3.4.2 ONU-TX section
The RSOA was acquired in TO-CAN package for lowest cost, and was here externally regulated in
temperature (to about 25 degrees), by means of a designed mechanical assembly. The transmission target
was @ 2.5Gbps, allowing burst mode operation and being TDM compatible. The TX includes a DS input
signal to cancel the DS signal arriving on the optical carrier. The erase procedure was made by re-
modulating a delayed sample of that DS signal in opposed phase in order to counteract the DS incoming
data.

Fig. 4.11 shows the layout of the electrical scheme of the 2.5G burst mode transmitter with RSOA device
at the ONU TX section. It has a high-frequency part with pre-equalizer, another for low frequency, DC
and Burst Enable.
Fig. 4. 11 – ONU-TX system board.
The prototype allows bias current being adjusted by a potentiometer between 50 and 80 mA. Optimum
bias current was around 55 to 60 mA. Also, low frequency gain can be adjusted.
Table 4.4 shows the minimum/maximum and typical values of the input/output at the TX section of the
SARDANA ONU.
Table 4. 4 – ONU TX section input/output values
Label Name Connector Minimum Values
Typical
values
Maximum Values
RSOA
Input/Output Optical Input PC/APC -17dBm -14dBm -5dBm
Data IN(+) Upstream (+) SMA 250mVpp 350mVpp 400mVpp
Data IN(-) Upstream (-) SMA 200mVpp 350mVpp 500mVpp
BE Burst Enable
Input SMA 1.75 Vp step 2.5 Vp step 3.3Vp
DS Cancellation Input
Burst Enable Input
Optical
Input/Output
Data (+) Input
Data (-) Input
BiasAdjust
LowFreq. Adjust

140
4.3.4.3 Optical Coupler
Due to the optical path in the tree section is bidirectional single fibre/single wavelength, a 2x2 optical
coupler was used in order to share signal in the same port between the RX systems and to feed the
reflective TX system, while the 2nd port was used as TX monitor.
For a RSOA gain of 14dB, to have around 0dBm optical power at the RSOA output is required an optical
power at the RSOA input around -14dBm, while to have an error free downstream at RX, around -17dBm
are required. This 3dB difference between the required optical powers for each device can be provided by
the appropriate optical coupler 70%/30%. A 70% of the input power would be for feeding the RSOA
(1.7dB of losses) and a 30% for feeding the APD receiver (5.4dB of losses).
4.3.4.4 SARDANA ONU Layer 1 Assembly
SARDANA ONU prototype front end module is shown in Fig. 4.12, with the detail of the electrical and
optical input/outputs. The optical input is for the bidirectional connector which takes the DS signal to the
ONU and which gives the optical US after DS erasing. The “Monitor” label points for the optical
monitoring output of the ONU.
RX electrical connector is the digitalized output (through a 10Gbps limiting amplifier) to provide the
digital CML electrical inputs suitable for electrical connection to the ONU Layer 2 board in differential
mode. TX electrical connectors are the electrical input data to be modulated for US transmission. The BE
electrical labelled is the electrical Burst Enabled input provided by the ONU Layer 2 circuit to activate
the ONU transmission.
Fig. 4. 12 - ONU module front-end.
Fig. 4.13 shows the picture of the mounted ONU prototype. The RX, the TX, and the DS cancellation
blocks are pointed out. The DS cancellation consists on a double delay line, on one hand, the optical path
to the rONU-TX must be delayed for the RX to detect the DS and re-inject that detected data on the TX to
counteract the optical arriving signal synchronously. A fine electrical delay tuning allows for the DS data
matching.

141
Fig. 4. 13 - Blocks of the ONU Layer 1 prototype module.
Optical and electrical I/O characteristics of the ONU L1 are show in Tables 4.5 and 4.6.
Table 4. 5 - ONU Layer 1 optical input/output characteristics
Label Name Fibre Connector Minimum Values**
Typical Values**
Maximum Values**
OPTICAL
TX/RX*
Optical
Input/out
Bidirectional
input SC/PC -15 dBm -12 dBm -10dBm
OPTICAL
TX/RX*
Optical
Input/out
Bidirectional
output SC/PC -5 dBm -2 dBm 0 dBm
OPTICAL
MON
Optical
Monitor output SC/PC -9 dBm -6 dBm -2 dBm
* OPTICAL TX/RX is only one connector for bidirectional operation (Input and output)
** Output and Input values are considered for a 70%/30% optical coupler.
Table 4. 6 - ONU Layer 1 electrical input/output characteristics
Label Name Connector Minimum
Value
Typical
Value
Maximum
Value
Data IN(+) Upstream(+) SMA 250mVpp 350mVpp 400mVpp
Data IN(-) Upstream (-) SMA 250mVpp 350mVpp 400mVpp
BE IN Burst Enable SMA 1.75 Vp step 2,5 Vp step 3.3Vp
Data OUT(+) Downstream (+) SMA 400mVpp
Data OUT (-) Downstream (-) SMA 400mVpp
Fig. 4.14 shows ONU Layer 1 and ONU Layer 2 prototypes in a rack of the SARDANA Network
subsystems.

142
Fig. 4. 14 - SARDANA rack with two ONU prototypes: ONU layer 2 (above) and opto-electrical ONUs layer 1
(middle) subsystem
4.4 Central Office (CO)
The CO centralizes the light generation for the whole network and its control. The optics at the CO
includes OLT boards, WDM multiplexers, optical pre/post-amplifiers, equalizers, protection switches and
monitors. Protection is centrally actively controlled from the OLT.
4.5 OLT Subsystem
This subsystem includes the OLT optical transmitter and the OLT optical receiver. Fig. 4.15 shows the
basically architecture of the OLT, including of the Layer 2 OLT, that will be presented in chapter 6.
Fig. 4. 15 – General Scheme of the layer 1/2 SARDANA OLT
In the OLT optical transmitter, dithering for the downstream carrier, to face Rayleigh backscattering in
the drop segment of the access network, and a stabilisation, for the optical modulator, are required. The
OLT receiver is simplest. It is based on acommercial XFP 2,5Gbps burst transceiver device.

143
4.5.1 OLT optical Transmitter
The SARDANA OLT was designed to use intensity modulation (IM) format [147-149] with reduced
extinction ratio. The OLT uses fixed wavelength lasers, based on a DFB laser diode, for a cost-effective
implementation. It must completely cover the C-band with 50 GHz ITU grid channel spacing in order to
be able to pass through any SARDANA RN.
An external modulation, based on a Mach-Zehnder modulator was placed for downstream modulation as
the best option for 10Gbps transmission over long distances due to its inherently low chirp.
While the DFB laser diode is fixed to a wavelength channel, it can be tuned by +/- 0.5 nm to locate the
carrier in the pass-band of the RN. Once the wavelength is settled at its desired channel, it deviates by less
than 0.01 nm. In addition, a small triangular modulation of the laser diode current allows for dithering at a
frequency of 10 kHz and a frequency deviation of 10 GHz. The residual amplitude modulation that
derives from the variation of the laser diode current is reduced at the optical modulator.
The optical Mach-Zehnder modulator is stabilised in its output power with a feedback circuit which
receives a small tapped portion of the output signal. The long-term drift was stabilised so that the output
power deviates by just 0.02 dB from its nominal value.
The high frequency data interface shows an electro-optical 3dB bandwidth of 10.2 GHz, while reflections
are below -13 dB in this frequency range.A functional scheme of the OLT is shown in Fig. 4.16.
Fig. 4. 16 – Block diagram of the SARDANA OLT transmission
All the different modules (dithering circuit; DFB laser diode board, current driver and temperature
controller) have been implemented in a prototype, as shown in Fig. 4.17.
Dithering Signal
From SARDANA Layer 2
Optical
Coupler
Power Supply
Dithering
Circuitry
Bias Circuit
& Stabilisation
Optical
Modulator
(Mach-Zender)
Fast Variable
Optical
Attenuator
Optical Source
(DFB laser)
Temperature
Controller
Current
Driver
RF
Interface
Bias
T
-15 +15GND-D +D
Tapped Monitor
Signal
Downstream
Optical
Coupler
Compensation
Signal

4.5.1.1 Dithering for Rayleigh Backscattering Mitigation
Dithering by frequency modulation of the downstream signal must be used to reduce the spectral overlap
and to add incoherence between the upstream and downstream signals to mitigate the penalties generated
by physical effects like Rayleigh Backscattering (RB) as well as from reflections at connectors between
the OLT and the ONU due to the bidirectional optical transmission. In IM-IM transmission, error free
upstream transmission has only been achieved for OSRR values higher than 17 dB [135]. The reduction
of RB requires low modulation frequencies. A significant and stable RB penalty reduction can be
obtained with a modulation frequency of above 3 kHz. Improvements in RB compensation gets to
saturation for frequency deviations of 10 GHz.
(a) Dithering circuitry for delivering a dithering signal to the DFB laser diode
(b) DFB laser diode board
(c) Current driver and temperature
controller for the laser diode.
Fig. 4. 17 - Integration of: a) Dithering circuitry for delivering a dithering signal to the DFB laser diode; (b) DFB
laser diode board; (c) and Current driver and temperature controller for the laser diode.
4.5.1.2 Optical Source
For the optical source, a DFB laser diode (Mitsubishi FU-68PDF) at a fixed wavelength of 1554.13 nm
was taken. The laser diode was packaged in a butterfly module, containing also a thermistor and a Peltier
element for temperature control. For this purpose, a temperature control circuit was attached to the DFB
CurrentDriver
Temp.Controller
CurrentDriver
Temp.Controller

145
be tuned into the centre wavelength of the drop filters in the RN of the PON. The dependence of the
emission wavelength on the temperature can be seen in Fig. 4.18.
Fig. 4. 18 -Dependence of the emission wavelength on the temperature.
4.5.1.3 Optical Modulator and Stabilization Circuit
An optical intensity modulator based on a Mach-Zehnder modulator (MZM) introduces the downstream
onto the optical carrier. Although the achievable ER was less than for an Electro-Absorption Modulator,
this adjusted with SARDANA requirements. Typical values were around 3 dB, and the Vπ voltage of the
used MZM was 4.1V.
To avoid problems with the polarization sensitivity of the MZM, a DFB laser diode with a polarization
maintaining (PM) fibre was connected to the already polarization maintaining fibre pigtail of the MZM.
An integrated attenuator at the MZM was used to counteract the previously induced amplitude
modulation in the DFB laser diode during the dithering process. As this variable attenuator was capable of
operation at the frequency dithering signal, no signal conditioning for the RF path was necessary,
simplifying the complexity and reducing the cost of the OLT transmitter at the same time. In an
alternative approach without variable attenuator, the bias of the MZM and the peak-to-peak voltage of the
RF signal would have to be adjusted to the dithering signal accordingly, requiring gain control in the RF
amplifier at a frequency well above 1 kHz. A stabilization circuit was inserted at the bias circuitry for the
MZM to eliminate drifts that are present over longer time-spans. For this reason, a simple PIN photo
diode was included in the bias circuit, to monitor the output power after the modulator. The stabilization
circuit is provided with the reference bias point, at which the MZM is intended to operate, according to
the desired ER that is chosen for the RF signal. By readjusting the bias point slightly – with a magnitude
that is low enough not to perturb the ER of the RF signal – the present slow drifts can be significantly
suppressed. An optical 5/95 coupler was inserted after the MZM. The overall bias circuitry has to be
delivered with a voltage of +15V, and does not take a current bigger than 20 mA. Long-term
measurements are shown in Fig. 4.19a for the applying the stabilisation circuit. Here there is no visible
drift.
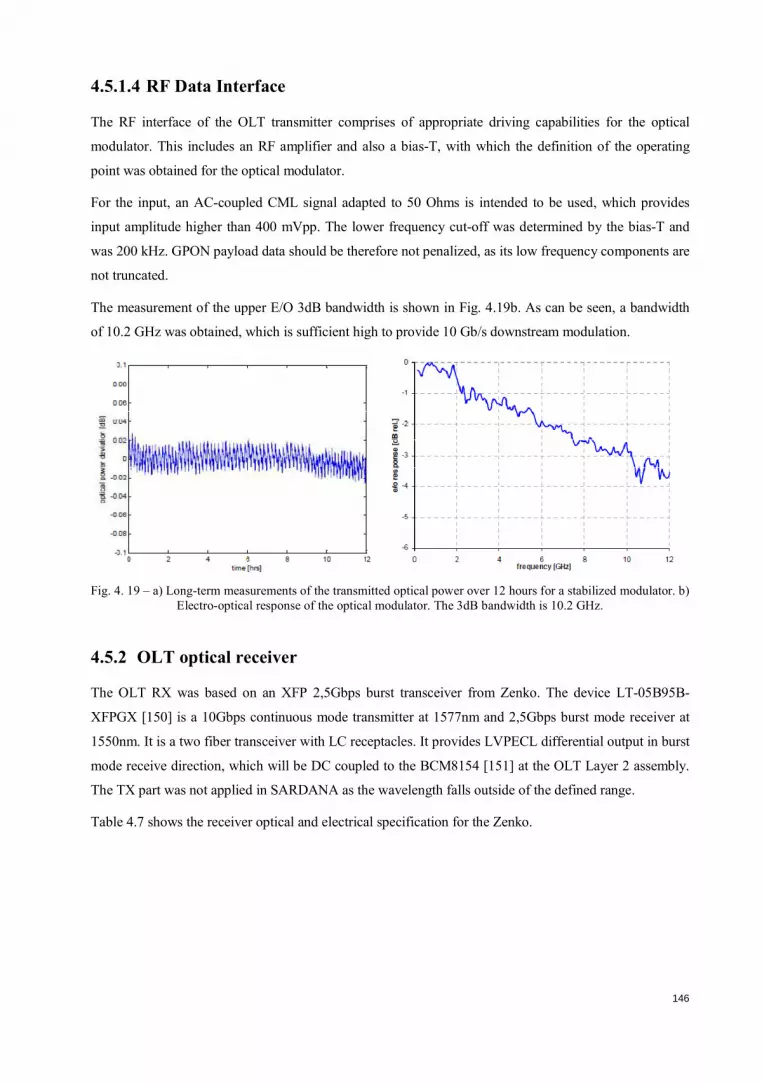
146
4.5.1.4 RF Data Interface
The RF interface of the OLT transmitter comprises of appropriate driving capabilities for the optical
modulator. This includes an RF amplifier and also a bias-T, with which the definition of the operating
point was obtained for the optical modulator.
For the input, an AC-coupled CML signal adapted to 50 Ohms is intended to be used, which provides
input amplitude higher than 400 mVpp. The lower frequency cut-off was determined by the bias-T and
was 200 kHz. GPON payload data should be therefore not penalized, as its low frequency components are
not truncated.
The measurement of the upper E/O 3dB bandwidth is shown in Fig. 4.19b. As can be seen, a bandwidth
of 10.2 GHz was obtained, which is sufficient high to provide 10 Gb/s downstream modulation.
Fig. 4. 19 – a) Long-term measurements of the transmitted optical power over 12 hours for a stabilized modulator. b)
Electro-optical response of the optical modulator. The 3dB bandwidth is 10.2 GHz.
4.5.2 OLT optical receiver
The OLT RX was based on an XFP 2,5Gbps burst transceiver from Zenko. The device LT-05B95B-
XFPGX [150] is a 10Gbps continuous mode transmitter at 1577nm and 2,5Gbps burst mode receiver at
1550nm. It is a two fiber transceiver with LC receptacles. It provides LVPECL differential output in burst
mode receive direction, which will be DC coupled to the BCM8154 [151] at the OLT Layer 2 assembly.
The TX part was not applied in SARDANA as the wavelength falls outside of the defined range.
Table 4.7 shows the receiver optical and electrical specification for the Zenko.

147
Table 4. 7 - Zenko LT-05B95B-XFPGXreceiver optical and electrical specification
Parameter Min Typical Max Units
Optical
Sensitivity -28 dBm
Saturation Optical Power -8 dBm
Operation Wavelength 1260 1650 nm
Date Rate 0 2.7 Gbps
Packet-to-packet spacing 25 ns
BM LOS Rise Time 1 ns
Optical Return Loss 40 @ 1550nm dB
Preamble period 35.2 ns
Electrical
Power Supply Current 130 160 mA
Data Output Voltage - Low 2.4 V
Data Output Voltage - High 1.6 V
Data Output Rise and Fall Time 150 ps
Tolerance to CID 100 bits
As an alternative to the Zenko receiver, a burst mode 2.5Gbps was designed to be adapted to the OLT
Receiver requirements, as shown in Fig. 4.20. The AC coupled receiver consist of several blocks: the
photo-detector PIN+TIA to detect the optical power and convert it into electrical current, a linear
amplifier to adequate the signal power, an electrical module which performs the square root mathematical
function over the incoming signal [152] and a limiting amplifier with differential CML AC outputs.
Fig. 4. 20 - OLT AC RX schematic diagram blocks.
Am
p
Am
p

148
4.5.3 Optical Amplification
Despite the functions of TX and RX, the OLT was designed to provide some extra functionality as optical
amplification. Amplification is performed to boost the DS signals and to preamplifier the US signals. The
booster’s specifications are shown in Table 4.8.
Table 4. 8 - Technical Specification of the high power amplifier
Parameter Values Units
Saturated Output Power 1 – 2 Max W
AC Supply voltage 240 V
Power Consumption 80 W
Mode of Operation Single Channel
Optical Bandwidth 1535-1567 nm
Noise Figure 5.5-6 nm
PDL 0.3 dB
PMD 0.7
Regarding the optical amplifiers, they are facing more challenging burst traffic for the upstream. Several
approaches for burst mode optical pre-amplification were analysed and finally, a new approach based in
high pumping combined with feed forward stabilization has been implemented in the prototype of optical
amplifiers required for the integration of the OLT.
After checking several versions and a comparison of the performances (summarized in table 4.9) the
Hybrid (1st stage fully linear plus a second stage stabilized by a feed forward signal) was implemented, as
shown in Fig. 4.21.
Table 4. 9 - Comparison of the performances
Noise Figure
Pump power requirements
Flexibility Stability (15 dB dynamic range)
Dual stage fully linear
preamplifier 4.6 dB 32dBm Pump power Best
Clamped preamplifier 5.1 dB 25 dBm Pump power + 2
Clamping signals Good
Hybrid Preamplifier 4.9 dB 29 dBm Pump power + 1
clamping signal
Good
(Best trade
Off)

Fig. 4. 21 - Hybrid amplifier design and prototype
4.5.3.1 Pump generation
The CO concentrates the pump generation for the remote amplification at the passive fibre plant and the
RNs. One prototype was built (Fig. 4.22) providing up to 8 W of pump at 1480 nm, based on a fibre laser
Raman modules fabricated by Keopsys.
Fig. 4. 22 - Internal scheme of the fibre based pump source for remotely pumped amplification and SARDANA
prototype fibre laser pump source.
Fig. 4.23 shows the configuration of the Remote Amplification System at the Central Office in the
SARDANA network.
Stage 2
Stage 1
Stabilizing signal
Laser diode
99% / 1% 99% / 1% Keopsys fibre laser module
19”, 3 units high Rack
Return Monitor Emission Monitor
50% / 50%
Output 1 Output 2
Isolator
FAN units
DCF
Signal in
Signal out
Stage 1
Stabilizing signal
Stage 2

150
Fig. 4. 23 - Remote Amplification System at the SARDANA Central Office
4.5.4 OLT subsystem racks
Fig. 4.24 shows the fully equipped OLT rack in the SARDANA demo lab environment.
Fig. 4. 24 - OLT racks: The 2100mm rack is equipped with the Service switch, two OLT Layer 2 sub-racks, four
OLT transmitter assemblies, two DWDM multiplexer/demultiplexer pairs for East and West ring segments,
protection and monitoring assembly, and fibre connect.

151
4.6 ODN (Optical Distribution Network)
The segment of network approached by SARDANA is the metro-access network. Fig. 4.25 represents the
end-to-end segmentation of the architecture with a maximum metro section = 80km and maximum access
section = 20km.
The network topology is hybrid with a central WDM ring, to offer instant communication protection in
case of fibre cut, plus TDM single-fibre trees, to the homes. The Remote Nodes perform wavelength
add&drop routing and optical amplification, although being fully passive. Strict passiveness is preserved
in the external fibre plant to minimize infrastructure cost.
The optical connection of the users by ONUs in the network of access is ensured by a point-to-point
architecture or point-to-multipoint (PON). At the border of the metro-access, one finds with the central
office with a specific optical equipment like the OLT of the PON.
Fig. 4. 25 – SARDANA metro-access Optical Distribution Network
SARDANA can be applied to different geographical and functional scenarios, regarding distances (ring,
feeder, drop), user density, user distribution also as integration collector of other access media like xDSL
or Cable Modem. Thus, 6 different scenarios were tested: Urban 1, Urban 2, Metro, Rural, Collector and
WDM-PON, as shown in Table 4.10. This last scenario is a particular case of no TDM (1:1 splitting),
using for point-to-point connections.
1:16
RN i
Signals
λλλλi1, 2, 3, 4
2:2 1:16
2:2
1:16
1:16
2km
λλλλi1, i2
200GHz
100GHz
1km
50/50 λλλλi1
Common
Rest
λλλλi3, i4 50GHz
λλλλi1
ONU
ONU
50GHz
λλλλi3
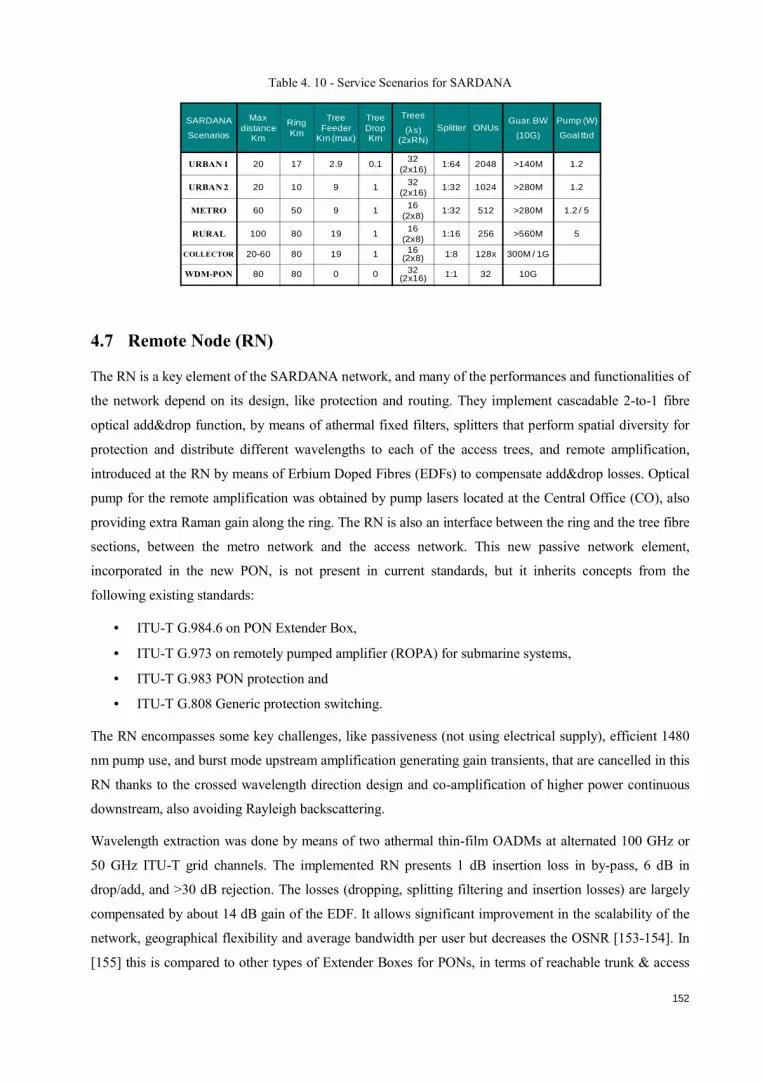
152
Table 4. 10 - Service Scenarios for SARDANA
4.7 Remote Node (RN)
The RN is a key element of the SARDANA network, and many of the performances and functionalities of
the network depend on its design, like protection and routing. They implement cascadable 2-to-1 fibre
optical add&drop function, by means of athermal fixed filters, splitters that perform spatial diversity for
protection and distribute different wavelengths to each of the access trees, and remote amplification,
introduced at the RN by means of Erbium Doped Fibres (EDFs) to compensate add&drop losses. Optical
pump for the remote amplification was obtained by pump lasers located at the Central Office (CO), also
providing extra Raman gain along the ring. The RN is also an interface between the ring and the tree fibre
sections, between the metro network and the access network. This new passive network element,
incorporated in the new PON, is not present in current standards, but it inherits concepts from the
following existing standards:
• ITU-T G.984.6 on PON Extender Box,
• ITU-T G.973 on remotely pumped amplifier (ROPA) for submarine systems,
• ITU-T G.983 PON protection and
• ITU-T G.808 Generic protection switching.
The RN encompasses some key challenges, like passiveness (not using electrical supply), efficient 1480
nm pump use, and burst mode upstream amplification generating gain transients, that are cancelled in this
RN thanks to the crossed wavelength direction design and co-amplification of higher power continuous
downstream, also avoiding Rayleigh backscattering.
Wavelength extraction was done by means of two athermal thin-film OADMs at alternated 100 GHz or
50 GHz ITU-T grid channels. The implemented RN presents 1 dB insertion loss in by-pass, 6 dB in
drop/add, and >30 dB rejection. The losses (dropping, splitting filtering and insertion losses) are largely
compensated by about 14 dB gain of the EDF. It allows significant improvement in the scalability of the
network, geographical flexibility and average bandwidth per user but decreases the OSNR [153-154]. In
[155] this is compared to other types of Extender Boxes for PONs, in terms of reachable trunk & access
SARDANA
Scenarios
Max distance
Km
Ring Km
Tree Feeder
Km (max)
Tree Drop Km
Trees
(λs) (2xRN)
Splitter ONUsGuar. BW
(10G)
Pump (W)
Goal tbd
URBAN 1 20 17 2.9 0.132
(2x16)1:64 2048 >140M 1.2
URBAN 2 20 10 9 1 32 (2x16)
1:32 1024 >280M 1.2
METRO 60 50 9 116
(2x8)1:32 512 >280M 1.2 / 5
RURAL 100 80 19 116
(2x8)1:16 256 >560M 5
COLLECTOR 20-60 80 19 1 16 (2x8) 1:8 128x 300M / 1G
WDM-PON 80 80 0 0 32(2x16) 1:1 32 10G

153
power budget. Were specified up to 16 RNs (32 wavelength channels), with a splitting ratio between 1
and 32 each. A basic diagram of the RN main blocks and its implementation is shown in Fig. 4.26.
Fig. 4. 26 - Remote Node a) basic structure and b) physical implementation
4.7.1 SARDANA RN operation
A basic operation of a SARDANA RN can be resumed in the next steps:
� The Central Office sends WDM signals to the Remote Nodes (RN)
� Each RN drops its assigned channels as the corresponding wavelength by 2 filters and a splitter
50:50 for resilience that splits the signals to two TDM trees
� Signals are amplified by EDFs
� The Remote Nodes receive the pumping power for the EDFs from the WDM ring
� Once amplified, the signals are transmitted to the ONUs
This operation is presented in Fig. 4.27.

154
Fig. 4. 27 – Basic operation of a SARDANA Remote Node
The RNs are completely transparent in the ring and compatible with the already deployed fibre structures
being no modification required as the network updates. The introduction of a new RN in the ring is a
simple task and just implies the transmission of two more wavelengths from the CO (one for each tree
served) [156].
4.8 SARDANA Test-bed
The implemented testbed demonstrates the following features: truly-passive extended PON, fundamental
resiliency, up to 1024 ONUs per PON, up to 100 km reach, 32 x 10G/2.5 Gbit/s (XGPON1 rates),
wavelength-agnostic single-fibre ONUs, neutral multi-operability optical infrastructure and cost
efficiency. A set of technological advances were developed in the project, like remotely pumped optical
amplification, colourless reflective ONU, optical downstream cancellation, 10G/2.5G MAC, compatible
with the xGPON GTC, etc. To stress the network, advanced new broadband multimedia services were
exhibited.
Fig. 4.28 shows the system diagram of the SARDANA test-bed, for the demonstration in Tellabs Oy
premises (Helsinki-Finland) [51]. It shows the ring-tree PON optics, the WDM routing and protection
modules, the colourless physical transceivers, the MAC section, the Ethernet clients and the service
layers. Five ONUs have been assembled for this demo.
The OLT was composed of the optical amplification stages, the pump source, the WDM multiplexing, the
Protection & Monitoring system, the coloured burst-mode transceivers, and the electrical circuits of the
RN iSignals
λλλλi1&2
2:2
1:16
1:16
λλλλ i1
200GHz
100GHz
50/50
λλλλ i2
1:32
1km
CO
RNn RN1

155
layer 2 (MAC and the Ethernet interfaces and OMCI control). A 10Gbit/s CX4 electrical Ethernet
interface connected OLT to the service nodes that supplies IP/Ethernet based Internet, IPTV and
Videoconferencing services. Different VLANs were used to separate services from each other.
Fig. 4. 28 - SARDANA testbed scheme (left), demo setup, downstream east spectrum, burst mode upstream frame,
DS and US eyes (right).
The 10Gbit/s serialized output drives the coloured DFB-MZM transmitters at the C-band in the odd 50
GHz ITU grid; they include frequency dithering for Rayleigh scattering reduction and modulation control,
fixing the DS-ER to 3.5 dB. The RX was based on burst-mode PIN TIA with SQRT compressor.
The protection module routes every wavelength channel to the East or West side of the PON ring,
depending on the corresponding RN distances and the ring protection conditions. It is based on an array
of mechanical switches, with total insertion loss below 2 dB, controlled by the Protection & Monitoring
module.
Four AWG multiplexers (East/West, Downstream/Upstream) set the WDM multiplex, passing through
DCF modules compensating 40Km of SSMF, optical booster/pre-amplifier and pump couplers. The
output power was 7 dBm per channel. The pump module, based on a Keopsys Raman fibre laser (@1480
nm), provided 1 W to the upstream fibres. Fig. 4.29 shows a part of the SARDANA testbed
implementation for the demo.

156
Fig. 4. 29 - SARDANA testbed implementation for the demo.
The central ring, doubled for DS and US, connects the Remote Nodes that add&drop two 100 GHz
adjacent wavelength channels to two access trees. This ring fibre length ranged from 20 to 100 Km.
The demo testbed included three RN (other RNs were emulated with attenuators). The RN provided
optical amplification of 10 up to16 dB, depending on the location, to overcome the extended power
budget requirements of the extracted channels, by means of internal EDFs remotely pumped from the
OLT. Each RN drops a fraction of the pump power travelling through the upstream ring [157]. The
bypass insertion loss of the RNs was only about 1 dB, guaranteeing ring scalability.
Every access TDM tree distributed a wavelength channel to the single-fibre single-wavelength colourless
ONUs. Three of them were based on RSOA, in simple TO-CAN package, modulated at 2.5Gbps with
pre-emphasis, providing upstream ER of about 7dB, and silent level of -12 dB at burst disable. The APD
received 10 Gbps downstream data counteracts the RSOA gain to reduce the DS ER crosstalk from 3.5
dB to 1.5 dB, thus being able to reuse it. The optical ONU gain, including the 30:70 coupler, was about
12.5 dB, launching -4 dBm. Other ONU were based on C-band tuneable laser externally modulated at
10G, on SOA-REAM and on SFP transceiver. A 10/100/1000 Base-T electrical Ethernet interface
connected ONU to the user’s nodes that receive IP/Ethernet based Internet, IPTV and Videoconferencing
services.
AWGs
MAC ONU 2
Pump &
Pre-Amp
PHY OLT 1
MAC OLT 1
MAC OLT 2
Tunable OLT
Boosters
MAC ONU 1
Evaluation
boards
RN1 & RN2
Fiber spools
10 GEth
SwitchesPHY ONU 2
PHY ONU 1
PHY ONU 2
PHY OLT 2

157
The upstream data was replicated to both sides of the ring by the RN, reaching the OLT, where it is pre-
amplified, WDM de-multiplexed and direction-selected by the protection module, lead to the RX. To deal
with its bursty nature, specific optical gain clamping techniques were developed, keeping the transient
distortion below 1dB. Extra 2dB of gain were obtained in the last upstream links because of Raman
amplification.
4.8.1 SARDANA Network tests
For the first time, the built Scalable Advanced Ring-based passive Dense Access Network Architecture
[51] was publicly demonstrated, experimentally showing the key concepts and results. Performances,
functionalities, requirements and impact on the deployment will be here discussed.
Three different test-bed public demonstrations with a high positive broad impact where made: the first
one in Espoo (Finland) in October 2010, the second in Lannion (France) in January over the metropolitan
18 Km ring cable, and the third one in the FTTH’2011, in Milan, in February [158-162]. In them, the key
functionalities and performances were tested and demonstrated using the built SARDANA prototype.
As a part of SARDANA system integration, the following network functionality was tested and
demonstrated in the first demo (Stakeholder demo in Helsinki-Finland):
• HD-video downstream/upstream up to eight HD-video channels delivered simultaneously from
SARDANA OLT/ONUs to STBs connected to SARDANA ONU/OLT using a commercial IPTV
delivery platform.
• Point-to-point Gigabit Ethernet delivery over the SARDANA network wavelength between ONU
and OLT sites, showing bidirectional video transmission.
• Ring protection switching between the East and West SARDANA ring for P2P GE transmission
based on fault detection by monitoring signals built in the protection and monitoring subsystem
(P&M) of the SARDANA system.
• Control IPTV service activation/deactivation from the OLT CPC to the ONU CPC via OMCC
over the SARDANA OLT and ONU MAC implementation.
Different services have run in parallel through the SARDANA network over four wavelength channels in
operation. Fig. 4.30 shows the network testbed scheme assembled for this demonstrator tests.

158
Fig. 4. 30 - Network setup for SARDANA demonstrator tests in Helsinki-Finland.
OLT1
10G Switch
Mux
ONU1
split1
VideoServer
W-5km
2km
RN1 5km
Mux
Pump
pamp bamp
RN2
P&M
E-5km
MuxMux
bamp pamp
Pump
OLT2
ONU2
split2
CPC
CPC
RRN
5km
split3
2km
ePC
ePC
OLT1
10G Switch
Mux
ONU1
split1
VideoServer
W-5km
2km
RN1 5km
Mux
Pump
pamp bamp
RN2
P&M
E-5km
MuxMux
bamp pamp
Pump
OLT2
ONU2
split2
CPC
CPC
RRN
5km
split3
2km
ePC
ePC

4.8.2 SARDANA Field Trial
The SARDANA network was installed over open fibre network in the Bretagne Lannion area (France), in
January, 2010. An 18 Km 12-fibre ring cable connected the Imagine-Lab (where the OLT and the main
equipment were installed), the ENSSAT (with a RN and ONU), and Orange Labs (with another
through a distribution tree), drawn in the Fig. 4.31.
The total ring loss was about 9 dB, including the losses of the SC/APC connectors at each location
panel. Extra 20 Km and 5 Km fibre spools where added between the OLT and the first and
respectively, at Imagine-Lab, composing a 43 Km ring. The single-fibre tree had a length of 5 km, and a
splitting of 1:16 (plus variable attenuator). A HD Video-Conferencing was established
communication with the remote ENSSAT location (at 8.7 East /8.8 km West).
Fig. 4. 31 – a) Field trial network scheme, b) Detail of the Imaging Lab and Orange Lab connection, and c) Lannion
ring map (in yellow).
Imagin Lab
Ilab Japan
LZI FT R&D
WE010
FT R&D
LF028
FT R&D
LD910
FT R&D
SC/APC
SC/APC
SC/APC
SC/APCSC/APC
SC/APC FC/PCFC/PC
500m
500m
200m
1320m
Orange Labs
Sardana Show Room
Total fiber length : 2520mSC-APC connectors except at WE010 where it is FC-PC (reflection of 25dB)
Connection between Imagin Lab and Orange Labs
SARDANA
Ring
SC/APC
1dB /0.95dB0.5dB/0.4dB
0.6dB/0.65dB
0.7dB/ 0.7dB
LZI
WE
LF
LD
LF
WE
LZI
PIR
PIR
Fibre 1 / Fibre 2
RN1100/5%
ONU21
ENSSAT labs
Hotel Enterprises
2km 2km
12x18kmImagin Lab
Showroom
RN2100/5%
RNrec2km 2km
ONU23
X km
X km
Y km
Y km
Orange Lab
ONU22
Kermaria
(administrative)
Tree Fibre
Fibres to RN (US&DS)
Ring Fibres
8700m ; 1,6dB US (#13)
2dB DS (#14)
8800m ; 2,35dB US (#13)
1.7dB DS (#14)
2.5km2.8dB
#13
#14
#14
#13

160
• Neutral multi-operator/service: different standards, bit rates and protocols were simultaneously
transported through the SARDANA network transparently over the wavelength channels. Fig. 4.32
and Table 4.11 summarize the obtained performances in terms of ring length, maximum number of
ONUs and down/up bit rates.
� 10G/2.5G XGPON1 MAC with 2 RSOA ONUs in a tree.
� Bidirectional 10G Ethernet with tunable lasers at ONU and OLT.
� Standard 1GEth SFPs with RSOA transceiver and evaluation board.
� Standard 1GEth SFPs with commercial RSOA SFP transceiver (pure WDM-PON).
� Standard 1G Eth SFPs, with fixed lasers at 1550.12 nm (up/down with slight drift).
� 10G/10G 231-1 PRBS with SOA-REAM ONU.
Table 4. 11 – SARDANA’s performance in terms of ring length, maximum number of ONUs and down/up bit rates.
Demo Application ONU L ring (km)
Split ONUs
Espoo 10/2.5 Gbps RSOA 25 16 256
Lannion 10/2.5 Gbps BM RSOA 43 16 256
Lannion 10G/10G Eth Tunable Laser 43 8 128
Lannion 10G/10G PRBS SOA-REAM 75 4 64
Lannion 10G/2.5G PRBS RSOA 23 64 1024
Lannion, Milan 1G/1G Eth RSOA 43 32 512
Lannion 1G/1G Eth SFP 43 64 1024
Lannion Commercial 2.5G RSOA SFP 43 2 32
Barcelona 10G/5G PRBS RSOA 100 16 256
• High-bandwidth real-time bidirectional HD multimedia services, over the different WDM channels:
� HD-Video downstream broadcast and HD-Video upstream, from ONU to server.
� HD-Video Conferencing; a P2P VLAN is configured between two ONUs by creating two 1:1
VLAN from OLT to two ONUs VC service ports that map to VC-GEM port IDs across the
SXGPON.
� Service control over OMCI (CPC-to-CPC).
• MAC ranging over differential 6 Km of two TDM ONU channels in a XGPON frame (70 Km in
separate tests).
• ONU colourlessness: a RSOA ONU, first operating at the 1551.32, was exchanged with others
RSOA ONUs. The service continued the operation correctly, with sensitivity differences below 2dB.

161
• The total power budget, considering the metro ring and the access trees, is about 35 dB, for the
reference 10/2.5Gbps channel. The DS and US are balanced by means of the DS-ER and the ONU
splitter. Sensitivities were measured at 10-6 BER, where pixelation starts to be visible.
• 1024-ONUs was practically emulated, adding optical attenuators and dummy channels.
• Rayleigh backscattering and reflection tolerance: with the implemented techniques, like wavelength
dithering, the impairment was negligible up to 6 Km of drop fibre, and using angled connectors.
Fig. 4. 32 - Performances of the systems transported in the SARDANA test-bed
• Resiliency; the OLT RX LoS alarms with fibre disconnected between RNs and between OLT and
RN, triggering the P&M (Protection and Monitoring) system to reroute the channels. Protection
switching proved not to interrupt nor impair the Ethernet connection: video transmission quality
remained unchanged to the eye, since switches activation is around 20 to 25 ms. The differential
sensitivity between normal mode and protection mode of the different channel transmissions were
below 3 dB.
4.9 Energy efficiency
Different long-reach optical access networks are studied with respect to their power efficiency. Special
focus is dedicated to the hybrid TDM/WDM PON proposed in the SARDANA project, in which remote
amplification is utilized for reach extension. The structures of the remote nodes and subsystems for reach
extension are shown and discussed in [163]. In principle two SARDANA situations were considered:
SARDANA with “non-commercial” devices (SARDANA1), and SARDANA with market ready
components (SARDANA2).
In Fig. 4.33, the results for unlimited and limited upstream are reported. SARDANA, especially the
version 2, expresses the best performances in terms of power efficiency. The influence of uplink capacity
limitation on power efficiency is evaluated, i.e., the access networks’ efficiencies are presented for
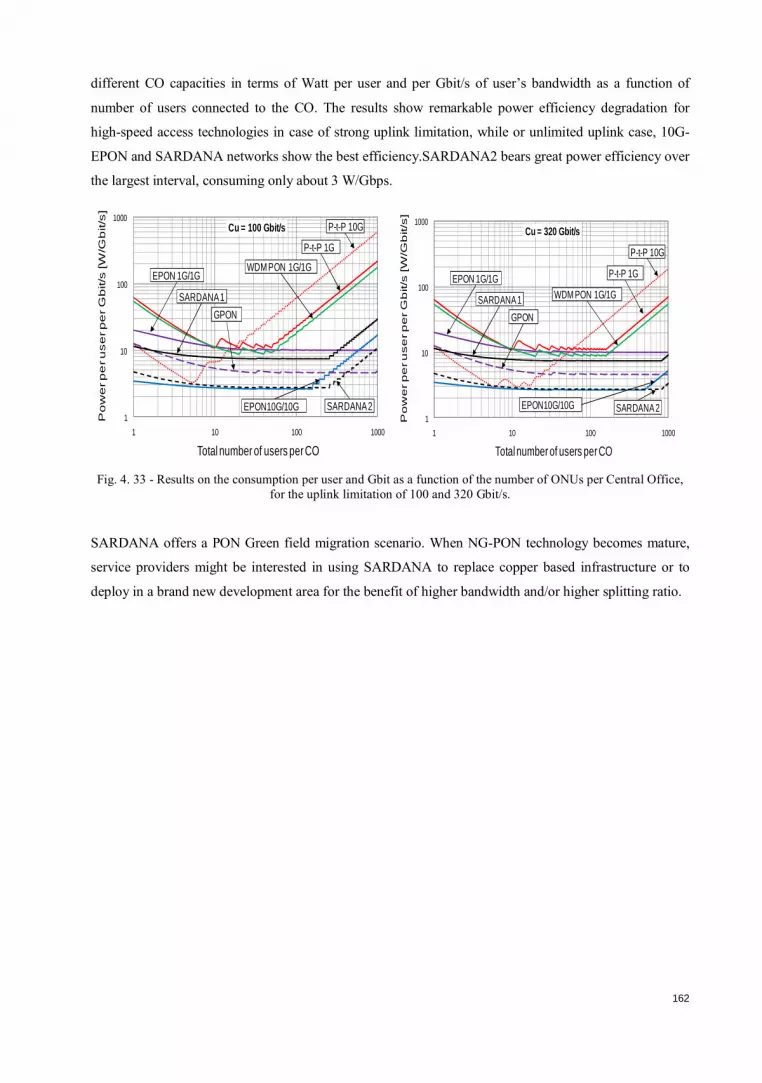
162
different CO capacities in terms of Watt per user and per Gbit/s of user’s bandwidth as a function of
number of users connected to the CO. The results show remarkable power efficiency degradation for
high-speed access technologies in case of strong uplink limitation, while or unlimited uplink case, 10G-
EPON and SARDANA networks show the best efficiency.SARDANA2 bears great power efficiency over
the largest interval, consuming only about 3 W/Gbps.
Fig. 4. 33 - Results on the consumption per user and Gbit as a function of the number of ONUs per Central Office,
for the uplink limitation of 100 and 320 Gbit/s.
SARDANA offers a PON Green field migration scenario. When NG-PON technology becomes mature,
service providers might be interested in using SARDANA to replace copper based infrastructure or to
deploy in a brand new development area for the benefit of higher bandwidth and/or higher splitting ratio.
1
10
100
1000
1 10 100 1000
EPON10G/10G SARDANA 2
Total number of users per CO
Po
we
r p
er u
se
r p
er G
bit/s
[W
/Gb
it/s
]
Cu = 100 Gbit/s
P-t-P 1G
WDM PON 1G/1G
P-t-P 10G
SARDANA 1
GPON
EPON 1G/1G
1
10
100
1000
1 10 100 1000
SARDANA 1
GPON
EPON 1G/1G P-t-P 1G
WDM PON 1G/1G
P-t-P 10G
EPON10G/10G SARDANA 2
Total number of users per CO
Po
we
r p
er u
se
r p
er G
bit/s
[W
/Gb
it/s
]
Cu = 320 Gbit/s

163
4.10 Conclusion
The new all-optically integrated metro-access network proposed in the SARDANA has demonstrated
practical feasibility, extended performances, functionality and efficiency in terms of cost and energy
consumption, aiming towards future FTTH. A number of technical innovative advances, summarized in
next table, have been developed to achieve the SARDANA goals:
• End Users/PON increased from 64 to 1024 users; 100-kilometer reach, integrating metro &
access network; and 2.5 Gbps to 10 Gps, for symmetrical 300 Mbps per user, carry to “One Order
of Magnitude” the state-of-art (at that instant).
• WDM Ring + TDM Trees, flexibly allocated, by doing Scalable and Upgradeable the network.
• A competitive cost structure and infrastructure minimized: complexity centralized at the CO,
WDM Ring + TDM Trees, passive external plant bi-directional single-fibre / single-wavelength
access, colourless reflective ONUs, US for wavelength reuse.
• No Maintenance, No Power Needed with a passive external plant (RN optically powered from
Central Office).
• Robustness of network, through the use of a dual-ring protection, for centralized management and
light generation, and for a dynamic EE and resource allocation.
• Neutral Network, with support and compatibility with standards XGPON, GPON, BPON, EPON,
10G Ethernet (multi-operator capable).
SARDANA optimize and extends the design, architecture and capabilities of the WDM/TDM PON
presented in the chapter 2.
The implemented test-bed demonstrated truly-passive extended PON, fundamental resiliency, XGPON1
rates, wavelength-agnostic single-fibre ONUs, neutral multi-operability optical infrastructure and cost
efficiency in practical condition.
The technological advances developed in the project, like distributed add&drop, remotely pumped optical
amplification, wavelength dithering, colourless reflective ONU with optical DS cancellation and opto-
electronic equalization, and 10G/2.5G XGPON MAC, enable the feasibility of the new network concept
for its application in future PON migrations. Enhanced performances can be pursued with improved
RSOA or tuneable laser technologies, with burst-mode RX and FEC coding, and with optimization of the
MAC and signalling procedures on the Layer 2, as will be seen in the following chapter.

164
Chapter 5
5. NG-PON Layer 2 Optimization
This chapter provides a comprehensive discussion focused on the architecture, signalling and protocols of
the NG-PON layer 2 and its optimization.
From the G.987.3 FSAN-ITU standard recommendation [97] (and backwards compatible), it expands this
discussion to propose a design for the SARDANA network architecture, in line with their Metro-Access
dimensioning and PHY characteristics.
Special attention is given to the SARDANA Transmission Convergence (STC) layer, each of their sub-
layers and the different header formats, as well as the processes of medium access control (MAC) and
ONU initialization.
The flexibility of the proposed architecture provided to future Dynamic Bandwidth Assignment
algorithms aimed to achieve efficient Quality of Service requirements.

165
5.1. SARDANA NG-PON (SPON) Layer 2
This section presents a proposal for SARDANA Transmission Convergence (STC) Layer and guidelines
of the MAC system as a function of the PHY layer particularities. In general, SARDANA TC protocol
could be used or extended to next generation network architectures.
A number of system functionalities, common to existing networking technologies (metro-WDM, GPON,
XG-PON or 10GEth systems), have to be incorporated in the SARDANA’s Control and Management
planes and others are extended to exploit the SARDANA’s PHY layer characteristics.
So, SARDANA 10 Gigabit-capable PON TC Layer proposal is inspired mainly in the ITU/FSAN
specifications and preserves relevant features that are straightforward implemented [97,164-168]. Also,
SARDANA considers co-existence with GPON [99,125,169-170] and GE-PON [94], compatibility with
XG-PON1; and with the SXGPON, the initial proposal for SARDANA from Tellabs [171]. Fig. 5.1
shows a scheme of this genesis.
Fig. 5. 1 - SARDANA MAC architecture layer 2 overview
So, this proposal considers boundary conditions related to SARDANA metro/access network,
bidirectional transmission on single-fibre/single-wavelength with downstream carrier reuse (by use of
rONUs), long reach, physical impairments and cost-effective implementation.
A SARDANA OMCI (ONT Management and Control Interface) was developed as a part of this project.
This protocol session allows SARDANA layer-2 architecture to implement control for the ONUs. OMCI
discussion is not addressed in this work.
SARDANA MAC Architecture – Layer 2
Optimization
ITU-T/FSAN
G.984.3/G.987.3
SARDANA
boundary
conditions
SXGPON
proposal
SARDANA
OMCI
SARDANA PHY – Layer 1

166
5.1.1. SARDANA NG-PON Layer Architecture
Fig. 5.2 shows a protocol view point of the SARDANA system architecture on the OSI network reference
model. SARDANA 10 Gbps Transmission Convergence layer (STC) is positioned between the PHY layer
and the SARDANA’s services layer (Ethernet and OMCI clients).
Fig. 5. 2 - SARDANA NG-PON system architecture
Similarly to XGPON-XGTC (in annex A), SARDANA divides the Transmission Convergence (TC) layer
in three sub-layers (the STC service adaptation sub-layer, the STC framing sub-layer, and the STC PHY
adaptation sub-layer), with basically the same functionality.
The OMCI client is the OMCI message processing entity that communicates with the Service Adaptation
sub-layer [164].
An Ethernet interface section at the OLT/ONU allows layer 2 protocol communication between
SARDANA and entities (service provider and user premises), and PHY Ethernet frame transport through
the SNI/UNI interfaces.
5.1.1.1. SARDANA OLT layer Architecture
Fig. 5.3 shows the layer design for the SARDANA OLT. STC layer consists of a Control and
Management (C/M) plane, which manages user traffic flows, OAM features and signalling for reliable
data transmission. A User plane (U) carries user data traffic.

167
Fig. 5. 3 - SARDANA OLT system architecture on the OSI network reference model
An option to incorporate QoS from the upper layers, in particular from diffserv IP layer protocol, is
suggested in this work through of the implementation of the SARDANA GPON Encapsulation Method
(SGEM) header.
The Physical Layer Operation, administration and management (PLOAM) processor [97] and Dynamic
Bandwidth Allocation (DBA) control are implemented on the STC header in the Framing sub-layer.
The STC frame is FEC processed, scrambled and serialized before to be sent to PHY layer.
5.1.1.2. SARDANA ONU layer Architecture
As the OLT, similar functionalities are being developing at the SARDANA ONU layer architecture.
However, different to OLT, an upstream bandwidth management implements the functions of sending the
T-CONT status information to the OLT DBA control. Fig. 5.4 shows SARDANA ONU system
architecture on the OSI network reference model.

168
Fig. 5. 4 - SARDANA ONU system architecture on the OSI network reference model
Particular Ethernet SARDANA interface uses an UNI three-port 10/100/1000 Base-T for Ethernet
connexion with the user’s premises.
PON ODN
User
premises
OMCC
PHY Layer
SGEM TC Adapter
TCP/UDP
(RTP,RTCP)
IP
Eth
MAC
Eth
PMD
SNMP
ONU MIBApplications
OMCI
QoS
DiffServ
Service
Adaptation
Sublayer
Eth
PMD
Eth
MAC
ONU
OMCI
Adapter
US-BW
Manag.
Ethernet
Interface
PLOAM
Processor
Framing
Sublayer
STC Framing
PHY Adaptation
Sublayer
FEC, Scrambling, SERDES
UNI
C/M Plane U Plane
Header Payload
PayloadHeader
10/100/1000 Base-T
Layer
5,6,7
Layer
4
Layer
3
OSI
model
Layer
2
Layer
1
STC

169
5.1.2. SARDANA Transmission Convergence (STC) Design
SARDANA TC layer specifies the formats and procedures of encapsulation from/to upper layer SDUs for
its transport via the optical distribution network (ODN) and the ONUs’ medium access control (MAC) in
the PON.
SARDANA TC system is a mid-term upgrade of the GPON GTC in-line with the XG-PON protocol
specification from FSAN participants, specifically XG-PON1 TC (XGTC) for compatibility reasons.
However, necessary modifications, adaptations and extensions are required to the new features of the
SARDANA system, attending to:
• The increased service demands in NG-PON: PON long reach, more ONUs and more users per
PON (this forces to implementing an agile ONU initialization process and to simplify the ranging
mechanism);
• Different ODN topologies: WDM ring and TDM tree linked, with aggregation and overlaying
from/to GPON/EPON TDM trees by wavelength multiplexing, serving each multiplexed TDM
network (a wavelength allocation algorithm for tuneable RN would optimize the wavelength
distribution, by considering that our ONUs are colorless; it was not implemented in this work);
• Passive ODN long-reach (up to 100 km), based on the use of passive remote nodes with EDF
remote pumping with extra Raman amplification, generating extra power budget for covering
extra longer distances;
• Cost-efficient implementation of the PHY Layer with improved performance and complexity
reduction: ODN tree section with one fibre/one wavelength and colourless ONUs based on
reflective SOAs (this forces to apply a DBA mechanism able to avoid cases where RB can affect
the upstream transmission);
• Network impairments from the downstream channel reuse in the upstream transmission (TDM
section) and non-linear transmission impairments from remote pumping (WDM section),
requiring new monitoring techniques of impairments;
• FEC techniques. It would provide also strong robustness to access networks and to increment the
power budget;
• Support for multi-operator/multi-service feature. This is an important strategy to implement an
open network infrastructure. It provides the capability of a customer to choose between several
operators sharing the same external infrastructure. This functionality could be also possible from
the Passive Remote Node advanced design, and can be implemented at different layers and with
different techniques. This forces to optimize some fields in the original GEM/XGEM and XTC to
allow internetworking multi-level.
The management & control planes are structured in sub-layers for the processes of service adaptation
(from/to higher layers), framing of the information to be transported and physical adaptation to optical

170
transmission/reception. These processes are implemented by means of messages, added on the frame’s
header. User plane is implemented to data transport into STC payload.
Similar to XGTC, the frame formats are devised so that the frames and their elements are aligned to 4-
byte word boundaries. Also, information is transported over the PON network into 125 us frames.
5.1.3. SARDANA TC Service Adaptation Sub-layer
This sub-layer is responsible of the encapsulation, multiplexation and delineation of the SDUs (Ethernet
frames or other layer-2 protocols and OMCI information) into GEM frames adapted to SARDANA
(SGEM). In the practice, the principal function of this sub-layer is to provide a well-defined service
interface for the upper layers in order to send information at the destination on transparent fashion.
5.1.3.1. SARDANA GEM (SGEM) Frame basic functions
A new GEM is proposed for SARDANA, named SGEM. Its protocol has two functions: to provide
delineation of the user data frames and to provide the port identification for multiplexing. In downstream
direction, continuous frames are transmitted from the OLT to the entire ONUs using the SGEM payload
partition. In upstream direction, burst frames are transmitted from the ONUs to the OLT using the
configured SGEM allocation time.
SGEM Frame structure
The SGEM is a variable-length framing mechanism that provides a transparent SDU encapsulation and
connection-oriented transportation over the PON. The SGEM framing is identical in both the DS and the
US.
SGEM consists of a header (fixed length) and a payload section (variable length), as shown in Fig. 5.5.
Fig. 5. 5 - Service Adaptation Sub-layer and SGEM framing

171
a) SGEM Header
SGEM header is extended up to 8 bytes with respect to GEM header (5 bytes), for compatibility with XG-
PON, and new fields are incorporated. Fig. 5.6 shows GPON GEM frame [125] and the new formats for
the 10 Gbit/s GEM frames from FSAN (XGEM) [97] and SARDANA (SGEM).
Fig. 5. 6 - GPON GEM frame and the new formats for the 10 Gbit/s GEM frames from FSAN and SARDANA.
To maintain co-existence with GPON and XGPON, some fields are similar:
a) PLI (payload length indicator) field (14-bits). By extending respect to GPON GEM frame (PLI=12-
bits, 4095 bytes), this can carry longer data unit from upper layer (up to 214=16k bytes of payload
from the SGEM client).
b) Key index field (2-bits). The indicator of the data encryption key is used to encrypt the XGEM
payload. In SARDANA is also implemented.
c) Port-ID field (16-bits). Extending the 12-bits in GPON, now can carry up to 64K unique traffic
identifiers on the SARDANA PON to provide traffic multiplexing on a T-CONT. In the DS
direction, each ONU filters the DS SGEM frames based on their SGEM Port-IDs and processes only
the SGEM frames that belong to that ONU. In the US direction, within each bandwidth allocation,
PLI
12 bits
Port ID
12 bits
PTI
3
bits
HEC
13 bits
Fragment Payload
(max. 212
Bytes)
GEM Frame
GEM Header - 5 Bytes Payload
XGEM Frame
PLI
14 bits
Port ID
16 bits
Options
18 bits
HEC
13 bits
Fragment Payload (max. 214
Bytes)
(0 – 3 Bytes padding
to reach a word-alignment)
XGEM Header - 8 Bytes Payload
SGEM Frame
PLI
14 bits
Port ID
16 bits
HEC
13 Bits
SGEM Header - 8 Bytes Payload
PT
3 bits
Key
Index
2
bits
SN
8 bits
Key Index
2
bits
LF
1
bit
Prot
ID
3
bits
GPON
XG-PON1
SARDANA
New fields
LF
1bit
Fragment Payload (max. 214
Bytes)
(0 – 3 Bytes padding
to reach a word-alignment)
QoS
4
bits

172
the ONU uses the XGEM Port-ID as a multiplexing key to identify the XGEM frames that belong to
different US logical connections.
d) Last Fragment field (1-bit). It is used to identify if the payload transported is a complete SDU
(LF=1) or it is the last fragment of a SDU (LF=0).
e) HEC (header error control) field (13-bit). This operates on the 63 initial bits of the header.
Different from XGEM, in SARDANA SGEM other fields are included to exploit their metro/access
coverage and as a function of the PHY characteristics:
f) Protocol ID field (3-bits). This field carry information of the protocols used in the upper layers,
specially the identification of the protocols used on the metro network (Ethernet, MPLS,
SDH/SONET, ATM, others) or transport network connected to SARDANA (GMPLS). Up to 8
protocol IDs could be identified. The field’s implementation extends the service capabilities of a
PON. It is important in SARDANA for:
• Multi-protocol management, by considering the PHY metro-access characteristics of the
SARDANA.
• Overlay capacity over SARDANA from different service providers working on metro/transport
network protocols.
• Control and management of multiple services (multi-services capability);
• Control and management of the contents from different operators (multi-operator capability);
g) PT (payload type) field (3-bits). PT indicates information of the following payload contents
(Ethernet, OMCI, others). So, up to 8 different payload types can be differentiated.
h) QoS (Quality-of Service) field (4-bits). This field would allow optimizing services as real-time
transmissions, security, QoS and other higher layer services. Management of quality of services
(QoS) for the applications carried between the Ethernet frames or from other link protocols;
i) Sequence Number (SN) field (8-bits). This field would aid the better order of the packets received,
considering the long reach nature of the SARDANA networks and the latency issues. With 8 bits up
to 256 information sequences could be maintained.
These new fields give SARDANA TC capacities to deploy internetworking functions. The
implementation of these new fields is described in detail in chapter 6.

173
b) SGEM payload
It transports the SDUs, which include the user data frames (encapsulates in Ethernet frames or other
Layer 2 protocols) and high-level PON management frames (OMCI frames). So, the SGEM payload
length depends on the length of the encapsulated SDU.
The SGEM payload variable-length field is expected to match the word boundary (to complete the 4-byte
word). Adding padding bytes (0~3 bytes) at the end of payload is a possible way to meet the word
boundary requirement. The length of actual payload as well as padding is indicated by the PLI field of the
SGEM header.

174
5.1.4. SARDANA TC (STC) Framing Sub-layer
This sub-layer supports the functions of frame/burst encapsulation. The payload is based on one or more
SGEM frames from the Service Adaptation sub-layer. The header includes messages of operations,
administration and maintenance (OAM) and medium access control, as shown in Fig. 5.7. The SDU
resultant is a structure near to 125 µs (STC) similar by compatibility with XGTC frame.
Fig. 5. 7 - Encapsulation process in the SARDANA framing sub-layer
5.1.4.1. SARDANA Downstream Frame
The DS frame length is extended into a word boundary (4-Bytes). It has the fixed size of 135432 bytes
and consists of a header and a payload section. Extensions and similarities from the current GTC
downstream frame structure (GPON) and the XTC downstream frame (XG-PON) are highlighted, as
shown in Fig. 5.8.
a) STC frame header
The STC DS header consists of two variable size partitions: the bandwidth map partition (BWmap) and
DS PLOAM (PLOAMd) partition, and four fields of fixed size. The OLT sends the header in a broadcast
manner and every ONU receives and then acts upon the relevant information contained therein.
PLOAMd message in SARDANA
In SARDANA the PLOAMd message has a variable length (8, 16, 24 or 32-bytes) instead of a fixed
length of 13 bytes (GPON) [125] or 48-bytes (XGPON) [97]. This allows releasing more space in the
header to favour the payload section space. Thus, PLOAM length increased efficiency per transmitted
frame of between 1.5 and 6 times with respect to XG-PON can be reached. Also, a little and flexible
PLOAMd allows a faster ONU initialization process in the system.

175
Fig. 5. 8 - Downstream frame header and changes respect to GPON and XGPON
A vector formed by two fields: PLOAM count (6-bits) and PLOAM length (3-bits) will be required to
specify the number of PLOAMs and their respective lengths.
HEC field (13-bits) is an error detection and correction field for the BW map Length field and for the
PLOAM count and PLOAM length structure. The SARDANA PLOAM message structure is shown in
Table 5.1.
Table 5. 1 - PLOAM message structure
Byte Field Description
1-2 ONU-ID It specifies the message recipient in the DS direction or the message sender in the US direction.
3 Message type ID An 8-bit field that indicates the type of the message and defines the semantics of the message payload.
4 Sequence Number An 8-bit field containing a sequence number counter that is used to ensure robustness of the PLOAM channel.
5-32 Message Content In SARDANA is a variable field as a function of the message content. So, a PLOAM messages can reach 8, 16, 24 or 32-bytes
Bandwidth map (BWmap) in SARDANA
The STC BWmap is a series of 8-byte allocation structures, in part similar to XGTC [97]. The number of
allocations is given in the BWmap length field. In STC, this field has 10-bits, allowing to 210 Allocs-ID
for future expansion. A description of the BWmap structure is shown in Fig. 5.9.

176
Fig. 5. 9 - BWmap structure in STC
• The Alloc-ID field (12-bits). It indicates the recipient of the bandwidth allocation (a T-CONT or an
OMCC channel).
• The DBRu field (1-bit). If DBRu=1, ONU should send the DBRu report at the OLT for the given
Alloc-ID.
• The PLOAM-L field (3-bits). The PLOAM length indicates at the ONU that should or not send a
PLOAMu message (of variable length) as a part of the XGTC burst header. Table 5.2 shows the
PLOAMu length options for this field.
Table 5. 2 – PLOAM-L field code
PLOAM-L field
code
PLOAMu length
(bytes)
000 Not PLOAMu
001 8
010 16
011 24
100 32
101 reserved
110 reserved
111 reserved
• The StartTime field (16-bits) indicates the location of the first byte of the US XGTC burst within the
US PHY frame. It has a granularity of 1 word (4-bytes). The value of StartTime = 0 corresponds to
the first word of the US PHY frame. The maximum StartTime value is 9719, and corresponds to the
case where the last burst sent from an ONU is a Dynamic Bandwidth Report upstream (DBRu).
• The GrantSize field (16-bits) indicates the length of the STC payload (plus the DBRu overhead,
when transmitted), and the STC header (does not include the STC trailer and the FEC overhead).Due
to US rate is 2.48832 Gbps (and the US frame can carry 38880 bytes), the maximum allocation size
BW mapN*8 bytes
Alloc Structure 1
8 bytes
Alloc Structure 2
8 bytes
Alloc Structure 3
8 bytes
Alloc Structure N
8 bytes
Alloc-ID
12-bits
Start Time
16-bits
Grant Size
16-bits
FWI
1 bit
HEC
13 bits
DBRu
1-bit
PLOAM-L
3-bit
RGC
2-bits

177
is 9720 words and the maximum burst size = 9720 words (in the case 1 unique ONU is occupying
the entire US frame).Table 6 shows particular GrantSize values.
• FWI field (1-bit). This parameter allows OLT to be capable to control the transmission of the rONU.
When FWI=1, RSOA switches from off-state to on-state, and is ready to sends a burst.
• RGC field (2-bit). The RSOA Gain Control (RGC) field enables capacities to control the gain power
in a RSOA, when a rONU implements a gain control circuitry. Up to 4-level of gain could be
controlled.
• HEC field (13-bits), used for error detection and correction for the allocation structure.
In SARDANA, each BWmap partition may contain at most 1024 allocation structures (BWmap
length=10 bits).In the practice, by design considerations, only a maximum of 512 allocation structures are
considered (transmission time = 3.3us). Also, BWmap is sent before any possible PLOAM message and
is structured in increasing order of start time. These facts allow ONU the maximum possible time in
preparing a response.
The medium access control system of the OLT, based on DBRu and PLOAMu information (and a DBA
algorithm), establishes the frequency and size of allocations to each ONU and each Alloc-ID.
b) STC Payload
The payload carries data information for all ONUs. Payload length is extended to a word boundary
respect to GPON format. This is done by extending the GEM frame format R*4 bytes, as a XGTC
payload.
5.1.4.2. SARDANA Upstream Frame
The upstream 125 us frame consists of multiple transmission bursts from different ONUs. The upstream
burst from an ONU has a dynamically determined size and consists of a burst header and one or more
bandwidth allocation intervals (according to the BWmap information), associated with a specific Alloc-
ID.
a) STC burst header
During each allocation period, according to the OLT control, the ONU can transmit a 4-byte fixed or non-
fixed header, by depending of the PLOAMu field presence. Fig. 5.10 shows the upstream burst structures
in XGTC and SARDANA TC.
ONU-ID field (12-bit)
The value of this field is assigned to the ONU during the initialization process. The OLT can check this
field to confirm that the correct ONU is transmitting.

178
PLOAMu field
Similar to downstream, PLOAMu message is extended into a word boundary and has variable length (8,
16, 24 or32-bytes), or 0 bytes. The length is specified by the PLOAMu length sub-field into burst status
field.
Burst Status field (7 bits)
SARDANA burst header incorporates Burst Status field as an indicator of the messages present into burst.
This field will help the OLT to know if the burst carries DBRu structures and PLOAMu message and its
respective length, allowing fast decodification of the burst payload.
• PLOAMu length sub-field (3 bits): It is an indicator of PLOAM message presence and its length
into the burst header. This is shown in Table 5.3.
• DBRu status sub-field (3 bits): It is an indicator of allocation overhead for each of the Allocs-ID of
the T-CONT buffers (if present). The 4-byte DBRu structure carries a buffer occupancy status report
which is associated with a specific Alloc-ID. This is shown in Table 5.3.
Table 5. 3 – PLOAM status and DBRu status information code
• Dying Gasp (DG) flag (1 bit). When DG=1, the ONU has detected a problem. This indication may
assist the OLT in distinguishing ODN problems from premises issues. This field is similar with XG-
PON.
PLOAMu Status
000 Not PLOAMu
001 8 bytes - PLOAMu
010 16 bytes - PLOAMu
011 24 bytes - PLOAMu
100 32 bytes - PLOAMu
101 reserved
110 reserved
111 reserved
DBRu Status
000 Alloc ID default - Not DBRu
001 Alloc ID default with DBRu
010 Alloc ID type 1 - Not DBRu
011 Alloc ID type 1 with DBRu
100 Alloc ID type 2 - Not DBRu
101 Alloc ID type 2 with DBRu
110 Alloc ID type 3 - Not DBRu
111 Alloc ID type 3 with DBRu

179
Fig. 5. 10 - Upstream burst structures in XGTC, and changes for SARDANA TC
DBRu field
The Dynamic Bandwidth Report upstream (DBRu) field sends traffic status to OLT in order to enable
DBA computation. This structure can or cannot be present in the burst allocation. This is controlled by the
OLT. It is formed by the Buffer Occupancy (BufOcc) (3 bytes) that contains the total amount of SDU
traffic in the buffers associated with an Alloc-ID at the ONU; and a CRC-8(1 byte) for error detection
into the DBRu.
b) Upstream STC burst Payload
The payload length is variable and it is extended to a word boundary, similar to downstream payload.
c) Upstream STC burst trailer
It contains a 4-byte wide bit-interleaved even parity (BIP) field computed over the entire STC burst. If
FEC is turned-off, the OLT RX verifies the BIP to estimate the BER on the upstream optical link [97].

180
5.1.5. SARDANA TC - PHY Adaptation Sub-layer
This sub-layer is responsible for providing physical synchronization, FEC and scrambling for the DS and
US transmission. In other words, it is in charge for preparing the STC frame for the PHY layer. Fig. 5.11
shows encapsulation process in the SARDANA PHY adaptation sub-layer.
NRZ (non-return-to-zero) Code and Scrambler
The scrambled NRZ line code is selected for application in both the upstream and downstream directions
as XG-PON [97].
FEC
FEC support is mandatory for both OLT and ONU in the upstream/downstream directions. It is used to
introduce redundancy in the transmitted data to detect and correct certain transmission errors. It is based
on Reed-Solomon (RS) codes. In the downstream direction, the FEC code is RS (248,216). In the
upstream direction, the FEC code is RS(248,232). FEC process is similar the XG-PON. An
implementation detailed can be obtained in [97].
Fig. 5. 11 - Encapsulation process in the SARDANA PHY adaptation sub-layer
5.1.5.1. DS PHY frame
Downstream PHY frame duration is 125 us, which at the rate of 9.95328 Gbit/s corresponds to 155520
bytes. In SARDANA this structure is similar to XG-PON to maintain compatibility, as shown in Fig.
5.12.
It consists of a 24-byte physical synchronization block (PSBd) and a PHY frame payload protected by
FEC and scrambled. Downstream PHY frame is broadcast sent for all ONUs in the PON.

181
Physical Synchronization Block (PSBd)
As a XG-PON frame, PSBd contains three separate 8-byte structures: PSync, SFC field and PON-ID
field, as shown in Fig. 5.13.
PHY synchronization (PSync) contains a fixed 64-bit pattern (0xC5E5 1840 FD59 BB49), used by the
ONU to achieve alignment with the OLT.
The Super frame counter (SFC), increments by one in each downstream PHY frame. It has a 51-bit super
frame counter and a 13-bit HEC field.
The PON-ID structure is used in SARDANA to identify each PON tree (each PON corresponds with one
wavelength), and is an important field for the internetworking functions and to establish different offsets
on the systems (as a function of the maximum reach of a PON). It contains a 51-bit PON-ID and a 13-bit
HEC field.
Fig. 5. 12 - Downstream PHY frame structure at the SARDANA TC layer
Downstream PHY frame payload
It is scrambling and has the size of 155496 bytes (135432 bytes of the XGTC frame plus 20064 parity
bytes from FEC).
Service
Adaptation
Sub-layer
Framing
Sub-layer
PHY
Adaptation
Sub-layer
Link
Layer
PHY
Layer
SARDANA
TC Layer

182
Fig. 5. 13 – Downstream PHY frame with payload and physical synchronization block (PSBd)
5.1.5.2. US PHY burst
Each ONU transmits PHY bursts in the corresponding allocation time and remains idle in-between the
bursts. It consists of an upstream physical synchronization block (PSBu) and a PHY burst payload (STC
burst + FEC + scrambled). Burst timing and duration is controlled by the OLT by means of BWmap. Fig.
5.14 shows US PHY burst from ONUs as contributions into the US PHY frame, and the fields that form
the US Physical Synchronization Block (PSBu).
Upstream PHY burst payload
It is achieved from the US STC burst, applying FEC and scrambling the result obtained.
Upstream Physical Synchronization Block (PSBu)
It contains Preamble and Delimiter fields that allow the OLT to delineate burst and to adjust to the level
and the synchronization of the optical signal. The length and pattern of preamble and delimiter is fixed in
SARDANA and is shown in Fig. 5.15.
Preamble and Delimiter bytes mark the start of burst transmission from the ONU. The length of the field
increases with higher transmission rate to facilitate clock recovery and frame synchronization in a multi-
clock environment.
Scrambled PHY frame PayloadPSB
d
PHY frame (125us)
Scrambled PHY frame PayloadPSB
d
PHY frame (125us)
PHY
Adaptation
Sub-layerPSync PON-IDSFC
SF
Counter
8 bytes 8 bytes 8 bytes
HEC PON-ID HEC
OLT
Scrambled PHY frame PayloadPSB
dONU 1
ONU i
24 bytes 155496 bytes
Header Payload
0xC5E5 1840 FD59 BB49
Scrambled PHY frame PayloadPSB
d

183
Fig. 5. 14 – Upstream PHY frame and PHY bursts
In SARDANA this overhead time is used to:
• Synchronize RSOA TX on/off time,
• Added timing drift tolerance,
• Signal amplitude recovery,
• Signal phase recovery (clock recovery),
• Start of burst delimitation.
Fig. 5.15 shows the PSBu in SARDANA. The time to each process is determined by experimental
considerations, some based on constraint equations.
Fig. 5. 15 – Guard Time, Preamble and Delimiter structure in SARDANA networks
Guard Time
Although not part of PSBu, BWmap allows suitable guard time between US bursts from different ONUs
to prevent collisions. It fits the RSOA Tx enable/RSOA Tx disable times and includes the margin for the
US PHY frame (125us)
PHY
Adaptation
Sub-layer
PSBu Payload
Preamble Delimiter
OLT
ONU 1
ONU i
(38880 bytes @2.488Gbps)
PSBu Payload
PHY burst
PSBuPayload
PSBuPayload
PHY burst PHY burst PHY burst
PSBuPayload
US PHY frame (125us)
PSBuPayload
PHY burst
Guard
TimeGuard
Time

184
individual ONU transmission drift. The minimum guard time in XGPON is 64 bits (20 km standard
reach) [97]. The constraint equations with which the OLT must comply are [168]:
tg>tRSOAon + tu, and
tg>tRSOAoff + tu, …..(5.1)
So, two processes, RSOA TX on/off time and timing drift tolerance (tu), are considered in the guard time
(tg). In this time the ONU will transmit no more power that the nominal zero level.
The timing drift tolerance is a timing uncertainty. This uncertainty arises from variations of the time
caused by fibre and component variations with temperature and other environmental factors. In
SARDANA, due to the long distances considered (in the range of 100 km using SSMF), the operation
wavelength (third window) and the high speed of 10Gbps, the chromatic dispersion impact on the pulse
broadening and consequently, inter-symbolic interference (ISI) can occur.
By considering tu basically as pulse broadening and the chromatic dispersion for 1550nm D1550=17ps /
(nm·km) and ∆λ the spectral width of the emitter, hence:
tu = D1550 · Lmax · ∆λ
For ∆λ=0.2nm, the spectral width of a RSOA and a DFB laser, and for a maximum fibre length 100 km
then tu = 0.34 ns.
RSOA response time
Considering a typical RSOA with commercial parameter values: Lcavity=600 um (cavity length) and
G=21dB (RSOA gain), as used in SARDANA. Then, phase shifting at the ONU output in t=tRSOAon, as
shown in Fig. 5.16, is:
∆$ � 2 � �YwxW%y0z
with Vg = group velocity = c/n
a) Considering the RSOA cavity as a silica SiO2 optical medium (n=1.5), then ∆t = 6ps.
b) Considering the RSOA cavity like a laser cavity � n=3.6 (refraction index for laser), then ∆t = 14.5
ps.
Fig. 5. 16 – Phase shifting between DS Signal and US signal reflected

185
Then, RSOA device response time can be considered negligible. Now, considering RSOA initialization
from the off-state and additional delays due to associated circuitry, tRSOAon≈ 10 ns. This value was
obtained in practical measures as shown in Fig. 5.17.
Fig. 5. 17 - RSOA response time: initialization and additional delays due to associated circuitry (tRSOAon ≈ 10 ns,
in 2ns/div).
Then, tRSOAon= tRSOAoff =10ns. From (1), the minimum guard time is 2·tg
With tg> 10 ns + 0.34 ns =10.34 ns
For an US bit rate 2.48832 Gbps, this corresponds to tg(bits) > 25.8 bits.
By incrementing the reliability above 50%, hence tg (bits) = 40 bits.
Finally, SARDANA Guard Time is fixed in 80 bits
Preamble time
During the preamble time (tp), the RSOA-based ONU will transmit a preamble pattern that provides
maximal transition density for amplitude recovery and clock recovery functions. In SARDANA, the
signal level is recovered, in the first 32 bits, using controlled runs of identical digits (16 bits “1” and 16
bits “0”). In this way the decision threshold is fixed. The signal clock phase is recovered using a
maximum transition density pattern in the last 128 bits of the preamble.
Finally, the 160-bit SARDANA pattern preamble is 0xFFFF0000AAAA…..AA.
Delimiter time
During the delimiter time (td), the ONU will transmit a special data pattern with optimal autocorrelation
properties that enable the OLT to find the beginning of the burst. A simple relationship between the
number of bits in the delimiter (N) and the number of bit errors tolerated (E) is [125]:
E=int(N/4)-1
……..(5.2)
Given a BER, the probability of a severely errored burst (Pseb) is given by [125]:
��Q# � � �{ ? 1� � "{<|C; ……..(5.3)

186
Substituting (5.2) in (5.3):
��Q# � } �~�$�8r�� � "{<W:%��� �
Table 5.4 shows some values of delimiter lengths and their Probability of a severely errored burst for a
BER=1.0E-4.
Table 5. 4 - Probability of a severely errored burst as a function of delimiter length [125]
Delimiter Length
(N)
Probability of a severely
errored burst (Pseb)
16 1.8E-13
32 1.1E-25
64 4.9E-50
With these considerations, the recommended allocations for the SARDANA PSBu are given in Table 5.5.
Table 5. 5 - Burst mode overhead time recommended allocation for OLT functions
Upstream
data rate
2.48832(Gbit/s)
RSOA Tx
enable
(tRSOAon+tu)
RSOA Tx
disable
(tRSOAoff+tu)
Guard
time
(tg)
Preamble
time
(tp)
Delimiter
time
(td)
Total
time
(tT)
bits 40 40 80 160 32 272
Time (ns) 32.15 64.3 12.86 109.3
Maximum Maximum Minimum Suggested Suggested Suggested
So, a PSBu with Preamble and Delimiter fields of 192 bits (77.16 ns) plus a Guard Time of 80 bits (32.15
ns) are consistent with the SARDANA PHY layer. Fig. 5.18 shows the SARDANA PON OLT receiver
timing signalling from the Table 5.5 values.

Fig. 5. 18 – SARDANA Upstream Physical Synchronization Block (PSBu) definition values and OLT Receiver
Timing setup (adapted from [150])
From Fig. 5.18, it is possible at the OLT receiver a preamble bit loss of 70-75% due to adjust in the
RSOA initialization processes. Fig. 5.19 shows an US burst test with a PSBu of 128 ns that we obtained
in our lab.
Fig. 5. 19 – US Burst with a PSBu of 128 ns
Upstream Burst Size – Minimum and Maximum values
ONU burst allocation for upstream transmission is defined from the OLT and is indicated on the
Size field of the BWmap (in the DS frame header). Minimum and maximum size values for the burst of
an US transmission are shown in Table 5.6.
Preamble + Delimiter
Guard Time
Payload

188
Table 5. 6 - Minimum and Maximum Size values for the burst of an US transmission
BWmap Grant Size
Length bytes time
0 Only PLOAM* (not payload) 16 ~ 51 ns
1 Only DBRu (not payload) 4 ~13ns
4 Payload minimum 16 ~ 51ns
9720 Payload maximum 38880 125 us
*It is used in the ONU activation process (in response to SN grants)
5.2. SARDANA Media Access Control Processes
In the downstream direction, the traffic multiplexing functionality is centralized. The OLT multiplexes
SGEM frames onto the transmission medium using SGEM Port-ID as a key to identify the ONU target.
Each ONU filters the downstream SGEM frames, based on their SGEM Port-IDs, to obtain the
information that was addressed towards that ONU.
In the upstream direction, the traffic multiplexing functionality is distributed. The OLT provides media
access control for the upstream traffic. Each DS PHY frame (125 us) contains a bandwidth map (BWmap)
that specifies a sequence of non-overlapping upstream transmissions by different ONUs in the
corresponding US PHY frame.
Each burst contains a start pointer indicating the beginning of the burst within the US PHY frame and a
sequence of grant sizes that the ONU is allowed to transmit.
So, the OLT grants allocations to the traffic-bearing entities within the ONUs that are identified by their
allocation IDs (Alloc-IDs). Bandwidth allocations to different Alloc-IDs are multiplexed in time. Within
each allocation, the ONU uses the SGEM Port-ID to identify the SGEM frames that belong to different
upstream logical connections.
The OLT (using the PLOAM channel) assigns an ONU-ID, an identifier to an ONU during its activation.
Each ONU is assigned one or more Alloc_IDs. The ONU’s default Alloc-ID is implicitly assigned with
and is equal to the ONU-ID. Fig. 5.20 shows the bandwidth map allocation for two ONUs and the process
of alignment into the US PHY frame.

189
Fig. 5. 20 - Media access control based on bandwidth map allocation for two ONUs
Each DS PHY frame reaches different ONUs at generally different time instants. So, US transmission
from different ONUs needs to be equalized. The ranging serve to align the ONU US burst transmissions
on such a way that it reaches the OLT at precisely the same instant that other ONUs US transmission.
5.2.1. Timing relationships OLT-ONU in SARDANA network
During the initialization processes from a new ONU, the OLT must temporarily suppress upstream
transmission by the in-service ONUs to avoid collisions, because OLT does not yet know the equalization
delay for this new ONU. This time interval is referred to as a quiet window.
Quiet window (QW)
Frequently, the OLT opens a QW for ONU discovery (250 – 450us in XGPON). OLT, by means of a
serial number grant, invites any ONU onto the PON that has not been activated to connect to the network.
The OLT creates a quiet window halting the ONUs using either zero pointers allocation structures, or no
allocations at all. The ONUs in “operation state” will stop sending data in the upstream direction as long
as the “halt requests” are received. QW must span the time between the earliest ONU response and the
latest possible ONU response.
In XG-PON are used two quiet windows (to implement Serial Number (SN) grant and Ranging grant
processes). Due to XG-PON normal coverage is 20 km (max. 40 km), this procedure is not very critical.
In contrast, the SARDANA network was designed to a coverage ≈ 100 km, and then a method more
efficient will be necessary.

190
5.2.2. RSOA-based ONU Starting, Initialization and Registration
In SARDANA network, ONU starting, initialization and registration is conditioned by the particular
characteristics of its PHY layer.
The OLT controls the ONU activation process by means of bandwidth grants and exchanging PLOAM
messages. To support the activation procedure, the ONU maintains two timers: Ranging timer (Tr) and
Loss of Synchronism timer (Ts).
Timer Tr is used to abort an unsuccessful activation attempt by limiting the time in the Ranging process.
Initial value of Tr is 10 seconds [97].
Timer Ts is used to assert a failure to recover from an intermittent loss of synchronism condition by
limiting the time an ONU in the Failure Process. The initial value is 100 ms [97].
In the ONU activation process, timing relations and messages exchanged between OLT and RSOA-based
ONU are defined in only 3 processes, as shown in the activation processes flow (Fig. 5.22).
(1) ONU starting Process
Initially, when an ONU is active, APD RX is active and the RSOA TX is not active. The OLT is
transmitting valid downstream frames. The ONU starts operation by listening these DS transmissions and
from the Hunt state searches for the PSync pattern and Super Frame Counter (SFC) structure in the PSBd
header by using a local state machine, as shown in Fig. 5.21.
In SARDANA, if for 2 consecutive PSBd’s either PSync or SFC verification fails; the ONU declares loss
of downstream synchronization and returns the Hunt state.
Once two consecutive frames with a valid PSync and SFC are attained, the ONU moves to next process
(2).

191
Fig. 5. 21 – ONU synchronization state machine (modified from G.987.3_F10.3).
(2) ONU Parameter Initialization and Ranging Process
Different from XGPON, in SARDANA the Initialization and Ranging Process are done in the same
process, in order to optimize the use of the quiet window.
The ONU activates its RSOA TX for burst mode according to the OLT control. The ONU listens to the
Profile PLOAM messages (periodically used by the OLT). If the ONU receives a serial number grant
(addressed to the broadcast Alloc-ID) with a known burst profile, it responds with a Serial_Number_ONU
PLOAM message. So, the OLT discovers the serial number of this new ONU.
During this PLOAMd grant (DS) and PLOAMu acquisition (US), the OLT measures the ONU round trip
delay (RTD), computes the equalization delay (EqD) and sends a Ranging_Time message at the ONU. In
this process, a quiet window time, established from the OLT, must suspend US TX from the ONUs in-
service to avoid collisions between these ONUs and the new ONU in activation process.
SARDANA incorporates the Ranging process together with the Parameter Initialization process by
reducing the number of Quiet Window needed to only one, optimizing, thus, network time consumption
and operation time of all ONUs in-service of the PON during the activation process of a new ONU.
The OLT sends an Assign_ONU-ID PLOAM message to the ONU. The ONU sets the ONU-ID along
with the default Alloc-ID and OMCC XGEM Port-ID. Also, the ONU adjusts the start of its upstream
PHY frame clock, based on its assigned equalization delay.
Finally, the new ONU transitions to the Operation process (3).
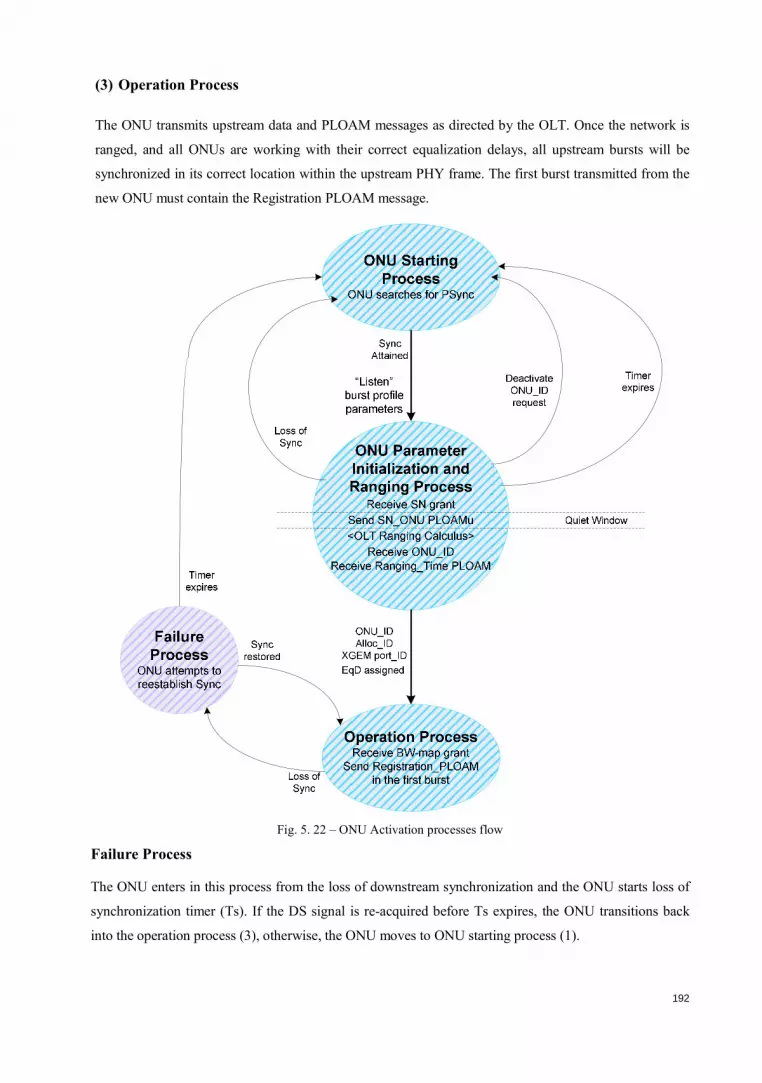
192
(3) Operation Process
The ONU transmits upstream data and PLOAM messages as directed by the OLT. Once the network is
ranged, and all ONUs are working with their correct equalization delays, all upstream bursts will be
synchronized in its correct location within the upstream PHY frame. The first burst transmitted from the
new ONU must contain the Registration PLOAM message.
Fig. 5. 22 – ONU Activation processes flow
Failure Process
The ONU enters in this process from the loss of downstream synchronization and the ONU starts loss of
synchronization timer (Ts). If the DS signal is re-acquired before Ts expires, the ONU transitions back
into the operation process (3), otherwise, the ONU moves to ONU starting process (1).

193
The OLT monitors the phase delay and BER of the ONUs in regular operation. Based on the phase
information, the OLT may re-compute and update the equalization delay for any ONU.
5.2.3. RSOA-based ONU upstream transmission timing
The round-trip delay (RTD) is the time interval between a DS PHY frame and the reception of the US
PHY burst from the ONU earliest. The RTD is composed of the round-trip propagation delay (as a
function of the length fibre between OLT-ONU) and the ONU response time. In order to align the burst
on the US PHY frame by avoiding collision from other ONUs, an ONU has to delay the transmission
beyond its regular response time. This delay is named as ONU equalization delay (EqD).
The start of the DS PHY frame with the BWmap is the reference for all the ONU transmission (and does
not the receipt of the corresponding burst allocation itself). The ONU maintains synchronization with the
DS PHY frame clock and offset, given by the sum of the ONU response time and the requisite delay. This
is shown in Fig. 5.23.
Fig. 5. 23 - ONU transmission timing diagram
a) ONU response time
ONU response time is obtained from the response time of the Layer 2 processes and Layer 1 devices
processing.
SARDANA Layer 2 ONU response time
The ONU should be sufficient time to receive the DS frame, perform DS and US FEC and prepare an
upstream response. All ONUs are required to have an ONU response time of 35±1 µs [97].

194
SARDANA Layer 1 ONU response time
As demonstrated in section 5.1.5.2, by considering a typical RSOA like a laser cavity (n=3.6), then a
device response ∆t = 14.5 ps can be expected. With an associated circuitry the response time of the PHY
layer can be estimated on tRSOAon= tRSOAoff = 10ns. Then, the PHY layer response time is considered
negligible compared with the response time due to processing of the Layer 2.
b) ONU’s Equalization Delay (EqD)
It is the total extra delays that may be required to apply to the US transmission beyond its response time
to compensate for variation of propagation of individual ONUs, in order to avoid the probability of
collision with other ONUs.
The upstream data, received at the OLT receiver, is based on the sum of all ONUs transmitted data. To
avoid possible collisions, a transmission within the upstream frame is assigned to each ONU, where only
this specific ONU is allowed to send data. In addition, all ONUs must appear equidistant from the OLT
for upstream framing, i.e., the beginning of all upstream frames from all ONUs should reach the OLT at
the same time. In order to achieve this, an Equalization-Delay (EqD) is assigned to each ONU. The ONU
delays the upstream phase, in reference to the downstream phase, based on the assigned EqD value.
Once the OLT has supplied each ONU with its EqD value, it is considered synchronized to the beginning
of the upstream PHY frame. The US burst is transmitted within the allocation structure specified with
respect to the beginning of this upstream PHY frame.
5.2.4. Timing during ONU Serial Number Acquisition and Ranging
Due to the process of the Serial Number (SN) grant and the PLOAM ONU response, it is also possible to
compute the ranging. Then, the EqD can be done by using a unique quiet window. So, a less intrusive
QW process is implemented. Also, when the ONU is in the Operation state, the OLT may use any grant to
this ONU to perform in-service round-trip delay measurement and equalization delay adjustment [97].
a) Serial Number Acquisition process
Although SARDANA ODN maximal distance is Lmin+Dmax ≈ 100 km, the calculation to avoid
collision between ONUs is basically done over the maximum differential range, due to temporal TDMA
process is delimited at the drop section. By following the standard [97], ONUs maximum differential is
20 km. This is shown in Fig. 5.24.

195
Fig. 5. 24 - SARDANA ODN maximal distance: Lmin+Dmax ≈ 100 km
It is assumed that OLT use discovered Serial_Number method and pre-assigned equalization delay is 0.
Since the SN grant is a broadcast BW allocation addressed to all ONUs, other ONUs, also in initialization
process, may respond to it, and a collision may occur. So, to reduce the probability of collision between
news ONUs the requisite delay in the SN process is a locally-generated random delay.
In SARDANA, the Serial_Number_ONU PLOAMu message is 16 bytes (in XGPON is 48 Bytes), as
shown in Table 5.7.
Table 5. 7 - Serial_Number_ONU PLOAMu message
Octet Content Description
1-2 0x03FF Unassigned ONU-ID
3 0x01 Message type ID “Serial_number_ONU”
4 0x00 Sequence number
5-8 Vendor_ID Code set for the Vendor_ID
9-12 VSSN Vendor-specific serial number
13-16 Ramdom delay Ramdom delay used by the ONU when sending this message in bit times.
Considering worst case (64 ONUs trying reconnection at the same time), SN PLOAM burst response
from an ONU would need a time slot of ~155ns to avoid collisions with other ONUs, as shown in Table
5.8.
Table 5. 8 - SN PLOAM burst response time from an ONU
Fields Length (bytes) Time (ns)
PSBu 32 ~ 103
PLOAMu 16 ~ 52
total 48 ~155

196
By incrementing this margins to 0.2 us for higher reliability, then in a PON with 32 ONUs, this random
delay can be between 0 and 6.4 us. The Timing during ONU Serial Number Acquisition is shown in Fig.
5.25.
Fig. 5. 25 - Timing during ONU Serial Number Acquisition
In this stage, the OLT starts a Quiet Window process, stopping traffic of the ONUs in service. The offset
of the quiet window is determined by the minimum delays in the system: the minimum round-trip
propagation delay (RTDmin) by considering the nearest ONU expected on the PON (Lmin), the minimum
ONU processing time, and the dynamically generated StartTime value of the serial number grant [97]:
������Q% � u��<4��~��iW: ? <�viW: ? �$��$�~��
……(5.4)
<�viW: � 2 � ��~� � ��1552.2_ �
The Quiet window size during SN acquisition is settled by the maximum variation of the unknown round-
trip delay components (round-trip propagation delay, ONU response time, and ONU random delay) and
the SN response burst time (preamble, delimiter, PLOAM message):
��%WiQ � u��<4��~��xw� ? 2 � viw� � ��1552.2_ � ? <���iw� ? �#6��% ………(5.5)
OLT
ONU
Start of the US PHY frame
(Start Time=0)
Propag.
delay
Response
Time min
PSync
PSBdPHY frame N
PSync
PSBdPHY frame N+1
PSBdPHY frame N+2
PSync PSync
Quiet Window (us)
PSBu PLOAM
SN Grant
Alloc-ID=1023
Start Time= x
GrantSize=0
Propag.
delay
Serial_Number
PLOAM message
(broadcast)
Offset
Earliest expected
Serial_Number PLOAM
Latest expected
Serial_Number PLOAM
Propag.
delay
PSBu PLOAM
Propag.
delay
Random
Delay max
Response
Time max
nearest
ONUfarthest
Start
Timex

197
b) SARDANA quiet window calculation
1) Offset of the quiet window in SN state:
a) Start time considerations:
Response SN burst size: PSBu + PLOAMu = 16 + 32 = 48 bytes
Considering 32 ONUs for each wavelength:
Start Time ONU1= 0 (first allocation to ONU nearest) � 0 us
Start Time ONU32 = 1488 bytes (372 words) (to ONU farthest) � 9.7 us
Start Time min = 0 us
Start Time max ≈ 10 us
For this calculation it is considered the Start Time minimum (0 us).
b) Minimum ONU respond Time: 34 us [97]
c) Round-trip delay (based on SARDANA ODN - limit case: 100 km):
OLT – RNnearest = 5 km
OLT – RNfarthest = 70 km
RN – TDM Coupler = 10 km
TDM Coupler - ONUnearest = 0 km
ONUnearest - ONUfarthest = 20 km (Dmax)
Lmin = (OLT–RNnearest) + (RN–TDM Coupler) +(TDM Coupler-ONUnearest) = 15 km
<�viW: � 2 � �iW: � ��;���.�_ � RTDmin = 150 us
So, the offset quiet window in SARDANA, by using eq. (5.4) is:
������Q% � 34 ? 150 ? 0 � 184 34 For the Lmax = 80 km (Fig. 5.24), the maximum offset quiet window in SARDANA is:
������Q% � 34 ? 800 ? 0 � 834 34 2) Size of the quiet window in SN state (eq. 5.5):
a) Random delay maximum = 6.4 us.
b) ONU Response time variation = 2 us.
c) RTDDmax=20km = 200 us
d) Burst size = 48 bytes (PSBu + PLOAMu SN response)
Burst time = 0.155 us (this value is negligible).
��%WiQ � 2 ? 200 ? 6.4 � 208.4 34

198
Finally, Fig. 5.26 shows the ONU initialization values obtained for the SARDANA network.
Fig. 5. 26 - ONU initialization values in SARDANA network
In SARDANA the Quiet Window is fixed (since maximum differential length between ONUs remains
fixed). Offset QW depends of the OLT – RN – TDMcoupler distances. In the best case, when OLT-RN is 5
km, and by considering RN – TDMcoupler distances (10 km), this value is 184 us (for a total of 15 km), as
shown in Fig. 5.26.
In the worst case (OLT-RN up to 70 km), this value can reach up to 834 us (for a total of 80 km). OLT
have capacity to know this OLT – RN distance from the PON-ID field (at the PSBd header), associated
with a wavelength and a RN.
c) Ranging Process
In SARDANA, the effective Ranging process is done in two phases:
-The calculus of the EqD: They are done during the QW in the SN PLOAM grant and SN PLOAM
response processes.
-The assign of the ONU-ID: the ONU interprets any directed BW allocation with the PLOAMu flag set as
a ranging grant and responds to it with a Registration PLOAM message. As seen, in SARDANA it is not
necessary to implement a new QW and does not stop transmissions occurring at the ONUs in operation,
optimizing the PON processes.
The EqD can be recalculated and adjusted from the US transmission. In-service EqD adjustment allows
small corrections without having to re-range the ONU.

199
5.2.5. Optimization of the ONU activation process
In the initialization process, because the OLT has not yet calculated the EqD for a new ONU, it opens a
quiet window to prevent collision between the serial number response of this ONU and the regular
transmissions by in-service ONUs. This process affects 4 o 5 consecutive bandwidth maps. An
optimization of the OLT relating with the management of this resource should ensure that the impact on
the bandwidth and real-time traffic is minimized.
As seen, SARDANA reduces to one the QW in the ONU activation, optimizing this process. However,
due to maximum reach of the SARDANA (100 km), the offset with respect to the start of the QW
penalizes with extra delay this process. Fig. 5.27 shows the optimization done in SARDANA by using a
unique QW and the message exchange OLT-ONU in the initialization process for a new ONU, in this
example, located at 80 km from the OLT. Due to ONU maximum differential (Dmax) is like the standard
(20 km), the QW is practically the same than XGPON.
The need to provide a re-arranging of the BWmaps providing extra allocations to the affected Alloc-IDs,
immediately before and/or immediately after the quiet window is mentioned in [97]. However, it does not
explain the implementation.
By considering that in the activation process of a PON, OLT discovers the OLT-RN and OLT-TDMcoupler
distances, and knowing that drop section with Dmax= 20km (TDmax= 100us) is the unique provable scenario
of a collision, then:
1. Because OLT knows the OLT-TDMcoupler distances and the nearest ONU at the OLT is also at this
point (or very close to it), the Lmin is automatically discovered.
2. A unique 125us US frame can provide capacities to transport the SN request from a new ONU
(TDmax= 100us< 125us). A quiet window for this time would be sufficient to grant not collision in the
drop.
3. So, after the OLT sends a SN_grant PLOAM messages and opening a QW, in the next DS frame
(125us after), a closing QW should be sent. So, it not would be necessary to await the arrival of the
SN_ONU PLOAM response to close the QW, as occurred in (5.4). In this DS frame, also a BWmap
with BW allocations, in correspondence with the last reports from the ONUs in service (before the
QW) would be attended. A new requirement with DBRu = 1 for actualization of the queue status
from the ONUs should be also sent.
4. After the arrival of the SN_ONU PLOAMu response, the OLT will send the Assign_ONU-ID
message and the Ranging_Time grant with the EqD for a new ONU.
5. In the next US frame, the ONUs in service, as a response at step 3, update the OLT BW allocation
table with their Alloc-ID buffer occupation reports. The PON regular operation is then re-
established.

200
6. After receiving Assign_ONU-ID and Ranging Time grant, new ONU know their transmission
parameters, and respond with a Registration PLOAM message. The activation process is finished.
Fig. 5. 27 – Message exchange optimization on the ONU activation process in SARDANA network.
Fig. 5.28 shows the global optimization of the ONU activation in SARDANA network.
By optimizing Quiet Window in SARDANA network new values are obtained for the offset and QW.
Modifying from eq. (5.4):
������Q% � u��<4��~��iW: ? v�X��_��`��1�$~`����Ni� ? �$��$�~�� ……….(5.6) ������Q% � 34 34 ? 400 34 ? 0 � 434 34
PSBd (PSYNC, SFC) +BWmap
PSBd + Profile PLOAMd + BWmapSN grant
Assign_ONU-ID + Ranging_Time grant
Registration PLOAM
Qu
iet
Win
do
w
SN_ONU PLOAMu

201
Fig. 5. 28 - Optimization sequence of the ONU activation process in SARDANA network
Modifying from eq. (5.5), with Tburst negligible:
��%WiQ � u��<4��~��xw� ? viw� � ��1552.2_ � ? <���iw� ? �#6��% ……..(5.7) ��%WiQ � 2 34 ? 100 34 ? 6.4 34 � 108.4 34
These optimization practical results are shown in Fig. 5.29.
OLTnew
ONU
PSBd (PSYNC, SFC) +BWmap
PSBd + Profile PLOAMd + BWmap
SN grant + open QW
Assign_ONU-ID + Ranging Time grantDS frame
Registration PLOAM
125us
QW
OLT close the QW
and sends BW map
with request of
DBRu to update the
ONU status report
ONU adjust the
start of this US PHY
frame clock based
on this EqD and
responds with the
Registration
PLOAMu messages
together with all
ONUs in the PON
125us
125us
125us
125us
125us
125us
125us
125us
125us
125us
125us
125us
125us
125us
Start Time125us
125us
SN_ONU PLOAMu
BWmap + DBRu=1 + close QW
US frame + DBRu report
US frame
nearest
ONUfarthest
ONU
US frame
OLT time
Processing
and
response
time
125us
125us
EqD + ONU Response Time
ONUs in-service
resume their
operations
Lmin
Dmax
1
2
3
4
5
6
125us
125us
ONU Response Time variation
+
Maximum random delay
ONU Response Time
offset
QW

202
Fig. 5. 29 – Practical values from the optimization on the ONU activation process in SARDANA network
By comparing SARDANA with XG-PON we can see that the implementation of one unique QW by
SARDANA practically compensates the differences in ODN coverage (80 km) of both networks.
In the same conditions (both networks with 20 km), SARDANA would need 242.4 us (QWoffset= 134 us
and QW = 108.4 us) to implement a QW. So, this ONU activation optimization proposes, by itself, would
be 4 times more efficient than the XG-PON recommendation.
By considering that a BWmap is implementable on the STC header of a DS PHY frame and sent, in
normal operation state, each 125 us, QW mechanism affects up to eight BWmaps during ONU activation
in XGPON. SARDANA optimization reduces the impact of the QW to 5 BWmaps in the most critical
ODN scenario (100 km).
By applying optimization on the ONU initialization process it is possible to reduce the penalties due to
QW mechanism implementation. This improvement allows flexibleness on the frequency control of
signalling for the discovering of a new ONU. However, it is a trade-off between better traffic flux and the
fast ONU activation.
OLT
SN grant + open QW
Offset
QW
125us
125us
125us
SN_ONU PLOAMu
BWmap + DBRu=1 + close QW
US frame
farthest
ONUL = 80 km Dmax=20km
nearest
ONU
QWONU Response
Time variation
+
Maximum random
delay
(2 us + 6.4 us)
ONU Response Time
(34 us)
Delay Propagation
(400 us)
Delay Dmax
Propagation
(100 us)
EqD
Start Time

203
Fig. 5.30 shows comparative curves between XG-PON (max. 20 km) and SARDANA without/with
optimization for the ONU activation process.
In the SARDANA case, are considered the Remote Node nearest (at 5 km from the OLT) and the RN
farthest (at 70 km from the OLT). In all the cases is considered a RN to TDM coupler distances of 10
km. The differential distances between ONUs is the same of the XG-PON (20 km).
Fig. 5. 30 - ONU activation process: XG-PON and SARDANA without/with optimization.
A better performance is shown for using optimization in SARDANA. Initialization process (serial number
and ranging acquisition) can be obtained in the worst case on 543 us. This enables SARDANA to
implements ranging in critical long-reach distances.
In Fig 5.31, by considering that XG-PON could be extensive up to 100 km and for using this
approximation as a reference, and from eqs. 5.4, 5.5 and [97], we can see a comparative between
SARDANA and XG-PON for the ONU initialization process.
200
300
400
500
600
700
800
900
1.000
1.100
0 10 20 30 40 50 60 70 80 90 100
L (km)
T (us)
OLT Nearest
ONU
Farhest
ONU
TDM RN
Nearest
RN
Farhest
RN
Coupler
ONU
Farhest
ONU
Differential
Distance
(20 km)
TDM
Coupler
ONU ONU
Differential
Distance
(20 km)
XG-PON SARDANA
SARDANA
Optimized
RN
Differential
Distance
(20 km)
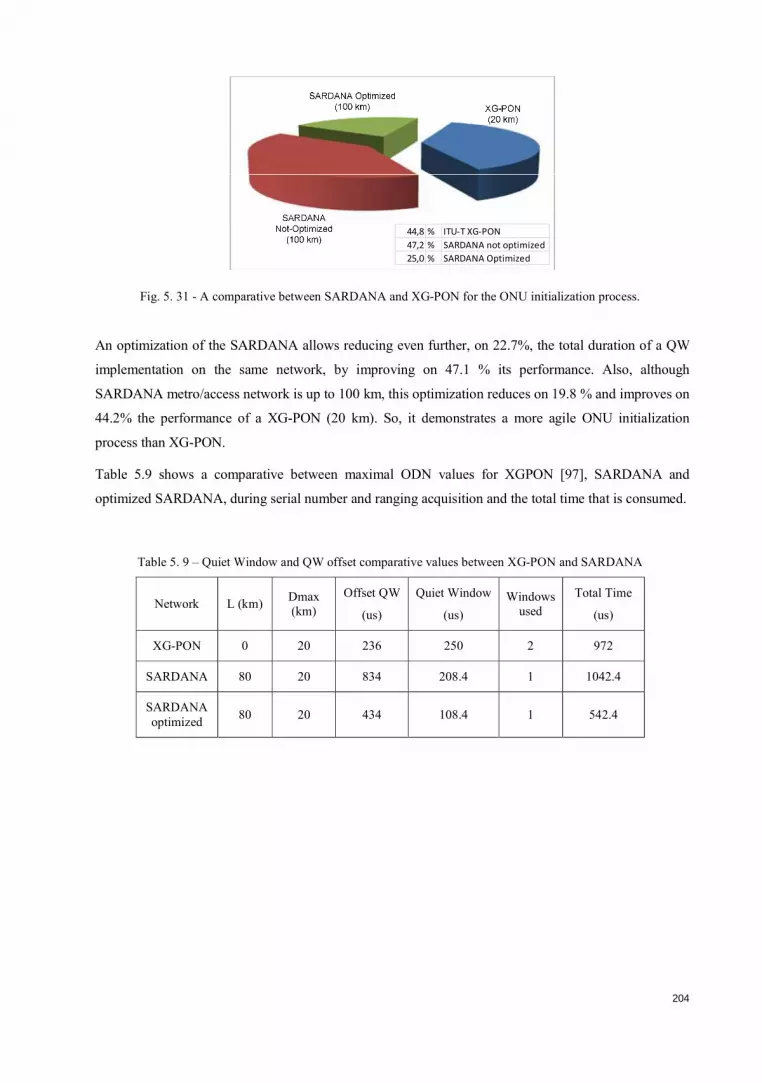
204
Fig. 5. 31 - A comparative between SARDANA and XG-PON for the ONU initialization process.
An optimization of the SARDANA allows reducing even further, on 22.7%, the total duration of a QW
implementation on the same network, by improving on 47.1 % its performance. Also, although
SARDANA metro/access network is up to 100 km, this optimization reduces on 19.8 % and improves on
44.2% the performance of a XG-PON (20 km). So, it demonstrates a more agile ONU initialization
process than XG-PON.
Table 5.9 shows a comparative between maximal ODN values for XGPON [97], SARDANA and
optimized SARDANA, during serial number and ranging acquisition and the total time that is consumed.
Table 5. 9 – Quiet Window and QW offset comparative values between XG-PON and SARDANA
Network L (km) Dmax (km)
Offset QW
(us)
Quiet Window
(us)
Windows used
Total Time
(us)
XG-PON 0 20 236 250 2 972
SARDANA 80 20 834 208.4 1 1042.4
SARDANA
optimized 80 20 434 108.4 1 542.4
44,8 % ITU-T XG-PON
47,2 % SARDANA not optimized
25,0 % SARDANA Optimized

205
5.2.6. Equalization Delay (EqD) Calculus
The OLT obtains the upstream PHY frame offset (Teqd) using the next expression:
Teqd≥ ONU Response Time max + 2 (TLmin + TDmax) ……(5.8)
Teqd value remains constant through the lifetime of the PON. The EqD of an ONU is found as:
EqDONUi = Teqd– RTD = Teqd– (∆SN –Start_Time)
……(5.9)
With ∆SN being the elapsed time between the DS PHY frames containing the SN grant and the US PHY
burst containing the SN response PLOAM. Fig. 5.32 shows these processes.
Fig. 5. 32 - Equalization delay calculation during SN process
The ONU is considered synchronized at the beginning of the US PHY frame when it is supplied with its
equalization delay value. The US burst is transmitted within the interval specified by the BWmap (start
time) with respect to the beginning of the US PHY frame.
In the practice, the EqD value depends of the Dmax than the ODN length. For SARDANA networks, in
the ONU parameter initialization process, will have the following values from (5.8):
Teqd_max= 36 us + 2 (T80km + T20km) = 1036 us
Li
Dm
ax

206
From (5.9):
RTD = ∆SN – Start_Time
For maximum EqD�RTDmin�Start_Time= 0 us
RTDmin= ONU Response Time min + 2 (T80km) = 34us + 2·(400us) = 834 us
EqDmax = Teqd– RTD = 202 us
Fig. 5.33 shows maximum EqD calculation for the SARDANA network.
Fig. 5. 33 - Maximum EqD value for the Dmax=20 km on the SARDANA network.
5.2.7. Timing during the Operation State of the PON
The ONU maintains its US PHY frame clock synchronized with the DS PHY frame clock and offset by
the sum of the ONU response time and the assigned EqD, specified by the OLT. The ONU transmits burst
data on the US frame according to the content of the BWmap (BW allocation and Start Time) received
from the OLT on the DS frame. Fig. 5.34 shows the timing for a burst from an ONU.
OLT
125us
farthest
ONUL = 80 km Dmax=20km
nearest
ONU
ONU max
Response Time
(36 us)
Delay Propagation
(400 us)
Delay Dmax
Propagation
(100 us)
EqDmax
US PHY
Frame
ONU min
Response Time
(34 us)
Start of the US
PHY Frame
834 us
1036 us
EqDmax = 202 us

207
Fig. 5. 34 - Timing during the Operation State

208
5.3. Conclusions
Different of XGEM from XG-PON, in SARDANA SGEM other fields are included to exploit their
metro/access coverage and as a function of the PHY characteristics. So, multi-protocol management,
overlay transmission capacity (from different service providers), multi-services and multi-operator
capability are deployable. Also, QoS and other higher layer services are possible. These new fields give
SARDANA TC capacities to deploy internetworking functions.
In SARDANA, the PLOAM message (downstream and upstream) has a variable length (8, 16, 24 or 32-
bytes) instead of a fixed length of 48-bytes (XGPON). In this way, increased efficiency between 1.5x and
6x times can be reached. This allows releasing more space in the header to favour the payload section
space.
Also, SARDANA burst header incorporates an indicator of the messages. This field will help the OLT to
know if the burst carries DBRu structures and PLOAMu messages, allowing fast decodification of the
burst payload.
Calculations to obtain an Upstream Physical Synchronization Block (PSBu) consistent with the
SARDANA PHY layer were done. A Preamble and Delimiter fields of 192 bits (77.16 ns) plus a Guard
Time of 80 bits (32.15 ns) are specified.
In this work, an agile ONU activation process by simplification of the ranging state is shown. This
mechanism reduces to one the use of a QW in the ONU initialization process, by improving the
efficiency. Even so, a QW instance penalizes the system. In this work, an optimization to mitigate this
issue is presented. Although SARDANA metro/access network 100 km, this optimization improves in
44% the performance with respect to XG-PON (20 km).
In XGPON, QW mechanism affects up to eight BWmaps during ONU activation. SARDANA
optimization reduces the impact of the QW to five BWmaps in the most critical ODN scenario (100 km).

209
Chapter 6
6. SARDANA NG-PON Layer 2 Implementation and Internetworking
In this chapter, an implementation proposal for the SARDANA Transmission Convergence (STC) layer 2
and internetworking processes through SARDANA networks are shown.
A comprehensive detail of the OLT and ONU STC prototype implementation is explained. These sub-
systems are deployed using a base board based on a FPGA Stratix IV GX development kit from Altera.
Setups for connections between base board and interfaces, and these with clients at the higher layers or
OMCI CPC and with the optical PHY SARDANA ODN, through OLT/ONU optical assemblies, are also
discussed.
About of SARDANA internetworking, this chapter deals about the relationship of SARDANA with other
communications systems in the context of broadband access and aims at describing the connectivity
requirements of SARDANA.
Although SARDANA system can share the infrastructure with current GPON and GE-PON systems as a
NGPON1; however, it cannot make full use of the SARDANA features, so we state that SARDANA is
mainly positioned in the NGPON-2 generation. Better than this, SARDANA can transport those different
systems in an efficient way.

210
The requirements of SARDANA from the Service layer viewpoint are detailed. The concept and
implementation of multiprotocol management are described. This process enables to SARDANA for
implementation of internetworking. So, procedures of Interoperability and Overlaying, for cover
requirements from higher layers and other providers and networks, are explained.
These internetworking services can be implemented between metro networks (at the metro network level)
or as an interconnection add/drop node, into a core transport network.
6.1. SARDANA Layer 2 Implementation The physical implementation of the SARDANA layer 2 is based on the OLT/ONU SARDANA
Transmission Convergence (STC) implementation, in order to obtain the functional characteristics,
explained in the previous chapter, operating at10/2.5 Gbps downstream/upstream data rate.
Similar to the first draft of the SARDANA layer 2 (SXGPON 64-bit data path) [171], a FPGA, such as
Altera Stratix IV [173], will be used as a base for the SARDANA layer 2 testbed designs. This FPGA
theoretically supports clock frequencies up to 600 MHz.
6.1.1. FPGA clock frequency and data path definition
The performance of a FPGA depends of the latency and the throughput. Latency measures how many
clock cycles are required to process the data from the input to the output. Throughput defines the
maximum amount of data that can be processed in a certain time of frame. The FPGAs speed has a
theoretical limit in its maximum clock frequency.
The data rate can be represented to be directly proportional to the data path width and the data processing
frequency into the FPGA and is referred to as clock frequency in the FPGA context. This relationship is
represented by:
Data rate (bps) = Data path width (bits) · Clock frequency (Hz)
The clock frequency is inversely proportional to the data processing time referred to as clock cycle in the
FPGA context.
For FPGA clock frequency to support downstream 9.95328 Gbps is necessary to parallelize the data to a
wide enough data path. By compatibility with XGPON design, where the frame formats are aligned to 4-
byte word boundaries [97], a 32-bit data path is considered. Hence, for 10 Gbps, the clock frequency
necessary for this data path is:
Clock frequency = 9.95328 Gbps / 32 bits = 311.04 MHz
Similarly, in the US path, for 2.48832 Gbps data rate, the clock frequency with 32-bit data path is 77.76
MHz.
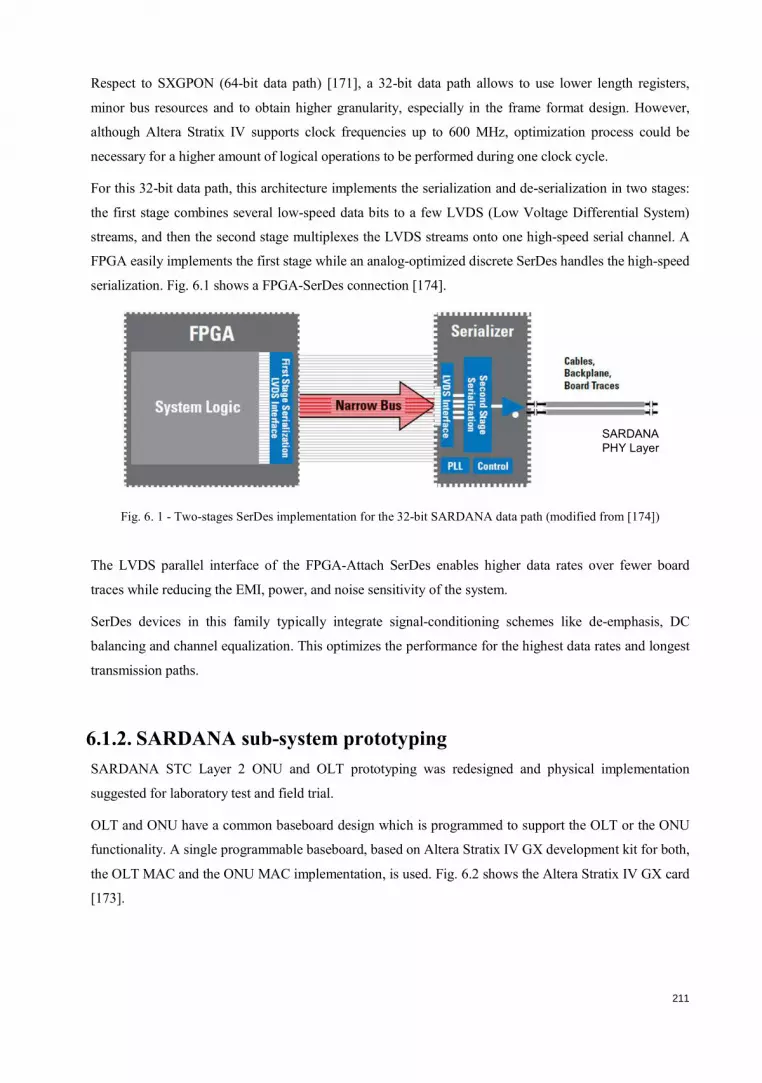
211
Respect to SXGPON (64-bit data path) [171], a 32-bit data path allows to use lower length registers,
minor bus resources and to obtain higher granularity, especially in the frame format design. However,
although Altera Stratix IV supports clock frequencies up to 600 MHz, optimization process could be
necessary for a higher amount of logical operations to be performed during one clock cycle.
For this 32-bit data path, this architecture implements the serialization and de-serialization in two stages:
the first stage combines several low-speed data bits to a few LVDS (Low Voltage Differential System)
streams, and then the second stage multiplexes the LVDS streams onto one high-speed serial channel. A
FPGA easily implements the first stage while an analog-optimized discrete SerDes handles the high-speed
serialization. Fig. 6.1 shows a FPGA-SerDes connection [174].
Fig. 6. 1 - Two-stages SerDes implementation for the 32-bit SARDANA data path (modified from [174])
The LVDS parallel interface of the FPGA-Attach SerDes enables higher data rates over fewer board
traces while reducing the EMI, power, and noise sensitivity of the system.
SerDes devices in this family typically integrate signal-conditioning schemes like de-emphasis, DC
balancing and channel equalization. This optimizes the performance for the highest data rates and longest
transmission paths.
6.1.2. SARDANA sub-system prototyping SARDANA STC Layer 2 ONU and OLT prototyping was redesigned and physical implementation
suggested for laboratory test and field trial.
OLT and ONU have a common baseboard design which is programmed to support the OLT or the ONU
functionality. A single programmable baseboard, based on Altera Stratix IV GX development kit for both,
the OLT MAC and the ONU MAC implementation, is used. Fig. 6.2 shows the Altera Stratix IV GX card
[173].
SARDANA
PHY Layer

212
Fig. 6. 2 - OLT/ONU prototype base board based on FPGA Altera Stratix IV GX
Also, two sub-systems are necessary for the interface with the higher layers and the optics assembly. So,
the baseboard provides two HSMC (High Speed Mezzanine Connector) for the interconnection of these
sub-systems: one is used for SNI/UNI Ethernet interface module in the data link level. The other HSMC
is used for the optical interface module with the PHY Layer OLT level (OLT Burst Receive/Frame Send)
and PHY Layer ONU level (ONU Burst Send/Frame Receive). OLT and ONU PON interface modules
are based in the optical module board TST9061 from Tellabs Inc.
6.1.2.1. Ethernet Interface Module
The Ethernet interface module is used according to the application interface (SNI or UNI). SNI and UNI
both differ in the transmission rate and the Ethernet protocol (although backward compatible). In the case
of SARDANA design, two interfaces are used:
a) 10GE interface, for SNI interfaces.
b) 10/100/1000Base-T for UNI interface
a) 10 GE SNI Interface
The STC FPGA design is using an internal 10G Ethernet MAC IPR (IP reach)-Block that interfaces to an
Ethernet HSMC interface module via a XAUI interface. It is used preferably at the OLT like SNI
interface by the amount of information exchange. Alternatively, HSMC CX4 Adapter Board can be used
with 10G Ethernet applications using CX-4 copper interfaces. Fig. 6.3 shows these interfaces.

213
Fig. 6. 3 - Ethernet interface modules for SNI a) HSMC CX4 Adapter Board b) HSMC board based on XAUI
interface connects with Altera Stratix IV FPGA Development Kit.
b) 10/100/1000 Base-T UNI Interface
The STC FPGA design is using an internal triple speed Ethernet MAC IPR-Block that interfaces to the
four port triple speed MAC HSMC interface module via four SGMII interfaces, as shown in Fig. 6.4.
Again electrical Ethernet ports 10/100/1000Base-T, using four standard RJ-45 connectors, are used to
connection to the CPE (Customer Premises Equipment) at the ONU. One of the ports is dedicated for
SARDANA OMCI system and the remaining three ports are for Ethernet services (multicast IPTV,
Internet access and videoconferencing).
Fig. 6. 4 - Ethernet interface modules for UNI: HSMC 4-Ports 10/100/1000Base-T RJ-45 port Adapter Board

214
6.1.2.2. Optical interface module (TST 9061)
The Optical interface module (TST9061) provides serial differential SMA connectors for OLT and ONU
TX/RX optical PHY layer modules, and a XFP gage for OLT and ONU receiver/transmit signal test, as
shown in Fig. 6.5. This module perform electrical interface between framers and serializer/deserializer
parts. A Broadcom BCM8154 [151], a multi-rate low-power 10G NRZ/duobinary transceiver with 10G
clock and 16:1 serializer/deserializer clock and data recovery IC is used as both the OLT and ONU
transceiver.
Fig. 6. 5 - Optical HSMC module board (TST9061) for the OLT and ONU assemblies.
The TST9061 connects to the baseboard MAC FPGA Altera Stratix IV via the second HSMC connector,
as shown in Fig. 6.6.
Fig. 6. 6 - Optical interface module (TST9061), connected on the MAC base board Altera Stratix IV GX

215
There are two variants of optical module TST9061: OLT TX/RX and ONU TX/RX modules. The only
difference is the XFP RX components used and the choice of some passive components (coupling resistor
and capacitors). The same TST9061 board layout is used for both optical module types.
6.1.3. OLT Layer 2 Prototyping
6.1.3.1. OLT STC TX
The OLT transmits 10Gbps downstream frame to the ONUs. A 32-bit parallel 311 MHz LVDS does
interface over the HSMC between the OLT base boards and the OLT optical module interface. On the
optical interface module, the BCM8154 serializes this framer interface to an LVDS 10Gbps CML signal.
This is transmitted via two differential right angle PCB edged SMA jacks (RPC-2.92) and 50 ohms
precision coaxial cables to the transmitter OLT optical assembly at the PHY layer.
Fig. 6.7 shows the block diagram of the layer architecture in the OLT implementation and interfaces.
FPGA processor implements all the function and processes of the STC layer. At the Service Adaptation
sub-layer, FPGA implements MPM functionality and interfaces with the Ethernet client, at SNI, through
the Ethernet CX-4 10 Gbps interface.
Fig. 6. 7 – Block diagram of the SARDANA OLT Layer1/Layer 2 implementation

216
At the Framing sub-layer, FPGA deploys framing, PLOAM processing and DBA control. At the PHY
adaptation sub-layer, it implements FEC, scrambled and a first stage of SerDes. A second SerDes stage is
implemented at the TST-9061 optical interface and delivery/receiving a CML signal to/from OLT optics
assembly, at the PHY layer. Finally, OLT optics assembly interfaces with SARDANA ODN at 10
Gbps/2.5Gbps optical signal.
6.1.3.2. OLT STC RX
The OLT receives 2.5Gbps upstream frame consisting of bursts sent from the ONUs in the PON. The
BCM8154 deserializes the LVDS signal that is received from the OLT RX PHY layer optical module, to
32-bit SPON MAC framer interface. The implementation uses BCM8154 demultiplexer for sampling 2.5
Gbps serial burst received to the parallel 32-bit interface.
Fig. 6.8 presents a pictorial diagram of the OLT Layer 2/Layer 1 setup implementation. It shows the
interconnections of the Altera Stratix IV FPGA GX card module with their interface modules: the
Ethernet 10 Gbps CX4 adapter (at SNI) and the Optics Interface TST9061, connected at the OLT
SARDANA optics assembly. CPC control unit connection and Central Office setup is also shown.
Fig. 6. 8 – OLT Layer 1/Layer 2 implementation based on Altera Stratix IV FPGA GX card module pictorial
diagram. The Interfaces through Ethernet CX4 adapter and Optics Interface TST9061, as well as the CPC control
unit and the OLT Optics Assembly are shown.
PCI Backplane
HSMC
DFB Laser
Temperature
Controller
Current
Driver
Bias
Bias
Circuitry
Dithering
Circuitry
Mach Zehnder
Modulator
Fast Variable
Optical Att
Central
Office
OLT
Optics
Assembly
Data
Servers
Provider’s
Video
Server
Pre-Amp
CPC
SNI
Ethernet
CX4
HSMC
Adapter
FPGA
OMCICLI/Telnet
Ethernet Switch
Port XFPMAC
CoS – 8 level
VLANs
Data
Servers
Video
Server
10 Gbps
Ethernet
Ethernet
Metro
RX
TX
Ethernet
CX4
SARDANA
ODN
PHY
Layer
Link
Layer
STC
Layer
APD
TX/RX
L2 Test
XFP
TST
9061
BCM
8154
SMATX RX
SMA
XFP
Diff.Coax
2.5 GbpsCML
signal
Booster

217
6.1.4. ONU Layer 2 Prototyping
6.1.4.1. ONU STC TX
Upstream burst at 2.5Gbit/s is transmitted from the ONU to the OLT. The ONU base board SPON framer
interface is a 32-bit parallel 77.76 MHz LVDS interface to the BCM8154 transceiver on the ONU optical
module. This connects to the transmitter ONU optical assembly at the PHY layer, with 50 ohm precision
coaxial cables. A control for TX off needs to be provided to suppress the rONU transmitted optical signal
between the rONU upstream allocations.
Figure 6.9 shows the block diagram of the layer architecture in the ONU implementation and interfaces.
Similar to OLT implementation, FPGA processor implements all the function and processes of the STC
layer. It interfaces with the Ethernet client, at UNI, through the 4-port Ethernet 10/100/1000 Base-T
interface. At the PHY layer, ONU optics assembly interfaces with SARDANA ODN at 2.5 Gbps /10
Gbps optical signal.
Fig. 6. 9 - SARDANA ONU Layer1/Layer 2 and FPGA implementation
Service
Adaptation
Sublayer
CPC
10/100/1000 Mbps
SARDANA
ONU
OMCI
adapter
ONU SARDANA TRANSMISSION CONVERGENCE
FEC and Scrambled
SERDES
Ethernet
Interface
Ethernet
Interface
Ethernet
Interface
Framing
Sublayer
FPGA
PHY Layer
Ethernet Clients
Optical RX/TX 10Gbps / 2.5Gbps
UNI
TST 9061CML
Optics
Assembly
PLOAM
processor
Optical
Interface
LVDS32-bitPHY
Adaptation
Sublayer
MPM
processor

218
6.1.4.2. ONU STC RX
The ONU optical module receives a 10Gbps downstream frame from the OLT, performs interface from
this serial 10Gbps CML signal to 32-bit 311 MHz LVDS, and send it to the ONU base board over HSMC
connector.
Fig. 6.10 presents a pictorial diagram of the ONU Layer 2/Layer 1 setup. It shows the interconnections of
the Altera Stratix IV FPGA GX card module with their interface modules: the Ethernet 10/100/1000
Base-T adapter (at UNI) and the Optics Interface TST9061, connected at the ONU SARDANA optics
assembly. CPC control unit connection and user’s premises setup is also shown.
Fig. 6. 10 –The ONU Layer 1/Layer 2 implementation pictorial diagram, based on Altera Stratix IV FPGA GX card module. Interfaces through Ethernet 10/100/1000 Base-T adapter and Optics Interface TST9061, as well as the CPC
control unit and the ONU optics assembly
Ethernet
LAN
ONU
SplitterDiff.Coax
2.5 Gbps
RJ-45
CAT 5, 5e, 6
PCI Backplane
HSMC
Downstream
Cancellation
RSOA
User’s
Premises
ONU
Optics
Assembly
XFP
CPC
UNI
Ethernet
10/100/1000
HSMC
Adapter
FPGA
OMCICLI/Telnet
SARDANA
ODN
PHY
Layer
Link
Layer
STC
Layer
APD
TX/RX
Layer 2 Test
CML
signal
RSOA
Control
Ethernet
10/100/1000
Base-T
TST
9061
BCM
8154
SMATX RX
SMABE
Burst
Enable
XFP

219
6.1.5. Control of the SARDANA STC processes A single interface for CLI (Command Line Interface) based on register read/write access is provided by the boards.
An external PC is used to configure the boards via this CLI using Telnet connection. The Nios II embedded
processor in the FPGA design on the OLT/ONU protoboards and the software running on a PC allows register
read/write access for board configuration. An Ethernet USB port on the OLT/ONU protoboards is used for
connecting to the Control PC (CPC) configuration Ethernet port.
Fig. 6.11 shows a network test diagram. Control PC connections with the OLT and the ONU are established for
network control, through the SARDANA and by means an Ethernet switch for supervision.
Fig. 6. 11 - SARDANA demonstrator network for Management & Control test
This demonstrator network was implemented to test the functionalities of management and control on the
Layer 2 architecture and on the PHY particular topology. Here, SARDANA network allows
communications services through the OLT to devices at the customer ONU site. A 10G Ethernet Switch
at Central Office site connects Link layer services with the OLT protoboards. Node/Network services and
the CPC connect to the services Switch via 1GE interfaces. The protoboards are planned to offer direct
10/100/1000Base-T interfaces (at the UNI/CPC) as well in addition to the electrical 10GBase-CX4
Ethernet interface (at the SNI). The CPE site customer switch interface to the PON uses 1GE ports. The
OLT 10GE interface is per SARDANA-PON. So, one 10GE OLT interface is required per each
SARDANA wavelength.

220
Ethernet VLANs are used to separate the different service in the PON level. Each VLAN provided from
the Service Switch get mapped to different GEM-ports and each GEM-port from the PON gets mapped to
different VLANs in the OLT.
IPTV service is using a dedicated multicast VLAN to Multicast GEM port association. Each ONU and
CPE site is provided with all multicast channels to simplify the design. Internet access is provided via 1:1
VLAN access instead of 1:N scheme to avoid MAC switching functionality implementation at the OLT.
Videoconference service is also relying on 1:1 VLAN access. CPE video equipment connects to ONU 1G
port at two ONU locations and a VLAN cross-connection is provided at the Service Switch for point-to-
point video transmission.
The element management from the Control PC is using a dedicated OMCI-VLAN and OMCC
interworking [164-169] to transport management messages over the PON.
Also, some considerations for simplest test implementation are taking into account:
1) Just a single PON support for the OLT protoboard is need. This may allow us to fit OLT MAC in a
single programmable device.
2) Only maximum four ONUs per PON is supported in the prototype. It is anticipated that the number
of prototypes we can make is very limited. This low number of ONUs per PON could simplify
operation a lot.
3) Fixed bandwidth assignment per ONU. This simplifies OLT bandwidth management and grant
allocation – OMCI and user data T-CONTs are always allocated
4) No downstream encryption, in demos and trial we do not guarantee privacy. This should simplify
design.
5) FEC is not supported initially. It would be good if it were possible to support it in later releases to get
the additional dB or two to the power budget.
6) Expect the Access MAC tables to be very small in the SARDANA demo and trial networks – only 1-
4 ONUs per PON.
7) DBRu is not implemented.
8) Upstream BW map SStart and SStop 16-bit field is defined.
9) No GEM fragmentation is performed.

221
6.1.6. SARDANA Layer 2 system operation Figure 6.12 shows SARDANA system layer 2 implementation via FPGA in-built at the Altera Stratix IV
GX board; read/write registers and OMCI control using telnet, via CPC; Ethernet and Optical (TST 9061)
interfaces; OLT, ONU and ODN SARDANA.
At a glance, the processes at the SARDANA system (e. g. downstream transmission) are:
1) The VLAN tagged Ethernet user frames, received at the baseboard from Ethernet Metro network via
SNI, are passed through the 10GE MAC to the 10G OLT transmit block. The user frames are adapted for
transport over the PON SGEM port-IDs.
2) The OMC/Ethernet frames are passed on to the OMCI interworking function that adapts the
OMC/Ethernet to OMC/OMCC-SGEM port-ID transport.
3) Both user frames and control frames are multiplexed to the DS SGTC frame payload. A PSBd basic
should be implemented by using the Psync code. ASTC frame should be implementing an US BW map,
resulting of the DBA algorithm. In first instance, a static bandwidth assignment will be used.
4) The downstream frame is sent to OLT optical module interface over the HSMC in 16 bits parallel
622MHz LVDS logic.
5) The BCM8154, on the optical module, serializes this framer interface to an LVDS 10Gps CML signal
that is connected via two right angle PCB edged SMA jacks (RPC-2.92) and 50 Ohm precision coaxial
cables to the transmitter OLT optics assembly.
6) In this OLT optics assembly, electrical 10 Gbps CML signal modulates a 1550nm optical carrier via an
MZM. Resultant optical signal is multiplexed on a fibre and sent to SARDANA optical distribution
network (ODN).
7) At the user’s premises, the ONU optics assembly receiver gets it 10GbpsDS frame. It implements
optical-to-electrical conversion via PD.
8) The electrical 10Gbit/s CML signal is converted to 16-bits parallel 622MHz LVDS signal by the
BCM81541:16 SERDES transceiver. This signal is transport to the baseboard via HSMC connector.
9) This DS-frame is fed into the ONU MAC RX block which finds frame delineation and drops the user
data SGEM port-ID and OMCC SGEM port-ID fragments from STC payload for either frame reassembly
or OMCI IWF for adaptation to Ethernet/OMC.

222
Fig. 6. 12 - SARDANA network system: MAC and PHY implementation
10) Ethernet frames are delivered to user equipment, via UNI interface.
11) Also, ONU STC RX read the US BW map from STC frame header and organizes the upstream burst
signal to send.
TDM
Ethernet
LAN
PCI Backplane
HS
MCUser’s
Premises
XFP
CPC
UNI
FPGA
STC
Layer
Ethernet
10/100/1000
Base-T
TST
9061
BCM
8154
SMA
TX
RX
SMA
BE
Burst
Enable
XFP
WDM
RN3
RNn
RN2 RN4
RN1
Coupler
PCI Backplane
HSMC
DFB Laser
Temperature
Controller
Current
Driver
Bias
Bias
Circuitry
Dithering
Circuitry
Mach Zehnder
Modulator
Fast Variable
Optical Att
Central
Office
OLT
Optics
Assembly
Pre-Amp
CPC
SNI
Ethernet
CX4
HSMC
Adapter
FPGA
Ethernet Switch
10 Gbps
Ethernet
Ethernet
Metro
RX
TX
Ethernet
CX4
PHY
Layer
STC
Layer
APD
TX/RX
L2 Test
XFP
TST
9061
BCM
8154
SMA
TX RX
SMA
XFP
Diff.Coax
2.5 GbpsCML
signal Bo
os
ter
ONU
SplitterDownstream
Cancellation
RSOA
ONU
Optics
AssemblySARDANA
ODN
APD
RSOA
Control

223
A direct connection between OLT and ONU protoboards for using XFP transceiver [150] at 10 Gbps is
implemented for layer 2 test for compliance.
It is interesting to note that OMCI management operation has a processing slower than a PLOAM or an
OAM embedded. For this reason it is a GEM client (OMCI information is into GEM payload).
A SARDANA Layer2 back-to-back for OMC/Ethernet and CLI/Telnet tests was done in Tellabs-Oy, in
Finland. It is shown in Fig. 6.13.
Fig. 6. 13 – SARDANA Layer 2 B2B setup used at the Tellabs OY (Espoo-Finland) for OMC/Ethernet and
CLI/Telnet tests.

224
6.1.7. Interlayer encapsulation process in SARDANA Figure 6.14 presents the sequence of operations between layers in the encapsulation process in
downstream transmission on SARDANA network. To facilitate the presentation of this sequence, it is
considered that an entire Ethernet frame is allocated in the SGEM frame and, therefore, full Ethernet
frame is transmitted.
User’s Data and OMCI information are transferred to the SARDANA TC layer from application software
in the Application layer. In SARDANA, OMCI commands use a CLI (Command Line Interface) to
interact with TC layer by means Ethernet protocol.
In the Transport layer, the information is fragmented. Here, two protocols are used depending on the
nature of the information or services to transmit, as data can be time-sensitive or not:
o Internet data information or e-mail, they are not latency sensitive. They use TCP (Transmission
Control Protocol).
o Videoconferencing, VoIP, IPTV, etc, are real time data services. They use UDP (User Datagram
Protocol), often together with RTP (Real-time Transport Protocol) or Real-Time Control Protocol
(RTCP), for the reliable transmission.
A transport header is added it to associate this fragment to a socket. The PDU (protocol data unit) in this
layer is named “segment”. Here it is necessary to make a distinction. In layered systems, the PDU is a
unit of data that is specified in a protocol of a given layer and that consists of protocol-control
information of the given layer and possibly user data of that layer; whilst a service data unit (SDU) is a
unit of data that has been passed down from a higher layer (n) to a lower layer (n-1) and that has not yet
been encapsulated into a protocol data unit (PDU) by this lower layer [172,175]. All the data contained in
the SDU becomes encapsulated within the PDU.
By continuing, at the Network Layer, a header with IP address and other network parameters are added at
this segment. The information is sent as a “packet” (PDU of layer 3) to the Link layer.
At the Link layer, the Ethernet protocol takes this SDU as its payload and adding a Destine/Source MAC
address as header. This frame is the frame client (SDU) of the SARDANA TC layer.
So, considering real-time data transmission (e.g. Videoconferencing), where SIP or H.323 protocols are
used at the OSI model Session Layer (considered here as a part of the Application Layer), and
RTP/UDP/IP is the popular protocol stack, the application-layer packets go through RTP, UDP, IP and
Ethernet.
Therefore, 12 (UDP) + 8 (RTP) + 20 (IP) + 18 (Ethernet) = 58 bytes is added into each packet before
SGEM encapsulation.

225
So, the data frame flows in the U-Plane, it is fragmented and encapsulated into a SGEM payload and is
identified by its traffic type (implicitly indicated by an Alloc-ID) and its Port-ID (used to identify flows)
allocated in a SGEM header.
Fig. 6. 14 - Interlayer encapsulation in the SARDANA Network Downstream process
Data Services
(HTTP, SMTP,
etc)
TCP
IP
LLC
MAC Ethernet 802.3
OMCI Adapter
Port-ID Filter
PLOAM
OAM
Embedded
GEM Fragmentation
GEM Header
Alloc-ID Filter
GEM Partition
PCBd
TC Frame
FEC, Scrambler, NRZ
GEM Payload
Encryption
BIP
PHY
PMD: PON
OMCI
Telnet CLI
Data
DataH4
DataH4H3
Segment
Packet
DataH4H3
TC Frame
EthGhPCBd
GEM Payload
TC Payload
bits
11000110110111….
Lightwave
Transport
Header
Packet
Header
Data Services
(IPTV,VoIP,
Videoconferencing)
UDP
DataH4H3
Frame
Eth
Ethernet Frame

226
This SGEM frame is multiplexed into a STC frame together other SGEM frames. Now, a new header,
named STC header, is added to this data frame. This header is formed by parameters and messages from
Embedded OAM block and PLOAM block. Embedded OAM provides time sensitive OAM
functionalities consisting of Granting, Key switching for security and DBA related functionalities.
Bandwidth assignment and QoS control are performed in every T-CONT. PLOAM block provides PON
management functionalities, such as ranging, activation of ONU, establishment of OMCC, etc.
This downstream STC frame is finally adapted at the physical layer with PSBd (PSync) and FEC,
Scrambler and NRZ processes, into a 125 us DS PHY frame, before to be sent.

227
6.2. SARDANA Internetworking Traditionally, the optical layer of the network has been viewed as a simple transport medium. Its primary
function has been to provide a connection between electrical layer devices in the form of static, high-
capacity pipes [176]. The introduction of intelligent optical networking changes this paradigm.
SARDANA optical network introduces increased functionality that electrical layer devices (e. g. IP
routers, Ethernet switches) can now use to enhance and optimize end-user network services.
SARDANA Internetworking capabilities are shown in this section. This contribution deals about the
relationship of SARDANA with other communications systems in the context of broadband access, and
aims at describing the connectivity requirements of SARDANA. Because their Metro-Access coverage
and Transmission Convergence (TC) layer capabilities, SARDANA network can provide transport
services to other providers networks.
Although SARDANA system can share the infrastructure with current GPON [125] and GE-PON
systems [177] as a NG-PON1; however, these systems cannot make full use of the SARDANA features,
so we state that SARDANA is mainly positioned in the NG-PON2 generation. Better than this,
SARDANA can transport those different systems in an efficient way.
These internetworking services can be implemented between metro networks (at the metro network
level), or as an interconnection add/drop node (into a backhaul transport network), or as an overlay
gateway (between different networks).
For each of these services, SARDANA network can offer end-to-end transport by encapsulating
information (into SGEM/STC frames) at L2/L3 management levels or by using transparent transport
services, at L1 level.
In order for different protocols from different layers to be transported by SARDANA network, a multi-
protocol management mechanism is proposed for implementation at STC SARDANA. This enables
SGEM header to incorporate new fields (different of XGEM, from ITU-T G.987.3, as shown in 5.1.3.1
section) to offer new features as advanced networking functionalities and QoS.
So, Protocol ID field carry information from protocols used in the upper layers of a metro network
(Ethernet, MPLS, SDH/SONET, ATM, IP, others) or protocols used in transport networks (e.g. GMPLS).
This implementation extends the service capabilities of a PON. Also, PT (payload type) field, transport
information of the payload contents, and QoS (Quality-of Service) field can be used to ensure privileged
services at real-time transmissions, security-sensitive data and QoS itself.

228
6.2.1. Ethernet frame over SGEM
Ethernet frame over a GEM frame is the typical and regular transmission mode in a G-PON FTTH
network [97]. Ethernet frame (except preamble and SFD fields) is carried directly in the SGEM payload,
equal to XGEM. Each Ethernet frame is mapped into a single SGEM or, as maximum, two SGEM
frames. An SGEM frame may not encapsulate more than one Ethernet frame. Fig. 6.15 shows a part of
the Link Layer (OSI model) from a viewpoint of framing.
Fig. 6. 15 - Ethernet frame mapping into SGEM payload (modified from G.987.3_F9-5)
After, the SGEM frame (header + Payload) will be encapsulated as a payload of next SARDANA sub-
layer (the Framing sub-layer) and will be a new SDU of the STC frame.
6.2.2. Multi-Protocol Management (MPM) In SARDANA Transmission Convergence (STC) architecture, a mechanism based on a fast analysis of
the L2/L3 (link layer/network layer) headers allows to obtain relevant information of protocols, formats
and services operating in the upper layers. This information is very important to implement
internetworking and interoperability services. This mechanism is deployable via a multi-protocol
management (MPM) processor, as an additional processing function of the FPGA at the STC Service
Adaptation Sub-layer, previous to SGEM encapsulation process.
6.2.2.1. MPM processing
In normal operation, the delineation process in MPM relies upon the presence of a Link protocol header at
the beginning of every SDU frame. By considering that a SGEM frame may not encapsulate more than
one Link protocol frame, the SGEM payload section will contain the Link protocol header (or a part of it,
SGEM Frame
HEC
SGEM Header(8 bytes)
SGEM Payload(N+18 bytes+Padding)
SN
Ethernet
Preamble
Ethernet Header(22 bytes)
Ethernet Payload(Standar:1500 bytes)
(Jumbo: 9000 bytes)
SFD DA MAC Client Data
Port
IDPLI
Pad
SALength
or
Type
F
C
S
Inter
packet
gap
OH
12 7 1 6 6 2N
4
0-3
PTIProt
IDKey
Index DA SALength
or
TypeMAC Client Data
LINK LAYER
Ethernet Sub-Layer
Service Adaptation Sub-Layer
SARDANA TC
Qo
S

229
e.g. in Ethernet are relevant 14 bytes of its header, as shown in Fig. 6.15), as well as all the Link protocol
payload content. This last payload, in turn, contains, in their first bytes, the header from the Network
protocol (L3) (e.g. an IP header), at which gives the link services.
So, MPM detects the start of the SDU, establish the boundaries of both two headers using a bit counter
and making a mapped of this information. Subsequently, read the content of the fields detected and
process this information. Relevant essence is transmitted to the SGEM header, into the Protocol-ID, PT
and QoS fields. This SGEM frame is sent to framing sub-layer where is encapsulated into a STC 125us
frame to be transmitted afterwards to all network. Fig. 6.16 shows the encapsulation process between
layers, based on the OSI model, and the MPM processing.
Also, MPM processor provides this information to QoS process and DBA control. By considering that
traffic classification may be carried out at various levels of the OSI model: at the application layer (by
means of the user’s identity, the URL, etc.), at the transport layer (by means of TCP or UDP ports), at
network layer (by means of IP packet addresses, the ToS fields, diffServ), and at the link layer (e.g.
VLAN identifier), a system as SARDANA MPM, capable to detect traffic type of the higher layers, gives
at the network client capabilities to management transparently its services for each of their network users.
Fig. 6. 16 - Encapsulation between layers based on the OSI model and MPM processes.
HEC
SGEM Header SGEM Payload
SN
L2 Payload
SDU Layer 2
Port
IDPLI
P
a
d
0-3
PTIProt
ID
Key
Index
LINK LAYER
Service Adaptation Sub-Layer
SARDANA TC
Qo
S
L3 Payload
SDU Layer 3
L3
Header
L3
HeaderL3 Payload
MPM
Processor
NETWORK LAYER
L2
Header
L3
Header
L2
HeaderL3 Payload
FPGA
L3
L2
TRANSPORT LAYER
DBA
Control
QoS
process
L4
Framing Sub-Layer

230
6.2.2.2. MPM processing for IP over Ethernet services
By considering Ethernet protocol [177] and IP protocol [178] the most used link layer/network layer
protocols, these will be used to explain the process done by MPM.
IP Packet Header
The IPv4 packet header consists of 14 fields, of which 13 are required and one is optional. So, without
considering the optional field, its length is 20 bytes. IP header is shown in Fig. 6.17.
The most significant fields of this header for MPM STC SARDANA are:
Version: Identify the IP version field. In this example, we consider the IPv4. IP version 6 header can be
found in [179]. Also, because not all networks support dual-stack (IPv4/IPv6), tunneling is used for IPv4
networks to talk to IPv6 networks (and vice-versa).
Internet Header Length (IHL): This field specifies the size of the header. The minimum value for this
field is 5, which is a length of 20 bytes. The maximum length is 60 bytes [178].
0 1 2 3 0 1 2 3 4 5 6 7 8 9 10 11 12 13 14 15 16 17 18 19 20 21 22 23 24 25 26 27 28 29 30 31
Version IHL DSCP ECN Total Length
Identification Flags Fragment Offset
Time To Live Protocol HeaderChecksum
Source IP Address
Destination IP Address
Options
Fig. 6. 17 - IP header format
Protocol: This field defines the protocol used in the data portion of the IP datagram. The Internet
Assigned Numbers Authority (IANA) maintains a list of IP protocol numbers which was originally
defined in the RFC 790 and actualized in the RFC 1700 [180]. Also, a list of IP protocol numbers used in
this field can be found in the RFC 5237 [181] and IANA list [182]. A part of these protocol numbers (in
Hexadecimal) and references are shown in Table 6.1.
Differentiated Services Code Point (DSCP): Or “Type of Service” field. This field is now defined by RFC
2474 [183] for Differentiated services (DiffServ).
Total Length: Defines the entire packet (fragment) size, including header and data, in bytes. The
minimum-length packet is 20 bytes (20-byte header + 0 bytes data) and the maximum is 65,535 bytes (the
maximum value of a 16-bit word). The largest datagram that any host is required to be able to reassemble
is 576 bytes.
20
bytes

231
Source address (SA) and Destination address (DA): This field is the IPv4 address of the sender/receiver
of the packet.
Table 6. 1 – Partial list of IP protocol numbers used in the Protocol field.
Hex Keyword Protocol References
0x01 ICMP Internet Control Message Protocol RFC 792
0x02 IGMP Internet Group Management Protocol RFC 1112
0x04 IPv4 IPv4 (encapsulation) RFC 791
0x05 ST Internet Stream Protocol RFC 1190, RFC 1819
0x06 TCP Transmission Control Protocol RFC 793
0x08 EGP Exterior Gateway Protocol RFC 888
0x09 IGP Interior Gateway Protocol
0x11 UDP User Datagram Protocol RFC 768
0x29 IPv6 IPv6 (encapsulation) RFC 2473, RFC 3056
0x2E RSVP Resource Reservation Protocol RFC 2205
0x84 SCTP Stream Control Transmission Protocol
0x85 FC Fibre Channel
Fig. 6.18 shows an IP packet being encapsulated into an Ethernet frame. Important parameters from the
IP header [178] for networking procedures are processed by the multi-protocol management processor
and transmitted via new fields into SGEM header.
Fig. 6. 18 – IP header mapping from Ethernet frame for multi-protocol management in SARDANA metro/access
network

232
A more explicit mapping scheme how MPM STC SARDANA processes the information obtained from
the L3/L2 headers is shown in Fig. 6.19.
Fig. 6. 19 – MPM mapped of the IP/Ethernet headers (from Ethernet frame), on the SGEM frame.
Information from field Address MAC DA and MAC SA (Ethernet header), and IP SA and IP DA (IP
header), are processed to establish users/networks target, and are carried in the Port-ID field on the
SGEM header.
From the Length/Type field (Ethernet) is possible obtain up to two information: if this value is higher than
or equal 1536 (decimal, maximum value of an Ethernet frame) [177], it indicates the protocol type into
the payload, and this information is presented in the PTI field of the SGEM. Otherwise, this will shows
Ethernet frame length information, which will be used in the PLI SGEM field. Also, IP Total Length field
can be used to estimate the value in PLI.
From the IP version and Protocol fields it is possible to determine the transport protocol type beyond the
layer 3 (e. g. an UDP with RTCP Transport layer protocols for real-time audio/video transmission). This
information is presented in the PTI SGEM field.
From the IP DSCP field, differentiated service type (based on diffServ mechanism) can be obtained to
establish the quality of services levels for this particular IP payload. This information is shown in the QoS
SGEM field.

233
6.2.3. Network interoperability across SARDANA SARDANA can be considered as a neutral/open network layer that can be shared by different PON
operators in equal terms, with a high level of transparency, to guarantee their independency.
Interoperability at different levels is possible. It ensures the interconnection of the network elements of
SARDANA at the physical layer and management levels (layer2 or layer3).
6.2.3.1. SARDANA interoperability at Layer 1 level
Where SARDANA can provide a more advantageous solution is in the physical layer, specifically in the
wavelength domain. The ring-tree topology of SARDANA provides an extra degree of freedom to
allocate Remote Nodes or wavelengths to groups of users in a flexible way, as shown in Fig. 6.20.
Fig. 6. 20 – SARDANA – XGPON (or GPON/GE-PON) interoperability PHY layer processes, for interconnection
through a SARDANA remote node (RN).
RNi
TDM
Coupler
RN2
RN1
RN8
SARDANA
WDM
Metro
rONU
1
OLT4
CO
OLT3
OLT1
rONU
2
rONU
N
TDM
Coupler
ONU
1
ONU
2
ONU
N
λ1
PortAccess
STC
STC
STC
λ4
SARDANA
TDM
Accessλ3
OLT
XGPON
λtx
λrx
OLT
XGPON
1575-1580nm
1260-1280nm
GPON
or
GE-PON
max. 20 km
from/to feeder
λus
λds txrx

234
Fig. 6.20 shows interoperability PHY layer between SARDANA and PON networks from operators using
XGPON/GPON or 10GE-PON/GE-PONstandards. In order to reach this purpose, a SARDANA remote
node (RN) is adapted by disconnecting one of the branches of its regular wavelength filter and leasing this
port for TX/RX from the PON client. Here, different of SARDANA, XGPON/GPON or 10GE-PON/GE-
PON networks use at least two wavelengths (DS/US) to implement their transmissions.
6.2.3.2. SARDANA interoperability at higher Layer level
Interoperability end-to-end between networks must consider management at the higher level
(internetworking). SARDANA offer capabilities for transmission end-to-end in its Metro/Access network
for encapsulating the PDU higher layers from Service’s networks.
MPLS over SGEM
Multi-protocol label switching (MPLS) is a hybrid technology aimed at enabling very fast forwarding. IP
packets are switched through the MPLS domain through simple label lookups. In practice, labels are used
to differentiate the type of service to each packet within the MPLS domain [176,184-185].
In MPLS, the assignment of a particular packet to a particular Forwarding Equivalence Class (FEC) is
done just once, as the packet enters the network. The FEC (a set of packets with similar characteristics
which may be forwarded the same way) to which the packet is assigned is encoded as a short fixed length
value known as a "label". When a packet is forwarded to its next hop, the label is sent along with it; that
is, the packets are "labeled" before they are forwarded [185-186].
In SARDANA, MPLS packets are carried directly in the SGEM frame payload. In this case, SARDANA
network transmit edge-to-edge this information. From the MPLS viewpoint, SARDANA network
provides a tunnelling point-to-point for a MPLS Label Edge Router (LER) in order to transport their
SDUs. As shown in Fig. 6.21, a MPLS packet from the Link Layer is encapsulated into a single SGEM
frame at the Service Adaptation sub-layer. Also, it is possible mapping into multiple SGEM frames. An
SGEM frame may not encapsulate more than one MPLS packet.

235
Fig. 6. 21 – MPLS packet mapping into XGEM frame
Also, significant information can be obtained for the MPLS payload (from the encapsulated IP header),
for using multi-protocol management utility to the transport of the upper layer data with QoS.
6.2.3.3. SARDANA capabilities for Core Network Services
A SARDANA OLT can be used as an edge node of a transport (core) network and offer overlay
capacities. The overlay model is commonly referred to as the user-network interface model. The electrical
(or optical) layer devices (user/client) operate more or less independently of the optical devices (network).
In this client-server network architecture provisioning of bandwidth is made possible. The client device
(e.g. a router, a switch or an OXC) request the connection and the server (the SARDANA network) grants
the request for bandwidth.
SGEM Frame
HEC
SGEM Header(8 bytes)
SGEM Payload
SNPort
IDPLI
Pad
0-3
PTIProt
IDKey
Index
MPLS
Label
StackIP Payload
Service Adaptation Sub-Layer
SARDANA TC
Qo
S
MPLS PayloadMPLS
Label
Stack
MPLS Label Stack – 4 Bytes(RFC 3032)
Multiprotocol Management
IP
Header
LINK LAYER
IP
Header
4
IP Payload
IP Packet
IP
Header
IP Header – 20 Bytes(RFC 791)
20
NETWORK LAYER
MPLS Payload

236
Fig. 6.22 shows this scenario. In this case, SARDANA is doing tunnelling, between the OLT and a
Remote Node (RN), for the client data transport. A requirement for this particular implementation is that
the network client, to whom the service is given, is working at the same wavelength of any OLT - RN
pair of the SARDANA network and this is available. These constrains are due to the WDM filters at the
RN (as seen in Chapter 5), and the traffic conditions of the network in that moment.
GMPLS transport over SARDANA
Generalized MPLS (GMPLS) [172,187-189] is a common control and signalling transport protocol for
switching and routing at the backbone. This extends MPLS to encompass time-division (e.g.,
SONET/SDH, PDH, G.709), wavelength (lambdas), and spatial switching (e.g., incoming port or fibre to
outgoing port or fibre). So, different of MPLS, in GMPLS transport protocol a label can be a wavelength.
Thus, GMPLS network switches lambdas between their entities.
Fig. 6. 22 - SARDANA metro MPLS point-to-point transmission and overlay capacities for the GMPLS Transport
Network
For conveying SDUs from the GMPLS transport network, SARDANA OLT should behave like a
Lambda Switch Capable (LSC) interface and switch SDUs based on the wavelength on which these data

237
are received. A LSC, such as an Optical Cross-Connect (OXC), can operate at the level of an individual
wavelength.
a) Internetworking at the SARDANA PHY level
An edge OXC should transport information in the same lambda of an OLT of the SARDANA central
office (associated with a RN of the ring), if this OXC want to use the SARDANA overlay capabilities.
In Fig. 6.22, two GMPLS networks (GMPLSa and GMPLSb) are linked through SARDANA network.
OXCs switchs lambdas into GMPLS network as a function of the ligthpath to be used. In this example,
the edge OXC uses the λ16 (a wavelength capable of being filtered by a SARDANA RN) to connect
straightforward with the OLT output port. Hear, it is not necessary any STC layer 2 processing.
Interoperability occurs at the SARDANA PHY level. SARDANA metro makes tunnelling functions
between OLT output and RN and vice versa, offering add/drop bidirectional remote passive amplification
for the GMPLS data transmitted, working as a transparent ligthpath between these transport networks.
Also, Fig. 6.22 shows MPLS packets carried edge-to-edge directly for SARDANA. Here, layer 2
interoperability is implemented through STC capabilities. MPLS packets are loaded into SGEM frame
payloads and transport across the entire infrastructure.
b) Internetworking at the SARDANA L2/L3 Layer
Although STC layer corresponds to the Layer 2 of the OSI model, SARDANA STC is able to perform
transport capabilities between different networks, by using tunnelling, and with QoS for using multi-
protocol management utility.
As seen in section 6.2.1., SARDANA STC implementation uses Ethernet protocol as natural interface
with other client networks. Then, to implement support for Layer 3 connectivity, some transmission
devices should be added at the Central Office (CO). An edge-to-edge connection through SARDANA to
provide support at the Layer 3 communications between a GMPLS network (at the backhaul) and an IP
network (at the access) is shown in Fig. 6.23. In this GMPLS network, the Interface Switching Capability
(ISC) is a LSC (lambda switch capable) [188]. This LSC is deployable via a GMPLS OXC. This OXC,
associated at an IP Switch/Router, allows the CO operate as a GMPLS edge, offering transport services to
an IP network at other edge of the network. For this configuration, due to electric connection between
routers, lambda requirement for traffic through SARDANA network is irrelevant.
IP packets, encapsulated into Ethernet frames by this IP Switch/Router, are sent via a 10G Ethernet port
to the 10 Gbps Ethernet CX-4 HSMC adapters at the SARDANA OLT. The first 34 bytes of each
Ethernet frame are examined into the STC layer for the multi-protocol management utility to obtain
relevant information, before to been capsulated into SGEM frames and tunnelled over SARDANA ODN.

238
Fig. 6. 23 – Internetworking between a GMPLS network and an IP network by SARDANA tunnelling capabilities.
At the other edge, according to the Port-ID, DS frame is filtered, SGEM frames are
demultiplexed and decapsulated, and then sent to the 10/100/1000 Base-T Ethernet port
corresponding. This port is connected to an edge IP Switch/Router into the IP network target.
GMPLS
OXC
IP network
OXCOXC
RNm
TDM
Coupler
RN2
RN1
RN8
SARDANA
WDM
Metro
ONU
1
OLT1
CO
OLT2
ONU
2
ONU
N
TDM
Coupler
ONU
1
ONU
2
ONU
N
λ1
λ2
STC
STC
STC
λ16
SARDANA
TDM
Access
OLT16
λ5λ1
λ15
OLT15
λ16
STC: SARDANA Transmission Convergence
STC with
Multiprotocol
Management
capabilities
IP
SW
Router
CX-4
10Gbps
port
STC
IP
SW
Router
1G Eth
port
OXC
SARDANA Tunneling
IP
SW
Router
IP
SW
Router
Ethernet
InterfaceEthernet
Interface
Ethernet
Port
Ethernet
Port

239
6.3. Conclusions An implementation proposal for the STC SARDANA architecture over the SXGPON original draft is
shown in this chapter. OLT and ONU prototypes are deployable based on an FPGA that implements a 32-
bit architecture, and suitable interfaces for interconnection with higher layer clients and OLT/ONU
optical assemblies at the PHY layer.
Connectivity requirements and possible configurations for SARDANA internetworking with other
communications systems in the context of broadband access are proposed. A Multi-Protocol Management
processor, deployable at FPGA, is defined and its function necessary to do feasible advanced
characteristics of connectivity and interoperability, enhancing Metro-Access capabilities of the
SARDANA network and empowering Transmission Convergence (TC) layer functionalities.
These internetworking services can be implemented at the metro network level or at core transport
network level.

240
Chapter 7
7. Conclusions and future work
7.1. General Conclusions
Because of the increasing demands on broadband access for interactive applications, clients and operators
expect more from standard and commercial PON networks. Solutions have been presented for FSAN and
IEEE standardization groups to improve bandwidth. Nevertheless, other requirement that includes long
reach and service support capabilities, as well as cost-effective architectures, enhanced performance and
real passiveness of access nodes, improved bandwidth assignments and metro/access networks capacity
need to be satisfied. A powerful alternative is the optimization over existing PON networks in direction to
NG-PON networks.
In such sense, this Thesis proposes a redesign and optimization of three PON architectures: WDM-PON,
TDM-PON and the hybrid WDM/TDM PON, in terms of minimum deployment cost and enhanced
performance oriented to greenfield NG-PON.
At PHY level, a cost-effective long reach truly-passive WDM/TDM rONU-based PON network for 1000
users, and at MAC level, an efficient access control and latency requirements, are the target.
In WDM-PON different parameters are susceptible to be optimized to obtain a better performance of the
system. So, by analysing the RB behaviour in a WDM-PON, the better performance can be achieved if
the distribution element (a Demux) is placed either in the ONU or OLT vicinity, by demonstrating that
the Rayleigh substantially varies depending on the position of the distribution element since it is

241
determined by the fibre length and by the ONU gain applied, where the ONU gain takes a new optimum
depending on that exact position of the Demux. These results can be used efficiently to minimize the RB
effect in the next generation WDM access networks.
Also, a SCM WDM/TDM PON with ONU rSOA based, cost-effective, simple design and full service
coverage, was designed, simulated, optimized and implemented. Several parameters (OLT output power,
ONU splitting ratio, ERs, feeder fibre length, RSOA gain, modulation formats, etc.), become important
optimization elements in order to find the best upstream/downstream trade-off. This prototype was
successfully tested showing high performance, robustness, versatility and reliability. So, the system is
able to give coverage up to 1280 users at 2.5 Gb/s / 1.25 Gb/s downstream/upstream, over 20 Km, and
being compatible with the GPON ITU-T recommendation.
Rayleigh backscattering in burst mode TDM-PON transmission was for the first time deeply analyzed and
their effects and behavior deterministically formulated. Critical cases are presented in downstream
transmission for configurations with lower ONU numbers (ex. rural scenarios) due to a higher energy
concentration in the upstream burst and lower tree losses, and the resulting Rayleigh effect. In these cases,
a network design with suitable bandwidth assignment (at layer 2 - MAC) and ONU gain control /power
output control (at layer 1 - PHY) can mitigate these issues.
In the upstream direction, the difficulties are for scenarios with 32/64 ONUs, due to higher tree losses.
Single-fibre/wavelength reflective PON has been optimized focusing on the best tradeoff between ODN
power budget and US-oSRR. RSOA gain is the key parameter. By using FEC to BER 5E-4, an optimal
DS cancellation, a RSOA gain=21dB, an OLT output power between 0 to 3 dBm and a 90/10 TX/RX
ONU splitting ratio, up to 32 users can be reached with a power budget margin tolerance to >0.5 dB. By
redistributing the ODN (by feeder fibre reduction and drop increases), it is possible to improve the power
budget tolerance to > 1.5 dB.
These optimization precedents have enabled the SARDANA to extend the design, architecture and
capabilities of a WDM/TDM PON for a long reach metro-access network. The implemented test-bed
demonstrates truly-passive extended PON, fundamental resiliency, XGPON1 rates, wavelength-agnostic
single-fibre ONUs, neutral multi-operability optical infrastructure and cost efficiency in practical
condition.
The technological advances developed in this project, like distributed add&drop, remotely pumped
optical amplification, wavelength dithering, colourless reflective ONU with optical DS cancellation and
opto-electronic equalization, and 10/2.5 Gb/s rates, enable the feasibility of the new network concept for
its application in future PON migrations. Enhanced performances can be pursued with improved RSOA
or tuneable laser technologies, with burst-mode OLT RX and FEC coding.
To optimize the MAC and signalling procedures of the SARDANA, a proposal of Transmission
Convergence sub-layer, (OSI model layer 2) is presented as a relevant contribution of this work. It is

242
based on the optimization of the standards GPON and XG-PON (for compatibility), but applied to a long
reach metro-access TDM/WDM PON rSOA-based network.
New fields in the GEM (now SGEM) are included to encompass long reach metro/access coverage and as
a function of their PHY characteristics. So, multi-protocol management, overlay transmission capacity
(from different service providers), multi-services and multi-operator capability are deployable. Also, QoS
and other higher layer services are possible. These new fields give SARDANA TC capacities to deploy
internetworking functions.
The PLOAM message has a variable length. In this way, increased efficiency between 1.5x and 6x times
can be reached, with respect to XG-PON. This allows releasing more space in the header to favour the
payload section space.
An optimal Preamble and Delimiter fields of 192 bits (77.16 ns) plus a Guard Time of 80 bits (32.15 ns)
as a function of the SARDANA PHY layer are defined.
In this work, an agile ONU activation process, by simplification of the ranging state, is presented. This
mechanism reduces to one the use of a QW, by improving the efficiency. Although SARDANA
metro/access network is up to 100 km, this optimization improves up to a 44% the performance with
respect to XG-PON (20 km).
In XGPON, QW mechanism affects up to eight BWmaps during ONU activation. SARDANA
optimization reduces the impact of the QW to five BWmaps in the most critical ODN scenario (100 km).
A physical implementation proposal for this STC SARDANA is also presented. OLT and ONU
prototypes are deployable based on an FPGA that implements a 32-bit architecture, and suitable interfaces
for interconnection with higher layer clients and PHY optical layer.
Connectivity requirements and possible configurations for SARDANA internetworking with other
communications systems in the context of broadband access at the PHY level, at the metro network level
or at core transport network level are proposed. A Multiprotocol Management processor, deployable at
FPGA, is defined to do feasible advanced characteristics of connectivity and interoperability, enhancing
Metro-Access capabilities of the SARDANA network and empowering Transmission Convergence (TC)
layer functionalities.

243
7.2. Future research
Three themes are proposed to meet the requirements of a WDM/TDM long reach PON network at the
layer 2 management:
1. A deep study on PON traffic for a metro-access network on different scenarios, in order to obtain
relevant information for the optimization of the bandwidth management.
2. By considering that Quality of Service (QoS) capabilities are an integral part of the end-to-end QoS
provisioning mechanisms, we propose a study and implementation of QoS levels. They are
necessary, but not sufficient, to ensure that the QoS objectives of end-to-end traffic flows are met. It
is associated with the ways and means to allocate available resources (including processing capacity,
buffer space, and bandwidth), to individual traffic flows and traffic flow aggregates.
3. With these two inputs we propose the design of a most fair Dynamic Bandwidth allocation (DBA)
for a more optimum bandwidth management. Thus, the network operator can add more subscribers
to the metro-access network due to more efficient bandwidth use, and subscribers can enjoy
enhanced services, such as those requiring variable rate with peaks extending beyond the levels that
can reasonably be allocated statically.

244
Annex A
A. ITU-T XG-PON Layer 2 Architecture
XG-PON Layer 2 architecture is based on the transmission convergence layer (XGTC layer) for 10-
gigabit capable passive optical network systems and is specified in the recommendation ITU-T G.987.3
from FSAN [97]. This provides a wide range of broadband and narrow-band services to end-users.
A.1. XGTC layer structure
The XGTC layer specifies the formats and procedures for mapping between upper layer SDUs (Service
Data Users) and suitable bit streams for modulating the optical carrier, and it is present at both the OLT
and ONU sides of an XG-PON system. It is composed of three sub-layers: the XGTC service adaptation
sub-layer, the XGTC framing sub-layer, and the XGTC PHY adaptation sub-layer. The frame formats are
devised so that the frames and their fields are aligned to 4-byte word boundaries [97] whenever possible.
A.2. XGTC layer procedures
a) In the downstream direction
The interface between the XGTC layer and the PMD (Physical Medium Dependent) layer [97], is
represented by a continuous bit stream at the nominal interface rate, which is partitioned into 125 µs
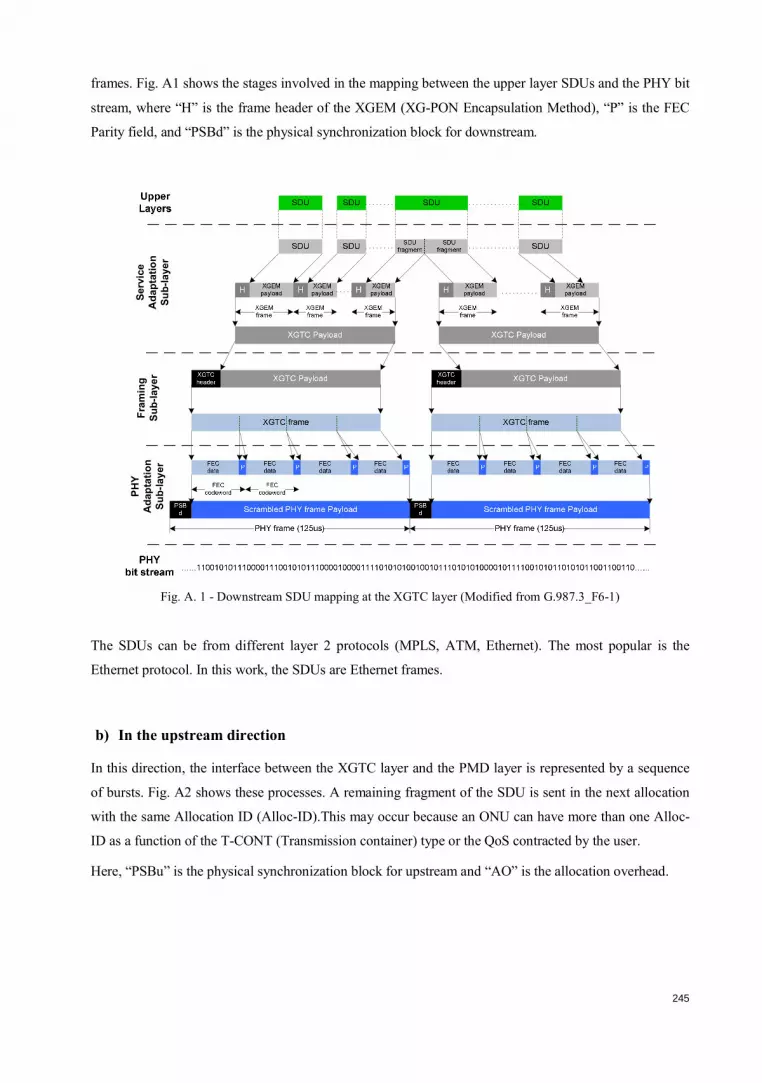
245
frames. Fig. A1 shows the stages involved in the mapping between the upper layer SDUs and the PHY bit
stream, where “H” is the frame header of the XGEM (XG-PON Encapsulation Method), “P” is the FEC
Parity field, and “PSBd” is the physical synchronization block for downstream.
Fig. A. 1 - Downstream SDU mapping at the XGTC layer (Modified from G.987.3_F6-1)
The SDUs can be from different layer 2 protocols (MPLS, ATM, Ethernet). The most popular is the
Ethernet protocol. In this work, the SDUs are Ethernet frames.
b) In the upstream direction
In this direction, the interface between the XGTC layer and the PMD layer is represented by a sequence
of bursts. Fig. A2 shows these processes. A remaining fragment of the SDU is sent in the next allocation
with the same Allocation ID (Alloc-ID).This may occur because an ONU can have more than one Alloc-
ID as a function of the T-CONT (Transmission container) type or the QoS contracted by the user.
Here, “PSBu” is the physical synchronization block for upstream and “AO” is the allocation overhead.
Service
Adaptation
Sub-layer
Framing
Sub-layer
PHY
Adaptation
Sub-layer

246
Fig. A. 2 -Upstream SDU mapping at the XGTC layer (Modified from G.987.3_F6-2)
A.3. Sub-Layers of the XGTC Layer
The XGTC layer is composed of three sub-layers, as shown in the Figs. A2 and A3:
a) Transmission Convergence (TC) Service adaptation sub-layer: implements the concepts of
frame encapsulation based on XGEM (XG-PON encapsulation method) and port identification
(XGEM Port-ID).
In TX, it performs the functions of SDU fragmentation (user data frame and OMCI (ONU
management and control interface) traffic), XGEM port-ID assignation and frame encapsulation
to obtain a XGEM frame.
In RX, it performs XGEM frame delineation, filtered of XGEM (based on the XGEM port-IDs)
and reassembles the fragmented SDUs, delivering them to their respective clients.
b) TC framing sub-layer: is concerned with the structure of the 125 µs XGTC frame. It supports
the functions of frame/burst encapsulation based on XGTC and delineation frame/burst,
embedded operations, administration and maintenance (OAM) processing, physical layer OAM
(PLOAM) transport (an operation and management channel between the OLT and the ONUs that
is close to real time and is based on a fixed set of messages), and Alloc-ID filtering.

247
It has three functionalities:
1) Multiplexing and demultiplexing
DS: PLOAM and XGEM portions are multiplexed into a 125us XGTC frame.
US: Each portion is abstracted according to header indicator.
2) Header creation and decode
DS: XGTC frame header is created and is formatted in a DS frame.
US: XGTC header is decoded. Embedded OAM is performed.
3) Routing function based on Alloc-ID
It is performed for data from/to XGEM TC Adapters.
c) PHY adaptation sub-layer: Responsible for the reception and delineation of the signal
transmitted over the ODN. This sub-layer executes forward error correction (FEC) over the
XGTC frame/burst and performs scrambling (it manipulates the FEC data stream before
transmitting, and the process is reversed by a descrambler at the receiving side, to improve the
consecutive identical digit (CID) immunity). After, sets the PSBd (in downstream), or burst mode
overhead (PSBu, in upstream), and provides timing alignment and line coding.
A.4. XGPON Management System
This part describes practical issues between the service node interface (SNI: at the OLT side), and the
user-network interface (UNI: at the ONU side). The control, operation and management information in
the system is carried over three channels: embedded OAM and PLOAM channels (these manage the
functions of the PMD and XGTC layers) and OMCI channel (managing higher (service-defining) layers).
a) Embedded OAM. This channel is implemented on several fields, defined in the DS/US frame/burst
header and in the embedded structures for time-sensitive OAM functionalities (US PHY burst
timing, profile control and dynamic bandwidth assignment (DBA) signalling).
b) PLOAM channel. The physical layer OAM (PLOAM) messaging channel is an operations and
management facility between OLT and ONUs that is based on a set of fixed messages (48 bytes),
transported within a XGTC header. It supports the following functions: burst profile communication,
ONU activation, ONU registration, protection switching signalling and power management [97]. The
ONU processing time and the response generation from a downstream PLOAM message is 750 us.
c) ONU management and control interface (OMCI). The OMCI uses the OMCI channel (OMCC) to
manage the service-defining layers (above the XGTC) [164]. The XGTC layer must provide an
XGEM-based transport interface for this management traffic.

248
Fig. A3 shows the XGTC information flow from/to clients at the upper layers passing through the XGTC
layer and the functionalities of the three sub-layers.
Fig. A. 3 - The XGTC information flow (Modified from G.987.3_F6-3)
Service Adaptation
Sublayer
Framing
Sublayer
PHY
Adaptation
Sublayer

249
Annex B
B. Publication List and Research Activities
B.1. Publications in International, Peer-Reviewed Journals:
1. Schrenk, Bernhard; Chanclou, Philippe; López Pastor, Eduardo Tommy; Lázaro Villa, José
Antonio; Klonidis, Dimitrios; Bonada Bo, Francesc; Saliou, Fabienne; Polo Querol, Víctor; Le, Q.T.;
Brenot, Romain; de Valicourt, Guilhem; Kazmierski, Christophe; Prat , Josep; “Demonstration of a
remotely dual-pumped long-reach PON for flexible deployment”; Journal of Lightwave
Technology (JLT), vol. 30, num. 7, p. 953-961, April 2012.
2. López Pastor, Eduardo Tommy; Lázaro Villa, José Antonio; Arellano Pinilla, Cristina; Polo
Querol, Víctor; Prat Gomà, Josep Joan; “Optimization of Rayleigh-limited WDM-PONs with
reflective ONU by MUX positioning and optimal ONU gain”; IEEE Photonics Technology
Letters (PTL), vol. 22, num. 2, p. 97-99. January 2010.
B.2. Publications in Scientific Congresses:
1. López Pastor, Eduardo Tommy; Polo Querol, Víctor; Lázaro Villa, José A.; Prat Gomà, Josep;
“Optimal trade-off for a bidirectional single-fibre single-wavelength TDM-PON rSOA-based
ONU”. 15th International Conference on Transparent Optical Networks (ICTON). IEEE, Cartagena,
Spain, June 24-27, 2013.
2. López Pastor, Eduardo Tommy; Polo Querol, Víctor; Lázaro Villa, José A.; Prat Gomà, Josep;
“Network Dimensioning for a TDM-PON Deployment Single-Fibre Single-Wavelength-Reuse
Based on Reflective ONUs”. 14th International Conference on Transparent Optical Networks
(ICTON). IEEE, July 2 – 5, 2012, Coventry, England.

250
3. López Pastor, Eduardo Tommy; Lázaro Villa, José Antonio; Polo Querol, Víctor; Prat Gomà,
Josep Joan; “Bandwidth assignment criteria against rayleigh backscattering effect in TDM-
PON single-fibre wavelength-reuse networks”. 13th International Conference on Transparent
Optical Networks (ICTON). IEEE, Stockholm, Sweden, 2011.
4. B. Schrenk, J.A. Lazaro, Eduardo T. Lopez, D. Klonidis, F. Bonada, F. Saliou, V. Polo, Q.T. Le, P.
Chanclou, J.Prat, “Demonstration of a Remotely Pumped Long-Reach WDM/TDM 10 Gb/s
PON with Reflective User Terminals”, ECOC 2011, Paper Tu 12.C.3 (96), 18-22 September,
Geneva, Switzerland, 2011.
5. J.Prat, V.Polo, J.A.Lazaro, F.Bonada, Eduardo T. Lopez, B.Schrenk, P. Chanclou, “Demonstration
and Field Trial of a Scalable Resilient Hybrid ng-PON”, ECOC 2011, Paper Tu 6.C.3 (62), 18-22
September, Geneva, Switzerland, 2011.
6. Jose A. Lazaro, V. Polo, B. Schrenk, F. Bonada, I. Cano, E.T. Lopez, C. Kazmierski, et.al, “Optical
Subsystems for Next Generation Access Networks”, Access Networks and In-house
Communications (ANIC-2011), paper AMD1, 12 - 14 June 2011, Toronto, Canada (OSA
publication).
7. J. Prat, V. Polo, J. A. Lazaro, F. Bonada, Eduardo T. Lopez, B. Schrenk, M. Omella, F. Saliou, Q.
T. Le, P. Chanclou, D. Leino, R. Soila, S. Spirou, L. Costa, A. Teixeira, G. M. T. Beleffi, D.
Klonidis, and I. Tomkos, "Test-bed functionality of the SARDANA Hybrid NG-PON"; in Access
Networks and In-house Communications (ANIC), Optical Society of America (OSA) Technical
Digest, paper AMD1, Toronto, Canada, June 12, 2011.
8. Fàbrega Sánchez, Josep Maria; López Pastor, Eduardo Tommy; El Mardini, Ahmad; Polo Querol,
Víctor; Lázaro Villa, José Antonio; Soila, Risto; Prat Gomà, Josep Joan; “Deployment analysis of
TDM/WDM single fiber PON with colourless ONU operating at 2.5 Gbps subcarrier
multiplexed downstream and 1.25 Gbps upstream”. National Fiber Optic Engineers Conference
2010 OFC/NFOEC. San Diego, CA, 2010.
9. Eduardo T. Lopez, Jose Lazaro, Cristina Arellano, Victor Polo, Josep Prat “ONU Optimal Gain
and Position of the Distribution Element in Rayleigh-limited WDM and TDM PONs with
reflective ONU”; ECOC 2009, Vienna, Austria, Paper We.P6.27, 2009
10. J. M. Fàbrega, Eduardo T. López, V. Polo, J.A. Lazaro, J. Prat, “Optical Network Based on
Reflective Semiconductor Optical Amplifier Using Electrical Subcarrier Multiplex for Enhancing
Bidirectional Transmission”, 6ª Reunión Española de Optoelectrónica OPTOEL’09, Malaga, Spain,
July 2009.
11. Fabrega, J. M.; López Pastor, Eduardo Tommy; Lázaro Villa, José Antonio; Zuhdi, Muneer; Prat
Gomà, Josep Joan; “Demonstration of a full duplex PON featuring 2.5 Gbps Sub Carrier
Multiplexing downstream and 1.25 Gbps upstream with colourless ONU and simple optics”;
34th European Conference on Optical Communications (ECOC). Paper We.1.F.6; Brussels –
Belgium, 2008.

251
B.3. Books:
1 Title: “REDES DE COMUNICAÇÃO CONVERGENTES - Tecnologias e protocolos”. (May
2008) 1 ed. Editor: UnB (Universidade de Brasilia). Language: Portuguese (ISBN : 978-
8585862268). Authors: Antonio J. Martins Soares, Eduardo Tommy Lopez Pastor, Humberto
Abdalla Jr, Priscila Barreto.
2 Title: “NEXT-GENERATION FTTH PASSIVE OPTICAL NETWORKS: Research
Towards Unlimited Bandwidth Access” (June 2008). 1 ed. Editor: Springer. Language: English
(ISBN-13: 978-1402084690). Authors: Josep Prat, Jose A. Lazaro, Bernhard Schrenk, Eduardo
T. López, Fabio Neri, Antonio Teixeira, Mireia Omella, Victor Polo, Francesc Bonada, Philippe
Chanclou, Josep M. Fàbrega, Ton Koonen, et.al.
B.4. Research Projects:
1. Project 217122, STREP: SARDANA: “Scalable Advanced Ring-based passive Dense Access
Network Architecture” (2008-2010) 7FP (7e Framework Programme Strep – Union Europea).
Activity ICT-1-1.1 – Network of the Future. Participants: UPC, France Telecom/Orange, Tellabs,
Instituto de Telecomunicações (IT), High Institute of Communication and Information Technology
(ISCOM), Research and Educational Laboratory in Information Technology (AIT) and
INTRACOM.
2. EURO-FOS Project: Europe’s Reasearch Network on Photonic Systems - Network of Excellence
project (2008-2012). 7th Framework Programme (FP7). European Commission Activity: Information
and Communications Technologies (ICT). CE4: Next-generation Optical Access Subsystems.
Participants: France Telecom/Orange, UPC, Institut Telecom, Tellabs, Alcatel-Thales III-V labs, VPI
Systems.
3. “Scaling PON systems beyond current standards” Research Project UPC-Tellabs (2007-2008)
Participants: Tellabs, Inc (USA), - UPC.
4. Project TEC2008-01887 247445 - TEYDE “Techniques and devices for the next generation of
extended optical fiber access networks: Extended-FTTH”. Ministerio de Ciencia e Innovación –
Spain. Period: 2009-2011

252
Annex C
C. Biography
Eduardo Tommy López Pastor was born in Lima, Perú. He holds the B.Sc (1994) in Electronics
Engineering from the Universidad Nacional Mayor de San Marcos de Lima. He received the M.Sc.
degree in Electrical Engineering (2002) and PhD degree in Telecommunications (2007), both given by
the Universidade de Brasilia (UnB), Brasilia DF - Brazil.
In 2007 he joined the Optical Communications Group (GCO) of the Department of Signal Theory and
Communications of the UPC, tutored by Dr. Josep Prat, where he finishes his PhD research in 2013.
His work is focused on optical access networks, specifically in FTTH-PONs metro-access networks, at the
PHY and MAC levels.
The work presented in this Ph.D. thesis was funded, in part, by the Alßan Program, "high level
scholarships of the European Union to Latin America". This work was carried out within the European
SARDANA and EURO-FOS projects, the Scaling Project and the TEC2008-01887 247445 - TEYDE
Project.

253
References
[1] ITU-T; “G.987.1 - 10 Gigabit-capable Passive Optical Network (XG-PON): General Requirements”; Geneve, January 2010.
[2] IEEE; “802.3av – Part 3: Carrier Sense Multiple Access with Collision Detection (CSMA/CD) Access Method and Physical Layer Specifications – Amendment 1: Physical Layer Specification and Management Parameters for 10 Gb/s Passive Optical Networks”; 30 October 2009.
[3] Dissanayake, S.D. ; Armstrong, J. ; “Comparison of ACO-OFDM, DCO-OFDM and ADO-OFDM in IM/DD Systems”; Journal of Lightwave Technology, Volume: 31, Issue: 7; Publication Year: 2013 , Page(s): 1063 -
1072
[4] Linglong Dai ; Z.Wang ; Zhixing Yang; “Time-Frequency Training OFDM with High Spectral Efficiency and Reliable Performance in High Speed Environments”; IEEE Journal on Selected Areas in Communications, Volume: 30 , Issue: 4; Publication Year: 2012 , Page(s): 695 – 707.
[5] Hussin, S. ; Puntsri, K. ; Noe, R.; “Performance analysis of optical OFDM systems”; 3rd International Congress ICUMT 2011; Publication Year: 2011 , Page(s): 1 – 5.
[6] Guoying Zhang ; De Leenheer, M. ; Morea, A. ; Mukherjee, B.; “A Survey on OFDM-Based Elastic Core Optical Networking”; Communications Surveys & Tutorials, IEEE; Volume: 15 , Issue: 1 ; Publication
Year: 2013 , Page(s): 65 – 87. [7] Guoying Zhang ; De Leenheer, M. ; Mukherjee, B.; “Optical traffic grooming in OFDM-based elastic
optical networks”; IEEE/OSA Journal of Optical Communications and Networking, Vol. 4 , Issue: 11,
Publication Year: 2012 , Page(s): B17 - B25.
[8] Xingwen Yi ; Fontaine, N.K. ; Scott, R.P. ; Yoo, S.; “Tb/s Coherent Optical OFDM Systems Enabled byOptical Frequency Combs”; Journal of Lightwave Technology, Volume: 28 , Issue: 14, Publication Year:
2010 , Page(s): 2054 – 2061. [9] Qi Yang ; Yan Tang ; Ma, Y. ; Shieh, William; “Experimental Demonstration and Numerical Simulation of
107-Gb/s High Spectral Efficiency Coherent Optical OFDM”; Journal of Lightwave Technology, Volume: 27
, Issue: 3, Publication Year: 2009 , Page(s): 168 – 176.
[10] Charrua, P.M.A.; Cartaxo, A.V.T.; “Optimized filtering for AMI-RZ and DCS-RZ SSB signals in 40-Gb/s/ch-based UDWDM systems”; Photonics Technology Letters, IEEE, Volume: 17 , Issue: 1; Publication Year:
2005 , Page(s): 223 – 225.
[11] Smolorz, S. ; Gottwald, E. ; Rohde, H. ; Smith, D. ; Poustie, A.; “Demonstration of a coherent UDWDM-PON with real-time processing”; OFC/NFOEC, 2011,Publication Year: 2011 , Page(s): 1 – 3.
[12] Pavlovic, N.B. ; Cartaxo, A.V.T.; “Optimization of Single-Sideband DCS-RZ Format for Long-Haul 43-Gb/s/channel Ultradense WDM Systems”; Journal of Lightwave Technology, Volume: 25 , Issue: 2,
Publication Year: 2007 , Page(s): 481 – 489.
[13] Kasai, K. ; Otuya, D.O. ; Yoshida, M. ; Hirooka, T.; “Single-Carrier 800-Gb/s 32 RZ/QAM Coherent Transmission Over 225 km Employing a Novel RZ-CW Conversion Technique”; Photonics Technology
Letters, IEEE, Vol. 24 , Issue: 5,Publication Year: 2012 , Page(s): 416 – 418.
[14] Nakazawa, M., Okamoto, S., Omiya, T., Kasai, K., Yoshida, M.; “256-QAM (64 Gb/s) Coherent Optical Transmission Over 160 km with an Optical Bandwidth of 5.4 GHz”; Photonics Technology Letters, IEEE,
Volume: 22, Issue: 3, Publication Year: 2010, Page(s): 185 - 187.
[15] Creaner, M.J.; et.al.; “Field demonstration of coherent transmission system with diode-pumped erbium doped fibre amplifiers”; Electronics Letters, Vol. 26 , Issue: 7,Publication Year: 1990 , Page(s): 442- 444.
[16] Karlsson, M. ; Agrell, E.; “Four-dimensional optimized constellations for coherent optical transmission systems”;36th European Conference and Exhibition on Optical Communication (ECOC), 2010, Publication
Year: 2010 , Page(s): 1- 6.
[17] R. P. Davey, et al., “DWDM Reach Extension of a GPON to 135 km”, IEEE/OSA J.Lightwave Technol., vol. 24, pp. 29-31, Jan. 2006.
[18] M. Maier and M. Herzog, “STARGATE: The Next Evolutionary Step toward Unleashing the Potential of WDM EPONs”, IEEE Comm. Mag., vol. 45, pp. 50-56, May 2007.
[19] B. Zakowski, “Passive vs. Active Optical Networking: Real Estate Developers Wonder”; BROADBAND PROPERTIES journal; www.broadbandproperties.com, May 2004
[20] F.T. An et al., “SUCCESS: A Next-Generation Hybrid WDM/TDM Optical Access Network Architecture,” IEEE/OSA J. Lightwave Technol., vol. 22, pp. 2557-2569, Nov. 2004.

254
[21] J.M. Oh, S.G. Koo, D. Lee, and S.J. Park, “Enhancement of the Performance of a Reflective SOA-Based Hybrid WDM/TDM PON System With a Remotely Pumped Erbium-Doped Fiber Amplifier”, IEEE/OSA J.
Lightwave Technol., vol. 26, pp. 144-149, Jan. 2008.
[22] J.A. Lazaro, C. Bock, V. Polo, R.I. Martinez, and J. Prat, “Remotely amplified combined ring-tree dense access network architecture using reflective RSOA-based ONU”, OSA J. of Optical Netw., vol. 6, pp. 801-807, Jun.
2007.
[23] C.-H. Lee, W. V. Sorin, and B. Y. Kim, "Fiber to the Home Using a PON Infrastructure," Lightwave Technology, Journal of, vol. 24, pp. 4568-4583, 2006.
[24] C. Martin, “Realization of a Super PON Demonstrator”, in Proc. NOC’97, Antwerp, Belgium, pp. 188-193, Jun. 1997.
[25] M. O. van Deventer et al., “Architecture for 100 km 2048 split bidirectional Super PONs from ACTS-PLANET”, Proc. SPIE, vol. 2919, pp. 245-251, Nov. 1996.
[26] D.P. Shea and J.E. Mitchell, “A 10 Gb/s 1024-Way Split 100-km Long Reach Optical Access Network”, IEEE/OSA J. Lightwave Technol., vol. 25, pp. 685-693, Mar. 2007.
[27] K.-I. Suzuki, Y. Fukada, D. Nesset, and R. Davey, “Amplified gigabit PON systems”, OSA J. Optical Netw., vol. 6, pp. 422-433, May 2007.
[28] A. Lovric, and S. Aleksic, “Power Efficiency of Extended Reach 10G-EPON andTDM/WDM PON”, in Proc. OFC’10, NMC4, San Diego (CA), United States, Mar. 2010.
[29] B. Schrenk, “Characterization and Design of Multifunction Photonic Devices for Next Generation Fiber-to-the-Home Optical Network Units”, Doctoral Thesis, March 2011.
[30] C. Arellano, “Investigation of Reflective Optical Network Units for Bidirectional Passive Optical Access Networks”; Doctoral Thesis, Universitat Politecnica de Catalunya, June 2007.
[31] Christopher Ferenc Marki; “Design and optimization of bidirectional and optical logic systems in the presence of noise”; Doctoral Thesis, UNIVERSITY OF CALIFORNIA, SAN DIEGO, 2007.
[32] J.R. Stern, J.W. Balance, D.W. Faulkner, S. Hornung, D. Payne and K. Oakley, “Passive optical local networks for telephony applications and beyond”, IEE Electron. Lett., vol. 23,pp.1255-1256, 1987.
[33] L.G. Kazovsky, W. Shaw, D. Gutierrez, N. Cheng, and S. Wong, “Next-Generation OpticalAccess Networks”, IEEE/OSA J. Lightwave Technol., vol. 25, pp. 3428-3442, Nov. 2007.
[34] R.D. Feldman, E.E. Harstead, S. Jiang, T.H. Wood, and M. Zirngibl, “An Evaluation of Architectures Incorporating Wavelength Division Multiplexing for Broad-Band Fiber Access”,IEEE/OSA J. Lightwave
Technol., vol. 16, pp. 1546-1559, Sept. 1998.
[35] Bernhard Schrenk; “Characterization and Design of Multifunction Photonic Devices for Next-Generation Fiber-to-the-Home Optical Networks Units”; Doctoral Thesis, Universitat Politecnica de Catalunya, March 2011.
[36] O. Gerstel, “Optical Networking: A Practical Perspective”, IEEE Hot Interconnects, Aug.2000. [37] P. P. Iannone and K. C. Reichmann, “Strategic and Tactical Uses for Extended PON”, inProc. OFC’08,
Workshop Presentation, Feb. 2008.
[38] R. P. Davey et al., “DWDM Reach Extension of a GPON to 135 km”, IEEE/OSA J. Lightwave Technol., vol. 24, pp. 29-31, Jan. 2006.
[39] I. Van de Voorde, C.M. Martin, J. Vandewege, and X.Z. Qiu, “The super PON demonstrator: an exploration of possible evolution paths for optical access networks”, IEEE Comm. Mag., vol. 38, pp. 74-82, Feb. 2000.
[40] J. Bauwelinck et al., “Full-Duplex 10 Gb/s Transmission in Ultra-Dense PONs With Tree Splits >1:1k and Noise-Powered Extender Box”, in Proc. ECOC’10, Tu.5.B.4, Torino, Italy, Sept. 2010.
[41] C. Antony et al., “Demonstration of a Carrier Distributed, 8192-Split Hybrid DWDM/TDMA PON over 124km Field-Installed Fibers”, in Proc. OFC’10, PDPD8, San Diego (CA),United States, Mar. 2010.
[42] R. Kjaer, I. T. Monroy, L. K. Oxenløwe, P. Jeppesen, and B. Palsdottir, “Bi-directional 120 km Long-reach PON Link Based on Distributed Raman Amplification”, in Proc. LEOS’06,WEE3, Montreal, Canada, Oct.
2006.
[43] A. Banerjee et al., “Wavelength-division-multiplexed passive optical network (WDMPON) technologies for broadband access: a review”, OSA J. Optical Netw., vol. 4, pp. 737-758,2005.
[44] K. Takada, M. Abe, T. Shibata, and K. Okamoto, “1-GHz-Spaced 16-Channel Arrayed-Waveguide Grating for a Wavelength Reference Standard in DWDM Network Systems”,IEEE/OSA J. Lightwave Technol., vol. 20, pp.
822-825, May 2002.
[45] W. Jiang, K. Okamoto, F.M. Soares, F. Olsson, S. Lourdudoss, and S.J.B. Yoo, “5 GHz Channel Spacing InP-Based 32-Channel Arrayed-Waveguide Grating”, in Proc. OFC’09,OWO2, San Diego (CA), United States,
Mar. 2009.
[46] Bond, Rob (Telcordia); “ITU PON – Past, Present, and Future”; FTTH Council Webinar, July 30, 2008 [47] Nokia Siemens Networks; “Future optical connectivity: Ultra Dense Wave Division Multiplexing
connectivity”; White Paper, Finland, 2012..
[48] M. O. van Deventer et al., “Architecture for 100 km 2048 split bidirectional Super PONs from ACTS-PLANET”, Proc. SPIE, vol. 2919, pp. 245-251, Nov. 1996.

255
[49] D.P. Shea and J.E. Mitchell, “A 10 Gb/s 1024-Way Split 100-km Long Reach Optical Access Network”, IEEE/OSA J. Lightwave Technol., vol. 25, pp. 685-693, Mar. 2007.
[50] Gysel, Peter; Staubli, Roland;“Statistical Properties of Rayleigh Backscattering inSingle-Mode Fibers”; Journal of Lightwave Technology. Vol 8. No 4, April 1990.
[51] J. Prat, et. al. “Results from EU Project SARDANA on 10G extended reach WDM PONs”, OSA, OFC/ NFOEC 2010, paper OThG5.
[52] G. Das et al., Proc. ECOC’09, P6.28 (2009). [53] T. Koonen, et al., Photonic Network Comm., vol. 3 (3), July 2001. [54] B. Lannoo et al., Proc. ICTON’10, Mo.C4.3, Invited (2010). [55] G. Das, B. Lannoo, D. Colle, M. Pickavet, P. Demeester, “A Hybrid WDM/TDM PON Architecture Using
Wavelength Selective Switches”, IEEE 4th International Symposium on Advanced Networks and
Telecommunication Systems, 2010.
[56] J. Prat, J. Lazaro, P.Chanclou, R.Soila, P.Velanas, A.Teixeira, et. al.,“Hybrid Ring-Tree WDM/TDM-PON Optical Distribution Network”, Th.B3.1, ICTON 2009.
[57] J.J. Lepley, M.P. Thakur, I. Tsalamanis, C. Bock, C. Arellano, J. Prat, S.D. Walker, “VDSL Transmission over a Fibre Extended Access Network”, OSA J. Optical Netw., vol. 4, pp.517-523, 2005.
[58] J.H. Lee et al., “First Commercial Deployment of a Colorless Gigabit WDM/TDM Hybrid PON System Using Remote Protocol Terminator”, IEEE/OSA J. Lightwave Technol., vol. 28,pp. 344-351, Feb. 2010.
[59] H. Rohde, S. Smolorz, E. Gottwald, and K. Kloppe “Next Generation Optical Access: 1Gbit/s for Everyone”, in Proc. ECOC’09, Th.10.5.5, Vienna, Austria, Sept. 2009.
[60] S. Yamashita et al, Electron. Lett., 32 (1996), 1298-1299 [61] J. Hubneret all, Electron. Lett., 33 (1997), 139-140 [62] A. Bellemare at all, J. Lightwave Technol., 18 (2000), 825-831 [63] S. Kim, et all, Optics Comm., 190 (2001), 291-302. [64] J. Buus, and E.J Murphy, “Tunable lasers in optical networks”, IEEE/OSA J. Lightwave Technol., vol. 24, pp.
5-11, Jan. 2006.
[65] M. Mestre et al., “Tuning Characteristics and Switching Speed of a Modulated Grating Y Structure Laser for Wavelength Routed PONs”, in Proc. ANIC’10, AthC2, Karlsruhe, Germany,Jun. 2010.
[66] G. Talli and P. D. Townsend, “Hybrid DWDM-TDM Long-Reach PON for Next-Generation Optical Access”, IEEE/OSA J. Lightwave Technol., vol. 24, pp. 2827-2834, July2006.
[67] G. de Valicourt et al., “High Gain (30 dB) and High Saturation Power (11 dBm) RSOA Devices as Colorless ONU Sources in Long-Reach Hybrid WDM/TDM-PON Architecture”,IEEE Photonics Technol. Lett., vol. 22,
pp. 191-193, Feb. 2010.
[68] A. Garreau et al., “10Gbit/s Amplified Reflective Electroabsorption Modulator for Colorless Access Networks”, in Proc. IPRM’06, Tu.A2.3, pp. 168-170, Princeton, United States,May 2006.
[69] J. Prat, P. E. Balaguer, J.M. Gené, O. Díaz and S. Figuerola, “Fiber-to-the-Home Technologies,” Kluwer Ac. Publishers, ISBN1-4020-7136-1, 2002.
[70] Lopez, E.T. ; Lazaro, J.A. ; Arellano, C. ; Polo, V. ; Prat, J.; “Optimization of Rayleigh-Limited WDM-PONs With Reflective ONU by MUX Positioning and Optimal ONU Gain”; Photonics Technology Letters,
IEEE,Volume: 22 , Issue: 2, January 2010 , Page(s): 97 – 99.
[71] Lopez, E.T. ; Lazaro, J.A. ; Arellano, C. ; Polo, V. ; Prat, J.; “ONU optimal gain and position of the distribution element in rayleigh-limited WDM and TDM PONs with reflective ONU”; 35th European Conference on
Optical Communication, 2009. ECOC '09. Publication Year: 2009, Page(s): 1 – 2.
[72] Segarra, J. ; Sales, V. ; Prat, J.; “Traffic Performance of an Access Hybrid WDM/TDM PON with Colorless Reflective-ONUs under Different Distances OLT-ONUs”; 9th International Conference on
Transparent Optical Networks, 2007. ICTON '07.Volume: 1, 2007, Page(s): 287 – 292.
[73] El-Sahn, Z.A. ; Buset, J.M. ; Plant, D.V.; “Bidirectional WDM PON enabled by reflective ONUs and a novel overlapped-subcarrier multiplexing technique”; Optical Fiber Communication Conference and Exposition
(OFC/NFOEC), 2011, Page(s): 1 – 3.
[74] Arellano, C. ; Langer, K.-D. ; Prat, J.; “Reflections and Multiple Rayleigh Backscattering in WDM Single-Fiber Loopback Access Networks”; Journal of Lightwave Technology, Volume: 27 , Issue: 1
Publication Year: 2009 , Page(s): 12 – 18.
[75] Kwon, Hyuk-Choon ; Yong-Yuk Won ; Sang-Kook Han; “A self-seeded reflective SOA-based optical network unit for optical beat interference robust WDM/SCM-PON link”; Photonics Technology Letters, IEEE Volume:
18 , Issue: 17, 2006 , Page(s): 1852 – 1854.
[76] Fresi, F. ; Berrettini, G. ; Das Barman, A. ; Debnath, S. ;Poti, L. ; Bogoni, A.; “Single RSOA based ONU for RZ symmetrical WDM PONs at 2.5 Gb/s”; International Conference on Photonics in Switching, 2008. PS
2008. Page(s): 1 – 2.
[77] Jin, X.Q. ; Groenewald, J. ; Hugues-Salas, E. ; Giddings, R.P. ;Tang, J.M.; “Upstream Power Budgets of IMDD Optical OFDMA PONs Incorporating RSOA Intensity Modulator-Based Colorless ONUs”; Journal of
Lightwave Technology, Volume: 31 , Issue: 12,2013 , Page(s): 1914 – 1920.

256
[78] M. D. Feuer, et. al., “Single-port laser-amplifier modulators for local access,” P. Technology Letters, Vol. 8, No. 9, pp. 1175-1177, September 1996.
[79] N. Buldawoo, S. Mottet, F. Le Gall, D. Sigonge, D. Meichenin and S. Chelles, “A Semiconductor Laser Amplifier-Reflector for the future FTTH Applications,” Poc. ECOC97 Edinburgh, pp. 196-199, 1997.
[80] N. Buldawoo, S. Mottet, H. Dupont, D. Sigogne and D. Mechenin, “Transmission Experiment using a laser amplifier-reflector for DWDM access network,” Proc. ECOC98 Madrid, pp.273-274, 1998.
[81] J.J. Koponen and M. J. Söderlund, “A duplex WDM passive optical network with 1:16 power split using reflective SOA remodulator at ONU,” Proc. OFC 2004 Los Angeles, MF 99.
[82] J. Prat, C. Arellano , V. Polo and C. Bock, “Optical Network Unit Based on a Bidirectional Reflective Semiconductor Optical Amplifier for Fiber-to-the-Home Networks,” IEEE Photonics Technology Letters , vol.
17, no. 1, pp. 250-252, January 2005.
[83] ITU-T G.984.2-Amendment; “Gigabit-capable PON (G-PON): Physical Media Dependent (PMD) layer Specifications”. Nov. 10, 2005.
[84] I. Tafur et al., “Monolithically integrated reflective SOA-EA carrier re-modulator forbroadband access nodes.” OSA Optics Expr., vol. 14, pp. 8060-8064, Sept. 2006.
[85] E.K. MacHale et al., “Extended-Reach PON Employing 10 Gb/s Integrated ReflectiveEAM-SOA”, in Proc. ECOC’08, Th.2.F.1, Brussels, Belgium, Sept. 2008.
[86] M. Omella, V. Polo, J. Lazaro, B. Schrenk, and J. Prat, “RSOA Transmission by Direct Duobinary Modulation”, in Proc. ECOC’08, Tu.3.E.4, Brussels, Belgium, Sept. 2008.
[87] K.Y. Cho, Y. Takushima, and Y.C. Chung, “Demonstration of 11-Gb/s, 20-km Reach WDM PON using Directly-Modulated RSOA with 4-ary PAM Signal”, in Proc. OFC’10,OWG1, San Diego (CA), United States,
Mar. 2010.
[88] K. Petermann, “Laser Diode Modulation and Noise,” Dordrecht, Kluwer, 1988. [89] J.E. Bowers, “High speed semiconductor laser design and performance”, Solid-StateElectronics, vol. 30, pp. 1-
11, Jan. 1987.
[90] P.J. Corvini and T.L. Koch, “Computer Simulation of High-Bit-Rate Optical Fiber Transmission Using Single-Frequency Lasers”, IEEE/OSA J. Lightwave Technol., vol. 5, pp.1591-1595, Nov. 1987.
[91] K. Kanayama, Y. Ando, R. Nagase, S. Iwano, and K. Matsunaga, "Advanced physical contact technology for optical connectors," Photonics Technology Letters, IEEE, vol. 4, pp. 1284-1287, 1992.
[92] Van Deventer, M. Oskar; “Fundamentals of Bidirectional Transmission over a Single Optical Fibre”, Kluwer Academic Publishers, 1996.
[93] D. Derickson,”Fibre optics test and measurement” Hewlett‐Packard Professional Books, Ed.Prentice Hall, 1997. [94] IEEE 802.3ah (E-PON); “Part 3: Carrier Sense Multiple Access with Collision Detection (CSMA/CD) Access
Method and Physical Layer Specifications”; September 2004.
[95] Telcordia; “ITU PON – Past, Present, and Future - A Review of ITU-T PON Activities”, FTTH Council Webinar, July 30, 2008.
[96] ITU-T G.987.2; “10-Gigabit-capable Passive Optical Networks (XG-PON): Physical Media Dependent (PMD) layer Specific.”. Jan, 2010.
[97] ITU-T G.987.3; “10-Gigabit-capable passive optical networks (XG-PON): Transmission convergence (TC) specifications”, October, 2010.
[98] ITU-T G.987.4; “10-Gigabit-capable passive optical networks (XG-PON): ONU management and control interface specification (OMCI)”, Nov, 2010.
[99] ITU-T G.984.2; “Gigabit-capable PON (G-PON): Physical Media Dependent (PMD) layer Specifications”. March, 2003.
[100] Junichi Kani, Ken-Ichi Suzuki “Standardization Trends of Next-generation 10 Gigabit-class Passive Optical Network Systems”, NTT Technical Review, Vol. 7, No. 11, Nov. 2009.
[101] E. MacHale, G. Talli, P.D. Townsend, et.al, “Signal-Induced Rayleigh Noise Reduction using Gain Saturation in an Integrated R-EAM-SOA” OFC 2009 – OThA6. Conference on 22-26 March 2009 Page(s):1-3.
[102] G.Talli, C.Chow, P.D. Townsend, “Modeling of Modulation Formats for Interferometric Noise Mitigation”, IEEE JLT vol. 26 no. 17, Sep. 2008.
[103] J. A. Lazaro, C. Arellano, J. Prat, “Rayleigh Scattering Reduction by Means of Optical Frequency Dithering in Passive Optical Networks With Remotely Seeded ONUs”, IEEE PTL, Vol. 19, No. 2, 2007
[104] ITU-T GPON 984.2 Amendment 1 to G.984.2, Gigabit-capable Passive Optical Networks (G-PON):
Physical Media Dependent (PMD) layer Specifications (2006).
[105] Y. Shibata, et al., “2.5-Gbit/s wavelength channel data rewriter using semiconductor optical
saturator/modulator for drop-and-rewrite WDM networks”, in Proc. ECOC 2003, paper Th2.3.3, 2003.
[106] C. W. Chow, “Wavelength remodulation using DPSK down-and-upstream with extinction ratio for 10-Gb/s DWDM-passive optical networks,” IEEE. Photon. Technol. Lett., vol. 20, no. 1, Jan., pp. 12-14, 2008.
[107] L. Y. Chan, et al., “Demonstration of data re-modulation for upstream traffic in WDM access networks using injection-locked FP laser as modulator”, in Proc. OFC 2001, paper WU5, 2001.

257
[108] W. R. Lee, et. al., “Bidirectional WDM-PON based on gain-saturated reflective semiconductor optical amplifier,” IEEE. Photon. Technol. Lett., vol. 17, no. 11, Nov., pp. 2460-2462, 2005.
[109] Miyazaki, T.; “Superposition of QPSK over inverse-RZ for 3-bit/symbol transmission”, in Proc. ECOC 2004, paper We3.4.7, 2004
[110] Y. Tian, Y. Su, L. Yi, L. Leng, X. Tian, H. He, and X. Xu, “Optical VPN in PON based on DPSK erasing/rewriting and DPSK/IM formatting using a single Mach–Zehnder modulator,” in Proc. ECOC, Cannes,
France, Sep. 24–28, 2006, Paper Tu4.5.6.
[111] J. Fabrega, A. El Mardini, V. Polo, E. T. López, R. Soila, J. Prat, “Deployment analysis of TDM/WDM Single Fiber PON with Colourless ONU Operating at 2.5 Gbps Subcarrier Multiplexed Downstream and 1.25 Gbps
Upstream”, In Proc. OFC/NFOEC 2010, paper NWB5.
[112] J. Fabrega, E. T. López, J. A. Lázaro, M. Zuhdi, J. Prat, Demonstration of a full duplex PON featuring 2.5 Gbps Sub Carrier Multiplexing downstream and 1.25 Gbps upstream with colourless ONU and simple optics”,
in Proc. ECOC'08, paper We.1.F.6.
[113] J. Fabrega, V. Polo, E. T. López, J. A. Lázaro, J. Prat, “Optical Network Based on Reflective Semiconductor Optical Amplifier Using Electrical Subcarrier Multiplex for Enhancing Bidirectional Transmission”, 6a
Reunión española de Optoelectrónica OPTOEL’09, paper COM-8
[114] W. Hung, et al., “An Optical Network Unit for WDM Access Networks with Downstream DPSK and Upstream Re-modulated OOK Data Using Injection-Locked FP Laser”, IEEE PTL, Oct. 2003.
[115] M. Schneider et al, “Monolithically integrated optoelectronic circuits using HBT, EAM, and TEAT”, in Proc MWP03, pp.349-352.
[116] H. Takesue, T. Sugie, “Data rewrite of wavelength channel using saturated SOA modulator for WDM Metro/Access networks with centralized light sources”, Proc. ECOC’02, 8.5.6, Copenhagen (DE), September
2002
[117] Arellano, C.; Polo, V.; Bock, C.; Prat, J. "Bidirectional single fibre transmission based on a RSOA ONU for FTTH using FSK-IM modulation formats", Optical Fiber Communication Conference, 2005. Technical
Digest. OFC/NFOEC, On page(s): 3 pp. Vol. 3 Volume: 3, 6-11 March 2005
[118] K. Y. Cho and et al. “Demonstration of RSOA-based WDM-PON operating at symmetric rate of 1.25 Gb/s with high rejection tolerance”. In Proceedings of the Conference on Optical Fiber Communication and the
National Fiber Optic Engineers Conference, 2008 (OFC/NFOEC 2008), San Diego (CA), March 2008.
[119] C. J. Clark, A. A. Moulthrop, M. S. Muha, and C. P. Silva. “Transmission response measurements of frequency-translating devices using a vector network analyzer”. IEEE Transactions on Microwave Theory and
Techniques, 44(12):2724-2737, December 1996.
[120] J. G. Proakis, “Digital Communications,” Chapter 5, pp. 233-320 [121] B. Schrenk, et al. “Employing feed-forward downstream cancellation in optical network units for 2.5G/1.25G
RSOA-based and 10G/10G REAM-based PON for efficient wavelength reuse”, ICTON '09 (2009).
[122] F. Payoux, P. Chanclou, T. Soret, N. Genay, “Demonstration of a RSOA-based WavelengthRemodulation Scheme in 1.25 Gbit/s Bidirectional HybridWDM-TDM PON”, OFC 2006, 5-10 March 2006.
[123] E. T. Lopez, et al, “Network dimensioning for a TDM-PON deployment single-fibre single-wavelength-reuse based on reflective ONUs”D3.5, 14th ICTON 2012, 4 Sep 2012.
[124] ITU-T G.987.3; “10-Gigabit-capable passive optical networks (XG-PON): Transmission convergence (TC) specifications”, October, 2010.
[125] ITU-T G.984.3; “Gigabit-capable passive optical networks (G-PON): Transmission convergence (TC) specifications”, February, 2004.
[126] Eduardo Tommy López, J.A. Lázaro, V. Polo, and J. Prat; “Bandwidth assignment criteria against Rayleigh Backscattering effect in TDM-PON single-fibre wavelength-reuse networks”, 13th International Conference on
Transparent Optical Networks (ICTON), 26-30 June 2011, Stockholm, Sweden.
[127] Eduardo Tommy López, Victor Polo, J.A. Lázaro, and Josep Prat; “Optimal Trade-off for a Bidirectional Single-Fibre Single-Wavelength TDM-PON rSOA-based ONU”, 15th International Conference on
Transparent Optical Networks (ICTON), 24-27 June 2013, Cartagena, Spain.
[128] J.H. Yu, N. Kim, B.W. Kim, “Remodulation schemes with reflective SOA for colorless DWDM PON”, JON, vol. 6, pp. 1041, Aug. 2007.
[129] E. Conforti, et. al. “Carrier reuse with gain compression and feed-forward semiconductor optical amplifiers”, Transactions on Microwave Theory and Techniques, vol. 50, pp. 77-81, Jan. 2002.
[130] E. Kehayas, et al, “All-Optical Carrier Recovery with Periodic Optical Filtering for Wavelength Reuse in RSOA-based Colorless ONUs in Full-Duplex 10Gbps WDM-PONs”, Proc. OFC’10, OWG4 (2010).
[131] European 7th Framework Programme project SARDANA (www.ict-sardana.eu). [132] ITU-T G984.1, “Gigabit-capable Passive Optical Networks (G-PON): General characteristics”, March, 2003.

258
[133] ITU-T G987.1, “10-Gigabit-capable passive optical networks (XG-PON): General requirements”, January, 2010.
[134] B. Schrenk, F. Bonada, M. Omella, J.A. Lazaro, J. Prat, “Enhanced Transmission in Long Reach WDM/TDM Passive Optical Networks by Means of Multiple Downstream Cancellation Techniques”, ECOC 2009, paper
We.8.5.4, Vienna.
[135] V. Polo, B. Schrenk, F. Bonada, J. Lazaro and J. Prat, “Reduction of Rayleigh Backscattering and Reflection Effects in WDM-PONs by Optical Frequency Dithering”, ECOC 2008, Brussels, Sept. 2008, paper P421.
[136] M. Omella, I. Papagiannakis, B. Schrenk, D. Klonidis, A. N. Birbas J. Kikidis, J. Prat and I. Tomkos, “Full-Duplex Bidirectional Transmission at 10 Gbps in WDM PONs with RSOA-based ONU using Offset Optical
Filtering and Electronic Equalization” OFC 2009, San Diego, Paper OThA7.
[137] D. Torrientes, P. Chanclou, F. Laurent, S. Tsyier, Y. Chang, B. Charbonnier and C. Kazmierski, “10Gbit/s for Next Generation PON with Electronic Equalization using Un-cooled 1.55µm Directly Modulated Laser”,
ECOC 2009”, Vienna, PDP Th.3.5.
[138] B. Schrenk, J.A. Lazaro, C. Kazmierski, J. Prat, “Colourless FSK/ASK Optical Network Unit Based on a Fabry Pérot Type SOA/REAM for Symmetrical 10 Gb/s WDM-PONs”, ECOC 2009, Vienna, paper We.7.5.6.
[139] M. Omella, J.A. Lázaro, J. Prat, “Driving Requirements for Wavelength Shifting in Colorless ONU with Dual-Arm Modulator”, IEEE/OSA J. Lightwave Technol., vol. 27, no. 17, Sept. 2009.
[140] J. Fabrega, “Homodyne OLT-ONU design for access optical networks”, Doctoral Thesis, February, 2010. [141] P. Gysel, R. K. Staubli, “Statistical Properties of Rayleigh Backscattering in Single-Mode Fibres”, IEEE J.
Lightwave Technol., vol.8, no.4, pp.561-567, April 1990
[142] P. Gysel, R. K. Staubli, “Spectral properties of Rayleigh backscattered light from single mode fibres caused by a modulated probe signal, IEEE J. Lightwave Technol., vol.8, no.12,December 1990.
[143] R. K. Staubli, P. Gysel, “Crosstalk penalties due to coherent Rayleigh noise in bidirectional optical communication systems” IEEE J. Lightwave Technol. vol.9, no.3, March 1991.
[144] P. P. Bohn, S. K. Dass, “Return Loss Requirements for Optical Duplex Transmission”, IEEEJ. Lightwave Technol., vol.5, no.2, February 1987.
[145] T. H. Wood, R. A. Linke, “Observation of Coherent Rayleigh Noise in Single-Source Bidirectional Optical Fiber Systems”, IEEE J. Lightwave Technol., vol.6, no.2, February 1988.
[146] S. Radic, N. Vukovic, S. Chandrasekhar, A. Velingker and A. Srivastava, “Forward Error Correction Performance in the Presence of Rayleigh-Dominated Transmission noise”, Photonic. Technol. Lett., vol.15,
no.2, February 2003.
[147] Nataša B. Pavlovic, Liliana N. Costa, and Antonio L. J. Teixeira, “SSB NRZ and SSB Manchester Downstream Signals for Remodulated Extended Reach WDM-TDM PONs,” Proc. ECOC’09, 20-24
September, 2009, Vienna, Austria, paper P6.26, 2009.
[148] Nataša B. Pavlovic, Liliana N. Costa, and Antonio Teixeira, “Intensity Modulated Remodulation Scheme Based on Single-Sideband Manchester Downstream Signal for Usage in Ring Tree Networks,” Proc.
CONFTELE 2009, Sª Mª Feira, Portugal, paper 90, May 2009.
[149] P. J. Winzer, et. al., “Advanced optical modulation formats,” Proceedings of the IEEE, vol. 94, no. 5, pp. 952-985, May 2006.
[150] Zenko, “1577 nm TX / 1550 nm RX, 3.3V, 10 Gbps Continuous TX/2.5Gbps Burst‐Mode RX, XFP NG-PON OLT Transceiver with RSSI; DDM Capability, RoHS Compliant LT-05B95B-XFPGX”, Zenko Technologies
Inc., Preliminary Data Sheet, ver.1, April 2009.
[151] Broadcom, “BCM8154 Multirate 10Gbps NRZ/DuobinaryTranceiver”, BroadcomPreliminary Data Sheet, 8154-DS202-R, 2008.
[152] J. Prat et al., “Electronic Equalization of Photo-detection by Means of an SQRT Module”, Proc. ICTON'07, Rome, Italy, paper We.C3.6 (2007).
[153] C. Bock, J. A. Lazaro, J. Prat, "Extensions of TDM-PON standards to a single-fibre ring access network featuring resilience and service overlay", IEEE/OSA Journal of Lightwave Technology, June 2007, pp. 1416-
1421.
[154] J. A. Lazaro, J. Prat, P. Chanclou, G. M. Tosi, A. Teixeira, I. Tomkos, R. Soila, V. Koratzinos, “Scalable Extended Reach PON”, Proceedings OFC’08,OThL2 (invited), 24-28 Feb. 2008.
[155] F. Saliou, P. Chanclou, F. Laurent, N. Genay, J.A. Lazaro, F. Bonada and J. Prat. “Reach Extension Strategies for Passive Optical Networks", J. Opt. Com. Networks, vol.1, no.4, Sept. 2009.
[156] J. A. Lazaro, C. Bock, V. Polo, R. I. Martinez, J. Prat, "Remotely amplified combined ring-tree dense access network architecture using reflective RSOA-based ONU", Journal of Optical Networking, May 2007 vol. 6,
Issue 6, pp. 801-807.

259
[157] B. Schrenk et al., "Remotely Pumped Long-Reach Hybrid PON", IEEE/OSA JLT, vol. 29, no.5, March 1, 2011.
[158] IEEE Communications Surveys, “Long-Reach Optical Access Networks”,
http://networks.cs.ucdavis.edu/~mukherje/links/huan-cst-lrponsurvey-1Q2010.pdf, 1-mar-2009.
[159] Fibresystems.org, “France Telecom: bring it PON”, fibresystems.org/cws/article/tech/39443, 10-jun-2009. [160] Imagine LAB; “SARDANA Field-Trial in Lannion, on January 20th”, http://imaginlab.fr/blogen/?p=299, Jan-
2011.
[161] ABC newspaper, “El proyecto Sardana de fibra óptica liderado por UPC super aprueba en Francia”, http://www.abc.es/agencias/noticia.asp?noticia=681962, 7-Feb-2011.
[162] La Vanguardia newspaper “El proyecto Sardana se presenta en Milán”, 8-Feb-2011. [163] A. Lovrić, S. Aleksić, J.A. Lazaro, G.M. TosiBeleffi, J. Prat, V. Polo, "Power Efficiency of SARDANA and
Other Long-Reach Optical Access Networks", accepted in ONDM’11.
[164] ITU-T Rec. G.988, “ONU management and control interface (OMCI) specification”; October, 2010. [165] Effenberger, F; Mukai, H; Kani, J; Rasztovits-Wiech, M; “Next-Generation PON—Part III: System
Specifications for XG-PON”, IEEE Communications Magazine, Nov. 2009.
[166] Luo, Y; Effenberger, F; Gao, B; “Transmission Convergence Layer Framing in XG-PON1”, Sarnoff Symposium, 2009. SARNOFF '09. IEEE, March 30 2009-April 1 2009 Page(s):1 – 5.
[167] Kani, J; Bourgart, F; et.al; “Next-Generation PON—Part I: System Specifications for XG-PON”, IEEE Communications Magazine, Nov. 2009.
[168] Effenberger, F; Mukai, H; Pfeiffer, T; “Next-Generation PON—Part II: System Specifications for XG-PON”, IEEE Communications Magazine, Nov. 2009.
[169] ITU-T Rec. G.984.4, “Gigabit- Capable Passive Optical Networks (G PON): ONT Management and Control Interface Specification,” 2008.
[170] ITU-T G.984.3 Implementers’ Guide for ITU-T Rec. G.984.3 Gigabit-capable Passive Optical Networks (G-PON): Transmission convergence layer specification 2004.
[171] Leino, Dmitri, “10 Gigabit-capable Passive Optical Network Transmission Convergence layer design”; Master Thesis - Aalto University School of Science and Technology; Espoo, 23 April 2010.
[172] Tanenbaum, Andrew S. “Computer Networks”, Fourth Edition, Ed. Prentice Hall, August 2002 [173] Altera Stratix IV Device Handbook, Altera Inc. November, 2009. Available on-line in:
http://www.altera.com/literature/hb/stratix-iv/stratix4_handbook.pdf.
[174] National Semiconductors; “LVDS Owner’s Manual: Including High-Speed CML and Signal Conditioning”; Fourth Edition, 2008.
[175] Federal Standards 1037C; “Telecommunications: Glossary of Telecommunication Terms”, August, 1996 [176] Dixit, Sudhir S.; “IP over WDM: Building the Next Generation Optical Internet”; Ed. Wiley-Interscience, 1st
edition, 2003.
[177] IEEE Std 802.3; “Part 3: Carrier sense multiple access with collision detection (CSMA/CD) access method and physical layer specifications”; March, 2002.
[178] RFC 791 -“INTERNET PROTOCOL - DARPA INTERNET PROGRAM PROTOCOL SPECIFICATION”, IETF, September, 1981.
[179] RFC 2460 - Internet Protocol, Version 6 (IPv6) Specification, Network Working Group, IETF, December 1998
[180] RFC 1700 -“ASSIGNED NUMBERS”; Network Working Group, IETF, October 1994 [181] RFC 5237 - “IANA Allocation Guidelines for the Protocol Field”; Network Working Group, IETF; February,
2008
[182] IANA Protocol Numbers http://www.iana.org/assignments/protocol-numbers/protocol-numbers.xml [183] RFC 2474 – “Definition of the Differentiated Services Field (DS Field) in the IPv4 and IPv6 Headers”;
Network Working Group, IETF, December 1998
[184] López Pastor, E.T.; Martins Soares, A.J.; Abdalla Junior, H.; et. al. “Redes de Comunicação Convergentes: Tecnologias e Protocolos” – Ed. Universidade de Brasilia, 2008, 272 p.
[185] RFC 3031 – “Multiprotocol Label Switching Architecture”; Network Working Group, IETF, January, 2001 [186] RFC 3032 – “MPLS Label Stack Encoding”; Network Working Group, IETF, January, 2001. [187] RFC 3945 – “Generalized Multi-Protocol Label Switching (GMPLS) Architecture”, Network Working Group,
IETF, October, 2004.
[188] RFC 5212 – “Requirements for GMPLS-Based Multi-Region and Multi-Layer Networks (MRN/MLN)”; Network Working Group, IETF; July,2008
[189] Maier, Martin; “Optical Switching Networks”; Cambridge University Press, 2008.

260
[190] Yasin M. Karfaa, M. Ismail, Abbou F. M, and S. Shaari; “Effects of Crosstalk in an Array Waveguide Grating Add/Drop Router on the Performance of WDM Networks”; Proceedings of the 2007 IEEE International
Conference on Telecommunications and Malaysia International Conference on Communications, 14-17 May
2007, Penang, Malaysia.
[191] Data sheet AWG dwdm 50 ghz mux/demux @ 1.55 µm - Lumenon Innovative Lightwave Technology, Inc. (2005).