water quality in the upper illinois river basin, illinois, indiana, and wisconsin, 1999-2001
TRANSCRIPT

Water Quality in the Upper Illinois River BasinIllinois, Indiana, and Wisconsin, 1999–2001
U.S. Department of the InteriorU.S. Geological Survey
Circular 1230
Points of Contact and Additional InformationThe companion Web site for NAWQA summary reports:
http://water.usgs.gov/nawqa/nawqa_sumr.html
Other NAWQA summary reports
River Basin AssessmentsAcadian-Pontchartrain Drainages (Circular 1232)Albemarle-Pamlico Drainage Basin (Circular 1157)Allegheny and Monongahela River Basins (Circular 1202)Apalachicola-Chattahoochee-Flint River Basin (Circular 1164)Central Arizona Basins (Circular 1213)Central Columbia Plateau (Circular 1144)Central Nebraska Basins (Circular 1163)Connecticut, Housatonic and Thames River Basins (Circular 1155)Cook Inlet Basin (Circular 1240)Delaware River Basin (Circular 1227)Delmarva Peninsula (Circular 1228)Eastern Iowa Basins (Circular 1210)Georgia-Florida Coastal Plain (Circular 1151)Great and Little Miami River Basins (Circular 1229) Great Salt Lake Basins (Circular 1236)Hudson River Basin (Circular 1165)Island of Oahu (Circular 1239)Kanawha - New River Basin (Circular 1204)Lake Erie - Lake Saint Clair Drainages (Circular 1203)Long Island - New Jersey Coastal Drainages (Circular 1201)Lower Illinois River Basin (Circular 1209)Lower Susquehanna River Basin (Circular 1168)Lower Tennessee River Basin (Circular 1233)Las Vegas Valley Area and the Carson and Truckee River Basins (Circular 1170)Mississippi Embayment (Circular 1208)Mobile River Basin (Circular 1231)New England Coastal Basins (Circular 1226)
Northern Rockies Intermontane Basins (Circular 1235)Ozark Plateaus (Circular 1158)Potomac River Basin (Circular 1166)Puget Sound Basin (Circular 1216)Red River of the North Basin (Circular 1169)Rio Grande Valley (Circular 1162)Sacramento River Basin (Circular 1215)San Joaquin-Tulare Basins (Circular 1159)Santa Ana Basin (Circular 1238)Santee River Basin and Coastal Drainages (Circular 1206)South-Central Texas (Circular 1212)South Platte River Basin (Circular 1167)Southern Florida (Circular 1207)Trinity River Basin (Circular 1171)Upper Colorado River Basin (Circular 1214)Upper Mississippi River Basin (Circular 1211)Upper Snake River Basin (Circular 1160)Upper Tennessee River Basin (Circular 1205)Western Lake Michigan Drainages (Circular 1156)White River Basin (Circular 1150)Willamette Basin (Circular 1161)Yakima River Basin (Circular 1237)Yellowstone River Basin (Circular 1234)
National AssessmentsThe Quality of Our Nation‘s Waters—Nutrients and Pesticides (Circular 1225)
Upper Illinois River Basin contact and Web site:
USGS State RepresentativeU.S. Geological SurveyWater Resources Discipline221 N. Broadway Ave., Urbana, IL 61801e-mail: [email protected]://il.water.usgs.gov/nawqa/uirb
National NAWQA Program:
Chief, NAWQA ProgramU.S. Geological SurveyWater Resources Discipline12201 Sunrise Valley Drive, MS 413Reston, VA 20192http://water.usgs.gov/nawqa/
Front cover: Chicago River, Chicago, Illinois, taken December, 2003, from the Wabash Street Bridge while facing east (Galen Arnold).
Back cover: Right, sampling for invertebrates at the Salt Creek at Bellwood, Ill., site ; left, processing algae samples at the Des Plaines River at Russell, Ill., site. (Photographs by Debbie L. Adolphson, U.S. Geological Survey.)

Water Quality in the Upper Illinois River Basin, Illinois, Indiana, and Wisconsin, 1999–2001
By George E. Groschen, Terri L. Arnold, Mitchell A. Harris, David H. Dupré, Faith A. Fitzpatrick, Barbara C. Scudder, William S. Morrow, Jr., Paul J. Terrio, Kelly L. Warner, and Elizabeth A. Murphy
Circular 1230
U.S. Department of the InteriorU.S. Geological Survey
U.S. Department of the InteriorGale A. Norton, Secretary
U.S. Geological SurveyCharles G. Groat, Director
U.S. Geological Survey, Reston, Virginia: 2004
For sale by U.S. Geological Survey, Information Services Box 25286, Denver Federal Center Denver, CO 80225
For more information about the USGS and its products: Telephone: 1-888-ASK-USGS World Wide Web: http://www.usgs.gov/
Any use of trade, product, or firm names in this publication is for descriptive purposes only and does not imply endorsement by the U.S. Government.
Although this report is in the public domain, permission must be secured from the individual copyright owners to reproduce any copyrighted materials contained within this report.
Suggested citation:Groschen, George E., Arnold, Terri L., Harris, Mitchell A., Dupré, David H., Fitzpatrick, Faith A., Scudder, Barbara C., Morrow, Jr., William S., Terrio, Paul J., Warner, Kelly L., and Murphy, Elizabeth A., 2004, Water quality in the Upper Illinois River Basin, Illinois, Indiana, and Wisconsin, 1999–2001: Reston, Va., U.S. Geological Survey Circular 1230, 42 p.
Library of Congress Cataloging-in-Publication Data
Water quality in the Upper Illinois River Basin,Illinois, Indiana, and Wisconsin, 1999–2001 / George E. Groschen … [et. al.]. p. cm. -- (Circular ; 1230) Includes bibliographical references. ISBN 0-607-94066-2 1. Water quality -- Illinois -- Upper Illinois River Basin. I. Groschen, G. E. II. Geological Survey (U.S.) III. U.S. Geological Survey circular ; 1230. TD224.I3.W373 2003 363.739’42’0977--dc22 2003063148

Contents
National Water-Quality Assessment Program ………………………………………………… ivWhat kind of water-quality information does the NAWQA Program provide? …………… v
Introduction to this Report …………………………………………………………………… viSummary of Findings ………………………………………………………………………… 1
Stream and River Highlights ……………………………………………………… 1Ground-Water Highlights …………………………………………………………… 2
Introduction to the Upper Illinois River Basin ………………………………………………… 3Major Findings ………………………………………………………………………………… 6
Urbanization significantly affects streams, biological communities, and ground water … 6Ammonia and phosphorus are elevated in urban streams and rivers because of
wastewater ………………………………………………………………… 6Domestic and industrial wastewater increased organic contaminants in streams
and rivers …………………………………………………………………… 7Insecticides, such as diazinon, are associated with urban land use ……………… 9Volatile organic compounds were detected in Salt Creek ………………………… 10Lake sediment reflects urbanization ……………………………………………… 10Biological conditions are adversely affected in urbanizing areas ………………… 12Organochlorine-pesticide and PAH concentrations were elevated in urban-stream
sediment and fish ………………………………………………………… 12Contaminants in sediments present risks to aquatic life in and near the
Illinois River ………………………………………………………………… 14Urban land-use study covers multiple watersheds in the Des Plaines and Fox River
Basins ……………………………………………………………………… 14VOCs, pesticides, and nitrate were detected in shallow ground water underlying
urban land ………………………………………………………………… 16Recharge to the ground-water system decreases with urbanization ……………… 16
Extensive agriculture affects streams and ground water ……………………………… 17Nitrate and total nitrogen are elevated in agricultural streams …………………… 17Nitrogen varies significantly in agricultural streams because of geology and land-
management practices …………………………………………………… 17Herbicides are common in agricultural streams and in ground water …………… 18
Water quality has changed since the early 1980s ……………………………………… 19Ammonia in streams and rivers decreased and nitrate increased ………………… 19Changes in pesticide use are reflected in streams and rivers …………………… 19Ten-year-old shallow ground water has higher pesticide concentrations than more
recent ground water ……………………………………………………… 20Study-Unit Design …………………………………………………………………………… 21
Stream Chemistry and Ecology …………………………………………………… 21Ground-Water Chemistry …………………………………………………………… 21
References Cited ……………………………………………………………………………… 23Glossary ……………………………………………………………………………………… 25Appendix—Water-Quality Data from the Upper Illinois River Basin in a National Context …… 27


What kind of water-quality information does the NAWQA Program provide?Water-quality assessments by a single program cannot possibly address all of the Nation’s water-resources needs and issues. Therefore, it is necessary to define the context within which NAWQA information is most useful.
• Total resource assessment—NAWQA assessments are long-term and interdisciplinary, and include information on water chemistry, hydrology, land use, stream habitat, and aquatic life. Assessments are not limited to a specific geographic area or water-resource problem at a specific time. Therefore, the findings describe the general health of the total water resource, as well as emerging water issues, thereby helping managers and decision makers to set priorities.
• Source-water characterization—Assessments focus on the quality of the available, untreated resource and thereby complement (rather than duplicate) Federal, State, and local programs that monitor drinking water. Findings are compared to drinking-water standards and health advisories as a way to characterize the resource.
• Compounds studied—Assessments focus on chemical compounds that have well-estab-lished methods of investigation. It is not financially or technically feasible to assess all the contaminants in our Nation’s waters. In general, the NAWQA Program investigates those pesticides, nutrients, volatile organic compounds, and metals that have been or are currently used commonly in agricultural and urban areas across the Nation. A complete list of compounds studied is on the NAWQA Web site at http://water.usgs.gov/nawqa.
• Detection compared to risk—Compounds are measured at very low concentrations, often 10 to 100 times lower than Federal or State standards and health advisories. Detec-tion of compounds, therefore, does not necessarily translate to risks to human health or aquatic life. However, these analyses are useful for identifying and evaluating emerging issues, as well as for tracking contaminant levels over time.
• Multiple scales—Assessments are guided by a nationally consistent study design and uniform methods of sampling and analysis. Findings thereby pertain not only to water quality of a particular stream or aquifer, but also contribute to the larger picture of how and why water quality varies regionally and nationally. This consistent, multi-scale approach helps to determine if a water-quality issue is isolated or pervasive. It also allows direct comparisons of how human activities and natural processes affect water quality in the Nation’s diverse environmental settings.
v
vi
Introduction to this Report
This report contains the major findings of a 1999–2001 assessment of water quality in the upper Illinois River Basin. It is one of a series of reports by the National Water-Quality Assessment (NAWQA) Program that present major findings in 51 major river basins and aquifer systems across the Nation.
In these reports, water quality is discussed in terms of local, State, and regional issues. Condi-tions in a particular basin or aquifer system are compared to conditions found elsewhere and to selected national benchmarks, such as those for drinking-water quality and the protection of aquatic organisms.
This report is intended for individuals working with water-resource issues in Federal, State, or local agencies, universities, public-interest groups, or in the private sector. The information will be useful in addressing a number of current issues, such as the effects of agricultural and urban land use on water quality, human health, drinking water, source-water protection, hypoxia and excessive growth of algae and plants, pesticide registration, and monitoring and sampling strat-egies. This report also is for individuals who wish to know more about the quality of streams and ground water in areas near where they live, and how that water quality compares to the quality of water in other areas across the Nation.
The water-quality conditions in the upper Illinois River Basin summarized in this report are discussed in detail in other reports that can be accessed from (http://il.water.usgs.gov/nawqa/uirb). Detailed technical information, data and analyses, collection and analytical methodology, models, graphs, and maps that support the findings presented in this report in addition to reports in this series from other basins can be accessed from the national NAWQA Web site at (http://water.usgs.gov/nawqa).
“Water quality data and analysis for the Upper Illinois River Basin NAWQA study will be useful in developing Illinois nutrient standards and prioritizing the development of standards for other pollut-ants.”
Richard Lanyon, Director of Research and Develop-ment, Metropolitan Water Reclama-tion District of Greater Chicago
“The NAWQA study results from the upper Illinois River Assessment are extremely valuable to assist with efforts of water resource planning and management, given the potential predicted population growth, limitations on the use of Lake Michigan and the sta-tus of the sustained recharge of the deep aquifer system in northeastern Illinois.”
Richard Cobb, Illinois Environmental Protection Agency
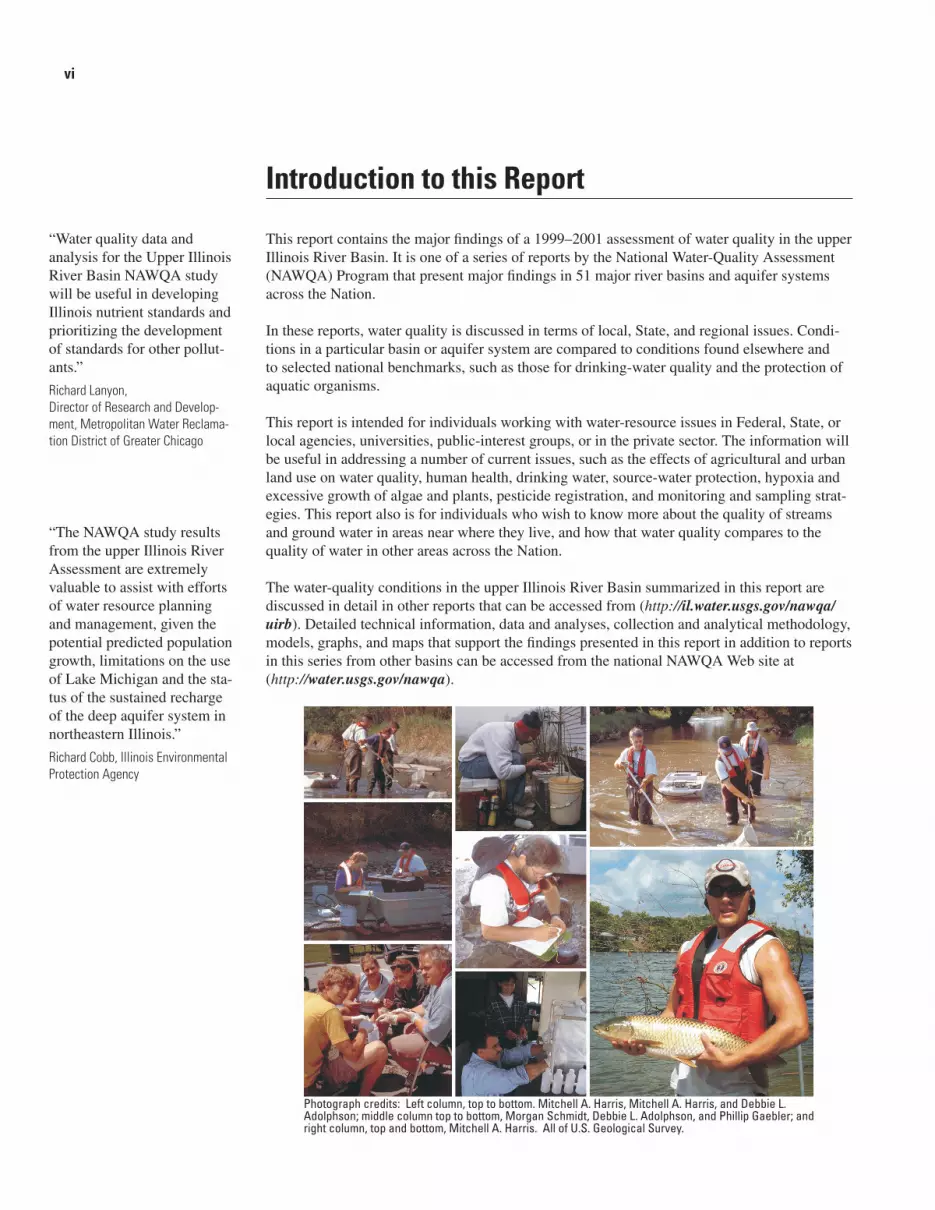
Photograph credits: Left column, top to bottom. Mitchell A. Harris, Mitchell A. Harris, and Debbie L. Adolphson; middle column top to bottom, Morgan Schmidt, Debbie L. Adolphson, and Phillip Gaebler; and right column, top and bottom, Mitchell A. Harris. All of U.S. Geological Survey.

Summary of Findings 1
Summary of Findings
Land use (1993) in the upper Illinois River Basin is a combina-tion of intensive row-crop farming and urban. Chicago is the third largest city in the Nation and has some of the most heavily industrialized areas in the United States.
Stream and River Highlights
During 1999–2001, water quality in upper Illinois River Basin streams and rivers largely reflected the amount of agricultural or urban land in their basins. Since the mid-1850s, channel and drainage modifications, urban development in the Chicago area, agricultural runoff, and other activities have altered water quality, biological communities, and habitat for aquatic organisms. Concentrations of chemicals in stream water occasionally exceeded guidelines for the protection of aquatic life and drinking water, such as for nitrate, phospho-rus, diazinon, and organic wastewater compounds. Concentra-tions in the Des Plaines and Kankakee Rivers were least likely to exceed standards and guidelines. Although area streams and rivers generally are not used as drinking-water sources, elevated concentrations can affect aquatic wildlife and the quality of water for downstream Illinois River water users.• The ammonia concentration (flow-weighted mean) at the Chicago Sanitary and Ship Canal at Romeoville was 0.64 mg/L (milligrams per liter), the highest measured in the upper Illinois River Basin and the fourth highest of 109 streams and rivers measured nationwide by the NAWQA Program during 2000–01. (See page 6.)
• In every stream-water sample collected from urban or mixed
land-use watersheds, phosphorus concentrations exceeded the U.S. Environmental Protection Agency (USEPA) desired goal to prevent excessive growth of algae and other nuisance plants (0.10 mg/L). (See page 6.)
• Nitrate concentrations of 12.3 mg/L (flow-weighted means) at the agricultural stream sites Sugar Creek at Milford and Iroquois River near Chebanse were the highest among 109 streams sampled during 1999–2001 for the NAWQA Pro-gram nationwide. (See page 17.)
• Natural features (including glacial geology, soils, and hydrology) and land-management practices (including artificial drainage) affect nutrients in streams, as indicated by nitrogen in runoff at the Iroquois River near Chebanse and the Kankakee River near Momence, Ill. (See pages 17–18.)
• The insecticide diazinon was detected frequently in streams and rivers in urban and mixed land-use areas. Specifically, diazinon was detected in 93 percent of samples collected at
Small Streams Major Rivers
AgriculturalUrban
Selected Indicators of Stream-Water Quality
MixedLand Uses
—
Nitrate
Totalphosphorus
Herbicides
Insecticides
Semivolatileorganics3
Organo-chlorinesin tissue2
Organo-chlorinesin sediment2
Proportion of samples with detected concentrationsgreater than or equal to health-related nationalguidelines for drinking water, protection of aquatic life, orthe desired goal for preventing nuisance plant growth
Proportion of samples with detected concentrations lessthan health-related national guidelines for drinkingwater, protection of aquatic life, or the desired goal forpreventing nuisance plant growth
Proportion of samples with no detections
Not assessed
1 Arsenic, mercury, and metals.2 DDT and PCBs.3 Byproducts of fossil-fuel combustion; components of coal and crude
oil, in sediment and fish tissue.
Traceelementsin sediment1
Traceelementsin tissue1
—
—
—
—
—
—
—
2 Water Quality in the Upper Illinois River Basin
Salt Creek at Western Springs (nearly 80 percent urban land) and concentrations in 18 percent of samples exceeded the guideline for protection of aquatic life. (See pages 9–10.)
• Benthic invertebrates that are sensitive to pollution and habi-tat disturbance, such as mayflies, stoneflies, and caddisflies, were most common in streams whose watersheds are less than 4 percent urban land. Aquatic communities were degraded where urban areas cover as little as 25 percent of the watershed. (See page 12.)
• Diverse fish communities that include species sensitive to pollution (as indicated by high Index of Biotic Integrity scores) were found at Indian Creek, which drains less than 1 percent urban land (score of 57); Big Rock Creek, which drains less than 1 percent urban land (score of 52); and Genesee Creek, which drains about 7 percent urban land (score of 52). (See page 12.)
• Herbicides were detected frequently in streams and rivers, particularly those draining agricultural land. For example, atrazine was detected in every sample from streams and riv-ers draining agricultural or mixed land-use watersheds. (See pages 18–19.)
Trends in Stream-Water Quality
• Ammonia concentrations decreased during 1978–97 in areas where sewage-treatment processes were enhanced, but nitrate concentrations increased. The enhancements transformed ammonia to nitrate, making effluent less toxic to fish. (See page 19.)
• Detections of alachlor and cyanazine have decreased in streams and rivers since the early 1990s because of decreased use of these herbicides. (See pages 19–20.)
Ground-Water Highlights
Ground water is the largest source of drinking water in the upper Illinois River Basin (15 percent of the drinking water), except for Lake Michigan (82 percent). Commonly used herbicides and nitrate were less frequently detected in well-water samples than in stream and river samples.• Shallow ground water in the upper Illinois River Basin generally meets drinking-water standards and guidelines; standards or guidelines have not been established for many pesticides and most breakdown products detected. (See pages 16, 17–20.)
• Detections of synthetic chemicals were frequent in samples collected from monitoring wells and domestic-supply wells
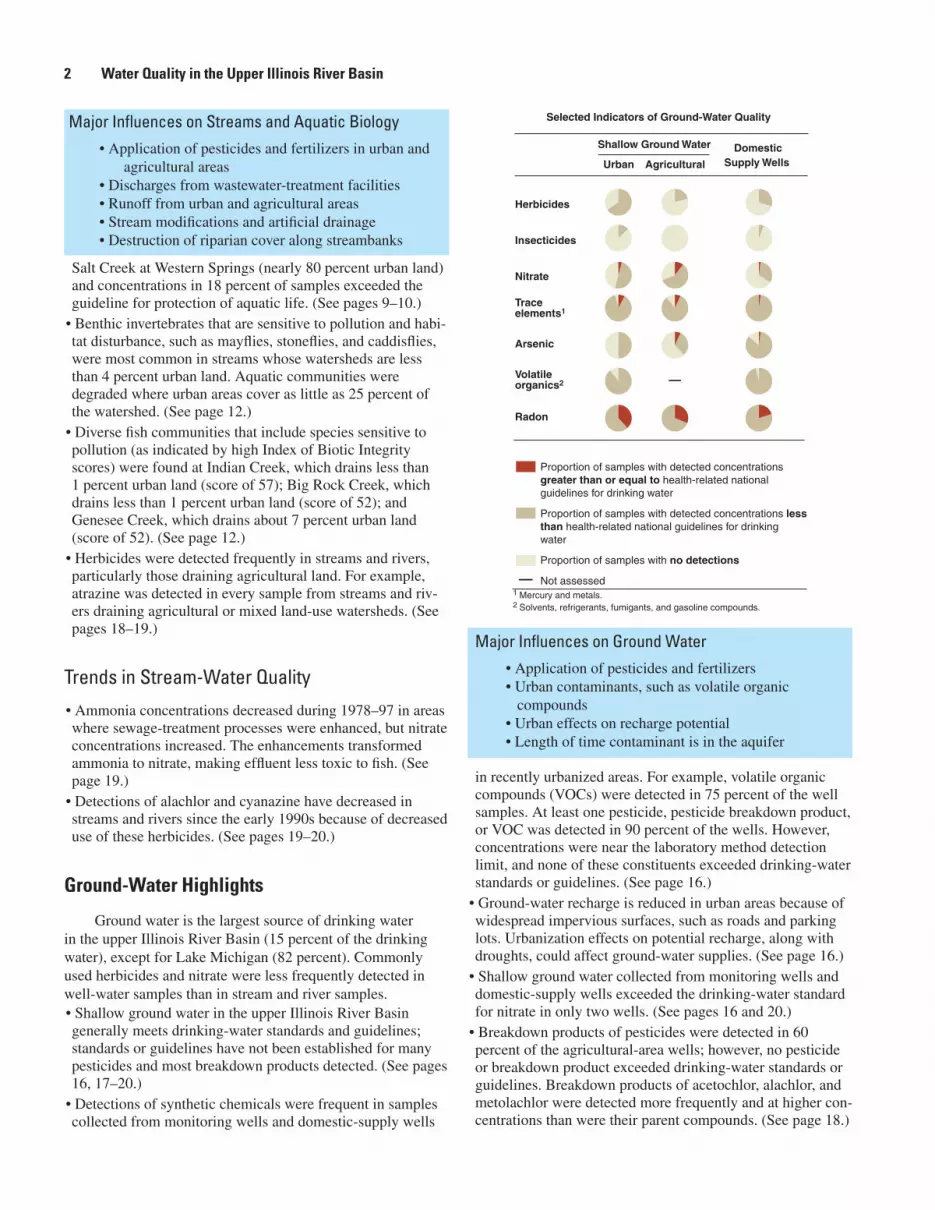
in recently urbanized areas. For example, volatile organic compounds (VOCs) were detected in 75 percent of the well samples. At least one pesticide, pesticide breakdown product, or VOC was detected in 90 percent of the wells. However, concentrations were near the laboratory method detection limit, and none of these constituents exceeded drinking-water standards or guidelines. (See page 16.)
• Ground-water recharge is reduced in urban areas because of widespread impervious surfaces, such as roads and parking lots. Urbanization effects on potential recharge, along with droughts, could affect ground-water supplies. (See page 16.)
• Shallow ground water collected from monitoring wells and domestic-supply wells exceeded the drinking-water standard for nitrate in only two wells. (See pages 16 and 20.)
• Breakdown products of pesticides were detected in 60 percent of the agricultural-area wells; however, no pesticide or breakdown product exceeded drinking-water standards or guidelines. Breakdown products of acetochlor, alachlor, and metolachlor were detected more frequently and at higher con-centrations than were their parent compounds. (See page 18.)
Major Influences on Ground Water• Application of pesticides and fertilizers • Urban contaminants, such as volatile organic
compounds• Urban effects on recharge potential• Length of time contaminant is in the aquifer
Selected Indicators of Ground-Water Quality
Shallow Ground Water
Supply WellsAgriculturalUrban
Domestic
Nitrate
Traceelements1
Arsenic
Herbicides
Insecticides
Radon
Volatileorganics2
—
Proportion of samples with detected concentrationsgreater than or equal to health-related nationalguidelines for drinking water
Proportion of samples with detected concentrations lessthan health-related national guidelines for drinkingwater
Proportion of samples with no detections
Not assessed1 Mercury and metals.2 Solvents, refrigerants, fumigants, and gasoline compounds.
—
Major Influences on Streams and Aquatic Biology• Application of pesticides and fertilizers in urban and
agricultural areas• Discharges from wastewater-treatment facilities• Runoff from urban and agricultural areas• Stream modifications and artificial drainage• Destruction of riparian cover along streambanks

Introduction 3
Introduction to the Upper Illinois River BasinThe upper Illinois River Basin
includes parts of 16 counties in northeastern Illinois, 13 counties in northwestern Indiana, 7 counties in southeastern Wisconsin, and 1 county in southwestern Michigan (fig. 1). The drainage area is 11,000 mi2 (square miles) upstream from Ottawa, Ill., on the Illinois River. The Kankakee River drains the largest part, flowing from Indiana into Illinois and joined by the Iroquois River. The Des Plaines River flows north to south from Wisconsin into Illinois, turns southwest at Lyons, Ill., and follows the Chicago Sanitary and
Ship Canal (CSSC). The Des Plaines River drainage area includes 673 mi2 that originally drained to Lake Michi-gan through the Chicago and Calumet Rivers. The Chicago River Basin is the smallest part of the upper Illinois River Basin. The Chicago River flowed into Lake Michigan prior to the opening of the CSSC in 1900. The direction of flow in the Chicago River and its South Branch was reversed as a result of the opening of this canal. The canal allows for diversion of water from the Lake Michigan watershed into the Des Plaines River at Joliet, Ill. (Lanyon, 2000). The
Illinois River main stem flows from the confluence of the Des Plaines and Kankakee Rivers westward toward Ottawa, Ill. In this report, the Chicago River Basin (and CSSC) is discussed as part of the Des Plaines River Basin.
In the upper Illinois River Basin, ground water occurs in shallow (less than about 100 feet) sand and gravel deposits, shallow bedrock (less than about 200 feet), and deep (greater than 500 feet) bedrock. In many areas, ground water in sand and gravel deposits and shallow bedrock often is vulnerable to contamination from activities associ-
Figure 1. The upper Illinois River Basin is relatively flat, so streams and rivers generally are slow moving. The physiography is defined chiefly among the small watersheds monitored. Clockwise from the upper left, the photographs depict (1) Salt Creek at Western Springs (the monitori t River nea credit Geological Survey.)
4
2
3
5
1
4 Water Quality in the Upper Illinois River Basin
ated with urban and agricultural land. Water in deeper bedrock is less vulnera-ble, particularly in areas where it is con-fined by relatively impermeable shale. Ground water in deep bedrock moves along relatively long flowpaths, gener-ally from west to east within the basin, because of geologic features. In the sand and gravel deposits and shallow bedrock, the water moves generally along shorter flowpaths and within local flow systems, with variable directions depending on topography and other landscape features.
Land Use
Agriculture accounts for about 75 percent of the land use in the upper Illinois River Basin (1990 estimate, from Hitt, 1994; fig. 2). Corn is the principal row crop harvested followed by soy-beans. Although urban land accounts for less than 20 percent of the basin (Hitt, 1994), its effect on water quality is substantial. Most urban development is concentrated in and around Chicago (Arnold and others, 1999; see map on p. 1). The land drained by the Calumet and lower Des Plaines Rivers historically was some of the most heavily industrial-ized in the Nation.
Similar to many areas across the Nation, a substantial amount of growth and land development is sprawling out from core downtown areas. For example, from 1970 to 1990, the population of the Chicago Primary Metropolitan Statisti-cal Area (PMSA—which comprises the Illinois counties of Cook, DeKalb, Du Page, Grundy, Kane, Kendall, Lake, McHenry, and Will) grew by 5 percent (U.S. Census Bureau, 2002), whereas the amount of land classified as urban
expanded by 24 percent from 1970 to 1993 (Anderson and others, 1976; Vogelmann and others, 2001). Similar estimates for urban expansion are not available for more recent years.
Population Change
Population or population density is a primary indicator of urban land use. Of the approximately 9.1 million people currently living in the basin, about 8 million live in the Chicago PMSA (2.9 million within the city limits of Chicago). Total population within the upper Illinois River Basin has increased from 7,211,669 in 1970 to 9,123,658 in 2000, about a 21-percent increase (U.S.
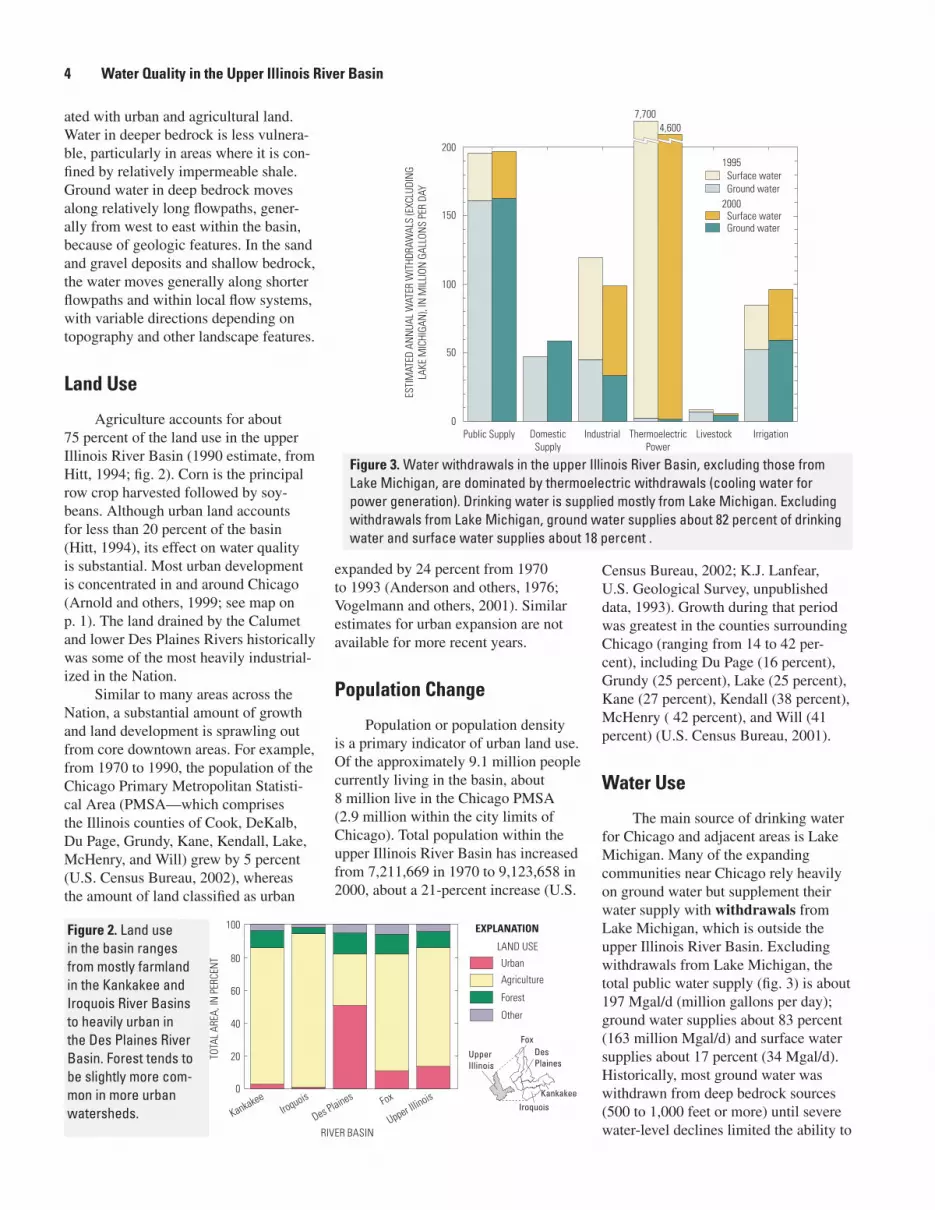
Figure 3. Water withdrawals in the upper Illinois River Basin, excluding those from Lake Michigan, are dominated by thermoelectric withdrawals (cooling water for power generation). Drinking water is supplied mostly from Lake Michigan. Excluding withdrawals from Lake Michigan, ground water supplies about 82 percent of drinking water and surface water supplies about 18 percent .
Census Bureau, 2002; K.J. Lanfear, U.S. Geological Survey, unpublished data, 1993). Growth during that period was greatest in the counties surrounding Chicago (ranging from 14 to 42 per-cent), including Du Page (16 percent), Grundy (25 percent), Lake (25 percent), Kane (27 percent), Kendall (38 percent), McHenry ( 42 percent), and Will (41 percent) (U.S. Census Bureau, 2001).
Water Use
The main source of drinking water for Chicago and adjacent areas is Lake Michigan. Many of the expanding communities near Chicago rely heavily on ground water but supplement their water supply with withdrawals from Lake Michigan, which is outside the upper Illinois River Basin. Excluding withdrawals from Lake Michigan, the total public water supply (fig. 3) is about 197 Mgal/d (million gallons per day); ground water supplies about 83 percent (163 million Mgal/d) and surface water supplies about 17 percent (34 Mgal/d). Historically, most ground water was withdrawn from deep bedrock sources (500 to 1,000 feet or more) until severe water-level declines limited the ability to
Figure 2. Land use in the basin ranges from mostly farmland in the Kankakee and Iroquois River Basins to heavily urban in the Des Plaines River Basin. Forest tends to be slightly more com-mon in more urban watersheds.

Introduction 5
Figure 5. The deviation of annual precipitation from normal for the study period indicates that the basin was wetter than normal in the northern part and slightly drier than normal in the southern part.
Figure 4. Although there were local variations, near-normal precipitation, streamflow, and ground-water levels prevailed during the study period.
pump water. Recently, sand and gravel aquifers near land surface (less than about 100 feet deep) have been tapped and will continue to supply increas-ing amounts of drinking water. These ground-water supplies are especially vulnerable to contamination resulting from human activity.
Ground-water withdrawals likely will continue to increase because of strict control on Lake Michigan with-drawals and increasing demand. Water-use estimates made in 2000 showed a 2-percent increase in ground-water withdrawals and a 4-percent increase in surface-water withdrawals as com-pared to 1995 estimates. Thermoelectric power generation is the single largest use of water in the basin. In 2000, water used to cool electric power generating equipment (nearly 100 percent surface water) accounted for about 91 percent (4,580 Mgal/d) of the water withdrawn from all sources inside the basin. Of the surface water withdrawn from within the basin, 47 percent (65 Mgal/d) is used for industry; in contrast, only 11 percent (34 Mgal/d) of ground water is used for industry. It is estimated that 27 percent (37 Mgal/d) of surface-water withdrawals and 19 percent (60 Mgal/d) of ground-water withdrawals supplied water for irrigation in the agricultural parts of the upper Illinois River Basin.
Weather and Hydrologic Conditions During Study Period
Although the climate of an area tends to affect water quality over the long term (decades or more), variations in weather can affect water quality from month to month, season to season, and year to year. Streamflow and ground-water levels, which depend directly on rainfall, were near normal during the study period (1999–2001; fig. 4); how-ever, precipitation was slightly above normal in the northern part of the basin and slightly below normal in the south-ern part (fig. 5).
The Chicago River is an important economic and tourist resource in downtown Chicago. (Photograph by Metropolitan Water Reclama-tion District of Greater Chicago.)

6 Water Quality in the Upper Illinois River Basin
Major Findings
Urbanization signifi-cantly affects streams, biological communities, and ground water
Less than 20 percent of the area of the upper Illinois River Basin is urban land. Its effects on water quality and aquatic habitat1 are substantial, how-ever, due to heavily concentrated popu-lation, impervious areas, and residential, commercial, and industrial wastewater sources. Water-quality issues in Chicago and the surrounding urbanizing areas include the contamination of ground water, surface water, and sediment, and biological degradation resulting from urban runoff and discharge from indus-trial and wastewater-treatment plants (WWTP). Degradation of streams and rivers includes (1) elevated concentra-tions of ammonia and phosphorus and the presence of organic wastewater con-taminants such as disinfectants, pharma-ceuticals and steroids, and insecticides; (2) increased frequency of occurrence and concentrations of trace elements and organochlorine compounds, such as DDT, and polychlorinated biphe-nyls (PCBs) in sediment and fish; and (3) decreased numbers and diversity of pollution-sensitive species of fish and benthic invertebrates.
Ammonia and phosphorus are elevated in urban streams and rivers because of wastewater
Concentrations of ammonia and phosphorus are elevated in the urban Des Plaines River Basin (including the Chicago River, the Chicago Sanitary and Ship Canal, the Calumet Sag Chan-nel, and the Du Page River) because of municipal and industrial treated-waste-water discharges. The major recipient of ammonia and phosphorus is the CSSC, which receives discharge from
of algae and other nuisance plants. In contrast, phosphorus concentrations exceeded the 0.10-mg/L goal in only 53 percent of samples collected from streams or rivers draining agricultural land. Over the past two decades of data collection by the Illinois Environmental Protection Agency (IEPA), few trends in phosphorus concentrations were observed except at two sites downstream from major WWTPs, North Branch of the Chicago River at Niles and CSSC at Lockport, where phosphorus concentra-tion continued to increase (Sullivan, 2000).
Inputs of nutrients (forms of nitrogen and phosphorus) throughout the upper Illinois River Basin result in elevated concentrations at the most downstream site—the Illinois River at Ottawa. Data collected from 1978 through 1997 by the USGS and the IEPA showed that median concentra-tions of ammonia, nitrate, and total phosphorus were among the highest in the entire Mississippi River Basin (Sul-livan, 2000). Similarly, annual average amounts of nutrients, or loads, leaving the upper Illinois River Basin at Ottawa (fig. 6) were among the highest in the entire Mississippi River Basin; total nitrogen loads were 66,000 tons per year for water years (Oct.–Sept.) 2000-2001.
Figure 6. The amount of nutrients transported from the upper Illinois River Basin is among the highest in the Nation. The load of nitrogen (sum of nitrate and nitrite and unfiltered organic and ammonia nitrogen) increases substantially downstream.
1 Terms defined in glossary are in bold type where first used.
three large WWTPs of the Metropolitan Water Reclamation District of Greater Chicago. The flow-weighted mean concentration of ammonia in the CSSC at Romeoville, 0.64 milligram per liter (mg/L), was the highest measured in the upper Illinois River Basin and was the fourth highest of 109 streams and rivers in all land-use categories sampled nationwide by the NAWQA Program during 2000–01. Ammonia also was ele-vated upstream at the Des Plaines River at Riverside (0.23 mg/L), ranking eighth nationally, and in Salt Creek at Western Springs (0.19 mg/L), ranking eleventh. Concentrations of dissolved ammonia were above the national background concentration of 0.1 mg/L (Mueller and Helsel, 1996) throughout the year at all three sites because of the relatively consistent input of wastewater discharge.
Similar to ammonia, the concen-tration of phosphorus was highest in the CSSC, and had a flow-weighted mean concentration of 1.4 mg/L, rank-ing fourth of 109 streams and rivers sampled nationwide. Phosphorus also was elevated in Salt Creek at Western Springs (1.3 mg/L, seventh highest of 109 nationwide), which drains residen-tial and other urban land in Cook and Du Page Counties, Ill., and receives treated wastewater from 12 treatment plants. In every water sample col-lected from streams or rivers draining urban land or a mix of urban and other land uses, phosphorus concentrations exceeded 0.10 mg/L, the U.S. Environ-mental Protection Agency (USEPA) desired goal to prevent excessive growth

Major Findings 7
Domestic and industrial waste-water increased organic con-taminants in streams and rivers
Water samples were collected at sites in 46 watersheds in July 2000 dur-ing low flow, when wastewater effluent can dominate streamflow in urban areas. This special study was done to assess the occurrence of organic wastewater compounds, including solvents, disinfec-tants, preservatives, flavors, fragrances, stimulants, antioxidants, detergents, fumigants, gasoline, hydrocarbons, fire retardants, pesticides, estrogen, fecal steroids, polymers, plasticizers, and an analgesic. Some of the compounds are regulated by the USEPA, whereas
others are not regulated but are known to be toxic to aquatic life. The types and amounts of compounds are controlled, in large part, by the size and number of WWTPs in urban and urbanizing watersheds. In fact, organic wastewater compounds are often useful indicators of the relative contributions of wastewater effluent to streamflow, which is impor-tant because data on actual discharges generally are not publicly available.
At least 6 of 45 compounds that typically are found in domestic and industrial wastewater were detected in streams and rivers draining the 19 special-study watersheds with more than 25 percent urban land (fig. 7). Tris(2–chloroethyl) phosphate, which is used as a flame retardant in plastics—especially
Figure 7. Detections of organic waste-water compounds tend to be higher with increased urban land in the watershed.
PERCENTAGE OF URBAN LAND
PE
RC
EN
TAG
E O
F O
RG
AN
ICC
OM
PO
UN
DS
DE
TE
CT
ED
IN S
AM
PL
E
0 20 40 60 80 1000
10
20
30
40
50
Trend line
NUMBER OF DETECTIONS, BY COMPOUND AND PERCENTAGE OF URBAN AREA
Urban area in watershed Fluoranthene Pyrene
Naphtha-lene
DiazinonTris(2–
chloroethyl) phosphate
Triclosan 17ß–Estradiol
(PAH) (PAH) (PAH, fumigant) (Insecticide)
(Flame retardant)
(Anti- bacterial)
(Estrogen hormone)
25 percent or less 5 4 12 7 10 8 0
Greater than 25 percent 19 18 18 19 16 12 1
Table 1. Organic wastewater compounds in stream water are associated with increased urban land [PAH; polycyclic aromatic hydro-carbon]
Urban area streams and rivers are often dominated by wastewater discharge
An estimated 70 percent of the total annual flow of the combined Des Plaines River and CSSC is treated wastewater downstream from Romeoville (Friends of the Chicago River, 2002). About one-half of the nutrient load from the upper Illinois River Basin to the Illinois River can be attributed to point sources such as waste-water-treatment plant (WWTP) effluent (L.P. Gianessi, written commun., 1986), particularly in the lower Des Plaines River Basin. According to the U.S. Environmen-tal Protection Agency (2003) Envirofacts database, 105 major WWTPs discharge into streams and rivers of the upper Illinois River Basin (fig. 8). A “major discharger” is a facility that discharges at least 1 Mgal/d or serves a population of at least 10,000 people. Of the 105 major dis-chargers in the upper Illinois River Basin, 25 have average flow capacities of 10 Mgal/d or greater. The Metropolitan Water Reclamation District of Greater Chicago operates seven WWTPs, including the three largest. The Stickney WWTP, with a capacity of 1,200 Mgal/d, is the largest plant in the District and one of the largest in the world.
Figure 8. The Chicago metropolitan area has a large number of wastewater treatment plants. These plants discharge treated wastewater to rivers and streams.
8 Water Quality in the Upper Illinois River Basin
Tunnel and Reservoir Plan designed to keep raw sewage from rivers
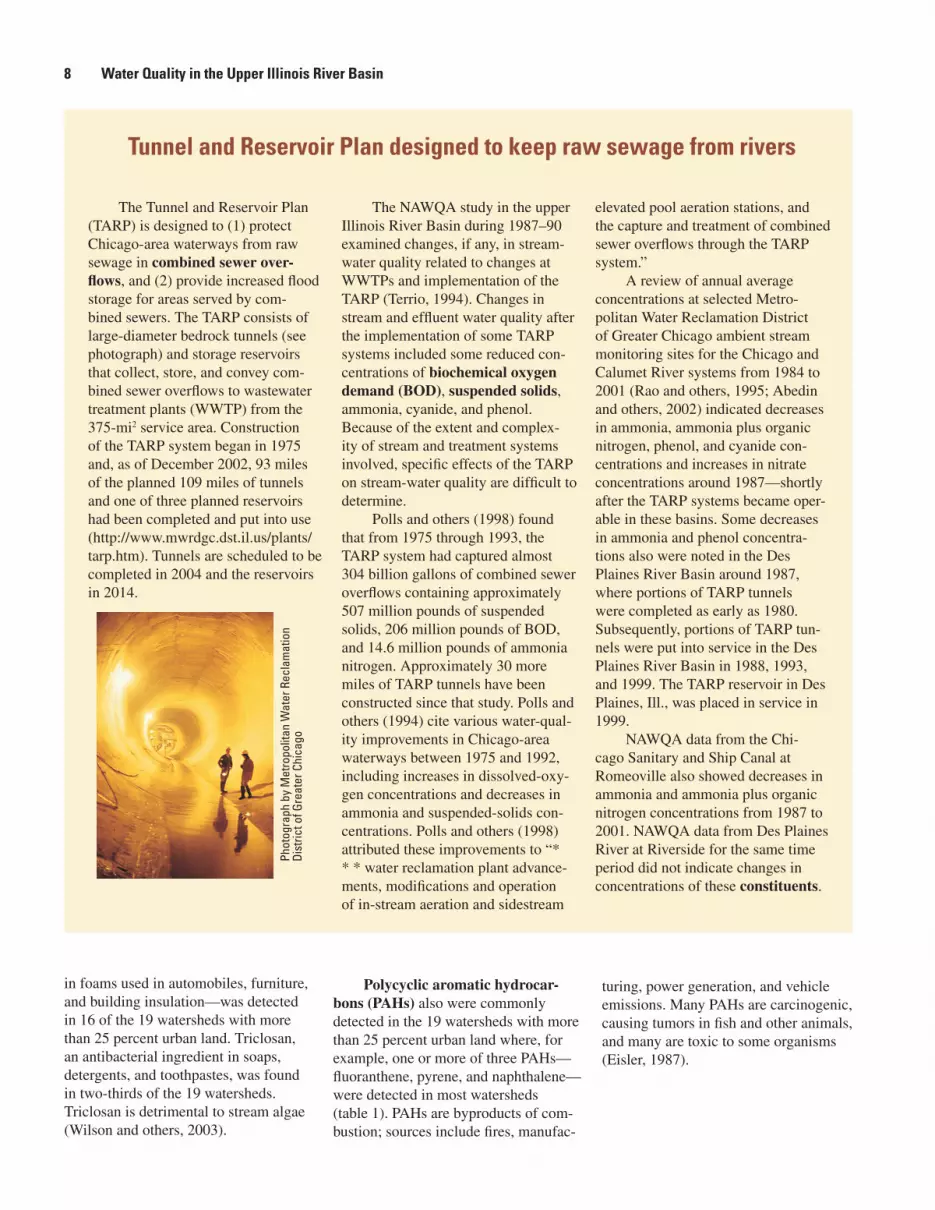
The Tunnel and Reservoir Plan (TARP) is designed to (1) protect Chicago-area waterways from raw sewage in combined sewer over-flows, and (2) provide increased flood storage for areas served by com-bined sewers. The TARP consists of large-diameter bedrock tunnels (see photograph) and storage reservoirs that collect, store, and convey com-bined sewer overflows to wastewater treatment plants (WWTP) from the 375-mi2 service area. Construction of the TARP system began in 1975 and, as of December 2002, 93 miles of the planned 109 miles of tunnels and one of three planned reservoirs had been completed and put into use (http://www.mwrdgc.dst.il.us/plants/tarp.htm). Tunnels are scheduled to be completed in 2004 and the reservoirs in 2014.
The NAWQA study in the upper Illinois River Basin during 1987–90 examined changes, if any, in stream-water quality related to changes at WWTPs and implementation of the TARP (Terrio, 1994). Changes in stream and effluent water quality after the implementation of some TARP systems included some reduced con-centrations of biochemical oxygen demand (BOD), suspended solids, ammonia, cyanide, and phenol. Because of the extent and complex-ity of stream and treatment systems involved, specific effects of the TARP on stream-water quality are difficult to determine.
Polls and others (1998) found that from 1975 through 1993, the TARP system had captured almost 304 billion gallons of combined sewer overflows containing approximately 507 million pounds of suspended solids, 206 million pounds of BOD, and 14.6 million pounds of ammonia nitrogen. Approximately 30 more miles of TARP tunnels have been constructed since that study. Polls and others (1994) cite various water-qual-ity improvements in Chicago-area waterways between 1975 and 1992, including increases in dissolved-oxy-gen concentrations and decreases in ammonia and suspended-solids con-centrations. Polls and others (1998) attributed these improvements to “* * * water reclamation plant advance-ments, modifications and operation of in-stream aeration and sidestream
elevated pool aeration stations, and the capture and treatment of combined sewer overflows through the TARP system.”
A review of annual average concentrations at selected Metro-politan Water Reclamation District of Greater Chicago ambient stream monitoring sites for the Chicago and Calumet River systems from 1984 to 2001 (Rao and others, 1995; Abedin and others, 2002) indicated decreases in ammonia, ammonia plus organic nitrogen, phenol, and cyanide con-centrations and increases in nitrate concentrations around 1987—shortly after the TARP systems became oper-able in these basins. Some decreases in ammonia and phenol concentra-tions also were noted in the Des Plaines River Basin around 1987, where portions of TARP tunnels were completed as early as 1980. Subsequently, portions of TARP tun-nels were put into service in the Des Plaines River Basin in 1988, 1993, and 1999. The TARP reservoir in Des Plaines, Ill., was placed in service in 1999.
NAWQA data from the Chi-cago Sanitary and Ship Canal at Romeoville also showed decreases in ammonia and ammonia plus organic nitrogen concentrations from 1987 to 2001. NAWQA data from Des Plaines River at Riverside for the same time period did not indicate changes in concentrations of these constituents.
in foams used in automobiles, furniture, and building insulation—was detected in 16 of the 19 watersheds with more than 25 percent urban land. Triclosan, an antibacterial ingredient in soaps, detergents, and toothpastes, was found in two-thirds of the 19 watersheds. Triclosan is detrimental to stream algae (Wilson and others, 2003).
Polycyclic aromatic hydrocar-bons (PAHs) also were commonly detected in the 19 watersheds with more than 25 percent urban land where, for example, one or more of three PAHs—fluoranthene, pyrene, and naphthalene—were detected in most watersheds (table 1). PAHs are byproducts of com-bustion; sources include fires, manufac-
turing, power generation, and vehicle emissions. Many PAHs are carcinogenic, causing tumors in fish and other animals, and many are toxic to some organisms (Eisler, 1987).
Phot
ogra
ph b
y M
etro
polit
an W
ater
Rec
lam
atio
n Di
stric
t of G
reat
er C
hica
go
Major Findings 9
Insecticides, such as diazinon, are associated with urban land use
The most distinct difference between pesticides detected in urban and agricultural areas was the prevalence of insecticides in urban streams. Insecti-cides were detected more often, and usu-ally at higher concentrations, in urban streams than in agricultural streams. In urban and mixed-land-use streams
Pharmaceuticals and household chemicals in streams are a national concern, but potential health effects are uncertain
Certain chemical compounds, used every day in homes, industry, and agriculture can enter streams and rivers in wastewater. These compounds—referred to as “organic wastewater compounds”—are not typically removed in wastewater treatment. They include human and veterinary drugs (including antibiot-ics), hormones, detergents, disin-fectants, plasticizers, fire retardants, insecticides, and antioxidants. In a national NAWQA study of streams in 30 States, 1 or more of 95 organic wastewater compounds were detected in 80 percent of 139 streams sampled, and 82 of the 95 compounds were detected at least once (Kolpin and others, 2002). The most frequently detected compounds—found in more than half of the streams—were coprostanol (fecal steroid), cholesterol (plant and animal steroid), N,N–diethyltoluamide (insect repellent called DEET), caffeine (stimulant), triclosan (antibacterial disinfectant), tris(2–chloroethyl) phosphate (a fire retardant), and 4–nonylphenol (a detergent breakdown product). Gen-erally, these compounds were detected at very low concentrations (in most cases, less than 1 part per billion). Mixtures of the compounds were common, however; 50 percent of the streams contained seven or more.
Seven streams in the upper Illinois River Basin were sampled as
part of the national study. Detected compounds were similar to those found nationally. For example, caf-feine was found in all upper Illinois streams sampled. This is consistent with previous studies in 1994 in which caffeine was found in the Illinois River at sites near Chicago down to the confluence with the Mis-sissippi River (Pereira and others, 1995). Caffeine’s widespread use by humans and its chemical stabil-ity make it ideal for tracing human waste. Four antibiotics commonly used for humans and animals were detected in urban and mixed-land-use streams in the upper Illinois River Basin. These compounds included erythromycin–H
2O, an erythromycin
breakdown product (detected in four streams), trimethoprim (detected in three streams), lincomycin (detected in two streams), and sulfamethoxazole (detected in one stream). Other com-monly detected compounds in the urban and mixed-land-use streams included deodorizers, polycyclic aromatic hydrocarbons (PAHs), plasticizers, insecticides, solvents, fire retardants, and detergent breakdown products.
The highest number of com-pounds detected in the upper Illinois River Basin was 34 in the Chicago Sanitary and Ship Canal (CSSC) at Romeoville, and 16 of these were not detected in any other stream in
the basin. The CSSC receives a large amount of treated wastewater—it was built in the late 19th century to divert sewage down the Illinois River and away from Lake Michigan. The CSSC continues to receive treated wastewater from the largest waste-water-treatment plants. The CSSC contained various nonantibiotic pre-scription drugs—cimetidine (antacid), dehydronifedipine (antianginal), diltiazem (antihypertensive), and metformin (antidiabetic). Other indicators of human and(or) animal waste were in the CSSC sample—coprostanol, cholesterol, and the urinary steroid cis-androsterone.
Knowledge of the potential human and environmental health effects of these 95 compounds is highly varied. Drinking-water stan-dards or other human or ecological health criteria have been established for 14, but measured concentrations rarely exceeded any of the stan-dards or criteria. Thirty-three com-pounds are known or suspected to be hormonally active; 46 are pharmaceu-tically active. Little is known about the potential health effects to humans or aquatic organisms exposed to the low levels of most of these com-pounds or the mixtures of compounds found.
and rivers, insecticides were detected at or above 0.05 microgram per liter (µg/L) in 21 to 53 percent of samples; in agricultural streams, insecticides were detected in only 12 percent of samples.
The occurrence of the insecticide diazinon in urban streams and rivers is clearly linked to its use. Diazinon is widely used on lawns and gardens and in buildings to control cockroaches, silver-fish, ants, and fleas. As a result, diazinon was detected in all water samples col-lected for the urban study at streams and
rivers draining greater than 25-percent urban land. The compound was detected less frequently in streams draining 25 percent or less urban land. For example, diazinon was detected at only 2 of 15 stream or river sites with less than 7 percent urban land. Diazinon was not detected in predominantly agricultural streams at concentrations at or above 0.05 µg/L.
In contrast to agricultural areas, where pesticide occurrence is linked to seasonal application periods, detec-

10 Water Quality in the Upper Illinois River Basin
tions of diazinon did not vary season-ally at the urban sites because it is used throughout the year. For example, 17 of 43 samples (40 percent) collected at Salt Creek at Western Springs (which drains nearly 80 percent urban land) from March 1999 through August 2001 contained diazinon at or above 0.05 µg/L, and concentrations in 14 percent of samples exceeded the Great Lakes water-quality criterion (0.08 µg/L) for protection of aquatic life (International Joint Commission, 1999). Similarly, 7 of 31 samples (22 percent) collected at Des Plaines River at Riverside (which drains nearly 50 percent urban land) contained detectable concentrations of diazinon, and concentrations in 19 percent of the samples exceeded the criterion.
Volatile organic compounds were detected in Salt Creek
Volatile organic compounds (VOCs) were commonly detected in the urbanized Salt Creek at Western Springs. For example, trichloromethane (chloroform) was detected in all 18 samples collected over a 12-month period, and bromodichloromethane and chlorodibromomethane were both detected in more than 75 per-cent of samples. These three com-pounds are trihalomethanes (THMs), which are created when chlorinated water reacts with naturally occur-ring dissolved organic matter. The compounds 1,4-dichlorobenzene (or paradichlorobenzene, used in mothballs as an insecti-cide) and tetrachloroethylene (or perchloroethylene, a commonly used dry-cleaning solvent) also were detected in more than 75 percent of the samples. Methyl tert-butyl ether (MTBE) was detected in 65 percent of the samples. MTBE, an oxidizing agent, is used in less than 20 percent of gasoline in the Chicago area where reformulated gasoline use is required by USEPA for minimizing air pollution. MTBE, as with VOCs, is easily transported in the atmosphere and deposited with rain or as a gas on land and streams, often at great distances from its original source.
The concentrations of VOCs detected in Salt Creek were low, well below USEPA water-quality standards and guidelines. Multiple VOCs were detected in each sample—from a mini-mum of 4 compounds to a maximum of 16; the average number of compounds detected in a single sample was 9. Standards and guidelines are determined for individual compounds, and the toxic synergistic effects of mixtures of VOCs are not well understood.
Lake sediment reflects urbanization
The chemical composition of the sediment at the bottom of Lake in the Hills has changed along with the sur-rounding landscape. The village of Lake in the Hills, in McHenry County, Ill., experienced a population and develop-ment boom in the early 1990s. Between 1970 and 1993, the area of developed land (urban, mostly residential) in the watershed increased from 14 to 21 per-cent (Vogelmann and others, 2001). By 1999, 57 percent of the watershed was developed (fig. 9).
Increased concentrations of several contaminants (sodium, lead, and PAHs) in the lake bed sediments illustrate the correlation between urbanization of
the Lake in the Hills watershed and the change in sediment chemistry. The sodium concentration in the sediment rose sharply in the 1990s. This rise coincides with the intensive period of housing and road development in the watershed. Sodium in surface water can result from natural sources and as well as from human activity. Sodium from the salt applied to roads in the winter eventually is carried into the lake, but the relatively high sodium deep in the lake sediments is likely related to the geologic material underlying the lake.
SO
DIU
M, I
N P
AR
TS
PE
R M
ILL
ION
DATE OF SEDIMENT
LE
AD
, IN
PA
RT
S P
ER
MIL
LIO
NTO
TAL
PO
LYC
YC
LIC
AR
OM
AT
IC H
YD
RO
-C
AR
BO
NS
, IN
PA
RT
S P
ER
BIL
LIO
N
5,000
4,000
3,000
2,00055
25
45
35
1940 1960 1980 2000
14,000
12,000
10,000
8,000
6,000
4,000
2,000
0
Figure 10. Sediment from the bottom of Lake in the Hills has recorded the history of polycyclic aromatic hydrocarbons, sodium, and lead deposition in the water-shed. These contaminants are associated with urban development.
Figure 9. The Lake in the Hills watershed underwent intense urban development during the 1990s.

Major Findings 11
Nationwide, some of the highest levels of polycyclic aromatic hydrocarbons were detected in sediment near Chicago
PAHs enter the atmosphere through incomplete combustion of hydrocarbon fuels and other organic material (Kay and others, 2003). As automotive traffic in an area increases, so does the con-centration of PAHs in the atmosphere. The PAHs settle out of the atmosphere onto the lake or the ground, where they can be carried into the lake by overland runoff, especially from streets and park-ing lots. The concentration of PAHs in the lake sediment began to rise gradually in the early 1990s, then sharply in the late 1990s (fig. 10).
Other contaminants in the bot-tom sediments of Lake in the Hills that trace the history of manmade pollution are lead, PCBs, and DDT. The lead
concentration in the sediment increased steadily from 1940 to the mid-1970s, then declined. The use of lead in gaso-line was phased out in the United States from 1975 to 1986. The decrease in lead concentration in the bottom sedi-ment occurred after the phaseout began. Nationally, the percentage of children aged 1–5 years with blood levels of lead exceeding the Centers for Dis-ease Control recommended level of 10 micrograms per deciliter dropped from 4.4 percent in 1991–94 to 2.2 percent in 1999–2000 (National Center for Envi-ronmental Health, 2003), also reflecting the phaseout of lead.
The total concentration of PCBs in the sediment of Lake in the Hills
(not shown in fig. 10) increased from the late 1950s through the mid-1970s then declined until 1990. Nationally, the production of PCBs was discontinued in 1979. After 1990, the concentration of PCBs in the lake sediment began to increase. Several processes could have contributed to this increase, but the information available is insufficient to determine the cause.
The DDT concentration in the bot-tom sediment of Lake in the Hills (not shown in fig. 10) rose steadily through the 1950s and 1960s. Use of DDT was discontinued in 1972; consequently, the concentration in the sediment declined from 1970 to the late 1990s.
Polycyclic aromatic hydro-carbons (PAHs) are formed by the incomplete combustion of hydro-carbons—coal, oil, gasoline, and wood—and can result from many urban sources including fires, indus-trial and powerplant emissions, home heating, and automobile and other vehicle emissions. PAHs are toxic to aquatic life, and several are suspected carcinogens, causing tumors in fish and other animals (Eisler, 1987).
PAHs were measured in bed sediment by the NAWQA Program at 1,023 stream sites across the Nation. One or more PAHs were detected at 80 percent of all sites. Total PAH con-centrations, defined as the sum of con-centrations of 16 PAH compounds, are displayed on the national maps at right. Concentrations of specific PAHs were compared with the respec-tive Probable Effect Level (PEL) established by the Canadian Council of Ministers of the Environment (2001); this sediment-quality guide-line defines a concentration above which adverse effects on aquatic life are frequently anticipated. Canadian
guidelines are available for only 12 of the 16 PAHs analyzed. No equivalent U.S. guidelines are established. At 169 streams across the Nation, at least one PEL was exceeded.
Concentrations of total PAHs in sediment at sites in the upper Illinois River Basin were among the highest 25 percent of all sites sampled nation-ally by the NAWQA Program. At Salt Creek at Western Springs and Des Plaines River at Riverside, concentra-tions of total PAHs were among the highest 5 percent in the country, and various individual PAHs at each site exceeded their respective PEL. At Salt Creek at Western Springs (urban land use), 8 of 12 PAHs exceeded guidelines, and 10 of 12 PAH guide-lines were exceeded at Des Plaines River at Riverside (mixed urban and agricultural land use). Sugar Creek at Milford (draining greater than 90 percent agricultural land use) had the lowest concentration of total PAHs in sediment of all upper Illinois River Basin sites, and it ranked in the second-highest 55 percent (middle category) in the country.

12 Water Quality in the Upper Illinois River Basin
Biological conditions are adversely affected in urbanizing areas
NAWQA findings showed that ben-thic-invertebrate communities changed as watersheds became increasingly urbanized (see “Urban land-use study covers multiple watersheds in the Des Plaines and Fox River Basins” on page 14). For example, the number of ben-thic-invertebrate taxa sensitive to pollu-tion, such as mayflies (Ephemeroptera), stoneflies (Plecoptera), and caddisflies (Trichoptera) (also referred to as “EPT taxa”), and total invertebrate taxa decreased as the percentage of urban land within a watershed increased (fig. 11 and graphs in “Stream quality degrades as urbanization increases in four major metropolitan areas” on page 15). The decrease in numbers and proportions of sensitive species was especially pronounced in water-sheds with as little as 15 percent urban land (fig. 11 and graphs on page 15). Similarly, the number and proportion of insensitive species, such as aquatic worms and snails, increased with
increasing amounts of urban land. The greatest diversity of invertebrate taxa (generally an indicator of a healthy ecosystem) was found in the least urban-ized streams (those draining less than 4 percent urban land), including Boone Creek, with 48 different taxa; Somonauk Creek with 45 taxa; and Little Rock Creek, with 41 taxa. Similarly, the most EPT taxa (as many as 16 taxa) were found at Blackberry Creek, Little Rock Creek, and Jackson Creek, all of which drain less than 4 percent urban land.
Fish communities also changed as watersheds became more urban-ized, as indicated by the revised Illinois Index of Biotic Integrity (IBI) scores (fig. 12) (Roy Smogor, Illinois Envi-ronmental Protection Agency, written commun., 2003). Sites with less than 25 percent urban land had higher average IBI scores and more fish species than sites with greater than 25 percent urban land (table 2). The highest revised IBI scores were calculated for Indian Creek, which drains less than 1 percent urban land (score of 57); Big Rock Creek, which drains less than 1 percent urban land (score of 52); Genesee Creek, which drains about 7 percent urban land (score of 52); and Ferson Creek, which drains about 17 percent urban land (score of 51). Sensitive species, such as rosyface shiners and banded darters, were found only at sites with less than 25 percent urban land. Non-native species were more common in streams draining watersheds with large amounts of urban land use. Aside from the widespread common carp, various other nonnative species were identi-fied during fish sampling. Specifically, the oriental weatherfish was found in Midlothian Creek (72 percent of the watershed in urban land), and the western mosquitofish and goldfish were
Figure 12. Index of Biotic Integrity scores were highest for streams draining the least urban land. Watersheds with greater than about 25 percent urban land had the lowest biotic integrity scores.
0
10
20
30
40
60
50
0 20 40 60 80 100
IND
EX
OF
BIO
TIC
INT
EG
RIT
Y
PERCENTAGE OF URBAN LAND
found in the Skokie River (60 percent of the watershed in urban land).
Organochlorine-pesticide and PAH concentrations were elevated in urban-stream sediment and fish
Streambed-sediment concentrations of total DDT, PAHs, and PCBs were generally related to urban sources in the Chicago metropolitan area. In Salt Creek at Western Springs, concentrations of DDD and DDT in sediment were high, in the top 3 percent of concentrations for all NAWQA samples nationally. Concentrations of total DDT in whole common carp increased with percentage of urban land in the stream basins. Total DDT in whole-body common carp from the Des Plaines at Riverside, Salt Creek at Western Springs, and Illinois River at Marseilles were in the top 5 percent of all national NAWQA samples, and among NAWQA studies nationwide, Salt Creek had the highest fish-tissue concentration of DDT in urban streams. The highest concentrations of PAHs in the upper Illinois River Basin were in samples from the Chicago area. At the highly urbanized Salt Creek at Western Springs, one PAH—fluoranthene—was detected at 3,100 micrograms per kilo-gram (µg/kg) in the sediments. At the predominantly urban Des Plaines River at Riverside, 2,400 µg/kg fluoranthene
Table 2. Fish species and Index of Biotic Integrity reflect land use in the watershed. Numbers of species and sensitive spe-cies decreased with increased urban land.
Urban area in watershed
Mean values for 44 sampled streams
Number of native fish
species
Number of sensitive species
Index of Biotic Integrity
25 percent or less 17 2.7 40.2
Greater than 25 percent
9.6 0.7 19.2
Figure 11. Number of invertebrate taxa decreased with increased urban land.
PERCENTAGE OF URBAN LAND
NU
MB
ER
OF
INV
ER
TE
BR
AT
E T
AX
A
Trend line
60
50
40
30
20
100 20 40 60 80 100

Major Findings 13
Mercury is emitted to the envi-ronment by natural sources, such as volcanoes and geologic springs, and human-related activities, primarily coal combustion, waste incinera-tion, industrial uses, and mining. Inorganic mercury (the form emit-ted to the environment) is generally not a health concern—it is poorly absorbed by the digestive tract. The real issue is methylmercury—an organic form that is highly toxic to the nervous system. Methylmercury is produced from inorganic mercury by methylation, a microbial process controlled by certain bacteria and enhanced by chemical and environ-mental variables such as the pres-ence of organic matter and oxygen. Methylmercury levels increase up the food web and typically are most concentrated in the muscle tissue of predatory fish, such as largemouth bass and walleye.
USGS is examining mercury concentrations in streambed sediment, water, and fish tissue in relation to sources of mercury in three basins across the Nation (Brigham and oth-ers, 2003). Findings from one of the first national assessments by NAWQA (Krabbenhoft and others, 1999) showed that the amount of wetlands in a watershed was the most important factor in methylmercury production; however, methylmercury concentra-tions in sediment also were related to total mercury concentrations, water
pH, and sediment organic carbon and sulfate concentrations.
Five streams in the upper Illinois River Basin were sampled in 1998 as part of a national assessment of mer-cury by the USGS. Methylmercury concentrations in fillets of predator fish from the five streams ranged from 70 to 170 µg/kg (Brumbaugh and oth-ers, 2001) and so were below the U.S. Environmental Protection Agency (2002) human consumption guideline of 300 µg/kg wet weight; all mercury concentrations in sediment also were below current guidelines. Consis-tent with national findings from the study, the site with the highest density of wetlands (Des Plaines River at Russell) had the highest concentra-tions of methylmercury in sediment and fish tissue. In comparison, a site that drained mostly urban land and no wetland (Salt Creek at Western Springs) had the highest total mercury concentration in sediment but much lower methylmercury concentrations
in sediment and fish. Sediment from the Des Plaines River at Russell and Salt Creek at Western Springs con-tained 3.6 and 1.1 µg/kg methylmer-cury, respectively, and these values were higher than the national median concentration of 0.62 µg/kg. Addi-tional sites were sampled in 1998 as part of other NAWQA studies, and sediment mercury concentrations were elevated at two sites: the Des Plaines River at Riverside, which drains predominantly urban land, and the Illinois River at Ottawa, which
drains an area of mixed land use. Total mercury concentrations in sedi-ment at these two sites exceeded the 2001 Canadian freshwater sediment-quality guidelines for probable effects on benthic communities (Canadian Council of Ministers of the Environ-ment, 2001).
Mercury is not a new issue for water-resource managers in the upper Illinois River Basin. For example, Illi-nois, Indiana, Michigan, and Wiscon-sin each have some form of statewide methylmercury fish-consumption advisory. Water bodies in the basin that have more restrictive consump-tion advice (generally to limit to one meal per month) for some fish species (largemouth, smallmouth, and white bass) are the Chicago River (includ-ing North and South Branches, North Shore Channel, Chicago Sanitary and Ship Canal), Lake Calumet, Lake in the Hills, Midlothian Reservoir, and the Kankakee River.
was detected in the sediment. Concen-trations of total PCBs in whole fish from the Illinois River decreased with dis-tance downstream from Chicago. Total PCB concentrations in whole common carp ranged from a high of 4,400 µg/kg at the Illinois River at Marseilles, Ill.
(about 7 miles upstream from Ottawa) to a low of 190 µg/kg at the Illinois River at Hardin, Ill., about 20 miles upstream from the Mississippi River (about 280 river miles downstream from Chicago).
Mercury in fish is a national concern
14 Water Quality in the Upper Illinois River Basin
Contaminants in sediments present risks to aquatic life in and near the Illinois River
Streambed sediment samples and fish collected from 28 to 30 river sites during 1996 to 1999 in the Illinois River Basin (upper and lower) were analyzed for trace elements and synthetic organic compounds. At a subset of 15 sites, fish and benthic invertebrates were collected to determine species and abundance.
The ecological risk to aquatic biota from chemicals in sediment in the Illinois River Basin was estimated by comparison to consensus-based guide-
lines, Canadian guidelines, and other benchmarks for probable toxic effects on aquatic life (MacDonald and oth-ers, 2000; Ingersoll and others, 2001; Canadian Council of Ministers of the Environment, 2001). Comparisons to these guidelines for trace elements may be overprotective because sediment concentrations in the NAWQA study were determined for the fine fraction (<0.063 mm), whereas guidelines were based on concentrations for the bulk fraction (>2 mm). Canadian guide-lines for arsenic were exceeded at the Kankakee River and its tributary, Pitner Ditch; however, the larger consen-sus-based guidelines for arsenic were
exceeded only at Pitner Ditch. Con-sensus-based and Canadian guidelines for trace elements and (or) synthetic organic compounds were exceeded at five sites in the Chicago area. Consen-sus-based guidelines for probable toxic effects from multiple chemicals (metals, total PAHs, total PCBs, and sum-DDE) were exceeded at Salt Creek at Western Springs, Des Plaines River at Riverside, and the Illinois River at Ottawa.
Total DDT in whole fish from Salt Creek at Western Springs, Des Plaines River at Riverside, and Illinois River at Marseilles exceeded New York State guidelines for protection of fish-eating wildlife from mortality, reproductive impairment, and organ damage (Newell and others, 1987). Concentrations of total PCBs in whole fish from all sites on the Illinois River and on 10 tributar-ies exceeded these guidelines. Dieldrin concentrations in whole fish from eight sites, all with predominantly agricultural land use, also exceeded the guidelines (B.C. Scudder, U.S. Geological Survey, written commun., 2003).
The toxicity of contaminants in sediments may be adversely affecting benthic invertebrates at some sites in the Illinois River Basin. Elevated concentra-tions of chromium, copper, and nickel in sediment correlated with more degraded invertebrate assemblages, based on a Family Biotic Index for invertebrates (Hilsenhoff, 1988). Although a simi-lar relation was not seen for fish, high concentrations of several chemicals may have contributed to the poor-quality fish assemblage at the Des Plaines River at Riverside.
NAWQA findings for sediment and fish collected from the Illinois River Basin were used to develop probability-based models for predicting ecological risk for fish across the basin. Without such models, predicting risk would require much more data than were col-lected in this broad region. One model simulation indicated that cadmium is adversely affecting fish survival or reproduction over the Illinois River Basin. Other model simulations indi-cated a greater than 50-percent certainty that the threshold concentrations for toxic effects from chromium, nickel,
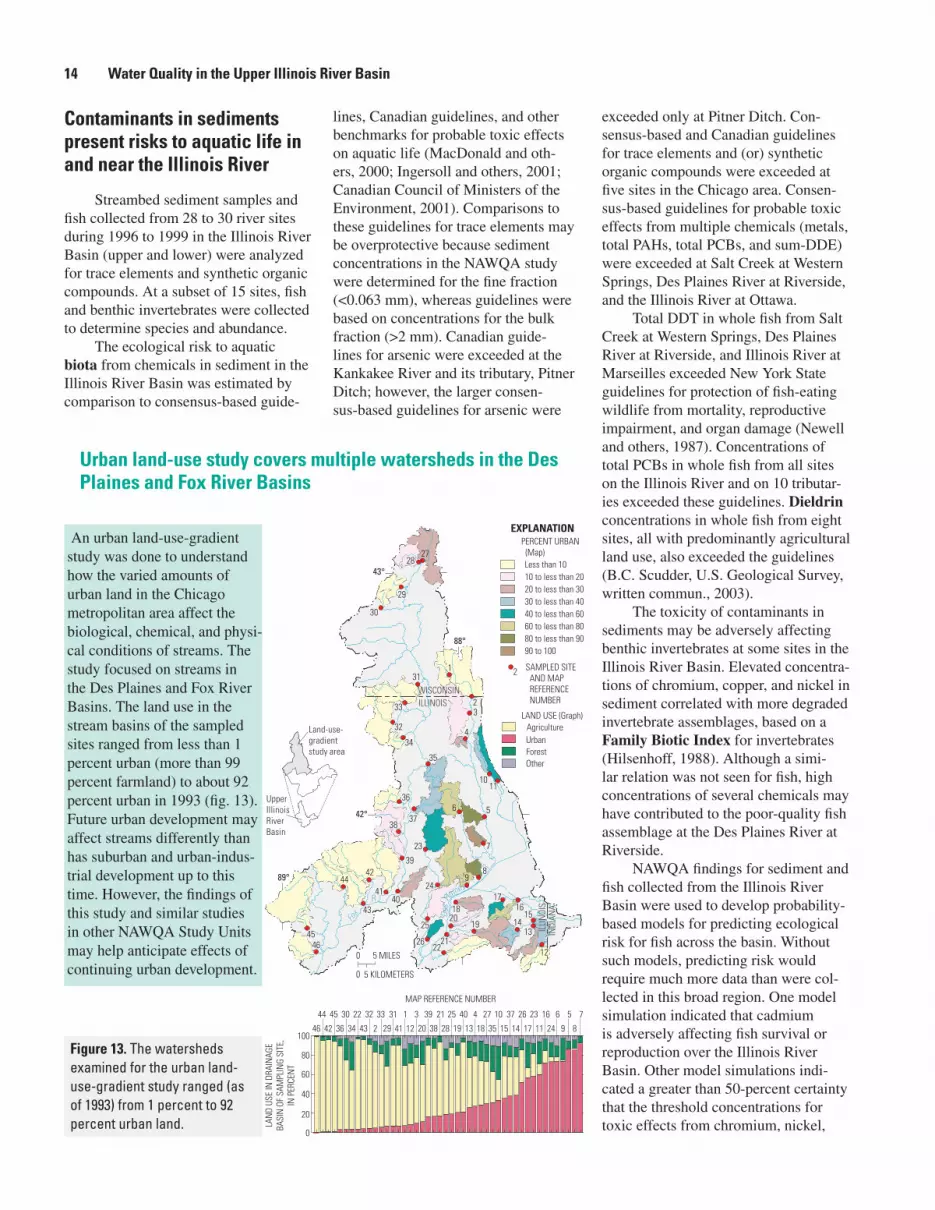
An urban land-use-gradient study was done to understand how the varied amounts of urban land in the Chicago metropolitan area affect the biological, chemical, and physi-cal conditions of streams. The study focused on streams in the Des Plaines and Fox River Basins. The land use in the stream basins of the sampled sites ranged from less than 1 percent urban (more than 99 percent farmland) to about 92 percent urban in 1993 (fig. 13). Future urban development may affect streams differently than has suburban and urban-indus-trial development up to this time. However, the findings of this study and similar studies in other NAWQA Study Units may help anticipate effects of continuing urban development.
Figure 13. The watersheds examined for the urban land-use-gradient study ranged (as of 1993) from 1 percent to 92 percent urban land.
Urban land-use study covers multiple watersheds in the Des Plaines and Fox River Basins

Major Findings 15
Urbanization can degrade water quality and affect sensi-tive aquatic life, according to a comparison of NAWQA findings among studies in the major metropolitan areas of Boston (New England Coastal Basins), Philadelphia (Delaware River Basin), Dayton and Cincinnati (Great and Little Miami River Basins), and Chicago (upper Illinois River Basin). These studies, which compared conditions among streams in watersheds ranging from minimally to highly urbanized, showed declines in indica-tors of biological-community health—and increases in chemical indicators of human activity—with increases in percentage of urban land. For example, the number of benthic invertebrate species sensitive to pollution, such as the “EPT taxa” (may-flies [Ephemeroptera], stoneflies [Plecoptera], and caddisflies [Trichoptera]), generally decreased with increasing urban-land percentage in all four metropolitan areas. The declines in EPT taxa were steepest from 0 to about 20 percent urban land, and with the exception of Dayton/Cincinnati, the decline contin-ues with increased urbanization. The anomalous pattern in the Dayton/Cincinnati area may be associated, in part, with effects of high percentages of agricultural land in some of its less urbanized watersheds, as well as the absence of study sites with much more than 50 percent urban land.
Over space and time, invertebrate communities integrate the effects of many factors, including chemical changes, physi-cal habitat alterations, and changes in types of food available to invertebrate consumers. Among the chemical changes noted with increasing urban land in the metropolitan areas studied were increased chloride concentrations and increased potential pesticide toxicity to benthic invertebrates. Chloride sources include municipal and industrial discharges, septic systems, and road-salt runoff. Other organic and inorganic chemicals may be associated with chloride from these sources. The potential toxicity of the mixture of pesticides detected in stream water increased with increasing urban land percentage, according to the Pesticide Toxicity Index (a measure for ranking sites based on summed concentrations of detected pesticides and the toxicity of each pesticide to benthic invertebrates [Munn and Gilliom, 2001]). The increase was especially pronounced at relatively low percentages of urban land. Contributing fac-tors may include the amount, relative toxicity, and timing of pesticides—particularly insecticides—that are applied in urban settings.
Patterns of nitrate concentration with increasing urban land were not consistent among the four metropolitan areas. In fact, the only clear increase in nitrate concentrations with urbanization was in the Boston area. This is, in part, because nutrients in Boston-area streams are associated primarily with urban sources and are not affected by additional sources, such as fertilizers applied on agricultural land. Moreover, watersheds with minimal urban land in the Boston area are mainly forested, and nitrate concentrations in those streams were low (less than
0.1 mg/L). In contrast, nitrate concentrations in streams decreased with increasing urbanization in the Dayton/Cincinnati area and in minimally to moderately urban settings of the Chicago area, whereas in the Philadelphia area they neither increased nor decreased; fertilizers applied to crops contribute to the higher nitrate concentrations in some less urbanized watersheds in these settings. Sewage may be a factor contributing to the high nutrient concentrations in some highly urban Chicago streams.
In summary, biological and chemical characteristics in streams respond to increases in urban land in their respective water-sheds. The responses may differ in pattern and in rate, however, so approaches for monitoring the effects of urbanization on streams may need to be tailored to specific metropolitan areas. Findings of these NAWQA studies may help in developing and prioritizing optimal management strategies for a particular setting.
Stream quality degrades as urbanization increases in four major metropolitan areas
Selected examples of biological and chemical indicators, in relation to urbanization. Smoothed lines are shown in plots for which Spearman rank correlations were statistically signifi-cant at a probability value of less than 0.05.

16 Water Quality in the Upper Illinois River Basin
some individual PAHs, and DDT com-pounds would be exceeded in sediment across the basin in areas where samples were not collected.
VOCs, pesticides, and nitrate were detected in shallow ground water underlying urban land
A mixture of synthetic chemicals, including VOCs, pesticides, and nitrate, was detected in water in shallow glacial aquifers underlying urban areas in northeastern Illinois and southeastern Wisconsin. Specifically, VOCs were detected in nearly 75 percent of samples collected from 26 monitoring wells and 17 domestic-supply wells. Fifteen of 65 measured VOCs were detected at least once, and the most commonly detected compound—trichloromethane (chloroform)—was present in nearly 25 percent of the wells at or above a common reporting level of 0.05 µg/L. Trichloromethane is a THM compound. Trichloromethane in these wells could result either from treating a domestic-supply well with chlorine bleach to kill bacteria or (in monitoring wells that are not treated) from lawn watering with chlorinated water supplied by a local water utility. Other VOCs that were detected have natural and manmade sources.
Similarly, pesticides and their breakdown products were detected in about 75 percent of the wells at or above the detection limit. Twenty-nine compounds were detected of the 83 pesticides and related compounds that were analyzed, and the most commonly detected compound—deethylatrazine, a breakdown product of atrazine—was detected in 45 percent of the wells at or above a common reporting level of 0.05 µg/L. The herbicide atrazine (commonly used to control weeds on lawns, gardens, parks, and golf courses in residential areas) and its breakdown products deethylatrazine, deethyl-deisopropylatrazine, deiso-propylatrazine, and hydroxyatrazine accounted for almost half of the pesti-cide detections at or above a common
reporting level of 0.05 µg/L. Nitrate also was common in urban wells and was detected above a naturally occurring (or “background”) concentration of 2 mg/L (Mueller and Helsel, 1996) in 30 percent of the wells.
Although VOCs or pesticides were present at or above the detection limit in samples from 90 percent of the wells, concentrations of individual contami-nants generally were low. In comparison to similar NAWQA studies of shallow ground water in urban areas nationwide, detections of VOCs in samples from these upper Illinois River Basin wells were relatively few. Concentrations did not exceed any USEPA drinking-water standards or guidelines for VOCs or pes-ticides. With the exception of MTBE, all VOC concentrations were at or below 0.2 µg/L. With the exception of the pes-ticide MCPA (a herbicide used to control annual weeds), all pesticide detections were about 100 times lower than the relevant standard or guideline. Concen-trations of nitrate exceeded the USEPA Maximum Contaminant Level (MCL) drinking-water standard of 10 mg/L in only one well. No standards have been established for many of the VOC and pesticide compounds and their break-down products, however, and current standards do not yet account for expo-sure to mixtures of these compounds.
Recharge to the ground-water system decreases with urbanization
The likelihood that water will move downward from the land surface and reach the ground-water system is referred to as “recharge potential.” Many factors can affect recharge, including land use, soil permeability, type and thickness of surficial depos-its, and bedrock geology. For example, recharge is less likely in settings where relatively impermeable soils overlie glacial till deposits than in settings where permeable soils and sandy glacial deposits allow rapid influx and vertical movement of water. Similarly, recharge in urban areas with many impervious surfaces, such as roofs, roads, and park-ing lots, is less likely than in unpaved settings.
Potential recharge was mod-eled in the upper Illinois River Basin by incorporating changing land use over time (1970 to 1990) with spatial information on geology, soils, and other natural features (Arnold and Friedel, 2000). The model ranked potential recharge in different areas of the basin relative to other areas; actual recharge was not measured. Model simulations showed that as the amount of urban
Figure 14. Potential recharge to aquifers varies with the type of land use (1990), soils, and geology.

Major Findings 17
land in the basin increased from 14 to 17 percent between 1970 and 1990, the overall recharge potential decreased. In addition, the simulations indicated that recharge potential of aquifers decreased when cultivated land, forest, orchard, or open space (less than 1 percent of the total area) was developed for residential use. Recharge potential increased when new residential land use replaced land use with a lower potential for infiltra-tion, such as barren land (about 0.02 percent of the upper Illinois River Basin area).
The model simulations indicated that recharge potential varies geographi-cally because of a combination of land use and natural features. For example, recharge potential is relatively high in the Kankakee River Basin and in areas of the upper Fox River Basin where agricultural land with moderate to high soil permeability overlies thin (less than 100 feet) sand and gravel deposits and carbonate bedrock (fig. 14). Recharge potential is moderately low in the Chicago River Basin in areas where urban land with low soil permeability overlies thin (less than 100 feet thick) clay deposits and carbonate bedrock. Recharge potential also is low in the southwestern part of the Iroquois River Basin, where agricultural land with low soil permeability overlies thick (greater than 100 feet thick) clay deposits and shale bedrock; and in the northern Des Plaines River Basin, where soil with low permeability overlies thick clay deposits and carbonate bedrock in urban land areas.
Changes in recharge and recharge potential can be related directly to man-agement of water supplies, in terms of both quantity and quality. For example, increasing urban land use may decrease the amount of recharge and affect ground-water supplies, particularly dur-ing sustained dry periods and droughts (Otto and others, 2002). In addition, ground water in areas of high recharge potential generally has high potential for contamination from chemicals, such as pesticides, that are applied on the land surface.
Extensive agriculture affects streams and ground water
About 75 percent of the upper Illi-nois River Basin is used for agriculture, primarily to grow corn and soybeans. Applications of fertilizers and pesticides, plus artificial drainage, have contributed to elevated concentrations of nitrate, total nitrogen, and herbicides in streams and ground water, and of organochlorine pesticides in bed sediments.
Nitrate and total nitrogen are elevated in agricultural streams
Among 109 streams sampled during 1999–2001 for the NAWQA Program nationwide, the highest flow-weighted mean concentrations of nitrate were at Sugar Creek at Milford (12.3 mg/L) and at Iroquois River near Chebanse (12.3 mg/L). These were the only two streams (of 109 sampled nationally during 1999–2001) at which the flow-weighted mean concentrations exceeded the USEPA MCL of 10 mg/L for nitrate. (For the purposes of this report, the analytical data reported as nitrite plus nitrate as nitrogen are called “nitrate” even though a small amount of nitrite may be present in the sample. Nitrite content usually is insignificant compared to that of nitrate.) The flow-weighted mean concentrations of nitrate were lower at CSSC at Romeoville (5.3 mg/L); however, it ranked sixth nation-wide, and the concentration at Illinois River at Ottawa (5.3 mg/L) ranked sev-enth for nitrate of the 109 national sites.
Total nitrogen concentration is the sum of the concentrations of all forms of nitrogen in unfiltered water samples (reported as nitrogen). Iroquois River at Chebanse (17.5 mg/L) had the high-est flow-weighted mean concentration of total nitrogen for the 109 sites, and Sugar Creek (13.0 mg/L) was the second highest.
Nitrogen varies significantly in agricultural streams because of geology and land- management practices
Natural features (including gla-cial geology, soils, and hydrology) and land-management practices (including drainage) affect nutrients in streams, as indicated by nitrogen concentrations in runoff from two corn and soybean watersheds—the watersheds of the Iroquois River upstream from Chebanse, Ill., and the Kankakee River upstream from Momence, Ill. Specifically, total nitrogen in runoff at Chebanse was high (flow-weighted mean concentration of 17 mg/L)—the highest of any stream or river sampled in the basin. In contrast, the total nitrogen concentration in runoff at Momence was the lowest in the basin (flow-weighted mean concentration of 4.1 mg/L). These findings are consistent with data collected at these sites over the past two decades by the Illinois Envi-ronmental Protection Agency, as well as NAWQA data collected during 1987–90.
Geologic setting and agricultural practices help to explain some of the difference in nitrogen concentration. Specifically, glacial soils and sedi-ment in the Iroquois River Basin are predominantly clay-rich till deposits that are relatively impermeable and poorly drained. A common agricultural practice in this predominantly corn- and soybean-growing area, therefore, is to install subsurface drains (also called tile drains) about 3 to 4 feet into the soil to lower the water table and to help aer-ate the crop root zone. Water is rapidly transported from the root zone to the drains, along with soluble contaminants such as nitrogen and pesticides, then to ditches and streams, and ultimately to the Iroquois River.
In contrast, glacial materials in the Kankakee River Basin generally are sandy, permeable, and well drained, allowing water to move rapidly and vertically into the ground. Subsurface drains are not used to the same extent as in the Iroquois River Basin. Ground-water discharge accounts for a larger component of flow in streams in the

18 Water Quality in the Upper Illinois River Basin
Kankakee River Basin above Momence (Arihood and Basch, 1994) than in the Iroquois River Basin. Interchanges between ground water and surface water are indicated by similar nitrogen concentrations. Specifically, the mean concentration of nitrate in 16 shallow wells in the Kankakee River Basin was 4.0 mg/L, and the flow-weighted mean concentration of nitrate in the Kankakee River at Momence was 4.1 mg/L. Nitrogen concentrations in ground-water discharge and in receiving streams in the Kankakee Basin are relatively low because of chemical transformations and relatively slow movement along ground-water flowpaths (compared to flow in subsurface drains and streams) and dilution.
Herbicides are common in agricultural streams and in ground water
Herbicides, which are used to control weeds on corn and soybean fields, were detected more often and at higher concentrations in streams and rivers in the upper Illinois River Basin than in ground water. For example, atrazine—the most heavily used her-bicide in Illinois and Indiana, and the most commonly detected pesticide in surface and ground water—was detected in every sample from streams and rivers draining agricultural or mixed-land-use watersheds at or above a common reporting level of 0.05 µg/L (fig. 15). Further, concentrations exceeded the USEPA drinking-water standard (3 µg/L) in 22 percent of samples from Sugar Creek at Milford. In contrast, atrazine was detected (at or above 0.05 µg/L) in only 4 percent of samples collected from 52 wells in a nearby agricultural area (Kankakee River Basin), and no sample exceeded the standard. The greatest concentration of atrazine detected in sur-face water was 23 µg/L in Sugar Creek at Milford in May 2000. The greatest concentration of atrazine detected in ground water (0.35 µg/L) was from a monitoring well in the Kankakee River Basin sampled in July 1999. Acetochlor was detected in 45 percent of samples
from Sugar Creek but was not detected in ground water.
Compared to streams, ground water had many fewer detections of the most commonly detected compounds, such as atrazine, metolachlor, and acetochlor (fig. 15). Compounds that were detected in Sugar Creek but not in nearby ground water included simazine, prometon, metribuzin, and acetochlor. At least one compound was detected in all samples from Sugar Creek at Milford, and seven compounds were detected in four samples. In many ground-water samples (35 percent), however, no pesticide or related compound was detected.
Breakdown products of commonly applied herbicides such as metolachlor, alachlor, acetochlor, and atrazine were
detected more often and at higher con-centrations than the original pesticide in ground water (fig. 16). For example, breakdown products were detected in 60 percent of the ground-water sam-ples, whereas original pesticides were detected in only 17 percent. The detec-tion frequency of deethyldeisopropyl atrazine and hydroxyatrazine were simi-lar to those for the original compound, atrazine, but their concentrations gener-ally were greater than that of atrazine. Metolachlor ethane sulfonic acid (ESA), the most commonly detected breakdown product in ground water, was detected in 40 percent of the samples. Concentra-tions of metolachlor breakdown prod-ucts (including metolachlor ESA and metolachlor oxanilic acid) were substan-
Figure 16. Breakdown products of pesticides were detected more often in ground water than the original pesti-cide. Acetochlor was not detected in ground water, but its breakdown products were. Detections were equal to or greater than 0.05 microgram per liter. (ESA, ethane sulfonic acid; OA, oxanilic acid)
FREQUENCY OF DETECTION, IN PERCENT
not detectedAcetochlorAcetochlor ESA
Acetochlor OA
Metolachlor OA
Metolachlor ESAMetolachlor
AlachlorAlachlor ESA
Alachlor OA
AtrazineDeethyldeisopropyl atrazine
Deisopropyl atrazine
Hydroxyatrazine
Deisopropyl atrazine
Deethylhydroxyatrazine
Deisopropylhydroxyatrazine
0 10 20 30 40
Figure 15. Herbicides are the most heavily applied pesticides and were detected (equal to or greater than 0.05 microgram per liter) in streams and rivers and ground-water samples. [Note different scales in the graphs.]
FREQUENCY OF DETECTION, IN PERCENT
MIXED LAND-USE WATERSHEDS
EXPLANATION
STREAMS ANDRIVERSWELLS
10 8 6 4 2 0 0 20 40 60 80 100
Atrazine
Metolachlor
Acetochlor
Cyanazine
Prometon
Metribuzin
Simazine
Alachlor
Diazinon
Imazaquin
Bentazon
Bromacil
URBAN AREASAGRICULTURAL AREAS
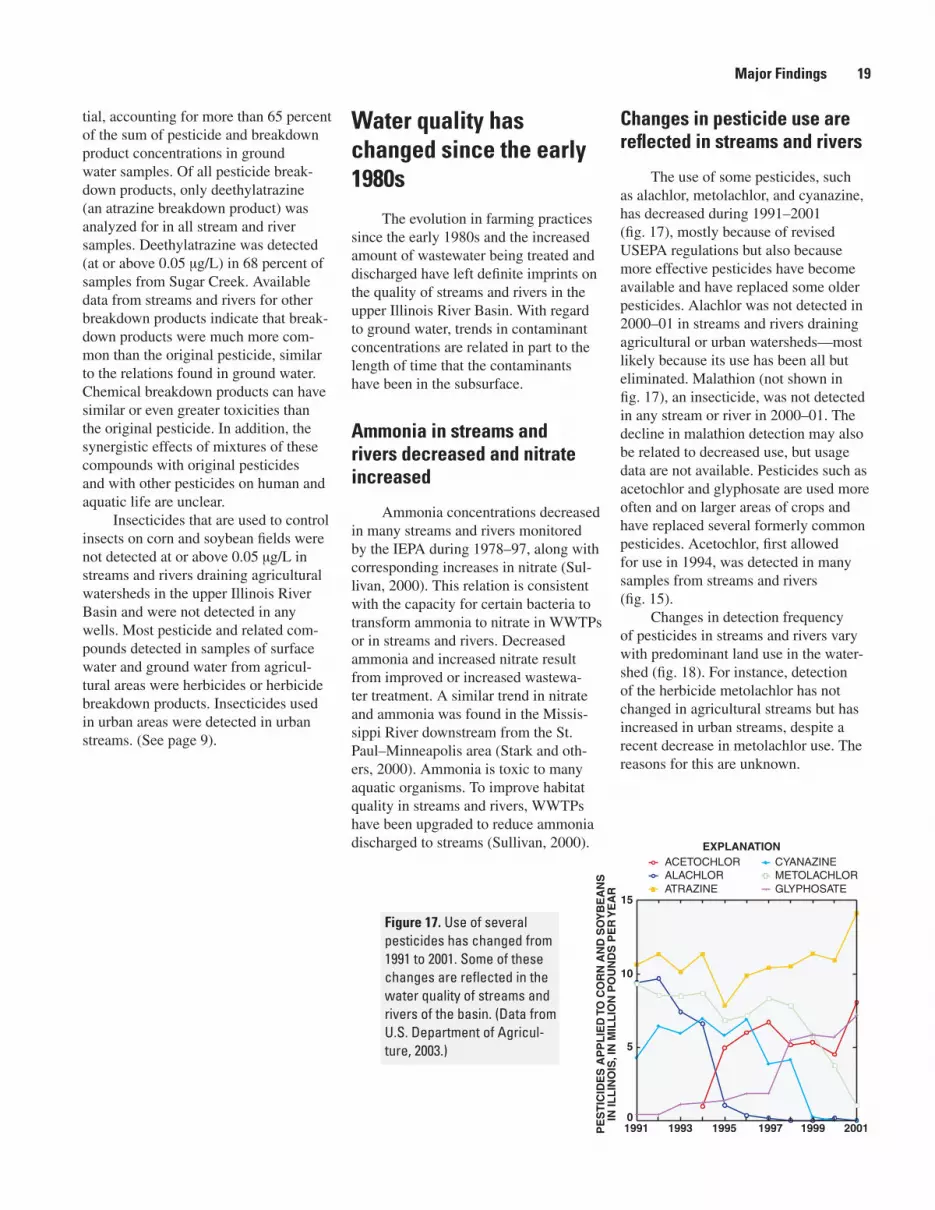
Major Findings 19
tial, accounting for more than 65 percent of the sum of pesticide and breakdown product concentrations in ground water samples. Of all pesticide break-down products, only deethylatrazine (an atrazine breakdown product) was analyzed for in all stream and river samples. Deethylatrazine was detected (at or above 0.05 µg/L) in 68 percent of samples from Sugar Creek. Available data from streams and rivers for other breakdown products indicate that break-down products were much more com-mon than the original pesticide, similar to the relations found in ground water. Chemical breakdown products can have similar or even greater toxicities than the original pesticide. In addition, the synergistic effects of mixtures of these compounds with original pesticides and with other pesticides on human and aquatic life are unclear.
Insecticides that are used to control insects on corn and soybean fields were not detected at or above 0.05 µg/L in streams and rivers draining agricultural watersheds in the upper Illinois River Basin and were not detected in any wells. Most pesticide and related com-pounds detected in samples of surface water and ground water from agricul-tural areas were herbicides or herbicide breakdown products. Insecticides used in urban areas were detected in urban streams. (See page 9).
Water quality has changed since the early 1980s
The evolution in farming practices since the early 1980s and the increased amount of wastewater being treated and discharged have left definite imprints on the quality of streams and rivers in the upper Illinois River Basin. With regard to ground water, trends in contaminant concentrations are related in part to the length of time that the contaminants have been in the subsurface.
Ammonia in streams and rivers decreased and nitrate increased
Ammonia concentrations decreased in many streams and rivers monitored by the IEPA during 1978–97, along with corresponding increases in nitrate (Sul-livan, 2000). This relation is consistent with the capacity for certain bacteria to transform ammonia to nitrate in WWTPs or in streams and rivers. Decreased ammonia and increased nitrate result from improved or increased wastewa-ter treatment. A similar trend in nitrate and ammonia was found in the Missis-sippi River downstream from the St. Paul–Minneapolis area (Stark and oth-ers, 2000). Ammonia is toxic to many aquatic organisms. To improve habitat quality in streams and rivers, WWTPs have been upgraded to reduce ammonia discharged to streams (Sullivan, 2000).
Changes in pesticide use are reflected in streams and rivers
The use of some pesticides, such as alachlor, metolachlor, and cyanazine, has decreased during 1991–2001 (fig. 17), mostly because of revised USEPA regulations but also because more effective pesticides have become available and have replaced some older pesticides. Alachlor was not detected in 2000–01 in streams and rivers draining agricultural or urban watersheds—most likely because its use has been all but eliminated. Malathion (not shown in fig. 17), an insecticide, was not detected in any stream or river in 2000–01. The decline in malathion detection may also be related to decreased use, but usage data are not available. Pesticides such as acetochlor and glyphosate are used more often and on larger areas of crops and have replaced several formerly common pesticides. Acetochlor, first allowed for use in 1994, was detected in many samples from streams and rivers (fig. 15).
Changes in detection frequency of pesticides in streams and rivers vary with predominant land use in the water-shed (fig. 18). For instance, detection of the herbicide metolachlor has not changed in agricultural streams but has increased in urban streams, despite a recent decrease in metolachlor use. The reasons for this are unknown.
Figure 17. Use of several pesticides has changed from 1991 to 2001. Some of these changes are reflected in the water quality of streams and rivers of the basin. (Data from U.S. Department of Agricul-ture, 2003.)
1991 1993 1995 1997 1999 2001
EXPLANATIONACETOCHLORALACHLORATRAZINE
CYANAZINEMETOLACHLORGLYPHOSATE
PE
ST
ICID
ES
AP
PL
IED
TO
CO
RN
AN
D S
OY
BE
AN
SIN
ILL
INO
IS, I
N M
ILL
ION
PO
UN
DS
PE
R Y
EA
R
0
5
10
15

20 Water Quality in the Upper Illinois River Basin
Additional Information
The data collected by NAWQA for this study are only a small part of the store of data for the Chicago Waterway. The Illinois Environmental Protection Agency, the Metropolitan Water Reclama-tion District of Greater Chicago, and other organizations collect large amounts of water-quality and biological data in the Water-way. Recently, the Friends of the Chicago River—a nonprofit group dedicated to improving the Chicago River—wrote a report describing all the sources and types of data that have been col-lected historically and that are being collected currently. More information from these organiza-tions can be found at these URLs: http://www.epa.state.il.us, http://www.mwrdgc.dst.il.us, and http://www.chicagoriver.org.
Ten-year-old shallow ground water has higher pesticide concentrations than more recent ground water
In the Kankakee River Basin, pesticides or breakdown products were detected more than twice as frequently in ground water recharged prior to 1990 (82 percent detection) than in ground water recharged after 1989 (33 percent detection). The highest concentra-tions of atrazine, alachlor, metolachlor, and related breakdown products were detected in samples of water recharged prior to 1990. The Kankakee River Basin is an agricultural area that overlies
some of the sandiest and most perme-able soils in the upper Illinois River Basin.
Age of ground water in the shallow aquifer (less than 100 feet deep) was estimated by means of chlorofluorocar-bon (CFC) concentrations. The term “ground-water age” refers to the time that has elapsed since the water first entered the soil. CFCs (known commer-cially as Freon compounds) have been used for decades in air conditioners and refrigerators. The release of CFCs to the atmosphere and their incorporation into the water cycle have closely followed their production and use; therefore, CFCs have been used to estimate the age of ground water that was recharged less than 50 years ago.
Approximately 58 percent of the water samples from the sand aquifer in the Kankakee River Basin have recharge ages from 1990 to 1999. Deeper ground water generally is older—the estimated age of ground water in the Kankakee River Basin is older by about 2 years for every foot of depth below land surface. One way in which chemical condi-tions in the aquifer change over time is through decreasing concentration of dis-solved oxygen. Ground water recharged since 1990 contains concentrations of dissolved oxygen (originally derived from the atmosphere, similar to CFCs) above the detection limit of 1 mg/L; however, ground water older than 1990 generally lacks detectable dissolved oxygen, presumably as a result of micro-biological activity or chemical reactions that consume oxygen.
It is not known whether the lack of dissolved oxygen (less than 1 mg/L) in deeper, older water in the aquifer allows pesticides to persist longer than in younger oxygen-rich water or whether pesticide application rates have declined in recent years and thus recent recharge has smaller concentrations of fewer pesticides; however, either of these possibilities, or both, could explain the fewer detections of pesticides in younger ground water. More detailed information on historical application rates of pesti-cides may help explain this unexpected pattern.
Nitrate contamination, however, tends to decrease with age and depth in the Kankakee River area ground water. Denitrification is a bacterially mediated conversion of nitrate to nitrogen gas (N
2) in ground water where dissolved
oxygen is absent. Deep in the aquifer, nitrate concentrations decline because of denitrification, and ammonia con-centrations increase slightly. Higher ammonia concentrations in samples of ground water older than 1980 and high nitrate concentrations in ground water recharged since 1980 imply that ground water in this area undergoes denitrification in approximately 20 years.
Figure 18. Detections of alachlor in streams declined from 1990 to 2001 in agricultural and urban watersheds. Detections of other pesticides either declined or increased. In general, declines are the result of decreased use of the pesticide. Metribuzin is not used in urban areas and was not detected in urban streams or rivers. (nd, not detected)
FREQUENCY OF DETECTION,IN PERCENT
AtrazineMetolachlorCyanazine
AlachlorMetribuzinSimazinePrometonDiazinon
Malathion0 20 40 60 80 100
AGRICULTURAL LAND USE2000–011990–91
0 20 40 60 80 100FREQUENCY OF DETECTION,
IN PERCENT
URBAN LAND USE
1990–91 2000–01
nd
nd
MetolachlorAtrazine
CyanazineAlachlor
SimazinePrometonDiazinon
Malathion
nd
nd
nd
nd

Study-Unit Design 21
Study-Unit DesignThe upper Illinois River Basin Study-Unit design blends
an assessment of local water-quality issues within a nationally consistent structure that incorporates a multiscale, interdisci-plinary approach to stream and bed sediment chemistry, stream ecology, and ground-water chemistry (Gilliom and others,
1995).
Stream Chemistry and Ecology
The main objective of the stream-chemistry component was to assess the relation of urban or agricultural land use and natural setting—a combination of geology, soils, and physiog-raphy—to chemical constituents in streams and rivers. Stream and river sampling locations were distributed among subbasins and on the Illinois River. Sampled watersheds included those with either mainly agricultural land use, mainly urban land use, and watersheds with substantial influence from multiple land uses. Relatively large watersheds tend to be of mixed land use and include small but substantial forested areas. Sites were sampled at regular intervals for a period of 2–3 years. One
reference site, where land use was relatively undeveloped, was sampled. Ecology sampling focused on the effects of land use and setting on algae, macroinvertebrates, and fish communi-ties. The ecology sampling sites were distributed at or near the stream-chemistry sites. Special study urban-land-use-gradient sites, primarily in the Fox and Des Plaines River Basins, were sampled for chemistry and biota during a 3-week period in August 2000.
Ground-Water Chemistry
One objective of the ground-water chemistry component was to determine whether the chemical constituents of ground water were related to agricultural or urban land uses (land-use surveys). Another objective in two aquifer surveys of domestic (household) wells was to assess the overall water quality in selected drinking-water source aquifers (sand and gravel shal-low aquifers) and to determine whether they are affected by land-use practices.
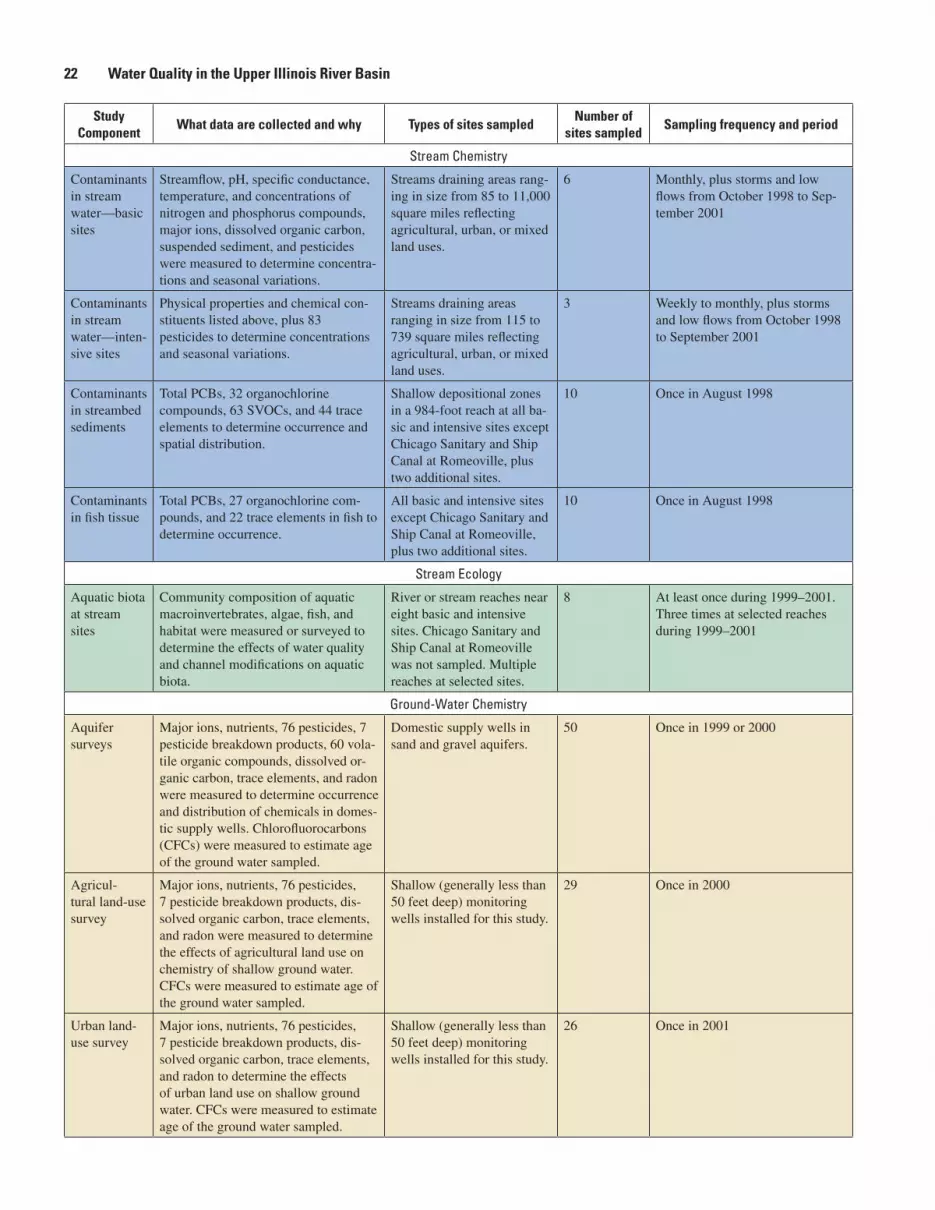
22 Water Quality in the Upper Illinois River Basin
Study Component
What data are collected and why Types of sites sampledNumber of
sites sampledSampling frequency and period
Stream Chemistry
Contaminants in stream water—basic sites
Streamflow, pH, specific conductance, temperature, and concentrations of nitrogen and phosphorus compounds, major ions, dissolved organic carbon, suspended sediment, and pesticides were measured to determine concentra-tions and seasonal variations.
Streams draining areas rang-ing in size from 85 to 11,000 square miles reflecting agricultural, urban, or mixed land uses.
6 Monthly, plus storms and low flows from October 1998 to Sep-tember 2001
Contaminants in stream water—inten-sive sites
Physical properties and chemical con-stituents listed above, plus 83 pesticides to determine concentrations and seasonal variations.
Streams draining areas ranging in size from 115 to 739 square miles reflecting agricultural, urban, or mixed land uses.
3 Weekly to monthly, plus storms and low flows from October 1998 to September 2001
Contaminants in streambed sediments
Total PCBs, 32 organochlorine compounds, 63 SVOCs, and 44 trace elements to determine occurrence and spatial distribution.
Shallow depositional zones in a 984-foot reach at all ba-sic and intensive sites except Chicago Sanitary and Ship Canal at Romeoville, plus two additional sites.
10 Once in August 1998
Contaminants in fish tissue
Total PCBs, 27 organochlorine com-pounds, and 22 trace elements in fish to determine occurrence.
All basic and intensive sites except Chicago Sanitary and Ship Canal at Romeoville, plus two additional sites.
10 Once in August 1998
Stream Ecology
Aquatic biota at stream sites
Community composition of aquatic macroinvertebrates, algae, fish, and habitat were measured or surveyed to determine the effects of water quality and channel modifications on aquatic biota.
River or stream reaches near eight basic and intensive sites. Chicago Sanitary and Ship Canal at Romeoville was not sampled. Multiple reaches at selected sites.
8 At least once during 1999–2001. Three times at selected reaches during 1999–2001
Ground-Water Chemistry
Aquifer surveys
Major ions, nutrients, 76 pesticides, 7 pesticide breakdown products, 60 vola-tile organic compounds, dissolved or-ganic carbon, trace elements, and radon were measured to determine occurrence and distribution of chemicals in domes-tic supply wells. Chlorofluorocarbons (CFCs) were measured to estimate age of the ground water sampled.
Domestic supply wells in sand and gravel aquifers.
50 Once in 1999 or 2000
Agricul-tural land-use survey
Major ions, nutrients, 76 pesticides, 7 pesticide breakdown products, dis-solved organic carbon, trace elements, and radon were measured to determine the effects of agricultural land use on chemistry of shallow ground water. CFCs were measured to estimate age of the ground water sampled.
Shallow (generally less than 50 feet deep) monitoring wells installed for this study.
29 Once in 2000
Urban land-use survey
Major ions, nutrients, 76 pesticides, 7 pesticide breakdown products, dis-solved organic carbon, trace elements, and radon to determine the effects of urban land use on shallow ground water. CFCs were measured to estimate age of the ground water sampled.
Shallow (generally less than 50 feet deep) monitoring wells installed for this study.
26 Once in 2001
References Cited 23
References CitedAbedin, Zainul, Pietz, R.I., and Tata, P., 2002, Annual sum-
mary report, Water quality within the waterways system of the Metropolitan Water Reclamation District of Greater Chi-cago: Metropolitan Water Reclamation District of Greater Chicago Research and Development Department Report 02–14, 93 p. plus appendixes.
Anderson, J.R., Hardy, E.E., and Roach, J.T., 1976, A land use and land cover classification system for use with remote sensor data: U.S. Geological Survey Professional Paper 964, 28 p.
Arihood, L.D., and Basch, M.E., 1994, Geohydrology and simulated ground-water flow in an irrigated area of north-western Indiana: U.S. Geological Survey Water-Resources Investigations Report 92–4046, 38 p.
Arnold, T.L., and Friedel, M.J., 2000, Effects of land use on recharge potential of surficial and shallow bedrock aquifers in the upper Illinois River Basin: U.S. Geological Survey Water-Resources Investigations Report 00–4027, 18 p.
Arnold, T.L., Sullivan, D.J., Harris, M.A., Fitzpatrick, F.A., Scudder, B.C., Ruhl, P.M., Hanchar, D.W., and Stewart, J.S., 1999, Environmental setting of the upper Illinois River Basin and implications for water quality: U.S. Geological Survey Water-Resources Investigations Report 98–4268, 67 p.
Brigham, M.E., Krabbenhoft, D.P., and Hamilton, P.A., 2003, Mercury in stream ecosystems—New studies initiated by the U.S. Geological Survey: U.S. Geological Survey Fact sheet 016–03, 4 p.
Brumbaugh, W.G., Krabbenhoft, D.P., Helsel, D.R., Wiener, J.G., and Echols, K.R., 2001, A national pilot study of mer-cury contamination of aquatic ecosystems along multiple gradients—Bioaccumulation in fish: U.S. Geological Survey Biological Science Report USGS/BRD/BSR–2001–0009, 25 p.
Canadian Council of Ministers of the Environment (CCME), 2001, Canadian sediment quality guidelines for the protec-tion of aquatic life—Summary tables, updated, in Canadian environmental quality guidelines, 1999, updated 2001: Canadian Council of Ministers of the Environment, Winni-peg, Canada,12 p.
Eisler, Ronald, 1987, Polycyclic aromatic hydrocarbon haz-ards to fish, wildlife, and invertebrates—A synoptic review: Laurel, Md., Patuxent Wildlife Research Center, U.S. Fish and Wildlife Service Biological Report 85 (1.11), 81 p.
Friends of the Chicago River, 2002, Monitoring the Chicago River—Assessing a tool for river improvement: Unpub-lished report on file at Friends of the Chicago River, Chi-cago, Ill., 52 p.
Gilliom, R.J., Alley, W.M., and Gurtz, M.E., 1995, Design of the National Water-Quality Assessment Program—Occur-rence and distribution of water-quality conditions: U.S. Geological Survey Circular 1112, 33 p.
Hilsenhoff, W.L., 1988, Rapid field assessment of organic pol-lution with a family-level biotic index: Journal of the North American Benthological Society; v. 7, no. 1, p. 65–68.
Hitt, K.J., 1994, Refining 1970’s land-use data with 1990 population data to indicate new residential development: U.S. Geological Survey Water-Resources Investigations Report 94–4250. 15 p.
Ingersoll, C.G., MacDonald, D.D., Wang, N., Crane, J.L., Field, L.J., Haverland, P.S., Kemble, N.E., Lindskoog, R.A., Severn, C., and Smorong, D.E., 2001, Predictions of sedi-ment toxicity using consensus-based freshwater sediment quality guidelines: Archives of Environmental Contamina-tion and Toxicology, v. 41, p. 8–21.
International Joint Commission,1999, Revised Great Lakes Water Quality Agreement of 1978, as amended by Protocol signed November 18, 1987: International Joint Commission United States and Canada, September,1989.
Kay, R.T., Arnold, T.L, Cannon, W.F., Graham, D., Morton, E., and Bienert, R., 2003, Assessment of concentrations of polynuclear aromatic hydrocarbons and inorganic con-stituents in ambient surface soils, Chicago, Illinois: U.S. Geological Survey Water-Resources Investigations Report 03–4105, 79 p.
Kolpin, D.W., Furlong, E.T., Meyer, M.T., Thurman, E.M., Zaugg, S.D., Barber, L.B., and Buxton, H.T., 2002, Pharma-ceuticals, hormones, and other organic wastewater contami-nants in U.S. streams, 1999–2000—A national reconnais-sance: Environmental Science & Technology, v. 36, no. 6, p. 1202–1211.
Krabbenhoft, D.P., Wiener, J.G., Brumbaugh, W.G., Olson, M.L., DeWild, J.F., and Sabin, T.J., 1999, A national pilot study of mercury contamination of aquatic ecosystems along multiple gradients, in Morganwalp, D.W., and Bux-ton, H.T, eds., U.S. Geological Survey Toxic Substances Hydrology Program—Proceedings of the technical meeting, Charleston, S.C., March 8–12, 1999—volume 2, Contami-nation of Hydrologic Systems and Related Ecosystems: U.S. Geological Survey Water-Resources Investigations Report 99–4018B, p. 147–160.
24 Water Quality in the Upper Illinois River Basin
Lanyon, Richard, 2000, Chicago River reversal solves public health crisis: Wetland Matters, Newsletter of the Wetlands Initiative, v. 5, no. 2, p. 1–11.
MacDonald, D.D., Ingersoll, C.G., and Berger, T.A., 2000, Development and evaluation of consensus-based sediment quality guidelines for freshwater ecosystems: Archives of Environmental Contamination and Toxicology, v. 39, p. 20–31
Mueller, D.K., and Helsel, D.R., 1996, Nutrients in the Nation’s water—Too much of a good thing?: U.S. Geologi-cal Survey Circular 1136, 24 p.
Munn, M.D., and Gilliom, R.J., 2001, Pesticide Toxicity Index for freshwater aquatic organisms: U.S. Geological Survey Water-Resources Investigations Report 01–4077, 61 p.
National Center for Environmental Health, 2003, Second national report on human exposure to environmental chemi-cals: National Center for Environmental Health publication 02–0716, 251 p., accessed April 2003 at http://www.cdc.gov/nceh/
Newell, A.J., Johnson, D.W., and Allen, L.K., 1987, Niagara River Biota Contamination Project—Fish flesh criteria for piscivorous wildlife: New York State Department of Environmental Conservation, Division of Fish and Wild-life, Bureau of Environmental Protection, Technical Report 87–3, 182 p.
Otto, Betsy; Ransel, K., Todd, J., Lovaas, D., Stuztman, H., and Bailey, J., 2002, Paving our way to water shortages—How sprawl aggravates the effects of drought: accessed March 20, 2003 at http://www.smartgrowthamerica.org/
Pereira, W.E., Moody, J.A., Hostettler, F.D., Rostad, C.E., and Leiker, T.J., 1995, Concentrations and mass transport of pesticides and organic contaminants in the Mississippi River and some of its tributaries, 1987–89 and 1991–92: U.S. Geological Survey Open-File Report 94–376, 169 p.
Polls, Irwin, Dennison, S.G., Sedita, S.J., and Lue-Hing, C., 1998, Water quality improvements in the Chicago and Calu-met Waterways between 1975 and 1993, associated with the operation of water reclamation plants, the Tunnel and Reservoir System, and instream and sidestream aeration sta-tions: Metropolitan Water Reclamation District of Greater Chicago Research and Development Department Report 98–23, 42 p.
Polls, Irwin, Lanyon, R., Sedita, S.J., Zenz, D.R., and Lue-Hing, C., 1994, Fact or fiction—Has the water quality improved in Chicago area waterways?: Metropolitan Water Reclamation District of Greater Chicago Research and Development Department Report 94–23, 31 p.
Rao, K.C., Kalka, K., Sawyer, B., and Zenz, D.R., 1995, 1994 annual summary report, water quality within the waterways system of the Metropolitan Water Reclamation District of Greater Chicago: Metropolitan Water Reclamation District of Greater Chicago Research and Development Department Report 95–15, 58 p. (plus appendixes).
Stark. J.R., Hanson, P.E., Goldstein, R.M., Fallon, J.D., Fong, A.L., Lee, K.E., Kroenig, S.E., and Andrews, W.J., 2000, Water quality in the Upper Mississippi River Basin, Min-nesota, Wisconsin, South Dakota, Iowa and North Dakota, 1995–98: U.S. Geological Survey Circular 1211, 35 p.
Sullivan, D.J., 2000, Nutrients and suspended solids in surface waters of the upper Illinois River Basin in Illinois, Indiana, and Wisconsin, 1978–97: U.S. Geological Survey Water-Resources Investigations Report 99–4275, 57 p.
Terrio, P.J., 1994, Relations of changes in wastewater-treat-ment practices to changes in stream-water quality during 1978–88 in the Chicago area, Illinois, and implications for regional and national water-quality assessments: U.S. Geological Survey Water-Resources Investigations Report 93–4188, 56 p.
U.S. Census Bureau, 2001, Ranking tables for metropolitan areas—Population in 2000 and population change from 1990–2000, table 1: Accessed June 6, 2003, at URL http://www.census.gov/population/www/cen2000/phc-t3.html.
U.S. Census Bureau, 2002, American FactFinder: Accessed March 25, 2003, at URL http://factfinder.census.gov/servlet/BasicFactsServlet.
U.S. Department of Agriculture, National Agricultural Sta-tistics Service, 2003: Accessed February 7, 2003, at http://jan.mannlib.cornell.edu/reports/nassr/other/pcu-bb/
U.S. Environmental Protection Agency, Office of Water, 2002, Drinking water standards and health advisories: Publication EPA 822–R—02–038, 12 p.
U.S. Environmental Protection Agency, 2003, Envirofacts database: Digital data, Accessed January 29, 2003, at URL http://www.epa.gov/enviro/
Vogelmann, J.E., Howard, S.M., Yang, L., Larson, C.R., Wylie, B.K., and Van Driel, N., 2001, Completion of the 1990s National land cover data set for the conterminous United States from Landsat Thematic Mapper data and ancillary data sources: Photogrammetric Engineering and Remote Sensing, v. 67, p. 650–662.
Wilson, B.A., Smith, V.H., deNoyelles, Frank, Jr., and Larive, C.K., 2003, Effects of three pharmaceutical and personal care products on natural freshwater algal assemblages: Environmental Science & Technology, v. 37, no. 9, p. 1713–1719.
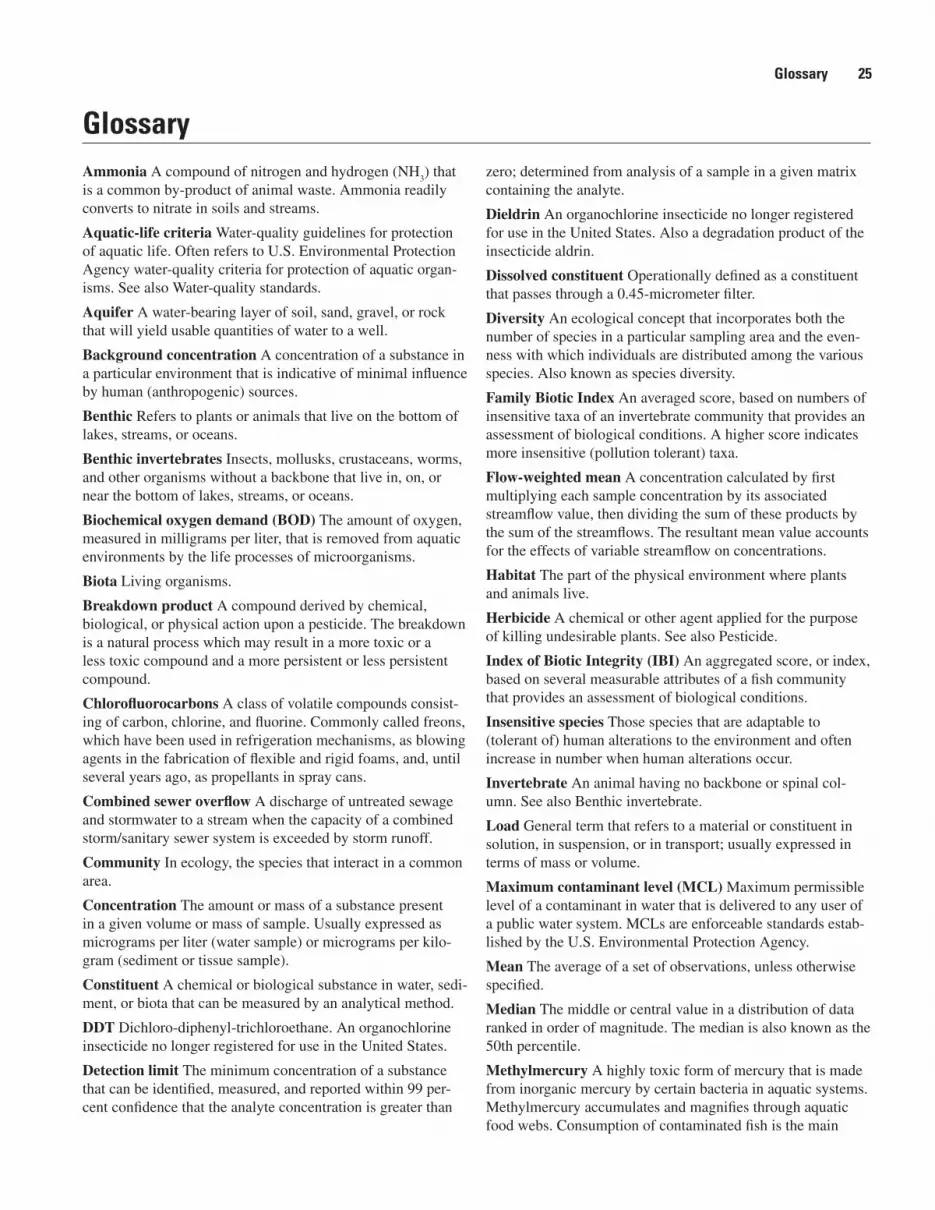
Glossary 25
GlossaryAmmonia A compound of nitrogen and hydrogen (NH
3) that
is a common by-product of animal waste. Ammonia readily converts to nitrate in soils and streams.
Aquatic-life criteria Water-quality guidelines for protection of aquatic life. Often refers to U.S. Environmental Protection Agency water-quality criteria for protection of aquatic organ-isms. See also Water-quality standards.
Aquifer A water-bearing layer of soil, sand, gravel, or rock that will yield usable quantities of water to a well.
Background concentration A concentration of a substance in a particular environment that is indicative of minimal influence by human (anthropogenic) sources.
Benthic Refers to plants or animals that live on the bottom of lakes, streams, or oceans.
Benthic invertebrates Insects, mollusks, crustaceans, worms, and other organisms without a backbone that live in, on, or near the bottom of lakes, streams, or oceans.
Biochemical oxygen demand (BOD) The amount of oxygen, measured in milligrams per liter, that is removed from aquatic environments by the life processes of microorganisms.
Biota Living organisms.
Breakdown product A compound derived by chemical, biological, or physical action upon a pesticide. The breakdown is a natural process which may result in a more toxic or a less toxic compound and a more persistent or less persistent compound.
Chlorofluorocarbons A class of volatile compounds consist-ing of carbon, chlorine, and fluorine. Commonly called freons, which have been used in refrigeration mechanisms, as blowing agents in the fabrication of flexible and rigid foams, and, until several years ago, as propellants in spray cans.
Combined sewer overflow A discharge of untreated sewage and stormwater to a stream when the capacity of a combined storm/sanitary sewer system is exceeded by storm runoff.
Community In ecology, the species that interact in a common area.
Concentration The amount or mass of a substance present in a given volume or mass of sample. Usually expressed as micrograms per liter (water sample) or micrograms per kilo-gram (sediment or tissue sample).
Constituent A chemical or biological substance in water, sedi-ment, or biota that can be measured by an analytical method.
DDT Dichloro-diphenyl-trichloroethane. An organochlorine insecticide no longer registered for use in the United States.
Detection limit The minimum concentration of a substance that can be identified, measured, and reported within 99 per-cent confidence that the analyte concentration is greater than
zero; determined from analysis of a sample in a given matrix containing the analyte.
Dieldrin An organochlorine insecticide no longer registered for use in the United States. Also a degradation product of the insecticide aldrin.
Dissolved constituent Operationally defined as a constituent that passes through a 0.45-micrometer filter.
Diversity An ecological concept that incorporates both the number of species in a particular sampling area and the even-ness with which individuals are distributed among the various species. Also known as species diversity.
Family Biotic Index An averaged score, based on numbers of insensitive taxa of an invertebrate community that provides an assessment of biological conditions. A higher score indicates more insensitive (pollution tolerant) taxa.
Flow-weighted mean A concentration calculated by first multiplying each sample concentration by its associated streamflow value, then dividing the sum of these products by the sum of the streamflows. The resultant mean value accounts for the effects of variable streamflow on concentrations.
Habitat The part of the physical environment where plants and animals live.
Herbicide A chemical or other agent applied for the purpose of killing undesirable plants. See also Pesticide.
Index of Biotic Integrity (IBI) An aggregated score, or index, based on several measurable attributes of a fish community that provides an assessment of biological conditions.
Insensitive species Those species that are adaptable to (tolerant of) human alterations to the environment and often increase in number when human alterations occur.
Invertebrate An animal having no backbone or spinal col-umn. See also Benthic invertebrate.
Load General term that refers to a material or constituent in solution, in suspension, or in transport; usually expressed in terms of mass or volume.
Maximum contaminant level (MCL) Maximum permissible level of a contaminant in water that is delivered to any user of a public water system. MCLs are enforceable standards estab-lished by the U.S. Environmental Protection Agency.
Mean The average of a set of observations, unless otherwise specified.
Median The middle or central value in a distribution of data ranked in order of magnitude. The median is also known as the 50th percentile.
Methylmercury A highly toxic form of mercury that is made from inorganic mercury by certain bacteria in aquatic systems. Methylmercury accumulates and magnifies through aquatic food webs. Consumption of contaminated fish is the main

26 Water Quality in the Upper Illinois River Basin
source of methylmercury to humans and fish-eating wildlife, whose central nervous systems can be adversely affected by the chemical.
Micrograms per kilogram (µg/kg) A unit expressing the concentration of constituents in sediment as weight (micro-grams) of constituent per unit weight; equivalent to one part per billion.
Micrograms per liter (µg/L) A unit expressing the concentra-tion of constituents in solution as weight (micrograms) of sol-ute per unit volume (liter) of water; equivalent to one part per billion in most stream water and ground water. One thousand micrograms per liter equals 1 mg/L.
Milligrams per liter (mg/L) A unit expressing the concen-tration of chemical constituents in solution as weight (mil-ligrams) of solute per unit volume (liter) of water; equivalent to one part per million in most stream water and ground water. One thousand micrograms per liter equals 1 mg/L.
Nitrate An ion consisting of nitrogen and oxygen (NO3–).
Nitrate is a plant nutrient and is very mobile in soils.
Nutrient Element or compound essential for animal and plant growth. Common nutrients in fertilizer include nitrogen, phos-phorus, and potassium.
Organochlorine compound Synthetic organic compounds containing chlorine. As generally used, term refers to com-pounds containing mostly or exclusively carbon, hydrogen, and chlorine. Examples include organochlorine insecticides, polychlorinated biphenyls, and some solvents containing chlorine.
Overland runoff The part of surface runoff flowing over land surfaces toward stream channels.
Pesticide A chemical applied to crops, rights-of-way, lawns, or residences to control weeds, insects, fungi, nematodes, rodents or other “pests.”
Phosphorus A nutrient essential for growth that can play a key role in stimulating aquatic growth in lakes and streams.
Point source A source at a discrete location such as a dis-charge pipe, drainage ditch, tunnel, well, concentrated live-stock operation, or floating craft.
Polychlorinated biphenyls (PCBs) A mixture of chlori-nated derivatives of biphenyl, marketed under the trade name Aroclor with a number designating the chlorine content (such as Aroclor 1260). PCBs were used in transformers and capaci-tors for insulating purposes and in gas pipeline systems as a lubricant. Sale for new use was discontinued by law in 1979.
Polycyclic aromatic hydrocarbon (PAH) A class of organic compounds with a fused-ring aromatic structure. PAHs result from incomplete combustion of organic carbon (including wood), municipal solid waste, and fossil fuels, as well as from natural or anthropogenic introduction of uncombusted coal and oil. PAHs include benzo[a]pyrene, fluoranthene, and pyrene.
Probable Effect Level (PEL) An estimate of the concentra-tion of a contaminant in bed sediment above which adverse biological effects frequently occur.
Recharge Water that infiltrates the ground and reaches the saturated zone.
Sensitive species Species that are not adaptable to human alterations to the environment and therefore decline in num-bers where such alterations occur. See also Insensitive species.
Subsurface drain A shallow drain installed in an irrigated field to intercept the rising ground-water level and maintain the water table at an acceptable depth below the land surface.
Suspended sediment Particles of rock, sand, soil, and organic detritus carried in suspension in the water column, in contrast to sediment that moves on or near the streambed.
Suspended solids Different from suspended sediment only in the way that the sample is collected and analyzed.
Taxon (plural taxa) Any identifiable group of taxonomically related organisms.
Total concentration Refers to the concentration of a constitu-ent regardless of its form (dissolved or bound) in a sample.
Total DDT The sum of DDT and its breakdown products, including DDD and DDE.
Volatile organic compounds (VOCs) Organic chemicals that have a high vapor pressure relative to their water solu-bility. VOCs include components of gasoline, fuel oils, and lubricants, as well as organic solvents, fumigants, some inert ingredients in pesticides, and some byproducts of chlorine disinfection.
Water-quality standards State-adopted and U.S. Environ-mental Protection Agency-approved ambient standards for water bodies. Standards include the use of the water body and the water-quality criteria that must be met to protect the designated use or uses.
Watershed The portion of the surface of the Earth that con-tributes water to a stream through overland runoff, including tributaries and impoundments. Equivalent to “drainage basin” or “basin.” In this report, refers specifically to the drainage area above a particular measurement point.
Water table The point below the land surface where ground water is first encountered and below which the earth is saturated. Depth to the water table varies widely across the country.
Withdrawal The act or process of removing, such as remov-ing water from a stream for irrigation or public water supply.

Appendix—Water-Quality Data from the Upper Illinois River Basin in a National Context
27
����������������������������������������������������������������������������������������������������������������������������������������������������������������������������������������������������������������������������������������������������������������������������������������������������������������������������������������������������������������������������������������������������
��������������������������������������
������������������������������������������������������������������������������������������������������������������������������������������������������������������������������������������������������������������������������������������������������������������������������������������������������������������������������������������������������������������������������������������������������������������������������������������������������������������������������������������������������������������������������������������������������������������������������������������������������������������
���������������������������������������������������������������������������������������������������������������������������������������������������������������������������������������������������������������������������������������������������������������������������������������������������������������������������������������������������������������������������������������������������������������������������������
���������������� �����������������������������������������������������
�����������������������������������������������������������������������������������
�� ��������������������������������������������������������������������������������������������������������������������������������������������������������������������������������������������������������������������������������������������������������������������������������������������������������������������������
������������������������������������������������������������������������������������������������
���������������������������������������������������������������������������������������������
������������������������������������
������������������������������������������������������������������������������������������������������������������������������������������������������������������������������������������������������������������
������������������������������������������
�������������������������������������������������������������������������������������������������������
�������������������������������������������������������������������������������������������������������������������������������������������������������
������������������������������������������������������������������
����������������������������������������������������������
�����������������������������������������������
���������������������������������������
��������������������������������������������
��
�����
�������������������������������������������������������������������������������������������������
��������
�������
��������
�������
���������
�������
���������������������������������������������������������������������������������������������������������������������������������������������������������������������������������������������������������������������������������������������������������������������������������������������������������������������������������������������������������������������������
�
�
�
��
��������������������������������������
�������� ������� ������� ������ ������ ������� ������ ��������
����������������������������������������������������������������������������������������
������������������������������
������������������������
�
����������������������������������������������������������������������������������������������������������������������������������������������������������������������������������������������������������������������������������������������������������������������������������������������������������������������������������������������������������������������������������������������������������������������������������������������������������������������������������������������������������������������������������������������������������������������������������������������������������
������������������������������������������������������������������������������ ����������������������������������������������������������������������������������������������������������������������������������� ���������������������������������������������������������������������
���������������������������������������
�������� ���������� ���������� ��
������� ��������� ��������� ��
���������������������������������
����������� ������������� ������������� ��
��������� ����������� ����������� ��
�����������������������������
� ��������� ��� ��������� ��� ��������� ��
�������� ���������� ���������� ��
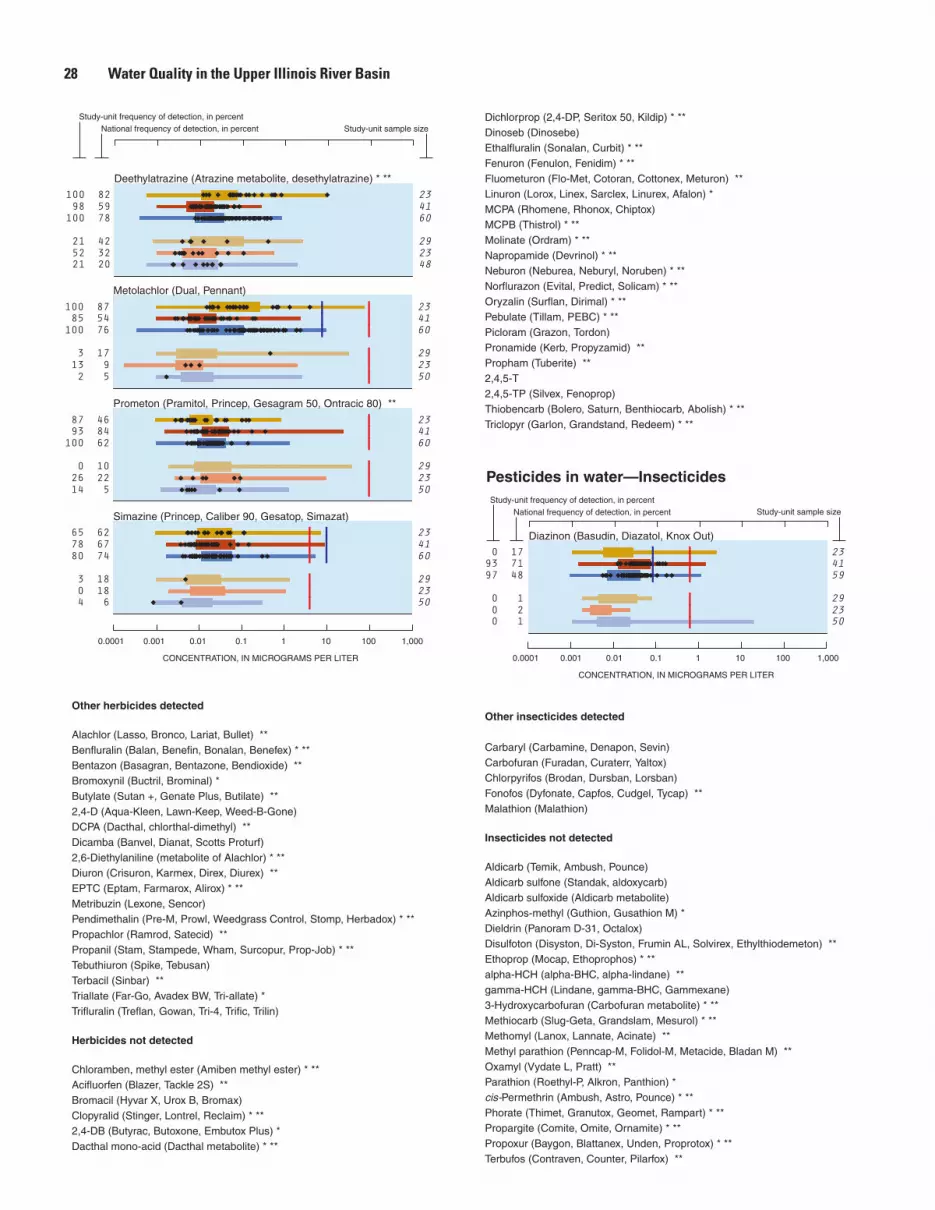
28 Water Quality in the Upper Illinois River Basin
��������������������������������������
��������� �������� ��������� �������� ��������� ���������� �������� ����������
�����������������������������������������������������������������������������
������������������������������������������� ����������������������
������������������������������������������������������������
��������� ���������� ����������� ��
�������� ���������� ���������� ��
�����������������������������
����������� ������������ ������������� ��
�������� ����������� ���������� ��
����������������������������������������������������������
��������� ����������� ������������ ��
�������� ����������� ����������� ��
��������������������������������������������������
� ��������� ��� ��������� ��� ��������� ��
�������� ���������� ���������� ��
�������������������������
����������������������������������������������������������������������������������������������������������������������������������������������������������������������������������������������������������������������������������������������������������������������������������������������������������������������������������������������������������������������������������������������������������������������������������������������������������������������������������������������������������������������������������������������������������������������������������������������������������������������������������������������������������������������������������������������������������������������������������������������������������������������������������������������������������������������������������
�����������������������
�����������������������������������������������������������������������������������������������������������������������������������������������������������������������������������������������������������������������������������������������������������
��������������������������������������
�������� ������� ������� ������ ������ ������� ������ ��������
���������������������������������������������������������������������������������������� ����������������������
��������������������������������������������������������������������������������������������������������������������������������������������������������������������������������������������������������������������������������������������������������������������������������������������������������������������������������������������������������������������������������������������������������������������������������������������������������������������������������������������������������������������������������������������������������������������������������������������������������������������������������������������������������������������������������������������������������������������������
����������������������������������������
��������� ������������ ������������ ��
�������� ���������� ���������� ��
�����������������������������
�����������������������������������������������������������������������������������������������������������������������������������������������������������������������������������������
�������������������������
�����������������������������������������������������������������������������������������������������������������������������������������������������������������������������������������������������������������������������������������������������������������������������������������������������������������������������������������������������������������������������������������������������������������������������������������������������������������������������������������������������������������������������������������������������������������������������������������������������������������������������������������������������������������������������������������������������������������������������������������������������������������������������������������������������������������������������������������������������������������������������������������������������������

Appendix 29
���������������������������������������������������������������������������������������������������������������������
��������������������������������������������������������������������������������������� ����������������������
��������������������������������������
���������� ��������� ���������� �������� ���������� ����������� ����������� ������������
�����������������������������������������������
��������� ��
��������� ��������� ���������� ��
�����������������������������������������������
��������� ��
�������� ���������� ��
��������������������������������������������������
���������� ��
��������� ��������� ���������� ��
�������������������������
���������� ��
��������� ���������� ����������� ��
�������������������������������������
� ��������� ��
��������� ��������� ���������� ��
�������������������������������
����������� ��
��������� ���������� ���������� ��
����������������������������������������������������������������������������������������������������������������������������������������������������������������������������������������������������������������������������������������������������������������������������������������������������������������������������������������������������������������������������������������������������������������������������������������������������������������������������������������������������������������
������������������������������������������������������������������������������������������������������������������������������������������������������������������������������������������������������������������������������������������������������������������������������������������������������������������������������������������
�����������������
���������������������������������������������������������������������������������������������������������������������������������������������������������������������������������������������������������������������������������������������������������������������������������������������������������������������������������������������������������������������������������������������������������������������������������������������������������������������������������������������������������������������������������������������������������������������������������������������������������������������������������������������������������������������������������������������������������������������������������������������������������������������������������������������������������������������������������������������������������������������������������������������������������������������������������������������������������������������������������������������������������������������������������������������������������������������������������������������������������������������������������������������������������������������������������������������������������������������������������������������������������������������������������������������������������������������������������������������������������������������������������������������������������������������������������������������������������������������������������������������������������������������������������������������������������������������������������������������������������������������������������������������������������������������������������������������������������������������������������������������������������������������������������������������������������������������������������������������������������������������������������������������������������������������������������������������������������������������������������������������������������������������������������������������������������������������������������������������������������������������������������������������������������������������������������������������������������������������������������������������������������������������������������������������������������������������������������������������������������������������������������������������������������������������������������������

30 Water Quality in the Upper Illinois River Basin
��������������������������������������
���������� ��������� ���������� ������� ���������� ������������
���������������������������������������������������������������
������������������������������������������� ����������������������
��������������������������������������
������������������� �������� ��������� ���������� ������������������������������������������������������
��������������������������������������
������������������� �������� ��������� ���������� ������������������������������������������������������
���������������������������������������������������������������������������
������������������������������������������� ����������������������
���������������������������������������������
������������������������������������������� ����������������������
������������������������
�������� ������������ ���������� ��
�������� ���������� ���������� ��
�����������������
��������� ������������ ����������� ��
��������� ����������� ����������� ��
����������������������������������������
��������� ������������� ����������� ��
��������� ����������� ����������� ��
���������������������������
��������� ������������� ������������ ��
���������
��������� ����������� ����������� ��
������������
�������� ���������� ����������� ��
�����������
���������� ������������ ������������ ��
�������������������������������������������������������������������������������������
���������������������������������������������
������������������������������������������������������������������������������������������������
�������� ������ ������� �������� ��������� ���������� ��������
�����������������������������������������������������������
���������������������������������������������������������������������������������������� ����������������������
���������������������������������������
��������� ���������� ����������� �
��������� ���������� ���������� �
�����������������������������
���������� ���������� ����������� �
�������� ��������� ���������� �
�����������������������������������
�������� ��������� ��������� �
��������� ���������� ���������� �
��������������
��������� ���������� ����������� �
�������� ���������� ����������� �
��������������������������������������������������������������������������������������������������������������������������������������������������������������������������������������������������������������������������������������������������������
��������������������������������������������������
��������� ��������� ������������ ��
��������� ��������� ���������� ��
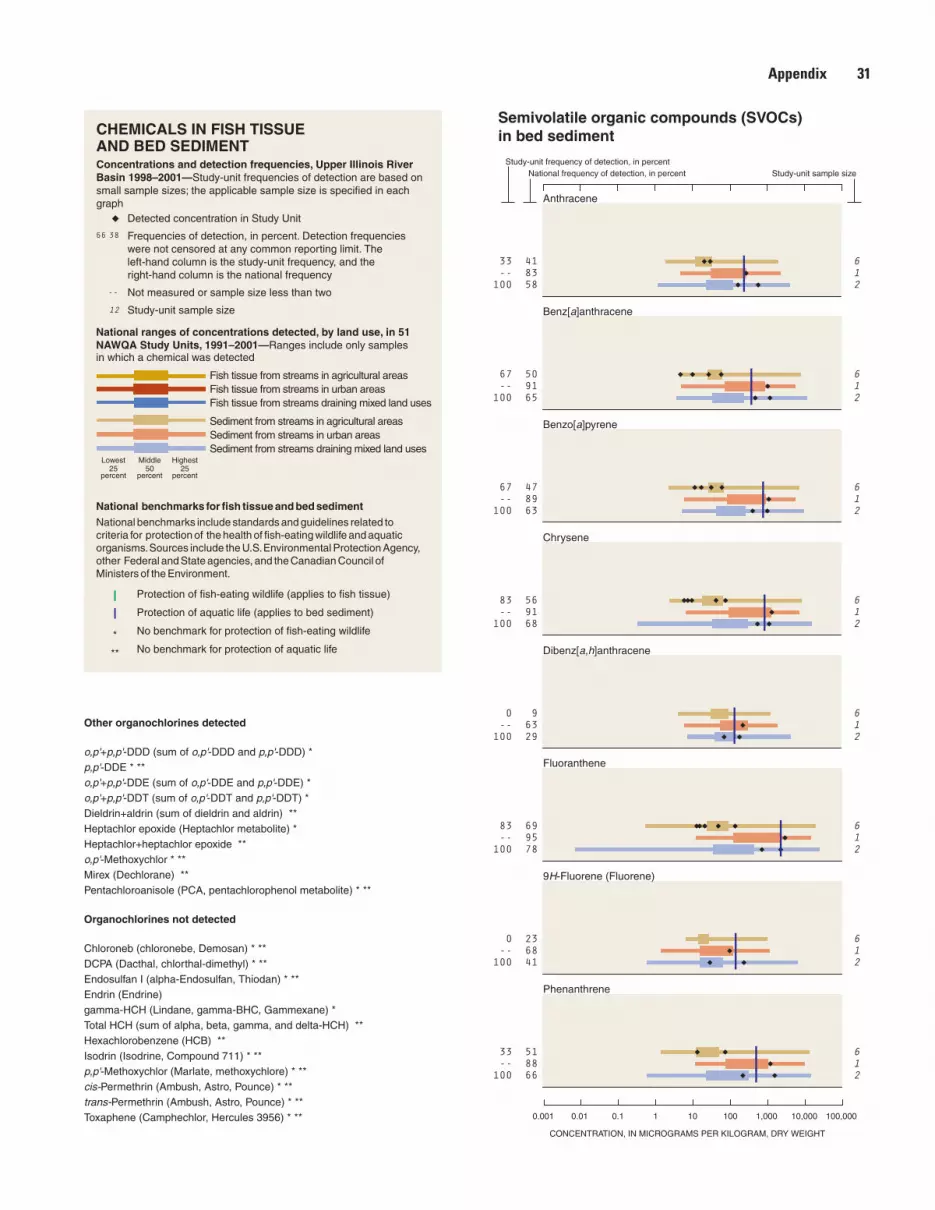
Appendix 31
��������������������������������������������������������������������������������������������������������������������������������������
��������������������������������������������������������������������������������������������������������������������������������
�����������������������������������������������������������
����������������������������������������������������
���������������������������������������������������
�������������������������������������������
�
�
��
�������������������������������������������������������������������������������������������������������������������������������������������������������������������������������������������������������������������������������������������������
��������
�������
��������
�������
���������
�������
������������������������������������������������������������������������������������������������������������������������������������������������������������������������������������������������������������������������������������������������������������������������������������������������������������������������������������������������������������������
�
��������������������������������������������������������������������������������������������������������������������������������������������������������
������������������������������������
������������������������������������������������������������������������������������������������������������������������������������������������������������������������������������������������������������������
�����������������������������������������
����������������������
�����
��
��
������������������������������
����������������������������������������������������������������������������������������������������������������������������������������������������������������������������������������������������������������������������������������������������������������������������������������������������������������������������������������������������������������������������������������������
����������������������������
�������������������������������������������������������������������������������������������������������������������������������������������������������������������������������������������������������������������������������������������������������������������������������������������������������������������������������������������������������������������������������������������������������������������������������������������������������������������������������������������������
�����������������������������������������������������
��������������������������� � ������� �������� ��������� ���������� ���������
����������������������������������������������������������������������������������������
�����������������������������������������������������
����������������������
������������
��������� ���������� ����������� �
������������������ �
��������� ���������� ����������� �
��������������� �
��������� ���������� ����������� �
����������
��������� ���������� ����������� �
���������������������� �
�������� ���������� ����������� �
�������������
��������� ���������� ����������� �
������������������������
�������� ���������� ����������� �
��������������
��������� ���������� ����������� �
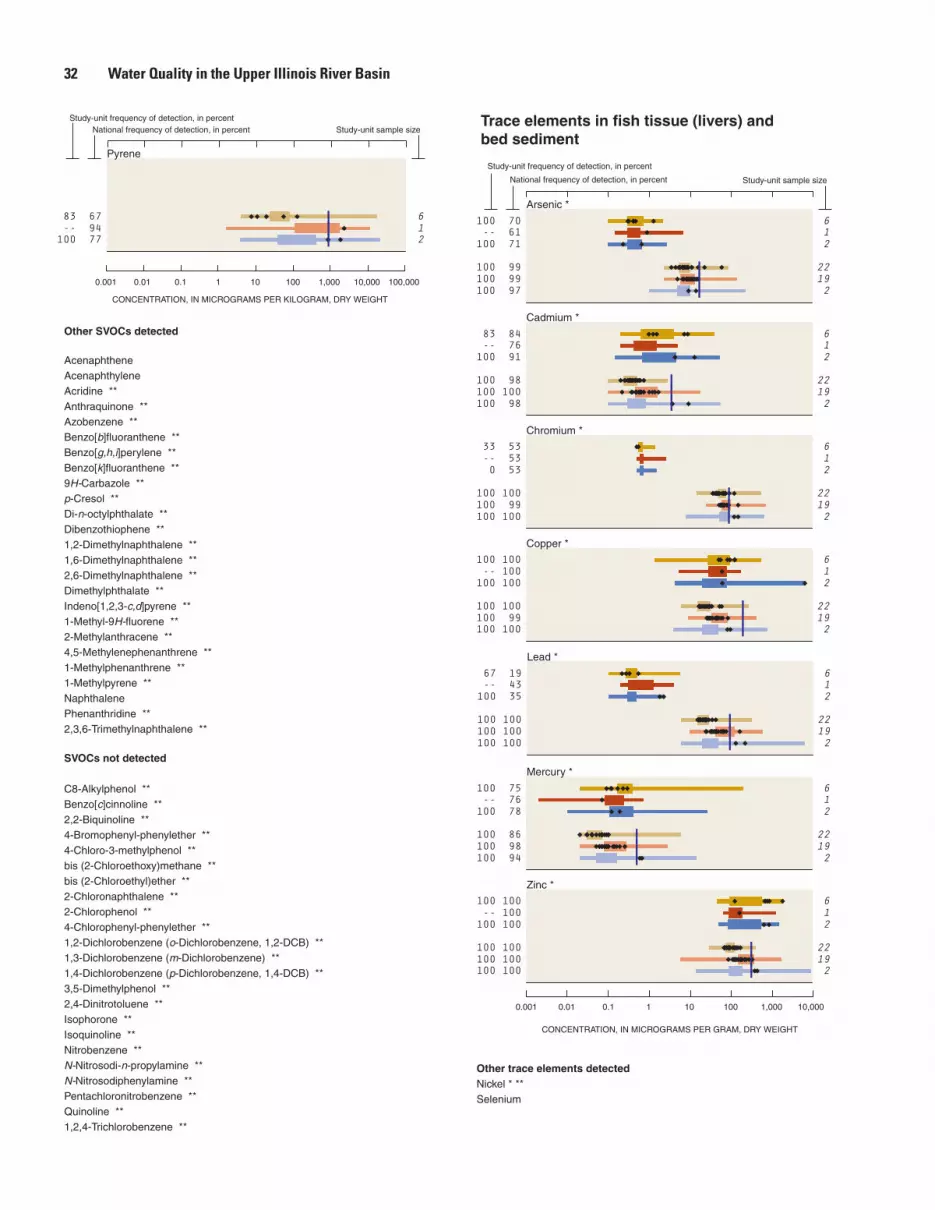
32 Water Quality in the Upper Illinois River Basin
����������������� ������� �������� ��������� �������� ��������������� �
���������������������������������������������
�������������������������������������������
��������������������������������������������������������
����������������������
�����������������������������������������������������
��������������������������� � ������� �������� ��������� ���������� ���������
���������������������������������������������������������������������������������������� ����������������������
���������
��������� ���������� ����������� �
��������������������
�������������������������������������������������������������������������������������������������������������������������������������������������������������������������������������������������������������������������������������������������������������������������������������������������������������������������������������������������������������������������������������������������������������������������������������������������������������������������������������������������������������������������������������������
������������������
��������������������������������������������������������������������������������������������������������������������������������������������������������������������������������������������������������������������������������������������������������������������������������������������������������������������������������������������������������������������������������������������������������������������������������������������������������������������������������������������������������������������������������������������������������������������������������������������������������������������������
����������
��������� ��������� ���������� �
���������� ������������ ������������ �
����������
�������� ��������� ���������� �
���������� ������������ ������������ �
�����������
�������� ��������� �������� �
���������� ������������ ������������ �
���������
��������� ��������� ���������� �
���������� ������������ ������������ �
�������
�������� ��������� ���������� �
���������� ������������ ������������ �
����������
��������� ��������� ���������� �
���������� ������������ ������������ �
�������
��������� ��������� ���������� �
���������� ������������ ������������ �
�������������������������������������������������
�������������������������������������������������

Coordination with agencies and organizations in the Upper Illinois River Basin was integral to the success of this water-quality assessment. We thank those who served as members of our liaison committee.
Federal AgenciesU.S. Army Corps of EngineersU.S. Department of Agriculture, Natural
Resources Conservation ServiceU.S. Environmental Protection AgencyU.S. Fish and Wildlife Service
State AgenciesIllinois Department of AgricultureIllinois Department of Natural ResourcesIllinois Department of Public HealthIllinois Environmental Protection AgencyIllinois Farm BureauIllinois Natural History SurveyIllinois Pollution Control BoardIllinois State Geological SurveyIllinois State Water SurveyIllinois Waste Management and
Research Center
Indiana Department of Environmental Management
Indiana Department of Natural Resources
Wisconsin Department of Natural Resources
Local AgenciesCook County, IllinoisForest Preserve District of Will CountyFox Metro Water ReclamationKane County, IllinoisKankakee Waste Water UtilityLake County Forest PreservesMcHenry County Conservation DistrictMetropolitan Water Reclamation District
of Greater ChicagoNortheastern Illinois Planning
Commission
Southeastern Wisconsin Regional Planning Commission
UniversitiesNortheastern Illinois UniversityUniversity of IllinoisUniversity of Wisconsin
Other public and private organizationsFox Waterway AgencyFriends of the Chicago RiverFriends of the Critters and the Salt CreekKankakee River ProjectMaster Property Owners Association,
Inc., for the Wonder Lake Illinois AreaThe Nature Conservancy
We thank the following individuals for contributing to this effort: Richard Lanyon, Metropolitan Water Reclamation District of Greater Chicago, for technical review of manuscriptDennis McKenna, Illinois Department of Agriculture, for technical review of manuscriptGregg Good, Illinois Environmental Protection Agency, for technical review of manuscriptRoy Smogor, Illinois Environmental Protection Agency, for technical review of manuscriptLisa Nowell, U.S. Geological Survey Pesticide Synthesis Team, for technical review of manuscriptRobert Gilliom, U.S. Geological Survey Pesticide Synthesis Team, for technical review of manuscriptMartin Gurtz, U.S. Geological Survey, for technical review of manuscriptStephen Smith, U.S. Geological Survey, for technical review of manuscriptCarol Couch, U.S. Geological Survey Ecology Synthesis Team, for technical review of manuscriptGregory E. Schwarz, U.S. Geological Survey Nutrient Synthesis team, for technical review of manuscriptJohn Zogorski, U.S. Geological Survey, for technical review of manuscriptGregory Delzer, U.S. Geological Survey, for technical review of manuscriptJennifer Hogan, U.S. Geological Survey, for colleague review of manuscriptPixie Hamilton, U.S. Geological Survey, for editorial review of manuscriptMichael Yurewicz, U.S. Geological Survey, for editorial review of manuscriptAngel Martin, U.S. Geological Survey, for editorial review of manuscriptMichael Eberle, U.S. Geological Survey, for editorial review of manuscriptPhillip Redman, U.S. Geological Survey, for layout review of manuscriptEdward Swibas, U.S. Geological Survey, for layout review of manuscriptRobert Olmstead, U.S. Geological Survey, for layout review of manuscriptMary Kidd, U.S. Geological Survey, for layout review of manuscriptKen Hlinka, Illinois State Water Survey, for providing ground-water levelsAll the Landowners, for giving us permission to collect samples from their property
Groschen and others— W
ater Quality in the Upper Illinois River Basin U.S. Geological Survey Circular 1230
National Water-Quality Assessment (NAWQA) ProgramUpper Illinois River Basin
NAWQA