wang_trehu_2016.pdf - uo geophysics
TRANSCRIPT
Im
Ka
b
a
ARRAA
KMSC
C
h0
Journal of Geodynamics 98 (2016) 1–18
Contents lists available at ScienceDirect
Journal of Geodynamics
jou rn al hom ep age: ht tp : / /www.e lsev ier .com/ locate / jog
nvited review paper: Some outstanding issues in the study of greategathrust earthquakes—The Cascadia example
elin Wanga,∗, Anne M. Tréhub
Pacific Geoscience Centre, Geological Survey of Canada, Natural Resources Canada, 9860 West Saanich Road, Sidney, British Columbia, CanadaCollege of Oceanic and Atmospheric Sciences, Oregon State University, Corvallis, OR 97331-5503, USA
r t i c l e i n f o
rticle history:eceived 12 September 2015eceived in revised form 14 March 2016ccepted 15 March 2016vailable online 29 March 2016
eywords:egathrust earthquakes
ubduction zoneascadia
a b s t r a c t
Because of a combination of new observational tools and a flurry of large megathrust earthquakes,tremendous progress has been made in recent years towards understanding the process of great subduc-tion earthquakes at Cascadia and other subduction zones around the world. This review article attemptsto clarify some of widely used geodynamic concepts and identify the most important scientific questionsfor future research related to megathrust behaviour. It is important to specify how the megathrust seis-mogenic zone has been defined when comparing data and models. Observations and concepts currentlyused to define the seismogenic zone include: (A) the stability transition in rate-and-state dependent fric-tion; (B) the slip zone of large interplate earthquakes; (C) the distribution of small-medium earthquakes;and (D) the geodetically-determined zone of fault locking. Land-based geodetic measurements indicatethat the Cascadia megathrust is locked to some extent, but the degree of locking is not well constrained.The near absence of detectable interplate seismicity, with the exception of a segment near 44.5◦N andnear the Mendocino Triple Junction, is presently interpreted to indicate full locking along most of Cas-cadia. Resolving the locking state requires seafloor geodetic measurements. The slip behaviour of theshallowest segment of the megathrust and its tsunamigenic potential are complex and variable. Struc-tural studies combined with modeling have the potential to improve our understanding of the signatureleft in the structure by the slip history. For several reasons, but mostly because of interseismic viscoelas-tic stress relaxation, the downdip limit of megathrust locking cannot be reliably constrained by geodeticdata. Independent information is needed on the composition and thermal state of fault zone materials.The spatial relationship between the seismogenic zone and the zone of Episodic Tremor and Slip (ETS)remains controversial. Observations from the Nankai subduction zone and the San Andreas Fault suggestthat ETS does not mark a simple spatial transition from seismic to aseismic behaviour and that multi-
ple transitions may be present because of petrological and rheological changes with depth. Coseismicrupture in the AD 1700 Cascadia earthquake has been shown to vary along strike, and it is important toinvestigate whether the position of boundaries between high slip and low slip are stationary with time(and therefore probably geologically controlled) and are reflected in current interseismic locking of themegathrust.Crown Copyright © 2016 Published by Elsevier Ltd. All rights reserved.
ontents
1. Introduction . . . . . . . . . . . . . . . . . . . . . . . . . . . . . . . . . . . . . . . . . . . . . . . . . . . . . . . . . . . . . . . . . . . . . . . . . . . . . . . . . . . . . . . . . . . . . . . . . . . . . . . . . . . . . . . . . . . . . . . . . . . . . . . . . . . . . . . . . . . . . . 22. What is the seismogenic zone? . . . . . . . . . . . . . . . . . . . . . . . . . . . . . . . . . . . . . . . . . . . . . . . . . . . . . . . . . . . . . . . . . . . . . . . . . . . . . . . . . . . . . . . . . . . . . . . . . . . . . . . . . . . . . . . . . . . . . . . . . . 3
2.1. Defining the “seismogenic zone” . . . . . . . . . . . . . . . . . . . . . . . . . . . . . . . . . . . . . . . . . . . . . . . . . . . . . . . . . . . . . . . . . . . . . . . . . . . . . . . . . . . . . . . . . . . . . . . . . . . . . . . . . . . . . . . . . 3
2.1.1. Definition A: based on rate-state frictional properties . . .2.1.2. Definition B: based on observed rupture of large earthqu2.1.3. Definition C: based on distribution of small and medium∗ Corresponding author.E-mail address: [email protected] (K. Wang).
ttp://dx.doi.org/10.1016/j.jog.2016.03.010264-3707/Crown Copyright © 2016 Published by Elsevier Ltd. All rights reserved.
. . . . . . . . . . . . . . . . . . . . . . . . . . . . . . . . . . . . . . . . . . . . . . . . . . . . . . . . . . . . . . . . . . . . . . . . . . . . . . 3akes . . . . . . . . . . . . . . . . . . . . . . . . . . . . . . . . . . . . . . . . . . . . . . . . . . . . . . . . . . . . . . . . . . . . . . . . 3
earthquakes . . . . . . . . . . . . . . . . . . . . . . . . . . . . . . . . . . . . . . . . . . . . . . . . . . . . . . . . . . . . . . . 3
2 K. Wang, A.M. Tréhu / Journal of Geodynamics 98 (2016) 1–18
2.1.4. Definition D: based on geodetically inferred interseismic locking . . . . . . . . . . . . . . . . . . . . . . . . . . . . . . . . . . . . . . . . . . . . . . . . . . . . . . . . . . . . . . . . . . . . 42.2. A brief history of Cascadia seismogenic zone models . . . . . . . . . . . . . . . . . . . . . . . . . . . . . . . . . . . . . . . . . . . . . . . . . . . . . . . . . . . . . . . . . . . . . . . . . . . . . . . . . . . . . . . . . . . . 4
3. Locking or creeping? . . . . . . . . . . . . . . . . . . . . . . . . . . . . . . . . . . . . . . . . . . . . . . . . . . . . . . . . . . . . . . . . . . . . . . . . . . . . . . . . . . . . . . . . . . . . . . . . . . . . . . . . . . . . . . . . . . . . . . . . . . . . . . . . . . . . . 43.1. Relevance of offshore seismicity . . . . . . . . . . . . . . . . . . . . . . . . . . . . . . . . . . . . . . . . . . . . . . . . . . . . . . . . . . . . . . . . . . . . . . . . . . . . . . . . . . . . . . . . . . . . . . . . . . . . . . . . . . . . . . . . . 43.2. Importance of seafloor geodesy . . . . . . . . . . . . . . . . . . . . . . . . . . . . . . . . . . . . . . . . . . . . . . . . . . . . . . . . . . . . . . . . . . . . . . . . . . . . . . . . . . . . . . . . . . . . . . . . . . . . . . . . . . . . . . . . . . 5
4. Slip behaviour of the shallowest segment of the megathrust and tsunami generation . . . . . . . . . . . . . . . . . . . . . . . . . . . . . . . . . . . . . . . . . . . . . . . . . . . . . . . . . . . . . . . . 64.1. Buried rupture and splay fault scenarios . . . . . . . . . . . . . . . . . . . . . . . . . . . . . . . . . . . . . . . . . . . . . . . . . . . . . . . . . . . . . . . . . . . . . . . . . . . . . . . . . . . . . . . . . . . . . . . . . . . . . . . . . 64.2. Trench-breaching rupture . . . . . . . . . . . . . . . . . . . . . . . . . . . . . . . . . . . . . . . . . . . . . . . . . . . . . . . . . . . . . . . . . . . . . . . . . . . . . . . . . . . . . . . . . . . . . . . . . . . . . . . . . . . . . . . . . . . . . . . . 74.3. Tsunami earthquakes . . . . . . . . . . . . . . . . . . . . . . . . . . . . . . . . . . . . . . . . . . . . . . . . . . . . . . . . . . . . . . . . . . . . . . . . . . . . . . . . . . . . . . . . . . . . . . . . . . . . . . . . . . . . . . . . . . . . . . . . . . . . . 8
5. Downdip limit of the seismogenic zone . . . . . . . . . . . . . . . . . . . . . . . . . . . . . . . . . . . . . . . . . . . . . . . . . . . . . . . . . . . . . . . . . . . . . . . . . . . . . . . . . . . . . . . . . . . . . . . . . . . . . . . . . . . . . . . . . 85.1. Geodetic interseismic deformation cannot constrain the downdip limit . . . . . . . . . . . . . . . . . . . . . . . . . . . . . . . . . . . . . . . . . . . . . . . . . . . . . . . . . . . . . . . . . . . . . . . 9
5.1.1. Stress shadow . . . . . . . . . . . . . . . . . . . . . . . . . . . . . . . . . . . . . . . . . . . . . . . . . . . . . . . . . . . . . . . . . . . . . . . . . . . . . . . . . . . . . . . . . . . . . . . . . . . . . . . . . . . . . . . . . . . . . . . . . . . 95.1.2. Temporal changes in locking width . . . . . . . . . . . . . . . . . . . . . . . . . . . . . . . . . . . . . . . . . . . . . . . . . . . . . . . . . . . . . . . . . . . . . . . . . . . . . . . . . . . . . . . . . . . . . . . . . . . . 95.1.3. Viscoelastic effects and “interseismic” stress relaxation . . . . . . . . . . . . . . . . . . . . . . . . . . . . . . . . . . . . . . . . . . . . . . . . . . . . . . . . . . . . . . . . . . . . . . . . . . . . . . . 95.1.4. Upper plate deformation and block models . . . . . . . . . . . . . . . . . . . . . . . . . . . . . . . . . . . . . . . . . . . . . . . . . . . . . . . . . . . . . . . . . . . . . . . . . . . . . . . . . . . . . . . . . . . . 95.1.5. Interseismic vertical deformation . . . . . . . . . . . . . . . . . . . . . . . . . . . . . . . . . . . . . . . . . . . . . . . . . . . . . . . . . . . . . . . . . . . . . . . . . . . . . . . . . . . . . . . . . . . . . . . . . . . . . 10
5.2. New questions about the thermal limit and fault gouge rheology . . . . . . . . . . . . . . . . . . . . . . . . . . . . . . . . . . . . . . . . . . . . . . . . . . . . . . . . . . . . . . . . . . . . . . . . . . . . . 105.2.1. The role of gabbro . . . . . . . . . . . . . . . . . . . . . . . . . . . . . . . . . . . . . . . . . . . . . . . . . . . . . . . . . . . . . . . . . . . . . . . . . . . . . . . . . . . . . . . . . . . . . . . . . . . . . . . . . . . . . . . . . . . . . 115.2.2. Hydrothermal cooling of the subducting crust . . . . . . . . . . . . . . . . . . . . . . . . . . . . . . . . . . . . . . . . . . . . . . . . . . . . . . . . . . . . . . . . . . . . . . . . . . . . . . . . . . . . . . . 11
6. Controversial relationship between the seismogenic zone and ETS . . . . . . . . . . . . . . . . . . . . . . . . . . . . . . . . . . . . . . . . . . . . . . . . . . . . . . . . . . . . . . . . . . . . . . . . . . . . . . . . . . . 116.1. Does updip limit of ETS correspond to the downdip limit of the seismogenic zone? . . . . . . . . . . . . . . . . . . . . . . . . . . . . . . . . . . . . . . . . . . . . . . . . . . . . . . . . . .116.2. ETS and the mantle wedge corner . . . . . . . . . . . . . . . . . . . . . . . . . . . . . . . . . . . . . . . . . . . . . . . . . . . . . . . . . . . . . . . . . . . . . . . . . . . . . . . . . . . . . . . . . . . . . . . . . . . . . . . . . . . . . . 12
7. Along-strike variations of slip behaviour . . . . . . . . . . . . . . . . . . . . . . . . . . . . . . . . . . . . . . . . . . . . . . . . . . . . . . . . . . . . . . . . . . . . . . . . . . . . . . . . . . . . . . . . . . . . . . . . . . . . . . . . . . . . . . . 138. Summary . . . . . . . . . . . . . . . . . . . . . . . . . . . . . . . . . . . . . . . . . . . . . . . . . . . . . . . . . . . . . . . . . . . . . . . . . . . . . . . . . . . . . . . . . . . . . . . . . . . . . . . . . . . . . . . . . . . . . . . . . . . . . . . . . . . . . . . . . . . . . . . . 14
Acknowledgements . . . . . . . . . . . . . . . . . . . . . . . . . . . . . . . . . . . . . . . . . . . . . . . . . . . . . . . . . . . . . . . . . . . . . . . . . . . . . . . . . . . . . . . . . . . . . . . . . . . . . . . . . . . . . . . . . . . . . . . . . . . . . . . . . . . . .15 . . . . . .
1
oitSerhpmabsiikimAi
rpg(c2hgMcesteot
References . . . . . . . . . . . . . . . . . . . . . . . . . . . . . . . . . . . . . . . . . . . . . . . . . . . . . . . . . . . .
. Introduction
Many populated coastal areas around the world, such as partf the west coast of North America, where the Juan de Fuca plates subducting along the Cascadia subduction zone, are under thehreat of future great subduction earthquakes and their tsunamis.trategies for mitigating risks need to keep up with the rapidlyvolving knowledge of subduction zone geodynamics and megath-ust slip behaviour. Revolutions in seismic and geodetic monitoringave led to discoveries that raise new scientific questions androvide tantalizing glimpses into new approaches for risk manage-ent. Recent great earthquakes such as the 2004 Mw = 9.2 Sumatra
nd 2011 Mw = 9.0 Tohoku-oki earthquakes have resulted in a num-er of scientific surprises. In this review article, we examine variouscientific concepts and models that are being used to guide risk mit-gation practices. In contrast to most review articles, our emphasiss on what is poorly known and on how to proceed to improve ournowledge. We do not attempt to review all the outstanding issuesn this vast research field but only discuss those we deem to be the
ost urgent for improving hazard assessment and risk mitigation.lthough the geographical focus is Cascadia, much of the discussion
s applicable to other subduction zones.There has never been an instrumentally recorded large megath-
ust earthquake in Cascadia. Knowledge of the size and recurrenceattern of past megathrust earthquakes comes mostly from coastaleological studies (Atwater, 1987) and marine turbidite recordsAdams, 1990; Goldfinger et al., 2012). Although some of the spe-ific conclusions of these studies are still contentious (Atwater et al.,014; Goldfinger et al., 2014), it is widely accepted that Cascadiaas produced great earthquakes that rupture most of the mar-in on average about every five centuries. That the most recentw ∼ 9 Cascadia earthquake occurred on 26 January 1700 is indi-
ated by an “orphan” tsunami in Japanese historical records (Sataket al., 2003). If the megathrust is assumed to have been fully lockedince that time, ∼15 m of slip deficit has accumulated based on
he MORVEL Juan de Fuca/North America plate vector (Demetst al., 2010). Without instrumental records of a great earthquake,ur understanding of Cascadia megathrust earthquake cycles andheir impact is based on interpretation of the paleoseismic and. . . . . . . . . . . . . . . . . . . . . . . . . . . . . . . . . . . . . . . . . . . . . . . . . . . . . . . . . . . . . . . . . . . . . . . . . . . . 15
paleo-tsunami evidence, modeling of modern geodetic obser-vations of interseismic deformation, very limited and localizedseismicity, episodic tremor and slip (ETS) observed down-dip of thenominal locked zone, theoretical inferences about the megathrust’sslip behaviour, and what we can infer from comparative studieswith other subduction zones where great earthquakes have beeninstrumentally recorded.
To apply knowledge gained from other subduction zones to Cas-cadia and vice versa, we must recognize Cascadia’s special or uniquecharacteristics. Appreciating these characteristics highlights whyCascadia serves as an end-member representative for some mar-gins and a contrasting example for others.
1) Because of the young age (<15 Ma) of the subducting oceanicplate and moderate convergence rate (3–4 cm/year), Cascadiahas a very warm megathrust and subducting slab. This providesopportunities for studying the effect of temperature on rock rhe-ology, fault friction, and slab dehydration under rather extremethermal conditions.
2) The subducting plate has ample sediment supply resulting in adeformation front but no bathymetric trench. The high sedimentsupply also leads to a large accretionary prism with sometimesatypical structural characteristics that vary dramatically alongstrike. Both creep or seismogenic motion of the shallow megath-rust where it breaches the buried trench should perturb thesediment cover, giving rise to distinctive geological and geodeticsignatures.
3) Partly because of the thick sediment cover, the incoming plateis one of the smoothest among all subduction zones. Moreover,because of the young age and hence small elastic thickness ofthe plate, the horst and graben structure formed in response toplate flexure and outer rise development is subdued. The roleof sedimentation and of basement topography, both exposedand buried, in controlling fault zone structure and seismogenicbehaviour is of great interest.
4) Cascadia is an archetype for the production of episodic slowslip accompanied by non-volcanic seismic tremor (ETS) wherethe plate interface is at a depth of 30–40 km. The physicalmechanisms of ETS and whether slip during great earthquakes
l of Geodynamics 98 (2016) 1–18 3
5
6
ct
2
2
rttwste(tmaimtteazfa
2
1eenttbasorfvssT
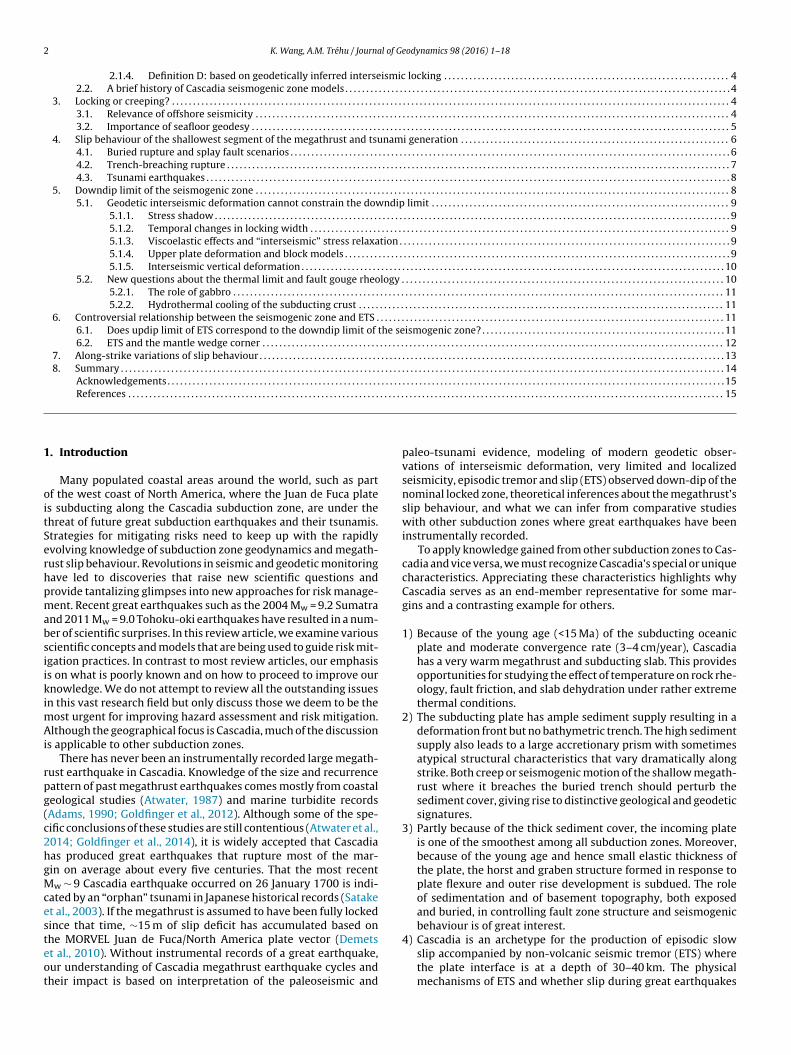
Fig. 1. Four definitions of the seismogenic zone in the context of rate-state frictionas discussed in Section 2.1. The zone of velocity-weakening (a–b < 0), commonlyregarded as the “theoretical” seismogenic zone, is where earthquakes may nucle-ate. The actual seismic rupture, the “observed” seismogenic zone, may go far into thevelocity-strengthening area due to low degrees of strengthening or dynamic weak-ening. Low-magnitude interplate seismicity may or may not occur over a broaderdepth range. The downdip width of the interseismically locked zone is difficult toconstrain using geodetic observations and is seen to decrease with time in rate-stateearthquake cycle models (Section 5.1). Red-dashed line shows possible downdip
K. Wang, A.M. Tréhu / Journa
approaches, or possibly even extends into, the ETS zone is anactive area of investigation.
) At present, more than three centuries after the last great earth-quake, Cascadia is at a late stage of interseismic deformation.After secular deformation of the upper plate is subtracted, Cas-cadia’s forearc crust exhibits wholesale landward motion and alow rate of elastic margin-normal shortening, in contrast withother margins that have experienced great earthquakes morerecently.
) The level of background seismicity on the Cascadia megathrustis extraordinarily low, with seismicity on the central 550 km ofthe megathrust restricted to a few distinct patches. The recur-rence of great earthquakes of Mw 8–9 against the backdrop ofvery low background seismicity provides an intriguing exampleof a characteristic earthquake sequence that deserves furtherresearch.
In the following, we review recent geodetic and seismologicalharacteristics of the Cascadia subduction zone and discuss ques-ions raised by those data.
. What is the seismogenic zone?
.1. Defining the “seismogenic zone”
The seismogenic zone of a subduction megathrust commonlyefers to a depth range (or downdip distance) where the subduc-ion interface exhibits stick-slip behaviour and is therefore thoughto be capable of producing relatively large thrust earthquakes. Heree only consider the situation in which the megathrust can be rea-
onably approximated using a smooth contact surface. Studies ofhe complex internal structure of subduction faults can be found in,.g., Bachmann et al. (2009), Kimura et al. (2012), and Rowe et al.2013). Geometrical irregularities such as those associated withhe subduction of large topographic features strongly influence the
egathrust’s seismogenic behaviour (Wang and Bilek, 2014; Gaond Wang, 2014; Scholl et al., 2015), and will be briefly addressedn Section 7. Although the slip behaviour within the nominal seis-
ogenic zone may vary between stick-slip and creep along strike,he concept of a seismogenic zone is useful for framing hypotheseso explain how earthquakes work (Dixon and Moore, 2007). How-ver, different researchers sometimes use different observationsnd concepts to define the geographical extent of the seismogenicone, leading to apparent conflicts between interpretations. Theour most widely seen approaches to defining the seismogenic zonere summarized below.
.1.1. Definition A: based on rate-state frictional propertiesAccording to the rate-and-state dependent friction law (Scholz,
998; Marone, 1998), applicable to very low slip rates («0.1 m/s),arthquakes can nucleate only where the composite friction param-ter (a − b) is negative. Very often, this zone of potential earthquakeucleation is referred to as the seismogenic zone. For (a − b) < 0,he frictional behaviour is referred to as velocity-weakening (i.e.,he faster the fault slips, the weaker it becomes). The oppositeehaviour is velocity-strengthening, which prevents rupture nucle-tion but may allow rupture propagation. Fig. 1 shows a widely usedcenario of (a − b) variation with downdip distance or depth basedn interpretations of laboratory measurements of representativeock samples (Scholz, 2002; Hyndman and Wang, 1993). For realaults, it is not clear how far the rupture can propagate into the
elocity-strengthening area. It depends on the degree of coseismictrengthening (Hu and Wang, 2008) and whether a high enoughlip rate can be attained to allow dynamic weakening to occur (Dioro et al., 2011; Noda and Lapusta, 2013).variations in (a–b) in Cascadia and some other subduction zones, to be discussed inSection 6.
2.1.2. Definition B: based on observed rupture of largeearthquakes
This is the definition that is most closely related to seismologi-cal and geodetic observations and is the most useful for predictingground shaking for hazard assessment. However, it can only beapplied where large earthquakes have been well recorded. More-over, because of the rate dependence of coseismic slip behaviour,as mentioned in the preceding paragraph, it is difficult to inferfault frictional properties from the observed rupture and vice versa.For great earthquakes, the rupture likely propagates beyond thevelocity-weakening area (Fig. 1), and what stops the rupture mayinvolve different processes in difference places and at differenttimes.
2.1.3. Definition C: based on distribution of small and mediumearthquakes
Interplate thrust events with magnitudes less than 5, andoccasionally up to about 7, are often used to define the megath-rust seismogenic zone in regions where there have not beeninstrumentally-recorded great earthquakes. Taking the JapanTrench as an example, this definition introduces a perplexing ques-tion about megathrust seismogenesis. Although smaller interplateearthquakes are known to have occurred to depths as great as50–60 km, rupture during the 2011 Mw = 9 Tohoku-oki earthquakewas mostly above 40 km. In fact, all the known Mw ≥ 9 eventsworldwide appear to be limited to relatively shallow depths, eventhough smaller events can be deeper. Although not yet rigorouslyverified, it appears that smaller interplate earthquakes are dis-tributed over a wider depth range than great earthquakes. Even inthe same great earthquake, higher-frequency seismic waves appearto be radiated from the deeper part of the rupture (Lay, 2015),indicating a change in fault zone properties. Moreover, small earth-quakes are often abundant on creeping segments of faults. Forexample, many small thrust events occur at 35–45 depth alongthe mostly aseismic plate interface at the Mariana subduction zone(Emry et al., 2011). This indicates that the extent of the “seismo-
genic zone” depends on the size of the earthquakes used to defineit. Depending on the research objective, one may need to distin-guish between zones that generate large events and those that
4 l of G
ga
2l
ltniomtsgmsgpf((efFttrw
2
mtedvt
bT(tlti(Hftsoc(a(
sevsedPs
K. Wang, A.M. Tréhu / Journa
enerate small events, although defining “large” and “small” maylso depend on the objective.
.1.4. Definition D: based on geodetically inferred interseismicocking
This definition is widely used in subduction zones where veryarge earthquakes have not occurred recently but modern geode-ic data are abundant (like Cascadia). Unless there are adequateear-field (including seafloor) measurements, however, it is of lim-
ted quantitative value for reasons to be discussed in Section 5.1f this paper. Because much of the locked zone is offshore whileost of the geodetic observations to date are on land, and because
he inelastic behaviour of the system (especially the astheno-phere) during interseismic deformation is still poorly understood,eodetic definitions of the megathrust locked zone are severelyodel-dependent. To first order, if there are alternating zones along
trike of locking and creeping that are large enough to be resolved,eodetically determined interseismic locking can approximatelyredict the along-strike distribution of patches of greatest slip inuture great earthquakes, as demonstrated at the Japan TrenchHashimoto et al., 2009; Loveless and Meade, 2010), in Costa RicaProtti et al., 2013), and in central and northern Chile (e.g., Morenot al., 2011). Inferring the distribution of slip in the dip directionrom pre-event geodetic locking models, however, is more difficult.or example, all of the Japan Trench locking models published prioro the 2011 Tohoku-oki earthquake substantially over-predictedhe downdip extent of locking and, by interpretation, of the futureupture zone. Because this ambiguity is relevant to Cascadia, weill discuss it in greater detail in Section 5.
.2. A brief history of Cascadia seismogenic zone models
As mentioned in Introduction, there has never been an instru-entally recorded great earthquake at Cascadia, and at present
here is a nearly complete absence of interplate seismicity (Tréhut al., 2015). Models of the seismogenic zone are thus based onefinitions A and D as summarized in Section 2.1, with along-strikeariations and recurrence behaviour based on the paleoseismic his-ory (Goldfinger et al., 2012; Wang et al., 2013).
Hyndman and Wang (1993) used thermally-controlled frictionalehaviour to define the Cascadia seismogenic zone (definition A).hey proposed that the updip limit of the velocity-weakening zoneFig. 1) could be defined by a temperature of ∼150 ◦C, which markshe transition of clay minerals smectite to illite, and the downdipimit could be defined by a temperature of ∼350 ◦C, which markshe transition between velocity– weakening and −strengtheningn quartz-rich materials. By hand-extrapolating two-dimensional2D) thermal model results from four margin-normal profiles,yndman and Wang (1995) proposed a seismogenic zone model
or the entire Cascadia megathrust (Fig. 2a). They assumed that aemperature of ∼450 ◦C could be the maximum limit of coseismiclip. At the time, it was incorrectly thought that the downdip limitf interseismic locking and the downdip limit of coseismic slip wereoincident and that elastic models based on available geodetic dataleveling and tide gauge) could constrain this boundary. Other vari-tions of this model include Flück et al. (1997) and Burgette et al.2009).
With increased recognition of the importance of viscoelastictress relaxation during interseismic strain accumulation, Wangt al. (2003) proposed an elastic dislocation model in which aery wide “effective transition zone” from full locking to fulllip is used to account approximately for the missing viscoelastic
ffects (Fig. 2b). Recognizing various issues with the older geodeticata and interpretation, Wang et al. (2003) decided to use Globalositioning System (GPS) velocities and various strain rate mea-urements as model constraints, but they still used the temperatureeodynamics 98 (2016) 1–18
argument of Hyndman and Wang (1995) to define the downdiplimit of full locking because of the lack of offshore data to constrainthe models (see Section 4.1). They also used the results of Wellsand Simpson (2001) to deal with secular upper plate deformation.They assumed that coseismic slip would recover slip deficits in thelocked zone but with a downdip transition extending to the middleof the interseismic effective transition zone. The resultant “long-narrow” coseismic rupture model, similar to that of Hyndman andWang (1995), was used by Satake et al. (2003) and Cherniawskyet al. (2007) in their tsunami modeling.
For coseismic slip, the model of uniform rupture plus transi-tion shown in Fig. 2a and b is obviously unrealistic. For improvedtsunami modeling, Priest et al. (2010), based on the reasoningof Wang and He (2008), assumed a bell-shaped downdip coseis-mic slip distribution for which a simplified version is shown inFig. 2c. The location of the peak coseismic slip in Fig. 2c correspondsroughly to the downdip end of the locked zone in Fig. 2b. Vari-ous modified versions of this model were used to develop tsunamisource scenarios for hazard assessment (Priest et al., 2010; Witteret al., 2012, 2013), some involving splay faulting.
With the rapid expansion of campaign and continuous GPS net-works in the beginning of the 21st century, contemporary GPSvelocities and strain rates at Cascadia became much better defined.McCaffrey et al. (2007, 2013) inverted these data to determine thelocking state of the megathrust and the motion of various upperplate crustal blocks. In these elastic models, some of the effects ofviscoelastic relaxation may have been integrated into the elasticblock motion estimates. The models of Schmalzle et al. (2014), asan update of McCaffrey et al. (2013), are shown in Fig. 2d and e.The two models, as well as those of McCaffrey et al. (2013), fit thedata equally well, and the difference between them is due to differ-ent assumptions made to constrain the inversion. If these lockingpatterns are interpreted to represent slip distributions for futureearthquakes, they represent seismogenic zones based on defini-tion D. These results demonstrate the difficulty of resolving platelocking patterns from purely land-based geodetic observations.
3. Locking or creeping?
Based on discussions in the preceding section, it is clear thatland-based geodetic observations cannot constrain the zone ofinterseismic locking at Cascadia, although they unambiguouslyindicate that the megathrust must be locked to some degree. Thestate of locking/creep is expected to vary along strike as well asdown dip, an important issue we will address in Section 7.
3.1. Relevance of offshore seismicity
To first order, land-based geodetic observations at Cascadia canbe explained by either a narrow zone of full locking or a widerzone of partial locking of the megathrust, and many variationsin between. Other independent information, such as backgroundinterplate seismicity, is therefore needed to help infer the stateof locking. Seismicity determined from onshore networks supple-mented by limited offshore ocean bottom seismometer (OBS) dataindicates that at present Cascadia’s plate interface is anomalouslydeficient in earthquake activity (Fig. 3).
North of Cape Blanco, M > 3 earthquakes of any type are absentfrom the continental margin in catalogues dating back to 1989, withthe exception of recurrent seismicity of M < 5 events in clustersoffshore central Oregon (red square in Fig. 3) and several events off-
shore Vancouver Island. All events off central Oregon that have beenstudied in detail appear to be located on or near the plate bound-ary and have thrust faulting mechanisms consistent with plateconvergence (Tréhu et al., 2008, 2015; Williams et al., 2011). The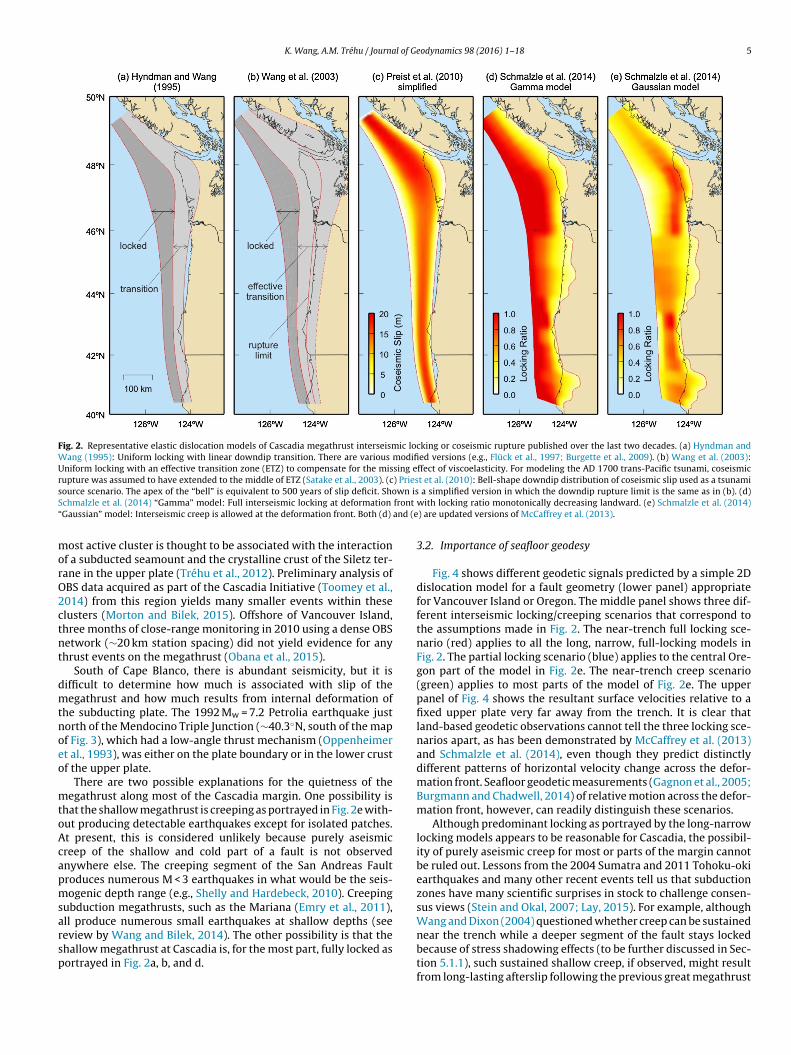
K. Wang, A.M. Tréhu / Journal of Geodynamics 98 (2016) 1–18 5
Fig. 2. Representative elastic dislocation models of Cascadia megathrust interseismic locking or coseismic rupture published over the last two decades. (a) Hyndman andWang (1995): Uniform locking with linear downdip transition. There are various modified versions (e.g., Flück et al., 1997; Burgette et al., 2009). (b) Wang et al. (2003):Uniform locking with an effective transition zone (ETZ) to compensate for the missing effect of viscoelasticity. For modeling the AD 1700 trans-Pacific tsunami, coseismicrupture was assumed to have extended to the middle of ETZ (Satake et al., 2003). (c) Priest et al. (2010): Bell-shape downdip distribution of coseismic slip used as a tsunamis wn isS front
“ and (e
morO2ctnt
dmtnoeo
mtoAcapmsarsp
ource scenario. The apex of the “bell” is equivalent to 500 years of slip deficit. Shochmalzle et al. (2014) “Gamma” model: Full interseismic locking at deformation
Gaussian” model: Interseismic creep is allowed at the deformation front. Both (d)
ost active cluster is thought to be associated with the interactionf a subducted seamount and the crystalline crust of the Siletz ter-ane in the upper plate (Tréhu et al., 2012). Preliminary analysis ofBS data acquired as part of the Cascadia Initiative (Toomey et al.,014) from this region yields many smaller events within theselusters (Morton and Bilek, 2015). Offshore of Vancouver Island,hree months of close-range monitoring in 2010 using a dense OBSetwork (∼20 km station spacing) did not yield evidence for anyhrust events on the megathrust (Obana et al., 2015).
South of Cape Blanco, there is abundant seismicity, but it isifficult to determine how much is associated with slip of theegathrust and how much results from internal deformation of
he subducting plate. The 1992 Mw = 7.2 Petrolia earthquake justorth of the Mendocino Triple Junction (∼40.3◦N, south of the mapf Fig. 3), which had a low-angle thrust mechanism (Oppenheimert al., 1993), was either on the plate boundary or in the lower crustf the upper plate.
There are two possible explanations for the quietness of theegathrust along most of the Cascadia margin. One possibility is
hat the shallow megathrust is creeping as portrayed in Fig. 2e with-ut producing detectable earthquakes except for isolated patches.t present, this is considered unlikely because purely aseismicreep of the shallow and cold part of a fault is not observednywhere else. The creeping segment of the San Andreas Faultroduces numerous M < 3 earthquakes in what would be the seis-ogenic depth range (e.g., Shelly and Hardebeck, 2010). Creeping
ubduction megathrusts, such as the Mariana (Emry et al., 2011),ll produce numerous small earthquakes at shallow depths (see
eview by Wang and Bilek, 2014). The other possibility is that thehallow megathrust at Cascadia is, for the most part, fully locked asortrayed in Fig. 2a, b, and d.a simplified version in which the downdip rupture limit is the same as in (b). (d)with locking ratio monotonically decreasing landward. (e) Schmalzle et al. (2014)) are updated versions of McCaffrey et al. (2013).
3.2. Importance of seafloor geodesy
Fig. 4 shows different geodetic signals predicted by a simple 2Ddislocation model for a fault geometry (lower panel) appropriatefor Vancouver Island or Oregon. The middle panel shows three dif-ferent interseismic locking/creeping scenarios that correspond tothe assumptions made in Fig. 2. The near-trench full locking sce-nario (red) applies to all the long, narrow, full-locking models inFig. 2. The partial locking scenario (blue) applies to the central Ore-gon part of the model in Fig. 2e. The near-trench creep scenario(green) applies to most parts of the model of Fig. 2e. The upperpanel of Fig. 4 shows the resultant surface velocities relative to afixed upper plate very far away from the trench. It is clear thatland-based geodetic observations cannot tell the three locking sce-narios apart, as has been demonstrated by McCaffrey et al. (2013)and Schmalzle et al. (2014), even though they predict distinctlydifferent patterns of horizontal velocity change across the defor-mation front. Seafloor geodetic measurements (Gagnon et al., 2005;Burgmann and Chadwell, 2014) of relative motion across the defor-mation front, however, can readily distinguish these scenarios.
Although predominant locking as portrayed by the long-narrowlocking models appears to be reasonable for Cascadia, the possibil-ity of purely aseismic creep for most or parts of the margin cannotbe ruled out. Lessons from the 2004 Sumatra and 2011 Tohoku-okiearthquakes and many other recent events tell us that subductionzones have many scientific surprises in stock to challenge consen-sus views (Stein and Okal, 2007; Lay, 2015). For example, althoughWang and Dixon (2004) questioned whether creep can be sustained
near the trench while a deeper segment of the fault stays lockedbecause of stress shadowing effects (to be further discussed in Sec-tion 5.1.1), such sustained shallow creep, if observed, might resultfrom long-lasting afterslip following the previous great megathrust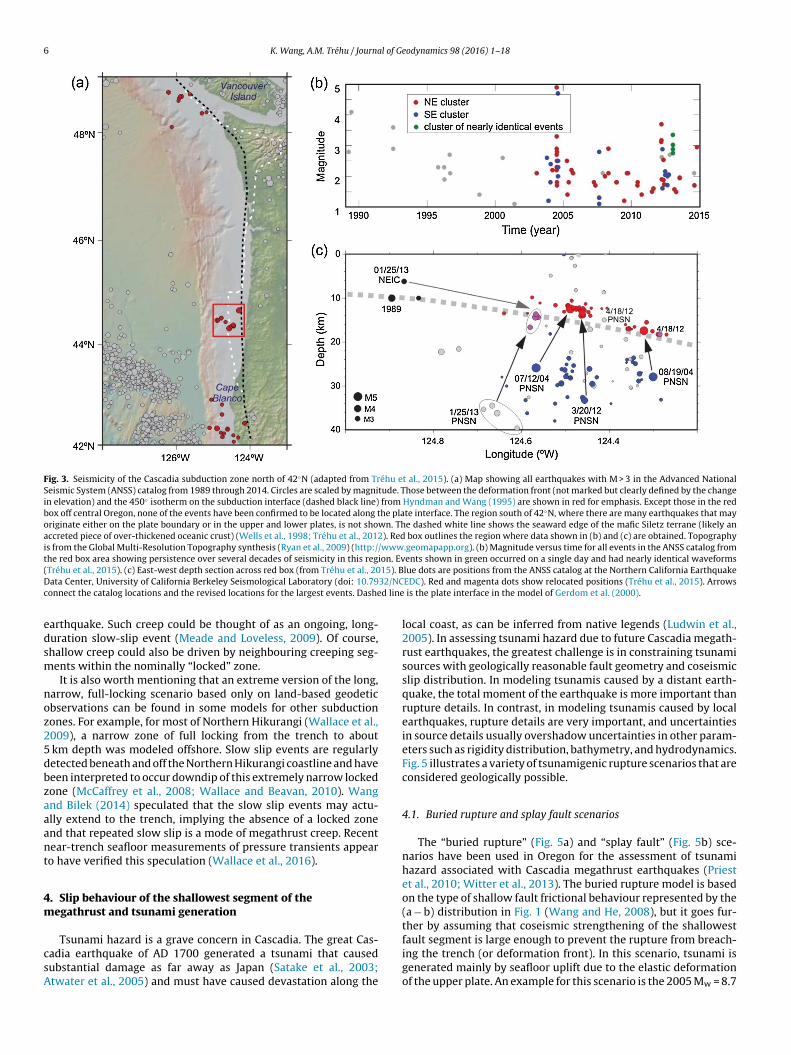
6 K. Wang, A.M. Tréhu / Journal of Geodynamics 98 (2016) 1–18
Fig. 3. Seismicity of the Cascadia subduction zone north of 42◦N (adapted from Tréhu et al., 2015). (a) Map showing all earthquakes with M > 3 in the Advanced NationalSeismic System (ANSS) catalog from 1989 through 2014. Circles are scaled by magnitude. Those between the deformation front (not marked but clearly defined by the changein elevation) and the 450◦ isotherm on the subduction interface (dashed black line) from Hyndman and Wang (1995) are shown in red for emphasis. Except those in the redbox off central Oregon, none of the events have been confirmed to be located along the plate interface. The region south of 42◦N, where there are many earthquakes that mayoriginate either on the plate boundary or in the upper and lower plates, is not shown. The dashed white line shows the seaward edge of the mafic Siletz terrane (likely anaccreted piece of over-thickened oceanic crust) (Wells et al., 1998; Tréhu et al., 2012). Red box outlines the region where data shown in (b) and (c) are obtained. Topographyis from the Global Multi-Resolution Topography synthesis (Ryan et al., 2009) (http://www.geomapapp.org). (b) Magnitude versus time for all events in the ANSS catalog fromthe red box area showing persistence over several decades of seismicity in this region. Events shown in green occurred on a single day and had nearly identical waveforms( 15). BD 32/NCc d line
edsm
noz25dbzaaant
4m
csA
Tréhu et al., 2015). (c) East-west depth section across red box (from Tréhu et al., 20ata Center, University of California Berkeley Seismological Laboratory (doi: 10.79onnect the catalog locations and the revised locations for the largest events. Dashe
arthquake. Such creep could be thought of as an ongoing, long-uration slow-slip event (Meade and Loveless, 2009). Of course,hallow creep could also be driven by neighbouring creeping seg-ents within the nominally “locked” zone.It is also worth mentioning that an extreme version of the long,
arrow, full-locking scenario based only on land-based geodeticbservations can be found in some models for other subductionones. For example, for most of Northern Hikurangi (Wallace et al.,009), a narrow zone of full locking from the trench to about
km depth was modeled offshore. Slow slip events are regularlyetected beneath and off the Northern Hikurangi coastline and haveeen interpreted to occur downdip of this extremely narrow lockedone (McCaffrey et al., 2008; Wallace and Beavan, 2010). Wangnd Bilek (2014) speculated that the slow slip events may actu-lly extend to the trench, implying the absence of a locked zonend that repeated slow slip is a mode of megathrust creep. Recentear-trench seafloor measurements of pressure transients appearo have verified this speculation (Wallace et al., 2016).
. Slip behaviour of the shallowest segment of theegathrust and tsunami generation
Tsunami hazard is a grave concern in Cascadia. The great Cas-adia earthquake of AD 1700 generated a tsunami that causedubstantial damage as far away as Japan (Satake et al., 2003;twater et al., 2005) and must have caused devastation along the
lue dots are positions from the ANSS catalog at the Northern California EarthquakeEDC). Red and magenta dots show relocated positions (Tréhu et al., 2015). Arrows
is the plate interface in the model of Gerdom et al. (2000).
local coast, as can be inferred from native legends (Ludwin et al.,2005). In assessing tsunami hazard due to future Cascadia megath-rust earthquakes, the greatest challenge is in constraining tsunamisources with geologically reasonable fault geometry and coseismicslip distribution. In modeling tsunamis caused by a distant earth-quake, the total moment of the earthquake is more important thanrupture details. In contrast, in modeling tsunamis caused by localearthquakes, rupture details are very important, and uncertaintiesin source details usually overshadow uncertainties in other param-eters such as rigidity distribution, bathymetry, and hydrodynamics.Fig. 5 illustrates a variety of tsunamigenic rupture scenarios that areconsidered geologically possible.
4.1. Buried rupture and splay fault scenarios
The “buried rupture” (Fig. 5a) and “splay fault” (Fig. 5b) sce-narios have been used in Oregon for the assessment of tsunamihazard associated with Cascadia megathrust earthquakes (Priestet al., 2010; Witter et al., 2013). The buried rupture model is basedon the type of shallow fault frictional behaviour represented by the(a − b) distribution in Fig. 1 (Wang and He, 2008), but it goes fur-ther by assuming that coseismic strengthening of the shallowest
fault segment is large enough to prevent the rupture from breach-ing the trench (or deformation front). In this scenario, tsunami isgenerated mainly by seafloor uplift due to the elastic deformationof the upper plate. An example for this scenario is the 2005 Mw = 8.7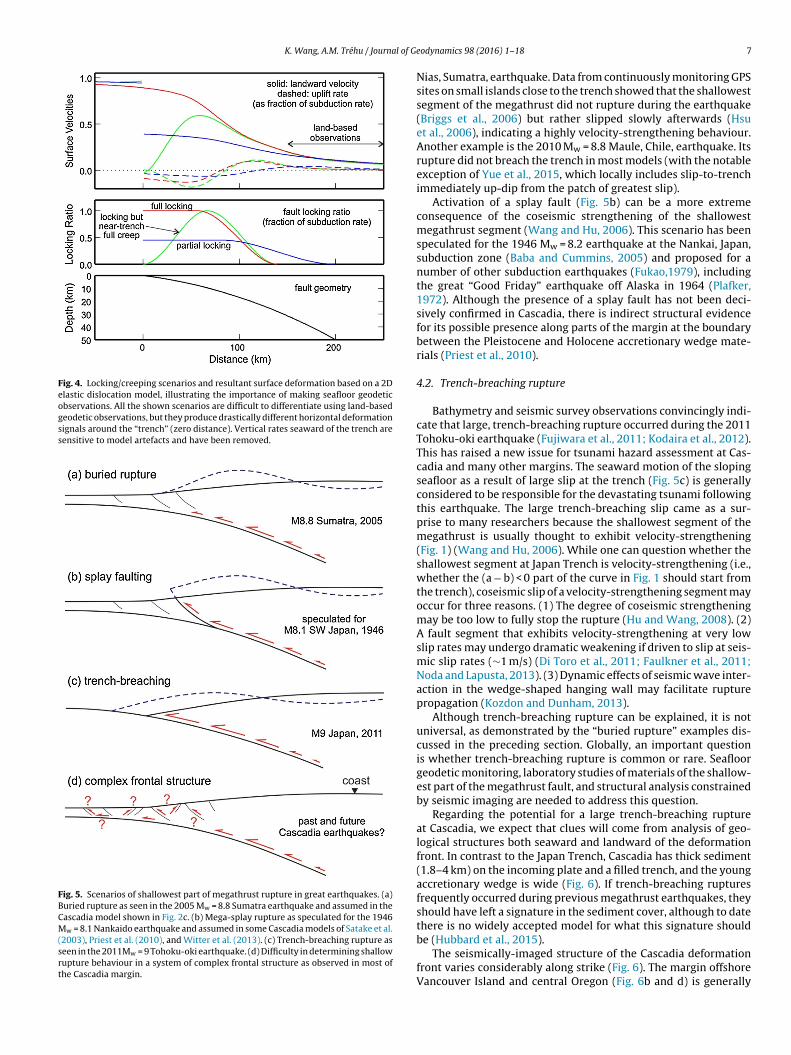
K. Wang, A.M. Tréhu / Journal of Ge
Fig. 4. Locking/creeping scenarios and resultant surface deformation based on a 2Delastic dislocation model, illustrating the importance of making seafloor geodeticobservations. All the shown scenarios are difficult to differentiate using land-basedgeodetic observations, but they produce drastically different horizontal deformationsignals around the “trench” (zero distance). Vertical rates seaward of the trench aresensitive to model artefacts and have been removed.
Fig. 5. Scenarios of shallowest part of megathrust rupture in great earthquakes. (a)Buried rupture as seen in the 2005 Mw = 8.8 Sumatra earthquake and assumed in theCascadia model shown in Fig. 2c. (b) Mega-splay rupture as speculated for the 1946Mw = 8.1 Nankaido earthquake and assumed in some Cascadia models of Satake et al.(2003), Priest et al. (2010), and Witter et al. (2013). (c) Trench-breaching rupture asseen in the 2011Mw = 9 Tohoku-oki earthquake. (d) Difficulty in determining shallowrupture behaviour in a system of complex frontal structure as observed in most ofthe Cascadia margin.
odynamics 98 (2016) 1–18 7
Nias, Sumatra, earthquake. Data from continuously monitoring GPSsites on small islands close to the trench showed that the shallowestsegment of the megathrust did not rupture during the earthquake(Briggs et al., 2006) but rather slipped slowly afterwards (Hsuet al., 2006), indicating a highly velocity-strengthening behaviour.Another example is the 2010 Mw = 8.8 Maule, Chile, earthquake. Itsrupture did not breach the trench in most models (with the notableexception of Yue et al., 2015, which locally includes slip-to-trenchimmediately up-dip from the patch of greatest slip).
Activation of a splay fault (Fig. 5b) can be a more extremeconsequence of the coseismic strengthening of the shallowestmegathrust segment (Wang and Hu, 2006). This scenario has beenspeculated for the 1946 Mw = 8.2 earthquake at the Nankai, Japan,subduction zone (Baba and Cummins, 2005) and proposed for anumber of other subduction earthquakes (Fukao,1979), includingthe great “Good Friday” earthquake off Alaska in 1964 (Plafker,1972). Although the presence of a splay fault has not been deci-sively confirmed in Cascadia, there is indirect structural evidencefor its possible presence along parts of the margin at the boundarybetween the Pleistocene and Holocene accretionary wedge mate-rials (Priest et al., 2010).
4.2. Trench-breaching rupture
Bathymetry and seismic survey observations convincingly indi-cate that large, trench-breaching rupture occurred during the 2011Tohoku-oki earthquake (Fujiwara et al., 2011; Kodaira et al., 2012).This has raised a new issue for tsunami hazard assessment at Cas-cadia and many other margins. The seaward motion of the slopingseafloor as a result of large slip at the trench (Fig. 5c) is generallyconsidered to be responsible for the devastating tsunami followingthis earthquake. The large trench-breaching slip came as a sur-prise to many researchers because the shallowest segment of themegathrust is usually thought to exhibit velocity-strengthening(Fig. 1) (Wang and Hu, 2006). While one can question whether theshallowest segment at Japan Trench is velocity-strengthening (i.e.,whether the (a − b) < 0 part of the curve in Fig. 1 should start fromthe trench), coseismic slip of a velocity-strengthening segment mayoccur for three reasons. (1) The degree of coseismic strengtheningmay be too low to fully stop the rupture (Hu and Wang, 2008). (2)A fault segment that exhibits velocity-strengthening at very lowslip rates may undergo dramatic weakening if driven to slip at seis-mic slip rates (∼1 m/s) (Di Toro et al., 2011; Faulkner et al., 2011;Noda and Lapusta, 2013). (3) Dynamic effects of seismic wave inter-action in the wedge-shaped hanging wall may facilitate rupturepropagation (Kozdon and Dunham, 2013).
Although trench-breaching rupture can be explained, it is notuniversal, as demonstrated by the “buried rupture” examples dis-cussed in the preceding section. Globally, an important questionis whether trench-breaching rupture is common or rare. Seafloorgeodetic monitoring, laboratory studies of materials of the shallow-est part of the megathrust fault, and structural analysis constrainedby seismic imaging are needed to address this question.
Regarding the potential for a large trench-breaching ruptureat Cascadia, we expect that clues will come from analysis of geo-logical structures both seaward and landward of the deformationfront. In contrast to the Japan Trench, Cascadia has thick sediment(1.8–4 km) on the incoming plate and a filled trench, and the youngaccretionary wedge is wide (Fig. 6). If trench-breaching rupturesfrequently occurred during previous megathrust earthquakes, theyshould have left a signature in the sediment cover, although to datethere is no widely accepted model for what this signature should
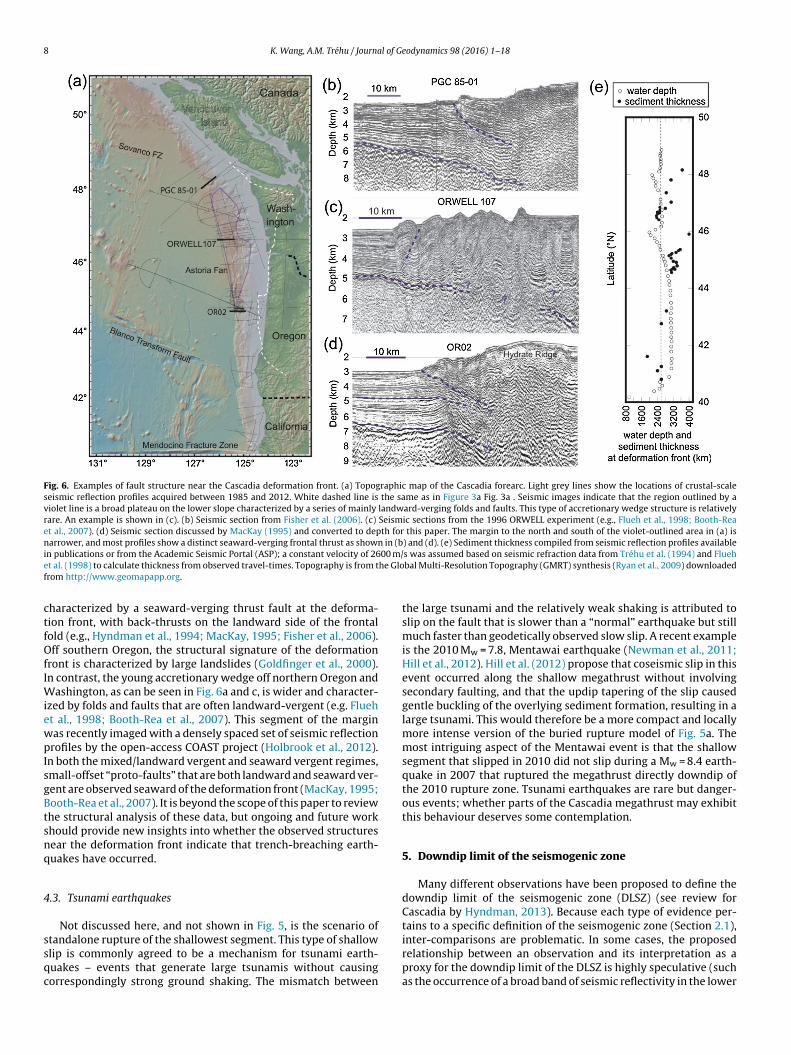
be (Hubbard et al., 2015).The seismically-imaged structure of the Cascadia deformationfront varies considerably along strike (Fig. 6). The margin offshoreVancouver Island and central Oregon (Fig. 6b and d) is generally
8 K. Wang, A.M. Tréhu / Journal of Geodynamics 98 (2016) 1–18
Fig. 6. Examples of fault structure near the Cascadia deformation front. (a) Topographic map of the Cascadia forearc. Light grey lines show the locations of crustal-scaleseismic reflection profiles acquired between 1985 and 2012. White dashed line is the same as in Figure 3a Fig. 3a . Seismic images indicate that the region outlined by aviolet line is a broad plateau on the lower slope characterized by a series of mainly landward-verging folds and faults. This type of accretionary wedge structure is relativelyrare. An example is shown in (c). (b) Seismic section from Fisher et al. (2006). (c) Seismic sections from the 1996 ORWELL experiment (e.g., Flueh et al., 1998; Booth-Reaet al., 2007). (d) Seismic section discussed by MacKay (1995) and converted to depth for this paper. The margin to the north and south of the violet-outlined area in (a) isnarrower, and most profiles show a distinct seaward-verging frontal thrust as shown in (b) and (d). (e) Sediment thickness compiled from seismic reflection profiles availablei 00 m/e he Glof
ctfOfIWiewpIsgBtsnq
4
ssqc
n publications or from the Academic Seismic Portal (ASP); a constant velocity of 26t al. (1998) to calculate thickness from observed travel-times. Topography is from trom http://www.geomapapp.org.
haracterized by a seaward-verging thrust fault at the deforma-ion front, with back-thrusts on the landward side of the frontalold (e.g., Hyndman et al., 1994; MacKay, 1995; Fisher et al., 2006).ff southern Oregon, the structural signature of the deformation
ront is characterized by large landslides (Goldfinger et al., 2000).n contrast, the young accretionary wedge off northern Oregon and
ashington, as can be seen in Fig. 6a and c, is wider and character-zed by folds and faults that are often landward-vergent (e.g. Flueht al., 1998; Booth-Rea et al., 2007). This segment of the marginas recently imaged with a densely spaced set of seismic reflectionrofiles by the open-access COAST project (Holbrook et al., 2012).
n both the mixed/landward vergent and seaward vergent regimes,mall-offset “proto-faults” that are both landward and seaward ver-ent are observed seaward of the deformation front (MacKay, 1995;ooth-Rea et al., 2007). It is beyond the scope of this paper to reviewhe structural analysis of these data, but ongoing and future workhould provide new insights into whether the observed structuresear the deformation front indicate that trench-breaching earth-uakes have occurred.
.3. Tsunami earthquakes
Not discussed here, and not shown in Fig. 5, is the scenario of
tandalone rupture of the shallowest segment. This type of shallowlip is commonly agreed to be a mechanism for tsunami earth-uakes – events that generate large tsunamis without causingorrespondingly strong ground shaking. The mismatch betweens was assumed based on seismic refraction data from Tréhu et al. (1994) and Fluehbal Multi-Resolution Topography (GMRT) synthesis (Ryan et al., 2009) downloaded
the large tsunami and the relatively weak shaking is attributed toslip on the fault that is slower than a “normal” earthquake but stillmuch faster than geodetically observed slow slip. A recent exampleis the 2010 Mw = 7.8, Mentawai earthquake (Newman et al., 2011;Hill et al., 2012). Hill et al. (2012) propose that coseismic slip in thisevent occurred along the shallow megathrust without involvingsecondary faulting, and that the updip tapering of the slip causedgentle buckling of the overlying sediment formation, resulting in alarge tsunami. This would therefore be a more compact and locallymore intense version of the buried rupture model of Fig. 5a. Themost intriguing aspect of the Mentawai event is that the shallowsegment that slipped in 2010 did not slip during a Mw = 8.4 earth-quake in 2007 that ruptured the megathrust directly downdip ofthe 2010 rupture zone. Tsunami earthquakes are rare but danger-ous events; whether parts of the Cascadia megathrust may exhibitthis behaviour deserves some contemplation.
5. Downdip limit of the seismogenic zone
Many different observations have been proposed to define thedowndip limit of the seismogenic zone (DLSZ) (see review forCascadia by Hyndman, 2013). Because each type of evidence per-tains to a specific definition of the seismogenic zone (Section 2.1),
inter-comparisons are problematic. In some cases, the proposedrelationship between an observation and its interpretation as aproxy for the downdip limit of the DLSZ is highly speculative (suchas the occurrence of a broad band of seismic reflectivity in the lower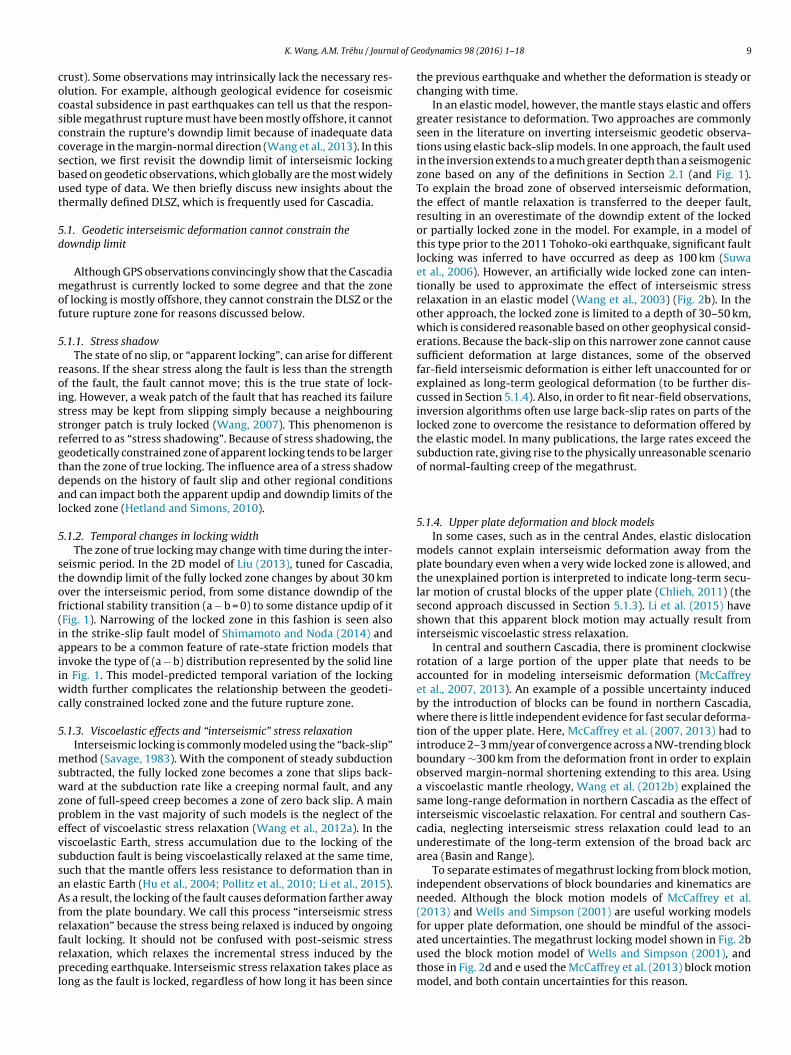
l of Ge
cocsccsbut
5d
mof
5
roissrgtdal
5
stof(iaiiwc
5
mswzpevssaAfrfrpl
(2013) and Wells and Simpson (2001) are useful working modelsfor upper plate deformation, one should be mindful of the associ-
K. Wang, A.M. Tréhu / Journa
rust). Some observations may intrinsically lack the necessary res-lution. For example, although geological evidence for coseismicoastal subsidence in past earthquakes can tell us that the respon-ible megathrust rupture must have been mostly offshore, it cannotonstrain the rupture’s downdip limit because of inadequate dataoverage in the margin-normal direction (Wang et al., 2013). In thisection, we first revisit the downdip limit of interseismic lockingased on geodetic observations, which globally are the most widelysed type of data. We then briefly discuss new insights about thehermally defined DLSZ, which is frequently used for Cascadia.
.1. Geodetic interseismic deformation cannot constrain theowndip limit
Although GPS observations convincingly show that the Cascadiaegathrust is currently locked to some degree and that the zone
f locking is mostly offshore, they cannot constrain the DLSZ or theuture rupture zone for reasons discussed below.
.1.1. Stress shadowThe state of no slip, or “apparent locking”, can arise for different
easons. If the shear stress along the fault is less than the strengthf the fault, the fault cannot move; this is the true state of lock-ng. However, a weak patch of the fault that has reached its failuretress may be kept from slipping simply because a neighbouringtronger patch is truly locked (Wang, 2007). This phenomenon iseferred to as “stress shadowing”. Because of stress shadowing, theeodetically constrained zone of apparent locking tends to be largerhan the zone of true locking. The influence area of a stress shadowepends on the history of fault slip and other regional conditionsnd can impact both the apparent updip and downdip limits of theocked zone (Hetland and Simons, 2010).
.1.2. Temporal changes in locking widthThe zone of true locking may change with time during the inter-
eismic period. In the 2D model of Liu (2013), tuned for Cascadia,he downdip limit of the fully locked zone changes by about 30 kmver the interseismic period, from some distance downdip of therictional stability transition (a − b = 0) to some distance updip of itFig. 1). Narrowing of the locked zone in this fashion is seen alson the strike-slip fault model of Shimamoto and Noda (2014) andppears to be a common feature of rate-state friction models thatnvoke the type of (a − b) distribution represented by the solid linen Fig. 1. This model-predicted temporal variation of the locking
idth further complicates the relationship between the geodeti-ally constrained locked zone and the future rupture zone.
.1.3. Viscoelastic effects and “interseismic” stress relaxationInterseismic locking is commonly modeled using the “back-slip”
ethod (Savage, 1983). With the component of steady subductionubtracted, the fully locked zone becomes a zone that slips back-ard at the subduction rate like a creeping normal fault, and any
one of full-speed creep becomes a zone of zero back slip. A mainroblem in the vast majority of such models is the neglect of theffect of viscoelastic stress relaxation (Wang et al., 2012a). In theiscoelastic Earth, stress accumulation due to the locking of theubduction fault is being viscoelastically relaxed at the same time,uch that the mantle offers less resistance to deformation than inn elastic Earth (Hu et al., 2004; Pollitz et al., 2010; Li et al., 2015).s a result, the locking of the fault causes deformation farther away
rom the plate boundary. We call this process “interseismic stresselaxation” because the stress being relaxed is induced by ongoing
ault locking. It should not be confused with post-seismic stresselaxation, which relaxes the incremental stress induced by thereceding earthquake. Interseismic stress relaxation takes place asong as the fault is locked, regardless of how long it has been since
odynamics 98 (2016) 1–18 9
the previous earthquake and whether the deformation is steady orchanging with time.
In an elastic model, however, the mantle stays elastic and offersgreater resistance to deformation. Two approaches are commonlyseen in the literature on inverting interseismic geodetic observa-tions using elastic back-slip models. In one approach, the fault usedin the inversion extends to a much greater depth than a seismogeniczone based on any of the definitions in Section 2.1 (and Fig. 1).To explain the broad zone of observed interseismic deformation,the effect of mantle relaxation is transferred to the deeper fault,resulting in an overestimate of the downdip extent of the lockedor partially locked zone in the model. For example, in a model ofthis type prior to the 2011 Tohoko-oki earthquake, significant faultlocking was inferred to have occurred as deep as 100 km (Suwaet al., 2006). However, an artificially wide locked zone can inten-tionally be used to approximate the effect of interseismic stressrelaxation in an elastic model (Wang et al., 2003) (Fig. 2b). In theother approach, the locked zone is limited to a depth of 30–50 km,which is considered reasonable based on other geophysical consid-erations. Because the back-slip on this narrower zone cannot causesufficient deformation at large distances, some of the observedfar-field interseismic deformation is either left unaccounted for orexplained as long-term geological deformation (to be further dis-cussed in Section 5.1.4). Also, in order to fit near-field observations,inversion algorithms often use large back-slip rates on parts of thelocked zone to overcome the resistance to deformation offered bythe elastic model. In many publications, the large rates exceed thesubduction rate, giving rise to the physically unreasonable scenarioof normal-faulting creep of the megathrust.
5.1.4. Upper plate deformation and block modelsIn some cases, such as in the central Andes, elastic dislocation
models cannot explain interseismic deformation away from theplate boundary even when a very wide locked zone is allowed, andthe unexplained portion is interpreted to indicate long-term secu-lar motion of crustal blocks of the upper plate (Chlieh, 2011) (thesecond approach discussed in Section 5.1.3). Li et al. (2015) haveshown that this apparent block motion may actually result frominterseismic viscoelastic stress relaxation.
In central and southern Cascadia, there is prominent clockwiserotation of a large portion of the upper plate that needs to beaccounted for in modeling interseismic deformation (McCaffreyet al., 2007, 2013). An example of a possible uncertainty inducedby the introduction of blocks can be found in northern Cascadia,where there is little independent evidence for fast secular deforma-tion of the upper plate. Here, McCaffrey et al. (2007, 2013) had tointroduce 2–3 mm/year of convergence across a NW-trending blockboundary ∼300 km from the deformation front in order to explainobserved margin-normal shortening extending to this area. Usinga viscoelastic mantle rheology, Wang et al. (2012b) explained thesame long-range deformation in northern Cascadia as the effect ofinterseismic viscoelastic relaxation. For central and southern Cas-cadia, neglecting interseismic stress relaxation could lead to anunderestimate of the long-term extension of the broad back arcarea (Basin and Range).
To separate estimates of megathrust locking from block motion,independent observations of block boundaries and kinematics areneeded. Although the block motion models of McCaffrey et al.
ated uncertainties. The megathrust locking model shown in Fig. 2bused the block motion model of Wells and Simpson (2001), andthose in Fig. 2d and e used the McCaffrey et al. (2013) block motionmodel, and both contain uncertainties for this reason.
10 K. Wang, A.M. Tréhu / Journal of G
Fig. 7. Nankai leveling data over a subduction earthquake cycle based on Thatcher(1984), with survey time spans shown colour coded. Data have been hand-smoothedto accentuate long-wavelength patterns. Both lines start from the coast (left end onfigure). However, at Cascadia, the coast line would be located much farther landwardas shown. (a) Line K (along west shore of Kii Peninsula), used by Thatcher and Rundle(Sa
5
dttecmfllseimcsw(id
prcorlhLda
1984) to represent the subduction earthquake deformation cycle in general. (b) Line2 (through the island of Shikoku), used by Hyndman et al. (1995) and Hyndmannd Wang (1995) for comparison with Cascadia.
.1.5. Interseismic vertical deformationIncluding land-based vertical interseismic deformation data
oes not improve resolution of megathrust locking at Cascadia;he drastically different models in Fig. 2e and d both included thisype of data as constraints. Nevertheless, elastic dislocation mod-ls often lead to an impression that the vertical data can betteronstrain the downdip limit of locking. As shown by the elasticodels in Fig. 4, in comparison to the horizontal component of sur-
ace motion, the vertical component is indeed more sensitive to theocation and sharpness of the downdip termination of megathrustocking. However, although the models in Fig. 4 correctly demon-trate the importance of having seafloor geodetic observations,specially for resolving the updip extent of locking, they do notllustrate one of the most diagnostic aspects of interseismic defor-
ation – its evolution with time. The best vertical data set thatovers a full earthquake cycle are the leveling data from the Nankaiubduction zone, southwest Japan (Thatcher, 1984), some of whichere compared with Cascadia leveling data in previous studies
Hyndman et al., 1995; Hyndman and Wang, 1995). It is illuminat-ng to re-examine what these data can tell us about interseismiceformation.
Uplift rates from Nankai leveling data along two margin-normalrofiles nearest to the rupture zone of the 1946 Mw = 8.2 megath-ust earthquake are reproduced in Fig. 7. Both lines start at theoast and extend landward. The measurements over a timespanf about three to four decades before the 1946 earthquake (red)epresent late-stage interseismic deformation. To accentuate theong-wavelength characteristics of these measurements, we have
and-smoothed the data originally presented by Thatcher (1984).eveling only measures relative elevation changes (or tilts). Theata are sometimes tied to tide gauges so that sea level is useds a common reference. Because tide gauge data introduce othereodynamics 98 (2016) 1–18
errors and because we are interested only in the overall shape ofthe elevation profiles, we make no effort to tie the measurementsto a common reference. Every profile in Fig. 7 is thus subject to anarbitrary vertical shift.
The most striking feature of these Nankai observations is theirchange with time, consistent with the prediction of viscoelasticmodels (Thatcher and Rundle, 1984). By comparing the mid-cycleprofile (blue) to the coseismic profile (gray) and assuming elas-tic behaviour, Hyndman and Wang (1995) thought at the timethat interseismic and coseismic deformation were mirror imagesof each other. With global observations, we now understand thatinterseismic deformation changes with time because of viscoelasticrelaxation of the mantle (Wang et al., 2012a; Sun et al., 2014).
The second striking feature is that the uplift rate profile at thelate stage of interseismic deformation is rather flat. Compared toNankai, paleoseismic data indicate that Cascadia megathrust rup-tures were located farther offshore (Leonard et al., 2010; Wanget al., 2013), so that the largest coseismic subsidence occurredat the coast or on the continental shelf (Fig. 7). If the late-stageNankai observations (Fig. 7, red lines) are applicable to Cascadia, thecoastal area is not necessarily tilting landward (Fig. 7a) as predictedby many elastic models (Fig. 4). Sea level observations indicatelandward tilting of Vancouver Island over the past few thousandyears (Hutchinson et al., 2000), which cannot be explained usinginterseismic deformation. If this signal is subtracted from previouspublished leveling data (Wang et al., 2003), the remaining flat pro-file is reminiscent of the Nankai leveling observations. Reportedleveling data for the Cascadia margin generally show landward tilt(e.g., Burgette et al., 2009). Whether they reflect mostly, or includea component of, longer-term tilt as inferred for Vancouver Island isyet to be investigated.
In general, the value of vertical interseismic deformation obser-vations has not been adequately explored. One reason is the poorsignal-to-noise ratio. In interseismic GPS velocities, the verticalcomponent is much smaller than the horizontal component (Fig. 4)yet the uncertainties are well known to be much larger. Vari-ous meteorological and hydrological processes give rise to verticaldeformation signals of timescales of years to decades, and removingthese “noises” for the purpose of isolating interseismic deformationsignals remains a challenge. Another reason is that at subduc-tion zones the geological and geodynamic processes responsiblefor crustal tilting, detected by vertical measurements, are morepoorly understood than those responsible for crustal straining,detected by horizontal measurements. For example, what causesthe millennium-timescale landward tilting of Vancouver Islandmentioned above is presently unknown.
5.2. New questions about the thermal limit and fault gougerheology
There is no question that thermally-regulated rheology pro-vides the ultimate control on the downdip termination of seismicbehaviour of subduction megathrusts, although the exact temper-ature may depend on a number of other parameters. Assuming adowndip distribution of friction parameter (a − b) as representedby the solid line in Fig. 1, Hyndman and Wang (1993) proposed todefine the seismogenic zone using the deeper stability transition(definition A in Section 2.1). Laboratory friction experiments ongranitic rocks showed that the transition happens at temperaturesaround 350 ◦C (Blanpied et al., 1991). Crustal earthquakes appearto be limited by a similar temperature (Wong and Chapman, 1990).
Hyndman and Wang (1993) used this temperature to define thestability transition. They also assumed that the actual seismic rup-ture could extend into the velocity-strengthening zone of (a − b) > 0but was limited by, for lack of more precise knowledge, a tempera-
l of Ge
tp
5
gnifsieLtdrwtoactCaz
raadtmfeSdsfgptmga
5
sttbauiaehcib22ban
K. Wang, A.M. Tréhu / Journa
ure of 450 ◦C. Here we discuss two new issues prompted by recentublications.
.2.1. The role of gabbroHe et al. (2007) reported over 30 friction experiments on gabbro
ouge under hydrothermal conditions for various combinations oformal stress, pore fluid pressure, and temperature. For the major-
ty of the experiments, the gouge exhibited velocity-strengtheningor the tested temperatures up to 600 ◦C, with a few experimentshowing velocity-weakening in the 200–300 ◦C range. Two exper-ments at 416 ◦C and one at 507 ◦C, at effective pressure 100 MPa,xhibited velocity-weakening. These two data points were used byiu and Rice (2009) to argue for seismogenic behaviour of gabbro upo a temperature of 510 ◦C in rate-state friction modelling of Casca-ia slow slip events. In contrast, Mitchell et al. (2015) more recentlyeported friction experiment results for gabbro that show velocity-eakening for temperatures higher than 100 ◦C and up to 600 ◦C,
he highest temperature tested in their experiments, for a varietyf laboratory conditions. Because the igneous oceanic crust is maficnd the subducting slab may be in contact with the gabbroic lowerrust of the upper plate Crescent/Siletz terrane (Tréhu et al., 1994),he frictional behaviour of gabbro gouge may be relevant for theascadia megathrust. If earthquakes could initiate here at temper-tures as high as 510–600 ◦C, the downdip limit of the seismogenicone (definition A) would be much deeper than generally thought.
A key question, however, is whether gabbro represents megath-ust fault gouge. Because the surface of the basaltic oceanic crustlways has relief, it always carries some sediment as it subducts,nd in some cases several hundred meters of sediment may be sub-ucted, as suggested by Fig. 6b and d. At greater depths, pieces ofhe underside of the upper plate and/or the top of the oceanic crust
ay be entrained in the subduction process. The fault zone there-ore consists of a melange of rocks from various sources (Kimurat al., 2012), with bands of more localized shear (Rowe et al., 2013).eafloor sediments, especially terrigenous sediment that is abun-ant at Cascadia, are rich in quartz, and these entrained sedimentstrongly affect megathrust behaviour. He et al. (2013) conductedurther experiments on the primary ingredients of gabbro, pla-ioclase and pyroxene. They found that although plagioclase andyroxene gouge tend to exhibit velocity-weakening over a wideemperature range, the addition of a small amount of quartz can
ake the gouge highly velocity-strengthening. The appropriateouge composition for Cascadia, and how it changes along strikend dip, deserves further research.
.2.2. Hydrothermal cooling of the subducting crustRecently, effects of vigorous hydrothermal circulation in the
ubducted oceanic crust have been incorporated into models ofhe shallow thermal regime of subduction zones. It is well knownhat fractured basaltic crust of young oceanic lithosphere hostsuoyancy-driven hydrothermal convection (see Sclater (2004) for
historical account), and that convection can still be vigorous evennder a nearly impermeable sediment cover (Davis et al., 1997). It
s logical to envision that the circulation may be sustained evenfter subduction if there is high enough permeability and largenough thermal buoyancy. Spinelli and Wang (2008) showed thateat flow measurements in one area of the Nankai subduction zoneannot be explained unless very vigorous hydrothermal circulations assumed to occur in the subducted crust. The same concept haseen applied to other subduction zones (e.g., Rotman and Spinelli,014; Wang et al., 2015), including Cascadia (Cozzens and Spinelli,
012). In these models, the fluid circulation itself is not simulated,ut the thermal effect of the circulation is parameterized by usingvery high thermal conductivity value representing high Nusseltumber following the recipe of Davis et al. (1997).
odynamics 98 (2016) 1–18 11
The effect of the circulation is to “move” heat from the deeperpart of the system to the trench, resulting in a warmer trench butcolder megathrust at greater depths. In the results of Cozzens andSpinelli (2012), the location of the 350 ◦C isotherm of the Casca-dia megathrust is moved landward by 30–55 km from what wasshown in Hyndman and Wang (1995). Hyndman (2013) questionsthe necessity of introducing this vigorous circulation at Casca-dia. Indeed, the same heat flow data off and on Vancouver Islandhave been examined in several thermal modeling studies (Wanget al., 1995; Currie et al., 2004; Wada and Wang, 2009; Gao andWang, 2014), and can be explained without including circulation.Therefore, how the circulation affects megathrust temperature atCascadia is still an open question.
6. Controversial relationship between the seismogeniczone and ETS
Since the discovery of episodic slow slip events (SSEs) in Cas-cadia (Dragert et al., 2001) and non-volcanic seismic tremor thataccompanies them (Obara, 2002; Rogers and Dragert, 2003), ETSand a variety of related phenomena have been the focus of intensestudy in Cascadia and around the world. Here we will not attempta comprehensive review of the many studies characterizing thetime/space patterns of ETS but will focus on a few issues relatedto understanding the seismogenic behaviour of the megathrust.See Schwartz and Rokosky (2007) or Peng and Gomberg (2010) forglobal reviews and Gomberg et al. (2010) and Boyarko et al. (2015)for reviews focusing on Cascadia.
Cascadia SSEs are centered at a depth of about 30–40 km if mod-elled using the plate interface geometry of McCrory et al. (2004,2012) (Dragert and Wang, 2011). In map view, the tremor distribu-tion presented in most publications is shifted slightly landward ofthe corresponding SSEs (e.g., Dragert and Wang, 2011; Wech andCreager, 2011; Boyarko et al., 2015). Determining tremor depth isdifficult and depends on the method used (Kao et al., 2005). Smalllow-frequency earthquakes (LFEs) embedded in the tremor cloudare interpreted to be particularly energetic tremor sources andare representative of tremor sources more generally (Shelly et al.,2007). Based on this interpretation, LFEs identified and located byBostock et al. (2012) and Royer and Bostock (2014) best define thetremor location in northern Cascadia. These LFEs form a rather thinband, consistent with the interpretation that LFEs and tremor orig-inate mostly along, and are driven by slip or shear of, the faultzone. The same understanding applies to the LFE/tremor distribu-tion in the Nankai subduction zone (Obara, 2010) and along the SanAndreas Fault (Shelly and Hardebeck, 2010). When tremor occurswithout a geodetic signal, it is probably because the responsible slipis too small to be detected with commonly used geodetic methods(e.g., Wang et al., 2008; Obara, 2011; Dragert and Wang, 2011). Inthis situation, tremor is considered a proxy for slip.
6.1. Does updip limit of ETS correspond to the downdip limit ofthe seismogenic zone?
A question of paramount importance to both subduction zonegeodynamics and earthquake risk mitigation is whether ETSmarks the downdip limit of the seismogenic zone (Chapman andMelbourne, 2009). Based on rate-state modeling, SSEs can be man-ifestations of oscillatory behaviour of the fault within the velocityweakening zone (a − b < 0) but very near the stability transition of(a − b) = 0 (see Fig. 1, red solid line) under extremely low effective
normal stresses (e.g., Liu and Rice, 2009). Thus, using seismogeniczone definition A (Fig. 1), the modeled SSEs should be within theseismogenic zone but near its downdip limit. If the actual rupturein great earthquakes extends deeper than the stability transition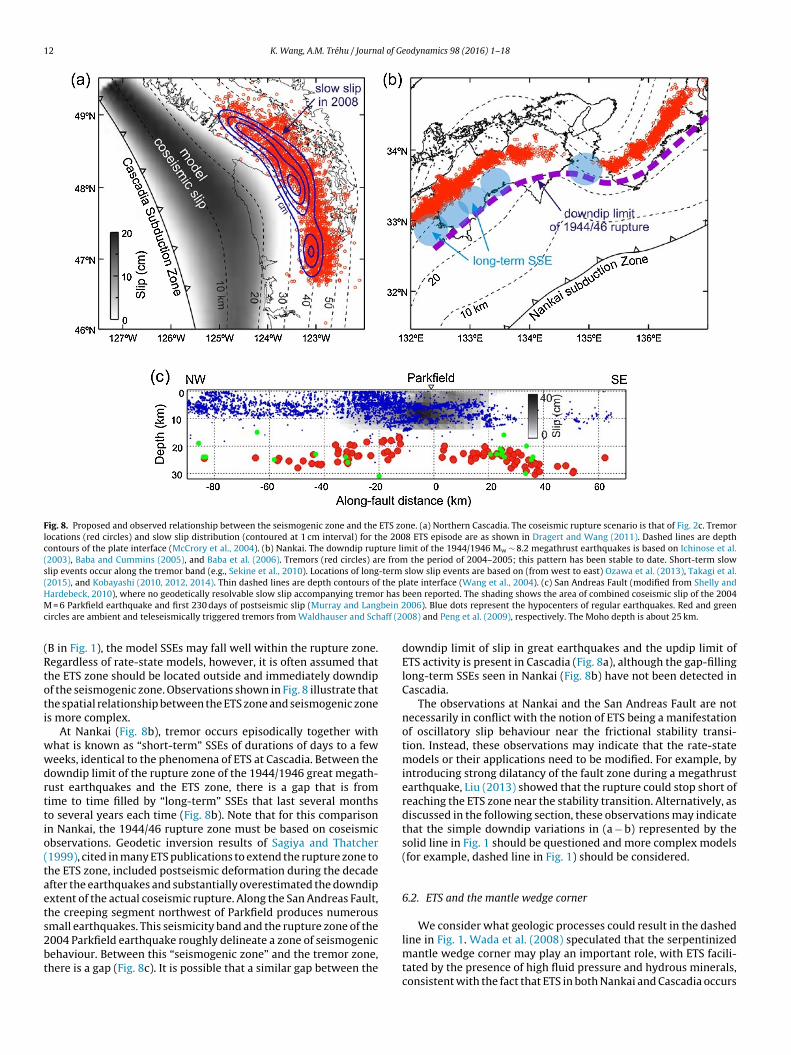
12 K. Wang, A.M. Tréhu / Journal of Geodynamics 98 (2016) 1–18
Fig. 8. Proposed and observed relationship between the seismogenic zone and the ETS zone. (a) Northern Cascadia. The coseismic rupture scenario is that of Fig. 2c. Tremorlocations (red circles) and slow slip distribution (contoured at 1 cm interval) for the 2008 ETS episode are as shown in Dragert and Wang (2011). Dashed lines are depthcontours of the plate interface (McCrory et al., 2004). (b) Nankai. The downdip rupture limit of the 1944/1946 Mw ∼ 8.2 megathrust earthquakes is based on Ichinose et al.(2003), Baba and Cummins (2005), and Baba et al. (2006). Tremors (red circles) are from the period of 2004–2005; this pattern has been stable to date. Short-term slowslip events occur along the tremor band (e.g., Sekine et al., 2010). Locations of long-term slow slip events are based on (from west to east) Ozawa et al. (2013), Takagi et al.(2015), and Kobayashi (2010, 2012, 2014). Thin dashed lines are depth contours of the plate interface (Wang et al., 2004). (c) San Andreas Fault (modified from Shelly andH r has
M bein 2c aff (2
(Rtoti
wwdrttio(taets2bt
ardebeck, 2010), where no geodetically resolvable slow slip accompanying tremo = 6 Parkfield earthquake and first 230 days of postseismic slip (Murray and Lang
ircles are ambient and teleseismically triggered tremors from Waldhauser and Sch
B in Fig. 1), the model SSEs may fall well within the rupture zone.egardless of rate-state models, however, it is often assumed thathe ETS zone should be located outside and immediately downdipf the seismogenic zone. Observations shown in Fig. 8 illustrate thathe spatial relationship between the ETS zone and seismogenic zones more complex.
At Nankai (Fig. 8b), tremor occurs episodically together withhat is known as “short-term” SSEs of durations of days to a feweeks, identical to the phenomena of ETS at Cascadia. Between theowndip limit of the rupture zone of the 1944/1946 great megath-ust earthquakes and the ETS zone, there is a gap that is fromime to time filled by “long-term” SSEs that last several monthso several years each time (Fig. 8b). Note that for this comparisonn Nankai, the 1944/46 rupture zone must be based on coseismicbservations. Geodetic inversion results of Sagiya and Thatcher1999), cited in many ETS publications to extend the rupture zone tohe ETS zone, included postseismic deformation during the decadefter the earthquakes and substantially overestimated the downdipxtent of the actual coseismic rupture. Along the San Andreas Fault,he creeping segment northwest of Parkfield produces numerousmall earthquakes. This seismicity band and the rupture zone of the
004 Parkfield earthquake roughly delineate a zone of seismogenicehaviour. Between this “seismogenic zone” and the tremor zone,here is a gap (Fig. 8c). It is possible that a similar gap between thebeen reported. The shading shows the area of combined coseismic slip of the 2004006). Blue dots represent the hypocenters of regular earthquakes. Red and green
008) and Peng et al. (2009), respectively. The Moho depth is about 25 km.
downdip limit of slip in great earthquakes and the updip limit ofETS activity is present in Cascadia (Fig. 8a), although the gap-fillinglong-term SSEs seen in Nankai (Fig. 8b) have not been detected inCascadia.
The observations at Nankai and the San Andreas Fault are notnecessarily in conflict with the notion of ETS being a manifestationof oscillatory slip behaviour near the frictional stability transi-tion. Instead, these observations may indicate that the rate-statemodels or their applications need to be modified. For example, byintroducing strong dilatancy of the fault zone during a megathrustearthquake, Liu (2013) showed that the rupture could stop short ofreaching the ETS zone near the stability transition. Alternatively, asdiscussed in the following section, these observations may indicatethat the simple downdip variations in (a − b) represented by thesolid line in Fig. 1 should be questioned and more complex models(for example, dashed line in Fig. 1) should be considered.
6.2. ETS and the mantle wedge corner
We consider what geologic processes could result in the dashed
line in Fig. 1. Wada et al. (2008) speculated that the serpentinizedmantle wedge corner may play an important role, with ETS facili-tated by the presence of high fluid pressure and hydrous minerals,consistent with the fact that ETS in both Nankai and Cascadia occurs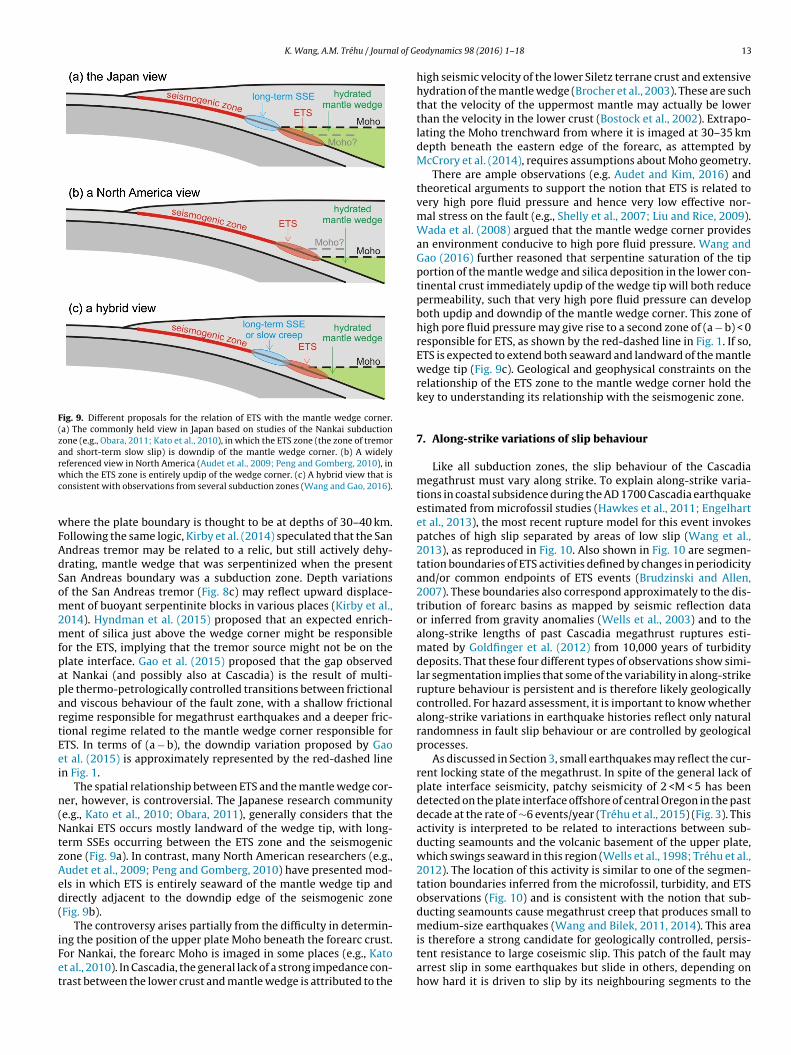
K. Wang, A.M. Tréhu / Journal of Ge
Fig. 9. Different proposals for the relation of ETS with the mantle wedge corner.(a) The commonly held view in Japan based on studies of the Nankai subductionzone (e.g., Obara, 2011; Kato et al., 2010), in which the ETS zone (the zone of tremorand short-term slow slip) is downdip of the mantle wedge corner. (b) A widelyrwc
wFAdSom2mfpapartEei
n(NtzAed(
iFet
eferenced view in North America (Audet et al., 2009; Peng and Gomberg, 2010), inhich the ETS zone is entirely updip of the wedge corner. (c) A hybrid view that is
onsistent with observations from several subduction zones (Wang and Gao, 2016).
here the plate boundary is thought to be at depths of 30–40 km.ollowing the same logic, Kirby et al. (2014) speculated that the Sanndreas tremor may be related to a relic, but still actively dehy-rating, mantle wedge that was serpentinized when the presentan Andreas boundary was a subduction zone. Depth variationsf the San Andreas tremor (Fig. 8c) may reflect upward displace-ent of buoyant serpentinite blocks in various places (Kirby et al.,
014). Hyndman et al. (2015) proposed that an expected enrich-ent of silica just above the wedge corner might be responsible
or the ETS, implying that the tremor source might not be on thelate interface. Gao et al. (2015) proposed that the gap observedt Nankai (and possibly also at Cascadia) is the result of multi-le thermo-petrologically controlled transitions between frictionalnd viscous behaviour of the fault zone, with a shallow frictionalegime responsible for megathrust earthquakes and a deeper fric-ional regime related to the mantle wedge corner responsible forTS. In terms of (a − b), the downdip variation proposed by Gaot al. (2015) is approximately represented by the red-dashed linen Fig. 1.
The spatial relationship between ETS and the mantle wedge cor-er, however, is controversial. The Japanese research communitye.g., Kato et al., 2010; Obara, 2011), generally considers that theankai ETS occurs mostly landward of the wedge tip, with long-
erm SSEs occurring between the ETS zone and the seismogenicone (Fig. 9a). In contrast, many North American researchers (e.g.,udet et al., 2009; Peng and Gomberg, 2010) have presented mod-ls in which ETS is entirely seaward of the mantle wedge tip andirectly adjacent to the downdip edge of the seismogenic zoneFig. 9b).
The controversy arises partially from the difficulty in determin-
ng the position of the upper plate Moho beneath the forearc crust.or Nankai, the forearc Moho is imaged in some places (e.g., Katot al., 2010). In Cascadia, the general lack of a strong impedance con-rast between the lower crust and mantle wedge is attributed to theodynamics 98 (2016) 1–18 13
high seismic velocity of the lower Siletz terrane crust and extensivehydration of the mantle wedge (Brocher et al., 2003). These are suchthat the velocity of the uppermost mantle may actually be lowerthan the velocity in the lower crust (Bostock et al., 2002). Extrapo-lating the Moho trenchward from where it is imaged at 30–35 kmdepth beneath the eastern edge of the forearc, as attempted byMcCrory et al. (2014), requires assumptions about Moho geometry.
There are ample observations (e.g. Audet and Kim, 2016) andtheoretical arguments to support the notion that ETS is related tovery high pore fluid pressure and hence very low effective nor-mal stress on the fault (e.g., Shelly et al., 2007; Liu and Rice, 2009).Wada et al. (2008) argued that the mantle wedge corner providesan environment conducive to high pore fluid pressure. Wang andGao (2016) further reasoned that serpentine saturation of the tipportion of the mantle wedge and silica deposition in the lower con-tinental crust immediately updip of the wedge tip will both reducepermeability, such that very high pore fluid pressure can developboth updip and downdip of the mantle wedge corner. This zone ofhigh pore fluid pressure may give rise to a second zone of (a − b) < 0responsible for ETS, as shown by the red-dashed line in Fig. 1. If so,ETS is expected to extend both seaward and landward of the mantlewedge tip (Fig. 9c). Geological and geophysical constraints on therelationship of the ETS zone to the mantle wedge corner hold thekey to understanding its relationship with the seismogenic zone.
7. Along-strike variations of slip behaviour
Like all subduction zones, the slip behaviour of the Cascadiamegathrust must vary along strike. To explain along-strike varia-tions in coastal subsidence during the AD 1700 Cascadia earthquakeestimated from microfossil studies (Hawkes et al., 2011; Engelhartet al., 2013), the most recent rupture model for this event invokespatches of high slip separated by areas of low slip (Wang et al.,2013), as reproduced in Fig. 10. Also shown in Fig. 10 are segmen-tation boundaries of ETS activities defined by changes in periodicityand/or common endpoints of ETS events (Brudzinski and Allen,2007). These boundaries also correspond approximately to the dis-tribution of forearc basins as mapped by seismic reflection dataor inferred from gravity anomalies (Wells et al., 2003) and to thealong-strike lengths of past Cascadia megathrust ruptures esti-mated by Goldfinger et al. (2012) from 10,000 years of turbiditydeposits. That these four different types of observations show simi-lar segmentation implies that some of the variability in along-strikerupture behaviour is persistent and is therefore likely geologicallycontrolled. For hazard assessment, it is important to know whetheralong-strike variations in earthquake histories reflect only naturalrandomness in fault slip behaviour or are controlled by geologicalprocesses.
As discussed in Section 3, small earthquakes may reflect the cur-rent locking state of the megathrust. In spite of the general lack ofplate interface seismicity, patchy seismicity of 2 <M < 5 has beendetected on the plate interface offshore of central Oregon in the pastdecade at the rate of ∼6 events/year (Tréhu et al., 2015) (Fig. 3). Thisactivity is interpreted to be related to interactions between sub-ducting seamounts and the volcanic basement of the upper plate,which swings seaward in this region (Wells et al., 1998; Tréhu et al.,2012). The location of this activity is similar to one of the segmen-tation boundaries inferred from the microfossil, turbidity, and ETSobservations (Fig. 10) and is consistent with the notion that sub-ducting seamounts cause megathrust creep that produces small tomedium-size earthquakes (Wang and Bilek, 2011, 2014). This area
is therefore a strong candidate for geologically controlled, persis-tent resistance to large coseismic slip. This patch of the fault mayarrest slip in some earthquakes but slide in others, depending onhow hard it is driven to slip by its neighbouring segments to the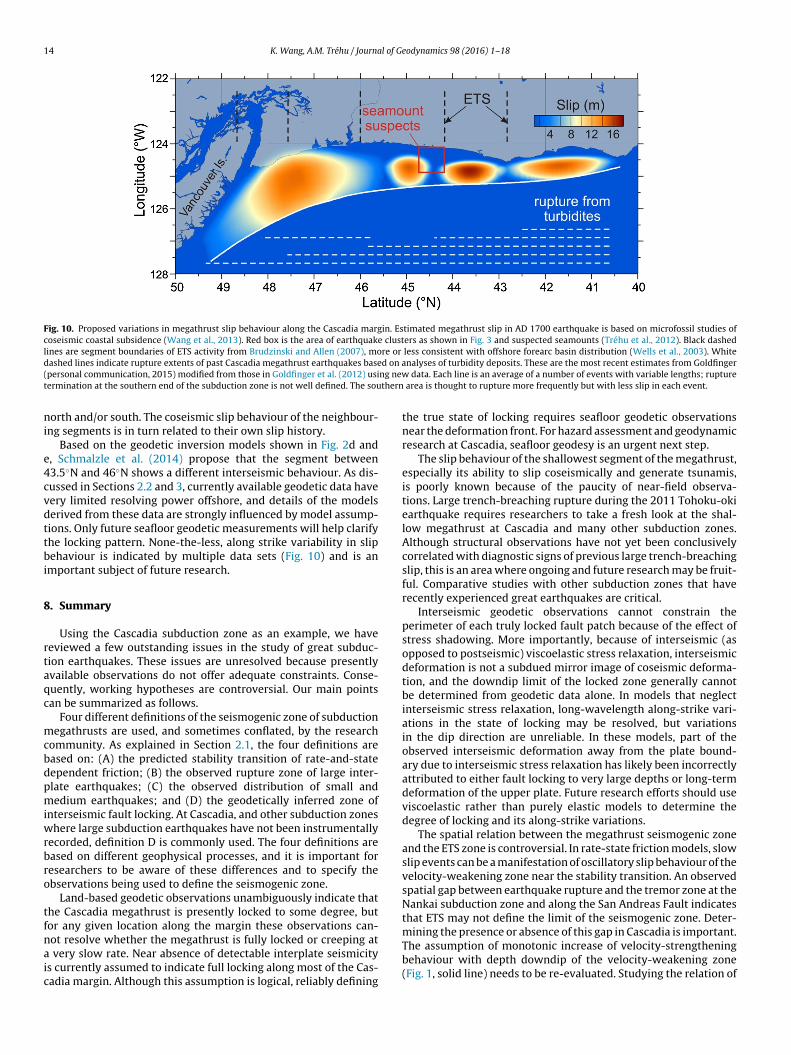
14 K. Wang, A.M. Tréhu / Journal of Geodynamics 98 (2016) 1–18
Fig. 10. Proposed variations in megathrust slip behaviour along the Cascadia margin. Estimated megathrust slip in AD 1700 earthquake is based on microfossil studies ofcoseismic coastal subsidence (Wang et al., 2013). Red box is the area of earthquake clusters as shown in Fig. 3 and suspected seamounts (Tréhu et al., 2012). Black dashedlines are segment boundaries of ETS activity from Brudzinski and Allen (2007), more or less consistent with offshore forearc basin distribution (Wells et al., 2003). Whited d on a( ng newt thern
ni
e4cvdttbi
8
rtaqc
mcbdpmiwrbro
tfnaic
ashed lines indicate rupture extents of past Cascadia megathrust earthquakes basepersonal communication, 2015) modified from those in Goldfinger et al. (2012) usiermination at the southern end of the subduction zone is not well defined. The sou
orth and/or south. The coseismic slip behaviour of the neighbour-ng segments is in turn related to their own slip history.
Based on the geodetic inversion models shown in Fig. 2d and, Schmalzle et al. (2014) propose that the segment between3.5◦N and 46◦N shows a different interseismic behaviour. As dis-ussed in Sections 2.2 and 3, currently available geodetic data haveery limited resolving power offshore, and details of the modelserived from these data are strongly influenced by model assump-ions. Only future seafloor geodetic measurements will help clarifyhe locking pattern. None-the-less, along strike variability in slipehaviour is indicated by multiple data sets (Fig. 10) and is an
mportant subject of future research.
. Summary
Using the Cascadia subduction zone as an example, we haveeviewed a few outstanding issues in the study of great subduc-ion earthquakes. These issues are unresolved because presentlyvailable observations do not offer adequate constraints. Conse-uently, working hypotheses are controversial. Our main pointsan be summarized as follows.
Four different definitions of the seismogenic zone of subductionegathrusts are used, and sometimes conflated, by the research
ommunity. As explained in Section 2.1, the four definitions areased on: (A) the predicted stability transition of rate-and-stateependent friction; (B) the observed rupture zone of large inter-late earthquakes; (C) the observed distribution of small andedium earthquakes; and (D) the geodetically inferred zone of
nterseismic fault locking. At Cascadia, and other subduction zoneshere large subduction earthquakes have not been instrumentally
ecorded, definition D is commonly used. The four definitions areased on different geophysical processes, and it is important foresearchers to be aware of these differences and to specify thebservations being used to define the seismogenic zone.
Land-based geodetic observations unambiguously indicate thathe Cascadia megathrust is presently locked to some degree, butor any given location along the margin these observations can-
ot resolve whether the megathrust is fully locked or creeping atvery slow rate. Near absence of detectable interplate seismicitys currently assumed to indicate full locking along most of the Cas-adia margin. Although this assumption is logical, reliably defining
nalyses of turbidity deposits. These are the most recent estimates from Goldfinger data. Each line is an average of a number of events with variable lengths; rupture
area is thought to rupture more frequently but with less slip in each event.
the true state of locking requires seafloor geodetic observationsnear the deformation front. For hazard assessment and geodynamicresearch at Cascadia, seafloor geodesy is an urgent next step.
The slip behaviour of the shallowest segment of the megathrust,especially its ability to slip coseismically and generate tsunamis,is poorly known because of the paucity of near-field observa-tions. Large trench-breaching rupture during the 2011 Tohoku-okiearthquake requires researchers to take a fresh look at the shal-low megathrust at Cascadia and many other subduction zones.Although structural observations have not yet been conclusivelycorrelated with diagnostic signs of previous large trench-breachingslip, this is an area where ongoing and future research may be fruit-ful. Comparative studies with other subduction zones that haverecently experienced great earthquakes are critical.
Interseismic geodetic observations cannot constrain theperimeter of each truly locked fault patch because of the effect ofstress shadowing. More importantly, because of interseismic (asopposed to postseismic) viscoelastic stress relaxation, interseismicdeformation is not a subdued mirror image of coseismic deforma-tion, and the downdip limit of the locked zone generally cannotbe determined from geodetic data alone. In models that neglectinterseismic stress relaxation, long-wavelength along-strike vari-ations in the state of locking may be resolved, but variationsin the dip direction are unreliable. In these models, part of theobserved interseismic deformation away from the plate bound-ary due to interseismic stress relaxation has likely been incorrectlyattributed to either fault locking to very large depths or long-termdeformation of the upper plate. Future research efforts should useviscoelastic rather than purely elastic models to determine thedegree of locking and its along-strike variations.
The spatial relation between the megathrust seismogenic zoneand the ETS zone is controversial. In rate-state friction models, slowslip events can be a manifestation of oscillatory slip behaviour of thevelocity-weakening zone near the stability transition. An observedspatial gap between earthquake rupture and the tremor zone at theNankai subduction zone and along the San Andreas Fault indicatesthat ETS may not define the limit of the seismogenic zone. Deter-
mining the presence or absence of this gap in Cascadia is important.The assumption of monotonic increase of velocity-strengtheningbehaviour with depth downdip of the velocity-weakening zone(Fig. 1, solid line) needs to be re-evaluated. Studying the relation of
l of Ge
ts
svgtrobttngttf
A
fmba2
R
A
A
A
A
A
A
B
B
B
B
B
B
B
B
B
K. Wang, A.M. Tréhu / Journa
he ETS zone with the mantle wedge corner is important to under-tanding its relation with the seismogenic zone.
The Cascadia megathrust exhibits along-strike variations in itslip behaviour. The present state of interseismic locking may alsoary along strike but is difficult to resolve using only land-basedeodetic observations because the signal is very small comparedo uncertainties in the data. Along-strike variations in the occur-ence of interplate seismicity may contain information on the statef locking vs. creep. At Cascadia, a possible candidate for creep iseneath the continental shelf off central Oregon, where interac-ion between a subducting seamount and the crystalline crust ofhe upper plate may be responsible for small earthquakes on andear the megathrust. In future research, it is important to investi-ate whether there are structurally controlled, persistent barrierso large coseismic slip, as well as other factors that may give riseo heterogeneity in slip behaviour such as pore fluid pressure andault gouge composition.
cknowledgements
The authors thank the Editorial team of Journal of Geodynamicsor inviting us to write this review article and two anony-
ous reviewers for their comments. AMT was partially supportedy U.S. National Science Foundation grants 1130013, 1147975,nd 1355878. This is Geological Survey of Canada contribution0150275.
eferences
dams, J., 1990. Paleoseismicity of the Cascadia subduction zone: evidence fromturbidites off the Oregon-Washington margin. Tectonics 9 (4), 569–583, http://dx.doi.org/10.1029/TC009i004p00569.
twater, B.F., Satoko, M.-R., Kenji, S., Yoshinobu, T., Kazue, U., Yamaguchi, D.K.,2005. The Orphan Tsunami of 1700: Japanese Clues to a Parent Earthquake inNorth America. In: U.S. Geological Survey (Ed.). U.S. Geol. Surv. and Univ. ofWash. Press.
twater, B.F., Carson, B., Griggs, G.B., Johnson, H.P., Salmi, M.S., 2014. Rethinkingturbidite paleoseismology along the Cascadia subduction zone. Geology,http://dx.doi.org/10.1130/g35902.1.
twater, B.F., 1987. Evidence for great Holocene earthquakes along the outer coastof Washington State. Science 236, 942–944.
udet, P., Kim, Y., 2016. Teleseismic constraints on the geological environment ofdeep episodic slow earthquakes in subduction zone forearcs: a review.Tectonophysics 670, 1–16, http://dx.doi.org/10.1016/j.tecto.2016.01.005.
udet, P., Bostock, M.G., Christensen, N.I., Peacock, S.M., 2009. Seismic evidence foroverpressured subducted oceanic crust and megathrust fault sealing. Nature457, 76–78, http://dx.doi.org/10.1038/nature07650.
aba, T., Cummins, P.R., 2005. Contiguous rupture areas of two Nankai Troughearthquakes revealed by high-resolution tsunami waveform inversion.Geophys. Res. Lett. 32, http://dx.doi.org/10.1029/2004gl022320, L08305.
aba, T., Cummins, P.R., Hori, T., Kaneda, Y., 2006. High precision slip distributionof the 1944 Tonankai earthquake inferred from tsunami waveforms: possibleslip on a splay fault. Tectonophysics 426, 119–134.
achmann, R., Oncken, O., Glodny, J., Seifert, W., Georgieva, V., Sudo, M., 2009.Exposed plate interface in the European Alps reveals fabric styles andgradients related to an ancient seismogenic coupling zone. J. Geophys. Res.114, http://dx.doi.org/10.1029/2008jb005927, B05402.
lanpied, M.L., Lockner, D.A., Byerlee, J.D., 1991. Fault stability inferred fromgranite sliding experiments at hydrothermal conditions. Geophys. Res. Lett. 18,609–612, http://dx.doi.org/10.1029/91GL00469.
ooth-Rea, G., Klaeschen, D., Grevemeyer, I., Reston, T., 2007. Heterogeneousdeformation in the Cascadia convergent margin and its relation to thermalgradient (Washington, NW USA). Tectonics 27, http://dx.doi.org/10.1029/2007tc002209, TC4005.
ostock, M.G., Hyndman, R.D., Rondenay, S., Peacock, S.M., 2002. An invertedcontinental Moho and serpentinization of the forearc mantle. Nature 417,536–538, http://dx.doi.org/10.1038/417536a.
ostock, M.G., Royer, A.A., Hearn, E.H., Peacock, S.M., 2012. Low frequencyearthquakes below southern Vancouver Island. Geochem. Geophys. Geosyst.13, http://dx.doi.org/10.1029/2012gc004391.
oyarko, D.C., Brudzinski, M.R., Porritt, R.W., Allen, R.M., Tréhu, A.M., 2015.
Automated detection and location of tectonic tremor along the entire Cascadiamargin from 2005 to 2011. Earth Planet. Sci. Lett. 430, 160–170.riggs, R.W., et al., 2006. Deformation and slip along the Sunda Megathrust in thegreat 2005 Nias-Simeulue earthquake. Science 311, 1897–1901, http://dx.doi.org/10.1126/science.1122602.
odynamics 98 (2016) 1–18 15
Brocher, T.M., Parsons, T., Tréhu, A.M., Snelson, C.M., Fisher, M.A., 2003. Seismicevidence for widespread serpentinized forearc upper mantle along theCascadia margin. Geology 31, 267–270, http://dx.doi.org/10.1130/0091-7613(2003)031<0267:SEFWSF>2.0.CO;2.
Brudzinski, M.R., Allen, R.M., 2007. Segmentation in episodic tremor and slip allalong Cascadia. Geology 35 (10), 907–910.
Burgette, R.J., Weldon, R., Schmidt, D.A., 2009. Interseismic uplift rates for westernOregon and along strike variation in locking on the Cascadia subduction zone.J. Geophys. Res. 114, http://dx.doi.org/10.1029/2008JB005679, B01408.
Burgmann, R., Chadwell, D., 2014. Seafloor geodesy. Annu. Rev. Earth Planet. Sci.42, 509–534, http://dx.doi.org/10.1146/annurev-earth-060313-054953.
Chapman, J.S., Melbourne, T.I., 2009. Future Cascadia megathrust rupturedelineated by episodic tremor and slip. Geophys. Res. Lett. 36, http://dx.doi.org/10.1029/2009gl040465, L22301.
Cherniawsky, J.Y., Titov, V.V., Wang, K., Li, J.-Y., 2007. Numerical simulations oftsunami waves and currents for southern Vancouver Island from a Cascadiamegathrust earthquake. Pure Appl. Geophys. 164, 465–492.
Chlieh, M., 2011. Interseismic coupling and seismic potential along the CentralAndes subduction zone. J. Geophys. Res. 116, http://dx.doi.org/10.1029/2010jb008166, B12405.
Cozzens, B.D., Spinelli, G.A., 2012. A wider seismogenic zone at Cascadia due tofluid circulation in subducting oceanic crust. Geology 40, 899–902, http://dx.doi.org/10.1130/G33019.1.
Currie, C.A., Wang, K., Hyndman, R.D., He, J., 2004. The thermal effects ofslab-driven mantle flow above a subducting plate: the Cascadia subductionzone and backarc. Earth Planet. Sci. Lett. 223, 35–48.
Davis, E.E., Wang, K., He, J., Chapman, D., Villinger, H., Rosenberger, A., 1997. Anunequivocal case for high Nusselt number hydrothermal convection insediment-buried igneous oceanic crust. Earth Planet. Sci. Lett. 146, 137–150.
Demets, C., Gordon, R.G., Argus, D.F., 2010. Geologically current plate motions.Geophys. J. Int. 181, 1–80, http://dx.doi.org/10.1111/j.1365-246X.2009.04491.x.
Di Toro, G., et al., 2011. Fault lubrication during earthquakes. Nature 427 (6973),436–439.
Dragert, H., Wang, K., 2011. Temporal evolution of an ETS event along the northernCascadia margin. J. Geophys. Res. 116, http://dx.doi.org/10.1029/2011JB008609, B12406.
Dragert, H., Wang, K., James, T.S., 2001. A silent slip event on the deeper Cascadiasubduction interface. Science 292, 1525–1528.
Emry, E.L., Wiens, D.A., Shiobara, H., Sugioka, H., 2011. Seismogenic characteristicsof the Northern Mariana shallow thrust zone from local array data. Geochem.Geophys. Geosyst. 12, http://dx.doi.org/10.1029/2011GC003853, Q12008.
Engelhart, S.E., Horton, B.P., Vane, C.H., Nelson, A.R., Witter, R.C., Brody, S.R.,Hawkes, A.D., 2013. Modern foraminifera, �13C, and bulk geochemistry ofcentral Oregon tidal marshes and their application in paleoseismology.Palaeogeogr. Palaeoclimatol. Palaeoecol. 377, 13–17.
Faulkner, D.R., Mitchell, T.M., Behnsen, J., Hirose, T., Shimamoto, T., 2011. Stuck inthe mud? Earthquake nucleation and propagation through accretionaryforearcs. Geophys. Res. Lett. 38, http://dx.doi.org/10.1029/2011gl048552,L18303.
Fisher, M., Michael, A., Hyndman, R.D., Johnson, S.Y., Brocher, T.M., Crosson, R.S.,Wells, R.E., Calvert, A.J., ten Brink, U.S., 2006. Crustal structure and earthquakehazards of the subduction zone in southwestern British Columbia and westernWashington, in: Kayen, R., ed., Earthquake hazards of the Pacific Northwestcostal and marine regions: USGS Professional Paper 1661-C.
Flueh, E.R., et al., 1998. New seismic images of the Cascadia subduction zone fromcruise SO108-ORWELL. Tectonophysics 293, 69–84.
Fujiwara, T., Kodaira, S., No, T., Kaiho, Y., Takahashi, N., Kaneda, Y., 2011. TheTohoku-oki earthquake: displacement reaching the trench axis. Science 334,1240, http://dx.doi.org/10.1126/science.1211554.
Fukao, Y., 1979. Tsunami earthquakes and subduction processes near deep-seatrenches. J. Geophys. Res. 84 (5), 2303–2314.
Flück, P., Hyndman, R.D., Wang, K., 1997. 3-D dislocation model for greatearthquakes of the Cascadia subduction zone. J. Geophys. Res. 102,20539–20550.
Gagnon, K., Chadwell, C.D., Norabuena, E., 2005. Measuring the onset of locking inthe Peru-Chile trench with GPS and acoustic measurements. Nature 434(7030), 205–208, http://dx.doi.org/10.1038/nature03412.
Gao, X., Wang, K., 2014. Strength of stick-slip and creeping subductionmegathrusts from heat flow observations. Science 345, 1038–1041, http://dx.doi.org/10.1126/science.1255487.
Gao, X., Wang, K., Wada, I., He, J., 2015. On the rheology of slow slip events aroundcontinental Moho. In: American Geophysical Union Fall Meeting AbstractT31C-2902, San Francisco.
Gerdom, M., Tréhu, A.M., Flueh, E.R., Klaeschen, D., 2000. The continental marginoff Oregon from seismic investigations. Tectonophysics 329, 79–97.
Goldfinger, C., Kulm, L.V.D., McNeill, L.C., Watts, P., 2000. Super-scale failure of thesouthern Oregon Cascadia margin. Pure Appl. Geophys. 157 (6–8), 1189–1226.
Goldfinger, C., et al., 2012. Turbidite event history: Methods and implications forHolocene paleoseismicity of the Cascadia subduction zone. U.S. Geol. Surv.Prof. Pap., 1661-F.
Goldfinger, C., Hamilton, T.S., Beeson, J., Galer, S., Nelson, C.H., Patton, J.R., Morey,A.E., Udrekh, U., 2014. Turbidite paleoseismology: site Selection, physiography,sediment supply, current dynamics and temporal considerations as applied inCascadia and elsewhere. In: American Geophysical Union Fall Meeting FallMeeting Abstract T52-08, San Francisco.
1 l of G
G
H
H
H
H
H
H
H
H
H
H
H
H
H
H
H
H
H
H
I
K
K
K
K
K
K
6 K. Wang, A.M. Tréhu / Journa
omberg, J., Cascadia 2007, Beyond Working Group, 2010. Slow-slip phenomena inCascadia from 2007 and beyond: a review. Geol. Soc. Am. Bull. 122 (7–8),963–978, http://dx.doi.org/10.1130/B30287.1.
ashimoto, C., Noda, A., Sagiya, T., Matsu’ura, M., 2009. Interplate seismogeniczones along the Kuril–Japan trench inferred from GPS data inversion. Nat.Geosci. 2, 141–145, http://dx.doi.org/10.1038/NGEO421.
awkes, A.D., Horton, B.P., Nelson, A.R., Vane, C.H., Sawai, Y., 2011. Coastalsubsidence in Oregon, USA, during the giant Cascadia earthquake of AD 1700.Quat. Sci. Rev. 30, 364–376, http://dx.doi.org/10.1016/j.quascirev.2010.11.017.
e, C., Wang, Z., Yao, W., 2007. Frictional sliding of gabbro gouge underhydrothermal conditions. Tectonophysics 445, 353–362, http://dx.doi.org/10.1016/j.tecto.2007.09.008.
e, C., Luo, L., Hao, Q.-M., Zhou, Y., 2013. Velocity-weakening behavior ofplagioclase and pyroxene gouges and stabilizing effect of small amounts ofquartz under hydrothermal conditions. J. Geophys. Res. 118, 3408–3430,http://dx.doi.org/10.1002/jgrb.50280.
etland, E.A., Simons, M., 2010. Post-seismic and interseismic fault creep II:transient creep and interseismic stress shadows on megathrusts. Geophys. J.Int. 181, 99–112, http://dx.doi.org/10.1111/j.1365-246X.2009.04482.x.
ill, E.M., et al., 2012. The 2010 Mw 7.8 Mentawai earthquake: very shallow sourceof a rare tsunami earthquake determined from tsunami field survey andnear-field GPS data. J. Geophys. Res. 117, http://dx.doi.org/10.1029/2012JB009159, B06402.
olbrook, W.S., Kent, G., Keranen, K., Johnson, H.P., Tréhu, A., Tobin, H.,Caplan-Auerbach, J., Beeson, J., 2012. Cascadia forearc seismic survey:open-access data available. EOS, Trans. Am. Geophys. Soc. 93 (50), 521–522.
su, Y.-J., Simons, M., Avouac, J.-P., Galetzka, J., Sieh, K., Chlieh, M., Natawidjaja, D.,Prawirodirdjo, L., Bock, Y., 2006. Frictional afterslip following the 2005Nias-Simeulue earthquake, Sumatra. Science 312, 1921–1926, http://dx.doi.org/10.1126/science.1126960.
u, Y., Wang, K., 2008. Coseismic strengthening of the shallow portion of thesubduction fault and its effects on wedge taper. J. Geophys. Res. 113, http://dx.doi.org/10.1029/2008jb005724, B12411.
u, Y., Wang, K., He, J., Klotz, J., Khazaradze, G., 2004. Three-dimensionalviscoelastic finite element model for postseismic deformation of the great1960 Chile earthquake. J. Geophys. Res. 109, http://dx.doi.org/10.1029/2004jb003163, B1240.
ubbard, J., Barbot, S., Hill, E.M., Tapponnier, P., 2015. Coseismic slip on shallowdécollement megathrusts: implications for seismic and tsunami hazard.Earth-Sci. Rev. 141, 45–55.
utchinson, I., Guilbault, J.-P., Clague, J.J., Bobrowsky, P.T., 2000. Tsunamis andtectonic deformation at the northern Cascadia margin: a 3000-year recordfrom Deserted Lake Vancouver Island, British Columbia, Canada. Holocene 10,429–439.
yndman, R.D., 2013. Downdip landward limit of Cascadia great earthquakerupture. J. Geophys. Res. 118, 5530–5549, http://dx.doi.org/10.1002/jgrb.50390.
yndman, R.D., Wang, K., 1993. Thermal constraints on the zone of major thrustearthquake failure—the Cascadia subduction zone. J. Geophys. Res. 98,2039–2060.
yndman, R.D., Wang, K., 1995. The rupture zone of Cascadia great earthquakesfrom current deformation and thermal regime. J. Geophys. Res. 100,22133–22154.
yndman, R.D., McCrory, P.A., Wech, A., Kao, H., Ague, J., 2015. Cascadia subductingplate fluids channelled to fore-arc mantle corner: ETS and silica deposition. J.Geophys. Res. 120, 4344–4358, http://dx.doi.org/10.1002/2015JB011920.2015.
yndman, R.D., Spence, G.D., Yuan, T., Davis, E.E., 1994. Regional geophysics anstructural framework of the Vancouver Island margin accretionary prims. In:Proceedings of the Ocean Drilling Program, Initial Reports, 146, College StationTX (Ocean Drilling Program), pp. 399–419.
yndman, R.D., Wang, K., Yamano, M., 1995. Thermal constraints on theseismogenic portion of the southwestern Japan subduction thrust. J. Geophys.Res. 100, 15373–15392.
chinose, G.A., Thio, H.K., Somerville, P.G., Sato, T., Ishii, T., 2003. Rupture process ofthe 1944 Tonankai earthquake (Ms 8.1) from the inversion of teleseismic andregional seismograms. J. Geophys. Res. 108 (B10), 2497, http://dx.doi.org/10.1029/2003JB002393.
ao, H., Shan, S.-J., Dragert, H., Rogers, G., Cassidy, J.F., Ramachandran, K., 2005. Awide depth distribution of seismic tremors along the northern Cascadiamargin. Nature 436, 841–844, http://dx.doi.org/10.1038/nature03903.
ato, A., et al., 2010. Variations of fluid pressure within the subducting oceaniccrust and slow earthquakes. Geophys. Res. Lett. 37, http://dx.doi.org/10.1029/2010gl043723, L14310.
imura, G., Yamaguchi, A., Hojo, M., Kitamura, Y., Kameda, J., Ujiie, K., Hamada, Y.,Hamahashi, M., Hina, S., 2012. Tectonic mélange as fault rock of subductionplate boundary. Tectonophysics 568–569, 25–38, http://dx.doi.org/10.1016/j.tecto.2011.08.025.
irby, S.H., Wang, K., Brocher, T.M., 2014. A large mantle water source for thenorthern San Andreas fault system: a ghost of subduction past. Earth PlanetsSpace 66, 67, http://dx.doi.org/10.1186/1880-5981-66-67.
obayashi, A., 2010. A small scale long-term slow slip occurred in the western
Shikoku in 2005. J. Seismol. Soc. Jpn. 63, 97–100, in Japanese with Englishabstract.obayashi, A., 2012. Long-term slow slip event around Kochi City from 1977 to1980. J. Seismol. Soc. Jpn. 64, 63–73, in Japanese with English abstract.
eodynamics 98 (2016) 1–18
Kobayashi, A., 2014. A long-term slow slip event from 1996 to 1997 in the KiiChannel, Japan. Earth Planets Space 66, 9.
Kodaira, S., No, T., Nakamura, Y., Fujiwara, T., Kaiho, Y., Miura, S., Takahashi, N.,Kaneda, Y., Taira, A., 2012. Coseismic fault rupture at the trench axis during the2011 Tohoku-oki earthquake. Nat. Geosci. 5, 646–650, http://dx.doi.org/10.1038/ngeo1547.
Kozdon, J.E., Dunham, E.M., 2013. Rupture to the trench: dynamic rupturesimulations of the 11 March 2011 Tohoku earthquake. Bull. Seismol. Soc. Am.103, 1275–1289, http://dx.doi.org/10.1785/0120120136.
Lay, T., 2015. The surge of great earthquakes from 2004 to 2014. Earth Planet. Sci.Lett. 409, 133–146.
Leonard, L.J., Currie, C.A., Mazzotti, S., Hyndman, R.D., 2010. Rupture area anddisplacement of past Cascadia great earthquakes from coastal coseismicsubsidence. Geol. Soc. Am. Bull. 122 (11–12), 2079–2096, http://dx.doi.org/10.1130/B30108.1.
Li, S., Moreno, M., Bedford, J., Rosenau, M., Oncken, O., 2015. Revisiting viscoelasticeffects on interseismic deformation and locking degree: a case study of thePeru-North Chile subduction zone. J. Geophys. Res. 120, http://dx.doi.org/10.1002/2015jb011903.
Liu, Y., 2013. Numerical simulations on megathrust rupture stabilized under strongdilatancy strengthening in slow slip region. Geophys. Res. Lett. 40, 1311–1316,http://dx.doi.org/10.1002/grl.50298.
Liu, Y., Rice, J.R., 2009. Slow slip predictions based on granite and gabbro frictiondata compared to GPS measurements in northern Cascadia. J. Geophys. Res.114, http://dx.doi.org/10.1029/2008jb006142, B09407.
Loveless, J.P., Meade, B.J., 2010. Geodetic imaging of plate motions, slip rates, andpartitioning of deformation in Japan. J. Geophys. Res. 115, http://dx.doi.org/10.1029/2008jb006248, B02410.
Ludwin, R.S., et al., 2005. Dating the 1700 Cascadia earthquake: great coastalearthquakes in native stories. Seismol. Res. Lett. 76 (2), 140–148.
MacKay, M., 1995. Structural variation and landward vergence at the toe of theOregon accretionary prism. Tectonics 14, 1309–1320.
Marone, C., 1998. Laboratory-derived friction laws and their application to seismicfaulting. Ann. Rev. Earth Planet. Sci. 26, 649–696.
Meade, B.J., Loveless, J.P., 2009. Predicting the geodetic signature of Mw ≥ 8 slowslip events. Geophys. Res. Lett. 36, 1–5, http://dx.doi.org/10.1029/2008GL036364.
McCaffrey, R., King, R.W., Payne, S.J., Lancaster, M., 2013. Active tectonics ofnorthwestern U.S. inferred from GPS-derived surface velocities. J. Geophys.Res. 118, 709–723, http://dx.doi.org/10.1029/2012JB009473.
McCaffrey, R., Qamar, A., King, R., Wells, R.E., Khazaradze, G., Williams, C.A.,Stevens, C.W., Vollick, J.J., Zwick, P.C., 2007. Fault locking, block rotation andcrustal deformation in the Pacific Northwest. Geophys. J. Int. 169, 1315–1340.
McCaffrey, R., Wallace, L.M., Beavan, J., 2008. Slow slip and frictional transition atlow temperature at the Hikurangi subduction zone. Nat. Geosci. 1, 316–320.
McCrory, P.A., Blair, L., Oppenheimer, D.H., Walter, S.R., 2004. Depth to the Juan DeFuca Slab Beneath the Cascadia Subduction Margin—A 3-D Model for SortingEarthquakes, Vol. 91. U.S. Geol. Surv, 22 pp.
McCrory, P.A., Blair, J.L., Waldhauser, F., Oppenheimer, D.H., 2012. Juan de Fuca slabgeometry and its relation to Wadati-Benioff zone seismicity. J. Geophys. Res.117, http://dx.doi.org/10.1029/2012jb009407, B09306.
McCrory, P.A., Hyndman, R.D., Blair, J.L., 2014. Relationship between the Cascadiafore-arc mantle wedge, nonvolcanic tremor, and the downdip limit ofseismogenic rupture. Geochem. Geophys. Geosyst. 15, 1071–1095, http://dx.doi.org/10.1002/2013GC005144.
Mitchell, E.K., Fialko, Y., Brown, K.M., 2015. Frictional properties of gabbro atconditions corresponding to slow slip events in subduction zones. Geochem.Geophys. Geosyst. 16, 4006–4020, http://dx.doi.org/10.1002/2015GC006093.
Moreno, M., Melnick, D., Rosenau, M., Bolte, J., Klotz, J., Echtler, H., Baez, J., Bataille,K., Chen, J., Bevis, M., Hase, H., Oncken, O., 2011. Heterogeneous plate lockingin the South? Central Chile subduction zone: Building up the next greatearthquake. Earth Planet. Sci. Lett. 305 (3), 413–424 http://dx.doi.org/10.1016/j.epsl.2011.03.025.
Morton, E.A., Bilek, S.L., 2015. Preliminary event detection of earthquakes using theCascadia Initiative data. Seismol. Res. Lett. 86 (5), 1270–1277, http://dx.doi.org/10.1785/0220150098.
Murray, J., Langbein, J., 2006. Slip on the San Andreas Fault at Parkfield, California,over two earthquake cycles, and the implications for seismic hazard. Bull.Seismol. Soc. Am. 96, S283–S303, http://dx.doi.org/10.1785/0120050820.
Newman, A.V., Hayes, G., Wei, Y., Convers, J., 2011. The 25 October 2010 Mentawaitsunami earthquake, from real-time discriminants, finite fault rupture, andtsunami excitation. Geophys. Res. Lett. 38, http://dx.doi.org/10.1029/2010gl046498, L05302.
Noda, H., Lapusta, N., 2013. Stable creeping fault segments can become destructiveas a result of dynamic weakening. Nature 493, 518–521, http://dx.doi.org/10.1038/nature11703.
Obana, K., Scherwath, M., Yamamoto, Y., Kodaira, S., Wang, K., Spence, G., Riedel,M., Kao, H., 2015. Earthquake activity in northern Cascadia subduction zone offVancouver Island revealed by ocean bottom seismograph observations. Bull.Seismol. Soc. Am. 150 (1), 489–495.
Obara, K., 2002. Nonvolcanic deep tremor associated with subduction in southwest
Japan. Science 296, 1679–1681, http://dx.doi.org/10.1126/science.1070378.Obara, K., 2010. Phenomenology of deep slow earthquake family in southwestJapan: spatiotemporal characteristics and segmentation. J. Geophys. Res. 115,http://dx.doi.org/10.1029/2008jb006048, B00A25.
l of Ge
O
O
O
P
P
P
P
P
P
R
R
R
R
R
S
S
S
S
S
SS
S
S
S
S
S
S
S
S
S
K. Wang, A.M. Tréhu / Journa
bara, K., 2011. Characteristics and interactions between non-volcanic tremor andrelated slow earthquakes in the Nankai subduction zone, southwest Japan. J.Geodyn. 52, 229–248.
ppenheimer, D., et al., 1993. The Cape Mendocino California, earthquake sequenceof April, 1992: Subduction at the triple junction. Science 261, 433–438.
zawa, S., Yarai, H., Imakiire, T., Tobita, M., 2013. Spatial and temporal evolution ofthe long-term slow slip in the Bungo Channel, Japan. Earth Planets Space 65,67–73, http://dx.doi.org/10.5047/eps.2012.06.009.
eng, Z., Gomberg, J., 2010. An integrated perspective of the continuum betweenearthquakes and slow-slip phenomena. Nat. Geosci. 3, 599–607.
eng, Z., Vidale, J.E., Wech, A.G., Nadeau, R.M., Creager, K.C., 2009. Remotetriggering of tremor along the San Andreas Fault in central California. J.Geophys. Res. 114, http://dx.doi.org/10.1029/2008jb006049, B00A06.
lafker, G., 1972. Tectonics, in The Great Alaska Earthquake of 1964, Seismologyand Geodesy. Natl. Acad. of Sci., Washington, D.C, pp. 113–188.
ollitz, F.F., McCrory, P., Wilson, D., Svarc, J., Puskas, C., Smith, R.B., 2010.Viscoelastic-cycle model of interseismic deformation in the northwesternUnited States. Geophys. J. Int. 181, 665–696, http://dx.doi.org/10.1111/j.1365-246X.2010.04546.x.
riest, G.P., Goldfinger, C., Wang, K., Witter, R.C., Zhang, Y., Baptista, A.M., 2010.Confidence levels for tsunami-inundation limits in northern Oregon inferredfrom a 10,000-year history of great earthquakes at the Cascadia subductionzone. Nat. Hazards 54 (1), 27–73, http://dx.doi.org/10.1007/s11069-009-9453-5.
rotti, M., Gonzalez, V., Newman, A.V., et al., 2013. Nicoya earthquake rupturean-ticipated by geodetic measurement of the locked plate interface. Nat.Geosci. 7 (2), 117–121, http://dx.doi.org/10.1038/ngeo2038.
ogers, G., Dragert, H., 2003. Episodic tremor and slip on the Cascadia subductionzone: the chatter of silent slip. Science 300, 1942–1943.
otman, H.M.M., Spinelli, G.A., 2014. Remarkably consistent thermal state of thesouth central Chile subduction zone from 36 ◦S to 45 ◦S. J. Geophys. Res. 119,http://dx.doi.org/10.1002/2013JB010811.
owe, C.D., Moore, J.C., Remitti, F., the IODP Expedition 343/343T Scientists, 2013.The thickness of subduction plate boundary faults from the seafloor into theseismogenic zone. Geology 41, 991–994.
oyer, A.A., Bostock, M.G., 2014. A comparative study of low frequency earthquaketemplates in northern Cascadia. Earth Planet. Sci. Lett. 402, 247–256.
yan, W.B.F., et al., 2009. Global multi-resolution topography synthesis. Geochem.Geophys. Geosyst. 10, http://dx.doi.org/10.1029/2008gc002332, Q03014.
agiya, T., Thatcher, W., 1999. Coseismic slip resolution along a plate boundarymegathrust: the Nankai Trough, southwest Japan. J. Geophys. Res. 104,1111–1129, http://dx.doi.org/10.1029/98jb02644.
atake, K., Wang, K., Atwater, B.F., 2003. Fault slip and seismic moment of the 1700Cascadia earthquake inferred from Japanese tsunami descriptions. J. Geophys.Res. 108 (B11), 2535, http://dx.doi.org/10.1029/2003jb002521.
avage, J.C., 1983. A dislocation model of strain accumulation and release at asubduction zone. J. Geophys. Res. 88, 4984–4996.
chmalzle, G.M., McCaffrey, R., Creager, K.C., 2014. Central Cascadia subductionzone creep. Geochem. Geophys. Geosyst. 15, 1515–1532, http://dx.doi.org/10.1002/2013GC005172.
choll, D.W., Kirby, S.H., von Huene, R., Ryan, H., Wells, R.E., Geist, E.L., 2015. Great(≥Mw8.0) megathrust earthquakes and the subduction of excess sediment andbathymetrically smooth seafloor. Geosphere 11 (2), 236–265, http://dx.doi.org/10.1130/GES01079.1.
cholz, C.H., 1998. Earthquakes and friction laws. Nature 391, 37–42.cholz, C.H., 2002. The Mechanics of Earthquakes and Faulting, 2nd edition.
Cambridge University Press, Cambridge, 471.chwartz, S.Y., Rokosky, J.M., 2007. Slow slip events and seismic tremor at
circum-pacific subduction zones. Rev. Geophys. 45, http://dx.doi.org/10.1029/2006rg000208, RG3004.
clater, J.G., 2004. Variability of heat flux through the seafloor: discovery ofhydrothermal circulation in the oceanic crust. In: Davis, E.E., Eldderfi eld, H.(Eds.), Hydrogeology of the Oceanic Lithosphere. Cambridge University Press,New York, pp. 3–27.
ekine, S., Hirose, H., Obara, K., 2010. Along-strike variations in short-term slowslip events in the southwest Japan subduction zone. J. Geophys. Res. 115,http://dx.doi.org/10.1029/2008jb006059, B00A27.
helly, D.R., Beroza, G.C., Ide, S., 2007. Non-volcanic tremor and low-frequencyearthquake swarms. Nature 446, 305–307, http://dx.doi.org/10.1038/nature05666.
helly, D.R., Hardebeck, J.L., 2010. Precise tremor source locations and amplitudevariations along the lower-crustal central San Andreas Fault. Geophys. Res.Lett. 37, http://dx.doi.org/10.1029/i2010GL043672.
himamoto, T., Noda, H., 2014. A friction to flow constitutive law and itsapplication to a 2-D modeling of earthquakes. J. Geophys. Res. 119, 8089–8106,http://dx.doi.org/10.1002/2014JB011170.
pinelli, G.A., Wang, K., 2008. Effects of fluid circulation in subducting crust onseismogenic zone temperatures. Geology 36 (11), 887–890.
tein, S., Okal, E.A., 2007. Ultralong period seismic study of the December 2004Indian Ocean earthquake and implications for regional tectonics and thesubduction process. Bull. Seismol. Soc. Am. 97, S279–S295, http://dx.doi.org/
10.1785/0120050617.un, T., Wang, K., Iinuma, T., Hino, H., He, J., Fujimoto, H., Kido, M., Osada, Y., Miura,S., Ohta, Y., Hu, Y., 2014. Prevalence of viscoelastic relaxation after the 2011Tohoku-oki earthquake. Nature 513, 84–87, http://dx.doi.org/10.1038/nature13778.
odynamics 98 (2016) 1–18 17
Suwa, Y., Miura, S., Hasegawa, A., Sato, T., Tachibana, K., 2006. Interplate couplingbeneath NE Japan inferred from three-dimensional displacement field. J.Geophys. Res. 111, http://dx.doi.org/10.1029/2004jb003203, B04402.
Takagi, R., Obara, K., Maeda, T., 2015. Slow slip event within a gap between tremorand locked zones in the Nankai subduction zone. Geophys. Res. Lett. 43, http://dx.doi.org/10.1002/2015gl066987.
Thatcher, W., 1984. The earthquake deformation cycle at the Nankai Trough,southwest Japan. J. Geophys. Res. 89 (B5), 3087–3101.
Thatcher, W., Rundle, J.B., 1984. A viscoelastic coupling model for the cyclicdeformation due to periodically repeated earthquakes at subduction zones. J.Geophys. Res. 89, 7631–7640.
Toomey, D.R., et al., 2014. The Cascadia Initiative: a sea change in seismologicalstudies of subduction zones. Oceanography 27 (2), 138–150, http://dx.doi.org/10.5670/oceanog.2014.49.
Tréhu, A.M., Asudeh, I., Brocher, T.M., Luetgert, J.H., Mooney, W.D., Nabelek, J.L.,Nakamura, Y., 1994. Crustal architecture of the Cascadia forearc. Science 266,237–243.
Tréhu, A.M., Blakely, R.J., Williams, M.C., 2012. Subducted seamounts and recentearthquakes beneath the central Cascadia forearc. Geology 40, 103–106, http://dx.doi.org/10.1130/G32460.1.
Tréhu, A.M., Braunmiller, J., Nabelek, J.L., 2008. Probable low-angle thrustearthquakes on the Juan de Fuca-North America plate boundary. Geology 36,127–130, http://dx.doi.org/10.1130/G24145A.1.
Tréhu, A.M., Braunmiller, J., Davis, E., 2015. Seismicity of the central Cascadiacontinental margin near 44.5◦N: a decadal view. Seis. Res. Lett. 86, 819–829,http://dx.doi.org/10.1785/0220140207.
Wada, I., Wang, K., 2009. Common depth of slab-mantle decoupling: reconcilingdiversity and uniformity of subduction zones. Geochem. Geophys. Geosyst. 10,Q10009.
Wada, I., Wang, K., He, J., Hyndman, R.D., 2008. Weakening of the subductioninterface and its effects on surface heat flow, slab dehydration, and mantlewedge serpentinization. J. Geophys. Res. 113, http://dx.doi.org/10.1029/2007JB005190, B04402.
Waldhauser, F., Schaff, D.P., 2008. Large-scale relocation of two decades ofNorthern California seismicity using cross-correlation and double-differencemethods. J. Geophys. Res. 113, http://dx.doi.org/10.1029/2007jb005479,B08311.
Wallace, L.M., Beavan, J., 2010. Diverse slow slip behavior at the Hikurangisubduction margin, New Zealand. J. Geophys. Res. 115, http://dx.doi.org/10.1029/2010jb007717, B12402.
Wallace, L.M., et al., 2009. Characterizing the seismogenic zone of a major plateboundary subduction thrust: Hikurangi margin, New Zealand. Geochem.Geophys. Geosyst. 10, http://dx.doi.org/10.1029/2009gc002610, Q10006.
Wallace, L.M., Webb, S.C., Ito, Y., Mochizuki, K., Hino, R., Henrys, S., Schwartz, S.,Sheehan, A., 2016. Slow slip near the trench at the Hikurangi subduction zone,New Zealand. Science, in press.
Wang, K., 2007. Elastic and viscoelastic models of subduction earthquake cycles.In: Dixon, T., Moore, C. (Eds.), The Seismogenic Zone of Subduction ThrustFaults. Columbia University Press, pp. 540–575.
Wang, K., Bilek, S.L., 2011. Do subducting seamounts generate or stop largeearthquakes? Geology 39, 819–822, http://dx.doi.org/10.1130/G31856.1.
Wang, K., Bilek, S.L., 2014. Invited review paper: fault creep caused by subductionof rough seafloor relief. Tectonophysics 610, 1–24.
Wang, K., Dixon, T., 2004. Coupling semantics and science in earthquake research.Eos Trans. AGU 85 (May (18)), 180.
Wang, K., Gao, X., 2016. On the relationship between the seismogenic zone and theETS zone. In: Abstract 94122, American Geophysical Union ChapmanConference on Slow Slip Phenomena, Ixtapa, Mexico, 21–25 February 2016https://agu.confex.com/agu/16chapman1/webprogram/Paper94122.html.
Wang, K., He, J., 2008. Effects of frictional behavior and geometry of subductionfault on coseismic seafloor deformation. Bull. Seismol. Soc. Am. 98 (2),571–579.
Wang, K., Hu, Y., 2006. Accretionary prisms in subduction earthquake cycles: thetheory of dynamic Coulomb wedge. J. Geophys. Res. 111, http://dx.doi.org/10.1029/2005jb004094, B06410.
Wang, K., Hu, Y., He, J., 2012a. Deformation cycles of subduction earthquakes in aviscoelastic earth. Nature 484, 327–332, http://dx.doi.org/10.1038/nature11032.
Wang, K., Wada, I., Ishikawa, Y., 2004. Stresses in the subducting slab beneathsouthwest Japan and relation with plate geometry, tectonic forces, slabdehydration, and damaging earthquakes. J. Geophys. Res. 109, http://dx.doi.org/10.1029/2003jb002888, B08304.
Wang, K., Dragert, H., Kao, H., Roeloffs, E., 2008. Characterizing an“uncharacteristic” ETS event in northern Cascadia. Geophys. Res. Lett. 35,http://dx.doi.org/10.1029/2008GL034415, L15303.
Wang, K., He, J., Schulzeck, F., Hyndman, R.D., Riedel, M., 2015. Thermal conditionof the 27 October 2012 Mw = 7.8 Haida Gwaii subduction earthquake at theobliquely convergent Queen Charlotte margin. Bull. Seismol. Soc. Am. 105 (2B),1290–1300.
Wang, K., Mulder, T., Rogers, G.C., Hyndman, R.D., 1995. Case for very low couplingstress on the Cascadia subduction fault. J. Geophys. Res. 100, 12907–12918.
Wang, K., Wells, R., Mazzotti, S., Hyndman, R.D., Sagiya, T., 2003. A reviseddislocation model of interseismic deformation of the Cascadia subductionzone. J. Geophys. Res. 108, 2026, http://dx.doi.org/10.1029/2001JB001227.
Wang, P.-L., Engelhart, S.E., Wang, K., Hawkes, A.D., Horton, B.P., Nelson, A.R.,Witter, R.C., 2013. Heterogeneous rupture in the great Cascadia earthquake of
1 l of G
W
W
W
W
W
W
Yue, H., Lay, T., Rivera, L., An, C., Vigny, C., Tong, X., Baez Soto, J.C., 2015. Localizedfault slip to the trench in the 2010 Maule, Chile Mw = 8.8 earthquake from jointinversion of high-rate GPS, teleseismic body waves, InSAR, campaign GPS, andtsunami observations: slip in the 2010 Maule, Chile earthquake. J. Geophys.
8 K. Wang, A.M. Tréhu / Journa
1700 inferred from coastal subsidence estimates. J. Geophys. Res. 118, 1–14,http://dx.doi.org/10.1002/jgrb.50101.
ang, Y., Wang, K., He, J., 2012b. On the possibility of interseismic creep of theCascadia megathrust. In: American Geophysical Union Fall Meeting AbstractT23E-2717, San Francisco.
ech, A.G., Creager, K.C., 2011. A continuum of stress, strength and slip in theCascadia subduction zone. Nat. Geosci. 4 (9), 624–628, http://dx.doi.org/10.1038/NGEO1215.
ells, R.E., Simpson, R.W., 2001. Northward migration of the Cascadia forearc inthe northwestern U.S. and implications for subduction deformation. EarthPlanets Space 53, 275–283.
ells, R.E., Blakely, R.J., Sugiyama, Y., Scholl, D.W., Dinterman, P.A., 2003.Basin-centered asperities in great subduction zone earthquakes: a linkbetween slip, subsidence, and subduction erosion? J. Geophys. Res. 108 (B10),2507, http://dx.doi.org/10.1029/2002jb002072.
ells, R.E., Weaver, C.S., Blakely, R.J., 1998. Fore-arc migration in Cascadia and itsneotectonic significance. Geology 26 (8), 759–762.
illiams, M.C., Tréhu, A.M., Braunmiller, J., 2011. Seismicity at the Cascadia plateboundary beneath the Oregon continental shelf. Bull. Seismol. Soc. Am. 101,940–950.
eodynamics 98 (2016) 1–18
Witter, R.C., Zhang, Y.J., Wang, K., Goldfinger, C., Priest, G.R., Allan, J.C., 2012.Coseismic slip on the southern Cascadia megathrust implied by tsunamideposits in an Oregon lake and earthquake-triggered marine turbidites. J.Geophys. Res. 117, http://dx.doi.org/10.1029/2012jb009404, B10303.
Witter, R.C., Zhang, Y.J., Wang, K., Priest, G.R., Goldfinger, C., Stimely, L., English, J.T.,Ferro, P.A., 2013. Simulated tsunami inundation for a range of Cascadiamegathrust earthquake scenarios at Bandon Oregon, USA. Geosphere 9 (6),1–21.
Wong, I.G., Chapman, D.S., 1990. Deep intraplate earthquakes in the westernUnited States and their relationship to lithospheric temperatures. Bull.Seismol. Soc. Am. 80, 589–599.
Res. 119 (10), http://dx.doi.org/10.1002/2014JB011340.