volume 7 number 4 october-december 2019 - international
TRANSCRIPT
1 Volume 7 Number 4 October-December 2019

I
CONTENTS
www.ijop.net
Volume 7, Number 4 October-December 2019
International Journal of Physiology
1. Survey of Changes in the Erythrocyte Sedimentation Rate at the Different Stages of Therapy by Westergren Method in the Patients of Pulmonary Tuberculosis in the Malwa Region of Madhya Pradesh .....1Abhishek Kumar, Abhilasha Dutta, Anjali Prasad, Manila Jain
2. Study of Variation in Lipid Profile Parameters in Pre Menopausal and Post Menopausal Subjects .................6Akshay Berad, Vishakha
3. Analysis of One Best MCQS in Five Preuniversity Physiology Examinations ...............................................10Amit A. Upadhyah, Pankaj B. Maheria, Jitendra Patel
4. Does Dark Chocolate Relieve Menstrual Pain in Adult Women?: A Study Among Indian Population ..........16Amita Verma, Archana Kadam
5. Is Paid Period Leave Justified in Working Women: A Crossectional Study ....................................................22Amita Verma, Archana Kadam
6. Effect of Ventromedial Hypothalamus on Food Intake, Body Weight, Insulin Resistance, Lipid Profile and Thyroid Profile in High-Fat Diet Obese Female Wistar Rats ....................................................................27Archana Gaur T., G.K. Pal, Pravati Pal
7. Effect of Yoga on Mild to Moderate Hypertension ..........................................................................................35Arpith M.N., Revathi Devi M.L., Manjunatha S.N.,
8. Cross Sectional Analytical Study of Effects of Resistance Training on the Improvement of Cardiovascular Endurance, Flexibility & Muscular Endurance in Adults .......................................................40AvinashTekade , Yogesh Gupta
9. Comparative Study between the Effect of Short Term and Long Term Exposure to Cotton Dust on Pulmonary Function Tests in Cotton Mill Workers .........................................................................................46Charulata Kadam, Afshan Kausar, Charushila Atul Rukadikar, N.A. Deokar
10. Role of Serotonin in Memory by Tryptophan Loading Method among First Year Medical Students .............51D.D. Musmade, Vivek Nalgirkar, Disha Chaudhary, Krishnakhi Deba, Sarthak Pawar, Pritesh Jadhav
11. A Comparative Study of Sleep Quality and Heart Rate Variability Index in Shifts and Non-Shift Working Population of Bengaluru ....................................................................................................................54Davana Sunkari, Venkatesh. S
II12. Assessment of Plasma Vitamin B12 and Folic Acid During Postmenopausal Period .......................................58
Deepak Tambe, Sudhir Gavali, A Pranita, J. S. Kharche, Gayatri Godbole, Anuradha Joshi
13. Do Learning Styles Influenced by Gender: A Qualitative Study Among Physiology Undergraduate Medical Students ..............................................................................................................................................61Afshan Kausar, Sayed Badar Daimi, Charulata Chandrakant Kadam
14. Assessment of Blood Pressure and Cognitive Dysfunction in Pune Urban Elderly Population ......................67Gayatri Godbole, Shrirang Godbole, Jayshree S Kharche, Pranita Ashok, Anuradha Joshi
15. Effect of Iron Deficiency Anemia on Autonomic Nervous System in Adolescent Girls .................................71Gunjan Jain, Namrata Kaushik, J. L. Agarwal, P. N. Singh, Manoj Kumar Jain .
16. Platelet Count and its Correlation with Blood Sugar Level in Type 2 Diabetes Mellitus Patients ..................75Jabir PK, Madhusudhan U, Venugopal R
17. Role of Meditation in Prevention of Cardiovascular Diseases: An Analytical Study in Hyper-Reactors of Cold Pressor Test .........................................................................................................................................79Jitendra Mahour, Yogesh Gupta
18. Gender Difference in Emotional Intelligence and its Component Traits in Medical Students ........................85Kamalakannan Vadivel, Nilesh N Kate
19. A Comparative Study of Pulmonary Function Test in School Children of Industrial Area and Non Industrial Area ..................................................................................................................................................89Keshav Kashyap, Anil Latiyar
20. Conventional Method to Evaluate Autonomic Functions in Obese Type–II Diabetics ...................................94Kosuri. Satish, A.V. Siva Kumar, Sk. Kareem, K.N. Maruthy, Sasikala. P, Ch. Kiran Kumar
21. Correlation of HbA1c Levels with Monocyte-lymphocyte and Platelet-lymphocyte Ratios in Type 2 Diabetics of Bengaluru City .............................................................................................................................99Suguna S, M.S. Kusumadevi
22. Relationship Between Vitamin D and HbA1c Levels in Patients with Type 2 Diabetes Mellitus of Bengaluru City ................................................................................................................................................104Suguna S, M.S. Kusumadevi
23. Heart Rate Variability Changes during Sahaja Yoga Meditation ...................................................................109Madhur S Rai, Yashoda R Kattimani, Sandeep U Rai, RS Inamdar
24. Association of Bleeding Time and Clotting Time with ABO Blood Groups Among Healthy Adults ..........114Mangala Gowri S.R., Dr. Kancharla Sirisha
25. Association of ABO Blood Group with Breast Cancer: An Observational Study .........................................120Neelima Kumari, Ashutosh Kumar, Manish Kumar
26. Study of Minute Ventilation, Maximum Voluntary Ventilation and Dyspneic Index During Pregnancy: An Observational, Prospective and Comparative Study ................................................................................123Neelima Kumari, Ashutosh Kumar, Manish Kumar
III27. Left Ventricular Mass Index as a Diagnostic Predictor for Hypertrophy of the Left Ventricle in
Hypertensive Patients .....................................................................................................................................127Meenu, Satheesh Balakrishnan
28. Evaluation of Modifiable Risk Factors in the Development of Age Related Macular Degeneration in Kashmiri Population .......................................................................................................................................133Mehak Mufti, Hammad Nasti, Tajali Shora
29. A Comparative Study of Pulmonary Function Test Parameters between the Smokers and Non-Smokers among the Three Wheeler Auto-Rickshaw Drivers in Puducherry Region ...................................................137Mohan Ram. P, Dhanalakshmi. Y, Jothi Marie Feula. A, Manju Rajaram, Subitha. L, Arvind. N, Umamaheshwari K
30. A Study on Effect of Acute Exercise on Pulmonary Function Tests of First Year M.B.B.S. Students .........141Mumtaz Gowhar, Iram Jaan
31. Assessment of Forced Vital Capacity and FEV1 as Pulmonary Function Tests in Males with Type-2 Diabetes Mellitus ............................................................................................................................................145Neelima Narayan Nerkar, Pranita Ashok, V R Purandare
32. Comparison of Pulmonary Function Tests among Females and Males Working at Construction Sites ........149NeeraGoel, NirajYadav, PN Singh
33. Study of Pattern of Dyslipidaemia among Type 2 Diabetes Mellitus Patients Seeking Care in GMERS Medical College Patan, Gujarat, India ............................................................................................................156Dharmesh K. Patel, Nehal S. Patel
34. Neck Circumference as a Novel Measure of Central Obesity in Young Adults: Correlation with other Anthropometric Indices ..................................................................................................................................161Nida Nowreen, Manmeet Kour
35. Study of Changes in QTc Interval with Menstrual Cycle in Young Adult Female Basket Ball Players .......165Priya C. Rao, Chethan H.A.
36. A Comparative Study of Heart Rate Variability During Acute Mental Stress in Obese ................................167Priya S.A., Rajalakshmi R., Savitri P Siddanagoudar, Nanjundaiah N.
37. Glycogen Loading and its Effect on Athletic Performance ............................................................................172Priyanka Mirdha , Vivek Nalgirkar
38. Effect of Gastroesophageal Reflux Disease on Pulmonary Function Tests ....................................................175Puneeth M., Prashanth Kumar M.
39. Awareness of Air Pollution and Related Health Risk in Traffic Police of Pune City-A Pilot Study .............179Rahul A. Pawar, Jayshree S. Kharche, Pranita Ashok, Gayatri Godbole, Anuradha Joshi
40. Status of Lipid Peroxidation and Iron Levels in Bronchial Asthma ...............................................................183Ramadevi P., A.V. Siva Kumar, K.N. Maruthy, Ch. Kiran Kumar, Sasikala P.
41. Electrodiagnostic Features of Ulnar Nerve in Patients with Chronic Obstructive Pulmonary Disease .........188Rashmi Dave, Sanjeev Kumar Shrivastava, Asha Shrivastava, Rajesh Paul
IV42. The Influence of Premenstrual Stress on Auditiory and Visual Reaction Time in I Year MBBS Students ...194
Rekha KN, Gopi Kumar MS, Jamuna BL, Ranganath MD
43. A Study of Correlation Between Blood Groups and Anemia in Young Adults .............................................199Reshmarani, Shilpa N., Subhash Chimkode
44. Acute Effect of Hemodialysis on Cognition in Patient of End Stage Renal Disease .....................................203Sanaul Mustafa Ansari, Kumar Siddharth, Ashok Sharan
45. Comparison of Somatosensory Evoked Potentials Between Genders in Healthy South Indian Population ..208Sarath Babu Viswanathan, P.V. Balaji, Girwar Singh Gaur, Akshay Berad
46. A Study to Correlate Perceived Stress with Marital Status in Working Men and Women in Bengaluru City .................................................................................................................................................................212Shashwata Biswas, Srinivasulu Naidu S.
47. Improvement in Cardiovascular Status by Addition of Minimal amount of Raw Vegetables, Fruits and Sprouts in the Daily Diet ................................................................................................................................216Shobha Kini, Rohini Bhadre
48. A Comparative Study of Pulmonary Function Tests Type 2 Diabetes Mellitus and Non-Diabetes ..............220Shweta, A. Santa Kumari
49. A Comparative Study on Different Types of Attention in Abacus Users & Non Users ................................226Sneha Jaiswal, Shashikala K.T.
50. Inter-Gender and Intra-Gender Differences of Parenting Stress among Mothers of Children with Special Needs and Normal Children ..............................................................................................................229Sowmya P., Preethi B.L.
51. Effect of Yoga (Pranayama and Suryanamaskar) on Cardio Pulmonary functions among Adults. ...............233Suhas Y. Shirur, Veena H.C., Pradhyumn
52. Introduction and Assessment of Jigsaw Method of Teaching on Challenging Topics in Physiology for First Year Medical Students ...........................................................................................................................238Suman Sharma, Sangita Chauhan, Manjinder Kaur
53. Relationship of Emotional Intelligence with Pre-Hypertension and its Impact on Autonomic Nervous System as Assessed by Heart Rate Variability in Adult Males ......................................................................246Sumit Garg, J.L. Agarwal
54. Digital Screens Accelerates Visual Fatigue in Young Females than Young Males .......................................251T. Sahithi Deepthi, K.N. Maruthy
55. Cardiovascular Reactivity (CVR) in Male Young Adults of Hypertensive Parents in North India ...............255Verma Anjali, Kumar Manoj, Adhana Ritu, Kumar Jay Ballabh, Kaur Jaspreet
56. Association of Major Blood Group with Bleeding Time & Clotting Time ....................................................260Verma Anjali, Chaurasia R., Adhana Ritu, Kumar Jay Ballabh, Kaur Jaspreet
57. Evaluation of Absolute Eosinophil Count and Peak Expiratory Flow Rate in COPD Patients .....................265M. Janaki, Payasam Rajeswari, K. Sreedhar Babu, K. Bharani

V58. A Comparison of Plasma HDL-C Levels in Moderate Intensity Continous Exercise Versus High
Intensity Intermittent Exercise Among Young Adults ...................................................................................268Suguna S., R. Vidhyalakshmi
59. A Comparative Study of Cognitive Functions among Male and Female Medical Students in a Teaching Hospital of South Kerala ................................................................................................................................273Prashanth P., Arun Kumar H.P., S. Lincoln Deva Kumar
International Journal of Physiology, October-December 2019, Vol.7, No. 4 1
Survey of Changes in the Erythrocyte Sedimentation Rate at the Different Stages of Therapy by Westergren Method in the Patients of Pulmonary Tuberculosis in the Malwa Region of
Madhya Pradesh
Abhishek Kumar1, Abhilasha Dutta1, Anjali Prasad2, Manila Jain3
1Associate Professor, Dept. of Physiology, VIMS Pawapuri Nalanda, Bihar, 2Associate Professor, Dept. of Anatomy, 3Professor & Head, Dept. of Physiology, Index Medical College Hospital & Research Centre,
Indore, Madhya Pradesh, India
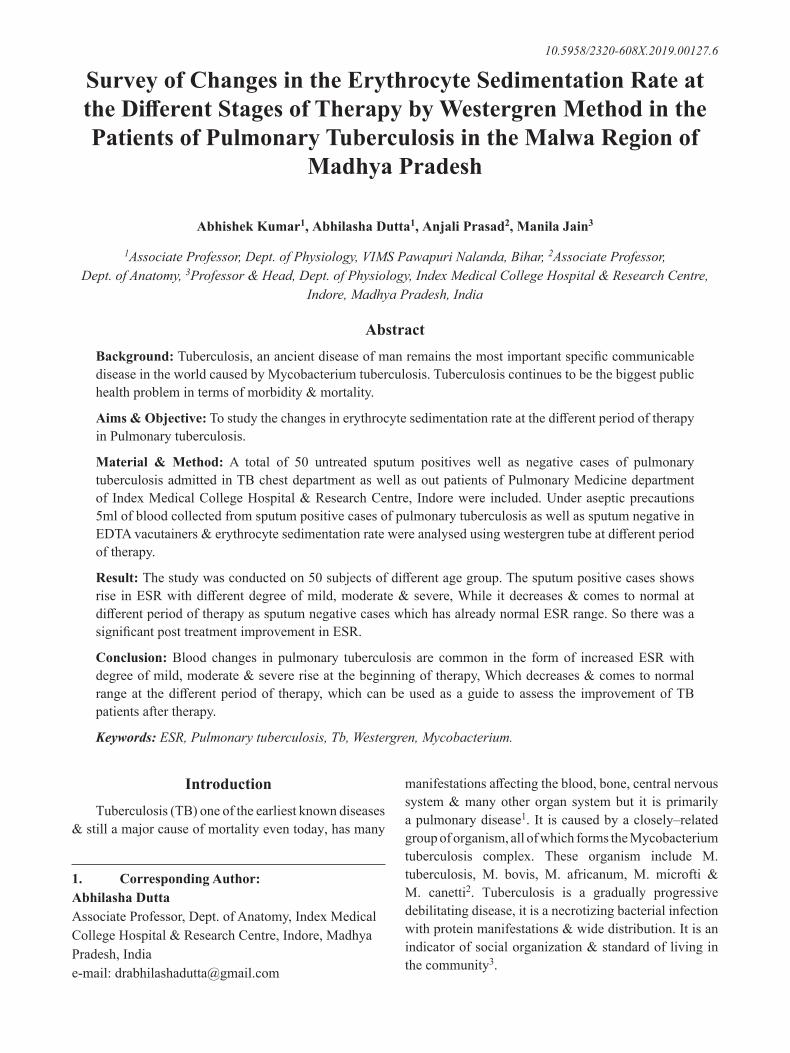
AbstractBackground: Tuberculosis, an ancient disease of man remains the most important specific communicable disease in the world caused by Mycobacterium tuberculosis. Tuberculosis continues to be the biggest public health problem in terms of morbidity & mortality.
Aims & Objective: To study the changes in erythrocyte sedimentation rate at the different period of therapy in Pulmonary tuberculosis.
Material & Method: A total of 50 untreated sputum positives well as negative cases of pulmonary tuberculosis admitted in TB chest department as well as out patients of Pulmonary Medicine department of Index Medical College Hospital & Research Centre, Indore were included. Under aseptic precautions 5ml of blood collected from sputum positive cases of pulmonary tuberculosis as well as sputum negative in EDTA vacutainers & erythrocyte sedimentation rate were analysed using westergren tube at different period of therapy.
Result: The study was conducted on 50 subjects of different age group. The sputum positive cases shows rise in ESR with different degree of mild, moderate & severe, While it decreases & comes to normal at different period of therapy as sputum negative cases which has already normal ESR range. So there was a significant post treatment improvement in ESR.
Conclusion: Blood changes in pulmonary tuberculosis are common in the form of increased ESR with degree of mild, moderate & severe rise at the beginning of therapy, Which decreases & comes to normal range at the different period of therapy, which can be used as a guide to assess the improvement of TB patients after therapy.
Keywords: ESR, Pulmonary tuberculosis, Tb, Westergren, Mycobacterium.
1. Corresponding Author: Abhilasha Dutta Associate Professor, Dept. of Anatomy, Index Medical College Hospital & Research Centre, Indore, Madhya Pradesh, India e-mail: [email protected]
IntroductionTuberculosis (TB) one of the earliest known diseases
& still a major cause of mortality even today, has many
manifestations affecting the blood, bone, central nervous system & many other organ system but it is primarily a pulmonary disease1. It is caused by a closely–related group of organism, all of which forms the Mycobacterium tuberculosis complex. These organism include M. tuberculosis, M. bovis, M. africanum, M. microfti & M. canetti2. Tuberculosis is a gradually progressive debilitating disease, it is a necrotizing bacterial infection with protein manifestations & wide distribution. It is an indicator of social organization & standard of living in the community3.
10.5958/2320-608X.2019.00127.6
2 International Journal of Physiology, October-December 2019, Vol.7, No. 4
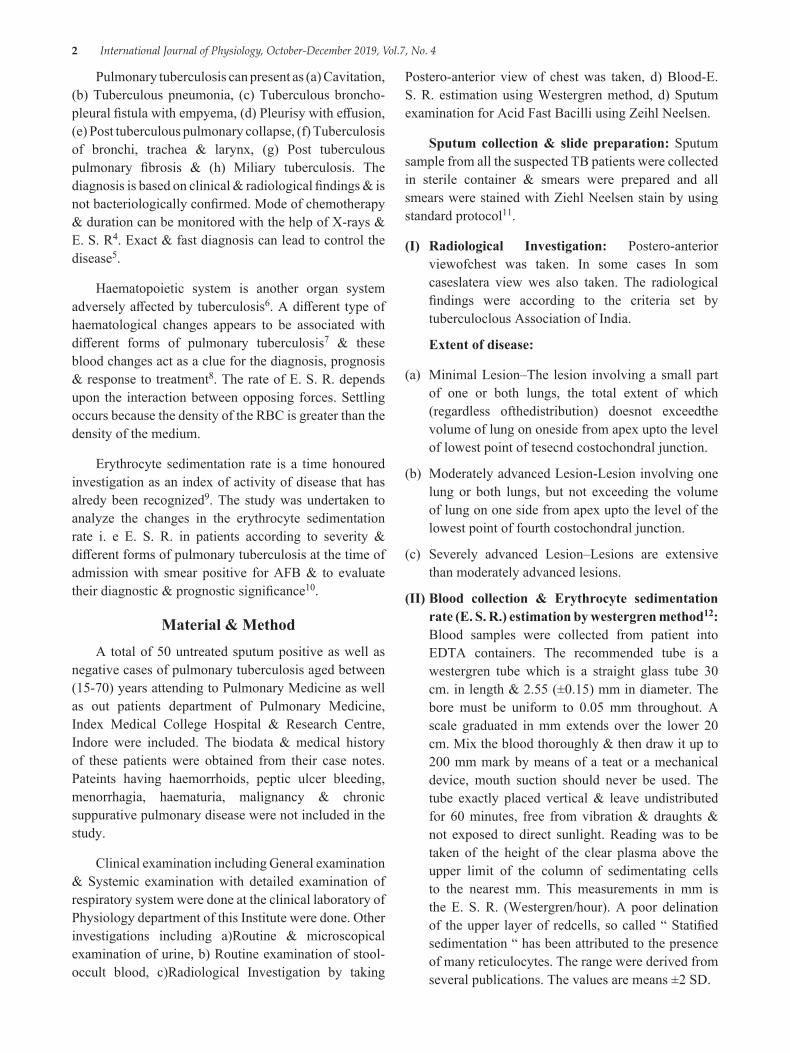
Pulmonary tuberculosis can present as (a) Cavitation, (b) Tuberculous pneumonia, (c) Tuberculous broncho-pleural fistula with empyema, (d) Pleurisy with effusion, (e) Post tuberculous pulmonary collapse, (f) Tuberculosis of bronchi, trachea & larynx, (g) Post tuberculous pulmonary fibrosis & (h) Miliary tuberculosis. The diagnosis is based on clinical & radiological findings & is not bacteriologically confirmed. Mode of chemotherapy & duration can be monitored with the help of X-rays & E. S. R4. Exact & fast diagnosis can lead to control the disease5.
Haematopoietic system is another organ system adversely affected by tuberculosis6. A different type of haematological changes appears to be associated with different forms of pulmonary tuberculosis7 & these blood changes act as a clue for the diagnosis, prognosis & response to treatment8. The rate of E. S. R. depends upon the interaction between opposing forces. Settling occurs because the density of the RBC is greater than the density of the medium.
Erythrocyte sedimentation rate is a time honoured investigation as an index of activity of disease that has alredy been recognized9. The study was undertaken to analyze the changes in the erythrocyte sedimentation rate i. e E. S. R. in patients according to severity & different forms of pulmonary tuberculosis at the time of admission with smear positive for AFB & to evaluate their diagnostic & prognostic significance10.
Material & MethodA total of 50 untreated sputum positive as well as
negative cases of pulmonary tuberculosis aged between (15-70) years attending to Pulmonary Medicine as well as out patients department of Pulmonary Medicine, Index Medical College Hospital & Research Centre, Indore were included. The biodata & medical history of these patients were obtained from their case notes. Pateints having haemorrhoids, peptic ulcer bleeding, menorrhagia, haematuria, malignancy & chronic suppurative pulmonary disease were not included in the study.
Clinical examination including General examination & Systemic examination with detailed examination of respiratory system were done at the clinical laboratory of Physiology department of this Institute were done. Other investigations including a)Routine & microscopical examination of urine, b) Routine examination of stool-occult blood, c)Radiological Investigation by taking
Postero-anterior view of chest was taken, d) Blood-E. S. R. estimation using Westergren method, d) Sputum examination for Acid Fast Bacilli using Zeihl Neelsen.
Sputum collection & slide preparation: Sputum sample from all the suspected TB patients were collected in sterile container & smears were prepared and all smears were stained with Ziehl Neelsen stain by using standard protocol11.
(I) Radiological Investigation: Postero-anterior viewofchest was taken. In some cases In som caseslatera view wes also taken. The radiological findings were according to the criteria set by tuberculoclous Association of India.
Extent of disease:
(a) Minimal Lesion–The lesion involving a small part of one or both lungs, the total extent of which (regardless ofthedistribution) doesnot exceedthe volume of lung on oneside from apex upto the level of lowest point of tesecnd costochondral junction.
(b) Moderately advanced Lesion-Lesion involving one lung or both lungs, but not exceeding the volume of lung on one side from apex upto the level of the lowest point of fourth costochondral junction.
(c) Severely advanced Lesion–Lesions are extensive than moderately advanced lesions.
(II) Blood collection & Erythrocyte sedimentation rate (E. S. R.) estimation by westergren method12: Blood samples were collected from patient into EDTA containers. The recommended tube is a westergren tube which is a straight glass tube 30 cm. in length & 2.55 (±0.15) mm in diameter. The bore must be uniform to 0.05 mm throughout. A scale graduated in mm extends over the lower 20 cm. Mix the blood thoroughly & then draw it up to 200 mm mark by means of a teat or a mechanical device, mouth suction should never be used. The tube exactly placed vertical & leave undistributed for 60 minutes, free from vibration & draughts & not exposed to direct sunlight. Reading was to be taken of the height of the clear plasma above the upper limit of the column of sedimentating cells to the nearest mm. This measurements in mm is the E. S. R. (Westergren/hour). A poor delination of the upper layer of redcells, so called “ Statified sedimentation “ has been attributed to the presence of many reticulocytes. The range were derived from several publications. The values are means ±2 SD.
International Journal of Physiology, October-December 2019, Vol.7, No. 4 3
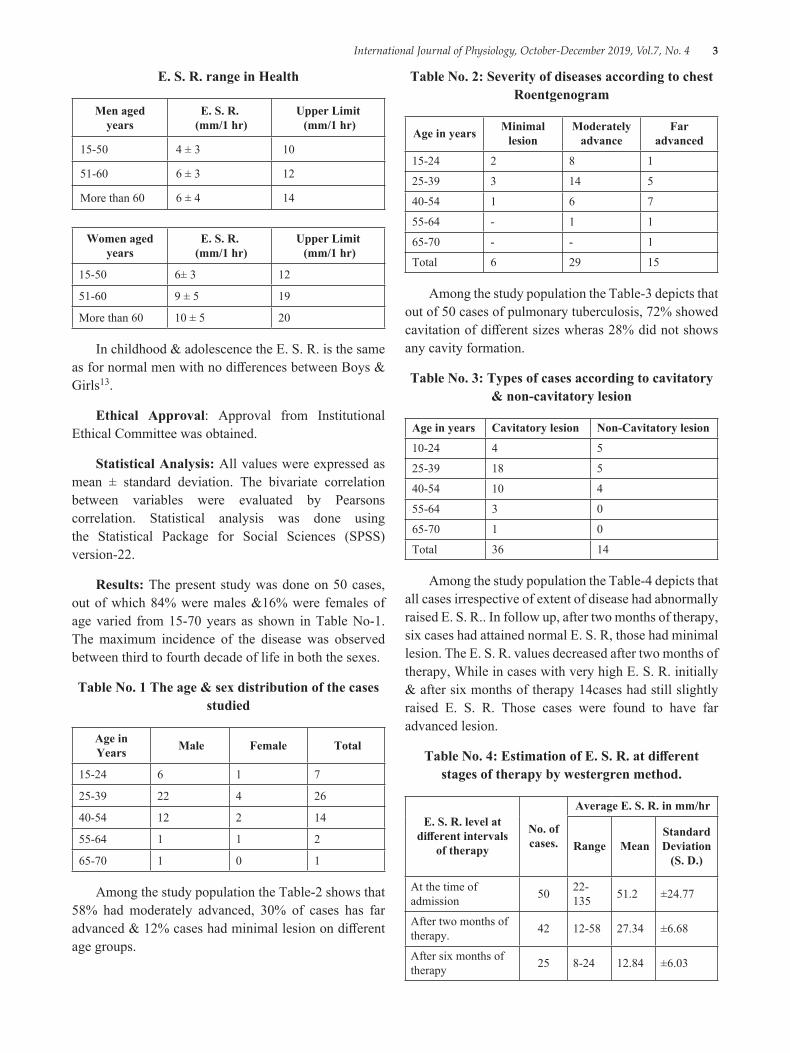
E. S. R. range in Health
Men aged years
E. S. R. (mm/1 hr)
Upper Limit (mm/1 hr)
15-50 4 ± 3 10
51-60 6 ± 3 12
More than 60 6 ± 4 14
Women aged years
E. S. R. (mm/1 hr)
Upper Limit (mm/1 hr)
15-50 6± 3 12
51-60 9 ± 5 19
More than 60 10 ± 5 20
In childhood & adolescence the E. S. R. is the same as for normal men with no differences between Boys & Girls13.
Ethical Approval: Approval from Institutional Ethical Committee was obtained.
Statistical Analysis: All values were expressed as mean ± standard deviation. The bivariate correlation between variables were evaluated by Pearsons correlation. Statistical analysis was done using the Statistical Package for Social Sciences (SPSS) version-22.
Results: The present study was done on 50 cases, out of which 84% were males &16% were females of age varied from 15-70 years as shown in Table No-1. The maximum incidence of the disease was observed between third to fourth decade of life in both the sexes.
Table No. 1 The age & sex distribution of the cases studied
Age in Years Male Female Total
15-24 6 1 7
25-39 22 4 26
40-54 12 2 14
55-64 1 1 2
65-70 1 0 1
Among the study population the Table-2 shows that 58% had moderately advanced, 30% of cases has far advanced & 12% cases had minimal lesion on different age groups.
Table No. 2: Severity of diseases according to chest Roentgenogram
Age in years Minimal lesion
Moderately advance
Far advanced
15-24 2 8 1
25-39 3 14 5
40-54 1 6 7
55-64 - 1 1
65-70 - - 1
Total 6 29 15
Among the study population the Table-3 depicts that out of 50 cases of pulmonary tuberculosis, 72% showed cavitation of different sizes wheras 28% did not shows any cavity formation.
Table No. 3: Types of cases according to cavitatory & non-cavitatory lesion
Age in years Cavitatory lesion Non-Cavitatory lesion
10-24 4 5
25-39 18 5
40-54 10 4
55-64 3 0
65-70 1 0
Total 36 14
Among the study population the Table-4 depicts that all cases irrespective of extent of disease had abnormally raised E. S. R.. In follow up, after two months of therapy, six cases had attained normal E. S. R, those had minimal lesion. The E. S. R. values decreased after two months of therapy, While in cases with very high E. S. R. initially & after six months of therapy 14cases had still slightly raised E. S. R. Those cases were found to have far advanced lesion.
Table No. 4: Estimation of E. S. R. at different stages of therapy by westergren method.
E. S. R. level at different intervals
of therapy
No. of cases.
Average E. S. R. in mm/hr
Range MeanStandard Deviation
(S. D.)
At the time of admission 50 22-
135 51.2 ±24.77
After two months of therapy. 42 12-58 27.34 ±6.68
After six months of therapy 25 8-24 12.84 ±6.03
4 International Journal of Physiology, October-December 2019, Vol.7, No. 4
DiscussionESR is regarded as test f activity in pulmonary
tuberculosis14. Elevated ESR to different level is one of the indicators of increased activity of disease & a prognostic device, as evident in our work. It elevates in those patient with rise in sputum positivity. Earlier studies also shows the elevated ESR as reported by Chakraborti AK et al15, DeodhareSG16& Hungund BR et al17.
In our study, 50 untreated sputum positive as well as negative cases of pulmonary tuberculosis were studied for changes in ESR estimated by westergren method & again follow up after two months & after six months. The age range of these 50 cases varied from 15 to 70 years. The mximum number of these patients (i. e 84%) were in the third & fourth decade of life in both sexes. 84% of them were male & 16% were female with male:female ratio 5:1 respectively. In support of our study Westergren18 (1921) also observed that out of 60 cases studied 46 were within third & fourth decade of life in both sexes in his study group. While in contrast to our study Khan19 et al observed that 37.5% of cases were below 40 yearsof age, 39.7% between 41-60 years of age & above 60 years were of 22.7%. The male & female ratio being 76:12 in their study group. So in this way this study differs from the present study.
Kailasam20et al (1985) observed that out of 511 patients studied 47 (9.2%) were of minimal lesion, 299 (58.5%) of moderately advanced lesion & 167 (32.3%) are of far advanced lesion. The present study mimicks the observations brought about by Kailsam20 et al.
Out of 50 cases 72% os cases were of cavitatory lesion. All showed a very high level of ESR value by Wintrobes method. After two months of therapy, fall in ESR values were observed, but non-attained normal value. After six months of therapy 6 out of 21 cases showed normal ESR. Westergren SG18 (1921) observed in his studies of 369 patients that majority of his patients were having cavitatory lesion in all age group ranging from 15-60 years. All except few cases showed a moderate to high rise of ESR While few cases showed a very minimal rise in ESR.
Pagel W21 (1964) observed that the test is of no specific assistance in diagnosis in lesion of minimal extent. It frequently yields a nrmal value. In the present study, it was observed that the cases with minimal lesion showed a raised ESR pattern, although the rise wasnot
very significant. Present observation was in accordance with Westergren SG18 (1921) Who states that the rise of ESR was a indication of pathological process in the human body. In follow up all cases showed fall in ESRafter 2 months of anti-tubercular therapy irrespective of extent & type of lesion. While after 6 months of therapy all except few attained normal ESR. Westergren18 (1921), Pagel W21 (1964) & Khan19 et al all have noticed fall in ESR during the course of treatment at frequent intervals & invariably attainednormal ESR after 6 month of therapy.
ConclusionAll cases had very high sedimentation rate but
cases with minimal lesion had lower sedimentation rate than far advanced lesion. The ESR of patients with tuberculosis varies with the anti-tubercular theray durin different time interval.
After 2 months of therapy the ESR tends to fall gradually & in 2 cases out of 4 cases of minimal lesion returned to normal, While after 6 month of therapy 16 out of 25 cases studied showed increased ESR, as these cases were of far advanced lesion & 10 cases out of 18 were of moderately advanced lesion. Blood changes in pulmonary tuberculosis are common in the form of increased ESR. No blood abnormality is specific for pulmonary tuberculosis & there is not much difference in blood changes in cavitatory lesion or non-cavitatory lesions. But some cases of far advanced lesion in which the blood changes are more marked. All the blood abnormalities are secondary to pulmonary tuberculosis 7 returned to normal rang with proper anti-tubercular therapy.
So, E. S. R. is raised irrespective of lesion indicating activity of disease & should be repeated frequently to access the healing process with the different period of anti-tubercular therapy.
Conflict of Interest: None
Source of Funding: Nil
References1. Akpan P, Patience A, Ephora A. Some haemtological
parameter of tuberculosis in Infected Africans:The Nigerian perspective. J of Nat. Sci Res. 2012; 2 (1):
2. Iseman MD (2000). A Clinical Guide to Tuberculosis. Philadelphia; Lipincott, Williams & Wilikins.
International Journal of Physiology, October-December 2019, Vol.7, No. 4 5
3. Murray JL, Styblok R, Roumillon A. Tuberculosis in developing countries. Bulletin Inter. Union of Tubercular Dis. 1990; 65: 6-24.
4. Dale DC. Chronic Neutropenia, Medicine. 1979: 58-128.
5. Al-Zamel F. Detection & Diagnosis of Mycobacterium Tuberculosis. Expert Review of Anti-infective Therapy. 2009; 7: 1099-108.
6. Schlossberg T. Tuberculosis & Nontuberculous Mycobacterial Infections. 4th Ed. Philadelphia, Pennysilvania, United States of America: WB Saunders Company; 1999.
7. Glasser RM. The Significance of Haematologic Abnormalities in Patients with Tuberculosis. Arch Intern. Med. 1970: 125; 691-95.
8. Charles M. The Haematological & Biochemical Changes in Severe Pulmonary Tuberculosis. J Med. 1989 (273):1751-59.
9. Cutler JV, Lewis SM. Practical Application of Blood Sedimentaion Rate. Gen Med Am J of Medicine. 1984: 1931.
10. Molay B, Chaudhary BL, Shukla S. Haematological Profile among Pulmonary Tuberculosis Patients in Tertiary Care Hospital. Int. J of Bioassays. 2015; 05: 3900-02.
11. Iqbal S, Iqbal R, Khan MM. Comparison of two Conventional Technique Used for the Diagnosis of Tuberculosis Cases. Int J Agri Bioassays. 2003; 5 (4): 545-47.
12. Dacie SJ, Lewis SM. Ranges & Normal Values, Practical Haematology. 10th Edition. U. K: Churchill Livingstone Pub; 2006:pp. no-14-17.
13. Lasardi AD. The Erythrocyte Sedimentation Rate. Pediatric Clinics of North America. 1972:1173.
14. Muhammad S, Ferhat A. Haematiological Profile & Risk Factors Associated with Pulmonary Tuberculosis Patients in Quetta, Pakisthan. Pak J Med Sci. 2014; Jan-Feb 30 (1):36-40.
15. Chakraborti AK, Dutta AK, Dasgupta B. Haematological Changes in Disseminated Tuberculosis. Ind. J Tuber. 1995; 42:165-8.
16. Dheodhare SG. General Pathology & Pathology of Systems. 6th Ed. Mumbai. Popular Prakashan Pvt Ltd Ed. Phildelphia. Pennsylvania USA W Saunders Company. 2001; 29 (9); 769-775.
17. Hungund BR, Sangolli SS, Bannar HB. Blood & Bone Marrow Findings in Tuberculosis in Adults. A Cross Sectional Study. Al Ameen J Med Sci. 2012; 5 (4), 362-66.
18. Westergren SG. Studies of the Supension Stability of the Blood in Pulmonary Tuberculosis. Am J of Med Sci. 1921; 186:57.
19. Khan MA. Clinical & Roentrographic Spectrum of Pulmonary Tuberculosis in the Adult. Am J Med Sci. 1977; 62:31.
20. Kailasam K. Serum Protein Profile in Patents with Pulmonary Tuberculosis. Ind J Med Sci. 81:551-57.
21. Pagel W. Pulmonary Tuberculosis. Am. J. of Res. Tuberculosis. 59:311.
6 International Journal of Physiology, October-December 2019, Vol.7, No. 4
Study of Variation in Lipid Profile Parameters in Pre Menopausal and Post Menopausal Subjects
Akshay Berad1, Vishakha2
1Associate Professor, Dept. of Physiology, RIMS, Adilabad, Telangana, India, 2Tutor, Dept. of Physiology, Dr. Baba Saheb Ambedkar Medical College & Hospital, Delhi, India
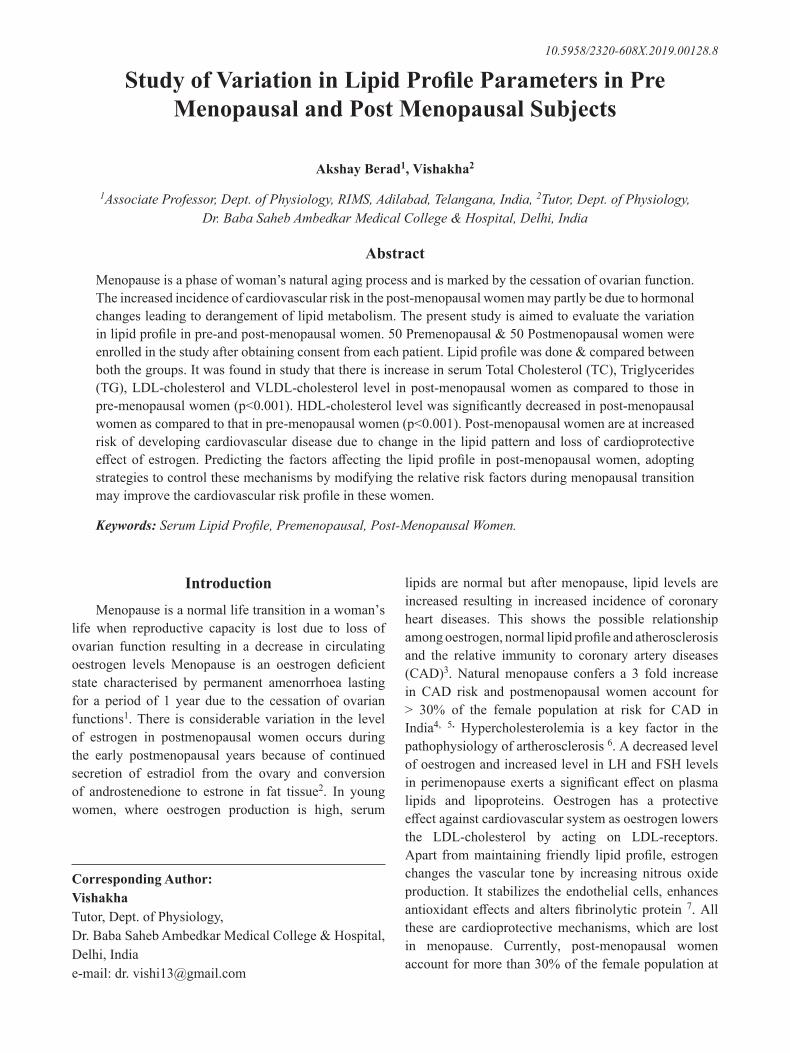
AbstractMenopause is a phase of woman’s natural aging process and is marked by the cessation of ovarian function. The increased incidence of cardiovascular risk in the post-menopausal women may partly be due to hormonal changes leading to derangement of lipid metabolism. The present study is aimed to evaluate the variation in lipid profile in pre-and post-menopausal women. 50 Premenopausal & 50 Postmenopausal women were enrolled in the study after obtaining consent from each patient. Lipid profile was done & compared between both the groups. It was found in study that there is increase in serum Total Cholesterol (TC), Triglycerides (TG), LDL-cholesterol and VLDL-cholesterol level in post-menopausal women as compared to those in pre-menopausal women (p<0.001). HDL-cholesterol level was significantly decreased in post-menopausal women as compared to that in pre-menopausal women (p<0.001). Post-menopausal women are at increased risk of developing cardiovascular disease due to change in the lipid pattern and loss of cardioprotective effect of estrogen. Predicting the factors affecting the lipid profile in post-menopausal women, adopting strategies to control these mechanisms by modifying the relative risk factors during menopausal transition may improve the cardiovascular risk profile in these women.
Keywords: Serum Lipid Profile, Premenopausal, Post-Menopausal Women.
IntroductionMenopause is a normal life transition in a woman’s
life when reproductive capacity is lost due to loss of ovarian function resulting in a decrease in circulating oestrogen levels Menopause is an oestrogen deficient state characterised by permanent amenorrhoea lasting for a period of 1 year due to the cessation of ovarian functions1. There is considerable variation in the level of estrogen in postmenopausal women occurs during the early postmenopausal years because of continued secretion of estradiol from the ovary and conversion of androstenedione to estrone in fat tissue2. In young women, where oestrogen production is high, serum
lipids are normal but after menopause, lipid levels are increased resulting in increased incidence of coronary heart diseases. This shows the possible relationship among oestrogen, normal lipid profile and atherosclerosis and the relative immunity to coronary artery diseases (CAD)3. Natural menopause confers a 3 fold increase in CAD risk and postmenopausal women account for > 30% of the female population at risk for CAD in India4, 5. Hypercholesterolemia is a key factor in the pathophysiology of artherosclerosis 6. A decreased level of oestrogen and increased level in LH and FSH levels in perimenopause exerts a significant effect on plasma lipids and lipoproteins. Oestrogen has a protective effect against cardiovascular system as oestrogen lowers the LDL-cholesterol by acting on LDL-receptors. Apart from maintaining friendly lipid profile, estrogen changes the vascular tone by increasing nitrous oxide production. It stabilizes the endothelial cells, enhances antioxidant effects and alters fibrinolytic protein 7. All these are cardioprotective mechanisms, which are lost in menopause. Currently, post-menopausal women account for more than 30% of the female population at
Corresponding Author: Vishakha Tutor, Dept. of Physiology, Dr. Baba Saheb Ambedkar Medical College & Hospital, Delhi, India e-mail: dr. [email protected]
10.5958/2320-608X.2019.00128.8
International Journal of Physiology, October-December 2019, Vol.7, No. 4 7
risk for Coronary Artery Disease 8. Therefore this study was aimed to evaluate the variability of lipid profile in pre menopausal and post menopausal women.
Material and MethodThe present study was undertaken in the department
of Physiology, in tertiary care institute.
Study Design
Study groups includes
Group-1: Fifty premenopausal women [Age between 30 to 45 years]
Group-2: Fifty postmenopausal women [Age between 46 to 65 years]
Inclusion Criteria:
Suitable subjects who accept to take part in this research, Subjects with no history of any chronic disorder, Premenopausal women with a history of regular menstrual cycle.
Exclusion Criteria
● Pregnant women
● Patients on drugs for abnormal lipids or hormone therapy
● Patients with history of hysterectomy, oophorectomy
● Patients with cardiovascular disease, diabetes mellitus, hypertension, obesity, or metabolic diseases.
All the subjects included in the study were included in the study after getting informed consent. Each patient underwent detailed clinical history, physical examination and investigations. In this study, we measured serum levels of lipid profile comprising of Total Cholesterol (TC), Triglyceride (TG), High Density Lipoprotein Cholesterol, (HDL-C), Low Density Lipoprotein Cholesterol (LDL-C) and Very Low Density Lipoprotein Cholesterol (VLDL-C). Estimation of plasma HDL level was done using Immune Precipitation Method, Total Cholesterol and Triglyceride using enzymatic method, VLDL Cholesterol & LDL Cholesterol was calculated using the Friedewald Equation9.
The detailed history and anthropometric measurements were recorded. Weight, Height, was measured from each subject and BMI was calculated by using formula wt in kg/(ht in m)2.
Data AnalysisAll values were expressed as mean ± Standard
Deviation. Comparison of mean was done by independent samples t-test. The statistical analysis was performed using SPSS 21 version. Statistical significance was considered at P < 0.05.
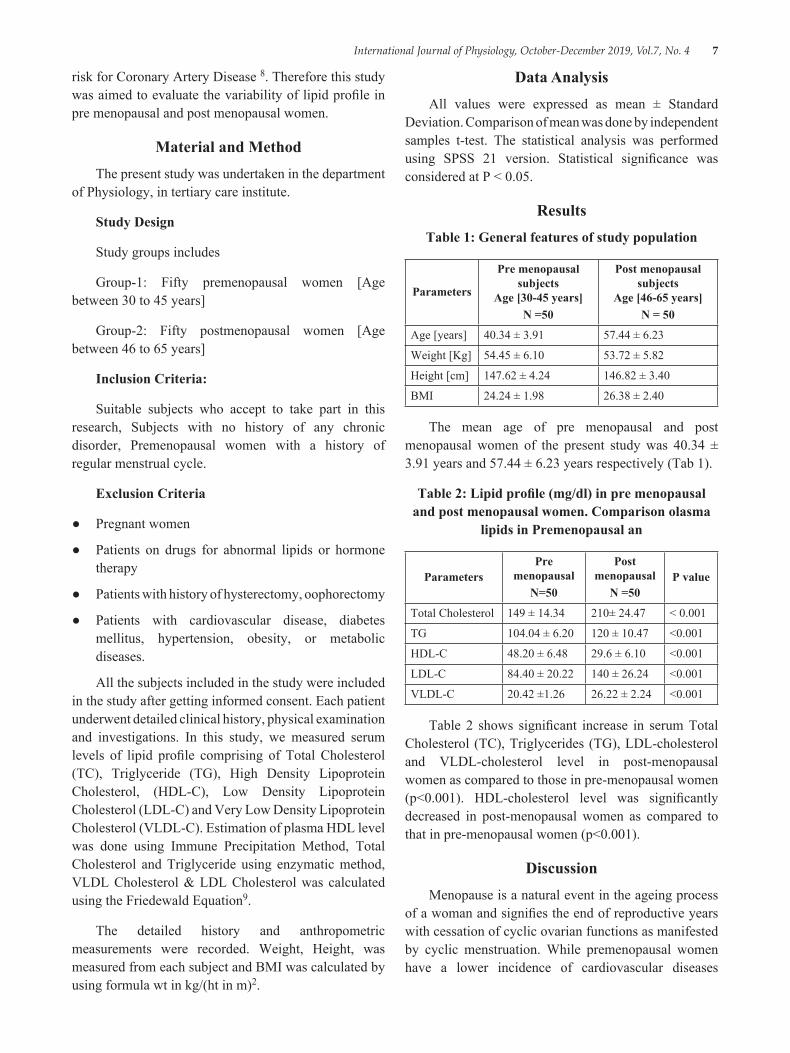
ResultsTable 1: General features of study population
Parameters
Pre menopausal subjects
Age [30-45 years]N =50
Post menopausal subjects
Age [46-65 years]N = 50
Age [years] 40.34 ± 3.91 57.44 ± 6.23
Weight [Kg] 54.45 ± 6.10 53.72 ± 5.82
Height [cm] 147.62 ± 4.24 146.82 ± 3.40
BMI 24.24 ± 1.98 26.38 ± 2.40
The mean age of pre menopausal and post menopausal women of the present study was 40.34 ± 3.91 years and 57.44 ± 6.23 years respectively (Tab 1).
Table 2: Lipid profile (mg/dl) in pre menopausal and post menopausal women. Comparison olasma
lipids in Premenopausal an
ParametersPre
menopausalN=50
Post menopausal
N =50P value
Total Cholesterol 149 ± 14.34 210± 24.47 < 0.001
TG 104.04 ± 6.20 120 ± 10.47 <0.001
HDL-C 48.20 ± 6.48 29.6 ± 6.10 <0.001
LDL-C 84.40 ± 20.22 140 ± 26.24 <0.001
VLDL-C 20.42 ±1.26 26.22 ± 2.24 <0.001
Table 2 shows significant increase in serum Total Cholesterol (TC), Triglycerides (TG), LDL-cholesterol and VLDL-cholesterol level in post-menopausal women as compared to those in pre-menopausal women (p<0.001). HDL-cholesterol level was significantly decreased in post-menopausal women as compared to that in pre-menopausal women (p<0.001).
DiscussionMenopause is a natural event in the ageing process
of a woman and signifies the end of reproductive years with cessation of cyclic ovarian functions as manifested by cyclic menstruation. While premenopausal women have a lower incidence of cardiovascular diseases
8 International Journal of Physiology, October-December 2019, Vol.7, No. 4
(CVD) compared with men of the same age, the incidence of the disease in women increases dreadfully after the age of 50 years. The anti-atherogenic effect of estrogens and the protection of females against CVD, especially coronary heart disease are well described during the premenopausal period. Indeed, there is convincing evidence that menopause is associated with a pro-atherogenic lipid profile characterised by low HDL, higher LDL and TGs levels10. The present study shows that there are variations of the lipid profile in post menopausal women as compared to pre menopausal women. This can be explained that after menopause, there is decrease oestrogen level and other hormonal effect in the women which may result to abnormal glucose and insulin metabolism, ultimately produced abnormal effect on the lipid metabolism. The findings in our study are in accordance with other studies done by Kalavathi et al 11, Muzzio et al 12 and Matthews et al 13, where the TC was increased in post-menopausal women when compared to pre-menopausal women and is statistically significant (P < 0.05). There was significant reduction in the cardio protective HDL-C and significant increase in the atherosclerotic LDL-C in post Menopausal Women which was in consistent with the findings of Igweh et al14. The increased LDL-C and the decreased in the cardio protective HDL-C is an indication that menopause is an independent risk factor for developing cardiovascular disease in post menopausal women. Lipoprotein lipase (LPL) is regulated by circulating estrogen. LPL catalyzes the hydrolysis of VLDL-C to form intermediate-density lipoprotein and later LDL-C. Estrogen deficiency after menopause increases the plasma LPL and hepatic lipase activity causing plasma LDL-C to accumulate and also leads to down-regulation of LDL receptors. Menopause leads to changes in lipid profile by reducing HDL, and elevating Total Cholesterol (TC), triglycerides (TG), LDL-cholesterol and VLDL-cholesterol, thus increasing the risk for cardiovascular disease. The results of this study were in agreement with those of earlier studies, which suggested that changes in lipid profile were caused by reduced oestrogen concentrations which were seen in menopause.
ConclusionFrom our study it is evident that the mean values
of total Cholesterol, LDL were higher and HDL was lower in post menopausal women due to estrogen deficiency when compared with pre menopausal women. Dyslipidemia occurs due to multifactorial reasons like physical activity, life style, diet, smoking,
alcohol consumption, ethnicity and genetic makeup. So further extensive studies with importance to the duration following menopause need to be done to understand the underlying mechanisms. Hence, as the changes in lipid profile correlates directly with the change of oestrogen level. It accounts for increased CAD risk in perimenopausal women compared to premenopausal women. The risk maximises in menopause in the women. The estimation of lipo-proteins like HDL and LDL serves as a more reliable tool in predicting the risk of coronary heart disease in perimenopausal and postmenopausal women. Specific evaluation, treatment and prevention strategies must be implemented to reduce the CVD burden and promote health in post menopausal women.
Ethical Clearance: Taken from institutional ethical committee
Source of Funding: Self
Conflict of Interest: Nil
References1. Sacks FM, Murray AM et al. Hormone Therapy to
Prevent Disease and Prolong Life in Postmenopausal Women. Ann Int Med 1992; 117:202-352.
2. Matthews KA, Cauley J. Menopause and mid-life changes. In: Hazzard WR, Blass JP, Ettinger WH Jr, Halter JB, Ouslander JG, eds. Principles of Geriatric Medicine and Gerontology. 4th ed. New York, NY:McGraw-Hill; 1999:179-190.
3. Do KA, Green A et al. Longitudinal Study of Risk Factors for Coronary Heart Disease Across the Menopausal Transition. Am J epidemiology 2000; 151:584-593.
4. Bang HO, Dyerberg J et al: Acta Med Scand 1972; 192:85.
5. Barbara B, Sherwin, Morrie M, Gelfand et al. Postmenopausal Oestrogen and Androgen Replacement and Lipoprotein Lipid Concentration. Am J Obstet Gyanecol 1987; 156:414-419.
6. Igweh JC, Aloamaka CP. Cholesterol Profile of Adults Resident in Eastern Nigeria. O. J. Med. 2003; 15 (3):46-50.
7. Taddec S, Virdis A, Ghiadoni L, Mattec P, Sudano I, Bernini, G. Menopause is associated with endothelial dysfunction in women. Hypertension. 1996; 28:576-582.
International Journal of Physiology, October-December 2019, Vol.7, No. 4 9
8. Arora S, Jain A, Chitra R. Effects of short-term hormone replacement on atherogenic indices in Indian postmenopausal women. Indian J Clin Biochem. 2006; 21:41-47.
9. Friedwald WT, Levy RJ, Friedrickson DS. Estimation of concentration of low density lipoprotein cholesterol in plasma without use of preparative ultracentrifuge. Clin Chem. 1972:18:499-502
10. Waren MP, Halpert S. Hormone Replacement Therapy: Controversies, Pros and Cons. Best Prac Res Clin Endocrinol Metab 2004; 18: 317-32
11. Kalavathi L, Dhruvanarayan HR, Zachariah E. Plasma estradiol and lipid profile in perimenopausal
women. Indian J Physiol Pharmacol. 1991; 35:260-262.
12. Matthews KA, Meilahn E, Kuller LH, Kelsey SF, Caggiula AW, Wing RR. Menopause and risk factors for coronary heart disease. N Engl J Med. 1989; 321:641-6.
13. Muzzio ML, Berg G, Zago V, Basilio F, Sanguinetti S, Lopez G. Circulating small dense LDL, endothelial injuring factors and fibronectin in healthy postmenopa
14. Igweh JC, Aloamaka CP. Cholesterol Profile of Adults Resident in Eastern Nigeria. O. J. Med. 2003; 15 (3):46-50.
10 International Journal of Physiology, October-December 2019, Vol.7, No. 4
Analysis of One Best MCQS in Five Preuniversity Physiology Examinations
Amit A. Upadhyah1, Pankaj B. Maheria2, Jitendra Patel3
1Associate Professor, Physiology, GMERS Medical College Valsad, 2Associate Professor of Anatomy, GMERS Medical College Dharpur Patan, 3Associate Professor of Physiology,
Gujarat Adani Institute of Medical Sciences, Bhuj
AbstractObjectives: One-best MCQs (Multiple Choice Questions) is a popular form of assessment where the student selects the best possible answer from the options provided. The objective of this study was to analyze the MCQs used in preliminary examinations in terms of Difficulty Index, Differentiation Index and Distracter efficiency.
Method: Total 100 MCQ items with one correct option and three distracters were taken from past 5 years preuniversity examinations and analyzed for level of difficulty and power of discrimination. A total of 149, 156, 154, 156 and 148 students appeared for the exam in each year. The Difficulty index was calculated by the formula P = R/T. High and low groups consisting of upper and lower 27 % students, respectively, were taken after arranging the scores in descending order for calculating the Discrimination Index as follows:DI = 2 x [ (H-L) /N]. Distracter efficiency was determined on the basis of the number of Nonfunctioning Distracters (NF-Ds). An ideal item should have a DFI between 0.30-70.0, a DI of >0.24 and a DE of 100%.
Results: The Difficulty indices for the ten papers of 10 MCQ`s each were (Mean±S. D) 0.50±0.24, 0.49±0.25, 0.52±0.23, 0.55±0.19, 0.73±0.22, 0.68±0.18, 0.53±0.24, 0.65±0.18, 0.54±0.3, 0.47±0.26 respectively. Differentiation indices were (Mean±S. D)0.37±0.12, 0.34±0.17, 0.35±0.14, 0.43±0.15, 0.40±0.15, 0.43±0.17, 0.40±0.20, 0.46±0.11, 0.40±0.16, 0.40±0.20. Thus as a whole, the papers were of average difficulty and were able to differentiate between the students. Thirtyfive MCQs were ideal MCQs. In individual analysis, total 37 MCQs were very easy (Difficulty Index>0.70) and 18 were found to be very tough (Difficulty Index<0.30). In Distracter analysis, 20% of the distracters were found to be nonfunctional (NFDs). 30% of the MCQ`s had One NFD, while 9% and 4% had two and three NFD`s respectively.
Conclusion: Overall, the papers had very good difficulty and differentiation indices which were quite consistent over the five years but there are a few MCQs and distracters which need to be modified to further enhance accurate assessment of the students.
Keywords: Item analysis, Differentiation index, Discrimination index, Distractor efficiency, Physiology.
Corresponding Author: Pankaj Maheria Department of Anatomy, GMERS Medical College, Dharpur Patan e-mail: [email protected]
IntroductionOne-best MCQs (Multiple Choice Questions) is a
popular form of assessment where the student selects
the best possible answer from the options provided. They allow comprehensive assessment of numerous topics from the syllabus and properly constructed MCQs assess high orders of cognitive processing of Blooms Taxonomy instead of mere recall of facts1. They are good for measuring knowledge, comprehension and could be designed to measure application and analysis2. MCQ tests reduce reliance on skills of writing and self-expression and are less likely to be affected by subjective bias from the marker, and are therefore more reliable. It is widely recognized that one best MCQs can be a valid
10.5958/2320-608X.2019.00129.X
International Journal of Physiology, October-December 2019, Vol.7, No. 4 11
and reliable tool for all types of assessment, provided they are properly constructed and inclusion is evidence based. The objective of this study was to analyze the MCQs used in preliminary examinations in terms of Difficulty Index, Differentiation Index and Distractor efficiency for testing their validity as assessment tools.
Method: This was a retrospective study in which MCQ asked in preuniversity physiology examination over five years were analysed. At the end of teaching in the first professional M. B. B. S, a preuniversity examination is held two to three weeks before the summative university examination, covering the entire physiology curriculum specified for first professional M. B. B. S. Although taken towards the end of first professional, it is a part of formative assessment and marks have a major contribution to the internal assessment. The physiology syllabus is examined by two papers on separate days with pre decided bifurcation of syllabus, consisting of a section of 10 MCQs followed by subjective Questions. Clear directions were provided at the beginning of section. Uniform formatting was used in all the question papers. The questions were first constructed by individual teacher and submitted to head of the department who selected the final questions based on her academic judgement and examination experience. Some of the items were used in more than 1 year by the paper setter without any access to statistical data. While constructing the MCQs, adequate care was exercised to avoid item-writing flaws like repetition of part of the stem in an option, complicated or ambiguous stem, use of double negatives, etc.
The items were of one-best type, with a single stem in the form of either a question or an incomplete statement, and four alternatives containing one correct or best alternative (answer)and three incorrect or inferior alternatives (distractors). Student would select the one best possible option to the question posed. Time allowed for MCQs in each paper was ten minutes after which MCQ answer sheets were collected and students moved on to subjective questions. A total of 149, 156, 154, 156 and 148 students appeared for the exam in the five successive years respectively. Each correct answer
was scored 1 and incorrect as 0. There was no negative marking for incorrect answers.
Total 100 MCQ items were evaluated quantitatively for level of difficulty, power of discrimination and efficacy of distractors. The Difficulty index was calculated by the formula DFI = R/T, where R is the number of correct responses and T is the total number of responses 3. This value is usually reported as a proportion, ranging from 0.0 to 1.0. A value of 0.0 would indicate that no one answered the item correctly. A value of 1.0 would indicate that everyone answered the item correctly. Items with difficulty index between 0.30-0.70 are considered good4.
High and low groups consisting of upper and lower 27 % students, respectively, were taken after arranging the scores in descending order, as recommended by Kelly TL5. The Discrimination Index was then calculated as follows: DI = 2 x [ (H-L) /N]; where, N is the total number of students in both high and low groups. H and L are the number of correct responses in the high and low groups, respectively. Discrimination index may range from +1 to-1. A score of 1.0 indicates that the upper 27% of the group all answered the question correctly and the lowest 27% of the group answered the question incorrectly. A score of-1.0 indicates that the lowest 27% of the group all answered the question correctly, and the upper 27% of the group all answered the question incorrectly. Items with Discrimination Index> 0.24 were taken as good discriminators.
Distractor efficiency was determined on the basis of the number of Nonfunctioning Distractors (NF-Ds). NF-Ds were those selected by less than 5% of students in an item 6, 7. Distractor efficiency in items with 0, 1, 2 and 3 NFD will be 100%, 66.7%, 33, 3% and 0% respectively. An ideal item should have a DFI between 0.30-70.0, a DI of >0.24 and a DE of 100%.
All the data was completely anonymous and non-individual related. Frequency distribution was created for all 100 items and Item analysis was done using Microsoft excel.
12 International Journal of Physiology, October-December 2019, Vol.7, No. 4
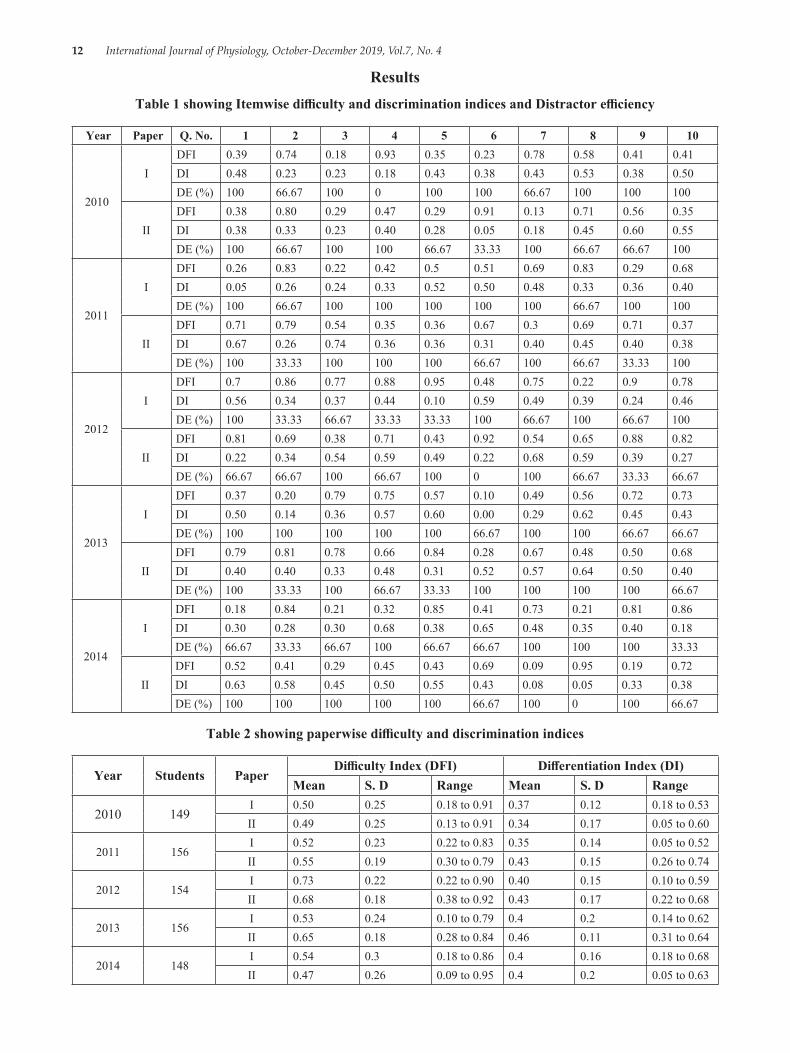
ResultsTable 1 showing Itemwise difficulty and discrimination indices and Distractor efficiency
Year Paper Q. No. 1 2 3 4 5 6 7 8 9 10
2010
IDFI 0.39 0.74 0.18 0.93 0.35 0.23 0.78 0.58 0.41 0.41DI 0.48 0.23 0.23 0.18 0.43 0.38 0.43 0.53 0.38 0.50DE (%) 100 66.67 100 0 100 100 66.67 100 100 100
IIDFI 0.38 0.80 0.29 0.47 0.29 0.91 0.13 0.71 0.56 0.35DI 0.38 0.33 0.23 0.40 0.28 0.05 0.18 0.45 0.60 0.55DE (%) 100 66.67 100 100 66.67 33.33 100 66.67 66.67 100
2011
IDFI 0.26 0.83 0.22 0.42 0.5 0.51 0.69 0.83 0.29 0.68DI 0.05 0.26 0.24 0.33 0.52 0.50 0.48 0.33 0.36 0.40DE (%) 100 66.67 100 100 100 100 100 66.67 100 100
IIDFI 0.71 0.79 0.54 0.35 0.36 0.67 0.3 0.69 0.71 0.37DI 0.67 0.26 0.74 0.36 0.36 0.31 0.40 0.45 0.40 0.38DE (%) 100 33.33 100 100 100 66.67 100 66.67 33.33 100
2012
IDFI 0.7 0.86 0.77 0.88 0.95 0.48 0.75 0.22 0.9 0.78DI 0.56 0.34 0.37 0.44 0.10 0.59 0.49 0.39 0.24 0.46DE (%) 100 33.33 66.67 33.33 33.33 100 66.67 100 66.67 100
IIDFI 0.81 0.69 0.38 0.71 0.43 0.92 0.54 0.65 0.88 0.82DI 0.22 0.34 0.54 0.59 0.49 0.22 0.68 0.59 0.39 0.27DE (%) 66.67 66.67 100 66.67 100 0 100 66.67 33.33 66.67
2013
IDFI 0.37 0.20 0.79 0.75 0.57 0.10 0.49 0.56 0.72 0.73DI 0.50 0.14 0.36 0.57 0.60 0.00 0.29 0.62 0.45 0.43DE (%) 100 100 100 100 100 66.67 100 100 66.67 66.67
IIDFI 0.79 0.81 0.78 0.66 0.84 0.28 0.67 0.48 0.50 0.68DI 0.40 0.40 0.33 0.48 0.31 0.52 0.57 0.64 0.50 0.40DE (%) 100 33.33 100 66.67 33.33 100 100 100 100 66.67
2014
IDFI 0.18 0.84 0.21 0.32 0.85 0.41 0.73 0.21 0.81 0.86DI 0.30 0.28 0.30 0.68 0.38 0.65 0.48 0.35 0.40 0.18DE (%) 66.67 33.33 66.67 100 66.67 66.67 100 100 100 33.33
IIDFI 0.52 0.41 0.29 0.45 0.43 0.69 0.09 0.95 0.19 0.72DI 0.63 0.58 0.45 0.50 0.55 0.43 0.08 0.05 0.33 0.38DE (%) 100 100 100 100 100 66.67 100 0 100 66.67
Table 2 showing paperwise difficulty and discrimination indices
Year Students PaperDifficulty Index (DFI) Differentiation Index (DI)
Mean S. D Range Mean S. D Range
2010 149I 0.50 0.25 0.18 to 0.91 0.37 0.12 0.18 to 0.53II 0.49 0.25 0.13 to 0.91 0.34 0.17 0.05 to 0.60
2011 156I 0.52 0.23 0.22 to 0.83 0.35 0.14 0.05 to 0.52II 0.55 0.19 0.30 to 0.79 0.43 0.15 0.26 to 0.74
2012 154I 0.73 0.22 0.22 to 0.90 0.40 0.15 0.10 to 0.59II 0.68 0.18 0.38 to 0.92 0.43 0.17 0.22 to 0.68
2013 156I 0.53 0.24 0.10 to 0.79 0.4 0.2 0.14 to 0.62II 0.65 0.18 0.28 to 0.84 0.46 0.11 0.31 to 0.64
2014 148I 0.54 0.3 0.18 to 0.86 0.4 0.16 0.18 to 0.68II 0.47 0.26 0.09 to 0.95 0.4 0.2 0.05 to 0.63
International Journal of Physiology, October-December 2019, Vol.7, No. 4 13
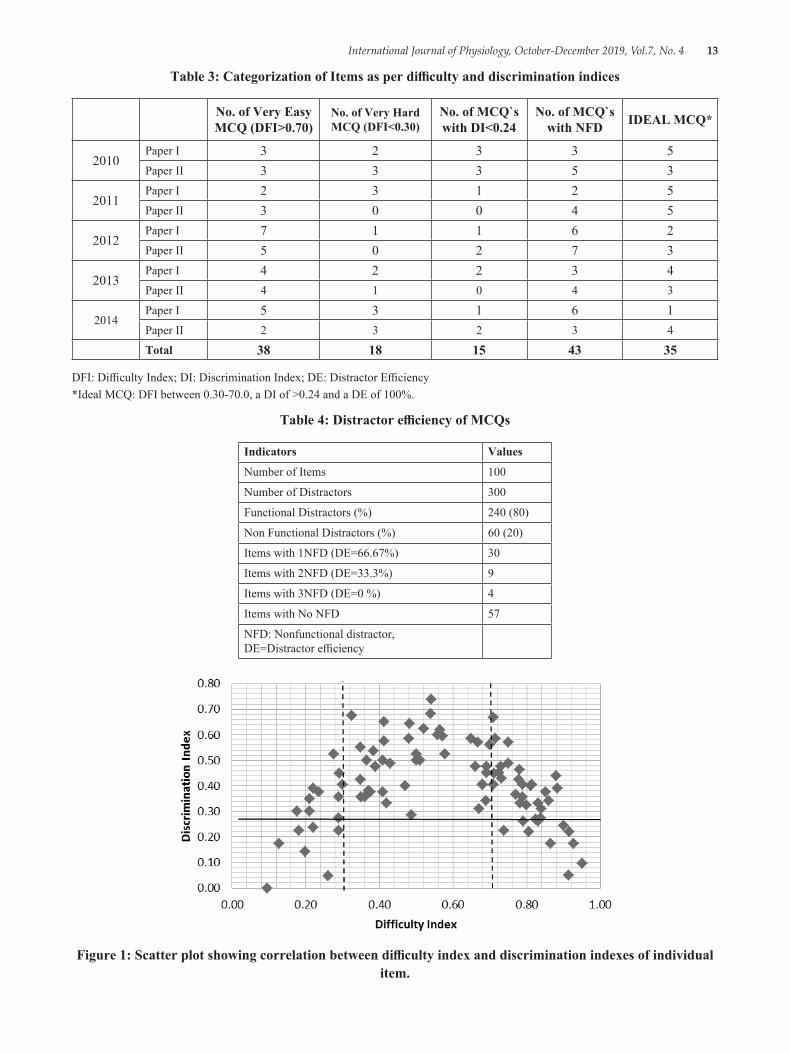
Table 3: Categorization of Items as per difficulty and discrimination indices
No. of Very Easy MCQ (DFI>0.70)
No. of Very Hard MCQ (DFI<0.30)
No. of MCQ`s with DI<0.24
No. of MCQ`s with NFD IDEAL MCQ*
2010Paper I 3 2 3 3 5Paper II 3 3 3 5 3
2011Paper I 2 3 1 2 5Paper II 3 0 0 4 5
2012Paper I 7 1 1 6 2Paper II 5 0 2 7 3
2013Paper I 4 2 2 3 4Paper II 4 1 0 4 3
2014Paper I 5 3 1 6 1Paper II 2 3 2 3 4
Total 38 18 15 43 35
DFI: Difficulty Index; DI: Discrimination Index; DE: Distractor Efficiency*Ideal MCQ: DFI between 0.30-70.0, a DI of >0.24 and a DE of 100%.
Table 4: Distractor efficiency of MCQs
Indicators Values
Number of Items 100
Number of Distractors 300
Functional Distractors (%) 240 (80)
Non Functional Distractors (%) 60 (20)
Items with 1NFD (DE=66.67%) 30
Items with 2NFD (DE=33.3%) 9
Items with 3NFD (DE=0 %) 4
Items with No NFD 57
NFD: Nonfunctional distractor, DE=Distractor efficiency
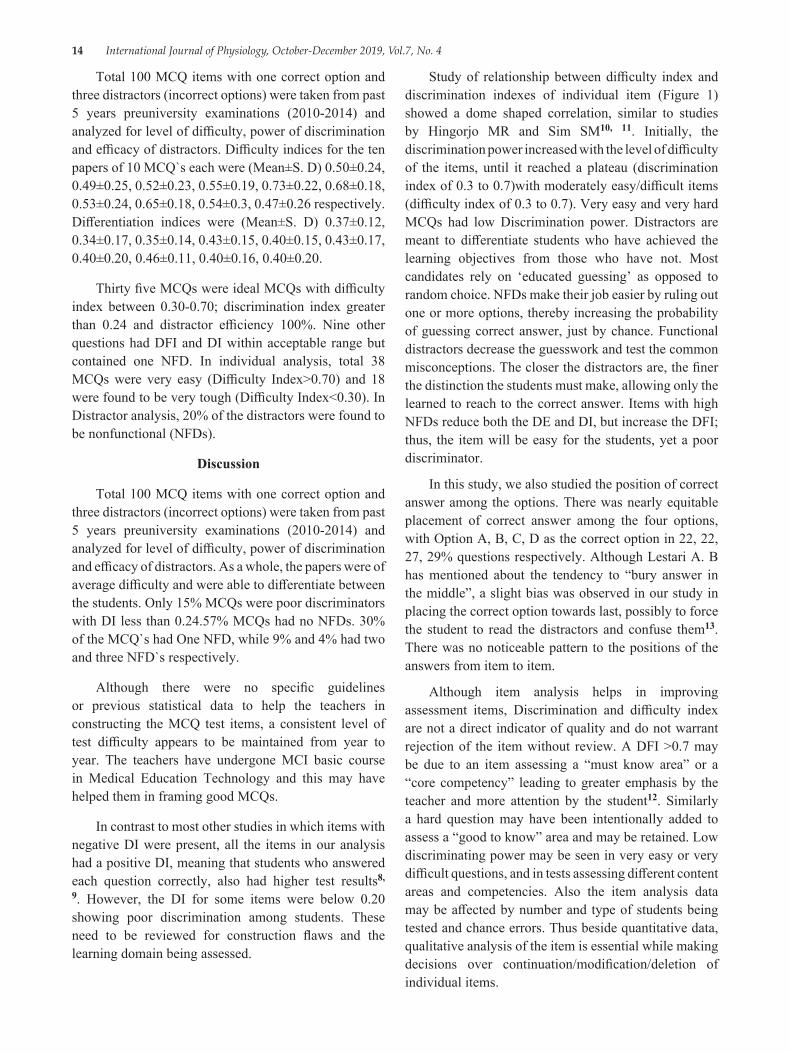
Figure 1: Scatter plot showing correlation between difficulty index and discrimination indexes of individual item.
14 International Journal of Physiology, October-December 2019, Vol.7, No. 4
Total 100 MCQ items with one correct option and three distractors (incorrect options) were taken from past 5 years preuniversity examinations (2010-2014) and analyzed for level of difficulty, power of discrimination and efficacy of distractors. Difficulty indices for the ten papers of 10 MCQ`s each were (Mean±S. D) 0.50±0.24, 0.49±0.25, 0.52±0.23, 0.55±0.19, 0.73±0.22, 0.68±0.18, 0.53±0.24, 0.65±0.18, 0.54±0.3, 0.47±0.26 respectively. Differentiation indices were (Mean±S. D) 0.37±0.12, 0.34±0.17, 0.35±0.14, 0.43±0.15, 0.40±0.15, 0.43±0.17, 0.40±0.20, 0.46±0.11, 0.40±0.16, 0.40±0.20.
Thirty five MCQs were ideal MCQs with difficulty index between 0.30-0.70; discrimination index greater than 0.24 and distractor efficiency 100%. Nine other questions had DFI and DI within acceptable range but contained one NFD. In individual analysis, total 38 MCQs were very easy (Difficulty Index>0.70) and 18 were found to be very tough (Difficulty Index<0.30). In Distractor analysis, 20% of the distractors were found to be nonfunctional (NFDs).
Discussion
Total 100 MCQ items with one correct option and three distractors (incorrect options) were taken from past 5 years preuniversity examinations (2010-2014) and analyzed for level of difficulty, power of discrimination and efficacy of distractors. As a whole, the papers were of average difficulty and were able to differentiate between the students. Only 15% MCQs were poor discriminators with DI less than 0.24.57% MCQs had no NFDs. 30% of the MCQ`s had One NFD, while 9% and 4% had two and three NFD`s respectively.
Although there were no specific guidelines or previous statistical data to help the teachers in constructing the MCQ test items, a consistent level of test difficulty appears to be maintained from year to year. The teachers have undergone MCI basic course in Medical Education Technology and this may have helped them in framing good MCQs.
In contrast to most other studies in which items with negative DI were present, all the items in our analysis had a positive DI, meaning that students who answered each question correctly, also had higher test results8, 9. However, the DI for some items were below 0.20 showing poor discrimination among students. These need to be reviewed for construction flaws and the learning domain being assessed.
Study of relationship between difficulty index and discrimination indexes of individual item (Figure 1) showed a dome shaped correlation, similar to studies by Hingorjo MR and Sim SM10, 11. Initially, the discrimination power increased with the level of difficulty of the items, until it reached a plateau (discrimination index of 0.3 to 0.7)with moderately easy/difficult items (difficulty index of 0.3 to 0.7). Very easy and very hard MCQs had low Discrimination power. Distractors are meant to differentiate students who have achieved the learning objectives from those who have not. Most candidates rely on ‘educated guessing’ as opposed to random choice. NFDs make their job easier by ruling out one or more options, thereby increasing the probability of guessing correct answer, just by chance. Functional distractors decrease the guesswork and test the common misconceptions. The closer the distractors are, the finer the distinction the students must make, allowing only the learned to reach to the correct answer. Items with high NFDs reduce both the DE and DI, but increase the DFI; thus, the item will be easy for the students, yet a poor discriminator.
In this study, we also studied the position of correct answer among the options. There was nearly equitable placement of correct answer among the four options, with Option A, B, C, D as the correct option in 22, 22, 27, 29% questions respectively. Although Lestari A. B has mentioned about the tendency to “bury answer in the middle”, a slight bias was observed in our study in placing the correct option towards last, possibly to force the student to read the distractors and confuse them13. There was no noticeable pattern to the positions of the answers from item to item.
Although item analysis helps in improving assessment items, Discrimination and difficulty index are not a direct indicator of quality and do not warrant rejection of the item without review. A DFI >0.7 may be due to an item assessing a “must know area” or a “core competency” leading to greater emphasis by the teacher and more attention by the student12. Similarly a hard question may have been intentionally added to assess a “good to know” area and may be retained. Low discriminating power may be seen in very easy or very difficult questions, and in tests assessing different content areas and competencies. Also the item analysis data may be affected by number and type of students being tested and chance errors. Thus beside quantitative data, qualitative analysis of the item is essential while making decisions over continuation/modification/deletion of individual items.
International Journal of Physiology, October-December 2019, Vol.7, No. 4 15
Conclusion: Overall, the papers had very good difficulty and differentiation indices which were quite consistent over the five years but there are a few MCQs and distractors which need to be modified to further enhance accurate assessment of the students. Items having average difficulty and high discrimination with functioning distractors should be incorporated into future tests, providing an evidence based pathway for the improvement of student learning.
Ethical Clearance: Taken from Institutional Ethical committee
Source of Funding: Self
Conflict of Interest: Nil
References1. Mukhopadhyay M, Bhowmick M, Chakraborty S,
Roy D, Sen PK, Chakraborty I. Evaluation of MCQs for judgment of higher levels of cognitive learning. Gomal J Med Sci. 2010 Dec 31; 8 (2):112-6.
2. Moeen-uz-Zafar Khan BM. Evaluation of modified essay questions (MEQ) and multiple choice questions (MCQ) as a tool for assessing the cognitive skills of undergraduate medical students. International journal of health sciences. 2011 Jan; 5 (1):39.
3. Singh T, Gupta P, Singh D. Principles of Medical Education. 3rd ed. New Delhi: Jaypee Brothers Medical Publishers (P) Ltd. Test and item analysis; 2009:70.
4. Guilbert J-J: Educational handbook for health personnel. WHO Offset Publication No. 35. Geneva: World Health Organisation, 1977
5. Kelley TL. The selection of upper and lower groups for the validation of test items. Journal of educational psychology. 1939 Jan; 30 (1):17.
6. Tarrant M, Ware J, Mohammed AM. An assessment of functioning and non-functioning distractors in multiple-choice questions: a descriptive analysis. BMC medical education. 2009 Dec; 9 (1):40.
7. Haladyna TM, Downing SM. How many options is enough for a multiple-choice test item?. Educational and Psychological Measurement. 1993 Dec; 53 (4):999-1010.
8. Hingorjo MR, Jaleel F. Analysis of one-best MCQs: the difficulty index, discrimination index and distractor efficiency. JPMA-Journal of the Pakistan Medical Association. 2012 Feb 1; 62 (2):142.
9. Rehman A, Aslam A, Hassan SH. Item analysis of multiple choice questions. Pakistan Oral & Dental Journal. 2018 Sep 10; 38 (2):291-3.
10. Sim SM, Rasiah RI. Relationship between item difficulty and discrimination indices in true/false-type multiple choice questions of a para-clinical multidisciplinary paper. Annals-Academy of Medicine Singapore. 2006 Feb 1; 35 (2):67.
11. Mitra NK, Nagaraja HS, Ponnudurai G, Judson JP. The levels of difficulty and discrimination indices in type A multiple choice questions of pre-clinical semester 1 multidisciplinary summative tests. IeJSME. 2009; 3 (1):2-7.
12. Kolte V. Item analysis of multiple choice questions in physiology examination. Indian J of Basic & Applied Medical Research. 2015; 4 (4):320-6.
13. Lestari A. B, Principles of Item construction, Available at the URL http://www. academia. edu/4880473/Princples_of_item_construction, Last accessed 26th March 2019
16 International Journal of Physiology, October-December 2019, Vol.7, No. 4
Does Dark Chocolate Relieve Menstrual Pain in Adult Women?: A Study Among Indian Population
Amita Verma1, Archana Kadam2
1Assistant Professor, 2Associate Professor, Dept. of Physiology, Dr. D.Y. Patil Medical College, Navi Mumbai
AbstractIntroduction: Premenstrual pain (PMS) and Dysmenorrhea or painful menstruation is defined as a severe, painful, cramping sensation in the lower abdomen that is often accompanied by other symptoms, such as sweating, headaches, nausea, etc all occurring just before or during the menses1. A variety of drugs, predominantly non steroidal anti-inflammatory drugs (NSAIDS) are used to provide analgesia during the period. The present study was undertaken to evaluate the claims of Dark chocolate as an alternative to NSAIDS.
Methodology: 90 selected students were divided into 3groups and were provided 120gms/day of dark chocolate, milk chocolate and no chocolate based on their group. Numeric Rate Scale (NRS) was used to measure pain before and after intervention.
Result: Pre menstrual pain and menstrual pain was significantly reduced after the consumption of Dark chocolate.
Keywords: Premenstrual pain, non steroidal anti-inflammatory drugs, Numeric Rate Scale.
Corresponding Author: Archana Kadam Associate Professor, Dept. of Physiology, Dr. D.Y. Patil Medical College, Navi Mumbai e-mail: [email protected]
IntroductionAdolescence in girls has been recognized as a special
period which signifies the transition from girlhood to womanhood and is marked with the onset of menarche, an important milestone which is often associated with problems of irregular menstruation, excessive bleeding and dysmenorrhoea.3,4 Dysmenorrhea or painful menstruation is defined as a severe, painful, cramping sensation in the lower abdomen that is often accompanied by other symptoms, such as sweating, headaches, nausea, vomiting, diarrhoea, and tremulousness, all occurring just before or during the menses. 1 Dysmenorrhea may be categorized into two types as primary and secondary. Primary dysmenorrhea is defined as painful menses among females with normal pelvic anatomy, frequently beginning during adolescence. It is observed only in ovulatory cycles, frequently emerging within 6 to 12 months after menarche with no pathology or organic
basis. Secondary dysmenorrhea is a menstrual pain associated with underlying pathology and its onset might be years after menarche. 5The cause of primary dysmenorrhea is not well established. However, the responsible cause has been identified on the hyper-production of uterine prostaglandins, particularly of PGF 2α and PGE 2, thus resulting in increased uterine tone and high-amplitude contractions.6
Women with dysmenorrhea have higher levels of prostaglandins, during the first two days of menses. 7 under the control by progesterone while immediately prior to menstruation, prostaglandin levels increase. 6, 8
The levels of prostaglandin F2α are especially high during the first two days of menstruation in women with severe primary dysmenorrhea 9 who are treated by use of NSAIDs such as aspirin, ibuprofen and naproxen, or by use of Prostaglandin inhibitors which though being better in pain relief cause GI disturbances and have a propensity for severe side effects on long term use. 1, 10, 11
There is some evidence supporting the role of some dietary supplements, including Omega-3 fatty acids, such as fish oil, vitamin B1, vitamin B6, vitamin D, vitamin E, magnesium and vitamin B6, on menstrual
10.5958/2320-608X.2019.00130.6
International Journal of Physiology, October-December 2019, Vol.7, No. 4 17
pain relief. 12, 13, 14. Disruption of calcium regulation has been proposed as an underling factor for increasing incidence and severity of menstrual pain 15, 16
Chocolate is rich in vitamin A, B1, C, D, and vitamin E. In addition, chocolate also contains anti-oxidants of phenol and flavonoids, rich in minerals such as calcium, potassium, iron, a little omega 3 and 6, and high magnesium17 which can reduce menstrual pain and premenstrual occurrence in women. Because of the mentioned benefits of dark chocolate, this study was undertaken to examine the effect of dark chocolate on menstrual pain in adolescent women.
Materials & MethodStudy Design: This was experimental study with
randomized testing with control group design.
The study was conducted on medical students at DY Patil Medical College Navi Mumbai. 90 samples were recruited by random sampling technique. The students who had given the history of severe primary dysmenorrhea were selected for the present study.
Inclusion criteria:
(a) Single, Young woman aged 18-21 years
(b) Experiencing severe pre menstrual and menstrual pain in the last 6months
(c) Regular menstrual cycle
(d) Not taking analgesic medication in last 24 hours
Exclusion criteria: Students with history of any chronic illnesses, or those using any contraceptive pills or any vitamin supplements
Intervention: 90 students that were selected were divided into 3 groups of 30 students each.
Group 1: Received 120gms/day of dark chocolate for 3 days.
Group 2: Received 120gms/day of milk chocolate for 3days
Group 3: With severe dysmenorrhea who did not receive any chocolate.
Doses given from onset of PMS till Second day of menses.
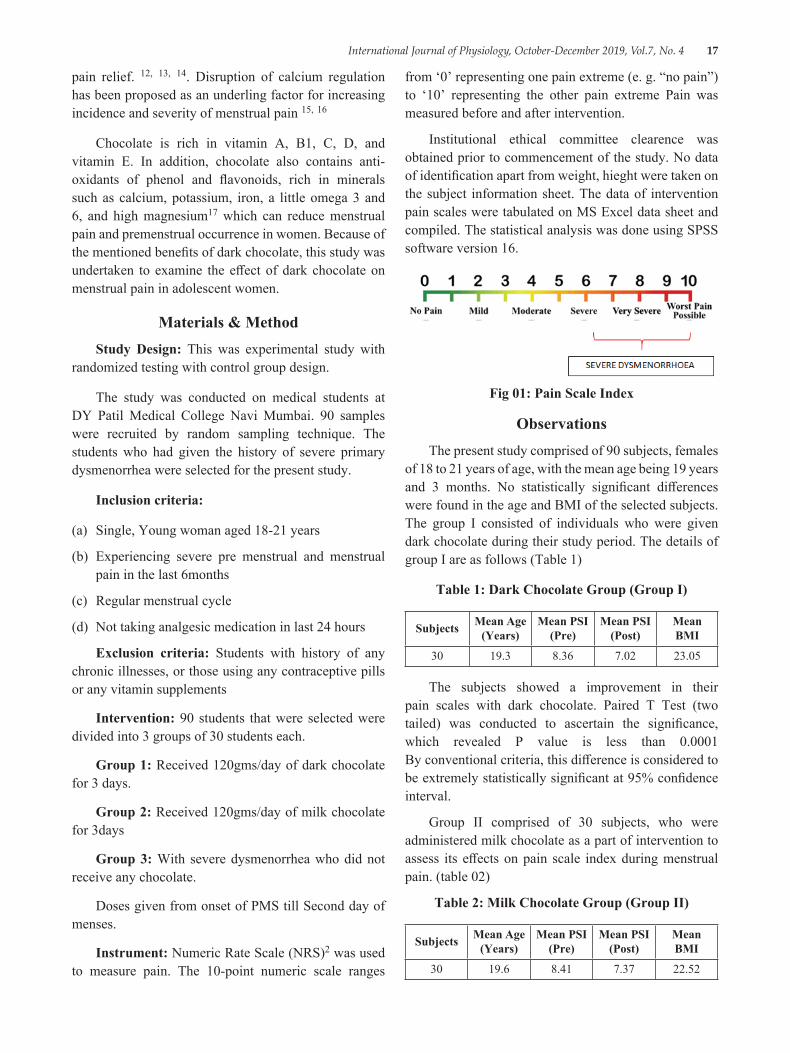
Instrument: Numeric Rate Scale (NRS)2 was used to measure pain. The 10-point numeric scale ranges
from ‘0’ representing one pain extreme (e. g. “no pain”) to ‘10’ representing the other pain extreme Pain was measured before and after intervention.
Institutional ethical committee clearence was obtained prior to commencement of the study. No data of identification apart from weight, hieght were taken on the subject information sheet. The data of intervention pain scales were tabulated on MS Excel data sheet and compiled. The statistical analysis was done using SPSS software version 16.
Fig 01: Pain Scale Index
ObservationsThe present study comprised of 90 subjects, females
of 18 to 21 years of age, with the mean age being 19 years and 3 months. No statistically significant differences were found in the age and BMI of the selected subjects. The group I consisted of individuals who were given dark chocolate during their study period. The details of group I are as follows (Table 1)
Table 1: Dark Chocolate Group (Group I)
Subjects Mean Age (Years)
Mean PSI (Pre)
Mean PSI (Post)
Mean BMI
30 19.3 8.36 7.02 23.05
The subjects showed a improvement in their pain scales with dark chocolate. Paired T Test (two tailed) was conducted to ascertain the significance, which revealed P value is less than 0.0001 By conventional criteria, this difference is considered to be extremely statistically significant at 95% confidence interval.
Group II comprised of 30 subjects, who were administered milk chocolate as a part of intervention to assess its effects on pain scale index during menstrual pain. (table 02)
Table 2: Milk Chocolate Group (Group II)
Subjects Mean Age (Years)
Mean PSI (Pre)
Mean PSI (Post)
Mean BMI
30 19.6 8.41 7.37 22.52
18 International Journal of Physiology, October-December 2019, Vol.7, No. 4
In terms of pain, the subjects showed a mild improvement with administration of milk chocolate. Paired T Test (two tailed) was conducted to ascertain the significance, which revealed that the P value < 0.0001 By conventional criteria, this difference is considered to be statistically significant at a confidence interval of 95%.
Table:3 Control Group (Group I)
Subjects Mean Age (Years) Mean PSI Mean BMI
30 19.3 8.43 22.71
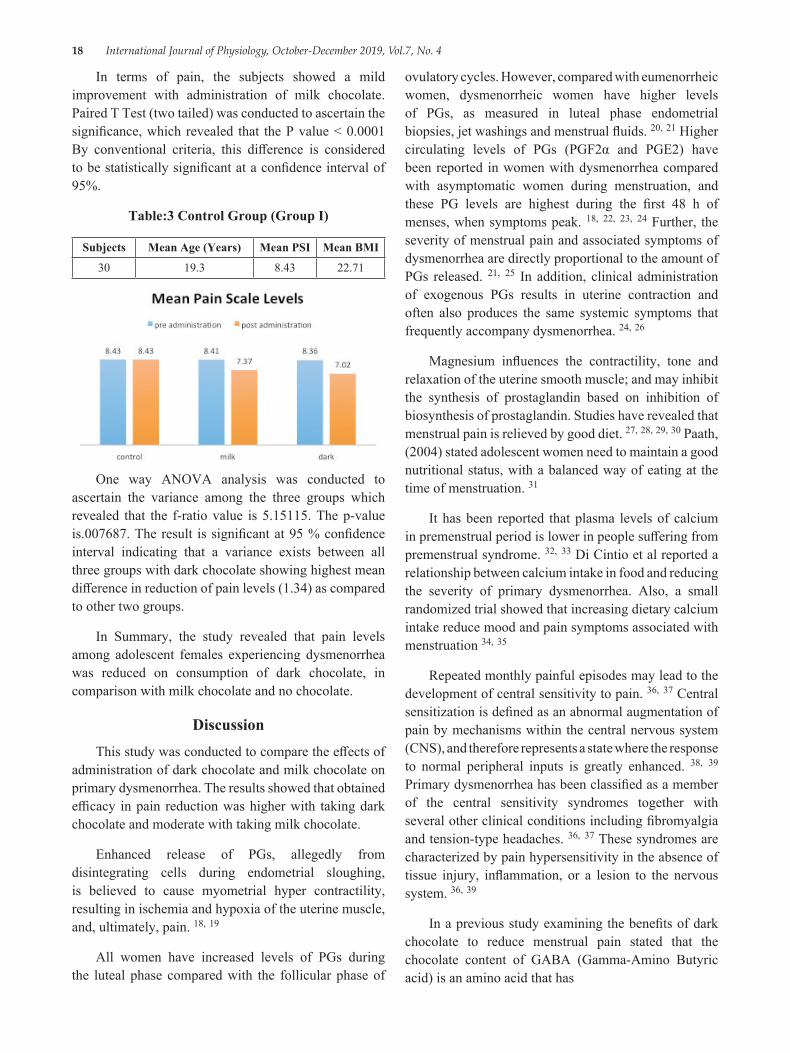
One way ANOVA analysis was conducted to ascertain the variance among the three groups which revealed that the f-ratio value is 5.15115. The p-value is.007687. The result is significant at 95 % confidence interval indicating that a variance exists between all three groups with dark chocolate showing highest mean difference in reduction of pain levels (1.34) as compared to other two groups.
In Summary, the study revealed that pain levels among adolescent females experiencing dysmenorrhea was reduced on consumption of dark chocolate, in comparison with milk chocolate and no chocolate.
DiscussionThis study was conducted to compare the effects of
administration of dark chocolate and milk chocolate on primary dysmenorrhea. The results showed that obtained efficacy in pain reduction was higher with taking dark chocolate and moderate with taking milk chocolate.
Enhanced release of PGs, allegedly from disintegrating cells during endometrial sloughing, is believed to cause myometrial hyper contractility, resulting in ischemia and hypoxia of the uterine muscle, and, ultimately, pain. 18, 19
All women have increased levels of PGs during the luteal phase compared with the follicular phase of
ovulatory cycles. However, compared with eumenorrheic women, dysmenorrheic women have higher levels of PGs, as measured in luteal phase endometrial biopsies, jet washings and menstrual fluids. 20, 21 Higher circulating levels of PGs (PGF2α and PGE2) have been reported in women with dysmenorrhea compared with asymptomatic women during menstruation, and these PG levels are highest during the first 48 h of menses, when symptoms peak. 18, 22, 23, 24 Further, the severity of menstrual pain and associated symptoms of dysmenorrhea are directly proportional to the amount of PGs released. 21, 25 In addition, clinical administration of exogenous PGs results in uterine contraction and often also produces the same systemic symptoms that frequently accompany dysmenorrhea. 24, 26
Magnesium influences the contractility, tone and relaxation of the uterine smooth muscle; and may inhibit the synthesis of prostaglandin based on inhibition of biosynthesis of prostaglandin. Studies have revealed that menstrual pain is relieved by good diet. 27, 28, 29, 30 Paath, (2004) stated adolescent women need to maintain a good nutritional status, with a balanced way of eating at the time of menstruation. 31
It has been reported that plasma levels of calcium in premenstrual period is lower in people suffering from premenstrual syndrome. 32, 33 Di Cintio et al reported a relationship between calcium intake in food and reducing the severity of primary dysmenorrhea. Also, a small randomized trial showed that increasing dietary calcium intake reduce mood and pain symptoms associated with menstruation 34, 35
Repeated monthly painful episodes may lead to the development of central sensitivity to pain. 36, 37 Central sensitization is defined as an abnormal augmentation of pain by mechanisms within the central nervous system (CNS), and therefore represents a state where the response to normal peripheral inputs is greatly enhanced. 38, 39 Primary dysmenorrhea has been classified as a member of the central sensitivity syndromes together with several other clinical conditions including fibromyalgia and tension-type headaches. 36, 37 These syndromes are characterized by pain hypersensitivity in the absence of tissue injury, inflammation, or a lesion to the nervous system. 36, 39
In a previous study examining the benefits of dark chocolate to reduce menstrual pain stated that the chocolate content of GABA (Gamma-Amino Butyric acid) is an amino acid that has
International Journal of Physiology, October-December 2019, Vol.7, No. 4 19
a major function as a neurotransmitter in the central nervous system. Gamma aminobutyric acid inhibits nerve transmission in the brain, calming nervous activity. The 5-HT creates a sense of comfort and increase serotonin levels. L-taurine gives rise to body-wide relaxation. L-glutamine can be utilized directly by the brain for energy production in brain cells. Thus it can improve brain function and facilitate the utilization of GABA and S-HTP. In theory, magnesium has a direct effect on vascular pressure and can regulate the entry of calcium into the smooth muscle cells of the uterus, so magnesium affects contraction and relaxation of smooth muscle of the uterus. 41
Magnesium can also suppress inflammation by inhibiting the formation of prostaglandins. So in the group treated with dark chocolate states menstrual pain is reduced significantly. 41
Copper is a cofactor for a number of enzymes and is required for iron transport and other process. 43, 44 Dark chocolate provides 31% whereas milk chocolate provides 10% of the U. S. RDA for copper per 100-kcal serving, dark chocolate provides 25% of the RDA (1.90 mg) and Milk chocolate contains 5% of the RDA for iron. 42 A study in 2005 stated, dark chocolate contains complex carbohydrates, antioxidants (flavonoid polyphenols), vitamin B6, unsaturated fatty acids (omega 3 and omega 6) and minerals (magnesium, calcium, iron) that influence and regulate menstrual cycle by balancing the levels of the sex hormones in the blood during the luteal phase of the cycle. 44
Conclusion: The study concluded that in the selected study group, the pain levels during dysmenorrhoea was significantly reduced by administration of dark chocolate as compared to no administration. The use of a natural substitute is a viable option to NSAIDS as it carries none of the side effects associated with the drugs. The study is limited by the small sample size and lack of variability in the age group of the subjects. A wider study is needed to effectively apply this in the entire population.
Conflict of Interest: None
Source of Funding: Self Funded
References1. Lobo RA, Gershenson DM, Lentz GM, Valea FA.
Comprehensive Gynecology E-Book. Elsevier Health Sciences; 2016 Jun 22.
2. Judha M, Sudarti FA. Teori pengukuran nyeri dan nyeri persalinan. Jogjakarta, Muha Medika. 2012.
3. Agarwal AK, Agarwal A. A study of dysmenorrhea during menstruation in adolescent girls. Indian journal of community medicine: official publication of Indian Association of Preventive & Social Medicine. 2010 Jan; 35 (1):159.
4. Dhingra R, Kumar A, Kour M. Knowledge and practices related to menstruation among tribal (Gujjar) adolescent girls. Studies on Ethno-Medicine. 2009 Jan 1; 3 (1):43-8.
5. Sharma N, Sagayaraj M, Sujatha B. Menstrual characteristics and prevalence of dysmenorrhea in college students. International Journal of Scientific and Research Publications. 2014; 4 (10):1-6.
6. Iacovides S, Avidon I, Baker FC. What we know about primary dysmenorrhea today: a critical review. Human reproduction update. 2015 Sep 7; 21 (6):762-78.
7. Dawood MY. Primary dysmenorrhea: advances in pathogenesis and management. Obstetrics & Gynecology. 2006 Aug 1; 108 (2):428-41.
8. Wong CL, Farquhar C, Roberts H, Proctor M. Oral contraceptive pill as treatment for primary dysmenorrhoea. Cochrane Database of Systematic Reviews. 2009 (2).
9. Nair P, Grover VL, Kannan AT. Awareness and practices of menstruation and pubertal changes amongst unmarried female adolescents in a rural area of East Delhi. Indian journal of community medicine. 2007 Apr 1; 32 (2):156.
10. Morrison BW, Daniels SE, Kotey P, Cantu N, Seidenberg B. Rofecoxib, a specific cyclooxygenase-2 inhibitor, in primary dysmenorrhea: a randomized controlled trial. Obstetrics & Gynecology. 1999 Oct 1; 94 (4):504-8.
11. Smith WL, Langenbach R. Why there are two cyclooxygenase isozymes. The Journal of clinical investigation. 2001 Jun 15; 107 (12):1491-5.
12. Liu CZ, Xie JP, Wang LP, Zheng YY, Ma ZB, Yang H, Chen X, Shi GX, Li SL, Zhao JP, Han JX. Immediate analgesia effect of single point acupuncture in primary dysmenorrhea: a randomized controlled trial. Pain Medicine. 2011 Feb 1; 12 (2):300-7.
13. Penland JG, Johnson PE. Dietary calcium and manganese effects on menstrual cycle symptoms. American journal of obstetrics and gynecology. 1993 May 1; 168 (5):1417-23.
20 International Journal of Physiology, October-December 2019, Vol.7, No. 4
14. Charandabi SM, Mirghafourvand M, Chegini SN, Javadzadeh Y. Calcium With and Without Magnesium for Primary Dysmenorrhea: A Double-Blind Randomized Placebo Controlled Trial. Int J Women’s Health Reprod Sci. 2017 Oct 1; 5 (4):332-8.
15. Alvir JM, Thys-Jacobs S. Premenstrual and menstrual symptom clusters and response to calcium treatment. Psychopharmacology bulletin. 1991.
16. Thys-Jacobs S. Micronutrients and the premenstrual syndrome: the case for calcium. Journal of the American College of Nutrition. 2000 Apr 1; 19 (2):220-7.
17. Nurazizah E, Tih F, Suwindere W. Black chocolate consumption reduces subjective symptoms in 18-22 years old females with premenstrual syndrome. Journal of Medicine and Health. 2015 Feb 27; 1 (1).
18. Dawood MY. Dysmenorrhea and prostaglandins. InGynecologic endocrinology 1987 (pp. 405-421). Springer, Boston, MA.
19. Hayaishi O, Matsumura H. Prostaglandins and sleep. Adv Neuroimmunol 1995; 5:211-216.
20. Chan WY, Hill JC. Determination of menstrual prostaglandin levels in nondysmenorrheic and dysmenorrheic subjects. Prostaglandins 1978; 15:365-375.
21. Lundstrom V, Green K. Endogenous levels of prostaglandin F2alpha and its main metabolites in plasma and endometrium of normal and dysmenorrheic women. Am JObstet Gynecol 1978; 130:640-646.
22. Hofmeyr GJ. Dysmenorrhoea. In: Bassin J (ed). Topics in Obstetrics and Gynaecology. Johannesburg: Julmar Communications, 1996, 269-274.
23. Coco AS. Primary dysmenorrhea. Am Fam Physician 1999; 60:489-496.
24. Chan WY, Dawood MY, Fuchs F. Prostaglandins in primary dysmenorrhea. Comparison of prophylactic and nonprophylactic treatment with ibuprofen and use of oral contraceptives. Am J Med 1981; 70:535-541.
25. Dawood MY. Dysmenorrhea. Endometrium 1995; 6:363-377.
26. Lavin, N., Manual of Endocrinology and Metabolism. Boston: Little, Brown; (1986).
Website available at:http://www. franco-lania.com/manual-of-endocrinology-and-metabolism-lavin. pdf
27. Al-Ghamid, S. M., Cameron, E. C., and Sutton, RA., Magnesium deficiency: pathophysiologic and clinical overview. Am J Kidney Dis (1994) 24:737-52
28. Walker, S. M., In vitro synthesis of prostaglandin F2a by human endometrium. Abstracts of the Twenty-first British Congress of Obstetrics and Gynecology, (1977) P 37. Sheffield. Website available at:http://iasj. net/iasj?func=fulltext&aId=72026
29. Andrea J, Candace N. Pelvic Pain and Dysmenorrhea. In: Novak E, Berek JS. Berek & Novak’s Gynecology. 14th ed. Philadelphia: Lippincott Williams & Wilkins; 2007:506-534.
30. Paath, E. F. (2004) Gizi dalam Kesehatan Reproduksi. Jakarta: EGC
31. Muneyvirci-Delale O, Nacharaju VL, Altura BM, Alutra BT. Sex steroid hormones modulate serum ionized magnesium and calcium levels throughout the menstrual cycle in women. Fertil Steril. 1998; 69 (5):958-962.
32. Thys-Jacobs S, Mcmahon D, Bilezikian JP. Cyclical changes in calcium metabolism across the menstrual cycle in women with premenstrual dysphoric disorder. J Clin Endocrinol Metab. 2007; 92 (8):2952-2959
33. Di Cintio E, Parazzini F, Tozzi L, et al. Dietary habits, reproductive and menstrual factors and risk of dysmenorrhoea. Eur J Epidemiol. 1997; 13 (8):925-930.
34. Penland JG, Johnson PE. Dietary calcium and manganese effects on menstrual cycle symptoms. Am J Obstet Gynecol. 1993; 168 (5):1417-1423.
35. Yunus MB. Fibromyalgia and overlapping disorders: the unifying concept of centralsensitivity syndromes. Semin Arthritis Rheum 2007; 36:339-356.
36. Yunus MB. Central sensitivity syndromes: a new paradigm and group nosology for fibromyalgia and overlapping conditions, and the related issue of disease versus illness. Semin Arthritis Rheum 2008; 37:339-352.
37. Woolf CJ. Pain: moving from symptom control toward mechanism-specific pharmacologic management. Ann Intern Med 2004; 140:441-451

International Journal of Physiology, October-December 2019, Vol.7, No. 4 21
38. Woolf CJ. Central sensitization: uncovering the relation between pain and plasticity. Anesthesiol 2007; 106:864-867.
39. Sessle BJ. What is pain, and why and how do we experience pain? In: Lavigne G, SessleBJ, Choiniere M, Soja PJ (eds). Sleep and Pain. Seattle: IASP Press, 2007, 23-43.
40. Smith, G. Z., & Smith, C. C. (2012). Chocolate candies fortified with natural amino acids and/or herbal nutrients for relief of insomnia, pms, and difficulty concentrating: Google Patents
41. National Academy of Sciences. Institute of Medicine. Dietary Reference Intakes (DRIs):
Recommended Intakes for Individuals, Vitamins. 2004184. National Academy of Sciences. Institute of Medicine. Dietary Reference Intakes (DRIs): Recommended Intakes for Individuals, Vitamins. 2004
42. Olivares M. Uauy R. Copper as an essential nutrient. Am J Clin Nutr. 1996; 63:791S-796S.
43. Uauy R. Olivares M. Gonzalez M. Essentiality of copper in humans. Am J Clin Nutr. 1998; 67:952S-959S.
44. Speroff, L., & Fritz, M. A. (2005). Clinical gynecologicendocrinology and infertility: lippincottWilliams & wilkins
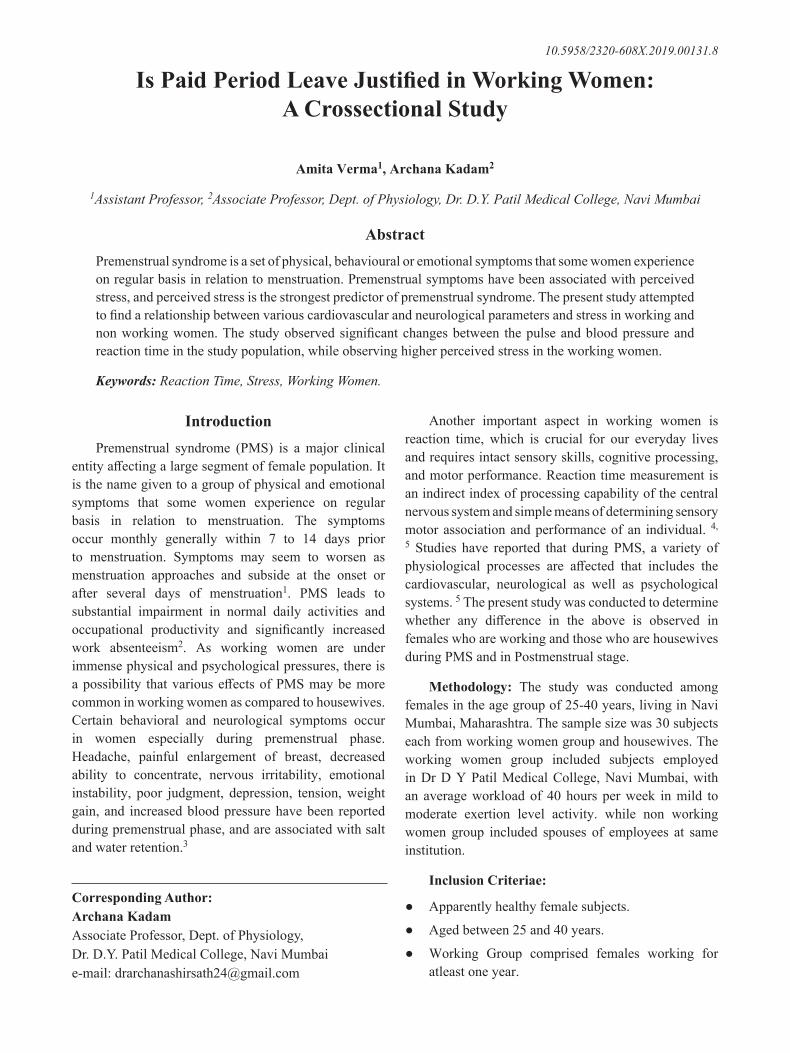
22 International Journal of Physiology, October-December 2019, Vol.7, No. 4
Is Paid Period Leave Justified in Working Women: A Crossectional Study
Amita Verma1, Archana Kadam2
1Assistant Professor, 2Associate Professor, Dept. of Physiology, Dr. D.Y. Patil Medical College, Navi Mumbai
AbstractPremenstrual syndrome is a set of physical, behavioural or emotional symptoms that some women experience on regular basis in relation to menstruation. Premenstrual symptoms have been associated with perceived stress, and perceived stress is the strongest predictor of premenstrual syndrome. The present study attempted to find a relationship between various cardiovascular and neurological parameters and stress in working and non working women. The study observed significant changes between the pulse and blood pressure and reaction time in the study population, while observing higher perceived stress in the working women.
Keywords: Reaction Time, Stress, Working Women.
Corresponding Author: Archana Kadam Associate Professor, Dept. of Physiology, Dr. D.Y. Patil Medical College, Navi Mumbai e-mail: [email protected]
IntroductionPremenstrual syndrome (PMS) is a major clinical
entity affecting a large segment of female population. It is the name given to a group of physical and emotional symptoms that some women experience on regular basis in relation to menstruation. The symptoms occur monthly generally within 7 to 14 days prior to menstruation. Symptoms may seem to worsen as menstruation approaches and subside at the onset or after several days of menstruation1. PMS leads to substantial impairment in normal daily activities and occupational productivity and significantly increased work absenteeism2. As working women are under immense physical and psychological pressures, there is a possibility that various effects of PMS may be more common in working women as compared to housewives. Certain behavioral and neurological symptoms occur in women especially during premenstrual phase. Headache, painful enlargement of breast, decreased ability to concentrate, nervous irritability, emotional instability, poor judgment, depression, tension, weight gain, and increased blood pressure have been reported during premenstrual phase, and are associated with salt and water retention.3
Another important aspect in working women is reaction time, which is crucial for our everyday lives and requires intact sensory skills, cognitive processing, and motor performance. Reaction time measurement is an indirect index of processing capability of the central nervous system and simple means of determining sensory motor association and performance of an individual. 4, 5 Studies have reported that during PMS, a variety of physiological processes are affected that includes the cardiovascular, neurological as well as psychological systems. 5 The present study was conducted to determine whether any difference in the above is observed in females who are working and those who are housewives during PMS and in Postmenstrual stage.
Methodology: The study was conducted among females in the age group of 25-40 years, living in Navi Mumbai, Maharashtra. The sample size was 30 subjects each from working women group and housewives. The working women group included subjects employed in Dr D Y Patil Medical College, Navi Mumbai, with an average workload of 40 hours per week in mild to moderate exertion level activity. while non working women group included spouses of employees at same institution.
Inclusion Criteriae:
● Apparently healthy female subjects.
● Aged between 25 and 40 years.
● Working Group comprised females working for atleast one year.
10.5958/2320-608X.2019.00131.8
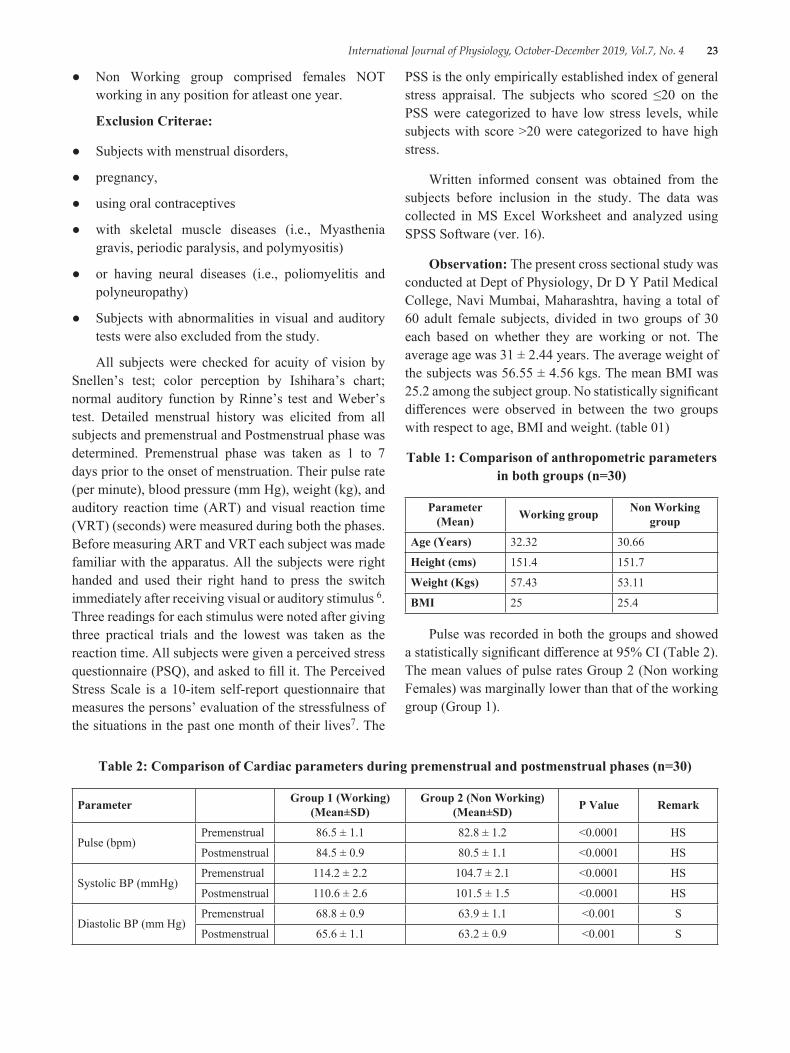
International Journal of Physiology, October-December 2019, Vol.7, No. 4 23
● Non Working group comprised females NOT working in any position for atleast one year.
Exclusion Criterae:
● Subjects with menstrual disorders,
● pregnancy,
● using oral contraceptives
● with skeletal muscle diseases (i.e., Myasthenia gravis, periodic paralysis, and polymyositis)
● or having neural diseases (i.e., poliomyelitis and polyneuropathy)
● Subjects with abnormalities in visual and auditory tests were also excluded from the study.
All subjects were checked for acuity of vision by Snellen’s test; color perception by Ishihara’s chart; normal auditory function by Rinne’s test and Weber’s test. Detailed menstrual history was elicited from all subjects and premenstrual and Postmenstrual phase was determined. Premenstrual phase was taken as 1 to 7 days prior to the onset of menstruation. Their pulse rate (per minute), blood pressure (mm Hg), weight (kg), and auditory reaction time (ART) and visual reaction time (VRT) (seconds) were measured during both the phases. Before measuring ART and VRT each subject was made familiar with the apparatus. All the subjects were right handed and used their right hand to press the switch immediately after receiving visual or auditory stimulus 6. Three readings for each stimulus were noted after giving three practical trials and the lowest was taken as the reaction time. All subjects were given a perceived stress questionnaire (PSQ), and asked to fill it. The Perceived Stress Scale is a 10-item self-report questionnaire that measures the persons’ evaluation of the stressfulness of the situations in the past one month of their lives7. The
PSS is the only empirically established index of general stress appraisal. The subjects who scored ≤20 on the PSS were categorized to have low stress levels, while subjects with score >20 were categorized to have high stress.
Written informed consent was obtained from the subjects before inclusion in the study. The data was collected in MS Excel Worksheet and analyzed using SPSS Software (ver. 16).
Observation: The present cross sectional study was conducted at Dept of Physiology, Dr D Y Patil Medical College, Navi Mumbai, Maharashtra, having a total of 60 adult female subjects, divided in two groups of 30 each based on whether they are working or not. The average age was 31 ± 2.44 years. The average weight of the subjects was 56.55 ± 4.56 kgs. The mean BMI was 25.2 among the subject group. No statistically significant differences were observed in between the two groups with respect to age, BMI and weight. (table 01)
Table 1: Comparison of anthropometric parameters in both groups (n=30)
Parameter (Mean) Working group Non Working
group
Age (Years) 32.32 30.66
Height (cms) 151.4 151.7
Weight (Kgs) 57.43 53.11
BMI 25 25.4
Pulse was recorded in both the groups and showed a statistically significant difference at 95% CI (Table 2). The mean values of pulse rates Group 2 (Non working Females) was marginally lower than that of the working group (Group 1).
Table 2: Comparison of Cardiac parameters during premenstrual and postmenstrual phases (n=30)
Parameter Group 1 (Working) (Mean±SD)
Group 2 (Non Working) (Mean±SD) P Value Remark
Pulse (bpm)Premenstrual 86.5 ± 1.1 82.8 ± 1.2 <0.0001 HS
Postmenstrual 84.5 ± 0.9 80.5 ± 1.1 <0.0001 HS
Systolic BP (mmHg)Premenstrual 114.2 ± 2.2 104.7 ± 2.1 <0.0001 HS
Postmenstrual 110.6 ± 2.6 101.5 ± 1.5 <0.0001 HS
Diastolic BP (mm Hg)Premenstrual 68.8 ± 0.9 63.9 ± 1.1 <0.001 S
Postmenstrual 65.6 ± 1.1 63.2 ± 0.9 <0.001 S
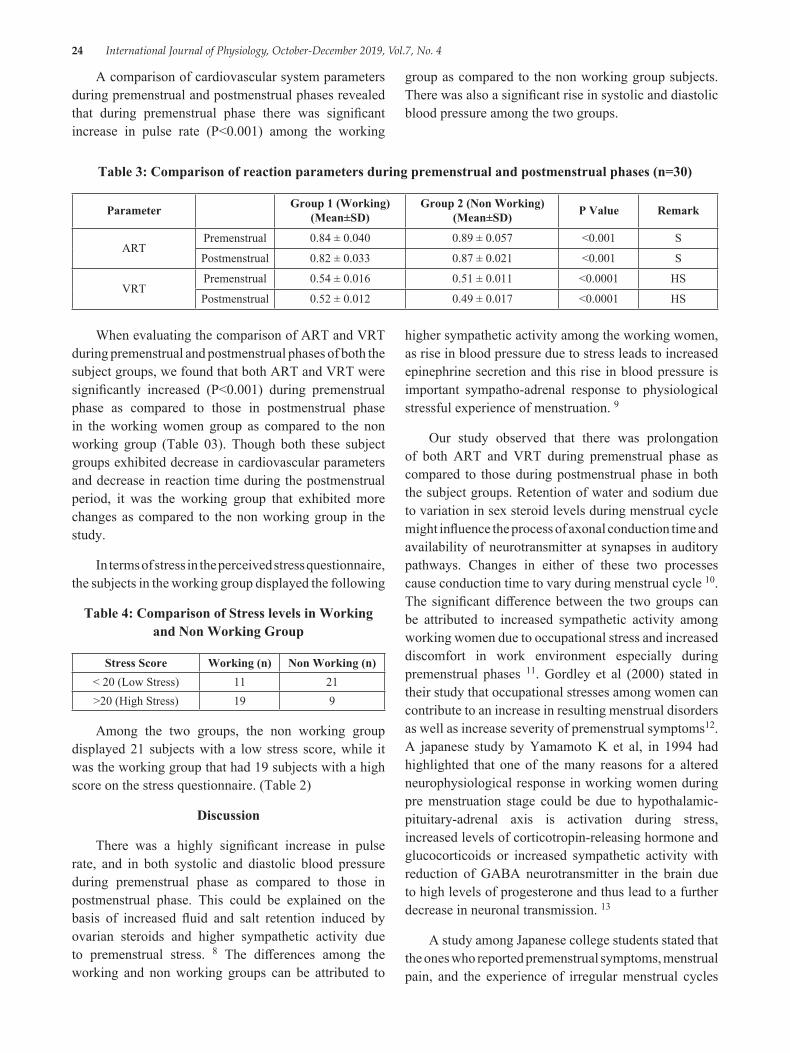
24 International Journal of Physiology, October-December 2019, Vol.7, No. 4
A comparison of cardiovascular system parameters during premenstrual and postmenstrual phases revealed that during premenstrual phase there was significant increase in pulse rate (P<0.001) among the working
group as compared to the non working group subjects. There was also a significant rise in systolic and diastolic blood pressure among the two groups.
Table 3: Comparison of reaction parameters during premenstrual and postmenstrual phases (n=30)
Parameter Group 1 (Working) (Mean±SD)
Group 2 (Non Working) (Mean±SD) P Value Remark
ARTPremenstrual 0.84 ± 0.040 0.89 ± 0.057 <0.001 S
Postmenstrual 0.82 ± 0.033 0.87 ± 0.021 <0.001 S
VRTPremenstrual 0.54 ± 0.016 0.51 ± 0.011 <0.0001 HS
Postmenstrual 0.52 ± 0.012 0.49 ± 0.017 <0.0001 HS
When evaluating the comparison of ART and VRT during premenstrual and postmenstrual phases of both the subject groups, we found that both ART and VRT were significantly increased (P<0.001) during premenstrual phase as compared to those in postmenstrual phase in the working women group as compared to the non working group (Table 03). Though both these subject groups exhibited decrease in cardiovascular parameters and decrease in reaction time during the postmenstrual period, it was the working group that exhibited more changes as compared to the non working group in the study.
In terms of stress in the perceived stress questionnaire, the subjects in the working group displayed the following
Table 4: Comparison of Stress levels in Working and Non Working Group
Stress Score Working (n) Non Working (n)< 20 (Low Stress) 11 21>20 (High Stress) 19 9
Among the two groups, the non working group displayed 21 subjects with a low stress score, while it was the working group that had 19 subjects with a high score on the stress questionnaire. (Table 2)
Discussion
There was a highly significant increase in pulse rate, and in both systolic and diastolic blood pressure during premenstrual phase as compared to those in postmenstrual phase. This could be explained on the basis of increased fluid and salt retention induced by ovarian steroids and higher sympathetic activity due to premenstrual stress. 8 The differences among the working and non working groups can be attributed to
higher sympathetic activity among the working women, as rise in blood pressure due to stress leads to increased epinephrine secretion and this rise in blood pressure is important sympatho-adrenal response to physiological stressful experience of menstruation. 9
Our study observed that there was prolongation of both ART and VRT during premenstrual phase as compared to those during postmenstrual phase in both the subject groups. Retention of water and sodium due to variation in sex steroid levels during menstrual cycle might influence the process of axonal conduction time and availability of neurotransmitter at synapses in auditory pathways. Changes in either of these two processes cause conduction time to vary during menstrual cycle 10. The significant difference between the two groups can be attributed to increased sympathetic activity among working women due to occupational stress and increased discomfort in work environment especially during premenstrual phases 11. Gordley et al (2000) stated in their study that occupational stresses among women can contribute to an increase in resulting menstrual disorders as well as increase severity of premenstrual symptoms12. A japanese study by Yamamoto K et al, in 1994 had highlighted that one of the many reasons for a altered neurophysiological response in working women during pre menstruation stage could be due to hypothalamic-pituitary-adrenal axis is activation during stress, increased levels of corticotropin-releasing hormone and glucocorticoids or increased sympathetic activity with reduction of GABA neurotransmitter in the brain due to high levels of progesterone and thus lead to a further decrease in neuronal transmission. 13
A study among Japanese college students stated that the ones who reported premenstrual symptoms, menstrual pain, and the experience of irregular menstrual cycles
International Journal of Physiology, October-December 2019, Vol.7, No. 4 25
had higher stress scores than those who did not. The results suggest that psychosocial stress is independently associated with premenstrual symptoms and the experience of irregular menstrual cycles among college students 14. Similarly a study by Nagma S et al, among medical students in India showed that the students with high stress levels (PSS >20) experienced irregular cycles more often than the ones with low stress levels (PSS ≤20). 15 Our study is in concurrence with both the above studies in observing that there is a definitive evidence of increased stress among the working group of subjects during their premenstrual phase and is documentable in various parameters.
ConclusionOur study concludes that there is a significant
increase in pulse rate, blood pressure auditory reaction time and visual reaction time among the working group women during premenstrual period as compared to non working women. There is also a higher level of perceived stress among the working group. Premenstrual stress also affects the sympathetic system among both the groups but more effects were observed in working women as compared to non working women in our study. The limiting factor in our study was the small sample size and lack of diversity in choosing subjects. The lacunae of this study may be filled by further studies employing a larger and wider sample size. Finally we conclude that though a number of nations such as Japan, Taiwan, Indonesia and South Korea have provisions for paid menstrual leave, there have been cases of developed countries where such provisions have been met with severe criticism and disparity16.We end with a question of whether India should follow suit and provide such measures or continue with its draconian policies?
Ethical Clearance: Obtained from Institutional Ethical Committee
Conflict of Interest: Nil
Source of Funding: Self Funded
References1. Thomas B, Mathew B, Sharon B et al. Premenstrual
syndrome. University of Pennsylvania health system 1997: 1-2.
2. Dean BB, Borenstein J E. A prospective assessment investigating the relationship between work productivity and impairment with premenstrual
syndrome. J Occup Environment Med 2004; 46:649-56.
3. Babyminakshi PL, Mangala KA, Afroz S, Nanda S, Sudhir P. Effect of premenstrual stress on cardiovascular system and central nervous system. J Obstet Gynecol. 2006; 56:156-8.
4. Bamne SN, Bamne AS. Effect of premenstrual stress on reaction time of 18-20 years age group. Natl J Physiol Pharm Pharmacol 2017; 7 (7):737-739.
5. Das S, Gandhi A, Mondal S. Effect of premenstrual stress on audiovisual reaction time and audiogram. Indian J Physiol Pharmacol. 1997; 41 (1):67-70.
6. Moody DB. Reaction time as an index of sensory function. InAnimal psychophysics: The design and conduct of sensory experiments 1970 (pp. 277-302). Springer, Boston, MA.
7. Fliege H, Rose M, Arck P, Walter OB, Kocalevent RD, Weber C, Klapp BF. The Perceived Stress Questionnaire (PSQ) reconsidered: validation and reference values from different clinical and healthy adult samples. Psychosomatic medicine. 2005 Jan 1; 67 (1):78-88.
8. Rode MV, Kamble P, Phatak MS, Jadhao P, Tayde P. Effect of premenstrual stress on autonomic function. Annals of neurosciences. 2010 Jul; 17 (3):131.
9. Freyschuss UL, Hjemdahl PA, Juhlin-Dannfelt AN, Linde BI. Cardiovascular and sympathoadrenal responses to mental stress: influence of beta-blockade. American Journal of Physiology-Heart and Circulatory Physiology. 1988 Dec 1; 255 (6):H1443-51.
10. Mehta V, Chakrabarty AS. Autonomic functions during different phases of menstrual cycle. Indian journal of physiology and pharmacology. 1993 Jan; 37 (1):56-8.
11. Girija B, Veeraiah SH. Effect of different phases of menstrual cycle on physical working capacity in Indian population. Indian J Physiol Pharmacol. 2011; 55 (2):165-9.
12. Gordley LB, Lemasters G, Simpson SR, Yiin JH. Menstrual disorders and occupational, stress, and racial factors among military personnel. Journal of occupational and environmental medicine. 2000 Sep 1; 42 (9):871-81.
13. Figatalamanca, I. and Hatch, M. C., 1994. Reproduction and the workplace-what we know

26 International Journal of Physiology, October-December 2019, Vol.7, No. 4
and where we go from here. International Journal of Occupational Medicine and Toxicology, 3 (3), pp. 279-303.
14. Yamamoto K, Okazaki A, Sakamoto Y, Funatsu M. The relationship between premenstrual symptoms, menstrual pain, irregular menstrual cycles, and psychosocial stress among Japanese college students. Journal of Physiological Anthropology. 2009 May 31; 28 (3):129-36.
15. Nagma S, Kapoor G, Bharti R, Batra A, Batra A, Aggarwal A, Sablok A. To evaluate the effect of perceived stress on menstrual function. Journal of clinical and diagnostic research: JCDR. 2015 Mar; 9 (3):QC01.
16. Przybylo E, Fahs B. Feels and Flows: On the Realness of Menstrual Pain and Cripping Menstrual Chronicity. Feminist Formations. 2018; 30 (1):206-29.
International Journal of Physiology, October-December 2019, Vol.7, No. 4 27
Effect of Ventromedial Hypothalamus on Food Intake, Body Weight, Insulin Resistance, Lipid Profile and Thyroid Profile in
High-Fat Diet Obese Female Wistar Rats
Archana Gaur T.1, G.K. Pal2, Pravati Pal3
1Assistant Professor, Dept of Physiology, Chengalpattu Medical College, Chennai, India, 2Professor (Senior Scale), 3Professor and Head, Department of Physiology, JIPMER, Puducherry, India
AbstractBackground: Diet is one of the risk factors for obesity and VMH plays a substantial role in food intake and obesity. Food intake and body weight differ preferentially with gender. Insulin resistance, thyroid, and lipid profile are intimately linked to body metabolism. Thus, this study was conducted to assess the role of VMH on metabolism
Materials and Method: The study was conducted in the Dept. of Physiology, JIPMER after ethics committee approval. The animals were fed on HFD (total of 12 female albino Wistar rats) for a period of 10 weeks. After obtaining a basal recording of food intake, body weight, glucose, insulin, thyroid, and lipid profile for a period of 1 week, animals were divided into control and experimental subgroups (each 6 female). Experimental rats underwent electrolytic ablation of VMH whereas control rats underwent sham lesion. Then a post-lesion recording was taken for four weeks and compared between groups with appropriate statistics.
Results: VMH lesion increased food intake, body weight, blood glucose, insulin, and insulin resistance in the experimental group. VMH lesion didn’t have much influence on lipid profile and thyroid profile.
Conclusion: VMH has a significant role in feeding behavior, adiposity genesis, insulin-glucose homeostasis, and lipid metabolism.
Keywords: High-fat diet, ventromedial hypothalamus, obese rat.
Corresponding Author: Archana Gaur T. Assistant Professor, Department of Physiology, Chengalpattu Medical College e-mail: [email protected] Contact: 9962053334
IntroductionGlobally obesity is a major health issue(1). As per
the reports of WHO, around 2.8 million deaths occur per year due to obesity(2). The rate of obesity prevalence is doubled among adults and the rate was tripled among children(3). Several factors have been shown to regulate the body weight or cause adiposity which includes environmental, genetic, social and nutrition(4). The behavioral component of food intake and adiposity
is proposed to be influenced by hypothalamic (Ventromedial hypothalamus, lateral hypothalamus, and arcuate nuclei) and limbic system. Both adiposity and calorie intake were integrated by many nuclei of the hypothalamus(5, 6). VMH is considered to be the major satiety center which holds responsible for feeding behavior(4). Among the brain regions, ventromedial hypothalamus (VMH) is linked to food intake regulation and body weight in animal models(7). Li S. Zhang Hy et al have documented that diet-induced animal model to reflect a general apt obesity model(8) and high-fat diet is one of the accepted models for inducing obesity in rats. The diet intake alters the body metabolism. It has been shown that blood variables such as glucose, insulin, thyroid hormones, and lipid profile components represent energy homeostasis(9, 10). Though lesion of VMH is found to cause obesity(11), its effect in already
10.5958/2320-608X.2019.00132.X
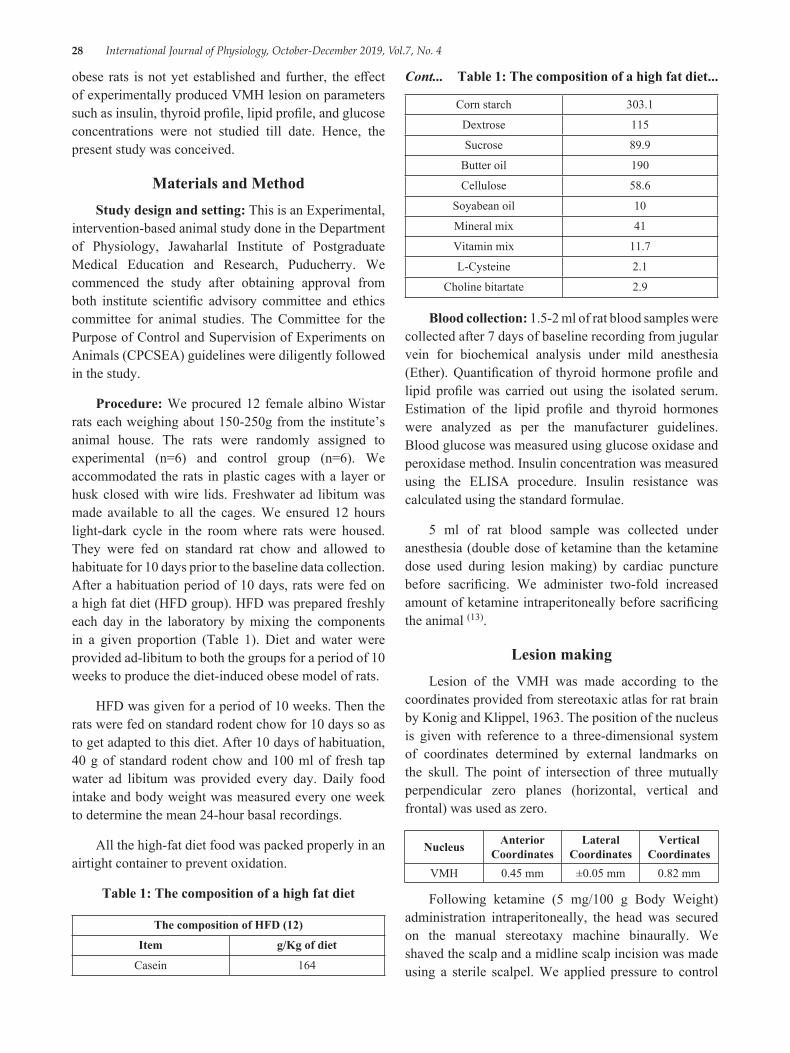
28 International Journal of Physiology, October-December 2019, Vol.7, No. 4
obese rats is not yet established and further, the effect of experimentally produced VMH lesion on parameters such as insulin, thyroid profile, lipid profile, and glucose concentrations were not studied till date. Hence, the present study was conceived.
Materials and MethodStudy design and setting: This is an Experimental,
intervention-based animal study done in the Department of Physiology, Jawaharlal Institute of Postgraduate Medical Education and Research, Puducherry. We commenced the study after obtaining approval from both institute scientific advisory committee and ethics committee for animal studies. The Committee for the Purpose of Control and Supervision of Experiments on Animals (CPCSEA) guidelines were diligently followed in the study.
Procedure: We procured 12 female albino Wistar rats each weighing about 150-250g from the institute’s animal house. The rats were randomly assigned to experimental (n=6) and control group (n=6). We accommodated the rats in plastic cages with a layer or husk closed with wire lids. Freshwater ad libitum was made available to all the cages. We ensured 12 hours light-dark cycle in the room where rats were housed. They were fed on standard rat chow and allowed to habituate for 10 days prior to the baseline data collection. After a habituation period of 10 days, rats were fed on a high fat diet (HFD group). HFD was prepared freshly each day in the laboratory by mixing the components in a given proportion (Table 1). Diet and water were provided ad-libitum to both the groups for a period of 10 weeks to produce the diet-induced obese model of rats.
HFD was given for a period of 10 weeks. Then the rats were fed on standard rodent chow for 10 days so as to get adapted to this diet. After 10 days of habituation, 40 g of standard rodent chow and 100 ml of fresh tap water ad libitum was provided every day. Daily food intake and body weight was measured every one week to determine the mean 24-hour basal recordings.
All the high-fat diet food was packed properly in an airtight container to prevent oxidation.
Table 1: The composition of a high fat diet
The composition of HFD (12)
Item g/Kg of diet
Casein 164
Corn starch 303.1
Dextrose 115
Sucrose 89.9
Butter oil 190
Cellulose 58.6
Soyabean oil 10
Mineral mix 41
Vitamin mix 11.7
L-Cysteine 2.1
Choline bitartate 2.9
Blood collection: 1.5-2 ml of rat blood samples were collected after 7 days of baseline recording from jugular vein for biochemical analysis under mild anesthesia (Ether). Quantification of thyroid hormone profile and lipid profile was carried out using the isolated serum. Estimation of the lipid profile and thyroid hormones were analyzed as per the manufacturer guidelines. Blood glucose was measured using glucose oxidase and peroxidase method. Insulin concentration was measured using the ELISA procedure. Insulin resistance was calculated using the standard formulae.
5 ml of rat blood sample was collected under anesthesia (double dose of ketamine than the ketamine dose used during lesion making) by cardiac puncture before sacrificing. We administer two-fold increased amount of ketamine intraperitoneally before sacrificing the animal (13).
Lesion makingLesion of the VMH was made according to the
coordinates provided from stereotaxic atlas for rat brain by Konig and Klippel, 1963. The position of the nucleus is given with reference to a three-dimensional system of coordinates determined by external landmarks on the skull. The point of intersection of three mutually perpendicular zero planes (horizontal, vertical and frontal) was used as zero.
Nucleus Anterior Coordinates
Lateral Coordinates
Vertical Coordinates
VMH 0.45 mm ±0.05 mm 0.82 mm
Following ketamine (5 mg/100 g Body Weight) administration intraperitoneally, the head was secured on the manual stereotaxy machine binaurally. We shaved the scalp and a midline scalp incision was made using a sterile scalpel. We applied pressure to control
Cont... Table 1: The composition of a high fat diet...
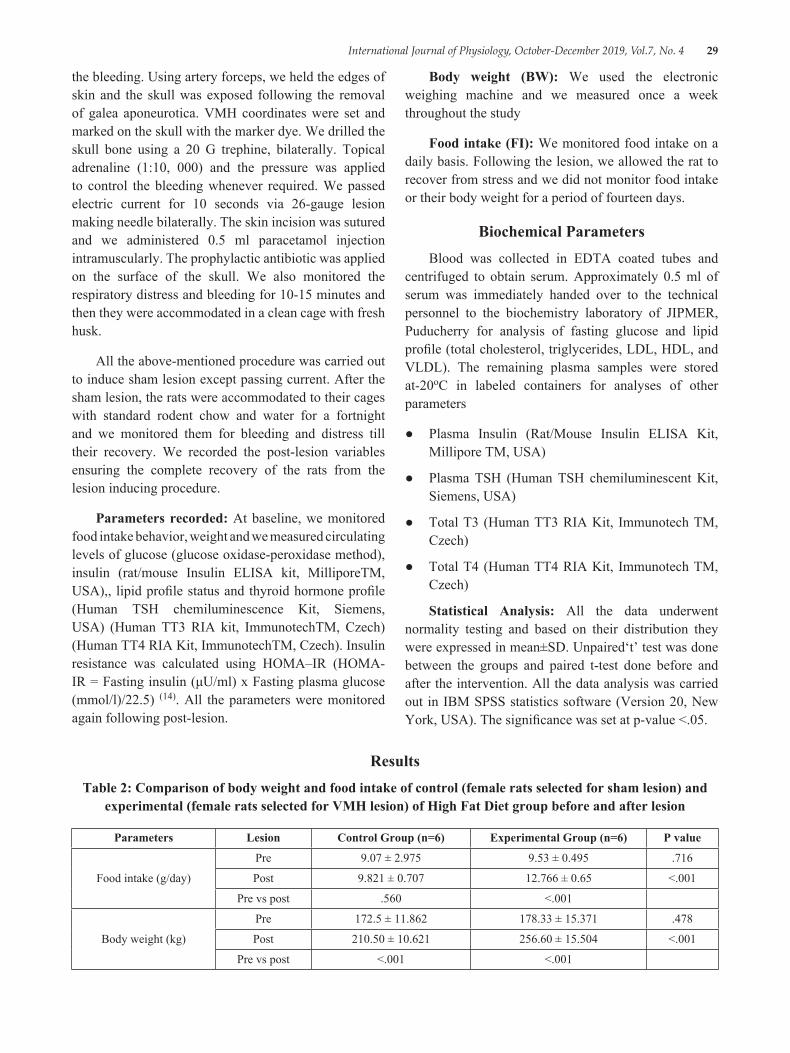
International Journal of Physiology, October-December 2019, Vol.7, No. 4 29
the bleeding. Using artery forceps, we held the edges of skin and the skull was exposed following the removal of galea aponeurotica. VMH coordinates were set and marked on the skull with the marker dye. We drilled the skull bone using a 20 G trephine, bilaterally. Topical adrenaline (1:10, 000) and the pressure was applied to control the bleeding whenever required. We passed electric current for 10 seconds via 26-gauge lesion making needle bilaterally. The skin incision was sutured and we administered 0.5 ml paracetamol injection intramuscularly. The prophylactic antibiotic was applied on the surface of the skull. We also monitored the respiratory distress and bleeding for 10-15 minutes and then they were accommodated in a clean cage with fresh husk.
All the above-mentioned procedure was carried out to induce sham lesion except passing current. After the sham lesion, the rats were accommodated to their cages with standard rodent chow and water for a fortnight and we monitored them for bleeding and distress till their recovery. We recorded the post-lesion variables ensuring the complete recovery of the rats from the lesion inducing procedure.
Parameters recorded: At baseline, we monitored food intake behavior, weight and we measured circulating levels of glucose (glucose oxidase-peroxidase method), insulin (rat/mouse Insulin ELISA kit, MilliporeTM, USA),, lipid profile status and thyroid hormone profile (Human TSH chemiluminescence Kit, Siemens, USA) (Human TT3 RIA kit, ImmunotechTM, Czech) (Human TT4 RIA Kit, ImmunotechTM, Czech). Insulin resistance was calculated using HOMA–IR (HOMA-IR = Fasting insulin (μU/ml) x Fasting plasma glucose (mmol/l)/22.5) (14). All the parameters were monitored again following post-lesion.
Body weight (BW): We used the electronic weighing machine and we measured once a week throughout the study
Food intake (FI): We monitored food intake on a daily basis. Following the lesion, we allowed the rat to recover from stress and we did not monitor food intake or their body weight for a period of fourteen days.
Biochemical ParametersBlood was collected in EDTA coated tubes and
centrifuged to obtain serum. Approximately 0.5 ml of serum was immediately handed over to the technical personnel to the biochemistry laboratory of JIPMER, Puducherry for analysis of fasting glucose and lipid profile (total cholesterol, triglycerides, LDL, HDL, and VLDL). The remaining plasma samples were stored at-20oC in labeled containers for analyses of other parameters
● Plasma Insulin (Rat/Mouse Insulin ELISA Kit, Millipore TM, USA)
● Plasma TSH (Human TSH chemiluminescent Kit, Siemens, USA)
● Total T3 (Human TT3 RIA Kit, Immunotech TM, Czech)
● Total T4 (Human TT4 RIA Kit, Immunotech TM, Czech)
Statistical Analysis: All the data underwent normality testing and based on their distribution they were expressed in mean±SD. Unpaired‘t’ test was done between the groups and paired t-test done before and after the intervention. All the data analysis was carried out in IBM SPSS statistics software (Version 20, New York, USA). The significance was set at p-value <.05.
ResultsTable 2: Comparison of body weight and food intake of control (female rats selected for sham lesion) and
experimental (female rats selected for VMH lesion) of High Fat Diet group before and after lesion
Parameters Lesion Control Group (n=6) Experimental Group (n=6) P value
Food intake (g/day)
Pre 9.07 ± 2.975 9.53 ± 0.495 .716
Post 9.821 ± 0.707 12.766 ± 0.65 <.001
Pre vs post .560 <.001
Body weight (kg)
Pre 172.5 ± 11.862 178.33 ± 15.371 .478
Post 210.50 ± 10.621 256.60 ± 15.504 <.001
Pre vs post <.001 <.001
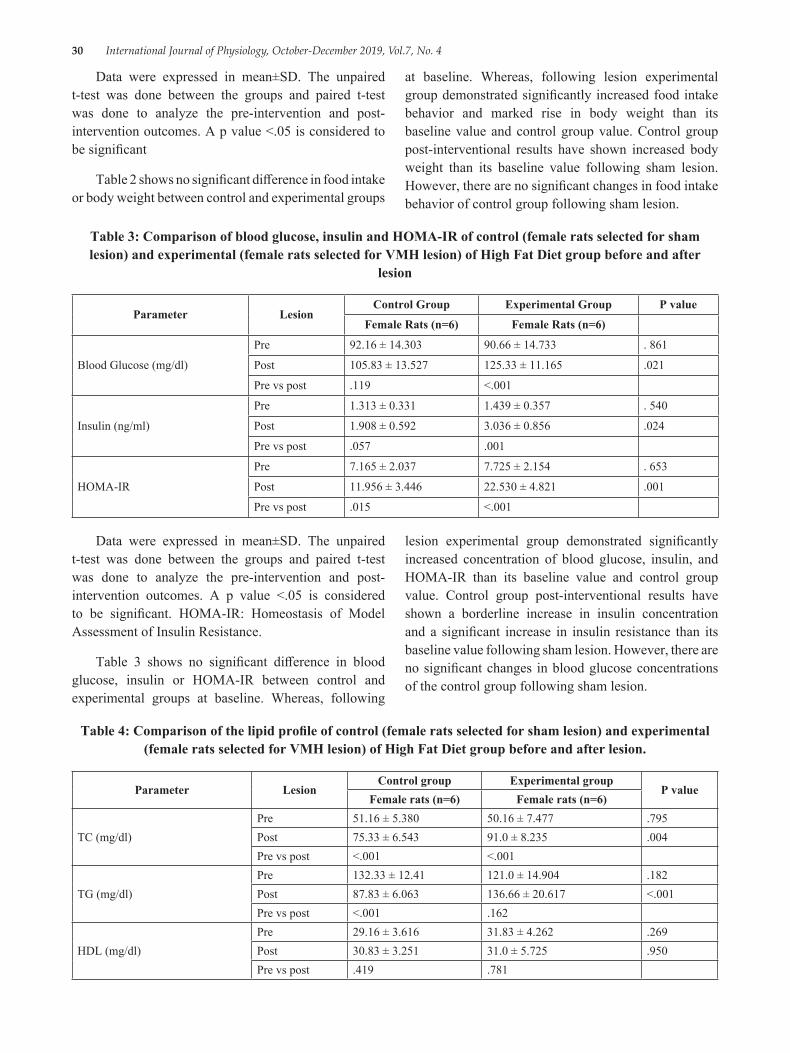
30 International Journal of Physiology, October-December 2019, Vol.7, No. 4
Table 3: Comparison of blood glucose, insulin and HOMA-IR of control (female rats selected for sham lesion) and experimental (female rats selected for VMH lesion) of High Fat Diet group before and after
lesion
Parameter LesionControl Group Experimental Group P value
Female Rats (n=6) Female Rats (n=6)
Blood Glucose (mg/dl)
Pre 92.16 ± 14.303 90.66 ± 14.733 . 861
Post 105.83 ± 13.527 125.33 ± 11.165 .021
Pre vs post .119 <.001
Insulin (ng/ml)
Pre 1.313 ± 0.331 1.439 ± 0.357 . 540
Post 1.908 ± 0.592 3.036 ± 0.856 .024
Pre vs post .057 .001
HOMA-IR
Pre 7.165 ± 2.037 7.725 ± 2.154 . 653
Post 11.956 ± 3.446 22.530 ± 4.821 .001
Pre vs post .015 <.001
Data were expressed in mean±SD. The unpaired t-test was done between the groups and paired t-test was done to analyze the pre-intervention and post-intervention outcomes. A p value <.05 is considered to be significant
Table 2 shows no significant difference in food intake or body weight between control and experimental groups
at baseline. Whereas, following lesion experimental group demonstrated significantly increased food intake behavior and marked rise in body weight than its baseline value and control group value. Control group post-interventional results have shown increased body weight than its baseline value following sham lesion. However, there are no significant changes in food intake behavior of control group following sham lesion.
Data were expressed in mean±SD. The unpaired t-test was done between the groups and paired t-test was done to analyze the pre-intervention and post-intervention outcomes. A p value <.05 is considered to be significant. HOMA-IR: Homeostasis of Model Assessment of Insulin Resistance.
Table 3 shows no significant difference in blood glucose, insulin or HOMA-IR between control and experimental groups at baseline. Whereas, following
lesion experimental group demonstrated significantly increased concentration of blood glucose, insulin, and HOMA-IR than its baseline value and control group value. Control group post-interventional results have shown a borderline increase in insulin concentration and a significant increase in insulin resistance than its baseline value following sham lesion. However, there are no significant changes in blood glucose concentrations of the control group following sham lesion.
Table 4: Comparison of the lipid profile of control (female rats selected for sham lesion) and experimental (female rats selected for VMH lesion) of High Fat Diet group before and after lesion.
Parameter LesionControl group Experimental group
P valueFemale rats (n=6) Female rats (n=6)
TC (mg/dl)Pre 51.16 ± 5.380 50.16 ± 7.477 .795Post 75.33 ± 6.543 91.0 ± 8.235 .004Pre vs post <.001 <.001
TG (mg/dl)Pre 132.33 ± 12.41 121.0 ± 14.904 .182Post 87.83 ± 6.063 136.66 ± 20.617 <.001Pre vs post <.001 .162
HDL (mg/dl)Pre 29.16 ± 3.616 31.83 ± 4.262 .269Post 30.83 ± 3.251 31.0 ± 5.725 .950Pre vs post .419 .781
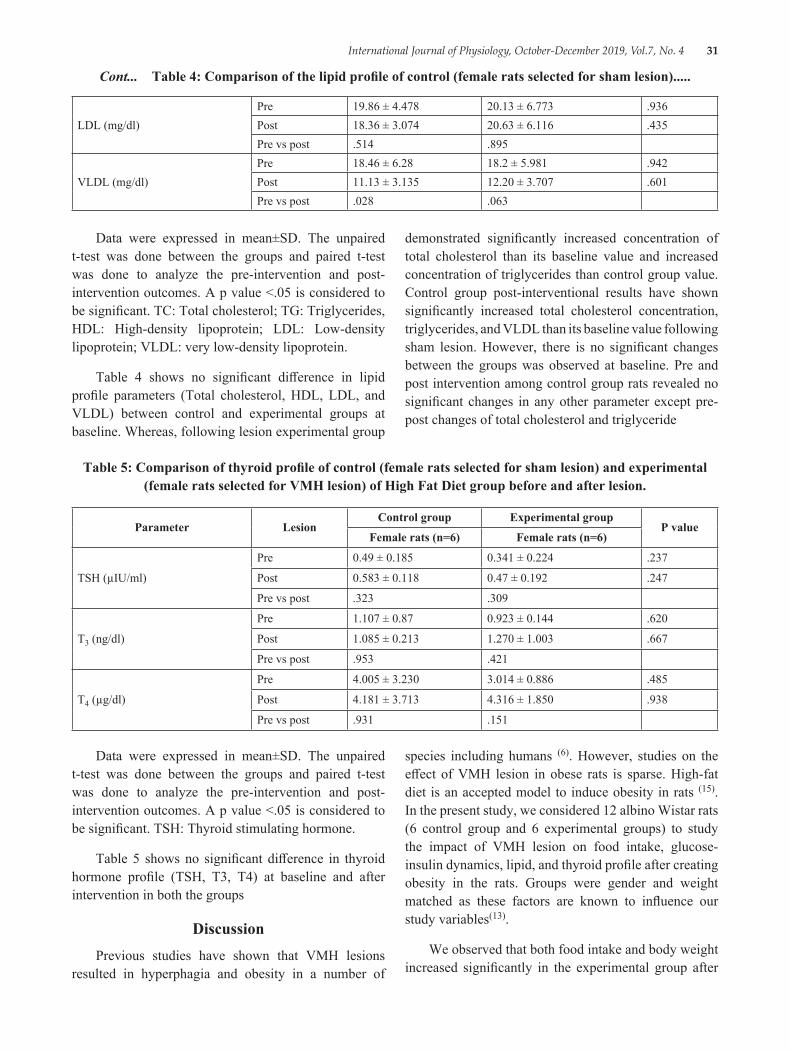
International Journal of Physiology, October-December 2019, Vol.7, No. 4 31
LDL (mg/dl)Pre 19.86 ± 4.478 20.13 ± 6.773 .936Post 18.36 ± 3.074 20.63 ± 6.116 .435Pre vs post .514 .895
VLDL (mg/dl)Pre 18.46 ± 6.28 18.2 ± 5.981 .942Post 11.13 ± 3.135 12.20 ± 3.707 .601Pre vs post .028 .063
Cont... Table 4: Comparison of the lipid profile of control (female rats selected for sham lesion).....
Data were expressed in mean±SD. The unpaired t-test was done between the groups and paired t-test was done to analyze the pre-intervention and post-intervention outcomes. A p value <.05 is considered to be significant. TSH: Thyroid stimulating hormone.
Table 5 shows no significant difference in thyroid hormone profile (TSH, T3, T4) at baseline and after intervention in both the groups
DiscussionPrevious studies have shown that VMH lesions
resulted in hyperphagia and obesity in a number of
species including humans (6). However, studies on the effect of VMH lesion in obese rats is sparse. High-fat diet is an accepted model to induce obesity in rats (15). In the present study, we considered 12 albino Wistar rats (6 control group and 6 experimental groups) to study the impact of VMH lesion on food intake, glucose-insulin dynamics, lipid, and thyroid profile after creating obesity in the rats. Groups were gender and weight matched as these factors are known to influence our study variables(13).
We observed that both food intake and body weight increased significantly in the experimental group after
Data were expressed in mean±SD. The unpaired t-test was done between the groups and paired t-test was done to analyze the pre-intervention and post-intervention outcomes. A p value <.05 is considered to be significant. TC: Total cholesterol; TG: Triglycerides, HDL: High-density lipoprotein; LDL: Low-density lipoprotein; VLDL: very low-density lipoprotein.
Table 4 shows no significant difference in lipid profile parameters (Total cholesterol, HDL, LDL, and VLDL) between control and experimental groups at baseline. Whereas, following lesion experimental group
demonstrated significantly increased concentration of total cholesterol than its baseline value and increased concentration of triglycerides than control group value. Control group post-interventional results have shown significantly increased total cholesterol concentration, triglycerides, and VLDL than its baseline value following sham lesion. However, there is no significant changes between the groups was observed at baseline. Pre and post intervention among control group rats revealed no significant changes in any other parameter except pre-post changes of total cholesterol and triglyceride
Table 5: Comparison of thyroid profile of control (female rats selected for sham lesion) and experimental (female rats selected for VMH lesion) of High Fat Diet group before and after lesion.
Parameter LesionControl group Experimental group
P valueFemale rats (n=6) Female rats (n=6)
TSH (µIU/ml)
Pre 0.49 ± 0.185 0.341 ± 0.224 .237
Post 0.583 ± 0.118 0.47 ± 0.192 .247
Pre vs post .323 .309
T3 (ng/dl)
Pre 1.107 ± 0.87 0.923 ± 0.144 .620
Post 1.085 ± 0.213 1.270 ± 1.003 .667
Pre vs post .953 .421
T4 (µg/dl)
Pre 4.005 ± 3.230 3.014 ± 0.886 .485
Post 4.181 ± 3.713 4.316 ± 1.850 .938
Pre vs post .931 .151
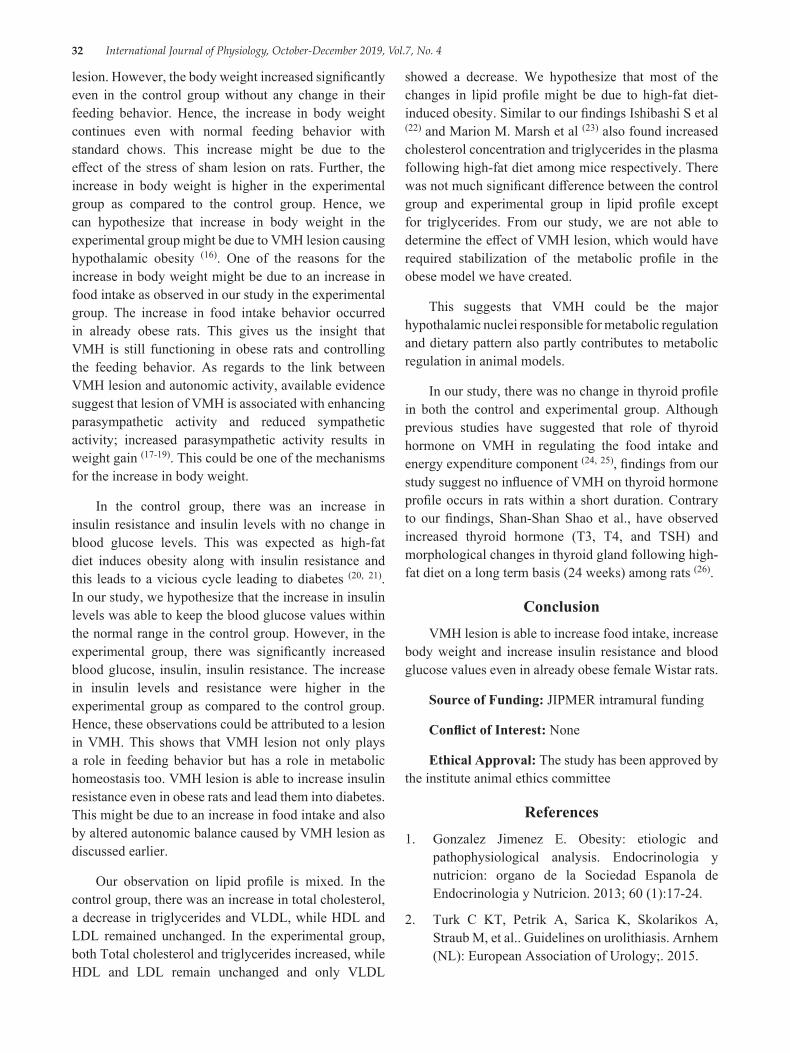
32 International Journal of Physiology, October-December 2019, Vol.7, No. 4
lesion. However, the body weight increased significantly even in the control group without any change in their feeding behavior. Hence, the increase in body weight continues even with normal feeding behavior with standard chows. This increase might be due to the effect of the stress of sham lesion on rats. Further, the increase in body weight is higher in the experimental group as compared to the control group. Hence, we can hypothesize that increase in body weight in the experimental group might be due to VMH lesion causing hypothalamic obesity (16). One of the reasons for the increase in body weight might be due to an increase in food intake as observed in our study in the experimental group. The increase in food intake behavior occurred in already obese rats. This gives us the insight that VMH is still functioning in obese rats and controlling the feeding behavior. As regards to the link between VMH lesion and autonomic activity, available evidence suggest that lesion of VMH is associated with enhancing parasympathetic activity and reduced sympathetic activity; increased parasympathetic activity results in weight gain (17-19). This could be one of the mechanisms for the increase in body weight.
In the control group, there was an increase in insulin resistance and insulin levels with no change in blood glucose levels. This was expected as high-fat diet induces obesity along with insulin resistance and this leads to a vicious cycle leading to diabetes (20, 21). In our study, we hypothesize that the increase in insulin levels was able to keep the blood glucose values within the normal range in the control group. However, in the experimental group, there was significantly increased blood glucose, insulin, insulin resistance. The increase in insulin levels and resistance were higher in the experimental group as compared to the control group. Hence, these observations could be attributed to a lesion in VMH. This shows that VMH lesion not only plays a role in feeding behavior but has a role in metabolic homeostasis too. VMH lesion is able to increase insulin resistance even in obese rats and lead them into diabetes. This might be due to an increase in food intake and also by altered autonomic balance caused by VMH lesion as discussed earlier.
Our observation on lipid profile is mixed. In the control group, there was an increase in total cholesterol, a decrease in triglycerides and VLDL, while HDL and LDL remained unchanged. In the experimental group, both Total cholesterol and triglycerides increased, while HDL and LDL remain unchanged and only VLDL
showed a decrease. We hypothesize that most of the changes in lipid profile might be due to high-fat diet-induced obesity. Similar to our findings Ishibashi S et al (22) and Marion M. Marsh et al (23) also found increased cholesterol concentration and triglycerides in the plasma following high-fat diet among mice respectively. There was not much significant difference between the control group and experimental group in lipid profile except for triglycerides. From our study, we are not able to determine the effect of VMH lesion, which would have required stabilization of the metabolic profile in the obese model we have created.
This suggests that VMH could be the major hypothalamic nuclei responsible for metabolic regulation and dietary pattern also partly contributes to metabolic regulation in animal models.
In our study, there was no change in thyroid profile in both the control and experimental group. Although previous studies have suggested that role of thyroid hormone on VMH in regulating the food intake and energy expenditure component (24, 25), findings from our study suggest no influence of VMH on thyroid hormone profile occurs in rats within a short duration. Contrary to our findings, Shan-Shan Shao et al., have observed increased thyroid hormone (T3, T4, and TSH) and morphological changes in thyroid gland following high-fat diet on a long term basis (24 weeks) among rats (26).
ConclusionVMH lesion is able to increase food intake, increase
body weight and increase insulin resistance and blood glucose values even in already obese female Wistar rats.
Source of Funding: JIPMER intramural funding
Conflict of Interest: None
Ethical Approval: The study has been approved by the institute animal ethics committee
References1. Gonzalez Jimenez E. Obesity: etiologic and
pathophysiological analysis. Endocrinologia y nutricion: organo de la Sociedad Espanola de Endocrinologia y Nutricion. 2013; 60 (1):17-24.
2. Turk C KT, Petrik A, Sarica K, Skolarikos A, Straub M, et al.. Guidelines on urolithiasis. Arnhem (NL): European Association of Urology;. 2015.
International Journal of Physiology, October-December 2019, Vol.7, No. 4 33
3. Afane JS, Olweny EO, Bercowsky E, Sundaram CP, Dunn MD, Shalhav AL, et al. Flexible ureteroscopes: a single center evaluation of the durability and function of the new endoscopes smaller than 9Fr. The Journal of urology. 2000; 164 (4):1164-8.
4. FH. E. Epidemiology of obesity. In: Obesity. Philaldelphia: Lippincott;. 1992: p. 330-42.
5. Peters A, Pellerin L, Dallman MF, Oltmanns KM, Schweiger U, Born J, et al. Causes of obesity: looking beyond the hypothalamus. Prog Neurobiol. 2007; 81 (2):61-88.
6. King B. The rise, fall, and resurrection of the ventromedial hypothalamus in the regulation of feeding behavior and body weight2006.221-44 p.
7. Steven FM LR, Monika F. The interface between behaviour, brain, and immunity. Am Psychol 1996; :49:1004-17..
8. Li S, Zhang HY, Hu CC, Lawrence F, Gallagher KE, Surapaneni A, et al. Assessment of diet-induced obese rats as an obesity model by comparative functional genomics. Obesity (Silver Spring, Md). 2008; 16 (4):811-8.
9. Gaur A, Pal GK, Ananthanarayanan PH, Pal P. Role of Ventromedial hypothalamus in high fat diet induced obesity in male rats: association with lipid profile, thyroid profile and insulin resistance. Annals of neurosciences. 2014; 21 (3):104-7.
10. Lechan RM, Fekete C. The TRH neuron: a hypothalamic integrator of energy metabolism. Progress in brain research. 2006; 153:209-35.
11. Felten SY FD. Innervation of lymphoid tissue. In: Ader R, Felten DL, Cohen N, editors. Psychoneuroimmunology, 2 nd ed. San Diego: Academic Press; 1991.p. 27-61.
12. Smith RS DJL, Zachwieja JJ, Roy H, Nguyen Tand Rood JC, et al. Fat and carbohydrate balances during adaptation to a high-fat diet. Am J Clin Nutr 2000; :71:450-7.
13. Dev S, Pal P, Pal GK, Ananthanarayanan PH, Lalitha V, Gaur A, et al. Role of ventromedial hypothalamus on energy homeostasis in albino rats: effect of gender. Indian journal of physiology and pharmacology. 2012; 56 (2):107-16.
14. Emoto M, Nishizawa Y, Maekawa K, Hiura Y, Kanda H, Kawagishi T, et al. Homeostasis model assessment as a clinical index of insulin resistance in type 2 diabetic patients treated with sulfonylureas. Diabetes care. 1999; 22 (5):818-22.
15. Park S-Y, Cho Y-R, Kim H-J, Higashimori T, Danton C, Lee M-K, et al. Unraveling the Temporal Pattern of Diet-Induced Insulin Resistance in Individual Organs and Cardiac Dysfunction in <span class=”sc”>c57bl/6</span> Mice. Diabetes. 2005; 54 (12):3530-40.
16. Williams G, Bing C, Cai XJ, Harrold JA, King PJ, Liu XH. The hypothalamus and the control of energy homeostasis: different circuits, different purposes. Physiology & behavior. 2001; 74 (4-5):683-701.
17. Valensi P, Doare L, Perret G, Germack R, Paries J, Mesangeau D. Cardiovascular vagosympathetic activity in rats with ventromedial hypothalamic obesity. Obesity research. 2003; 11 (1):54-64.
18. Sakaguchi T, Bray GA, Eddlestone G. Sympathetic activity following paraventricular or ventromedial hypothalamic lesions in rats. Brain research bulletin. 1988; 20 (4):461-5.
19. Straznicky NE, Lambert GW, Lambert EA. Neuroadrenergic dysfunction in obesity: an overview of the effects of weight loss. Current opinion in lipidology. 2010; 21 (1):21-30.
20. Oakes ND, Bell KS, Furler SM, Camilleri S, Saha AK, Ruderman NB, et al. Diet-induced muscle insulin resistance in rats is ameliorated by acute dietary lipid withdrawal or a single bout of exercise: parallel relationship between insulin stimulation of glucose uptake and suppression of long-chain fatty acyl-CoA. Diabetes. 1997; 46 (12):2022-8.
21. Xu H, Barnes GT, Yang Q, Tan G, Yang D, Chou CJ, et al. Chronic inflammation in fat plays a crucial role in the development of obesity-related insulin resistance. The Journal of clinical investigation. 2003; 112 (12):1821-30.
22. Ishibashi S, Goldstein JL, Brown MS, Herz J, Burns DK. Massive xanthomatosis and atherosclerosis in cholesterol-fed low density lipoprotein receptor-negative mice. The Journal of clinical investigation. 1994; 93 (5):1885-93.

34 International Journal of Physiology, October-December 2019, Vol.7, No. 4
23. Marsh MM, Walker VR, Curtiss LK, Banka CL. Protection against atherosclerosis by estrogen is independent of plasma cholesterol levels in LDL receptor-deficient mice. Journal of lipid research. 1999; 40 (5):893-900.
24. Kong WM, Martin NM, Smith KL, Gardiner JV, Connoley IP, Stephens DA, et al. Triiodothyronine stimulates food intake via the hypothalamic ventromedial nucleus independent of changes in energy expenditure. Endocrinology. 2004; 145 (11):5252-8.
25. Lopez M, Varela L, Vazquez MJ, Rodriguez-Cuenca S, Gonzalez CR, Velagapudi VR, et al. Hypothalamic AMPK and fatty acid metabolism mediate thyroid regulation of energy balance. Nature medicine. 2010; 16 (9):1001-8.
26. Shao S-s, Zhao Y-f, Song Y-f, Xu C, Yang J-m, Xuan S-m, et al. Dietary high-fat lard intake induces thyroid dysfunction and abnormal morphology in rats. Acta pharmacologica Sinica. 2014; 35 (11):1411-20.
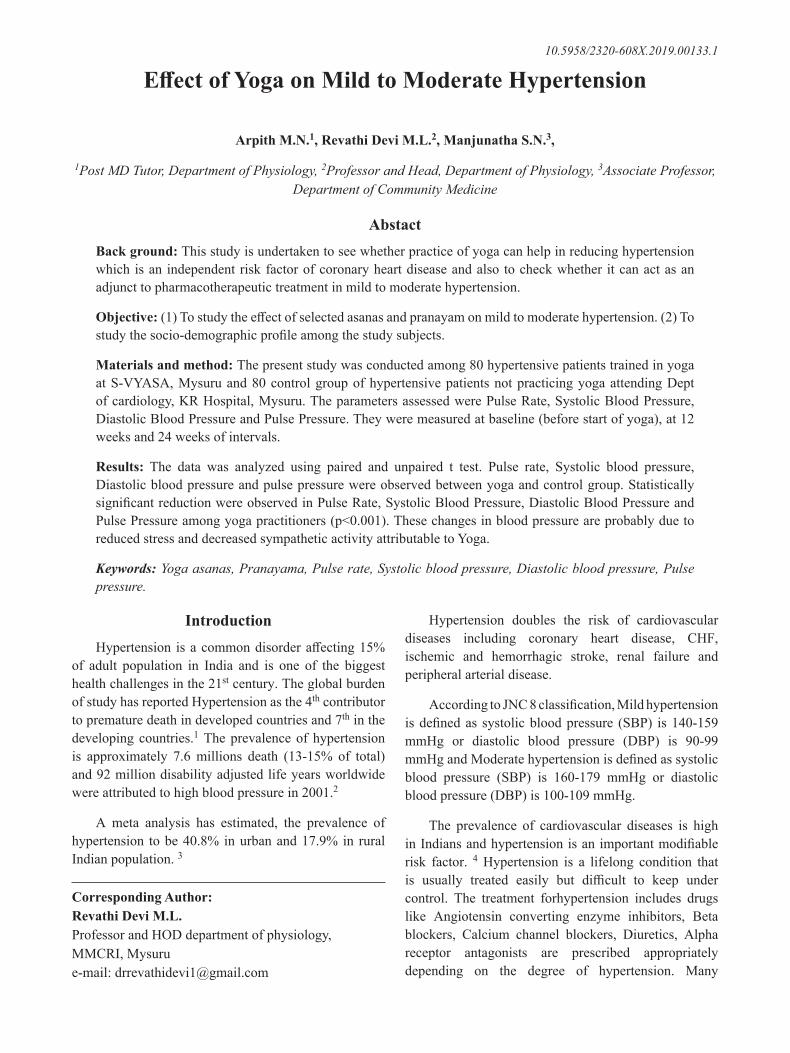
International Journal of Physiology, October-December 2019, Vol.7, No. 4 35
Effect of Yoga on Mild to Moderate Hypertension
Arpith M.N.1, Revathi Devi M.L.2, Manjunatha S.N.3,
1Post MD Tutor, Department of Physiology, 2Professor and Head, Department of Physiology, 3Associate Professor, Department of Community Medicine
AbstactBack ground: This study is undertaken to see whether practice of yoga can help in reducing hypertension which is an independent risk factor of coronary heart disease and also to check whether it can act as an adjunct to pharmacotherapeutic treatment in mild to moderate hypertension.
Objective: (1) To study the effect of selected asanas and pranayam on mild to moderate hypertension. (2) To study the socio-demographic profile among the study subjects.
Materials and method: The present study was conducted among 80 hypertensive patients trained in yoga at S-VYASA, Mysuru and 80 control group of hypertensive patients not practicing yoga attending Dept of cardiology, KR Hospital, Mysuru. The parameters assessed were Pulse Rate, Systolic Blood Pressure, Diastolic Blood Pressure and Pulse Pressure. They were measured at baseline (before start of yoga), at 12 weeks and 24 weeks of intervals.
Results: The data was analyzed using paired and unpaired t test. Pulse rate, Systolic blood pressure, Diastolic blood pressure and pulse pressure were observed between yoga and control group. Statistically significant reduction were observed in Pulse Rate, Systolic Blood Pressure, Diastolic Blood Pressure and Pulse Pressure among yoga practitioners (p<0.001). These changes in blood pressure are probably due to reduced stress and decreased sympathetic activity attributable to Yoga.
Keywords: Yoga asanas, Pranayama, Pulse rate, Systolic blood pressure, Diastolic blood pressure, Pulse pressure.
IntroductionHypertension is a common disorder affecting 15%
of adult population in India and is one of the biggest health challenges in the 21st century. The global burden of study has reported Hypertension as the 4th contributor to premature death in developed countries and 7th in the developing countries.1 The prevalence of hypertension is approximately 7.6 millions death (13-15% of total) and 92 million disability adjusted life years worldwide were attributed to high blood pressure in 2001.2
A meta analysis has estimated, the prevalence of hypertension to be 40.8% in urban and 17.9% in rural Indian population. 3
Hypertension doubles the risk of cardiovascular diseases including coronary heart disease, CHF, ischemic and hemorrhagic stroke, renal failure and peripheral arterial disease.
According to JNC 8 classification, Mild hypertension is defined as systolic blood pressure (SBP) is 140-159 mmHg or diastolic blood pressure (DBP) is 90-99 mmHg and Moderate hypertension is defined as systolic blood pressure (SBP) is 160-179 mmHg or diastolic blood pressure (DBP) is 100-109 mmHg.
The prevalence of cardiovascular diseases is high in Indians and hypertension is an important modifiable risk factor. 4 Hypertension is a lifelong condition that is usually treated easily but difficult to keep under control. The treatment forhypertension includes drugs like Angiotensin converting enzyme inhibitors, Beta blockers, Calcium channel blockers, Diuretics, Alpha receptor antagonists are prescribed appropriately depending on the degree of hypertension. Many
Corresponding Author: Revathi Devi M.L. Professor and HOD department of physiology, MMCRI, Mysuru e-mail: [email protected]
10.5958/2320-608X.2019.00133.1
36 International Journal of Physiology, October-December 2019, Vol.7, No. 4
hypertensives require two or more drugs of different combinations to control blood pressure.5 Distressing side effects of drugs affect health related quality of patients. So not only medications but also diet, life style changes, alternative treatment are essential in treating essential hypertension.6 The etiology for essential hypertension is multifactorial like obesity, smoking, alcohol and stress. Among these factors, Stress is one of the contributing factor.7 Yoga is a science and its practice harmonizes the body and mind. Asanas and Pranayama are relaxation techniques, which are proven to reduce stress. 8 These relaxation techniques are non drug, non invasive, easy to practice, cost effective in controlling blood pressure, and do not have any appreciable side effects or symptoms6. An integrated approach to hypertension management is required. Many scientific studies support the use of yoga practice in treatment of hypertension. But it has not been standardized and fully recognized by medical professionals. Yoga techniques is proved to be beneficial in mild and moderate hypertensives, along with drug therapy. 9 Hence the present study is an attempt to evaluate the effect of yoga techniques in patients with mild to moderate hypertension.
Objectives1. To study the effect of selected asanas and pranayam
on mild to moderate hypertension.2. To study the socio-demographic profile among the
study subjects
Materials and MethodSource of data: The present study was conducted
among 80 hypertensive patients practicing yoga at S-VYASA Mysore and 80 age and sex matched control group of hypertensive patients not practicing yoga who were registered from Dept of cardiology, KR Hospital, Mysore. Cases and controls were chosen in the age group of 40-60 years.
Sample size: Sample size was calculated using a power of 80% and error of 10% at 5% significance. Prevalence of hypertension in India is 0.4% and proportions of hypertensives in age group of 40-60 years is 32.5%. Using the formula 4pq/r2 the sample size was found to be 80 per cell. Hence the total sample size for the yoga and Non yoga groups is 160. This sample size also accounted for the attrition rate.
Inclusion criteria:1. Mild to moderate Hypertensive adults under
treatment in the age group 40-60 years.
2. Regular yoga practitioners for study group.
3. Subjects who are not involved in yoga, pranayama, mediation or any other form of exercises like dance or sports for control group.
Exclusion criteria:
1. For both groups, all cases of secondary hypertension.
2. History of cardiovascular or respiratory diseases.
3. History of major surgeries in past 6 months.
Method of Collection of Data:
● Subjects were examined for their General physical health, Subject’s clinical History and details were taken according to the standard Performa. Based on inclusion and exclusion criteria the candidates will be selected.
● Informed written consent was taken from all subjects in the study.
ResultsThe present study entitled “EFFECT OF YOGA
ON MILD TO MODERATE HYPERTENSION” was conducted in Department of cardiology, Mysore Medical College and Research Institute, Mysore in collaboration with‘S-VYASA’ Group Yoga Mandir, Mysore.
Presentation of Data: Master chart showing the indices of various parameters were tabulated at 12 weeks and 24 weeks. A group of 80 who were trained with yoga and Pranayama and a group of 80 who were not trained with Yoga and Pranayama were analyzed for the results. The results obtained were expressed as mean ± standard deviation.
Thus data analysis was done by using appropriate statistical tools.
Proportions, frequency, mean and standard deviation was calculated. The Independent-Sample t Test procedure is used to compare means of yoga group and control group.
Paired t test is used to compare means in yoga group at 12 weeks and 24 weeks and in control group at 12 weeks and 24 weeks.
In these tests of significance a p value <0.001 was considered statistically highly significant, p value <0.05 was considered significant and p value >0.05 was considered insignificant.
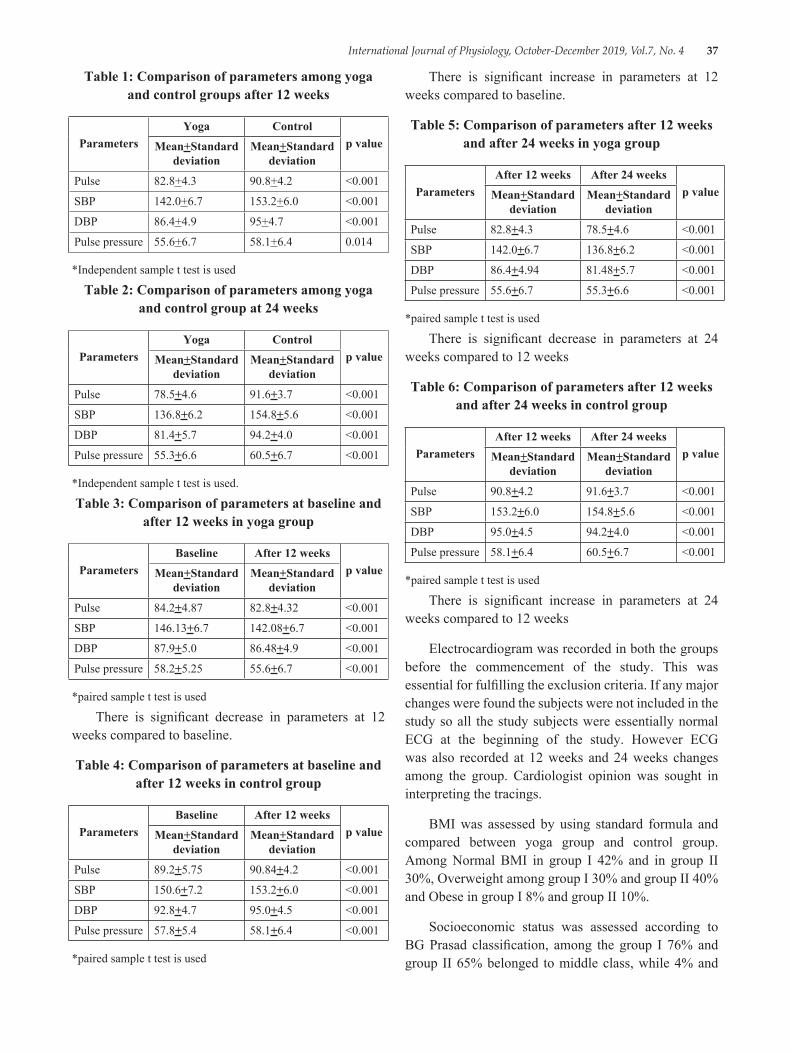
International Journal of Physiology, October-December 2019, Vol.7, No. 4 37
Table 1: Comparison of parameters among yoga and control groups after 12 weeks
ParametersYoga Control
p valueMean+Standard deviation
Mean+Standard deviation
Pulse 82.8+4.3 90.8+4.2 <0.001
SBP 142.0+6.7 153.2+6.0 <0.001
DBP 86.4+4.9 95+4.7 <0.001
Pulse pressure 55.6+6.7 58.1+6.4 0.014
*Independent sample t test is used
Table 2: Comparison of parameters among yoga and control group at 24 weeks
ParametersYoga Control
p valueMean+Standard deviation
Mean+Standard deviation
Pulse 78.5+4.6 91.6+3.7 <0.001
SBP 136.8+6.2 154.8+5.6 <0.001
DBP 81.4+5.7 94.2+4.0 <0.001
Pulse pressure 55.3+6.6 60.5+6.7 <0.001
*Independent sample t test is used.
Table 3: Comparison of parameters at baseline and after 12 weeks in yoga group
ParametersBaseline After 12 weeks
p valueMean+Standard deviation
Mean+Standard deviation
Pulse 84.2+4.87 82.8+4.32 <0.001
SBP 146.13+6.7 142.08+6.7 <0.001
DBP 87.9+5.0 86.48+4.9 <0.001
Pulse pressure 58.2+5.25 55.6+6.7 <0.001
*paired sample t test is used
There is significant decrease in parameters at 12 weeks compared to baseline.
Table 4: Comparison of parameters at baseline and after 12 weeks in control group
ParametersBaseline After 12 weeks
p valueMean+Standard deviation
Mean+Standard deviation
Pulse 89.2+5.75 90.84+4.2 <0.001
SBP 150.6+7.2 153.2+6.0 <0.001
DBP 92.8+4.7 95.0+4.5 <0.001
Pulse pressure 57.8+5.4 58.1+6.4 <0.001
*paired sample t test is used
There is significant increase in parameters at 12 weeks compared to baseline.
Table 5: Comparison of parameters after 12 weeks and after 24 weeks in yoga group
ParametersAfter 12 weeks After 24 weeks
p valueMean+Standard deviation
Mean+Standard deviation
Pulse 82.8+4.3 78.5+4.6 <0.001
SBP 142.0+6.7 136.8+6.2 <0.001
DBP 86.4+4.94 81.48+5.7 <0.001
Pulse pressure 55.6+6.7 55.3+6.6 <0.001
*paired sample t test is used
There is significant decrease in parameters at 24 weeks compared to 12 weeks
Table 6: Comparison of parameters after 12 weeks and after 24 weeks in control group
ParametersAfter 12 weeks After 24 weeks
p value Mean+Standard deviation
Mean+Standard deviation
Pulse 90.8+4.2 91.6+3.7 <0.001
SBP 153.2+6.0 154.8+5.6 <0.001
DBP 95.0+4.5 94.2+4.0 <0.001
Pulse pressure 58.1+6.4 60.5+6.7 <0.001
*paired sample t test is used
There is significant increase in parameters at 24 weeks compared to 12 weeks
Electrocardiogram was recorded in both the groups before the commencement of the study. This was essential for fulfilling the exclusion criteria. If any major changes were found the subjects were not included in the study so all the study subjects were essentially normal ECG at the beginning of the study. However ECG was also recorded at 12 weeks and 24 weeks changes among the group. Cardiologist opinion was sought in interpreting the tracings.
BMI was assessed by using standard formula and compared between yoga group and control group. Among Normal BMI in group I 42% and in group II 30%, Overweight among group I 30% and group II 40% and Obese in group I 8% and group II 10%.
Socioeconomic status was assessed according to BG Prasad classification, among the group I 76% and group II 65% belonged to middle class, while 4% and
38 International Journal of Physiology, October-December 2019, Vol.7, No. 4
14% belonged to lower middle class among group I and group II respectively. Only 1% among group II belonged to upper middle class.
DiscussionThe study was conducted on 160 subjects who
had mild or moderate hypertension of which 80, who practiced yoga formed the yoga group and 80 formed the control group who did not practice yoga.
80 Hypertensive patients practiced yoga in S-VYASA Group, Mysore and 80 hypertensive patients not practicing yoga were enrolled from department of cardiology, KR hospital, Mysore.
The mean age of the study (yoga) group was 49.8+6.35 years and the control group was 49.85+5.25 years. The total data collection duration was 6 months and divided as baseline (before start of yoga), 12 weeks and 24 weeks.
Pulse rate, Systolic blood pressure, Diastolic blood pressure, and Pulse pressure significantly decreased at 24 weeks in study group, when compared at baseline and at 12 weeks.
Effect on Heart rate: In the present study PR is decreased from 84.2, 82.8 and 78.5 at baseline, 12 weeks and 24 weeks respectively and the difference in mean pulse rate showed statistically significant with p value <0.001.
The present study agrees with the study done by Sharma M et al (2013) in which there was significant reduction of heart rate among yoga trained hypertensive individuals10.
Effect on Blood pressure: In the present study Systolic blood pressure, Diastolic blood pressure and Pulse pressure significantly decreased at 24 weeks compared to baseline and 12 weeks as follows SBP (146.13, 136.8 and 142.08), DBP (87.9, 86.48 and 81.48) and Pulse pressure (58.2, 55.6 and 55.3) respectively. The difference in mean SBP, DBP and PP showed statistically significant with p value < 0.001.
The present study is consistent with the study done by Prakash S and Gupta R (2015) in which there was significant reduction in SBP and DBP, the study group who practiced yoga compared to control group. 11
The present study is consistent with the study done by N. Victoria Devi and Sarada N (2017) in which 3 months
of yoga intervention showed significant reduction in PR, SBP, DBP among yoga group. 12
Effect on Electrocardiogram: There was no ECG changes in the yoga and control groups at 12 and 24 weeks of interval. This is in agreement with the study done by Seemamani et al (2011) in which ECG did not show any statistically significant changes13.
The yogic exercises involve physical, mental and spiritual tasks which are performed in a comprehensive manner. Yoga after a long duration affects hypothalamus and brings about a decrease in the systolic and diastolic blood pressures through its influence on the vasomotor center, which reduces the sympathetic tone and the peripheral resistance.14 Yoga involves pranayama i.e., a voluntary alteration of the breathing pattern which increases parasympathetic tone in the yoga practitioners.15,16
ConculsionThe study demonstrated that regular practice of
yoga and pranayama has beneficial effects on reducing hypertension in mild to moderate hypertensive patients. The reduction in Pulse rate, Systolic blood pressure, Diastolic blood pressure and Pulse pressure among yoga and pranayama practitioners were statistically significant.
Limitations
Recommendations
Health care providers should be aware of the factors related to the non-adherence of lifestyle modification and should try to intervene them.
Ethical Clearance: Taken from institutional ethical committee, MMC&RI, Mysuru.
Source of Funding: SELF
Conflict of Interest: NIL
Reference1. Rao CR, Kamath VG, Shetty A, Kamath A.
High blood pressure prevalence and Significant Correlates: A Quantitative Analysis from Coastal Karnataka, India. ISRN Prev Med 2013; 2013:1-6.
2. Harrison’s Principle of internal medicine. International. 17thed. New York: McGraw-Hill Education Publication; 2015.

International Journal of Physiology, October-December 2019, Vol.7, No. 4 39
3. Midha T, Nath B, Kumari R, Rao YK, Pandey U. Prevalence of Hypertension in India. World Journal of Meta Analysis 26 Aug 2013; 1 (2); 83-9.
4. Devi P1, Rao M, Sigamani A2, Faruqui A3, et al. Prevalence, risk factors and awareness of hypertension in India: a systemic review. J Hum Hypertens 2013; 27 (5):281-7.
5. James PA, Oparil S, Carther BL, Cushman WC, Dennison-Himmelfarb C, et al. Evidence based guideline for the management of high blood pressure in adults. The Journal of the American Medical Association 5 Feb 2014; 311 (5):507-20.
6. Satyanarayana P, Benerji GV, Dulala RK, Meka FB, Kummari NR. Effect of yoga on heart rate, blood pressure, body mass index. IOSR Journal of Dental and Medical Sciences 2013; 8:36-9.
7. Kulkarni S, O’Farrell I, Erasi M, Kochar MS. Stress and Hypertension. Wisconsin Medical Society 1998 Dec; 97 (11):348.
8. Gururaja D, Harano K, Kobayashi H. Effect of yoga on mental health: Comparative study between young and senior subjects in Japan. Int J Yoga 2011 Jan-Jun; 4 (1):7-12.
9. Deepa T, Sethu GN, Thirrunavukkarasu. Effect of yoga and meditation on mild to moderate essential hypertensives. Journal of Clinical and Diagnostic Research 2012 Feb; 6 (1):21-6.
10. Sharma M, Meena M, Sharma R, Meena CB, Meena PD, Chauhan N. Study on the effect of yoga (yogasans, pranayama and meditation) training on hypertension. Ind J Sci Res and2013; 1 (2):89-95.
11. Prakash S, Gupta R. To study the role of yoga in management of hypertension. International Journal of Biomedical and Advance Research 2015; 6 (10):686-8.
12. Devi NV, Sarada N. Effect of yoga on heart rate and blood pressure in mild hypertensive patients (stage I). J Evolution Med Dent Sci 2017; 6 (22):1754-7.
13. Mani S, Kaur H, Maini N. Effect of Rajyoga medication on the heart rate, blood pressure and ECG. Journal of Clinical and Diagnostic Research 2011 Dec; 5 (8):1519-22.
14. Cooper MJ, Aygen MM. A relaxation technique in the management of hypercholesterolemia. J Human Stress 1979 Dec; 5 (4):24-7.
15. Wenger MA, Bagchi BK, Anand BK. Voluntary controls of the heart and pulse. Circulation 1961 Dec 24; 1319-25.
16. Anand BK, Chhina GS, Singh B. Investigations on Yogis who claimed to stop their heart beat. Indian J Med Res 1961; 49 (1):90-4.
40 International Journal of Physiology, October-December 2019, Vol.7, No. 4
Cross Sectional Analytical Study of Effects of Resistance Training on the Improvement of Cardiovascular Endurance,
Flexibility & Muscular Endurance in Adults
AvinashTekade 1, Yogesh Gupta2
1Professor and Head, Dept. of Physiology, GMC Chandrapur, 2Assistant Professor, Dept. of Physiology, Gandhi Medical College, Bhopal
AbstractResistant training is one of the most important way of workouts which is seeking attention in modern days exercise patterns. Such training is also associated with reduction in the risk of hypertension and allied metabolic diseases especially in population served by sedentary lifestyle. Thus the present study was designed to examine the effects of 3 months to 1 year resistance training on cardiovascular endurance, flexibility, muscular endurance and physical fitness which enables us to confirm changes in performances in adults. On successful completion of training it was observed that significant increase in strength, power and working abilities of participants enrolled. Major gain of the study was seen in participants aging 30-39years. This finding of the present study clearly demarcates the benefit of starting the resistance training at an earlier age is always favourable. Hence we conclude that in health promotion of resistance training more emphasis should be targeted to the population groups with lower physical activity levels who are at maximum risk of having cardiovascular and obesity like diseases.
Keywords: Muscular endurance, cardiovascular endurance, flexibility, muscle strength, Resistance Training, physical fitness.
IntroductionStrength and resistance training exercise is one of
most important types of workout that is to be performed routinely. It is benefiting the individuals by increasing strength of bones, muscles and connective tissues; by lowering risk of cardiovascular injury and thus providing with better quality of life. 1
Also reduction in the risk of hypertension is associated with planned workouts. Consistent involvement with resistance training can prevent chronic disease and mental illness during later adulthood. The origins of adulthood physical activity are suggested to be in adolescence physical activity. 2
Sedentary lifestyle is considered to be the reason for major health problems like metabolic disorders, obesity, Cardiovascular disorders of the later ages in life with increasing trend of in young adults. 3 It is clear that, along with nutrition and lifestyle modifications; exercise plays a significant role in overcoming these disorders. 4 Many research studies have shown that exercise specially resistance training in young adults is significantly increasing the measures of healthy life. 5
A major concern is developing and investigating effective and practical interventions for those who are at the risk of developing health such problems. Thus, our aim was to examine how resistance training improve physical, social and mental performances in adults. 6
In Indian setup we don’t have the exact literature which will inform how much change will be there in the Physique parameters with exercise which we tried to conduit with the present study.
Method & Procedure: In this cross sectional analytical study sample size of 135 participants was
Corresponding Author: Yogesh Gupta E-503, Comfort Heights, Nayapura, New Jail Road, Sanjeev Nagar, Bhopal 462038 e-mail: dryogi. [email protected] Cell: 09421270902
10.5958/2320-608X.2019.00134.3
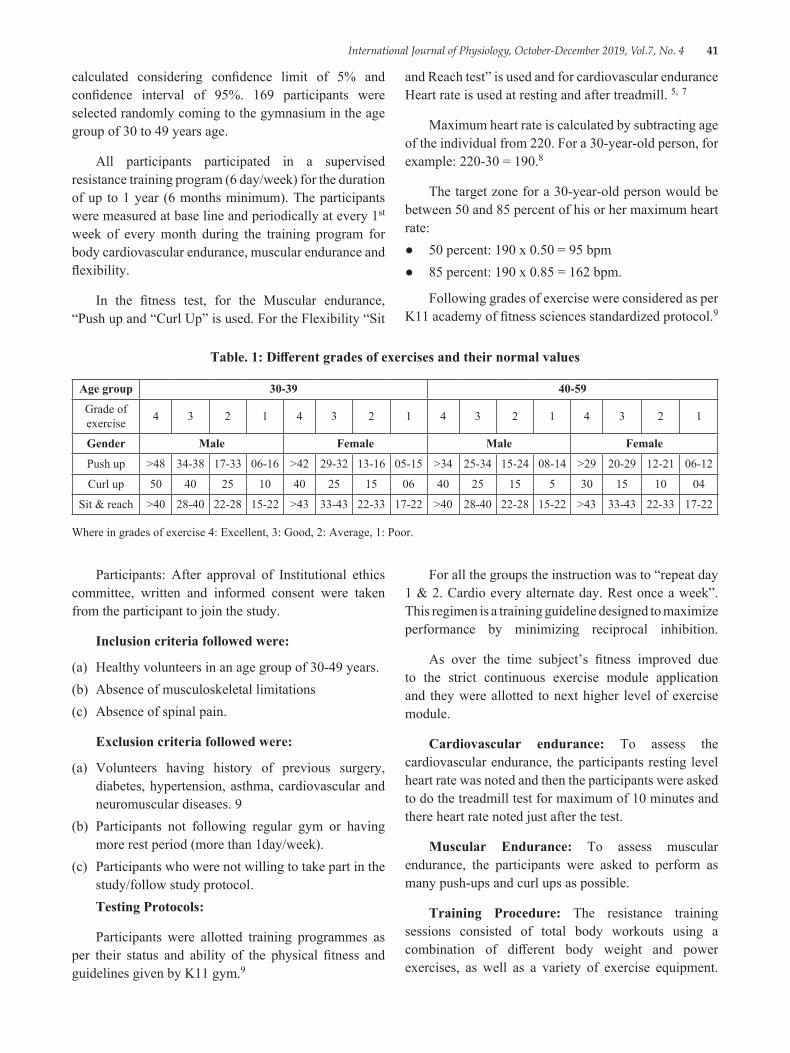
International Journal of Physiology, October-December 2019, Vol.7, No. 4 41
calculated considering confidence limit of 5% and confidence interval of 95%. 169 participants were selected randomly coming to the gymnasium in the age group of 30 to 49 years age.
All participants participated in a supervised resistance training program (6 day/week) for the duration of up to 1 year (6 months minimum). The participants were measured at base line and periodically at every 1st week of every month during the training program for body cardiovascular endurance, muscular endurance and flexibility.
In the fitness test, for the Muscular endurance, “Push up and “Curl Up” is used. For the Flexibility “Sit
and Reach test” is used and for cardiovascular endurance Heart rate is used at resting and after treadmill. 5, 7
Maximum heart rate is calculated by subtracting age of the individual from 220. For a 30-year-old person, for example: 220-30 = 190.8
The target zone for a 30-year-old person would be between 50 and 85 percent of his or her maximum heart rate:● 50 percent: 190 x 0.50 = 95 bpm● 85 percent: 190 x 0.85 = 162 bpm.
Following grades of exercise were considered as per K11 academy of fitness sciences standardized protocol.9
Table. 1: Different grades of exercises and their normal values
Age group 30-39 40-59
Grade of exercise 4 3 2 1 4 3 2 1 4 3 2 1 4 3 2 1
Gender Male Female Male Female
Push up >48 34-38 17-33 06-16 >42 29-32 13-16 05-15 >34 25-34 15-24 08-14 >29 20-29 12-21 06-12
Curl up 50 40 25 10 40 25 15 06 40 25 15 5 30 15 10 04
Sit & reach >40 28-40 22-28 15-22 >43 33-43 22-33 17-22 >40 28-40 22-28 15-22 >43 33-43 22-33 17-22
Where in grades of exercise 4: Excellent, 3: Good, 2: Average, 1: Poor.
Participants: After approval of Institutional ethics committee, written and informed consent were taken from the participant to join the study.
Inclusion criteria followed were:
(a) Healthy volunteers in an age group of 30-49 years.(b) Absence of musculoskeletal limitations(c) Absence of spinal pain.
Exclusion criteria followed were:
(a) Volunteers having history of previous surgery, diabetes, hypertension, asthma, cardiovascular and neuromuscular diseases. 9
(b) Participants not following regular gym or having more rest period (more than 1day/week).
(c) Participants who were not willing to take part in the study/follow study protocol.Testing Protocols:
Participants were allotted training programmes as per their status and ability of the physical fitness and guidelines given by K11 gym.9
For all the groups the instruction was to “repeat day 1 & 2. Cardio every alternate day. Rest once a week”. This regimen is a training guideline designed to maximize performance by minimizing reciprocal inhibition.
As over the time subject’s fitness improved due to the strict continuous exercise module application and they were allotted to next higher level of exercise module.
Cardiovascular endurance: To assess the cardiovascular endurance, the participants resting level heart rate was noted and then the participants were asked to do the treadmill test for maximum of 10 minutes and there heart rate noted just after the test.
Muscular Endurance: To assess muscular endurance, the participants were asked to perform as many push-ups and curl ups as possible.
Training Procedure: The resistance training sessions consisted of total body workouts using a combination of different body weight and power exercises, as well as a variety of exercise equipment.
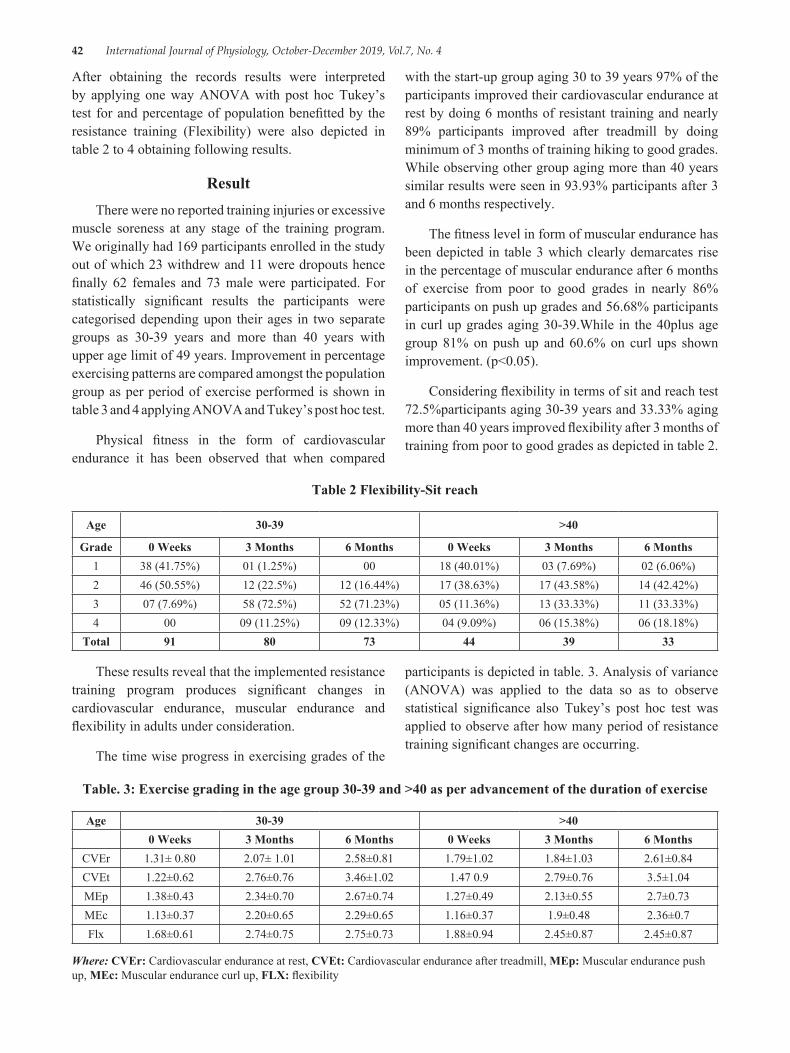
42 International Journal of Physiology, October-December 2019, Vol.7, No. 4
After obtaining the records results were interpreted by applying one way ANOVA with post hoc Tukey’s test for and percentage of population benefitted by the resistance training (Flexibility) were also depicted in table 2 to 4 obtaining following results.
ResultThere were no reported training injuries or excessive
muscle soreness at any stage of the training program. We originally had 169 participants enrolled in the study out of which 23 withdrew and 11 were dropouts hence finally 62 females and 73 male were participated. For statistically significant results the participants were categorised depending upon their ages in two separate groups as 30-39 years and more than 40 years with upper age limit of 49 years. Improvement in percentage exercising patterns are compared amongst the population group as per period of exercise performed is shown in table 3 and 4 applying ANOVA and Tukey’s post hoc test.
Physical fitness in the form of cardiovascular endurance it has been observed that when compared
with the start-up group aging 30 to 39 years 97% of the participants improved their cardiovascular endurance at rest by doing 6 months of resistant training and nearly 89% participants improved after treadmill by doing minimum of 3 months of training hiking to good grades. While observing other group aging more than 40 years similar results were seen in 93.93% participants after 3 and 6 months respectively.
The fitness level in form of muscular endurance has been depicted in table 3 which clearly demarcates rise in the percentage of muscular endurance after 6 months of exercise from poor to good grades in nearly 86% participants on push up grades and 56.68% participants in curl up grades aging 30-39.While in the 40plus age group 81% on push up and 60.6% on curl ups shown improvement. (p<0.05).
Considering flexibility in terms of sit and reach test 72.5%participants aging 30-39 years and 33.33% aging more than 40 years improved flexibility after 3 months of training from poor to good grades as depicted in table 2.
Table 2 Flexibility-Sit reach
Age 30-39 >40
Grade 0 Weeks 3 Months 6 Months 0 Weeks 3 Months 6 Months1 38 (41.75%) 01 (1.25%) 00 18 (40.01%) 03 (7.69%) 02 (6.06%)2 46 (50.55%) 12 (22.5%) 12 (16.44%) 17 (38.63%) 17 (43.58%) 14 (42.42%)3 07 (7.69%) 58 (72.5%) 52 (71.23%) 05 (11.36%) 13 (33.33%) 11 (33.33%)4 00 09 (11.25%) 09 (12.33%) 04 (9.09%) 06 (15.38%) 06 (18.18%)
Total 91 80 73 44 39 33
These results reveal that the implemented resistance training program produces significant changes in cardiovascular endurance, muscular endurance and flexibility in adults under consideration.
The time wise progress in exercising grades of the
participants is depicted in table. 3. Analysis of variance (ANOVA) was applied to the data so as to observe statistical significance also Tukey’s post hoc test was applied to observe after how many period of resistance training significant changes are occurring.
Table. 3: Exercise grading in the age group 30-39 and >40 as per advancement of the duration of exercise
Age 30-39 >400 Weeks 3 Months 6 Months 0 Weeks 3 Months 6 Months
CVEr 1.31± 0.80 2.07± 1.01 2.58±0.81 1.79±1.02 1.84±1.03 2.61±0.84CVEt 1.22±0.62 2.76±0.76 3.46±1.02 1.47 0.9 2.79±0.76 3.5±1.04MEp 1.38±0.43 2.34±0.70 2.67±0.74 1.27±0.49 2.13±0.55 2.7±0.73MEc 1.13±0.37 2.20±0.65 2.29±0.65 1.16±0.37 1.9±0.48 2.36±0.7Flx 1.68±0.61 2.74±0.75 2.75±0.73 1.88±0.94 2.45±0.87 2.45±0.87
Where: CVEr: Cardiovascular endurance at rest, CVEt: Cardiovascular endurance after treadmill, MEp: Muscular endurance push up, MEc: Muscular endurance curl up, FLX: flexibility
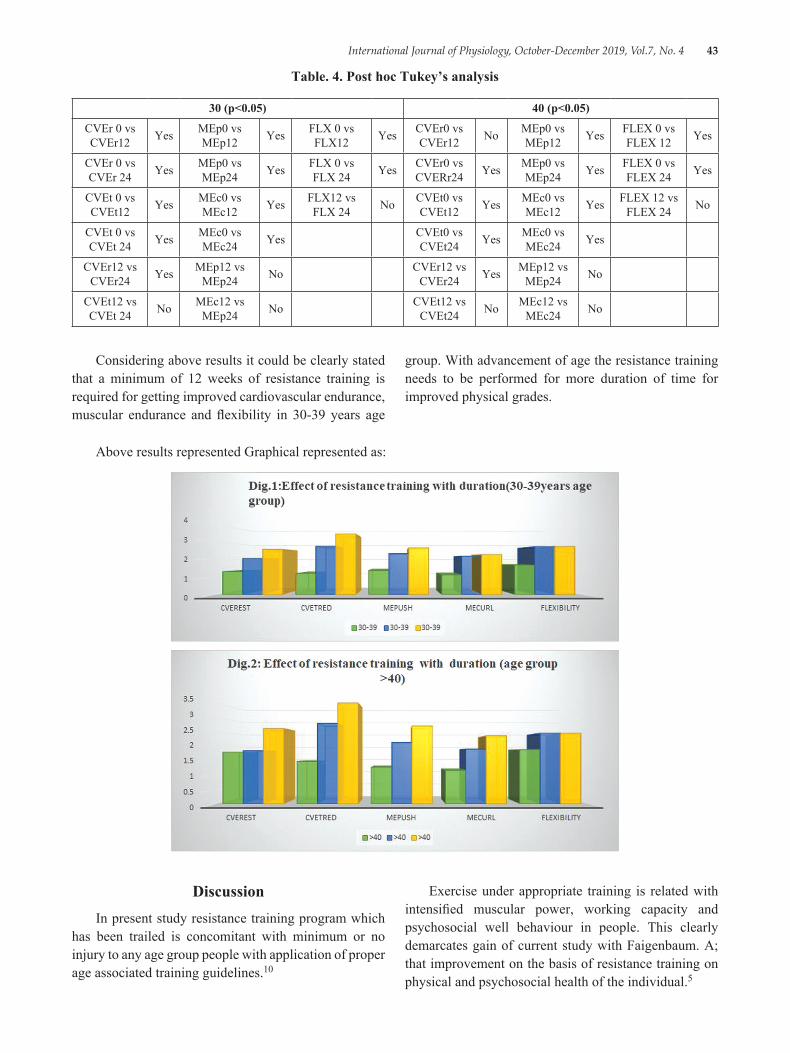
International Journal of Physiology, October-December 2019, Vol.7, No. 4 43
Table. 4. Post hoc Tukey’s analysis
30 (p<0.05) 40 (p<0.05)
CVEr 0 vs CVEr12 Yes MEp0 vs
MEp12 Yes FLX 0 vs FLX12 Yes CVEr0 vs
CVEr12 No MEp0 vs MEp12 Yes FLEX 0 vs
FLEX 12 Yes
CVEr 0 vs CVEr 24 Yes MEp0 vs
MEp24 Yes FLX 0 vs FLX 24 Yes CVEr0 vs
CVERr24 Yes MEp0 vs MEp24 Yes FLEX 0 vs
FLEX 24 Yes
CVEt 0 vs CVEt12 Yes MEc0 vs
MEc12 Yes FLX12 vs FLX 24 No CVEt0 vs
CVEt12 Yes MEc0 vs MEc12 Yes FLEX 12 vs
FLEX 24 No
CVEt 0 vs CVEt 24 Yes MEc0 vs
MEc24 Yes CVEt0 vs CVEt24 Yes MEc0 vs
MEc24 Yes
CVEr12 vs CVEr24 Yes MEp12 vs
MEp24 No CVEr12 vs CVEr24 Yes MEp12 vs
MEp24 No
CVEt12 vs CVEt 24 No MEc12 vs
MEp24 No CVEt12 vs CVEt24 No MEc12 vs
MEc24 No
Considering above results it could be clearly stated that a minimum of 12 weeks of resistance training is required for getting improved cardiovascular endurance, muscular endurance and flexibility in 30-39 years age
group. With advancement of age the resistance training needs to be performed for more duration of time for improved physical grades.
Above results represented Graphical represented as:
DiscussionIn present study resistance training program which
has been trailed is concomitant with minimum or no injury to any age group people with application of proper age associated training guidelines.10
Exercise under appropriate training is related with intensified muscular power, working capacity and psychosocial well behaviour in people. This clearly demarcates gain of current study with Faigenbaum. A; that improvement on the basis of resistance training on physical and psychosocial health of the individual.5
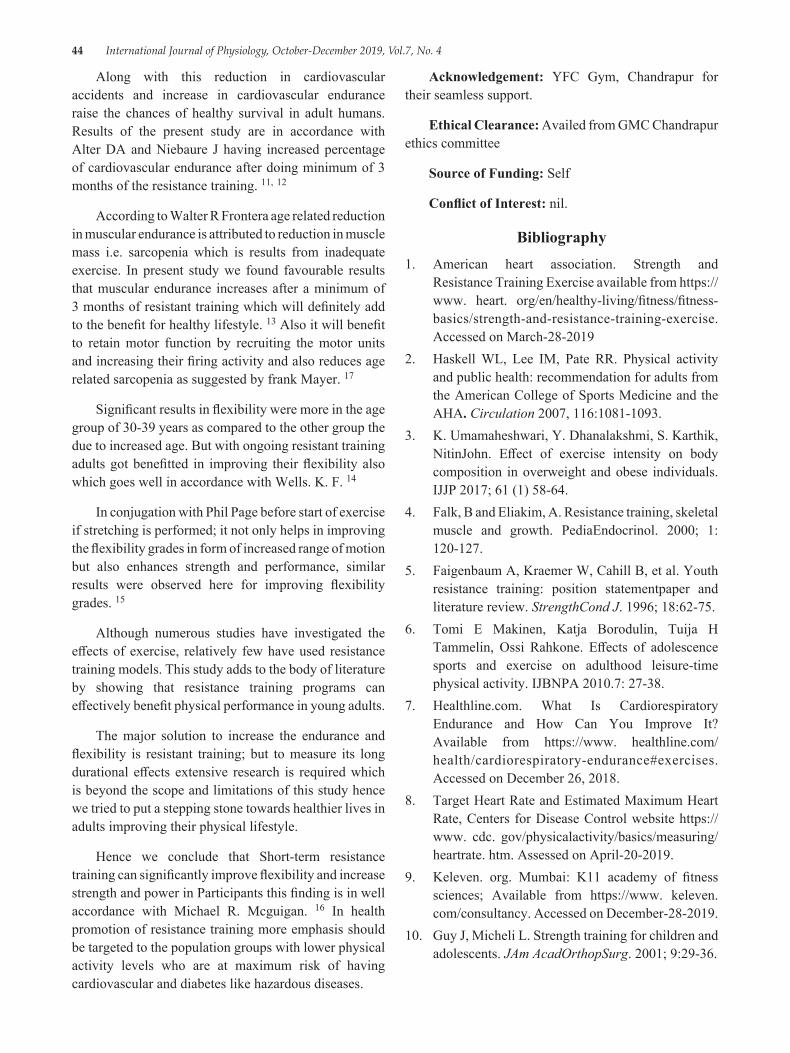
44 International Journal of Physiology, October-December 2019, Vol.7, No. 4
Along with this reduction in cardiovascular accidents and increase in cardiovascular endurance raise the chances of healthy survival in adult humans. Results of the present study are in accordance with Alter DA and Niebaure J having increased percentage of cardiovascular endurance after doing minimum of 3 months of the resistance training. 11, 12
According to Walter R Frontera age related reduction in muscular endurance is attributed to reduction in muscle mass i.e. sarcopenia which is results from inadequate exercise. In present study we found favourable results that muscular endurance increases after a minimum of 3 months of resistant training which will definitely add to the benefit for healthy lifestyle. 13 Also it will benefit to retain motor function by recruiting the motor units and increasing their firing activity and also reduces age related sarcopenia as suggested by frank Mayer. 17
Significant results in flexibility were more in the age group of 30-39 years as compared to the other group the due to increased age. But with ongoing resistant training adults got benefitted in improving their flexibility also which goes well in accordance with Wells. K. F. 14
In conjugation with Phil Page before start of exercise if stretching is performed; it not only helps in improving the flexibility grades in form of increased range of motion but also enhances strength and performance, similar results were observed here for improving flexibility grades. 15
Although numerous studies have investigated the effects of exercise, relatively few have used resistance training models. This study adds to the body of literature by showing that resistance training programs can effectively benefit physical performance in young adults.
The major solution to increase the endurance and flexibility is resistant training; but to measure its long durational effects extensive research is required which is beyond the scope and limitations of this study hence we tried to put a stepping stone towards healthier lives in adults improving their physical lifestyle.
Hence we conclude that Short-term resistance training can significantly improve flexibility and increase strength and power in Participants this finding is in well accordance with Michael R. Mcguigan. 16 In health promotion of resistance training more emphasis should be targeted to the population groups with lower physical activity levels who are at maximum risk of having cardiovascular and diabetes like hazardous diseases.
Acknowledgement: YFC Gym, Chandrapur for their seamless support.
Ethical Clearance: Availed from GMC Chandrapur ethics committee
Source of Funding: Self
Conflict of Interest: nil.
Bibliography1. American heart association. Strength and
Resistance Training Exercise available from https://www. heart. org/en/healthy-living/fitness/fitness-basics/strength-and-resistance-training-exercise. Accessed on March-28-2019
2. Haskell WL, Lee IM, Pate RR. Physical activity and public health: recommendation for adults from the American College of Sports Medicine and the AHA. Circulation 2007, 116:1081-1093.
3. K. Umamaheshwari, Y. Dhanalakshmi, S. Karthik, NitinJohn. Effect of exercise intensity on body composition in overweight and obese individuals. IJJP 2017; 61 (1) 58-64.
4. Falk, B and Eliakim, A. Resistance training, skeletal muscle and growth. PediaEndocrinol. 2000; 1: 120-127.
5. Faigenbaum A, Kraemer W, Cahill B, et al. Youth resistance training: position statementpaper and literature review. StrengthCond J. 1996; 18:62-75.
6. Tomi E Makinen, Katja Borodulin, Tuija H Tammelin, Ossi Rahkone. Effects of adolescence sports and exercise on adulthood leisure-time physical activity. IJBNPA 2010.7: 27-38.
7. Healthline.com. What Is Cardiorespiratory Endurance and How Can You Improve It? Available from https://www. healthline.com/health/cardiorespiratory-endurance#exercises. Accessed on December 26, 2018.
8. Target Heart Rate and Estimated Maximum Heart Rate, Centers for Disease Control website https://www. cdc. gov/physicalactivity/basics/measuring/heartrate. htm. Assessed on April-20-2019.
9. Keleven. org. Mumbai: K11 academy of fitness sciences; Available from https://www. keleven.com/consultancy. Accessed on December-28-2019.
10. Guy J, Micheli L. Strength training for children and adolescents. JAm AcadOrthopSurg. 2001; 9:29-36.

International Journal of Physiology, October-December 2019, Vol.7, No. 4 45
11. Alter DA, Oh PI, Chong A. Relationship between cardiac rehabilitation and survival after acute cardiac hospitalization within a universal health care system. Eur J Cardiovasc Prev Rehabil. 2009; 16:102-113.11.
12. Niebauer J, Clark AL, Coats AJ. Exercise training in chronic heart failure: effects on pro-inflammatory markers. Eur J Heart Fail. 2005; 7:189-193.
13. Walter R. Frontera, Virginia A. Hughes, Karyn J. A cross-sectional study of muscle strength and mass in 45-to 70 year-old men and women. J. Appl. Physiol. 1991; 71 (2): 644-650.
14. Wells, K. F., Dillon, E. K. The sit and reach. A test of back and leg flexibility. Research Quarterly, 1999; 23.115-118.
15. Phil Page. Current concepts in muscle stretching for exercise and rehabilitation. IJSPT. Feb 2012; 7 (1): 109-114.
16. Michael Mcguigan, Melissa Tatasciore, Robert U. Newton. Eight weeks of resistance training can significantly alter body composition in children who are overweight or obese. JSCR. 2008; 22 (6): 11-16.
17. Frank Mayer, Friederike Scharhag-Rosenberger, Anja Carlsohn, Jürgen Scharhag. The Intensity and Effects of Strength Training in the Elderly. Dtsch Arztebl Int. 2011; 108 (21): 359-64.
46 International Journal of Physiology, October-December 2019, Vol.7, No. 4
Comparative Study between the Effect of Short Term and Long Term Exposure to Cotton Dust on Pulmonary Function Tests in
Cotton Mill Workers
Charulata Kadam1, Afshan Kausar2, Charushila Atul Rukadikar3, N.A. Deokar4
1Asst. Professor Dept of Physiology, SSPM Medical College And Lifetime Hospital, Padve-Kasal, Dist. Sindhudurg, Maharashtra, 2Assistant Professor, Department of Physiology JIIU’S Indian Institute of Medical
Science & Research, (JIIU’S IIMSR) Medical College, Warudi, Badnapur, Jalna, Maharashtra, 3Charushila Atul Rukadikar, Asst. Professor Dept of Physiology Zydus medical college and hospital, dahod, Gujarat, 4N.A. Deokar,
Asso. Professor, Department of Physiology, Government Medical College, Miraj, Sangali, Maharashtra, India
AbstractBackground: Byssinosis is the most common disease affecting the cotton textile workers; symptom complexes like mill fever, weaver’s cough, mattress-maker‘s cough, also occur in textile workers. 1Cotton workers are at risk for occupational lung disease, including byssinosis and chronic bronchitis3. The present study was done to compare the effect of short term exposure and long term exposure to cotton dust in cotton mill workers and suggest precautions them to prevent this.
Objective: To compare the effect of short term and long term exposure to cotton dust on pulmonary function tests in cotton mill workers.
Method: In this study, one group of fifty workers exposed for short term duration and other sixty four, for long term duration exposure were examined for PFTs of age 25-50 years. PFTs were carried out using spirometer.
Results or observations: The present study found that there is statistically significant difference in PFTs between the short term exposed group and long term exposure group of 25-50 years age.
Discussion & conclusion: The results of the present study helped us to understand and compare the short-term and long term exposure group better and suggest workers to take precautions to avoid more subtle effects that can occur.
Keywords: Cotton dust, PFT, short term exposure, long term exposure.
the cotton textile workers; though other symptom complexes like mill fever, weaver’s cough, mattress-maker’s cough, also occur in textile workers. 1
Cotton workers are at risk for occupational lung disease, including byssinosis and chronic bronchitis. The initial phase of byssinosis is characterized by acute reversible symptoms, such as wheezing, chest tightness, shortness of breath, or cough, and is typically evident on the first day back to work after an absence of 48 h or more (‘Monday Dyspnea’). These early symptoms are generally accompanied by reversible changes in pulmonary function (across-shift drops in FEV1). With continued exposure, the disease may progress to a stage
IntroductionFor nearly 300 years, work in textile industry has
been recognized as, an occupational hazard. 2 Byssinosis is the most common, widely studied, disease affecting
Corresponding Author: Afshan Kausar Assistant Professor, Department of Physiology JIIU’S Indian Institute of Medical Science & Research, (JIIU’S IIMSR)Medical College, Warudi, Badnapur, Jalna, Maharashtra e-mail:dr. [email protected]
10.5958/2320-608X.2019.00135.5
International Journal of Physiology, October-December 2019, Vol.7, No. 4 47
in which symptoms are present throughout the work week and may eventually result in severe pulmonary disability. 3, 4
Longitudinal studies conducted in recent decades have produced conflicting results in understanding the chronic effects of exposure, especially with regard to functional impairments, although some studies failed to find chronic effects. 5, 6, 7
Previous studies suggested that respiratory symptoms in cotton textile workers were reversible, and reporting symptoms varied substantially from survey to survey whereas chronic symptoms persevered. 5, 8, 9
In this context, the present study has been undertaken to study, the effect of short term and long term duration exposure, to cotton dust on pulmonary function tests, in cotton mill workers. The results of the present study will help us to understand and compare the short-term and long term exposure group and suggest workers to take precautions to avoid more subtle effects that can occur.
Material and MethodThe present study was approved by the Institution
Ethical Committee. Pulmonary function tests were done in 50 cotton mill workers exposed for short term duration (1-5 years) and 64 cotton mill workers exposed for long term duration (6-20 years) of age 25-50 years.
The informed written consent was taken from study group after explaining the procedure to them. The study was done at a Spinning Mill with permission from the Management of the mill. The mill processes raw, ginned cotton to yarn.
The procedure of spirometry, a noninvasive investigation to be performed in the study for obtaining lung functions was explained to the subjects in vernacular, in detail. They, having understood the details, unconditionally consented to participate in the study. Workers were treated with due respect during all the meetings, while the tests were being conducted on them. Their work was not disturbed.
They were selected on the basis of following inclusion and exclusion criteria:
Inclusion criteria:
1. Study group individuals (both sex) working of age 25-50 years in cotton mill exposed for short term duration of 1-5 years and long term duration of 6-20 years.
2. Individuals in both groups are working in cotton mill for more than 8 hours per day for 6 days a week.
Exclusion criteria: Subjects having,
1. Previous exposure to cotton or other occupational dust.
2. Those with history of smoking, tobacco chewing and alcohol intake.
3. Those with history of COPD, Bronchial Asthma and any other allergic conditions like allergic rhinitis.
4. Those with history of Cardio vascular diseases, Hypertension and Diabetes Mellitus.
1. Study group 1/Short term group: Fifty cotton mill workers, of age 25-50 years working at cotton mill exposed for 1-5 years duration (short term)9
2. Study group 2/Long term group: Sixty four cotton mill workers, of age 25-50 years working at cotton mill exposed for 6-20 years duration (long term)
Method of collection of data: Following parameters evaluated in study groups:
● After taking informed written consent from each subject, a structured questionnaire was given to the subjects, to elicit the detail occupational history and history of past or present respiratory illnesses.
The following Symptoms were asked: any history of (a) Chest Tightness, (b) Difficulty in Breathing, (c) Cough, (d) Wheezing and Phlegm.
● Lung Function Tests:
Procedure: Each subject was made to relax for minimum 5 minutes prior to performing the PFT procedure. The relaxed subject, in a sitting position, was asked to grip the sterile mouth piece as demonstrated to him/her prior to the recording. When the subject was confident and familiar with the procedure, he/she was asked first to perform maximal inspiration after a deep expiration. The subject was then instructed to expire with maximal effort (maximal expiration). The mouth piece was then removed and the actual values were printed for analysis. Each subject (Study groups or Control), was asked to repeat the maximum forced expiratory effort three times, each time with adequate rest in between, and the best reading of the three was considered for analysis. The PFTs data’s are analyzed by Spirolab III and a diagnosis of obstructive or restrictive disease is made.
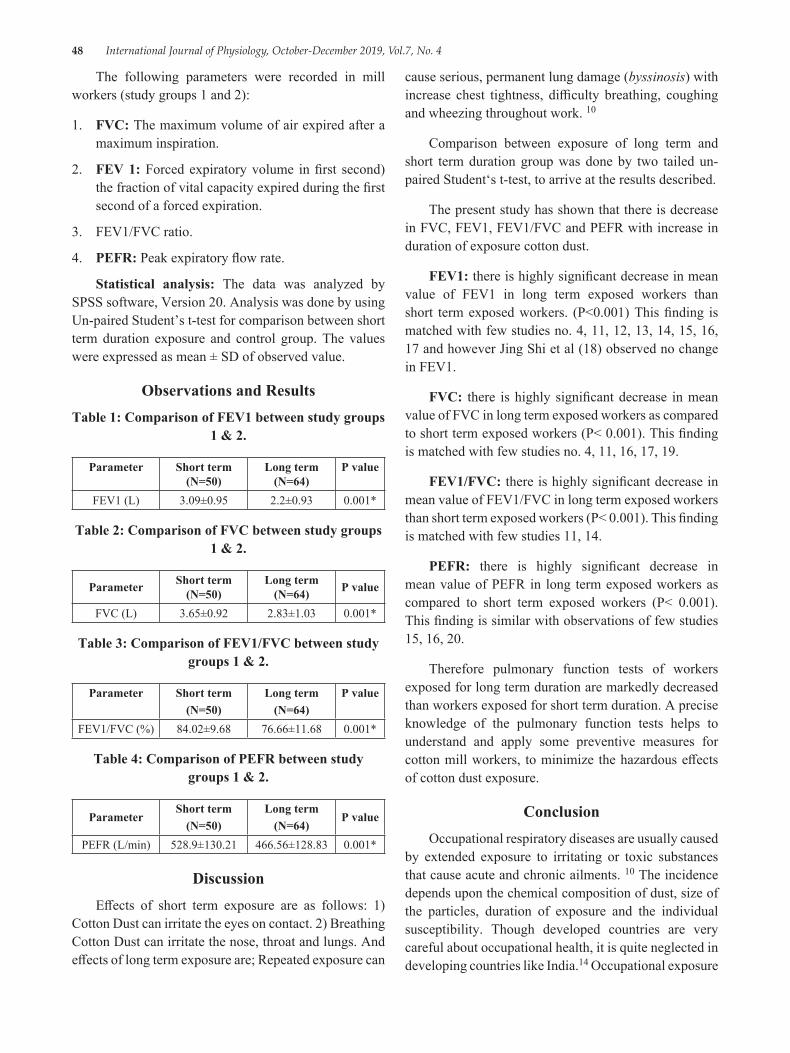
48 International Journal of Physiology, October-December 2019, Vol.7, No. 4
The following parameters were recorded in mill workers (study groups 1 and 2):
1. FVC: The maximum volume of air expired after a maximum inspiration.
2. FEV 1: Forced expiratory volume in first second) the fraction of vital capacity expired during the first second of a forced expiration.
3. FEV1/FVC ratio.
4. PEFR: Peak expiratory flow rate.
Statistical analysis: The data was analyzed by SPSS software, Version 20. Analysis was done by using Un-paired Student’s t-test for comparison between short term duration exposure and control group. The values were expressed as mean ± SD of observed value.
Observations and ResultsTable 1: Comparison of FEV1 between study groups
1 & 2.
Parameter Short term (N=50)
Long term (N=64)
P value
FEV1 (L) 3.09±0.95 2.2±0.93 0.001*
Table 2: Comparison of FVC between study groups 1 & 2.
Parameter Short term (N=50)
Long term (N=64) P value
FVC (L) 3.65±0.92 2.83±1.03 0.001*
Table 3: Comparison of FEV1/FVC between study groups 1 & 2.
Parameter Short term(N=50)
Long term(N=64)
P value
FEV1/FVC (%) 84.02±9.68 76.66±11.68 0.001*
Table 4: Comparison of PEFR between study groups 1 & 2.
Parameter Short term
(N=50) Long term
(N=64) P value
PEFR (L/min) 528.9±130.21 466.56±128.83 0.001*
DiscussionEffects of short term exposure are as follows: 1)
Cotton Dust can irritate the eyes on contact. 2) Breathing Cotton Dust can irritate the nose, throat and lungs. And effects of long term exposure are; Repeated exposure can
cause serious, permanent lung damage (byssinosis) with increase chest tightness, difficulty breathing, coughing and wheezing throughout work. 10
Comparison between exposure of long term and short term duration group was done by two tailed un-paired Student‘s t-test, to arrive at the results described.
The present study has shown that there is decrease in FVC, FEV1, FEV1/FVC and PEFR with increase in duration of exposure cotton dust.
FEV1: there is highly significant decrease in mean value of FEV1 in long term exposed workers than short term exposed workers. (P<0.001) This finding is matched with few studies no. 4, 11, 12, 13, 14, 15, 16, 17 and however Jing Shi et al (18) observed no change in FEV1.
FVC: there is highly significant decrease in mean value of FVC in long term exposed workers as compared to short term exposed workers (P< 0.001). This finding is matched with few studies no. 4, 11, 16, 17, 19.
FEV1/FVC: there is highly significant decrease in mean value of FEV1/FVC in long term exposed workers than short term exposed workers (P< 0.001). This finding is matched with few studies 11, 14.
PEFR: there is highly significant decrease in mean value of PEFR in long term exposed workers as compared to short term exposed workers (P< 0.001). This finding is similar with observations of few studies 15, 16, 20.
Therefore pulmonary function tests of workers exposed for long term duration are markedly decreased than workers exposed for short term duration. A precise knowledge of the pulmonary function tests helps to understand and apply some preventive measures for cotton mill workers, to minimize the hazardous effects of cotton dust exposure.
ConclusionOccupational respiratory diseases are usually caused
by extended exposure to irritating or toxic substances that cause acute and chronic ailments. 10 The incidence depends upon the chemical composition of dust, size of the particles, duration of exposure and the individual susceptibility. Though developed countries are very careful about occupational health, it is quite neglected in developing countries like India.14 Occupational exposure
International Journal of Physiology, October-December 2019, Vol.7, No. 4 49
to cotton dust leads to development of various pulmonary disorders, byssinosis being the most important of them. 2
This study was conducted to enlighten and compare the effects of short term (1-5 years) and the long term (6-20 years) exposure (study groups), to cotton dust, on the pulmonary functions in cotton mill workers.
Pulmonary function tests were carried out on cotton textile workers and controls using ‘Spiro lab III’.
Comparison between Short term and Long term duration exposure groups was done by unpaired Student‘s t-test (by calculating mean and standard deviation, SD).
Following conclusions are drawn from the study:
1. Dynamic lung volumes and capacities (FEV1 and FVC) were compared between long term exposed group and the short term exposed group, they were significantly affected with increasing years of exposure to cotton dust.
2. Also the mean values of PEFR were lower in long term exposed group than the short term exposed group, suggesting more decline with increasing years of exposure to cotton dust in these workers.
3. Above results point towards an obstructive airway pathology probably affecting the larger airways in cotton textile workers. 28, 29
Hence, we conclude in our study that the short term duration exposure (1-5years) as well as long term duration exposure (6-20 years) produces changes in the lung functions of cotton mill workers and with increasing duration of exposure, there is decreasing levels of lung functions.
Precautions in the form of yearly medical examinations of the workers and decreasing the dust levels in the industry have to be undertaken to prevent the development of chronic and irreversible lung diseases.
Conflict of Interest: Nil
Source of Funding: Self.
Acknowledgement: Author likes to thank all mill workers for their participation in the study. And also thanks my husband Mr. K. J. Jayakumar for encouragement.
References1. Anndrew Churg, Francis HY Green. Pathology of
Occupational Lung Disease. 2nd edition. Williams and Wilkins; 1998.
2. Rosen stock L., Cullen MR, Carl AB, Carrie AR. Textbook of Clinical Occupational and Environmental Medicine, 2nd edition. Elsevier Saunders; 2005.
3. Bouhuys A, Beck GJ, Shoenberg JB. Priorities in prevention of chronic lung disease. Lung, 1979; 156:129-48.
4. C. Christiani David, Xiao-Rong Wang, Lei-Da Pan, Hong-Xi Zhang, Bi-Xiong Sun, Helian Dai, et al. “Longitudinal Changes in Pulmonary Function and Respiratory Symptoms in Cotton Textile Workers”. American Journal of Respiratory and Critical Care Medicine 2001; 163 (4):847-853.
5. Fox AJ, Tombleson SBL, Watt A, Wilkie AG. A survey of respiratory disease in cotton operatives: Part I. Symptoms and ventilation results. Br J Ind Med 1973; 30:42-47.
6. Larson RK, Barman ML. A longitudinal study of pulmonary function in cotton gin workers in the San Joaquin Valley. Chest 1989; 96:819-23.
7. Berry G, Mckerrow CB, Molyneux MKB, Rossiter CE, Tombleson JBL. A study of the acute and chronic changes in ventilatory capacity of workers in Lancashire cotton mills. Br J Ind Med 1973; 30:25-36.
8. Molyneux MKB, Tombleson JBL. An epidemiological study of respiratory symptoms in Lancashire mills, 1963-1966. Br J Ind Med 1970; 27:225-34.
9. Fox AJ, Tombleson SBL, Watt A, Wilkie AG. A survey of respiratory disease in cotton operatives: Part II. Symptoms, dust estimation, and the effects of smoking habits. Br J Ind Med 1973; 30:48-53.
10. Kasper DL, Braunwald E, Fauci AS, Hausee SL, Longo DL, Jemesen JL. Environmental lung disease. In, Harrison‘s principle of internal medicine, 16th edition. New York: McGraw Hill 2008; 1521-27.
11. Zuskin E, Ivanovic D, Schachter EN, Theodre JW. A Ten Year Follow-Up Study of Cotton Textile Workers. Am Rev Resir Dis 1991; 143:301-5.
12. Glindmeyer HW, Lefante JJ, Jones RN, Rando RJ, Hassan M, Kader A et al. Exposure Related
50 International Journal of Physiology, October-December 2019, Vol.7, No. 4
Declines in the Lung Function of Cotton Textile Workers. Am Rev Respir Dis 1991; 144:675-83.
13. Glindmeyer HW, Lefante JJ, Jones RN, Rando RJ, Weill H. Cotton Dust and Across-Shift Drop in FEV1 as Predictors of Annual Change in FEV1. Am J Respir Crit Care Med 1994; 149:584-90.
14. Jiang CQ, Lam TH, Kong C, Cui CA, Huang HK, Chan DC et al. Byssinosis in Guanzhou. Occup Environ Med 1995; 52 (4):268-72.
15. Ramaswamy P, Sambandam S, Ramalingam A, Arnold J, Balakrishnan K, Thanasekharan V. Pulmonary Functions of Workers in Textile Units of Tamil Nadu, India. Epidemiology 2003; 14 (5):S76.
16. Saadat Ali Khan Aiza Saadia. Pulmonary Function Studies in Pakistani Cotton Ginners. Pak J Physiol 2006; 2 (1).
17. Hasan Kahraman, Mustafa Haki Sucakli, Talat Kilic, Mustafa Celik, Nurhan Koksal, Hasan Cetin Ekerbicer. Longitudinal pulmonary functional loss
in cotton textile workers: A 5-year follow-up study. Med Sci Monit, 2013; 19:1176-82.
18. Abebe Y, Seboxa T. Byssinosis and Other Respiratory Disorders among Textile Mill Workers in Bahr Dar North-West Ethiopia. Ethiop Med J 1995; 33 (1); 13 (2):33-49.
19. Larson, Barman ML. Longitudinal Study of Pulmonary Function in Cotton Ginners in the San Joaquin Valley. Chest 1989; 96:819-23.
20. Tiwari RR, Zodpey SP, Deshpande SG, Vasudeo ND. Peak Expiratory Flow Rate in Handloom Weavers. Ind J Physiol Pharmacol 1998; 42 (2):266-70.
21. Crapo RO, Jensen RL. Standards and Interpretive Issues in Lung Function Testing. Res Care 2003; 48:764-72.
22. Crapo RO, Becklake Margaret. Lung Function Testing: Selection of Reference Values and Interpretative Strategies. Am Rev Respir Dis 1991; 144:1202-18.
International Journal of Physiology, October-December 2019, Vol.7, No. 4 51
Role of Serotonin in Memory by Tryptophan Loading Method among First Year Medical Students
D.D. Musmade1, Vivek Nalgirkar2, Disha Chaudhary3, Krishnakhi Deba3, Sarthak Pawar3, Pritesh Jadhav3
1Ph.D. Scholar, 2Prof. and Head, 3Medical Student, Dept. of Physiology, Dr. D.Y. Patil Medical College, Nerul, Navi Mumbai
AbstractSerotonin is a widely studies compound with known effects on mood, memory, emotions and other neuropsychiatric parameters. The present study was conducted to assess the effects of serotonin increase on memory among first year medical students. The study was done using tryptophan loading method, which was given to the subjects over a period of ten days. Pre and Post administration questionnaires were used to assess their memory, while serotonin levels were also estimated before and after the study. The results revealed that administration of serotonin has a impact on memory among the selected study subjects.
Keywords: Memory, Medical Students, Serotonin.
precursor may lead to impaired affective working memory but also to enhanced attention and recognition of fear and happiness. Sub-chronic effects include an increased recognition of happiness and a decreased recognition of disgust as well as a decreased processing of negative stimuli. These cognitive changes seem to be unrelated to changes in mood. Tryptophan loading seems to have a broader range of effects on cognitive performance compared to the effects of receptor-agonist and antagonist administration.(6)
The present study was conducted to ascertain the effect on memory on healthy adult subjects who a tryptophan loading diet, while measuring their serotonin levels before administration and after completion of the study.
Methodology: The present study was a prospective study conducted at Dr. D. Y. Patil Medical College, Hospital and Research center, Nerul, Navi Mumbai. In this study participants were first year medical students aged between 18 to 25 years.
Institutional ethical clearance was obtained prior to starting the study.
Total number of participants was 20, comprising of 10 male and 10 female participants without any pre morbidities and not on any medications. Daily 30 gms of protein power was given to participants in morning at the same time for 10 days. Serotonin level of blood was
IntroductionSerotonin (5-hydroxytryptamien, 5-HT) has been
linked to emotional and motivational aspects of human behavior, including anxiety, depression, impulsivity, etc. Several clinically effective drugs exert effects via 5-HT systems.(1) Growing evidence suggests that those effects play an important role in learning and memory. Whether the role of serotonin is related to memory and/or behavioral or emotional aspects remains an important question.(2) A key question that remains is whether 5-HT markers (e. g., receptors) directly or indirectly participate and/or contribute to the physiological and pharmacological basis of memory and its pathogenesis.
Cognitive dysfunctions (eg. dysfunctions in the processing of neutral as opposed to emotional information) associated with depressive disorders have been subject of many studies.(3,4) Other studies have compared the effects of tryptophan loading with the effects of tryptophan depletion on cognitive functioning, mood and neuroendocrine measures (prolactin and cortisol) in healthy participants.(5) The studies concluded that in healthy subjects enhancement of the serotonin
Corresponding Author: Dr. Vivek Nalgirkar Prof. and Head, Dept. of Physiology, Dr. D.Y. Patil Medical College, Nerul, Navi Mumbai e-mail: [email protected]
10.5958/2320-608X.2019.00136.7
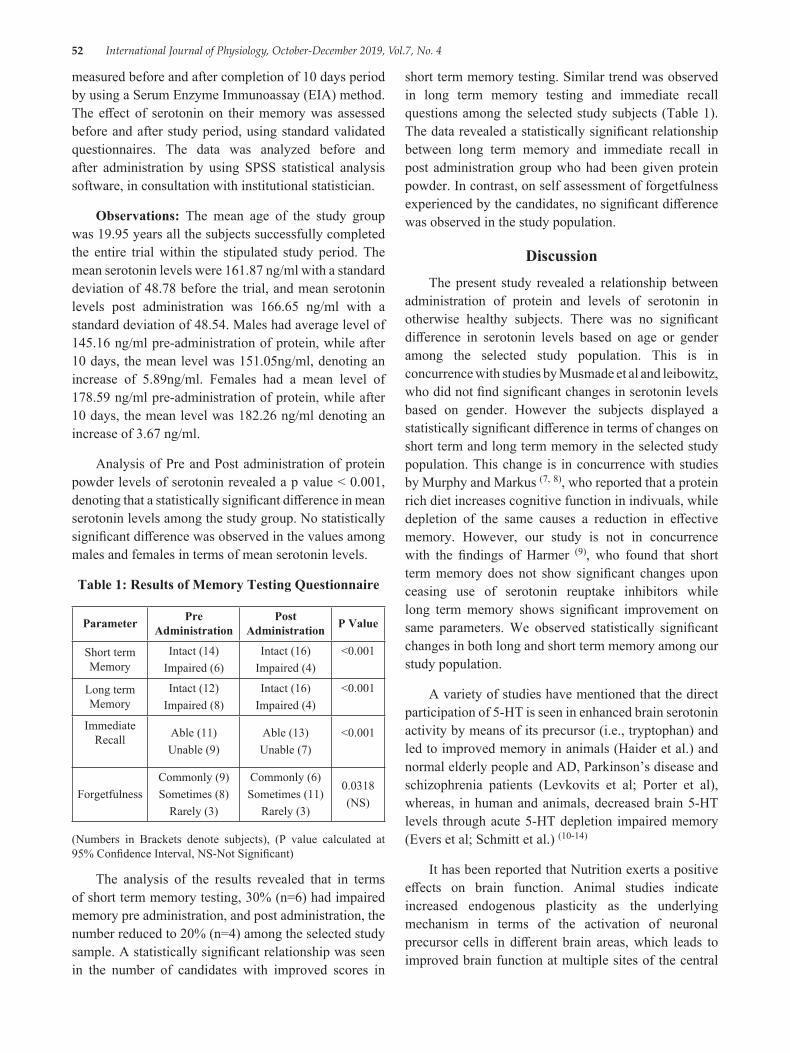
52 International Journal of Physiology, October-December 2019, Vol.7, No. 4
measured before and after completion of 10 days period by using a Serum Enzyme Immunoassay (EIA) method. The effect of serotonin on their memory was assessed before and after study period, using standard validated questionnaires. The data was analyzed before and after administration by using SPSS statistical analysis software, in consultation with institutional statistician.
Observations: The mean age of the study group was 19.95 years all the subjects successfully completed the entire trial within the stipulated study period. The mean serotonin levels were 161.87 ng/ml with a standard deviation of 48.78 before the trial, and mean serotonin levels post administration was 166.65 ng/ml with a standard deviation of 48.54. Males had average level of 145.16 ng/ml pre-administration of protein, while after 10 days, the mean level was 151.05ng/ml, denoting an increase of 5.89ng/ml. Females had a mean level of 178.59 ng/ml pre-administration of protein, while after 10 days, the mean level was 182.26 ng/ml denoting an increase of 3.67 ng/ml.
Analysis of Pre and Post administration of protein powder levels of serotonin revealed a p value < 0.001, denoting that a statistically significant difference in mean serotonin levels among the study group. No statistically significant difference was observed in the values among males and females in terms of mean serotonin levels.
Table 1: Results of Memory Testing Questionnaire
Parameter Pre Administration
Post Administration P Value
Short term Memory
Intact (14)Impaired (6)
Intact (16)Impaired (4)
<0.001
Long term Memory
Intact (12)Impaired (8)
Intact (16)Impaired (4)
<0.001
Immediate Recall Able (11)
Unable (9)Able (13)Unable (7)
<0.001
ForgetfulnessCommonly (9)Sometimes (8)
Rarely (3)
Commonly (6)Sometimes (11)
Rarely (3)
0.0318(NS)
(Numbers in Brackets denote subjects), (P value calculated at 95% Confidence Interval, NS-Not Significant)
The analysis of the results revealed that in terms of short term memory testing, 30% (n=6) had impaired memory pre administration, and post administration, the number reduced to 20% (n=4) among the selected study sample. A statistically significant relationship was seen in the number of candidates with improved scores in
short term memory testing. Similar trend was observed in long term memory testing and immediate recall questions among the selected study subjects (Table 1). The data revealed a statistically significant relationship between long term memory and immediate recall in post administration group who had been given protein powder. In contrast, on self assessment of forgetfulness experienced by the candidates, no significant difference was observed in the study population.
DiscussionThe present study revealed a relationship between
administration of protein and levels of serotonin in otherwise healthy subjects. There was no significant difference in serotonin levels based on age or gender among the selected study population. This is in concurrence with studies by Musmade et al and leibowitz, who did not find significant changes in serotonin levels based on gender. However the subjects displayed a statistically significant difference in terms of changes on short term and long term memory in the selected study population. This change is in concurrence with studies by Murphy and Markus (7, 8), who reported that a protein rich diet increases cognitive function in indivuals, while depletion of the same causes a reduction in effective memory. However, our study is not in concurrence with the findings of Harmer (9), who found that short term memory does not show significant changes upon ceasing use of serotonin reuptake inhibitors while long term memory shows significant improvement on same parameters. We observed statistically significant changes in both long and short term memory among our study population.
A variety of studies have mentioned that the direct participation of 5-HT is seen in enhanced brain serotonin activity by means of its precursor (i.e., tryptophan) and led to improved memory in animals (Haider et al.) and normal elderly people and AD, Parkinson’s disease and schizophrenia patients (Levkovits et al; Porter et al), whereas, in human and animals, decreased brain 5-HT levels through acute 5-HT depletion impaired memory (Evers et al; Schmitt et al.) (10-14)
It has been reported that Nutrition exerts a positive effects on brain function. Animal studies indicate increased endogenous plasticity as the underlying mechanism in terms of the activation of neuronal precursor cells in different brain areas, which leads to improved brain function at multiple sites of the central
International Journal of Physiology, October-December 2019, Vol.7, No. 4 53
serotonergic system, increasing the volume of grey matter in learning-and memory-associated brain regions, and improving cognitive function. This phenomenon opens up noninvasive causal therapeutic options in neurodegenerative disorders and during aging-associated cognitive decline by inducing changes in lifestyle. (15)
ConclusionOur study concluded that minor improvements
in memory can be elicited by use of nutritional supplementation in healthy subjects. This could possibly pave the way for further research in novel therapeutic interventions in the memory enhancement of various types of patients and in other diseases under conditions of memory formation, amnesia or forgetting and should be explored in the near future. Together with the improved diagnostics of the disease, new therapeutic interventions will cause further specialization, with increased treatment and caring costs amplified by the ever-growing number of patients with memory disorders. Our study is limited by the low number of study participants.
Conflict of Interest: Nil
Source of Funding: Self Funded
References1. Aloyo VJ, Berg KA, Spampinato U, Clarke WP,
Harvey JA. Current status of inverse agonism at serotonin2A (5-HT2A) and 5-HT2C receptors. Pharmacology & therapeutics. 2009 Feb 1; 121 (2):160-73.
2. Barnes NM, Sharp T. A review of central 5-HT receptors and their function. Neuropharmacology. 1999 Aug 1; 38 (8):1083-152.
3. Deuschle M, Kniest A, Niemann H, Erb-Bies N, Colla M, Hamann B, Heuser I. Impaired declarative memory in depressed patients is slow to recover: clinical experience. Pharmacopsychiatry. 2004 Jul; 37 (04):147-51.
4. Wagner S, Müller C, Helmreich I, Huss M, Tadić A. A meta-analysis of cognitive functions in children and adolescents with major depressive disorder. European child & adolescent psychiatry. 2015 Jan 1; 24 (1):5-19.
5. Musmade DD, Nalgirkar V, Satav J, Chaudhari P, Pradyumna T. Role of Serotonin on Appetite in first year medical students. Sch J App Med Sci 2019, 7 (2):775-777.
6. Leibowitz SF, Alexander JT. Hypothalamic serotonin in control of eating behavior, meal size, and body weight. Biological psychiatry. 1998 Nov 1; 44 (9):851-64.
7. Murphy F, Smith K, Cowen P, Robbins T, Sahakian B. The effects of tryptophan depletion on cognitive and affective processing in healthy volunteers. Psychopharmacology. 2002 Aug 1; 163 (1):42-53.
8. Markus CR, Olivier B, de Haan EH. Whey protein rich in α-lactalbumin increases the ratio of plasma tryptophan to the sum of the other large neutral amino acids and improves cognitive performance in stress-vulnerable subjects. The American journal of clinical nutrition. 2002 Jun 1; 75 (6):1051-6.
9. Harmer CJ, Shelley NC, Cowen PJ, Goodwin GM. Increased positive versus negative affective perception and memory in healthy volunteers following selective serotonin and norepinephrine reuptake inhibition. American Journal of Psychiatry. 2004 Jul 1; 161 (7):1256-63.
10. Haider S, Khaliq S, Ahmed SP, Haleem DJ. Long-term tryptophan administration enhances cognitive performance and increases 5HT metabolism in the hippocampus of female rats. Amino Acids. 2006 Nov 1; 31 (4):421-5.
11. Levkovitz Y, Ophir-Shaham O, Bloch Y, Treves I, Fennig S, Grauer E. Effect of L-tryptophan on memory in patients with schizophrenia. The Journal of nervous and mental disease. 2003 Sep 1; 191 (9):568-73.
12. Porter RJ, Lunn BS, O’BRIEN JT. Effects of acute tryptophan depletion on cognitive function in Alzheimer’s disease and in the healthy elderly. Psychological medicine. 2003 Jan; 33 (1):41-9.
13. Schmitt JA, Wingen M, Ramaekers JG, Evers EA, Riedel WJ. Serotonin and human cognitive performance. Current pharmaceutical design. 2006 Jul 1; 12 (20):2473-86
14. Evers EA, Tillie DE, Van Der Veen FM, Lieben CK, Jolles J, Deutz NE, Schmitt JA. Effects of a novel method of acute tryptophan depletion on plasma tryptophan and cognitive performance in healthy volunteers. Psychopharmacology. 2004 Dec 1; 177 (1-2):217-23.
15. Strüder HK, Weicker H. Physiology and pathophysiology of the serotonergic system and its implications on mental and physical performance. Part I. International journal of sports medicine. 2001 Oct; 22 (07):467-81.
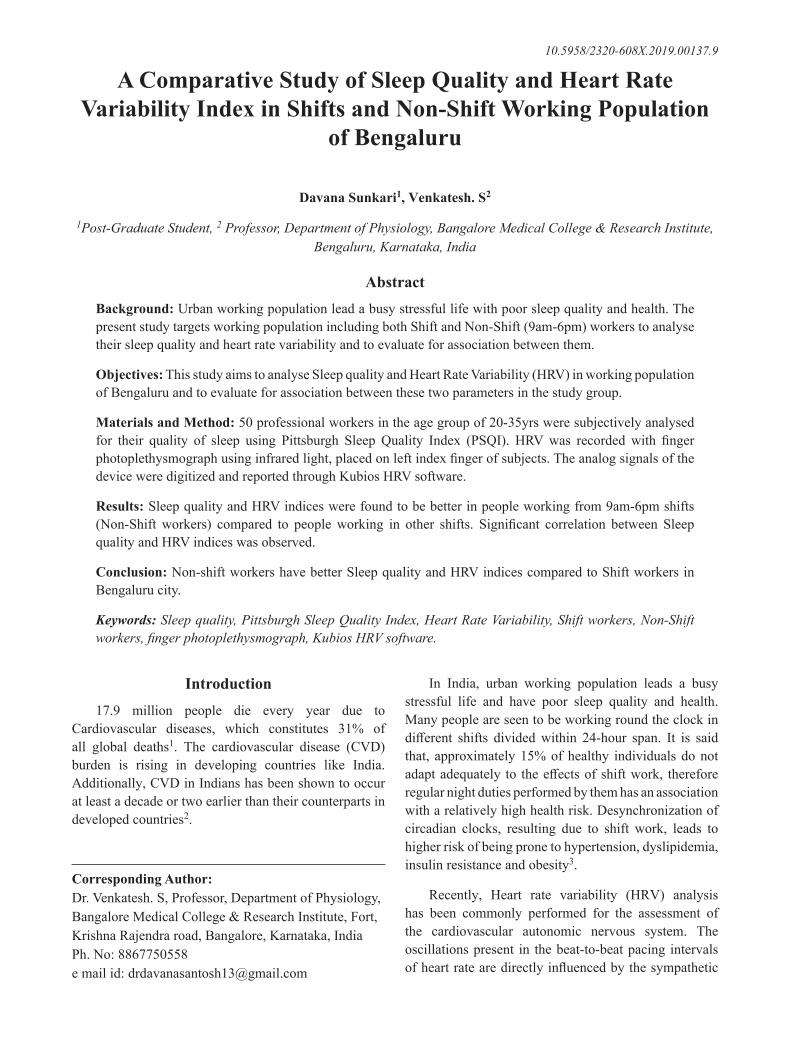
54 International Journal of Physiology, October-December 2019, Vol.7, No. 4
A Comparative Study of Sleep Quality and Heart Rate Variability Index in Shifts and Non-Shift Working Population
of Bengaluru
Davana Sunkari1, Venkatesh. S2
1Post-Graduate Student, 2 Professor, Department of Physiology, Bangalore Medical College & Research Institute, Bengaluru, Karnataka, India
AbstractBackground: Urban working population lead a busy stressful life with poor sleep quality and health. The present study targets working population including both Shift and Non-Shift (9am-6pm) workers to analyse their sleep quality and heart rate variability and to evaluate for association between them.
Objectives: This study aims to analyse Sleep quality and Heart Rate Variability (HRV) in working population of Bengaluru and to evaluate for association between these two parameters in the study group.
Materials and Method: 50 professional workers in the age group of 20-35yrs were subjectively analysed for their quality of sleep using Pittsburgh Sleep Quality Index (PSQI). HRV was recorded with finger photoplethysmograph using infrared light, placed on left index finger of subjects. The analog signals of the device were digitized and reported through Kubios HRV software.
Results: Sleep quality and HRV indices were found to be better in people working from 9am-6pm shifts (Non-Shift workers) compared to people working in other shifts. Significant correlation between Sleep quality and HRV indices was observed.
Conclusion: Non-shift workers have better Sleep quality and HRV indices compared to Shift workers in Bengaluru city.
Keywords: Sleep quality, Pittsburgh Sleep Quality Index, Heart Rate Variability, Shift workers, Non-Shift workers, finger photoplethysmograph, Kubios HRV software.
In India, urban working population leads a busy stressful life and have poor sleep quality and health. Many people are seen to be working round the clock in different shifts divided within 24-hour span. It is said that, approximately 15% of healthy individuals do not adapt adequately to the effects of shift work, therefore regular night duties performed by them has an association with a relatively high health risk. Desynchronization of circadian clocks, resulting due to shift work, leads to higher risk of being prone to hypertension, dyslipidemia, insulin resistance and obesity3.
Recently, Heart rate variability (HRV) analysis has been commonly performed for the assessment of the cardiovascular autonomic nervous system. The oscillations present in the beat-to-beat pacing intervals of heart rate are directly influenced by the sympathetic
Introduction17.9 million people die every year due to
Cardiovascular diseases, which constitutes 31% of all global deaths1. The cardiovascular disease (CVD) burden is rising in developing countries like India. Additionally, CVD in Indians has been shown to occur at least a decade or two earlier than their counterparts in developed countries2.
Corresponding Author: Dr. Venkatesh. S, Professor, Department of Physiology, Bangalore Medical College & Research Institute, Fort, Krishna Rajendra road, Bangalore, Karnataka, India Ph. No: 8867750558 e mail id: [email protected]
10.5958/2320-608X.2019.00137.9
International Journal of Physiology, October-December 2019, Vol.7, No. 4 55
and parasympathetic systems. Usually, time and frequency domain and nonlinear method are used to interpret the physiological information present within the HRV signal. The classical spectral analysis of the HRV signal, enables separation of power distribution in different frequency bands. The low frequency (LF) band corresponds mainly to sympathetic activity, the high frequency (HF) band is related to respiratory sinus arrhythmia mediated by parasympathetic activity and the LF/HF ratio indicates overall balance between sympathetic and parasympathetic systems.
Photoplethysmography (PPG) is a noninvasive technique for monitoring beat-to-beat relative blood volume changes in the microvascular bed of peripheral tissues using infra-red rays. The autonomic influences on spontaneous fluctuations in finger blood volume can be assessed by spectral analysis of the PPG signal. The PPG waveform characteristics such as amplitude, baseline and cycle period can be used for the study of autonomic control of the peripheral vascular tone4.
Heart rate, cardiac autonomic activity shows circadian variation (i.e., under constant behavioral and environmental conditions). This knowledge of behavioral vs. circadian modulation of cardiometabolic function is of clinical relevance given the increased risk for the development of diabetes, obesity, and cardiovascular disease in shift workers5.We aimed to analyse and evaluate the association between Sleep quality and Heart Rate Variability (HRV) in Shift and Non-shift working population of Bengaluru.
Method and MaterialsAfter getting clearance from ethics committee,
written informed consent was taken from all the participants and detailed clinical examination was done as per study protocol. Subjects were asked to arrive to the Department of Physiology, Bangalore Medical College and Research Institute. Detailed history was taken, and examination was done. It was a comparative study and the 50 subjects, included were grouped as Shift workers (25 in number, amongst whom 14 were males and 11 were females and worked in shifts of 11pm-8am /4pm-1am /5pm-2am /6pm-3am) and Non-Shift workers (25 in number, 13 males and 12 females and worked 9am-6pm) belonging to the age group of 21-36yrs.
Inclusion criteria
1. Professional workers
2. Education-Graduates
Exclusion criteria
1. BMI–≥ 25 kg/m²
2. Medical/Psychiatric Illness
3. Smoking, Alcohol intake
4. Substance abuse
5. Drug intake/Medications
Height & weight were measured by using stadiometer & digital weighing balance. BMI was calculated by using the formula Weight in Kg/Height in meter square. Blood Pressure and Heart rate were recorded by using automated B. P. apparatus.
All the subjects were asked to fill the PSQI assessment and were scored accordingly. PSQI questionnaire included 9 questions related to the sleep habits of past 1 month and each of the answers were scored (except for question no 1 and 3). Seven standard components were used to score the answers as per the protocol of the PSQI questionnaire and a total score of “5” or greater was indicative of poor sleep quality6.
All the subjects were clearly instructed in prior to come to the lab before intake of food/beverage, after having a well-rested sleep (sleep timings varied in subjects of the test group). They were instructed to avoid caffeine/any beverage 2 hours before measurement7. Appropriate environment necessary for HRV recording was setup, with not too bright lights, sound proofing and temperature set at room temperature.
Each of the subjects were given 15 mins time to get accustomed to the new environment and to attain comfortable resting state. HRV was measured by Digital finger pulse plethysmography using infra-red light with wave length of 940 nm; placed on the right index finger of the subject. The output signal was digitalized by digital converter with a frequency of 100 Hz; which was connected to the computer and analyzed through Kubios software8.
HRV measurement was done for 5 mins and during the process, it was ensured that the subject was comfortably seated. Subjects were instructed to keep their eyes open throughout the recording, breathing quietly and to not move or talk or fall asleep7.
Statistical analysis: The measured HRV was compared between night shift and Non-shift employees.
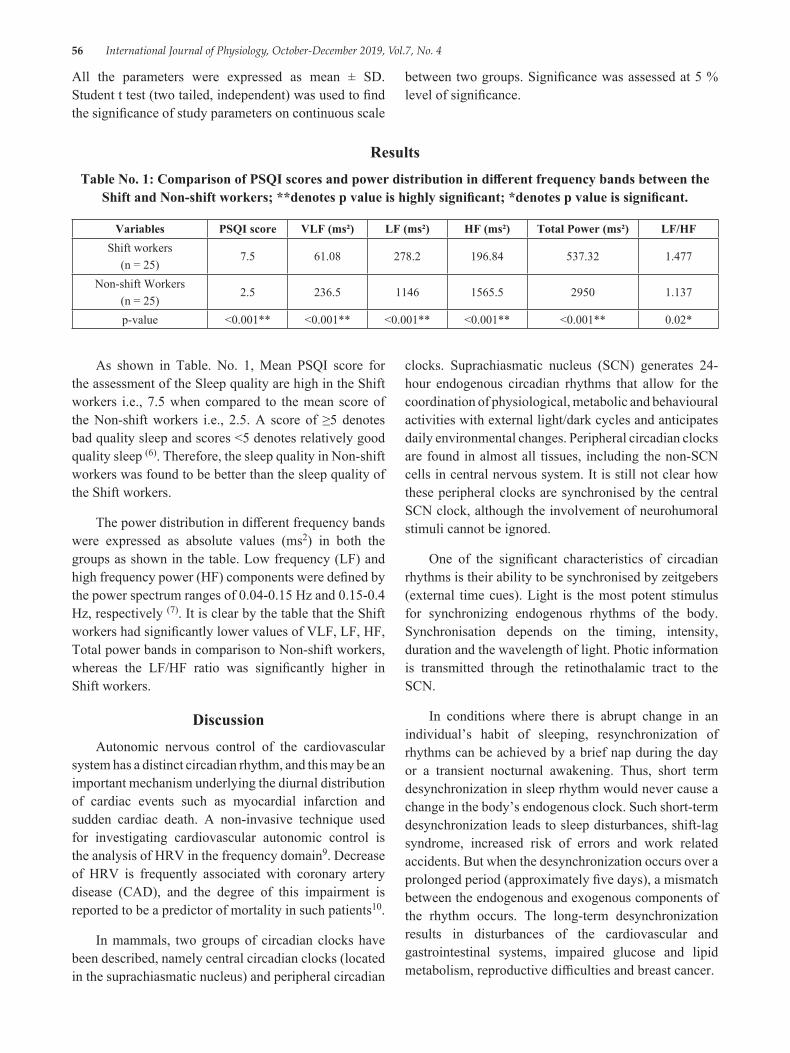
56 International Journal of Physiology, October-December 2019, Vol.7, No. 4
All the parameters were expressed as mean ± SD. Student t test (two tailed, independent) was used to find the significance of study parameters on continuous scale
between two groups. Significance was assessed at 5 % level of significance.
ResultsTable No. 1: Comparison of PSQI scores and power distribution in different frequency bands between the
Shift and Non-shift workers; **denotes p value is highly significant; *denotes p value is significant.
Variables PSQI score VLF (ms²) LF (ms²) HF (ms²) Total Power (ms²) LF/HFShift workers
(n = 25)7.5 61.08 278.2 196.84 537.32 1.477
Non-shift Workers(n = 25)
2.5 236.5 1146 1565.5 2950 1.137
p-value <0.001** <0.001** <0.001** <0.001** <0.001** 0.02*
As shown in Table. No. 1, Mean PSQI score for the assessment of the Sleep quality are high in the Shift workers i.e., 7.5 when compared to the mean score of the Non-shift workers i.e., 2.5. A score of ≥5 denotes bad quality sleep and scores <5 denotes relatively good quality sleep (6). Therefore, the sleep quality in Non-shift workers was found to be better than the sleep quality of the Shift workers.
The power distribution in different frequency bands were expressed as absolute values (ms2) in both the groups as shown in the table. Low frequency (LF) and high frequency power (HF) components were defined by the power spectrum ranges of 0.04-0.15 Hz and 0.15-0.4 Hz, respectively (7). It is clear by the table that the Shift workers had significantly lower values of VLF, LF, HF, Total power bands in comparison to Non-shift workers, whereas the LF/HF ratio was significantly higher in Shift workers.
DiscussionAutonomic nervous control of the cardiovascular
system has a distinct circadian rhythm, and this may be an important mechanism underlying the diurnal distribution of cardiac events such as myocardial infarction and sudden cardiac death. A non-invasive technique used for investigating cardiovascular autonomic control is the analysis of HRV in the frequency domain9. Decrease of HRV is frequently associated with coronary artery disease (CAD), and the degree of this impairment is reported to be a predictor of mortality in such patients10.
In mammals, two groups of circadian clocks have been described, namely central circadian clocks (located in the suprachiasmatic nucleus) and peripheral circadian
clocks. Suprachiasmatic nucleus (SCN) generates 24-hour endogenous circadian rhythms that allow for the coordination of physiological, metabolic and behavioural activities with external light/dark cycles and anticipates daily environmental changes. Peripheral circadian clocks are found in almost all tissues, including the non-SCN cells in central nervous system. It is still not clear how these peripheral clocks are synchronised by the central SCN clock, although the involvement of neurohumoral stimuli cannot be ignored.
One of the significant characteristics of circadian rhythms is their ability to be synchronised by zeitgebers (external time cues). Light is the most potent stimulus for synchronizing endogenous rhythms of the body. Synchronisation depends on the timing, intensity, duration and the wavelength of light. Photic information is transmitted through the retinothalamic tract to the SCN.
In conditions where there is abrupt change in an individual’s habit of sleeping, resynchronization of rhythms can be achieved by a brief nap during the day or a transient nocturnal awakening. Thus, short term desynchronization in sleep rhythm would never cause a change in the body’s endogenous clock. Such short-term desynchronization leads to sleep disturbances, shift-lag syndrome, increased risk of errors and work related accidents. But when the desynchronization occurs over a prolonged period (approximately five days), a mismatch between the endogenous and exogenous components of the rhythm occurs. The long-term desynchronization results in disturbances of the cardiovascular and gastrointestinal systems, impaired glucose and lipid metabolism, reproductive difficulties and breast cancer.
International Journal of Physiology, October-December 2019, Vol.7, No. 4 57
Shift work also changes the diurnal variation of blood pressure. The normal daily circadian blood pressure rhythm is characterized by a nocturnal fall and diurnal rise. People who work in night shifts show limited or no nocturnal BP fall. Cardiovascular outcomes usually worsen in individuals who have an excessive morning BP surge and in those who lack the normal nocturnal BP fall3.
In a study conducted by Kunikullaya et al., it was determined that sleepiness was significantly higher among night shift workers as measured by Epworth Sleepiness Scale (p<0.001). Night shift employees were found to have lower values of HF power (ms2), and higher values of LF Power (ms2) than day shift employees, unlike the present study. LF/HF power also showed higher values (%) suggesting decreased vagal activity and sympathetic over activity, when compared to day shift employees2.
Hulsegge G et al conducted a study where shift workers had no significantly different HRV parameters than day workers, except for a lower VLF (B: 0.21; 95% CI: 0.36-0.05) in non-night shift workers (p < 0.05). Results differed significantly by gender (p for interaction < 0.10): among men, shift work was negatively associated with RMSSD (B: 7.83; 95% CI: 14.28-1.38), SDNN (B: 7.0; 95% CI: 12.27-1.78), VLF (B: 0.27; 95% CI: 0.46-0.09) and Total Power (B: 0.61; 95% CI: 1.20-0.03), while among women, shift work was only associated with the LF/HF ratio (B: 0.29; 95% CI: 0.54-0.03)11.
Limitations: Although the present study was age and gender matched amongst the two groups, the sample size was very small (n=50; 25 Shift workers and 25 Non-shift workers).
Conclusion: Individuals working in night shifts tend to have more of sympathetic activity showing Sympatho-Vagal imbalance with higher LF/HF ratio values. Sleeplessness and disturbance in circadian rhythm could be the cause for the imbalance. Such people should be offered regular occupational health services which should include the screening of risk factors for cardiovascular diseases, such as: a history of shift work, smoking, high blood pressure, obesity, alcohol use, high blood lipid levels, physical inactivity and work stress.
Conflict of Interest: Nil
Source of Funding: Self
Ethical Clearance: Taken from the Ethical committee of the Institution
References1. WHO | Cardiovascular diseases (CVDs). WHO
[Internet]. 2018 [cited 2018 Dec 11]; Available from: https://www. who. int/cardiovascular_diseases/en/
2. Kunikullaya KU, Kirthi SK, Venkatesh D, Goturu J. Heart Rate Variability Changes in Business Process Outsourcing Employees Working in Shifts. Indian Pacing Electrophysiol J. 2010; 10 (10): 439-446.
3. Mosendane T, Raal FJ. Shift work and its effects on the cardiovascular system. Cardiovasc J Afr [Internet]. 2008; 19 (4):210. Available from: http://www. ncbi. nlm. nih. gov/pubmed/18776968%5Cnpapers2://publication/uuid/4D1504F1-C990-4766-82A3-119CF26F991B
4. Selvaraj N, Jaryal A, Santhosh J, Deepak KK, Anand S. Assessment of heart rate variability derived from finger-tip photoplethysmography as compared to electrocardiography. J Med Eng Technol. 2008; 32 (6):479-84.
5. Rüger M, Scheer F. Effects on circadian disruption on cardiometabolic system. Rev Endocr Metab Disord. 2011; 10 (4):245-60.
6. Sun W, Yu Y, Yuan J, Li C, Liu T, Lin D, et al. Sleep duration and quality among different occupations-China national study. PLoS One. 2015; 10 (3):6-13.
7. Yahya N. Heart Rate Variability Analysis System In Mobile Phone. 2012; (June):24.
8. V P, Buhutkar P, Bhutkar M, G S. A comparative study of arterial stiffness indices between smokers & non smokers. Int J Med Res Heal Sci. 2013; 2 (3):533.
9. Guo YF, Stein PK. Circadian rhythm in the cardiovascular system: Chronocardiology. Am Heart J. 2003; 145 (5):779-86.
10. Huikuri H V., Jokinen V, Syvänne M, Nieminen MS, Airaksinen KEJ, Ikäheimo MJ, et al. Heart rate variability and progression of coronary atherosclerosis. Arterioscler Thromb Vasc Biol [Internet]. 1999 Aug [cited 2019 Mar 20]; 19 (8):1979-85. Available from: https://www. ahajournals. org/doi/10.1161/01. ATV. 19.8.1979
11. Hulsegge G, Gupta N, Proper KI, van Lobenstein N, IJzelenberg W, Hallman DM, et al. Shift work is associated with reduced heart rate variability among men but not women. Int J Cardiol [Internet]. 2018; 258:109-14. Available from: https://doi. org/10.1016/j. ijcard. 2018.01.089
58 International Journal of Physiology, October-December 2019, Vol.7, No. 4
Assessment of Plasma Vitamin B12 and Folic Acid During Postmenopausal Period
Deepak Tambe1, Sudhir Gavali2, A Pranita1, J. S. Kharche2, Gayatri Godbole1, Anuradha Joshi6
1Assistant Professor, 2Associate Professor, 3Professor & Head, Department of Physiology, Bharati Vidyapeeth (Deemed to be University) Medical College, Pune
AbstractObjective: With increasing age and hormonal changes in life of women there is change in levels of micronutrients like vitamin B12 and folic acid. Very little data is available on the association between the basal levels of micronutrients such as VitB12, folic acid in pre and post menopausal women. Presence of an association will throw light on the role of micronutrients in prevention of CVS diseases in menopausal women. This would reinforce the role of micronutrients as a cheap viable option in the prevention of CVD in menopausal women.
Method: Plasma vitamin B12 and folic acid level were measured by radioimmunoassay in 60 pre and postmenopausal women.
Results: Vitamin B12 and folic acid concentrations were statistically significantly lower in postmenopausal group when compared to premenopausal group. (p value <0.005)
Conclusion: This study has provided baseline levels of folic acid and vitamin B12 with their association with menopause. This may be helpful for planning supplementation studies of the micronutrients.
Keywords: Vitamin B12, folic acid, Homocysteine, Menopause.
oxidizing free radicals. After menopause this protection is lost due to estrogen deficiency.
Hormone replacement therapy (HRT) was the focus of medical research for the last 10-15 years. Initially it was observed that it protects postmenopausal women from CVD but now it has been proved that it can significantly increase the risk for heart attack, strokes and breast cancer. It is therefore not justified in exposing patient to so many serious diseases just to protect them from CVD.
Various studies show that supplementation of folic acid and VitB12 decreases Homocysteine levels. 2-4
Very little data is available on the association between the basal levels of micronutrients such as VitB12, folic acid in pre and post menopausal women. Presence of an association will throw light on the role of micronutrients in prevention of CVS diseases in menopausal women. This would reinforce the role of micronutrients as a cheap viable option in the prevention of CVD in menopausal women.
IntroductionWith increasing life expectancy a woman spends
almost 1/3rd of her life in menopause. Cardiovascular diseases (CVD) which becomes an important cause of mortality in women worldwide. Framingham studies have demonstrated a fourfold increase in the incidence of cardio vascular diseases (CVD) in post menopausal (PM) period. 1
It has been shown that premenopausal women are protected from CVD by estrogen having a favorable effect on plasma homocysteine levels thus protecting the vascular endothelium from damaging effects of
Corresponding Author: Dr. Sudhir Gavali 805, Neelam Apartments, Shree Mahalaxmi Nagar, Chaitraban, Bibwewadi, Pune - 411037 Phone No.: 8796974215 e-mail: [email protected]
10.5958/2320-608X.2019.00138.0
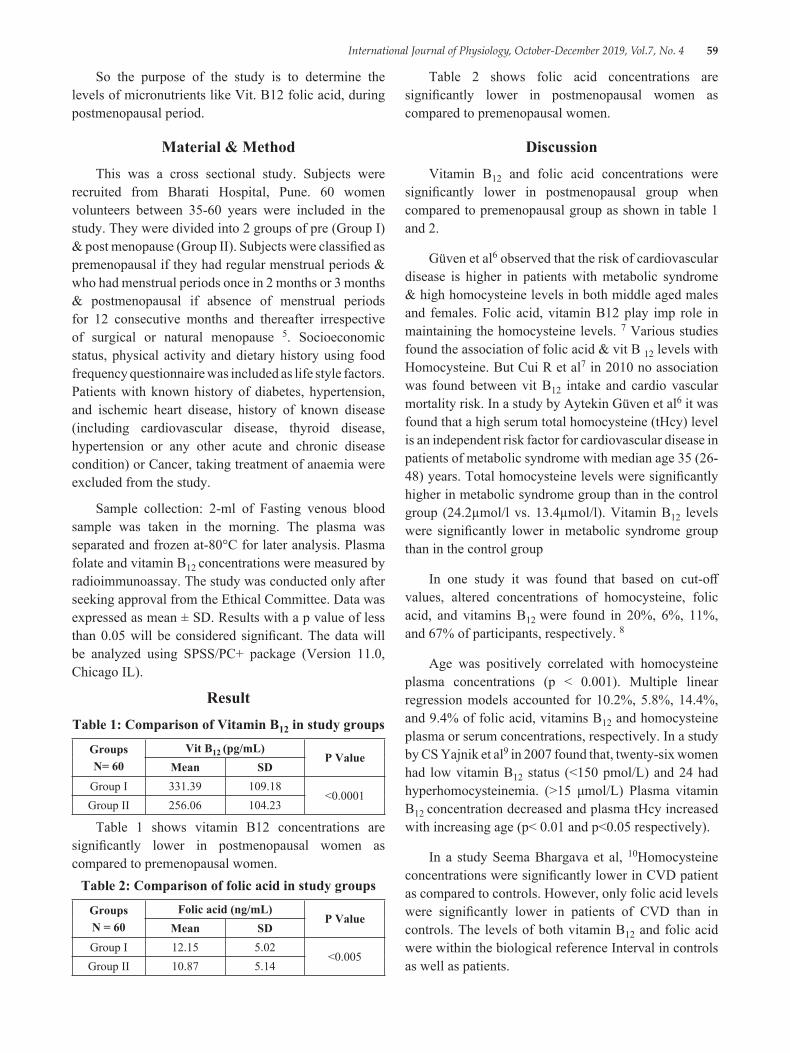
International Journal of Physiology, October-December 2019, Vol.7, No. 4 59
So the purpose of the study is to determine the levels of micronutrients like Vit. B12 folic acid, during postmenopausal period.
Material & MethodThis was a cross sectional study. Subjects were
recruited from Bharati Hospital, Pune. 60 women volunteers between 35-60 years were included in the study. They were divided into 2 groups of pre (Group I) & post menopause (Group II). Subjects were classified as premenopausal if they had regular menstrual periods & who had menstrual periods once in 2 months or 3 months & postmenopausal if absence of menstrual periods for 12 consecutive months and thereafter irrespective of surgical or natural menopause 5. Socioeconomic status, physical activity and dietary history using food frequency questionnaire was included as life style factors. Patients with known history of diabetes, hypertension, and ischemic heart disease, history of known disease (including cardiovascular disease, thyroid disease, hypertension or any other acute and chronic disease condition) or Cancer, taking treatment of anaemia were excluded from the study.
Sample collection: 2-ml of Fasting venous blood sample was taken in the morning. The plasma was separated and frozen at-80°C for later analysis. Plasma folate and vitamin B12 concentrations were measured by radioimmunoassay. The study was conducted only after seeking approval from the Ethical Committee. Data was expressed as mean ± SD. Results with a p value of less than 0.05 will be considered significant. The data will be analyzed using SPSS/PC+ package (Version 11.0, Chicago IL).
ResultTable 1: Comparison of Vitamin B12 in study groups
GroupsN= 60
Vit B12 (pg/mL)P Value
Mean SDGroup I 331.39 109.18
<0.0001Group II 256.06 104.23
Table 1 shows vitamin B12 concentrations are significantly lower in postmenopausal women as compared to premenopausal women.
Table 2: Comparison of folic acid in study groups
GroupsN = 60
Folic acid (ng/mL)P Value
Mean SDGroup I 12.15 5.02
<0.005Group II 10.87 5.14
Table 2 shows folic acid concentrations are significantly lower in postmenopausal women as compared to premenopausal women.
DiscussionVitamin B12 and folic acid concentrations were
significantly lower in postmenopausal group when compared to premenopausal group as shown in table 1 and 2.
Güven et al6 observed that the risk of cardiovascular disease is higher in patients with metabolic syndrome & high homocysteine levels in both middle aged males and females. Folic acid, vitamin B12 play imp role in maintaining the homocysteine levels. 7 Various studies found the association of folic acid & vit B 12 levels with Homocysteine. But Cui R et al7 in 2010 no association was found between vit B12 intake and cardio vascular mortality risk. In a study by Aytekin Güven et al6 it was found that a high serum total homocysteine (tHcy) level is an independent risk factor for cardiovascular disease in patients of metabolic syndrome with median age 35 (26-48) years. Total homocysteine levels were significantly higher in metabolic syndrome group than in the control group (24.2µmol/l vs. 13.4µmol/l). Vitamin B12 levels were significantly lower in metabolic syndrome group than in the control group
In one study it was found that based on cut-off values, altered concentrations of homocysteine, folic acid, and vitamins B12 were found in 20%, 6%, 11%, and 67% of participants, respectively. 8
Age was positively correlated with homocysteine plasma concentrations (p < 0.001). Multiple linear regression models accounted for 10.2%, 5.8%, 14.4%, and 9.4% of folic acid, vitamins B12 and homocysteine plasma or serum concentrations, respectively. In a study by CS Yajnik et al9 in 2007 found that, twenty-six women had low vitamin B12 status (<150 pmol/L) and 24 had hyperhomocysteinemia. (>15 μmol/L) Plasma vitamin B12 concentration decreased and plasma tHcy increased with increasing age (p< 0.01 and p<0.05 respectively).
In a study Seema Bhargava et al, 10Homocysteine concentrations were significantly lower in CVD patient as compared to controls. However, only folic acid levels were significantly lower in patients of CVD than in controls. The levels of both vitamin B12 and folic acid were within the biological reference Interval in controls as well as patients.
60 International Journal of Physiology, October-December 2019, Vol.7, No. 4
Cui R et al7 studied that association of dietary folate and vitamin B12 intakes with risk of cardiovascular disease in Asian populations aged between 40 to 79 years. Dietary folate intake was inversely associated with mortality from heart failure for men and with mortality from stroke, coronary heart disease, and total cardiovascular disease for women. No association was found between vitamin B12 intake and mortality risk.
ConclusionIt was observed that vitamin B12 and folic acid
concentrations were significantly lower in postmenopausal group when compared to premenopausal group. This study has provided baseline levels of folic acid and vitamin B12 with their association with menopause. This may be helpful for planning supplementation studies of the same.
Source of Funding: The project was funded by Bharati Vidyapeeth (Deemed to be University) Medical College, Pune.
Conflict of Interest: Nil
References1. Carr MC: The emergence of the metabolic syndrome
with menopause. Journal of Clinical Endocrinology and Metabolism 2003, 88 (6):2404-2411.
2. Emanuela Setola, Lucilla Domenica Monti, Elena Galluccio1, AltinPalloshi, Gabriele Fragasso, Rita Paroni et al. Insulin resistance and endothelial function are improved after folate and vitamin B12 therapy in patients with metabolic syndrome: relationship between homocysteine levels and hyperinsulinemia. European Journal of Endocrinology. 2004; 151: 483-489.
3. Tao Huang, Jusheng Zheng, Ying Chen, Bin Yang, Mark L Wahlqvist, Duo Li. High consumption of omega-3 polyunsaturated fatty acids decrease plasma homocysteine: A meta-analysis of randomized, placebo-controlled trials. Nutrition. 2011 Apr 16.[Epub ahead of print]. DOI: 10.1016/j. nut. 2010.12.011.
4. Anvita Kale, NileshNaphade, Swati Sapkale, MarellasvKamaraju, Anil kumar Pillai Sadhana Joshi, SahebaraoMahadik. Reduced folic acid, vitamin B12 and docosahexaenoic acid and increased homocysteine and cortisol in never-medicated schizophrenia patients: Implications for altered one-carbon metabolism. Psychiatry Research 175 (2010) 47-53.
5. Dudley EC, Hopper JL, Taffe J, Guthrie JR, Burger HG, Dennerstein L. Using longitudinal data to define the perimenopause by menstrual cycle characteristics. Climacteric. 1998; 1:18-
6. Guven A, Inanc F, Kilinc M, Ekerbicer H. Plasma homocysteine and lipoprotein (a) levels in Turkish patients with metabolic syndrome. Heart Vessels. 2005 Nov; 20 (6):290-5.
7. Cui R, Iso H, Date C, Kikuchi S, Tamakoshi A Dietary folate and vitamin b6 and B12 intake in relation to mortality from cardiovascular diseases: Japan collaborative cohort study. Stroke. 2010 Jun; 41 (6):1285-9.
8. Dankner, Angela Chetrit, Flora Lubin, Ben-Ami Sela. Life-style habits and homocysteine levels in an elderly population. Aging Clinical and Experimental Research. December 2004, Volume 16 (6)437-442.
9. Yajnik, Swapna S Deshpande, Himangi G Lubree, SS Naik, DS Bhat, Bhagyashree S Uradey et al Vitamin B12 Deficiency and Hyperhomocysteinemia in Rural and Urban Indians. JAPI. 2006; 54: 775-783.
10. Seema Bhargava, Arif Ali, Eishaan Kamta Bhargava, Anjali Manocha, Mamta Kankra, Sabari Das and Lalit Mohan Srivastava. Lowering homocysteine and modifying nutritional status with folic acid and vitamin B12 in Indian patients of vascular disease and modifying nutritional status with folic acid and vitamin B12 in Indian patients of vascular disease. Clin Biochem Nutr. 2012 May; 50 (3): 222-226.
International Journal of Physiology, October-December 2019, Vol.7, No. 4 61
Do Learning Styles Influenced by Gender: A Qualitative Study Among Physiology Undergraduate Medical Students
Afshan Kausar1, Sayed Badar Daimi2, Charulata Chandrakant Kadam3
1Assistant Professor, Department of Physiology JIIU’S Indian Institute of Medical Science & Research, (JIIU’S IIMSR) Medical College, Warudi, Badnapur, Jalna, 2Associate Professor, Department of Physiology, JIIU’S IIMSR,
Warudi, Badnapur, Jalna, 3Assistant Professor, Department of Physiology, SSPM Medical College and Lifetime Hospital, Padve Kasal - Malvan, Sindhudurg, Maharashtra
AbstractIntroduction: Current and future trends in medical learning enforce huge burden of mastering a different set of competencies among medical student. Furthermore, the important task in medical education isto provide adequate and satisfactory student learning. Thus, better awareness of learning style preferences and various factors (such as gender) influencing learning styles, can help in delivery of rewarding, satisfying and pleasant learning experience to the students.
Aim: The study was planned with the aim of assessing the influence of gender on learning style preferences among Undergraduate Medical Students of Physiology.
Materials and Method: In this cross-sectional study among 100 undergraduate medical students of physiology, Visual, Aural, Read/write and Kinesthetic (VARK) questionnaire version 7.8 was used to collect information of students’ learning style preferences. Descriptive statistics were used to describe the variables. Chi-square test was performed to evaluate the influence of gender on learning style preferences.
Results: In the study, 82.22%Males and 68.75% females exhibited multiple sensory preferences. Furthermore only 17.77%Male, 31.25% Female, preferred a single sensory modality for receiving information. However gender differences were NOT significant.
Conclusion: Most students both male and female had preferences for multimodal learning style. Furthermore gender had no significant association with learning style preference.
Keywords: Learning styles, VARK Questionnaire,
Education is considered as important key for person’s career path and for ensuring professional advancement1. Hence learning is lifelong educational process. Present and future trends in medical learning impose huge burden of mastering a diverse set of competencies among medical student. As a consequence, medical educational approaches are becoming more challenging, complex and multifaceted 2.
Moreover, the learning environment in medical education system is gradually transforming towards student-centered learning approaches, instead of conventional teacher-centered approach3. To address this goal, teachers should understand their students’ learning style preferences. The students might have
IntroductionLearning means in what manner human accepts,
comprehend and engross, information and experiences. Besides, it also includes memorizing and processing the information and experience, and further transformation into knowledge, skills, conduct, behavior and attitude.
Corresponding Author: Dr. Sayed Badar Daimi Associate Professor, Department of Physiology, JIIU’S IIMSR, Warudi, Badnapur, Jalna, Maharashtra - 431202, India e-mail:[email protected]
10.5958/2320-608X.2019.00140.9
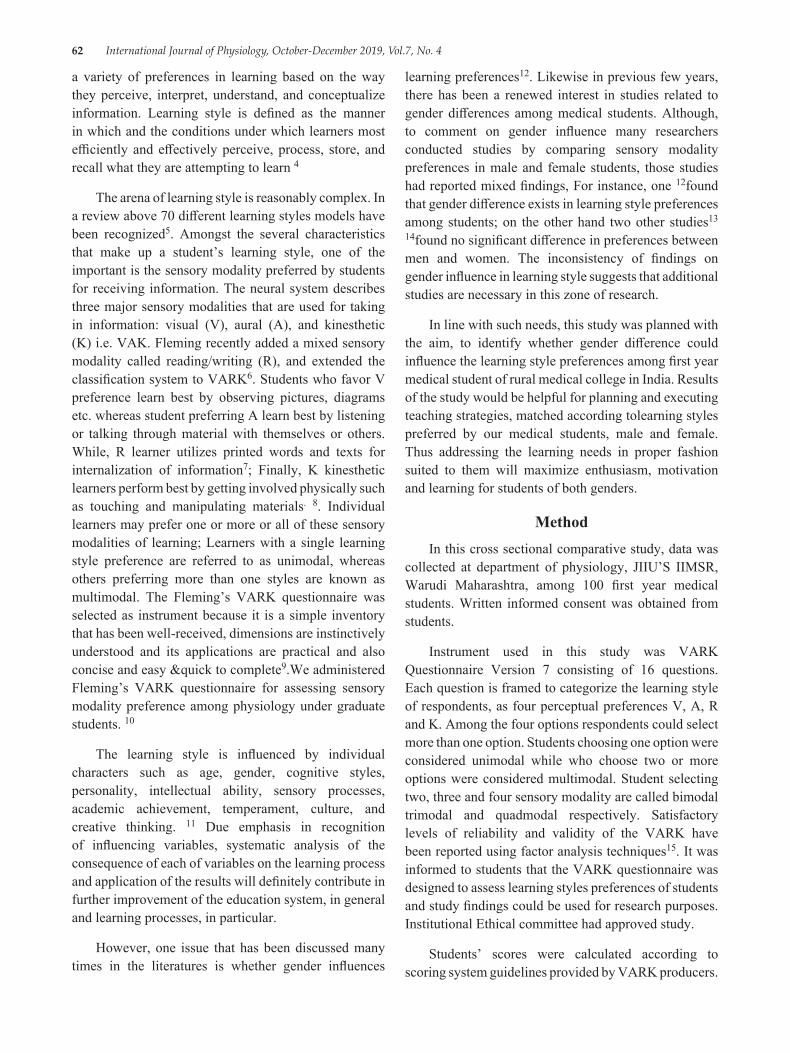
62 International Journal of Physiology, October-December 2019, Vol.7, No. 4
a variety of preferences in learning based on the way they perceive, interpret, understand, and conceptualize information. Learning style is defined as the manner in which and the conditions under which learners most efficiently and effectively perceive, process, store, and recall what they are attempting to learn 4
The arena of learning style is reasonably complex. In a review above 70 different learning styles models have been recognized5. Amongst the several characteristics that make up a student’s learning style, one of the important is the sensory modality preferred by students for receiving information. The neural system describes three major sensory modalities that are used for taking in information: visual (V), aural (A), and kinesthetic (K) i.e. VAK. Fleming recently added a mixed sensory modality called reading/writing (R), and extended the classification system to VARK6. Students who favor V preference learn best by observing pictures, diagrams etc. whereas student preferring A learn best by listening or talking through material with themselves or others. While, R learner utilizes printed words and texts for internalization of information7; Finally, K kinesthetic learners perform best by getting involved physically such as touching and manipulating materials. 8. Individual learners may prefer one or more or all of these sensory modalities of learning; Learners with a single learning style preference are referred to as unimodal, whereas others preferring more than one styles are known as multimodal. The Fleming’s VARK questionnaire was selected as instrument because it is a simple inventory that has been well-received, dimensions are instinctively understood and its applications are practical and also concise and easy &quick to complete9.We administered Fleming’s VARK questionnaire for assessing sensory modality preference among physiology under graduate students. 10
The learning style is influenced by individual characters such as age, gender, cognitive styles, personality, intellectual ability, sensory processes, academic achievement, temperament, culture, and creative thinking. 11 Due emphasis in recognition of influencing variables, systematic analysis of the consequence of each of variables on the learning process and application of the results will definitely contribute in further improvement of the education system, in general and learning processes, in particular.
However, one issue that has been discussed many times in the literatures is whether gender influences
learning preferences12. Likewise in previous few years, there has been a renewed interest in studies related to gender differences among medical students. Although, to comment on gender influence many researchers conducted studies by comparing sensory modality preferences in male and female students, those studies had reported mixed findings, For instance, one 12found that gender difference exists in learning style preferences among students; on the other hand two other studies13 14found no significant difference in preferences between men and women. The inconsistency of findings on gender influence in learning style suggests that additional studies are necessary in this zone of research.
In line with such needs, this study was planned with the aim, to identify whether gender difference could influence the learning style preferences among first year medical student of rural medical college in India. Results of the study would be helpful for planning and executing teaching strategies, matched according tolearning styles preferred by our medical students, male and female. Thus addressing the learning needs in proper fashion suited to them will maximize enthusiasm, motivation and learning for students of both genders.
MethodIn this cross sectional comparative study, data was
collected at department of physiology, JIIU’S IIMSR, Warudi Maharashtra, among 100 first year medical students. Written informed consent was obtained from students.
Instrument used in this study was VARK Questionnaire Version 7 consisting of 16 questions. Each question is framed to categorize the learning style of respondents, as four perceptual preferences V, A, R and K. Among the four options respondents could select more than one option. Students choosing one option were considered unimodal while who choose two or more options were considered multimodal. Student selecting two, three and four sensory modality are called bimodal trimodal and quadmodal respectively. Satisfactory levels of reliability and validity of the VARK have been reported using factor analysis techniques15. It was informed to students that the VARK questionnaire was designed to assess learning styles preferences of students and study findings could be used for research purposes. Institutional Ethical committee had approved study.
Students’ scores were calculated according to scoring system guidelines provided by VARK producers.
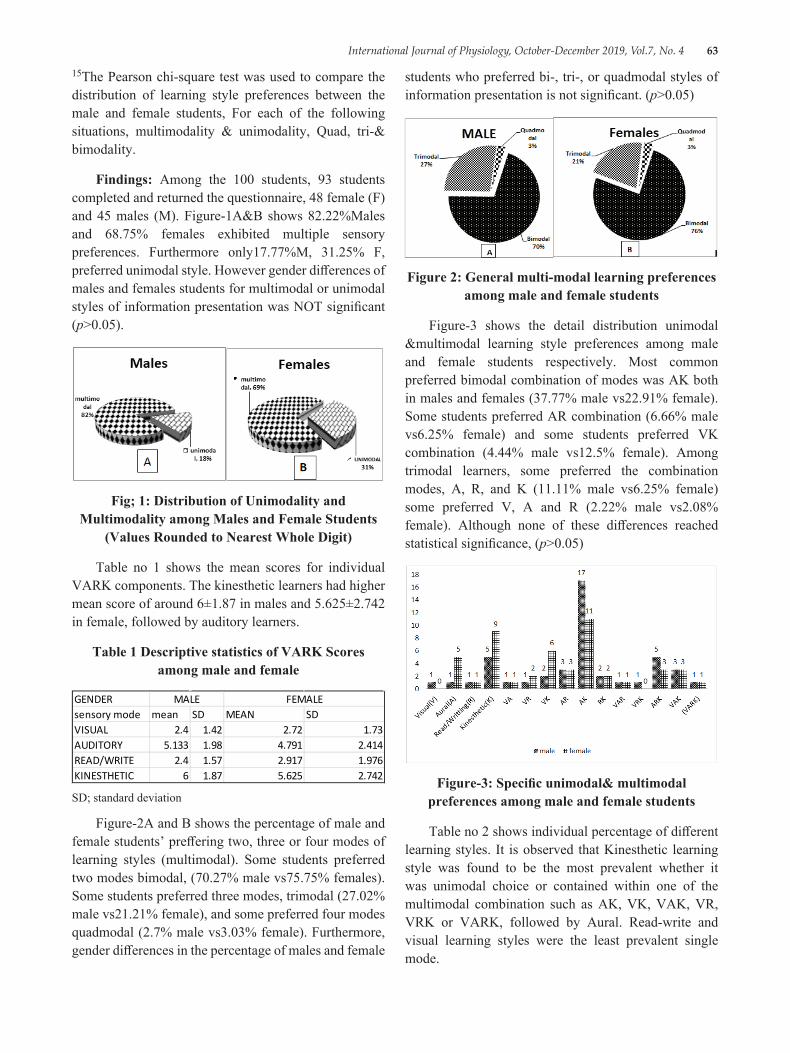
International Journal of Physiology, October-December 2019, Vol.7, No. 4 63
15The Pearson chi-square test was used to compare the distribution of learning style preferences between the male and female students, For each of the following situations, multimodality & unimodality, Quad, tri-& bimodality.
Findings: Among the 100 students, 93 students completed and returned the questionnaire, 48 female (F) and 45 males (M). Figure-1A&B shows 82.22%Males and 68.75% females exhibited multiple sensory preferences. Furthermore only17.77%M, 31.25% F, preferred unimodal style. However gender differences of males and females students for multimodal or unimodal styles of information presentation was NOT significant (p>0.05).
Fig; 1: Distribution of Unimodality and Multimodality among Males and Female Students
(Values Rounded to Nearest Whole Digit)
Table no 1 shows the mean scores for individual VARK components. The kinesthetic learners had higher mean score of around 6±1.87 in males and 5.625±2.742 in female, followed by auditory learners.
Table 1 Descriptive statistics of VARK Scores among male and female
GENDER sensory mode mean SD MEAN SDVISUAL 2.4 1.42 2.72 1.73AUDITORY 5.133 1.98 4.791 2.414READ/WRITE 2.4 1.57 2.917 1.976KINESTHETIC 6 1.87 5.625 2.742
MALE FEMALE
SD; standard deviation
Figure-2A and B shows the percentage of male and female students’ preffering two, three or four modes of learning styles (multimodal). Some students preferred two modes bimodal, (70.27% male vs75.75% females). Some students preferred three modes, trimodal (27.02% male vs21.21% female), and some preferred four modes quadmodal (2.7% male vs3.03% female). Furthermore, gender differences in the percentage of males and female
students who preferred bi-, tri-, or quadmodal styles of information presentation is not significant. (p>0.05)
Figure 2: General multi-modal learning preferences among male and female students
Figure-3 shows the detail distribution unimodal &multimodal learning style preferences among male and female students respectively. Most common preferred bimodal combination of modes was AK both in males and females (37.77% male vs22.91% female). Some students preferred AR combination (6.66% male vs6.25% female) and some students preferred VK combination (4.44% male vs12.5% female). Among trimodal learners, some preferred the combination modes, A, R, and K (11.11% male vs6.25% female) some preferred V, A and R (2.22% male vs2.08% female). Although none of these differences reached statistical significance, (p>0.05)
Figure-3: Specific unimodal& multimodal preferences among male and female students
Table no 2 shows individual percentage of different learning styles. It is observed that Kinesthetic learning style was found to be the most prevalent whether it was unimodal choice or contained within one of the multimodal combination such as AK, VK, VAK, VR, VRK or VARK, followed by Aural. Read-write and visual learning styles were the least prevalent single mode.
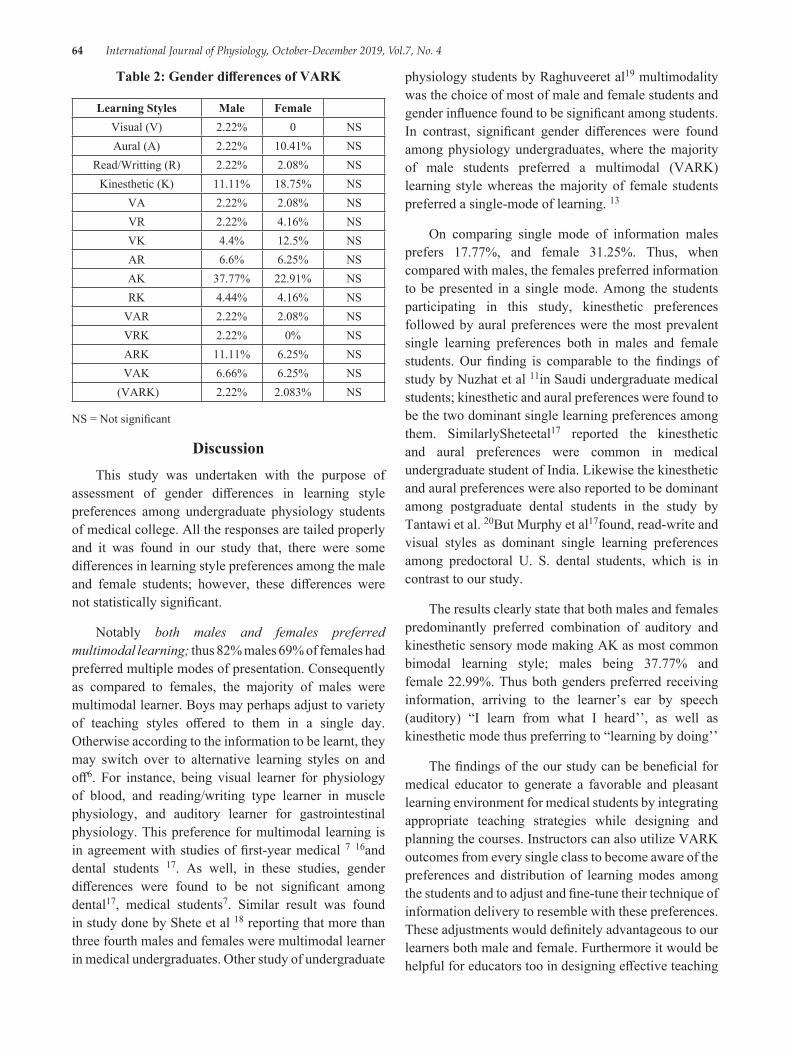
64 International Journal of Physiology, October-December 2019, Vol.7, No. 4
Table 2: Gender differences of VARK
Learning Styles Male FemaleVisual (V) 2.22% 0 NSAural (A) 2.22% 10.41% NS
Read/Writting (R) 2.22% 2.08% NSKinesthetic (K) 11.11% 18.75% NS
VA 2.22% 2.08% NSVR 2.22% 4.16% NSVK 4.4% 12.5% NSAR 6.6% 6.25% NSAK 37.77% 22.91% NSRK 4.44% 4.16% NS
VAR 2.22% 2.08% NSVRK 2.22% 0% NSARK 11.11% 6.25% NSVAK 6.66% 6.25% NS
(VARK) 2.22% 2.083% NS
NS = Not significant
DiscussionThis study was undertaken with the purpose of
assessment of gender differences in learning style preferences among undergraduate physiology students of medical college. All the responses are tailed properly and it was found in our study that, there were some differences in learning style preferences among the male and female students; however, these differences were not statistically significant.
Notably both males and females preferred multimodal learning; thus 82% males 69% of females had preferred multiple modes of presentation. Consequently as compared to females, the majority of males were multimodal learner. Boys may perhaps adjust to variety of teaching styles offered to them in a single day. Otherwise according to the information to be learnt, they may switch over to alternative learning styles on and off6. For instance, being visual learner for physiology of blood, and reading/writing type learner in muscle physiology, and auditory learner for gastrointestinal physiology. This preference for multimodal learning is in agreement with studies of first-year medical 7 16and dental students 17. As well, in these studies, gender differences were found to be not significant among dental17, medical students7. Similar result was found in study done by Shete et al 18 reporting that more than three fourth males and females were multimodal learner in medical undergraduates. Other study of undergraduate
physiology students by Raghuveeret al19 multimodality was the choice of most of male and female students and gender influence found to be significant among students. In contrast, significant gender differences were found among physiology undergraduates, where the majority of male students preferred a multimodal (VARK) learning style whereas the majority of female students preferred a single-mode of learning. 13
On comparing single mode of information males prefers 17.77%, and female 31.25%. Thus, when compared with males, the females preferred information to be presented in a single mode. Among the students participating in this study, kinesthetic preferences followed by aural preferences were the most prevalent single learning preferences both in males and female students. Our finding is comparable to the findings of study by Nuzhat et al 11in Saudi undergraduate medical students; kinesthetic and aural preferences were found to be the two dominant single learning preferences among them. SimilarlySheteetal17 reported the kinesthetic and aural preferences were common in medical undergraduate student of India. Likewise the kinesthetic and aural preferences were also reported to be dominant among postgraduate dental students in the study by Tantawi et al. 20But Murphy et al17found, read-write and visual styles as dominant single learning preferences among predoctoral U. S. dental students, which is in contrast to our study.
The results clearly state that both males and females predominantly preferred combination of auditory and kinesthetic sensory mode making AK as most common bimodal learning style; males being 37.77% and female 22.99%. Thus both genders preferred receiving information, arriving to the learner’s ear by speech (auditory) “I learn from what I heard’’, as well as kinesthetic mode thus preferring to “learning by doing’’
The findings of the our study can be beneficial for medical educator to generate a favorable and pleasant learning environment for medical students by integrating appropriate teaching strategies while designing and planning the courses. Instructors can also utilize VARK outcomes from every single class to become aware of the preferences and distribution of learning modes among the students and to adjust and fine-tune their technique of information delivery to resemble with these preferences. These adjustments would definitely advantageous to our learners both male and female. Furthermore it would be helpful for educators too in designing effective teaching
International Journal of Physiology, October-December 2019, Vol.7, No. 4 65
that will influence students learning through different modalities.
However, knowledge of students learning style must not be the only factor utilized for their effective learning practices 21 Nevertheless, in undergraduate courses, delivering the information through the method matching students’ learning style preferences, resulted in higher achievement among students than when mismatched 22. Awareness into the specific preferences of individual classes would help instructors tailor both their presentations and Method of assessment for each individual class. In addition, the present study suggests that males may have a broader range of learning preferences than females. It is essential for Instructors to be familiar of these differences and accordingly widen their range of presentation and teaching strategies and also must introduce active learning approaches. With active learning strategies, visual learners are reached by observing models, illustration, photographs and demonstrations. Auditory learners are directed through discussion, during peer instruction23and debate. Read and write type learners should be addressed through interactions with textual materials. Kinesthetic and tactile learners are fulfilled by handling models and role playing.24
Study limitations: The limitations of this study are small sample size, and designing this study only in the pre-clinical subject of the medical course. Further studies with larger sample size may support to detect whether any significant differences in this zone exist. The findings of the study should be generalized with caution in other settings in the region and worldwide.
ConclusionIdentifying students’ learning styles is undoubtedly,
essential from pedagogical point of view. This study has revealed that, learning style preferences among the undergraduate physiology students are not sensitive to gender difference. Furthermore, the study found that both male and female physiology students have a strong preference for kinesthetic learning style, either single or in combination with other sensory modes. Undergraduate physiology students are multimodal learners.
Conflict of Interest: none
Source of Funding: self
References1. (Zu, 2009). Zu, S. (2009). E-learning importance
and design. Retrieved from http://itec. sfsu. edu/wp/860wp/F04_860_zu_elearning. pdf
2. Divaris K, Barlow PJ, Chendea SA, Cheong WS, Dounis A, Dragan IF, et al. Theacademic environment: the students’ perspective. Eur J Dent Educ. 2008; 12 (suppl1):120-30.
3. Kharb P, Samanta PP, Jindal M, Singh V. The learning styles and the preferred [2]teaching-learning strategies of first year medical students. JClinDiagn Res. 2013; 7:1089-92.
4. James W, Gardner D. Learning styles: implication for distance learning. NewDir Adult ContinEduc67: 19-32, 1995.
5. Coffield F, Moseley D, Hall E, Ecclestone K. Learning Stylesand Pedagogy in Post-16 Learning: a systematic and CritcalReview. London: Learning Skills and Research Center, 2004.
6. Fleming ND. I’m different; not dumb: modes of presentation (VARK) in the tertiary classroom. In: Research and Developlement in Higher Education, edited by Zelmer A. Canberra, Australia: Proceedings of the 1995 Annual Conference of the Higher Education and Research Development Society of Australia, 1995, p. 303-318.
7. Baykan Z, Nacar M. Learning styles of first-year medical students attending ErciyesUniversity in Kayseri, Turkey. AdvPhysiolEduc 2007; 31:158-60.
8. Dobson J. A comparison between learning style preferences and sex, status, and course performance. AdvPhysiolEduc 2010; 34:197-204.
9. Mkonto N. Students’ Learning Preferences. Journal of Studies in Education 2015; 5: 212-225.
10. Fleming N. VARK: a guide to learning styles 2007 [cited 2011 24 July 2011]; Available from: http://www. varklearn.com/english/index. asp
11. Nuzhat A, Salem R, Quadri M, Al-Hamdan N. Learning style preferences of medical students: a single institute experience from Saudi Arabia. Int J Med Educ 2011; 2: 70-3
12. Wehrwein E, Lujan H, DiCarlo S. Gender differences in learning style preferences among undergraduate physiology students. AdvPhysiolEduc 2007; 31:153-7
66 International Journal of Physiology, October-December 2019, Vol.7, No. 4
13. Alkhasawneh IM, Mrayyan MT, Docherty C, Alashram S, Yousef HY. Problem-based learning (PBL): assessing students’ learning preferences using VARK. Nurse Ed Today 28: 572-579, 2008
14. Slater JA, Lujan HL, DiCarlo SE. Does gender influence learning style preferences of first-year medical students? AdvPhysiolEduc31: 336-342, 2007
15. Leite W, Svinicki M, Shi Y. Attempted validation of scores of the VARK: learning styles inventory with multitrait–multimethod confirmatory factor analysis models Educational and Psychological Measurement. 2010; 70 (2):323-39.
16. Lujan HL, DiCarlo SE. First-year medical students prefer multiple learning styles. AdvPhysiolEduc30: 13-16, 2006
17. Murphy RJ, Gray SA, Straja SR, Bogert MC. Student learning preferences and teaching implications. J Dent Educ68: 859-66, 2004.
18. DrShete Anjali N, Dr K D Garkal, DrNidhiYadav, Dr. Rahul Salwe, Dr. Beulah Rainer Gender Influence on Learning Styles of Undergraduate Medical Students International Journal of Medical Science and EducationPage 233-241 Vol. 3; Issue: 3; July-Sept 2016
19. RaghuveerChoudhary, Puja Dullo, RV Tandon, Gender Differences in Learning Style Preferences Offirst Year Medical Students Pak J Physiol 2011; 7 (2) pg no 42-45
20. El Tantawi M. Factors affecting postgraduate dental students’ performance in a biostatistics and research design course. J Dent Educ 2009; 73 (5):614-23.
21. Suskie L. What are learning styles? Can we identify them? What is their place in an assessment program. Best Pract. 2003; 3:13-15.
22. Utilization of learning styles in dental curriculum development. N Y State Dent J 2002; 68 (8):34-8.
23. Cortright, R. N., Collins, H. L. &DiCarlo, S. E. (2005) Peer instruction enhanced meaningful learning: ability to solve novel problems, Advances in Physiology Education, 2005; 29:107-111
24. Kumar, L. R., Voralu, K., Pani, S. P. &Sethuraman, K. R. (2009) Predominant Learning styles adopted by AIMST University students in Malaysia, South East Asian Journal of Medical Education, 2009; 3, (1): 37-46
International Journal of Physiology, October-December 2019, Vol.7, No. 4 67
Assessment of Blood Pressure and Cognitive Dysfunction in Pune Urban Elderly Population
Gayatri Godbole1, Shrirang Godbole2, Jayshree S Kharche3, Pranita Ashok4, Anuradha Joshi5
1Assistant professor, Department of Physiology, Bharati Vidyapeeth (Deemed to be University) Medical College, Pune, 2JR 2 Department of Orthopedics, MIMER Medical College, Talegaon, 3Associate Professor, Department
of Physiology, Bharati Vidyapeeth (Deemed to be University) Medical College, Pune, 4Assistant Professor, Department of Physiology, Bharati Vidyapeeth (Deemed to be University) Medical College, Pune, 5Professor &
Head, Department of Physiology, Bharati Vidyapeeth (Deemed to be University) Medical College, Pune
AbstractObjective: Elderly population in India is increasing sharply. The medical problems like neurocognitive disorders are on rise. Screening tests used for detection of such disorders is Mini Mental State Examination (MMSE). Cerebrovascular diseases can lead to neurocognitive disorders and hypertension is one of the risk factor for cerebrovascular diseases Therefore blood pressure was correlated with Mini Mental State Examination.
Method: 300 (males and females) aged more than 60 years were screened. Subjects were administered Mini Mental State Examination (MMSE) questionnaire and blood pressure was measured. MMSE score was correlated with Blood Pressure.
Result: It was found that systolic blood pressure was increased in subjects with cognitive impairment though the rise is statistically insignificant. Whereas diastolic blood pressure was less in subjects with cognitive impairment as compared to normal subjects.
Conclusion: The systolic blood pressure was increased in subjects with cognitive impairment though the rise was statistically insignificant.
Keywords: Blood Pressure, Dementia, Cognitive dysfunction, MMSE.
functions of the brain like thinking, reasoning and remembering. Dementia occurs when these functions decrease significantly than what occurs with normal aging. It is one of the age related condition affecting self-care and quality of life. Such disorder places great burden on the individual, relatives and ultimately on the society.2 These Neurocognitive disorders can result from a variety of diseases and injuries that primarily or secondarily affect the brain, such as Alzheimer’s disease or cerebrovascular diseases. 3, 4 Hypertention is one of the risk factor for cerebrovascular diseases.
There is less awareness about this condition in the population at large. The symptoms are neglected thinking of it as a natural, age related process. This results in gradual worsening which can be prevented by early detection.
Corresponding Author: Jayshree S Kharche Department of Physiology, Bharati Vidyapeeth (Deemed to be University) Medical College, Pune e-mail: [email protected] Mobile No.: 9823535324
IntroductionIndia is facing demographic transition. There has
been a sharp increase in the number of elderly people between 1991 and 2001 and it has been projected that by the year 2050, the number would rise to about 324 million. This statistics for the elderly in India introduces a new set of medical, social, and economic problems.1
Neurocognitive disorder characterized by a progressive loss of intellectual and judgmental
10.5958/2320-608X.2019.00141.0
68 International Journal of Physiology, October-December 2019, Vol.7, No. 4
Variety of screening tests are used for early detection of cognitive disorders. The Mini Mental State Examination (MMSE) is one such test. The MMSE is a simple and practical tool used for early detection and assessment of cognitive functions of the brain or dementia.4
Various studies have highlighted relationship of blood pressure (BP) with cognitive decline. 5, 6 while some researchers have suggested reduction in BP may worsen cerebral perfusion causing an increased risk of cardiovascular diseases. 7 Thus it was more complex to study the role of blood pressure on the brain. Therefore, the purpose of the study was to correlate blood pressure with Mini Mental State Examination test of dementia.
Material and MethodIt was a cross sectional study. Institutional ethics
committee approval was obtained. 300 (males and females) aged more than 60 years were screened. Known cases of depression, dementia, stroke and subjects with severe hearing impairment were excluded.
History was taken and detailed physical examination was done. Subjects were administered mini mental state examination (MMSE) questionnaire. 8 which assesses cognitive function in relation to orientation, memory, attention and calculation, language and visual construction. The maximum possible score is 30. MMSE scores above 23 indicate normal cognitive function and score of <23 indicate both the likelihood of cognitive impairment and the need for further evaluation. Blood pressure of subjects with MMSE score <23 was compared.
Blood pressure recording (BP): Blood pressure of the entire population was recorded with their consent using the guidelines mentioned by the American Heart Association (AHA). The instrument used was the standard mercury manometer. Blood pressure of the selected population was be recorded at a fixed time in the day to avoid the diurnal variation.
Systolic and diastolic blood pressure was measured in the right arm in supine position by using a mercury-column sphygmomanometer positioned near heart level after 5 min rest. Two readings of Systolic Blood Pressure (SBP) and Diastolic Blood Pressure (DBP) were recorded. 9
Results of blood pressure was interpreted as follows as per the guidelines of American Heart Association:10
Normal: Less than 120/80 mm Hg
Elevated: Systolic between 120-129 and diastolic less than 80
Stage 1: Systolic between 130-139 or diastolic between 80-89
Stage 2: Systolic at least 140 or diastolic at least 90 mm Hg
Hypertensive crisis: Systolic over 180 and/or diastolic over 120
Statistical analysis: According to the information collected the data was analyzed using percentage and correlation coefficient test. From correlation coefficient r value was calculated and then p value computed from it. P value less than 0.05 was considered as statistically significant.
Observations and ResultsTable 1: Anthropometric measurements in study
subjects
ParameterTotal (n=300)(Mean±SD)
Age in years 70.44±8.95Height (cm) 156.57±9.28Weight (Kg) 60.26±11.57
The above table showed that the mean age of the study population was 70.44 years. Mean height and weight was 156.57 cm and 60.26 Kg respectively.
Table 2: Correlation of systolic and diastolic blood pressure with MMSE in study
Parameter MMSE Group N Mean± SD P-value
(n = 300) > 23 234 0.90 ± 0.08
SBP≤ 23 66 141.53 ± 18.71
0.395 (NS)> 23 234 139.36 ± 16.43
DBP≤ 23 66 83.48 ± 11.00
0.302 (NS)> 23 234 86.57 ± 40.66
NS = Not Significant
The above table showed that the systolic blood pressure was increased in subjects with cognitive impairment though the rise is statistically insignificant. Whereas diastolic blood pressure was less in subjects with cognitive impairment as compared to normal subjects.
International Journal of Physiology, October-December 2019, Vol.7, No. 4 69
DiscussionTable 1 shows demographic characteristics of study
population in which mean age was70.44 years. [Table1].
Table 2 in the present study showed that, the systolic blood pressure was increased in subjects with cognitive impairment though the rise is statistically insignificant. Whereas diastolic blood pressure was less in subjects with cognitive impairment as compared to normal subjects.
Similar observation was found in a 6 year observational study conducted by Chengxuan Qiu et al. 11 They found both low diastolic and high systolic pressure are associated with an increased risk of dementia in elderly population. The association may be attributed to atherosclerotic process in cerebral blood vessels. In addition, low diastolic blood pressure may increase dementia risk by affecting cerebral perfusion. 11
Various studies have examined the relationship between blood pressure and risk of dementia. 12, 13 Though the findings were inconsistent, an association between elevated blood pressure and increased incidence of dementia was observed. Thus, high systolic pressure in elderly may be a risk factor for dementia.
Various studies 11, 14suggested that low diastolic blood pressure is associated with an increased incidence of dementia. Possible suggested mechanisms could be either cerebral hypoperfusion seems to precede the neurodegenerative pathological changes15 or increased large arterial stiffness and widespread atherosclerosis in elderly people. 16
Trial data on the benefits of reducing SBP on cognitive outcomes is not conclusive; however, all the research in this domain is based on older adults and whether better control of blood pressure at younger ages modifies risk for dementia is unknown. Probable suggested mechanism could be that, cerebral small vessel disease is likely to be an important mechanism underlying the association of high blood pressure and cognitive dysfunction. 17
Several observational studies have analyzed the relationship between hypertension and the risk of dementia. In a one of the study conducted in Sweden study higher systolic and diastolic blood pressure was correlated with dementia in population aging 70 years and above.18 Honolulu-Asia Aging Study suggests elevated levels of blood pressure in middle age can
increase the risk for late age dementia in men never treated with anti-hypertensive medication. However, some studies did not report any association. 19, 20
Limitations of the study: The limitation of this study is that it was a cross-sectional study and a limited duration study. The study needs to be conducted in a larger population with supportive laboratory investigations and follow up.
Conclusions: Our study showed that the systolic blood pressure was increased in subjects with cognitive impairment though the rise was statistically insignificant. Therefore regular assessment and timely management of blood pressure is necessary to prevent complications.
Ethical Clearance: Taken from Bharti Vidyapeeth Medical College, Pune ethical committee.
Source of Funding: The project was funded by ICMR-STS.
Conflict of Interest: NIL
References1. Subaiya, Lekha and Dhananjay W Bansod.
Demographics of Population Ageing in India: Trends and Differentialsî, BKPAI Working Paper No. 1, United Nations Population Fund (UNFPA), New Delhi. 2011.
2. Arielle W. Tolman, Matthew M. Kurtz. Neurocognitive Predictors of Objective and Subjective Quality of Life in Individuals With Schizophrenia: A Meta-Analytic Investigation, Schizophrenia Bulletin. March 2012; 38 (2): 304-315.
3. Shaji KS, Jotheeswaran AT, Girish N, Srikala Bharath, Amit Dias, Meera Pattabiraman and Mathew Varghese. Alzheimer’s & Related Disorders Society of India. The Dementia India Report: prevalence, impact, costs and services for Dementia. (Eds) ARDSI, New Delhi. 2010.
4. Bart Sheehan, Assessment scales in dementia. Ther Adv Neurol Disord. 2012; 5 (6):349-358.
5. Kennelly SP, Lawlor BA, Kenny RA. Blood pressure and dementia-a comprehensive review. Ther. Adv. Neurol. Disord. 2009; 2:241-60.
6. Schneider ALC, Sharrett AR, Patel MD, Alonso A, Coresh J, Mosley T, et al. Education and cognitive change over 15 years: The atherosclerosis risk in
70 International Journal of Physiology, October-December 2019, Vol.7, No. 4
communities study. J. Am. Geriatr. Soc. 2012; 60:1847-53.
7. Mancia and Grassi, Antihypertensive Treatment and the J-Curve. Hypertension. 2014; 63:29-36.
8. Shilpa Gaidhane, Abhay M Gaidhane, Quazi Syed Zahiruddin, Nazli Khatib, Essential hypertension and cognitive function in elderly. Global Journal of Medicine and Public Health. 2014; 3:1-12.
9. Katherine T. Mills, Joshua D. Bundy, Tanika N. Kelly, Jennifer E. Reed, Patricia M. Kearney, Kristi Reynolds, et al. Global Disparities of Hypertension Prevalence and Control-A Systematic Analysis of Population-Based Studies From 90 Countries. Circulation. 2016; 441-450.
10. http://www. acc. org/latest-in-cardiology/articles/2017/11/08/11/47/mon-5pm-bpguideline-aha-2017.
11. Chengxuan Qiu, Eva von Strauss, Johan Fastbom, Bengt Winblad, Laura Fratiglioni. Low Blood Pressure and Risk of Dementia in the Kungsholmen ProjectA 6-Year Follow-up Study. Arch Neurol. 2003; 60 (2):223-228.
12. Qiu CX, Winblad B, Fratiglioni L. The age-dependent relation of blood pressure to cognitive function and dementia. Lancet Neurol. 2005; 4:487-499.
13. Chobanian AV. Hypertension in 2017-what is the right target? JAMA. 2017; 317:579-580.
14. Morris P A Hebert L E Glynn RJBennett DAEvans DA Association of incident Alzheimer disease and
blood pressure measured from 13 years before to 2 years after diagnosis in a large community study. Arch Neurol. 2001; 58:1640-1646.
15. de la Torre JC Alzheimer disease as a vascular disorder: nosological evidence. Stroke. 2002; 33:1152-1162.
16. Bots ML Witteman JCMHofman Ade Jong PTVMGrobbee DE Low diastolic blood pressure and atherosclerosis in elderly subjects: the Rotterdam Study. Arch Intern Med. 1996; 156:843-848.
17. Jessica G Abell, Mika Kivimäki, Aline Dugravot, Adam G Tabak, Aurore Fayosse, Martin Shipley, et al. Association between systolic blood pressure and dementia in the Whitehall II cohort study: role of age, duration, and threshold used to define hypertension. Eur Heart J. Sep 2018; 39 (33): 3119-3125.
18. Skoog I, Lernfelt B, Landahl S, Palmertz B, Andreasson LA, Nilsson L, Persson G, Odén A, Svanborg A. 15-year longitudinal study of blood pressure and dementia. Lancet. April 1996; Volume 347 (9009): 1141-1145.
19. Qiu C, Winblad B, Fratiglioni L. The age-dependent relation of blood pressure to cognitive function and dementia. Lancet Neurol. 2005; 4:487-499.
20. Barnes DE, Yaffe K. The projected effect of risk factor reduction on Alzheimer’s disease prevalence. Lancet Neurol. 2011; 10:819-828.
International Journal of Physiology, October-December 2019, Vol.7, No. 4 71
Effect of Iron Deficiency Anemia on Autonomic Nervous System in Adolescent Girls
Gunjan Jain1, Namrata Kaushik2, J. L. Agarwal3, P. N. Singh4, Manoj Kumar Jain5.
1Assistant Professor Physiology Department G S Medical College & Hospital Pilkhuwa Hapur, 2Assistant Professor Physiology Department G S Medical College & Hospital Pilkhuwa Hapur, 3Professor Physiology department Saraswathi Institute of Medical Sciences Hapur, 4Professor Physiology Department G S Medical
College & Hospital Pilkhuwa Hapur, 5Associate Professor Medicine Department G S Medical College & Hospital Pilkhuwa Hapur
AbstractIntroduction: Anemia is a major health problem especially among the economically disadvantaged segments of population in developing countries like India. Involvement of Autonomic Nervous System (ANS) in cases of anemia has been a matter of considerable speculation. Slight to moderate impairment may be observed in mental and motor development of infants with Iron deficiency anaemia (IDA).
Material & Method: Study included 30 apparently healthy adolescent girls as control and 90 adolescent girls as cases having IDA. Haemoglobin was done and blood pressure and ECG were recorded.
Result: Mean rise in SBP And DBP and Mean RR interval was significantly reduced in anemic patient as compared to control subjects.
Conclusion: We found significant relation between Mean rise in SBP And DBP and Mean RR interval in IDA
Keywords: IDA, ANS, SBP, DBP, RR interval.
blood) in adult non-pregnant females and below 13gm/dL in adult male3.
Iron has been found having role in development of CNS, synthesis of neurotransmitter, myelination4. Iron being a component of several essential enzymes like succinyl dehydrogenase; cytochrome reductase is also required for neuronal metabolic activity5. In Brain, Iron is concentrated in oligodendrocyte largely in white matter, then grey matter. Oligodendrocytes requires iron to synthesize fatty acids and cholesterol for myelin production, which is mainly concern with the conduction in nerve fiber6.
Involvement of Autonomic Nervous System (ANS) in cases of anemia has been a matter of considerable speculation. Slight to moderate impairment may be observed in mental and motor development of infants with IDA7. Hence the study was carried out to evaluate the effect of IDA on ANS.
IntroductionAnemia is a major health problem especially among
the economically disadvantaged segments of population in developing countries like India. The prevalence rate is highest being 30% in developing countries as compared to 8% in developed countries1. Studies in India show that 65% infants and toddlers, 60% of Children (1-6 years of age), 88% adolescent girls and 85% pregnant women are anemic. The commonest form in these patients is iron Deficiency Anemia (IDA)2.
WHO expert group proposed that “anemia is considered to exist” when Hb is below 12gm/dL (venous
Corresponding Author: Dr. Namrata Kaushik Assistant Professor Physiology Department G S Medical College & Hospital Pilkhuwa Hapur. Address: F 108 KW Srishti Raj nagar extension Ghaziabad e-mail: [email protected]
10.5958/2320-608X.2019.00142.2
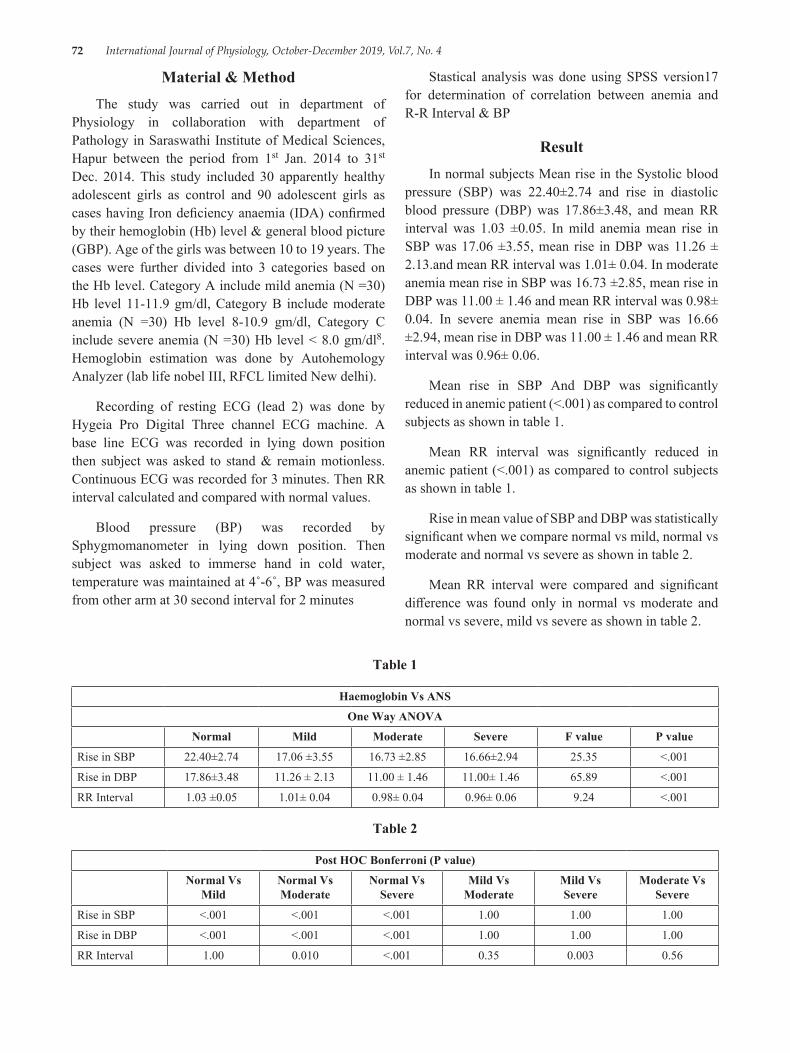
72 International Journal of Physiology, October-December 2019, Vol.7, No. 4
Material & MethodThe study was carried out in department of
Physiology in collaboration with department of Pathology in Saraswathi Institute of Medical Sciences, Hapur between the period from 1st Jan. 2014 to 31st Dec. 2014. This study included 30 apparently healthy adolescent girls as control and 90 adolescent girls as cases having Iron deficiency anaemia (IDA) confirmed by their hemoglobin (Hb) level & general blood picture (GBP). Age of the girls was between 10 to 19 years. The cases were further divided into 3 categories based on the Hb level. Category A include mild anemia (N =30) Hb level 11-11.9 gm/dl, Category B include moderate anemia (N =30) Hb level 8-10.9 gm/dl, Category C include severe anemia (N =30) Hb level < 8.0 gm/dl8. Hemoglobin estimation was done by Autohemology Analyzer (lab life nobel III, RFCL limited New delhi).
Recording of resting ECG (lead 2) was done by Hygeia Pro Digital Three channel ECG machine. A base line ECG was recorded in lying down position then subject was asked to stand & remain motionless. Continuous ECG was recorded for 3 minutes. Then RR interval calculated and compared with normal values.
Blood pressure (BP) was recorded by Sphygmomanometer in lying down position. Then subject was asked to immerse hand in cold water, temperature was maintained at 4˚-6˚, BP was measured from other arm at 30 second interval for 2 minutes
Stastical analysis was done using SPSS version17 for determination of correlation between anemia and R-R Interval & BP
ResultIn normal subjects Mean rise in the Systolic blood
pressure (SBP) was 22.40±2.74 and rise in diastolic blood pressure (DBP) was 17.86±3.48, and mean RR interval was 1.03 ±0.05. In mild anemia mean rise in SBP was 17.06 ±3.55, mean rise in DBP was 11.26 ± 2.13.and mean RR interval was 1.01± 0.04. In moderate anemia mean rise in SBP was 16.73 ±2.85, mean rise in DBP was 11.00 ± 1.46 and mean RR interval was 0.98± 0.04. In severe anemia mean rise in SBP was 16.66 ±2.94, mean rise in DBP was 11.00 ± 1.46 and mean RR interval was 0.96± 0.06.
Mean rise in SBP And DBP was significantly reduced in anemic patient (<.001) as compared to control subjects as shown in table 1.
Mean RR interval was significantly reduced in anemic patient (<.001) as compared to control subjects as shown in table 1.
Rise in mean value of SBP and DBP was statistically significant when we compare normal vs mild, normal vs moderate and normal vs severe as shown in table 2.
Mean RR interval were compared and significant difference was found only in normal vs moderate and normal vs severe, mild vs severe as shown in table 2.
Table 1
Haemoglobin Vs ANS
One Way ANOVA
Normal Mild Moderate Severe F value P value
Rise in SBP 22.40±2.74 17.06 ±3.55 16.73 ±2.85 16.66±2.94 25.35 <.001
Rise in DBP 17.86±3.48 11.26 ± 2.13 11.00 ± 1.46 11.00± 1.46 65.89 <.001
RR Interval 1.03 ±0.05 1.01± 0.04 0.98± 0.04 0.96± 0.06 9.24 <.001
Table 2
Post HOC Bonferroni (P value)
Normal Vs Mild
Normal Vs Moderate
Normal Vs Severe
Mild Vs Moderate
Mild Vs Severe
Moderate Vs Severe
Rise in SBP <.001 <.001 <.001 1.00 1.00 1.00
Rise in DBP <.001 <.001 <.001 1.00 1.00 1.00
RR Interval 1.00 0.010 <.001 0.35 0.003 0.56
International Journal of Physiology, October-December 2019, Vol.7, No. 4 73
DiscussionIn this study we attempted to establish effects of
grades of IDA on autonomic nervous system. in normal subjects mean rise in SBP and DBP was significantly more as compared to different grades of anemia. Mean RR interval was significantly more in normal subjects then anemic group. Most of the scientific studies on the effects of iron deficiency anemia deals with infants, young children and pregnant women. however very few studies dealing with the effect of IDA on autonomic nervous system have been reported. Hence this study was carried out to evaluate the effect of IDA on ANS.
Nagi et. al. demonstrate decrease in SBP and DBP in mild and moderate cases of anemia9. Studies done by Nityanand et. al. and K Singh et. al on patients on severe anemia also showed a decrease in resting SBP and DBP10, 11.Whereas study done by Kapoor et. al. showed no change in resting SBP in mild, moderate and severe anemic cases12. Mani et. al. observed resting SBP to be significantly more in anemic children13. Cold pressor test is known to stimulate nor-metanephrine and metanephrine release from the neurons and adrenal medulla14. A blunting of BP response in the present study points towards decrease in sympathetic activity IDA response. Similar response seen in study done by Bedi et. al. but on malnourished children15.
Nityanand observed abnormal postural tachy-cardia index along with normal atropine response implying dysfunction of afferent limb of para sympathetic reflex arch10.
Involvement of ANS in cases of anemia has been matter of considerable speculation. A short circulatory time occurs as compensatory mechanism in anemic to maintain tissue oxygenation. It naturally leads to an increase in resting heart rate which was present in our study and others. Another well known mechanism for physiological compensation is decreased hemoglobin oxygen affinity in tissues leading to increase oxygen extraction of anemic blood by the tissues which occurs due to increase in concentration of 2, 3 Biphosphoglycerate (2, 3 BPG) in RBC’s in anemia.
2, 3 BPG shift the hemoglobin oxygen dissociation curve to the right thus allowing the tissues to strip hemoglobin of its oxygen12. Kapoor et. al suggested that increase in resting heart rate in anemic could be due to depleted cardiac reserve12.
ConclusionIn this study we assessed that in IDA, autonomic
function was deranged. So, there should be an increased awareness in medical fraternity and population in general, of deleterious effect of IDA. Hence need for prevention, early detection and intervention of IDA in adolescents is required to reduce the autonomic complication.
Conflict of Interest: Nil
Funding Agencies: Self
Ethical Clearance: Obtained
References1. Bhaskaran P. Micronutrient deficiencies in
Children-The Problem and extent. Indian J. Paediatrics. 1995; 62: 145-146.
2. Kapur D, Agarwal KN, Agarwal DK. Nutritional anemia and its control. Indian journal Paediatric. 2002 july; 69 (7):607-616.
3. WHO 1968 Technical report survey No. 405.4. Beard JL, Connor JR, Jones BC. Iron in the brain.
Nutr. Rev. 1993; 51:157-170.5. Galan P, Heregberg S, Touiton. the activity of
tissue enzymes in iron deficient rat and man: An overview; comp. Biochem Physiol. 1984; 77: 647-653.
6. Connor JR, Benkovic SA. Iron regulation in brain: histochemical, biochemical and molecular consideration. Ann Neurol. 1992; 32 (S):S51-61.
7. Bhavanani AB, Madanmohan, Udupa K. Acute effect of much bhastrika (a yogic bellows type breathing) on reaction time. Indian J. Physiol, Pharmacol. 2003; 47 (3): 297-300.
8. Hallberg L, Bengtsson C, Lapidus L, Lindstedt Get al. Screening foe iron deficiency: an analysis based on bone marrow examinations and serum ferritin determinations in a population sample of women. Br. J. Haemat. 1993; 85:787-798.
9. Nagi MK, Chawla S, Mann SK. Effect of anemia on physical work capacity among school girls. Ind. J. Physiol and allied Sci. 1993; 47 (30):123-127.
10. Nand N, Mohan R, Khosla SN, Kumar P. Autonomic function tests in cases of chronic severe anemia. J. Assoc Physicians India. 1989 Aug; 37 (8):508-510.
11. Singh K, Singh PI. Autonomic function in chronic severe anemia. Indian J. Med. Sci. 1994 Apr; 48 (4): 93-95.

74 International Journal of Physiology, October-December 2019, Vol.7, No. 4
12. Kapoor RK, Singh Lokendra, Mehrotra S, Mishra PK, Chandra Mahesh. Demasking of subclinical left ventricular dysfunction in anemic children. Indian Paediatrics. 1999; 36:991-998.
13. Mani A, Singh T, Calton R, Chacko B, Cherian B. cardiovascular response in anemia. Indian J Paediatric. 2005; 72:297-300.
14. Robertson D, Johnson GA, Robertson RM, Nies AS, Shand DG, Oates JA. Comparative assessment of stimuli that release neuronal and adrenomedullary catecholamines in man. Circulation. 1979; 53:637.
15. Bedi M, Babbar R, Chakrabarty AS. Cold pressor response in normal and malnourished children UPP. 1998; 42 (4): 569-571.
International Journal of Physiology, October-December 2019, Vol.7, No. 4 75
Platelet Count and its Correlation with Blood Sugar Level in Type 2 Diabetes Mellitus Patients
Jabir PK1, Madhusudhan U2, Venugopal R3
1Assistant Professor, Department of Physiology, 2Associate Professor, Department of Physiology, 3Tutor, Department of Biochemistry, DM Wayanad Institute of Medical Sciences, Naseeranagar, Wayanad
AbstractIntroduction: Diabetes Mellitus (DM) is defined as a complex disease with chronic hyperglycemiaand is a global public health problem; the long-term sequelae of which are long-term macrovascular and microvascular complications. Studies show role of hematological indices especially platelet indices in contributing to the vascular injury in diabetic patients. Thus, the aim of this study was to determine platelet indices and their correlation with fasting blood glucose levelin type 2 DM patients in comparison with healthy controls.
Method: A retrospective study was conducted at DM Wayanad Institute of Medical Sciences, Kerala, India from Istof January 2018 to 31st of June. A total of 238 participants (119 cases and 119 healthy controls) were selected using systematic random sampling technique. Data is retrieved from Medical Records Department. Parameters are lab investigation values those are already done on patients who came to DM WIMS. FBS was estimated using (Cobasintegra 400 plus) automated clinical chemistry analyzer and hematological parameters using fully automated (Sysmex XT-1800i) analyzer.
Independent sample t-test. The sample size required to study the correlation is 90 at 5% level of significance and 80% power assuming the population correlation to be. 3 (moderate correlation). The statistical analysis was done using SPSS 15.0 version. After checking for normality Pearson’s or Spearman correlation analysis is carried out to study the correlation. A P-value, 0.05 was considered as statistically significant.
Result: There was no significant correlation between platelet indices, mean platelet volume, platelet distribution width in the diabetic patients.
Conclusion: Even though previous study showed statistically significant difference in platelet indices of diabetic patients compared to controls in our study there is no such statistical significance. Further studies should be done in large population.
Keywords: Fasting blood glucose, platelet indices, platelet count, platelet distribution width, type 2 diabetes mellitus.
Cardiovascular diseases in both men and women. By definition Diabetes Mellitus is a metabolic-cum vascular syndrome of multiple aetiologies characterized by chronic hyperglycaemia with disturbances of carbohydrates, fat and protein metabolism resulting from defects in insulin secretion, insulin action or both. Many researches shows that haematological parameters are altered in Diabetes Mellitus.1 High levels of glucose in Diabetes causes fluctuations in metabolism of cells which seems to contributed by increased production of reactive oxygen species (ROS) and nonenzymatic glycation of many macromolecules. This results in changes in structure and function of cells and production
IntroductionMany epidemiological and pathological studies
show that diabetes is an independent risk factor for
Corresponding Author: Madhusudhan U
Associate Professor, Department of Physiology, DM Wayanad institute of medical sciences, Naseeranagar, Wayanad e-mail: [email protected] Contact No.: 9902351486
10.5958/2320-608X.2019.00143.4
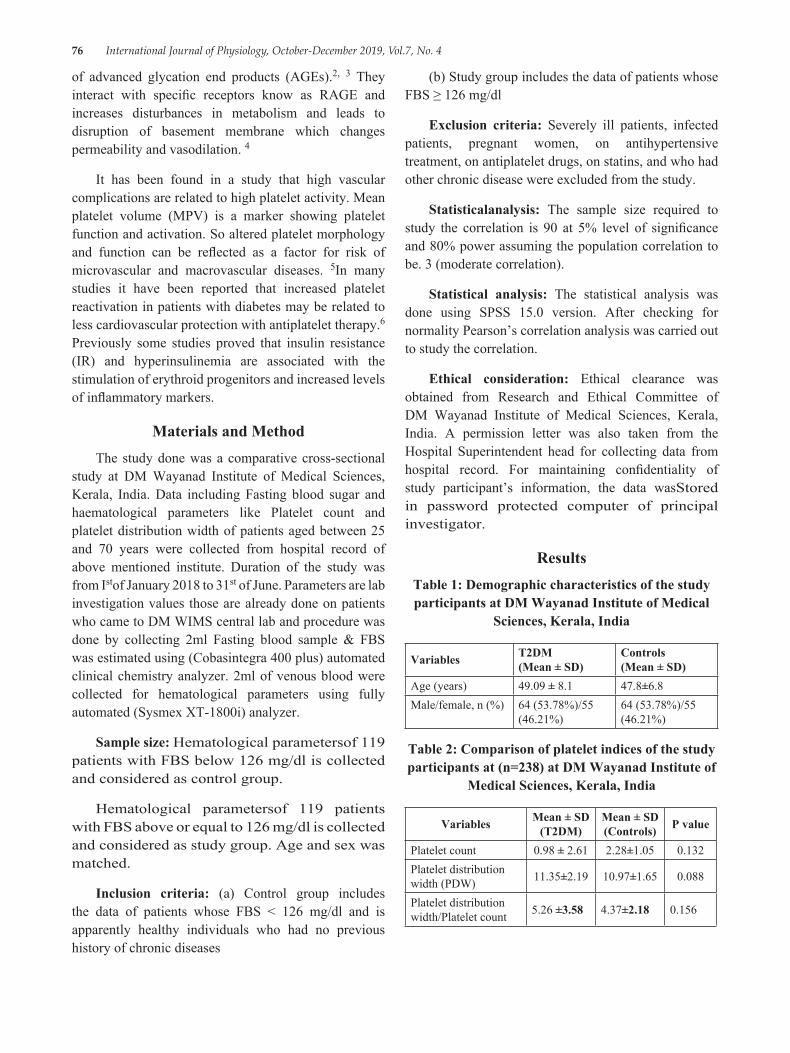
76 International Journal of Physiology, October-December 2019, Vol.7, No. 4
of advanced glycation end products (AGEs).2, 3 They interact with specific receptors know as RAGE and increases disturbances in metabolism and leads to disruption of basement membrane which changes permeability and vasodilation. 4
It has been found in a study that high vascular complications are related to high platelet activity. Mean platelet volume (MPV) is a marker showing platelet function and activation. So altered platelet morphology and function can be reflected as a factor for risk of microvascular and macrovascular diseases. 5In many studies it have been reported that increased platelet reactivation in patients with diabetes may be related to less cardiovascular protection with antiplatelet therapy.6 Previously some studies proved that insulin resistance (IR) and hyperinsulinemia are associated with the stimulation of erythroid progenitors and increased levels of inflammatory markers.
Materials and MethodThe study done was a comparative cross-sectional
study at DM Wayanad Institute of Medical Sciences, Kerala, India. Data including Fasting blood sugar and haematological parameters like Platelet count and platelet distribution width of patients aged between 25 and 70 years were collected from hospital record of above mentioned institute. Duration of the study was from Istof January 2018 to 31st of June. Parameters are lab investigation values those are already done on patients who came to DM WIMS central lab and procedure was done by collecting 2ml Fasting blood sample & FBS was estimated using (Cobasintegra 400 plus) automated clinical chemistry analyzer. 2ml of venous blood were collected for hematological parameters using fully automated (Sysmex XT-1800i) analyzer.
Sample size: Hematological parametersof 119 patients with FBS below 126 mg/dl is collected and considered as control group.
Hematological parametersof 119 patients with FBS above or equal to 126 mg/dl is collected and considered as study group. Age and sex was matched.
Inclusion criteria: (a) Control group includes the data of patients whose FBS < 126 mg/dl and is apparently healthy individuals who had no previous history of chronic diseases
(b) Study group includes the data of patients whose FBS ≥ 126 mg/dl
Exclusion criteria: Severely ill patients, infected patients, pregnant women, on antihypertensive treatment, on antiplatelet drugs, on statins, and who had other chronic disease were excluded from the study.
Statisticalanalysis: The sample size required to study the correlation is 90 at 5% level of significance and 80% power assuming the population correlation to be. 3 (moderate correlation).
Statistical analysis: The statistical analysis was done using SPSS 15.0 version. After checking for normality Pearson’s correlation analysis was carried out to study the correlation.
Ethical consideration: Ethical clearance was obtained from Research and Ethical Committee of DM Wayanad Institute of Medical Sciences, Kerala, India. A permission letter was also taken from the Hospital Superintendent head for collecting data from hospital record. For maintaining confidentiality of study participant’s information, the data wasStored in password protected computer of principal investigator.
ResultsTable 1: Demographic characteristics of the study participants at DM Wayanad Institute of Medical
Sciences, Kerala, India
Variables T2DM (Mean ± SD)
Controls (Mean ± SD)
Age (years) 49.09 ± 8.1 47.8±6.8Male/female, n (%) 64 (53.78%)/55
(46.21%)64 (53.78%)/55 (46.21%)
Table 2: Comparison of platelet indices of the study participants at (n=238) at DM Wayanad Institute of
Medical Sciences, Kerala, India
Variables Mean ± SD (T2DM)
Mean ± SD (Controls) P value
Platelet count 0.98 ± 2.61 2.28±1.05 0.132Platelet distribution width (PDW) 11.35±2.19 10.97±1.65 0.088
Platelet distribution width/Platelet count 5.26 ±3.58 4.37±2.18 0.156
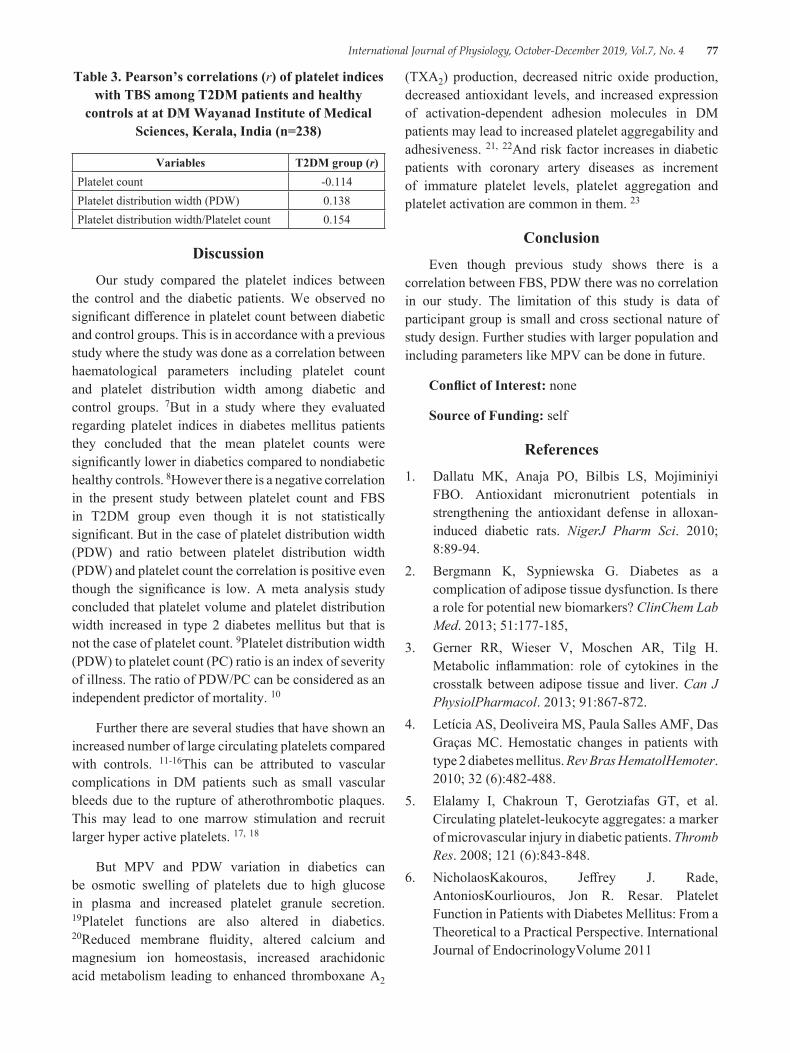
International Journal of Physiology, October-December 2019, Vol.7, No. 4 77
Table 3. Pearson’s correlations (r) of platelet indices with TBS among T2DM patients and healthy
controls at at DM Wayanad Institute of Medical Sciences, Kerala, India (n=238)
Variables T2DM group (r)Platelet count -0.114Platelet distribution width (PDW) 0.138Platelet distribution width/Platelet count 0.154
DiscussionOur study compared the platelet indices between
the control and the diabetic patients. We observed no significant difference in platelet count between diabetic and control groups. This is in accordance with a previous study where the study was done as a correlation between haematological parameters including platelet count and platelet distribution width among diabetic and control groups. 7But in a study where they evaluated regarding platelet indices in diabetes mellitus patients they concluded that the mean platelet counts were significantly lower in diabetics compared to nondiabetic healthy controls. 8However there is a negative correlation in the present study between platelet count and FBS in T2DM group even though it is not statistically significant. But in the case of platelet distribution width (PDW) and ratio between platelet distribution width (PDW) and platelet count the correlation is positive even though the significance is low. A meta analysis study concluded that platelet volume and platelet distribution width increased in type 2 diabetes mellitus but that is not the case of platelet count. 9Platelet distribution width (PDW) to platelet count (PC) ratio is an index of severity of illness. The ratio of PDW/PC can be considered as an independent predictor of mortality. 10
Further there are several studies that have shown an increased number of large circulating platelets compared with controls. 11-16This can be attributed to vascular complications in DM patients such as small vascular bleeds due to the rupture of atherothrombotic plaques. This may lead to one marrow stimulation and recruit larger hyper active platelets. 17, 18
But MPV and PDW variation in diabetics can be osmotic swelling of platelets due to high glucose in plasma and increased platelet granule secretion. 19Platelet functions are also altered in diabetics. 20Reduced membrane fluidity, altered calcium and magnesium ion homeostasis, increased arachidonic acid metabolism leading to enhanced thromboxane A2
(TXA2) production, decreased nitric oxide production, decreased antioxidant levels, and increased expression of activation-dependent adhesion molecules in DM patients may lead to increased platelet aggregability and adhesiveness. 21, 22And risk factor increases in diabetic patients with coronary artery diseases as increment of immature platelet levels, platelet aggregation and platelet activation are common in them. 23
ConclusionEven though previous study shows there is a
correlation between FBS, PDW there was no correlation in our study. The limitation of this study is data of participant group is small and cross sectional nature of study design. Further studies with larger population and including parameters like MPV can be done in future.
Conflict of Interest: none
Source of Funding: self
References1. Dallatu MK, Anaja PO, Bilbis LS, Mojiminiyi
FBO. Antioxidant micronutrient potentials in strengthening the antioxidant defense in alloxan-induced diabetic rats. NigerJ Pharm Sci. 2010; 8:89-94.
2. Bergmann K, Sypniewska G. Diabetes as a complication of adipose tissue dysfunction. Is there a role for potential new biomarkers? ClinChem Lab Med. 2013; 51:177-185,
3. Gerner RR, Wieser V, Moschen AR, Tilg H. Metabolic inflammation: role of cytokines in the crosstalk between adipose tissue and liver. Can J PhysiolPharmacol. 2013; 91:867-872.
4. Letícia AS, Deoliveira MS, Paula Salles AMF, Das Graças MC. Hemostatic changes in patients with type 2 diabetes mellitus. Rev Bras HematolHemoter. 2010; 32 (6):482-488.
5. Elalamy I, Chakroun T, Gerotziafas GT, et al. Circulating platelet-leukocyte aggregates: a marker of microvascular injury in diabetic patients. Thromb Res. 2008; 121 (6):843-848.
6. NicholaosKakouros, Jeffrey J. Rade, AntoniosKourliouros, Jon R. Resar. Platelet Function in Patients with Diabetes Mellitus: From a Theoretical to a Practical Perspective. International Journal of EndocrinologyVolume 2011
78 International Journal of Physiology, October-December 2019, Vol.7, No. 4
7. BeleteBiadgo, MulugetaMelku, Solomon MekonnenAbebe,, MollaAbebe. Hematological indices and their correlation with fasting blood glucose level and anthropometric measurements in type 2 diabetes mellitus patients in Gondar, Northwest Ethiopia. Diabetes, Metabolic Syndrome and Obesity: Targets and Therapy 2016:9 91-99
8. Archana Buch, Supreet Kaur, Rahul Nair, AmbujJainPlatelet volume indices as predictive biomarkers for diabetic complications in Type 2 diabetic patients. Journal of Laboratory Physicians. 2017 Apr-Jun; 9 (2): 84-88.
9. Francesco Zaccardi etal. Platelet mean volume, distribution width, and count in type 2 diabetes, impaired fasting glucose, and metabolic syndrome: a meta‐analysis. Diabetes metabolism research and review. 2014https://doi. org/10.1002/dmrr. 2625
10. Purbiya P, Golwala ZM, Manchanda A, Sreenivas V, PuliyelJM. Platelet Distribution Width to Platelet Count Ratio as an Index of Severity of Illness. Indian J Pediatr. 2018 Jan; 85 (1):10-14.
11. Cakir L, Aktas G, Enginyurt O, Cakir S. Mean platelet volume increases in type 2 diabetes mellitus independent of HbA1c level. ActaMedicaMediterranea. 2014; 30:425.
12. Jabeen F, Rizvi HA, Aziz F, Wasti AZ. Hyperglycemic induced variations in hematological indices in type 2 diabetics. IJAR. 2013; 1 (8):322-334.
13. Ihara A, Kawamoto T, Matsumoto K, Shouno S, Morimoto T, Noma Y. Relationship between hemostatic factors and the platelet index in patients with ischemic heart disease. PathophysiolHaemostThromb. 2006; 35 (5):388-391.
14. Khandekar MM, Khurana AS, Deshmukh SD, Kakrani AL, Katdare AD, Inamdar AK. Platelet volume indices in patients with coronary artery
disease and acute myocardial infarction: an Indian scena. J ClinPathol. 2006; 59 (2):146-149.
15. Yenigün EC, GülayOkyay GU, Pirpir A, Hondur A, Yıldırım IS. Increased mean platelet volume in type 2 diabetes mellitus. Dicle Medical Journal. 2014; 41 (1):17-22.
16. Ulutas KT, Dokuyucu R, Sefil E, et al. Evaluation of mean platelet volume in patients with type 2 diabetes mellitus and blood glucose regulation: a marker for atherosclerosis? Int J ClinExp Med. 2014; 7 (4):955-961.
17. Charles LE, Fekedulegn D, McCall T, Burchfiel CM, Andrew ME, ViolantiJM. Obesity, white blood cell counts, and platelet counts among police officers. Obesity. 2007; 15 (11):2846-2854.
18. Kodiatte TA, Manikyam UK, Rao SB, et al. Mean platelet volume in type 2 diabetes mellitus. J Lab Physicians. 2012; 4 (1):5-9.
19. Charles LE, Fekedulegn D, McCall T, Burchfiel CM, Andrew ME, ViolantiJM. Obesity, white blood cell counts, and platelet counts among police officers. Obesity. 2007; 15 (11):2846-2854.
20. Mortensen SB, Larsen SB, Grove EL, Kristensen SD, Hvas AM. Reduced platelet response to aspirin in patients with coronary artery disease and type 2 diabetes mellitus. Thromb Res. 2010; 126 (4):e318–e322.
21. Colwell JA, Nesto RW. The platelet in diabetes. Diabetes Care. 2003; 26:2181-2188.
22. Halushka PV, Rogers RC, Loadholt CB, Colwell JA. Increased platelet thromboxane synthesis in diabetes mellitus. J Lab Clin Med. 1981; 97:87-96.
23. Christensen KH, Grove EL, Würtz M, Christensen SD, Hvas AM. Reduced antiplatelet effect of aspirin during 24 hours in patients with coronary artery disease and type 2 diabetes. Platelets. 2015; 26 (3):230-235.
International Journal of Physiology, October-December 2019, Vol.7, No. 4 79
Role of Meditation in Prevention of Cardiovascular Diseases: An Analytical Study in Hyper-Reactors of Cold Pressor Test
Jitendra Mahour1, Yogesh Gupta2
1Associate Professor, 2Assistant Professor, Gandhi Medical College, Bhopal, (MP)
AbstractLiving a happy and healthy life on all planes is possible through the unified practice of yoga, pranayama’s, exercise, and meditation (dhyana) especially when performed consciously and with awareness. Such mindful meditation when performed on regular basis it helps to relieve stress from body and mind. Hence we undertook the present study to observe the effects of regular Meditation on the hyper reactors of cold pressure test (CPT) to find out their future outcomes in improving the modernized stressful life.
After getting ethical approval to the study subjects willing to participate in the study were selected and after performing cold pressor test (CPT) 383 hyper reactors were considered for the guided meditation sessions for 3 month. The sessions were conducted for 10 min both in morning and evening. After completing the session successfully it was observed that nearly 241 (62.83%) previous hyper reactors were turned into hypo reactors. Hence we conclude thatnon pharmacological method like meditation should be encouraged to enhance significant improvements in cardiovascularparameters like systolic and diastolic BP in population having high risk of cardiovascular disease.
Keywords: Cold pressor test (CPT), hyper reactors, hypo reactors, meditation, cardiovascular risk.
hang-ups. Meditation is nothing buta spiritual traditions that is the inbornknowledge of close connection between mind and the body, which may possibly be achieved by the regularMeditation sessions. 2
Emotional stress causes excess of adrenaline secretion from adrenal medulla leading to tachycardia, high blood pressure etc. Later it was found that all these manifestations occur not only from adrenaline secretion but also from over activity of the sympathetic nervous system which liberates nor-adrenaline at its nerve endings. 3
Such constantly increasing emotional stresses and changes in physiological speciation of hormones causes increasing threat for cardiovascular diseases impairing the normal life of an individual. To find out these future threats autonomic function testing could be the best investigation emphasizing on impending outcomes. 4
Hines & Brown devised a method to test the reactivity of the body to cold stress. They observed the effect of pain caused cold stress in the form of rise in blood pressure and on this basis subjects could be classified as hypo-reactors or hyper-reactors. The hyper-reactors to
IntroductionModern man is the victim of stress and stress related
disorders which threaten to disrupt his life totally. Being holistic in its approach, yoga offers the best way out of this ‘whirlpool of stresses’. Living a happy and healthy life on all planes is possible through the unified practice of yoga, pranayama’s, exercise, and meditation (dhyana) especially when performed consciously and with awareness. 1
Meditation and exercisehelp us to develop strength, flexibility, will power, good health, and stability. Meditation helpsus to control our emotions & stabilize the mind which are linked to breathing. Rhythmic breathing is ideal for controlling stress and overcoming emotional
Corresponding Author: Dr. Yogesh Gupta E-503, Comfort Heights, Comfort green, Nayapura, New-jail road, Sanjeev nagar, Bhopal. 462038 e-mail: dryogi. [email protected] Cell: +91 9421270902
10.5958/2320-608X.2019.00144.6
80 International Journal of Physiology, October-December 2019, Vol.7, No. 4
cold stress are likely to develop cardiac disorders later on in any phase of life. These hyper-reactive subjects should be properly dealt with to lower the incidence of such disorders. 5
Hence we undertook the present study to observe the effects of regular Meditation on the hyper reactors of cold pressure test (CPT) to find out their future outcomes in improving the modernized stressful life.
Material and MethodThe present study was carried out in Department of
Physiology Gandhi Medical College, Bhopal. (M. P.) in collaboration with Brahmakumari center for yoga and Meditation, Bhopal. A sample size of 383 participants was calculated using SampSize online stats calculator with prevalence of hypertension in Bhopal city to 53.3%,6 confidence interval of 95% and precision to be 5 %.7
Young adults from Bhopal city aging 18-30 years participated in the study. After taking institutional ethics approval written and informed consent was taken from the participants. Then baseline parameters like Height, weight, systolic blood pressure (SBP), diastolic blood pressure (DBP), systemic blood pressure (BP) and heart rate (HR) was taken. For measuring BP traditional mercury sphygmomanometer was used and BP was recorded by both palpation and auscultation method by a two different investigators to reduce chance of errors.
Then cold pressor test was performed on the participants (details of which given below) and the hyper-reactors of CPT were separated for further study. On the selected hyper-reactors we trained them to perform mindful meditation for 10 minutes daily in morning session from 6 a. m. to 7 a. m. and in evening session from 6.30 p. m. to 7.30 p. m. The scientific training for mindful meditation was given by trained professional trainers at Brahmakumari center for Raj yoga and Meditation, Bhopal.
This training we implemented for a minimum of three months before taking the second session of recording SBP, DBP, BP and HR. The cold pressor test we performed was as follows:
Cold Pressor Test8: The reactivity of all the subjects to cold stress was studied by the cold pressor test of Hines & Brown. The technique is as follows:
The subject is allowed to rest in supine position in a quiet room with maintained temperature from 27 to 30 degree centigrade for 20-30 minutes. Readings of blood pressure were taken until basal level had been approximated.
With the subject still supine, and with the cuff of the sphygmomanometer on one arm, the opposite hand is immersed in ice water (2-40C), to a point just above the wrist. With the hand still in water, readings of the blood pressure were taken at the end of 60 seconds. The hand is removed from ice water soon as the readings had been made and then the readings were taken every two minutes until the blood pressure returned to its previous basal level. Subject were allowed to remove their hands any point time if they feel unbearable pain as per convenience.
On the basis of observations, the subjects were divided into two groups depending on their responses to cold stress:
Hyper-reactors: Those subjects in whom the systolic blood pressure raised more than 20 mm Hg and/or diastolic blood pressure raised more than 15 mm Hg.
Hypo-reactors: Those subjects in whom the systolic blood pressure didn’t exceed 20 mm Hg and /or diastolic blood pressure more than 15 mmHg.
In present study we considered hyper-reactors only as they are supposed to be the victims of hypertension and mortal cardiac vascular diseases in future affecting the disability adjusted life years (DALY).
Each subject underwent a detailed history and clinical examination with the following inclusion and exclusion criteria.
Inclusion Criteria:
1. Healthy, nonsmoker, with no cardiorespiratory disorders.
2. Subjects not doing any type of physical exercise.
Exclusion Criteria:
I. Subjects who were taking other physical activity like gym, athletics etc.
II. Subjects who were smokers, alcoholic, with respiratory disorders, jaundice, diabetes or any other disease related with cardiorespiratory system.
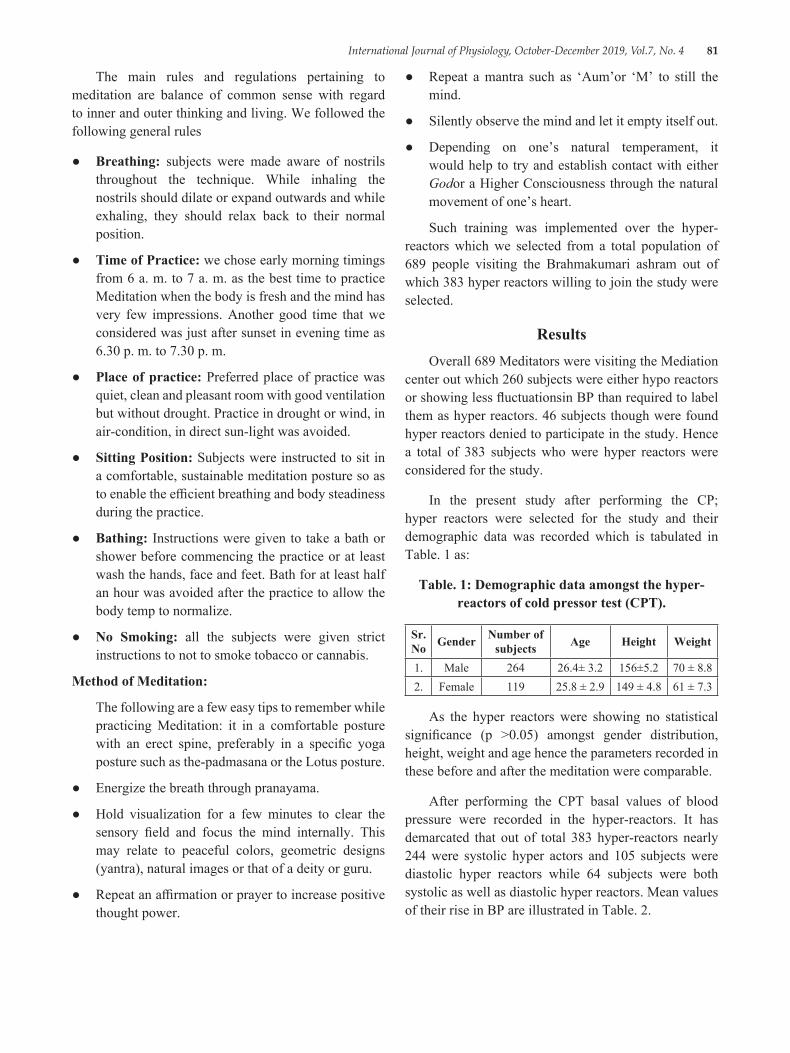
International Journal of Physiology, October-December 2019, Vol.7, No. 4 81
The main rules and regulations pertaining to meditation are balance of common sense with regard to inner and outer thinking and living. We followed the following general rules
● Breathing: subjects were made aware of nostrils throughout the technique. While inhaling the nostrils should dilate or expand outwards and while exhaling, they should relax back to their normal position.
● Time of Practice: we chose early morning timings from 6 a. m. to 7 a. m. as the best time to practice Meditation when the body is fresh and the mind has very few impressions. Another good time that we considered was just after sunset in evening time as 6.30 p. m. to 7.30 p. m.
● Place of practice: Preferred place of practice was quiet, clean and pleasant room with good ventilation but without drought. Practice in drought or wind, in air-condition, in direct sun-light was avoided.
● Sitting Position: Subjects were instructed to sit in a comfortable, sustainable meditation posture so as to enable the efficient breathing and body steadiness during the practice.
● Bathing: Instructions were given to take a bath or shower before commencing the practice or at least wash the hands, face and feet. Bath for at least half an hour was avoided after the practice to allow the body temp to normalize.
● No Smoking: all the subjects were given strict instructions to not to smoke tobacco or cannabis.
Method of Meditation:
The following are a few easy tips to remember while practicing Meditation: it in a comfortable posture with an erect spine, preferably in a specific yoga posture such as the-padmasana or the Lotus posture.
● Energize the breath through pranayama.
● Hold visualization for a few minutes to clear the sensory field and focus the mind internally. This may relate to peaceful colors, geometric designs (yantra), natural images or that of a deity or guru.
● Repeat an affirmation or prayer to increase positive thought power.
● Repeat a mantra such as ‘Aum’or ‘M’ to still the mind.
● Silently observe the mind and let it empty itself out.
● Depending on one’s natural temperament, it would help to try and establish contact with either Godor a Higher Consciousness through the natural movement of one’s heart.
Such training was implemented over the hyper-reactors which we selected from a total population of 689 people visiting the Brahmakumari ashram out of which 383 hyper reactors willing to join the study were selected.
ResultsOverall 689 Meditators were visiting the Mediation
center out which 260 subjects were either hypo reactors or showing less fluctuationsin BP than required to label them as hyper reactors. 46 subjects though were found hyper reactors denied to participate in the study. Hence a total of 383 subjects who were hyper reactors were considered for the study.
In the present study after performing the CP; hyper reactors were selected for the study and their demographic data was recorded which is tabulated in Table. 1 as:
Table. 1: Demographic data amongst the hyper-reactors of cold pressor test (CPT).
Sr. No Gender Number of
subjects Age Height Weight
1. Male 264 26.4± 3.2 156±5.2 70 ± 8.82. Female 119 25.8 ± 2.9 149 ± 4.8 61 ± 7.3
As the hyper reactors were showing no statistical significance (p >0.05) amongst gender distribution, height, weight and age hence the parameters recorded in these before and after the meditation were comparable.
After performing the CPT basal values of blood pressure were recorded in the hyper-reactors. It has demarcated that out of total 383 hyper-reactors nearly 244 were systolic hyper actors and 105 subjects were diastolic hyper reactors while 64 subjects were both systolic as well as diastolic hyper reactors. Mean values of their rise in BP are illustrated in Table. 2.
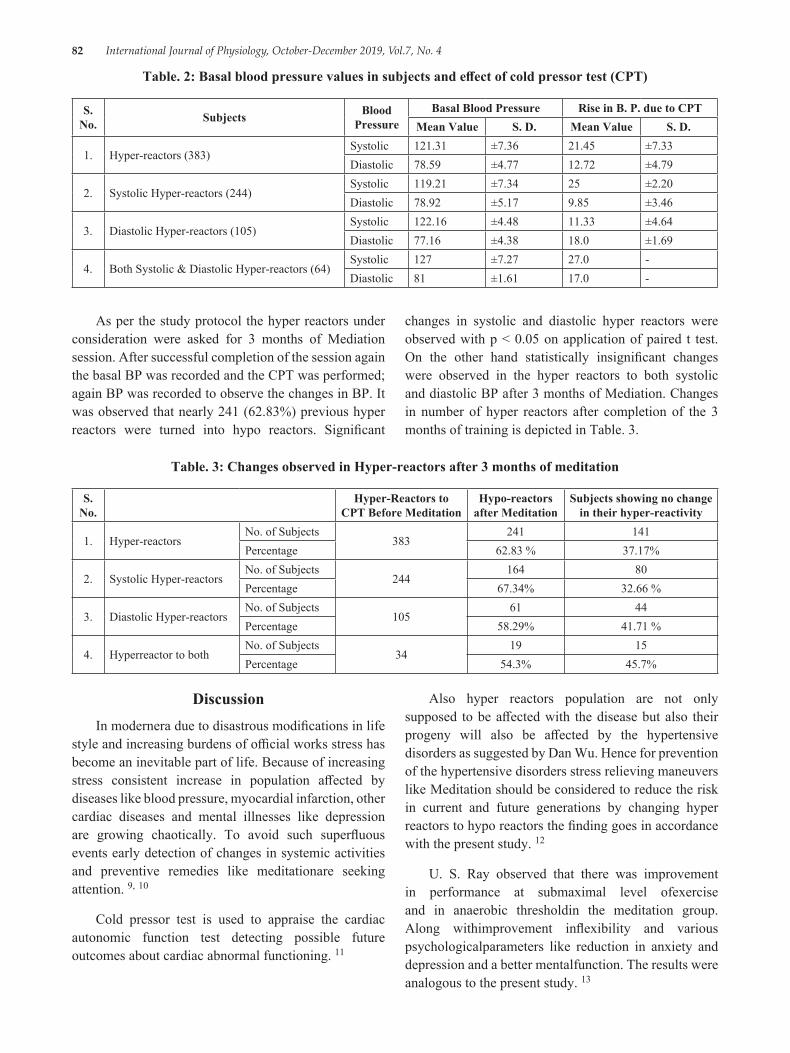
82 International Journal of Physiology, October-December 2019, Vol.7, No. 4
Table. 2: Basal blood pressure values in subjects and effect of cold pressor test (CPT)
S. No. Subjects Blood
PressureBasal Blood Pressure Rise in B. P. due to CPT
Mean Value S. D. Mean Value S. D.
1. Hyper-reactors (383)Systolic 121.31 ±7.36 21.45 ±7.33Diastolic 78.59 ±4.77 12.72 ±4.79
2. Systolic Hyper-reactors (244)Systolic 119.21 ±7.34 25 ±2.20Diastolic 78.92 ±5.17 9.85 ±3.46
3. Diastolic Hyper-reactors (105)Systolic 122.16 ±4.48 11.33 ±4.64Diastolic 77.16 ±4.38 18.0 ±1.69
4. Both Systolic & Diastolic Hyper-reactors (64)Systolic 127 ±7.27 27.0 -Diastolic 81 ±1.61 17.0 -
As per the study protocol the hyper reactors under consideration were asked for 3 months of Mediation session. After successful completion of the session again the basal BP was recorded and the CPT was performed; again BP was recorded to observe the changes in BP. It was observed that nearly 241 (62.83%) previous hyper reactors were turned into hypo reactors. Significant
changes in systolic and diastolic hyper reactors were observed with p < 0.05 on application of paired t test. On the other hand statistically insignificant changes were observed in the hyper reactors to both systolic and diastolic BP after 3 months of Mediation. Changes in number of hyper reactors after completion of the 3 months of training is depicted in Table. 3.
Table. 3: Changes observed in Hyper-reactors after 3 months of meditation
S. No.
Hyper-Reactors to CPT Before Meditation
Hypo-reactors after Meditation
Subjects showing no change in their hyper-reactivity
1. Hyper-reactorsNo. of Subjects
383241 141
Percentage 62.83 % 37.17%
2. Systolic Hyper-reactorsNo. of Subjects
244164 80
Percentage 67.34% 32.66 %
3. Diastolic Hyper-reactorsNo. of Subjects
10561 44
Percentage 58.29% 41.71 %
4. Hyperreactor to bothNo. of Subjects
3419 15
Percentage 54.3% 45.7%
DiscussionIn modernera due to disastrous modifications in life
style and increasing burdens of official works stress has become an inevitable part of life. Because of increasing stress consistent increase in population affected by diseases like blood pressure, myocardial infarction, other cardiac diseases and mental illnesses like depression are growing chaotically. To avoid such superfluous events early detection of changes in systemic activities and preventive remedies like meditationare seeking attention. 9, 10
Cold pressor test is used to appraise the cardiac autonomic function test detecting possible future outcomes about cardiac abnormal functioning. 11
Also hyper reactors population are not only supposed to be affected with the disease but also their progeny will also be affected by the hypertensive disorders as suggested by Dan Wu. Hence for prevention of the hypertensive disorders stress relieving maneuvers like Meditation should be considered to reduce the risk in current and future generations by changing hyper reactors to hypo reactors the finding goes in accordance with the present study. 12
U. S. Ray observed that there was improvement in performance at submaximal level ofexercise and in anaerobic thresholdin the meditation group. Along withimprovement inflexibility and various psychologicalparameters like reduction in anxiety and depression and a better mentalfunction. The results were analogous to the present study. 13
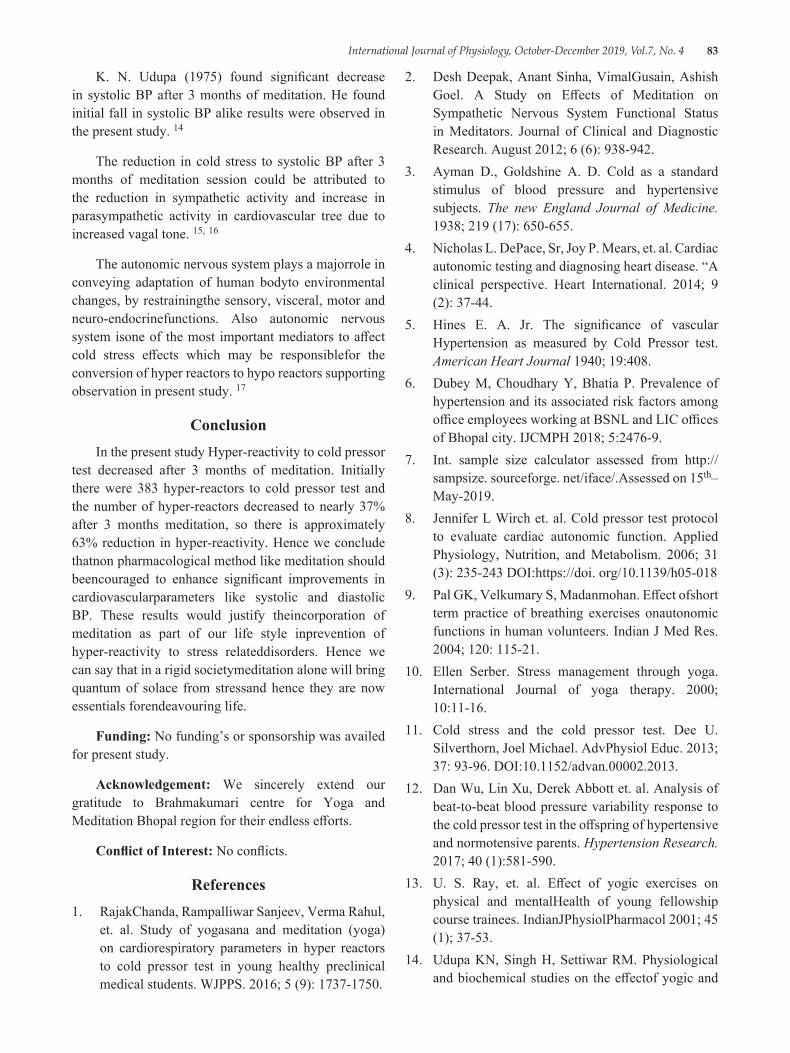
International Journal of Physiology, October-December 2019, Vol.7, No. 4 83
K. N. Udupa (1975) found significant decrease in systolic BP after 3 months of meditation. He found initial fall in systolic BP alike results were observed in the present study. 14
The reduction in cold stress to systolic BP after 3 months of meditation session could be attributed to the reduction in sympathetic activity and increase in parasympathetic activity in cardiovascular tree due to increased vagal tone. 15, 16
The autonomic nervous system plays a majorrole in conveying adaptation of human bodyto environmental changes, by restrainingthe sensory, visceral, motor and neuro-endocrinefunctions. Also autonomic nervous system isone of the most important mediators to affect cold stress effects which may be responsiblefor the conversion of hyper reactors to hypo reactors supporting observation in present study. 17
ConclusionIn the present study Hyper-reactivity to cold pressor
test decreased after 3 months of meditation. Initially there were 383 hyper-reactors to cold pressor test and the number of hyper-reactors decreased to nearly 37% after 3 months meditation, so there is approximately 63% reduction in hyper-reactivity. Hence we conclude thatnon pharmacological method like meditation should beencouraged to enhance significant improvements in cardiovascularparameters like systolic and diastolic BP. These results would justify theincorporation of meditation as part of our life style inprevention of hyper-reactivity to stress relateddisorders. Hence we can say that in a rigid societymeditation alone will bring quantum of solace from stressand hence they are now essentials forendeavouring life.
Funding: No funding’s or sponsorship was availed for present study.
Acknowledgement: We sincerely extend our gratitude to Brahmakumari centre for Yoga and Meditation Bhopal region for their endless efforts.
Conflict of Interest: No conflicts.
References1. RajakChanda, Rampalliwar Sanjeev, Verma Rahul,
et. al. Study of yogasana and meditation (yoga) on cardiorespiratory parameters in hyper reactors to cold pressor test in young healthy preclinical medical students. WJPPS. 2016; 5 (9): 1737-1750.
2. Desh Deepak, Anant Sinha, VimalGusain, Ashish Goel. A Study on Effects of Meditation on Sympathetic Nervous System Functional Status in Meditators. Journal of Clinical and Diagnostic Research. August 2012; 6 (6): 938-942.
3. Ayman D., Goldshine A. D. Cold as a standard stimulus of blood pressure and hypertensive subjects. The new England Journal of Medicine. 1938; 219 (17): 650-655.
4. Nicholas L. DePace, Sr, Joy P. Mears, et. al. Cardiac autonomic testing and diagnosing heart disease. “A clinical perspective. Heart International. 2014; 9 (2): 37-44.
5. Hines E. A. Jr. The significance of vascular Hypertension as measured by Cold Pressor test. American Heart Journal 1940; 19:408.
6. Dubey M, Choudhary Y, Bhatia P. Prevalence of hypertension and its associated risk factors among office employees working at BSNL and LIC offices of Bhopal city. IJCMPH 2018; 5:2476-9.
7. Int. sample size calculator assessed from http://sampsize. sourceforge. net/iface/.Assessed on 15th–May-2019.
8. Jennifer L Wirch et. al. Cold pressor test protocol to evaluate cardiac autonomic function. Applied Physiology, Nutrition, and Metabolism. 2006; 31 (3): 235-243 DOI:https://doi. org/10.1139/h05-018
9. Pal GK, Velkumary S, Madanmohan. Effect ofshort term practice of breathing exercises onautonomic functions in human volunteers. Indian J Med Res. 2004; 120: 115-21.
10. Ellen Serber. Stress management through yoga. International Journal of yoga therapy. 2000; 10:11-16.
11. Cold stress and the cold pressor test. Dee U. Silverthorn, Joel Michael. AdvPhysiol Educ. 2013; 37: 93-96. DOI:10.1152/advan.00002.2013.
12. Dan Wu, Lin Xu, Derek Abbott et. al. Analysis of beat-to-beat blood pressure variability response to the cold pressor test in the offspring of hypertensive and normotensive parents. Hypertension Research. 2017; 40 (1):581-590.
13. U. S. Ray, et. al. Effect of yogic exercises on physical and mentalHealth of young fellowship course trainees. IndianJPhysiolPharmacol 2001; 45 (1); 37-53.
14. Udupa KN, Singh H, Settiwar RM. Physiological and biochemical studies on the effectof yogic and

84 International Journal of Physiology, October-December 2019, Vol.7, No. 4
certain other exercises. Indian J Med Res. 1975; 63: 620-624.
15. Gopal KC, Bhatnagar OP, Subramanian N, Nishith SD. Effect of yogasanas & pranayamas on bloodpressure, pulse rate & some respiratory functions. Indian J Physiol Pharmacol. 1973; 17:273-76.
16. Vyas R, Dikshit N. Effect of meditation onrespiratory system, cardiovascular system andlipid profile. IJPP. 2002; 46:487-91.
17. Park SH, Han KS. Blood Pressure Response to Meditation and Yoga: A Systematic Review and Meta-Analysis. J Altern Complement Med. Sep 2017; 23 (9):685-695.doi: 10.1089/acm. 2016.0234.
International Journal of Physiology, October-December 2019, Vol.7, No. 4 85
Gender Difference in Emotional Intelligence and its Component Traits in Medical Students
Kamalakannan Vadivel1, Nilesh N Kate2
1Assistant Professor, Dr Kamalakannan Vadivel, 2Professor, Dept. of Physiology, ESIC Medical College, Gulbarga, Karnataka
AbstractIntroduction: Emotional intelligence (EI) is a measure of emotional awareness. Higher EI is associated with improved patient-physician relationship, increased empathy, improved teamwork and communication abilities, stress management, organization commitment, leadership and higher academic performance. The aim of this study is to assess EI in medical students and to investigate if there is any gender difference in EI. We also studied the difference in the EI traits in relation to gender.
Materials and Method: It is an observational, survey based study. EI was assessed using Schutte Self Report Emotional Intelligence Test (SSEIT). SSEIT was distributed to 278 students after informed consent. Students have to respond on a five point Likert’s scale. The data obtained were interpreted using descriptive statistics and analyzed with R statistical software package.
Results: 21% of students were found to have very high EI. 71% were found to have average EI. 8% were found to have low EI. Among the male students, 75% were having average EI score, 18% had high EI and 7% had very low EI. Among the female participants, 68% were found to have average EI, 23% had very high EI and 9% had low EI. EI was similar in both genders and the component traits measured by SSEIT were also similar in both gender.
Conclusion: EI and its trait is similar in both genders. Training modules can be incorporated in graduate medical education programme to improve EI in both genders.
Keywords: Emotional intelligence, gender difference, SSEIT, EI trait.
of first contact of the community while being globally relevant1.
To achieve this, an IMG must be able to perform effectively, ethically & appropriately in carrying out his responsibilities as a clinician, a leader, as a member of health care system, a communicator and a lifelong learner. An IMG must also be able to provide health service that is clinically relevant and sound and he/she must be emotionally responsive2. The accreditation council for graduate medical education have identified and defined six competencies which include patient care, professionalism, system based practice, interpersonal and communication skills, medical knowledge, practice based learning and improvement3.
To identify the strategies that will improve the above competencies, it is essential to identify the underlying
IntroductionMedical education is aimed at imparting the
medical students with broad range of skill sets so as to enable them to deliver high quality health service. Accordingly, MCI has come up with revised graduate medical education regulation 2017. The aim of revised regulation is to create an “Indian Medical Graduate” (IMG) possessing requisite knowledge, skills, attitudes, values and responsiveness, so that she or he may function appropriately and effectively as a physician
Corresponding Author: Dr Kamalakannan V Assistant Professor, Dept. of Physiology, ESIC Medical College, Gulbarga, Karnataka e-mail: [email protected]
10.5958/2320-608X.2019.00145.8
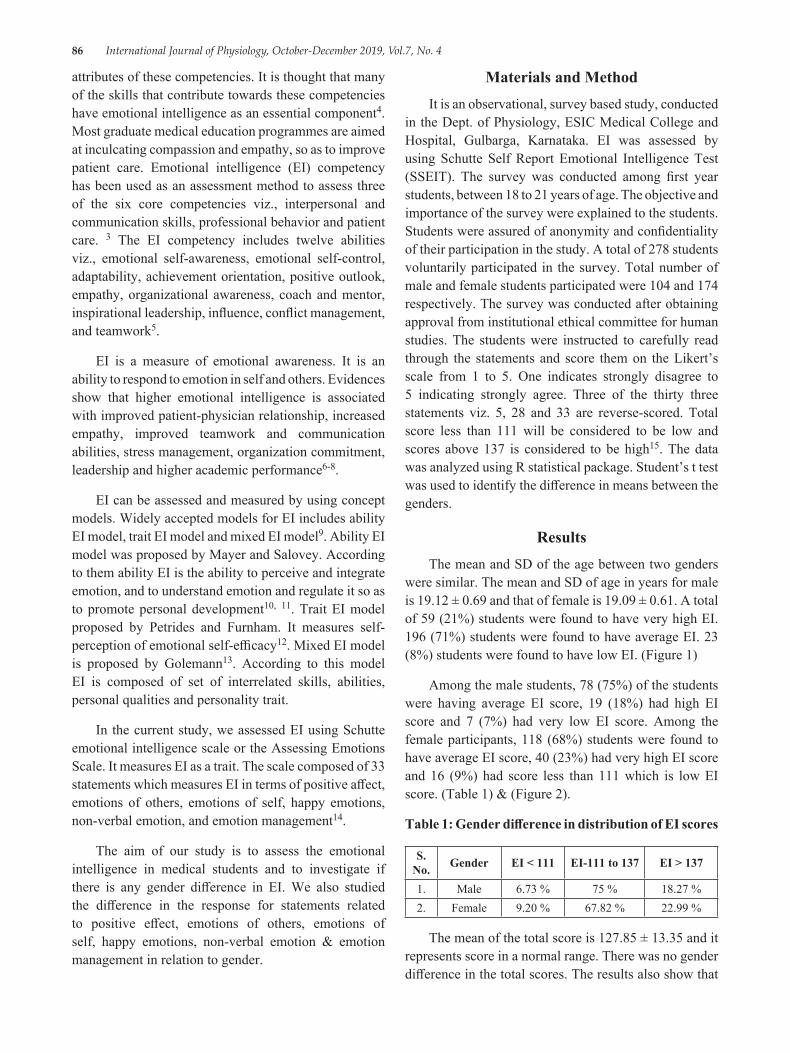
86 International Journal of Physiology, October-December 2019, Vol.7, No. 4
attributes of these competencies. It is thought that many of the skills that contribute towards these competencies have emotional intelligence as an essential component4. Most graduate medical education programmes are aimed at inculcating compassion and empathy, so as to improve patient care. Emotional intelligence (EI) competency has been used as an assessment method to assess three of the six core competencies viz., interpersonal and communication skills, professional behavior and patient care. 3 The EI competency includes twelve abilities viz., emotional self-awareness, emotional self-control, adaptability, achievement orientation, positive outlook, empathy, organizational awareness, coach and mentor, inspirational leadership, influence, conflict management, and teamwork5.
EI is a measure of emotional awareness. It is an ability to respond to emotion in self and others. Evidences show that higher emotional intelligence is associated with improved patient-physician relationship, increased empathy, improved teamwork and communication abilities, stress management, organization commitment, leadership and higher academic performance6-8.
EI can be assessed and measured by using concept models. Widely accepted models for EI includes ability EI model, trait EI model and mixed EI model9. Ability EI model was proposed by Mayer and Salovey. According to them ability EI is the ability to perceive and integrate emotion, and to understand emotion and regulate it so as to promote personal development10, 11. Trait EI model proposed by Petrides and Furnham. It measures self-perception of emotional self-efficacy12. Mixed EI model is proposed by Golemann13. According to this model EI is composed of set of interrelated skills, abilities, personal qualities and personality trait.
In the current study, we assessed EI using Schutte emotional intelligence scale or the Assessing Emotions Scale. It measures EI as a trait. The scale composed of 33 statements which measures EI in terms of positive affect, emotions of others, emotions of self, happy emotions, non-verbal emotion, and emotion management14.
The aim of our study is to assess the emotional intelligence in medical students and to investigate if there is any gender difference in EI. We also studied the difference in the response for statements related to positive effect, emotions of others, emotions of self, happy emotions, non-verbal emotion & emotion management in relation to gender.
Materials and MethodIt is an observational, survey based study, conducted
in the Dept. of Physiology, ESIC Medical College and Hospital, Gulbarga, Karnataka. EI was assessed by using Schutte Self Report Emotional Intelligence Test (SSEIT). The survey was conducted among first year students, between 18 to 21 years of age. The objective and importance of the survey were explained to the students. Students were assured of anonymity and confidentiality of their participation in the study. A total of 278 students voluntarily participated in the survey. Total number of male and female students participated were 104 and 174 respectively. The survey was conducted after obtaining approval from institutional ethical committee for human studies. The students were instructed to carefully read through the statements and score them on the Likert’s scale from 1 to 5. One indicates strongly disagree to 5 indicating strongly agree. Three of the thirty three statements viz. 5, 28 and 33 are reverse-scored. Total score less than 111 will be considered to be low and scores above 137 is considered to be high15. The data was analyzed using R statistical package. Student’s t test was used to identify the difference in means between the genders.
ResultsThe mean and SD of the age between two genders
were similar. The mean and SD of age in years for male is 19.12 ± 0.69 and that of female is 19.09 ± 0.61. A total of 59 (21%) students were found to have very high EI. 196 (71%) students were found to have average EI. 23 (8%) students were found to have low EI. (Figure 1)
Among the male students, 78 (75%) of the students were having average EI score, 19 (18%) had high EI score and 7 (7%) had very low EI score. Among the female participants, 118 (68%) students were found to have average EI score, 40 (23%) had very high EI score and 16 (9%) had score less than 111 which is low EI score. (Table 1) & (Figure 2).
Table 1: Gender difference in distribution of EI scores
S. No. Gender EI < 111 EI-111 to 137 EI > 137
1. Male 6.73 % 75 % 18.27 %2. Female 9.20 % 67.82 % 22.99 %
The mean of the total score is 127.85 ± 13.35 and it represents score in a normal range. There was no gender difference in the total scores. The results also show that
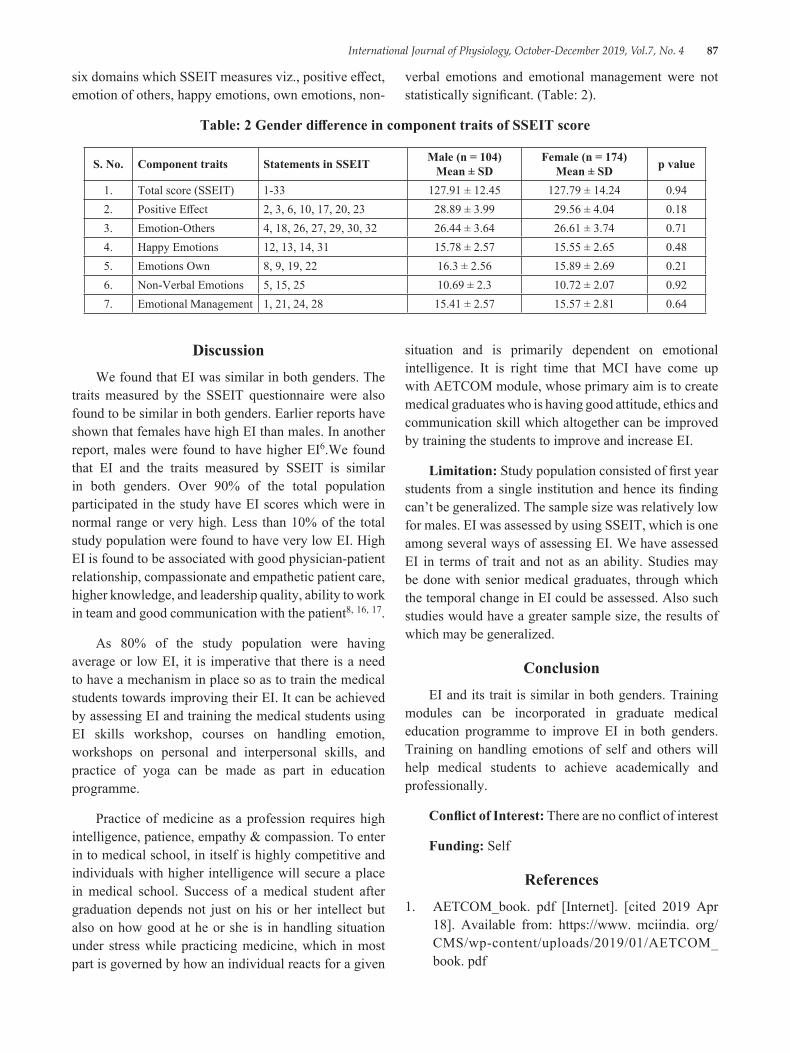
International Journal of Physiology, October-December 2019, Vol.7, No. 4 87
six domains which SSEIT measures viz., positive effect, emotion of others, happy emotions, own emotions, non-
verbal emotions and emotional management were not statistically significant. (Table: 2).
Table: 2 Gender difference in component traits of SSEIT score
S. No. Component traits Statements in SSEIT Male (n = 104) Mean ± SD
Female (n = 174) Mean ± SD p value
1. Total score (SSEIT) 1-33 127.91 ± 12.45 127.79 ± 14.24 0.942. Positive Effect 2, 3, 6, 10, 17, 20, 23 28.89 ± 3.99 29.56 ± 4.04 0.183. Emotion-Others 4, 18, 26, 27, 29, 30, 32 26.44 ± 3.64 26.61 ± 3.74 0.714. Happy Emotions 12, 13, 14, 31 15.78 ± 2.57 15.55 ± 2.65 0.485. Emotions Own 8, 9, 19, 22 16.3 ± 2.56 15.89 ± 2.69 0.216. Non-Verbal Emotions 5, 15, 25 10.69 ± 2.3 10.72 ± 2.07 0.927. Emotional Management 1, 21, 24, 28 15.41 ± 2.57 15.57 ± 2.81 0.64
DiscussionWe found that EI was similar in both genders. The
traits measured by the SSEIT questionnaire were also found to be similar in both genders. Earlier reports have shown that females have high EI than males. In another report, males were found to have higher EI6.We found that EI and the traits measured by SSEIT is similar in both genders. Over 90% of the total population participated in the study have EI scores which were in normal range or very high. Less than 10% of the total study population were found to have very low EI. High EI is found to be associated with good physician-patient relationship, compassionate and empathetic patient care, higher knowledge, and leadership quality, ability to work in team and good communication with the patient8, 16, 17.
As 80% of the study population were having average or low EI, it is imperative that there is a need to have a mechanism in place so as to train the medical students towards improving their EI. It can be achieved by assessing EI and training the medical students using EI skills workshop, courses on handling emotion, workshops on personal and interpersonal skills, and practice of yoga can be made as part in education programme.
Practice of medicine as a profession requires high intelligence, patience, empathy & compassion. To enter in to medical school, in itself is highly competitive and individuals with higher intelligence will secure a place in medical school. Success of a medical student after graduation depends not just on his or her intellect but also on how good at he or she is in handling situation under stress while practicing medicine, which in most part is governed by how an individual reacts for a given
situation and is primarily dependent on emotional intelligence. It is right time that MCI have come up with AETCOM module, whose primary aim is to create medical graduates who is having good attitude, ethics and communication skill which altogether can be improved by training the students to improve and increase EI.
Limitation: Study population consisted of first year students from a single institution and hence its finding can’t be generalized. The sample size was relatively low for males. EI was assessed by using SSEIT, which is one among several ways of assessing EI. We have assessed EI in terms of trait and not as an ability. Studies may be done with senior medical graduates, through which the temporal change in EI could be assessed. Also such studies would have a greater sample size, the results of which may be generalized.
ConclusionEI and its trait is similar in both genders. Training
modules can be incorporated in graduate medical education programme to improve EI in both genders. Training on handling emotions of self and others will help medical students to achieve academically and professionally.
Conflict of Interest: There are no conflict of interest
Funding: Self
References1. AETCOM_book. pdf [Internet]. [cited 2019 Apr
18]. Available from: https://www. mciindia. org/CMS/wp-content/uploads/2019/01/AETCOM_book. pdf
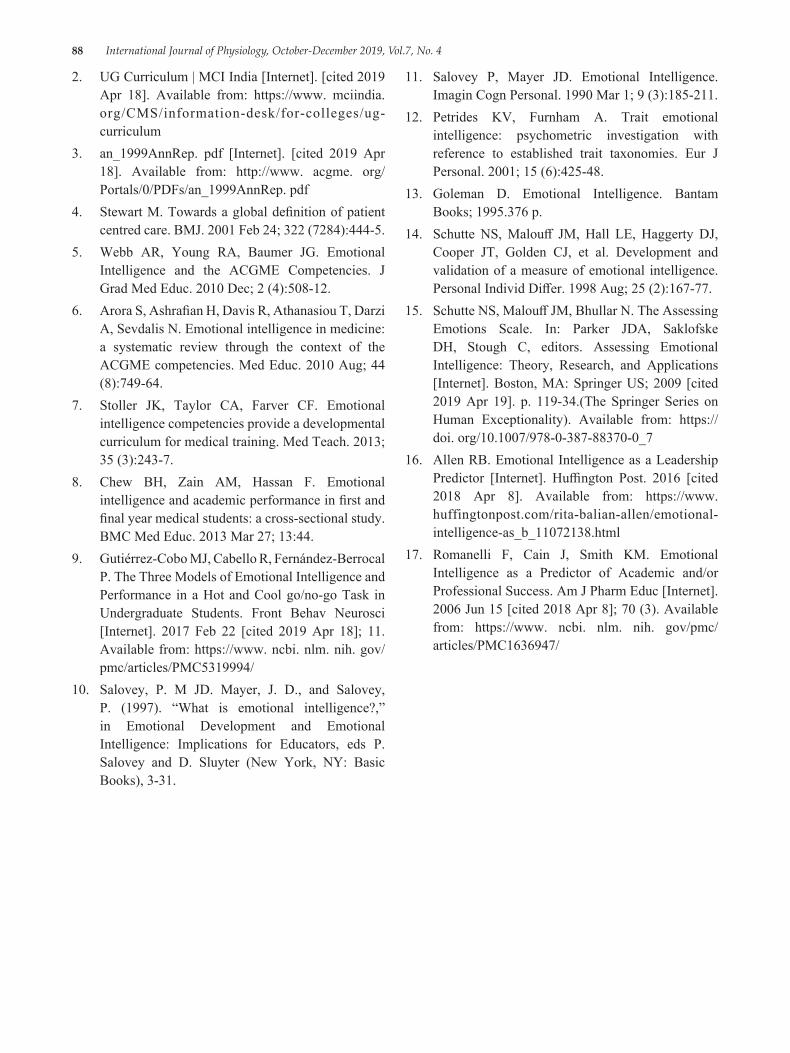
88 International Journal of Physiology, October-December 2019, Vol.7, No. 4
2. UG Curriculum | MCI India [Internet]. [cited 2019 Apr 18]. Available from: https://www. mciindia. org/CMS/information-desk/for-colleges/ug-curriculum
3. an_1999AnnRep. pdf [Internet]. [cited 2019 Apr 18]. Available from: http://www. acgme. org/Portals/0/PDFs/an_1999AnnRep. pdf
4. Stewart M. Towards a global definition of patient centred care. BMJ. 2001 Feb 24; 322 (7284):444-5.
5. Webb AR, Young RA, Baumer JG. Emotional Intelligence and the ACGME Competencies. J Grad Med Educ. 2010 Dec; 2 (4):508-12.
6. Arora S, Ashrafian H, Davis R, Athanasiou T, Darzi A, Sevdalis N. Emotional intelligence in medicine: a systematic review through the context of the ACGME competencies. Med Educ. 2010 Aug; 44 (8):749-64.
7. Stoller JK, Taylor CA, Farver CF. Emotional intelligence competencies provide a developmental curriculum for medical training. Med Teach. 2013; 35 (3):243-7.
8. Chew BH, Zain AM, Hassan F. Emotional intelligence and academic performance in first and final year medical students: a cross-sectional study. BMC Med Educ. 2013 Mar 27; 13:44.
9. Gutiérrez-Cobo MJ, Cabello R, Fernández-Berrocal P. The Three Models of Emotional Intelligence and Performance in a Hot and Cool go/no-go Task in Undergraduate Students. Front Behav Neurosci [Internet]. 2017 Feb 22 [cited 2019 Apr 18]; 11. Available from: https://www. ncbi. nlm. nih. gov/pmc/articles/PMC5319994/
10. Salovey, P. M JD. Mayer, J. D., and Salovey, P. (1997). “What is emotional intelligence?,” in Emotional Development and Emotional Intelligence: Implications for Educators, eds P. Salovey and D. Sluyter (New York, NY: Basic Books), 3-31.
11. Salovey P, Mayer JD. Emotional Intelligence. Imagin Cogn Personal. 1990 Mar 1; 9 (3):185-211.
12. Petrides KV, Furnham A. Trait emotional intelligence: psychometric investigation with reference to established trait taxonomies. Eur J Personal. 2001; 15 (6):425-48.
13. Goleman D. Emotional Intelligence. Bantam Books; 1995.376 p.
14. Schutte NS, Malouff JM, Hall LE, Haggerty DJ, Cooper JT, Golden CJ, et al. Development and validation of a measure of emotional intelligence. Personal Individ Differ. 1998 Aug; 25 (2):167-77.
15. Schutte NS, Malouff JM, Bhullar N. The Assessing Emotions Scale. In: Parker JDA, Saklofske DH, Stough C, editors. Assessing Emotional Intelligence: Theory, Research, and Applications [Internet]. Boston, MA: Springer US; 2009 [cited 2019 Apr 19]. p. 119-34.(The Springer Series on Human Exceptionality). Available from: https://doi. org/10.1007/978-0-387-88370-0_7
16. Allen RB. Emotional Intelligence as a Leadership Predictor [Internet]. Huffington Post. 2016 [cited 2018 Apr 8]. Available from: https://www. huffingtonpost.com/rita-balian-allen/emotional-intelligence-as_b_11072138.html
17. Romanelli F, Cain J, Smith KM. Emotional Intelligence as a Predictor of Academic and/or Professional Success. Am J Pharm Educ [Internet]. 2006 Jun 15 [cited 2018 Apr 8]; 70 (3). Available from: https://www. ncbi. nlm. nih. gov/pmc/articles/PMC1636947/
International Journal of Physiology, October-December 2019, Vol.7, No. 4 89
A Comparative Study of Pulmonary Function Test in School Children of Industrial Area and Non Industrial Area
Keshav Kashyap1, Anil Latiyar2
1Associate professor, Department of Physiology, Chhattisgarh institute of medical sciences Bhilaspur (CG), 2Assistant Professor, Department of Physiology, College name: LTBRKM Gov. Medical College Jagdalpur
AbstractBackground: Pulmonary function test is an important tool in the diagnosis, assessment and management of respiratory diseases in adults and older children. The main objective was to study the pulmonary function test in school children of industrial and Non industrial area.
Method: The study was carried out in a school of industrial area i.e., Advani Arlicon Higher secondary School, Urla Road, Birgaon and a school of Non Industrial area i.e., Vivekananda Higher Secondary School, Mana Camp of Raipur city from April to August 2012.. The subjects were evaluated through pulmonary function test by using Spirometry method. A total of 400 subjects aged between 11-18 years were included. For the study Permission from Institutional Ethics Committee was obtained. Initially informed individual consent was taken from all the patients included in the study.
Results: When Mean FEV1 (in liters) for Males in Cases was compared with Controls, p value was found to be <0.0001.When Mean FEV1 (in liters) for Females in Cases was compared with Controls, p value was found <0.0001.When PEFR (in liters/Sec) for Males in Cases was compared with Controls, p value was found to be 0.0290.When PEFR (in liters/Sec) for Females in Cases was compared with Controls, p value was found to be 0.3117.
Conclusion: To conclude, the problems are diverse, but it is important to keep close control over pollutants. Some preventable strategies need to be taken for acceptable environment for the future generations.
Keywords: Pulmonary function test, School children’s, Industrial area, Non industrial area.
and the size and integrity of the pulmonary capillary bed. Although they do not provide a diagnosis per se, different patterns of abnormalities are seen in various respiratory diseases which help to establish diagnosis. 2
Several factors can be responsible for disruption of normal lung development and growth, leading to reduced lung function. These include intrauterine growth retardation, viral infections, premature birth, inflammatory conditions, genetic changes and environmental toxicants.3
Children have increased exposure to many air pollutants as compared with adults because of higher minute ventilation and higher levels of physical activity and also because children spend more time outdoors than adults.
Respiratory health status in urban & rural 220 school children of 6 to 15 years of age group found, significantly
IntroductionPulmonary function test is an important tool in the
diagnosis, assessment and management of respiratory diseases in adults and children. 1
Pulmonary function tests are valuable investigations in the management of patients with suspected or previously diagnosed respiratory diseases.
They provide important information relating to the large and small airways, the pulmonary parenchyma
Corresponding Author: Dr Anil Latiyar Assistant Professor, Department of Physiology, College name: LTBRKM Gov. Medical College Jagdalpur., Dimrapal, Type 4 quarter no: 21, jagdalpur, 494001 e-mail: [email protected]
10.5958/2320-608X.2019.00146.X
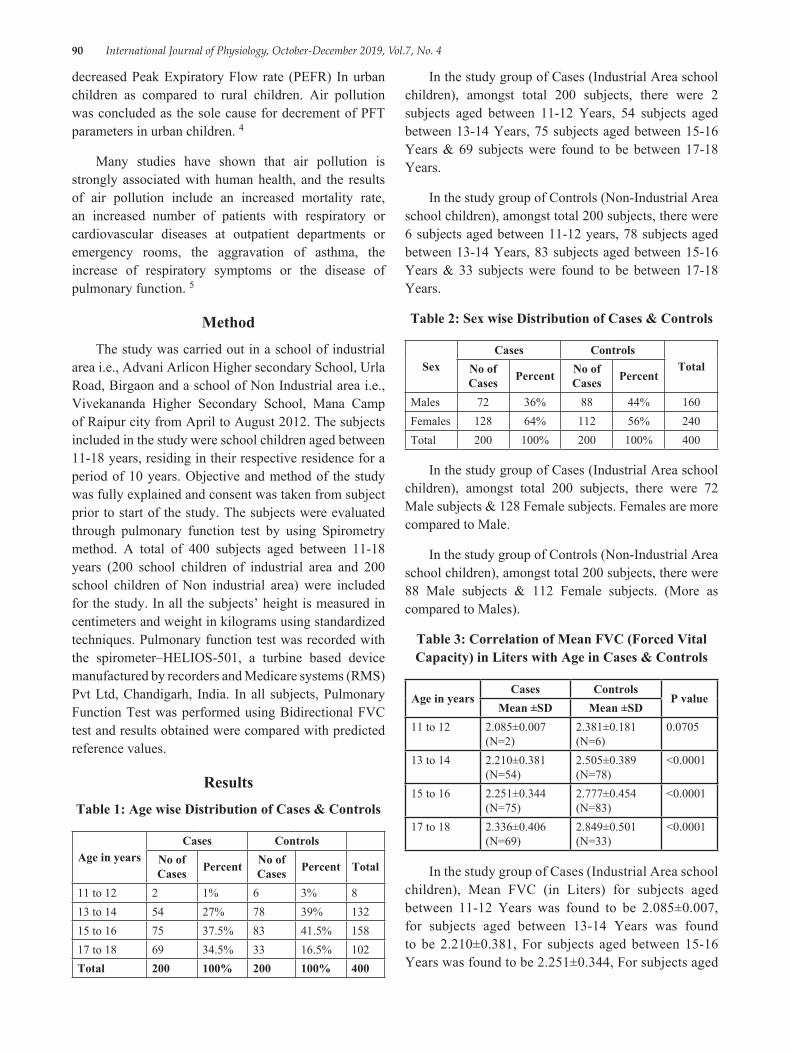
90 International Journal of Physiology, October-December 2019, Vol.7, No. 4
decreased Peak Expiratory Flow rate (PEFR) In urban children as compared to rural children. Air pollution was concluded as the sole cause for decrement of PFT parameters in urban children. 4
Many studies have shown that air pollution is strongly associated with human health, and the results of air pollution include an increased mortality rate, an increased number of patients with respiratory or cardiovascular diseases at outpatient departments or emergency rooms, the aggravation of asthma, the increase of respiratory symptoms or the disease of pulmonary function. 5
MethodThe study was carried out in a school of industrial
area i.e., Advani Arlicon Higher secondary School, Urla Road, Birgaon and a school of Non Industrial area i.e., Vivekananda Higher Secondary School, Mana Camp of Raipur city from April to August 2012. The subjects included in the study were school children aged between 11-18 years, residing in their respective residence for a period of 10 years. Objective and method of the study was fully explained and consent was taken from subject prior to start of the study. The subjects were evaluated through pulmonary function test by using Spirometry method. A total of 400 subjects aged between 11-18 years (200 school children of industrial area and 200 school children of Non industrial area) were included for the study. In all the subjects’ height is measured in centimeters and weight in kilograms using standardized techniques. Pulmonary function test was recorded with the spirometer–HELIOS-501, a turbine based device manufactured by recorders and Medicare systems (RMS) Pvt Ltd, Chandigarh, India. In all subjects, Pulmonary Function Test was performed using Bidirectional FVC test and results obtained were compared with predicted reference values.
ResultsTable 1: Age wise Distribution of Cases & Controls
Age in yearsCases Controls
No of Cases Percent No of
Cases Percent Total
11 to 12 2 1% 6 3% 813 to 14 54 27% 78 39% 13215 to 16 75 37.5% 83 41.5% 15817 to 18 69 34.5% 33 16.5% 102Total 200 100% 200 100% 400
In the study group of Cases (Industrial Area school children), amongst total 200 subjects, there were 2 subjects aged between 11-12 Years, 54 subjects aged between 13-14 Years, 75 subjects aged between 15-16 Years & 69 subjects were found to be between 17-18 Years.
In the study group of Controls (Non-Industrial Area school children), amongst total 200 subjects, there were 6 subjects aged between 11-12 years, 78 subjects aged between 13-14 Years, 83 subjects aged between 15-16 Years & 33 subjects were found to be between 17-18 Years.
Table 2: Sex wise Distribution of Cases & Controls
SexCases Controls
TotalNo of Cases Percent No of
Cases Percent
Males 72 36% 88 44% 160Females 128 64% 112 56% 240Total 200 100% 200 100% 400
In the study group of Cases (Industrial Area school children), amongst total 200 subjects, there were 72 Male subjects & 128 Female subjects. Females are more compared to Male.
In the study group of Controls (Non-Industrial Area school children), amongst total 200 subjects, there were 88 Male subjects & 112 Female subjects. (More as compared to Males).
Table 3: Correlation of Mean FVC (Forced Vital Capacity) in Liters with Age in Cases & Controls
Age in yearsCases Controls
P valueMean ±SD Mean ±SD
11 to 12 2.085±0.007 (N=2)
2.381±0.181 (N=6)
0.0705
13 to 14 2.210±0.381 (N=54)
2.505±0.389 (N=78)
<0.0001
15 to 16 2.251±0.344 (N=75)
2.777±0.454 (N=83)
<0.0001
17 to 18 2.336±0.406 (N=69)
2.849±0.501 (N=33)
<0.0001
In the study group of Cases (Industrial Area school children), Mean FVC (in Liters) for subjects aged between 11-12 Years was found to be 2.085±0.007, for subjects aged between 13-14 Years was found to be 2.210±0.381, For subjects aged between 15-16 Years was found to be 2.251±0.344, For subjects aged
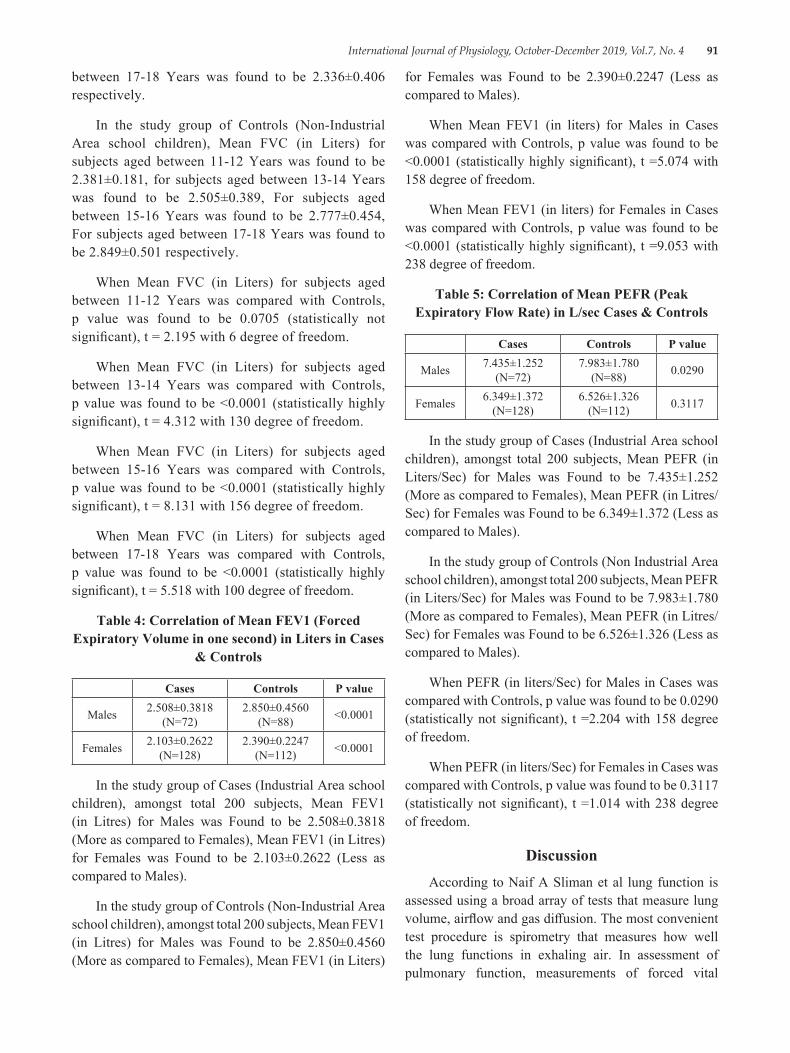
International Journal of Physiology, October-December 2019, Vol.7, No. 4 91
between 17-18 Years was found to be 2.336±0.406 respectively.
In the study group of Controls (Non-Industrial Area school children), Mean FVC (in Liters) for subjects aged between 11-12 Years was found to be 2.381±0.181, for subjects aged between 13-14 Years was found to be 2.505±0.389, For subjects aged between 15-16 Years was found to be 2.777±0.454, For subjects aged between 17-18 Years was found to be 2.849±0.501 respectively.
When Mean FVC (in Liters) for subjects aged between 11-12 Years was compared with Controls, p value was found to be 0.0705 (statistically not significant), t = 2.195 with 6 degree of freedom.
When Mean FVC (in Liters) for subjects aged between 13-14 Years was compared with Controls, p value was found to be <0.0001 (statistically highly significant), t = 4.312 with 130 degree of freedom.
When Mean FVC (in Liters) for subjects aged between 15-16 Years was compared with Controls, p value was found to be <0.0001 (statistically highly significant), t = 8.131 with 156 degree of freedom.
When Mean FVC (in Liters) for subjects aged between 17-18 Years was compared with Controls, p value was found to be <0.0001 (statistically highly significant), t = 5.518 with 100 degree of freedom.
Table 4: Correlation of Mean FEV1 (Forced Expiratory Volume in one second) in Liters in Cases
& Controls
Cases Controls P value
Males 2.508±0.3818 (N=72)
2.850±0.4560 (N=88) <0.0001
Females 2.103±0.2622 (N=128)
2.390±0.2247 (N=112) <0.0001
In the study group of Cases (Industrial Area school children), amongst total 200 subjects, Mean FEV1 (in Litres) for Males was Found to be 2.508±0.3818 (More as compared to Females), Mean FEV1 (in Litres) for Females was Found to be 2.103±0.2622 (Less as compared to Males).
In the study group of Controls (Non-Industrial Area school children), amongst total 200 subjects, Mean FEV1 (in Litres) for Males was Found to be 2.850±0.4560 (More as compared to Females), Mean FEV1 (in Liters)
for Females was Found to be 2.390±0.2247 (Less as compared to Males).
When Mean FEV1 (in liters) for Males in Cases was compared with Controls, p value was found to be <0.0001 (statistically highly significant), t =5.074 with 158 degree of freedom.
When Mean FEV1 (in liters) for Females in Cases was compared with Controls, p value was found to be <0.0001 (statistically highly significant), t =9.053 with 238 degree of freedom.
Table 5: Correlation of Mean PEFR (Peak Expiratory Flow Rate) in L/sec Cases & Controls
Cases Controls P value
Males 7.435±1.252 (N=72)
7.983±1.780 (N=88) 0.0290
Females 6.349±1.372 (N=128)
6.526±1.326 (N=112) 0.3117
In the study group of Cases (Industrial Area school children), amongst total 200 subjects, Mean PEFR (in Liters/Sec) for Males was Found to be 7.435±1.252 (More as compared to Females), Mean PEFR (in Litres/Sec) for Females was Found to be 6.349±1.372 (Less as compared to Males).
In the study group of Controls (Non Industrial Area school children), amongst total 200 subjects, Mean PEFR (in Liters/Sec) for Males was Found to be 7.983±1.780 (More as compared to Females), Mean PEFR (in Litres/Sec) for Females was Found to be 6.526±1.326 (Less as compared to Males).
When PEFR (in liters/Sec) for Males in Cases was compared with Controls, p value was found to be 0.0290 (statistically not significant), t =2.204 with 158 degree of freedom.
When PEFR (in liters/Sec) for Females in Cases was compared with Controls, p value was found to be 0.3117 (statistically not significant), t =1.014 with 238 degree of freedom.
DiscussionAccording to Naif A Sliman et al lung function is
assessed using a broad array of tests that measure lung volume, airflow and gas diffusion. The most convenient test procedure is spirometry that measures how well the lung functions in exhaling air. In assessment of pulmonary function, measurements of forced vital
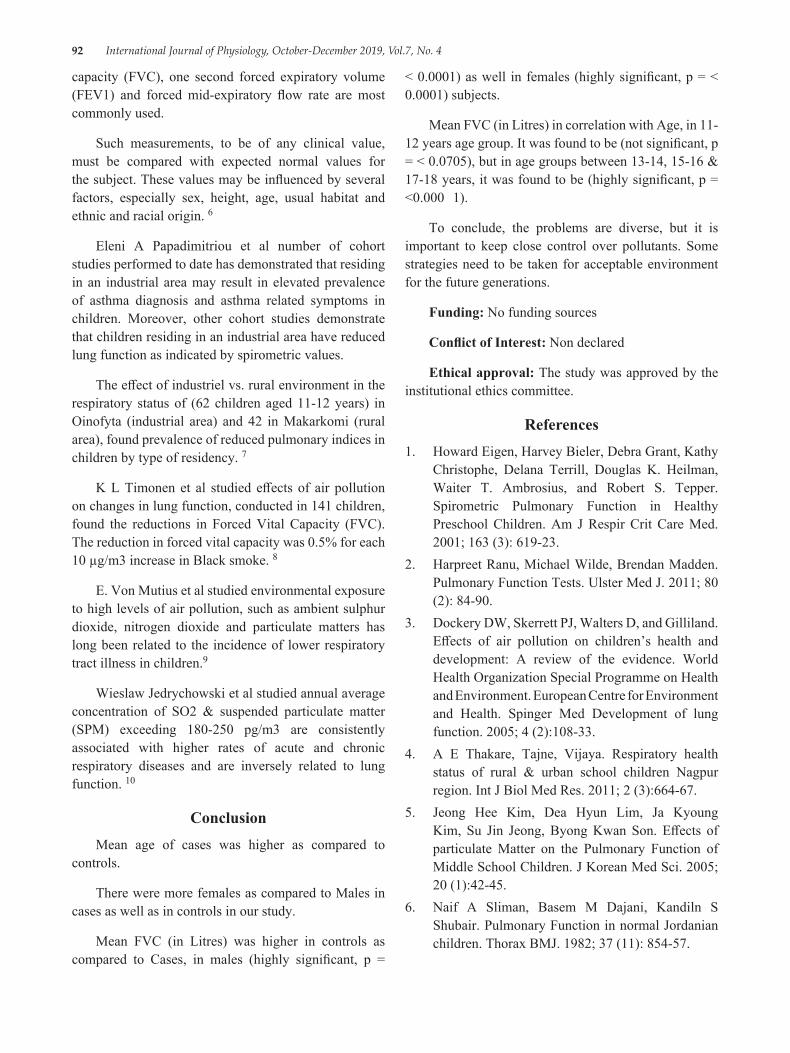
92 International Journal of Physiology, October-December 2019, Vol.7, No. 4
capacity (FVC), one second forced expiratory volume (FEV1) and forced mid-expiratory flow rate are most commonly used.
Such measurements, to be of any clinical value, must be compared with expected normal values for the subject. These values may be influenced by several factors, especially sex, height, age, usual habitat and ethnic and racial origin. 6
Eleni A Papadimitriou et al number of cohort studies performed to date has demonstrated that residing in an industrial area may result in elevated prevalence of asthma diagnosis and asthma related symptoms in children. Moreover, other cohort studies demonstrate that children residing in an industrial area have reduced lung function as indicated by spirometric values.
The effect of industriel vs. rural environment in the respiratory status of (62 children aged 11-12 years) in Oinofyta (industrial area) and 42 in Makarkomi (rural area), found prevalence of reduced pulmonary indices in children by type of residency. 7
K L Timonen et al studied effects of air pollution on changes in lung function, conducted in 141 children, found the reductions in Forced Vital Capacity (FVC). The reduction in forced vital capacity was 0.5% for each 10 µg/m3 increase in Black smoke. 8
E. Von Mutius et al studied environmental exposure to high levels of air pollution, such as ambient sulphur dioxide, nitrogen dioxide and particulate matters has long been related to the incidence of lower respiratory tract illness in children.9
Wieslaw Jedrychowski et al studied annual average concentration of SO2 & suspended particulate matter (SPM) exceeding 180-250 pg/m3 are consistently associated with higher rates of acute and chronic respiratory diseases and are inversely related to lung function. 10
ConclusionMean age of cases was higher as compared to
controls.
There were more females as compared to Males in cases as well as in controls in our study.
Mean FVC (in Litres) was higher in controls as compared to Cases, in males (highly significant, p =
< 0.0001) as well in females (highly significant, p = < 0.0001) subjects.
Mean FVC (in Litres) in correlation with Age, in 11-12 years age group. It was found to be (not significant, p = < 0.0705), but in age groups between 13-14, 15-16 & 17-18 years, it was found to be (highly significant, p = <0.000 1).
To conclude, the problems are diverse, but it is important to keep close control over pollutants. Some strategies need to be taken for acceptable environment for the future generations.
Funding: No funding sources
Conflict of Interest: Non declared
Ethical approval: The study was approved by the institutional ethics committee.
References1. Howard Eigen, Harvey Bieler, Debra Grant, Kathy
Christophe, Delana Terrill, Douglas K. Heilman, Waiter T. Ambrosius, and Robert S. Tepper. Spirometric Pulmonary Function in Healthy Preschool Children. Am J Respir Crit Care Med. 2001; 163 (3): 619-23.
2. Harpreet Ranu, Michael Wilde, Brendan Madden. Pulmonary Function Tests. Ulster Med J. 2011; 80 (2): 84-90.
3. Dockery DW, Skerrett PJ, Walters D, and Gilliland. Effects of air pollution on children’s health and development: A review of the evidence. World Health Organization Special Programme on Health and Environment. European Centre for Environment and Health. Spinger Med Development of lung function. 2005; 4 (2):108-33.
4. A E Thakare, Tajne, Vijaya. Respiratory health status of rural & urban school children Nagpur region. Int J Biol Med Res. 2011; 2 (3):664-67.
5. Jeong Hee Kim, Dea Hyun Lim, Ja Kyoung Kim, Su Jin Jeong, Byong Kwan Son. Effects of particulate Matter on the Pulmonary Function of Middle School Children. J Korean Med Sci. 2005; 20 (1):42-45.
6. Naif A Sliman, Basem M Dajani, Kandiln S Shubair. Pulmonary Function in normal Jordanian children. Thorax BMJ. 1982; 37 (11): 854-57.

International Journal of Physiology, October-December 2019, Vol.7, No. 4 93
7. Eleni A Papadimitriou, Elena Riza and Leonidas Pililitsis, Georgios Chrousos, Athena Linos. The Effect of Industrial vs. Rural Environment the Respiratory Status of School Children. Environment and Natural Resources J. 2011; 1 (1):25-35.
8. K L Timonen, J Pekkanen, P Tiittanen, R O Salinen. Effects of air pollution on changes in lung function induced by exercise in children with chronic respiratory symptoms. Occupational Environmental Medicine BMJ. 2002; 59 (2):129-34.
9. E. Von Mutius, D. L. Sherrill, C. Fritzsch, F. D. Martinez, M. D. Lebowitz. Air pollution and upper respiratory symptoms in children from East Germany, Eur Respir J. 1995; 8 (5):723-28.
10. Wieslaw Jedrychowski, Elzbieta Flak, and Elzbieta Mroz. The Adverse Effect of Low Levels of Ambient Air Pollutants on Lung Function Growth in Preadolescent Children. Environmental Health Perspectives J. 1999; 107 (8): 669-74.
94 International Journal of Physiology, October-December 2019, Vol.7, No. 4
Conventional Method to Evaluate Autonomic Functions in Obese Type–II Diabetics
Kosuri. Satish1, A.V. Siva Kumar2, Sk. Kareem2, K.N. Maruthy3, Sasikala. P3, Ch. Kiran Kumar4
1General Practitioner, Dr. Aster Mobile Clinic, Dubai, UAE, 2Research Scholar, Department of Physiology, Narayana Medical College, Nellore, 3Professor, Department of Physiology, Narayana Medical College, Nellore,
4Associate Professor, Department of Physiology, Narayana Medical College, Nellore
AbstractIntroduction: The efficiency and functional status of autonomic activity can be assessed by using the simple noninvasive tests for effective diagnosis of autonomic imbalance in various diseases. The obesity and diabetes mellitus are the leading clinical conditions which deviates the autonomic tone and affects homeostasis. This study had objective of investigating alterations in sympatho vagal balance in obese type II diabetes mellitus.
Method: The autonomic function tests were done in thirty obese diabetic adults and 30 non obese adults aged between 30-50 years. All the procedures were performed in the morning after their light breakfast in a less noise and illuminated room.
Results: The results showed all autonomic function tests are statistically significant except valsalva manoeuvre. Trend in decrease in these variables in obese diabetes were suggestive of decreased efficiency of autonomic balance.
Conclusion: Therefore, early detection of functional impairment of autonomic changes and its appropriate management is the only means by which the morbidity and mortality can be reduced.
Keywords: Obesity, Autonomic nervous system, Diabetes mellitus, Body Mass Index.
countries 2. The greatest relative increase is expected to occur in countries in the Middle East, and India. DM in these countries is associated with higher mortality rates because of acute and chronic complications that occur early in the course of the disease 3. It is accepted that hyperglycemia among persons with diabetes causes degradation of the microvasculature that results in Peripheral and autonomic diabetic neuropathy which are common chronic complications of DM that occur in diabetic patients4. DAN in diabetes is an irreversible complication, but early detection is important, because although the condition cannot be reversed, intensive diabetes care may delay its further development. DAN may affect both the parasympathetic and sympathetic nervous system5.
In India Nutritional problem is gradually shifting from undernourishment to obesity. This shift is because of the advent of civilization, sedentary lifestyle and high-calorie diet. Autonomic neuropathy is a common
IntroductionAccording to WHO, the term Diabetes Mellitus
(DM) describes a metabolic disorder of multiple etiology, characterized by chronic hyperglycemia with disturbances of carbohydrate, protein and fat metabolism, resulting from defects in insulin secretion or insulin action or both1. Diabetes mellitus (DM) is increasingly common worldwide. Estimates indicate that the total number of people with DM will more than double from 171 million in 2000 to 366 million in 2030. By 2030, more than 75% of people with DM will live in developing
Corresponding Author: Mr. A.V. Siva Kumar Faculty & Ph.D. Scholar, Department Of Physiology, Narayana Medical College, Nellore-524003 Contact: +918341644980, 8555844682 e-mail: reddy. [email protected]
10.5958/2320-608X.2019.00147.1
International Journal of Physiology, October-December 2019, Vol.7, No. 4 95
and serious complication of Type–II Diabetes mellitus associated with obesity 6. It is generally accepted that the increasing prevalence of diabetes is associated with increased rates of obesity and it has been estimated that 90% of type 2 diabetes is attributable to excess weight7.
Ewing et al. suggested utilizing a standard battery of autonomic functions tests, including heart rate (HR) variation in response to deep breathing, HR response to standing, postural changes in BP, the Valsalva manoeuver, and sustained handgrip. Thus, genetic and environmentally caused variations in autonomic nervous regulation may exist; hence, studying responses to autonomic function tests in DM patients is highly warranted. Recent studies show the past two decades have correlated sympathetic nervous system activity in normal-weight and obese individuals8. These studies include hypertension, myocardial infarction, congestive heart failure, and vascular thrombosis. It is mainly because of Autonomic dysfunction where the sympathetic activity is decreased and parasympathetic activity is increased. The aim of the study was to establish reference values for a battery of five easy-to-use, non-invasive cardiovascular autonomic function tests for clinical use. The study was undertaken to assess the AFT in obese Type–II Diabetics and the results were compared with non-obese Type–II Diabetic controls.
Materials and MethodThis is a cross-sectional study undertaken in the
Department of Physiology, Narayana Medical College, and Nellore. Institutional Ethical clearance was obtained for this study. Entire AFT procedure was explained to the each subject and informed written consent was taken as per the declaration of Helsinki. All the subjects were instructed to maintain their normal sleep pattern, not to ingest beverages with caffeine or alcohol, and not to perform physical exercise before the evaluations. This test was conducted in morning after 2 hours of light breakfast. Subjects were encouraged to void urine before commence of recording. In all the procedures were done in a less illuminated and noise free room. The test group subjects were Obese Type 2 Diabetes Mellitus patients, who were otherwise normal attending the outpatient department, and central laboratory of Narayana Medical College and Hospital. The control group subjects were teaching and non-teaching staff of Narayana Medical College. All subjects underwent autonomic function tests which included 1) Deep Breathing Test 2) Valsalva Manoeuver 3) Cold Pressor test (Cold pressure test) 4) Heart rate response to standing 5) Hand grip test.
Anthropometric measurements: Anthropometric measurements such as height by stadiometer, weight by the electronic weighing machine were assessed. BMI was calculated by dividing body weight (in kg) by height (in meters) squared. The BMI less than 25 kg/m2 considered as normal weight, 25-30 kg/m2 as overweight and more than 30kg/m2 as obese.
Deep breathing test: Heart rate increases during inspiration due to decreased cardiac vagal activity and decreases during expiration due to increased vagal activity. This is detected by recording the heart rate while the subject is breathing deeply. The subject was instructed to maintain deep breathing at a rate of six breaths per minute. The subject was made to lie down in supine position. ECG electrodes were connected for recording Lead II ECG. While the subject was breathing deeply maximum and minimum heart rates were recorded with each respiratory cycle.
Valsalva manoeuver: The Valsalva ratio is a measure of parasympathetic and sympathetic functions. For the response to occur in Valsalva manoeuver parasympathetic acts as afferent and efferent and sympathetic acts as a part of the efferent pathway. Therefore the Valsalva ratio assesses more of parasympathetic function. The Valsalva ratio is a measure of the change of heart rate that takes place during a brief period of forced expiration against closed glottis or mouthpiece (Valsalva manoeuver). During and after the Valsalva manoeuver there will be the change in cardiac vagal efferent and sympathetic vasomotor activity, resulting from stimulation of carotid sinus, aortic arch baroreceptors, and other intra-thoracic stretch receptors.
Blood pressure response to cold pressor test: The subject was asked to sit on the chair and instructed regarding the test, blood pressure was measured from the right arm by the auscultatory method. The subject was asked to submerge one of his limbs in cold water for 60 seconds. BP was recorded at the end of 60 seconds of submersion of the limb.
Heart rate response to standing: On changing the posture from supine to standing heart rate increases immediately by 10-20 beats per minute. This is detected by recording ECG in supine and standing postures. The subject was made to lie down in the supine posture. Electrodes were connected from the subject to the cardio win system. The subject was asked to relax completely for a minimum period of 10 minutes. Basal heart rate
96 International Journal of Physiology, October-December 2019, Vol.7, No. 4
was recorded by using cardio win system. The subject was asked to stand up immediately and change in heart rate was noted from the cardio win. Heart rate response to standing was determined by using the formula heart rate in standing position–heart rate in supine position.
Blood pressure response to sustained handgrip: The subject was then asked to the dynamometer with the left hand to determine the maximum voluntary contraction. The handgrip was then maintained steadily at 30% of that maximum voluntary contraction for 1 minute. Again blood pressure was measured with the cuff of the sphygmomanometer on the right arm by auscultatory method, at the end of 1 minute after the onset of handgrip. The difference in the blood pressure was noted.
Statistical analysis: Statistical analysis was carried out using graph pad prism & data was represented as mean and SD. Normality of data was tested using Kolmogorov-Smirnov test. A p value of > 0.05 indicated normal Gaussian distribution. As the data sets were skewed, Mann-Whitney test was performed and Spearman correlation were done to find out associations.
ResultsTable 1 shows Age distribution and BMI in Obese
and Non-obese diabetic patients.
Status of Obese diabetes Mean age BMIObese DM 38.640.27 32.4±2.37Non-obese DM 36.92±0.23 25.02±4.23P value 0.73 <0.01
Table 2 shows different parameters of AFT in Obese and Non-obese diabetic patients.
Test Mean Obese DM
Mean Non obese DM
P value
E: I ratio 1.47± 0.22 1.22± 0.27 <0.05Valsalva maneuver 1.18± 0.16 1.33± 0.23 0.07Cold pressor (SBP) 19.60±2.99 9.44±2.53 <0.01Cold pressor (DBP) 10.66±3.6 7.06±3.8 0.02HR response to standing 19.9±2.01 11.8±3.40 <0.01Handgrip (SBP) 5.33±2.3 8.33±3.56 <0.01Handgrip (DBP) 6.1±2.8 4.1±3.1 0.05
DiscussionThe autonomic nervous system consists of
sympathetic and parasympathetic divisions. Intact cardiac autonomic innervations are essential for normal
heart rate. The sympathetic nervous system has control of the myocardial contractility and heart rate whereas the parasympathetic effect is essential on the heart rate. The resting heart rate measurement signifies the autonomic tone at rest while, the cardiovascular response to stimuli which is essentially reflexive in nature.
Under resting conditions, the cardiovascular system is under the control of both the division of the autonomic nervous system. The fact that variability of the heart rate occurs because of the autonomic innervations of the SA node has been utilized to develop the following tests that stimulate the autonomic supply and produce variability in heart rate. The extent of the control by these two autonomic limbs varies from individual to individual. The autonomic reactivity was assessed in the study group by viewing the reflex of the cardiovascular system to lab stressors like standing from the supine position, undergoing handgrip exercise and by giving a painful stimulus by immersing the hand in cold water. The parasympathetic reactivity and sympathetic reactivity were separately tested by these stressors.
Heart rate response to standing: When a subject assumes an erect posture from supine posture, gravity causes pooling of blood in the lower limbs. As a result venous return, cardiac output and arterial BP decreases. This leads to decrease stretch of baroreceptors and activation of the vasomotor center. This, in turn, leads to increased sympathetic discharge, decreased vagal tone and an instantaneous increase in HR. In our study Heart rate is increased in all the subjects but this heart rate was significantly increased in the hypertensive group when compared to the normotensive group. This finding indicates the possible dysfunction of the sympathetic and parasympathetic component of the autonomic nervous system. The findings in our study correlated with the study conducted by WW McCrory, AA Klein et. al 11. This is reflected in our study as increased Heart rate response to standing.
It is difficult to show the BP response to standing because according to WHO, for recording Arterial BP by sphygmomanometer three minutes duration is required. But, within 15-30 seconds Baroreceptor mechanism corrects the change in BP in response to standing. The results of all the above-mentioned tests are statistically significant.
Cold pressor test: Under conditions of stress either physical or psychological origin there is activation of the sensory nervous system. The cold pressor response
International Journal of Physiology, October-December 2019, Vol.7, No. 4 97
consists of placing the hands in cold water acts as a painful stimulus, which has been used to study the autonomic response. In cold pressor test, an increase in the SBP by 10-20 mm of Hg and DBP by 10 mm of Hg is considered as a normal response. The afferent fibers for this response are the somatic fibers carrying the pain sensation which are stimulated by placing the hand in cold water and efferent fibers are the sympathetic fibers. In our study there is a significant rise in systolic blood pressure was found in the hypertensive group, whereas diastolic blood pressure also rises significantly in the hypertensive group over the normotensive group by cold pressor test. The pattern of the rising of blood pressure was within 30 seconds reaching its peak at around 60 seconds and the basal blood pressure was achieved within 2 minutes in normotensive subjects and the prolonged pressor response was found in hypertensive patients.
Generally, Cold pressor test is largely related to great sympathetic efferent discharge causing arterial vasoconstriction. Hypertensive subjects respond to cold pressor stimulus with a predominant rise in total peripheral resistance and also there were higher levels of plasma norepinephrine. The findings in our study correlated with the study conducted by Benetos A. 12 and Douglas L. et. al 13. The result of the above-mentioned tests is statistically significant.
Hand grip test: Isometric exercise produces a significant increase in blood pressure and heart rate, a response which can easily be elicited by using sustained hand grip. In this test, increase in blood pressure is due to increased sympathetic activity mediated by the alpha-adrenergic receptors. An increase in heart rate in response to handgrip is due to impulses from the limbic cortex, motor cortex, and the proprioceptors as afferent inputs into the cardiac centers cause inhibition vagal tone and increases in heart rate. Impaired sympathetic noradrenergic function of SA node, myocardial activity and peripheral resistance in patients is responsible for decreased SBP and DBP values, increased heart rate in the handgrip. The results for the above-mentioned tests are statistically significant similar findings were reported by Vijayalakshmi et. al 14.
Deep breathing test: In healthy young individuals breathing at a normal rate, the heart rate varies with the phases of respiration i. e; heart rate accelerates during inspiration and decelerates during expiration, Sinus arrhythmia is a normal phenomenon and is due
to fluctuation in parasympathetic output to the heart. Baroreceptors are solely responsible for resting heart tone in the normal breathing individuals. During inspiration, neuronal activity of inspiration neurons in the medulla besides initiating inspiration also discharge to nucleus tractus solitarius (NTS), nucleus accumbens and inhibit both the relay centers of the baroreceptors, NTS-NA pathway. This leads to inhibition of vagal tone which in turn increases heart rate during inspiration and a decreases during expiration. An altered sympathovagal balance and reduced influence of parasympathetic nervous system on heart rate lead to impaired heart rate variability in respiration which is reflected in our study as increased E: I ratio values. The results of the above test are not statistically significant.
Valsalva manoeuver: The Valsalva ratio is a measure of vagal and sympathetic activity on the heart. For the response to occur in Valsalva manoeuver, parasympathetic acts as afferent and efferent. Sympathetic acts as a part of the efferent pathway. Therefore, Valsalva manoeuver assesses more of parasympathetic activity. The result of the above-mentioned test was statistically not significant. Similar findings have been reported by Sujatha gautam et. al15.
Limitations: The present study has some limitations, the conventional AFT are cumbersome to perform the procedures and analyze the data results. It is tedious to determine the autonomic derangement. There are so many advanced noninvasive techniques to determine neuropathy in the autonomic nervous system like HRV and dynamic pupillometry 9, 10.
Conclusion: The autonomic derangement can be evaluated by traditional autonomic function tests. The improper management of glycemic index and lipid profile leads to long nerve neuropathy in diabetic patients which is augmented by obesity.
Conflict of Interest: None declared
Funding: There is no financial support for this research work and publication of the article.
References1. Vinik AI, Nevoret M, Casellini C, Parson H. D i a b
e t i c N e u ro p a t h y. Endocrinol Metab Clin NA [Internet]. 2013; 42 (4):747-87.
2. Diabetes N, Clearinghouse I. Diabetic Neuropathies : The Nerve Damage of Diabetes.
98 International Journal of Physiology, October-December 2019, Vol.7, No. 4
3. Chessa M, Butera G, Lanza GA, Bossone E, Delogu A, De Rosa G, et al. Role of heart rate variability in the early diagnosis of diabetic autonomic neuropathy in children. Herz. 2002;
4. Niakan E, Harati Y, Comstock JP. Diabetic Autonomic Neuropathy. Metab Clin Exp. 1986; 35 (3):224-34.
5. Matsumoto T, Ushiroyama T, Kimura T, Hayashi T, Moritani T. Altered autonomic nervous system activity as a potential etiological factor of premenstrual syndrome and premenstrual dysphoric disorder. Biopsychosoc Med [Internet]. 2007 [cited 2018 Sep 24]; 1:1-8.
6. A. V. Siva kumar, N Mallikarjuna Reddy, Ch Kiran Kumar, Sk Kareem, M PN. Comparative Study of Sympathetic Cardiovascular Tests in Obese and Non–Obese Adults. 2017; 5:4114-117.
7. A. V. Siva kumar, K. N. Maruthy, Sk. Kareem, Ch. Kiran kumar, Naidu MP, Altered pulmonary ventilatory mechanics induced by Obesity. International journal of Research, 2017; 04:4295-303.
8. Dobrek Ł, Thor P. Current concepts in clinical and laboratory assessments of autonomic nervous system activity. J Pre-Clinical Clin Res. 2015; 9 (1):63-8.
9. Kumar AS, Padmavathi R, Maruthy K, Sowjanya B, Kumar K. An Innovative Technique to Evaluate Quantitative Pupillary Light Reflex by Dynamic Pupillometry using Infrared Videography. Journal of Clinical & Diagnostic Research. 2019 Apr 1; 13 (4).
10. Pullaganti M, Kumar SA, Maruthy KN, Gurja JP, Chintala KK. Association of stress with heart rate variability in different phases of the menstrual cycle. National Journal of Physiology, Pharmacy and Pharmacology. 2019; 9 (3):256-60.
11. WW McCrory, AA Klein et. al. “Sympathetic nervous system and exercise tolerance response in normotensive and hypertensive adolescents” J Am Coll Cardio. 1984 Feb; 3 (2 Pt. 1):381-386.
12. Benetos A, Safar ME. Response to the cold pressor test in normotensive and hypertensive patients. American journal of hypertension. 1991 Jul 1; 4 (7_Pt_1):627-629.
13. Douglas L. W., Sheldon G. S., Lila Eleveback, J Hypertens 1984, 6, 301-306.
14. Vijayalakshmi P, Surendiran A. Effect of slow and fast pranayams on reaction time and cardiorespiratory variables. Indian J Physiol Pharmacol. 2005; 49 (3):313-18.
15. Sujatha guatam et. al, Correlation of autonomic indices with thyroid status, IJPP, 47 (2):164-70.
International Journal of Physiology, October-December 2019, Vol.7, No. 4 99
Correlation of HbA1c Levels with Monocyte-lymphocyte and Platelet-lymphocyte Ratios in Type 2 Diabetics of
Bengaluru City
Suguna S1, M.S. Kusumadevi2
1Associate Professor, 2Professor, Department of Physiology, Bangalore Medical College and Research Institute, Fort, K R road, Bengaluru-560002, Karnataka, India
AbstractBackground: Diabetes mellitus (DM) is a systemic disease having serious microvascular and macrovascular complications. These complications in type 2 DM has an inflammatory pathology. Many inflammatory markers have been found to be related to these complications, such as interleukin1 (IL1), IL6, IL8, transforming growth factor beta 1 (TGF-β1) and tumour necrosis factor alpha (TNF α). However, their measurement is not used routinely as it is not easy to do it, in this respect. The white blood cell (WBC) count and its subtypes are classic indicators of inflammation and their measurement is done routinely and also their estimation is cost effective.
Aim of the Work: To correlate HbA1c levels with monocyte-lymphocyte and platelet-lymphocyte ratios in type 2 diabetics of Bengaluru city.
Materials and Method: A total of 50 type 2 diabetics without complications were included in the study with a mean age of 55.78 (SD:13.77) years of both gender previously diagnosed regardless of their sociodemographic characteristics and were invited for the assessment of complete blood count (CBC) and HbA1c levels in Infilife healthcare private limited of Bengaluru city. The platelet-lymphocyte ratio and monocyte-lymphocyte ratio were calculated as the ratios of the platelets and monocytes to lymphocytes, respectively. All counts were determined from the same automated blood sample measurement.
Results: Mean (SD) P/L ratio and M/L ratio were 0.14 (0.36) & 7.37 (3.43) respectively. There was no significant correlation (at p=0.05) between HbA1c levels and P/L ratio[r= (-0.46)]) and L/M ratio[r=0.05].
Conclusion: In the present study, there was no statistically significant correlation between HbA1c levels and P/L ratio[r= (-0.46)]) and L/M ratio[r=0.05] in patients with type 2 diabetes mellitus of Bengaluru city.
Keywords: HbA1c, monocyte-lymphocyte and platelet-lymphocyte ratios, type 2 diabetes mellitus.
diabetic neuropathy while macrovascular complications include stroke, cardiovascular diseases (CVDs), and peripheral vascular diseases 1.
Subclinical inflammation contributes to enhancement of metabolic disturbances, which eventually leads to vascular complications, a major cause of morbidity and mortality in diabetic patients 2, 3.
The white blood cell (WBC) count and its subtypes are classic indicators of inflammation 4. The platelet-to-lymphocyte ratio (PLR), monocyte-to-lymphocyte ratio (MLR), and neutrophil-to-lymphocyte ratio (NLR) are
IntroductionDiabetes mellitus (DM) is a systemic disease
having serious microvascular and macrovascular complications. Microvascular complications include diabetic nephropathy (DN), diabetic retinopathy, and
Corresponding Author: M.S. Kusumadevi Professor, Department of Physiology, Bangalore Medical College and Research Institute, Fort, K R road, Bengaluru-560002, Karnataka, India
10.5958/2320-608X.2019.00148.3
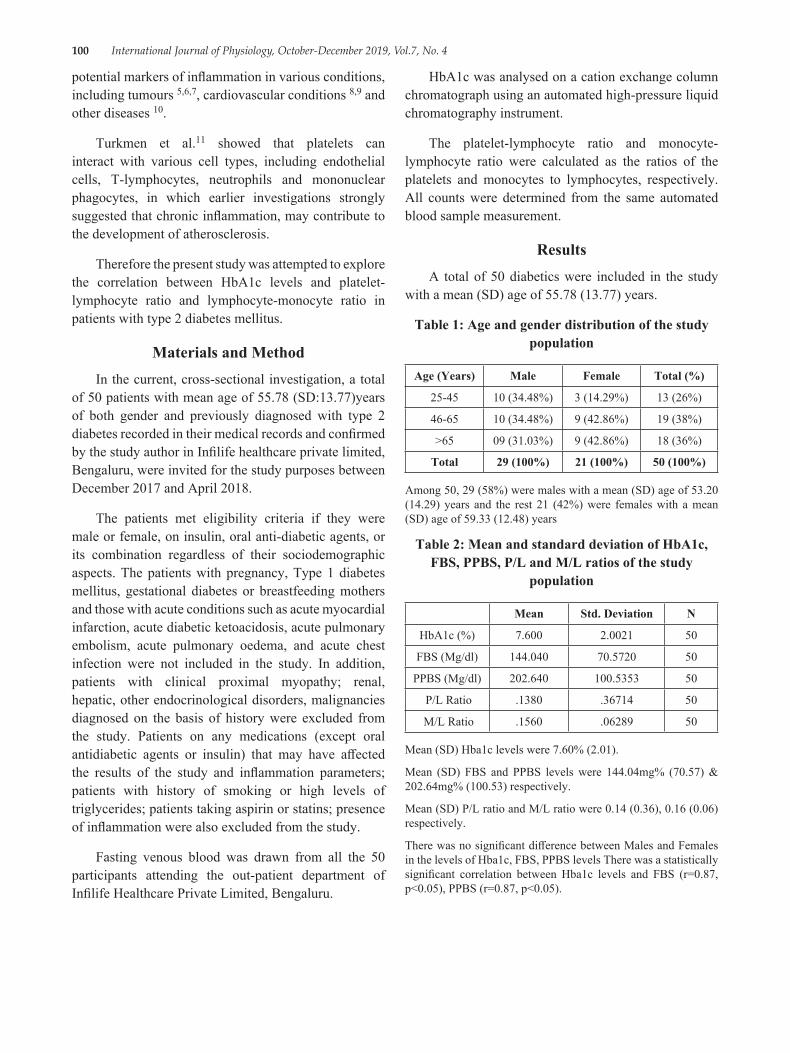
100 International Journal of Physiology, October-December 2019, Vol.7, No. 4
potential markers of inflammation in various conditions, including tumours 5,6,7, cardiovascular conditions 8,9 and other diseases 10.
Turkmen et al.11 showed that platelets can interact with various cell types, including endothelial cells, T-lymphocytes, neutrophils and mononuclear phagocytes, in which earlier investigations strongly suggested that chronic inflammation, may contribute to the development of atherosclerosis.
Therefore the present study was attempted to explore the correlation between HbA1c levels and platelet-lymphocyte ratio and lymphocyte-monocyte ratio in patients with type 2 diabetes mellitus.
Materials and MethodIn the current, cross-sectional investigation, a total
of 50 patients with mean age of 55.78 (SD:13.77)years of both gender and previously diagnosed with type 2 diabetes recorded in their medical records and confirmed by the study author in Infilife healthcare private limited, Bengaluru, were invited for the study purposes between December 2017 and April 2018.
The patients met eligibility criteria if they were male or female, on insulin, oral anti-diabetic agents, or its combination regardless of their sociodemographic aspects. The patients with pregnancy, Type 1 diabetes mellitus, gestational diabetes or breastfeeding mothers and those with acute conditions such as acute myocardial infarction, acute diabetic ketoacidosis, acute pulmonary embolism, acute pulmonary oedema, and acute chest infection were not included in the study. In addition, patients with clinical proximal myopathy; renal, hepatic, other endocrinological disorders, malignancies diagnosed on the basis of history were excluded from the study. Patients on any medications (except oral antidiabetic agents or insulin) that may have affected the results of the study and inflammation parameters; patients with history of smoking or high levels of triglycerides; patients taking aspirin or statins; presence of inflammation were also excluded from the study.
Fasting venous blood was drawn from all the 50 participants attending the out-patient department of Infilife Healthcare Private Limited, Bengaluru.
HbA1c was analysed on a cation exchange column chromatograph using an automated high-pressure liquid chromatography instrument.
The platelet-lymphocyte ratio and monocyte-lymphocyte ratio were calculated as the ratios of the platelets and monocytes to lymphocytes, respectively. All counts were determined from the same automated blood sample measurement.
ResultsA total of 50 diabetics were included in the study
with a mean (SD) age of 55.78 (13.77) years.
Table 1: Age and gender distribution of the study population
Age (Years) Male Female Total (%)
25-45 10 (34.48%) 3 (14.29%) 13 (26%)
46-65 10 (34.48%) 9 (42.86%) 19 (38%)
>65 09 (31.03%) 9 (42.86%) 18 (36%)
Total 29 (100%) 21 (100%) 50 (100%)
Among 50, 29 (58%) were males with a mean (SD) age of 53.20 (14.29) years and the rest 21 (42%) were females with a mean (SD) age of 59.33 (12.48) years
Table 2: Mean and standard deviation of HbA1c, FBS, PPBS, P/L and M/L ratios of the study
population
Mean Std. Deviation N
HbA1c (%) 7.600 2.0021 50
FBS (Mg/dl) 144.040 70.5720 50
PPBS (Mg/dl) 202.640 100.5353 50
P/L Ratio .1380 .36714 50
M/L Ratio .1560 .06289 50
Mean (SD) Hba1c levels were 7.60% (2.01).
Mean (SD) FBS and PPBS levels were 144.04mg% (70.57) & 202.64mg% (100.53) respectively.
Mean (SD) P/L ratio and M/L ratio were 0.14 (0.36), 0.16 (0.06) respectively.
There was no significant difference between Males and Females in the levels of Hba1c, FBS, PPBS levels There was a statistically significant correlation between Hba1c levels and FBS (r=0.87, p<0.05), PPBS (r=0.87, p<0.05).
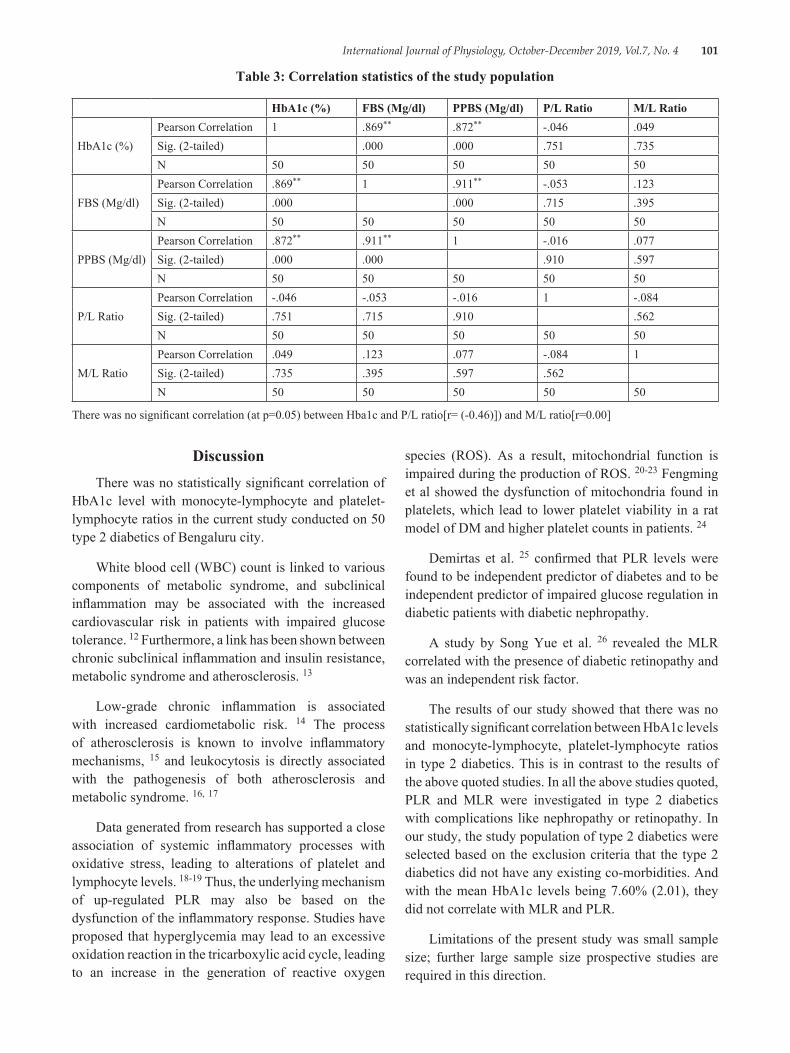
International Journal of Physiology, October-December 2019, Vol.7, No. 4 101
Table 3: Correlation statistics of the study population
HbA1c (%) FBS (Mg/dl) PPBS (Mg/dl) P/L Ratio M/L Ratio
HbA1c (%)Pearson Correlation 1 .869** .872** -.046 .049Sig. (2-tailed) .000 .000 .751 .735N 50 50 50 50 50
FBS (Mg/dl)Pearson Correlation .869** 1 .911** -.053 .123Sig. (2-tailed) .000 .000 .715 .395N 50 50 50 50 50
PPBS (Mg/dl)Pearson Correlation .872** .911** 1 -.016 .077Sig. (2-tailed) .000 .000 .910 .597N 50 50 50 50 50
P/L RatioPearson Correlation -.046 -.053 -.016 1 -.084Sig. (2-tailed) .751 .715 .910 .562N 50 50 50 50 50
M/L RatioPearson Correlation .049 .123 .077 -.084 1Sig. (2-tailed) .735 .395 .597 .562N 50 50 50 50 50
There was no significant correlation (at p=0.05) between Hba1c and P/L ratio[r= (-0.46)]) and M/L ratio[r=0.00]
DiscussionThere was no statistically significant correlation of
HbA1c level with monocyte-lymphocyte and platelet-lymphocyte ratios in the current study conducted on 50 type 2 diabetics of Bengaluru city.
White blood cell (WBC) count is linked to various components of metabolic syndrome, and subclinical inflammation may be associated with the increased cardiovascular risk in patients with impaired glucose tolerance. 12 Furthermore, a link has been shown between chronic subclinical inflammation and insulin resistance, metabolic syndrome and atherosclerosis. 13
Low-grade chronic inflammation is associated with increased cardiometabolic risk. 14 The process of atherosclerosis is known to involve inflammatory mechanisms, 15 and leukocytosis is directly associated with the pathogenesis of both atherosclerosis and metabolic syndrome. 16, 17
Data generated from research has supported a close association of systemic inflammatory processes with oxidative stress, leading to alterations of platelet and lymphocyte levels. 18-19 Thus, the underlying mechanism of up-regulated PLR may also be based on the dysfunction of the inflammatory response. Studies have proposed that hyperglycemia may lead to an excessive oxidation reaction in the tricarboxylic acid cycle, leading to an increase in the generation of reactive oxygen
species (ROS). As a result, mitochondrial function is impaired during the production of ROS. 20-23 Fengming et al showed the dysfunction of mitochondria found in platelets, which lead to lower platelet viability in a rat model of DM and higher platelet counts in patients. 24
Demirtas et al. 25 confirmed that PLR levels were found to be independent predictor of diabetes and to be independent predictor of impaired glucose regulation in diabetic patients with diabetic nephropathy.
A study by Song Yue et al. 26 revealed the MLR correlated with the presence of diabetic retinopathy and was an independent risk factor.
The results of our study showed that there was no statistically significant correlation between HbA1c levels and monocyte-lymphocyte, platelet-lymphocyte ratios in type 2 diabetics. This is in contrast to the results of the above quoted studies. In all the above studies quoted, PLR and MLR were investigated in type 2 diabetics with complications like nephropathy or retinopathy. In our study, the study population of type 2 diabetics were selected based on the exclusion criteria that the type 2 diabetics did not have any existing co-morbidities. And with the mean HbA1c levels being 7.60% (2.01), they did not correlate with MLR and PLR.
Limitations of the present study was small sample size; further large sample size prospective studies are required in this direction.
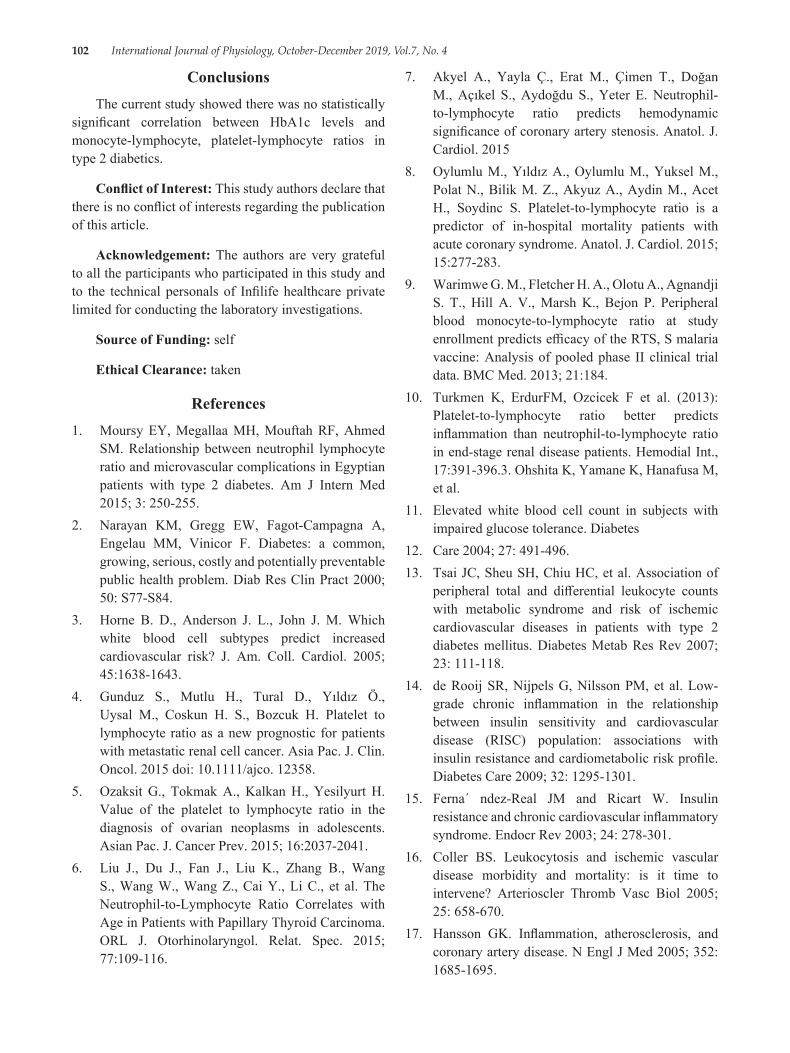
102 International Journal of Physiology, October-December 2019, Vol.7, No. 4
ConclusionsThe current study showed there was no statistically
significant correlation between HbA1c levels and monocyte-lymphocyte, platelet-lymphocyte ratios in type 2 diabetics.
Conflict of Interest: This study authors declare that there is no conflict of interests regarding the publication of this article.
Acknowledgement: The authors are very grateful to all the participants who participated in this study and to the technical personals of Infilife healthcare private limited for conducting the laboratory investigations.
Source of Funding: self
Ethical Clearance: taken
References1. Moursy EY, Megallaa MH, Mouftah RF, Ahmed
SM. Relationship between neutrophil lymphocyte ratio and microvascular complications in Egyptian patients with type 2 diabetes. Am J Intern Med 2015; 3: 250-255.
2. Narayan KM, Gregg EW, Fagot-Campagna A, Engelau MM, Vinicor F. Diabetes: a common, growing, serious, costly and potentially preventable public health problem. Diab Res Clin Pract 2000; 50: S77-S84.
3. Horne B. D., Anderson J. L., John J. M. Which white blood cell subtypes predict increased cardiovascular risk? J. Am. Coll. Cardiol. 2005; 45:1638-1643.
4. Gunduz S., Mutlu H., Tural D., Yıldız Ö., Uysal M., Coskun H. S., Bozcuk H. Platelet to lymphocyte ratio as a new prognostic for patients with metastatic renal cell cancer. Asia Pac. J. Clin. Oncol. 2015 doi: 10.1111/ajco. 12358.
5. Ozaksit G., Tokmak A., Kalkan H., Yesilyurt H. Value of the platelet to lymphocyte ratio in the diagnosis of ovarian neoplasms in adolescents. Asian Pac. J. Cancer Prev. 2015; 16:2037-2041.
6. Liu J., Du J., Fan J., Liu K., Zhang B., Wang S., Wang W., Wang Z., Cai Y., Li C., et al. The Neutrophil-to-Lymphocyte Ratio Correlates with Age in Patients with Papillary Thyroid Carcinoma. ORL J. Otorhinolaryngol. Relat. Spec. 2015; 77:109-116.
7. Akyel A., Yayla Ç., Erat M., Çimen T., Doğan M., Açıkel S., Aydoğdu S., Yeter E. Neutrophil-to-lymphocyte ratio predicts hemodynamic significance of coronary artery stenosis. Anatol. J. Cardiol. 2015
8. Oylumlu M., Yıldız A., Oylumlu M., Yuksel M., Polat N., Bilik M. Z., Akyuz A., Aydin M., Acet H., Soydinc S. Platelet-to-lymphocyte ratio is a predictor of in-hospital mortality patients with acute coronary syndrome. Anatol. J. Cardiol. 2015; 15:277-283.
9. Warimwe G. M., Fletcher H. A., Olotu A., Agnandji S. T., Hill A. V., Marsh K., Bejon P. Peripheral blood monocyte-to-lymphocyte ratio at study enrollment predicts efficacy of the RTS, S malaria vaccine: Analysis of pooled phase II clinical trial data. BMC Med. 2013; 21:184.
10. Turkmen K, ErdurFM, Ozcicek F et al. (2013): Platelet-to-lymphocyte ratio better predicts inflammation than neutrophil-to-lymphocyte ratio in end-stage renal disease patients. Hemodial Int., 17:391-396.3. Ohshita K, Yamane K, Hanafusa M, et al.
11. Elevated white blood cell count in subjects with impaired glucose tolerance. Diabetes
12. Care 2004; 27: 491-496.13. Tsai JC, Sheu SH, Chiu HC, et al. Association of
peripheral total and differential leukocyte counts with metabolic syndrome and risk of ischemic cardiovascular diseases in patients with type 2 diabetes mellitus. Diabetes Metab Res Rev 2007; 23: 111-118.
14. de Rooij SR, Nijpels G, Nilsson PM, et al. Low-grade chronic inflammation in the relationship between insulin sensitivity and cardiovascular disease (RISC) population: associations with insulin resistance and cardiometabolic risk profile. Diabetes Care 2009; 32: 1295-1301.
15. Ferna´ ndez-Real JM and Ricart W. Insulin resistance and chronic cardiovascular inflammatory syndrome. Endocr Rev 2003; 24: 278-301.
16. Coller BS. Leukocytosis and ischemic vascular disease morbidity and mortality: is it time to intervene? Arterioscler Thromb Vasc Biol 2005; 25: 658-670.
17. Hansson GK. Inflammation, atherosclerosis, and coronary artery disease. N Engl J Med 2005; 352: 1685-1695.
International Journal of Physiology, October-December 2019, Vol.7, No. 4 103
18. Demircelik MB, Kurtul A, Ocek H, et al. Association between platelet-to-lymphocyte ratio and contrast-induced nephropathy in patients undergoing percutaneous coronary intervention for acute coronary syndrome. Cardiorenal Med 2015; 5:96-104.
19. Ying HQ, Deng QW, He BS, et al. The prognostic value of preoperative NLR, d-NLR, PLR and LMR for predicting clinical outcome in surgical colorectal cancer patients. Med Oncol 2014; 31:305.
20. Abakay O, Abakay A, Sen HS, et al. The relationship between inflammatory marker levels and pulmonary tuberculosis severity. Inflammation 2015; 38:691-696.
21. Colwell JA, Winocour PD, Halushka PV. Do platelets have anything to do with diabetic microvascular disease. Diabetes 1983; 32:14-19.
22. Brownlee M. Biochemistry and molecular cell biology of diabetic complications. Nature 2001; 414:813-820.
23. Savu O, Sunkari VG, Botusan IR, et al. Stability of mitochondrial DNA against reactive oxygen species (ROS) generated in diabetes. Diabetes Metab Res Rev 2011; 27:470-479.
24. Wu F, Liu Y, Luo L, et al. Platelet mitochondrial dysfunction of DM rats and DM patients. Int J Clin Exp Med 2015; 8:6937-6946.
25. Demirtas L, Degirmenci H, Akbas EM et al. Association of hematological indicies with diabetes, impaired glucose regulation and microvascular complications of diabetes. International Journal of Clinical and Experimental Medicine. 2015: 8 (7):11420-11427.
26. Song Yue, 1, † Jiahua Zhang, 1, † Jingyang Wu, 1 Weiping Teng, 2 Lei Liu, 1, * and Lei Chen1, *Omorogieva Ojo. Use of the Monocyte-to-Lymphocyte Ratio to Predict Diabetic Retinopathy. Int J Environ Res Public Health. 2015 Aug; 12 (8): 10009-10019.
104 International Journal of Physiology, October-December 2019, Vol.7, No. 4
Relationship Between Vitamin D and HbA1c Levels in Patients with Type 2 Diabetes Mellitus of Bengaluru City
Suguna S1, M.S. Kusumadevi2
1Associate Professor, 2Professor, Department of physiology, Bangalore Medical College and Research Institute, Fort, K R road, Bengaluru, Karnataka, India
AbstractBackground: Studies show that vitamin D affects insulin sensitivity and insulin secretion, and vitamin D deficiency may also contribute to impaired glucose tolerance. 1, 2
Objectives: The purpose of this study was to examine the association between serum 25 (OH)D and glycosylated haemoglobin (HbA1c) levels in patients with type 2 diabetes mellitus of Bengaluru city.
Materials and Method: A total of 50 type 2 diabetics were included in the study with a mean age of 55.78 (SD:13.77) years of both gender previously diagnosed regardless of their sociodemographic characteristics and were invited for the assessment of vitamin D and HbA1c levels in Infilife healthcare private limited of Bengaluru city.
Results: Mean (SD) Hba1c and vitamin D levels were 7.17% (2.451) & 19.43 (16.094) ng/ml respectively. There was no statistically significant correlation between Hba1c and vitamin D levels with a correlation coefficient (r) of-0.109[p = 0.05].
Conclusion: In the present study, there was no correlation between vitamin D levels and glycaemic control in patients with type 2 diabetes mellitus of Bengaluru city. Since there are conflicting results in the literature, further investigations may be more beneficial to highlight the relationship between glycaemic control and vitamin D.
Keywords: HbA1c, vitamin D, diabetes mellitus.
level on which it particularly acts and exerts its multiple metabolic effects besides on bones and muscles.6 Pertaining to diabetes mellitus (DM), vitamin D has a significant role in maintaining glucose homeostasis. Decreasing vitamin D levels in serum have proven to increase insulin resistance (IR) and development of type 2 diabetes mellitus (T2DM). 7 Studies have proved that vitamin D affects insulin secretion and tyrosine phosphorylation of the insulin receptor.8 Observational studies all over the world have inferred an association between hypovitaminosis D and IR. Also, studies have observed inverse relationship between glycated haemoglobin (HbA1c) levels and vitamin D status in diabetics.9 A meta-analysis proved that vitamin D supplementation was associated with reduction in fasting blood sugar and HBA1C levels among type 2 diabetics having vitamin D deficiency.10 One more trial also exhibited that with vitamin D supplementation, mean
IntroductionOne of the most common causes of vitamin D
deficiency is reduced exposure to sunlight which ignites the synthesis of vitamin D through skin. 1 Apart from its most commonly understood roles with muscles and bones, vitamin D has numerous other functions. 4, 5
Vitamin D has recently gained substantial importance in the field of medicine and endocrinology because of the latest research on new receptors at tissue
Corresponding Author: M.S. Kusumadevi Professor, Department of physiology, Bangalore Medical College and Research Institute, Fort, K R road, Bengaluru-560002, Karnataka, India
10.5958/2320-608X.2019.00149.5
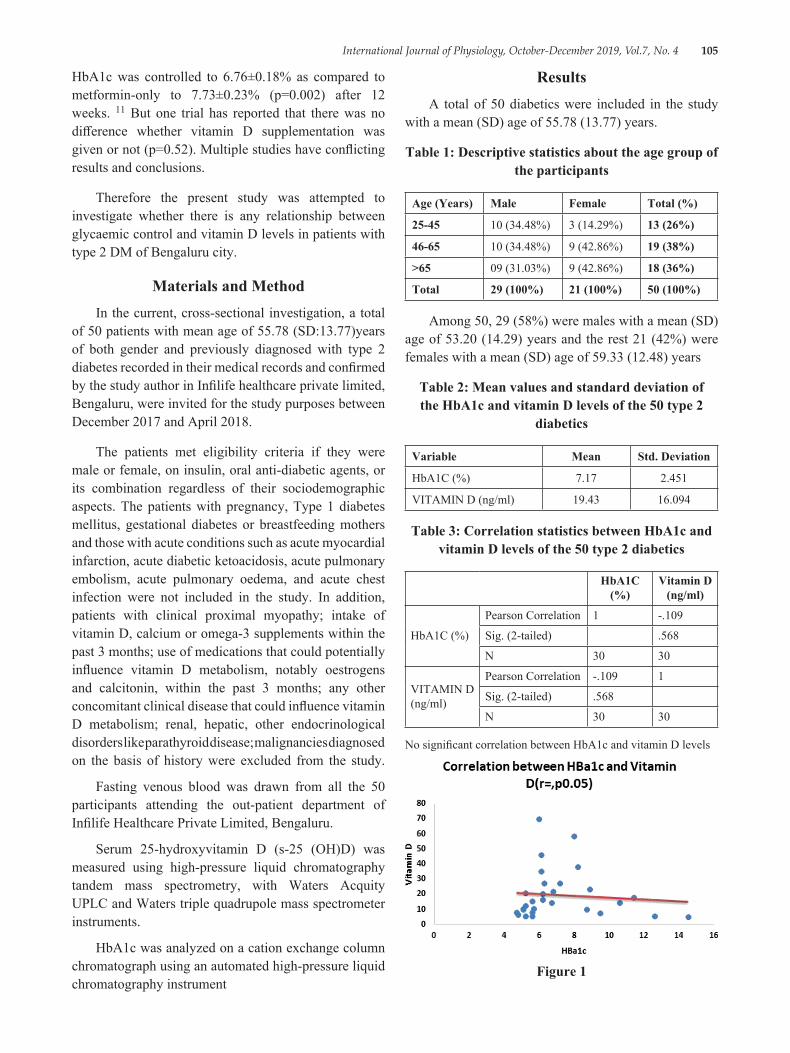
International Journal of Physiology, October-December 2019, Vol.7, No. 4 105
HbA1c was controlled to 6.76±0.18% as compared to metformin-only to 7.73±0.23% (p=0.002) after 12 weeks. 11 But one trial has reported that there was no difference whether vitamin D supplementation was given or not (p=0.52). Multiple studies have conflicting results and conclusions.
Therefore the present study was attempted to investigate whether there is any relationship between glycaemic control and vitamin D levels in patients with type 2 DM of Bengaluru city.
Materials and MethodIn the current, cross-sectional investigation, a total
of 50 patients with mean age of 55.78 (SD:13.77)years of both gender and previously diagnosed with type 2 diabetes recorded in their medical records and confirmed by the study author in Infilife healthcare private limited, Bengaluru, were invited for the study purposes between December 2017 and April 2018.
The patients met eligibility criteria if they were male or female, on insulin, oral anti-diabetic agents, or its combination regardless of their sociodemographic aspects. The patients with pregnancy, Type 1 diabetes mellitus, gestational diabetes or breastfeeding mothers and those with acute conditions such as acute myocardial infarction, acute diabetic ketoacidosis, acute pulmonary embolism, acute pulmonary oedema, and acute chest infection were not included in the study. In addition, patients with clinical proximal myopathy; intake of vitamin D, calcium or omega-3 supplements within the past 3 months; use of medications that could potentially influence vitamin D metabolism, notably oestrogens and calcitonin, within the past 3 months; any other concomitant clinical disease that could influence vitamin D metabolism; renal, hepatic, other endocrinological disorders like parathyroid disease; malignancies diagnosed on the basis of history were excluded from the study.
Fasting venous blood was drawn from all the 50 participants attending the out-patient department of Infilife Healthcare Private Limited, Bengaluru.
Serum 25-hydroxyvitamin D (s-25 (OH)D) was measured using high-pressure liquid chromatography tandem mass spectrometry, with Waters Acquity UPLC and Waters triple quadrupole mass spectrometer instruments.
HbA1c was analyzed on a cation exchange column chromatograph using an automated high-pressure liquid chromatography instrument
ResultsA total of 50 diabetics were included in the study
with a mean (SD) age of 55.78 (13.77) years.
Table 1: Descriptive statistics about the age group of the participants
Age (Years) Male Female Total (%)
25-45 10 (34.48%) 3 (14.29%) 13 (26%)
46-65 10 (34.48%) 9 (42.86%) 19 (38%)
>65 09 (31.03%) 9 (42.86%) 18 (36%)
Total 29 (100%) 21 (100%) 50 (100%)
Among 50, 29 (58%) were males with a mean (SD) age of 53.20 (14.29) years and the rest 21 (42%) were females with a mean (SD) age of 59.33 (12.48) years
Table 2: Mean values and standard deviation of the HbA1c and vitamin D levels of the 50 type 2
diabetics
Variable Mean Std. Deviation
HbA1C (%) 7.17 2.451
VITAMIN D (ng/ml) 19.43 16.094
Table 3: Correlation statistics between HbA1c and vitamin D levels of the 50 type 2 diabetics
HbA1C (%)
Vitamin D (ng/ml)
HbA1C (%)
Pearson Correlation 1 -.109
Sig. (2-tailed) .568
N 30 30
VITAMIN D (ng/ml)
Pearson Correlation -.109 1
Sig. (2-tailed) .568
N 30 30
No significant correlation between HbA1c and vitamin D levels
Figure 1
106 International Journal of Physiology, October-December 2019, Vol.7, No. 4
DiscussionThe results of the current study revealed that there
was no statistically significant correlation between HbA1c and vitamin D levels in type 2 diabetic patients of Bengaluru city.
Clinical trials have inferred mixed results regarding association of low vitamin D and development of diabetes even though epidemiological studies have established strong linkages between hypovitaminosis D and impaired glucose tolerance (IGT). 12 Some epidemiological studies also advocate a relationship between low vitamin D and microvascular diabetic complications. 13 Besides, 1, 25 dihydroxycholecalciferol exerts its action in maintaining euglycaemic environment in multiple ways. Activated vitamin D acts on beta cells of pancreas to impart insulin receptor gene expression. 14 Moreover, vitamin D after its activation causes increase in serum calcium levels by enhancing its small intestinal absorption and calcium is a prerequisite for the insulin release from beta cells of pancreas. In the recent past, studies on beta cells of pancreas have discovered that they have receptors for active form of vitamin D and these receptors have intrinsic capacity to convert inactive form of vitamin D to its active form. 15
Researchers studied the role of vitamin D on glucose homeostasis and IR in T2DM patients and concluded that vitamin D replacement significantly declines HbA1c. 16 Another research contrarily exhibited no significant difference in the change of HbA1c between the groups.17 The study on the effect of vitamin D supplementation on glycaemic control in T2DM (SUNNY Trial) also endorsed that mean baseline HbA1c was same in both groups even after 6 months. 18 Another interventional study done amongst 129 Korean patients failed to prove a therapeutic role of vitamin D in improving HbA1c or IR despite achieving its physiological serum levels. 19 A team of researchers did meta-analysis to see the results of vitamin D supplementation and improved vitamin D status on blood sugar levels and IR in diabetic patients. They concluded that supplementation of Vitamin D, a minimum dose of 100µg/d (4000 IU/d), significantly reduces fasting blood glucose, HbA1c, and homeostatic model assessment of insulin resistance (HOMA-IR) index, and helped to control glycaemic response and improve insulin sensitivity in T2DM patients. 20 These conflicting conclusions led to some more interventional clinical trials and a landmark meta-analysis reported that there is no substantial or statistical evidence to date that
vitamin D in its active form has a clinical and therapeutic role in treatment of T2DM patients in addition to the conventional anti-diabetic medicines. 21 On the contrary, a substantial number of observational studies established impaired glucose tolerance and hypovitaminosis D. Many ongoing studies have made the observations that deficiency of vitamin D is an independent risk factor for development of type 2 diabetes. 22 It still is a question to be answered that if vitamin D insufficiency and IR are a cause and effect phenomenon as both these entities are explicit among diabetics.
Vitamin D is a crucial factor in type 2 DM because it regulates adipogenesis during adipocyte differentiation, stimulates insulin synthesis, protects pancreatic B cells and decreases insulin resistance in muscles. 23
In a study conducted on patients with diabetes mellitus, Al-Timimi DJ at al. showed that vitamin D deficiency was significantly associated with glycaemic control. 24
In this present study, contrary to Al-Timimi DJ at al., there was no association between vitamin D and glycaemic control.
Even though diabetic patients have lower vitamin D values than healthy control in the literature, there is currently inadequate evidence of the useful effect in recommending vitamin D supplementation as a means of improving glycaemia or insulin resistance. 25
ConclusionBased on the results obtained from this present
study, the following conclusions can be drawn:
Vitamin D wasn’t associated with glycaemic control.
Finally, a major limitation of our study was the cross-sectional study that was considered. Single blood sampling was the other limitation. The other major limitation of the present study was small sample size; further large sample size prospective studies are required in this direction. For these reasons, further investigations may be more beneficial to highlight the relationship between glycaemic control and vitamin D.
Conflict of Interest: This study authors declare that there is no conflict of interests regarding the publication of this article.
Acknowledgement: The authors are very grateful to all the participants who participated in this study
International Journal of Physiology, October-December 2019, Vol.7, No. 4 107
and to the technical personals of Infilife healthcare private limited, Bengaluru for conducting the laboratory investigations.
Source of Funding: Self
Ethical Clearance: Taken
References1. Elsammak MY, Al-Wosaibi AA, Al-Howeish A,
Alsaeed J. Vitamin d deficiency in Saudi Arabs. Horm Metab Res. 2010; 42 (5):364-368.
2. Bener A, Al-Ali M, Hoffmann GF. High prevalence of vitamin D deficiency in young children in a highly sunny humid country: a global health problem. Minerva Pediatr. 2009; 61 (1):15-22.
3. Pilz S, Tomaschitz A, Ritz E, Pieber TR. Vitamin D status and arterial hypertension: a systematic review. Nat Rev Cardiol. 2009; 6:621-30.
4. Ross AC, Manson JE, Abrams SA, Aloia JF, Brannon PM, Clinton SK, et al. The 2011 report on dietary reference intakes for calcium and vitamin D from the Institute of Medicine: what clinicians need to know? J Clin Endocrinol Metab. 2011; 96:53-8.
5. Bouillon R, Carmeliet G, Verlinden L, van Etten E, Verstuyf A, Luderer HF, et al. Vitamin D and human health: lessons from vitamin D receptor null mice. Endocr Rev. 2008; 29:726-76.
6. Knutsen KV, Madar AA, Lagerløv P, Brekke M, Raastad T, Stene LC, et al. Does vitamin D improve muscle strength in adults? A randomized, double-blind, Metformin only-controlled trial among ethnic minorities in Norway. J Clin Endocrinol Metab. 2014; 99:194-202.
7. Hutchinson MS, Figenschau Y, Njølstad I, Schirmer H, Jorde R. Serum 25-hydroxyvitamin D levels are inversely associated with glycated haemoglobin (HbA1c). The Tromsø Study. Scand J Clin Lab Invest. 2011; 71:399-406.
8. Iqbal K, Islam N, Mehboobali N, Asghar A, Iqbal MP. Association of vitamin D deficiency with poor glycaemic control in diabetic patients. J Pak Med Assoc. 2016; 66:1562-5.
9. Wu C, Qiu S, Zhu X, Li L. Vitamin D supplementation and glycemic control in type 2 diabetes patients: A systematic review and meta-analysis. Metabolism. 2017; 73:67-76.
10. Rad EY, Djalali M, Koohdani F, Saboor-Yaraghi AA, Eshraghian MR, Javanbakht MH, et al. The effects of vitamin D supplementation on glucose control and insulin resistance in patients with diabetes type 2: a randomized clinical trial study. Iran J Public Health. 2014; 43:1651-6.
11. Mitri J, Muraru M, Pittas A. Vitamin D and type 2 diabetes: a systematic review. Eur J Clin Nutr. 2011; 65:1005-15.
12. Alam U, Arul-Devah V, Javed S, Malik RA. Vitamin D and Diabetic Complications: True or False Prophet? Diabetes Therapy. 2016; 7:11-26.
13. Tao M, Zhang Z, Ke Y, He J, Fu W, Zhang C, et al. Association of serum 25-hydroxyvitamin D with insulin resistance and ?-cell function in a healthy Chinese female population. Acta Pharmacol Sinica. 2013; 34: 1070-4.
14. Berridge MJ. Vitamin D deficiency and diabetes. Biochem J. 2017; 474:1321-32.
15. Rad EY, Djalali M, Koohdani F, Saboor-Yaraghi AA, Eshraghian MR, Javanbakht MH, et al. The effects of vitamin D supplementation on glucose control and insulin resistance in patients with diabetes type 2: a randomized clinical trial study. Iran J Public Health. 2014; 43:1651-6.
16. Al-Sofiani ME, Jammah A, Racz M, Khawaja RA, Hasanato R, El-Fawal HA, et al. Effect of vitamin D supplementation on glucose control and inflammatory response in type II diabetes: a double blind, randomized clinical trial. Int J Endocrinol Metab. 2015; 13: E22604.
17. Krul-Poel YH, Westra S, ten Boekel E, ter Wee MM, van Schoor NM, van Wijland H, et al. Effect of vitamin D supplementation on glycemic control in patients with type 2 diabetes (SUNNY Trial): a randomized A Randomized Placebo-Controlled Trial. Diabetes Care. 2015; 38:1420-6.
18. Ryu O-H, Lee S, Yu J, Choi M-G, Yoo HJ, Mantero F. A prospective randomized controlled trial of the effects of vitamin D supplementation on long-term glycaemic control in type 2 diabetes mellitus of Korea. Endocr J. 2014; 61:167-76.
19. Mirhosseini N, Vatanparast H, Mazidi M, Kimball SM. The Effect of Improved Serum 25-Hydroxyvitamin D Status on Glycemic Control in Diabetic Patients: A Meta-Analysis. J Clin Endocrinol Metab. 2017; 102:3097-110.

108 International Journal of Physiology, October-December 2019, Vol.7, No. 4
20. Krul-Poel YH, Ter Wee MM, Lips P, Simsek S. Management of endocrine disease: The effect of vitamin D supplementation on glycaemic control in patients with type 2 diabetes mellitus: a systematic review and meta-analysis. Eur J Endocrinol. 2017; 176:R1-14.
21. Deleskog A, Hilding A, Brismar K, Hamsten A, Efendic S, Östenson C-G. Low serum 25-hydroxyvitamin D level predicts progression to type 2 diabetes in individuals with prediabetes but not with normal glucose tolerance. Diabetologia. 2012; 55:1668-78.
22. Hutchinson MS, Figenschau Y, Njolstad I, Schirmer H, Jorde R. Serum 25-hydroxyvitamin D levels are inversely associated with glycated haemoglobin (HbA (1c)). The Tromso Study. Scand J Clin Lab Invest. 2011; 71 (5):399-406.
23. Mitri J, Pittas AG. Vitamin D and diabetes. Endocrinol Metab Clin North Am. 2014; 43 (1):205-232.
24. Pittas AG, Dawson-Hughes B. Vitamin D and diabetes. J Steroid Biochem Mol Biol. 2010; 121 (1-2):425-429.
International Journal of Physiology, October-December 2019, Vol.7, No. 4 109
Heart Rate Variability Changes during Sahaja Yoga Meditation
Madhur S Rai1, Yashoda R Kattimani2, Sandeep U Rai3, RS Inamdar4
1Assistant Professor, Department of Physiology, 2Associate Professor Department of Physiology, 3Professor and Unit Head, Department of Medicine, 4Professor and Head, Department of Physiology, MGM Medical
College and Hospital, Navi Mumbai, Maharashtra, India
AbstractBackground & Objectives: Yoga and meditation is now widely accepted world wide as an effective tool to combat stress. Heart Rate Variability (HRV) is a noninvasive tool to measure sympathetic and parasympathetic function of the autonomic nervous system. Yoga, by modulating stress, has shown to decrease the activity of sympathetic component of autonomic nervous system and enhance parasympathetic component. Only few studies have compared HRV at baseline with HRV during or after single session of yoga. Thus, this study was undertaken with the objectives to compare HRV changes of Sahaja Yoga Meditators in resting state with their Meditation state and to compare these changes with HRV changes in the control group in resting and meditation mimicking state.
Method: A prospective randomized controlled study was conducted. The study group comprised of 30 randomly selected long term Sahaja yoga mediators and a control group of 30 subjects with no prior practice of any kind of meditation. HRV was recorded in both the groups in normal resting state, during meditation (yoga group) and with eyes closed (mimicking meditation in control group).
Results: Study showed decrease in LF (sympathetic activity) increase in HF (parasympathetic activity) and decrease in LF/HF ratio thus implying a more relaxed, parasympathetic dominant state, in the yoga group during meditation.
Conclusion: The study shows Sahaja Yoga meditation leads to a parasympathetic dominant (relaxed) state and thus can be used as an effective mind body technique to combat stress.
Keywords: Heart Rate Variability (HRV), Non-Yoga group, Sahaja Yoga Meditation, Yoga group.
independent inverse marker of cardiovascular risk. 2Power spectrum analysis of HRV, assesses the short term autonomic cardiovascular control systems in subjects with sinus rhythm. Low Frequency (LF 0.04-0.15Hz) determines mixed sympathetic-parasympathetic activity and baro-receptor control. High frequency (HF 0.15-0.4Hz) is linked to parasympathetic dependent activity. Their ratio LF/HF represents the sympatho-vagal balance. 3
Heart Rate Variability is considered a measure of neuro-cardiac function that reflects heart brain interactions and Autonomic Nervous System. An optimal level of HRV reflects healthy function, adaptability and resilience within an individual. 4 Too much instability indicates arrhythmias or nervous system disturbance,
IntroductionIn recent times, stress related disorders are found
to be on the rise. Most diseases, whether they are psychological, psychosomatic or metabolic disorders are now thought to have stress as an etiological factor. Yoga and meditation is now widely accepted and being increasingly used as an effective tool to combat stress. Beneficial health effects of meditation are often attributed to positive changes in autonomic nervous system, manifesting as reduced heart rate, respiratory rate, reduced oxygen uptake and reduced plasma circulating catecholamine levels 1 and recently as changes in HRV and assist with a wide range of stress-related disorders.
Heart Rate Variability (HRV) is recognized as an
10.5958/2320-608X.2019.00150.1
110 International Journal of Physiology, October-December 2019, Vol.7, No. 4
too little variation indicates inadequate functioning in various levels of self regulatory control systems. Heart rate and HRV rhythm are affected both by sympathetic and parasympathetic stimulation. However with sympathetic stimulation there is a slow response, a 5-10 seconds delay whereas parasympathetic stimulation is instantaneous.
Sahaja yoga Meditation is a modern modification of an ancient knowledge that helps every individual with every background to achieve a state of thoughtless awareness with mental silence and complete inner peace, via activation of parasympathetic-limbic pathways (Harrison et al., 2004). 5 It has shown to decrease autonomic activity in meditators6, 7, 8 compared to controls. Changes in Physiological parameters that were noted included a reduction in heart rate, respiratory rate, systolic blood pressure and reduction of urinary vanillyl mandelic acid (VMA), a break down product of stress hormone Adrenalin and an increase of Galvanic Skin Resistance, 6 all of which reflected a de-stressed state.
Electro-physiological (EEG) studies comparing the brain activation of Sahaja Yoga meditation practitioners have shown specific brain activation patterns indicating a relaxed state of mind & subjective feelings of happiness along with better interconnectivity amongst different brain regions. 9 Randomized trials on SY Meditation using active control groups have demonstrated significant improvements in depressive mood and work stress in workers. 10In other similar studies, on SY Meditation, positive effects have been shown in depression & anxiety11, in enhanced Quality of life 12 and on improving Psychological health. 13 In fact, the same physiological effects achieved with Sahaja Yoga Meditation in healthy individuals, could also be seen in patients with bronchial asthma, 14 hypertension, 15 epilepsy, 16 attention deficit hyperactivity disorder in children17 and Stress. 18
The characteristic physiological change achieved by SYM is the relaxation response. According to ancient yogic philosophy, it is hypothesized that during meditation there is activation of the subtle energy (kundalini), which actualizes in limbic system of the brain. The limbic system is connected with hypothalamus and through this route it exerts its effect on autonomic nervous system. The release of various hormones in response to stress is modulated by the limbic system-HPA axis. Modulation of Stress can in turn lead to improvement in numerous life style diseases, like diabetes, hypertension, etc.
Material and MethodThe study was conducted in the Clinical Laboratory
of Physiology department, MGM Medical College, Kamothe, Navi Mumbai during the period June 2015 to December 2016. Ethical clearance from Institutional Ethical Committee was obtained prior to the commencement of the study. The subjects were explained the study protocol and the right to terminate during the course of study. Written informed consent was taken.
Inclusion Criteria:
1. Men and non-pregnant women aged 25-70 years, those who were practicing Sahaja Yoga meditation for more than 5 years.
2. Those subjects willing to give consent and comply with study protocol.
3. Subjects had to be non-smokers, non-alcoholic, able to read, write and understand English.
Exclusion Criteria:
1. Individuals who were not willing to give consent, who were smokers or alcoholic.
2. Patients on medication (treatment for CVS diseases) known to alter HRV, in a significant way.
3. For control group, those practicing any other form of meditation, Tai Chi, etc.
Methodology: Prior to the study, baseline data was collected from all the participants. Their demographic profile, name, age, sex, height, weight was recorded.
Recording of HRV: The subject was then made to sit comfortably. The probe of the peripheral pulse analyzer was clipped to the subject’s right hand index finger. The probe was connected to the Anu-Photorheograph, which was connected to a desktop computer having software for HRV (Variability Analyzer) and subject’s recordings resting condition were obtained.
After the recordings in normal resting state, the subject was then asked to start meditation and he/she had to signal by tapping his/her finger on chair when they felt they have reached a deep meditative state. HRV recordings were started, after the subject signaled by tapping. With similar procedure, 30 subjects of Sahaja Yoga group were investigated.
After the recordings for mediators group, HRV was recorded for all the controls in normal resting state and
International Journal of Physiology, October-December 2019, Vol.7, No. 4 111
during meditation mimicking state (eyes closed) with similar procedure.
HRV recordings were assessed with Flex Comp Infiniti amplifier and the data analyzed using the frequency domain. Very low frequency (VLF 0.0033-0.04Hz), low frequency (LF 0.04-0.15Hz) and high frequency (HF0.15-0.4 Hz)) and expressed in normalized units. Total power (Tp) was calculated between 0.00-0.5Hz and expressed in absolute unit of millisecond squared.
Statistical Analysis: Analysis of the data was done using Paired t test. Results are given as mean, standard deviation (SD), t value and p value; p value < 0.05 was considered as significant
ResultsTable I: HRV parameters Resting State Yoga
Group and Control Group Eyes Open
Group Tp LF HF LF/HFYoga (Mean) 2340.433 12.65793 32.62243 0.437225±SD 3873.162 6.686202 10.4814 0.268843Nonyoga (Control) (Mean)
2340.433 15.21927 28.5473 0.616379
±SD 3873.162 9.799845 9.965145 0.473009t-stat 0 1.183 -1.543 1.804p Value 1 0.242 0.128 0.076
Power Spectral Density studies:Total power-in resting state in both Yoga and Non-Yoga groups similar.LF-Reduced, HF Increased and LF/HF Ratio Reduced in Yoga group.p values are not significant
Table II: HRV parameters Yoga Group during Meditation/Non Yoga Eyes Closed (Meditation
mimicking State):
Group Tp LF HF LF/HFYoga (Mean) 6914.433 8.94153 34.39987 0.294533±SD 21385.03 5.529304 12.83617 0.255662Nonyoga (Control) (Mean)
2617.433 17.61817 28.38217 0.802926
±SD 2961.114 10.12994 10.83196 0.765566t-stat -1.09017 4.117921 -1.96241 3.449858p Value 0.280149 0.000123 0.054518 0.001052
There is increase in total power during meditation, decrease in LF with a p value of 0.000123, increase in HF with a p value of 0.054 and decrease in LF/HF ratio with a p value of 0.001052 which are highly significant.
Table III: HRV parameters YOGA Group Resting State/Meditation State
Group Tp LF HF LF/HFResting State (Mean) 2340.433 12.657 32.62243 0.437225
±SD 3873.162 6.686202 10.4814 0.268843Meditation State (Mean) 6914.433 8.941533 34.39987 0.294553
±SD 21385.03 5.529304 12.83617 0.255662t stat -1.358 3.054 -0.791 2.805p value 0.185 0.005 0.435 0.009
Total power-increased during meditation, LF-Reduced with a p value of 0.005 (statistically significant). HF Increased showing parasympathetic activity and LF/HF ratio reduced showing better sympatho vagal balance in Yoga group.
Table IV: HRV parameters Non-Yoga Group (Control Group) EyesOpen and Eyes Closed
Group Tp LF HF LF/HFNon Yoga Eyes Open (Mean) 2340.433 15.21927 28.5473 0.616379
±SD 3873.162 9.799845 9.965145 0.473009Non Yoga Eyes Closed (Mean) 2617.433 17.61817 28.38217 0.802926
±SD 2961.114 10.12994 10.83196 0.765566t stat -0.30192 -0.99902 0.076165 -1.32195p value 0.764864 0.326049 0.939811 0.196519
Total power slightly increased with eyes closed. Mean LF is higher with eyes closed than with eyes open-statistically not significant.
DiscussionYoga involves various mind body practices aimed
to bestow the practitioner with physical, mental, psychological and spiritual development. Studies report that regular yoga practice improves several clinical conditions associated with autonomic dysfunction such as hypertension,19 diabetes, anxiety and depression.20 Two systemic reviews report that yoga practices have profound effects on autonomic and metabolic activities and reduce cardiovascular risk.20
112 International Journal of Physiology, October-December 2019, Vol.7, No. 4
Heart rate in healthy humans is influenced by physical, emotional and cognitive activities.21 HRV reflects the dynamic balance arising from co activation or co-inhibition of the sympathetic and parasympathetic nervous systems.22 In healthy individuals, acute increase in HF-HRV generally occurs in meditation23 although individual differences in direction of change have been reported. 24 Consistent with these reports we found that 70% of Sahaja yoga participants showed increased HF-HRV in our study.
A comprehensive review of the literature of Yoga and heart rate variability suggests that yoga can affect cardiac autonomic regulation with increased HRV and vagal dominance during yoga practices. Of these studies, four reported reduced LFn. u. and increased HFn. u.24,25 A recent study reported increase in both frequency and time domains8 whereas another study of coronary heart disease patients reported a marginal increase in absolute power of HF-HRV after 16 weeks of meditation compared to control group that received health education.
The present study shows reduced mean R-R interval of 0.7397 against Non yoga group R-R interval of 0.7577; also there is reduction in mean R-R interval during Sahaja yoga meditation (0.7743) as compared to control group with eyes closed (0.7577). This is consistent with the findings of Nesvold et all 26 who studied HRV during nondirective meditation.
There is increase in total power, decrease in LF i.e. sympathetic activity, increase in HF i.e. parasympathetic activity and decrease in LF/HF ratio with a p value of 0.0010502 (statistically highly significant), implying a more relaxed state and enhanced parasympathetic modulation of HRV in yoga during meditation. These findings are similar to various studies on HRV done during meditation. 7, 27
Elevated HF-HRV is associated with greater cognitive performance, 28 better regulation of effect during daily stress, better modulation of emotional expression and defensive reactions, better attention regulation, effective impulse control29 and behavioral regulation.
The association between HF-HRV and self regulation is supported by the evidence that the brain structures that regulate autonomic balance overlap with the networks that serve executive, social, effective attention and motivational behaviors. 27 Higher HF-HRV indicate enhanced emotional and attention regulation abilities.30
Studies have shown that Sahaja yoga meditation modulates one’s ability to modulate stress and maybe one of the reasons for more robust sympatho vagal balance, as reflected by HRV measures. The present study shows Sahaja Yoga meditation leads to a parasympathetic dominant (relaxed) state and thus can be a useful technique to combat stress. More rigorous studies with detailed reporting of yoga and meditation practices are required to conclusively determine the effect of yoga and meditation on HRV.
Conflict of Interest: Nil
Source of Funding: Self
References1. Benson H, Beary J F, Carol MP.. The Relaxation
Response. Psychiatry1974; 37 (1): 37-46.2. Tsuji H, Larson MG, Venditti FJ Jr, Manders ES,
Evans JC, Feldman CL, et al.. Impact of Reduced Heart Rate Variability on risk for cardiac events. The Framingham Heart Study. Circulation 1996 Dec 1; 94 (11): 2850-2855
3. Akselrod S, Gordon D, Ubel FA, Shannon DC, BargerAC, Cohen RJ. Power Spectrum Analysis of Heart Rate Fluctuation: A Quantitative probe of beat-to-beat Cardio-vascular Control. Science 1981; 213 (4504): 213-222.
4. Singer DH. High heart rate variability, marker of healthy longevity. Am J Cardiol. 2010; 106 (6):910.
5. Harrison LJ, Manocha R, Rubia K.. Sahaja Yoga Meditation as a family treatment programme for children with attention deficit-hyperactivity disorder. Clinical Child Psychology and Psychiatry, 2004; 9 (4):479-497.
6. Rai UC, Sethi S, Singh S. Some effects of Sahaja Yoga and its role in the prevention of stress disorders. Journal of International Medical Sciences. 1988; 19-23.
7. Rai MS, Kattimani YR, Rai SU. Effect of Sahaja yoga Meditation on Heart Rate Variability. MGM Journal of Medical Sciences 2016; 3 (3):126-130.
8. Yunati MS, Deshp VK, Yuwanate AH.. Dynamics of heart rate induced by Sahaja yoga meditation in healthy normal subjects above 40 years. Natl J Physiol Pharm Pharmacol 2014; 4 (1): 80-85.
9. Aftanas LI, Golocheikine SA.. Linear and non-linear concomitants of Altered state of consciousness during meditation: high resolution
International Journal of Physiology, October-December 2019, Vol.7, No. 4 113
EEG investigation. International Journal of Psychophysiology 2002 (a); 45 (1-2): 158-1158.
10. Manocha R, Black D, Sarris J, Stough C.. A Randomized, Controlled Trial of Meditation for Work Stress, Anxiety and Depressed Mood in Full-Time Workers. Evidence Based Complementary and Alternative Medicine 2011; Article ID 960583, 8 pages.
11. Aftanas L, Golosheykin S.. Impact of Regular Meditation practice on EEG activity at Rest and during Evoked Negative Emotions. International Journal of Neuroscience 2005; 115 (6): 893.
12. Chung S, Brooks MM, Rai M, Balk JL, MD, Rai S.. Effect of Sahaja Yoga Meditation on Quality of Life, Anxiety and Blood Pressure Control. The Journal Of Alternative And Complementary Medicine 2012; 18 (6): 589-596.
13. Khalsa SB.. Yoga as a Therapeutic intervention: A Bibliometric analysis of published research studies. Indian Journal Physiol Pharmacol. 2004; 48:269-285
14. Manocha R, Marks G B, Kenchington P, Peters D, Salome CM.. Sahaja Yoga in the Management of Moderate to Severe Asthma: A Randomized Controlled trial. Thorax 2002; 57 (2): 110-115.
15. Chugh D.. The Effects of Sahaja Yoga in Bronchial Asthma and Essential Hypertension. New Delhi Medicos 1997; 13 (5):46-47.
16. Panjwani U, Selvamurthy W, Singh SH, Gupta HL, Thakur L, Rai UC.. Effect of Sahaja yoga practice on Seizure Control and EEG changes in patients of Epilepsy. Indian J Med Res 1996; 103:165-72.
17. Harrison LJ, Manocha R, Rubia K.. Sahaja Yoga Meditation as a family treatment programme for children with Attention Deficit-Hyperactivity disorder. Clinical Child Psychology and Psychiatry 2004; 9 (4): 479-497.
18. Panjwani U, Gupta HL, Singh SH, Rai U.. Effect of Sahaja yoga practice on stress management in patients of Epilepsy. Indian J Physiol Pharmacol 1995; 39 (2):111-6.
19. Tyagi A, Cohen M.. Yoga and Hypertension: A systematic review. Alternative Therapy Health Med 2014; 20:32-59.
20. Innes KE, Bourguignon C, Taylor AG.. Risk indices associated with the Insulin Resistance Syndrome, Cardiovascular Disease and possible protection
with Yoga: A systematic Review. J Am Board Fam Pract 2005; 18:491-519.
21. Thayer JF, Hansen AL, Saus-Rose E, Johnsen BH.. Heart Rate Variability, Prefrontal Neural function, and Cognitive performance: The Neurovisceral Integration Perspective on Self-regulation, Adaptation, and Health. Annals of Behavioral Medicine 2009; 37:141-53.
22. Berntson GG, Bigger JT Jr., Eckberg DL, Grossman P, Kaufmann PG, Malik M, et al.. Heart rate variability: Origins, method, and interpretive caveats. Psychophysiology 1997; 34:623-48.
23. Telles S, Raghavendra BR, Naveen KV, Manjunath NK, Kumar S, Subramanya P.. Changes in Autonomic Variables following Two Meditative states described in Yoga Texts. J Altern Complement Med. 2013; 19:35-42.
24. Vempati RP, Telles S.. Yoga-based Guided Relaxation reduces Sympathetic Activity judged from Baseline levels. Psychol Rep. 2002; 90:487-494
25. Markil N, Whitehurst M, Jacobs PL, Zoeller RF.. Yoga Nidra Relaxation increases Heart Rate Variability and is Unaffected by a Prior bout of Hatha yoga. J Altern Complement Med. N Y N 2012; 18:953-8.
26. Nesvold A, Fagerland MW, Davanger S, Ellingsen Ø, Solberg EE, Holen A, Sevre K, Atar D.. Increased heart rate variability during nondirective meditation. Eur J Prev Cardiol. 2012 Aug; 19 (4):773-80.
27. Peng CK, Henry IC, Mietus JE, Hausdorff JM, Khalsa G, Benson H, Goldberger AL.. Heart rate dynamics during three forms of meditation. Int J Cardiol. 2004 May; 95 (1):19-27.
28. Hansen AL, Johnsen BH, Sollers JJ, Stenvik K, Thayer JF.. Heart Rate Variability and its relation to Prefrontal Cognitive function: The Effects of Training and Detraining. Eur. J. Appl. Physiol. 2004; 93: 263-272.
29. Allen MT, Matthews KA, Kenyon K L.. The Relationships of Resting Baroreflex Sensitivity, Heart Rate Variability and Measures of Impulse Control in Children and Adolescents. Int. J. Psychophysiol. 2000; 37:185-194.
30. Appelhans B M, Luecken LJ.. Heart Rate Variability as an Index of Regulated Emotional Responding. Rev. Gen. Psychol. 2006; 10:229-240.
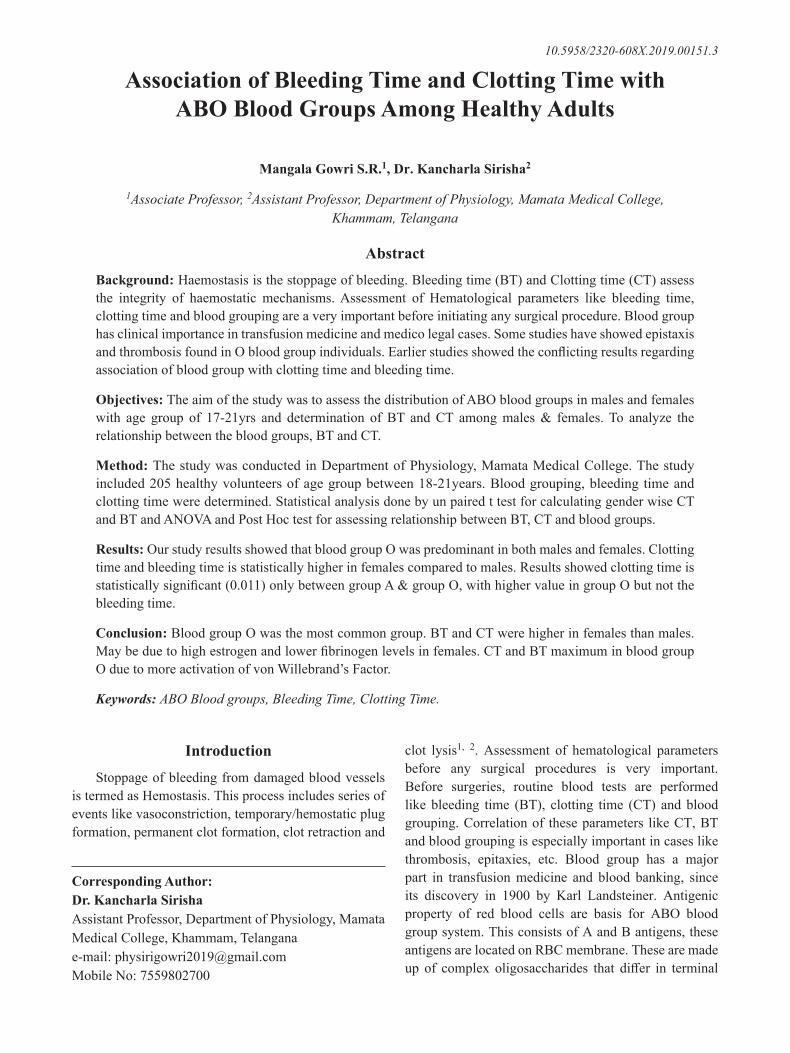
114 International Journal of Physiology, October-December 2019, Vol.7, No. 4
Association of Bleeding Time and Clotting Time with ABO Blood Groups Among Healthy Adults
Mangala Gowri S.R.1, Dr. Kancharla Sirisha2
1Associate Professor, 2Assistant Professor, Department of Physiology, Mamata Medical College, Khammam, Telangana
AbstractBackground: Haemostasis is the stoppage of bleeding. Bleeding time (BT) and Clotting time (CT) assess the integrity of haemostatic mechanisms. Assessment of Hematological parameters like bleeding time, clotting time and blood grouping are a very important before initiating any surgical procedure. Blood group has clinical importance in transfusion medicine and medico legal cases. Some studies have showed epistaxis and thrombosis found in O blood group individuals. Earlier studies showed the conflicting results regarding association of blood group with clotting time and bleeding time.
Objectives: The aim of the study was to assess the distribution of ABO blood groups in males and females with age group of 17-21yrs and determination of BT and CT among males & females. To analyze the relationship between the blood groups, BT and CT.
Method: The study was conducted in Department of Physiology, Mamata Medical College. The study included 205 healthy volunteers of age group between 18-21years. Blood grouping, bleeding time and clotting time were determined. Statistical analysis done by un paired t test for calculating gender wise CT and BT and ANOVA and Post Hoc test for assessing relationship between BT, CT and blood groups.
Results: Our study results showed that blood group O was predominant in both males and females. Clotting time and bleeding time is statistically higher in females compared to males. Results showed clotting time is statistically significant (0.011) only between group A & group O, with higher value in group O but not the bleeding time.
Conclusion: Blood group O was the most common group. BT and CT were higher in females than males. May be due to high estrogen and lower fibrinogen levels in females. CT and BT maximum in blood group O due to more activation of von Willebrand’s Factor.
Keywords: ABO Blood groups, Bleeding Time, Clotting Time.
clot lysis1, 2. Assessment of hematological parameters before any surgical procedures is very important. Before surgeries, routine blood tests are performed like bleeding time (BT), clotting time (CT) and blood grouping. Correlation of these parameters like CT, BT and blood grouping is especially important in cases like thrombosis, epitaxies, etc. Blood group has a major part in transfusion medicine and blood banking, since its discovery in 1900 by Karl Landsteiner. Antigenic property of red blood cells are basis for ABO blood group system. This consists of A and B antigens, these antigens are located on RBC membrane. These are made up of complex oligosaccharides that differ in terminal
IntroductionStoppage of bleeding from damaged blood vessels
is termed as Hemostasis. This process includes series of events like vasoconstriction, temporary/hemostatic plug formation, permanent clot formation, clot retraction and
Corresponding Author: Dr. Kancharla Sirisha Assistant Professor, Department of Physiology, Mamata Medical College, Khammam, Telangana e-mail: [email protected] Mobile No: 7559802700
10.5958/2320-608X.2019.00151.3
International Journal of Physiology, October-December 2019, Vol.7, No. 4 115
sugar. The gene coding these antigens are located on chromosome 9 & chromosome 193. Studies have shown association of ABO blood group with various diseases like duodenal ulcers, gastric carcinoma, thrombosis, Diabetes Mellitus etc4, 5.
According to Mourner AE et al and Qureshi MH et al, there is a clear association between ABO blood group status and Von Willebrand’s factor (vWF). They stated that gene locus of ABO blood group on the chromosome 9q34 have influence on the vWF gene5, 6.vWF is a glycoprotein secreted by endothelial cells and platelets. vWF plays an important role in temporary haemostatic plug formation, as it helps in platelet adhesion and platelet aggregation, and it activates clotting mechanism by regulating circulating levels of factor VIII (anti-hemophilic factor A) that leads to definite clot formation2. Any deficiency of vWF leads to haemorrhagic disorder, while elevated levels are risk for thrombotic events7, 8, 9. Researchers have found that in O blood group epistaxis is more common as compared to other ABO groups, may be due to over expression of vWF in them. 10, 11
Bleeding time is the time interval between puncture of blood vessel to stoppage of bleeding. This test assess functioning of platelets like platelet adhesion and aggregation. Any defects in platelets can prolong the bleeding time that can occur as congenital deficiency or acquired 12. Clotting time is the duration of time interval between the puncture of blood vessels and fibrin threads formation. 13 Defective or deficient clotting factors prolongs clotting time. The relationship between BT, CT and blood group have influence in certain disease conditions like epitaxies, thrombosis, etc. So, this study was taken up to evaluate bleeding and clotting time among various blood groups.
Materials and Method: The study was conducted in department of Physiology, Mamata medical college. 205 medical and dental students with age group of 18-21years were taken for study, both male and female students participated voluntarily in study after giving informed consent. Subjects with history of smoking, chronic use of drugs (NSAIDs), any hematological disorders were excluded. Subjects were explained about the purpose of study and about using data information for publication in research journals. Informed consent was taken. The study was approved by the institutional ethical committee.
All the medical and dental students determine their blood grouping, bleeding time and clotting time during their 1st year of study as a part of their curriculum in hematology practical. The available data reports of ABO blood group, bleeding time and clotting time of 205 students over duration of one year was analyzed.
Blood Group: Blood groups were determined by using standard antisera method. Under aseptic precautions, sterile lancet was used to prick the tip of middle finger. A blood sample was taken on glass slides and mixed with anti-A, anti-B and anti-D sera, and checked for agglutination, presence or absence of clumping determine the blood group. Agglutination was confirmed by using low-power objective of a compound microscope14.
Bleeding Time: Duke’s filter paper method was used to determine the bleeding time. Under aseptic precautions, tip of the middle finger was pricked with sterile Lancet and the time was noted, and the period required to stop the bleeding was recorded every 30 sec by taking impressions on filter paper. Bleeding time was calculated by multiplying the number of drops on the filter paper with time (30 sec). The normal values of BT by Duke’s filter paper method is 1-4 min 14.
Clotting time: Wright’s Capillary tube method was used to find out the clotting time. Under aseptic precautions middle finger tip was pricked, capillary tube was filled with blood and time was noted. Capillary tube was broken every 30 sec 1-2 cm from the end, until the formation of fibrin thread across the gap between the ends of the tube. The normal Clotting time ranges between 2-8 min14.
Statistical analysis: The results were given as Mean ± Standard Deviation and range values. Comparisons were performed using student’s t-test for 2 group comparisons. For CT and BT between males and females. The p value of 0.05 or less was considered as statistical significance. ANOVA test and post Hoc test was used to compare clotting and bleeding time in different ABO blood groups.
ResultsOur study included 205 subjects. Out of which 150
were females and 55 were males. Data were analyzed and results showed that blood group O was predominant in both males and females, followed by blood groups B, A, and AB in case of females (O>B>A>AB) and A, B
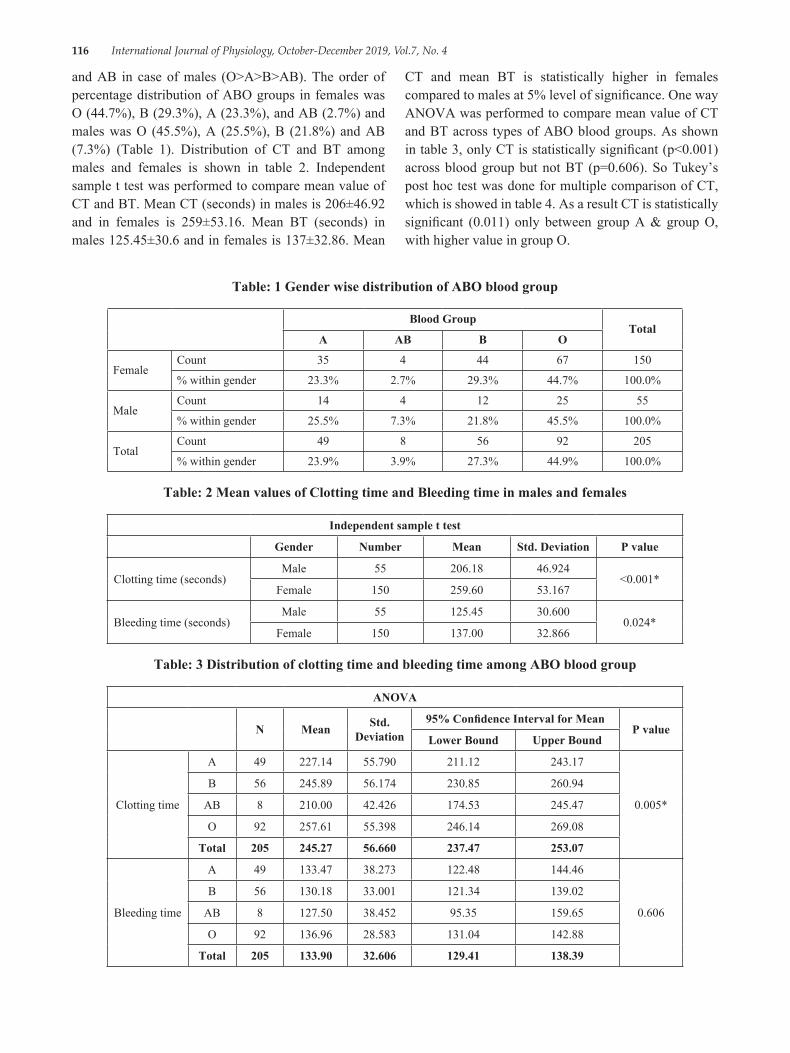
116 International Journal of Physiology, October-December 2019, Vol.7, No. 4
and AB in case of males (O>A>B>AB). The order of percentage distribution of ABO groups in females was O (44.7%), B (29.3%), A (23.3%), and AB (2.7%) and males was O (45.5%), A (25.5%), B (21.8%) and AB (7.3%) (Table 1). Distribution of CT and BT among males and females is shown in table 2. Independent sample t test was performed to compare mean value of CT and BT. Mean CT (seconds) in males is 206±46.92 and in females is 259±53.16. Mean BT (seconds) in males 125.45±30.6 and in females is 137±32.86. Mean
CT and mean BT is statistically higher in females compared to males at 5% level of significance. One way ANOVA was performed to compare mean value of CT and BT across types of ABO blood groups. As shown in table 3, only CT is statistically significant (p<0.001) across blood group but not BT (p=0.606). So Tukey’s post hoc test was done for multiple comparison of CT, which is showed in table 4. As a result CT is statistically significant (0.011) only between group A & group O, with higher value in group O.
Table: 1 Gender wise distribution of ABO blood group
Blood GroupTotal
A AB B O
FemaleCount 35 4 44 67 150
% within gender 23.3% 2.7% 29.3% 44.7% 100.0%
MaleCount 14 4 12 25 55
% within gender 25.5% 7.3% 21.8% 45.5% 100.0%
TotalCount 49 8 56 92 205
% within gender 23.9% 3.9% 27.3% 44.9% 100.0%
Table: 2 Mean values of Clotting time and Bleeding time in males and females
Independent sample t test
Gender Number Mean Std. Deviation P value
Clotting time (seconds)Male 55 206.18 46.924
<0.001*Female 150 259.60 53.167
Bleeding time (seconds)Male 55 125.45 30.600
0.024*Female 150 137.00 32.866
Table: 3 Distribution of clotting time and bleeding time among ABO blood group
ANOVA
N Mean Std. Deviation
95% Confidence Interval for MeanP value
Lower Bound Upper Bound
Clotting time
A 49 227.14 55.790 211.12 243.17
0.005*
B 56 245.89 56.174 230.85 260.94
AB 8 210.00 42.426 174.53 245.47
O 92 257.61 55.398 246.14 269.08
Total 205 245.27 56.660 237.47 253.07
Bleeding time
A 49 133.47 38.273 122.48 144.46
0.606
B 56 130.18 33.001 121.34 139.02
AB 8 127.50 38.452 95.35 159.65
O 92 136.96 28.583 131.04 142.88
Total 205 133.90 32.606 129.41 138.39
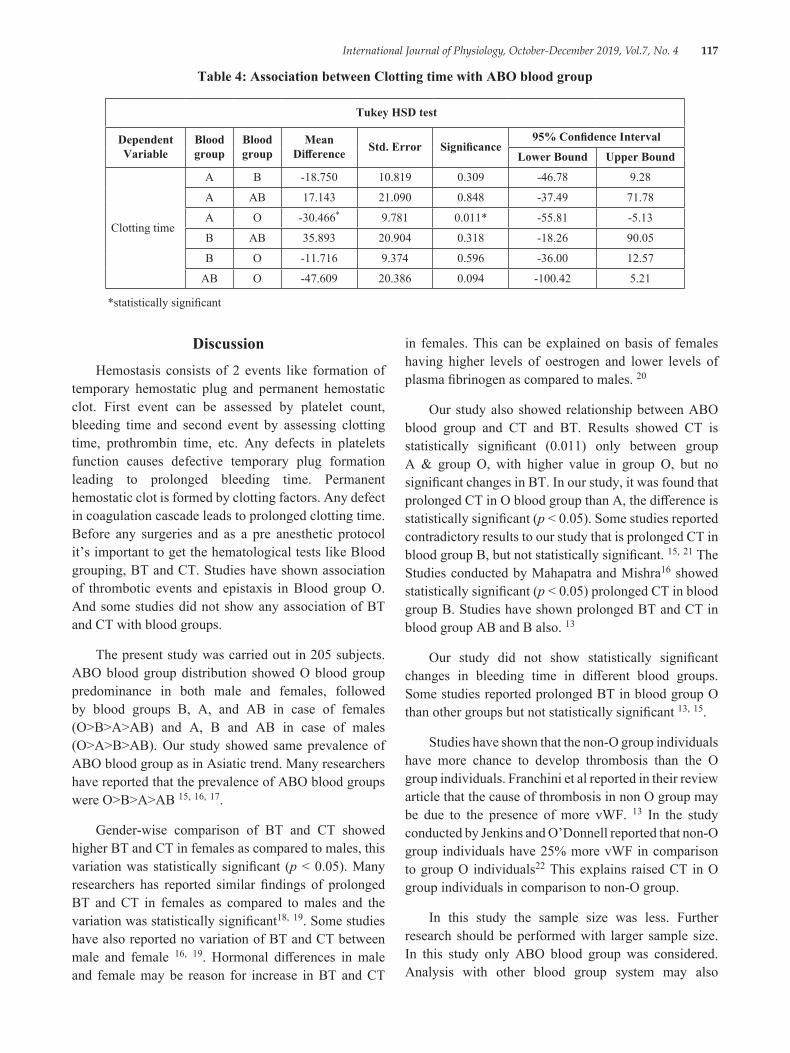
International Journal of Physiology, October-December 2019, Vol.7, No. 4 117
Table 4: Association between Clotting time with ABO blood group
Tukey HSD test
Dependent Variable
Blood group
Blood group
Mean Difference Std. Error Significance
95% Confidence Interval
Lower Bound Upper Bound
Clotting time
A B -18.750 10.819 0.309 -46.78 9.28
A AB 17.143 21.090 0.848 -37.49 71.78
A O -30.466* 9.781 0.011* -55.81 -5.13
B AB 35.893 20.904 0.318 -18.26 90.05
B O -11.716 9.374 0.596 -36.00 12.57
AB O -47.609 20.386 0.094 -100.42 5.21
*statistically significant
DiscussionHemostasis consists of 2 events like formation of
temporary hemostatic plug and permanent hemostatic clot. First event can be assessed by platelet count, bleeding time and second event by assessing clotting time, prothrombin time, etc. Any defects in platelets function causes defective temporary plug formation leading to prolonged bleeding time. Permanent hemostatic clot is formed by clotting factors. Any defect in coagulation cascade leads to prolonged clotting time. Before any surgeries and as a pre anesthetic protocol it’s important to get the hematological tests like Blood grouping, BT and CT. Studies have shown association of thrombotic events and epistaxis in Blood group O. And some studies did not show any association of BT and CT with blood groups.
The present study was carried out in 205 subjects. ABO blood group distribution showed O blood group predominance in both male and females, followed by blood groups B, A, and AB in case of females (O>B>A>AB) and A, B and AB in case of males (O>A>B>AB). Our study showed same prevalence of ABO blood group as in Asiatic trend. Many researchers have reported that the prevalence of ABO blood groups were O>B>A>AB 15, 16, 17.
Gender-wise comparison of BT and CT showed higher BT and CT in females as compared to males, this variation was statistically significant (p < 0.05). Many researchers has reported similar findings of prolonged BT and CT in females as compared to males and the variation was statistically significant18, 19. Some studies have also reported no variation of BT and CT between male and female 16, 19. Hormonal differences in male and female may be reason for increase in BT and CT
in females. This can be explained on basis of females having higher levels of oestrogen and lower levels of plasma fibrinogen as compared to males. 20
Our study also showed relationship between ABO blood group and CT and BT. Results showed CT is statistically significant (0.011) only between group A & group O, with higher value in group O, but no significant changes in BT. In our study, it was found that prolonged CT in O blood group than A, the difference is statistically significant (p < 0.05). Some studies reported contradictory results to our study that is prolonged CT in blood group B, but not statistically significant. 15, 21 The Studies conducted by Mahapatra and Mishra16 showed statistically significant (p < 0.05) prolonged CT in blood group B. Studies have shown prolonged BT and CT in blood group AB and B also. 13
Our study did not show statistically significant changes in bleeding time in different blood groups. Some studies reported prolonged BT in blood group O than other groups but not statistically significant 13, 15.
Studies have shown that the non-O group individuals have more chance to develop thrombosis than the O group individuals. Franchini et al reported in their review article that the cause of thrombosis in non O group may be due to the presence of more vWF. 13 In the study conducted by Jenkins and O’Donnell reported that non-O group individuals have 25% more vWF in comparison to group O individuals22 This explains raised CT in O group individuals in comparison to non-O group.
In this study the sample size was less. Further research should be performed with larger sample size. In this study only ABO blood group was considered. Analysis with other blood group system may also
118 International Journal of Physiology, October-December 2019, Vol.7, No. 4
necessary. Plasma vWF levels should be estimated to rule out any reasons for the difference clotting and bleeding time among ABO blood groups.
Method of measurement of BT (Duke’s method) and CT (wright’s capillary tube method) are not very accurate method. So further studies can be conducted using other test method such as estimation of prothrombin time, activated partial thromboplastin time and determination of coagulation factor.
ConclusionOur study concluded that testing hematological
parameters like blood grouping, BT, CT is mandatory before surgical procedures because of their association with thrombotic and epistaxis events. In this study, blood group O was the most common group while blood group AB was the least. Gender-wise BT and CT were higher in females than males. May be due to high estrogen and lower fibrinogen levels in females. CT and BT maximum in number in blood group O may be due to more activation of vWF. In this study we concluded that O blood group females are prone to certain diseases like epistaxis and thrombosis.
Conflict of Interest: NIL
Source of Funding: NIL
Acknowledgement: We sincerely thank, students, staff and colleagues of Department of Physiology of Mamata Medical College, Khammam, Telangana.
References1. Duke WW. The relation of blood platelets to
hemorrhagic disease. JAMA 1910; 55 (14):1185-1192.
2. Borchgrevi nk Cf. Platelet adhesion in vitro in patients with bleeding disorders. Acta Med Scand 1961; 170:231-243.
3. Ganong WF. Review of medical physiology. 24th edn. New York: MCGraw–Hill Education, 2012.p 560.
4. Zhang H, Mooney CJ, Reilly MP. ABO blood group and cardiovascular diseases. Int J Vasc Med 2012; ID 641927:1-11.
5. Qureshi MA, Bhatti R. Frequency of ABO blood groups among the diabetes mellitus type 2 patients. J Coll Physicians Surg Pak 2003; 13:453-5.
6. Mourant AE. Blood relations: blood groups and anthropology. Oxford:oxford university press. 1983:1-146.
7. Favaloro EJ, Soltani S, McDonald J, Grezchink E, Easton L, Favaloro JW. Reassessment of ABO blood group, sex, and age on laboratory parameters used to diagnose von Willebrand disoreder. Potential influence on the diagnosis vs the potential association with risk of thrombosis Am J Clin Pathl. 2005; 124 (6):910-7.
8. Ruggeri ZM, Zimmerman TS. The complex multimeric composition of factor VIII/vWF. Blood, 1981; 57:1140-3.
9. Sadler JE. Von Willebrand factor. Ann Rev Biochem. 1998, 67:395-424.
10. Reddy VM, Daniel M, Bright E, Broad SR, Moir AA. Is there an association between blood group O and epistaxis?J Laryngol otol 2008; 122 (4):366-8.
11. Ruggeri ZM: Structure of von Willebrand factor and its function in platelet adhesion and thrombus formation. Best Prac Res Clin Haematol 2001; 14:257-9.
12. Issitt PD (1985). Applied blood group serology, Montgomery Scientific Publications.
13. Franchini M, Capra F, Targher G, Montogonana M and Lippi G (2007). Relationship between ABO blood group and von Willebrand factor levels: from biology to clinical implications. Thrombosis journal, 5:1.
14. Pal GK and Pal P (2001). Textbook of practical physiology, Orient Blackswan.
15. Thenmozhi S, Neelambikai N, Aruna P. Comparison of bleeding time and clotting time in different ABO blood groups. Natl J Physiol 2013; 1 (1):19-24.
16. Mahapatra B, Mishra N. Comparison of bleeding time and clotting time in different blood groups. Am J Infect Dis 2009; 5 (2):113-5.
17. Kohli PG, Kaur H, Maini S,. Relationship of bleeding time and clotting time with blood groups. Res J Pharm Biol Chem Sci 2014; 5 (2)1780-3.
18. Adhana R, Chaurasiya R, Verma A. Comparison of bleeding time and clotting time between males and females. Natl J Physiol Pharm Pharmacol 2018; 8 (10):1388-1390.
19. Monika Gavali, Yogesh Gavali, Samir Singru and Krishnakant Patil. Gender-Does it affect BT (Bleeding Time) or CT (Clotting Time):A cross

International Journal of Physiology, October-December 2019, Vol.7, No. 4 119
sectional study in medical students. Al Ameen J Med Sc i 2016; 9 (4):236-240
20. Ercan M, Yeğİn E, Akdenİz H, Irmak H, Bayiroğlu F and Tuncer İ (1998). Effect of Estrogen on Fibrinogen Clotting Time in Rabbits. Turkish journal of veterinary and animal sciences. 22:137-140.
21. Patil SV, Gaikwad PB, Vaidya SR, Patil US, Kittad
SD. To study the blood group distribution and its relationship with bleeding and clotting time in dental students. Asian J Med Pharm Sci 2013; 1 (1):1-4.
22. Jenkins PV, O’Donnell JS. ABO blood group determines plasma von Willebrand factor levels: A biologic function after all? Transfusion 2006; 46 (10):1836-44
120 International Journal of Physiology, October-December 2019, Vol.7, No. 4
Association of ABO Blood Group with Breast Cancer: An Observational Study
Neelima Kumari1, Ashutosh Kumar2, Manish Kumar3
1Associate Professor, Department of Physiology, Katihar Medical College, Katihar, 2Associate Professor, Department of Microbiology, JLNMCH, Bhagalpur, 3Associate Professor, Department of Pharmacology,
IGIMS, Patna
AbstractIntroduction: The present study was conducted to analyse the relation of ABO blood groups with breast carcinoma.
Materials and Method: The study was conducted on 100 clinically diagnosed breast cancer patients. The standard agglutination test was used to determine the blood groups. Association of ABO blood groups and risk of breast cancers was found out with Odd Ratios (ORs) with 95% Confidence Interval (CI).
Results: Breast cancer was found minimum in blood group ‘AB’ and maximum in blood group ‘A’. It may be due to influence of blood group antigens on systemic inflammatory response which has been associated with the malignancies. The ABO antigen expressed on the surface of malignant cells appears to be different from the antigen expressed on normal tissue.
Conclusions: High frequency of breast cancer was found in blood group A followed by B and O strong relationship between blood group and breast cancer. The different expression of antigens on the surface of cancer cells might alter motility, apoptosis and immune escape. These mechanisms might influence the initiation and spread of malignancies.
Keywords: ABO blood group, Breast cancer.
tumor cells and endothelial cells of distant organs. [4] In many cancers, the deficiency of A or B epitope has been reported which is associated with accumulation of their precursor, which causes enhanced malignancy.
Material and Method: This observational study was conducted in the Department of Physiology, Surgery and Obstetrics & Gynaecology of Katihar Medical College, Katihar for a period of 12 months from May 2017 to April 2018.
A total of 100 newly and confirmed diagnosed breast cancer patients were taken for this study as cases. A written informed consent was obtained from all subjects before their participation. The data of age, sex, ABO blood group and pathological status of cancer were collected from the outdoor department.
Inclusion criteria:1. Female patients of any age group.2. Pathologically confirmed diagnosis of breast cancer
attending OPD.
IntroductionAbout one million new cases of breast cancer are
diagnosed every year. [1] In some tumors, alteration of ABO/Lewis-related antigens is associated with malignant transformation.[2] Blood group carbohydrate antigens on the surface of cancer cells can be regarded as an end product of tumor progression that can be used as useful prognostic and diagnostic markers. [3] ABO blood group genes are mapped at 9q34.2 region in which genetic alteration is common in many cancers. The loss or presence of blood group antigens can increase cellular motility or facilitate the interaction between
Corresponding Author: Dr. Neelima Kumari Associate Professor, Department of Physiology, Katihar Medical College, Katihar Mobile No-9934066846 e-mail: [email protected]
10.5958/2320-608X.2019.00152.5
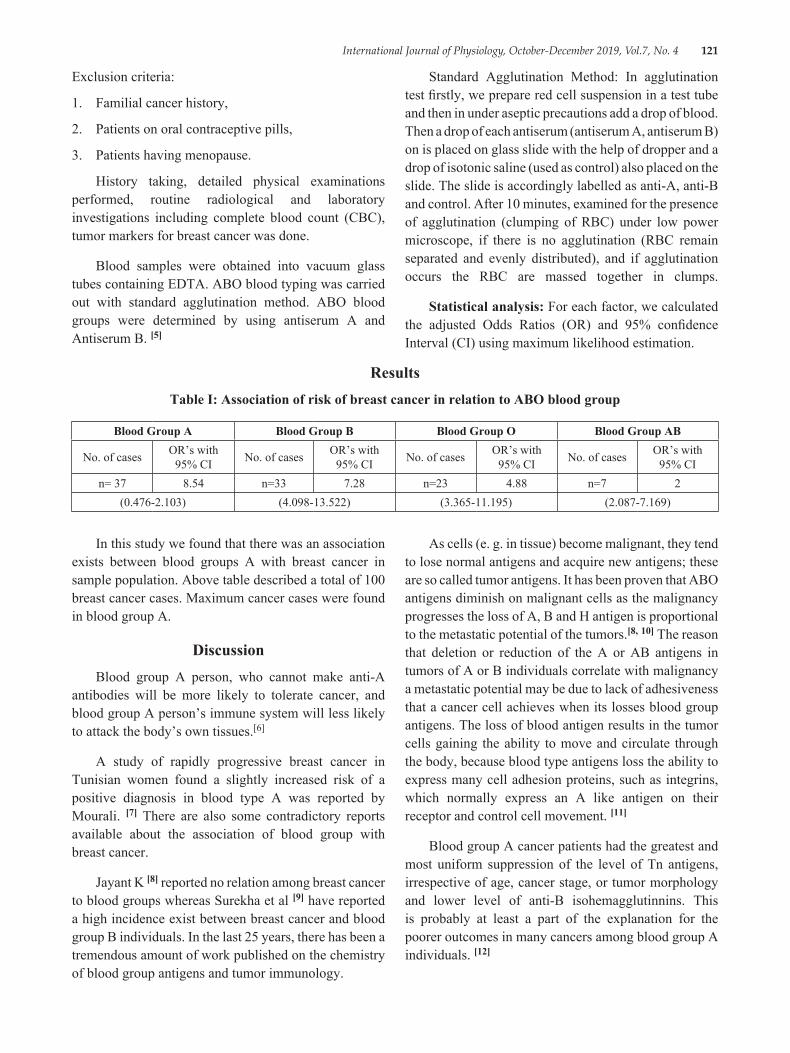
International Journal of Physiology, October-December 2019, Vol.7, No. 4 121
Exclusion criteria:
1. Familial cancer history,
2. Patients on oral contraceptive pills,
3. Patients having menopause.
History taking, detailed physical examinations performed, routine radiological and laboratory investigations including complete blood count (CBC), tumor markers for breast cancer was done.
Blood samples were obtained into vacuum glass tubes containing EDTA. ABO blood typing was carried out with standard agglutination method. ABO blood groups were determined by using antiserum A and Antiserum B. [5]
Standard Agglutination Method: In agglutination test firstly, we prepare red cell suspension in a test tube and then in under aseptic precautions add a drop of blood. Then a drop of each antiserum (antiserum A, antiserum B) on is placed on glass slide with the help of dropper and a drop of isotonic saline (used as control) also placed on the slide. The slide is accordingly labelled as anti-A, anti-B and control. After 10 minutes, examined for the presence of agglutination (clumping of RBC) under low power microscope, if there is no agglutination (RBC remain separated and evenly distributed), and if agglutination occurs the RBC are massed together in clumps.
Statistical analysis: For each factor, we calculated the adjusted Odds Ratios (OR) and 95% confidence Interval (CI) using maximum likelihood estimation.
ResultsTable I: Association of risk of breast cancer in relation to ABO blood group
Blood Group A Blood Group B Blood Group O Blood Group AB
No. of cases OR’s with 95% CI No. of cases OR’s with
95% CI No. of cases OR’s with 95% CI No. of cases OR’s with
95% CIn= 37 8.54 n=33 7.28 n=23 4.88 n=7 2
(0.476-2.103) (4.098-13.522) (3.365-11.195) (2.087-7.169)
In this study we found that there was an association exists between blood groups A with breast cancer in sample population. Above table described a total of 100 breast cancer cases. Maximum cancer cases were found in blood group A.
DiscussionBlood group A person, who cannot make anti-A
antibodies will be more likely to tolerate cancer, and blood group A person’s immune system will less likely to attack the body’s own tissues.[6]
A study of rapidly progressive breast cancer in Tunisian women found a slightly increased risk of a positive diagnosis in blood type A was reported by Mourali. [7] There are also some contradictory reports available about the association of blood group with breast cancer.
Jayant K [8] reported no relation among breast cancer to blood groups whereas Surekha et al [9] have reported a high incidence exist between breast cancer and blood group B individuals. In the last 25 years, there has been a tremendous amount of work published on the chemistry of blood group antigens and tumor immunology.
As cells (e. g. in tissue) become malignant, they tend to lose normal antigens and acquire new antigens; these are so called tumor antigens. It has been proven that ABO antigens diminish on malignant cells as the malignancy progresses the loss of A, B and H antigen is proportional to the metastatic potential of the tumors.[8, 10] The reason that deletion or reduction of the A or AB antigens in tumors of A or B individuals correlate with malignancy a metastatic potential may be due to lack of adhesiveness that a cancer cell achieves when its losses blood group antigens. The loss of blood antigen results in the tumor cells gaining the ability to move and circulate through the body, because blood type antigens loss the ability to express many cell adhesion proteins, such as integrins, which normally express an A like antigen on their receptor and control cell movement. [11]
Blood group A cancer patients had the greatest and most uniform suppression of the level of Tn antigens, irrespective of age, cancer stage, or tumor morphology and lower level of anti-B isohemagglutinnins. This is probably at least a part of the explanation for the poorer outcomes in many cancers among blood group A individuals. [12]
122 International Journal of Physiology, October-December 2019, Vol.7, No. 4
Hakomori suggested that if the immune surveillance theory is correct and we recognize tumor antigens as foreign, leading to attack of the tumor, then the “A-like” properties of tumor antigens may not be recognized by group A patients. [13]
Tumor Immune Surveillance in the immune system can specifically identify and eliminate tumor cells on the basis of their expression of tumor specific antigens or molecules induced by cellular stress whereby immune system identifies the cancerous or precancerous cells and eliminates them before they can cause harm. [14] It would be interesting to know that the percentage of patients in this particular study were of Blood Group “A”. [15] It appears that a more integrated treatment protocol should be considered using conventional modalities as well as dietary modifications.
Blood Group “A” individuals have a very low immunologic response to T and Tn antigens because they share the same sugar (N-acetygalactosamine). This allows the cancer cells to bypass the immune system and replicate with little interference from the type A antibodies will have an effect on cancer survivorship. [15]
ConclusionSome studies on blood groups showed positive
association and others were negative. It appears that different blood groups are associated with breast cancer; Blood group A apparently increases the risk for cancer. This study concludes that, in case of breast cancer, high frequency of breast cancer was found in blood group A followed by B and O strong relationship between blood group and breast cancer.
Source of Funding: Self
Conflict of Interest: None
Ethical Clearance: Taken
References1. Ferlay J, Shin HR, Bray F, Forman D, Mathers
C, Parkin DM. Estimates of worldwide burden of cancer in 2008: GLOBOCAN 2008. Int J Cancer 2010; 127: 2893-2917
2. Su M, Lu SM, Tian DP, Zhao H, Li XY, et al. Relationship between ABO bloodgroups and carcinoma of esophagus and cardia in Chaosan inhabitants of China. World J Gastroenterol 2001; 7: 657-661
3. Ichikawa D, Handa K, Hakomori S. Histo-blood group A/B antigen deletion/reduction vs. continuous
expression in human tumor cells as correlated with their malignancy. Int J Cancer 1998; 76: 284-289
4. Pack SD, Karkera JD, Zhuang Z, Pak ED, Balan KV. Molecular cytogenetic fingerprinting of esophageal squamous cell carcinoma by comparative genomic hybridization reveals a consistent pattern of chromosomal alterations. Genes Chrom Cancer 1999; 25: 160-168.68 Saxena, Chawla, Gupta and Gaur Indian J Physiol Pharmacol 2015; 59 (1)
5. Jain AK. In: Manual of Practical Physiology for MBBS. Groups. Arya Publication, New Delhi. 2007; 43-45
6. Kawaguchi T. Adhesion molecules and carbohydrates in cancer si Byori 1996; 44: 1138-1146
7. Mourali, N, Muenz LR, Tabbane F, Belhassen S, Bahi J, Levine PH. Epidemiologic features of rapidly progressing breast cancer in Tunisia. Cancer 1980; 46: 2741-2746.
8. Garraty G. Blood groups and disease: a historical perspective. Transfus Med Rev 2000; 14: 291-301.
9. Surekha D, Shrinivasan A, Sailaja K, Rao D. Association of esterase D and AB0 blood group in breast cancer. In: Trends in Human Genetics, Biotechnology and Bioinformatics: Next 5 years. 29th Annual conference of Indian Society of Human Genetics, Bangalore. 2004; 122-123
10. Garratty G. Do blood groups have a biological role? En. Garratty G, ed. Immunobiology of transfusion Medicine. Newyork: Dekker 1994; 201-255
11. Ichikawa D, Handa K, Hakamori S. Histo-blood group AJ B antigen deletion/reduction vs. continuous expression in human tumor cells as correlated with their malignancy. Int J Cancer 1998; 76: 284-289
12. Kurtenkov O, Klaamas K, Miljukhina L. The cancer level of natural anti-Thomsen-Friedenriech antigen (TFA) agglutinins in sera of patients with gastric cancer related to ABO (H) blood group phenotype. Int J Cancer 1995; 60: 781-785
13. Hakomori S. Antigen structure and genetic basis of histoblood groups A, B and O: their changes associated with human cancer. Biochim Biophys Acta 1999; 1473 (1): 247-266
14. Dunn GP, Bruce AT, Ikeda H, Old LJ, Schreiber RD. Cancer immunoediting: from immunosurvillance to tumor escape. Nat Immunol 2002: 3:991-998
15. Bennett Malissa. Breast Cancer and Blood Type A. ed, Bennett M. Blood Group A cancer Immunologic Factors. Natural Health Blog, 30 October, 2008
International Journal of Physiology, October-December 2019, Vol.7, No. 4 123
Study of Minute Ventilation, Maximum Voluntary Ventilation and Dyspneic Index During Pregnancy: An Observational,
Prospective and Comparative Study
Neelima Kumari1, Ashutosh Kumar2, Manish Kumar3
1Associate Professor, Department of Physiology, Katihar Medical College, Katihar, 2Associate Professor, Department of Microbiology, JLNMCH, Bhagalpur, 3Associate Professor, Department of Pharmacology,
IGIMS, Patna
AbstractIntroduction: This study was designed to evaluate the Minute ventilation (MV). Maximum Voluntary Ventilation (MVV) & Dyspneic Index (DI) in different trimesters of pregnancy and compare the results with non pregnant control group.
Materials and Method: This study was carried out in 80 healthy women in the age range of 20-40 years with 20 subjects each in 1st, 2nd, 3rd trimesters of pregnancy and non-pregnant control group. The respiratory parameters were recorded in study and control groups. Statistical analysis was done by SPSS Software Package.
Results: It was observed that there was a significant decrease in MVV and dyspneic index (DI) in all trimesters of pregnancy and an insignificant variation in MV when compared to the control group. These changes are due to pressure of enlarging gravid uterus, elevating the diaphragm and restricting the movements of lungs thus hampering forceful expiration. The decrease seen in MVV in 1st trimester might be due to the effect of bronchoconstriction due to decreased alveolar Pco2.
Conclusions: Decrease in respiratory parameters was seen particularly in first trimester of pregnancy compared to 2nd & 3rd. The normal Minute Ventilation tries to maintain the respiratory need of pregnancy at rest. At increased physiological needs of respiration or during exercise the decreased Maximum Voluntary Ventilation makes pregnant female dyspneic.
Keywords: Pregnancy, Minute Ventilation, Maximum Voluntary Ventilation and Dyspneic Index.
uterus can have an effect. [1] In Pregnant women there is increases in minute ventilation (VE), tidal volume, alveolar ventilation and a reduction in arterial PCO2.[2, 3] There is renal excretion of bicarbonate, resulting in a state of partly compensated respiratory alkalosis (arterial pH 7.43-7.47). [4] These effects appear in the first trimester and may promote placental gas exchange before development of an effective fetal circulatory system. [4]
The aim of the study was to evaluate the effect of pregnancy on Static & dynamic lung volumes and capacities in the subjects of Indian pregnant women in the age range of 20-40 years in different trimesters of pregnancy and compare them with healthy age matched non-pregnant control group.
IntroductionThe changes that occur in thoracic cage are rise
in the diaphragm by four centimetres, widening of sub-costal angle increasing the transverse diameter by two centimetres & thoracic circumferences by six centimetres. These changes begin before the size of
Corresponding Author: Dr. Manish Kumar Associate Professor, Department of Pharmacology, Indira Gandhi Institute of Medical Sciences, Sheikhpura, Patna-800014, Bihar Mobile No.: 9304093698 e-mail: [email protected]
10.5958/2320-608X.2019.00153.7
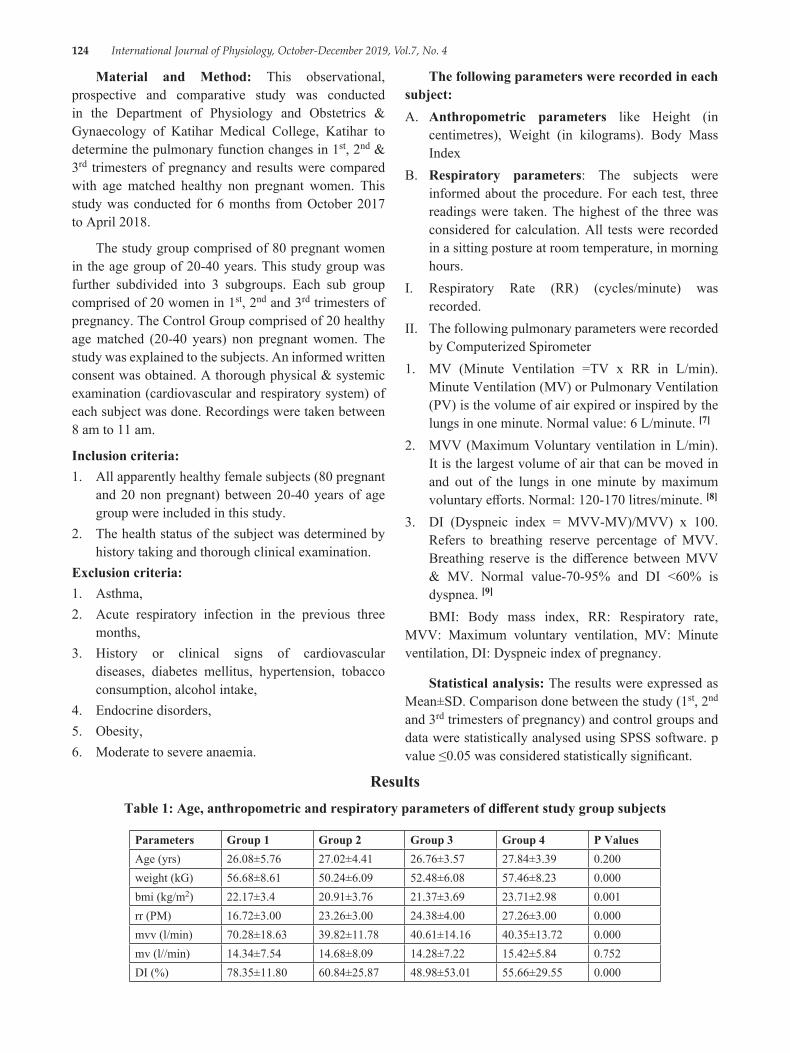
124 International Journal of Physiology, October-December 2019, Vol.7, No. 4
Material and Method: This observational, prospective and comparative study was conducted in the Department of Physiology and Obstetrics & Gynaecology of Katihar Medical College, Katihar to determine the pulmonary function changes in 1st, 2nd & 3rd trimesters of pregnancy and results were compared with age matched healthy non pregnant women. This study was conducted for 6 months from October 2017 to April 2018.
The study group comprised of 80 pregnant women in the age group of 20-40 years. This study group was further subdivided into 3 subgroups. Each sub group comprised of 20 women in 1st, 2nd and 3rd trimesters of pregnancy. The Control Group comprised of 20 healthy age matched (20-40 years) non pregnant women. The study was explained to the subjects. An informed written consent was obtained. A thorough physical & systemic examination (cardiovascular and respiratory system) of each subject was done. Recordings were taken between 8 am to 11 am.
Inclusion criteria:1. All apparently healthy female subjects (80 pregnant
and 20 non pregnant) between 20-40 years of age group were included in this study.
2. The health status of the subject was determined by history taking and thorough clinical examination.
Exclusion criteria:1. Asthma,2. Acute respiratory infection in the previous three
months,3. History or clinical signs of cardiovascular
diseases, diabetes mellitus, hypertension, tobacco consumption, alcohol intake,
4. Endocrine disorders,5. Obesity,6. Moderate to severe anaemia.
The following parameters were recorded in each subject:A. Anthropometric parameters like Height (in
centimetres), Weight (in kilograms). Body Mass Index
B. Respiratory parameters: The subjects were informed about the procedure. For each test, three readings were taken. The highest of the three was considered for calculation. All tests were recorded in a sitting posture at room temperature, in morning hours.
I. Respiratory Rate (RR) (cycles/minute) was recorded.
II. The following pulmonary parameters were recorded by Computerized Spirometer
1. MV (Minute Ventilation =TV x RR in L/min). Minute Ventilation (MV) or Pulmonary Ventilation (PV) is the volume of air expired or inspired by the lungs in one minute. Normal value: 6 L/minute. [7]
2. MVV (Maximum Voluntary ventilation in L/min). It is the largest volume of air that can be moved in and out of the lungs in one minute by maximum voluntary efforts. Normal: 120-170 litres/minute. [8]
3. DI (Dyspneic index = MVV-MV)/MVV) x 100. Refers to breathing reserve percentage of MVV. Breathing reserve is the difference between MVV & MV. Normal value-70-95% and DI <60% is dyspnea. [9]
BMI: Body mass index, RR: Respiratory rate, MVV: Maximum voluntary ventilation, MV: Minute ventilation, DI: Dyspneic index of pregnancy.
Statistical analysis: The results were expressed as Mean±SD. Comparison done between the study (1st, 2nd and 3rd trimesters of pregnancy) and control groups and data were statistically analysed using SPSS software. p value ≤0.05 was considered statistically significant.
ResultsTable 1: Age, anthropometric and respiratory parameters of different study group subjects
Parameters Group 1 Group 2 Group 3 Group 4 P ValuesAge (yrs) 26.08±5.76 27.02±4.41 26.76±3.57 27.84±3.39 0.200weight (kG) 56.68±8.61 50.24±6.09 52.48±6.08 57.46±8.23 0.000bmi (kg/m2) 22.17±3.4 20.91±3.76 21.37±3.69 23.71±2.98 0.001rr (PM) 16.72±3.00 23.26±3.00 24.38±4.00 27.26±3.00 0.000mvv (l/min) 70.28±18.63 39.82±11.78 40.61±14.16 40.35±13.72 0.000mv (l//min) 14.34±7.54 14.68±8.09 14.28±7.22 15.42±5.84 0.752DI (%) 78.35±11.80 60.84±25.87 48.98±53.01 55.66±29.55 0.000
International Journal of Physiology, October-December 2019, Vol.7, No. 4 125
Anthropometric parameters: The Mean±SD of age, weight, BMI have been shown in Table 1. All groups are similar by age. There was a decrease in weight in 1st & increase in 3rd trimester compared to control. BMI increased significantly in 3rd trimester compared to control
Respiratory parameters: The Mean±SD of RR. MVV, MV and DI have been presented in Table I. There was a gradual increase in RR from 1st to 3rd trimesters compared to control. There was no significant difference in the minute ventilation between the study and control groups. A highly significant decrease in MVV was observed in all trimesters with a maximum decrease in 1st trimester. DI was significantly reduced in all trimesters compared to control group with maximum decrease in 2nd trimester.
DiscussionThe present study showed a significant increase
in weight & BMI in 3rd trimester. [10] A significant increase in RR from 1st to 3rd trimester of pregnancy as compared to control group which is in agreement with Bernhard Heidemann, who stated that PaCO2 falls and then levels off at 4.1kPa (31 mmHg) by the end of the first trimester. This is caused by a 10% increase in the respiratory rate, secondary to progesterone mediated hypersensitivity to CO2, and an increase in alveolar and minute ventilation, secondary to increased respiratory rate and tidal volume.[11]
Present study showed insignificant increase in MV in all trimesters as compared to control group. A study by Emilia Kolarzyk showed increase in MV during pregnancy. The increase in MV was caused by a significant increase in tidal volume. [12] The study by Aaron P also showed increase in MV which is due to changes in osmolality, (SID) strong ion differences & angiotensin II levels, which have been implicated in the control of ventilation.[13]
There was a significant decrease in MVV in all trimesters compared to control group with maximum decrease in 1st trimester. The decline in the MVV in first trimester is due to morning sickness (lack of nutrition) and also due to lodging of trophoblast cell in the alveoli from the maternal uterine sinuses. In the 2nd and 3rd trimester, it may be due to mechanical pressure of enlarging gravid uterus, elevating the diaphragm and restricting the movements of lungs and thus hampering the forceful expiration and may also be due to
bronchoconstriction effect of decreased alveolar Pco2.[14] Present study also demonstrates a significant decrease in DI in all trimesters as compared to control group with maximum decrease in 2nd trimester. The decrease in the DI shows that pregnant women in all trimesters are dyspneic on exertion, [5] but some individuals showed negative DI indicating dyspnea at rest in all trimesters.
ConclusionThe normal Minute Ventilation tries to maintain
the respiratory need of pregnancy at rest. At increased physiological needs of respiration or during exercise the decreased Maximum Voluntary Ventilation makes her dyspneic. Further studies are needed to establish the cause for decrease in respiratory parameters particularly in first trimester of pregnancy compared to 2nd & 3rd.
Source of Funding: Self
Conflict of Interest: None
Ethical Clearance: Taken
References1. McAuliffe F, Kametasa N, Costellob J, Rafferty
GF, Greenough A, Nicolaidesa K. Respiratory function in singleton and twin pregnancy. Br J Obstet Gynaecol 2002; 109: 765-769.
2. Pivarnik JM, Lee. W, Spillman T. Maternal respiration and blood gases during aerobic exercise performed at moderate altitude. Med Sci Sports Exerc 1992; 24: 868-872
3. Wolfe LA, Walker RMC, Bonen A, McGrath MJ. Effects of pregnancy and chronic exercise on respiratory responses to graded exercise. J Appl Physiol 1994; 76: 1928-1936
4. Liberatore SM, Pistelli R, Patalano F, Moneta E, Incalzi RA, Ciappi C, Respiratory function during pregnancy. Respiration 1984; 46: 145-150
5. George RB, Light RW, Matthay MA, Matthay RA. Essentials of pulmonary a critical care medicine. In: Chest medicine. 2nd edition. New York: McGraw-Hill 2001; 101-122
6. Chhabra S, Nangia V, Ingley KN. Changes in respiratory function tests during pregnancy. Ind J Physiol Pharmacol 1988; 32: 56-60
7. Arthur John E. Respiratory system. In: Guyton & Hall Text book of Medical Physiology. 12th edition. Philadelphia: Saunders, 2011; 471

126 International Journal of Physiology, October-December 2019, Vol.7, No. 4
8. Pal GK. Pal P. Clinical examination of respiratory system. In: Textbook of Practical Physiology. 2nd edition. Chennai: Orient Longmann Pvt Ltd, 2005; 154-161
9. Khurana Indu. Respiratory system. In: Text of medical Physiology. 1st edition Anand Jha (eds). Elsevier India Private limited 2010; 468-482
10. Dutta DC. In: Text book of Obstetrics. 6th edition. Hiralala Konar (eds) Kolkata; New Central Book Agency Ltd. 2004; 50-344
11. Heidemann B. Changes in maternal physiology during pregnancy. Anaesthesia 2005; 20: 21-24
12. Kolarzyk E, Szot WM. Lyszczarz J. Lung function and breathing regulation parameters during pregnancy. Arch Gynecol Obstet 2005; 272: 53-58
13. Heehan PA. Wolfe AL. Plasma acid-base regulation above and below ventilator threshold in late gestation. J Appl Physiol 2000; 88: 149-157
14. Monga U. Kumari K. Pulmonary Function in Punjabi Pregnant Women. Ind J Phsiol Pharmacol 2000; 44: 115-116
International Journal of Physiology, October-December 2019, Vol.7, No. 4 127
Left Ventricular Mass Index as a Diagnostic Predictor for Hypertrophy of the Left Ventricle in Hypertensive Patients
Meenu1, Satheesh Balakrishnan2
1Assistant professor, Department of Physiology, 2Assistant Professor, Department of Nephrology, Pushpagiri Medical College, Thiruvalla, Kerala, India
AbstractBackground: Patient suffering from hypertension are at increased incidence of suffering from increase in size of left ventricular mass (hypertrophy) due to associated risk factor like male sex, advanced age, males including addiction to smoking and alcohol. Measurement of left ventricular mass index helps in detecting the increase in size of left ventricular mass (hypertrophy).
Objectives: To evaluate increase in size of left ventricular mass (hypertrophy) in relation to ventricular mass index of left ventricle in hypertensive patients.
Method: A total 100 patients were grouped into 2 groups and named as Group I who served as Normal-Left ventricular mass index-N-LVMI) and Group II who served as Increased Left ventricular mass index-I-LVMI (More than 118g/m2 in males and 109 g/m2 in females. All patients were evaluated for past history and related cardiovascular parameters. About 67 patients among 100 had normal LVMI and 33 patients as per Penn’s convention formula had increased LVMI. Body surface area was calculated by using formula 0.20247 x Height (m) 0.725 x Weight (Kg) 0.425 according to DuBois and DuBois formula. LVMI for males is 118gm/m2 and 109 gm/m2 in females as per normal Indian population and a value above suggests increase in size of left ventricular mass (hypertrophy).
Statistics: Chi-square test.
Results: Mean with ± standard deviation in age (in years) was 50 ± 10.3 and 58± 9.8 in patients without LVH and un patients with LVH respectively. Lateral shift of the apex was seen more in Group II (24.2%) when compared to Group I which showed 4.6%. Apical impulse was found to be 33.3% in Group II as compared to Group I. Chest X ray showed 27.2% in Group II compared to Group I which was 15% for Group I in-terms of cardiac enlargement. Patients having LVH were 51.5% in Group II as compared to 17.9% in Group I for SOKOLOV LYON INDEX and in terms of ROMHILT ESTES, Group II with 42.4% and Group II with 8.9% patients. Patient having concentric LVH as per results of 2 D ECHO patients in Group II was 78.8% compared to patients in Group I which was 11.9%.
Conclusion: There was a substantial and positive association that shows a strong association between LVMI and increase in size of left ventricular mass (hypertrophy) in hypertensive patients as evident from our study.
Keywords: Left ventricular hypertrophy, Left ventricular mass index, Risk Factors.
IntroductionA maladaptive response due to long term blood
pressure along with risk factors like atrial fibrillation, systolic and or diastolic heart failure is the major etiological factor for pathogenesis of LVH and sudden cardiac arrest in patients suffering from hypertension1. Hypertension leads to increase in afterload and LV wall
Corresponding Author: Satheesh Balakrishnan Assistant professor, Department of Nephrology, Pushpagiri Medical College, Thiruvalla Mob No.: 9497634957 e-mail: [email protected]
10.5958/2320-608X.2019.00154.9
128 International Journal of Physiology, October-December 2019, Vol.7, No. 4
stress followed by stimulation of myocyte leading to increase in size of left ventricular mass (hypertrophy), collagen formation and fibroblasts which is the main etiology for cardiac remodeling and deposition of fibrous tissue disproportionate fashion. This leads to decrease in LV compliance thus reducing diastolic function. Coronary blood flow reserve gets greatly affected as a consequence of structural changes in coronary arteries including fibrosis of myocardial interstitial cells and in myocardial mass possibly with myocardial ischemia causing transient diastolic dysfunction2. American Society of Echocardiography stated reference ranges for LV mass and LV mass indexed (LVMI) to body surface area (BSA) using M-mode and two-dimensional (2D) echocardiography recently looks different, because the value may vary significantly in Indian population3-5. A predictor in disguise for cardiovascular complications is increased LVM in general population and in hypertensive patients is strongly correlated apart from advancing age is and reduction in LVH proved to be important in prognosis6. Keeping this view in mind, we have tried to study of increase in size of left ventricular mass (hypertrophy) with special reference to left ventricular mass index in patients suffering from hypertension.
Materials and MethodInstitution Ethics Committee clearance was obtained
from Manipal University, Mangalore, Karnataka, India wide Ref. No PIMSRC/E1/385A/51/2014, before conducting the study. Informed consent was taken from each study participant.
Inclusion criteria: In our study, among 100 samples, we have considered patients above the age of 30 years suffering from hypertension irrespective of duration and type of treatment receiving were taken for the study
Exclusion criteria:
1. Patient suffering from secondary hypertension
2. Patients with congenital heart defects and or with valvular heart defects
3. Patients suffering from cardiomyopathy.
4. Patients having diabetes mellitus.
All the cardiovascular parameters were evaluated
Following clinical data were obtained from all patients.
1. Age and sex of the patients.
2. Body surface area
3. Duration of hypertension
4. Treatment receiving.
5. History of stroke or recurrent transient ischemic attacks
6. Standard cuff blood pressure in right upper limbs was taken twice, mean value was taken as the blood pressure.
7. Cardiovascular examinations.
8. Ophthalmic examination for any evidence of hypertensive retinopathy.
9. Routine blood and urine investigations
10. Chest X-ray: To measure exact cardio thoracic ratio
11. ECG was obtained from all patients. ECG criteria which was used in our study was Sokolov-Lyon index and Romhilt-Estes score system. In Sokolov-Lyon index, S in V1 + R in V5/V6>35 mm was regarded as increase in size of left ventricular mass (hypertrophy). In Romhilt-Estes score system, total score is 12. Score of 5 or more was regarded as increase in size of left ventricular mass (hypertrophy).
12. Echocardiographic Method-with Combined M mode and also included 2-dimensional echocardiographic studies were performed in all patients.
Penn’s convention formula is LVM-1.04 (LVIDd + PWT + IVST3)-LVIDd3-14gm for LVMI
The DuBois and DuBois formula is 0.20247 x Height (m)0.725 x Weight (Kg)0.425 LVMI = LVM /BSA.
Males with118gm/m2 and 109 gm/m2 in females is the normal LVMI for Indian population. A value over and above this is clear suggestive of increase in size of left ventricular mass (hypertrophy).
Statistical Analysis: Chi-square test was used. p value was calculated and we found statistically significant relation between increase in size of left ventricular mass (hypertrophy) and ischemic heart disease and stroke.
ResultsOur entire study samples were divided in to 2 groups.
Group I was considered as Normal LVMI and Group II with Increased LVMI which was more than 118g/m2 in
International Journal of Physiology, October-December 2019, Vol.7, No. 4 129
males and 109 g/m2 in females.
Demographic features: In our study, we found that males 76 and females were 24 among 100 samples. About 33 subjects had I-LVMI and 67 patients had N-LVMI. Among males 50 had N-LVMI and 26 had I-LVMI. Among females, 7 had I-LVMI and 17 had N-LVMI. 50± 10.3 and 58± 9.8 is the mean age in years in patients without LVH and in patients with LVH respectively. Mean BSA in group I is1.7±0.1 and in group II is 1.72±0.1 (Table 1).
Table 1
Demographic FeaturesSex Patients-N-LVMI Patients-INC-LVMIMales 65% 35%Females 70% 30%
Personal HabitsAddiction Patients–N-LVMI Patients–Inc-LVMIAlcohol 32.8% 39.39%Smoking 55.8% 60.6%
N-LVMI = Normal Left ventricular mass index, INC-LVMI=Increased Left ventricular mass index
Blood pressure changes: The mean systolic blood pressure in mm of Hg is 134±12 in Group I and 158± 14 in Group II. The mean diastolic BP in mm of Hg is 82 ± 6 in Group I and 98 ± 8 in Group II (Table 2).
Table 2
Blood Pressure ChangesCriteria Patients–N-LVMI Patients–INC-LVMIMean systolic BP 134± 12 mm of Hg 158± 14 mm of HgMean diastolic BP 82 ±6 mm of Hg 98 ± 8 mm of Hg
Duration of HypertensionDuration in years Patients–N-LVMI Patients–INC-LVMI<5 72% 28%6-10 41% 59%>10 22% 78%
Treatment HistoryTreatment Patients–N-LVMI Patients–INC-LVMIRegular-1 drug 52% 48%Regular-2 drug 66% 34%No /Irregular 24% 76%
Clinical FeaturesClinical findings Patients–N-LVMI Patients–INC-LVMIApex lateral shift 4.6% 24.2%
Clinical FindingsApex lateral shift 4.6% 24.2%Character heaving 5.9% 33.3%
Auscultatory FindingsLOUD A2 4.4% 15.15%S4 5.9% 18.18%ESM 7.4% 18.1%
N-LVMI = Normal Left ventricular mass index, INC-LVMI=Increased Left ventricular mass index
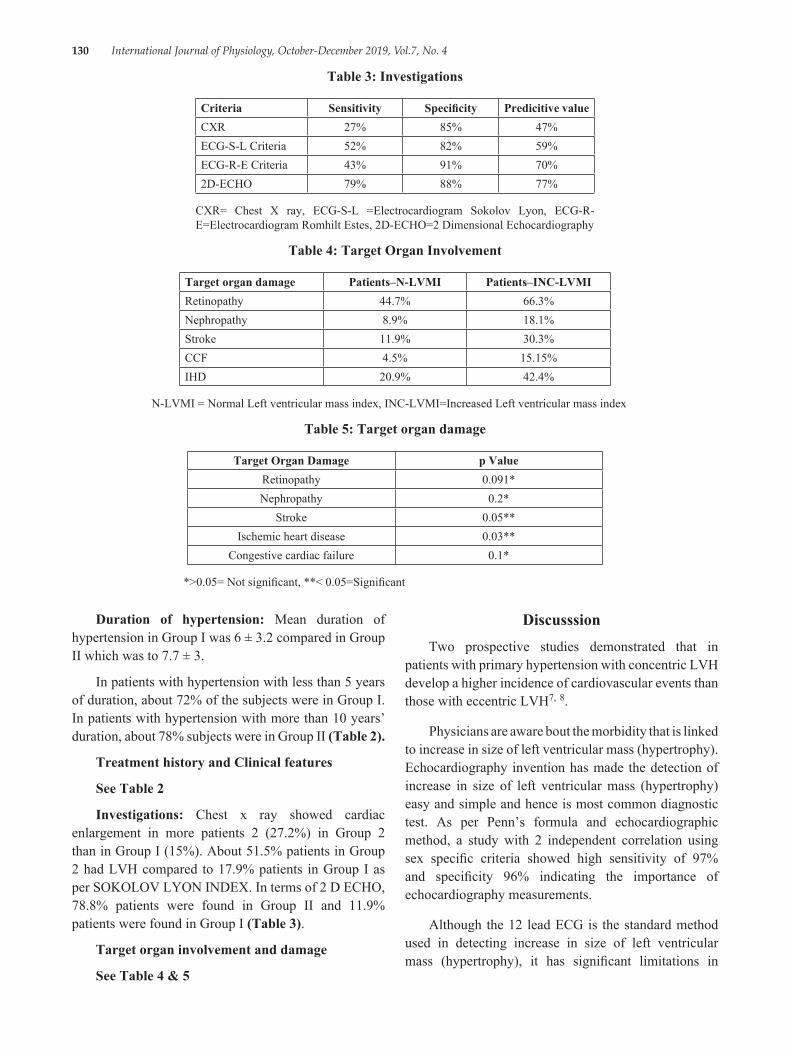
130 International Journal of Physiology, October-December 2019, Vol.7, No. 4
Table 3: Investigations
Criteria Sensitivity Specificity Predicitive valueCXR 27% 85% 47%ECG-S-L Criteria 52% 82% 59%ECG-R-E Criteria 43% 91% 70%2D-ECHO 79% 88% 77%
CXR= Chest X ray, ECG-S-L =Electrocardiogram Sokolov Lyon, ECG-R-E=Electrocardiogram Romhilt Estes, 2D-ECHO=2 Dimensional Echocardiography
Table 4: Target Organ Involvement
Target organ damage Patients–N-LVMI Patients–INC-LVMIRetinopathy 44.7% 66.3%Nephropathy 8.9% 18.1%Stroke 11.9% 30.3%CCF 4.5% 15.15%IHD 20.9% 42.4%
N-LVMI = Normal Left ventricular mass index, INC-LVMI=Increased Left ventricular mass index
Table 5: Target organ damage
Target Organ Damage p ValueRetinopathy 0.091*Nephropathy 0.2*
Stroke 0.05**Ischemic heart disease 0.03**
Congestive cardiac failure 0.1*
*>0.05= Not significant, **< 0.05=Significant
Duration of hypertension: Mean duration of hypertension in Group I was 6 ± 3.2 compared in Group II which was to 7.7 ± 3.
In patients with hypertension with less than 5 years of duration, about 72% of the subjects were in Group I. In patients with hypertension with more than 10 years’ duration, about 78% subjects were in Group II (Table 2).
Treatment history and Clinical features
See Table 2
Investigations: Chest x ray showed cardiac enlargement in more patients 2 (27.2%) in Group 2 than in Group I (15%). About 51.5% patients in Group 2 had LVH compared to 17.9% patients in Group I as per SOKOLOV LYON INDEX. In terms of 2 D ECHO, 78.8% patients were found in Group II and 11.9% patients were found in Group I (Table 3).
Target organ involvement and damage
See Table 4 & 5
DiscusssionTwo prospective studies demonstrated that in
patients with primary hypertension with concentric LVH develop a higher incidence of cardiovascular events than those with eccentric LVH7, 8.
Physicians are aware bout the morbidity that is linked to increase in size of left ventricular mass (hypertrophy). Echocardiography invention has made the detection of increase in size of left ventricular mass (hypertrophy) easy and simple and hence is most common diagnostic test. As per Penn’s formula and echocardiographic method, a study with 2 independent correlation using sex specific criteria showed high sensitivity of 97% and specificity 96% indicating the importance of echocardiography measurements.
Although the 12 lead ECG is the standard method used in detecting increase in size of left ventricular mass (hypertrophy), it has significant limitations in
International Journal of Physiology, October-December 2019, Vol.7, No. 4 131
sensitivity and specificity, and little value in estimating the quantitative extent increase in size of left ventricular mass (hypertrophy).
In a previous study, the LVMI for Indian population was studied as 118g/m2 in males and 109/m2 in females. These values were taken as the reference values in this study and used as gold standard for increase in size of left ventricular mass (hypertrophy) 10.
Demographic FeaturesSex: Males were more in our study compared to
female with increase in size of left ventricular mass (hypertrophy).
Age: As age proceeds the incidence of increase in size of left ventricular mass (hypertrophy) also increases especially if patient already suffering from hypertension as evident from our study.
Duration of hypertension: Chronicity of hypertension plays a significant role in the development of increase in size of left ventricular mass (hypertrophy) which is similar study Ross et al11.
Blood pressure: The mean systolic and diastolic BP were more in our study especiallt in patients suffering from increased LVH.
Treatment: Patients on regular treatment showed decreased incidence of increase in size of left ventricular mass (hypertrophy) compared with the patients with no treatment or irregular treatment.
Clinical correlations: Our study showed positive correlation with the long standing duration of hypertension and increase in size of left ventricular mass (hypertrophy) and reduced ventricular compliance which is similar to other studies11-13.
Investigation: Our study had showed about 27% for chest X-ray, 52% for Sokolov-lyon, 43% for ECG, and 79% for 2D-Echo. In 12 lead ECG, Sokolov–Lyon indexhas been found to be more sensitive than Romhilt-Estes scoring, but the specificity and accuracy are more with Romhilt Estes scoring system14-16.
Target organ involvement and damage: In our study, the relation between the LVH and incidence of coronary artery disease and stroke was statistically significant which is similar to Framingham heart study and Eurostroke studies17-20.
ConclusionOur study has strongly showed positive co-relation
that exists between LVMI which serves as a predictor in disguise for disguise for left ventricular ̀ in hypertensive patients.
Conflict of Interest: Nil
Source of Funding: Self
References1. Richard E. Katholi, Daniel M. Couri. Left
Ventricular Hypertrophy: Major Risk Factor in Patients with Hypertension: Update and Practical Clinical Applications. Int J Hypertens. 2011; 2011: 495349.
2. Thomas Kahan, Lennart Bergfeldt. hypertrophy of the left ventricle in hypertension: its arrhythmogenic potential. Heart. 2005; 91 (2): 250-256.
3. Lang RM, Badano LP, Mor-Avi V, Afilalo J, Armstrong A, Ernande L, et al. Recommendations for cardiac chamber quantification by echocardiography in adults: an update from the American Society of Echocardiography and the European Association of Cardiovascular Imaging. J Am Soc Echocardiogr. 2015; 28:1-39.
4. Hudsmith LE, Petersen SE, Francis JM, Robson MD, Neubauer S. Normal human left and right ventricular and left atrial dimensions using steady state free precession magnetic resonance imaging. J Cardiovasc Magn Reson. 2005; 7:775-82.
5. Sandstede J, Lipke C, Beer M, Hofmann S, Pabst T, Kenn W, et al. Age-and gender-specific differences in left and right ventricular cardiac function and mass determined by cine magnetic resonance imaging. Eur Radiol. 2000; 10:438-42.
6. Markus P. Schlaich Roland E. Schmieder. Left Ventricular Hypertrophy and its Regression: Pathophysiology and Therapeutic Approach: Focus on Treatment by Antihypertensive Agents, American Journal of Hypertension. 1998; 11 (11): 1394-1404.
7. Koren MJ, Devereux RB, Casale PN et al. Relation of left ventricular mass and geometry to morbidity and mortality in uncomplicated essential hypertension. Ann Int Med. 1991; 114: 345-352.
8. Foley RN, Parfrey PS, Harnett JDet al. The prognostic importance of left ventricular geometry
132 International Journal of Physiology, October-December 2019, Vol.7, No. 4
in uremic cardiomyopathy. J Am Soc Nephrol. 1995; 5: 2024-2031.
9. George A. Mensah. Hypertension and Target Organ Damage: Don’t Believe Everything You Think. Ethn Dis. 2016; 26 (3): 275-278.
10. Hammond IW, Devereux RB, Aldermann MH The prevalence and correlates of echocardiographic left ventricular hypertrophy among employed patients with uncomplicated hypertension Am Coll Cardio. 1986; 7:639-650.
11. Eilen SO. Crawford MH, O Rourke RA. Accuracy of precordial palpation for detecting LV volume. Ann Intern Med. 1983; 99:628-630.
12. Edward D, Frohlich D. Medical clinics of North America: Part 1 and Essential Hypertension. 1997; 1077-1098.
13. Julius Nathan. Accuracy of echocardiography versus electrocardiography in detecting left ventricular hypertrophy. JACC. 1983; 2:305-311.
14. Janeway TC. A clinical study of hypertensive cardiovascular disease. Arch Intern Med. 1913; 12:755.
15. Papademetriou V, Gottdiener JS. Fletcher RD. Diastolic LV function and LVH in patients with borderline or mild hypertension: Am J Cardiol. 1985; 56:546-550.
16. Muscholl MW, Schunkert H, Muders F, Elsner D, Kuch B, Hense HW, Riegger G A. Neurohormonal activity and left ventricular geometry in patients with essential hypertension. Am Heart. J 1998; 135.
17. Johan Sundstrom, Lars Lind, Johan Arnlv, Bjorn Zethelius, Bertil Anpdren, Echocardiographic and electrocardiographic diagnoses of left ventricular hypertrophy predict mortality independently of each other in a population of elderly men. Circulation. 2001; 103:2346
18. Fagard RH et. al. Prognostic significance of electrocardiographic voltages and their serial changes in elderly with systolic hypertension. Hypertension. 2004; 44 (4):459-64.
19. Shigemitsu Y1, Hamada M, Okayama H, Hara Y, Hayashi Y, Kodama K, Kohara K, Hiwada K. Left ventricular hypertrophy precedes other target-organ damage in primary aldosteronism. Hypertension. 1997 Mar; 29 (3):723-7.
20. Richard B. Devereux et. al. Prognostic Significance of Left Ventricular Mass Change During Treatment of Hypertension. JAMA. 2004; 282 (19): 2350-2356
International Journal of Physiology, October-December 2019, Vol.7, No. 4 133
Evaluation of Modifiable Risk Factors in the Development of Age Related Macular Degeneration in Kashmiri Population
Mehak Mufti1, Hammad Nasti2, Tajali Shora3
1Assistant Professor, Department of Physiology, 2Consultant, Al Kabir Eye Care Center, Srinagar, 3Assistant Professor Department of Community Medicine, Government Medical College, Anantanag
AbstractAge Related Macular Degeneration (ARMD) is the leading cause of irreversible visual loss, adversely affecting the quality of life. It is a degenerative disorder of the macula involving the choriocapillaries, Bruchs membrane, retinal pigment epithelium and the photoreceptors. It is a multifactorial disease occurring due to a complex interplay of genetic and environmental factors. Gender, ethnicity, smoking, obesity, hypertension, diabetes, history of cardiovascular disorders, high fat intake, low intake of carotenoids, history of cataract surgery, blue iris colour, high sunlight exposure are some of the risk factors, many of which are very well documented and some still remain controversial due to lack of evidence.
Objective: The aim of our study was to evaluate the role of some of the modifiable non genetic risk factors in the causation of ARMD and the role of healthy lifestyle in preventing the visual loss due to ARMD.
Materials & Method: This is a case control study which was conducted on the outdoor patients attending Al Kabir eye care center, Srinagar. The ARMD status of the patients was confirmed by thorough ophthalmological examination by a single opthalmologist. Height, weight BMI, history of smoking, history of hypertension, hyperopia, and cataract surgery was taken. Iris color was noted. Detailed dietary history regarding intake of fruits, vegetables, beef, lamb, and fish was taken. Data was analysed using Chi square test.
Result: We found that prevalence of ARMD increases after 60 years of age. History of smoking, history of higher intake of beef and lamb is strongly associated with ARMD (p value <0.01and <0.03 respectively). We did not find any association between ARMD and history of cataract surgery, hyperopia or hypertension nor did our study find any significant difference in the association of ARMD and iris colour.
Conclusion: From our analysis we can conclude that ARMD is a disease of the older population and cigarette smoking, excessive consumption of beef and lamb are significant risk factors for the causation of ARMD.
Keywords: ARMD, Smoking, Diet, Lifestyle.
choriocapillaries, Bruchs membrane, retinal pigment epithelium and the photoreceptors. It is the leading cause of irreversible visual loss, adversely affecting the quality of life and causing many people to lose their independence in their retirement years. In the U. S, it is responsible for 54 % of severe visual loss. It is believed that, more than 1 in 10 white individuals aged 80 and above will have advanced ARMD. Patients with advanced ARMD in one eye have 50 % chance of developing it in the other eye in 5 years time.1,2,3,4
ARMD has two main types; dry/non exudative and wet/exudative. Dry ARMD is more common and
IntroductionAge related macular degeneration (ARMD) is
a degenerative disorder of the macula involving the
Corresponding Author Dr. Mehak Mufti Assistant professor Department of physiology GMC Anantanag J&K Mob.: 7889788272 e-mail: [email protected]
10.5958/2320-608X.2019.00155.0
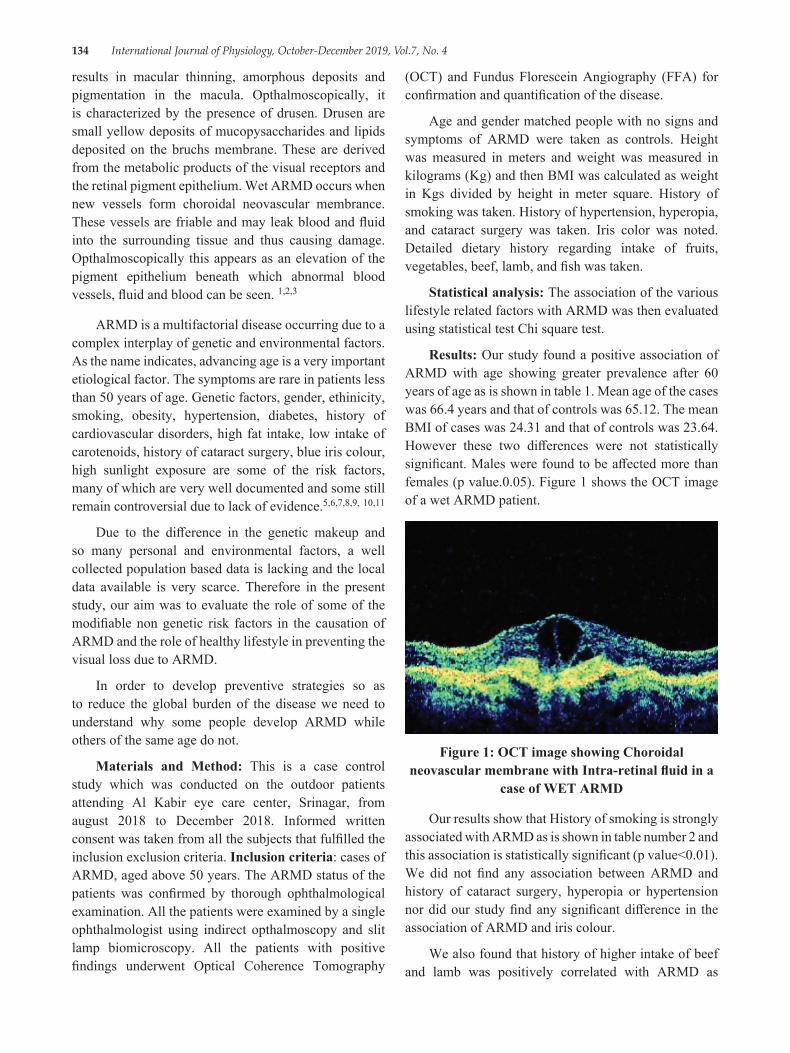
134 International Journal of Physiology, October-December 2019, Vol.7, No. 4
results in macular thinning, amorphous deposits and pigmentation in the macula. Opthalmoscopically, it is characterized by the presence of drusen. Drusen are small yellow deposits of mucopysaccharides and lipids deposited on the bruchs membrane. These are derived from the metabolic products of the visual receptors and the retinal pigment epithelium. Wet ARMD occurs when new vessels form choroidal neovascular membrance. These vessels are friable and may leak blood and fluid into the surrounding tissue and thus causing damage. Opthalmoscopically this appears as an elevation of the pigment epithelium beneath which abnormal blood vessels, fluid and blood can be seen. 1,2,3
ARMD is a multifactorial disease occurring due to a complex interplay of genetic and environmental factors. As the name indicates, advancing age is a very important etiological factor. The symptoms are rare in patients less than 50 years of age. Genetic factors, gender, ethinicity, smoking, obesity, hypertension, diabetes, history of cardiovascular disorders, high fat intake, low intake of carotenoids, history of cataract surgery, blue iris colour, high sunlight exposure are some of the risk factors, many of which are very well documented and some still remain controversial due to lack of evidence.5,6,7,8,9, 10,11
Due to the difference in the genetic makeup and so many personal and environmental factors, a well collected population based data is lacking and the local data available is very scarce. Therefore in the present study, our aim was to evaluate the role of some of the modifiable non genetic risk factors in the causation of ARMD and the role of healthy lifestyle in preventing the visual loss due to ARMD.
In order to develop preventive strategies so as to reduce the global burden of the disease we need to understand why some people develop ARMD while others of the same age do not.
Materials and Method: This is a case control study which was conducted on the outdoor patients attending Al Kabir eye care center, Srinagar, from august 2018 to December 2018. Informed written consent was taken from all the subjects that fulfilled the inclusion exclusion criteria. Inclusion criteria: cases of ARMD, aged above 50 years. The ARMD status of the patients was confirmed by thorough ophthalmological examination. All the patients were examined by a single ophthalmologist using indirect opthalmoscopy and slit lamp biomicroscopy. All the patients with positive findings underwent Optical Coherence Tomography
(OCT) and Fundus Florescein Angiography (FFA) for confirmation and quantification of the disease.
Age and gender matched people with no signs and symptoms of ARMD were taken as controls. Height was measured in meters and weight was measured in kilograms (Kg) and then BMI was calculated as weight in Kgs divided by height in meter square. History of smoking was taken. History of hypertension, hyperopia, and cataract surgery was taken. Iris color was noted. Detailed dietary history regarding intake of fruits, vegetables, beef, lamb, and fish was taken.
Statistical analysis: The association of the various lifestyle related factors with ARMD was then evaluated using statistical test Chi square test.
Results: Our study found a positive association of ARMD with age showing greater prevalence after 60 years of age as is shown in table 1. Mean age of the cases was 66.4 years and that of controls was 65.12. The mean BMI of cases was 24.31 and that of controls was 23.64. However these two differences were not statistically significant. Males were found to be affected more than females (p value.0.05). Figure 1 shows the OCT image of a wet ARMD patient.
Figure 1: OCT image showing Choroidal neovascular membrane with Intra-retinal fluid in a
case of WET ARMD
Our results show that History of smoking is strongly associated with ARMD as is shown in table number 2 and this association is statistically significant (p value<0.01). We did not find any association between ARMD and history of cataract surgery, hyperopia or hypertension nor did our study find any significant difference in the association of ARMD and iris colour.
We also found that history of higher intake of beef and lamb was positively correlated with ARMD as
International Journal of Physiology, October-December 2019, Vol.7, No. 4 135
is shown in table 3 and this association is statistically significant (p value < 0.03). However we did not find a positive association between higher consumption of fish and low incidence of ARMD.
Table 1: Age wise distribution of subjects
Age Group ARMD N (%)
Non ARMD N (%)
Total N (%)
50-54 01 (02) 00 (00) 01 (01)55-59 04 (08) 10 (20) 14 (14)60-64 13 (26) 12 (24) 25 (25)65-69 20 (40) 22 (44) 42 (42)70-74 09 (18) 05 (10) 14 (14)≥75 03 (06) 01 (02) 04 (04)Total 50 (100) 50 (100) 100 (100)
Chi Square = 5.85, P Value=0.321
Table 2: Distribution of subjects as per their History of Smoking
Non SmokerN (%)
Present Smoker N (%)
TotalN (%)
Armd 18 (36) 32 (64) 50 (100)Non Armd 29 (58) 21 (42) 50 (100)Total 47 (47) 53 (53) 100 (100)
Chi Square= 4.87, P Value = 0.01
Table 3: History of Intake of Beef/Lamb
PresentN (%)
AbsentN (%)
TotalN (%)
Armd 43 (86) 07 (14) 50 (100)Non Armd 34 (68) 16 (32) 50 (100)Total 77 (77) 23 (23) 100 (100)
Chi Square= 4.57, P Value= 0.03
DiscussionARMD is a disease of the old age, therefore our
study population included subjects > 50 years of age and we also found ARMD to be more prevalent after 60 years of age and this is well supported by literature. 8 We did not find a significant association between BMI and ARMD and this is supported by some other studies as well. 21 However some studies have found BMI as a moderate risk factor for ARMD. 5, 8 Debra A et al in their study have found that the relation between ARMD and BMI is independent of age and cigarette smoking and obesity is a significant risk factor for dry ARMD 18. In our study population males were affected more
than females but the results in this regard differ and are inconclusive. 8, 10, 17
We found that history of smoking is positively and significantly associated with ARMD. This is in accordance with previous studies. 8, 15, 16, 21 J R Evans et al in their study found that current smokers were twice at risk of ARMD as compared to non smokers and ex smokers are at an intermediate risk. People who have quit smoking more than 20 years ago were not at an increased risk of ARMD causing visual loss. 12 As per the Brever Dam study also, the risk of ARMD is higher in current smokers as compared to Ex smokers and non smokers. 14
Our study did not find a significant association between between hypertension, cataract surgery iris color and history of ARMD. Many other studies have shown similar results 13, 16, 20, 21. Literature is still divided on whether or not these factors pose a risk for the development of ARMD and many researchers have found contradictory results. 8, 10
Diet also seems to play an important role in the causation of ARMD. Studies have found higher intake of fruits and vegetables is inversely related to ARMD 9. Higher intake of carotenoids is recommended as a preventable dietary modification for ARMD 13. Higher intake of dietary lutein is associated with reduced risk of ARMD 15. Our results show higher intake of beef and lamb to be positively related with ARMD. History of higher consumption of beef, pork or lamb (>one serving per week) is associated with 35 % increased risk of ARMD when compared to people who take < one serving per month. On the other hand, higher intake of fish seems to play a protective role. Consumption of fish > 4 times a week was associated with lower risk of ARMD as compared to people who consumed fish < 3 times per month. Positive association has been found between intake of linolenic acid (found in food sources like beef, pork, and lamb) and ARMD and an inverse relation between DHA (found in food sources like fish) and ARMD 19.
ConclusionFrom our analysis we can conclude that ARMD is
a disease of the older population and cigarette smoking, excessive consumption of beef and lamb are significant risk factors for the causation of ARMD.
136 International Journal of Physiology, October-December 2019, Vol.7, No. 4
Hence, in an adjunct with prescribing therapies it is important to make lifestyle and environment modifications. Creating awareness about some of the lifestyle modifications like quitting cigarette smoking, reducing body weight, role of exercise, role of antioxidants in the diet will help to lower the burden of the disease and help people lead a healthy life. Patients should be encouraged to eat diet rich in fruits and vegetables and cut down on intake of beef/lamb as a main dish.
Conflict of Intrest: None
Sourse of Funding: Self
Ethical Clearance was taken from institutioinal ethical committee.
References:1. Epidemiology and risk factors for age related
macular degeneration. In: Andrew P, Schachat and Shrinivas R Sadda. editors. Ryans retina. 6th ed. Elsevier; p 1273-84
2. Acquired macular disorders. In: Ken Nishal. editors. Jack J Kanski Brad Bowling clinical ophthalmology. A systemic approach. 7th ed. Elsevier; p 594-645
3. Diseases of retina. In Ramanjit Sihota, Radhika Tandon. editors. Parson’s disease of the eye. 22nd ed. Elsevier; 2015.p 309-39
4. Friedman DS, Beneta J, Munoz B, et al. Prevalence of age related macular degeneration in the United States. Arch Opthalmol 2004; 122:564-72
5. Yim JL, Montgomery D. Risk factors for glaucoma. geriatric medicine midlife and beyond. 2007; 43-48
6. McMonnies CW. Glaucoma history and risk factors. J Optometry 2017; 10:71-8
7. McConnell V, Silvestri G. Age related macular degeneration. Ulster Med J 2005; 74 (2) 82-92
8. Chakravarthy et al. Clinical risk factors for age related macular degeneration:a systemic review and meta analysis. BMC Opthalmology 2010; 10:31
9. Mares JA, Voland RP, Sondel SA et al. Healthy lifestyles related to subsequent prevalence of age related macular degeneration. Arch Opthalmol 2011; 129 (4) 470-80
10. Beatty S, Boulton M, Henson D, KOH H, Murray J. Macular pigment and age related macular degeneration. Br J Opthalmol 1999; 83; 867-77
11. Paulus TVM. Age related macular degeneration. N Engl J Med 2006:335:1474-85
12. Evans JR, Fletcher AE, Wormald RPL. 28 000 cases of age related macular degeneration causing visual loss in people aged 75 years and above in the united kingdom may be attributable to smoking. Br J Opthalmol 2005; 89:550-3
13. John G. Age related macular degeneration. Postgrad Med J 1998; 74:203-207.
14. Klein R, Klein BE, Linton KL, De Mets DL. The Breaver Dam Eye Study. The relation of age related maculopathy to smoking. Am J Epidemol 1993; 137:190-200
15. Seddon JM, Reynolds R, Rosner B. Assosiation of smoking, body masss index, dietary lutein and the LIPC genetic variant rs10468017 with advanced age related macular degeneration. Molecular vision 2010; 16:2412-24
16. Khan JC, Shahid H, Thurlby DA et al. Age related macular degeneration and sun exposure, iris colour and skin sensitivity to sunlight. Br J Opthalmol 2006; 90:29-32
17. Colijn JM, Gabrielle HS, Prokofyeva E et al. Prevalence of age related macular degeneration in Europe. Am academy of Opthalmol 2017; 124:1753-63
18. Schaumberg DA, Hankinson S, Robert J. Body mass index and the incidence of visually significant age related macular degeneration in men. Arch Opthalmol 2011; 119:1259-65
19. Cho E, Hung S, Willett WC et al. prospective study of dietary fat and the risk of age related macular degeneration. Am J Clin Nutr 2001; 73:209-18
20. Chaine G, Hullo A, Sahel J et al. Case control study of risk factors for age related macular degeneration. Br J opthalmol 1998; 82:996-1002
21. Klein R, Karen J, Cruickshanks et al. The prevalence of age related macular degeneration and associated risk factors. Arch opthalmol 2010; 128:750-8
International Journal of Physiology, October-December 2019, Vol.7, No. 4 137
A Comparative Study of Pulmonary Function Test Parameters between the Smokers and Non-Smokers among the Three Wheeler Auto-Rickshaw Drivers in Puducherry Region
Mohan Ram. P1, Dhanalakshmi. Y2, Jothi Marie Feula. A3, Manju Rajaram4, Subitha. L5, Arvind. N6, Umamaheshwari K7
1MBBS Intern, Jipmer, Puducherry, 2Associate Professor, Department of Physiology, JIPMER, 3Senior Resident, Department of Physiology, JIPMER, 4Additional Professor and HOD, Department of Pulmonary Medicine,
JIPMER, 5Associate Professor, Department of P&SM, JIPMER, 6MBBS Intern, Jipmer, Puducherry, 7Professor, Department of Physiology, ESI Medical College, K.K. Nagar, Chennai
AbstractBackground: Occupational health is attaining significance for the reason that long term exposure to automobile fumes and environmental pollutants can lead to irreversible morbidity. This study will help in assessing the effects of smoking and occupational exposure to ambient air pollution on respiratory functions.
Aim: To assess and compare pulmonary function parameters among smoking and non-smoking auto rickshaw drivers.
Methodology: Auto rickshaw drivers between 20 to 50 years of age were recruited in the study and grouped into smokers and non smokers. Anthropometric parameters, pack years of smoking amongst smokers, years of driving were obtained. The Pulmonary function test parameters were recorded by a standard computerized Spirometer model “SPIROLAB III”. All parameters were analyzed using Student’s independent ‘t’ test in SPSS 19 version.
Results: There was a statistically significant reduction in PEFR among smokers when compared to non smokers. The mean FVC, FEV1, FEV1/FVC and FEF25-75 were also found to be reduced in smokers when compared to non-smokers but were not statistically significant.
Conclusion: The study showed that Peak Expiratory Flow Rate is reduced significantly among smokers when compared to non smokers in three wheeler auto rickshaw drivers.
Keywords: PEFR, auto rickshaw drivers, Pulmonary function test, duration of driving.
year1. Automobile emission is the outstanding cause of outdoor air pollution2. Automobile fumes contain hazardous pollutants like carbon monoxide, carbon dioxide, nitrogen dioxide, sulfur dioxide and ozone that may lead to respiratory and systemic illness2. Petrol is a combination of complex hydrocarbons and 95% of it is constituted by aliphatic hydrocarbons and less than 2% by aromatic hydrocarbon (benzene). Benzene is the most hazardous pollutant. Various studies have concluded that long term exposure to Benzene and other polyaromatic hydrocarbons contribute to increase in respiratory morbidity3. The major mode of public transport in developing countries like India is the buses
Corresponding Author: Dr. Dhanalakshmi. Y. Associate Professor, Dept. of Physiology, Jipmer, Puducherry Mobile: 9444781210 e-mail: [email protected]
Introduction Outdoor air pollution one of the major cause
of non–communicable cardiopulmonary diseases worldwide attributes to 5.4% of the total deaths every
10.5958/2320-608X.2019.00156.2
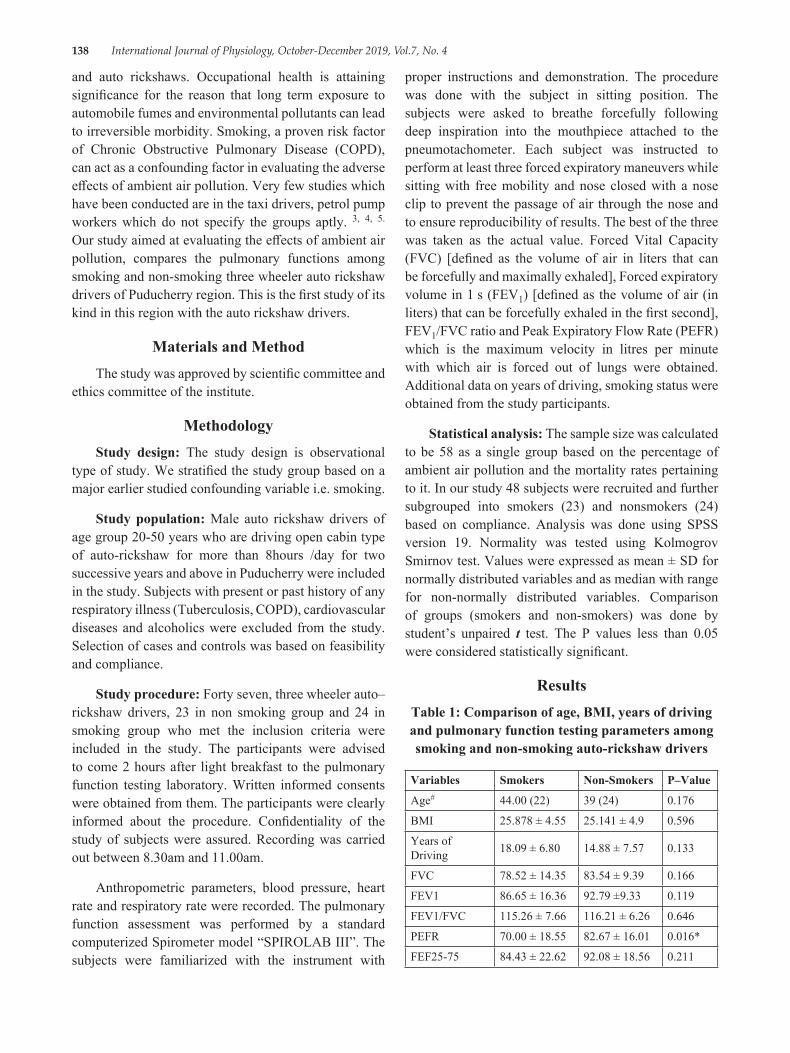
138 International Journal of Physiology, October-December 2019, Vol.7, No. 4
and auto rickshaws. Occupational health is attaining significance for the reason that long term exposure to automobile fumes and environmental pollutants can lead to irreversible morbidity. Smoking, a proven risk factor of Chronic Obstructive Pulmonary Disease (COPD), can act as a confounding factor in evaluating the adverse effects of ambient air pollution. Very few studies which have been conducted are in the taxi drivers, petrol pump workers which do not specify the groups aptly. 3, 4, 5. Our study aimed at evaluating the effects of ambient air pollution, compares the pulmonary functions among smoking and non-smoking three wheeler auto rickshaw drivers of Puducherry region. This is the first study of its kind in this region with the auto rickshaw drivers.
Materials and MethodThe study was approved by scientific committee and
ethics committee of the institute.
MethodologyStudy design: The study design is observational
type of study. We stratified the study group based on a major earlier studied confounding variable i.e. smoking.
Study population: Male auto rickshaw drivers of age group 20-50 years who are driving open cabin type of auto-rickshaw for more than 8hours /day for two successive years and above in Puducherry were included in the study. Subjects with present or past history of any respiratory illness (Tuberculosis, COPD), cardiovascular diseases and alcoholics were excluded from the study. Selection of cases and controls was based on feasibility and compliance.
Study procedure: Forty seven, three wheeler auto–rickshaw drivers, 23 in non smoking group and 24 in smoking group who met the inclusion criteria were included in the study. The participants were advised to come 2 hours after light breakfast to the pulmonary function testing laboratory. Written informed consents were obtained from them. The participants were clearly informed about the procedure. Confidentiality of the study of subjects were assured. Recording was carried out between 8.30am and 11.00am.
Anthropometric parameters, blood pressure, heart rate and respiratory rate were recorded. The pulmonary function assessment was performed by a standard computerized Spirometer model “SPIROLAB III”. The subjects were familiarized with the instrument with
proper instructions and demonstration. The procedure was done with the subject in sitting position. The subjects were asked to breathe forcefully following deep inspiration into the mouthpiece attached to the pneumotachometer. Each subject was instructed to perform at least three forced expiratory maneuvers while sitting with free mobility and nose closed with a nose clip to prevent the passage of air through the nose and to ensure reproducibility of results. The best of the three was taken as the actual value. Forced Vital Capacity (FVC) [defined as the volume of air in liters that can be forcefully and maximally exhaled], Forced expiratory volume in 1 s (FEV1) [defined as the volume of air (in liters) that can be forcefully exhaled in the first second], FEV1/FVC ratio and Peak Expiratory Flow Rate (PEFR) which is the maximum velocity in litres per minute with which air is forced out of lungs were obtained. Additional data on years of driving, smoking status were obtained from the study participants.
Statistical analysis: The sample size was calculated to be 58 as a single group based on the percentage of ambient air pollution and the mortality rates pertaining to it. In our study 48 subjects were recruited and further subgrouped into smokers (23) and nonsmokers (24) based on compliance. Analysis was done using SPSS version 19. Normality was tested using Kolmogrov Smirnov test. Values were expressed as mean ± SD for normally distributed variables and as median with range for non-normally distributed variables. Comparison of groups (smokers and non-smokers) was done by student’s unpaired t test. The P values less than 0.05 were considered statistically significant.
ResultsTable 1: Comparison of age, BMI, years of driving and pulmonary function testing parameters among smoking and non-smoking auto-rickshaw drivers
Variables Smokers Non-Smokers P–Value
Age# 44.00 (22) 39 (24) 0.176
BMI 25.878 ± 4.55 25.141 ± 4.9 0.596
Years of Driving 18.09 ± 6.80 14.88 ± 7.57 0.133
FVC 78.52 ± 14.35 83.54 ± 9.39 0.166
FEV1 86.65 ± 16.36 92.79 ±9.33 0.119
FEV1/FVC 115.26 ± 7.66 116.21 ± 6.26 0.646
PEFR 70.00 ± 18.55 82.67 ± 16.01 0.016*
FEF25-75 84.43 ± 22.62 92.08 ± 18.56 0.211
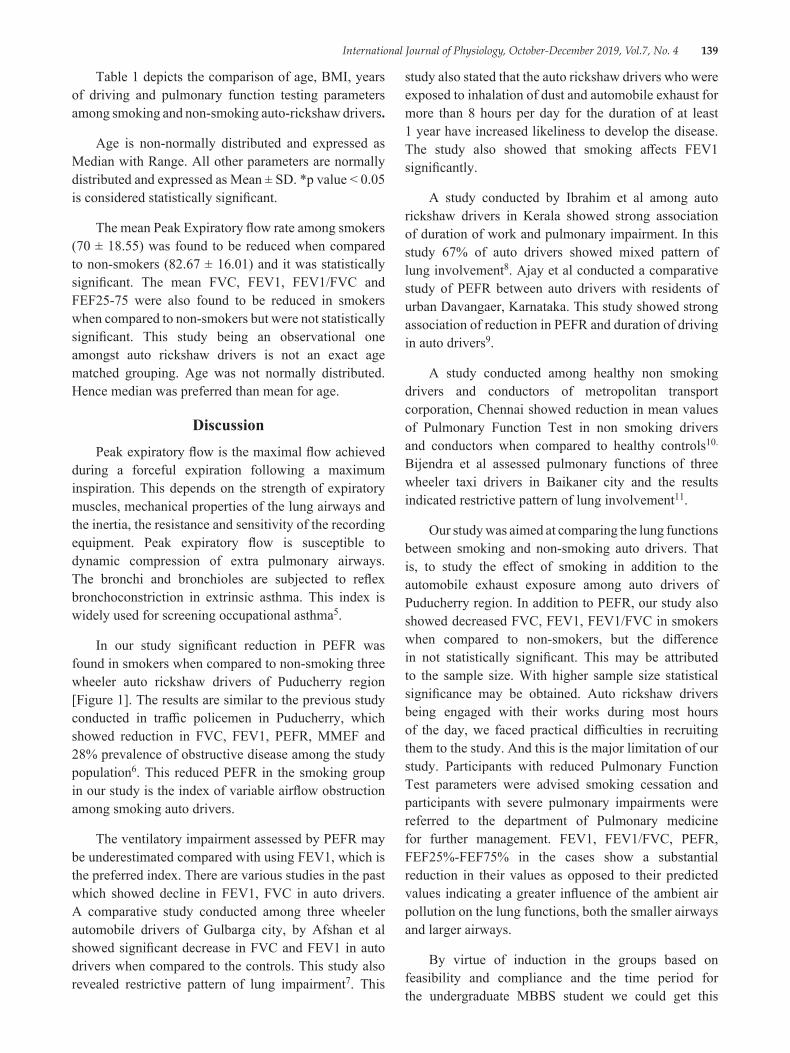
International Journal of Physiology, October-December 2019, Vol.7, No. 4 139
Table 1 depicts the comparison of age, BMI, years of driving and pulmonary function testing parameters among smoking and non-smoking auto-rickshaw drivers.
Age is non-normally distributed and expressed as Median with Range. All other parameters are normally distributed and expressed as Mean ± SD. *p value < 0.05 is considered statistically significant.
The mean Peak Expiratory flow rate among smokers (70 ± 18.55) was found to be reduced when compared to non-smokers (82.67 ± 16.01) and it was statistically significant. The mean FVC, FEV1, FEV1/FVC and FEF25-75 were also found to be reduced in smokers when compared to non-smokers but were not statistically significant. This study being an observational one amongst auto rickshaw drivers is not an exact age matched grouping. Age was not normally distributed. Hence median was preferred than mean for age.
DiscussionPeak expiratory flow is the maximal flow achieved
during a forceful expiration following a maximum inspiration. This depends on the strength of expiratory muscles, mechanical properties of the lung airways and the inertia, the resistance and sensitivity of the recording equipment. Peak expiratory flow is susceptible to dynamic compression of extra pulmonary airways. The bronchi and bronchioles are subjected to reflex bronchoconstriction in extrinsic asthma. This index is widely used for screening occupational asthma5.
In our study significant reduction in PEFR was found in smokers when compared to non-smoking three wheeler auto rickshaw drivers of Puducherry region [Figure 1]. The results are similar to the previous study conducted in traffic policemen in Puducherry, which showed reduction in FVC, FEV1, PEFR, MMEF and 28% prevalence of obstructive disease among the study population6. This reduced PEFR in the smoking group in our study is the index of variable airflow obstruction among smoking auto drivers.
The ventilatory impairment assessed by PEFR may be underestimated compared with using FEV1, which is the preferred index. There are various studies in the past which showed decline in FEV1, FVC in auto drivers. A comparative study conducted among three wheeler automobile drivers of Gulbarga city, by Afshan et al showed significant decrease in FVC and FEV1 in auto drivers when compared to the controls. This study also revealed restrictive pattern of lung impairment7. This
study also stated that the auto rickshaw drivers who were exposed to inhalation of dust and automobile exhaust for more than 8 hours per day for the duration of at least 1 year have increased likeliness to develop the disease. The study also showed that smoking affects FEV1 significantly.
A study conducted by Ibrahim et al among auto rickshaw drivers in Kerala showed strong association of duration of work and pulmonary impairment. In this study 67% of auto drivers showed mixed pattern of lung involvement8. Ajay et al conducted a comparative study of PEFR between auto drivers with residents of urban Davangaer, Karnataka. This study showed strong association of reduction in PEFR and duration of driving in auto drivers9.
A study conducted among healthy non smoking drivers and conductors of metropolitan transport corporation, Chennai showed reduction in mean values of Pulmonary Function Test in non smoking drivers and conductors when compared to healthy controls10. Bijendra et al assessed pulmonary functions of three wheeler taxi drivers in Baikaner city and the results indicated restrictive pattern of lung involvement11.
Our study was aimed at comparing the lung functions between smoking and non-smoking auto drivers. That is, to study the effect of smoking in addition to the automobile exhaust exposure among auto drivers of Puducherry region. In addition to PEFR, our study also showed decreased FVC, FEV1, FEV1/FVC in smokers when compared to non-smokers, but the difference in not statistically significant. This may be attributed to the sample size. With higher sample size statistical significance may be obtained. Auto rickshaw drivers being engaged with their works during most hours of the day, we faced practical difficulties in recruiting them to the study. And this is the major limitation of our study. Participants with reduced Pulmonary Function Test parameters were advised smoking cessation and participants with severe pulmonary impairments were referred to the department of Pulmonary medicine for further management. FEV1, FEV1/FVC, PEFR, FEF25%-FEF75% in the cases show a substantial reduction in their values as opposed to their predicted values indicating a greater influence of the ambient air pollution on the lung functions, both the smaller airways and larger airways.
By virtue of induction in the groups based on feasibility and compliance and the time period for the undergraduate MBBS student we could get this
140 International Journal of Physiology, October-December 2019, Vol.7, No. 4
distribution only. Hence it could seem as age being an important implicator in the responses though we consider it due to the fact of ambient air pollution.
Our study stated that the auto rickshaw drivers who were exposed to inhalation of dust and automobile exhaust for more than 8 hours per day for the duration of at least 1 year have increased likeliness to develop the disease. The study also showed that smoking affects FEV1 significantly. Also significant reduction in PEFR was found in smokers when compared to non-smoking three wheeler auto rickshaw drivers of Puducherry region [Table1]. The results are similar to the previous study conducted in traffic policemen in Puducherry, which showed reduction in FVC, FEV1, PEFR, MMEF. In addition to PEFR, our study also showed decreased FVC, FEV1, FEV1/FVC in smokers when compared to non-smokers, but the difference is not statistically significant. This may be attributed to the sample size. With higher sample size statistical significance may be obtained.
A study by balashanmugam et al (6) states that the percentage of autorickshaw drivers was around 11% in Puducherry in 2009. The study also takes the percentage of other type of drivers and quantifies the ambient air pollution. Hence this being an occupational hazard does significantly contribute to the morbidity of the said group of subjects and thence their effects on the PFT. Our study was aimed at observing the responses pertaining to the effects of air pollution based on their work nature and duration mainly. Hence it does not necessarily imply or attribute the effects only due to smoking.
Also the age and duration of driving in the smokers were more when compared to non smokers, which could have acted as confounding variable.
Auto rickshaw drivers being engaged with their daily routine (driving) during most hours of the day lead to practical difficulties in recruiting them to the study. And this is the major limitation of our study.
ConclusionOur study showed significant reduction in Peak
Expiratory Flow Rate in smokers when compared to non-smokers among three wheeler auto rickshaw drivers of Puducherry region. Further studies with a bigger sample size may help to demonstrate significant difference in other spirometric parameters, between smoking and non smoking autorickshaw drivers.
Ethical Clearance: Our proposal was carried out after obtaining the institute ethics committee clearance and permission.
Source of Funding: Self.
Conflict of Interest: NIL.
References1. Outdoor air pollution. Available from: http//www.
who. int/gho/phe/outdoor_air_pollution/burden/en.2. P Balashanmugam, A R Ramanathan and V
Nehru kumar. Ambient air quality monitoring in Puducherry. Int J Eng Res Appl.. 2012; 2 (2):300-307.
3. Rajan R, Chetlapally S K, Bagavandas M. Global review of studies on traffic police with special focus on environmental health effects. Int J Occup Med Environ Health. 2014; 27 (4):523-535.
4. Kesavacnahndrani C, Rastogi S K, Anand M, Mathur N, Dhawan A. Lung function abnormalities among petrol-pump workers of Lucknow, North India. Curr Sci. 2006; 90:9.
5. Cotes J, Chinn DJ, Miller MR. Lung function-6th edition. Oxford Blackwell publishing Ltd. 2006:510.
6. Ranganadin P, Chinnakali P, Vasudevan K, Rajaram M. Respiratory health status of traffic policemen in puducherry, South India. Int J Cur Res Rev, 2013; 05 (07).
7. Afroz A, Veeresh S, Manjushree S, Amrutha S I. A comparative study among the three wheeler automobile drivers on Pulmonary function tests in adult males of gulbarga city. Int J Med Res Health Sci. 2013; 2 (1):35-39.
8. Farooque I, Jayachandra S. Al Ameen. Pulmonary function tests in nonsmoking auto rickshaw drivers. J Med Sci. 2014; 7 (3):240-243.
9. Ajay KT, Vatsala A R, Prabhuraj, Sangam J. Comparative Study of PEFR between auto drivers with the residents of urban Davangere. Pharm. Sci. & Res. 2014; 6 (5):226-228.
10. Jayalakshmi B S, Shivakumar S. Pulmonary function tests in healthy non smoking male transport workers-A study from Chennai, India. National Journal of Research in Community Medicine. 2015; 4 (2):192-198.
11. Binawara B K, Gahlot S, Malthur K C, Kakwar A, Gupta R, Rajnee. Pulmonary Function tests in three wheeler diesel taxi drivers in Bikaner City. Pak J Physiol. 2010; 6 (1).
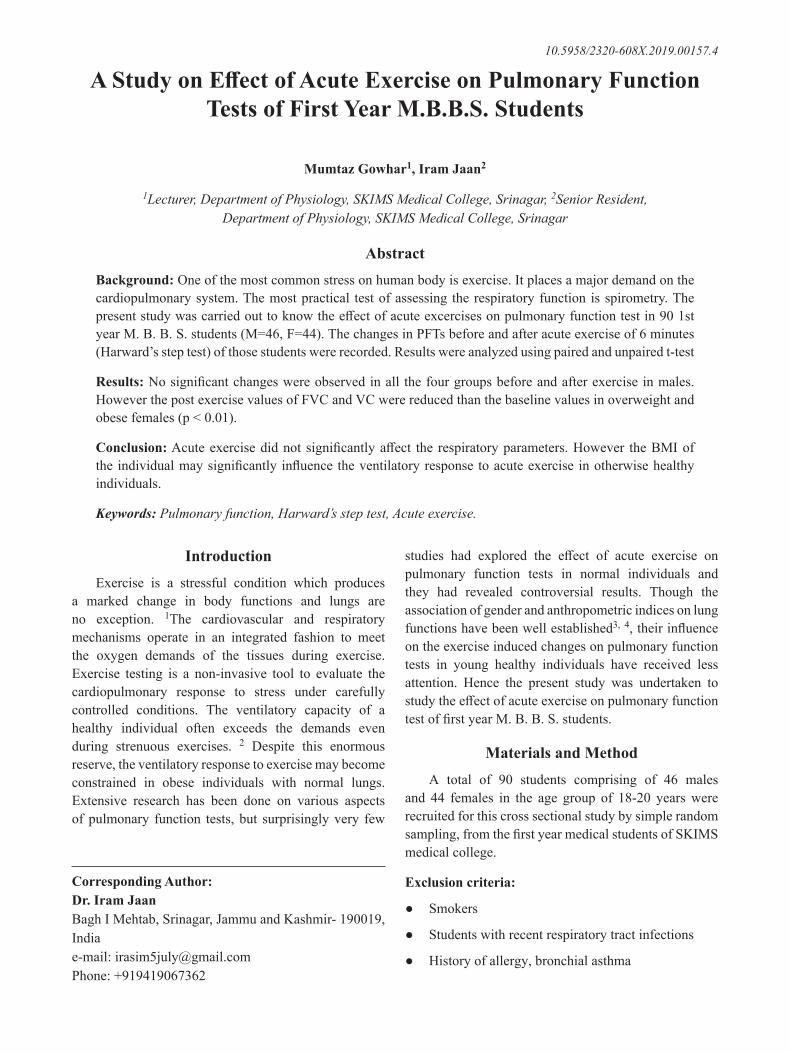
International Journal of Physiology, October-December 2019, Vol.7, No. 4 141
A Study on Effect of Acute Exercise on Pulmonary Function Tests of First Year M.B.B.S. Students
Mumtaz Gowhar1, Iram Jaan2
1Lecturer, Department of Physiology, SKIMS Medical College, Srinagar, 2Senior Resident, Department of Physiology, SKIMS Medical College, Srinagar
AbstractBackground: One of the most common stress on human body is exercise. It places a major demand on the cardiopulmonary system. The most practical test of assessing the respiratory function is spirometry. The present study was carried out to know the effect of acute excercises on pulmonary function test in 90 1st year M. B. B. S. students (M=46, F=44). The changes in PFTs before and after acute exercise of 6 minutes (Harward’s step test) of those students were recorded. Results were analyzed using paired and unpaired t-test
Results: No significant changes were observed in all the four groups before and after exercise in males. However the post exercise values of FVC and VC were reduced than the baseline values in overweight and obese females (p < 0.01).
Conclusion: Acute exercise did not significantly affect the respiratory parameters. However the BMI of the individual may significantly influence the ventilatory response to acute exercise in otherwise healthy individuals.
Keywords: Pulmonary function, Harward’s step test, Acute exercise.
studies had explored the effect of acute exercise on pulmonary function tests in normal individuals and they had revealed controversial results. Though the association of gender and anthropometric indices on lung functions have been well established3, 4, their influence on the exercise induced changes on pulmonary function tests in young healthy individuals have received less attention. Hence the present study was undertaken to study the effect of acute exercise on pulmonary function test of first year M. B. B. S. students.
Materials and MethodA total of 90 students comprising of 46 males
and 44 females in the age group of 18-20 years were recruited for this cross sectional study by simple random sampling, from the first year medical students of SKIMS medical college.
Exclusion criteria:
● Smokers
● Students with recent respiratory tract infections
● History of allergy, bronchial asthma
IntroductionExercise is a stressful condition which produces
a marked change in body functions and lungs are no exception. 1The cardiovascular and respiratory mechanisms operate in an integrated fashion to meet the oxygen demands of the tissues during exercise. Exercise testing is a non-invasive tool to evaluate the cardiopulmonary response to stress under carefully controlled conditions. The ventilatory capacity of a healthy individual often exceeds the demands even during strenuous exercises. 2 Despite this enormous reserve, the ventilatory response to exercise may become constrained in obese individuals with normal lungs. Extensive research has been done on various aspects of pulmonary function tests, but surprisingly very few
Corresponding Author: Dr. Iram Jaan Bagh I Mehtab, Srinagar, Jammu and Kashmir- 190019, India e-mail: [email protected] Phone: +919419067362
10.5958/2320-608X.2019.00157.4
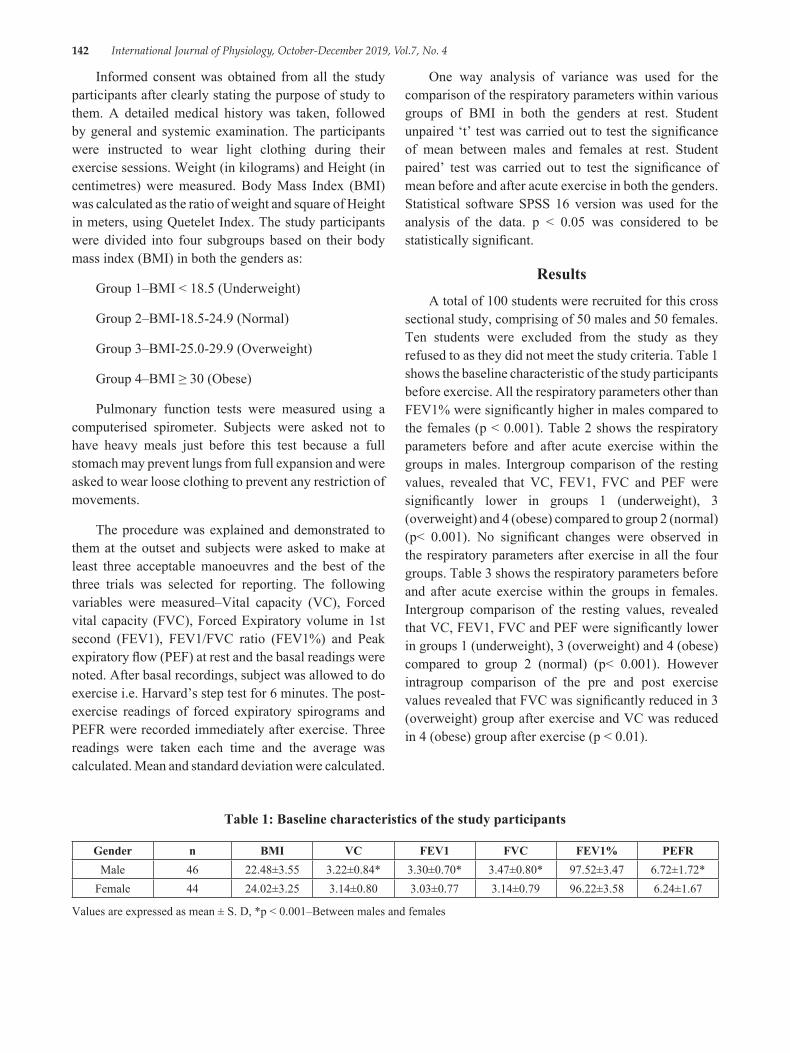
142 International Journal of Physiology, October-December 2019, Vol.7, No. 4
Informed consent was obtained from all the study participants after clearly stating the purpose of study to them. A detailed medical history was taken, followed by general and systemic examination. The participants were instructed to wear light clothing during their exercise sessions. Weight (in kilograms) and Height (in centimetres) were measured. Body Mass Index (BMI) was calculated as the ratio of weight and square of Height in meters, using Quetelet Index. The study participants were divided into four subgroups based on their body mass index (BMI) in both the genders as:
Group 1–BMI < 18.5 (Underweight)
Group 2–BMI-18.5-24.9 (Normal)
Group 3–BMI-25.0-29.9 (Overweight)
Group 4–BMI ≥ 30 (Obese)
Pulmonary function tests were measured using a computerised spirometer. Subjects were asked not to have heavy meals just before this test because a full stomach may prevent lungs from full expansion and were asked to wear loose clothing to prevent any restriction of movements.
The procedure was explained and demonstrated to them at the outset and subjects were asked to make at least three acceptable manoeuvres and the best of the three trials was selected for reporting. The following variables were measured–Vital capacity (VC), Forced vital capacity (FVC), Forced Expiratory volume in 1st second (FEV1), FEV1/FVC ratio (FEV1%) and Peak expiratory flow (PEF) at rest and the basal readings were noted. After basal recordings, subject was allowed to do exercise i.e. Harvard’s step test for 6 minutes. The post-exercise readings of forced expiratory spirograms and PEFR were recorded immediately after exercise. Three readings were taken each time and the average was calculated. Mean and standard deviation were calculated.
One way analysis of variance was used for the comparison of the respiratory parameters within various groups of BMI in both the genders at rest. Student unpaired ‘t’ test was carried out to test the significance of mean between males and females at rest. Student paired’ test was carried out to test the significance of mean before and after acute exercise in both the genders. Statistical software SPSS 16 version was used for the analysis of the data. p < 0.05 was considered to be statistically significant.
ResultsA total of 100 students were recruited for this cross
sectional study, comprising of 50 males and 50 females. Ten students were excluded from the study as they refused to as they did not meet the study criteria. Table 1 shows the baseline characteristic of the study participants before exercise. All the respiratory parameters other than FEV1% were significantly higher in males compared to the females (p < 0.001). Table 2 shows the respiratory parameters before and after acute exercise within the groups in males. Intergroup comparison of the resting values, revealed that VC, FEV1, FVC and PEF were significantly lower in groups 1 (underweight), 3 (overweight) and 4 (obese) compared to group 2 (normal) (p< 0.001). No significant changes were observed in the respiratory parameters after exercise in all the four groups. Table 3 shows the respiratory parameters before and after acute exercise within the groups in females. Intergroup comparison of the resting values, revealed that VC, FEV1, FVC and PEF were significantly lower in groups 1 (underweight), 3 (overweight) and 4 (obese) compared to group 2 (normal) (p< 0.001). However intragroup comparison of the pre and post exercise values revealed that FVC was significantly reduced in 3 (overweight) group after exercise and VC was reduced in 4 (obese) group after exercise (p < 0.01).
Table 1: Baseline characteristics of the study participants
Gender n BMI VC FEV1 FVC FEV1% PEFRMale 46 22.48±3.55 3.22±0.84* 3.30±0.70* 3.47±0.80* 97.52±3.47 6.72±1.72*
Female 44 24.02±3.25 3.14±0.80 3.03±0.77 3.14±0.79 96.22±3.58 6.24±1.67
Values are expressed as mean ± S. D, *p < 0.001–Between males and females
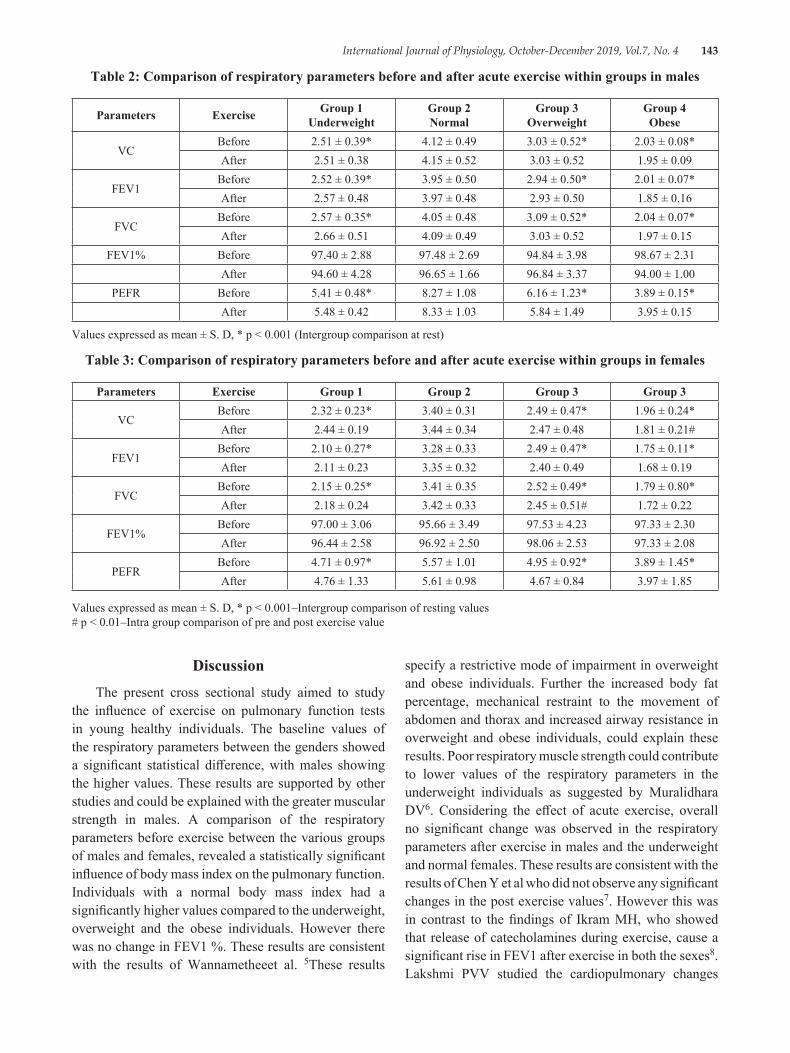
International Journal of Physiology, October-December 2019, Vol.7, No. 4 143
Table 2: Comparison of respiratory parameters before and after acute exercise within groups in males
Parameters Exercise Group 1 Underweight
Group 2 Normal
Group 3 Overweight
Group 4 Obese
VCBefore 2.51 ± 0.39* 4.12 ± 0.49 3.03 ± 0.52* 2.03 ± 0.08*After 2.51 ± 0.38 4.15 ± 0.52 3.03 ± 0.52 1.95 ± 0.09
FEV1Before 2.52 ± 0.39* 3.95 ± 0.50 2.94 ± 0.50* 2.01 ± 0.07*After 2.57 ± 0.48 3.97 ± 0.48 2.93 ± 0.50 1.85 ± 0.16
FVCBefore 2.57 ± 0.35* 4.05 ± 0.48 3.09 ± 0.52* 2.04 ± 0.07*After 2.66 ± 0.51 4.09 ± 0.49 3.03 ± 0.52 1.97 ± 0.15
FEV1% Before 97.40 ± 2.88 97.48 ± 2.69 94.84 ± 3.98 98.67 ± 2.31After 94.60 ± 4.28 96.65 ± 1.66 96.84 ± 3.37 94.00 ± 1.00
PEFR Before 5.41 ± 0.48* 8.27 ± 1.08 6.16 ± 1.23* 3.89 ± 0.15*After 5.48 ± 0.42 8.33 ± 1.03 5.84 ± 1.49 3.95 ± 0.15
Values expressed as mean ± S. D, * p < 0.001 (Intergroup comparison at rest)
Table 3: Comparison of respiratory parameters before and after acute exercise within groups in females
Parameters Exercise Group 1 Group 2 Group 3 Group 3
VCBefore 2.32 ± 0.23* 3.40 ± 0.31 2.49 ± 0.47* 1.96 ± 0.24*After 2.44 ± 0.19 3.44 ± 0.34 2.47 ± 0.48 1.81 ± 0.21#
FEV1Before 2.10 ± 0.27* 3.28 ± 0.33 2.49 ± 0.47* 1.75 ± 0.11*After 2.11 ± 0.23 3.35 ± 0.32 2.40 ± 0.49 1.68 ± 0.19
FVCBefore 2.15 ± 0.25* 3.41 ± 0.35 2.52 ± 0.49* 1.79 ± 0.80*After 2.18 ± 0.24 3.42 ± 0.33 2.45 ± 0.51# 1.72 ± 0.22
FEV1%Before 97.00 ± 3.06 95.66 ± 3.49 97.53 ± 4.23 97.33 ± 2.30After 96.44 ± 2.58 96.92 ± 2.50 98.06 ± 2.53 97.33 ± 2.08
PEFRBefore 4.71 ± 0.97* 5.57 ± 1.01 4.95 ± 0.92* 3.89 ± 1.45*After 4.76 ± 1.33 5.61 ± 0.98 4.67 ± 0.84 3.97 ± 1.85
Values expressed as mean ± S. D, * p < 0.001–Intergroup comparison of resting values # p < 0.01–Intra group comparison of pre and post exercise value
DiscussionThe present cross sectional study aimed to study
the influence of exercise on pulmonary function tests in young healthy individuals. The baseline values of the respiratory parameters between the genders showed a significant statistical difference, with males showing the higher values. These results are supported by other studies and could be explained with the greater muscular strength in males. A comparison of the respiratory parameters before exercise between the various groups of males and females, revealed a statistically significant influence of body mass index on the pulmonary function. Individuals with a normal body mass index had a significantly higher values compared to the underweight, overweight and the obese individuals. However there was no change in FEV1 %. These results are consistent with the results of Wannametheeet al. 5These results
specify a restrictive mode of impairment in overweight and obese individuals. Further the increased body fat percentage, mechanical restraint to the movement of abdomen and thorax and increased airway resistance in overweight and obese individuals, could explain these results. Poor respiratory muscle strength could contribute to lower values of the respiratory parameters in the underweight individuals as suggested by Muralidhara DV6. Considering the effect of acute exercise, overall no significant change was observed in the respiratory parameters after exercise in males and the underweight and normal females. These results are consistent with the results of Chen Y et al who did not observe any significant changes in the post exercise values7. However this was in contrast to the findings of Ikram MH, who showed that release of catecholamines during exercise, cause a significant rise in FEV1 after exercise in both the sexes8. Lakshmi PVV studied the cardiopulmonary changes
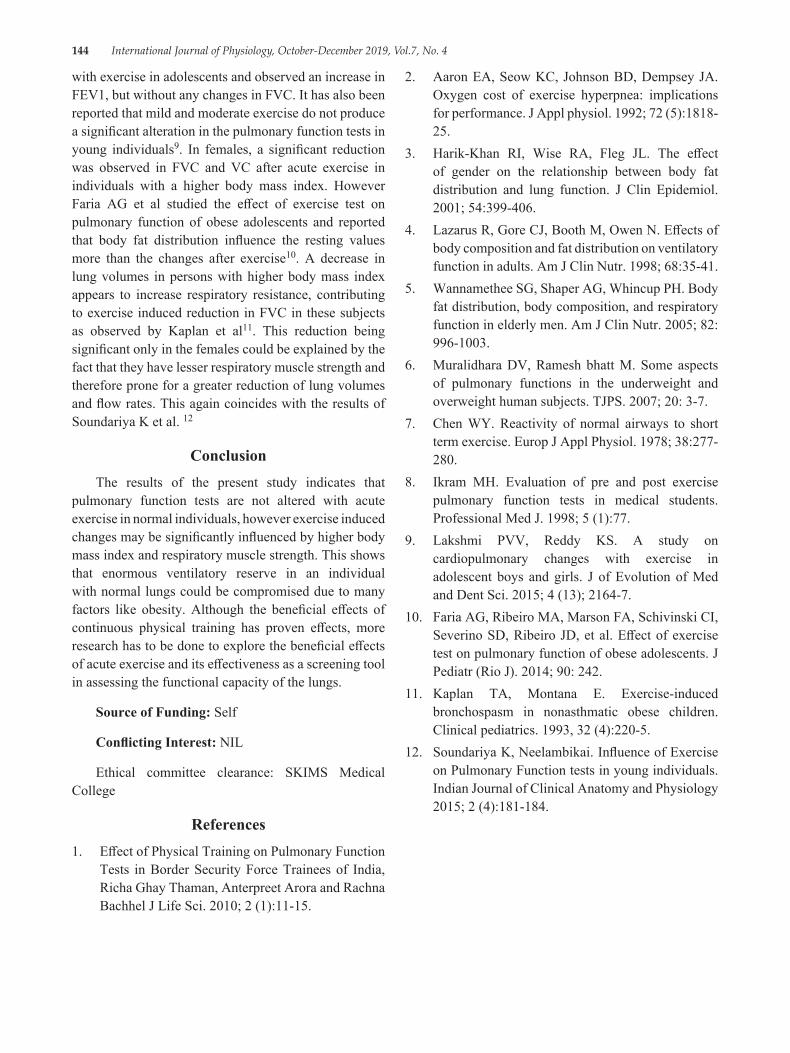
144 International Journal of Physiology, October-December 2019, Vol.7, No. 4
with exercise in adolescents and observed an increase in FEV1, but without any changes in FVC. It has also been reported that mild and moderate exercise do not produce a significant alteration in the pulmonary function tests in young individuals9. In females, a significant reduction was observed in FVC and VC after acute exercise in individuals with a higher body mass index. However Faria AG et al studied the effect of exercise test on pulmonary function of obese adolescents and reported that body fat distribution influence the resting values more than the changes after exercise10. A decrease in lung volumes in persons with higher body mass index appears to increase respiratory resistance, contributing to exercise induced reduction in FVC in these subjects as observed by Kaplan et al11. This reduction being significant only in the females could be explained by the fact that they have lesser respiratory muscle strength and therefore prone for a greater reduction of lung volumes and flow rates. This again coincides with the results of Soundariya K et al. 12
ConclusionThe results of the present study indicates that
pulmonary function tests are not altered with acute exercise in normal individuals, however exercise induced changes may be significantly influenced by higher body mass index and respiratory muscle strength. This shows that enormous ventilatory reserve in an individual with normal lungs could be compromised due to many factors like obesity. Although the beneficial effects of continuous physical training has proven effects, more research has to be done to explore the beneficial effects of acute exercise and its effectiveness as a screening tool in assessing the functional capacity of the lungs.
Source of Funding: Self
Conflicting Interest: NIL
Ethical committee clearance: SKIMS Medical College
References1. Effect of Physical Training on Pulmonary Function
Tests in Border Security Force Trainees of India, Richa Ghay Thaman, Anterpreet Arora and Rachna Bachhel J Life Sci. 2010; 2 (1):11-15.
2. Aaron EA, Seow KC, Johnson BD, Dempsey JA. Oxygen cost of exercise hyperpnea: implications for performance. J Appl physiol. 1992; 72 (5):1818-25.
3. Harik-Khan RI, Wise RA, Fleg JL. The effect of gender on the relationship between body fat distribution and lung function. J Clin Epidemiol. 2001; 54:399-406.
4. Lazarus R, Gore CJ, Booth M, Owen N. Effects of body composition and fat distribution on ventilatory function in adults. Am J Clin Nutr. 1998; 68:35-41.
5. Wannamethee SG, Shaper AG, Whincup PH. Body fat distribution, body composition, and respiratory function in elderly men. Am J Clin Nutr. 2005; 82: 996-1003.
6. Muralidhara DV, Ramesh bhatt M. Some aspects of pulmonary functions in the underweight and overweight human subjects. TJPS. 2007; 20: 3-7.
7. Chen WY. Reactivity of normal airways to short term exercise. Europ J Appl Physiol. 1978; 38:277-280.
8. Ikram MH. Evaluation of pre and post exercise pulmonary function tests in medical students. Professional Med J. 1998; 5 (1):77.
9. Lakshmi PVV, Reddy KS. A study on cardiopulmonary changes with exercise in adolescent boys and girls. J of Evolution of Med and Dent Sci. 2015; 4 (13); 2164-7.
10. Faria AG, Ribeiro MA, Marson FA, Schivinski CI, Severino SD, Ribeiro JD, et al. Effect of exercise test on pulmonary function of obese adolescents. J Pediatr (Rio J). 2014; 90: 242.
11. Kaplan TA, Montana E. Exercise-induced bronchospasm in nonasthmatic obese children. Clinical pediatrics. 1993, 32 (4):220-5.
12. Soundariya K, Neelambikai. Influence of Exercise on Pulmonary Function tests in young individuals. Indian Journal of Clinical Anatomy and Physiology 2015; 2 (4):181-184.
International Journal of Physiology, October-December 2019, Vol.7, No. 4 145
Assessment of Forced Vital Capacity and FEV1 as Pulmonary Function Tests in Males with Type-2 Diabetes Mellitus
Neelima Narayan Nerkar1, Pranita Ashok2, V R Purandare3
1Assistant Professor, Dr Vasantrao Pawar Medical College Adgaon, Nasik, 2Assistant Professor, Bharati Vidyapeeth Medical College, Pune, 3Ex Professor At D Y Patil Medical College Pune
AbstractIntroduction: Diabetes mellitus (DM) is a group of metabolic diseases. It is associated with well known complications linked to either microangiopathy, macroangiopathy or a combination of both. Some studies found that there were changes in respiratory system or pulmonary functions in diabetes so this study was planned to see the effect of type 2 DM on pulmonary functions.
Materials & Method: The present study was undertaken in two groups. Hundred male individuals were included in the study with each group comprised of 50 individuals. For pulmonary function tests we used computerized Spirometer Statistical difference between the data obtained in various groups was evaluated by z test.
Observations: Reduction in FVC-Forced vital capacity reduction is statistically significant. FEV1-reduction is statistically significant. FEV1/FVC (%) reduction is statistically significant.
Conclusion: So it is always better to detect the respiratory damage in diabetes patient at an early stage to prevent the further complications
Keywords: FVC, FEV1, Males, Type 2 DM
secretion. In the other, much more prevalent category type 2 diabetes the cause is a combination of resistance to insulin action and an inadequate compensatory insulin secretory response. 3, 4, 5
The severity of metabolic abnormality can progress, regress or stay the same. Diabetes mellitus has been appropriately labeled a silent killer. It is associated with well known complications linked to either microangiopathy, macroangiopathy or a combination of both, such as diabetic nephropathy, neuropathy, retinopathy, cataracts, coronary artery disease, cerebro-vascular disease, diabetic cardiomyopathy, peripheral arterial disease etc. 6, 7
Some workers found that there were changes in respiratory system or pulmonary functions in diabetes1-2. Therefore it was planned to study the effect of type 2 DM on pulmonary functions.
Materials and MethodThe present study was undertaken in two groups.
Hundred male individuals were included in the study with each group comprised of 50 individuals.
IntroductionThe earliest mention of diabetes like illness
characterized by Polyuria can be traced to Egyptian papyrus dating back to around 1550 BC. 1
Diabetes was recognized as a disease entity in ancient Indian Ayurveda (the science of life and longevity) Diabetes mellitus (DM) is a group of metabolic diseases characterized by hyperglycemia resulting from defects in insulin secretion, insulin action or both. 2
The vast majority of cases of diabetes fall into two broad etio pathogenic categories. In one category, type 1 diabetes, the cause in an absolute deficiency of insulin
Corresponding Author: Pranita Ashok 601, 7th Floor Vishwa Apartment, Ashok Stambh, Nasik - 422001 Mobile No: 9850062612 e-mail: [email protected],
10.5958/2320-608X.2019.00158.6
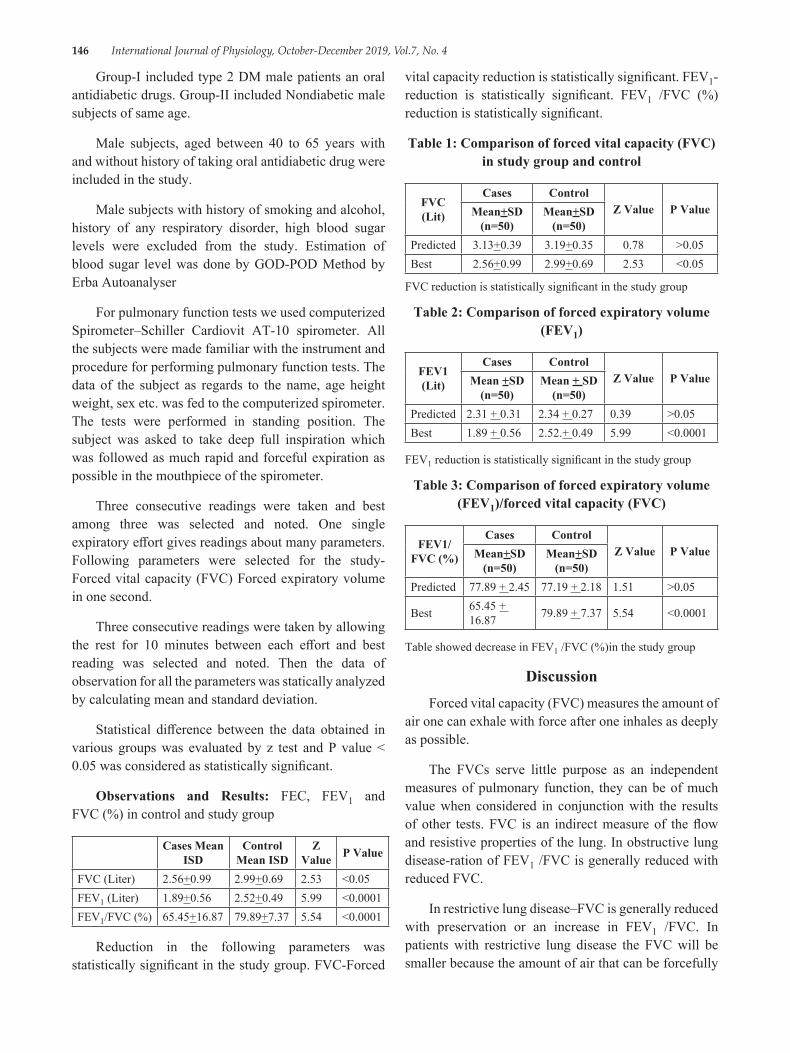
146 International Journal of Physiology, October-December 2019, Vol.7, No. 4
Group-I included type 2 DM male patients an oral antidiabetic drugs. Group-II included Nondiabetic male subjects of same age.
Male subjects, aged between 40 to 65 years with and without history of taking oral antidiabetic drug were included in the study.
Male subjects with history of smoking and alcohol, history of any respiratory disorder, high blood sugar levels were excluded from the study. Estimation of blood sugar level was done by GOD-POD Method by Erba Autoanalyser
For pulmonary function tests we used computerized Spirometer–Schiller Cardiovit AT-10 spirometer. All the subjects were made familiar with the instrument and procedure for performing pulmonary function tests. The data of the subject as regards to the name, age height weight, sex etc. was fed to the computerized spirometer. The tests were performed in standing position. The subject was asked to take deep full inspiration which was followed as much rapid and forceful expiration as possible in the mouthpiece of the spirometer.
Three consecutive readings were taken and best among three was selected and noted. One single expiratory effort gives readings about many parameters. Following parameters were selected for the study-Forced vital capacity (FVC) Forced expiratory volume in one second.
Three consecutive readings were taken by allowing the rest for 10 minutes between each effort and best reading was selected and noted. Then the data of observation for all the parameters was statically analyzed by calculating mean and standard deviation.
Statistical difference between the data obtained in various groups was evaluated by z test and P value < 0.05 was considered as statistically significant.
Observations and Results: FEC, FEV1 and FVC (%) in control and study group
Cases Mean ISD
Control Mean ISD
Z Value P Value
FVC (Liter) 2.56+0.99 2.99+0.69 2.53 <0.05FEV1 (Liter) 1.89+0.56 2.52+0.49 5.99 <0.0001FEV1/FVC (%) 65.45+16.87 79.89+7.37 5.54 <0.0001
Reduction in the following parameters was statistically significant in the study group. FVC-Forced
vital capacity reduction is statistically significant. FEV1-reduction is statistically significant. FEV1 /FVC (%) reduction is statistically significant.
Table 1: Comparison of forced vital capacity (FVC) in study group and control
FVC (Lit)
Cases ControlZ Value P ValueMean+SD
(n=50)Mean+SD
(n=50)Predicted 3.13+0.39 3.19+0.35 0.78 >0.05Best 2.56+0.99 2.99+0.69 2.53 <0.05
FVC reduction is statistically significant in the study group
Table 2: Comparison of forced expiratory volume (FEV1)
FEV1 (Lit)
Cases ControlZ Value P ValueMean +SD
(n=50)Mean + SD
(n=50)Predicted 2.31 + 0.31 2.34 + 0.27 0.39 >0.05Best 1.89 + 0.56 2.52.+ 0.49 5.99 <0.0001
FEV1 reduction is statistically significant in the study group
Table 3: Comparison of forced expiratory volume (FEV1)/forced vital capacity (FVC)
FEV1/FVC (%)
Cases ControlZ Value P ValueMean+SD
(n=50)Mean+SD
(n=50)Predicted 77.89 + 2.45 77.19 + 2.18 1.51 >0.05
Best 65.45 + 16.87 79.89 + 7.37 5.54 <0.0001
Table showed decrease in FEV1 /FVC (%)in the study group
DiscussionForced vital capacity (FVC) measures the amount of
air one can exhale with force after one inhales as deeply as possible.
The FVCs serve little purpose as an independent measures of pulmonary function, they can be of much value when considered in conjunction with the results of other tests. FVC is an indirect measure of the flow and resistive properties of the lung. In obstructive lung disease-ration of FEV1 /FVC is generally reduced with reduced FVC.
In restrictive lung disease–FVC is generally reduced with preservation or an increase in FEV1 /FVC. In patients with restrictive lung disease the FVC will be smaller because the amount of air that can be forcefully
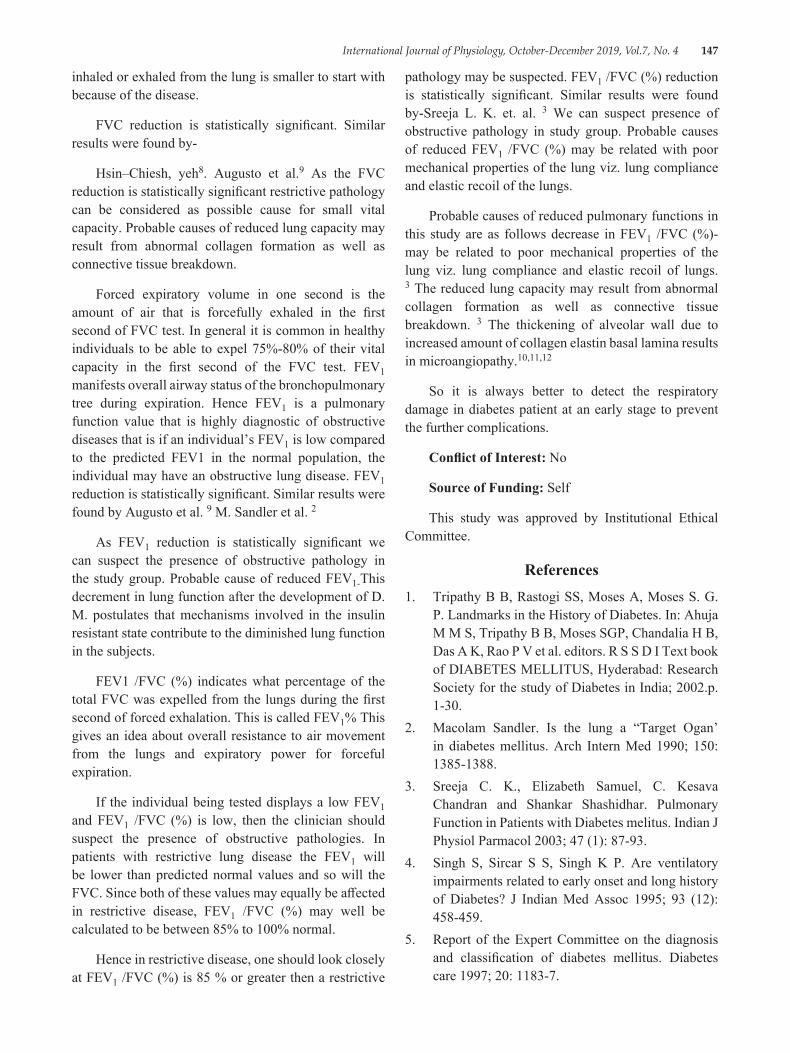
International Journal of Physiology, October-December 2019, Vol.7, No. 4 147
inhaled or exhaled from the lung is smaller to start with because of the disease.
FVC reduction is statistically significant. Similar results were found by-
Hsin–Chiesh, yeh8. Augusto et al.9 As the FVC reduction is statistically significant restrictive pathology can be considered as possible cause for small vital capacity. Probable causes of reduced lung capacity may result from abnormal collagen formation as well as connective tissue breakdown.
Forced expiratory volume in one second is the amount of air that is forcefully exhaled in the first second of FVC test. In general it is common in healthy individuals to be able to expel 75%-80% of their vital capacity in the first second of the FVC test. FEV1 manifests overall airway status of the bronchopulmonary tree during expiration. Hence FEV1 is a pulmonary function value that is highly diagnostic of obstructive diseases that is if an individual’s FEV1 is low compared to the predicted FEV1 in the normal population, the individual may have an obstructive lung disease. FEV1 reduction is statistically significant. Similar results were found by Augusto et al. 9 M. Sandler et al. 2
As FEV1 reduction is statistically significant we can suspect the presence of obstructive pathology in the study group. Probable cause of reduced FEV1-This decrement in lung function after the development of D. M. postulates that mechanisms involved in the insulin resistant state contribute to the diminished lung function in the subjects.
FEV1 /FVC (%) indicates what percentage of the total FVC was expelled from the lungs during the first second of forced exhalation. This is called FEV1% This gives an idea about overall resistance to air movement from the lungs and expiratory power for forceful expiration.
If the individual being tested displays a low FEV1 and FEV1 /FVC (%) is low, then the clinician should suspect the presence of obstructive pathologies. In patients with restrictive lung disease the FEV1 will be lower than predicted normal values and so will the FVC. Since both of these values may equally be affected in restrictive disease, FEV1 /FVC (%) may well be calculated to be between 85% to 100% normal.
Hence in restrictive disease, one should look closely at FEV1 /FVC (%) is 85 % or greater then a restrictive
pathology may be suspected. FEV1 /FVC (%) reduction is statistically significant. Similar results were found by-Sreeja L. K. et. al. 3 We can suspect presence of obstructive pathology in study group. Probable causes of reduced FEV1 /FVC (%) may be related with poor mechanical properties of the lung viz. lung compliance and elastic recoil of the lungs.
Probable causes of reduced pulmonary functions in this study are as follows decrease in FEV1 /FVC (%)-may be related to poor mechanical properties of the lung viz. lung compliance and elastic recoil of lungs. 3 The reduced lung capacity may result from abnormal collagen formation as well as connective tissue breakdown. 3 The thickening of alveolar wall due to increased amount of collagen elastin basal lamina results in microangiopathy.10,11,12
So it is always better to detect the respiratory damage in diabetes patient at an early stage to prevent the further complications.
Conflict of Interest: No
Source of Funding: Self
This study was approved by Institutional Ethical Committee.
References1. Tripathy B B, Rastogi SS, Moses A, Moses S. G.
P. Landmarks in the History of Diabetes. In: Ahuja M M S, Tripathy B B, Moses SGP, Chandalia H B, Das A K, Rao P V et al. editors. R S S D I Text book of DIABETES MELLITUS, Hyderabad: Research Society for the study of Diabetes in India; 2002.p. 1-30.
2. Macolam Sandler. Is the lung a “Target Ogan’ in diabetes mellitus. Arch Intern Med 1990; 150: 1385-1388.
3. Sreeja C. K., Elizabeth Samuel, C. Kesava Chandran and Shankar Shashidhar. Pulmonary Function in Patients with Diabetes melitus. Indian J Physiol Parmacol 2003; 47 (1): 87-93.
4. Singh S, Sircar S S, Singh K P. Are ventilatory impairments related to early onset and long history of Diabetes? J Indian Med Assoc 1995; 93 (12): 458-459.
5. Report of the Expert Committee on the diagnosis and classification of diabetes mellitus. Diabetes care 1997; 20: 1183-7.

148 International Journal of Physiology, October-December 2019, Vol.7, No. 4
6. Alberti K G M M, Zimmet P. Definition, diagnosis and classification of Diabetes Mellitus and its complications part 1: Diagnosis and classification of diabetes mellitus, provisional report of WHO Consultation Group. Diabet Med 1998; 15: 539-55
7. John B. Buse, Kenneth S. Polonsky, and Charies F. Burant. Type 2 Diabetes Mellitus. In: Larsen P. R., Kronenberg H M, Melmed S, Polonsky K. S. editors Williams Textbook of Endocrinology 10th ed. Philadelphia, Pennsylvania: SAUNDERS; 2002. P. 1427-83.
8. Hyh H C, Punjabi N. M., Wang N Y, Pankow J S, Duncan B. B. and Brancati F L, Vital capacity as a pretictor of incident type 2 diabetes. Diabetes Care, 2005; 28: 1472-79
9. Litonjuna A A, Lazarus R, Sparrow D, De Molles D and Weiss S. Lung Function in type 2 diabetes 2005: 99 (12): 1583-1590.
10. Ashapherwani, Desai A G, Solepure A, B, A study of pulmonary functions of competitive swimmers. Indian J Physiol Pharmacol 1989; 4: 228-232.
11. Sandler M, Bunn A E, Steward R I. Cross-Section Study of Pulmonary function in patients with insulin–dependent diabetes mellitus. AM Rev Respir Dis.-1987: 135: 223-228.
12. Weynand B, Jonckheere, A, Frans A, Rahier J. Diabetes mellitus induces a thickening of the pulmonary basal lamina respiration 1999; 66: 14-19.
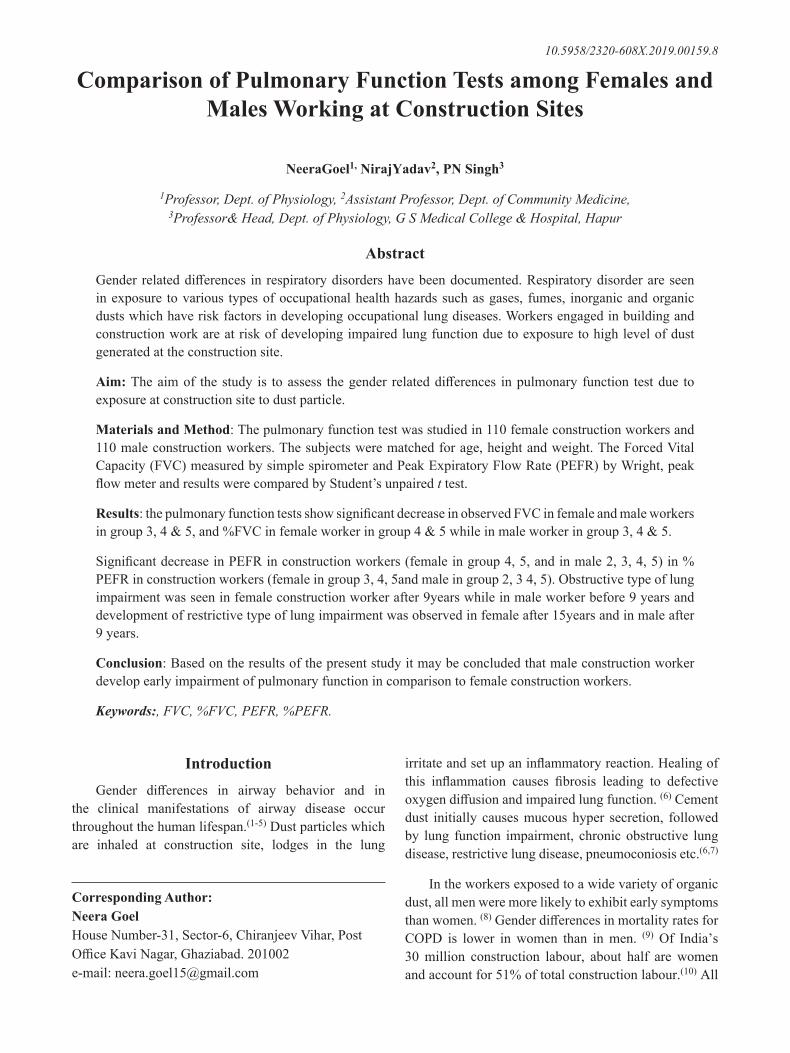
International Journal of Physiology, October-December 2019, Vol.7, No. 4 149
Comparison of Pulmonary Function Tests among Females and Males Working at Construction Sites
NeeraGoel1, NirajYadav2, PN Singh3
1Professor, Dept. of Physiology, 2Assistant Professor, Dept. of Community Medicine, 3Professor& Head, Dept. of Physiology, G S Medical College & Hospital, Hapur
AbstractGender related differences in respiratory disorders have been documented. Respiratory disorder are seen in exposure to various types of occupational health hazards such as gases, fumes, inorganic and organic dusts which have risk factors in developing occupational lung diseases. Workers engaged in building and construction work are at risk of developing impaired lung function due to exposure to high level of dust generated at the construction site.
Aim: The aim of the study is to assess the gender related differences in pulmonary function test due to exposure at construction site to dust particle.
Materials and Method: The pulmonary function test was studied in 110 female construction workers and 110 male construction workers. The subjects were matched for age, height and weight. The Forced Vital Capacity (FVC) measured by simple spirometer and Peak Expiratory Flow Rate (PEFR) by Wright, peak flow meter and results were compared by Student’s unpaired t test.
Results: the pulmonary function tests show significant decrease in observed FVC in female and male workers in group 3, 4 & 5, and %FVC in female worker in group 4 & 5 while in male worker in group 3, 4 & 5.
Significant decrease in PEFR in construction workers (female in group 4, 5, and in male 2, 3, 4, 5) in % PEFR in construction workers (female in group 3, 4, 5and male in group 2, 3 4, 5). Obstructive type of lung impairment was seen in female construction worker after 9years while in male worker before 9 years and development of restrictive type of lung impairment was observed in female after 15years and in male after 9 years.
Conclusion: Based on the results of the present study it may be concluded that male construction worker develop early impairment of pulmonary function in comparison to female construction workers.
Keywords:, FVC, %FVC, PEFR, %PEFR.
irritate and set up an inflammatory reaction. Healing of this inflammation causes fibrosis leading to defective oxygen diffusion and impaired lung function. (6) Cement dust initially causes mucous hyper secretion, followed by lung function impairment, chronic obstructive lung disease, restrictive lung disease, pneumoconiosis etc.(6,7)
In the workers exposed to a wide variety of organic dust, all men were more likely to exhibit early symptoms than women. (8) Gender differences in mortality rates for COPD is lower in women than in men. (9) Of India’s 30 million construction labour, about half are women and account for 51% of total construction labour.(10) All
IntroductionGender differences in airway behavior and in
the clinical manifestations of airway disease occur throughout the human lifespan.(1-5) Dust particles which are inhaled at construction site, lodges in the lung
Corresponding Author: Neera Goel House Number-31, Sector-6, Chiranjeev Vihar, Post Office Kavi Nagar, Ghaziabad. 201002 e-mail: [email protected]
10.5958/2320-608X.2019.00159.8
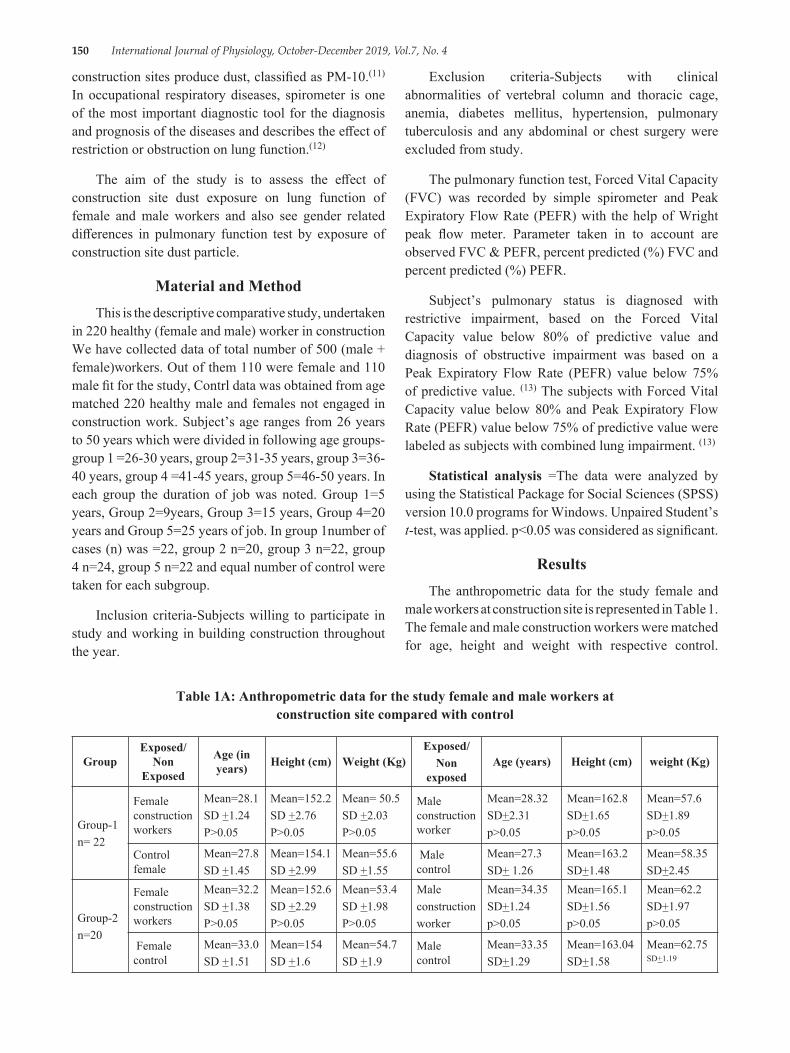
150 International Journal of Physiology, October-December 2019, Vol.7, No. 4
construction sites produce dust, classified as PM-10.(11) In occupational respiratory diseases, spirometer is one of the most important diagnostic tool for the diagnosis and prognosis of the diseases and describes the effect of restriction or obstruction on lung function.(12)
The aim of the study is to assess the effect of construction site dust exposure on lung function of female and male workers and also see gender related differences in pulmonary function test by exposure of construction site dust particle.
Material and MethodThis is the descriptive comparative study, undertaken
in 220 healthy (female and male) worker in construction We have collected data of total number of 500 (male + female)workers. Out of them 110 were female and 110 male fit for the study, Contrl data was obtained from age matched 220 healthy male and females not engaged in construction work. Subject’s age ranges from 26 years to 50 years which were divided in following age groups-group 1 =26-30 years, group 2=31-35 years, group 3=36-40 years, group 4 =41-45 years, group 5=46-50 years. In each group the duration of job was noted. Group 1=5 years, Group 2=9years, Group 3=15 years, Group 4=20 years and Group 5=25 years of job. In group 1number of cases (n) was =22, group 2 n=20, group 3 n=22, group 4 n=24, group 5 n=22 and equal number of control were taken for each subgroup.
Inclusion criteria-Subjects willing to participate in study and working in building construction throughout the year.
Exclusion criteria-Subjects with clinical abnormalities of vertebral column and thoracic cage, anemia, diabetes mellitus, hypertension, pulmonary tuberculosis and any abdominal or chest surgery were excluded from study.
The pulmonary function test, Forced Vital Capacity (FVC) was recorded by simple spirometer and Peak Expiratory Flow Rate (PEFR) with the help of Wright peak flow meter. Parameter taken in to account are observed FVC & PEFR, percent predicted (%) FVC and percent predicted (%) PEFR.
Subject’s pulmonary status is diagnosed with restrictive impairment, based on the Forced Vital Capacity value below 80% of predictive value and diagnosis of obstructive impairment was based on a Peak Expiratory Flow Rate (PEFR) value below 75% of predictive value. (13) The subjects with Forced Vital Capacity value below 80% and Peak Expiratory Flow Rate (PEFR) value below 75% of predictive value were labeled as subjects with combined lung impairment. (13)
Statistical analysis =The data were analyzed by using the Statistical Package for Social Sciences (SPSS) version 10.0 programs for Windows. Unpaired Student’s t-test, was applied. p<0.05 was considered as significant.
ResultsThe anthropometric data for the study female and
male workers at construction site is represented in Table 1. The female and male construction workers were matched for age, height and weight with respective control.
Table 1A: Anthropometric data for the study female and male workers at construction site compared with control
GroupExposed/
Non Exposed
Age (in years) Height (cm) Weight (Kg)
Exposed/Non
exposedAge (years) Height (cm) weight (Kg)
Group-1n= 22
Female construction workers
Mean=28.1SD +1.24P>0.05
Mean=152.2SD +2.76P>0.05
Mean= 50.5SD +2.03P>0.05
Male construction worker
Mean=28.32SD+2.31p>0.05
Mean=162.8SD+1.65p>0.05
Mean=57.6SD+1.89p>0.05
Control female
Mean=27.8SD +1.45
Mean=154.1SD +2.99
Mean=55.6SD +1.55
Male control
Mean=27.3SD+ 1.26
Mean=163.2SD+1.48
Mean=58.35SD+2.45
Group-2n=20
Female construction workers
Mean=32.2SD +1.38P>0.05
Mean=152.6SD +2.29P>0.05
Mean=53.4SD +1.98P>0.05
Maleconstructionworker
Mean=34.35SD+1.24p>0.05
Mean=165.1SD+1.56p>0.05
Mean=62.2SD+1.97p>0.05
Female control
Mean=33.0SD +1.51
Mean=154SD +1.6
Mean=54.7SD +1.9
Male control
Mean=33.35SD+1.29
Mean=163.04SD+1.58
Mean=62.75SD+1.19
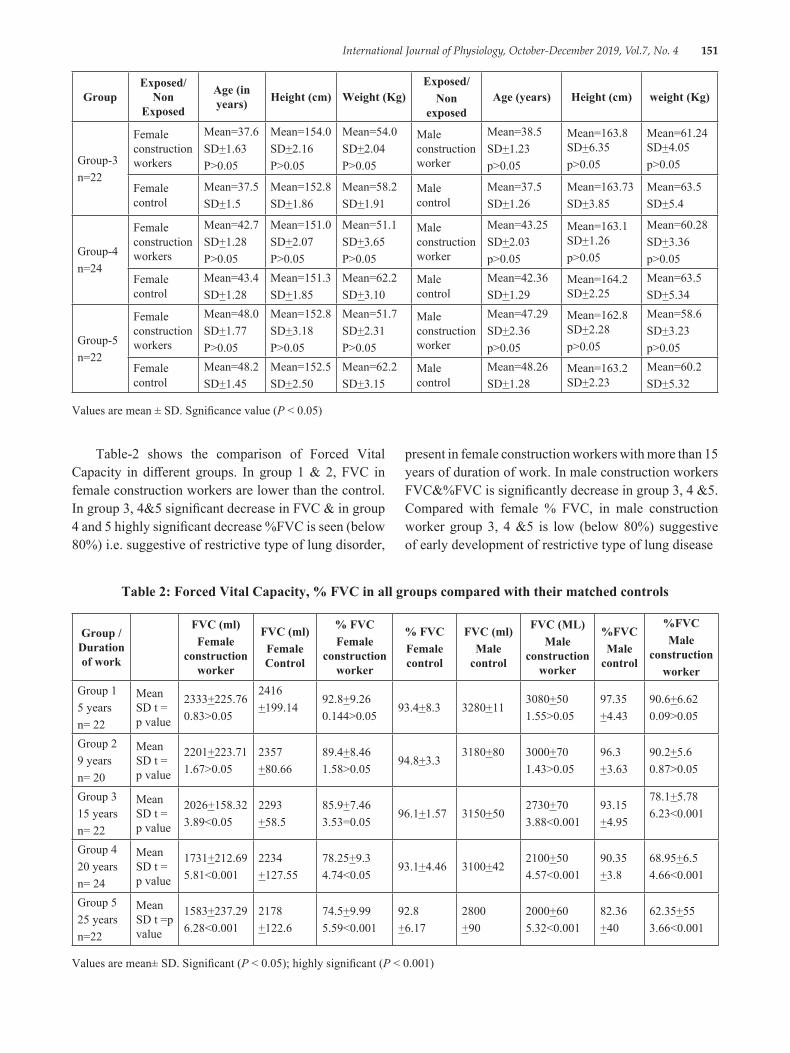
International Journal of Physiology, October-December 2019, Vol.7, No. 4 151
GroupExposed/
Non Exposed
Age (in years) Height (cm) Weight (Kg)
Exposed/Non
exposedAge (years) Height (cm) weight (Kg)
Group-3n=22
Female construction workers
Mean=37.6SD+1.63P>0.05
Mean=154.0SD+2.16P>0.05
Mean=54.0SD+2.04P>0.05
Male construction worker
Mean=38.5SD+1.23p>0.05
Mean=163.8 SD+6.35p>0.05
Mean=61.24 SD+4.05p>0.05
Female control
Mean=37.5SD+1.5
Mean=152.8SD+1.86
Mean=58.2SD+1.91
Male control
Mean=37.5SD+1.26
Mean=163.73SD+3.85
Mean=63.5SD+5.4
Group-4n=24
Female construction workers
Mean=42.7SD+1.28P>0.05
Mean=151.0SD+2.07P>0.05
Mean=51.1SD+3.65P>0.05
Male construction worker
Mean=43.25SD+2.03p>0.05
Mean=163.1 SD+1.26p>0.05
Mean=60.28SD+3.36p>0.05
Female control
Mean=43.4SD+1.28
Mean=151.3SD+1.85
Mean=62.2SD+3.10
Male control
Mean=42.36SD+1.29
Mean=164.2 SD+2.25
Mean=63.5SD+5.34
Group-5n=22
Female construction workers
Mean=48.0SD+1.77P>0.05
Mean=152.8SD+3.18P>0.05
Mean=51.7SD+2.31P>0.05
Male construction worker
Mean=47.29SD+2.36p>0.05
Mean=162.8 SD+2.28p>0.05
Mean=58.6SD+3.23p>0.05
Female control
Mean=48.2SD+1.45
Mean=152.5SD+2.50
Mean=62.2SD+3.15
Male control
Mean=48.26SD+1.28
Mean=163.2 SD+2.23
Mean=60.2SD+5.32
Values are mean ± SD. Sgnificance value (P < 0.05)
Table-2 shows the comparison of Forced Vital Capacity in different groups. In group 1 & 2, FVC in female construction workers are lower than the control. In group 3, 4&5 significant decrease in FVC & in group 4 and 5 highly significant decrease %FVC is seen (below 80%) i.e. suggestive of restrictive type of lung disorder,
present in female construction workers with more than 15 years of duration of work. In male construction workers FVC&%FVC is significantly decrease in group 3, 4 &5. Compared with female % FVC, in male construction worker group 3, 4 &5 is low (below 80%) suggestive of early development of restrictive type of lung disease
Table 2: Forced Vital Capacity, % FVC in all groups compared with their matched controls
Group /Duration of work
FVC (ml)Female
construction worker
FVC (ml)Female Control
% FVCFemale
construction worker
% FVCFemale control
FVC (ml)Male
control
FVC (ML)Male
construction worker
%FVCMale
control
%FVCMale
constructionworker
Group 15 yearsn= 22
Mean SD t = p value
2333+225.760.83>0.05
2416+199.14
92.8+9.260.144>0.05
93.4+8.3 3280+113080+501.55>0.05
97.35+4.43
90.6+6.620.09>0.05
Group 29 yearsn= 20
Mean SD t = p value
2201+223.711.67>0.05
2357+80.66
89.4+8.461.58>0.05
94.8+3.33180+80 3000+70
1.43>0.0596.3+3.63
90.2+5.60.87>0.05
Group 315 yearsn= 22
Mean SD t = p value
2026+158.323.89<0.05
2293+58.5
85.9+7.463.53=0.05
96.1+1.57 3150+502730+703.88<0.001
93.15+4.95
78.1+5.786.23<0.001
Group 420 yearsn= 24
Mean SD t = p value
1731+212.695.81<0.001
2234+127.55
78.25+9.34.74<0.05
93.1+4.46 3100+422100+504.57<0.001
90.35+3.8
68.95+6.54.66<0.001
Group 525 yearsn=22
Mean SD t =p value
1583+237.296.28<0.001
2178+122.6
74.5+9.995.59<0.001
92.8+6.17
2800+90
2000+605.32<0.001
82.36+40
62.35+553.66<0.001
Values are mean± SD. Significant (P < 0.05); highly significant (P < 0.001)
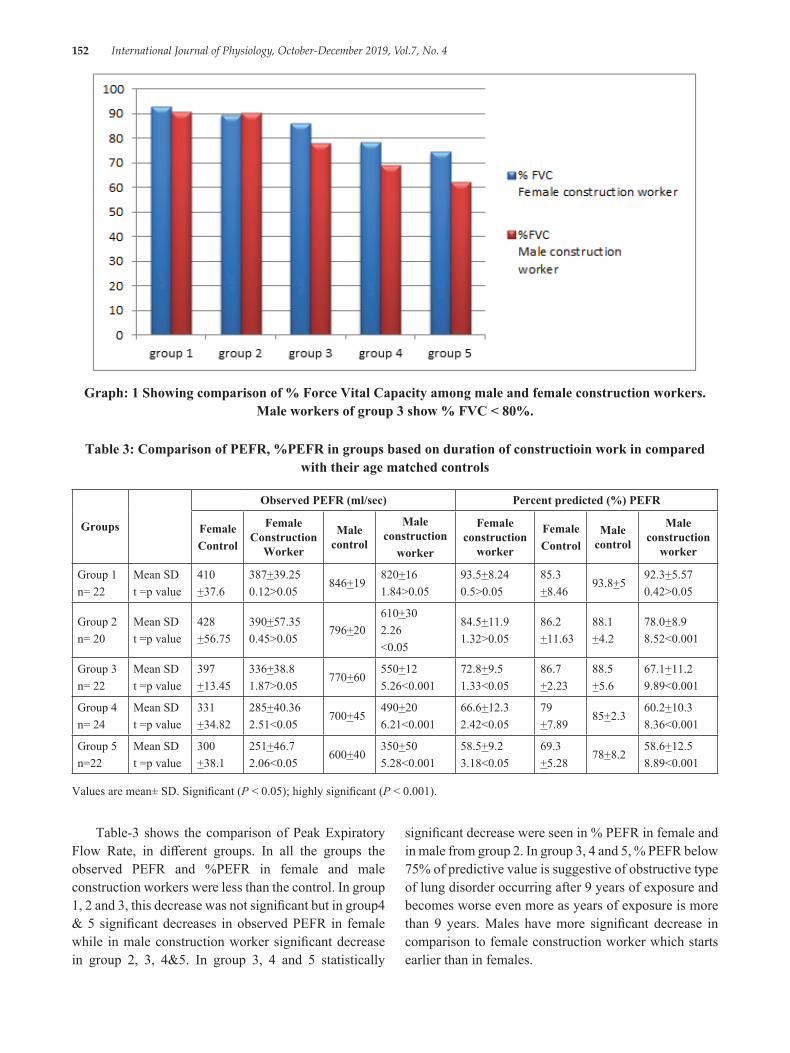
152 International Journal of Physiology, October-December 2019, Vol.7, No. 4
Graph: 1 Showing comparison of % Force Vital Capacity among male and female construction workers. Male workers of group 3 show % FVC < 80%.
Table 3: Comparison of PEFR, %PEFR in groups based on duration of constructioin work in compared with their age matched controls
Groups
Observed PEFR (ml/sec) Percent predicted (%) PEFR
FemaleControl
Female Construction
Worker
Male control
Male construction
worker
Female construction
worker
FemaleControl
Male control
Male construction
worker
Group 1n= 22
Mean SDt =p value
410+37.6
387+39.250.12>0.05
846+19820+161.84>0.05
93.5+8.240.5>0.05
85.3+8.46
93.8+592.3+5.570.42>0.05
Group 2n= 20
Mean SDt =p value
428+56.75
390+57.350.45>0.05
796+20610+302.26<0.05
84.5+11.91.32>0.05
86.2+11.63
88.1+4.2
78.0+8.98.52<0.001
Group 3n= 22
Mean SDt =p value
397+13.45
336+38.81.87>0.05
770+60550+125.26<0.001
72.8+9.51.33<0.05
86.7+2.23
88.5+5.6
67.1+11.29.89<0.001
Group 4n= 24
Mean SDt =p value
331+34.82
285+40.362.51<0.05
700+45490+206.21<0.001
66.6+12.32.42<0.05
79+7.89
85+2.360.2+10.38.36<0.001
Group 5n=22
Mean SDt =p value
300+38.1
251+46.72.06<0.05
600+40350+505.28<0.001
58.5+9.23.18<0.05
69.3+5.28
78+8.258.6+12.58.89<0.001
Values are mean± SD. Significant (P < 0.05); highly significant (P < 0.001).
Table-3 shows the comparison of Peak Expiratory Flow Rate, in different groups. In all the groups the observed PEFR and %PEFR in female and male construction workers were less than the control. In group 1, 2 and 3, this decrease was not significant but in group4 & 5 significant decreases in observed PEFR in female while in male construction worker significant decrease in group 2, 3, 4&5. In group 3, 4 and 5 statistically
significant decrease were seen in % PEFR in female and in male from group 2. In group 3, 4 and 5, % PEFR below 75% of predictive value is suggestive of obstructive type of lung disorder occurring after 9 years of exposure and becomes worse even more as years of exposure is more than 9 years. Males have more significant decrease in comparison to female construction worker which starts earlier than in females.
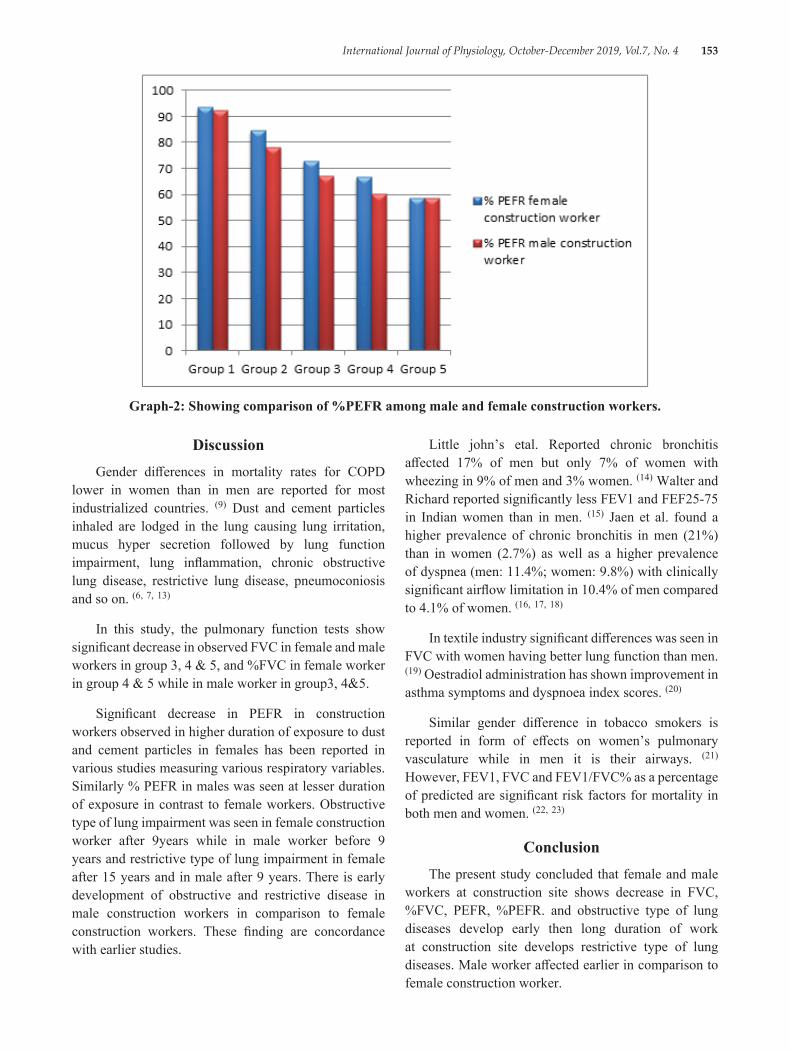
International Journal of Physiology, October-December 2019, Vol.7, No. 4 153
Graph-2: Showing comparison of %PEFR among male and female construction workers.
Little john’s etal. Reported chronic bronchitis affected 17% of men but only 7% of women with wheezing in 9% of men and 3% women. (14) Walter and Richard reported significantly less FEV1 and FEF25-75 in Indian women than in men. (15) Jaen et al. found a higher prevalence of chronic bronchitis in men (21%) than in women (2.7%) as well as a higher prevalence of dyspnea (men: 11.4%; women: 9.8%) with clinically significant airflow limitation in 10.4% of men compared to 4.1% of women. (16, 17, 18)
In textile industry significant differences was seen in FVC with women having better lung function than men. (19) Oestradiol administration has shown improvement in asthma symptoms and dyspnoea index scores. (20)
Similar gender difference in tobacco smokers is reported in form of effects on women’s pulmonary vasculature while in men it is their airways. (21) However, FEV1, FVC and FEV1/FVC% as a percentage of predicted are significant risk factors for mortality in both men and women. (22, 23)
ConclusionThe present study concluded that female and male
workers at construction site shows decrease in FVC, %FVC, PEFR, %PEFR. and obstructive type of lung diseases develop early then long duration of work at construction site develops restrictive type of lung diseases. Male worker affected earlier in comparison to female construction worker.
DiscussionGender differences in mortality rates for COPD
lower in women than in men are reported for most industrialized countries. (9) Dust and cement particles inhaled are lodged in the lung causing lung irritation, mucus hyper secretion followed by lung function impairment, lung inflammation, chronic obstructive lung disease, restrictive lung disease, pneumoconiosis and so on. (6, 7, 13)
In this study, the pulmonary function tests show significant decrease in observed FVC in female and male workers in group 3, 4 & 5, and %FVC in female worker in group 4 & 5 while in male worker in group3, 4&5.
Significant decrease in PEFR in construction workers observed in higher duration of exposure to dust and cement particles in females has been reported in various studies measuring various respiratory variables. Similarly % PEFR in males was seen at lesser duration of exposure in contrast to female workers. Obstructive type of lung impairment was seen in female construction worker after 9years while in male worker before 9 years and restrictive type of lung impairment in female after 15 years and in male after 9 years. There is early development of obstructive and restrictive disease in male construction workers in comparison to female construction workers. These finding are concordance with earlier studies.
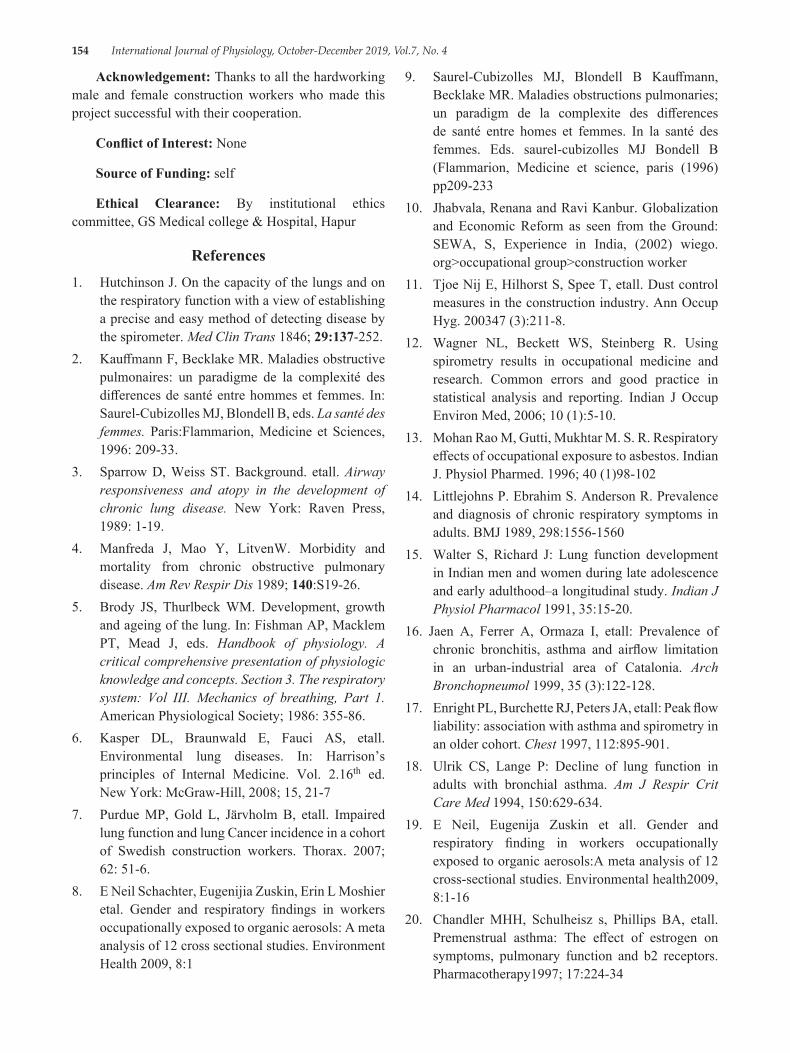
154 International Journal of Physiology, October-December 2019, Vol.7, No. 4
Acknowledgement: Thanks to all the hardworking male and female construction workers who made this project successful with their cooperation.
Conflict of Interest: None
Source of Funding: self
Ethical Clearance: By institutional ethics committee, GS Medical college & Hospital, Hapur
References1. Hutchinson J. On the capacity of the lungs and on
the respiratory function with a view of establishing a precise and easy method of detecting disease by the spirometer. Med Clin Trans 1846; 29:137-252.
2. Kauffmann F, Becklake MR. Maladies obstructive pulmonaires: un paradigme de la complexité des differences de santé entre hommes et femmes. In: Saurel-Cubizolles MJ, Blondell B, eds. La santé des femmes. Paris:Flammarion, Medicine et Sciences, 1996: 209-33.
3. Sparrow D, Weiss ST. Background. etall. Airway responsiveness and atopy in the development of chronic lung disease. New York: Raven Press, 1989: 1-19.
4. Manfreda J, Mao Y, LitvenW. Morbidity and mortality from chronic obstructive pulmonary disease. Am Rev Respir Dis 1989; 140:S19-26.
5. Brody JS, Thurlbeck WM. Development, growth and ageing of the lung. In: Fishman AP, Macklem PT, Mead J, eds. Handbook of physiology. A critical comprehensive presentation of physiologic knowledge and concepts. Section 3. The respiratory system: Vol III. Mechanics of breathing, Part 1. American Physiological Society; 1986: 355-86.
6. Kasper DL, Braunwald E, Fauci AS, etall. Environmental lung diseases. In: Harrison’s principles of Internal Medicine. Vol. 2.16th ed. New York: McGraw-Hill, 2008; 15, 21-7
7. Purdue MP, Gold L, Järvholm B, etall. Impaired lung function and lung Cancer incidence in a cohort of Swedish construction workers. Thorax. 2007; 62: 51-6.
8. E Neil Schachter, Eugenijia Zuskin, Erin L Moshier etal. Gender and respiratory findings in workers occupationally exposed to organic aerosols: A meta analysis of 12 cross sectional studies. Environment Health 2009, 8:1
9. Saurel-Cubizolles MJ, Blondell B Kauffmann, Becklake MR. Maladies obstructions pulmonaries; un paradigm de la complexite des differences de santé entre homes et femmes. In la santé des femmes. Eds. saurel-cubizolles MJ Bondell B (Flammarion, Medicine et science, paris (1996)pp209-233
10. Jhabvala, Renana and Ravi Kanbur. Globalization and Economic Reform as seen from the Ground: SEWA, S, Experience in India, (2002) wiego. org>occupational group>construction worker
11. Tjoe Nij E, Hilhorst S, Spee T, etall. Dust control measures in the construction industry. Ann Occup Hyg. 200347 (3):211-8.
12. Wagner NL, Beckett WS, Steinberg R. Using spirometry results in occupational medicine and research. Common errors and good practice in statistical analysis and reporting. Indian J Occup Environ Med, 2006; 10 (1):5-10.
13. Mohan Rao M, Gutti, Mukhtar M. S. R. Respiratory effects of occupational exposure to asbestos. Indian J. Physiol Pharmed. 1996; 40 (1)98-102
14. Littlejohns P. Ebrahim S. Anderson R. Prevalence and diagnosis of chronic respiratory symptoms in adults. BMJ 1989, 298:1556-1560
15. Walter S, Richard J: Lung function development in Indian men and women during late adolescence and early adulthood–a longitudinal study. Indian J Physiol Pharmacol 1991, 35:15-20.
16. Jaen A, Ferrer A, Ormaza I, etall: Prevalence of chronic bronchitis, asthma and airflow limitation in an urban-industrial area of Catalonia. Arch Bronchopneumol 1999, 35 (3):122-128.
17. Enright PL, Burchette RJ, Peters JA, etall: Peak flow liability: association with asthma and spirometry in an older cohort. Chest 1997, 112:895-901.
18. Ulrik CS, Lange P: Decline of lung function in adults with bronchial asthma. Am J Respir Crit Care Med 1994, 150:629-634.
19. E Neil, Eugenija Zuskin et all. Gender and respiratory finding in workers occupationally exposed to organic aerosols:A meta analysis of 12 cross-sectional studies. Environmental health2009, 8:1-16
20. Chandler MHH, Schulheisz s, Phillips BA, etall. Premenstrual asthma: The effect of estrogen on symptoms, pulmonary function and b2 receptors. Pharmacotherapy1997; 17:224-34

International Journal of Physiology, October-December 2019, Vol.7, No. 4 155
21. Mansi MA, Hanley JA, Ernst P, etall. Environmental exposure to tobacco smoking and lung function in young adults. Am Rev Respir Dis 1988; 138:296-9
22. Lange P, Groth S, Nyobe J, et all: Decline of the lung function related to the type of tobacco smoked inhalation. Thorax 1990, 45:22-26.
23. Lange P, Nyboe J, Appleyard M, et all: Spirometric findings and mortality in never-smokers. J Clin Epidemiol 1990, 43:867-873.
156 International Journal of Physiology, October-December 2019, Vol.7, No. 4
Study of Pattern of Dyslipidaemia among Type 2 Diabetes Mellitus Patients Seeking Care in GMERS Medical College
Patan, Gujarat, India
Dharmesh K. Patel1, Nehal S. Patel2
1Associate Professor, Department of Physiology, GMERS Medical Collage Patan, Gujarat, 2Assistant Professor, Department of Physiology, Banas Medical College and Research Institute, Palanpur, Gujarat
AbstractBackground: Patients with type-2 diabetes have increased risk of myocardial infarction associated with atherogenic dyslipidemia. The diabetic dyslipidemia is characterised by elevations of low density lipoproteins (LDL), triglycerides (TG) and decreased high density lipoproteins (HDL). Lipid particles in diabetic dyslipidemia patients are more atherogenic than in non-diabetic people. Therefore, lipid abnormalities in diabetes should be aggressively treated the at the earlier.
Objective: (a) To study the pattern of dyslipidemia in diabetic patients, and (b) To compare lipid profile among patients with poor glycaemic control and good glycaemic control patients. (c) To access cardiovascular risk status according to criteria of Adult treatment panel III of National Cholesterol Education Program (NCEP).
Material & Method: The present study was carried out at GMERS medical college, Patan Gujarat during period from July 2018 to December 2018. All patient was advised for 12-14 hours overnight fasting and blood samples were collected on next morning before breakfast for lipid profile, FBS, PPBS, HbA1C. Cardiovascular risk status was evaluated according to the criteria of Adult treatment panel III of National Cholesterol Education Program (NCEP).
Results: Out of 150 patients, 46 (30.6%) patients had good glycaemic control and 104 (69.4%) had poor glycaemic control. The patients with poor glycaemic control are at borderline to high cardiovascular risk status as determined by TG and LDL-C levels and serum cholesterol levels.
Conclusion: From the present study we can conclude that diabetic patients with poor glycaemic control are at higher cardiovascular risk according to serum cholesterol, LDL-C levels and TG levels. In addition to glycemic control, HbA1c can be utilized as a potential biomarker to predict dyslipidemia in type 2 diabetic patients
Keywords: Glycaemic control, HbA1c, Dyslipidemia, Cardiovascular risk.
by impaired carbohydrate metabolism with raised blood glucose as well as altered lipid and protein metabolism.1 According to International Diabetes Federation, 41 million diabetic patients were in India (2006) which will increase to 70 million in 2025. Majority of them are type 2 diabetic patients. 2 Diabetes mellitus is ranked 7th among leading causes of mortality in developing nations.3 Coronary heart disease, stroke, diabetic retinopathy, diabetic renal disease and neuropathy etc are major complication of diabetes. Impaired lipid metabolism are major contributors to these complications. 4 Patients
IntroductionDiabetes mellitus (DM) is a group of metabolic
diseases caused by peripheral insulin resistance or impaired insulin secretion or both. It is characterised
Corresponding Author: Dr. Nehal S. Patel Department of Physiology, Banas Medical College and Research Institute, Palanpur, Gujarat e-mail: [email protected]
10.5958/2320-608X.2019.00139.2
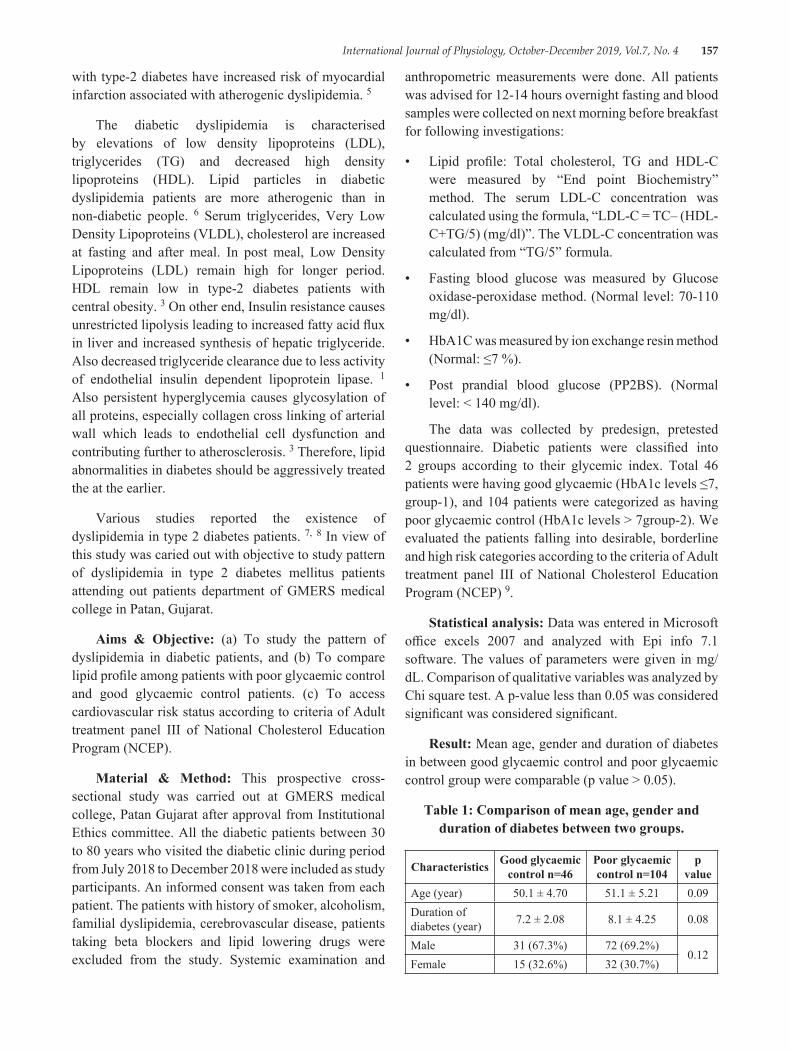
International Journal of Physiology, October-December 2019, Vol.7, No. 4 157
with type-2 diabetes have increased risk of myocardial infarction associated with atherogenic dyslipidemia. 5
The diabetic dyslipidemia is characterised by elevations of low density lipoproteins (LDL), triglycerides (TG) and decreased high density lipoproteins (HDL). Lipid particles in diabetic dyslipidemia patients are more atherogenic than in non-diabetic people. 6 Serum triglycerides, Very Low Density Lipoproteins (VLDL), cholesterol are increased at fasting and after meal. In post meal, Low Density Lipoproteins (LDL) remain high for longer period. HDL remain low in type-2 diabetes patients with central obesity. 3 On other end, Insulin resistance causes unrestricted lipolysis leading to increased fatty acid flux in liver and increased synthesis of hepatic triglyceride. Also decreased triglyceride clearance due to less activity of endothelial insulin dependent lipoprotein lipase. 1 Also persistent hyperglycemia causes glycosylation of all proteins, especially collagen cross linking of arterial wall which leads to endothelial cell dysfunction and contributing further to atherosclerosis. 3 Therefore, lipid abnormalities in diabetes should be aggressively treated the at the earlier.
Various studies reported the existence of dyslipidemia in type 2 diabetes patients. 7, 8 In view of this study was caried out with objective to study pattern of dyslipidemia in type 2 diabetes mellitus patients attending out patients department of GMERS medical college in Patan, Gujarat.
Aims & Objective: (a) To study the pattern of dyslipidemia in diabetic patients, and (b) To compare lipid profile among patients with poor glycaemic control and good glycaemic control patients. (c) To access cardiovascular risk status according to criteria of Adult treatment panel III of National Cholesterol Education Program (NCEP).
Material & Method: This prospective cross-sectional study was carried out at GMERS medical college, Patan Gujarat after approval from Institutional Ethics committee. All the diabetic patients between 30 to 80 years who visited the diabetic clinic during period from July 2018 to December 2018 were included as study participants. An informed consent was taken from each patient. The patients with history of smoker, alcoholism, familial dyslipidemia, cerebrovascular disease, patients taking beta blockers and lipid lowering drugs were excluded from the study. Systemic examination and
anthropometric measurements were done. All patients was advised for 12-14 hours overnight fasting and blood samples were collected on next morning before breakfast for following investigations:
• Lipid profile: Total cholesterol, TG and HDL-C were measured by “End point Biochemistry” method. The serum LDL-C concentration was calculated using the formula, “LDL-C = TC– (HDL-C+TG/5) (mg/dl)”. The VLDL-C concentration was calculated from “TG/5” formula.
• Fasting blood glucose was measured by Glucose oxidase-peroxidase method. (Normal level: 70-110 mg/dl).
• HbA1C was measured by ion exchange resin method (Normal: ≤7 %).
• Post prandial blood glucose (PP2BS). (Normal level: < 140 mg/dl).
The data was collected by predesign, pretested questionnaire. Diabetic patients were classified into 2 groups according to their glycemic index. Total 46 patients were having good glycaemic (HbA1c levels ≤7, group-1), and 104 patients were categorized as having poor glycaemic control (HbA1c levels > 7group-2). We evaluated the patients falling into desirable, borderline and high risk categories according to the criteria of Adult treatment panel III of National Cholesterol Education Program (NCEP) 9.
Statistical analysis: Data was entered in Microsoft office excels 2007 and analyzed with Epi info 7.1 software. The values of parameters were given in mg/dL. Comparison of qualitative variables was analyzed by Chi square test. A p-value less than 0.05 was considered significant was considered significant.
Result: Mean age, gender and duration of diabetes in between good glycaemic control and poor glycaemic control group were comparable (p value > 0.05).
Table 1: Comparison of mean age, gender and duration of diabetes between two groups.
Characteristics Good glycaemic control n=46
Poor glycaemic control n=104
p value
Age (year) 50.1 ± 4.70 51.1 ± 5.21 0.09Duration of diabetes (year) 7.2 ± 2.08 8.1 ± 4.25 0.08
Male 31 (67.3%) 72 (69.2%)0.12
Female 15 (32.6%) 32 (30.7%)
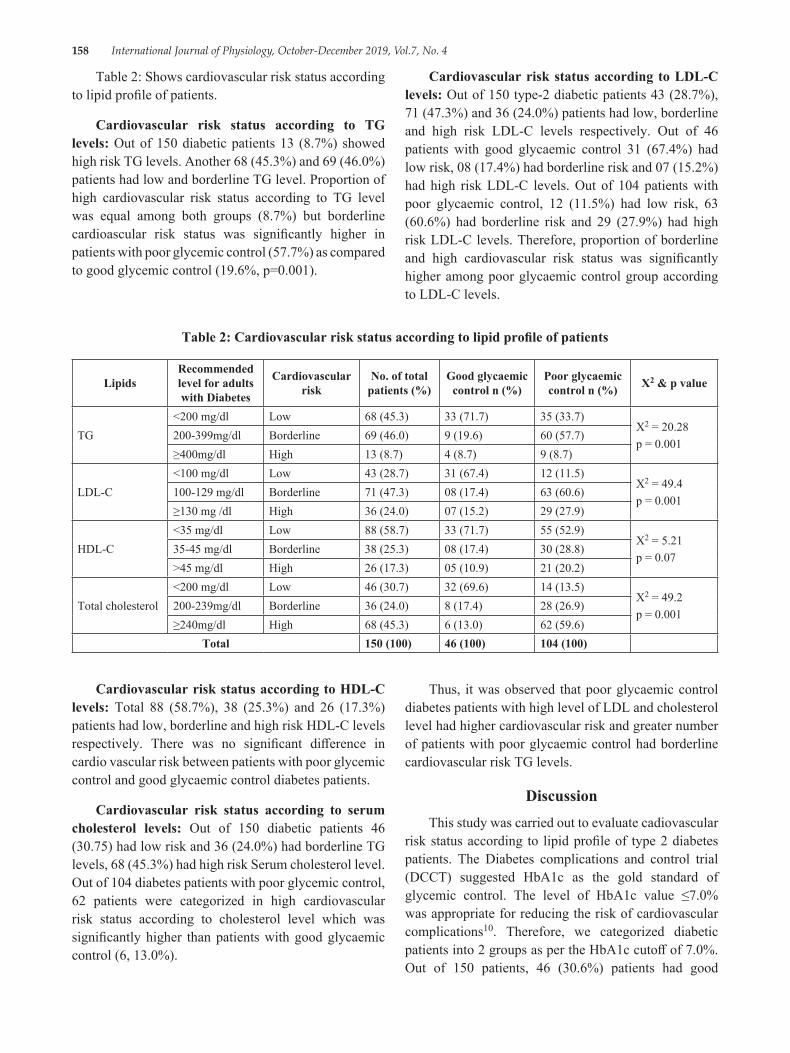
158 International Journal of Physiology, October-December 2019, Vol.7, No. 4
Table 2: Shows cardiovascular risk status according to lipid profile of patients.
Cardiovascular risk status according to TG levels: Out of 150 diabetic patients 13 (8.7%) showed high risk TG levels. Another 68 (45.3%) and 69 (46.0%) patients had low and borderline TG level. Proportion of high cardiovascular risk status according to TG level was equal among both groups (8.7%) but borderline cardioascular risk status was significantly higher in patients with poor glycemic control (57.7%) as compared to good glycemic control (19.6%, p=0.001).
Cardiovascular risk status according to LDL-C levels: Out of 150 type-2 diabetic patients 43 (28.7%), 71 (47.3%) and 36 (24.0%) patients had low, borderline and high risk LDL-C levels respectively. Out of 46 patients with good glycaemic control 31 (67.4%) had low risk, 08 (17.4%) had borderline risk and 07 (15.2%) had high risk LDL-C levels. Out of 104 patients with poor glycaemic control, 12 (11.5%) had low risk, 63 (60.6%) had borderline risk and 29 (27.9%) had high risk LDL-C levels. Therefore, proportion of borderline and high cardiovascular risk status was significantly higher among poor glycaemic control group according to LDL-C levels.
Table 2: Cardiovascular risk status according to lipid profile of patients
LipidsRecommended level for adults with Diabetes
Cardiovascular risk
No. of total patients (%)
Good glycaemic control n (%)
Poor glycaemic control n (%) X2 & p value
TG<200 mg/dl Low 68 (45.3) 33 (71.7) 35 (33.7)
X2 = 20.28p = 0.001
200-399mg/dl Borderline 69 (46.0) 9 (19.6) 60 (57.7)≥400mg/dl High 13 (8.7) 4 (8.7) 9 (8.7)
LDL-C<100 mg/dl Low 43 (28.7) 31 (67.4) 12 (11.5)
X2 = 49.4p = 0.001
100-129 mg/dl Borderline 71 (47.3) 08 (17.4) 63 (60.6)≥130 mg /dl High 36 (24.0) 07 (15.2) 29 (27.9)
HDL-C<35 mg/dl Low 88 (58.7) 33 (71.7) 55 (52.9)
X2 = 5.21p = 0.07
35-45 mg/dl Borderline 38 (25.3) 08 (17.4) 30 (28.8)>45 mg/dl High 26 (17.3) 05 (10.9) 21 (20.2)
Total cholesterol<200 mg/dl Low 46 (30.7) 32 (69.6) 14 (13.5)
X2 = 49.2p = 0.001
200-239mg/dl Borderline 36 (24.0) 8 (17.4) 28 (26.9)≥240mg/dl High 68 (45.3) 6 (13.0) 62 (59.6)
Total 150 (100) 46 (100) 104 (100)
Cardiovascular risk status according to HDL-C levels: Total 88 (58.7%), 38 (25.3%) and 26 (17.3%) patients had low, borderline and high risk HDL-C levels respectively. There was no significant difference in cardio vascular risk between patients with poor glycemic control and good glycaemic control diabetes patients.
Cardiovascular risk status according to serum cholesterol levels: Out of 150 diabetic patients 46 (30.75) had low risk and 36 (24.0%) had borderline TG levels, 68 (45.3%) had high risk Serum cholesterol level. Out of 104 diabetes patients with poor glycemic control, 62 patients were categorized in high cardiovascular risk status according to cholesterol level which was significantly higher than patients with good glycaemic control (6, 13.0%).
Thus, it was observed that poor glycaemic control diabetes patients with high level of LDL and cholesterol level had higher cardiovascular risk and greater number of patients with poor glycaemic control had borderline cardiovascular risk TG levels.
DiscussionThis study was carried out to evaluate cadiovascular
risk status according to lipid profile of type 2 diabetes patients. The Diabetes complications and control trial (DCCT) suggested HbA1c as the gold standard of glycemic control. The level of HbA1c value ≤7.0% was appropriate for reducing the risk of cardiovascular complications10. Therefore, we categorized diabetic patients into 2 groups as per the HbA1c cutoff of 7.0%. Out of 150 patients, 46 (30.6%) patients had good
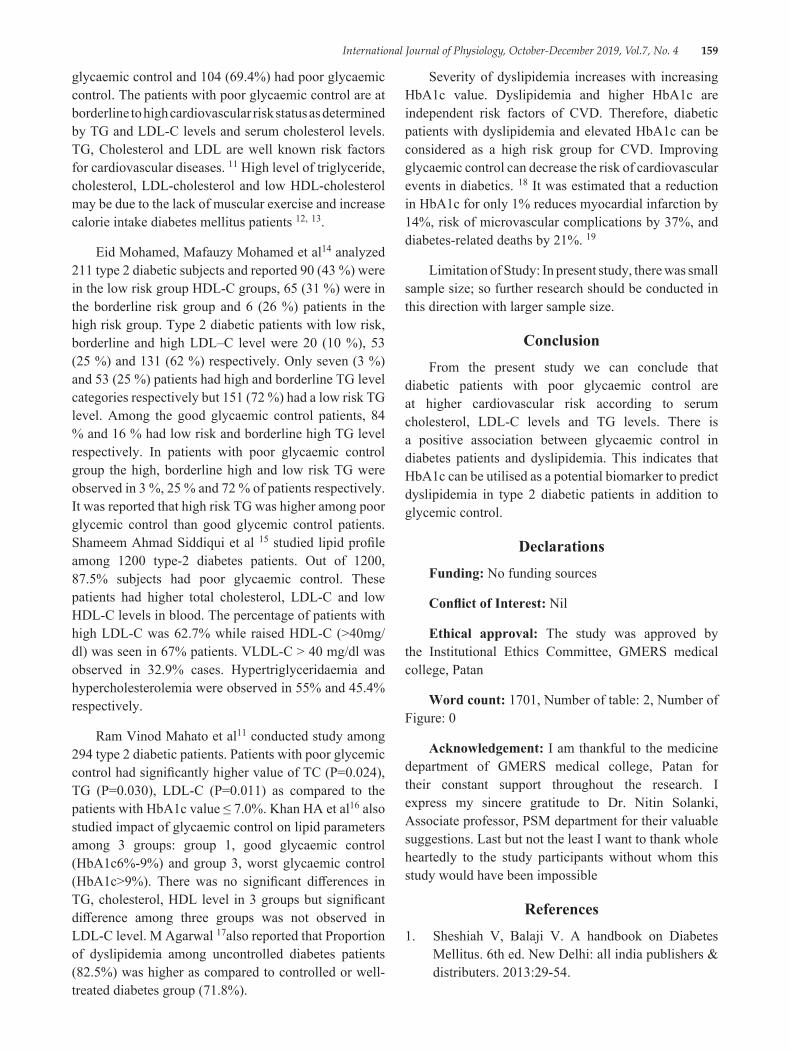
International Journal of Physiology, October-December 2019, Vol.7, No. 4 159
glycaemic control and 104 (69.4%) had poor glycaemic control. The patients with poor glycaemic control are at borderline to high cardiovascular risk status as determined by TG and LDL-C levels and serum cholesterol levels. TG, Cholesterol and LDL are well known risk factors for cardiovascular diseases. 11 High level of triglyceride, cholesterol, LDL-cholesterol and low HDL-cholesterol may be due to the lack of muscular exercise and increase calorie intake diabetes mellitus patients 12, 13.
Eid Mohamed, Mafauzy Mohamed et al14 analyzed 211 type 2 diabetic subjects and reported 90 (43 %) were in the low risk group HDL-C groups, 65 (31 %) were in the borderline risk group and 6 (26 %) patients in the high risk group. Type 2 diabetic patients with low risk, borderline and high LDL–C level were 20 (10 %), 53 (25 %) and 131 (62 %) respectively. Only seven (3 %) and 53 (25 %) patients had high and borderline TG level categories respectively but 151 (72 %) had a low risk TG level. Among the good glycaemic control patients, 84 % and 16 % had low risk and borderline high TG level respectively. In patients with poor glycaemic control group the high, borderline high and low risk TG were observed in 3 %, 25 % and 72 % of patients respectively. It was reported that high risk TG was higher among poor glycemic control than good glycemic control patients. Shameem Ahmad Siddiqui et al 15 studied lipid profile among 1200 type-2 diabetes patients. Out of 1200, 87.5% subjects had poor glycaemic control. These patients had higher total cholesterol, LDL-C and low HDL-C levels in blood. The percentage of patients with high LDL-C was 62.7% while raised HDL-C (>40mg/dl) was seen in 67% patients. VLDL-C > 40 mg/dl was observed in 32.9% cases. Hypertriglyceridaemia and hypercholesterolemia were observed in 55% and 45.4% respectively.
Ram Vinod Mahato et al11 conducted study among 294 type 2 diabetic patients. Patients with poor glycemic control had significantly higher value of TC (P=0.024), TG (P=0.030), LDL-C (P=0.011) as compared to the patients with HbA1c value ≤ 7.0%. Khan HA et al16 also studied impact of glycaemic control on lipid parameters among 3 groups: group 1, good glycaemic control (HbA1c6%-9%) and group 3, worst glycaemic control (HbA1c>9%). There was no significant differences in TG, cholesterol, HDL level in 3 groups but significant difference among three groups was not observed in LDL-C level. M Agarwal 17also reported that Proportion of dyslipidemia among uncontrolled diabetes patients (82.5%) was higher as compared to controlled or well-treated diabetes group (71.8%).
Severity of dyslipidemia increases with increasing HbA1c value. Dyslipidemia and higher HbA1c are independent risk factors of CVD. Therefore, diabetic patients with dyslipidemia and elevated HbA1c can be considered as a high risk group for CVD. Improving glycaemic control can decrease the risk of cardiovascular events in diabetics. 18 It was estimated that a reduction in HbA1c for only 1% reduces myocardial infarction by 14%, risk of microvascular complications by 37%, and diabetes-related deaths by 21%. 19
Limitation of Study: In present study, there was small sample size; so further research should be conducted in this direction with larger sample size.
ConclusionFrom the present study we can conclude that
diabetic patients with poor glycaemic control are at higher cardiovascular risk according to serum cholesterol, LDL-C levels and TG levels. There is a positive association between glycaemic control in diabetes patients and dyslipidemia. This indicates that HbA1c can be utilised as a potential biomarker to predict dyslipidemia in type 2 diabetic patients in addition to glycemic control.
DeclarationsFunding: No funding sources
Conflict of Interest: Nil
Ethical approval: The study was approved by the Institutional Ethics Committee, GMERS medical college, Patan
Word count: 1701, Number of table: 2, Number of Figure: 0
Acknowledgement: I am thankful to the medicine department of GMERS medical college, Patan for their constant support throughout the research. I express my sincere gratitude to Dr. Nitin Solanki, Associate professor, PSM department for their valuable suggestions. Last but not the least I want to thank whole heartedly to the study participants without whom this study would have been impossible
References1. Sheshiah V, Balaji V. A handbook on Diabetes
Mellitus. 6th ed. New Delhi: all india publishers & distributers. 2013:29-54.
160 International Journal of Physiology, October-December 2019, Vol.7, No. 4
2. Sicree R, Shaw J, Zimmet P. Diabetes and impaired glucose tolerance. In: Gan D, Diabetes Atlas. International Diabetes Federation, 3rd ed. Belgium: International Diabetes Federation. 2006; 15-09.
3. Bhambhani GD, Bhambhani RG, Thakor NC. Lipid profile of patients with diabetes mellitus: a cross sectional study. Int J Res Med Sci 2015; 3:3292-5.
4. Borle A, Chhari N, Gupta G, Bathma V. Study of prevalence and pattern of Dyslipidaemia in Type 2 Diabetes Mellitus patients attending Rural Health Training Centre of medical college in Bhopal, Madhya Pradesh, India. Int J Community Med Public Health 2016; 3:140-44.
5. American Diabetes Association. Diagnosis and Classification of Diabetes Mellitus, Diabetes Care. 2011, 34, 62-9.
6. Goldberg IJ. Clinical review 124: Diabetic Dyslipidemia: Causes and Consequences. J Clin Endocrinol Metabol. 2001; 86: 965-71.
7. Song Q, Liu X, Wang A, Wang Y, Zhou Y, Zhou W, et al. Associations between non-traditional lipid measures and risk for type 2 diabetes mellitus in a Chinese community population: a cross-sectional study. Lipids Health Dis. 2016; 15:70.
8. Gordon L, Ragoobirsingh D, Morrison E Y, Choo-Kang E, McGrowder D, Martorell E. Lipid profile of type 2 diabetic and hypertensive patients in the jamaican population. J Lab Physicians. 2010; 2:25-30.
9. Executive Summary of the Third Report of THE National Cholesterol Education Programe (NCEP)Expert Panel on detection, Evaluation, And Treatment of High Blood cholesterol in Adults (Adult Treatment Panel III)JAMA 2001; 285:2486-7
10. Rohlfing CL, Wiedmeyer HM, Little RR, England JD, Tennill A, Goldstein DE. Defining the relationship between plasma glucose and HbA1c: analysis of glucose profiles and HbA1c in the
Diabetes Control and Complications Trial. Diabetes care. 2002 Feb 1; 25 (2):275-78.
11. VinodMahato R, Gyawali P, Raut PP, Regmi P, Singh KP, Pandeya DR, Gyawali P. Association between glycaemic control and serum lipid profile in type 2 diabetic patients: Glycated haemoglobin as a dual biomarker. Biomedical Research 2011; 22 (3): 375-80.
12. Das S, Samal KC, Tripathy BB. Factors influencing plasma lipids and lipoprotein cholesterol in Indian NIDDM. J. Dia. Assoc. Ind. 1992; 32 (2).
13. Yogi K. Lipid peroxide and human diseases. Chemistry and Physics of Lipid. 1999; 45:337-51.
14. Mohamed E, Mohamed M, Rashid FA. Dyslipidaemic pattern of patients with type 2 diabetes mellitus. The Malaysian journal of medical sciences: MJMS. 2004 Jan; 11 (1):44-1.
15. Syes SH. Frequency distribution of atherogenic dyslipidaemia in Saudi type 2 diabetic patients. Pak J Physiol 2006; 2 (2):20-2.
16. Khan HA, Sobki SH, Khan SA. Association between glycaemic control and serum lipids profile in type 2 diabetic patients: HbA 1c predicts dyslipidaemia. Clinical and experimental medicine. 2007 Mar 1; 7 (1):24-9.
17. Agarwal M, Patel JP, Lala MK. Association between glycemic control and serum lipid profile in known diabetic patients of Civil Hospital, Ahmedabad. International Journal of Medical Science and Public Health. 2016 Feb 1; 5 (2):356-61.
18. Selvin E, Wattanakit K, Steffes MW, Coresh J, Sharrett AR. HbA1c and peripheral arterial disease in diabetes: the Atherosclerosis Risk in Communities study. Diabetes care. 2006 Apr 1; 29 (4):877-82.
19. American Diabetes Association. Glycemic targets. Sec. 5. In standards of medical care in diabetes-2016. Diabetes Care 2016; 39 Suppl 1:S39-46.
International Journal of Physiology, October-December 2019, Vol.7, No. 4 161
Neck Circumference as a Novel Measure of Central Obesity in Young Adults: Correlation with other Anthropometric Indices
Nida Nowreen1, Manmeet Kour2
1Lecture, Department of Physiology, 2Lecture, Department of Anatomy, G.M.C. Srinagar, J&K, India
AbstractBackground: Obesity is an important yet the most neglected public health problem that has assumed epidemic proportions even in developing countries. Many simple anthropometric indices, including the body mass index (BMI), waist circumference (WC) are being widely used as markers to reflect obesity. In recent years, there has been growing interest in the utility of neck circumference (NC) in identifying people with obesity. This new index of upper body adiposity is quite easy to determine, does not require much body exposure, and is believed to correlate with other obesity indices.
Objectives: This study was undertaken with the purpose to find out the relationship of neck circumference (NC) with other anthropometrical indices.
Materials and Method: This cross sectional study was carried out over a period of six months among 192 medical students. The participants were examined for various anthropometric parameters such as height, weight, and NC. BMI was calculated. The correlation between NC and other indices (BMI, weight WC) was assessed by calculating the Pearson’s correlation coefficient (r) and P > 0.05 was taken as statistically significant.
Results: Neck circumference (NC) positively correlated with BMI, weight and WC. The correlation was statistically significant (P < 0.001).
Conclusion: Our study revealed a positive and significant correlation between neck circumference (NC)and other anthropometric indices like BMI, weight and waist circumference (WC) in young medical students, indicating an increase in BMI, weight and waist circumference (WC) with an increase in neck circumference (NC) or vice versa.
Keywords: Neck circumference, Body Mass Index, Waist circumference, Obesity, Overweight.
groups.[1,2] A high prevalence of overweight and obesity has been observed in adolescent students as well which is increasingly becoming one of the most prominent conditions affecting them. [3] Overweight and obesity are known risk factors for non-communicable diseases such as cardiovascular diseases, hypertension, diabetes, cancer (breast, colon, and endometrial), osteoarthritis, and fractures. [2] High levels of fat deposit is associated with increased levels of free fatty acids which forms one of the causes for the metabolic abnormalities observed in obesity. [4]Many simple anthropometric indices, including the body mass index (BMI), waist circumference (WC) are being widely used as markers to reflect obesity or central obesity and to predict metabolic syndrome or other cardiovascular risks. [5] It has been
IntroductionObesity is an important yet the most neglected public
health problem that has assumed epidemic proportions even in developing countries. Earlier thought to be a problem of developed countries, it has now become an important worldwide contributor to morbidity and mortality among all ages and socioeconomic
Corresponding Author: Dr Nida Nowreen Lecture, Department of Physiology, G. M. C. Srinagar, J&K, India e-mail: [email protected]
10.5958/2320-608X.2019.00160.4
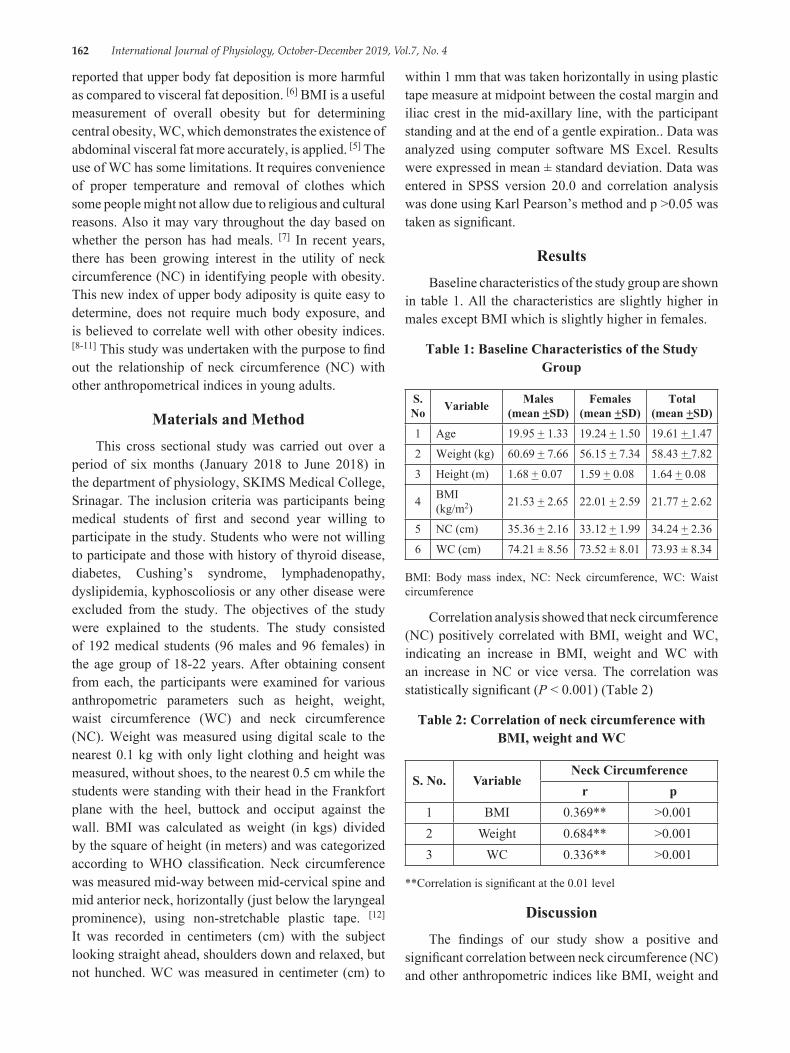
162 International Journal of Physiology, October-December 2019, Vol.7, No. 4
reported that upper body fat deposition is more harmful as compared to visceral fat deposition. [6] BMI is a useful measurement of overall obesity but for determining central obesity, WC, which demonstrates the existence of abdominal visceral fat more accurately, is applied. [5] The use of WC has some limitations. It requires convenience of proper temperature and removal of clothes which some people might not allow due to religious and cultural reasons. Also it may vary throughout the day based on whether the person has had meals. [7] In recent years, there has been growing interest in the utility of neck circumference (NC) in identifying people with obesity. This new index of upper body adiposity is quite easy to determine, does not require much body exposure, and is believed to correlate well with other obesity indices. [8-11] This study was undertaken with the purpose to find out the relationship of neck circumference (NC) with other anthropometrical indices in young adults.
Materials and MethodThis cross sectional study was carried out over a
period of six months (January 2018 to June 2018) in the department of physiology, SKIMS Medical College, Srinagar. The inclusion criteria was participants being medical students of first and second year willing to participate in the study. Students who were not willing to participate and those with history of thyroid disease, diabetes, Cushing’s syndrome, lymphadenopathy, dyslipidemia, kyphoscoliosis or any other disease were excluded from the study. The objectives of the study were explained to the students. The study consisted of 192 medical students (96 males and 96 females) in the age group of 18-22 years. After obtaining consent from each, the participants were examined for various anthropometric parameters such as height, weight, waist circumference (WC) and neck circumference (NC). Weight was measured using digital scale to the nearest 0.1 kg with only light clothing and height was measured, without shoes, to the nearest 0.5 cm while the students were standing with their head in the Frankfort plane with the heel, buttock and occiput against the wall. BMI was calculated as weight (in kgs) divided by the square of height (in meters) and was categorized according to WHO classification. Neck circumference was measured mid-way between mid-cervical spine and mid anterior neck, horizontally (just below the laryngeal prominence), using non-stretchable plastic tape. [12] It was recorded in centimeters (cm) with the subject looking straight ahead, shoulders down and relaxed, but not hunched. WC was measured in centimeter (cm) to
within 1 mm that was taken horizontally in using plastic tape measure at midpoint between the costal margin and iliac crest in the mid-axillary line, with the participant standing and at the end of a gentle expiration.. Data was analyzed using computer software MS Excel. Results were expressed in mean ± standard deviation. Data was entered in SPSS version 20.0 and correlation analysis was done using Karl Pearson’s method and p >0.05 was taken as significant.
ResultsBaseline characteristics of the study group are shown
in table 1. All the characteristics are slightly higher in males except BMI which is slightly higher in females.
Table 1: Baseline Characteristics of the Study Group
S. No Variable Males
(mean +SD)Females
(mean +SD)Total
(mean +SD)
1 Age 19.95 + 1.33 19.24 + 1.50 19.61 + 1.47
2 Weight (kg) 60.69 + 7.66 56.15 + 7.34 58.43 + 7.82
3 Height (m) 1.68 + 0.07 1.59 + 0.08 1.64 + 0.08
4 BMI (kg/m2) 21.53 + 2.65 22.01 + 2.59 21.77 + 2.62
5 NC (cm) 35.36 + 2.16 33.12 + 1.99 34.24 + 2.36
6 WC (cm) 74.21 ± 8.56 73.52 ± 8.01 73.93 ± 8.34
BMI: Body mass index, NC: Neck circumference, WC: Waist circumference
Correlation analysis showed that neck circumference (NC) positively correlated with BMI, weight and WC, indicating an increase in BMI, weight and WC with an increase in NC or vice versa. The correlation was statistically significant (P < 0.001) (Table 2)
Table 2: Correlation of neck circumference with BMI, weight and WC
S. No. Variable Neck Circumference
r p1 BMI 0.369** >0.0012 Weight 0.684** >0.0013 WC 0.336** >0.001
**Correlation is significant at the 0.01 level
DiscussionThe findings of our study show a positive and
significant correlation between neck circumference (NC) and other anthropometric indices like BMI, weight and
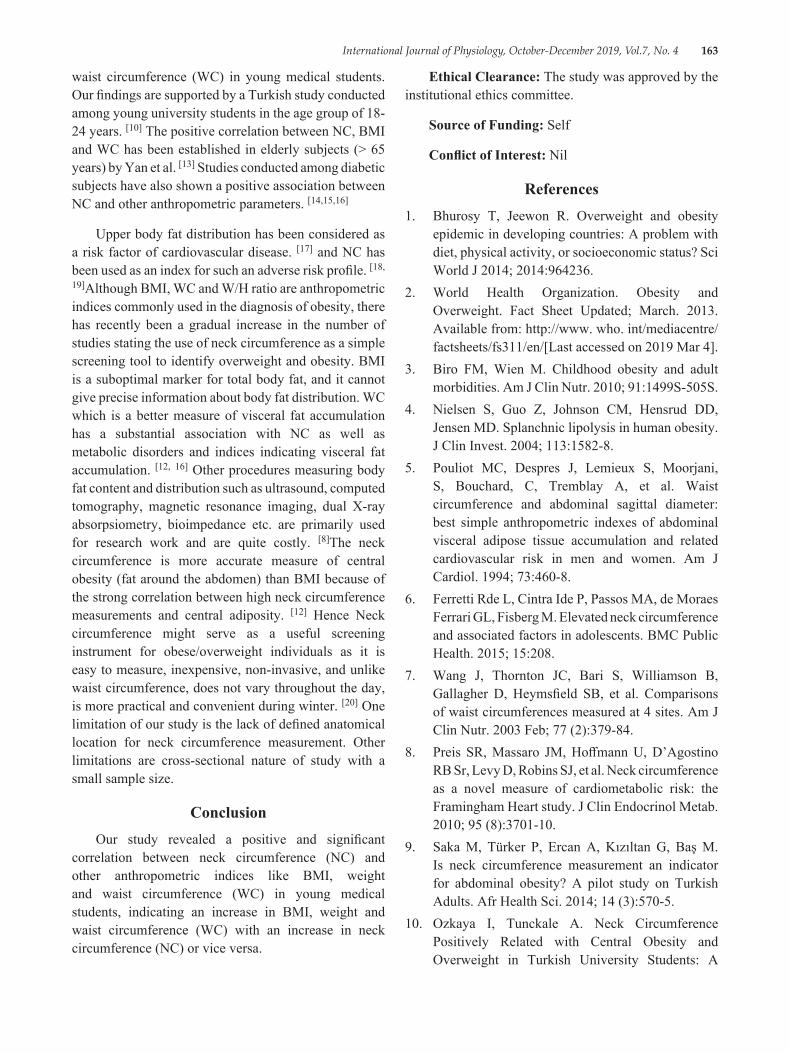
International Journal of Physiology, October-December 2019, Vol.7, No. 4 163
waist circumference (WC) in young medical students. Our findings are supported by a Turkish study conducted among young university students in the age group of 18-24 years. [10] The positive correlation between NC, BMI and WC has been established in elderly subjects (> 65 years) by Yan et al. [13] Studies conducted among diabetic subjects have also shown a positive association between NC and other anthropometric parameters. [14,15,16]
Upper body fat distribution has been considered as a risk factor of cardiovascular disease. [17] and NC has been used as an index for such an adverse risk profile. [18, 19]Although BMI, WC and W/H ratio are anthropometric indices commonly used in the diagnosis of obesity, there has recently been a gradual increase in the number of studies stating the use of neck circumference as a simple screening tool to identify overweight and obesity. BMI is a suboptimal marker for total body fat, and it cannot give precise information about body fat distribution. WC which is a better measure of visceral fat accumulation has a substantial association with NC as well as metabolic disorders and indices indicating visceral fat accumulation. [12, 16] Other procedures measuring body fat content and distribution such as ultrasound, computed tomography, magnetic resonance imaging, dual X-ray absorpsiometry, bioimpedance etc. are primarily used for research work and are quite costly. [8]The neck circumference is more accurate measure of central obesity (fat around the abdomen) than BMI because of the strong correlation between high neck circumference measurements and central adiposity. [12] Hence Neck circumference might serve as a useful screening instrument for obese/overweight individuals as it is easy to measure, inexpensive, non-invasive, and unlike waist circumference, does not vary throughout the day, is more practical and convenient during winter. [20] One limitation of our study is the lack of defined anatomical location for neck circumference measurement. Other limitations are cross-sectional nature of study with a small sample size.
ConclusionOur study revealed a positive and significant
correlation between neck circumference (NC) and other anthropometric indices like BMI, weight and waist circumference (WC) in young medical students, indicating an increase in BMI, weight and waist circumference (WC) with an increase in neck circumference (NC) or vice versa.
Ethical Clearance: The study was approved by the institutional ethics committee.
Source of Funding: Self
Conflict of Interest: Nil
References1. Bhurosy T, Jeewon R. Overweight and obesity
epidemic in developing countries: A problem with diet, physical activity, or socioeconomic status? Sci World J 2014; 2014:964236.
2. World Health Organization. Obesity and Overweight. Fact Sheet Updated; March. 2013. Available from: http://www. who. int/mediacentre/factsheets/fs311/en/[Last accessed on 2019 Mar 4].
3. Biro FM, Wien M. Childhood obesity and adult morbidities. Am J Clin Nutr. 2010; 91:1499S-505S.
4. Nielsen S, Guo Z, Johnson CM, Hensrud DD, Jensen MD. Splanchnic lipolysis in human obesity. J Clin Invest. 2004; 113:1582-8.
5. Pouliot MC, Despres J, Lemieux S, Moorjani, S, Bouchard, C, Tremblay A, et al. Waist circumference and abdominal sagittal diameter: best simple anthropometric indexes of abdominal visceral adipose tissue accumulation and related cardiovascular risk in men and women. Am J Cardiol. 1994; 73:460-8.
6. Ferretti Rde L, Cintra Ide P, Passos MA, de Moraes Ferrari GL, Fisberg M. Elevated neck circumference and associated factors in adolescents. BMC Public Health. 2015; 15:208.
7. Wang J, Thornton JC, Bari S, Williamson B, Gallagher D, Heymsfield SB, et al. Comparisons of waist circumferences measured at 4 sites. Am J Clin Nutr. 2003 Feb; 77 (2):379-84.
8. Preis SR, Massaro JM, Hoffmann U, D’Agostino RB Sr, Levy D, Robins SJ, et al. Neck circumference as a novel measure of cardiometabolic risk: the Framingham Heart study. J Clin Endocrinol Metab. 2010; 95 (8):3701-10.
9. Saka M, Türker P, Ercan A, Kızıltan G, Baş M. Is neck circumference measurement an indicator for abdominal obesity? A pilot study on Turkish Adults. Afr Health Sci. 2014; 14 (3):570-5.
10. Ozkaya I, Tunckale A. Neck Circumference Positively Related with Central Obesity and Overweight in Turkish University Students: A
164 International Journal of Physiology, October-December 2019, Vol.7, No. 4
Preliminary Study. Cent Eur J Public Health. 2016; 24 (2):91-4.
11. Alfadhli EM, Sandokji AA, Zahid BN, Makkawi MA, Alshenaifi RF, Thani TS, et al. Neck circumference as a marker of obesity and a predictor of cardiometabolic risk among Saudi subjects. Saudi Med J. 2017; 38 (12):1219-23.
12. Ben-Noun L, Sohar E, Laor A. Neck circumference as a simple screening measure for identifying overweight and obese patients. Obes Res 2001; 9:470-477
13. Yan Q, Sun D, Li X, Zheng Q, Li L, Gu C, Feng B. Neck circumference is a valuable tool for identifying metabolic syndrome and obesity in Chinese elder subjects: a community-based study. Diabetes Metab Res Rev. 2014 Jan; 30 (1):69-76.
14. Yang GR, Yuan SY, Fu HJ, Wan G, Zhu LX, Bu XL, et al. Neck circumference positively related with central obesity, overweight, and metabolic syndrome in Chinese subjects with type 2 diabetes: Beijing CommunityDiabetes Study 4. Diabetes Care. 2010 Nov; 33 (11):2465-7.
15. Nowreen N, Sonika S, Sachdev S. Neck Circumference as an alternative anthropometric measure of obesity in patients of Type 2 Diabetes
Mellitus-A Hospital Based Study. IOSR Journal of Dental and Medical Sciences 2017; 16: 27-30.
16. Aswathappa J, Garg S, Kutty K, Shankar V. Neck circumference as an anthropometric measure of obesity in diabetics. N Am J Med Sci. 2013 Jan; 5 (1):28-31.
17. Vague J. The degree of masculine differentiation of obesities: A factor determining predisposition to diabetes, atherosclerosis, gout, and uric calculous disease. Am J Clin Nutr 1956; 4:20-34.
18. Sjöström CD, Håkangård AC, Lissner L, Sjöström L. Body compartment and subcutaneous adipose tissue distribution–Risk factor patterns in obese subjects. Obes Res 1995; 3:9-22.
19. Sjostrom CD, Lissner L, Sjostrom L. Relationship between changes in body composition and changes in cardiovascular risk factors: The SOS intervention study: Swedish obese subjects. Obes Res 1997; 5:519-30.
20. Mazicioglu MM, Kurtoglu S, Ozturk A, Hatipoglu N, Cicik B, Ustunbas HB. Percentiles and mean values for neck circumference in Turkish children aged 6-18 years. Acta Paediatr 2010; 99 (12): 1847-53.
International Journal of Physiology, October-December 2019, Vol.7, No. 4 165
Study of Changes in QTc Interval with Menstrual Cycle in Young Adult Female Basket Ball Players
Priya C. Rao1, Chethan H.A.2
1Associate Professor, 2Professor, Subbaiah Institute of Medical Sciences, Purale, Shimoga
AbstractObjective: Study of changes in QTc interval with menstrual cycle in young adult female basketball players.
Method: Healthy young female adults in the age group of 18-22 years physicaly fit subjects were selected among general population. Sample size was 40. Parameters of ECG, QT interval, RR interval, QTc Interval were recorded during different phases of menstrual cycle.
Mean and Standard deviation was calculated.
Results: There was significant rise in QTc Interval recorded during menstrual phase
Conclusion: Women are at risk of developing ventricular arrhythmias during menstrual phase as compared to Proliferative and Secretory phase.
Keywords: Corrected QT interval (QTc), Ventricular arrhythmias, gonadal hormones.
for a wide range of life science applications. Since 1988, Powerlab (also MacLab) systems have been used for data acquisition and analysis by the world’s best academic, government and private organizations. Powerlab systems combine software-controlled input of parameters, extensive signal conditioning options, variable sampling speeds and powerful real-time computations with the advantages of computer-based data display and analysis. They offer the functionality of a chart recorder, XYT plotter, digital voltmeter and storage oscilloscope in one compact unit. LabChart software, supplied with Powerlab systems helps in analysing the data. In the present study by using Powerlab Heart rate measurement, ECG recordings were done on subjects in supine posture.
Methodology: The study was conducted in the research laboratory, department of Physiology,. Informed and written consent was taken from the subjects who underwent the study with their own will and wish. Ethical clearence was taken from our institute.
Inclusion Criteria:
• Young healthy adults female subjects playing basketball in the age group of 18-22yrs
• Female with regular menstrual cycle
IntroductionGonadal Hormones influence the cardiovascular
system by affecting repolarization or via autonomic nervous system. Estrogen and Progesterone bring about changes in blood pressure, blood volume, heart rate and vascular tone. These hormnes have influence on ventricular extrasystole and arrythmias. (1, 2)
Aims &objective: Study of changes in QTc interval with mensrual cycle in young adult female basketball players.
Materials and Method: Healthy young female adults in the age group of 18-22 years physicaly fit subjects playing basketball were selected among general population. Sample size was 40. Parameters of ECG, QT interval, RRinterval, QTc interval were recorded during different phases of menstrual cycle.
Materials: AD instrument Powerlab (Model-ML870, Serial#830-0732).
AD Instruments provides computer-based data acquisition systems for research and education. Powerlab data acquisition systems and choice of LabChart, LabTutor and LabAuthor software, provide outstanding data acquisition, display, analysis and authoring features
10.5958/2320-608X.2019.00161.6
166 International Journal of Physiology, October-December 2019, Vol.7, No. 4
• Non obese BMI 18-22.9 kg/m2.• Non smoker• Non alcoholic• EuglycemicExclusion criteria• H/o Migraine, Diabetis Mellitus, Hypertension• Any systemic illness• Any Drug history• Habitual disorders including smoking, alcoholism
Subjects were asked to lie down in supine position.
All subjects had regular mestrual cycle and none was taking any medication.
Baseline ECG was recorded: RR interval and QT interval were recorded. Corrected QT was recorded using formula QTc =QT/√RR. Recordings of ECG are made in Proliferative and Secretory.
And menstrual phase.
Statistical Analysis: Mean and Standard deviation was calculated. Data were tested for significance using ANOVA. Microsoft Excel and EPI-INFO package were used for data entry and statistical analyses respectively. Paired t-test was applied at 5% level to test the significance of changes in above parameters
ResultsTable showing Changes in QTc interval with phases
of Menstrual Cycle
Phase Mean S.D. Menstrual 428.65 36.17
Proliferative 407.12 18.65Secretory 409.79 22.89
P value <0.05
QTc interval is more during menstrual phase as compared to Proliferative and Secretory phase.
DiscussionGonadal hormones Estrogen and Progesterone
increase muscarnic cholinergic activity.(4)
They also regulate Calcium uptake in cardiac muscle.(5, 8)
Estrogen levels are lowest in menstrual phase, there is increase in heart rate and reduced RR interval menstrual phase (6, 7)
QTc Interval is inversly prportional to RR Interval(3)
QTc Interval is more in mensrual phase than Proliferative and Secretory phase.
ConclusionThere is variation of QTc Interval with menstrual
cycle. Women are at risk of developing ventricular arrhythmias during menstrual phase as compared to Proliferative and Secretory phase. Estrogen is cardioprotective hormone.
Conflict of Interest: Nil
Ethical Clearance: Ethical clearance was obtained from the institutional ethical clearance committee.
Funding: Self.
References1. Gallerane M, Manfredin R, et all. Circadian variation
in occurence of supraventricular tachycardia in clinically healthy subjects. Chroniboil International journal 1995; 12:55-61
2. CoxMM, Myerburg RJ et all. Cycling of inducibility of supraventricular tachycardia in women and its implications for timing of electrophysiologic procedures. American Journal of Cardiology, 1999; 83:1049-54
3. Rosano GM, Giuseppe ML, et all Cyclical variation in Supraventricular tachycardia in women. Lancet, 1996; 347:786-88
4. Ettinger SM, Siber DH, Gray KS, et all. Influence of ovarian cycle on sympathetic neural outflow during static exercise. Jornal of Applied Physiology, 1996; 80:245-251
5. Jiang C, Poole Wilson PA, Sarrel PM, et all. Effect of 17b-estradiol on contraction, Calcium current and intracellular free calcium in guinea pig isolated cardiac myocytes. British Journal of Pharmacology, 1992; 106:739-745
6. Dart AM, DuXJ andKingwell BA. Gender, sex hormoneand autonomic nervous control of cardiovascular system. Cardiovascular Res, 2002; 53 (3):678-87
7. Larsen JA, Kadish AH. Effect of gender on cardiac arrhythmias. Journal of cardiovascular electrophysiology, 1998; 9:655-64
8. Katsube Y, Yokoshiki Het all. Ltype Calcium currents in ventricular myocytes from neonatal and adult rats. Can Journal of Physiology Pharmacology, 1998; 76:873-881
International Journal of Physiology, October-December 2019, Vol.7, No. 4 167
A Comparative Study of Heart Rate Variability During Acute Mental Stress in Obese
Priya S.A.1, Rajalakshmi R.2, Savitri P Siddanagoudar3, Nanjundaiah N.4
1Assistant Professor, Department of Physiology, JSS MedicaL College, JSSAHE&R, Mysuru, 2Professor and HOD, Department of Physiology, JSS Medical College, JSSAHE&R, Mysuru, 3Associate Professor, Department
of Physiology, SDMCollege of Medical Sciences & Hospital, Dharwad, 4Senior Resident, Department of Surgery, Kodagu Institute of Medical Sciences & Hospital, Madikeri, Karnataka
AbstractBackground: Under normal circumstances, reaction to mental stress would be increase in heart rate. Fluctuation in the time intervals in the successive heart beat is assessed by Heart rate variability (HRV). Analysis of heart rate variability during acute mental stress throws light on autonomic regulation. Since Obesity is morbid condition leading to cardiovascular disorder, we intend to study the heart rate variability during acute mental stress in obese individuals.
Method and results: This is a Case-control study conducted on 60 male adults (30 obese and 30 non obese) between 18 to24 years. All the subjects underwent mental arithmetic stress task for 5minutes. Then they were investigated for HRV parameters before mental stress task and during mental stress by recording ECG in lead II.
Results: In the time domain variables of HRV, mean heart rate showed a statistical significant increase (p ˂ 0.001) in both obese and non obese individuals, while RMSSD and SDNN showed a statistical significant (p˂ 0.001) decrease in obese individuals and non obese individuals did not show statistical significant change during the mental stress task. During mental stress task there was decrease in all the components of frequency domain of HRV in obese with decrease in LFnu being statistically significant (p= 0.002). Whereas in non obese individuals, there was statistical increase in LF nu (p ˂ 0.001) and LF/HF ratio (p ˂ 0.05).
Conclusion: To conclude, this study indicates that the short-term mental stress led to changes in autonomic regulation both in obese and non obese group, but there was autonomic dysregulation in obese group in the form of decrease in parasympathetic activity.
Keywords: Acute Mental Stress, Obesity, Heart rate variability.
Till date about different types of arithmetic manipulations of RR intervals have been used for
assessing autonomic activity 2. Analysing Heart rate variability (HRV) represents one of the most promising such markers. It is the fluctuation in the time interval between consecutive heartbeats and provides powerful means of observing interplay between sympathetic and parasympathetic nervous systems3.
From physiological point of view, a sympathetic dominance linked to increase in HRV may explain the relationship between stress and cardiovascular effects. Study by Shen B et al4 indicate stress is an independent risk factor for acute myocardial infarction. The increased
IntroductionMental stress is a huge problem that affects many
physiological parameters in our body causing imbalance in homeostatic mechanism 1. No consensus about stress exists with respect to both definition and measurement. But our body responds to mental stress by increasing heart rate. We know that changes in heart rate are mainly depended on autonomic nervous system.
Corresponding Author: Dr. Rajalakshmi R. Professor and HOD, Department of Physiology, JSS Medical College, JSSAHE&R, Mysuru. Karnataka
10.5958/2320-608X.2019.00162.8
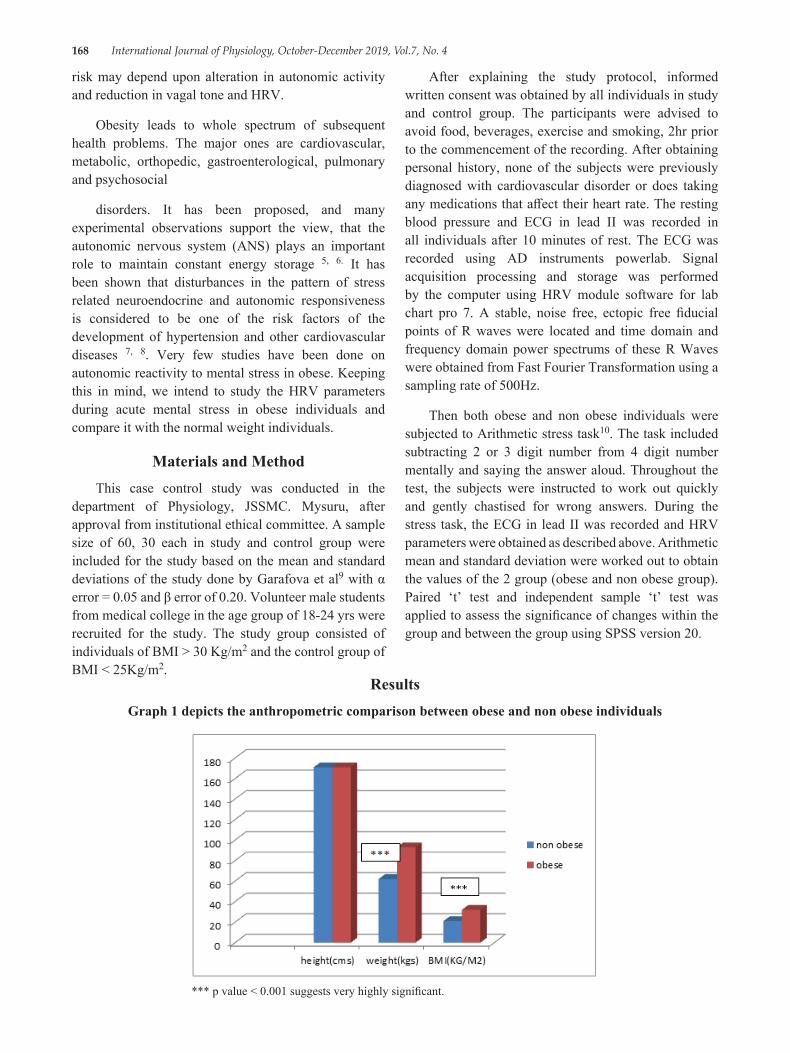
168 International Journal of Physiology, October-December 2019, Vol.7, No. 4
risk may depend upon alteration in autonomic activity and reduction in vagal tone and HRV.
Obesity leads to whole spectrum of subsequent health problems. The major ones are cardiovascular, metabolic, orthopedic, gastroenterological, pulmonary and psychosocial
disorders. It has been proposed, and many experimental observations support the view, that the autonomic nervous system (ANS) plays an important role to maintain constant energy storage 5, 6. It has been shown that disturbances in the pattern of stress related neuroendocrine and autonomic responsiveness is considered to be one of the risk factors of the development of hypertension and other cardiovascular diseases 7, 8. Very few studies have been done on autonomic reactivity to mental stress in obese. Keeping this in mind, we intend to study the HRV parameters during acute mental stress in obese individuals and compare it with the normal weight individuals.
Materials and MethodThis case control study was conducted in the
department of Physiology, JSSMC. Mysuru, after approval from institutional ethical committee. A sample size of 60, 30 each in study and control group were included for the study based on the mean and standard deviations of the study done by Garafova et al9 with α error = 0.05 and β error of 0.20. Volunteer male students from medical college in the age group of 18-24 yrs were recruited for the study. The study group consisted of individuals of BMI > 30 Kg/m2 and the control group of BMI < 25Kg/m2.
After explaining the study protocol, informed written consent was obtained by all individuals in study and control group. The participants were advised to avoid food, beverages, exercise and smoking, 2hr prior to the commencement of the recording. After obtaining personal history, none of the subjects were previously diagnosed with cardiovascular disorder or does taking any medications that affect their heart rate. The resting blood pressure and ECG in lead II was recorded in all individuals after 10 minutes of rest. The ECG was recorded using AD instruments powerlab. Signal acquisition processing and storage was performed by the computer using HRV module software for lab chart pro 7. A stable, noise free, ectopic free fiducial points of R waves were located and time domain and frequency domain power spectrums of these R Waves were obtained from Fast Fourier Transformation using a sampling rate of 500Hz.
Then both obese and non obese individuals were subjected to Arithmetic stress task10. The task included subtracting 2 or 3 digit number from 4 digit number mentally and saying the answer aloud. Throughout the test, the subjects were instructed to work out quickly and gently chastised for wrong answers. During the stress task, the ECG in lead II was recorded and HRV parameters were obtained as described above. Arithmetic mean and standard deviation were worked out to obtain the values of the 2 group (obese and non obese group). Paired ‘t’ test and independent sample ‘t’ test was applied to assess the significance of changes within the group and between the group using SPSS version 20.
ResultsGraph 1 depicts the anthropometric comparison between obese and non obese individuals
*** p value < 0.001 suggests very highly significant.
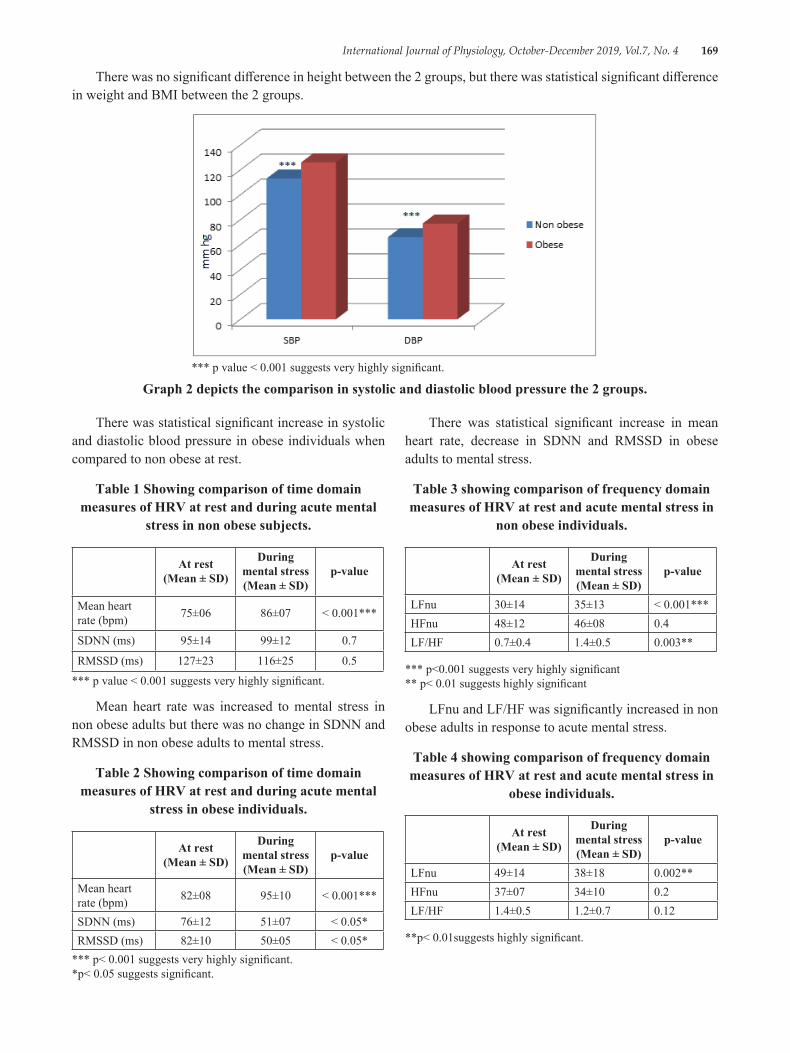
International Journal of Physiology, October-December 2019, Vol.7, No. 4 169
There was no significant difference in height between the 2 groups, but there was statistical significant difference in weight and BMI between the 2 groups.
*** p value < 0.001 suggests very highly significant.
Graph 2 depicts the comparison in systolic and diastolic blood pressure the 2 groups.
There was statistical significant increase in systolic and diastolic blood pressure in obese individuals when compared to non obese at rest.
Table 1 Showing comparison of time domain measures of HRV at rest and during acute mental
stress in non obese subjects.
At rest (Mean ± SD)
During mental stress (Mean ± SD)
p-value
Mean heart rate (bpm) 75±06 86±07 < 0.001***
SDNN (ms) 95±14 99±12 0.7
RMSSD (ms) 127±23 116±25 0.5
*** p value < 0.001 suggests very highly significant.
Mean heart rate was increased to mental stress in non obese adults but there was no change in SDNN and RMSSD in non obese adults to mental stress.
Table 2 Showing comparison of time domain measures of HRV at rest and during acute mental
stress in obese individuals.
At rest (Mean ± SD)
During mental stress (Mean ± SD)
p-value
Mean heart rate (bpm) 82±08 95±10 < 0.001***
SDNN (ms) 76±12 51±07 < 0.05*RMSSD (ms) 82±10 50±05 < 0.05*
*** p< 0.001 suggests very highly significant. *p< 0.05 suggests significant.
There was statistical significant increase in mean heart rate, decrease in SDNN and RMSSD in obese adults to mental stress.
Table 3 showing comparison of frequency domain measures of HRV at rest and acute mental stress in
non obese individuals.
At rest (Mean ± SD)
During mental stress (Mean ± SD)
p-value
LFnu 30±14 35±13 < 0.001***HFnu 48±12 46±08 0.4LF/HF 0.7±0.4 1.4±0.5 0.003**
*** p<0.001 suggests very highly significant ** p< 0.01 suggests highly significant
LFnu and LF/HF was significantly increased in non obese adults in response to acute mental stress.
Table 4 showing comparison of frequency domain measures of HRV at rest and acute mental stress in
obese individuals.
At rest (Mean ± SD)
During mental stress (Mean ± SD)
p-value
LFnu 49±14 38±18 0.002**HFnu 37±07 34±10 0.2LF/HF 1.4±0.5 1.2±0.7 0.12
**p< 0.01suggests highly significant.
170 International Journal of Physiology, October-December 2019, Vol.7, No. 4
There was decrease in LFnu and no significant change in HFnu and LF/HF ratio in obese adults to mental stress.
DiscussionThe basal blood pressure was increased in obese
individuals when compared to non obese individuals. This indicates that sympathetic nervonal activity is increased at rest in obese people. A large body of evidence clearly shows that sympathetic activity is increased in human obesity 11, 12. So; at rest sympathetic nervous system is over activated in obese individuals.
In our study mean heart rate was increased in response to acute mental stress in both obese and non obese individuals. The difference in heart rate between resting condition and mental stress was expected as result of flight and fight response. But the time domain measures of HRV, that is SDNN and RMSSD was decreased in obese individuals in response to stress. SDNN (standard deviation of the NN interval) is mathematically equal to total power of spectral analysis and reflects all the cyclic components responsible for variability in the period of recording13. So a decrease in SDNN in obese individuals during acute mental stress indicates decrease in autonomic neuronal activity. The square root of the mean squared differences of successive NN intervals (RMSSD) is mediated predominantly by the parasympathetic influences on S A node 14.
Since RMSSD was decreased during acute mental stress, this indicated reduced parasympathetic activity. In a study by R. K. Mehta 15, similar findings were noted.
As expected there was significant increase in LF/HF ratio and LFnu in non obese individuals suggesting sympathetic system predominance during acute mental stress. These results are consistent with the data reported by Garafova9 and Visnovcova 16.Wheras the frequency domain measures of HRV in obese individuals in response to acute mental stress showed a decrease in LFnu. As LFnu represents low frequency in the spectral band of HRV, it reflects the activities of both sympathetic and parasympathetic activity. As HFnu was also decreased, though not statically significant, we can say that there is parasympathetic withdrawal seen in obese individuals during acute mental stress that resulted in increase in mean heart rate in obese individuals during mental stress. This clearly indicates a reduced autonomic modulation to acute mental stress in obese individuals. Thus obesity causes differential activity of autonomic nervous system
during mental stress as indicated in the review article by Maria Paulo et al 17.
To conclude, our study showed an increase in heart rate in response to acute mental arithmetic task in both obese and non obese individuals. The increase in heart rate in non obese individuals was mainly due to sympathetic activity but in case of obese individuals it was due to parasympathetic withdrawal which may result in many stress induced ailments in them.
Limitation of the study: Our study did not include gender moderation and did not include estimation of plasma epinephrine levels that could have added to the topic.
Conflict of Interest: NIL
Source of Funding: Self
References1. Chandola, T, Britton A, Brunner E, Hemingway
H, Malik M, Kumari M, Badrick E, and Marmot M. Work stress and coronary heart disease: what are the mechanisms? Eur Heart Journal 2008; 29 (5):640-648.
2. Latha Rajendra Kumar, Chandrakala Shenoy. A novel technique using measurements of galvanic skin resistance and heart rate variability to review the autonomic changes in chronic alcoholics. Pak J Physiol 2007; 3 (2):13-15.
3. Hansson M, Jonsson P. Estimation of HRV spectrogram using multiple window method focusing on the high frequency power. Med Eng Phys. 2006; 28: 749-61
4. Shen B, Avivi YE, Todaro JF, Spiro A, Laurenceau J, Ward KD et al. Anxiety characteristics independently and prospectively predict myocardial infarction in men:the unique contribution of anxiety among psychologic factors. J Am Coll Cardiol. 2008; 51:113-9.
5. Bray GA, York DA. Hypothalamic and genetic obesity in experimental animals: An autonomic and endocrine hypothesis. Physiol Rev. 1979; 59:719-809.
6. Rohner-Jeanrenaud F. A neuroendocrine reappraisal of the dual-centre hypothesis: Its implications for obesity and insulin resistance. Int J Obes. 1995; 19:517-534.
International Journal of Physiology, October-December 2019, Vol.7, No. 4 171
7. Treiber FA, Karamak TW, Schneiferman N, Sheffield D, Kapuku G, Taylor T. Cardiovascular reactivity and development of preclinical and clinical disease states. Psychosom Med 2003; 65: 46-62.
8. Pierce TW, Grim RD, King JS: Cardiovascular reactivity and family history of hypertension: a meta-analysis. Psychophysiology. 2005; 42: 125-131.
9. Garafova A, Penesova A, Cizmarova E, Marko A, Vlcek M, Jezova D. Cardiovascular and Sympathetic Responses to a Mental Stress Task in Young Patients With Hypertension and/or Obesity. Physiol. Res. 63 (Suppl. 4): S459-S467, 2014.
10. Holly RM, Allson HN, Carlos EN, et al. Impact of Acute Mental Stress on Sympathetic Nerve Activity and Regional Blood Flow in Advanced Heart Failure; Implications for Triggering Adverse Cardiac Events. Circulation 1997; 96 (6):1835-42.
11. G. Grassi, R. Dell’Oro, A. Facchini, F. Q. Trevano, G. B. Bolla, and G. Mancia. Effect of central and peripheral body fat distribution on sympathetic and baroreflex function in obese normotensives. Journal of Hypertension. 2004; (22, 12):2363-2369.
12. N. E. Straznicky, E. A. Lambert, G. W. Lambert, K. Masuo, M. D. Esler, and P. J. Nestel, Effects of dietary weight loss on sympathetic activity and cardiac risk factors associated with the metabolic
syndrome. The Journal of Clinical Endocrinology &Metabolism. 2005; (90, 11): 5998-6005.
13. Guidelines of Heart rate variability. Standards of measurement, physiological interpretation, and clinical use. Task Force of The European Society of Cardiology and The North American Society of Pacing and Electrophysiology. European Heart Journal (1996) 17, 354-381.
14. Gary G. Berntson, J. Thomas Bigger, Dwain L, Eckberg, Paul Grossman, Peter G Kaufmann, Marek Malik et al. Heart rate variability:Origins, method, and interpretive caveats. Psychophysiology. 1997; 34:623-648.
15. Mehta R. K. Impacts of obesity and stress on neuromuscular fatigue development and associated heart rate variability. Int J Obes (Lond). 2015 Feb; 39 (2):208-13.
16. Visnovcova Z, Mestanik M, Javorka M, Mokra D, Gala M, Jurko A, Calkovska A, Tonhajzerova I. Complexity and time asymmetry of heart rate variability are altered in acute mental stress. Physiol Meas 35: 1319-1334, 2014.
17. Maria Paola Canale, Simone Manca di Villahermosa, Giuliana Martino, Valentina Rovella, Annalisa Noce, Antonino De Lorenzo et al. Obesity-Related Metabolic Syndrome: Mechanisms of Sympathetic Over activity–A review article. International journal of Endocrinology. 2013; 1-12.
172 International Journal of Physiology, October-December 2019, Vol.7, No. 4
Glycogen Loading and its Effect on Athletic Performance
Priyanka Mirdha 1, Vivek Nalgirkar2
1Assistant Lecturer, 2Professor and Head, Dept. of Physiology, Dr. D.Y. Patil Medical College, Nerul, Navi Mumbai, India
AbstractVarious studies and modalities have been screened and adopted in improving athletic performance in recent times. One of the most widely studied parameter was the addition of dietary carbohydrate to increase endurance capability. The present study was conducted to ascertain the effects of glycogen loading on performance among healthy male athletes in Navi Mumbai region. The study reported that there was a significant relationship between increased performance and glycogen loading regime in the selected study population.
Keywords: Athletes, glycogen loading, Performance.
It is well established that the concentration of glycogen in skeletal muscle can be manipulated by changes in the carbohydrate content of the diet and/or depleting exercise (6, 7), with this in mind, the present study was conducted to assess the effects of glycogen loading on performance capacity of healthy male athletes.
Methodology: The present was an experimental study was conducted among young healthy male Athletes at Dr D Y Patil Medical College, Navi Mumbai. A total of 10 subjects were selected for the pilot study. Institutional ethical clearance was obtained prior to the resumption of data collection and written informed consent was obtained from all the candidates. A proper glycogen loading protocol of 7 days were given to the subjects under consultation and supervision of a dietician. Detailed Exercise program of 7 days for glycogen depletion and loading is also provided along with diet and was monitored by sports specialist. Fasting blood glucose levels (FBG) and Leg press test were elicited from the subjects in both pre and post glycogen loading regime.
Results: The observations revealed that the mean age of the subjects was 19.4 years with a standard deviation of 1.83 years. The subjects were having a mean BMI of 21.68 ± 1.49 at the commencement of study period. Fasting blood glucose estimations revealed a mean value of 88.6 ± 4.11 mg/dl in the pre administration phase. The leg press results displayed a mean value of 186 ± 26.43 kgs prior to administration of glycogen loading in the selected study population.
Corresponding Author: Dr. Vivek Nalgirkar Prof. and Head, Dept. of Physiology, Dr. D.Y. Patil Medical College, Nerul, Navi Mumbai e-mail: [email protected]
IntroductionChristiansen and Hansen were the first to explore
systematically the link between diet and exercise capacity. Their study clearly showed the benefits of utilizing a high carbohydrate diet before prolonged exercise and was the first to establish the importance of carbohydrate content in diets of athletes preparing for competition. (1)
A high carbohydrate diet increases the stores of liver and muscle glycogen (2, 3). The focus of these studies was the influence of dietary carbohydrate loading on endurance capacity rather than on endurance performance. Capacity is the time to fatigue when performing a particular exercise.
During repeated bouts of short-duration high-intensity exercise performed over a prolonged period of time, it could be expected that glycogen availability may become a limiting factor for the ability to sustain a high-power output and thus affect the performance. The importance of muscle glycogen during prolonged exercise was also confirmed in subsequent studies (4, 5), which showed that fatigue occurs when muscle glycogen concentrations are reduced to low values.
10.5958/2320-608X.2019.00163.X
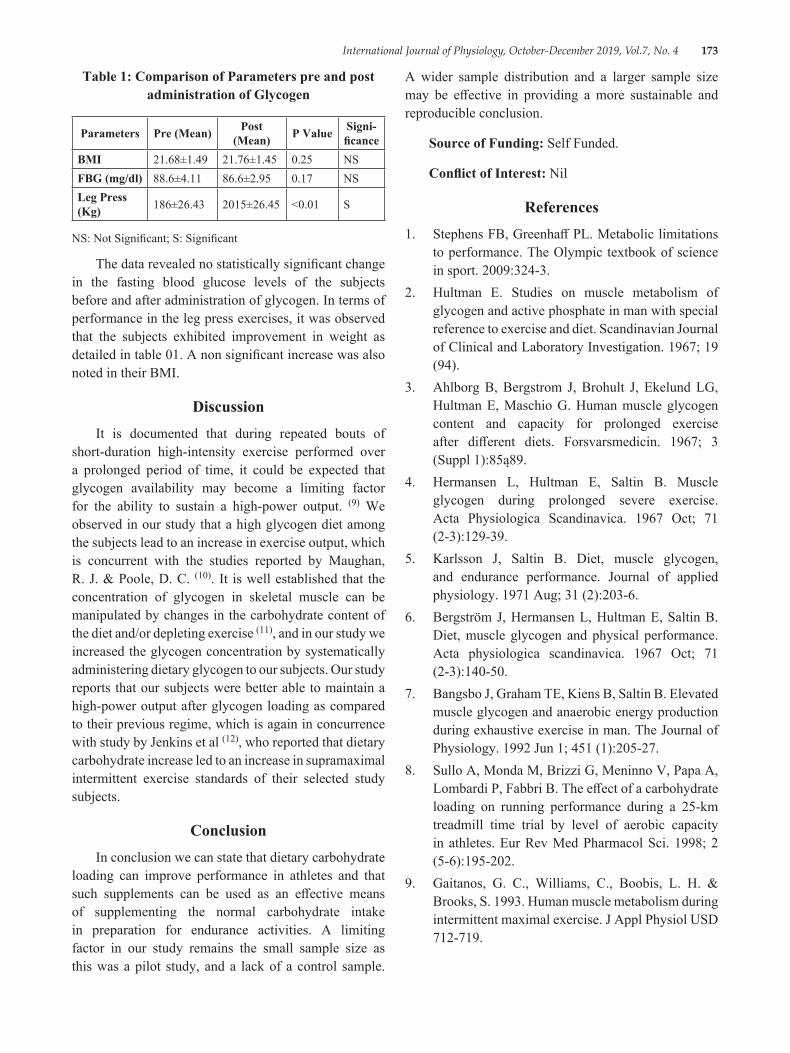
International Journal of Physiology, October-December 2019, Vol.7, No. 4 173
Table 1: Comparison of Parameters pre and post administration of Glycogen
Parameters Pre (Mean) Post (Mean) P Value Signi-
ficanceBMI 21.68±1.49 21.76±1.45 0.25 NSFBG (mg/dl) 88.6±4.11 86.6±2.95 0.17 NSLeg Press (Kg) 186±26.43 2015±26.45 <0.01 S
NS: Not Significant; S: Significant
The data revealed no statistically significant change in the fasting blood glucose levels of the subjects before and after administration of glycogen. In terms of performance in the leg press exercises, it was observed that the subjects exhibited improvement in weight as detailed in table 01. A non significant increase was also noted in their BMI.
DiscussionIt is documented that during repeated bouts of
short-duration high-intensity exercise performed over a prolonged period of time, it could be expected that glycogen availability may become a limiting factor for the ability to sustain a high-power output. (9) We observed in our study that a high glycogen diet among the subjects lead to an increase in exercise output, which is concurrent with the studies reported by Maughan, R. J. & Poole, D. C. (10). It is well established that the concentration of glycogen in skeletal muscle can be manipulated by changes in the carbohydrate content of the diet and/or depleting exercise (11), and in our study we increased the glycogen concentration by systematically administering dietary glycogen to our subjects. Our study reports that our subjects were better able to maintain a high-power output after glycogen loading as compared to their previous regime, which is again in concurrence with study by Jenkins et al (12), who reported that dietary carbohydrate increase led to an increase in supramaximal intermittent exercise standards of their selected study subjects.
ConclusionIn conclusion we can state that dietary carbohydrate
loading can improve performance in athletes and that such supplements can be used as an effective means of supplementing the normal carbohydrate intake in preparation for endurance activities. A limiting factor in our study remains the small sample size as this was a pilot study, and a lack of a control sample.
A wider sample distribution and a larger sample size may be effective in providing a more sustainable and reproducible conclusion.
Source of Funding: Self Funded.
Conflict of Interest: Nil
References1. Stephens FB, Greenhaff PL. Metabolic limitations
to performance. The Olympic textbook of science in sport. 2009:324-3.
2. Hultman E. Studies on muscle metabolism of glycogen and active phosphate in man with special reference to exercise and diet. Scandinavian Journal of Clinical and Laboratory Investigation. 1967; 19 (94).
3. Ahlborg B, Bergstrom J, Brohult J, Ekelund LG, Hultman E, Maschio G. Human muscle glycogen content and capacity for prolonged exercise after different diets. Forsvarsmedicin. 1967; 3 (Suppl 1):85ą89.
4. Hermansen L, Hultman E, Saltin B. Muscle glycogen during prolonged severe exercise. Acta Physiologica Scandinavica. 1967 Oct; 71 (2‐3):129-39.
5. Karlsson J, Saltin B. Diet, muscle glycogen, and endurance performance. Journal of applied physiology. 1971 Aug; 31 (2):203-6.
6. Bergström J, Hermansen L, Hultman E, Saltin B. Diet, muscle glycogen and physical performance. Acta physiologica scandinavica. 1967 Oct; 71 (2‐3):140-50.
7. Bangsbo J, Graham TE, Kiens B, Saltin B. Elevated muscle glycogen and anaerobic energy production during exhaustive exercise in man. The Journal of Physiology. 1992 Jun 1; 451 (1):205-27.
8. Sullo A, Monda M, Brizzi G, Meninno V, Papa A, Lombardi P, Fabbri B. The effect of a carbohydrate loading on running performance during a 25-km treadmill time trial by level of aerobic capacity in athletes. Eur Rev Med Pharmacol Sci. 1998; 2 (5-6):195-202.
9. Gaitanos, G. C., Williams, C., Boobis, L. H. & Brooks, S. 1993. Human muscle metabolism during intermittent maximal exercise. J Appl Physiol USD 712-719.

174 International Journal of Physiology, October-December 2019, Vol.7, No. 4
10. Maughan, R. J. & Poole, D. C. 1981. The effects of a glycogen-loading regimen on the capacity to perform anaerobic exercise. Eur J Appl Physiol RTD 211±219.
11. Balsom PD, Gaitanos GC, Söderlund K, Ekblom B. High-intensity exercise and muscle glycogen
availability in humans. Acta Physiologica Scandinavica. 1999 Apr 1; 165:337-46.
12. Jenkins, D. G., Palmer, J. & Spillman, D. 1993. The inuence of dietary carbohydrate on performance of supramaximal intermittent exercise. Eur J Appl Physiol TUD 309±314.
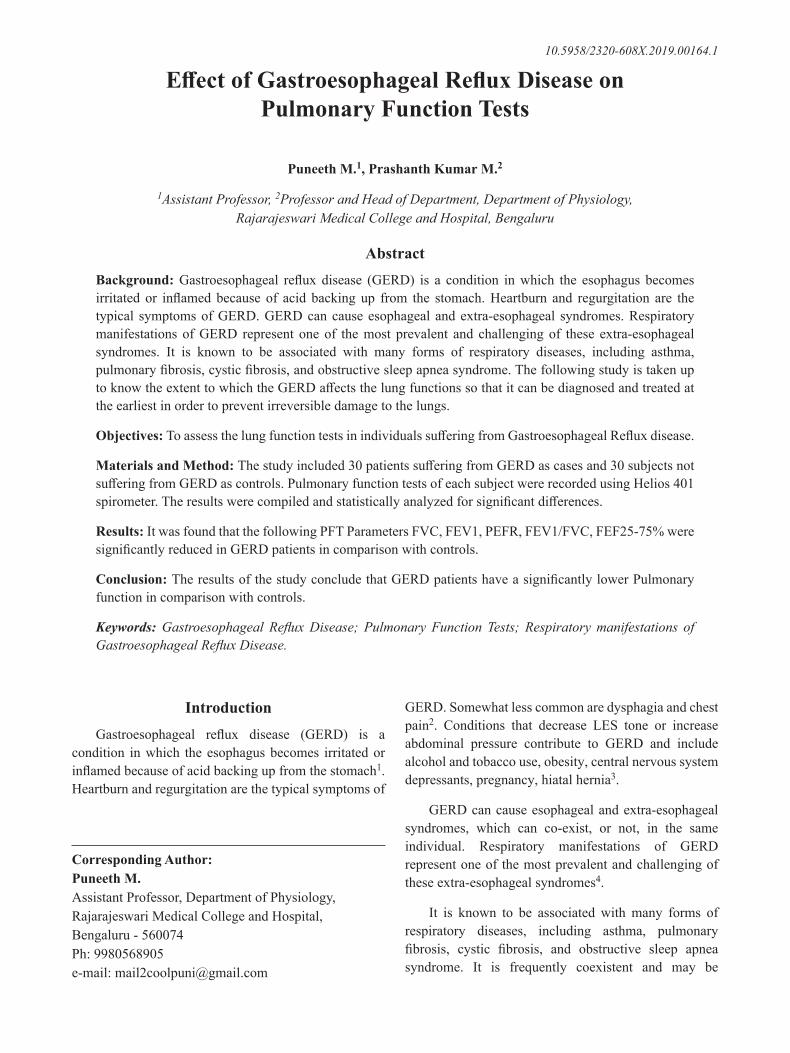
International Journal of Physiology, October-December 2019, Vol.7, No. 4 175
Effect of Gastroesophageal Reflux Disease on Pulmonary Function Tests
Puneeth M.1, Prashanth Kumar M.2
1Assistant Professor, 2Professor and Head of Department, Department of Physiology, Rajarajeswari Medical College and Hospital, Bengaluru
AbstractBackground: Gastroesophageal reflux disease (GERD) is a condition in which the esophagus becomes irritated or inflamed because of acid backing up from the stomach. Heartburn and regurgitation are the typical symptoms of GERD. GERD can cause esophageal and extra-esophageal syndromes. Respiratory manifestations of GERD represent one of the most prevalent and challenging of these extra-esophageal syndromes. It is known to be associated with many forms of respiratory diseases, including asthma, pulmonary fibrosis, cystic fibrosis, and obstructive sleep apnea syndrome. The following study is taken up to know the extent to which the GERD affects the lung functions so that it can be diagnosed and treated at the earliest in order to prevent irreversible damage to the lungs.
Objectives: To assess the lung function tests in individuals suffering from Gastroesophageal Reflux disease.
Materials and Method: The study included 30 patients suffering from GERD as cases and 30 subjects not suffering from GERD as controls. Pulmonary function tests of each subject were recorded using Helios 401 spirometer. The results were compiled and statistically analyzed for significant differences.
Results: It was found that the following PFT Parameters FVC, FEV1, PEFR, FEV1/FVC, FEF25-75% were significantly reduced in GERD patients in comparison with controls.
Conclusion: The results of the study conclude that GERD patients have a significantly lower Pulmonary function in comparison with controls.
Keywords: Gastroesophageal Reflux Disease; Pulmonary Function Tests; Respiratory manifestations of Gastroesophageal Reflux Disease.
GERD. Somewhat less common are dysphagia and chest pain2. Conditions that decrease LES tone or increase abdominal pressure contribute to GERD and include alcohol and tobacco use, obesity, central nervous system depressants, pregnancy, hiatal hernia3.
GERD can cause esophageal and extra-esophageal syndromes, which can co-exist, or not, in the same individual. Respiratory manifestations of GERD represent one of the most prevalent and challenging of these extra-esophageal syndromes4.
It is known to be associated with many forms of respiratory diseases, including asthma, pulmonary fibrosis, cystic fibrosis, and obstructive sleep apnea syndrome. It is frequently coexistent and may be
IntroductionGastroesophageal reflux disease (GERD) is a
condition in which the esophagus becomes irritated or inflamed because of acid backing up from the stomach1. Heartburn and regurgitation are the typical symptoms of
Corresponding Author: Puneeth M. Assistant Professor, Department of Physiology, Rajarajeswari Medical College and Hospital, Bengaluru - 560074 Ph: 9980568905 e-mail: [email protected]
10.5958/2320-608X.2019.00164.1
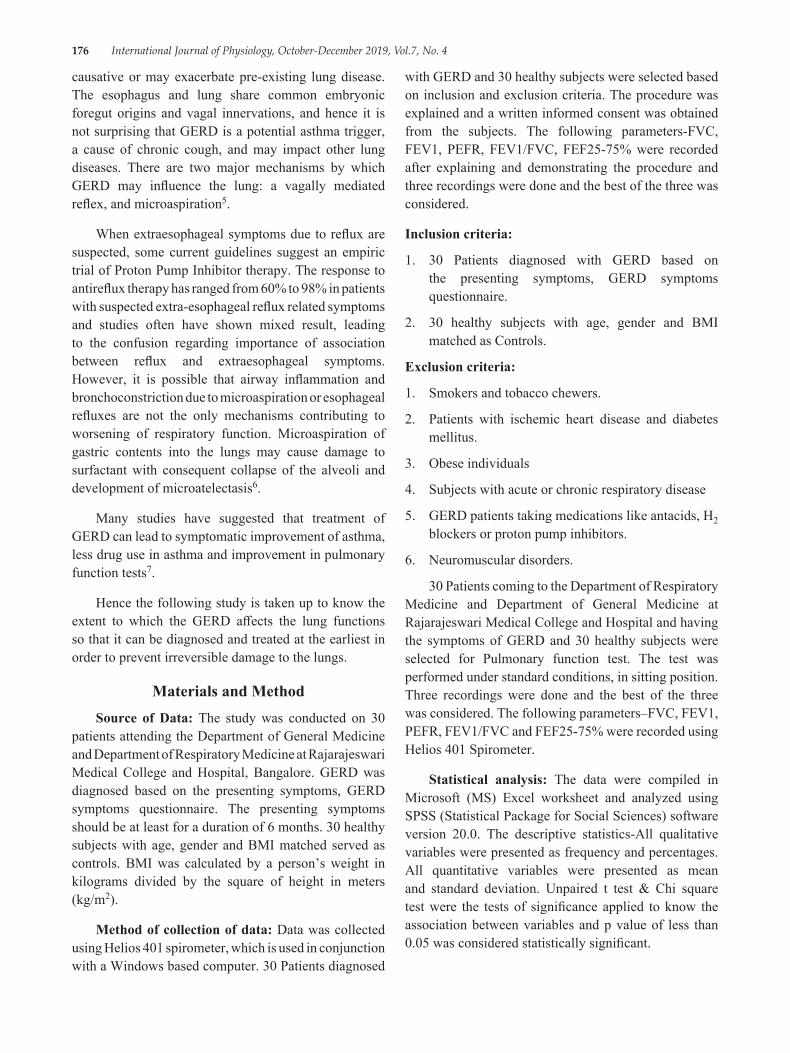
176 International Journal of Physiology, October-December 2019, Vol.7, No. 4
causative or may exacerbate pre-existing lung disease. The esophagus and lung share common embryonic foregut origins and vagal innervations, and hence it is not surprising that GERD is a potential asthma trigger, a cause of chronic cough, and may impact other lung diseases. There are two major mechanisms by which GERD may influence the lung: a vagally mediated reflex, and microaspiration5.
When extraesophageal symptoms due to reflux are suspected, some current guidelines suggest an empiric trial of Proton Pump Inhibitor therapy. The response to antireflux therapy has ranged from 60% to 98% in patients with suspected extra-esophageal reflux related symptoms and studies often have shown mixed result, leading to the confusion regarding importance of association between reflux and extraesophageal symptoms. However, it is possible that airway inflammation and bronchoconstriction due to microaspiration or esophageal refluxes are not the only mechanisms contributing to worsening of respiratory function. Microaspiration of gastric contents into the lungs may cause damage to surfactant with consequent collapse of the alveoli and development of microatelectasis6.
Many studies have suggested that treatment of GERD can lead to symptomatic improvement of asthma, less drug use in asthma and improvement in pulmonary function tests7.
Hence the following study is taken up to know the extent to which the GERD affects the lung functions so that it can be diagnosed and treated at the earliest in order to prevent irreversible damage to the lungs.
Materials and MethodSource of Data: The study was conducted on 30
patients attending the Department of General Medicine and Department of Respiratory Medicine at Rajarajeswari Medical College and Hospital, Bangalore. GERD was diagnosed based on the presenting symptoms, GERD symptoms questionnaire. The presenting symptoms should be at least for a duration of 6 months. 30 healthy subjects with age, gender and BMI matched served as controls. BMI was calculated by a person’s weight in kilograms divided by the square of height in meters (kg/m2).
Method of collection of data: Data was collected using Helios 401 spirometer, which is used in conjunction with a Windows based computer. 30 Patients diagnosed
with GERD and 30 healthy subjects were selected based on inclusion and exclusion criteria. The procedure was explained and a written informed consent was obtained from the subjects. The following parameters-FVC, FEV1, PEFR, FEV1/FVC, FEF25-75% were recorded after explaining and demonstrating the procedure and three recordings were done and the best of the three was considered.
Inclusion criteria:
1. 30 Patients diagnosed with GERD based on the presenting symptoms, GERD symptoms questionnaire.
2. 30 healthy subjects with age, gender and BMI matched as Controls.
Exclusion criteria:
1. Smokers and tobacco chewers.
2. Patients with ischemic heart disease and diabetes mellitus.
3. Obese individuals
4. Subjects with acute or chronic respiratory disease
5. GERD patients taking medications like antacids, H2 blockers or proton pump inhibitors.
6. Neuromuscular disorders.
30 Patients coming to the Department of Respiratory Medicine and Department of General Medicine at Rajarajeswari Medical College and Hospital and having the symptoms of GERD and 30 healthy subjects were selected for Pulmonary function test. The test was performed under standard conditions, in sitting position. Three recordings were done and the best of the three was considered. The following parameters–FVC, FEV1, PEFR, FEV1/FVC and FEF25-75% were recorded using Helios 401 Spirometer.
Statistical analysis: The data were compiled in Microsoft (MS) Excel worksheet and analyzed using SPSS (Statistical Package for Social Sciences) software version 20.0. The descriptive statistics-All qualitative variables were presented as frequency and percentages. All quantitative variables were presented as mean and standard deviation. Unpaired t test & Chi square test were the tests of significance applied to know the association between variables and p value of less than 0.05 was considered statistically significant.
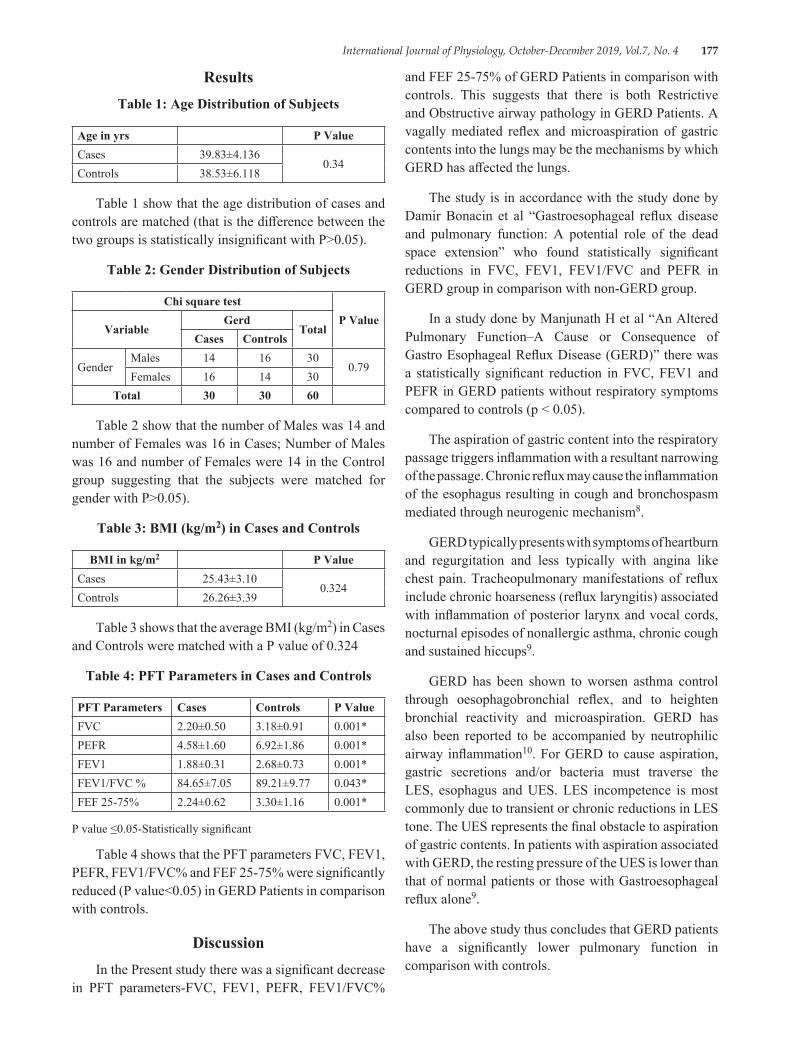
International Journal of Physiology, October-December 2019, Vol.7, No. 4 177
ResultsTable 1: Age Distribution of Subjects
Age in yrs P ValueCases 39.83±4.136
0.34Controls 38.53±6.118
Table 1 show that the age distribution of cases and controls are matched (that is the difference between the two groups is statistically insignificant with P>0.05).
Table 2: Gender Distribution of Subjects
Chi square testP Value
VariableGerd
TotalCases Controls
GenderMales 14 16 30
0.79Females 16 14 30
Total 30 30 60
Table 2 show that the number of Males was 14 and number of Females was 16 in Cases; Number of Males was 16 and number of Females were 14 in the Control group suggesting that the subjects were matched for gender with P>0.05).
Table 3: BMI (kg/m2) in Cases and Controls
BMI in kg/m2 P ValueCases 25.43±3.10
0.324Controls 26.26±3.39
Table 3 shows that the average BMI (kg/m2) in Cases and Controls were matched with a P value of 0.324
Table 4: PFT Parameters in Cases and Controls
PFT Parameters Cases Controls P ValueFVC 2.20±0.50 3.18±0.91 0.001*PEFR 4.58±1.60 6.92±1.86 0.001*FEV1 1.88±0.31 2.68±0.73 0.001*FEV1/FVC % 84.65±7.05 89.21±9.77 0.043*FEF 25-75% 2.24±0.62 3.30±1.16 0.001*
P value ≤0.05-Statistically significant
Table 4 shows that the PFT parameters FVC, FEV1, PEFR, FEV1/FVC% and FEF 25-75% were significantly reduced (P value<0.05) in GERD Patients in comparison with controls.
DiscussionIn the Present study there was a significant decrease
in PFT parameters-FVC, FEV1, PEFR, FEV1/FVC%
and FEF 25-75% of GERD Patients in comparison with controls. This suggests that there is both Restrictive and Obstructive airway pathology in GERD Patients. A vagally mediated reflex and microaspiration of gastric contents into the lungs may be the mechanisms by which GERD has affected the lungs.
The study is in accordance with the study done by Damir Bonacin et al “Gastroesophageal reflux disease and pulmonary function: A potential role of the dead space extension” who found statistically significant reductions in FVC, FEV1, FEV1/FVC and PEFR in GERD group in comparison with non-GERD group.
In a study done by Manjunath H et al “An Altered Pulmonary Function–A Cause or Consequence of Gastro Esophageal Reflux Disease (GERD)” there was a statistically significant reduction in FVC, FEV1 and PEFR in GERD patients without respiratory symptoms compared to controls (p < 0.05).
The aspiration of gastric content into the respiratory passage triggers inflammation with a resultant narrowing of the passage. Chronic reflux may cause the inflammation of the esophagus resulting in cough and bronchospasm mediated through neurogenic mechanism8.
GERD typically presents with symptoms of heartburn and regurgitation and less typically with angina like chest pain. Tracheopulmonary manifestations of reflux include chronic hoarseness (reflux laryngitis) associated with inflammation of posterior larynx and vocal cords, nocturnal episodes of nonallergic asthma, chronic cough and sustained hiccups9.
GERD has been shown to worsen asthma control through oesophagobronchial reflex, and to heighten bronchial reactivity and microaspiration. GERD has also been reported to be accompanied by neutrophilic airway inflammation10. For GERD to cause aspiration, gastric secretions and/or bacteria must traverse the LES, esophagus and UES. LES incompetence is most commonly due to transient or chronic reductions in LES tone. The UES represents the final obstacle to aspiration of gastric contents. In patients with aspiration associated with GERD, the resting pressure of the UES is lower than that of normal patients or those with Gastroesophageal reflux alone9.
The above study thus concludes that GERD patients have a significantly lower pulmonary function in comparison with controls.
178 International Journal of Physiology, October-December 2019, Vol.7, No. 4
Limitations: In the present study Pulmonary function tests were done on GERD patients who were diagnosed with the help of GERD Symptoms Questionnaire and not by ambulatory 24-to 48-hour esophageal pH recording; the latter being the standard method for diagnosing GERD. Diagnosing GERD with standard method would have resulted in more accurate diagnosis.
Acknowledgement: I thank the faculty of Department of Respiratory Medicine and Department of General Medicine, Rajarajeswari Medical College and Hospital, Bengaluru, for helping me in getting the Patients. I thank Dr. Santosh A, Assistant Professor, Department of Community Medicine for his assistance in statistics and also thank all the subjects who participated in the study for their co-operation.
ConclusionThe results of the study conclude that GERD
patients have a significantly lower Pulmonary function in comparison with controls.
Conflict of Interest: None
Source of Funding: Personal funds
Ethical Clearance: Permission was taken from Institutional Ethics Committee.
References1. Gaude GS. Pulmonary manifestations of
gastroesophageal reflux disease. Ann Thorac Med. 2009 Jul-Sep; 4 (3): 115-123.
2. Kahrilas PJ, Hirano I. Diseases of the Esophagus. In: Longo, Fauci, Kasper, Hauser, Jameson, Loscalzo, editors. Harrison’s Principles of Internal Medicine. 18th ed. Vol (2). New York: McGraw Hill Companies; 2012.p. 2433.
3. Kumar V, Abbas AK, Aster JC. Robbins Basic Pathology. 9th ed. Philadelphia: John F. Kennedy Blvd; 2013.p. 560.
4. Maher MM, Darwish AA. Study of respiratory disorders in endoscopically negative and positive gastroesophageal reflux disease. Saudi J Gastroenterol. 2010 Apr; 16 (2): 84-89.
5. Ali ER, Abdelhamid HM, Shalaby H. Effect of gastroesophageal reflux disease on spirometry, lung diffusion, and impulse oscillometry. Egypt J Bronchol. 2016; 10 (2): 189-196.
6. Bonacin D, Fabijanic D, Radic M, Puljiz Z, Trgo G, Bratanic A et al. Gastroesophageal reflux disease and pulmonary function: A potential role of the dead space extension. Med Sci Monit. 2012; 18 (5): CR271-275.
7. Sharifi A, Ansarin K. Effect of Gastroesophageal Reflux Disease on Disease Severity and Characteristics of Lung Functional Changes in Patients with Asthma. J Cardiovasc Thorac Res. 2014; 6 (4): 223-228.
8. Manjunath H, Venkatesh D, Jalihal U and Prashanth Kumar M. An Altered Pulmonary Function–A Cause or Consequence of Gastro Esophageal Reflux Disease (GERD). Al Ameen J Med Sci 2011; 4 (4): 391-395.
9. Zorowitz RD. Mechanisms of Aspiration Disorders. In: Fishman AP, Elias JA, Fishman JA, Grippi MA, Senior RM, Pack AI. Fishman’s Pulmonary Diseases and Disorders. 4th ed. Vol (1). New York: McGraw Hill Companies; 2008.p. 1308-1309.
10. Terada K, Muro S, Sato S, Ohara T, Haruna A, Marumo S et al. Impact of gastro-oesophageal reflux disease symptoms on COPD exacerbation. Thorax 2008; 63: 951-955.
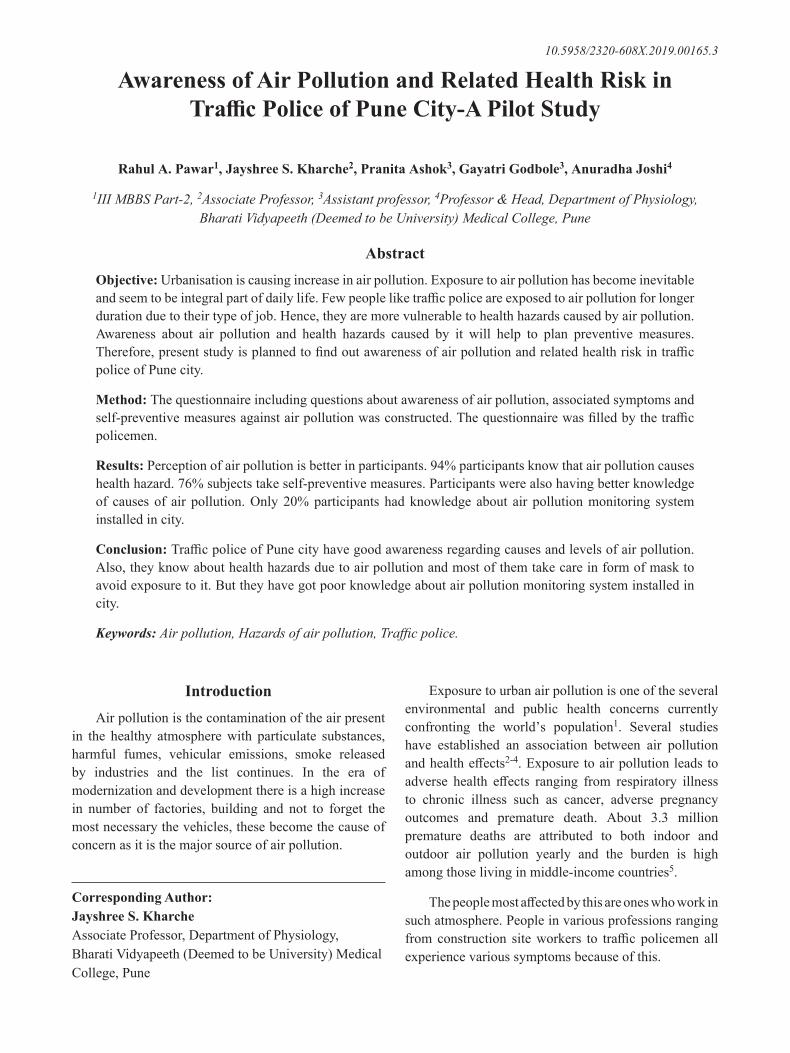
International Journal of Physiology, October-December 2019, Vol.7, No. 4 179
Awareness of Air Pollution and Related Health Risk in Traffic Police of Pune City-A Pilot Study
Rahul A. Pawar1, Jayshree S. Kharche2, Pranita Ashok3, Gayatri Godbole3, Anuradha Joshi4
1III MBBS Part-2, 2Associate Professor, 3Assistant professor, 4Professor & Head, Department of Physiology, Bharati Vidyapeeth (Deemed to be University) Medical College, Pune
AbstractObjective: Urbanisation is causing increase in air pollution. Exposure to air pollution has become inevitable and seem to be integral part of daily life. Few people like traffic police are exposed to air pollution for longer duration due to their type of job. Hence, they are more vulnerable to health hazards caused by air pollution. Awareness about air pollution and health hazards caused by it will help to plan preventive measures. Therefore, present study is planned to find out awareness of air pollution and related health risk in traffic police of Pune city.
Method: The questionnaire including questions about awareness of air pollution, associated symptoms and self-preventive measures against air pollution was constructed. The questionnaire was filled by the traffic policemen.
Results: Perception of air pollution is better in participants. 94% participants know that air pollution causes health hazard. 76% subjects take self-preventive measures. Participants were also having better knowledge of causes of air pollution. Only 20% participants had knowledge about air pollution monitoring system installed in city.
Conclusion: Traffic police of Pune city have good awareness regarding causes and levels of air pollution. Also, they know about health hazards due to air pollution and most of them take care in form of mask to avoid exposure to it. But they have got poor knowledge about air pollution monitoring system installed in city.
Keywords: Air pollution, Hazards of air pollution, Traffic police.
Exposure to urban air pollution is one of the several environmental and public health concerns currently confronting the world’s population1. Several studies have established an association between air pollution and health effects2-4. Exposure to air pollution leads to adverse health effects ranging from respiratory illness to chronic illness such as cancer, adverse pregnancy outcomes and premature death. About 3.3 million premature deaths are attributed to both indoor and outdoor air pollution yearly and the burden is high among those living in middle-income countries5.
The people most affected by this are ones who work in such atmosphere. People in various professions ranging from construction site workers to traffic policemen all experience various symptoms because of this.
IntroductionAir pollution is the contamination of the air present
in the healthy atmosphere with particulate substances, harmful fumes, vehicular emissions, smoke released by industries and the list continues. In the era of modernization and development there is a high increase in number of factories, building and not to forget the most necessary the vehicles, these become the cause of concern as it is the major source of air pollution.
Corresponding Author: Jayshree S. Kharche Associate Professor, Department of Physiology, Bharati Vidyapeeth (Deemed to be University) Medical College, Pune
10.5958/2320-608X.2019.00165.3
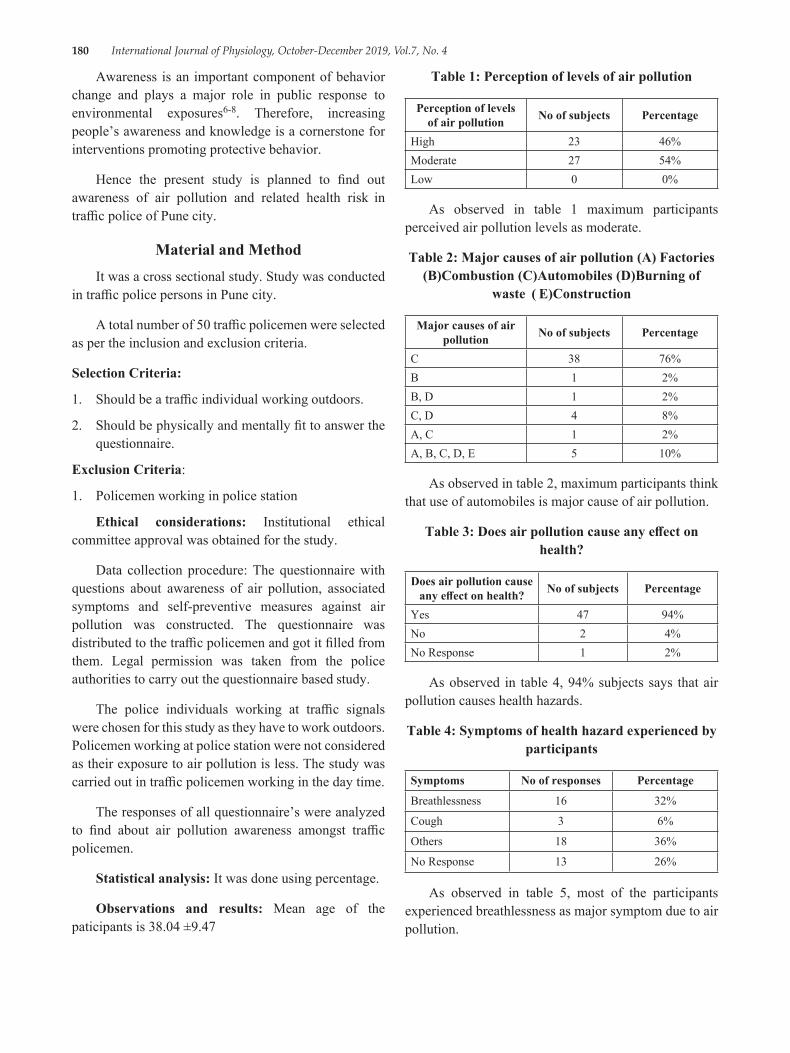
180 International Journal of Physiology, October-December 2019, Vol.7, No. 4
Awareness is an important component of behavior change and plays a major role in public response to environmental exposures6-8. Therefore, increasing people’s awareness and knowledge is a cornerstone for interventions promoting protective behavior.
Hence the present study is planned to find out awareness of air pollution and related health risk in traffic police of Pune city.
Material and MethodIt was a cross sectional study. Study was conducted
in traffic police persons in Pune city.
A total number of 50 traffic policemen were selected as per the inclusion and exclusion criteria.
Selection Criteria:
1. Should be a traffic individual working outdoors.
2. Should be physically and mentally fit to answer the questionnaire.
Exclusion Criteria:
1. Policemen working in police station
Ethical considerations: Institutional ethical committee approval was obtained for the study.
Data collection procedure: The questionnaire with questions about awareness of air pollution, associated symptoms and self-preventive measures against air pollution was constructed. The questionnaire was distributed to the traffic policemen and got it filled from them. Legal permission was taken from the police authorities to carry out the questionnaire based study.
The police individuals working at traffic signals were chosen for this study as they have to work outdoors. Policemen working at police station were not considered as their exposure to air pollution is less. The study was carried out in traffic policemen working in the day time.
The responses of all questionnaire’s were analyzed to find about air pollution awareness amongst traffic policemen.
Statistical analysis: It was done using percentage.
Observations and results: Mean age of the paticipants is 38.04 ±9.47
Table 1: Perception of levels of air pollution
Perception of levels of air pollution No of subjects Percentage
High 23 46%Moderate 27 54%Low 0 0%
As observed in table 1 maximum participants perceived air pollution levels as moderate.
Table 2: Major causes of air pollution (A) Factories (B)Combustion (C)Automobiles (D)Burning of
waste ( E)Construction
Major causes of air pollution No of subjects Percentage
C 38 76%B 1 2%B, D 1 2%C, D 4 8%A, C 1 2%A, B, C, D, E 5 10%
As observed in table 2, maximum participants think that use of automobiles is major cause of air pollution.
Table 3: Does air pollution cause any effect on health?
Does air pollution cause any effect on health? No of subjects Percentage
Yes 47 94%No 2 4%No Response 1 2%
As observed in table 4, 94% subjects says that air pollution causes health hazards.
Table 4: Symptoms of health hazard experienced by participants
Symptoms No of responses Percentage
Breathlessness 16 32%
Cough 3 6%
Others 18 36%
No Response 13 26%
As observed in table 5, most of the participants experienced breathlessness as major symptom due to air pollution.
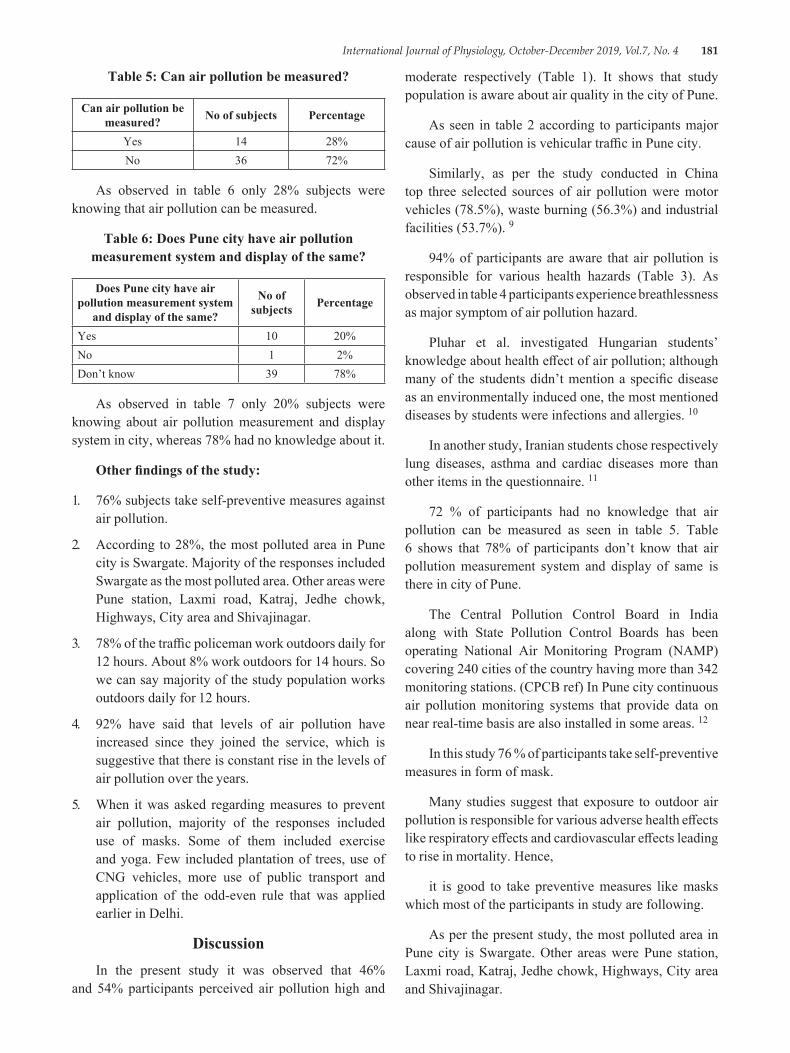
International Journal of Physiology, October-December 2019, Vol.7, No. 4 181
Table 5: Can air pollution be measured?
Can air pollution be measured? No of subjects Percentage
Yes 14 28%No 36 72%
As observed in table 6 only 28% subjects were knowing that air pollution can be measured.
Table 6: Does Pune city have air pollution measurement system and display of the same?
Does Pune city have air pollution measurement system
and display of the same?
No of subjects Percentage
Yes 10 20%No 1 2%Don’t know 39 78%
As observed in table 7 only 20% subjects were knowing about air pollution measurement and display system in city, whereas 78% had no knowledge about it.
Other findings of the study:
1. 76% subjects take self-preventive measures against air pollution.
2. According to 28%, the most polluted area in Pune city is Swargate. Majority of the responses included Swargate as the most polluted area. Other areas were Pune station, Laxmi road, Katraj, Jedhe chowk, Highways, City area and Shivajinagar.
3. 78% of the traffic policeman work outdoors daily for 12 hours. About 8% work outdoors for 14 hours. So we can say majority of the study population works outdoors daily for 12 hours.
4. 92% have said that levels of air pollution have increased since they joined the service, which is suggestive that there is constant rise in the levels of air pollution over the years.
5. When it was asked regarding measures to prevent air pollution, majority of the responses included use of masks. Some of them included exercise and yoga. Few included plantation of trees, use of CNG vehicles, more use of public transport and application of the odd-even rule that was applied earlier in Delhi.
DiscussionIn the present study it was observed that 46%
and 54% participants perceived air pollution high and
moderate respectively (Table 1). It shows that study population is aware about air quality in the city of Pune.
As seen in table 2 according to participants major cause of air pollution is vehicular traffic in Pune city.
Similarly, as per the study conducted in China top three selected sources of air pollution were motor vehicles (78.5%), waste burning (56.3%) and industrial facilities (53.7%). 9
94% of participants are aware that air pollution is responsible for various health hazards (Table 3). As observed in table 4 participants experience breathlessness as major symptom of air pollution hazard.
Pluhar et al. investigated Hungarian students’ knowledge about health effect of air pollution; although many of the students didn’t mention a specific disease as an environmentally induced one, the most mentioned diseases by students were infections and allergies. 10
In another study, Iranian students chose respectively lung diseases, asthma and cardiac diseases more than other items in the questionnaire. 11
72 % of participants had no knowledge that air pollution can be measured as seen in table 5. Table 6 shows that 78% of participants don’t know that air pollution measurement system and display of same is there in city of Pune.
The Central Pollution Control Board in India along with State Pollution Control Boards has been operating National Air Monitoring Program (NAMP) covering 240 cities of the country having more than 342 monitoring stations. (CPCB ref) In Pune city continuous air pollution monitoring systems that provide data on near real-time basis are also installed in some areas. 12
In this study 76 % of participants take self-preventive measures in form of mask.
Many studies suggest that exposure to outdoor air pollution is responsible for various adverse health effects like respiratory effects and cardiovascular effects leading to rise in mortality. Hence,
it is good to take preventive measures like masks which most of the participants in study are following.
As per the present study, the most polluted area in Pune city is Swargate. Other areas were Pune station, Laxmi road, Katraj, Jedhe chowk, Highways, City area and Shivajinagar.
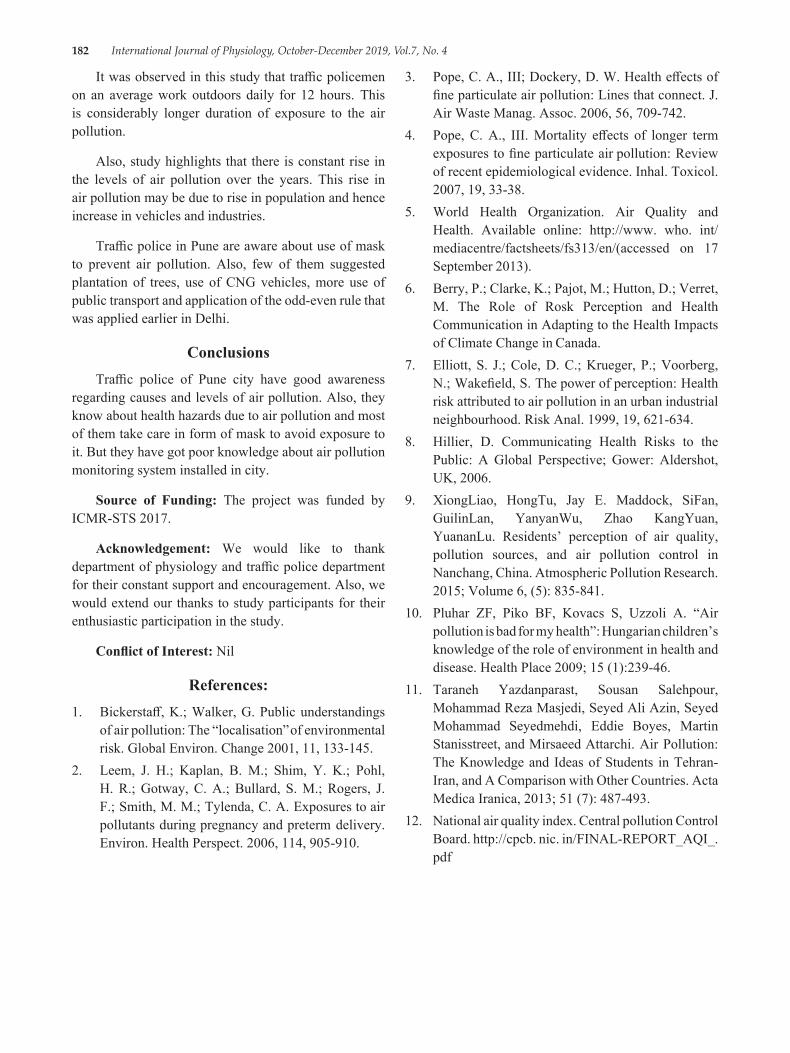
182 International Journal of Physiology, October-December 2019, Vol.7, No. 4
It was observed in this study that traffic policemen on an average work outdoors daily for 12 hours. This is considerably longer duration of exposure to the air pollution.
Also, study highlights that there is constant rise in the levels of air pollution over the years. This rise in air pollution may be due to rise in population and hence increase in vehicles and industries.
Traffic police in Pune are aware about use of mask to prevent air pollution. Also, few of them suggested plantation of trees, use of CNG vehicles, more use of public transport and application of the odd-even rule that was applied earlier in Delhi.
ConclusionsTraffic police of Pune city have good awareness
regarding causes and levels of air pollution. Also, they know about health hazards due to air pollution and most of them take care in form of mask to avoid exposure to it. But they have got poor knowledge about air pollution monitoring system installed in city.
Source of Funding: The project was funded by ICMR-STS 2017.
Acknowledgement: We would like to thank department of physiology and traffic police department for their constant support and encouragement. Also, we would extend our thanks to study participants for their enthusiastic participation in the study.
Conflict of Interest: Nil
References:1. Bickerstaff, K.; Walker, G. Public understandings
of air pollution: The “localisation” of environmental risk. Global Environ. Change 2001, 11, 133-145.
2. Leem, J. H.; Kaplan, B. M.; Shim, Y. K.; Pohl, H. R.; Gotway, C. A.; Bullard, S. M.; Rogers, J. F.; Smith, M. M.; Tylenda, C. A. Exposures to air pollutants during pregnancy and preterm delivery. Environ. Health Perspect. 2006, 114, 905-910.
3. Pope, C. A., III; Dockery, D. W. Health effects of fine particulate air pollution: Lines that connect. J. Air Waste Manag. Assoc. 2006, 56, 709-742.
4. Pope, C. A., III. Mortality effects of longer term exposures to fine particulate air pollution: Review of recent epidemiological evidence. Inhal. Toxicol. 2007, 19, 33-38.
5. World Health Organization. Air Quality and Health. Available online: http://www. who. int/mediacentre/factsheets/fs313/en/(accessed on 17 September 2013).
6. Berry, P.; Clarke, K.; Pajot, M.; Hutton, D.; Verret, M. The Role of Rosk Perception and Health Communication in Adapting to the Health Impacts of Climate Change in Canada.
7. Elliott, S. J.; Cole, D. C.; Krueger, P.; Voorberg, N.; Wakefield, S. The power of perception: Health risk attributed to air pollution in an urban industrial neighbourhood. Risk Anal. 1999, 19, 621-634.
8. Hillier, D. Communicating Health Risks to the Public: A Global Perspective; Gower: Aldershot, UK, 2006.
9. XiongLiao, HongTu, Jay E. Maddock, SiFan, GuilinLan, YanyanWu, Zhao KangYuan, YuananLu. Residents’ perception of air quality, pollution sources, and air pollution control in Nanchang, China. Atmospheric Pollution Research. 2015; Volume 6, (5): 835-841.
10. Pluhar ZF, Piko BF, Kovacs S, Uzzoli A. “Air pollution is bad for my health”: Hungarian children’s knowledge of the role of environment in health and disease. Health Place 2009; 15 (1):239-46.
11. Taraneh Yazdanparast, Sousan Salehpour, Mohammad Reza Masjedi, Seyed Ali Azin, Seyed Mohammad Seyedmehdi, Eddie Boyes, Martin Stanisstreet, and Mirsaeed Attarchi. Air Pollution: The Knowledge and Ideas of Students in Tehran-Iran, and A Comparison with Other Countries. Acta Medica Iranica, 2013; 51 (7): 487-493.
12. National air quality index. Central pollution Control Board. http://cpcb. nic. in/FINAL-REPORT_AQI_. pdf
International Journal of Physiology, October-December 2019, Vol.7, No. 4 183
Status of Lipid Peroxidation and Iron Levels in Bronchial Asthma
Ramadevi P.1, A.V. Siva Kumar2, K.N. Maruthy3, Ch. Kiran Kumar4, Sasikala P.3
1Assistant Professor, Dept. of Physiology, ACSR Medical College, 2Faculty/Ph.D. Research Scholar, Department of Physiology, Narayana Medical College, 3Professor, Department of Physiology, Narayana Medical College,
4Associate Professor, Department of Physiology, Narayana Medical College, Nellore
AbstractIntroduction: The Oxidative stress, specifically lipid peroxidation, is believed to contribute to the pathophysiology of asthma. Low antioxidant levels and oxidative stress due to airway inflammation may be determinant of asthma severity. Level of plasma malondialdehyde (MDA) was used as index of lipid peroxidation. Even elevated iron levels also contribute for production of ROC and free radicals which causes inflammation in bronchial asthma. So the present study was aimed to reveal the relationship between lipid peroxidation and bronchial asthma.
Method: The FEV1% was measured to categorize the asthmatic patients and controls. Later MDA and serum iron levels were measured in thirty asthma cases and 30 healthy volunteers aged between 18-45 years. All the procedures were performed in the morning after their light breakfast in a less noise and illuminated room.
Results: The results showed serum MDA and iron levels significantly increased in bronchial asthmatic patients were suggestive of lipid peroxidation and oxidative stress in asthmatic patients compared to controls.
Conclusion: Therefore, Oxidative stress and lipid peroxidation are the key factors to produce ROC and free radicals which aggravates bronchial asthma.
Keywords: Oxidative stress, Body Mass Index, Bronchial asthma, Lipid peroxidation.
and adults from kinder garden and school through work to retirement2. According to WHO estimates that 300 million people are affected by asthma globally with 2.5 lakhs of deaths every year2. It is the commonest chronic disease contributing a third of all chronic disorders. In India alone the prevalence is 2-3.5%. At least 25 to 35 million Indians are asthmatics and the economic burden of this disease in India is thus huge3. Now it is recognized as a major cause of disability, medical expense and preventable death. Pathophysiologically asthma involves many different cells and cellular elements like basophils, eosinophils, lymphocytes, mast cells, macrophages and mediators like cytokines, chemokines, histamine, leucotreines, reactive oxygen species and thromboxanes. Although asthma is multifactorial in origin, inflammation is believed to be the corner stone of the disease4. Airway inflammation and remodeling are critical components of asthma; furthermore environmental exposures throughout life can modulate the expression of asthma susceptibility genes, making asthma a dynamic disease5.
IntroductionAsthma is defined as chronic inflammatory process
characterized by reversible and variable air flow obstruction due to bronchial hyper responsiveness secondary to multiple external stimuli in which genetic factors interact with environmental factors1. Symptomatically asthma is characterized by recurrent attacks of cough, wheeze and breathlessness. It is a major public health problem across the globe. Asthma does not respect age or gender, affecting both children
Corresponding Author: Mr. A.V. Siva Kumar, Faculty & Ph.D. Scholar, Department Of Physiology, Narayana Medical College, Nellore - 524003 Contact: +918341644980, 8555844682 e-mail: [email protected]
10.5958/2320-608X.2019.00166.5
184 International Journal of Physiology, October-December 2019, Vol.7, No. 4
Asthma has attracted the full spectrum of biochemical investigations from studies of the prevalence of asthma in different populations6. These studies continue to refine the scientific understanding of asthma and suggest new approaches to diagnosis and treatment3. Bronchial asthma is one of the free radical mediated inflammatory condition of the air ways (oxidative stress) 7. Oxidative stress is a unique pathophysiological condition resulting from the disrupted balance between oxidants and antioxidant levels and may be determinant of severity of asthma. Increased level of free radicals may cause oxidative damage of all biomolecules like nucleic acids, proteins, lipids and saccharides8. The inflammatory reaction is initiated by the formation of allergen antigen complex. Inflammatory cells are activated during inflammation and produce variety of chemicals along with free radicals9. These free radicals induce lipid peroxidation leading to chain of reactions causing increased level of lipid peroxidation products like malondialdehyde (MDA). MDA is most important and frequently used biomarker providing an indication of the overall lipid peroxidation level in the blood10. So one of the purpose of the present study is to monitor the extent of lipid peroxidation and severity of bronchial asthma as measured by FEV1 (forced expiratory volume in the first second). It has been reported that high iron stores increase the free radical production and may elevate the asthma risk11. Another experimental study shows, overloading the rats by giving iron dextran injection increase lipid peroxidation12. In view of this the present study is under taken to know the effect of iron stores in the production of free radicals and correlate the same with the severity of the disease as it is less studied.
Materials and MethodIt is an analytical cross-sectional study undertaken
by the authors in Department of Physiology, Narayana medical college, Nellore. The study protocol was reviewed and approved by Institutional ethical committee of the same college. The test group subjects were Bronchial asthmatic patients, who were otherwise normal, attending outpatient department, and central laboratory of Narayana Medical College and Hospital. The non-random sampling procedure was executed for recruitment of cases and controls. The cases were included in both genders with less than 2 years duration of bronchial asthma without other confounding factors. The controls were recruited from the primary investigator acquaintances from Narayana medical college. All the
participants were fully explained about the procedures were carried out in the day time at ambient room temperature and written consent was obtained from each participant as per the declaration of Helsinki. The tests were conducted in 30 Bronchial asthmatic patients and compared with 30 age matched controls. A detailed history was taken including personal, medical, past history, drug history and duration of disease.
Spirowin: The bronchial asthma was determined by different spirometric parameters carried out with a computerized spirometer (Spirowin Version 2.0) and the following lung function parameters were recorded
Demographic measurements: In each subject height in centimeters measured by stadiometer and weight in kilograms were measured by electronic weighing machine. Body Mass Index (BMI) for each subject was calculated using the formula BMI = Weight (Kgs) /Height (m2).
Spirometric parameters: The test procedure was explained to the subjects and a demonstration of the test procedure was given. They were allowed to sit quietly for 10 minutes to become mentally and physically relaxed prior to testing. Subjects were asked to inspire as much as possible and hold the sterile mouth piece in the mouth, with the lips forming a tight seal around the mouth piece, and asked to inspire maximally, expire maximally and inspire with maximum effort again. After preliminary trials, the test was performed three times in the standing position and the best recording was taken. The FEV1% was obtained from the digital spirowin automatically.
Blood parameters: Venous blood was taken from the each participant mixed with EDTA. The plasma was separated by centrifugation and malondialdehyde (MDA) which indicate the status of lipid peroxidation, total iron levels were estimated using spectrophotometry.
Statistical analysis: The data sets were analyzed by graph pad prism & data was represented as mean and SD. Normality of data was tested using Kolmogorov-Smirnov test. A p value of > 0.05 indicated normal Gaussian distribution. As the data sets were skewed, Mann-Whitney test was performed and Spearman correlation were done to find out associations.
Results: The obtained values from the protocol were expressed as mean ± SD in the tables.
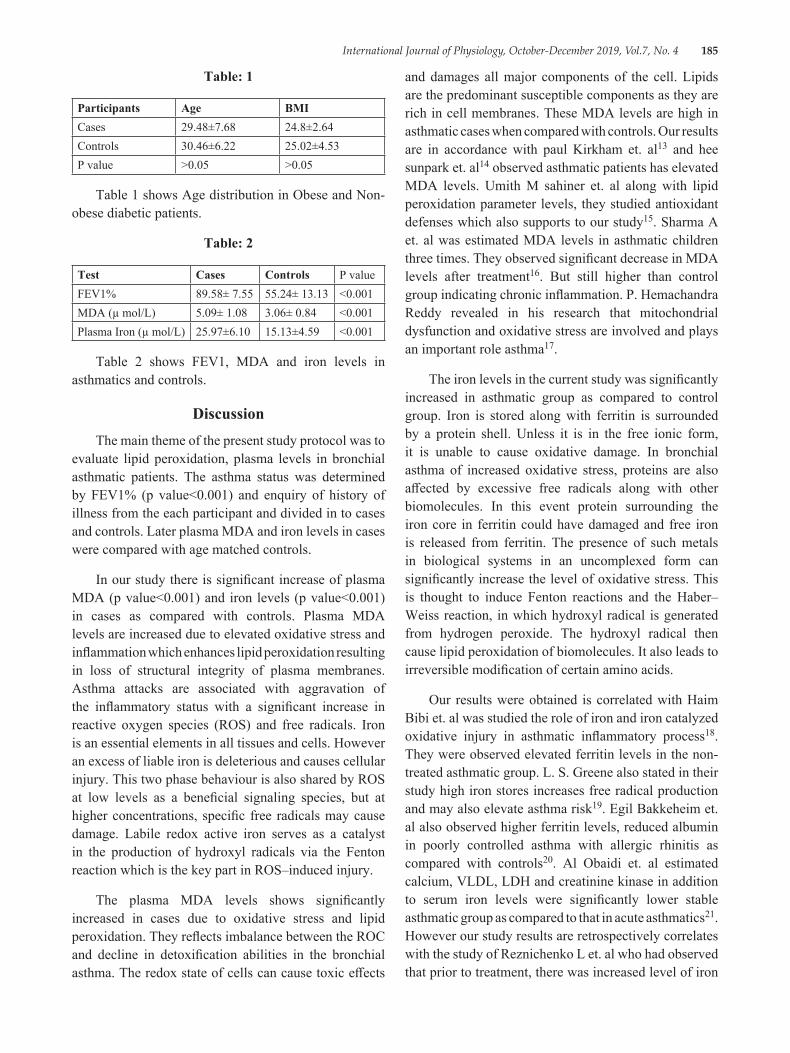
International Journal of Physiology, October-December 2019, Vol.7, No. 4 185
Table: 1
Participants Age BMICases 29.48±7.68 24.8±2.64Controls 30.46±6.22 25.02±4.53P value >0.05 >0.05
Table 1 shows Age distribution in Obese and Non-obese diabetic patients.
Table: 2
Test Cases Controls P valueFEV1% 89.58± 7.55 55.24± 13.13 <0.001MDA (µ mol/L) 5.09± 1.08 3.06± 0.84 <0.001Plasma Iron (µ mol/L) 25.97±6.10 15.13±4.59 <0.001
Table 2 shows FEV1, MDA and iron levels in asthmatics and controls.
DiscussionThe main theme of the present study protocol was to
evaluate lipid peroxidation, plasma levels in bronchial asthmatic patients. The asthma status was determined by FEV1% (p value<0.001) and enquiry of history of illness from the each participant and divided in to cases and controls. Later plasma MDA and iron levels in cases were compared with age matched controls.
In our study there is significant increase of plasma MDA (p value<0.001) and iron levels (p value<0.001) in cases as compared with controls. Plasma MDA levels are increased due to elevated oxidative stress and inflammation which enhances lipid peroxidation resulting in loss of structural integrity of plasma membranes. Asthma attacks are associated with aggravation of the inflammatory status with a significant increase in reactive oxygen species (ROS) and free radicals. Iron is an essential elements in all tissues and cells. However an excess of liable iron is deleterious and causes cellular injury. This two phase behaviour is also shared by ROS at low levels as a beneficial signaling species, but at higher concentrations, specific free radicals may cause damage. Labile redox active iron serves as a catalyst in the production of hydroxyl radicals via the Fenton reaction which is the key part in ROS–induced injury.
The plasma MDA levels shows significantly increased in cases due to oxidative stress and lipid peroxidation. They reflects imbalance between the ROC and decline in detoxification abilities in the bronchial asthma. The redox state of cells can cause toxic effects
and damages all major components of the cell. Lipids are the predominant susceptible components as they are rich in cell membranes. These MDA levels are high in asthmatic cases when compared with controls. Our results are in accordance with paul Kirkham et. al13 and hee sunpark et. al14 observed asthmatic patients has elevated MDA levels. Umith M sahiner et. al along with lipid peroxidation parameter levels, they studied antioxidant defenses which also supports to our study15. Sharma A et. al was estimated MDA levels in asthmatic children three times. They observed significant decrease in MDA levels after treatment16. But still higher than control group indicating chronic inflammation. P. Hemachandra Reddy revealed in his research that mitochondrial dysfunction and oxidative stress are involved and plays an important role asthma17.
The iron levels in the current study was significantly increased in asthmatic group as compared to control group. Iron is stored along with ferritin is surrounded by a protein shell. Unless it is in the free ionic form, it is unable to cause oxidative damage. In bronchial asthma of increased oxidative stress, proteins are also affected by excessive free radicals along with other biomolecules. In this event protein surrounding the iron core in ferritin could have damaged and free iron is released from ferritin. The presence of such metals in biological systems in an uncomplexed form can significantly increase the level of oxidative stress. This is thought to induce Fenton reactions and the Haber–Weiss reaction, in which hydroxyl radical is generated from hydrogen peroxide. The hydroxyl radical then cause lipid peroxidation of biomolecules. It also leads to irreversible modification of certain amino acids.
Our results were obtained is correlated with Haim Bibi et. al was studied the role of iron and iron catalyzed oxidative injury in asthmatic inflammatory process18. They were observed elevated ferritin levels in the non-treated asthmatic group. L. S. Greene also stated in their study high iron stores increases free radical production and may also elevate asthma risk19. Egil Bakkeheim et. al also observed higher ferritin levels, reduced albumin in poorly controlled asthma with allergic rhinitis as compared with controls20. Al Obaidi et. al estimated calcium, VLDL, LDH and creatinine kinase in addition to serum iron levels were significantly lower stable asthmatic group as compared to that in acute asthmatics21. However our study results are retrospectively correlates with the study of Reznichenko L et. al who had observed that prior to treatment, there was increased level of iron
186 International Journal of Physiology, October-December 2019, Vol.7, No. 4
which was decreased after using iron chelating agents with simultaneous decrease of inflammation 22. Both iron and lipid peroxidation products increased in the research of Ekmekci were studied that oxidation of lipoproteins is facilitated by iron and copper in bronchial asthma cases23. The findings of our study are in contradictory with the findings of Vural H et. al who showed no changes in serum iron and ferritin levels in bronchial asthma cases when compared with control group24.
Limitations: In our study the sample size was limited and it addresses the population of this geographical area, separate study in males and females was not conducted. A multicentric study with larger sample size will be carried out in future to understand the relation between MDA and iron levels in asthmatics.
ConclusionThe present study concludes that, there is increased
lipid peroxidation in bronchial asthma cases due to inflammation which is evidenced by increased levels of malondialdehyde. There is also concomitant increase in plasma iron levels which may be due to release of iron from iron stores which further aggravate lipid peroxidation by Fenton and Heberwiess reactions. Thus there is significant positive correlation between MDA and iron levels. The asthma can be controlled by biofeedback mechanism which alters the visceral responses25.
Conflict of Interest: On behalf of all authors, the corresponding author states that there is none declared any type of conflict regarding this research work.
Funding: There is no financial support for this work to be carried out and publication.
References1. Wood LG, Gibson PG, Garg ML. Biomarkers
of lipid peroxidation, airway inflammation and asthma. European Respiratory Journal. 2003 Jan 1; 21 (1):177-86.
2. Corradi M, Pignatti P, Manini P, Andreoli R, Goldoni M, Poppa M, Moscato G, Balbi B, Mutti A. Comparison between exhaled and sputum oxidative stress biomarkers in chronic airway inflammation. European Respiratory Journal. 2004 Dec 1; 24 (6):1011-7.
3. Soriano JB, Abajobir AA, Abate KH, Abera SF, Agrawal A, Ahmed MB, Aichour AN, Aichour I, Aichour MT, Alam K, Alam N. Global, regional,
and national deaths, prevalence, disability-adjusted life years, and years lived with disability for chronic obstructive pulmonary disease and asthma, 1990-2015: a systematic analysis for the Global Burden of Disease Study 2015. The Lancet Respiratory Medicine. 2017 Sep 1; 5 (9):691-706.
4. Bousquet J, Jeffery PK, Busse WW, Johnson M, Vignola AM. Asthma: from bronchoconstriction to airways inflammation and remodeling. American journal of respiratory and critical care medicine. 2000 May 1; 161 (5):1720-45.
5. Larsen GL, Beskid C, Shirnamé-Moré L. Environmental air toxics: role in asthma occurrence?. Environmental health perspectives. 2002 Aug; 110 (suppl 4):501-4.
6. Vibhooti P, Rajan G, Seema B, Preeti K. Chronotherapy for nocturnal asthama. Indian Journal of Research in Pharmacy and Biotechnology. 2013 May 1; 1 (3):288.
7. Rahman I, Morrison D, Donaldson K, MacNee W. Systemic oxidative stress in asthma, COPD, and smokers. American journal of respiratory and critical care medicine. 1996 Oct; 154 (4):1055-60.
8. Li N, Hao M, Phalen RF, Hinds WC, Nel AE. Particulate air pollutants and asthma: a paradigm for the role of oxidative stress in PM-induced adverse health effects. Clinical immunology. 2003 Dec 1; 109 (3):250-65.
9. Nadeem A, Chhabra SK, Masood A, Raj HG. Increased oxidative stress and altered levels of antioxidants in asthma. Journal of Allergy and Clinical Immunology. 2003 Jan 1; 111 (1):72-8.
10. Wood LG, Fitzgerald DA, Gibson PC, Cooper DM, Garg ML. Lipid peroxidation as determined by plasma isoprostanes is related to disease severity in mild asthma. Lipids. 2000 Sep; 35 (9):967.
11. Mylonas C, Kouretas D. Lipid peroxidation and tissue damage. In Vivo (Athens, Greece). 1999; 13 (3):295-309.
12. Srinivasarao D, Jayarraj IA, Jayraajº R, Prabha ML. A study on Antioxidantand Anti-inflammatory activity of Vasicine against lung damage in rats. Indian J Allergy Asthma Immunol. 2006; 20 (1):1-7.
13. Kirkham P, Rahman I. Oxidative stress in asthma and COPD: antioxidants as a therapeutic strategy. Pharmacology & therapeutics. 2006 Aug 1; 111 (2):476-94.
International Journal of Physiology, October-December 2019, Vol.7, No. 4 187
14. Kim SR, Lee KS, Park HS, Park SJ, Min KH, Jin SM, Lee YC. Involvement of IL-10 in peroxisome proliferator-activated receptor γ-mediated anti-inflammatory response in asthma. Molecular pharmacology. 2005 Dec 1; 68 (6):1568-75.
15. Chan HP, Goodsitt MM, Helvie MA, Hadjiiski LM, Lydick JT, Roubidoux MA, Bailey JE, Nees A, Blane CE, Sahiner B. ROC study of the effect of stereoscopic imaging on assessment of breast lesions. Medical physics. 2005 Apr; 32 (4):1001-9.
16. Sharma JB, Sharma A, Bahadur A, Vimala N, Satyam A, Mittal S. Oxidative stress markers and antioxidant levels in normal pregnancy and pre‐eclampsia. International Journal of Gynecology & Obstetrics. 2006 Jul; 94 (1):23-7.
17. Reddy PH. Mitochondrial dysfunction and oxidative stress in asthma: implications for mitochondria-targeted antioxidant therapeutics. Pharmaceuticals. 2011 Mar; 4 (3):429-56.
18. Bibi H, Shoseyov D, Feigenbaum D, Genis M, Friger M, Peled R, Sharff S. The relationship between asthma and obesity in children: is it real or a case of over diagnosis?. Journal of Asthma. 2004 Jan 1; 41 (4):403-10.
19. Greene LS. Asthma and oxidant stress: nutritional, environmental, and genetic risk factors. Journal of the American College of Nutrition. 1995 Aug 1; 14 (4):317-24.
20. Bakkeheim E, Mowinckel P, Carlsen KH, Håland G, Carlsen KC. Paracetamol in early infancy:
the risk of childhood allergy and asthma. Acta Paediatrica. 2011 Jan 1; 100 (1):90-6.
21. Al Obaidi AH, Samarai AM. Biochemical markers as a response guide for steroid therapy in asthma. Journal of Asthma. 2008 Jan 1; 45 (5):425-8.
22. Reznichenko L, Amit T, Zheng H, Avramovich‐Tirosh Y, Youdim MB, Weinreb O, Mandel S. Reduction of iron‐regulated amyloid precursor protein and β‐amyloid peptide by (–)‐epigallocatechin‐3‐gallate in cell cultures: implications for iron chelation in Alzheimer’s disease. Journal of neurochemistry. 2006 Apr; 97 (2):527-36.
23. Ekmekci OB, Donma O, Ekmekci H, Yildirim N, Uysal O, Sardogan E, Demirel H, Demir T. Plasma paroaoxonase activities, lipoprotein oxidation, and trace element interaction in asthmatic patients. Biological trace element research. 2006 Jun 1; 111 (1-3):41-52.
24. Vural H, Uzun K, Uz E, Kocyigit A, Cigli A, Akyol Ö. Concentrations of copper, zinc and various elements in serum of patients with bronchial asthma. Journal of trace elements in medicine and biology. 2000 Jun 1; 14 (2):88-91.
25. Kumar CK, Kumar AS, Madhurima P, Maruthy KN, Preetham GJ. Assessment of psychomotor skills using finger pulse guided biofeedback tool in young medical students. Annals of Medical Physiology. 2018 Dec 31; 2 (4):36-9.
188 International Journal of Physiology, October-December 2019, Vol.7, No. 4
Electrodiagnostic Features of Ulnar Nerve in Patients with Chronic Obstructive Pulmonary Disease
Rashmi Dave1, Sanjeev Kumar Shrivastava2, Asha Shrivastava3, Rajesh Paul4
1Assistant Professor, Department of Physiology, Gandhi Medical College, 2Corresponding Author & Associate Professor, Department of Physiology, Gandhi Medical College, 3Professor and Head, Department of Physiology,
Chirayu Medical College, 4JR III, Department of Physiology Gandhi Medical College, Bhopal
AbstractBackground & Objectives: Present study was aimed to assess abnormalities of ulnar nerve in stable COPD patients.
Method: Study comprised of 60 healthy adults and 60 stable COPD patients (40-50 years) with no clinical neuropathy. Duration of illness and spirometric indices (FEV1%, FEV1/FVC, PEFR %) were assessed. Nerve conduction study of motor and sensory component of ulnar nerve was recorded bilaterally using RMS EMG MKII. Distal latency, nerve conduction velocity and compound motor action potential (CMAP) and sensory nerve action potential (SNAP) were analysed. Significant abnormality was defined as variations beyond mean ± 2SD from healthy adults.
Results: Observations revealed significantly prolonged distal latency and decreased conduction velocity (demyelination), decreased CMAP (axonal loss) bilaterally of both sensory and motor components of ulnar nerve in COPD patients compared with controls.
Interpretation & conclusion: Observation suggests that hypoxemia of COPD, by inducing direct action on nerve fibres or pontomedullary portion of brain or by enhancing effect of other neurotoxic substances causes nerve impairment.
Keywords: Nerve conduction study, hypoxemia, demyelination, axonal loss.
malnutrition, metabolic syndrome, diabetes, and lung cancer. These comorbidities have a major impact on quality of life and survival. The mechanisms by which the many COPD-related comorbidities develop are still unclear. It has been suggested that systemic inflammation also contributes to the disease process. In spite of this, its causes are likely multifactorial (inactivity, poor diet, hypoxia, and inflammation). 2
Smoking, long lasting COPD, airway obstruction is believed to affect ponto medullary portion of brain by altering blood gases causing hypoxemia, hypercapnia and respiratory acidosis 3. Association of COPD patients with peripheral neuropathy has been reported in previous studies. 4, 5 The association of polyneuropathy with COPD is described in literature 6-12
Hypoxemia is the most important cause13. Hypoxia results from hyperventilation and ventilation perfusion imbalance. There is restrictive transport of oxygen in
IntroductionChronic obstructive pulmonary disease (COPD)
is a common preventable and treatable disease, characterized by persistent respiratory symptoms and airflow limitation that is due to airway and/or alveolar abnormalities usually caused by significant exposure to noxious particles or gases1. COPD has been identified to have multisystem involvement with significant extrapulmonary manifestations. Patients with COPD frequently suffer from various comorbidities, such as cardiovascular disease, osteoporosis, depression,
Corresponding Author: Dr. Sanjeev Kumar Shrivastava Associate Professor, Department of Physiology, Gandhi Medical College, Bhopal-462001 e-mail: [email protected]
10.5958/2320-608X.2019.00167.7
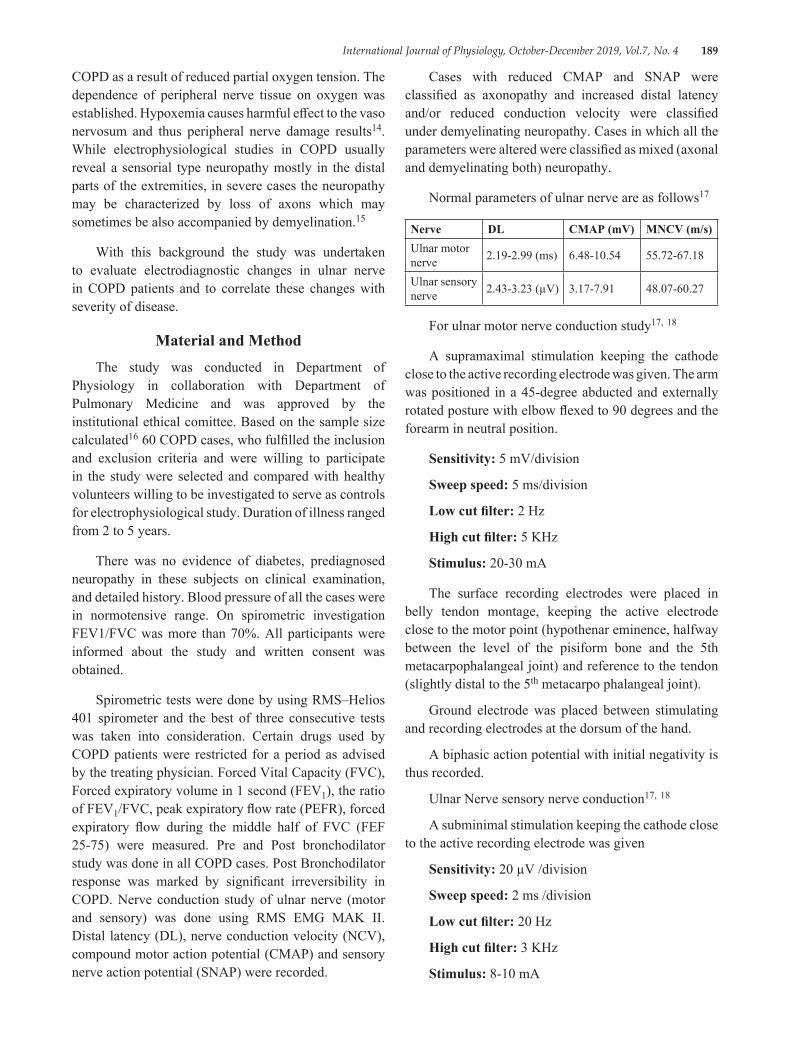
International Journal of Physiology, October-December 2019, Vol.7, No. 4 189
COPD as a result of reduced partial oxygen tension. The dependence of peripheral nerve tissue on oxygen was established. Hypoxemia causes harmful effect to the vaso nervosum and thus peripheral nerve damage results14.While electrophysiological studies in COPD usually reveal a sensorial type neuropathy mostly in the distal parts of the extremities, in severe cases the neuropathy may be characterized by loss of axons which may sometimes be also accompanied by demyelination.15
With this background the study was undertaken to evaluate electrodiagnostic changes in ulnar nerve in COPD patients and to correlate these changes with severity of disease.
Material and MethodThe study was conducted in Department of
Physiology in collaboration with Department of Pulmonary Medicine and was approved by the institutional ethical comittee. Based on the sample size calculated16 60 COPD cases, who fulfilled the inclusion and exclusion criteria and were willing to participate in the study were selected and compared with healthy volunteers willing to be investigated to serve as controls for electrophysiological study. Duration of illness ranged from 2 to 5 years.
There was no evidence of diabetes, prediagnosed neuropathy in these subjects on clinical examination, and detailed history. Blood pressure of all the cases were in normotensive range. On spirometric investigation FEV1/FVC was more than 70%. All participants were informed about the study and written consent was obtained.
Spirometric tests were done by using RMS–Helios 401 spirometer and the best of three consecutive tests was taken into consideration. Certain drugs used by COPD patients were restricted for a period as advised by the treating physician. Forced Vital Capacity (FVC), Forced expiratory volume in 1 second (FEV1), the ratio of FEV1/FVC, peak expiratory flow rate (PEFR), forced expiratory flow during the middle half of FVC (FEF 25-75) were measured. Pre and Post bronchodilator study was done in all COPD cases. Post Bronchodilator response was marked by significant irreversibility in COPD. Nerve conduction study of ulnar nerve (motor and sensory) was done using RMS EMG MAK II. Distal latency (DL), nerve conduction velocity (NCV), compound motor action potential (CMAP) and sensory nerve action potential (SNAP) were recorded.
Cases with reduced CMAP and SNAP were classified as axonopathy and increased distal latency and/or reduced conduction velocity were classified under demyelinating neuropathy. Cases in which all the parameters were altered were classified as mixed (axonal and demyelinating both) neuropathy.
Normal parameters of ulnar nerve are as follows17
Nerve DL CMAP (mV) MNCV (m/s)Ulnar motor nerve 2.19-2.99 (ms) 6.48-10.54 55.72-67.18
Ulnar sensory nerve 2.43-3.23 (µV) 3.17-7.91 48.07-60.27
For ulnar motor nerve conduction study17, 18
A supramaximal stimulation keeping the cathode close to the active recording electrode was given. The arm was positioned in a 45-degree abducted and externally rotated posture with elbow flexed to 90 degrees and the forearm in neutral position.
Sensitivity: 5 mV/division
Sweep speed: 5 ms/division
Low cut filter: 2 Hz
High cut filter: 5 KHz
Stimulus: 20-30 mA
The surface recording electrodes were placed in belly tendon montage, keeping the active electrode close to the motor point (hypothenar eminence, halfway between the level of the pisiform bone and the 5th metacarpophalangeal joint) and reference to the tendon (slightly distal to the 5th metacarpo phalangeal joint).
Ground electrode was placed between stimulating and recording electrodes at the dorsum of the hand.
A biphasic action potential with initial negativity is thus recorded.
Ulnar Nerve sensory nerve conduction17, 18
A subminimal stimulation keeping the cathode close to the active recording electrode was given
Sensitivity: 20 µV /division
Sweep speed: 2 ms /division
Low cut filter: 20 Hz
High cut filter: 3 KHz
Stimulus: 8-10 mA
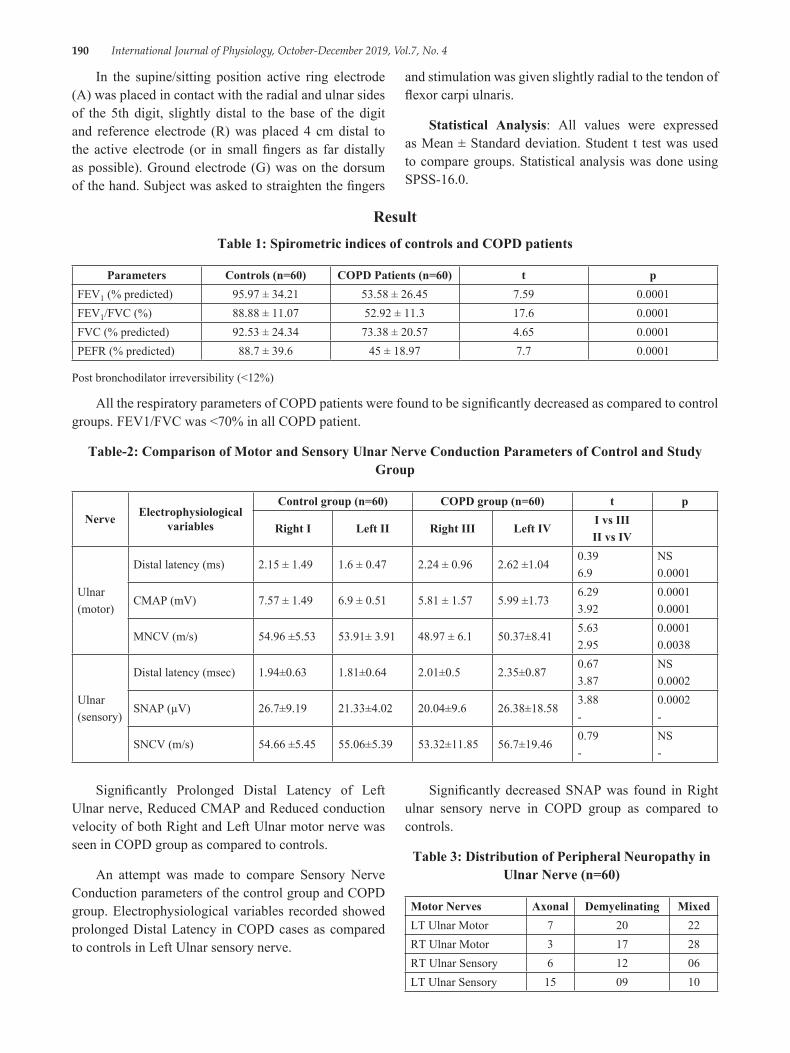
190 International Journal of Physiology, October-December 2019, Vol.7, No. 4
In the supine/sitting position active ring electrode (A) was placed in contact with the radial and ulnar sides of the 5th digit, slightly distal to the base of the digit and reference electrode (R) was placed 4 cm distal to the active electrode (or in small fingers as far distally as possible). Ground electrode (G) was on the dorsum of the hand. Subject was asked to straighten the fingers
and stimulation was given slightly radial to the tendon of flexor carpi ulnaris.
Statistical Analysis: All values were expressed as Mean ± Standard deviation. Student t test was used to compare groups. Statistical analysis was done using SPSS-16.0.
ResultTable 1: Spirometric indices of controls and COPD patients
Parameters Controls (n=60) COPD Patients (n=60) t pFEV1 (% predicted) 95.97 ± 34.21 53.58 ± 26.45 7.59 0.0001FEV1/FVC (%) 88.88 ± 11.07 52.92 ± 11.3 17.6 0.0001FVC (% predicted) 92.53 ± 24.34 73.38 ± 20.57 4.65 0.0001PEFR (% predicted) 88.7 ± 39.6 45 ± 18.97 7.7 0.0001
Post bronchodilator irreversibility (<12%)
All the respiratory parameters of COPD patients were found to be significantly decreased as compared to control groups. FEV1/FVC was <70% in all COPD patient.
Table-2: Comparison of Motor and Sensory Ulnar Nerve Conduction Parameters of Control and Study Group
Nerve Electrophysiological variables
Control group (n=60) COPD group (n=60) t p
Right I Left II Right III Left IVI vs IIIII vs IV
Ulnar(motor)
Distal latency (ms) 2.15 ± 1.49 1.6 ± 0.47 2.24 ± 0.96 2.62 ±1.040.396.9
NS0.0001
CMAP (mV) 7.57 ± 1.49 6.9 ± 0.51 5.81 ± 1.57 5.99 ±1.736.293.92
0.00010.0001
MNCV (m/s) 54.96 ±5.53 53.91± 3.91 48.97 ± 6.1 50.37±8.415.632.95
0.00010.0038
Ulnar(sensory)
Distal latency (msec) 1.94±0.63 1.81±0.64 2.01±0.5 2.35±0.870.673.87
NS0.0002
SNAP (µV) 26.7±9.19 21.33±4.02 20.04±9.6 26.38±18.583.88-
0.0002-
SNCV (m/s) 54.66 ±5.45 55.06±5.39 53.32±11.85 56.7±19.460.79-
NS-
Significantly Prolonged Distal Latency of Left Ulnar nerve, Reduced CMAP and Reduced conduction velocity of both Right and Left Ulnar motor nerve was seen in COPD group as compared to controls.
An attempt was made to compare Sensory Nerve Conduction parameters of the control group and COPD group. Electrophysiological variables recorded showed prolonged Distal Latency in COPD cases as compared to controls in Left Ulnar sensory nerve.
Significantly decreased SNAP was found in Right ulnar sensory nerve in COPD group as compared to controls.
Table 3: Distribution of Peripheral Neuropathy in Ulnar Nerve (n=60)
Motor Nerves Axonal Demyelinating MixedLT Ulnar Motor 7 20 22RT Ulnar Motor 3 17 28RT Ulnar Sensory 6 12 06LT Ulnar Sensory 15 09 10
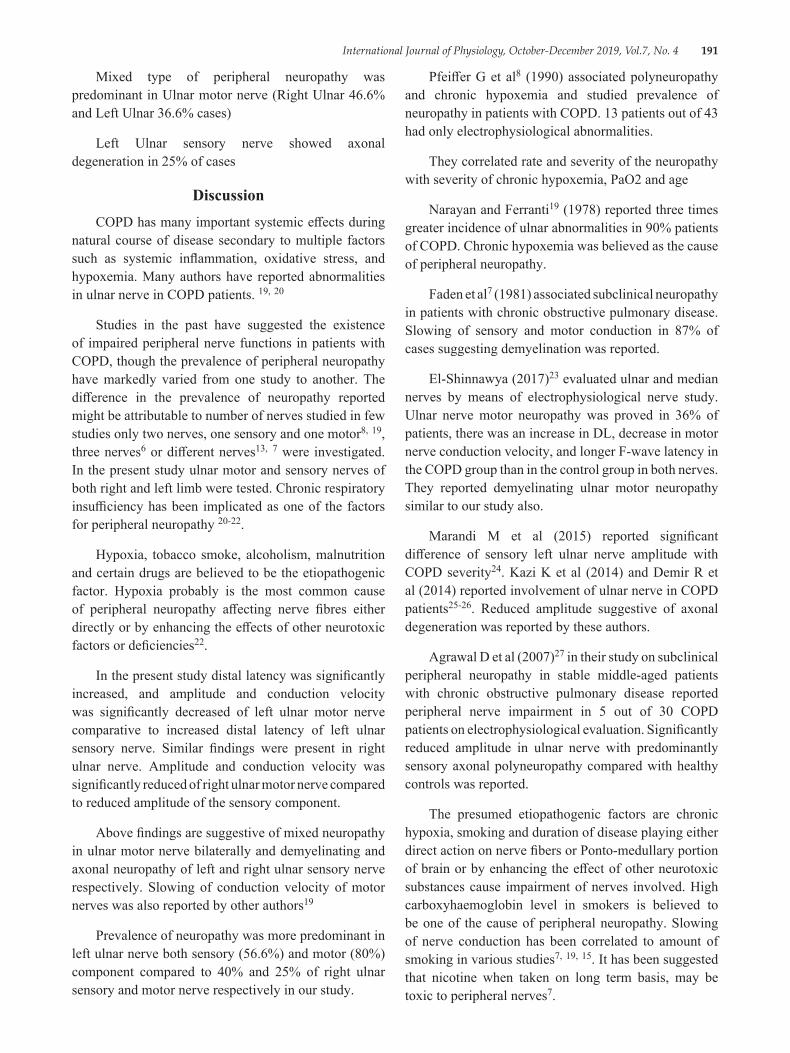
International Journal of Physiology, October-December 2019, Vol.7, No. 4 191
Mixed type of peripheral neuropathy was predominant in Ulnar motor nerve (Right Ulnar 46.6% and Left Ulnar 36.6% cases)
Left Ulnar sensory nerve showed axonal degeneration in 25% of cases
DiscussionCOPD has many important systemic effects during
natural course of disease secondary to multiple factors such as systemic inflammation, oxidative stress, and hypoxemia. Many authors have reported abnormalities in ulnar nerve in COPD patients. 19, 20
Studies in the past have suggested the existence of impaired peripheral nerve functions in patients with COPD, though the prevalence of peripheral neuropathy have markedly varied from one study to another. The difference in the prevalence of neuropathy reported might be attributable to number of nerves studied in few studies only two nerves, one sensory and one motor8, 19, three nerves6 or different nerves13, 7 were investigated. In the present study ulnar motor and sensory nerves of both right and left limb were tested. Chronic respiratory insufficiency has been implicated as one of the factors for peripheral neuropathy 20-22.
Hypoxia, tobacco smoke, alcoholism, malnutrition and certain drugs are believed to be the etiopathogenic factor. Hypoxia probably is the most common cause of peripheral neuropathy affecting nerve fibres either directly or by enhancing the effects of other neurotoxic factors or deficiencies22.
In the present study distal latency was significantly increased, and amplitude and conduction velocity was significantly decreased of left ulnar motor nerve comparative to increased distal latency of left ulnar sensory nerve. Similar findings were present in right ulnar nerve. Amplitude and conduction velocity was significantly reduced of right ulnar motor nerve compared to reduced amplitude of the sensory component.
Above findings are suggestive of mixed neuropathy in ulnar motor nerve bilaterally and demyelinating and axonal neuropathy of left and right ulnar sensory nerve respectively. Slowing of conduction velocity of motor nerves was also reported by other authors19
Prevalence of neuropathy was more predominant in left ulnar nerve both sensory (56.6%) and motor (80%) component compared to 40% and 25% of right ulnar sensory and motor nerve respectively in our study.
Pfeiffer G et al8 (1990) associated polyneuropathy and chronic hypoxemia and studied prevalence of neuropathy in patients with COPD. 13 patients out of 43 had only electrophysiological abnormalities.
They correlated rate and severity of the neuropathy with severity of chronic hypoxemia, PaO2 and age
Narayan and Ferranti19 (1978) reported three times greater incidence of ulnar abnormalities in 90% patients of COPD. Chronic hypoxemia was believed as the cause of peripheral neuropathy.
Faden et al7 (1981) associated subclinical neuropathy in patients with chronic obstructive pulmonary disease. Slowing of sensory and motor conduction in 87% of cases suggesting demyelination was reported.
El-Shinnawya (2017)23 evaluated ulnar and median nerves by means of electrophysiological nerve study. Ulnar nerve motor neuropathy was proved in 36% of patients, there was an increase in DL, decrease in motor nerve conduction velocity, and longer F-wave latency in the COPD group than in the control group in both nerves. They reported demyelinating ulnar motor neuropathy similar to our study also.
Marandi M et al (2015) reported significant difference of sensory left ulnar nerve amplitude with COPD severity24. Kazi K et al (2014) and Demir R et al (2014) reported involvement of ulnar nerve in COPD patients25-26. Reduced amplitude suggestive of axonal degeneration was reported by these authors.
Agrawal D et al (2007)27 in their study on subclinical peripheral neuropathy in stable middle-aged patients with chronic obstructive pulmonary disease reported peripheral nerve impairment in 5 out of 30 COPD patients on electrophysiological evaluation. Significantly reduced amplitude in ulnar nerve with predominantly sensory axonal polyneuropathy compared with healthy controls was reported.
The presumed etiopathogenic factors are chronic hypoxia, smoking and duration of disease playing either direct action on nerve fibers or Ponto-medullary portion of brain or by enhancing the effect of other neurotoxic substances cause impairment of nerves involved. High carboxyhaemoglobin level in smokers is believed to be one of the cause of peripheral neuropathy. Slowing of nerve conduction has been correlated to amount of smoking in various studies7, 19, 15. It has been suggested that nicotine when taken on long term basis, may be toxic to peripheral nerves7.
192 International Journal of Physiology, October-December 2019, Vol.7, No. 4
Improvement in peripheral nerve function has been noted in some patients following treatment of malnutrition, suggesting metabolic abnormalities in schwann cell or malnutrition as a probable cause of peripheral neuropathy6.
Thus early identification of the peripheral neuropathy in COPD patients with no clinically detected impairment may help in planning and management of the COPD patients.
ConclusionThe observation of the study revealed mixed
neuropathy in ulnar motor nerve bilaterally and demyelinating and axonal neuropathy of left and right ulnar sensory nerve respectively suggesting that hypoxia caused by airway obstruction in COPD may cause abnormality in peripheral nerve characterised by loss of axons and degeneration of schwann cells resulting in axonopathy or demyelination. Findings from this study indicate that peripheral neuropathy occurred in association with mild chronic respiratory insufficiency.
Study limitation: No investigation of the blood gas levels in COPD patients is the limitation of the study.
Conflict of Interest: None
Source of Funding: None
Ethical Clearance: taken by Institutional Ethical Committee
References1. WHO Report, Geneva, http:www. goldcopd.com
2019 report2. WHO Report, Geneva, http:www. goldcopd.com
2014 report3. Kayachan O, Beder S, Deda G, Karnak D.
Neurophysiological changes in COPD patients with Chronic respiratory insufficiency. Acta neurol. belg., 2001, 101, 160-165
4. Gupta PP, Agarwal D. Chronic obstructive pulmonary disease and peripheral neuropathy. Lung India 2006; 23:25-33
5. Agarwal D, Vohra R, Gupta PP, Sood S. Sub-clinical peripheral neuropathy in stable patients with COPD in 40-60 years age group. Singapore Med J 2007; 48:887-94.
6. Pfeifer G, Kunze K, Bruche M, Kutzner M, Ladurner G, Malin JP, Trachman WP: Polyneuropathy associated with hypoxemia: prevalence in patients with chronic obstructive pulmonary disease. J Neurol, 1990; 237: 230-3.
7. Jarratt JA, Morgan CN, Twomey JA, Abraham, R Sheaff, PC Pilling, JB Payan, Mitchell JD, Tang O Arnaud F, Howard P: Neuropathy in chronic obstructive pulmonary disease: multi-center electrophysiological and clinical study. Eur Respir J, 1992; 5: 517-24.
8. Poza JJ, Marti-Masso JF: Peripheral neuropathy associated with chronic obstructive pulmonary disease. Neurologia, 1997 12 (9): 189-94.
9. American Thoracic Society: Standards for diagnosis and care of COPD and asthma. Am Rev Respir Dis, 1987 163 225-44.
10. Paramelle B Vila A Stoebner P Muller P Gavele D Lesbros J Brambilla J: Peripheral neuropathies and chronic hypoxemia in chronic obstructive pulmonary disease. Eur J Respir Dis, 1986; 69 (suppl. 146): 715.
11. Ozge C, Ozge A, Yilmaz A, Yalninkaya DE, Ηalikolu M. Cranial optic nerve involvement in patients with severe COPD. Respirology 2005; 10:666-72
12. Kayachan O, Beder S, Deda G, Karnak D. Neurophysiological changes in COPD patients with chronic respiratory insufficiency. Acta neurol. Belg., 2001, 101, 160-165
13. Sipahio¤lu B, K›z›ltan M, Hac›hekimo¤lu A, et al. COPD and neuropathy. Solunum 1995; 19: 960-6.
14. Daniel WW Biostatistics: A Foundation for Analysis in the Health Sciences, 1999, 7th edition New York: John Wiley & Sons.
15. Misra K, Kalita J Clinical Neurophysiology Third edition 2014
16. Buschbacher R, Prahlow N Manual of nerve conduction study 2nd edition 2006
17. Narayan M, Ferranti R. Nerve conduction impairment in patients with respiratory insufficiency and severe chronic hypoxemia. Arch Phys Med Rehabil 1978; 59:188-92.
18. G Valli, S Barbieri, P Sergi, Z Fayoumi and P Berardinelli. Evidence of motor neuron involvement in chronic respiratory insufficiency. Journal of Neurology, Neurosurgery, and Psychiatry, 1984, 47: 1117-1121.
International Journal of Physiology, October-December 2019, Vol.7, No. 4 193
19. Moore N, Lerebours G, Senant J, Ozenne G, David Ph, Nouvet G–Peripheral neuropathy in chronic obstructive lungdisease. Lancet, 1985, II:1311
20. Vila A, Reymond F, Paramelle B, Stoebner P, Ouvrard-Hernandez AM, Muller P, Pollak P. Neuropathies and chronic respiratory insufficiency: electrophysiologic study. Rev Electroencephalogr Neurophysiol Clin 1986; 15: 331-40.
21. Nowak D, Bruch M, Arnaud F, Fabel H, Kiessling D, Nolte D, Overlack A, Rolke M, Ulmer WT, Worth H, et al. Peripheral neuropathies in patients with chronic obstructive pulmonary disease: a multicenter prevalence study. Lung 1990; 168: 43-51.
22. Gupta PP, Agarwal D Chronic Obstructive Pulmonary Disease and peripheral neuropathy. Lung India 2006; 23:25-33
23. El-Shinnawya OM, Khedrb E, Metwallya M, Hassana A, Shaddada A. Peripheral neuropathy in chronic obstructive pulmonary disease Journal of
Current Medical Research and Practice January- April 2017, 2:17-24.
24. Marandi, M., Kahnamouii, S., Mikaeili, H., and Hadavy, M. Peripheral Nervous System Involvement Associated with Chronic Obstructive Pulmonary Disease. Advances in Environmental Biology. 2014.8; 544-548.
25. Kazi, K., Mehta, A., and Mulla, M. Electrophysiological Evaluation of Peripheral Nerves in Patients with Chronic Obstructive Pulmonary Disease. International Journal of Basic and Applied Physiology. 2012.1; 83-7.
26. Demir R., Ozel L., Ozdemir G., Kocaturk, I., and Ulvi H. Neurophysiological Changes in Patients with Chronic Obstructive Pulmonary Diseases. Eur J Gen Med. 2014.11; 153-156
27. Agrawal D, Vohra R, Gupta PP, Sood S. Subclinical peripheral neuropathy in stable middle-aged patients with chronic pulmonary pulmonary disease. Singapore Med J 2007; 48 (10): 887
194 International Journal of Physiology, October-December 2019, Vol.7, No. 4
The Influence of Premenstrual Stress on Auditiory and Visual Reaction Time in I Year MBBS Students
Rekha KN1, Gopi Kumar MS2, Jamuna BL3, Ranganath MD4
1Assistant Professor, Dept. of Physiology, Rajarajeswari Medical College & Hospital, Bengaluru, 2Assistant Professor, Dept. of Physiology, Xavier University School of Medicine, Aruba, 3Professor, Dept. of Physiology,
4Retired Professor, Dept. of Physiology, Rajarajeswari Medical College & Hospital, Bengaluru
AbstractIntroduction: Premenstrual syndrome (PMS) is characterized by a cluster of psychological and somatic symptoms in the late luteal phase of the menstrual cycle which subsides with the onset of menses. The prevalence of premenstrual tension is 2 to 10 % for disabling symptoms where as minor symptoms are seen in 85% of women. Thus the performance of individual will be reduced during premenstrual phase. Reaction Time is a simple, non invasive performance task test which assesses the processing capabilities of CNS. In the present study, simple auditory reaction time (ART) and visual reaction time (VRT) were determined in 60 healthy female subjects between the age group 17 to 20 years during pre and postmenstrual phases.
Objectives: To compare the auditory and visual reaction time in premenstrual and postmenstrual phases of menstrual cycle.
Methodology: 60 normal healthy female students in the age group 17-20 years, having regular menstrual cycles were selected from I year MBBS students, RRMCH. PC 1000 Hz Reaction timer was used to measure auditory and visual reaction time.
Results and discussion: The mean ART in premenstrual and postmenstrual phase were 167+ 21 ms and 144+23 ms respectively. The mean VRT in premenstrual and post menstrual phase were 200+22 ms and 176+16 ms respectively. The P value for both ART and VRT was <0.0001 and results were considered extremely significant. This is attributed to delay in axonal conduction which occurs because of salt and water retention in premenstrual phase.
Keywords: Premenstrual stress, ART, VRT.
and gynecologists criteria is 30% increase in intensity of symptoms of premenstrual syndrome from cycle day 5 to 6 as compared with the six day interval before the onset of menses for at least 2 consecutive cycles.
The prevalence of premenstrual tension is 2 to 10 percent for disabling symptoms, whereas minor symptoms are seen in 85 percent of woman. The commonly occurring symptoms are anxiety, irritability, depression, mood swings, difficult in concentration, insomnia, headache and fatigue. 1 These symptoms can reduce the performance of individuals during the premenstrual phase. Changes in the autonomic functions may be responsible for some of the symptoms produced through endorphins and have been held responsible for behavioral changes. 2
IntroductionPremenstrual syndrome (PMS) is characterized
by a cluster of psychological and somatic symptoms in the late luteal phase of the menstrual cycle which subsides with the onset of menses. Pre menstrual tension syndrome as per American Congress of obstetricians
Corresponding Author: Gopi Kumar M.S. Assistant Professor, Department of Physiology, Xavier University school of Medicine, Aruba Ph: +2977411611 e-mail: drrekhamanu. [email protected]
10.5958/2320-608X.2019.00168.9
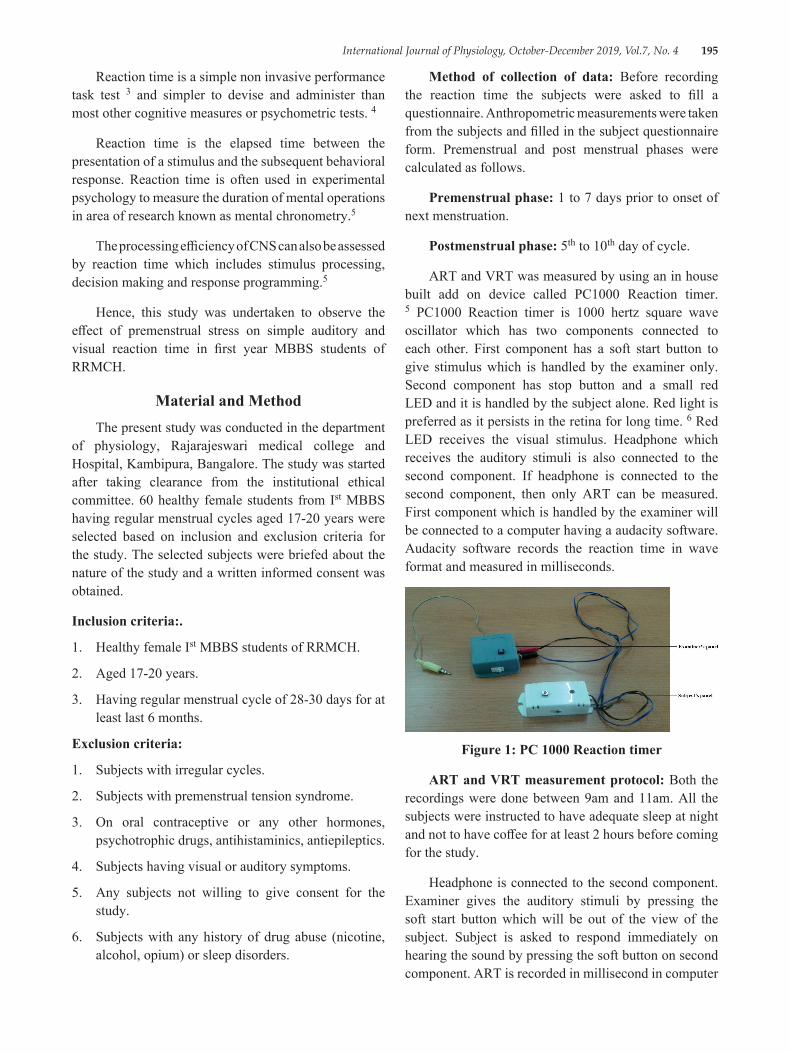
International Journal of Physiology, October-December 2019, Vol.7, No. 4 195
Reaction time is a simple non invasive performance task test 3 and simpler to devise and administer than most other cognitive measures or psychometric tests. 4
Reaction time is the elapsed time between the presentation of a stimulus and the subsequent behavioral response. Reaction time is often used in experimental psychology to measure the duration of mental operations in area of research known as mental chronometry.5
The processing efficiency of CNS can also be assessed by reaction time which includes stimulus processing, decision making and response programming.5
Hence, this study was undertaken to observe the effect of premenstrual stress on simple auditory and visual reaction time in first year MBBS students of RRMCH.
Material and MethodThe present study was conducted in the department
of physiology, Rajarajeswari medical college and Hospital, Kambipura, Bangalore. The study was started after taking clearance from the institutional ethical committee. 60 healthy female students from Ist MBBS having regular menstrual cycles aged 17-20 years were selected based on inclusion and exclusion criteria for the study. The selected subjects were briefed about the nature of the study and a written informed consent was obtained.
Inclusion criteria:.
1. Healthy female Ist MBBS students of RRMCH.
2. Aged 17-20 years.
3. Having regular menstrual cycle of 28-30 days for at least last 6 months.
Exclusion criteria:
1. Subjects with irregular cycles.
2. Subjects with premenstrual tension syndrome.
3. On oral contraceptive or any other hormones, psychotrophic drugs, antihistaminics, antiepileptics.
4. Subjects having visual or auditory symptoms.
5. Any subjects not willing to give consent for the study.
6. Subjects with any history of drug abuse (nicotine, alcohol, opium) or sleep disorders.
Method of collection of data: Before recording the reaction time the subjects were asked to fill a questionnaire. Anthropometric measurements were taken from the subjects and filled in the subject questionnaire form. Premenstrual and post menstrual phases were calculated as follows.
Premenstrual phase: 1 to 7 days prior to onset of next menstruation.
Postmenstrual phase: 5th to 10th day of cycle.
ART and VRT was measured by using an in house built add on device called PC1000 Reaction timer. 5 PC1000 Reaction timer is 1000 hertz square wave oscillator which has two components connected to each other. First component has a soft start button to give stimulus which is handled by the examiner only. Second component has stop button and a small red LED and it is handled by the subject alone. Red light is preferred as it persists in the retina for long time. 6 Red LED receives the visual stimulus. Headphone which receives the auditory stimuli is also connected to the second component. If headphone is connected to the second component, then only ART can be measured. First component which is handled by the examiner will be connected to a computer having a audacity software. Audacity software records the reaction time in wave format and measured in milliseconds.
Figure 1: PC 1000 Reaction timer
ART and VRT measurement protocol: Both the recordings were done between 9am and 11am. All the subjects were instructed to have adequate sleep at night and not to have coffee for at least 2 hours before coming for the study.
Headphone is connected to the second component. Examiner gives the auditory stimuli by pressing the soft start button which will be out of the view of the subject. Subject is asked to respond immediately on hearing the sound by pressing the soft button on second component. ART is recorded in millisecond in computer
196 International Journal of Physiology, October-December 2019, Vol.7, No. 4
using audacity software. Similarly VRT is measured by instructing the subject to press stop button in second component as soon as she sees the red light. Five readings of each stimulus were recorded and the lowest was considered as the reaction time. Stimulus was given at random intervals.
These recordings were taken both during pre and post menstrual phases of the cycle.
Statistical Analysis: All results were expressed as mean+ SD. Student’s paired “t” test was used to analyze the data using SPSS software. P value of less than 0.05 was considered as statistically significant.
Findings: Our study comprised of 60 healthy females, aged between 17-20 years. Table 1 shows anthropometry parameters of the subjects.
The mean ART in premenstrual and postmenstrual phase were 167+ 21 ms and 144+23 ms respectively as shown in table 2. ART is significantly prolonged in premenstrual period (p value <0.0001).
The mean VRT in premenstrual and post menstrual phase were 200+22 ms and 176+16 ms respectively (table 2). VRT value is also significantly higher in premenstrual period (p value <0.0001).
Table 1: Anthropometric Parameters
Variables Mean ±SDHeight (Mt) 154.83+4.7Weight (Kgs) 54.45+6.3BMI (Kg/Mt2) 22.69+2.2
Table 2: Recordings of ART & VRT in pre & post menstrual phases.
ParametersPremenstrual
phase (20th-27th day) Mean ±SD
Postmenstrual phase (5th-10th
day) Mean ±SDP value
ART (millisec) 167±21 144±23 <0.0001VRT (millisec) 200±22 176±16 <0.0001
DiscussionIn present study, statistically significant increase in
mean ART value was observed in premenstrual phase compared to post menstrual phase. Increase in ART value observed in our study is in accordance with work done by Das et al in 1996 7, Asmita SN and Pushpa AP in 20108 and Pawar Babyminakshi L in 2006.9
Visual reaction time value was increased in premenstrual phase compared to postmenstrual phase in our work which is statistically significant. Similar findings were observed in a study by Das et al in 1996 7, Pawar Babyminakshi L et al in 2006 9 and Afroz Afshan et al in 2012.10
A menstrual cycle includes cyclic changes in sex hormone levels. Low levels of oestradiol and progesterone are present during the menstrual phase. The follicular phase is characterized by a gradual increase in oestradiol levels, which culminates in the preovulatory period. The central point of a menstrual cycle is ovulation, which occurs between days 10 and 14. It is controlled by the pituitary gland, which increasingly secretes the follicle-stimulating hormone (FSH) and luteinizing hormone (LH), followed by a higher amount of oestradiol from the follicles. During this period, basal body temperature values increase. After ovulation, oestradiol levels are lower, but progesterone levels start to increase. The luteal phase is characterized by high levels of oestradiol and progesterone. 11
Many Neurophysiologic studies have shown that the brain regions involved in affective state and cognition are diffusely affected by ovarian hormones. 12
Most of the behavioural & emotional patterns observed during the premenstrual phase is mainly attributed to the increased activity of sympathetic division of autonomic nervous system. Sympathetic activity is more during premenstrual phase because of estrogen. 13
Progesterone acts at the level of plasma membrane of selected cells by a nongenemic mechanism `to inhibit the activation of adenylcyclase. Progesterone through some metabolites acts in the brain as an anesthetic /anxiolytic agent by binding to gamma aminobutyric acid A (GABA) receptor. GABA is an inhibitory
Neurotransmitter. These metabolites are formed in women during premenstrual phase when progesterone excretion is high. These metabolites inhibits neural transmission through GABA A receptors, hyperpolarising the neuronal cells. This neural transmission inhibition affects sensorimotor association and processing capability of central nervous system. 14
The reaction time is the time interval between the onset of the stimulus and the initiation of the response. The reaction time provides an indirect index of the
International Journal of Physiology, October-December 2019, Vol.7, No. 4 197
processing capability of the CNS and a simple means of determining the sensorimotor performance. 5
Bruce and Russel have indicated that varying level of sex steroids during different phases of menstrual cycle have sodium and water retaining effect associated with weight gain in females. This retention of salt and water could modify the axonal conduction and alter the rate of impulse transmission. Further, it is also suggested to alter the availability of the neurotransmitter at the synaptic level. They have concluded that the increased synaptic delay coupled with the reduced velocity of nerve impulse due to the effect of female sex hormones affects the sensorimotor co-ordination and the processing speed of the Central Nervous System. 15, 16
Possible neuroendocrine causes of premenstrual edema are estrogen, progesterone, and renin-angiotensin-aldosterone axis. Estrogen increases the level of plasma renin substrate through enhanced hepatic synthesis, which leads to elevation of plasma angiotensin. This results in an elevated secretion and excretion of aldosterone. It shows that sodium retaining effect of estrogen is independent of its ability to augment aldosterone production. Progesterone is a partial agonist of aldosterone and blocks the effect of aldosterone at renal tubules. During the luteal phase of menstrual cycle, there is no change in level of plasma renin substrate but there is rise in renin concentration leading to an increase in plasma renin activity with an increase in plasma aldosterone level and excretion. 17
A study by Mahesh B et al in 2013, have demonstrated that exercise improves reaction time by improving cerebral blood flow. 18
ConclusionThis fact of prolonged reaction time during
premenstrual period can be considered in neurological and behavioural assessment of women. In the modern era, women are equally involved in all fields like men. Because of this premenstrual syndrome of psychological or physical nature, it may limit their functional capacity affecting quality of life & if severe may lead to sickness absentism.
Women with premenstrual symptoms should modify their life style by doing exercises regularly and reducing intake of water and salt during premenstrual period which helps in improving their quality of life.
Conflict of Interest: None
Source of Funding: Personal funds.
Ethical Clearance: Permission was taken from institutional research and ethical committee
References1. Joshi JV, Pandey SN, Galvankar N, Gogate JA.
Prevalence of premenstrual symptoms: Preliminary and brief review of management strategies. Journal of Midlife Health. Jan–Jun 2010; 1 (1): 30-34.
2. Mehta V. Chalranartu AS. Autonomic functions during different phases of menstrual cycle. Ind J Physiol Pharmacol. 1993; 37: 56-8.
3. Becker D, Creutzfeldt OD, Schwibbe M, Wuttke W. Electrophysiological and psychological changes induced by steroid hormones in men and women. Acta Psychiatr Belq. 1980 Sep–Oct; 80 (5): 674-97.
4. Geoff Der, GlasgowIan J. Deary Age and Sex Differences in Reaction Time in Adulthood: Results From the United Kingdom Health and Lifestyle Survey University of University of Edinburgh, Psychology and Aging. 2006; 21 (1): 62-73.
5. Niruba, Maruthy. Glycosylated Hemoglobin verses Reaction time in Diabetics–A cross sectional study. National Journal of Basic Medical Science. 2011 April-June; 4 (1): 198-201.
6. Hema S, Konrad P. Critical flicker fusion test of potential vision. Journal of Cataract and refractive surgery. 2007 February; 33: 232-9.
7. Das S, Gandhi A, Mondal S. Effect of premenstrual stress on audiovisual reaction time and audiogram. Indian J Physio Pharmacol. 1997; 41 (1): 67-70.
8. Asmita SN, Pushpa AP. A Study of auditory reaction time in different phases of the normal menstrual cycle. Indian J Physio Pharmacol. 2010; 54 (4): 386-390.
9. Babyminakshi PL, Mangala KA, Afroz S, Nanda SD, Sudhir CP. Effect of premenstrual stress on cardiovascular system and central nervous system. J Obstet Gynecol India. 2006 April; 56 (2): 156-158.
10. Afroz A, Ashutosh B, Swati IA. The influence of different phases of normal menstrual cycle on simple visual reaction time. International Journal of Bioassays. 2013; 02 (04): 716-718.
11. Simin N, and Ravlic A. changes in body temperature and reaction times during menstrual cycle. Arh Hig Rada Toksikol. 2013; 64: 99-106.

198 International Journal of Physiology, October-December 2019, Vol.7, No. 4
12. McEwen B. Estrogen action throughout brain. Recent Prog Hormon Res. 2002; 57: 357-384.
13. Ashwini NN, Vaishali VP, Samir K, Mangala V. Autonomic function tests during pre and post menstrual phases in young women. Pravara medical review. 2011; 3 (2): 24-30.
14. Garry F, Gant C, MacDonald PC et al (eds). Williams obstetrics 20th (edn). Connecticut. Appleton and Lange. 1997: 84-6.
15. Bruce J, Russell GF. Premenstrual tension: a study of weight changes and balances of sodium, water and potassium. Lancet. 1962; 11: 267-271.
16. Lalita HN, Jayshree VG. Effect of age, gender and body mass index on visual and auditory reaction times in Indian population. Indian J Physiol Pharmacol. 2012; 56 (1): 94-99.
17. Reid RL, Yen SSC. Premenstrual syndrome. Am J ObstetGynecol. 1981; 139: 85-104.
18. Mahesh B, Kalpesh V, Gitesh D. Maulik P, Hitesh J, Varsha J. A comparative study of visual reaction time in badminton players and healthy controls. Indian Journal of Applied Basic Medical Sciences. 2013 Jan; 15 (20): 76-81.
International Journal of Physiology, October-December 2019, Vol.7, No. 4 199
A Study of Correlation Between Blood Groups and Anemia in Young Adults
Reshmarani1, Shilpa N.2, Subhash Chimkode3
1Assistant Professor, Department of Physiology, BRIMS, Bidar, 2Assistant Professor, Department of Physiology, KBNIMS, Gulbarga, 3Professor and HOD, Department of Physiology, BRIMS, Bidar, Karnataka
AbstractAnaemia is a global nutritional problem common in developing countries. Most common type of anaemia is iron deficiency anaemia. Anaemia can be corrected by giving iron supplements and vitamins, but it has its own side effects when given on long term. So, this study aims to know whether there is any relation between blood group and occurrence of anaemia, so that preventive measures can be taken to combat anaemia in individuals who are more prone to it.
Methodology: The study is conducted on 198 MBBS students (males and females) who are in the age group of 18-25 years in Bidar institute of medical sciences, Bidar. Blood sample is taken using finger prick, under aseptic conditions and blood group is determined using glass slide method using antisera A, B and D. Hemoglobin concentration is estimated using Sahli’s method.
Results: In our study we found that students with blood group B (24%)are more prone for anemia, followed by O (16%), AB (10%) and blood group A (8%). Blood group A almost resistant to anemia.
Conclusion: We can conclude that regular intake of iron and vitamin supplements could be suggested to the individuals who are more susceptible to anemia based on their blood groups.
Keywords: Blood group, Hemoglobin, Anaemia.
the inheritance of genes to establish parentage. Two particular types of antigens are much more likely than the others to cause blood transfusion reactions. They are the O-A-B system of antigens and the Rh system. 3 ABO and Rh are recognized as the major clinically significant blood group antigens.
The rhesus blood group system was the fourth system to be discovered. 1The ABO blood group individuals are divided into four major blood groups, namely, A, B, AB and O, according to the presence of antigens and agglutinins. Blood group A blood has type A antigens, blood group B has type B antigens and blood group O has neither A nor B antigens.
The Rhesus antigen (name because a related antigen was first discovered in Rhesus monkeys), is found in the red blood cells of approximately 85%-90% of the people. This is the second most important blood group system due to its immunogenicity in Rh negative individuals in blood transfusion or pregnancy. Rh positive individuals have RhD antigen on the surface of their red blood cells
IntroductionBlood is a specialized connective tissue with
complete and unchangeable identity. It provides one of the means of connection between the cells of different parts of the body and external environment. 1 In modern medicine blood transfusion is an important measure for replacing blood loss.2 At least 30 commonly occurring antigens and hundreds of other rare antigen have been found in human blood cells, especially on the surfaces of the cell membranes. Most of the antigens are weak and therefore are of importance principally for studying
Corresponding Author: Dr. Shilpa N. Assistant Professor, Department of Physiology, KBNIMS, Gulbarga, Karnataka Plot No. 77, Shri Guru Sharana Nilaya, Srinagar Colony, New Jewargi Road, Gulbarga - 585102, Karnataka
10.5958/2320-608X.2019.00169.0
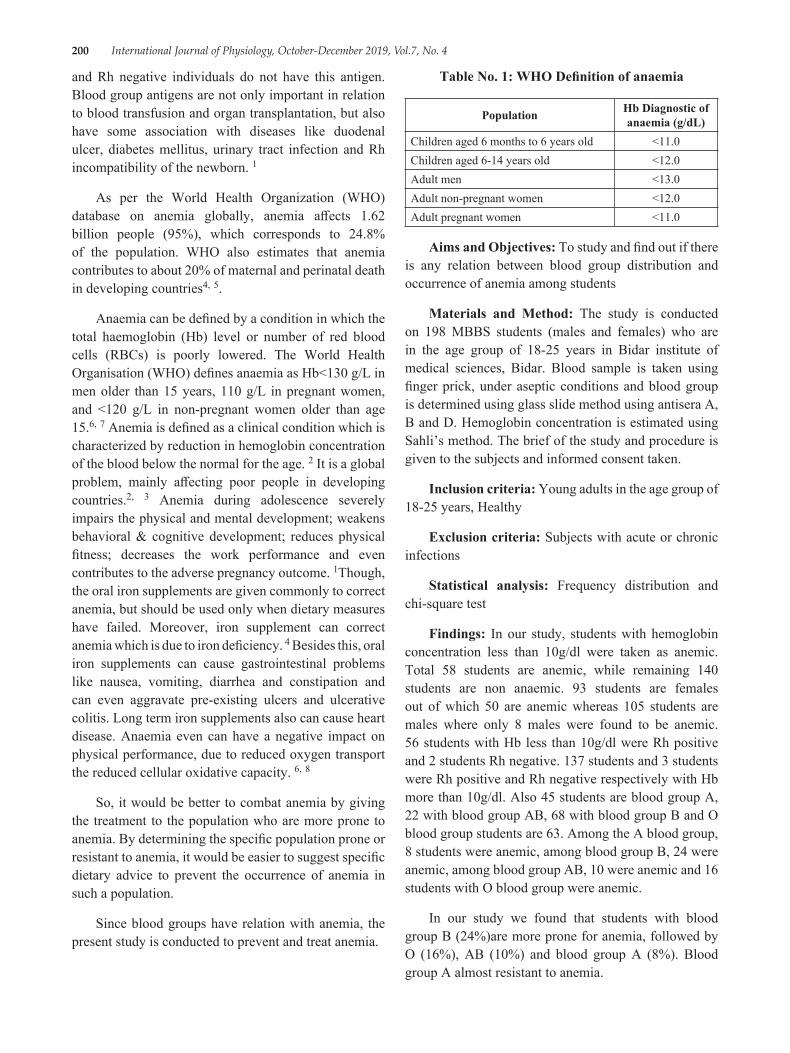
200 International Journal of Physiology, October-December 2019, Vol.7, No. 4
and Rh negative individuals do not have this antigen. Blood group antigens are not only important in relation to blood transfusion and organ transplantation, but also have some association with diseases like duodenal ulcer, diabetes mellitus, urinary tract infection and Rh incompatibility of the newborn. 1
As per the World Health Organization (WHO) database on anemia globally, anemia affects 1.62 billion people (95%), which corresponds to 24.8% of the population. WHO also estimates that anemia contributes to about 20% of maternal and perinatal death in developing countries4, 5.
Anaemia can be defined by a condition in which the total haemoglobin (Hb) level or number of red blood cells (RBCs) is poorly lowered. The World Health Organisation (WHO) defines anaemia as Hb<130 g/L in men older than 15 years, 110 g/L in pregnant women, and <120 g/L in non-pregnant women older than age 15.6, 7 Anemia is defined as a clinical condition which is characterized by reduction in hemoglobin concentration of the blood below the normal for the age. 2 It is a global problem, mainly affecting poor people in developing countries.2, 3 Anemia during adolescence severely impairs the physical and mental development; weakens behavioral & cognitive development; reduces physical fitness; decreases the work performance and even contributes to the adverse pregnancy outcome. 1Though, the oral iron supplements are given commonly to correct anemia, but should be used only when dietary measures have failed. Moreover, iron supplement can correct anemia which is due to iron deficiency. 4 Besides this, oral iron supplements can cause gastrointestinal problems like nausea, vomiting, diarrhea and constipation and can even aggravate pre-existing ulcers and ulcerative colitis. Long term iron supplements also can cause heart disease. Anaemia even can have a negative impact on physical performance, due to reduced oxygen transport the reduced cellular oxidative capacity. 6, 8
So, it would be better to combat anemia by giving the treatment to the population who are more prone to anemia. By determining the specific population prone or resistant to anemia, it would be easier to suggest specific dietary advice to prevent the occurrence of anemia in such a population.
Since blood groups have relation with anemia, the present study is conducted to prevent and treat anemia.
Table No. 1: WHO Definition of anaemia
Population Hb Diagnostic of anaemia (g/dL)
Children aged 6 months to 6 years old <11.0Children aged 6-14 years old <12.0Adult men <13.0Adult non-pregnant women <12.0Adult pregnant women <11.0
Aims and Objectives: To study and find out if there is any relation between blood group distribution and occurrence of anemia among students
Materials and Method: The study is conducted on 198 MBBS students (males and females) who are in the age group of 18-25 years in Bidar institute of medical sciences, Bidar. Blood sample is taken using finger prick, under aseptic conditions and blood group is determined using glass slide method using antisera A, B and D. Hemoglobin concentration is estimated using Sahli’s method. The brief of the study and procedure is given to the subjects and informed consent taken.
Inclusion criteria: Young adults in the age group of 18-25 years, Healthy
Exclusion criteria: Subjects with acute or chronic infections
Statistical analysis: Frequency distribution and chi-square test
Findings: In our study, students with hemoglobin concentration less than 10g/dl were taken as anemic. Total 58 students are anemic, while remaining 140 students are non anaemic. 93 students are females out of which 50 are anemic whereas 105 students are males where only 8 males were found to be anemic. 56 students with Hb less than 10g/dl were Rh positive and 2 students Rh negative. 137 students and 3 students were Rh positive and Rh negative respectively with Hb more than 10g/dl. Also 45 students are blood group A, 22 with blood group AB, 68 with blood group B and O blood group students are 63. Among the A blood group, 8 students were anemic, among blood group B, 24 were anemic, among blood group AB, 10 were anemic and 16 students with O blood group were anemic.
In our study we found that students with blood group B (24%)are more prone for anemia, followed by O (16%), AB (10%) and blood group A (8%). Blood group A almost resistant to anemia.
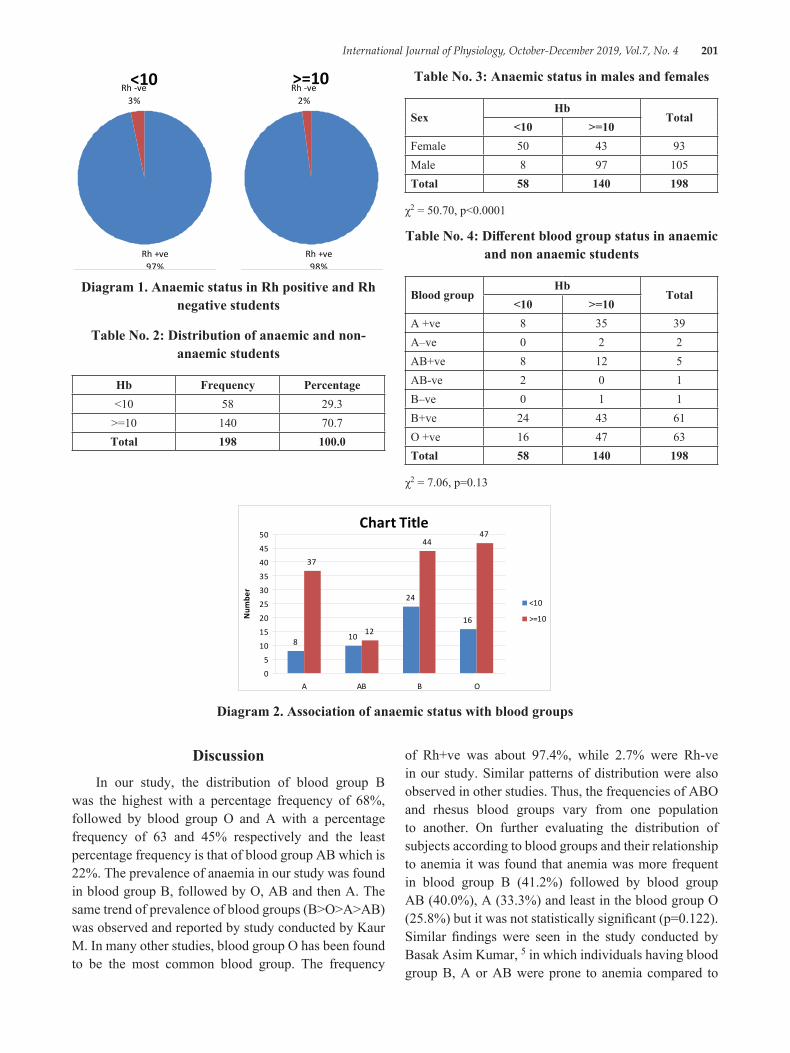
International Journal of Physiology, October-December 2019, Vol.7, No. 4 201
<10
Rh +ve97%
Rh -ve3%
>=10
Rh +ve98%
Rh -ve2%
Diagram 1. Anaemic status in Rh positive and Rh negative students
Table No. 2: Distribution of anaemic and non-anaemic students
Hb Frequency Percentage<10 58 29.3
>=10 140 70.7Total 198 100.0
Table No. 3: Anaemic status in males and females
SexHb
Total<10 >=10
Female 50 43 93Male 8 97 105Total 58 140 198
χ2 = 50.70, p<0.0001
Table No. 4: Different blood group status in anaemic and non anaemic students
Blood groupHb
Total<10 >=10
A +ve 8 35 39A–ve 0 2 2AB+ve 8 12 5AB-ve 2 0 1B–ve 0 1 1B+ve 24 43 61O +ve 16 47 63Total 58 140 198
χ2 = 7.06, p=0.13
Chart Title
8 10
24
16
37
12
4447
0
5
10
15
20
25
30
35
40
45
50
A AB B O
Num
ber
<10
>=10
Diagram 2. Association of anaemic status with blood groups
DiscussionIn our study, the distribution of blood group B
was the highest with a percentage frequency of 68%, followed by blood group O and A with a percentage frequency of 63 and 45% respectively and the least percentage frequency is that of blood group AB which is 22%. The prevalence of anaemia in our study was found in blood group B, followed by O, AB and then A. The same trend of prevalence of blood groups (B>O>A>AB) was observed and reported by study conducted by Kaur M. In many other studies, blood group O has been found to be the most common blood group. The frequency
of Rh+ve was about 97.4%, while 2.7% were Rh-ve in our study. Similar patterns of distribution were also observed in other studies. Thus, the frequencies of ABO and rhesus blood groups vary from one population to another. On further evaluating the distribution of subjects according to blood groups and their relationship to anemia it was found that anemia was more frequent in blood group B (41.2%) followed by blood group AB (40.0%), A (33.3%) and least in the blood group O (25.8%) but it was not statistically significant (p=0.122). Similar findings were seen in the study conducted by Basak Asim Kumar, 5 in which individuals having blood group B, A or AB were prone to anemia compared to
202 International Journal of Physiology, October-December 2019, Vol.7, No. 4
blood group O but was statistically significant. On the other hand, there was no such relationship between Rh factor and the occurrence of anemia between the above mentioned populations. Anemia during adolescence severely impairs the physical and mental development; weakens behavioral and cognitive development; reduces physical fitness; decreases the work performance and even contributes to the adverse pregnancy outcome Mild anemia can adversely affect the productivity and is also known to reduce the immune-competence. The average prevalence of anemia is 25-80% seen in several studies across the Indian subcontinent in a study conducted by ICMR in sixteen districts in eleven different states reporting a prevalence rate of anemia 90.1% among the adolescent girls of 11-18 years age groups. In their study, 35% anemia was seen in the 300 students studied. In further evaluating gender wise it was found that anemia was significantly more in the girls (44.8%) compared to the boys (17.6%) with a ‘p’ value of 0.0001. The similar higher prevalence of anemia was found in the rural girls (98%) and boys (56%) of Punjab. This study reveals that there is a relationship between blood group and anemia, though not statistically significant which could be due to small sample size. Similar finding was found in our study where girls are more prone to anaemia. The individuals with blood group antigen alpha and beta are comparatively more prone to be anemia, whereas the individuals devoid of these anti gens are resistant to anemia. So, the regular intake of iron and vitamin rich diet in individuals having blood groups A, B, and AB can prevent the occurrence of anemia.
ConclusionWe conclude that individuals with blood group B
are more prone to anaemia followed by blood group O, AB and least is with blood group A. Based on their blood groups, we can advice regular intake of diet rich in iron
and vitamins or also their supplements to the individual who are more susceptible to anaemia.
Conflict of Interest: None
Source of Funding: Self
Ethical Clearance: Taken
References1. Kaur M. Relationship and Distribution of ABO,
Rh Blood Groups and Hemoglobin Concentration among the Adolescents J Phys Pharm Adv 2015, 5 (9): 703-712 DOI: 10.5455/jppa. 20150917122244
2. Relationship between blood group and anemia–A case study
3. Guyton and Hall, Textbook of Medical Physiology; Second South Asia Edition
4. Basak Asim Kumar and Maji Kaushik: Blood group and anemia:Exploring a new relationship, Journal of Public Health and Epidemiology Vol 5 (1), pp. 43-45, January 2013
5. Harvey P (2004). A strategic approach to anemia control, MOST, The USAID micronutrients program, Arlington, Virginia. http://health. nytimes.com/health/guides/disease/anemia/treatment. html retrieved on 12.02.12.
6. Salma AlDallal, Iron Deficiency Anemia: A Short Review, Journal of Cancer Research and Immuno-Oncology, Vol 2, Issue 1, 1000106
7. Goddard AF, James MW, McIntyre AS, Scott BB (2011) Guidelines for the management of iron deficiency anaemia. Gut 60: 1309-1316.
8. Zhang AS, Enns CA (2009) Molecular mechanisms of normal iron homeostasis. Hematology. Am Soc Hematol Educ Program 1: 207-214.
International Journal of Physiology, October-December 2019, Vol.7, No. 4 203
Acute Effect of Hemodialysis on Cognition in Patient of End Stage Renal Disease
Sanaul Mustafa Ansari1, Kumar Siddharth1, Ashok Sharan2
1Junior Resident (Academic), 2Professor& Head, Department of Physiology, Indira Gandhi Institute of Medical Sciences, Patna
AbstractAim: To assess effect of hemodialysis on cognitive control.
Introduction: Studies till date have not confirmed the immediate effect of hemodialysis on cognitive function. Cognitive control consists of core cognitive functions such as working memory and inhibition. In several studies it was observed that patients performed worse than healthy control in terms of fluency, working memory, inhibitory control, cognitive flexibility, and decision-making. This study was specifically designed to observe the effect of hemodialysis on learning and memory (Cognitive Control) in fifty ambulatory male subjects of end stage renal disease undergoing twice a week hemodialysis of age more than 21years.
Material and Method Subjects on hemodialysis for more than 2 months up to a year were only included. They were instructed about methodology of Stroop color Word Test, Backward digit span Test and Ray Auditory Verbal learning Test. Following instruction on methodology they were given five practice sessions. They were then tested before and after hemodialysis.
Result: Post hemodialysis, the reaction time for Stroop color condition, Stroop word condition and Strop color word condition was less and this was found to be statistically significant when compared to pre-hemodialysis. This indicates an improvement in executive control acutely after dialysis.
If we look at backward digit span test and RAVLT total score, delayed recall and average recall no significant change was seen. The RAVLT immediate recall time changed significantly after hemodialysis.
Conclusion: There is acute effect of hemodialysis on executive function (cognitive control) domain of cognition.
Keywords: Hemodialysis, cognitive control, Stroop Color Word Test.
growth in the health care infrastructure. Parallel to this increase in the longevity a number of researches related to the impairment in the cognitive abilities has seen an upward graph in the recent years. Multifaceted impairment in the cognitive decline primarily in the domain of executive functions, short term memory and cognitive control.
Studies have explored cognitive functions in ESRD-HD patients by using a comprehensive test battery encompassing the domains of updating (fluency, working memory, and reasoning), inhibitory control, cognitive flexibility, planning and decision-making.
IntroductionBetter longevity of the patient of End renal disease
has seen a recent upsurge in the prevalence mainly due to the recent advances in the treatment modality like peritoneal dialysis and hemodialysis and tremendous
Corresponding Author: Dr. Kumar Siddharth Junior Resident (Academic), Department of Physiology, IGIMS, Patna e-mail: [email protected] Mobile: 9939606091
10.5958/2320-608X.2019.00170.7
204 International Journal of Physiology, October-December 2019, Vol.7, No. 4
In several studies it was observed that patients performed worse than healthy control in terms of fluency, working memory, inhibitory control, cognitive flexibility, and decision-making.
Literatures till date give a conflicting view of the immediate effect of hemodialysis on cognitive function.
In case of verbal fluency, Harciarek et al.1 found a reduced rate of word production of in a task of phonological fluency, while Post et al.2, using the Fluency-Controlled Oral Word Association Test (COWAT), showed a reduced performance in phonological and semantic verbal fluency. While studying working memory, Anwar et al. and Costa et al. observed lower performance by ESRD-HD patients in comparison to healthy controls.3,4 Some earlier studies also demonstrated impaired inhibitory control in ESRD-HD patients.5,2 However, with respect to cognitive flexibility, Anwar et al.3 and Post et al.2 observed in ESRD-HD patients on the Trail Making Test B, a reduced performance. Evaluating reasoning, Pereira et al. in another study reported significant deteriorations in non-verbal fluency reasoning by ESRD-HD patients.6
Cognitive control encompasses core cognitive process like inhibition, working memory and cognitive flexibility. Key elements like selection, scheduling and coordinated programming process are needed for cognitive control that is brought about by target oriented, self-regulatory operations of brain 11.
We undertook this study to add to the existing literature our finding on the acute effect of haemodialysis on one particular area of cognitive function i.e. cognitive control that has been quite neglected by the researchers.
Material and MethodThis study was performed as a before-after analytical
research in patients on maintenance hemodialysis older than 20 years of age, in dialysis unit of department of Nephrology; IGIMS Patna. Only patients who were on maintenance hemodialysis for more than 2 months and less than one year were included in the study.
The study population consisted of 50 ambulatory male patients with ESRD (GFR < 15 mL/m undergoing maintenance hemodialysis twice a week. The causes of ESRD were diabetes mellitus type II (20%), arterial hypertension (35%), glomerulonephritis (30%), and cystic kidney disease (15%).
Inclusion criteria:
(a) Age above 20 years
(b) MMSE score more than 28
(c) Stable clinical and functional state
(d) Education level; Matriculation and above
Exclusion criteria
(a) Cardiovascular disorders
(b) Known lung disease, such as asthma or COPD
(c) Neuromuscular disorders and neuropsychiatric disorder
(d) Being a past or active smoker
(e) Malnutrition (BMI < 18).
(f) Patients showing any sign and symptoms of uremic encephalopathy
The study had the prior approval of the institute ethics committee. All subjects gave informed signed consent.
Hemodialysis: All the included patients in the study were on hemodialysis two times per week in the morning shifts. Dialysis was done using Dialog+ B BRAUN Melsungen AG, Germany machines. The patients included were kept on a strict maintenance regime. The water was treated by a reverse-osmosis de-ionizing system.
The Dialyzers were multiple-use, 1.3 m2 surface area high-flux synthetic hollow fiber polynephron (Nipro Corporation, Japan) with bicarbonate-based dialysate (Glucose 1 mmol/L, Na+ 140 mEq/L, HCO3
-32 mEq/L, K+ 2.0 mEq/L, Ca2+ 1.25 mmol/L, Mg2+ 0.5 mEq/L). The prescribed duration was 3 h with a blood flow rate of 250-350 ml/min and dialysate flow rate of 500 ml/min. Spirometry was performed twice for the eligible patients who consented to participate in the study; before the hemodialysis session and immediately after it.
Cognitive Function Testing: They were instructed on methodology of Stroop colour Word Test, Ray Auditory Verbal Test and Backward digit span. Following instruction on methodology they were given five practice sessions. Any query about the test was answered.
Stroop Colour Word Test 15: Vitoria version of Stroop Colour Word Test was used. It consists of three
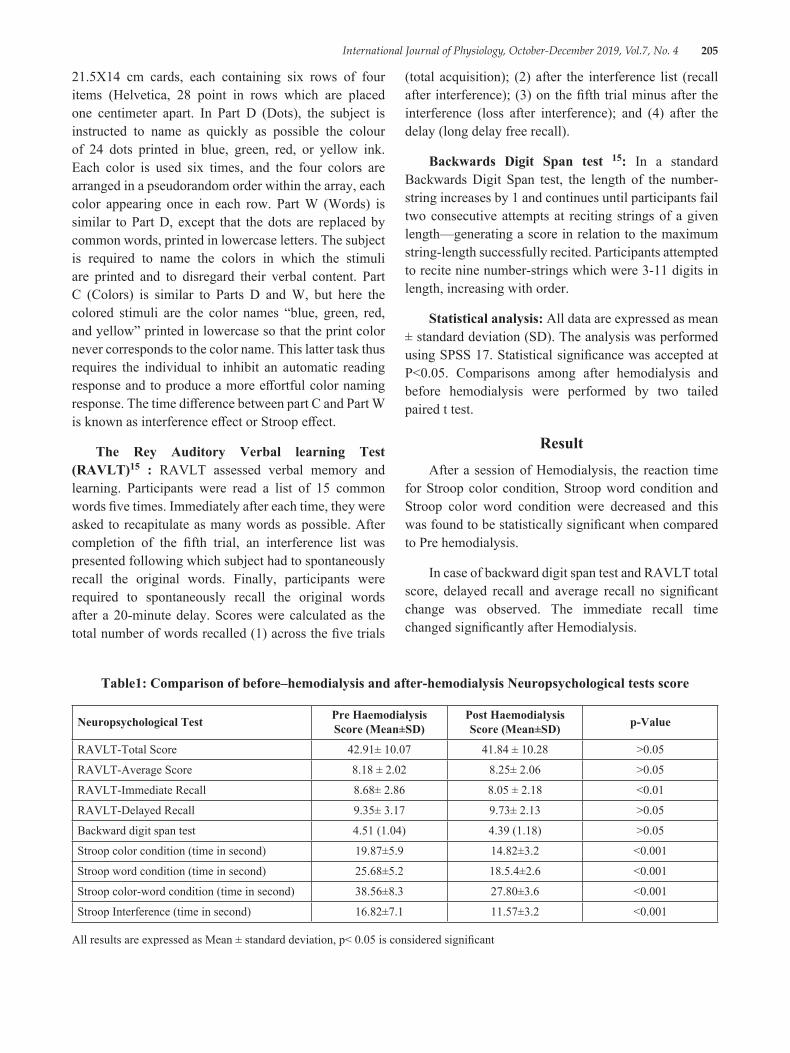
International Journal of Physiology, October-December 2019, Vol.7, No. 4 205
21.5X14 cm cards, each containing six rows of four items (Helvetica, 28 point in rows which are placed one centimeter apart. In Part D (Dots), the subject is instructed to name as quickly as possible the colour of 24 dots printed in blue, green, red, or yellow ink. Each color is used six times, and the four colors are arranged in a pseudorandom order within the array, each color appearing once in each row. Part W (Words) is similar to Part D, except that the dots are replaced by common words, printed in lowercase letters. The subject is required to name the colors in which the stimuli are printed and to disregard their verbal content. Part C (Colors) is similar to Parts D and W, but here the colored stimuli are the color names “blue, green, red, and yellow” printed in lowercase so that the print color never corresponds to the color name. This latter task thus requires the individual to inhibit an automatic reading response and to produce a more effortful color naming response. The time difference between part C and Part W is known as interference effect or Stroop effect.
The Rey Auditory Verbal learning Test (RAVLT)15 : RAVLT assessed verbal memory and learning. Participants were read a list of 15 common words five times. Immediately after each time, they were asked to recapitulate as many words as possible. After completion of the fifth trial, an interference list was presented following which subject had to spontaneously recall the original words. Finally, participants were required to spontaneously recall the original words after a 20-minute delay. Scores were calculated as the total number of words recalled (1) across the five trials
(total acquisition); (2) after the interference list (recall after interference); (3) on the fifth trial minus after the interference (loss after interference); and (4) after the delay (long delay free recall).
Backwards Digit Span test 15: In a standard Backwards Digit Span test, the length of the number-string increases by 1 and continues until participants fail two consecutive attempts at reciting strings of a given length—generating a score in relation to the maximum string-length successfully recited. Participants attempted to recite nine number-strings which were 3-11 digits in length, increasing with order.
Statistical analysis: All data are expressed as mean ± standard deviation (SD). The analysis was performed using SPSS 17. Statistical significance was accepted at P<0.05. Comparisons among after hemodialysis and before hemodialysis were performed by two tailed paired t test.
ResultAfter a session of Hemodialysis, the reaction time
for Stroop color condition, Stroop word condition and Stroop color word condition were decreased and this was found to be statistically significant when compared to Pre hemodialysis.
In case of backward digit span test and RAVLT total score, delayed recall and average recall no significant change was observed. The immediate recall time changed significantly after Hemodialysis.
Table1: Comparison of before–hemodialysis and after-hemodialysis Neuropsychological tests score
Neuropsychological Test Pre Haemodialysis Score (Mean±SD)
Post Haemodialysis Score (Mean±SD) p-Value
RAVLT-Total Score 42.91± 10.07 41.84 ± 10.28 >0.05
RAVLT-Average Score 8.18 ± 2.02 8.25± 2.06 >0.05
RAVLT-Immediate Recall 8.68± 2.86 8.05 ± 2.18 <0.01
RAVLT-Delayed Recall 9.35± 3.17 9.73± 2.13 >0.05
Backward digit span test 4.51 (1.04) 4.39 (1.18) >0.05
Stroop color condition (time in second) 19.87±5.9 14.82±3.2 <0.001
Stroop word condition (time in second) 25.68±5.2 18.5.4±2.6 <0.001
Stroop color-word condition (time in second) 38.56±8.3 27.80±3.6 <0.001
Stroop Interference (time in second) 16.82±7.1 11.57±3.2 <0.001
All results are expressed as Mean ± standard deviation, p< 0.05 is considered significant
206 International Journal of Physiology, October-December 2019, Vol.7, No. 4
DiscussionPost hemodialysis, the reaction time for Stroop color
condition, Stroop word condition and Strop color word condition was less and this was found to be statistically significant when compared to pre-hemodialysis. This indicates an improvement in executive control acutely after dialysis.
If we look at backward digit span test and RAVLT total score, delayed recall and average recall no significant change was seen. The RAVLT immediate recall time changed significantly after hemodialysis.
Tests for cognitive function are of two major classes, neuropsychological and neurophysiological. In our study we have focused on the neuropsychological testing but similar studies with event related potential (ERP) must be evaluated.
Tilki HE, Akpolat T, Tunalı G, Kara A & Onar MK in their study documented the presence of electrophysiological and psychometric test abnormalities in chronic renal failure patients, and showed that continuous ambulatory peritoneal dialysis (CAPD) patients may have better outcomes as compared to HD patients. 8
Earlier studies evaluating MMS scores and P300 latency in uraemia were focused on HD patients. There are only a few studies assessing P300 latency and with dissimilar study designs. Gallai et al. demonstrated improvements in P300 latency after dialysis in 20 patients undergoing HD treatment. 9
Abnormal P300 and visual evoked potential latencies were found in 22 patients (13 were maintained on long term hemodialysis and 9 were being given only a low-protein diet) in a study by Cohen et al. 10
Tennyson et al. evaluated long-latency event-related potentials and the Symbol Digit Modalities Test in 10 hemodialysis patients. Significant increases in N200 and P300 amplitude were observed after dialysis treatment in these 10 patients. In their study, ERP component latency and the Symbol Digit Modalities Test were not affected by dialysis. Control groups were not used. 11
Evers et al. investigated visually evoked ERPs in 33 neurologically asymptomatic patients before and after they underwent hemodialysis. They compared the data with those of age-matched healthy subjects.
Before hemodialysis, the patients’ P300 latency was significantly prolonged as compared with that of the control group. After hemodialysis, P300 latency of the patients decreased, this was statistically significant. 12
This study evaluated in some detail cognitive outcomes in psychometric testing of ESRD patients on maintenance hemodialysis. The neuropsychological tests consisted of tests measuring learning ability, working memory, executive function and cognitive control. The post-hemodialysis testing had poorer performance only on some of these parameters than the pre-hemodialysis scores. Between the pre-hemodialysis and post-hemodialysis studies it should be noted that Stroop word condition, Stroop color condition, Stroop word-color condition and Stroop interference test all showed significant improvement in performance. This stressed the beneficial effect of hemodialysis on executive functions and cognitive control domains of the subject. There was an insignificant increase in performance in RAVLT-average score and RAVLT-delayed recall. A slight improvement was seen in backward digit span test but was not significant. The backward digit span assesses working memory.
There was no significant change in RAVLT-total, RAVLT-average, RAVLT-delayed recall scores. RAVLT-immediate recall scores differed significantly in the post hemodialysis test. The RAVLT is a measure of learning ability. It requires learning and memorizing function over a longer time. The available alertness of dialysis patients lasts to keep up with the short-term memory functions but immediate recall is still affected. Higher brain actions are involved, which are apparently reduced in patients on HD. Patients on hemodialysis are more likely able to memorize, concentrate and manage situations a day after dialysis. Lower cognitive function is a major hinderance as it impairs self-management, and follow a complicated pharmacologic time-table. Errors in medication and diet due to decreased cognitive performance can have deleterious consequences. As pointed out by Elias et al., the measures of everyday cognitive abilities relevant to patient understanding of the disease and treatments should be outlined, studied and implemented. 13
Harciarek et al. 1 and Lux et al. 14 are two studies similar to ours but both had a sample size smaller than ours. Lux et al. had only 12 subjects and Harciarek et al had 20. In contrast to our study both the studies show an increase in cognitive performance in namely executive
International Journal of Physiology, October-December 2019, Vol.7, No. 4 207
functions, psychomotor performance and learning and memory. One of the major limitations of our study was testing of only a few domains of cognition.
ConclusionThere is acute effect of hemodialysis on executive
function (cognitive control) domain of cognition.
Conflict of Interest: None
Ethical Clearance: Taken
Source of Funding: Self
Acknowledgement: Nil
References1. Harciarek M, Williamson JB, Biedunkiewicz B,
Lichodziejewska-Niemierko M, Dębska-Ślizień A, Rutkowski B. Risk factors for selective cognitive decline in dialyzed patients with end-stage renal disease:evidence from verbal fluency analysis. J Int Neuropsychol Soc. 2012 Jan; 18 (1):162±167.https://doi. org/10.1017/S1355617711001445 PMID: 22088797
2. Post JB, Morin KG, Sano M, Jegede AB, Langhoff E, Spungen AM, et al. Increased presence of cognitive impairment in hemodialysis patients in the absence of neurological events. Am J Nephrol. 2012; 35 (2):120±126.https://doi. org/10.1159/000334871 PMID: 22212437
3. Anwar W, Ezzat H, Mohab A. Comparative study of impact of hemodialysis and renal transplantation on cognitive functions in ESRD patients. Nefrologia. 2015 Nov-Dec; 35 (6):5 67±71.
4. Costa AS, Tiffin-Richards FE, Holschbach B, Frank RD, Vassiliadou A, KruÈger T, et al. Clinical predictors of individual cognitive fluctuations in patients undergoing hemodialysis. Am J Kidney Dis. 2014 Sep; 64 (3):434±442.https://doi. org/10.1053/j. ajkd. 2014.02.012 PMID: 24679895
5. Murray AM, Tupper DE, Knopman DS, Gilbertson DT, Pederson SL, Li S, et al. Cognitive impairment in hemodialysis patients is common. Neurology. 2006 Jul 25; 67 (2):216±223.https://doi. org/10.1212/01.wnl.0000225182.15532.40 PMID: 16864811
6. Pereira AA, Weiner DE, Scott T, Chandra P, Bluestein R, Griffith J, et al. Subcortical cognitive impairment in dialysis patients. Hemodial Int. 2007 Jul; 11 (3):309±314.https://doi. org/10.1111/j. 1542-4758.2007.00185.x PMID: 17576295
7. Hillman CH, Pontifex MB, Raine LB, Castelli MD, Hall EC, KrameAF. The effect of acute treadmill walking on cognitive control and academic achievement in preadolescent children. Neuroscience. 2009 March 31; 159 (3): 1044-1054
8. Tilki HE, Akpolat T, Tunalı G, Kara A & Onar MK. Effects of haemodialysis and continuous ambulatory peritoneal dialysis on P300 cognitive potentials in uraemic patients, Upsala Journal of Medical Sciences, 109:1, 43-48, 2004. DOI: 10.3109/2000-1967-109
9. Gallai, V., Alberti, A., Buoncristiani, U., Firenze, C. & Mazzotta, G.: Changes in auditory P3 event-related potentials in uremic patients undergoing HD. Electromyogr Clin Neurophysol 34: 397-402, 1994.
10. Cohen S. N., Syndulko K., Rever B., Kraut J., Coburn J., Tourtellotte W. W. Visual evoked potentials and long latency event-related potentials in chronic renal failure. Neurology 33; 1219-1222, 1983.
11. Tennyson T. E., Brown W. S., Vaziri N. D., Jennison J. H. Event-related potential changes during hemodialysis. Int J Artif Organs 8: 269-276, 1985.
12. Evers, S., Tepel, M., Obladen, M., Suhr, B., Husstedt, I. W., Grotemeyer, K. H. & Zidek, W.: Influence of end-stage renal failure and hemodialysis on event-related potentials. J Clin Neurophysiol15 (1): 58-63, 1998.
13. Elias MF, Dore GA, Davey A. Kidney disease and cognitive function. Contrib Nephrol 2013; 179: 42-57
14. Lux S, Mirzazade S, Kuzmanovic B et al. Differential activation of memory-relevant brain regions during a dialysis cycle. Kidney Int 2010; 78: 794-802
15. Strauss E, Sherman EMS, Spreen O. A Compendium of Neuropsychological Tests: Administration, Norms, and Commentary, Third Edition. Oxford university press. (2003)
208 International Journal of Physiology, October-December 2019, Vol.7, No. 4
Comparison of Somatosensory Evoked Potentials Between Genders in Healthy South Indian Population
Sarath Babu Viswanathan1, P.V. Balaji2, Girwar Singh Gaur3, Akshay Berad4
1Assistant Professor, 2Professor, Vinayaka Mission's Medical College. Karaikal. Puducherry, 3Professor, Department of Physiology, JIPMER, Puducherry, India, 4Associate Professor,
Department of Physiology, RIMS, Adilabad, Telangana
AbstractEvoked potential recordings (EPR) are designed to test the three most important of the five senses, touch, hearing and sight. Together, these three senses account for most of the incoming information absorbed by the brain. Evoked potentials (EPs) are important tools to study nerve impulse conduction in central nervous system. SEPs are one of the commonly used EPs which measure the transmission in somatosensory pathways. Aim of study was comparison of somatosensory evoked potentials between genders in healthy south indian population. Study was conducted in 120 healthy volunteers of both male & female in the age group of 15 to 60 years. Recording of SEPs was done in subjects. Informed written consent was obtained after explaining the procedures and answering all their queries. Normative data for Somatosensory Evoked Potential (SEP) for upper limb and lower limb in terms of both latency and amplitude were collected. statistical analysis was done using SPSS 20.0. In the present study, no significant correlation was found between gender and latencies of the waves both in upper and lower limbs. Amplitudes of the waves also could not be correlated with gender.Keywords: Somatosensory evoked potential, Gender.
EPs which measure the transmission in somatosensory pathways by any mode of stimulation whether it is electrical or mechanical. Evoked potentials are usually summated surface electrical potentials generated and recorded on the scalp overlying primary receptive areas of the brain corresponding to somatosensory system in parietal cortex 1. The SEPs assess the intactness of the sensory pathway and the long course makes it easy to evaluate. The stimulation of median nerve generate a number of wave forms, negative waves are designated by N and positive waves are designated by P. Usually the significant negative wave N20 and Positive wave P24 are recorded. The N20 is generated by Ventro-postero lateral (VPL) nucleus of thalamus and the primary sensory cortex. Tibial SEPs are recorded by stimulating the posterior tibial nerve. The important waves are P45 and N55. SEPs have a good correlation with impairment of joint position and vibration position2. For an abnormality in SEP to occur, a significant degree of sensory impairment should take place3.
Materials & MethodStudy was conducted in 120 healthy volunteers of
both male & female in the age group of 15 to 60 years.
Corresponding Author: Dr. P. V. Balaji Professor, Department of Physiology, Vinayaka Mission’s Medical College, Karaikal, Puducherry, India e-mai: [email protected]
IntroductionThe five human senses of sight, hearing, smell,
taste and touch are imperative to life. Impairment or nonfunctioning of any one of these incapacitates a human being to such a degree that the sufferer can only be considered as disabled. Evoked potential recordings (EPR) are designed to test the three most important of the five senses, touch, hearing and sight. Together, these three senses account for most of the incoming information absorbed by the brain. They are also the most easily monitored parameters. Studies have shown that sight accounts for as much as 70% of the huge and varied volume of information absorbed by a human being. Touch sense is responsible for another 15% and hearing sense for 10%. Evoked potentials (EPs) are important tools to study nerve impulse conduction in central nervous system. SEPs are one of the commonly used
10.5958/2320-608X.2019.00171.9
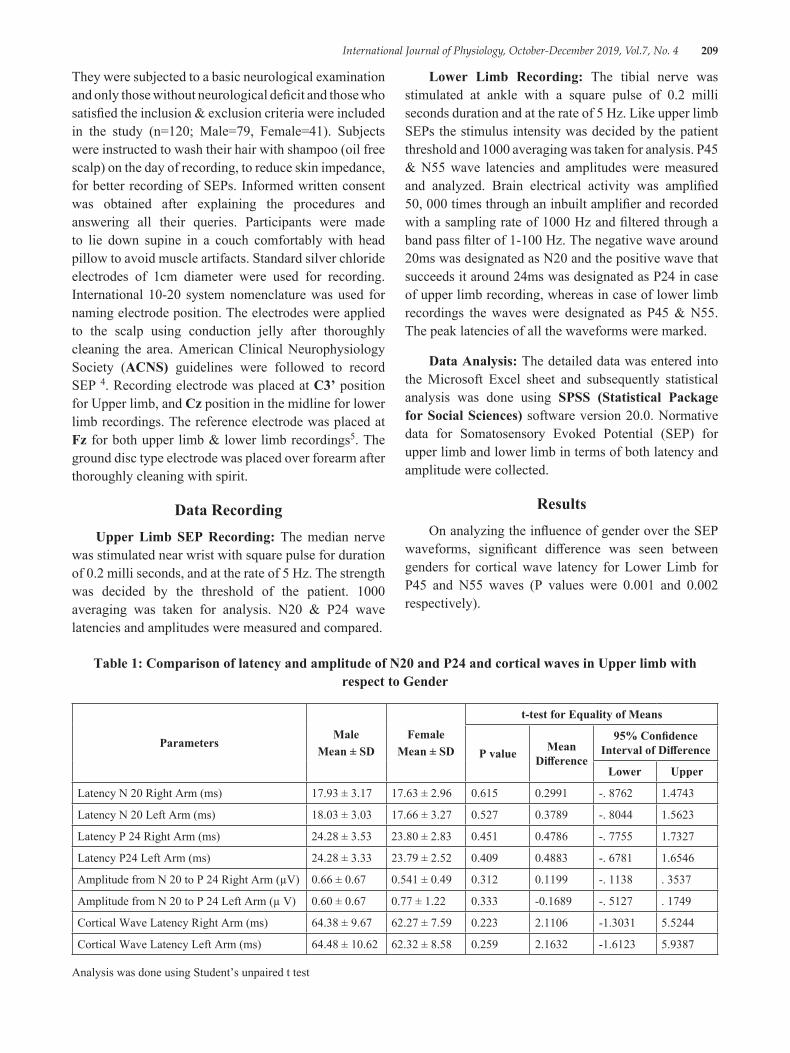
International Journal of Physiology, October-December 2019, Vol.7, No. 4 209
They were subjected to a basic neurological examination and only those without neurological deficit and those who satisfied the inclusion & exclusion criteria were included in the study (n=120; Male=79, Female=41). Subjects were instructed to wash their hair with shampoo (oil free scalp) on the day of recording, to reduce skin impedance, for better recording of SEPs. Informed written consent was obtained after explaining the procedures and answering all their queries. Participants were made to lie down supine in a couch comfortably with head pillow to avoid muscle artifacts. Standard silver chloride electrodes of 1cm diameter were used for recording. International 10-20 system nomenclature was used for naming electrode position. The electrodes were applied to the scalp using conduction jelly after thoroughly cleaning the area. American Clinical Neurophysiology Society (ACNS) guidelines were followed to record SEP 4. Recording electrode was placed at C3’ position for Upper limb, and Cz position in the midline for lower limb recordings. The reference electrode was placed at Fz for both upper limb & lower limb recordings5. The ground disc type electrode was placed over forearm after thoroughly cleaning with spirit.
Data RecordingUpper Limb SEP Recording: The median nerve
was stimulated near wrist with square pulse for duration of 0.2 milli seconds, and at the rate of 5 Hz. The strength was decided by the threshold of the patient. 1000 averaging was taken for analysis. N20 & P24 wave latencies and amplitudes were measured and compared.
Lower Limb Recording: The tibial nerve was stimulated at ankle with a square pulse of 0.2 milli seconds duration and at the rate of 5 Hz. Like upper limb SEPs the stimulus intensity was decided by the patient threshold and 1000 averaging was taken for analysis. P45 & N55 wave latencies and amplitudes were measured and analyzed. Brain electrical activity was amplified 50, 000 times through an inbuilt amplifier and recorded with a sampling rate of 1000 Hz and filtered through a band pass filter of 1-100 Hz. The negative wave around 20ms was designated as N20 and the positive wave that succeeds it around 24ms was designated as P24 in case of upper limb recording, whereas in case of lower limb recordings the waves were designated as P45 & N55. The peak latencies of all the waveforms were marked.
Data Analysis: The detailed data was entered into the Microsoft Excel sheet and subsequently statistical analysis was done using SPSS (Statistical Package for Social Sciences) software version 20.0. Normative data for Somatosensory Evoked Potential (SEP) for upper limb and lower limb in terms of both latency and amplitude were collected.
ResultsOn analyzing the influence of gender over the SEP
waveforms, significant difference was seen between genders for cortical wave latency for Lower Limb for P45 and N55 waves (P values were 0.001 and 0.002 respectively).
Table 1: Comparison of latency and amplitude of N20 and P24 and cortical waves in Upper limb with respect to Gender
ParametersMale
Mean ± SDFemale
Mean ± SD
t-test for Equality of Means
P value Mean Difference
95% Confidence Interval of Difference
Lower Upper
Latency N 20 Right Arm (ms) 17.93 ± 3.17 17.63 ± 2.96 0.615 0.2991 -. 8762 1.4743
Latency N 20 Left Arm (ms) 18.03 ± 3.03 17.66 ± 3.27 0.527 0.3789 -. 8044 1.5623
Latency P 24 Right Arm (ms) 24.28 ± 3.53 23.80 ± 2.83 0.451 0.4786 -. 7755 1.7327
Latency P24 Left Arm (ms) 24.28 ± 3.33 23.79 ± 2.52 0.409 0.4883 -. 6781 1.6546
Amplitude from N 20 to P 24 Right Arm (µV) 0.66 ± 0.67 0.541 ± 0.49 0.312 0.1199 -. 1138 . 3537
Amplitude from N 20 to P 24 Left Arm (µ V) 0.60 ± 0.67 0.77 ± 1.22 0.333 -0.1689 -. 5127 . 1749
Cortical Wave Latency Right Arm (ms) 64.38 ± 9.67 62.27 ± 7.59 0.223 2.1106 -1.3031 5.5244
Cortical Wave Latency Left Arm (ms) 64.48 ± 10.62 62.32 ± 8.58 0.259 2.1632 -1.6123 5.9387
Analysis was done using Student’s unpaired t test
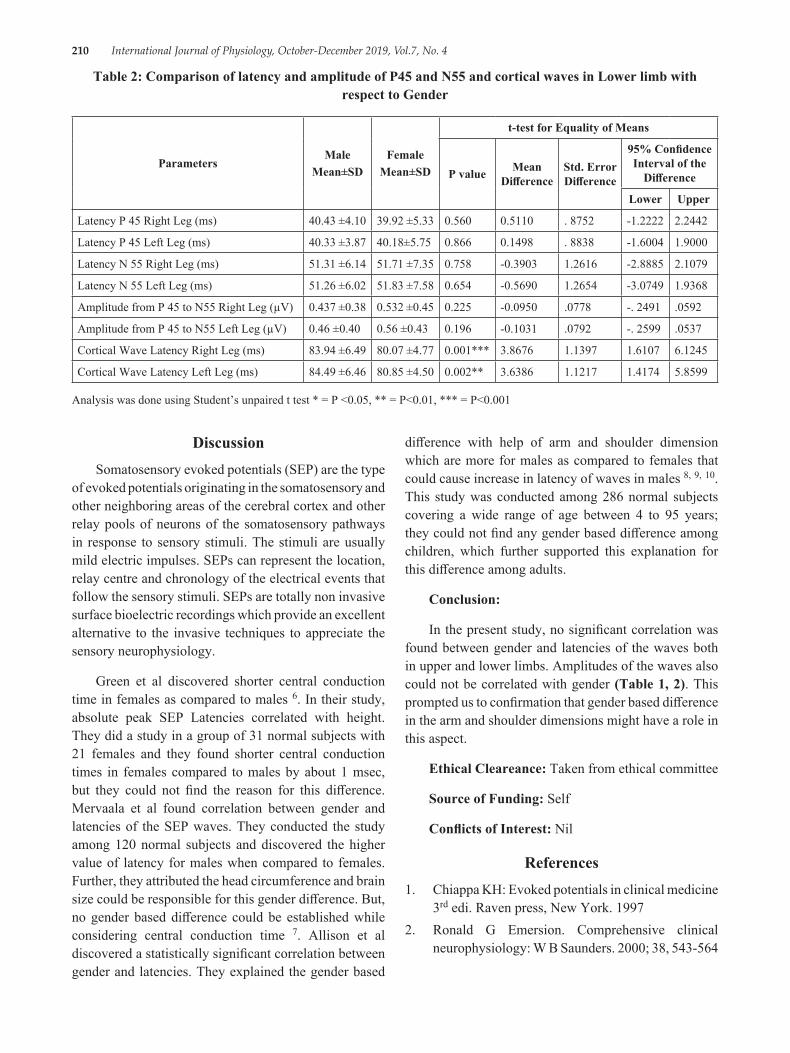
210 International Journal of Physiology, October-December 2019, Vol.7, No. 4
Table 2: Comparison of latency and amplitude of P45 and N55 and cortical waves in Lower limb with respect to Gender
ParametersMale
Mean±SDFemale
Mean±SD
t-test for Equality of Means
P value Mean Difference
Std. Error Difference
95% Confidence Interval of the
Difference
Lower Upper
Latency P 45 Right Leg (ms) 40.43 ±4.10 39.92 ±5.33 0.560 0.5110 . 8752 -1.2222 2.2442
Latency P 45 Left Leg (ms) 40.33 ±3.87 40.18±5.75 0.866 0.1498 . 8838 -1.6004 1.9000
Latency N 55 Right Leg (ms) 51.31 ±6.14 51.71 ±7.35 0.758 -0.3903 1.2616 -2.8885 2.1079
Latency N 55 Left Leg (ms) 51.26 ±6.02 51.83 ±7.58 0.654 -0.5690 1.2654 -3.0749 1.9368
Amplitude from P 45 to N55 Right Leg (µV) 0.437 ±0.38 0.532 ±0.45 0.225 -0.0950 .0778 -. 2491 .0592
Amplitude from P 45 to N55 Left Leg (µV) 0.46 ±0.40 0.56 ±0.43 0.196 -0.1031 .0792 -. 2599 .0537
Cortical Wave Latency Right Leg (ms) 83.94 ±6.49 80.07 ±4.77 0.001*** 3.8676 1.1397 1.6107 6.1245
Cortical Wave Latency Left Leg (ms) 84.49 ±6.46 80.85 ±4.50 0.002** 3.6386 1.1217 1.4174 5.8599
Analysis was done using Student’s unpaired t test * = P <0.05, ** = P<0.01, *** = P<0.001
difference with help of arm and shoulder dimension which are more for males as compared to females that could cause increase in latency of waves in males 8, 9, 10. This study was conducted among 286 normal subjects covering a wide range of age between 4 to 95 years; they could not find any gender based difference among children, which further supported this explanation for this difference among adults.
Conclusion:
In the present study, no significant correlation was found between gender and latencies of the waves both in upper and lower limbs. Amplitudes of the waves also could not be correlated with gender (Table 1, 2). This prompted us to confirmation that gender based difference in the arm and shoulder dimensions might have a role in this aspect.
Ethical Cleareance: Taken from ethical committee
Source of Funding: Self
Conflicts of Interest: Nil
References1. Chiappa KH: Evoked potentials in clinical medicine
3rd edi. Raven press, New York. 19972. Ronald G Emersion. Comprehensive clinical
neurophysiology: W B Saunders. 2000; 38, 543-564
DiscussionSomatosensory evoked potentials (SEP) are the type
of evoked potentials originating in the somatosensory and other neighboring areas of the cerebral cortex and other relay pools of neurons of the somatosensory pathways in response to sensory stimuli. The stimuli are usually mild electric impulses. SEPs can represent the location, relay centre and chronology of the electrical events that follow the sensory stimuli. SEPs are totally non invasive surface bioelectric recordings which provide an excellent alternative to the invasive techniques to appreciate the sensory neurophysiology.
Green et al discovered shorter central conduction time in females as compared to males 6. In their study, absolute peak SEP Latencies correlated with height. They did a study in a group of 31 normal subjects with 21 females and they found shorter central conduction times in females compared to males by about 1 msec, but they could not find the reason for this difference. Mervaala et al found correlation between gender and latencies of the SEP waves. They conducted the study among 120 normal subjects and discovered the higher value of latency for males when compared to females. Further, they attributed the head circumference and brain size could be responsible for this gender difference. But, no gender based difference could be established while considering central conduction time 7. Allison et al discovered a statistically significant correlation between gender and latencies. They explained the gender based
International Journal of Physiology, October-December 2019, Vol.7, No. 4 211
3. Kenry H Levin, Hans O Luders. Comprehensive clinical neurophysiology: WB Saunders. 2000; 36: 507-564
4. Ray Cooper, colin D Binnie, Richard Billings. Techniques in Clinical Neurophysiology-A Practical Manaua. Amsterdam: Elsevier Churchill Livingstone, Elsevier Ltd; 2005. P 58
5. U K Misra. Clinical Neurophysiology: J Kalita, editors:B. I Churchill Livingstone Pvt Ltd, New Delhi Publishers; 1999:293-295
6. Green JB, Walcoff MR, Lucke JF Comparison of phenytoin and phenobarbital effects on far-field auditory and somatosensory evoked potential interpeak latencies. Epilepsia. 1982; 23 (4):417-21
7. Mervaala E, Paakkonen A, Partanen JV, The influence of age, gender, height on the interpretation
of median nerve SEPS. Electroencephalogr Clin Neurophysiol 1988; 71 (2):109-13
8. Allison T, Wood CC, Goff WR Brain stem auditory, pattern-reversal visual, and short-latency somatosensory evoked potentials: latencies in relation to age, sex, and brain and body size Electroencephalogr Clin Neurophysiol. 1983; 55 (6):619-36
9. Eric S. Rosenthal The Utility of EEG, SSEP, and other Neurophysiologic Tools to Guide Neurocritical Care Neurotherapeutics (2012); 9:24-36
10. Liberson WT; Contributions to the history of the discovery of brain stem somato-sensory potentials Electromyogr Clin Neurophysiol. 1994; 34 (1):49-51
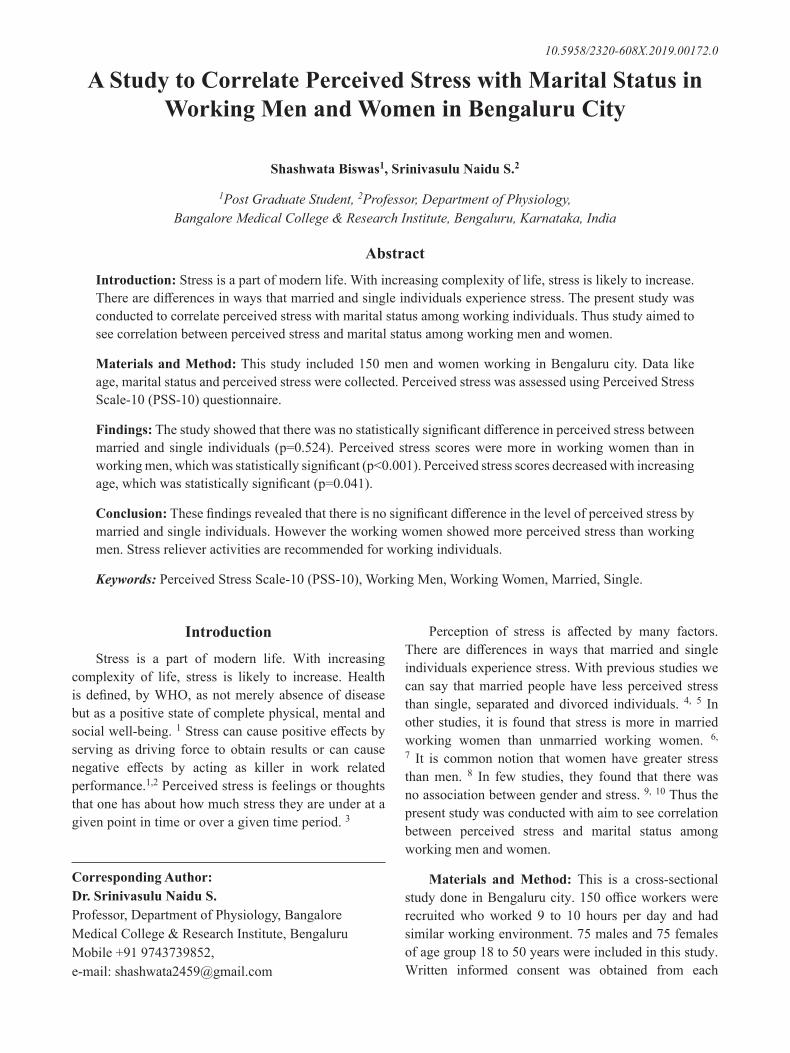
212 International Journal of Physiology, October-December 2019, Vol.7, No. 4
A Study to Correlate Perceived Stress with Marital Status in Working Men and Women in Bengaluru City
Shashwata Biswas1, Srinivasulu Naidu S.2
1Post Graduate Student, 2Professor, Department of Physiology, Bangalore Medical College & Research Institute, Bengaluru, Karnataka, India
AbstractIntroduction: Stress is a part of modern life. With increasing complexity of life, stress is likely to increase. There are differences in ways that married and single individuals experience stress. The present study was conducted to correlate perceived stress with marital status among working individuals. Thus study aimed to see correlation between perceived stress and marital status among working men and women.
Materials and Method: This study included 150 men and women working in Bengaluru city. Data like age, marital status and perceived stress were collected. Perceived stress was assessed using Perceived Stress Scale-10 (PSS-10) questionnaire.
Findings: The study showed that there was no statistically significant difference in perceived stress between married and single individuals (p=0.524). Perceived stress scores were more in working women than in working men, which was statistically significant (p<0.001). Perceived stress scores decreased with increasing age, which was statistically significant (p=0.041).
Conclusion: These findings revealed that there is no significant difference in the level of perceived stress by married and single individuals. However the working women showed more perceived stress than working men. Stress reliever activities are recommended for working individuals.
Keywords: Perceived Stress Scale-10 (PSS-10), Working Men, Working Women, Married, Single.
Perception of stress is affected by many factors. There are differences in ways that married and single individuals experience stress. With previous studies we can say that married people have less perceived stress than single, separated and divorced individuals. 4, 5 In other studies, it is found that stress is more in married working women than unmarried working women. 6, 7 It is common notion that women have greater stress than men. 8 In few studies, they found that there was no association between gender and stress. 9, 10 Thus the present study was conducted with aim to see correlation between perceived stress and marital status among working men and women.
Materials and Method: This is a cross-sectional study done in Bengaluru city. 150 office workers were recruited who worked 9 to 10 hours per day and had similar working environment. 75 males and 75 females of age group 18 to 50 years were included in this study. Written informed consent was obtained from each
IntroductionStress is a part of modern life. With increasing
complexity of life, stress is likely to increase. Health is defined, by WHO, as not merely absence of disease but as a positive state of complete physical, mental and social well-being. 1 Stress can cause positive effects by serving as driving force to obtain results or can cause negative effects by acting as killer in work related performance.1,2 Perceived stress is feelings or thoughts that one has about how much stress they are under at a given point in time or over a given time period. 3
Corresponding Author: Dr. Srinivasulu Naidu S. Professor, Department of Physiology, Bangalore Medical College & Research Institute, Bengaluru Mobile +91 9743739852, e-mail: [email protected]
10.5958/2320-608X.2019.00172.0
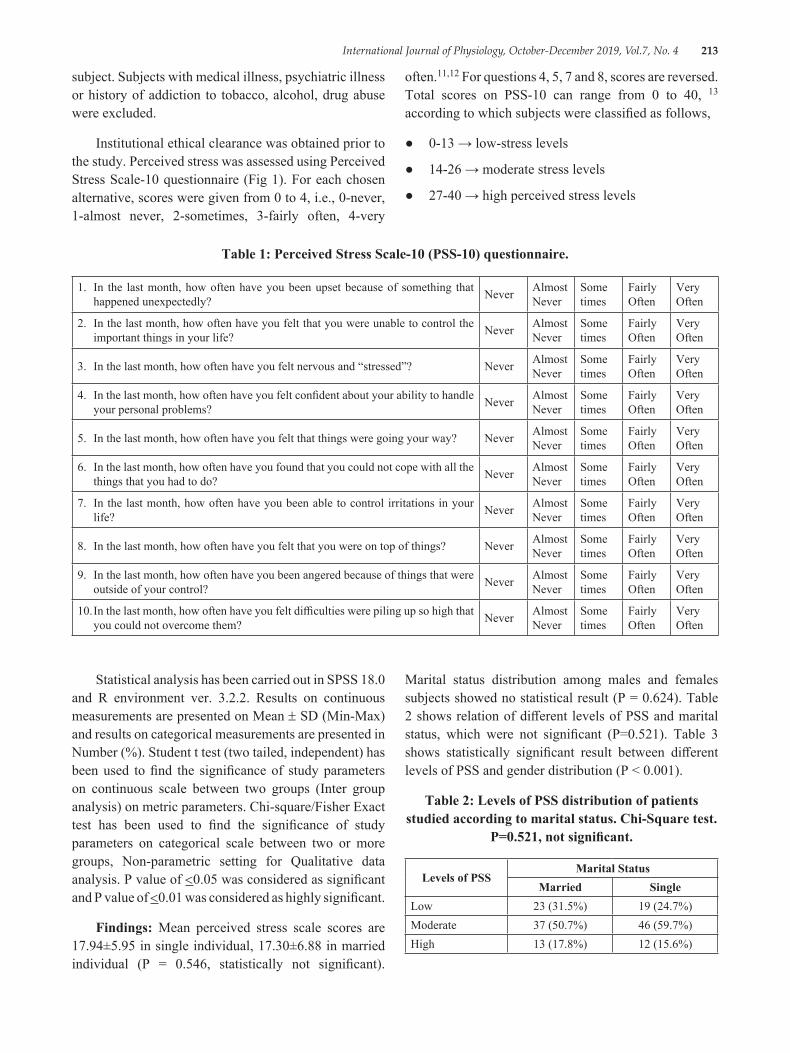
International Journal of Physiology, October-December 2019, Vol.7, No. 4 213
subject. Subjects with medical illness, psychiatric illness or history of addiction to tobacco, alcohol, drug abuse were excluded.
Institutional ethical clearance was obtained prior to the study. Perceived stress was assessed using Perceived Stress Scale-10 questionnaire (Fig 1). For each chosen alternative, scores were given from 0 to 4, i.e., 0-never, 1-almost never, 2-sometimes, 3-fairly often, 4-very
often.11,12 For questions 4, 5, 7 and 8, scores are reversed. Total scores on PSS-10 can range from 0 to 40, 13 according to which subjects were classified as follows,
● 0-13 → low-stress levels
● 14-26 → moderate stress levels
● 27-40 → high perceived stress levels
Table 1: Perceived Stress Scale-10 (PSS-10) questionnaire.
1. In the last month, how often have you been upset because of something that happened unexpectedly? Never Almost
NeverSome times
Fairly Often
Very Often
2. In the last month, how often have you felt that you were unable to control the important things in your life? Never Almost
NeverSome times
Fairly Often
Very Often
3. In the last month, how often have you felt nervous and “stressed”? Never Almost Never
Some times
Fairly Often
Very Often
4. In the last month, how often have you felt confident about your ability to handle your personal problems? Never Almost
NeverSome times
Fairly Often
Very Often
5. In the last month, how often have you felt that things were going your way? Never Almost Never
Some times
Fairly Often
Very Often
6. In the last month, how often have you found that you could not cope with all the things that you had to do? Never Almost
NeverSome times
Fairly Often
Very Often
7. In the last month, how often have you been able to control irritations in your life? Never Almost
NeverSome times
Fairly Often
Very Often
8. In the last month, how often have you felt that you were on top of things? Never Almost Never
Some times
Fairly Often
Very Often
9. In the last month, how often have you been angered because of things that were outside of your control? Never Almost
NeverSome times
Fairly Often
Very Often
10. In the last month, how often have you felt difficulties were piling up so high that you could not overcome them? Never Almost
NeverSome times
Fairly Often
Very Often
Statistical analysis has been carried out in SPSS 18.0 and R environment ver. 3.2.2. Results on continuous measurements are presented on Mean ± SD (Min-Max) and results on categorical measurements are presented in Number (%). Student t test (two tailed, independent) has been used to find the significance of study parameters on continuous scale between two groups (Inter group analysis) on metric parameters. Chi-square/Fisher Exact test has been used to find the significance of study parameters on categorical scale between two or more groups, Non-parametric setting for Qualitative data analysis. P value of <0.05 was considered as significant and P value of <0.01 was considered as highly significant.
Findings: Mean perceived stress scale scores are 17.94±5.95 in single individual, 17.30±6.88 in married individual (P = 0.546, statistically not significant).
Marital status distribution among males and females subjects showed no statistical result (P = 0.624). Table 2 shows relation of different levels of PSS and marital status, which were not significant (P=0.521). Table 3 shows statistically significant result between different levels of PSS and gender distribution (P < 0.001).
Table 2: Levels of PSS distribution of patients studied according to marital status. Chi-Square test.
P=0.521, not significant.
Levels of PSSMarital Status
Married SingleLow 23 (31.5%) 19 (24.7%)Moderate 37 (50.7%) 46 (59.7%)High 13 (17.8%) 12 (15.6%)
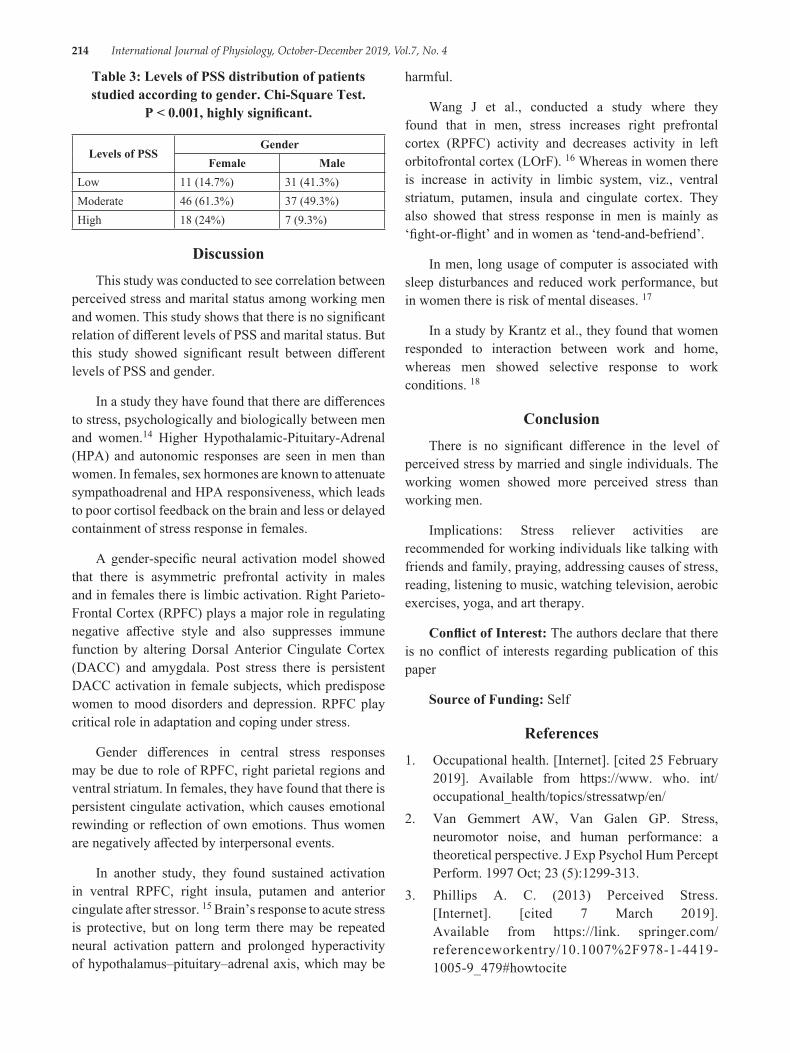
214 International Journal of Physiology, October-December 2019, Vol.7, No. 4
Table 3: Levels of PSS distribution of patients studied according to gender. Chi-Square Test.
P < 0.001, highly significant.
Levels of PSSGender
Female MaleLow 11 (14.7%) 31 (41.3%)Moderate 46 (61.3%) 37 (49.3%)High 18 (24%) 7 (9.3%)
DiscussionThis study was conducted to see correlation between
perceived stress and marital status among working men and women. This study shows that there is no significant relation of different levels of PSS and marital status. But this study showed significant result between different levels of PSS and gender.
In a study they have found that there are differences to stress, psychologically and biologically between men and women.14 Higher Hypothalamic-Pituitary-Adrenal (HPA) and autonomic responses are seen in men than women. In females, sex hormones are known to attenuate sympathoadrenal and HPA responsiveness, which leads to poor cortisol feedback on the brain and less or delayed containment of stress response in females.
A gender-specific neural activation model showed that there is asymmetric prefrontal activity in males and in females there is limbic activation. Right Parieto-Frontal Cortex (RPFC) plays a major role in regulating negative affective style and also suppresses immune function by altering Dorsal Anterior Cingulate Cortex (DACC) and amygdala. Post stress there is persistent DACC activation in female subjects, which predispose women to mood disorders and depression. RPFC play critical role in adaptation and coping under stress.
Gender differences in central stress responses may be due to role of RPFC, right parietal regions and ventral striatum. In females, they have found that there is persistent cingulate activation, which causes emotional rewinding or reflection of own emotions. Thus women are negatively affected by interpersonal events.
In another study, they found sustained activation in ventral RPFC, right insula, putamen and anterior cingulate after stressor. 15 Brain’s response to acute stress is protective, but on long term there may be repeated neural activation pattern and prolonged hyperactivity of hypothalamus–pituitary–adrenal axis, which may be
harmful.
Wang J et al., conducted a study where they found that in men, stress increases right prefrontal cortex (RPFC) activity and decreases activity in left orbitofrontal cortex (LOrF). 16 Whereas in women there is increase in activity in limbic system, viz., ventral striatum, putamen, insula and cingulate cortex. They also showed that stress response in men is mainly as ‘fight-or-flight’ and in women as ‘tend-and-befriend’.
In men, long usage of computer is associated with sleep disturbances and reduced work performance, but in women there is risk of mental diseases. 17
In a study by Krantz et al., they found that women responded to interaction between work and home, whereas men showed selective response to work conditions. 18
ConclusionThere is no significant difference in the level of
perceived stress by married and single individuals. The working women showed more perceived stress than working men.
Implications: Stress reliever activities are recommended for working individuals like talking with friends and family, praying, addressing causes of stress, reading, listening to music, watching television, aerobic exercises, yoga, and art therapy.
Conflict of Interest: The authors declare that there is no conflict of interests regarding publication of this paper
Source of Funding: Self
References1. Occupational health. [Internet]. [cited 25 February
2019]. Available from https://www. who. int/occupational_health/topics/stressatwp/en/
2. Van Gemmert AW, Van Galen GP. Stress, neuromotor noise, and human performance: a theoretical perspective. J Exp Psychol Hum Percept Perform. 1997 Oct; 23 (5):1299-313.
3. Phillips A. C. (2013) Perceived Stress. [Internet]. [cited 7 March 2019]. Available from https://link. springer.com/referenceworkentry/10.1007%2F978-1-4419-1005-9_479#howtocite
International Journal of Physiology, October-December 2019, Vol.7, No. 4 215
4. Palner J, Mittelmark MB. Differences between married and unmarried men and women in the relationship between perceived physical health and perceived mental health. Norsk Epidermiologi. 2002; 12 (1):55-61
5. Riaz M, Abid M, Ullah M, Khalid S. A Study on Social Support and Stress among Married Women School Teachers. IJEMHHR. 2016; 18 (4):1
6. Patil M. Stress Level of Working and Non Working Women. IJIP. 2016; 3 (2).
7. Parveen N. Investigating occupational stress among married and unmarried working women in Hyderabad city. BJPP. Jan 2009; 5:21-37.
8. Gender and stress. [Internet]. [cited 5 March 2019]. Available from https://www. apa. org/news/press/releases/stress/2010/gender-stress
9. Ramesh N, Joseph B, Kiran PR, Kurian J, Babu AT. Perceived Professional Stress Levels among Employees in an Information Technology Company, Bangalore. Ntl J Community Med 2016; 7 (4):231-234.
10. Yadav P. Prevalence of Tension Type Headache among Young Adults and Their Gender Difference on Percieved Stress Scale: A Comparative Study. IJIP. 2016; 4 (1).
11. Cohen S, Kamarck T, Mermelstein R. A global measure of perceived stress. J Health Soc Behav 1983; 24:385-96.
12. Perceived stress scale by Sheldon Cohen. [Internet]. [cited 28 February 2019]. Available from https://
www. northottawawellnessfoundation. org/wp-content/uploads/2018/04/PerceivedStressScale. pdf
13. Perceived stress scale. [Internet]. [cited 25 February 2019]. Available from https://das. nh. gov/wellness/docs/percieved%20stress%20scale. pdf
14. Verma R, Balhara YPS, Gupta CS. Gender differences in stress response: Role of developmental and biological determinants. Ind Psychiatry J. 2011 Jan-Jun; 20 (1): 4-10.
15. Wang J, Rao H, Wetmore GS, Furlan PM, Korczykowski M, Dinges DF, et al. Perfusion functional MRI reveals cerebral blood flow pattern under psychological stress. Proc Natl Acad Sci U S A. 2005; 102:17804-9
16. Wang J, Korczykowski M, Rao H, Fan Y, Pluta J, Gur RC, et al. Gender difference in neural response to psychological stress. Soc Cogn Affect Neurosci. 2007; 24:227-39
17. Thomée S, Härenstam A, Hagberg M. Computer use and stress, sleep disturbances, and symptoms of depression among young adults-a prospective cohort study. BMC Psychiatry. 2012 Oct 22; 12:176.
18. Krantz G, Berntsson L, Lundberg U. Total workload, work stress and perceived symptoms in Swedish male and female white-collar employees. Eur J Public Health. 2005 Apr; 15 (2):209-14.
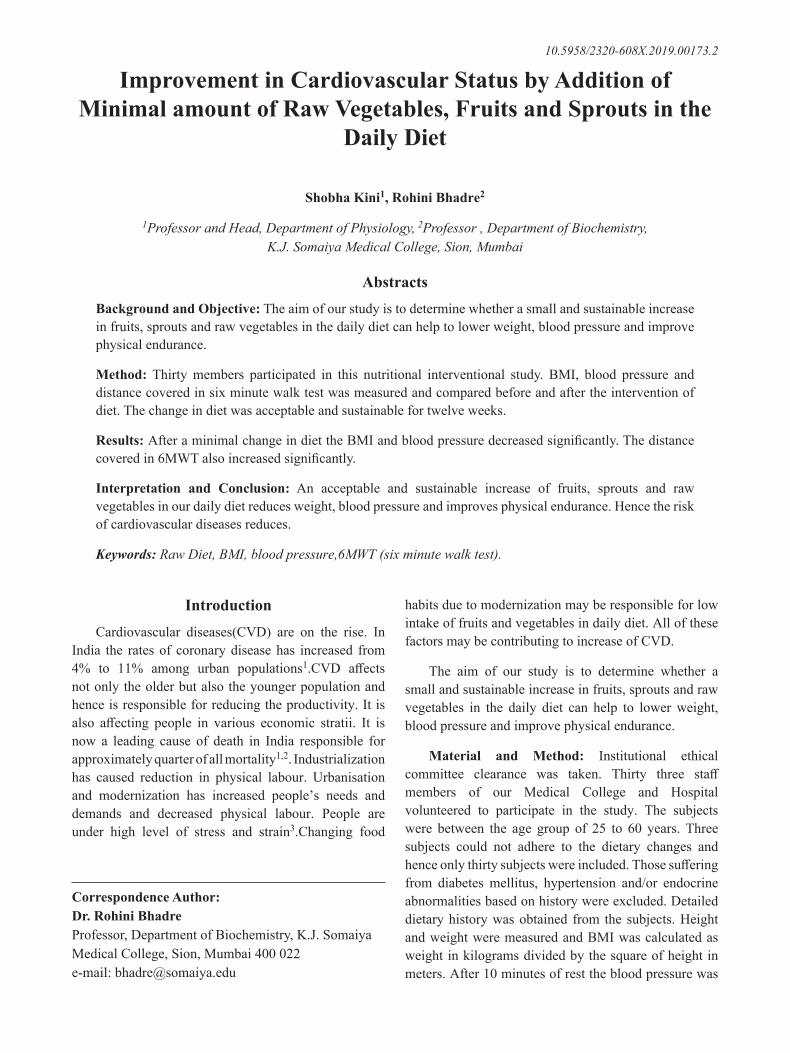
216 International Journal of Physiology, October-December 2019, Vol.7, No. 4
Improvement in Cardiovascular Status by Addition of Minimal amount of Raw Vegetables, Fruits and Sprouts in the
Daily Diet
Shobha Kini1, Rohini Bhadre2
1Professor and Head, Department of Physiology, 2Professor , Department of Biochemistry, K.J. Somaiya Medical College, Sion, Mumbai
AbstractsBackground and Objective: The aim of our study is to determine whether a small and sustainable increase in fruits, sprouts and raw vegetables in the daily diet can help to lower weight, blood pressure and improve physical endurance.
Method: Thirty members participated in this nutritional interventional study. BMI, blood pressure and distance covered in six minute walk test was measured and compared before and after the intervention of diet. The change in diet was acceptable and sustainable for twelve weeks.
Results: After a minimal change in diet the BMI and blood pressure decreased significantly. The distance covered in 6MWT also increased significantly.
Interpretation and Conclusion: An acceptable and sustainable increase of fruits, sprouts and raw vegetables in our daily diet reduces weight, blood pressure and improves physical endurance. Hence the risk of cardiovascular diseases reduces.
Keywords: Raw Diet, BMI, blood pressure,6MWT (six minute walk test).
habits due to modernization may be responsible for low intake of fruits and vegetables in daily diet. All of these factors may be contributing to increase of CVD.
The aim of our study is to determine whether a small and sustainable increase in fruits, sprouts and raw vegetables in the daily diet can help to lower weight, blood pressure and improve physical endurance.
Material and Method: Institutional ethical committee clearance was taken. Thirty three staff members of our Medical College and Hospital volunteered to participate in the study. The subjects were between the age group of 25 to 60 years. Three subjects could not adhere to the dietary changes and hence only thirty subjects were included. Those suffering from diabetes mellitus, hypertension and/or endocrine abnormalities based on history were excluded. Detailed dietary history was obtained from the subjects. Height and weight were measured and BMI was calculated as weight in kilograms divided by the square of height in meters. After 10 minutes of rest the blood pressure was
IntroductionCardiovascular diseases(CVD) are on the rise. In
India the rates of coronary disease has increased from 4% to 11% among urban populations1.CVD affects not only the older but also the younger population and hence is responsible for reducing the productivity. It is also affecting people in various economic stratii. It is now a leading cause of death in India responsible for approximately quarter of all mortality1,2. Industrialization has caused reduction in physical labour. Urbanisation and modernization has increased people’s needs and demands and decreased physical labour. People are under high level of stress and strain3.Changing food
Correspondence Author: Dr. Rohini Bhadre Professor, Department of Biochemistry, K.J. Somaiya Medical College, Sion, Mumbai 400 022 e-mail: [email protected]
10.5958/2320-608X.2019.00173.2
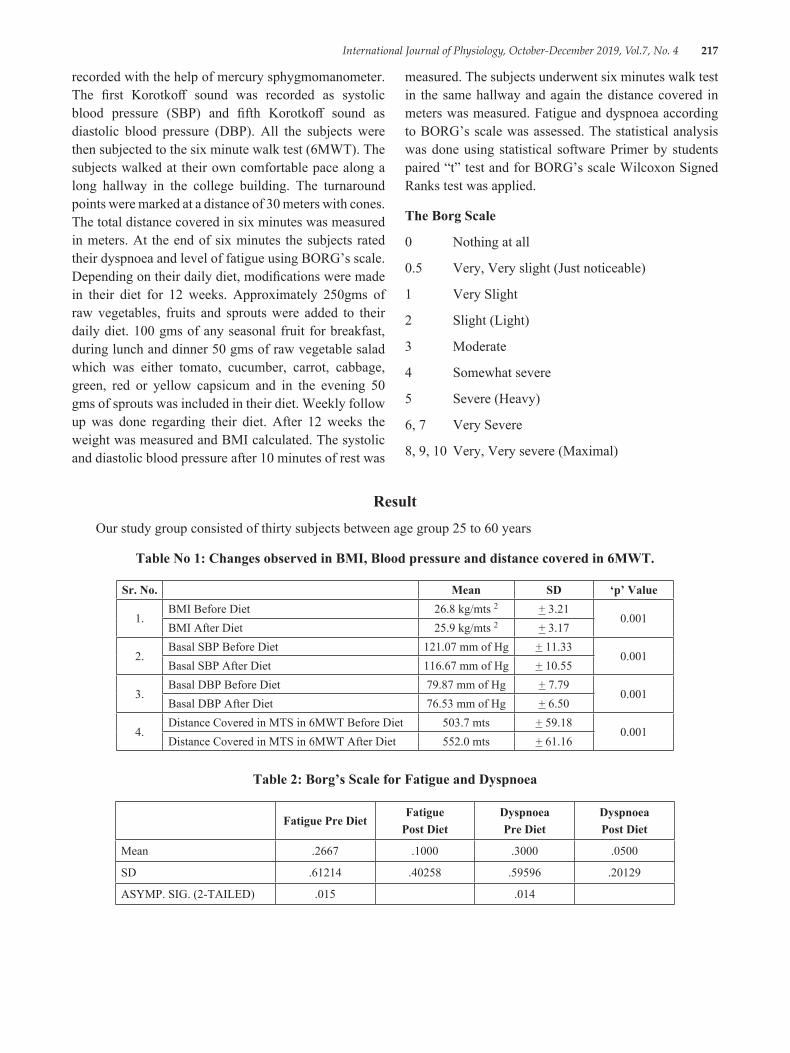
International Journal of Physiology, October-December 2019, Vol.7, No. 4 217
recorded with the help of mercury sphygmomanometer. The first Korotkoff sound was recorded as systolic blood pressure (SBP) and fifth Korotkoff sound as diastolic blood pressure (DBP). All the subjects were then subjected to the six minute walk test (6MWT). The subjects walked at their own comfortable pace along a long hallway in the college building. The turnaround points were marked at a distance of 30 meters with cones. The total distance covered in six minutes was measured in meters. At the end of six minutes the subjects rated their dyspnoea and level of fatigue using BORG’s scale. Depending on their daily diet, modifications were made in their diet for 12 weeks. Approximately 250gms of raw vegetables, fruits and sprouts were added to their daily diet. 100 gms of any seasonal fruit for breakfast, during lunch and dinner 50 gms of raw vegetable salad which was either tomato, cucumber, carrot, cabbage, green, red or yellow capsicum and in the evening 50 gms of sprouts was included in their diet. Weekly follow up was done regarding their diet. After 12 weeks the weight was measured and BMI calculated. The systolic and diastolic blood pressure after 10 minutes of rest was
measured. The subjects underwent six minutes walk test in the same hallway and again the distance covered in meters was measured. Fatigue and dyspnoea according to BORG’s scale was assessed. The statistical analysis was done using statistical software Primer by students paired “t” test and for BORG’s scale Wilcoxon Signed Ranks test was applied.
The Borg Scale
0 Nothing at all
0.5 Very, Very slight (Just noticeable)
1 Very Slight
2 Slight (Light)
3 Moderate
4 Somewhat severe
5 Severe (Heavy)
6, 7 Very Severe
8, 9, 10 Very, Very severe (Maximal)
ResultOur study group consisted of thirty subjects between age group 25 to 60 years
Table No 1: Changes observed in BMI, Blood pressure and distance covered in 6MWT.
Sr. No. Mean SD ‘p’ Value
1.BMI Before Diet 26.8 kg/mts 2 + 3.21
0.001BMI After Diet 25.9 kg/mts 2 + 3.17
2.Basal SBP Before Diet 121.07 mm of Hg + 11.33
0.001Basal SBP After Diet 116.67 mm of Hg + 10.55
3.Basal DBP Before Diet 79.87 mm of Hg + 7.79
0.001Basal DBP After Diet 76.53 mm of Hg + 6.50
4.Distance Covered in MTS in 6MWT Before Diet 503.7 mts + 59.18
0.001Distance Covered in MTS in 6MWT After Diet 552.0 mts + 61.16
Table 2: Borg’s Scale for Fatigue and Dyspnoea
Fatigue Pre DietFatigue
Post DietDyspnoeaPre Diet
DyspnoeaPost Diet
Mean .2667 .1000 .3000 .0500
SD .61214 .40258 .59596 .20129
ASYMP. SIG. (2-TAILED) .015 .014
218 International Journal of Physiology, October-December 2019, Vol.7, No. 4
DiscussionObesity and hypertension are two important risks
factors predisposing to cardiovascular diseases1. Increase in body weight since many years has been associated with an increased risk of hypertension4,5.
Dietary factors influence these risks of CVD6 and the change in dietary habits have accelerated over the past few decades. In a study by Barry M Popkin changes in diet mostly involved reductions in fiber and whole grain intakes and increase in intake of animal and partially hydrogenated fats along with addition of caloric sweeteners7. In a study by Soumya Deb to assess the prevalence of risk factors for cardiovascular disease it was found that the high-risk dietary pattern was practiced more by the younger people as compared with the elders1.
A change towards healthy diet is a need of the hour. It is difficult to change one’s diet to a healthier option especially if it is for a long period. Dietary changes need to take into account a persons habits, taste preference and sociocultural background8. Adherence to a diet depends on its acceptability9. The benefits of treating cardiovascular risk factors like obesity and high blood pressure are also well known. Increase in intake of fast food like burgers, ready to eat food and decrease intake of fruits and raw vegetables is responsible for increasing weight. In a study by Vioque J et al it was observed that increasing intake of fruits and vegetables was associated with lowering the risk of weight gain among Mediterranean population10.Similar finding were observed in our study where the BMI decreased from mean of 26.8 + 3.21 to 25.9 + 3.17 kg/mts 2 after dietary intervention. This was also observed in a study done in Northern Indians by R.B.Singh et al where they found that greater the intake of fruits and vegetables greater was the improvement in central obesity11. In another similar study by PK Newby et al it was concluded that diet high in fruits, vegetables, whole grains and reduced-fat dairy resulted in smaller gains in BMI over a period of few years12.
Certain risk factors are known to affect blood pressure like increasing age, gender, central obesity, sedentary lifestyle, excess salt intake13 and also change in eating habits .Fruits and vegetables provide important vitamins, minerals like potassium, magnesium, fiber, and complex carbohydrates14,15,16 and are low in salt5 which may help to lower blood pressure17. The rate of consumption of fruit and vegetables is low in India
though a large percent of the population is vegetarians2. In a study by C Kalaivani Ashok, S Karunanidhi in young female college students in Chennai city the intake of fruits and vegetables was lower than the recommended requirement.18.So in our study we introduced four serving of fruits, salads and sprouts in the daily routine. Any fruit/vegetable was allowed depending on the financial capability of the subject. After change in diet we noted average drop in the systolic and diastolic blood pressure of 4 mm of Hg and 3 mm of Hg respectively. This is comparable with a study by Q Chan et al where the systolic and diastolic blood pressure was found to be inversely related to intake of both raw and cooked vegetables and this relation was more with raw vegetables19.In a meta analysis it was concluded that reduced sodium intake and increased potassium intake could make a contribution to the prevention of hypertension, especially when blood pressure is already elevated20.
The six minute walk test (6MWT) is a simple, inexpensive and safe test which measures the distance that a subject can walk on a flat hard surface in six minutes. It is a well tolerated and acceptable test to patient. The 6MWT as a sub-maximal exercise test, evaluates the global and integrated responses of the pulmonary, cardiovascular and muscular components and reflects the functional exercise level for daily physical activities21. Most daily activities are of sub maximal level. The 6MWT has also been used as a one-time measure of functional status of patients and aids in determining the morbidity and mortality in lung and heart disease.21. It is most commonly used as a baseline and follow-up assessment after a specific intervention or in monitoring disease progression. The change in the distance walked in the 6-minute walk can be used to trace the change in exercise capacity over time22.In our study the subjects showed an improvement in the distance covered in 6 MWT from a mean of 503.7 + 59.18 mts to 552 + 61.16 mts after the dietary intervention. In our study after the 6MWT we also found improvement in level of fatigue and dyspnoea which was significant.
ConclusionAn acceptable and sustainable increase of fruits,
sprouts and raw vegetables in our daily diet reduces weight, blood pressure and improve physical endurance. Hence the risk of cardiovascular diseases reduces.
Acknowledgement: Nil
Conflict of Interest: Nil
International Journal of Physiology, October-December 2019, Vol.7, No. 4 219
References1. Deb S, Dasgupta A. A Study on Risk Factors of
Cardiovascular Diseases in an Urban Health Center of Kolkata. Indian J Community Med. 2008 Oct; 33(4): 271–275.
2. Prabhakaran D, Jeemon P, Roy A. Cardiovascular Diseases in India: Current Epidemiology and Future Directions. Circulation. 2016 Apr 19;133(16):1605-20.
3. Mathur KS.Environmental Factors in Coronary Heart Disease An Epidemiologic Study at Agra (India). Circulation. May 1960; XXI: 684-689.
4. Chiang BN, Perlman LV, Epstein FH: Overweight and hypertension. A review. Circulation. 1969;39:403-421.
5. Chockalingam A, Abbott D, Bass M, Battista R et al. Recommendations of the Canadian Consensus Conference on Non-pharmacological Approaches to the Management of High Blood Pressure Mar. 21-23, 1989, Halifax, Nova Scotia. 1990 Jun 15. CMAJ; 142(12): 1397–1409.
6. Simon L., JoAnn EM, I-Min Lee, Cole SR, et al. Fruit and vegetable intake and risk of cardiovascular disease: the Women’s Health Study. Am J Clin Nutr. 2000;72:922–8.
7. Popkin BM. Global nutrition dynamics: the world is shifting rapidly toward a diet linked with noncommunicable diseases. Am J Clin Nutr. August 2006; 84(2): 289-298.
8. Rowe S. Alexander N, AlmeidaN, Black R et al. Food Science Challenge: Translating the Dietary Guidelines for Americans to Bring About Real Behavior Change. Journal of Food Science. January/February 2011 ; 76(1):R29–R37.
9. Barnard ND, Gloede L. ,Cohen J., Jenkins DJA, et al. A low-fat vegan diet elicits greater macronutrient changes, but is comparable in adherence and acceptability, compared with a more conventional diabetes diet among individuals with type 2 diabetes. J Am Diet Assoc. 2009 Feb; 109(2): 263–272.
10. Vioque J, Weinbrenner T, Castelló A, Asensio L et al. Intake of Fruits and Vegetables in Relation to 10‐year Weight Gain Among Spanish Adults. Obesity .2008 March;16(3):664-670.
11. Singh RB, Niaz MA. and Ghosh S. Effect on central obesity and associated disturbances of low-energy, fruit- and vegetable-enriched prudent diet in north Indians. Postgrad Med J. 1994 Dec; 70(830): 895–900.
12. Newby PK, Muller D, Hallfrisch J, Qiao N, et al. Dietary patterns and changes in body mass index and waist circumference in adults. Am J Clin Nutr. 2003 Jun;77(6):1417-25.
13. Catherine S, Saju CR, Jeffy B. Prevalence and risk factors of hypertension among adults aged 25-64 years in a rural area of Thrissur in Kerala. Int J Community Med Public Health. 2017May;4(5):1714-1721.
14. Hariri M, Darvishi L, Maghsoudi Z, Khorvash F et al. Intakes of Vegetables and Fruits are Negatively Correlated with Risk of Stroke in Iran. Int J Prev Med. 2013 May; 4(2): S300–S305.
15. Krauss RM, Deckelbaum RJ, Ernst N, Fisher E, et al. Dietary Guidelines for Healthy American Adults. A Statement for Health Professionals From the Nutrition Committee, American Heart Association. Circulation. 1996 Oct 1; 94(7):1795-800.
16. Kokubo Yoshihiro. Prevention of Hypertension and Cardiovascular Diseases A Comparison of Lifestyle Factors in Westerners and East Asians. Hypertension. 2014;63:655-660.
17. Appel LJ, Moore TJ, Obarzanek E, Vollmer WM et al. A Clinical Trial of the Effects of Dietary Patterns on Blood Pressure. N Engl J Med. 1997; 336:1117-1124.
18. Ashok CK and Karunanidhi S. Prevalence of overweight and obesity among young female college students in Chennai city. J Obes Metab Res. 2016;3:23-31.
19. Chan Q, Stamler J, Brown IJ, Daviglus ML, et al. Relation of raw and cooked vegetable consumption to blood pressure: the INTERMAP Study. Journal of Human Hypertension. 2014; 28: 353–359.
20. Geleijnse JM, Kok FJ and Grobbee DE. Blood pressure response to changes in sodium and potassium intake: a metaregression analysis of randomised trials. Journal of Human Hypertension. 2003; 17: 471–480.
21. ATS Statement: Guidelines for the Six-Minute Walk Test This Official Statement of the American Thoracic Society Was Approved By The Ats Board of Directors March 2002.
22. Charles B. and Tonya Z.What Can be Learned in 6 Minutes? 6-Minute Walk Test Primer and Role in Pulmonary Arterial Hypertension. Advances in PH Journal. 2010; 9 (2).
220 International Journal of Physiology, October-December 2019, Vol.7, No. 4
A Comparative Study of Pulmonary Function Tests Type 2 Diabetes Mellitus and Non-Diabetes
Shweta1, A. Santa Kumari2
1Assistance Professor, Department of Physiology, Government Medical College, 2Professor & HOD, Department of Physiology,OMC, Suryapet, Telangana
AbstractBackground: Diabetes Mellitus still remains one of the foremost causes of Morbidity and Mortality in both the developing and developed nations. Diabetes Mellitus includes a heterogenous group of hyperglycemic disorders. The presence of extensive microvascular circulation and abundant connective tissue in lungs, raises the possibility that lung tissue could be a target organ in Type2 Diabetes Mellitus
Objective: To study the effects of Type 2 Diabetes Mellitus on lung function tests.
Materials and Method: 80 male subjects, 40Type 2 Diabetes-study group, 40 Healthy-controls selected from Vaishnavi Hospital, Hyderabad. Medspiror instrument was used to record lung functions. Following parameters were recorded: Forced vital capacity (FVC), Forced Expiratory Volume in 1st sec (FEV1), FEV1 /FVC ratio, Forced Expiratory Flow in middle half of FVC (FEF 25-75%) and Peak Expiratory Flow Rate (PEF). Statistical analysis was done using unpaired t-test in windows stat 9.2 software.
Results: Study group showed statistically greater percentage reduction in FVC, FEV1, FEF 25-75% and PEF compared to control group.
Conclusion: Type2Diabetes Mellitus may be a causative factor for derangement in lung functions due to altered connective tissue, thickening of basal lamina of alveolar membrane and capillary endothelium. All these factors are leading to Restrictive Lung disorder, which exacerbate with increasing blood sugar levels and duration of Type2 Diabetes Mellitus. Therefore lung is considered as a TARGET ORGAN in Type2Diabetes Mellitus.
Keywords: T2DM & Pulmonary Function Test.
insulin resulting in decreased peripheral glucose uptake or INCREASED HEPATIC GLUCOSE OUTPUT.2-3
This entity is accompanied by wide spread biochemical, morphological and functional abnormalities which induce certain complications involving kidney, heart, blood vessels, nerves, skin, liver, collagen and elastic fibers. Thus Diabetes is a multisystem disorder that affects many organs of human body. 4
There are histopathological modifications seen in lungs of Diabetic subjects such as thickened alveolar epithelial cells and pulmonary capillary basal lamina leading to decreased elastic recoiling of lung tissue. There is defective diffusion of gases due to reduced pulmonary capillary blood volume and thickening of basement membrane.
IntroductionDiabetes mellitus, a pan-metabolic disorder,
is principally characterized by chronic/sustained hyperglycemia: ‘A syndrome rather than a disease entity’1.
Type 2 Diabetes is known to include wide range of disorders differing in progression and outlook. The underlying mechanism is due to either DIMINISHED INSULIN SECRETION, an islet cell defect, associated with increased peripheral resistance to the action of
Corresponding Author: Dr. Shweta Assistant Professor, GMC, Dr. A. Santa kumari Prof & HOD, Dept of Physiology, OMC
10.5958/2320-608X.2019.00174.4
International Journal of Physiology, October-December 2019, Vol.7, No. 4 221
This non-enzymatic glycosylation inducing modification of lung connective tissue is most likely the mechanism underlying the mechanical pulmonary dysfunction in Diabetes.
This suggests lung as a ‘’Target organ’’ in Diabetes Mellitus. 5
Epidemiology: There were 66.8 million cases of Diabetes in India in 2014, Diabetes raw national prevalence (%) 8.56.WHO projects that Diabetes will be the 7th leading cause of death in 2030.6-7
Prevalence of Diabetes in adults worldwide was estimated to be 4.0% in 1995 and to rise to 5.4% by the year 2025. It is higher in developed than in developing countries.
The major part of this numerical increase will occur in developing countries. There will be a 42% increase from 51 to 72 million, in the developed countries and a 170% increase from 84 to 228 million, in the developing countries.
1. By the year 2025, >75% of people with Diabetes will reside in developing countries, as compared with 62% in 1995.
2. In the year 2025 the countries with the largest number of people with Diabetes will be India, China, and the U. S.
3. The majority of people with Diabetes are aged > or =65 years. This pattern will be accentuated by the year 2025.
4. It is appraised that there will be more than 200 million Diabetes with in next 10 years. By this time India has become the ‘DIABETES CAPITAL’ of the world, with 3 crore people affected, which is tip of ice berg. 8-9
5. COPD, which is defined functionally by a reduction of the ratio between FEV1 and forced vital capacity (FVC) below 70%, is one of the leading causes of mortality and quality-adjusted life years lost in the US as well as worldwide.
This restrictive spirometric pattern is also associated within significant functional impairment. 10-13
Materials and MethodMethodology: Ethical committee approval was
obtained from the institutional ethical committee of Osmania Medical College.
Informed consent was taken from the subjects and purpose of study was explained along with the benefits and risks.
Sample Size:
● 80 Male subjects were selected. 40 healthy males subjects with age group being 40-55yrs with no history of Type 2 Diabetes Mellitus are taken as control group.
● The present study was undertaken in co-operation with Vaishnavi hospital, Hyderabad, during the period of 2014-2015.
● The present study was done to elicit the consequence of Type 2 Diabetes Mellitus on lung function test among adult male of age group 40-55yrs. The lung function tests were correlated with those in normal healthy adult male subjects having no history of smoking. The duration of Type 2 Diabetes Mellitus and blood sugar levels were contemplated to study the effects of Diabetes Mellitus.
Preparation:
● The subjects were asked to wear loose-clothing to prevent compression of thorax
● They were asked to relax for 5-10min before and after Pre-test and Post-test
● Subjects were instructed not to have heavy meal before the test.
Inclusion Criteria:
1. 40 male subjects with history of Type 2 Diabetes Mellitus for more than 10 yrs
2. Age group: 40-55yrs
Exclusion criteria: Female subjects, smokers, previous lung diseases or infections, any cardiovascular diseases, any known history of neuromuscular diseases, malignancy, any surgery in past, any abnormalities of thoracic or verterbral column, obese person (BMI:<30Kg/m2)
Study and Control group were preferred as per inclusion and exclusion criteria. Clinical examination of Respiratory system was done to know its function as base level. FBS/PPBS were done on same day of lung function tests.
The PFT’S were done in morning sessions 11-1pm, using MEDSPIROR parameters taken were
FVC, FEV1 (L), FEV1/FVC%, FEF25-75%, PEFR
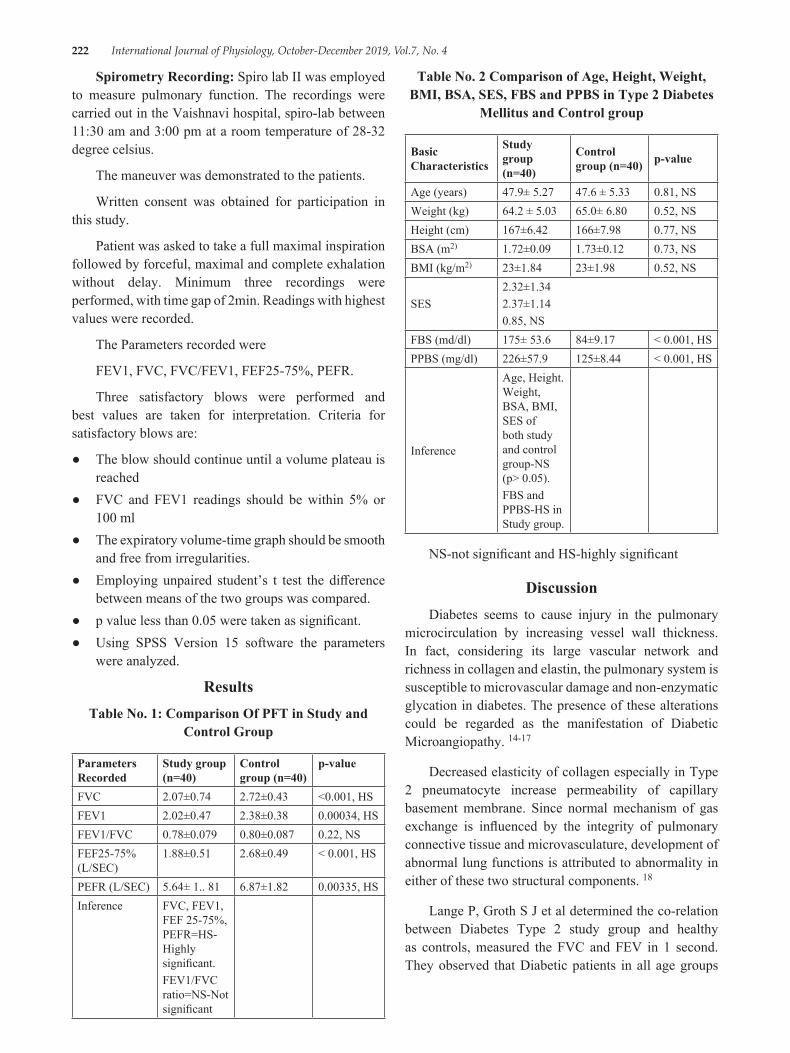
222 International Journal of Physiology, October-December 2019, Vol.7, No. 4
Spirometry Recording: Spiro lab II was employed to measure pulmonary function. The recordings were carried out in the Vaishnavi hospital, spiro-lab between 11:30 am and 3:00 pm at a room temperature of 28-32 degree celsius.
The maneuver was demonstrated to the patients.
Written consent was obtained for participation in this study.
Patient was asked to take a full maximal inspiration followed by forceful, maximal and complete exhalation without delay. Minimum three recordings were performed, with time gap of 2min. Readings with highest values were recorded.
The Parameters recorded were
FEV1, FVC, FVC/FEV1, FEF25-75%, PEFR.
Three satisfactory blows were performed and best values are taken for interpretation. Criteria for satisfactory blows are:
● The blow should continue until a volume plateau is reached
● FVC and FEV1 readings should be within 5% or 100 ml
● The expiratory volume-time graph should be smooth and free from irregularities.
● Employing unpaired student’s t test the difference between means of the two groups was compared.
● p value less than 0.05 were taken as significant.● Using SPSS Version 15 software the parameters
were analyzed.
ResultsTable No. 1: Comparison Of PFT in Study and
Control Group
Parameters Recorded
Study group (n=40)
Control group (n=40)
p-value
FVC 2.07±0.74 2.72±0.43 <0.001, HSFEV1 2.02±0.47 2.38±0.38 0.00034, HSFEV1/FVC 0.78±0.079 0.80±0.087 0.22, NSFEF25-75% (L/SEC)
1.88±0.51 2.68±0.49 < 0.001, HS
PEFR (L/SEC) 5.64± 1.. 81 6.87±1.82 0.00335, HSInference FVC, FEV1,
FEF 25-75%, PEFR=HS-Highly significant.FEV1/FVC ratio=NS-Not significant
Table No. 2 Comparison of Age, Height, Weight, BMI, BSA, SES, FBS and PPBS in Type 2 Diabetes
Mellitus and Control group
Basic Characteristics
Study group (n=40)
Control group (n=40) p-value
Age (years) 47.9± 5.27 47.6 ± 5.33 0.81, NSWeight (kg) 64.2 ± 5.03 65.0± 6.80 0.52, NSHeight (cm) 167±6.42 166±7.98 0.77, NSBSA (m2) 1.72±0.09 1.73±0.12 0.73, NSBMI (kg/m2) 23±1.84 23±1.98 0.52, NS
SES2.32±1.342.37±1.140.85, NS
FBS (md/dl) 175± 53.6 84±9.17 < 0.001, HSPPBS (mg/dl) 226±57.9 125±8.44 < 0.001, HS
Inference
Age, Height. Weight, BSA, BMI, SES of both study and control group-NS (p> 0.05).FBS and PPBS-HS in Study group.
NS-not significant and HS-highly significant
DiscussionDiabetes seems to cause injury in the pulmonary
microcirculation by increasing vessel wall thickness. In fact, considering its large vascular network and richness in collagen and elastin, the pulmonary system is susceptible to microvascular damage and non-enzymatic glycation in diabetes. The presence of these alterations could be regarded as the manifestation of Diabetic Microangiopathy. 14-17
Decreased elasticity of collagen especially in Type 2 pneumatocyte increase permeability of capillary basement membrane. Since normal mechanism of gas exchange is influenced by the integrity of pulmonary connective tissue and microvasculature, development of abnormal lung functions is attributed to abnormality in either of these two structural components. 18
Lange P, Groth S J et al determined the co-relation between Diabetes Type 2 study group and healthy as controls, measured the FVC and FEV in 1 second. They observed that Diabetic patients in all age groups
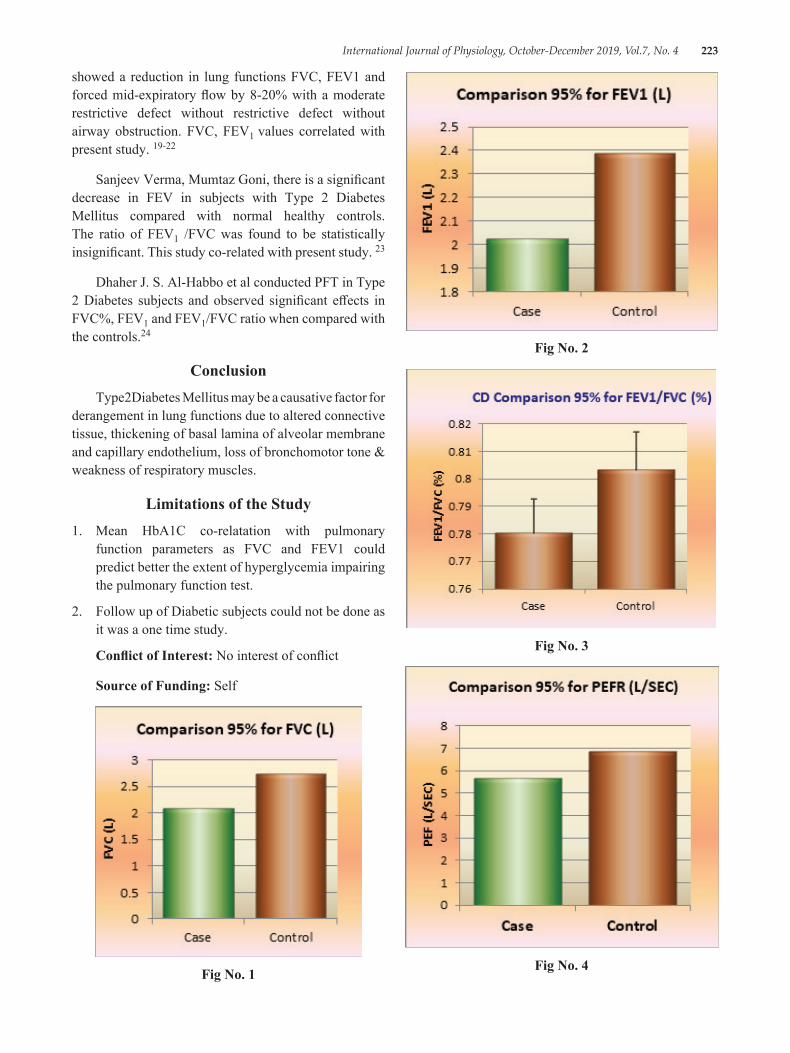
International Journal of Physiology, October-December 2019, Vol.7, No. 4 223
showed a reduction in lung functions FVC, FEV1 and forced mid-expiratory flow by 8-20% with a moderate restrictive defect without restrictive defect without airway obstruction. FVC, FEV1 values correlated with present study. 19-22
Sanjeev Verma, Mumtaz Goni, there is a significant decrease in FEV in subjects with Type 2 Diabetes Mellitus compared with normal healthy controls. The ratio of FEV1 /FVC was found to be statistically insignificant. This study co-related with present study. 23
Dhaher J. S. Al-Habbo et al conducted PFT in Type 2 Diabetes subjects and observed significant effects in FVC%, FEV1 and FEV1/FVC ratio when compared with the controls.24
ConclusionType2Diabetes Mellitus may be a causative factor for
derangement in lung functions due to altered connective tissue, thickening of basal lamina of alveolar membrane and capillary endothelium, loss of bronchomotor tone & weakness of respiratory muscles.
Limitations of the Study1. Mean HbA1C co-relatation with pulmonary
function parameters as FVC and FEV1 could predict better the extent of hyperglycemia impairing the pulmonary function test.
2. Follow up of Diabetic subjects could not be done as it was a one time study.
Conflict of Interest: No interest of conflict
Source of Funding: Self
Fig No. 1
Fig No. 2
Fig No. 3
Fig No. 4
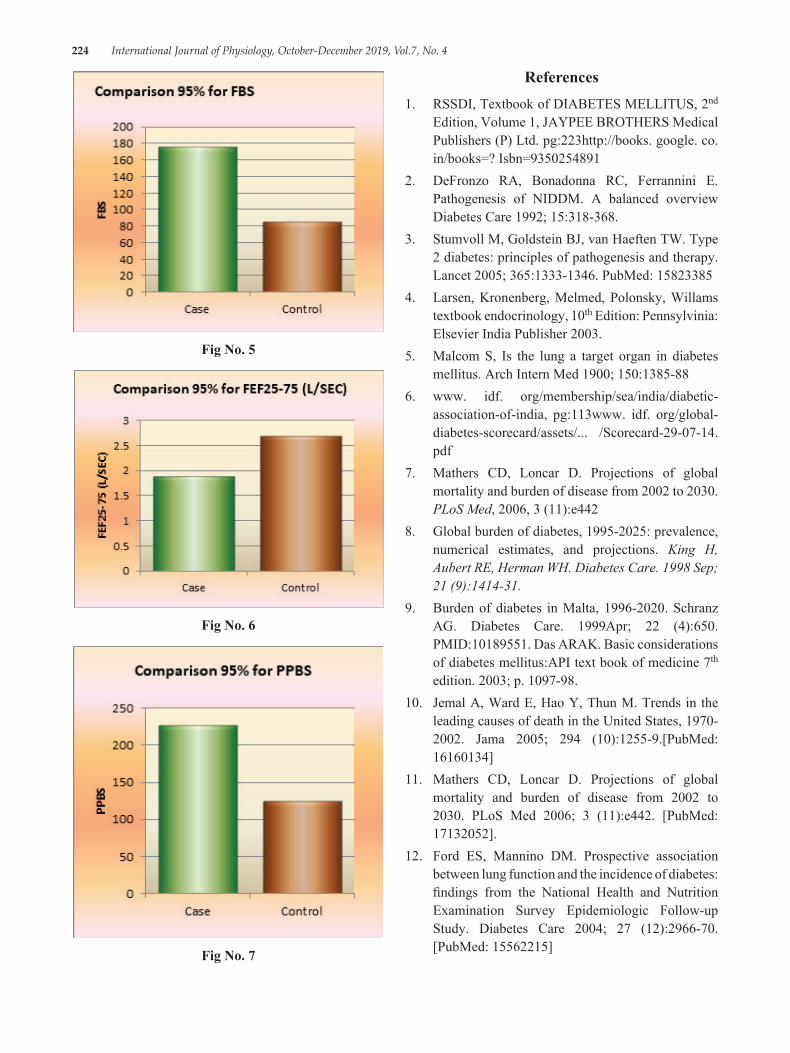
224 International Journal of Physiology, October-December 2019, Vol.7, No. 4
Fig No. 5
Fig No. 6
Fig No. 7
References1. RSSDI, Textbook of DIABETES MELLITUS, 2nd
Edition, Volume 1, JAYPEE BROTHERS Medical Publishers (P) Ltd. pg:223http://books. google. co. in/books=? Isbn=9350254891
2. DeFronzo RA, Bonadonna RC, Ferrannini E. Pathogenesis of NIDDM. A balanced overview Diabetes Care 1992; 15:318-368.
3. Stumvoll M, Goldstein BJ, van Haeften TW. Type 2 diabetes: principles of pathogenesis and therapy. Lancet 2005; 365:1333-1346. PubMed: 15823385
4. Larsen, Kronenberg, Melmed, Polonsky, Willams textbook endocrinology, 10th Edition: Pennsylvinia: Elsevier India Publisher 2003.
5. Malcom S, Is the lung a target organ in diabetes mellitus. Arch Intern Med 1900; 150:1385-88
6. www. idf. org/membership/sea/india/diabetic-association-of-india, pg:113www. idf. org/global-diabetes-scorecard/assets/... /Scorecard-29-07-14.pdf
7. Mathers CD, Loncar D. Projections of global mortality and burden of disease from 2002 to 2030. PLoS Med, 2006, 3 (11):e442
8. Global burden of diabetes, 1995-2025: prevalence, numerical estimates, and projections. King H, Aubert RE, Herman WH. Diabetes Care. 1998 Sep; 21 (9):1414-31.
9. Burden of diabetes in Malta, 1996-2020. Schranz AG. Diabetes Care. 1999Apr; 22 (4):650. PMID:10189551. Das ARAK. Basic considerations of diabetes mellitus:API text book of medicine 7th edition. 2003; p. 1097-98.
10. Jemal A, Ward E, Hao Y, Thun M. Trends in the leading causes of death in the United States, 1970-2002. Jama 2005; 294 (10):1255-9.[PubMed: 16160134]
11. Mathers CD, Loncar D. Projections of global mortality and burden of disease from 2002 to 2030. PLoS Med 2006; 3 (11):e442. [PubMed: 17132052].
12. Ford ES, Mannino DM. Prospective association between lung function and the incidence of diabetes: findings from the National Health and Nutrition Examination Survey Epidemiologic Follow-up Study. Diabetes Care 2004; 27 (12):2966-70.[PubMed: 15562215]
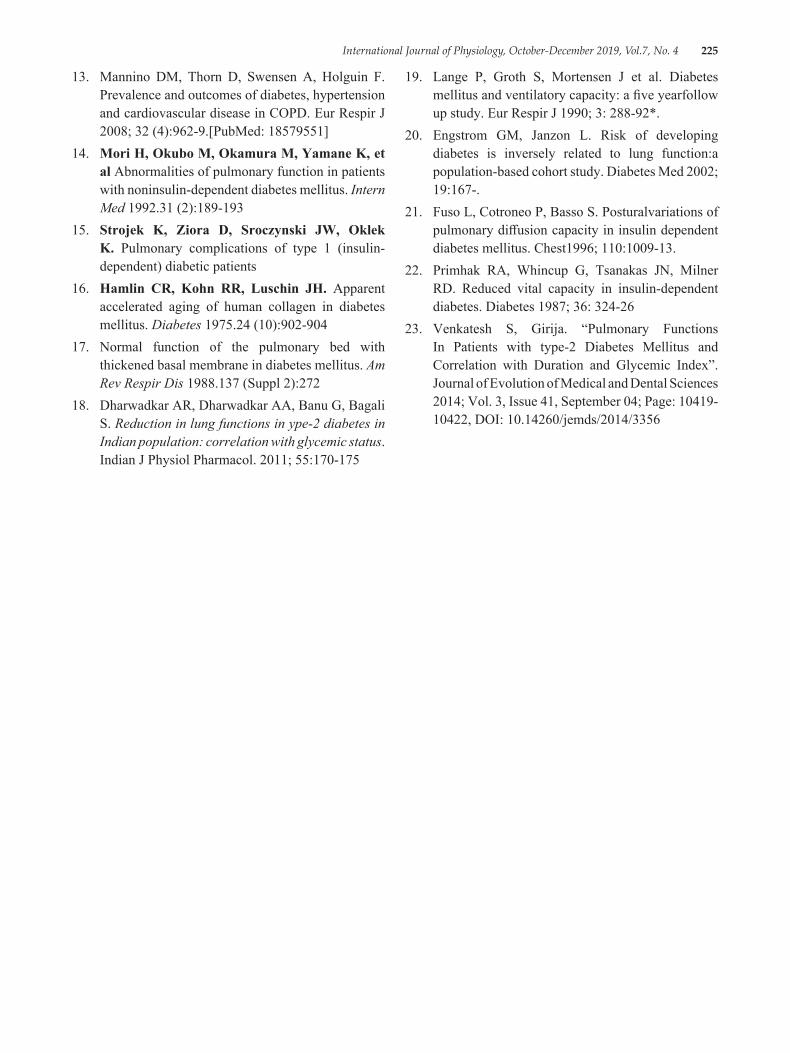
International Journal of Physiology, October-December 2019, Vol.7, No. 4 225
13. Mannino DM, Thorn D, Swensen A, Holguin F. Prevalence and outcomes of diabetes, hypertension and cardiovascular disease in COPD. Eur Respir J 2008; 32 (4):962-9.[PubMed: 18579551]
14. Mori H, Okubo M, Okamura M, Yamane K, et al Abnormalities of pulmonary function in patients with noninsulin-dependent diabetes mellitus. Intern Med 1992.31 (2):189-193
15. Strojek K, Ziora D, Sroczynski JW, Oklek K. Pulmonary complications of type 1 (insulin-dependent) diabetic patients
16. Hamlin CR, Kohn RR, Luschin JH. Apparent accelerated aging of human collagen in diabetes mellitus. Diabetes 1975.24 (10):902-904
17. Normal function of the pulmonary bed with thickened basal membrane in diabetes mellitus. Am Rev Respir Dis 1988.137 (Suppl 2):272
18. Dharwadkar AR, Dharwadkar AA, Banu G, Bagali S. Reduction in lung functions in ype-2 diabetes in Indian population: correlation with glycemic status. Indian J Physiol Pharmacol. 2011; 55:170-175
19. Lange P, Groth S, Mortensen J et al. Diabetes mellitus and ventilatory capacity: a five yearfollow up study. Eur Respir J 1990; 3: 288-92*.
20. Engstrom GM, Janzon L. Risk of developing diabetes is inversely related to lung function:a population-based cohort study. Diabetes Med 2002; 19:167-.
21. Fuso L, Cotroneo P, Basso S. Posturalvariations of pulmonary diffusion capacity in insulin dependent diabetes mellitus. Chest1996; 110:1009-13.
22. Primhak RA, Whincup G, Tsanakas JN, Milner RD. Reduced vital capacity in insulin-dependent diabetes. Diabetes 1987; 36: 324-26
23. Venkatesh S, Girija. “Pulmonary Functions In Patients with type-2 Diabetes Mellitus and Correlation with Duration and Glycemic Index”. Journal of Evolution of Medical and Dental Sciences 2014; Vol. 3, Issue 41, September 04; Page: 10419-10422, DOI: 10.14260/jemds/2014/3356
226 International Journal of Physiology, October-December 2019, Vol.7, No. 4
A Comparative Study on Different Types of Attention in Abacus Users & Non Users
Sneha Jaiswal1, Shashikala K.T.2
1Post-Graduate Student, 2Associate Professor, Department of Physiology, Bangalore Medical College & Research Institute, Bengaluru, Karnataka
AbstractBackground: Abacus is an ancient instrument used for calculating numbers through basic arithmetic system. It has become popular among children of small ages as it helps in understanding basic arithmetic system & also helps in expanding brain usage. It activates nerve cells by providing stimuli like moving fingers & talking aloud. However, Increase in concentration of abacus students may be pre-dominating effect of training program. So this study was taken up to see effect of abacus learning on attention of children.
Objectives: To test & compare different types of attention in abacus users & non users.
Materials and Method: A total of 40 abacus users (upto 7 levels of abacus training) and 40 abacus non users who were of 10-15 years were tested for focussed attention by colour trail test, sustained attention by children paced auditory serial addition test and divided attention by symbol digit modality test. Results were statistically analysed using student ‘t’ test.
Results: Abacus users performed better than the controls in colour trail test (p=0.0001), children paced auditory serial addition test (p=0.01) and symbol digit modality test (p=0.01).
Conclusion: Abacus users have better focussed attention, sustained attention and divided attention compared to non abacus users.
Keywords: Abacus, Focussed attention, Sustained attention, Divided attention.
their minds with unusual speed. Various researchers have demonstrated that Abacus based Mental Calculation training is an effective intervention to improve children’s mental arithmetical ability, but it remains unclear whether the training affects high-order math abilities. Neuroimaging studies have indicated that abacus experts perform mental calculation by using motor and visual-spatial resources Arithmetic calculations are performed by altering the configurations of beads that represent numbers. It has become popular among children of small ages as it helps in understanding basic arithmetic system & also helps in expanding brain usage. It activates nerve cells by providing stimuli like moving fingers However, Increase in concentration of abacus students may be pre-dominating effect of training program. So this study was taken up to see effect of abacus learning on attention of children.1, 2
Objectives: To test & compare different types of attention in abacus users & non users
IntroductionAbacus is an old and unique arithmetic tool which
has been used in many Asian countries like Japan, Korea, China, and India since 1200 AD. In abacus, Arithmetic calculations are performed by altering the configurations of beads that represent numbers called as physical abacus. First, Abacus users learn to calculate with a physical abacus, then gradually they can calculate extraordinary large numbers via an imagined abacus in
Corresponding Author: Dr. Sneha Jaiswal Post-Graduate Student, Department of Physiology, Bangalore Medical College & Research Institute, Bengaluru, Karnataka, Department of Physiology, Bangalore Medical College & Research Institute, Fort, Krishna Rajendra Road, Bengaluru, Karnataka 560002 e-mail: [email protected]
10.5958/2320-608X.2019.00175.6
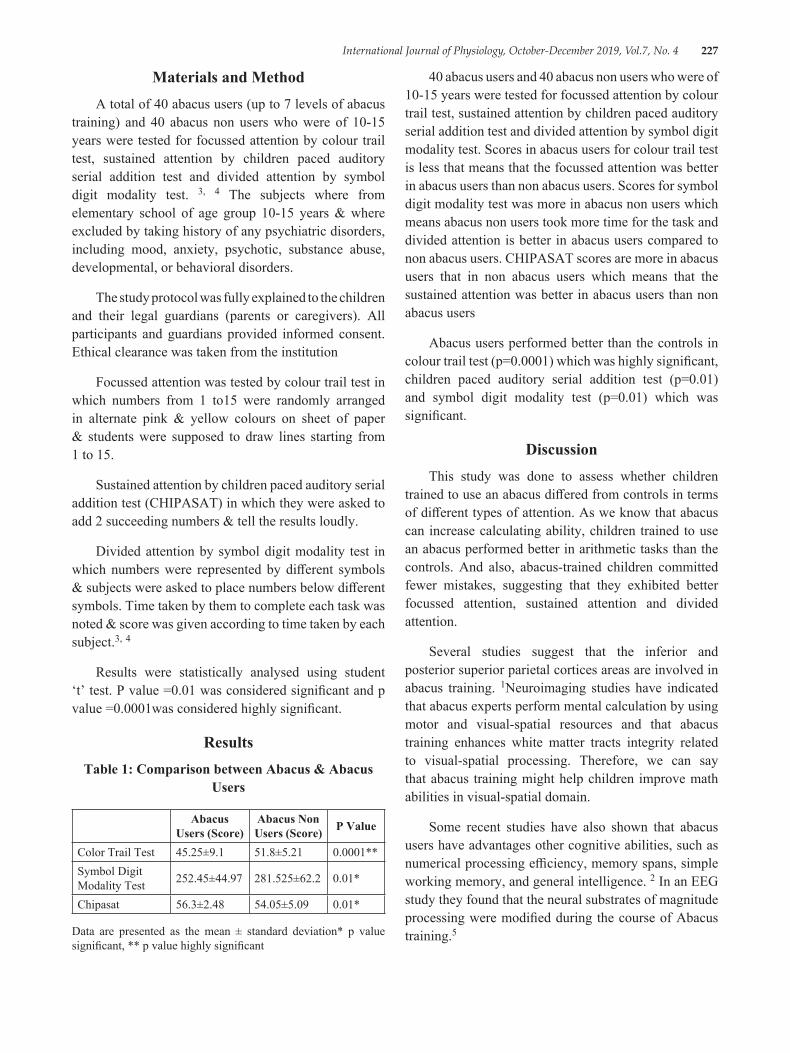
International Journal of Physiology, October-December 2019, Vol.7, No. 4 227
Materials and MethodA total of 40 abacus users (up to 7 levels of abacus
training) and 40 abacus non users who were of 10-15 years were tested for focussed attention by colour trail test, sustained attention by children paced auditory serial addition test and divided attention by symbol digit modality test. 3, 4 The subjects where from elementary school of age group 10-15 years & where excluded by taking history of any psychiatric disorders, including mood, anxiety, psychotic, substance abuse, developmental, or behavioral disorders.
The study protocol was fully explained to the children and their legal guardians (parents or caregivers). All participants and guardians provided informed consent. Ethical clearance was taken from the institution
Focussed attention was tested by colour trail test in which numbers from 1 to15 were randomly arranged in alternate pink & yellow colours on sheet of paper & students were supposed to draw lines starting from 1 to 15.
Sustained attention by children paced auditory serial addition test (CHIPASAT) in which they were asked to add 2 succeeding numbers & tell the results loudly.
Divided attention by symbol digit modality test in which numbers were represented by different symbols & subjects were asked to place numbers below different symbols. Time taken by them to complete each task was noted & score was given according to time taken by each subject.3, 4
Results were statistically analysed using student ‘t’ test. P value =0.01 was considered significant and p value =0.0001was considered highly significant.
ResultsTable 1: Comparison between Abacus & Abacus
Users
Abacus Users (Score)
Abacus Non Users (Score) P Value
Color Trail Test 45.25±9.1 51.8±5.21 0.0001**Symbol Digit Modality Test 252.45±44.97 281.525±62.2 0.01*
Chipasat 56.3±2.48 54.05±5.09 0.01*
Data are presented as the mean ± standard deviation* p value significant, ** p value highly significant
40 abacus users and 40 abacus non users who were of 10-15 years were tested for focussed attention by colour trail test, sustained attention by children paced auditory serial addition test and divided attention by symbol digit modality test. Scores in abacus users for colour trail test is less that means that the focussed attention was better in abacus users than non abacus users. Scores for symbol digit modality test was more in abacus non users which means abacus non users took more time for the task and divided attention is better in abacus users compared to non abacus users. CHIPASAT scores are more in abacus users that in non abacus users which means that the sustained attention was better in abacus users than non abacus users
Abacus users performed better than the controls in colour trail test (p=0.0001) which was highly significant, children paced auditory serial addition test (p=0.01) and symbol digit modality test (p=0.01) which was significant.
DiscussionThis study was done to assess whether children
trained to use an abacus differed from controls in terms of different types of attention. As we know that abacus can increase calculating ability, children trained to use an abacus performed better in arithmetic tasks than the controls. And also, abacus-trained children committed fewer mistakes, suggesting that they exhibited better focussed attention, sustained attention and divided attention.
Several studies suggest that the inferior and posterior superior parietal cortices areas are involved in abacus training. 1Neuroimaging studies have indicated that abacus experts perform mental calculation by using motor and visual-spatial resources and that abacus training enhances white matter tracts integrity related to visual-spatial processing. Therefore, we can say that abacus training might help children improve math abilities in visual-spatial domain.
Some recent studies have also shown that abacus users have advantages other cognitive abilities, such as numerical processing efficiency, memory spans, simple working memory, and general intelligence. 2 In an EEG study they found that the neural substrates of magnitude processing were modified during the course of Abacus training.5
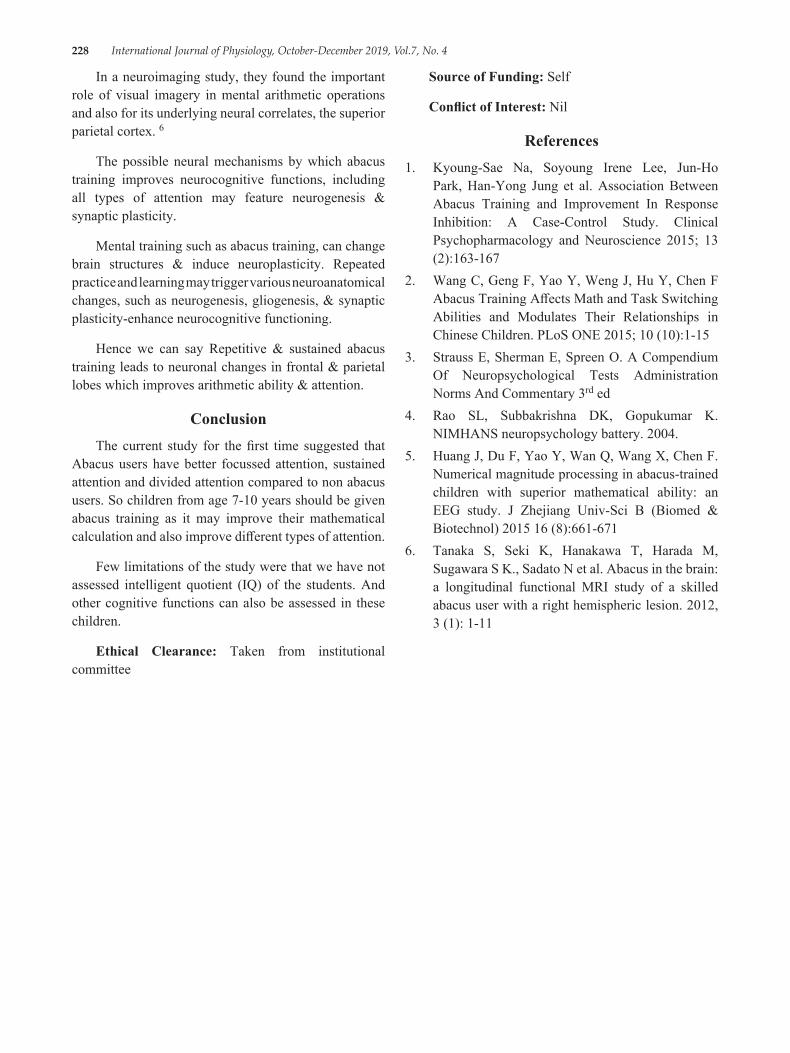
228 International Journal of Physiology, October-December 2019, Vol.7, No. 4
In a neuroimaging study, they found the important role of visual imagery in mental arithmetic operations and also for its underlying neural correlates, the superior parietal cortex. 6
The possible neural mechanisms by which abacus training improves neurocognitive functions, including all types of attention may feature neurogenesis & synaptic plasticity.
Mental training such as abacus training, can change brain structures & induce neuroplasticity. Repeated practice and learning may trigger various neuroanatomical changes, such as neurogenesis, gliogenesis, & synaptic plasticity-enhance neurocognitive functioning.
Hence we can say Repetitive & sustained abacus training leads to neuronal changes in frontal & parietal lobes which improves arithmetic ability & attention.
ConclusionThe current study for the first time suggested that
Abacus users have better focussed attention, sustained attention and divided attention compared to non abacus users. So children from age 7-10 years should be given abacus training as it may improve their mathematical calculation and also improve different types of attention.
Few limitations of the study were that we have not assessed intelligent quotient (IQ) of the students. And other cognitive functions can also be assessed in these children.
Ethical Clearance: Taken from institutional committee
Source of Funding: Self
Conflict of Interest: Nil
References1. Kyoung-Sae Na, Soyoung Irene Lee, Jun-Ho
Park, Han-Yong Jung et al. Association Between Abacus Training and Improvement In Response Inhibition: A Case-Control Study. Clinical Psychopharmacology and Neuroscience 2015; 13 (2):163-167
2. Wang C, Geng F, Yao Y, Weng J, Hu Y, Chen F Abacus Training Affects Math and Task Switching Abilities and Modulates Their Relationships in Chinese Children. PLoS ONE 2015; 10 (10):1-15
3. Strauss E, Sherman E, Spreen O. A Compendium Of Neuropsychological Tests Administration Norms And Commentary 3rd ed
4. Rao SL, Subbakrishna DK, Gopukumar K. NIMHANS neuropsychology battery. 2004.
5. Huang J, Du F, Yao Y, Wan Q, Wang X, Chen F. Numerical magnitude processing in abacus-trained children with superior mathematical ability: an EEG study. J Zhejiang Univ-Sci B (Biomed & Biotechnol) 2015 16 (8):661-671
6. Tanaka S, Seki K, Hanakawa T, Harada M, Sugawara S K., Sadato N et al. Abacus in the brain: a longitudinal functional MRI study of a skilled abacus user with a right hemispheric lesion. 2012, 3 (1): 1-11
International Journal of Physiology, October-December 2019, Vol.7, No. 4 229
Inter-Gender and Intra-Gender Differences of Parenting Stress among Mothers of Children with Special Needs and
Normal Children
Sowmya P.1, Preethi B.L.2
1Assistant Professor, Department of Physiology, Bowring and Lady Curzon Medical College and Research Institute, 2Associate Professor, Department of Physiology, M.S. Ramaiah Medical College
AbstractIntroduction: Parenting is a major form of stress, especially in children with special needs. However this stress has not been properly understood as evident from paucity of literature in this area.
Objective: (i) To evaluate parenting stress among parents (mother & father) of children with special needs and normal children. (ii) To compare parenting stress among mothers of special children and normal children.
Method: Assessment of parenting stress using Sheldon Cohen Perceived Stress Scale questionnaire on (i) Parents of 60 special (study group) and 60 normal (control group) children aged between 5 and 12 years. (ii) Mothers of children with special needs and mothers of normal children. The Questionnaire was provided to both parents, they were seated separately in order to avoid bias. Statistical analysis was done using Unpaired t-test.
Results: (i) The study group scored higher as compared to the control group with their means and standard deviations being (18.914+ 5.24) and (16.12+ 4.18) respectively. The statistical value of significance (p value) is 0.0019. (ii) The mothers of children with special needs scored higher than mothers of normal children with their means and standard deviations being (19.04 + 5.68) and (15.08 + 5.06) respectively, the p value is 0.014.
Conclusion: Present study showed that the parents of special children had significantly higher parenting stress levels as compared to the parents of normal children and mothers of special need children were more stressed than the mothers of normal children. It is important to address this stress as it could lead to impairments of overall quality of life in both parents and their child or children.
Keywords: Parenting stress, Maternal stress, Special needs, The Perceived Stress Scale (PSS).
healthy development 2) simply tolerable with no strong effects 3) toxic and conducive to physical, emotional, and mental impairment (Centre on the Developing Child, 2015). It is important to note that “stress” is defined not necessarily by an individual’s experience, but by their behavioural, emotional, cognitive, biological and interpersonal responses to that experience. In general, stress can be defined as “a negative emotional experience accompanied by predictable biochemical, physiological, cognitive, and behavioural changes that are directed either towards altering the stressful event or accommodating to its effects” 1, 2. However, while stress is generally defined as a negative emotional experience.
IntroductionStress is an inevitable, normal experience that is felt
when an individual is unsure if they can meet the demands of their environment1. Depending on the context, stress can be one of three things: 1) positive and conducive to
Correspondence Author: Dr Sowmya P. Assistant Professor, Department of Physiology, Bowring and Lady Curzon Medical College and Research Institute, Bangalore 560001 e-mail: sowmya. [email protected]
10.5958/2320-608X.2019.00176.8
230 International Journal of Physiology, October-December 2019, Vol.7, No. 4
Parenting is the process of promoting and supporting the physical, emotional, social, and intellectual development of a child from infancy to adulthood. “Parenting stress” as stress that is felt in response to the demands of being a parent — stress that is often experienced as negative feelings toward the self and toward the child or children. By definition these negative feelings are directly attributable to the demands of parenthood3.
Special needs is a term used in clinical diagnostic and functional development to describe individuals who require assistance for disabilities that may be medical, mental, or psychological4. These are the children, who may have challenges which are more severe than the typical child, and could possibly last a lifetime, they will need extra support, and additional services. They will have distinct goals, need added guidance and help them in meeting their academic, social, emotional, and sometimes medical milestones. These Families may experience a myriad of emotions upon diagnosis, including anger, grief, loss, and denial5. There are four major types of special needs children:
1. Physical–muscular dystrophy, multiple sclerosis, chronic asthma, epilepsy, etc.
2. Developmental–down syndrome, autism, dyslexia, processing disorders
3. Behavioral/Emotional–ADD, bi-polar, oppositional defiance disorder, etc.
4. Sensory Impaired–Blind, visually impaired, deaf, limited hearing11
Becoming a mother often brings about personal adjustments and alterations in the individual’s self-identity and family relations, thereby leading to new attachment-related experiences6, 7, 8. Increase maternal stress in the parenting role has direct effects on the parent–child relationship. A significant association between perceived infant temperament and parenting stress was also found9. Mothers of children with special needs may experience stress associated with increased care giving demands and co ordination of care as well as the presence of co occurring behavioural and medical conditions. Average level of stress are high across all developmental periods from infancy through adolescence. (Baker et al 2003; Lopez, Cliffard, Minnes & Quellette–kunz, 2008), and there is some evidence to suggest that parenting stress increases over time10. Resilience and the course of daily parenting stress in families of young children with
intellectual disabilities10. The mothers of special need children are faced with multiple challenges across their children’s lives, including overcoming disappointments and fears associated with the original diagnosis, securing appropriate medical interventions, school placements and much more.
Sheldon Cohen Perceived Stress Scale (PSS) is the most widely used psychological instrument for measuring the perception of stress. It is a measure of the degree to which situations in one’s life are appraised as stressful. Items were designed to tap how unpredictable, uncontrollable, and overloaded respondents find their lives. The scale also includes a number of direct queries about current levels of experienced stress.
Material and MethodAssessment of parenting stress was done using
Sheldon Cohen Perceived Stress Scale questionnaire. It was conducted on i) Parents of 60 special (study group) and 60 normal (control group) children, aged between 5 and 12 years. The parents were aged between 30 to 50 years. ii) Mothers of children with special needs and mothers of normal children.
The Questionnaire was provided to both parents, they were seated separately in order to avoid bias.
Inclusion Criteria
1. Age of parents should between 30-50 years.
2. Age of children should be between 5-12 years.
3. Study group includes i) Fathers and mothers of children with special needs. ii) Mothers of children with special needs.
4. Control group includes i) Fathers and mothers of normal children. ii) Mothers of normal children.
Statistical analysis: The F-Test was used to compare two Variances. The PSS score was then analysed using Unpaired t-test.
Result(i) The parents of children with special needs [study
group (i)] scored higher as compared to the parents of normal children [control group (i)] with their means and standard deviations being (18.914+ 5.24) and (16.12+ 4.18) respectively. The statistical value of significance (p value) is 0.0019.
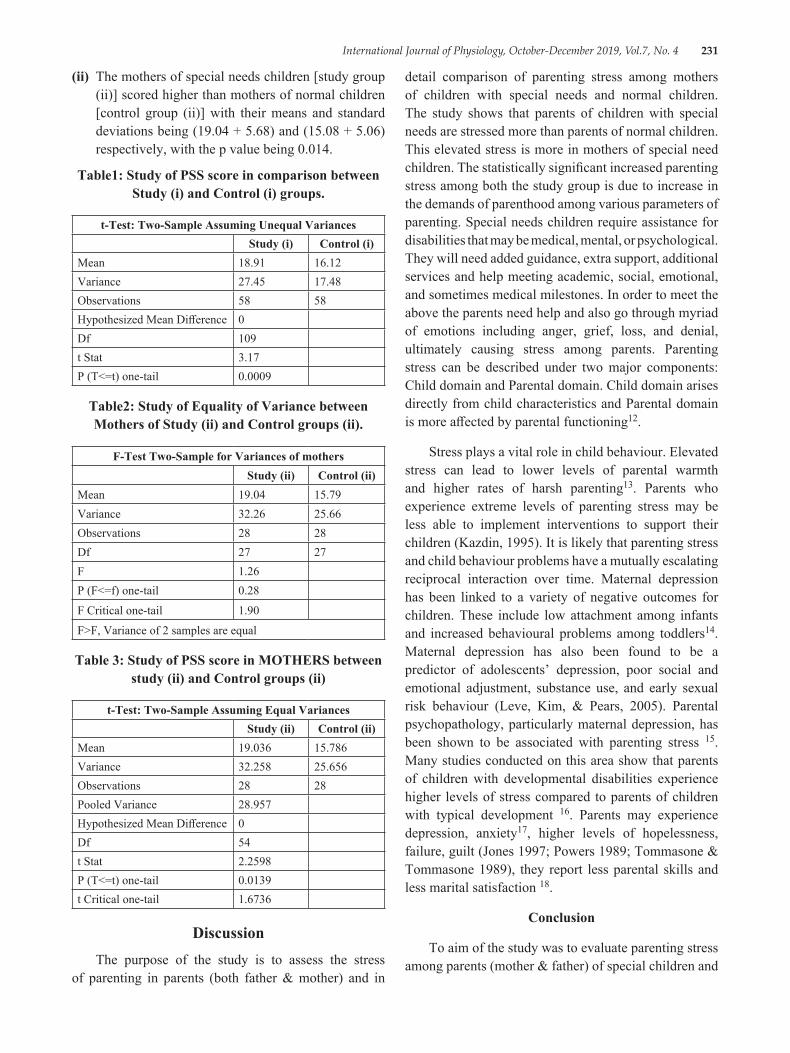
International Journal of Physiology, October-December 2019, Vol.7, No. 4 231
(ii) The mothers of special needs children [study group (ii)] scored higher than mothers of normal children [control group (ii)] with their means and standard deviations being (19.04 + 5.68) and (15.08 + 5.06)respectively, with the p value being 0.014.
Table1: Study of PSS score in comparison between Study (i) and Control (i) groups.
t-Test: Two-Sample Assuming Unequal VariancesStudy (i) Control (i)
Mean 18.91 16.12Variance 27.45 17.48Observations 58 58Hypothesized Mean Difference 0Df 109t Stat 3.17P (T<=t) one-tail 0.0009
Table2: Study of Equality of Variance between Mothers of Study (ii) and Control groups (ii).
F-Test Two-Sample for Variances of mothers Study (ii) Control (ii)
Mean 19.04 15.79Variance 32.26 25.66Observations 28 28Df 27 27F 1.26P (F<=f) one-tail 0.28
F Critical one-tail 1.90
F>F, Variance of 2 samples are equal
Table 3: Study of PSS score in MOTHERS between study (ii) and Control groups (ii)
t-Test: Two-Sample Assuming Equal Variances Study (ii) Control (ii)
Mean 19.036 15.786Variance 32.258 25.656Observations 28 28Pooled Variance 28.957Hypothesized Mean Difference 0Df 54t Stat 2.2598P (T<=t) one-tail 0.0139t Critical one-tail 1.6736
DiscussionThe purpose of the study is to assess the stress
of parenting in parents (both father & mother) and in
detail comparison of parenting stress among mothers of children with special needs and normal children. The study shows that parents of children with special needs are stressed more than parents of normal children. This elevated stress is more in mothers of special need children. The statistically significant increased parenting stress among both the study group is due to increase in the demands of parenthood among various parameters of parenting. Special needs children require assistance for disabilities that may be medical, mental, or psychological. They will need added guidance, extra support, additional services and help meeting academic, social, emotional, and sometimes medical milestones. In order to meet the above the parents need help and also go through myriad of emotions including anger, grief, loss, and denial, ultimately causing stress among parents. Parenting stress can be described under two major components: Child domain and Parental domain. Child domain arises directly from child characteristics and Parental domain is more affected by parental functioning12.
Stress plays a vital role in child behaviour. Elevated stress can lead to lower levels of parental warmth and higher rates of harsh parenting13. Parents who experience extreme levels of parenting stress may be less able to implement interventions to support their children (Kazdin, 1995). It is likely that parenting stress and child behaviour problems have a mutually escalating reciprocal interaction over time. Maternal depression has been linked to a variety of negative outcomes for children. These include low attachment among infants and increased behavioural problems among toddlers14. Maternal depression has also been found to be a predictor of adolescents’ depression, poor social and emotional adjustment, substance use, and early sexual risk behaviour (Leve, Kim, & Pears, 2005). Parental psychopathology, particularly maternal depression, has been shown to be associated with parenting stress 15. Many studies conducted on this area show that parents of children with developmental disabilities experience higher levels of stress compared to parents of children with typical development 16. Parents may experience depression, anxiety17, higher levels of hopelessness, failure, guilt (Jones 1997; Powers 1989; Tommasone & Tommasone 1989), they report less parental skills and less marital satisfaction 18.
Conclusion
To aim of the study was to evaluate parenting stress among parents (mother & father) of special children and
232 International Journal of Physiology, October-December 2019, Vol.7, No. 4
normal children and to compare parenting stress among mothers of special children and normal children. Stress was assessed using Sheldon Cohen Perceived Stress Scale questionnaire. PSS score was analysed using Unpaired t test. The study shows that parents of children with special needs are stressed more than parents of normal children which is statistically significant (p value is 0.0019). This elevated stress is more in mothers of special need children with statistical significance (p value) of 0.014.
Our study creates further scope to evaluate physiological parameters of stress mainly quantitative levels. It also calls for studying interventions to reduce parenting stress among parents of children with special needs.
Conflict of Interest: ‘The author (s) declare (s) that there is no conflict of interest’
Source of Funding: Self
Ethical Clearance: Taken from Ethical review board Ramaiah Medical college and Hospitals.
References1. Patnaik, Geetika. Life skill enhancement strategies
to minimize stress. Social science international 2014; 30 (2):281-89.
2. Baum A. Stress, intrusive imagery and chronic distress. Health Psychology 1990; 9 (6):653-75.
3. Deater‐Deckard K. Parenting stress and child adjustment: Some old hypotheses and new questions. Clinical Psychology Science and Practice 1998; 5 (3)
4. “ Special needs”. https://en. wikipedia. org/wiki/Special_needs
5. Children with special needs. U. S. Department of Health and Human Services: Parenting a Child with a Disability. https://specialneedsplanning. net/children-with-special-needs/.
6. Stern D. The Motherhood Constellation: A Unified View of Parent–infant Psychotherapy. New York, 1st edn., NY: Basic Books 1995:52
7. Earle S. Pregnancy and the maintenance of self-identity: implications for antenatal care in the community. Health Soc Care Commun 2000; 8:235-41.
8. Ikeda M, Hayashi M, Kamibeppu K. The relationship between attachment style and postpartum depression. Attach Hum Dev 2014; (16):557-72.
9. Moe V, Von Soest T, Fredriksen E, Olafsen K. S & Smith L. The Multiple Determinants of Maternal Parenting Stress 12 Months after Birth: The Contribution of Antenatal Attachment Style, Adverse Childhood Experiences, and Infant Temperament. Frontiers in psychology 1987; 9.
10. Gerstein ED, Crnic KA, Blacher J, Baker BL. Resilience and the course of daily parenting stress in families of young children with intellectual disabilities. J Intellect Disabil Res 2009 Dec; 53 (12):981-97.
11. Hauser-Cram P, Warfield ME, Shonkoff JP, Krauss MW, Sayer A, Upshur CC. Children with disabilities: a longitudinal study of child development and parent well-being. Monogr Soc Res Child Dev 2001; 66 (3):1-114.
12. Carina Coulacoglou, Donald H. Saklofske. The Assessment of Family, Parenting, and Child Outcomes. Psychometrics and Psychological Assessment, 2017.
13. Mary E. Haskett, Lisa S. Ahern, Caryn S. Ward &Jason C. Allaire. Factor Structure and Validity of the Parenting Stress Index-Short Form. J Clin Child Adolesc Psychol 2006 Jun; 35 (2):302-12.
14. Caughy M. O, Huang KY & Lima. J. J Child Fam Stud 2009; 18 (10).
15. Van der Oord S, Prins PJ, Oosterlaan J, Emmelkamp PM. The association between parenting stress, depressed mood and informant agreement in ADHD and ODD. Behav Res Ther. 2006 Nov; 44 (11):1585-95.
16. Hastings R. P, Kovshoff H, Ward N. J et al. J Autism Dev Disord 2005; 35:635-35
17. Beckman, Dyson, Emerson, Bristol & Schopher, Hoppes. Journal of Educational and Social Research; 3 (7):580-80
18. JR Rodrigue, SB Morgan, G Geffken. Families of autistic children: Psychological functioning of mothers. Journal of clinical child psychology; 19: 365-70.
International Journal of Physiology, October-December 2019, Vol.7, No. 4 233
Effect of Yoga (Pranayama and Suryanamaskar) on Cardio Pulmonary functions among Adults.
Suhas Y. Shirur1, Veena H.C.2, Pradhyumn3
1Assistant Professor, Department of Physiology, Kodagu Institute of Medical Sciences, Madikeri, 2Assistant Professor, Department of Physiology, Kodagu Institute of Medical Sciences, Madikeri, 33rd yr MBBS Student,
Kodagu Institute of Medical Sciences, Madikeri
AbstractBackground: Yoga has been an ancient practice in India which promises many benefits both physical and mental. Present study was to assess the effect of long term practice of yoga on cardiorespiratory functions.
Method: The study was conducted on 64 subjects of age 20-65 years. Study group consisted of 32 yoga practitioners, practicing yoga daily for a minimum period of one year. Control group consisted of 32 subjects who never practiced yoga or any other exercises. Data on physical characteristics such as age, height, weight and Body Mass Index were obtained. Cardio respiratory parameters were assessed among both the groups.
Results: The mean Heart rate, Systolic Blood Pressure, Diastolic Blood Pressure and Mean arterial pressure, Respiratory rate was significantly lower among yoga group compared to non yoga group. The mean breath holding time, forced vital capacity, forced expiratory volume in one second, peak expiratory flow rate and maximum volume ventilation are higher among yoga group
Conclusion: Regular practice of yoga improves the cardiopulmonary functions in both genders among healthy individuals hence we conclude that yoga practice can be incorporated in our lifestyle and hence prevents cardio respiratory disease in future.
Keywords: Yoga, Cardiopulmonary functions, Spirometer.
physical, mental, emotional and spiritual dimensions of the individual. The benefits of yoga are innumerable and at the same time indispensable for a harmonial life 3.
Among all the benefits a few of them include increase in agility and strength of the body, enhancement of memory and the cognitive functioning of the brain, increase in efficiency of respiration and cardiac activity, prevention of degenerative disease and the increase in parasympathetic dominance 4. Breath is one of the mystery and the deeper mystery of our consciousness. One of few mechanisms contributing to a state of calm alertness includes increased parasympathetic drive. By voluntarily controlling breathing patterns, it is possible to influence autonomic nervous system functions, including heart rate variability and cardiac vagal tone, chemoreflex sensitivity. The act of concentration while performing pranayama removes the attention from worldly worries and de-stress him. This decreases adrenaline release which in turn decreases sympathetic activity, decreases heart rate, respiratory rate and blood pressure 5.
IntroductionYoga is said to be psyco-somatic-spiritual discipline
for achieving coalition and consonance between our body and mind. The term Yoga has its verbal root as ‘Yuj’ in Sanskrit which means ‘Joining’ 1. The origin of yoga dates back to the Indus Valley Civilization (3300-1900 BC) as well as the Eastern states of India. There is also the prediction in our indispensable history of an early form of yoga known as Nirodhayoga (yoga of cessation) at the time of Mahabharata 2.Yoga is an ancient Indian philosophical and religious tradition discipline designed to bring balance and health to the
Corresponding Author: Dr. Veena H.C. Assistant Professor, Department of Physiology, Kodagu Institute of Medical Sciences, Madikeri e-mail: [email protected]
10.5958/2320-608X.2019.00177.X
234 International Journal of Physiology, October-December 2019, Vol.7, No. 4
Pranayama improves overall performance of the body. The regular practice of pranayama increases chest wall expansion and almost all lung functions. The beneficial effect of different pranayama is well reported and has sound scientific basis 6. Pranayama makes efficient use of abdominal and diaphragmatic muscles and improves the respiratory apparatus 7.Yoga strengthens the respiratory musculature due to which chest and lungs inflate and deflate to fullest possible extent and muscles are made to work to maximal extent.8
Much of information is available only with short term practice of yoga and their effects on cardiorespiratory functions. Hence our present study is to assess the effect of long term practice of yoga on cardiorespiratory parameters.
Material and MethodType of the study: This is a cross sectional
comparative study for duration of 2 months, conducted at Madikeri, Karnataka.
Study population: comprises of 64 healthy subjects of both sex in the age group of 20 to 65 years. The subjects were divided in to two groups. Study group consisting of 32 healthy subjects, selected randomly from a group of regular yoga practitioners practicing yoga daily for a minimum period of one year. Control group consisting of 32 healthy subjects who never practiced yoga or any other exercises.
Sample size: This sample size was found enough to estimate the cardiorespiratory parameters with 10% allowable error and 80% power.
Inclusion criteria:
Study group consists of yoga practitioners, practicing yoga daily for a minimum period of one year, in the age group of 20 to 65 years.
Control group consists of subjects who never practiced yoga or any other exercises in the age group of 20 to 65 years.
Exclusion criteria: The subjects with history of major respiratory, cardiac illness or neurological disorders or with history of major surgery in the recent past, smoking, alcohol consumption, obesity and pregnant females were excluded from our study.
Study Design: The study was performed after obtaining ethical clearance from institutional ethical
committee and after receiving informed and written consent from all the participants.
All the data were collected at a fixed time of the day between 6am to 8am to minimize any diurnal variation.
Data on physical characteristics such as age, height, weight and Body Mass Index were obtained. Parameters such as Heart rate (HR), Systolic Blood Pressure (SBP), Diastolic Blood Pressure (DBP), Respiratory Rate (RR), Breath holding time (BHT), Forced Vital Capacity (FVC), Forced Expiratory Volume in one second (FEV1), peak expiratory flow rate (PEFR) and Maximum entilatory Volume (MVV) were assessed among both the groups.
Heart rate (beats/min) was measured with help of ECG in lead II. Blood Pressure (SBP and DBP mm of Hg) was recorded in supine position in the right upper limb by using mercury sphygmomanometer after rest for 5 minutes. Three readings were taken at an interval of 15 minutes each and average of the three values calculated. Respiratory rate (breaths/min) was taken clinically by inspection. Subject was asked to lie in supine position on examination table in well ventilated and well lighted examination room. Clothing from the chest and abdomen was removed. Frequency of breathing was counted by observing abdominal wall movement for a full one minute from foot end position. Three such reading taken at the interval of 5 minutes and average is taken as a final reading.
Breath holding time was measured in seconds from the time of holding breath after quit expiration till the breaking point of the held breath by using stop watch in comfortable sitting position in which subjects were asked to hold breath by closing both nostril voluntarily by pinching nose between his/her thumb and index finger and closed mouth.
Forced vital capacity FVC), Forced Expiratory Volume in one second (FEV1), Maximum Ventilatory Volume (MVV)and peak expiratory flow rate (PEFR) were recorded using computerised spirometer-RMS Medispiror Helios 702. All the subjects were made acquainted with spirometer before actual recording.
For recording of FVC, FVC test was done on medispiror. The procedure was explained to subject before carrying the test. They were asked to practice the procedure. After sufficient exposure to practice the subjects were asked to begin relaxed tidal breathing
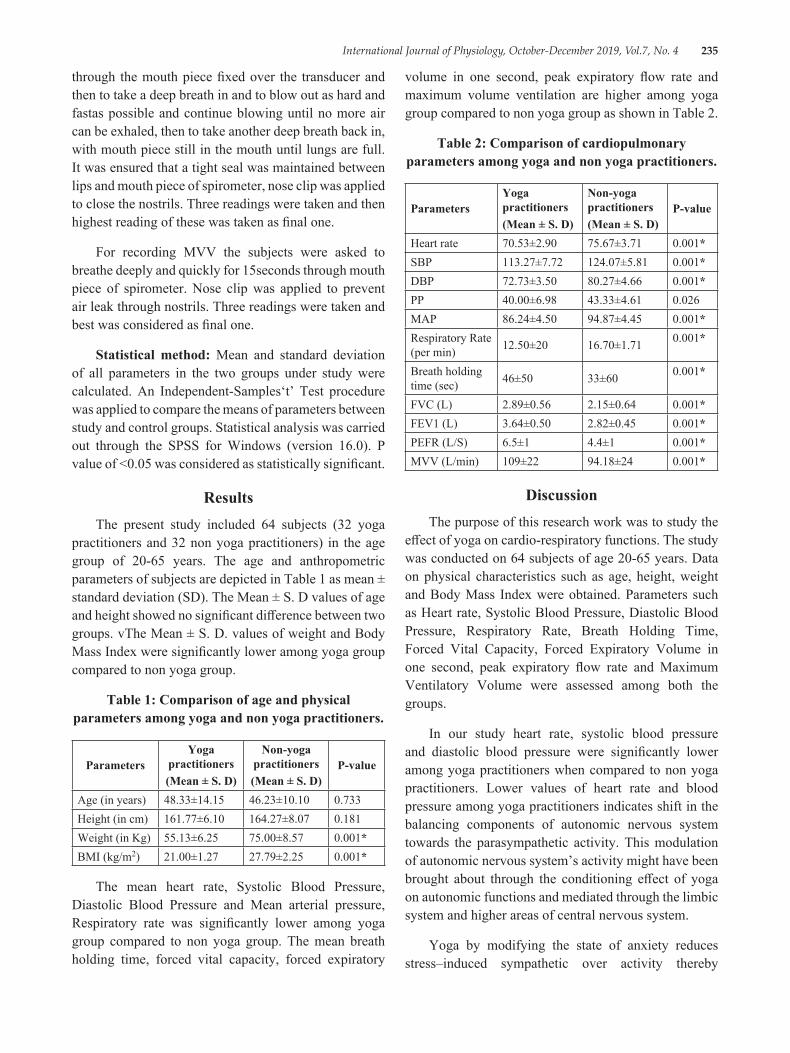
International Journal of Physiology, October-December 2019, Vol.7, No. 4 235
through the mouth piece fixed over the transducer and then to take a deep breath in and to blow out as hard and fastas possible and continue blowing until no more air can be exhaled, then to take another deep breath back in, with mouth piece still in the mouth until lungs are full. It was ensured that a tight seal was maintained between lips and mouth piece of spirometer, nose clip was applied to close the nostrils. Three readings were taken and then highest reading of these was taken as final one.
For recording MVV the subjects were asked to breathe deeply and quickly for 15seconds through mouth piece of spirometer. Nose clip was applied to prevent air leak through nostrils. Three readings were taken and best was considered as final one.
Statistical method: Mean and standard deviation of all parameters in the two groups under study were calculated. An Independent-Samples‘t’ Test procedure was applied to compare the means of parameters between study and control groups. Statistical analysis was carried out through the SPSS for Windows (version 16.0). P value of <0.05 was considered as statistically significant.
ResultsThe present study included 64 subjects (32 yoga
practitioners and 32 non yoga practitioners) in the age group of 20-65 years. The age and anthropometric parameters of subjects are depicted in Table 1 as mean ± standard deviation (SD). The Mean ± S. D values of age and height showed no significant difference between two groups. vThe Mean ± S. D. values of weight and Body Mass Index were significantly lower among yoga group compared to non yoga group.
Table 1: Comparison of age and physical parameters among yoga and non yoga practitioners.
ParametersYoga
practitioners(Mean ± S. D)
Non-yoga practitioners(Mean ± S. D)
P-value
Age (in years) 48.33±14.15 46.23±10.10 0.733Height (in cm) 161.77±6.10 164.27±8.07 0.181Weight (in Kg) 55.13±6.25 75.00±8.57 0.001*BMI (kg/m2) 21.00±1.27 27.79±2.25 0.001*
The mean heart rate, Systolic Blood Pressure, Diastolic Blood Pressure and Mean arterial pressure, Respiratory rate was significantly lower among yoga group compared to non yoga group. The mean breath holding time, forced vital capacity, forced expiratory
volume in one second, peak expiratory flow rate and maximum volume ventilation are higher among yoga group compared to non yoga group as shown in Table 2.
Table 2: Comparison of cardiopulmonary parameters among yoga and non yoga practitioners.
ParametersYoga practitioners(Mean ± S. D)
Non-yoga practitioners(Mean ± S. D)
P-value
Heart rate 70.53±2.90 75.67±3.71 0.001*SBP 113.27±7.72 124.07±5.81 0.001*DBP 72.73±3.50 80.27±4.66 0.001*PP 40.00±6.98 43.33±4.61 0.026MAP 86.24±4.50 94.87±4.45 0.001*Respiratory Rate (per min) 12.50±20 16.70±1.71 0.001*
Breath holding time (sec) 46±50 33±60 0.001*
FVC (L) 2.89±0.56 2.15±0.64 0.001*FEV1 (L) 3.64±0.50 2.82±0.45 0.001*PEFR (L/S) 6.5±1 4.4±1 0.001*MVV (L/min) 109±22 94.18±24 0.001*
DiscussionThe purpose of this research work was to study the
effect of yoga on cardio-respiratory functions. The study was conducted on 64 subjects of age 20-65 years. Data on physical characteristics such as age, height, weight and Body Mass Index were obtained. Parameters such as Heart rate, Systolic Blood Pressure, Diastolic Blood Pressure, Respiratory Rate, Breath Holding Time, Forced Vital Capacity, Forced Expiratory Volume in one second, peak expiratory flow rate and Maximum Ventilatory Volume were assessed among both the groups.
In our study heart rate, systolic blood pressure and diastolic blood pressure were significantly lower among yoga practitioners when compared to non yoga practitioners. Lower values of heart rate and blood pressure among yoga practitioners indicates shift in the balancing components of autonomic nervous system towards the parasympathetic activity. This modulation of autonomic nervous system’s activity might have been brought about through the conditioning effect of yoga on autonomic functions and mediated through the limbic system and higher areas of central nervous system.
Yoga by modifying the state of anxiety reduces stress–induced sympathetic over activity thereby
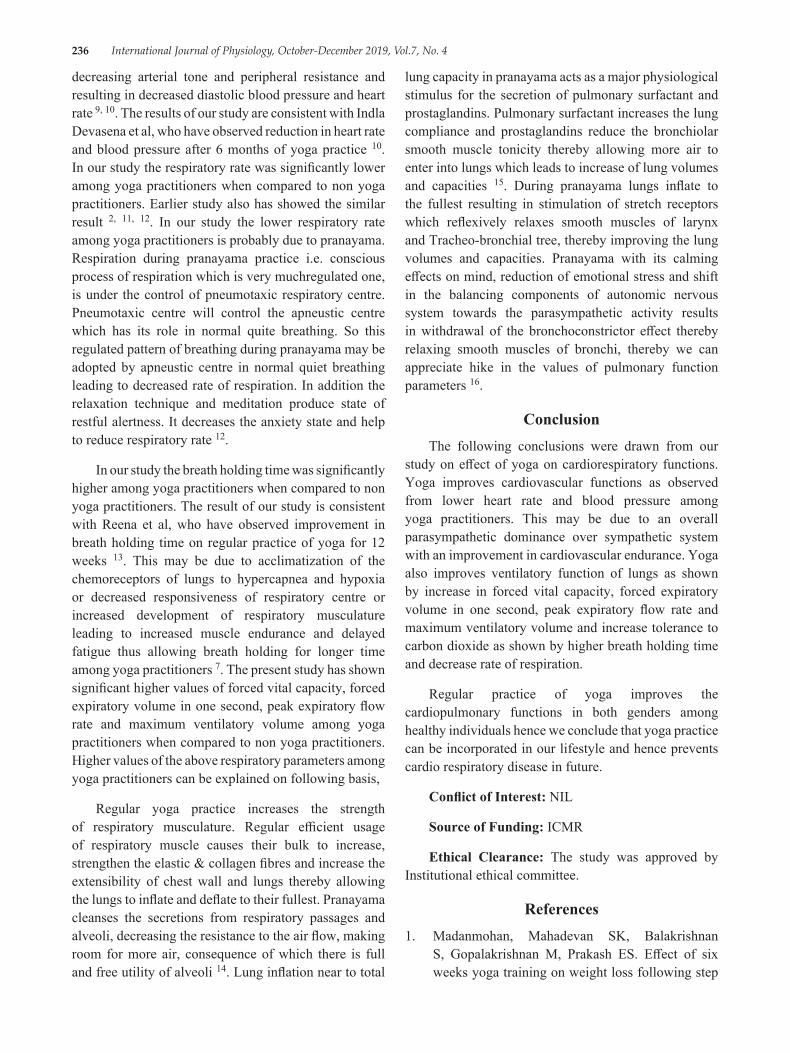
236 International Journal of Physiology, October-December 2019, Vol.7, No. 4
decreasing arterial tone and peripheral resistance and resulting in decreased diastolic blood pressure and heart rate 9, 10. The results of our study are consistent with Indla Devasena et al, who have observed reduction in heart rate and blood pressure after 6 months of yoga practice 10. In our study the respiratory rate was significantly lower among yoga practitioners when compared to non yoga practitioners. Earlier study also has showed the similar result 2, 11, 12. In our study the lower respiratory rate among yoga practitioners is probably due to pranayama. Respiration during pranayama practice i.e. conscious process of respiration which is very muchregulated one, is under the control of pneumotaxic respiratory centre. Pneumotaxic centre will control the apneustic centre which has its role in normal quite breathing. So this regulated pattern of breathing during pranayama may be adopted by apneustic centre in normal quiet breathing leading to decreased rate of respiration. In addition the relaxation technique and meditation produce state of restful alertness. It decreases the anxiety state and help to reduce respiratory rate 12.
In our study the breath holding time was significantly higher among yoga practitioners when compared to non yoga practitioners. The result of our study is consistent with Reena et al, who have observed improvement in breath holding time on regular practice of yoga for 12 weeks 13. This may be due to acclimatization of the chemoreceptors of lungs to hypercapnea and hypoxia or decreased responsiveness of respiratory centre or increased development of respiratory musculature leading to increased muscle endurance and delayed fatigue thus allowing breath holding for longer time among yoga practitioners 7. The present study has shown significant higher values of forced vital capacity, forced expiratory volume in one second, peak expiratory flow rate and maximum ventilatory volume among yoga practitioners when compared to non yoga practitioners. Higher values of the above respiratory parameters among yoga practitioners can be explained on following basis,
Regular yoga practice increases the strength of respiratory musculature. Regular efficient usage of respiratory muscle causes their bulk to increase, strengthen the elastic & collagen fibres and increase the extensibility of chest wall and lungs thereby allowing the lungs to inflate and deflate to their fullest. Pranayama cleanses the secretions from respiratory passages and alveoli, decreasing the resistance to the air flow, making room for more air, consequence of which there is full and free utility of alveoli 14. Lung inflation near to total
lung capacity in pranayama acts as a major physiological stimulus for the secretion of pulmonary surfactant and prostaglandins. Pulmonary surfactant increases the lung compliance and prostaglandins reduce the bronchiolar smooth muscle tonicity thereby allowing more air to enter into lungs which leads to increase of lung volumes and capacities 15. During pranayama lungs inflate to the fullest resulting in stimulation of stretch receptors which reflexively relaxes smooth muscles of larynx and Tracheo-bronchial tree, thereby improving the lung volumes and capacities. Pranayama with its calming effects on mind, reduction of emotional stress and shift in the balancing components of autonomic nervous system towards the parasympathetic activity results in withdrawal of the bronchoconstrictor effect thereby relaxing smooth muscles of bronchi, thereby we can appreciate hike in the values of pulmonary function parameters 16.
ConclusionThe following conclusions were drawn from our
study on effect of yoga on cardiorespiratory functions. Yoga improves cardiovascular functions as observed from lower heart rate and blood pressure among yoga practitioners. This may be due to an overall parasympathetic dominance over sympathetic system with an improvement in cardiovascular endurance. Yoga also improves ventilatory function of lungs as shown by increase in forced vital capacity, forced expiratory volume in one second, peak expiratory flow rate and maximum ventilatory volume and increase tolerance to carbon dioxide as shown by higher breath holding time and decrease rate of respiration.
Regular practice of yoga improves the cardiopulmonary functions in both genders among healthy individuals hence we conclude that yoga practice can be incorporated in our lifestyle and hence prevents cardio respiratory disease in future.
Conflict of Interest: NIL
Source of Funding: ICMR
Ethical Clearance: The study was approved by Institutional ethical committee.
References1. Madanmohan, Mahadevan SK, Balakrishnan
S, Gopalakrishnan M, Prakash ES. Effect of six weeks yoga training on weight loss following step
International Journal of Physiology, October-December 2019, Vol.7, No. 4 237
test, respiratory pressures, handgrip strength and handgrip endurance in young healthy subjects. Indian J Physiol Pharmacol 2008; 52: 164-170.
2. Somwanshi S D, Handergulle S M, Adgaonkar B D. Effect of Sudarshankriya Yoga on Cardiorespiratory Parameters. International Journal of Recent Trends in Science and Technology 2013; 8 (1):62-66.
3. Keshur AK, Hitesh A J, Nileshwari H V. Effect of Yoga on pulmonary Function tests. International Journal of Research in Medical Sciences 2015; 3 (9):2357-2361
4. Madanmohan, Rai UC, Balavittal V, Thombre DP, Swami Gitananda. Cardiorespiratory changes during savitri pranayama and shavasan. The yoga review 1983; 3: 25-34.
5. Raghuraj P, Ramakrishnan AG, Nagendra HR, Shirely Telles. Effect of two selected yogic breathing techniques on heart rate variability. Indian J Physiol Pharmacol 1998; 42: 467-72.
6. Joshi LN, Joshi VD & Gokhale LV. Effect of short term Pranayama practice on breathing rate and ventilatory functions of lung. Indian J Physiol Pharmacol. 1992; 32:105-08
7. Makwana K, et al. Effect of short term yoga practice on ventilatory function tests. Indian J Physiol Pharmacol. 1988; 32 (3):202-08.
8. Karthik P S, Chandrashekar M, Ambareesha K. Effect of Pranayama and Suryanamaskar on Pulmonary Functions in Medical Students.
9. Bhargava R, Gogate MG and Macarenhas JF. Autonomic responses to breath holding and its variations following pranayama. Indian J Physiol Pharmacol 1988; 32 (4); 257-264.
10. Gopal KS, Bhatnagar OP, Subramanian N, Nishith SD. Effect of yogasana and pranayamas on blood pressure, pulse rate and some respiratory functions. Indian J Physiol Pharmocol 1973; 17 (3); 273-276
11. Makwana, K., N. Khirwadkar, C. Gupta, 1988. Effect of short term yoga practice on ventilator function tests. Indian J Physiol Pharmacol., 32:202-208.
12. Patil Y, Sawant R S. Study of effect of bhastrika pranamaya on pulmonary function. International Research Journal of Pharmacy. 2012; 3 (3):204-207.
13. Reena KR, Prathamesh K, Manish K. Effect of Yoga training on breathing rate and lung functions in patients of bronchial asthma. International journal of recent trends in science and technology. 2013; 5 (3); 127-129.
14. Shankarappa V, Prashanth P, NachanAnnamalai, VarunMalhotra. The short term effect of Pranayama on lung parameters. Jounal of clinical and diagnostic research. 2012; 6 (1): 27-30.
15. Doijad VP and Surdi AD. Effect of short term Yoga practice on pulmonary function tests. Indian Journal of basic and applied Medical Research. 2012; 1 (3):226-30
16. Melhotra PK, Verma N, Tiwari S, Kumar P. Pulmonary functions in Indian sportsmen playing different games. Indian lournal of physiology and pharmacology. 1998; 42:412-6
238 International Journal of Physiology, October-December 2019, Vol.7, No. 4
Introduction and Assessment of Jigsaw Method of Teaching on Challenging Topics in Physiology for
First Year Medical Students
Suman Sharma1, Sangita Chauhan1, Manjinder Kaur2
1Associate Professor, 2Professor & HOD, Department of Physiology, Geetanjali Medical College & Hospital, Udaipur
AbstractIntroduction: Working with active participation in a group results in success. It has been observed that the attendance and performance of the students is reducing in small group teaching because of their lack of interest. Jigsaw method is an innovative and cooperative method of teaching and learning as it involves active participation of students, focuses on fellow learners’ co-operation and reassures team work.
Objectives: The present study is aimed for introducing and assessing the effectiveness of Jigsaw method in enhancing cognitive and communication skills in M.B.B.S. students and it also attempts to train the faculty for this teaching learning method.
Methodology: A didactic lecture on the topic “Auditory system: EAR” was taken by the faculty of the Department of Physiology for 150 first year MBBS students. A prevalidated questionnaire based pre-test was taken in the tutorial hours. Students were randomly divided into 4 expert groups. Each group was given 4 subtopics of ear and they had 30 minutes to prepare it. After that, one student from each expert group was selected and a new mixed group of 4students each was made. The new group was asked to discuss the topic in 30 minutes. Now a Post-test was taken. Student feedback was taken by a prevalidated questionnaire of feedback Reflection writing of the faculty and students were also taken.
Result: It was observed that there was a 118% gain of knowledge in the students P< 0.0001 120.88% students agreed that this teaching learning method was helpful, time saving and doubt clearing. 23.96% students strongly agree that this method should be conducted more frequently in future and in the other departments also. 57.14% faculty suggested that this method needs more planning to execute but at the same time they agreed that it involved active participation of students and faculty both.
Conclusion: Cooperative learning like Jigsaw facilitates learning in small groups with fellow learner and encourages team work which ultimately enhances the teaching learning experience.
Keywords: Cooperative learning, small group teaching learning method, Jigsaw.
and develops a problem solving attitude in them. All this together transforms the students from a dependent learner to an active, self directed, lifelong learner. The effectiveness of an educational system greatly depends on the method of teaching they choose to teach their students.1,2,3 Learning is an active process in which the student and teacher have to work mutually to make the knowledge-sharing process enjoyable and easier for comprehension. For an effective learning teaching should facilitate development of analytical approaches to a problem and to address areas which pose difficulties
Corresponding Author: Dr Sangita Chauhan Assistant Professor, Department of Physiology, Geetanjali Medical College & Hospital, Udaipur e-mail: [email protected]
IntroductionA medical educational institution plays a key role
in training a generation in knowledgeable and skilful manner, enhances the critical thinking of the students
10.5958/2320-608X.2019.00178.1
International Journal of Physiology, October-December 2019, Vol.7, No. 4 239
for the students. Thus, it becomes essential to design an approach to teaching and learning that is best suited to the needs of the students.4
Hence, the role of teacher from “Sage on Stage” as information dispenser needs to be shifted to “Guide by Side” facilitating active learning. Cooperative learning is an active learning approach, in which students improve comprehension, knowledge, critical thinking, problem solving, clinical skills, self confidence and communication including listening. Jigsaw is one of the method which teaches cooperation rather competition..5
.This method promotes students motivation in learning positive attitude, develops interpersonal skills, leadership qualities and improves communication by peer- peer teaching.6
A good teacher exposes the students and prepares them for the challenging situations in life and trains them with the opportunities for interaction, consultation, cooperation, discussion, and develops skills that helps them debate with themselves and with their teachers so that they can develop the power of thinking and participation. By critical analysis students can recognise their gap of knowledge and areas of difficulties.
Physiology is the basic subject taught in I MBBS forming base of Pathology, Pharmacology and Medicine. The in depth knowledge of all these three subjects with skill can make a Indian Medical Graduate (IMG) more compatible for the society. In Depth knowledge of basic sciences in Physiology with vast syllabus makes some topics complex and difficult to understand and learn. Student’s lack of interest and poor participation in small group teachings by didactic lectures inspires us to take the more difficult and challenging topics in an innovative manner.
Because of lack of active learning participation, the IMG is not competent enough to understand the subject thoroughly and is not able to acquire this knowledge up to its affective domain. This makes the student incompetent and is not able o diagnose and provide primary care even for common public health problems which later on become a cause of great disability, morbidity and mortality in the general population.
So the aim of the present study is, to introduce, apply and assess the jigsaw method on the challenging topics in Physiology for first year students. By the active learning process students may correlate the basic science up to cognitive level and start taking keen in depth interest in
the subject so that IMG becomes competent enough to diagnose and provide primary health care services.
Aim and ObjectivesGoal:
To improve the competency of IMG.
To develop interpersonal skills of IMG. i.e. interaction, consultation, cooperation.
To develop problem solving skills of IMG.
To develop the power of thinking and meaningful learning of IMG.
Enhance Peer – peer interaction.
Objective:
To conduct jigsaw method on challenging topics of physiology for first year medical students.
To train the faculty for jigsaw method.
To obtain the students and teachers perception for this newer teaching methodology in physiology.
To assess the students for the topic taught by the jigsaw method.
Material and MethodMethodology:
Study area: Geetanjali Medical College & Hospital, Udaipur (Raj.).
Study population: 150 first year professional MBBS students (preclinical year semester II) in the Department of Physiology.
Study design: Cross sectional interventional study.
Inclusion criteria: Participants were randomly selected from the whole class who volunteerd for attending the study. The study was conducted on 150 MBBS first year professional students batch 2017-18 (preclinical year semester II) in the Department of Physiology, Geetanjali Medical College & Hospital, Udaipur (Raj.).
Exclusion criteria: Students who were absent that day and those not willing to participate in the study were excluded from the study.
The activity was performed after obtaining the permission of the Institutional Ethical committee ref. no.
240 International Journal of Physiology, October-December 2019, Vol.7, No. 4
GU/HREC/EC/2018/1523 dated 16/04/2018, HOD of Department of Physiology and from the Dean. A written informed consent was signed by the participants. The names and identifiable information was not recorded in all sessions in order to preserve anonymity. The faculty members were sensitized by discussing the proposed plan of study with them. The whole task was executed in the presence of facilitators. The plan and objectives of the study was explained before the study began.
The proposed work was started after delivering the conventional didactic lecture for 2 hrs to the students on the topic “Auditory System: Ear”
The teaching methodology was applied on the tutorial hours spanning over a period of 3 hours. The feedback of students and reflection writing by students and faculty members were taken and analyzed by statistics.
On the next day participants came to the Department for Jigsaw teaching 7 on the topic “Auditory system- EAR”. A structured questionnaire including 10 questions was prepared and validated for pre-test and post-test which was used to assess the students learning experiences. The pre-test was taken for all 150 students. The students were then divided into 4 groups namely A, B, C, and D. Each group had 37 students. Now this A group further divided into 4 Parent groups i.e. A1 A2 A 3A4 .Each group now had 9 members. Topics were also divided into 4 subtopics. All the topics were having specific learning objectives (SLO). These subtopics were assigned to each group & the group was given a time period of 30 minutes to prepare. After 30 minutes, expert groups were formed by including students from each parent group i.e. A1 C1D1 BI. The Expert group now explains their topic and helps the peers to understand the
topic for 30 minutes with the help of available resources, and clearing their doubts if any from the facilitators. After 30 minutes the expert went back to their parent group. Each expert now provided all the information gathered through the discussion and tells them the depth and specific point on the same topic. After that the students gave the post-test.
A prevalidated questionnaire for feedback comprising both closed ended and open ended 10 questions prepared on the basis of 5 point Likert’scale (1= strongly disagree,2=disagree,3=neutral,4=agree,5=strongly agree) were used to assess the learning experience of the students, their perception towards the activity and the level of satisfaction. Feedback was taken by both students and from faculties also. Students submitted their response for newer methodology in the form of reflective writing in WWW model e.g. what happened, so what, and what next. (The planning chart for methodology is shown in Figure : 1)
Stastical analysis: Appropriate Stastical analysis was done on the quantitative and qualitative data. Descriptive statistics were used and data was expressed as percentage. Gain % and range of score was performed on the data of pre-test and post-test and a p<0.0001 was considered as significant. Mean and standard deviation was used to measure the quantitative variables. Mean score was calculated for the close ended statement with Liker’s Scale response. The open ended questions were analysed by content analysis for identifying, interpreting and obtaining themes for student’s responses.
Feasibility: Project was feasible and was conducted during tutorial hours in the Department with the help of all teaching and non-teaching staff members.
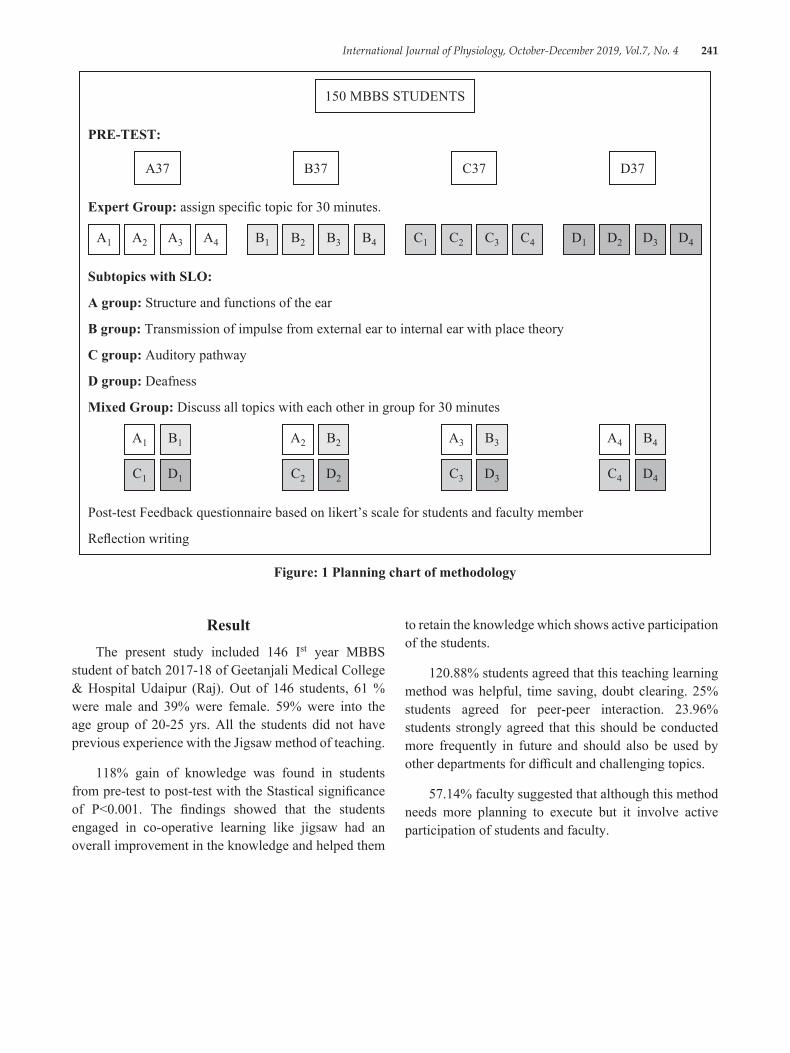
International Journal of Physiology, October-December 2019, Vol.7, No. 4 241
150 MBBS STUDENTS
PRE-TEST:
A37 C37B37 D37
Expert Group: assign specific topic for 30 minutes.
A1 A2 A3 A4 B1 B2 B3 B4 C1 C2 C3 C4 D1 D2 D3 D4
Subtopics with SLO:
A group: Structure and functions of the ear
B group: Transmission of impulse from external ear to internal ear with place theory
C group: Auditory pathway
D group: Deafness
Mixed Group: Discuss all topics with each other in group for 30 minutes
A1 B1
C1 D1
A3 B3
C3 D3
A2 B2
C2 D2
A4 B4
C4 D4
Post-test Feedback questionnaire based on likert’s scale for students and faculty member
Reflection writing
Figure: 1 Planning chart of methodology
to retain the knowledge which shows active participation of the students.
120.88% students agreed that this teaching learning method was helpful, time saving, doubt clearing. 25% students agreed for peer-peer interaction. 23.96% students strongly agreed that this should be conducted more frequently in future and should also be used by other departments for difficult and challenging topics.
57.14% faculty suggested that although this method needs more planning to execute but it involve active participation of students and faculty.
ResultThe present study included 146 Ist year MBBS
student of batch 2017-18 of Geetanjali Medical College & Hospital Udaipur (Raj). Out of 146 students, 61 % were male and 39% were female. 59% were into the age group of 20-25 yrs. All the students did not have previous experience with the Jigsaw method of teaching.
118% gain of knowledge was found in students from pre-test to post-test with the Stastical significance of P<0.001. The findings showed that the students engaged in co-operative learning like jigsaw had an overall improvement in the knowledge and helped them
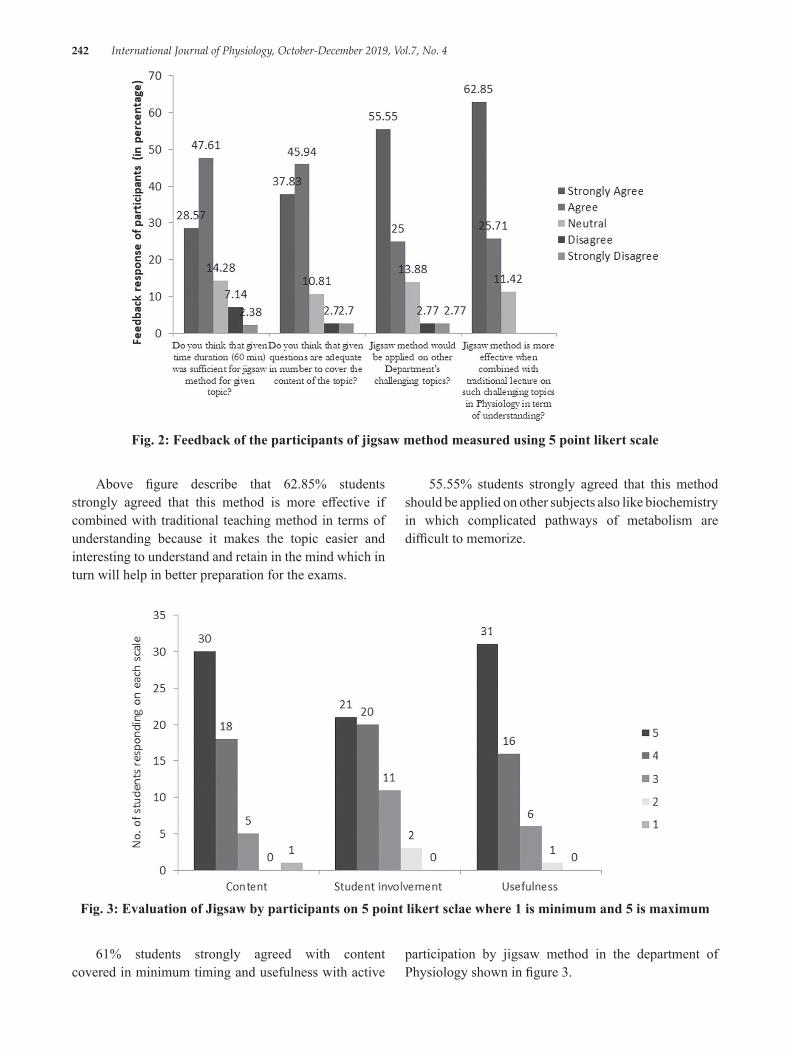
242 International Journal of Physiology, October-December 2019, Vol.7, No. 4
Fig. 2: Feedback of the participants of jigsaw method measured using 5 point likert scale
Above figure describe that 62.85% students strongly agreed that this method is more effective if combined with traditional teaching method in terms of understanding because it makes the topic easier and interesting to understand and retain in the mind which in turn will help in better preparation for the exams.
55.55% students strongly agreed that this method should be applied on other subjects also like biochemistry in which complicated pathways of metabolism are difficult to memorize.
Fig. 3: Evaluation of Jigsaw by participants on 5 point likert sclae where 1 is minimum and 5 is maximum
61% students strongly agreed with content covered in minimum timing and usefulness with active
participation by jigsaw method in the department of Physiology shown in figure 3.
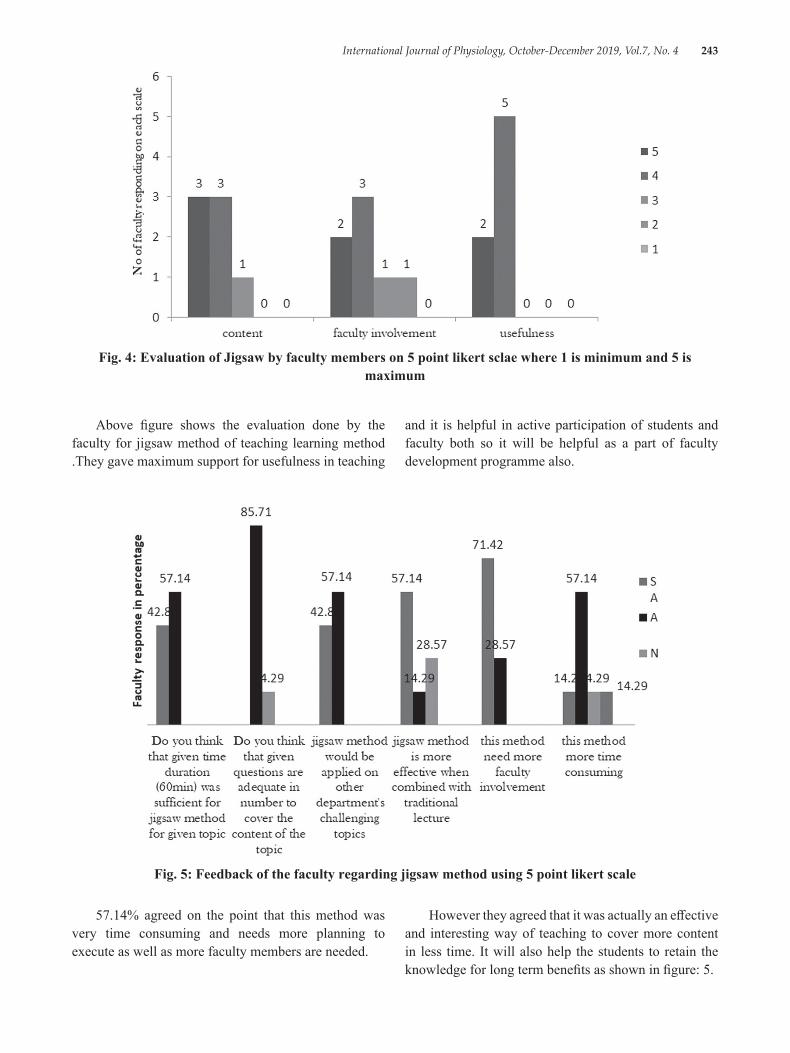
International Journal of Physiology, October-December 2019, Vol.7, No. 4 243
Fig. 4: Evaluation of Jigsaw by faculty members on 5 point likert sclae where 1 is minimum and 5 is maximum
and it is helpful in active participation of students and faculty both so it will be helpful as a part of faculty development programme also.
Above figure shows the evaluation done by the faculty for jigsaw method of teaching learning method .They gave maximum support for usefulness in teaching
Fig. 5: Feedback of the faculty regarding jigsaw method using 5 point likert scale
57.14% agreed on the point that this method was very time consuming and needs more planning to execute as well as more faculty members are needed.
However they agreed that it was actually an effective and interesting way of teaching to cover more content in less time. It will also help the students to retain the knowledge for long term benefits as shown in figure: 5.
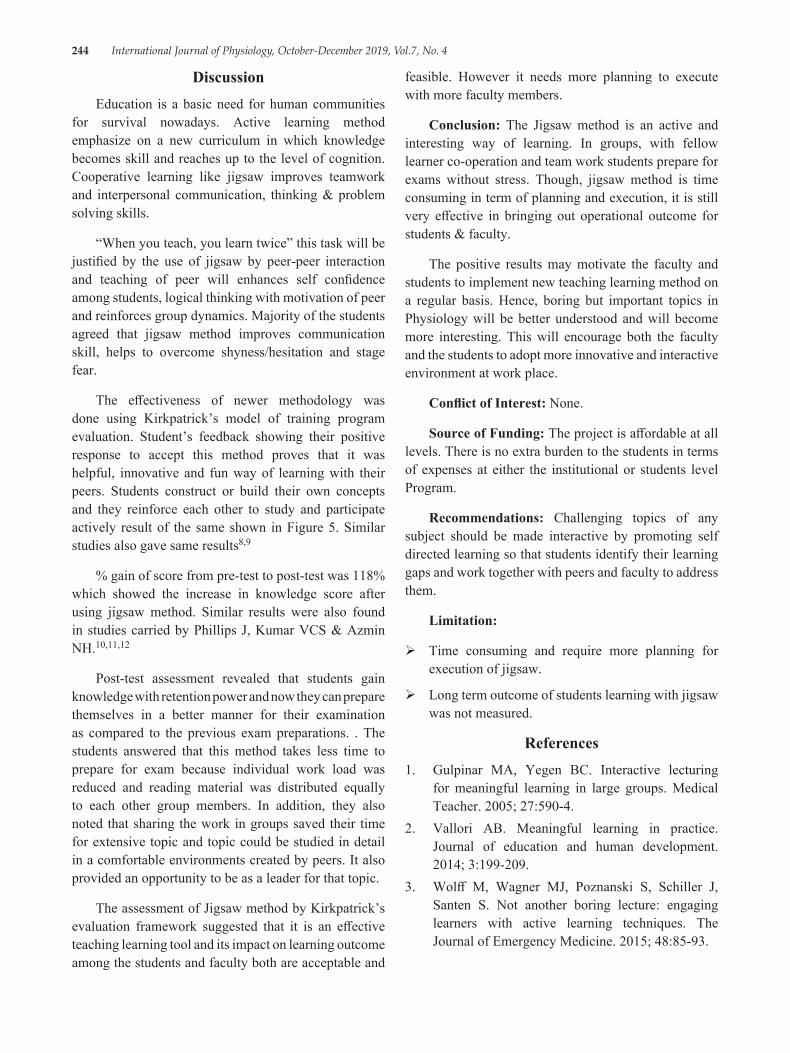
244 International Journal of Physiology, October-December 2019, Vol.7, No. 4
DiscussionEducation is a basic need for human communities
for survival nowadays. Active learning method emphasize on a new curriculum in which knowledge becomes skill and reaches up to the level of cognition. Cooperative learning like jigsaw improves teamwork and interpersonal communication, thinking & problem solving skills.
“When you teach, you learn twice” this task will be justified by the use of jigsaw by peer-peer interaction and teaching of peer will enhances self confidence among students, logical thinking with motivation of peer and reinforces group dynamics. Majority of the students agreed that jigsaw method improves communication skill, helps to overcome shyness/hesitation and stage fear.
The effectiveness of newer methodology was done using Kirkpatrick’s model of training program evaluation. Student’s feedback showing their positive response to accept this method proves that it was helpful, innovative and fun way of learning with their peers. Students construct or build their own concepts and they reinforce each other to study and participate actively result of the same shown in Figure 5. Similar studies also gave same results8,9
% gain of score from pre-test to post-test was 118% which showed the increase in knowledge score after using jigsaw method. Similar results were also found in studies carried by Phillips J, Kumar VCS & Azmin NH.10,11,12
Post-test assessment revealed that students gain knowledge with retention power and now they can prepare themselves in a better manner for their examination as compared to the previous exam preparations. . The students answered that this method takes less time to prepare for exam because individual work load was reduced and reading material was distributed equally to each other group members. In addition, they also noted that sharing the work in groups saved their time for extensive topic and topic could be studied in detail in a comfortable environments created by peers. It also provided an opportunity to be as a leader for that topic.
The assessment of Jigsaw method by Kirkpatrick’s evaluation framework suggested that it is an effective teaching learning tool and its impact on learning outcome among the students and faculty both are acceptable and
feasible. However it needs more planning to execute with more faculty members.
Conclusion: The Jigsaw method is an active and interesting way of learning. In groups, with fellow learner co-operation and team work students prepare for exams without stress. Though, jigsaw method is time consuming in term of planning and execution, it is still very effective in bringing out operational outcome for students & faculty.
The positive results may motivate the faculty and students to implement new teaching learning method on a regular basis. Hence, boring but important topics in Physiology will be better understood and will become more interesting. This will encourage both the faculty and the students to adopt more innovative and interactive environment at work place.
Conflict of Interest: None.
Source of Funding: The project is affordable at all levels. There is no extra burden to the students in terms of expenses at either the institutional or students level Program.
Recommendations: Challenging topics of any subject should be made interactive by promoting self directed learning so that students identify their learning gaps and work together with peers and faculty to address them.
Limitation:
Time consuming and require more planning for execution of jigsaw.
Long term outcome of students learning with jigsaw was not measured.
References1. Gulpinar MA, Yegen BC. Interactive lecturing
for meaningful learning in large groups. Medical Teacher. 2005; 27:590-4.
2. Vallori AB. Meaningful learning in practice. Journal of education and human development. 2014; 3:199-209.
3. Wolff M, Wagner MJ, Poznanski S, Schiller J, Santen S. Not another boring lecture: engaging learners with active learning techniques. The Journal of Emergency Medicine. 2015; 48:85-93.
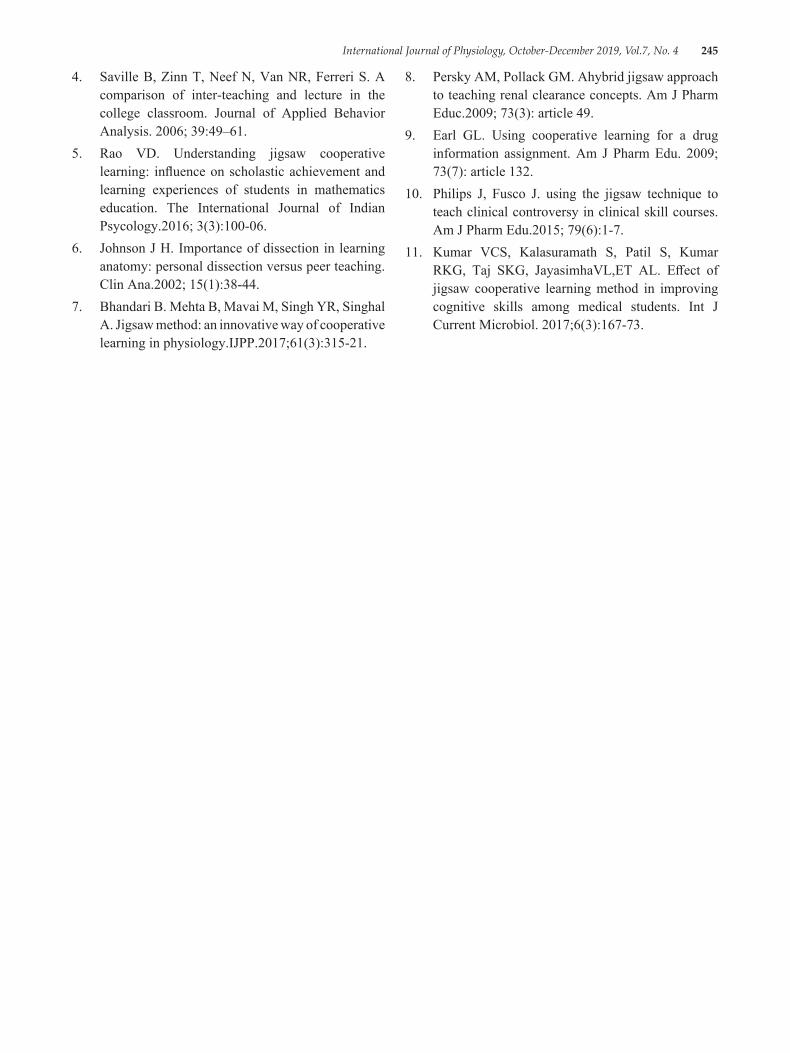
International Journal of Physiology, October-December 2019, Vol.7, No. 4 245
4. Saville B, Zinn T, Neef N, Van NR, Ferreri S. A comparison of inter-teaching and lecture in the college classroom. Journal of Applied Behavior Analysis. 2006; 39:49–61.
5. Rao VD. Understanding jigsaw cooperative learning: influence on scholastic achievement and learning experiences of students in mathematics education. The International Journal of Indian Psycology.2016; 3(3):100-06.
6. Johnson J H. Importance of dissection in learning anatomy: personal dissection versus peer teaching.Clin Ana.2002; 15(1):38-44.
7. Bhandari B. Mehta B, Mavai M, Singh YR, Singhal A. Jigsaw method: an innovative way of cooperative learning in physiology.IJPP.2017;61(3):315-21.
8. Persky AM, Pollack GM. Ahybrid jigsaw approach to teaching renal clearance concepts. Am J Pharm Educ.2009; 73(3): article 49.
9. Earl GL. Using cooperative learning for a drug information assignment. Am J Pharm Edu. 2009; 73(7): article 132.
10. Philips J, Fusco J. using the jigsaw technique to teach clinical controversy in clinical skill courses. Am J Pharm Edu.2015; 79(6):1-7.
11. Kumar VCS, Kalasuramath S, Patil S, Kumar RKG, Taj SKG, JayasimhaVL,ET AL. Effect of jigsaw cooperative learning method in improving cognitive skills among medical students. Int J Current Microbiol. 2017;6(3):167-73.
246 International Journal of Physiology, October-December 2019, Vol.7, No. 4
Relationship of Emotional Intelligence with Pre-Hypertension and its Impact on Autonomic Nervous System as Assessed by
Heart Rate Variability in Adult Males
Sumit Garg1, J.L. Agarwal2
1Associate Professor, Physiology, 2Dean/ Director Research, Professor & Head, Physiology, Saraswathi Institute of Medical Sciences, Hapur
AbstractObjectives:
1. To compare emotional intelligence score in normotensives and pre-hypertensives.2. To compare emotional intelligence score with heart rate variability (HRV)3. To compare HRV in normotensives and pre-hypertensives.
Methodology: 30 pre-hypertensive males and 30 age matched controls of 25 – 50years of age were enrolled. BP was measured using mercury sphygmomanometer. Pre-hypertension was defined as systolic BP from 121 to 139mm Hg or diastolic BP from 80 to 89mm Hg. Emotional intelligence was measured by Schutte Self-Reported Emotional Intelligence Test and subjects were categorized into two groups: Group A: Low EI (Score <111), Group B: High EI (Score >111) HRV was measured in the supine position for 5 minutes. Frequency domain parameters viz HFnu and LF/HF ratio were used for analysis of autonomic dominance.
Results: Mean EI score was significantly less in pre-hypertensives as compared to controls. Low EI subjects had a significantly lower mean HFnu and a significantly higher mean LF/HF ratio showing lower parasympathetic and higher sympathetic activity in them. Pre-hypertensives had lower mean HFnu and higher LF/HF ratio showing lower parasympathetic and higher sympathetic activity in them.
Conclusions: Low EI subjects are more prone to develop pre-hypertension, had lower parasympathetic & higher sympathetic activity increasing the risk to develop hypertension in future.
Clinical Significance: Beside life style modification, improving EI is an important measure to manage pre-hypertension and prevent hypertension.
Keywords: Emotional Intelligence; Prehypertension; Heart Rate Variability.
or DBP 80–89 mmHg.1 According to a study done in urban Indian Population, the age and sex adjusted prevalence of prehypertension was 32.3 per cent; it was significantly higher in males (36%) compared to females 28.1%. Prehypertension tends to progress to hypertension over a relatively short time course, and is a risk factor for development of microalbuminuria and cardiovascular disease, with consequently increased mortality. However, the origins and pathogenesis of the syndrome are not yet well understood.2
In the modern times enhanced performance demands stress is present universally, and none of us can escape
IntroductionPrehypertension is an emerging common risk factor
for not only hypertension, but also cardiovascular target organ complications. The term “prehypertension” was defined in 2003 by JNC 7 as SBP 120–139 and/
Corresponding Author: Dr. J.L. Agarwal Dean/ Director Research, Professor & Head, Physiology, SIMS, Hapur e-mail: [email protected]
10.5958/2320-608X.2019.00179.3
International Journal of Physiology, October-December 2019, Vol.7, No. 4 247
daily life stresses. Stress is the result of an interaction between the individual and the environment in which the individual assesses deficiencies in coping strategies in response to a demanding situation. There is the existence of four processes during this interaction. The first is perception of internal or external stimulus; the second is evaluation of that stimulus as a threat to wellbeing; the third is appraisal of cognitive, physical coping resources, and the fourth is complex set of cognitive and somatic responses known as the stress response.3,4
Researches have found a wide range of important life outcomes can be predicted by the emotional intelligence (EI). EI is the ability to recognize emotion, reason with emotion and emotion-related information, and process emotional information as part of general problem solving. High-level of EI can significantly predict healthy functioning, as well as the distress and experience of traumatic stress. Individuals with high EI experienced less stress at work.4
Emotions have been defined as “brief, organized set of responses (including psychological changes, expressive behaviours, action tendencies, and subjective experiences) that optimize how individuals address challenges and exploit opportunities that arise in the events that they encounter”. Intelligence has been defined as “ability to understand complex ideas, adapt effectively to the environment, learn from experience, engage in various forms of reasoning overcome obstacles by taking thought”.5 EI is defined as “the ability to perceive and express emotion, assimilate emotion and thought, understand and reason with emotion, and regulate emotion in the self and others.”7
Schutte Self Report Emotional Intelligence Test is a valid and reliable questionnaire to assess EI. It consists of 33 questions. A score below 111 is considered as low EI.8
Autonomic nervous system (ANS) activity is viewed as a major component of the emotion response. For example, negative emotions such as anger, anxiety & fear response are characterized by sympathetic response such as α and β adrenergically mediated cardiovascular effects: increased heart rate, increased blood pressure (BP), and increased total peripheral resistance. Whereas positive emotions such as amusement, contentment, affection response is characterized by sympathetic deactivation or parasympathetic dominance. 9
Valuable insight of ANS function can be gained non- invasively through Heart rate variability (HRV) analysis,
a measurement of beat to beat changes in heart rate. HRV is a simple and non-invasive indicator for the detection and investigation of possible cardiac autonomic activity whether sympathetic or parasympathetic dominance. Low HRV is often an indicator of abnormal and inadequate adaptation of the ANS, which may indicate presence of physiological malfunction. The decrease in autonomic activity can be an early sign for the prediction of the risk for cardiovascular and metabolic disease.10
The present study was designed to determine the association between Pre-Hypertension, EI and HRV.
Objectives:
1. To compare EI score in normotensives and pre-hypertensives.
2. To compare EI score with HRV
3. To compare HRV in normotensives and pre-hypertensives.
Materials and MethodThe present study was a cross sectional study
designed to investigate the association among pre-hypertension, EI and HRV. The study was done in Department of Physiology, Saraswathi Institute of Medical Sciences, Hapur. Ethical clearance was obtained from the Institutional Ethical Committee and written informed consent was obtained by all subjects. The study consisted of 30 Pre-hypertensive male subjects between 25 – 50 years of age and equal number of age matched normotensive controls were enrolled in the study. Subjects who were smokers & alcoholics and who were suffering from diabetes mellitus, hypertension, cardiovascular or respiratory diseases were excluded from the study.
BP was measured using mercury sphygmomanometer taking all necessary precautions. Subjects were allowed to sit quietly for 15 min prior to assessment of BP; three consecutive measurements were made 5 min apart, and BP was determined as the mean of the three readings. Pre-hypertension was defined as systolic BP from 121 to 139mm Hg or diastolic BP from 80 to 89mm Hg. 1
EI was measured by Schutte Self-Reported Emotional Intelligence Test. It consists of 33 questions. Each question asks about emotions or reactions associated with emotions. After deciding whether a statement is generally true, the subjects were supposed to use the 5-point scale to respond to the statement: “1”
248 International Journal of Physiology, October-December 2019, Vol.7, No. 4
if strongly disagree, the “2” if somewhat disagree, “3” neither agree nor disagree, the “4” somewhat agree, and the “5” strongly agree. Each item is given marks according to the option serial and responses to items 5, 28, and 33 are reverse coded. The total sum will give the EI score and subjects were categorized into two groups:
Group A: Low EI (Score < 111),Group B: High EI (Score > 111)8
Method of measuring HRVHRV was measured in the following way:
ECG was recorded using standardized in house built Analogue ECG Amplifier, with Audacity 1.3.13 license free software in the supine position for 5 minutes after 10 minutes of supine rest. Subjects were instructed to close the eyes and to avoid talking, moving of hands, legs and body, coughing and sleeping during the test.
ECG was recorded in dot wave form with 8000 samples/second, the recorded wave was subjected to digital filtering to filter the noise and amplification to increase the size of ECG wave. Using beat finder every ‘R’ wave was recorded as beat and the real time was noted. The data was then exported as labels to notepad and from there to Microsoft excel to find out ‘R-R’ interval, this was saved in notepad. The notepad file was opened in Kubios HRV Analysis software 2.2 version license free software and the report sheet was saved in JPEG format. Frequency domain parameters viz HFnu and LF/HF ratio were used for analysis of autonomic dominance (sympathetic or parasympathetic).11,12
Descriptive statistical analysis was carried out on the data thus obtained. Independent t test was used for comparison among EI, Pre-hypertension and frequency domain parameters of HRV. Significance was assessed at 5% level of significance.
ResultsMean age of the subjects was 39.2 + 5.23 years.
Low EI was observed in 23 out of 60 subjects (38.3%) out of which 20 subjects were pre-hypertensives and 3 normotensives. Mean EI score was significantly less in pre-hypertensives as compared to normotensive controls [Table 1]. Low EI subjects had a significantly lower mean HFnu and a significantly higher mean LF/HF ratio [Table 2] showing lower parasympathetic and higher sympathetic activity in them. Pre-hypertensives had lower mean HFnu and higher LF/HF ratio than normotensive controls [Table 3] showing lower parasympathetic and higher sympathetic activity in them.
DiscussionOur study intended to investigate the relationship
of EI with pre-hypertension and its impact on ANS in adult males. Pre-hypertensives had a lower EI than their normotensive counterparts which means they cannot manage their emotions well and are emotionally unstable. Our results were consistent with other studies. A study done in Bhavnagar revealed a low EI among hypertensives as compared to normotensives. Lower EI can be claimed to contribute to the occurrence of physical problems, such as abnormal BP. Failure to manage anger, the control of which indicates better EI, increases blood cholesterol and adrenaline and thus hardens the arteries and increases the probability of affliction with cardiovascular disease.13
A study done by Mokhtari et al showed that training on EI without employing other approaches, such as psychotherapy, family therapy and counselling, resulted in a significant reduction in systolic and diastolic BP of patients suffering from coronary artery disease. This clearly indicates that lower EI can be one of the cause of high BP. 14
As discussed above, EI is the ability to restrain negative feelings such as anger, self-doubt, stress, anxiety and instead focus on positive ones such as confidence, empathy and congeniality. Low emotional intelligent individuals find it hard to manage their negative emotions and land up being under constant stress. This stress activates sympathetic nervous system which may cause an increase in BP in them. Our study showed that low EI subjects had significantly lower mean HFnu and a significantly higher mean LF/HF ratio. This reveals that they have lower parasympathetic and higher sympathetic activity. Our study showed an increased sympathetic activity in Pre-hypertensives as analysed by HRV indicating sympathetic dominance in pre-hypertensives.15
The researchers found that both anger and appreciation caused a change in autonomic activation. The two emotional states produced very different effects in terms of sympatho-vagal balance. Anger produced sympathetically dominated power spectrum, whereas appreciation produced shift toward increased parasympathetic activity.16,17
These shifts were correlated with shifts in HRV to ‘healthier’ patterns correlating with lower cardiac risk. It strongly suggest that shifting to and maintaining a
International Journal of Physiology, October-December 2019, Vol.7, No. 4 249
sincere, positive emotional state may shift physiology towards better health. This may explain why optimists have significantly lower mortality than pessimists.18
Executive brain areas, such as the prefrontal cortex, exert an inhibitory influence on sub-cortical structures, such as the amygdala, allowing an individual to adaptively respond to demands from the environment, and organize their emotional and behavioural responses effectively. Thus, at rest, active cortical brain areas are indicative of greater inhibitory and emotional regulation. These neural structures are also responsible for the regulation of the autonomic nervous system activity. The heart is under tonic inhibitory control by the ANS. Vagal parasympathetic control represents the major descending inhibitory pathway, adaptively regulating emotional responses. It is suggested that this common reciprocal inhibitory cortico-subcortical neural circuit serves as the structural link between psychological processes such as regulation of emotions. The individuals with low EI fails to regulate emotions and are under constant negative stress, so the inhibitory influence of pre-frontal cortex is deranged and this results in increased sympathetic activity and decreased parasympathetic activity in them.19
Our study also showed a strong association of pre-hypertension with increased sympathetic & decreased parasympathetic activity. Similarly, a study showed autonomic imbalance in pre-hypertensives was due to increase in both sympathetic activity and vagal inhibition. Increased BP was associated with reduced HRV in children. Children with high BP had a significantly lower HF and higher LF/HF ratio indicating a sympathetic dominance in high BP.20,21Another study indicates sympatho-vagal balance may be altered towards sympathetic predominance in essential hypertension which is supported by markedly decreased parasympathetic activity.22A significant decrease in HFnu and a significant increase in LFnu & LF/HF ratio in hypertensives as compared to normotensives showing sympathetic dominance has been shown.23
Table 1: Comparison of EI in Pre-hypertensives and normotensives
N Mean + Std. Deviation p value
EI Normotensives 30 127.2 + 13.5 < 0.01Pre-hypertensives 30 109.5 + 11.2
Table 2: Comparison of HFnu & LF/HF ratio with EI
N Mean + Std. Deviation p value
HFnu Low EI 23 46.12 + 9.98 < 0.01Normal EI 37 73.12 + 9.09
LF/HF RatioLow EINormal EI
2337
1.27 + 0.550.39 + 0.2
< 0.01
Table 3: Comparison of HFnu & LF/HF ratio in Pre-hypertensives and normotensives
N Mean + Std. Deviation p value
HFnu Normotensives 30 54.73 + 10.95 < 0.01Pre-hypertensives 30 71.1 + 16.76
LF/HF ratio
NormotensivesPre-hypertensives
3030
0.44 + 0.241.03 + 0.67
< 0.01
ConclusionThe present study showed that there exists a direct
relationship of EI with Pre-hypertension & ANS. Low EI subjects are more prone of becoming pre-hypertensives through decrease in parasympathetic & increase in sympathetic activity increasing the risk to develop hypertension in near future.
In modern times, as a result of fast changing social values & lifestyle, there is an increase in feeling of insecurity, increased ambitions and feeling of competition to excel. This contributes to emotional imbalance which leads to various physical, psychological and psychosomatic problems due to sympatho-parasympathetic imbalance along with pre-hypertension and finally hypertension and other cardiovascular morbidities. So, to prevent pre-hypertension and its consequences, besides life style modification, we have to strengthen our EI.
Conflict of Interest: Nil
Source of Funding: Self
References1. Chobanian AV, Bakris GL, Black HR, et al. The
Seventh Report of the Joint National Committee on Prevention, Detection, Evaluation, and Treatment of High Blood Pressure: the JNC 7 report. JAMA 2003; 289:2560–72.
250 International Journal of Physiology, October-December 2019, Vol.7, No. 4
2. Yadav S, Boddula R, Genitta G, Bhatia V, Bansal B, Kongara S et al. Prevalence & risk factors of pre-hypertension & hypertension in an affluent north Indian population. Indian J Med Res 2008;128:712-720.
3. Lazarus RS and Folkman S. Stress, Appraisal, and Coping, New York: 4. Springer. 1984.
4. Singh Y, Sharma R. Relationship between general intelligence, emotional intelligence, stress levels and stress reactivity. Annals of Neurosciences 2012;19(3):107-111.
5. Cote S. Emotional Intelligence in Organizations. Annual Review of Organizational Psychology and Organization Behavior 2014;1:459–488.
6. Petrides, KV, Furnham A. Trait emotional intelligence: behavioural validation in two studies of emotion recognition and reactivity to mood induction. European Journal of Personality 2003;17(1): 39–57.
7. Cherniss C. Emotional Intelligence: Toward Clarification of a Concept. Industrial and Organizational Psychology 2010;3(2):110–126.
8. Schutte NS, Malouff JM, Hall LE, Haggerty DJ, Cooper JT, Golden C et al. Development and validation of a measure of emotional intelligence. Personality and Individual Differences 1998; 25(2): 167–177.
9. Kreibig SD. Autonomic Nervous System Activity in Emotion: A Review. J Biopsycho 2010;03:1-10.
10. McCraty R, Atkinson M, Tomasino D, Goelitz J, Mayrovitz HN. The impact of an emotional self-management skills course on psychosocial functioning and autonomic recovery to stress in middle school children. Integr Physiol Behav Sci. 1999 Oct-Dec;34(4):246-68.
11. Mahesh Kumar K, Dilara K, Maruthy KN, Sundareswaran L. Validation of PC based Sound Card with Biopac for digitilization of ECG recording in Short term HRV Analysis. N Am J Med Sci 2016;8(7):307-311.
12. Tarvanien MP, Niskanen JP, Lipponen JA, Rantaaho PO, Karjalainen PA. Kubios HRV – Heart rate variability software. Computer method and programs in Biomedicine 2014;113(1):210-220.
13. Kantariya AS, Desai MD. Emotional Intelligence in Patients with High Blood Pressure and Heart
Disease. The International Journal of Indian Psychology 2016;4(1):20-24.
14. Mokhtari Z, Alipor A, HasanzadehPS, Exiri FM. The Effect of Components of Emotional Intelligence on Physical Health Indicators of Hospitalized Cardiac Patients. Pars Journal of Medical Sciences 2014;12(1):9-16.
15. Mayuran L. Impact of emotional intelligence on stress management: study of schools with banks in Jaffna district. Global Journal of Commerce and Management Perspectives 2013;2(6):67 – 71.
16. McCraty R, Atkinson M, Tiller WA, Glein R, Watkins AD. The effects of emotions on short term power spectrum analysis of heart rate variability. The American Journal of Cardiology 1995;76(14):1089-1093.
17. Tiller W, McCraty R, & Atkinson M. Altern Ther Health Med. 1996; 2(1):52.
18. Kubzansky LD, Sparrow D, Vokonas P, Kawachi I et al. Is the glass half empty? A prospective study of optimism and coronary heart disease in the normative aging study. Psychosom Med. 2001; 63:910–916.
19. Williams DP, Cash C, Rankin C, Bernardi A, Koenig J, Thayer JF. Resting heart rate variability predicts self-reported difficulties in emotion regulation: a focus on different facets of emotion regulation.Front Psychol 6:1-8.
20. Pal GK, Amudharaj D, Pal P, Saranya K, Lalitha V, Gopinath K et al. Study of sympathovagal imbalance by spectral analysis -of heart rate variability in young pre-hypertensives. Indian J Physiol Pharmacol 2011;55(4):357–363
21. Xie GL, Wang JH, Zhou Y, Xu H, Sun JH, Yang SR et al. Association of High Blood Pressure with Heart Rate Variability in Children. Iran J Pediatr 2013; 23 (1): 37-44.
22. Patil SS, Gyanajyoti. A study of heart rate, blood pressure and heart rate variability at rest, in normotensive and hypertensive adult male subjects. Int J Cur Res Rev 2015;15(18): 11-14.
23. Natarajan N, Balakrishnan AK, Ukkirapandian K. A study on analysis of Heart Rate Variability in hypertensive individuals. International Journal of Biomedical and Advance Research 2014;5(2):109-111.
International Journal of Physiology, October-December 2019, Vol.7, No. 4 251
Digital Screens Accelerates Visual Fatigue in Young Females than Young Males
T. Sahithi Deepthi1, K.N. Maruthy2
1Tutor, 2Professor& HOD, Department of Physiology, Narayana Medical College, Chinthareddypalem, Nellore
AbstractYounger populations of this modern age are highly exposed to digital screens of different kinds of electronic gadgets. Continuous exposure to digital screens leads to eye strains/ visual fatigue which may impact poor orientation and reduction in efficiency.
Aim: To assess the visual fatigue among young male and female subjects by using critical flickering fusion frequency (CFFF).
Material and Method: A total of 60 young healthy adults of age 17-19 years were invited to participate .Of them 30 were males and 30 were females. The CFFF and visual fatigue protocol consists of the subject has to observe flickering light emitting from red LED module. The changes in light flickering were recognized and report by the subjects. The resulting data was statistically analyzed.
Results: Mean CFFF values for male participants are 45.7 ±23.5 Hertz, female participants is 41.4 ±13.9 Hertz with highly significant p value =0.000. The result of our study appears to be reflecting sex differences in visual fatigue. A statistically significant difference between male and females CFFF data was observed.
Conclusion: CFFF can be considered to be a non-invasive tool, useful for screening of diseases of the optic nerve and also an effective indicator of visual fatigue. Occurrence of visual fatigue is seems to be more common in young females than young males which may impact their work performance. This might be reduced by proper guidance; simple changes and precautions such as maintain distance between the screens and eye, regular blinking while seeing the devices.
Keywords: Critical Flickering Fusion Frequency, Visual Fatigue, Digital Screens, Young Females, Young Males.
Now a day’s many people without gender variation are suffering from visual fatigue. Work and lifestyle changes increased the demand for viewing digital screens of electronic gadgets such as computers, video gaming, cell phones and TV etc. Eye strains because of flickering lights can trigger occurrence of ocular migraine1.
In the past, visual fatigue has most often been examined in specific work related tasks like reading2.Recent studies reported that 3D, stereoscopic displays are the major causes for visual fatigue3. The association between eyestrain with alcoholism, crime, and melancholia is highlighted in 20th century4. Poor academic performance, social isolation, headaches, and general psychological malaise are the consequences of eyestrains. Many activities are impaired in association with visual fatigue such as bicycling5 typing6,
IntroductionPerformance of many tasks mainly depends up on
visual system .Like the other muscles of the body, eyes can also get fatigued. Prolonged visual activity leads to visual fatigue. Visual fatigue is referred to as eyestrain. Visual Fatigue is associated with decreased arousal that may impair the ability to perform a task which may also impact concentration ability and decrease in efficiency.
Corresponding Author: Miss T. Sahithi Deepthi Tutor/Demonstrator, Department of Physiology, Narayan Medical College, Nellore, Andhra Pradesh Mobile: 8500539217 e-mail ID: [email protected]
10.5958/2320-608X.2019.00180.X
252 International Journal of Physiology, October-December 2019, Vol.7, No. 4
driving7etc. It is typical to recognize difference between general and visual fatigue. Spatial frequency adaptation may be associated with visual fatigue8.
Along with visual activity, visual fatigue is also influenced by environmental as well as individual factors. The symptoms of visual fatigue classified into ocular-surface related, oculomotor related and monocular effects10. Monocular effects of visual fatigue are evaluated by self-reporting method11 and Critical flicker fusion frequency threshold (CFF). In research of fatigue, Cfff has been used since the 1940s and still continues till today 12, 13.
The present study has been done on younger population who were living in the world of digital screens and also to make them aware of related diseases.
Materials and Method After obtained approval from ethical committee,
the study was carried out in the Department of Physiology in Narayana Medical College, Nellore. CFFF was done on 60 volunteers. Of them 30 were young male and 30 were young adult female. All participates were between the age of 17 to 19 years who were in good health at the time of data collection. Participants with old age, Psychiatric disease, history of epilepsy, habit of alcohol and smoking were excluded from the study. The critical flicker fusion (CFFF) frequency was measured with a standard electronic module i.e., CFFF test apparatus was build by Professor - Dr.K.N.Maruthy, in the Exercise Physiology Laboratory in the Department of Physiology at Narayana Medical College Nellore, to assess the subject’s visual fatigue and visual sensory sensitivity.
CFFF test can measured the minimal number of flashes per second where an intermittent light stimulus can no longer be stimulates as a continuous sensation. Written consent form is given to all the volunteers. The test was conducted in dusky room with a single 40-w bulb fixed behind the participant. The module contains a board of white background with a central flickering red light emitting diode with a wave length of 160 nm .The frequency of red light diode can be changed at different frequencies ranging from 10 to 80 Hz with the help of SweepGen software.
The subject was made to sit comfortably infront of the red light emitting module from recommended distance i.e.80 cms. While the subject to be tested is looking straight at the LED, the frequency of flicker
was slowly changed with the help of software until the participants reported that they have perceived the light from LED is flickered or constant. The data regarding the procedure was obtained from SweepGen software.
Statistical analysis comprised comparison, using unpaired Student’s t-test of visual fatigue between the healthy young male and female groups.
ResultsThe results are given in Table 1. Comparison
of visual fatigue by using critical flickering fusion frequency (CFFF) among young male and young female subjects showed statistically highly significant with p value of 0.000. Data showed that there was a reduction in the CFFF value in young female subjects than young male.
Table 1: CFFF values between young male and young female subjects.
S.No. Status Mean Standard Deviation P Value
1. Male group 45.72 23.5270.000
2. Female group 41.46 13.912
DiscussionNow a day electronic gadgets are the essential
equipments in everywhere as a result the young population is exposed to a variety of digital screens that rise hazards related to continuous usage. Visual fatigue is rarely becoming as a serious condition. Commonest cause for eye fatigue are continuous driving, reading, exposure to bright light and staring for long periods at digital devices. The symptoms related to eye strain includes tired, itching and burning eyes .Reduced critical fusion frequency has been used as an index of central fatigue14.The problems raised by visual fatigue adversely affect the user quality of life, efficiency and reduced their productivity15. The prevalence of visual fatigue is higher in VDT operators16. Studies done on Indian information technology professionals showed that prevalence of visual symptoms is high in the IT professionals 17.
Critical flickering fusion frequency (CFFF) is one of the cognitive function tests used to measure the time resolving ability of eye. It is expressed in Hz, which is referred as threshold frequency18.The ability to distinguish discrete sensory events is measured by threshold. Threshold frequency is related to persistence
International Journal of Physiology, October-December 2019, Vol.7, No. 4 253
of vision. Since the quick and easy administrative method of CFFF, it can be used widely in human population to study the human performance, behavior, fatigue, central nervous system activity and arousal. An increase in CFF threshold indicates an increase in visual sensory sensitivity. On the contrary, a decrease in CFF threshold indicates an increase of visual fatigue 19.
In our study, young male subjects showed high CFFF value than young female subjects (Table 1). Diffusion of flickering light initiates metabolic activities in the retina. An increased sensory threshold leads to arousal of cortical visual system 20. Normal CFFF ranges from 35- 40 Hz 21. CFFF value is slightly more than normal range in female participants but it is less when compared to male participants. Reduction in flicker sensitivity in females showed delays in the impulse response function. That implies the sensory thresholds, cortical arousal and alertness mechanism are inhibited in females which are influenced by eyestrains. Retina and left cerebral cortex are involving in perception of flickering of light 22.
CFFF is accepted and used as an indicator of the cortex arousal level and as an indicator of physical human fatigue and mental workload. It was reported previously that the females are fatigued more than males when exposed to same type of work 23. However there is no gender variation in fatigue related to the mental work 24. .Flickering lights are one of the causes for ocular migraine headaches commonly founded in females than males. Prevalence of visual fatigue in female population is more than males which is reflected in our study CFFF.
CFFF parameter is significantly less in female when compared to male group. Many studies stated that the CFFF was wide implication in the study of arousal and fatigue. Any electronic equipment when used properly and purposefully does not cause adverse affects for the users. In another study, CFFFR threshold values are slightly higher in males when compared to females and these values are statistically not significant25.Consequences related to visual fatigue like migraine is most common in females. And also there is a variation in the performance of task between male and female. Females are exhibiting different fatigue characters than males. Visual fatigue may relive after taking rest or a change in task. However some studies have reported that subjects are not complaining about visual discomfort even with visual fatigue 26.
ConclusionThe data of our study found significant changes in
CFFF between male and female subjects. It is appears to be reflecting that there is a variation in visual fatigue among young male and females. Occurrence of visual fatigue is seems to be more common in young females than young males. This may suggest that proper guidance and education about the usage of gadgets may prevent the prevalence of hazards related to continuous usage. Taking precautions like maintaining specific distance between digital gadgets and regular gaps between the works and also eye blink often while using digital devices may help to reduce visual fatigue. The results may also suggest that CFFF could be treated as an indicator for visual fatigue.
Source of Support: Nil
Conflict of Interest: Nil
Source of Funding: Nil
Ethical Clearance: The Study Was Approved By Institutional Ethical Committee of Narayana Medical College, Nellore.
References1. Think about Your Eyes. American optometric
association, 2019.2. Griffing H, Franz, S. I. On the conditions of fatigue
in reading. Psychological Review. 1896; 3(5):513-530.
3. Emoto, M, Nojiri, Y, Okano, F. Changes In Fusion Vergence limit and its Hysteresis after Viewing Stereoscopic TV .Displays, 25 (2-3), 67-76.
4. Anon. Eye strain and its effect on health. [Electronic Version]. The New York Times. Retrieved August 1, 2008 database.
5. Anon. Say bicycle eye is a reality: Erect posture riding, a careless glance at the landscape, and protection against glare the remedy. [Electronic Version]. The Chicago Tribune, 2008; pg. 46. Retrieved August 1.
6. Anon. Typewriter and the eye: It aids the vision and the oculist likewise. The contradiction explained. New York practitioner gives instances where the machine is invaluable to many classes of workers. [Electronic Version]. ProQuest Historical Newspapers the New York Times, 2008; pg. 2. Retrieved August 1.
254 International Journal of Physiology, October-December 2019, Vol.7, No. 4
7. Anon. Eyes Can’t Stand the Pace of Auto Speeding and Moving Pictures [Electronic Version]. The Washington Post (1877-1954), SM4. Retrieved August 4, 2008 from ProQuest Historical Newspapers the Washington Post, 1877 – 1992.
8. Watten, R. G, Lie, I, Magnussen, S.VDU work, contrast adaptation, and visual fatigue. Behaviour & Information Technology, 1992;11(5):262-267.
9. John M. Sullivanv, Fatigue and the Driver, UMTRI -50 -2008.
10. Dillon, T. W, Emurian, H. H. Reports of visual fatigue resulting from use of a video display unit. Computers in Human Behavior, 1995; 11(1): 77-84.
11. Simonson, E, Brozek, J. Effects of illumination level on visual performance and fatigue. Journal of the Optical Society of America, 1948; 38(4): 384-397.
12. Luczak, A, Sobolewski, A. Longitudinal changes in critical flicker fusion Frequency: An indicator of human workload. Ergonomics, 2005; 48(15): 1770-1792.
13. Ernst Simonson and Norbert Enzer, Measurement of fusion frequency of flicker as a test for fatigue of the central nervous system, Journal of Indus. Hyg. Tox, 23,1941; 83-89.
14. Subratty AH, Korumtollee F, Occupational overuse syndrome among keyboard users in Maurittus. Indian journal on occupation and environment.2005; 9(2): 71-9.
15. De Seneviratne , G K K Sewwandi, S Sharmilee. Visual and musculoskeletal problem among video display operators and their ergonomic and working condition [Internet]. 2001; Page 204-9. Available from http:// www.med.cmb.ac.lk.
16. Sharma AK, Khera S, Khandekar J. Computer related health problems among Information Technology Professionals in Delhi. Indian visual
symptoms and stress were found to be more common in software field. Journal of Community Medicine, 2006; 32(1): 36-8.
17. Dr.R.N.Roy,” A Text Book of Biophysics”, 2009; page: 421. 2009.
18. Li, Z, Jiao, K, Chen,et al, “Reducing the effects of driving fatigue with magnitopuncture stimulation,” Accident Analysis and Prevention, 2004; 36 (4): 501-505.
19. Wells EF, Bernstein GM, Scott BW, et al, CFFF responses in visual cortex, Journal of Ophthalmology.2006; 90 (30): 342 346.
20. S. Yadav, R. Boddula , G.Genitta , et al, Prevelance and risk factors of prehypertensive and hypertensive in an affluent north Indian population , Journal of Medical Respiration , 2008; 128: 712-720.
21. Iwasaki, Kurimoto, S, Noro, K. The change in colour Critical Flicker Fusion (CFFF) values and accommodation times during experimental repetitive tasks with CRT display screens. Ergonomics, 1989; 32(3), 293-305.
22. Maclaren D, Gibson H, Parry-Billings M et.al. A review of metabolic and physiological factors in fatigue. Exercise Sports Scientific Review, 1989; 17:29-66.
23. Åhsberg, Gamberale, F.Perceived fatigue during physical work: An Experimental Evaluation of a Fatigue Inventory, IJIE, 1998; 21, 117-131.
24. Wells EF, Bernstein GM, Scott BW,et al, CFFF responses in visual cortex, Journal of Ophthalmology, 2006; 90 (30): 342 346..
25. Wolska, Switula, M. Luminance of the surround and visual fatigue of VDT operators. International Journal of Occupational Safety and Ergonomics, 1999; 5(4): 553-581.
26. John M. Sullivan, A Study of Critical Flickering Fusion Frequency Rate in Media Players, Fatigue and the Driver, UMTRI -50 -2008.
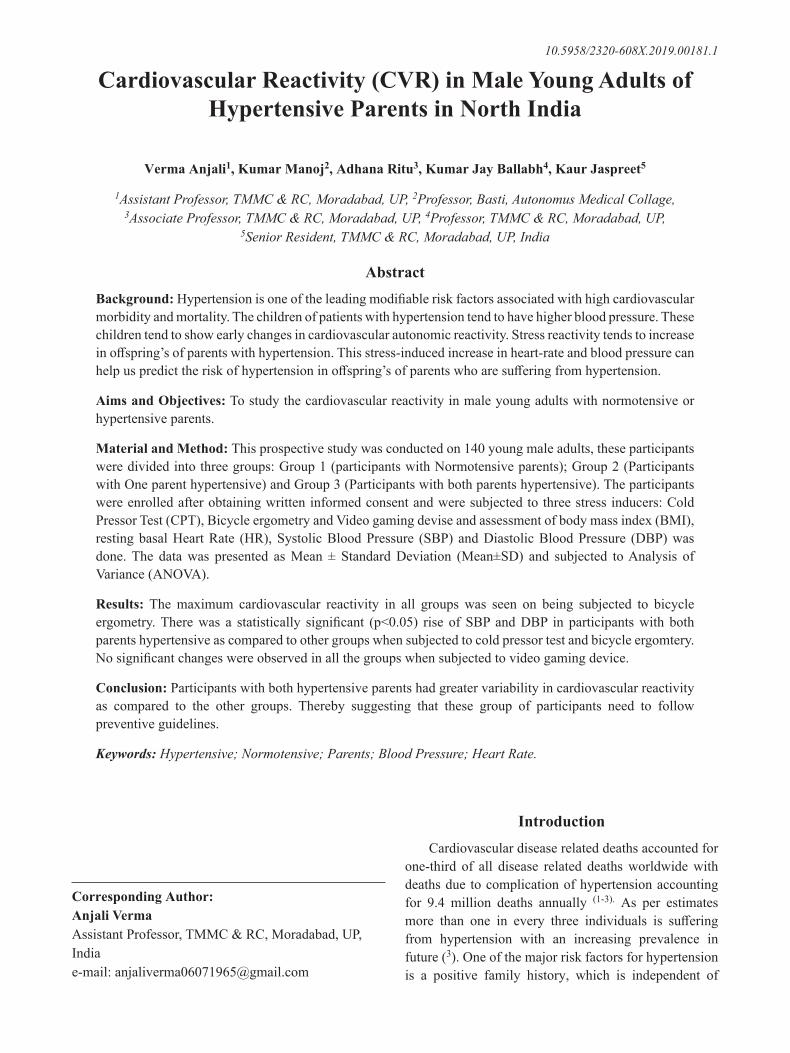
International Journal of Physiology, October-December 2019, Vol.7, No. 4 255
Cardiovascular Reactivity (CVR) in Male Young Adults of Hypertensive Parents in North India
Verma Anjali1, Kumar Manoj2, Adhana Ritu3, Kumar Jay Ballabh4, Kaur Jaspreet5
1Assistant Professor, TMMC & RC, Moradabad, UP, 2Professor, Basti, Autonomus Medical Collage, 3Associate Professor, TMMC & RC, Moradabad, UP, 4Professor, TMMC & RC, Moradabad, UP,
5Senior Resident, TMMC & RC, Moradabad, UP, India
AbstractBackground: Hypertension is one of the leading modifiable risk factors associated with high cardiovascular morbidity and mortality. The children of patients with hypertension tend to have higher blood pressure. These children tend to show early changes in cardiovascular autonomic reactivity. Stress reactivity tends to increase in offspring’s of parents with hypertension. This stress-induced increase in heart-rate and blood pressure can help us predict the risk of hypertension in offspring’s of parents who are suffering from hypertension.
Aims and Objectives: To study the cardiovascular reactivity in male young adults with normotensive or hypertensive parents.
Material and Method: This prospective study was conducted on 140 young male adults, these participants were divided into three groups: Group 1 (participants with Normotensive parents); Group 2 (Participants with One parent hypertensive) and Group 3 (Participants with both parents hypertensive). The participants were enrolled after obtaining written informed consent and were subjected to three stress inducers: Cold Pressor Test (CPT), Bicycle ergometry and Video gaming devise and assessment of body mass index (BMI), resting basal Heart Rate (HR), Systolic Blood Pressure (SBP) and Diastolic Blood Pressure (DBP) was done. The data was presented as Mean ± Standard Deviation (Mean±SD) and subjected to Analysis of Variance (ANOVA).
Results: The maximum cardiovascular reactivity in all groups was seen on being subjected to bicycle ergometry. There was a statistically significant (p<0.05) rise of SBP and DBP in participants with both parents hypertensive as compared to other groups when subjected to cold pressor test and bicycle ergomtery. No significant changes were observed in all the groups when subjected to video gaming device.
Conclusion: Participants with both hypertensive parents had greater variability in cardiovascular reactivity as compared to the other groups. Thereby suggesting that these group of participants need to follow preventive guidelines.
Keywords: Hypertensive; Normotensive; Parents; Blood Pressure; Heart Rate.
IntroductionCardiovascular disease related deaths accounted for
one-third of all disease related deaths worldwide with deaths due to complication of hypertension accounting for 9.4 million deaths annually (1-3). As per estimates more than one in every three individuals is suffering from hypertension with an increasing prevalence in future (3). One of the major risk factors for hypertension is a positive family history, which is independent of
Corresponding Author: Anjali Verma Assistant Professor, TMMC & RC, Moradabad, UP, India e-mail: [email protected]
10.5958/2320-608X.2019.00181.1
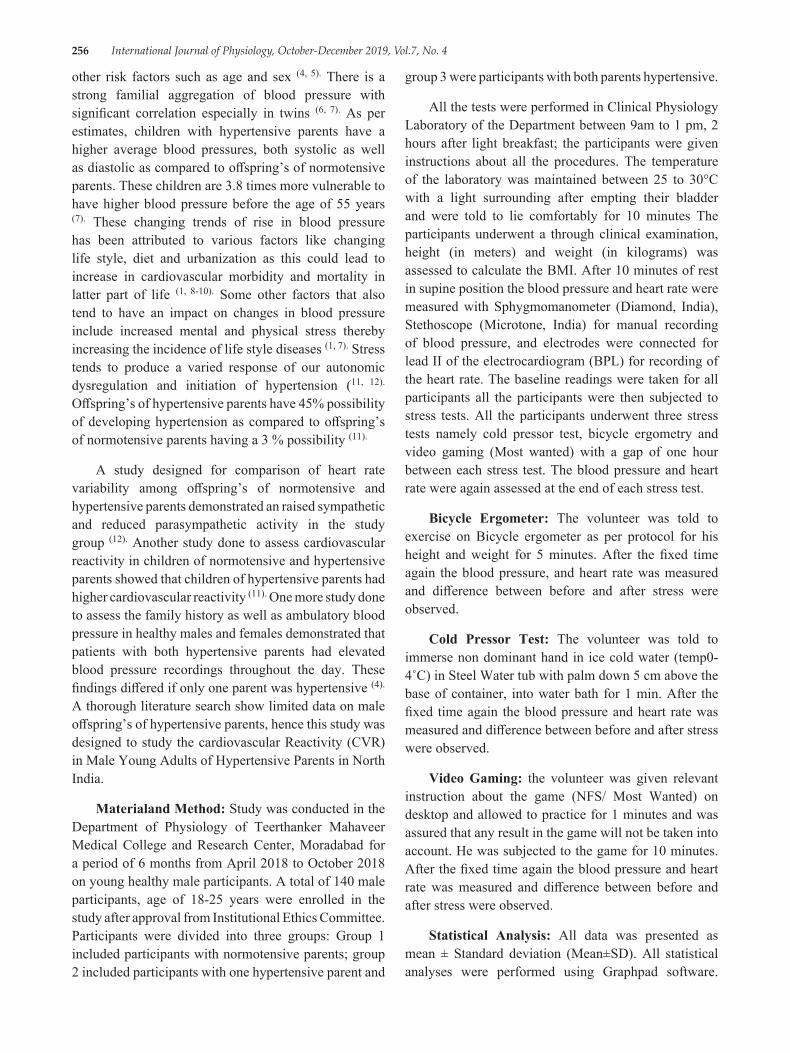
256 International Journal of Physiology, October-December 2019, Vol.7, No. 4
other risk factors such as age and sex (4, 5). There is a strong familial aggregation of blood pressure with significant correlation especially in twins (6, 7). As per estimates, children with hypertensive parents have a higher average blood pressures, both systolic as well as diastolic as compared to offspring’s of normotensive parents. These children are 3.8 times more vulnerable to have higher blood pressure before the age of 55 years (7). These changing trends of rise in blood pressure has been attributed to various factors like changing life style, diet and urbanization as this could lead to increase in cardiovascular morbidity and mortality in latter part of life (1, 8-10). Some other factors that also tend to have an impact on changes in blood pressure include increased mental and physical stress thereby increasing the incidence of life style diseases (1, 7). Stress tends to produce a varied response of our autonomic dysregulation and initiation of hypertension (11, 12). Offspring’s of hypertensive parents have 45% possibility of developing hypertension as compared to offspring’s of normotensive parents having a 3 % possibility (11).
A study designed for comparison of heart rate variability among offspring’s of normotensive and hypertensive parents demonstrated an raised sympathetic and reduced parasympathetic activity in the study group (12). Another study done to assess cardiovascular reactivity in children of normotensive and hypertensive parents showed that children of hypertensive parents had higher cardiovascular reactivity (11). One more study done to assess the family history as well as ambulatory blood pressure in healthy males and females demonstrated that patients with both hypertensive parents had elevated blood pressure recordings throughout the day. These findings differed if only one parent was hypertensive (4). A thorough literature search show limited data on male offspring’s of hypertensive parents, hence this study was designed to study the cardiovascular Reactivity (CVR) in Male Young Adults of Hypertensive Parents in North India.
Materialand Method: Study was conducted in the Department of Physiology of Teerthanker Mahaveer Medical College and Research Center, Moradabad for a period of 6 months from April 2018 to October 2018 on young healthy male participants. A total of 140 male participants, age of 18-25 years were enrolled in the study after approval from Institutional Ethics Committee. Participants were divided into three groups: Group 1 included participants with normotensive parents; group 2 included participants with one hypertensive parent and
group 3 were participants with both parents hypertensive.
All the tests were performed in Clinical Physiology Laboratory of the Department between 9am to 1 pm, 2 hours after light breakfast; the participants were given instructions about all the procedures. The temperature of the laboratory was maintained between 25 to 30°C with a light surrounding after empting their bladder and were told to lie comfortably for 10 minutes The participants underwent a through clinical examination, height (in meters) and weight (in kilograms) was assessed to calculate the BMI. After 10 minutes of rest in supine position the blood pressure and heart rate were measured with Sphygmomanometer (Diamond, India), Stethoscope (Microtone, India) for manual recording of blood pressure, and electrodes were connected for lead II of the electrocardiogram (BPL) for recording of the heart rate. The baseline readings were taken for all participants all the participants were then subjected to stress tests. All the participants underwent three stress tests namely cold pressor test, bicycle ergometry and video gaming (Most wanted) with a gap of one hour between each stress test. The blood pressure and heart rate were again assessed at the end of each stress test.
Bicycle Ergometer: The volunteer was told to exercise on Bicycle ergometer as per protocol for his height and weight for 5 minutes. After the fixed time again the blood pressure, and heart rate was measured and difference between before and after stress were observed.
Cold Pressor Test: The volunteer was told to immerse non dominant hand in ice cold water (temp0-4˚C) in Steel Water tub with palm down 5 cm above the base of container, into water bath for 1 min. After the fixed time again the blood pressure and heart rate was measured and difference between before and after stress were observed.
Video Gaming: the volunteer was given relevant instruction about the game (NFS/ Most Wanted) on desktop and allowed to practice for 1 minutes and was assured that any result in the game will not be taken into account. He was subjected to the game for 10 minutes. After the fixed time again the blood pressure and heart rate was measured and difference between before and after stress were observed.
Statistical Analysis: All data was presented as mean ± Standard deviation (Mean±SD). All statistical analyses were performed using Graphpad software.
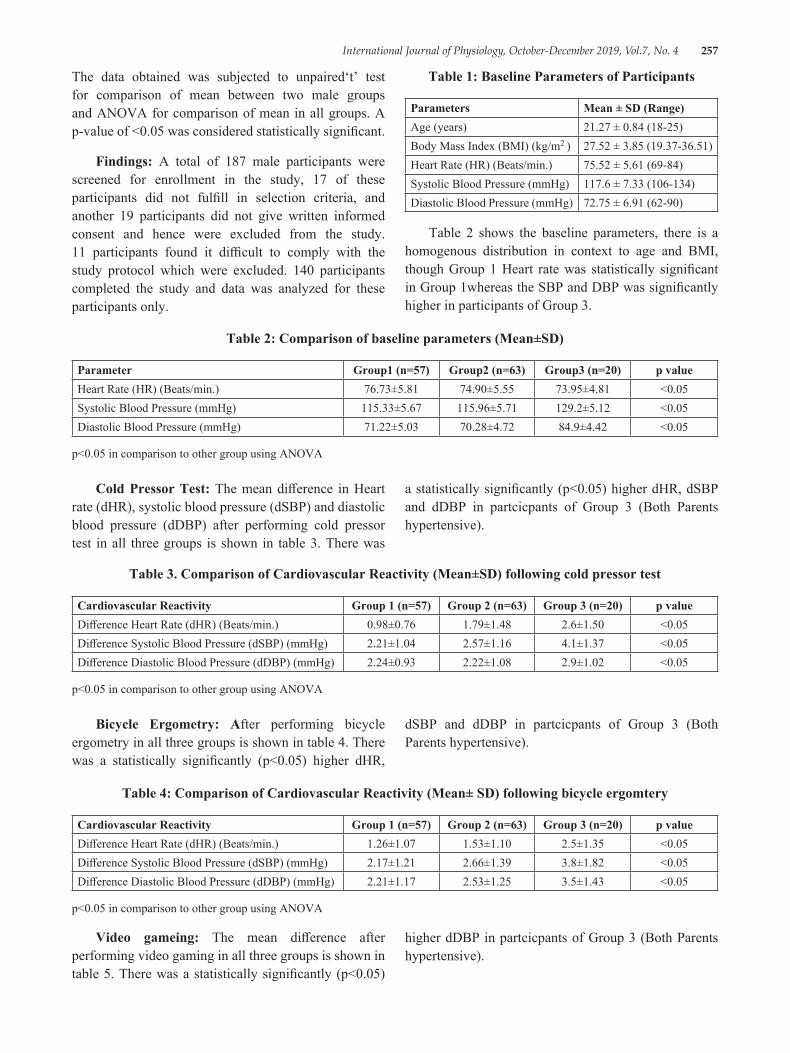
International Journal of Physiology, October-December 2019, Vol.7, No. 4 257
The data obtained was subjected to unpaired‘t’ test for comparison of mean between two male groups and ANOVA for comparison of mean in all groups. A p-value of <0.05 was considered statistically significant.
Findings: A total of 187 male participants were screened for enrollment in the study, 17 of these participants did not fulfill in selection criteria, and another 19 participants did not give written informed consent and hence were excluded from the study. 11 participants found it difficult to comply with the study protocol which were excluded. 140 participants completed the study and data was analyzed for these participants only.
Table 1: Baseline Parameters of Participants
Parameters Mean ± SD (Range)Age (years) 21.27 ± 0.84 (18-25)Body Mass Index (BMI) (kg/m2 ) 27.52 ± 3.85 (19.37-36.51)Heart Rate (HR) (Beats/min.) 75.52 ± 5.61 (69-84)Systolic Blood Pressure (mmHg) 117.6 ± 7.33 (106-134)Diastolic Blood Pressure (mmHg) 72.75 ± 6.91 (62-90)
Table 2 shows the baseline parameters, there is a homogenous distribution in context to age and BMI, though Group 1 Heart rate was statistically significant in Group 1whereas the SBP and DBP was significantly higher in participants of Group 3.
Table 2: Comparison of baseline parameters (Mean±SD)
Parameter Group1 (n=57) Group2 (n=63) Group3 (n=20) p valueHeart Rate (HR) (Beats/min.) 76.73±5.81 74.90±5.55 73.95±4.81 <0.05Systolic Blood Pressure (mmHg) 115.33±5.67 115.96±5.71 129.2±5.12 <0.05Diastolic Blood Pressure (mmHg) 71.22±5.03 70.28±4.72 84.9±4.42 <0.05
p<0.05 in comparison to other group using ANOVA
Cold Pressor Test: The mean difference in Heart rate (dHR), systolic blood pressure (dSBP) and diastolic blood pressure (dDBP) after performing cold pressor test in all three groups is shown in table 3. There was
a statistically significantly (p<0.05) higher dHR, dSBP and dDBP in partcicpants of Group 3 (Both Parents hypertensive).
Table 3. Comparison of Cardiovascular Reactivity (Mean±SD) following cold pressor test
Cardiovascular Reactivity Group 1 (n=57) Group 2 (n=63) Group 3 (n=20) p valueDifference Heart Rate (dHR) (Beats/min.) 0.98±0.76 1.79±1.48 2.6±1.50 <0.05Difference Systolic Blood Pressure (dSBP) (mmHg) 2.21±1.04 2.57±1.16 4.1±1.37 <0.05Difference Diastolic Blood Pressure (dDBP) (mmHg) 2.24±0.93 2.22±1.08 2.9±1.02 <0.05
p<0.05 in comparison to other group using ANOVA
Bicycle Ergometry: After performing bicycle ergometry in all three groups is shown in table 4. There was a statistically significantly (p<0.05) higher dHR,
dSBP and dDBP in partcicpants of Group 3 (Both Parents hypertensive).
Table 4: Comparison of Cardiovascular Reactivity (Mean± SD) following bicycle ergomtery
Cardiovascular Reactivity Group 1 (n=57) Group 2 (n=63) Group 3 (n=20) p valueDifference Heart Rate (dHR) (Beats/min.) 1.26±1.07 1.53±1.10 2.5±1.35 <0.05Difference Systolic Blood Pressure (dSBP) (mmHg) 2.17±1.21 2.66±1.39 3.8±1.82 <0.05Difference Diastolic Blood Pressure (dDBP) (mmHg) 2.21±1.17 2.53±1.25 3.5±1.43 <0.05
p<0.05 in comparison to other group using ANOVA
Video gameing: The mean difference after performing video gaming in all three groups is shown in table 5. There was a statistically significantly (p<0.05)
higher dDBP in partcicpants of Group 3 (Both Parents hypertensive).
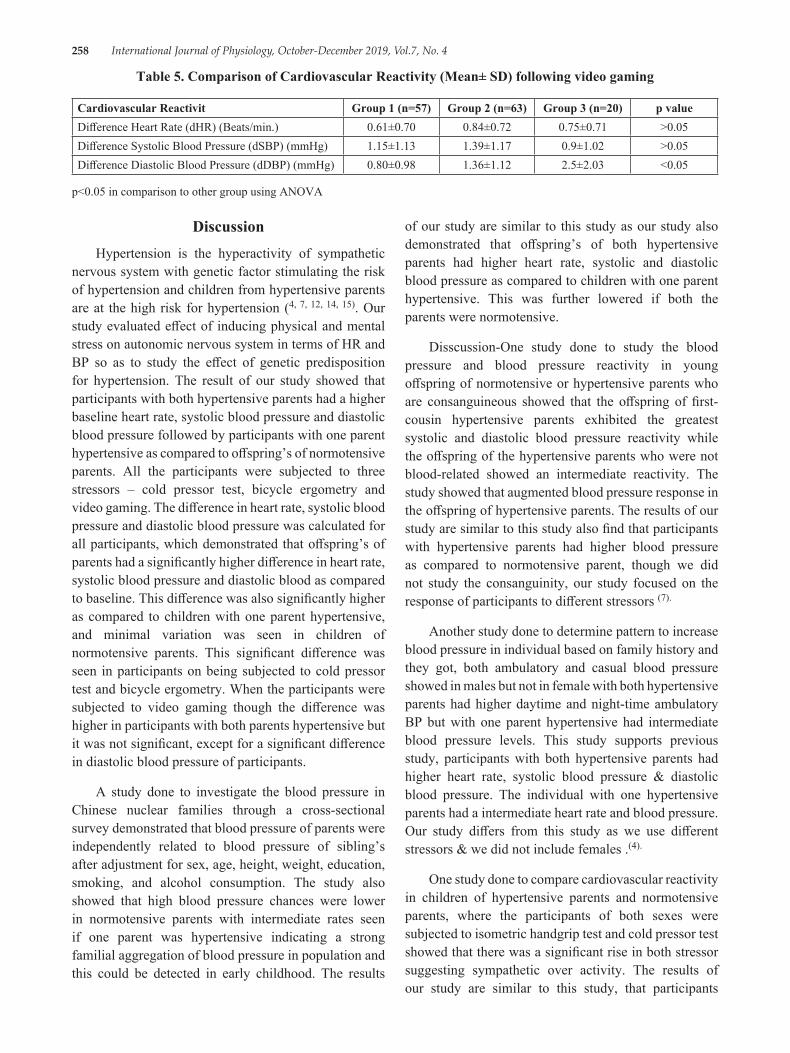
258 International Journal of Physiology, October-December 2019, Vol.7, No. 4
DiscussionHypertension is the hyperactivity of sympathetic
nervous system with genetic factor stimulating the risk of hypertension and children from hypertensive parents are at the high risk for hypertension (4, 7, 12, 14, 15). Our study evaluated effect of inducing physical and mental stress on autonomic nervous system in terms of HR and BP so as to study the effect of genetic predisposition for hypertension. The result of our study showed that participants with both hypertensive parents had a higher baseline heart rate, systolic blood pressure and diastolic blood pressure followed by participants with one parent hypertensive as compared to offspring’s of normotensive parents. All the participants were subjected to three stressors – cold pressor test, bicycle ergometry and video gaming. The difference in heart rate, systolic blood pressure and diastolic blood pressure was calculated for all participants, which demonstrated that offspring’s of parents had a significantly higher difference in heart rate, systolic blood pressure and diastolic blood as compared to baseline. This difference was also significantly higher as compared to children with one parent hypertensive, and minimal variation was seen in children of normotensive parents. This significant difference was seen in participants on being subjected to cold pressor test and bicycle ergometry. When the participants were subjected to video gaming though the difference was higher in participants with both parents hypertensive but it was not significant, except for a significant difference in diastolic blood pressure of participants.
A study done to investigate the blood pressure in Chinese nuclear families through a cross-sectional survey demonstrated that blood pressure of parents were independently related to blood pressure of sibling’s after adjustment for sex, age, height, weight, education, smoking, and alcohol consumption. The study also showed that high blood pressure chances were lower in normotensive parents with intermediate rates seen if one parent was hypertensive indicating a strong familial aggregation of blood pressure in population and this could be detected in early childhood. The results
of our study are similar to this study as our study also demonstrated that offspring’s of both hypertensive parents had higher heart rate, systolic and diastolic blood pressure as compared to children with one parent hypertensive. This was further lowered if both the parents were normotensive.
Disscussion-One study done to study the blood pressure and blood pressure reactivity in young offspring of normotensive or hypertensive parents who are consanguineous showed that the offspring of first-cousin hypertensive parents exhibited the greatest systolic and diastolic blood pressure reactivity while the offspring of the hypertensive parents who were not blood-related showed an intermediate reactivity. The study showed that augmented blood pressure response in the offspring of hypertensive parents. The results of our study are similar to this study also find that participants with hypertensive parents had higher blood pressure as compared to normotensive parent, though we did not study the consanguinity, our study focused on the response of participants to different stressors (7).
Another study done to determine pattern to increase blood pressure in individual based on family history and they got, both ambulatory and casual blood pressure showed in males but not in female with both hypertensive parents had higher daytime and night-time ambulatory BP but with one parent hypertensive had intermediate blood pressure levels. This study supports previous study, participants with both hypertensive parents had higher heart rate, systolic blood pressure & diastolic blood pressure. The individual with one hypertensive parents had a intermediate heart rate and blood pressure. Our study differs from this study as we use different stressors & we did not include females .(4).
One study done to compare cardiovascular reactivity in children of hypertensive parents and normotensive parents, where the participants of both sexes were subjected to isometric handgrip test and cold pressor test showed that there was a significant rise in both stressor suggesting sympathetic over activity. The results of our study are similar to this study, that participants
Table 5. Comparison of Cardiovascular Reactivity (Mean± SD) following video gaming
Cardiovascular Reactivit Group 1 (n=57) Group 2 (n=63) Group 3 (n=20) p valueDifference Heart Rate (dHR) (Beats/min.) 0.61±0.70 0.84±0.72 0.75±0.71 >0.05Difference Systolic Blood Pressure (dSBP) (mmHg) 1.15±1.13 1.39±1.17 0.9±1.02 >0.05Difference Diastolic Blood Pressure (dDBP) (mmHg) 0.80±0.98 1.36±1.12 2.5±2.03 <0.05
p<0.05 in comparison to other group using ANOVA
International Journal of Physiology, October-December 2019, Vol.7, No. 4 259
with hypertensive parents had higher cardiovascular reactivity. This study also demonstrated that even heart rate and systolic blood pressure was higher in participants with both parents hypertensive, followed by those with one hypertensive parents. Our study also differ, as we also included video gaming as one of the stressors which demonstrated that participants with both hypertensive parents had significantly higher diastolic blood pressure (11).
ConclusionMaximum cardiovascular reactivity was seen with
hand grip test followed by cold pressor test. The results of our study showed that participants had maximum cardiovascular reactivity with cold pressor test and bicycle ergometry. Our study differs from this study as we included only male participants and we further analysed the effect of family history of hypertension and its effect on the cardiovascular reactivity for further risk analysis (13).
Conflict of Interest: Firstly the sample size is small, a large sample size could give variable result, but given the participation of healthy volunteers and limited duration for study this study would not have been feasible it the size was increased. Secondly further stratification of participants based on elaborate family history could have given variable result but that would have required a longer duration for study which would not have been feasible. Thirdly we could have added life style modification as an intervention but this would have diluted our study purpose, as our study wanted to only study the effect of genetic constitution of the participants.
Source of Funding: TMMC & RC.Moradabad
Ethical Clearance: Approval from Institutional Ethics Committee
References1. Sharma NC. India the third most obese country in
the world. [Internet] India today.intoday.in 2014. [Cited 30 Aug. 2016]. Available from: http://indiatoday.intoday.in/story/obesity-india-weighs-third-on-obesity-scale/1/365876.html
2. Jain AK. The endocrine system, Textbook of Physiology,3rded. Avichal Publishing Company, New Delhi (India): 2012 Pp 745-8.
3. Wang F, Tiwari VK, Wang H. Risk factors for hypertension in India and China: A comparative study. Health and Population-Perspectives and Issues 2014;37:40-9
4. Goldstein IB, Shapiro D, Guthrie D. Ambulatory blood pressure and family history of hypertension in healthy men and women. AJH 2006;19:486-91.
5. Gupta L, Dondiya D, Panchal V, Jain D, Goyal B. Cardiovascular responses to autonomic stressors in young adults belonging to hypertensive family. Integrative Journal of Medicine and Pharmacological Science 2014;4(6):19-25.
6. Kumar A, Midha T, Nigam S, Kaur S, Gupta S. Correlates of BMI among medical graduates in Kanpur. J Prevent Med Holistic Health 2016;2(2):51-3.
7. Zaida AM, Al Kharusi W, Hassan MO. Exaggerated blood pressure reactivity in offspring of first cousin hypertensive parents. J Sci Res Med Sci 2001;3(2):81-5.
8. Dayananda G, Murthy N. Blood pressure changes in normotensive subjects with and without family history of hypertension. J Physiological and Biomedical Science 2009;22:35-7.
9. Kiren J, Priya J. Prevalence and risk factors associated with hypertension among children and adolescents. International Journal of Current Advanced Research 2017;6(5):3656-9.
10. Rebbeck TR, Turner ST, Sing CF. Probability of having hypertension: effects of sex, history of hypertension in parents and other risk factors. J Clin Epidermiol 1996;49(7):727-34.
11. Lalita MC, Sonali G, Laxmikant JB. Altered cardiovascular reactivity in children of hypertensive parents. National Journal of Basic Medical Sciences 2016;6(4):151-6.
12. Muralikrishnan K, Balasubramanium K, Rao BV. Heart rate variability in normotensive subjects with family history of hypertension. Indian J Physiol Pharmacol 2011;55(3):253-61.
13. Verma A, Kumar M, Saxena I, Kumar J. Cardiovascular reactivity to stressors in Indian young adults with normotensive parents. J Clin Diagn Res 2013;7(10):2130-2.
14. Merlo C, Sorino N, Myers J, Sassone B, Pasanisi G, Mandini S, et.al. Moderate walking speed predicts hospitalisation in hypertensive patients with cardiovascular diseases. European Journal of Preventive Cardiology 2018;25(14):1558-60.
15. Zinner SH, Levy PS, Kass EH. Familial aggregation of blood pressure in childhood. N Engl J Med 1971;284:401-4.
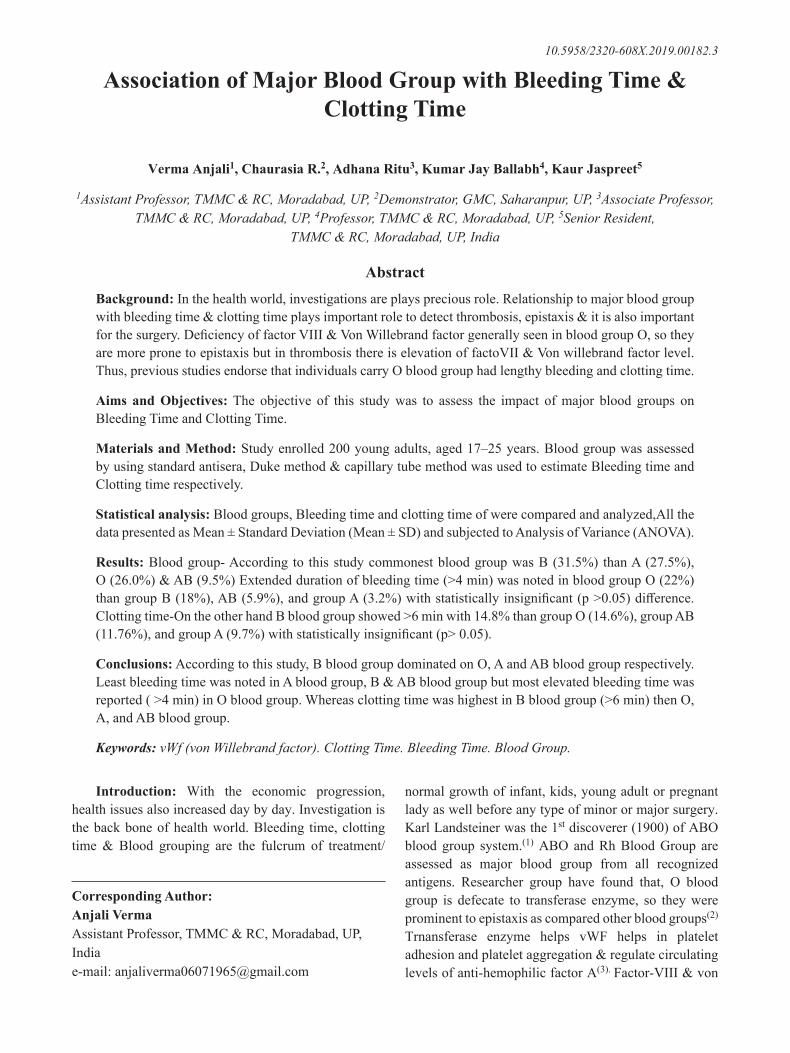
260 International Journal of Physiology, October-December 2019, Vol.7, No. 4
Association of Major Blood Group with Bleeding Time & Clotting Time
Verma Anjali1, Chaurasia R.2, Adhana Ritu3, Kumar Jay Ballabh4, Kaur Jaspreet5
1Assistant Professor, TMMC & RC, Moradabad, UP, 2Demonstrator, GMC, Saharanpur, UP, 3Associate Professor, TMMC & RC, Moradabad, UP, 4Professor, TMMC & RC, Moradabad, UP, 5Senior Resident,
TMMC & RC, Moradabad, UP, India
AbstractBackground: In the health world, investigations are plays precious role. Relationship to major blood group with bleeding time & clotting time plays important role to detect thrombosis, epistaxis & it is also important for the surgery. Deficiency of factor VIII & Von Willebrand factor generally seen in blood group O, so they are more prone to epistaxis but in thrombosis there is elevation of factoVII & Von willebrand factor level. Thus, previous studies endorse that individuals carry O blood group had lengthy bleeding and clotting time.
Aims and Objectives: The objective of this study was to assess the impact of major blood groups on Bleeding Time and Clotting Time.
Materials and Method: Study enrolled 200 young adults, aged 17–25 years. Blood group was assessed by using standard antisera, Duke method & capillary tube method was used to estimate Bleeding time and Clotting time respectively.
Statistical analysis: Blood groups, Bleeding time and clotting time of were compared and analyzed,All the data presented as Mean ± Standard Deviation (Mean ± SD) and subjected to Analysis of Variance (ANOVA).
Results: Blood group- According to this study commonest blood group was B (31.5%) than A (27.5%), O (26.0%) & AB (9.5%) Extended duration of bleeding time (>4 min) was noted in blood group O (22%) than group B (18%), AB (5.9%), and group A (3.2%) with statistically insignificant (p >0.05) difference. Clotting time-On the other hand B blood group showed >6 min with 14.8% than group O (14.6%), group AB (11.76%), and group A (9.7%) with statistically insignificant (p> 0.05).
Conclusions: According to this study, B blood group dominated on O, A and AB blood group respectively. Least bleeding time was noted in A blood group, B & AB blood group but most elevated bleeding time was reported ( >4 min) in O blood group. Whereas clotting time was highest in B blood group (>6 min) then O, A, and AB blood group.
Keywords: vWf (von Willebrand factor). Clotting Time. Bleeding Time. Blood Group.
normal growth of infant, kids, young adult or pregnant lady as well before any type of minor or major surgery. Karl Landsteiner was the 1st discoverer (1900) of ABO blood group system.(1) ABO and Rh Blood Group are assessed as major blood group from all recognized antigens. Researcher group have found that, O blood group is defecate to transferase enzyme, so they were prominent to epistaxis as compared other blood groups(2)
Trnansferase enzyme helps vWF helps in platelet adhesion and platelet aggregation & regulate circulating levels of anti-hemophilic factor A(3). Factor-VIII & von
Introduction: With the economic progression, health issues also increased day by day. Investigation is the back bone of health world. Bleeding time, clotting time & Blood grouping are the fulcrum of treatment/
Corresponding Author: Anjali Verma Assistant Professor, TMMC & RC, Moradabad, UP, India e-mail: [email protected]
10.5958/2320-608X.2019.00182.3
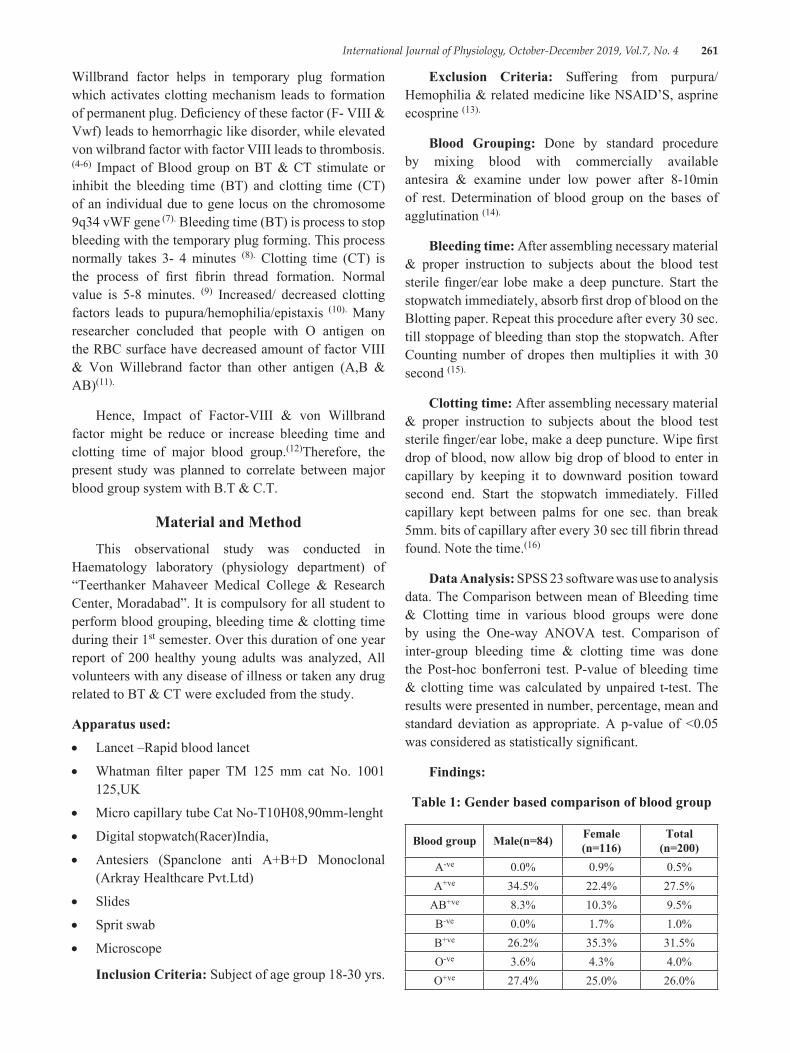
International Journal of Physiology, October-December 2019, Vol.7, No. 4 261
Willbrand factor helps in temporary plug formation which activates clotting mechanism leads to formation of permanent plug. Deficiency of these factor (F- VIII & Vwf) leads to hemorrhagic like disorder, while elevated von wilbrand factor with factor VIII leads to thrombosis. (4-6) Impact of Blood group on BT & CT stimulate or inhibit the bleeding time (BT) and clotting time (CT) of an individual due to gene locus on the chromosome 9q34 vWF gene (7). Bleeding time (BT) is process to stop bleeding with the temporary plug forming. This process normally takes 3- 4 minutes (8). Clotting time (CT) is the process of first fibrin thread formation. Normal value is 5-8 minutes. (9) Increased/ decreased clotting factors leads to pupura/hemophilia/epistaxis (10). Many researcher concluded that people with O antigen on the RBC surface have decreased amount of factor VIII & Von Willebrand factor than other antigen (A,B & AB)(11).
Hence, Impact of Factor-VIII & von Willbrand factor might be reduce or increase bleeding time and clotting time of major blood group.(12)Therefore, the present study was planned to correlate between major blood group system with B.T & C.T.
Material and MethodThis observational study was conducted in
Haematology laboratory (physiology department) of “Teerthanker Mahaveer Medical College & Research Center, Moradabad”. It is compulsory for all student to perform blood grouping, bleeding time & clotting time during their 1st semester. Over this duration of one year report of 200 healthy young adults was analyzed, All volunteers with any disease of illness or taken any drug related to BT & CT were excluded from the study.
Apparatus used:
• Lancet –Rapid blood lancet
• Whatman filter paper TM 125 mm cat No. 1001 125,UK
• Micro capillary tube Cat No-T10H08,90mm-lenght
• Digital stopwatch(Racer)India,
• Antesiers (Spanclone anti A+B+D Monoclonal (Arkray Healthcare Pvt.Ltd)
• Slides
• Sprit swab
• Microscope
Inclusion Criteria: Subject of age group 18-30 yrs.
Exclusion Criteria: Suffering from purpura/Hemophilia & related medicine like NSAID’S, asprine ecosprine (13).
Blood Grouping: Done by standard procedure by mixing blood with commercially available antesira & examine under low power after 8-10min of rest. Determination of blood group on the bases of agglutination (14).
Bleeding time: After assembling necessary material & proper instruction to subjects about the blood test sterile finger/ear lobe make a deep puncture. Start the stopwatch immediately, absorb first drop of blood on the Blotting paper. Repeat this procedure after every 30 sec. till stoppage of bleeding than stop the stopwatch. After Counting number of dropes then multiplies it with 30 second (15).
Clotting time: After assembling necessary material & proper instruction to subjects about the blood test sterile finger/ear lobe, make a deep puncture. Wipe first drop of blood, now allow big drop of blood to enter in capillary by keeping it to downward position toward second end. Start the stopwatch immediately. Filled capillary kept between palms for one sec. than break 5mm. bits of capillary after every 30 sec till fibrin thread found. Note the time.(16)
Data Analysis: SPSS 23 software was use to analysis data. The Comparison between mean of Bleeding time & Clotting time in various blood groups were done by using the One-way ANOVA test. Comparison of inter-group bleeding time & clotting time was done the Post-hoc bonferroni test. P-value of bleeding time & clotting time was calculated by unpaired t-test. The results were presented in number, percentage, mean and standard deviation as appropriate. A p-value of <0.05 was considered as statistically significant.
Findings:
Table 1: Gender based comparison of blood group
Blood group Male(n=84) Female (n=116)
Total (n=200)
A-ve 0.0% 0.9% 0.5%A+ve 34.5% 22.4% 27.5%
AB+ve 8.3% 10.3% 9.5%B-ve 0.0% 1.7% 1.0%B+ve 26.2% 35.3% 31.5%O-ve 3.6% 4.3% 4.0%O+ve 27.4% 25.0% 26.0%
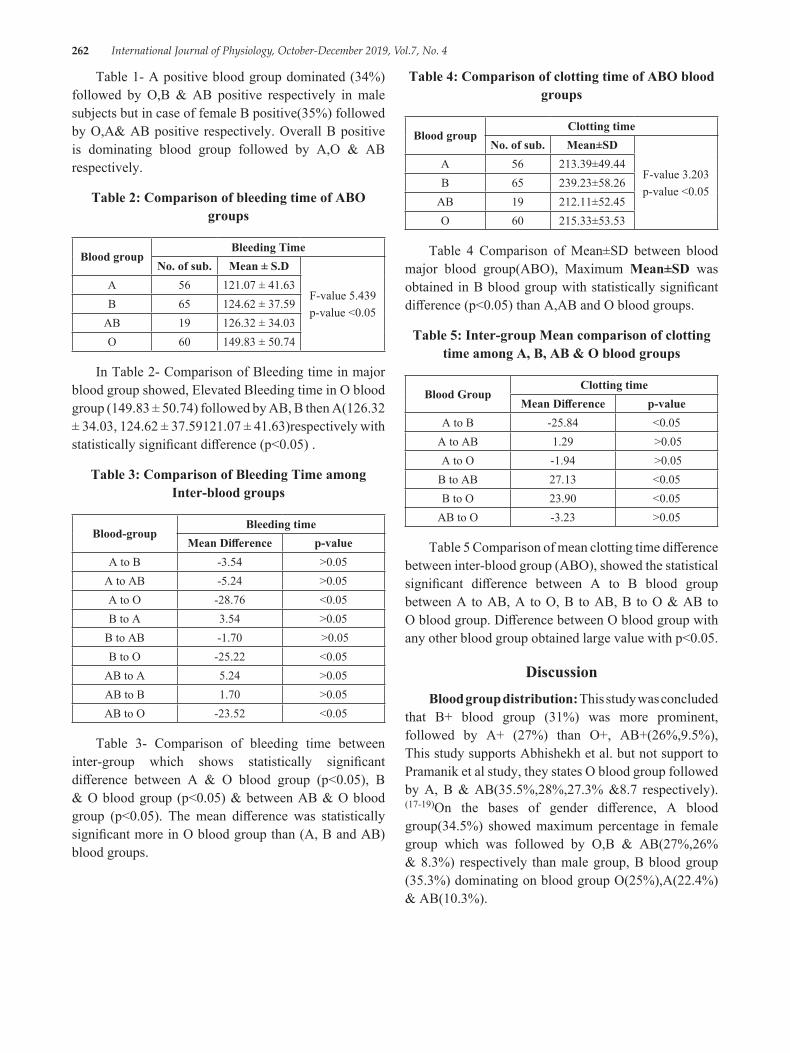
262 International Journal of Physiology, October-December 2019, Vol.7, No. 4
Table 1- A positive blood group dominated (34%) followed by O,B & AB positive respectively in male subjects but in case of female B positive(35%) followed by O,A& AB positive respectively. Overall B positive is dominating blood group followed by A,O & AB respectively.
Table 2: Comparison of bleeding time of ABO groups
Blood groupBleeding Time
No. of sub. Mean ± S.D
F-value 5.439p-value <0.05
A 56 121.07 ± 41.63B 65 124.62 ± 37.59
AB 19 126.32 ± 34.03O 60 149.83 ± 50.74
In Table 2- Comparison of Bleeding time in major blood group showed, Elevated Bleeding time in O blood group (149.83 ± 50.74) followed by AB, B then A(126.32 ± 34.03, 124.62 ± 37.59121.07 ± 41.63)respectively with statistically significant difference (p<0.05) .
Table 3: Comparison of Bleeding Time among Inter-blood groups
Blood-groupBleeding time
Mean Difference p-valueA to B -3.54 >0.05
A to AB -5.24 >0.05A to O -28.76 <0.05B to A 3.54 >0.05
B to AB -1.70 >0.05B to O -25.22 <0.05
AB to A 5.24 >0.05AB to B 1.70 >0.05AB to O -23.52 <0.05
Table 3- Comparison of bleeding time between inter-group which shows statistically significant difference between A & O blood group (p<0.05), B & O blood group (p<0.05) & between AB & O blood group (p<0.05). The mean difference was statistically significant more in O blood group than (A, B and AB) blood groups.
Table 4: Comparison of clotting time of ABO blood groups
Blood groupClotting time
No. of sub. Mean±SD
F-value 3.203p-value <0.05
A 56 213.39±49.44B 65 239.23±58.26
AB 19 212.11±52.45O 60 215.33±53.53
Table 4 Comparison of Mean±SD between blood major blood group(ABO), Maximum Mean±SD was obtained in B blood group with statistically significant difference (p<0.05) than A,AB and O blood groups.
Table 5: Inter-group Mean comparison of clotting time among A, B, AB & O blood groups
Blood GroupClotting time
Mean Difference p-valueA to B -25.84 <0.05
A to AB 1.29 >0.05A to O -1.94 >0.05
B to AB 27.13 <0.05B to O 23.90 <0.05
AB to O -3.23 >0.05
Table 5 Comparison of mean clotting time difference between inter-blood group (ABO), showed the statistical significant difference between A to B blood group between A to AB, A to O, B to AB, B to O & AB to O blood group. Difference between O blood group with any other blood group obtained large value with p<0.05.
DiscussionBlood group distribution: This study was concluded
that B+ blood group (31%) was more prominent, followed by A+ (27%) than O+, AB+(26%,9.5%), This study supports Abhishekh et al. but not support to Pramanik et al study, they states O blood group followed by A, B & AB(35.5%,28%,27.3% &8.7 respectively).(17-19)On the bases of gender difference, A blood group(34.5%) showed maximum percentage in female group which was followed by O,B & AB(27%,26% & 8.3%) respectively than male group, B blood group (35.3%) dominating on blood group O(25%),A(22.4%) & AB(10.3%).

International Journal of Physiology, October-December 2019, Vol.7, No. 4 263
Comparison of BT & CT according to blood group: This study concluded that O blood group had maximum value of bleeding time as compared to other blood groups with statistically significant difference(p<0.05).
Similarly in other study the BT was highest in blood group O than A,B & AB blood groups. On the bases of inter group comparison O blood group showed statistically significant difference with any other blood group.
B blood group predominate to A, B and AB ,this result was not support to some previous studies, they concluded that O blood group showed the highest value than other (A,B& AB)blood group. (17-20)On the bases of inter group comparison B blood group showed statistically significant difference with any other blood group
ConclusionThis study showed definite corporation between
major blood group with BT and CT, due to getting higher value of O blood group. Prevalence of bleeding disorders such as gastrointestinal infections and epistaxis is more in O blood group & these individuals can be advice to acquire healthy measures & regular health checkup to reduce the risk of communicable diseases, morbidity and modality.
Conflict of Interest: There is certain limitation of this study, sample size is very small (200) large sample could strengthen the study. Secondly, major blood group includes ABO & Rh system due to unavailability of Rh Negative blood group individual’s study was not strengthen.
Source of Funding: TMMC & RC.Moradabad
Ethical Clearance: Approval from Institutional Ethics Committee
References1. Ahmed A B. ABO & Rhesus blood group distribution
in Hadhramout population. Hadhramout for studies & Researches. Issue No.4 Sep.2003.
2. Reddy VM, Daniel M, Bright E, Broad SR, Moir AA. Is there an association between blood group O and epistaxis? J Laryngol Otol 2008;122(4):366–8.
3. Ganong WF. Review of Medical Physiology. 24th edn. New York: McGraw-Hill Education, 2012. p. 560.
4. Baishya R, Sarkar R, Barman B. Blood group & its relationship with bleeding time & clotting time-an observational sudy among the 1Sst MBBS students of Gauhati medical college, Gauhati.Int j Med sci.2017;5(9):4147-50.
5. Roy B, Banerjee I, Sathian B, Mondal M, Saha CG.Blood group distribution and its relationship with bleeding time and clotting time:A medical school based observational study among Nepali, Indian & Sri Lankan students.Nepal Journal of Epidermiology 2011;1(4):135-140
6. Ruggeri ZM: Structure of von Willebrand factor and its function in platelet adhesion and thrombus formation. Best Prac Res Clin Haematol 2001;14:257–9.
7. Qureshi MA, Bhatti R. Frequency of ABO blood groups among the diabetes mellitus type 2 patients. J Coll Physicians Surg Pak 2003;13:453–5.
8. Bijlani R.L, Manjunatha S. The physiology of haemostasis.Understanding medical physiology, India, Jaypee publication, 5th edition, Pp 111-17.
9. Guyton and Hall, Text book for medical physiology, Philadelphia, Elsevier Saunders, 12th edition, 2016.Pp467.
10. Pal G.K, Pal P, Nanda N. Comprehensive Text book of medical physiology, India, Ahuja Publishing House, 1ST edition 2017 Vol(1), Pp148.
11. Wiggings KL, Smith NL, Glazer NL, Rosendaal FR, Heckbert SR, Psaty BM, Rice KM and Lumley T. ABO genotype and risk of thrombotic events and hemorrhagic stroke. J. Thromb. Haemost., 2009. 7: 263-9.
12. Barrett Kim. Ganong’s. physiology of haemostasis.Review of Medical Physiology, 23rd Edition. The Mc Graw-Hill companies. 2012; Pp539.
13. Mahapatra B, Mishra N. Comparison of Bleeding Time and Clotting Time in Different Blood Groups. Am. J. Inf. Dis. 2009;5(2):106-8
14. Ghai CL. A text book of practical physiology. 9th edition. Jaypee brothers Medical Publisher, New Delhi; 2015:Pp88
15. Pal G.K, Pal P, Nanda N. Physiology practical examination, India, Ahuja Publishing House, 8th edition 2017, Pp98.
16. Jain AK.Essentials of MD/DNB Physiology practical examination.1st Edition.Arya publications, New Delhi.2016:Pp 36.

264 International Journal of Physiology, October-December 2019, Vol.7, No. 4
17. Abhishekh B, Mayadevi S, Meena D, Usha KC. Disribution of ABO & Rhesus –D blood group in & around Thiruvananthpuram, Kerala Medical Journall, 2011;1, 28-29.
18. Pramanik T, Adhikari P.Trend of blood group distribution among the different ethic groups of Kathmandu Vally. Nepal Med coll J.2006;8(4):248-9.
19. Kaur M. Blood group distribution and its relationship with bleeding time and clotting time. National Journal of Physiology, Pharmacy and Pharmacology. 2015;5(3):253-7.
20. Baishya, Sarkar R, Barma B. Blood group and its relationship with bleeding and clotting time-observational study among the 1st MBBS students of Gauhati medical college, Guwahati.Int J R es Med sci. 2017;5(9):4147-50.
International Journal of Physiology, October-December 2019, Vol.7, No. 4 265
It has been suggested that with severe COPD, there is an increased number of leucocytes, which is correlated with PFT suggesting a role for this inflammatory response in the clinical progression of the disease3. Elevated eosinophil blood count has generally been associated with indications of an allergic reaction. Peak expiratory flow rate is a good parameter for detecting patients with COPD and tests of PEFR reflect changes in airways caliber [8] . So the objective of this study was to investigate the effect of PEFR and circulating eosinophils in COPD patients .
Materials and MethodStudy Design: 80 adults (50 males and 30 females)
between 40 to 65 years of age were selected for the study. The study group consisted of 80 COPD patients referred from Department of Medicine of Santhiram Medical College,Nandiyal. Institutional ethical committee approval was taken before the start of the research and all subjects who participated in the study were given a consent form to sign before the experiment was carried.
IntroductionChronic obstructive pulmonary disease (COPD) is
the fourth leading cause of death in India and a major worldwide healthcare problem. Chronic obstructive pulmonary disease (COPD) is characterised by the progressive, partially reversible air flow limitation which occurs in association with a chronic inflammatory reaction triggered by smoking or other inhalation in predisposed subjects1,2. Leucocytes are important cells, which mediate various inflammatory responses. Inflammation has been identified as an important factor for disease exacerbation in obstructive lung disease. In this study, we used neutrophil and eosinophil counts as biomarkers for exacerbation in obstructive lung disease.
Evaluation of Absolute Eosinophil Count and Peak Expiratory Flow Rate in COPD Patients
M. Janaki1, Payasam Rajeswari2, K. Sreedhar Babu3, K. Bharani3
1Professor & HOD, Department of Pathology, Santhiram Medical College, Nandyal,Kurnool District, AP, India, 2Designed Associate Professor, Department of Physiology, Kurnool Medical College, Kurnool, AP, India,
3Post Graduate Student, Department of Pathology, Santhiram Medical College, Nandyal
AbstractBackground: Chronic obstructive pulmonary disease (COPD) is a major public health problem leading to high health care utilizations, poor health-related quality of life, and substantial cost burden and deaths worldwide.
Aim: To assess the peak expiratory flow rate ( PEFR) and absolute eosinophil count (AEC) in COPD patients.
Method: This observational study was carried out among 80 COPD patients, volunteers referred from Medicine department of Santhiram Medical College . PEFR recorded was correlated with eosinophils.
Results: The mean PEFR value was 214.7 ± 49.39 and mean absolute eosinophil count value was 749.7 ± 152.01. There was strong negative significant correlation (-0.80) between PEFR and absolute eosinophil count (p < 0.05) .
Conclusion: The findings indicated that whenever the blood parameter eosinophils increased, there was a decrease in the PEFR in COPD patients.
Keywords: COPD, Peak expiratory flow rate, absolute eosinophil count.
Corresponding Author: Dr. Payasam Rajeswari Designed Associate Professor, Department of Physiology, Kurnool Medical College, Kurnool, AP, India
10.5958/2320-608X.2019.00183.5
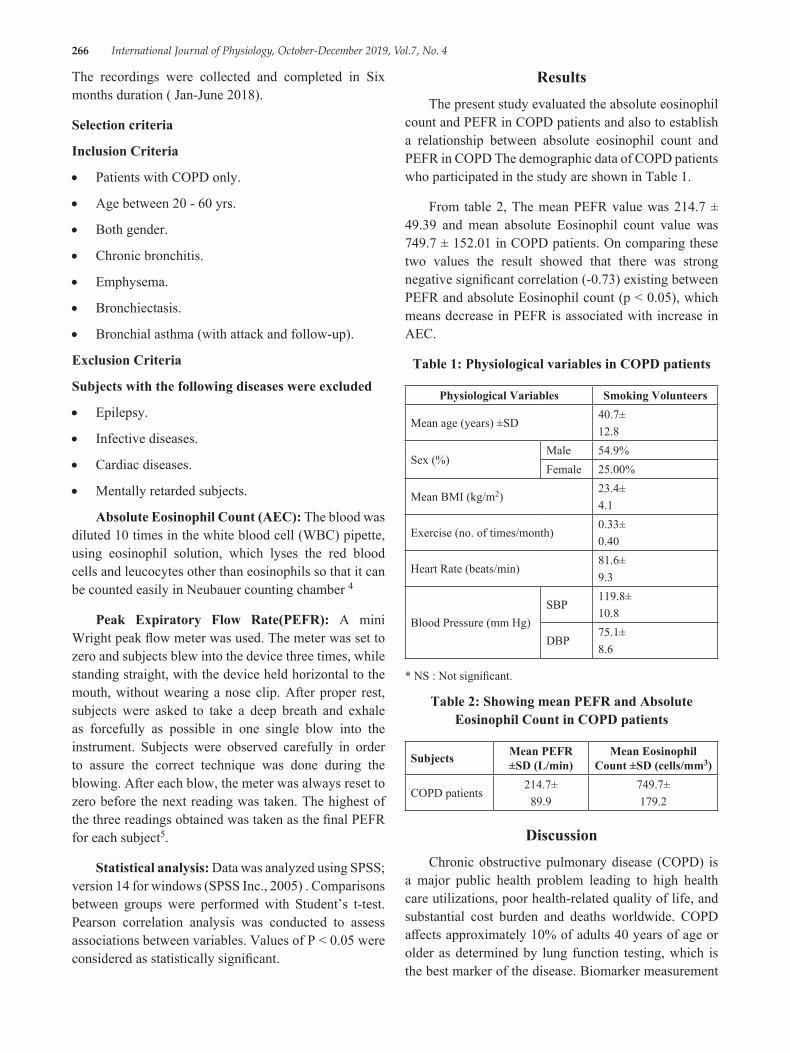
266 International Journal of Physiology, October-December 2019, Vol.7, No. 4
The recordings were collected and completed in Six months duration ( Jan-June 2018).
Selection criteria
Inclusion Criteria
• Patients with COPD only.
• Age between 20 - 60 yrs.
• Both gender.
• Chronic bronchitis.
• Emphysema.
• Bronchiectasis.
• Bronchial asthma (with attack and follow-up).
Exclusion Criteria
Subjects with the following diseases were excluded
• Epilepsy.
• Infective diseases.
• Cardiac diseases.
• Mentally retarded subjects.
Absolute Eosinophil Count (AEC): The blood was diluted 10 times in the white blood cell (WBC) pipette, using eosinophil solution, which lyses the red blood cells and leucocytes other than eosinophils so that it can be counted easily in Neubauer counting chamber 4
Peak Expiratory Flow Rate(PEFR): A mini Wright peak flow meter was used. The meter was set to zero and subjects blew into the device three times, while standing straight, with the device held horizontal to the mouth, without wearing a nose clip. After proper rest, subjects were asked to take a deep breath and exhale as forcefully as possible in one single blow into the instrument. Subjects were observed carefully in order to assure the correct technique was done during the blowing. After each blow, the meter was always reset to zero before the next reading was taken. The highest of the three readings obtained was taken as the final PEFR for each subject5.
Statistical analysis: Data was analyzed using SPSS; version 14 for windows (SPSS Inc., 2005) . Comparisons between groups were performed with Student’s t-test. Pearson correlation analysis was conducted to assess associations between variables. Values of P < 0.05 were considered as statistically significant.
ResultsThe present study evaluated the absolute eosinophil
count and PEFR in COPD patients and also to establish a relationship between absolute eosinophil count and PEFR in COPD The demographic data of COPD patients who participated in the study are shown in Table 1.
From table 2, The mean PEFR value was 214.7 ± 49.39 and mean absolute Eosinophil count value was 749.7 ± 152.01 in COPD patients. On comparing these two values the result showed that there was strong negative significant correlation (-0.73) existing between PEFR and absolute Eosinophil count (p < 0.05), which means decrease in PEFR is associated with increase in AEC.
Table 1: Physiological variables in COPD patients
Physiological Variables Smoking Volunteers
Mean age (years) ±SD40.7±12.8
Sex (%)Male 54.9%Female 25.00%
Mean BMI (kg/m2)23.4±4.1
Exercise (no. of times/month)0.33±0.40
Heart Rate (beats/min)81.6±9.3
Blood Pressure (mm Hg)SBP
119.8±10.8
DBP75.1±8.6
* NS : Not significant.
Table 2: Showing mean PEFR and Absolute Eosinophil Count in COPD patients
Subjects Mean PEFR ±SD (L/min)
Mean Eosinophil Count ±SD (cells/mm3)
COPD patients214.7±
89.9749.7±179.2
DiscussionChronic obstructive pulmonary disease (COPD) is
a major public health problem leading to high health care utilizations, poor health-related quality of life, and substantial cost burden and deaths worldwide. COPD affects approximately 10% of adults 40 years of age or older as determined by lung function testing, which is the best marker of the disease. Biomarker measurement
International Journal of Physiology, October-December 2019, Vol.7, No. 4 267
in sputum and blood during acute COPD exacerbations identify four major phenotypic clusters of patients: bacterial (35%), viral (30%), eosinophilic (24%), and pauciinflammatory with minimal inflammatory changes (11%)6,7,8.
It has been suggested that with severe COPD there is an increase in number of leucocytes, which is correlated with PFT suggesting a role for leucocytes in this inflammatory response in the clinical progression of the disease. Leucocytes are important haemocytic cells, which mediate various inflammatory responses. Inflammation has been identified as an important factor for disease exacerbation in obstructive lung disease. As the leucocyte have the important role in body’s defense mechanism, it is natural that their number increase with the severity of COPD. The present result also supports the above mentioned fact. Further, to find out the relative role of individual leucocytes, the PFTs were compared with different leucocytes.. An increase in the white blood cells that may be produced during an allergic reaction (eosinophils) may indicate that a condition such as asthma is causing the symptoms9,10,11. In our result also, there was significantly high increase in absolute eosinophil count with decrease in PEFR.
Thus, our study concludes that both pulmonary and AEC parameter showed a negative correlation and signifying the inverse relationship between the AEC and pulmonary parameter. This inverse relationship if established may help the family physician to understand the severity of COPD and direct them to the referral centre for early diagnosis and treatment.
ConclusionIn short, the findings of this study indicate that the
severity of COPD diagnosed with pulmonary function tests have negative correlation with the AEC, i.e. whenever the blood parameter (eosinophil) increases there was a decrease in the pulmonary test parameter in COPD patients
Conflict of Interest: Nil
Acknowledgement: We sincerely thank all the patients who gave consent and participated in this study.
Source of Funding: Self
Reference1. Murray CJ, Lopez AD. Alternative projections of
mortality and disability by cause 1990-2020: global burden of disease study. Lancet. 1997; 349:1498-1504
2. Wilkinson TMA, Donladson GC, Hurst JR, et al. Early therapy improves outcome of exacerbations of chronic obstructive pulmonary disease. Am J Respir Crit Care Med. 2004; 169:1298-1303.
3. Soler-Cataluna JJ, Martinez-Garcia MA, Roman Sanchez P, et al. Severe acute exacerbations and mortality in patients with chronic obstructive pulmonary disease. Thorax. 2005; 60:925-931.
4. Dacie, J.V. and Lewis, S.M. . Differential Leucocyte Count. In Practical Haematology, 7th edition: London: Churchill Livingstone. 1991; 70-71.
5. Halgate ST and Frew A. Respiratory Disease. In: Clinical Medicine 5th Ed. PK, MC. Ed. Edinburgh W.B Saunders Co. 2002; 849.
6. Fira-Mladinescu O, Tudorache V, Mihăicută S, et al. New concepts in the pathogenesis and pathophysiology of COPD. Pneumologia 2007;56(1):26-31.
7. Velthove KJ, Bracke M, Souverein PC, et al. Identification of exacerbations in obstructive lung disease through biomarkers. Biomarkers 2009;14(7):523-8.
8. Turato G, Zuin R, Miniati M, et al. Airway inflammation in severe chronic obstructive pulmonary disease: relationship with lung function and radiologic emphysema. Am J Respir Crit Care Med 2002;166(1):105-10.
9. Chattopadhyay BP, Mahata A, Kundu S, et al. A study on blood eosinophil level and ventilatory pulmonary function of the workers exposed to storage grain dust. Indian J Occup Environ Med 2007;11(1):21-5.
10. Annesi I, Kauffmann F, Oryszczyn MP, et al. Leukocyte count and bronchial hyperresponsiveness. J Allergy Clin Immunol 1988;82(6):1006-11.
11. Global Initiative for Chronic Obstructive Lung Disease (GOLD). Global Strategy for the Diagnosis, Management, and Prevention of Chronic Obstructive Pulmonary Disease, Updated 2003. National Heart, Lung, and Blood Institute, World Health Organization; 2003.
268 International Journal of Physiology, October-December 2019, Vol.7, No. 4
IntroductionA sedentary lifestyle has been characterized as an
independent risk factor for cardiovascular disease.1 The Framingham Heart Study in 1970’s identified HDL-C as a powerful risk factor inversely associated with
Corresponding Author: R. Vidhyalakshmi Post Graduate, Department of physiology, Bangalore Medical College and Research Institute, Fort, K.R. Road, Bengaluru - 560002, Karnataka, India
A Comparison of Plasma HDL-C Levels in Moderate Intensity Continous Exercise Versus High Intensity Intermittent
Exercise Among Young Adults
Suguna S.1, R. Vidhyalakshmi2
1Associate Professor, 2Post Graduate, Department of Physiology, Bangalore Medical College and Research Institute, Fort, K.R. Road, Bengaluru, Karnataka, India
AbstractBackground: Elevated levels of High Density Lipoprotein Cholesterol (HDL-C) has been associated with a decreased risk of coronary heart disease (CHD). An active lifestyle is necessary in order to improve lipid HDL-C, which includes physical exercise. Continuous and interval/intermittent training are widely used to improve performance in athletes. It is also used to promote a healthy lifestyle. Interval training is considered as ‘better training’, consists of repeated periods of high intensity alternating with lower intensity, whereas continuous exercise is characterized by constant submaximal workload. Both MICT and HIIT are known to improve the cardiovascular function and lipid profile. In recent studies it is been shown that HIIT is more beneficial to MICT in maintaining a good cardiovascular health and lipid profile. The present study is therefore intended to compare the HDL-C levels in young adults practicing moderate intensity continuous exercise (MICT) who are athletes and high intensity intermittent exercise(HIIT) who are badminton players.
Objectives:
1. To measure plasma HDL-C levels in athletes and badminton players
2. To compare the plasma HDL-C levels in young adults practicing moderate intensity continuous exercise (athletes) and high intensity intermittent exercise (badminton players).
Materials & Method: This study is done on 30 healthy athletes (18 males and 12 females) and 30 healthy badminton players (18 males and 12 females) of bangalore who are practicing regularly for atleast 3 years in the age group of 18 – 25 years .Subjects who are smokers,alcoholics and any H/O Diabetes Mellitus, Hypertension, musculoskeletal disorders and those on steroid therapy were excluded. Informed consent was taken . After general physical examination and history taking- HDL-C levels was assessed with 2 ml venous blood sample after 8 hours of fasting. Subjects were matched for Age,Sex and BMI .Descriptive statistics and Students ‘t’ test is used for statistical analysis.
Results: HDL-C levels were significantly higher in players practicing high intensity intermittent exercise (Badminton) when compared to athletes with a P value of 0.039.
Conclusion: The HDL-C levels in Badminton players is more when compared to athletes hence HIIT is found to be more effective than MICT in maintaining a good cardiovascular health and promoting a healthy lifestyle.
Keywords: Badminton, High intensity intermittent exercise (HIIT), HDL-C, Athletes.
10.5958/2320-608X.2019.00184.7
International Journal of Physiology, October-December 2019, Vol.7, No. 4 269
the incidence of CHD. Physical Exercise is one of the lifestyle integrations that has been recommended for improving HDL-C. Continuous and interval/intermittent training are widely used to improve performance in athletes. It is also done to promote healthy lifestyle in sedentary individuals.2 Continuous training is defined as an exercise (e.g., running, cycling, swimming, etc.) lasting atleast 20 minutes and held at steady intensity during the entire bout.3 This continuous exercise can be performed at low and moderate intensities(MICT) . MICT is defined as continuous aerobic exercise with an intensity of 60–75% of maximum Heart Rate (HRmax) .High intensity interval exercise (HIIT) is characterised by relatively short bouts of high intensity workloads interspersed by periods of rest or low intensity activity Each HIIT session is done from 20 to 30 minutes with an interval period of upto 4 minutes at an intensity of >85% of maximum heart rate (HRmax).Both continuous and intermittent exercise have positive effects on cardiovascular health and lipid metabolism 4. A few studies have examined the cardiovascular and metabolic responses between the two types of exercises and it had shown contradictory results . The differences between these exercises are attributed to the variability of the exercise protocol (duration, type, and intensity, ratio of work at high intensity/low or complete rest), which in turn resulted in recruitment of different energy systems. Also since HIIT increases the post exercise fat oxidation it is said to improve the lipid profile better than MICT .5 The increase in fatty acid translocase (FAT/CD36),a transport protein and plasma membrane fatty acid-binding protein (FABPpm), found in the sarcolemma, the mitochondrial membrane, and in a cytoplasmic pool in skeletal muscle, contributes to the enhanced fat oxidation by increasing the rate of free fatty acid transfer across the muscle and mitochondrial membrane. HIIT has been used as a time-efficient program to improve physical fitness and cardiovascular disease risk factors . Furthermore, it was chosen as the most enjoyable physical activity program compared to MICT.6 This study is intended to compare the plasma HDL-C levels in young adults practicing moderate intensity continuous exercise (athletes) versus high intensity intermittent exercise(badminton players).
Materials and MethodStudy Design: Cross-sectional study
Study Place: Bangalore
Study Population: Young healthy adults in the age group of 18-25 yrs who are athletes and badminton players.
Study Period: April – May 2019
Study Group:
1. Young adults regularly practicing moderate intensity continous exercise (athletes)
2. Young adults regularly practicing high intensity intermittent exercise (badminton players)
Ethical Clearance and Informed Consent: Taken
Inclusion Criteria:
1. Healthy Men and Women2. Age group of 18-25 yrs.3. Practicing badminton for more than 3 years.4. Athletes who are practicing for more than 3 years.
Exclusion Criteria:1. H/O musculoskeletal disorders.2. H/O acute infections.3. H/O steroid therapy.4. H/O Diabetes mellitus, hypertension.5. H/O Endocrine disorders.6. H/O Smoking.7. H/O alcohol.8. H/O substance abuse.
The study was started after the subjects fulfilled the inclusion criteria and were enrolled after obtaining consent .The study group includes a total of 60 participants in the age group of 18-25 years out of which 30 of them were athletes (18 males and 12 females) and 30 of them were Badminton players ( 17 males and 13 females). Collection of data and blood samples from the athletes and badminton players were done from the players who practiced regularly in Kanteerava Stadium, Bengaluru. History and General Physical Examination along with anthropometry was done to rule out any abnormalities .The subject’s demographic details (Age, Sex, BMI ) were taken . Subjects were matched for Age, Sex and BMI.
Anthropometry: The subject’s body weight and height were measured and the body mass index (BMI) was calculated by dividing the weight (kg) by square of height (m 2 ).
270 International Journal of Physiology, October-December 2019, Vol.7, No. 4
Biochemical Parameters: HDL-C levels was assessed with 2 ml venous blood sample after 8 hours of fasting. Serum samples were centrifuged for 10 minutes to obtain the plasma HDL levels which was done by enzymatic colour test with the reagent OSR6587 using BECKMAN COULTER DxH500 machine at Infosys Lab, Victoria Hospital, Bangalore.
Participants: The participants were categorised based on type of exercise into 2 groups.
1. Young healthy adults practicing moderate intensity continuous exercise:
This group included athletes who were running 1500mts 3 times a week for atleast 20 minutes each session.
2. Young healthy adults practicing high intensity intermittent exercise:
This group included badminton players who were playing 3 times a week for atleast 20 minutes each session
Statistical Analysis: The data was analysed using descriptive statistics to match the subjects based on Age, Sex and BMI . Students ‘t’ test was done to compare the differences between the 2 subject groups .The statistical analysis was done in Microsoft Excel version 2010. Data is expressed as mean ± SD. P value <0.05 is considered significant.
ResultsTable 1 : Gender Distribution of participants
Gender Group I (Athletes) Group II (Badminton)Male 18 17Female 12 13Total 30 30
Table 1 shows the Gender design in Group-I (Athletes) and Group II (Badminton players). The participants comprised of 30 in group I which included 18 males and 12 females. Similarly there were 30 participants in group II which included 17 males and 13 females .
Table 2 : Comparison of study parameters by Gender
Group I (Athletes) Group II(Badminton)Males Females p value Males Females p value
AGE(Yrs) 20.0±1.5 19.3±1.61 0.10 21.3±2.0 20.6±2.1 0.10BMI(kg/m2) 21.7±1.5 20.5±1.3 0.12 21.9±3.1 21.8±1.6 0.45PLASMA HDL-C(mg/dl) 43.1±6.1 43.6±5.5 0.40 46.8±7.4 47.2±5.8 0.44
p value <0.05 is significant
Table 2 shows the results for the subjects matched with Age, Sex and BMI by applying paired ‘t’ test in Microsoft Excel. The mean±SD value for age in Group I males were 20.0±1.55 and in females was 19.3±1.61 yrs and the p value was 0.10 which is not statistically significant .Similarly the mean±SD value for age in Group II males was 21.3±2.0 yrs and in females was 20.6±2.1 yrs and the p value was 0.45 which was not statistically significant. The plasma HDL-C levels in Group I male athletes was 43.1±6.1mg/dl and in females was 43.6±5.5mg/dl and the p value was 0.40 which is not significant .The plasma HDL-C levels in Group II males was 46.8±7.4mg/dl and 47.2±5.8mg/dl and the p value was 0.44. Hence from this Table we can see that in our study the sex and BMI did not influence the changes in HDL –C cholesterol and they were not statistically significant.
Table 3: Comparison of Study parameters by Group
Group I (Athletes)
Group II (Badminton) p value
Age 19.7±1.7yrs 20.4±1.8yrs 0.14BMI 20.9±1.4kg/m2 21.9±2.5kg/m2 0.07PLASMA HDL-C 43.3±5.7mg/dl 46.7±6.6mg/dl *0.03
*p value <0.05 is significant
Table 3 shows the comparison of Age, BMI and plasma HDL-C levels in both the groups by applying unpaired ‘t’ test. The mean±SD values for Age in athelets was 19.7±1.7yrs and in badminton players was 20.4±1.8 yrs and the p value was 0.14 which is not significant. The mean±SD value for BMI in athelets was 20.9±1.4kg/m2
and in badminton players was 21.9±2.5kg/m2 and the p value was 0.07 which was also not significant. The
International Journal of Physiology, October-December 2019, Vol.7, No. 4 271
plasma HDL values of athletes was 43.3±5.7mg/dl and in badminton players was 46.7±6.6 mg/dl and the p value was 0.03 which was statistically significant.
DiscussionPhysical inactivity is an independent risk factor
for chronic diseases. The World Health Organization (WHO) generally recommends adults to engage in physical activity for 150 min/week to maintain their cardiovascular health and to protect from the risk factors of Coronary heart disease (CHD).Moderate intensity continuous training (MICT) has been considered as the most effective modality for the prevention and management of cardio vascular diseases but in recent times, high-intensity interval training (HIIT), which refers to alternating short bursts of high-intensity exercise and recovery periods, has become a popular alternative primarily because of its time efficiency, as lack of time is a commonly cited barrier to exercise participation.7 With concern on maintaining a good lipid profile HIIT is more beneficial to MICT in promoting the secretion of catecholamines, epinephrine norepinephrine and growth hormone all of which promotes the fat decomposition and also to achieve effective weight loss. According to a study done by Alahmadi (2014: 3), exercises to reduce body fat levels can be done with both moderate-intensity continuous training (MICT) and High intensity intermittent training .In MICT there is increase in the mitochondrial biogenensis activity through activation of metabolic enzymes such as AMPK, CPT-1 and ACC whereas in High intensity interval training (HIIT) body fat levels are reduced by activating the cardio metabolic component which is found to be more effective.8 On comparing with MICT,in HIIT there is increased post exercise fat oxidation and energy expenditure (Excess post energy oxygen consumption-EPOC) which decreases the Total cholesterol and LDL cholesterol and increases the High Density Cholesterol (HDL).9In a study done by Perry et al. (2008), they found that fat oxidation, or fat burning was significantly higher after 6 weeks of interval training. Studies have also shown that a combination of both aerobic and anaerobic exercise which is seen in HIIT are known to alter lipoprotein profiles and increase HDL, which is associated with anti-oxidant enzymes.10 Badminton by nature is a high intensity intermittent exercise and this sport is highly demanding, with an average heart rate (HR) of over 85% of the player’s maximal HR. The intermittent actions during this game are demanding on both the aerobic and anaerobic systems which is around 60-70% on the
aerobic system and approximately 30% on the anaerobic system.11In our study we found that HDL-C levels in badminton players which is an HIIT exercise was significantly more than in athletes who were practicing MICT indicating that HIIT is superior to MICT in maintaining good lipid profile and in turn maintaining a good cardiovascular health.
Limitations: The study would be more effective if the sample size was more .Also, cardiovascular risk factors involves many aspects such as body composition, aerobic capacity but our study was restricted to see the effects of MICT and HIIT only on lipid metabolism.
ConclusionAs physical training is very essential to maintain a
good cardiovascular profile in both sports personalities and common induviduals there is a necessity to include physical activity in our daily life. There are various modalities of physical activities varying in intensity,duration, environment .The most common method of exercise practiced as of now is the moderate intensity exercise but recent research work has shown that high intensity intermittent exercise (HIIT) is now been followed as an alternative to MICT as it is time efficient and superior to MICT in cardiovascular functions and lipid metabolism. So in our study we compared the HDL –C levels which is a powerful risk factor for CHD in those practicing MICT(athletes) and those practicing HIIT (Badminton). A total of 60 participants were taken which included 30 healthy young adults who were regularly practicing MICT (Athletes-18 males and 12 females ) and 30 healthy young adults who were regularly practicing HIIT (badminton players -17 males and 13 females). The study was done from the period of April-May 2019. Anthropometry which included height, weight and BMI was done. Plasma HDL-C levels was done by taking 2 ml venous blood sample after 8 hrs of fasting. The test was done in Infosys Lab,Victoria Hospital, Bangalore. The subjects were matched for age, sex and BMI. Student ‘t’ test was used to compare the plasma HDL-C levels in 2 groups. The results of Plasma HDL-C was significantly higher in Group II (HIIT-Badminton).Therefore from our study we can conclude that HIIT is more beneficial to MICT . As the training modalities used in HIIT are short in time, the motivation and adherence of people to HIIT training will be more as compared to MICT. Badminton which is a simple indoor recreational sport, by its nature of High intensity intermittent exercise could be a time efficient way to
272 International Journal of Physiology, October-December 2019, Vol.7, No. 4
improve the cardiovascular function and to maintain a healthy lifestyle .
Acknowledgement: I m grateful to all the participants of the study for their kind cooperation and to technical professionals of Infosys Lab,Victoria Hospital for conducting the laboratory investigations .
Conflict of Interest: Nil conflict.
Source of Funding: Self.
Ethical Clearance: Taken.
References1. Guimarães G, Ciolac E, Carvalho V, D’Avila
V, Bortolotto L, Bocchi E. Effects of continuous vs. interval exercise training on blood pressure and arterial stiffness in treated hypertension. Hypertension Research. 2010;33(6):627-632.
2. Nassef Y, Lee K, Nfor O, Tantoh D, Chou M, Liaw Y. The Impact of Aerobic Exercise and Badminton on HDL Cholesterol Levels in Adult Taiwanese. Nutrients. 2019;11(3):515.
3. Tschakert G, Hofmann P. High-Intensity Intermittent Exercise: Methodological and Physiological Aspects. International Journal of Sports Physiology and Performance. 2013;8(6):600-610.
4. Wewege M, van den Berg R, Ward R, Keech A. The effects of high-intensity interval training vs. moderate-intensity continuous training on body composition in overweight and obese adults: a systematic review and meta-analysis. Obesity Reviews. 2017;18(6):635-646.
5. Spanoudaki S. Interval versus Continuous Training. Journal of Sports Medicine & Doping Studies. 2011;01(01):102.
6. A. Alahmadi M. High-intensity Interval Training and Obesity. Journal of Novel Physiotherapies. 2014;04(03):1-6.
7. Alansare A, Alford K, Lee S, Church T, Jung H. The Effects of High-Intensity Interval Training vs Moderate-Intensity Continous Training on Heart Rate Variability in Physically Inactive Adults .International Journal of Environmental Research and Public Health.2018;15(7):1500-1508.
8. YanuarDhumaArdhiyantoa,SamsulMu’arifa. https: / /www.researchgate.net/publication/ 327230432_Reducing_LDL_Choles terol_through_MICT_and_HIIT. Vol. 2019. p. 1–14.
9. Zhang H, Tong T, Quiu W, Wang J, Nie J, He Y. Effect of high-intensity interval training protocol on abdominal fat reduction in overweight chinese women: a randomized controlled trial. Kinesiology. 2015;47(1):57-66.
10. Zuhl M, Kravitz l. HIIT vs Continous training-Battle of aerobic Titans : Idea Fitness Journal.2012 ;9(12):34-40.
11. Phomsoupha M, Laffaye G. The Science of Badminton: Game Characteristics, Anthropometry, Physiology, Visual Fitness and Biomechanics. Sports Medicine. 2014;45(4):473-495.
International Journal of Physiology, October-December 2019, Vol.7, No. 4 273
A Comparative Study of Cognitive Functions among Male and Female Medical Students in a Teaching Hospital of
South Kerala
Prashanth P.1, Arun Kumar H.P.1, S. Lincoln Deva Kumar2
1Associate Professor, 2Professor, Department of Physiology, Travancore Medical College and Hospital, Kollam
AbstractBackground: Reaction time (RT) is a measure of the response to a stimulus. RT plays a very important role in our lives as its practical implications may be of great consequences. Factors that can affect the average human RT include age, sex, left or right hand, central versus peripheral vision, practice, fatigue, fasting, breathing cycle, personality types, exercise, and intelligence of the subject.
The Critical Flicker Fusion frequency (CFFF) test provides an index of central nervous system activity or cortical arousal which measures mental arousal and alertness. It is used as an indicator of physical human fatigue, mental work load and cognitive function as well.
Aim: The aim was to compare visual reaction time (VRT), auditory reaction time(ART) and critical flicker fusion frequency on the basis of gender.
Materials and Method: The present comparative study was conducted on 100 healthy medical students in age group of 18–24 years. PC 1000Hz reaction timer was used to measure auditory and visual reaction time. The task was to press the key as soon as the stimulus is presented. Three readings of each stimulus were taken, and their average of three RT’s for each stimuli were recorded. Statistical analysis was done using independent sample t test. CFFF was measured by indigenous apparatus. Both ascending and descending frequencies are recorded and average of two is taken as CFFF.
Results: In both the sexes’ RT to the auditory stimulus was significantly less (P < 0.001) as compared to the visual stimulus. Significant difference was found between RT of male and female medical students (P < 0.001) and males have quicker reaction time than females. Males have higher CFFF than females, but statistically not significant.
Keywords: Reaction time,Auditory reaction time,Visual reaction time,Critical flicker fusion frequency.
Reaction time (RT) testing is one of the oldest diagnostic method used in modern psychology, and is known as simple and sensitive cognitive function test(2).
Reaction time has physiological significance and is a simple and non - invasive test for peripheral as well as central neural structures1. Reaction time measurement is an indirect index of processing capability of central nervous system. Reaction time measurement helps in determining sensory motor association and performance of an individual. It determines the alertness of a person because how quickly a person responds to a stimulus depends on his reaction time.(3)
IntroductionReaction time (RT) is a measure of the quickness
with which an organism responds to some sort of stimulus. RT is defined as the interval of time between the presentation of the stimulus and appearance of appropriate voluntary response in the subject(1)
Corresponding Author: Dr Arun Kumar H.P. Associate Professor, Department of Physiology, Travancore Medical College and Hospital, NH Bypass, Mylapore, Thattamala .P.O., Kollam- 691020 e-mail: [email protected]
10.5958/2320-608X.2019.00185.9
274 International Journal of Physiology, October-December 2019, Vol.7, No. 4
Out of these various factors, in this study we have studied the time taken between application of visual stimulus and auditory stimulus and response obtained and comparison of the response in boys and girls volunteer.
Reaction time involves three phases as follows: a) processing of the stimulus, b) making decision about it and c) programming a response. Therefore, RT measurement includes: 1- The sensory neural code latency traversing both in central and peripheral pathways, 2- Both cognitive and Perceptive processing, 3- A motor signal traversing both peripheral and central neuronal structures 4- And eventually the latency in the end effectors activation such as muscle activation2
Human RT works by having a nervous system recognize the stimulus. The neurons then relay the message to the brain. The message then travels from the brain to the spinal cord, which then reaches person’s hands and fingers. The motor neurons directs the hands and fingers how to react. RT in response to a situation can significantly influence our lives due its practical implications. Fast RTs can produce rewards (e.g. in sports) whereas slow RT can produce grave consequences (e.g. driving and road safety matters).(1)
In the literature very few studies can be found determining RTs in medical students. Thus, this study was conducted to scientifically contribute to the field of RT, the difference if any to RTs between the two sexes.
Critical flicker fusion frequency (CFFF) is the frequency at which an intermittent light stimulus appears to be completely steady to the observer (As defined by Encyclopedia of psychopharmacology). It is the frequency at which the lowest level of continuous flicker is perceived as steady source of light. The flickering light will reach the retina based on temporal processing of visual stimulus. Temporal resolution of flickering stimulus is often limited by brain, so CFFF is used to assess the Cognitive function, CNS arousal in neurology & pharmacology. Normal CFFF value is 35-40 Hz. If the frequency at which frames are displayed in a film falls below the CFFF, the image will be perceived as jerky. Sub threshold intermittent light is perceived as flicker, if the flicker frequency is increased the flickering gradually becomes less distinct until it is no longer perceived as flickering but as steady source of light. (4)
So the present study aims to compare the reaction time and CFFF between male and female medical students.
Material and MethodStudy design: observational study.
Sample size: 50 male and 50 female(Total -100) MBBS students were randomly selected from their respective batch register.
Sampling method: Simple Random sampling
Intervention: Nil
A brief explanation regarding the purpose of study and cognitive tests was given to the subjects. They were explained in detail about the procedure to be performed in their vernacular language. Informed consent was taken from all the participants. Complete history is obtained and clinical examination was done. Auditory and visual screening was carried out on the subjects to rule out any auditory or visual impairment
Cognitive function tests: Audio visual reaction time, Critical flicker fusion frequency.
The auditory and visual reaction time is measured among males and female medical students in a quiet secluded room, whose ambient temperature is about 27°C, using the PC1000Hz reaction timer with their right upper limb, from 10am -12 noon for the subjects.
Study tool: Indigenously built reaction timer device, CFFF apparatus and a personal computer with Audacity software.
Device used – Indigenously built reaction timer device and a personal computer is used to measure audio visual reaction time.
Reaction Timer: The device is a PC1000 reaction timer6,7 to measure Auditory and visual reaction time. PC1000 is a 1000 hertz square wave oscillator which has a soft key for ‘start ‘and ‘stop’ function. This instrument has two components (A&B) connected to each other. Component (A) has a start button and it will be handled by the examiner only, second component (B) has a stop button which will be handled by the subject which is small red LED since Red light persists for a long time in retina & head phone(1000Hz tone) which receives the Visual &Auditory stimulus respectively. These two components are connected to a Personal computer which has audacity software installed in it. Audacity software records the reaction time in 0.001sec accuracy in wave format.
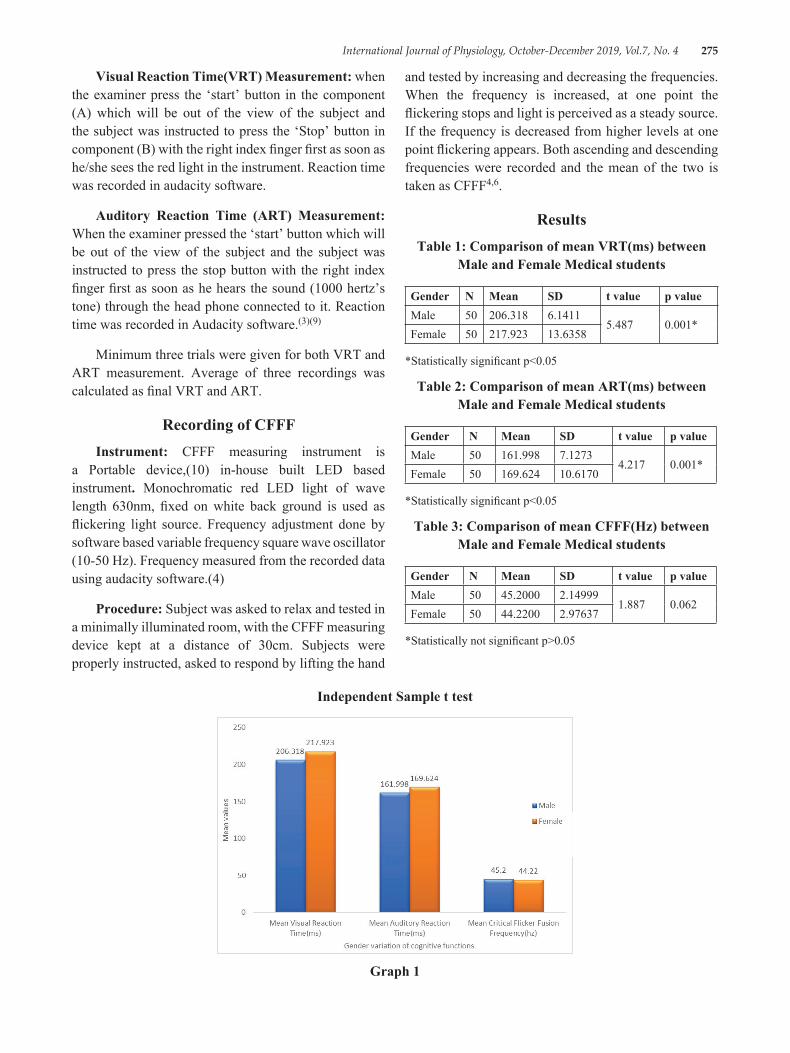
International Journal of Physiology, October-December 2019, Vol.7, No. 4 275
Visual Reaction Time(VRT) Measurement: when the examiner press the ‘start’ button in the component (A) which will be out of the view of the subject and the subject was instructed to press the ‘Stop’ button in component (B) with the right index finger first as soon as he/she sees the red light in the instrument. Reaction time was recorded in audacity software.
Auditory Reaction Time (ART) Measurement: When the examiner pressed the ‘start’ button which will be out of the view of the subject and the subject was instructed to press the stop button with the right index finger first as soon as he hears the sound (1000 hertz’s tone) through the head phone connected to it. Reaction time was recorded in Audacity software.(3)(9)
Minimum three trials were given for both VRT and ART measurement. Average of three recordings was calculated as final VRT and ART.
Recording of CFFFInstrument: CFFF measuring instrument is
a Portable device,(10) in-house built LED based instrument. Monochromatic red LED light of wave length 630nm, fixed on white back ground is used as flickering light source. Frequency adjustment done by software based variable frequency square wave oscillator (10-50 Hz). Frequency measured from the recorded data using audacity software.(4)
Procedure: Subject was asked to relax and tested in a minimally illuminated room, with the CFFF measuring device kept at a distance of 30cm. Subjects were properly instructed, asked to respond by lifting the hand
and tested by increasing and decreasing the frequencies. When the frequency is increased, at one point the flickering stops and light is perceived as a steady source. If the frequency is decreased from higher levels at one point flickering appears. Both ascending and descending frequencies were recorded and the mean of the two is taken as CFFF4,6.
ResultsTable 1: Comparison of mean VRT(ms) between
Male and Female Medical students
Gender N Mean SD t value p valueMale 50 206.318 6.1411
5.487 0.001*Female 50 217.923 13.6358
*Statistically significant p<0.05
Table 2: Comparison of mean ART(ms) between Male and Female Medical students
Gender N Mean SD t value p valueMale 50 161.998 7.1273
4.217 0.001*Female 50 169.624 10.6170
*Statistically significant p<0.05
Table 3: Comparison of mean CFFF(Hz) between Male and Female Medical students
Gender N Mean SD t value p valueMale 50 45.2000 2.14999
1.887 0.062Female 50 44.2200 2.97637
*Statistically not significant p>0.05
Independent Sample t test
Graph 1
276 International Journal of Physiology, October-December 2019, Vol.7, No. 4
DiscussionThe study was conducted among 100 healthy
medical students to study the VRT and ART and how do they vary on the basis of gender, and sedentary and regularly exercising healthy students.
Table1 and Table 2 shows that both VRT and ART are less in males as compared to females and found to be statistically significant.
Table 3 reveals that CFFF values are slightly higher in males than females and this was not statistically significant(4)(6)(7).
A review of the literature on the influence of gender on RT shows that in almost every age group, males have faster RTs as compared to females. Researches done by Misra et al also showed that males responded faster than females(2). Study done by Shelton and Kumar(12) Nikam and Gadkari also reported similar findings to support females have longer RTs than males(13). The results of our study agree with these studies and indicate that male medical students have faster RTs when compared to female medical students for both auditory, as well as visual stimuli.
The male-female difference is due to the lag between the presentation of the stimulus and the beginning of muscle contraction. It is documented in the literature that the muscle contraction time is the same for males and females and motor responses in males are comparatively stronger than females, this explains why males have faster simple RTs for both auditory as well as visual stimuli. Now a days the male advantage is getting smaller, possibly because more women are participating in driving and fast-action. Longer reaction times in females could be attributed to fluid and salt retention due to female sex hormones affecting sensorimotor co-ordination.(1).
Our observation are consistent with the observations of the other workers who observed that females had a longer reaction time when compared to males.((10)(11). Bruce and Russel (1962) explained it on the basis of varying level of sex steroids during different phases of menstrual cycle which have sodium and water retaining effect(5)(8)(1). This retention of salt and water could modify the axonal conduction. It is also suggested to alter the availability of the neurotransmitter at the synaptic level. This modulation of neurotransmitter coupled with altered rate of impulse transmission due to
fluctuation in the levels of hormones affect the sensory motor association with the processing speed at the Central Nervous System(1) (8)(11)
ConclusionMales have faster reaction time when compared to
females due to strong motor responses. Females have long reaction time when compare to males due to salt and water retention affecting sensory motor coordination. CFFF is higher in males than compared to females but statistically not significant.
Conflict of Interest: No
Source of Support: Self support
Ethical Clearance: Ethical clearance has been taken from institutional ethical clearance committee.
References1. Avnis Aditya Jain, Ramta Bansalh Kumar, and K D
Singh;A comparative study of visual and auditory reaction times on the basis of gender and physical activity levels of medical first year students: Int J Appl Basic Med Res. 2015 May-Aug; 5(2): 124-127.
2. Moradi, A. & Esmaeilzadeh, S. Simple reaction time and obesity in children: whether there is a relationship?. Environ Health Prev Med (2017) 22: 2.
3. N Parekh , IPR Gajbhiye ,MJ Wahane . The Study of Auditory and Visual Reaction time in healthy Controls,Patients of Diabetes Mellitus on Modern Allopathic Treatment and those Performing Aerobic Exercises. J Indian Acad Clin Med. 2004;5(3):149–56.
4. P Vijetha ,T Jeevaratnam , KN Maruthy et al. Assessment of psychomotor function by critical flicker fusion frequency: correlation with age, ejpmr, 2016,3(7), 275-2
5. Mishra N, Mahajan KK, Maini BK. Comparative study of visual and auditory reaction time of hands and feet in males and females. Ind J Physiol Pharmacol 1985; 29: 213–218.
6. Chiranjeevi kumar Endukuru, K.N.Maruthy, T.S.Deepthi . A Study of Critical Flickering Fusion Frequency Rate in Media Players ;International Journal of Multidisciplinary Research and Development , Volume: 2, Issue: 5, 499-502.
International Journal of Physiology, October-December 2019, Vol.7, No. 4 277
7. Gayathiri, MV Shobha, A Jagadamba. To Study the Effect of Excessive Daytime Sleepiness on Critical Fusion Frequency in Medical Students. Volume 16, Issue 4 Ver. VIII (April. 2017), Pg 60-64.
8. MK Ritesh ,PG Tejas ,BM Hemanth ,AG Pradnya , JS Chinmay . Effect Of Gender Difference On Visual Reaction Time : A Study On Medical Students Of Bhavnagar Region, IOSR Journal of Pharmacy Vol. 2, Issue 3, May-June, 2012, pg.452-454.
9. MM Umapathy, Sembian, Babitha,N Ethiya and K Muthuselvi . Study of Auditory, Visual Reaction Time and Glycemic Control (HBA1C) in Chronic Type II Diabetes Mellitus: J Clin Diagn Res C13. 2014 Sep; 8(9): Pg BC 11–BC13.
10. N Parekh , IPR Gajbhiye ,MJ Wahane . The Study of Auditory and Visual Reaction time in healthy
Controls,Patients of Diabetes Mellitus on Modern Allopathic Treatment and those Performing Aerobic Exercises. J Indian Acad Clin Med. 2004;5(3):149-56.
11. D.Venkatesh, DL.Ramachandra, BB Suresh . and BK Rajan. Impact of psychological stress, gender and colour on visual response latency; Indian J Physiol Pharmacol 2002; 46 (3): 333-337.
12. Shelton J, Kumar GP. Comparison between auditory and visual simple reaction times. Neurosci Med. 2010;1:30–2
13. Nikam LH, Gadkari JV. Effect of age, gender and body mass index on visual and auditory reaction times in Indian population. Indian J Physiol Pharmacol. 2012;56:94–9.