volatiles retention during rehumidification of freeze dried food models
TRANSCRIPT
J. Fd Technol. (1978) 13, 265-280
Volatiles retention during rehumidification of freeze dried food models
OGBEMI 0. OMATETE" AND C . JUDSON KING?
Summary
Observations of structural collapse during rehumidification of freeze dried substances are used to interpret previously reported data for volatiles loss v. time. The results are in accord with a diffusion-based analysis. At low moisture contents the diffusion coefficient is so low as to give only very small losses, while at high moisture contents it is high enough to give complete loss in a relatively short time. The behaviour at intermediate moisture contents depends upon whether or not there is simultaneous structure collapse. If there is no collapse, volatiles-loss data appear to agree well with a slab-diffusion analysis based upon constant diffusivity and unchanging slab thickness - the average thickness of webs within the porous substance. When there is simultaneous collapse, it is necessary to take into account the continuous increase in web thickness as diffusion occurs. A model is derived based upon a linear increase in web thickness with increasing time, and is shown to agree with experi- mental data for volatiles loss at intermediate moisture contents in several different systems which show structural collapse.
Introduction
Freeze drying can give excellent retention of volatile aroma substances present in liquid foods and related model systems. Nearly all important volatile aroma compounds have quite high relative volatiles in aqueous solution (Bomben et al., 1973); hence in order to explain the high observed retentions it is necessary to postulate a rate limiting mechanism for volatiles loss.
Authors' address: Department of Chemical Engineering, University of California,
* Present address: Department of Chemical Engineering, University of Lagos, Lagos,
t To whom correspondence should be addressed.
Berkeley, California 94720.
Nigeria.
0022-1 163/78/0800-0265$02.00 0 1 978 Blackwell Scientific Publications
266 0. 0. Omatete and C. J. King
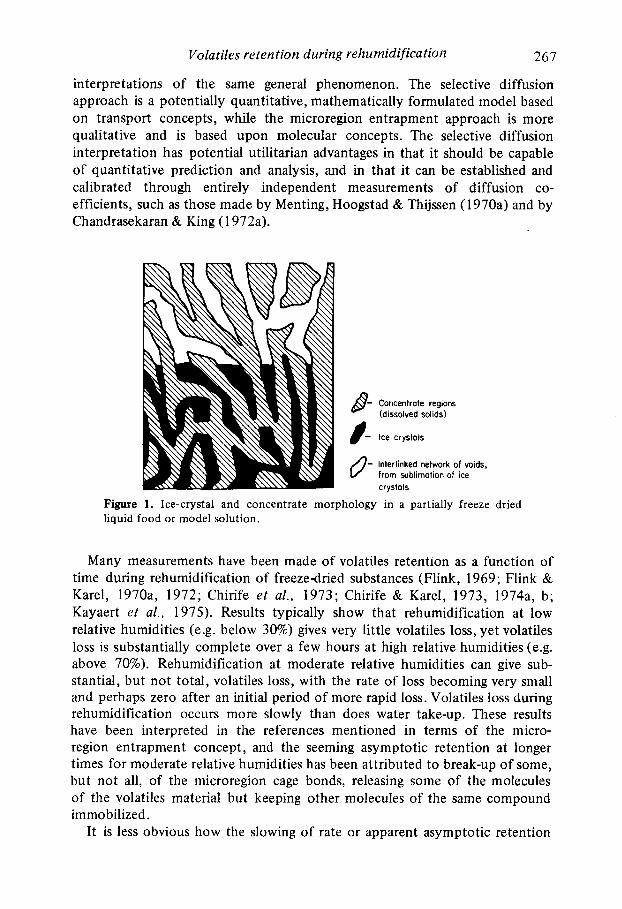
Two basic mechanisms have been proposed for the interpretation of volatiles loss during freeze drying. One, first put forward by Thijssen and associates (Thijssen & Rulkens, 1968, 1969; Thijssen, 1971), is based upon selective diffusion. Through independent measurements of diffusion coefficients of volatiles and water, Thijssen and associates found that diffusion coefficients for both drop markedly as dissolved solids contents increase, but that the diffusion coefficients for volatiles drop to a considerably greater extent. Thus, above a certain dissolved solids content, water is removed by diffusion at a significant rate, but other volatile compounds are not. Freezing prior to freeze drying gives a microscale separation of ice crystals from residual concentrate, as shown in the lower portion of Fig. 1. This increases the dissolved solids content of the residual concentrate and thereby increases the selectivity for transport of water as opposed to volatiles, once the concentrate webs are exposed by the retreating ice front. Furthermore, evaporative drying of the concentrate webs after passage of the ice front increases the selectivity still further. Below the collapse temperature, the concentrate webs are viscous enough so that they will not flow appreciably during evaporative drying. More properly, the volatiles diffusion process should be considered as a ternary system of volatile, water and dissolved solids (Chandrasekaran & King, 1972b), but the basic concept of selective diffusion remains unchanged. The selective diffusion analysis has also been extended to volatiles retention during other dewatering processes, such as air drying (Menting, Hoogstad & Thijssen, 1970b; Chandrasekaran & King, 1972b), spray drying (Rulkens & Thijssen, 1972) and concentration by extraction of water (Kerkhof & Thijssen, 1974).
Flink, Karel and associates (Flink & Karel, 1970a, b, 1972; Chirife & Karel, 1973, 1974a, b ; Chirife, Karel & Flink, 1973; Flink, 1974; Kayaert et al., 1975) have interpreted volatiles retention through the concept of microregion entrapment, in which volatile compounds are immobilized within cages formed by association of molecules of dissolved solids, such as by hydrogen bonding of carbohydrate molecules. The degree of immobilization would then relate t o the water content, freezing conditions and other variables.
Through the selective diffusion concept the directional effects of numerous processing variables on volatiles retention in freezing drying can be explained in terms of the influences of these variables on the dimensionless Fourier group DtlL’, and the resulting increase in volatiles loss with increasing values of that group (King, 1970, 1971, 1972). Here D is the diffusion coefficient of the volatile substance in the concentrate webs (Fig. l ) , L is the average thickness of the concentrate webs, and t is the time elapsed between passage of the ice front and sufficient drying of the concentrate webs to reduce volatiles loss to a negligible rate. This analysis includes the effects of initial dissolved solids content, freezing rate, specimen thickness and drying rate or ice front tempera- ture. Flink (1974) presents an interpretation of the directional effects of the same processing variables through the microregion-entrapment concept. In fact, it has been noted (King, 1971; Flink, 1974) that in many ways the selective diffusion and microregion entrapment concepts are macro- and microscale
Vo la tiles re ten tio n during re h u midi fica tio n 267
interpretations of the same general phenomenon. The selective diffusion approach is a potentially quantitative, mathematically formulated model based on transport concepts, while the microregion entrapment approach is more qualitative and is based upon molecular concepts. The selective diffusion interpretation has potential utilitarian advantages in that it should be capable of quantitative prediction and analysis, and in that it can be established and calibrated through entirely independent measurements of diffusion co- efficients, such as those made by Menting, Hoogstad & Thijssen (1970a) and by Chandrasekaran & Xing (1 972a).
8- f- U-
Concentrate regions (dissolved solids)
Ice crystals
Interlinked network of voids, from sublimation of ice crystals
Figure 1. Ice-crystal and concentrate morphology in a partially freeze dried liquid food or model solution.
Many measurements have been made of volatiles retention as a function of time during rehumidification of freezedried substances (Flink, 1969; Flink & Karel, 1970a, 1972; Chirife et al., 1973; Chirife & Karel, 1973, 1974a, b; Kayaert et al., 1975). Results typically show that rehumidification at low relative humidities (e.g. below 30%) gives very little volatiles loss, yet volatiles loss is substantially complete over a few hours at high relative humidities (e.g. above 70%). Rehumidification at moderate relative humidities can give sub- stantial, but not total, volatiles loss, with the rate of loss becoming very small and perhaps zero after an initial period of more rapid loss. Volatiles loss during rehumidification occurs more slowly than does water take-up. These results have been interpreted in the references mentioned in terms of the micro- region entrapment concept, and the seeming asymptotic retention at longer times for moderate relative humidities has been attributed to break-up of some, but not all, of the microregion cage bonds, releasing some of the molecules of the volatiles material but keeping other molecules of the same compound immobilized.
It is less obvious how the slowing of rate or apparent asymptotic retention
268 0. 0. Omatete and C. J . King
for rehumidification at moderate humidities can be rationalized through the selective diffusion concept. The rate is slowed in many cases to a substantially greater extent than would be predicted by applying a simple slab diffusion model to a concentrate web of a given thickness (King & Massaldi, 1976). A mathematical model where a fraction of the volatile material obeys the simple diffusion model while the remaining fraction is totally immobilized would be able to fit the observed curves. However the distinction of different degrees of mobility for the same solute at different locations runs counter to the usual concepts of diffusion in solutions, except for such extreme situations as partially crystalline polymers. It seems preferable to interpret volatiles loss through a diffusion model without resort to such a concept, if possible.
King & Massaldi ( 1976) have identified and analysed probable effects of factors which could alter the predictions of a simple diffusion model applied to concentrate webs during rehumidification. These include variations of the diffusion coefficient with water content, temperature and/or volatiles con- centration; segregation of volatiles into a second, immiscible phase within the concentrate webs, etc. They concluded that the most likely interpretation involves differences in thickness of the concentrate webs. Thin webs should give more rapid volatiles loss, and thick webs should give much slower percent- wise loss; this is the effect of L 2 in the denominator of the Fourier number, Dt/L2. For all solutions of the diffusion equation the percent removal of a substance increases with increasing values of the group Dt/L2 (Crank, 1975; Treybal, 1968; etc.). Thicker webs have a lower surface to volume ratio and therefore lose volatiles at a slower rate, per unit volume.
As was noted by King & Massaldi (1 976), the disparity in web thicknesses should be particularly pronounced when collapse occurs. Collapse is a phenomenon where the webs of semi-solid matter in a porous product flow under the impetus of surface tension and thereby close off some or all of the pores (Bellows & King, 1973). Collapse occurs for freeze drying of food liquids at too high a frozen-core temperature (MacKenzie, 1965. Bellows & King, 1973), as well as for storage of porous, dried products under conditions of too high temperature and/or relative humidity (Tsourouflis, Flink & Karel, 1976).
Partial collapse can form a number of very thick webs and can thereby markedly slow down the rate of volatiles loss from these thicker webs. In an example given by King & Massaldi (1976), a difference of a factor of 10 between web thicknesses within a specimen can give near-asymptotic volatiles retention curves of the sort observed by Flink & Karel(l972) and Chrife et al. ( 1973) for freeze dried maltose and polyvinylpyrrolidone.
From qualitative knowledge of such systems and from observations reported by Flink & Karel (1972, etc.), it seems likely that collapse occurred during some of the experiments on volatiles loss during rehumidification. The purpose of the present work was therefore to investigate experimentally the degree of collapse occurring during rehumidification experiments of the sort for which volatiles losses have been observed, and to relate the rate characteristics of collapse to the rate characteristics of volatiles loss.
Volatiles retention during rehumidification 269
Materials and methods
Sample preparation
Solutions in water were prepared, each containing 20% w/w lactose, maltose, polyvinylpyrrolidone (PVP), bovine serum albumin (BSA) or dextran (MW 9 X lo4 or 2.2 X lo6). Maltose and p-lactose (98%) were supplied by Matheson, Coleman & Bell, Inc. PVP was Type NP-K30, Control No. 10203, GAF Corp. Dextran fractions were OR1 2 12 and 478-1-A (intrinsic viscosities 0.27 and 0.68, respectively) from Pharmacia Uppsala. BSA was Sigma Chemical Corp. A-4503,96-98% purity. All compounds dissolved at room temperature, except for the dextrans which required heat. The dextran and BSA solutions were quite viscous. BSA dissolved with some difficulty and formed a persistent foam.
15 ml of solution were poured into an open Petri dish, 9 cm in diameter, and were frozen in a cold room at - 15°C overnight. The frozen samples were dried in the freezing drying unit described by Bellows & King (1 973). Maltose and lactose gave porous freeze dried products in 5 hr at a chamber pressure of 200 pm and a bottom platen temperature of 30°C.
The other substances were freeze dried at 200 pm without applying heat to the platens, and acceptable products were obtained in 8 hr. The freeze dried PVP and dextran products appeared to be less porous than the lactose and maltose products. BSA freeze dried to give two very porous and brittle layers; one was the foam and the other the solution.
Re h u midificatio n effects
Rehumidification was carried out in vacuum desiccators similar to that used by Flink (1 969). Saturated salt solution in a Petri dish at the bottom of the desiccator was agitated slowly with a magnetic stirrer to maintain constant relative humidity. Saturated solutions of KC2 H302, MgClz 6H202, Mg(N03)2. 6 H 2 0 and NaCl were used to achieve relative humidities of 23, 32, 52 and 75%, respectively (Wexler & Hagesawa, 1954; Labuza et al., 1976). Over the Petri dish was a wire mesh, on top of which were placed watch glasses containing the samples. Aluminium foil was formed into a high wall around the watch glasses to prevent salt solution from splashing into the samples. At the beginning of each experiment the salt solution was degassed by putting the desiccator under vacuum for about 15 min. Then the samples were put into the desiccator, which was again evacuated for 30 min. The measured pressure was always around 1 torr when evacuation was stopped.
The sample was then observed visually at given time intervals, and changes were recorded. After some time, some of the samples would shrink and then change into a glassy transparent mass. The onset of this glassy transparent state was relatively sharp and well defined. The time of onset was recorded as the
2 70 0. 0. Omatete and C. J . King
collapse time. If there was no visible change after 24 hr, part of the sample was removed and observed under an optical microscope. The appearance of this substance was compared to the original freeze dried sample to see if there was any difference. At the ends of all rehumidification experiments in which no visual changes occurred, the samples were again observed in the microscope. For the microscopic observation, part of the sample was granulated before it was viewed.
Effect of heating
Chirife & Karel (1974a, b) reported the effect of heating on volatiles loss from freeze dried BSA and maltose samples. They reported an asymptotic retention level for maltose at 100°C. Their experiment was repeated in the present work, using a vacuum oven containing activated charcoal and anhydrous calcium sulfate (Drierite). All the six freeze dried samples were put in the vacuum oven, which was controlled at 100 A 1°C. The samples were observed at 6 h r intervals for 47 hr. The experiment was repeated with the oven at 140 f: 1"C, and the samples were observed at the end of 24 hr.
Experimental results
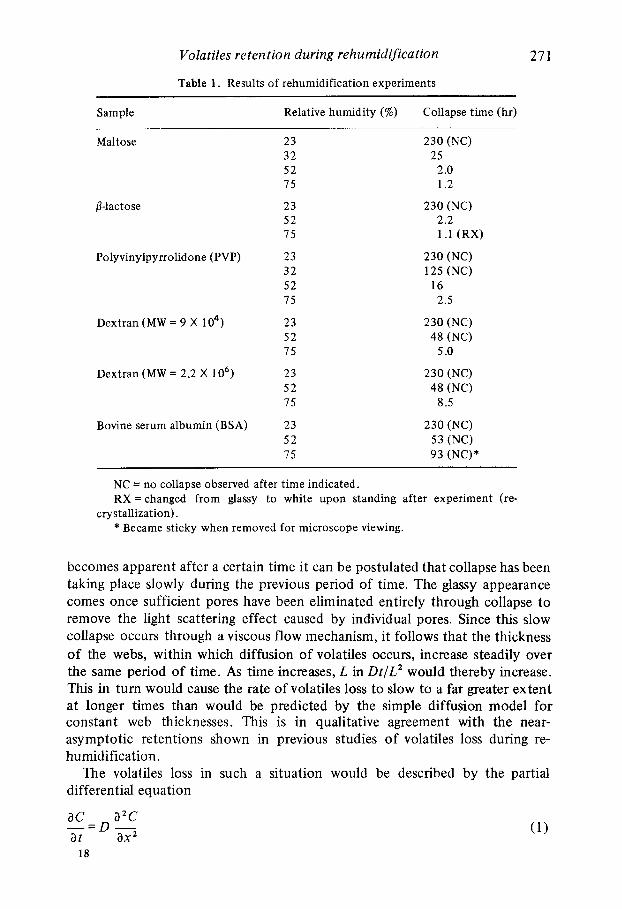
Table 1 gives results of the observations of collapse during rehumidification of the various freeze dried specimens. Collapse was observed to occur at the time after the start of rehumidification indicated in the right-hand column. NC indicates that no collapse was observed.
Collapse during freeze drying results from closure of pores due to viscous flow (Bellows & King, 1973). It results in much bubbling and spattering, with shrinkage, aberrations in the drying rate and volatiles loss. Collapse during rehumidification produces no spattering, and there were usually no signs of bubbles, since there was no vapour evolution. Incipient collapse was signalled by shrinking, with the sample then becoming a highly viscous and glassy material, in contrast to the opaque and porous appearance of the freeze dried samples before collapse.
In the heating experiments there was no visible change in any of the six samples after 41 hr at 100°C. After 24 hr at 140°C the maltose and lactose samples showed apparent melting and charring, PVP and BSA turned yellow but showed no apparent collapse, and the dextrans remained unchanged in appearance.
Model for volatiles loss during collapse upon rehumidification
A cursive comparison of the results in Table 1 with the previous studies of volatiles loss behaviour upon rehumidification shows that in several cases volatiles loss and collapse occur simultaneously. In cases where a glassy state
Volatiles retention during rehumidification 27 1
Table 1. Results of rehumidification experiments
Sample Relative humidity (%) Collapse time (hr)
Maltose
0-lactose
Polyvinylpyrrolidone (PVP)
Dextran (MW = 9 X lo4)
Dextran (MW = 2.2 X lo6)
Bovine serum albumin (BSA)
23 32 52 75
23 52 75
23 32 52 75
23 52 75
23 52 75
23 52 75
230 (NC)
2 .o 1.2
230 (NC) 2.2 1.1 (RX)
25
230 (NC) 125 (NC)
2.5
230 (NC) 48 (NC)
5 .O
230 (NC) 48 (NC)
8.5
230 (NC) 53 (NC) 93 (NC)*
16
NC = no collapse observed after time indicated. RX = changed from glassy to white upon standing after experiment (re-
* Became sticky when removed for microscope viewing. crystallization).
becomes apparent after a certain time it can be postulated that collapse has been taking place slowly during the previous period of time. The glassy appearance comes once sufficient pores have been eliminated entirely through collapse to remove the light scattering effect caused by individual pores. Since this slow collapse occurs through a viscous flow mechanism, it follows that the thickness of the webs, within which diffusion of volatiles occurs, increase steadily over the same period of time. As time increases, L in Dt/LZ would thereby increase. This in turn would cause the rate of volatiles loss to slow to a far greater extent at longer times than would be predicted by the simple diffusion model for constant web thicknesses. This is in qualitative agreement with the near- asymptotic retentions shown in previous studies of volatiles loss during re- humidification.
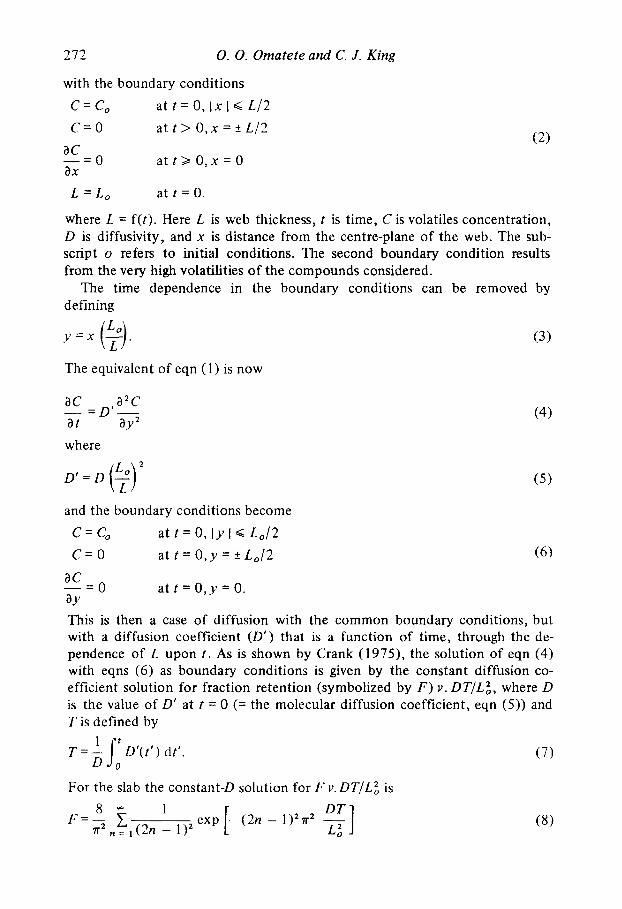
The volatiles loss in such a situation would be described by the partial differential equation
ac - a2c a t D a x z _-
18
272
with the boundary conditions
0. 0. Omatete and C. J . King
c = c, c = o
at t = 0, I x I < L / 2 at t > 0,x = 5 L / 2
ac ax -- - 0 at t 2 0,x = 0
L = L , at t = 0.
where L = f(t). Here L is web thickness, t is time, C is volatiles concentration, D is diffusivity, and x is distance from the centre-plane of the web. The sub- script o refers to initial conditions. The second boundary condition results from the very high volatilities of the compounds considered.
The time dependence in the boundary conditions can be removed by defining
y = x (+) The equivalent of eqn (1) is now
a2C - 1
ac - - D 7 at a Y where
2
D' = D (2) and the boundary conditions become c = c, c = o
at t = 0 , I y I < L 0 / 2 at t = 0 , y = 2 L 0 / 2
(4)
This is then a case of diffusion with the common boundary conditions, but with a diffusion coefficient (D') that is a function of time, through the de- pendence of L upon t . As is shown by Crank (1975), the solution of eqn (4) with eqns (6) as boundary conditions is given by the constant diffusion co- efficient solution for fraction retention (symbolized by F ) v. D T / L i , where D is the value of D' at t = 0 (= the molecular diffusion coefficient, eqn ( 5 ) ) and T is defined by
1 * T = Jo D ' ( t ' ) dt'.
For the slab the constant-D solution for F 1.7. D T / L i is
(7)
Vo la tiles re ten tio n during reh u midifica tion 2 73
(Crank, 1975; Treybal, 1968). Plots of Fv. DTILZ corresponding to eqn (8) are given by Treybal (1 968), among others. The constant-D solution for F as a function of DTIL; (eqn (8)) can then be converted to the desired solution ( F as a function of Dt/L;) by integrating eqn (7) and determining the value o f t corresponding to each value of T. If L does not change with time, T may be directly replaced by t in eqn (8).
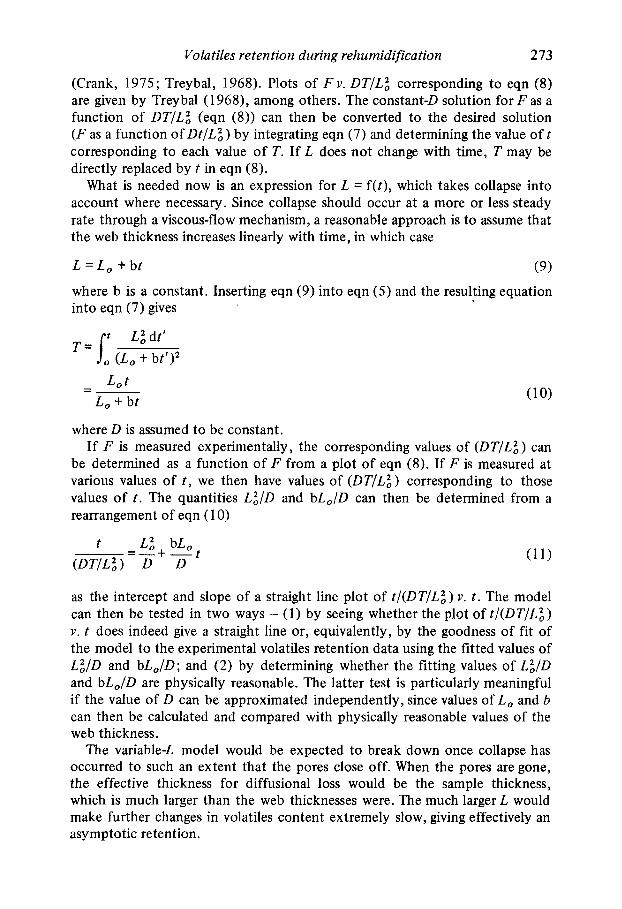
What is needed now is an expression for L = f(t), which takes collapse into account where necessary. Since collapse should occur at a more or less steady rate through a viscous-flow mechanism, a reasonable approach is to assume that the web thickness increases linearly with time, in which case
L = L o + b t (9) where b is a constant. Inserting eqn (9) into eqn (5) and the resulting equation into eqn (7) gives
r L:dt' T = J', (Lo + bt'I2
- LO t -- Lo + bt
where D is assumed to be constant. If F is measured experimentally, L e corresponding values a (DT/LZ) can
be determined as a function of F from a plot of eqn (8). If F is measured at various values of t , we then have values of (DTIL;) corresponding to those values of t . The quantities LZ/D and bLo/D can then be determined from a rearrangement of eqn (1 0)
Lz bLo =-+-t t (DTILZ) D D
as the intercept and slope of a straight line plot of t/(DT/LZ) v. t . The model can then be tested in two ways - (1) by seeing whether the plot of t/(DT/L2,) v. t does indeed give a straight line or, equivalently, by the goodness of fit of the model to the experimental volatiles retention data using the fitted values of L;/D and bLo/D; and (2) by determining whether the fitting values of LZ/D and bLo/D are physically reasonable. The latter test is particularly meaningful if the value of D can be approximated independently, since values of Lo and b can then be calculated and compared with physically reasonable values of the web thickness.
The variable-L model would be expected to break down once collapse has occurred to such an extent that the pores close off. When the pores are gone, the effective thickness for diffusional loss would be the sample thickness, which is much larger than the web thicknesses were. The much larger L would make further changes in volatiles content extremely slow, giving effectively an asymptotic retention.
274 0. 0. Omatete and C. J. King
For either constant L or variable L , the effective value of L must be an appropriate average of the various web thicknesses which exist in the porous specimen.
Interpretation of volatiles-retention data
Measured values of diffusion coefficients for volatile compounds in solutions of sucrose and maltodextrin decrease by orders of magnitude as the moisture content decreases (Menting et al., 1970a; Chandrasekaran & King, 1972a). Presumably, this behaviour extends to all the systems considered in this work.
In the various studies made by Flink, Karel and co-workers very little volatiles loss occurs upon rehumidification to relatively low relative humidities (20% and below). From Table 1 it can also be seen that collapse does not occur at these moisture contents. Apparently, the value of the diffusion coefficient is so low that the quantity Dt /L2 never becomes large enough to give a signifi- cant volatiles loss.
For rehumidification to very high relative humidities (7 5% and greater), Flink, Karel and co-workers typically find essentially complete loss of volatiles. In these cases collapse also occurs, as shown in Table 1 (except possibly for BSA) and the time required for a glassy appearance to develop (collapse time) is usually less than that reported for complete volatiles loss. Presumably in these cases the volatiles diffusivity is so large that the group Dt/L2 becomes quite large, even though the web thickness, L , increases due to collapse.
At intermediate relative humidities the behaviour is more complex and will be explored individually for the different substances investigated.
Dex trail
Flink (1 969) and Flink & Karel (1972) report volatiles loss data for re- humidification of Dextran 10 (MW about 10000) at relative humidities of 20, 52 and 75%. At 20% humidity there was little or no loss, presumably because of low D. In the present work, no evidence of collapse was found for the dextran samples at 23 and 52% relative humidities, but there was relatively rapid collapse at 75% humidity. Extrapolation of the molecular weight effect observed here suggests that collapse would have been still more rapid at 75% humidity for the 10000 MW Dextran used by Flink and Karel.
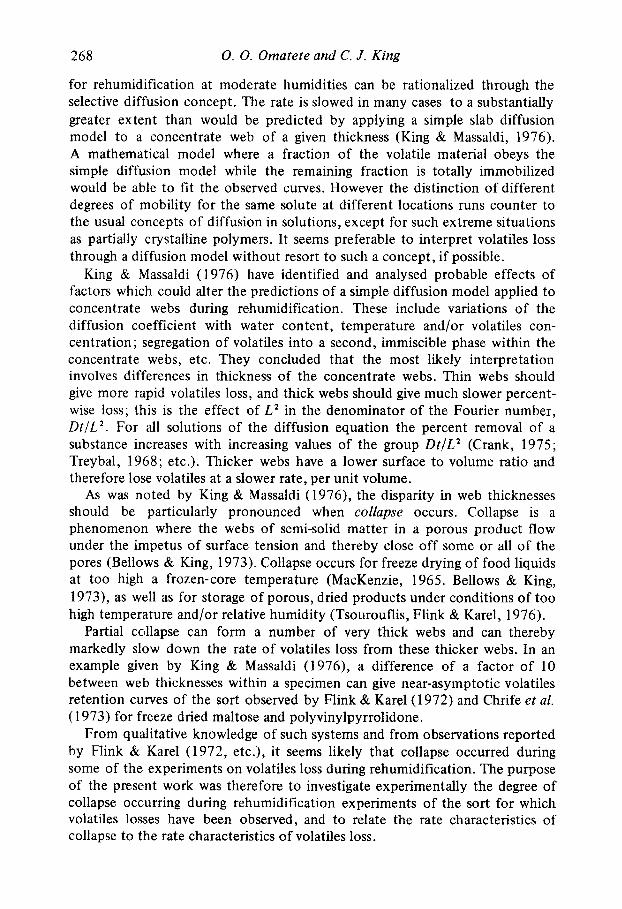
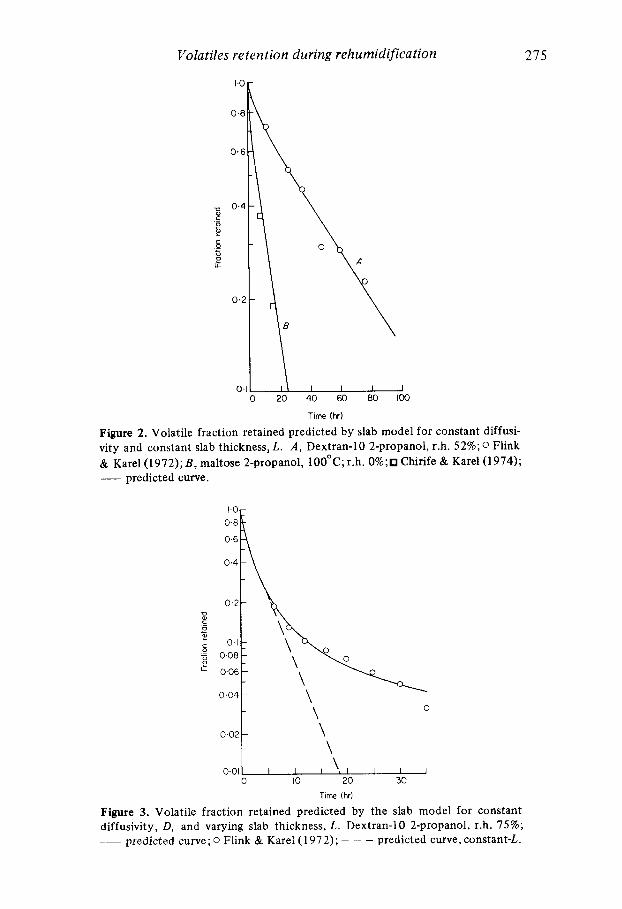
These collapse observations are consistent with the volatiles loss data in- terpreted through the diffusion analysis, as shown in Figs 2 and 3. In Fig. 2 data for the retention of 2-propanol in Dextran-10 at 52% relative humidity (Flink & Karel, 1972) are plotted as open circles. Curve A , based upon the constant-D, constant-L diffusion model (no increase of L from collapse) fits these data well, using L2/D = 570 hr. This value of L z / D could correspond, for example, to L = 50 pm and D = 1.2 X lo-" cm*/sec.
Volatiles retention during rehumidification
0.01
275
I I , \, , I I I
Time (hr)
Figure 2. Volatile fraction retained predicted by slab model for constant diffusi- vity and constant slab thickness, L. A , Dextran-10 2-propanol, r.h. 52%; 0 Flink & Karel(1972);B, maltose 2-propanol, 100°C; r.h. 0%; Chirife & Karel(l974); - predicted curve.
2 76 0. 0. Omatete and C. J. King
At 75% relative humidity the two dextran samples in Table 1 did collapse, and it would therefore be expected that the value of L would have increased during the volatiles loss experiment conducted by Flink & Karel(l972) at the same humidity. Their data are plotted in Fig. 3. The curve in that figure comes from the increasing-L model and fits the data well. The curve was derived by fitting the slope and intercept in eqn (1 l ) , obtaining L:/D = 28 hr and bLJD = 2.5. These values might, for example, correspond to Lo = 50 pm, D = 2.5 X lo-'' cm2/sec, and b = 4.5 pm/hr. From this value of b, the effective average web thickness would increase from Lo = 50 to 185 pm after 30 hr.
The values of D inferred from the volatiles loss curves at both 52 and 75% relative humidity agree closely with values of D measured independently by Menting et al. (1970a) for acetone in solutions of maltodextrin (a similar substance) with water concentrations (1 0 and 17%) in equilibrium with relative humidities of 52 and 75%.
The solution for constant D and constant L (=Lo) is shown as the dashed curve. A considerable difference from the variable-L curve is evident.
Maltose
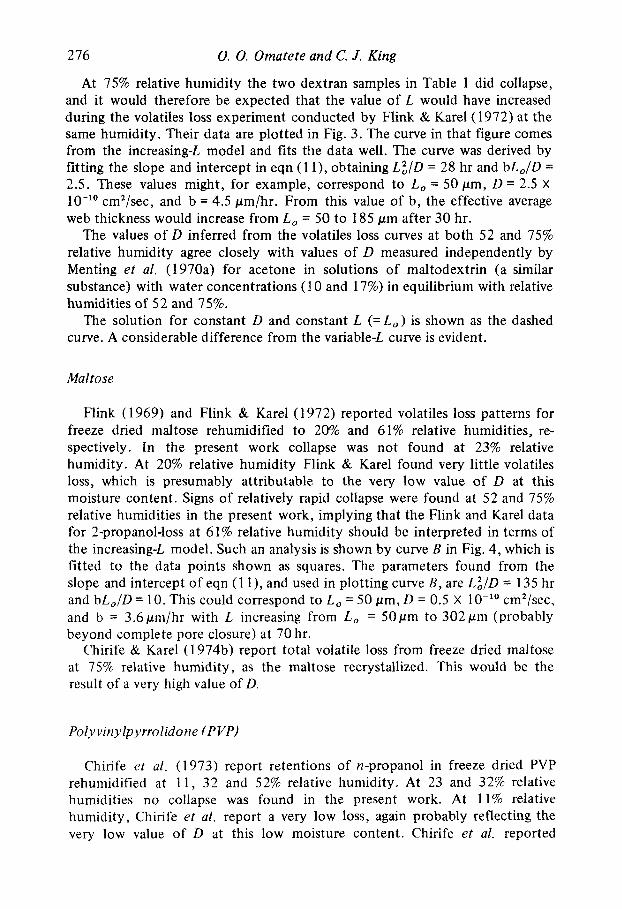
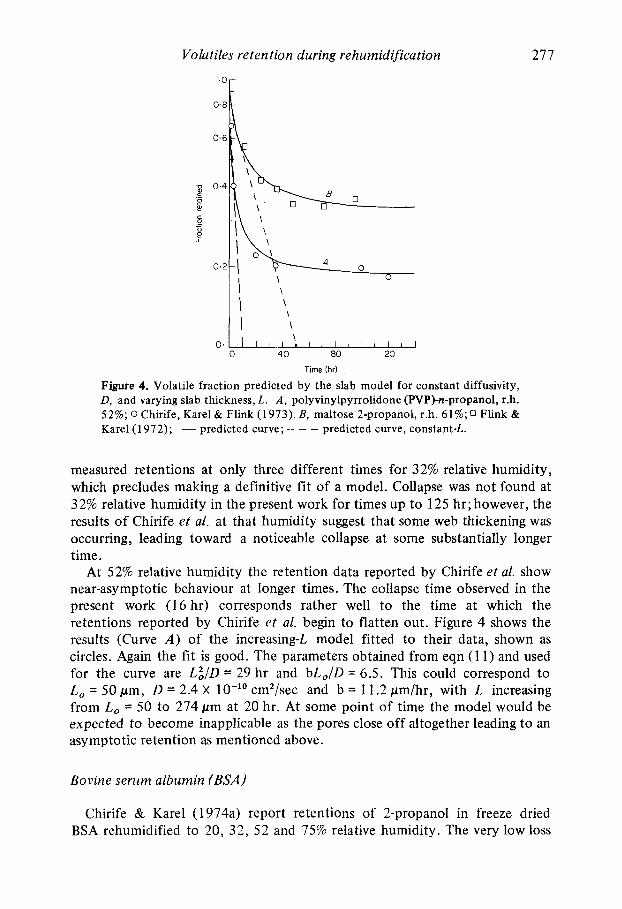
Flink ( 1 969) and Flink & Karel (1 972) reported volatiles loss patterns for freeze dried maltose rehumidified to 20% and 61% relative humidities, re- spectively. In the present work collapse was not found at 23% relative humidity. At 20% relative humidity Flink & Karel found very little volatiles loss, which is presumably attributable to the very low value of D at this moisture content. Signs of relatively rapid collapse were found at 52 and 75% relative humidities in the present work, implying that the Flink and Karel data for 2-propanol-loss at 61% relative humidity should be interpreted in terms of the increasing-L model. Such an analysis is shown by curve B in Fig. 4, which is fitted to the data points shown as squares. The parameters found from the slope and intercept of eqn (1 l ) , and used in plotting curve B , are L:/D = 135 hr and bLo/D = 10. This could correspond to Lo = 50 pm, D = 0.5 X lo-'' cm2/sec, and b = 3.6pm/hr with L increasing from Lo = 50pm to 302pm (probably beyond complete pore closure) at 70 hr.
Chirife & Karel (1974b) report total volatile loss from freeze dried maltose at 75% relative humidity, as the maltose recrystallized. This would be the result of a very high value of D.
Polv v iny lp y rro 1 id o ne ( P VP)
Chirife et al. (1973) report retentions of n-propanol in freeze dried PVP rehumidified at 11, 32 and 52% relative humidity. At 23 and 32% relative humidities no collapse was found in the present work. At 11% relative humidity, Chirife et al. report a very low loss, again probably reflecting the very low value of D at this low moisture content. Chirife et al. reported
Vo la tiles re ten tio n during re humidification 277
1 )I I , ;\k I , I I I I , , , \
0.1 0 40 80 I20
Time (hr)
Figure 4. Volatile fraction predicted by the slab model for constant diffusivity, D, and varying slab thickness, L. A , polyvinylpyrrolidone (PVP)-n-propanol, r.h. 52%; 0 Chirife, Karel& Flink (1973). B, maltose 2-propanol, r.h. 61%;0 Flink & Karel(l972); __ predicted curve; - - - predicted curve, constant-l.
measured retentions at only three different times for 32% relative humidity, which precludes making a definitive fit of a model. Collapse was not found at 32% relative humidity in the present work for times up to 125 hr; however, the results of Chirife et al. at that humidity suggest that some web thickening was occurring, leading toward a noticeable collapse at some substantially longer time.
At 52% relative humidity the retention data reported by Chirife et al. show near-asymptotic behaviour at longer times. The collapse time observed in the present work (16 hr) corresponds rather well to the time at which the retentions reported by Chirife et al. begin to flatten out. Figure 4 shows the results (Curve A ) of the increasing-L model fitted to their data, shown as circles. Again the fit is good. The parameters obtained from eqn (1 1) and used for the curve are LE/D = 29 hr and bL,/D = 6.5. This could correspond to Lo = 50 pm, D = 2.4 X lo-'' cm2/sec and b = 1 1.2 pm/hr, with L increasing from Lo = 50 to 274 pm at 20 hr. At some point of time the model would be expected to become inapplicable as the pores close off altogether leading to an asymptotic retention as mentioned above.
Bovine serum albumin (BSA)
Chirife & Karel ( 1974a) report retentions of 2-propanol in freeze dried BSA rehumidified to 20, 32, 52 and 75% relative humidity. The very low loss
278 0. 0. Omatete and C. J . King
at 20 and 32% relative humidities probably corresponds to a very low value of D , as for the other systems. From Fig. 5 of Chirife & Karel ( 1974a) it appears that the rate of loss slows considerably at longer times and that the interpreta- tion must be in terms of the increasing-l model with a substantial rate of increase in web thickness. The collapse observations in the present work do not bear this out, with there having been no visible signs of collapse after 53 hr at 52% and 93 hr at 75% relative humidity. However, the sample did become sticky at 75% relative humidity, suggesting some collapse. The collapse properties are probably highly sensitive to impurities and to the prior processing history of the albumin.
Other systems
Flink (1969) and Flink & Karel (1972) report very low loss of 2-propanol at 20% relative humidity and total loss, associated with recrystallization, at 6 1% relative humidity for freeze dried lactose. The recrystallization phenomenon was also observed in the present work. Presumably these results can be attributed to very low and very high values of D at 20 and 61% relative humidity, respectively.
Chirife & Karel (1973) report retentions of 2-propanol during rehumidifica- tion of freeze dried starch suspension at 11, 52 and 75% relative humidity. It would appear that D is very low at 1 1 and 52% relative humidity, and very large at 75% relative humidity. There was no evidence of retention levelling off a t an intermediate value.
Kayaert et al. (1975) report volatiles retentions in a freeze dried mixture of various gums during rehumidification at 11, 52 and 75% relative humidities. No collapse observations were made for this system in the present work, but from the results of Kayaert et al. it would appear that the system is highly prone to collapse during rehumidification, with the increasing-l model being needed for interpretation of the results at all three relative humidities.
Effect of heating
Chirife & Karel (1974b) measured loss of 1-propanol for freeze dried maltose held in a dry atmosphere at temperatures ranging up to 100°C for 74 hr. There was no observable volatiles loss at temperatures of 82°C and lower, but at 100°C substantial loss was observed. In the present work, collapse was observed for freeze dried maltose held at 140°C, but not for maltose at 100°C. Hence it is appropriate t o interpret the data of Chirife & Karel at 100°C in terms of the constant-D, constant4 model. Curve B in Fig. 2 shows the results of such a fit, with L2/D equal t o 94 hr. The fit to the two points is good.
For BSA, Chirife & Karel ( 1974a) found no appreciable volatiles loss during heating at temperatures up to 100°C in a dry atmosphere. No collapse was
Volatiles retention during rehumidification 279
observed for these conditions in the present work, and the low loss presumably reflects low values of D, even at 100°C.
Conclusions
Data reported previously for volatiles loss during rehumidification of freeze dried food models have been interpreted in terms of experiments monitoring structural collapse during the humidification process. The results are in agree- ment with a diffusion based analysis. At low relative humidities the diffusion coefficient is sufficiently low so that the group Dt/L2 never becomes large enough to allow substantial loss of volatiles. At very high relative humidities the increased moisture content makes the diffusion coefficient become so large that complete loss occurs relatively rapidly. At intermediate relative humidities, collapse of structure may or may not occur slowly as volatiles loss proceeds. If no collapse occurs, it is appropriate to interpret volatiles loss in terms of a constant-D, constant-L model; this was confirmed from data for Dextran-10 at 52% relative humidity at 25°C and from data for maltose in a dry atmosphere at 100°C. If collapse does occur, it is appropriate to interpret volatiles loss in terms of a model where the web thickness, L , within a sample increases with time. Results for Dextran-10 at 75% relative humidity, for maltose at 52% relative humidity, and for PVP at 61% relative humidity agree well with a quantitative model which allows L to increase linearly with in- creasing time.
It seems preferably to interpret volatiles loss in this fashion, without intro- ducing the concept of some fraction of the volatiles being totally immobilized, while the remaining fraction is available for loss.
Acknowledgments
0. 0. Omatete is grateful to the University of Lagos for a leave of absence and for financial support during the period of this study.
References
Bellows, R.J. & King, C.J. (1 973) AZChE Syrnp. Ser. 69, (1 32), 33. Bomben, J.L., Bruin, S., Thijssen, H.A.C. & Merson, R.L. (1973) In: Advances in Food
Research, Vol. 20, (Ed. by G.F. Stewart, E. Mrak and C.O. Chichester). Academic Press, New York.
Chirife,J.& Karel,M.(1973)J.Agr. Food Chern. 21,936. Chirife, J . & Karel, M. (1974a) Cryobiology, 11, 107. Chirife, J. & Karel, M. ( l974b)J . Fd Technol. 9, 13. Chirife, J., Karel, M. & Flink, J. (1973) J. Fd Sci. 38,671. Chandrasekaran, S.K. & King, C.J. (1972a)AZChEJ. 18,513. Chandrasekaran, S.K. & King, C.J. (1972b)AZChEJ. 18,520.
280
Crank, J. (1 975) The Mathematics of Diffusion, 2nd edn. Oxford University Press, Oxford. Flink, J. (1 969) Ph.D. thesis, Massachusetts Institute of Technology, Cambridge, Mass. Flink, J. (1974) Pres. a t Symp. on Flavor Chemistry of Processed Foods, Amer. Chem. SOC.
Flink, J. & Karel, M. (1970a)J. Agr. Fd Chem. 18,295. Flink, J. & Karel,M.(1970b)J. Fd Sci. 35,444. Flink, J. & Karel, M. (1972) J . Fd Technol. 7 , 199. Kayaert, G., Tobback, P., Maes, E:, Flink, J. & Karel, M. (1975) J. Fd Technol. 10, 11. Kerkhof, PJ.A.M. & Thijssen, H.A.C. (1974) J. Fd Technol. 9,415. King, C. J. (1 970) Recent developments in food dehydration technology. Proc. 3rd Intl.
Cong. o f F o o d Sci. & Technol, Washington, D.C. p. 565. King, C J . (1971) Freeze Drying of Foods. CRC Press, Chemical Rubber Co., Cleveland,
Ohio. Reprint of CRC Critical Reviews in Food Technology, 1, 379 (1970), with new Appendix.
King, C.J. (1972) ch. 6 , Freeze Drying. In: Food Dehydration, 2nd edn, Vol. 1 (Ed. by W.B. Van Arsdel, M.J. Copley and A.I. Morgan Jr). AVI Publ. Co., Westport, Conn.
King, C J . & Massaldi, H.A. (1976) Proc. 4th Intl. Cong. of Food Sci. & Technol. (IUFoST), Madrid, 4,183.
Labuza, T.P., Acott, K., Tatini, S.R., Lee, R.Y., Flink, J. & McCall, W. (1976) J. Fd Sci. 41,910.
MacKenzie, A.P. (1965) Ann. New York Acad. Sci. 125,522. Menting, L.C., Hoodstad, B. & Thijssen, H.A.C. (1970a) J. Fd Technol. 5, 11 1. Menting, L.C., Hoogstad, B. & Thijssen, H.A.C. ( 1 970b) J. Fd Technol. 5 , 127. Rulkens, W.H. & Thijssen, H.A.C. (1 972) J. Fd Technol. 7 , 9 5 . Thijssen, H.A.C. (1971) J. Appl. Chem. & Biotechnol. 21, 372. Thijssen, H.A.C. & Rulkens, W.H. ( 1 968) De lngenieur, 80, (47), 45. Thijssen, H.A.C. & Rulkens, W.H. (1969) In: Syrnp. on Thermodynamic Properties of
Treybal, R.E. (1968) Mass Transfer Operations, ch. 4. McGraw-Hill, New York. Tsourouflis, S., Flink, J. & Karel, M. (1 976) J. Sci. Fd Agn'c. 27,509. Wexler, A. & Hagesawa, S. ( 1 954) J. Res. Nut. Bur. Stds. 53, 19.
0. 0. Omatete and C. J. King
Mtg, Atlantic City, N.J.
Freeze-Drying. Intl. Inst. of Refrig., Lausanne, Switzerland.
(Received I 7 October 19 77)