vol. 41 (2) may 2018 - pertanika journal
TRANSCRIPT

Jou
rna
l of T
rop
ical A
gricu
ltura
l Scie
nce
Jou
rna
l of T
rop
ical A
gricu
ltura
l Scie
nce
Jo
urn
al o
f Tro
pica
l Ag
ricultu
ral S
cien
ce
Vol. 41 (2) May 2018
VOL. 41 (2) MAY 2018
Pertanika JTAS
Pertanika Editorial O�ce, Journal DivisionO�ce of the Deputy Vice Chancellor (R&I) 1st Floor, IDEA Tower II UPM-MTDC Technology CentreUniversiti Putra Malaysia43400 UPM SerdangSelangor Darul EhsanMalaysia
http://www.pertanika.upm.edu.my/E-mail: [email protected]: +603 8947 1622 / 1619
Pertanika Journal of Tropical Agricultural Science Vol. 40 (2) May 2017
Contents
ForewordNayan Deep S. Kanwal i
Review ArticlesUtilisation of Oil Palm Fronds as Ruminant Feed and Its Effect on Fatty Acid Metabolism
215
Ghani, A. A. A., Rusli, N. D., Shahudin, M. S., Goh Y. M., Zamri-Saad, M., Hafandi, A. and Hassim, H. A.
Formation and Utilisation of Acid Sulfate Soils in Southeast Asia for Sustainable Rice Cultivation
225
J. Shamshuddin, Q. A. Panhwar, F. J. Alia, M. A. R. S. Shazana, O. Radziah and C. I. Fauziah
Regular ArticlesEffects of Soaking Periods and Adhesive Concentrations on the Properties of Phenol Formaldehyde Resin Treated Oil Palm Wood
247
Khairunnisha, I. P. N., Bakar, E. S., Rachel, J. L., Halis, R. and Choo, A. C. Y.
Integrity Evaluation in Cryopreserved Bull Semen257
Baiee, F. H., Wahid, H., Rosnina, Y., Ariff, O. M., Yimer, N., Salman, H., Tarig, A. A. and Khumran, A. M.
Effects of Shading and Fertiliser on the Growth and Antioxidant Content of Olives (Olea europaea L.)
269
Arlinda Puspita Sari, Triadiati Triadiati and Diah Ratnadewi
Enhancing Solubility of Curcumin in Turmeric Oleoresin for Improving Productive Performance of Broiler Chickens
279
Porn-anek, P. and Promkot, C.
Translocation and Elimination of Cu in Avicennia marina 285Martuti, N. K. T., Widianarko, B. and Yulianto, B.
Utilisation of Local Crops as Alternative Media for Fungal Growth 295Wongjiratthiti, A. and Yottakot, S.
Jou
rna
l of T
rop
ica
l Ag
ricu
ltura
l Sci
en
ce
Jo
urn
al o
f Tro
pic
al A
gricu
ltura
l Sci
en
ce
Jou
rna
l of T
rop
ica
l Ag
ricu
ltura
l Sci
en
ce
Journal of Tropical Agricultural ScienceAbout the JournalOverviewPertanika Journal of Tropical Agricultural Science (JTAS) is the official journal of Universiti Putra Malaysia published by UPM Press. It is an open-access online scientific journal which is free of charge. It publishes the scientific outputs. It neither accepts nor commissions third party content.
Recognized internationally as the leading peer-reviewed interdisciplinary journal devoted to the publication of original papers, it serves as a forum for practical approaches to improving quality in issues pertaining to tropical agriculture and its related fields.
JTAS is a quarterly (February, May, August and November) periodical that considers for publication original articles as per its scope. The journal publishes in English and it is open to authors around the world regardless of the nationality.
The Journal is available world-wide.
Aims and scopePertanika Journal of Tropical Agricultural Science aims to provide a forum for high quality research related to tropical agricultural research. Areas relevant to the scope of the journal include: agricultural biotechnology, biochemistry, biology, ecology, fisheries, forestry, food sciences, genetics, microbiology, pathology and management, physiology, plant and animal sciences, production of plants and animals of economic importance, and veterinary medicine.
HistoryPertanika was founded in 1978. A decision was made in 1992 to streamline Pertanika into three journals as Journal of Tropical Agricultural Science, Journal of Science & Technology, and Journal of Social Sciences & Humanities to meet the need for specialised journals in areas of study aligned with the interdisciplinary strengths of the university.
After 37 years, as an interdisciplinary journal of Agriculture, the revamped Journal, a leading agricultural journal in Malaysia now focuses on tropical agricultural research and its related fields.
Goal of PertanikaOur goal is to bring the highest quality research to the widest possible audience.
Quality We aim for excellence, sustained by a responsible and professional approach to journal publishing. Submissions are guaranteed to receive a decision within 14 weeks. The elapsed time from submission to publication for the articles averages 5-6 months.
Abstracting and indexing of PertanikaPertanika is almost 40 years old; this accumulated knowledge has resulted in Pertanika JTAS being abstracted and indexed in SCOPUS (Elsevier), Thomson (ISI) Web of Knowledge [BIOSIS & CAB Abstracts], EBSCO & EBSCOhost, DOAJ, Agricola, Cabell’s Directories, Google Scholar, MyAIS, ISC & Rubriq (Journal Guide).
Future visionWe are continuously improving access to our journal archives, content, and research services. We have the drive to realise exciting new horizons that will benefit not only the academic community, but society itself.
Jou
rna
l of T
rop
ical A
gricu
ltura
l Scie
nce
Jou
rna
l of T
rop
ical A
gricu
ltura
l Scie
nce
Jo
urn
al o
f Tro
pica
l Ag
ricultu
ral S
cien
ce
Citing journal articlesThe abbreviation for Pertanika Journal of Tropical Agricultural Science is Pertanika J. Trop. Agric. Sci.
Publication policyPertanika policy prohibits an author from submitting the same manuscript for concurrent consideration by two or more publications. It prohibits as well publication of any manuscript that has already been published either in whole or substantial part elsewhere. It also does not permit publication of manuscript that has been published in full in Proceedings.
Code of EthicsThe Pertanika Journals and Universiti Putra Malaysia takes seriously the responsibility of all of its journal publications to reflect the highest in publication ethics. Thus all journals and journal editors are expected to abide by the Journal’s codes of ethics. Refer to Pertanika’s Code of Ethics for full details, or visit the Journal’s web link at http://www.pertanika.upm.edu.my/code_of_ethics.php
International Standard Serial Number (ISSN)An ISSN is an 8-digit code used to identify periodicals such as journals of all kinds and on all media–print and electronic. All Pertanika journals have ISSN as well as an e-ISSN.
Journal of Tropical Agricultural Science: ISSN 1511-3701 (Print); ISSN 2231-8542 (Online).
Lag time A decision on acceptance or rejection of a manuscript is reached in 3 to 4 months (average 14 weeks). The elapsed time from submission to publication for the articles averages 5-6 months.
AuthorshipAuthors are not permitted to add or remove any names from the authorship provided at the time of initial submission without the consent of the Journal’s Chief Executive Editor.
Manuscript preparationRefer to Pertanika’s Instructions to Authors at the back of this journal.
Most scientific papers are prepared according to a format called IMRAD. The term represents the first letters of the words Introduction, Materials and Methods, Results, And, Discussion. IMRAD is simply a more ‘defined’ version of the “IBC” [Introduction, Body, Conclusion] format used for all academic writing. IMRAD indicates a pattern or format rather than a complete list of headings or components of research papers; the missing parts of a paper are: Title, Authors, Keywords, Abstract, Conclusions, and References. Additionally, some papers include Acknowledgments and Appendices.
The Introduction explains the scope and objective of the study in the light of current knowledge on the subject; the Materials and Methods describes how the study was conducted; the Results section reports what was found in the study; and the Discussion section explains meaning and significance of the results and provides suggestions for future directions of research. The manuscript must be prepared according to the Journal’s Instructions to Authors.
Editorial processAuthors are notified with an acknowledgement containing a Manuscript ID on receipt of a manuscript, and upon the editorial decision regarding publication.
Pertanika follows a double-blind peer-review process. Manuscripts deemed suitable for publication are usually sent to reviewers. Authors are encouraged to suggest names of at least three potential reviewers at the time of submission of their manuscript to Pertanika, but the editors will make the final choice. The editors are not, however, bound by these suggestions.
Jou
rna
l of T
rop
ica
l Ag
ricu
ltura
l Sci
en
ce
Jo
urn
al o
f Tro
pic
al A
gricu
ltura
l Sci
en
ce
Jou
rna
l of T
rop
ica
l Ag
ricu
ltura
l Sci
en
ce
Notification of the editorial decision is usually provided within ten to fourteen weeks from the receipt of manuscript. Publication of solicited manuscripts is not guaranteed. In most cases, manuscripts are accepted conditionally, pending an author’s revision of the material.
As articles are double-blind reviewed, material that might identify authorship of the paper should be placed only on page 2 as described in the first-4 page format in Pertanika’s Instructions to Authors given at the back of this journal.
The Journal’s peer-reviewIn the peer-review process, three referees independently evaluate the scientific quality of the submitted manuscripts.
Peer reviewers are experts chosen by journal editors to provide written assessment of the strengths and weaknesses of written research, with the aim of improving the reporting of research and identifying the most appropriate and highest quality material for the journal.
Operating and review processWhat happens to a manuscript once it is submitted to Pertanika? Typically, there are seven steps to the editorial review process:
1. The Journal’s chief executive editor and the editorial board examine the paper to determine whether it is appropriate for the journal and should be reviewed. If not appropriate, the manuscript is rejected outright and the author is informed.
2. The chief executive editor sends the article-identifying information having been removed, to three reviewers. Typically, one of these is from the Journal’s editorial board. Others are specialists in the subject matter represented by the article. The chief executive editor asks them to complete the review in three weeks.
Comments to authors are about the appropriateness and adequacy of the theoretical or conceptual framework, literature review, method, results and discussion, and conclusions. Reviewers often include suggestions for strengthening of the manuscript. Comments to the editor are in the nature of the significance of the work and its potential contribution to the literature.
3. The chief executive editor, in consultation with the editor-in-chief, examines the reviews and decides whether to reject the manuscript, invite the author(s) to revise and resubmit the manuscript, or seek additional reviews. Final acceptance or rejection rests with the Edito-in-Chief, who reserves the right to refuse any material for publication. In rare instances, the manuscript is accepted with almost no revision. Almost without exception, reviewers’ comments (to the author) are forwarded to the author. If a revision is indicated, the editor provides guidelines for attending to the reviewers’ suggestions and perhaps additional advice about revising the manuscript.
4. The authors decide whether and how to address the reviewers’ comments and criticisms and the editor’s concerns. The authors return a revised version of the paper to the chief executive editor along with specific information describing how they have answered’ the concerns of the reviewers and the editor, usually in a tabular form. The author(s) may also submit a rebuttal if there is a need especially when the author disagrees with certain comments provided by reviewer(s).
5. The chief executive editor sends the revised paper out for re-review. Typically, at least one of the original reviewers will be asked to examine the article.
6. When the reviewers have completed their work, the chief executive editor in consultation with the editorial board and the editor-in-chief examine their comments and decide whether the paper is ready to be published, needs another round of revisions, or should be rejected.

Jou
rna
l of T
rop
ical A
gricu
ltura
l Scie
nce
Jou
rna
l of T
rop
ical A
gricu
ltura
l Scie
nce
Jo
urn
al o
f Tro
pica
l Ag
ricultu
ral S
cien
ce
7. If the decision is to accept, an acceptance letter is sent to all the author(s), the paper is sent to the Press. The article should appear in print in approximately three months.
The Publisher ensures that the paper adheres to the correct style (in-text citations, the reference list, and tables are typical areas of concern, clarity, and grammar). The authors are asked to respond to any minor queries by the Publisher. Following these corrections, page proofs are mailed to the corresponding authors for their final approval. At this point, only essential changes are accepted. Finally, the article appears in the pages of the Journal and is posted on-line.

Vol. 41 (2) May 2018
A scientific journal published by Universiti Putra Malaysia Press
TROPICAL AGRICULTURAL SCIENCE


JTASJournal of Tropical Agricultural Science
AN INTERNATIONAL PEER-REVIEWED JOURNAL
EDITOR-IN-CHIEFMohd. Zamri-Saad, MalaysiaVeterinary Pathology
CHIEF EXECUTIVE EDITORNayan Deep S. Kanwal Environmental Issues – Landscape Plant Modelling Applications
UNIVERSITY PUBLICATIONS COMMITTEEZulkifli Idrus, Chair
EDITORIAL STAFFJournal Officers:Chai Sook Keat, ScholarOne
Kanagamalar Silvarajoo, ScholarOne
Tee Syin-Ying, ScholarOne
Ummi Fairuz Hanapi, Publication Officer
Editorial Assistants:Florence Jiyom Rahimah Razali Zulinaardawati Kamarudin
COPY EDITORSCrescentia Morais Doreen Dillah Pooja Terasha Stanslas
PRODUCTION STAFFPre-press Officers:Kanagamalar Silvarajoo Nur Farrah Dila Ismail Wong Lih Jiun
Layout & Typeset:Lilian Loh Kian Lin Wong Wai Mann
WEBMASTERMohd Nazri Othman
PUBLICITY & PRESS RELEASEMagdalene Pokar (ResearchSEA) Florence Jiyom
EDITORIAL OFFICEJOURNAL DIVISION Office of the Deputy Vice Chancellor (R&I) 1st Floor, IDEA Tower II UPM-MTDC Technology Centre Universiti Putra Malaysia 43400 Serdang, Selangor Malaysia.Gen Enq.: +603 8947 1622 | 1616E-mail: [email protected]: www.journals-jd.upm.edu.my
PUBLISHERUPM PRESSUniversiti Putra Malaysia 43400 UPM, Serdang, Selangor, Malaysia.Tel: +603 8946 8855, 8946 8854 Fax: +603 8941 6172E-mail: [email protected] URL: http://penerbit.upm.edu.my
EDITORIAL BOARD2018-2020
Baharuddin SallehPlant pathologist / Mycologist, Universiti Sains Malaysia, Malaysia.
David Edward Bignell Soil biology and termite biology, University of London, UK.
Eric Standbridge Microbiology, Molecular genetics, Universiti of California, USA.
Ghizan Saleh Plant breeding and genetics, Universiti Putra Malaysia, Malaysia.
Idris Abd. Ghani Entomology Insect taxonomy and biodiversity, Integrated pest management, Biological control, Biopesticides, Universiti Kebangsaan Malaysia, Malaysia.
Jamilah BakarFood Science and Technology, Food Quality / Processing and Preservation, Universiti Putra Malaysia, Malaysia.
Alexander SalenikovichForestry, Wood and Forest Sciences, Université Laval, Canada.
Banpot NapompethEntomology, Kasetsart University, Thailand.
Denis J. WrightPest Management, Imperial College London, UK.
Graham MatthewsPest Management, Imperial College London, UK.
Kadambot H.M. Siddique, FTSECrop and environment physiology, Germplasm enhancement, The University of Western Australia, Australia.
Leng-Guan Saw Botany and Conservation, Plant Ecology, Forest Research Institute Malaysia (FRIM), Kepong, Malaysia.
Mohd. Azmi Ambak Fisheries, Universiti Malaysia Terengganu, Malaysia.
Nor Aini Ab-Shukor Tree improvement, Forestry genetics & biotechnology, Universiti Putra Malaysia, Malaysia.
Richard T. Corlett Biological Sciences, Terrestrial Ecology, Climate Change, Conservation Biology, Biogeography, National University of Singapore, Singapore.
Shamshuddin Jusop Soil science, Soil mineralogy, Universiti Putra Malaysia, Malaysia.
Son RaduFood safety, Risk assessment, Molecular biology, Universiti Putra Malaysia, Malaysia.
Srini KaveriVeterinary, Immunology, INSERM, Centre de Recherche Cordeliers, Paris, France.
Suman Kapur Biological Sciences, Agricultural and Animal Biotechnology, Birla Institute of Technology and Science BITS-Pilani, Hyderabad, India.
Wen-Siang Tan Molecular biology, Virology, Protein chemistry, Universiti Putra Malaysia, Malaysia.
Zora Singh Horticulture, Production technology and post-handling of fruit crops, Curtin University, Australia.
INTERNATIONAL ADVISORY BOARD2018-2021
Jane M. Hughes Genetics, Griffith University, Australia.
Malcolm Walkinshaw Biochemistry, University of Edinburgh, Scotland.
Manjit S. Kang Plant Breeding and Genetics, Louisiana State University Agric. Center, Baton Rouge, USA.
Peter B. Mather Ecology and Genetics, Queensland University of Technology, Australia.
Syed M. Ilyas Project Director, National Institute of Rural Development, Post Harvest Engineering and Technology, Indian Council of Agricultural Research, Hyderabad, India.
Tanveer N. Khan Plant Breeding and Genetics, The UWA Institute of Agriculture, The University of Western Australia, Australia.
ABSTRACTING AND INDEXING OF PERTANIKA JOURNALSPertanika is almost 40 years old; this accumulated knowledge has resulted in the journals being abstracted and indexed in SCOPUS (Elsevier), Clarivate Analytics [formerly known as Thomson (ISI)] Web of Science™ Core Collection- Emerging Sources Citation Index (ESCI). Web of Knowledge [BIOSIS & CAB Abstracts], EBSCO and EBSCOhost, DOAJ, ERA, Google Scholar, TIB, MyCite, Islamic World Science Citation Center (ISC), ASEAN Citation Index (ACI), Cabell’s Directories & Journal Guide.
The publisher of Pertanika will not be responsible for the statements made by the authors in any articles published in the journal. Under no circumstances will the publisher of this publication be liable for any loss or damage caused by your reliance on the advice, opinion or information obtained either explicitly or implied through the contents of this publication.All rights of reproduction are reserved in respect of all papers, articles, illustrations, etc., published in Pertanika. Pertanika provides free access to the full text of research articles for anyone, web-wide. It does not charge either its authors or author-institution for refereeing/publishing outgoing articles or user-institution for accessing incoming articles.No material published in Pertanika may be reproduced or stored on microfilm or in electronic, optical or magnetic form without the written authorization of the Publisher.
Copyright © 2018 Universiti Putra Malaysia Press. All Rights Reserved.

Pertanika Journal of Tropical Agricultural Science Vol. 41 (2) May 2018
Contents
ForewordNayan Deep S. Kanwal i
TributeTributes In Memory of the Life of Professor Emeritus Dr. CHIN Hoong-Fong
505
Chief Executive Editor, Pertanika Journals
Review ArticlesToxicity Effects of Fish Histopathology on Copper Accumulation 519
Siti Nadzirah Padrilah, Mohd Khalizan Sabullah, Mohd Yunus Abd Shukor, Nur Adeela Yasid, Nor Aripin Shamaan and Siti Aqlima Ahmad
Mammary Gland Tumours in the Dog, a Spontaneous Tumour Model of Comparative Value to Human Breast Cancer
541
Kabiru Sahabi, Sujey Kumar Rajendren, Jia Ning Foong and Gayathri Thevi Selvarajah
Changes in Rice Physiology and Soil Conditions during Low-Water-Input Rice Production System - A Short Review
575
Jahan, M. S.
A Mini Review on Phytochemical Constituents and Pharmacological Activities of Adenium obesum
591
Mohamed Shafiq, S., Ling, A. P. K., Lim, C. L., Chye, S. M. and Koh, R. Y.
Regular ArticlesGram-positive Bacteria with Commercial Potential from the Gastrointestines of Holothuria (Mertensiothuria) Leucospilota (Timun Laut) and Stichopus Horrens (Gamat) from Malaysian Waters
605
Kamarul Rahim Kamarudin and Maryam Mohamed Rehan
The Analysis of Arbutin in Mao (Antidesma thwaitesianum Muell. Arg.) Extracts
621
Thongjuta Suwanprasert
Rice Ratooning Using the Salibu System and the System of Rice Intensification Method Influenced by Physiological Traits
637
Pinta Omas Pasaribu, Triadiati and Iswandi Anas
Effect of Foliar Fertiliser on Banana 655Noor Asma’ Mohd Anuar Mushoddad, Nurul Syaza Abdul Latif and Suhaimi Othman@Osman
Effect of Conventional and Superheated Steam Roasting on the Total Phenolic Content, Total Flavonoid Content and DPPH Radical Scavenging Activities of Black Cumin Seeds
663
Liang, L. C., Zzaman, W., Yang, T. A. and Easa, A. M.
Effect of Antimicrobial Activities on the Various Solvents Extracts of Leaves of Scurrula Ferruginea (Jack) Danser (Loranthaceae)
677
Vanielie Terrence Justine, Muskhazli Mustafa and Rusea Go
Effect of Various Composting Methods on the Concentration and Viability of Ascaris suum Eggs in Organic Fertilisers
687
Arianne L. Andes and Vachel Gay V. Paller
Use of Bio-Chemical Surfactant Producing Endophytic Bacteria Isolated from Rice Root for Heavy Metal Bioremediation
699
Arun Karnwal
Plant Growth Promoting Rhizobacteria (PGPR) Application with Different Nitrogen Fertilizer Levels in Rice (Oryza sativa L.)
715
Hamid Ghaffari, Abdollatif Gholizadeh, Abbas Biabani, Alireza Fallah and Mohammad Mohammadian
Effects of Non-Medicated and Medicated Urea Molasses Multinutrient Blocks on Dry Matter Intake, Growth Performance, Body Condition Score and Feed Conversion Ratio of Saanen Lactating Does Fed Conventional Diets
729
Mira, P., Wan Zahari, M., Rusli, N. D. and Mat, K. 741
Deficit Irrigation for Improving the Postharvest Quality of Lowland Tomato Fruits
Mohammed, H. N., Mahmud, T. M. M. and Puteri Edaroyati, M. W. 759
Natural Products from Stem Bark of Calophyllum andersoniiKeng Hong Tee, Gwendoline Cheng Lian Ee, Ka Woong Wong, Thiruventhan Karunakaran, Vivien Yi Mian Jong and Soek Sin Teh
Influence of Maternal Dietary Energy and Protein on the Embryonic Development of FUNAAB – Alpha Chickens
769
B. Saleh, S. T. Mbap, D. J. U. Kalla and U. D. Doma
Investigative Baseline Reference on the Status of Pork pH, Shear Force, Colour, Drip and Cooking Loss in RYR1 Mutation Free, Commercial 3-way Crosses in Malaysia
777
Michelle-Fong, W. C., Ooi, P. T., Awis, Q. S. and Goh, Y. M.
Development and Validation of an Unsaturated Soil Water Flow Model for Oil Palm
787
Teh, C. B. S.
Anther Dehiscence, Pollen Viability and Stigma Receptivity Study on Cultivars of Black Pepper (Piper nigrum L.)
801
Chen, Y. S., Dayod, M. and Tawan, C. S.
Gene Action Mechanism for Drought Tolerance in Extra-Early Yellow Maize Inbreds
815
Shaibu, A. S.
Assessment of Soybean Resistance to Whitefly (Bemisia tabaci Genn.) Infestations
825
Kurnia Paramita Sari and Apri Sulistyo
Balance of Nitrogen in Plant-Soil System with the Presence of Compost+Charcoal
833
Erry Purnomo, Franky Sinaga, Indri P Amanda and Riverina DP Putra
Technology Assessment of Growing Superior Mungbean (Vigna radiata L.) Varieties on a Dryland in North Lombok
845
I Komang Damar Jaya, Sudirman, Aris Budianto, Abdurachman Hanafi and I Nyoman Soemeinaboedhy
Effect of Cytokinins on In Vitro Growth of Hypocotyl and Cotyledon of Tomato (Lycopersicon esculentum)
855
Wina Dian Savitri, Popy Hartatie Hardjo, Leonardo Tejo Gunawan Putra Hardianto and Steven Sutanto
Effect of Phytase Enzyme on Growth, Nutrient Digestibility and Survival Rate of Catfish (Pangasius hypothalamus) Fingerlings
865
Diana Rachmawati and Istiyanto Samidjan
Preserving Blue Swimming Crab (Portunus pelagicus): Its Conservation using Trap Modifications in Betahwalang, Demak
879
Herry Boesono, Dhian Meita Hapsari, Aristi Dian Purnama Fitri and Kukuh Eko Prihantoko
Growth Pattern of Barb (Barbodes balleroides) at the Period of Inundation in Jatigede Reservoir, Sumedang Regency, West Java
889
Titin Herawati, Atikah Nurhayati and Sona Yudha Diliana
Effect of Proteolytic Plant-Derived Enzyme on Gourami (Osphronemus goramy Lac.) Growth Rate
897
Yuli Andriani, Yeni Mulyani, Irfan Zidni, Muhammad Yusra Sadri and Putra Nur Wicaksono

Bioinsecticide Entomopathogenic Nematodes as Biological Control Agent for Sustainable Agriculture
907
Didik Sulistyanto, Ralf-Udo Ehlers and Bachtiar H.Simamora
Short CommunicationPrevalence of Avian Polyomavirus in Psittacine Birds in the Klang Valley 917
Z. Zanon, N. Najihah, J. Abu and A. R. Mariatulqabtiah
Foreword
Welcome to the Second Issue 2018 of the Journal of Tropical Agricultural Science (JTAS)!
JTAS is an open-access journal for studies in Tropical Agricultural Science published by Universiti Putra Malaysia Press. It is independently owned and managed by the university and run on a non-profit basis for the benefit of the world-wide science community.
This issue contains 31 articles, out of which four are review papers, one is a short communication and 26 are regular papers. The authors of these articles come from different countries, namely Malaysia, Thailand, the Philippines, Germany, Nigeria, Bangladesh, India, Iran and Indonesia.
The first review paper aims to briefly cover the toxicity effects of fish histopathology on copper accumulation (Siti Nadzirah Padrilah, Mohd Khalizan Sabullah, Mohd Yunus Abd Shukor, Nur Adeela Yasid, Nor Aripin Shamaan and Siti Aqlima Ahmad). The second review paper focusses on mammary gland tumours in dogs, as spontaneous tumour models of comparative value in treating human breast cancer (Kabiru Sahabi, Sujey Kumar Rajendren, Jia Ning Foong and Gayathri Thevi Selvarajah), while the third examines the changes in rice physiology and soil conditions in the low-water-input rice production system (Jahan, M. S.). The last review article in this issue reports on phytochemical constituents and pharmacological activities of Adenium obesum (Mohamed Shafiq, S., Ling, A. P. K., Lim, C. L., Chye, S. M. and Koh, R. Y.). Z. Zanon, N. Najihah, J. Abu and A. R. Mariatulqabtiah in their short communication discuss the prevalence of avian polyomavirus in psittacine birds in the Klang Valley.
The 26 regular papers cover a wide range of topics. In the first research paper, gram-positive bacteria with commercial potential from the gastrointestines of Holothuria (mertensiothuria) leucospilota (timun laut) and Stichopus horrens (gamat) from Malaysian waters are studied (Kamarul Rahim Kamarudin and Maryam Mohamed Rehan). The next paper discusses the analysis of arbutin in Mao (Antidesma thwaitesianum Muell. arg.) extracts (Thongjuta Suwanprasert). The other papers are studies on: rice ratooning using the salibu system and the rice intensification method influenced by physiological traits (Pinta Omas Pasaribu, Triadiati and Iswandi Anas); the effect of foliar fertiliser
on banana (Noor Asma’ Mohd Anuar Mushoddad, Nurul Syaza Abdul Latif and Suhaimi Othman@Osman); the effect of conventional and superheated steam roasting on the total phenolic content, total flavonoid content and DPPH radical scavenging activities of black cumin (Liang, L. C., Zzaman, W., Yang, T. A. and Easa, A. M.); the effect of antimicrobial activities on the various solvent extracts of leaves of Scurrula ferruginea (Jack) danser (loranthaceae) (Vanielie Terrence Justine, Muskhazli Mustafa and Rusea Go); the effect of various composting methods on the concentration and viability of Ascaris suum eggs in organic fertilisers (Arianne L. Andes and Vachel Gay V. Paller); the use of bio-chemical surfactant producing endophytic bacteria isolated from rice root for heavy metal bioremediation (Arun Karnwal); the effect of naphthalene acetic acid (NAA) on oil content and quality of the mustard plant (Hamid Ghaffari, Abdollatif Gholizadeh, Abbas Biabani, Alireza Fallah and Mohammad Mohammadian); the effects of non-medicated and medicated urea molasses multi-nutrient blocks on dry matter intake, growth performance, body condition score and feed conversion ratio of Saanen lactating in conventional diets (Mira, P., Wan Zahari, M., Rusli, N. D. and Mat, K.); deficit irrigation for improving the postharvest quality of lowland tomato fruits (Mohammed, H. N., Mahmud, T. M. M. and Puteri Edaroyati, M. W.); natural products from stem bark of Calophyllum andersonii (Keng Hong Tee, Gwendoline Cheng Lian Ee, Ka Woong Wong, Thiruventhan Karunakaran, Vivien Yi Mian Jong and Soek Sin Teh); influence of maternal dietary energy and protein on the embryonic development of FUNAAB-Alpha chickens (B. Saleh, S. T. Mbap, D. J. U. Kalla and U. D. Doma); investigative baseline reference on the status of pork pH, shear force, colour, drip and cooking loss in RYR1 mutation free, commercial three-way crosses in Malaysia (Michelle-Fong, W. C., Ooi, P. T., Awis, Q. S. and Goh, Y. M.); development and validation of an unsaturated soil water flow model for oil palm (Teh, C. B. S.); anther dehiscence, pollen viability and stigma receptivity on cultivars of black pepper (Piper nigrum L.) (Chen, Y. S., Dayod, M. and Tawan, C. S.); gene action mechanism for drought tolerance in extra-early yellow maize inbreds (Shaibu, A. S.); assessment of soybean resistance to whitefly (Bemisia tabaci Genn.) infestation (Kurnia Paramita Sari and Apri Sulistyo); balance of nitrogen in plant-soil system with the presence of compost + charcoal (Erry Purnomo, Franky Sinaga, Indri P Amanda and Riverina DP Putra); technology assessment of growing superior mungbean (Vigna radiata L.) varieties on a dryland in north Lombok (I Komang Damar Jaya, Sudirman, Aris Budianto, Abdurachman Hanafi and I Nyoman Soemeinaboedhy); the effect of cytokinins on i- vitro growth of hypocotyls and cotyledon of tomato (Lycopersicon esculentum) (Wina Dian Savitri, Popy Hartatie Hardjo, Leonardo Tejo Gunawan Putra Hardianto

and Steven Sutanto); the effect of phytase enzyme on growth, nutrient digestibility and survival rate of catfish (Pangasius hypothalamus) fingerlings (Diana Rachmawati and Istiyanto Samidjan); preserving blue swimming crab (Portunus pelagicus) using trap modifications in Betahwalang, Demak (Herry Boesono, Dhian Meita Hapsari, Aristi Dian Purnama Fitri and Kukuh Eko Prihantoko); the growth pattern of barb (Barbodes balleroides) at the period of inundation in Jatigede Reservoir, Sumedang Regency, West Java (Titin Herawati, Atikah Nurhayati and Sona Yudha Diliana); the effect of proteolytic plant-derived enzyme on gourami (Osphronemus goramy Lac.) growth rate (Yuli Andriani, Yeni Mulyani, Irfan Zidn, Muhammad Yusra Sadri and Putra Nur Wicaksono); and bioinsecticide entomopathogenic nematodes as biological control agents for sustainable agriculture (Didik Sulistyanto, Ralf-Udo Ehlers and Bachtiar H.Simamora).
I anticipate that you will find the evidence presented in this issue to be intriguing, thought-provoking and useful in reaching new milestones in your own research. Please recommend the journal to your colleagues and students to make this endeavour meaningful.
All the papers published in this edition underwent Pertanika’s stringent peer-review process involving a minimum of two reviewers comprising internal as well as external referees. This was to ensure that the quality of the papers justified the high ranking of the journal, which is renowned as a heavily-cited journal not only by authors and researchers in Malaysia but by those in other countries around the world as well.
I would also like to express my gratitude to all the contributors, namely the authors, reviewers and editors, who have made this issue possible. Last but not least, the editorial assistance of the journal division staff is fully appreciated.
JTAS is currently accepting manuscripts for upcoming issues based on original qualitative or quantitative research that opens new areas of inquiry and investigation.
Chief Executive EditorNayan Deep S. KANWAL, FRSA, ABIM, AMIS, [email protected]


Journal of Tropical Agricultural Sciences Journal of Tropical Agricultural Sciences Journal of Tropical Agricultural Sciences
ISSN: 1511-3701 © Universiti Putra Malaysia Press
In Memoriam
Life is like making tea. Boil your ego. Evaporate your worries. Dilute your sorrows.
Filter your mistakes, and get a taste of happiness.Professor Emeritus Dr. CHIN Hoong-Fong
TributesIn Memory of the Life of
Professor Emeritus Dr. CHIN Hoong-Fong
To Professor Emeritus Dr. Chin Hoong-Fong, a teacher, scientist and writer with a
life-long love for seeds, we pay tribute in this article. Professor Emeritus Dr. Chin passed
away peacefully on 18 March, 2018. He was 83 years old. A funeral service was held
for him on Friday morning, 23 March, 2018 at the Church of St. Francis Xavier, Petaling
Jaya. Prof. Chin is survived by his sons, Colin, Simon and Vincent, grandchildren, Patrick,
Shireen, Karen, Lucas and Sebastian, sister, Mrs Saw and brother, Chin Kim Thong.
Jour
nal o
f Tro
pica
l Agr
icul
tura
l Sci
ence
s
Jo
urna
l of T
ropi
cal A
gric
ultu
ral S
cien
ces
Jour
nal o
f Tro
pica
l Agr
icul
tura
l Sci
ence
sTributes In Memory of the Life of Prof. Emeritus Dr. CHIN Hoong-Fong
Pertanika J. Trop. Agric. Sci. 41 (2): 505 – 518 (2018)506
The authors of
these tributes are
greatly honoured
by this task and are
privileged to be
assigned the duty
of collating precious
memories of the life
of this renowned
seed scientist who
pioneered the storage
of recalcitrant seed
in the 1970s. A true
icon of Universiti Putra
Malaysia (UPM), Chin
Hoong-Fong was a
great teacher who
taught and trained
over 10,000 graduates
in agriculture over 58
years of dedicated
teaching in UPM, his
only place of work for
the entire span of his
working life. He spent his lifetime promoting agriculture and seed science, sharing his vast
knowledge in over 100 research papers and 13 books. He was also an avid photographer,
artist and poet.
SEEDS OF FRIENDSHIPSeeds of friendship worth more than gold
Sown in the hearts of young and old
Appreciated and properly stored they survive
In fertile or even poor soil they thrive
The world over these seeds we sow
Over land and sea they may go
With phone and email we will not be apart
Such true friendship remains in our hearts
Strong bonds of friendships will withstand stress
Though trials and endurance put us to test
But the fruits of joy and sorrow we nurture and share
Bring happiness and satisfaction beyond compare
Through good and lean years, friends by our side will stand
Active, able and strong, a helping hand they will lend
In twilight years, fragile and senile, we cannot fend
Only true friends remain till the end
H.F. Chin
Journal of Tropical Agricultural Sciences Journal of Tropical Agricultural Sciences Journal of Tropical Agricultural SciencesPertanika Journal of Tropical Agricultural Science
Pertanika J. Trop. Agric. Sci. 41 (2): 505 – 518 (2018) 507
The Early Years
Chin Hoong-Fong was born in Kuala Lumpur in 1935 and grew up on a two-acre
plot of land along Jalan Ampang in Kuala Lumpur, Malaysia. That land is shorter than a
five-minute drive from the Petronas Twin Towers today. He started his schooling at the
late age of 11 at the Methodist Boys School after World War II. At school, he joined the
Science Society, and what he learnt there planted in him an early interest in agriculture.
In 1955, after completing Form Five, he embarked on an arduous two-week journey to
Australia. It began with a train ride to Singapore, then a cargo-boat ride to Freemantle
and finally, a transcontinental train ride to Melbourne. He did his matriculation at
the University High School in Melbourne and then took up agricultural science in the
University of Melbourne, graduating with a Bachelor of Agricultural Science in 1960. In
the following year he started work as a lecturer at the College of Agriculture Serdang,
known today as Universiti Putra Malaysia.
Teacher and Writer
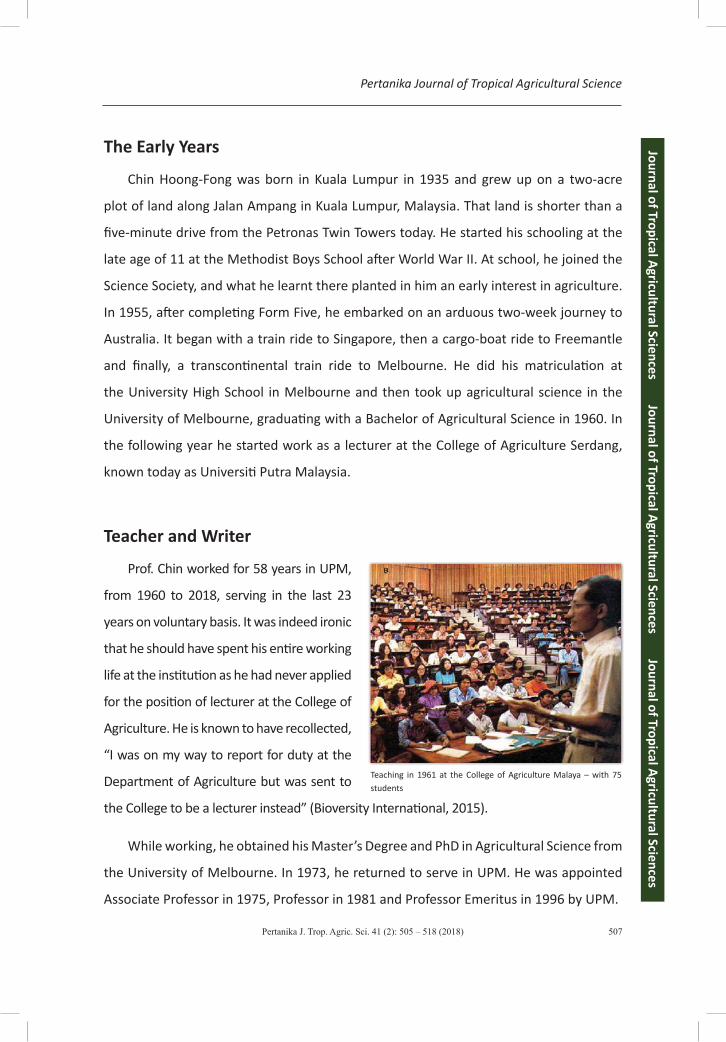
Prof. Chin worked for 58 years in UPM,
from 1960 to 2018, serving in the last 23
years on voluntary basis. It was indeed ironic
that he should have spent his entire working
life at the institution as he had never applied
for the position of lecturer at the College of
Agriculture. He is known to have recollected,
“I was on my way to report for duty at the
Department of Agriculture but was sent to
the College to be a lecturer instead” (Bioversity International, 2015).
While working, he obtained his Master’s Degree and PhD in Agricultural Science from
the University of Melbourne. In 1973, he returned to serve in UPM. He was appointed
Associate Professor in 1975, Professor in 1981 and Professor Emeritus in 1996 by UPM.
Teaching in 1961 at the College of Agriculture Malaya – with 75 students
Jour
nal o
f Tro
pica
l Agr
icul
tura
l Sci
ence
s
Jo
urna
l of T
ropi
cal A
gric
ultu
ral S
cien
ces
Jour
nal o
f Tro
pica
l Agr
icul
tura
l Sci
ence
sTributes In Memory of the Life of Prof. Emeritus Dr. CHIN Hoong-Fong
Pertanika J. Trop. Agric. Sci. 41 (2): 505 – 518 (2018)508
In recognition of his contributions to the University of Melbourne and international
agriculture, Prof. Chin was awarded the Honorary Degree of Doctor of Agricultural
Science by University of Melbourne in 1994. It is indeed a rarity for anyone to obtain
four degrees in the same discipline from the same university as Prof. Chin did. Indeed, at
the award ceremony in Melbourne, Prof. Chin declared it was the proudest moment and
happiest day of his life.
Prof. Chin was also known to be a prolific writer. He wrote or edited 13 books related
to seed conservation, horticulture and general agriculture. Among the more significant
of these are Agricultural and Horticultural Seeds in Malaysia (1969), Seed Technology
in the Tropics (1977) and Recalcitrant Seeds (1980). He also wrote books of general
interest such as The Hibiscus: Queen of Tropical Flowers (1986), Malaysian Flowers in
Colour (1977), Malayan Fruits in Colour (1980), Malaysian Trees in Colour (1992) and
Malaysian Vegetables in Colour (1999). He was also an avid gardener and photographer,
and he combined his love for nature and his creativity in poems he wrote in his free time
that were inspired by his passion for plants and belief in people. In 1986, he helped to
produce three series of stamps on Malaysian flowers, fruits and agricultural crops.
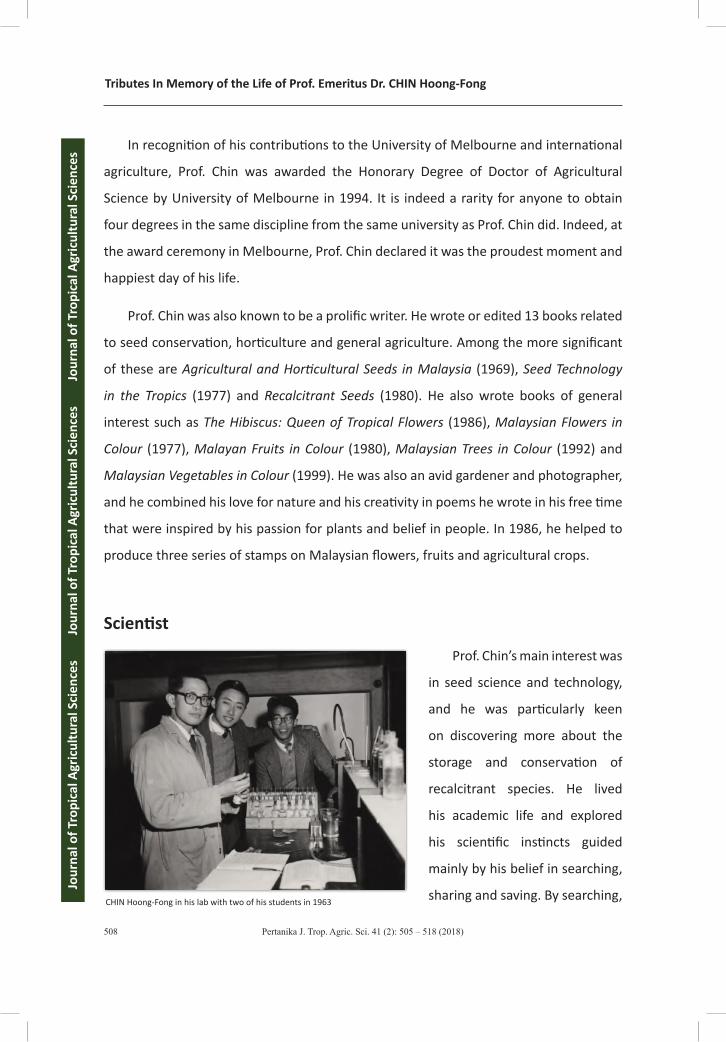
Scientist
Prof. Chin’s main interest was
in seed science and technology,
and he was particularly keen
on discovering more about the
storage and conservation of
recalcitrant species. He lived
his academic life and explored
his scientific instincts guided
mainly by his belief in searching,
sharing and saving. By searching, CHIN Hoong-Fong in his lab with two of his students in 1963
Journal of Tropical Agricultural Sciences Journal of Tropical Agricultural Sciences Journal of Tropical Agricultural SciencesPertanika Journal of Tropical Agricultural Science
Pertanika J. Trop. Agric. Sci. 41 (2): 505 – 518 (2018) 509
he meant the quest for knowledge, which he acknowledged was a life-long process.
Sharing, he believed, was akin to the act of sowing seeds of knowledge and dispersing
and disseminating those seeds by imparting knowledge and skills to others. Finally, when
he spoke of saving, he was referring to the conservation of plant genetic resources via
seed storage. Prof. Chin’s adherence to these principles are reflected in his numerous
publications and in his work, which was devoted to developing various methods of seed
storage and the cryopreservation of plant genetic resources.
His life’s work
received national and
international recognition
from various national and
international bodies, and
he was appointed to many
important committees
based on his contribution
to agricultural science. For
instance, he was Chairman
of the Technical Committee
on Planting Materials of SIRIM and Chairman of the Technical Committee on Seed
Storage of the International Seed Testing Association (ISTA) for nine years. He contributed
extensively to Bioversity International. Bioversity International is a global research-for-
development organization that delivers scientific evidence, management practices and
policy options to use and safeguard agricultural biodiversity to attain sustainable global
food and nutrition security. Bioversity International and Universiti Putra Malaysia have a
long and successful history. In 2001, UPM became the first public education institution
in Malaysia to partner with Bioversity to publish a field genebank management guide
that is still the go-to document for field genebank managers worldwide. His history with
Bioversity International dates back to the 1980s, when he served two terms as member
of the Board of Trustees of the organisation, then called the International Board on
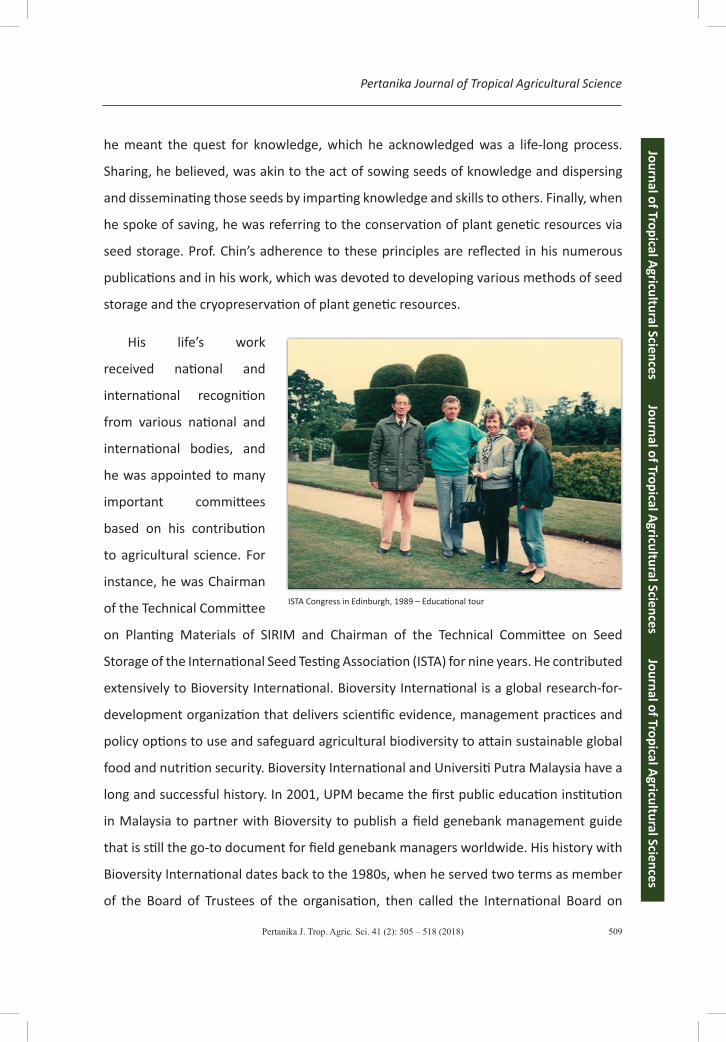
ISTA Congress in Edinburgh, 1989 – Educational tour
Jour
nal o
f Tro
pica
l Agr
icul
tura
l Sci
ence
s
Jo
urna
l of T
ropi
cal A
gric
ultu
ral S
cien
ces
Jour
nal o
f Tro
pica
l Agr
icul
tura
l Sci
ence
sTributes In Memory of the Life of Prof. Emeritus Dr. CHIN Hoong-Fong
Pertanika J. Trop. Agric. Sci. 41 (2): 505 – 518 (2018)510
Plant Genetic Resources (IBPGR). More recently, he sat on the committee of Svalbard
International Seed Bank, a bank established in an attempt to ensure against the loss of
seeds in other genebanks during large-scale regional or global crises.
The scientific community in Malaysia will also remember him for the National
Seed Symposium, which he chaired and organised. He first initiated the National Seed
Symposium in 1976 i.e. 42 years ago, when the seeds for the establishment of a National
Seed Association were sown. His dream became a reality in 2008 when the National Seed
Association of Malaysia (NSAM) was born. Till then, he had chaired and organised five
symposia, which are now a biannual event. NSAM, founded by Prof. Chin, today plays a
very important role in Malaysian agriculture by providing input on seeds and planting
material. Prof. Chin represented NSAM in the National Seed Council, a committee within
the Ministry of Agriculture and Agro-Based Industry.
Honours and Awards
Prof. Chin was Professor Emeritus at the Department of Crop Science, Faculty of
Agriculture, UPM from 1996. He was also an Honorary Research Fellow of Bioversity
International from 1997. For his long service and contribution he received the
Johan Setia Mahkota (JSM) from the Yang Dipertuan Agong in 1990. In 1994, he was
conferred the honorary degree of Doctor of Agricultural Science by the University of
Melbourne, his alma mater, and was appointed Foundation Fellow of the Academy of
Science Malaysia in 1995 by the Ministry of Science, Technology and Environment. For
his contribution to seed science and technology he was presented a special award by
the Asian Pacific Seed Association (APSA) by the then former Minister of Agriculture,
YB Tan Sri Muhyiddin Yassin, at the Asian Seed Congress 2006. More recently, in the
year 2015, the Incorporated Society of Planters (ISP) awarded him the Fellowship of
the ISP (FISP), an award given in recognition of outstanding meritorious service to the
plantation industy.

Journal of Tropical Agricultural Sciences Journal of Tropical Agricultural Sciences Journal of Tropical Agricultural SciencesPertanika Journal of Tropical Agricultural Science
Pertanika J. Trop. Agric. Sci. 41 (2): 505 – 518 (2018) 511
He was also
appointed one of
50 ASM Foundation
Fellows in 1995
by the Ministry of
Science, Technology
and Environmental
Sciences under the
Biological, Agricultural
and Environmental
Sciences. The appointment was made in view of his outstanding achievements and
contribution to the nation through his research especially into seed science and
technology and through his teaching. His involvement in ASM was seen in his participation
in the ASM Bioversity Committee (2001-2002) and the ASM Publication Committee
(2001-2002).
Personal Reflections O.M. LaiDepartment of Bioprocess Technology, Faculty of Biotechnology & Biomolecular Sciences, Universiti Putra Malaysia
I had the privilege of knowing Prof. Chin as a young PhD student in the early 1990s. He
was a gentleman of small stature, frail built and soft spoken. Over the past two decades,
we formed a strong bond through our shared love for writing and food. He was always
my number one fan and critic when it came to perfecting the art of baking and cooking
our local Malaysian delicacies, which he loved. To many, he was a prominent writer and
renowned seed scientist with a long, illustrious career. To me, he was a simple man
who loved the simple things of life such as gardening, photography and listening to the
old sentimental songs of yesteryears and who served UPM and Malaysia unselfishly.
CHIN Hoong-Fong with former Prime Minister of Malaysia, Tun Dr. Mahathir Mohamad in 1991
Jour
nal o
f Tro
pica
l Agr
icul
tura
l Sci
ence
s
Jo
urna
l of T
ropi
cal A
gric
ultu
ral S
cien
ces
Jour
nal o
f Tro
pica
l Agr
icul
tura
l Sci
ence
sTributes In Memory of the Life of Prof. Emeritus Dr. CHIN Hoong-Fong
Pertanika J. Trop. Agric. Sci. 41 (2): 505 – 518 (2018)512
Isaac Newton, in his letter to Robert Hooke in 1676 wrote, “If I have seen a little further
than others, it is by standing upon the shoulders of giants.” Prof. Emeritus Chin Hoong-
Fong may not be your idea of a giant but he made ‘giant’ contributions to the field of
agriculture and in particular, seed science. It is now for us and for future generations to
stand upon the shoulders of this gentle ‘giant’, valuing and celebrating his life’s work, to
push even further the boundary of tropical agriculture. I will miss him.
U.R. SinniahDepartment of Crop Science, Faculty of Agriculture, Universiti Putra Malaysia
It is with great sadness that I write this reflection on my beloved teacher, mentor and
godfather. I have known Prof. Chin Hoong-Fong since 1988 as a young student at the
Faculty of Agriculture. Since then, particularly 1998 onwards, we worked together on
various occasions due to our common interest in seeds. I am lucky to have had someone
take me under his wing upon my return from the UK with a Doctorate in Seed Science
and Technology. Early days in career development can be tough, but I was well guided
by Prof. Chin. Our major event together was the 3rd National Seed Symposium in 2003,
where through the orgnising of this symposium I learnt that hard work is the only way to
success. Subsequently, together we organised a total of nine symposia and established
the National Seed Association Malaysia in 2008, of which I am the current President.
He was a very simple man who contributed skill and knowledge selflessly. I am and will
always be impressed by his ability to attract people. He had many friends and I guess
his positive attitude towards life and his outgoing personality made him a memorable
persona. My lunch dates with him will be the most missed appointments as it was
almost a monthly event when we had vegetarian briyani and shared a cup of masala tea
together. On each occasion, he never failed to bring with him an album to update me
on this activities, one of which was his hobby, photography. The scientific community
has lost a great man who displayed absolute passion for seeds and agriculture, but his
inspirational pursuit of excellence will always be remembered and emulated by the many
students he produced.
Journal of Tropical Agricultural Sciences Journal of Tropical Agricultural Sciences Journal of Tropical Agricultural SciencesPertanika Journal of Tropical Agricultural Science
Pertanika J. Trop. Agric. Sci. 41 (2): 505 – 518 (2018) 513
Pertanika Community
With great sadness the death of Professor Emeritus Dr. Chin Hoong-Fong was announced
on 18 March, 2018. The news of his passing has been hard to take for those of us
who knew him for a long time — nearly 25 years: since the late 1990s. The Pertanika
community are greatly saddened by this news. Prof. Chin Hoong-Fong was one of the
founding Editors-in-Chief of Pertanika. For us, as a journal’s editor, we could not have
had a better role model than Professor Chin.
He was instrumental in the initial establishment of Pertanika, and the journal is
indebted to him for its success today as a prestigious journal. Prof. Chin served as Editor-
in-Chief of Pertanika from 1983-1996. Indeed, the seeds he sowed in almost 13 years
at the helm have borne good fruit, seen in the strong reputation that the journal now
enjoys under the dynamic leadership of current Chief Executive Editor, Dr. Nayan Kanwal.
Prof. Chin worked tirelessly to build up Pertanika while serving at the same time as a
researcher and lecturer at UPM. He was probably the most observant person we have
ever known. He noticed everything.
The passing of Prof. Chin is an incalculable loss to the seed conservation, to the lay
public and to his many admirers and friends. We extend our heartfelt condolences to his
family, friends and colleagues. We will continue to mourn him for a long time.
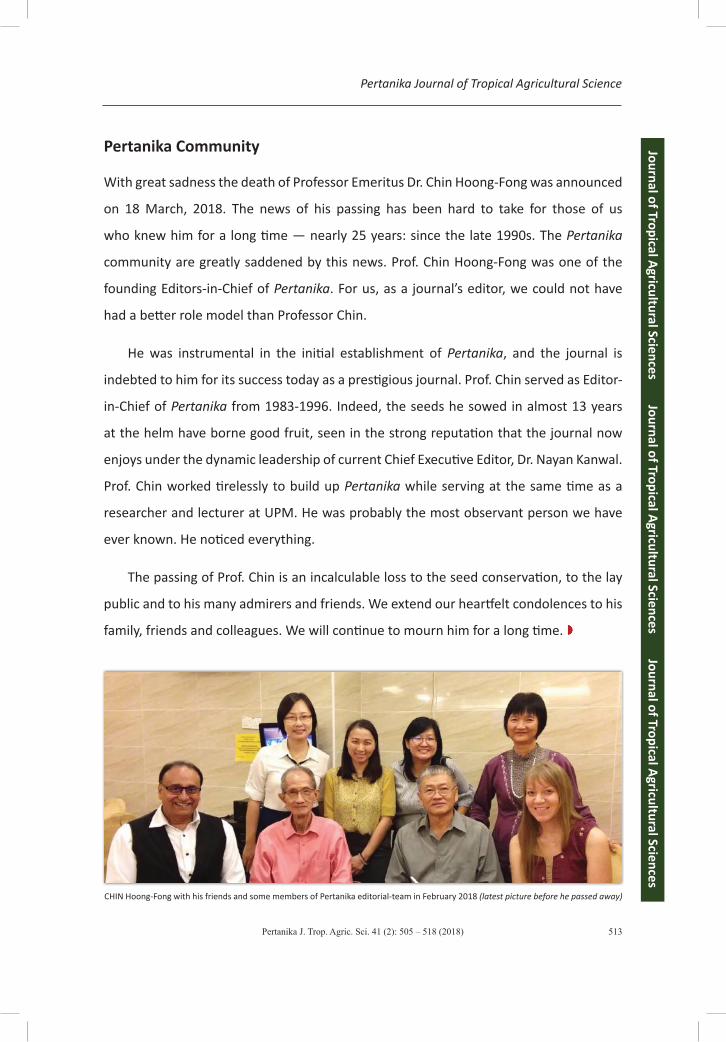
CHIN Hoong-Fong with his friends and some members of Pertanika editorial-team in February 2018 (latest picture before he passed away)

Jour
nal o
f Tro
pica
l Agr
icul
tura
l Sci
ence
s
Jo
urna
l of T
ropi
cal A
gric
ultu
ral S
cien
ces
Jour
nal o
f Tro
pica
l Agr
icul
tura
l Sci
ence
sTributes In Memory of the Life of Prof. Emeritus Dr. CHIN Hoong-Fong
Pertanika J. Trop. Agric. Sci. 41 (2): 505 – 518 (2018)514
Nayan Deep S. KANWAL, FRSA, ABIM, AMIS, Ph.D.Chief Executive Editor, Pertanika
The news of Professor Chin’s demise was hard to believe and for days I still hoped that it
was a mistake. The last time I received a message from him (about a week or two before
he left us), he sounded upbeat and said he was in a hospital receiving treatment.
I first met Professor Chin in September, 1996, when I joined Universiti Putra Malaysia.
In 2006, our former Deputy Vice Chancellor, Professor Abu Bakar Salleh, announced
a publication drive for the University, giving me a challenge to reshape the Pertanika
journal. I found myself named as the Executive Editor for the three journals and often
consulting Professor Chin as one of the founding Editors-in-Chief who lead Pertanika
with great commitment. I myself learned a lot in the process, not only on the technical
skills of managing a journal, but also on being both firm and kind with authors. What has
impressed me the most is the persuasive strength of his academic discourse.
Prof. Chin was extremely well-read, an incorrigible raconteur, an excellent scientist
and a loyal friend. He enjoyed his work thoroughly, and found the dynamic environment
of the university and the ethnic diversity of its staff and students delightful and refreshing.
Hoong-Fong leaves behind a lasting legacy. He was down to earth and did not stand by
ceremony, thus he did not demand any of the privileges that are sometimes associated
with people of his distinction. This made him very approachable, and someone in whose
presence one could be very comfortable.
That is what I know of him. His style was not to celebrate the status of his professorial
knowledge but rather to share this knowledge and also to acknowledge his indebtedness
to the academic community – his colleagues, his collaborators, and the diverse range of
intellectuals who in one way or the other shaped his thinking and the direction of his
academic work.
The objective of this Tribute is not only to honour a gentleman (CHIN Hoong-Fong)
who gave a great deal to the scientific community in his region, but also to honour him
for giving much to the Pertanika journals.
It was a great privilege having known and worked with him. He will be sorely missed.

Journal of Tropical Agricultural Sciences Journal of Tropical Agricultural Sciences Journal of Tropical Agricultural SciencesPertanika Journal of Tropical Agricultural Science
Pertanika J. Trop. Agric. Sci. 41 (2): 505 – 518 (2018) 515
Alvin Kah-Wei HeeDepartment of Biology, Faculty of Science, Universiti Putra Malaysia
I met Professor Emeritus Dr. Chin Hoong-
Fong soon after I joined UPM in 2008.
We often met for lunch and I never failed
to join him at the Serdang Chinese New
Year reunion dinner that he meticulously
organised.
He was a good friend, colleague and
mentor to me. He truly lived a meaningful
life and impacted our lives in many ways.
Family and friends were dearest to him and
work was his passion. Today, we, Alvin, Suk-Ling, Shawn and Ryan Hee, have adopted a
PET like the one he used to have – Patience, Endurance and Tolerance. We will sorely
miss his wit and humour. Forever cherished and always in our hearts will you be, Prof.
Chin!
Riina JalonenHead, Malaysia Office, Bioversity International
The legacy of a life-long love for seeds
Searching, sharing and saving are the keys in my life. Searching to me stands for the
quest for knowledge which is a life-long process… Sharing is to sow seeds of knowledge,
dispersing and disseminating by imparting knowledge and skills to others. As I strongly
believe sharing one’s knowledge is a way of achieving immortality… Saving refers to the
conservation of plant genetic resources via seed storage… I have a vision and dreams
of miracle seeds to feed the world’s future generations. – Professor Emeritus Dr. Chin
Hoong-Fong.
CHIN Hoong-Fong’s last birthday cake on 21 February 2018
Jour
nal o
f Tro
pica
l Agr
icul
tura
l Sci
ence
s
Jo
urna
l of T
ropi
cal A
gric
ultu
ral S
cien
ces
Jour
nal o
f Tro
pica
l Agr
icul
tura
l Sci
ence
sTributes In Memory of the Life of Prof. Emeritus Dr. CHIN Hoong-Fong
Pertanika J. Trop. Agric. Sci. 41 (2): 505 – 518 (2018)516
One can’t find better words for describing the life and contributions of the iconic seed
scientist, Professor Emeritus Dr. Chin Hoong-Fong (1935-2018) than those of the man
himself. They resonate with the passion and keenness of a world-renowned researcher,
teacher, observer of life, writer and poet – someone, above all, who had exceptionally
strong values and a vision for a better world and who devoted his life to finding ways to
spread those values and make those dreams reality.
Prof. Chin served Bioversity International for almost 30 years as a Member of the
Board of Trustees (1987-1992) and as Honorary Fellow and Honorary Research Fellow
(1997-2018). These positions of trust were an acknowledgement of his significant
contribution to seed science and technology and, thereby, to global food security.
One of Prof. Chin’s dreams came true in 2008 with the establishment of the Svalbard
Global Seed Vault in the Technical Committee of which he also served. The Vault
celebrated its 10th anniversary in February 2018; today, it conserves more than 890,000
samples of seeds from almost every country in the world.
Another dream of Prof. Chin’s that lives on and is now dreamt by thousands of
other researchers around the world is that of a cryo-collection of crops, similar to the
Svalbard Vault, but for the thousands of crop species whose seeds cannot be stored in
a freezer. Seeds of many tropical crops and fruits such as coffee, coconut and mango
do not tolerate drying and quickly lose their viability. Prof Chin pioneered in Malaysia,
a method known as cryopreservation for conserving the invaluable genetic resources
of such crops. This method allows storing of plant embryos or other tissue in ultra-cold
temperatures in liquid nitrogen for almost indefinite periods so that they can be regrown
into full plants when needed.
Thanks to Prof. Chin’s knowledge and the wisdom that motivated him to
share that knowledge with others, his legacy lives on for the benefit of current and
future generations, just as he envisioned. His work is fulfilled; may his soul rest in
peace.
Journal of Tropical Agricultural Sciences Journal of Tropical Agricultural Sciences Journal of Tropical Agricultural SciencesPertanika Journal of Tropical Agricultural Science
Pertanika J. Trop. Agric. Sci. 41 (2): 505 – 518 (2018) 517
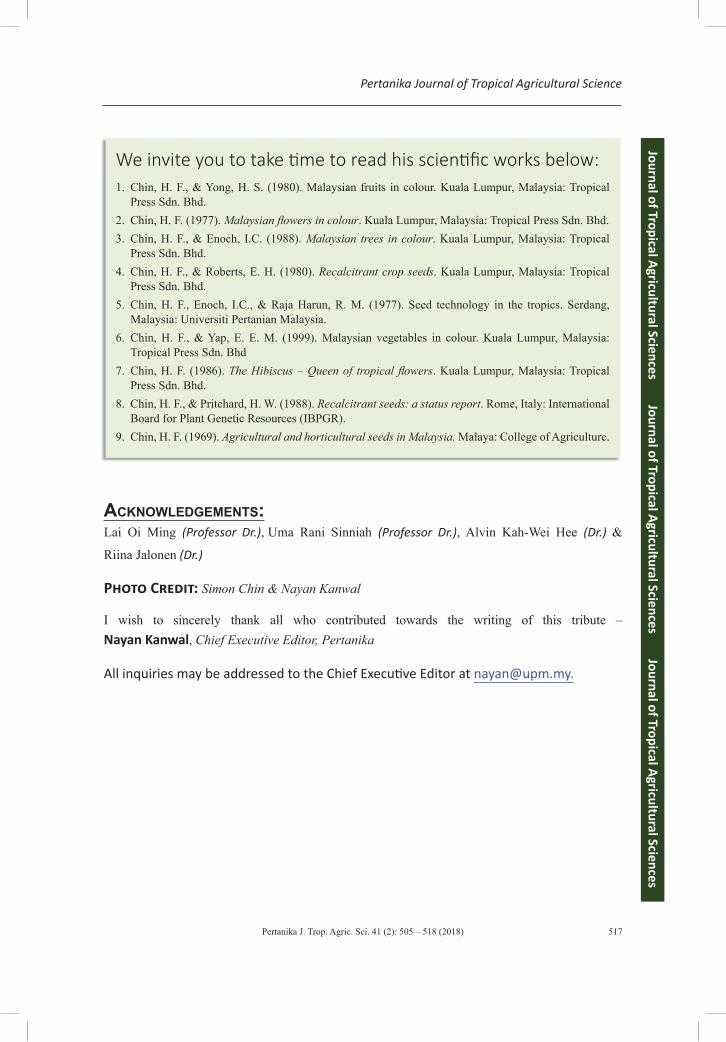
We invite you to take time to read his scientific works below:1. Chin, H. F., & Yong, H. S. (1980). Malaysian fruits in colour. Kuala Lumpur, Malaysia: Tropical
Press Sdn. Bhd.2. Chin, H. F. (1977). Malaysian flowers in colour. Kuala Lumpur, Malaysia: Tropical Press Sdn. Bhd.3. Chin, H. F., & Enoch, I.C. (1988). Malaysian trees in colour. Kuala Lumpur, Malaysia: Tropical
Press Sdn. Bhd.4. Chin, H. F., & Roberts, E. H. (1980). Recalcitrant crop seeds. Kuala Lumpur, Malaysia: Tropical
Press Sdn. Bhd.5. Chin, H. F., Enoch, I.C., & Raja Harun, R. M. (1977). Seed technology in the tropics. Serdang,
Malaysia: Universiti Pertanian Malaysia.6. Chin, H. F., & Yap, E. E. M. (1999). Malaysian vegetables in colour. Kuala Lumpur, Malaysia:
Tropical Press Sdn. Bhd7. Chin, H. F. (1986). The Hibiscus – Queen of tropical flowers. Kuala Lumpur, Malaysia: Tropical
Press Sdn. Bhd.8. Chin, H. F., & Pritchard, H. W. (1988). Recalcitrant seeds: a status report. Rome, Italy: International
Board for Plant Genetic Resources (IBPGR).9. Chin, H. F. (1969). Agricultural and horticultural seeds in Malaysia. Malaya: College of Agriculture.
Acknowledgements:Lai Oi Ming (Professor Dr.), Uma Rani Sinniah (Professor Dr.), Alvin Kah-Wei Hee (Dr.) &
Riina Jalonen (Dr.)
Photo Credit: Simon Chin & Nayan Kanwal
I wish to sincerely thank all who contributed towards the writing of this tribute – Nayan Kanwal, Chief Executive Editor, Pertanika
All inquiries may be addressed to the Chief Executive Editor at [email protected].

Pertanika J. Trop. Agric. Sci. 41 (2): 519 – 540 (2018)
ISSN: 1511-3701 © Universiti Putra Malaysia Press
TROPICAL AGRICULTURAL SCIENCEJournal homepage: http://www.pertanika.upm.edu.my/
ARTICLE INFOArticle history:Received: 01 August 2016Accepted: 22 March 2018
E-mail addresses:[email protected] (Siti Nadzirah Padrilah)[email protected] (Mohd Khalizan Sabullah)[email protected] (Mohd Yunus Abd Shukor)[email protected] (Nur Adeela Yasid)[email protected] (Nor Aripin Shamaan)[email protected], [email protected](Siti Aqlima Ahmad)* Corresponding author
Review Article
Toxicity Effects of Fish Histopathology on Copper Accumulation
Siti Nadzirah Padrilah1, Mohd Khalizan Sabullah2, Mohd Yunus Abd Shukor1, Nur Adeela Yasid1, Nor Aripin Shamaan3 and Siti Aqlima Ahmad1*1Department of Biochemistry, Faculty of Biotechnology and Biomolecular Sciences, Universiti Putra Malaysia, 43400 UPM, Serdang, Selangor, Malaysia2Faculty of Science and Natural Resources, Universiti Malaysia Sabah, Jalan UMS, 88400 UMS, Kota Kinabalu, Sabah, Malaysia3Faculty of Medicine and Health Sciences, Universiti Sains Islam Malaysia, 55100 USIM, Kuala Lumpur, Malaysia
ABSTRACT
Copper is a significant trace element necessary for the normal growth and metabolism of living organisms. However, this element may become very dangerous if used beyond its limit, turning into continuous metal compounds with the ability to accumulate in water and cause imbalance to the biological system. Aquaculture activities can also be affected due to the increase in environmental pollution. Copper is observed with the ability to cause some deleterious effects on fish by its toxicity, which can be evaluated from the molecular and structural level of the organism. This is because fish is one of the aquatic organisms that are able to accumulate heavy metals in their tissue. Generally, this accumulation is influenced by several factors namely, metal concentration, time of exposure, ways of metal uptake, environmental condition (water temperature, pH) and intrinsic factors (fish age, size). Different organs of fish show different affinity to copper accumulation.
Therefore, this review was conducted with the purpose of investigating the harmful effects of copper on fish as a result of the accumulation of copper in fish organs and the histopathological alteration encountered in fish.
Keywords: Bioaccumulation, copper contamination, environmental pollution, fish, histopathological effects, toxicity

Pertanika J. Trop. Agric. Sci. 41 (2): 519 – 540 (2018)
Siti Nadzirah Padrilah, Mohd Khalizan Sabullah, Mohd Yunus Abd Shukor, Nur Adeela Yasid, Nor Aripin Shamaan and Siti Aqlima Ahmad
520
INTRODUCTION
Heavy metal pollution in rivers has been observed as a serious concern as it is increasing steadily throughout the world each year. This is due to the release of pollutants from the various sources of industrial, agricultural and mining waste such as leaching of mineral and soil erosion as well as anthropogenic activities either directly or indirectly into the aquatic system. This has resulted in disruption to ecological balance of different systems (Joshi, 2011). Heavy metal pollution is unsafe for all living organisms, including aquatic organisms and humans. Aquatic systems are specifically more sensitive to heavy metal pollution, and the level of such metals in aquatic environments due to anthropogenic sources is rising (Ashraf et al., 2012).
Fish is an aquatic organism of high economic value that responds to environmental changes. Thus, it is extremely suitable to be utilised as an indicator for pollution studies. Moreover, fish is a good bioaccumulator as it has the optimum size for analysis and a long lifespan and is easily obtained in large quantity to be sampled for accumulated metals (Ashraf et al., 2012; Batvari et al., 2008). Bioaccumulation is a process where chemicals infiltrate an organism either through exposure to a contaminated medium or through consumption of food containing the chemicals (Perera et al., 2015). Bioaccumulation in fish usually occurs when it is exposed to chemical pollutants, including heavy
metals, especially copper. Once the chemical pollutants enter the fish’s body, it can damage and weaken the mechanism concerned, which leads to physiological, pathological and biochemical alterations. In addition, copper in a toxic form might serve as a stressor agent for fish that can inhibit several biological functions and cause some histopathological alterations (Sabullah et al., 2014). In conjunction with this statement, Monteiro et al. (2012) also mentioned that copper toxicity may disrupt biochemical functions and cellular morphology.
Hence, it is essential that the levels of a contaminant are determined and the water quality criteria are analysed to produce an accurate conclusion on pollutant exposure in fish. Biological measurement, also known as a biomarker, is one of the best steps for evaluating the presence of pollutant exposure and its impact on the cells of fish. This is because the abnormalities caused by copper in fish may result in cellular and histological changes. These histopathological alterations are then used to indicate the condition of the environment and represent time-integrated endogenous and exogenous impact on the organism stemming from alterations at the lower level of biological organisation (Paulo et al., 2012). Histopathological changes in animal tissue especially fish are powerful indicators for prior exposure of aquatic environmental stressors. Besides that, histopathology can give the net result of adverse biochemical and physiological changes in an organism as it allows the
Pertanika J. Trop. Agric. Sci. 41 (2): 519 – 540 (2018)
Effects of Heavy Metal on Aquatic Organisms
521
identification of specific target organs, cells and organelles infected in vivo. According to Reddy (2012) and Hinton and Lauren (1990), histopathology is often the easiest method of assessing both short- and long-term toxic effects for field assessment. Abubakar et al. (2014) further added that the advantage of using histopathological biomarkers in environmental monitoring is that this category of biomarkers allows the changes on specific target organs to be tested.
In recent years, chemical biomonitoring and histopathology have often been combined with the evaluation of biomarkers representing early indicators of biological effects. Driven by the increase in environmental pollution, the utilisation of fish as a biomarker has attracted a growing interest in pollution studies; thus, the need to develop physiological, histopathological and biochemical biomarkers that are able to indicate stress on organisms exposed to toxicants in the environment has also become urgent. Therefore, this review is focussed on the adverse effects of copper on bioaccumulation and on histopathological studies with the aim of elucidating the most pronounced alteration induced by toxicants on aquatic organisms and their environment.
Copper
Copper is a very toxic metal that is often considered poisonous even at low concentration, but is highly demanded by industry. Apparently, the demand for copper continues to increase annually as it
is used in water pipelines, intelligent houses and buildings, electrical motors, power lines, electrical appliances, healthcare, environment-related industries, computers and communication devices. According to AQM COPPER INC, the outlook for copper is greatly focussed in China, where copper consumption is increasing as a result of overall economic growth. This has further increased the use of copper in industry, while increasing copper contamination of the environment. Besides industrial use, copper also plays a vital role in the metabolic function of organisms such as vertebrate and invertebrate animals (Ajani & Akpoilih, 2010; Bambang et al., 1995), plants (Ahsan et al., 2007) and both prokaryotes and eukaryotes (Balamurugan & Schaffner, 2006). In fact, it is also an essential micronutrient required for body metabolism.
There are various functions demonstrated by copper in every organism where its importance in the metabolic processes and cellular biochemistry includes its vital role in cellular respiration. Copper also acts as a catalytic co-factor for at least 12 major proteins (Bambang et al., 1995) and 30 different enzymes (Ajani & Akpoilih, 2010) responsible for countless metabolic processes required to sustain life. Some examples of these enzymes are those indispensable in cellular activities for signal transduction and cell regulation such as superoxidase dismutase (for protection against free radicals), cytochrome c oxidase (mitochondrial electron transport chain), tyrosinase (for
Pertanika J. Trop. Agric. Sci. 41 (2): 519 – 540 (2018)
Siti Nadzirah Padrilah, Mohd Khalizan Sabullah, Mohd Yunus Abd Shukor, Nur Adeela Yasid, Nor Aripin Shamaan and Siti Aqlima Ahmad
522
pigmentation), peptidylglycine alpha-amidating mono-oxygenase (neuropeptide and peptide hormone processing), lysyl oxidase (collagen maturation), dopamine B-hydroxylase and monoamine oxidase (Ajani & Akpoilih, 2010; Balamurugan & Schaffner, 2006). Besides that, copper in the form of copper sulphate is also important for the aquatic environment as it can be utilised to control algae and kill slugs and snails in irrigation water systems and municipal water treatment systems and it is used in therapeutic chemicals for various ectoparasitic and bacterial infections (Sabullah et al., 2014; Shuhaimi-Othman et al., 2010; Wani et al., 2013).
Copper Toxicity and Distribution in Living Organisms
In terms of toxicity, both copper excess and copper deficiency could disrupt healthy metabolic function by creating mineral imbalance in metabolic processes. Thus, having the proper level and ratio
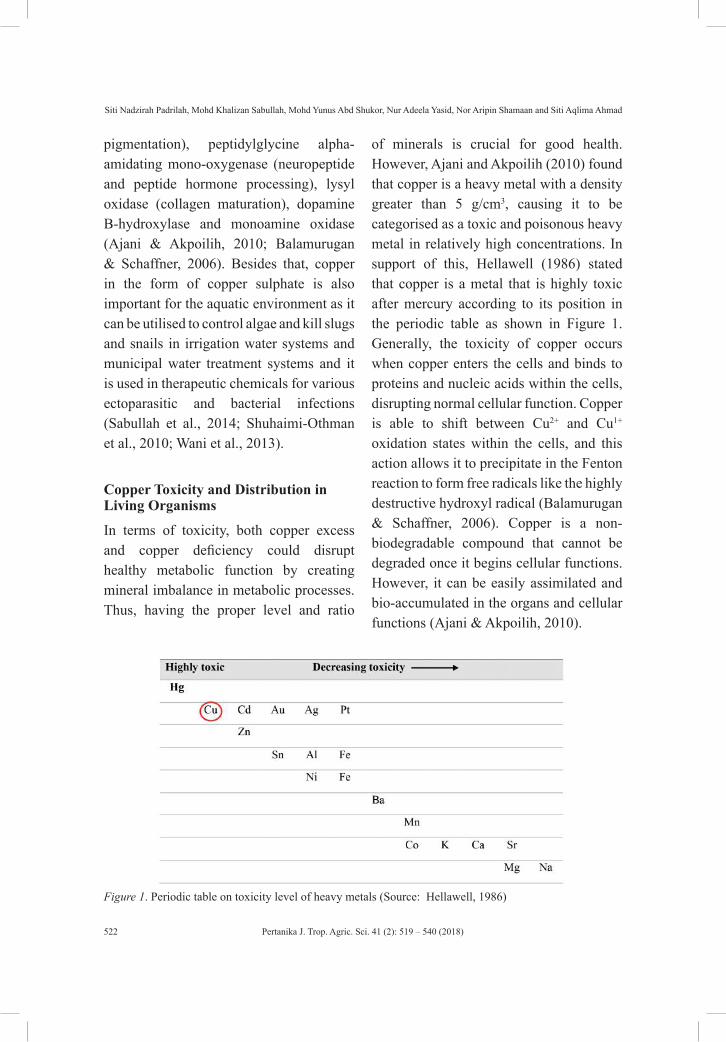
of minerals is crucial for good health. However, Ajani and Akpoilih (2010) found that copper is a heavy metal with a density greater than 5 g/cm3, causing it to be categorised as a toxic and poisonous heavy metal in relatively high concentrations. In support of this, Hellawell (1986) stated that copper is a metal that is highly toxic after mercury according to its position in the periodic table as shown in Figure 1. Generally, the toxicity of copper occurs when copper enters the cells and binds to proteins and nucleic acids within the cells, disrupting normal cellular function. Copper is able to shift between Cu2+ and Cu1+ oxidation states within the cells, and this action allows it to precipitate in the Fenton reaction to form free radicals like the highly destructive hydroxyl radical (Balamurugan & Schaffner, 2006). Copper is a non-biodegradable compound that cannot be degraded once it begins cellular functions. However, it can be easily assimilated and bio-accumulated in the organs and cellular functions (Ajani & Akpoilih, 2010).
Figure 1. Periodic table on toxicity level of heavy metals (Source: Hellawell, 1986)

Pertanika J. Trop. Agric. Sci. 41 (2): 519 – 540 (2018)
Effects of Heavy Metal on Aquatic Organisms
523
Toxicity in Aquatic Organisms
The presence of copper in water or an aquatic environment occurs through several pathways including mining activities, the discharge of industrial and agricultural waste and runoff from mineral deposits. Kamaruzzam et al. (2008) stated that the level of copper in an aquatic environment is caused by the loading and off-loading of fish, cleaning of boats and ships, ballasting, painting and repairing boats, large ships and cargo. These problems may contribute to the contamination of fresh water systems, causing an adverse impact on aquatic organisms as well as on human health (Farombi et al., 2007). It is known that copper cannot be destroyed or degraded through biological degradation and that it has the ability to accumulate in aquatic organisms, especially fish. Thus, it causes toxicants to be deleterious to aquatic environments and consequently, to the humans who depend on aquatic products as a food source.
Copper can easily accumulate in the tissue of aquatic animals, especially fish as they are the final trophic link of the hydro ecosystem (Balambigai & Aruna, 2011; Cepanko et al., 2010). Several studies have been conducted on the accumulation of copper in aquatic organisms, especially fish and crustaceans including shrimp (Balambigai & Aruna, 2011; Bambang et al., 1995; Cunha et al., 2007; Franciscato et al., 2009; Sabullah et al., 2015). According to El-Moselhy et al. (2014), metal bioaccumulation by fish is subsequently accumulated in specific
organs and later distributed to different organs such as the liver, kidney, gills, heart, bone, brain and digestive tract. Although copper is an essential micronutrient for fish and other aquatic organisms, it may also become the most toxic to them when it becomes accumulated in their organs. The most toxic form of copper is the cupric ion (Cu2+). Fish and crustaceans have been discovered to be 10 to 100 times more sensitive to the toxicity of copper than mammals (Solomon, 2009).
The effects of copper on aquatic organisms can be directly or indirectly lethal. Considering the fact that the gills of a fish are the organ that is directly in contact with water, they are the first organ to respond to environmental pollution and also the first to be affected by copper. Copper may affect the cardiovascular and nervous system of the fish once it becomes accumulated in the gills since it has the ability to regulate the transport of salt (NaCl) into and out of the fish. Besides disturbing the balance of salt in fish, copper can also reduce sperm and egg production in many fish species including fathead minnows (Solomon, 2009). On top of that, it can affect the glucose metabolism and cellular structure of fish as reported in the study by Sabullah et al. (2014, 2015).
Bioaccumulation of Copper in Fish Tissue
Heavy metals are known to be easily bioaccumulated in fish tissue as fish is a good bioaccumulator (Sabullah et al., 2015). Studies conducted on the bioaccumulation
Pertanika J. Trop. Agric. Sci. 41 (2): 519 – 540 (2018)
Siti Nadzirah Padrilah, Mohd Khalizan Sabullah, Mohd Yunus Abd Shukor, Nur Adeela Yasid, Nor Aripin Shamaan and Siti Aqlima Ahmad
524
of heavy metals in living organisms are related to the biomagnification process, which describes the pathway of toxicants from one trophic level to another. Ashraf et al. (2012) and El-Moselhy et al. (2014) stated that the accumulation of metals in fish depends on several factors such as the trophic level, location, feeding behaviour, size, age, duration of exposure to metals and concentration of metals. Various metals are accumulated in the body of fish in different amounts because different metals have different affinity to fish tissue, different uptake and different deposition and excretion rates as recorded in Table 1. Most fish are found at the top of the aquatic food chain and can potentially accumulate a high metal content even in mildly polluted conditions. According to Jezierska and Witeska (2006), the concentration of metal accumulated in the body of fish is usually related inversely to the size and age of the fish. The smallest and the youngest fish are commonly enriched by the accumulated substances compared to larger fish. This is because different species and size of fish contribute to different sensitivity levels toward contaminants. Therefore, metal concentration in fish could be used as an index to estimate the level of pollution especially in aquatic bodies (Akan et al., 2012).
Studies on the bioaccumulation of pollutants by fish are based on these two important reasons. The first reason is to determine the pollutant concentration in fish; this reflects the degree of the environmental pollution, the tolerance
limit of the fish species and the effects of the pollutant on the fish. The second reason is to assess the spatial, temporal, speciation trends and transfer processes in the fish species along their food chain (Czedli et al., 2014). However, the first reason was seen to be more important as studies in this field have extended to environmental biomonitoring. Currently, studies predicting toxic effects based on the environment or tissue have been difficult to conduct, whereas many research studies examine the relationship between metal exposure, accumulation and toxicity under laboratory conditions (Annabi et al., 2013; Vijver et al., 2004).
According to the literature, metals that accumulate in fish including copper originate directly from food, water and contaminant residue, and their level of accumulation may reach the concentration of hundreds to thousands of times above the concentration measured in the food, water and sediments (El-Moselhy et al., 2014; Kumar & Prabhahar, 2012). One of the important functions of copper is its use as an algaecide (Ajani & Akpoilih, 2010; Carvalho & Fernandes, 2006), which is globally used to kill algae and to prevent fish from being killed or harmed. However, this application is not safe for all aquatic organisms, especially fish as it can easily enter the fish’s body regardless of its amount. It is worth noting that several authors have demonstrated that animal tissue contaminated in the laboratory can accumulate heavy metals in a concentration and contamination period dependent
Pertanika J. Trop. Agric. Sci. 41 (2): 519 – 540 (2018)
Effects of Heavy Metal on Aquatic Organisms
525
manner (Annabi et al., 2013; Francis et al., 1984). According to Jezierska and Witeska (2006), environmental factors strongly affect the accumulation of heavy metals in fish because labile metal compounds are the most dangerous to fish. Labile metal compounds have been categorised as a soluble form of heavy metals in water that contributes the most danger to fish. They include various ionic forms with different availability to fish. It has been confirmed by a lot of data from previous research such as studies on the accumulation of various heavy metals in fish organs by Ghosh and Adhikari (2006), Mohammadnabizadeh et al. (2014) and Velma et al. (2009) that most of the heavy metals in water are in labile form.
Copper contamination may be accumulated in fish as they are exposed to copper at high concentrations. Copper is commonly consumed by fish for metabolism functions; however, it becomes toxic if the fish are exposed to a higher concentration for a longer period. The gills are the first organ to accumulate heavy metals at a level higher than the concentration deemed toxic through absorption along the gill surface and gut tract wall (Annabi et al., 2013). The accumulated copper is then distributed and bioaccumulated in the main organs and bodily systems of the fish including the liver, spleen and kidney through the blood. Copper has been reported to become accumulated in the gills of Cyprinus carpio in the presence of kaolin particles (Tao et al., 2002). Tao et al. (2002) also stated that the adsorption affinity constant
of kaolin for copper at various pH levels has affected the accumulation process in the gill microenvironment due to mucus competition from the copper and the slight increase in water pH. The pH level and mucus binding in the fish gill microenvironment are the most important factors behind the changes in copper speciation. Furthermore, Çoǧun and Kargın (2004) have stated that the accumulation of copper in Oreochromis niloticus is affected by pH. It was identified that temperature may also affect the accumulation of copper and other heavy metals. This statement is in agreement with that published by Carvalho and Fernandes (2006), who mentioned that the changes in the blood parameter of Prochilodus scrofa showed a complex response at high temperature.
In a previous study conducted by Karayakar et al. (2010), it was observed that copper was accumulated more in the liver of Anguilla compared to the gills and muscles. A similar observation was also obtained by Rajkowska and Protasowicki (2013), who presented that copper was mostly accumulated in the fish liver compared to other organs (kidney, digestive tract, skin, spleen, gills and muscles). In addition, the result obtained from the study of Al-Yousuf et al. (2000) displayed the same observation in copper accumulation. Meanwhile, Das and Gupta (2013) stated in their study that the liver recorded the highest concentration of copper followed by the gills, kidney, flesh, bones and brain. Hence, based on the data in all these previous studies, it can be concluded that
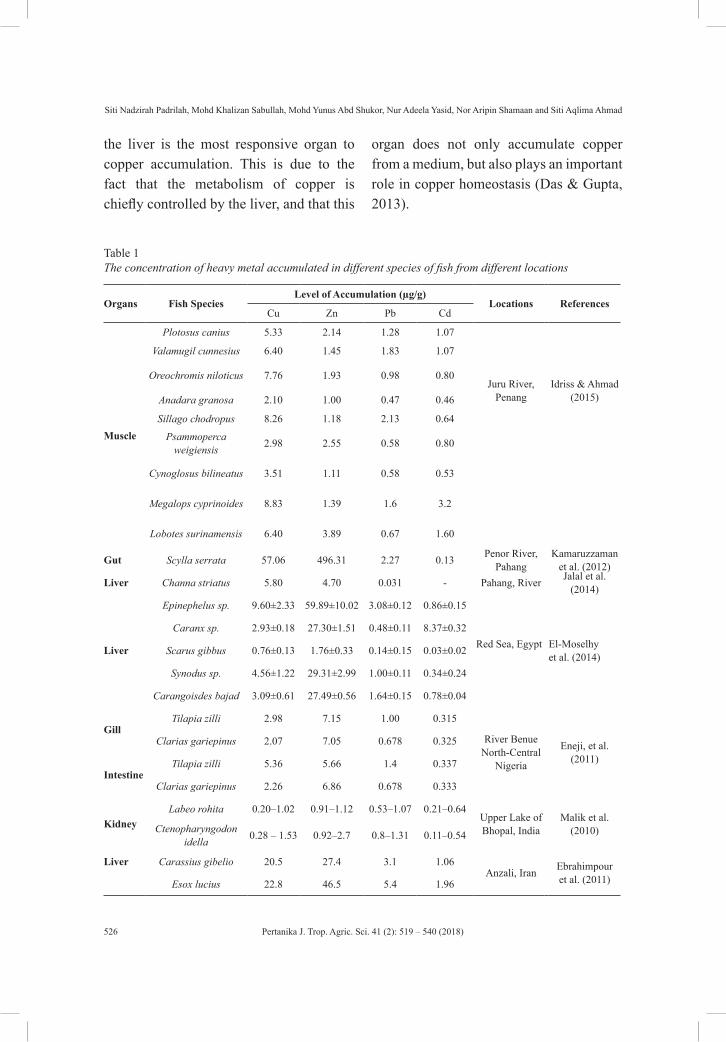
Pertanika J. Trop. Agric. Sci. 41 (2): 519 – 540 (2018)
Siti Nadzirah Padrilah, Mohd Khalizan Sabullah, Mohd Yunus Abd Shukor, Nur Adeela Yasid, Nor Aripin Shamaan and Siti Aqlima Ahmad
526
the liver is the most responsive organ to copper accumulation. This is due to the fact that the metabolism of copper is chiefly controlled by the liver, and that this
organ does not only accumulate copper from a medium, but also plays an important role in copper homeostasis (Das & Gupta, 2013).
Table 1The concentration of heavy metal accumulated in different species of fish from different locations
Organs Fish SpeciesLevel of Accumulation (µg/g)
Locations ReferencesCu Zn Pb Cd
Muscle
Plotosus canius 5.33 2.14 1.28 1.07
Juru River, Penang
Idriss & Ahmad (2015)
Valamugil cunnesius 6.40 1.45 1.83 1.07
Oreochromis niloticus 7.76 1.93 0.98 0.80
Anadara granosa 2.10 1.00 0.47 0.46
Sillago chodropus 8.26 1.18 2.13 0.64
Psammoperca weigiensis 2.98 2.55 0.58 0.80
Cynoglosus bilineatus 3.51 1.11 0.58 0.53
Megalops cyprinoides 8.83 1.39 1.6 3.2
Lobotes surinamensis 6.40 3.89 0.67 1.60
Gut Scylla serrata 57.06 496.31 2.27 0.13 Penor River, Pahang
Kamaruzzaman et al. (2012)
Liver Channa striatus 5.80 4.70 0.031 - Pahang, River Jalal et al. (2014)
Liver
Epinephelus sp. 9.60±2.33 59.89±10.02 3.08±0.12 0.86±0.15
Red Sea, Egypt El-Moselhy et al. (2014)
Caranx sp. 2.93±0.18 27.30±1.51 0.48±0.11 8.37±0.32
Scarus gibbus 0.76±0.13 1.76±0.33 0.14±0.15 0.03±0.02
Synodus sp. 4.56±1.22 29.31±2.99 1.00±0.11 0.34±0.24
Carangoisdes bajad 3.09±0.61 27.49±0.56 1.64±0.15 0.78±0.04
GillTilapia zilli 2.98 7.15 1.00 0.315
River Benue North-Central
Nigeria
Eneji, et al. (2011)
Clarias gariepinus 2.07 7.05 0.678 0.325
IntestineTilapia zilli 5.36 5.66 1.4 0.337
Clarias gariepinus 2.26 6.86 0.678 0.333
KidneyLabeo rohita 0.20–1.02 0.91–1.12 0.53–1.07 0.21–0.64
Upper Lake of Bhopal, India
Malik et al. (2010)Ctenopharyngodon
idella 0.28 – 1.53 0.92–2.7 0.8–1.31 0.11–0.54
Liver Carassius gibelio 20.5 27.4 3.1 1.06Anzali, Iran Ebrahimpour
et al. (2011)Esox lucius 22.8 46.5 5.4 1.96
Pertanika J. Trop. Agric. Sci. 41 (2): 519 – 540 (2018)
Effects of Heavy Metal on Aquatic Organisms
527
Histopathological Evaluation
Histopathology is the microscopic evaluation of altered morphology expressing a disease process in an organism, and it is used to display the disease patterns in a population of fish (Osman et al., 2010). According to Liebel et al. (2013), histopathological events can be considered efficient as they can quickly detect water pollution and express the health condition of exposed tissue. Therefore, they are suitable to be used as a biomarker as they give an early response or measurable biological event due to exposure to pollutants (Liebel et al., 2013; Miranda et al., 2008; Ribeiro et al., 2005). Other than that, the main objective of a histopathological study is to observe cellular changes that occur in the target organs of fish. This is because a histopathology study involves cellular biomarkers, which can provide a better indication of the health of an organism and has also been proven to be a cost-effective tool for determining the health of fish population and reflecting the health of the entire aquatic ecosystem (Devi & Mishra, 2013).
Fish are relatively sensitive to the changes that occur in their surroundings, including an increase in pollution. The health of fish may thus reflect and display the health status of a specific aquatic ecosystem. Early toxic effects of pollution are only evident at the cellular or tissue level before significant changes can be identified in the physical appearance and behaviour of the fish. On the other hand, histopathological analysis appears to
be a very sensitive parameter crucial in determining the cellular changes occurring in the target organs such as the gills, liver, kidney, brain spleen, gonads and muscles (Al-Balawi et al., 2013; Gaber et al., 2014; Hadi & Ahwan, 2012; Sabullah et al., 2015). Various studies have been conducted using the histopathology of fish organs as a biomarker to indicate water quality. For instance, a study on histopathological effects of the acute toxicity level of copper sulphate on Puntius conchonius revealed that metallic salts are capable of producing severe damage in the gills and necrotic changes in the liver and kidney (Pant et al., 1980). A study done by Khabbazi et al. (2015) also stated that copper absorption may result in some alterations on the gills of rainbow trout seen as epithelial hyperthrophy, hyperplasia, lamella fusion, lamella aneurysm and edema. The gills are the first organ to come into contact with waterborne pollutants due to its stable contact with the external environment. Heavy metals accumulated in the gills will affect the respiration and osmoregulation processes, causing cellular damage to gill cells (Maharajan et al., 2016; Pandey et al., 2008). A study by Figueiredo-Fernandes et al. (2007) on Oreochromis niloticus treated with copper showed similar abnormalities in the gill tissues including epithelium lifting, interstitial edema, lamellae fusion and lamellae aneurysm. Aneurysm and edema were observed to be clearly related to short-term copper exposure, while lamellae fusion was related to chronic exposure of copper (Khabbazi et al., 2015).
Pertanika J. Trop. Agric. Sci. 41 (2): 519 – 540 (2018)
Siti Nadzirah Padrilah, Mohd Khalizan Sabullah, Mohd Yunus Abd Shukor, Nur Adeela Yasid, Nor Aripin Shamaan and Siti Aqlima Ahmad
528
Different organs may show different cellular changes due to the different level of copper accumulation they may be prone to. The liver is one of the most important organs due to its location, function and blood supply, and is associated with the detoxification and biotransformation process (Van der Oost, Beyer, & Vermeulen, 2003). It is also one of the organs most affected by toxicants in the water (Maharajan et al., 2016). At the initial toxicity level, the morphology of parenchyma cells was seen to demonstrate some histopathological alterations such as cytoplasmic vacuolation, dilation and congestion of sinusoid that depend on the concentration of toxicants and time of exposure (Sabullah et al., 2014; Younis et al., 2013). The normal ultrastructure visualisation of parenchyma cells with untreated toxicants showed the normal polygonal shape with the normal form of nuclear envelope, endoplasmic reticulum and spherical shape of mitochondria and cytoplasm. However, treated parenchyma cells usually display the karyorhexis, karyolysis and pyknosis of nucleus with clumping of nuclear chromatin, ruptured plasma membrane, apoptosis, blebbing, cell budding formation, necrosis and lipidosis (Abdel-Moneim & Abdel-Mohsen, 2010; El-Sayyad et al., 2010; Figueiredo-Fernandes et al., 2007; Sabullah et al., 2014). Liver alteration of Anabas testudineus has displayed the results of necrosis, vascular haemorrhage, dilated sinusoids and vacuolar degeneration after being treated with copper (Nandan &
Kumar, 2014). A similar observation of copper-induced histopathological changes in the liver of Nile tilapia (Oreochromis niloticus) was also reported by Abdel-Tawwab (2016). In addition, a study carried out by Udotong and John (2015) also showed similar alterations in the liver by displaying diffuse hepatocyte necrosis. General necrosis, also known as degenerative alterations, was given the highest importance factor because it was considered a direct effect of toxicants. It is generally irreversible, and its persistence or progression may lead to a partial or total loss of organ function (Agamy, 2012). All these alterations may attribute to the direct toxic effect of pollutants on hepatocytes, since the liver is the detoxification site for all types of toxin and chemical (Fatma, 2009).
Just like the gills and the liver, muscle tissue also comes in close contact with toxicants dissolved in water. Hence, the reactions in histopathology of the muscle are spontaneous. In a study done by Maharajan et al. (2016), the muscle showed progressive damage in its structure such as thickening and separation of muscle bundles with severe intracellular edema. Similar abnormalities were also displayed in the study by Das and Mukherjee (2000), where the separation of muscle bundles was considered an interesting observation; it was believed that copper may induce hyperactivity and excitability in animals, leading to the release of lactic acid and subsequently, muscular fatigue. Another observation by Al-Tamimi et al. (2015)
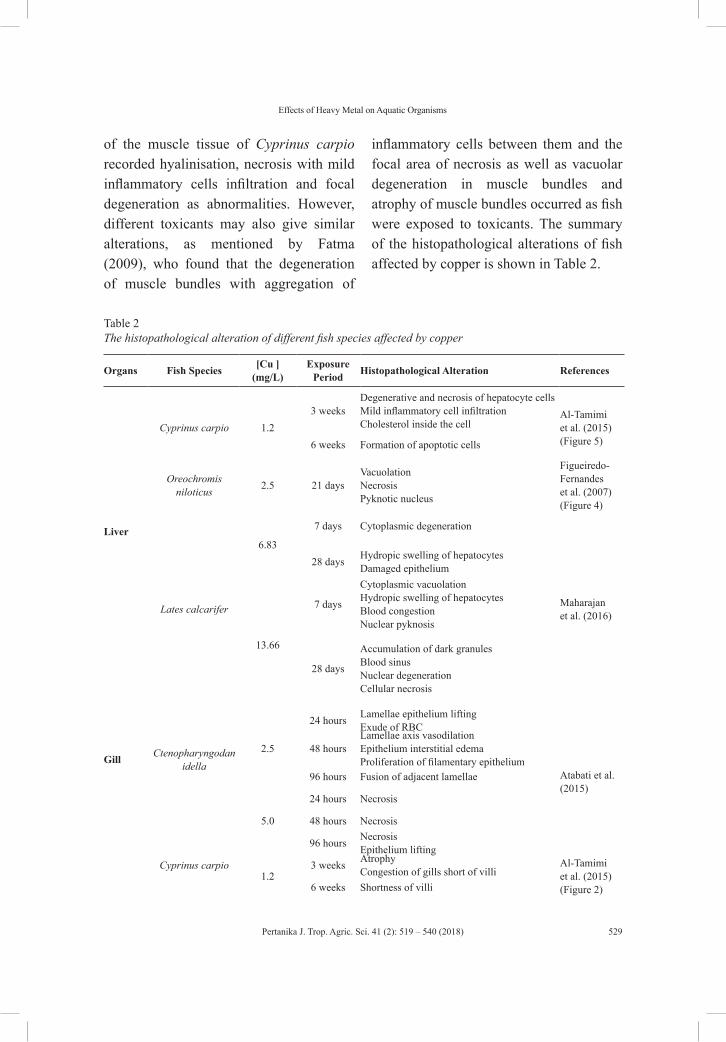
Pertanika J. Trop. Agric. Sci. 41 (2): 519 – 540 (2018)
Effects of Heavy Metal on Aquatic Organisms
529
of the muscle tissue of Cyprinus carpio recorded hyalinisation, necrosis with mild inflammatory cells infiltration and focal degeneration as abnormalities. However, different toxicants may also give similar alterations, as mentioned by Fatma (2009), who found that the degeneration of muscle bundles with aggregation of
inflammatory cells between them and the focal area of necrosis as well as vacuolar degeneration in muscle bundles and atrophy of muscle bundles occurred as fish were exposed to toxicants. The summary of the histopathological alterations of fish affected by copper is shown in Table 2.
Table 2The histopathological alteration of different fish species affected by copper
Organs Fish Species [Cu ](mg/L)
Exposure Period Histopathological Alteration References
Liver
Cyprinus carpio 1.23 weeks
Degenerative and necrosis of hepatocyte cellsMild inflammatory cell infiltrationCholesterol inside the cell
Al-Tamimi et al. (2015)(Figure 5)6 weeks Formation of apoptotic cells
Oreochromis niloticus 2.5 21 days
VacuolationNecrosisPyknotic nucleus
Figueiredo-Fernandes et al. (2007)(Figure 4)
Lates calcarifer
6.83
7 days Cytoplasmic degeneration
Maharajan et al. (2016)
28 days Hydropic swelling of hepatocytesDamaged epithelium
13.66
7 days
Cytoplasmic vacuolationHydropic swelling of hepatocytesBlood congestionNuclear pyknosis
28 days
Accumulation of dark granulesBlood sinusNuclear degenerationCellular necrosis
Gill Ctenopharyngodan idella
2.5
24 hours Lamellae epithelium liftingExude of RBC
Atabati et al. (2015)
48 hoursLamellae axis vasodilationEpithelium interstitial edemaProliferation of filamentary epithelium
96 hours Fusion of adjacent lamellae
5.0
24 hours Necrosis
48 hours Necrosis
96 hours NecrosisEpithelium lifting
Cyprinus carpio1.2
3 weeks AtrophyCongestion of gills short of villi
Al-Tamimi et al. (2015)(Figure 2)6 weeks Shortness of villi
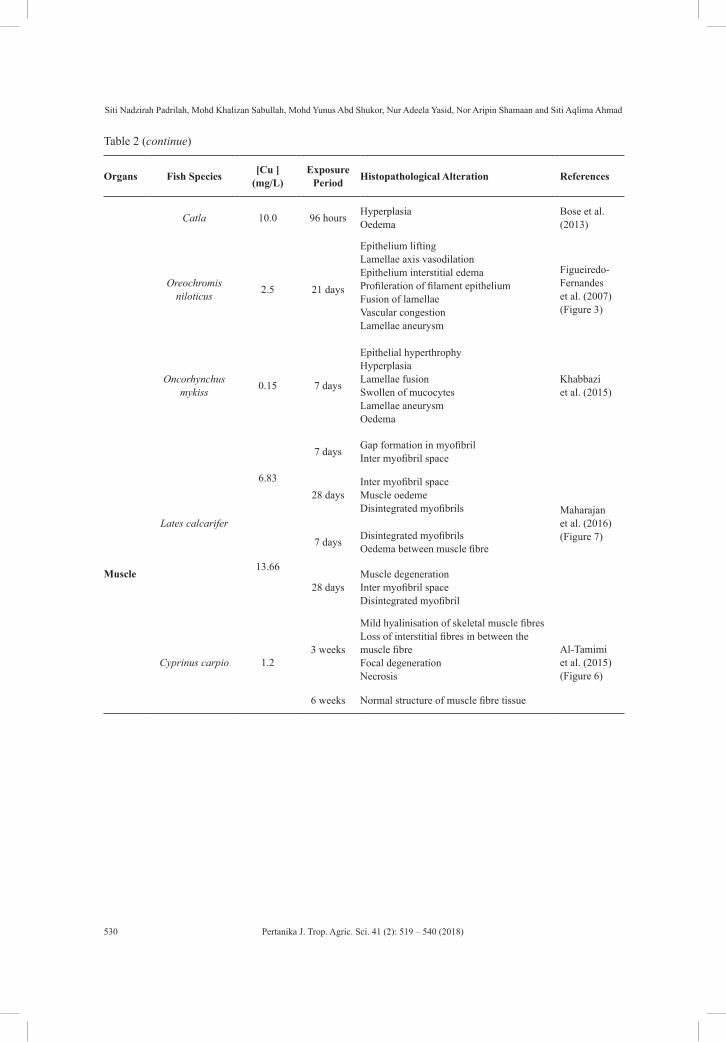
Pertanika J. Trop. Agric. Sci. 41 (2): 519 – 540 (2018)
Siti Nadzirah Padrilah, Mohd Khalizan Sabullah, Mohd Yunus Abd Shukor, Nur Adeela Yasid, Nor Aripin Shamaan and Siti Aqlima Ahmad
530
Table 2 (continue)
Organs Fish Species [Cu ](mg/L)
Exposure Period Histopathological Alteration References
Catla 10.0 96 hours HyperplasiaOedema
Bose et al. (2013)
Oreochromis niloticus 2.5 21 days
Epithelium liftingLamellae axis vasodilationEpithelium interstitial edemaProfileration of filament epitheliumFusion of lamellaeVascular congestionLamellae aneurysm
Figueiredo-Fernandes et al. (2007)(Figure 3)
Oncorhynchus mykiss 0.15 7 days
Epithelial hyperthrophyHyperplasiaLamellae fusionSwollen of mucocytesLamellae aneurysmOedema
Khabbazi et al. (2015)
Muscle
Lates calcarifer
6.83
7 days Gap formation in myofibrilInter myofibril space
Maharajan et al. (2016)(Figure 7)
28 daysInter myofibril spaceMuscle oedemeDisintegrated myofibrils
13.66
7 days Disintegrated myofibrilsOedema between muscle fibre
28 daysMuscle degenerationInter myofibril spaceDisintegrated myofibril
Cyprinus carpio 1.23 weeks
Mild hyalinisation of skeletal muscle fibresLoss of interstitial fibres in between the muscle fibreFocal degenerationNecrosis
Al-Tamimi et al. (2015)(Figure 6)
6 weeks Normal structure of muscle fibre tissue

Pertanika J. Trop. Agric. Sci. 41 (2): 519 – 540 (2018)
Effects of Heavy Metal on Aquatic Organisms
531
(a) (b) (c)
Figure 2. Histological changes of gills in Cyprinus carpio during three-week period (a) Normal; (b) At a concentration of 0.5 mg Cu/L; (c) At a concentration of 0.9 mg Cu/L. (a) It is clear that there were no abnormal changes in the control sample; (b) At a concentration of 0.5 mg/L during three-week period showing presence of congestion (c) with short villi (SV); (c) At a concentration of 0.9 mg/L during three-week period showing short villi (SV). H&E; 400x. (Source: Al-Tamimi et al., 2015)
(a) (b)
(c) (d) (e)
Figure 3. Representative light micrographs of gills in control and copper-treated (B-E, 2.5 mg-l CuSO4, 21 days) tilapia, Oreochromis niloticus. (a) Control fish, showing normal appearance of gill filaments (f) and lamellae (L). (b) Gills from exposed fish showing an intense lamellar epithelium lifting (Lf). Note the epithelium proliferation in the above filament (FP). (c) Section of gills with lamellar axis vasodilation (v) and evident epithelium interstitial edema (**) in the filament near the lamellar axis. (d) Proliferation of filamentar epithelium (Fp) with fusion of adjacent lamellae (Lfu). (e) Gill epithelium of treated fish showing vascular congestion or lamellar aneurisms (a). cc=chloride cell, cvs=central venous sinus, fe=filament epithelium, pc=pillar cell, pv=pavement cell. HE, bars=20μm (Source: Figueiredo-Fernandes et al., 2007)
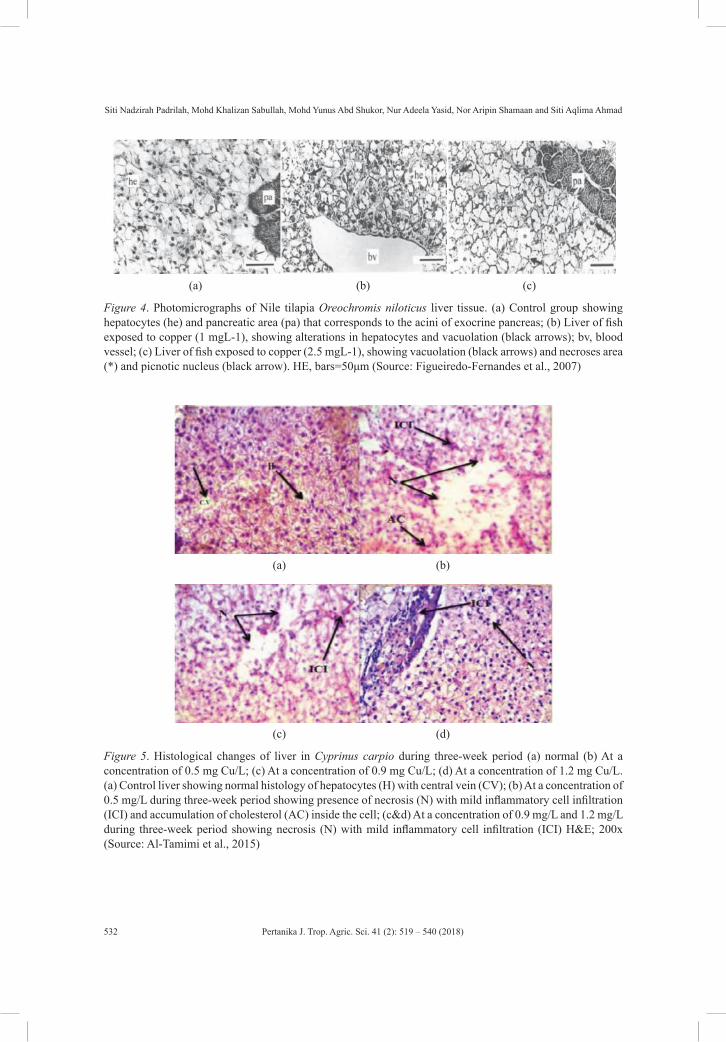
Pertanika J. Trop. Agric. Sci. 41 (2): 519 – 540 (2018)
Siti Nadzirah Padrilah, Mohd Khalizan Sabullah, Mohd Yunus Abd Shukor, Nur Adeela Yasid, Nor Aripin Shamaan and Siti Aqlima Ahmad
532
(a) (b) (c)
Figure 4. Photomicrographs of Nile tilapia Oreochromis niloticus liver tissue. (a) Control group showing hepatocytes (he) and pancreatic area (pa) that corresponds to the acini of exocrine pancreas; (b) Liver of fish exposed to copper (1 mgL-1), showing alterations in hepatocytes and vacuolation (black arrows); bv, blood vessel; (c) Liver of fish exposed to copper (2.5 mgL-1), showing vacuolation (black arrows) and necroses area (*) and picnotic nucleus (black arrow). HE, bars=50μm (Source: Figueiredo-Fernandes et al., 2007)
(a) (b)
(c) (d)
Figure 5. Histological changes of liver in Cyprinus carpio during three-week period (a) normal (b) At a concentration of 0.5 mg Cu/L; (c) At a concentration of 0.9 mg Cu/L; (d) At a concentration of 1.2 mg Cu/L.(a) Control liver showing normal histology of hepatocytes (H) with central vein (CV); (b) At a concentration of 0.5 mg/L during three-week period showing presence of necrosis (N) with mild inflammatory cell infiltration (ICI) and accumulation of cholesterol (AC) inside the cell; (c&d) At a concentration of 0.9 mg/L and 1.2 mg/L during three-week period showing necrosis (N) with mild inflammatory cell infiltration (ICI) H&E; 200x (Source: Al-Tamimi et al., 2015)
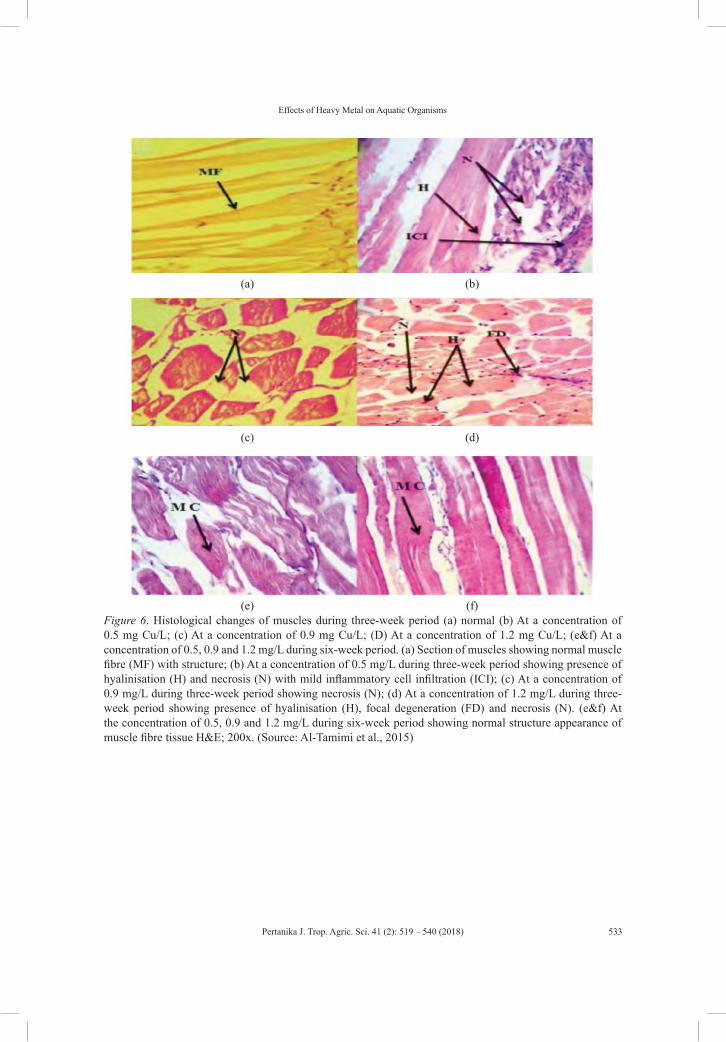
Pertanika J. Trop. Agric. Sci. 41 (2): 519 – 540 (2018)
Effects of Heavy Metal on Aquatic Organisms
533
(a) (b)
(c) (d)
(e) (f)Figure 6. Histological changes of muscles during three-week period (a) normal (b) At a concentration of 0.5 mg Cu/L; (c) At a concentration of 0.9 mg Cu/L; (D) At a concentration of 1.2 mg Cu/L; (e&f) At a concentration of 0.5, 0.9 and 1.2 mg/L during six-week period. (a) Section of muscles showing normal muscle fibre (MF) with structure; (b) At a concentration of 0.5 mg/L during three-week period showing presence of hyalinisation (H) and necrosis (N) with mild inflammatory cell infiltration (ICI); (c) At a concentration of 0.9 mg/L during three-week period showing necrosis (N); (d) At a concentration of 1.2 mg/L during three-week period showing presence of hyalinisation (H), focal degeneration (FD) and necrosis (N). (e&f) At the concentration of 0.5, 0.9 and 1.2 mg/L during six-week period showing normal structure appearance of muscle fibre tissue H&E; 200x. (Source: Al-Tamimi et al., 2015)
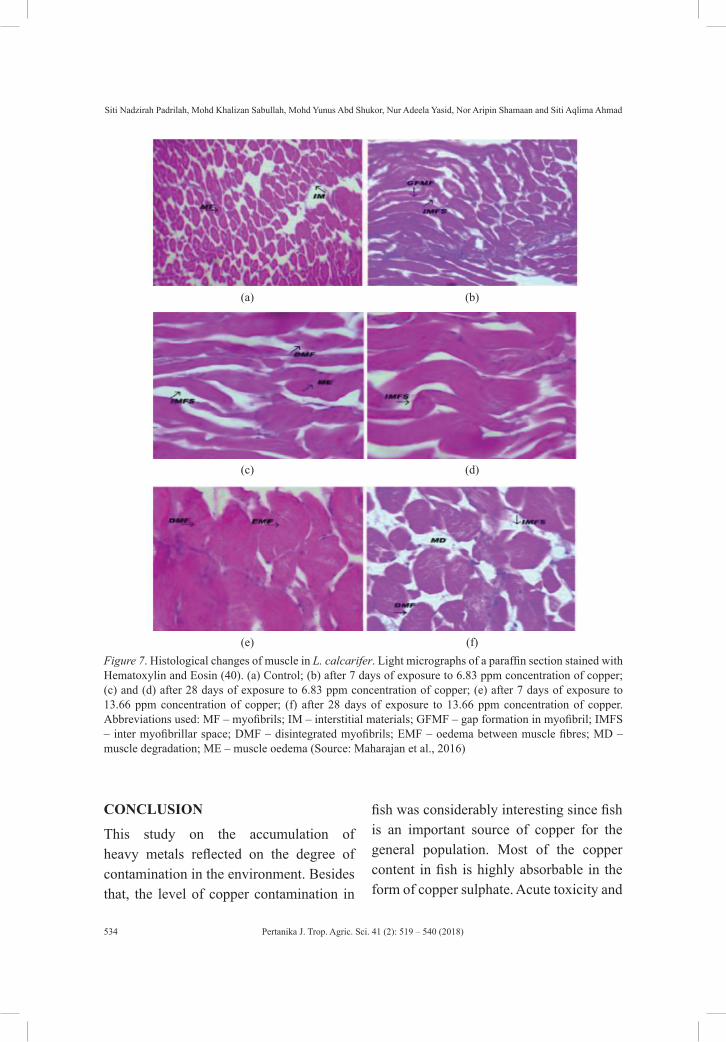
Pertanika J. Trop. Agric. Sci. 41 (2): 519 – 540 (2018)
Siti Nadzirah Padrilah, Mohd Khalizan Sabullah, Mohd Yunus Abd Shukor, Nur Adeela Yasid, Nor Aripin Shamaan and Siti Aqlima Ahmad
534
(a) (b)
(c) (d)
(e) (f)Figure 7. Histological changes of muscle in L. calcarifer. Light micrographs of a paraffin section stained with Hematoxylin and Eosin (40). (a) Control; (b) after 7 days of exposure to 6.83 ppm concentration of copper; (c) and (d) after 28 days of exposure to 6.83 ppm concentration of copper; (e) after 7 days of exposure to 13.66 ppm concentration of copper; (f) after 28 days of exposure to 13.66 ppm concentration of copper. Abbreviations used: MF – myofibrils; IM – interstitial materials; GFMF – gap formation in myofibril; IMFS – inter myofibrillar space; DMF – disintegrated myofibrils; EMF – oedema between muscle fibres; MD – muscle degradation; ME – muscle oedema (Source: Maharajan et al., 2016)
CONCLUSION
This study on the accumulation of heavy metals reflected on the degree of contamination in the environment. Besides that, the level of copper contamination in
fish was considerably interesting since fish is an important source of copper for the general population. Most of the copper content in fish is highly absorbable in the form of copper sulphate. Acute toxicity and
Pertanika J. Trop. Agric. Sci. 41 (2): 519 – 540 (2018)
Effects of Heavy Metal on Aquatic Organisms
535
physiological effects on aquatic organisms following waterborne copper exposure can be altered by several parameters including the concentration of the copper absorbed and the time of exposure. Other studies have also proven that the application of histopathological alteration can be used as a biomarker of copper exposure.
ACKNOWLEDGEMENT
This review was supported in part by a grant from Putra-IPS (9481400).
REFERENCESAbdel-Moneim, A. M., & Abdel-Mohsen, H. A.
(2010). Ultrastructure changes in hepatocytes of catfish Clarias gariepinus from Lake Mariut, Egypt. Journal of Environmental Biology, 31(5), 715–720.
Abdel-Tawwab, M. (2016). Effect of feed availability on susceptibility of Nile tilapia, Oreochromis niloticus (L.) to environmental zinc toxicity: Growth performance, biochemical response, and zinc bioaccumulation. Aquaculture, 464, 309–315.
Abubakar, M. I., Ezeri, G. N., Omoniyi, I. T., & Akinloye, O. A. (2014). Histopathology of the gills, livers and kidney of Clarias gariepinus (Burchell, 1822) exposed to Sniper 1000EC under laboratory conditions. Journal of Medical and Applied Biosciences, 6(1), 44–60.
Agamy, E. (2012). Histopathological changes in the livers of rabbit fish (Siganus canaliculatus) following exposure to crude oil and dispersed oil. Toxicologic Pathology, 40(8), 1128–1140.
Ahsan, N., Lee, D. G., Lee, S. H., Kang, K. Y., Lee, J. J., Kim, P. J., … & Lee, B. H. (2007). Excess copper induced physiological and proteomic changes in germinating rice seeds. Chemosphere, 67(6), 1182–1193.
Ajani, E. K., & Akpoilih, B. U. (2010). Effect of chronic dietary copper exposure on haematology and histology of common carp (Cyprinus carpio L.). Journal of Applied Sciences and Environmental Management, 14(4), 39–45.
Akan, J. C., Mohmoud, S., Yikala, B. S., & Ogugbuaja, V. O. (2012). Bioaccumulation of some heavy metals in fish samples from River Benue in Vinikilang, Adamawa State, Nigeria. American Journal of Analytical Chemistry, 3(11), 727–736.
Al-Balawi, H. F. A., Al-Akel, A. S., Al-Misned, F., Suliman, E. A. M., Al-Ghanim, K. A., Mahboob, S., & Ahmad, Z. (2013). Effects of sub-lethal exposure of lead acetate on histopathology of gills, liver, kidney and muscle and its accumulation in these organs of Clarias gariepinus. Brazilian Archives of Biology and Technology, 56(2), 293–302.
Al-Tamimi, A. H., Al-Azzawi, A. J., & Al-A’dhmi, M. A. (2015). Chronic toxicity assessment of histological changes and micronuclei in fish Cyprinus carpio L. after exposed to copper. American Scientific Research Journal for Engineering, Technology and Sciences, 13(1), 194–210.
Al-Yousuf, M. H., El-Shahawi, M. S., & Al-Ghais, S. M. (2000). Trace metals in liver, skin and muscle of Lethrinus lentjan fish species in relation to body length and sex. Science of the Total Environment, 256(2–3), 87–94.
Annabi, A., Said, K., & Messaoudi, I. (2013). Cadmium: Bioaccumulation, histopathology and detoxifying mechanisms in fish. American Journal of Research Communication, 4(1), 60–79.
Ashraf, M. A., Maah, M. J., & Yusoff, I. (2012). Bioaccumulation of heavy metals in fish species collected from former tin mining catchment. International Journal of Environmental Research, 6(1), 209–218.
Pertanika J. Trop. Agric. Sci. 41 (2): 519 – 540 (2018)
Siti Nadzirah Padrilah, Mohd Khalizan Sabullah, Mohd Yunus Abd Shukor, Nur Adeela Yasid, Nor Aripin Shamaan and Siti Aqlima Ahmad
536
Atabati, A., Keykhosravi, A., Askari-Hesni, M., Vatandoost, J., & Motamedi, M. (2015). Effects of copper sulfate on gill histopathology of grass carp (Ctenopharyngodon idella). Iranian Journal of Ichthyology, 2(1), 35–42.
Balambigai, N., & Aruna, D. (2011). Impact of copper sulphate, an essential micronutrient on ACh, AChE and Na+K+ATPase in various tissues of the fish Cyprinus carpio (L.). Research Journal of Environmental Toxicology, 5(2), 141–146.
Balamurugan, K., & Schaffner, W. (2006). Copper homeostasis in eukaryotes: Teetering on a tightrope. Biochimica et Biophysica Acta (BBA) – Molecular Cell Research, 1763(7), 737–746.
Bambang, Y., Thuet, P., Charmantier-Daures, M., Trilles, J. P., & Charmantier, G. (1995). Effect of copper on survival and osmoregulation of various developmental stages of the shrimp Penaeus japonicus bate (Crustacea, Decapoda). Aquatic Toxicology, 33(2), 125–139.
Batvari, B. P. D., Kamala-Kannan, S., Shanthi, K., Krishnamoorthy, R., Lee, K. J., & Jayaprakash, M. (2008). Heavy metals in two fish species (Carangoidel malabaricus and Belone stronglurus) from Pulicat Lake, North of Chennai, Southeast Coast of India. Environmental Monitoring and Assessment, 145(1–3), 167–175.
Bose, M., Ilavazhahan, M., Tamilselvi, R., & Viswanathan, M. (2013). Effect of heavy metals on the histopathology of gills and brain of fresh water fish Calta calta. Biomedical and Pharmacology Journal, 6(1), 99–105.
Carvalho, C. S., & Fernandes, M. N. (2006). Effect of temperature on copper toxicity and hematological responses in the neotropical fish Prochilodus scrofa at low and high pH. Aquaculture, 251(1), 109–117.
Cepanko, V., Idzelis, R. L., Kesminas, V., & Ladygiene, R. (2010). Radiological investigation of roach and perch from some lakes in Lithuania. Journal of Environmental Engineering and Landscape Management, 14(4), 199–205.
Çoǧun, H. Y., & Kargın, F. (2004). Effects of pH on the mortality and accumulation of copper in tissues of Oreochromis niloticus. Chemosphere, 55(2), 277–282.
Cunha, I., Mangas-Ramirez, E., & Guilhermino, L. (2007). Effects of copper and cadmium on cholinesterase and glutathione S-transferase activities of two marine gastropods (Monodonta lineata and Nucella lapillus). Comparative Biochemistry and Physiology Part C: Toxicology and Pharmacology, 145(4), 648–657.
Czedli, H., Csedreki, L., Sziki, A. G., Jolankai, G., Pataki, B., Hancz, C., … & Nagy, S. A. (2014). Investigation of the bioaccumulation of copper in fish. Fresenius Environmental Bulletin, 23(7), 1547–1552.
Das, B. K., & Mukherjee, S. C. (2000). A histopathological study of carp (Labeo rohita) exposed to hexachlorocyclohexane. Veterinarski Arhiv, 70(4), 169–180.
Das, S., & Gupta, A. (2013). Accumulation of copper in different tissues and changes in oxygen consumption rate in Indian Flying Barb, Esomus danricus (Hamilton-Buchanan) exposed to sub-lethal concentrations of copper. Jordan Journal of Biological Sciences, 6(1), 21–24.
Devi, Y., & Mishra, A. (2013). Histopathological alterations in gill and liver anotomy of fresh water, air breathing fish Channa punctatus after Pesticide Hilban® (Chlorpyrifos) treatment. Advanced Biomedical Research, 4(2), 57–62.
Pertanika J. Trop. Agric. Sci. 41 (2): 519 – 540 (2018)
Effects of Heavy Metal on Aquatic Organisms
537
Ebrahimpour, M., Pourkhabbaz, A., Baramaki, R., Babaei, H., & Rezaei, M. (2011). Bioaccumulation of heavy metals in freshwater fish species, Anzali, Iran. Bulletin of Environmental Contamination and Toxicology, 87(4), 386–392.
El-Moselhy, K. M., Othman, A. I., Abd El-Azem, H., & El-Metwally, M. E. A. (2014). Bioaccumulation of heavy metals in some tissues of fish in the Red Sea, Egypt. Egyptian Journal of Basic and Applied Sciences, 1(2), 97–105.
El-Sayyad, H. I., Zaki, V. H., El-Shebly, A. M., & El-Badry, D. A. (2010). Studies on the effects of bacterial diseases on skin and gill structure of Clarias gariepinus in Dakahlia Province, Egypt. Annals of Biological Research, 1(4), 106–118.
Eneji, I. S., Sha’Ato, R., & Annune, P. A. (2011). Bioaccumulation of heavy metals in fish (Tilapia zilli and Clarias gariepinus) organs from River Benue, North-Central Nigeria. Pakistan Journal of Analytical and Environmental Chemistry, 12(1–2), 25–31.
Farombi, E. O., Adelowo, O. A., & Ajimoko, Y. R. (2007). Biomarkers of oxidative stress and heavy metal levels as indicators of environmental pollution in African catfish (Clarias gariepinus) from Nigeria Ogun River. International Journal of Environmental Research and Public Health, 4(2), 158–165.
Fatma, A. S. M. (2009). Histopathological studies on Tilapia zillii and Solea vulgaris from Lake Qarun, Egypt. World Journal of Fish and Marine Sciences, 1(1), 29–39.
Figueiredo-Fernandes, A., Ferreira-Cardoso, J. V., Garcia-Santos, S., Monteiro, S. M., Carrola, J., Matos, P., & Fontaínhas-Fernandes, A. (2007). Histopathological changes in liver and gill epithelium of Nile tilapia, Oreochromis niloticus, exposed to waterborne copper. Pesquisa Veterinária Brasileira, 27(3), 103–109.
Francis, P. C., Birge, W. J., & Black, J. A. (1984). Effects of cadmium-enriched sediment on fish and amphibian embryo-larval stages. Ecotoxicology and Environmental Safety, 8(4), 378–387.
Franciscato, C., Bueno, T. M., Moraes-Silva, L., Duarte, F. A., Flores, É. M., Dressler, V. L., & Pereira, M. E. (2009). High doses of zinc and copper alter neither cerebral metal levels nor acetylcholinesterase activity of suckling rats. EXCLI Journal, 8, 138–147.
Gaber, H. S., Abbas, W. T., Authman, M. M. N., & Gaber, S. A. (2014). Histological and biochemical studies on some organs of two fish species in Bardawil Lagoon, North Sinai, Egypt. Global Veterinarian, 12(1), 1–11.
Ghosh, L., & Adhikari, S. (2006). Accumulation of heavy metals in freshwater fish – An assessment of toxic interactions with calcium. American Journal of Food Technology, 1(2), 139–148.
Hadi, A., & Ahwan, S. (2012). Histopathological changes in gills, liver and kidney of fresh water fish, Tilapia zillii, exposed to aluminum. International Journal of Pharmacy and Sciences, 3(11), 2071–2081.
Hellawell, J. M. (1986). Biological indicators of freshwater pollution and environmental management. USA: Elsevier Applied Science Publishers.
Hinton, D. E., & Lauren, J. C. (1990). Integrative histopathology approaches to detecting effects of environmental stress on fishes. American Fisheries Society Symposium, 8, 51–56.
Idriss, A. A., & Ahmad, A. K. (2015). Heavy metal concentrations in fish from Juru River, estimation of the health risk. Bulletin of Environmental Contamination and Toxicology, 94(2), 204–208.

Pertanika J. Trop. Agric. Sci. 41 (2): 519 – 540 (2018)
Siti Nadzirah Padrilah, Mohd Khalizan Sabullah, Mohd Yunus Abd Shukor, Nur Adeela Yasid, Nor Aripin Shamaan and Siti Aqlima Ahmad
538
Jalal, K. C. A., Mohd, A. Y., Habab, M., & Kamaruzzaman, B. Y. (2014). Bioaccumulation of selected metals in fresh water Haruan fish (Channastriatus) collected from Pahang river basin, Malaysia. Oriental Journal of Chemistry, 29(4), 1553–1558.
Jezierska, B., & Witeska, M. (2006). The metal uptake and accumulation in fish living in polluted waters. In I. Twardowska, H. E. Allen, M. M. Häggblom, & S. Stefaniak (Eds.), Soil and water pollution monitoring, protection and remediation (pp. 107–114). Dordrecht: Springer Netherlands. Retrieved from http://link.springer.com/chapter/10.1007/978-1-4020-4728-2_6
Joshi, P. (2011). Impact of zinc sulphate on behavioural responses in the freshwater fish Clarias batrachus (Linn.). Online International Interdisciplinary Research Journal, 1(2), 76–82.
Kamaruzzaman, B. Y., John, B. A., Maryam, B. Z., Jalal, K. C. A., & Shahbuddin, S. (2012). Bioaccumulation of heavy metals (Cd, Pb, Cu and Zn) in Scylla serrata (Forsskal 1775) collected from Sungai Penor, Pahang, Malaysia. Pertanika Journal of Tropical Agricultural Science, 35(1), 183–190.
Kamaruzzam, B. Y., Ong, M. C., & Jalal, K. C. A. (2008). Level of copper, zinc and lead in fishes of Mangabang Telipot River, Terengganu, Malaysia. Journal of Biological Sciences, 8(7), 1181–1186.
Karayakar, F., Cicik, B., Ciftci, N., Karaytug, S., Erdem, C., & Ozcan, A. Y. (2010). Accumulation of copper in liver, gill and muscle tissues of Anguilla anguilla (Linnaeus, 1758). Journal of Animal and Veterinary Advances, 9(17), 2271–2274.
Khabbazi, M., Harsij, M., Hedayati, S. A. A., Gerami, M. H., & Ghafari-Farsani, H. (2015). Histopathology of rainbow trout gills after exposure to copper. Iranian Journal of Ichthyology, 1(3), 191–196.
Kumar, P. M., & Prabhahar, C. (2012). Bioaccumulation of heavy metals in fish from waste water: A review. International Journal of Pharmaceutical and Biological Archive, 3(6), 13550–1359.
Liebel, S., Tomotake, M. E. M., & Ribeiro, C. A. O. (2013). Fish histopathology as biomarker to evaluate water quality. Ecotoxicology and Environmental Contamination, 8(2), 09–15.
Maharajan, A., Kitto, M. R., Paruruckumani, P. S., & Ganapiriya, V. (2016). Histopathology biomarker responses in Asian sea bass, Lates calcarifer (Bloch) exposed to copper. The Journal of Basic and Applied Zoology, 77, 21–30.
Malik, N., Biswas, A. K., Qureshi, T. A., Borana, K., & Virha, R. (2010). Bioaccumulation of heavy metals in fish tissues of a freshwater lake of Bhopal. Environmental Monitoring and Assessment, 160(1–4), 267–276.
Miranda, A. L., Roche, H., Randi, M. A. F., Menezes, M. L., & Ribeiro, C. A. (2008). Bioaccumulation of chlorinated pesticides and PCBs in the tropical freshwater fish Hoplias malabaricus: Histopathological, physiological, and immunological findings. Environment International, 34(7), 939–949.
Mohammadnabizadeh, S., Pourkhabbaz, A., & Afshari, R. (2014). Analysis and drtermination of trace metals (nickel, cadmium, chromium, and lead) in tissues of Pampus argenteus and Platycephalus indicus in the Hara Reserve, Iran. Journal of Toxicology, 2014, 1-6. https://doi.org/10.1155/2014/576496
Monteiro, S. M., Oliveira, E., Fontaínhas-Fernandes, A., & Sousa, M. (2012). Effects of sublethal and lethal copper concentrations on the gill epithelium ultrastructure of Nile tilapia, Oreochromis niloticus. Zoological Studies, 51(7), 977–987.
Pertanika J. Trop. Agric. Sci. 41 (2): 519 – 540 (2018)
Effects of Heavy Metal on Aquatic Organisms
539
Nandan, S., & Kumar, B. G. (2014). Copper toxicity: Haematological and histopathological changes and prophylactic role of vitamin C in the fish, Anabas testudineus (Bloch, 1792). Journal of Zoology Studies, 1(3), 4–13.
Osman, A. G. M., Reheem, A.-E., Baset, M. A. E., AbuelFadl, K. Y., & Rab, A. G. G. (2010). Enzymatic and histopathologic biomarkers as indicators of aquatic pollution in fishes. Natural Science, 2(11), 1302–1311.
Pandey, S., Parvez, S., Ansari, R. A., Ali, M., Kaur, M., Hayat, F., … & Raisuddin, S. (2008). Effects of exposure to multiple trace metals on biochemical, histological and ultrastructural features of gills of a freshwater fish, Channa punctata Bloch. Chemico-Biological Interactions, 174(3), 183–192.
Pant, S. C., Kumar, S., & Khanna, S. S. (1980). Toxicity of copper sulphate and zinc sulphate to fresh water teleost Puntius conchonius (Ham.) in hard water. Comparative Physiology and Ecology, 5(3), 146–149.
Paulo, D. V., Fontes, F. M., & Flores-Lopes, F. (2012). Histopathological alterations observed in the liver of Poecilia vivipara (Cyprinodontiformes: Poeciliidae) as a tool for the environmental quality assessment of the Cachoeira River, BA. Brazilian Journal of Biology, 72(1), 131–140.
Perera, P. A. C. T., Kodithuwakku, S. P., Sundarabarathy, T. V., & Editrisinghe, U. (2015). Bioaccumulation of cadmium on freshwater fish: An environmental perspective. Insight Ecology, 4(1), 1–12.
Rajkowska, M., & Protasowicki, M. (2013). Distribution of metals (Fe, Mn, Zn, Cu) in fish tissues in two lakes of different trophy in Northwestern Poland. Environmental Monitoring and Assessment, 185(4), 3493–3502.
Reddy, P. B. (2012). Histopathogical studies as potential and direct biomarkers of pollution. Trends in Life Sciences, 1(1), 27–31.
Ribeiro, C. A. O., Vollaire, Y., Sanchez-Chardi, A., & Roche, H. (2005). Bioaccumulation and the effects of organochlorine pesticides, PAH and heavy metals in the Eel (Anguilla anguilla) at the Camargue Nature Reserve, France. Aquatic Toxicology, 74(1), 53–69.
Sabullah, M. K., Ahmad, S. A., Shukor, M. Y., Gansau, A. J., Syed, M. A., Sulaiman, M. R., & Shamaan, N. A. (2015). Heavy metal biomarker: Fish behavior, cellular alteration, enzymatic reaction and proteomics approaches. International Food Research Journal, 22(2), 435–454.
Sabullah, M. K., Shukor, M. Y., Sulaiman, M. R., Shamaan, N. A., Syed, M. A., Khalid, A., & Ahmad, S. A. (2014). The effect of copper on the ultrastructure of Puntius javanicus hepatocyte. Australian Journal of Basic and Applied Science, 8(15), 245–51.
Shuhaimi-Othman, M., Nadzifah, Y., Ahmad, A. K., & others. (2010). Toxicity of copper and cadmium to freshwater fishes. World Academy of Science, Engineering and Technology, 65, 869–871.
Solomon, F. (2009). Impacts of copper on aquatic ecosystems and human health. Environment and Communities, 25(8), 25-28.
Tao, S., Long, A., Dawson, R. W., Xu, F., Li, B., Cao, J., & Fang, J. (2002). Copper speciation and accumulation in the gill microenvironment of carp (Cyprinus carpio) in the presence of kaolin particles. Archives of Environmental Contamination and Toxicology, 42(3), 325–331.
Udotong, J. I., & John, O. U. (2015). Histopathological changes in liver and muscle of tilapia fish from QIRE exposed to concentrations of heavy metals. World Academy of Science, Engineering and Technology, 9(6), 659–662.

Pertanika J. Trop. Agric. Sci. 41 (2): 519 – 540 (2018)
Siti Nadzirah Padrilah, Mohd Khalizan Sabullah, Mohd Yunus Abd Shukor, Nur Adeela Yasid, Nor Aripin Shamaan and Siti Aqlima Ahmad
540
Van der Oost, R., Beyer, J., & Vermeulen, N. P. E. (2003). Fish bioaccumulation and biomarkers in environmental risk assessment: A review. Environmental Toxicology and Pharmacology, 13(2), 57–149.
Velma, V., Vutukuru, S. S., & Tchounwou, P. B. (2009). Ecotoxicology of hexavalent chromium in freshwater fish: A critical review. Reviews on Environmental Health, 24(2), 129–145.
Vijver, M. G., van Gestel, C. A. M., Lanno, R. P., van Straalen, N. M., & Peijnenburg, W. J. G. M. (2004). Internal metal sequestration and its ecotoxicological relevance: A review. Environmental Science and Technology, 38(18), 4705–4712.
Wani, A. A., Sikdar-Bar, M., & Khan, H. A. (2013). Acute toxicity of copper sulphate to African catfish, Clarias gariepinus. GERF Bulletin of Biosciences, 4(1), 14–18.
Younis, E. M., Abdel-Warith, A. A., Al-Asgah, N. A., Ebaid, H., & Mubarak, M. (2013). Histological changes in the liver and intestine of Nile tilapia, Oreochromis niloticus, exposed to sublethal concentrations of cadmium. Pakistan Journal of Zoology, 45(3), 833–841.

Pertanika J. Trop. Agric. Sci. 41 (2): 541 – 574 (2018)
ISSN: 1511-3701 © Universiti Putra Malaysia Press
TROPICAL AGRICULTURAL SCIENCEJournal homepage: http://www.pertanika.upm.edu.my/
ARTICLE INFOArticle history:Received: 18 July 2017Accepted: 30 November 2017
E-mail addresses:[email protected] (Kabiru Sahabi)[email protected] (Sujey Kumar Rajendren)[email protected] (Jia Ning Foong)[email protected] (Gayathri Thevi Selvarajah)* Corresponding author
Review Article
Mammary Gland Tumours in the Dog, a Spontaneous Tumour Model of Comparative Value to Human Breast Cancer
Kabiru Sahabi, Sujey Kumar Rajendren, Jia Ning Foong and Gayathri Thevi Selvarajah*Department of Veterinary Clinical Studies, Faculty of Veterinary Medicine, Universiti Putra Malaysia, 43400 UPM Serdang, Selangor, Malaysia
ABSTRACT
Mammary gland tumours are the most common neoplasia diagnosed in the female dog. These tumours occur spontaneously or naturally as in humans, 50% of which are commonly diagnosed as malignant. Metastasis to other tissues especially the lung is a common cause of death in these dogs. Treatment of canine mammary gland tumours (CMT) involves mainly surgical resection with wide margin followed by chemotherapy with cytotoxic drugs for those with lymph node and distant metastasis. With the dog continuously described as a very suitable and valuable large animal model of human breast cancer, it becomes very obvious that CMT can be a model to further understand the biology of cancer as well as screening for new therapeutic agents that could be used to treat human breast cancer and CMT more effectively. This review focuses on research work that has been done on CMT over the past years, describing the epidemiology, diagnostics and recent advances in therapy for CMT as well as discussing the significance of the dog CMT as spontaneous animal model for human breast cancer.
Keywords: Cancer biology, dog model, histopathology, human breast cancer, mammary tumours
INTRODUCTION
In mammals, a modification of sweat gland results in the formation of the mammary gland, consisting of a network of ducts that are surrounded by adipose-rich fibrovascular stroma (Santos, Marcos, & Faustino, 2010; Sorenmo, Rasotto,
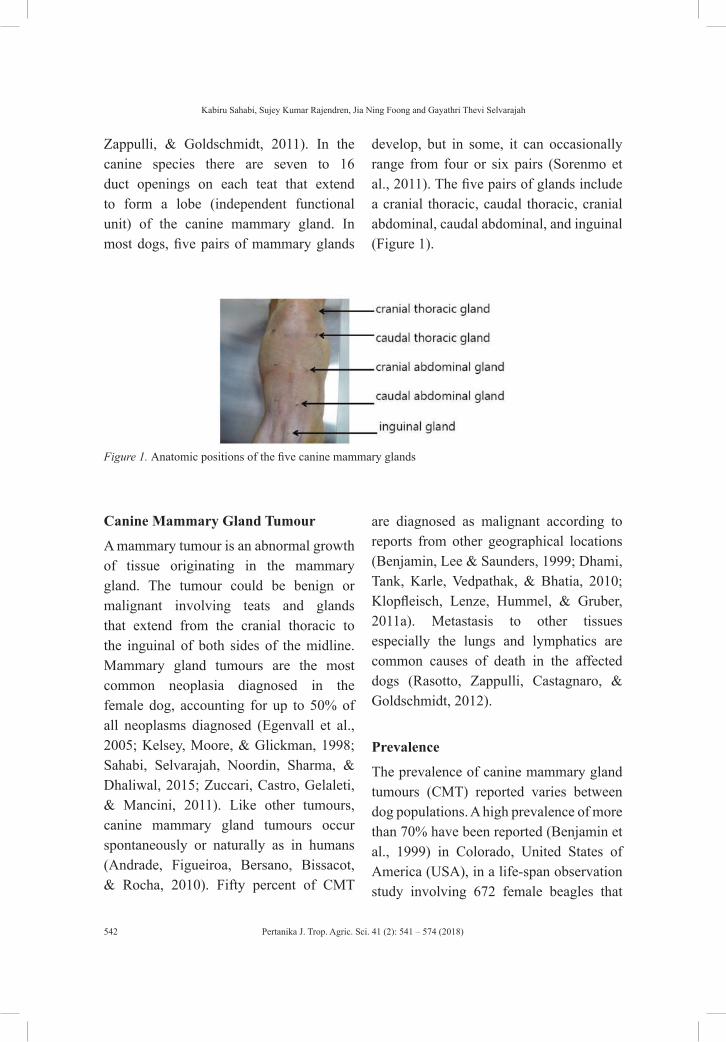
Pertanika J. Trop. Agric. Sci. 41 (2): 541 – 574 (2018)
Kabiru Sahabi, Sujey Kumar Rajendren, Jia Ning Foong and Gayathri Thevi Selvarajah
542
Zappulli, & Goldschmidt, 2011). In the canine species there are seven to 16 duct openings on each teat that extend to form a lobe (independent functional unit) of the canine mammary gland. In most dogs, five pairs of mammary glands
develop, but in some, it can occasionally range from four or six pairs (Sorenmo et al., 2011). The five pairs of glands include a cranial thoracic, caudal thoracic, cranial abdominal, caudal abdominal, and inguinal (Figure 1).
Figure 1. Anatomic positions of the five canine mammary glands
Canine Mammary Gland Tumour
A mammary tumour is an abnormal growth of tissue originating in the mammary gland. The tumour could be benign or malignant involving teats and glands that extend from the cranial thoracic to the inguinal of both sides of the midline. Mammary gland tumours are the most common neoplasia diagnosed in the female dog, accounting for up to 50% of all neoplasms diagnosed (Egenvall et al., 2005; Kelsey, Moore, & Glickman, 1998; Sahabi, Selvarajah, Noordin, Sharma, & Dhaliwal, 2015; Zuccari, Castro, Gelaleti, & Mancini, 2011). Like other tumours, canine mammary gland tumours occur spontaneously or naturally as in humans (Andrade, Figueiroa, Bersano, Bissacot, & Rocha, 2010). Fifty percent of CMT
are diagnosed as malignant according to reports from other geographical locations (Benjamin, Lee & Saunders, 1999; Dhami, Tank, Karle, Vedpathak, & Bhatia, 2010; Klopfleisch, Lenze, Hummel, & Gruber, 2011a). Metastasis to other tissues especially the lungs and lymphatics are common causes of death in the affected dogs (Rasotto, Zappulli, Castagnaro, & Goldschmidt, 2012).
Prevalence
The prevalence of canine mammary gland tumours (CMT) reported varies between dog populations. A high prevalence of more than 70% have been reported (Benjamin et al., 1999) in Colorado, United States of America (USA), in a life-span observation study involving 672 female beagles that
Pertanika J. Trop. Agric. Sci. 41 (2): 541 – 574 (2018)
Review on Mammary Gland Tumours in the Dog
543
were experimentally exposed to radiation. An incidence of 51% per year for CMT in clinical cases in the USA has been reported Kelsey et al. (1998). In Sweden, a study was conducted involving a population of more than 80,000 insured female dogs and the incidence of CMT was reported to be 111 dogs per 10,000 dog year at risk (DYAR) (Egenvall et al., 2005). In clinical reports on CMT, the incidence reported from Europe ranges from 26.5% to 70% (Merlo et al., 2008; Valenčáková-Agyagosová & Ledecký, 2011). An incidence of 205 cases/100,000 dogs/year in the United Kingdom was also reported by Dobson, Samuel, Milstein, Rogers, & Wood (2002). In India, the prevalence of CMT was reported to be 24.3% to 39.9% (Dhami et al., 2010; Srivastava, Sharma, & Singh, 2009). In Malaysia, Sahabi et al., 2015 reported a prevalence of 39% for CMT among all neoplasia cases diagnosed in the pathology laboratory of the Faculty of Veterinary Medicine, Universiti Putra Malaysia, from 2006 to 2012. In a survey of tumours of domestic animals in South Africa, over a 40-year period, CMT was grouped under genital tract tumours in female dogs. The genital tract tumours make up 10.2% of the tumours affecting dogs and the CMT subgroup make up 80% of the genital tract tumours (Bastianello, 1983). At the time of diagnosis, a range between 52% to 86% of the mammary gland tumours in the dog have been reported as malignant (Klopfleisch, Lenze, Hummel, & Gruber, 2011b; Zuccari et al., 2008).
Aetiopathogenesis and Risk Factors
Hormonal Influence. As a bitch grows, mammary stem cell differentiation into ductal, alveolar and myoepithelial cells is regulated by hormones. Oestrogen is involved in the proliferation of the duct while progesterone is involved in the development of alveoli in the mammary gland of animals (Toniti, Buranasinsup, Kongcharoen, Puchadapirom, & Kasorndorkbua, 2009). At maturity, the release of oestrogen initiates mammary gland development, which is completed during and after pregnancy by progesterone and prolactin respectively (Sorenmo et al., 2011). The activity of progesterone peaks during pregnancy and the diestrous phase of the oestrous cycle in the intact bitch, resulting in the development of lobules and ducts lined by multiple layers of epithelium. Prolonged diestrous (prolonged progesterone activity) and exposure to progestegens (progesterone based contraceptives) have been shown to induce CMT development (Gräf & Etreby, 1978). The activity of oestrogen receptors is a major stimulator of cell proliferation in mammary epithelium, and has a close physiological association with progesterone receptor expression (Klopfleisch et al., 2011c). One of the most important causes of mammary gland tumour development in dogs is early exposure to ovarian hormones (Sorenmo et al., 2011). Endocrine aetiology of canine mammary tumour is well-defined, with non-spayed (intact) bitches having four times higher risk than bitches spayed before two years of age (Queiroga, Raposo, Carvalho, Prada, & Pires (2011).
Pertanika J. Trop. Agric. Sci. 41 (2): 541 – 574 (2018)
Kabiru Sahabi, Sujey Kumar Rajendren, Jia Ning Foong and Gayathri Thevi Selvarajah
544
Immunohistochemical studies have identified oestrogen and progesterone receptors in benign and malignant tumours, which strongly points to a hormonal cause (Queiroga et al., 2011). Variable proportions of oestrogen receptors (ER) in malignant and benign tumours have been demonstrated by immunohistochemical and biomedical methods and its presence has been associated with a favourable prognosis (Martin De Las Mulas et al., 2004). Two isoforms of the oestrogen receptors are known - oestrogen receptor alpha (ERα) and oestrogen receptor beta (ERβ), with the former being the major oestrogen receptor (Balfe et al., 2004). Canine mammary tumour progression from benign to malignant is related to steroid dependency, as receptors of oestrogen and progesterone were expressed in 70% benign and 50% malignant tumours (Philibert et al., 2003). Using immunohistochemistry, it was revealed that ERβ-positive tumours were largely more benign than malignant (Martin De Las Mulas et al., 2004). Generally ER positive CMT and more differentiated compared to ER negative CMT (MacEwen, Patnaik, Harvey, & Panko, 1982)
Age. Age is said to be one of the very important factors that influence the risk of canine mammary gland tumour development. Research carried out in a large closed beagle colony showed that mammary neoplasia occurs mainly in adult dogs (Taylor et al., 1976). According to the same study, the incidence rate of CMT remained low in dogs up to seven
years of age (the earliest cancer occurred at seven years of age). At eight years of age, a sharp rise in the incidence was observed, which remained high as the age increases. In a study by Sahabi et al., 2015, the mean age of occurrence of CMT in the dog population was 8.66 years, while the median age was nine years. Moreover, age of the dogs was significantly associated with CMT development in the dogs. No mammary tumour was seen in a population of over 500 male dogs in the said study. The earliest age for mammary gland tumour in dogs however, may vary between breeds according to the natural life span. A range of eight to 11 years is reported as the age of dogs affected by CMT (Sorenmo et al., 2011). A progressive increase in the incidence of mammary gland tumour was observed in dogs from three to nine years of age, after which the frequency declined and reached its lowest at 15 years (Mitchell, De la Iglesia, Wenkoff, Van Dreumel, & Lumb, 1974).
Breed Predisposition. Mammary gland tumour is more common in toy and miniature breeds (Itoh, et al., 2005; Mitchell et al., 1974; Philibert et al., 2003; Sorenmo et al., 2011; Zatloukal, Lorenzova, & Tichý, 2005). According to a study carried out in Sweden by Egenvall et al. (2005) involving more than 80,000 insured female dogs, the incidence of CMT varied between breeds. The English springer spaniel had incidence of 319 dogs per 10,000 DYAR, while the Rough Collie had an incidence of five dogs in 10,000 DYAR. Poodle was the shown to
Pertanika J. Trop. Agric. Sci. 41 (2): 541 – 574 (2018)
Review on Mammary Gland Tumours in the Dog
545
be the most susceptible breed representing 25% of 720 dogs with mammary gland tumour cases (Mitchell et al., 1974). Larger breeds such as Afghan Hound, Brittany Spaniel, English Setter, German Shepherd and Pointer are also at an increased risk of mammary gland tumour development (Sorenmo et al., 2011). Pure breed dogs are reported to have a higher representation in CMT compared to mixed breed (Perez Alenza, Peña, Del Castillo, & Nieto, 2000; Philibert et al., 2003; Sahabi et al., 2015; Zatloukal et al., 2005) .
Obesity. Mammary gland tumour development in dogs has been linked to obesity. Dogs that are obese at one year of age or if they are obese at one year before the diagnosis of CMT, have a higher prevalence of mammary gland tumour than those that do not (Perez Alenza et al., 2000; Philibert et al., 2003). A decreased risk of developing mammary gland tumour in dogs is associated with poor body condition at nine to 12 months of age, but interestingly enough, obese animals of the same age in the study did not have a higher risk of mammary gland tumour development (Sorenmo et al., 2011). In another study, there was little or no association between adult body conformations with the risk of CMT in intact or spayed bitches (Sonnenschein, Glickman, Goldschmidt, & McKee, 1991). Obesity increases the risk of breast cancer development in postmenopausal women, due to increasing local and free circulating oestrogen. Obesity in dogs may influence the development
of mammary gland tumour via the same mechanisms (Sorenmo et al., 2011). A high intake of beef, pork and a decreased consumption of chicken has been linked to a high incidence of mammary gland tumour in dogs (Perez Alenza et al., 2000). The development and biological behaviour of mammary gland tumour are believed to be influenced by body fat content, as Philibert et al. (2003) reported a shorter survival of obese dogs with mammary gland tumour, compared to those with poor body condition at nine to 12 months of age.
Clinical Presentation
Typically, the owner of the dog will present their pet dogs to the veterinarian with a primary complaint of lump(s) observed on the mammary gland(s) (Figure 2). Depending on the tumour type, and /or time taken from the start of tumour development to the time of presentation to the veterinarian, other clinical signs such as ulceration around the affected gland(s), anorexia, pyrexia, emaciation, change in gait, signs of pain, in some cases, anaemia and other signs of systemic illnesses can occur. The caudal abdominal and inguinal mammary glands are most commonly affected as compared to other glands in the dog (Sahabi et al., 2015; Sorenmo et al., 2011). This has been suggested to be attributable to a more abundant glandular tissue and the larger size and the longer time of secretory activity in the abdominal and inguinal glands (Mitchell et al., 1974). Furthermore, low incidence of mammary gland tumour in male dogs could be due
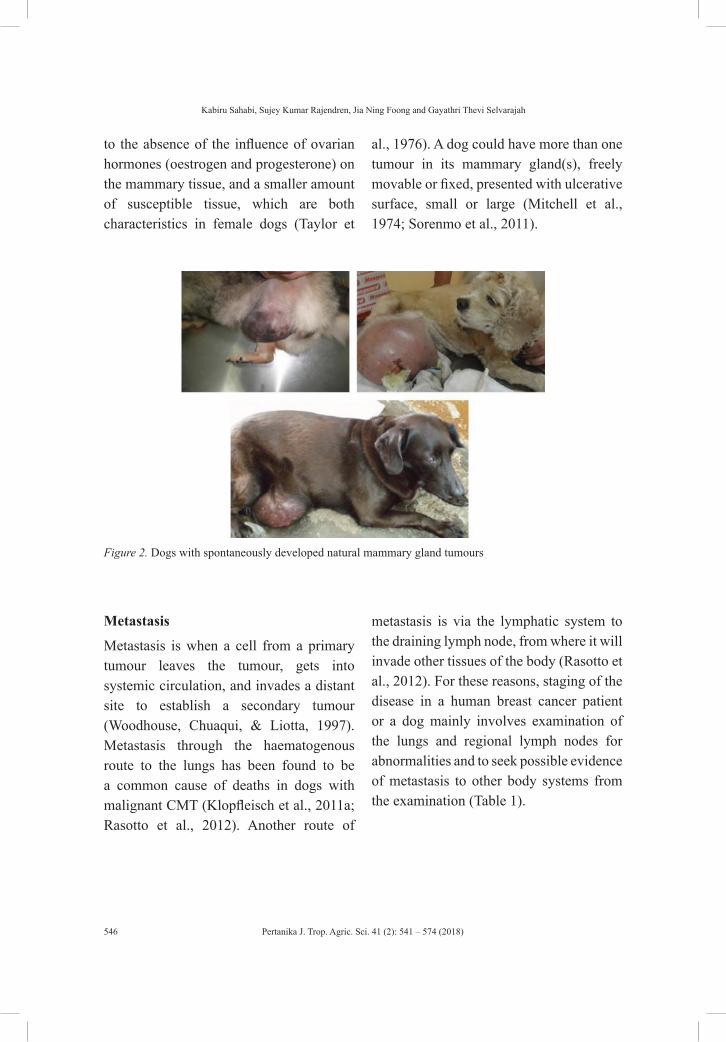
Pertanika J. Trop. Agric. Sci. 41 (2): 541 – 574 (2018)
Kabiru Sahabi, Sujey Kumar Rajendren, Jia Ning Foong and Gayathri Thevi Selvarajah
546
to the absence of the influence of ovarian hormones (oestrogen and progesterone) on the mammary tissue, and a smaller amount of susceptible tissue, which are both characteristics in female dogs (Taylor et
al., 1976). A dog could have more than one tumour in its mammary gland(s), freely movable or fixed, presented with ulcerative surface, small or large (Mitchell et al., 1974; Sorenmo et al., 2011).
Figure 2. Dogs with spontaneously developed natural mammary gland tumours
Metastasis
Metastasis is when a cell from a primary tumour leaves the tumour, gets into systemic circulation, and invades a distant site to establish a secondary tumour (Woodhouse, Chuaqui, & Liotta, 1997). Metastasis through the haematogenous route to the lungs has been found to be a common cause of deaths in dogs with malignant CMT (Klopfleisch et al., 2011a; Rasotto et al., 2012). Another route of
metastasis is via the lymphatic system to the draining lymph node, from where it will invade other tissues of the body (Rasotto et al., 2012). For these reasons, staging of the disease in a human breast cancer patient or a dog mainly involves examination of the lungs and regional lymph nodes for abnormalities and to seek possible evidence of metastasis to other body systems from the examination (Table 1).
Pertanika J. Trop. Agric. Sci. 41 (2): 541 – 574 (2018)
Review on Mammary Gland Tumours in the Dog
547
Table 1Sites for metastasis in dogs with mammary gland tumours
Organ/tissue of metastasis ReferencesLymph node(s) (Kim et al., 2011; Sorenmo et al., 2000)Lung (Sorenmo et al., 2011)Liver, kidney and spleen (Kim et al., 2011; Valenčáková-Agyagosová & Ledecký, 2011) Brain, eye, skin, bone, heart (Kim et al., 2011; Valenčáková-Agyagosová & Ledecký, 2011)
Diagnostic Investigations
In any condition, diagnosis starts with history taking and obtaining signalment of the dog including information on age, breed, neuter status, breeding information, use of exogenous hormones, history of trauma and vaccinations. Physical examination should include examinations that do not focus on the affected mammary glands but also other systems in the body to detect presence of concurrent illnesses. During examination of the tumour, the following should be noted: size, site, number of affected glands and the surrounding tissues, whether they are sessile, movable or ulcerated. The regional lymph node(s) should be carefully palpated and examined to evaluate enlargements, which could be possible in cases of metastasis.
Differential diagnoses typical for masses such as hematoma, abscessation, cyst formation, granuloma or neoplasia / hyperplasia have to be included for masses involving the mammary glands. However, it is difficult to diagnose neoplasia just by observation of the masses, especially those with only a single gland affected. Canine mammary tumours can appear cystic, presented with infection and necrotic
tissue (pus) or even ulceration with active bleeding. Infections on the mammary tumour are relatively common because of the high possibility for the dog to lick or bite on the tumour; or contaminated with soil bacteria when the dog lies down.
Diagnostic Cytology. Fine needle aspiration (FNA) and diagnostic cytology has been described as a valuable diagnostic tool (Santos et al., 2013) (Figure 3). Although easy to perform, tumour classification is difficult, as tissue architecture is not available in FNA (Hellmén & Lindgren, 1989). Fine needle aspiration is very important in the initial stage of the diagnosis as it helps to exclude differential diagnoses such as mastitis, abscessation and hyperplasia (Cassali et al., 2011), with an accuracy rate of 79% reported (Hellmén & Lindgren, 1989). When there is ulceration or discharge present from the affected teat, an impression smear of the ulcerated site or discharge can be useful specimen to facilitate diagnostic cytology. In such cases, there is no need to perform an active FNA or incisional biopsy sampling.
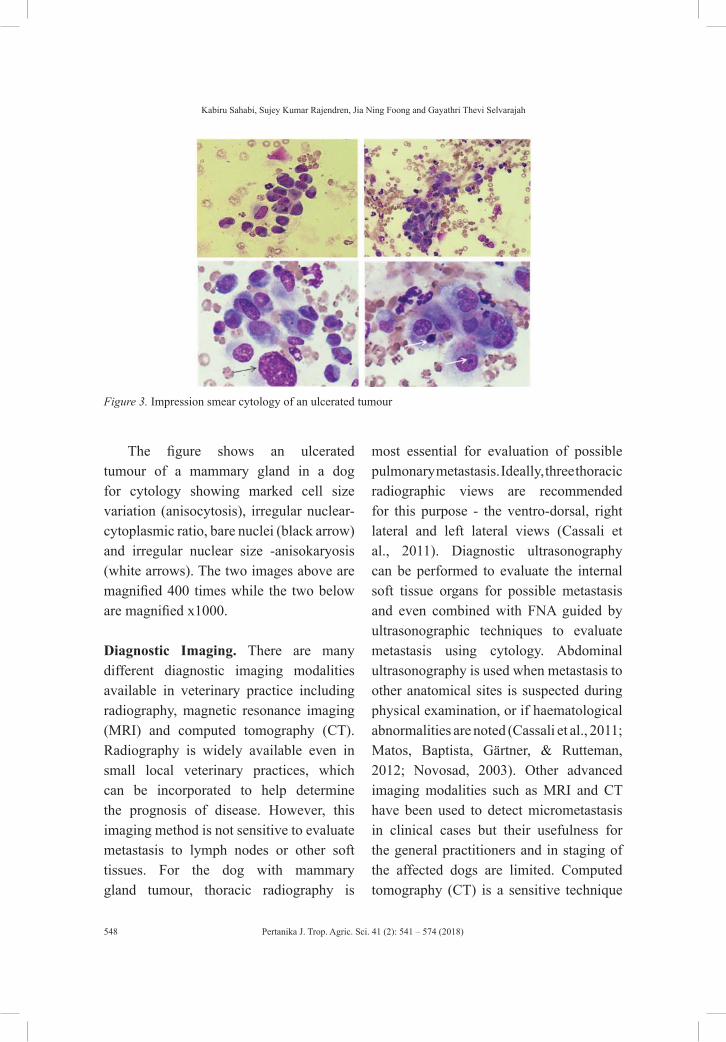
Pertanika J. Trop. Agric. Sci. 41 (2): 541 – 574 (2018)
Kabiru Sahabi, Sujey Kumar Rajendren, Jia Ning Foong and Gayathri Thevi Selvarajah
548
Figure 3. Impression smear cytology of an ulcerated tumour
The figure shows an ulcerated tumour of a mammary gland in a dog for cytology showing marked cell size variation (anisocytosis), irregular nuclear-cytoplasmic ratio, bare nuclei (black arrow) and irregular nuclear size -anisokaryosis (white arrows). The two images above are magnified 400 times while the two below are magnified x1000.
Diagnostic Imaging. There are many different diagnostic imaging modalities available in veterinary practice including radiography, magnetic resonance imaging (MRI) and computed tomography (CT). Radiography is widely available even in small local veterinary practices, which can be incorporated to help determine the prognosis of disease. However, this imaging method is not sensitive to evaluate metastasis to lymph nodes or other soft tissues. For the dog with mammary gland tumour, thoracic radiography is
most essential for evaluation of possible pulmonary metastasis. Ideally, three thoracic radiographic views are recommended for this purpose - the ventro-dorsal, right lateral and left lateral views (Cassali et al., 2011). Diagnostic ultrasonography can be performed to evaluate the internal soft tissue organs for possible metastasis and even combined with FNA guided by ultrasonographic techniques to evaluate metastasis using cytology. Abdominal ultrasonography is used when metastasis to other anatomical sites is suspected during physical examination, or if haematological abnormalities are noted (Cassali et al., 2011; Matos, Baptista, Gärtner, & Rutteman, 2012; Novosad, 2003). Other advanced imaging modalities such as MRI and CT have been used to detect micrometastasis in clinical cases but their usefulness for the general practitioners and in staging of the affected dogs are limited. Computed tomography (CT) is a sensitive technique

Pertanika J. Trop. Agric. Sci. 41 (2): 541 – 574 (2018)
Review on Mammary Gland Tumours in the Dog
549
that is able to detect micro-metastasis to the lungs of less than six mm in diameter (Cassali et al., 2011; Matos et al., 2012). Computed tomography may also be used to monitor response to therapy (Matos et al., 2012).
Histopathology. Histopathology is the method of choice and has been described as the “gold standard” to achieve an accurate diagnosis for CMT (Cassali et al., 2011; Rasotto et al., 2012). It allows for the study of the histopathology characteristics of the tumour such as the mitotic index, differentiation, degree of pleomorphism, amount of necrosis, and invasion of neoplastic cells into adjacent blood vessels and lymphatic and the evaluation of margins of the excised tumour (Cassali et al., 2011). Routine histopathology is performed using hematoxylin and eosin staining protocols, which most of the time are sufficient
for diagnosing CMT. However, selected subtypes or histopathology variants of CMT could be more difficult to diagnose using routine staining and require special staining or immunohistochemistry techniques for an accurate diagnosis (Matos et al., 2012).
World Health Organization (WHO), in 1974, presented the first international histological classification of tumours of domestic animals and in 1999, a modification (Table 2) of the classification system was published (Hampe & Misdorp, 1974; Misdorp, Else, & Hellmen, 1999). These were the basis for the classification of tumours in domestic animals including mammary gland tumours of the dog. Recently, some modifications to the classification systems for canine mammary tumours were proposed because of the need to incorporate newly described histologic subtypes of CMT (Goldschmidt, Peña, Rasotto, & Zappulli, 2011).
Table 2The World Health Organization (WHO) classification (1999) of canine mammary gland tumours
Tumour type Tumour sub-type1. Malignant tumours 1.1 Non-infiltrating (in situ) carcinoma
1.2 Complex carcinoma1.3 Simple carcinoma 1.3.1 Tubulopapillary carcinoma 1.3.2 Solid carcinoma 1.3.3 Anaplastic carcinoma1.4 Special types of carcinomas 1.4.1 Spindle cell carcinoma 1.4.2 Squamous cell carcinoma 1.4.3 Mucinous carcinoma 1.4.4 Lipid rich carcinoma1.5 Sarcoma 1.5.1 Fibrosarcoma 1.5.2 Osteosarcoma 1.5.3 Other sarcomas1.6 Carcinosarcoma1.7 Carcinoma or sarcoma in benign tumour
Pertanika J. Trop. Agric. Sci. 41 (2): 541 – 574 (2018)
Kabiru Sahabi, Sujey Kumar Rajendren, Jia Ning Foong and Gayathri Thevi Selvarajah
550
Table 2 (continue)
Tumour type Tumour sub-type2. Benign tumours 2.1 Adenoma
2.1.1 Simple adenoma 2.1.2 Complex adenoma 2.1.3 Basaloid adenoma2.2 Fibroadenoma 2.2.1 Low-cellularity fibroadenoma 2.2.2 High-cellularity fibroadenoma2.3 Benign mixed tumour2.4 Duct papilloma
3. Unclassified tumours
4. Mammary hyperplasia and dysplasia 4.1 Ductal hyperplasia
4.2 Lobular hyperplasia 4.2.1 Epithelial hyperplasia 4.2.2 Adenosis4.3 Cysts4.4 Duct ectasia4.5 Focal fibrosis (fibrosclerosis)4.6 Gynecomastia
A brief description of the histopathology features of the types of canine mammary gland tumours (Cassali et al., 2011; Goldschmidt et al., 2011) is described below.
Benign Mammary Gland Tumours
Adenoma. This type of tumour is composed of well differentiated epithelial or myoepithelial cells. It is classified as simple tubular type. The solid nodes are composed of fusocellular cells and are called myoepitheliomas. It is a rare tumour in dogs.
Complex Adenomas or Adenomyoepitheliomas. The origin of this tumour is from continuous proliferation of myoepithelial and epithelial cells, without
forming myxoid matrix. It is characterised by having a capsule, no necrosis, atypia and low mitosis.
Basaloid Adenoma. This type of tumour consists of uniform cords on basaloid monomorphic epithelial cells nest. The cells of the periphery are arranged side-by-side manner and are oriented against a thin basal lamina. In most cases the tumours are small.
Fibroadenoma. This type of tumour originates from the proliferation of stromal and epithelial elements. Two sub types are described as: (1) pericanicular fibroadenoma (the stroma surrounds the epithelium) and (2) intracanicular fibroadenoma (the stroma compresses and deforms the epithelium).
Pertanika J. Trop. Agric. Sci. 41 (2): 541 – 574 (2018)
Review on Mammary Gland Tumours in the Dog
551
Benign Mixed Tumour. This type of tumour consists of proliferated cells that appear either fusiform or stellate, morphologically resembling mesenchymal cells and epithelial components, producing adipose tissue and/or cartilage and/or bone, sometimes with fibrous tissue. The cells are sometimes embedded in abundant myxoid matrix. There is some level of pleomorphism and atypia. It is the most common benign tumour in dogs.
Ductal Papilloma. This type of tumour is lobed or ramified in a distended duct. There is proliferation of the epithelium of ducts on a fibro-vascular axis. Cellular atypia is evident on the epithelium, and nuclear hyperchromasia. There is minimal mitotic activity and the epithelium is distributed as a single layer on a layer of myoepithelial cells.
Malignant Mammary Gland Tumours
Ductal Carcinoma In-situ. This is the most common of the two types of carcinoma in-situ, the other type is lobular ductal carcinoma in-situ. It is often associated with invasive canine mammary carcinomas. The tumour develops in the extra- or intra-lobular ducts. DCIS is characterised by the proliferation of epithelial cells in more than two ductal units in one histological section. The cellular architecture of the cells is atypical, characterised by connecting bridges in the ductal lumen. There is also polarisation of epithelial cells in a layer associated with another continuous layer comprising myoepithelial cells. There are micro-calcifications seen in the ductal lumen.
Lobular Carcinoma In-situ. In this type of tumour, epithelial proliferation causes the filling and expansion of the terminal lobular units. About 50% of the lobe is affected and the lumen is completely lost, but the basement membrane is maintained. The cells have the same shape, with small and spherical nuclei. The nuclei are small with discrete and uniform nucleoli. There is noticeable invagination of the cytoplasmic membrane due to a single vacuole around the nucleus.
Carcinoma in a Mixed Tumour. Mixed tumours exhibit a complex histological pattern, having cellular components from epithelial and mesenchymal origin. Some of the cells can turn malignant, giving rise to carcinoma in mixed tumours. Carcinoma in mixed tumours composed of nodules or foci of highly pleomorphic epithelial cells with atypical mitoses, arising in benign mixed tumours.
Complex Carcinoma or Malignant Adenomyoepitheliomas. This tumour is made up of epithelial and myoepithelial cells proliferation. However, myxoid matrix is not evident. Other features include atypia, necrosis, and absence of a capsule and high mitotic activity.
Papillary Carcinoma. Papillary aborescent epithelial proliferation with a central fibrovascular stroma characterises this tumour. These lesions are classified as papilloma, carcinoma in-situ in papilloma, papillary carcinoma in-situ, invasive and
Pertanika J. Trop. Agric. Sci. 41 (2): 541 – 574 (2018)
Kabiru Sahabi, Sujey Kumar Rajendren, Jia Ning Foong and Gayathri Thevi Selvarajah
552
non-invasive papillary carcinomas. In benign tumours, neoplastic papillae that have within them myoepithelial cells could be observed between basement membrane and the epithelial cells. This characteristic is not seen in the malignant variant.
Tubular Carcinoma. Predominantly tubular arrangement of the proliferated epithelial cells qualifies this type of tumour. The amount of stroma is variable. With or without necrosis, peritumoural lymphocytes can be seen. The rate of tissue and vessel invasion is high in these tumours.
Solid Carcinoma. This is a common cancer of dogs that is usually seen when the tumour has stayed for a long time without surgical intervention. On histopathology, the epithelial cells are solidly arranged in chords, sheets or clusters. The cells are not differentiated, with small hyperchromatic nuclei with a high mitotic index. In some cases, the cells will exhibit vacuolated cytoplasm. There is variable amount (small to moderate) of stroma and areas of necrosis.
Micropapillary Carcinoma. Microscopically, this tumour is characterised by the presence of cystic spaces that look like lymphatic vessels distributed within the mammary gland tissue. Within the spaces, a micropapillary pattern which is morule like, is assumed by clusters of epithelial cells. The cytoplasm is eosinophilic and abundant. The nucleus is vesicular and pleomorphic with prominent nucleoli. Lymph node metastasis is common and the
mitotic index is variable. For confirmation, immunohistochemistry can demonstrate the epithelial membrane antigen which will be the form of micropapillary arrangement of the cells.
Invasive Lobular Carcinoma. This type of CMT shows small cells in a linear arrangement, which are non-polar and are uniform in size. The tumour is diffusely invasive with large amount of fibrous stroma. Solid foci may be formed by the tumour cells, containing mucin and having a signet appearance, or arranged around benign ducts in a parallel way.
Pleomorphic Lobular Carcinoma. First found in dogs in 2002, this tumour is a result of the dispersal of epithelial cells in the stroma, or an irregular outline of the cells in a linear pattern. The cytoplasm is abundant and eosinophilic with accentric and pleomorphic nuclei. Cytoplasmic vacuoles are sometimes seen.
Secretory Carcinoma. With fine needle aspiration biopsy (FNAB), the cells are round to oval and in the form of clusters. The nucleoli are fragmented and the chromatin is irregularly distributed. The cells have a clear and abundant cytoplasm with the nucleus pushed to the periphery by secretory vacuoles. Histopathologically, this tumour is seen as an infiltrative carcinoma, with the neoplastic cells having peripherally displaced nucleus by large vacuoles and a clear cytoplasm. The proliferation pattern could be solid and/or tubular with
Pertanika J. Trop. Agric. Sci. 41 (2): 541 – 574 (2018)
Review on Mammary Gland Tumours in the Dog
553
eosinophilic spaces filled with secretion. In secretory carcinoma, the intracytoplasmic content of the cells is PAS positive.
Mucinous Carcinoma. The presence of abundant extracellular mucinous material characterises this tumour. It is also known as gelatinous carcinoma. The proliferated cells may form solid, tubular or papillary structure. Large amount of mucinous eosinophilic secretions fill the spaces in these structures. The secretion is also PAS positive in diastase and alcian blue. The accumulated mucin is mostly located in the intraductal structure. When the mucoid content leaks from the intraductal structure, it then becomes invasive mucinous carcinoma.
Lipid-rich Carcinoma. This tumour is uncommon in dogs and is characterised by an expansive growth. The stroma separates the nests and cords of neoplastic cells. The cytoplasm of the cells is vacuolated and the nuclei are round to flat. There may be peripheral displacement of the nucleus by vacuoles. When 80% of the tumour cells are lipid producing, the diagnosis is confirmed. The cells of this tumour are PAS negative.
Squamous Cell Carcinoma. This tumour is characterised by areas of squamous differentiation in the solidly arranged sheets and cords of tumour cells. Keratin pearls (keratin layers) are found in the centre of the more differentiated tumour. Invasion of the lymphatics in these tumours is not uncommon.
Spindle Cell Carcinoma. This tumour is not very common in dogs. On histopathology, there is presence of spindle cells in bundles or in a circular pattern. The cytoplasm of the cells appears eosinophilic and might be vacuolated. The nuclei could also be vacuolated with a fragmented chromatin. These features should be seen in at least 80% of the tumour section in order to confirm the diagnosis.
Anaplastic Carcinoma. This histologic sub type of CMT is highly aggressive with early metastasis and recurrence and is considered to have the worst prognosis. This tumour is diffusely infiltrative. The proliferating epithelial cells are large, atypical with linear outline. The stroma is loose, abundant and reactive, with individual cells invading it. The cells are also anaplastic, with one or two prominent nucleoli and chromatin fragmentation. The tumour has a high mitotic index with marked anisocytosis. Blood and lymphatic vascular structures invasion by neoplastic cells could be observed and one of the prominent features of this tumour is inflammation.
Fibrosarcoma. These tumours are malignant and are made up of fibroblasts with varying amounts of collagen. Collagen-producing spindle-shaped cells are arranged as reticular fibres form these tumours. Fibrosarcomas are among the most encountered mammary sarcomas in the dog.
Pertanika J. Trop. Agric. Sci. 41 (2): 541 – 574 (2018)
Kabiru Sahabi, Sujey Kumar Rajendren, Jia Ning Foong and Gayathri Thevi Selvarajah
554
Osteosarcoma. This sarcoma is characterised by the formation of bone and/or osteoid by the neoplastic cells. Osteosarcoma could occur as combined or non-combined (pure). The combined form has both osseous and cartilaginous malignant tissues. There is high mitoses and pleomorphism.
Carcinosarcoma. In the dog, the features of carcinosarcoma resemble those described in humans. The cut surfaces of these tumours are firm to bony with a clear delineation. The cells are epithelial-like and well delineated. The type of differentiation varies including solid, adeno, mucinous, anaplastic, squamous, and sarcomatous areas with fibroblastic, chondroblastic and osteomatous differentiation. When present, metastasis is of mixed type, sarcomatous or carcinomatous.
Other Sarcomas. Other sarcomas that could occur in the mammary gland include pure chondrosarcoma, haemangiosarcoma and liposarcoma. These are extremely rare and have similar features to those observed in other organs.
Blood and Urine Profile. Haematological abnormalities are often observed in dogs bearing mammary gland tumour. In human mammary carcinoma, thrombocytopenia might be used as prognostic indicator. In a study on 246 dogs with CMT, thrombocytosis, hypergammaglobulinaemia and neutropaenia were most obvious abnormalities (Lallo, Ferrarias,
Stravino, Rodriguez, & Zucare, 2016). Thrombocytosis has been linked with systemic inflammatory reaction which involves interleukin-1 beta and interleukin-6 which is abundant in mammary gland tumour (Lallo et al., 2016). Hypergammaglobulinaemia is due to acute or chronic inflammatory reaction going on at the mammary gland (Lallo et al., 2016). Some haematological changes can be due to paraneoplastic syndromes. Paraneoplastic syndromes are tumour related alterations in anatomical structure or function or both that take place further from the tumour (Bergman, 2012). Mammary gland carcinoma or adenocarcinoma can cause hypercalcaemia (Bergman, 2012). Hypercalcaemia is due to pathological bone resorption caused by the cytokines that induce oesteoclast differentiation and activity. Parathyroid hormone-related protein (PTHrP) is one of the cytokine involved in oesteoclast differentiation and activity. PTHrP is also secreted by normal mammary gland during lactation. Thus, in the case of mammary gland tumour the production of PTHrP will be high which leads to hypercalcaemia (DeMauro & Wysolmerski, 2005).
Urinalysis has no significant impact and is not able to provide prognostic value for dogs with CMT. However, there has been a study discussing the possibility of proteinuria development in dogs with mammary carcinoma (Crivellenti et al., 2016) which is caused by by-products from neoplastic cell’s interaction with immune cells to form
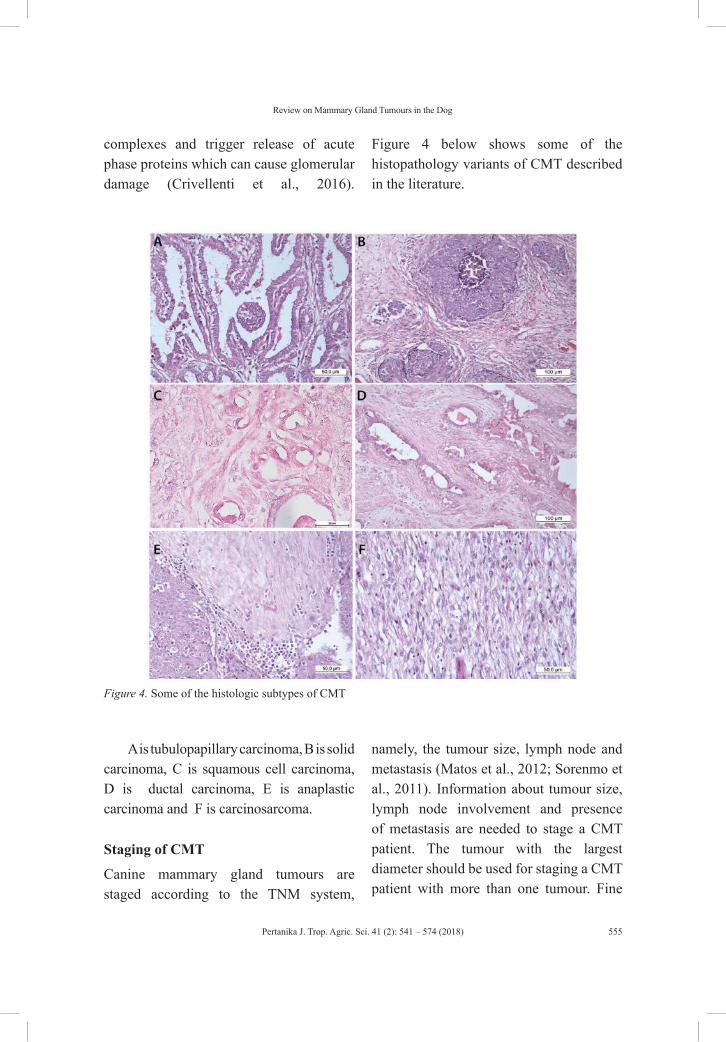
Pertanika J. Trop. Agric. Sci. 41 (2): 541 – 574 (2018)
Review on Mammary Gland Tumours in the Dog
555
complexes and trigger release of acute phase proteins which can cause glomerular damage (Crivellenti et al., 2016).
Figure 4 below shows some of the histopathology variants of CMT described in the literature.
Figure 4. Some of the histologic subtypes of CMT
A is tubulopapillary carcinoma, B is solid carcinoma, C is squamous cell carcinoma, D is ductal carcinoma, E is anaplastic carcinoma and F is carcinosarcoma.
Staging of CMT
Canine mammary gland tumours are staged according to the TNM system,
namely, the tumour size, lymph node and metastasis (Matos et al., 2012; Sorenmo et al., 2011). Information about tumour size, lymph node involvement and presence of metastasis are needed to stage a CMT patient. The tumour with the largest diameter should be used for staging a CMT patient with more than one tumour. Fine
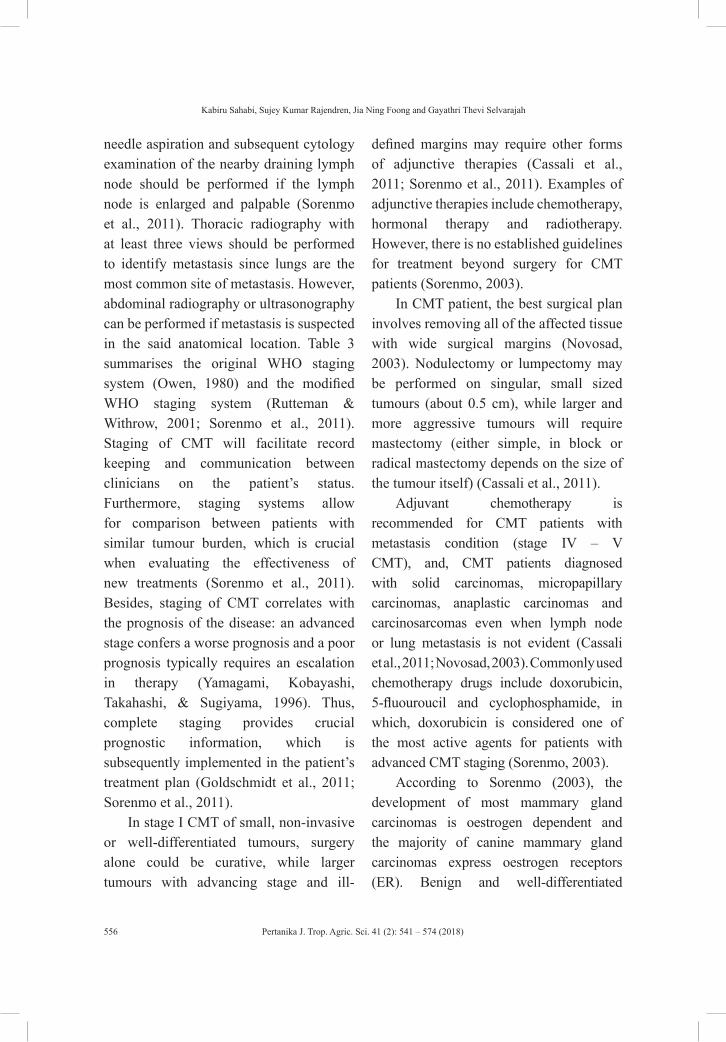
Pertanika J. Trop. Agric. Sci. 41 (2): 541 – 574 (2018)
Kabiru Sahabi, Sujey Kumar Rajendren, Jia Ning Foong and Gayathri Thevi Selvarajah
556
needle aspiration and subsequent cytology examination of the nearby draining lymph node should be performed if the lymph node is enlarged and palpable (Sorenmo et al., 2011). Thoracic radiography with at least three views should be performed to identify metastasis since lungs are the most common site of metastasis. However, abdominal radiography or ultrasonography can be performed if metastasis is suspected in the said anatomical location. Table 3 summarises the original WHO staging system (Owen, 1980) and the modified WHO staging system (Rutteman & Withrow, 2001; Sorenmo et al., 2011). Staging of CMT will facilitate record keeping and communication between clinicians on the patient’s status. Furthermore, staging systems allow for comparison between patients with similar tumour burden, which is crucial when evaluating the effectiveness of new treatments (Sorenmo et al., 2011). Besides, staging of CMT correlates with the prognosis of the disease: an advanced stage confers a worse prognosis and a poor prognosis typically requires an escalation in therapy (Yamagami, Kobayashi, Takahashi, & Sugiyama, 1996). Thus, complete staging provides crucial prognostic information, which is subsequently implemented in the patient’s treatment plan (Goldschmidt et al., 2011; Sorenmo et al., 2011).
In stage I CMT of small, non-invasive or well-differentiated tumours, surgery alone could be curative, while larger tumours with advancing stage and ill-
defined margins may require other forms of adjunctive therapies (Cassali et al., 2011; Sorenmo et al., 2011). Examples of adjunctive therapies include chemotherapy, hormonal therapy and radiotherapy. However, there is no established guidelines for treatment beyond surgery for CMT patients (Sorenmo, 2003).
In CMT patient, the best surgical plan involves removing all of the affected tissue with wide surgical margins (Novosad, 2003). Nodulectomy or lumpectomy may be performed on singular, small sized tumours (about 0.5 cm), while larger and more aggressive tumours will require mastectomy (either simple, in block or radical mastectomy depends on the size of the tumour itself) (Cassali et al., 2011).
Adjuvant chemotherapy is recommended for CMT patients with metastasis condition (stage IV – V CMT), and, CMT patients diagnosed with solid carcinomas, micropapillary carcinomas, anaplastic carcinomas and carcinosarcomas even when lymph node or lung metastasis is not evident (Cassali et al., 2011; Novosad, 2003). Commonly used chemotherapy drugs include doxorubicin, 5-fluouroucil and cyclophosphamide, in which, doxorubicin is considered one of the most active agents for patients with advanced CMT staging (Sorenmo, 2003).
According to Sorenmo (2003), the development of most mammary gland carcinomas is oestrogen dependent and the majority of canine mammary gland carcinomas express oestrogen receptors (ER). Benign and well-differentiated
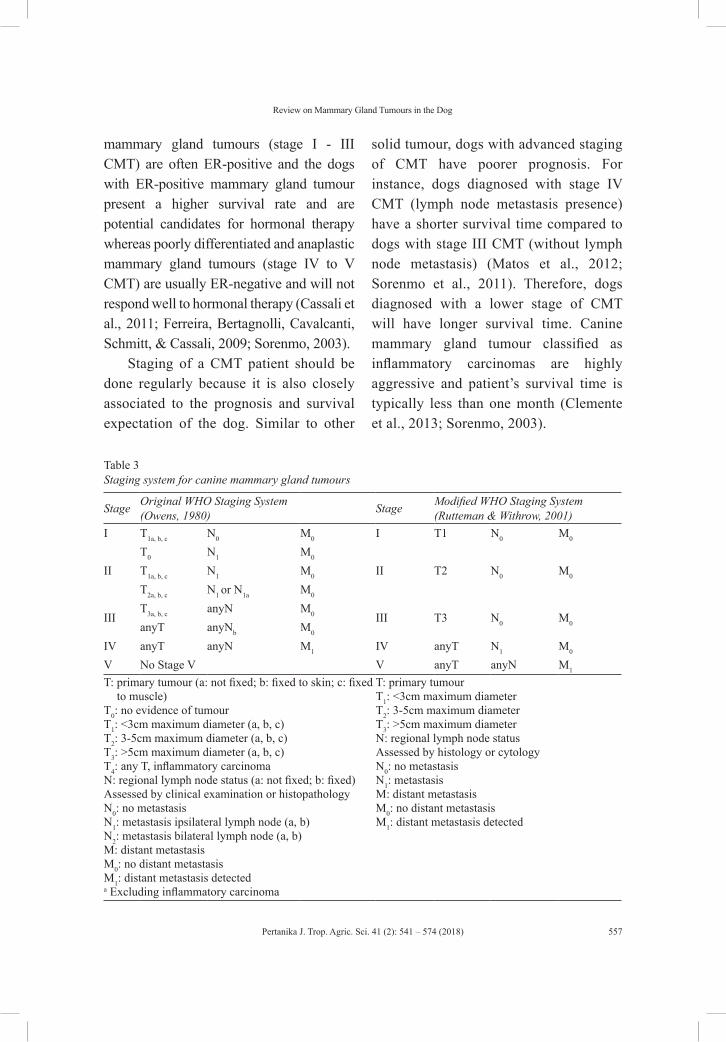
Pertanika J. Trop. Agric. Sci. 41 (2): 541 – 574 (2018)
Review on Mammary Gland Tumours in the Dog
557
mammary gland tumours (stage I - III CMT) are often ER-positive and the dogs with ER-positive mammary gland tumour present a higher survival rate and are potential candidates for hormonal therapy whereas poorly differentiated and anaplastic mammary gland tumours (stage IV to V CMT) are usually ER-negative and will not respond well to hormonal therapy (Cassali et al., 2011; Ferreira, Bertagnolli, Cavalcanti, Schmitt, & Cassali, 2009; Sorenmo, 2003).
Staging of a CMT patient should be done regularly because it is also closely associated to the prognosis and survival expectation of the dog. Similar to other
solid tumour, dogs with advanced staging of CMT have poorer prognosis. For instance, dogs diagnosed with stage IV CMT (lymph node metastasis presence) have a shorter survival time compared to dogs with stage III CMT (without lymph node metastasis) (Matos et al., 2012; Sorenmo et al., 2011). Therefore, dogs diagnosed with a lower stage of CMT will have longer survival time. Canine mammary gland tumour classified as inflammatory carcinomas are highly aggressive and patient’s survival time is typically less than one month (Clemente et al., 2013; Sorenmo, 2003).
Table 3Staging system for canine mammary gland tumours
Stage Original WHO Staging System (Owens, 1980) Stage Modified WHO Staging System
(Rutteman & Withrow, 2001)I T1a, b, c N0 M0 I T1 N0 M0
IIT0 N1 M0
II T2 N0 M0T1a, b, c N1 M0
T2a, b, c N1 or N1a M0
IIIT3a, b, c anyN M0 III T3 N0 M0anyT anyNb M0
IV anyT anyN M1 IV anyT N1 M0
V No Stage V V anyT anyN M1
T: primary tumour (a: not fixed; b: fixed to skin; c: fixed to muscle)
T0: no evidence of tumourT1: <3cm maximum diameter (a, b, c)T2: 3-5cm maximum diameter (a, b, c)T3: >5cm maximum diameter (a, b, c)T4: any T, inflammatory carcinomaN: regional lymph node status (a: not fixed; b: fixed)Assessed by clinical examination or histopathologyN0: no metastasisN1: metastasis ipsilateral lymph node (a, b)N2: metastasis bilateral lymph node (a, b)M: distant metastasisM0: no distant metastasisM1: distant metastasis detecteda Excluding inflammatory carcinoma
T: primary tumour T1: <3cm maximum diameter T2: 3-5cm maximum diameter T3: >5cm maximum diameter N: regional lymph node status Assessed by histology or cytologyN0: no metastasisN1: metastasis M: distant metastasisM0: no distant metastasisM1: distant metastasis detected
Pertanika J. Trop. Agric. Sci. 41 (2): 541 – 574 (2018)
Kabiru Sahabi, Sujey Kumar Rajendren, Jia Ning Foong and Gayathri Thevi Selvarajah
558
Histologic Grading of Canine Mammary Gland Tumours
Histologic malignant grade of tumour is a simple histological assessment done on Haematoxylin and Eosin (H&E) stained tissue slides that is used to determine the extent of differentiation of solid tumours. There is no specific grading system for CMT, however, the “Elston and Ellis grading method” for human breast adenocarcinoma has been applied on CMT and found to be associated with prognosis in the affected dogs (Karayannopoulou, Constantinidis, & Dessiris, 2005). The grading method evaluates the tubule formation in the tumour tissue, nuclear pleomorphism and mitosis per 10 high power field (Goldschmidt et al., 2011). The tubule formation is scored 1, 2 or 3, depending on whether the tubule formation in the tissue is more than 75%, 10-75% and less than 10% respectively. The nuclear pleomorphism is scored 1, 2 or 3, depending on whether the nuclear size is uniform, moderately variable shape and size and marked variation in size respectively. The mitoses criteria is scored 1, 2 or 3 if there are 0 to 9 mitotic figures, 10 to 19 mitotic figures and more than 20 mitotic figures per 10 high power fields respectively. If the total score of a tissue is 3 to 5, it is scored as grade 1 (low grade). If the score is 6 to 7, it is scored as grade 2 (intermediate grade). If the total score of a tissue is 8 to 9, it is scored grade 3 (high grade).
Therapeutic Modalities
Surgery. Surgical excision is the recommended therapeutic procedure for
the treatment of CMT (Cassali et al., 2011; Novosad, 2003), and is also the most widely used form of treatment (Novosad, 2003). In the absence of metastasis, surgery has the highest chance of curing the condition (Cassali et al., 2011). In addition to improving survival time and quality of life, by eliminating pain and discomfort, surgically excised tumours allow for more in-depth examination by histopathology (Cassali et al., 2011). The extent and type of surgery to be performed is determined by the characteristics of the tumour. The size and location of the lesion, extent of the disease and lymphatic drainage are all considered in the choice of surgical procedure to be performed. Nodulectomy or lumpectomy may be done on small sized tumours (about 0.5 cm), while larger and more aggressive tumours require mastectomy (simple, in block or radical) (Cassali et al., 2011). While some researchers recommend the excision of the whole mammary chain to prevent recurrence, some argue that there is no difference in recurrence and survival of these patients compared to those that undergo local excision (Novosad, 2003). In small, non-invasive or well demarcated tumours, surgery alone could be curative, while larger tumours with ill-defined margins may require other forms of adjunctive therapies (Cassali et al., 2011). Figure 5 shows a dog with recurrent or regrowth of invasive mammary carcinoma after mastectomy, due to high grade of the tumour and poor surgical margins.
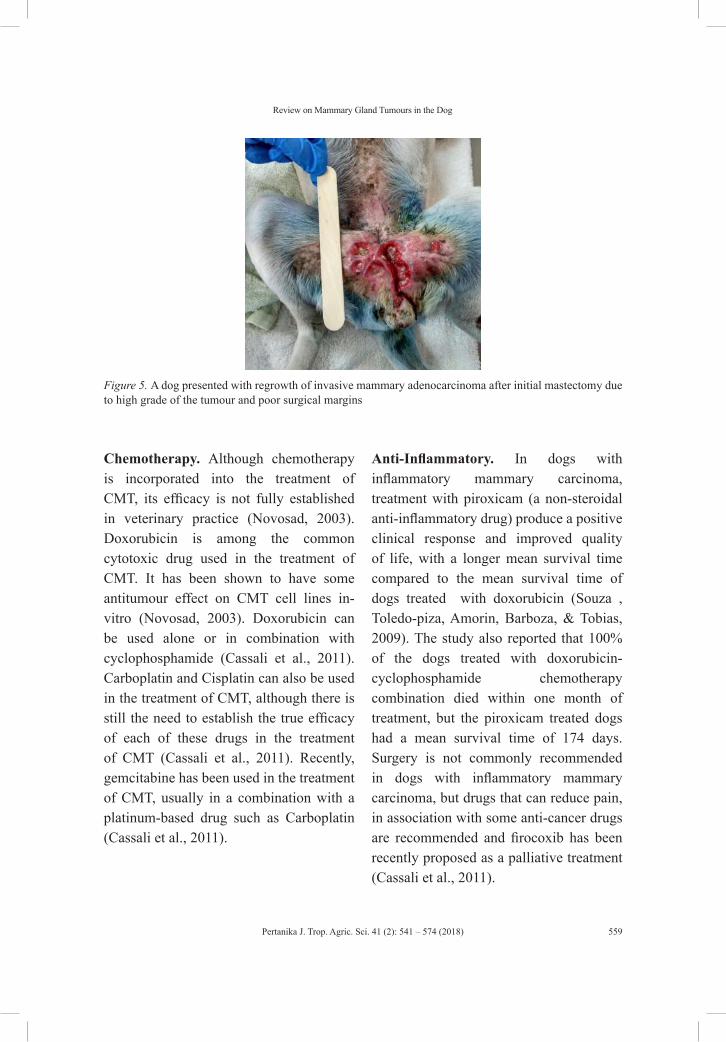
Pertanika J. Trop. Agric. Sci. 41 (2): 541 – 574 (2018)
Review on Mammary Gland Tumours in the Dog
559
Figure 5. A dog presented with regrowth of invasive mammary adenocarcinoma after initial mastectomy due to high grade of the tumour and poor surgical margins
Chemotherapy. Although chemotherapy is incorporated into the treatment of CMT, its efficacy is not fully established in veterinary practice (Novosad, 2003). Doxorubicin is among the common cytotoxic drug used in the treatment of CMT. It has been shown to have some antitumour effect on CMT cell lines in-vitro (Novosad, 2003). Doxorubicin can be used alone or in combination with cyclophosphamide (Cassali et al., 2011). Carboplatin and Cisplatin can also be used in the treatment of CMT, although there is still the need to establish the true efficacy of each of these drugs in the treatment of CMT (Cassali et al., 2011). Recently, gemcitabine has been used in the treatment of CMT, usually in a combination with a platinum-based drug such as Carboplatin (Cassali et al., 2011).
Anti-Inflammatory. In dogs with inflammatory mammary carcinoma, treatment with piroxicam (a non-steroidal anti-inflammatory drug) produce a positive clinical response and improved quality of life, with a longer mean survival time compared to the mean survival time of dogs treated with doxorubicin (Souza , Toledo-piza, Amorin, Barboza, & Tobias, 2009). The study also reported that 100% of the dogs treated with doxorubicin-cyclophosphamide chemotherapy combination died within one month of treatment, but the piroxicam treated dogs had a mean survival time of 174 days. Surgery is not commonly recommended in dogs with inflammatory mammary carcinoma, but drugs that can reduce pain, in association with some anti-cancer drugs are recommended and firocoxib has been recently proposed as a palliative treatment (Cassali et al., 2011).

Pertanika J. Trop. Agric. Sci. 41 (2): 541 – 574 (2018)
Kabiru Sahabi, Sujey Kumar Rajendren, Jia Ning Foong and Gayathri Thevi Selvarajah
560
Hormonal Therapy. Hormonal therapy is employed in human practice in patients with oestrogen receptor-positive (ER+) breast tumours (Novosad, 2003). Such ER+ tumour patients have a favourable prognosis (Martin De Las Mulas et al., 2004) and are the targets for hormonal therapy in breast cancer in humans and mammary gland tumours in dogs (Cassali et al., 2011). Tamoxifen (an antiestrogenic agent) has been suggested in the treatment of spayed dogs with ER+ CMT, although side-effects such as pyometra, mammary masses/secretions and death have been observed in the study involving 20 healthy dogs (10 intact and 10 spayed). A controlled dose for up to 120 days is suggested with assessment and control of side effects (Tavares et al., 2010). The efficacy of hormonal therapy is ambiguous in CMT, as conflicting results of success and failure have been reported (Novosad, 2003).
Palliative Radiation Therapy. Radiation therapy is not commonly used as primary therapy in the management of CMT, except in non-resectable tumours (inflammatory mammary carcinoma), or incomplete resection of tumours and as palliative treatment (Novosad, 2003). The major disadvantage of radiotherapy is the development of secondary tumours and other abnormalities such as fat necrosis (Looper, 2007). Moreover, radiation has been used to induce mammary cancers experimentally in dogs (Benjamin et al., 1999; Deeg et al., 1983). In an experimental study, intraoperative radiation therapy
was done on adult dogs to determine its short and long term effects on tissues and organs, leading to the development several types of cancers in the dogs (Barnes et al., 1990). This is also a similar scenario where radiotherapy has been associated with the development of lung cancer and cardiomyopathies in human patients diagnosed with breast cancer (Jabbari et al., 2013; Travis et al., 2012).
Prognostic Factors
Several prognostic factors have been identified for the dogs diagnosed with mammary tumours (Table 4). The prognostic factors may be associated with the dog itself, the tumour characteristics or even the various markers that the tumour expresses, where they have been described in reports as independent prognostic factors. Among the most important prognostic factors in CMT is the histopathological detection of regional lymph node metastasis (Klopfleisch et al., 2010a), that contributes to poor postsurgical survival (Rasotto et al., 2012).
Immunohistochemistry. Immunohistochemistry is a technique to specifically evaluate the distribution of protein or antigen in biological tissues using specific antibodies (Ramos-Vara, 2005). Immunohistochemistry is one of the popular techniques which is commonly used to describe and evaluate protein expression for prognosis, survival, predict response to therapy or even used to identify proteins/
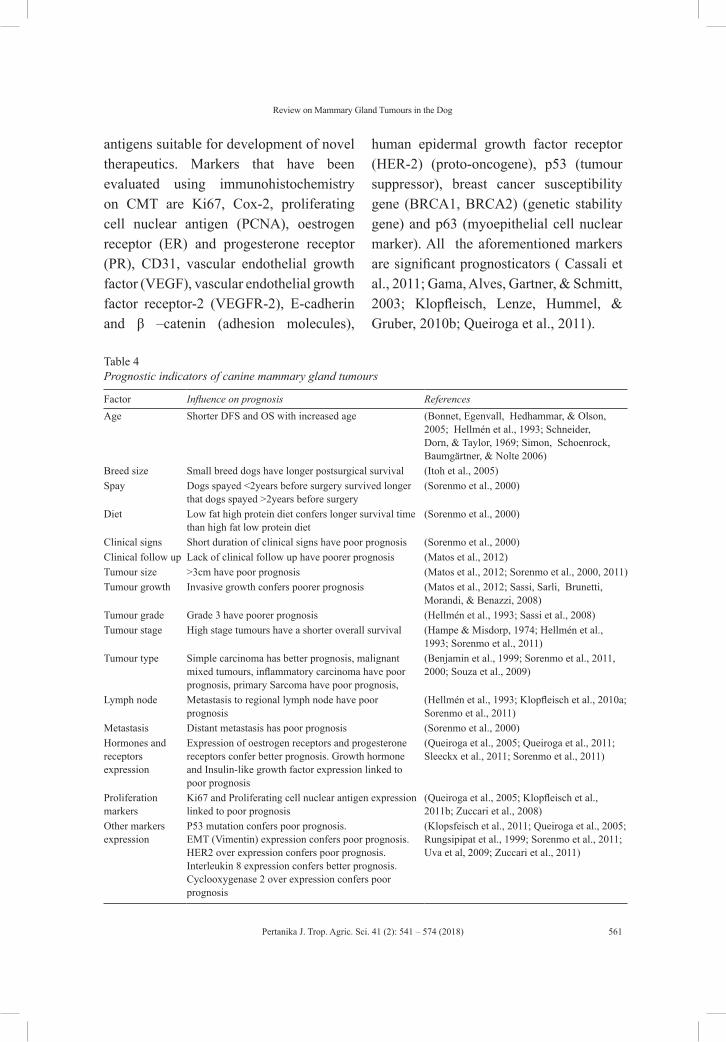
Pertanika J. Trop. Agric. Sci. 41 (2): 541 – 574 (2018)
Review on Mammary Gland Tumours in the Dog
561
antigens suitable for development of novel therapeutics. Markers that have been evaluated using immunohistochemistry on CMT are Ki67, Cox-2, proliferating cell nuclear antigen (PCNA), oestrogen receptor (ER) and progesterone receptor (PR), CD31, vascular endothelial growth factor (VEGF), vascular endothelial growth factor receptor-2 (VEGFR-2), E-cadherin and β –catenin (adhesion molecules),
human epidermal growth factor receptor (HER-2) (proto-oncogene), p53 (tumour suppressor), breast cancer susceptibility gene (BRCA1, BRCA2) (genetic stability gene) and p63 (myoepithelial cell nuclear marker). All the aforementioned markers are significant prognosticators ( Cassali et al., 2011; Gama, Alves, Gartner, & Schmitt, 2003; Klopfleisch, Lenze, Hummel, & Gruber, 2010b; Queiroga et al., 2011).
Table 4Prognostic indicators of canine mammary gland tumours
Factor Influence on prognosis ReferencesAge Shorter DFS and OS with increased age (Bonnet, Egenvall, Hedhammar, & Olson,
2005; Hellmén et al., 1993; Schneider, Dorn, & Taylor, 1969; Simon, Schoenrock, Baumgärtner, & Nolte 2006)
Breed size Small breed dogs have longer postsurgical survival (Itoh et al., 2005)Spay Dogs spayed <2years before surgery survived longer
that dogs spayed >2years before surgery(Sorenmo et al., 2000)
Diet Low fat high protein diet confers longer survival time than high fat low protein diet
(Sorenmo et al., 2000)
Clinical signs Short duration of clinical signs have poor prognosis (Sorenmo et al., 2000)Clinical follow up Lack of clinical follow up have poorer prognosis (Matos et al., 2012)Tumour size >3cm have poor prognosis (Matos et al., 2012; Sorenmo et al., 2000, 2011)Tumour growth Invasive growth confers poorer prognosis (Matos et al., 2012; Sassi, Sarli, Brunetti,
Morandi, & Benazzi, 2008)Tumour grade Grade 3 have poorer prognosis (Hellmén et al., 1993; Sassi et al., 2008)Tumour stage High stage tumours have a shorter overall survival (Hampe & Misdorp, 1974; Hellmén et al.,
1993; Sorenmo et al., 2011)Tumour type Simple carcinoma has better prognosis, malignant
mixed tumours, inflammatory carcinoma have poor prognosis, primary Sarcoma have poor prognosis,
(Benjamin et al., 1999; Sorenmo et al., 2011, 2000; Souza et al., 2009)
Lymph node Metastasis to regional lymph node have poor prognosis
(Hellmén et al., 1993; Klopfleisch et al., 2010a; Sorenmo et al., 2011)
Metastasis Distant metastasis has poor prognosis (Sorenmo et al., 2000)Hormones and receptors expression
Expression of oestrogen receptors and progesterone receptors confer better prognosis. Growth hormone and Insulin-like growth factor expression linked to poor prognosis
(Queiroga et al., 2005; Queiroga et al., 2011; Sleeckx et al., 2011; Sorenmo et al., 2011)
Proliferation markers
Ki67 and Proliferating cell nuclear antigen expression linked to poor prognosis
(Queiroga et al., 2005; Klopfleisch et al., 2011b; Zuccari et al., 2008)
Other markers expression
P53 mutation confers poor prognosis.EMT (Vimentin) expression confers poor prognosis. HER2 over expression confers poor prognosis. Interleukin 8 expression confers better prognosis. Cyclooxygenase 2 over expression confers poor prognosis
(Klopsfeisch et al., 2011; Queiroga et al., 2005; Rungsipipat et al., 1999; Sorenmo et al., 2011; Uva et al, 2009; Zuccari et al., 2011)
Pertanika J. Trop. Agric. Sci. 41 (2): 541 – 574 (2018)
Kabiru Sahabi, Sujey Kumar Rajendren, Jia Ning Foong and Gayathri Thevi Selvarajah
562
Carcinosarcomas showed high VEGFR-2 expression on immunohistochemistry which suggesting that it may be one of the activated molecular pathways in this aggressive tumour type and that VEGFR-2 inhibitors may be used as potential treatment to improve the prognosis of affected dogs. Both VEGF and VEGFR-2 immunoreactivities were independent of patients’ overall survival (OS) and disease-free survival (DFS) (Santos, Lopes, Gärtner, & Matos, 2016). In a similar report, 26 canine simple mammary adenocarcinomas were found to express markers associated with angiogenesis including VEGF and VEGFR-2 at 96% and 100% of the tissues. Vascular endothelial growth factor may stimulate tumour cell proliferation through an autocrine loop, since VEGF and VEGFR-2 were expressed in most tumours (Al-Dissi, Haines, Singh, & Kidney, 2010). VEGF is able to increase the microvascular permeability (Nakamura, Savinvov, Lu, & Brodie, 2013) thus, tumours with higher expression of VEGF and receptors may also stimulate the neoplastic cell migration through lymphatic vessels.
Ki-67. This antigen is a nuclear protein actively expressed in cycling cells, but not after mitosis (Gerdes et al., 1984). It has been found to be expressed in many tumours of the dog and man (Queiroga, Raposo, Carvalho, Prada, & Pires, 2011). A poor prognosis has been linked to immunohistochemical expression of Ki-67 in dogs with CMT (Peña, Nieto, Pérez-
Alenza, Cuesta, & Castaño, 1998). Ki-67 expression has been associated with a short disease free and overall survival time as well as correlates with advanced histologic tumour grade (Morris et al., 2009; Sarli, Preziosi, Benazzi, Castellani, & Marcato, 2002).
Proliferating Cell Nuclear Antigen
Knowing the proliferation status of any tumour is an important basis for the determination of the malignancy of the tumour and prognosis (Funakoshi et al., 2000; Torres et al., 2005). Proliferating cell nuclear antigen (PCNA) is a protein synthesised by cells in the S-phase of the cell cycle and it is seen accumulated in the nucleolus of the cells in the late G1 and early S-phases of the cell cycle (Mathews, Bernstein, Franza, & Garrels, 1984; van Dierendonck, Wijsman, Keijzer, van de Velde, & Cornelisse, 1991). Immunohistochemical detection of PCNA expressed in tumour cells has been critical in the evaluation of the proliferative activity of the tumours (Sarli et al., 2002). In CMT, PCNA expression has been found to correlate with aggression of tumours and has been described as an indicator of malignancy (Funakoshi et al., 2000; Peña et al., 1998; Queiroga et al., 2011; Torres et al., 2005).
In CMT, PCNA expression positively correlates with a shorter disease-free interval (Löhr, Teifke, Failing, & Weiss, 1997). Co-expression of PCNA and other prognostic markers have been analysed and PCNA expression is co-related with Ki-67 in dysplasias and benign mammary
Pertanika J. Trop. Agric. Sci. 41 (2): 541 – 574 (2018)
Review on Mammary Gland Tumours in the Dog
563
tumours in the dog (Löhr et al., 1997; Nowak, Madej, Dziegiel, & Kanzawa, 2006; Peña et al., 1998). Expression of PCNA was found to inversely correlate with oestrogen receptor alpha (ERα) (Perez-Alenza et al., 2000). This finding suggests that as the tumour advances, hormonal dependency is lost and neoplastic cells increase in cell proliferation where malignancy is acquired.
Vimentin. Epithelial-mesenchymal transition (EMT) in tumours allows epithelial cells to transform into mesenchymal cells capable of migration and tissue invasion, which are the first steps in the establishment of metastasis (Wu et al., 2006). This transition is characterised by the overexpression of certain intermediate filaments such as Vimentin (Genelhu, Cardoso, Gobbi, & Cassali, 2007; Mendez, Kojima, & Goldman, 2010; Yoshida et al., 2013). Vimentin has been shown to be expressed in myoepithelial and mesenchymal cells, as well as overexpressed in CMT. Vimentin expression has also been used to identify CMT with luminal epithelial lineage (Griffey et al., 1993; Rabanal & Else, 1994; Toniti et al., 2009). However, the status of Vimentin as a prognosticator in CMT is yet to be ascertained as conflicting findings have been reported (Vos et al., 1993).
Oestrogen Receptor (ER). Oestrogen plays a major role in mammary gland development and oestrous cycle through the activation of oestrogen receptors (Chang et al., 2009; Martin De Las Mulas
et al., 2004; Rehm, Stanislaus, & Williams, 2007). Two forms of oestrogen receptors ERα and ERβ have been reported in the literature (Chang et al., 2009). Favourable prognosis has been linked to oestrogen receptor expression in malignant mammary tumours (Martin De Las Mulas et al., 2004). Oestrogen receptors are reported to be expressed in more benign than malignant CMT (Chang et al., 2009). Tumours that are less than 5 cm in diameter and without nodal or distant metastasis are associated with oestrogen receptor expression (Chang et al., 2009).
Progesterone Receptor (PR). Progesterone plays a significant role in oestrous cycle and pregnancy through the activation of progesterone receptors (Rehm et al., 2007). In canine mammary tumours, PR expressing tumours have been found to be more benign than malignant, less than 5cm in diameter have no lymph node or distant metastasis and the dogs survive longer than those with tumours expressing only Oestrogen receptors (Chang et al., 2009). Progesterone receptor has been targeted with success for therapy in PR positive canine mammary carcinoma cells (Guil-Luna et al., 2011). Absence of any correlation between PR expression and tumour subtype has also been reported in CMT (Toniti et al., 2009).
Recent Advancements in Therapeutics for CMT
There has been limited advancement in the improved or advanced therapies for dogs
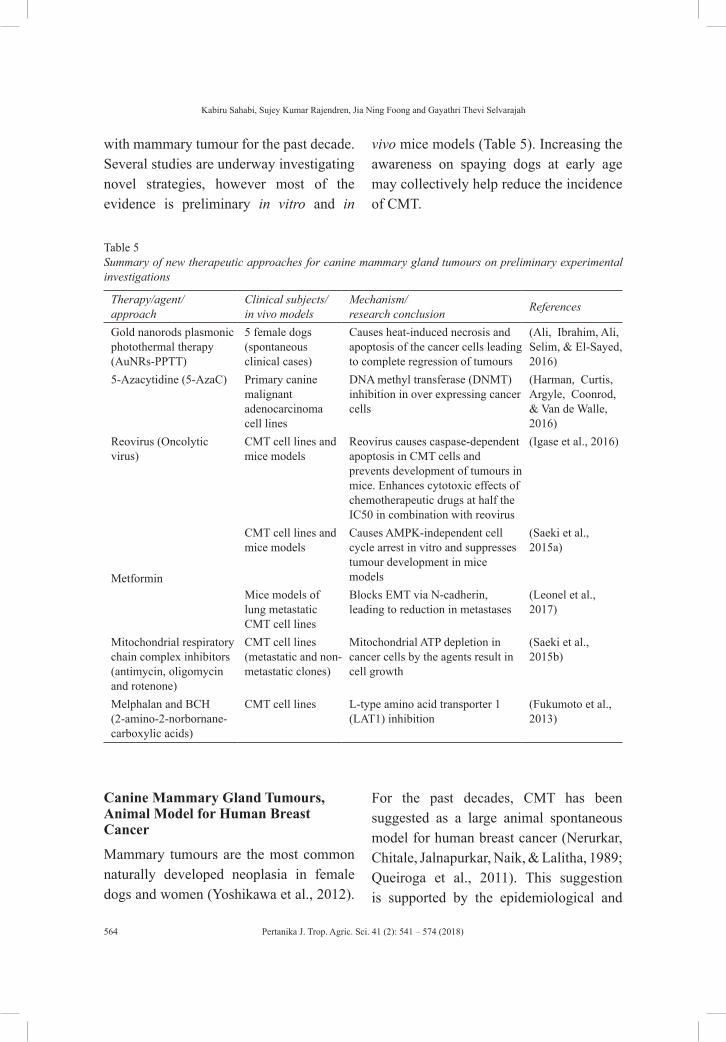
Pertanika J. Trop. Agric. Sci. 41 (2): 541 – 574 (2018)
Kabiru Sahabi, Sujey Kumar Rajendren, Jia Ning Foong and Gayathri Thevi Selvarajah
564
with mammary tumour for the past decade. Several studies are underway investigating novel strategies, however most of the evidence is preliminary in vitro and in
vivo mice models (Table 5). Increasing the awareness on spaying dogs at early age may collectively help reduce the incidence of CMT.
Table 5 Summary of new therapeutic approaches for canine mammary gland tumours on preliminary experimental investigations
Therapy/agent/ approach
Clinical subjects/ in vivo models
Mechanism/ research conclusion References
Gold nanorods plasmonic photothermal therapy (AuNRs-PPTT)
5 female dogs (spontaneous clinical cases)
Causes heat-induced necrosis and apoptosis of the cancer cells leading to complete regression of tumours
(Ali, Ibrahim, Ali, Selim, & El-Sayed, 2016)
5-Azacytidine (5-AzaC) Primary canine malignant adenocarcinoma cell lines
DNA methyl transferase (DNMT) inhibition in over expressing cancer cells
(Harman, Curtis, Argyle, Coonrod, & Van de Walle, 2016)
Reovirus (Oncolytic virus)
CMT cell lines and mice models
Reovirus causes caspase-dependent apoptosis in CMT cells and prevents development of tumours in mice. Enhances cytotoxic effects of chemotherapeutic drugs at half the IC50 in combination with reovirus
(Igase et al., 2016)
Metformin
CMT cell lines and mice models
Causes AMPK-independent cell cycle arrest in vitro and suppresses tumour development in mice models
(Saeki et al., 2015a)
Mice models of lung metastatic CMT cell lines
Blocks EMT via N-cadherin, leading to reduction in metastases
(Leonel et al., 2017)
Mitochondrial respiratory chain complex inhibitors (antimycin, oligomycin and rotenone)
CMT cell lines (metastatic and non-metastatic clones)
Mitochondrial ATP depletion in cancer cells by the agents result in cell growth
(Saeki et al., 2015b)
Melphalan and BCH (2-amino-2-norbornane-carboxylic acids)
CMT cell lines L-type amino acid transporter 1 (LAT1) inhibition
(Fukumoto et al., 2013)
Canine Mammary Gland Tumours, Animal Model for Human Breast Cancer
Mammary tumours are the most common naturally developed neoplasia in female dogs and women (Yoshikawa et al., 2012).
For the past decades, CMT has been suggested as a large animal spontaneous model for human breast cancer (Nerurkar, Chitale, Jalnapurkar, Naik, & Lalitha, 1989; Queiroga et al., 2011). This suggestion is supported by the epidemiological and

Pertanika J. Trop. Agric. Sci. 41 (2): 541 – 574 (2018)
Review on Mammary Gland Tumours in the Dog
565
histopathological similarities that have been observed between the two (Queiroga et al., 2011) and the failure of mouse models (transgenic and xenografts) to mimic the tumour heterogeneity, dependence on steroids and tumour microenvironment, which are the essential features of human breast cancer (Uva et al., 2009).
The prevalence of mammary tumours is higher in dogs compared to women, which gives CMT an edge over human breast cancer in terms of availability for research and clinical trials (Queiroga et al., 2011; Nerurkar et al., 1989; Yoshikawa et al., 2012). Age as risk factor of mammary neoplasia has a somewhat similar influence in both human breast cancer and canine mammary gland tumours. It is reported that the age for onset of mammary tumours in dogs is after six years and peak age of occurrence is eight to 11 years, while 40 years of age is the reported onset age in human breast cancer and 50 to 58 years is the peak age of occurrence (Queiroga et al., 2011). The use of postmenopausal hormone replacement therapies have been linked to an increased risk of breast cancer in women (Amadou, Fabre, Torres-Mejía, & Ortega-Olvera, 2013) while the influence of ovarian hormones in CMT occurrence as demonstrated by early ovariectomy or lack of it has also been reported (Queiroga et al., 2011; Sorenmo et al., 2011). It has been reported that certain breeds are at a higher risk of developing CMT (Itoh et al., 2005), so in human breast cancer too, some races are reported to be more at risk compared to others (Pillai, Tay, Nair, & Leong,
2012; Sullivan et al., 2013). Other factors such as diet and obesity as risk factors for developing mammary tumours are also reported to have similar associations in both dogs and humans (Sonnenschein et al., 1991; Amadou et al., 2013).
The clinical presentation of mammary tumours is similar in dogs and humans, with patients presenting symptoms such as palpable masses of various sizes in the breast tissue or mammary gland chain, skin ulcerations, chest wall infiltration, enlarged lymph nodes, nipple retraction more notable in human, pain, and in some cases, pus or haemorrhage (Chang, Liao, Wong, Lai, & Liu, 2007; Grandi, Colodel, Rocha, & Sequeira, 2011; Nandeesh, Anitha, & Shravan Rajpurohit, 2013; Yoneyama & Nakamura, 2013). Large percentage of the tumours are diagnosed malignant and the most common site of metastasis is the regional lymph nodes, which significantly influence prognosis (Queiroga et al., 2011).
The methods of treatment in dogs with mammary gland tumours are very similar to the approach used in human breast cancer. Depending on the severity and stage of the disease, surgical approach is considered the most effective treatment, either alone or in combination with chemotherapy or hormonal therapy (Cassali et al., 2011; Yoneyama & Nakamura, 2013). Hormonal therapy is not commonly employed in CMT treatment due to toxicity of tamoxifen in dogs (Tavares et al., 2010). Chemotherapeutic agents commonly used in both species include Doxorubicin,
Pertanika J. Trop. Agric. Sci. 41 (2): 541 – 574 (2018)
Kabiru Sahabi, Sujey Kumar Rajendren, Jia Ning Foong and Gayathri Thevi Selvarajah
566
cyclophosphamide, piroxicam, and firocoxib, to mention a few (Cassali et al., 2011; Nandeesh et al., 2013; Novosad, 2003). Triple negative breast cancer (ER, PR- and HER2-) is the most difficult cancer phenotype to treat, due to its lack of steroid hormone dependency that could be targeted with Tamoxifen (Kabos, et al. 2012), and has also been described in the canine species, with similar characteristics (Kim, Lim, Im, Kim, & Sur, 2013). Factors affecting postsurgical survival in patients with breast cancer are similar with those predicting survival in dogs with mammary gland tumours (Philibert et al., 2003). Factors such as histologic tumour grade, tumour stage, presence of lymph node or distant metastasis, skin ulceration, increased age at diagnosis, oestrogen receptor, HER2, and BRCA expressions described to influence post-mastectomy survival in breast cancer patients have also been shown to influence postsurgical survival in dogs with mammary gland tumours (Perez-Alenza et al., 2000; Philibert et al., 2003; Chang et al., 2007). Histopathological findings and lesions of CMTs and human breast cancers have been demonstrated to be very similar, with very few histological subtypes described in human breast cancer and yet to be described in CMT (Goldschmidt et al., 2011). Staging and histopathology grading systems used in human breast cancers have been effectively applied in CMT with minimal or no modifications (Goldschmidt et al., 2011; Philibert et al., 2003). Several breast cancer susceptibility genes such as BRCA, HER2 and molecular markers are described as
risk and prognostic factors in human breast cancer. These genes and markers have been found with similar alterations, expression patterns and prognostic values in CMT (Klopfleisch, Schütze, & Gruber, 2010c; Queiroga et al., 2011; Rivera & Von Euler, 2011; Uva et al., 2009).
Current and future areas of research in both canine and human mammary gland tumours are all geared towards the discovery of novel molecular markers and therapeutic targets that will facilitate diagnosis, predict prognosis and possibly therapeutic targets (Queiroga et al., 2011).
CONCLUSION
Spontaneous canine mammary gland tumours have a significant and unique role in understanding cancer biology as well as in the development of new therapeutic agents for the effective treatment of the disease in humans and in dogs.
REFERENCESAl-Dissi, A. N., Haines, D. M., Singh, B., Kidney,
B. A. (2010). Immunohistochemical expression of vascular endothelial growth factor and vascular endothelial growth factor receptor-2 in canine simple mammary gland adenocarcinomas. Canadian Veterinary Journal, 51(10), 1109-1114.
Ali, M. R. K., Ibrahim, I. M., Ali, H. R., Selim, S. A., & El-Sayed, M. A. (2016). Treatment of natural mammary gland tumors in canines and felines using gold nanorods-assisted plasmonic photothermal therapy to induce tumor apoptosis. International Journal of Nanomedicine, 11, 4849-4863.
Pertanika J. Trop. Agric. Sci. 41 (2): 541 – 574 (2018)
Review on Mammary Gland Tumours in the Dog
567
Amadou, A., Fabre, A., Torres-Mejía, G., & Ortega-Olvera, C. (2013). Hormonal therapy and risk of breast cancer in Mexican women. PloS One, 8(11), e79695.
Andrade, F. H., Figueiroa, F. C., Bersano, P. R., Bissacot, D. Z., & Rocha, N. S. (2010). Malignant mammary tumor in female dogs: environmental contaminants. Diagnostic Pathology, 5(1), 45.
Balfe, P., McCann, A., McGoldrick, A., McAllister, K., Kennedy, M., Dervan, P., & Kerin, M. J. (2004). Estrogen receptor alpha and beta profiling in human breast cancer. European Journal of Surgical Oncology the Journal of the European Society of Surgical Oncology and the British Association of Surgical Oncology, 30(5), 469-474.
Barnes, M., Duray, P., DeLuca, A., Anderson, W., Sindelar, W., & Kinsella, T. (1990). Tumor induction following intraoperative radiotherapy: late results of the National Cancer Institute canine trials. International Journal of Radiation Oncology, Biology, Physics, 19(3), 651-660.
Bastianello, S. S. (1983). A survey on neoplasia in domestic species over a 40-year period from 1935 to 1974 in the Republic of South Africa. VI. Tumours occurring in dogs. The Onderstepoort Journal of Veterinary Research, 50(3), 199-220.
Benjamin, S. A., Lee, A. C., & Saunders, W. J. (1999). Classification and behavior of canine mammary epithelial neoplasms based on life-span observations in beagles. Veterinary Pathology, 36(5), 423-436.
Bergman, P. J. (2012). Paraneoplastic hypercalcemia. Topics in Companion Animal Medicine, 27(4), 156-158.
Bonnett, B. N., Egenvall, A., Hedhammar, Å., & Olson, P. (2005). Mortality in over 350,000 insured Swedish dogs from 1995–2000: Breed-, gender-, age- and cause-specific rates. Acta Veterinaria Scandinavica, 46(3), 105-120.
Cassali, G. D., Lavalle, G. E., De Nardi, A. B., Ferreira, E., Bertagnolli, A. C., Estrela-Lima, A., ... & Sobral, R. A. (2011). Consensus for the diagnosis, prognosis and treatment of canine mammary tumors. Brazilian Journal of Veterinary Pathology, 4(2), 153-180.
Chang, C. C., Tsai, M. H., Liao, J. W., Chan, J. P. W., Wong, M. L., & Chang, S. C. (2009). Evaluation of hormone receptor expression for use in predicting survival of female dogs with malignant mammary gland tumors. Journal of the American Veterinary Medical Association, 235(4), 391-396.
Chang, S. C., Liao, J. W., Wong, M. L., Lai, Y. S., & Liu, C. I. (2007). Mammary carcinoma with sebaceous differentiation in a dog. Veterinary Pathology, 44(4), 525-527.
Clemente, M., Sánchez-Archidona, A. R., Sardón, D., Díez, L., Martín-Ruiz, A., Caceres, S., et al. (2013). Different role of COX-2 and angiogenesis in canine inflammatory and non-inflammatory mammary cancer. The Veterinary Journal, 197(2), 427-432.
Crivellenti, L. Z., Silva, G. E., Borin-Crivellenti, S., Cianciolo, R., Adin, C. A., Dantas, M., ... & Santana, A. E. (2016). Prevalence of glomerulopathies in canine mammary carcinoma. PLoS ONE, 11(10), 1-10.
Deeg, H. J., Prentice, R., Fritz, T. E., Sale, G. E., Lombard, L. S., Thomas, E. D., & Storb, R. (1983). Increased incidence of malignant tumors in dogs after total body irradiation and marrow transplantation. International Journal of Radiation Oncology, Biology, Physics, 9(10), 1505-1511.
DeMauro, S., & Wysolmerski, J. (2005). Hypercalcemia in breast cancer: An echo of bone mobilization during lactation? Journal of Mammary Gland Biology and Neoplasia, 10(2), 157-167.
Pertanika J. Trop. Agric. Sci. 41 (2): 541 – 574 (2018)
Kabiru Sahabi, Sujey Kumar Rajendren, Jia Ning Foong and Gayathri Thevi Selvarajah
568
Dhami, M. A., Tank, P. H., Karle, A. S., Vedpathak, H. S., & Bhatia, A. S. (2010). Epidemiology of canine mammary gland tumours in Gujarat, veterinary world, 3(6), 282-285.
Dobson, J. M., Samuel, S., Milstein, H., Rogers, K., & Wood, J. L. N. (2002). Canine neoplasia in the UK: Estimates of incidence rates from a population of insured dogs. The Journal of Small Animal Practice, 43(6), 240-246.
Egenvall, A., Bonnett, B. N., Ohagen, P., Olson, P., Hedhammar, A., & Von Euler, H. (2005). Incidence of and survival after mammary tumors in a population of over 80,000 insured female dogs in Sweden from 1995 to 2002. Preventive Veterinary Medicine, 69(1-2), 109-127.
Ferreira, E., Bertagnolli, A. C., Cavalcanti, M. F., Schmitt, F. C., & Cassali, G. D. (2009). The relationship between tumour size and expression of prognostic markers in benign and malignant canine mammary tumours. Veterinary and Comparative Oncology, 7(4), 230-235.
Fukumoto, S., Hanazono, K., Komatsu, T., Ueno, H., Kadosawa, T., Iwano, H., & Uchide, T. (2013). L-type amino acid transporter 1 (LAT1): A new therapeutic target for canine mammary gland tumour. The Veterinary Journal, 198(1), 164-169.
Funakoshi, Y., Nakayama, H., Uetsuka, K., Nishimura, R., Sasaki, N., & Doi, K. (2000). Cellular proliferative and telomerase activity in canine mammary gland tumors. Veterinary Pathology, 37(2), 177-183.
Gama, A., Alves, A., Gartner, F., & Schmitt, F. (2003). P63: A novel myoepithelial cell marker in canine mammary tissues. Veterinary Pathology, 40(4), 412-420.
Genelhu, M. C. L. S., Cardoso, S. V, Gobbi, H., & Cassali, G. D. (2007). A comparative study between mixed-type tumours from human salivary and canine mammary glands. BMC Cancer, 7(1), 218.
Gerdes, J., Lemke, H., Baisch, H., Wacker, H. H., Schwab, U., & Stein, H. (1984). Cell cycle analysis of a cell proliferation-associated human nuclear antigen defined by the monoclonal antibody Ki-67. Journal of Immunology, 133(4), 1710-1715.
Goldschmidt, M., Peña, L., Rasotto, R., & Zappulli, V. (2011). Classification and grading of canine mammary tumors. Veterinary Pathology, 48(1), 117-131.
Gräf, K., & Etreby, M. E. (1978). Endocrinology of reproduction in the female beagle dog and its significance in mammary gland tumorigenesis. Acta Endocrinologica. Supplementum, 222, 1-34.
Grandi, F., Colodel, M. M., Rocha, R. M., & Sequeira, J. L. (2011). Sebaceous metaplasia in a canine mammary gland non-infiltrative carcinoma with myoepithelial component. Journal of Veterinary Diagnostic Investigation, 23(6), 1230-1233.
Griffey, S. M., Madewell, B. R., Dairkee, S. H., Hunt, J. E., Naydan, D. K., & Higgins, R. J. (1993). Immunohistochemical reactivity of basal and luminal epithelium-specific cytokeratin antibodies within normal and neoplastic canine mammary glands. Veterinary Pathology, 30(2), 155-161.
Guil-Luna, S., Sánchez-Céspedes, R., Millan, Y., De Andres, F. J., Rollon, E., Domingo, V., ... & Martín de Las Mulas, J. (2011). Aglepristone decreases proliferation in progesterone receptor-positive canine mammary carcinomas. Journal of Veterinary Internal Medicine / American College of Veterinary Internal Medicine, 25(3), 518-523.
Hampe, J. F., & Misdorp, W. (1974). Tumours and dysplasias of the mammary gland. Bulletin of the World Health Organization, 50(1-2), 111-133.
Pertanika J. Trop. Agric. Sci. 41 (2): 541 – 574 (2018)
Review on Mammary Gland Tumours in the Dog
569
Harman, R. M., Curtis, T. M., Argyle, D. J., Coonrod, S. A., & Van de Walle, G. R. (2016). A comparative study on the in vitro effects of the DNA methyltransferase inhibitor 5-azacytidine (5-AzaC) in breast/mammary cancer of different mammalian species. Journal of Mammary Gland Biology and Neoplasia, 21(1-2), 51-66.
Hellmén, E., Bergström, R., Holmberg, L., Spångberg, I. B., Hansson, K., & Lindgren, A. (1993). Prognostic factors in canine mammary tumors: A multivariate study of 202 consecutive cases. Veterinary Pathology, 30(1), 20-27.
Hellmén, E., & Lindgren, A. (1989). The accuracy of cytology in diagnosis and DNA analysis of canine mammary tumours. Journal of Comparative Pathology, 101(4), 443-450.
Igase, M., Hwang, C. C., Kambayashi, S., Kubo, M., Coffey, M., Miyama, T. S., ... & Mizuno, T. (2016). Oncolytic reovirus synergizes with chemotherapeutic agents to promote cell death in canine mammary gland tumor. Canadian Journal of Veterinary Research = Revue Canadienne de Recherche Veterinaire, 80(1), 21-31.
Itoh, T., Uchida, K., Ishikawa, K., Kushima, K., Kushima, E., Tamada, H., ... & Shii, H. (2005). Clinicopathological survey of 101 canine mammary gland tumors: differences between small-breed dogs and others. The Journal of Veterinary Medical Science the Japanese Society of Veterinary Science, 67(3), 345-347.
Jabbari, K., Azarmahd, N., Babazade, S., & Amouheidari, A. (2013). Optimizing of the tangential technique and supraclavicular fields in 3 dimensional conformal radiation therapy for breast cancer. Journal of Medical Signals and Sensors, 3(2), 107–16.
Kabos, P., Finlay-Schultz, J., Li, C., Kline, E., Finlayson, C., Wisell, J., ... & Sartorius, C. A. (2012). Patient-derived luminal breast cancer xenografts retain hormone receptor heterogeneity and help define unique estrogen-dependent gene signatures. Breast Cancer Research and Treatment, 135(2), 415-432.
Karayannopoulou, M., Kaldrymidou, E., Constantinidis, T. C., & Dessiris, A. (2005). Histological grading and prognosis in dogs with mammary carcinomas: application of a human grading method. Journal of Comparative Pathology, 133(4), 246-52.
Kelsey, J. L., Moore, A. S., & Glickman, L. T. (1998). Epidemiologic studies of risk factors for cancer in pet dogs. Epidemiologic Reviews, 20(2), 204-217.
Kim, J. H., Im, K. S., Kim, N. H., Chon, S. K., Doster, A. R., & Sur, J. H. (2011). Inflammatory mammary carcinoma with metastasis to the brain and distant organs in a spayed Shih Tzu dog. Journal of Veterinary Diagnostic Investigation, 23(5), 1079-1082.
Kim, N. H., Lim, H. Y., Im, K. S., Kim, J. H., & Sur, J. H. (2013). Identification of triple-negative and basal-like canine mammary carcinomas using four basal markers. Journal of Comparative Pathology, 148(4), 298-306.
Klopfleisch, R., Lenze, D., Hummel, M., & Gruber, A. D. (2011a). The metastatic cascade is reflected in the transcriptome of metastatic canine mammary carcinomas. Veterinary Journal, 190(2), 236-243.
Klopfleisch, R., Klose, P., Weise, C., Bondzio, A., Multhaup, G., Einspanier, R., & Gruber, A. D. (2010a). Proteome of metastatic canine mammary carcinomas: similarities to and differences from human breast cancer. Journal of Proteome Research, 9(12), 6380-6391.
Pertanika J. Trop. Agric. Sci. 41 (2): 541 – 574 (2018)
Kabiru Sahabi, Sujey Kumar Rajendren, Jia Ning Foong and Gayathri Thevi Selvarajah
570
Klopfleisch, R., Lenze, D., Hummel, M., & Gruber, A. D. (2010b). Metastatic canine mammary carcinomas can be identified by a gene expression profile that partly overlaps with human breast cancer profiles. BMC Cancer, 10(1), 618.
Klopfleisch, R., Lenze, D., Hummel, M., & Gruber, A. D. (2011b). The metastatic cascade is reflected in the transcriptome of metastatic canine mammary carcinomas. Veterinary Journal, 190(2), 236-243.
Klopfleisch, R., Schütze, M., & Gruber, A. D. (2010c). Loss of p27 expression in canine mammary tumors and their metastases. Research in Veterinary Science, 88(2), 300-303.
Klopfleisch, R., von Euler, H., Sarli, G., Pinho, S. S., Gärtner, F., & Gruber, A. D. (2011c). Molecular carcinogenesis of canine mammary tumors: news from an old disease. Veterinary Pathology, 48(1), 98-116.
Lallo, M. A., Ferrarias, T. M., Stravino, A., Rodriguez, J. F. M., & Zucare, R. L. C. (2016). Alterações hematológicas em cadelas portadoras de tumores de mama [Hematologic abnormalities in dogs bearing mammary tumors]. Revista Brasileira de Ciência Veterinária, 23(1/2), 3–8.
Leonel, C., Borin, T. F., de Carvalho Ferreira, L., Moschetta, M. G., Bajgelman, M. C., Viloria-Petit, A. M., & de Campos Zuccari, D. A. P. (2017). Inhibition of epithelial-mesenchymal transition and metastasis by combined TGFbeta knockdown and metformin treatment in a canine mammary cancer Xenograft Model. Journal of Mammary Gland Biology and Neoplasia, 22(1), 27-41.
Löhr, C. V, Teifke, J. P., Failing, K., & Weiss, E. (1997). Characterization of the proliferation state in canine mammary tumors by the standardized AgNOR method with postfixation and immunohistologic detection of Ki-67 and PCNA. Veterinary Pathology, 34(3), 212-221.
Looper, J. S. (2007). Fat necrosis simulating recurrent neoplasia following external beam radiotherapy in a dog. Veterinary Radiology and Ultrasound, 48(1), 86-88.
MacEwen, E. G., Patnaik, A. K., Harvey, H. J., & Panko, W. B. (1982). Estrogen receptors in canine mammary tumors. Cancer Research, 42(6), 2225-2229.
Martín De Las Mulas, J., Ordás, J., Millán, M. Y., Chacón, F., De Lara, M., Espinosa De Los Monteros, A., ... & Jover, A. (2004). Immunohistochemical expression of estrogen receptor beta in normal and tumoral canine mammary glands. Veterinary Pathology, 41(3), 269-272.
Mathews, M. B., Bernstein, R. M., Franza, B. R., & Garrels, J. I. (1984). Identity of the proliferating cell nuclear antigen and cyclin. Nature, 309(5966), 374-376.
Matos, A. J. F., Baptista, C. S., Gärtner, M. F., & Rutteman, G. R. (2012). Prognostic studies of canine and feline mammary tumours : The need for standardized procedures. The Veterinary Journal, 193(1), 24-31.
Mendez, M. G., Kojima, S.-I., & Goldman, R. D. (2010). Vimentin induces changes in cell shape, motility, and adhesion during the epithelial to mesenchymal transition. The FASEB Journal, 24(6), 1838-1851.
Merlo, D. F., Rossi, L., Pellegrino, C., Ceppi, M., Cardellino, U., Capurro, C., ... & Bocchini, V. (2008). Cancer incidence in pet dogs: Findings of the Animal Tumor Registry of Genoa, Italy. Journal of Veterinary Internal Medicine / American College of Veterinary Internal Medicine, 22(4), 976-84.
Misdorp, W., Else, R. W., & Hellmen, E. L. T. (1999). Histologic classification of mammary tumours of the dog and the cat (2nd ser., vol. 7.). Washington, D.C.: Armed Force Institute of Pathology and World Health Organization.
Pertanika J. Trop. Agric. Sci. 41 (2): 541 – 574 (2018)
Review on Mammary Gland Tumours in the Dog
571
Mitchell, L., De la Iglesia, F. A., Wenkoff, M. S., Van Dreumel, A. A., & Lumb, G. (1974). Mammary tumors in dogs: survey of clinical and pathological characteristics. The Canadian Veterinary Journal. La Revue Vétérinaire Canadienne, 15(5), 131-138.
Morris, J. S., Nixon, C., King, O. J. A., Morgan, I. M., & Philbey, A. W. (2009). Expression of TopBP1 in canine mammary neoplasia in relation to histological type, Ki67, ERalpha and p53. Veterinary Journal, 179(3), 422-429.
Nakamura, J., Savinvov, A., Lu, Q., Brodie, A. (2013). Estrogen regulates vascular endothelial growth/permeability factor expression in 7,12dimethylbenz(a)anthracene-induced rat mammary tumors. Endocrinology, 137(12), 5589-5596.
Nandeesh, M., Anitha, T. K., & Shravan Rajpurohit, S. R. (2013). Neuroendocrine Carcinoma of Breast: A Rare Case Vignette. Journal of clinical and diagnostic research: JCDR, 7(11), 2585.
Nerurkar, V. R., Chitale, A. R., Jalnapurkar, B. V., Naik, S. N., & Lalitha, V. S. (1989). Comparative pathology of canine mammary tumours. Journal of Comparative Pathology, 101(4), 389-397.
Novosad, C. A. (2003). Principles of treatment for mammary gland tumors. Clinical Techniques in Small Animal Practice, 18(2), 107-109.
Nowak, M., Madej, J. A., Dziegiel, P., & Kanzawa, H. (2006). Immunohistochemical identification method of tumour cells in the S phase of mitotic cycle and its usefulness in diagnostics of mammary gland adenocarcinomas in bitches. Polish Journal of Veterinary Sciences, 9(1), 57-62.
Owens L. N. (1980). Classification of tumors in domestic animals (1st Ed.). Geneva: World Health Organization.
Peña, L. L., Nieto, A. I., Pérez-Alenza, D., Cuesta, P., & Castaño, M. (1998). Immunohistochemical detection of Ki-67 and PCNA in canine mammary tumors: Relationship to clinical and pathologic variables. Journal of Veterinary Diagnostic Investigation, 10(3), 237-246.
Perez-Alenza, M. D., Peña, L., Del Castillo, N., & Nieto, A. I. (2000). Incidence and prognosis of canine mammary tumours. The Journal of Small Animal Practice, 41(10), 476-476.
Philibert, J. C., Snyder, P. W., Glickman, N., Glickman, L. T., Knapp, D. W., & Waters, D. J. (2003). Influence of host factors on survival in dogs with malignant mammary gland tumors. Journal of Veterinary Internal Medicine American College of Veterinary Internal Medicine, 17(1), 102-106.
Pllai, S. K., Tay, A., Nair, S., & Leong, C. O. (2012). Triple-negative breast cancer is associated with EGFR, CK5/6 and c-KIT expression in Malaysian women. BMC Clinical Pathology, 12(1), 18.
Queiroga, F. L., Pérez-Alenza, M. D., Silvan, G., Peña, L., Lopes, C., & Illera, J. C. (2005). Role of steroid hormones and prolactin in canine mammary cancer. The Journal of Steroid Biochemistry and Molecular Biology, 94(1-3), 181-187.
Queiroga, F. L., Raposo, T., Carvalho, M. I., Prada, J., & Pires, I. (2011). Canine mammary tumours as a model to study human breast cancer: most recent findings. In Vivo (Athens, Greece), 25(3), 455-465.
Rabanal, R. M., & Else, R. W. (1994). Immunohistochemical localisation of cytokeratin and vimentin intermediate filament proteins in canine mammary tumours. Research in Veterinary Science, 56(2), 225-233.
Ramos-Vara, J. A. (2005). Technical aspects of immunohistochemistry. Veterinary Pathology, 42(4), 405–26.
Pertanika J. Trop. Agric. Sci. 41 (2): 541 – 574 (2018)
Kabiru Sahabi, Sujey Kumar Rajendren, Jia Ning Foong and Gayathri Thevi Selvarajah
572
Rasotto, R., Zappulli, V., Castagnaro, M., & Goldschmidt, M. H. (2012). A retrospective study of those histopathologic parameters predictive of invasion of the lymphatic system by canine mammary carcinomas. Veterinary Pathology, 49(2), 330-340.
Rehm, S., Stanislaus, Ã. D. J., & Williams, A. M. (2007). Estrous cycle-dependent histology and review of sex steroid receptor expression in dog reproductive tissues and mammary gland and associated hormone levels, 245(Issue), 233-245.
Rivera, P., & Von Euler, H. (2011). Molecular biological aspects on canine and human mammary tumors. Veterinary Pathology, 48(1), 132-146.
Rungsipipat, A., Tateyama, S., Yamaguchi, R., Uchida, K., Miyoshi, N., & Hayashi, T. (1999). Immunohistochemical analysis of c-yes and c-erbB-2 oncogene products and p53 tumor suppressor protein in canine mammary tumors. The Journal of Veterinary Medical Science / the Japanese Society of Veterinary Science, 61(1), 27-32.
Rutteman G. R., & Withrow S. J. (2001). Tumors of the mammary gland. In E. M. S. J. Withrow (Ed.), Small animal clinical oncology (3rd ed.) (pp. 455–477). Philadelphia, PA: WB Saunders.
Saeki, K., Watanabe, M., Michishita, M., Tsuboi, M., Sugano, S., Yoshitake, R., ... & Matsumoto, K. (2015a). Phenotypic screening of a library of compounds against metastatic and non-metastatic clones of a canine mammary gland tumour cell line. The Veterinary Journal, 205(2), 288-296.
Saeki, K., Watanabe, M., Tsuboi, M., Sugano, S., Yoshitake, R., Tanaka, Y., ... & Nishimura, R. (2015b). Anti-tumour effect of metformin in canine mammary gland tumour cells. The Veterinary Journal, 205(2), 297-304.
Sahabi, K., Selvarajah, G. T., & Noordin M. M., Sharma, R. S. K., & Dhaliwal, G. K. (2015). Retrospective Histopathological Study of Canine Mammary Gland Tumours Diagnosed from 2006 – 2012 in Universiti Putra Malaysia. Journal of Veterinary Malaysia, 27(1), 1–6.
Santos, A. A., Lopes, C. C., Ribeiro, J. R., Martins, L. R., Santos, J. C., Amorim, I. F., ... & Matos, A. J. (2013). Identification of prognostic factors in canine mammary malignant tumours: A multivariable survival study. BMC Veterinary Research, 9(1), 1.
Santos, A., Lopes, C., Gärtner, F., Matos, A. J. (2016). VEGFR-2 expression in malignant tumours of the canine mammary gland: A prospective survival study. Veterinary and comparative oncology, 4(3), 83-92.
Santos, M., Marcos, R., & Faustino, A. M. R. (2010). Histological Study of Canine Mammary Gland During the Oestrous Cycle. Reproduction in Domestic Animals, 45(5), 146-154.
Sarli, G., Preziosi, R., Benazzi, C., Castellani, G., & Marcato, P. S. (2002). Prognostic value of histologic stage and proliferative activity in canine malignant mammary tumors. Journal of Veterinary Diagnostic Investigation, 14(1), 25-34.
Sassi, F., Sarli, G., Brunetti, B., Morandi, F., & Benazzi, C. (2008). Immunohistochemical characterization of mammary squamous cell carcinoma of the dog. Journal of Veterinary Diagnostic Investigation, 20(6), 766-773.
Schneider, R., Dorn, C. R., & Taylor, D. O. (1969). Factors influencing canine mammary cancer development and postsurgical survival. Journal of the National Cancer Institute, 43(6), 1249-1261.

Pertanika J. Trop. Agric. Sci. 41 (2): 541 – 574 (2018)
Review on Mammary Gland Tumours in the Dog
573
Simon, D., Schoenrock, D., Baumgärtner, W., & Nolte, I. (2006). Postoperative adjuvant treatment of invasive malignant mammary gland tumors in dogs with doxorubicin and docetaxel. Journal of Veterinary Internal Medicine / American College of Veterinary Internal Medicine, 20, 1184-1190.
Sleeckx, N., de Rooster, H., Veldhuis Kroeze, E. J. B., Van Ginneken, C., & Van Brantegem, L. (2011). Canine mammary tumours, an overview. Reproduction in Domestic Animals = Zuchthygiene, 46(6), 1112–31.
Sonnenschein, E. G., Glickman, L. T., Goldschmidt, M. H., & McKee, L. J. (1991). Body conformation, diet, and risk of breast cancer in pet dogs: A case-control study. American Journal of Epidemiology, 133(7), 694-703.
Sorenmo, K. (2003). Canine mammary gland tumors. The Veterinary Clinics of North America. Small Animal Practice, 33(3), 573-576.
Sorenmo, K. U., Rasotto, R., Zappulli, V., & Goldschmidt, M. H. (2011). Development, anatomy, histology, lymphatic drainage, clinical features, and cell differentiation markers of canine mammary gland neoplasms. Veterinary Pathology, 48(1), 85-97.
Sorenmo, K. U., Shofer, F. S., & Goldschmidt, M. H. (2000). Effect of spaying and timing of spaying on survival of dogs with mammary carcinoma. Journal of Veterinary Internal Medicine American College of Veterinary Internal Medicine, 14(3), 266-270.
Souza, C. H. D. M., Toledo-piza, E., Amorin, R., Barboza, A., & Tobias, K. M. (2009). Inflammatory mammary carcinoma in 12 dogs: Clinical features, cyclooxygenase-2 expression, and response to piroxicam treatment, The Canadian Veterinary Journal, 50(5), 506.
Srivastava, A. K., Sharma, A. K., & Singh, B. (2009). Canine mammary tumours : A study on occurrence and distribution pattern, 33(1), 109-111.
Sullivan, H. C., Oprea-Ilies, G., Adams, A. L., Page, A. J., Kim, S., Wang, J., et al. (2013). Triple-negative breast carcinoma in African American and Caucasian women: Clinicopathology, immunomarkers, and outcome. Applied Immunohistochemistry and Molecular Morphology, 22(1), 17-23.
Tavares, W. L., Lavalle, G. E., Figueiredo, M. S., Souza, A. G., Bertagnolli, A. C., Viana, F. A., ... & Cassali, G. D. (2010). Evaluation of adverse effects in tamoxifen exposed healthy female dogs. Acta Veterinaria Scandinavica, 52(1), 67.
Taylor, G. N., Shabestari, L., Williams, J., Mays, C. W., Angus, W., & McFarland, S. (1976). Mammary neoplasia in a closed beagle colony. Cancer Research, 36(8), 2740-2743.
Toniti, W., Buranasinsup, S., Kongcharoen, A., Puchadapirom, P., & Kasorndorkbua, C. (2009). Immunohistochemical determination of estrogen and progesterone receptors in canine mammary tumors, Name of Journal, 10, 907-912.
Torres, L. N., Matera, J. M., Vasconcellos, C. H., Avanzo, J. L., Hernandez-Blazquez, F. J., & Dagli, M. L. Z. (2005). Expression of connexins 26 and 43 in canine hyperplastic and neoplastic mammary glands. Veterinary Pathology, 42(5), 633-641.
Travis, L. B., Ng, A. K., Allan, J. M., Pui, C.-H., Kennedy, A. R., & Xu, X. G. (2012). Second malignant neoplasms and cardiovascular disease following radiotherapy. Journal of the National Cancer Institute, 104(5), 357-370.
Uva, P., Aurisicchio, L., Watters, J., Loboda, A., Kulkarni, A., Castle, J., ... & Marconato, L. (2009). Comparative expression pathway analysis of human and canine mammary tumors. BMC Genomics, 10(1), 135.
Valenčáková-Agyagosová, A., & Ledecký, V. (2011). Incidence of Mammary Gland Tumors in Bitches admitted to the University of Veterinary Medicine And Pharmacy In Košice In. Folia, 55(4), 162-166.
Pertanika J. Trop. Agric. Sci. 41 (2): 541 – 574 (2018)
Kabiru Sahabi, Sujey Kumar Rajendren, Jia Ning Foong and Gayathri Thevi Selvarajah
574
van Dierendonck, J. H., Wijsman, J. H., Keijzer, R., van de Velde, C. J., & Cornelisse, C. J. (1991). Cell-cycle-related staining patterns of anti-proliferating cell nuclear antigen monoclonal antibodies. Comparison with BrdUrd labeling and Ki-67 staining. The American Journal of Pathology, 138(5), 1165-72.
Vos, J. H., Van den Ingh, T. S. G. A. M., Misdorp, W., Molenbeek, R. F., Van Mil, F. N., Rutteman, G. R., ... & Ramaekers, F. C. S. (1993). Immunohistochemistry with keratin, vimentin, desmin, and alpha-smooth muscle actin monoclonal antibodies in canine mammary gland: malignant mammary tumours. The Veterinary Quarterly, 15(3), 96-102.
Woodhouse, E. C., Chuaqui, R. F., & Liotta, L. A. (1997). General mechanisms of metastasis. Cancer, 80(8 Suppl), 1529-1537.
Wu, X., Chen, H., Parker, B., Rubin, E., Zhu, T., Lee, J. S., ... & Sukumar, S. (2006). HOXB7, a homeodomain protein, is overexpressed in breast cancer and confers epithelial-mesenchymal transition. Cancer Research, 66(19), 9527-9534.
Yamagami, T., Kobayashi, T., Takahashi, K., & Sugiyama, M. (1996). Prognosis for canine malignant mammary tumors based on TNM and histologic classification. The Journal of Veterinary Medical Science / the Japanese Society of Veterinary Science, 58(11), 1079-1083.
Yoneyama, K., & Nakamura, H. (2013). An elderly patient with advanced breast cancer who responded to treatment with letrozole-a case report. Gan to Kagaku Ryoho. Cancer & Chemotherapy, 40(13), 2565-2567.
Yoshida, K., Saito, T., Kamida, A., Matsumoto, K., Saeki, K., Mochizuki, M., ... & Nakagawa, T. (2013). Transforming growth factor-β transiently induces vimentin expression and invasive capacity in a canine mammary gland tumor cell line. Research in Veterinary Science, 94(3), 539-541.
Yoshikawa, Y., Ochiai, K., Morimatsu, M., Suzuki, Y., Wada, S., Taoda, T., ... & Watanabe, K. (2012). Effects of the missense mutations in canine BRCA2 on BRC repeat 3 functions and comparative analyses between canine and human BRC repeat 3. PloS One, 7(10), e45833.
Zatloukal, J., Lorenzova, J., & Tichý, F. (2005). Breed and age as risk factors for canine mammary tumours. Acta Veterinaria Brno 74(1), 103-109.
Zuccari, D. A. P. C., Castro, R., Gelaleti, G. B., & Mancini, U. M. (2011). Interleukin-8 expression associated with canine mammary tumors. Genetics and Molecular Research GMR, 10(3), 1522-1532.
Zuccari, D. A., Pavam, M. V., Terzian, C. B., Pereira, R. S., Ruiz, C. M., & Andrade, J. C. (2008). Immunohistochemical evaluation of e-cadherin, Ki-67 and PCNA in canine mammary neoplasias: correlation of prognostic factors and clinical outcome. Pesquisa Veterinária Brasileira, 28(4), 207-215.
Pertanika J. Trop. Agric. Sci. 41 (2): 575 – 590 (2018)
ISSN: 1511-3701 © Universiti Putra Malaysia Press
TROPICAL AGRICULTURAL SCIENCEJournal homepage: http://www.pertanika.upm.edu.my/
ARTICLE INFOArticle history:Received: 11 August 2017Accepted: 2 October 2017
E-mail address:[email protected] (Jahan, M. S.)
Review Article
Changes in Rice Physiology and Soil Conditions during Low-Water-Input Rice Production System - A Short Review
Jahan, M. S.Department of Agriculture and Biotechnology, Faculty of Bioresources and Food Industry, University Sultan Zainal Abidin, 22200 UniSZA, Besut, Terengganu, Malaysia
ABSTRACT
Water wise rice production is now a primary concern that ensures saving of considerable amount of fresh water volume as well overcoming water shortage for rice production. Several potential types of research have revealed that low water input for rice cultivation increases the productivity of water and sustains the production of rice. Several other studies have also proven the effects of water levels on the yield and yield parameters of rice plants. However, it is still necessary to update current scientific findings on low water use rice production which is related with the changes of plant and soil parameters. To date, it has been established that low water use in rice cultivation does not affect rice yield and rice parameters but saves voluminous amount of fresh water and reduces greenhouse gas emission. This review demonstrates different aspects of water use for rice cultivation and offers current updates on the changes of plant parameters and soil chemical properties. Finally, this review confirms that reducing water input from a traditional practice to water-wise rice cultivation sustains rice production without affecting plant and soil parameters.
Keywords: Irrigation, light-related properties and yield, rice, sustainable rice production, physiological properties
INTRODUCTION
In Asia, rice provides approximately 32% of calorie uptake and uses 50% of freshwater used in rice farming (IRRI, 2001). However, water availability was seen to drop by 40 to 60% between 1955
Pertanika J. Trop. Agric. Sci. 41 (2): 575 – 590 (2018)
Jahan, M. S.
576
and 1990, and more decline of 15 to 54% was witnessed in the following several years (Gleick, 1993). The decreasing area of land cultivated with irrigated rice and shifting of diets from starch-based to meat and dairy products require greater amounts of fresh water, resulting in water scarcity (Hoekstra & Chapagain, 2008). According to Tuong and Bouman (2003), rice is very sensitive to water stress, therefore, low water input may threaten food security, resulting in reduction of rice yields (Cassman, Olk, & Doberman, 1997) and soil health (Jahan, 2004). Therefore, sustainable rice production is necessary under stress conditions to feed the rapidly growing world population. In this regard, yields of rice must be sustained with less water input to increase water productivity for irrigated rice system, particularly in Asia, where 50% of irrigation water is used for rice production (Barker, Dawe, Tuong, Bhuiyan, & Guerra, 1999). Consequently, an innovative system is needed to confirm that low water status of the soil will not affect rice production but improve rice ecosystem. Several recent reports have confirmed that low water use in rice cultivation does not affect rice yield, soil properties and plant physiological parameters (Jahan, 2004; Jahan, 2016; Jahan, Khanif, Sinniah, Nozulaidi, & Khairi, 2012; Khairi, Naqib, Nozulaidi, Hasan, & Jahan, 2017).
Traditional flooding irrigation in rice cultivation did not increase yield and yield parameters than that of low water use rice cultivation (Khairi, Nozulaidi, Afifah, & Jahan, 2015a; Khairi et al., 2017). In fact,
it saturated to 1 cm flooding sustained rice production and saved a larger amount of fresh water compared to traditional flooding system. Water stress causes soil moisture deficit and affects the plant’s height, tiller numbers (Jahan, Nozulaidi, Khairi, & Khanif, 2013a; Khairi, Nozulaidi, & Jahan, 2015b). Plants respond to stress conditions such as drought and salinity by changing the morphology and physiological parameters of rice plants (Khairi et al., 2015b; Nozulaidi, Khairi, & Jahan, 2015). Similarly, Jahan (2016) reported that rice has exhibited reduction of filled grains and increased unfilled grains due to water stress.
Flooded condition increases Fe(II) and Mn(II), which are controlled by the soil pH levels (Jahan, Khanif, & Sinniah, 2013b; Ponnamperuma, Attanandana, & Beye, 1973). The flooding soil has shown higher availability of phosphorus compared to the dry soil (Gupta, Ladha, Singh, Singh, & Pathak, 2007; Jahan, 2016), and flooding has been found to reduce oxygen concentration and cause anaerobiosis that declines redox potential (Eh) value to less than –150 mV where low water input shows relatively oxidised condition that increases Eh value of more than - 150 mV (Jahan & Khanif, 2005a). Instead, the availability of water in the soil improves the availability of nutrients to rice plants (Jahan, Khanif, Syed Omar, & Sinniah, 2004; Jahan et al., 2013a; Jahan & Khanif, 2005b, 2005c).
Water deficit disturbs leaf water potentials, gas exchange through opening of guard cells (Khairi et al., 2015a; 2017), which is closed under water stress (Jahan,
Pertanika J. Trop. Agric. Sci. 41 (2): 575 – 590 (2018)
Low Water Rice Production
577
Nozulaidi, Khandaker, Afifah, & Husna, 2014; 2016). Low water input reduces the relative water content of leaves, photosynthesis rate, transpiration rate and CO2 movement (Khairi, Nozulaidi, & Jahan, 2016). Antioxidants, such as glutathione monoethyl ester, and N-acetyle cysteine which increase glutathione content in cells (Jahan, Nakamura, & Murata, 2011), have been found in several studies to reduce the detrimental effects of low nutrients and water stress on physiological, and light-related parameters of arabidopsis plants (Jahan et al., 2011, 2014, 2016), rice plants (Nozulaidi 2015; Khairi et al., 2015a) and corn plants (Inani, Nozulaidi, Khairi, Abdulkadir, & Jahan, 2015; Munirah, Jahan, & Nashriyah, 2015a; Munirah, Khairi, Nozulaidi, & Jahan, 2015b; Syuhada et al., 2014; Syuhada & Jahan, 2016). Therefore, it is important to focus on recent developments in the innovative use of water for sustainable rice production and justify the soil and plant parameters. This review cites new understanding of the low water use on plant and soil parameters for sustainable rice production.
Water Assessment for Agriculture
The global water scenarios were set by World Water Council during the preparation of World Water Vision. The increase in greenhouse gas concentrations in the atmosphere due to the burning of fossil fuels, deforestation, land-use changes, livestock and fertilisation has increased global average temperature (IPCC, 2008). Fresh water covers about three percent of
the total global water resources and less than one percent of fresh water (less than 0.01% of total global water) is available on the earth’s liquid surface (Mayers et al., 2009). Groundwater is a significant source of water, which is nearly half of the world’s drinking water (WWAP, 2009) and also represents approximately 43% of all water used for irrigation (Siebert et al., 2010). Shiklomanov (1999) asserted that rapid population growth has resulted in withdrawals of water over the last 50 years (WWAP, 2009) from agriculture and industry, which may affect water-depended crop production.
According to the statistics by WEF (20110, irrigated agriculture uses about 70% of the total freshwater or approximately 3100 billion m3 which is expected to increase to 4500 billion m3 by 2030. Several food-importing countries have been buying or leasing land in developing countries to improve their food security and water security (Braun & Meinzen-Dick, 2009). Economic growth combined with increased individual wealth has led to a shift from starch-based diets to meat and dairy, which have had the greatest impact on water consumption over the past 30 years (FAO, 2006). This system requires eight to 10 times more water than cereal production (WWAP, 2009). Rainfed agriculture covers about 80% of agricultural land worldwide associated with low yield and high on-farm water losses (WWAP, 2009). Water productivity plays an important role in reducing the demand for agricultural water use (Molden
Pertanika J. Trop. Agric. Sci. 41 (2): 575 – 590 (2018)
Jahan, M. S.
578
et al., 2007). In urban agriculture, using wastewater for agriculture reduces fresh water requirements (Qadir et al., 2007). Water conservation techniques reduce fresh water use for crop production (DOE, 2002). Therefore, it is important that innovative information and communications technologies be settled for the sustainable management of water resources and use for rice production from where a larger amount of fresh water can be diverted to municipal purposes.
Changes of Physiological Parameters of Rice Plants under Water Conditions
Chlorophyll (Chl) content rules on light reaction in the reaction center of photosystem II and shows an imperative character on plant growth (Jahan et al., 2016). Deficient soil water emulates Chl content of leaf of rice plants (Khairi et al., 2015a), which may disturb photosynthesis rate (Munirah et al., 2015a; Inani et al., 2015) and reduction of CO2 assimilation (Awal & Ikeda, 2002). This result shows consistent results with the study where Khairi et al. (2015a) confirmed accumulation of lower Chl content in leaves of rice plants to be due to low water and sustained similar effect on Chl fluorescences and quantum yield. Therefore, water levels at saturated to above do not affect Chl-controlled plant growth. Furthermore, Chl content is positively correlated with glutathione (GSH) content in plants (Jahan et al., 2016) and supports that low water might touch GSH content (Okuma et al., 2011). Besides, transpiration and stomatal conductance decline in leaves
are endorsed by low water, which might increase abscisic acid-persuaded stomatal closure (Jahan et al., 2008; Okuma et al., 2011). There is positive relationship between reduction of Chl and GSH content to the stomatal aperture (Jahan et al., 2016). However, no effect of intracellular GSH is confirmed (Jahan et al., 2013a). Low water inputs reduce transpirational water loss through leaves of rice plants (Awal & Ikeda, 2002), tissue water potential (Kato et al., 2004) which suggest that cell water potential is essential for the growth of rice plants which might enhance nutrients’ availability for roots (Khairi, Nozulaidi, Afifah, & Jahan, 2015a).
Low water input significantly reduces Chl parameters, that is, non-photochemical quenching (NPQ) in rice plants (Khairi et al., 2015a). In addition, Foyer and Harbinson (1999) also stated that NPQ regulates Chl parameters and protects light reaction in the pathway of photosynthetic electron (Bailey, Mann, Robinson, & Scanlan, 2005). Moreover, NPQ also shows positive relation to the photosynthesis in plants (Schubert, Andersson, & Snoeijs, 2006). Water level below than saturated condition significantly affects NPQ than flooding condition (Khairi et al., 2015a). These results relate to the fact that water stress disturbs light energy and NPQ in plants and finally reduces photosynthesis (Schubert et al., 2006) and glutathione biosynthesis (Jahan et al., 2016).
Several investigations have reported application of soil amendments (Chelah, Nordin, Musliania, Khanif, & Jahan,
Pertanika J. Trop. Agric. Sci. 41 (2): 575 – 590 (2018)
Low Water Rice Production
579
2011), trace elements (Inani et al., 2015; Munirah et al., 2015a; Syuhada et al., 2014), low water input (Jahan et al., 2013a, 2013b; Khairi et al., 2015a), salinity (Nozulaidi et al., 2015), and antioxidant such as glutathione (Inani et al., 2015; Munirah et al., 2015b; Syuhada & Jahan, 2016) coordinate relative water content (RWC), plant growth, and light parameters in different plants. Low water irrigation controls RWC of leaf of rice plants (Khairi et al., 2017), photosynthesis rate (Kura-Hotta, Satoh, & Katoh, 1987), light-regulated RWC (Jahan et al., 2016), and salinity-induced plant growth (Nozulaidi et al., 2015). Furthermore, low water irrigation decreases photosynthesis rate, and transpiration rate to reduce carbon dioxide (CO2) assimilation in plants during the process of photosynthesis (Awal & Ikeda, 2002). Therefore, it is possible that dry soil condition induces drought stress to the rice plants, which finally close the stoma (Jahan et al., 2008; Okuma et al., 2011) under which transpirational water loss (Awal & Ikeda, 2002), tissue water potential (Kato et al., 2004) to drop in production of rice (Khairi et al., 2015a) is seen. Consequently, irrigation of water for rice production in an innovative way is a scientific concern to sustain rice production in low water conditions.
Changes of Yield Parameters of Rice Plants under Water Conditions
Rice production is related to extensive water circumstances, soil categories and climates. Conventional flooding scheme
needs a larger quantity of fresh water in rice cultivation (Jahan, 2016; Khairi et al., 2015a; Nozulaidi et al., 2015). Different water input affects the number of tillers and panicles of rice plants differently, including filled grains and yield of rice plants (Sariam, Khanif, & Zahrah, 2002). This effect of low water extends to vegetative growth, grain yield, root length and root weight of rice plants (Jahan, 2016; Khairi et al., 2015b; Nozulaidi et al., 2015) and nutritional accumulation in rice grains (Singh & Bhattacharyya, 1989). Saturated or above water level shows no effect on yield parameters of rice plants (Khairi et al., 2015a, 2015b; Tuong & Bouman, 2003). Water deficit reduces flowering and grain yield by 50% and 21%, respectively (Mahmood, David, & Legates, 2004; Pirdashti, Sarvestani, Nematzadeh, & Ismail, 2004). It is because of reduction of different physiological parameters such as transpirational function (Vandeleur et al., 2009), tissue water potential (Kato et al., 2004), chlorophyll content (Sheela & Alexander, 1996) and photosynthetic units and photosynthesis (Kura-Hotta et al., 1987) of rice plants.
Water stress also seriously affects anthesis and grain filling of rice plants and leads to spikelet degeneration, spikelet sterility and reduction in grain setting, increase in unfilled grain, and reduction of 1000-grain weight (Chen, 2004; Wu, Yongsheng, & Yan, 2011). In addition, alternative dry and wet soil conditions significantly affect rice yields due to the degree of water stress induced to the rice
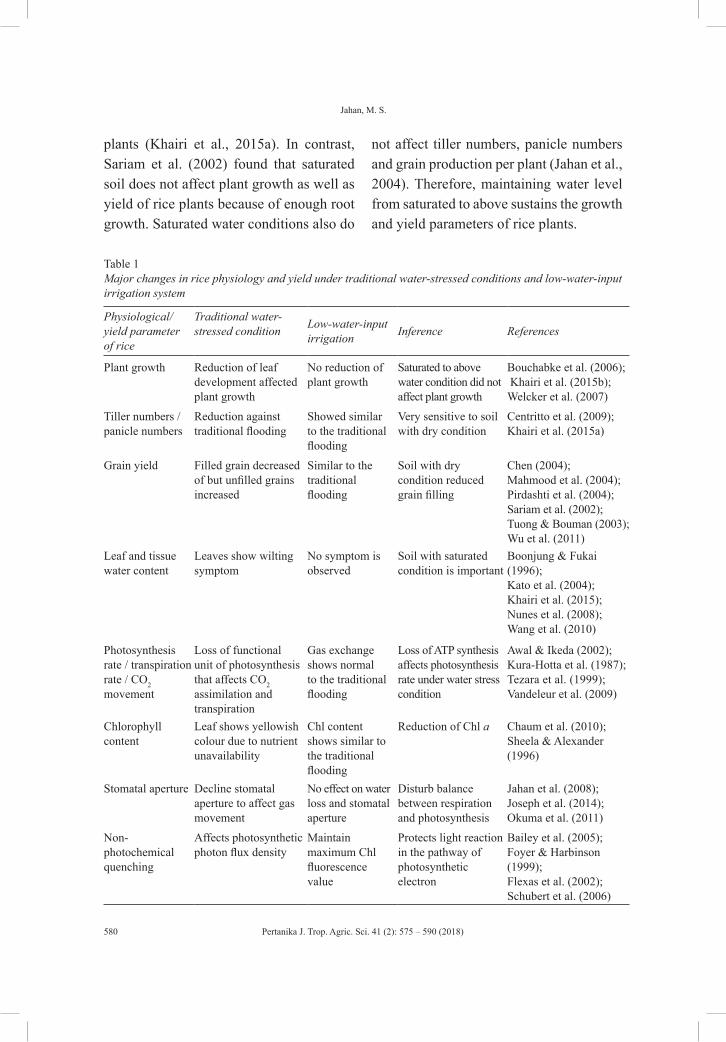
Pertanika J. Trop. Agric. Sci. 41 (2): 575 – 590 (2018)
Jahan, M. S.
580
plants (Khairi et al., 2015a). In contrast, Sariam et al. (2002) found that saturated soil does not affect plant growth as well as yield of rice plants because of enough root growth. Saturated water conditions also do
not affect tiller numbers, panicle numbers and grain production per plant (Jahan et al., 2004). Therefore, maintaining water level from saturated to above sustains the growth and yield parameters of rice plants.
Table 1Major changes in rice physiology and yield under traditional water-stressed conditions and low-water-input irrigation system
Physiological/yield parameter of rice
Traditional water-stressed condition Low-water-input
irrigation Inference References
Plant growth Reduction of leaf development affected plant growth
No reduction of plant growth
Saturated to above water condition did not affect plant growth
Bouchabke et al. (2006); Khairi et al. (2015b); Welcker et al. (2007)
Tiller numbers / panicle numbers
Reduction against traditional flooding
Showed similar to the traditional flooding
Very sensitive to soil with dry condition
Centritto et al. (2009); Khairi et al. (2015a)
Grain yield Filled grain decreased of but unfilled grains increased
Similar to the traditional flooding
Soil with dry condition reduced grain filling
Chen (2004);Mahmood et al. (2004);Pirdashti et al. (2004); Sariam et al. (2002); Tuong & Bouman (2003); Wu et al. (2011)
Leaf and tissue water content
Leaves show wilting symptom
No symptom is observed
Soil with saturated condition is important
Boonjung & Fukai (1996); Kato et al. (2004); Khairi et al. (2015); Nunes et al. (2008); Wang et al. (2010)
Photosynthesis rate / transpiration rate / CO2 movement
Loss of functional unit of photosynthesis that affects CO2 assimilation and transpiration
Gas exchange shows normal to the traditional flooding
Loss of ATP synthesis affects photosynthesis rate under water stress condition
Awal & Ikeda (2002); Kura-Hotta et al. (1987); Tezara et al. (1999); Vandeleur et al. (2009)
Chlorophyll content
Leaf shows yellowish colour due to nutrient unavailability
Chl content shows similar to the traditional flooding
Reduction of Chl a Chaum et al. (2010); Sheela & Alexander (1996)
Stomatal aperture Decline stomatal aperture to affect gas movement
No effect on water loss and stomatal aperture
Disturb balance between respiration and photosynthesis
Jahan et al. (2008); Joseph et al. (2014); Okuma et al. (2011)
Non-photochemical quenching
Affects photosynthetic photon flux density
Maintain maximum Chl fluorescence value
Protects light reaction in the pathway of photosynthetic electron
Bailey et al. (2005); Foyer & Harbinson (1999); Flexas et al. (2002); Schubert et al. (2006)
Pertanika J. Trop. Agric. Sci. 41 (2): 575 – 590 (2018)
Low Water Rice Production
581
Changes of Phytoavailability of Plants’ Nutrients under Water Conditions
Soil water condition changes the properties of soil including phytoavailability of nutrients, radical oxygen transport and ionic balancing (Laskov, Horn, & Hupfer, 2006). Flooding water condenses oxygen source in the soil, which disturbs various anaerobic microorganisms and finally change the oxidised condition to reduced condition (Ponnamperuma, 1972). Nevertheless, oxygen must be contacted in roots, otherwise, it may lead to lacking of root energy (Drew, 1990). A reduced condition of soil shakes different processes of submerged soil including chemical and biological functions (Gambrell & Patrick, 1978). More nutrients dissolve in water during high flooding, most of which, are lost from soil through leaching (Tsheboeng, Bonyongo, & Murray-Hudson, 2014). Flooding condition displaces oxygen which declines organic matter decomposition and results in low nutrients in soil (Gallardo, 2003).
Irrigated rice uses portion of applied nitrogen (N) fertiliser in which substantial quantities of applied N are misplaced by leaching, denitrification, and volatilisation (Blair, Faulkner, Till, & Poulton, 2006; Zhao, Wu, Dong, & Li 2010). Nitrogen use efficiency in flooded soil is only about 30 to 35% and about 50% of applied N is lost through different N transformation processes (Zhao et al., 2010). Nutrient phytoavailability in non-flooded soils is relatively distinct from the flooded soil. In flooded soil, nitrate is rapidly denitrified
(Ponnamperuma, 1972) and NH4-N would be the largest source of N nutrient for plants (Godshalk & Wetzel, 1978). Rice plants accumulate significant amount of N at the vegetative stage than that of later stage including ripening stage (Jahan, 2016).
Phosphorus (P) phytoavailability rises in submerged soil encompasses the reduction of ferric to ferrous phosphate while AlPO4 hydrolysis and FePO4 reduction are important (Patrick & Mahapatra, 1968). Flooding condition induces P availability after the soil is flooded (Jahan et al., 2004; Khairi et al., 2017). Flooding at prolonged period enhanced the fixation rate of P in soil through increasing P affinity to clay structure and pH dependency (Gallardo, 2003; Mitsch & Gosselink, 2000; Patrick & Mahapatra, 1968). Anoxic condition due to prolonged flooding increases P mobilisation in soil (Gallardo, 2003; Mitsch and Gosselink, 2000). Potassium is displaced by Fe2+ and NH4
+ from the colloidal exchange sites of the soil in the flooded soil (Ponnamperuma, 1972). This result leads to availability of the K concentration in the flooded soil by decreasing the fixation rate. Olk, Cassmon and Carlson (1995) stated that available K dropped after the flooding and decreased gradually with increasing growth of plants (Jahan, 2004; Khairi et al., 2017). Low flooding depth increases K content at the root zone (Tsheboeng et al., 2014) while high flooding reduces the K content due to leaching and dilution (Conklin, 2005). This result suggests that flooding increases solubility of potassium.
Pertanika J. Trop. Agric. Sci. 41 (2): 575 – 590 (2018)
Jahan, M. S.
582
Availability of Fe2+ increases in flooded soil due to the fact that hydrated Fe3+ is reduced to Fe2+ (Ponnamperuma, 1972; Yoshida, 1981). In the flooded paddy soil, reducing phases trigger redox depletion of iron (Charlet, Markelova, Parsons, Couture, & Madé, 2013). The availability of Zn in the flooded soil increases under different flooding conditions (Jahan, 2016), and flooding also increases micronutrient solubility (Green, Heil, Cardon, Butters, & Kelly, 2003) and mass flow of Fe and Mn into roots. In contrast, prolonged flooding increases movement of micronutrients towards the subsoil. Thus, submergence causes the movement and precipitation of Fe or Mn in paddy soil development (Greipsson, 1996). This process may deplete nutrients from the topsoil through the reactions of adsorption-desorption or processes of precipitation-dissolution (Adriano, Wenzel, Vangronsveld, & Bolan, 2004). Periodical changes of flooding condition cause a variation in availability of nutrients to plants (Sebastian & Prasad, 2015) and contribute to mobilisation of micronutrients in the soil (Jahan, 2004; Jahan & Khanif, 2005c). Taken together, the above discussion indicates that low water use increases micronutrients in flooded soil for rice plants and sustained rice production (Jahan et al., 2016). Nevertheless, continuous flooding stimulates methane emission, a greenhouse gas, due to organic matter decomposition in anaerobic condition. Emissions of CH4 and nitrous oxide are intensely linked to soil oxidation status (Hou, Chen, Wang, Van Cleemput, & Patrick, 2000).
Changes of Soil Redox State under Water Conditions
Depletion of oxygen in rice soils differs due to the different physical and chemical properties of soil which undergo reduction reactions that result in a drop in redox potential (Scharpenseel, Pfeiffer, & Becker-Heidmann, 1996). Reducing condition of the paddy soil causes a redox depletion of nutrients such as iron (Fe) and manganese (Mn) (Charlet, et al., 2013). In rice soils, water conditions affect redox potential (Eh) values (Jahan, 2004) that can contribute to environmental factors as well as to the territorial population (Pennington & Walters, 2006). Flooded water elevates enzyme activity such as alcohol dehydrogenase in numerous plants (Crawford, 1992) linked to anaerobic respiration. Root and rhizomes attain oxygen, which permit plants to maintain respiration and oxidisation and create oxygen gradient in soil redox state (Youssef & Saenger, 1998). This result is consistent with the previous study that low water level increases redox states in rice soil (Jahan & Khanif, 2005a). Increasing flooding level and time reduces redox value lower than 150 mV (Jahan, 2004) under which methane (CH4) is produced and can affect the environment. The production of methane is one of the environmental constraints that significantly increase climate change factors (Kludze & DeLaune, 1995). However, when the water level is saturated to 1 cm flooding, the redox value increases to more than -100 mV (Jahan & Khanif, 2005a). This
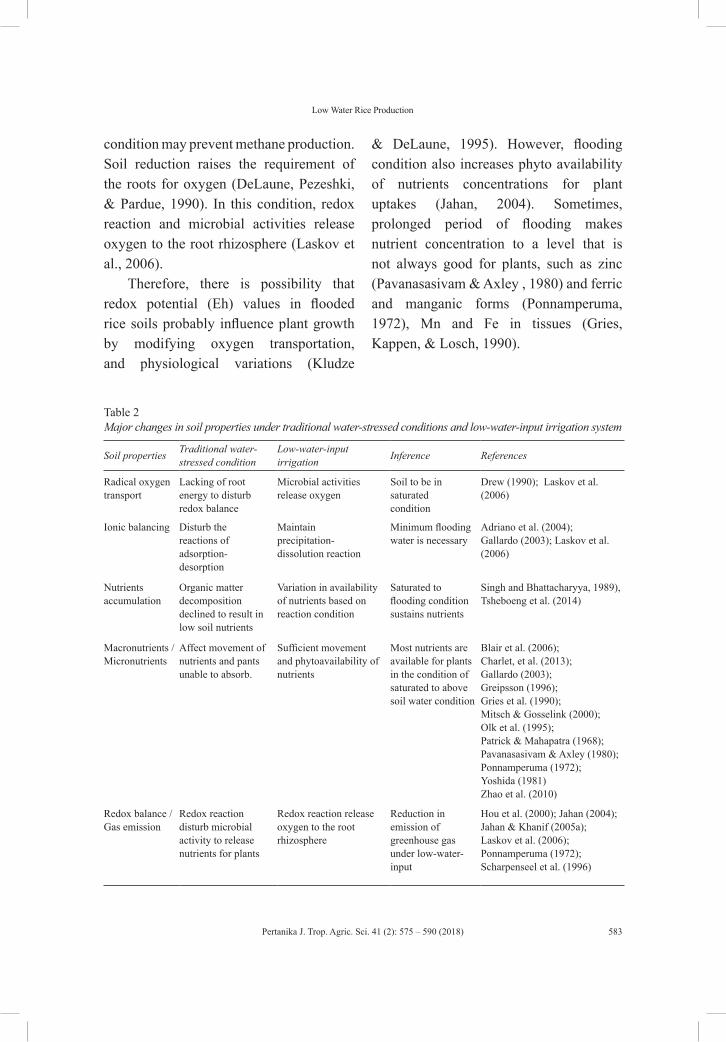
Pertanika J. Trop. Agric. Sci. 41 (2): 575 – 590 (2018)
Low Water Rice Production
583
condition may prevent methane production. Soil reduction raises the requirement of the roots for oxygen (DeLaune, Pezeshki, & Pardue, 1990). In this condition, redox reaction and microbial activities release oxygen to the root rhizosphere (Laskov et al., 2006).
Therefore, there is possibility that redox potential (Eh) values in flooded rice soils probably influence plant growth by modifying oxygen transportation, and physiological variations (Kludze
& DeLaune, 1995). However, flooding condition also increases phyto availability of nutrients concentrations for plant uptakes (Jahan, 2004). Sometimes, prolonged period of flooding makes nutrient concentration to a level that is not always good for plants, such as zinc (Pavanasasivam & Axley , 1980) and ferric and manganic forms (Ponnamperuma, 1972), Mn and Fe in tissues (Gries, Kappen, & Losch, 1990).
Table 2Major changes in soil properties under traditional water-stressed conditions and low-water-input irrigation system
Soil properties Traditional water-stressed condition
Low-water-input irrigation Inference References
Radical oxygen transport
Lacking of root energy to disturb redox balance
Microbial activities release oxygen
Soil to be in saturated condition
Drew (1990); Laskov et al. (2006)
Ionic balancing Disturb the reactions of adsorption-desorption
Maintain precipitation-dissolution reaction
Minimum flooding water is necessary
Adriano et al. (2004); Gallardo (2003); Laskov et al. (2006)
Nutrients accumulation
Organic matter decomposition declined to result in low soil nutrients
Variation in availability of nutrients based on reaction condition
Saturated to flooding condition sustains nutrients
Singh and Bhattacharyya, 1989), Tsheboeng et al. (2014)
Macronutrients / Micronutrients
Affect movement of nutrients and pants unable to absorb.
Sufficient movement and phytoavailability of nutrients
Most nutrients are available for plants in the condition of saturated to above soil water condition
Blair et al. (2006); Charlet, et al. (2013); Gallardo (2003); Greipsson (1996); Gries et al. (1990);Mitsch & Gosselink (2000); Olk et al. (1995); Patrick & Mahapatra (1968); Pavanasasivam & Axley (1980);Ponnamperuma (1972);Yoshida (1981) Zhao et al. (2010)
Redox balance / Gas emission
Redox reaction disturb microbial activity to release nutrients for plants
Redox reaction release oxygen to the root rhizosphere
Reduction in emission of greenhouse gas under low-water-input
Hou et al. (2000); Jahan (2004); Jahan & Khanif (2005a); Laskov et al. (2006); Ponnamperuma (1972);Scharpenseel et al. (1996)
Pertanika J. Trop. Agric. Sci. 41 (2): 575 – 590 (2018)
Jahan, M. S.
584
CONCLUSION
The recent advancement of water productivity in rice cultivation provides a new opportunity for the yield potential under low water conditions. The intention is to minimise water scarcity on rice production through low water input rice cultivation. Therefore, the influence of low water use in rice cultivation increases water sustainability to be diverted for other purposes. The progress in physiological functions of rice plants under drought stress may be caused by the discovery of genes motivating the complex physiological and biochemical aspects of rice plants. Therefore, giant investments in genomic analysis of rice plants is important to develop molecular markers for the capacity of the plant to osmotically regulate water stress. For example, the combination of the C4 photosynthetic pathway into C3 could be a conceivable upsurge to water productivity of rice plants and sustain rice production under low water condition without affecting the physiology, yield and soil parameters. Furthermore, hormonal signaling to the rice plants needs to be investigated to find out the relation between water levels and nutrient mobilisation in rice plants.
ACKNOWLEDGEMENTS
This research work was maintained by the grant of FRGS/2/2014/STWN03/UNISZA/02/1 from the Ministry of Higher Education Malaysia (MOHE) to Associate Prof. Dr. Md. Sarwar Jahan.
REFERENCESAdriano, D. C., Wenzel, W., Vangronsveld, W.
J., & Bolan, N. S. (2004). Role of assisted natural remediation in environmental cleanup. Geoderma, 122(2-4), 121–142.
Awal, M. A., & Ikeda, T. (2002). Recovery strategy following the imposition of episodic soil moisture deficit in stands of peanut (arachis hypogea L.). Journal of Agro Crop Science, 188(3), 185 –192.
Bailey, S., Mann, N. H., Robinson, C., & Scanlan, D. J. (2005). The occurrence of rapidly reversible non-photochemical quenching of chlorophyll-a fluorescence in cyanobacteria. The Federation of European Biochemical Societies Letter, 579(1), 275–280.
Barker, R., Dawe, D., Tuong, T. P., Bhuiyan, S. I., & Guerra, L. C. (1999). The outlook for water resources in the year 2020: Challenges for research on water management in rice production. In Assessment and Orientation Towards the 21st Century Proceedings of 19th Session of the International Rice Commission (pp.96-109). Cairo, Egypt: Publisher.
Blair, N., Faulkner, R. D., Till, A. R., & Poulton, P. R. (2006). Long-term management impacts on soil C, N and physical fertility: Part 1, Broadbalk experiment. Soil Tillage Research, 91(1-2), 30-38.
Boonjung, H., & Fukai, S. (1996). Effects of soil water deficit at different growth stages on rice growth and yield under upland conditions. 1. Growth during drought. Field Crops Research, 48(1), 37-45.
Bouchabke, O., Tardieu, F., & Simonneau, T. (2006). Leaf growth and turgor in growing cells of maize (zea mays L.) respond to evaporative demand under moderate irrigation but not in water-saturated soil. Plant, Cell and Environment, 29(6), 1138-148.
Pertanika J. Trop. Agric. Sci. 41 (2): 575 – 590 (2018)
Low Water Rice Production
585
Braun, V. J., & Meinzen-Dick, R. (2009). ‘Land grabbing’ by foreign investors in developing countries: Risks and opportunities. IFPRI Policy Brief 13.Washington DC, International Food Policy Research Institute (IFPRI).
Cassman, K. G., Olk, D. C., & Doberman, A. (1997). Scientific evidence of yield and productivity declines in irrigated rice systems of tropical Asia. IRC Newsletter, 46, 7-27.
Centritto, M., Lauteri, M., Monteverdi, M. C., & Serraj, R. (2009). Leaf gas exchange, carbon isotope discrimination, and grain yield in contrasting rice genotypes subjected to water deficits during the reproductive stage. Journal of Experimental Botany, 60(8), 2325-2339.
Cha-um, S., Nhung, N. T. H., & Kirdmanee, C. (2010). Effect of mannitol- and salt-induced iso-osmotic stress on proline accumulation, photosynthetic abilities and growth characters of rice cultivars (Oryza sativa L. spp. indica). Pakistan Journal of Botany, 42(2), 927-941.
Charlet, L., Markelova, E., Parsons, C., Couture, R., & Madé, B. (2013). Redox oscillation impact on natural and engineered biogeochemical systems: Chemical resilience and implications for contaminant mobility. Proceeding of Earth Planetary Science, 7, 135-138.
Chelah, M. K. B., Nordin, M. N. B., Musliania, M. I., Khanif, Y. M., & Jahan, M. S. (2011). Composting increases BRIS soil health and sustains rice production on BRIS soil. Science Asia, 37(4), 291-295.
Chen, S. (2004). Research progression on effect of water stress on growth and development and yield in rice. Reclaim and Rice Cultivation, 5, 12-14.
Conklin, A. R. (2005). Introduction to soil chemistry: Analysis and instrumentation. New Jersey: John Wiley and Sons.
Crawford, R. M. M. (1992). Oxygen availability as an ecological limit to plant distribution. Advances in Ecological Research, 23, 93-285.
DeLaune, R. D., Pezeshki, S. R., & Pardue, J. H. (1990). An oxidation-reduction buffer for evaluating physiological response of plants to root oxygen stress. Environmental and Experimental Botany, 30(2), 243-247.
DOE (US Department of Energy). (2002). Domestic water conservation technologies. Office of Energy Efficiency and Renewable Energy, Federal Energy Management Program Federal Technology Alerts. Retrieved from www.eere.energy.gov/femp/pdfs/22799.pdf
Drew, M.C. (1990). Sensing soil oxygen. Plant, Cell and Environment, 13, 681-693.
FAO. (2006). World agriculture: Towards 2030/2050. Interim report. Prospects for food, nutrition, agriculture and major commodity groups. Rome. Retrieved from http://www.fao.org/fileadmin/ user_upload/esag/docs/Interim_report_ AT2050web.pdf
Flexas, J., Escalona, J. M., Evain, S., Gulías, J., Moya, I., Osmond, C. B., & Medrano, H. (2002). Steady-state chlorophyll fluorescence (Fs) measurements as a tool to follow variations of net CO2 assimilation and stomatal conductance during water-stress in C3 plants. Physiologia plantarum, 114(2), 231-240.
Foyer, C. H., & Harbinson, J. (1999). Relationships between antioxidant metabolism and carotenoids in the regulation of photosynthesis. In H. A. Frank, A. J. Young, G. Britton, & R. J. Cogdell (Eds.), The photochemistry of carotenoids (pp. 303-325). Dordrecht, Netherlands: Kluwer Academic Publishers.
Gallardo, A. (2003). Spatial variability of soil properties in a floodplain forest in Northwest Spain. Ecosystems, 6(6), 564-576.
Pertanika J. Trop. Agric. Sci. 41 (2): 575 – 590 (2018)
Jahan, M. S.
586
Gambrell, R. P., & Patrick, W. H. (1978). Chemical and microbiological properties of anaerobic soils and sediments. In D. D. Hook, & R. M. M Crawford (Eds), Plant life in anaerobic environments (pp. 375-423). Ann Arbor, MI, USA: Publisher.
Gleick, P. H. (1993). Water in crisis: A guide to the world’s fresh water resources. Oxford University Press, New York, USA.
Godshalk, G. L., & Wetzel, R. G. (1978). Decomposition in the littoral zone of lakes. In R. E. Good, D. F. Whigham, & R. L. Simpson (Eds.), Freshwater wetlands (pp.131-143). New York: Academic Press.
Green, C. H., Heil, D. M., Cardon, G. E., Butters, G. L. & Kelly, E. F. (2003). Solubilization of manganese and trace metals in soils affected by acid mine runoff. Journal Environmental Quality, 32(4), 1323-1334.
Greipsson, S. (1996). Effect of iron plaque on roots of rice on growth of plants in excess zinc and accumulation of phosphorus in plants in excess copper or nickel. Journal of Plant Nutrition, 18(8), 1659–1665.
Gries, C., Kappen, L., & Losch, R. (1990). Mechanism of flood tolerance in reed (phragmites australis). The New Phytologist, 114(4), 589-593.
Gupta, R. K., Ladha, J. K., Singh, J., Singh, G., & Pathak, H. (2007). Yield and phosphorus transformations in a rice-wheat system with crop residue and phosphorus management. Soil Science Society of America Journal, 71(5), 1500–1507.
Hoekstra, A. Y., & Chapagain, A. K. (2008). Globalization of water: Sharing the planet’s freshwater resources. Oxford: Blackwell Publishing.
Hou, A. X., Chen, G. X., Wang, Z. P., Van Cleemput, O., & Patrick,W. H. Jahan, (2000). Methane and nitrous oxide emissions from rice field in relation to soil redox and microbiological processes. Soil Science Society of America Journal, 64(6), 2180-2186.
Inani, N., Nozulaidi, M., Khairi, M., Abdulkadir, A. B., & Jahan, M. S. (2015). Glutathione functions on physiological characters of corn plants to enhance Mn-induced corn production. Pertanika Journal of Tropical Agricultural Science, 38(4), 509-518.
IPCC (Intergovernmental Panel on Climate Change). (2008). Climate Change and Water. Technical Paper of the Intergovernmental Panel on Climate Change. Geneva, IPCC. Retrieved from www.ipcc.ch/pdf/technicalpapers/climate-change-water-en.pdf
Jahan M. S. (2016). Rice production under different water inputs. City: LAP LAMBERT Academic Publishing.
Jahan, M. S. (2004). Rice production under different water inputs. (Unpublished doctoral thesis). Universiti Putra Malaysia, Serdang, Malaysia.
Jahan, M. S., & Khanif, Y. M. (2005a). Low water rice production and its effect on redox potential and soil pH. Journal of Agronomy, 4, 142-146.
Jahan, M. S., & Khanif, Y. M. (2005b). Techniques of water saving in rice production in Malaysia. Asian Journal of Plant Sciences, 4(1), 83–84.
Jahan, M. S., & Khanif, Y. M. (2005c). The effect of different water levels on rice yield and Cu and Zn concentration. Journal of Agronomy, 4(2), 116-121.
Jahan, M. S., Khanif, Y. M., & Sinniah, U. R. (2013b). Effects of low water input on rice yield: Fe and Mn bioavailability in soil. Pertanika Journal of Tropical Agricultural Science, 36(1), 27-34.
Pertanika J. Trop. Agric. Sci. 41 (2): 575 – 590 (2018)
Low Water Rice Production
587
Jahan, M. S., Khanif, Y. M., Sinniah, U. R., Nozulaidi, M. B. N., & Khairi, M. B. C. L. (2012). Bioavailability of soil nitrogen in low water input rice production. Journal of Sustainability Science & Management, 7(2), 207-212.
Jahan, M. S., Khanif, Y. M., Syed Omar, S. R., & Sinniah, U. R. (2004). The effect of different water regimes on yield and bioavailability of phosphorus in rice production in Malaysia. Malaysian Journal of Soil Science, 8, 53-62.
Jahan, M. S., Nakamura, Y., & Murata, Y. (2011). Histochemical quantification of GSH contents in guard cells of Arabidopsis thaliana. Science Asia, 37(3), 281-284.
Jahan, M. S., Nozulaidi, M., Khandaker, M. M., Afifah, A., & Husna, N. (2014). Control of plant growth and water loss by a lack of light-harvesting complexes in photosystem-II in Arabidopsis thaliana ch1-1 mutant. Acta Physiologia Plantarum, 36(7), 1627-1635.
Jahan, M. S., Nozulaidi, M. B. N., Khairi, M. B. C. L, & Khanif, Y. M. (2013a). Effects of water stress on rice production: bioavailability of potassium in soil. Journal of Stress Physiology and Biochemistry, 9(2), 97-107.
Jahan, M. S., Ogawa, K., Nakamura, Y., Shimoishi, Y., Mori, I. C., & Murata, Y. (2008). Deficient glutathione in guard cells facilitates abscisic acid-induced stomatal closure but does not affect light-induced stomatal opening. Bioscience, Biotechnology, and Biochemistry, 72(10), 2795-2798.
Joseph, T., Whitehead, D., & Turnbull, M. H. (2014). Soil water availability influences the temperature response of photosynthesis and respiration in a grass and a woody shrub. Functional Plant Biology, 41(5), 468-481.
Kato, Y., Satoshi, H., Akiniko, K., Abe, J., Urasaki, K., & Yamagishi, J. (2004, Month). Enhancing grain yield of rice (Oryza sativa L.) under upland conditions in Japan. Paper presented at the 4th International Crop Science Congress, Brisbane, Australia.
Khairi, M., Naqib, S. A., Nozulaidi, M., Hasan, M. M., & Jahan, M. S. (2017) Low water input confers sustainable rice production without affecting soil, plant physiological and yields parameters. Australian Journal of Crop Science, 11(8), 1068-1077.
Khairi, M., Nozulaidi, M., & Jahan, M. S. (2015b). Effects of different water levels on physiology and yield of salinity rice variety. Australian Journal of Basic Applied Science, 9(2), 339-45.
Khairi, M., Nozulaidi, M., & Jahan, M. S. (2016). Effects of flooding and alternate wetting and drying on the yield performance of upland rice. Pertanika Journal of Tropical Agricultural Science, 39(3), 299-309.
Khairi, M., Nozulaidi, M., Afifah, A., & Jahan, M. S. (2015a). Effect of various water regimes on rice production in lowland irrigation. Australian Journal of Crop Science, 9(2), 153-159.
Kludze, H. K., & DeLaune, R. D. (1995). Gaseous exchange and wetland plant response to soil redox intensity and capacity. Soil Science Society of America Journal, 59(3), 939-945.
Kura-Hotta, M., Satoh, K., & Katoh, S. (1987). Relationship between photosynthesis and chlorophyll content during leaf senescence of rice seedlings. Plant and Cell Physiology, 28(7), 1321-1329.
Laskov, C., Horn, O., & Hupfer, M. (2006). Environmental factors regulating the radial oxygen loss from roots of Myriophyllum spicatum and Potamogeton crispus. Aquatic Botany, 84(4), 333-340.
Pertanika J. Trop. Agric. Sci. 41 (2): 575 – 590 (2018)
Jahan, M. S.
588
Mahmood, R., David, R., & Legates, M. M. (2004). The role of soil water availability in potential rain fed rice productivity in Bangladesh: Applications of the CERES-Rice model. Applied Geography, 24(2), 139-159.
Mayers, J., Batchelor, C., Bond, I., Hope, R. A., Morrison, E., & Wheeler, B. (2009). Water ecosystem services and poverty under climate change: Key issues and research priorities. Natural Resource Issues No. 17. London: International Institute for Environment and Development.
Mitsch, W. J. & Gosselink, J. G. (2000). Wetlands (3rd Ed.). New York: John Wiley and Sons.
Molden, D., Oweis, T. Y., Pasquale, S., Kijne, J. W., Hanjra, M. A., & Bindraban, P. S. (2007). Pathways for increasing agricultural water productivity. In D. Molden, (Ed.), Water for food, water for life: A comprehensive assessment of water management in agriculture (pp. 279-310). Colombo, Sri Lanka: International Water Management Institute (IWMI).
Munirah, N., Jahan, M. S., & Nashriyah, M. (2015a). N-acetylcysteine and Zn regulate corn yield. Science Asia, 41, 246-250.
Munirah, N., Khairi, M., Nozulaidi, M., & Jahan, M. S. (2015b). The effects of zinc application on physiology and production of corn plants. Australian Journal of Basic and Applied Sciences, 9(2), 362-367.
Nozulaidi, M., Khairi, M., & Jahan, M. S. (2015). Effects of different salinity levels on rice production. Australian Journal of Basic and Applied Sciences, 9(5), 524-530.
Nunes, C., Araujo, S. S., da Silva, J. M., Fevereiro, M. P. S., & da Silva, A. B. (2008). Physiological responses of the legume model Medicago truncatula cv. Jemalong to water deficit. Environmental and Experimental Botany, 63(1-3), 289-296.
Okuma, E., Jahan, M. S., Munemasa, S., Hossain, M. A., Muroyama, D., Islam, M. M., ... & Mori, I. C. (2011). Negative regulation of abscisic acid-induced stomatal closure by glutathione in Arabidopsis. Journal of plant physiology, 168(17), 2048-2055.
Olk, D. C., Cassmon, K. G., & Carlson, R. M. (1995). Kinetics potassium fixation in vermiculite soil under different moisture regimes. Soil Science Society of America Journal, 59(2), 423–429.
Patrick, W. H., & Mahaparta, I. C. (1968). Transformation and availability to rice of nitrogen and phosphorus in waterlogged soils. Advances in Agronomy, 20, 323-359.
Pavanasasivam, V., & Axley, J. H. (1980). Influence of flooding on the availability of soil zinc. Communications in Soil Science and Plant Analysis, 11(2), 163-174.
Pennington, M. R., & Walters, M. B. (2006). The response of vegetation zonation and soil redox potential in created wetlands. Forest Ecology and Management, 233(1), 1-10.
Pirdashti, H., Sarvestani, Z. T., Nematzadeh, G., & Ismail, A. (2004, Month). Study of water stress effects in different growth stages on yield and yield components of different rice (Ooyza sativa L.) cultivars. Paper presented at the 4th International Crop Science Congress. Brisbane, Australia.
Ponamperuma, F. N., Attanandana, T., & Beye, G. (1973). Amelioration of three acid sulfate soils for lowland rice. In H. Dosh (Ed.), International Institute for Land Reclamation and Improvement (pp. 391-406). Wageningen, Netherlands: Publ.18.
Ponnamperuma, F. N. (1972). The chemistry of submerged soils. Advances in Agronomy, 24, 29-96.
Pertanika J. Trop. Agric. Sci. 41 (2): 575 – 590 (2018)
Low Water Rice Production
589
Qadir, M., Wichelns, D., Raschid-Sally, L., Minhas, P. S., Drechsel, P., Bahri, A., … & va der Hoek, W. (2007). Agricultural use of marginal-quality water - Opportunities and challenges. In D. Molden (Ed.), Water for food, Water for life: A comprehensive assessment of water management in agriculture (pp. 425-453). Earthscan, London, UK.
Sariam, O., Khanif, Y. M., & Zahrah, T. (2002). Rice growth and nitrogen uptake as influenced by water management. Malaysian Journal of Soil Science, 6, 1-11.
Scharpenseel, H. W., Pfeiffer, E. M., & Becker-Heidmann, P. (1996). Organic carbon storage in tropical hydromorphic soils. In M. R. Carter & B. A. Stewart (Eds.), Structure andorganic matter storage in agricultural soils (pp. 361-392). Boca Raton, Florida: Lewis Publishers.
Schubert, H., Andersson, M., & Snoeijs, P. (2006). Relationship between photosynthesis and non-photochemical quenching of chlorophyll fluorescence in two red algae with different carotenoid compositions. Marine Biology, 149(5), 1003-1013.
Sebastian, A., & Prasad, M. N. V. (2015). Trace element management in rice. Agronomy, 5(3), 374-404.
Sheela, K. R., & Alexander, V. T. (1996). Physiological response of rice varieties as influenced by soil moisture and seed hardening. Indian Journal Plant Physiology, 38, 269-271.
Shiklomanov, I. A. (1999). World water resources at the beginning of the 21st century. Report for the International Hydrological Programme, UNESCO, St. Petersburg, Russian Federation. Retrieved from unesco.org/water/ihp/db/shiklomanov/
Siebert, S., Burke, J., Faures, J. M., Frenken, K., Hoogeveen, J., Döll, P., & Portmann, F. T. (2010). Groundwater use for irrigation - A global inventory. Hydrology and Earth System Sciences, 14(10), 1863-80.
Singh, K. N., & Bhattacharyya, H. C. (1989). Direct seeded rice. New Delhi: Oxford and I.B.H. Publication.
Syuhada, N., & Jahan, M. J. (2016). Glutathione functions on physiological characters to increase copper-induced corn production. Russian Agricultural Sciences, 42(1), 5-10.
Syuhada, N., Jahan, M. S., Nashriyah, M., Khairi, M., Nozulaidi, M., & Razali, M. H. B. (2014). Application of copper increased corn yield through enhancing physiological functions. Australian Journal of Basic and Applied Sciences, 8(16), 282-286.
Tezara, W., Mitchell, V., Driscoll, S., & Lawlor, D. (1999). Water stress inhibits plant photosynthesis by decreasing coupling factor and ATP. Nature, 401(6756), 914-917.
Tsheboeng, G., Bonyongo, M., & Murray-Hudson, M. (2014). Flood variation and soil nutrient content in flood plain vegetation communities in the Okavango Delta. South African Journal of Science, 110(3-4), 1-5.
Tuong, T. P., & Bouman, B. A. M. (2003). Rice production in water-scarce environments. In J. W. Kijne, R. Barker, & D. Molden (Eds.), Water productivity in agriculture: Limits and opportunities for improvements (pp. 53-67). Wallingofrd UK: CABI Publishing.
Vandeleur, R. K., Mayo, G., Shelden, M. C., Matthew-Gilliham, M., Kaiser, B. N., & Tyerman, S. D. (2009). The role of plasma membrane intrinsic protein aquaporins in water transport through roots: Diurnal and drought stress responses reveal different strategies between isohydric and anisohydric cultivars of grapevine. Plant Physiology, 149(1), 445-460.
Pertanika J. Trop. Agric. Sci. 41 (2): 575 – 590 (2018)
Jahan, M. S.
590
Wang, H. Z., Zhang, L. H., Jun, M. A., Li, X. Y., Yan, L. I., Zhang, R. P., & Wang, R. Q. (2010). Effects of water stress on reactive oxygen species generation and protection system in rice during grain-filling stage. Agriculture Science China, 9(5), 633-641.
WEF. (2011). Global risks 2011: Sixth edition. World Economic Forum. Retrieved July 17, 2011, from http://riskreport.weforum.org/global-risks-2011.pdf
Welcker, C., Boussuge, B., Bencivenni, C., Ribaut, J. M., & Tardieu, F. (2007). Are source and sink strengths genetically linked in maize plants subjected to water deficit? A QTL study of the responses of leaf growth and of anthesis-silking interval to water deficit. Journal of Experimental Botany, 58(2), 339-349.
Wu, N., Yongsheng, G., & Yan, S. (2011). Effect of water stress on physiological traits and yield in rice backcross lines after anthesis. Energy Procedia, 5, 255-260.
WWAP. (2009). World Water Development Report 3: Water in a Changing World. Paris/London, UNESCO/ Earthscan. World Water Assessment Programme. Retrieved from www.unesco.org/water/wwap/wwdr/wwdr3/
Yoshida, S. (1981). Fundamentals of rice crop science. Los Banos, Philippines: International Rice Research Institute.
Youssef, T., & Saenger, P. (1998). Photosynthetic gas exchange and accumulation of phytotoxins in mangrove seedlings in response to soil physico-chemical characteristics associated with waterlogging. Tree Physiology, 18(5), 317-324.
Zhao, L., Wu, L., Dong, C., & Li, Y. (2010). Rice yield, nitrogen utilization and ammonia volatilization as influenced by modified rice cultivation at varying nitrogen rates. Agricultural Sciences, 1(1), 10-16.
Pertanika J. Trop. Agric. Sci. 41 (2): 591 – 604 (2018)
ISSN: 1511-3701 © Universiti Putra Malaysia Press
TROPICAL AGRICULTURAL SCIENCEJournal homepage: http://www.pertanika.upm.edu.my/
ARTICLE INFOArticle history:Received: 4 July 2017Accepted: 25 September 2017
E-mail addresses:[email protected] (Mohamed Shafiq, S.)[email protected] (Ling, A. P. K.)[email protected] (Lim, C. L.)[email protected] (Chye, S. M.)[email protected] (Koh, R. Y.)* Corresponding author
Review Article
A Mini Review on Phytochemical Constituents and Pharmacological Activities of Adenium obesum
Mohamed Shafiq, S., Ling, A. P. K., Lim, C. L., Chye, S. M. and Koh, R. Y.*International Medical University, Division of Applied Biomedical Science and Biotechnology, School of Health Sciences, 57000, Bukit Jalil, Kuala Lumpur, Malaysia
ABSTRACT
Adenium obesum is a common plant found in many households in Malaysia. Its phytochemical constituents are believed to have contributed to its vast medicinal properties. Five types of compounds were isolated and identified from the plant, namely cardiac glycosides, pregnanes, triterpenes, flavonoids and carbohydrates. These compounds confer the plant its reported pharmacological activities such as antibacterial, antiviral, anticancer, antioxidant, immunomodulation and antiparasitic effects. The plant’s antibacterial effects against some bacterial strains such as Proteus mirabilis and Pseudomonas aeruginosa were investigated while its antiviral activity was tested against H1N1. Its anticancer activity was found to be mediated through the hedgehog/GLI signalling pathway. For the immunomodulatory effect, A. obesum was found to promote proliferation of B and T cells. This review outlines in detail the pharmacological activities of A. obesum while further correlating these activities with the phytochemical constituents present.
Keywords: Adenium obesum, natural product, pharmacological activity, phytochemicals
INTRODUCTION
Adenium obesum (A. obesum) or more commonly known as the desert rose or Sabi star, is native to the Sahal region, south of Sahara Africa in Oman (Al-Aklabi et al., 2016). This particular bonsai plant is mainly used as an ornamental plant typically in Malaysian houses as it grows very well in tropical climates (Al-
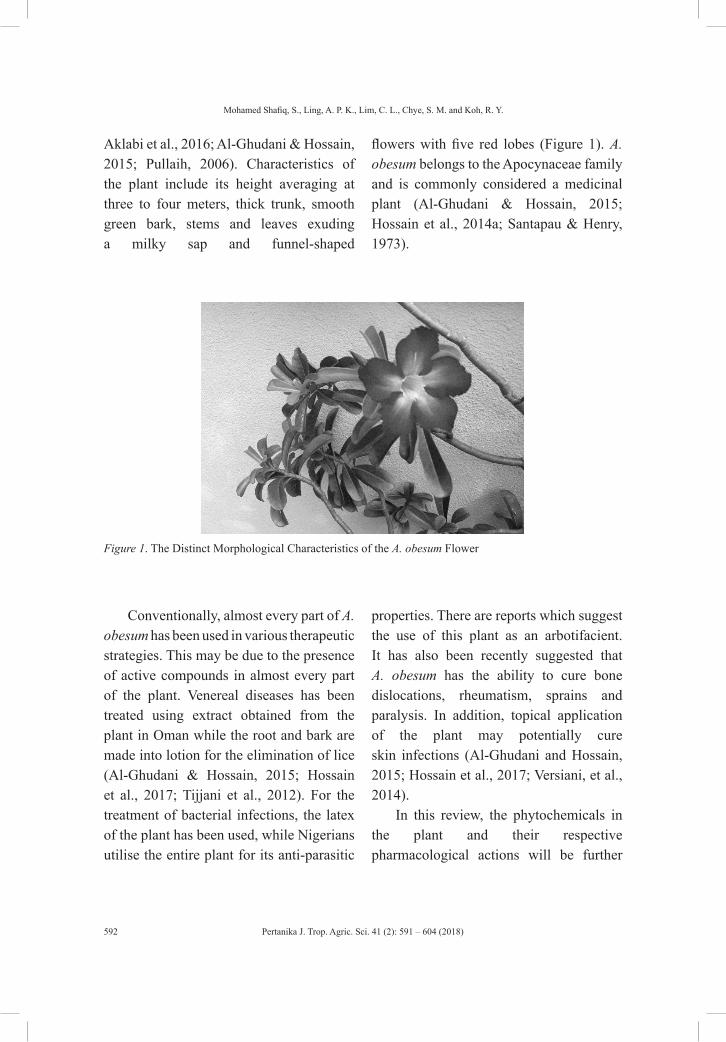
Pertanika J. Trop. Agric. Sci. 41 (2): 591 – 604 (2018)
Mohamed Shafiq, S., Ling, A. P. K., Lim, C. L., Chye, S. M. and Koh, R. Y.
592
Aklabi et al., 2016; Al-Ghudani & Hossain, 2015; Pullaih, 2006). Characteristics of the plant include its height averaging at three to four meters, thick trunk, smooth green bark, stems and leaves exuding a milky sap and funnel-shaped
flowers with five red lobes (Figure 1). A. obesum belongs to the Apocynaceae family and is commonly considered a medicinal plant (Al-Ghudani & Hossain, 2015; Hossain et al., 2014a; Santapau & Henry, 1973).
Figure 1. The Distinct Morphological Characteristics of the A. obesum Flower
Conventionally, almost every part of A. obesum has been used in various therapeutic strategies. This may be due to the presence of active compounds in almost every part of the plant. Venereal diseases has been treated using extract obtained from the plant in Oman while the root and bark are made into lotion for the elimination of lice (Al-Ghudani & Hossain, 2015; Hossain et al., 2017; Tijjani et al., 2012). For the treatment of bacterial infections, the latex of the plant has been used, while Nigerians utilise the entire plant for its anti-parasitic
properties. There are reports which suggest the use of this plant as an arbotifacient. It has also been recently suggested that A. obesum has the ability to cure bone dislocations, rheumatism, sprains and paralysis. In addition, topical application of the plant may potentially cure skin infections (Al-Ghudani and Hossain, 2015; Hossain et al., 2017; Versiani, et al., 2014).
In this review, the phytochemicals in the plant and their respective pharmacological actions will be further
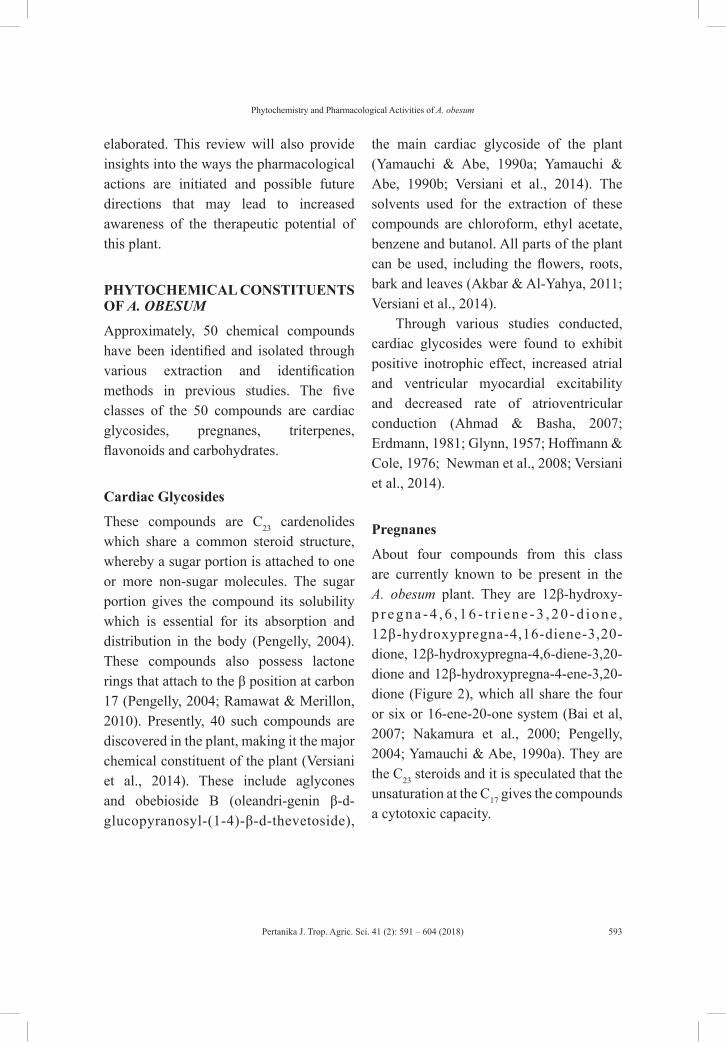
Pertanika J. Trop. Agric. Sci. 41 (2): 591 – 604 (2018)
Phytochemistry and Pharmacological Activities of A. obesum
593
elaborated. This review will also provide insights into the ways the pharmacological actions are initiated and possible future directions that may lead to increased awareness of the therapeutic potential of this plant.
PHYTOCHEMICAL CONSTITUENTS OF A. OBESUM
Approximately, 50 chemical compounds have been identified and isolated through various extraction and identification methods in previous studies. The five classes of the 50 compounds are cardiac glycosides, pregnanes, triterpenes, flavonoids and carbohydrates.
Cardiac Glycosides
These compounds are C23 cardenolides which share a common steroid structure, whereby a sugar portion is attached to one or more non-sugar molecules. The sugar portion gives the compound its solubility which is essential for its absorption and distribution in the body (Pengelly, 2004). These compounds also possess lactone rings that attach to the β position at carbon 17 (Pengelly, 2004; Ramawat & Merillon, 2010). Presently, 40 such compounds are discovered in the plant, making it the major chemical constituent of the plant (Versiani et al., 2014). These include aglycones and obebioside B (oleandri-genin β-d-glucopyranosyl-(1-4)-β-d-thevetoside),
the main cardiac glycoside of the plant (Yamauchi & Abe, 1990a; Yamauchi & Abe, 1990b; Versiani et al., 2014). The solvents used for the extraction of these compounds are chloroform, ethyl acetate, benzene and butanol. All parts of the plant can be used, including the flowers, roots, bark and leaves (Akbar & Al-Yahya, 2011; Versiani et al., 2014).
Through various studies conducted, cardiac glycosides were found to exhibit positive inotrophic effect, increased atrial and ventricular myocardial excitability and decreased rate of atrioventricular conduction (Ahmad & Basha, 2007; Erdmann, 1981; Glynn, 1957; Hoffmann & Cole, 1976; Newman et al., 2008; Versiani et al., 2014).
Pregnanes
About four compounds from this class are currently known to be present in the A. obesum plant. They are 12β-hydroxy-p r e g n a - 4 , 6 , 1 6 - t r i e n e - 3 , 2 0 - d i o n e , 12β-hydroxypregna-4,16-diene-3,20-dione, 12β-hydroxypregna-4,6-diene-3,20-dione and 12β-hydroxypregna-4-ene-3,20-dione (Figure 2), which all share the four or six or 16-ene-20-one system (Bai et al, 2007; Nakamura et al., 2000; Pengelly, 2004; Yamauchi & Abe, 1990a). They are the C23 steroids and it is speculated that the unsaturation at the C17 gives the compounds a cytotoxic capacity.
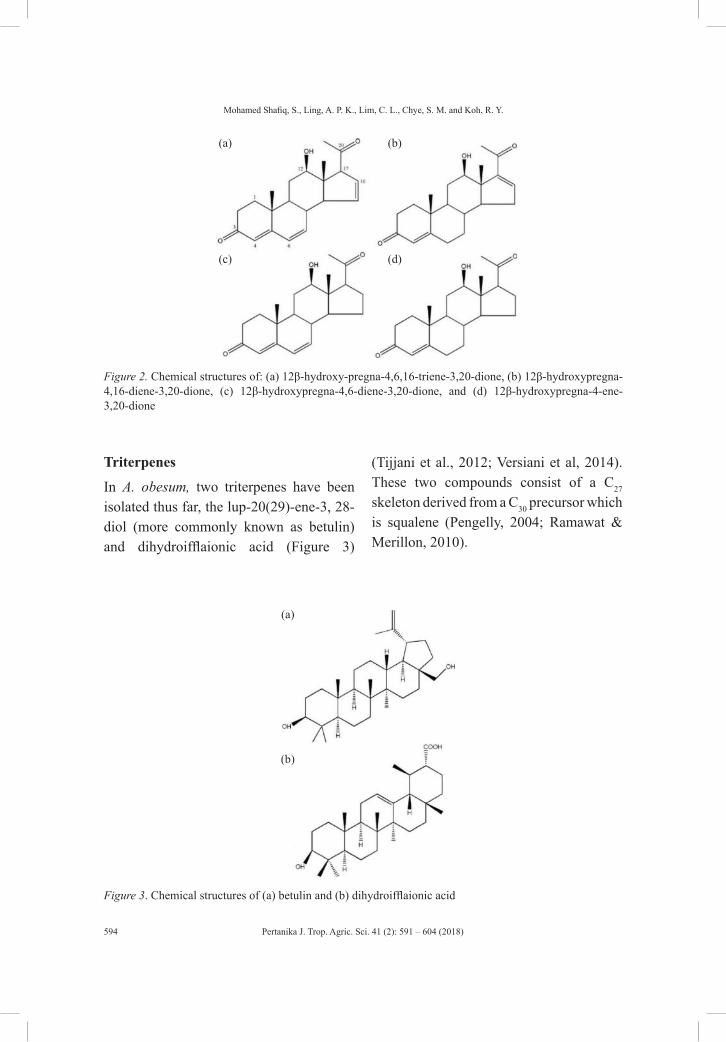
Pertanika J. Trop. Agric. Sci. 41 (2): 591 – 604 (2018)
Mohamed Shafiq, S., Ling, A. P. K., Lim, C. L., Chye, S. M. and Koh, R. Y.
594
(a) (b)
(c) (d)
Figure 2. Chemical structures of: (a) 12β-hydroxy-pregna-4,6,16-triene-3,20-dione, (b) 12β-hydroxypregna-4,16-diene-3,20-dione, (c) 12β-hydroxypregna-4,6-diene-3,20-dione, and (d) 12β-hydroxypregna-4-ene-3,20-dione
Triterpenes
In A. obesum, two triterpenes have been isolated thus far, the lup-20(29)-ene-3, 28-diol (more commonly known as betulin) and dihydroifflaionic acid (Figure 3)
(Tijjani et al., 2012; Versiani et al, 2014). These two compounds consist of a C27 skeleton derived from a C30 precursor which is squalene (Pengelly, 2004; Ramawat & Merillon, 2010).
(a)
(b)
Figure 3. Chemical structures of (a) betulin and (b) dihydroifflaionic acid

Pertanika J. Trop. Agric. Sci. 41 (2): 591 – 604 (2018)
Phytochemistry and Pharmacological Activities of A. obesum
595
Flavonoids
The two subclasses of flavonoids, the flavonols and anthocyanins, were isolated from A. obesum (Versiani et al., 2014). The flavonols are quercetin 3,3’-dimethylether and kaempferol 3-methyl ether, and the anthocyanin is cyanindin 3-O-(4-O-α-L-rhamnopyranosyl)-β-D-galactopyranoside (Figure 4) (Alseini, 2014; Versiani et al., 2014; Hossain et al., 2017). These compounds appear as yellow and white plant pigments. Antioxidant activity of the plant is believed to be associated with the presence of these compounds (Alseini, 2014; Al-Ghudani & Hossain, 2015). The redox property of the compounds
allows them to act as reducing agents in the antioxidant system (Alseini, 2014; Pengelly, 2004). Other than that, these compounds may also play a role against diabetes mellitus and hyperlipidaemia (Alseini, 2014). Hossain et al. (2017) found that ethyl acetate extract of A. obesum stem contains flavonoids 5,7,3′,4′-tetrahydroxy flavone and 3,5,7,3′,4′,5′-hexahydroxy flavone (Figure 5). In addition, Meda et al. (2016) discovered four flavonols in the plant, including two quercetin glycosides (rutin and isoquercitrin) and two kaempferol glycosides (kaempferol 3-O-rutinoside and kaempferol 3-O-glucoside).
(a)
(c)
(b)
Figure 4. Chemical structures of: (a) quercetin 3,3’-dimethylether, (b) kaempferol 3-methyl ether and (c) cyanindin 3-O-(4-O-α-L-rhamnopyranosyl)-β-D-galactopyranoside
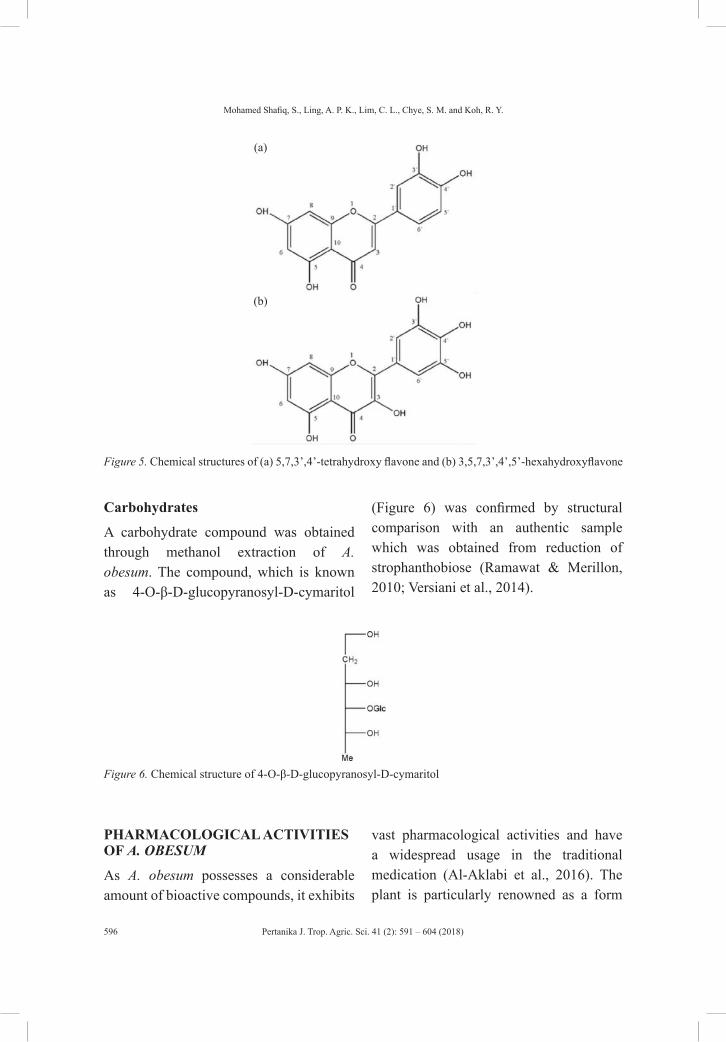
Pertanika J. Trop. Agric. Sci. 41 (2): 591 – 604 (2018)
Mohamed Shafiq, S., Ling, A. P. K., Lim, C. L., Chye, S. M. and Koh, R. Y.
596
(a)
(b)
Figure 5. Chemical structures of (a) 5,7,3’,4’-tetrahydroxy flavone and (b) 3,5,7,3’,4’,5’-hexahydroxyflavone
Carbohydrates
A carbohydrate compound was obtained through methanol extraction of A. obesum. The compound, which is known as 4-O-β-D-glucopyranosyl-D-cymaritol
(Figure 6) was confirmed by structural comparison with an authentic sample which was obtained from reduction of strophanthobiose (Ramawat & Merillon, 2010; Versiani et al., 2014).
Figure 6. Chemical structure of 4-O-β-D-glucopyranosyl-D-cymaritol
PHARMACOLOGICAL ACTIVITIES OF A. OBESUM
As A. obesum possesses a considerable amount of bioactive compounds, it exhibits
vast pharmacological activities and have a widespread usage in the traditional medication (Al-Aklabi et al., 2016). The plant is particularly renowned as a form
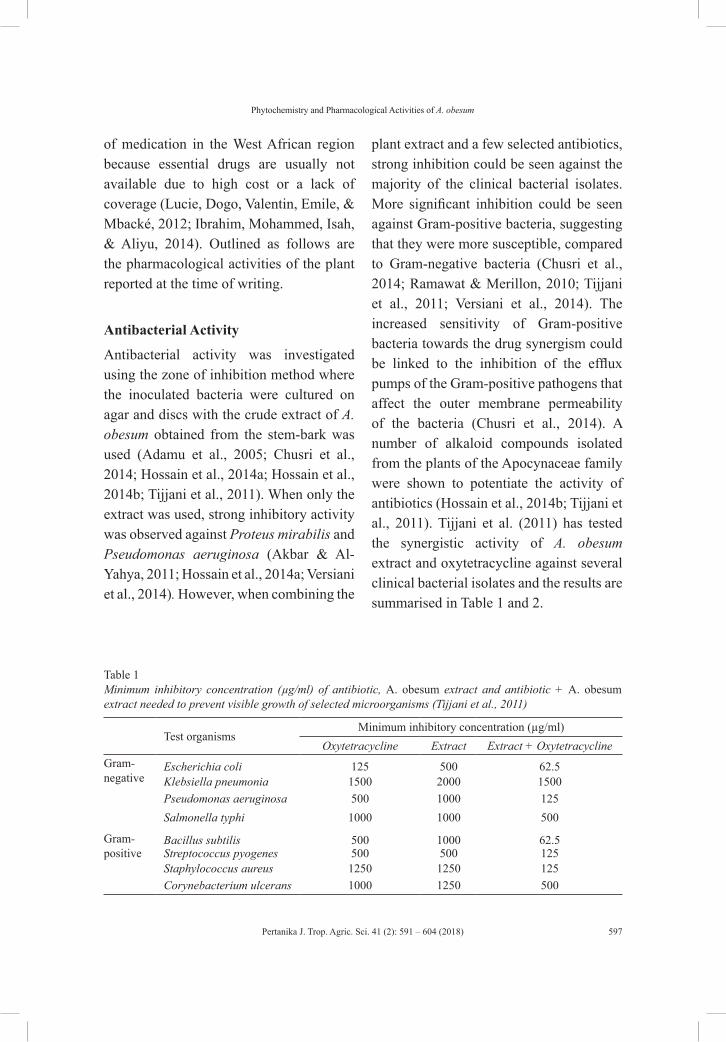
Pertanika J. Trop. Agric. Sci. 41 (2): 591 – 604 (2018)
Phytochemistry and Pharmacological Activities of A. obesum
597
of medication in the West African region because essential drugs are usually not available due to high cost or a lack of coverage (Lucie, Dogo, Valentin, Emile, & Mbacké, 2012; Ibrahim, Mohammed, Isah, & Aliyu, 2014). Outlined as follows are the pharmacological activities of the plant reported at the time of writing.
Antibacterial Activity
Antibacterial activity was investigated using the zone of inhibition method where the inoculated bacteria were cultured on agar and discs with the crude extract of A. obesum obtained from the stem-bark was used (Adamu et al., 2005; Chusri et al., 2014; Hossain et al., 2014a; Hossain et al., 2014b; Tijjani et al., 2011). When only the extract was used, strong inhibitory activity was observed against Proteus mirabilis and Pseudomonas aeruginosa (Akbar & Al-Yahya, 2011; Hossain et al., 2014a; Versiani et al., 2014). However, when combining the
plant extract and a few selected antibiotics, strong inhibition could be seen against the majority of the clinical bacterial isolates. More significant inhibition could be seen against Gram-positive bacteria, suggesting that they were more susceptible, compared to Gram-negative bacteria (Chusri et al., 2014; Ramawat & Merillon, 2010; Tijjani et al., 2011; Versiani et al., 2014). The increased sensitivity of Gram-positive bacteria towards the drug synergism could be linked to the inhibition of the efflux pumps of the Gram-positive pathogens that affect the outer membrane permeability of the bacteria (Chusri et al., 2014). A number of alkaloid compounds isolated from the plants of the Apocynaceae family were shown to potentiate the activity of antibiotics (Hossain et al., 2014b; Tijjani et al., 2011). Tijjani et al. (2011) has tested the synergistic activity of A. obesum extract and oxytetracycline against several clinical bacterial isolates and the results are summarised in Table 1 and 2.
Table 1Minimum inhibitory concentration (µg/ml) of antibiotic, A. obesum extract and antibiotic + A. obesum extract needed to prevent visible growth of selected microorganisms (Tijjani et al., 2011)
Test organismsMinimum inhibitory concentration (µg/ml)
Oxytetracycline Extract Extract + OxytetracyclineGram-negative
Escherichia coli 125 500 62.5Klebsiella pneumonia 1500 2000 1500Pseudomonas aeruginosa 500 1000 125Salmonella typhi 1000 1000 500
Gram-positive
Bacillus subtilis 500 1000 62.5Streptococcus pyogenes 500 500 125Staphylococcus aureus 1250 1250 125Corynebacterium ulcerans 1000 1250 500
Pertanika J. Trop. Agric. Sci. 41 (2): 591 – 604 (2018)
Mohamed Shafiq, S., Ling, A. P. K., Lim, C. L., Chye, S. M. and Koh, R. Y.
598
Table 2 Zone of inhibition by antibiotic, A. obesum extract and antibiotic + A. obesum extract (Tijjani et al., 2011)
Test organismsZone of inhibition (mm)
Oxytetracycline Extract Extract + OxytetracyclineGram-
negativeEscherichia coli 25 20 27Klebsiella pneumonia 6 0 0Pseudomonas aeruginosa 20 18 24Salmonella typhi 17 19 24
Gram-positive
Bacillus subtilis 27 25 32
Streptococcus pyogenes 29 26 37Staphylococcus aureus 26 26 30Corynebacterium ulcerans 21 19 26
Antiviral Activity
A. obesum extracts showed to reduce titre of the influenza A/PR/8/34 (or commonly known as the H1N1) virus (Kiyohara et al., 2012; Nagai et al., 1995). This might be attributed to the presence of the secondary metabolites such as anthocyanin glycosides and cardiotonic glycosides, which are both steroids. Through open silica gel column chromatography, it could be confirmed that the active compound responsible for the reduction of the virus is oleandrigenin-β-D-glucosyl (1,2,3,4)-β-D-digitalose, which is a cardiac glycoside (Hossain et al., 2014a; Nagai et al., 1995; Zu et al., 2012). The antiviral activity of
A. obesum extract was proven by utilising Madin-Darby canine kidney (MDCK) cells infected with the virus. The methanolic extract of aerial parts of the plant was used in the study. Results showed that the plant extract reduced viral sialidase activity, and significantly decreased cell viability after the cells were exposed to the plant extract (Kiyohara et al., 2012). These results are presented in Table 3. The findings suggest considerable cytotoxicity from the usage of the plant extract for the treatment of viral infections. Hence, an optimum dosage of the extract needs to be carefully considered.
Table 3 Anti-influenza virus activity of A. obesum extract as compared to the standard antiviral drug (Kiyohara et al., 2012)
Compound tested Virus titre (% of control)
Cytotoxicity against MDCK cell (%)
Adenium obesum extract 0.7 49.2Control (water) 100 0Zanamivir 0.3 4.1
Pertanika J. Trop. Agric. Sci. 41 (2): 591 – 604 (2018)
Phytochemistry and Pharmacological Activities of A. obesum
599
Anticancer Activity
An abnormal hedgehog/GLI signalling pathway has been proven to be a foundation for the rapid expansion of tumours (Arai et al., 2011). Methanolic extracts of A. obesum prevented the progression of the signalling cascade, hence hindering the proliferation of pancreatic cancer (PANC1) cells (Arai et al., 2011; Farah et al., 2016). The target proteins which were inhibited were PTCH and BCL2. Cytotoxicity of A. obesum was also seen in other cancer cell lines such as breast (MCF-7), liver (HEPG2) and cervical (HeLa) (Almehdar et al., 2012; Ebrahim et al., 2013). This could be attributed to the presence of five active compounds which consist of four glycosides (cardenolides somalin, hongheloside A, 16-acetylstrospeside and honghelin) and one flavonol (3,3’-bis(O-metyl)quercetin) (Pengelly, 2004; Versiani et al., 2014).
Furthermore, the plant toxicity could be linked to excess production of reactive oxygen species (ROS) induced by the five active compounds mentioned (Farah et al., 2016). ROS is reported to be capable
of inducing mitochondrial damage, apoptosis, oxidative stress and changes of DNA, causing damage to the genome (Hossain et al., 2014a). Further studies suggested that 3β-O(β-D-monoglycosidic) compounds with the cardenolide skeleton were most adept in inducing cytotoxicity (Bai et al., 2007; Versiani et al., 2014). Although A. obesum extracts was found to inhibit cancer cell growth effectively, however evidence suggested that it was also cytotoxic to normal cells. Almehda et al. (2012) tested the cytotoxic activities of A. obesum on various cell lines and the results are summarised in Table 4. In the study, three human cancer cell lines, namely, MCF7, HEPG2 and HeLa cells, together with human normal melanocytes (HFB4) were used. Sulforhodamine B colorimetric assay was used to evaluate the extract’s cytotoxic effect. Doxorubicin, a well-known anticancer drug, was used as positive control. Half maximal inhibitory concentration (IC50) for the extract was calculated from the optical density values resulting from the colorimetric assay.
Table 4Cytotoxic activities of A. obesum methanolic extract and its fractions on various cell lines (Almehda et al., 2012)
Crude/Fraction of extract
Half maximal inhibitory concentration, IC50 (µg/ml)
MCF7 HEPG2 HeLa HFB4
Crude 11.6 18.7 6.9 5.2
Petroleum ether 12.7 23.1 13.7 21.9
Chloroform 3.15 4..78 3.15 7.01
Butanol 3.56 4.17 3.15 3.96
Pertanika J. Trop. Agric. Sci. 41 (2): 591 – 604 (2018)
Mohamed Shafiq, S., Ling, A. P. K., Lim, C. L., Chye, S. M. and Koh, R. Y.
600
According to Newman et al. (2008), cardiac glycosides of A. obesum could be used as effective therapeutic anticancer agents, especially when comparing their effect to contemporary anticancer medications which have toxic side effects, making this plant a potential alternative medicine for cancer treatment. On the other hand, pregnanes were cytotoxic against P388 murine leukemia cell lines. Pregnanes, with a l6-ene-20-one system, were found to be cytotoxic against adriamycin- and vincristine-resistant P388 cells. These pregnanes were also effective against adriamycin- and vincristine-sensitive P388 cells. However, pregnanes with no unsaturation at the C-16/C-17 position were not cytotoxic, indicating that the presence of a conjugated system involving the C-20 ketone group in pregnane is important for the cytotoxic activity (Nakamura et al., 2000). Previous research showed that betulin possessed cytotoxic effect on the BT-549 breast cancer cell line, which might serve as a potent agent in cancer medications. The results showed that betulin inhibited cancer cell proliferation with an IC50 value between 4.3-4.9 μg/mL (Šiman et al., 2016).
Immunomodulation
Previous studies have identified the A. obesum as a plant capable of enhancing the immune system. Increase in the concentrations of the ethanolic plant extract led to an increase in the white blood cell count especially the lymphocytes
(Abalaka et al., 2012; Versiani et al., 2014). The ethanolic extract enhanced B and T cell proliferation through the synthesis of IgM (Ramawat & Merillon, 2010; Versiani et al., 2014). There were no signs of hepatotoxicity from this extract (Abalaka et al., 2012; Arai et al., 2011), and no indication of toxicity on prolonged usage. The dose used was very minimal, lower than the median lethal dose (LD50) of 5000 mg/kg. Previous studies suggest that presence of the antioxidative secondary metabolites of the plant prevented oxidative damage and counteracted the toxicity induced by the plant (Pengelly, 2004; Ramawat & Merillon, 2010). Thus, the plant may be safe for oral consumption. However, the study has been conducted on Wistar rats and further toxicity studies should be conducted in clinical trials (Abalaka et al., 2012).
Other Therapeutic Benefits
Other studies have also reported that the plant possessed antimalarial and antitrypanosomal activities (Abdel-Sattar et al., 2009; Atawodi et al., 2002; Versiani et al., 2014). Reports suggested that all plant extracts from the petroleum ether, chloroform, methanol and aqueous fractions showed inhibition of the Trypanosoma brucei brucei parasite. The active compound which showed antiparasitic activity was botulin, which is a triterpene (Ibrahim et al., 2014; Ramawat & Merillon, 2010). For the study of the antimalarial activity, human lung fibroblasts (MRC-5) infected
Pertanika J. Trop. Agric. Sci. 41 (2): 591 – 604 (2018)
Phytochemistry and Pharmacological Activities of A. obesum
601
with the parasite were used. The cells were also used in testing the cytotoxicity of the extract; and the results indicated that the extract’s toxicity was low (Abdel-Sattar et al., 2009).
CONCLUSION
A. obesum is commonly used as an ornamental plant in the Asian regions while in the African and Arabian Peninsula, this plant is used as a form of traditional medicine. To date, approximately 50 chemical compounds have been isolated from the plant, exhibiting a wide variety of effects including anticancer, antibacterial and antiviral properties, all which are promising and warrant further investigation.
FUTURE DIRECTION
To date, only chemical compounds from the moderately polar fractions from A. obesum have been documented, while the non-polar and the highly polar fractions have been given little attention. Hence, extraction using various solvents from low to high polarities are needed to isolate a wide range of compounds from the plant. Furthermore, the biological activities tested for A. obesum are limited. Most studies are focused on its antimicrobial and anticancer effects. Hence, more research should be conducted to explore the plant’s effect on emerging diseases that lack effective treatment such as neurodegenerative and metabolic diseases.
The entire plant as a whole is toxic as it contains very high concentrations of cardiac glycosides. Utilisation of drug modification and synthesis technologies to overcome the toxicity issue of the compounds could be explored. On the other hand, isolation and identification of the bioactive compounds are essential. Investigation on the mechanism of action of each of the active compound is also important to aid in better understanding of the effects of the compound.
REFERENCESAbalaka, S. E., Fatihu, M. Y., Doguwar, N., Ibrahim,
G., & Ambali, S. F. (2012). Hepatotoxicity of ethanol extract of Adenium obesum stem bark in Wistar rats. British Journal of Pharmaceutical Research, 4, 1041-1052.
Abdel-Sattar, E., Harraz, F. M., Al-Ansari, S. M., El-Mekkawy, S., Ichino, C., Kiyohara, H., ... & Yamada, H. (2009). Antiplasmodial and antitrypanosomal activity of plants from the Kingdom of Saudi Arabia. Journal of Natural Medicines, 63(2), 232-239.
Adamu, H. M., Abayeh, O. J., Agho, M. O., Abdullahi, A. L., Uba, A., Dukku, H. U., & Wufem, B. M. (2005). An ethnobotanical survey of Bauchi State herbal plants and their antimicrobial activity. Journal of Ethnopharmacology, 99(1), 1-4.
Ahmad, V. U., & Basha, A. (2007). Spectroscopic data of steroid glycosides; Spirostanes, bufanolides, cardenolides. Heidelberg: Springer.
Akbar, S., & Al-Yahya, M. A. (2011). Screening of Saudi plants for phytoconstituents, pharmacological and antimicrobial properties. Australian Journal of Medical Herbalism, 23(2), 76-88.
Pertanika J. Trop. Agric. Sci. 41 (2): 591 – 604 (2018)
Mohamed Shafiq, S., Ling, A. P. K., Lim, C. L., Chye, S. M. and Koh, R. Y.
602
Al-Aklabi, A., Al-Khulaidi, A. W., Hussain, A., & Al-Sagheer, N. (2016). Main vegetation types and plant species diversity along an altitudinal gradient of Al Baha region, Saudi Arabia. Saudi Journal of Biological Sciences, 23(6), 687-697.
Al-Ghudani, M. K. N., & Hossain, M. A. (2015). Determination of total phenolics, flavonoids and antioxidant activity of root crude extracts of Adenium obesum traditionally used for the treatment of bone dislocations and rheumatism. Asian Pacific Journal of Tropical Disease, 5, S155-158.
Almehdar, H., Abdallah, H. M., Osman, A. M, M., & Abdel-Sattar, E. A. (2012). In vitro cytotoxic screening of selected Saudi medicinal plants. Journal of Natural Medicines, 66(2), 406-412.
Alseini, A. I. I. (2014). Total phenolic, total flavonoid contents and radical scavenging activities of 10 Arabian herbs and spices. Unique Journal of Pharmaceutical and Biological Sciences, 2(3), 5-11.
Arai, M. A., Tateno, C., Koyano, T., Kowithayakorn, T., Kawabe, S., & Ishibashi, M. (2011). New hedgehog/GLI-signaling inhibitors from Adenium obesum. Organic and Biomolecular Chemistry, 9(4), 1133-1139.
Atawodi, S. E., Ameh, D. A., Ibrahim, S., Andrew, J. N., Nzelibe, H. C., Onyike, E. O., ... & Sallau, A. B. (2002). Indigenous knowledge system for treatment of trypanosomiasis in Kaduna State of Nigeria. Journal of Ethnopharmacology, 79(2), 279-282.
Bai, L., Wang, L., Zhao, M., Toki, A., Hasegawa, T., Ogura, H., ... & Ando, M. (2007). Bioactive pregnanes from nerium oleander. Journal of Natural Products, 70(1), 14-18.
Chusri, S., Siriyong, T., Na-Phatthalung, P., & Voravuthikunchai, S. P. (2014). Synergistic effects of ethnomedicinal plants of Apocynaceae family and antibiotics against clinical isolates of acinetobacter baumannii. Asian Pacific Journal of Tropical Medicine, 7(6), 456-461.
Ebrahim, N., Rastrelli, L., & Kershi, R. M. (2013). Free radical scavenging activity and anthocyanin in flower of Adenium obesum collected from Yemen. Journal of Pharmacy and Phytotheraputics, 1(5), 5-7.
Erdmann, E. (1981). Influence of Cardiac Glycosides on Their Receptor. Heidelberg: Springer.
Farah, M. A., Ali, M. A., Chen, S. M., Li, Y., Al-Hemaid, F. M., Abou-Tarboush, F. M., ... & Lee, J. (2016). Silver nanoparticles synthesized from Adenium obesum leaf extract induced DNA damage, apoptosis and autophagy via generation of reactive oxygen species. Colloids Surfaces B Biointerfaces, 141, 158-169.
Glynn, I. M. (1957). The action of cardiac glycosides in sodium and potassium movements in human red cells. The Journal of Physiology, 136(1), 148-173.
Hoffmann, J. J., & Cole, J. R. (1976). Phytochemical investigation of Adenium obesum Forskal (Apocynaceae): Isolation and identification of cytotoxic agents. Journal of Pharmaceutical Sciences, 20, 1967-1969.
Hossain, M. A., Al-Abri, T. H. A., Al-Musalami, A. H. S., Akhtar, M. S., & Said, S. (2014a). Evaluation of different extraction methods on antimicrobial potency of Adenium obesum stem against food borne pathogenic bacterial strains in Oman. Asian Pacific Journal of Tropical Disease, 4, 985-989.
Pertanika J. Trop. Agric. Sci. 41 (2): 591 – 604 (2018)
Phytochemistry and Pharmacological Activities of A. obesum
603
Hossain, M. A., Al-Musalami, A. H. S., Akhtar, M. S., & Said, S. (2014b). A comparison of the antimicrobial effectiveness of different polarities crude extracts from the leaves of Adenium obesum used in Omani traditional medicine for the treatment of microbial infections. Asian Pacific Journal of Tropical Disease, 4, S934-937.
Hossain, M. A., Sohail Akhtar, M., Said, S., & Al-Abri, T. H. A. (2017). Two new flavonoids from Adenium obesum grown in Oman. Journal of King Saudi University - Science, 29(1), 62-69.
Ibrahim, M. A., Mohammed, A., Isah, M. B., & Aliyu, A. B. (2014). Anti-trypanosomal activity of African medicinal plants: A review update. Journal of Ethnopharmacology, 154(1), 26-54.
Kiyohara, H., Ichino, C., Kawamura, Y., Nagai, T., Sato, N., & Yamada, H., et al. (2012). In vitro anti-influenza virus activity of a cardiotonic glycoside from Adenium obesum (Forssk.). Phytomedicine, 19(2), 111-114.
Lucie, A. T., Dogo, S., Valentin, K., Emile, A. C., & Mbacké, S. (2012). Medicinal plants used in some rural districts in Senegal (West Africa). American-Eurasian Journal of Sustainable Agriculture, 6(4), 325-332.
Meda, N., Fraisse, D., Gnoula, C., Peyrode, C., Texier, O., Senejoux, F., et al. (2016). Characterization and quantification of polyphenolic compounds from Adenium obesum leaves. Chemistry of Natural Compounds, 1(52), 134-135.
Nagai, T., Moriguchi, R., Suzuki, Y., Tomimori, T., & Yamada, H. (1995). Mode of action of the anti-influenza virus activity of plant flavonoid, 5,7,4′-trihydroxy-8-methoxyflavone, from the roots of Scutellaria baicalensis. Antiviral Research, 26(1), 11-25.
Nakamura, M., Ishibashi, M., Okuyama, E., Koyano, T., Kowithayakorn, T., Hayashi, M., & Komiyama, K. (2000). Cytotoxic pregnanes from leaves of Adenium obesum. Natural Medicines, 54(3), 158-159.
Newman, R. A., Yang, P., Pawlus, A. D., & Block, K. I. (2008). Cardiac glycosides as novel cancer therapeutic agents. Molecular Interventions, 8(1), 36-49.
Pengelly, A. (2004). The Constituents of Medicinal Plants. Oxfordshire: CABI Publishing.
Pullaih, T. (2006). Encyclopedia of World Medicinal Plants. New Delhi: Regency Publications.
Ramawat, K. G., & Merillon, J. M. (2010). Bioactive molecules and medicinal plants. Heidelberg: Springer.
Santapau, H., & Henry, A. N. (1973). A dictionary of the flowering plants in India. New Delhi: Publications & Information Directorate, Council of Scientific and Industrial Research.
Šiman, P., Filipová, A., Tichá, A., Niang, M., Bezrouk, A., & Havelek, R. (2016). Effective method of purification of betulin from birch bark: The importance of its purity for scientific and medicinal use. PLoS One, 11(5), e0154933.
Tijjani, A., Sallau, M., & Sunus, I. (2011). Synergistic activity of methanolic extract of Adenium obesum (Apocynaceae) stem-bark and oxytetracycline against some clinical bacterial isolates. Bayero Journal of Pure and Applied Sciences, 4(1), 79-82.
Tijjani, A., Ndukwe, I. G., & Ayo, R. G. (2012). Isolation and characterization of Lup-20(29)-ene-3, 28- diol (Betulin) from the stem-bark of Adenium obesum (apocynaceae). Tropical Journal of Pharmaceutical Research, 11(2), 259-262.

Pertanika J. Trop. Agric. Sci. 41 (2): 591 – 604 (2018)
Mohamed Shafiq, S., Ling, A. P. K., Lim, C. L., Chye, S. M. and Koh, R. Y.
604
Versiani, M., Ahmed, S. K., Ikram, A., Ali, S. T., Yasmeen, K., & Faizi, S. (2014). Chemical constituents and biological activities of Adenium obesum. Chemistry and Biodiversity, 11(2), 171-180.
Yamauchi, T., & Abe, F. (1990a). Cardiac glycosides and pregnanes from Adenium obesum (Studies on the constituents of Adenium. I). Chemical and Pharmaceutical Bulletin, 38(3), 669-672.
Yamauchi, T., & Abe, F. (1990b). 2’-O-acetates of obeside B, honghelin, and obebiosides A and B from Adenium obesum (Studies on the constituents of Adenium. II). Chemical and Pharmaceutical Bulletin, 38(5), 1140-1142.
Zu, M., Yang, F., Zhou, W., Liu, A., Du, G., & Zheng, L. (2012). In vitro anti-influenza virus and anti-inflammatory activities of the aflavin derivatives. Antiviral Research, 94(3), 217-224.
Pertanika J. Trop. Agric. Sci. 41 (2): 605 – 620 (2018)
ISSN: 1511-3701 © Universiti Putra Malaysia Press
TROPICAL AGRICULTURAL SCIENCEJournal homepage: http://www.pertanika.upm.edu.my/
ARTICLE INFOArticle history:Received: 19 August 2015Accepted: 26 January 2016
E-mail addresses:[email protected] (Kamarul Rahim Kamarudin)[email protected] (Maryam Mohamed Rehan)* Corresponding author
Gram-positive Bacteria with Commercial Potential from the Gastrointestines of Holothuria (Mertensiothuria) Leucospilota (Timun Laut) and Stichopus Horrens (Gamat) from Malaysian Waters
Kamarul Rahim Kamarudin* and Maryam Mohamed RehanFood Biotechnology, Faculty of Science and Technology, Universiti Sains Islam Malaysia, 71800 USIM, Nilai, Negeri Sembilan, Malaysia
ABSTRACT
A few studies on the presence of microbes and their association in sea cucumbers can be found to date, especially in Apostichopus japonicus. However, such studies on Malaysian sea cucumbers and in the gastrointestines of the echinoderms are still lacking. Therefore, the aims of this study are to isolate and identify associated bacteria in the gastrointestines of two common species of Malaysian sea cucumbers i.e. Holothuria (Mertensiothuria) leucospilota (Brandt, 1835), the most dominant sea cucumber species in Malaysia, and Stichopus horrens Selenka, 1867, the commercial gamat species. A number of six genera of Gram-positive bacteria representing the order Bacillales and the order Micrococcales i.e. Bacillus, Brevibacillus, Lysinibacillus, Staphylococcus, Dermacoccus and Micrococcus are isolated from the gastrointestines of H. leucospilota, as suggested by the phylogenetic trees of partial 16S rRNA gene sequences. Meanwhile, three genera of Gram-positive bacteria that represent the order Bacillales i.e. Bacillus, Brevibacillus and Lysinibacillus are isolated from the gastrointestines of S. horrens. Interestingly, 60% of the bacterial species have been known to contain commercial potentials mainly as antibiotic producers, and only bacteria with commercial potentials were present in the gastrointestines of S. horrens. In contrast to that, bacteria that could be pathogenic were also present in the gastrointestines of H. leucospilota. The presence of all bacteria that have been
known to contain commercial potentials in the gastrointestines of S. horrens and more diverse microbial population in H. leucospilota could be due to the higher level of antimicrobial properties in the gastrointestines of S. horrens. However,

Pertanika J. Trop. Agric. Sci. 41 (2): 605 – 620 (2018)
Kamarul Rahim Kamarudin and Maryam Mohamed Rehan
606
experiments on antibacterial properties of the isolates have to be done and those proven to contain commercial potential can be exploited towards the development of industrial applications in Malaysia.
Keywords: 16S rRNA gene, bacteria, gastrointestines, Holothuria leucospilota, Stichopus horrens
INTRODUCTION
Sea cucumber (Phylum Echinodermata: Class Holothuroidea) is a renowned echinoderm in Malaysia due to its gamat species e.g. Stichopus horrens Selenka, 1867 or dragonfish and Stichopus herrmanni Semper, 1868 or curryfish that are well known for their medicinal value (Kamarudin et al., 2017; Kamarudin et al., 2015; Hashim, 2011). At least 52 sea cucumber species inhabit Malaysian waters (Kamarudin et al., 2015, Hashim, 2011; Kamarudin et al., 2010a, 2010b; Sim et al., 2009; Kamarudin et al., 2009; Zulfigar et al., 2008; Zaidnuddin, 2002). In fact, Malaysia is geographically part of the Coral Triangle recognised as the global centre of marine biodiversity. Timun laut, gamat, trepang, balat, bat, brunok/beronok and hoi sum or hai shen are the popular local names in Malaysia. This marine-dwelling soft animal is consumed as food e.g. as a popular Chinese delicacy during the Chinese New Year celebration, and is exploited as traditional and modern medicines.
Analgesic effects, anti-anaphylaxis effects, therapeutic effects and antioxidant properties are among the medicinal properties discovered in Malaysian sea
cucumbers (e.g. Hashim, 2011; Osama et al., 2009; Khartini et al., 2003; Fredalina et al., 1999; Ridzwan et al., 1995). The coelomic fluid of S. herrmanni has been shown to cause a vasorelaxation effect on rat coronary arteries (Hashim, 2011; Tan et al., 2005) and antioxidant activities have been detected in the coelomic fluid of Malaysian sea cucumbers (Hashim, 2011; Hawa et al., 1999). The medicinal properties of Malaysian sea cucumbers are speculated to have a correlation with the existence and contribution of some microbes including pigment-producing strains associated with them. The functions of plant pigments were classified into five main groups by Wissgott and Bortlik (1996) i.e. (1) to convert light energy during photosynthesis in the presence of chromophore; (2) to serve as a communication medium between plants and animals; (3) to cause detoxification of reactive oxygen species i.e. antioxidation; (4) to play a role in response to stress; and (5) to be responsible for unknown functions of pigments. The microbial pigments are believed to hold all or some of the functions.
S. horrens is the most popular gamat species in Malaysia. Known as dragonfish in English, it is locally known as gamat emas in Malaysia. Gamat is the most well accepted Malaysian sea cucumber among Malaysians. However, it is actually a specific local name for all species of the family Stichopodidae that are well known to have medicinal properties. Holothuria (Mertensiothuria) leucospilota (Brandt 1835), a non-gamat species, is the most
Pertanika J. Trop. Agric. Sci. 41 (2): 605 – 620 (2018)
Bacteria with Commercial Potential in Two Sea Cucumber Species
607
dominant species in Malaysia (Kamarudin et al., 2015; 2011). It is known as white threadfish in English or bat puntil. It is a long and black tubular sea cucumber often with a reddish body. This local species may have microbes that help it to adapt to numerous conditions.
Farouk et al. (2007) isolated 30 bacterial strains from Holothuria (Halodeima) atra Jaeger, 1833 or lollyfish from Malaysian waters. Antimicrobial activity associated with Malaysian sea cucumbers was also found (Farouk et al., 2007; Kaswandi et al., 2007; Ridzwan et al., 2003). A number of seven strains recorded moderate antibacterial activity against Klebsiella pneumoniae, Serratia marcescens, Pseudomonas aeruginosa, and Enterococcus faecalis (Farouk et al., 2007). Despite the fact that there are 142 research papers on Malaysian sea cucumbers until the year 2011 (Kamarudin, 2011), there is still a lack of studies on the presence and association of microbes in Malaysian sea cucumbers, specifically in the gastrointestines. Hence, this study primarily aimed to isolate and identify bacteria associated with the gastrointestines of two common species of Malaysian sea cucumbers i.e. H. leucospilota, the most dominant sea cucumber species in Malaysia, and S. horrens, the commercial gamat species using the non-protein-coding region 16S ribosomal RNA gene. S. horrens and H. leucospilota (Brandt 1835) or white threadfish from Pangkor Island, Perak Darul Ridzuan, Malaysia were used in this study for isolation and identification
of microbes inhabiting the gastrointestines of both species. The gastrointestinal part was chosen to represent the internal parts of the species. It is a long and coiled alimentary canal inside the sea cucumber. Both species can be found under rocks or on the sandy sea floor of Malaysian waters. In fact, the use of the 16S rRNA gene marker for bacterial species identification is as important as the morphological approach. Both approaches always complement each other in order to achieve more accurate identification. Therefore, 16S rRNA gene sequencing was incorporated in this study for bacterial species identification.
MATERIALS AND METHOD
Study Site
The specimen collection of H. leucospilota and S. horrens was conducted at Teluk Nipah and Pangkor Laut, Pangkor Island, Perak Darul Ridzuan, Malaysia, respectively (Figure 1). Each species was collected in triplicate. The samplings took place from 8 to 9 November, 2011 and were done during low tide. There were no fixed or standard sampling hours, and the Global Positioning System (GPS) was used to read the position of the sampling site (not shown specifically). The live and fresh specimens were stored in clean ice boxes containing ice cubes or sea water during sampling. Prior to transporting the specimens from the study sites to the laboratory that took approximately seven hours, the specimens were frozen and stored in sterilised storage boxes.
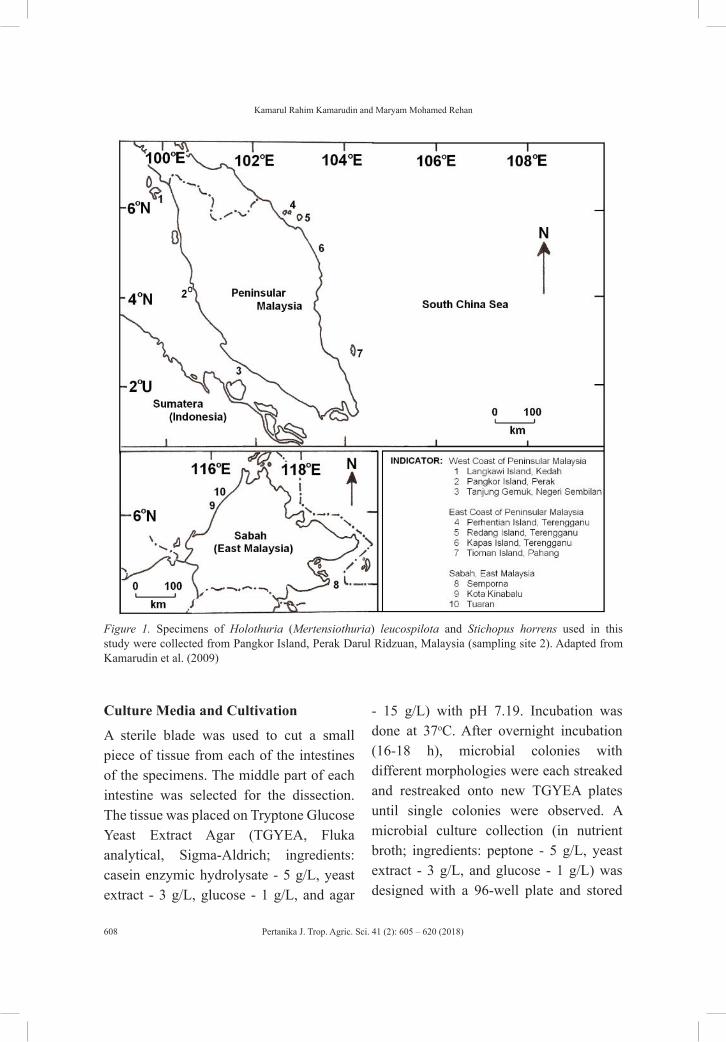
Pertanika J. Trop. Agric. Sci. 41 (2): 605 – 620 (2018)
Kamarul Rahim Kamarudin and Maryam Mohamed Rehan
608
Figure 1. Specimens of Holothuria (Mertensiothuria) leucospilota and Stichopus horrens used in this study were collected from Pangkor Island, Perak Darul Ridzuan, Malaysia (sampling site 2). Adapted from Kamarudin et al. (2009)
Culture Media and Cultivation
A sterile blade was used to cut a small piece of tissue from each of the intestines of the specimens. The middle part of each intestine was selected for the dissection. The tissue was placed on Tryptone Glucose Yeast Extract Agar (TGYEA, Fluka analytical, Sigma-Aldrich; ingredients: casein enzymic hydrolysate - 5 g/L, yeast extract - 3 g/L, glucose - 1 g/L, and agar
- 15 g/L) with pH 7.19. Incubation was done at 37oC. After overnight incubation (16-18 h), microbial colonies with different morphologies were each streaked and restreaked onto new TGYEA plates until single colonies were observed. A microbial culture collection (in nutrient broth; ingredients: peptone - 5 g/L, yeast extract - 3 g/L, and glucose - 1 g/L) was designed with a 96-well plate and stored
Pertanika J. Trop. Agric. Sci. 41 (2): 605 – 620 (2018)
Bacteria with Commercial Potential in Two Sea Cucumber Species
609
in a freezer until further use. Nutrient agar (ingredients: peptone - 5 g/L, yeast extract - 3 g/L, glucose - 1 g/L, and agar - 15 g/L) with pH 6.8 was used for strain activation from the microbial culture collection. All facilities used for the isolation and culturing were in clean condition and each surface was sterilised prior to every use in order to minimise any potential of contamination.
Total Genomic DNA Extraction
Geneaid Genomic DNA Mini Kit (Blood/Cultured Cell) was used for the total genomic DNA (tgDNA) extraction. Electrophoresis was then used for determination of estimated yields of tgDNA, the quantity and quality, on 1% agarose gel with ethidium bromide as gel stain.
Polymerase Chain Reaction
Two universal primers of the 16S rRNA gene were used for the standard thermal cycle amplification (i.e. Polymerase Chain Reaction (PCR)). The expected length of PCR products was approximately 1.5 kilo base pairs (kb).
PB36 (forward) – 5’ – AGR GTT TGA TCM TGG CTC AG – 3’ (20 bases) PB38 (reverse) – 5’ – GKT ACC TTG TTA CGA CTT – 3’ (18 bases)
PCR was performed using the Eppendorf Mastercycler gradient, which is a thermal cycler in 50 μL reaction volume i.e. 33.75 μL of sterilised dH2O, 5.0 μL of 10X PCR reaction buffer, 3.0 μL of magnesium chloride
(25 mM), 2.5 μL of each universal primer (5 μM), 1.0 μL of dNTP mix (10 mM), 2.0 μL of the DNA extract and 0.25 μL of 5 u/μL Taq DNA polymerase. The cycle parameters were 5 min at 95oC for initial denaturation, 45 s at 95oC for denaturation, 90 s at an optimised temperature (i.e. 55oC) for annealing, 1 min 30 s at 72oC (60 s/kb; 29 cycles) for extension, 7 min at 72oC for final extension and then hold at 4oC. Electrophoresis was then used for determination of estimated yields of PCR products, the quantity and quality, on 1% agarose gel with ethidium bromide as gel stain.
PCR Products Purification and DNA Sequencing
Direct purification of the PCR products was done using the Geneaid Gel/PCR DNA Fragments Extraction Kit. Purified PCR products were sent for DNA sequencing in suspension form. DNA sequencing was done at First BASE Laboratories Sdn Bhd, Seri Kembangan, Selangor Darul Ehsan, Malaysia.
Phylogenetic Analyses
The results of fluorescence-based DNA sequence analyses received from First BASE Laboratories Sdn Bhd were displayed using the Chromas Lite (version 2.01) programme (Copyright © 1998-2005 Technelysium Pty Ltd). The ClustalX (version 2.1) programme (Thompson et al., 1997) was used to run a multiple sequence alignment for forward reaction sequences and subsequently aligned
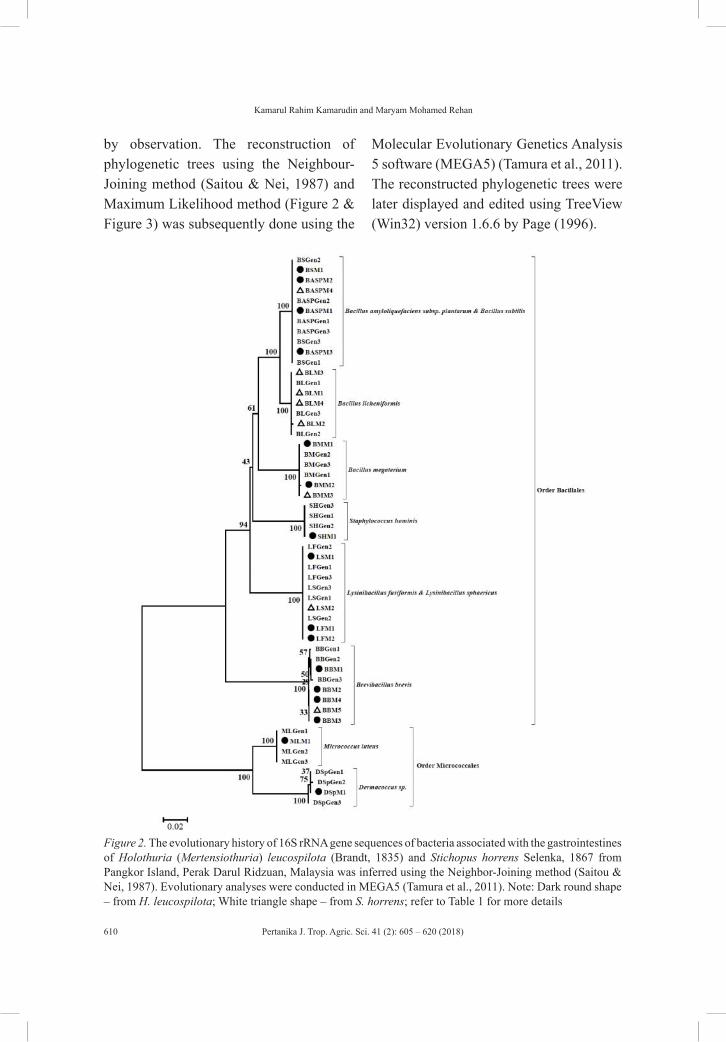
Pertanika J. Trop. Agric. Sci. 41 (2): 605 – 620 (2018)
Kamarul Rahim Kamarudin and Maryam Mohamed Rehan
610
by observation. The reconstruction of phylogenetic trees using the Neighbour-Joining method (Saitou & Nei, 1987) and Maximum Likelihood method (Figure 2 & Figure 3) was subsequently done using the
Molecular Evolutionary Genetics Analysis 5 software (MEGA5) (Tamura et al., 2011). The reconstructed phylogenetic trees were later displayed and edited using TreeView (Win32) version 1.6.6 by Page (1996).
Figure 2. The evolutionary history of 16S rRNA gene sequences of bacteria associated with the gastrointestines of Holothuria (Mertensiothuria) leucospilota (Brandt, 1835) and Stichopus horrens Selenka, 1867 from Pangkor Island, Perak Darul Ridzuan, Malaysia was inferred using the Neighbor-Joining method (Saitou & Nei, 1987). Evolutionary analyses were conducted in MEGA5 (Tamura et al., 2011). Note: Dark round shape – from H. leucospilota; White triangle shape – from S. horrens; refer to Table 1 for more details
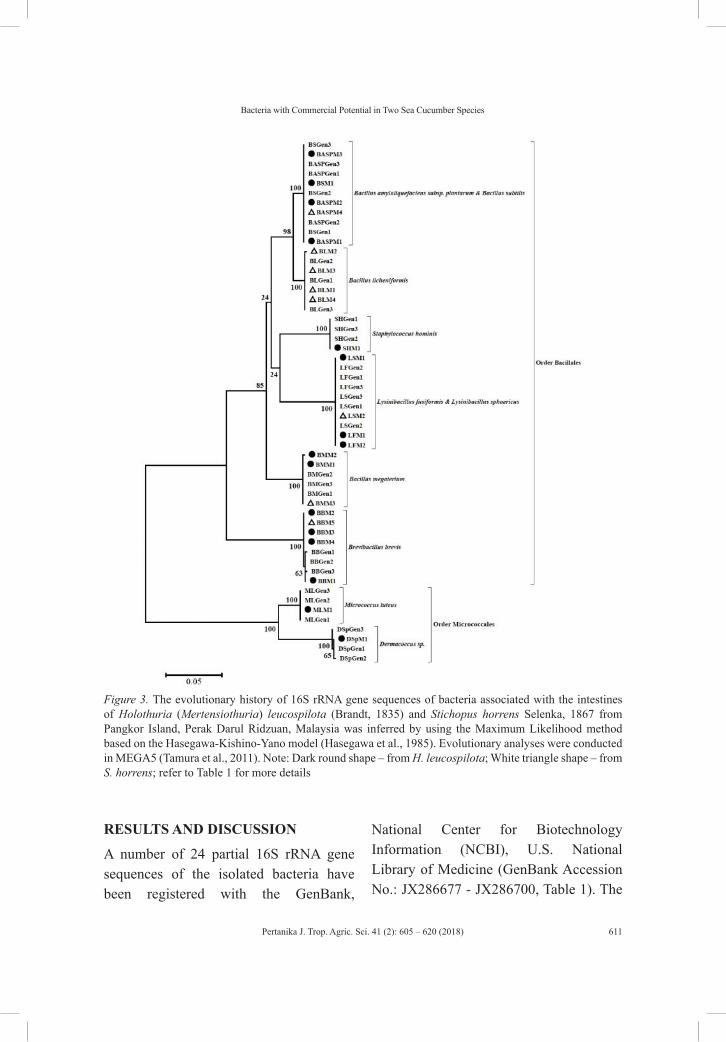
Pertanika J. Trop. Agric. Sci. 41 (2): 605 – 620 (2018)
Bacteria with Commercial Potential in Two Sea Cucumber Species
611
Figure 3. The evolutionary history of 16S rRNA gene sequences of bacteria associated with the intestines of Holothuria (Mertensiothuria) leucospilota (Brandt, 1835) and Stichopus horrens Selenka, 1867 from Pangkor Island, Perak Darul Ridzuan, Malaysia was inferred by using the Maximum Likelihood method based on the Hasegawa-Kishino-Yano model (Hasegawa et al., 1985). Evolutionary analyses were conducted in MEGA5 (Tamura et al., 2011). Note: Dark round shape – from H. leucospilota; White triangle shape – from S. horrens; refer to Table 1 for more details
RESULTS AND DISCUSSION
A number of 24 partial 16S rRNA gene sequences of the isolated bacteria have been registered with the GenBank,
National Center for Biotechnology Information (NCBI), U.S. National Library of Medicine (GenBank Accession No.: JX286677 - JX286700, Table 1). The
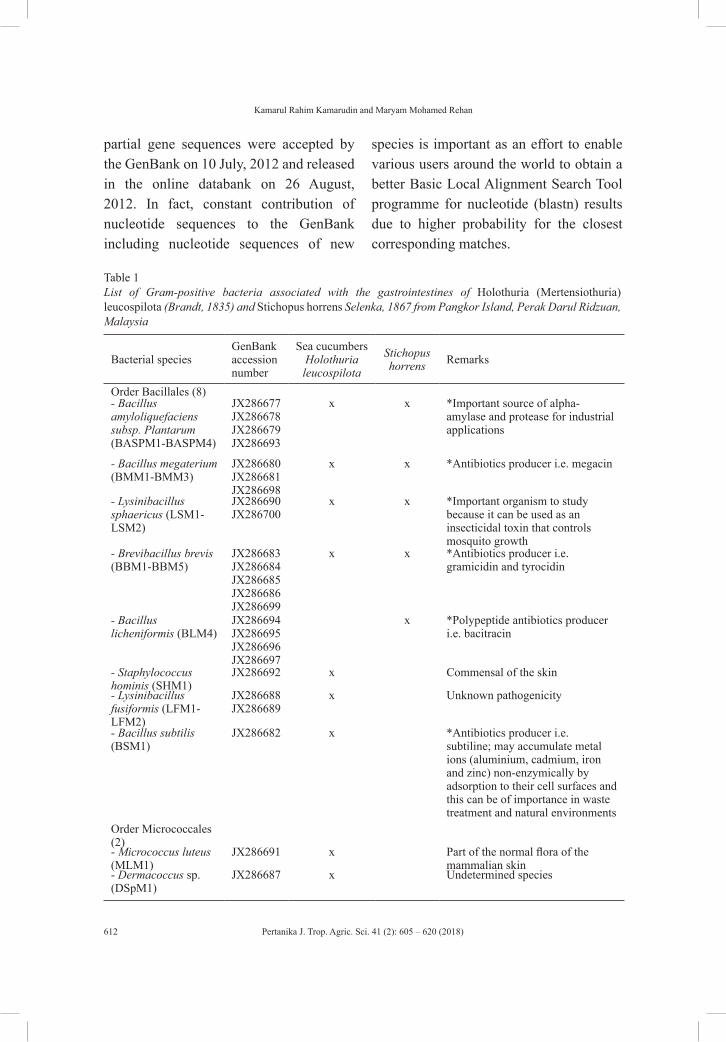
Pertanika J. Trop. Agric. Sci. 41 (2): 605 – 620 (2018)
Kamarul Rahim Kamarudin and Maryam Mohamed Rehan
612
partial gene sequences were accepted by the GenBank on 10 July, 2012 and released in the online databank on 26 August, 2012. In fact, constant contribution of nucleotide sequences to the GenBank including nucleotide sequences of new
species is important as an effort to enable various users around the world to obtain a better Basic Local Alignment Search Tool programme for nucleotide (blastn) results due to higher probability for the closest corresponding matches.
Table 1List of Gram-positive bacteria associated with the gastrointestines of Holothuria (Mertensiothuria) leucospilota (Brandt, 1835) and Stichopus horrens Selenka, 1867 from Pangkor Island, Perak Darul Ridzuan, Malaysia
Bacterial speciesGenBank accession number
Sea cucumbersHolothuria leucospilota
Stichopus horrens Remarks
Order Bacillales (8)- Bacillus amyloliquefaciens subsp. Plantarum (BASPM1-BASPM4)
JX286677 JX286678 JX286679 JX286693
x x *Important source of alpha-amylase and protease for industrial applications
- Bacillus megaterium (BMM1-BMM3)
JX286680 JX286681JX286698
x x *Antibiotics producer i.e. megacin
- Lysinibacillus sphaericus (LSM1-LSM2)
JX286690JX286700
x x *Important organism to study because it can be used as an insecticidal toxin that controls mosquito growth
- Brevibacillus brevis (BBM1-BBM5)
JX286683 JX286684 JX286685 JX286686JX286699
x x *Antibiotics producer i.e. gramicidin and tyrocidin
- Bacillus licheniformis (BLM4)
JX286694 JX286695 JX286696 JX286697
x *Polypeptide antibiotics producer i.e. bacitracin
- Staphylococcus hominis (SHM1)
JX286692 x Commensal of the skin
- Lysinibacillus fusiformis (LFM1-LFM2)
JX286688 JX286689
x Unknown pathogenicity
- Bacillus subtilis (BSM1)
JX286682 x *Antibiotics producer i.e. subtiline; may accumulate metal ions (aluminium, cadmium, iron and zinc) non-enzymically by adsorption to their cell surfaces and this can be of importance in waste treatment and natural environments
Order Micrococcales (2)- Micrococcus luteus (MLM1)
JX286691 x Part of the normal flora of the mammalian skin
- Dermacoccus sp. (DSpM1)
JX286687 x Undetermined species

Pertanika J. Trop. Agric. Sci. 41 (2): 605 – 620 (2018)
Bacteria with Commercial Potential in Two Sea Cucumber Species
613
The phylogenetic analyses involved 54 nucleotide sequences including 30 corresponding sequences from the BLAST results. Elimination was done in all positions containing gaps and missing data. As a result, the final dataset contained a total of 776 positions. Phylogenetic confidence was estimated by bootstrapping (Felsenstein, 1985) with 1000 replicate data sets. For the reconstruction of the Neighbour-Joining tree (Figure 2), the optimal tree with the sum of branch length equals to 0.49601184 is shown. The distance-based tree was drawn to scale, with branch lengths in the same units as those of the evolutionary distances used to infer the phylogenetic tree. The Tamura-Nei method (Tamura & Nei, 1993) was incorporated to compute the evolutionary distances and the distances are in the units of the number of base substitutions per site. Meanwhile, the Maximum Likelihood tree with the highest log likelihood (-2926.6407) is shown in Figure 3. The percentage of trees in which the associated taxa clustered together is shown next to the branches. Initial tree(s) for the heuristic search were obtained automatically. When the number of common sites was < 100 or less than one fourth of the total number of sites, the maximum parsimony method was used; otherwise the BIONJ method with Maximum Composite Likelihood (MCL) distance matrix was used. The branches corresponding to partitions reproduced in less than 50% bootstrap replicates were collapsed. The reconstruction of the Maximum Likelihood tree was based on
the Hasegawa-Kishino-Yano model (1985). The percentage of replicate trees in which the associated taxa clustered together in the bootstrap test (1000 replicates) is shown next to the branches.
Six genera of Gram-positive bacteria from the order Bacillales (four genera) and order Micrococcales (two genera) i.e. Bacillus, Brevibacillus, Lysinibacillus, Staphylococcus, Dermacoccus and Micrococcus were isolated from the gastrointestines of H. leucospilota as inferred using the Neighbour-Joining method (Figure 2) and Maximum Likelihood method (Figure 3) based on partial 16S rRNA gene sequences. Lukman et al. (2014) isolated five bacterial genera from the coelomic fluid of H. leucospilota i.e. Bacillus, Exiguobacterium, Pseudomonas, Stenotrophomonas and Vibrio. In addition, Kamarudin et al. (2013) isolated an orange-pigment-producing Staphylococcus kloosii from the respiratory tree of H. leucospilota from Teluk Nipah, Pangkor Island, Perak, Malaysia. In terms of the gastrointestines of S. horrens, three genera of Gram-positive bacteria from order Bacillales i.e. Bacillus, Brevibacillus and Lysinibacillus were isolated. Three genera of gram-positive bacteria from the Micrococcaceae family i.e. Kytococcus, Micrococcus and either Kocuria or Rothia were isolated from the coelomic fluid of Stichopus chloronotus or the greenfish, one of the gamat species in Malaysia (Lukman et al., 2014). The order Bacillales formed the major group of eight bacterial species followed by the order Micrococcales with two bacterial species
Pertanika J. Trop. Agric. Sci. 41 (2): 605 – 620 (2018)
Kamarul Rahim Kamarudin and Maryam Mohamed Rehan
614
(Figure 2 & Figure 3). Morphologically, the Gram-staining technique stains Gram-positive bacteria with a dark blue or violet colour.
In terms of genus composition of the bacterial community in the gastrointestines of H. leucospilota and S. horrens (Figure 4), the genus Bacillus was the largest group and it was present in both species along with the genus Brevibacillus and genus Lysinibacillus. Li et al. (2016) reported that the genus Bacillus was the main enzyme-producing microflora in the gut of Apostichopus japonicus. Interestingly, 60% of the associated bacteria have been acknowledged to hold commercial potential, specifically as antibiotic producers (Table 1). Only bacteria with commercial potentials were present in the gastrointestines of S. horrens. On the contrary, unknown potentials of bacteria that could be pathogenic were also present in the gastrointestines of H. leucospilota. In other words, more diverse microbial population was observed in the gastrointestines of H. leucospilota. Omran and Allam (2013) isolated five human Gram-negative pathogenic bacteria i.e. Esherichia coli, Klebsiella pneumoniae, Pseudomonas aeruginosa, Salmonella sp. and Shigella sp.; and a yeast Candida albicans from Holothuria polii collected from the Mediterranean Sea. However, experiments on the antibacterial properties have to be done in the future in order to confirm the presence of commercial potential among the isolates. In addition, a high level of antimicrobial properties in the
gastrointestines of S. horrens could be one of the contributing factors for the presence of all bacteria with commercial potential in the gastrointestines of S. horrens. According to Lukman et al. (2014), a number of environmental factors could contribute to the less diverse microbial population in Stichopus chloronotus from Tioman Island, Pahang Darul Makmur, Malaysia compared to H. leucospilota from Dayang Bunting Island, Yan, Kedah Darul Aman, Malaysia e.g. the feeding behaviour of H. leucospilota, the higher level of antimicrobial properties of coelomic fluid in S. chloronotus and the penetration of light surrounding the habitats of both species.
In order to facilitate and provide better insight into the bacterial communities in the gastrointestines of gamat species and timun laut species of Malaysian sea cucumbers, more studies with additional specimens of S. horrens and H. leucospilota from wide-ranging geographical locations and the use of different molecular techniques accompanied by morphological approaches for bacterial species identification are suggested. Besides that, the bacterial isolation methods by Gao et al. (2017) can be considered in future in order to isolate as much bacterial species as possible and also to further minimise the potential of any contamination. The current outcomes also suggested that the two sea cucumber species could be the new sources of bacteria with known commercial potential that can be exploited for the development of industrial applications in Malaysia.
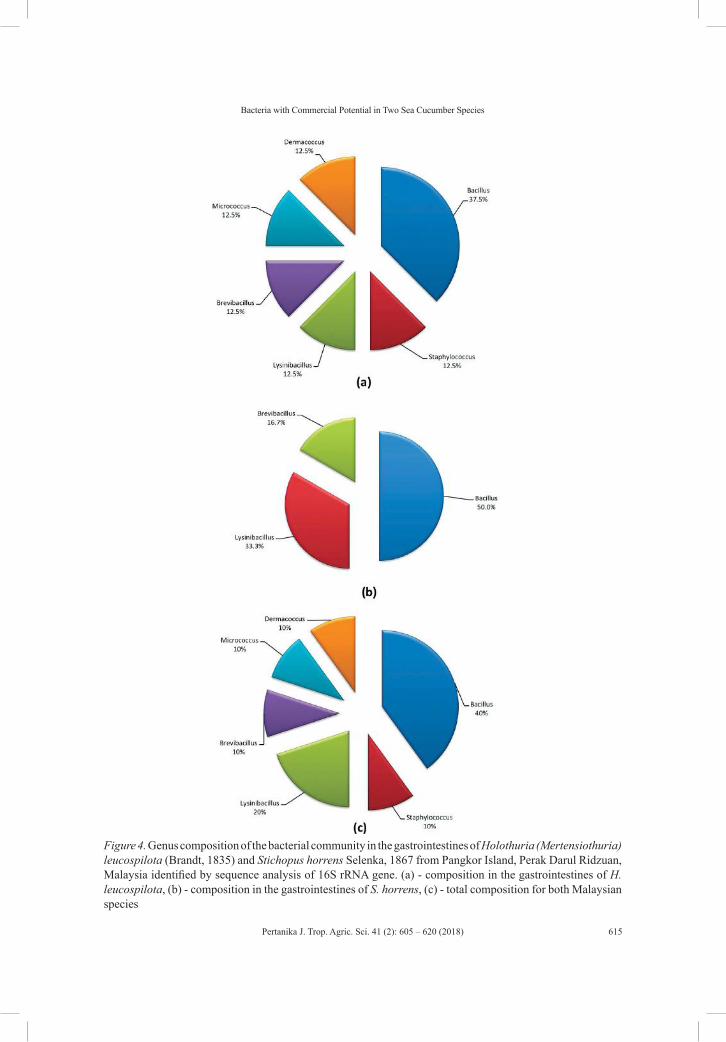
Pertanika J. Trop. Agric. Sci. 41 (2): 605 – 620 (2018)
Bacteria with Commercial Potential in Two Sea Cucumber Species
615
Figure 4. Genus composition of the bacterial community in the gastrointestines of Holothuria (Mertensiothuria) leucospilota (Brandt, 1835) and Stichopus horrens Selenka, 1867 from Pangkor Island, Perak Darul Ridzuan, Malaysia identified by sequence analysis of 16S rRNA gene. (a) - composition in the gastrointestines of H. leucospilota, (b) - composition in the gastrointestines of S. horrens, (c) - total composition for both Malaysian species
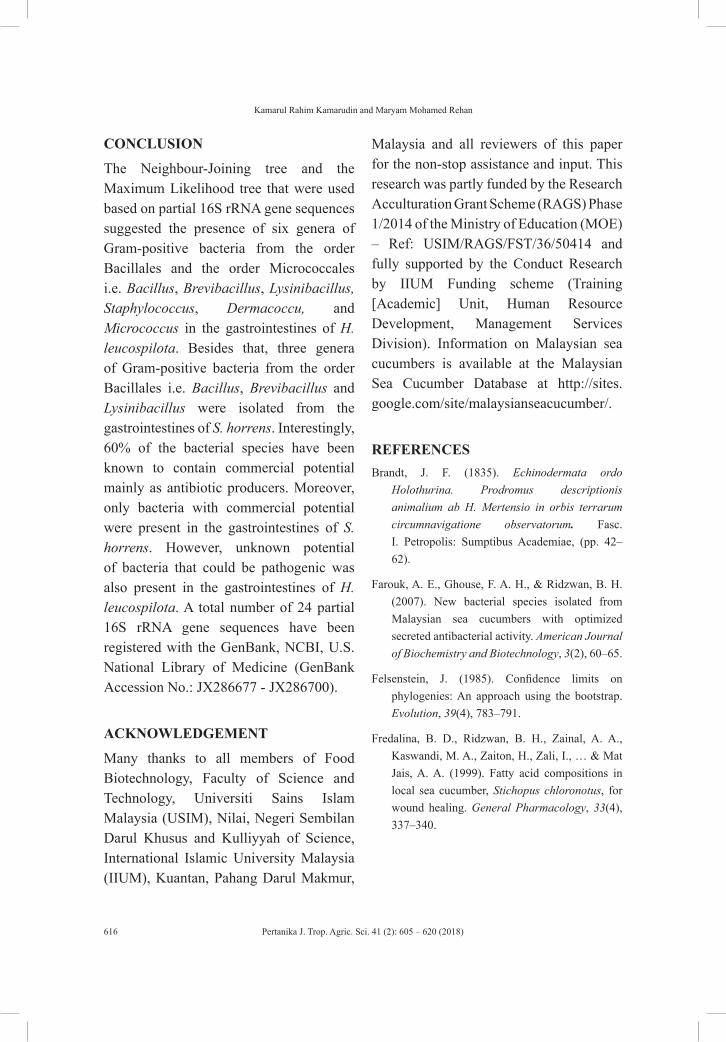
Pertanika J. Trop. Agric. Sci. 41 (2): 605 – 620 (2018)
Kamarul Rahim Kamarudin and Maryam Mohamed Rehan
616
CONCLUSION
The Neighbour-Joining tree and the Maximum Likelihood tree that were used based on partial 16S rRNA gene sequences suggested the presence of six genera of Gram-positive bacteria from the order Bacillales and the order Micrococcales i.e. Bacillus, Brevibacillus, Lysinibacillus, Staphylococcus, Dermacoccu, and Micrococcus in the gastrointestines of H. leucospilota. Besides that, three genera of Gram-positive bacteria from the order Bacillales i.e. Bacillus, Brevibacillus and Lysinibacillus were isolated from the gastrointestines of S. horrens. Interestingly, 60% of the bacterial species have been known to contain commercial potential mainly as antibiotic producers. Moreover, only bacteria with commercial potential were present in the gastrointestines of S. horrens. However, unknown potential of bacteria that could be pathogenic was also present in the gastrointestines of H. leucospilota. A total number of 24 partial 16S rRNA gene sequences have been registered with the GenBank, NCBI, U.S. National Library of Medicine (GenBank Accession No.: JX286677 - JX286700).
ACKNOWLEDGEMENT
Many thanks to all members of Food Biotechnology, Faculty of Science and Technology, Universiti Sains Islam Malaysia (USIM), Nilai, Negeri Sembilan Darul Khusus and Kulliyyah of Science, International Islamic University Malaysia (IIUM), Kuantan, Pahang Darul Makmur,
Malaysia and all reviewers of this paper for the non-stop assistance and input. This research was partly funded by the Research Acculturation Grant Scheme (RAGS) Phase 1/2014 of the Ministry of Education (MOE) – Ref: USIM/RAGS/FST/36/50414 and fully supported by the Conduct Research by IIUM Funding scheme (Training [Academic] Unit, Human Resource Development, Management Services Division). Information on Malaysian sea cucumbers is available at the Malaysian Sea Cucumber Database at http://sites.google.com/site/malaysianseacucumber/.
REFERENCESBrandt, J. F. (1835). Echinodermata ordo
Holothurina. Prodromus descriptionis animalium ab H. Mertensio in orbis terrarum circumnavigatione observatorum. Fasc. I. Petropolis: Sumptibus Academiae, (pp. 42–62).
Farouk, A. E., Ghouse, F. A. H., & Ridzwan, B. H. (2007). New bacterial species isolated from Malaysian sea cucumbers with optimized secreted antibacterial activity. American Journal of Biochemistry and Biotechnology, 3(2), 60–65.
Felsenstein, J. (1985). Confidence limits on phylogenies: An approach using the bootstrap. Evolution, 39(4), 783–791.
Fredalina, B. D., Ridzwan, B. H., Zainal, A. A., Kaswandi, M. A., Zaiton, H., Zali, I., … & Mat Jais, A. A. (1999). Fatty acid compositions in local sea cucumber, Stichopus chloronotus, for wound healing. General Pharmacology, 33(4), 337–340.
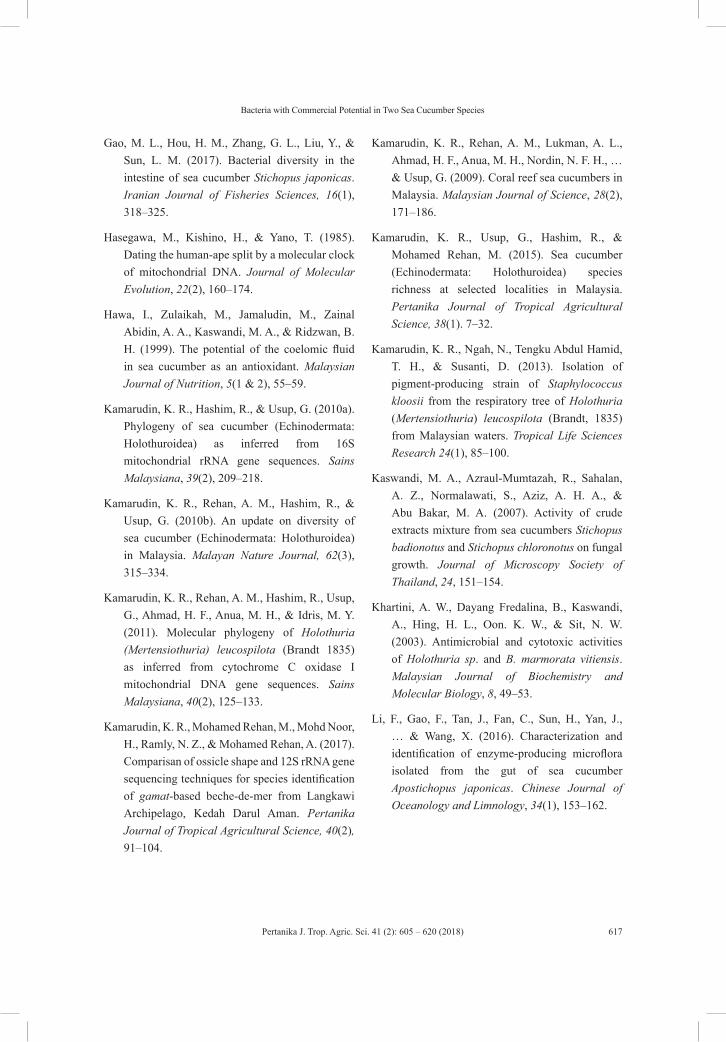
Pertanika J. Trop. Agric. Sci. 41 (2): 605 – 620 (2018)
Bacteria with Commercial Potential in Two Sea Cucumber Species
617
Gao, M. L., Hou, H. M., Zhang, G. L., Liu, Y., & Sun, L. M. (2017). Bacterial diversity in the intestine of sea cucumber Stichopus japonicas. Iranian Journal of Fisheries Sciences, 16(1), 318–325.
Hasegawa, M., Kishino, H., & Yano, T. (1985). Dating the human-ape split by a molecular clock of mitochondrial DNA. Journal of Molecular Evolution, 22(2), 160–174.
Hawa, I., Zulaikah, M., Jamaludin, M., Zainal Abidin, A. A., Kaswandi, M. A., & Ridzwan, B. H. (1999). The potential of the coelomic fluid in sea cucumber as an antioxidant. Malaysian Journal of Nutrition, 5(1 & 2), 55–59.
Kamarudin, K. R., Hashim, R., & Usup, G. (2010a). Phylogeny of sea cucumber (Echinodermata: Holothuroidea) as inferred from 16S mitochondrial rRNA gene sequences. Sains Malaysiana, 39(2), 209–218.
Kamarudin, K. R., Rehan, A. M., Hashim, R., & Usup, G. (2010b). An update on diversity of sea cucumber (Echinodermata: Holothuroidea) in Malaysia. Malayan Nature Journal, 62(3), 315–334.
Kamarudin, K. R., Rehan, A. M., Hashim, R., Usup, G., Ahmad, H. F., Anua, M. H., & Idris, M. Y. (2011). Molecular phylogeny of Holothuria (Mertensiothuria) leucospilota (Brandt 1835) as inferred from cytochrome C oxidase I mitochondrial DNA gene sequences. Sains Malaysiana, 40(2), 125–133.
Kamarudin, K. R., Mohamed Rehan, M., Mohd Noor, H., Ramly, N. Z., & Mohamed Rehan, A. (2017). Comparisan of ossicle shape and 12S rRNA gene sequencing techniques for species identification of gamat-based beche-de-mer from Langkawi Archipelago, Kedah Darul Aman. Pertanika Journal of Tropical Agricultural Science, 40(2), 91–104.
Kamarudin, K. R., Rehan, A. M., Lukman, A. L., Ahmad, H. F., Anua, M. H., Nordin, N. F. H., … & Usup, G. (2009). Coral reef sea cucumbers in Malaysia. Malaysian Journal of Science, 28(2), 171–186.
Kamarudin, K. R., Usup, G., Hashim, R., & Mohamed Rehan, M. (2015). Sea cucumber (Echinodermata: Holothuroidea) species richness at selected localities in Malaysia. Pertanika Journal of Tropical Agricultural Science, 38(1). 7–32.
Kamarudin, K. R., Ngah, N., Tengku Abdul Hamid, T. H., & Susanti, D. (2013). Isolation of pigment-producing strain of Staphylococcus kloosii from the respiratory tree of Holothuria (Mertensiothuria) leucospilota (Brandt, 1835) from Malaysian waters. Tropical Life Sciences Research 24(1), 85–100.
Kaswandi, M. A., Azraul-Mumtazah, R., Sahalan, A. Z., Normalawati, S., Aziz, A. H. A., & Abu Bakar, M. A. (2007). Activity of crude extracts mixture from sea cucumbers Stichopus badionotus and Stichopus chloronotus on fungal growth. Journal of Microscopy Society of Thailand, 24, 151–154.
Khartini, A. W., Dayang Fredalina, B., Kaswandi, A., Hing, H. L., Oon. K. W., & Sit, N. W. (2003). Antimicrobial and cytotoxic activities of Holothuria sp. and B. marmorata vitiensis. Malaysian Journal of Biochemistry and Molecular Biology, 8, 49–53.
Li, F., Gao, F., Tan, J., Fan, C., Sun, H., Yan, J., … & Wang, X. (2016). Characterization and identification of enzyme-producing microflora isolated from the gut of sea cucumber Apostichopus japonicas. Chinese Journal of Oceanology and Limnology, 34(1), 153–162.
Pertanika J. Trop. Agric. Sci. 41 (2): 605 – 620 (2018)
Kamarul Rahim Kamarudin and Maryam Mohamed Rehan
618
Lukman, A. L., Nordin, N. F. H., & Kamarudin, K. R. (2014). Microbial population in the coelomic fluid of Stichopus chloronotus and Holothuria (Mertensiothuria) leucospilota collected from Malaysian waters. Sains Malaysiana, 43(7), 1013–1021.
Omran, N. E., & Allam, N. G. (2013). Screening of microbial contamination and antimicrobial activity of sea cucumber Holothuria polii. Toxicology and Industrial Health, 29(10), 944–954.
Osama, Y. A., Ridzwan, H., Muhammad, T., Jamaludin, M. D., Masa-Aki, I., & Zali, B. I. (2009). In vitro antioxidant and antiproliferative activities of three Malaysian sea cucumber species. European Journal of Scientific Research, 37(3), 376–387.
Page, R. D. M. (1996). TREEVIEW: An application to display phylogenetic trees on personal computers. Computer Applications in the Biosciences, 12(4), 357–358.
Ridzwan, B. H. (2011). Timun laut warisan Malaysia. Kuala Lumpur, Malaysia: Research Management Centre, International Islamic University Malaysia.
Ridzwan, B. H., Kaswandi, M. A., Azman, Y., & Fuad, M. (1995). Screening for anti-bacterial agents in three species of sea cucumber from coastal areas of Sabah. General Pharmacology, 26(7), 1539–1543.
Ridzwan, B. H., Leong, T. C., & Idid, S. Z. (2003). The antinociceptive effects of water extracts from sea cucumber Holothuria leucospilota Brandt, Bohadschia marmorata vitiensis Jaeger and coelomic fluid from Stichopus hermanii. Pakistan Journal of Biological Sciences, 6(24), 2068–2072.
Saitou, N., & Nei, M. (1987). The neighbor-joining method: A new method for reconstructing phylogenetic trees. Molecular Biology and Evolution, 4(4), 406-425.
Selenka, E. (1867). Beiträge zur Anatomie und Systematik der Holothurien. Zeitschrift für wissenschartliche Zoologie, 17, 291–374.
Sim, Y. K., Tan, S. H., & Zulfigar, Y. (2009). The diversity and abundance of the sea cucumber (Echinodermata: Holothuroidea) from the archipelagos of Beting Patinggi Ali, Beting Raja Jarom and Pulau Layang-Layang, South China Sea. In 6th IMT-GT UNINET Conference 2008: Sustaining Natural Resources Towards Enhancing the Quality of Life within the IMT-GT Zone (pp.357–360). Penang: The Gurney Resort Hotel, 2008, August 25-30.
Tamura, K., & Nei, M. (1993). Estimation of the number of nucleotide substitutions in the control region of mitochondrial DNA in humans and chimpanzees. Molecular Biology and Evolution, 10(3), 512–526.
Tamura, K., Peterson, D., Peterson, N., Stecher, G., Nei, M., & Kumar S. (2011). MEGA5: Molecular evolutionary genetics analysis using maximum likelihood, evolutionary distance, and maximum parsimony methods. Molecular Biology and Evolution, 28(10), 2731–2739.
Tan, W. T., Fong, Y. S., & Ridzwan, B. H. (2005). The effect of coelomic fluid Stichopus hermanii on isolated perfused rat hearts and the involvement of prostaglandin in its mechanism of action. Pakistan Journal of Biological Sciences, 8(1), 78–84.
Thompson, J. D., Gibson, T. J., Plewniak, F., Jeanmougin, F., & Higgins, D. G. (1997). The ClustalX windows interface: flexible strategies for multiple sequence alignment aided by the quality analysis tools. Nucleic Acids Research, 25(24), 4876–4882.
Wissgott, U., & Bortlik, K. (1996). Prospects for new natural food colorants. Trends in Food Science and Technology, 7(9), 298–302.

Pertanika J. Trop. Agric. Sci. 41 (2): 605 – 620 (2018)
Bacteria with Commercial Potential in Two Sea Cucumber Species
619
Zaidnuddin, I. (2002). Sea cucumber species diversity and abundance from the south– western waters of Balik Pulau, Penang. In P. S. Choo, I. Ismail, P. E. Chee, & T. T. Chuah (Eds.), Workshop on the impact of development on the coastal fisheries off south–west penang Island, Malaysia (pp. 57–62). Fisheries Research Institute, Penang, Malaysia.
Zulfigar, Y., Sim, Y. K., Tan, S. H., & Shirayama, Y. (2008). Field guide to the Echinoderms (Sea cucumber and Sea Stars) of Malaysia (p. 103). The Nippon Foundation, Japan: Kyoto University Press.


Pertanika J. Trop. Agric. Sci. 41 (2): 621 – 636 (2018)
ISSN: 1511-3701 © Universiti Putra Malaysia Press
TROPICAL AGRICULTURAL SCIENCEJournal homepage: http://www.pertanika.upm.edu.my/
ARTICLE INFOArticle history:Received: 04 June 2016Accepted: 29 March 2018
E-mail address:[email protected] (Thongjuta Suwanprasert)
The Analysis of Arbutin in Mao (Antidesma thwaitesianum Muell. Arg.) Extracts
Thongjuta SuwanprasertProgram of Chemistry, Faculty of Science and Technology, Sakon Nakhon Rajabhat University, 680 Nittayo Road, Mueang District, Sakon Nakhon, 47000, Thailand
ABSTRACT
Arbutin is a skin-lightening agent that was discovered in berry fruit plants such as bearberry. The Mao tree produces the Mao fruit, which is quite similar to berries. The hypothesis of this research is based on the possibility of the discovery of arbutin in different parts of the Mao tree (Antidesma thwaitesianum Muell. Arg.). The purpose of this research was to determine the presence of arbutin in the unripe fruits (green Mao fruits, GMF), ripe fruits (red Mao fruits, RMF), mature fruits (black Mao fruits, BMF), young Mao leaves (YML) and mature Mao leaves (MML). The arbutin in the samples was isolated by thin layer chromatography (TLC) and quantified using high performance liquid chromatography (HPLC). The results showed that MML contained the greatest amount of arbutin (10.6 mg/100 g of raw material). The arbutin in MML was isolated using solid phase extraction (SPE) and preparative thin layer chromatography (PTLC) and was characterised via ESI-MS. The results of MS confirmed the presence of arbutin in the PTLC extract of MML. The crude and PTLC extracts of MML were tested for inhibitory activity against tyrosinase compared with the arbutin standard. The tyrosinase inhibition activities suggested that IC50 of the crude extract of MML (IC50 = 7.703 mg/l) and PTLC extract of MML (IC50 =9.428 mg/l) were more effective than the arbutin standard (IC50 = 14.012 mg/l).
Keywords: Antidesma thwaitesianum Muell Arg., arbutin, Mao fruit analysis, Mao leaf analysis, tyrosinase inhibitor
INTRODUCTION
Mao or Maoluang, whose scientific name is Antidesma thwaitesianum Muell., is a wild plant in the Euphorbiaceae family. It is mostly grown in northeastern Thailand. The flowers of the Mao tree bloom from
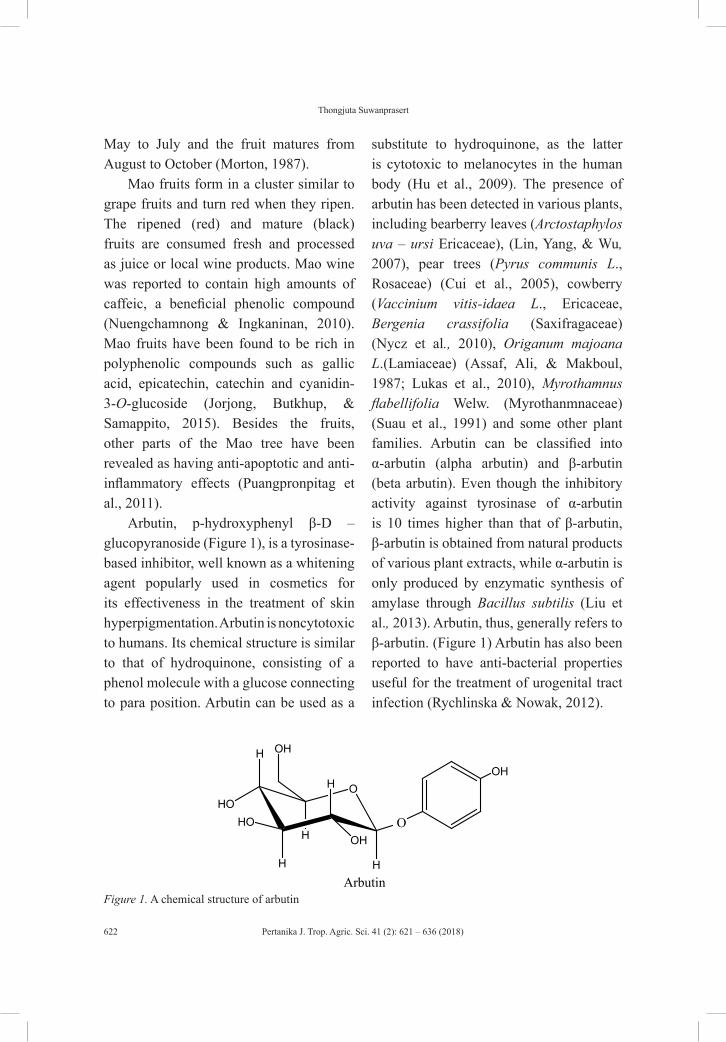
Pertanika J. Trop. Agric. Sci. 41 (2): 621 – 636 (2018)
Thongjuta Suwanprasert
622
May to July and the fruit matures from August to October (Morton, 1987).
Mao fruits form in a cluster similar to grape fruits and turn red when they ripen. The ripened (red) and mature (black) fruits are consumed fresh and processed as juice or local wine products. Mao wine was reported to contain high amounts of caffeic, a beneficial phenolic compound (Nuengchamnong & Ingkaninan, 2010). Mao fruits have been found to be rich in polyphenolic compounds such as gallic acid, epicatechin, catechin and cyanidin-3-O-glucoside (Jorjong, Butkhup, & Samappito, 2015). Besides the fruits, other parts of the Mao tree have been revealed as having anti-apoptotic and anti-inflammatory effects (Puangpronpitag et al., 2011).
Arbutin, p-hydroxyphenyl β-D – glucopyranoside (Figure 1), is a tyrosinase-based inhibitor, well known as a whitening agent popularly used in cosmetics for its effectiveness in the treatment of skin hyperpigmentation. Arbutin is noncytotoxic to humans. Its chemical structure is similar to that of hydroquinone, consisting of a phenol molecule with a glucose connecting to para position. Arbutin can be used as a
substitute to hydroquinone, as the latter is cytotoxic to melanocytes in the human body (Hu et al., 2009). The presence of arbutin has been detected in various plants, including bearberry leaves (Arctostaphylos uva – ursi Ericaceae), (Lin, Yang, & Wu, 2007), pear trees (Pyrus communis L., Rosaceae) (Cui et al., 2005), cowberry (Vaccinium vitis-idaea L., Ericaceae, Bergenia crassifolia (Saxifragaceae) (Nycz et al., 2010), Origanum majoana L.(Lamiaceae) (Assaf, Ali, & Makboul, 1987; Lukas et al., 2010), Myrothamnus flabellifolia Welw. (Myrothanmnaceae) (Suau et al., 1991) and some other plant families. Arbutin can be classified into α-arbutin (alpha arbutin) and β-arbutin (beta arbutin). Even though the inhibitory activity against tyrosinase of α-arbutin is 10 times higher than that of β-arbutin, β-arbutin is obtained from natural products of various plant extracts, while α-arbutin is only produced by enzymatic synthesis of amylase through Bacillus subtilis (Liu et al., 2013). Arbutin, thus, generally refers to β-arbutin. (Figure 1) Arbutin has also been reported to have anti-bacterial properties useful for the treatment of urogenital tract infection (Rychlinska & Nowak, 2012).
O
O
H
HO
H
HO
H
H
OHH
OH
OH
ArbutinFigure 1. A chemical structure of arbutin
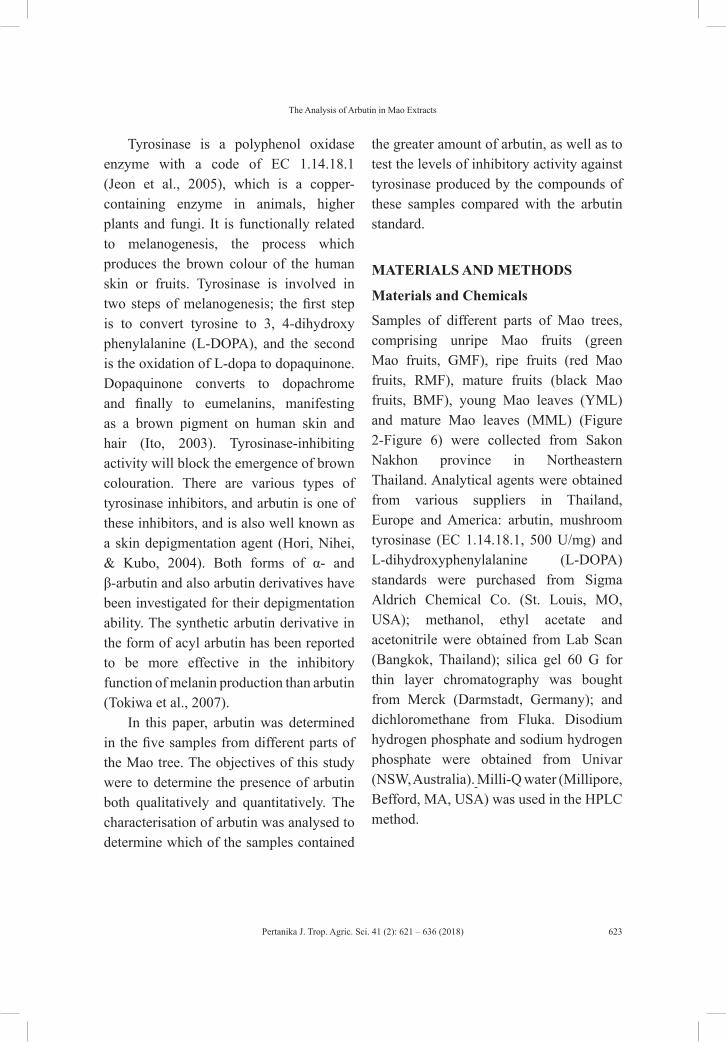
Pertanika J. Trop. Agric. Sci. 41 (2): 621 – 636 (2018)
The Analysis of Arbutin in Mao Extracts
623
Tyrosinase is a polyphenol oxidase enzyme with a code of EC 1.14.18.1 (Jeon et al., 2005), which is a copper-containing enzyme in animals, higher plants and fungi. It is functionally related to melanogenesis, the process which produces the brown colour of the human skin or fruits. Tyrosinase is involved in two steps of melanogenesis; the first step is to convert tyrosine to 3, 4-dihydroxy phenylalanine (L-DOPA), and the second is the oxidation of L-dopa to dopaquinone. Dopaquinone converts to dopachrome and finally to eumelanins, manifesting as a brown pigment on human skin and hair (Ito, 2003). Tyrosinase-inhibiting activity will block the emergence of brown colouration. There are various types of tyrosinase inhibitors, and arbutin is one of these inhibitors, and is also well known as a skin depigmentation agent (Hori, Nihei, & Kubo, 2004). Both forms of α- and β-arbutin and also arbutin derivatives have been investigated for their depigmentation ability. The synthetic arbutin derivative in the form of acyl arbutin has been reported to be more effective in the inhibitory function of melanin production than arbutin (Tokiwa et al., 2007).
In this paper, arbutin was determined in the five samples from different parts of the Mao tree. The objectives of this study were to determine the presence of arbutin both qualitatively and quantitatively. The characterisation of arbutin was analysed to determine which of the samples contained
the greater amount of arbutin, as well as to test the levels of inhibitory activity against tyrosinase produced by the compounds of these samples compared with the arbutin standard.
MATERIALS AND METHODS
Materials and Chemicals
Samples of different parts of Mao trees, comprising unripe Mao fruits (green Mao fruits, GMF), ripe fruits (red Mao fruits, RMF), mature fruits (black Mao fruits, BMF), young Mao leaves (YML) and mature Mao leaves (MML) (Figure 2-Figure 6) were collected from Sakon Nakhon province in Northeastern Thailand. Analytical agents were obtained from various suppliers in Thailand, Europe and America: arbutin, mushroom tyrosinase (EC 1.14.18.1, 500 U/mg) and L-dihydroxyphenylalanine (L-DOPA) standards were purchased from Sigma Aldrich Chemical Co. (St. Louis, MO, USA); methanol, ethyl acetate and acetonitrile were obtained from Lab Scan (Bangkok, Thailand); silica gel 60 G for thin layer chromatography was bought from Merck (Darmstadt, Germany); and dichloromethane from Fluka. Disodium hydrogen phosphate and sodium hydrogen phosphate were obtained from Univar (NSW, Australia). Milli-Q water (Millipore, Befford, MA, USA) was used in the HPLC method.
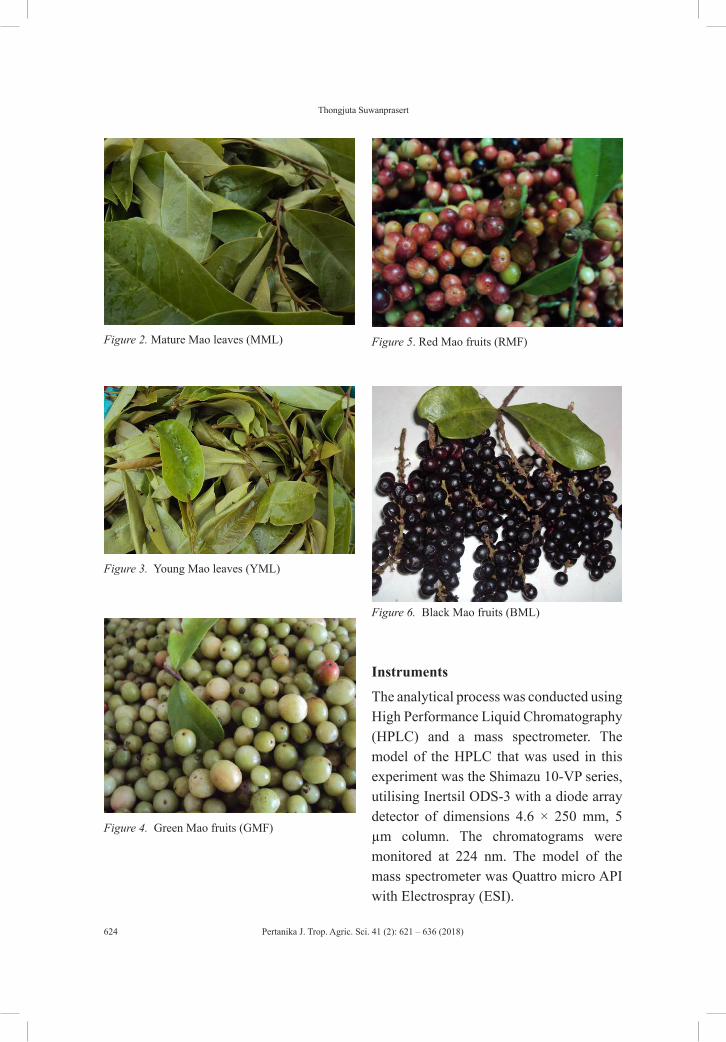
Pertanika J. Trop. Agric. Sci. 41 (2): 621 – 636 (2018)
Thongjuta Suwanprasert
624
Figure 2. Mature Mao leaves (MML)
Figure 3. Young Mao leaves (YML)
Figure 4. Green Mao fruits (GMF)
Figure 5. Red Mao fruits (RMF)
Figure 6. Black Mao fruits (BML)
Instruments
The analytical process was conducted using High Performance Liquid Chromatography (HPLC) and a mass spectrometer. The model of the HPLC that was used in this experiment was the Shimazu 10-VP series, utilising Inertsil ODS-3 with a diode array detector of dimensions 4.6 × 250 mm, 5 µm column. The chromatograms were monitored at 224 nm. The model of the mass spectrometer was Quattro micro API with Electrospray (ESI).

Pertanika J. Trop. Agric. Sci. 41 (2): 621 – 636 (2018)
The Analysis of Arbutin in Mao Extracts
625
Qualitative and Quantitative Analysis of Arbutin
Crude extraction. Fresh samples of unripe Mao fruits (green Mao fruits, GMF), ripe fruits (red Mao fruits, RMF), mature fruits (black Mao fruits, BMF), young Mao leaves (YML) and mature Mao leaves (MML) were weighed at 500-1500 g and dried at a temperature of 50ºC for 6 h before being ground into small pieces. Each sample was soaked in 1500 ml of methanol for five days at room temperature. Then the extracting solvent was decanted and removed via the evaporation process. The five crude extracts were weighed and kept for further analysis.
Thin layer chromatography (TLC). Each crude extract of five samples, weighing about 1.0 g was spotted on 5 x 10 cm of TLC plates (about 10 plates) in which the arbutin standard level was marked as a reference. The plates were placed into a vessel with mobile phase system of 100 % of acetonitrile and left on the plates until the solvent permeated the samples to separate the arbutin. All the spots were detected at 254 nm of UV light source to compare the level of samples moving up to the level of the arbutin standard. The spots from the extracts that were of the same level as the arbutin standard were scraped from all the TLC plates and collected. The isolated arbutin was extracted from the silica particles using methanol. The extracting solvent was then separated from the silica particle via centrifugation.
High performance liquid chromatography (HPLC). After centrifugation, the separated extracting solvent was removed. Then 0.01 g of the isolated arbutin was weighed and dissolved in 10.0 ml of ultrapure water (Milli-Q) for chromatographic analysis. A reverse phase HPLC system was equipped with Inertsil ODS-3 4.6 × 250 mm, 5 µm column and a diode array detector at the wavelength 224 nm. The column temperature was set at 35°C. The injection volume of 20 µl was used and the elution was performed at a flow rate at 1 mL/min under the isocratic system of acetonitrile: water, 80 : 20 v/v.
The qualitative and quantification of arbutin. The quantification of arbutin in the five crude extracts was performed as described by Lukas et al. (2010) with modifications. Briefly, 1.0 g of the weighed methanolic crude extract was isolated by TLC method. The isolated arbutin samples were dissolved in 10.0 ml methanol. The samples were then filtered through a 0.45-μm Nylon membrane. An aliquot of 20 μl of each sample, with or without co-elution with the purified arbutin, was then subjected to analytical HPLC analysis as described earlier to determine the presence of arbutin. A standard calibration curve for arbutin was prepared with solutions ranging from 10 to 100 mg/l. A concentration curve was constructed using the average area calculated by the software, Shimadzu Class VP. An aliquot of 20 μl of the isolated arbutin extract was injected onto the HPLC column and eluted as described earlier. The calculated concentration of arbutin was expressed in mg/l.
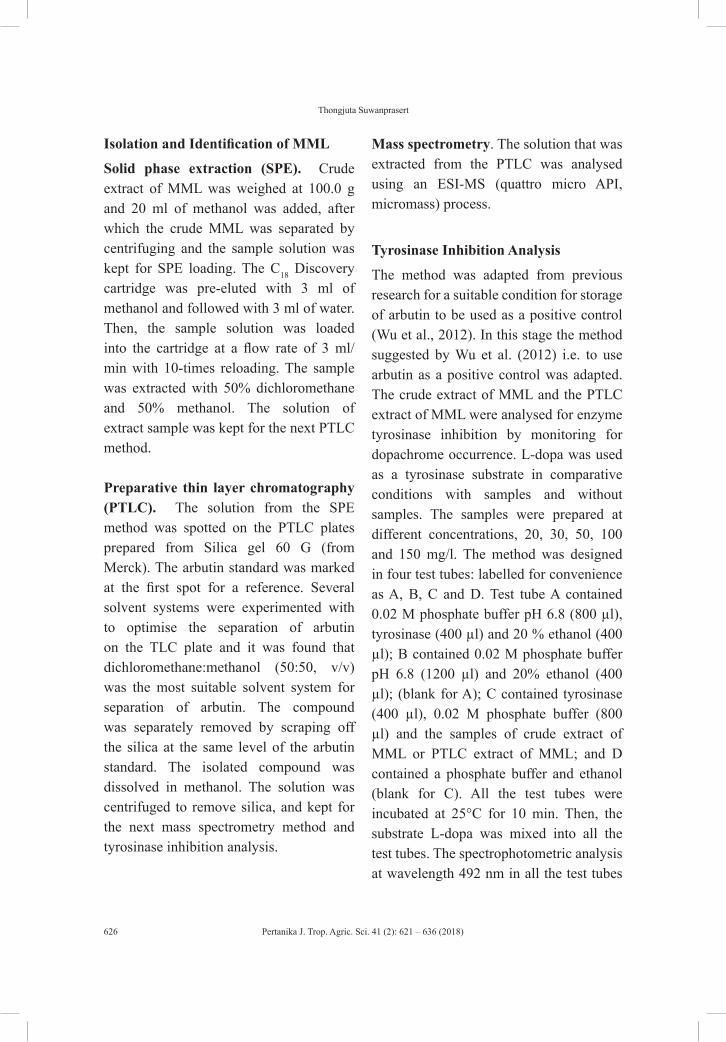
Pertanika J. Trop. Agric. Sci. 41 (2): 621 – 636 (2018)
Thongjuta Suwanprasert
626
Isolation and Identification of MML
Solid phase extraction (SPE). Crude extract of MML was weighed at 100.0 g and 20 ml of methanol was added, after which the crude MML was separated by centrifuging and the sample solution was kept for SPE loading. The C18 Discovery cartridge was pre-eluted with 3 ml of methanol and followed with 3 ml of water. Then, the sample solution was loaded into the cartridge at a flow rate of 3 ml/min with 10-times reloading. The sample was extracted with 50% dichloromethane and 50% methanol. The solution of extract sample was kept for the next PTLC method.
Preparative thin layer chromatography (PTLC). The solution from the SPE method was spotted on the PTLC plates prepared from Silica gel 60 G (from Merck). The arbutin standard was marked at the first spot for a reference. Several solvent systems were experimented with to optimise the separation of arbutin on the TLC plate and it was found that dichloromethane:methanol (50:50, v/v) was the most suitable solvent system for separation of arbutin. The compound was separately removed by scraping off the silica at the same level of the arbutin standard. The isolated compound was dissolved in methanol. The solution was centrifuged to remove silica, and kept for the next mass spectrometry method and tyrosinase inhibition analysis.
Mass spectrometry. The solution that was extracted from the PTLC was analysed using an ESI-MS (quattro micro API, micromass) process.
Tyrosinase Inhibition Analysis
The method was adapted from previous research for a suitable condition for storage of arbutin to be used as a positive control (Wu et al., 2012). In this stage the method suggested by Wu et al. (2012) i.e. to use arbutin as a positive control was adapted. The crude extract of MML and the PTLC extract of MML were analysed for enzyme tyrosinase inhibition by monitoring for dopachrome occurrence. L-dopa was used as a tyrosinase substrate in comparative conditions with samples and without samples. The samples were prepared at different concentrations, 20, 30, 50, 100 and 150 mg/l. The method was designed in four test tubes: labelled for convenience as A, B, C and D. Test tube A contained 0.02 M phosphate buffer pH 6.8 (800 µl), tyrosinase (400 µl) and 20 % ethanol (400 µl); B contained 0.02 M phosphate buffer pH 6.8 (1200 µl) and 20% ethanol (400 µl); (blank for A); C contained tyrosinase (400 µl), 0.02 M phosphate buffer (800 µl) and the samples of crude extract of MML or PTLC extract of MML; and D contained a phosphate buffer and ethanol (blank for C). All the test tubes were incubated at 25°C for 10 min. Then, the substrate L-dopa was mixed into all the test tubes. The spectrophotometric analysis at wavelength 492 nm in all the test tubes
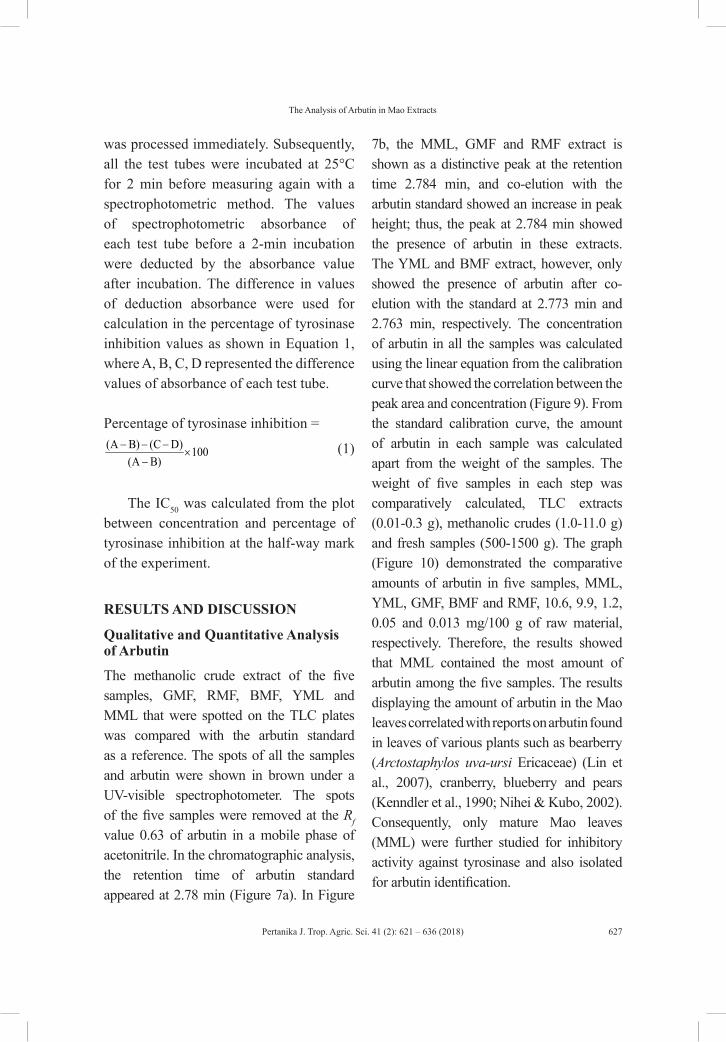
Pertanika J. Trop. Agric. Sci. 41 (2): 621 – 636 (2018)
The Analysis of Arbutin in Mao Extracts
627
was processed immediately. Subsequently, all the test tubes were incubated at 25°C for 2 min before measuring again with a spectrophotometric method. The values of spectrophotometric absorbance of each test tube before a 2-min incubation were deducted by the absorbance value after incubation. The difference in values of deduction absorbance were used for calculation in the percentage of tyrosinase inhibition values as shown in Equation 1, where A, B, C, D represented the difference values of absorbance of each test tube.
Percentage of tyrosinase inhibition =(A B) (C D) 100
(A B)− − −
×− (1)
The IC50 was calculated from the plot between concentration and percentage of tyrosinase inhibition at the half-way mark of the experiment.
RESULTS AND DISCUSSION
Qualitative and Quantitative Analysis of Arbutin
The methanolic crude extract of the five samples, GMF, RMF, BMF, YML and MML that were spotted on the TLC plates was compared with the arbutin standard as a reference. The spots of all the samples and arbutin were shown in brown under a UV-visible spectrophotometer. The spots of the five samples were removed at the Rf value 0.63 of arbutin in a mobile phase of acetonitrile. In the chromatographic analysis, the retention time of arbutin standard appeared at 2.78 min (Figure 7a). In Figure
7b, the MML, GMF and RMF extract is shown as a distinctive peak at the retention time 2.784 min, and co-elution with the arbutin standard showed an increase in peak height; thus, the peak at 2.784 min showed the presence of arbutin in these extracts. The YML and BMF extract, however, only showed the presence of arbutin after co-elution with the standard at 2.773 min and 2.763 min, respectively. The concentration of arbutin in all the samples was calculated using the linear equation from the calibration curve that showed the correlation between the peak area and concentration (Figure 9). From the standard calibration curve, the amount of arbutin in each sample was calculated apart from the weight of the samples. The weight of five samples in each step was comparatively calculated, TLC extracts (0.01-0.3 g), methanolic crudes (1.0-11.0 g) and fresh samples (500-1500 g). The graph (Figure 10) demonstrated the comparative amounts of arbutin in five samples, MML, YML, GMF, BMF and RMF, 10.6, 9.9, 1.2, 0.05 and 0.013 mg/100 g of raw material, respectively. Therefore, the results showed that MML contained the most amount of arbutin among the five samples. The results displaying the amount of arbutin in the Mao leaves correlated with reports on arbutin found in leaves of various plants such as bearberry (Arctostaphylos uva-ursi Ericaceae) (Lin et al., 2007), cranberry, blueberry and pears (Kenndler et al., 1990; Nihei & Kubo, 2002). Consequently, only mature Mao leaves (MML) were further studied for inhibitory activity against tyrosinase and also isolated for arbutin identification.

Pertanika J. Trop. Agric. Sci. 41 (2): 621 – 636 (2018)
Thongjuta Suwanprasert
628
(a)
a
(b)
(c)
Figure 7. Chromatograms of (a) an arbutin standard (b) mature Mao leave (MML) extract and (c) mature Mao leaf (MML) extract spiked with arbutin standard shown at the peaks at retention time 2.784 min under the condition of mobile phase acetonitrile:water, 80:20, v/v, Inertsil ODS-3, 4.6 × 250 mm, 5 µm, column at 35°C and DAD 224 nm
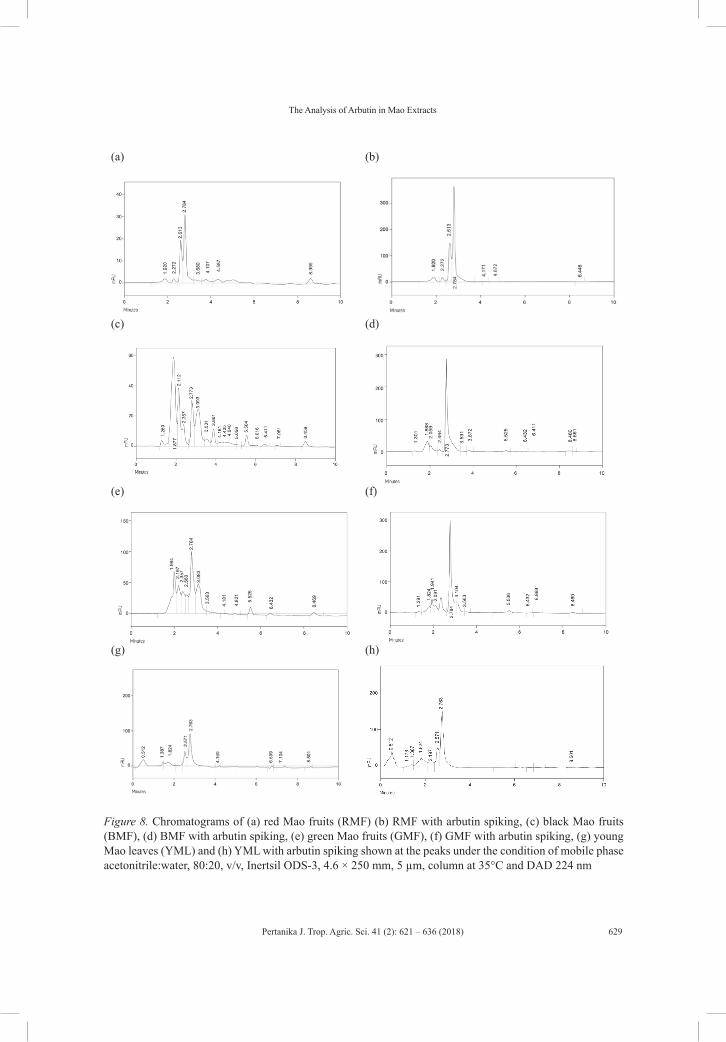
Pertanika J. Trop. Agric. Sci. 41 (2): 621 – 636 (2018)
The Analysis of Arbutin in Mao Extracts
629
(a) (b)
(c) (d)
(e) (f)
(g) (h)
Figure 8. Chromatograms of (a) red Mao fruits (RMF) (b) RMF with arbutin spiking, (c) black Mao fruits (BMF), (d) BMF with arbutin spiking, (e) green Mao fruits (GMF), (f) GMF with arbutin spiking, (g) young Mao leaves (YML) and (h) YML with arbutin spiking shown at the peaks under the condition of mobile phase acetonitrile:water, 80:20, v/v, Inertsil ODS-3, 4.6 × 250 mm, 5 µm, column at 35°C and DAD 224 nm
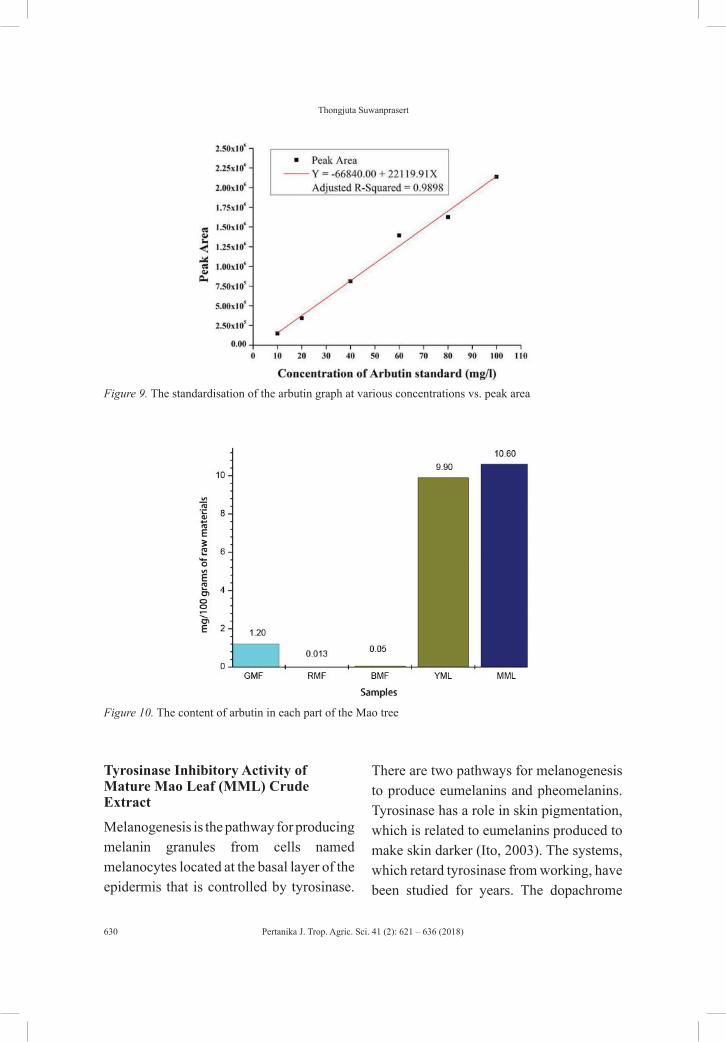
Pertanika J. Trop. Agric. Sci. 41 (2): 621 – 636 (2018)
Thongjuta Suwanprasert
630
Figure 9. The standardisation of the arbutin graph at various concentrations vs. peak area
Figure 10. The content of arbutin in each part of the Mao tree
Tyrosinase Inhibitory Activity of Mature Mao Leaf (MML) Crude Extract
Melanogenesis is the pathway for producing melanin granules from cells named melanocytes located at the basal layer of the epidermis that is controlled by tyrosinase.
There are two pathways for melanogenesis to produce eumelanins and pheomelanins. Tyrosinase has a role in skin pigmentation, which is related to eumelanins produced to make skin darker (Ito, 2003). The systems, which retard tyrosinase from working, have been studied for years. The dopachrome
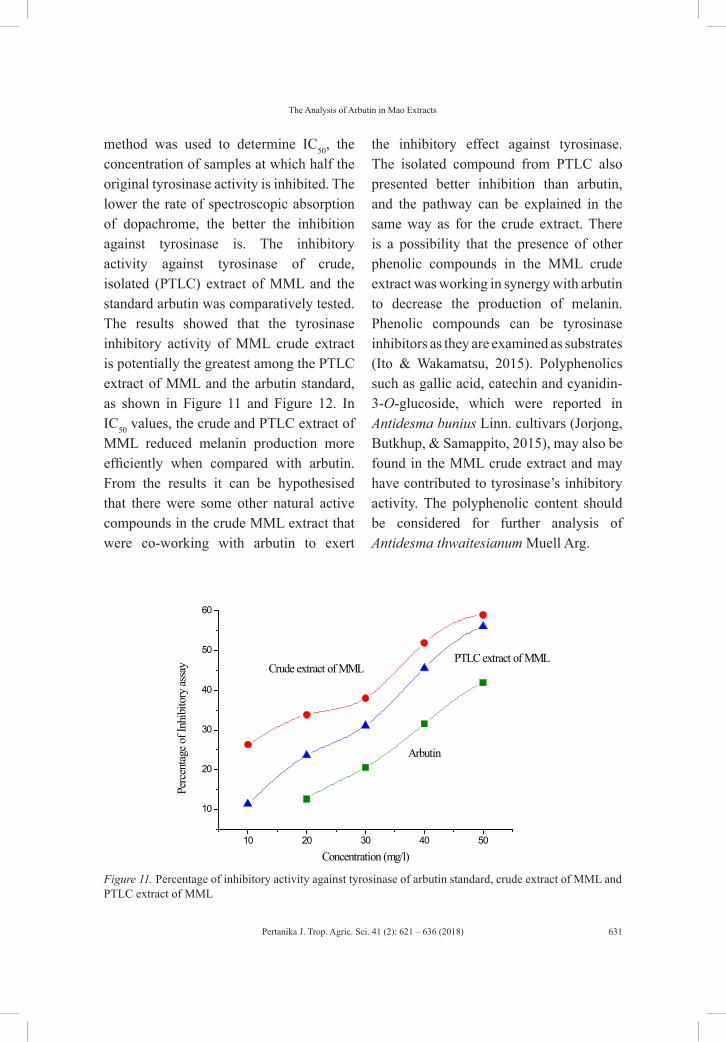
Pertanika J. Trop. Agric. Sci. 41 (2): 621 – 636 (2018)
The Analysis of Arbutin in Mao Extracts
631
method was used to determine IC50, the concentration of samples at which half the original tyrosinase activity is inhibited. The lower the rate of spectroscopic absorption of dopachrome, the better the inhibition against tyrosinase is. The inhibitory activity against tyrosinase of crude, isolated (PTLC) extract of MML and the standard arbutin was comparatively tested. The results showed that the tyrosinase inhibitory activity of MML crude extract is potentially the greatest among the PTLC extract of MML and the arbutin standard, as shown in Figure 11 and Figure 12. In IC50 values, the crude and PTLC extract of MML reduced melanin production more efficiently when compared with arbutin. From the results it can be hypothesised that there were some other natural active compounds in the crude MML extract that were co-working with arbutin to exert
the inhibitory effect against tyrosinase. The isolated compound from PTLC also presented better inhibition than arbutin, and the pathway can be explained in the same way as for the crude extract. There is a possibility that the presence of other phenolic compounds in the MML crude extract was working in synergy with arbutin to decrease the production of melanin. Phenolic compounds can be tyrosinase inhibitors as they are examined as substrates (Ito & Wakamatsu, 2015). Polyphenolics such as gallic acid, catechin and cyanidin-3-O-glucoside, which were reported in Antidesma bunius Linn. cultivars (Jorjong, Butkhup, & Samappito, 2015), may also be found in the MML crude extract and may have contributed to tyrosinase’s inhibitory activity. The polyphenolic content should be considered for further analysis of Antidesma thwaitesianum Muell Arg.
10 20 30 40 50
10
20
30
40
50
60
Perc
enta
ge o
f Inh
ibito
ry as
say
Concentration (mg/l)
Arbutin
Crude extract of MMLPTLC extract of MML
Figure 11. Percentage of inhibitory activity against tyrosinase of arbutin standard, crude extract of MML and PTLC extract of MML
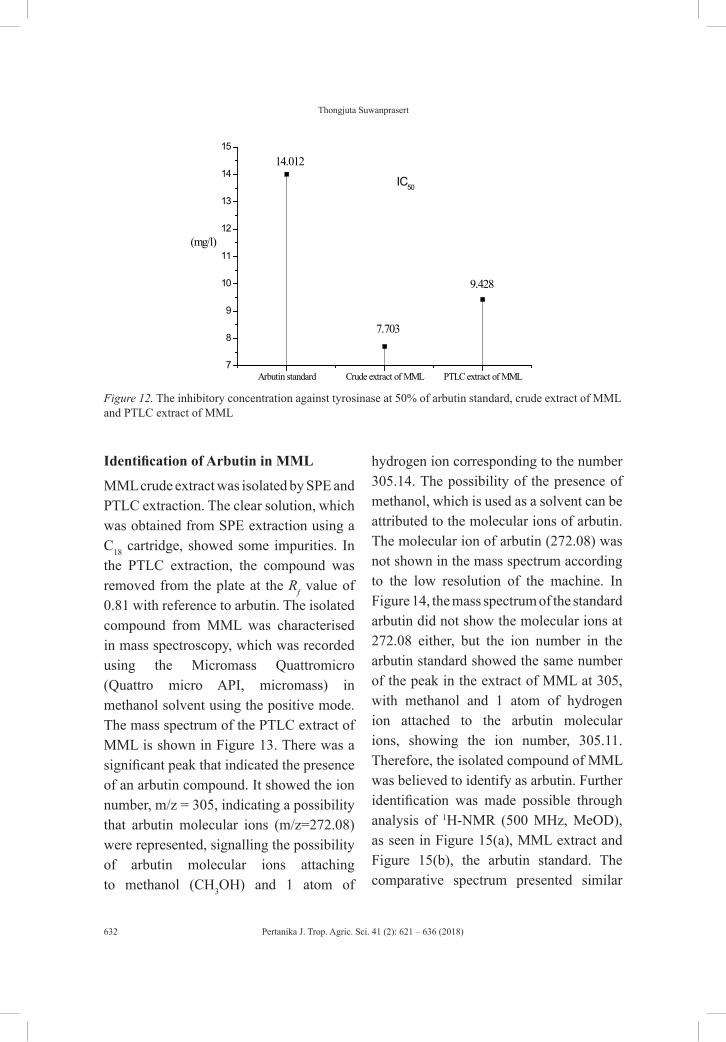
Pertanika J. Trop. Agric. Sci. 41 (2): 621 – 636 (2018)
Thongjuta Suwanprasert
632
Arbutin standard Crude extract of MML PTLC extract of MML7
8
9
10
11
12
13
14
15
(mg/l)
14.012
7.703
9.428
IC50
Figure 12. The inhibitory concentration against tyrosinase at 50% of arbutin standard, crude extract of MML and PTLC extract of MML
Identification of Arbutin in MML
MML crude extract was isolated by SPE and PTLC extraction. The clear solution, which was obtained from SPE extraction using a C18 cartridge, showed some impurities. In the PTLC extraction, the compound was removed from the plate at the Rf value of 0.81 with reference to arbutin. The isolated compound from MML was characterised in mass spectroscopy, which was recorded using the Micromass Quattromicro (Quattro micro API, micromass) in methanol solvent using the positive mode. The mass spectrum of the PTLC extract of MML is shown in Figure 13. There was a significant peak that indicated the presence of an arbutin compound. It showed the ion number, m/z = 305, indicating a possibility that arbutin molecular ions (m/z=272.08) were represented, signalling the possibility of arbutin molecular ions attaching to methanol (CH3OH) and 1 atom of
hydrogen ion corresponding to the number 305.14. The possibility of the presence of methanol, which is used as a solvent can be attributed to the molecular ions of arbutin. The molecular ion of arbutin (272.08) was not shown in the mass spectrum according to the low resolution of the machine. In Figure 14, the mass spectrum of the standard arbutin did not show the molecular ions at 272.08 either, but the ion number in the arbutin standard showed the same number of the peak in the extract of MML at 305, with methanol and 1 atom of hydrogen ion attached to the arbutin molecular ions, showing the ion number, 305.11. Therefore, the isolated compound of MML was believed to identify as arbutin. Further identification was made possible through analysis of 1H-NMR (500 MHz, MeOD), as seen in Figure 15(a), MML extract and Figure 15(b), the arbutin standard. The comparative spectrum presented similar
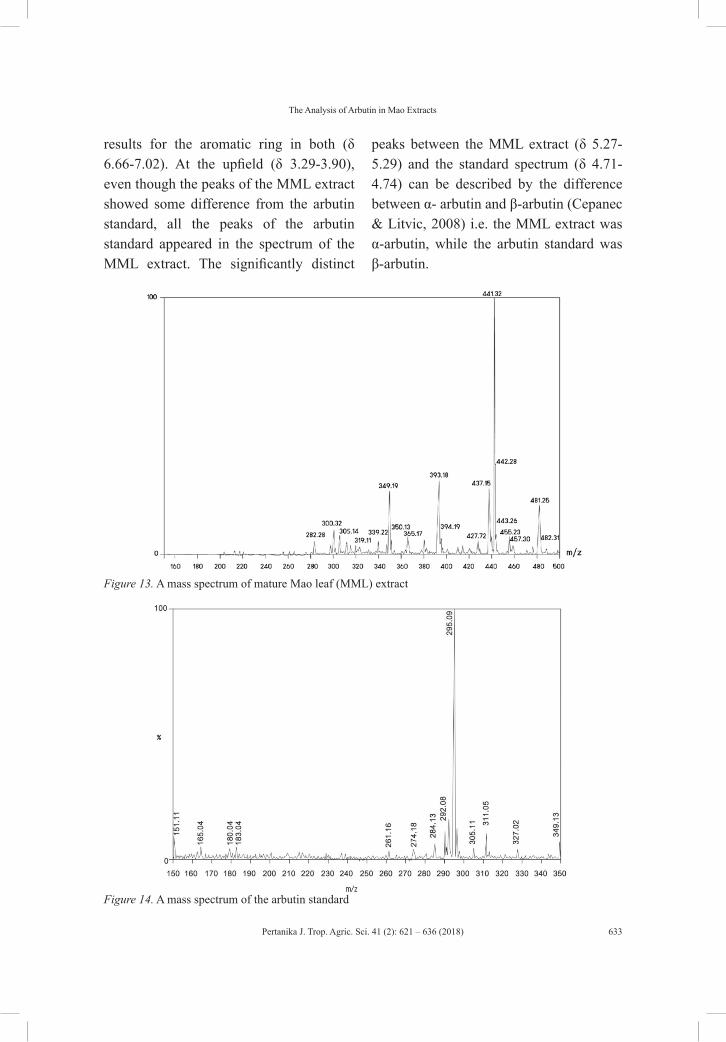
Pertanika J. Trop. Agric. Sci. 41 (2): 621 – 636 (2018)
The Analysis of Arbutin in Mao Extracts
633
results for the aromatic ring in both (δ 6.66-7.02). At the upfield (δ 3.29-3.90), even though the peaks of the MML extract showed some difference from the arbutin standard, all the peaks of the arbutin standard appeared in the spectrum of the MML extract. The significantly distinct
peaks between the MML extract (δ 5.27-5.29) and the standard spectrum (δ 4.71-4.74) can be described by the difference between α- arbutin and β-arbutin (Cepanec & Litvic, 2008) i.e. the MML extract was α-arbutin, while the arbutin standard was β-arbutin.
Figure 13. A mass spectrum of mature Mao leaf (MML) extract
Figure 14. A mass spectrum of the arbutin standard
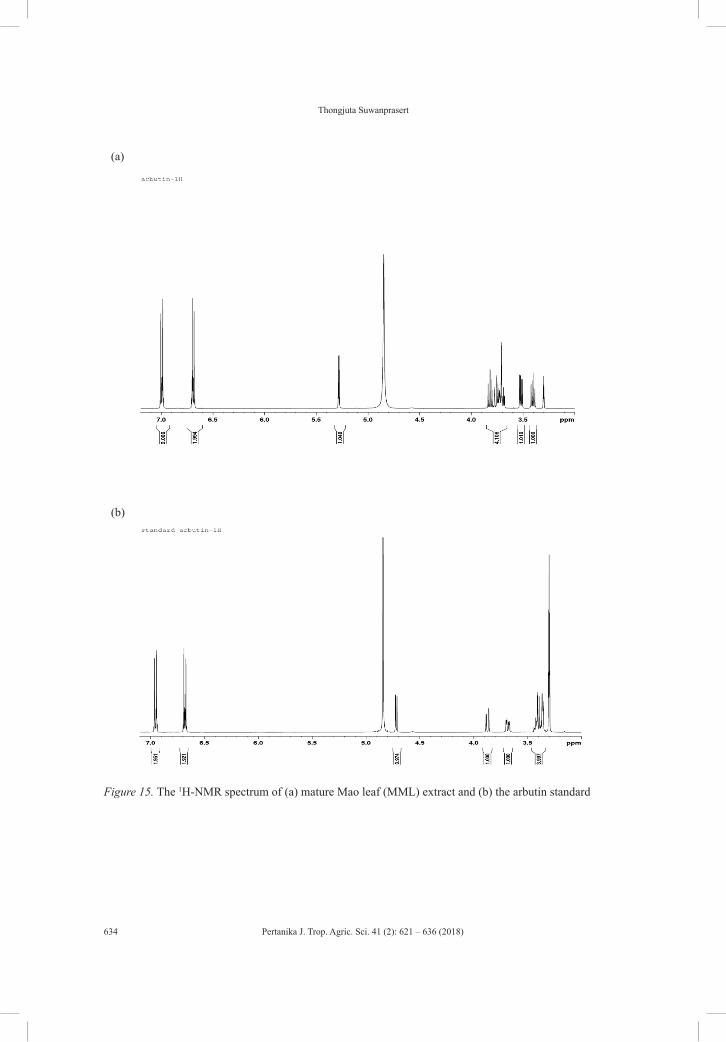
Pertanika J. Trop. Agric. Sci. 41 (2): 621 – 636 (2018)
Thongjuta Suwanprasert
634
(a)
(b)
Figure 15. The 1H-NMR spectrum of (a) mature Mao leaf (MML) extract and (b) the arbutin standard
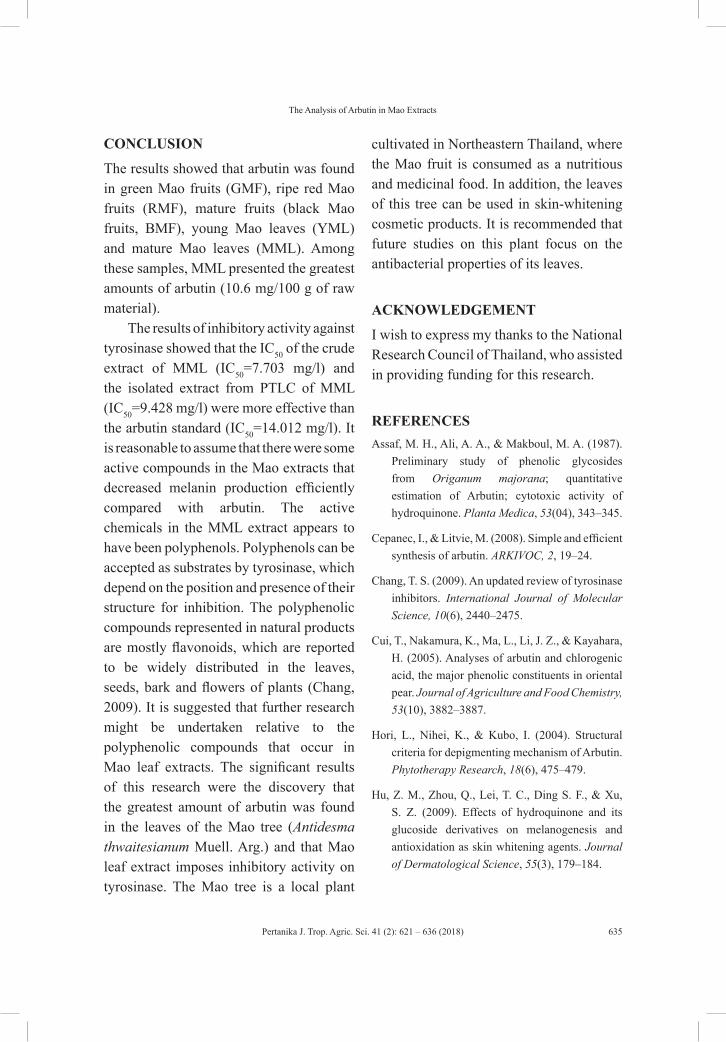
Pertanika J. Trop. Agric. Sci. 41 (2): 621 – 636 (2018)
The Analysis of Arbutin in Mao Extracts
635
CONCLUSION
The results showed that arbutin was found in green Mao fruits (GMF), ripe red Mao fruits (RMF), mature fruits (black Mao fruits, BMF), young Mao leaves (YML) and mature Mao leaves (MML). Among these samples, MML presented the greatest amounts of arbutin (10.6 mg/100 g of raw material).
The results of inhibitory activity against tyrosinase showed that the IC50 of the crude extract of MML (IC50=7.703 mg/l) and the isolated extract from PTLC of MML (IC50=9.428 mg/l) were more effective than the arbutin standard (IC50=14.012 mg/l). It is reasonable to assume that there were some active compounds in the Mao extracts that decreased melanin production efficiently compared with arbutin. The active chemicals in the MML extract appears to have been polyphenols. Polyphenols can be accepted as substrates by tyrosinase, which depend on the position and presence of their structure for inhibition. The polyphenolic compounds represented in natural products are mostly flavonoids, which are reported to be widely distributed in the leaves, seeds, bark and flowers of plants (Chang, 2009). It is suggested that further research might be undertaken relative to the polyphenolic compounds that occur in Mao leaf extracts. The significant results of this research were the discovery that the greatest amount of arbutin was found in the leaves of the Mao tree (Antidesma thwaitesianum Muell. Arg.) and that Mao leaf extract imposes inhibitory activity on tyrosinase. The Mao tree is a local plant
cultivated in Northeastern Thailand, where the Mao fruit is consumed as a nutritious and medicinal food. In addition, the leaves of this tree can be used in skin-whitening cosmetic products. It is recommended that future studies on this plant focus on the antibacterial properties of its leaves.
ACKNOWLEDGEMENT
I wish to express my thanks to the National Research Council of Thailand, who assisted in providing funding for this research.
REFERENCESAssaf, M. H., Ali, A. A., & Makboul, M. A. (1987).
Preliminary study of phenolic glycosides from Origanum majorana; quantitative estimation of Arbutin; cytotoxic activity of hydroquinone. Planta Medica, 53(04), 343–345.
Cepanec, I., & Litvie, M. (2008). Simple and efficient synthesis of arbutin. ARKIVOC, 2, 19–24.
Chang, T. S. (2009). An updated review of tyrosinase inhibitors. International Journal of Molecular Science, 10(6), 2440–2475.
Cui, T., Nakamura, K., Ma, L., Li, J. Z., & Kayahara, H. (2005). Analyses of arbutin and chlorogenic acid, the major phenolic constituents in oriental pear. Journal of Agriculture and Food Chemistry, 53(10), 3882–3887.
Hori, L., Nihei, K., & Kubo, I. (2004). Structural criteria for depigmenting mechanism of Arbutin. Phytotherapy Research, 18(6), 475–479.
Hu, Z. M., Zhou, Q., Lei, T. C., Ding S. F., & Xu, S. Z. (2009). Effects of hydroquinone and its glucoside derivatives on melanogenesis and antioxidation as skin whitening agents. Journal of Dermatological Science, 55(3), 179–184.
Pertanika J. Trop. Agric. Sci. 41 (2): 621 – 636 (2018)
Thongjuta Suwanprasert
636
Ito, S. (2003). A chemist’s view of melanogenesis. Pigment Cell and Melanoma Research, 16(3), 230–236.
Ito, S., & Wakamtsu, K. (2015). A convenient screening method to differentiate phenolic skin whitening tyrosinase inhibitors from leukoderma-inducing phenols. Journal of Dermatological Science, 80(1), 8–24.
Jeon, S. H., Kim, K. H., Koh, J. U., & Kong, K. H. (2005). Inhibitory effects on L-dopa oxidation of tyrosinase by skin-whitening agents. Bulletin of the Korean Chemical Society, 26(7), 1135–1137.
Jorjong, S., Butkhup, L., & Samappito, S. (2015). Phytochemicals and antioxidant capacities of Mao-Luang (Antidesma bunius L.) cultivars from Northeastern Thailand. Food Chemistry, 181, 248–255.
Kenndler, E., Schwer, C., Fritsche, B., & Pohm, M. (1990). Determination of arbutin in uvae-ursi folium (bearberry leaves) by capillary zone electrophoresis. Journal of Chromatography A, 514, 383–388.
Kusz, J., & Switlicka, A. (2010). Arbutin: Isolation, X-ray structure and computational studies. Journal of Molecular Structure, 980(1), 13–17.
Lin, Y. H., Yang, Y. H., & Wu, S. M. (2007). Experimental design and capillary electrophoresis for simultaneous analysis of arbutin, kojic acid and hydroquinone in cosmetics. Journal of Pharmaceutical and Biomedical Analysis, 44(1), 279–282.
Liu, C., Zhang, P., Liu, L., Xu, T., Tan, T., Wang, F., & Deng, L. (2013). Isolation of α-arbutin from Xanthomonas CGMCC 1243 fermentation broth by macroporous resin adsorption chromatography. Journal of Chromatography B, 925, 104–109.
Lukas, B., Schmiderer, C., Mitteregger, U., & Novak, J. (2010). Arbutin in marjoram and oregano. Food Chemistry, 121(1), 185–190.
Morton, J. (1987). Bignay. In Fruits of warm climates. Miami: Florida Flair Books.
Nihei, K., & Kubo, I. (2002). Identification of oxidation product of arbutin in mushroom tyrosinase assay system. Bioorganic and Medicinal Chemistry Letters, 13(14), 2409–2412.
Nuengchamnong, N., & Ingkaninan, K. (2010). On-line HPLC-MS-DPPH assay for the analysis of phenolic antioxidant compounds in fruit wine: Antidesma thwaitesianum Muell. Food Chemistry, 118(1), 147–152.
Nycz, J. E., Malecki, G., Morag, M., Nowak, G., Ponikiewski, L., Puangpronpitag, D., … & Surh, Y. J. (2011). Molecular mechanism underlying anti-apoptotic and anti-inflammatory effects of Mamao (Antidesma thwaitesianum Müll. Arg.) polyphenolics in human breast epithelial cells. Food Chemistry, 127(4), 1450–1458.
Rychlinska, I., & Nowak, S. (2012). Quantitative determination of arbutin and hydroquinone in different plant materials by HPLC. Notulae Botanicae Horti Agrobotanici Cluj-Napoca, 40(2), 109–113.
Suau, R., Cuevas, A., Valpuesta, V., & Reid, M. S. (1991). Arbutin and sucrose in the leaves of the resurrection plant Myrothamnus flabellifolia. Phytochemistry, 30(8), 2555–2556.
Tokiwa, Y., Kitagwa, M., Raku, T., Yanagitani, S., & Yoshino, K. (2007). Enzymatic synthesis of Arbutin undecylenic acid ester and its inhibitory effect on melanin synthesis. Bioorganic and Medicinal Chemistry Letters, 17(11), 3105–3108.
Wu, X., Yin, S., Zhong, J., Ding, W., Wan, J., & Xie, Z. (2012). Mushroom Tyrosinase inhibitors from Aloe barbadensis Miller. Fitoterapia, 83(8), 1706– 1711.

Pertanika J. Trop. Agric. Sci. 41 (2): 637 – 654 (2018)
ISSN: 1511-3701 © Universiti Putra Malaysia Press
TROPICAL AGRICULTURAL SCIENCEJournal homepage: http://www.pertanika.upm.edu.my/
ARTICLE INFOArticle history:Received: 22 June 2016Accepted: 26 January 2018
E-mail addresses:[email protected] (Pinta Omas Pasaribu)[email protected] (Triadiati)[email protected] (Iswandi Anas)* Corresponding author
Rice Ratooning Using the Salibu System and the System of Rice Intensification Method Influenced by Physiological Traits
Pinta Omas Pasaribu1, Triadiati2* and Iswandi Anas3
1Study Program of Plant Biology, Graduate School, Bogor Agricultural University, Darmaga Campus, Bogor 16680, Indonesia2Department of Biology, Faculty of Mathematics and Natural Sciences, Bogor Agricultural University, Darmaga Campus, Bogor 16680, Indonesia3Department of Soil and Land Resources, Bogor Agricultural University,Darmafa Campus, Bogor 16680, Indonesia
ABSTRACT
Rice productivity can be increased by improving land productivity with a ratoon crop of salibu system cultivated with the System of Rice Intensification (SRI) method. Rice cultivation using SRI is a method to increase the rice growth and development by managing the plants, soil, water and nutrients. Ratooning is the ability of the rice plant to regenerate new tillers after harvest. The beneficial aspects of ratoon are the increase of rice productivity and efficiency in terms of time, labour and cost. The local people of West Sumatra commonly re-cut the rice stalk at seven days after the main crop harvest. This method is called the salibu system, which is a modification of a ratooned crop that produces a higher yield than the non-salibu system (no cutting after first harvesting). The aims of this study are to analyse the physiological characteristics of ratooned rice and its agronomic performance under the salibu system using the SRI method. The Randomised Complete Block Design (RCBD) was used for the main crop to compare SRI and conventional methods, while RCBD with the factors of cutting technique and cultivation methods was used for the ratooned crop. The cultivation methods were SRI and the conventional methods, while the cutting technique was the salibu vs the usual (non-salibu)
systems. The results indicate that the main crop under SRI was found to have a greater photosynthetic rate and higher vegetative and reproductive parameters than plants cultivated under the conventional method. The above trends were also observed in the ratooned crop for SRI using the salibu sytem compared with other combinations of
Pertanika J. Trop. Agric. Sci. 41 (2): 637 – 654 (2018)
Pinta Omas Pasaribu, Triadiati and Iswandi Anas
638
cutting and cultivation methods. There was no interaction between cutting technique and cultivation method in the ratooned crop. The main crop yield using SRI was 24% higher than using the conventional method. Subsequently, the ratoon-crop yield under the salibu system using SRI was approximately 50% of the main crop. The ability of rice plants to produce a ratoon crop was highly influenced by their carbohydrate content and the phytohormones that remain in the intercalary meristem tissues of stubble after harvest. Furtheremore, better yield of the ratooned crop is possible by increasing fertilisers (especially nitrogen), as could be done in future research into ways of improving this innovation.
Keywords: Carbohydrates, intercalary meristem, photosynthetic, phytohormones
INTRODUCTION
An innovative cultivation technology for irrigated rice, namely, the System of Rice Intensification (SRI) developed in Madagascar, has been found to be capable of substantially improving rice productivity (Kabir & Uphoff, 2007; Sato & Uphoff, 2007; Thakur et al., 2010; Wu et al., 2015). However, SRI is still a developing innovation whose concepts and practices have been proven in increasing rice output and farmers’ income but decreasing input such as seeds, fertilisers, pesticides and water. The increase of yield is achieved not by introducing new varieties or increasing external input, but rather by changing the management of plants, soil, water and nutrients (Ahmed et al., 2015; Barison &
Uphoff, 2011). SRI proposes the use of young sedlings (8-12 days), planting of single seedlings (just one seedling per hill), wider spacing (usually 25 cm x 25 cm), maintaining moist soil condition (without flooding), use of a mechanical weeder that also aerates the soil, thus providing optimal growth conditions for the plants and enhanced soil organic matter. These practices aim to obtain better performance in terms of yield and resource productivity (Stoop et al., 2002). In contrast to SRI practices, the conventional method generally involves using considerably older seedlings (25 days old or more), planting three to five seedlings per hill, using closer spacing (20 cm × 20 cm or less), maintaining soil condition i.e. mostly flooded and fertilisation mostly using inorganic fertiliaers (Kediyal & Dimri, 2009). The effectiveness of the SRI method has been demonstrated in more than 50 countries around the world, including major rice-producing countries such as India, China, Vietnam and the Philippines (Katambara et al., 2013). The suitability of using SRI in Indonesia has been reported in various studies, showing SRI practices increasing rice yield by 24-78% (Bakrie et al., 2010; Hidayati et al., 2016; Hutabarat, 2011; Sato & Uphoff, 2007).
In addition to using the SRI method, growing a second rice crop from harvested plants (a practice known as ratooning) is the newest practical way to increase total rice production per unit area. A ratoon is a new stalk with regrowth of new tillers after the main crop is harvested using a sickle knife.
Pertanika J. Trop. Agric. Sci. 41 (2): 637 – 654 (2018)
Rice Ratooning under the Salibu System with SRI Method
639
Ratoons can increase rice productivity by the second cropping season at a low additional cost. Ratooning is a practical method to increase the additional number of rice panicles per unit of area and of time, provided that the plants can produce new tillers and branches at the base and nodes of the harvested plant of the main crop (Akhgari & Niyaki, 2014; Harrell et al., 2009; Nair & Rosamma, 2002; Oad et al., 2002a) .
Ratoon rice has a shorter production period than that of the main crop (Akhgari & Niyaki, 2014; Chauhan et al., 1985; Faruq et al., 2014; Oad et al., 2002b). Production costs are lower due to the minimal expenditure needed for land preparation, transplantation, and crop maintenance (Faruq et al., 2014). Although a ratooned rice crop can be harvested in 45 days after harvesting the main crop, its production is generally and relatively low compared with its main crop using the conventional method i.e. one ton per ha (Suwandi et al., 2012). In a field trial in Bangladesh, Begum et al. (2002) showed that the highest grain yield (1.56 t ha-1) resulting from a ratoon crop was 25.2% of the main crop. The yield and most of the other plant attributes were lower and its field duration was also shorter than that of the main crop.
Uneven growth and maturation of plants, various diseases and insect attack are the main causes for production of ratooned rice than the main crop (Chauhan et al., 1985; Oad et al., 2002a, 2002b). However, the production of ratooned rice can be improved with harvesting
technology. Erdiman (2013) reported that local people in West Sumatra, Indonesia, commonly re-cut the rice stalk at seven days after main crop harvesting. This method is called the salibu system, which is a modification of the ratoon crop, and it eventually allows higher production than the usual (non-salibu) methods (no cutting of the rice stalk after main-crop harvesting). Getting a second rice crop from the same planting benefits farmers due to the shorter cycle for the second crop and cheaper production costs as a result of no tilling and raising seedlings (Faruq et al., 2014; Nair & Rosamma, 2002; Sanni et al., 2009; Tari, 2011). A second rice crop under the salibu system has higher production than that using standard methods; however, the reasons for this, traceable to particular physiological characteristics of ratooned rice plants using the salibu system, are still not widely known. Therefore, this study was carried out with the aim of analysing and evaluating the physiological characteristics of ratooned rice under the salibu system when using the SRI method, especially under Bogor’s rice-growing conditions.
MATERIALS AND METHOD
Research Site
This study was conducted from June 2014 to February 2015 in Sindang Barang Jero, West Bogor District, Bogor. The materials used in this study were Ciherang rice variety and inorganic fertilisers i.e. urea (45.7% N), SP-36 (36.3% P2O5), KCl (61.1% K2O) and 2.5 t compost per ha.
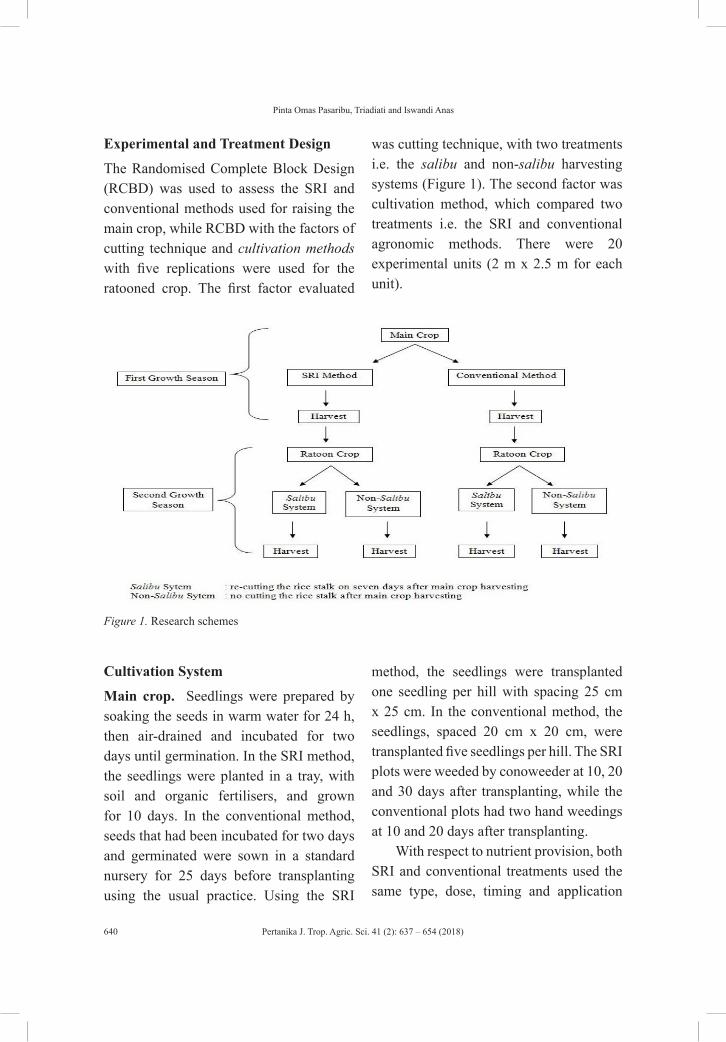
Pertanika J. Trop. Agric. Sci. 41 (2): 637 – 654 (2018)
Pinta Omas Pasaribu, Triadiati and Iswandi Anas
640
Experimental and Treatment Design
The Randomised Complete Block Design (RCBD) was used to assess the SRI and conventional methods used for raising the main crop, while RCBD with the factors of cutting technique and cultivation methods with five replications were used for the ratooned crop. The first factor evaluated
was cutting technique, with two treatments i.e. the salibu and non-salibu harvesting systems (Figure 1). The second factor was cultivation method, which compared two treatments i.e. the SRI and conventional agronomic methods. There were 20 experimental units (2 m x 2.5 m for each unit).
Figure 1. Research schemes
Cultivation System
Main crop. Seedlings were prepared by soaking the seeds in warm water for 24 h, then air-drained and incubated for two days until germination. In the SRI method, the seedlings were planted in a tray, with soil and organic fertilisers, and grown for 10 days. In the conventional method, seeds that had been incubated for two days and germinated were sown in a standard nursery for 25 days before transplanting using the usual practice. Using the SRI
method, the seedlings were transplanted one seedling per hill with spacing 25 cm x 25 cm. In the conventional method, the seedlings, spaced 20 cm x 20 cm, were transplanted five seedlings per hill. The SRI plots were weeded by conoweeder at 10, 20 and 30 days after transplanting, while the conventional plots had two hand weedings at 10 and 20 days after transplanting.
With respect to nutrient provision, both SRI and conventional treatments used the same type, dose, timing and application
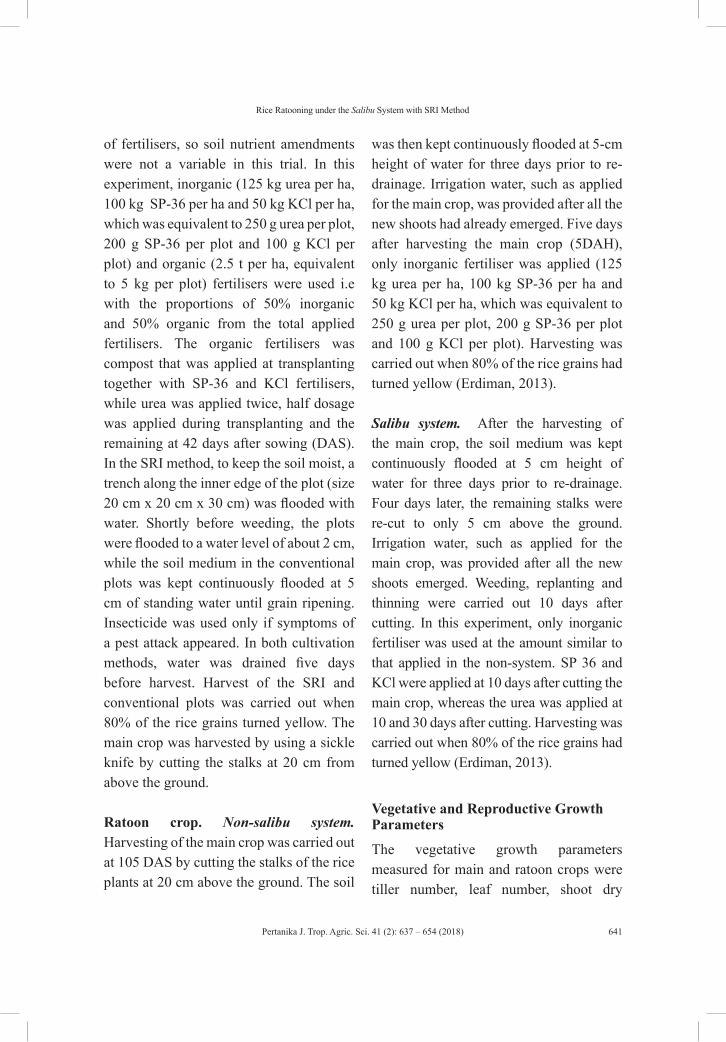
Pertanika J. Trop. Agric. Sci. 41 (2): 637 – 654 (2018)
Rice Ratooning under the Salibu System with SRI Method
641
of fertilisers, so soil nutrient amendments were not a variable in this trial. In this experiment, inorganic (125 kg urea per ha, 100 kg SP-36 per ha and 50 kg KCl per ha, which was equivalent to 250 g urea per plot, 200 g SP-36 per plot and 100 g KCl per plot) and organic (2.5 t per ha, equivalent to 5 kg per plot) fertilisers were used i.e with the proportions of 50% inorganic and 50% organic from the total applied fertilisers. The organic fertilisers was compost that was applied at transplanting together with SP-36 and KCl fertilisers, while urea was applied twice, half dosage was applied during transplanting and the remaining at 42 days after sowing (DAS). In the SRI method, to keep the soil moist, a trench along the inner edge of the plot (size 20 cm x 20 cm x 30 cm) was flooded with water. Shortly before weeding, the plots were flooded to a water level of about 2 cm, while the soil medium in the conventional plots was kept continuously flooded at 5 cm of standing water until grain ripening. Insecticide was used only if symptoms of a pest attack appeared. In both cultivation methods, water was drained five days before harvest. Harvest of the SRI and conventional plots was carried out when 80% of the rice grains turned yellow. The main crop was harvested by using a sickle knife by cutting the stalks at 20 cm from above the ground.
Ratoon crop. Non-salibu system. Harvesting of the main crop was carried out at 105 DAS by cutting the stalks of the rice plants at 20 cm above the ground. The soil
was then kept continuously flooded at 5-cm height of water for three days prior to re-drainage. Irrigation water, such as applied for the main crop, was provided after all the new shoots had already emerged. Five days after harvesting the main crop (5DAH), only inorganic fertiliser was applied (125 kg urea per ha, 100 kg SP-36 per ha and 50 kg KCl per ha, which was equivalent to 250 g urea per plot, 200 g SP-36 per plot and 100 g KCl per plot). Harvesting was carried out when 80% of the rice grains had turned yellow (Erdiman, 2013).
Salibu system. After the harvesting of the main crop, the soil medium was kept continuously flooded at 5 cm height of water for three days prior to re-drainage. Four days later, the remaining stalks were re-cut to only 5 cm above the ground. Irrigation water, such as applied for the main crop, was provided after all the new shoots emerged. Weeding, replanting and thinning were carried out 10 days after cutting. In this experiment, only inorganic fertiliser was used at the amount similar to that applied in the non-system. SP 36 and KCl were applied at 10 days after cutting the main crop, whereas the urea was applied at 10 and 30 days after cutting. Harvesting was carried out when 80% of the rice grains had turned yellow (Erdiman, 2013).
Vegetative and Reproductive Growth Parameters
The vegetative growth parameters measured for main and ratoon crops were tiller number, leaf number, shoot dry
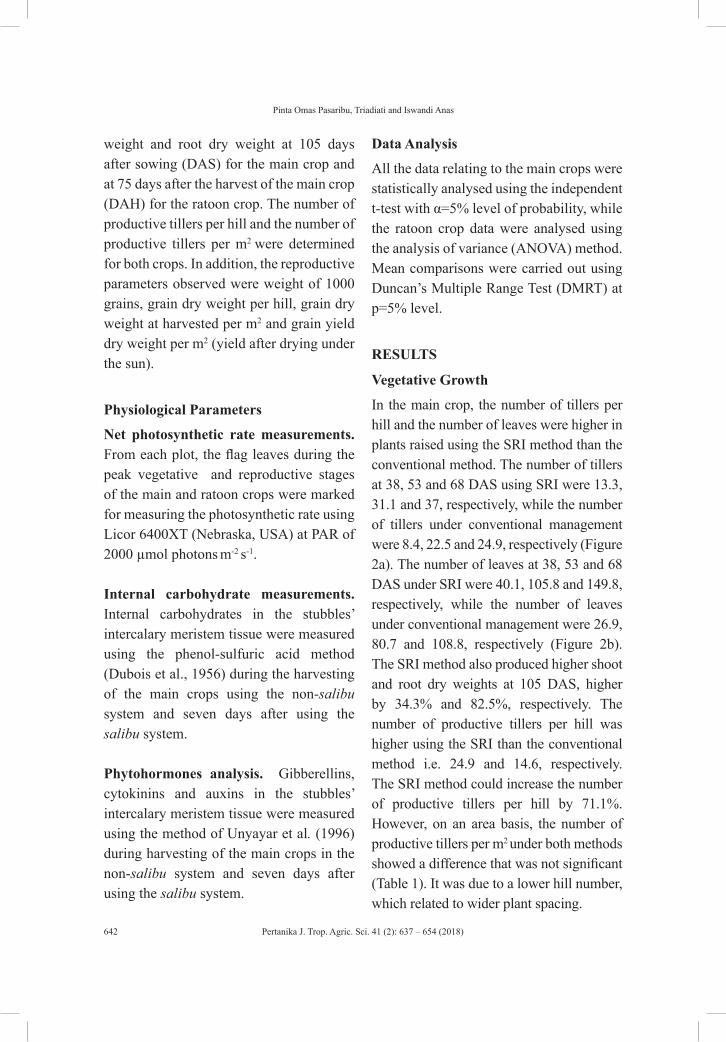
Pertanika J. Trop. Agric. Sci. 41 (2): 637 – 654 (2018)
Pinta Omas Pasaribu, Triadiati and Iswandi Anas
642
weight and root dry weight at 105 days after sowing (DAS) for the main crop and at 75 days after the harvest of the main crop (DAH) for the ratoon crop. The number of productive tillers per hill and the number of productive tillers per m2 were determined for both crops. In addition, the reproductive parameters observed were weight of 1000 grains, grain dry weight per hill, grain dry weight at harvested per m2 and grain yield dry weight per m2
(yield after drying under the sun).
Physiological Parameters
Net photosynthetic rate measurements. From each plot, the flag leaves during the peak vegetative and reproductive stages of the main and ratoon crops were marked for measuring the photosynthetic rate using Licor 6400XT (Nebraska, USA) at PAR of 2000 µmol photons m
-2 s-1.
Internal carbohydrate measurements. Internal carbohydrates in the stubbles’ intercalary meristem tissue were measured using the phenol-sulfuric acid method (Dubois et al., 1956) during the harvesting of the main crops using the non-salibu system and seven days after using the salibu system.
Phytohormones analysis. Gibberellins, cytokinins and auxins in the stubbles’ intercalary meristem tissue were measured using the method of Unyayar et al. (1996) during harvesting of the main crops in the non-salibu system and seven days after using the salibu system.
Data Analysis
All the data relating to the main crops were statistically analysed using the independent t-test with α=5% level of probability, while the ratoon crop data were analysed using the analysis of variance (ANOVA) method. Mean comparisons were carried out using Duncan’s Multiple Range Test (DMRT) at p=5% level.
RESULTS
Vegetative Growth
In the main crop, the number of tillers per hill and the number of leaves were higher in plants raised using the SRI method than the conventional method. The number of tillers at 38, 53 and 68 DAS using SRI were 13.3, 31.1 and 37, respectively, while the number of tillers under conventional management were 8.4, 22.5 and 24.9, respectively (Figure 2a). The number of leaves at 38, 53 and 68 DAS under SRI were 40.1, 105.8 and 149.8, respectively, while the number of leaves under conventional management were 26.9, 80.7 and 108.8, respectively (Figure 2b). The SRI method also produced higher shoot and root dry weights at 105 DAS, higher by 34.3% and 82.5%, respectively. The number of productive tillers per hill was higher using the SRI than the conventional method i.e. 24.9 and 14.6, respectively. The SRI method could increase the number of productive tillers per hill by 71.1%. However, on an area basis, the number of productive tillers per m2 under both methods showed a difference that was not significant (Table 1). It was due to a lower hill number, which related to wider plant spacing.
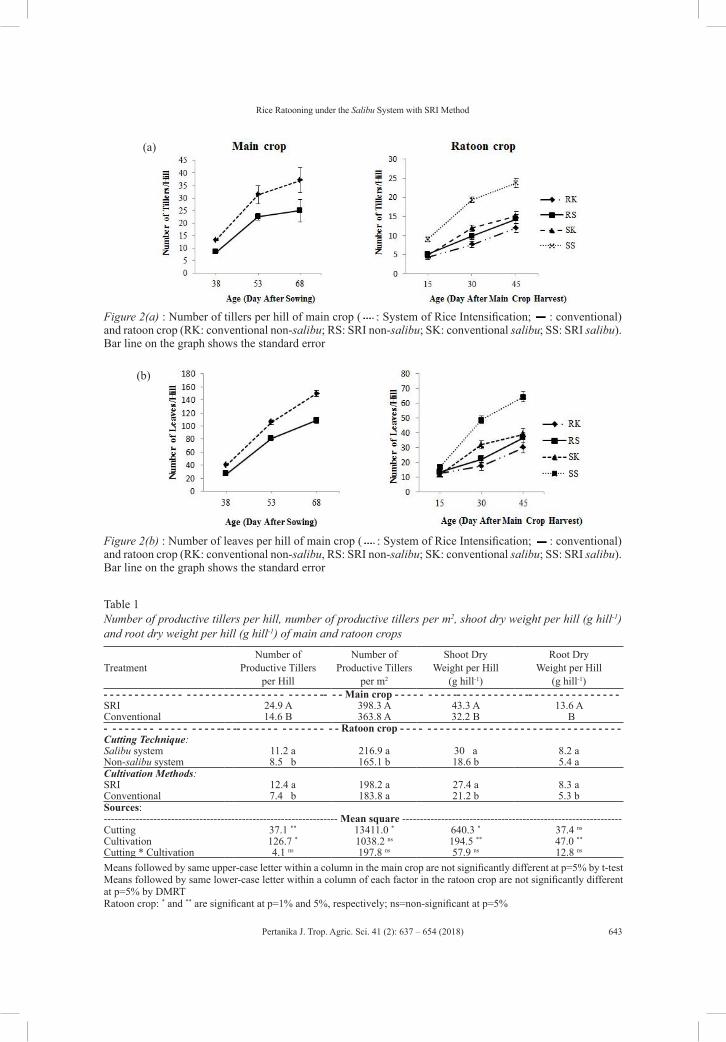
Pertanika J. Trop. Agric. Sci. 41 (2): 637 – 654 (2018)
Rice Ratooning under the Salibu System with SRI Method
643
(a)
Figure 2(a) : Number of tillers per hill of main crop ( : System of Rice Intensification; : conventional) and ratoon crop (RK: conventional non-salibu; RS: SRI non-salibu; SK: conventional ; SS: SRI salibu). Bar line on the graph shows the standard error
(b)
Figure 2(b) : Number of leaves per hill of main crop ( : System of Rice Intensification; : conventional) and ratoon crop (RK: conventional non-salibu, RS: SRI non-salibu; SK: conventional salibu; SS: SRI salibu). Bar line on the graph shows the standard error
Table 1Number of productive tillers per hill, number of productive tillers per m2, shoot dry weight per hill (g hill-1) and root dry weight per hill (g hill-1) of main and ratoon crops
TreatmentNumber of
Productive Tillers per Hill
Number of Productive Tillers
per m2
Shoot Dry Weight per Hill
(g hill-1)
Root Dry Weight per Hill
(g hill-1)- - - - - - - - - - - - - - - - - - - - - - - - - - - - - - - - - - -- - - Main crop - - - - - - - - - -- - - - - - - - - - - -- - - - - - - - - - - - - - - SRI 24.9 A 398.3 A 43.3 A 13.6 AConventional 14.6 B 363.8 A 32.2 B B- - - - - - - - - - - - - - - - - -- - -- - - - - - - - - - - - - - - - Ratoon crop - - - - - - - - - - - - - - - - - - - - - - - -- - - - - - - - - - - - Cutting Technique:Salibu system 11.2 a 216.9 a 30 a 8.2 aNon-salibu system 8.5 b 165.1 b 18.6 b 5.4 aCultivation Methods:SRI 12.4 a 198.2 a 27.4 a 8.3 aConventional 7.4 b 183.8 a 21.2 b 5.3 bSources:------------------------------------------------------------------ Mean square --------------------------------------------------------------Cutting 37.1 ** 13411.0 * 640.3 * 37.4 ns
Cultivation 126.7 * 1038.2 ns 194.5 ** 47.0 **
Cutting * Cultivation 4.1 ns 197.8 ns 57.9 ns 12.8 ns
Means followed by same upper-case letter within a column in the main crop are not significantly different at p=5% by t-testMeans followed by same lower-case letter within a column of each factor in the ratoon crop are not significantly different at p=5% by DMRTRatoon crop: * and ** are significant at p=1% and 5%, respectively; ns=non-significant at p=5%
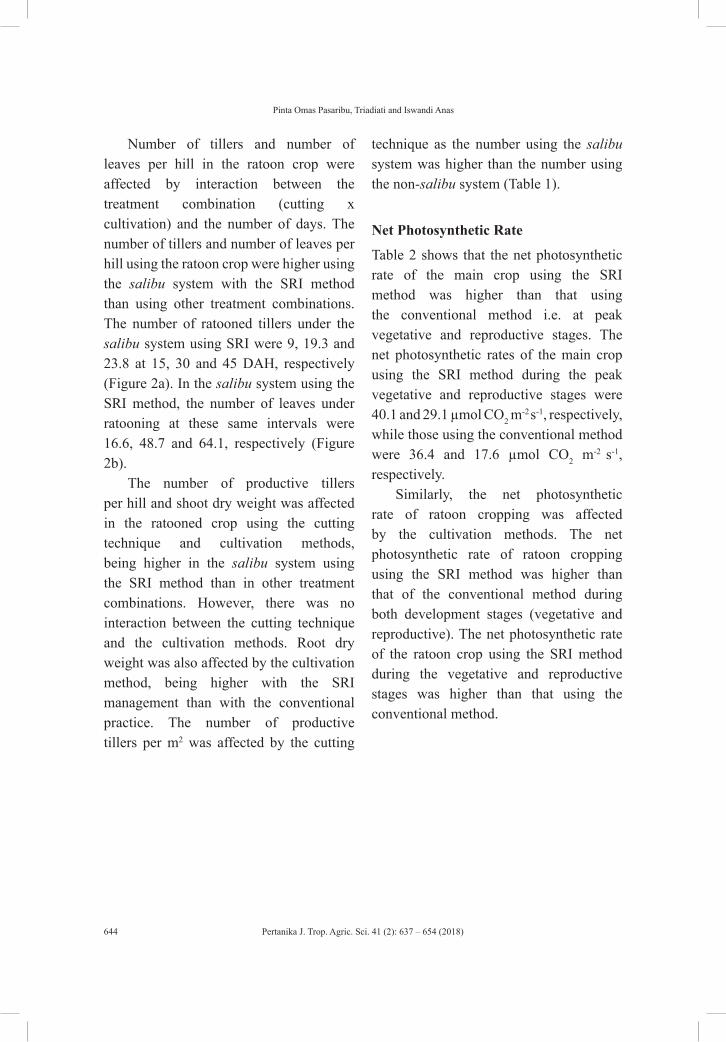
Pertanika J. Trop. Agric. Sci. 41 (2): 637 – 654 (2018)
Pinta Omas Pasaribu, Triadiati and Iswandi Anas
644
Number of tillers and number of leaves per hill in the ratoon crop were affected by interaction between the treatment combination (cutting x cultivation) and the number of days. The number of tillers and number of leaves per hill using the ratoon crop were higher using the salibu system with the SRI method than using other treatment combinations. The number of ratooned tillers under the salibu system using SRI were 9, 19.3 and 23.8 at 15, 30 and 45 DAH, respectively (Figure 2a). In the salibu system using the SRI method, the number of leaves under ratooning at these same intervals were 16.6, 48.7 and 64.1, respectively (Figure 2b).
The number of productive tillers per hill and shoot dry weight was affected in the ratooned crop using the cutting technique and cultivation methods, being higher in the salibu system using the SRI method than in other treatment combinations. However, there was no interaction between the cutting technique and the cultivation methods. Root dry weight was also affected by the cultivation method, being higher with the SRI management than with the conventional practice. The number of productive tillers per m2 was affected by the cutting
technique as the number using the salibu system was higher than the number using the non-salibu system (Table 1).
Net Photosynthetic Rate
Table 2 shows that the net photosynthetic rate of the main crop using the SRI method was higher than that using the conventional method i.e. at peak vegetative and reproductive stages. The net photosynthetic rates of the main crop using the SRI method during the peak vegetative and reproductive stages were 40.1 and 29.1 µmol CO2 m
-2 s-1, respectively, while those using the conventional method were 36.4 and 17.6 µmol CO2 m-2 s-1, respectively.
Similarly, the net photosynthetic rate of ratoon cropping was affected by the cultivation methods. The net photosynthetic rate of ratoon cropping using the SRI method was higher than that of the conventional method during both development stages (vegetative and reproductive). The net photosynthetic rate of the ratoon crop using the SRI method during the vegetative and reproductive stages was higher than that using the conventional method.
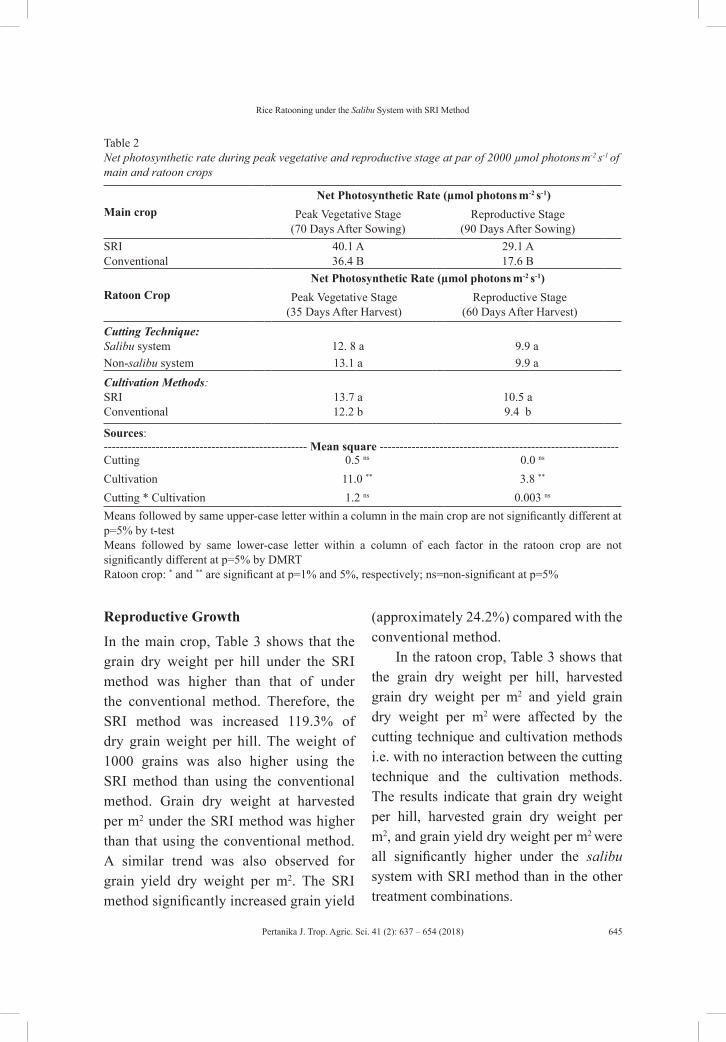
Pertanika J. Trop. Agric. Sci. 41 (2): 637 – 654 (2018)
Rice Ratooning under the Salibu System with SRI Method
645
Table 2Net photosynthetic rate during peak vegetative and reproductive stage at par of 2000 µmol photons m
-2 s-1 of main and ratoon crops
Main cropNet Photosynthetic Rate (µmol photons m
-2 s-1)Peak Vegetative Stage
(70 Days After Sowing)Reproductive Stage
(90 Days After Sowing)SRI 40.1 A 29.1 AConventional 36.4 B 17.6 B
Ratoon CropNet Photosynthetic Rate (µmol photons m
-2 s-1)Peak Vegetative Stage
(35 Days After Harvest)Reproductive Stage
(60 Days After Harvest)Cutting Technique:Salibu system 12. 8 a 9.9 aNon-salibu system 13.1 a 9.9 aCultivation Methods:SRIConventional
13.7 a12.2 b
10.5 a9.4 b
Sources:--------------------------------------------------- Mean square ------------------------------------------------------------Cutting 0.5 ns 0.0 ns
Cultivation 11.0 ** 3.8 **
Cutting * Cultivation 1.2 ns 0.003 ns
Means followed by same upper-case letter within a column in the main crop are not significantly different at p=5% by t-testMeans followed by same lower-case letter within a column of each factor in the ratoon crop are not significantly different at p=5% by DMRTRatoon crop: * and ** are significant at p=1% and 5%, respectively; ns=non-significant at p=5%
Reproductive Growth
In the main crop, Table 3 shows that the grain dry weight per hill under the SRI method was higher than that of under the conventional method. Therefore, the SRI method was increased 119.3% of dry grain weight per hill. The weight of 1000 grains was also higher using the SRI method than using the conventional method. Grain dry weight at harvested per m2 under the SRI method was higher than that using the conventional method. A similar trend was also observed for grain yield dry weight per m2. The SRI method significantly increased grain yield
(approximately 24.2%) compared with the conventional method.
In the ratoon crop, Table 3 shows that the grain dry weight per hill, harvested grain dry weight per m2 and yield grain dry weight per m2 were affected by the cutting technique and cultivation methods i.e. with no interaction between the cutting technique and the cultivation methods. The results indicate that grain dry weight per hill, harvested grain dry weight per m2, and grain yield dry weight per m2 were all significantly higher under the salibu system with SRI method than in the other treatment combinations.
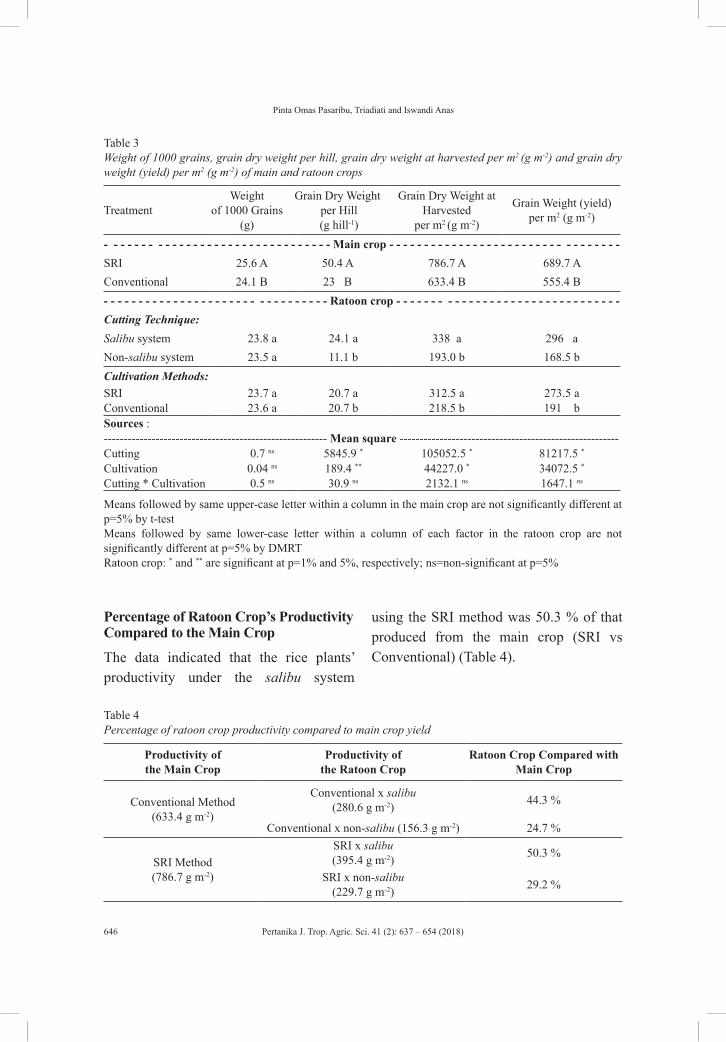
Pertanika J. Trop. Agric. Sci. 41 (2): 637 – 654 (2018)
Pinta Omas Pasaribu, Triadiati and Iswandi Anas
646
Table 3Weight of 1000 grains, grain dry weight per hill, grain dry weight at harvested per m2 (g m-2) and grain dry weight (yield) per m2 (g m-2) of main and ratoon crops
TreatmentWeight
of 1000 Grains (g)
Grain Dry Weight per Hill (g hill-1)
Grain Dry Weight at Harvested
per m2 (g m-2)
Grain Weight (yield) per m2 (g m-2)
- - - - - - - - - - - - - - - - - - - - - - - - - - - - - - - - Main crop - - - - - - - - - - - - - - - - - - - - - - - - - - - - - - - - - SRI 25.6 A 50.4 A 786.7 A 689.7 AConventional 24.1 B 23 B 633.4 B 555.4 B- - - - - - - - - - - - - - - - - - - - - - - - - - - - - - - - Ratoon crop - - - - - - - - - - - - - - - - - - - - - - - - - - - - - - - -Cutting Technique:Salibu system 23.8 a 24.1 a 338 a 296 aNon-salibu system 23.5 a 11.1 b 193.0 b 168.5 bCultivation Methods:SRI 23.7 a 20.7 a 312.5 a 273.5 aConventional 23.6 a 20.7 b 218.5 b 191 bSources :-------------------------------------------------------- Mean square -------------------------------------------------------Cutting 0.7 ns 5845.9 * 105052.5 * 81217.5 *
Cultivation 0.04 ns 189.4 ** 44227.0 * 34072.5 *
Cutting * Cultivation 0.5 ns 30.9 ns 2132.1 ns 1647.1 ns
Means followed by same upper-case letter within a column in the main crop are not significantly different at p=5% by t-testMeans followed by same lower-case letter within a column of each factor in the ratoon crop are not significantly different at p=5% by DMRTRatoon crop: * and ** are significant at p=1% and 5%, respectively; ns=non-significant at p=5%
Percentage of Ratoon Crop’s Productivity Compared to the Main Crop
The data indicated that the rice plants’ productivity under the salibu system
using the SRI method was 50.3 % of that produced from the main crop (SRI vs Conventional) (Table 4).
Table 4Percentage of ratoon crop productivity compared to main crop yield
Productivity ofthe Main Crop
Productivity of the Ratoon Crop
Ratoon Crop Compared with Main Crop
Conventional Method(633.4 g m-2)
Conventional x salibu(280.6 g m-2) 44.3 %
Conventional x non-salibu (156.3 g m-2) 24.7 %
SRI Method(786.7 g m-2)
SRI x salibu(395.4 g m-2) 50.3 %
SRI x non-salibu(229.7 g m-2) 29.2 %
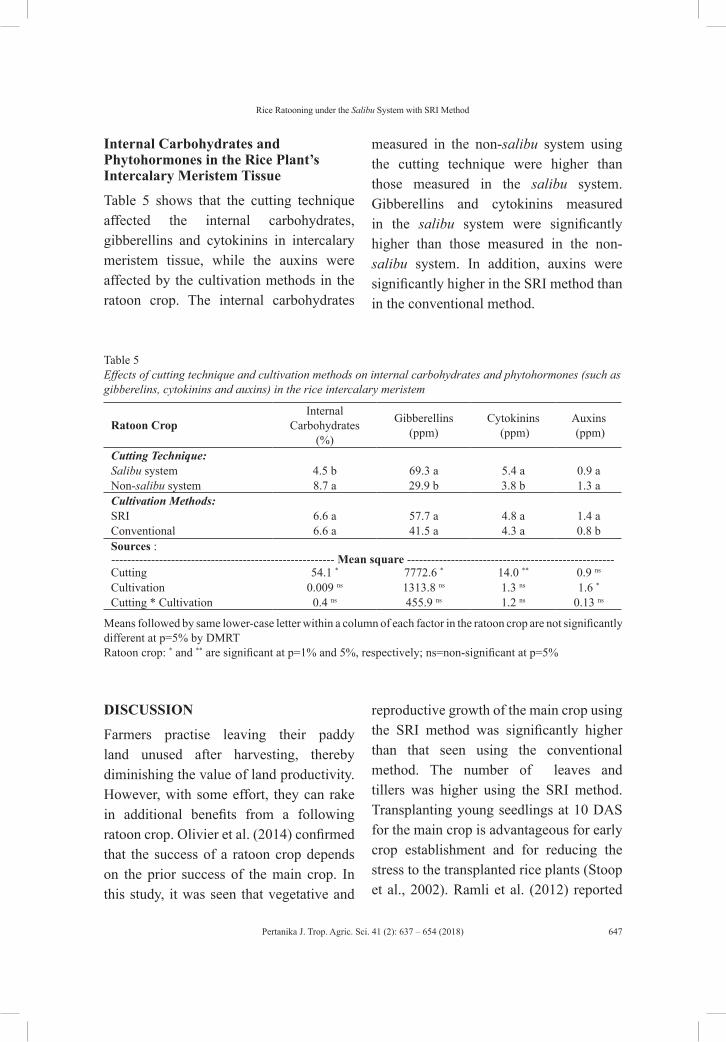
Pertanika J. Trop. Agric. Sci. 41 (2): 637 – 654 (2018)
Rice Ratooning under the Salibu System with SRI Method
647
Internal Carbohydrates and Phytohormones in the Rice Plant’s Intercalary Meristem Tissue
Table 5 shows that the cutting technique affected the internal carbohydrates, gibberellins and cytokinins in intercalary meristem tissue, while the auxins were affected by the cultivation methods in the ratoon crop. The internal carbohydrates
measured in the non-salibu system using the cutting technique were higher than those measured in the salibu system. Gibberellins and cytokinins measured in the salibu system were significantly higher than those measured in the non-salibu system. In addition, auxins were significantly higher in the SRI method than in the conventional method.
Table 5Effects of cutting technique and cultivation methods on internal carbohydrates and phytohormones (such as gibberelins, cytokinins and auxins) in the rice intercalary meristem
Ratoon CropInternal
Carbohydrates (%)
Gibberellins (ppm)
Cytokinins (ppm)
Auxins (ppm)
Cutting Technique:Salibu system 4.5 b 69.3 a 5.4 a 0.9 aNon-salibu system 8.7 a 29.9 b 3.8 b 1.3 aCultivation Methods:SRI 6.6 a 57.7 a 4.8 a 1.4 aConventional 6.6 a 41.5 a 4.3 a 0.8 bSources :-------------------------------------------------------- Mean square ----------------------------------------------------Cutting 54.1 * 7772.6 * 14.0 ** 0.9 ns
Cultivation 0.009 ns 1313.8 ns 1.3 ns 1.6 *
Cutting * Cultivation 0.4 ns 455.9 ns 1.2 ns 0.13 ns
Means followed by same lower-case letter within a column of each factor in the ratoon crop are not significantly different at p=5% by DMRTRatoon crop: * and ** are significant at p=1% and 5%, respectively; ns=non-significant at p=5%
DISCUSSION
Farmers practise leaving their paddy land unused after harvesting, thereby diminishing the value of land productivity. However, with some effort, they can rake in additional benefits from a following ratoon crop. Olivier et al. (2014) confirmed that the success of a ratoon crop depends on the prior success of the main crop. In this study, it was seen that vegetative and
reproductive growth of the main crop using the SRI method was significantly higher than that seen using the conventional method. The number of leaves and tillers was higher using the SRI method. Transplanting young seedlings at 10 DAS for the main crop is advantageous for early crop establishment and for reducing the stress to the transplanted rice plants (Stoop et al., 2002). Ramli et al. (2012) reported
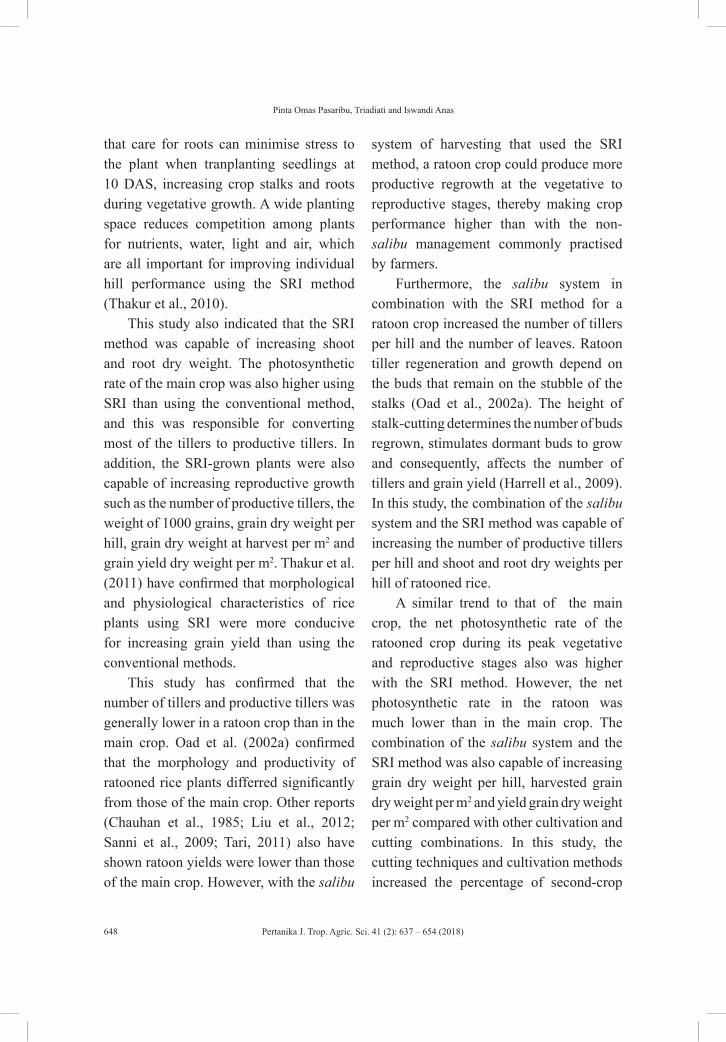
Pertanika J. Trop. Agric. Sci. 41 (2): 637 – 654 (2018)
Pinta Omas Pasaribu, Triadiati and Iswandi Anas
648
that care for roots can minimise stress to the plant when tranplanting seedlings at 10 DAS, increasing crop stalks and roots during vegetative growth. A wide planting space reduces competition among plants for nutrients, water, light and air, which are all important for improving individual hill performance using the SRI method (Thakur et al., 2010).
This study also indicated that the SRI method was capable of increasing shoot and root dry weight. The photosynthetic rate of the main crop was also higher using SRI than using the conventional method, and this was responsible for converting most of the tillers to productive tillers. In addition, the SRI-grown plants were also capable of increasing reproductive growth such as the number of productive tillers, the weight of 1000 grains, grain dry weight per hill, grain dry weight at harvest per m2 and grain yield dry weight per m2. Thakur et al. (2011) have confirmed that morphological and physiological characteristics of rice plants using SRI were more conducive for increasing grain yield than using the conventional methods.
This study has confirmed that the number of tillers and productive tillers was generally lower in a ratoon crop than in the main crop. Oad et al. (2002a) confirmed that the morphology and productivity of ratooned rice plants differred significantly from those of the main crop. Other reports (Chauhan et al., 1985; Liu et al., 2012; Sanni et al., 2009; Tari, 2011) also have shown ratoon yields were lower than those of the main crop. However, with the salibu
system of harvesting that used the SRI method, a ratoon crop could produce more productive regrowth at the vegetative to reproductive stages, thereby making crop performance higher than with the non-salibu management commonly practised by farmers.
Furthermore, the salibu system in combination with the SRI method for a ratoon crop increased the number of tillers per hill and the number of leaves. Ratoon tiller regeneration and growth depend on the buds that remain on the stubble of the stalks (Oad et al., 2002a). The height of stalk-cutting determines the number of buds regrown, stimulates dormant buds to grow and consequently, affects the number of tillers and grain yield (Harrell et al., 2009). In this study, the combination of the salibu system and the SRI method was capable of increasing the number of productive tillers per hill and shoot and root dry weights per hill of ratooned rice.
A similar trend to that of the main crop, the net photosynthetic rate of the ratooned crop during its peak vegetative and reproductive stages also was higher with the SRI method. However, the net photosynthetic rate in the ratoon was much lower than in the main crop. The combination of the salibu system and the SRI method was also capable of increasing grain dry weight per hill, harvested grain dry weight per m2 and yield grain dry weight per m2 compared with other cultivation and cutting combinations. In this study, the cutting techniques and cultivation methods increased the percentage of second-crop
Pertanika J. Trop. Agric. Sci. 41 (2): 637 – 654 (2018)
Rice Ratooning under the Salibu System with SRI Method
649
productivity measured relatively to its respective main crop. This was higher using the combination of salibu system and SRI method than using other treatment combinations.
The higher ratoon rice productivity achieved using the combination of the salibu system and the SRI method was determined by examining the growth and physiological effects of the rice stalk re-cutting at seven days after main crop harvesting. Ichii (1983) confirmed that the rice plants’ ability to produce ratoon is influenced by internal and external conditions affecting the stubble and roots of rice plants. These include genetic traits, environmental conditions, water availability, soil fertility, sunlight, temperature, pests attack, plant diseases and the height of cutting (Mahadevappa et al., 1988).
The vigour of the root systems and high carbohydrate concentration in the stubble are prerequisites for the development of a ratoon crop after the main crop has been harvested (Oad et al., 2002a, 2002b). This study’s results indicated that the cutting technique used for a ratoon crop affected the internal carbohydrates in intercalary meristem tissue after the main crop was harvested. The concentration of internal carbohydrates in the intercalary meristem tissues was found to be higher under the non-salibu system after harvesting than that of the salibu system. Stubble from the main crop harvested using the salibu system were re-cut 5 cm above the ground on the seventh day after the main crop
was harvested, depreciating carbohydrate content in the stalks. The depreciating CH2O had a positive effect on tiller regrowth in the ratoon crop. Due to the fact that carbohydrate residue in the stubble and roots had translocated to initiated buds that produced new tillers in the ratoon crop, the carbohiydrate content in the stalks had depreciated.
The re-cutting process stimulates the growth or regrowth of shoots that can increase the number of tillers and leaves in the ratooned rice plant. Carbohydrate residue in the stubble and roots is translocated to initiate buds that produce new tillers. The proportion of plant material (photosynthate reserves) in the ratoon roots and stalks affects the growth of the plants that will emerge from the internodes. If there are adequate photosynthetic reserves to be re-assimilated in the stalks and the stalks still have the ability to sprout, then the ratoon shoots will start to appear on the second to 10th day after the main crop harvest (De Datta & Bernasor, 1988). Following re-cutting, sunlight will then control the cell division process and plant elongation (Okello et al., 2015), and eventually new shoots will be initiated.
In addition, the salibu system affects phytohormones. Phytohormones have a critical role in the formation of new shoots. Kurepin et al. (2007) reported that shoot growth is affected by interaction between the environment and plant growth regulators. The salibu system is capable of increasing gibberellins and kinetins, a class of cytokinins, in the intercalary meristem of
Pertanika J. Trop. Agric. Sci. 41 (2): 637 – 654 (2018)
Pinta Omas Pasaribu, Triadiati and Iswandi Anas
650
rice plants. It influences the number of new shoots more than in the non-salibu system. New shoots of ratoon crops emerge from the intercalary meristem tissue in internodes. The intercalary meristem tissue consists of the cells that are active to divide and grow. This tissue is the target of gibberelline to stimulate rice-stem elongation (Taiz & Zeiger, 2010). Gibberellins have a role in the process of cell enlargement, development and division in plants (Mahmoody & Noori, 2014) as well as in controlling stem elongation, germination and the transition from vegetative growth phase to reproductive phase (Thomas et al., 2005). Likewise, cytokinins have a role in triggering cell division and controlling the growth of shoot and root meristem tissue (Kyozuka, 2007).
In this study, auxins in the intercalary meristem tissue were affected by the cultivation method and they were significantly higher with the SRI method than with the conventional method. Auxins are produced in active meristematic tissue such as found at the tip of roots and shoots (Takahashi, 2013). Hidayati et al. 2016 comfirmed that the application of the SRI method had resulted in longer roots and heavier root biomass compared with the conventional method. The SRI method makes soil more favourable for aerobic activity and conditions that promote greater root growth. The biosynthesis of auxins is influenced by the oxygen level (Dai et al., 2013). The transport of auxins requires energy from the processes of metabolism, and their movement is hampered when
oxygen is lacking (Taiz & Zeiger, 2010). The auxins in intercalary meristem tissue using the conventional method were lower compared with using the SRI method. This was caused by continuous flooding practised in the conventional method that led to the reduced oxygen.
CONCLUSION
The main crop yielded using the SRI method had a significantly higher net photosynthesis rate and vegetative and reproductive growth compared with the conventional method. The yield achieved using the SRI method across the cultivation method was higher by 24% than that achieved using the conventional method. The ratooned crop in the salibu system in combination with the SRI method had a higher net photosynthetic rate and vegetative and reproductive growth than that in the other treatment combinations. The ratoon crop had a much lower net photosynthetic rate than the main crop. This was the possible main reason for the lower yield in the ratoon compared with the main crop. Grain yield achieved using the salibu system and the SRI method was higher, attaining approximately 50.3% of SRI main crop yield that was higher than in other treatment combinations. Furtheremore, a better yield of ratoon crop may be achieved by increasing fertilisers (especially nitrogen) that may increase vegetative regrowth of the ratoon, balancing top vegetative growth to the stubble and rooting system left over by the main crop. Thus, the net photosynthetic
Pertanika J. Trop. Agric. Sci. 41 (2): 637 – 654 (2018)
Rice Ratooning under the Salibu System with SRI Method
651
rate can be increased in the ratoon. The inclusion of higher fertiliser application rate (especially nitrogen) for the ratoon could be included in future research looking into ways to improve this innovation. Higher levels of internal carbohydrates conserved in the intercalary meristem of the main crop stubble and phytohormones such as gibberellins, cytokinins and auxins in this biomass significantly influenced the main rice crop’s ability to produce a successful and productive ratoon crop.
ACKNOWLEDGEMENT
The authors wish to thank the DIKTI (Directorate General of Higher Education) for the award of the Interior Graduate Education Scholarship (BPPDN) Candidate Lecturer 2013, Indonesia, and for providing financial support for this research. We would also like to thank Prof. Norman Uphoff of Cornel University, USA, for assisting in the correction of the manuscript draft.
REFERENCESAhmed, A. R., Dutta, B. K., & Ray, D. C. (2015).
Response of some rice varieties to different crop management practices towards morphological and yield parameters. International Journal of Scientific and Research Publications, 5(2), 1–6. Retrieved from http://www.ijrsp.org/
Akhgari, H., & Niyaki, S. A. N. (2014). Effects of first harvest time on total yield and yield components in twice harvesting of rice (Oryza sativa L.) in Rasht, Iran. International Journal of Biosciences, 4(5), 210–215. doi: 10.12692/ijb/4.5.210–215
Bakrie, M. M., Anas, I., Sugiyanta, & Indris, K. (2010). Application of inorganic and bio organic fertilizer on System of Rice Intensification. Journal Tanah dan Lingkungan, 12(2), 25–32. Retrieved from http://soil.ipb. ac.id/jtl
Barison, J., & Uphoff, N. (2011). Rice yield and its relation to root growth and nutrient-use efficiency under SRI and conventional cultivation: An evaluation in Madagaskar. Paddy and Water Environment, 9(1), 65–78. Retrieved from http://www.springer.com/
Begum, M. K., Hasan, K. M., Hossain, S. M. A., & Hossain, M. A. (2002). Effect of culm cutting height and nitrogenous fertilizer on the yield of ratoon of Late Boro Rice. Pakistan Journal of Agronomy, 1(4), 136–138. Retrieved from http://ansijournals.com/ja
Chauhan, J. S., Vergara, B. S., & Lopez, F. S. S. (1985). Rice ratooning. IRRI Research Paper Series, 102, 1–20. Retrieved from http://pdf.usaid.gov/pdf_docs/PNAAS845.pdf/
Dai, X., Mashiguchi, K., Chen, Q., Kasaharas, H., Kamiya, Y., Ojha, S., … & Zhao, Y. (2013). The biochemical mechanism of auxin biosynthesis by an Arabidopsis YUCCA flavin-containing monooxygenase. Journal of Biological Chemistry, 288(3), 1448–1457. Retrieved from http://www.jbc.org/
De Datta, S. K., & Bernasor, P. C. (1988). Agronomic principles and practices of rice rationing. In W. H. Smith, V. Kumble, & E. P. Cervantes (Eds.), Rice ratooning (pp. 163–176). Philippines: International Rice Research Institute. Retrieved from http://pdf.usaid.gov/pdf_docs/PNABD177.pdf/
Dubois, M., Giilles, K. A., Hamilton, J. K., Rebers, P. A., & Smith, F. (1956). Colorimetric method for determination of sugars and related substances. Analytical Chemistry, 28(3), 350–356. doi: 10.1021/ac60111a017
Pertanika J. Trop. Agric. Sci. 41 (2): 637 – 654 (2018)
Pinta Omas Pasaribu, Triadiati and Iswandi Anas
652
Erdiman. (2013). Teknologi salibu meningkatkan produktivitas lahan dan pendapatan petani. Retrieved from http://sumbar.litbang.pertanian.go.id/images/pdf/padisalibu.pdf
Faruq, G., Taha, R. M., & Prodhan, Z. H. (2014). Rice ratoon crop: A sustainable rice production system for tropical hill agriculture. Sustainability, 6(9), 5785–5800. doi: 10.3390/su6095785
Harrell, D. L., Bond, J. A., & Blanche, S. (2009). Evaluation of main-crop stubble height on ratoon rice growth and development. Field Crops Research, 114(3), 396–403. doi: 10.1016/j.fcr.2009.09.011
Hidayati, N., Triadiati, & Anas, I. (2016). Photosynthesis and transpiration rates of rice cultivated under the system of rice intensification and the effects on growth and yield. Hayati Journal of Biosciences, 23(2), 67–72. doi: 10.1016/j.hjb.2016.06.002
Hutabarat, T. R. (2011). Soil microbial population and the methane emissions in rice with a combination of fertilization on rice cultivation SRI (System of Rice Intensification). (M.Sc. thesis). Bogor Agricultural University, Indonesia.
Ichii, M. (1983). The effect of water management on ratoon ability of rice plants. The Agriculture, Forestry and Fisheries Research Information Technology Center, 34(2), 123–128. Retrieved from http://www.affrc.go.jp/en/
Kabir, H., & Uphoff, N. (2007). Results of disseminating the system of rice intensification with farmer field school methods in northern Myanmar. Experimental Agriculture, 43(4), 463–476. doi: 10.1017/s0014479707005340
Katambara, Z., Kahimba, F. C., Mahoo, H. F., Mbungu, W. B., Mhenga, F., Reuben, P., … & Nyarubamba, A. (2013). Adopting the system of rice intensification (SRI) in Tanzania: A review. Agricultural Sciences, 4(08), 369–375. doi: 10.4236/as.2013.48053
Kediyal, V. K., & Dimri, S. (2009). The traditional methods of rice cultivation and SRI in Uttarakhand Hills. Asian Agri-History, 13(4), 293–306. Retrieved from http://asianagrihistory.org/
Kurepin, L. V., Emery, R. J. N., Pharis, R. P., & Reid, D. M. (2007). The interaction of light quality and irradiance with gibberellins, cytokinins and auxins in regulating growth of Helianthus annuus hypocotyls. Plant Cell and Environment, 30(2), 147–155. doi: 10.1111/j.1365-3040.2006.01612.x
Kyozuka, J. (2007). Control of shoot and root meristem function by cytokinin. Current Opinion in Plant Biology, 10(5), 442–446. doi: 10.1111/j.pbi.2007.08010
Liu, K., Qin, J., Zhang, B., & Zhao, Y. (2012). Physiological traits, yields and nitrogen translocation of ratoon rice in response to different cultivations and planting periods. African Journal of Agricultural Research, 7(16), 2539–2545. doi: 10.5897/AJAR10.416
Mahadevappa, M. (1988). Agronomic principles and practices of rice rationing. In W. H. Smith, V. Kumble, & E. P. Cervantes (Eds.), Rice ratooning (pp. 69–78). Philippines: International Rice Research Institute. Retrieved from http://pdf.usaid.gov/pdf_docs/PNABD177.pdf/
Mahmoody, M., & Noori, M. (2014). Effect of gibberellic acid on growth and development plants and its relationship with abiotic stress. International Journal of Farming and Allied Sciences, 3(6), 717–721. Retrieved from http://www.ijfas.com
Nair, A. S., & Rosamma, C. A. (2002). Character association in ratoon crop of rice (Oryza sativa L.). Journal of Tropical Agriculture, 40, 1–3. Retrieved from http://www.jtropag.kau.in/
Pertanika J. Trop. Agric. Sci. 41 (2): 637 – 654 (2018)
Rice Ratooning under the Salibu System with SRI Method
653
Oad, F. C., Cruz, P. S., Memon, N., Oad, N. L., & Hassan, Z. U. (2002a). Rice ratooning management. Pakistan Journal of Applied Sciences, 2(1), 29–35. Retrieved from http://docsdrive.com/pdfs/ansinet/jas/2002/29-35.pdf
Oad, F. C., Samo, M. A., Hassan, Z. U., Cruz, P. S., & Oad, N. L. (2002b). Correlation and path analysis of quantitative characters of rice ratoon cultivars and advance lines. International Journal of Agriculture and Biology, 4(2), 204–207. Retrieved from http://www.ijab.org
Okello, R. C. O., De Visser, P. H. B., Heuvelink, E., Marcelis, L. F. M., & Struik, P. C. (2015). Light mediated regulation of cell division endoreduplication and cell expansion. Environmental and Experimental Botany, 30, 2922–2931. doi: 10.1016/j.envexpbot.2015.04.003
Olivier, K., Cherif, M., Kone, B., Emmanuel, D., & Firmin, K. K. (2014). Growth, yields and ratooning performance of lowland rice nerica L14 as affected by different fertilizers. India Journal Sciences Research and Technology, 2(2), 18–24. Retrieved from http://www.indjsrt.com
Ramli, Kaharuddin, & Samaria. (2012). Effect of time of transplanting on the growth different variety rice. Journal Agrisistem, 8(1), 1–12. Retrieved from http:// www.distrodoc.com/374703/
Sanni, K. A., Ojo, D. K., Adebisi, M. A., Somado, E. A., Ariyo, O. J., Sie, M., … & Tia, D. D. (2009). Ratooning potential of interspecific NERICA rice varietas. International Journal Botany, 5(1), 112–115. Retrieved from http://ansinet.com
Sato, S., & Uphoff, N. (2007). A review of on-farm evaluations of system of rice intensification methods in Eastern Indonesia. Perspectives in Agriculture, Veterinary Science, Nutrition and Natural Resources, 2(054), 1-12. doi: 10.1079/PAVSNNR20072054
Stoop, W. A., Uphoff, N., & Kassam, A. (2002). A review of agricultural research issue raised by the System of Rice Intensification (SRI) from Madagascar: Opportunities for improving system for resource poor farmer. Agricultural Systems, 71(3), 249–274. doi: 10.1016/s0308-521x(01)00070-1
Suwandi, S., Ammar, M., & Irsan, C. (2012). Application of extract compost increased yield and suppressed the diseases of ratoon rice crop in tidal swamp of Banyuasin Regency. Journal Lahan Suboptimal, 1(2), 116–122. Retrieved from http://www.jlsuboptimal.unsri.ac.id Taiz, L., & Zeiger, E. (2010). Plant physiology. California: Benjamin Cummings.
Takahashi, H. (2013). Auxin biology in roots. Plant Root (JSRR), 7, 49–64. Retrieved from http://www.plantroot.org
Tari, D. B. (2011). Effect of harvesting time and plant residual on agronomic traits of rice ratoon. American-Eurasian Journal Agriculture and Environment Sciences, 11(1), 129–132. Retrieved from http://www.idosi.org/aejaes/jas11(1)11/21.pdf
Thakur, A. K., Rath, S., Patil, D. U., & Kumar, A. (2011). Effects on rice plant morphology and physiology of water and associated management practices of the system of rice intensification and their implications for crop performance. Paddy Water Environment, 9(1), 13–24. doi: 10.1007/s10333-010-0236-0
Thakur, A. K., Rath, S., Roychowdhury, S., & Uphoff, N. (2010). Comparative performance of rice with system of rice intensification (SRI) and conventional management using different plant spacing. Experimental Agriculture, 196(2), 146–159. doi: 10.1111/j.1439-037x.2009.00406.x
Thomas, S. G., Rieu, I., & Steber, C. M. (2005). Gibberellin metabolism and signaling. Vitamins and Hormones, 72(5), 289–338. doi: 10.1016/s0083-6729(05)72009-4-2005a.pdf

Pertanika J. Trop. Agric. Sci. 41 (2): 637 – 654 (2018)
Pinta Omas Pasaribu, Triadiati and Iswandi Anas
654
Unyayar, S., Topcuoglu, S. F., & Unyayar, A. (1996). A modified method for extraction and identification of indole-3- acetic acid (IAA), gibberelin acid (GA3), abcisic acid (ABA) and zeatin produced by phanerochaetechrysosporium ME446. Bulgarian Journal Plant Physiol, 22(3-4), 105–110. Reterieved from http://www.bio21.bas.bg/ipp/gapbfiles/v-22/96_3-4_105_110.pdf
Wu, W., Ma, B., & Uphoff, N. (2015). A review of the system of rice intensification in China. Plant and soil, 393(1-2), 361-381. doi:10.1007/s11104-015-2440-6
Pertanika J. Trop. Agric. Sci. 41 (2): 655 – 662 (2018)
ISSN: 1511-3701 © Universiti Putra Malaysia Press
TROPICAL AGRICULTURAL SCIENCEJournal homepage: http://www.pertanika.upm.edu.my/
ARTICLE INFOArticle history:Received: 29 September 2016Accepted: 26 January 2018
E-mail addresses:[email protected] (Noor Asma’ Mohd Anuar Mushoddad)[email protected] (Nurul Syaza Abdul Latif)[email protected] (Suhaimi Othman@Osman)* Corresponding author
Effect of Foliar Fertiliser on Banana
Noor Asma’ Mohd Anuar Mushoddad*, Nurul Syaza Abdul Latif and Suhaimi Othman@OsmanFaculty of AgroBased Industry, Universiti Malaysia Kelantan, 17600 Jeli, Kelantan, Malaysia
ABSTRACT
An experiment was conducted at Bukit Perawas Ayer Lanas, Jeli Kelantan from December 2014 to April 2015 to study the effect of different rates of foliar fertiliser at vegetative stage for banana cultivation. Four levels of foliar fertiliser (0 ml L-1 [control], 1 ml L-1, 2 ml L-1 and 3 ml L-1) were applied monthly throughout the experimental period. Inorganic foliar fertiliser formulation HI-NKTM, a product of ACM Sdn. Bhd, was used. It consisted of 16:8:16 of NPK and a few trace elements Fe, Mn, Mo, Cu, Zn, B and Mo. Data on growth parameters such as pseudostem height, pseudostem girth and leaf area were recorded for the first 16 weeks of planting. A logistic growth model was used to predict the response of the banana plant to foliar fertiliser (from the 16th week to the 24th week of planting). The highest vegetative growth (pseudostem height, pseudostem girth and leaf area) was yielded by the treatment that used foliar fertiliser was applied at 1 ml L-1. The earliest results of plant growth response for treatment A, B and C could be seen in the second week of planting. The treatments followed the logistic growth curve in R2 ranging from 0.92 to 0.96. The pseudostem height, pseudostem girth and leaf area of the banana plants applied with 1 ml L-1 at the 16th week of planting were 59.87 cm, 20.53 cm and 1718.28 cm2, respectively. The prediction showed the maximum pseudostem height, pseudostem girth and leaf area at the 24th week of planting at the rate of 1 ml L-1 were 59.3 cm, 19.91 cm and 1785.17 cm2, respectively.
Keywords: Banana, foliar fertiliser, logistic growth
INTRODUCTION
The agricultural sector in Malaysia contributed significantly to the economic development of the country as the major source of income, employment and foreign
Pertanika J. Trop. Agric. Sci. 41 (2): 655 – 662 (2018)
Noor Asma’ Mohd Anuar Mushoddad, Nurul Syaza Abdul Latif and Suhaimi Othman@Osman
656
exchange at one time. Relatively high levels of fertiliser are required to ensure achievable yield and quality of cultivated crops. During the growing seasons, crops absorb various amounts of nutrients. Nutrient uptake is influenced by soil, climate and plant factors. Conventionally, granular fertilisers are used to grow the crops and maintain soil fertility status. However, inorganic fertilisers are produced using non-renewable resources that may deplete over time. Recently, foliar fertilisers have been used to correct micronutrient deficiencies in plants (Christensen, 2005). Foliar fertilisers can be an appropriate alternative to reduce the usage of inorganic granular fertilisers. During vegetative growth, plants require well-balanced nutrition in order to achieve high yields and quality. Optimum rates of foliar fertiliser application are important for the banana plant to receive sufficient nutrients for their growth and to prevent environmental pollution (Naheret al., 2011). Foliar fertilisers can supply macronutrients, which can be absorbed by the plant through the leaves but under several conditions. The conditions are: foliar fertiliser should be applied several times, there should be sufficient leaf area for major absorption and there must be correct nutrient concentration. Several studies have looked into macronutrients for foliar fertiliser application. Therefore, the author preferred to test the effects of applying macronutrients on banana plants that have a larger leaf area compared with other plants as such leaves have a high nutrient demand (Fageria et al., 2009).
Banana and plantain represent the largest fruit crop produced in the world and are known as a heavy feeder crop. They require large amounts of mineral nutrients to maintain high yields in commercial plantations. Intensive use of inorganic fertilisers is essential to supply sufficient nutrients to the plants, especially in areas with the problem of nutrient deficiency. The market price for inorganic granular fertilisers is high and its continuous usage can cause environmental pollution. There is a need for alternative fertiliser sources. Kumar and Kumar (2007) reported that spraying foliar fertiliser at the reproductive stage of the banana would increase the number of leaves having high chlorophyll content and improve fruit bunch weight. Foliar fertiliser application at the vegetative stage (before the reproductive stage) may lead to better growth performance of banana and higher quality of the fruit produced.
The prediction of plant growth is important in fertiliser application decision-making (Wardhani & Kusumastuti, 2013). In this study, the logistic growth model was used to predict the response in banana plant growth as a result of the different rates of foliar fertiliser application. The model was used as a tool for developing foliar fertiliser application decision-making. Based on the prediction, growers can plan the time when the foliar fertiliser must be applied or track the existence of any unfavourable condition that they can treat instantly to have healthier banana plants.
Pertanika J. Trop. Agric. Sci. 41 (2): 655 – 662 (2018)
Effect of Foliar Fertilizer on Banana
657
METHODS
Experiment Design
The experiment was conducted at post-nursery stage in a banana plantation, Bukit Perawas, Ayer Lanas, Jeli, Kelantan from December 2014 to April 2015. Banana (Musa acuminata cv. Berangan) seedlings originated from banana corn seedlings were planted on 16 December, 2014 at the post-nursery plot. The experiment was laid out in a randomised block design replicated three times. Inorganic foliar fertiliser HI-NKTM, a product of Agrichem (Sdn. Bhd), in liquid form was used. The N:P:K ratio was 16:8:16 and a few of the trace elements were Fe, Mn, Mo, Cu, Zn, B and Mo. The foliar fertiliser was diluted in water before it was sprayed on the banana plants. The four levels of foliar fertilisers were: A (1 ml L-1), B (2 ml L-1), C (3 ml L-1) and D (0 ml L-1, control). These fertilisers were applied monthly using an electric power sprayer early in the morning.
Data Collection
Data were collected weekly for 16 weeks of the vegetative stage. Non-destructive parameters measured were leaf area, pseudostem height and pseudostem girth. Banana leaf area (LA) was determined from length (L) and width (W) of the lamina according to the formula (Al-Harthi & Al-Yahyai, 2009):
[1]
Statistical Analysis
The analysis of variance (ANOVA) for pseudostem height, pseudostem girth and leaf area was performed following the F test. When F was significant at the p<0.05 level, treatment means were separated using Tukey’s test. Data were analysed following standard procedures using the SPSS software (version 21.0). Computation and preparation of graphs were done using the Microsoft Excel 2007 Programme.
The logistic growth model was used for model development (Wardhani & Kusumastuti, 2013):
[2]
where the parameter values were described as:y= Vegetative growth (pseudostem height
[cm], pseudostem girth [cm] and leaf area [cm2] at time, t
t=Time (week)K=Carrying capacity (cm)A=Constantr=Growth rate (cm w-1)
This model was derived from the logistic growth equation. The logistic growth model was used to predict the growth of corns and this model was found to fit better in describing the growth of corns compared to the Gompertz model (Wardhani & Kusumastuti, 2013). The logistic growth model has varied congruence for explaining the growth pattern for many species of animals and plants (Shi et al., 2013). The structure of this
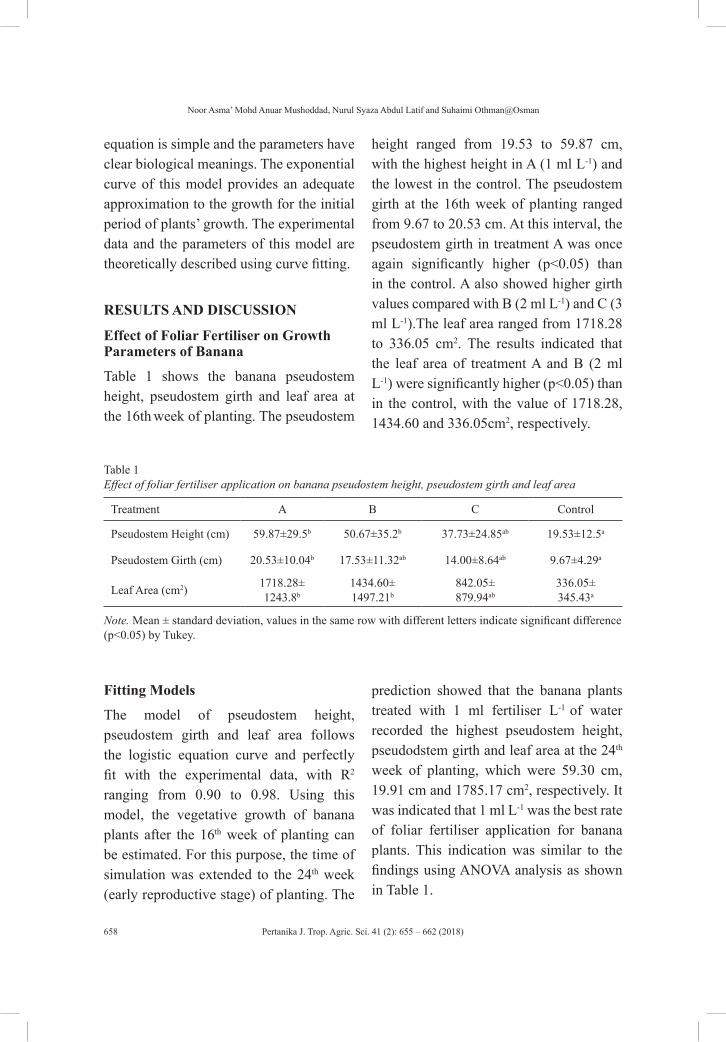
Pertanika J. Trop. Agric. Sci. 41 (2): 655 – 662 (2018)
Noor Asma’ Mohd Anuar Mushoddad, Nurul Syaza Abdul Latif and Suhaimi Othman@Osman
658
equation is simple and the parameters have clear biological meanings. The exponential curve of this model provides an adequate approximation to the growth for the initial period of plants’ growth. The experimental data and the parameters of this model are theoretically described using curve fitting.
RESULTS AND DISCUSSION
Effect of Foliar Fertiliser on Growth Parameters of Banana
Table 1 shows the banana pseudostem height, pseudostem girth and leaf area at the 16th week of planting. The pseudostem
height ranged from 19.53 to 59.87 cm, with the highest height in A (1 ml L-1) and the lowest in the control. The pseudostem girth at the 16th week of planting ranged from 9.67 to 20.53 cm. At this interval, the pseudostem girth in treatment A was once again significantly higher (p<0.05) than in the control. A also showed higher girth values compared with B (2 ml L-1) and C (3 ml L-1).The leaf area ranged from 1718.28 to 336.05 cm2. The results indicated that the leaf area of treatment A and B (2 ml L-1) were significantly higher (p<0.05) than in the control, with the value of 1718.28, 1434.60 and 336.05cm2, respectively.
Table 1Effect of foliar fertiliser application on banana pseudostem height, pseudostem girth and leaf area
Treatment A B C Control
Pseudostem Height (cm) 59.87±29.5b 50.67±35.2b 37.73±24.85ab 19.53±12.5a
Pseudostem Girth (cm) 20.53±10.04b 17.53±11.32ab 14.00±8.64ab 9.67±4.29a
Leaf Area (cm2) 1718.28±1243.8b
1434.60±1497.21b
842.05±879.94ab
336.05±345.43a
Note. Mean ± standard deviation, values in the same row with different letters indicate significant difference (p<0.05) by Tukey.
Fitting Models
The model of pseudostem height, pseudostem girth and leaf area follows the logistic equation curve and perfectly fit with the experimental data, with R2
ranging from 0.90 to 0.98. Using this model, the vegetative growth of banana plants after the 16th week of planting can be estimated. For this purpose, the time of simulation was extended to the 24th week (early reproductive stage) of planting. The
prediction showed that the banana plants treated with 1 ml fertiliser L-1 of water recorded the highest pseudostem height, pseudodstem girth and leaf area at the 24th
week of planting, which were 59.30 cm, 19.91 cm and 1785.17 cm2, respectively. It was indicated that 1 ml L-1 was the best rate of foliar fertiliser application for banana plants. This indication was similar to the findings using ANOVA analysis as shown in Table 1.
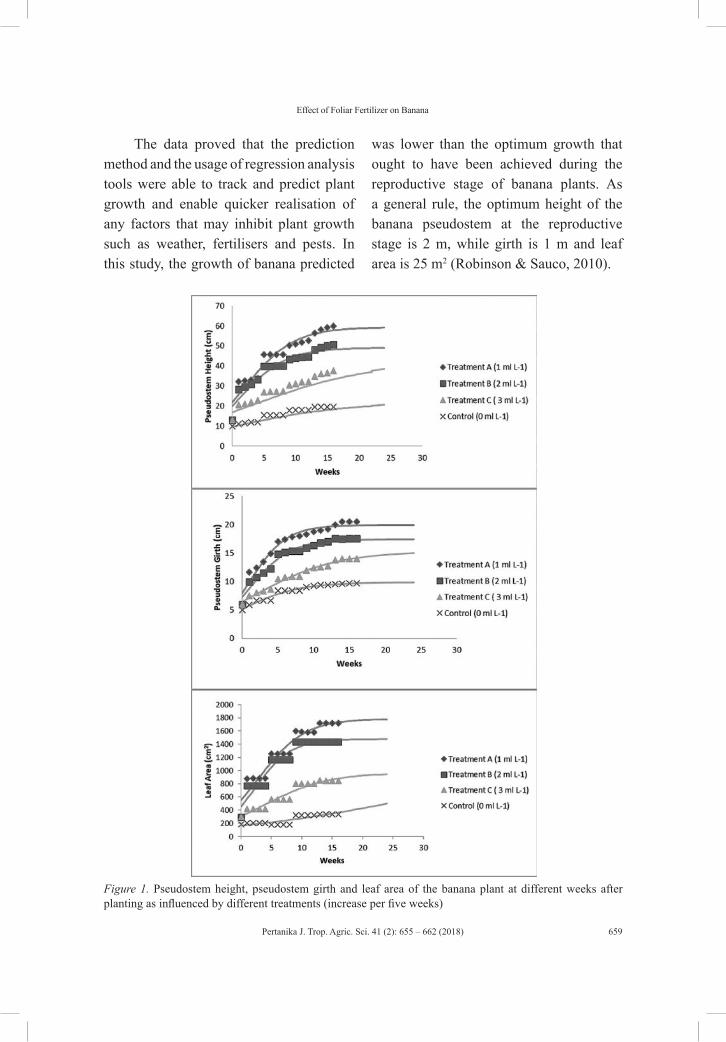
Pertanika J. Trop. Agric. Sci. 41 (2): 655 – 662 (2018)
Effect of Foliar Fertilizer on Banana
659
The data proved that the prediction method and the usage of regression analysis tools were able to track and predict plant growth and enable quicker realisation of any factors that may inhibit plant growth such as weather, fertilisers and pests. In this study, the growth of banana predicted
was lower than the optimum growth that ought to have been achieved during the reproductive stage of banana plants. As a general rule, the optimum height of the banana pseudostem at the reproductive stage is 2 m, while girth is 1 m and leaf area is 25 m2 (Robinson & Sauco, 2010).
Figure 1. Pseudostem height, pseudostem girth and leaf area of the banana plant at different weeks after planting as influenced by different treatments (increase per five weeks)
Pertanika J. Trop. Agric. Sci. 41 (2): 655 – 662 (2018)
Noor Asma’ Mohd Anuar Mushoddad, Nurul Syaza Abdul Latif and Suhaimi Othman@Osman
660
According to Figure 1, treatment A (1 ml L-1) presented faster growth performance starting from the first foliar fertiliser application than the other treatments. The earliest result of plant growth response for treatment A, B and C were seen in the second week of planting i.e. one week after the first foliar fertiliser application. However, the growth performance pattern decreased from the eighth week to the 16th week of planting. Plant growth rates depend on environmental factors. During the eighth to the 16th week of planting, the average monthly temperature was 26-28˚C. During this period, very little rain fell i.e. between 0 and 50 mm per month. The banana plants, therefore, underwent water stress, which inhibited growth.
Drought causes excess excitation energy at the chloroplast level and reduces photosynthesis capacity and thus, modifies plant growth. The impact of this is seen in reduced leaf area and altered biomass resulting in a slow growth rate (Zewdieet al., 2007). Knowing the proper rate of foliar fertiliser to apply is very important at early vegetative stages of the banana plant because the plant requires a sufficient amount of nutrients for its growth and the production of fruit i.e. resulting in higher yields. High yield in crop production refers to the quality and quantity of the harvests (Passam et al., 2007).
CONCLUSION
Based on the results, 1 ml L-1 showed the optimum dose of foliar fertiliser application and this can be recommended
for the vegetative growth of banana with a single application per month complemented with adequate moisture availability through watering. Usage of foliar fertiliser can reduce the cost of chemical fertiliser application to the soil for banana cultivation. Foliar fertiliser application is required in a small amount and involves minimum labour costs as it can be applied using a machine (power spray) for one time of application. Foliar fertiliser application can also be mixed with insecticides and fungicides at the same time. Therefore, the time and cost of labour can be minimised. Mathematical modelling predicted that vegetative growth parameters for the banana plant that had foliar fertiliser applied at 1 ml L-1 would be significantly higher than for the plants that had other rates of foliar fertiliser applied. As shown in the results, the effect of using foliar fertiliser was a growth spurt at just the first five weeks after fertiliser application, and this slowly decreased in the following weeks. The decreasing pattern in growth occurred starting from the eighth week to the 16th week of planting. This condition was related to the low rainfall received. Planters also need to be concerned about weather conditions when they plan to start banana planting.
REFERENCESAl-Harthi, K., & Al-Yahyai, R. (2009). Effect of
NPK fertilizer on growth and yield in Northern Omen. Journal of Horticulture and Forestry, 1(80), 160–167.
Pertanika J. Trop. Agric. Sci. 41 (2): 655 – 662 (2018)
Effect of Foliar Fertilizer on Banana
661
Christensen, P., & Smarts D. R. (Eds.). (2005). Foliar fertilization in vine mineral nutrient management programs. The soil environment on vine mineral nutrition symposium (p. 83–90). San Diego, California: American Society for Enology and Viticulture, ASEV.
Fageria, N. K., Filho, M. B., Moreira, A., & Guimarães, C. M. (2009). Foliar fertilizer of crops plants. Journal of Plant Nutrition, 32(6), 1044–1064.
Kumar. A. R., & Kumar. N., (2007). Sulfate of potash foliar spray effects on yield, quality, and post-harvest life of banana. Better Crops, 91(2), 22–24
Naher, U. A., Saleque, M. A., Panhwar, Q. A., Radziah, O., & Jusop, S. (2011). Techniques of efficient fertilizer management for wetland rice – A review. Australian Journal of Crop Sciences, 5(12), 1661–1669.
Passam, H. C., Karapanos, I. C., Bebeli, P. J., & Savvas, D. (2007). A review of recent research on tomato nutrition, breeding and post harvest technology with reference to fruit quality. The European Journal of Plant Science and Biotechnology, 1(1),1–21.
Robinson, J. C., & Sauco, V. G. (2010). Morphological characteristics and plant development. In J. C. Robinson & V. G. Sauco (Eds.), Bananas and plantains (2nd ed.) (pp. 51-66). United Kingdom: CAB International.
Shi, P. J., Men, X. Y., Sandhu, H. S., Chakraborty A., Li, B. L., Yang, F. O., … & Ge, F. (2013). The “general” ontogenetic growth model is inapplicable to crop growth. Ecological Modelling, 266, 1–9.
Wardhani, W. S., & Kusumastuti, P. (2013). Describing the height growth of corn using logistic and gompertz model. Agrivita, 35(3), 237–241
Zewdie, S., Olsson, M., & Fetene, M. (2007). Growth, gas exchange, chlorophyll as fluresecence, biomass accumulation and partitioning in droughted and irrigated plants of two enset (Ensete ventricosum Welw. Cheesman) Clones. Journal of Agronomy, 6(4), 499–508.

Pertanika J. Trop. Agric. Sci. 41 (2): 663 – 676 (2018)
ISSN: 1511-3701 © Universiti Putra Malaysia Press
TROPICAL AGRICULTURAL SCIENCEJournal homepage: http://www.pertanika.upm.edu.my/
ARTICLE INFOArticle history:Received: 09 December 2016Accepted: 09 March 2018
E-mail addresses:[email protected] (Liang, L. C.)[email protected] (Zzaman, W.)[email protected] (Yang, T. A.)[email protected] (Easa, A. M.)* Corresponding author
Effect of Conventional and Superheated Steam Roasting on the Total Phenolic Content, Total Flavonoid Content and DPPH Radical Scavenging Activities of Black Cumin Seeds
Liang, L. C.1, Zzaman, W.1,2*, Yang, T. A.1 and Easa, A. M.1 1Food Technology Division, School of Industrial Technology, Universiti Sains Malaysia, 11800 USM, Pulau Pinang, Malaysia2Food Engineering and Tea Technology, Shahjalal University of Science and Technology, Sylhet-3114, Bangladesh
ABSTRACT
The effect of superheated steam heating on the antioxidant properties of black cumin seed (Nigella sativa L.) compared to conventional hot air heating was investigated. A superheated steam oven was used in both methods using superheated steam mode and convection mode (hot air). It was operating at three different durations of 10, 20 and 30 min at 180 °C. The total phenolic content, total flavonoid content and radical scavenging activities were 15.04 mg GAE /g, 0.81 mg QE /g and 81.28% at 180°C for 30 min, respectively during superheated steaming. The total phenolic content (TPC), total flavonoid content (TFC) and DPPH radical-scavenging activities of black cumin seed increased significantly (p<0.05) when the time of heating was increased from 0 to 30 min for both treatments. The raw seed had the lowest antioxidant properties, which were TPC of 5.17 mg (GAE)/g, TFC of 0.29 mg (QE)/g and 61.27% radical scavenging activities. Positive correlations were found between the total phenolic content and DPPH scavenging activities of black cumin seed. The black cumin seed heated under superheated steam had significantly (p<0.05) higher TPC, TFC and DPPH radical scavenging activities compared with conventional hot air heating at almost all the heating times. Based on the results obtained, it can be
concluded that superheated steam can be used as an alternative method for roasting black cumin seed that yet maintains higher antioxidant properties.
Keywords: Black cumin seed, DPPH radical-scavenging, superheated steam, total flavonoid content, total phenolic content
Pertanika J. Trop. Agric. Sci. 41 (2): 663 – 676 (2018)
Liang, L. C., Zzaman, W., Yang, T. A. and Easa, A. M.
664
INTRODUCTION
Black cumin (Nigella sativa Linn.) seed, which belongs to the family Ranunculaceae, is a type of spice native to the Mediterranean region (Lutterodt et al., 2010). One of the most useful parts of the plant is the seeds, which are utilised worldwide for edible and medicinal applications (Ramadan, 2007). The seeds of Nigella sativa are widely utilised for medicines traditionally in India, Pakistan, Saudi Arabia, China and some other countries for the cure of headache, bronchitis, fever, rheumatism, liver and kidney disorders, influenza, cough and asthma and as a diuretic. The extract from the seeds, containing thymoquinone, has been reported as an active antioxidant. Spices are functional ingredients in food products. One of their major functions in the food industry is to enhance the taste of food. Spices also act as a protective, antioxidant and antimicrobial agent in human health (Nagi & Mansour, 2000; Lee et al., 2004; Dawidowicz et al., 2006).
Black cumin seed is a spice that is widely used in Indian cuisine due to its aromatic nature. It is used as a spice in the Indian sub-continent for various dishes, especially those that require a preservative. India is the biggest producer of these seeds in the world. Nepal, Sri Lanka, Bangladesh, Pakistan, Egypt and Iraq also produce black cumin seeds. Recent scientific investigation reported that the seeds show potential medicinal value including anti-carcinogenic, antibacterial, analgesic, anti-inflammatory, antipyretic and antiulcer properties. The exceptional curative
activities of the seed can be ascribed to its phenolic components that comprise the highest levels of antioxidant properties (Nagi & Mansour, 2000; Lee et al., 2004). There is growing indication that intake of a selection of phenolic components existing in natural spice-enhanced foods may reduce the threat of chronic disease due to the antioxidant properties of these products. Black cumin seeds have a strong spicy, warm, heavy, curry-like and hot, peppery taste. These features are dominated by cumin aldehyde. (Dawidowicz et al., 2006; Kanakdande et al., 2006).
The seeds have also been reported to be used in bakery and confectionery products. The seeds are sprinkled on loaves during bread making (Kiralan, 2012). A conventional hot air oven is regularly used for baking bread at a selected temperature and time of 180°C for 17 min. Black cumin seeds are also often dry roasted under hot air prior to their use as a culinary ingredient. However, a limitation of using a conventional hot air oven is that the heat transfer for baking using this method reduces the seeds’ antioxidant properties and phenolic compounds due to oxidation (Zzaman et al., 2014).
Superheated steam is an emerging technology that can be produced by heating saturated steam at a temperature higher than that of the boiling point of water. There are many inherent properties of superheated steam that make it attractive for not only drying but for many processing applications as well (Pronyk et al., 2004; Shan et al., 2016). The thermal properties
Pertanika J. Trop. Agric. Sci. 41 (2): 663 – 676 (2018)
Antioxidant Activities of Black Cumin (N. sativa) Seeds
665
of steam are higher than those of air at the same temperature, resulting in a higher heat transfer coefficient. Superheated steam provides an oxygen-free environment that may improve product qualities and eliminate fire and explosion hazards. Superheated steam has been successfully applied to many types of food product, including potato chips, tortilla chips, instant noodles, shrimp and others (Li et al., 1999). Most of the previous investigation into black cumin seeds showed that they have a potential activity as an antioxidant. However, the impact of superheated steaming and conventional hot air roasting on the antioxidant activities of black cumin seed has not been investigated. Therefore, the aims of this research were to evaluate the impact of superheated steam and conventional hot air roasting at different time spans on the total phenolic, total flavonoid and radical scavenging activities of black cumin (N. Sativa) seeds.
MATERIALS AND METHOD
Raw Material
Black cumin (Nigella Sativa L.) seeds imported from India were purchased from a local supermarket located at Bukit Jambul, Penang. The moisture content was less than 2% of the weight of the seeds. The seeds were stored in a hermetic container at room temperature until further use.
Chemicals
Gallic acid and aluminum chloride were obtained from Fisher Scientific, UK.
Methanol (99.8%) and sodium carbonate were obtained from QReC, New Zealand. Folin-Ciocalteu reagent and 2,2-diphenyl-1-picrylhydrazyl (DPPH) were purchased from Merck (Darmstadt, Germany). Potassium acetate was obtained from UNILAB, the Philippines. Quercetin was obtained from Sigma-Aldrich (USA). All chemicals and reagents used were analytical grades.
Roasting of Black cumin seed
The collected black cumin seeds were allowed to equilibrate before roasting at room temperature overnight. Approximately 100 g portions of cleaned medium size mature black seeds were used for roasting in this study. A superheated steam oven (SHARP, AX-1500) were used for the roasting of the seeds. The roasting process was carried out at 180°C for a duration of 10, 20 and 30 min.
Sample Extract Preparation
After roasting, the roasted and raw seeds were ground in a coffee blender at high speed for 4 min (Lebensstil Kollektion, Germany). The ground seeds were passed through a 1000 micron sieve and then stored in a plastic container until the samples were analysed. Prior to the extraction, the seeds were defatted by a Soxhlet apparatus at 80°C using petroleum ether (AOAC, 2000). The resulting defatted powder was dried at 60°C for 16 to 18 h. The dried and defatted powder samples were stored in a hermetic bottle; this was followed by
Pertanika J. Trop. Agric. Sci. 41 (2): 663 – 676 (2018)
Liang, L. C., Zzaman, W., Yang, T. A. and Easa, A. M.
666
extraction, where 0.5 g of each dried sample was prepared for extraction with 20 mL of solvent following the method described by Bucić-Kojić et al. (2011). The solvent was prepared by mixing 99.8% methanol and water to obtain 80% (v/v) aqueous methanol. The extraction was fixed in a Waterbath (90°C) shaker (Schwabach, Germany) and shaken for 120 minutes at 200 rpm. The suspension was centrifuged then for 25 min at 2300 x g (Kubota Tabletop Centrifuge Model 4000, Japan). The supernatant was separated to obtain the methanolic extract using disposable Pasteur pipets. The extracts were used in further experiments.
Total Phenolic Content
The total phenolic content of black cumin seed extract was measured based on the Folin-Ciocalteu assay according to the method described by Shin et al. (2014), with slight modification. Briefly, 40 µL of the black cumin seed extract was diluted by 3160 µL of distilled water, followed by addition of 200 µL of the Folin-Ciocalteu reagent, then allowed to react for 5 min. After this, 600 µL of 20% sodium carbonate solution was added to the reaction mixture. The solution was incubated at room temperature for 60 min. After incubation, the absorbance was read at 765 nm against a blank reagent without sample using a UV-Vis 1240 spectrophotometer (Shimadzu Corp, Nagakyo-ku, Kyoto, Japan). The analyses were performed in triplicate. Gallic acid was used as the standard in the calibration curve preparation (40-320
mg/L). The final results were expressed as mg of gallic acid equivalent per gram of seed weight.
Total Flavonoid Content
The aluminum chloride colorimetric method was used for total flavonoid determination according to the method described by Chen and Kitts (2008), with slight modification. Quercetin was used as the standard in the calibration curve preparation. The standard was prepared by dissolving 10 mg of quercetin in 100 ml methanol and then diluted to 10, 20, 30, 40, 50, 60, 100 mg/L using methanol. Briefly, 0.5 ml of seed extract was separately added into test tubes and mixed with 1.5 ml of methanol, 0.1 ml of 10% aluminum chloride, 0.1 ml of 1 M potassium acetate and 2.8 ml of distilled water. The tubes were covered with parafilm and incubated at room temperature for 30 min; the absorbance of the reaction mixture was measured at 415 nm. The analyses were performed in triplicate. The flavonoid content in each extract was expressed as mg quercetin equivalent (QE)/g of black cumin seed.
DPPH Radical Scavenging Activities
The free radical scavenging activities of black cumin seed samples were estimated according to the method of Sánchez-Moreno et al. (1998), with some modification. The analysis was performed based on the activities of 2,2-diphenyl-1-picrylhydrazyl (DPPH). The DPPH
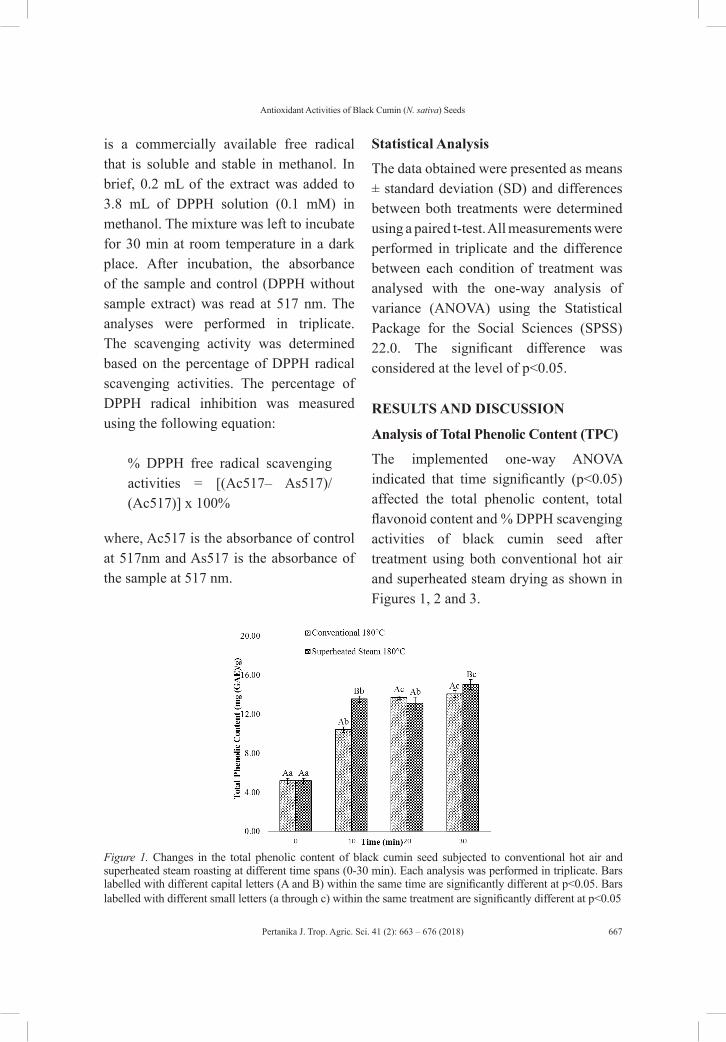
Pertanika J. Trop. Agric. Sci. 41 (2): 663 – 676 (2018)
Antioxidant Activities of Black Cumin (N. sativa) Seeds
667
is a commercially available free radical that is soluble and stable in methanol. In brief, 0.2 mL of the extract was added to 3.8 mL of DPPH solution (0.1 mM) in methanol. The mixture was left to incubate for 30 min at room temperature in a dark place. After incubation, the absorbance of the sample and control (DPPH without sample extract) was read at 517 nm. The analyses were performed in triplicate. The scavenging activity was determined based on the percentage of DPPH radical scavenging activities. The percentage of DPPH radical inhibition was measured using the following equation:
% DPPH free radical scavenging activities = [(Ac517– As517)/ (Ac517)] x 100%
where, Ac517 is the absorbance of control at 517nm and As517 is the absorbance of the sample at 517 nm.
Statistical Analysis
The data obtained were presented as means ± standard deviation (SD) and differences between both treatments were determined using a paired t-test. All measurements were performed in triplicate and the difference between each condition of treatment was analysed with the one-way analysis of variance (ANOVA) using the Statistical Package for the Social Sciences (SPSS) 22.0. The significant difference was considered at the level of p<0.05.
RESULTS AND DISCUSSION
Analysis of Total Phenolic Content (TPC)
The implemented one-way ANOVA indicated that time significantly (p<0.05) affected the total phenolic content, total flavonoid content and % DPPH scavenging activities of black cumin seed after treatment using both conventional hot air and superheated steam drying as shown in Figures 1, 2 and 3.
Figure 1. Changes in the total phenolic content of black cumin seed subjected to conventional hot air and superheated steam roasting at different time spans (0-30 min). Each analysis was performed in triplicate. Bars labelled with different capital letters (A and B) within the same time are significantly different at p<0.05. Bars labelled with different small letters (a through c) within the same treatment are significantly different at p<0.05
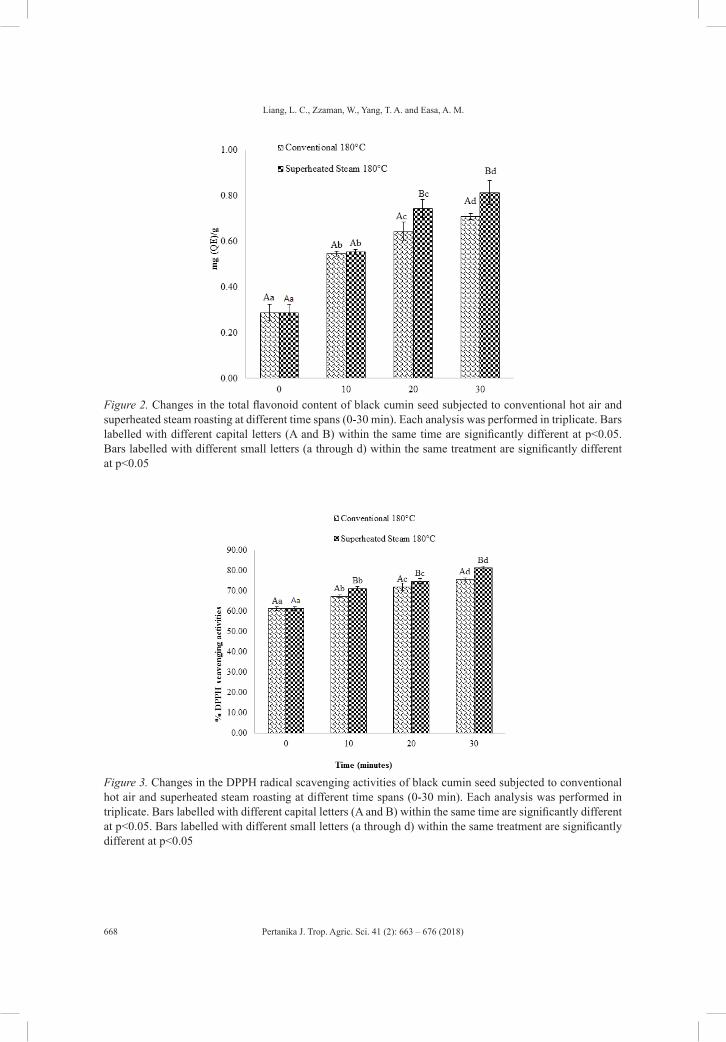
Pertanika J. Trop. Agric. Sci. 41 (2): 663 – 676 (2018)
Liang, L. C., Zzaman, W., Yang, T. A. and Easa, A. M.
668
Figure 2. Changes in the total flavonoid content of black cumin seed subjected to conventional hot air and superheated steam roasting at different time spans (0-30 min). Each analysis was performed in triplicate. Bars labelled with different capital letters (A and B) within the same time are significantly different at p<0.05. Bars labelled with different small letters (a through d) within the same treatment are significantly different at p<0.05
Figure 3. Changes in the DPPH radical scavenging activities of black cumin seed subjected to conventional hot air and superheated steam roasting at different time spans (0-30 min). Each analysis was performed in triplicate. Bars labelled with different capital letters (A and B) within the same time are significantly different at p<0.05. Bars labelled with different small letters (a through d) within the same treatment are significantly different at p<0.05
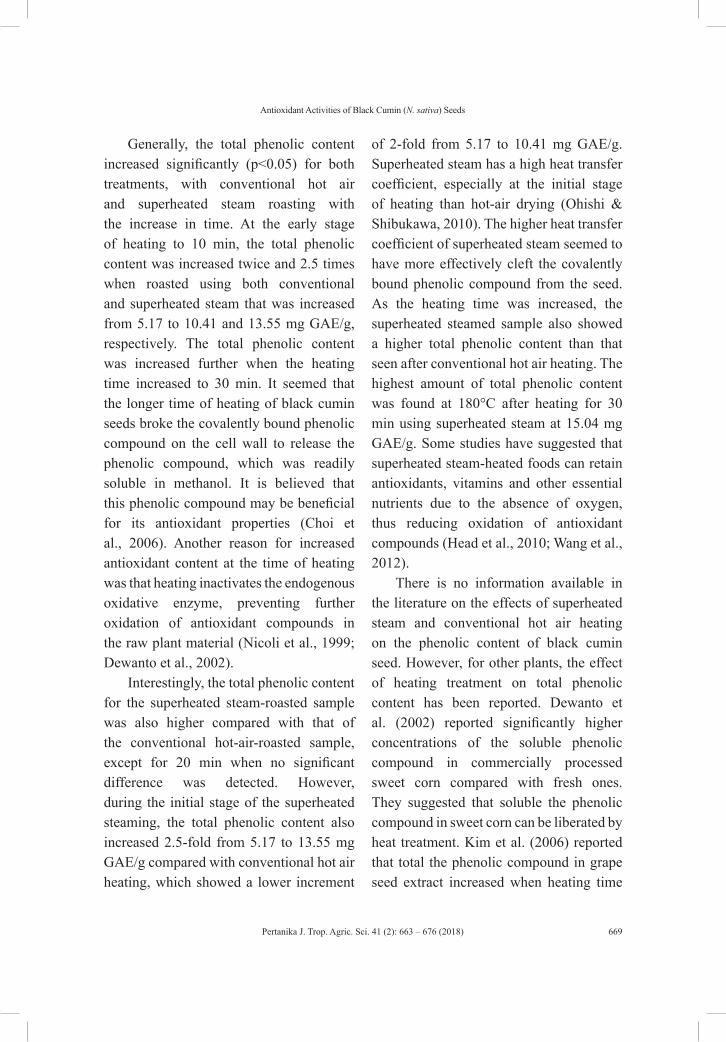
Pertanika J. Trop. Agric. Sci. 41 (2): 663 – 676 (2018)
Antioxidant Activities of Black Cumin (N. sativa) Seeds
669
Generally, the total phenolic content increased significantly (p<0.05) for both treatments, with conventional hot air and superheated steam roasting with the increase in time. At the early stage of heating to 10 min, the total phenolic content was increased twice and 2.5 times when roasted using both conventional and superheated steam that was increased from 5.17 to 10.41 and 13.55 mg GAE/g, respectively. The total phenolic content was increased further when the heating time increased to 30 min. It seemed that the longer time of heating of black cumin seeds broke the covalently bound phenolic compound on the cell wall to release the phenolic compound, which was readily soluble in methanol. It is believed that this phenolic compound may be beneficial for its antioxidant properties (Choi et al., 2006). Another reason for increased antioxidant content at the time of heating was that heating inactivates the endogenous oxidative enzyme, preventing further oxidation of antioxidant compounds in the raw plant material (Nicoli et al., 1999; Dewanto et al., 2002).
Interestingly, the total phenolic content for the superheated steam-roasted sample was also higher compared with that of the conventional hot-air-roasted sample, except for 20 min when no significant difference was detected. However, during the initial stage of the superheated steaming, the total phenolic content also increased 2.5-fold from 5.17 to 13.55 mg GAE/g compared with conventional hot air heating, which showed a lower increment
of 2-fold from 5.17 to 10.41 mg GAE/g. Superheated steam has a high heat transfer coefficient, especially at the initial stage of heating than hot-air drying (Ohishi & Shibukawa, 2010). The higher heat transfer coefficient of superheated steam seemed to have more effectively cleft the covalently bound phenolic compound from the seed. As the heating time was increased, the superheated steamed sample also showed a higher total phenolic content than that seen after conventional hot air heating. The highest amount of total phenolic content was found at 180°C after heating for 30 min using superheated steam at 15.04 mg GAE/g. Some studies have suggested that superheated steam-heated foods can retain antioxidants, vitamins and other essential nutrients due to the absence of oxygen, thus reducing oxidation of antioxidant compounds (Head et al., 2010; Wang et al., 2012).
There is no information available in the literature on the effects of superheated steam and conventional hot air heating on the phenolic content of black cumin seed. However, for other plants, the effect of heating treatment on total phenolic content has been reported. Dewanto et al. (2002) reported significantly higher concentrations of the soluble phenolic compound in commercially processed sweet corn compared with fresh ones. They suggested that soluble the phenolic compound in sweet corn can be liberated by heat treatment. Kim et al. (2006) reported that total the phenolic compound in grape seed extract increased when heating time
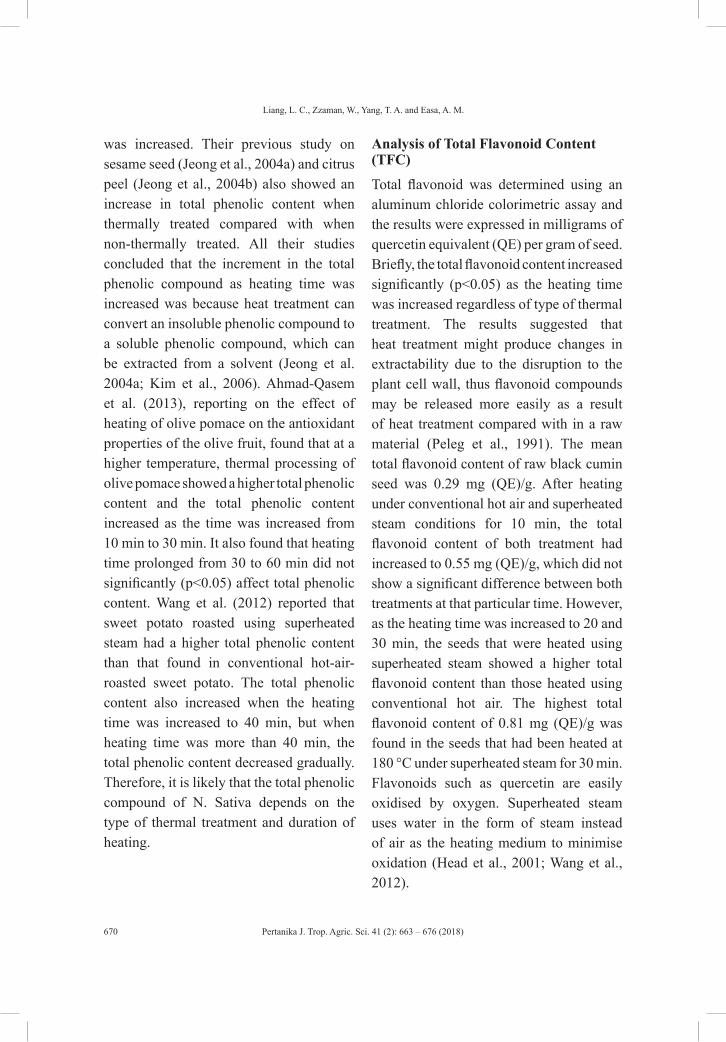
Pertanika J. Trop. Agric. Sci. 41 (2): 663 – 676 (2018)
Liang, L. C., Zzaman, W., Yang, T. A. and Easa, A. M.
670
was increased. Their previous study on sesame seed (Jeong et al., 2004a) and citrus peel (Jeong et al., 2004b) also showed an increase in total phenolic content when thermally treated compared with when non-thermally treated. All their studies concluded that the increment in the total phenolic compound as heating time was increased was because heat treatment can convert an insoluble phenolic compound to a soluble phenolic compound, which can be extracted from a solvent (Jeong et al. 2004a; Kim et al., 2006). Ahmad-Qasem et al. (2013), reporting on the effect of heating of olive pomace on the antioxidant properties of the olive fruit, found that at a higher temperature, thermal processing of olive pomace showed a higher total phenolic content and the total phenolic content increased as the time was increased from 10 min to 30 min. It also found that heating time prolonged from 30 to 60 min did not significantly (p<0.05) affect total phenolic content. Wang et al. (2012) reported that sweet potato roasted using superheated steam had a higher total phenolic content than that found in conventional hot-air-roasted sweet potato. The total phenolic content also increased when the heating time was increased to 40 min, but when heating time was more than 40 min, the total phenolic content decreased gradually. Therefore, it is likely that the total phenolic compound of N. Sativa depends on the type of thermal treatment and duration of heating.
Analysis of Total Flavonoid Content (TFC)
Total flavonoid was determined using an aluminum chloride colorimetric assay and the results were expressed in milligrams of quercetin equivalent (QE) per gram of seed. Briefly, the total flavonoid content increased significantly (p<0.05) as the heating time was increased regardless of type of thermal treatment. The results suggested that heat treatment might produce changes in extractability due to the disruption to the plant cell wall, thus flavonoid compounds may be released more easily as a result of heat treatment compared with in a raw material (Peleg et al., 1991). The mean total flavonoid content of raw black cumin seed was 0.29 mg (QE)/g. After heating under conventional hot air and superheated steam conditions for 10 min, the total flavonoid content of both treatment had increased to 0.55 mg (QE)/g, which did not show a significant difference between both treatments at that particular time. However, as the heating time was increased to 20 and 30 min, the seeds that were heated using superheated steam showed a higher total flavonoid content than those heated using conventional hot air. The highest total flavonoid content of 0.81 mg (QE)/g was found in the seeds that had been heated at 180 °C under superheated steam for 30 min. Flavonoids such as quercetin are easily oxidised by oxygen. Superheated steam uses water in the form of steam instead of air as the heating medium to minimise oxidation (Head et al., 2001; Wang et al., 2012).

Pertanika J. Trop. Agric. Sci. 41 (2): 663 – 676 (2018)
Antioxidant Activities of Black Cumin (N. sativa) Seeds
671
There is as yet no information on the effect of heating treatment on the flavonoid content of black cumin seed. However, the results of this study were consistent with those obtained from studying other plants as reported, for instance, by Choi et al. (2006), who reported significantly higher concentrations of free flavonoid content in Shiittake mushroom compared with that in raw Shiitake mushroom. Wang et al. (2012) reported that sweet potatoes roasted using conventional hot air and superheated steam also showed an increase in total flavonoid content as the heating time was increased to 40 min.
Analysis DPPH Radical Scavenging Activity
Free radicals are reactive species and are known to damage proteins, cause breakdown of DNA strands, initiate peroxidation and trigger various health problems and degenerative diseases such as cancer. Flavonoid and phenolic compounds in plants are the constituents that provide free radical scavenging ability due to their good hydrogen and electron acceptor activities. The DPPH radical scavenging activities assay is one of the known methods to measure antioxidant activities in black cumin seed (Mariod et al., 2009). The DPPH (2,2-diphenyl-1-picrylhydrazyl) is a stable radical showing maximum absorbance at 517 nm. Its purple colour fades rapidly when DPPH encounters radical scavengers. The reduction in the DPPH absorbance is the measure of scavenging activities.
The percentage of radical scavenging activities of the seed samples treated with conventional hot air and superheated steam in this study are shown in Figure 3. Generally, DPPH radical scavenging activities increased significantly (p<0.05) as heating time was increased in both thermal treatments. After the samples were heated using conventional hot air and superheated steam for 10 min, the DPPH radical scavenging activities increased to 67.30% and 71.20%, respectively. Radical scavenging activities increased further when heating was increased; the highest scavenging activity of 81.28% was found after treatment using superheated steam for 30 min. When the two methods of heating were compared, the results showed that the seeds heated using superheated steam showed higher scavenging activities than those heated using conventional hot air as heating time was increased. The results showed that black cumin seeds heated using superheated steam for 30 min showed the highest scavenging activities for DPPH, whereas the seeds heated using conventional hot air for 10 min showed the lowest. The superheated steam heating system is an oxygen-free environment as water is used as the heating medium, thus less oxidation occurs, resulting in higher antioxidant properties than when the conventional hot air heating system is used because oxygen is absent in the system (Head et al., 2010; Wang et al., 2012). Research into the effects of conventional hot air heating on antioxidant activities of other plant seeds, particularly grape seed,
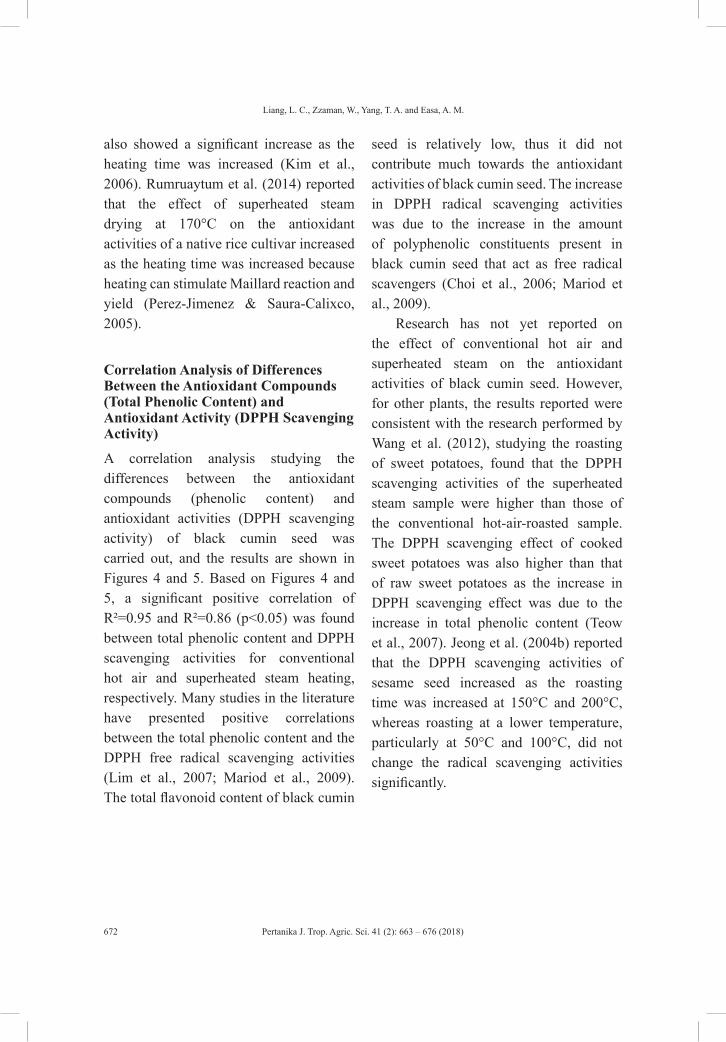
Pertanika J. Trop. Agric. Sci. 41 (2): 663 – 676 (2018)
Liang, L. C., Zzaman, W., Yang, T. A. and Easa, A. M.
672
also showed a significant increase as the heating time was increased (Kim et al., 2006). Rumruaytum et al. (2014) reported that the effect of superheated steam drying at 170°C on the antioxidant activities of a native rice cultivar increased as the heating time was increased because heating can stimulate Maillard reaction and yield (Perez-Jimenez & Saura-Calixco, 2005).
Correlation Analysis of Differences Between the Antioxidant Compounds (Total Phenolic Content) and Antioxidant Activity (DPPH Scavenging Activity)
A correlation analysis studying the differences between the antioxidant compounds (phenolic content) and antioxidant activities (DPPH scavenging activity) of black cumin seed was carried out, and the results are shown in Figures 4 and 5. Based on Figures 4 and 5, a significant positive correlation of R²=0.95 and R²=0.86 (p<0.05) was found between total phenolic content and DPPH scavenging activities for conventional hot air and superheated steam heating, respectively. Many studies in the literature have presented positive correlations between the total phenolic content and the DPPH free radical scavenging activities (Lim et al., 2007; Mariod et al., 2009). The total flavonoid content of black cumin
seed is relatively low, thus it did not contribute much towards the antioxidant activities of black cumin seed. The increase in DPPH radical scavenging activities was due to the increase in the amount of polyphenolic constituents present in black cumin seed that act as free radical scavengers (Choi et al., 2006; Mariod et al., 2009).
Research has not yet reported on the effect of conventional hot air and superheated steam on the antioxidant activities of black cumin seed. However, for other plants, the results reported were consistent with the research performed by Wang et al. (2012), studying the roasting of sweet potatoes, found that the DPPH scavenging activities of the superheated steam sample were higher than those of the conventional hot-air-roasted sample. The DPPH scavenging effect of cooked sweet potatoes was also higher than that of raw sweet potatoes as the increase in DPPH scavenging effect was due to the increase in total phenolic content (Teow et al., 2007). Jeong et al. (2004b) reported that the DPPH scavenging activities of sesame seed increased as the roasting time was increased at 150°C and 200°C, whereas roasting at a lower temperature, particularly at 50°C and 100°C, did not change the radical scavenging activities significantly.
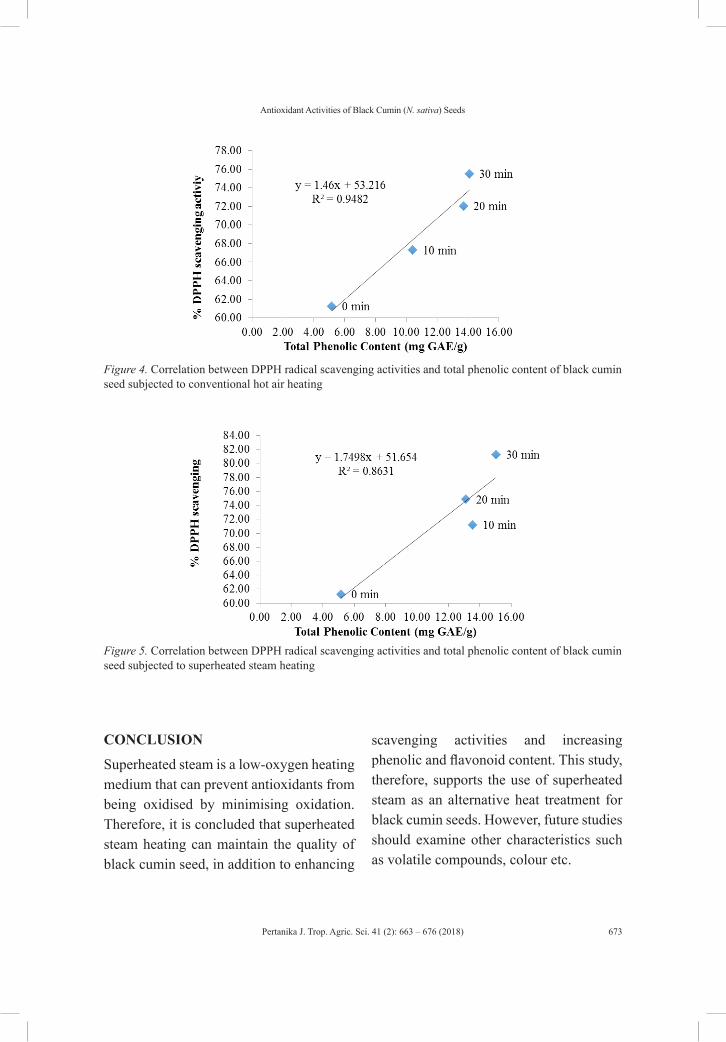
Pertanika J. Trop. Agric. Sci. 41 (2): 663 – 676 (2018)
Antioxidant Activities of Black Cumin (N. sativa) Seeds
673
Figure 4. Correlation between DPPH radical scavenging activities and total phenolic content of black cumin seed subjected to conventional hot air heating
Figure 5. Correlation between DPPH radical scavenging activities and total phenolic content of black cumin seed subjected to superheated steam heating
CONCLUSION
Superheated steam is a low-oxygen heating medium that can prevent antioxidants from being oxidised by minimising oxidation. Therefore, it is concluded that superheated steam heating can maintain the quality of black cumin seed, in addition to enhancing
scavenging activities and increasing phenolic and flavonoid content. This study, therefore, supports the use of superheated steam as an alternative heat treatment for black cumin seeds. However, future studies should examine other characteristics such as volatile compounds, colour etc.
Pertanika J. Trop. Agric. Sci. 41 (2): 663 – 676 (2018)
Liang, L. C., Zzaman, W., Yang, T. A. and Easa, A. M.
674
REFERENCESAhmad-Qasem, M. H., Barrajon-catalan, E., Micol,
V., Cárcel, J. A., & Garcia-perez, J. V. (2013). Influence of air temperature on drying kinetics and antioxidant potential of olive pomace. Journal of Food Engineering, 119(3), 516–524.
Bucić-Kojić, A., Planinić, M., Tomas, S., Jokić, S., Mujić, I., Bilić, M., & Velić, D. (2011). Effect of extraction conditions on the extractability of phenolic compounds from lyophilised fig fruits (Ficus Carica L.). Polish Journal of Food and Nutrition Sciences, 61(3), 195–199.
Chen, X. M., & Kitts, D. D. (2008). Antioxidant activities and chemical properties of crudes and fractionated Maillard reaction products derived from four sugar-amino acid Maillard reaction model systems. Annual New York Academic Science, 1126(1), 220–224.
Choi, Y., Lee, S. M., Chun, J., Lee, H. B., & Lee, J. (2006). Influence of heat treatment on the antioxidant activities and polyphenolic compounds of shiitake (Lentinus edodes) mushroom. Food Chemistry, 99(2), 381–387.
Dawidowicz, A. L., Wianowska, D., & Baraniak, B. (2006). The antioxidant properties of alcoholic extracts from Sambucus nigra L. (antioxidant properties of extracts). Lebensmittel-Wissenschaft und Technologic, 39(3), 308–315.
Dewanto, V., Wu, X., & Liu, R. H. (2002). Processed sweet corn has higher antioxidant activities. Journal of Agricultural and Food Chemistry, 50(17), 4959–4964.
Head, D. S., Cenkowski, S., Arntfield, S., & Henderson K. (2010). Superheated steam processing of oat groats. LWT – Food Science and Technology, 43(4), 690–694.
Horwitz, W. (2000). Official methods of analysis of AOAC International (17th Ed.). Association of Official Agricultural Chemists International.
Jeong, S. M., Kim, S. Y., Kim, D. R., Jo, S. C., Nam, K. C., & Ahn, D. U. (2004b). Effect of heat treatment on antioxidant activities of citrus peels. Journal of Agricultural and Food Chemistry, 52(11), 3389–3393.
Jeong, S. M., Kim, S. Y., Kim, D. R., Nam, K. C., Ahn, D. U., & Lee, S. C. (2004a). Effect of seed roasting conditions on the antioxidant activities of defatted sesame meal extracts. Journal of Food Science, 69(5), 377–381.
Kanakdande, D., Bhosale, R., & Singhal, R. (2006). Stability of cumin oleoresin microencapsulated in different combination of gum Arabic, maltodextrin and modified starch. Food Engineering and Technology Department, 67(4), 536–541.
Kim, S., Jeong, S., Park, W., Nam, K. C., Ahn, D. U., & Lee, S. (2006). Food chemistry effect of heating conditions of grape seeds on the antioxidant activities of grape seed extracts. Food Chemistry, 97(3), 472–479.
Kiralan, M. (2012). Volatile compounds of black cumin seeds (Nigella sativa L.) from microwave-heating and conventional roasting. Journal of Food Science, 77(4), 481–484.
Lee, J. Y., Hwang, W. I., & Lim, S. -T. (2004). Antioxidant and anticancer activities of organic extracts from Platycodon grandiflorum a. De Candolle roots. Journal of Ethnopharmacology, 93(2-3), 409–415.
Li, Y. B., Seyed-Yagoobi, J., Moreira, R. G., & Yamsaengsung, R. (1999). Superheated steam impingement drying of tortilla chips. Drying Technology, 17(1-2), 191–213.
Lim, Y. Y., Lim, T. T., & Tee, J. J. (2007). Antioxidant properties of several tropical fruits: A comparative study. Food Chemistry, 103(3), 1003–1008.
Pertanika J. Trop. Agric. Sci. 41 (2): 663 – 676 (2018)
Antioxidant Activities of Black Cumin (N. sativa) Seeds
675
Lutterodt, H., Luther, M., Slavin, M., Yin, J. J., Parry, J., Gao, J. M., & Yu, L. (2010). Fatty acid profile, thymoquinone content, oxidative stability and antioxidant properties of cold-pressed black cumin seed oils. Food Science and Technology, 43(9), 1409-1413.
Mariod, A. A., Ibrahim, R. M., Ismail, M., & Ismail, N. (2009). Antioxidant activities and phenolic content of phenolic rich fractions obtained from black cumin (Nigella sativa) seedcake. Food Chemistry, 116(1), 306–312.
Nagi, M. N., & Mansour, M. A. (2000). Protective effect of thymoquinone against doxorubicin induced cardiotoxicity in rats: A possible mechanism of protection. Pharmacological Research, 41(3), 283–289.
Nicoli, M. C., Anese, M., Parpinel, M. T., & Franceschi, S. (1999). Influence of processing on the antioxidant properties of fruits and vegetables. Trends in Food Science and Technology, 10(3), 94–100.
Ohishi, K., & Shibukawa, S. (2010). Investigation of the use of superheated steam with a household oven during the baking of sponge cake. Journal of Cookery Science of Japan, 43(5), 286–293.
Peleg, H., Naim, M., Rouseff, R. L., & Zehavi, U. (1991). Distribution of bound and free polyphenolic acids in oranges (Citrus sinensis) and grapefruit (Citrus paradise). Journal of the Science of Food and Agriculture, 57(3), 417–426.
Perez-Jimenez, J., & Saura-Calixco, F. (2005). Literature data may underestimate the actual antioxidant capacity of cereals. Journal of Agricultural and Food Chemistry, 53(12), 5036–5040.
Pronyk, C., Cenkowski, S., & Muir, W. E. (2004). Drying foodstuffs with superheated steam. Drying Technology, 22(5), 899–916.
Ramadan, M. F. (2007). Nutritional value, functional properties and nutraceutical applications of black cumin (Nigella sativa L.): An overview. International Journal of Food Science and Technology, 42(10), 1208–1218.
Rumruaytum, P., Borompichaichartkul, C., & Kongpensook, V. (2014). Effect of drying involving fluidisation in superheated steam on physicochemical and antioxidant properties of Thai native rice cultivars. Journal of Food Engineering Journal, 123, 143–147.
Sánchez-Moreno, C., Larrauri, J. A., & Saura-Calixto, F. A. (1998). Procedure to measure the antiradical efficiency of polyphenols. Journal of the Science of Food and Agriculture, 76(2), 270–276.
Shan, O. E., Zzaman, W., & Yang, T. A. (2016). Impact of different temperature-time profiles during superheated steam roasting on some physical changes of robusta coffee. Tropical Agricultural Science, 39(3), 311–320.
Shin, L. E. R., Zzaman, W., Kuang, Y. T., & Bhat, R. (2015). Influence of dehydration techniques on physicochemical, antioxidant and microbial qualities of Ipomoea aquatica Forsk.: An underutilized green leafy vegetable. Journal of Food Processing and Preservation, 39(6), 1118–1124.
Teow, C. C., Truong, V. D., McFeeters, R. F., Thompson, R. L., Pecota, K. V., & Yencho, G. C. (2007). Antioxidant activities, phenolic and b-carotene contents of sweet potato genotypes with varying flesh colours. Food Chemistry, 103(3), 829–838.
Wang, T., Chen, B., Shen, Y., Wong, J., Yang, C., & Lin, T. (2012). Influences of superheated steaming and roasting on the quality and antioxidant activities of cooked sweet potatoes. International Journal of Food Science and Technology, 47(8), 1720–1727.

Pertanika J. Trop. Agric. Sci. 41 (2): 663 – 676 (2018)
Liang, L. C., Zzaman, W., Yang, T. A. and Easa, A. M.
676
Zzaman, W., & Yang, T. A. (2014). Moisture, color and texture changes in cocoa beans during superheated steam roasting. Journal of Food Processing and Preservation, 38(3), 1364–1370.
Pertanika J. Trop. Agric. Sci. 41 (2): 677 – 686 (2018)
ISSN: 1511-3701 © Universiti Putra Malaysia Press
TROPICAL AGRICULTURAL SCIENCEJournal homepage: http://www.pertanika.upm.edu.my/
ARTICLE INFOArticle history:Received: 17 June 2017Accepted: 8 November 2017
E-mail addresses:[email protected] (Vanielie Terrence Justine)[email protected] (Muskhazli Mustafa)[email protected] (Rusea Go)* Corresponding author
Effect of Antimicrobial Activities on the Various Solvents Extracts of Leaves of Scurrula Ferruginea (Jack) Danser (Loranthaceae)
Vanielie Terrence Justine, Muskhazli Mustafa and Rusea Go*Department of Biology, Faculty of Science, Universiti Putra Malaysia, 43400 UPM, Serdang, Selangor, Malaysia
ABSTRACT
Scurrula ferruginea is widely distributed in Southeast Asian countries and has commonly been used as a medicinal plant to treat many diseases caused by microbes. This study was conducted to evaluate the effect of using various solvents extractions on S. ferruginea leaves and their antimicrobial activities. Oven dried (60°C) leaves of S. ferruginea were extracted with aqueous and organic solvents. Antimicrobial activities of the extracts were tested against Staphylococcus aureus S261, Escherichia coli E57, Candida albicans C205 and Trichophyton rubrum T62 using Disc Diffusion Method, Minimum Inhibitory Concentration (MIC), Minimum Bactericidal Concentration (MBC) and Minimum Fungicidal Concentration (MFC) respectively. The ideal solvent was 80% methanol with values of the zone of inhibition ranging from 7.98 to 9.71 mm and 450 to 900µg/mL (MIC and MBC) for S. aureus and E. coli, respectively. The present findings revealed that the leaves of S. ferruginea have inhibitory effects on several pathogenic microbes and can be suggested as a potential source of natural antimicrobial compounds.
Keywords: MBC, MFC, MIC, Mistletoes, Scurrula ferruginea
INTRODUCTION
The complexity of plant phytochemical due to the various chemical structures and properties in different polarity, makes it an unorthodox solvent for extracting bioactive compound for each plant species (Khoddami, Wilkes, & Roberts, 2013). Universal solvent extraction has been used to investigate the best solvent for extracting

Pertanika J. Trop. Agric. Sci. 41 (2): 677 – 686 (2018)
Vanielie Terrence Justine, Muskhazli Mustafa and Rusea Go
678
healing properties in plant materials. Traditionally, the aqueous solvent was used in ethnobotany practices and is found to be the most polar solvent. Meanwhile, organic solvents and their combination with water are considered modern and widely accepted as a result of positive outcomes in extracting more bioactive metabolites (Garcia-salas, Morales-soto, Segura-carretero, & Fernandez-gutierrez, 2010). The use of varying polarity solvents is crucial for a systematic approach in obtaining the finest solvent that shows optimum antimicrobial activity.
Medicinal plants that have been used since ancient times have therapeutic properties for numerous human diseases caused by pathogens. Bioactive compounds comprise phenolic compounds, alkaloids, flavonoids and tannins are notable sources of anti-infective agents that contribute to human health (Hassan, Sirat, Yagi, Koko, & Abdelwahab, 2011; Farjana, Zerin, & Kabir, 2014). Currently, several studies have shown that natural products possess more than one biological effects such as antioxidant and antimicrobial (Ahmad, Anwar, Hameed, & Boyce, 2011; Bano, Girmay, & Tan, 2012; Ghasemzadeh, Jaafar, Rahmat, & Ashkani, 2015; Norziah, Fezea, Bhat & Ahmad, 2015; Syukriah, Liza, Harisun, & Fadzillah, 2014). These make medicinal plants interesting sources of natural antimicrobial properties as they give numerous beneficial effects to human well-being.
Nowadays, antimicrobial resistance is rapidly increasing and has become a worldwide concern (Oldfield & Feng,
2014). This has prompted a deep awareness on the need for exploration of novel antimicrobial compounds from medicinal plants for alternative antimicrobial as it does not offer negative effects to human health like the way antibiotics do. O’Neill, (2016) reported that an approximate of 10 million lives will be lost globally by the year 2050 as a result of antibiotic resistance by microbes. This figure is more than the death that occurs from cancer annually. As such, a novel product of antimicrobial compound derived from plants needs to be explored and studied extensively.
Scurrula ferruginea (Jack) Danser is a hemiparasitic plant that is mainly distributed in Malaysia, Singapore, Indonesia, Vietnam, Thailand, Myanmar, the Philippines, Cambodia, China and Laos (Huaxing & Gilbert, 2003). In Malay, it is locally known as “dedalu api merah” and has been used in folk medicine in Southeast Asia. In traditional practices, leaves of S. ferruginea are used in the treatment of shingles, malaria, high blood pressure, wound healing, snake-bites, easing urination pain, hypertension, gastrointestinal conditions and protective medicine after childbirth (Burkill, 1996; Lemmens & Bunyapraphatsara, 2003; Mat-Salleh & Latiff, 2002; Werner, 2002). Thus, a systematic approach on the effect of solvent extraction on antimicrobial activity of Scurrula ferruginea is studied to determine the finest solvent that shows optimal inhibitory effects on selective microbes. To date, no literature has been reported on solvent effects on antimicrobial activities of this mistletoe.
Pertanika J. Trop. Agric. Sci. 41 (2): 677 – 686 (2018)
Antimicrobial Activity of Malaysian Mistletoe
679
MATERIALS AND METHODS
Preparation of Plant Material
The leaves of Scurrula ferruginea were collected at the full flowering stage and the plant was taxonomically authenticated by Prof. Dr. Rusea Go. The plant’s voucher specimen (RG4664), was deposited at the Biology Department Herbarium, Universiti Putra Malaysia (UPM). The leaf samples were oven dried at 60°C for 24 hours. The dried leaves were ground using a mill, and the powdered samples were then packaged in nylon linear low-density polyethylene pouches and stored in the dark at an ambient temperature.
Crude Extracts Preparation
The method described by Obeidat et al. (2012) was adopted with slight modification. For extraction of the dried powder, aqueous, organic and aqueous-organic solvents were used. About 10 grams of dried powder of S. ferruginea leaves were soaked in each of deionised water, 80% methanol, 80% acetone, and benzene solvents (1:10 w/v) respectively and extracted for 24 hours at 28±2°C with vigorous shaking at 200 rpm. The samples were then filtered through Whatman No. 1 filter paper before the filtrated aqueous extracts were lyophilised. The extracts were evaporated using a rotary evaporator at 40±1°C. The dried crude extracts were weighed and stock solution (100mg/ml) was prepared by diluting it according to their solvent before keeping at -20°C freezer.
Growth and Maintenance of Microbes
Four species of pathogenic microbes comprising Staphyloccocus aureus S261, Escherichia coli E57, Candida albicans C205 and Trichophyton rubrum T62 were obtained from Institute of Medical Research, Kuala Lumpur, Malaysia. Bacterial strains were maintained in nutrient agar plates and fungi strains in potato dextrose agar plates respectively in biosystematics plant and Microbe Laboratory, Biology Department, Faculty of Science, UPM. Malaysia. All microbes were kept in a chiller, at 4°C.
Antibacterial Activity
Antibacterial activity was determined using modification protocol by Hussain, Khan, Hussain and Habib (2011). Using disc diffusion method, an inoculum containing bacterial cells from agar plate stock was subcultured in 5 ml of Mueller-Hinton Broth (MHB) and incubated for 24 hours. Bacterial inoculum was prepared in 10 ml MHB that contained 1 x 10⁸ (CFU ml-1). A volume of 400 microliter 1 x 10⁸ (CFU ml-1) was poured evenly over the surface of 9 cm diameter petri dishes containing Mueller Hinton Agar (MHA).
Sample disc was prepared by using 6 mm antibiotic assay discs (Whatman Grade AA disc). Following this, 20 microliters (100 mg/ml) were pipetted from the stock sample and dropped to the sample discs. The discs were placed on a prepared bacterial MHA plates. Ciprofloxacin (100 µg/ml) and water were used as positive control and negative control respectively.
Pertanika J. Trop. Agric. Sci. 41 (2): 677 – 686 (2018)
Vanielie Terrence Justine, Muskhazli Mustafa and Rusea Go
680
Zone of inhibition (mm) of bacteria was examined after incubation for 24 hours at 37°C. All experiments were carried out in triplicates. Extracts that showed positive response or susceptibility to the strains were selected for further analysis.
Antifungal Activity
Antifungal activity was carried out using the method of Hussain et al. (2011) with modifications. Candida albicans and Trichophyton rubrum were cultivated in Saboraud Dextrose Agar (SDA) for 72 hours and 14 days at 28±2°C respectively. Fungal spores were collected using 0.05% between 80 and centrifuged at 3000 rpm for five minutes. Subsequently, the fungal inoculum was prepared in 10 ml Sabouraud Dextrose Broth (SDB) containing 1x10⁶
spore ml-1 using supernatant solution. About 400 microliter 1x10⁶ spore ml-1 were poured into SDA plates.
Then, 20 microliters (100 mg/ml) of plant extracts were pipetted and dropped to the sample discs. The sample discs were subsequently placed on a prepared fungal SDA plates. Nystatin (50 µg/mL) and water were used as positive control and negative control respectively. Zone of inhibition (mm) of bacteria was measured after incubation of 72 hours at 28±2°C. All experiments were carried out in triplicates. The extracts which showed positive response or susceptibility to the strains were selected for further analysis.
Minimum Inhibitory Concentration (MIC), Minimum Bactericidal Concentration (MBC) and Minimum Fungicidal Concentration (MFC)
MIC, MBC and MFC tests were performed in sterile 96-well microplates as described by Marvibaigi et al. (2014) and Al-Hussaini and Mahasneh (2011) with slight modification. All extracts were properly prepared and transferred to each microplate well in order to obtain a twofold serial dilution of the original extract (from the concentration, 1800 to 14.06 µg/ml). Experiments were performed with 100µl of stock sample added in the first three rows and 100 µl Mueller-Hinton broth (bacteria) and Sabouraud Dextrose Broth (fungi) used as diluents followed. Then, 30 microliters of bacteria 1 x 10⁸ (CFU ml-1) and fungi 1x10⁶
spore ml-1 samples were added to all rows. The plates were incubated at 37°C for 24 hours and 28±2°C for 72 hours for bacteria and fungi respectively, after which they were examined for the presence or absence of growth. The MIC was determined as the lowest concentration of extracts at which no colony was observed after incubation (no macroscopic visible growth).
In order to determine MBC and MFC, a small amount of sample from microplates with no visible growth were streaked gently on agar plates using a sterile cotton swab and incubated at 37°C for 24 hours and 28±2°C for 72 hours for bacteria and fungi respectively. MBC and MFC were defined as the lowest concentration of extract that inhibited 99.9% of the bacteria and fungi growth. Each experiment was repeated in triplicates.
Pertanika J. Trop. Agric. Sci. 41 (2): 677 – 686 (2018)
Antimicrobial Activity of Malaysian Mistletoe
681
Statistical Analysis
Results were expressed as the mean ± standard deviation of triplicate and analysed using SPSS software (version 22). One-way analysis of variance (ANOVA) with Duncan’s test was carried out to test significant difference between levels of treatment. P < 0.05 was considered significant and P < 0.01 as very significant.
RESULTS
Antimicrobial Activities
The analysis showed that extraction solvents significantly affected antimicrobial activity (disc diffusion method) of S. ferruginea leaves (p<0.05), as shown in Table 1. The zone of inhibition (mm) based on extraction solvents S.
aureus ranged from 7.91 mm to 9.63 mm. Methanol offered the highest inhibition zones (9.63 mm), followed by 80% methanol (9.55 mm) while the least was in acetone (7.91 mm). However, the zone of inhibition in E. coli varied from 7.10 mm to 8.26 mm. The highest zone of inhibition belonged to 80% methanol (8.26 mm), followed by methanol (8.20 mm) while the least was in acetone (7.10 mm). As expected, the negative controls showed no activity against any of the bacterial or fungal strains. The standard antibiotic ciprofloxacin exhibited the highest zone of inhibition (mm) in S. aureus (14.65 mm) and E. coli (12.43 mm) while nystatin gave 11.26 mm for C. albicans but there was no activity against T. rubrum.
Table 1 Antimicrobial activities (disc diffusion method) on leaf extracts of S. ferruginea.
Inhibition zones (mm ± SD)1
Samples Staphylococcus aureus S261
Escherichia coli E57
Candida albicans C205
Trichophyton rubrum T62
deionized water na na na na100% methanol 9.63±0.13c 8.20±0.02c na na80% methanol 9.55±0.16c 8.26±0.28c na na100% acetone 7.91±0.15a 7.10±0.04a na na80% acetone 8.86±0.03b 7.93±0.08b na na
benzene na na na naCiproflocaxin2 14.65±0.11d 12.43±0.16d ― ―
Nystatin3 ― ― 11.26±0.10a na
Values are means of three replicates (N=3 ± SD). Samples with similar letters superscript are significantly similar (p>0.05) checked by Duncan test. 1Inhibition zones including the diameter disk (6 mm); 2ciprofloxacin at 100 μg/ml; 3nystatin at 50 μg/ml; (na): not available; (―): not evaluated
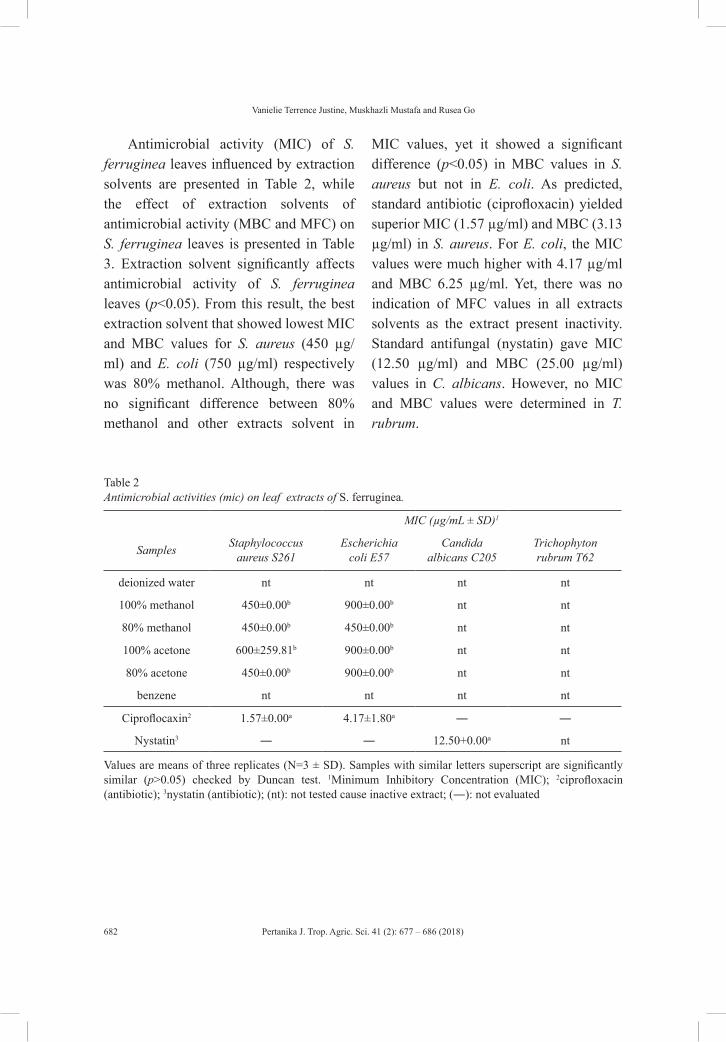
Pertanika J. Trop. Agric. Sci. 41 (2): 677 – 686 (2018)
Vanielie Terrence Justine, Muskhazli Mustafa and Rusea Go
682
Antimicrobial activity (MIC) of S. ferruginea leaves influenced by extraction solvents are presented in Table 2, while the effect of extraction solvents of antimicrobial activity (MBC and MFC) on S. ferruginea leaves is presented in Table 3. Extraction solvent significantly affects antimicrobial activity of S. ferruginea leaves (p<0.05). From this result, the best extraction solvent that showed lowest MIC and MBC values for S. aureus (450 µg/ml) and E. coli (750 µg/ml) respectively was 80% methanol. Although, there was no significant difference between 80% methanol and other extracts solvent in
MIC values, yet it showed a significant difference (p<0.05) in MBC values in S. aureus but not in E. coli. As predicted, standard antibiotic (ciprofloxacin) yielded superior MIC (1.57 µg/ml) and MBC (3.13 µg/ml) in S. aureus. For E. coli, the MIC values were much higher with 4.17 µg/ml and MBC 6.25 µg/ml. Yet, there was no indication of MFC values in all extracts solvents as the extract present inactivity. Standard antifungal (nystatin) gave MIC (12.50 µg/ml) and MBC (25.00 µg/ml) values in C. albicans. However, no MIC and MBC values were determined in T. rubrum.
Table 2 Antimicrobial activities (mic) on leaf extracts of S. ferruginea.
MIC (µg/mL ± SD)1
Samples Staphylococcus aureus S261
Escherichia coli E57
Candida albicans C205
Trichophyton rubrum T62
deionized water nt nt nt nt
100% methanol 450±0.00b 900±0.00b nt nt
80% methanol 450±0.00b 450±0.00b nt nt
100% acetone 600±259.81b 900±0.00b nt nt
80% acetone 450±0.00b 900±0.00b nt nt
benzene nt nt nt nt
Ciproflocaxin2 1.57±0.00a 4.17±1.80a ― ―
Nystatin3 ― ― 12.50+0.00a nt
Values are means of three replicates (N=3 ± SD). Samples with similar letters superscript are significantly similar (p>0.05) checked by Duncan test. 1Minimum Inhibitory Concentration (MIC); 2ciprofloxacin (antibiotic); 3nystatin (antibiotic); (nt): not tested cause inactive extract; (―): not evaluated
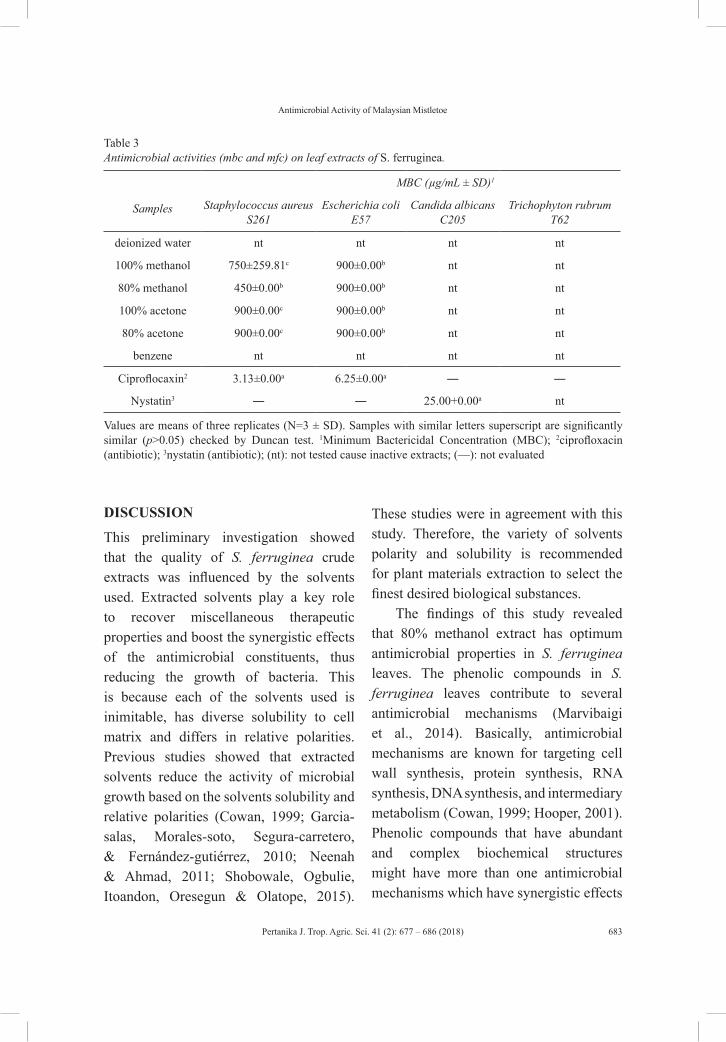
Pertanika J. Trop. Agric. Sci. 41 (2): 677 – 686 (2018)
Antimicrobial Activity of Malaysian Mistletoe
683
Table 3Antimicrobial activities (mbc and mfc) on leaf extracts of S. ferruginea.
Samples
MBC (µg/mL ± SD)1
Staphylococcus aureus S261
Escherichia coli E57
Candida albicans C205
Trichophyton rubrum T62
deionized water nt nt nt nt
100% methanol 750±259.81c 900±0.00b nt nt
80% methanol 450±0.00b 900±0.00b nt nt
100% acetone 900±0.00c 900±0.00b nt nt
80% acetone 900±0.00c 900±0.00b nt nt
benzene nt nt nt nt
Ciproflocaxin2 3.13±0.00a 6.25±0.00a ― ―
Nystatin3 ― ― 25.00+0.00a nt
Values are means of three replicates (N=3 ± SD). Samples with similar letters superscript are significantly similar (p>0.05) checked by Duncan test. 1Minimum Bactericidal Concentration (MBC); 2ciprofloxacin (antibiotic); 3nystatin (antibiotic); (nt): not tested cause inactive extracts; (—): not evaluated
DISCUSSION
This preliminary investigation showed that the quality of S. ferruginea crude extracts was influenced by the solvents used. Extracted solvents play a key role to recover miscellaneous therapeutic properties and boost the synergistic effects of the antimicrobial constituents, thus reducing the growth of bacteria. This is because each of the solvents used is inimitable, has diverse solubility to cell matrix and differs in relative polarities. Previous studies showed that extracted solvents reduce the activity of microbial growth based on the solvents solubility and relative polarities (Cowan, 1999; Garcia-salas, Morales-soto, Segura-carretero, & Fernández-gutiérrez, 2010; Neenah & Ahmad, 2011; Shobowale, Ogbulie, Itoandon, Oresegun & Olatope, 2015).
These studies were in agreement with this study. Therefore, the variety of solvents polarity and solubility is recommended for plant materials extraction to select the finest desired biological substances.
The findings of this study revealed that 80% methanol extract has optimum antimicrobial properties in S. ferruginea leaves. The phenolic compounds in S. ferruginea leaves contribute to several antimicrobial mechanisms (Marvibaigi et al., 2014). Basically, antimicrobial mechanisms are known for targeting cell wall synthesis, protein synthesis, RNA synthesis, DNA synthesis, and intermediary metabolism (Cowan, 1999; Hooper, 2001). Phenolic compounds that have abundant and complex biochemical structures might have more than one antimicrobial mechanisms which have synergistic effects
Pertanika J. Trop. Agric. Sci. 41 (2): 677 – 686 (2018)
Vanielie Terrence Justine, Muskhazli Mustafa and Rusea Go
684
against infectious microbes compared to synthetic antibiotics. However, this study does not fully clarify the potency against a range of microorganisms and which of the mechanisms are employed.
The varieties of chemical structure and function in plants secondary metabolites contribute to different potency against vast pathogenic microbes. Antifungal compounds embattled the formation or the function of ergosterol, which is an important component of fungal cell membrane, and form pores in the membrane that leads to K+ leakage, acidification, cellysis and death of fungus (Ghannoum & Rice, 1999; Hammond, 1977). Yet, the results from this study show no available antifungal compound that might be present in the S. ferruginea leaves extract that can be suggested as having inhibitory effects on C. albicans and T. rubrum.
Previous studies by Srinivasan, Nathan, Suresh and Perumalsamy, (2001) showed that only eight out of 50 plant crude extracts have antimicrobial activity against pathogenic fungi. The result of our study also support the findings by Hussain et al., (2011) who showed that Viscum album extracts (acetone, petroleum ether, ethyl acetate, chloroform, ethanol, methanol and water) did not have antifungal activity against S. cerevisiae and A. flavus. Similarly, another literature reported non-activity in water extract against most bacterial strains (Igbinosa, Igbinosa, & Aiyegoro, 2009).
Additionally, the results also display anthropophilic dermatophyte, where T. rubrum turned into ‘superbug’ which shows resistance to antifungal compound (nystatin). This is in disagreement with the previous study reported by Al-Janabi, (2006). It can be postulated that T. rubrum developed resistance to ergosterol biosynthesis inhibitors in nystatin. The antifungal compound becomes inactive and degraded when the biochemical reaction process which is binding the ergosterol is not completed. This is caused by proteolytic enzymes secreted into the extracellular medium (Chen et al., 2010; Ghannoum & Rice, 1999). As a result, the pathogenic fungi T. rubrum evolved to become resistant against nystatin.
This study also presents the case that Gram-positive bacteria are more susceptible than Gram-negative bacteria against antimicrobial extracts and antibiotics. This is due to the dissimilarity of a morphological component of the bacterial cells. It is noted that Gram-negative bacteria are protected by an outer membrane that acts as an impermeable membrane for many small molecules. On the other hand, Gram-positive bacteria are only protected by a thick layer of peptidoglycan (Wendakoon & Gagnon, 2012).
CONCLUSIONS
Malaysian mistletoe, S. ferruginea leaves extracts exhibit moderate antibacterial activity against Gram positive and Gram negative bacteria. However, no antifungal
Pertanika J. Trop. Agric. Sci. 41 (2): 677 – 686 (2018)
Antimicrobial Activity of Malaysian Mistletoe
685
activity is present against C. albicans and T. rubrum. It is found that 80% methanol extract offers the optimum degree of antimicrobials activity (disc diffusion method, MIC and MBC). These findings conclude that S. ferruginea leaves extract is an unprecedented source of antimicrobial compound.
REFERENCESAhmad, N., Anwar, F., Hameed, S., & Boyce, M. C.
(2011). Antioxidant and antimicrobial attributes of different solvent extracts from leaves and flowers of akk (Calotropis procera (Ait.) Ait. F.). Journal of Medicinal Plants Research, 5(19), 4879-4887.
Al-Hussaini, R., & Mahasneh, A. M. (2011). Antibacterial and antifungal activity of ethanol extract of different parts of medicinal plants in Jordan. Jordan Journal of Pharmaceutical Sciences, 4(1), 57-69.
Al-Janabi, A. A. H. S. (2006). Evaluation of antidermatophytes activity of Nystatin. Journal of Kerbala University, 4(4), 122-125.
Bano, A., Girmay, S., & Tan, G. (2012). Total phenolic content, antioxidant, antimicobial and anticancer activities of Lespedeza bicolor Turcz (Papilionaceae). International Conference on Applied Life Sciences Proceedings (pp. 259-264). City, State: Publisher.
Burkill, I. H. (1966). A dictionary of the economic products of the Malay peninsula (Vol. 2). Kuala Lumpur, Malaysia: Ministry of Agriculture and Co-operatives.
Chen, J., Yi, J., Liu, L., Yin, S., Chen, R., Li, M., Ye, C., et al. (2010). Substrate adaptation of Trichophyton rubrum secreted endoproteases. Microbial Pathogenesis, 48(2), 57-61.
Cowan, M. M. (1999). Plant products as antimicrobial agents. Clinical Microbiology Reviews, 12(4), 564-582.
Farjana, A., Zerin, N., & Kabir, M. S. (2014). Antimicrobial activity of medicinal plant leaf extracts against pathogenic bacteria. Asian Pacific Journal of Tropical Disease, 4(S2), S920-S923.
Garcia-salas, P., Morales-soto, A., Segura-carretero, A., & Fernández-gutiérrez, A. (2010). Phenolic-compound-extraction systems for fruit and vegetable samples. Molecules, 15(12), 8813-8826.
Ghannoum, M. A., & Rice, L. B. (1999). Antifungal agents: Mode of action, mechanisms of resistance, and correlation of these mechanisms with bacterial resistance. Clinical Microbiology Reviews, 12(4), 501-517.
Ghasemzadeh, A., Jaafar, H. Z. E., Rahmat, A., & Ashkani, S. (2015). Secondary metabolites constituents and antioxidant, anticancer and antibacterial activities of Etlingera elatior (Jack) R. M. Sm grown in different locations of Malaysia. BMC Complementary and Alternative Medicine, 15(1), 335-344.
Hammond, S. M. (1977). Biological activity of polyene antibiotics. Progress in Medicinal Chemistry, 14, 105-179.
Hassan, L. E. A., Sirat, H. M., Yagi, S. M. A., Koko, W. S., & Abdelwahab, S. I. (2011). In vitro antimicrobial activities of chloroformic, hexane and ethanolic extracts of Citrullus lanatus var. citroides (Wild melon). Journal of Medicinal Plants Research, 5(8), 1338-1344.
Hooper, D. C. (2001). Mechanisms of action of antimicrobials: focus on fluoroquinolones. Clinical Infectious Diseases, 32(1), 9-15.
Huaxing, Q., & Gilbert, G. M. (2003). Loranthaceae. Flora of China, 5, 220-239.

Pertanika J. Trop. Agric. Sci. 41 (2): 677 – 686 (2018)
Vanielie Terrence Justine, Muskhazli Mustafa and Rusea Go
686
Hussain, M. A., Khan, M. Q., Hussain, N., & Habib, T. (2011). Antibacterial and antifungal potential of leaves and twigs of Viscum album L. Journal of Medicinal Plants Research, 5(23), 5545–5549.
Igbinosa, O. O., Igbinosa, E. O., & Aiyegoro, O. A. (2009). Antimicrobial activity and phytochemical screening of stem bark extracts from Jatropha curcas (Linn). African Journal of Pharmacy and Pharmacology, 3(2), 58-62.
Khoddami, A., Wilkes, M. A., & Roberts, T. H. (2013). Techniques for analysis of plant phenolic compounds. Molecules, 18(2), 2328-2375.
Lemmens, R. H. M. J., & Bunyapraphatsara, N. (2003). Plant resources of South-East Asia: Medicinal and poisonous plants 3. Leiden, The Netherlands: Backhuys Publishers.
Marvibaigi, M., Amini, N., Supriyanto, E., Jamil, S., Abdul Majid, F. A., & Khangholi, S. (2014). Total phenolic content, antioxidant and antibacterial properties of Scurrula ferruginea extracts. Jurnal Teknologi, 70(5), 65-72.
Mat-Salleh, K., & Latiff, A. (2002). Tumbuhan ubatan Malaysia. Bangi, Selangor: Pusat Pengurusan Penyelidikan UKM.
Neenah, G. E., & Ahmad, E. M. (2011). Antimicrobial activity of extracts and latex of Calotropis procera (Ait.) and synergistic effect with reference antimicrobials. Research Journal of Medicinal Plant, 5(6), 706-716.
Norziah, M. H., Fezea, F. A., Bhat, R., & Ahmad, M. (2015). Effect of extraction solvents on antioxidant and antimicrobial properties of fenugreek seeds (Trigonella foenum-graecum L). International Food Research Journal, 22(3), 1261-1271.
O’Neill, J. (2016). Tackling a global health crisis: Initial steps. London: The Review on Antimicrobial Resistance.
Obeidat, M., Shatnawi, M., Al-alawi, M., Al-Zu’bi, E., Al-Dmoor, H., Al-Qudah, M., et al. (2012). Antimicrobial activity of crude extracts of some plant leaves. Research Journal of Microbiology, 7(1), 59-67.
Oldfield, E., & Feng, X. (2014). Resistance-resistant antibiotics. Trends in Pharmacological Sciences, 35(12), 664-74.
Salle, G. (1978). Origin and early growth of the sinkers of Viscum album L. Culture, 26, 21-26.
Shobowale, O. O., Ogbulie, N. J., Itoandon, E. E., Oresegun, M. O., & Olatope, S. O. A. (2015). Phytochemical and antimicrobial evaluation of aqueous and organic extracts of Calotropis procera Ait. leaf and latex. Nigerian Food Journal, 31(1), 77-82.
Srinivasan, D., Nathan, S., Suresh, T., & Perumalsamy, L. P. (2001). Antimicrobial activity of certain Indian medicinal plants used in folkloric medicine. Journal of Ethnopharmacology, 74(3), 217-220.
Syukriah, N., Liza, M. S., Harisun, Y., & Fadzillah, A. A. M. (2014). Effect of solvent extraction on antioxidant and antibacterial activities from Quercus infectoria (Manjakani). International Food Research Journal, 21(3), 1067-1073.
Wendakoon, C., & Gagnon, D. (2012). Evaluation of selected medicinal plants extracted in different ethanol concentrations for antibacterial activity against human pathogens. Journal of Medicinally Active Plants, 1(2), 60-68.
Werner, R. (2002). Medicines in Malay villages. Kuala Lumpur, Malaysia: University of Malaya Press.
Pertanika J. Trop. Agric. Sci. 41 (2): 687 – 698 (2018)
ISSN: 1511-3701 © Universiti Putra Malaysia Press
TROPICAL AGRICULTURAL SCIENCEJournal homepage: http://www.pertanika.upm.edu.my/
ARTICLE INFOArticle history:Received: 20 June 2017Accepted: 2 December 2017
E-mail addresses:[email protected] (Arianne L. Andes)[email protected] (Vachel Gay V. Paller)* Corresponding author
Effect of Various Composting Methods on the Concentration and Viability of Ascaris suum Eggs in Organic Fertilisers
Arianne L. Andes and Vachel Gay V. Paller*Animal Biology Division, Institute of Biological Sciences, University of the Philippines Los Baños, 4030 Laguna, Philippines
ABSTRACT
The process of composting supports biological methods and management practices, such as vermicomposting and microbial inoculation, to enhance soil quality using biodegradable materials. However, the use of manure from animals poses potential risk for soil-transmitted helminths (STH) contamination. This study is aimed to determine the influence of various composting methods on the concentration of artificially-inoculated Ascaris suum eggs. There were three treatments (vermicomposting, composting with lactic acid bacteria, sun dry-composting) and a control (composting alone) which were artificially inoculated with A. suum eggs. Composting was done for a period of 31 days. A. suum percent recovery was determined on the 10th and 31st day of the composting process. Results revealed no significant differences in the percent recovery of A. suum in the various composting methods (p>0.05). Meanwhile, on the 31st day, the control (11.09%±6.40) and sundry-composting (9.03%±3.04) showed the highest percent recovery, followed by composting with lactic acid bacteria (7.62%±4.41). No A. suum eggs were recovered for vermicomposting on the 31st day. However, statistical analysis revealed no significant difference among treatments and control (p>0.05). Nevertheless, the present results suggest that the various methods of composting showed a 93.07% mean reduction of A. suum egg concentration in the organic fertilizers produced, and that composting rendered mechanical damage to eggs leading to reduced viability. Nevertheless, the presence of some fertilised eggs that could develop into
infective embryonated eggs could still be a potential threat of viable eggs contaminating the organic fertilisers.
Keywords: Ascaris suum, composting, food safety, organic fertilizers
Pertanika J. Trop. Agric. Sci. 41 (2): 687 – 698 (2018)
Arianne L. Andes and Vachel Gay V. Paller
688
INTRODUCTION
Soil-transmitted helminths (STH) infects approximately 24% of the world’s population, affecting areas suffering from poverty (WHO, 2015). Diseases caused by these organisms range from asymptomatic to detrimental depending on the parasitic load of the host (Cook & Zumla, 2009). The presence of STHs in agricultural crops could be an alarming threat to food safety (Gajadhar, 2015). Ascaris suum is the most commonly used STH model species because of its characteristic thick egg shell. A. suum can only reproduce within its host, the pig. However, recent studies have revealed cases of ascariasis in humans caused by A. suum (Miller et al., 2015) and in some individuals, the disease concerns both A. suum and A. lumbricoides (da Silva Alves, et al., 2016; Leles, Gardner, Reinhard, Iñiguez, & Araujo, 2012). Ascaris spp. Has also been reported to exhibit the highest STH prevalence from soil samples in Laguna, Philippines (Horiuchi, Paller, & Uga, 2013).
Organic farming is being promoted by the Philippines government to the agricultural sector by virtue of the Republic Act 10068, also known as the Organic Agriculture Act of 2010 (Congress of the Philippines, 2010). Raw materials of fertilisers used in place of chemical fertilisers usually consist of biodegradable farm wastes, which are mainly made up of animal manure. There are various methods of composting which include bacteria inoculation, vermicomposting and sun-drying of animal manure. The manure can be contaminated with STHs if it comes
from an infected animal. Anthelminthic treatment is usually not administered on animals in organic farms, thereby increasing the risk of STH infection, contamination, and transmission. Though various methods on how to enhance composting have been developed, scientific evidence that deals with the effect of these methods on pathogens, such as Ascaris eggs, are still lacking. Hence, this study aims to determine the effect of various composting methods namely, microbial inoculation, sun drying and vermicomposting on the concentration and viability of STH, using A. suum as a model species.
METHODS
Experimental Design
The protocol was adapted from the practices of organic farms and organic fertiliser producers in Laguna, Philippines. A total of three experimental set-ups (lactic acid bacteria composting, vermicomposting, and sun-dry composting) and a control set-up (composting alone) were used in the present study. The control set-up and treatments were replicated with six beds, giving a total of 24 samples. Each bed contained two kilograms of swine manure and three kilograms of washed chopped banana trunk (total of five kilograms). The chopped banana trunks were washed thoroughly to wash out any possible parasite contamination. Banana trunk is commonly used in composting by local farmers in the Philippines as it is reported to produce better yields and improve organic fertiliser
Pertanika J. Trop. Agric. Sci. 41 (2): 687 – 698 (2018)
Effect of Various Composting Methods on the Viability of Ascaris suum
689
properties such as increase availability of micronutrients and soil moisture. The swine manure were obtained from local farms, and the swine were dewormed prior to collection of manure samples. Prior to inoculation, fecal samples were tested through Formalin-Ether Concentration technique (FECT) for possible presence of A. suum eggs. Positive fecal samples were not used in the experiments.
Treatments and Control
The lactic acid bacteria composting set-up was prepared through inoculation with lactic acid bacteria serum (LABS) prepared at a proportion of distilled water and LABS at a ratio of 995:5 ml. Application of 200ml of LABS to each bed was done on alternate days until the end of the composting process. For the sundry-composting set-up, the manure used was sundried for one week, exposed under the sun from 07:00 until 17:00. For vermicomposting set-up, approximately 300g of Eudrilus eugeniae (African nightcrawlers) were inoculated into vermicomposting bins after stabilising the compost for 10 days. Vermicomposting took place for another 21 days to complete the process. This protocol has been practised and recommended by organic farms and vermicompost producers. While the control set-up constituted manure and chopped banana trunks only, regular watering (every other day) of all set-ups were done to keep a moist mixture but not too wet, except for lactic acid bacteria composting which were watered with LABS concoction.
The mean number of eggs inoculated for the various treatments was about 10,904 ± 974 A. suum eggs, isolated from female gravid A. suum. Adult A. suum worms were collected from intestines of infected pigs from a slaughterhouse. Female worms were dissected two centimetres from its posterior end to obtain the uteri (Nordin, Nyberg, & Vinnerås, 2009) and were macerated with 0.1% HCl (to prevent growth of molds). The washings were subsequently placed in a 13-ml vial. The eggs were counted by obtaining 0.1 ml from the stock which was examined to account for the number of eggs under a light microscope.
Temperature and pH readings were recorded daily from all set-ups. A thermometer was placed at least five inches into the bin for five minutes, while pH was obtained using a pH meter that was placed in a soil-water (2 g : 1ml) paste for two minutes (Paller & de Chavez, 2014). The composting process for all treatments lasted for 31 days.
Ascaris suum Concentration and Developmental Stage Determination
Stabilization Period (0-10thday) Sample Processing. Humus samples obtained on the 10th day were processed through FECT as the compost at that time was still predominantly swine manure and was not homogenous yet. Two samples were obtained from each replicate bin during the collection on the 10th day. One gram of the sample was mixed with at least 7 ml of 10% formalin, and sieved through a 3-layered surgical gauze into a
Pertanika J. Trop. Agric. Sci. 41 (2): 687 – 698 (2018)
Arianne L. Andes and Vachel Gay V. Paller
690
test tube. Three milliliters of diethyl ether were added into the test tube and then covered with an electrical tape before shaking vigorously for 10 seconds. Then, the tubes were centrifuged at 1,500 rpm for five minutes. Formalin and ether were decanted, leaving a sediment layer at the bottom. The sediment was pipetted from the tube, placed over a glass slide and covered with a coverslip, and examined under the light microscope at 100x and 400x magnification. The number and stage of eggs recovered were recorded.
Composting Period (10th-31st day) Sample Processing. The humus samples obtained on the 31st day were air dried for at least 24 hours. Dried samples were strained through a 125 sieve, and two grams of these were placed in a test tube. Six milliliters of distilled water were added into the tube and was vortexed thoroughly to mix the soil and water. Following that, the tubes were centrifuged at 1800 rpm for 10 minutes. The liquid was decanted and 8 ml of 1.2 gravity sucrose solution was added into the sediment. The tube was again vortexed and then centrifuged at 1800 rpm for 10 minutes. Using a 10-ml syringe, 1.3 gravity sucrose solution filled the tubes up to the brim. A coverslip was used to transfer the upper portion of the solution into the glass slide. The slides were labeled and viewed under a light microscope at 100x and 400x. The number and stage of eggs recovered were recorded.
The size of specimens were identified using a microscope camera (OptixCam, China) and its software, ToupeView. The following equations (as modified from Gnani Charitha, Rayulu, Kondaiah, & Srilatha, 2013) were also used in the present study:
Statistical Analysis
All data were analysed in SPSS 20. Proportional recovery and percent recovery values were analysed using Shapiro-Wilk test to assess normality of sample sizes of less than 50. The parametric data gathered were subjected to One-Way ANOVA at α= 0.05 following Tukey’s Post-Hoc test for multivariate comparisons.
RESULTS AND DISCUSSION
Percent Recovery Analysis
Stabilization Period (0-10th day) Recovery. As shown in Figure 1.0A, the control set-up (composting) showed the highest mean percent recovery (59.13%±12.79%), followed by vermicomposting (49.73%±0.28%), lactic acid bacteria composting (35.80%±12.95%), and sundry-composting (32.11%±9.89%). However, statistical analysis revealed that there were no significant differences between the control and treatment groups. All set-ups at this

Pertanika J. Trop. Agric. Sci. 41 (2): 687 – 698 (2018)
Effect of Various Composting Methods on the Viability of Ascaris suum
691
stage underwent initial composting and thus may not show significant differences on percent recovery.
Composting Period (10th-31st day) Recovery. From the samples obtained on the 31st day, the control set-up exhibited the highest percent recovery (11.09%±6.40%). However, this time, it was followed by the sundry-composting (9.03%±3.04%) and the lactic acid bacteria composting (7.62%±4.41%). There were no eggs recovered from the vermicomposting set-ups (Figure 1.0B). Statistical analysis
showed no significant difference between the control and treatment groups. However, the percent recovery of all four set-ups exhibited a mean reduction rate of 93.07% in A. suum concentration. Related studies by Bowman, Liotta, McIntosh, and Lucio-Forster (2006) and Hill, Lalander, and Baldwin (2013) also reported that despite the control set-up having higher percent recovery than the vermicomposting set-up, statistical differences were not significant enough to show that vermicomposting could reduce the concentration of A. suum egg and other pathogens in soil.
(a)
(b)
Figure 1. Mean A. suum percent recovery of various composting methods on: (a) 10th day, and (b) 31st day
N=24; 6 replicates each treatment (T bars represent standard deviations)

Pertanika J. Trop. Agric. Sci. 41 (2): 687 – 698 (2018)
Arianne L. Andes and Vachel Gay V. Paller
692
In contrast, the study for the formulation of USEPA guidelines for composting (Eastman et al., 2001), A. suum concentration experienced a reduction of 98.87% through vermicomposting, and 74.24% through composting alone, in 144 hours. Hait and Tare (2011) also presented a similar conclusion in their study where A. suum concentrations gradually decreased throughout the composting process (144 days), and were not detectable after vermicomposting. On the other hand, a study by Sypula, Paluszak, Ligocka, and Skowron (2013) revealed that sun-drying during the spring (average 18°C) did not reduce and inactivate A. suum eggs, and could therefore pose as health hazard if applied to crops as fertiliser. In the present study, average temperature observed in all set-ups was 27.87 °C±0.94°C, higher than those reported in the studies mentioned above.
Viability Determination
Viability of Recoveries from the Stabilisation Period (0-10th day). The presence of embryonated eggs is an indication of development to an infective stage. However, in the study, no intact embryonated eggs were recovered, instead the eggs hatched into larvae. Fertilised eggs were also recovered from the samples. During the 10th day (Table 1.0A), the control (composting), lactic acid bacteria composting, and sundried compost recovered 50% fertilised eggs and 50% hatched larva, while the vermicomposting set-up contained 100% hatched larva. Based on these data, the fertilised eggs arrested
their development while the hatched larva were embryonated eggs that hatched from their shells. Nevertheless, the presence of fertilised eggs that could develop into infective embryonated eggs could still be a potential threat of viable eggs contaminating the organic fertilisers. Jones, Crewe, and Owen (1979) mentioned that helminth eggs ingested by earthworms could experience mechanical damage within the earthworm gut and this could trigger hatching into larvae. He further suggested that hatching could also be triggered by mechanical damage that could be inflicted by fungi and microbes during the composting process. Nevertheless, the A. suum eggs ingested by African nightcrawlers in the present study exhibited mechanical damage on its shell. The tendency to be subjected to mechanical damage while in the earthworm gut can also be influenced by the fact that the egg is corticated or not.
Viability of Recoveries from the Composting Period (10th – 31st day). On the 31st day (Table 1.0), egg recoveries from the control group (composting) and lactic acid bacteria composting comprised 100% hatched larva while the sundried set-up maintained its 50% fertilised eggs and 50% hatched larva recovery composition (Figure 2.0). There were no A. suum recovered from the vermicomposting set-up. The only set-up that had a modified environment compared to the 10th day was the vermicomposting set-up, where 300 g of Eudrilus euginea (African nightcrawlers) were inoculated.

Pertanika J. Trop. Agric. Sci. 41 (2): 687 – 698 (2018)
Effect of Various Composting Methods on the Viability of Ascaris suum
693
Table 1Number (n) and percent recovery (%) of A. Suum showing the proportion of developmental stages during the 10th and 31st day of composting process (n=24)
Set-up Fertilisedegg n±SD (%)
Embryonatedegg n (%)
Hatchedlarvae n±SD (%)
10th dayControl 3715.25 ± 803.63 (50) 0 3715.25 ± 803.63 (50)
Lactic acid bacteria 2249.40 ± 813.68 (50) 0 2249.40 ± 813.68 (50)
Sun drying 2017.55 ± 621.41 (50) 0 2017.55 ± 621.41 (50)
Vermicomposting 0 0 6249.31 ± 35.19 (100)
31st dayControl 0 0 1393.62 ± 804.25 (100)Lactic acid bacteria 0 0 957.56 ± 554.181 (100)
Sun drying 1134.75 ± 191.01 (50) 0 1134.75 ± 191.01 (50)
Vermicomposting 0 0 0
Note that no (0) embryonated eggs were recovered.
(a) (b)
(c) (d)
Figure 2. (a) and (b) A. suum larva recovered from the composting set-up on the 10th day (400x); (c) fertilized eggs recovered on the 10th day (200x); (d) fertilized egg recovered on the 31st day (400x)

Pertanika J. Trop. Agric. Sci. 41 (2): 687 – 698 (2018)
Arianne L. Andes and Vachel Gay V. Paller
694
In a study by Katakam, Thamsborg, Kyvsgaard, Dalsgaard and Mejer (2014), incubation upon recovery proved to add more information regarding the developmental state of the egg. They reported that fertilised eggs may remain in this stage for as long as six months in the soil without development but could resume development to embryonated stage (infective stage) at room temperature (26°C). This information suggests that fertilised eggs accounted in the present study cannot be directly considered as inviable as these may still resume embryonation. On the other hand, A. suum larvae that have hatched in the soil are no longer viable. A. suum egg shells are one of the most resistant from the helminths. Typical helminth egg shells would only consist of three layers: a vitelline layer, a middle chitinous layer and an inner lipid layer, while an A. suum egg shell has a total of five layers with additional uterine layers over the three basic layers (Perry & Wharton, 2011)
Physicochemical Factors Analysis
Temperature during the Stabilization Period (0-10th day). As shown in Figure 3.0A, none of the set-ups exhibited a drastic increase of temperature (mean=27.87°C±0.94°C), nor reached the minimum Ascaris inactivation temperature of 45°C (Kone et al., 2007). This temperature is expected to reach on the 14th day of composting (Goyal, Dhull, & Kapoor, 2005) in large-scale organic composts which are usually covered. This allows carbon dioxide
to build up, thus, the high temperature. However, the temperatures exhibited by the set-ups, with minimum of 25°C and a maximum of 30.50°C, were ideal for the E. euginea (African nightcrawlers) development and productivity. Similarly, Viljoen and Reinecke (1992) reported that E. eugeniae were most maturing, developing, and productive in temperatures 22°C to 29°C, and that temperatures beyond 30°C could be detrimental for them.
Bacterial pathogens and coliforms could be eliminated after several weeks of composting because of thermophilic changes that occur throughout the process. However, helminths are considered the most resistant (Davies, 2011). Since temperature plays a crucial role in composting, there are varying accounts as to the temperature and duration that helminth ova can be inactivated. Haug (1993) states that 55°C to 60°C for one or two days is enough to deactivate enteric bacteria, virus and helminth ova while Kone et al. (2007) suggested that 60+/-30 days is considered the optimum composting period to reduce all (90-100%) helminth eggs at 45°C.
Meanwhile, Ratasuk, Boonsaner, and Hawker (2012) reported that swine manure is sun dried in South East Asian countries as a low cost pre-application treatment. Ascaris ova are considered the most ultraviolet-resistant waterborne pathogen as reported by Brownwell and Nelson (2006). Decorticated Ascaris eggs were inactivated by 98.4% upon exposure to UV radiation indicating that their shells were truly resistant to UV exposure.

Pertanika J. Trop. Agric. Sci. 41 (2): 687 – 698 (2018)
Effect of Various Composting Methods on the Viability of Ascaris suum
695
pH During the Vermicomposting Period (10th – 31st day). In the same way as the temperature, the pH (Figure 3.0B) did not exhibit significant changes (mean=7.15±0.61) except for the sudden pH drop on Day 2. This result supports McKinley, Parzen, and Guzmán (2012) who have stated that low pH should be expected in the early stages of the composting period and is primarily accounted to Lactobacilli, a microbe which is normally found in composting ecology that induces acidic environment and high
temperature. Close to neutral readings were observed in the vermicompost, which sets a favourable condition for the worms. Acidic environment could be detrimental for the worms (Cekmecelioglu, Demirci, Graves, & Davitt, 2005) while alkaline soil pH hinders plant development (Valdez-Perez, Fernandez-Luqueno, Franco-Hernandez, Flores-Cotera, & Dendooven, 2011). Available studies relate nitrogen from increased ammonia concentration to low pH (4.60±0.01) (Hill et al., 2013).
(a)
(b)Figure 3. (a) Daily temperature (°c) and (b) ph readings of the different composting methods during the 31-day observation period
Pertanika J. Trop. Agric. Sci. 41 (2): 687 – 698 (2018)
Arianne L. Andes and Vachel Gay V. Paller
696
CONCLUSION
The effect of various composting methods (vermicomposting, composting with lactic acid bacteria, sun dry-composting) on the reduction of A. suum eggs was insignificant (p>0.05) compared with the control group. However, the study revealed that there was a 93.07% mean reduction of A. suum eggs observed in control and treatment groups, revealing that composting process is an effective way to reduce the number of parasite eggs in organic fertilisers. No embryonated eggs were recovered from the 10th and the 31st day of composting; fertilised eggs and hatched larvae were recovered instead. The development of the eggs from fertilised to embryonated stage could still occur and thus could still pose a threat as potential source of contamination. The longevity of infective A. suum eggs represents an important public health issue because of the widespread use of pig manure as a fertiliser. This study used A. suum as the model pathogen but there could be other parasite eggs that may be present in animal manure used in composting, although some reports have demonstrated that A. suum infects humans frequently. Thus, when animal waste is reused in agriculture, measures should be taken to ensure inactivation of pathogens. This study emphasises the importance of good farming practices to reduce the risk of harmful parasite eggs for food safety.
ABBREVIATIONS
ANOVA – Analysis of varianceATI-DA – Agricultural Training Institute – Department of AgricultureFECT – Formalin-ether concentration technique LABS – Lactic acid bacteria serumSTH – Soil-transmitted helminthsUSEPA – United States Environmental Protection Agency WHO – World Health Organisation
REFERENCESBowman, D. D., Liotta, J. L., McIntosh, M., & Lucio-
Forster, A. (2006). Ascaris suum Egg inactivation and destruction by the vermicomposting worm, eisenia foetida. Proceedings of the Water Environment Federation, 6(2), 11-18. doi: 10.2175/193864706783796880
Cekmecelioglu, D., Demirci, A., Graves, R. E., & Davitt, N. H. (2005). Optimization of windrow food waste composting to inactivate pathogenic microorganisms. Transactions of the American Society of Agricultural Engineers, 48(5), 2023-2032. doi: 10.13031/2013.17003
Congress of the Philippines. (2010). Republic Act No. 10068. Retrieved from http://www.senate.gov.ph/republic_acts/ra%2010068.pdf
Cook, G. C., & Zumla, A. I. (2009). Manson’s tropical diseases (22nd Ed.). Philadelphia: Saunders Elsevier Ltd.
da Silva Alves, E. B., Conceição, M. J., & Leles, D. (2016). Ascaris lumbricoides, Ascaris suum, or “Ascaris lumbrisuum?” Journal of Infectious Diseases, 213(8), 1355-1355. doi: 10.1093/infdis/jiw027
Pertanika J. Trop. Agric. Sci. 41 (2): 687 – 698 (2018)
Effect of Various Composting Methods on the Viability of Ascaris suum
697
Davies, P. (2011). Intensive swine production and pork safety. Foodborne Pathog, 8(2), 189-201. doi: 10.1089=fpd.2010.0717
Eastman, B. R., Kane, P. N., Edwards, C. A., Gunadi, T. B., Stermer, A. L., & Mobley, J. R. (2001). The effectiveness of vermiculture in human pathogen reduction for USEPA biosolids stabilization. Compost Science and Utilization, 9(1), 38-49.
Gajadhar, A. A. (2015). Foodborne parasites in the food supply web. City: Woodhead Publishing Series in Food Science, Technology and Nutrition.
Gnani Charitha, V., Rayulu, V. C., Kondaiah, P. M., & Srilatha, C. H. (2013). Comparative evaluation of floatation techniques for the detection of soil borne parasites. Journal of Parasitic Diseases, 37(2), 260-263. doi: 10.1007/s12639-012-0176-2
Goyal, S., Dhull, S. K., & Kapoor, K. K. (2005). Chemical and biological changes during composting of different organic waste and assessment of compost maturity. Bioresource Technology, 96(14), 1564-1591. doi: 10.1016/j.biortech.2004.12.012
Hait, S., & Tare, V. (2011). Optimizing vermistabilization of waste activated sludge using vermicompost as bulking material. Waste Management, 31(3), 502-511. doi: 10.1016/j.wasman.2010.11.004
Haug, R. T. (1993). The practical handbook of compost engineering. Boca Raton, Florida: Lewis Publisher.
Hill, G., Lalander, C., & Baldwin, S. A. (2013). The effectiveness and safety of vermi-versus conventional composting of human feces with Ascaris suum ova as model helminthic parasites. Journal of Sustainable Development, 6(4), 1-11. doi: 10.5539/jsd.v6n4p1
Horiuchi, S., Paller, V. G. V., & Uga, S. (2013). Soil contamination by parasite eggs in rural village in the Philippines. Tropical Biomedicine, 30(3), 495-503.
Jones, A. E., Crewe, W., & Owen, R. R. (1979). Enhanced survival of eggs of Ascaris following ingestion by earthworms. The Royal Society of Tropical Medicine and Hygiene, 73(3), 325-325.
Katakam, K. K., Thamsborg, S. M., Kyvsgaard, N. C., Dalsgaard, A., & Mejer, H. (2014). Development and survival of Ascaris suum eggs in deep litter of pigs. Parasitology, 141(12), 1646-1656. doi: 10.1017/S0031182014000912
Kone, D., Cofie, O., Zurbrugg, C., Gallizzi, K., Moser, D., Drescher, S., et al. (2007). Helminth eggs inactivation efficiency by faecal sludge dewatering and co-composting in tropical climates. Water Research, 41(19), 4397-402. doi: 10.1016/j.watres.2007.06.024
Leles, D., Gardner, S. L., Reinhard, K., Iñiguez, A., & Araujo, A. (2012). Are Ascaris lumbricoides and Ascaris suum a single species? Parasites and Vectors, 5(1), 42-48. doi: 10.1186/1756-3305-5-42
McKinley, J. W., Parzen, R. E., & Guzmán, A. M. (2012). Ammonia inactivation of Ascaris ova in ecological compost by using urine and ash. Applied and Environmental Microbiology, 78(15), 5133-5137. doi: 10.1128/AEM.00631-12
Miller, L. A., Colby, K., Manning, S. E., Hoenig, D., McEvoy, E., Montgomery, S., et al. (2015). Ascariasis in humans and pigs on small-scale farmers, Maine, USA, 2010-2013. Emerging Infectious Diseases, 21(2), 332-334. doi: 10.3201/eid2102.140048
Nair, J., Sekiozoic, V., & Anda, M. (2006). Effect of pre-composting on vermicomposting of kitchen waste. Bioresource Technology, 97(16), 2091–2095. doi: 10.1016/j.biortech.2005.09.020
Pertanika J. Trop. Agric. Sci. 41 (2): 687 – 698 (2018)
Arianne L. Andes and Vachel Gay V. Paller
698
Nordin, A., Nyberg, K., & Vinnerås, B. (2009). Inactivation of ascaris eggs in source-separated urine and feces by ammonia at ambient temperatures. Applied and Environmental Microbiology, 75(3), 662-667. doi:10.1128/AEM.01250-08
Paller, V. G. V. & de Chavez, E. R. C. (2014). Toxocara (nematoda: ascaridida) and other soil-transmitted helminth eggs contaminating soils in selected urban and rural areas in the Philippines. The Scientific World Journal, 2014, 1-6. doi: 10.1155/2014/386232
Perry, R., & Wharton, D. (2011). Molecular and physiological basis of nematode survival. Wallingford, UK: CAB International.
Ratasuk, N., Boonsaner, M., & Hawker, D. W. (2012): Effect of temperature, pH and illumination on abiotic degradation of oxytetracycline in sterilized swine manure. Journal of Environmental Science and Health, Part A: Toxic/Hazardous Substances and Environmental Engineering, 47(11), 1687-1694. doi: 10.1080/10934529.2012.687274.
Sypula, M., Paluszak, Z., Ligocka, A., & Skowron, K. (2013). Effects of spring season solar drying process on sanitation indicators in sewage sludge and potential as a method for fertilizer production. Annals of Agricultural and Environmental Medicine, 20(1), 8-12.
Valdez-Perez, M. A., Fernandez-Luqueno, F., Franco-Hernandez, O., Flores-Cotera, L. B., & Dendooven, L. (2011). Cultivation of beans (phaseolus vulgaris L.) in limed or unlimed wastewater sludge, vermicompost or inorganic amended soil. Scientia Horticulturae - Amsterdam, 128(4), 380-387. doi: 10.1016/j.scienta.2011.01.016
Viljoen, S. A., & Reinecke, A. J. (1992). The temperature requirements of the epigeic earthworm species Eudrilus eugeniae (oligochaeta) – A laboratory study. Soil Biol. Biochem, 24(12), 1345-1350. doi: 10.1016/0038-0717(92)90116-F
World Health Organization (WHO). (2015). Soil-transmitted helminth infections: Fact sheet. Retrieved from http://www.who.int/mediacentre/factsheets/fs366/en/
Pertanika J. Trop. Agric. Sci. 41 (2): 699 – 714 (2018)
ISSN: 1511-3701 © Universiti Putra Malaysia Press
TROPICAL AGRICULTURAL SCIENCEJournal homepage: http://www.pertanika.upm.edu.my/
ARTICLE INFOArticle history:Received: 20 June 2017Accepted: 30 November 2017
E-mail address:[email protected] (Arun Karnwal)
Use of Bio-Chemical Surfactant Producing Endophytic Bacteria Isolated from Rice Root for Heavy Metal Bioremediation
Arun KarnwalDepartment of Microbiology, School of Bioengineering and Biosciences, Lovely Professional University, Punjab 144411,India
ABSTRACT
A variety of microorganisms generate highly potent surface-active bio-molecules or biosurfactants, which vary in their chemical properties and molecular size. In the present study, bioremediation effect of Pseudomonas fluorescence RE1 (GenBank: MF102882.1) and RE17 (GenBank: MF103672.1) endophytes on heavy metals Zn, Cr, Cd, and Ni were investigated. A total of 56 morphologically distinct isolates from indigenous rice roots were selected and subsequently characterised genotypically by using 16S rRNA sequencing approach. Next, biosurfactant production and heavy metal removal ability by the isolates were screened on the basis of α and β hemolysis on blood agar plates, BATH assay, and CTAB method. Analysis of bioremediation of heavy metals was done by using atomic adsorption spectroscopy. Bioremediation analysis revealed that isolates RE1 and RE17 reduced the concentration of Zn by up to 92% and 90% at pH 7.5, respectively, while for Ni, % removal was the same for both strains at 95% at pH 7.5. Biosorption results for Cr and Cd showed highest metal removal efficiency by Pseudomonas fluorescence RE17 at pH 8, 92% and 98%, respectively. Both isolates showed significant metal removal efficiency at 32±1 °C for all experimental heavy metals. The present study suggests that all endophytes withstand at high concentration of testing heavy metals and can be used for bioremediation of heavy metals in contaminated environments.
Keywords: Biosurfactant, endophyte, plant growth promoting, phytohormones, rhamnolipids
INTRODUCTION
In past years, rapid industrialisation and its dependency on chemicals have generated and added various types of pollutions in the environment. This environmental pollution is becoming a very serious issue
Pertanika J. Trop. Agric. Sci. 41 (2): 699 – 714 (2018)
Arun Karnwal
700
of public health and ecology of many biotic factors involved in maintaining and balancing the earth’s ecosystem (Song et al., 2016). Heavy metal pollution is one of the examples of industrial pollution caused by various industrial and military activities (Amer et al., 2015; Robles-Gonzalez et al., 2008) during electroplating, metalworking, refinishing, drilling, and explosives production. Availability of heavy metals (Cd, Cr, Cu, Ni, As, Pb, and Zn) in soil or water may cause various hazardous effects in living organisms that cause multiple level of complications such as paralysis, seizures, brain damage, nerve damage, pericapillary hemorrhages, mesh lines on finger nails, adult respiratory distress syndrome, gastrointestinal upset, hemolysis, anemia, hypotension and other life-threatening complications (Chen et al., 2017; Salmani & Fazaelipoor, 2016). Therefore, removal of heavy metals from the environment is necessary for the safety of all biological entities.
In recent years, the use of biologically derived surfactants has attracted more attention for heavy metal removal from the environment over chemical surfactants. The reason for their preference over chemical surfactants are due to their less toxicity, biodegradability, environmental friendly, better foaming ability, more selectivity, effectively able to act at various temperature, pH and salinity conditions (Juwarkar et al., 2007; Kassab & Roane, 2006; Kim et al., 2008). Biosurfactants
are surface-active chemicals produced by either bacteria or fungi. They tend to accumulate at the interface of immiscible fluids and surfaces, where they reduce surface tension as well as interfacial tension (Parkinson, 1985). Additionally, it plays a significant role to make the environment clean from pollutants and contaminations (Zouari et al., 2017). These bio molecules can be formulated from various waste materials, therefore, their production is more economical and feasible in a large setup (Karnwal, 2017). Biosurfactants have a broad range of applications in industries and homes such as detergent, emulsification, frothing, moistening, penetrating, metal segregation, resource recovering and food additives (Lizardi-Jimenez & Hernandez-Martinez, 2017). Biosurfactants are produced by a wide range of microorganisms and therefore differ in their chemical structure and activity. Endophytes are defined as microorganisms that are found in the living tissues of plant hosts and do not cause harmful effects on the plants (Han et al., 2011). Biosurfactants are among the possible biological molecules isolated from these microorganisms.
Therefore, the aim of the present study was to isolate heavy metal resistant endophytes from rice roots, analyse the PGP traits of isolates and to evaluate their bioremediation effectiveness under in vitro conditions.
Pertanika J. Trop. Agric. Sci. 41 (2): 699 – 714 (2018)
Heavy Metal Bioremediation by Rice Endophytes
701
MATERIALS AND METHODS
Isolation of Heavy Metal-Resistant Endophytic Bacteria from Rice Root
A total of 40 healthy rice (Oryza sativa L. Basmati) plants were randomly selected and collected from agriculture field situated at Dehradun (30° 19’ N, 78° 04’ E) Uttarakhand, India. The collected plants were thoroughly washed to remove dust and other physical contaminants, and subsequently rinsed with sterilised distilled water (Karnwal, 2009). Sterile scalpel was used to dissect the root and shoot of the rice plants. Surface sterilisation of dissected roots was achieved by washing them with 95% ethyl alcohol followed by 3% sodium hypochlorite for two to three minutes (Govarthanan et al., 2016; Liu et al., 2014). The roots were washed again with sterile distilled water several times to remove sodium hypochlorite from the surface. After thorough rinsing, the surface-sterilised roots were dissected into small pieces Then, 1 gram of fresh weight root tissue was ground in sterile mortar and pestle with 0.85% sterilised saline solution. The ground tissue extract was serially diluted (sevenfold) in sterile saline and 100 µl aliquots were spread on nutrient agar plates (Hi-Media, India). These plates were incubated at 28±1°C for 48 hours. After incubation, morphologically distinct bacterial colonies were separately streaked on nutrient agar plates for the isolation of pure culture of endophytic bacteria for biosurfactant production and heavy metal study.
Heavy Metal Tolerance
Mineral salt medium (MSM) supplemented with 1ml of heavy metal (Zn, Cr, Cd and Ni) solution was used for screening the heavy metal tolerance ability of isolated endophytes. Various concentrations (ranging from 50 to 800 mg l-1) of heavy metals (ZnSO4.7H2O, K2Cr2O7, 3CdSO4.8H2O and NiSO4.6H2O) were used. Isolated endophytes were streaked and incubated on MSM plates supplemented with heavy metal (sterilised by filtration) at 32±1°C for 48 hours (Kamala-Kannan & Krishnamoorthy, 2006). The lowest concentration of the metal that completely inhibited the growth of bacteria was considered as minimal inhibitory concentration (MIC). A total of 25 bacterial isolates were selected for further study based on heavy metal tolerance study data.
Haemolysis Assay
All the 25 endophytes were purified and selected for biosurfactant production on blood agar plates. A pure culture of isolates was streaked on blood agar plates and incubated at 37±1°C for 24 hours. Bacterial colonies with clear zone of haemolysis were selected and reported as positive for biosurfactant production ability (Carrillo, Mardaraz, Pitta-Alvarez, & Giulietti, 1996). These colonies were further analysed to screen the ability of biosurfactant production and heavy metal removal optimisation at pH and temperature.
Pertanika J. Trop. Agric. Sci. 41 (2): 699 – 714 (2018)
Arun Karnwal
702
Bacterial Adhesion to Hydrocarbons (BATH) Assay
Microbial adhesion to hydrocarbons was performed as described by Rosenberg, Gutnick and Rosenberg (1980) with some modification. Individual endophytic bacterial suspension (2 ml) was dispensed in 20 ml volume screw capped culture tubes with a varied amount of hydrocarbon (hexane and crude oil) ranging from 0.1, 0.2, 0.3, 0.4 and 0.5 ml. Cell suspension and hydrocarbon mixture were vortexed for three minutes and allowed to equilibrate for 60 minutes for the completion of the biphasic formation. Cell adherence percentage to hydrocarbon was determined at 600 nm using a spectrophotometer as described by Van der Vegt, Van der Mei, & Noordmans (1991):
1 – (OD of the aqueous phase/OD of initial cell suspension) × 100
CTAB Assay
Siegmund and Wagner (1991) described a new method for the detection of extracellular glycolipids or other anionic surfactants on agar plates supplemented with cetyl-tri-methyl ammonium bromide (CTAB). For the detection of extracellular glycolipids, blue agar plates enriched with 200 µg ml-1 cetyl-tri-methyl ammonium bromide (CTAB) and 5 mg ml-1 methylene blue were streaked with the endophytic bacteria isolates (Siegmund & Wagner, 1991). The plates were then incubated at 37±1°C for 24 hours. Colonies with blue halos were marked as positive for biosurfactant and were selected for further
study. On the basis of the hemolytic, BATH and CTAB assay, three out of the 25 bacterial isolates were selected as highly potential biosurfactant producers for further studies. These colonies were named as RE1, RE6, and RE17.
Biosurfactant Production
Biosurfactant production was carried out as described by Karnwal (2017). For biosurfactant production, sugar cane waste supplemented with 10% glycerol was used as nutrient media. 10 ml of inoculum of each isolate (RE1, RE6, and RE17) was added into 100 ml of fermentation medium in Erlenmeyer flasks (in triplets). These flasks were incubated at 37±1°C for 24 hours at 150 rpm. After the incubation period, the fermentation broth was centrifuged at 5000 rpm for 10 minutes to obtain cell-free culture. The effectiveness of the biosurfactant was determined by Drop collapsing test, Oil-spreading test, and Emulsification index assay as described by Sarubbo, Luna and de Campos-Takaki (2006), and Morikawa et al. (1993).
Drop Collapsing Test
A qualitative approach was used to detect the biosurfactant production by the endophytes isolates as described by Jain, Collins-Thompson, Lee, & Trevors (1991). The drop collapsing assay depends on the destabilisation of liquid droplets by biosurfactant. Crude oil was used for this assay, where 96 well microtitre plate lid was filled with 2 µl of crude oil and equilibrated
Pertanika J. Trop. Agric. Sci. 41 (2): 699 – 714 (2018)
Heavy Metal Bioremediation by Rice Endophytes
703
for 24 hours at room temperature. Then, 4 μl of the cell-free culture was added to the surface of oil and drop size was observed after 1 minute. The result was considered positive when the drop was flat and negative for rounded drops (Youssef et al., 2004).
Oil-Spreading Assay
To examine the effectiveness of biosurfactant (cell-free culture), the lower lid of a petri plate was filled with 15 ml of sterile distilled water and 15 µl of crude oil was gently spread on the surface of the water layer. One drop of the extract was added to the surface of oil layer as described by Morikawa, Hirata, & Imanaka (2000). The size of oil free zone was recorded for each isolate to assess biosurfactant activity (Morikawa et al., 1993).
Emulsification Index (E24) Assay
The emulsifying capacity was evaluated by an emulsification index (E24) assay. E24 was determined by adding 2 ml of hexane or xylene in 2 ml of cell-free extract for each isolate in a separate test tube. These tubes were vortexed for two minutes and allowed to stand for 24 hours. Emulsification index percentage was then calculated as described by Sarubbo, et al. (2006) using the following equation:
E24 = height of emulsion formed × 100/total height of solution
Effects of Temperature and pH on Biosorption of Heavy Metals
Effects of temperature and pH on heavy metal biosorption were determined with RE1 and RE17. 100 ml of MSM supplemented with individual heavy metal (50 mg l-1 concentration) was separately inoculated with 10 ml of bacterial isolates RE1 and RE17 at several pH levels, ranging from 5 to 9 in Erlenmeyer flasks. These flasks were placed and incubated in a shaking incubator (200 rpm) at 32±1°C for 24 hours. After incubation, samples were collected from each flask and centrifuged at 10000 rpm for five minutes. Cell-free extract was filtered with Whatman No. 1 filter paper and analysed for residual heavy metal concentration by using atomic adsorption spectroscopy. Similarly, individual flask with a 100 ml heavy metal solution and 10 ml bacterial isolate was placed at different temperature (24, 28, 32, 36 and 40°C) for 24 hours and remaining heavy metal concentration in cell-free broth was analysed by atomic adsorption spectroscopy. All experiments were conducted in triplicates and the average mean was calculated from recorded data.
16s rRNA Sequencing
16S rRNA sequencing and phylogenetic analysis were done for both isolates RE1 and RE17. Universal 16S rRNA primers (8F 5’ AGAGTTTGATCCTGGCTCAG 3’ and U1517R 5’ ACGG(A/C)TACCTTGTTACGACTT 3’) were used for 16S rRNA amplification of bacterial isolates under PCR reaction (Srinivasan,
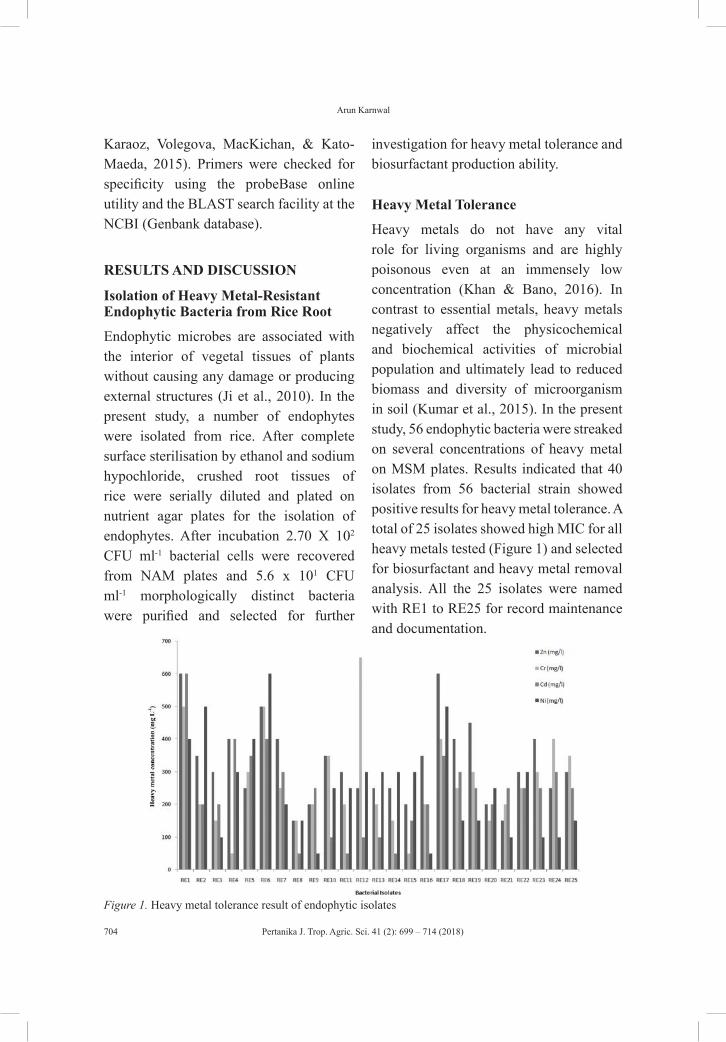
Pertanika J. Trop. Agric. Sci. 41 (2): 699 – 714 (2018)
Arun Karnwal
704
Karaoz, Volegova, MacKichan, & Kato-Maeda, 2015). Primers were checked for specificity using the probeBase online utility and the BLAST search facility at the NCBI (Genbank database).
RESULTS AND DISCUSSION
Isolation of Heavy Metal-Resistant Endophytic Bacteria from Rice Root
Endophytic microbes are associated with the interior of vegetal tissues of plants without causing any damage or producing external structures (Ji et al., 2010). In the present study, a number of endophytes were isolated from rice. After complete surface sterilisation by ethanol and sodium hypochloride, crushed root tissues of rice were serially diluted and plated on nutrient agar plates for the isolation of endophytes. After incubation 2.70 X 10²
CFU ml-1 bacterial cells were recovered from NAM plates and 5.6 x 101 CFU ml-1 morphologically distinct bacteria were purified and selected for further
investigation for heavy metal tolerance and biosurfactant production ability.
Heavy Metal Tolerance
Heavy metals do not have any vital role for living organisms and are highly poisonous even at an immensely low concentration (Khan & Bano, 2016). In contrast to essential metals, heavy metals negatively affect the physicochemical and biochemical activities of microbial population and ultimately lead to reduced biomass and diversity of microorganism in soil (Kumar et al., 2015). In the present study, 56 endophytic bacteria were streaked on several concentrations of heavy metal on MSM plates. Results indicated that 40 isolates from 56 bacterial strain showed positive results for heavy metal tolerance. A total of 25 isolates showed high MIC for all heavy metals tested (Figure 1) and selected for biosurfactant and heavy metal removal analysis. All the 25 isolates were named with RE1 to RE25 for record maintenance and documentation.
Figure 1. Heavy metal tolerance result of endophytic isolates
Pertanika J. Trop. Agric. Sci. 41 (2): 699 – 714 (2018)
Heavy Metal Bioremediation by Rice Endophytes
705
Haemolysis Assay
All the 25 bacterial isolates were streaked on blood agar plates to observe erythrocytelysis. According to Carrillo, Mardaraz, Pitta-Alvarez, & Giulietti, (1996), the presence of surfactant on blood agar plates results in the lysis of erythrocytes/hemolysis. In the present study, 18 bacterial isolates were reported as positive for haemolytic assay while the remaining seven isolates were negative for lysis of erythrocytes in blood agar plates. Blood agar is an enriched nutrient medium that supports the growth of various microorganisms (Pacwa-Plociniczak et al., 2016). However the use of blood agar has some limitations. First, the method is not specific, as lytic enzymes can also lead to clearing zones. Second, hydrophobic substrates cannot be included as sole carbon source in this assay. Third, diffusion restriction of the surfactant can inhibit the formation of clearing zones (Elazzazy et al., 2015; Hassanshahian, 2014). Few workers (Hassanshahian, 2014; Pacwa-Plociniczak et al., 2014; Yousuf et al., 2005) reported that some biosurfactants do not show any hemolytic activity at all in haemolysis assay Similarly, Youssef et al. (2007) also proved the poor relevance of this methodology.
Out of the 18 selected bacterial isolates, six were Gram negative and twelve were Gram positive in characteristic. These endophytes were detected as RE1 to RE6 (Gram positive) and RE11 to RE17, RE19, RE20, RE22-RE24 for Gram positive. Isolate RE1, RE5, RE6, RE12, RE14, RE17, RE19 and RE20 showed biggest haemolytic
zone and selected for BATH and CTAB assay. Mulligan, Cooper, and Neufeld (1984) recommend the blood agar method as a preliminary screening method which should be supported by other techniques based on surface activity measurements. Hence, in the present investigation BATH assay, drop collapse test, oil spreading assay and emulsification assay were included to confirm biosurfactant production.
BATH Assay
The method relies on the degree of adherence of cells to various liquid hydrocarbons. The BATH assay is an easy but an indirect screening technique for biosurfactant production. Pruthi and Cameotra (1997) showed that the potential of bacterium to stick to hydrocarbons may be a characteristic feature of biosurfactant productive microbes. Bacterial adherence to hydrocarbons (BATH) assay was conducted with RE1, RE5, RE6, RE12, RE14, RE17, RE19 and RE20 endophytic isolates. Experimental results revealed that cell adherence with hexane ranged from 09.2±1.1 to 67.5±0.32%, and crude oil from 25.8±0.84% to 86.2±1.5%. Isolate RE1, RE6 and RE17 showed highest cell attachment with hexane (58.2±0.1%, 67.5±0.32%, and 52.2±1.8% respectively) and crude oil (74.66±1.4%, 86.2±1.5%, and 69.1±0.26% respectively).
CTAB Assay
This method is a semi-quantitative assay for biosurfactant detection (Palacios,
Pertanika J. Trop. Agric. Sci. 41 (2): 699 – 714 (2018)
Arun Karnwal
706
Gomez-Anduro, Bashan, & de-Bashan, 2016). The results revealed that all isolates were positive and showed a dark blue clear zone around the colonies. Isolates RE1, RE6 and RE17 developed 65 mm, 72 mm and 60 mm zone respectively, while RE5 and RE12 generated zones of 35 mm and 51 mm in size respectively. For the biosurfactant production and heavy metal removal studies, RE1, RE6, and RE17 were selected due to their effective results for Haemolytic assay, BATH assay and CTAB assay.
Biosurfactant Poduction
All three isolates, RE1, RE6, and RE17 were grown in glycerol supplemented medium for the production of biosurfactant. The cell-free broth was obtained and used for drop collapsing assay. The drop collapse methodology has been applied as a qualitative technique to discover biosurfactant-producing microorganisms in natural environments (Bodour et al., 2003). This assay is fast, simple to perform, reproducible and needs very little specialised instrumentation. RE1 and RE17 were positive for drop collapse assay. Isolate RE6 was negative for drop collapse activity while it was positive for hemolytic, BATH and CTAB assay. These results suggest that RE1 and RE17 produced extracellular biosurfactant and were reported positive for drop collapse test but RE6 was unable to produce extracellular biosurfactant. However, its cell acted as biosurfactant and showed positive results in hemolytic, BATH and CTAB assay.
These results also suggested that in order to investigate the biosurfactant activity by microbial isolates, cell-free broth must be used instead of using cell culture (Karnwal, 2017).
Oil-Spreading Assay
Oil spreading assay results were in corroboration with drop collapse assay results. Isolates found positive with drop collapse test were also positive for oil spreading test. The oil spreading assay was utilised to review the surface activities of pure biosurfactant. This assay is fast and is extremely sensitive to surface active compounds (Ianieva, 2013). As for drop collapse test, RE1 and RE17 were shown to be positive, with similar results obtained for the oil spreading assay. Both RE1 and RE17 isolates showed high oil spreading activity due to extracellular biosurfactant production while isolate RE6 showed no oil spreading activity for present assay.
Emulsification index (E24) Assay
Emulsification properties of biosurfactants were measured in terms of emulsification activity (EA) and emulsification stability. The E24 assay is used to screen biosurfactant production by bacterial isolates (Jiménez et al., 2014). The presence of biosurfactant in cell-free broth will show emulsification of hydrocarbon in the test solution (Hajfarajollah, Mokhtarani, and Noghabi, 2014). In the present study, two hydrocarbons (crude oil and hexane) were used as the hydrophobic substrate.
Pertanika J. Trop. Agric. Sci. 41 (2): 699 – 714 (2018)
Heavy Metal Bioremediation by Rice Endophytes
707
Results revealed that cell-free broth of RE17 showed maximum %E24 value 77.5 with crude oil and 65.3 with hexane. The cell-free culture of RE1 showed a significant %E24 value with crude oil (69.9) and hexane (66.5). Result with RE6 was negative in comparison to other two isolates. Isolate RE6 did not show any %E24 with any hydrocarbon and reported negative for E24 assay. Emulsification activity is the measurement of a surface-active agent to make emulsions underneath bound conditions and directly associated with the oil drop size, the smaller of the dimensions was the higher of the activity (Abouseoud, Yataghene, Amrane, & Maachi, 2008; Ebrahimi & Tashi, 2012). The emulsion was produced as soon as one of the fluid phases was dispersed because of dispersal of tiny droplets in another liquid phase (Jiménez et al., 2014; Karnwal, 2017).
Hemolytic and BATH assays are not very reliable methods to test the biosurfactant production. Hence, it is inferred that extracellular products other than biosurfactants are responsible for the positive hemolytic and BATH activity observed with the strains showing negative emulsification activity (Thavasi, Sharma, & Jayalakshmi, 2011).
Effect of Temperature and pH on Heavy Metal Biosorption
The major advantages of biosorption technology are its effectiveness in reducing the concentration of heavy metal ions to very low levels and the use of inexpensive
biosorbent materials. Many investigators have reported the biosorption of heavy metals into pure cultures of bacteria and algae and onto natural microbial populations as the new bioremediation technology (Gutnick & Bach, 2005). In the present study, bacterial isolates were introduced to the biosorption experiments. Optimisation of biosorption process by Pseudomonas fluorescence endophytes was studied on zinc, nickel, cadmium, and chromium in this investigation with pH, metal ion concentration, and temperature optimisation.
Temperature and pH have been considered as the most important factors influencing the biosorption process in aqueous solution (Liu, Liu, Ju, Li, & Yu, 2016; Shaaban, Ibrahim, Abouhend, & El-Moselhy, 2015). Change in temperature and pH influenced the dissociation of the active group on biosorbent but also interfered in the solution ion chemistry (Shaaban et al., 2015). In the present study, both isolates were incubated at different temperatures in heavy metal enriched medium at optimum pH. Results of temperature study revealed that maximum biosorption of heavy metal was reported at 32±1°C, however, at higher temperature, biosorption of heavy metal and microbial growth was decreased (Figure 2, Figure 3). Bacterial isolate RE1 showed 89%, 90%, 86% and 94% significant metal removal efficiency from the sample at 32±1°C for Zn, Cr, Cd and Ni, respectively. Similar results were observed with RE17 isolate with higher metal removal efficiency as
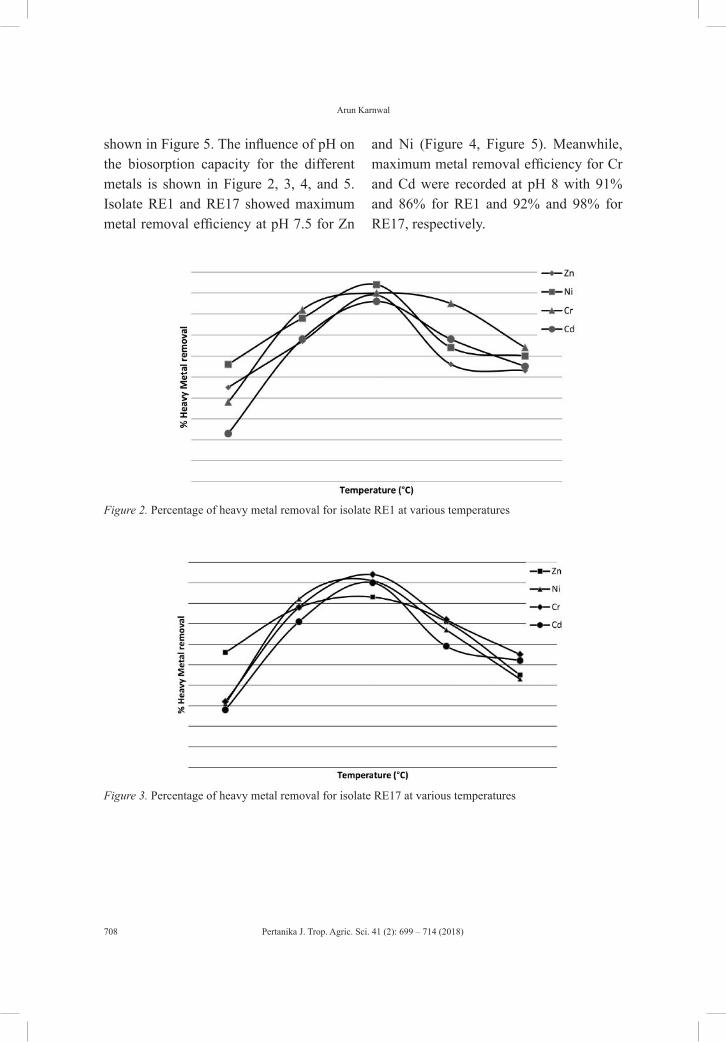
Pertanika J. Trop. Agric. Sci. 41 (2): 699 – 714 (2018)
Arun Karnwal
708
shown in Figure 5. The influence of pH on the biosorption capacity for the different metals is shown in Figure 2, 3, 4, and 5. Isolate RE1 and RE17 showed maximum metal removal efficiency at pH 7.5 for Zn
and Ni (Figure 4, Figure 5). Meanwhile, maximum metal removal efficiency for Cr and Cd were recorded at pH 8 with 91% and 86% for RE1 and 92% and 98% for RE17, respectively.
Figure 2. Percentage of heavy metal removal for isolate RE1 at various temperatures
Figure 3. Percentage of heavy metal removal for isolate RE17 at various temperatures
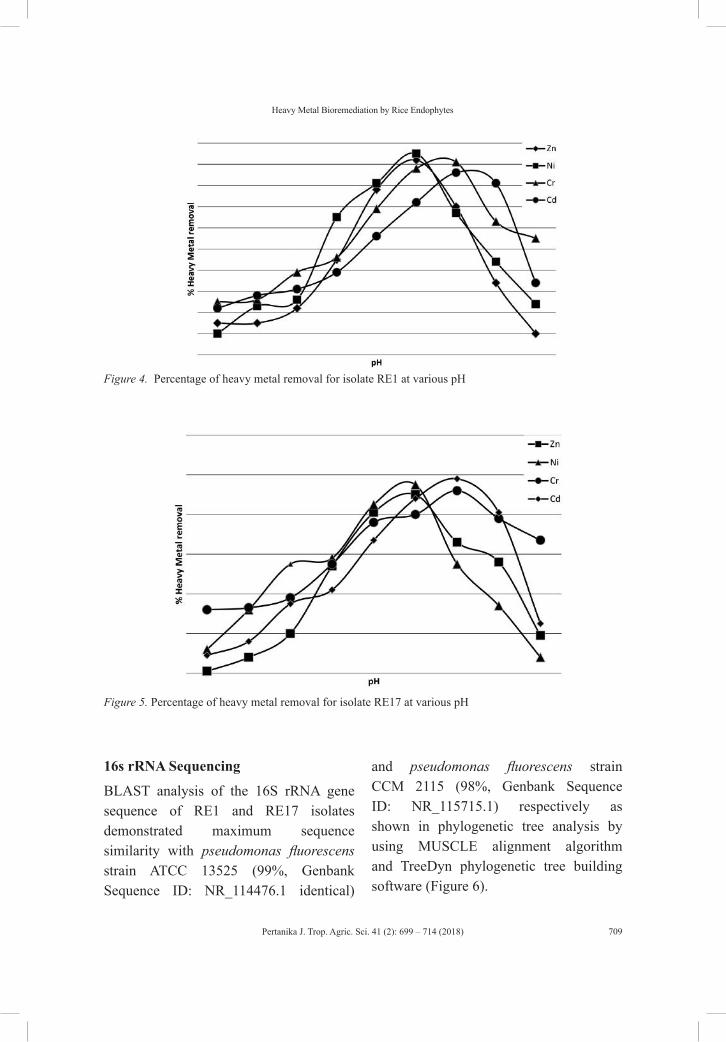
Pertanika J. Trop. Agric. Sci. 41 (2): 699 – 714 (2018)
Heavy Metal Bioremediation by Rice Endophytes
709
Figure 4. Percentage of heavy metal removal for isolate RE1 at various pH
Figure 5. Percentage of heavy metal removal for isolate RE17 at various pH
16s rRNA Sequencing
BLAST analysis of the 16S rRNA gene sequence of RE1 and RE17 isolates demonstrated maximum sequence similarity with pseudomonas fluorescens strain ATCC 13525 (99%, Genbank Sequence ID: NR_114476.1 identical)
and pseudomonas fluorescens strain CCM 2115 (98%, Genbank Sequence ID: NR_115715.1) respectively as shown in phylogenetic tree analysis by using MUSCLE alignment algorithm and TreeDyn phylogenetic tree building software (Figure 6).
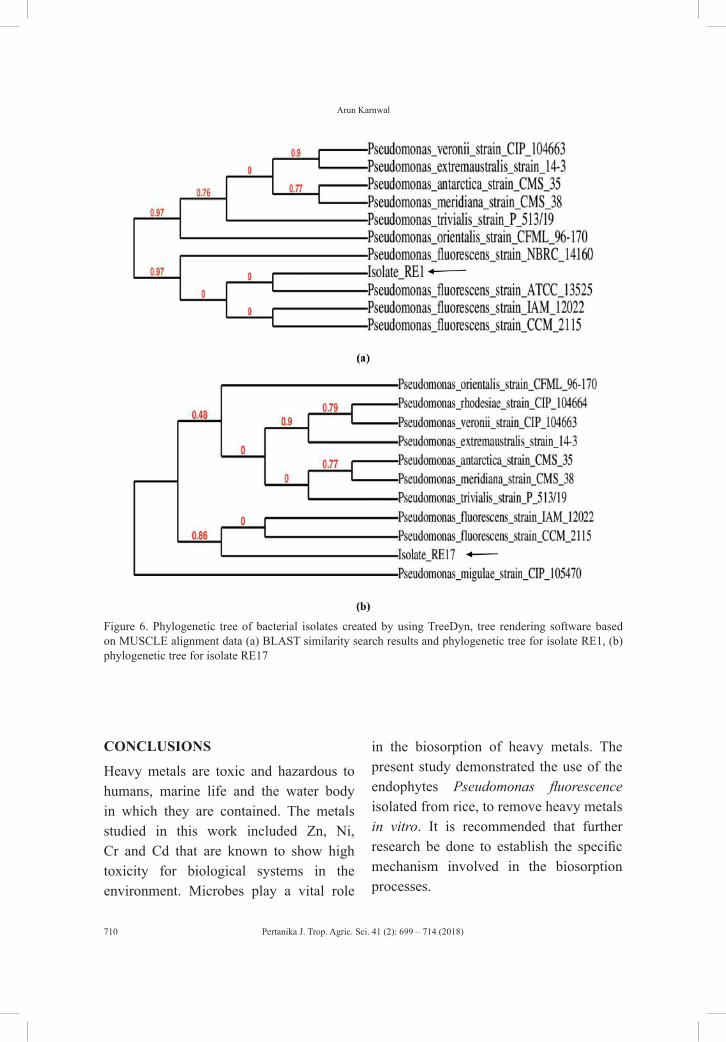
Pertanika J. Trop. Agric. Sci. 41 (2): 699 – 714 (2018)
Arun Karnwal
710
Figure 6. Phylogenetic tree of bacterial isolates created by using TreeDyn, tree rendering software based on MUSCLE alignment data (a) BLAST similarity search results and phylogenetic tree for isolate RE1, (b) phylogenetic tree for isolate RE17
CONCLUSIONS
Heavy metals are toxic and hazardous to humans, marine life and the water body in which they are contained. The metals studied in this work included Zn, Ni, Cr and Cd that are known to show high toxicity for biological systems in the environment. Microbes play a vital role
in the biosorption of heavy metals. The present study demonstrated the use of the endophytes Pseudomonas fluorescence isolated from rice, to remove heavy metals in vitro. It is recommended that further research be done to establish the specific mechanism involved in the biosorption processes.
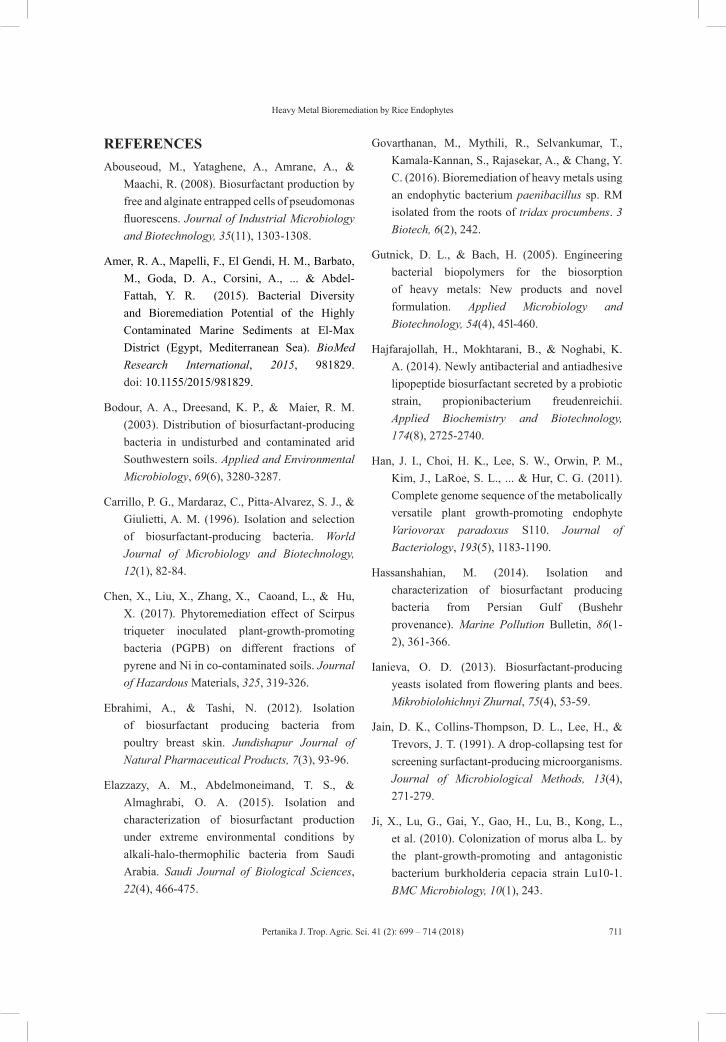
Pertanika J. Trop. Agric. Sci. 41 (2): 699 – 714 (2018)
Heavy Metal Bioremediation by Rice Endophytes
711
REFERENCESAbouseoud, M., Yataghene, A., Amrane, A., &
Maachi, R. (2008). Biosurfactant production by free and alginate entrapped cells of pseudomonas fluorescens. Journal of Industrial Microbiology and Biotechnology, 35(11), 1303-1308.
Amer, R. A., Mapelli, F., El Gendi, H. M., Barbato, M., Goda, D. A., Corsini, A., ... & Abdel-Fattah, Y. R. (2015). Bacterial Diversity and Bioremediation Potential of the Highly Contaminated Marine Sediments at El-Max District (Egypt, Mediterranean Sea). BioMed Research International, 2015, 981829. doi: 10.1155/2015/981829.
Bodour, A. A., Dreesand, K. P., & Maier, R. M. (2003). Distribution of biosurfactant-producing bacteria in undisturbed and contaminated arid Southwestern soils. Applied and Environmental Microbiology, 69(6), 3280-3287.
Carrillo, P. G., Mardaraz, C., Pitta-Alvarez, S. J., & Giulietti, A. M. (1996). Isolation and selection of biosurfactant-producing bacteria. World Journal of Microbiology and Biotechnology, 12(1), 82-84.
Chen, X., Liu, X., Zhang, X., Caoand, L., & Hu, X. (2017). Phytoremediation effect of Scirpus triqueter inoculated plant-growth-promoting bacteria (PGPB) on different fractions of pyrene and Ni in co-contaminated soils. Journal of Hazardous Materials, 325, 319-326.
Ebrahimi, A., & Tashi, N. (2012). Isolation of biosurfactant producing bacteria from poultry breast skin. Jundishapur Journal of Natural Pharmaceutical Products, 7(3), 93-96.
Elazzazy, A. M., Abdelmoneimand, T. S., & Almaghrabi, O. A. (2015). Isolation and characterization of biosurfactant production under extreme environmental conditions by alkali-halo-thermophilic bacteria from Saudi Arabia. Saudi Journal of Biological Sciences, 22(4), 466-475.
Govarthanan, M., Mythili, R., Selvankumar, T., Kamala-Kannan, S., Rajasekar, A., & Chang, Y. C. (2016). Bioremediation of heavy metals using an endophytic bacterium paenibacillus sp. RM isolated from the roots of tridax procumbens. 3 Biotech, 6(2), 242.
Gutnick, D. L., & Bach, H. (2005). Engineering bacterial biopolymers for the biosorption of heavy metals: New products and novel formulation. Applied Microbiology and Biotechnology, 54(4), 45l-460.
Hajfarajollah, H., Mokhtarani, B., & Noghabi, K. A. (2014). Newly antibacterial and antiadhesive lipopeptide biosurfactant secreted by a probiotic strain, propionibacterium freudenreichii. Applied Biochemistry and Biotechnology, 174(8), 2725-2740.
Han, J. I., Choi, H. K., Lee, S. W., Orwin, P. M., Kim, J., LaRoe, S. L., ... & Hur, C. G. (2011). Complete genome sequence of the metabolically versatile plant growth-promoting endophyte Variovorax paradoxus S110. Journal of Bacteriology, 193(5), 1183-1190.
Hassanshahian, M. (2014). Isolation and characterization of biosurfactant producing bacteria from Persian Gulf (Bushehr provenance). Marine Pollution Bulletin, 86(1-2), 361-366.
Ianieva, O. D. (2013). Biosurfactant-producing yeasts isolated from flowering plants and bees. Mikrobiolohichnyi Zhurnal, 75(4), 53-59.
Jain, D. K., Collins-Thompson, D. L., Lee, H., & Trevors, J. T. (1991). A drop-collapsing test for screening surfactant-producing microorganisms. Journal of Microbiological Methods, 13(4), 271-279.
Ji, X., Lu, G., Gai, Y., Gao, H., Lu, B., Kong, L., et al. (2010). Colonization of morus alba L. by the plant-growth-promoting and antagonistic bacterium burkholderia cepacia strain Lu10-1. BMC Microbiology, 10(1), 243.
Pertanika J. Trop. Agric. Sci. 41 (2): 699 – 714 (2018)
Arun Karnwal
712
Jiménez, J. T., Barrera, M. A. R., Lucena, M. V., Flores, A. B., Segura, D., Corral, V. I. W., et al. (2014). Production of biosurfactants by bacteria isolated from a mine tailing zone in Southern Mexico and their resistance to heavy metals. Journal of Bacteriology Research, 6(4), 23-31.
Juwarkar, A. A., Nair, A., Dubey, K. V., Singhand, S. K., & Devotta, S. (2007). Biosurfactant technology for remediation of cadmium and lead contaminated soils. Chemosphere, 68(10), 1996-2002.
Kamala-Kannan, S., & Krishnamoorthy, R. (2006). Isolation of mercury resistant bacteria and influence of abiotic factors on bioavailability of mercury - A case study in Pulicat Lake north of Chennai, south east India. Science of the Total Environment, 367(1), 341-352.
Karnwal, A. (2009). Production of indole acetic acid by fluorescent pseudomonas in the presence of L-tryptophan and rice root exudates. Journal of Plant Pathology, 19(1), 61-63.
Karnwal, A. (2017). Biosurfactant production by kcuria rosea and athrobacter luteolus using sugar cane waste as substrate. II Ponte, 73(2), 20-29.
Kassab, D. M., & Roane, T. M. (2006). Differential responses of a mine tailings Pseudomonas isolate to cadmium and lead exposures. Biodegradation, 17(4), 379-387.
Khan, N., & Bano, A. (2016). Role of plant growth promoting rhizobacteria and Ag-nano particle in the bioremediation of heavy metals and maize growth under municipal wastewater irrigation. International Journal of Phytoremediation, 18(3), 211-221.
Liu, B., Liu, J., Ju, M., Li, X., & Yu, Q. (2016). Purification and characterization of biosurfactant produced by bacillus licheniformis Y-1 and its application in remediation of petroleum contaminated soil. Marine Pollution Bulletin, 107(1), 46-51.
Liu, J., Liu, S., Sun, K., Sheng, Y., Gu, Y., & Gao, Y. (2014). Colonization on root surface by a phenanthrene-degrading endophytic bacterium and its application for reducing plant phenanthrene contamination. PLoS One, 9(9), e108249.
Morikawa, M., Diado, H., Takao, T., Murata, S., Shimonishi, Y., & Imanaka, T. (1993). A new lipopeptide biosurfactant produced by arthrobacter sp. strain MIS38. Journal of Bacteriology, 175(20), 6459-6466.
Morikawa, M., Hirata, Y., & Imanaka, T. (2000). A study on the structure function relationship of lipopeptide biosurfactants. Biochimica et Biophysica Acta, 1488(3), 211-218.
Mulligan, C., Cooper, D., & Neufeld, R. (1984). Selection of microbes producing biosurfactants in media without hydrocarbons. Journal of Fermentation Technology, 62(4), 311-314.
Palacios, O. A., Gomez-Anduro, G., Bashan, Y., & de-Bashan, L. E. (2016). Tryptophan, thiamine and indole-3-acetic acid exchange between chlorella sorokiniana and the plant growth-promoting bacterium azospirillum brasilense. FEMS Microbiology Ecology, 92(6), fiw077. doi:10.1093/femsec/fiw077
Pruthi, V., & Cameotra, S. (1997). Rapid identification of biosurfact ant-producing bacterial strains using a cell surface hydrophobicity technique. Biotechnology Techniques, 11(9), 671-674.
Rosenberg, M., Gutnick, D., & Rosenberg, E. (1980). Adherence of bacteria to hydrocarbons a simple method for measuring cell-surface hydrophobicity. FEMS Microbiology Letter, 9(1), 29-33.
Sarubbo, L. A., Luna, J. M., & de Campos-Takaki, G. M. (2006). Production and stability studies of the bioemulsifier obtained from a new strain of candida glabrata UCP 1002. Electronic Journal of Biotechnology, 9(4), 400-406.
Pertanika J. Trop. Agric. Sci. 41 (2): 699 – 714 (2018)
Heavy Metal Bioremediation by Rice Endophytes
713
Shaaban, M. T., Ibrahim, H. A. H., Abouhend, A. S., & El-Moselhy, K. M. (2015). Removal of heavy metals from aqueous solutions using multi-metals and antibiotics resistant bacterium isolated from the Red Sea, Egypt. American Journal of Microbiological Research, 3(3), 93-106.
Shaharoona, B., Arshad, M., & Zahir, Z. A. (2006). Effect of plant growth promoting rhizobacteria containing ACC-deaminase on maize (zea mays L.) growth under axenic conditions and on nodulation in mung bean (vigna radiata L.). Letters in Applied Microbiology, 42(2), 155-159.
Siegmund, I., & Wagner, F. (1991). New method for detecting rhamnolipids excreted by pseudomonas species during growth on mineral agar. Biotechnology Techniques, 5(4), 265-268.
Srinivasan, R., Karaoz, U., Volegova, M., MacKichan, J., & Kato-Maeda, M. (2015). Use of 16S rRNA gene for identification of a broad range of clinically relevant bacterial pathogens. PLoS One, 10(2), e0117617. doi:10.1371/journal.pone.0117617
Thavasi, R., Sharma, S., & Jayalakshmi, S. (2011). Evaluation of screening methods for the isolation of biosurfactant producing marine bacteria. Journal of Petroleum and Environmental Biotechnology, S1, 1-6. doi:10.4172/2157-7463.S1-001
Van der Vegt, W., Van der Mei, H., & Noordmans, J. (1991). Assessment of bacterial biosurfactant production through axisymmetrical drop shape-analysis by profile. Applied Microbiology and Biotechnology, 35(6), 766-770.
Youssef, N. H., Duncan, K. E., Nagle, D. P., Savage, K. N., Knapp, R. M., & McInerney, M. J. (2004). Comparison of methods to detect biosurfactant production by diverse microorganisms. Journal of Microbiological Methods, 56(3), 339-347.

Pertanika J. Trop. Agric. Sci. 41 (2): 715 – 728 (2018)
ISSN: 1511-3701 © Universiti Putra Malaysia Press
TROPICAL AGRICULTURAL SCIENCEJournal homepage: http://www.pertanika.upm.edu.my/
ARTICLE INFOArticle history:Received: 22 July 2017Accepted: 4 January 2018
E-mail addresses:[email protected] (Hamid Ghaffari)[email protected] (Abdollatif Gholizadeh)[email protected] (Abbas Biabani)[email protected] (Alireza Fallah)[email protected] (Mohammad Mohammadian)* Corresponding author
Plant Growth Promoting Rhizobacteria (PGPR) Application with Different Nitrogen Fertilizer Levels in Rice (Oryza sativa L.)
Hamid Ghaffari1*, Abdollatif Gholizadeh1, Abbas Biabani1, Alireza Fallah2 and Mohammad Mohammadian3
1Faculty of Agriculture and Natural Resources, Gonbad-e Qabus University, Gonbad, Golestan, Iran2The Research, Education and Agricultural Extension, Soil and Water Research Institute, Karaj, Alborz, Iran3Rice Research Institute in Mazandaran, Amol, Mazandaran, Iran
ABSTRACT
A factorial experiment was carried out through a completely randomised design with four replications in the Rice Research Institute of Iran, Deputy of Mazandaran (Amol), in 2012 in order to study the effect of Plant Growth Promoting Rhizobacteria (PGPR) with different levels of nitrogen fertilizer application on the yield and yield components of rice (Oryza Sativa L.).Treatments of this pot study included three factors; factor A - Ppeudomonas in four levels of control (no bacteria), P. putida-1, P. putida-2 and P. fluorescens (0,3,3 and 3 g, respectively), Factor B - azotobacter chroococcum in two levels: no aotobacter and azotobacter chroococcum (0 and 3 g, respectively), and factor C: nitrogen fertiliser from urea in four levels of 0, 80, 140 and 200 mg N/kg soil in two stages. The experiment was conducted in pot culture and open air environment. Different parameters were studied that included fertile tillers number, shoot dry weight, harvest index, flag leaf chlorophyll content, grain yield and grain nitrogen concentration. According to the analysis results of data variance, all traits except chlorophyll content had significant difference at P<0.01 level in the interaction of three factors of pseudomonas, azotobacter and nitrogen fertiliser level. The highest mean of flag leaf chlorophyll content was observed in treatment of pseudomonas putida-1 in 200 mg nitrogen fertiliser per kg soil of pot (43.48 SPAD number).
The highest mean of grain yield was seen in treatment of pseudomonas putida-1 and azotobacter in 200 mg nitrogen fertiliser per kg soil of pot (104.1 g/pot).
Keywords: Azotobacter and nitrogenous fertiliser, PGPR, pseudomonas, rice
Pertanika J. Trop. Agric. Sci. 41 (2): 701 – 728 (2018)
Hamid Ghaffari, Abdollatif Gholizadeh, Abbas Biabani, Alireza Fallah and Mohammad Mohammadian
716
INTRODUCTION
Chemical fertilisers are crucial elements in supply of plant nutrients. However, in recent years, excessive use of fertilisers in agricultural production has caused unpredicted environmental effects. Air and water pollution by pesticides, waste of soil and water resources and plant diseases are just a small part of environmental problems induced by chemical materials (Adesemoye, Torbert, & Kloepper, 2009; Koh & Song, 2007). Nitrogen nutrient management is a crucial strategy in regulating the rice growth and photosynthetic efficiency. In order to enhance production or yield, nitrogen fertiliser is increased which reduces farmer profits and deteriorates ecological environments (Long, Wan, Song, Jian, & Qin, 2013).
One way to reduce the negative impacts of chemical fertilisers on the environment is by inoculation with plant growth-promoting rhizobacteria (PGPR) (Velusamy, Immanuel, & Gnanamanickam, 2013). The recognition of plant growth-promoting rhizobacteria (PGPR), a group of beneficial plant bacteria, is potentially useful for stimulating plant growth and increasing crop yields PGPR has evolved over the past several years to where today researchers are able to repeatedly use it successfully in field experiments (Saharan & Nehra, 2011). PGPR is commonly used as inoculant for improving the growth and yield of agricultural crops and offers an attractive way to replace chemical fertilisers, pesticides, and supplements (Ashrafuzzaman et al., 2009).
Several chemical changes in soil are associated with PGPR, where some are able to establish themselves on the crop roots, especially if they are inoculated on the seed before planting. Also, most of the isolates have resulted in a significant increase in plant height, root length, and dry matter production of shoot and root of plants (Saharan & Nehra, 2011).
Various species of bacteria like pseudomonas, azospirillum, and azotobacter have been reported to enhance plant growth (Joseph, Ranjan Patra, & Lawrence, 2012; Kloepper, Lifshitz, & Zablotowicz, 2017). During the 1970s, Pseudomonas fluorescens and P. putida groups were investigated and azospirillum was found in order to enhance the growth of plants by affecting plant metabolism. In recent years, other bacterial genera, such as bacillus, flavobacterium, acetobacter, and several azospirillum have been evaluated (Nehra & Choudhary, 2015).
The study on the effect of peudomonas bacteria (Pseudomonas fluorescens) and azospirillum (Azospirillum lipoferum) with four levels of urea (25, 50, 75 and 100 kg /ha) Daylamani on Tarom rice showed that fertilization with azospirillum and pseudomonas bacteria has a significant difference at 1% (Khorshidi, Ardakani, Ramezanpour, Khavazi, & Zargari, 2011).
The study was conducted on the effects of several free-living rhizobacteria, including azotobacter, bacillus, enterobacter and xanthobacter in the accumulation of nitrogen, total dry matter yield and grain yield in rice plants (Oryza sativa L.)

Pertanika J. Trop. Agric. Sci. 41 (2): 715 – 728 (2018)
Plant Growth Promoting Rhizobacteria Application in Rice
717
indicated that the increase of grain yield was associated with the increase of root length, leaf area, and chlorophyll content (Alam, Cui, Yamagishi, & Ishii, 2001).
In the study done on isolation and characterisation of effective plant growth promoting rhizobacteria from Rice Rhizosphere of Indian Soil, eight efficient PGPR isolates were selected and identified as Pseudomonas aeruginosa, Pseudomonas putida, P. aeruginosa, Pseudomonas sp., P. aeruginosa, P. putida, P. aeruginosa and P. aeruginosa. Among all the strains, Pseudomonas putida was found to be the best in phosphorus solubilisation and was effective for rice production under Indo-Gangetic plain of Eastern Uttar Pradesh (Lavakush & Verma, 2012).
Evaluation of the effect of azosprillum, azobacter and chemical nitrogen fertiliser on rice (Oryza sativa L. var. Hashemi) has indicated that biofertiliser significantly affects the number of tillers. Nitrogen fertilisers significantly affect all measured traits and the interaction of biofertiliser × N fertiliser significantly affects flag leaf area, number of total tillers and biomass (Shakouri, Vajargah, Gavabar, Mafakheri, & Zargar, 2012).
This pot study investigates the effect of PGPR with different levels of nitrogen fertiliser application on the characteristics of flag leaves and yield components of rice in order to study the possibility of reducing the consumption of urea and the environmental degradation effects caused by the use of chemical fertilisers in agricultural products.
MATERIAL AND METHODS
The pot experiment was carried out in a completely randomised factorial design with four replications in the Rice Research Institute of Iran, Deputy of Mazandaran (Amol) during a growing season in one year and open-air environment in 2012. The experiment was conducted on Shiroodi high yielding rice variety. It was performed in the pot to control bacteria in the environment in order to ensure the preservation of bacterial populations and to avoid any interference with the treatment combinations of design.
The treatments consisted of three factors: factor A - pseudomonas in four levels of control (no bacteria), P. putida-1, P. putida-2 and P. fluorescens (0,3,3 and 3 g, respectively), factor B - azotobacter chroococcum in two levels control (no azotobacter) and azotobacter application (0 and 3 g, respectively), and factor C: nitrogen fertiliser from urea in four levels of 1- control (without nitrogen fertiliser), 2-80 mg nitrogen fertiliser per kilogramme of soil (in two stages of 40 mg), 3-140 mg of nitrogen fertiliser per kilogramme of soil (in two stages of 70 mg), and 4-200 mg of nitrogen fertiliser per kilogramme of soil (in two stages of 100 mg), respectively. The bacteria were prepared from the Iranian Soil and Water Research Institute, which were isolated from wheat fields.
In order to achieve the maximum utilisation of bacterial activity, the soil with low organic matter (0.67%) , total content of nitrogen 0.03%, and loam sandy texture was selected (Table 1).
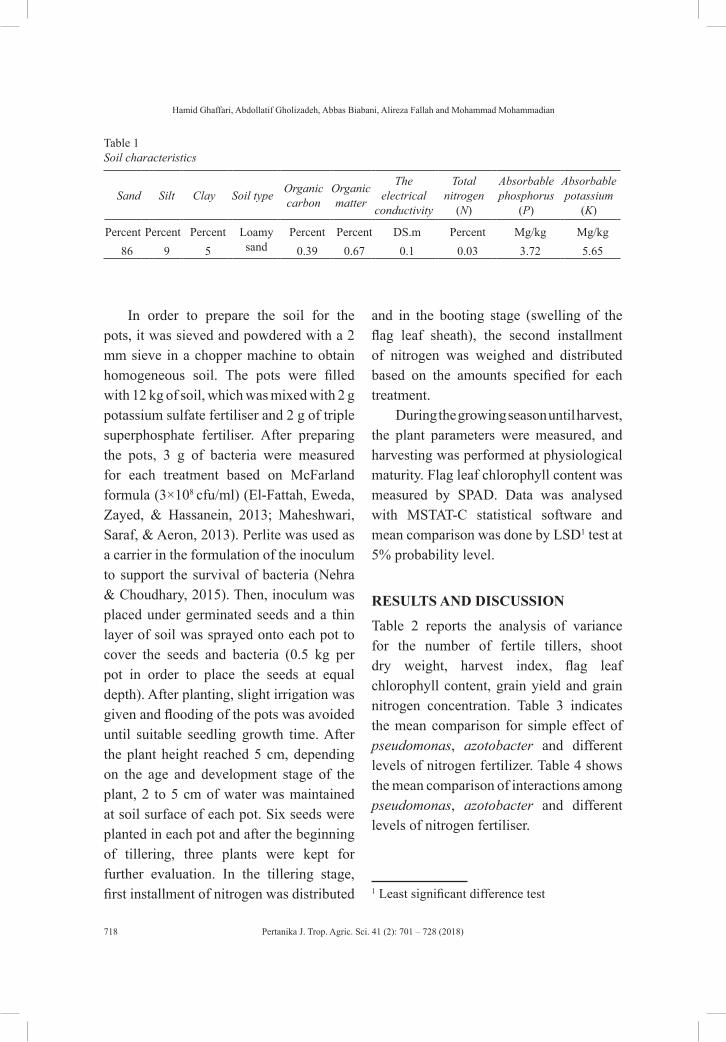
Pertanika J. Trop. Agric. Sci. 41 (2): 701 – 728 (2018)
Hamid Ghaffari, Abdollatif Gholizadeh, Abbas Biabani, Alireza Fallah and Mohammad Mohammadian
718
Table 1 Soil characteristics
Sand Silt Clay Soil type Organic carbon
Organic matter
The electrical
conductivity
Total nitrogen
(N)
Absorbable phosphorus
(P)
Absorbable potassium
(K)
Percent Percent Percent Loamy sand
Percent Percent DS.m Percent Mg/kg Mg/kg86 9 5 0.39 0.67 0.1 0.03 3.72 5.65
In order to prepare the soil for the pots, it was sieved and powdered with a 2 mm sieve in a chopper machine to obtain homogeneous soil. The pots were filled with 12 kg of soil, which was mixed with 2 g potassium sulfate fertiliser and 2 g of triple superphosphate fertiliser. After preparing the pots, 3 g of bacteria were measured for each treatment based on McFarland formula (3×10⁸ cfu/ml) (El-Fattah, Eweda, Zayed, & Hassanein, 2013; Maheshwari, Saraf, & Aeron, 2013). Perlite was used as a carrier in the formulation of the inoculum to support the survival of bacteria (Nehra & Choudhary, 2015). Then, inoculum was placed under germinated seeds and a thin layer of soil was sprayed onto each pot to cover the seeds and bacteria (0.5 kg per pot in order to place the seeds at equal depth). After planting, slight irrigation was given and flooding of the pots was avoided until suitable seedling growth time. After the plant height reached 5 cm, depending on the age and development stage of the plant, 2 to 5 cm of water was maintained at soil surface of each pot. Six seeds were planted in each pot and after the beginning of tillering, three plants were kept for further evaluation. In the tillering stage, first installment of nitrogen was distributed
and in the booting stage (swelling of the flag leaf sheath), the second installment of nitrogen was weighed and distributed based on the amounts specified for each treatment.
During the growing season until harvest, the plant parameters were measured, and harvesting was performed at physiological maturity. Flag leaf chlorophyll content was measured by SPAD . Data was analysed with MSTAT-C statistical software and mean comparison was done by LSD1 test at 5% probability level.
RESULTS AND DISCUSSION
Table 2 reports the analysis of variance for the number of fertile tillers, shoot dry weight, harvest index, flag leaf chlorophyll content, grain yield and grain nitrogen concentration. Table 3 indicates the mean comparison for simple effect of pseudomonas, azotobacter and different levels of nitrogen fertilizer. Table 4 shows the mean comparison of interactions among pseudomonas, azotobacter and different levels of nitrogen fertiliser.
1 Least significant difference test
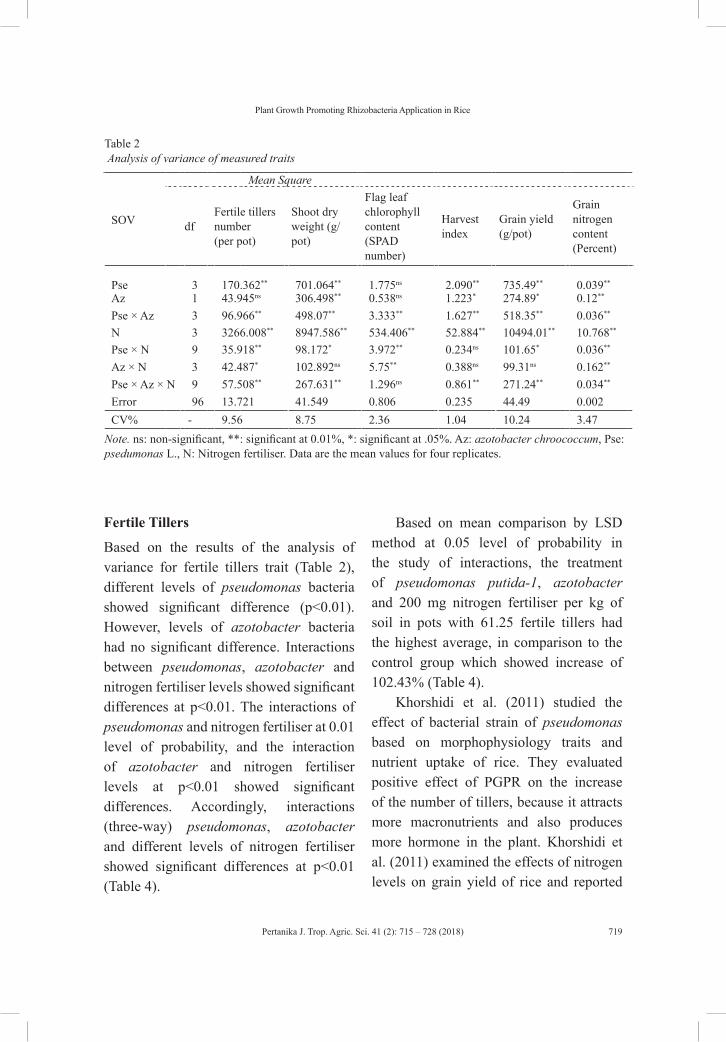
Pertanika J. Trop. Agric. Sci. 41 (2): 715 – 728 (2018)
Plant Growth Promoting Rhizobacteria Application in Rice
719
Table 2 Analysis of variance of measured traits
Mean Square
SOV dfFertile tillers number(per pot)
Shoot dry weight (g/pot)
Flag leaf chlorophyll content(SPAD number)
Harvest index
Grain yield (g/pot)
Grain nitrogen content (Percent)
Pse 3 170.362** 701.064** 1.775ns 2.090** 735.49** 0.039**
Az 1 43.945ns 306.498** 0.538ns 1.223* 274.89* 0.12**
Pse × Az 3 96.966** 498.07** 3.333** 1.627** 518.35** 0.036**
N 3 3266.008** 8947.586** 534.406** 52.884** 10494.01** 10.768**
Pse × N 9 35.918** 98.172* 3.972** 0.234ns 101.65* 0.036**
Az × N 3 42.487* 102.892ns 5.75** 0.388ns 99.31ns 0.162**
Pse × Az × N 9 57.508** 267.631** 1.296ns 0.861** 271.24** 0.034**
Error 96 13.721 41.549 0.806 0.235 44.49 0.002CV% - 9.56 8.75 2.36 1.04 10.24 3.47
Note. ns: non-significant, **: significant at 0.01%, *: significant at .05%. Az: azotobacter chroococcum, Pse: psedumonas L., N: Nitrogen fertiliser. Data are the mean values for four replicates.
Fertile Tillers
Based on the results of the analysis of variance for fertile tillers trait (Table 2), different levels of pseudomonas bacteria showed significant difference (p<0.01). However, levels of azotobacter bacteria had no significant difference. Interactions between pseudomonas, azotobacter and nitrogen fertiliser levels showed significant differences at p<0.01. The interactions of pseudomonas and nitrogen fertiliser at 0.01 level of probability, and the interaction of azotobacter and nitrogen fertiliser levels at p<0.01 showed significant differences. Accordingly, interactions (three-way) pseudomonas, azotobacter and different levels of nitrogen fertiliser showed significant differences at p<0.01 (Table 4).
Based on mean comparison by LSD method at 0.05 level of probability in the study of interactions, the treatment of pseudomonas putida-1, azotobacter and 200 mg nitrogen fertiliser per kg of soil in pots with 61.25 fertile tillers had the highest average, in comparison to the control group which showed increase of 102.43% (Table 4).
Khorshidi et al. (2011) studied the effect of bacterial strain of pseudomonas based on morphophysiology traits and nutrient uptake of rice. They evaluated positive effect of PGPR on the increase of the number of tillers, because it attracts more macronutrients and also produces more hormone in the plant. Khorshidi et al. (2011) examined the effects of nitrogen levels on grain yield of rice and reported
Pertanika J. Trop. Agric. Sci. 41 (2): 701 – 728 (2018)
Hamid Ghaffari, Abdollatif Gholizadeh, Abbas Biabani, Alireza Fallah and Mohammad Mohammadian
720
the grain yield to have increased because of nitrogen effect on the increasing number of fertile tillers. Abbasi, Esfahani, Rabiei and Kavousi (2007) also reported the effect of the nitrogen uptake on tiller numbers similarly.
Shoot Dry Weight
Based on the results of the analysis of variance for shoot dry weight trait (Table 2), interactions between pseudomonas and nitrogen fertiliser levels showed significant differences (p<0.01). The interaction of different levels of nitrogen fertiliser and azotobacter had no statistically significant difference. Other factors showed significant differences at 0.01 level of probability.
Based on the mean comparison by LSD method at 0.05 level of probability in the study of simple effect (Table 3), the treatment of Pseudomonas putida-1 with 78.70 mg had the highest average. In the study of interactions, the treatment of Pseudomonas putida-1 and 200 mg nitrogen fertiliser per kg of soil in pots without azotobacter application had the highest average.
Gardner, Pearce and Mitchell (2003) demonstrated that nitrogen is effective on the increase of biomass. Rajabi Agra, Bahmanyar, Ramezanpoor and Khavazi (2011) reported that application of the pseudomonas bacteria increases shoot dry weight of plants that could be attributed to the increased absorption of nutrients and improvement of the root systems and plant growth (Cakmakçi, Dönmez, Aydın, & Şahin, 2006). It seems that simultaneous
use of both bacteria at higher levels of nitrogen or increasing nitrogen absorption contributed to the growth of shoots, while consumption of bacteria in terms of lack of nitrogen in the soil suffered from nutrients bacteria did not have a successful performance that could be attributed to carbon and nitrogen deficiency or competition between bacteria in food shortages (Sylvia, Fuhrmann, Hartel, & Zuberer, 2005).
Harvest Index
Based on the results of the analysis of variance for harvest index trait (Table 2), levels of pseudomonas bacteria and the nitrogen fertiliser levels at 0.01 level of probability showed significant differences. The interactions of pseudomonas bacteria, azotobacter and nitrogen fertiliser levels showed significant differences at 0.01 level of probability.
Based on mean comparison by LSD method at 0.05 level of probability in the study of interactions, treatments of Pseudomonas putida-1 combined with azotobacter and consumption of 200 mg nitrogen fertiliser level per kg of soil with 48.67% showed the highest mean (Table 4).
Khorshidi et al. (2011) stated that harvest index is reduced by increase in the amount of nitrogen in rice production due to increased body weight, growth and biomass production. Also, they acknowledged that harvest index is decreased in the control treatment due to the extreme decrease of grain and straw yield.
Pertanika J. Trop. Agric. Sci. 41 (2): 715 – 728 (2018)
Plant Growth Promoting Rhizobacteria Application in Rice
721
Zargari, Khorshidi and Ardakani (2014) illustrated that the interaction between nitrogen, bacteria pseudomonas fluorescens and azospirillum lipoferum had a significant effect (p<0.01) on harvest index. Rahmani, Maleki, Mirzaeiheydari, and Naseri (2014) showed that bio-fertiliser has a significant effect on harvest index and the highest harvest index obtained from nitroxin treatment.
Flag Leaf Chlorophyll Content
Nitrogen rate with the effect on flag leaf chlorophyll content has a direct effect on photosynthetic response, the amount of photosynthesis per unit leaf area, plant growth and yield (Maheshwari et al., 2013). According to the results of the analysis of variance for flag leaf chlorophyll content (Table 2), different levels of nitrogen, interactions between azaotobacter and pseudomonas, pseudomonas and azotobacter, interactions between pseudomonas and nitrogen fertiliser application showed significant difference (p<0.01). No significant differences were observed in the remaining factors (Table 4).
Based on the mean comparison by LSD method at 0.05 level of probability, the treatment of 200 mg of nitrogen fertiliser and the treatment of no consumption of nitrogen fertilisers in the comparison of the simple effects (Table 3), had the highest (SAPD 42.69) and lowest (SAPD 33.09) mean, respectively. Comparison of the interactions between pseudomonas bacteria and azotobacter showed that all
treatments except the treatment of non-use were placed in Class A, indicating higher values. Comparison of interactions between pseudomonas and nitrogen fertiliser, treatment of Pseudomonas putida-1 at level of 200 mg nitrogen fertiliser per kg soil of pot demonstrated the highest mean and treatment of pseudomonas putida-1 without nitrogen fertiliser showed the lowest mean (Figure 1-3) .
It seems that the use of bacteria is useful when it is used along with enough nitrogen fertiliser and non-use of nitrogen fertiliser in this soil with the condition of the food poverty showed content less than control treatment. Faraji, Esfahani, Kavoosi, Nahvi and Rabiee (2011) stated that there is a significant linear relationship between the concentration of chlorophyll and nitrogen concentrations. Although the levels of azotobacter and pseudomonas had no significant difference in the change of chlorophyll, the difference was statistically significant at levels of nitrogen fertiliser alone. The interactions between pseudomonas bacteria and nitrogen as well as interactions between nitrogen and azotobacter indicated the importance of this element in determining the concentration of chlorophyll and photosynthesis in plants, thereby increasing the plant performance (Mahanta, Jha, & Rajkhowa, 2012; Maheshwari,et al. 2013; Okon & Labandera-Gonzalez, 1994). Alam, Cui, Yamagishi, and Ishii (2001) also illustrated that bacterial inoculation led to the increase in chlorophyll content, particularly in the last stage of the grain filling.
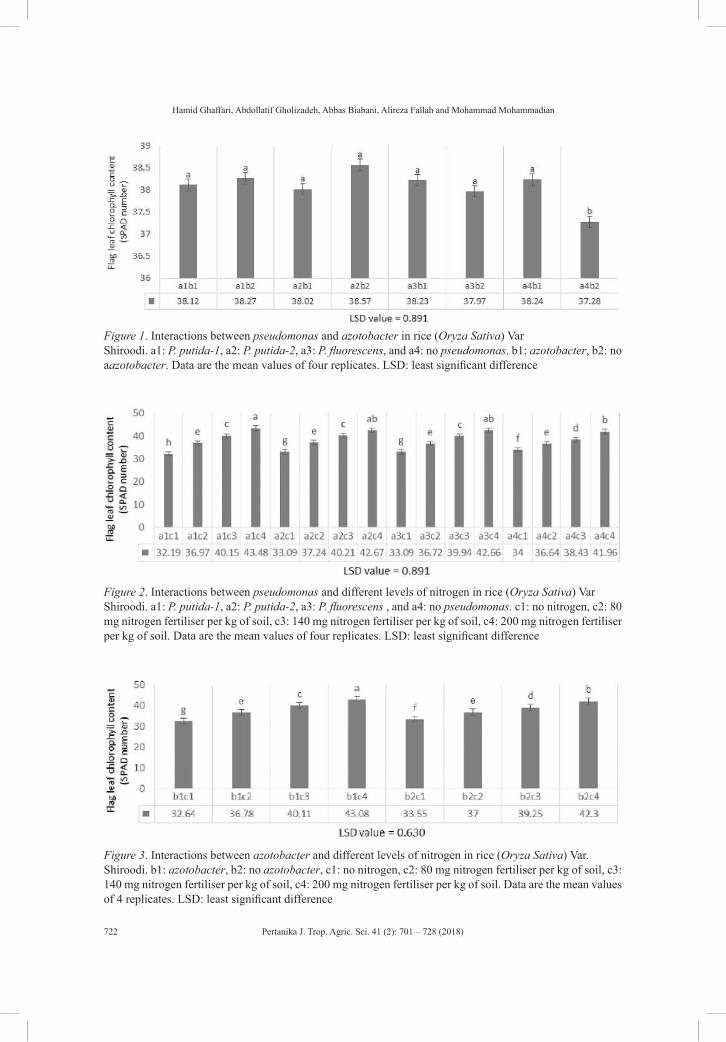
Pertanika J. Trop. Agric. Sci. 41 (2): 701 – 728 (2018)
Hamid Ghaffari, Abdollatif Gholizadeh, Abbas Biabani, Alireza Fallah and Mohammad Mohammadian
722
Figure 1. Interactions between pseudomonas and azotobacter in rice (Oryza Sativa) VarShiroodi. a1: P. putida-1, a2: P. putida-2, a3: P. fluorescens, and a4: no pseudomonas. b1: azotobacter, b2: no aazotobacter. Data are the mean values of four replicates. LSD: least significant difference
Figure 2. Interactions between pseudomonas and different levels of nitrogen in rice (Oryza Sativa) Var Shiroodi. a1: P. putida-1, a2: P. putida-2, a3: P. fluorescens , and a4: no pseudomonas. c1: no nitrogen, c2: 80 mg nitrogen fertiliser per kg of soil, c3: 140 mg nitrogen fertiliser per kg of soil, c4: 200 mg nitrogen fertiliser per kg of soil. Data are the mean values of four replicates. LSD: least significant difference
Figure 3. Interactions between azotobacter and different levels of nitrogen in rice (Oryza Sativa) Var. Shiroodi. b1: azotobacter, b2: no azotobacter, c1: no nitrogen, c2: 80 mg nitrogen fertiliser per kg of soil, c3: 140 mg nitrogen fertiliser per kg of soil, c4: 200 mg nitrogen fertiliser per kg of soil. Data are the mean values of 4 replicates. LSD: least significant difference
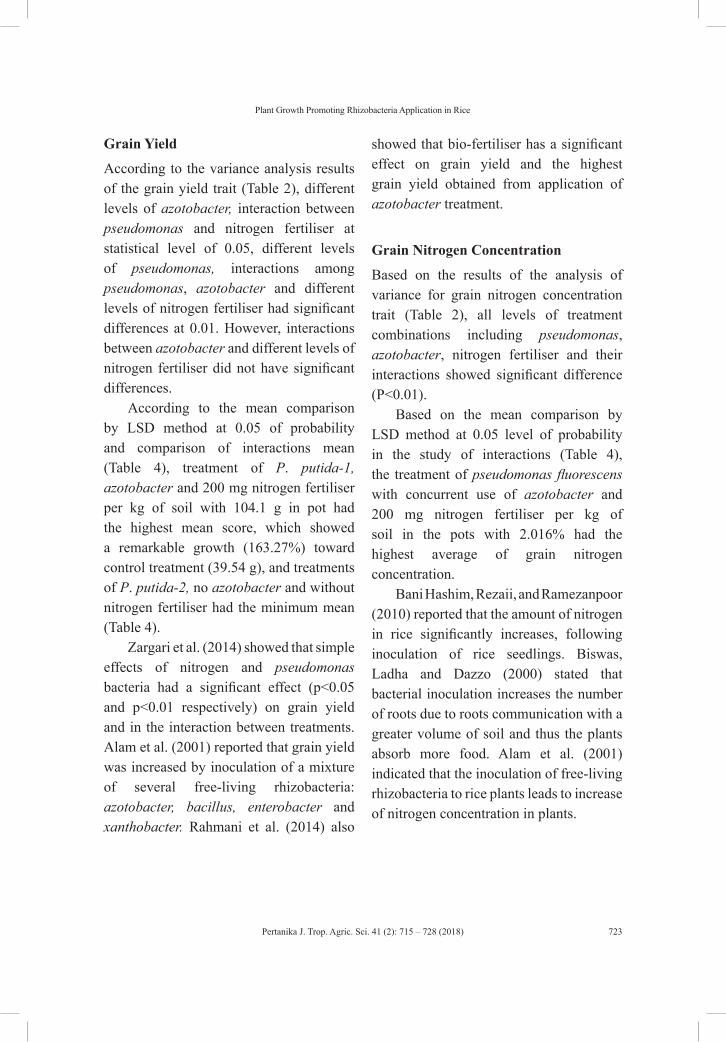
Pertanika J. Trop. Agric. Sci. 41 (2): 715 – 728 (2018)
Plant Growth Promoting Rhizobacteria Application in Rice
723
Grain Yield
According to the variance analysis results of the grain yield trait (Table 2), different levels of azotobacter, interaction between pseudomonas and nitrogen fertiliser at statistical level of 0.05, different levels of pseudomonas, interactions among pseudomonas, azotobacter and different levels of nitrogen fertiliser had significant differences at 0.01. However, interactions between azotobacter and different levels of nitrogen fertiliser did not have significant differences.
According to the mean comparison by LSD method at 0.05 of probability and comparison of interactions mean (Table 4), treatment of P. putida-1, azotobacter and 200 mg nitrogen fertiliser per kg of soil with 104.1 g in pot had the highest mean score, which showed a remarkable growth (163.27%) toward control treatment (39.54 g), and treatments of P. putida-2, no azotobacter and without nitrogen fertiliser had the minimum mean (Table 4).
Zargari et al. (2014) showed that simple effects of nitrogen and pseudomonas bacteria had a significant effect (p<0.05 and p<0.01 respectively) on grain yield and in the interaction between treatments. Alam et al. (2001) reported that grain yield was increased by inoculation of a mixture of several free-living rhizobacteria: azotobacter, bacillus, enterobacter and xanthobacter. Rahmani et al. (2014) also
showed that bio-fertiliser has a significant effect on grain yield and the highest grain yield obtained from application of azotobacter treatment.
Grain Nitrogen Concentration
Based on the results of the analysis of variance for grain nitrogen concentration trait (Table 2), all levels of treatment combinations including pseudomonas, azotobacter, nitrogen fertiliser and their interactions showed significant difference (P<0.01).
Based on the mean comparison by LSD method at 0.05 level of probability in the study of interactions (Table 4), the treatment of pseudomonas fluorescens with concurrent use of azotobacter and 200 mg nitrogen fertiliser per kg of soil in the pots with 2.016% had the highest average of grain nitrogen concentration.
Bani Hashim, Rezaii, and Ramezanpoor (2010) reported that the amount of nitrogen in rice significantly increases, following inoculation of rice seedlings. Biswas, Ladha and Dazzo (2000) stated that bacterial inoculation increases the number of roots due to roots communication with a greater volume of soil and thus the plants absorb more food. Alam et al. (2001) indicated that the inoculation of free-living rhizobacteria to rice plants leads to increase of nitrogen concentration in plants.
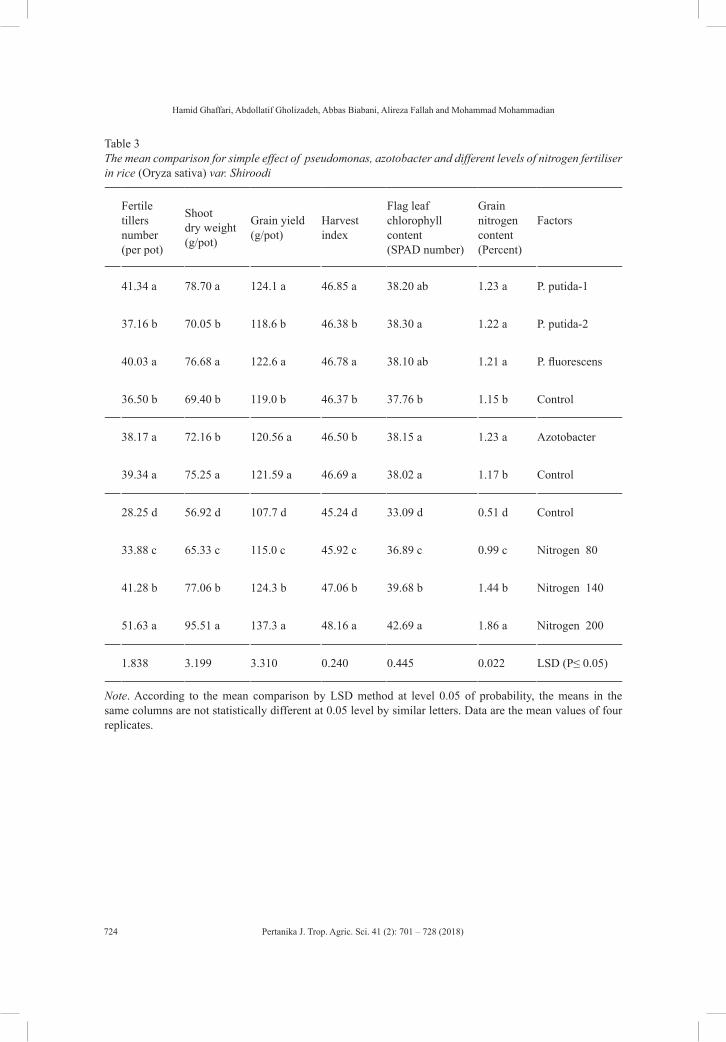
Pertanika J. Trop. Agric. Sci. 41 (2): 701 – 728 (2018)
Hamid Ghaffari, Abdollatif Gholizadeh, Abbas Biabani, Alireza Fallah and Mohammad Mohammadian
724
Table 3The mean comparison for simple effect of pseudomonas, azotobacter and different levels of nitrogen fertiliser in rice (Oryza sativa) var. Shiroodi
Fertile tillers number (per pot)
Shoot dry weight (g/pot)
Grain yield (g/pot)
Harvest index
Flag leaf chlorophyll content(SPAD number)
Grain nitrogen content (Percent)
Factors
41.34 a 78.70 a 124.1 a 46.85 a 38.20 ab 1.23 a P. putida-1
37.16 b 70.05 b 118.6 b 46.38 b 38.30 a 1.22 a P. putida-2
40.03 a 76.68 a 122.6 a 46.78 a 38.10 ab 1.21 a P. fluorescens
36.50 b 69.40 b 119.0 b 46.37 b 37.76 b 1.15 b Control
38.17 a 72.16 b 120.56 a 46.50 b 38.15 a 1.23 a Azotobacter
39.34 a 75.25 a 121.59 a 46.69 a 38.02 a 1.17 b Control
28.25 d 56.92 d 107.7 d 45.24 d 33.09 d 0.51 d Control
33.88 c 65.33 c 115.0 c 45.92 c 36.89 c 0.99 c Nitrogen 80
41.28 b 77.06 b 124.3 b 47.06 b 39.68 b 1.44 b Nitrogen 140
51.63 a 95.51 a 137.3 a 48.16 a 42.69 a 1.86 a Nitrogen 200
1.838 3.199 3.310 0.240 0.445 0.022 LSD (P≤ 0.05)
Note. According to the mean comparison by LSD method at level 0.05 of probability, the means in the same columns are not statistically different at 0.05 level by similar letters. Data are the mean values of four replicates.
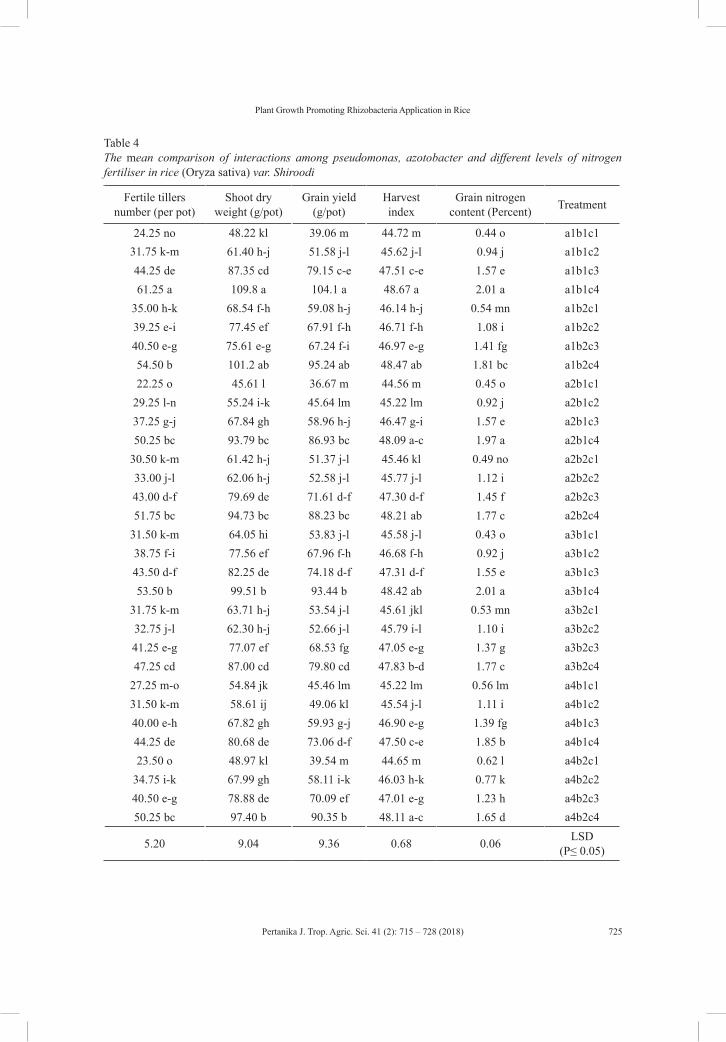
Pertanika J. Trop. Agric. Sci. 41 (2): 715 – 728 (2018)
Plant Growth Promoting Rhizobacteria Application in Rice
725
Table 4 The mean comparison of interactions among pseudomonas, azotobacter and different levels of nitrogen fertiliser in rice (Oryza sativa) var. Shiroodi
Fertile tillers number (per pot)
Shoot dry weight (g/pot)
Grain yield (g/pot)
Harvest index
Grain nitrogen content (Percent) Treatment
24.25 no 48.22 kl 39.06 m 44.72 m 0.44 o a1b1c131.75 k-m 61.40 h-j 51.58 j-l 45.62 j-l 0.94 j a1b1c244.25 de 87.35 cd 79.15 c-e 47.51 c-e 1.57 e a1b1c361.25 a 109.8 a 104.1 a 48.67 a 2.01 a a1b1c4
35.00 h-k 68.54 f-h 59.08 h-j 46.14 h-j 0.54 mn a1b2c139.25 e-i 77.45 ef 67.91 f-h 46.71 f-h 1.08 i a1b2c240.50 e-g 75.61 e-g 67.24 f-i 46.97 e-g 1.41 fg a1b2c354.50 b 101.2 ab 95.24 ab 48.47 ab 1.81 bc a1b2c422.25 o 45.61 l 36.67 m 44.56 m 0.45 o a2b1c1
29.25 l-n 55.24 i-k 45.64 lm 45.22 lm 0.92 j a2b1c237.25 g-j 67.84 gh 58.96 h-j 46.47 g-i 1.57 e a2b1c350.25 bc 93.79 bc 86.93 bc 48.09 a-c 1.97 a a2b1c4
30.50 k-m 61.42 h-j 51.37 j-l 45.46 kl 0.49 no a2b2c133.00 j-l 62.06 h-j 52.58 j-l 45.77 j-l 1.12 i a2b2c243.00 d-f 79.69 de 71.61 d-f 47.30 d-f 1.45 f a2b2c351.75 bc 94.73 bc 88.23 bc 48.21 ab 1.77 c a2b2c4
31.50 k-m 64.05 hi 53.83 j-l 45.58 j-l 0.43 o a3b1c138.75 f-i 77.56 ef 67.96 f-h 46.68 f-h 0.92 j a3b1c243.50 d-f 82.25 de 74.18 d-f 47.31 d-f 1.55 e a3b1c353.50 b 99.51 b 93.44 b 48.42 ab 2.01 a a3b1c4
31.75 k-m 63.71 h-j 53.54 j-l 45.61 jkl 0.53 mn a3b2c132.75 j-l 62.30 h-j 52.66 j-l 45.79 i-l 1.10 i a3b2c241.25 e-g 77.07 ef 68.53 fg 47.05 e-g 1.37 g a3b2c347.25 cd 87.00 cd 79.80 cd 47.83 b-d 1.77 c a3b2c4
27.25 m-o 54.84 jk 45.46 lm 45.22 lm 0.56 lm a4b1c131.50 k-m 58.61 ij 49.06 kl 45.54 j-l 1.11 i a4b1c240.00 e-h 67.82 gh 59.93 g-j 46.90 e-g 1.39 fg a4b1c344.25 de 80.68 de 73.06 d-f 47.50 c-e 1.85 b a4b1c423.50 o 48.97 kl 39.54 m 44.65 m 0.62 l a4b2c1
34.75 i-k 67.99 gh 58.11 i-k 46.03 h-k 0.77 k a4b2c240.50 e-g 78.88 de 70.09 ef 47.01 e-g 1.23 h a4b2c350.25 bc 97.40 b 90.35 b 48.11 a-c 1.65 d a4b2c4
5.20 9.04 9.36 0.68 0.06 LSD (P≤ 0.05)
Pertanika J. Trop. Agric. Sci. 41 (2): 701 – 728 (2018)
Hamid Ghaffari, Abdollatif Gholizadeh, Abbas Biabani, Alireza Fallah and Mohammad Mohammadian
726
According to the mean comparison by LSD method at level 0.05 of probability, the means in the same column are not statistically different at 0.05 level by similar letters. a1: P. putida-1, a2: P. putida-2, a3: P. fluorescens , and a4: no pseudomonas. b1: azotobacter, b2: no azotobacter, c1: no nitrogen, c2: 80 mg nitrogen fertiliser per kg of soil, c3: 140 mg nitrogen fertiliser per kg of soil, c4: 200 mg nitrogen fertiliser per kg of soil. Data are the mean values of four replicates. LSD: least significant difference.
According to the mean comparison by LSD method at level 0.05 of probability, the means in the same column are not statistically different at 0.05 level by similar letters. a1: P. putida-1, a2: P. putida-2, a3: P. fluorescens , and a4: no pseudomonas. b1: azotobacter, b2: no azotobacter, c1: no nitrogen, c2: 80 mg nitrogen fertiliser per kg of soil, c3: 140 mg nitrogen fertiliser per kg of soil, c4: 200 mg nitrogen fertiliser per kg of soil. Data are the mean values of four replicates. LSD: least significant difference.
CONCLUSIONS
The results show a large positive effect on uptake of nitrogen by plant and nitrogen content of grains. Flag leaf chlorophyll content is increased by usage of bacteria along with nitrogen fertiliser which has a significant effect on seed filling and yield enhancement. Increasing of grain yield along with harvest index and other yield components are promising results. Although fertilisers play a significant role in the increase of plant yield, PGPR
bacteria can be used to increase the effect of nitrogen fertilisers in rice paddy. Pseudomonas putida-1 has the best performance among pseudomonas bacteria in all traits. The combination of P. putida-1, azotobacter and 200 mg nitrogen fertiliser per kg of soil (the highest amount of fertiliser) is evaluated as the best treatment combination. Based on the results, the use of growth promoting bacteria with nitrogen fertiliser plays a useful and effective role in the increase of rice yield, especially when enough nitrogenous fertilisers are used, soil has little natural food sources and the high yielding varieties of rice are used (which require more fertilisers and food). On the other hand, consumption of PGPR bacteria is not useful without fertiliser and has a negative effect on most traits. The use of soils with a variety of tissue, porosity, fertility and other rice varieties can be investigated in future research.
REFERENCESAbbasi, H. A., Esfahani, M., Rabiei, B., & Kavousi,
M. (2007). Effect of nitrogen fertilizing management on rice (cv. Khazar) yield and its components in a paddy soil of Guilan Province. JWSS-Isfahan University of Technology, 10(4), 293-307.
Adesemoye, A. O., Torbert, H. A., & Kloepper, J. W. (2009). Plant growth-promoting rhizobacteria allow reduced application rates of chemical fertilizers. Microbial Ecology, 58(4), 921-929.
Alam, S., Cui, Z. J., Yamagishi, T., & Ishii, R. (2001). Grain yield and related physiological characteristics of rice plants (oryza sativa L.) inoculated with free-living rhizobacteria. Plant Production Science, 4(2), 126-130.
Pertanika J. Trop. Agric. Sci. 41 (2): 715 – 728 (2018)
Plant Growth Promoting Rhizobacteria Application in Rice
727
Ashrafuzzaman, M., Hossen, F. A., Ismail, M. R., Hoque, A., Islam, M. Z., Shahidullah, S. M., & Meon, S. (2009). Efficiency of plant growth-promoting rhizobacteria (PGPR) for the enhancement of rice growth. African Journal of Biotechnology, 8(7), 1247-1252.
Bani Hashim, F., Rezaii, M. A., & Ramezanpoor, M. R. (2010). The effect of bacteria on growth and nutrient concentration Pseudomonas with auxin production ability in rice (oryza sativa L. var Neda). Journal of Plant Research, 3(19), 63-56.
Biswas, J., Ladha, J., & Dazzo, F. (2000). Rhizobia inoculation improves nutrient uptake and growth of lowland rice. Soil Science Society of America Journal, 64(5), 1644-1650.
Cakmakçi, R., Dönmez, F., Aydın, A., & Şahin, F. (2006). Growth promotion of plants by plant growth-promoting rhizobacteria under greenhouse and two different field soil conditions. Soil Biology and Biochemistry, 38(6), 1482-1487.
Egamberdiyeva, D. (2005). Plant-growth-promoting rhizobacteria isolated from a Calcisol in a semi-arid region of Uzbekistan: Biochemical characterization and effectiveness. Journal of Plant Nutrition and Soil Science, 168(1), 94-99.
El-Fattah, D. A. A., Eweda, W. E., Zayed, M. S., & Hassanein, M. K. (2013). Effect of carrier materials, sterilization method, and storage temperature on survival and biological activities of Azotobacter chroococcum inoculant. Annals of Agricultural Sciences, 58(2), 111-118.
Faraji, F., Esfahani, M., Kavoosi, M., Nahvi, M., & Rabiee, B. (2011). Effect of nitrogen fertilizer on rice yield and conversion efficiency. Iranian Journal of Crop Sciences, 13(1), 77-61.
Gardner, F. P., Pearce, R. B., & Mitchell, R. L. (2003). Physiology of crop plants. Jodhpur, India: Scientific Publishers
Joseph, B., Ranjan Patra, R., & Lawrence, R. (2012). Characterization of plant growth promoting rhizobacteria associated with chickpea (Cicer arietinum L.). International Journal of Plant Production, 1(2), 141-152.
Khorshidi, Y. R., Ardakani, M. R., Ramezanpour, M. R., Khavazi, K., & Zargari, K. (2011). Response of yield and yield components of rice (oryza sativa L.) to Pseudomonas flouresence and Azospirillum lipoferum under different nitrogen levels. American-Eurasian Journal of Agricultural & Environmental Sciences, 10(3), 387-95.
Kloepper, J. W., Lifshitz, R., & Zablotowicz, R. M. (2017). Free-living bacterial inocula for enhancing crop productivity. Trends in Biotechnology, 7(2), 39-44.
Koh, R. H., & Song, H. G. (2007). Effects of application of Rhodopseudomonas sp. on seed germination and growth of tomato under axenic conditions. Journal of microbiology and biotechnology, 17(11), 1805-1810.
Lavakush, J. Y., & Verma, J. P. (2012). Isolation and characterization of effective plant growth promoting rhizobacteria from rice rhizosphere of Indian soil. Asian Journal Biological Science, 5, 294-303.
Long, J. R., Wan, Y. Z., Song, C. F., Jian, S. U. N., & Qin, R. J. (2013). Effects of nitrogen fertilizer level on chlorophyll fluorescens characteristics in flag leaf of super hybrid rice at late growth stage. Rice Science, 20(3), 220-228.
Mahanta, K., Jha, D. K., Rajkhowa, D. J., & Manoj-Kumar. (2012). Microbial enrichment of vermicompost prepared from different plant biomasses and their effect on rice (Oryza sativa L.) growth and soil fertility. Biological Agriculture & Horticulture, 28(4), 241-250.
Pertanika J. Trop. Agric. Sci. 41 (2): 701 – 728 (2018)
Hamid Ghaffari, Abdollatif Gholizadeh, Abbas Biabani, Alireza Fallah and Mohammad Mohammadian
728
Maheshwari, D. K., Saraf, M., & Aeron, A. (Eds.). (2013). Bacteria in agrobiology: Crop productivity. City: Springer Science & Business Media.
Nehra, V., & Choudhary, M. (2015). A review on plant growth promoting rhizobacteria acting as bioinoculants and their biological approach towards the production of sustainable agriculture. Journal of Applied and Natural Science, 7(1), 540-556.
Okon, Y., & Labandera-Gonzalez, CA. (1994). Agronomic applications of azospirillum in improving plan productivity with rhizosphere bacteria. In M. H. Ryder, P. M. Stephens, & G. D. Brown (Eds.). Commonwealth Scientific and Industrial Research Organization (pp. 274-278). Adelaide: Publisher.
Rahmani, A., Maleki, A., Mirzaeiheydari, M., & Naseri, R. (2014). Effect of plant growth promoting rhizobacteria (PGPR) and planting pattern on yield and its components of rice (oryza sativa L.) in Ilam Province, Iran. World Academy of Science, Engineering and Technology, International Journal of Biological, Biomolecular, Agricultural, Food and Biotechnological Engineering, 8(8), 912-918.
Rajabi Agra, S., Bahmanyar, M. A., Ramezanpoor, M. R., & Khavazi, K. (2011). The role of pseudomonas bacteria in reducing injuries from the use of saline water in rice (oryza sativa L.). Journal of Water in Agriculture, 25(1), 46-37.
Saharan, B. S., & Nehra, V. (2011). Plant growth promoting rhizobacteria: a critical review. Life Sciences and Medicine Research, 21(1), 30.
Shakouri, M. J., Vajargah, A. V., Gavabar, M. G., Mafakheri, S., & Zargar, M. (2012). Rice vegetative response to different biological and chemical fertilizers. Advances in Environmental Biology, 6, 859-863.
Sylvia, D. M., Fuhrmann, J. J., Hartel, P. G., & Zuberer, D. A. (Eds.). (2005). Principles and applications of soil microbiology. Upper Saddle River, NJ: Pearson Prentice Hall.
Velusamy, P., Immanuel, J. E., & Gnanamanickam, S. S. (2013). Rhizosphere bacteria for biocontrol of bacterial blight and growth promotion of rice. Rice Science, 20(5), 356-362.
Zargari, K., Khorshidi, Y. R., & Ardakani, M. R. (2014). Growth stimulant bacteria and nitrogen fertilizer effects plant nutrient uptake in rice (Oryza sativa L.). International Journal of Biosciences (IJB), 4(9), 218-226.
Pertanika J. Trop. Agric. Sci. 41 (2): 729 – 740 (2018)
ISSN: 1511-3701 © Universiti Putra Malaysia Press
TROPICAL AGRICULTURAL SCIENCEJournal homepage: http://www.pertanika.upm.edu.my/
ARTICLE INFOArticle history:Received: 20 September 2017Accepted: 8 December 2017
E-mail addresses:[email protected] (Mira, P.)[email protected] (Wan Zahari, M.)[email protected] (Rusli, N. D.)[email protected] (Mat, K.)* Corresponding author
Effects of Non-Medicated and Medicated Urea Molasses Multi-nutrient Blocks on Dry Matter Intake, Growth Performance, Body Condition Score and Feed Conversion Ratio of Saanen Lactating Does Fed Conventional Diets
Mira, P.1, Wan Zahari, M.2*, Rusli, N. D.1 and Mat, K.1 1Faculty of Agro Based Industry, Universiti Malaysia Kelantan, 17600 UMK, Jeli, Kelantan, Malaysia2Faculty of Veterinary Medicine, Universiti Malaysia Kelantan, 16100 UMK, Kota Bharu, Kelantan, Malaysia
ABSTRACT
In this study, 24 Saanen lactating does raised by a smallholder in Kemahang, Tanah Merah, Kelantan were randomly assigned to four groups with six goats in each group. The trial included evaluation of four dietary treatments, that is, T1: control group fed on basal diet only, which consisted of 3 kg Napier grass (Pennisetum purpureum) and 1 kg commercial goat pellet. Animals in T2, T3 and T4 received equal amounts of basal diet with supplementation of urea molasses multi-nutrient block (UMMB), medicated urea molasses multi-nutrient block (MUMB) and commercial mineral block (CMB) respectively. The total dry matter intake (DMI) (kg/d) in T2 (1.28) and T3 (1.24) were significantly higher (p<0.05) than in T1 (1.14) and T4 (1.15). However, there were no significant differences (p>0.05) between treatments on average daily gain (ADG) and body measurements. Highest ADG (g/d) were recorded in T2 (53.57) followed by T3 (45.63), T4 (39.68) and T1 (37.70). Similar trend was also recorded in body condition score (BCS) but there were no significant differences (p>0.05) between treatments. At the end of the 90 days of feeding trial, both T2 and T3 showed acceptable BCS, that is, at 3.25 and 3.08 respectively, while low BCS were recorded in T1 (2.63) and T4 (2.71). There was significant difference (p<0.05) between treatments on feed conversion ratio (FCR) which were at 0.84, 0.95, 1.20 and 1.46 for T2, T3, T4 and T1 respectively.
Both UMMB and MUMB were effective in enhancing appetite, DMI and ADG of the dairy goats, apart from minimising weight loss during lactation.
Keywords: Commercial mineral block, feed conversion ratio, lactating goats, MUMB, UMMB
Pertanika J. Trop. Agric. Sci. 41 (2): 729 – 740 (2018)
Mira, P., Wan Zahari, M., Rusli, N. D. and Mat, K.
730
INTRODUCTION
Small ruminant farming plays an important part in smallholder communities, and contributes substantially to the economic development in Malaysia (Melissa, Norsida, & Nolila, 2016). The demands for mutton and milk are increasing every year and the self-sufficiency levels for both items cannot be met if goats and sheep farming are not fast expanding. The interest in dairy goat farming in particular, has been observed in Peninsular Malaysia, especially in the eastern regions. Saanen is one of the most common breeds of goats raised by local smallholders owing to its high milk yield and its resistance to tropical diseases. However, the high cost of feed is one of the main constraints faced by local smallholders (Shanmugavelu & Quaza Nizamuddin, 2014; Wan Zahari, Chandrawathani, Sani, Nor Ismail, & Oshibe, 2007). In lactating dairy goats, poor nutritive values in daily feeds usually result in low milk yield and poor milk quality. Daily milk yield of 1.5 to 2.0 liters is commonly observed in Saanen dairy goats raised by smallholders in Kelantan.
Most smallholders utilise mineral or salt block as supplement to their lactating goats. This practice is usually aimed at increasing appetite of the animals, and not for rectifying mineral deficiencies or imbalances. Mineral blocks or salt blocks are imported and specifically produced to overcome mineral deficiencies only. Deficiencies of protein and energy are the main problems in local ruminants which can be solved by supplementing mineral
block or salt block. Hence, supplementation of urea-molasses multi-nutrient blocks (UMMB) is more appropriate as it is enriched with molasses and urea, as source of energy and protein respectively (Akter, Akbar, Shahjalal, & Ahmed, 2004; Manta, Aduba, Dada, & Onyemize, 2013). Besides, UMMB is also highly efficient as a vehicle of anthelminthic carrier and for this reason, it is known as ‘medicated UMMB’ or MUMB (Akbar, Ahmed, & Mondal, 2006). This study was aimed at comparing the effect of UMMB, MUMB and imported commercial mineral block (CMB) on dry matter intake (DMI), average daily gain (ADG), feed conversion ratio (FCR) and body condition score (BCS) of Saanen lactating does raised by a smallholder in Kemahang, Tanah Merah, Kelantan, Malaysia.
MATERIALS AND METHODS
Experimental Animals and Management
A total of 24 Saanen lactating does with different parity (primiparous and multiparous) were used in this trial. The animals were housed in separate pens and were fed individually over 90 days’ trial period.
Experimental Design and Treatments
The animals were allocated into four treatment groups based on randomised complete block design, with six goats per group based on their initial body weight (Mean±SE) of 40.58±1.50 kg and parity.
Pertanika J. Trop. Agric. Sci. 41 (2): 729 – 740 (2018)
UMMB and MUMB as Feed Supplements to Improve Performance in Dairy Goats
731
All animals in the treatment groups received equal amounts of basal diet - 3 kg fresh Napier grass and 1 kg commercial goat pellet for the control group, T1, and supplemented with either UMMB (group 2), MUMB (group 3) or commercial mineral block (group 4). The goats were fed routine diets two times per day, that is, goat pellet at 9.00 am and Napier grass (Pennisetum purpureum) at 12.00 noon. The supplements were provided in each pen for the animals to lick. Each UMMB, MUMB and CMB was provided in the form of 2 kg block. MUMB contained 0.05% of fenbendazole for each 1 kg of blocks. Intake of the supplement by each group was monitored daily, and when the blocks were fully consumed by the animals, new blocks were replaced.
Chemical Analysis
Samples of UMMB, MUMB, CMB and basal diet were subjected to chemical analysis to determine dry matter (DM), ash, crude protein (CP), crude fiber (CF), ether extract (EE), acid detergent fiber (ADF) and neutral detergent fiber (NDF). DM was determined by drying the sample in forced air oven at 110°C for 24 hours. Ash was determined by ashing the sample in carbolite furnace at 600°C for six hours. CP was analysed by digestion, distillation and titration processes while CF determination was conducted by washing and boiling the sample in acid and alkali. EE was determined by extraction with petroleum ether. ADF and NDF were analysed by washing and boiling the sample in ADF and
NDF solution respectively (AOAC, 1990). OM was determined by the equation of 100-ash (%) (Zaklovta, Hilali, Nefzaoui, & Haylani, 2011). All sample were analysed in triplicate and the results were expressed in % mean.
Data Collection and Analysis
Fresh feed intake and dry matter intake (DMI) of basal feed and supplements were taken daily by the difference of offer and refuse. Body weight of the goats and body measurements were measured on Day One of feeding trial, and every two weeks thereafter. The body measurements taken included heart girth (HG), body length (BL), height at wither (HW) and height at rumps (HR). HG was the circumference of the chest while BL was measured from the point of shoulder to the pin bone. HW and HR were measured as the distance from the floor to withers and rump respectively (Babale, Kibon, & Yahaya, 2015). BCS were evaluated before the feeding trial and every month thereafter based on 5-point scale. FCR was determined by dividing the total DMI to milk output over 90 days feeding period. All data were analysed by Analysis of Variance (ANOVA) using SPSS 2015 version 23.
RESULTS AND DISCUSSION
Chemical Composition of Basal Diet and Multi-nutrient Block
The composition of UMMB, MUMB and basal diet are presented in Table 1. UMMB contained 90.06% DM, 17.48% ash,
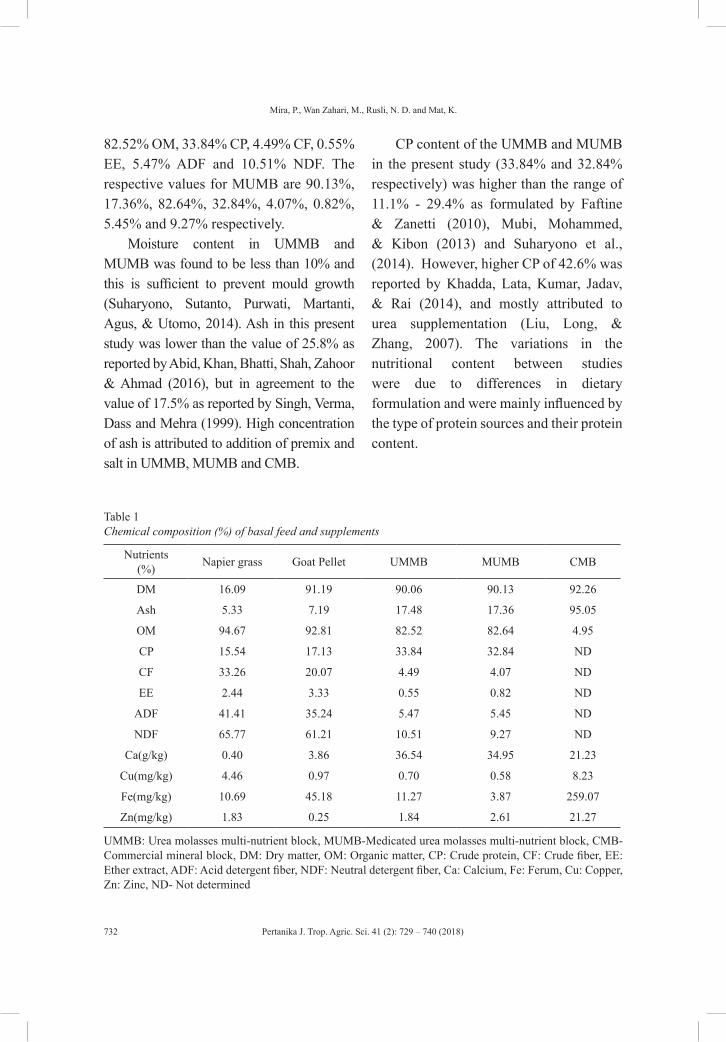
Pertanika J. Trop. Agric. Sci. 41 (2): 729 – 740 (2018)
Mira, P., Wan Zahari, M., Rusli, N. D. and Mat, K.
732
82.52% OM, 33.84% CP, 4.49% CF, 0.55% EE, 5.47% ADF and 10.51% NDF. The respective values for MUMB are 90.13%, 17.36%, 82.64%, 32.84%, 4.07%, 0.82%, 5.45% and 9.27% respectively.
Moisture content in UMMB and MUMB was found to be less than 10% and this is sufficient to prevent mould growth (Suharyono, Sutanto, Purwati, Martanti, Agus, & Utomo, 2014). Ash in this present study was lower than the value of 25.8% as reported by Abid, Khan, Bhatti, Shah, Zahoor & Ahmad (2016), but in agreement to the value of 17.5% as reported by Singh, Verma, Dass and Mehra (1999). High concentration of ash is attributed to addition of premix and salt in UMMB, MUMB and CMB.
CP content of the UMMB and MUMB in the present study (33.84% and 32.84% respectively) was higher than the range of 11.1% - 29.4% as formulated by Faftine & Zanetti (2010), Mubi, Mohammed, & Kibon (2013) and Suharyono et al., (2014). However, higher CP of 42.6% was reported by Khadda, Lata, Kumar, Jadav, & Rai (2014), and mostly attributed to urea supplementation (Liu, Long, & Zhang, 2007). The variations in the nutritional content between studies were due to differences in dietary formulation and were mainly influenced by the type of protein sources and their protein content.
Table 1Chemical composition (%) of basal feed and supplements
Nutrients(%) Napier grass Goat Pellet UMMB MUMB CMB
DM 16.09 91.19 90.06 90.13 92.26
Ash 5.33 7.19 17.48 17.36 95.05
OM 94.67 92.81 82.52 82.64 4.95
CP 15.54 17.13 33.84 32.84 ND
CF 33.26 20.07 4.49 4.07 ND
EE 2.44 3.33 0.55 0.82 ND
ADF 41.41 35.24 5.47 5.45 ND
NDF 65.77 61.21 10.51 9.27 ND
Ca(g/kg) 0.40 3.86 36.54 34.95 21.23
Cu(mg/kg) 4.46 0.97 0.70 0.58 8.23
Fe(mg/kg) 10.69 45.18 11.27 3.87 259.07
Zn(mg/kg) 1.83 0.25 1.84 2.61 21.27
UMMB: Urea molasses multi-nutrient block, MUMB-Medicated urea molasses multi-nutrient block, CMB-Commercial mineral block, DM: Dry matter, OM: Organic matter, CP: Crude protein, CF: Crude fiber, EE: Ether extract, ADF: Acid detergent fiber, NDF: Neutral detergent fiber, Ca: Calcium, Fe: Ferum, Cu: Copper, Zn: Zinc, ND- Not determined
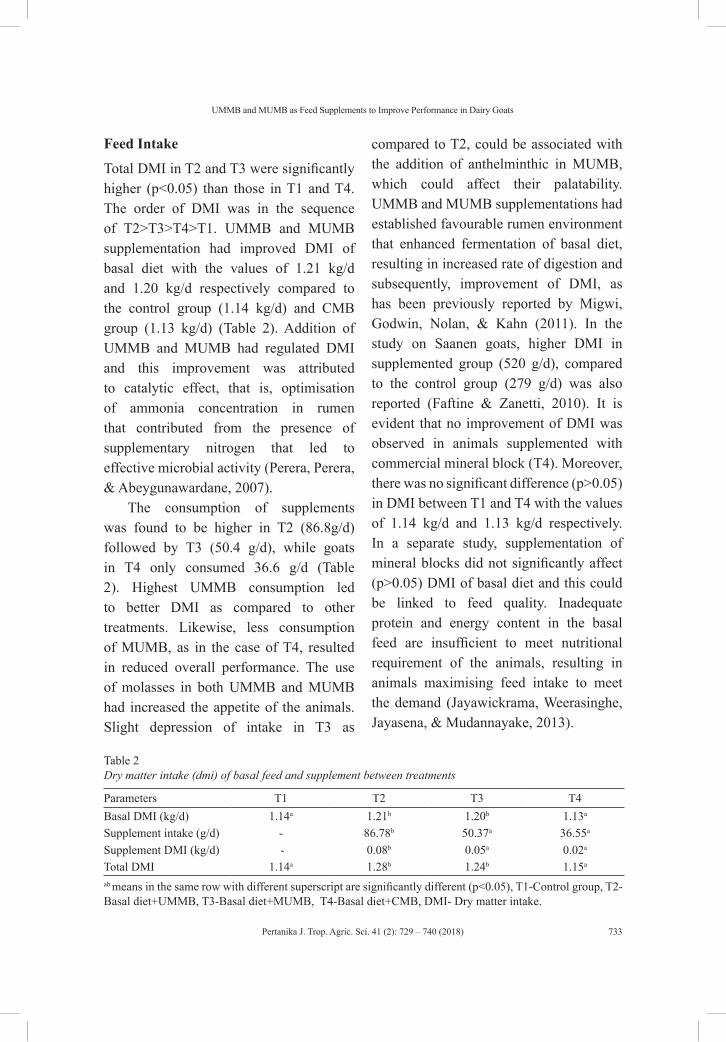
Pertanika J. Trop. Agric. Sci. 41 (2): 729 – 740 (2018)
UMMB and MUMB as Feed Supplements to Improve Performance in Dairy Goats
733
Feed Intake
Total DMI in T2 and T3 were significantly higher (p<0.05) than those in T1 and T4. The order of DMI was in the sequence of T2>T3>T4>T1. UMMB and MUMB supplementation had improved DMI of basal diet with the values of 1.21 kg/d and 1.20 kg/d respectively compared to the control group (1.14 kg/d) and CMB group (1.13 kg/d) (Table 2). Addition of UMMB and MUMB had regulated DMI and this improvement was attributed to catalytic effect, that is, optimisation of ammonia concentration in rumen that contributed from the presence of supplementary nitrogen that led to effective microbial activity (Perera, Perera, & Abeygunawardane, 2007).
The consumption of supplements was found to be higher in T2 (86.8g/d) followed by T3 (50.4 g/d), while goats in T4 only consumed 36.6 g/d (Table 2). Highest UMMB consumption led to better DMI as compared to other treatments. Likewise, less consumption of MUMB, as in the case of T4, resulted in reduced overall performance. The use of molasses in both UMMB and MUMB had increased the appetite of the animals. Slight depression of intake in T3 as
compared to T2, could be associated with the addition of anthelminthic in MUMB, which could affect their palatability. UMMB and MUMB supplementations had established favourable rumen environment that enhanced fermentation of basal diet, resulting in increased rate of digestion and subsequently, improvement of DMI, as has been previously reported by Migwi, Godwin, Nolan, & Kahn (2011). In the study on Saanen goats, higher DMI in supplemented group (520 g/d), compared to the control group (279 g/d) was also reported (Faftine & Zanetti, 2010). It is evident that no improvement of DMI was observed in animals supplemented with commercial mineral block (T4). Moreover, there was no significant difference (p>0.05) in DMI between T1 and T4 with the values of 1.14 kg/d and 1.13 kg/d respectively. In a separate study, supplementation of mineral blocks did not significantly affect (p>0.05) DMI of basal diet and this could be linked to feed quality. Inadequate protein and energy content in the basal feed are insufficient to meet nutritional requirement of the animals, resulting in animals maximising feed intake to meet the demand (Jayawickrama, Weerasinghe, Jayasena, & Mudannayake, 2013).
Table 2Dry matter intake (dmi) of basal feed and supplement between treatments
Parameters T1 T2 T3 T4Basal DMI (kg/d) 1.14a 1.21b 1.20b 1.13a
Supplement intake (g/d) - 86.78b 50.37a 36.55a
Supplement DMI (kg/d) - 0.08b 0.05a 0.02a
Total DMI 1.14a 1.28b 1.24b 1.15a
ab means in the same row with different superscript are significantly different (p<0.05), T1-Control group, T2-Basal diet+UMMB, T3-Basal diet+MUMB, T4-Basal diet+CMB, DMI- Dry matter intake.
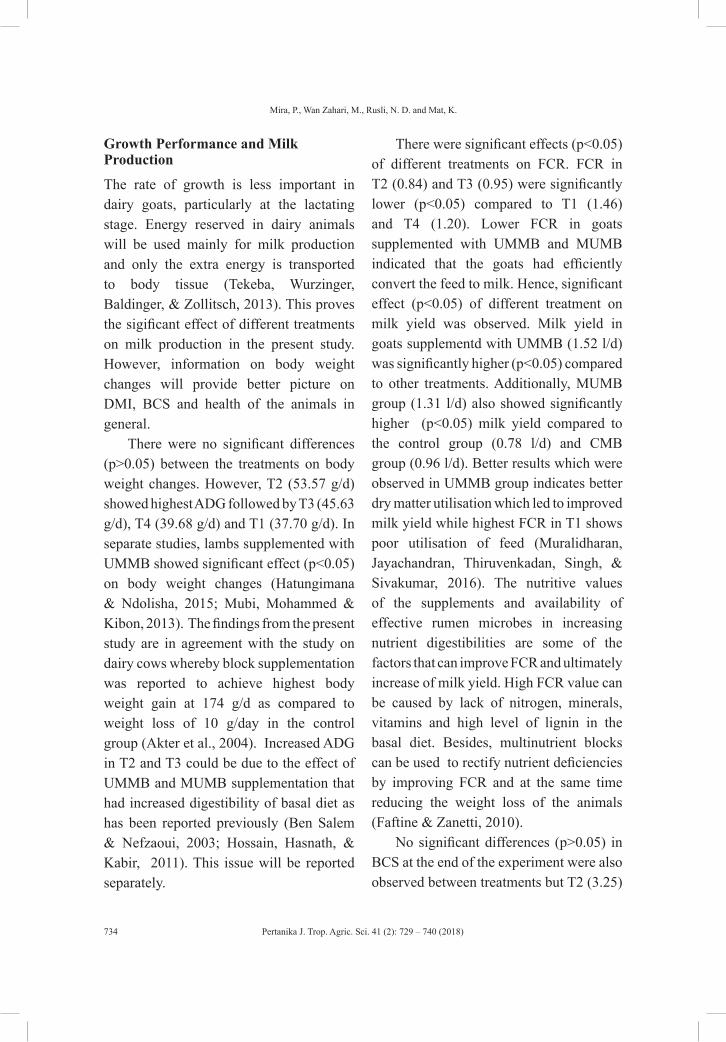
Pertanika J. Trop. Agric. Sci. 41 (2): 729 – 740 (2018)
Mira, P., Wan Zahari, M., Rusli, N. D. and Mat, K.
734
Growth Performance and Milk Production
The rate of growth is less important in dairy goats, particularly at the lactating stage. Energy reserved in dairy animals will be used mainly for milk production and only the extra energy is transported to body tissue (Tekeba, Wurzinger, Baldinger, & Zollitsch, 2013). This proves the sigificant effect of different treatments on milk production in the present study. However, information on body weight changes will provide better picture on DMI, BCS and health of the animals in general.
There were no significant differences (p>0.05) between the treatments on body weight changes. However, T2 (53.57 g/d) showed highest ADG followed by T3 (45.63 g/d), T4 (39.68 g/d) and T1 (37.70 g/d). In separate studies, lambs supplemented with UMMB showed significant effect (p<0.05) on body weight changes (Hatungimana & Ndolisha, 2015; Mubi, Mohammed & Kibon, 2013). The findings from the present study are in agreement with the study on dairy cows whereby block supplementation was reported to achieve highest body weight gain at 174 g/d as compared to weight loss of 10 g/day in the control group (Akter et al., 2004). Increased ADG in T2 and T3 could be due to the effect of UMMB and MUMB supplementation that had increased digestibility of basal diet as has been reported previously (Ben Salem & Nefzaoui, 2003; Hossain, Hasnath, & Kabir, 2011). This issue will be reported separately.
There were significant effects (p<0.05) of different treatments on FCR. FCR in T2 (0.84) and T3 (0.95) were significantly lower (p<0.05) compared to T1 (1.46) and T4 (1.20). Lower FCR in goats supplemented with UMMB and MUMB indicated that the goats had efficiently convert the feed to milk. Hence, significant effect (p<0.05) of different treatment on milk yield was observed. Milk yield in goats supplementd with UMMB (1.52 l/d) was significantly higher (p<0.05) compared to other treatments. Additionally, MUMB group (1.31 l/d) also showed significantly higher (p<0.05) milk yield compared to the control group (0.78 l/d) and CMB group (0.96 l/d). Better results which were observed in UMMB group indicates better dry matter utilisation which led to improved milk yield while highest FCR in T1 shows poor utilisation of feed (Muralidharan, Jayachandran, Thiruvenkadan, Singh, & Sivakumar, 2016). The nutritive values of the supplements and availability of effective rumen microbes in increasing nutrient digestibilities are some of the factors that can improve FCR and ultimately increase of milk yield. High FCR value can be caused by lack of nitrogen, minerals, vitamins and high level of lignin in the basal diet. Besides, multinutrient blocks can be used to rectify nutrient deficiencies by improving FCR and at the same time reducing the weight loss of the animals (Faftine & Zanetti, 2010).
No significant differences (p>0.05) in BCS at the end of the experiment were also observed between treatments but T2 (3.25)
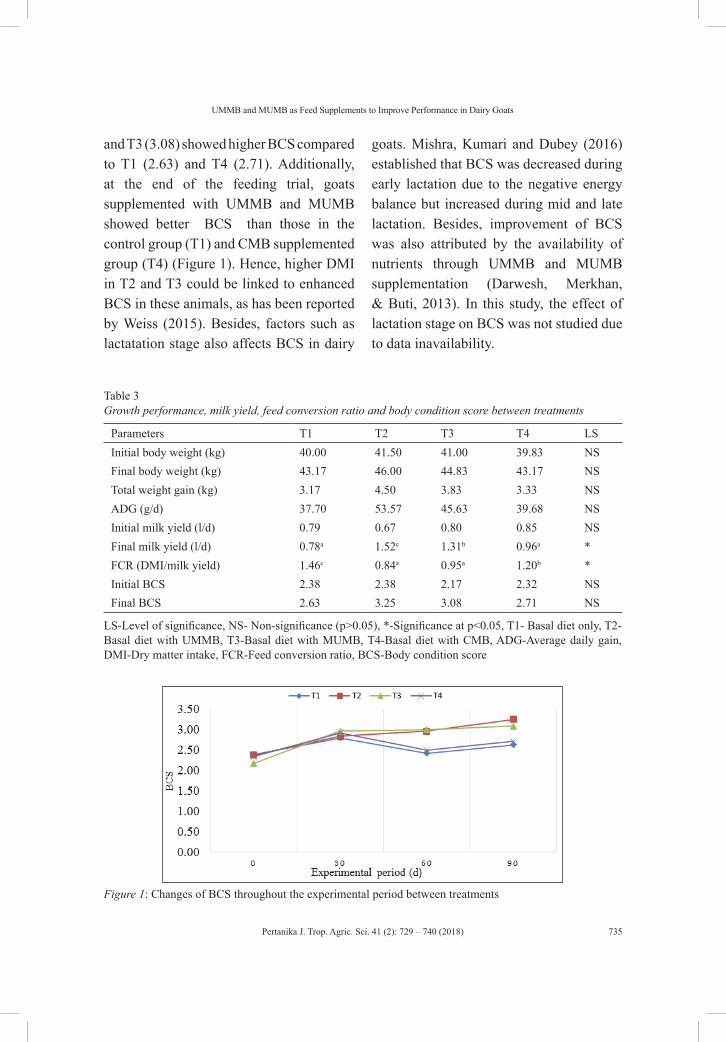
Pertanika J. Trop. Agric. Sci. 41 (2): 729 – 740 (2018)
UMMB and MUMB as Feed Supplements to Improve Performance in Dairy Goats
735
and T3 (3.08) showed higher BCS compared to T1 (2.63) and T4 (2.71). Additionally, at the end of the feeding trial, goats supplemented with UMMB and MUMB showed better BCS than those in the control group (T1) and CMB supplemented group (T4) (Figure 1). Hence, higher DMI in T2 and T3 could be linked to enhanced BCS in these animals, as has been reported by Weiss (2015). Besides, factors such as lactatation stage also affects BCS in dairy
goats. Mishra, Kumari and Dubey (2016) established that BCS was decreased during early lactation due to the negative energy balance but increased during mid and late lactation. Besides, improvement of BCS was also attributed by the availability of nutrients through UMMB and MUMB supplementation (Darwesh, Merkhan, & Buti, 2013). In this study, the effect of lactation stage on BCS was not studied due to data inavailability.
Table 3Growth performance, milk yield, feed conversion ratio and body condition score between treatments
Parameters T1 T2 T3 T4 LSInitial body weight (kg) 40.00 41.50 41.00 39.83 NSFinal body weight (kg) 43.17 46.00 44.83 43.17 NSTotal weight gain (kg) 3.17 4.50 3.83 3.33 NSADG (g/d) 37.70 53.57 45.63 39.68 NSInitial milk yield (l/d) 0.79 0.67 0.80 0.85 NSFinal milk yield (l/d) 0.78a 1.52c 1.31b 0.96a *FCR (DMI/milk yield) 1.46c 0.84a 0.95a 1.20b *Initial BCS 2.38 2.38 2.17 2.32 NSFinal BCS 2.63 3.25 3.08 2.71 NS
LS-Level of significance, NS- Non-significance (p>0.05), *-Significance at p<0.05, T1- Basal diet only, T2- Basal diet with UMMB, T3-Basal diet with MUMB, T4-Basal diet with CMB, ADG-Average daily gain, DMI-Dry matter intake, FCR-Feed conversion ratio, BCS-Body condition score
Figure 1: Changes of BCS throughout the experimental period between treatments
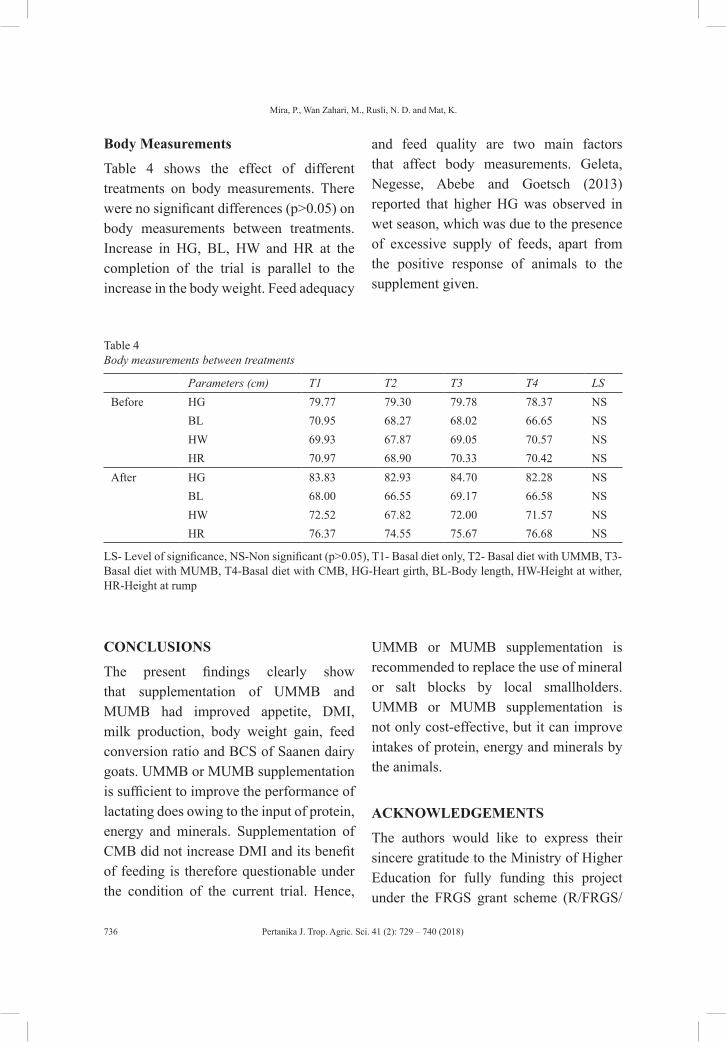
Pertanika J. Trop. Agric. Sci. 41 (2): 729 – 740 (2018)
Mira, P., Wan Zahari, M., Rusli, N. D. and Mat, K.
736
Body Measurements
Table 4 shows the effect of different treatments on body measurements. There were no significant differences (p>0.05) on body measurements between treatments. Increase in HG, BL, HW and HR at the completion of the trial is parallel to the increase in the body weight. Feed adequacy
and feed quality are two main factors that affect body measurements. Geleta, Negesse, Abebe and Goetsch (2013) reported that higher HG was observed in wet season, which was due to the presence of excessive supply of feeds, apart from the positive response of animals to the supplement given.
Table 4Body measurements between treatments
Parameters (cm) T1 T2 T3 T4 LSBefore HG 79.77 79.30 79.78 78.37 NS
BL 70.95 68.27 68.02 66.65 NSHW 69.93 67.87 69.05 70.57 NSHR 70.97 68.90 70.33 70.42 NS
After HG 83.83 82.93 84.70 82.28 NSBL 68.00 66.55 69.17 66.58 NSHW 72.52 67.82 72.00 71.57 NSHR 76.37 74.55 75.67 76.68 NS
LS- Level of significance, NS-Non significant (p>0.05), T1- Basal diet only, T2- Basal diet with UMMB, T3-Basal diet with MUMB, T4-Basal diet with CMB, HG-Heart girth, BL-Body length, HW-Height at wither, HR-Height at rump
CONCLUSIONS
The present findings clearly show that supplementation of UMMB and MUMB had improved appetite, DMI, milk production, body weight gain, feed conversion ratio and BCS of Saanen dairy goats. UMMB or MUMB supplementation is sufficient to improve the performance of lactating does owing to the input of protein, energy and minerals. Supplementation of CMB did not increase DMI and its benefit of feeding is therefore questionable under the condition of the current trial. Hence,
UMMB or MUMB supplementation is recommended to replace the use of mineral or salt blocks by local smallholders. UMMB or MUMB supplementation is not only cost-effective, but it can improve intakes of protein, energy and minerals by the animals.
ACKNOWLEDGEMENTS
The authors would like to express their sincere gratitude to the Ministry of Higher Education for fully funding this project under the FRGS grant scheme (R/FRGS/
Pertanika J. Trop. Agric. Sci. 41 (2): 729 – 740 (2018)
UMMB and MUMB as Feed Supplements to Improve Performance in Dairy Goats
737
A07.0/01083A/001/2015/000287) and to Mr. Mohd Nasaruddin bin Mohd Yusoff, the Managing Director of Yusof Eco Farm, Tanah Merah, Kelantan for providing the research facilities. Heartfelt gratitude is also extended to the Dean, Faculty of Agro Based Industry and Faculty of Veterinary Medicine, Universiti Malaysia Kelantan for granting use of the laboratories.
REFERENCES Abid, R., Khan, I., Bhatti, J. A., Shah, Z., Zahoor,
A., & Ahmad, S. (2016). Effect of medicated urea molasses blocks on sub-clinical parasitic infestations in goats. Online Journal of Animal and Feed Research, 6(2), 57-71.
Akbar, M. A., Ahmed, T. U., & Mondal, M. M. H. (2006). Improving animal productivity and reproductive efficiency: Development and testing medicated urea-molasses multi-nutrient blocks in rural farms of Bangladesh. In H. P. S., Makkar, & T. Smith (Eds.), Improving animal productivity by supplementary feeding of multi-nutrient blocks, controlling internal parasite and enhancing utilization of alternate feed resource (pp. 13-27). Austria: International Atomic Energy Agency.
Akter, Y., Akbar, M. A., Shahjalal, M., & Ahmed, T. U. (2004). Effect of urea molasses multi-nutrients block supplementation of dairy cows fed rice straw and green grasses on milk yield, composition, live weight gain of cows and calves and feed intake. Pakistan Journal of Biological Sciences, 7(9), 1523-1525.
AOAC. (1990). Official methods of analysis (15th Ed.). USA: Association of Official Analytical Chemists.
Babale, D. M., Kibon, A., & Yahaya, M. S. (2015). Performance and linear body measurements of Red Sokoto male goats on replacement levels of corn cobs for maize bran with cowpea husk basal diet. Net Journal of Agricultural Science, 3(2), 35-40.
Ben Salem, H., & Nefzaoui, A. (2003). Feed blocks as alternative supplements for sheep and goat. Small Ruminant Research, 49(3), 275-288.
Darwesh, K. A., Merkhan, K. Y., & Buti, E. T. S. (2013). Impact of lactation stage on the body condition score and milk quality of Black goat. International Journal of Agricultural and Food Research, 2(2), 48-52.
Faftine, O. L. J., & Zanetti, A. M. (2010). Effect of multinutrient block on feed digestibility and performance of goats fed maize stover during the dry season in south of Mozambique. Livestock Research for Rural Development, 9(22). Retrived April 1, 2014, from http://www.lrrd.org/lrrd22/9/faft22162.htm
Geleta, T., Negesse, T., Abebe, G., & Goetsch, A. L. (2013). Effect of supplementing grazing Arsi-Bale sheep with molasses-urea feed block on weight gain and economic return under farmers’ management condition. Journal of Cell and Animal Biology, 7(10), 125-131.
Hatungimana, E., & Ndolisha, P. (2015). Effect of urea molasses block supplementation on growth performance of sheep. International Journal of Novel Research in Life Science, 2(3), 38-43.
Hossain, F. M. A., Hasnath, M. R., & Kabir, M. S. (2011). Hematobiochemical dynamics and body weight gain of Black Bengal goat following urea molasses block (UMB) supplementation. Online Journal of Animal and Feed Research, 1(5), 182-185.
Pertanika J. Trop. Agric. Sci. 41 (2): 729 – 740 (2018)
Mira, P., Wan Zahari, M., Rusli, N. D. and Mat, K.
738
Jayawickrama, D. R., Weerasinghe, P., Jayasena, D., & Mudannayake, D. C. (2013). Effects of supplementation of urea-molasses multi-nutrient block (UMMB) on the performance of dairy cows fed good quality forage based diets with rice straw as a night feeding. Journal of Agricultural Science, 40(2), 123-129.
Khadda, B. S., Lata, K., Kumar, R., Jadav, J. K., & Rai, A. K. (2014). Effect of urea molasses mineral block on nutrient utilization, milk production and reproductive performance of crossbred cattle under semi-arid ecosystem. Indian Journal of Animal Science, 84(3), 302-305.
Liu, J. X., Long, B., & Zhang, D. (2007). Feed supplementation blocks experience in China. In H. P. S. Makkar, M. Sanchez, & A. W. Speedy (Eds), Feed supplementation blocks. Urea molasses multi-nutrient blocks: Simple and effective feed supplement technology for ruminant agriculture (pp. 89-109). Rome, Italy: Food and Agriculture Organization.
Melissa, A. Y., Norsida, M., & Nolila, M. N. (2016). Socio-economic factors in relation to small ruminant farming potential in Malaysia: Ranchers’ perspective. International Journal of Agriculture, Forestry and Plantation, 2, 72-76.
Mishra, S., Kumari, K., & Dubey, A. (2016). Body condition scoring of dairy cattle: A review. Journal of Veterinary Science, 2(1), 58-65.
Muralidharan, J., Jayachandran, S., Thiruvenkadan, A. K., Singh, A. P. D., & Sivakumar, K. (2015). Effect of concentrate and urea molasses mineral block supplementation on the blood biochemistry of off season Mecheri lambs. Indian Journal of Animal Research, 49(3), 409-412.
Manta, I. H., Aduba, J. J., Dada, J. T., & Onyemize, C. U. (2013). Development of urea molasses multi-nutrient block (UMMB) for ruminant animals as a supplementary feed to cushion the effect of draught in Northern Nigeria. International Journal of Environmental Science, 2(3), 106-109.
Mubi, A. A., Mohammed, I. D., & Kibon, A. (2013). Effects of multinutrient blocks supplementation on the performance of Yankasa sheep fed with basal diet of rice straw in the dry season of Guinea Savanna Region of Nigeria. Achives of Applied Science Research, 5(4), 172-178.
Migwi, P. K., Godwin, I., Nolan, J. V., & Kahn, P. (2011). The effect of energy supplementation on intake and utilization efficiency or urea-treated low-quality roughage in sheep I. Rumen digestion and feed intake. Asian Australasian Journal of Animal Science, 24(5), 623-635.
Perera, A. N. F., Perera, E. R. K., & Abeygunawardane, H. (2007).Development, use and impact of feed supplementation blocks: Experience in Sri Lanka. In H.P.S. Makkar, M. Sanchez, & A. W. Speedy (Eds.), Feed supplementation blocks. Urea-molasses multi-nutrient blocks: Simple and effective feed supplementation technology for ruminant agriculture (pp.119-129). Rome, Italy: Food and Agriculture Organization.
Singh, P., Verma, A. K., Dass, R. S., & Mehra, U. R. (1999). Performance of Pashmina kid goats fed oak (qercus semecarpifolia) leaves supplemented with a urea molasses mineral block. Small Ruminant Research, 31, 239-244.
Shanmugavelu, S., & Quaza Nizamuddin, H. N. (2014). Country report - Malaysia. Asian Australasian Dairy Goat Network, 57. Retrieved January 23, 2017, from http://www.aadgn.upm.edu.my/aadgn/file/7_Malaysia.pdf
Pertanika J. Trop. Agric. Sci. 41 (2): 729 – 740 (2018)
UMMB and MUMB as Feed Supplements to Improve Performance in Dairy Goats
739
Suharyono, Sutanto, H., Purwanti, Y., Martanti, Agus, A., & Utomo, R. (2014). The effect of urea molasses multi-nutrient and medicated block for beef cattle, beef and dairy cow. Atomic Indonesia, 40(2), 77-87.
Tekeba, E., Wurzinger, M., Baldinger, L., & Zollitsch, W. J. (2013). Effects of dietary supplementation with urea molasses multi-nutrient block on performance of mid lactating local Ethiopina and crossbred dairy cows. Livestock Research for Rural Development, 25(6). Retrieved April 23, 2017, from http://lrrd.cipav.org.co/lrrd25/6/teke25096.htm
Wan Zahari, M., Chandrawathani, P., Sani, R. A., Nor Ismail, M. S., & Oshibe, A. (2007). Production and evaluation of medicated urea-molasses mineral blocks for small ruminants in Malaysia. In H. P. S.Makkar, M. Sanchez, & A. W. Speedy (Eds), Feed supplementation blocks. Urea molasses multinutrient blocks: Simple and effective feed supplement technology for ruminant agriculture (pp. 213-231). Rome, Italy: Food and Agriculture Organization.
Weiss, B. (2015). Optimizing and evaluating dry matter intake of dairy cows. Advances in Dairy Technology, 27, 189-200.
Zaklovta, M., Hilali, M., Nefzaoui, A., & Haylani, M. (2011). Animal nutrition and product quality laboratory manual. Syria: International Center for Agricultural Research in the Dry Areas.

Pertanika J. Trop. Agric. Sci. 41 (2): 741 – 758 (2018)
ISSN: 1511-3701 © Universiti Putra Malaysia Press
TROPICAL AGRICULTURAL SCIENCEJournal homepage: http://www.pertanika.upm.edu.my/
ARTICLE INFOArticle history:Received: 31 July 2017Accepted: 8 November 2017
E-mail addresses:[email protected] (Mohammed, H. N.)[email protected] (Mahmud, T. M. M.)[email protected] (Puteri Edaroyati, M. W.)* Corresponding author
Deficit Irrigation for Improving the Postharvest Quality of Lowland Tomato Fruits
Mohammed, H. N.*, Mahmud, T. M. M. and Puteri Edaroyati, M. W.Department of Crop Science, Faculty of Agriculture, Universiti Putra Malaysia, 43400 UPM, Serdang, Selangor, Malaysia
ABSTRACT
Arable lands are facing serious water scarcity due to climate change and available resources are depleting at an alarming rate which necessitate efficient use of water for agriculture. Deficit irrigation is an on farm strategy which is widely used in many crops to maximise crop productivity in drought prone areas. The present study was initiated to assess the effect of deficit irrigation at different growth stages of tomato (lycopersicon esculentum) on yield and fruit quality traits under greenhouse condition. Four regimes of irrigation: (T1) regular watering to field capacity (as control), (T2) irrigation every four days during vegetative stage, (T3) irrigation every four days throughout flowering stage and (T4) irrigation every four days during fruiting stage were evaluated in this study. The experiment was set up in a Randomized Complete Block Design (RCBD) with four replications. Data were collected from three fruit maturity stages: M3 (stage three, matured green), M4 (stage four, pink) and M6 (stage six, red) for yield, fruit weight, fruit number and the fruit quality parameters viz, firmness, soluble solids concentration, titratable acidity, pH, ascorbic acid and lycopene content. The results showed variable effects of deficit irrigation on most parameters studied. Soluble solids concentration were significantly increased under deficit irrigation at the flowering stage and increased from 5.25 brix (control) to 7.7 brix (fruiting) at stage three maturity index. The pH increased from 3.83 (control) to 3.97 (flowering) and 3.94 (fruiting) when fruits were harvested at stage three maturity index. In addition, the highest fruit firmness (3.4 N) was observed when fruit was harvested at
stage three maturity under deficit irrigation (vegetative growth stage). Furthermore, lycopene content increased from 62.06 mg/kg in control plants to 67.91 mg/kg in plants which subjected to DI (vegetative) at stage six maturity index. However, water stress had no significant effect on titratable
Pertanika J. Trop. Agric. Sci. 41 (2): 741 – 758 (2018)
Mohammed, H. N., Mahmud, T. M. M. and Puteri Edaroyati, M. W.
742
acidity, ascorbic acid and fruit weight. From the observations of this study, it can be concluded that T3 and T4 were adequately appropriate DI practices for MT1 tomato plants that could be recommended to tomato growers as deficit irrigation strategy for higher yield and quality.
Keywords: Deficit irrigation, fruit quality, growth stages, tomato, yield
INTRODUCTION
Tomato (Lycopersicon esculentum) belongs to the family of Solanaceae (Costa & Heuvelink, 2005). It is the main vegetable crop that has attained tremendous popularity during the last century. Its popularity stems from the fact that it can be eaten fresh or in multiple processed forms (Kole, 2007). Tomato fruits are rich sources of valuable nutrients, particularly vitamins and minerals. Vitamin A and C, total soluble solids (TSS) and acid contents are commonly considered as fruit quality properties in tomato fruits (Ilahy, Hdider, Lenucci, Tlili, & Dalessandro, 2011). Lycopene is one of the important carotenoids in tomato, normally regarded as a vital factor for cardiovascular protection and helps to reduce reactive oxygen species (Abete et al., 2013). Tomato is also valuable as a model crop for physiological, cellular, biochemical, molecular and genetic studies because it is easily grown, has a short life cycle and is easy to manipulate (Kinet & Peet, 1997). It is used as a model plant species to study the physiology and biochemistry of seed development, germination and dormancy
(Suhartanto, 2002). Therefore, the tomato is an excellent tool to improve knowledge on horticultural crops ( Kinet & Peet, 1997; Taylor, 1986).
Considering its versatility and wide acceptability, fruit yield and quality are critical factors to be considered in its production. However, it has been reported that fruits produced in tropical regions have lower yield than those produced in temperate regions (Muhammad & Singh, 2007). One of the important factors that has hampered productivity in most third world countries is poor management of water resources.
Globally, water resources have been observed to be declining at an alarming rate, leading to fear of future widespread scarcity. According to Escobar (2010), by 2025 about half of the population in the world would be facing water scarcity. Water deficit or drought is the most common stress condition globally and is increasingly of concern worldwide (Mahajan & Tuteja, 2005; Reddy, Chaitanya, & Vivekanandan, 2004).
Tomatoes are very sensitive to drought stress, initially during vegetative development and, later, when the tomato is in the reproductive stage (Wudiri & Henderson, 1985). Agada (2016) however, pointed out the growing decline in water resources is real but poor management is in most cases the real cause of water related low productivity in agriculture and is also a major factor in the growing scarcity of water. In line with this opinion, Boutraa (2010) stated that only about 50% of all
Pertanika J. Trop. Agric. Sci. 41 (2): 741 – 758 (2018)
Deficit Irrigation Versus Postharvest Quality of Tomato
743
water available for agricultural purposes is utilised. The optimum requirements of irrigation lead to efficient management of water resources in such a way to enhance crop productivity. Water management practices are tools which can serve to protect our natural capital in water resources and avoid critical situations for the survival and sustainability of agriculture and economic activities which would prevent decline (Postel, 2000). Although the development of irrigation has contributed greatly to increased crop productivity as well as improvement in overall agricultural performance (Hussain & Wijerathna, 2004), it is not without its cost, including negative environmental and health consequences, such as increased water logging, scarcity, salinisation and water-borne diseases. Some of these problems can be remedied by better management strategies like deficit irrigation. Deficit irrigation is a water management method in which water is saved with accepting little yield reduction without any severe damage to the plant (English, 1990). Geert and Raes (2009) recommend it as a water saving technology in arid regions and other water scarcity prone areas. Although deficit irrigation strategies have the potential to optimise water productivity in horticulture, nevertheless, its effects on yield or harvest quality are crop-specific. Knowledge of how different crops cope with mild water deficits is the basis for a successful application of deficit irrigation into practice (Costa, Ortuño, & Chaves, 2007). This study describes the effect of limiting
water supply to emulate water stress during plant development on postharvest qualities of tomato fruits with the aim of identifying the effects of water stress at different phenological stages of tomato on yield and quality of fruits harvested at different fruit maturity stages. This will enable us to look at the benefits that can be derived with controlled stress imposed as management practice.
MATERIALS AND METHODS
The influence of different irrigation regimes on the yield and quality of tomato under greenhouse was conducted in Ladang 15, Faculty of Agriculture, Universiti Putra Malaysia. The experiment consisted of four irrigation regimes replicated four times in a Randomized Complete Block Design (RCBD). The total plants used were 48. The treatments were regular watering to field capacity (T1), as control group, irrigation every four days during vegetative stage (T2), irrigation every four days throughout flowering stage (T3), and irrigation every four days during fruiting stage (T4). Water stress treatments were imposed 40 days after sowing (T2), 54 days after sowing (T3) and 63 days after sowing (T4). For imposition of water stress, water amount was determined based on the percentage of field capacity. To calculate the field capacity, at the beginning of the experiments, pots were filled with known weight of mixture of coco peat: burnt paddy husk, saturated with water and allowed to drain freely for a period of two hours, until there was no change in weight.
Pertanika J. Trop. Agric. Sci. 41 (2): 741 – 758 (2018)
Mohammed, H. N., Mahmud, T. M. M. and Puteri Edaroyati, M. W.
744
The difference between this weight and soil dry weight (DW) was used to calculate 100% of water holding capacity. Plants were grown in poly bags, 24 cm by 28 cm in dimension. Each bag was placed on a black plastic sheet laid on the ground of the greenhouse, in order to trap soil material escaping from the drainage holes at the base of the bags as well as weed control. Any soil material escaped from the pot was returned to the bag, thus maintaining as much amount of soil as possible throughout the experiment. In each of the four blocks, plants with different treatments were randomly arranged at spacing of 50 cm between each bag.
Planting Media
The media consisted of a mixture of coco peat and burnt paddy husk (2:1 v/v). The dry media was placed in the bags and manually compacted. Media weight was approximately 1 kg per polybag.
Growing Conditions
The seeds were germinated on peat medium in trays with drainage holes. Seeds of MT1 tomato variety produced by Malaysia Research and Development Institute (MARDI) were used for the experiment. A single seed was sown per hole and covered with ~8 mm peat. The tray was placed on a raised platform and watered daily with a sprinkler. After three weeks, vigorous and uniform seedlings were selected and transplanted into the polybags. Fertiliser [N: P: K: Mg + TE (12:12:17:2+B)] was
used by side placement at transplanting and between two and six weeks after transplanting (WAT). Polybags were kept weed free through manual weeding. Control of pest, mainly white flies was done by spraying plants with Malathion (2.5 mLliter-1 of water) every week, from transplanting (21 days after sowing) to end of harvesting (75 days after transplanting).
Growth Parameters
Three plants were randomly selected from each replicate of the treatment and data were collected for the following parameters: plant height, number of leaves, fruit weight and number, fresh and dry shoots, as well as fresh and dry roots.
Plant Height (cm) and Number of Leaves
Plant height was measured from ground level to the tip of growing point using a meter ruler and the number of leaves was determined by counting.
Total Fruit Weight (g) and Number
The total yield and number of fruits were recorded at each sequential harvest. The fruits were harvested after they reached the mature green, pink and red stages. Fruit maturity stage was determined according to the USDA standard classification using human visual inspection. The fruits were counted and weighed accordingly on a weighing balance.
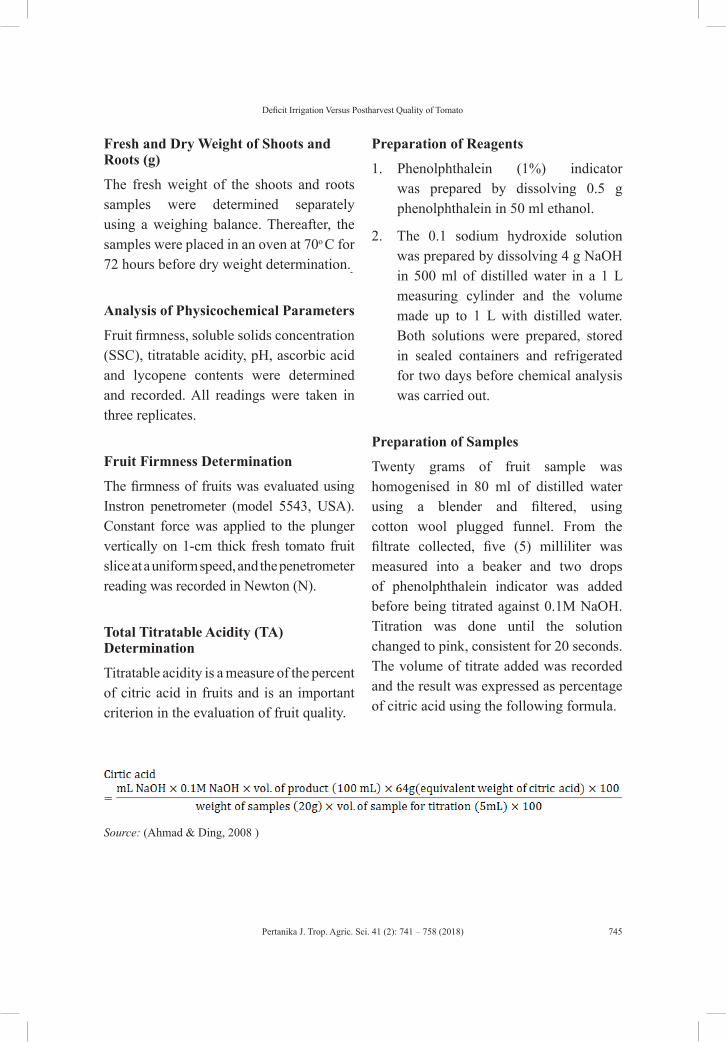
Pertanika J. Trop. Agric. Sci. 41 (2): 741 – 758 (2018)
Deficit Irrigation Versus Postharvest Quality of Tomato
745
Fresh and Dry Weight of Shoots and Roots (g)
The fresh weight of the shoots and roots samples were determined separately using a weighing balance. Thereafter, the samples were placed in an oven at 70o C for 72 hours before dry weight determination.
Analysis of Physicochemical Parameters
Fruit firmness, soluble solids concentration (SSC), titratable acidity, pH, ascorbic acid and lycopene contents were determined and recorded. All readings were taken in three replicates.
Fruit Firmness Determination
The firmness of fruits was evaluated using Instron penetrometer (model 5543, USA). Constant force was applied to the plunger vertically on 1-cm thick fresh tomato fruit slice at a uniform speed, and the penetrometer reading was recorded in Newton (N).
Total Titratable Acidity (TA) Determination
Titratable acidity is a measure of the percent of citric acid in fruits and is an important criterion in the evaluation of fruit quality.
Preparation of Reagents
1. Phenolphthalein (1%) indicator was prepared by dissolving 0.5 g phenolphthalein in 50 ml ethanol.
2. The 0.1 sodium hydroxide solution was prepared by dissolving 4 g NaOH in 500 ml of distilled water in a 1 L measuring cylinder and the volume made up to 1 L with distilled water. Both solutions were prepared, stored in sealed containers and refrigerated for two days before chemical analysis was carried out.
Preparation of Samples
Twenty grams of fruit sample was homogenised in 80 ml of distilled water using a blender and filtered, using cotton wool plugged funnel. From the filtrate collected, five (5) milliliter was measured into a beaker and two drops of phenolphthalein indicator was added before being titrated against 0.1M NaOH. Titration was done until the solution changed to pink, consistent for 20 seconds. The volume of titrate added was recorded and the result was expressed as percentage of citric acid using the following formula.
Source: (Ahmad & Ding, 2008 )
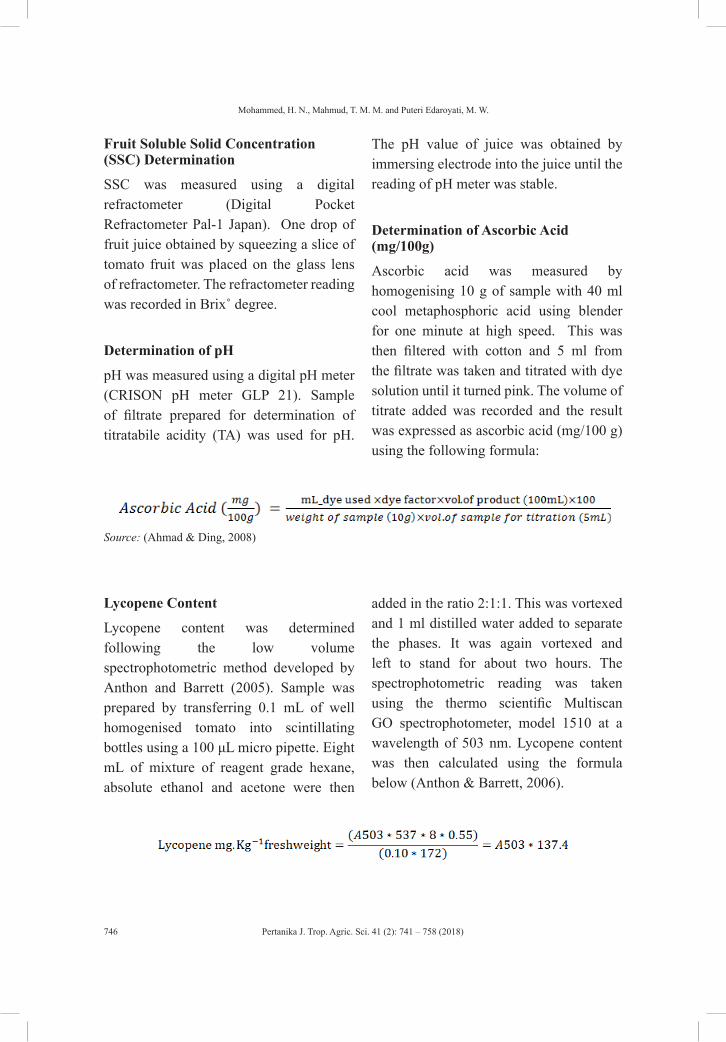
Pertanika J. Trop. Agric. Sci. 41 (2): 741 – 758 (2018)
Mohammed, H. N., Mahmud, T. M. M. and Puteri Edaroyati, M. W.
746
Fruit Soluble Solid Concentration (SSC) Determination
SSC was measured using a digital refractometer (Digital Pocket Refractometer Pal-1 Japan). One drop of fruit juice obtained by squeezing a slice of tomato fruit was placed on the glass lens of refractometer. The refractometer reading was recorded in Brix˚ degree.
Determination of pH
pH was measured using a digital pH meter (CRISON pH meter GLP 21). Sample of filtrate prepared for determination of titratabile acidity (TA) was used for pH.
The pH value of juice was obtained by immersing electrode into the juice until the reading of pH meter was stable.
Determination of Ascorbic Acid (mg/100g)
Ascorbic acid was measured by homogenising 10 g of sample with 40 ml cool metaphosphoric acid using blender for one minute at high speed. This was then filtered with cotton and 5 ml from the filtrate was taken and titrated with dye solution until it turned pink. The volume of titrate added was recorded and the result was expressed as ascorbic acid (mg/100 g) using the following formula:
Source: (Ahmad & Ding, 2008)
Lycopene Content
Lycopene content was determined following the low volume spectrophotometric method developed by Anthon and Barrett (2005). Sample was prepared by transferring 0.1 mL of well homogenised tomato into scintillating bottles using a 100 μL micro pipette. Eight mL of mixture of reagent grade hexane, absolute ethanol and acetone were then
added in the ratio 2:1:1. This was vortexed and 1 ml distilled water added to separate the phases. It was again vortexed and left to stand for about two hours. The spectrophotometric reading was taken using the thermo scientific Multiscan GO spectrophotometer, model 1510 at a wavelength of 503 nm. Lycopene content was then calculated using the formula below (Anthon & Barrett, 2006).
Pertanika J. Trop. Agric. Sci. 41 (2): 741 – 758 (2018)
Deficit Irrigation Versus Postharvest Quality of Tomato
747
537 gmol-1 is the molecular weight of lycopene, 8 ml is the volume of mixed solvents, 0.55 is the volume of the upper layer of the extraction mixture which contains the extracted lycopene, 0.10 g (0.1 ml) is the weight of tomato added and 172 mm is the extinction coefficient for lycopene in hexane.
Statistical Analysis
Results obtained were analysed using SAS (Version 9.4). One way independent Analysis of Variance (ANOVA) was conducted to measure the significant effects of the different types of irrigation treatment on the growth parameters measured, while a two way Anova was used to measure the significant effects of the differences of fruit maturity stages and treatments on the postharvest attributes for tomato fruit. The mean scores and standard deviations were also calculated. Fisher’s LSD multiple comparison was also performed to indicate where the differences exist at p<0.05.
RESULTS AND DISCUSSION
Growth Parameter
Plant Height and Number of Leaves. The results of the effect of different deficit irrigation treatments on plant height and number of leaves are presented in Table 1. The results show that water stress treatments have no significant effect on plant height and number of leaves under different water stress timings (p˃0.05), similar to the results reported by Nangare, Singh, Kumar and Minhas (2016), who
observed growth parameters monitored in terms of plant height to follow similar trends.
Fresh and Dry Weight Measurements. The highest fresh shoot weight of tomato was observed when water stress was imposed at flowering stage (T3) 432.25 (g/plant), which was not significantly different from the application at vegetative stage (T2). The highest significant fresh root weight gain was observed on plants experiencing water stress imposed at vegetative stage (T2) while the highest reduction was noted in T4 (fruiting), as illustrated in Table 1. However there was no significant different between T1 (control) and T3 (flowering). Dry shoot weight of plants imposed with water stress at fruiting stage was significantly lower than imposition at flowering stage but not significantly different from vegetative and control treatments. However, for the root, water stress applied at fruiting significantly reduced the dry weight compared to other treatments which were not much different. Since dry shoot weight was more distinct than dry root weight, total dry biomass of the plants followed the trend of dry shoot weight. The results of the present study are in line with the findings of Seng (2014), who reported that water stress decreased all the components of dry matter but the reductions were more pronounced in plants subjected to drought stress at fruiting growth stage. These dry matter components increased with developmental stages (higher at flowering and fruiting stages).
Pertanika J. Trop. Agric. Sci. 41 (2): 741 – 758 (2018)
Mohammed, H. N., Mahmud, T. M. M. and Puteri Edaroyati, M. W.
748
Plants in the vegetative growth stage had reduced DM attributes under drought (39 to 82%). At flowering, DM attributes were lowered by water deficit. At fruiting, only leaf DM was lowered by 6%. Furthermore, root - shoot ratios increased in plants subjected to drought stress but decreased in plants subjected to full irrigation (control plants) and with developmental stages.
Yield and Fruit Number. The results on the effect of different deficit irrigation treatments on yield and number of fruits are presented in Table 1. The results show that there are significant differences (p<0.05) between deficit irrigation imposed at different developmental stages on total fruit yield of tomatoes. Imposition of water stress at fruiting stage seems to be more sensitive compared to other stages. Significant total fruit weight reduction is observed when the plants are stressed at fruiting stage compared to other treatments which are not obviously different. Optimum water supply at fruiting period is highly crucial in determining the final yield of tomato fruits (Chen et al., 2013). Generally, a similar deficit irrigation (DI) effect was reported by Patanè, Tringali, and Sortino (2011), who found that DI at 50% evapotranspiration (ET) did not induce any losses in tomato total fruit yield when treatment started at flowering stage. Also these results were in line with the finding by Nuruddin (2001), who reported that tomato yield was effected significantly by water deficit
timing, and deficit irrigation at flowering growth stage gave the highest fresh yield whereas impositions of water stress at fruiting growth stage caused reduction in total fruit yield. The yield reduction in the plants when experienced moisture stress during the early fruiting stage, would have been due to reduced fruit size and fruit number. Furthermore, Wang, Du, Qiu and Dong (2011) reported that fruit maturation and harvesting stage is the most sensitive stage for tomato growth and yield, at which applying 1/3 or 2/3 irrigation amount of field capacity significantly reduces fruit yield. However, applying 1/3 or 2/3 irrigation amount of field capacity at either seedling growth stage or flowering stage has no negative impact on tomato yield. On fruit numbers, higher counts were observed when stress was applied at flowering and control treatment. On the contrary, when irrigation was reduced during vegetative and fruiting stage, the numbers were lower. There seems to be a contradiction for stress imposed at fruiting stage where the total fruit weight is high. This may be due to bigger fruit size obtained from this treatment. These results agree with the findings of Wang et al. (2011) who observed a clear response of the tomato fruit number related to irrigation treatments, compared to control treatment (full irrigation). Vegetative and fruiting stages significantly affected tomato fruit number while other treatment did not. Compared to control treatment, water deficit irrigation at vegetative and fruiting stage significantly decreased fruit
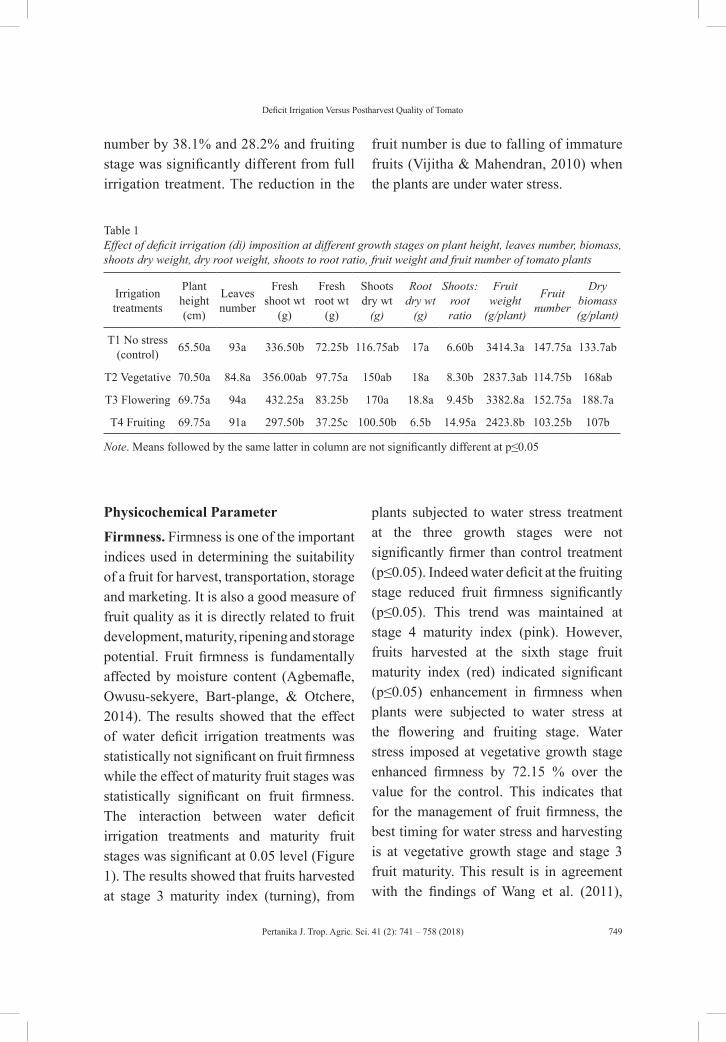
Pertanika J. Trop. Agric. Sci. 41 (2): 741 – 758 (2018)
Deficit Irrigation Versus Postharvest Quality of Tomato
749
number by 38.1% and 28.2% and fruiting stage was significantly different from full irrigation treatment. The reduction in the
fruit number is due to falling of immature fruits (Vijitha & Mahendran, 2010) when the plants are under water stress.
Table 1Effect of deficit irrigation (di) imposition at different growth stages on plant height, leaves number, biomass, shoots dry weight, dry root weight, shoots to root ratio, fruit weight and fruit number of tomato plants
Irrigation treatments
Plant height (cm)
Leaves number
Fresh shoot wt
(g)
Fresh root wt
(g)
Shoots dry wt
(g)
Root dry wt
(g)
Shoots: root ratio
Fruit weight
(g/plant)
Fruit number
Dry biomass (g/plant)
T1 No stress (control) 65.50a 93a 336.50b 72.25b 116.75ab 17a 6.60b 3414.3a 147.75a 133.7ab
T2 Vegetative 70.50a 84.8a 356.00ab 97.75a 150ab 18a 8.30b 2837.3ab 114.75b 168ab
T3 Flowering 69.75a 94a 432.25a 83.25b 170a 18.8a 9.45b 3382.8a 152.75a 188.7a
T4 Fruiting 69.75a 91a 297.50b 37.25c 100.50b 6.5b 14.95a 2423.8b 103.25b 107b
Note. Means followed by the same latter in column are not significantly different at p≤0.05
Physicochemical Parameter
Firmness. Firmness is one of the important indices used in determining the suitability of a fruit for harvest, transportation, storage and marketing. It is also a good measure of fruit quality as it is directly related to fruit development, maturity, ripening and storage potential. Fruit firmness is fundamentally affected by moisture content (Agbemafle, Owusu-sekyere, Bart-plange, & Otchere, 2014). The results showed that the effect of water deficit irrigation treatments was statistically not significant on fruit firmness while the effect of maturity fruit stages was statistically significant on fruit firmness. The interaction between water deficit irrigation treatments and maturity fruit stages was significant at 0.05 level (Figure 1). The results showed that fruits harvested at stage 3 maturity index (turning), from
plants subjected to water stress treatment at the three growth stages were not significantly firmer than control treatment (p≤0.05). Indeed water deficit at the fruiting stage reduced fruit firmness significantly (p≤0.05). This trend was maintained at stage 4 maturity index (pink). However, fruits harvested at the sixth stage fruit maturity index (red) indicated significant (p≤0.05) enhancement in firmness when plants were subjected to water stress at the flowering and fruiting stage. Water stress imposed at vegetative growth stage enhanced firmness by 72.15 % over the value for the control. This indicates that for the management of fruit firmness, the best timing for water stress and harvesting is at vegetative growth stage and stage 3 fruit maturity. This result is in agreement with the findings of Wang et al. (2011),
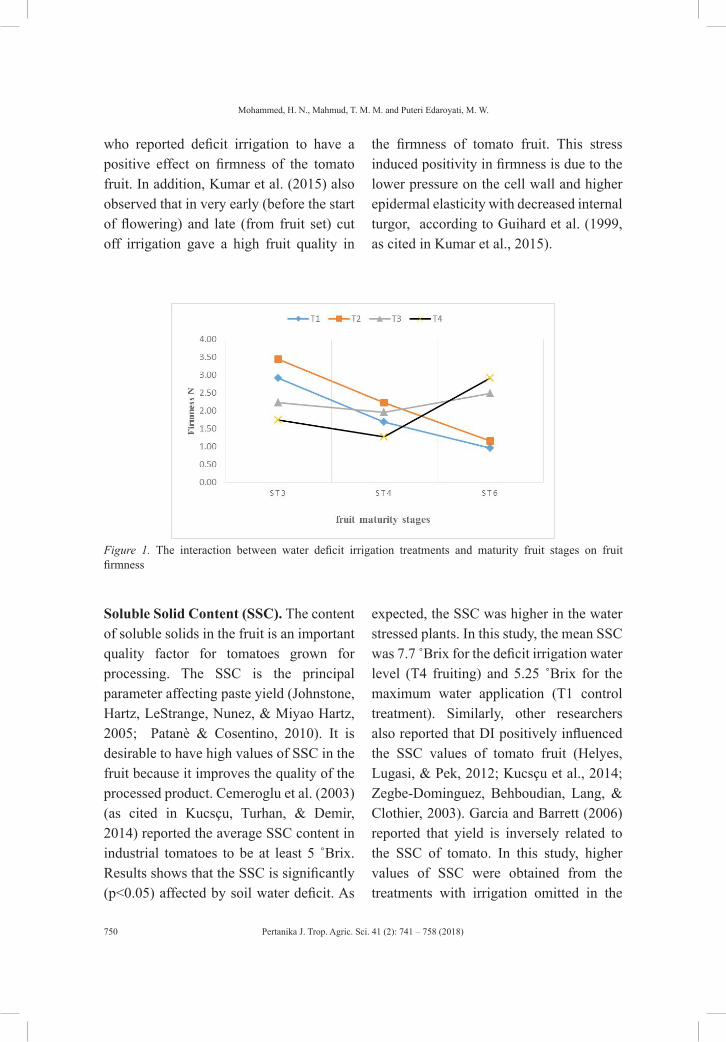
Pertanika J. Trop. Agric. Sci. 41 (2): 741 – 758 (2018)
Mohammed, H. N., Mahmud, T. M. M. and Puteri Edaroyati, M. W.
750
who reported deficit irrigation to have a positive effect on firmness of the tomato fruit. In addition, Kumar et al. (2015) also observed that in very early (before the start of flowering) and late (from fruit set) cut off irrigation gave a high fruit quality in
the firmness of tomato fruit. This stress induced positivity in firmness is due to the lower pressure on the cell wall and higher epidermal elasticity with decreased internal turgor, according to Guihard et al. (1999, as cited in Kumar et al., 2015).
Figure 1. The interaction between water deficit irrigation treatments and maturity fruit stages on fruit firmness
Soluble Solid Content (SSC). The content of soluble solids in the fruit is an important quality factor for tomatoes grown for processing. The SSC is the principal parameter affecting paste yield (Johnstone, Hartz, LeStrange, Nunez, & Miyao Hartz, 2005; Patanè & Cosentino, 2010). It is desirable to have high values of SSC in the fruit because it improves the quality of the processed product. Cemeroglu et al. (2003) (as cited in Kucsçu, Turhan, & Demir, 2014) reported the average SSC content in industrial tomatoes to be at least 5 ˚Brix. Results shows that the SSC is significantly (p<0.05) affected by soil water deficit. As
expected, the SSC was higher in the water stressed plants. In this study, the mean SSC was 7.7 Brix for the deficit irrigation water level (T4 fruiting) and 5.25 ˚Brix for the maximum water application (T1 control treatment). Similarly, other researchers also reported that DI positively influenced the SSC values of tomato fruit (Helyes, Lugasi, & Pek, 2012; Kucsçu et al., 2014; Zegbe-Dominguez, Behboudian, Lang, & Clothier, 2003). Garcia and Barrett (2006) reported that yield is inversely related to the SSC of tomato. In this study, higher values of SSC were obtained from the treatments with irrigation omitted in the
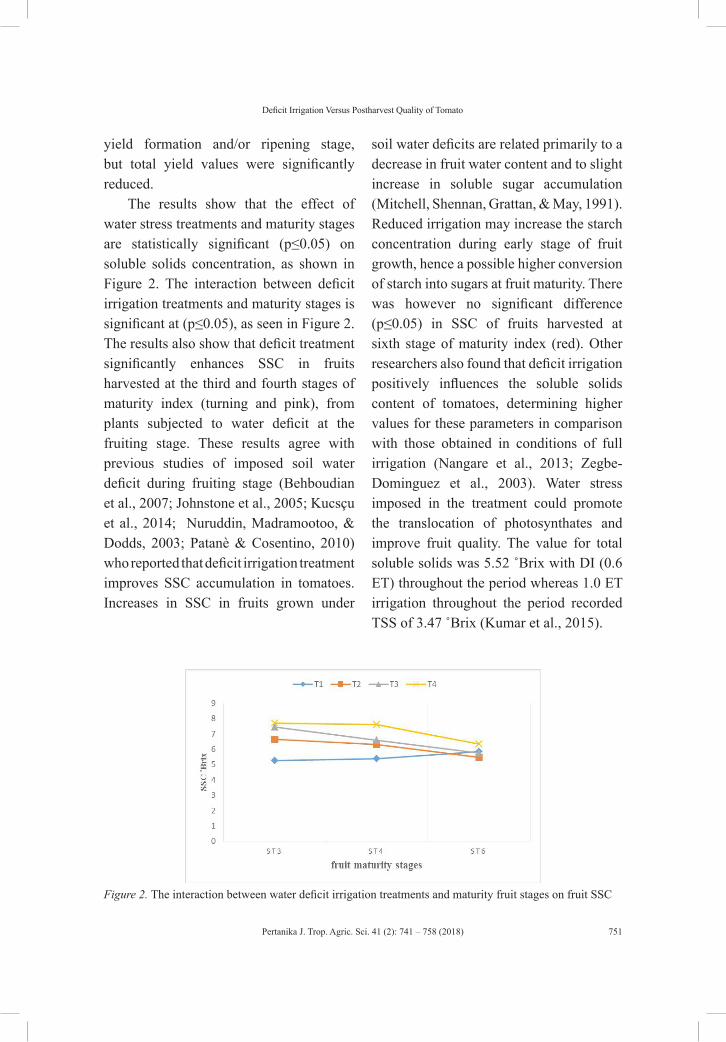
Pertanika J. Trop. Agric. Sci. 41 (2): 741 – 758 (2018)
Deficit Irrigation Versus Postharvest Quality of Tomato
751
yield formation and/or ripening stage, but total yield values were significantly reduced.
The results show that the effect of water stress treatments and maturity stages are statistically significant (p≤0.05) on soluble solids concentration, as shown in Figure 2. The interaction between deficit irrigation treatments and maturity stages is significant at (p≤0.05), as seen in Figure 2. The results also show that deficit treatment significantly enhances SSC in fruits harvested at the third and fourth stages of maturity index (turning and pink), from plants subjected to water deficit at the fruiting stage. These results agree with previous studies of imposed soil water deficit during fruiting stage (Behboudian et al., 2007; Johnstone et al., 2005; Kucsçu et al., 2014; Nuruddin, Madramootoo, & Dodds, 2003; Patanè & Cosentino, 2010) who reported that deficit irrigation treatment improves SSC accumulation in tomatoes. Increases in SSC in fruits grown under
soil water deficits are related primarily to a decrease in fruit water content and to slight increase in soluble sugar accumulation (Mitchell, Shennan, Grattan, & May, 1991). Reduced irrigation may increase the starch concentration during early stage of fruit growth, hence a possible higher conversion of starch into sugars at fruit maturity. There was however no significant difference (p≤0.05) in SSC of fruits harvested at sixth stage of maturity index (red). Other researchers also found that deficit irrigation positively influences the soluble solids content of tomatoes, determining higher values for these parameters in comparison with those obtained in conditions of full irrigation (Nangare et al., 2013; Zegbe-Dominguez et al., 2003). Water stress imposed in the treatment could promote the translocation of photosynthates and improve fruit quality. The value for total soluble solids was 5.52 ˚Brix with DI (0.6 ET) throughout the period whereas 1.0 ET irrigation throughout the period recorded TSS of 3.47 ˚Brix (Kumar et al., 2015).
Figure 2. The interaction between water deficit irrigation treatments and maturity fruit stages on fruit SSC

Pertanika J. Trop. Agric. Sci. 41 (2): 741 – 758 (2018)
Mohammed, H. N., Mahmud, T. M. M. and Puteri Edaroyati, M. W.
752
Titratable Acidity (TA). Tomato acidity is dependent on several factors such as cultural practices, varieties and growing conditions (Kumar et al., 2015). The results of analysis of fruit TA is presented in Table 2. It shows that the effect of deficit irrigation treatments and fruit maturity stages on TA were not significant (p≤0.05). The interaction between water deficit irrigation treatments and maturity fruit stages was also not significant (P≤0.05). Thus, the treatments did not have any significant effect on the titratable acidity of the tomato. These findings are supported by Agbemafle et al., (2014) who reported no significance differences (p˃0.05) in the level of titratable acidity with under water deficit tomatoes and well irrigated ones.
pH. Among the parameters analysed for the assessment of tomato quality, pH is very important because acidity influences the thermal processing conditions required for producing safe products. Although the pH of mature tomatoes may exceed 4.6, tomato products are generally classified as acid foods (pH < 4.6), which require moderate conditions of processing to control microbial spoilage and enzyme inactivation. In addition, tomato product flavor depends on the accumulation and balance between sugar and organic acid content (Hobson & Grierson 1993, as cited in Garcia & Barrett, 2006). The result of analysis of the effect of water deficit irrigation treatments and fruit maturity stages on pH is presented in Table 2. It shows the effect of water deficit irrigation
treatments and fruit maturity stages on pH value were statistically significant (p≤0.05). The interaction between water deficit irrigation treatments and fruit maturity stages was not significant (p≤0.05). This result is in agreement with the findings of Nuruddin et al. (2003) and Amor and Amor (2007) who reported that fruit quality, especially pH was significantly affected as a result of lower water availability for the roots, while Wahb-Allah and Al-Oman (2012) reported deficit irrigation treatments had significant positive effect on pH. The highest mean values of pH was attained by water stress treatments.
Ascorbic Acid (AA). Ascorbic acid (AA) in plants is necessary to offset oxidative stress, in addition to regulation of other plant metabolic processes. It has been detected in the majority of plant cell types and organelles. AA becomes the main antioxidant due to its ability to donate electrons in a wide range of enzymatic and non enzymatic reactions, thus detoxifying reactive oxygen species (ROS) (Kumar et al., 2015). The results of analysis of fruit AA is presented in Figure 3. It shows that the effect of deficit irrigation treatments and fruit maturity stages on AA were not significant (p≤0.05). The interaction between water deficit irrigation treatments and maturity fruit stages was also not significant (p≤0.05). Thus, the treatments did not have any significant effect on the ascorbic acid content of tomato fruits subjected to deficit water treatment. This result is in agreement with the findings
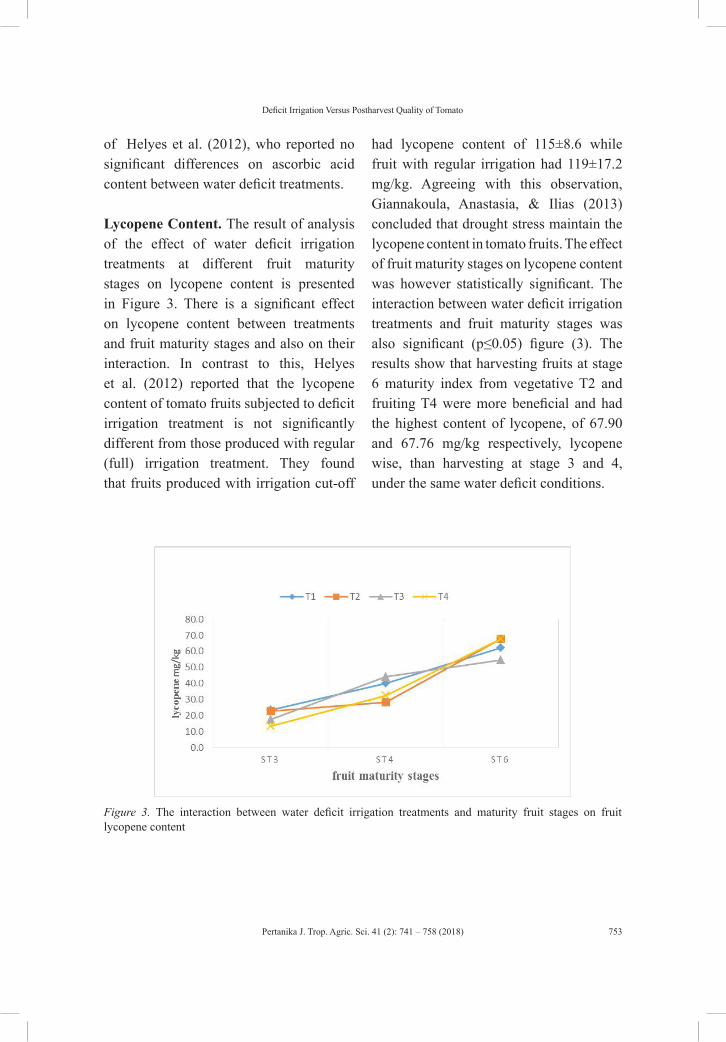
Pertanika J. Trop. Agric. Sci. 41 (2): 741 – 758 (2018)
Deficit Irrigation Versus Postharvest Quality of Tomato
753
of Helyes et al. (2012), who reported no significant differences on ascorbic acid content between water deficit treatments.
Lycopene Content. The result of analysis of the effect of water deficit irrigation treatments at different fruit maturity stages on lycopene content is presented in Figure 3. There is a significant effect on lycopene content between treatments and fruit maturity stages and also on their interaction. In contrast to this, Helyes et al. (2012) reported that the lycopene content of tomato fruits subjected to deficit irrigation treatment is not significantly different from those produced with regular (full) irrigation treatment. They found that fruits produced with irrigation cut-off
had lycopene content of 115±8.6 while fruit with regular irrigation had 119±17.2 mg/kg. Agreeing with this observation, Giannakoula, Anastasia, & Ilias (2013) concluded that drought stress maintain the lycopene content in tomato fruits. The effect of fruit maturity stages on lycopene content was however statistically significant. The interaction between water deficit irrigation treatments and fruit maturity stages was also significant (p≤0.05) figure (3). The results show that harvesting fruits at stage 6 maturity index from vegetative T2 and fruiting T4 were more beneficial and had the highest content of lycopene, of 67.90 and 67.76 mg/kg respectively, lycopene wise, than harvesting at stage 3 and 4, under the same water deficit conditions.
Figure 3. The interaction between water deficit irrigation treatments and maturity fruit stages on fruit lycopene content
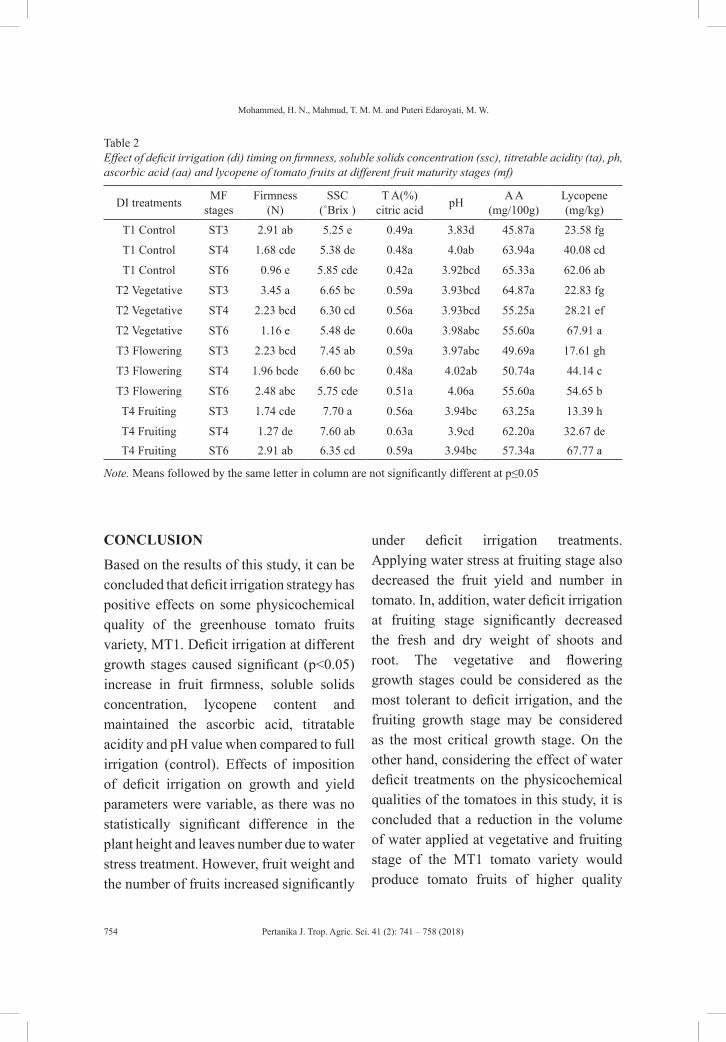
Pertanika J. Trop. Agric. Sci. 41 (2): 741 – 758 (2018)
Mohammed, H. N., Mahmud, T. M. M. and Puteri Edaroyati, M. W.
754
Table 2Effect of deficit irrigation (di) timing on firmness, soluble solids concentration (ssc), titretable acidity (ta), ph, ascorbic acid (aa) and lycopene of tomato fruits at different fruit maturity stages (mf)
DI treatments MF stages
Firmness (N)
SSC (˚Brix )
T A(%) citric acid pH A A
(mg/100g)Lycopene (mg/kg)
T1 Control ST3 2.91 ab 5.25 e 0.49a 3.83d 45.87a 23.58 fg
T1 Control ST4 1.68 cde 5.38 de 0.48a 4.0ab 63.94a 40.08 cd
T1 Control ST6 0.96 e 5.85 cde 0.42a 3.92bcd 65.33a 62.06 ab
T2 Vegetative ST3 3.45 a 6.65 bc 0.59a 3.93bcd 64.87a 22.83 fg
T2 Vegetative ST4 2.23 bcd 6.30 cd 0.56a 3.93bcd 55.25a 28.21 ef
T2 Vegetative ST6 1.16 e 5.48 de 0.60a 3.98abc 55.60a 67.91 a
T3 Flowering ST3 2.23 bcd 7.45 ab 0.59a 3.97abc 49.69a 17.61 gh
T3 Flowering ST4 1.96 bcde 6.60 bc 0.48a 4.02ab 50.74a 44.14 c
T3 Flowering ST6 2.48 abc 5.75 cde 0.51a 4.06a 55.60a 54.65 b
T4 Fruiting ST3 1.74 cde 7.70 a 0.56a 3.94bc 63.25a 13.39 h
T4 Fruiting ST4 1.27 de 7.60 ab 0.63a 3.9cd 62.20a 32.67 deT4 Fruiting ST6 2.91 ab 6.35 cd 0.59a 3.94bc 57.34a 67.77 a
Note. Means followed by the same letter in column are not significantly different at p≤0.05
CONCLUSION
Based on the results of this study, it can be concluded that deficit irrigation strategy has positive effects on some physicochemical quality of the greenhouse tomato fruits variety, MT1. Deficit irrigation at different growth stages caused significant (p<0.05) increase in fruit firmness, soluble solids concentration, lycopene content and maintained the ascorbic acid, titratable acidity and pH value when compared to full irrigation (control). Effects of imposition of deficit irrigation on growth and yield parameters were variable, as there was no statistically significant difference in the plant height and leaves number due to water stress treatment. However, fruit weight and the number of fruits increased significantly
under deficit irrigation treatments. Applying water stress at fruiting stage also decreased the fruit yield and number in tomato. In, addition, water deficit irrigation at fruiting stage significantly decreased the fresh and dry weight of shoots and root. The vegetative and flowering growth stages could be considered as the most tolerant to deficit irrigation, and the fruiting growth stage may be considered as the most critical growth stage. On the other hand, considering the effect of water deficit treatments on the physicochemical qualities of the tomatoes in this study, it is concluded that a reduction in the volume of water applied at vegetative and fruiting stage of the MT1 tomato variety would produce tomato fruits of higher quality
Pertanika J. Trop. Agric. Sci. 41 (2): 741 – 758 (2018)
Deficit Irrigation Versus Postharvest Quality of Tomato
755
than that of regularly watered plants. It could therefore be used as a strategy for enhancing fruit quality with reduced cost of production, from water and energy compensating for the yield losses due to the stress treatment.
REFERENCESAbete, I., Perez-Cornago, A., Navas-Carretero, S.,
Bondia-Pons, I., Zulet, M. A., & Martinez, J. A. (2013). A regular lycopene enriched tomato sauce consumption influences antioxidant status of healthy young-subjects: A crossover study. Journal of Functional Foods, 5(1), 28-5.
Agbemafle, R., Owusu-sekyere, J., Bart-plange, A., & Otchere, J. (2014). Effect of deficit irrigation and storage on physicochemical quality of tomato (lycopersicon esculentum Mill. var. pechtomech ). Journal of Food Science and Quality Management, 34, 113-120.
Ahmad, S. H., & Ding, P. (2008). Postharvest techniques for quaality characteristic evaluation of tropical fruit. Part 2, practical 2.30-4.30. City: Universiti Putra Malaysia.
Amor, M. A., & Amor, F. M. (2007). Response of tomato plants to deficit irrigation under surface or subsurface drip irrigation. Journal of Applied Horticulture, 9(2), 97-100.
Anthon, G., & Barrett, D. M. (2006). Standardization of a rapid spectrophotometric method for lycopene analysis. X International Symposium on the Processing Tomato Proceedings (pp. 111–128). Tunis, Tunisia: Publisher.
Behboudian, M. H., Clothier, B. E., & Zegbe, J. A. (2007). Response of tomato to partial rootzone drying and deficit irrigation. Revista Fitotecnia Mexicana, 30(2), 125-131.
Boutraa, T. (2010). Growth performance and biomass partitioning of the desert shrub Calotropis procera under water stress conditions. Research Journal of Agriculture and Biological Sciences, 6(1), 20-26.
Chen, J., Kang, S., Du, T., Qiu, R., Guo, P., & Chen, R. (2013). Quantitative response of greenhouse tomato yield and quality to water deficit at different growth stages. Agricultural Water Management, 129, 152-162. doi: 10.1016/j.agwat.2013.07.011.
Costa, J. M., & Heuvelink, E. (2005). Introduction: The tomato crop and industry. In Tomatoes (No. 13, pp. 1-20). Wallingford, UK: CAB International.
Costa, J. M., Ortuño, M. F., & Chaves, M. M. (2007). Deficit irrigation as a strategy to save water: physiology and potential application to horticulture. Journal of Integrative Plant Biology, 49(10), 1421-1434.
English, M (1990). Deficit irrigation. I: Analytic framework. Journal of Irrigation and Drianage Engineering, 116(3), 399-412.
Escobar, I. C. (2010). An overview of the global water situation. Journal of Sustainability Science and Engineering, 2, 3-5.
Garcia, E., & Barrett, D. M. (2006). Evaluation of processing tomatoes from two consecutive growing seasons: quality attributes, peelability and yield. Journal of Food Processing and Preservation, 30(1), 20-36.
Giannakoula, Anastasia E., & Ilias, I. F. (2013). The effect of water stress and salinity on growth and physiology of tomato (lycopersicon esculentum Mil.). Archives of Biological Sciences, 62(2), 611-620.
Helyes, L., Lugasi, A., & Pek, Z. (2012). Effect of irrigation on processing tomato yield and antioxidant components. Turkish Journal of Agriculture and Forestry, 36(6), 702-709.
Pertanika J. Trop. Agric. Sci. 41 (2): 741 – 758 (2018)
Mohammed, H. N., Mahmud, T. M. M. and Puteri Edaroyati, M. W.
756
Hussain, I., & Wijerathna, D. (2004). Irrigation and income-poverty alleviation: A comparative analysis of irrigation systems in developing Asia. Journal of International Water Management Institute, Colombo, 1-41.
Ilahy, R., Hdider, C., Lenucci, M. S., Tlili, I., & Dalessandro, G. (2011). Phytochemical composition and antioxidant activity of high-lycopene tomato (Solanum lycopersicum L.) cultivars grown in Southern Italy. Journal of Scientia Horticulturae, 127(3), 255-261.
Johnstone, P. R., Hartz, T. K., LeStrange, M., Nunez, J. J., & Miyao, E. M. (2005). Managing fruit soluble solids with late-season deficit irrigation in drip-irrigated processing tomato production. Journal of HortScience, 40(6), 1857-1861.
Kinet, J. M., & Peet, M. M. (1997). Tomato. Wallingford, UK: CAB International.
Kole, C. (2007). Genome mapping and molecular breeding in plants (Vol. 1). Heidelberg: Springer.
Kucsçu, H., Turhan, A., & Demir, A. O. (2014). The response of processing tomato to deficit irrigation at various phenological stages in a sub-humid environment. Journal of Agricultural Water Management, 133, 92-103.
Kumar, P. S., Singh, Y., Nangare, D. D., Bhagat, K., Kumar, M., Taware, P. B., ... & Minhas, P. S. (2015). Influence of growth stage specific water stress on the yield, physico-chemical quality and functional characteristics of tomato grown in shallow basaltic soils. Journal of Scientia Horticulturae, 197, 261-271.
Mahajan, S., & Tuteja, N. (2005). Cold, salinity and drought stresses: An overview. Archives of Biochemistry and Biophysics, 444(2), 139-158.
Mitchell, J. P., Shennan, C., Grattan, S. R., & May, D. M. (1991). Tomato fruit yields and quality under water deficit and salinity. Journal of the American Society for Horticultural Science, 116(2), 215–221.
Muhammad, A., & Singh, A. (2007). Yield of tomato as influenced by training and pruning in the Sudan savanna of Nigeria. Journal of Plant Science, 2(3), 310-317.
Nangare, D. D., Singh, Y., Kumar, P. S., & Minhas, P. S. (2016). Growth, fruit yield and quality of tomato (Lycopersicon esculentum Mill.) as affected by deficit irrigation regulated on phenological basis. Journal of Agricultural Water Management, 171, 73-79.
Nuruddin, M. M. (2001). Effects of water stress on tomato at different growth stages. (Doctoral dissertation). McGill University, Canada.
Nuruddin, M. M., Madramootoo, C. A., & Dodds, G. T. (2003). Effects of water stress at different growth stages on greenhouse tomato yield and quality. Journal of HortScience, 38(7), 1389-1393.
Patanè, C., & Cosentino, S. L. (2010). Effects of soil water deficit on yield and quality of processing tomato under a Mediterranean climate. Journal of Agricultural Water Management, 97(1), 131-138.
Patanè, C., Tringali, S., & Sortino, O. (2011). Effects of deficit irrigation on biomass, yield, water productivity and fruit quality of processing tomato under semi-arid Mediterranean climate conditions. Journal of Scientia Horticulturae, 129(4), 590-596.
Postel, S. L. (2000). Entering an era of water scarcity: the challenges ahead. Journal of Ecological Applications, 10(4), 941-948.
Reddy, A. R., Chaitanya, K. V., & Vivekanandan, M. (2004). Drought-induced responses of photosynthesis and antioxidant metabolism in higher plants. Journal of Plant Physiology, 161(11), 1189-1202.
Seng, K. H. (2014). The effects of drought, waterlogging and heat stress on tomatoes (solanum lycopersicon L.). (Doctoral dissertation). Lincoln University, New Zealand.
Pertanika J. Trop. Agric. Sci. 41 (2): 741 – 758 (2018)
Deficit Irrigation Versus Postharvest Quality of Tomato
757
Taylor, I. B. (1986). Biosystematics of the tomato. In The tomato crop (pp. 1-34). Dordrecht: Springer.
Vijitha, R., & Mahendran, S. (2010). Effect of moisture stress at different growth stages of tomato plant (Lycopersicon esculentum Mill.) on yield and quality of fruits. Journal of Science.University of Kelaniya, 5, 1-11.
Wahb-Allah, M. A., & Al-Omran, A. M. (2012). Effect of water quality and deficit irrigation on tomato growth, yield and water use efficiency at different developmental stages. Journal of Agricultural & Environmental Sciences, 11(2), 80-109.
Wang, F., Du, T., Qiu, R., & Dong, P. (2011). Effects of water stress at different growth stage on greenhouse multiple-trusses tomato yield and quality. In New Technology of Agricultural Engineering (ICAE), 2011 International Conference (provide full name of conference) Proceedings (pp. 282–287). IEEE.
Wudiri, B. B., & Henderson, D. W. (1985). Effects of water stress on flowering and fruit set in processing-tomatoes. Scientia Horticulturae, 27(3), 189–198.
Zegbe-Dominguez, J. A., Behboudian, M. H., Lang, A., & Clothier, B. E. (2003). Deficit irrigation and partial rootzone drying maintain fruit dry mass and enhance fruit quality in “Petopride”processing tomato (lycopersicon esculentum, Mill.). Journal of Scientia Horticulturae, 98(4), 505-510.

Pertanika J. Trop. Agric. Sci. 41 (2): 759 – 768 (2018)
ISSN: 1511-3701 © Universiti Putra Malaysia Press
TROPICAL AGRICULTURAL SCIENCEJournal homepage: http://www.pertanika.upm.edu.my/
ARTICLE INFOArticle history:Received: 24 August 2017Accepted: 8 November 2017
E-mail addresses:[email protected] (Keng Hong Tee)[email protected] (Gwendoline Cheng Lian Ee)[email protected] (Ka Woong Wong)[email protected] (Thiruventhan Karunakaran)[email protected] (Vivien Yi Mian Jong)[email protected] (Soek Sin Teh)* Corresponding author
Natural Products from Stem Bark of Calophyllum andersonii
Keng Hong Tee1, Gwendoline Cheng Lian Ee1*, Ka Woong Wong1, Thiruventhan Karunakaran1, Vivien Yi Mian Jong2 and Soek Sin Teh3
1Department of Chemistry, Faculty of Science, Universiti Putra Malaysia, 43400 Serdang, Selangor, Malaysia2Centre of Applied Science Studies, Universiti Teknologi Mara, 94300 UiTM, Kuching, Sarawak, Malaysia3Energy and Environment Unit, Engineering and Processing Division, Malaysian Palm Oil Board, 43000 MPOB, Kajang, Selangor Malaysia
ABSTRACT
Phytochemical study on the stem bark of Calophyllum andersonii has resulted in the isolation of five xanthones, namely (1) caloxanthone I, (2) pyranojacareubin, (3) macluraxanthone, (4) caloxanthone C, and (5) euxanthone. In this study, the compounds were subjected to various spectroscopic analyses including FT-IR, GC-MS, 1D and 2D NMR for structural elucidations. Furthermore, these xanthones were obtained for the first time from Calophyllum andersonii, a plant never reported before. All four extracts, namely hexane, chloroform, ethyl acetate and methanol extracts of the plant showed moderate inhibitions against Bacillus subtilis.
Keywords: Anti-microbial, calophyllum andersonii, xanthones
INTRODUCTION
The genus Calophyllum falls under the family of Clusiaceae. Calophyllum is known to contain rich amounts of secondary metabolites such as xanthones, coumarins and triterpenes (Kashman et al. 1992; Patil et al., 1993). This genus also produces some
chromanones and steroids (Su et al., 2008). Although this genus has been studied extensively, researchers are still looking for new potential lead compounds to be used for drug discovery studies. In fact, new xanthones and coumarins are still being discovered from the Calophyllum species (Aminudin, Ahmad, Taher, & Zulkifli, 2016; Li et al., 2016). Moreover, novel
Pertanika J. Trop. Agric. Sci. 41 (2): 759 – 768 (2018)
Keng Hong Tee, Gwendoline Cheng Lian Ee, Ka Woong Wong, Thiruventhan Karunakaran, Vivien Yi Mian Jong and Soek Sin Teh
760
phenolic compounds with new carbon skeletons have also been discovered lately (Nguyen et al., 2016). The genus is also well-known by its medicinal properties such as anti-HIV (Kashman et al., 1992), anti-microbial (Kawamura, Muhamud, Hashim, Sulaiman, & Ohara, 2012; Morel et al., 2001;), anti-cancer (Guilet et al., 2001; Mah et al., 2012), as well as anti-oxidant (Alkhamaiseh, Taher, Ahmad, Susanti, & Ichwan, 2011).
MATERIALS AND METHOD
Plant Material
The 2 kg stem bark of Calophyllum andersonii was collected from the Semenggok Forest Reserve in Semenggok, Kuching, Sarawak, Malaysia. An identification process was carried out on the plant sample by Dr Vivien Jong and a voucher specimen (DV01) was deposited at the Herbarium, Centre of Applied Science Studies, Universiti Teknologi Mara Sarawak Branch, Kuching, Malaysia.
General
A Leica Galen III instrument was used in determining the melting points. The infrared spectra were obtained on a Perkin-Elmer 100 Series FT-IR spectrometer using universal attenuated total reflection technique. Electron-ionised mass spectrometry was conducted using a Shimadzu GCMS-QP 5050A spectrometer at 80 to 200°C. The column used in the experiment was SGE BPX5 of dimensions 30 m x 0.25 mm I.D x 0.25 μm film
thickness. The UV spectra were recorded in ethanol using a Shimadzu UV-160A, UV-Visible Recording Spectrophotometer. NMR spectral analyses were carried out using JEOL 500MHz and 400MHz FT-NMR spectrometers, using CDCl3 as well as acetone-d6 as solvents and tetramethylsilane (TMS) as internal standard.
Extraction and Isolation
The dried stem bark of Calophyllum andersonii was ground into a total of two kg of fine powder. The extraction process on Calophyllum andersonii was carried out using four solvents consecutively, which were hexane, chloroform, ethyl acetate and methanol. The duration for each extraction was 72 hours. This was repeated three times for each solvent before the next solvent of higher polarity was introduced accordingly. The extracts were then concentrated by the removal of the solvents under reduced pressure. The yields of the extracts were 36.2 g of hexane extract, 73.0 g of chloroform extract, 14.4 g of ethyl acetate extract and 123.0 g of methanol extract. The crude extracts of Calophyllum andersonii were subjected to column chromatography using a stepwise gradient solvent system (hexane/chloroform, chloroform/ethyl acetate, ethyl acetate/methanol). The collected fractions were then monitored by TLC and fractions with similar characteristics were combined and further purified. The hexane and chloroform extracts that were subjected to gravity column chromatography resulted in 34 and 43 fractions respectively. The
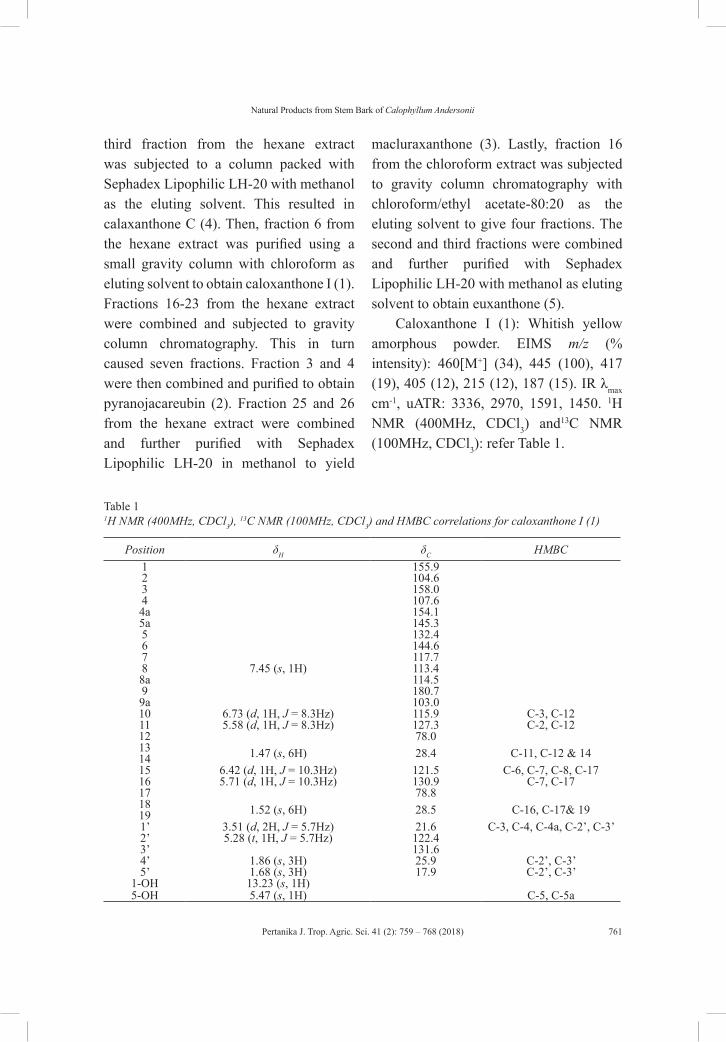
Pertanika J. Trop. Agric. Sci. 41 (2): 759 – 768 (2018)
Natural Products from Stem Bark of Calophyllum Andersonii
761
third fraction from the hexane extract was subjected to a column packed with Sephadex Lipophilic LH-20 with methanol as the eluting solvent. This resulted in calaxanthone C (4). Then, fraction 6 from the hexane extract was purified using a small gravity column with chloroform as eluting solvent to obtain caloxanthone I (1). Fractions 16-23 from the hexane extract were combined and subjected to gravity column chromatography. This in turn caused seven fractions. Fraction 3 and 4 were then combined and purified to obtain pyranojacareubin (2). Fraction 25 and 26 from the hexane extract were combined and further purified with Sephadex Lipophilic LH-20 in methanol to yield
macluraxanthone (3). Lastly, fraction 16 from the chloroform extract was subjected to gravity column chromatography with chloroform/ethyl acetate-80:20 as the eluting solvent to give four fractions. The second and third fractions were combined and further purified with Sephadex Lipophilic LH-20 with methanol as eluting solvent to obtain euxanthone (5).
Caloxanthone I (1): Whitish yellow amorphous powder. EIMS m/z (% intensity): 460[M+] (34), 445 (100), 417 (19), 405 (12), 215 (12), 187 (15). IR λmax cm-1, uATR: 3336, 2970, 1591, 1450. 1H NMR (400MHz, CDCl3) and13C NMR (100MHz, CDCl3): refer Table 1.
Table 11H NMR (400MHz, CDCl3),
13C NMR (100MHz, CDCl3) and HMBC correlations for caloxanthone I (1)
Position δH δC HMBC1 155.92 104.63 158.04 107.64a 154.15a 145.35 132.46 144.67 117.78 7.45 (s, 1H) 113.48a 114.59 180.79a 103.010 6.73 (d, 1H, J = 8.3Hz) 115.9 C-3, C-1211 5.58 (d, 1H, J = 8.3Hz) 127.3 C-2, C-1212 78.013 1.47 (s, 6H) 28.4 C-11, C-12 & 141415 6.42 (d, 1H, J = 10.3Hz) 121.5 C-6, C-7, C-8, C-1716 5.71 (d, 1H, J = 10.3Hz) 130.9 C-7, C-1717 78.818 1.52 (s, 6H) 28.5 C-16, C-17& 19191’ 3.51 (d, 2H, J = 5.7Hz) 21.6 C-3, C-4, C-4a, C-2’, C-3’2’ 5.28 (t, 1H, J = 5.7Hz) 122.43’ 131.64’ 1.86 (s, 3H) 25.9 C-2’, C-3’5’ 1.68 (s, 3H) 17.9 C-2’, C-3’
1-OH 13.23 (s, 1H)5-OH 5.47 (s, 1H) C-5, C-5a
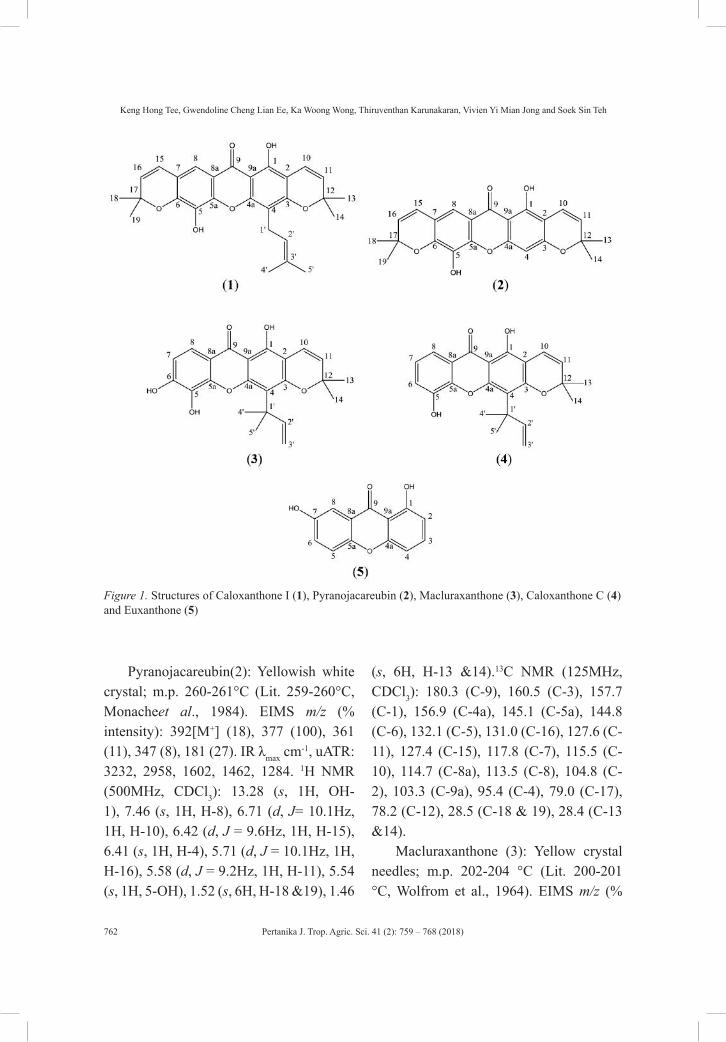
Pertanika J. Trop. Agric. Sci. 41 (2): 759 – 768 (2018)
Keng Hong Tee, Gwendoline Cheng Lian Ee, Ka Woong Wong, Thiruventhan Karunakaran, Vivien Yi Mian Jong and Soek Sin Teh
762
Figure 1. Structures of Caloxanthone I (1), Pyranojacareubin (2), Macluraxanthone (3), Caloxanthone C (4) and Euxanthone (5)
Pyranojacareubin(2): Yellowish white crystal; m.p. 260-261°C (Lit. 259-260°C, Monacheet al., 1984). EIMS m/z (% intensity): 392[M+] (18), 377 (100), 361 (11), 347 (8), 181 (27). IR λmax cm-1, uATR: 3232, 2958, 1602, 1462, 1284. 1H NMR (500MHz, CDCl3): 13.28 (s, 1H, OH-1), 7.46 (s, 1H, H-8), 6.71 (d, J= 10.1Hz, 1H, H-10), 6.42 (d, J = 9.6Hz, 1H, H-15), 6.41 (s, 1H, H-4), 5.71 (d, J = 10.1Hz, 1H, H-16), 5.58 (d, J = 9.2Hz, 1H, H-11), 5.54 (s, 1H, 5-OH), 1.52 (s, 6H, H-18 &19), 1.46
(s, 6H, H-13 &14).13C NMR (125MHz, CDCl3): 180.3 (C-9), 160.5 (C-3), 157.7 (C-1), 156.9 (C-4a), 145.1 (C-5a), 144.8 (C-6), 132.1 (C-5), 131.0 (C-16), 127.6 (C-11), 127.4 (C-15), 117.8 (C-7), 115.5 (C-10), 114.7 (C-8a), 113.5 (C-8), 104.8 (C-2), 103.3 (C-9a), 95.4 (C-4), 79.0 (C-17), 78.2 (C-12), 28.5 (C-18 & 19), 28.4 (C-13 &14).
Macluraxanthone (3): Yellow crystal needles; m.p. 202-204 °C (Lit. 200-201 °C, Wolfrom et al., 1964). EIMS m/z (%
Pertanika J. Trop. Agric. Sci. 41 (2): 759 – 768 (2018)
Natural Products from Stem Bark of Calophyllum Andersonii
763
intensity): 394[M+] (38), 379 (100), 337 (11), 325 (26). IR λmax cm-1, uATR: 3174, 2927, 1589, 1448. 1H NMR (400MHz, CDCl3): 13.51 (s, 1H, 1-OH), 7.76 (d, J = 8.3Hz, 1H), 6.93 (d, J = 8.3Hz, 1H), 6.76 (d, J = 10.1Hz, 1H), 6.72 (dd, J = 17.4 & 11.0Hz, 1H), 6.26 (s, 1H, 6-OH), 5.92 (s, 1H, 5-OH), 5.60 (d, J = 10.1Hz, 1H), 5.18 (dd, J = 17.3 & 1.8Hz, 1H), 5.04 (dd, J = 11.0 & 1.8Hz, 1H), 1.63 (s, 6H), 1.50 (s, 6H). 13C NMR (100MHz, CDCl3): 180.8 (C-9), 159.0 (C-3), 156.9 (C-2’), 156.8 (C-1), 154.1 (C-4a), 149.0 (C-6), 144.6 (C-5a), 131.1 (C-5), 127.2 (C-11), 117.5 (C-8), 116.1 (C-10), 113.7 (C-8a), 113.1 (C-4), 112.8 (C-7), 105.6 (C-2), 103.3 (C-3’), 103.1 (C-9a), 78.3 (C-12), 41.5 (C-1’), 28.2 (C-4’ & 5’), 28.0 (C-13 & 14).
Caloxanthone C (4): Fine yellow needles: m.p. 201-203°C (Lit. 201.5°C, Iinuma, Tosa, Tanaka, & Yonemori, 1994). EIMS m/z (% intensity): 378[M+] (29), 363 (100), 335 (8), 154 (13). IR λmax cm1, uATR: 3441, 2936, 1606, 1426, 1283. 1H NMR (400MHz, CDCl3): 13.42 (s,1H, 1-OH), 7.69 (dd, J = 6.4 & 1.8Hz, 1H, H-8), 7.24 (d, J = 7.3 & 1.8Hz, 1H, H-6), 7.22 (t, J = 6.4Hz, 1H, H-7), 6.77 (d, J = 8.2Hz, 1H, H-10), 6.69 (dd, J = 14.7 & 8.2Hz, 1H. H-2’), 6.39 (s, 1H, 5-OH), 5.62 (d, J = 8.2Hz, H-11), 5.22 (d, J = 14.7Hz, 1H, H-3’a), 5.06 (d, J = 8.2Hz, 1H, H-3’b), 1.64 (s, 6H, H-4’ & 5’), 1.51 (s, 6H, H-13 & 14). 13C NMR (100MHz, CDCl3): 181.4 (C-9), 159.4 (C-3), 156.7 (C-1), 155.8 (C-2’), 154.0 (C-4a), 145.4 (C-5), 144.2 (C-5a), 127.4 (C-11), 124.2 (C-7), 120.5 (C-8a), 119.7 (C-6), 116.1 (C-8), 116.0
(C-10), 113.2 (C-4), 105.6 (C-2), 104.1 (C-3’), 103.6 (C-9a), 78.4 (C-12), 41.4 (C-1’), 28.3 (C-13 & 14), 28.0 (C-4’ & 5’).
Euxanthone (5): Fine yellowish orange needles; m.p. 228-229°C (Lit. 226-229°C, Fujita, Liu, Ueda, & Takeda, 1992). EIMS m/z (% intensity): 228 [M+] (100), 200 (19), 144 (15), 115 (23). IR λmax cm-1, uATR: 3452, 2924, 1610, 1477, 1232. 1H NMR (400MHz, CDCl3): 12.69 (s, 1H, 1-OH), 8.96 (s, 1H, 7-OH), 7.67 (t, J = 8.3Hz, 1H, H-3), 7.58 (d, J = 2.7Hz, 1H, H-8), 7.50 (d, J = 9.2Hz, 1H, H-5), 7.41 (dd, J = 9.3 &3.7Hz, 1H, H-6), 6.97 (d, J = 8.3Hz, 1H, H-4), 6.74 (d, J = 8.3Hz, 1H, H-2). 13C NMR (100MHz, CDCl3): 182.1 (C-9), 161.9 (C-1), 156.5 (C-4a), 154.1 (C-7), 150.2 (C-5a), 137.0 (C-3), 125.3 (C-6), 121.0 (C-8a), 119.4 (C-5), 109.7 (C-2), 108.3 (C-9a), 106.9 (C-4).
Anti-Microbial Activity
Agar diffusion disc method was used for the anti-microbial test. Tests were carried out on six bacteria, which were Bacillus subtilis, Staphylococcus aureus, Pseudomonas aeruginosa, Escherichia coli, Serratia marcencens and Salmonella choleraesuis. For the growth media, Mueller-Hinton agar (MHA) was used. Chlorhexidine (0.5mg/ml) was used as the positive control and dimethyl sulfoxide (DMSO) as the negative control. The culture was standardised to 0.5 MacFarland standards. The streaking of microbes was carried out using a sterile spreader on a petri-dish with MHA prepared and solidified. A paper disc was then positioned on the petri-dish followed
Pertanika J. Trop. Agric. Sci. 41 (2): 759 – 768 (2018)
Keng Hong Tee, Gwendoline Cheng Lian Ee, Ka Woong Wong, Thiruventhan Karunakaran, Vivien Yi Mian Jong and Soek Sin Teh
764
by the sample extract (10 μl) dropped onto it. The concentrations of the sample extracts were 10 mg per 1.0 ml of DMSO for every extract (hexane, chloroform, ethyl acetate, methanol). After that, the petri-dish was incubated at 37°C for 24 hours in an inverted position. The clear inhibition zone was measured around the paper disc as the area where no microbes were growing. The tests were repeated three times to obtain the mean values and standard deviations.
RESULTS AND DISCUSSION
Caloxanthone I (1) was obtained from the hexane and chloroform extracts. The compound appeared as a whitish yellow amorphous powder.
The EIMS spectrum of the compound exhibited a molecular ion peak at m/z 460, which corresponded to the molecular formula C28H26O6. The IR analysis gave several bands that are common in all xanthones, which are at 3336, 2970, 1591and 1450cm-1.
From the 1H NMR spectrum, a chelated hydroxyl group (1-OH) and an aromatic proton (H-8) were revealed from two deshielded signals at δH 13.23 and δH 7.45 respectively. Besides, a pair of doublets at δH 6.73 (J = 8.3Hz, 1H, H-10) and δH 5.58 (J = 8.3Hz, 1H, H-11) showed the presence of a pyrano ring. Similarly, the occurrence of two doublets at δH 6.42 (J = 10.3Hz, 1H, H-15) and δH 5.71 (J = 10.3Hz, 1H, H-16) were due to another pyrano group in the structure. The presence of a prenyl moiety was justified by a series of proton signals
which resonated at δH 3.51 (d, J = 5.7Hz, 2H, H-1’), δH 5.28 (t, J = 5.7Hz, 1H, H-2’), δH 1.86 (s, 3H, H-4’) and δH 1.68 (s, 3H, H-5’).
From the 13C NMR spectrum, it was observed that there were 28 carbons in the structure. The DEPT spectrum revealed six methines, one methylene, six methyl groups and 15 quaternary carbons.
The position of one of the pyrano rings at C-2 and C-3 was confirmed from their long range correlations to H-11 and H-10 respectively. For another pyrano ring attached to C-6 and C-7, their 2J and 3J correlations to H-6, H-7 and H-8 confirmed this assignment. The correlations occurring between H-1’ and C-3, C-4, C-4a supported that the prenyl side chain was attached to C-4.
Based on the information obtained from the NMR analysis, the compound was elucidated to be caloxanthone I (1) that was previously isolated from the plant Calophyllum apetalum (Iinuma et al., 1997).
Pyranojacareubin (2) was obtained from the hexane and chloroform extracts as yellowish white crystals with melting point at 260 to 261°C. The EIMS spectrum recorded a molecular ion peak at m/z 392, a molecular weight which corresponds to the molecular formula C23H20O6. The IR spectrum showed absorptions at 3232, 2958, 1602 and 1462 cm-1.
From the 1H NMR, two hydroxyl protons were revealed by two separate signals at δH 13.51 (s, 1H, 1-OH) and δH 5.54 (s, 1H, 5-OH). Two pairs of doublets
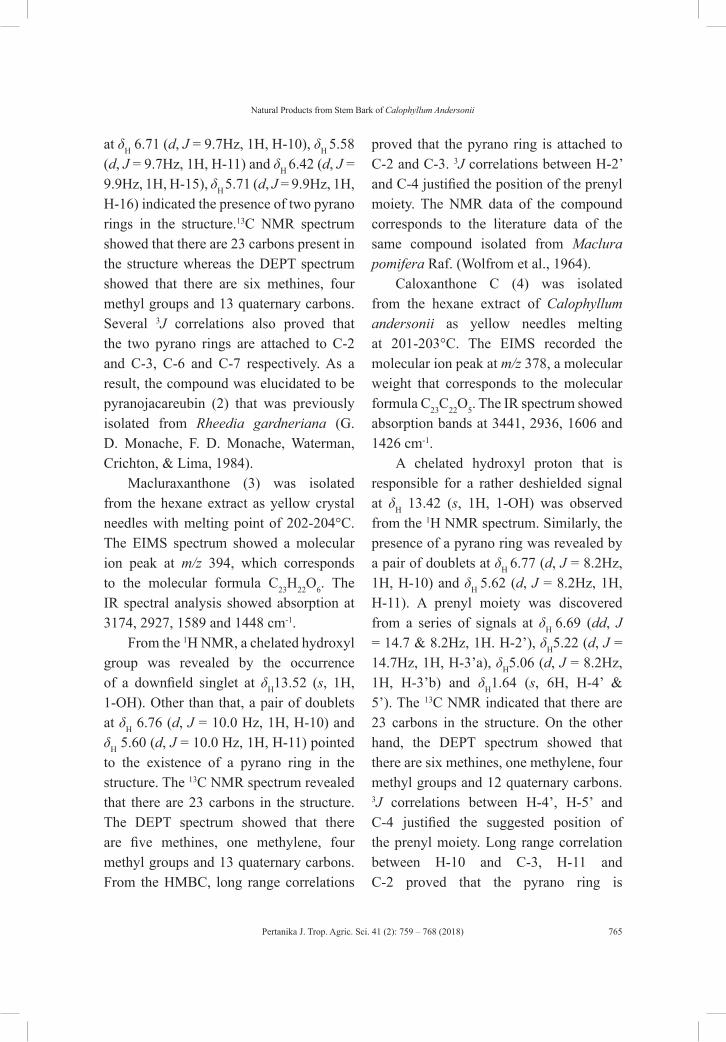
Pertanika J. Trop. Agric. Sci. 41 (2): 759 – 768 (2018)
Natural Products from Stem Bark of Calophyllum Andersonii
765
at δH 6.71 (d, J = 9.7Hz, 1H, H-10), δH 5.58 (d, J = 9.7Hz, 1H, H-11) and δH 6.42 (d, J = 9.9Hz, 1H, H-15), δH 5.71 (d, J = 9.9Hz, 1H, H-16) indicated the presence of two pyrano rings in the structure.13C NMR spectrum showed that there are 23 carbons present in the structure whereas the DEPT spectrum showed that there are six methines, four methyl groups and 13 quaternary carbons. Several 3J correlations also proved that the two pyrano rings are attached to C-2 and C-3, C-6 and C-7 respectively. As a result, the compound was elucidated to be pyranojacareubin (2) that was previously isolated from Rheedia gardneriana (G. D. Monache, F. D. Monache, Waterman, Crichton, & Lima, 1984).
Macluraxanthone (3) was isolated from the hexane extract as yellow crystal needles with melting point of 202-204°C. The EIMS spectrum showed a molecular ion peak at m/z 394, which corresponds to the molecular formula C23H22O6. The IR spectral analysis showed absorption at 3174, 2927, 1589 and 1448 cm-1.
From the 1H NMR, a chelated hydroxyl group was revealed by the occurrence of a downfield singlet at δH13.52 (s, 1H, 1-OH). Other than that, a pair of doublets at δH 6.76 (d, J = 10.0 Hz, 1H, H-10) and δH 5.60 (d, J = 10.0 Hz, 1H, H-11) pointed to the existence of a pyrano ring in the structure. The 13C NMR spectrum revealed that there are 23 carbons in the structure. The DEPT spectrum showed that there are five methines, one methylene, four methyl groups and 13 quaternary carbons. From the HMBC, long range correlations
proved that the pyrano ring is attached to C-2 and C-3. 3J correlations between H-2’ and C-4 justified the position of the prenyl moiety. The NMR data of the compound corresponds to the literature data of the same compound isolated from Maclura pomifera Raf. (Wolfrom et al., 1964).
Caloxanthone C (4) was isolated from the hexane extract of Calophyllum andersonii as yellow needles melting at 201-203°C. The EIMS recorded the molecular ion peak at m/z 378, a molecular weight that corresponds to the molecular formula C23C22O5. The IR spectrum showed absorption bands at 3441, 2936, 1606 and 1426 cm-1.
A chelated hydroxyl proton that is responsible for a rather deshielded signal at δH 13.42 (s, 1H, 1-OH) was observed from the 1H NMR spectrum. Similarly, the presence of a pyrano ring was revealed by a pair of doublets at δH 6.77 (d, J = 8.2Hz, 1H, H-10) and δH 5.62 (d, J = 8.2Hz, 1H, H-11). A prenyl moiety was discovered from a series of signals at δH 6.69 (dd, J = 14.7 & 8.2Hz, 1H. H-2’), δH5.22 (d, J = 14.7Hz, 1H, H-3’a), δH5.06 (d, J = 8.2Hz, 1H, H-3’b) and δH1.64 (s, 6H, H-4’ & 5’). The 13C NMR indicated that there are 23 carbons in the structure. On the other hand, the DEPT spectrum showed that there are six methines, one methylene, four methyl groups and 12 quaternary carbons. 3J correlations between H-4’, H-5’ and C-4 justified the suggested position of the prenyl moiety. Long range correlation between H-10 and C-3, H-11 and C-2 proved that the pyrano ring is
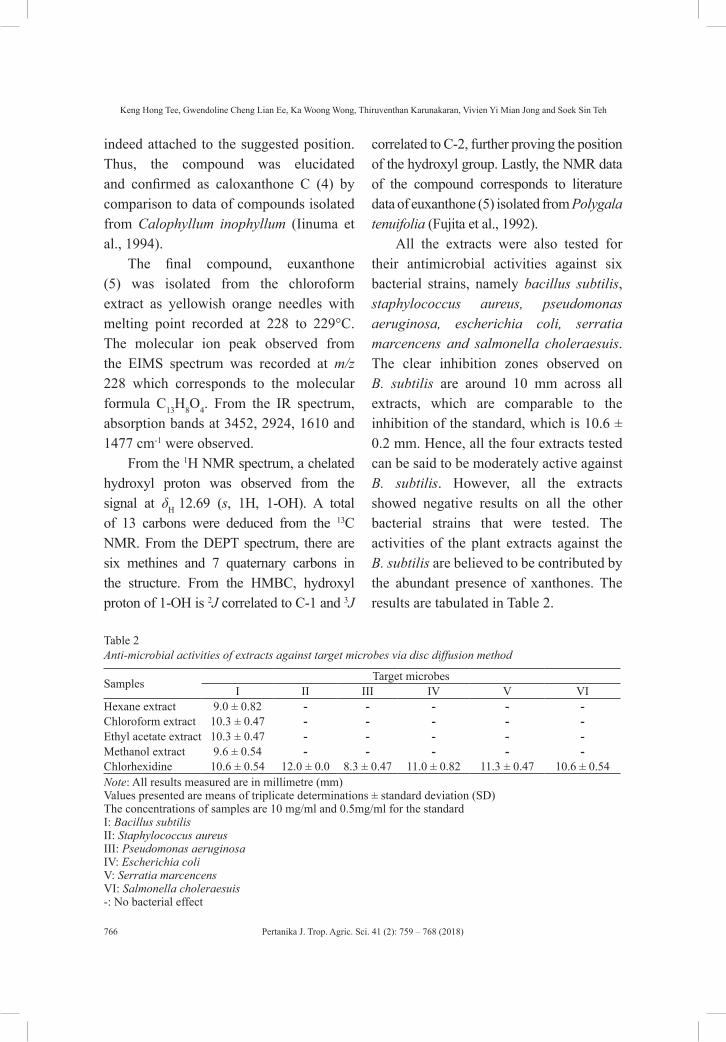
Pertanika J. Trop. Agric. Sci. 41 (2): 759 – 768 (2018)
Keng Hong Tee, Gwendoline Cheng Lian Ee, Ka Woong Wong, Thiruventhan Karunakaran, Vivien Yi Mian Jong and Soek Sin Teh
766
indeed attached to the suggested position. Thus, the compound was elucidated and confirmed as caloxanthone C (4) by comparison to data of compounds isolated from Calophyllum inophyllum (Iinuma et al., 1994).
The final compound, euxanthone (5) was isolated from the chloroform extract as yellowish orange needles with melting point recorded at 228 to 229°C. The molecular ion peak observed from the EIMS spectrum was recorded at m/z 228 which corresponds to the molecular formula C13H8O4. From the IR spectrum, absorption bands at 3452, 2924, 1610 and 1477 cm-1 were observed.
From the 1H NMR spectrum, a chelated hydroxyl proton was observed from the signal at δH 12.69 (s, 1H, 1-OH). A total of 13 carbons were deduced from the 13C NMR. From the DEPT spectrum, there are six methines and 7 quaternary carbons in the structure. From the HMBC, hydroxyl proton of 1-OH is 2J correlated to C-1 and 3J
correlated to C-2, further proving the position of the hydroxyl group. Lastly, the NMR data of the compound corresponds to literature data of euxanthone (5) isolated from Polygala tenuifolia (Fujita et al., 1992).
All the extracts were also tested for their antimicrobial activities against six bacterial strains, namely bacillus subtilis, staphylococcus aureus, pseudomonas aeruginosa, escherichia coli, serratia marcencens and salmonella choleraesuis. The clear inhibition zones observed on B. subtilis are around 10 mm across all extracts, which are comparable to the inhibition of the standard, which is 10.6 ± 0.2 mm. Hence, all the four extracts tested can be said to be moderately active against B. subtilis. However, all the extracts showed negative results on all the other bacterial strains that were tested. The activities of the plant extracts against the B. subtilis are believed to be contributed by the abundant presence of xanthones. The results are tabulated in Table 2.
Table 2Anti-microbial activities of extracts against target microbes via disc diffusion method
Samples Target microbesI II III IV V VI
Hexane extract 9.0 ± 0.82 - - - - -Chloroform extract 10.3 ± 0.47 - - - - -Ethyl acetate extract 10.3 ± 0.47 - - - - -Methanol extract 9.6 ± 0.54 - - - - -Chlorhexidine 10.6 ± 0.54 12.0 ± 0.0 8.3 ± 0.47 11.0 ± 0.82 11.3 ± 0.47 10.6 ± 0.54Note: All results measured are in millimetre (mm)Values presented are means of triplicate determinations ± standard deviation (SD)The concentrations of samples are 10 mg/ml and 0.5mg/ml for the standard I: Bacillus subtilisII: Staphylococcus aureusIII: Pseudomonas aeruginosaIV: Escherichia coliV: Serratia marcencensVI: Salmonella choleraesuis-: No bacterial effect
Pertanika J. Trop. Agric. Sci. 41 (2): 759 – 768 (2018)
Natural Products from Stem Bark of Calophyllum Andersonii
767
CONCLUSION
The phytochemical study conducted on Calophyllum andersonii has resulted in the isolation of five xanthones: (1) caloxanthone I, (2) pyranojacareubin, (3) macluraxanthone, (4) caloxanthone C, and (5) euxanthone. All these compounds were isolated from the stem bark of Calophyllum andersonii for the first time. This is also a first report on this plant. The clear inhibition zones of all the extracts on B. subtilis were around 10 mm. This is comparable to that of the standard at 11 mm. Therefore, all four extracts can be regarded as moderately active against bacillus subtilis. Thus, the plant can be studied further for its anti-microbial and biological properties as there is potential for it to contribute to the development of new drugs.
ACKNOWLEDGEMENTS
The authors would like to express their gratitude to Universiti Putra Malaysia for providing financial support under the PUTRA research grant (GP-IPS/2016/9505200) and for also providing the research facilities and technical support. The Sarawak Biodiversity Centre (SBC) is also acknowledged for granting permission to collect plant samples from Sarawak.
REFERENCESAlkhamaiseh, S. I., Taher, M., Ahmad, F., Susanti,
D., & Ichwan, S. J. A. (2011). Antioxidant and cytotoxic activities of calophyllum rubiginosum. International Journal of Phytomedicine, 3(2), 157-163.
Aminudin, N. I., Ahmad, F., Taher, M., & Zulkifli, R. M. (2016). Incrassamarin A-D: Four new 4-substituted coumarins from calophyllum incrassatum and their biological activities. Phytochemistry Letters, 16, 287-293.
Fujita, T., Liu, D. Y., Ueda, S., & Takeda, Y. (1992). Xanthones from polygala tenuifolia. Phytochemistry, 31(11), 3997-4000.
Guilet, D., Helesbeux, J. J., Seraphin, D., Sevenet, T., Richomme, P., & Brunetone, J. (2001). Novel cytotoxic 4-phenylfuranocoumarins from calophyllum dispar. Journal of Natural Products, 64(5), 563-568.
Iinuma, M., Ito, T., Tosa, H., Tanaka, T., Miyake, R., & Chelladurai, V. (1997). New linear pyranoxanthones from calophyllum apetalum. Heterocycles, 45(2), 299-307.
Iinuma, M., Tosa, H., Tanaka, T., & Yonemori, S. (1994). Two new xanthones in the underground part of calophyllum inophyllum. Heterocycles, 37(2), 833-838.
Kashman, Y., Gustafson, K. R., Fuller, R. W., McMahon, J. B., Currens, M. J., Buckheit, J. R., ... & Boyd, M. R. (1992). The calanolides, a novel HIV-inhibitory class of coumarin derivatives from the tropical rainforest tree, Calophyllum lanigerum. Journal of Medicinal Chemistry, 35(15), 2735-2743.
Kawamura, F., Muhamud, A., Hashim, R., Sulaiman, O., & Ohara, S. (2012). Two antifungal xanthones from the heartwood of Calophyllum symingtonianum. Japan Agricultural Research Quarterly, 46(2), 181-185.
Li, Z. L., Li, Y., Qin, N. B., Li, D. H., Liu, Z. G., Liu, Q., & Hua, H. M. (2016). Four new coumarins from the leaves of Calophyllum inophyllum. Phytochemistry Letters, 16, 203-206.
Mah, S. H., Ee, G. C. L., Teh, S. S., Rahmani, M., Lim, Y. M., & Go, R. (2012). Phylattrin, a new cytotoxic xanthone from Calophyllum soulattri. Molecules, 17(7), 8303-8311.
Pertanika J. Trop. Agric. Sci. 41 (2): 759 – 768 (2018)
Keng Hong Tee, Gwendoline Cheng Lian Ee, Ka Woong Wong, Thiruventhan Karunakaran, Vivien Yi Mian Jong and Soek Sin Teh
768
Morel, C., Séraphin, D., Teyrouz, A., Larcher, G., Bouchara, J. P., Litaudon, M., ... & Bruneton, J. (2002). New and antifungal xanthones from Calophyllum caledonicum. Planta Medica, 68(01), 41-44.
Monache, G. D., Monache, F. D., Waterman, P. G., Crichton, E. G., & Lima, R. A. D. (1984). Minor xanthones from Rheedia gardneriana. Phytochemistry, 23(8), 1757-1759.
Nguyen, L. T. T., Lai, N. T., Nguyen, L. T., Nguyen, H. T., Nguyen, D. M., & Nguyen, L. H. D. (2016). Thoreliolides A and B, two polyisoprenylated benzoylphloroglucinol derivatives with a new carbon skeleton from the fruits of Calophyllum thorelii. Tetrahedron Letters, 57(25), 2737-2741.
Patil, A. D., Freyer, A. J., Eggleston, D. S., Haltiwanger, R. C., Bean, M. F., Taylor, P. B., ... & Bartus, H. R. (1993). The inophyllums, novel inhibitors of HIV-1 reverse transcriptase isolated from the Malaysian tree, Calophyllum inophyllum Linn. Journal of Medicinal Chemistry, 36(26), 4131-4138.
Su, X. H., Zhang, M. L., Li, L. G., Huo, C. H., Gu, Y. C., & Shi, Q. W. (2008). Chemical constituents of the plants of the genus Calophyllum. Chemistry and Biodiversity, 5(12), 2579-2608.
Wolfrom, M. L., Dickey, E. E., McWain, P., Thompson, A., Looker, J. H., Windrath, O. M., & Komitsky Jr, F. (1964). Osage orange pigments. XIII. Isolation of three new pigments from the root bark. The Journal of Organic Chemistry, 29(3), 689-691.

Pertanika J. Trop. Agric. Sci. 41 (2): 769 – 776 (2018)
ISSN: 1511-3701 © Universiti Putra Malaysia Press
TROPICAL AGRICULTURAL SCIENCEJournal homepage: http://www.pertanika.upm.edu.my/
ARTICLE INFOArticle history:Received: 23 September 2017Accepted: 13 December 2017
E-mail addresses:[email protected] (B. Saleh)[email protected] (S. T. Mbap)[email protected] (D. J. U. Kalla)[email protected] (U. D. Doma)* Corresponding author
Influence of Maternal Dietary Energy and Protein on the Embryonic Development of FUNAAB – Alpha Chickens
B. Saleh1*, S. T. Mbap2, D. J. U. Kalla2 and U. D. Doma2 1Department of Animal Science, University of Maiduguri, 600230, Borno State, Nigeria2Department of Animal Production, Abubakar Tafawa Balewa University, 740004, Bauchi, Nigeria
ABSTRACT
The effects of varying maternal dietary energy and protein levels on the embryonic development of FUNAAB – alpha chickens were studied. Maternal diets were as follows: standard exotic layer diet (2600 Kcal/kg and 16%CP; Control), high energy low protein (2800Kcal/kg and 14%CP; HELP), high energy high protein (2800Kcal/kg and 18%CP; HEHP) and low energy high protein (2400Kcal/kg and 18%CP; LEHP). A total of 420 fertile eggs were collected and labelled according to maternal dietary treatments. Eggs (n=87) were broken out on days 6, 10, 15, 18 and 19 of incubation to ascertain the level of embryonic development. Embryo weight, length, percentage of weight change (PEWC) and relative embryonic weight (REW) were recorded for each embryo. A significant (p<0.01) influence of maternal diet on the embryonic weight was observed on all the days studied. The LEHP diet consistently maintained lower PEWC. The HEHP group supported better (p<0.05) relative embryonic weight (REW). By the 19th day, LEHP embryos were shorter (p<0.001) than those of the other groups. It was concluded that maternal dietary energy and protein levels influence the embryonic development of the FUNAAB – alpha chicken and that the diet of combinations control or HEHP maintain good developmental trajectory of embryos.
Keywords: Embryonic development, genetic, nutrition
INTRODUCTION
Studies in broilers have demonstrated that maternal nutrition influences chick body weight (Van Emous, Kwakkel, van Krimpen, & Hendriks, 2015). The effects of maternal nutrition could directly be through incorporation of nutrients into
Pertanika J. Trop. Agric. Sci. 41 (2): 769 – 776 (2018)
B. Saleh, S. T. Mbap, D. J. U. Kalla and U. D. Doma
770
the egg (Kenny & Kemp, 2007; Surai & Fisinin, 2012), or by triggering epigenetic modifications that regulate muscle progenitors (Saccone & Puri, 2010). The developing embryo is completely dependent for its growth and development on nutrients in the egg. Consequently, the physiological status of the chick at hatch (chick size, vigour and immune status) is greatly influenced by the nutrition of the hen.
Hatching egg composition varies with maternal nutrition, body composition, age, and strain (Nonis & Gous, 2013) which in turn also influence embryonic development and offspring performance. Moran (2007) stated that adequate deposition of protein in the egg by the hen is particularly important because towards the end of incubation it is highly used for gluconeogenesis by the embryo. Thus, nutritional deficiencies of the hen during egg formation may affect embryonic development. Kenny and Kemp (2007) reported that hens on low protein diets produced chicks with poor growth and higher mortality than those from hens on diets high in protein.
In Nigeria, efforts have been geared towards the development of indigenous chicken breeds with improved meat and egg production. These efforts have led to the development by the Federal University of Agriculture Abeokuta (FUNAAB) of the FUNAAB – alpha (Adebambo, 2015). However, there is little information on the influence of dietary protein and energy on
the embryonic development of this strain. Therefore, the objective of this work was to evaluate the effects of varying levels of dietary energy and protein on the embryonic development of the FUNAAB – alpha Nigerian chicken.
MATERIALS AND METHODS
A total of 420 fertile eggs, 105 eggs for each treatment group from hens fed varying levels of dietary energy and protein were used for this experiment. The maternal diets were standard exotic breeder diet (2600 Kcal/kg and 16%CP; Control), high energy-low protein (2800 Kcal/kg and 14%CP; HELP), high energy-high protein (2800 Kcal/kg and 18%CP; HEHP) and low energy-high protein (2400 Kcal/kg and 18%CP; LEHP). The standard diet was based on the recommendation of Olomu (2011) for exotic hens in the tropics. The management of the hens is as described by Saleh, Mbap, Kalla, Doma, and Duwa (2017) while the dietary formula is shown in Table 1. The eggs were collected and labelled according to maternal dietary treatments. There were 21 eggs from each group which were broken out on days 6, 10, 15, 18 and 19 of incubation andit’s the embryo was carefully removed and separated from all attachments such as chorioallantoic membrane and sac. The embryo was then wiped with an absorbent paper before weighing (Tona et al., 2010).
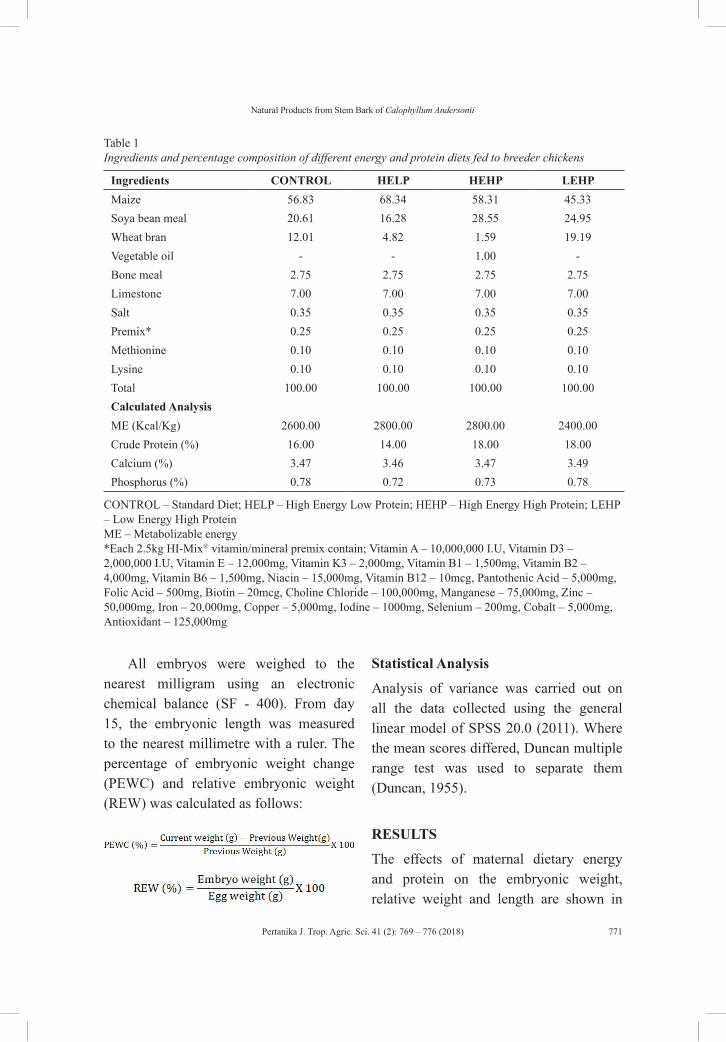
Pertanika J. Trop. Agric. Sci. 41 (2): 769 – 776 (2018)
Natural Products from Stem Bark of Calophyllum Andersonii
771
Table 1Ingredients and percentage composition of different energy and protein diets fed to breeder chickens
Ingredients CONTROL HELP HEHP LEHPMaize 56.83 68.34 58.31 45.33Soya bean meal 20.61 16.28 28.55 24.95Wheat bran 12.01 4.82 1.59 19.19Vegetable oil - - 1.00 -Bone meal 2.75 2.75 2.75 2.75Limestone 7.00 7.00 7.00 7.00Salt 0.35 0.35 0.35 0.35Premix* 0.25 0.25 0.25 0.25Methionine 0.10 0.10 0.10 0.10Lysine 0.10 0.10 0.10 0.10Total 100.00 100.00 100.00 100.00Calculated AnalysisME (Kcal/Kg) 2600.00 2800.00 2800.00 2400.00Crude Protein (%) 16.00 14.00 18.00 18.00Calcium (%) 3.47 3.46 3.47 3.49Phosphorus (%) 0.78 0.72 0.73 0.78
CONTROL – Standard Diet; HELP – High Energy Low Protein; HEHP – High Energy High Protein; LEHP – Low Energy High ProteinME – Metabolizable energy*Each 2.5kg HI-Mix® vitamin/mineral premix contain; Vitamin A – 10,000,000 I.U, Vitamin D3 – 2,000,000 I.U, Vitamin E – 12,000mg, Vitamin K3 – 2,000mg, Vitamin B1 – 1,500mg, Vitamin B2 – 4,000mg, Vitamin B6 – 1,500mg, Niacin – 15,000mg, Vitamin B12 – 10mcg, Pantothenic Acid – 5,000mg, Folic Acid – 500mg, Biotin – 20mcg, Choline Chloride – 100,000mg, Manganese – 75,000mg, Zinc – 50,000mg, Iron – 20,000mg, Copper – 5,000mg, Iodine – 1000mg, Selenium – 200mg, Cobalt – 5,000mg, Antioxidant – 125,000mg
All embryos were weighed to the nearest milligram using an electronic chemical balance (SF - 400). From day 15, the embryonic length was measured to the nearest millimetre with a ruler. The percentage of embryonic weight change (PEWC) and relative embryonic weight (REW) was calculated as follows:
Statistical Analysis
Analysis of variance was carried out on all the data collected using the general linear model of SPSS 20.0 (2011). Where the mean scores differed, Duncan multiple range test was used to separate them (Duncan, 1955).
RESULTS
The effects of maternal dietary energy and protein on the embryonic weight, relative weight and length are shown in
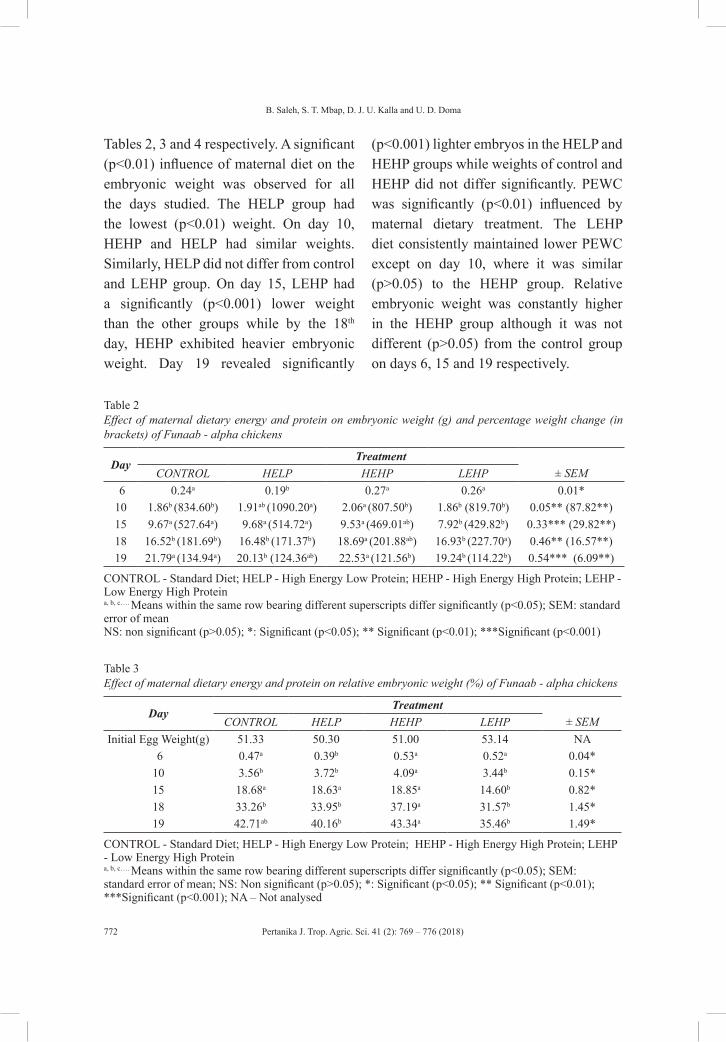
Pertanika J. Trop. Agric. Sci. 41 (2): 769 – 776 (2018)
B. Saleh, S. T. Mbap, D. J. U. Kalla and U. D. Doma
772
Tables 2, 3 and 4 respectively. A significant (p<0.01) influence of maternal diet on the embryonic weight was observed for all the days studied. The HELP group had the lowest (p<0.01) weight. On day 10, HEHP and HELP had similar weights. Similarly, HELP did not differ from control and LEHP group. On day 15, LEHP had a significantly (p<0.001) lower weight than the other groups while by the 18th day, HEHP exhibited heavier embryonic weight. Day 19 revealed significantly
(p<0.001) lighter embryos in the HELP and HEHP groups while weights of control and HEHP did not differ significantly. PEWC was significantly (p<0.01) influenced by maternal dietary treatment. The LEHP diet consistently maintained lower PEWC except on day 10, where it was similar (p>0.05) to the HEHP group. Relative embryonic weight was constantly higher in the HEHP group although it was not different (p>0.05) from the control group on days 6, 15 and 19 respectively.
Table 2Effect of maternal dietary energy and protein on embryonic weight (g) and percentage weight change (in brackets) of Funaab - alpha chickens
DayTreatment
CONTROL HELP HEHP LEHP ± SEM 6 0.24a 0.19b 0.27a 0.26a 0.01*10 1.86b (834.60b) 1.91ab (1090.20a) 2.06a (807.50b) 1.86b (819.70b) 0.05** (87.82**)15 9.67a (527.64a) 9.68a (514.72a) 9.53a (469.01ab) 7.92b (429.82b) 0.33*** (29.82**)18 16.52b (181.69b) 16.48b (171.37b) 18.69a (201.88ab) 16.93b (227.70a) 0.46** (16.57**)19 21.79a (134.94a) 20.13b (124.36ab) 22.53a (121.56b) 19.24b (114.22b) 0.54*** (6.09**)
CONTROL - Standard Diet; HELP - High Energy Low Protein; HEHP - High Energy High Protein; LEHP - Low Energy High Protein a, b, c…. Means within the same row bearing different superscripts differ significantly (p<0.05); SEM: standard error of mean NS: non significant (p>0.05); *: Significant (p<0.05); ** Significant (p<0.01); ***Significant (p<0.001)
Table 3Effect of maternal dietary energy and protein on relative embryonic weight (%) of Funaab - alpha chickens
DayTreatment
CONTROL HELP HEHP LEHP ± SEMInitial Egg Weight(g) 51.33 50.30 51.00 53.14 NA
6 0.47a 0.39b 0.53a 0.52a 0.04*10 3.56b 3.72b 4.09a 3.44b 0.15*15 18.68a 18.63a 18.85a 14.60b 0.82*18 33.26b 33.95b 37.19a 31.57b 1.45*19 42.71ab 40.16b 43.34a 35.46b 1.49*
CONTROL - Standard Diet; HELP - High Energy Low Protein; HEHP - High Energy High Protein; LEHP - Low Energy High Protein a, b, c…. Means within the same row bearing different superscripts differ significantly (p<0.05); SEM: standard error of mean; NS: Non significant (p>0.05); *: Significant (p<0.05); ** Significant (p<0.01); ***Significant (p<0.001); NA – Not analysed
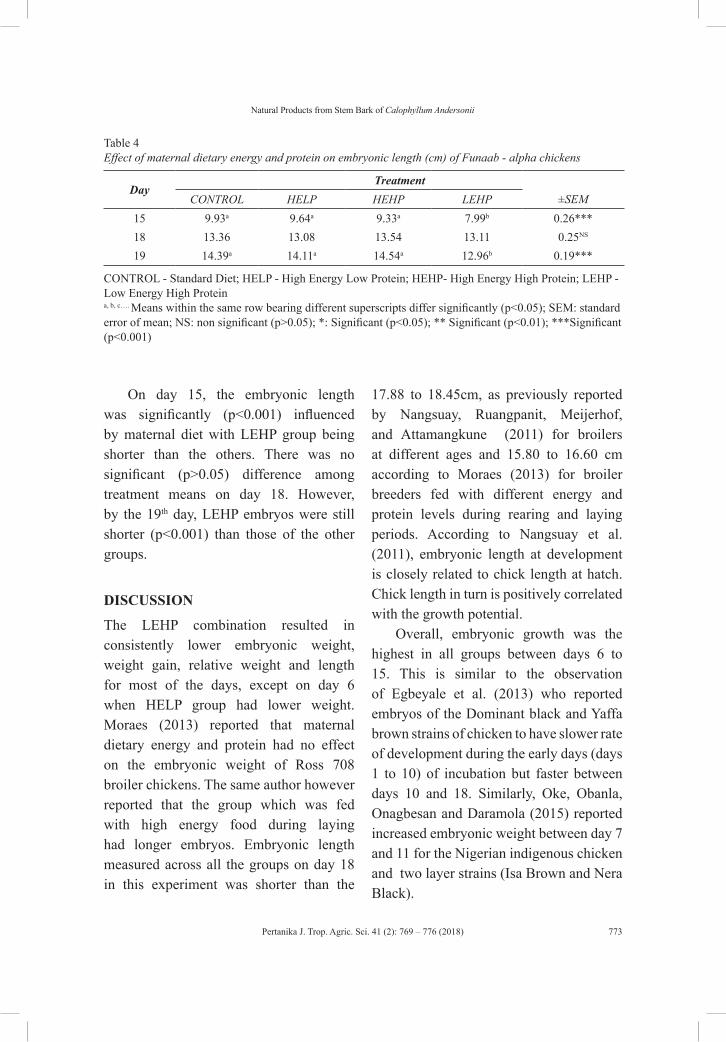
Pertanika J. Trop. Agric. Sci. 41 (2): 769 – 776 (2018)
Natural Products from Stem Bark of Calophyllum Andersonii
773
Table 4Effect of maternal dietary energy and protein on embryonic length (cm) of Funaab - alpha chickens
DayTreatment
CONTROL HELP HEHP LEHP ±SEM15 9.93a 9.64a 9.33a 7.99b 0.26***18 13.36 13.08 13.54 13.11 0.25NS
19 14.39a 14.11a 14.54a 12.96b 0.19***
CONTROL - Standard Diet; HELP - High Energy Low Protein; HEHP- High Energy High Protein; LEHP - Low Energy High Protein a, b, c…. Means within the same row bearing different superscripts differ significantly (p<0.05); SEM: standard error of mean; NS: non significant (p>0.05); *: Significant (p<0.05); ** Significant (p<0.01); ***Significant (p<0.001)
On day 15, the embryonic length was significantly (p<0.001) influenced by maternal diet with LEHP group being shorter than the others. There was no significant (p>0.05) difference among treatment means on day 18. However, by the 19th day, LEHP embryos were still shorter (p<0.001) than those of the other groups.
DISCUSSION
The LEHP combination resulted in consistently lower embryonic weight, weight gain, relative weight and length for most of the days, except on day 6 when HELP group had lower weight. Moraes (2013) reported that maternal dietary energy and protein had no effect on the embryonic weight of Ross 708 broiler chickens. The same author however reported that the group which was fed with high energy food during laying had longer embryos. Embryonic length measured across all the groups on day 18 in this experiment was shorter than the
17.88 to 18.45cm, as previously reported by Nangsuay, Ruangpanit, Meijerhof, and Attamangkune (2011) for broilers at different ages and 15.80 to 16.60 cm according to Moraes (2013) for broiler breeders fed with different energy and protein levels during rearing and laying periods. According to Nangsuay et al. (2011), embryonic length at development is closely related to chick length at hatch. Chick length in turn is positively correlated with the growth potential.
Overall, embryonic growth was the highest in all groups between days 6 to 15. This is similar to the observation of Egbeyale et al. (2013) who reported embryos of the Dominant black and Yaffa brown strains of chicken to have slower rate of development during the early days (days 1 to 10) of incubation but faster between days 10 and 18. Similarly, Oke, Obanla, Onagbesan and Daramola (2015) reported increased embryonic weight between day 7 and 11 for the Nigerian indigenous chicken and two layer strains (Isa Brown and Nera Black).
Pertanika J. Trop. Agric. Sci. 41 (2): 769 – 776 (2018)
B. Saleh, S. T. Mbap, D. J. U. Kalla and U. D. Doma
774
Embryonic weight and weight gain on days 15 and 18 as observed in this study are similar to those reported by Oke et al. (2015) for the Nigerian indigenous chicken. Relative embryonic weight for all the groups in this study were however, lower than those observed by Egbeyale et al. (2013) for the Dominant black and Yaffa brown strain of chicken. The observed difference may be related to the genetic difference between the strains used. Li, Zhao and Wu (2009), and Tona et al. (2010) reported an influence of breed (strain) on embryogenesis in chicken.
CONCLUSION
It is concluded that maternal dietary energy and protein levels influence embryonic development of the FUNAAB – alpha chicken and the standard or high energy high protein diets will maintain good developmental trajectory of embryos.
REFERENCESAdebambo, O. A. (2015) From PEARL project to
ACGG in Nigeria. Paper presented at the First ACGG Nigeria Innovation Platform Meeting Ibadan, Nigeria. Retrieved September 14, 2016, from https://cgspace.cgiar.org/bitstream/handle/10568/72670/acgg_pearl_nigeria_jul2015.pdf?sequence=1
Duncan, D. B. (1955) Multiple range and multiple F-tests. Biometrics, 11(1), 1-42.
Egbeyale, L. T., Sogunle, O. M., Abiola, S. S., Ozoje, M. O., Sowande, O. S., & Adeleye, O. O. (2013) Effect of weight and strain on the egg component utilization and embryonic weight during incubation. Archivos De Zootecnia, 62(238), 191-198.
Kenny, M., & Kemp, C. (2007) Breeder nutrition and chick quality. International Hatchery Practice, 19(4), 7-11.
Li, M., Zhao, C., & Wu, C. (2009) Differential embryo development among Tibetan chicken, drw and shouguang chicken exposed to chronic hypoxia. Asian-Australasian Journal of Animal Science, 22(3), 336-342.
Moraes, T. G. V. (2013) Effect of broiler breeder nutrition on reproductive and offspring performance. (Unpublished Master’s thesis). University of Alberta, Canada.
Moran, Jr. E. T. (2007) Nutrition of the developing embryo and hatchling. Poultry Science, 86(5), 1043-1049.
Nangsuay, A., Ruangpanit, Y., Meijerhof, R., & Attamangkune, S. (2011) Yolk absorption and embryo development of small and large eggs originating from young and old breeder hens. Poultry Science, 90(11), 2648-2655. doi:10.3382/ps.2011-01415
Nonis, M. K., & Gous, R. M. (2013) Modelling changes in the components of eggs from broiler breeders over time. British Poultry Science, 54(5), 603-610.
Oke, O. E., Obanla, L. O., Onagbesan, O. M., & Daramola, J. O. (2015) Growth trajectory of the Nigerian indigenous and exotic strains of chicken embryos during incubation under Nigerian condition. Pertanika Journal of Tropical Agricultural Science, 38(1), 45-55.
Olomu, J. M. (2011) Monogastric animal nutrition: Principles and practice (2nd Ed.). Benin, Nigeria: St Jackson Publishing.
Pertanika J. Trop. Agric. Sci. 41 (2): 769 – 776 (2018)
Natural Products from Stem Bark of Calophyllum Andersonii
775
Saccone, V., & Puri, P. L. (2010) Epigenetic regulation of skeletal myogenesis. Organogenesis, 6(1), 48-53.
Saleh, B., Mbap, S. T., Kalla, D. J. U., Doma, U. D., & Duwa, H. (2017) Effect of varying levels of dietary energy and protein on reproductive performance of FUNAAB - alpha hens. Livestock Research for Rural Development. Retrieved March 18, 2017, from http://www.lrrd.org/lrrd29/3/sale29057.html
SPSS. (2011). SPSS Statistics for windows, version 20.0 Armonk, NY. IBM Corp.
Surai, P., & Fisinin, V. I. (2012) Feeding breeders to avoid oxidative stress in embryos. In Proceedings of the XXIV World’s Poultry Congress (pp. 1-12). Salvador, Bahia, Brazil.
Tona, K., Onagbesan, O. M., Kamers, B., Everaert, N., Bruggeman, V., & Decuypere, E. (2010) Comparison of Cobb and Ross strains in embryo physiology and chick juvenile growth. Poultry Science, 89(8), 1677-1683.
Van Emous, R. A., Kwakkel, R. P., van Krimpen, M. M., & Hendriks, W. H. (2015) Effects of dietary protein levels during rearing and dietary energy levels during lay on body composition and reproduction in broiler breeder females. Poultry Science, 94(5), 1030-1042.

Pertanika J. Trop. Agric. Sci. 41 (2): 777 – 786 (2018)
ISSN: 1511-3701 © Universiti Putra Malaysia Press
TROPICAL AGRICULTURAL SCIENCEJournal homepage: http://www.pertanika.upm.edu.my/
ARTICLE INFOArticle history:Received: 23 September 2017Accepted: 13 December 2017
E-mail addresses:[email protected] (Michelle-Fong, W. C.)[email protected] (Ooi, P. T.)[email protected] (Awis, Q. S.)[email protected] (Goh, Y. M.)* Corresponding author
Investigative Baseline Reference on the Status of Pork pH, Shear Force, Colour, Drip and Cooking Loss in RYR1 Mutation Free, Commercial 3-way Crosses in Malaysia
Michelle-Fong, W. C.1, Ooi, P. T.2*, Awis, Q. S.3 and Goh, Y. M.1
1Department of Veterinary Pre-Clinical Studies, Faculty of Veterinary Medicine, Universiti Putra Malaysia, 43400 UPM, Serdang, Selangor Malaysia 2Department of Veterinary Clinical Studies, Faculty of Veterinary Medicine, Universiti Putra Malaysia, 43400 UPM, Serdang, Selangor, Malaysia3Department of Animal Sciences, Faculty of Agriculture, Universiti Putra Malaysia, 43400 UPM, Serdang, Selangor, Malaysia
ABSTRACT
This paper attempts to provide findings of an investigative study on the baseline status of the pork quality in Malaysia. With consumer preferences changing towards the selection of good quality meat for consumption, there is a need to establish an investigative reference for the operators in the industry to gauge the performance of their animals and pork quality. This is also important to increase the competitiveness among producers to continuously improve the pork quality available to consumers. In this study, 30 commercial three-way crossed female pigs were randomly selected from government accredited abattoirs from east and west Malaysia and longisimus dorsi were collected for the determination of pH, drip loss, cooking loss, shear force and colour. All animals were screened for the RYR1 gene and the results were then compiled with statistical analysis to obtain an investigative baseline pork quality data in Malaysia. The average pork quality obtained from this study falls within the category of Red, Soft and Exudative (RSE), with an average ultimate pH of 5.83, drip loss more than 5% and L* values at 45.94. We have proposed an investigative baseline meat quality data for Malaysian pork from the average commercial pork quality
data obtained. The proposed investigative pork quality baseline data in Malaysian is comparable in terms of studies done in other established countries and/or with international standards and falls within the RSE category of acceptable quality. It provides an investigative benchmark for researchers and end-producers to judge the
Pertanika J. Trop. Agric. Sci. 41 (2): 777 – 786 (2018)
Michelle-Fong, W. C., Ooi, P. T., Awis, Q. S. and Goh, Y. M.
778
quality of pork in an objective manner, both for consumption and for export purpose. Moreover, continuous selection against the RYR1 gene has successfully removed the gene from the sample size above, but constant random monitoring is still advisable if farms aim to ensure the elimination of this gene from their herd.
Keywords: Commercial 3-way cross pigs, drip loss, investigative pork quality baseline reference, pH; L* colour value, red soft exudative (RSE) meat, Ryanodine Receptor 1 (RYR1) mutation
INTRODUCTION
With consumer preferences changing towards the selection of good quality pork for consumption, there is a need to establish a reference for the operators in the industry to gauge the performance of their animals and the pork quality produced. This is also important to increase the competitiveness between producers to continuously improve the pork quality available to consumers.
Malaysia has approximately 772 farms and around 0.23 million sows in the production line, pushing the ex-farm value of the swine industry to an estimated RM2.5 billion in 2016 (Department of Veterinary Services, Malaysia, 2017). With a pork consuming population (PCP) of 30% out of 32 million, Malaysia remains self-sufficient in pork, where the local production supplies up to 95 % of the domestic consumption. In 1998, the industry culled off 1.1 million pigs during the Nipah virus outbreak. Designated breeder stock farms allocated by the Malaysian government, which supply
cross-bred breeder animals to local farmers since 1926, were abolished (Singh & Fong, 2014). Subsequently, the genetic diversity of breeder flocks was maintained by importing breeder stock from the USA, Canada, Denmark and several other countries (Department of Veterinary Services, Malaysia, 2017). For nearly two decades since, the swine industry in Malaysia has been running on individual farms’ self-developed swine herd breeding programmes, where the advantage lies with large private sectors with their own research and development facilities. Many resort to import breeder animals from well-known sources, for use in their own farms or for sale to other local commercial farmers (Singh & Fong, 2014). Other local farmers rely solely on local breeding companies for supply of purebred replacement animals to curb inbreeding problems. However, information on the current standard of commercial pork quality remains unknown to the general public.
In the 1980s and 90s, there was a major global emphasis placed on leaner pork, and intense genetic selection for fast growing, and lean animals was preferable. Due to consumer preferences, the pork industry has made significant progress in altering the composition of carcasses, to increase the lean-to-fat ratio of pork carcasses. Lean carcass, with high yielding cuts, attractive appearances and stability during cold storage are some of the characteristics considered by the industry as aspects of high-quality pork. Conversely, the selection for increased lean muscle mass
Pertanika J. Trop. Agric. Sci. 41 (2): 777 – 786 (2018)
Investigative Baseline Reference of Pork Quality in Malaysia
779
led to the selection for animals with halothane positive genes (Ryanodine Receptor 1 mutation; halothane gene mutation; Porcine Stress Syndrome gene mutation), which are highly susceptible to stress, which often increase the incidence of PSE meat. Stress in halothane positive pigs (also known as pigs carrying the RYR1 gene), both homozygous and heterozygous for the gene, triggers a higher rate of post-mortem anaerobic glycolysis, leading to low pH early post-mortem (Rosenvold & Anderson, 2003). When in combination with high temperatures, the high protein denaturation rate which occurs induces the development of PSE meat, with dramatic effects on the water holding capacity (WHC) or the drip loss (DL).
In the 1990s, Denmark, The Netherlands, Sweden and Switzerland had eradicated the presence of the Halothane gene from their selection lines (Rosenvold & Anderson, 2003), while in the U.S., vertically integrated pork production companies began to reduce or eliminate pigs with the halothane gene in the late 1990s, which resulted in calmer pigs that are less likely to die during transport (Grandin, 1992). However, the use of the halothane stress gene still occurs in marketing systems, such as in Malaysia, where producers are paid on the basis of the largest loin eye and the thinnest backfat. Payment systems of this kind encourage the producers to select pigs for maximum quantity of lean meat, instead of good quality pork, which has low PSE occurrence (Grandin, 1992).
This study was designed to obtain the mean average value of the commercial pork meat quality characteristics across the local commercial three-way crosses, as an investigative baseline reference data for important pork quality parameters in Malaysia. Screening for the RYR1 mutation was also done to ensure that the quality of the pork attained is not influenced by the presence of this stress activated gene.
MATERIALS AND METHODS
Animals
Commercial crossbreds (Duroc X Landrace X Large White) (n=30) were randomly selected from several government model pig farms, certified under the Livestock Farm Accreditation Scheme “SALT”, practising proper Standard Operation Procedures (SOP). All animals underwent a 12-hour on-farm fasting time before transportation to one accredited slaughter house adhering to the Good Management Practices (GMP) references and have various HACCPs to monitor for food safety, meat quality and traceability in all products (Veterinary Health Mark, VHM Accreditation). The lorries used had natural ventilation and the animals all underwent transportation time of less than three hours. Stocking density of the lorries was approximately 0.425 m2/100 kg pig and hydraulic lifts were used for loading and unloading. Transportation speed was at 60-70 km/h and it was done without stops, at the ambience temperature of approximately 29°C. All pigs were guided to the stunning area without the
Pertanika J. Trop. Agric. Sci. 41 (2): 777 – 786 (2018)
Michelle-Fong, W. C., Ooi, P. T., Awis, Q. S. and Goh, Y. M.
780
use of electric prods or whips and were handled as calmly as possible. Pigs were slaughtered, dressed and fabricated via automation processes and the samples were collected accordingly. The process of slaughtering, dressing and fabricating the pigs was carried out at accredited slaughter houses adhering to the Good Management Practices (GMP) references and have various HACCPs to monitor for food safety, meat quality and traceability in all products (Veterinary Health Mark, VHM Accreditation).
Sampling Procedures and Measurements
At 45 minutes post slaughter, pH and temperature were measured at 3 rib points (fourth, seventh, and tenth thoracic ribs), 7 cm away from the mid cutline, with a portable pH meter (Hanna Instruments, Woonsocket, RI, USA). At 24 hours post slaughter, ultimate pH and temperature were measured at the similar sites. Samples from the longissimus dorsi (LD) were collected for meat quality laboratory evaluations between the last thoracic to the fifth lumbar vertebrae, from the left-hand side of each carcass. LD samples for meat quality analysis were stored at -20°C until analysis.
Laboratory Evaluations
Drip loss of the LD was measured using the hanging bag method (Honikel, 1998) for 24 hours at 4°C. Cooking loss of individual
standardised chops of 2.54 cm, cooked in water bath until the internal temperature reaches 75°C, were expressed as a percentage of the initial weight (Honikel, 1998). Warner Bratzler Shear Force (WBSF) of each sample was determined by running 10 cylinder cores of 1.27 cm in diameter and 2 cm in length through a HD plus a texture analyser (Stable Micro System, Surrey, UK.), using a V blade (pre-test speed: 3.0 mm s−1; test speed: 1.0 mm s−1; post-test speed: 3.0 mm s−1) with a down stroke distance of 30.0 mm (Ruiz De Huidobro, Miguel, Blázquez, & Onega, 2005; Van Oeckel, Warnants, & Boucqué, 1996). The resistance of the cores to shearing was recorded every 0.01 s and plotted by a computer in a force-deformation plot. Objective colour (L*, a* and b*) was measured on the cut surface at the height of the last lumbar after 60 minutes blooming period with ColorFlex® colorimeter (Hunter Associates Laboratory, Reston, USA). The CIELAB L* was measured with a Hunter Labscan (HLS) equipped with D65 illuminant and 10° standard observer, with a measuring aperture of 30 mm (Kauffman et al, 1993).
All samples were assessed by applying Polymerase Chain Reaction-Restriction Fragment Length Polymorphism (PCR-RFLP) primer pairs, which was composed of detection of PSS mutations: PSS-F 5´- GAC ATC ATC CTT CTG GCT TCC -3´ and PSS-R: 5´- ATA GTT GAT GAG GTT TGT CTG C -3´ yield 221 bp normal products. PCR 221 bp sequence lying
Pertanika J. Trop. Agric. Sci. 41 (2): 777 – 786 (2018)
Investigative Baseline Reference of Pork Quality in Malaysia
781
within an exon 17 (18,475 to 18,695) was amplified from the RYR1 gene (Brenig & Brem, 1992). After denaturation for 5 minutes at 94°C, amplications were carried out for 35 cycles at 94°C×30 s, 56°C×45 s and 72°C×30 s with a final extension step of 5 minutes at 72°C in a GeneAmp PCR System 9700 (Applied Biosystems, CA, USA). The PSS genotype of PCR products was separately confirmed by PCR-RFLP. For RFLP analysis 10 µl of the 221 bp PSS fragment was digested with 5 units of HhaΙ at 37°C for 2 h. The digested DNA fragment was then separated by electrophoresis on 12% polyacrylamide gel in 1×TBE. The gel was pre-stained with redsafe (2 µg/ml) and visualized under UV light. All extraction of RYR1 PCR products were sent for sequencing to confirm the absence or presence of the mutation and its cutting sites.
Statistical Analysis
The average meat quality for all the samples was tabulated to obtain the average meat quality parameters reported as the investigative baseline data of pork quality in Malaysia, reported with its standard error of means.
RESULTS
The average live weight of all pigs weighed on farm was 105.5 ± 6.88 kg. Upon arriving at the abattoirs, the average live weight measured at 104.43 ± 5.91 kg,
giving an average travelling loss of 0.72%. After slaughtering, the average hot carcass weight was found to be at 89.59 ± 5.43 kg across all samples, giving an average dressing percentage of 85.79% and a 4% average chill loss when the carcasses were stored in chillers prior to distribution. Table 1 shows the average pork quality parameters of commercial interest obtained for Malaysian commercial three-way cross. This is proposed to be the investigative baseline data for pork quality in Malaysia. Table 2 shows the meat quality categories and criteria used in this study, according to Kauffman et al (1992), whereby, it is concluded that Malaysian Pork Quality standards are consistent with RSE (Reddish-pink, Soft and Exudative) category.
Results from PCR-RFLP showed that all samples were negative for the RYR1 mutation, where the site of cleavage for the HhaI was not mutated within the PCR product. Therefore, all RFLP PCR products exhibit two fragments of 145 bp and 76 bp (normal pig, C/C allele) on the gel, whereas mutant PCR-RFLP products exhibit one fragment of 221 bp (mutant pig, T/T allele) or exhibit three fragments of 221 bp, 145 bp and 76 bp (carrier pig, C/T allele). This is further confirmed with the virtual restriction of the sequencing results by using an online Restriction Mapper Version 3, available at http://www.restrictionmapper.org/.
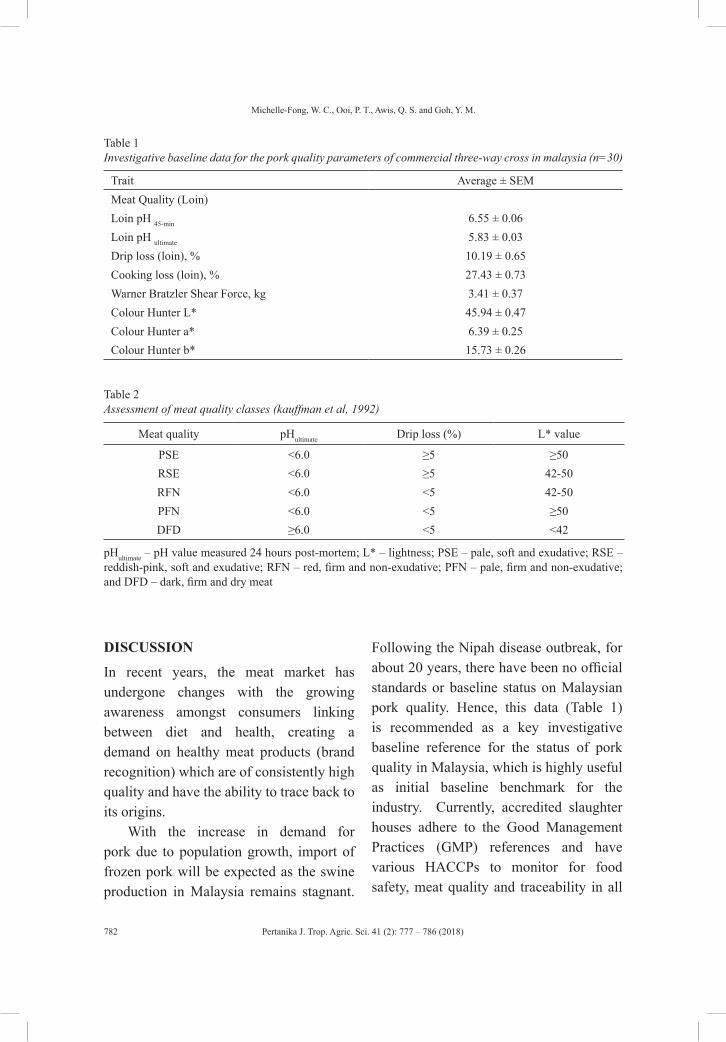
Pertanika J. Trop. Agric. Sci. 41 (2): 777 – 786 (2018)
Michelle-Fong, W. C., Ooi, P. T., Awis, Q. S. and Goh, Y. M.
782
Table 1Investigative baseline data for the pork quality parameters of commercial three-way cross in malaysia (n=30)
Trait Average ± SEMMeat Quality (Loin)Loin pH 45-min 6.55 ± 0.06Loin pH ultimate 5.83 ± 0.03Drip loss (loin), % 10.19 ± 0.65Cooking loss (loin), % 27.43 ± 0.73Warner Bratzler Shear Force, kg 3.41 ± 0.37Colour Hunter L* 45.94 ± 0.47Colour Hunter a* 6.39 ± 0.25Colour Hunter b* 15.73 ± 0.26
Table 2Assessment of meat quality classes (kauffman et al, 1992)
Meat quality pHultimate Drip loss (%) L* value
PSE <6.0 ≥5 ≥50RSE <6.0 ≥5 42-50RFN <6.0 <5 42-50PFN <6.0 <5 ≥50DFD ≥6.0 <5 <42
pHultimate – pH value measured 24 hours post-mortem; L* – lightness; PSE – pale, soft and exudative; RSE – reddish-pink, soft and exudative; RFN – red, firm and non-exudative; PFN – pale, firm and non-exudative; and DFD – dark, firm and dry meat
DISCUSSION
In recent years, the meat market has undergone changes with the growing awareness amongst consumers linking between diet and health, creating a demand on healthy meat products (brand recognition) which are of consistently high quality and have the ability to trace back to its origins.
With the increase in demand for pork due to population growth, import of frozen pork will be expected as the swine production in Malaysia remains stagnant.
Following the Nipah disease outbreak, for about 20 years, there have been no official standards or baseline status on Malaysian pork quality. Hence, this data (Table 1) is recommended as a key investigative baseline reference for the status of pork quality in Malaysia, which is highly useful as initial baseline benchmark for the industry. Currently, accredited slaughter houses adhere to the Good Management Practices (GMP) references and have various HACCPs to monitor for food safety, meat quality and traceability in all
Pertanika J. Trop. Agric. Sci. 41 (2): 777 – 786 (2018)
Investigative Baseline Reference of Pork Quality in Malaysia
783
products (Veterinary Health Mark, VHM Accreditation). Thus, the establishment of investigative baseline status of the pork quality in Malaysia is essential for future improvement.
Firstly, pH45min post slaughter is often used as an indicator of the early glycolytic rate in pig carcasses. Acute stress just prior to slaughter can lead to rapid rate of glycolysis and therefore rapid accumulation of lactate and a low muscle pH, resulting in pale, soft, exudative (PSE) pork. On the other hand, low muscle glycogen at slaughter can lead to insufficient lactic acid formation, high muscle pH and dark, firm dry (DFD) pork. The study found the classification done by Kauffman et al. (1992) to be the most suitable to explain the results obtained (Table 2). With the average pHultimate at 5.83, drip loss more than 5% and L* values at 45.94, samples obtained from Malaysia averagely falls into the category of the RSE (Red, Soft, Exudative) category, which is considered as one of the good quality meat. This is also evident when the results are compared to the ideal pHultimate suggested by NPPC Pork Quality Solutions Team, which is between 5.6-5.9. This is also consistent with other studies, where the pHultimate 5.63 predicts good meat quality in pork (Kušec & Kralik, 2003). This may indicate the effectiveness of Malaysia’s pre-slaughtering handling, the slaughtering process systems, as well as the post slaughter management in minimising the development of PSE (Pale, Soft and Exudative) and DFD (Dark, Firm and Dry) meat down the production line.
Many studies centred on the measurement of pHultimate as an indicator of meat quality (Fernandez & Tornberg 1991). pHultimate will only start to increase as a result of extreme depletion of glycogen (Pethick, Rowe & Tudor, 1995). The pHultimate presented in the study was below the standard acceptable limit of 6.0. As presented, the ultimate pH falls within the normal range of 5.6-5.9, as suggested by NPPC Pork Quality Solutions Team, consistent with other studies, where the ultimate pH mean of 5.63 predicts good meat quality in pork (Kauffman et al., 1993; Kušec & Kralik, 2003).
Secondly, colour is one of the strongest attributes influencing consumer’s visual judgement of meat quality. The three dimensions scale, which determines meat colour are lightness (L*), redness (a*) and yellowness (b*) and these are highly correlated with the visual perception of pink intensity (Lindahl, 2005; Ramos, Maloso, Delgado, & Francisquine, 2014). From this study, the colour of the meat in Malaysia tends to edge towards the darker hue, but it lies within the normal range of colour as of its surrounding countries, such as Thailand, with a mean L* value of 49 (Satsadeedech, Jiropas, Wattanachant, & Angkuraseranee, 2000).
Knowledge on the molecular mutation in the RYR1 and its association with MH (malignant hyperthermia) and PSS (Porcine Stress Syndrome) led to a development of simple, accurate and non-invasive test, which made it simpler to eliminate the mutated RYR1 gene from the
Pertanika J. Trop. Agric. Sci. 41 (2): 777 – 786 (2018)
Michelle-Fong, W. C., Ooi, P. T., Awis, Q. S. and Goh, Y. M.
784
population (Fujii et al., 1991). Generally, crossbreds with homozygotes for the normal NN allele of the Halothane gene showed darker muscle colour in the LD, when compared with the heterozygotes (Nn) or homozygotes (nn) (Apple, Stivarius, Reiman, Rakes, & Maxwell, 2002; Channon, Payne, & Warner, 2000; Hamilton, Payne, & Warner, 2000; Lindahl, 2005; Ohene-Adjei, Ellis, McKeith, & Brewer, 2003). Since the Halothane gene is known for its association with pale, soft and exudative (PSE) meat, the gene was tested for in the samples and was found to be negative. Therefore, in terms of consumer preference, the slight trade off in colour is negligible, especially when the overall meat quality is not compromised by the effects of the Halothane gene.
Furthermore, pork producers have made various attempts in order to accurately identify pig carcasses quality using rapidly known parameters available immediately during post-mortem for various down-line processing categorisation and price management. PH45min can be used as a predictor to classify meat for further down-processing at the slaughter line (Kušec & Kralik, 2003). A correlation table was obtained from this experiment which shows significant correlation between pH45min and colour Hunter a* values (r = -0.592; p<0.01). This suggests that the pH decline early post mortem can only be used to predict colour stability in Halothane gene free population.
Lastly, due to some undesirable relationships between meat quantity and quality, the balance on the emphasis on meat quality traits in the breeding programme is important to maximise sustainable genetic improvement of the swine carcass and also increase production efficiency in Malaysia. Moreover, with the export of swine meat from Malaysia dropping from RM75.88 million in 2013 to RM45.54 million in 2015, there is a need to increase the quality of the pork produced, as one of the measures to increase revenue obtained from the export of swine produces (Department of Veterinary Services, Malaysia, 2017). Hence, the initiation of a pork quality benchmark can relevantly serve as a guideline for farmers, regulatory personnel and pork retailers, aiming to improve the quality of pork harvested at the end of the processing line, be it for consumption or for future export of pork from Malaysia.
CONCLUSION
The proposed investigative pork quality reference falls within range to most standards found in various studies done internationally and falls in the RSE category, using the Kaufmann’s scale (Kauffman et al., 1993), which is satisfactory in terms of consumer perception. Continuous selection against the RYR1 gene has successfully removed the gene from the sample size above, but constant random monitoring is still advisable if farms aim to ensure the elimination of this gene from their herd.
Pertanika J. Trop. Agric. Sci. 41 (2): 777 – 786 (2018)
Investigative Baseline Reference of Pork Quality in Malaysia
785
STATEMENT OF ANIMAL RIGHTS
Samples were taken in a humane manner, with minimum handling of live animals. Meat and liver samples and data were collected post-mortem.
ACKNOWLEDGEMENTS
Authors thank the Faculty of Veterinary Medicine and the Faculty of Agriculture, Universiti Putra Malaysia for granting permission for the use of facilities in this study. The authors would like to thank the slaughterhouses and farms for the use of their facilities and equipment, as well as, allowing meat quality testing on their meat products. The authors would also like to thank Dr. Rachel Fong Wai Jing, the Assistant Director from the Livestock Commodity Development Division, Department of Veterinary Services for providing references on Malaysian pork industry.
REFERENCESApple, J. K., Stivarius, M. R., Reiman, J. D., Rakes,
L. K., & Maxwell, C. V. (2002). Halothane-genotype and duration of refrigerated storage effects on the quality of vaccum-packaged pork loins. Journal of Muscle Foods, 13(2), 103-122.
Brenig, B., & G. Brem. (1992). Genomic organization and analysis of the 5’ end of the porcine ryanodine receptor gene (RYR1). FEBS letters, 298(2-3), 277-279.
Channon, H. A., Payne, A. M. & Warner, R. D. (2000). Halothane genotype, pre-slaughter handling and stunning method all influence pork quality. Meat Science, 56(3), 291-299.
DVS. (2017). Malaysia: Recorded Slaughter of Livestock, 2012-2016. Livestock Statistics 2015/2016. Department of Veterinary Sciences. Retrieved from http://www.dvs.gov.my/index.php/pages/view/1743
Fernandez, X., & Tornberg, E. (1991). A review of the causes of variation in muscle glycogen. Journal of Muscle Foods, 2(3), 209-235. Retrieved from https://doi.org/10.1111/j.1745-4573.1991.tb00454.x
Fujii, J., Otsu, K., Zorzato, F., De Leon, S., Khanna, V. K., Weiler, J. E., ... & MacLennan, D. H. (1991). Identification of a mutation in porcine ryanodine receptor associated with malignant hyperthermia. Science, 253(5018), 448-451. Retrieved from http://www.sciencemag.org/cgi/pmidlookup?view=long&pmid=1862346
Grandin, T. (1992). Effects of genetic on handling and CO2 stunning of pigs. Meat Focus International, (July), 124-126. Retrieved from http://www.grandin.com/humane/meatfocus7-92.html
Hamilton, D. N., Ellis, M., Miller, K. D., McKeith, F. K., & Parrett, D. F. (2000). The effect of halothane gene and Rendement Napole genes on carcass and meat quality. Journal of Animal Science, 78(11), 2862-2867. Retrieved from https://www.scopus.com/record/display.uri?eid=2-s2.0-0034332050&origin=inward&txGid=fb1d608ff6a752dbac94548c67c5732e
Honikel, K. O. (1998). Reference methods for the assessment of physical characteristics of meat. Meat Science, 49(4), 447-457. Retrieved from https://doi.org/10.1016/S0309-1740(98)00034-5
Kauffman, R. G., Sybesma, W., Smulders, F. J. M., Eikelenboom, G., Engel, B., Van Laack, R. L. J. M., ... & Van der Wal, P. G. (1993). The effectiveness of examining early post-mortem musculature to predict ultimate pork quality. Meat Science, 34(3), 283-300. Retrieved from https://doi.org/10.1016/0309-1740(93)90078-V
Pertanika J. Trop. Agric. Sci. 41 (2): 777 – 786 (2018)
Michelle-Fong, W. C., Ooi, P. T., Awis, Q. S. and Goh, Y. M.
786
Kušec, G., Kralik, G., Petričević, A., Gutzmirtl, H., & Grgurić, D. (2003). Meat quality indicators and their correlation in two crosses of pigs. Agriculturae Conspectus Scientificus, 68(2), 115-119. Retrieved from http://hrcak.srce.hr/12301
Lindahl, G. (2005). Colour characteristics of fresh pork. (Doctoral Thesis). Swedish University of Agricultural Sciences, Sweden. Retrieved from http://pub.epsilon.slu.se/827/
Ohene-Adjei, S., Ellis, M., McKeith, F. K., & Brewer, M. S. (2002). Relationship of chilling rate and location within muscle on the quality of ham and loin muscles. Journal of Muscle Foods, 13(3), 239-251. doi: 10.1111/j.1745-4573.2002.tb00333.x
Pethick, D. W., Rowe, J. B., & Tudor, G. (1995). Glycogen metabolism and meat quality. Recent Advances in Animal Nutrition in Australia, 7, 97-103. Retrieved from http://livestocklibrary.com.au/handle/1234/19784
Ramos, P. M., & Delgado, E. F. (2014). Pork loin two-toning and drip loss in relation to steak cross-section anatomical position, plasma and exudate glucose. Scientia Agricola, 71(4), 266-273. Retrieved from https://dx.doi.org/10.1590/0103-9016-2013-0186
Rosenvold, K., & Anderson, H. J. (2003). Factors of significance for pork quality - A review. Meat Science, 64(3), 219-237. doi: 10.1016/S0309-1740(02)00186-9
Ruiz De Huidobro, F., Miguel, E., Blázquez, B., & Onega, E. (2005). A comparison between two methods (Warner-Bratzler and texture profile analysis) for testing either raw meat or cooked meat. Meat Science, 69(3), 527-536. doi.org/10.1016/j.meatsci.2004.09.008
Satsadeedech, K., Jiropas, S., Wattanachant, C., & Angkuraseranee, T. (2000). Effect of port size of colorflex ® colorimeter on pork colour. In Proceedings of the 7th IMT-GT UNINET and The 3rd International PSU-UNS Conferences on Bioscience (pp. 87-89). Prince of Songkla University, Thailand. Retrieved from https://www.researchgate.net/profile/Chaiyawan_Wat tanachant /publ ica t ion /261324239_Effect_of_Port_Size_of_ColorFlex_R_C o l o r i m e t e r _ o n _ P o r k _ C o l o u r /links/00b49533e2fb714c22000000/Effect-of-Port-Size-of-ColorFlex-R-Colorimeter-on-Pork-Colour.pdf.
Singh, M. G. S., & Fong, R. W. J. (2014). Swine breeding and production in Malaysia. Retrieved from https://www.google.com/url?sa=t&rct=j&q=&esrc=s&source=web&cd= 1&ved=0ahUKEwiogZ3uuqXVAhUCEpQ KHQLOCIoQFggnMAA&ur l=h t tp%3A %2F%2Fwww.agnet.org%2Fhtmlarea_file%2 Factivit ies%2F20140314102754%2FCR %25203%2520Dr.%2520Moktir%2520Singh% 2520AL%2520Gardir%2520Singh.p
Van Oeckel, M. J., Warnants, N., & Boucqué, C. V. (1999). Pork tenderness estimation by taste panel, Warner–Bratzler shear force and on-line methods. Meat Science, 53(4), 259-267. Retrieved from https://doi.org/10.1016/S0309-1740(99)00067-4
Pertanika J. Trop. Agric. Sci. 41 (2): 787 – 800 (2018)
ISSN: 1511-3701 © Universiti Putra Malaysia Press
TROPICAL AGRICULTURAL SCIENCEJournal homepage: http://www.pertanika.upm.edu.my/
ARTICLE INFOArticle history:Received: 4 October 2017Accepted: 8 December 2017
E-mail address:[email protected] (Teh, C. B. S.)
Development and Validation of an Unsaturated Soil Water Flow Model for Oil Palm
Teh, C. B. S.Department of Land Management, Faculty of Agriculture, Universiti Putra Malaysia, 43400 UPM, Serdang, Selangor, Malaysia
ABSTRACT
The development and use of a soil water model to predict the soil water flow and content under oil palm would be useful as a tool for more effective oil palm water management. Although many soil water models exist, none of them has been specifically developed, applied, and validated for oil palm. Consequently, the purpose of this study is to develop and validate such a model. Water flow was modelled following a one-dimensional “tipping bucket” system, and the soil profile was divided into several soil layers where the soil water and hydraulic characteristics for each layer were estimated based on the soil carbon content and soil texture. Darcy’s law was applied to estimate the various soil water fluxes. The soil water model included algorithms to estimate the root water uptake and water stress response by oil palm. Raw data of measured soil water content for several soil depths (up to 90 cm) from two studies (Moraidi et al., 2015; Nur Farahin, 2013) were obtained, so that the accuracy of the soil water model could be validated by comparing simulations of soil water content with measured values. The model was satisfactorily accurate, showing similar daily trend as that observed for the measured soil water content. Goodness-of-fit indexes further indicated that the model simulations showed little to no overall model bias and with an average absolute prediction error of only 10%. Future work is to increase model accuracy by estimating the daily actual evapotranspiration instead as assumed constant in this study.
Keywords: Darcy’s law, model, oil palm, soil moisture, water flow
INTRODUCTION
Oil palm irrigation studies as reviewed by Corley and Tinker (2016), have shown that despite the large annual rainfall amount in Malaysia, oil palm yields in the country
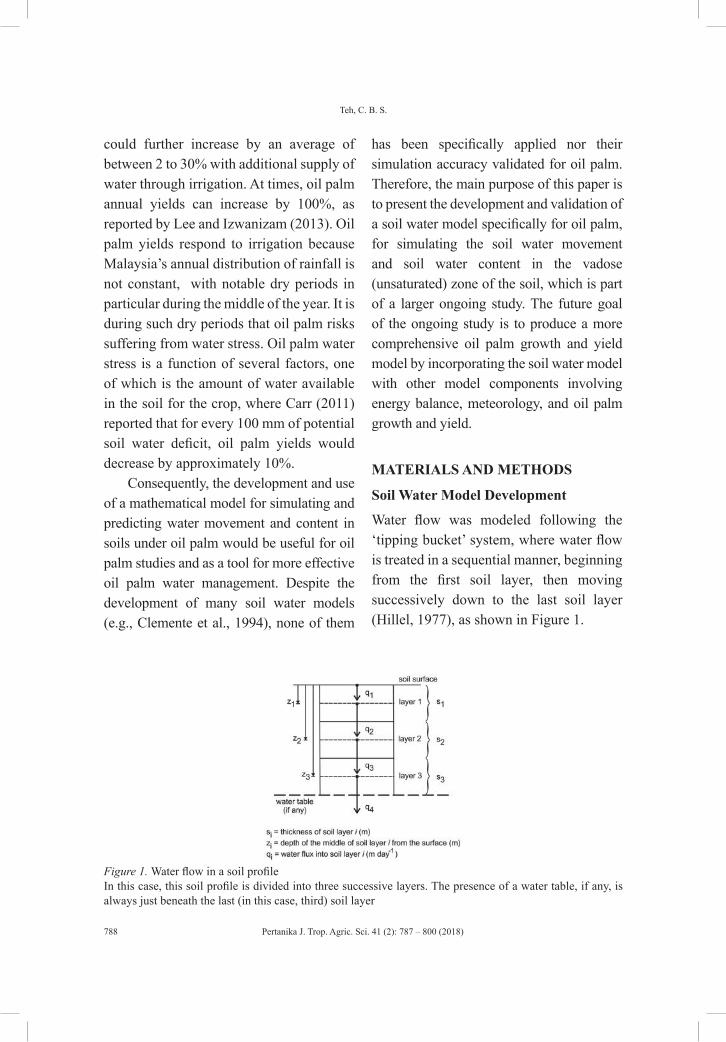
Pertanika J. Trop. Agric. Sci. 41 (2): 787 – 800 (2018)
Teh, C. B. S.
788
could further increase by an average of between 2 to 30% with additional supply of water through irrigation. At times, oil palm annual yields can increase by 100%, as reported by Lee and Izwanizam (2013). Oil palm yields respond to irrigation because Malaysia’s annual distribution of rainfall is not constant, with notable dry periods in particular during the middle of the year. It is during such dry periods that oil palm risks suffering from water stress. Oil palm water stress is a function of several factors, one of which is the amount of water available in the soil for the crop, where Carr (2011) reported that for every 100 mm of potential soil water deficit, oil palm yields would decrease by approximately 10%.
Consequently, the development and use of a mathematical model for simulating and predicting water movement and content in soils under oil palm would be useful for oil palm studies and as a tool for more effective oil palm water management. Despite the development of many soil water models (e.g., Clemente et al., 1994), none of them
has been specifically applied nor their simulation accuracy validated for oil palm. Therefore, the main purpose of this paper is to present the development and validation of a soil water model specifically for oil palm, for simulating the soil water movement and soil water content in the vadose (unsaturated) zone of the soil, which is part of a larger ongoing study. The future goal of the ongoing study is to produce a more comprehensive oil palm growth and yield model by incorporating the soil water model with other model components involving energy balance, meteorology, and oil palm growth and yield.
MATERIALS AND METHODS
Soil Water Model Development
Water flow was modeled following the ‘tipping bucket’ system, where water flow is treated in a sequential manner, beginning from the first soil layer, then moving successively down to the last soil layer (Hillel, 1977), as shown in Figure 1.
Figure 1. Water flow in a soil profileIn this case, this soil profile is divided into three successive layers. The presence of a water table, if any, is always just beneath the last (in this case, third) soil layer
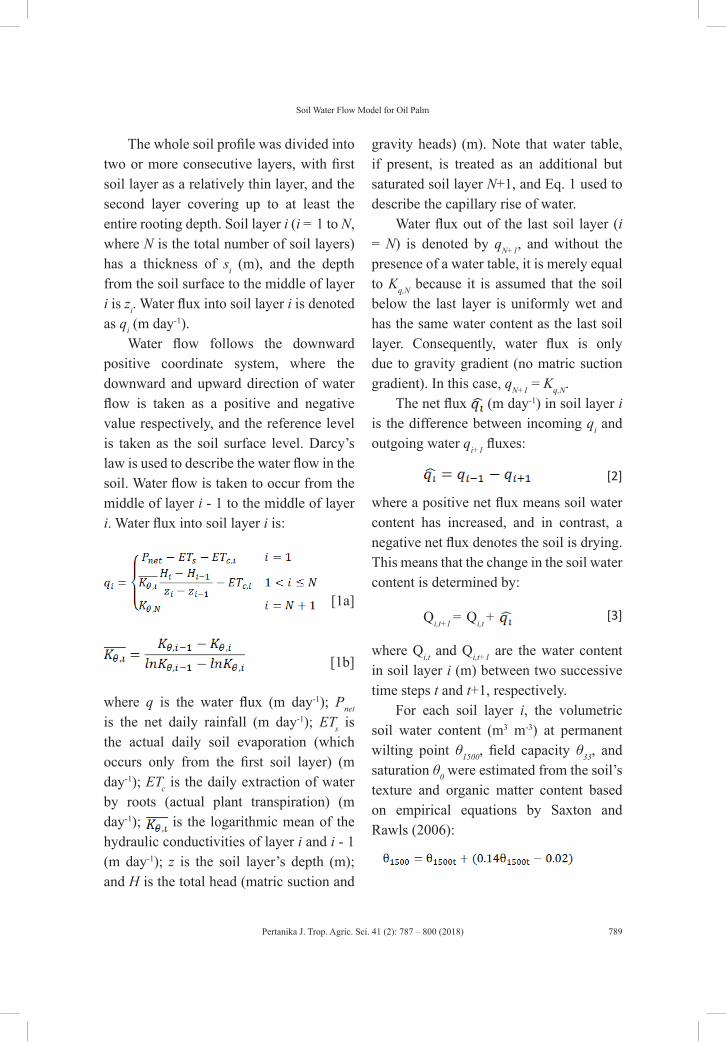
Pertanika J. Trop. Agric. Sci. 41 (2): 787 – 800 (2018)
Soil Water Flow Model for Oil Palm
789
The whole soil profile was divided into two or more consecutive layers, with first soil layer as a relatively thin layer, and the second layer covering up to at least the entire rooting depth. Soil layer i (i = 1 to N, where N is the total number of soil layers) has a thickness of si (m), and the depth from the soil surface to the middle of layer i is zi. Water flux into soil layer i is denoted as qi (m day-1).
Water flow follows the downward positive coordinate system, where the downward and upward direction of water flow is taken as a positive and negative value respectively, and the reference level is taken as the soil surface level. Darcy’s law is used to describe the water flow in the soil. Water flow is taken to occur from the middle of layer i - 1 to the middle of layer i. Water flux into soil layer i is:
[1a]
[1b]
where q is the water flux (m day-1); Pnet is the net daily rainfall (m day-1); ETs is the actual daily soil evaporation (which occurs only from the first soil layer) (m day-1); ETc is the daily extraction of water by roots (actual plant transpiration) (m day-1); is the logarithmic mean of the hydraulic conductivities of layer i and i - 1 (m day-1); z is the soil layer’s depth (m); and H is the total head (matric suction and
gravity heads) (m). Note that water table, if present, is treated as an additional but saturated soil layer N+1, and Eq. 1 used to describe the capillary rise of water.
Water flux out of the last soil layer (i = N) is denoted by qN+1, and without the presence of a water table, it is merely equal to Kq,N because it is assumed that the soil below the last layer is uniformly wet and has the same water content as the last soil layer. Consequently, water flux is only due to gravity gradient (no matric suction gradient). In this case, qN+1 = Kq,N.
The net flux (m day-1) in soil layer i is the difference between incoming qi and outgoing water qi+1 fluxes:
[2]
where a positive net flux means soil water content has increased, and in contrast, a negative net flux denotes the soil is drying. This means that the change in the soil water content is determined by:
Qi,t+1 = Qi,t + [3]
where Qi,t and Qi,t+1 are the water content in soil layer i (m) between two successive time steps t and t+1, respectively.
For each soil layer i, the volumetric soil water content (m3 m-3) at permanent wilting point θ1500, field capacity θ33, and saturation θ0 were estimated from the soil’s texture and organic matter content based on empirical equations by Saxton and Rawls (2006):
[4a]
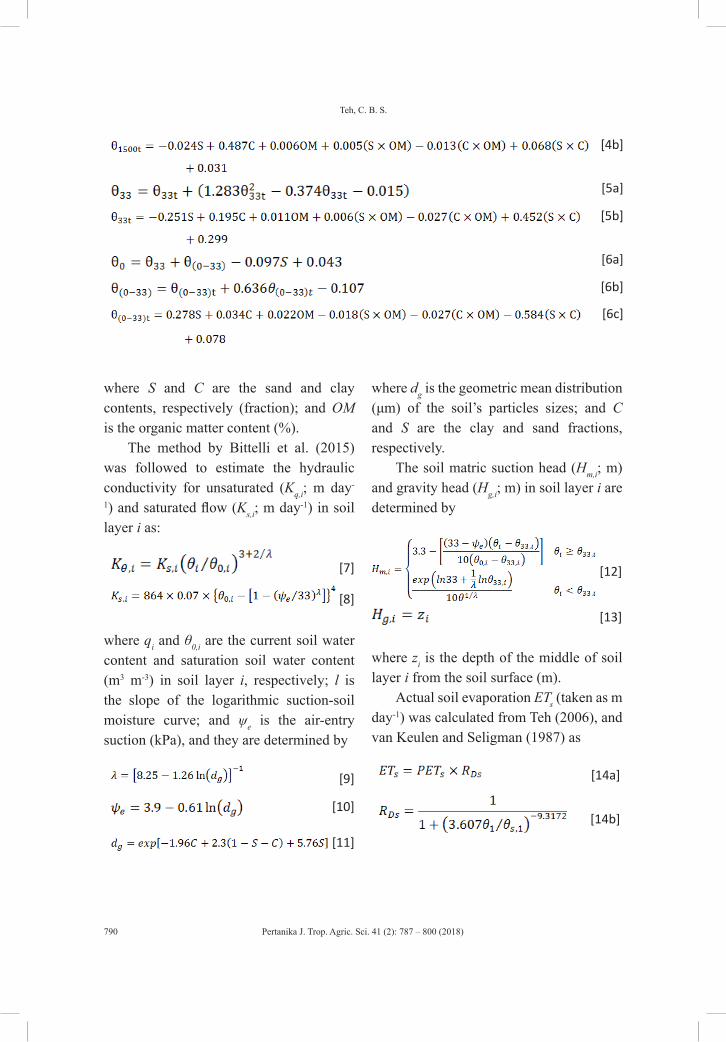
Pertanika J. Trop. Agric. Sci. 41 (2): 787 – 800 (2018)
Teh, C. B. S.
790
[4b]
[5a]
[5b]
[6a]
[6b]
[6c]
where S and C are the sand and clay contents, respectively (fraction); and OM is the organic matter content (%).
The method by Bittelli et al. (2015) was followed to estimate the hydraulic conductivity for unsaturated (Kq,i; m day-
1) and saturated flow (Ks,i; m day-1) in soil layer i as:
[7]
[8]
where qi and θ0,i are the current soil water content and saturation soil water content (m3 m-3) in soil layer i, respectively; l is the slope of the logarithmic suction-soil moisture curve; and ψe is the air-entry suction (kPa), and they are determined by
[9]
[10]
[11]
where dg is the geometric mean distribution (μm) of the soil’s particles sizes; and C and S are the clay and sand fractions, respectively.
The soil matric suction head (Hm,i; m) and gravity head (Hg,i; m) in soil layer i are determined by
[12]
[13]
where zi is the depth of the middle of soil layer i from the soil surface (m).
Actual soil evaporation ETs (taken as m day-1) was calculated from Teh (2006), and van Keulen and Seligman (1987) as
[14a]
[14b]
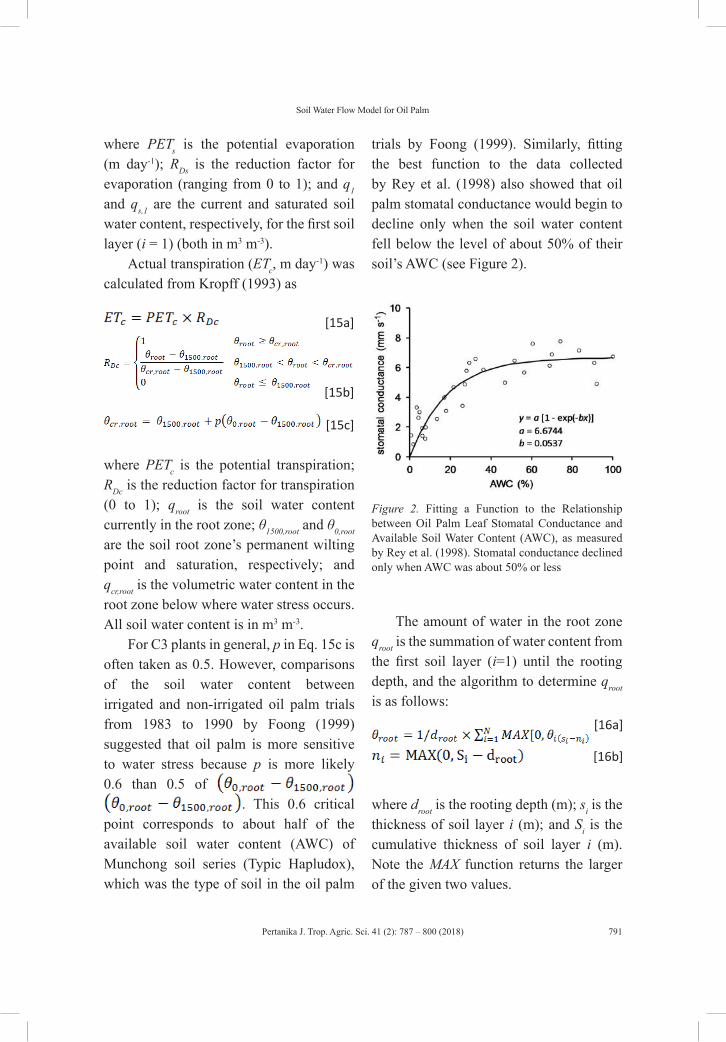
Pertanika J. Trop. Agric. Sci. 41 (2): 787 – 800 (2018)
Soil Water Flow Model for Oil Palm
791
where PETs is the potential evaporation (m day-1); RDs is the reduction factor for evaporation (ranging from 0 to 1); and q1 and qs,1 are the current and saturated soil water content, respectively, for the first soil layer (i = 1) (both in m3 m-3).
Actual transpiration (ETc, m day-1) was calculated from Kropff (1993) as
[15a]
[15b]
[15c]
where PETc is the potential transpiration; RDc is the reduction factor for transpiration (0 to 1); qroot is the soil water content currently in the root zone; θ1500,root and θ0,root are the soil root zone’s permanent wilting point and saturation, respectively; and qcr,root is the volumetric water content in the root zone below where water stress occurs. All soil water content is in m3 m-3.
For C3 plants in general, p in Eq. 15c is often taken as 0.5. However, comparisons of the soil water content between irrigated and non-irrigated oil palm trials from 1983 to 1990 by Foong (1999) suggested that oil palm is more sensitive to water stress because p is more likely 0.6 than 0.5 of
. This 0.6 critical point corresponds to about half of the available soil water content (AWC) of Munchong soil series (Typic Hapludox), which was the type of soil in the oil palm
trials by Foong (1999). Similarly, fitting the best function to the data collected by Rey et al. (1998) also showed that oil palm stomatal conductance would begin to decline only when the soil water content fell below the level of about 50% of their soil’s AWC (see Figure 2).
Figure 2. Fitting a Function to the Relationship between Oil Palm Leaf Stomatal Conductance and Available Soil Water Content (AWC), as measured by Rey et al. (1998). Stomatal conductance declined only when AWC was about 50% or less
The amount of water in the root zone qroot is the summation of water content from the first soil layer (i=1) until the rooting depth, and the algorithm to determine qroot is as follows:
[16a]
[16b]
where droot is the rooting depth (m); si is the thickness of soil layer i (m); and Si is the cumulative thickness of soil layer i (m). Note the MAX function returns the larger of the given two values.

Pertanika J. Trop. Agric. Sci. 41 (2): 787 – 800 (2018)
Teh, C. B. S.
792
The amount of water extracted by roots in each soil layer is based on the measured data for oil palm by Nelson et al. (2006) and on the root water uptake algorithm by Miyazaki (2005):
[17a]
[17b]
[17c]
where Sj is the cumulative thickness of soil layer j (summation of thickness of the current soil layer and all its preceding soil layers). Note that MIN in Eq. 17c is the minimum function, returning the smaller of the given two values.
Lastly, net rainfall Pnet refers to the amount of rain reaching the ground as both throughfall and stemflow. The larger the canopy cover or leaf area index, the larger the fraction of intercepted gross rainfall by the canopies and the smaller the net rainfall. Net rainfall studies on closed oil palm canopies by Lubis (2016), Chong (2012), Bentley (2007), Zulkifli et al. (2006), and Damih (1995) showed that throughfall and stemflow are on average (± s.e.) 61.3 ± 2.1 and 8.4 ± 1.0% of Pg, respectively (N = 430 rain events). Pnet (m day-1) is related to oil palm leaf area index L (m2 leaf m-2 ground) and Pg (m day-1) as follows:
[18]
where it is assumed that decreases linearly with L until closed canopies are reached, after which Pnet never exceeds 72.95% of Pg (Figure 3).
Figure 3. Strong Linear Relationship between Nett Rainfall and Gross Rainfall under Closed Oil Palm Canopies (Bentley, 2007; Chong, 2012; Damih, 1995; Lubis, 2016; Zulkifli et al., 2006) (N = 430)
Field Data Collection
The soil water model was validated by comparing simulations with measured soil water content. Raw data of daily soil water measurements under oil palm were obtained from Nur Farahin (2013) and Moraidi et al. (2015).
The oil palm plantation in the study by Nur Farahin (2013) study was located at Universiti Putra Malaysia campus (2.9805 °N and 101.7287 °E), Serdang, and the age of the oil palms were 19 years, with a planting density of 148 palms ha-1. The soil type was identified as Typic Hapludox (Munchong series). Soil water content at five random locations (over a total area of 0.1 ha) in the oil palm plantation was
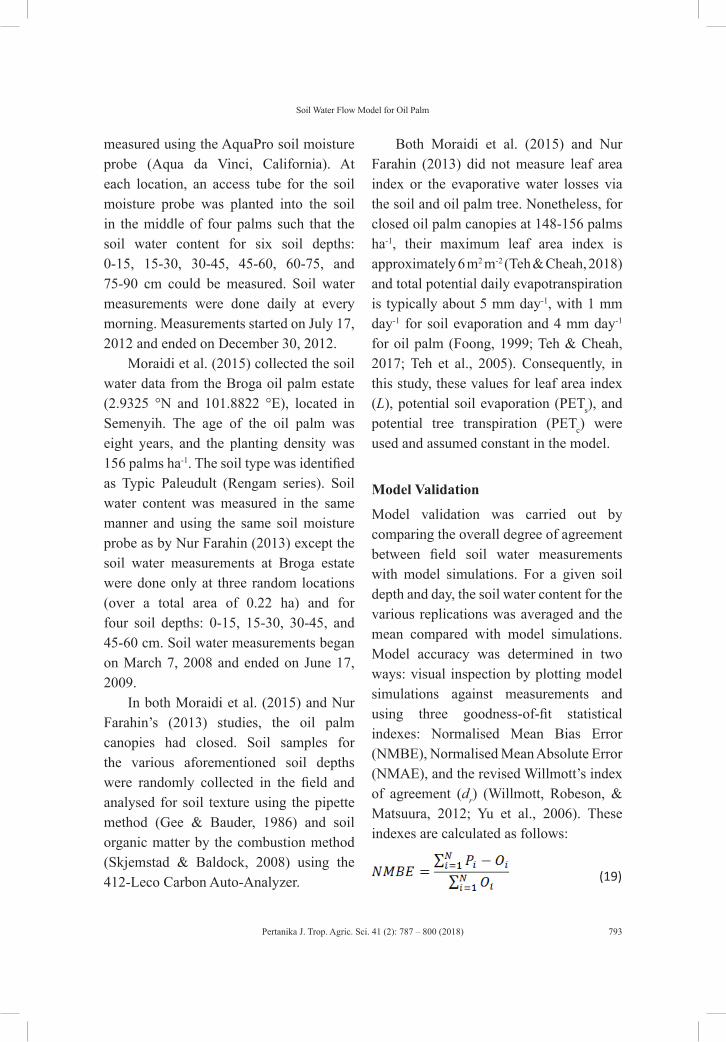
Pertanika J. Trop. Agric. Sci. 41 (2): 787 – 800 (2018)
Soil Water Flow Model for Oil Palm
793
measured using the AquaPro soil moisture probe (Aqua da Vinci, California). At each location, an access tube for the soil moisture probe was planted into the soil in the middle of four palms such that the soil water content for six soil depths: 0-15, 15-30, 30-45, 45-60, 60-75, and 75-90 cm could be measured. Soil water measurements were done daily at every morning. Measurements started on July 17, 2012 and ended on December 30, 2012.
Moraidi et al. (2015) collected the soil water data from the Broga oil palm estate (2.9325 °N and 101.8822 °E), located in Semenyih. The age of the oil palm was eight years, and the planting density was 156 palms ha-1. The soil type was identified as Typic Paleudult (Rengam series). Soil water content was measured in the same manner and using the same soil moisture probe as by Nur Farahin (2013) except the soil water measurements at Broga estate were done only at three random locations (over a total area of 0.22 ha) and for four soil depths: 0-15, 15-30, 30-45, and 45-60 cm. Soil water measurements began on March 7, 2008 and ended on June 17, 2009.
In both Moraidi et al. (2015) and Nur Farahin’s (2013) studies, the oil palm canopies had closed. Soil samples for the various aforementioned soil depths were randomly collected in the field and analysed for soil texture using the pipette method (Gee & Bauder, 1986) and soil organic matter by the combustion method (Skjemstad & Baldock, 2008) using the 412-Leco Carbon Auto-Analyzer.
Both Moraidi et al. (2015) and Nur Farahin (2013) did not measure leaf area index or the evaporative water losses via the soil and oil palm tree. Nonetheless, for closed oil palm canopies at 148-156 palms ha-1, their maximum leaf area index is approximately 6 m2 m-2 (Teh & Cheah, 2018) and total potential daily evapotranspiration is typically about 5 mm day-1, with 1 mm day-1 for soil evaporation and 4 mm day-1 for oil palm (Foong, 1999; Teh & Cheah, 2017; Teh et al., 2005). Consequently, in this study, these values for leaf area index (L), potential soil evaporation (PETs), and potential tree transpiration (PETc) were used and assumed constant in the model.
Model Validation
Model validation was carried out by comparing the overall degree of agreement between field soil water measurements with model simulations. For a given soil depth and day, the soil water content for the various replications was averaged and the mean compared with model simulations. Model accuracy was determined in two ways: visual inspection by plotting model simulations against measurements and using three goodness-of-fit statistical indexes: Normalised Mean Bias Error (NMBE), Normalised Mean Absolute Error (NMAE), and the revised Willmott’s index of agreement (dr) (Willmott, Robeson, & Matsuura, 2012; Yu et al., 2006). These indexes are calculated as follows:
(19)
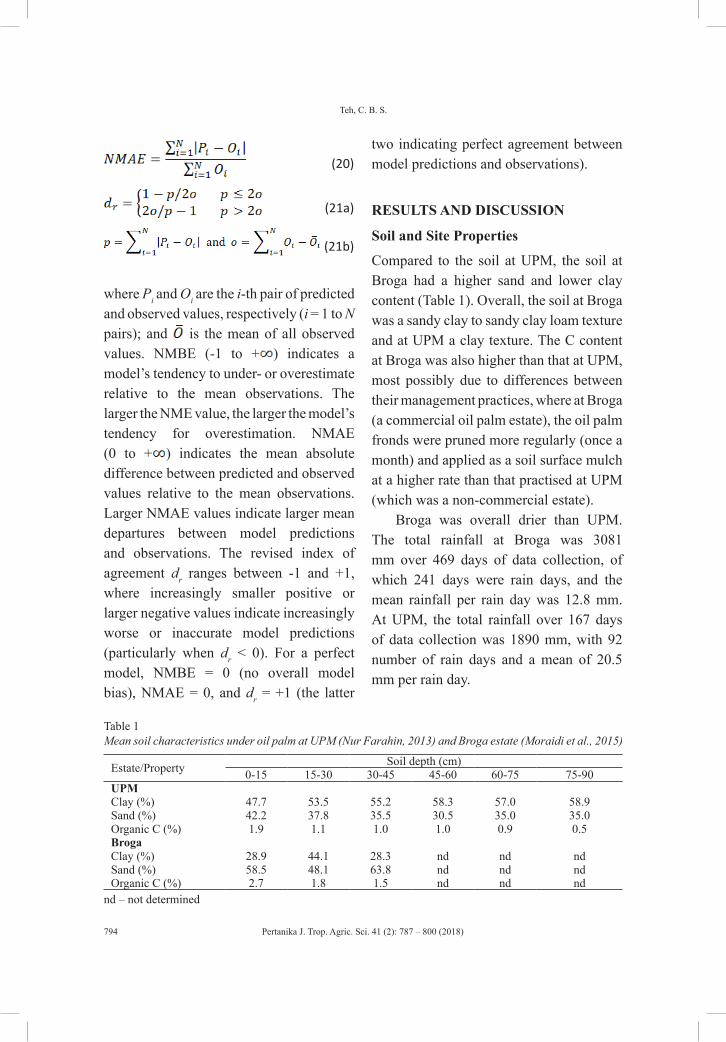
Pertanika J. Trop. Agric. Sci. 41 (2): 787 – 800 (2018)
Teh, C. B. S.
794
(20)
(21a)
(21b)
where Pi and Oi are the i-th pair of predicted and observed values, respectively (i = 1 to N pairs); and is the mean of all observed values. NMBE (-1 to + ) indicates a model’s tendency to under- or overestimate relative to the mean observations. The larger the NME value, the larger the model’s tendency for overestimation. NMAE (0 to + ) indicates the mean absolute difference between predicted and observed values relative to the mean observations. Larger NMAE values indicate larger mean departures between model predictions and observations. The revised index of agreement dr ranges between -1 and +1, where increasingly smaller positive or larger negative values indicate increasingly worse or inaccurate model predictions (particularly when dr < 0). For a perfect model, NMBE = 0 (no overall model bias), NMAE = 0, and dr = +1 (the latter
two indicating perfect agreement between model predictions and observations).
RESULTS AND DISCUSSION
Soil and Site Properties
Compared to the soil at UPM, the soil at Broga had a higher sand and lower clay content (Table 1). Overall, the soil at Broga was a sandy clay to sandy clay loam texture and at UPM a clay texture. The C content at Broga was also higher than that at UPM, most possibly due to differences between their management practices, where at Broga (a commercial oil palm estate), the oil palm fronds were pruned more regularly (once a month) and applied as a soil surface mulch at a higher rate than that practised at UPM (which was a non-commercial estate).
Broga was overall drier than UPM. The total rainfall at Broga was 3081 mm over 469 days of data collection, of which 241 days were rain days, and the mean rainfall per rain day was 12.8 mm. At UPM, the total rainfall over 167 days of data collection was 1890 mm, with 92 number of rain days and a mean of 20.5 mm per rain day.
Table 1Mean soil characteristics under oil palm at UPM (Nur Farahin, 2013) and Broga estate (Moraidi et al., 2015)
Estate/Property Soil depth (cm)0-15 15-30 30-45 45-60 60-75 75-90
UPMClay (%) 47.7 53.5 55.2 58.3 57.0 58.9Sand (%) 42.2 37.8 35.5 30.5 35.0 35.0Organic C (%) 1.9 1.1 1.0 1.0 0.9 0.5BrogaClay (%) 28.9 44.1 28.3 nd nd ndSand (%) 58.5 48.1 63.8 nd nd ndOrganic C (%) 2.7 1.8 1.5 nd nd nd
nd – not determined
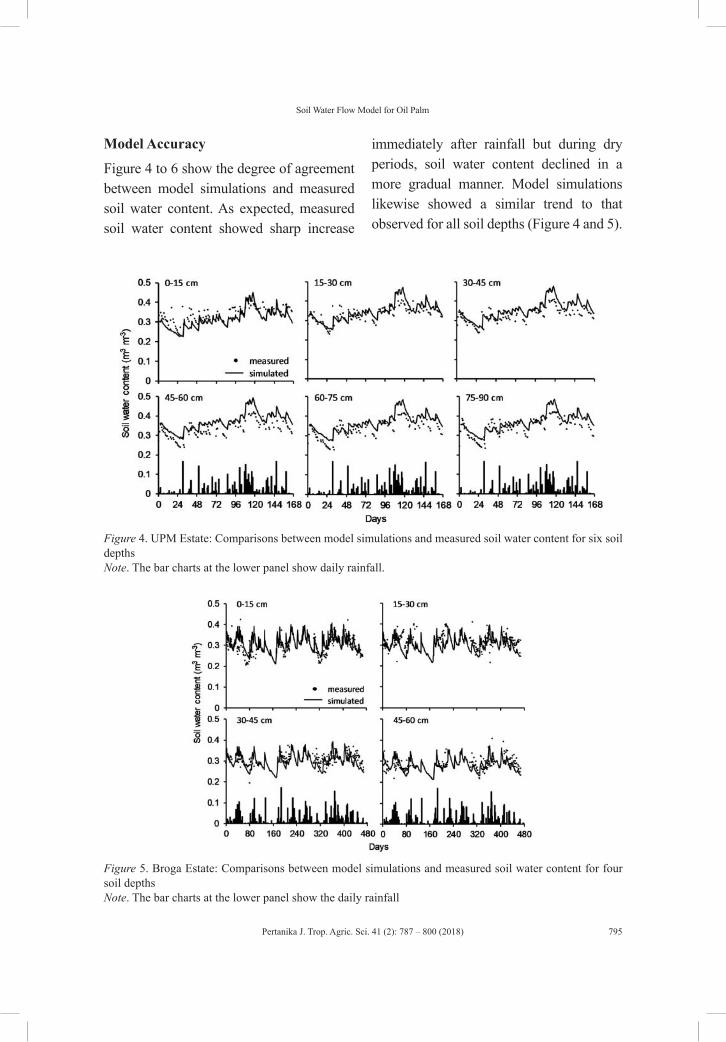
Pertanika J. Trop. Agric. Sci. 41 (2): 787 – 800 (2018)
Soil Water Flow Model for Oil Palm
795
Model Accuracy
Figure 4 to 6 show the degree of agreement between model simulations and measured soil water content. As expected, measured soil water content showed sharp increase
immediately after rainfall but during dry periods, soil water content declined in a more gradual manner. Model simulations likewise showed a similar trend to that observed for all soil depths (Figure 4 and 5).
Figure 4. UPM Estate: Comparisons between model simulations and measured soil water content for six soil depths Note. The bar charts at the lower panel show daily rainfall.
Figure 5. Broga Estate: Comparisons between model simulations and measured soil water content for four soil depths Note. The bar charts at the lower panel show the daily rainfall
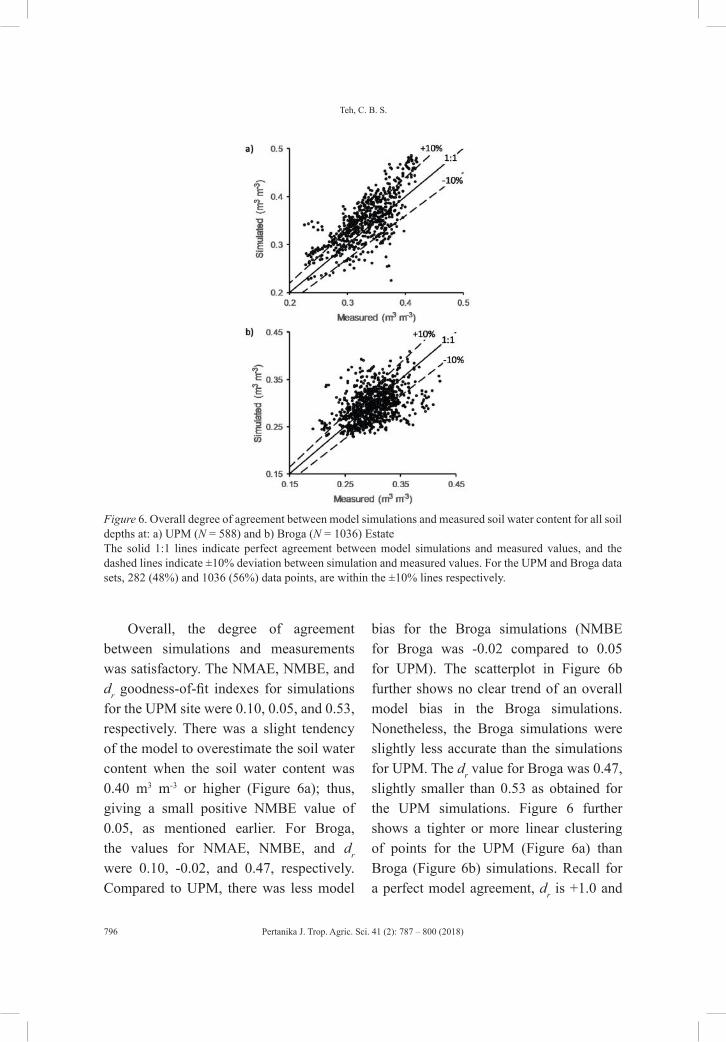
Pertanika J. Trop. Agric. Sci. 41 (2): 787 – 800 (2018)
Teh, C. B. S.
796
Figure 6. Overall degree of agreement between model simulations and measured soil water content for all soil depths at: a) UPM (N = 588) and b) Broga (N = 1036) EstateThe solid 1:1 lines indicate perfect agreement between model simulations and measured values, and the dashed lines indicate ±10% deviation between simulation and measured values. For the UPM and Broga data sets, 282 (48%) and 1036 (56%) data points, are within the ±10% lines respectively.
Overall, the degree of agreement between simulations and measurements was satisfactory. The NMAE, NMBE, and dr goodness-of-fit indexes for simulations for the UPM site were 0.10, 0.05, and 0.53, respectively. There was a slight tendency of the model to overestimate the soil water content when the soil water content was 0.40 m3 m-3 or higher (Figure 6a); thus, giving a small positive NMBE value of 0.05, as mentioned earlier. For Broga, the values for NMAE, NMBE, and dr were 0.10, -0.02, and 0.47, respectively. Compared to UPM, there was less model
bias for the Broga simulations (NMBE for Broga was -0.02 compared to 0.05 for UPM). The scatterplot in Figure 6b further shows no clear trend of an overall model bias in the Broga simulations. Nonetheless, the Broga simulations were slightly less accurate than the simulations for UPM. The dr value for Broga was 0.47, slightly smaller than 0.53 as obtained for the UPM simulations. Figure 6 further shows a tighter or more linear clustering of points for the UPM (Figure 6a) than Broga (Figure 6b) simulations. Recall for a perfect model agreement, dr is +1.0 and
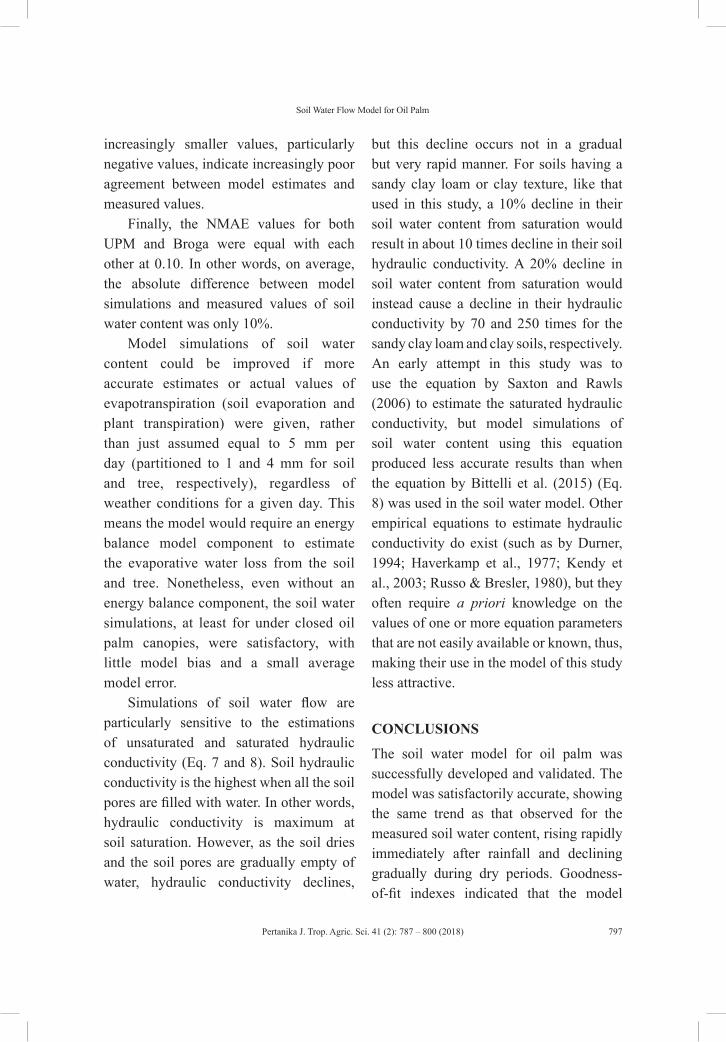
Pertanika J. Trop. Agric. Sci. 41 (2): 787 – 800 (2018)
Soil Water Flow Model for Oil Palm
797
increasingly smaller values, particularly negative values, indicate increasingly poor agreement between model estimates and measured values.
Finally, the NMAE values for both UPM and Broga were equal with each other at 0.10. In other words, on average, the absolute difference between model simulations and measured values of soil water content was only 10%.
Model simulations of soil water content could be improved if more accurate estimates or actual values of evapotranspiration (soil evaporation and plant transpiration) were given, rather than just assumed equal to 5 mm per day (partitioned to 1 and 4 mm for soil and tree, respectively), regardless of weather conditions for a given day. This means the model would require an energy balance model component to estimate the evaporative water loss from the soil and tree. Nonetheless, even without an energy balance component, the soil water simulations, at least for under closed oil palm canopies, were satisfactory, with little model bias and a small average model error.
Simulations of soil water flow are particularly sensitive to the estimations of unsaturated and saturated hydraulic conductivity (Eq. 7 and 8). Soil hydraulic conductivity is the highest when all the soil pores are filled with water. In other words, hydraulic conductivity is maximum at soil saturation. However, as the soil dries and the soil pores are gradually empty of water, hydraulic conductivity declines,
but this decline occurs not in a gradual but very rapid manner. For soils having a sandy clay loam or clay texture, like that used in this study, a 10% decline in their soil water content from saturation would result in about 10 times decline in their soil hydraulic conductivity. A 20% decline in soil water content from saturation would instead cause a decline in their hydraulic conductivity by 70 and 250 times for the sandy clay loam and clay soils, respectively. An early attempt in this study was to use the equation by Saxton and Rawls (2006) to estimate the saturated hydraulic conductivity, but model simulations of soil water content using this equation produced less accurate results than when the equation by Bittelli et al. (2015) (Eq. 8) was used in the soil water model. Other empirical equations to estimate hydraulic conductivity do exist (such as by Durner, 1994; Haverkamp et al., 1977; Kendy et al., 2003; Russo & Bresler, 1980), but they often require a priori knowledge on the values of one or more equation parameters that are not easily available or known, thus, making their use in the model of this study less attractive.
CONCLUSIONS
The soil water model for oil palm was successfully developed and validated. The model was satisfactorily accurate, showing the same trend as that observed for the measured soil water content, rising rapidly immediately after rainfall and declining gradually during dry periods. Goodness-of-fit indexes indicated that the model
Pertanika J. Trop. Agric. Sci. 41 (2): 787 – 800 (2018)
Teh, C. B. S.
798
simulations showed little to no overall model bias and with an average prediction error (mean absolute difference between simulation and measured values) was only 10%. Model simulations could be increased if measured values of soil evaporation and tree transpiration values were provided in the model, but field measurements of evapotranspiration, especially for oil palm, can be challenging. Nonetheless, soil water model in this study can be coupled with an energy balance model component to provide more accurate estimates of evapotranspiration to improve simulation accuracy of soil water flow and content.
REFERENCESBentley, A. (2007). Interception loss in Sedenak oil
palm plantation. (Unpublished undergraduate final year project report). Universiti Teknologi Malaysia, Skudai, Johor, Malaysia.
Bittelli, M., Campbell, G. S., & Tomeu, F. (2015). Soil physics with Python. Transport in the soil-plant-atmosphere system. Oxford, UK: Oxford University Press.
Carr, M. V. K. (2011). The water relations and irrigation requirements of oil palm (Elaeis guineensis): A review. Experimental Agriculture, 47(4), 629-652.
Chong, S. Y. (2012). Development of simple equations to estimate the net rainfall under closed tree canopies. (Unpublished Masters dissertation). Universiti Putra Malaysia, Serdang, Selangor, Malaysia.
Clemente, R. S., de Jong, R., Reynolds, W. D., &
Hares, M. (1994). Testing and comparisons of three unsaturated soil water flow models. Agricultural Water Management, 25(2), 135-152.
Corley, R. H. V., & Tinker, P. B. (2016). The oil palm (5th Ed.). Chichester, UK: Wiley-Blackwell.
Damih, A. (1995). Keberkesanan pemintasan air hujan oleh pokok kelapa sawit di dalam mengurangkan air larian permukaan [Effectiveness of rainfall interception by oil palm trees in reducing surface runoff]. (B.Sc. final year project report). Skudai, Malaysia: Universiti Teknologi Malaysia.
Durner, W. (1994), Hydraulic conductivity estimation for soils with heterogeneous pore structure. Water Resources Research, 30(2), 211–223.
Foong, F. S. (1999). Impact of moisture on potential evapotranspiration, growth and yield of oil palm. In D. Arifin, K. W. Chan & S. R. S. A. Sharifah (Eds.), Proceedings of the 1999 PORIM International Palm Oil Congress (Agriculture) (pp. 265-287). Bangi, Malaysia: Palm Oil Research Institute of Malaysia.
Gee, G. W., & Bauder, J. W. (1986). Particle-size analysis. In A. Klute (Ed.), Methods of Soil Analysis. Part 1. Physical and Mineralogical Methods (2nd Ed.) (pp. 363-375). Madison, WI: American Society of Agronomy–Soil Science Society of America.
Haverkamp, R., Vauclin, M., Touma, J., Wierenga, P. J., & Vachaud, G. (1977). A comparison of numerical simulation models for one-dimensional infiltration. Soil Science Society of America Journal, 41(2), 285-294.
Hillel, D. (1977). Computer simulation of soil-water dynamics: A compendium of recent work. Ottawa, Canada: International Development Research Centre.
Pertanika J. Trop. Agric. Sci. 41 (2): 787 – 800 (2018)
Soil Water Flow Model for Oil Palm
799
Kendy, E., Gerard-Marchant, P., Walter, M. T., Zhang, Y., Liu, C., & Steenhuis, T. S. (2003). A soil-water-balance approach to quantify groundwater recharge from irrigated cropland in the North China Plain. Hydrological Processes, 17(10), 2011-2031.
Kropff, M. J. (1993). Mechanisms of competition for light. In M. J. Kropff, & H. H. van Laar (Eds.), Modelling crop-weed interactions (pp. 33-61). Wallingford, UK: CAB International
Lee, C. T., & Izawanizam, A. (2013). Lysimeter studies and irrigation of oil palm in some inland soils of Peninsular Malaysia - Felda’s experience. The Planter, 89(1042), 15-29.
Lubis, M. E. S. (2016). Water dynamics and groundwater quality assessment in an oil palm ecosystem. (Unpublished doctoral thesis). Universiti Putra Malaysia, Serdang, Selangor, Malaysia.
Miyazaki, T. (2005). Water flow in soils. Boca Raton, FL: CRC Press.
Moraidi, A., Teh, C. B. S., Goh, K. J., Husni, M. H. A., & Fauziah, C. I. (2015). Effect of four soil and water conservation practices on soil physical processes in a non-terraced oil palm plantation. Soil and Tillage Research, 145, 62-71.
Nelson, P. N., Banabas, M., Scotter, D. R., & Webb, M. J. (2006). Using soil water depletion to measure spatial distribution of root activity in oil palm (Elaeis guineensis Jacq.) plantations. Plant Soil, 286(1-2), 109-121.
Nur Farahin, I. (2013). Spatial and temporal change in soil water content in an oil palm estate. (Unpublished undergraduate final year project). Universiti Putra Malaysia, Serdang, Selangor, Malaysia.
Rey, H., Quencez, P., Dufrêne, E., & Dubos, B. (1998). Oil palm water profiles and water supplies in Côte d’Ivoire. Plantations, Recherche, Développement, 5(1), 47-57.
Russo, D., & Bresler, E. (1980). Scaling soil hydraulic properties of a heterogeneous field soil. Soil Science of America Journal, 44(4), 681-684.
Saxton, K. E., & Rawls, W. J. (2006). Soil water characteristic estimates by texture and organic matter for hydrologic solutions. Soil Science Society of America Journal, 70(5), 1569-1578.
Skjemstad, J. O., & Baldock, J. A. (2008). Total and organic carbon. In M. R. Carter & E. G. Gregorich (Eds.), Soil sampling and methods of analysis (pp. 225-237). Boca Raton, FL: CRC Press.
Teh, C. B. S. (2006). Introduction to mathematical modeling of crop growth: How the equations are derived and assembled into a computer program. Boca Raton, FL: Brown Walker Press.
Teh, C. B. S., & Cheah, S. S. (2018). Modelling crop growth and yield in palm oil cultivation. In A. Rival (Ed.), Achieving sustainable cultivation of oil palm (pp. 183-227). Cambridge, UK: Burleigh Dodds Science Publishing.
Teh, C. B. S., Henson, I. E., Harun, H., Goh, K. J., & Husni, M. H. A. (2005). Modelling oil palm growth and yield. In C. B. S. Teh, O. H. Ahmed, C. I. Fauziah, A. Izham, W. D. Wan Noordin, & Z. Z. Zakaria (Eds.), SOILS 2005: Advances in soil science for sustainable food production. Proceedings of the Malaysian Society of Soil Science 2005 (pp. 204-206). Serdang, Malaysia: Malaysian Society of Soil Science.
van Keulen, H., & Seligman, N. G. (1987). Simulation of water use, nitrogen and growth of a spring wheat crop. Simulation Monographs. Wageningen, The Netherlands: Pudoc.
Willmott, C. J., Robeson, S. M., & Matsuura, K. (2012). A refined index of model performance. International Journal of Climatology, 32(13), 2088-2094.

Pertanika J. Trop. Agric. Sci. 41 (2): 787 – 800 (2018)
Teh, C. B. S.
800
Yu, S., Eder, B., Dennis, R., Chu, S. H., & Schwartz, S. E. (2006). New unbiased symmetric metrics for evaluation of air quality models. Atmospheric Science Letters, 7(1), 26-4.
Zulkifli, Y., Geoffery, J., Saw, A. L., & Norul, S. T. (2006). Preliminary study on throughfall spatial variability and stemflow characteristics under oil palm catchment. In Proceedings of the National Water Conference (in CD). Kuala Lumpur, Malaysia: Malaysian Hydrological Society.

Pertanika J. Trop. Agric. Sci. 41 (2): 801 – 814 (2018)
ISSN: 1511-3701 © Universiti Putra Malaysia Press
TROPICAL AGRICULTURAL SCIENCEJournal homepage: http://www.pertanika.upm.edu.my/
ARTICLE INFOArticle history:Received: 20 October 2017Accepted: 4 January 2018
E-mail addresses:[email protected], [email protected] (Chen, Y. S.)[email protected] (Dayod, M.)[email protected] (Tawan, C. S.)* Corresponding author
Anther Dehiscence, Pollen Viability and Stigma Receptivity Study on Cultivars of Black Pepper (Piper nigrum L.)
Chen, Y. S.1*, Dayod, M.2 and Tawan, C. S.3
1Malaysian Pepper Board, Jalan Utama, Pending Industrial Area, 93916, Kuching, Sarawak, Malaysia 2Agriculture Research Centre, Semongok, 93720, Kuching, Sarawak, Malaysia3Department of Plant Science and Environmental Ecology, Faculty of Resource Science and Technology, Universiti Malaysia Sarawak, 94300 UNIMAS, Kota Samarahan, Sarawak, Malaysia
ABSTRACT
A study on floral biology of black pepper cultivars that cover anther dehiscence, pollen viability and stigma receptivity was carried out with the aim to improve the efficiency of intervarietal hybridisation in black pepper breeding work. In this study, 10 black pepper cultivars were used, namely ‘Semongok Aman’, ‘Kuching’, ‘Semongok Emas’, ‘Semongok Perak’, ‘Semongok 1’, ‘Nyerigai’, ‘India’, ‘Lampung Daun Lebar’, ‘Sarikei’ and ‘Yong Petai’. The results show that anthesis in the 10 black pepper cultivars occurred between 10.25 pm and 10.50 pm. In the pollen viability study, results suggest that pollen are more viable between five and 10 hours after anther dehisced. However, there are variations among the cultivars for the optimum viable stage. For stigma receptivity, the results show that stigmas at Stage 2 (elongation and spreading of stigmata) and Stage 3 (complete emergence and wide spreading of stigmata) had better receptivity than Stage 1 (first appearance of stigmata). There was no difference in stigma receptivity stages among the 10 cultivars. This study thus, shows the most suitable time for intervarietal hybridisation via artificial pollination.
Keywords: Anther dehiscence, black pepper cultivars, pollen viability, stigma receptivity
INTRODUCTION
Black pepper, scientifically called Piper nigrum L., is a spice plant from the family of Piperaceae. The plant is known as the King of Spices, and is the world’s most widely used spice due to its unique aroma and pungency. In Malaysia, the
Pertanika J. Trop. Agric. Sci. 41 (2): 801 – 814 (2018)
Chen, Y. S., Dayod, M. and Tawan, C. S.
802
plant plays a pivotal role as a cash crop for smallholders and has become a major agricultural commodity, particularly in the state of Sarawak, since it was introduced in 1856 (Sim, 1993).
Hybridisation ensures a wide variety exists among the cultivars of black pepper ensuring quality attributes and yield. High yielding black pepper varieties are needed to compensate high production cost constraints in Malaysia (Sim, 1993). Intervarietal hybridisation has become the main thrust in the black pepper breeding programme since it was initiated in Agriculture Research Centre, Semongok of Sarawak in 1957. However, the breeding work is limited in achievement so far, with only one promising hybrid developed from crosses between Balankotta and Kuching. The hybrid, named Semongok Emas was released to farmers in 1991 (Sim, 1993). In India, two achievements through conventional breeding have been reported so far, that is, Panniyur 1 and Panniyur 3, both from crosses between Uthiaranotta and Cheriyakaniyakadan (Ravindran, Nair, & Matthew, 1981). Limited achievement of conventional black pepper breeding is possibly due to lack of fundamental information on the nature of the reproductive biology, particularly on pollen viability and stigma receptivity.
Ravindran et al. (1981), Sim (1985) and Chen (2011) have reported similar artificial pollination procedures for black pepper. In general, the artificial hybridisation was carried out by inseminating the pollen suspension of the male plant onto the
stigma of female plant. However, these reports had no specification concerning the viable stage of pollen for collection and the receptive stage of the stigma. So, there is some doubt regarding the reliability of the procedure and the technique of artificial pollination. In addition, intricacy in artificial pollination of black pepper is perhaps due to the catkin type of inflorescent, minute sized flower and lack of uniformity in emergence of anther and time of anthesis. Hence, a fundamental study in floral biology of black pepper is needed to ensure efficiency of conventional breeding.
The objectives of this study are to determine the time of anthesis, the nature of pollen viability and the stigma receptivity of black pepper, while in tandem, the aim is also to improve the efficiency of conventional breeding.
MATERIALS AND METHODS
Materials
The experiment was carried out from March to July 2016. The plant materials used in this study were obtained from a plant house at the Malaysian Pepper Board and a black pepper germplasm collection plot located at the Agriculture Research Center, Semongok. A total of 10 black pepper cultivars were used, namely Semongok Aman (SA), Kuching (KCH), Semongok Emas (SE), Semongok Perak (SP), Semongok 1 (S1), Nyerigai (NYE), India (IND), Lampung Daun Lebar (LDL), Sarikei (SAR) and Yong Petai (YP). For
Pertanika J. Trop. Agric. Sci. 41 (2): 801 – 814 (2018)
Floral Biology Study of P. Nigrum L
803
each cultivar, 10 plants were planted in pots sized 10 inches in diameter, with a potting mixture combination of topsoil, sand and peat moss at 1:1:1 ratio.
Methods
Pollen Morphology Study. Palynology study is crucial for identification of pollen. For this study, only cultivar SA was used. Previous research has proven the unlikeliness of morphological differences among black pepper cultivars’ pollen (Ravindran et al., 2000). Anthers were collected from the mature flowers and stored in a plastic centrifuge tube filled with 70% alcohol. These anthers were crushed with a glass rod and the solution was filtered through fine meshes with a 0.32mm aperture to collect pollen grains. The pollen grains were then prepared for light and scanning electron microscopy (SEM) by the standard method as described by Arora and Modi (2008). For the SEM study, pollen grains were suspended in a drop of ethanol and directly transpired with a fine pipette to a metallic stub using double sided cello tape and coated with gold palladium in a sputtering chamber. The SEM examination was carried out on a LEO electron microscope (Model LEO 430). The terminology of the pollen characteristics and analysis used is in accordance with Bhattacharya, Mujumdar and Bhattacharya (2006) and Agashe (2006).
Anther Dehiscence. Anther dehiscences on all cultivars were carried out in the first five months of 2016 at the plant
house, Malaysian Pepper Board. In each month, 10 days were randomly selected for carrying out the observation, regardless of weather conditions. The anthers selected for the study were at the pre-dehisced stage. Observation, with one hour intervals each time, was carried out starting from early morning until anther dehiscence was noticed. The preliminary judgment on anther dehiscence was made on the basis that whitish powder-like pollens were seen by the naked eye. Then, the released pollens were confirmed through stereomicroscope observation.
Pollen Viability Study. A total of 10 cultivars were evaluated in this study. Based on the finding of the anther dehiscence study, the pollen was classified into five stages for verification of the viability:• Stage 1: Right after anther dehisced • Stage 2: Five hours after anther dehisced • Stage 3: 10 hours after anther dehisced• Stage 4: 15 hours after anther dehisced• Stage 5: 20 hours after anther dehisced
The test was carried out in vitro. A moist condition for pollen germination was created by placing a glass slide on top of bent glass tubing, which was placed inside a petri dish with small amount of water added. This created a moist environment to maintain humidity of the medium to promote germination. Chen (2011) published the germination medium protocol for pollen viability test on P. colubrinum, which was then adapted to P. nigrum pollen
Pertanika J. Trop. Agric. Sci. 41 (2): 801 – 814 (2018)
Chen, Y. S., Dayod, M. and Tawan, C. S.
804
germination. The optimised liquid medium consisted of 10% sucrose, 100 mg/L boric acid, and 300 mg/L calcium nitrate.
To initiate the observation, pollen grains at the desired stage were carefully transferred onto the liquid medium. The pollen of P. nigrum takes at least six hours to initiate germination (Chen, 2011). After six hours of treatment, the glass slide was taken out of the petri dish, and the germinated pollen was then fixed with Carnoy’s fixative and stained with Safranin. Pollen grains were observable under the compound microscope with 400x magnification. Percent germinated pollen was counted via microscope and the length of the pollen tube was measured via a reticule (built-in scale on eyepiece). For all five stages of anther dehiscence, 100 grains of pollen for three replicated treatments were counted to obtain the percentage of pollen germination. For pollen tube length evaluation, 30 germinated pollen grains from three replications were calculated. Both the germination percentage and the pollen tube length were evaluated to indicate the level of pollen viability. The data were analysed with one-way ANOVA to identify the most viable stage of pollen.
Stigma Receptivity Study. This study was performed on the 10 cultivars to check receptivity difference. The receptivity is indicated by production of peroxidase on stigmatic surfaces. The production of peroxidase is indicated by a formation of blue dot on stigmatic surfaces (Chen, 2011). The dissolved Peroxtesmo KO
paper is needed because the stigma of black pepper is so minute (about one millimeter in size) and fragile that the test cannot be done with direct contact of the stigma with Peroxtesmo KO paper. The Peroxtesmo KO solution was prepared with a concentration of 5 paper/1 mL of distilled water. Observation must be done immediately within five minutes, after the treatment using the Fluorescent Stereo Microscope Leica M165 FC. The stigma at three distinctive stages was sampled for observation, that is: • Stage 1: First appearance of stigma
(Day 1 of emergence)• Stage 2: Elongation and spreading of
stigma (Day 2-3 of emergence) • Stage 3: Complete emergence and
wide spreading of stigma (Day 4-6 of emergence)
The description on stages of stigma was based on description by Sim (1979). For each cultivar and each stage of stigma, 30 stigma/inflorescence was collected for the test. One-way ANOVA statistical analysis was carried out to determine the most receptive stage of the stigma.
RESULTS AND DISCUSSION
Pollen Morphology Study
Pollen morphology of the black pepper cultivar ‘SA’ was studied via SEM observation with the aim to precisely collect the right pollen for anther dehiscence and viability study. SEM observation showed pollen grain size is about <10 µm
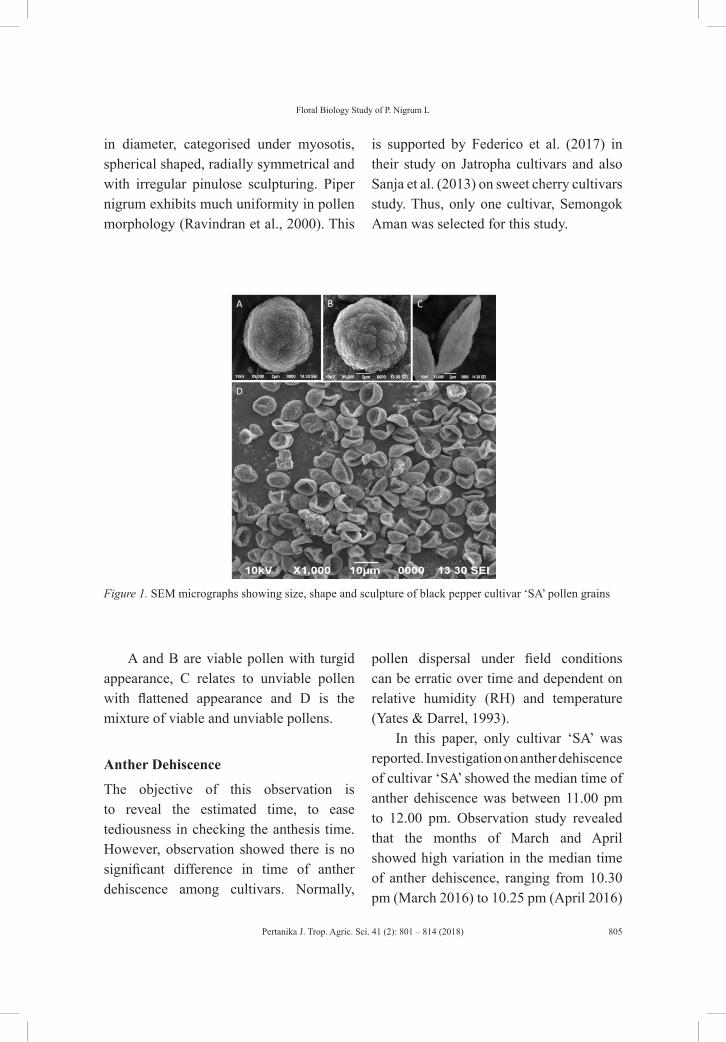
Pertanika J. Trop. Agric. Sci. 41 (2): 801 – 814 (2018)
Floral Biology Study of P. Nigrum L
805
in diameter, categorised under myosotis, spherical shaped, radially symmetrical and with irregular pinulose sculpturing. Piper nigrum exhibits much uniformity in pollen morphology (Ravindran et al., 2000). This
is supported by Federico et al. (2017) in their study on Jatropha cultivars and also Sanja et al. (2013) on sweet cherry cultivars study. Thus, only one cultivar, Semongok Aman was selected for this study.
Figure 1. SEM micrographs showing size, shape and sculpture of black pepper cultivar ‘SA’ pollen grains
A and B are viable pollen with turgid appearance, C relates to unviable pollen with flattened appearance and D is the mixture of viable and unviable pollens.
Anther Dehiscence
The objective of this observation is to reveal the estimated time, to ease tediousness in checking the anthesis time. However, observation showed there is no significant difference in time of anther dehiscence among cultivars. Normally,
pollen dispersal under field conditions can be erratic over time and dependent on relative humidity (RH) and temperature (Yates & Darrel, 1993).
In this paper, only cultivar ‘SA’ was reported. Investigation on anther dehiscence of cultivar ‘SA’ showed the median time of anther dehiscence was between 11.00 pm to 12.00 pm. Observation study revealed that the months of March and April showed high variation in the median time of anther dehiscence, ranging from 10.30 pm (March 2016) to 10.25 pm (April 2016)

Pertanika J. Trop. Agric. Sci. 41 (2): 801 – 814 (2018)
Chen, Y. S., Dayod, M. and Tawan, C. S.
806
(Figure 2), while in May, June, and July 2016, the median time recorded were 11.15 pm, 11.45 pm, and 11.50 pm, respectively. There were small variations in the time of anther dehiscence for the months of May, June, and July, compared to the months of March and April (Figure 2). However, statistical analysis proved the variation was a non-significant difference at (p≤0.05).
Based on the rainfall data in 2016 (Malaysian Meteorological Department), the months of March and April had higher rainfall compared to the subsequent months of May, June, and July. Reduced rainfall between May and July may
introduce higher temperatures and lower RH to the environment. Thus, the delay in anther dehiscence for the three months is most likely due to higher temperatures and lower RH factors. This finding is supported by Sato et al. (2000), who suggested that high temperature exposure could inhibit the anther dehiscence process. Other researchers (Sharp & Chisman, 1961; Jovanovic & Tucovis, 1975; Yates & Darrel, 1993; Ellis et al., 1998; Marcela et al., 2017) also reported the adverse effects of elevated temperatures and low RH influences on anther dehiscence in several crops that eventually affect the fruit set.
Figure 2. Time of anther dehiscence in cultivar Semongok Aman between March and July 2016
Pollen Viability Study
This study on pollen viability aimed to identify the optimum time for pollen collection for each of the 10 cultivars. Assessment of pollen germination
percentage and pollen tube length measurement via in vitro induced germination (Figure 3) was carried out to indicate the viability of pollen at various stages of collection.
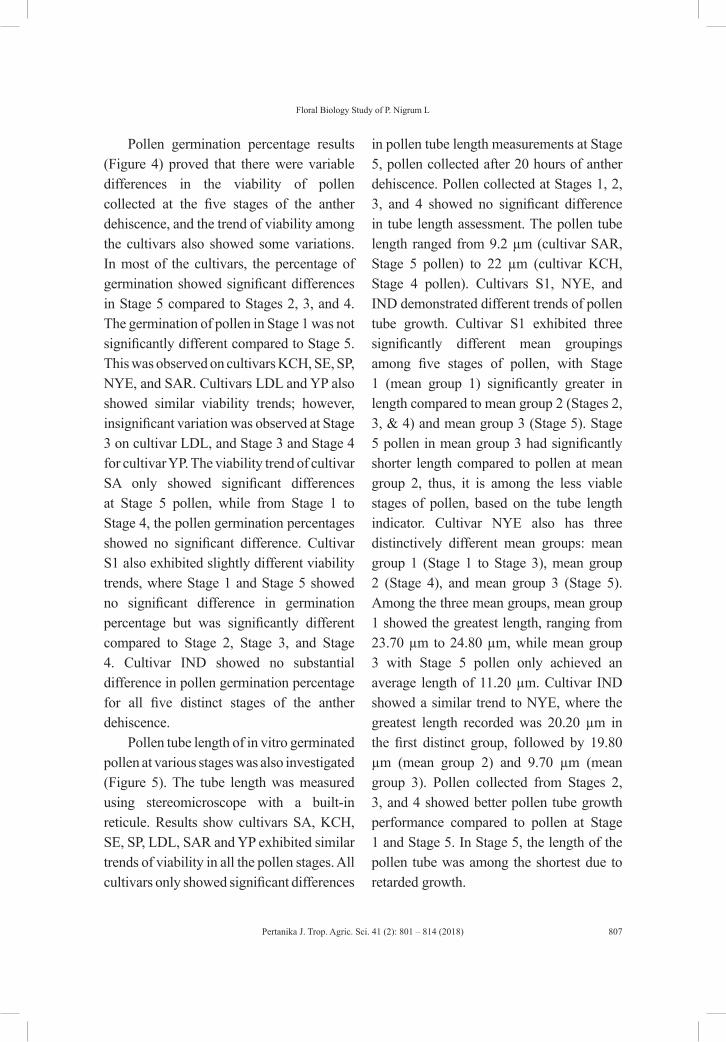
Pertanika J. Trop. Agric. Sci. 41 (2): 801 – 814 (2018)
Floral Biology Study of P. Nigrum L
807
Pollen germination percentage results (Figure 4) proved that there were variable differences in the viability of pollen collected at the five stages of the anther dehiscence, and the trend of viability among the cultivars also showed some variations. In most of the cultivars, the percentage of germination showed significant differences in Stage 5 compared to Stages 2, 3, and 4. The germination of pollen in Stage 1 was not significantly different compared to Stage 5. This was observed on cultivars KCH, SE, SP, NYE, and SAR. Cultivars LDL and YP also showed similar viability trends; however, insignificant variation was observed at Stage 3 on cultivar LDL, and Stage 3 and Stage 4 for cultivar YP. The viability trend of cultivar SA only showed significant differences at Stage 5 pollen, while from Stage 1 to Stage 4, the pollen germination percentages showed no significant difference. Cultivar S1 also exhibited slightly different viability trends, where Stage 1 and Stage 5 showed no significant difference in germination percentage but was significantly different compared to Stage 2, Stage 3, and Stage 4. Cultivar IND showed no substantial difference in pollen germination percentage for all five distinct stages of the anther dehiscence.
Pollen tube length of in vitro germinated pollen at various stages was also investigated (Figure 5). The tube length was measured using stereomicroscope with a built-in reticule. Results show cultivars SA, KCH, SE, SP, LDL, SAR and YP exhibited similar trends of viability in all the pollen stages. All cultivars only showed significant differences
in pollen tube length measurements at Stage 5, pollen collected after 20 hours of anther dehiscence. Pollen collected at Stages 1, 2, 3, and 4 showed no significant difference in tube length assessment. The pollen tube length ranged from 9.2 µm (cultivar SAR, Stage 5 pollen) to 22 µm (cultivar KCH, Stage 4 pollen). Cultivars S1, NYE, and IND demonstrated different trends of pollen tube growth. Cultivar S1 exhibited three significantly different mean groupings among five stages of pollen, with Stage 1 (mean group 1) significantly greater in length compared to mean group 2 (Stages 2, 3, & 4) and mean group 3 (Stage 5). Stage 5 pollen in mean group 3 had significantly shorter length compared to pollen at mean group 2, thus, it is among the less viable stages of pollen, based on the tube length indicator. Cultivar NYE also has three distinctively different mean groups: mean group 1 (Stage 1 to Stage 3), mean group 2 (Stage 4), and mean group 3 (Stage 5). Among the three mean groups, mean group 1 showed the greatest length, ranging from 23.70 µm to 24.80 µm, while mean group 3 with Stage 5 pollen only achieved an average length of 11.20 µm. Cultivar IND showed a similar trend to NYE, where the greatest length recorded was 20.20 µm in the first distinct group, followed by 19.80 µm (mean group 2) and 9.70 µm (mean group 3). Pollen collected from Stages 2, 3, and 4 showed better pollen tube growth performance compared to pollen at Stage 1 and Stage 5. In Stage 5, the length of the pollen tube was among the shortest due to retarded growth.
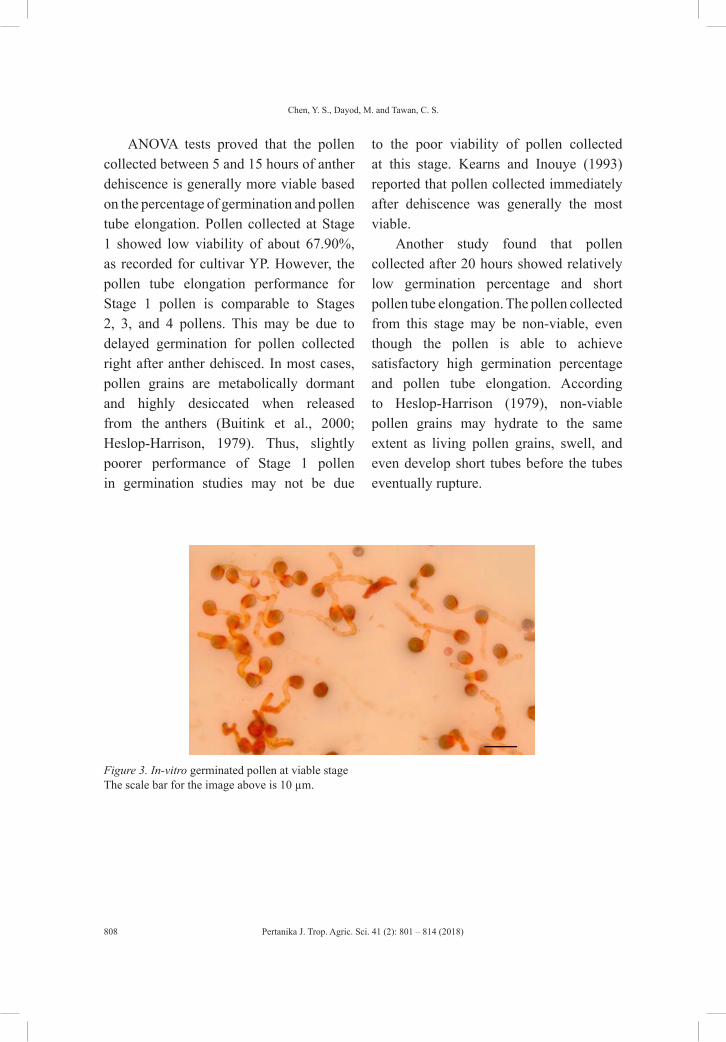
Pertanika J. Trop. Agric. Sci. 41 (2): 801 – 814 (2018)
Chen, Y. S., Dayod, M. and Tawan, C. S.
808
ANOVA tests proved that the pollen collected between 5 and 15 hours of anther dehiscence is generally more viable based on the percentage of germination and pollen tube elongation. Pollen collected at Stage 1 showed low viability of about 67.90%, as recorded for cultivar YP. However, the pollen tube elongation performance for Stage 1 pollen is comparable to Stages 2, 3, and 4 pollens. This may be due to delayed germination for pollen collected right after anther dehisced. In most cases, pollen grains are metabolically dormant and highly desiccated when released from the anthers (Buitink et al., 2000; Heslop-Harrison, 1979). Thus, slightly poorer performance of Stage 1 pollen in germination studies may not be due
to the poor viability of pollen collected at this stage. Kearns and Inouye (1993) reported that pollen collected immediately after dehiscence was generally the most viable.
Another study found that pollen collected after 20 hours showed relatively low germination percentage and short pollen tube elongation. The pollen collected from this stage may be non-viable, even though the pollen is able to achieve satisfactory high germination percentage and pollen tube elongation. According to Heslop-Harrison (1979), non-viable pollen grains may hydrate to the same extent as living pollen grains, swell, and even develop short tubes before the tubes eventually rupture.
Figure 3. In-vitro germinated pollen at viable stage The scale bar for the image above is 10 µm.
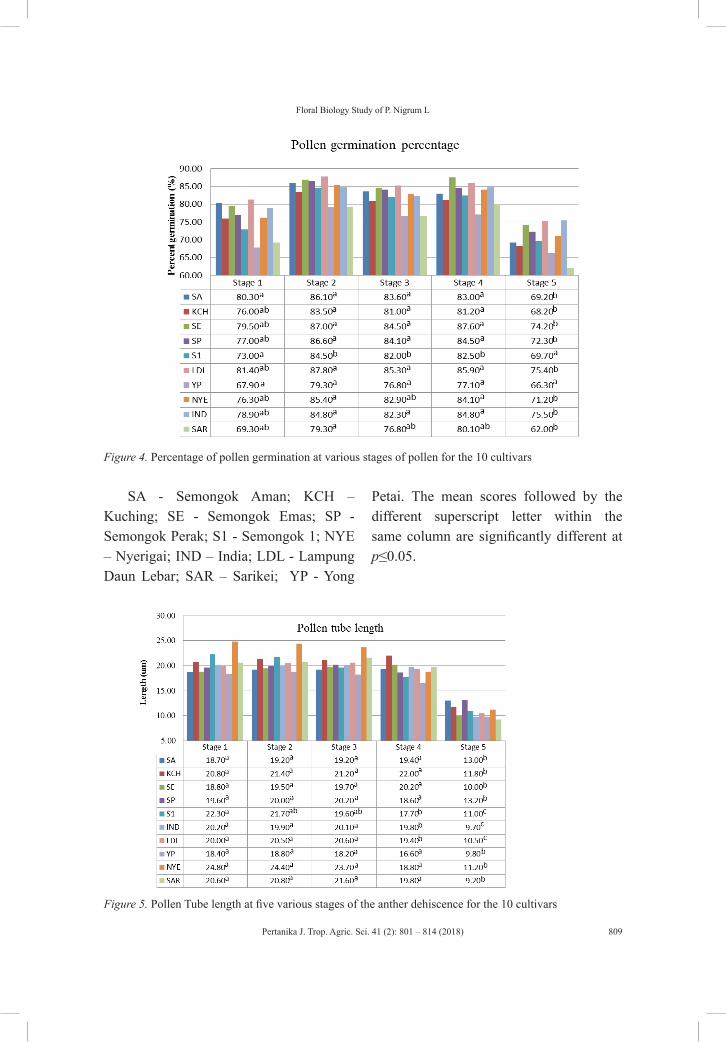
Pertanika J. Trop. Agric. Sci. 41 (2): 801 – 814 (2018)
Floral Biology Study of P. Nigrum L
809
Figure 4. Percentage of pollen germination at various stages of pollen for the 10 cultivars
SA - Semongok Aman; KCH – Kuching; SE - Semongok Emas; SP - Semongok Perak; S1 - Semongok 1; NYE – Nyerigai; IND – India; LDL - Lampung Daun Lebar; SAR – Sarikei; YP - Yong
Petai. The mean scores followed by the different superscript letter within the same column are significantly different at p≤0.05.
Figure 5. Pollen Tube length at five various stages of the anther dehiscence for the 10 cultivars
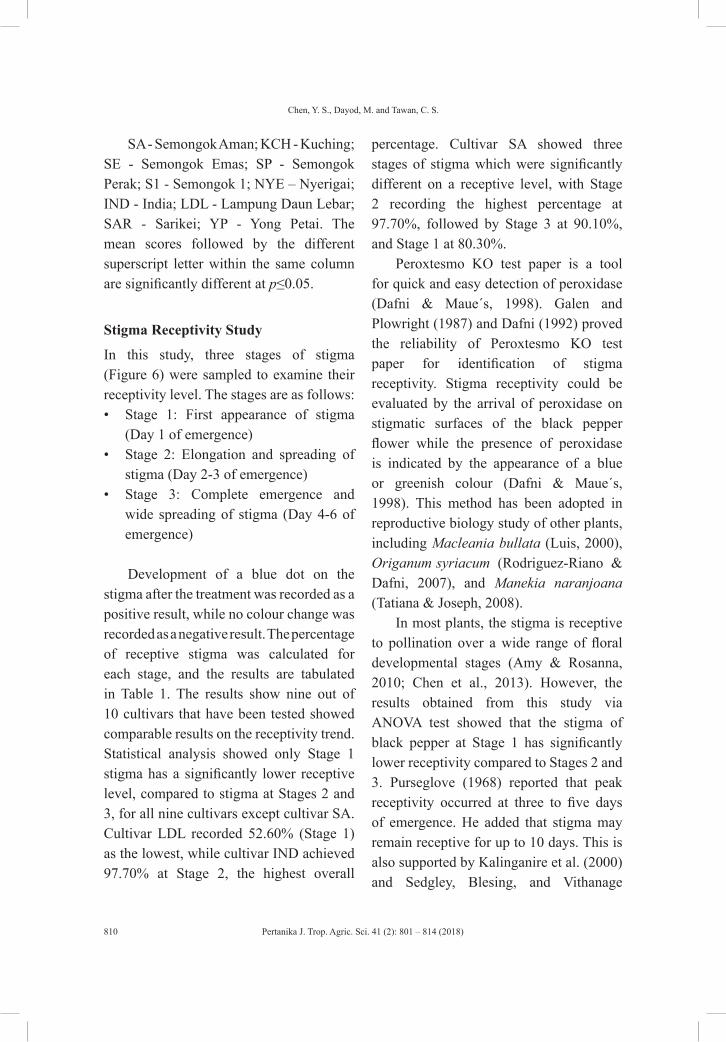
Pertanika J. Trop. Agric. Sci. 41 (2): 801 – 814 (2018)
Chen, Y. S., Dayod, M. and Tawan, C. S.
810
SA - Semongok Aman; KCH - Kuching; SE - Semongok Emas; SP - Semongok Perak; S1 - Semongok 1; NYE – Nyerigai; IND - India; LDL - Lampung Daun Lebar; SAR - Sarikei; YP - Yong Petai. The mean scores followed by the different superscript letter within the same column are significantly different at p≤0.05.
Stigma Receptivity Study
In this study, three stages of stigma (Figure 6) were sampled to examine their receptivity level. The stages are as follows:• Stage 1: First appearance of stigma
(Day 1 of emergence) • Stage 2: Elongation and spreading of
stigma (Day 2-3 of emergence) • Stage 3: Complete emergence and
wide spreading of stigma (Day 4-6 of emergence)
Development of a blue dot on the stigma after the treatment was recorded as a positive result, while no colour change was recorded as a negative result. The percentage of receptive stigma was calculated for each stage, and the results are tabulated in Table 1. The results show nine out of 10 cultivars that have been tested showed comparable results on the receptivity trend. Statistical analysis showed only Stage 1 stigma has a significantly lower receptive level, compared to stigma at Stages 2 and 3, for all nine cultivars except cultivar SA. Cultivar LDL recorded 52.60% (Stage 1) as the lowest, while cultivar IND achieved 97.70% at Stage 2, the highest overall
percentage. Cultivar SA showed three stages of stigma which were significantly different on a receptive level, with Stage 2 recording the highest percentage at 97.70%, followed by Stage 3 at 90.10%, and Stage 1 at 80.30%.
Peroxtesmo KO test paper is a tool for quick and easy detection of peroxidase (Dafni & Maue´s, 1998). Galen and Plowright (1987) and Dafni (1992) proved the reliability of Peroxtesmo KO test paper for identification of stigma receptivity. Stigma receptivity could be evaluated by the arrival of peroxidase on stigmatic surfaces of the black pepper flower while the presence of peroxidase is indicated by the appearance of a blue or greenish colour (Dafni & Maue´s, 1998). This method has been adopted in reproductive biology study of other plants, including Macleania bullata (Luis, 2000), Origanum syriacum (Rodriguez-Riano & Dafni, 2007), and Manekia naranjoana (Tatiana & Joseph, 2008).
In most plants, the stigma is receptive to pollination over a wide range of floral developmental stages (Amy & Rosanna, 2010; Chen et al., 2013). However, the results obtained from this study via ANOVA test showed that the stigma of black pepper at Stage 1 has significantly lower receptivity compared to Stages 2 and 3. Purseglove (1968) reported that peak receptivity occurred at three to five days of emergence. He added that stigma may remain receptive for up to 10 days. This is also supported by Kalinganire et al. (2000) and Sedgley, Blesing, and Vithanage
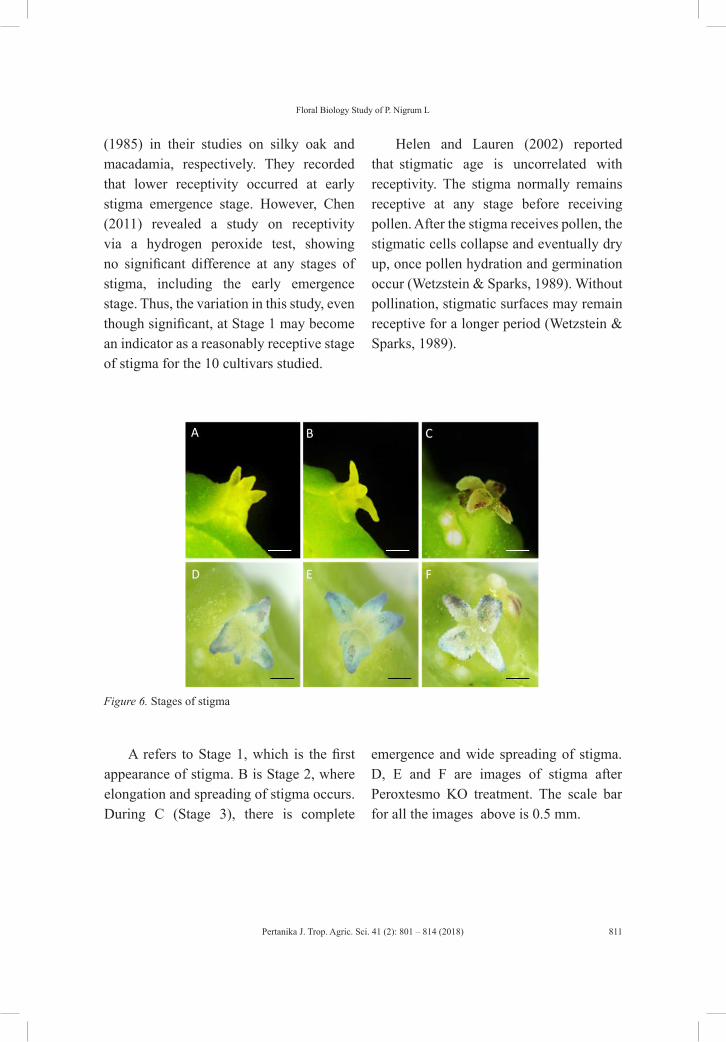
Pertanika J. Trop. Agric. Sci. 41 (2): 801 – 814 (2018)
Floral Biology Study of P. Nigrum L
811
(1985) in their studies on silky oak and macadamia, respectively. They recorded that lower receptivity occurred at early stigma emergence stage. However, Chen (2011) revealed a study on receptivity via a hydrogen peroxide test, showing no significant difference at any stages of stigma, including the early emergence stage. Thus, the variation in this study, even though significant, at Stage 1 may become an indicator as a reasonably receptive stage of stigma for the 10 cultivars studied.
Helen and Lauren (2002) reported that stigmatic age is uncorrelated with receptivity. The stigma normally remains receptive at any stage before receiving pollen. After the stigma receives pollen, the stigmatic cells collapse and eventually dry up, once pollen hydration and germination occur (Wetzstein & Sparks, 1989). Without pollination, stigmatic surfaces may remain receptive for a longer period (Wetzstein & Sparks, 1989).
Figure 6. Stages of stigma
A refers to Stage 1, which is the first appearance of stigma. B is Stage 2, where elongation and spreading of stigma occurs. During C (Stage 3), there is complete
emergence and wide spreading of stigma. D, E and F are images of stigma after Peroxtesmo KO treatment. The scale bar for all the images above is 0.5 mm.
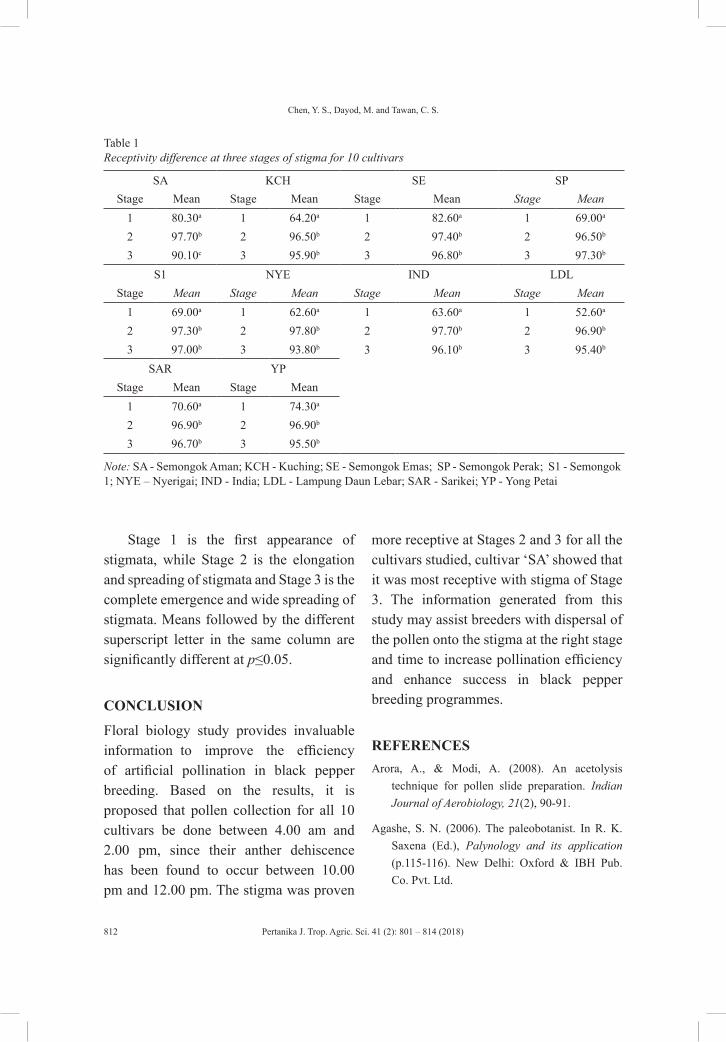
Pertanika J. Trop. Agric. Sci. 41 (2): 801 – 814 (2018)
Chen, Y. S., Dayod, M. and Tawan, C. S.
812
Table 1 Receptivity difference at three stages of stigma for 10 cultivars
SA KCH SE SPStage Mean Stage Mean Stage Mean Stage Mean
1 80.30a 1 64.20a 1 82.60a 1 69.00a
2 97.70b 2 96.50b 2 97.40b 2 96.50b
3 90.10c 3 95.90b 3 96.80b 3 97.30b
S1 NYE IND LDLStage Mean Stage Mean Stage Mean Stage Mean
1 69.00a 1 62.60a 1 63.60a 1 52.60a
2 97.30b 2 97.80b 2 97.70b 2 96.90b
3 97.00b 3 93.80b 3 96.10b 3 95.40b
SAR YPStage Mean Stage Mean
1 70.60a 1 74.30a
2 96.90b 2 96.90b
3 96.70b 3 95.50b
Note: SA - Semongok Aman; KCH - Kuching; SE - Semongok Emas; SP - Semongok Perak; S1 - Semongok 1; NYE – Nyerigai; IND - India; LDL - Lampung Daun Lebar; SAR - Sarikei; YP - Yong Petai
Stage 1 is the first appearance of stigmata, while Stage 2 is the elongation and spreading of stigmata and Stage 3 is the complete emergence and wide spreading of stigmata. Means followed by the different superscript letter in the same column are significantly different at p≤0.05.
CONCLUSION
Floral biology study provides invaluable information to improve the efficiency of artificial pollination in black pepper breeding. Based on the results, it is proposed that pollen collection for all 10 cultivars be done between 4.00 am and 2.00 pm, since their anther dehiscence has been found to occur between 10.00 pm and 12.00 pm. The stigma was proven
more receptive at Stages 2 and 3 for all the cultivars studied, cultivar ‘SA’ showed that it was most receptive with stigma of Stage 3. The information generated from this study may assist breeders with dispersal of the pollen onto the stigma at the right stage and time to increase pollination efficiency and enhance success in black pepper breeding programmes.
REFERENCESArora, A., & Modi, A. (2008). An acetolysis
technique for pollen slide preparation. Indian Journal of Aerobiology, 21(2), 90-91.
Agashe, S. N. (2006). The paleobotanist. In R. K. Saxena (Ed.), Palynology and its application (p.115-116). New Delhi: Oxford & IBH Pub. Co. Pvt. Ltd.
Pertanika J. Trop. Agric. Sci. 41 (2): 801 – 814 (2018)
Floral Biology Study of P. Nigrum L
813
Amy, C. D., & Rosanna, F. (2010). Floral development, stigma receptivity and pollen viability in eight Nolana (Solanaceae) species. Euphytica, 174(1), 105-117.
Bhattacharya, K., Mujumdar, M. R., & Bhattacharya, S. G. (2006). A textbook of palynology. Kolkata: New Central Book Agency Pvt. Ltd.
Buitink, J., Leprince, O., Hemminga, M. A., & Hoekstra, F. A. (2000). The effects of moisture and temperature on the ageing kinetics of pollen: Interpretation based on cytoplasmic mobility. Plant Cell Environment, 23(9), 967-74.
Chen, F., Yuan, W., Shi, X. P., & Ye, Y. M. (2013). Evaluation of pollen viability, stigma receptivity and fertilization success in Lagerstroemia indica L. African Journal of Biotechnology, 12(46), 6460-6467.
Chen, Y. S., Tawan. C. S., Paulus, A. D., Ng, S. C., & Sim, S. L. (2010). Developing method of interspecific hybridization between Piper nigrum and Piper colubrinum. In D. Kanakaruju, K. Meekiong, I. B. Ipor, C. K. Lim, P. T. Lim, H. A. Roslan (Eds.), Proceedings of the 3rd Regional Conference on Natural Resources in the Tropics (pp. 293-300). Kota Samarahan, Sarawak: Universiti Malaysia Sarawak.
Chen, Y. S. (2011). A study on interspecific hybridization between Piper nigrum and Piper colubrinum. (Unpublished Master thesis). Universiti Malaysia Sarawak, Kota Samarahan, Sarawak, Malaysia.
Dafni, A. (1992). Pollination ecology: A practical approach. New York, USA: Oriole Press at Oxford University Press.
Dafni, A., & Maue´s, M. M. (1998). A rapid and simple procedure to determine stigma receptivity. Sexual Plant Reproduction, 11(3), 177–180.
Ellis, R. H., Wheeler, T. R., & Hadley, P. (1998). Effect of high temperature stress at anthesis on grain yield and biomass of field-grown crops of wheat. Annals of Botany, 82(5), 631-639.
Federico, S. L., Lilia , A. M., Meléndez Miguel, A. A., Teodoro, R. G., Pedro, C. H., & Filiberto, H. C. (2017). Pollen morphology of four species of Jatropha (Euphorbiaceae), including toxic varieties, in Northwestern Mexico. International Journal Tropical Biology, 65(2), 799-806.
Galen, C., & Plowright, R. C. (1987). Testing the accuracy of using peroxidase activity to indicate stigma receptivity. Canadian Journal of Botany, 65(1), 107-111.
Helen, J. Y., & Lauren, G. (2002). Reproductive Biology: The effects of stigma age on receptivity in Silene alba (Caryophyllaceae). American Journal of Botany, 89(8), 1237-1241.
Heslop-Harrison, J. (1979). Aspects of the structure, cytochemistry and germination of the pollen of rye. Annals of Botany, 44, 1-47.
Hlaváčová, M., Klem, K., Smutná, P., Škarpa, P., Hlavinka, P., Novotná, K., ... & Trnka, M. (2017). Effect of heat stress at anthesis on yield formationin winter wheat. Plant Soil Environ, 63(3), 139-144.
Jovanovic, M., & Tucovic, A. (1975). Genetics of common and sessile oak (Quercus robur L. and Q. Petraea Liebl.). Annales Forestales, 7, 23-53.
Kalinganire, A., Harwood, C. E., Slee, M. U., & Simons, A. J. (2000). Floral structure, stigma receptivity and pollen viability in relation to protandry and self-incompatibility in silky oak (Grevillea robusta A. Cunn.). Annals of Botany, 86(1), 133-148.
Kearns, C. A., & Inouye, D. W. (1993). Techniques for pollination biologists. American Journal of Botany, 94, 1183-1192.
Pertanika J. Trop. Agric. Sci. 41 (2): 801 – 814 (2018)
Chen, Y. S., Dayod, M. and Tawan, C. S.
814
Luis, N. (2006). Pollination ecology and effect of nectar removal in Macleania bullata (Ericaceae). Biotropica, 31(4), 538-714.
Purseglove, J. W. (1968). Tropical Crops-Dicotyledon 2. Piperaceace: Piper nigrum L. (2n=52). London: Longman.
Ravindran, P. N., Nair, M. K., & Mathew, P. A. (1981). Mode of pollination and factors affecting fruit set in Piper nigrum L. in Puerto Rico. Crop Science, 2, 295-299.
Ravindran, P. N., Nirmal Baru, K., Sasikumar, B., & Krishnamurthy, K. S. (2000). Centres of pepper cultivation. In P. N. Ravindran (Ed.), Black pepper (Piper nigrum): Introduction (pp. 9-14). India: Hardwood Academy Publishers.
Rodriguez-Riano, T., & Dafni, A. (2007). Pollen-stigma interference in two gynodioecious species of Lamiaceae with intermediate individuals. Annals of Botany, 100(2), 423-431.
Sanja, R., Dragan, N., Radosav, C., & Milena, D. (2013). In vitro pollen germination and pollen grain morphology in some sweet cherry (Prunus avium L.) cultivars. Romanian Biotechnological Letters, 18(3), 8341-8349.
Sato, S., Peet, M. M., & Thomas, J. F. (2000). Determining critical pre- and post-anthesis periods and physiological processes in Lycopersicon esculentum Mill. exposed to moderately elevated temperatures. Journal of Experimental Botany, 53(371), 1187-1195.
Sedgley, M., Blesing, M. A., & Vithanage, H. I. M. V. (1985). A developmental study of the structure and pollen receptivity of the macadamia pistil in relation to protandry and self-incompatibility. Botanical Gazette, 146(1), 6-14.
Sharp, W. M., & Chisman, H. H. (1961). Flowering and fruiting in the white oaks, I. Staminate flowering through pollen dispersal. Ecology, 42(2), 365-372.
Sim, S. L. (1979). A preliminary report on floral biology and mode of pollination in pepper. In Proceedings of 14th Research Officers’ Annual Conference (pp. 35-46). Department of Agricultural, Sarawak, Malaysia.
Sim, S. L. (1993). Clonal selection and hybridization in pepper. In M. Y. Ibrahim, C. J. Bong, & I. B. Ipor (Eds.), The pepper industry: Problems and prospects (pp. 48-57). Universiti Pertanian Bintulu Campus, Sarawak, Malaysia.
Sim, S. L. (1985). Pepper breeding in Malaysia. In Proceedings of the National Conference on Pepper in Malaysia (pp. 47-55). Kuching, Sarawak.
Tatiana, A., & Joseph, H. W. (2008). Embryology of Manekia naranjoana (Piperaceae) and the origin of tetrasporic, 16-nucleate female gametophytes in Piperales. American Journal of Botany, 95(3), 272-285.
Wetzstein, H. Y., & Sparks, D. (1989). Stigma-Pollen interactions in pecan. Journal America Society Horticulture Science, 114, 355-359.
Yates, I. E., & Darrel, S. (1993). Environmental regulation of anther dehiscence and pollen germination in Pecan. Journal of America Society of Horticulture Science, 118(6), 699-706.
Pertanika J. Trop. Agric. Sci. 41 (2): 815 – 824 (2018)
ISSN: 1511-3701 © Universiti Putra Malaysia Press
TROPICAL AGRICULTURAL SCIENCEJournal homepage: http://www.pertanika.upm.edu.my/
ARTICLE INFOArticle history:Received: 3 November 2017Accepted: 09 January 2018
E-mail address:[email protected] (Shaibu, A. S.)
Gene Action Mechanism for Drought Tolerance in Extra-Early Yellow Maize Inbreds
Shaibu, A. S. Department of Agronomy, Bayero University, Kano, Nigeria
ABSTRACT
The effect of drought on crops is very significant and will affect world food supply due to climate change. Gene action, general combining ability (GCA) and specific (SCA) combining ability of 66 single cross hybrids of extra early maize derived using the diallel mating design involving 12 parents were evaluated under drought conditions. The design of the experiment was a 10 × 7 randomised incomplete block design with two replications. The mean squares of GCA were larger than those of SCA for the observed traits except for grain yield. The relative importance of GCA over SCA was observed to be close to unity for some of the observed traits. The correlation between yield and plant aspect, anthesis silking interval, ear aspect and stay green characteristics (SG) was negative and significant. Selection for genotype with low values in these traits will lead to indirect selection for high yielding genotypes. The inbred TZdEEI 11 and a hybrid, TZdEEI 1 × TZEEI 58, which had highly significant positive GCAs for grain yield and negative GCAs for SG, were identified as a good inbred line tester and single cross tester, respectively. From the study, the inheritance of genes was an additive effect, therefore, the prediction of performance of hybrids for the traits observed under drought conditions can be done using only GCA except for grain yield.
Keywords: Diallel, drought, extra early maize, GCA, grain yield, SCA
INTRODUCTION
Maize (Zea mays L.), being a primary staple food crop, provides calories for over 300 million people in West Africa. In Nigeria, the average yield per hectare is about 1.8 ton per ha (FAO Statistics Division, 2014) in the face of the
Pertanika J. Trop. Agric. Sci. 41 (2): 815 – 824 (2018)
Shaibu, A. S.
816
availability of high yielding varieties and better crop management when compared to 9.5 tons per ha in the USA and the world average of 5.5 tons per ha (Adnan et al., 2017). Low grain yield has been mainly attributed to biotic and abiotic stresses. Abiotic stress such as drought is becoming a permanent characteristic of sub-Saharan African climate. It has been reported that drought can reduce grain yield by 53% (Badu-Apraku et al., 2004). This reduction in grain yield has key effects on the world food supply due to the effects of climate change (Edmeades, 2013). In drought-prone areas, extra early maize varieties are highly desirable because of their reduced maturity period compared with other maturity groups. Identifying extra early maize that is drought tolerant will be an added advantage to farmers as the plant will be able to reach physiological maturity before the initiation of drought.
Host plant resistance is an economically feasible method of developing a drought-tolerant genotype but there is a need to identify drought tolerance testers that can be hybridised to exploit heterosis. Selection of lines with good grain yield and drought tolerance will require deciphering the genetic variances (combining ability) present in the genotypes. There are many ways of determining the combining ability of plants including diallel mating design. The diallel mating system allows statistical separation of progeny performance into GCA and SCA. Extra early inbred lines that are drought tolerant have been developed by the International Institute of Tropical
Agriculture (IITA). However, only a few extra early maturing maize varieties can tolerate drought. There is, therefore, a need to make crosses among these inbreds and select promising genotypes that will be able to tolerate, avoid and or escape drought. The aim of this research was to evaluate the performance of extra-early yellow maize single cross hybrids to determine gene action and examine their combining ability. Inbreds and hybrid testers tolerant to drought were also identified.
MATERIALS AND METHOD
A diallel mating system using 12 inbreds from the International Institute of Tropical Agriculture (IITA) was used to derive 66 single crosess without their parents and reciprocals. The crosses were generated during the wet season of 2013. The diallel crosses together with four checks were evaluated during the dry seasons of 2013/2014 at Ikenne using a 10 × 7 randomised incomplete-block design with two replications. The crosses were sown in single-row plots of 5 m in length with intra and inter row spacing of 0.4 m and 0.75 m, respectively.
Drought stress was imposed according to the method of Badu-Apraku et al. (2012). Irrigation was done for 21 days after planting (V5 to V6), after which the plants were left without water supply up to harvest. Fertiliser was applied at planting at the rate of 60 kg ha-1 N, P, and 60 kg ha-1 N was used to top dress at 2 weeks after planting (WAP). Data were recorded for days to anthesis: number of days to when
Pertanika J. Trop. Agric. Sci. 41 (2): 815 – 824 (2018)
Gene Action for Drought Tolerance in Extra-Early Maize
817
50% of the plant had shed pollen, days to silking, and number of days to when 50% of the silks had emerged, plant and ear height. These were measured in cm as the distance from the base of the plant to base of the tassel and upper cob, respectively. Stay green characteristics and ear aspect were scored using a 1-9 scale based on visual observations with 1 indicating <10% damage and 9 >90% damage. The plants were harvested at physiological maturity and grain yield was estimated on kg per ha basis. PROC GLM in SAS 9.3 (SAS Institute, 2012) was used to analyse the data collected. Blocks and rep were set as random effects in the analysis. The GCA and SCA effects of parents and crosses, respectively were estimated using the diallel SAS programme developed by Zhang et al. (2005) following Griffing’s method 4 model 1 (fixed model), which involved F1s only (Griffing, 1956). The diallel model is presented in Equation 1 (Hallauer & Miranda, 1988) under the assumption that the combining ability effects: ∑gi = 0 and ∑sij = 0 for each j (Griffing, 1956):
Y_ijk=μ+ g_i+ g_j+ s_ij+ ε_ijk …….. [1]
where,Y_ijk=Observed value for the ijth cross in the kth replicate
=Grand mean=GCA effects of the ith and jth
parentSCA effects of the ijth cross
Error term of the ijth cross in kth replication
The equation for the relative importance of GCA and SCA (Equation 2) was modified from Baker (1978) by Hung and Holland (2012).
…………………… [2]
where, K2GCA and K2SCA are the variance effects of GCA and SCA, respectively. The closer this ratio is to 1, the better the predictability of hybrid performance using only GCA.
A base index selection (Equation 3) (Menkir & Kling, 2007; Badu-Apraku et al., 2011) was used to select lines from the two extremes of the distribution in order to identify productive single-cross hybrids under drought conditions.
……………………………………….. [3]
where, YLI is the grain yield, EPP is the number of ears per plant, ASI is the anthesis silking interval, PASP is the plant aspect, EASP is the ear aspect and SG is the stay green characteristics.
RESULTS
Table 1 shows the GCA effect for grain yield and other agronomic traits. Two inbreds, TZdEEI 11 and TZdEEI 12, had significantly positive GCA effects for grain yield and in addition, TZdEEI 12 had a positive GCA for stay green characteristics and plant aspect. TZdEEI 4 and TZdEEI 5 had significant negative GCA effects for grain yield. TZdEEI 7 had a positive
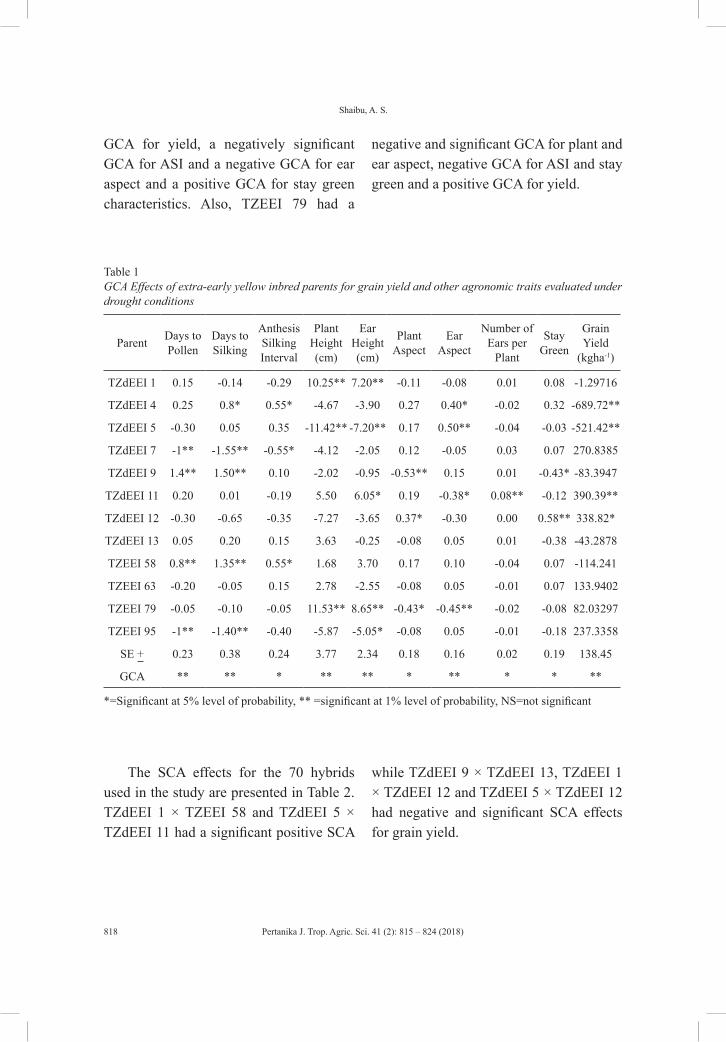
Pertanika J. Trop. Agric. Sci. 41 (2): 815 – 824 (2018)
Shaibu, A. S.
818
GCA for yield, a negatively significant GCA for ASI and a negative GCA for ear aspect and a positive GCA for stay green characteristics. Also, TZEEI 79 had a
negative and significant GCA for plant and ear aspect, negative GCA for ASI and stay green and a positive GCA for yield.
Table 1 GCA Effects of extra-early yellow inbred parents for grain yield and other agronomic traits evaluated under drought conditions
Parent Days to Pollen
Days to Silking
Anthesis Silking Interval
Plant Height (cm)
Ear Height (cm)
Plant Aspect
Ear Aspect
Number of Ears per
Plant
Stay Green
Grain Yield
(kgha-1)
TZdEEI 1 0.15 -0.14 -0.29 10.25** 7.20** -0.11 -0.08 0.01 0.08 -1.29716
TZdEEI 4 0.25 0.8* 0.55* -4.67 -3.90 0.27 0.40* -0.02 0.32 -689.72**
TZdEEI 5 -0.30 0.05 0.35 -11.42** -7.20** 0.17 0.50** -0.04 -0.03 -521.42**
TZdEEI 7 -1** -1.55** -0.55* -4.12 -2.05 0.12 -0.05 0.03 0.07 270.8385
TZdEEI 9 1.4** 1.50** 0.10 -2.02 -0.95 -0.53** 0.15 0.01 -0.43* -83.3947
TZdEEI 11 0.20 0.01 -0.19 5.50 6.05* 0.19 -0.38* 0.08** -0.12 390.39**
TZdEEI 12 -0.30 -0.65 -0.35 -7.27 -3.65 0.37* -0.30 0.00 0.58** 338.82*
TZdEEI 13 0.05 0.20 0.15 3.63 -0.25 -0.08 0.05 0.01 -0.38 -43.2878
TZEEI 58 0.8** 1.35** 0.55* 1.68 3.70 0.17 0.10 -0.04 0.07 -114.241
TZEEI 63 -0.20 -0.05 0.15 2.78 -2.55 -0.08 0.05 -0.01 0.07 133.9402
TZEEI 79 -0.05 -0.10 -0.05 11.53** 8.65** -0.43* -0.45** -0.02 -0.08 82.03297
TZEEI 95 -1** -1.40** -0.40 -5.87 -5.05* -0.08 0.05 -0.01 -0.18 237.3358
SE + 0.23 0.38 0.24 3.77 2.34 0.18 0.16 0.02 0.19 138.45
GCA ** ** * ** ** * ** * * **
*=Significant at 5% level of probability, ** =significant at 1% level of probability, NS=not significant
The SCA effects for the 70 hybrids used in the study are presented in Table 2. TZdEEI 1 × TZEEI 58 and TZdEEI 5 × TZdEEI 11 had a significant positive SCA
while TZdEEI 9 × TZdEEI 13, TZdEEI 1 × TZdEEI 12 and TZdEEI 5 × TZdEEI 12 had negative and significant SCA effects for grain yield.
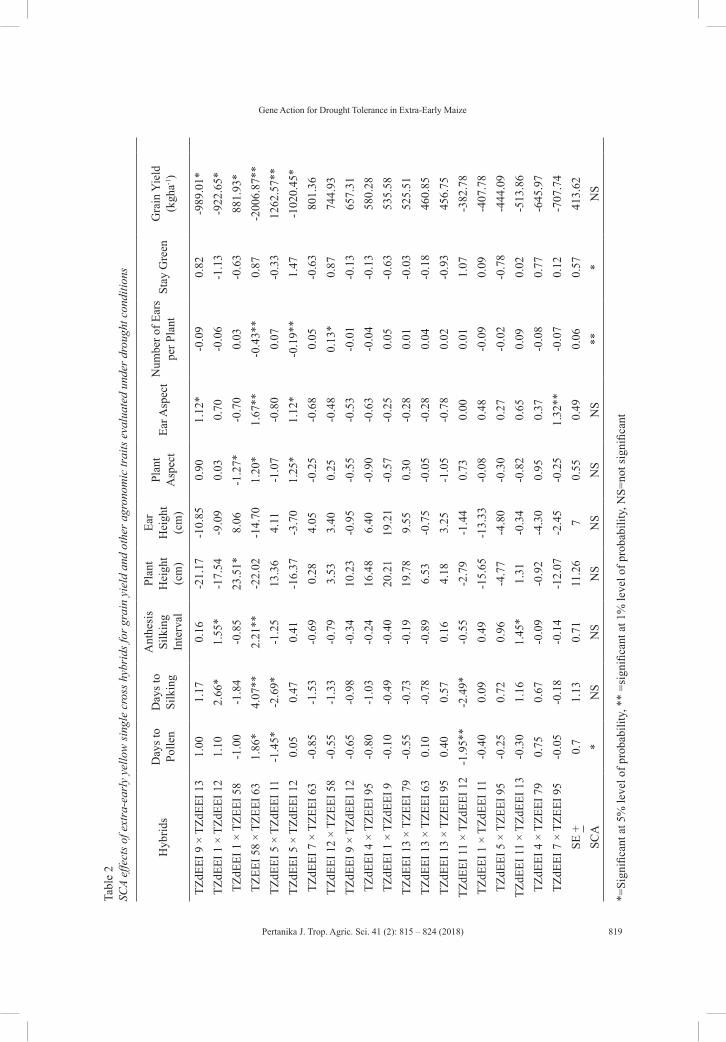
Pertanika J. Trop. Agric. Sci. 41 (2): 815 – 824 (2018)
Gene Action for Drought Tolerance in Extra-Early Maize
819
Tabl
e 2
SCA
effe
cts o
f ext
ra-e
arly
yel
low
sing
le c
ross
hyb
rids
for g
rain
yie
ld a
nd o
ther
agr
onom
ic tr
aits
eva
luat
ed u
nder
dro
ught
con
ditio
ns
Hyb
rids
Day
s to
Polle
nD
ays t
o Si
lkin
g
Ant
hesi
s Si
lkin
g In
terv
al
Plan
t H
eigh
t (c
m)
Ear
Hei
ght
(cm
)
Plan
t A
spec
tEa
r Asp
ect
Num
ber o
f Ear
s pe
r Pla
ntSt
ay G
reen
Gra
in Y
ield
(k
gha-1
)
TZdE
EI 9
× T
ZdEE
I 13
1.00
1.17
0.16
-21.
17-1
0.85
0.90
1.12
*-0
.09
0.82
-989
.01*
TZdE
EI 1
× T
ZdEE
I 12
1.10
2.66
*1.
55*
-17.
54-9
.09
0.03
0.70
-0.0
6-1
.13
-922
.65*
TZdE
EI 1
× T
ZEEI
58
-1.0
0-1
.84
-0.8
523
.51*
8.06
-1.2
7*-0
.70
0.03
-0.6
388
1.93
*TZ
EEI 5
8 ×
TZEE
I 63
1.86
*4.
07**
2.21
**-2
2.02
-14.
701.
20*
1.67
**-0
.43*
*0.
87-2
006.
87**
TZdE
EI 5
× T
ZdEE
I 11
-1.4
5*-2
.69*
-1.2
513
.36
4.11
-1.0
7-0
.80
0.07
-0.3
312
62.5
7**
TZdE
EI 5
× T
ZdEE
I 12
0.05
0.47
0.41
-16.
37-3
.70
1.25
*1.
12*
-0.1
9**
1.47
-102
0.45
*TZ
dEEI
7 ×
TZE
EI 6
3-0
.85
-1.5
3-0
.69
0.28
4.05
-0.2
5-0
.68
0.05
-0.6
380
1.36
TZdE
EI 1
2 ×
TZEE
I 58
-0.5
5-1
.33
-0.7
93.
533.
400.
25-0
.48
0.13
*0.
8774
4.93
TZdE
EI 9
× T
ZdEE
I 12
-0.6
5-0
.98
-0.3
410
.23
-0.9
5-0
.55
-0.5
3-0
.01
-0.1
365
7.31
TZdE
EI 4
× T
ZEEI
95
-0.8
0-1
.03
-0.2
416
.48
6.40
-0.9
0-0
.63
-0.0
4-0
.13
580.
28TZ
dEEI
1 ×
TZd
EEI 9
-0.1
0-0
.49
-0.4
020
.21
19.2
1-0
.57
-0.2
50.
05-0
.63
535.
58TZ
dEEI
13
× TZ
EEI 7
9-0
.55
-0.7
3-0
.19
19.7
89.
550.
30-0
.28
0.01
-0.0
352
5.51
TZdE
EI 1
3 ×
TZEE
I 63
0.10
-0.7
8-0
.89
6.53
-0.7
5-0
.05
-0.2
80.
04-0
.18
460.
85TZ
dEEI
13
× TZ
EEI 9
50.
400.
570.
164.
183.
25-1
.05
-0.7
80.
02-0
.93
456.
75TZ
dEEI
11
× TZ
dEEI
12
-1.9
5**
-2.4
9*-0
.55
-2.7
9-1
.44
0.73
0.00
0.01
1.07
-382
.78
TZdE
EI 1
× T
ZdEE
I 11
-0.4
00.
090.
49-1
5.65
-13.
33-0
.08
0.48
-0.0
90.
09-4
07.7
8TZ
dEEI
5 ×
TZE
EI 9
5-0
.25
0.72
0.96
-4.7
7-4
.80
-0.3
00.
27-0
.02
-0.7
8-4
44.0
9TZ
dEEI
11
× TZ
dEEI
13
-0.3
01.
161.
45*
1.31
-0.3
4-0
.82
0.65
0.09
0.02
-513
.86
TZdE
EI 4
× T
ZEEI
79
0.75
0.67
-0.0
9-0
.92
-4.3
00.
950.
37-0
.08
0.77
-645
.97
TZdE
EI 7
× T
ZEEI
95
-0.0
5-0
.18
-0.1
4-1
2.07
-2.4
5-0
.25
1.32
**-0
.07
0.12
-707
.74
SE +
0.7
1.13
0.71
11.2
67
0.55
0.49
0.06
0.57
413.
62SC
A*
NS
NS
NS
NS
NS
NS
***
NS
*=Si
gnifi
cant
at 5
% le
vel o
f pro
babi
lity,
**
=sig
nific
ant a
t 1%
leve
l of p
roba
bilit
y, N
S=no
t sig
nific
ant
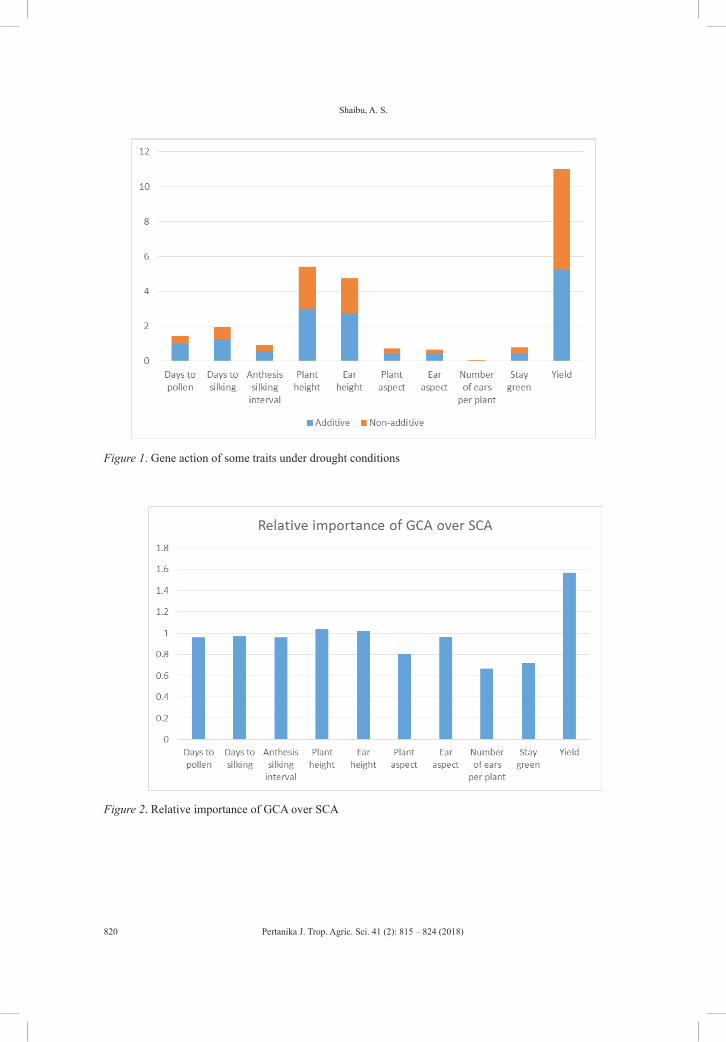
Pertanika J. Trop. Agric. Sci. 41 (2): 815 – 824 (2018)
Shaibu, A. S.
820
Figure 1. Gene action of some traits under drought conditions
Figure 2. Relative importance of GCA over SCA
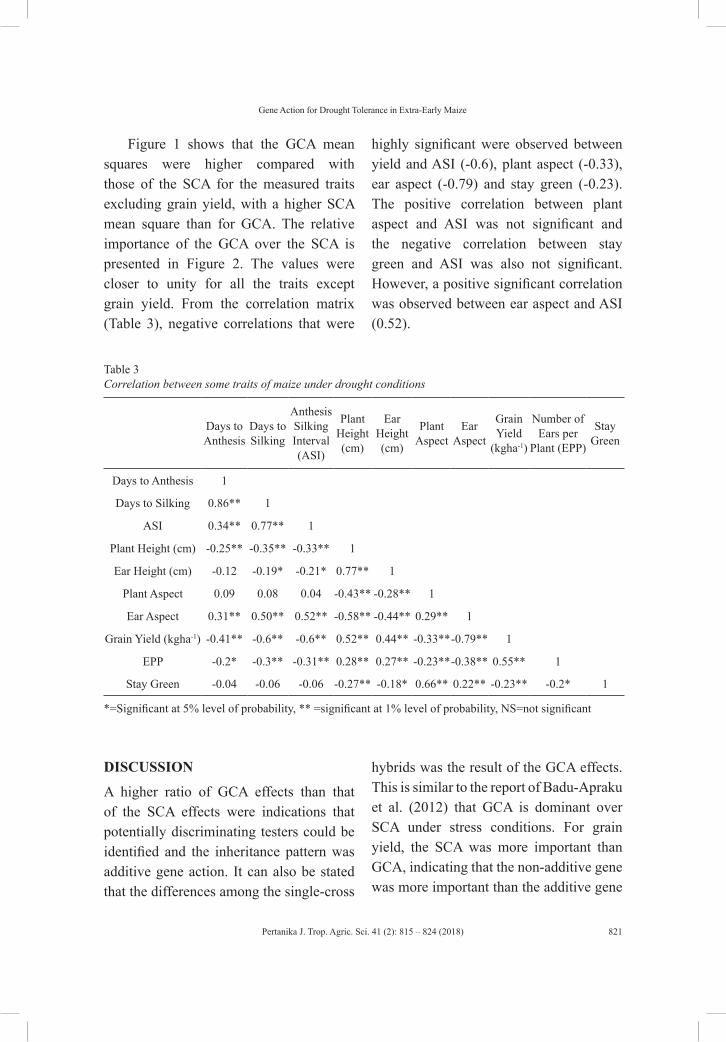
Pertanika J. Trop. Agric. Sci. 41 (2): 815 – 824 (2018)
Gene Action for Drought Tolerance in Extra-Early Maize
821
Figure 1 shows that the GCA mean squares were higher compared with those of the SCA for the measured traits excluding grain yield, with a higher SCA mean square than for GCA. The relative importance of the GCA over the SCA is presented in Figure 2. The values were closer to unity for all the traits except grain yield. From the correlation matrix (Table 3), negative correlations that were
highly significant were observed between yield and ASI (-0.6), plant aspect (-0.33), ear aspect (-0.79) and stay green (-0.23). The positive correlation between plant aspect and ASI was not significant and the negative correlation between stay green and ASI was also not significant. However, a positive significant correlation was observed between ear aspect and ASI (0.52).
Table 3 Correlation between some traits of maize under drought conditions
Days to Anthesis
Days to Silking
Anthesis Silking Interval (ASI)
Plant Height (cm)
Ear Height (cm)
Plant Aspect
Ear Aspect
Grain Yield
(kgha-1)
Number of Ears per
Plant (EPP)
Stay Green
Days to Anthesis 1
Days to Silking 0.86** 1
ASI 0.34** 0.77** 1
Plant Height (cm) -0.25** -0.35** -0.33** 1
Ear Height (cm) -0.12 -0.19* -0.21* 0.77** 1
Plant Aspect 0.09 0.08 0.04 -0.43** -0.28** 1
Ear Aspect 0.31** 0.50** 0.52** -0.58** -0.44** 0.29** 1
Grain Yield (kgha-1) -0.41** -0.6** -0.6** 0.52** 0.44** -0.33**-0.79** 1
EPP -0.2* -0.3** -0.31** 0.28** 0.27** -0.23**-0.38** 0.55** 1
Stay Green -0.04 -0.06 -0.06 -0.27** -0.18* 0.66** 0.22** -0.23** -0.2* 1
*=Significant at 5% level of probability, ** =significant at 1% level of probability, NS=not significant
DISCUSSION
A higher ratio of GCA effects than that of the SCA effects were indications that potentially discriminating testers could be identified and the inheritance pattern was additive gene action. It can also be stated that the differences among the single-cross
hybrids was the result of the GCA effects. This is similar to the report of Badu-Apraku et al. (2012) that GCA is dominant over SCA under stress conditions. For grain yield, the SCA was more important than GCA, indicating that the non-additive gene was more important than the additive gene

Pertanika J. Trop. Agric. Sci. 41 (2): 815 – 824 (2018)
Shaibu, A. S.
822
in the inheritance pattern under drought stress. Badu-Apraku et al. (2013) also reported the preponderance of non-additive gene action than additive gene action for grain yield under drought stress. The SCA was more responsible for the differences among the diallel crosses for grain yield. This result also appears consistent with the findings of Guei and Wassom (1992), who reported that there was preponderance of non-additive over additive genetic effects for grain yield in maize under drought stress. With the exception of grain yield, the ratio of the relative importance of GCA over SCA was close to unity. Therefore, GCA can be used solely to predict the performance of specific hybrids in drought-prone areas or selection in drought environments.
From the correlation obtained in this study, ASI, plant aspect, ear aspect and stay green characteristics were negatively correlated with yield. Selection of hybrids with low ASI and low score for plant aspect, ear aspect and stay green characteristics will indirectly lead to selection of hybrids with higher yields. Also, a breeding objective can be directed towards improving these traits. From these correlations it can also be inferred that lines with negative GCA and SCA for ASI, plant aspect, ear aspect and stay green characteristics and positive GCA grain yield are mostly desirable and tolerant to drought. Such relationship has been previously reported by Bolanos and Edmeades (1996) and Badu-Apraku et al. (2011), who independently reported a strong negative correlation between these
traits. The positive GCA recorded for TZdEEI 11 with respect to grain yield and a negative GCA for stay green characteristics indicated that this inbred line can combine with other inbred lines to produce high yielding hybrids under drought conditions and could also be used as testers. TZdEEI 12 had a positive GCA for yield and stay green characteristic, suggesting that this inbred line can also be used as a tester. The significant SCA values showed that hybrids can be selected as single cross testers with respect to a particular trait showing such significance. TZdEEI 1 × TZEEI 58 was found to be a tolerant single cross hybrid because it had a positive SCA for yield and negative SCA for ASI, plant aspect, ear aspect and stay green characteristics, while TZdEEI 9 × TZdEEI 13, TZdEEI 1 × TZdEEI 12, TZEEI 58 × TZEEI 63 and TZdEEI 5 × TZdEEI 12 were found to be susceptible single cross hybrids because they were the opposite of TZdEEI 1 × TZEEI 58.
CONCLUSION
In conclusion, additive gene action is more important in trait expression (with the exception of grain yield) than non-additive gene action in the set of hybrids used for this study. Also, performance of hybrids can be predicted using GCA solely. Anthesis silking interval, plant aspect, ear aspect and stay green characteristics were found to be traits that can be used for selection and improvement of grain yield of extra early maize in drought situations and could be used as indicators for drought
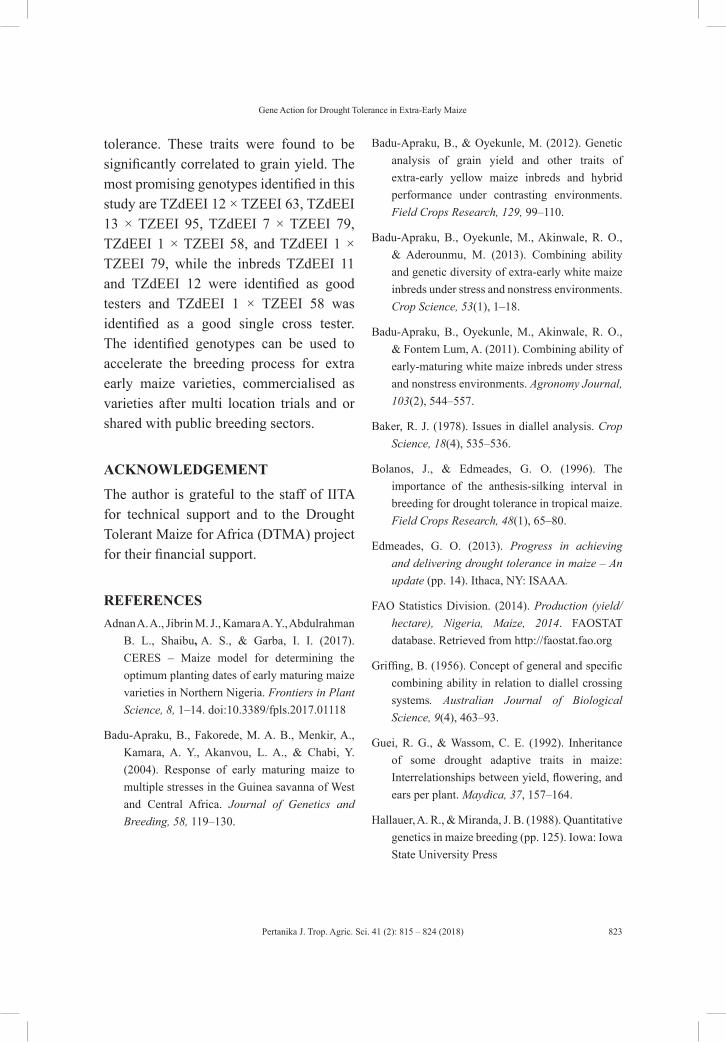
Pertanika J. Trop. Agric. Sci. 41 (2): 815 – 824 (2018)
Gene Action for Drought Tolerance in Extra-Early Maize
823
tolerance. These traits were found to be significantly correlated to grain yield. The most promising genotypes identified in this study are TZdEEI 12 × TZEEI 63, TZdEEI 13 × TZEEI 95, TZdEEI 7 × TZEEI 79, TZdEEI 1 × TZEEI 58, and TZdEEI 1 × TZEEI 79, while the inbreds TZdEEI 11 and TZdEEI 12 were identified as good testers and TZdEEI 1 × TZEEI 58 was identified as a good single cross tester. The identified genotypes can be used to accelerate the breeding process for extra early maize varieties, commercialised as varieties after multi location trials and or shared with public breeding sectors.
ACKNOWLEDGEMENT
The author is grateful to the staff of IITA for technical support and to the Drought Tolerant Maize for Africa (DTMA) project for their financial support.
REFERENCESAdnan A. A., Jibrin M. J., Kamara A. Y., Abdulrahman
B. L., Shaibu, A. S., & Garba, I. I. (2017). CERES – Maize model for determining the optimum planting dates of early maturing maize varieties in Northern Nigeria. Frontiers in Plant Science, 8, 1–14. doi:10.3389/fpls.2017.01118
Badu-Apraku, B., Fakorede, M. A. B., Menkir, A., Kamara, A. Y., Akanvou, L. A., & Chabi, Y. (2004). Response of early maturing maize to multiple stresses in the Guinea savanna of West and Central Africa. Journal of Genetics and Breeding, 58, 119–130.
Badu-Apraku, B., & Oyekunle, M. (2012). Genetic analysis of grain yield and other traits of extra-early yellow maize inbreds and hybrid performance under contrasting environments. Field Crops Research, 129, 99–110.
Badu-Apraku, B., Oyekunle, M., Akinwale, R. O., & Aderounmu, M. (2013). Combining ability and genetic diversity of extra-early white maize inbreds under stress and nonstress environments. Crop Science, 53(1), 1–18.
Badu-Apraku, B., Oyekunle, M., Akinwale, R. O., & Fontem Lum, A. (2011). Combining ability of early-maturing white maize inbreds under stress and nonstress environments. Agronomy Journal, 103(2), 544–557.
Baker, R. J. (1978). Issues in diallel analysis. Crop Science, 18(4), 535–536.
Bolanos, J., & Edmeades, G. O. (1996). The importance of the anthesis-silking interval in breeding for drought tolerance in tropical maize. Field Crops Research, 48(1), 65–80.
Edmeades, G. O. (2013). Progress in achieving and delivering drought tolerance in maize – An update (pp. 14). Ithaca, NY: ISAAA.
FAO Statistics Division. (2014). Production (yield/hectare), Nigeria, Maize, 2014. FAOSTAT database. Retrieved from http://faostat.fao.org
Griffing, B. (1956). Concept of general and specific combining ability in relation to diallel crossing systems. Australian Journal of Biological Science, 9(4), 463–93.
Guei, R. G., & Wassom, C. E. (1992). Inheritance of some drought adaptive traits in maize: Interrelationships between yield, flowering, and ears per plant. Maydica, 37, 157–164.
Hallauer, A. R., & Miranda, J. B. (1988). Quantitative genetics in maize breeding (pp. 125). Iowa: Iowa State University Press

Pertanika J. Trop. Agric. Sci. 41 (2): 815 – 824 (2018)
Shaibu, A. S.
824
Hung, H. Y., & Holland, J. B. (2012). Diallel analysis of resistance to fusarium ear rot and fumonisin contamination in maize. Crop Science, 52(5), 2173–2181. doi:10.2135/cropsci2012.03.0154
Menkir, A., & Kling, J. G. (2007). Response to recurrent selection for resistance to Striga hermonthica (Del.) Benth in a tropical maize population. Crop Science, 47(2), 674–682.
SAS Institute. (2001). Statistical analysis software (SAS). Users’ guide. Cary, NC: SAS Institute.
Zhang, Y., Kang, M. S., & Lamkey, K. R. (2005). DIALLEL-SAS05: A comprehensive program for Griffing’s and Gardner-Eberhart analyses. Agronomy Journal, 97(4), 1097–1106.
Pertanika J. Trop. Agric. Sci. 41 (2): 825 – 832 (2018)
ISSN: 1511-3701 © Universiti Putra Malaysia Press
TROPICAL AGRICULTURAL SCIENCEJournal homepage: http://www.pertanika.upm.edu.my/
ARTICLE INFOArticle history:Received: 18 September 2017Accepted: 30 April 2018
E-mail addresses:[email protected] (Kurnia Paramita Sari)[email protected] (Apri Sulistyo)* Corresponding author
Assessment of Soybean Resistance to Whitefly (Bemisia tabaci Genn.) Infestations
Kurnia Paramita Sari and Apri Sulistyo*Indonesian Legumes and Tuber Crops Research Institute, Jl. Raya Kendalpayak, Malang 65101, East Java, Indonesia
ABSTRACT
The use of resistant varieties is one of the best ways to control whitefly attacks. However, to date, there is no soybean variety that is resistant to whitefly. In this study, we aimed to assess the resistance of four soybean genotypes to whitefly. Anjasmoro variety was planted as a susceptible control while G100H was used as resistant control. The study was conducted in a greenhouse using a free-choice test. All soybean genotypes were planted in polybags and arranged in a randomised completely block design with three replicates. Resistance is categorised based on the intensity of leaf damage which occurred at 45-days-old plant. The leaf damage intensity was scored using two different methods. The results showed the intensity of leaf damage by using the first method varied between 7.43% (Dena 1) and 23.93% (Anjasmoro); while that of the second method ranged between 18.03% (G100H) and 37.85% (Anjasmoro). Anjasmoro was consistently classified as highly susceptible, while Gema was consistently categorised as moderately resistant to whitefly. Dena 1 and G100H were classified as moderately resistant - resistant, while Dega 1 and Devon 1 were categorised as susceptible - moderately resistant to whitefly. Resistance of soybean genotypes tested against whitefly correlated with the density of leaf trichomes. Correlation analysis shows a negative correlation between the intensity of leaf damage and the number of leaf trichomes (r = -0.29, p = 0.24) based on method 1, thus indicating a low antixenosis mechanism in whitefly resistant genotypes.
Keywords: Antixenosis mechanism, intensity of leaf damage, leaf trichomes, soybean, whitefly
INTRODUCTION
Whitefly (Bemisia tabaci Genn.) is a major pest in soybean cultivation in Indonesia. The attacks of whitefly can reduce soybean
Pertanika J. Trop. Agric. Sci. 41 (2): 825 – 832 (2018)
Kurnia Paramita Sari and Apri Sulistyo
826
yields, even crop failure and that can occur directly or indirectly. The direct damage occurs when nymphs and imago of whitefly pierce and suck the leaves liquid of the host plant causing chlorosis in the leaves (Hoodle, 2003). Honey dew excreted by the two stadia become a growth medium for the sooty mould on the leaf surface that causes disruption of the photosynthesis process (Hilje & Morales, 2008; Palumbo, 2016). The damage occurs indirectly when a virus carried by whitefly is transmitted to the host plant (Jones, 2003; Navas et al., 2011; Rodrigues et al., 2014).
One of the alternative techniques to control whitefly based on the principles of integrated pest management is to plant resistant varieties. Soybean varieties that are resistant to whitefly can be obtained through a soybean breeding programme. One important step to obtain resistant varieties is the selection of resistant plant. Planting soybean varieties resistance to whitefly infestations should consider several criteria. The density of leaf trichomes is one of morphological characters that are usually associated with resistance properties (Haq et al., 2003; Lima & Lara, 2004). In addition, the thickness of the leaves plays a role in determining antixenosis mechanism in soybean (Sulistyo & Inayati, 2016). When it is linked to the presence of pests, total population of egg, larva, pupa, and imago per leaf area can be used to determine soybean resistance to whitefly infestations (Gulluoglu et al., 2010). However, the nymph is the stage of whitefly that causes
the highest leaf damage, so its presence determines the level of resistance of soybean genotype (Xu et al., 2005; Amro et al., 2009; Xu et al., 2009; and Xu, 2009).
To the best of the present authors’ knowledge, there is yet to be a standard method to classify soybean genotypes according to their resistance characteristic against whitefly in Indonesia. A method often used is by calculating the intensity of leaf damage (Inayati & Marwoto, 2012) using five scores leaf damage that occurs in each leaf. Scores range from 0 (no damage symptoms) to 4 (appearance of sooty mould, abnormal pods and seeds). A Similar method is also used in black gram (Vigna mungo). Taggar, Gill and Sandhu (2013) scored leaf damages ranging from a score of 1 (no damage to the leaves) to a score of 5 (dry and die leaves), to determine black gram resistance to whitefly infestations. This study was aimed at developing two methods to determine the whitefly resistant soybean varieties based on their leaf damage.
MATERIALS AND METHODS
This study was conducted in a greenhouse from July to September 2016. Six genotypes of soybean were tested for resistance to whitefly infestations including Anjasmoro as susceptible control, G100H as resistant control, as well as four soybean varieties, namely Dega 1, Gema, Dena 1, and Devon 1. All genotypes were planted in polybags which 35 cm in diameter and
Pertanika J. Trop. Agric. Sci. 41 (2): 825 – 832 (2018)
Assessment of Soybean Resistance to Whitefly Infestations
827
35 cm in height. The planting medium was used was soil and compost at the ratio 1:1. Three seeds of each genotype were planted in one polybag. NPK fertiliser with a dose of 5 g per polybag was also provided. The research was arranged in a randomised completely block design with three replicates.
The resistance of six soybean genotypes to whitefly was tested using a free choice test. Each replicate is placed in bamboo cage covered with tile fabric in order to prevent the whitefly from flying to one replicate to the other , but still allows it to move from one genotype to another according to its preference. The bamboo cages were 200 cm in height x 150 cm wide x 350 cm long. Whitefly infestation was done on 21-day-old plants by placing 10 imago whiteflies to leaf surface of each individual plant (Mansaray & Sundufu, 2009).
The leaf damages were observed on plants 45 days after planting. They (the damages on the leaf) were scored based on two different methods. The first scoring method was based on Inayati and Marwoto (2012) the second method was adapted from Taggar et al. (2013). The resistance category of soybean genotypes was tested using Chiang and Talekar’s formula (1980). The leaf trichomes and leaf thickness were studied on 49-day-old plants to determine whether there was an antixenosis mechanism present. The fifth leaf from the above was used as a reference in calculating leaf trichomes and leaf thickness. The observations were performed under a light microscope.
RESULTS AND DISCUSSION
The Intensity of Leaf Damage and Resistance Category
Table 1 shows results of leaf damage using method 1. The intensity of leaf damage of six soybean genotypes varies between 7.43% and 23.98%. Anjasmoro which served as a susceptible control was the most severe with leaf damage reaching 23.98%. Among the four tested genotypes, none of which showed leaf damage more than the susceptible control. Meanwhile, G100H that served as a resistant control showed 10.91% of leaf damage. Better resistances in Dena 1 and Gema were observed with the intensities of leaves damage at 7.43% and 8.49% respectively, compared with resistant control-.
Using method 1 (Table 1) on four genotypes, it was found no soybean genotypes was highly resistant (HR). However, one resistant (R) genotype (Dena 1), one moderately resistant (MR) genotypes (Gema), and two susceptible (S) genotype (Dega 1 and Devon 1) were observed. The resistant control (G100H) was categorised as moderately resistant genotype. The susceptible control (Anjasmoro) was categorised as highly susceptible. These results indicate that the first method was effective in distinguishing between resistant and susceptible genotype of soybean to whitefly.
Table 1 shows leaf damage intensity of six soybean genotypes calculated using method 2 showed higher values, compared with method 1. These values ranged between 18.03% and 37.85%. In
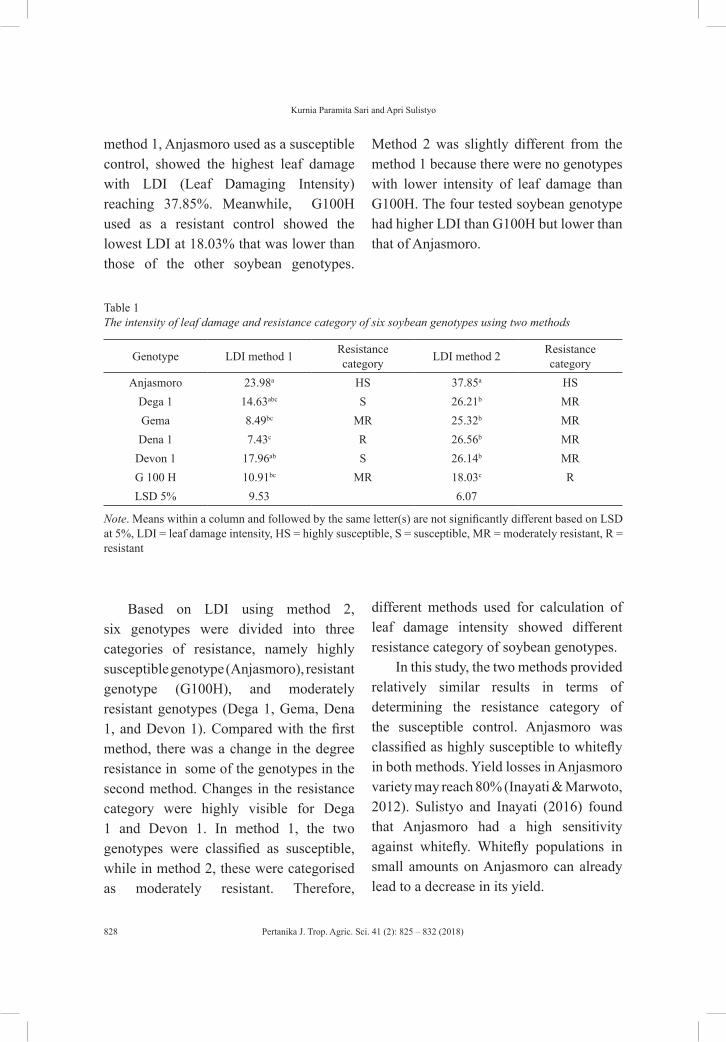
Pertanika J. Trop. Agric. Sci. 41 (2): 825 – 832 (2018)
Kurnia Paramita Sari and Apri Sulistyo
828
method 1, Anjasmoro used as a susceptible control, showed the highest leaf damage with LDI (Leaf Damaging Intensity) reaching 37.85%. Meanwhile, G100H used as a resistant control showed the lowest LDI at 18.03% that was lower than those of the other soybean genotypes.
Method 2 was slightly different from the method 1 because there were no genotypes with lower intensity of leaf damage than G100H. The four tested soybean genotype had higher LDI than G100H but lower than that of Anjasmoro.
Table 1The intensity of leaf damage and resistance category of six soybean genotypes using two methods
Genotype LDI method 1 Resistance category LDI method 2 Resistance
categoryAnjasmoro 23.98a HS 37.85a HS
Dega 1 14.63abc S 26.21b MRGema 8.49bc MR 25.32b MRDena 1 7.43c R 26.56b MR
Devon 1 17.96ab S 26.14b MRG 100 H 10.91bc MR 18.03c RLSD 5% 9.53 6.07
Note. Means within a column and followed by the same letter(s) are not significantly different based on LSD at 5%, LDI = leaf damage intensity, HS = highly susceptible, S = susceptible, MR = moderately resistant, R = resistant
Based on LDI using method 2, six genotypes were divided into three categories of resistance, namely highly susceptible genotype (Anjasmoro), resistant genotype (G100H), and moderately resistant genotypes (Dega 1, Gema, Dena 1, and Devon 1). Compared with the first method, there was a change in the degree resistance in some of the genotypes in the second method. Changes in the resistance category were highly visible for Dega 1 and Devon 1. In method 1, the two genotypes were classified as susceptible, while in method 2, these were categorised as moderately resistant. Therefore,
different methods used for calculation of leaf damage intensity showed different resistance category of soybean genotypes.
In this study, the two methods provided relatively similar results in terms of determining the resistance category of the susceptible control. Anjasmoro was classified as highly susceptible to whitefly in both methods. Yield losses in Anjasmoro variety may reach 80% (Inayati & Marwoto, 2012). Sulistyo and Inayati (2016) found that Anjasmoro had a high sensitivity against whitefly. Whitefly populations in small amounts on Anjasmoro can already lead to a decrease in its yield.

Pertanika J. Trop. Agric. Sci. 41 (2): 825 – 832 (2018)
Assessment of Soybean Resistance to Whitefly Infestations
829
In this study, Gema, Dena 1, and G100H soybean genotypes were classified as resistance – moderate resistance to whitefly. Therefore, it is suggested that Gema, Dena 1, and G100H consist of antixenosis that are resistant to whitefly. Sulistyo and Inayati (2016) reported that antixenosis resistance of Gema against whitefly correlates with the density and length of leaf trichomes, as well as leaf thickness. This may also explain why the resistance category of Gema is consistent despite using two different scoring methods.
Dena 1 is progeny of a cross between Argomulyo and IAC 100, while G100H is soybean genotype obtained through crosses between IAC 100 and Hymmeshirazu. The resistance of Dena 1 and G100H against whitefly are allegedly derived from IAC 100. Previous studies have pointed to IAC 100 as one of the soybean germplasms that can be used as a source of gene resistance against various pests (Piubelli et al., 2003;
Pinheiro, Vello, Rossetto, & Zucchi, 2005; Suharsono, 2006; Suharsono & Adie, 2010). The IAC 100 has a mechanism of antibiosis against whitefly by extending the period of nymphs and reducing the appearance of imago up to 80% (Lima & Lara, 2004), thus, showing symptoms of reduced damage (Vieira et al., 2011).
Leaf Trichomes and Leaf Thickness
Table 2 contains an analysis of variance that shows significant differences in the character of leaf trichomes among six soybean genotypes. Dena 1 and Dega 1 had the highest leaf trichomes at 88 and 82 respectively. The lowest number of trichomes were found on G100H and Anjasmoro, 45 and 47 trichomes respectively. It can be concluded that analysis of variance on the leaf thickness character showed no differences in leaf thickness among the six soybean genotypes.
Table 2Leaf trichomes and leaf thickness of six soybean genotypes
Genotype Leaf trichomes Leaf thickness (μm)
Anjasmoro 47.0c 0.43a
Dega 1 82.7ab 0.43a
Gema 64.7bc 0.40a
Dena 1 88.7a 0.44a
Devon 1 51.00c 0.44a
G 100 H 45.3c 0.43a
LSD 5% 22.43 0.07
Note. Means within a column and followed by the same letter(s) are not significantly different based on LSD at 5%
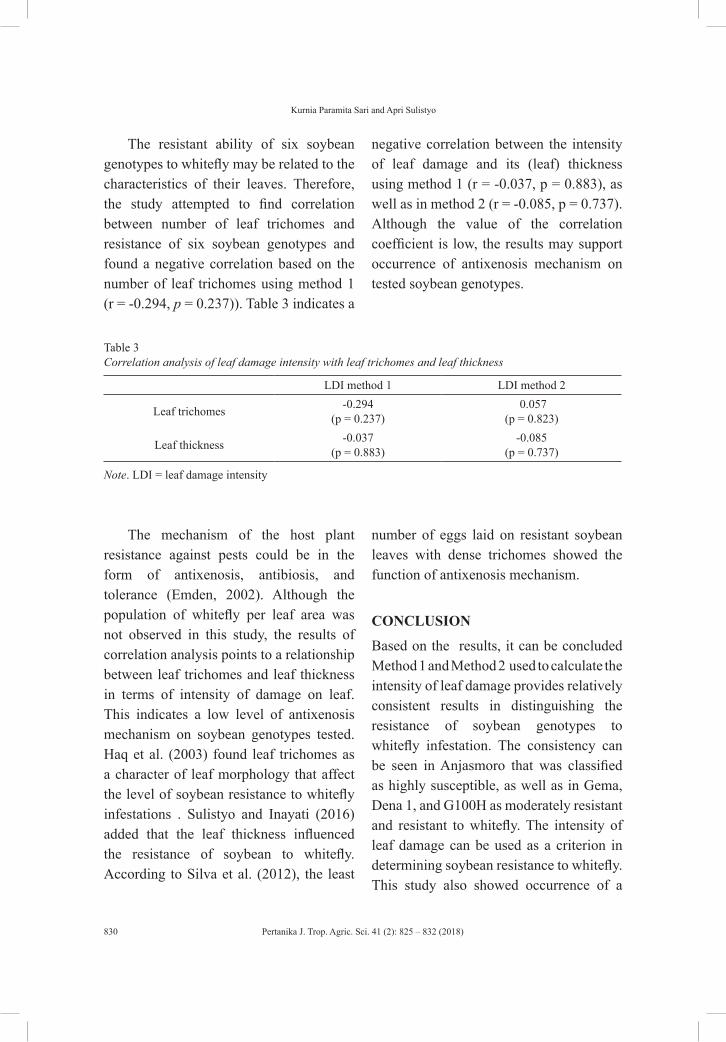
Pertanika J. Trop. Agric. Sci. 41 (2): 825 – 832 (2018)
Kurnia Paramita Sari and Apri Sulistyo
830
The resistant ability of six soybean genotypes to whitefly may be related to the characteristics of their leaves. Therefore, the study attempted to find correlation between number of leaf trichomes and resistance of six soybean genotypes and found a negative correlation based on the number of leaf trichomes using method 1 (r = -0.294, p = 0.237)). Table 3 indicates a
negative correlation between the intensity of leaf damage and its (leaf) thickness using method 1 (r = -0.037, p = 0.883), as well as in method 2 (r = -0.085, p = 0.737). Although the value of the correlation coefficient is low, the results may support occurrence of antixenosis mechanism on tested soybean genotypes.
Table 3Correlation analysis of leaf damage intensity with leaf trichomes and leaf thickness
LDI method 1 LDI method 2
Leaf trichomes -0.294(p = 0.237)
0.057(p = 0.823)
Leaf thickness -0.037(p = 0.883)
-0.085(p = 0.737)
Note. LDI = leaf damage intensity
The mechanism of the host plant resistance against pests could be in the form of antixenosis, antibiosis, and tolerance (Emden, 2002). Although the population of whitefly per leaf area was not observed in this study, the results of correlation analysis points to a relationship between leaf trichomes and leaf thickness in terms of intensity of damage on leaf. This indicates a low level of antixenosis mechanism on soybean genotypes tested. Haq et al. (2003) found leaf trichomes as a character of leaf morphology that affect the level of soybean resistance to whitefly infestations . Sulistyo and Inayati (2016) added that the leaf thickness influenced the resistance of soybean to whitefly. According to Silva et al. (2012), the least
number of eggs laid on resistant soybean leaves with dense trichomes showed the function of antixenosis mechanism.
CONCLUSION
Based on the results, it can be concluded Method 1 and Method 2 used to calculate the intensity of leaf damage provides relatively consistent results in distinguishing the resistance of soybean genotypes to whitefly infestation. The consistency can be seen in Anjasmoro that was classified as highly susceptible, as well as in Gema, Dena 1, and G100H as moderately resistant and resistant to whitefly. The intensity of leaf damage can be used as a criterion in determining soybean resistance to whitefly. This study also showed occurrence of a
Pertanika J. Trop. Agric. Sci. 41 (2): 825 – 832 (2018)
Assessment of Soybean Resistance to Whitefly Infestations
831
low antixenosis mechanism that correlates with leaf trichomes density of the soybean genotypes tested.
ACKNOWLEDGEMENT
The authors acknowledge with gratitude the grant provided by Ministry of Research, Technology and Higher Education through INSINAS scheme in 2016 (grant number RD-2016-0185).
REFERENCESAmro, M. A., Omar, M. S., Abdel-Moniem, A. S.,
& Yamani, K. M. M. (2009). Determination of resistance of experimental soybeans to the lima bean pod borer Etiella zinckenella Treitschke and the whitefly Bemisia tabaci Gennadius at Dakhla Oases, New Valley, Egypt. Archives of Phytopathology and Plant Protection, 42(6), 552-558.
Chiang, H. S., & Talekar, N. S. (1980). Identification of source of resistance to the beanfly and two other Agromyzid flies in soybean and mungbean. Journal of Economic Entomology, 73(2), 197-199.
Emden, H. (2002). Mechanisms of resistance: Antibiosis, antixenosis, tolerance, nutrition. In D. Pimentel (Ed.), Encyclopedia of pest management (pp. 483-486). Florida, USA: CRC Press.
Gulluoglu, L., Arioglu, H., & Kurt, C. (2010). Field evaluation of soybean cultivars for resistance to whitefly (Bemisia tabaci Genn.) infestations. African Journal of Agricultural Research, 5(7), 555-560.
Hilje, L., & Morales, F. J. (2008). Whitefly bioecology and management in Latin America. In J. Capinera (Ed), Encyclopedia of entomology (p. 4250-4260). New York, USA: Springer.
Hoodle, M. (2003). The biology and management of the silverleaf whitefly, Bemisia argentifolii Bellows and Perring (Homoptera: Aleyrodidae) on greenhouse grown ornamentals. Retrieved from http://www.biocontrol.ucr.edu/bemisia.html
Haq, I. U., Amjad, M., Kakakhel, S. A., & Khokhar, M. A. (2003). Morphological and physiological parameters of soybean resistance to insect pests. Asian Journal of Plant Science, 2(2), 202-204.
Inayati, A., & Marwoto. (2012). Pengaruh kombinasi aplikasi insektisida dan varietas unggul terhadap intensitas serangan kutu kebul dan hasil kedelai [Effects of combination insecticide application and varieties on whitefly infestation and soybean yield]. Penelitian Pertanian Tanaman Pangan, 31(1), 13-21.
Jones, D. R. (2003). Plant viruses transmitted by whiteflies. European Journal of Plant Pathology, 109(3), 195-219.
Lima, A. C. S., & Lara, F. M. (2004). Resistência de genótipos de soja à mosca branca Bemisa tabaci (Genn.) à biótipo B (Hemiptera: Aleyrodidae) [Resistance of soybean genotypes to the whitefly Bemisa tabaci (Genn.) to the biotype B (Hemiptera: Aleyrodidae)]. Neotropical Entomology, 33(1), 71-75.
Mansaray, A., & Sundufu, A. J. (2009). Oviposition, development and survivorship of the sweet potato whitefly Bemisia tabaci on soybean, Glycine max, and the garden bean, Phaseolus vulgaris. Journal of Insect Science, 9(1), 1-6.
Navas, C. J., Fiallo, O. E., & Sanchez, C. S. (2011). Emerging virus diseases transmitted by whiteflies. Annual Review of Phytopathology, 49, 219-248.
Palumbo, J. C. (2016). Insect management on desert vegetables and melons: Whiteflies. Vegetable IPM Update, 7(19), 1-9.
Pertanika J. Trop. Agric. Sci. 41 (2): 825 – 832 (2018)
Kurnia Paramita Sari and Apri Sulistyo
832
Pinheiro, J. B., Vello, N. A., Rossetto, C. J., & Zucchi, M. I. (2005). Potential of soybean genotypes as insect resistance source. Crop Breeding and Applied Biotechnology, 5, 294-301.
Piubelli, G. C., Hoffmann-Campo, C. B., Arruda, I. C., & Lara, F. M. (2003). Nymphal development, lipid content, growth and weight gain of Nezara viridula (L.) (Heteroptera: Pentatomidae) fed in soybean genotypes. Neotropical Entomology, 32(1), 127-312.
Rodrigues, J. C. V., Kondidie, D. B., Estevez-Jensen, C., Kitajima, E. W., Huckaba, R. M., & Foster, J. E. (2014). Infection in soybean and on multiple host plants in Puerto Rico by an isolate of cowpea mild mottle virus. Virus Reviews and Research, 19(1), 1-4.
Silva, J. P. G. F., Baldin, E. L. L., Souza, E. S., & Laurencao, A. L. (2012). Assessing Bemisia tabaci (Genn.) biotype B resistance in soybean genotypes: antixenosis and antibiosis. Chilean Journal of Agricultural Research, 72(4), 516-522.
Suharsono. (2006). Antixenosis morfologis salah satu faktor ketahanan kedelai terhadap hama pemakan polong [Morphological antioxosis is one of the factors of soybean resistance to pod feeding pods]. Buletin Palawija, 12, 29-34.
Suharsono, & Adie, M. M. (2010). Identifikasi sumber ketahanan aksesi plasma nutfah kedelai untuk ulat grayak Spodoptera litura F [Source of resistance in soybean germplasms to the common cutworm Spodoptera litura F.]. Buletin Plasma Nutfah, 16(1), 30-37.
Sulistyo, A., & Inayati, A. (2016). Mechanisms of antixenosis, antibiosis, and tolerance of fourteen soybean genotypes in response to whiteflies (Bemisia tabaci). Biodiversitas, 17(2), 447-453.
Taggar, G. K., Gill, R. S., & Sandhu, J. S. (2013). Evaluation of black gram (Vigna mungo (L.) Hepper) genotypes to the attack of whitefly, Bemisia tabaci (Gennadius) under screen-house conditions. Acta Phytopathologica et Entomologica Hungarica, 48(1), 53-62.
Vieira, S. S., Bueno, A. F., Boff, M. I., Bueno, R. C., & Hoffman-Campo, C.B. (2011). Resistance of soybean genotypes to Bemisia tabaci (Genn.) biotype B (Hemiptera: Aleyrodidae). Neotropical Entomology, 40(1), 117-122.
Xu, R. (2009). Evaluation and inheritance of resistance to whitefly Bemisia tabaci Gennadius in soybean. (Dissertation). Nanjing Agricultural College, China.
Xu, R., Li, W., Wang, C., Zhang, L., Dai, H., & Xing, H. (2009). Identification system of resistance to whitefly in soybean. Acta Agronomica Sinica, 35(3), 438-444.
Xu, R., Zhang, L., Wang, C., & Wang, J. (2005). Screening of soybean germplasm resistant to whitefly and the resistant mechanism. Journal of Plant Genetic Resources, 6(1), 56-62.
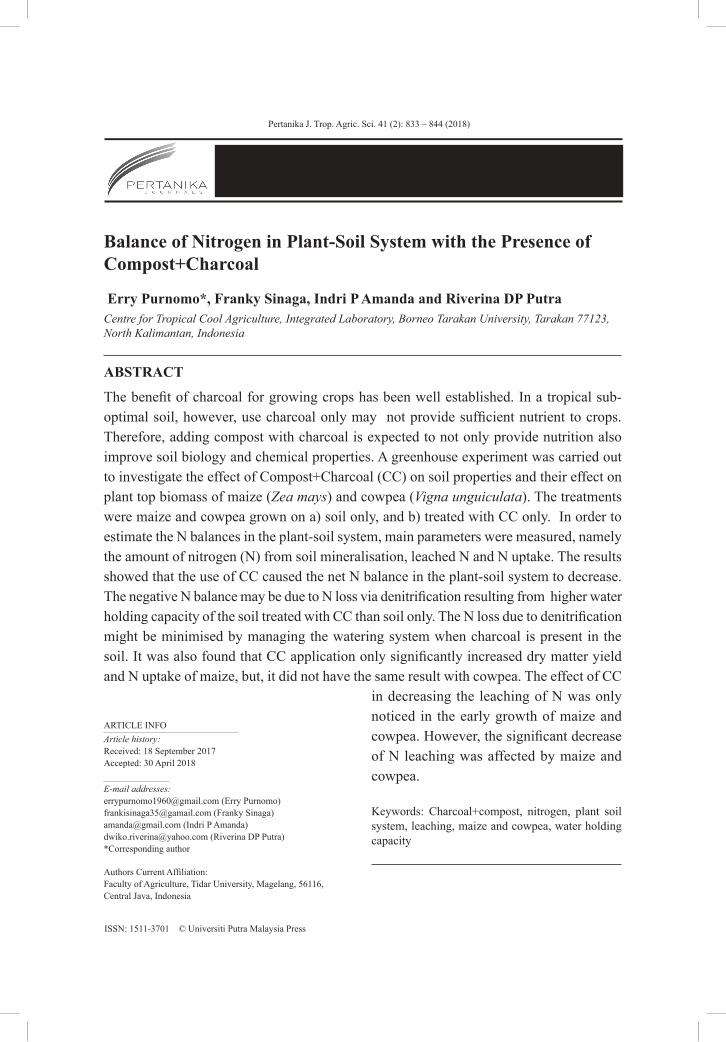
Pertanika J. Trop. Agric. Sci. 41 (2): 833 – 844 (2018)
ISSN: 1511-3701 © Universiti Putra Malaysia Press
TROPICAL AGRICULTURAL SCIENCEJournal homepage: http://www.pertanika.upm.edu.my/
ARTICLE INFOArticle history:Received: 18 September 2017Accepted: 30 April 2018
E-mail addresses:[email protected] (Erry Purnomo)[email protected] (Franky Sinaga)[email protected] (Indri P Amanda)[email protected] (Riverina DP Putra)*Corresponding author
Authors Current Affiliation:Faculty of Agriculture, Tidar University, Magelang, 56116, Central Java, Indonesia
Balance of Nitrogen in Plant-Soil System with the Presence of Compost+Charcoal
Erry Purnomo*, Franky Sinaga, Indri P Amanda and Riverina DP Putra Centre for Tropical Cool Agriculture, Integrated Laboratory, Borneo Tarakan University, Tarakan 77123, North Kalimantan, Indonesia
ABSTRACT
The benefit of charcoal for growing crops has been well established. In a tropical sub-optimal soil, however, use charcoal only may not provide sufficient nutrient to crops. Therefore, adding compost with charcoal is expected to not only provide nutrition also improve soil biology and chemical properties. A greenhouse experiment was carried out to investigate the effect of Compost+Charcoal (CC) on soil properties and their effect on plant top biomass of maize (Zea mays) and cowpea (Vigna unguiculata). The treatments were maize and cowpea grown on a) soil only, and b) treated with CC only. In order to estimate the N balances in the plant-soil system, main parameters were measured, namely the amount of nitrogen (N) from soil mineralisation, leached N and N uptake. The results showed that the use of CC caused the net N balance in the plant-soil system to decrease. The negative N balance may be due to N loss via denitrification resulting from higher water holding capacity of the soil treated with CC than soil only. The N loss due to denitrification might be minimised by managing the watering system when charcoal is present in the soil. It was also found that CC application only significantly increased dry matter yield and N uptake of maize, but, it did not have the same result with cowpea. The effect of CC
in decreasing the leaching of N was only noticed in the early growth of maize and cowpea. However, the significant decrease of N leaching was affected by maize and cowpea.
Keywords: Charcoal+compost, nitrogen, plant soil system, leaching, maize and cowpea, water holding capacity
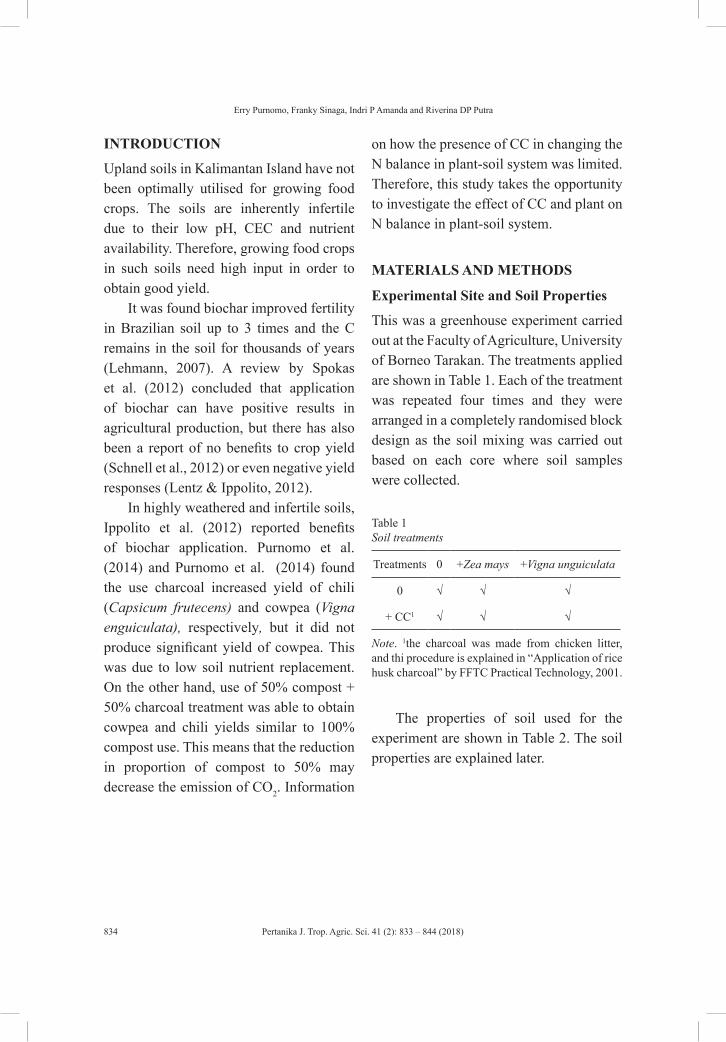
Pertanika J. Trop. Agric. Sci. 41 (2): 833 – 844 (2018)
Erry Purnomo, Franky Sinaga, Indri P Amanda and Riverina DP Putra
834
INTRODUCTION
Upland soils in Kalimantan Island have not been optimally utilised for growing food crops. The soils are inherently infertile due to their low pH, CEC and nutrient availability. Therefore, growing food crops in such soils need high input in order to obtain good yield.
It was found biochar improved fertility in Brazilian soil up to 3 times and the C remains in the soil for thousands of years (Lehmann, 2007). A review by Spokas et al. (2012) concluded that application of biochar can have positive results in agricultural production, but there has also been a report of no benefits to crop yield (Schnell et al., 2012) or even negative yield responses (Lentz & Ippolito, 2012).
In highly weathered and infertile soils, Ippolito et al. (2012) reported benefits of biochar application. Purnomo et al. (2014) and Purnomo et al. (2014) found the use charcoal increased yield of chili (Capsicum frutecens) and cowpea (Vigna enguiculata), respectively, but it did not produce significant yield of cowpea. This was due to low soil nutrient replacement. On the other hand, use of 50% compost + 50% charcoal treatment was able to obtain cowpea and chili yields similar to 100% compost use. This means that the reduction in proportion of compost to 50% may decrease the emission of CO2. Information
on how the presence of CC in changing the N balance in plant-soil system was limited. Therefore, this study takes the opportunity to investigate the effect of CC and plant on N balance in plant-soil system.
MATERIALS AND METHODS
Experimental Site and Soil Properties
This was a greenhouse experiment carried out at the Faculty of Agriculture, University of Borneo Tarakan. The treatments applied are shown in Table 1. Each of the treatment was repeated four times and they were arranged in a completely randomised block design as the soil mixing was carried out based on each core where soil samples were collected.
Table 1Soil treatments
Treatments 0 +Zea mays +Vigna unguiculata
0 √ √ √
+ CC1 √ √ √
Note. 1the charcoal was made from chicken litter, and thi procedure is explained in “Application of rice husk charcoal” by FFTC Practical Technology, 2001.
The properties of soil used for the experiment are shown in Table 2. The soil properties are explained later.
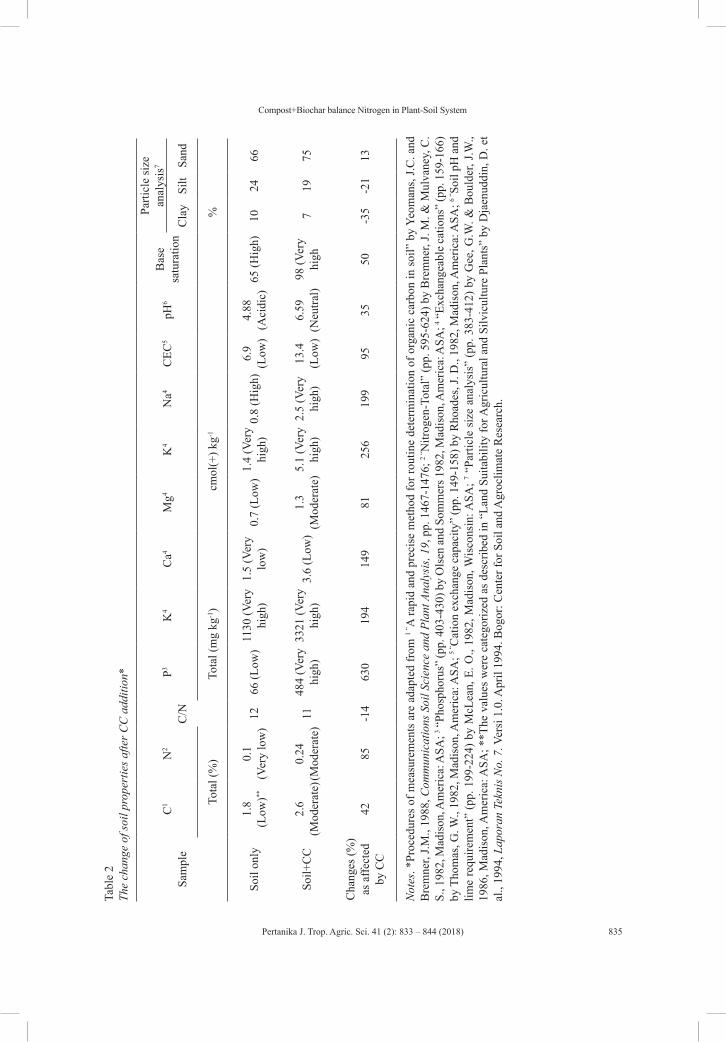
Pertanika J. Trop. Agric. Sci. 41 (2): 833 – 844 (2018)
Compost+Biochar balance Nitrogen in Plant-Soil System
835
Tabl
e 2
The
chan
ge o
f soi
l pro
pert
ies a
fter C
C a
dditi
on*
Sam
ple
C1
N2
C/N
P3K
4C
a4M
g4K
4N
a4C
EC5
pH6
Bas
e sa
tura
tion
Parti
cle
size
an
alys
is7
Cla
ySi
ltSa
nd
Tota
l (%
)To
tal (
mg
kg-1)
cmol
(+) k
g-1%
Soil
only
1.8
(Low
)**0.
1(V
ery
low
)12
66
(Low
)11
30 (V
ery
high
)1.
5 (V
ery
low
)0.
7 (L
ow)
1.4
(Ver
y hi
gh)
0.8
(Hig
h)6.
9 (L
ow)
4.88
(A
cidi
c)65
(Hig
h)10
2466
Soil+
CC
2.6
(Mod
erat
e)0.
24(M
oder
ate)
1148
4 (V
ery
high
)33
21 (V
ery
high
)3.
6 (L
ow)
1.3
(Mod
erat
e)5.
1 (V
ery
high
)2.
5 (V
ery
high
)13
.4
(Low
)6.
59
(Neu
tral)
98 (V
ery
high
719
75
Cha
nges
(%)
as a
ffect
ed
by C
C42
85-1
463
019
414
981
256
199
9535
50-3
5-2
113
Not
es. *
Proc
edur
es o
f mea
sure
men
ts a
re a
dapt
ed fr
om 1
“ A ra
pid
and
prec
ise
met
hod
for r
outin
e de
term
inat
ion
of o
rgan
ic c
arbo
n in
soi
l” b
y Ye
oman
s, J.C
. and
B
rem
ner,
J.M.,
1988
, Com
mun
icat
ions
Soi
l Sci
ence
and
Pla
nt A
naly
sis,
19, p
p. 1
467-
1476
; 2 “ N
itrog
en-T
otal
” (p
p. 5
95-6
24) b
y B
rem
ner,
J. M
. & M
ulva
ney,
C.
S., 1
982,
Mad
ison
, Am
eric
a: A
SA; 3 “
Phos
phor
us”
(pp.
403
-430
) by
Ols
en a
nd S
omm
ers 1
982,
Mad
ison
, Am
eric
a: A
SA; 4 “
Exch
ange
able
cat
ions
” (p
p. 1
59-1
66)
by T
hom
as, G
. W.,
1982
, Mad
ison
, Am
eric
a: A
SA; 5
“ Cat
ion
exch
ange
cap
acity
” (p
p. 1
49-1
58) b
y R
hoad
es, J
. D.,
1982
, Mad
ison
, Am
eric
a: A
SA; 6
“ Soi
l pH
and
lim
e re
quire
men
t” (p
p. 1
99-2
24) b
y M
cLea
n, E
. O.,
1982
, Mad
ison
, Wis
cons
in: A
SA; 7 “
Parti
cle
size
ana
lysi
s” (p
p. 3
83-4
12) b
y G
ee, G
.W. &
Bou
lder
, J.W
., 19
86, M
adis
on, A
mer
ica:
ASA
; **T
he v
alue
s w
ere
cate
goriz
ed a
s de
scrib
ed in
“La
nd S
uita
bilit
y fo
r Agr
icul
tura
l and
Silv
icul
ture
Pla
nts”
by
Dja
enud
din,
D. e
t al
., 19
94, L
apor
an T
ekni
s No.
7. V
ersi
1.0
. Apr
il 19
94. B
ogor
: Cen
ter f
or S
oil a
nd A
groc
limat
e R
esea
rch.
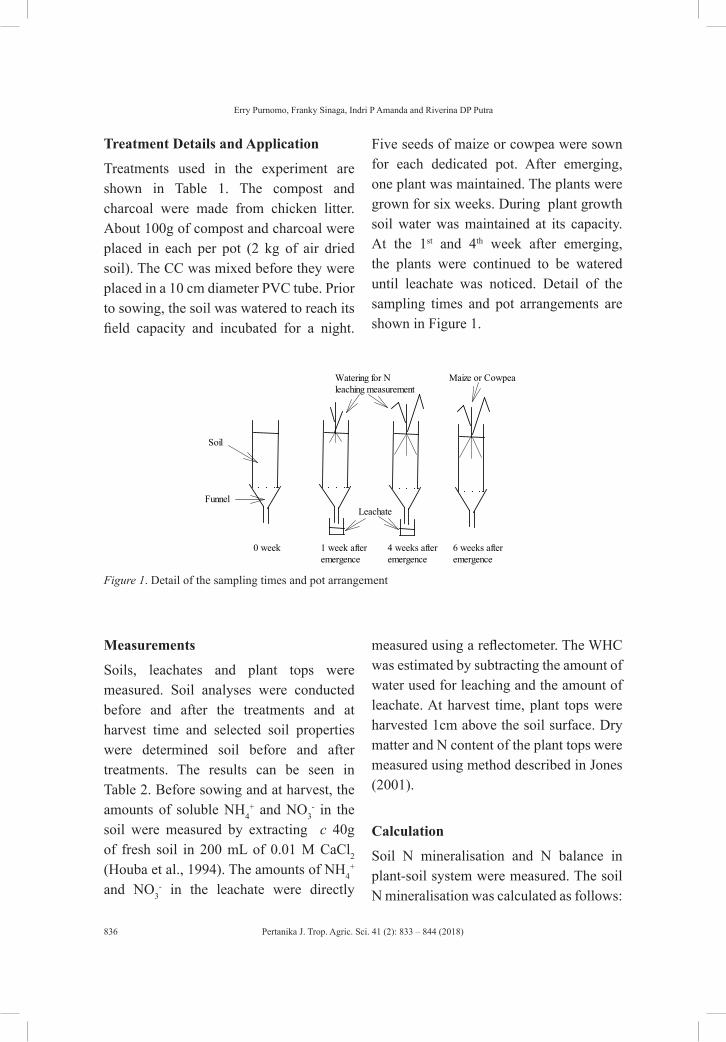
Pertanika J. Trop. Agric. Sci. 41 (2): 833 – 844 (2018)
Erry Purnomo, Franky Sinaga, Indri P Amanda and Riverina DP Putra
836
Treatment Details and Application
Treatments used in the experiment are shown in Table 1. The compost and charcoal were made from chicken litter. About 100g of compost and charcoal were placed in each per pot (2 kg of air dried soil). The CC was mixed before they were placed in a 10 cm diameter PVC tube. Prior to sowing, the soil was watered to reach its field capacity and incubated for a night.
Five seeds of maize or cowpea were sown for each dedicated pot. After emerging, one plant was maintained. The plants were grown for six weeks. During plant growth soil water was maintained at its capacity. At the 1st and 4th week after emerging, the plants were continued to be watered until leachate was noticed. Detail of the sampling times and pot arrangements are shown in Figure 1.
0 week 1 week afteremergence
4 weeks afteremergence
6 weeks afteremergence
Soil
Funnel
Watering for N leaching measurement
Leachate
Maize or Cowpea
Figure 1. Detail of the sampling times and pot arrangement
Measurements
Soils, leachates and plant tops were measured. Soil analyses were conducted before and after the treatments and at harvest time and selected soil properties were determined soil before and after treatments. The results can be seen in Table 2. Before sowing and at harvest, the amounts of soluble NH4
+ and NO3- in the
soil were measured by extracting c 40g of fresh soil in 200 mL of 0.01 M CaCl2 (Houba et al., 1994). The amounts of NH4
+ and NO3
- in the leachate were directly
measured using a reflectometer. The WHC was estimated by subtracting the amount of water used for leaching and the amount of leachate. At harvest time, plant tops were harvested 1cm above the soil surface. Dry matter and N content of the plant tops were measured using method described in Jones (2001).
Calculation
Soil N mineralisation and N balance in plant-soil system were measured. The soil N mineralisation was calculated as follows:
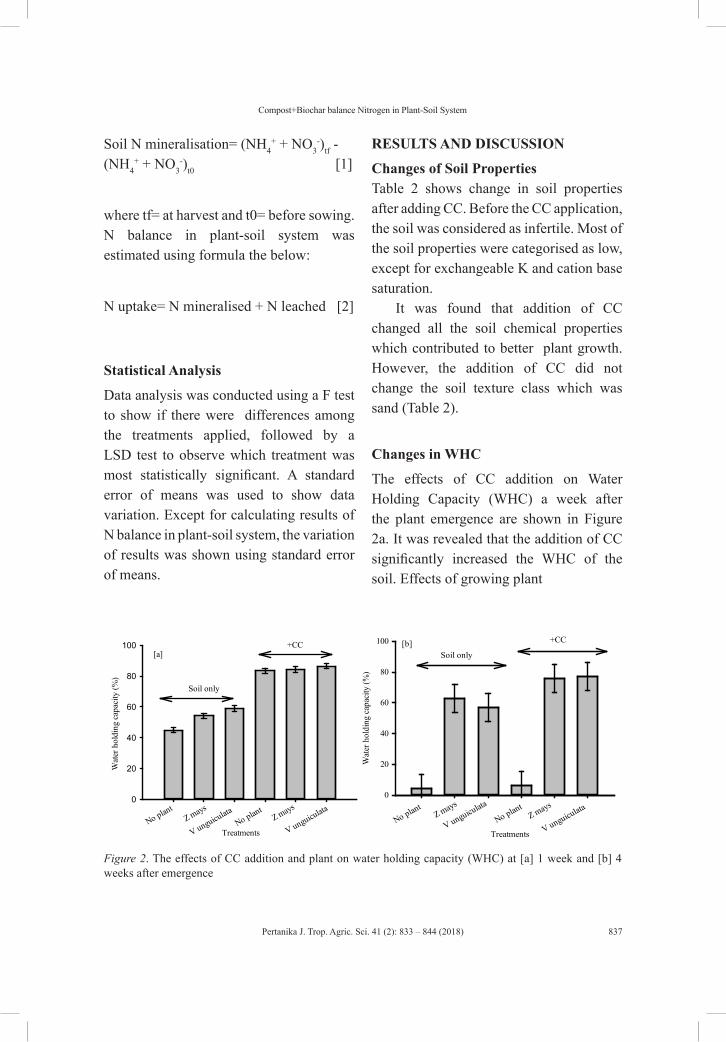
Pertanika J. Trop. Agric. Sci. 41 (2): 833 – 844 (2018)
Compost+Biochar balance Nitrogen in Plant-Soil System
837
Soil N mineralisation= (NH4+ + NO3
-)tf - (NH4
+ + NO3-)t0 [1]
where tf= at harvest and t0= before sowing.N balance in plant-soil system was estimated using formula the below:
N uptake= N mineralised + N leached [2]
Statistical Analysis
Data analysis was conducted using a F test to show if there were differences among the treatments applied, followed by a LSD test to observe which treatment was most statistically significant. A standard error of means was used to show data variation. Except for calculating results of N balance in plant-soil system, the variation of results was shown using standard error of means.
RESULTS AND DISCUSSION
Changes of Soil PropertiesTable 2 shows change in soil properties after adding CC. Before the CC application, the soil was considered as infertile. Most of the soil properties were categorised as low, except for exchangeable K and cation base saturation.
It was found that addition of CC changed all the soil chemical properties which contributed to better plant growth. However, the addition of CC did not change the soil texture class which was sand (Table 2).
Changes in WHC
The effects of CC addition on Water Holding Capacity (WHC) a week after the plant emergence are shown in Figure 2a. It was revealed that the addition of CC significantly increased the WHC of the soil. Effects of growing plant
Treatments
Wat
er h
oldi
ng c
apac
ity (%
)
0
20
40
60
80
100
No plantZ mays
V unguiculataNo plant
+CC
Soil only
[a]
Z mays
V unguiculata
Treatments
Wat
er h
oldi
ng c
apac
ity (%
)
0
20
40
60
80
100
No plantZ mays
V unguiculata
No plant
Soil only
+CC[b]
Z mays
V unguiculata
Figure 2. The effects of CC addition and plant on water holding capacity (WHC) at [a] 1 week and [b] 4 weeks after emergence
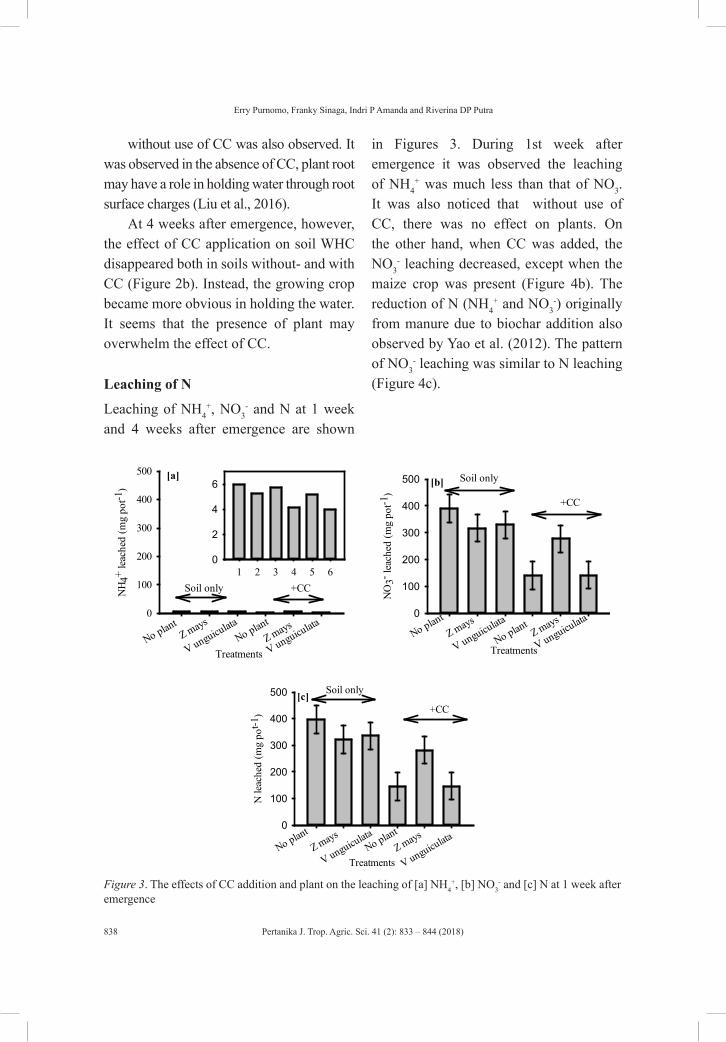
Pertanika J. Trop. Agric. Sci. 41 (2): 833 – 844 (2018)
Erry Purnomo, Franky Sinaga, Indri P Amanda and Riverina DP Putra
838
without use of CC was also observed. It was observed in the absence of CC, plant root may have a role in holding water through root surface charges (Liu et al., 2016).
At 4 weeks after emergence, however, the effect of CC application on soil WHC disappeared both in soils without- and with CC (Figure 2b). Instead, the growing crop became more obvious in holding the water. It seems that the presence of plant may overwhelm the effect of CC.
Leaching of N
Leaching of NH4+, NO3
- and N at 1 week and 4 weeks after emergence are shown
in Figures 3. During 1st week after emergence it was observed the leaching of NH4
+ was much less than that of NO3. It was also noticed that without use of CC, there was no effect on plants. On the other hand, when CC was added, the NO3
- leaching decreased, except when the maize crop was present (Figure 4b). The reduction of N (NH4
+ and NO3-) originally
from manure due to biochar addition also observed by Yao et al. (2012). The pattern of NO3
- leaching was similar to N leaching (Figure 4c).
Treatments
NH 4
+ le
ache
d (m
g po
t-1)
0
100
200
300
400
500
1 2 3 4 5 60
2
4
6
No plantZ mays
V unguiculataNo plant
+CCSoil only
[a]
V unguiculataZ mays
Treatments
NO
3- lea
ched
(mg
pot-1
)
0
100
200
300
400
500
No plantZ mays
V unguiculata
No plantZ mays
V unguiculata
+CC
Soil only[b]
Treatments
N le
ache
d (m
g po
t-1)
0
100
200
300
400
500
No plantZ mays
V unguiculataNo plant
+CC
Soil only[c]
Z mays
V unguiculata
Figure 3. The effects of CC addition and plant on the leaching of [a] NH4+, [b] NO3
- and [c] N at 1 week after emergence
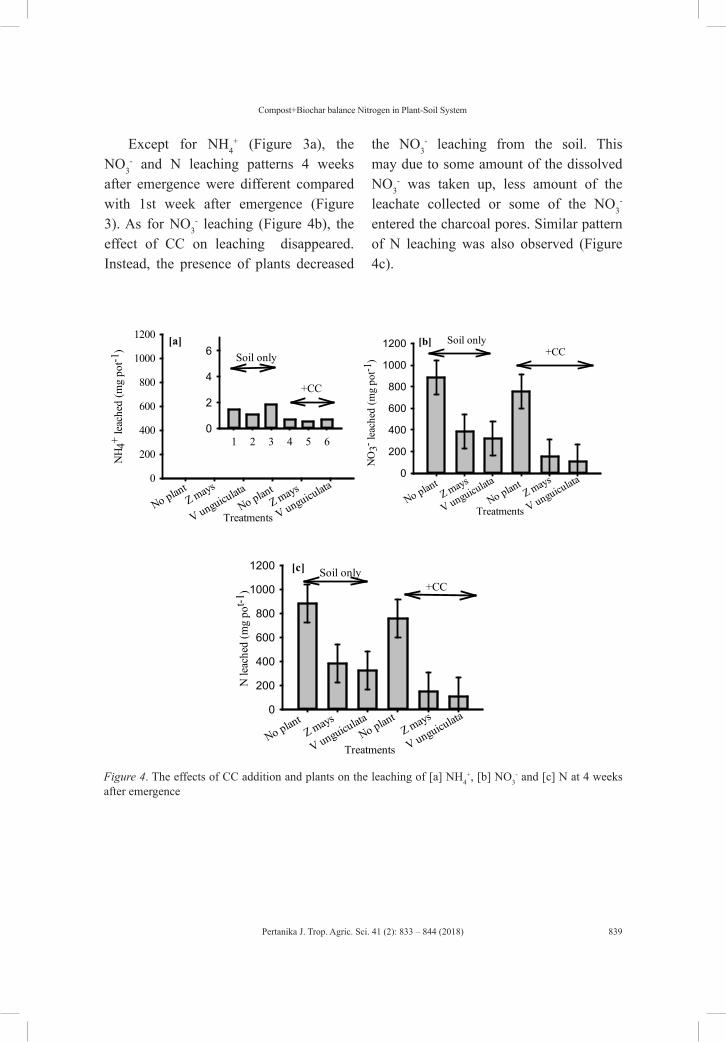
Pertanika J. Trop. Agric. Sci. 41 (2): 833 – 844 (2018)
Compost+Biochar balance Nitrogen in Plant-Soil System
839
Except for NH4+ (Figure 3a), the
NO3- and N leaching patterns 4 weeks
after emergence were different compared with 1st week after emergence (Figure 3). As for NO3
- leaching (Figure 4b), the effect of CC on leaching disappeared. Instead, the presence of plants decreased
the NO3- leaching from the soil. This
may due to some amount of the dissolved NO3
- was taken up, less amount of the leachate collected or some of the NO3
-
entered the charcoal pores. Similar pattern of N leaching was also observed (Figure 4c).
Treatments
NH 4
+ le
ache
d (m
g po
t-1)
0
200
400
600
800
1000
1200
1 2 3 4 5 60
2
4
6
No plantZ mays
V unguiculataNo plant
+CC
Soil only[a]
Z mays
V unguiculata
Treatments
NO
3- lea
ched
(mg
pot-1
)
0
200
400
600
800
1000
1200
No plantZ mays
V unguiculata
No plantZ mays
V unguiculata
+CCSoil only[b]
Treatments
N le
ache
d (m
g po
t-1)
0
200
400
600
800
1000
1200
No plantZ mays
V unguiculataNo plant
Z mays
V unguiculata
+CCSoil only[c]
Figure 4. The effects of CC addition and plants on the leaching of [a] NH4+, [b] NO3
- and [c] N at 4 weeks after emergence
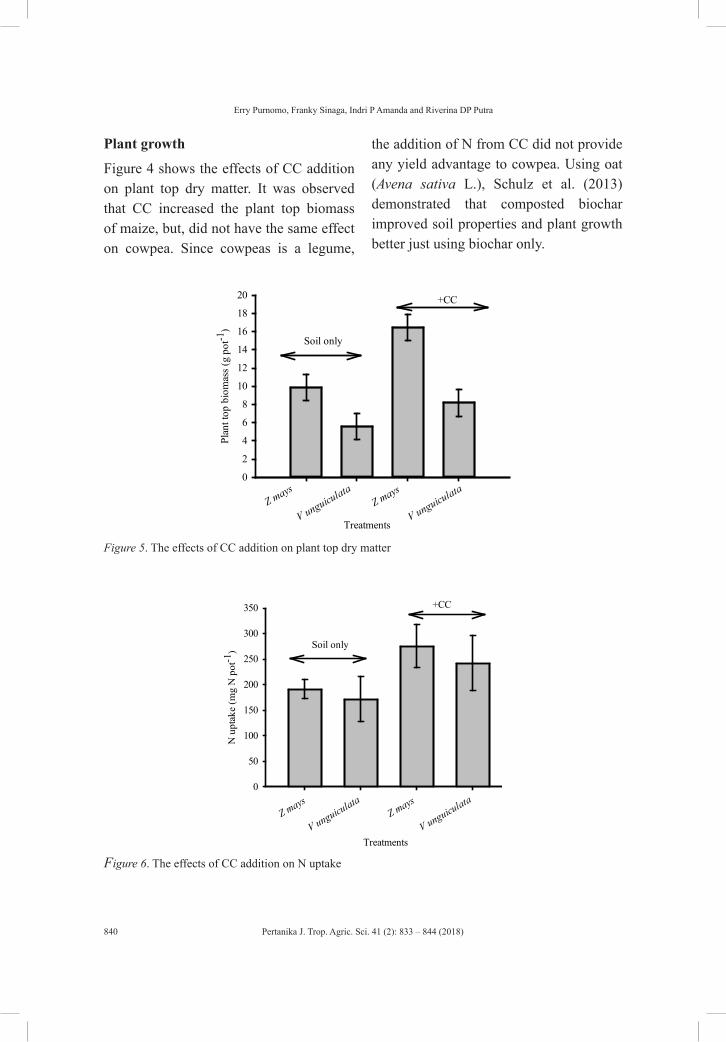
Pertanika J. Trop. Agric. Sci. 41 (2): 833 – 844 (2018)
Erry Purnomo, Franky Sinaga, Indri P Amanda and Riverina DP Putra
840
Plant growth
Figure 4 shows the effects of CC addition on plant top dry matter. It was observed that CC increased the plant top biomass of maize, but, did not have the same effect on cowpea. Since cowpeas is a legume,
the addition of N from CC did not provide any yield advantage to cowpea. Using oat (Avena sativa L.), Schulz et al. (2013) demonstrated that composted biochar improved soil properties and plant growth better just using biochar only.
Treatments
Plan
t top
bio
mas
s (g
pot-1
)
0
2
4
6
8
10
12
14
16
18
20 +CC
Soil only
Z mays
V unguiculataZ mays
V unguiculata
Figure 5. The effects of CC addition on plant top dry matter
Treatments
N u
ptak
e (m
g N
pot
-1)
0
50
100
150
200
250
300
350 +CC
Soil only
Z mays
V unguiculataZ mays
V unguiculata
Figure 6. The effects of CC addition on N uptake
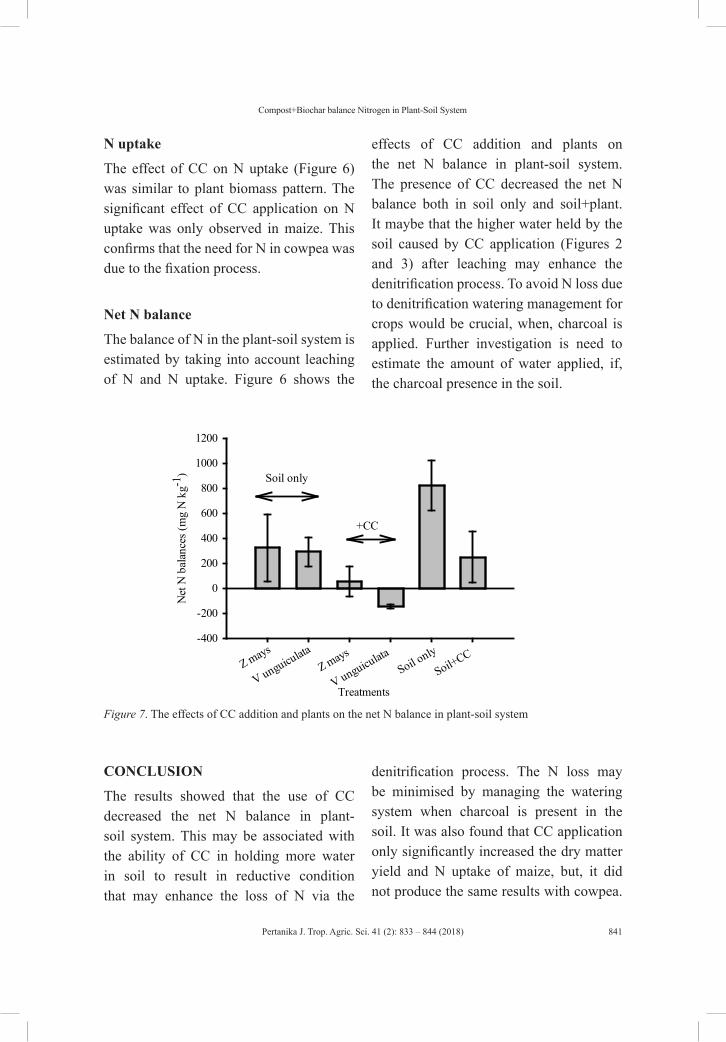
Pertanika J. Trop. Agric. Sci. 41 (2): 833 – 844 (2018)
Compost+Biochar balance Nitrogen in Plant-Soil System
841
N uptake
The effect of CC on N uptake (Figure 6) was similar to plant biomass pattern. The significant effect of CC application on N uptake was only observed in maize. This confirms that the need for N in cowpea was due to the fixation process.
Net N balance
The balance of N in the plant-soil system is estimated by taking into account leaching of N and N uptake. Figure 6 shows the
effects of CC addition and plants on the net N balance in plant-soil system. The presence of CC decreased the net N balance both in soil only and soil+plant. It maybe that the higher water held by the soil caused by CC application (Figures 2 and 3) after leaching may enhance the denitrification process. To avoid N loss due to denitrification watering management for crops would be crucial, when, charcoal is applied. Further investigation is need to estimate the amount of water applied, if, the charcoal presence in the soil.
Treatments
Net
N b
alan
ces (
mg
N k
g-1)
-400
-200
0
200
400
600
800
1000
1200
Z mays
V unguiculata
Soil only
Soil+CC
Soil only
+CC
Z mays
V unguiculata
Figure 7. The effects of CC addition and plants on the net N balance in plant-soil system
CONCLUSION
The results showed that the use of CC decreased the net N balance in plant-soil system. This may be associated with the ability of CC in holding more water in soil to result in reductive condition that may enhance the loss of N via the
denitrification process. The N loss may be minimised by managing the watering system when charcoal is present in the soil. It was also found that CC application only significantly increased the dry matter yield and N uptake of maize, but, it did not produce the same results with cowpea.
Pertanika J. Trop. Agric. Sci. 41 (2): 833 – 844 (2018)
Erry Purnomo, Franky Sinaga, Indri P Amanda and Riverina DP Putra
842
The use of CC significantly decreased the leaching of N during the early growth of maize and cowpea.
ACKNOWLEDGEMENT
Authors are grateful to the Department of Agrotechnology, Faculty of Agriculture, Borneo Tarakan University for providing facilities to undertake this experiment.
REFERENCESBremner, J. M., & Mulvaney, C. S. (1982). Nitrogen-
total. In A. L. Page, R. H., Miller, & D. R. Keeney (Eds.), Methods of soil analysis II, chemical and microbiological properties (2nd Ed.) (pp. 595-624). Madison, America: ASA.
Djaenuddin, D., Basuni, Hardjowigeno, S., Subagjo, H., Sukardi, M., Ismangun., & Jordens. E. R. (1994). Land suitability for agricultural and silviculture plants. Laporan Teknis No. 7. Versi 1.0. April 1994. Bogor, Indonesia: Center for Soil and Agroclimate Research.
FFTC Practical Technology (2001). Application of rice husk charcoal. Association for International Cooperation in Agriculture and Forestry, Japan. Retrieved from http://www.fftc.agnet.org/library.php?func=view&id= 20110716181529&type_id=7
Gee, G. W., & Boulder, J. W. (1986). Particle size analysis. In A., Klute (Ed.), Methods of soil analysis I, physical and mineralogy methods (2nd Ed.) (pp. 383-412). Madison, America: ASA.
Houba, V.J.G., Novozamky, I., & Timminghoff, E. (1994) Soil analysis procedures extraction with 0.01 M CaCl2. Wageningen, Netherland: Wageningen Agriculture University.
Ippolito, J. A., Laird, D. A., & Busscher, W. A. (2012). Environmental benefits of biochar. Journal of Environmental Quality, 41(4), 967-972.
Jones, B. (2001). Laboratory guide for conducting soil tests and plant analysis. New York, NY: CRC Press.
Lehmann, J. (2007). Biochar for mitigating climate change: carbon sequestration in the black. In Forum Geoöekologie (Vol. 18, pp. 15-17). New York, USA.
Lentz, R. D. & Ippolito J. A. (2012). Biochar and manure affect calcareous soil and corn silage nutrient concentrations and uptake. Journal of Environmental Quality 41(4), 1033–1043.
Liu, Z. D., Wang, H. C., & Xu, R. K. (2016). The effects of root surface charge and nitrogen forms on the adsorption of aluminium ions by the roots of rice with different aluminium tolerances. Plant and Soil, 408(1-2), 43-53.
McLean, E. O. (1982). Soil pH and lime requirement. In A. L. Page, R. H. Miller, & D. R. Keeney (Eds.), Methods of Soil Analysis. II. Chemical and Microbiological Properties (2nd Ed.) (pp. 199-224). Madison, America: ASA.
Olsen, S. R., & Sommers, L. E. (1982). Phosphorus. In A. L. Page, R. H. Miller, & D. R. Keeney (Eds.), Methods of soil analysis II, chemical and microbiological properties (2nd Ed.) (pp. 403-430). Madison, America: ASA.
Purnomo, E., Ismandari, T., Muttaqien, & Putra, R. D. P. (2014). Growing food crops with biochar: 2. Capsicum frutecens. Research report. University of Borneo Tarakan, Indonesia: Centre for Tropical Cool Agriculture.
Purnomo, E., Ismandari, T., Putra, R. D. P., Fathurrahman, Muttaqien, Mulyadi & Alwi, M. (2014). Growing food crops with biochar: 1. Vigna unguiculata. Research Report. University of Borneo Tarakan, Indonesia: Centre for Tropical Cool Agriculture.
Pertanika J. Trop. Agric. Sci. 41 (2): 833 – 844 (2018)
Compost+Biochar balance Nitrogen in Plant-Soil System
843
Rhoades, J. D. (1982) Cation exchange capacity. In A. L. Page, R. H. Miller, & D. R. Keeney (Eds.), Methods of soil analysis II, chemical and microbiological properties (2nd Ed.) (pp. 149-158). Madison, America: ASA.
Schnell, R. W., Vietor, D. M., Provin, T. L., Munster, C. L., & Capareda, S. (2012). Capacity of biochar application to maintain energy crop productivity: soil chemistry, sorghum growth, and runoff water quality effects. Journal of Environmental Quality, 41(4), 1044–1051.
Schulz, H., Dunst, G., & Glase, B. (2013). Positive effects of composted biochar on plant growth and soil fertility. Agronomy for Sustainable Development, 33(4), 817-827.
Spokas, K. A., Cantrell, K. B., Novak, J. M., Archer, D. A, Ippolito, J. A., Collins, H. P., & Nichols, K. A. (2012). Biochar: A synthesis of its agronomic impact beyond carbon sequestration. Journal of Environmental Quality, 41(4), 973–989.
Thomas, G. W. (1982). Exchangeable cations. In A. L. Page, R. H. Miller, & D. R. Keeney (Eds.), Methods of soil analysis II, chemical and microbiological properties (2nd Ed.) (pp. 159-166). Madison, America: ASA.
Yao, Y., Gao, B., Zhang, M., Inyang, M., & Zimmerman, A. R. (2012). Effect of biochar amendment on sorption and leaching of nitrate, ammonium, and phosphate in a sandy soil. Chemosphere, 89(11), 1467–1471.
Yeomans, J. C., & Bremner, J. M. (1988). A rapid and precise method for routine determination of organic carbon in soil. Communications in Soil Science and Plant Analysis, 19(13), 1467-1476.

Pertanika J. Trop. Agric. Sci. 41 (2): 845 – 854 (2018)
ISSN: 1511-3701 © Universiti Putra Malaysia Press
TROPICAL AGRICULTURAL SCIENCEJournal homepage: http://www.pertanika.upm.edu.my/
ARTICLE INFOArticle history:Received: 18 September 2017Accepted: 30 April 2018
E-mail addresses:[email protected] (I Komang Damar Jaya)[email protected] (Sudirman)[email protected] (Aris Budianto)[email protected] (Abdurachman Hanafi)[email protected] (I Nyoman Soemeinaboedhy)*Corresponding author
Technology Assessment of Growing Superior Mungbean (Vigna radiata L.) Varieties on a Dryland in North Lombok
I Komang Damar Jaya1*, Sudirman2, Aris Budianto2, Abdurachman Hanafi2 and I Nyoman Soemeinaboedhy2 1Postgraduate Program, University of Mataram. Jl. Pendidikan 37 Mataram 83125 Lombok, West Nusa Tenggara, Indonesia2Faculty of Agriculture, University of Mataram. Jl. Majapahit 62 Mataram 83125 Lombok, West Nusa Tenggara, Indonesia
ABSTRACT
This study was aimed at finding the highest yielding variety and its best growing technology among selected superior mungbean (Vigna radiata L.) varieties grown on a dryland. The assessment was done based on four field experiments conducted at Gumantar village, sub-district of Kayangan, and North Lombok. The soil was categorised as poor (low fertility) with 0.46% organic matter, 0.05% total nitrogen (N) (Kejdhal), 11.25 ppm available phosphate (P) (Olsen) and exchangeable potassium (K) 0.77 me%. Mungbean varieties of Kenari and Betet coupled with fertiliser rate, population density and time of weeding were the objects of assessment. The experiments focused on variety and fertiliser rate, population density and fertiliser rate, variety and population density, and time of weeding to study their effects on yield of mungbean. The results show the highest yielding variety was Kenari with yield ranging from 876 to 1,215 g/5 m2 (1.75 to 2.43-ton ha-1), followed by Betet, from 880 to 949 g/5 m2 (1.76 to 1.90 ton/ha). The optimum population density was at 500,000 plants ha-1 with fertiliser (NPK Phonska, 15-15-15) rate of 200 kg ha-1. It was found the weeding time improved yield and the best time for weeding was 49 Days After
Sowing (DAS). It appears that Kenari is the most suitable variety to be grown in North Lombok at population density of 500,000 plants ha-1 fertilised with Phonska at rate of 200 kg ha-1 and weeding at 49 DAS.
Keywords: Fertiliser, low soil fertility, population density, weeding, yield
Pertanika J. Trop. Agric. Sci. 41 (2): 845 – 854 (2018)
I Komang Damar Jaya, Sudirman, Aris Budianto, Abdurachman Hanafi and I Nyoman Soemeinaboedhy
846
INTRODUCTION
Change in land use is occurring worldwide at an alarming rate. In just five years, between 2000 and 2005, the annual conversion of forestland into non-forest uses was 6.3 million hectares (Food and Agriculture Organization & Joint Research Centre, 2012). As a result, greenhouse gasses have also increased significantly. Conversion of the forest into cropland for instance, resulted in a release of greenhouse gasses as many as 6.5±0.2 Gt CO2 per year (Kim & Kirscbaum, 2015). With that huge release of greenhouse gasses, global warming that leads to climate change is becoming a problem. Another form of land-use change is usage of cropland for non-agricultural purposes, such as housing, offices and shopping centres. These types of conversions usually occur in urban areas resulting in an increased pressure on the country’s natural resources (Jiang et al., 2013), such as drylands.
In Indonesia, the pressure to utilise dryland areas for growing food crops is mounting due to population increase in urban areas. Data shows temporarily unused land in Indonesia, dominated by dryland, declined as much as 4.48% from 2009 to 2013 (Ministry of Agriculture, 2014). The same trend is occurring in dryland areas in West Nusa Tenggara. More food crops are grown on drylands, especially during rainy seasons. In the past, the lands were mainly left alone and overgrown with natural vegetation but now, food crops such as maize, mungbean and groundnut are planted there during the rainy season.
Recent erratic rainfall pattern as a result of climate change has affected food crop productivity in dryland areas. Jaya et al. (2012) reported that excessive rainfall in Lombok in January and February 2012 had caused significant loss in maize and mungbean production in dryland of East Lombok. The El-Nino effects (dry rainy season) during the 2015/2016 rainy season, had also caused significant loss for farmers in North and East Lombok (Jaya, data not published). Unfortunately, most dryland farmers do not have sufficient technology and money to cope with detrimental effects of the changing climate while their livelihood and agricultural practices are dependent on weather. For these reasons, growing crops technology, such as the choice of crop species, time of planting and crops management, is becoming very important, especially for dryland farmers. Short growing period and multipurpose legume crops with a high economic value, such as mungbean, can be considered.
Mungbean is a drought-tolerant crop that rich in mineral and its sprouts contain high amounts of vitamin C and iron (Keatinge et al., 2011). This crop has been grown in Indonesia for long time by smallholder farmers and is now the third important legume after soybean and groundnut. Productivity of this crop varies greatly. In Yogyakarta province, for example, it was only 0.58-ton ha-1 in 2015, while in West Sulawesi, it was 1.36-ton ha-1 (Central Bureau of Statistics [CBS], 2016). According to the same source,

Pertanika J. Trop. Agric. Sci. 41 (2): 845 – 854 (2018)
Mungbean Growing Technology on a Dryland
847
mungbean productivity in West Nusa Tenggara, which is mainly grown in dryland areas, was only 1.61-ton ha-1. Some superior mungbean varieties, such as Kenari, Betet, Vima-1, Vima-2, Vima-3 had potential yield of more than 2.0-ton ha-1 (BALITKABI various sources). Based on the above, it is possible that inappropriate growing technologies, such as lack of population density, low rate of fertiliser application and variety selection have contributed to the low mungbean productivity in dryland of West Nusa Tenggara. Thus, it is critical to asses growing technology of mungbean on a dryland in order to improve crop productivity.
MATERIALS AND METHODS
Four field experiments, consisting of various growing technologies of cultivating mungbean, were conducted at the same time between September and November 2015 on a piece of dryland in Gumantar village, North Lombok. Climate type in the experimental area based on Oldeman classification is D type. Four experiments were conducted an Entisol soil with loam structure and was considered poor soil with 0.46% organic matter, total 0.05% nitrogen (N) (Kejdhal), available 11.25 ppm phosphate (P) (Olsen) and exchangeable potassium (K) 0.77 me%, pH 7.0 and field capacity 29% (%/V). Due to low soil fertility, all treatments were given a basal Urea fertiliser with a rate of 100 kg ha-1. Since the experiments were conducted during a dry season, a deep-well pump was
operated as the source of irrigation water. The irrigation was done by flooding the plots.
The first experiment tested the effect of Phonska (N-P-K, 15-15-15) fertiliser dosage and planting space/population density on yield of mungbean var. Kenari. The fertiliser dosage treatment consisted of four levels, namely at: 50, 100, 200 and 400 kg ha-1. Planting space/population density treatment consisted of two levels, namely: 20 x 20 cm and 40 x 20 cm. The population density in 20 x 20 cm and in 40 x 20 cm treatments was 500,000 and 250,000 plants ha-1, respectively since there were two seeds per hill.
In the second experiment, two mungbean varieties and four fertiliser dosages were tested for their effects on yield. The varieties were Kenari and Betet while the fertiliser (N-P-K, 15-15-15) dosages were: 0, 100, 200 and 300 kg ha-1. The third experiment tested the effect of mungbean variety and planting space/population density on yield. The varieties were Kenari and Betet while the three spacing were 40 x 10, 40 x 20 and 40 x 30 cm or equals to 500,000, 250,000 and 166,666 plants ha-1 since there were two seeds sown per hill. All three experiments were designed with a Randomized Block Design Factorial with three replications.
The fourth experiment was not a factorial experiment. There were six weeding treatments tested, namely: no weeding, weeding 3, 4, 5, 6 and 7 weeks after sowing (WAS). All the treatments were arranged in a Randomized Block Design
Pertanika J. Trop. Agric. Sci. 41 (2): 845 – 854 (2018)
I Komang Damar Jaya, Sudirman, Aris Budianto, Abdurachman Hanafi and I Nyoman Soemeinaboedhy
848
with three replications. The variety tested in this experiment was Kenari with planting density of 250,000 plants ha-1 (spacing of 20 x 40 cm). The crops were fertilised with 300 kg ha-1 of NPK Phonska fertiliser.
The plot size in all experiments was 2 x 2.5 m and there were five (5) clumps of mungbean crop sampled in each plot for individual measurements. Except for the weeding time experiment, the rest of the crops were mechanically weeded once at 4 WAS. Pesticide (Lamda Sihalotrin 106 g l-1, Tiametoksam 141 g l-1) was applied when the crops were attacked by aphids and leaf hopper. Irrigation water was applied once a week by flooding method due to the porosity of soil.
Variables measured for yield and yield components were number of pods, number of seeds per pod, seeds weight per plant, seeds weight per plot and weight of 1000 seeds. Number of pods was calculated at harvest and the rest of the variables were measured after harvest. Data collected was analysed using Analysis of Variance (ANOVA) at 5% level using statistical package Minitab 15.
RESULTS AND DISCUSSION
Results
No rain was recorded during the experiment period. The highest maximum temperature
and the lowest minimum temperature were 39oC and 21oC, respectively with an average relative humidity of 80%. The first harvest was done at 56 DAS for both Kenari and Betet. All crops in the treatment plots were harvested three times at a three-day interval. After three harvests, yield data collections ended.
Experiment 1. Fertiliser dosage and spacing (population density) experiment. No interaction was found between NPK fertiliser dosage and spacing in affecting yield and yield components of mungbean. Mungbean yield (seeds weight per plot) was not affected by fertiliser dosage but its yield components, such as pod number per plant and weight of 1000 seeds, were significantly affected, as seen in Table 1. There was no clear pattern of the effect of increasing fertiliser rate both on yield and yield components.
Mungbean at population density of 500,000 plants ha-1, which was achieved in planting density of 20 x 20 cm, produced significantly higher yield than that at 250,000 plants ha-1 (20 x 40 cm). The yield components were significantly higher in a lower population density as presented in Table 1.
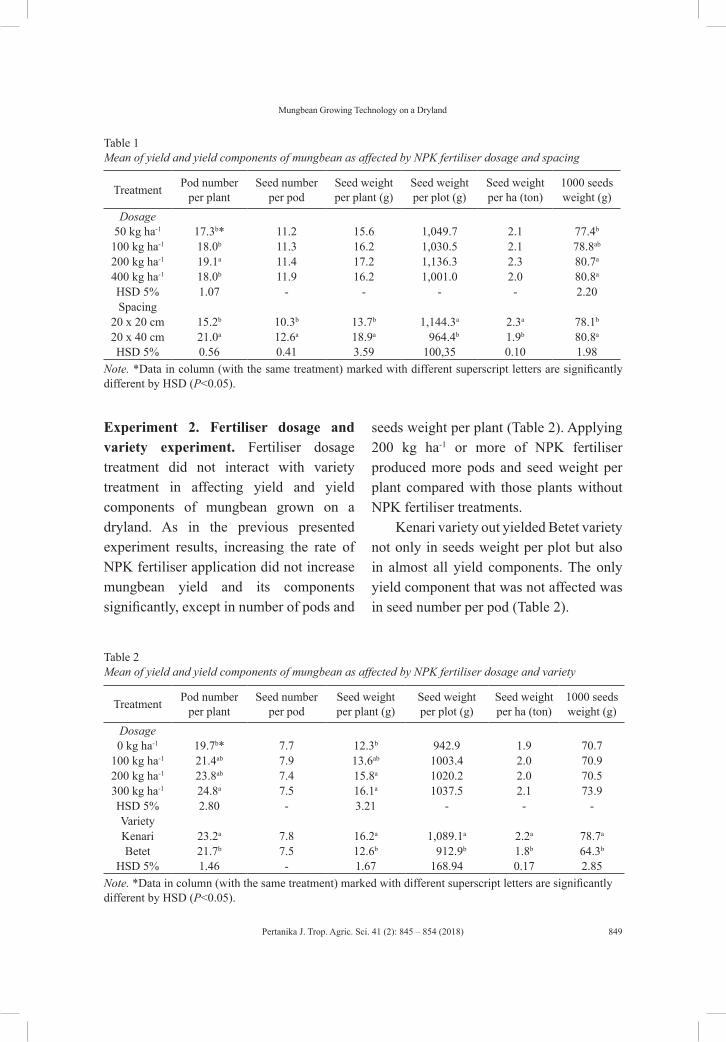
Pertanika J. Trop. Agric. Sci. 41 (2): 845 – 854 (2018)
Mungbean Growing Technology on a Dryland
849
Table 1Mean of yield and yield components of mungbean as affected by NPK fertiliser dosage and spacing
Treatment Pod number per plant
Seed number per pod
Seed weight per plant (g)
Seed weight per plot (g)
Seed weight per ha (ton)
1000 seeds weight (g)
Dosage50 kg ha-1 17.3b* 11.2 15.6 1,049.7 2.1 77.4b
100 kg ha-1 18.0b 11.3 16.2 1,030.5 2.1 78.8ab
200 kg ha-1 19.1a 11.4 17.2 1,136.3 2.3 80.7a
400 kg ha-1 18.0b 11.9 16.2 1,001.0 2.0 80.8a
HSD 5% 1.07 - - - - 2.20Spacing
20 x 20 cm 15.2b 10.3b 13.7b 1,144.3a 2.3a 78.1b
20 x 40 cm 21.0a 12.6a 18.9a 964.4b 1.9b 80.8a
HSD 5% 0.56 0.41 3.59 100,35 0.10 1.98Note. *Data in column (with the same treatment) marked with different superscript letters are significantly different by HSD (P<0.05).
Experiment 2. Fertiliser dosage and variety experiment. Fertiliser dosage treatment did not interact with variety treatment in affecting yield and yield components of mungbean grown on a dryland. As in the previous presented experiment results, increasing the rate of NPK fertiliser application did not increase mungbean yield and its components significantly, except in number of pods and
seeds weight per plant (Table 2). Applying 200 kg ha-1 or more of NPK fertiliser produced more pods and seed weight per plant compared with those plants without NPK fertiliser treatments.
Kenari variety out yielded Betet variety not only in seeds weight per plot but also in almost all yield components. The only yield component that was not affected was in seed number per pod (Table 2).
Table 2Mean of yield and yield components of mungbean as affected by NPK fertiliser dosage and variety
Treatment Pod number per plant
Seed number per pod
Seed weight per plant (g)
Seed weight per plot (g)
Seed weight per ha (ton)
1000 seeds weight (g)
Dosage0 kg ha-1 19.7b* 7.7 12.3b 942.9 1.9 70.7
100 kg ha-1 21.4ab 7.9 13.6ab 1003.4 2.0 70.9200 kg ha-1 23.8ab 7.4 15.8a 1020.2 2.0 70.5300 kg ha-1 24.8a 7.5 16.1a 1037.5 2.1 73.9HSD 5% 2.80 - 3.21 - - -VarietyKenari 23.2a 7.8 16.2a 1,089.1a 2.2a 78.7a
Betet 21.7b 7.5 12.6b 912.9b 1.8b 64.3b
HSD 5% 1.46 - 1.67 168.94 0.17 2.85Note. *Data in column (with the same treatment) marked with different superscript letters are significantly different by HSD (P<0.05).

Pertanika J. Trop. Agric. Sci. 41 (2): 845 – 854 (2018)
I Komang Damar Jaya, Sudirman, Aris Budianto, Abdurachman Hanafi and I Nyoman Soemeinaboedhy
850
Experiment 3. Spacing (population density) and variety experiment. Spacing or population density did not affect yield and yield components of mungbean. The spacing itself, however, significantly affected yield and some of the yield components (Table 3). Yield components that were not affected by spacing or population density were seed number per pod and weight of 1,000 seeds. Seed weight per plant decreased with the increase of population density
while seed weight per plot increased with the increase of population density.
Unlike fertiliser rate and variety experiment, there was no significant different between Kenari and Betet yield in spacing and variety treatments. However, most yield components, such as pod number per plant, seed weight per plant and weight of 1,000 seeds, were affected by variety (Table 3). The Kenari variety produced significantly higher yield components than Betet.
Table 3Mean of yield and yield components of mungbean as affected by spacing and variety
Treatment Pod number per plant
Seed number per pod
Seed weight per plant (g)
Seed weight per plot (g)
Seed weight per ha (ton)
1000 seeds weight (g)
Spacing40 x 10 cm 18.0c* 11.2 10.8b 1,215.4a 2.4a 69.340 x 20 cm 21.5b 11.3 15.2ab 993.5ab 2.0ab 70.340 x 30 cm 23.5a 11.4 18.3a 781.0b 1.6b 71.3HSD 5% 1.07 - 6.01 271.56 0.27 -VarietyKenari 25.6a 11.8 16.3a 1,085.6 2.2 79.1a
Betet 16.4b 11.5 11.9b 907.7 1.8 61.8b
HSD 5% 5.49 - 2.72 - 3.28*Data in column (with the same treatment) marked with different superscript letters are significantly different by HSD (P<0.05).
Experiment 4. Weeding treatment experiment. Weeding did not affect yield and yield components of mungbean. Even though the values of seed weight per plot in weeded plots appeared higher than that of the unweeded plot, those values actually did not significantly differ at 5% level. There was no clear pattern of the effect of weeding time on yield and yield components in all treatments as shown in Table 4 but weeding at 7 WAS appeared to be effective to improve yield of the mungbean.
The most dominant weed species found during the experiment was Cyperus rotundus. This weed, however, was only present during the early stage of the vegetative growth of the mungbean. When the mungbean canopy had formed a complete cover, other weed species, such as Eleusine indica, Cynodon dactylon and Euphorbia prumifolia, were recorded at the experimental site.
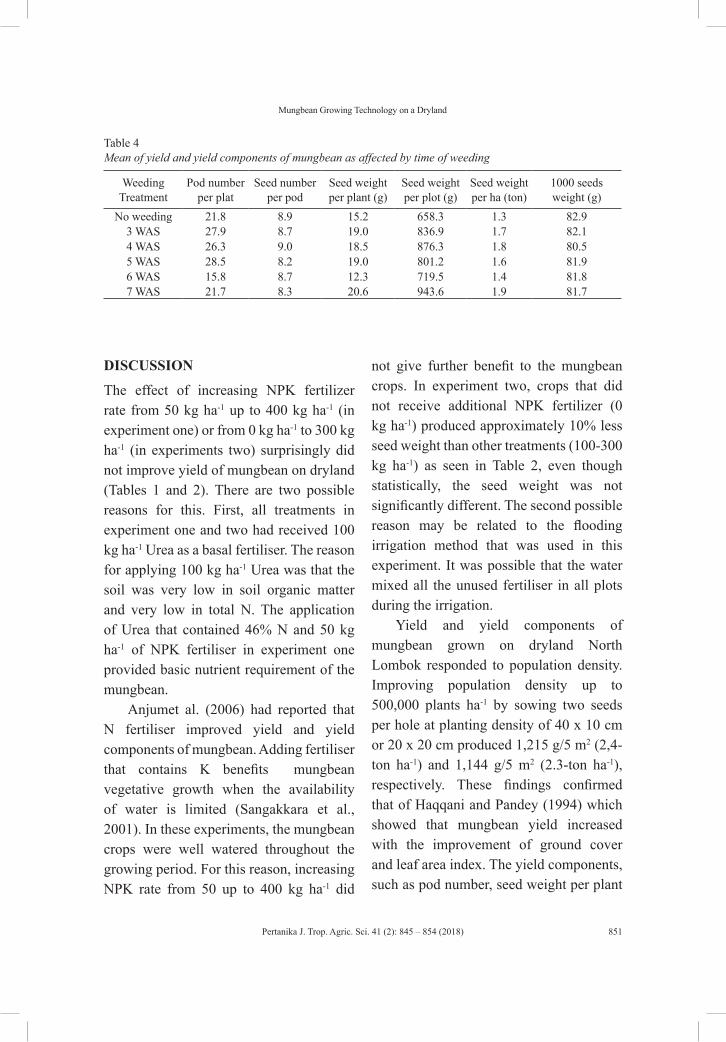
Pertanika J. Trop. Agric. Sci. 41 (2): 845 – 854 (2018)
Mungbean Growing Technology on a Dryland
851
Table 4Mean of yield and yield components of mungbean as affected by time of weeding
WeedingTreatment
Pod number per plat
Seed number per pod
Seed weight per plant (g)
Seed weight per plot (g)
Seed weight per ha (ton)
1000 seeds weight (g)
No weeding 21.8 8.9 15.2 658.3 1.3 82.93 WAS 27.9 8.7 19.0 836.9 1.7 82.14 WAS 26.3 9.0 18.5 876.3 1.8 80.55 WAS 28.5 8.2 19.0 801.2 1.6 81.96 WAS 15.8 8.7 12.3 719.5 1.4 81.87 WAS 21.7 8.3 20.6 943.6 1.9 81.7
DISCUSSION
The effect of increasing NPK fertilizer rate from 50 kg ha-1 up to 400 kg ha-1 (in experiment one) or from 0 kg ha-1 to 300 kg ha-1 (in experiments two) surprisingly did not improve yield of mungbean on dryland (Tables 1 and 2). There are two possible reasons for this. First, all treatments in experiment one and two had received 100 kg ha-1 Urea as a basal fertiliser. The reason for applying 100 kg ha-1 Urea was that the soil was very low in soil organic matter and very low in total N. The application of Urea that contained 46% N and 50 kg ha-1 of NPK fertiliser in experiment one provided basic nutrient requirement of the mungbean.
Anjumet al. (2006) had reported that N fertiliser improved yield and yield components of mungbean. Adding fertiliser that contains K benefits mungbean vegetative growth when the availability of water is limited (Sangakkara et al., 2001). In these experiments, the mungbean crops were well watered throughout the growing period. For this reason, increasing NPK rate from 50 up to 400 kg ha-1 did
not give further benefit to the mungbean crops. In experiment two, crops that did not receive additional NPK fertilizer (0 kg ha-1) produced approximately 10% less seed weight than other treatments (100-300 kg ha-1) as seen in Table 2, even though statistically, the seed weight was not significantly different. The second possible reason may be related to the flooding irrigation method that was used in this experiment. It was possible that the water mixed all the unused fertiliser in all plots during the irrigation.
Yield and yield components of mungbean grown on dryland North Lombok responded to population density. Improving population density up to 500,000 plants ha-1 by sowing two seeds per hole at planting density of 40 x 10 cm or 20 x 20 cm produced 1,215 g/5 m2 (2,4-ton ha-1) and 1,144 g/5 m2 (2.3-ton ha-1), respectively. These findings confirmed that of Haqqani and Pandey (1994) which showed that mungbean yield increased with the improvement of ground cover and leaf area index. The yield components, such as pod number, seed weight per plant

Pertanika J. Trop. Agric. Sci. 41 (2): 845 – 854 (2018)
I Komang Damar Jaya, Sudirman, Aris Budianto, Abdurachman Hanafi and I Nyoman Soemeinaboedhy
852
and weight of 1000 seeds were higher in a lower density since there was less intraspecific competition in the less dense population.
The superior variety of Kenari yielded better than the superior variety of Betet. Both varieties produced a constant yield by fertiliser and spacing treatments (Table 2 and 3). The average yield of Kenari and Betet was 1,087.4 g/5 m2 (2.2-ton ha-1) and 909.8 g/5 m2 (1.8-ton ha-1), respectively. Both varieties were produced by Balai Penelitian Kacang-kacangan dan Umbi-umbian (Indonesian Legumes and Tuber Crops Research Institute). Suhartina (2005) from the Institute described that the average yield of Betet is 1.5-ton ha-1 while Kenari is 1.38-ton ha-1. She added that Kenari variety can produce yield as high as 2.45-ton ha-1. It suggests that Kenari is a better option to be grown on dryland North Lombok.
It appeared that weed was not a great problem in mungbean growing areas in dryland of North Lombok. Seed weight per plot and other yield components were not significantly affected by weeding and time of weeding (Table 4). Earlier, Chatta et al. (2007) reported that weeds could cause 50% reduction in mungbean yield. Jaya and Nurrachman (2015) also reported that weeds could reduce the effectivity of fertiliser that was applied to mungbean crops. Weed species that are present during crop growth and developmental stages may determine the yield lost severity caused by weeds.
CONCLUSION
The mungbean superior variety of Kenari seems to be the best option to be grown on drylands of North Lombok. In order to improve productivity of this variety, a growing population of 500,000 plants ha-1, which can be achieved by plant spacing of 20 x 20 cm or 40 x 10 cm with two seeds per hole, is recommended. Applications of basal fertiliser of Urea at 100 kg ha-1 plus at least 50 kg ha-1 NPK Phonska are suggested in this study. Weeding at 7 WAS further improved productivity of mungbean grown on dryland.
Since there are so many superior varieties of mungbean produced by Indonesian Legumes and Tuber Crops Research Institute with great genetical variabilities, similar research with different varieties is needed in the near future. This kind of research is important to improve the livelihoods of dryland farmers who have to cope with some impacts of climate change.
AKNOWLEDGEMENT
The authors thank Sihabuddin, Solihah, Purniati, and Raden Yanti for their assistance in data collection. The study was part of Applied Research and Innovation Systems in Agriculture (ARISA) Dual Cropping Project (2016-2018) funded by Department of Foreign Affairs and Trade (DFAT) Australia contracted to Commonwealth Scientific and Industrial Research Organization (CSIRO).
Pertanika J. Trop. Agric. Sci. 41 (2): 845 – 854 (2018)
Mungbean Growing Technology on a Dryland
853
REFERENCESAnjum, M. S., Ahmed, Z. I., & Rauf, C. A. (2006).
Effect of rhizobium inoculation and nitrogen fertilizer on yield and yield components of mungbean. International Journal of Agriculture and Biology (Pakistan). (Abstract only). Retrieved from http://agris.fao.org/agris-search/search.do?recordID=PK2007000238
Central Bureau of Statistics [Badan Pusat Statistik] (2016). Tanaman kacang-kacangan per propinsi [Plant nuts per province]. Jakarta, Indonesia: Author.
Chatta, M. R., Jamil, M., & Mahmood, T. R. (2007). Yield and yield components of mungbean as affected by various weed control methods under rain-fed conditions of Pakistan. International Journal of Agriculture and Biology, 9(1), 114-119.
Food and Agriculture Organization & Joint Research Centre (2012). Global forest land-use change 1990-2005. FAO Forestry Paper No. 169. Commissioned by Food and Agriculture Organization of the United Nations and European Commission Joint Research Centre. Rome, Italy.
Haqqani, A. M. & Pandey, R. K. (1994). Response of mung bean to water stress and irrigation at various growth stages and plant densities. II: Yield and yield components. Tropical Agriculture, 71(4), 289-294.
Jaya, I. K. D. & Nurrachman (2015). Yield of some mungbean (Vigna radiata) varieties under different rates of fertilizer treatment following maize crops on dryland. In M. Sriasih, I. Hadi, Faturrahman, & M. Ihsan (Eds.), Proceeding of International Seminar on Tropical Natural Resources (pp. 650-658). Lombok, West Nusa Tenggara, Indonesia: Mataram University Press.
Jaya, I. K. D., Rosmilawati, Sudika, I. W., & Suriawan, L. J. (2012). Crop diversity on dryland as an adaptation strategy to climate change. In M. T. Fauzi, H. S. Yong, M. U. F. Krischbaum, M. Sarjan, L. Ujianto, A. Niklmatullah, I. W. Suana, S. Latifah, & W. D. Krisnayanti (Eds.), Proceeding of 2nd International Conference on Biodiversity (pp. 93-97). Lombok, West Nusa Tenggara, Indonesia: Mataram University Press.
Jiang, J., Deng, X., & Seto, K. C. (2013). The impact of urban expansion on agricultural land use intensity in China. Land Use Policy, 35, 33-39.
Keatinge, J. D. H., Easdown, W. J., Yang, R. Y., Chada, M. L., & Shanmegasundaram, S. (2011). Overcoming chronic malnutrition in future warming world: the key important of mungbean and vegetable soybean. Euphytica, 180(1), 129-141.
Kim, D. G., & Kirschbaum, M. U. F. (2015). The effect of land-use change on the net exchange rates of greenhouse gasses: A compilation of estimates. Agriculture, Ecosystems and Environment, 208, 114-126.
Ministry of Agriculture (2014). Temporarily Unused Land. Statistic of Agricultural Land 2009-2013. Centre for Agriculture Data and Information System. Secretariat General – Ministry of Agriculture. Retrieved from http://www.pertanian.go.id/file/Statistik_Lahan_2014.pdf
Sangakkara, V. R., Frehrer, M., & Nosberger, J. (2001). Influence of soil moisture and fertilizer potassium on the vegetative growth of mungbean (Vigna radiata L. Wilczek) and cowpea (Vigna unguilata L. Walp). Journal of Agronomy and Crop Science, 186(2), 73-81.
Suhartina. (2005). Deskripsi varietas unggul kacang-kacangan dan umbi-umbian [Description of superior variety of pulses and tubers]. Malang, Indonesia: Balai Penelitian Kacang-kacangan dan Umbi-umbian.


Pertanika J. Trop. Agric. Sci. 41 (2): 855 – 864 (2018)
ISSN: 1511-3701 © Universiti Putra Malaysia Press
TROPICAL AGRICULTURAL SCIENCEJournal homepage: http://www.pertanika.upm.edu.my/
ARTICLE INFOArticle history:Received: 18 September 2017Accepted: 30 April 2018
E-mail addresses:[email protected] (Wina Dian Savitri)[email protected] (Popy Hartatie Hardjo)[email protected] (Leonardo Tejo Gunawan Putra Hardianto)[email protected] (Steven Sutanto)*Corresponding author
Effect of Cytokinins on In Vitro Growth of Hypocotyl and Cotyledon of Tomato (Lycopersicon esculentum)
Wina Dian Savitri*, Popy Hartatie Hardjo, Leonardo Tejo Gunawan Putra Hardianto and Steven SutantoDepartment of Biology, Faculty of Biotechnology, University of Surabaya, Jawa Timur, 60292, Indonesia
ABSTRACT
Study of regeneration from different tissues or organs of plants is important as it gives information on how a piece of a plant can transform into its whole form. This process is even substantial when we talk about genetic engineering in plants, since no genetic engineering is valuable without knowing first the standard protocol for regenerating the transformed tissue or organs to become a whole plant. This experiment used hypocotyl and cotyledon of tomato cv. Tymoti as the explants was used to study how different concentrations (1.5-3 ppm) of cytokinins (Kinetin (Kin), 6-benzylaminopurine (BAP), thidiazuron (TDZ) and Zeatin (Zn)) affect its growth. As many as 16 explants were used for each treatment. The growth of both explants in the Murashige and Skoog (MS) media + vitamins showed that Zn and TDZ were superior among the other treatments in inducing calli and primordia organ.
Keywords: Cotyledon, cytokinins, hypocotyls, in vitro growth, tissue regeneration
INTRODUCTION
Cytokinins, theoretically, are plant growth regulators (PGRs) that trigger the differentiation of shoots. This PGR is primarily produced in root caps and then distributed into shoots
(Aloni et al., 2005). Several kinds of cytokinins have been discovered, namely thidiazuron (TDZ), 6-benzylaminopurine (BAP), 6-γ-γ-dimethylaminopurine (2-ip), kinetin and zeatin. Among all the cytokinins that have been mentioned above, 2-ip and zeatin are naturally occurring, while the rest are derived synthetically (Razdan, 2002).
Pertanika J. Trop. Agric. Sci. 41 (2): 855 – 864 (2018)
Wina Dian Savitri, Popy Hartatie Hardjo, Leonardo Tejo Gunawan Putra Hardianto and Steven Sutanto
856
Yet, some plant species showed a different responses toward cytokinins. For example, less than 25% up to 50% of callus occurred on muskmelon’s cotyledon explants cultured on MS media + vitamins incorporated with 1-2 ppm BAP, although 11.11% (1 out of 9 explants) and 44.44% (4 out of 9 explants) shoots were also produced from 1 ppm BAP and 2 ppm BAP respectively (Ishak, 2015). Our preliminary data on tomato cv. Tymoti showed that 0.5-3 ppm BAP applied on cotyledon and hypocotyls generated low to high callus structure on each explant. Savitri (2015) suggested that cotyledon explants of tomato cv. Tymoti cultured on MS medium + vitamins with the adding of 1-3 ppm BAP in combination with 0.1 ppm TDZ produced not only shoots but also calli that ranged from 18.75-56.25%. In addition, 0.5-2.5 ppm BAP or TDZ mixed with 0.1 ppm indole acetic acid (IAA) yielded 100% callus structure when applied to 10-week-old leaf discs of tomato cv. Tymoti cultured in dark condition (Savitri et al., 2016). Those findings represent that in relatively low concentration, cytokinins could also give rise to callus formation instead of shoot differentiation. Tomato cv. Tymoti is a hybrid that has already been sold commercially. This product is unique because it is suitable to be cultured on lowland, such as in Surabaya. Additionally, this product is resistant to Geminivirus and Pseudomonas solanacearum. This cultivar seems more promising than the others
because it can be planted in lowland, so that the hybrid can be used in the experiment as a sample to learn about the tomato regeneration by in vitro culture.
The current experiment is aimed at studying the effect of four different cytokinins, i.e. TDZ, BAP, kinetin and zeatin on four concentrations; these are 1.5, 2, 2.5 and 3 ppm for each cytokinin. The results could be beneficial to give information about tomato regeneration through indirect pathway. The indirect pathway is very useful to produce a new traits, because the callus can divide very fast without certain direction. This can lead to cell mutation where some of the daughter cells are different from the parent cell. The ultimate aim of this research is to find a new trait from tomato cv. Tymoti (crop improvements), such as shorter reproduction cycle and greater yields.
MATERIALS AND METHODS Plant Materials
The seeds of tomato cv. Tymoti were collected and surface sterilised by double dipping methods using sodium hypochlorite (NaOCl) solution, namely 2.63% (5 minutes) and 1.8% (15 minutes) respectively. These method were followed by rinsing it with sterile distilled water three times. The surface-sterile seeds (10-15) were cultured on ½ MS medium for 14 days. The hypocotyl and cotyledon were collected after that.
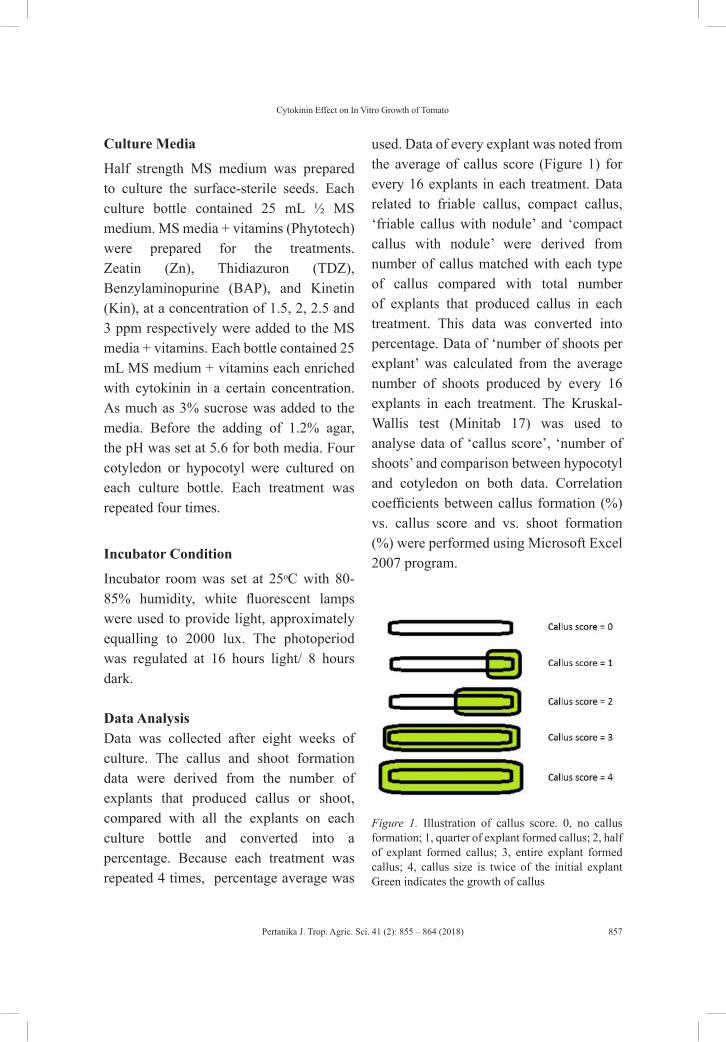
Pertanika J. Trop. Agric. Sci. 41 (2): 855 – 864 (2018)
Cytokinin Effect on In Vitro Growth of Tomato
857
Culture Media
Half strength MS medium was prepared to culture the surface-sterile seeds. Each culture bottle contained 25 mL ½ MS medium. MS media + vitamins (Phytotech) were prepared for the treatments. Zeatin (Zn), Thidiazuron (TDZ), Benzylaminopurine (BAP), and Kinetin (Kin), at a concentration of 1.5, 2, 2.5 and 3 ppm respectively were added to the MS media + vitamins. Each bottle contained 25 mL MS medium + vitamins each enriched with cytokinin in a certain concentration. As much as 3% sucrose was added to the media. Before the adding of 1.2% agar, the pH was set at 5.6 for both media. Four cotyledon or hypocotyl were cultured on each culture bottle. Each treatment was repeated four times.
Incubator Condition
Incubator room was set at 25ᵒC with 80-85% humidity, white fluorescent lamps were used to provide light, approximately equalling to 2000 lux. The photoperiod was regulated at 16 hours light/ 8 hours dark.
Data AnalysisData was collected after eight weeks of culture. The callus and shoot formation data were derived from the number of explants that produced callus or shoot, compared with all the explants on each culture bottle and converted into a percentage. Because each treatment was repeated 4 times, percentage average was
used. Data of every explant was noted from the average of callus score (Figure 1) for every 16 explants in each treatment. Data related to friable callus, compact callus, ‘friable callus with nodule’ and ‘compact callus with nodule’ were derived from number of callus matched with each type of callus compared with total number of explants that produced callus in each treatment. This data was converted into percentage. Data of ‘number of shoots per explant’ was calculated from the average number of shoots produced by every 16 explants in each treatment. The Kruskal-Wallis test (Minitab 17) was used to analyse data of ‘callus score’, ‘number of shoots’ and comparison between hypocotyl and cotyledon on both data. Correlation coefficients between callus formation (%) vs. callus score and vs. shoot formation (%) were performed using Microsoft Excel 2007 program.
Figure 1. Illustration of callus score. 0, no callus formation; 1, quarter of explant formed callus; 2, half of explant formed callus; 3, entire explant formed callus; 4, callus size is twice of the initial explant Green indicates the growth of callus
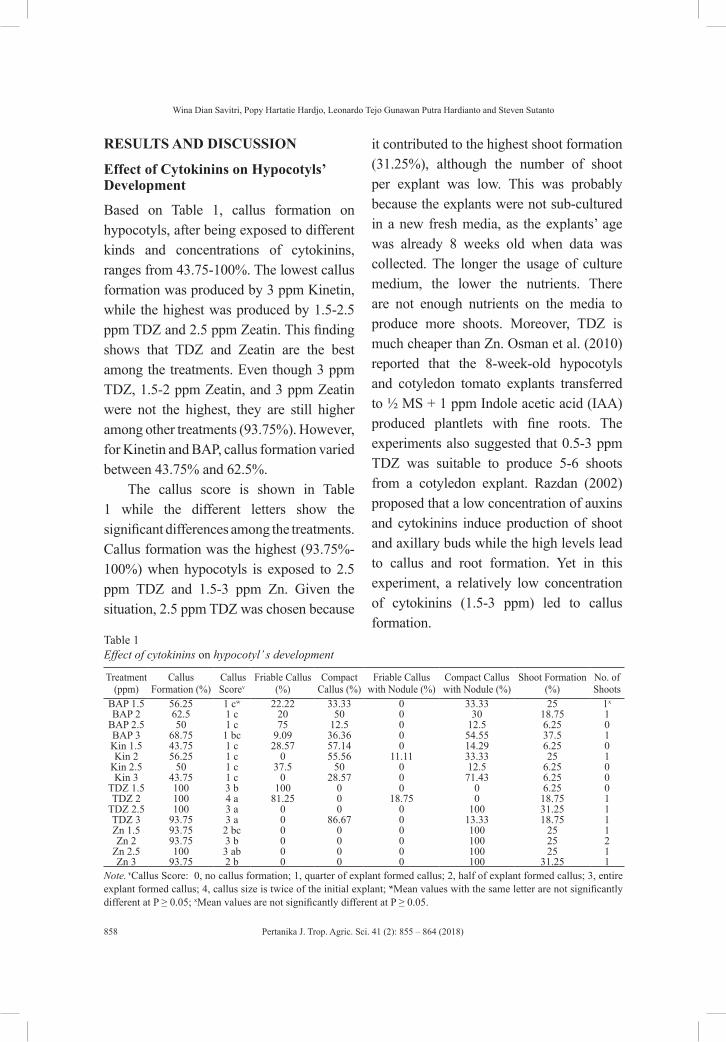
Pertanika J. Trop. Agric. Sci. 41 (2): 855 – 864 (2018)
Wina Dian Savitri, Popy Hartatie Hardjo, Leonardo Tejo Gunawan Putra Hardianto and Steven Sutanto
858
RESULTS AND DISCUSSION
Effect of Cytokinins on Hypocotyls’ Development
Based on Table 1, callus formation on hypocotyls, after being exposed to different kinds and concentrations of cytokinins, ranges from 43.75-100%. The lowest callus formation was produced by 3 ppm Kinetin, while the highest was produced by 1.5-2.5 ppm TDZ and 2.5 ppm Zeatin. This finding shows that TDZ and Zeatin are the best among the treatments. Even though 3 ppm TDZ, 1.5-2 ppm Zeatin, and 3 ppm Zeatin were not the highest, they are still higher among other treatments (93.75%). However, for Kinetin and BAP, callus formation varied between 43.75% and 62.5%.
The callus score is shown in Table 1 while the different letters show the significant differences among the treatments. Callus formation was the highest (93.75%-100%) when hypocotyls is exposed to 2.5 ppm TDZ and 1.5-3 ppm Zn. Given the situation, 2.5 ppm TDZ was chosen because
it contributed to the highest shoot formation (31.25%), although the number of shoot per explant was low. This was probably because the explants were not sub-cultured in a new fresh media, as the explants’ age was already 8 weeks old when data was collected. The longer the usage of culture medium, the lower the nutrients. There are not enough nutrients on the media to produce more shoots. Moreover, TDZ is much cheaper than Zn. Osman et al. (2010) reported that the 8-week-old hypocotyls and cotyledon tomato explants transferred to ½ MS + 1 ppm Indole acetic acid (IAA) produced plantlets with fine roots. The experiments also suggested that 0.5-3 ppm TDZ was suitable to produce 5-6 shoots from a cotyledon explant. Razdan (2002) proposed that a low concentration of auxins and cytokinins induce production of shoot and axillary buds while the high levels lead to callus and root formation. Yet in this experiment, a relatively low concentration of cytokinins (1.5-3 ppm) led to callus formation.
Table 1Effect of cytokinins on hypocotyl’ s development
Treatment (ppm)
Callus Formation (%)
Callus Scorev
Friable Callus (%)
Compact Callus (%)
Friable Callus with Nodule (%)
Compact Callus with Nodule (%)
Shoot Formation (%)
No. of Shoots
BAP 1.5 56.25 1 cw 22.22 33.33 0 33.33 25 1x
BAP 2 62.5 1 c 20 50 0 30 18.75 1BAP 2.5 50 1 c 75 12.5 0 12.5 6.25 0BAP 3 68.75 1 bc 9.09 36.36 0 54.55 37.5 1Kin 1.5 43.75 1 c 28.57 57.14 0 14.29 6.25 0Kin 2 56.25 1 c 0 55.56 11.11 33.33 25 1
Kin 2.5 50 1 c 37.5 50 0 12.5 6.25 0Kin 3 43.75 1 c 0 28.57 0 71.43 6.25 0
TDZ 1.5 100 3 b 100 0 0 0 6.25 0TDZ 2 100 4 a 81.25 0 18.75 0 18.75 1
TDZ 2.5 100 3 a 0 0 0 100 31.25 1TDZ 3 93.75 3 a 0 86.67 0 13.33 18.75 1Zn 1.5 93.75 2 bc 0 0 0 100 25 1Zn 2 93.75 3 b 0 0 0 100 25 2
Zn 2.5 100 3 ab 0 0 0 100 25 1Zn 3 93.75 2 b 0 0 0 100 31.25 1
Note. vCallus Score: 0, no callus formation; 1, quarter of explant formed callus; 2, half of explant formed callus; 3, entire explant formed callus; 4, callus size is twice of the initial explant; wMean values with the same letter are not significantly different at P ≥ 0.05; xMean values are not significantly different at P ≥ 0.05.
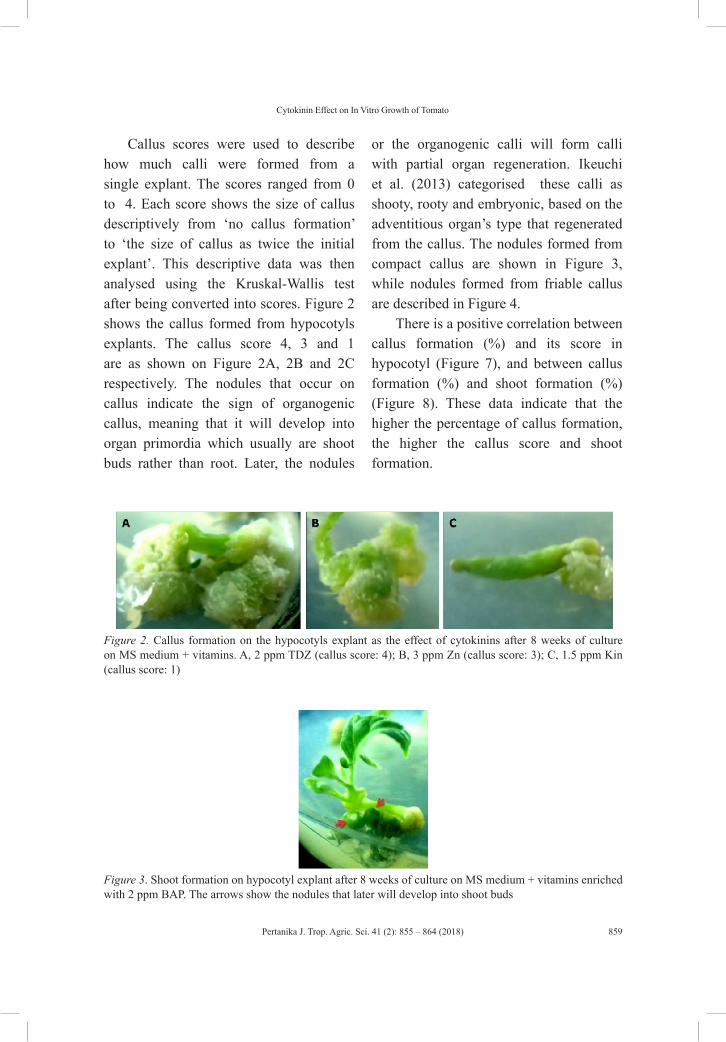
Pertanika J. Trop. Agric. Sci. 41 (2): 855 – 864 (2018)
Cytokinin Effect on In Vitro Growth of Tomato
859
Callus scores were used to describe how much calli were formed from a single explant. The scores ranged from 0 to 4. Each score shows the size of callus descriptively from ‘no callus formation’ to ‘the size of callus as twice the initial explant’. This descriptive data was then analysed using the Kruskal-Wallis test after being converted into scores. Figure 2 shows the callus formed from hypocotyls explants. The callus score 4, 3 and 1 are as shown on Figure 2A, 2B and 2C respectively. The nodules that occur on callus indicate the sign of organogenic callus, meaning that it will develop into organ primordia which usually are shoot buds rather than root. Later, the nodules
or the organogenic calli will form calli with partial organ regeneration. Ikeuchi et al. (2013) categorised these calli as shooty, rooty and embryonic, based on the adventitious organ’s type that regenerated from the callus. The nodules formed from compact callus are shown in Figure 3, while nodules formed from friable callus are described in Figure 4.
There is a positive correlation between callus formation (%) and its score in hypocotyl (Figure 7), and between callus formation (%) and shoot formation (%) (Figure 8). These data indicate that the higher the percentage of callus formation, the higher the callus score and shoot formation.
Figure 2. Callus formation on the hypocotyls explant as the effect of cytokinins after 8 weeks of culture on MS medium + vitamins. A, 2 ppm TDZ (callus score: 4); B, 3 ppm Zn (callus score: 3); C, 1.5 ppm Kin (callus score: 1)
Figure 3. Shoot formation on hypocotyl explant after 8 weeks of culture on MS medium + vitamins enriched with 2 ppm BAP. The arrows show the nodules that later will develop into shoot buds
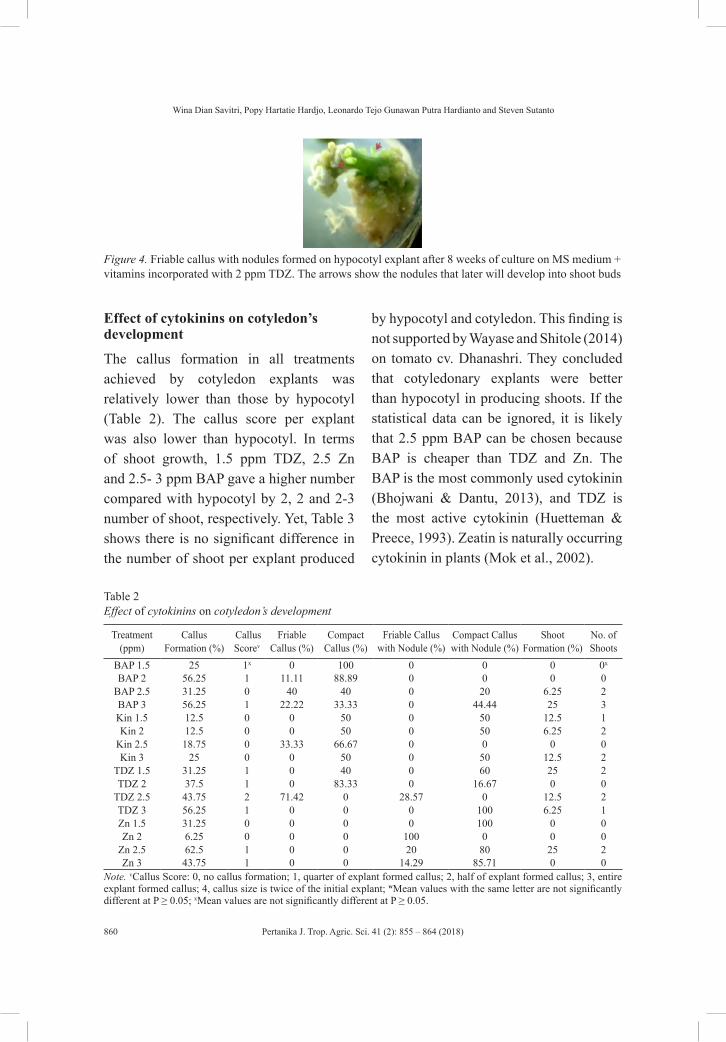
Pertanika J. Trop. Agric. Sci. 41 (2): 855 – 864 (2018)
Wina Dian Savitri, Popy Hartatie Hardjo, Leonardo Tejo Gunawan Putra Hardianto and Steven Sutanto
860
Figure 4. Friable callus with nodules formed on hypocotyl explant after 8 weeks of culture on MS medium + vitamins incorporated with 2 ppm TDZ. The arrows show the nodules that later will develop into shoot buds
Effect of cytokinins on cotyledon’s development
The callus formation in all treatments achieved by cotyledon explants was relatively lower than those by hypocotyl (Table 2). The callus score per explant was also lower than hypocotyl. In terms of shoot growth, 1.5 ppm TDZ, 2.5 Zn and 2.5- 3 ppm BAP gave a higher number compared with hypocotyl by 2, 2 and 2-3 number of shoot, respectively. Yet, Table 3 shows there is no significant difference in the number of shoot per explant produced
by hypocotyl and cotyledon. This finding is not supported by Wayase and Shitole (2014) on tomato cv. Dhanashri. They concluded that cotyledonary explants were better than hypocotyl in producing shoots. If the statistical data can be ignored, it is likely that 2.5 ppm BAP can be chosen because BAP is cheaper than TDZ and Zn. The BAP is the most commonly used cytokinin (Bhojwani & Dantu, 2013), and TDZ is the most active cytokinin (Huetteman & Preece, 1993). Zeatin is naturally occurring cytokinin in plants (Mok et al., 2002).
Table 2 Effect of cytokinins on cotyledon’s development
Treatment (ppm)
Callus Formation (%)
Callus Scorev
Friable Callus (%)
Compact Callus (%)
Friable Callus with Nodule (%)
Compact Callus with Nodule (%)
Shoot Formation (%)
No. of Shoots
BAP 1.5 25 1x 0 100 0 0 0 0x
BAP 2 56.25 1 11.11 88.89 0 0 0 0BAP 2.5 31.25 0 40 40 0 20 6.25 2BAP 3 56.25 1 22.22 33.33 0 44.44 25 3Kin 1.5 12.5 0 0 50 0 50 12.5 1Kin 2 12.5 0 0 50 0 50 6.25 2
Kin 2.5 18.75 0 33.33 66.67 0 0 0 0Kin 3 25 0 0 50 0 50 12.5 2
TDZ 1.5 31.25 1 0 40 0 60 25 2TDZ 2 37.5 1 0 83.33 0 16.67 0 0
TDZ 2.5 43.75 2 71.42 0 28.57 0 12.5 2TDZ 3 56.25 1 0 0 0 100 6.25 1Zn 1.5 31.25 0 0 0 0 100 0 0Zn 2 6.25 0 0 0 100 0 0 0
Zn 2.5 62.5 1 0 0 20 80 25 2Zn 3 43.75 1 0 0 14.29 85.71 0 0
Note. vCallus Score: 0, no callus formation; 1, quarter of explant formed callus; 2, half of explant formed callus; 3, entire explant formed callus; 4, callus size is twice of the initial explant; wMean values with the same letter are not significantly different at P ≥ 0.05; xMean values are not significantly different at P ≥ 0.05.
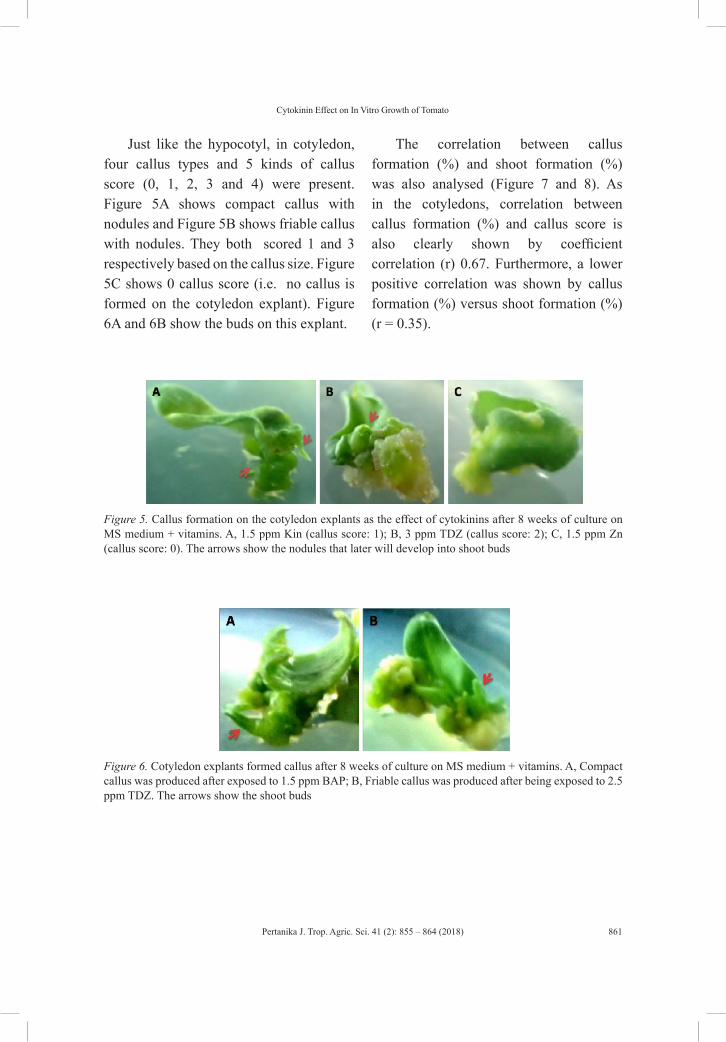
Pertanika J. Trop. Agric. Sci. 41 (2): 855 – 864 (2018)
Cytokinin Effect on In Vitro Growth of Tomato
861
Just like the hypocotyl, in cotyledon, four callus types and 5 kinds of callus score (0, 1, 2, 3 and 4) were present. Figure 5A shows compact callus with nodules and Figure 5B shows friable callus with nodules. They both scored 1 and 3 respectively based on the callus size. Figure 5C shows 0 callus score (i.e. no callus is formed on the cotyledon explant). Figure 6A and 6B show the buds on this explant.
The correlation between callus formation (%) and shoot formation (%) was also analysed (Figure 7 and 8). As in the cotyledons, correlation between callus formation (%) and callus score is also clearly shown by coefficient correlation (r) 0.67. Furthermore, a lower positive correlation was shown by callus formation (%) versus shoot formation (%) (r = 0.35).
Figure 5. Callus formation on the cotyledon explants as the effect of cytokinins after 8 weeks of culture on MS medium + vitamins. A, 1.5 ppm Kin (callus score: 1); B, 3 ppm TDZ (callus score: 2); C, 1.5 ppm Zn (callus score: 0). The arrows show the nodules that later will develop into shoot buds
Figure 6. Cotyledon explants formed callus after 8 weeks of culture on MS medium + vitamins. A, Compact callus was produced after exposed to 1.5 ppm BAP; B, Friable callus was produced after being exposed to 2.5 ppm TDZ. The arrows show the shoot buds
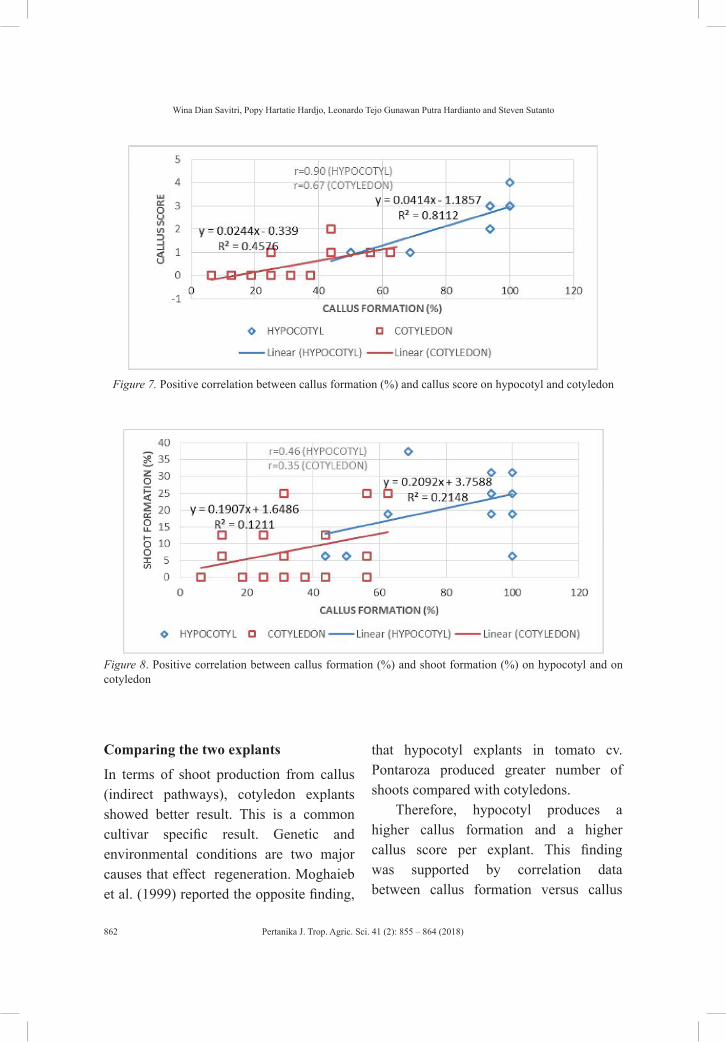
Pertanika J. Trop. Agric. Sci. 41 (2): 855 – 864 (2018)
Wina Dian Savitri, Popy Hartatie Hardjo, Leonardo Tejo Gunawan Putra Hardianto and Steven Sutanto
862
Figure 7. Positive correlation between callus formation (%) and callus score on hypocotyl and cotyledon
Figure 8. Positive correlation between callus formation (%) and shoot formation (%) on hypocotyl and on cotyledon
Comparing the two explants
In terms of shoot production from callus (indirect pathways), cotyledon explants showed better result. This is a common cultivar specific result. Genetic and environmental conditions are two major causes that effect regeneration. Moghaieb et al. (1999) reported the opposite finding,
that hypocotyl explants in tomato cv. Pontaroza produced greater number of shoots compared with cotyledons.
Therefore, hypocotyl produces a higher callus formation and a higher callus score per explant. This finding was supported by correlation data between callus formation versus callus
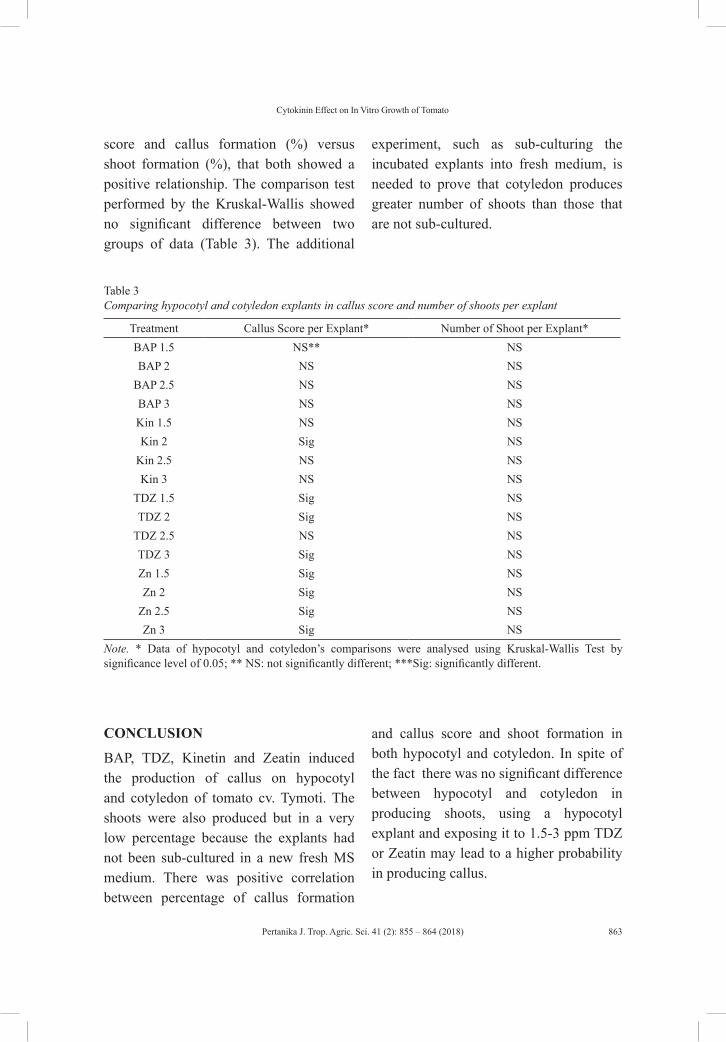
Pertanika J. Trop. Agric. Sci. 41 (2): 855 – 864 (2018)
Cytokinin Effect on In Vitro Growth of Tomato
863
score and callus formation (%) versus shoot formation (%), that both showed a positive relationship. The comparison test performed by the Kruskal-Wallis showed no significant difference between two groups of data (Table 3). The additional
experiment, such as sub-culturing the incubated explants into fresh medium, is needed to prove that cotyledon produces greater number of shoots than those that are not sub-cultured.
Table 3 Comparing hypocotyl and cotyledon explants in callus score and number of shoots per explant
Treatment Callus Score per Explant* Number of Shoot per Explant*BAP 1.5 NS** NSBAP 2 NS NS
BAP 2.5 NS NSBAP 3 NS NSKin 1.5 NS NSKin 2 Sig NS
Kin 2.5 NS NSKin 3 NS NS
TDZ 1.5 Sig NSTDZ 2 Sig NS
TDZ 2.5 NS NSTDZ 3 Sig NSZn 1.5 Sig NSZn 2 Sig NS
Zn 2.5 Sig NSZn 3 Sig NS
Note. * Data of hypocotyl and cotyledon’s comparisons were analysed using Kruskal-Wallis Test by significance level of 0.05; ** NS: not significantly different; ***Sig: significantly different.
CONCLUSION
BAP, TDZ, Kinetin and Zeatin induced the production of callus on hypocotyl and cotyledon of tomato cv. Tymoti. The shoots were also produced but in a very low percentage because the explants had not been sub-cultured in a new fresh MS medium. There was positive correlation between percentage of callus formation
and callus score and shoot formation in both hypocotyl and cotyledon. In spite of the fact there was no significant difference between hypocotyl and cotyledon in producing shoots, using a hypocotyl explant and exposing it to 1.5-3 ppm TDZ or Zeatin may lead to a higher probability in producing callus.
Pertanika J. Trop. Agric. Sci. 41 (2): 855 – 864 (2018)
Wina Dian Savitri, Popy Hartatie Hardjo, Leonardo Tejo Gunawan Putra Hardianto and Steven Sutanto
864
ACKNOWLEDGEMENT
Authors would like to thank Lembaga Penelitian dan Pengabdian kepada Masyarakat (LPPM) Ubaya for funding this research, and the Faculty of Biotechnology Ubaya for providing the facilities to complete these experiments.
REFERENCES Aloni, R., Langhans, M., Aloni, E., Dreieicher, E., &
Ullrich, C. I. (2005). Root-synthesized cytokinin in Arabidopsis is distributed in the shoot by the transpiration stream. Journal of Experimental Botany, 56(416), 1535–1544.
Bhojwani, S. S., & Dantu, P. K. (2013). Plant tissue culture: An introductory text. New Delhi, India: Springer.
Huetteman, C. A., & Preece, J. E. (1993). Thidiazuron: a potent cytokinin for woody plant tissue culture. Plant Cell, Tissue and Organ Culture, 33(2), 105 – 119.
Ikeuchi, M., Sugimoto, K., & Iwase, A. (2013). Plant Callus: Mechanisms of induction and repression. The Plant Cell, 25(9), 3159–3173.
Ishak, J. (2015). Studi regenerasi dan seleksi melon ‘action 434’ untuk transformasi genetik menggunakan Agrobacterium tumefaciens [Study of regeneration and selection of ‘434’ melon action for genetic transformation using Agrobacterium tumefaciens]. Skripsi (p. 33). Surabaya, Indonesia: Universitas Surabaya.
Moghaieb, R. E. A., Saneoka, H., & Fujita, K. (1999). Plant regeneration from hypocotyl and cotyledon explant of tomato (Lycopersicon esculentum Mill.). Soil Science and Plant Nutrition, 45(3), 639-646.
Mok, M. C., Martin, R. C., & Mok, D. W. S. (2000). Cytokinins: Biosynthesis, Metabolism and Perception. In Vitro Cellular & Developmental Biology - Plant, 36(2), 102 – 107.
Osman, M. G., Elhadi, E. A., & Khalafalla, M. M. (2010). Callus formation and organogenesis of tomato (Lycopersicon esculentum Mill, C.V. Omdurman) induced by thidiazuron. African Journal of Biotechnology, 9(28), 4407 – 4413.
Razdan, M. K. (2002). Introduction to plant tissue culture. Enfield (NH), USA: Science Publishers, Inc.
Savitri, W. D. (2015). Direct adventitious shoot formation from tomato hypocotyls and cotyledons. In Badruzsaufari, H., Suryajaya, Uripto, T. S., & Rodiansono (Eds.), Proceeding of International Conference on Natural and Environmental Sciences for Sustainable Development 2015 (pp. 77 – 81). Banjarbaru, Indonesia: Fakultas Matematika dan Ilmu Pengetahuan Alam Universitas Lambung Mangkurat.
Savitri, W. D., Ferina, A. B., Octavia, Y., Muliawan, E., & Effendi, E. E. (2016). Calluses from tomato cv. Tymoti and their morphological characteristics as supporting material for plant tissue culture lesson. In N. Ducha (Ed.) Prosiding Seminar Nasional Biologi 2016 (pp. 293 – 297). Surabaya, Indonesia: Universitas Negeri Surabaya.
Wayase, U. R., & Shitole. M.G. (2014). Effect of plant growth regulators on organogenesis in tomato (Lycopersicon esculentum Mill.) cv. Dhanashri. International Journal of Pure and Applied Sciences and Technology, 20(2), 65–71.
Pertanika J. Trop. Agric. Sci. 41 (2): 865 – 878 (2018)
ISSN: 1511-3701 © Universiti Putra Malaysia Press
TROPICAL AGRICULTURAL SCIENCEJournal homepage: http://www.pertanika.upm.edu.my/
ARTICLE INFOArticle history:Received: 18 September 2017Accepted: 30 April 2018
E-mail addresses:[email protected] (Diana Rachmawati)[email protected] (Istiyanto Samidjan)*Corresponding author
Effect of Phytase Enzyme on Growth, Nutrient Digestibility and Survival Rate of Catfish (Pangasius hypothalamus) Fingerlings
Diana Rachmawati* and Istiyanto SamidjanDepartment of Aquaculture, Faculty of Fisheries and Marine Sciences, Diponegoro University, Jawa Tengah 50275, Indonesia
ABSTRACT
This study was conducted to evaluate the effect of adding phytase enzyme in diet on growth performance, nutrient digestibility, and survival rate in fingerlings of P. hypothalamus. Fingerlings of P. hypothalamus with the average weight 1.81± 0.06 g per fingerling, used in this study were obtained from Muntilan, Central Java. An experimental randomised complete design was used with 5 treatments and 3 repetitions. The treatments were A (0 FTU kg–1 diet, B (150 FTU kg–1 diet), C (300 FTU kg–1 diet), D (450 FTU kg–1 diet), and E (600 FTU kg–1 diet). The parameters to be determined include specific growth rate (SGR), efficiency of feed utilisation (EFU), protein efficiency ratio (PER), apparent digestibility coefficient protein (ADCP), apparent digestibility coefficient phosphor (ADCF), survival rate (SR) and water quality parameters. The experimental results significantly (P<0.01) affected SGR, EFU, PER, ADCP and ADCF. On the other hand, the had insignificant (P>0.05) effect on SR of P. hypothalamus fingerlings. Based on the results, it is concluded that optimum doses of phytase enzyme in terms of SGR, EFU, PER, ADCP and ADCF in the catfish (P. hypothalamus) are 324, 314, 300, 300 and 300 FTU kg–1 diet respectively.
Keywords: Catfish, nutrient digestibility, P. hypothalamus fingerlings, phytase enzyme, specific growth,
survival rate
INTRODUCTION
Intensive catfish (P. hypothalamus) aquaculture needs artificial feed that contains complete nutrients. It should also be efficient and economical. Catfish (P. hypothalamus) needs a complete diet which contains fat, protein, carbohydrate, vitamin and minerals. Protein is the most important

Pertanika J. Trop. Agric. Sci. 41 (2): 865 – 878 (2018)
Diana Rachmawati and Istiyanto Samidjan
866
element in its diet to support growth (National Research Council [NRC], 1993). The protein in the supplemental diet can be either plant or animal based. The usage of plant-based protein is still limited, because most of them contain high fibre that is difficult to digest. Therefore, plant-based protein is not an optimal diet for the catfish. A common source of plant-based protein is soybean. According to Cao et al. (2007) plant-based protein also includes grains, such as rice and bean containing anti-nutrient compound in the form of phytate acid. They report that soybean contains 3.8% phytate acid chelates with minerals such as magnesium (Mg), manganese (Mn), iron (Fe), zinc (Zn), calcium (Ca) and protein which are beneficial for growth of plant, animal, and human. Debnath et al. (2005) found phytate acid (mio-inositol 1,2,3,4,5,6-heksakifosfat) is an anti-nutrient which obstructs nutrient absorption and decrease nutrient efficiency utilisation.
The plant-based feed will result in greater phosphorous pollution of our water. Phosphorous content in the plant-based feed cannot be utilised by the fish because there is a lack of phytase enzyme that could break down phytate acid (Cheng, & Hardy, 2003; Debnath et al., 2005; Kumar et al., 2011; Rachmawati et al., 2017). Kumar et al., (2011) explains that phytate acid is the main storage for phosphorous (P) in plant-based feed, around 80%. Phytate acid in the artificial feed would be excreted by the fish into the water. Microbes that
produce phytase enzyme will decompose the phytate acid into phosphorous and release it into the water. High phosphorous content in the water will trigger eutrophication process that hinders fish growth (Baruah et al., 2004). Jegannathan and Nielsen (2013) reported that fish needs phosphorous to fuel its growth. However, phosphorous cannot be directly absorbed by the fish, because it is bound by phytate acid. In turn, it is excreted into the water. According to Jobling et al. (2002), Chung (2001) and NRC (1993) phytase enzyme can increase diet utilisation and regulate nutrient excretion (phosphorous, nitrogen, and mineral) and also hydrolise Phytate in the diet into inositol and phosphate acid. Phytase enzyme hydrolises phytate in order to breakdown minerals (Chung, 2001). Baruah et al. (2007) also explain that phytase enzyme is able to hydrolise phytate (myo-inositol hexakisphosphate) into myo-inositol mono, di, tetra and pentaphosphate and organic phosphate. Phytase enzyme will unbind phosphorous from phytate acid and also unbind other nutrient elements (Ravindran, 2000). The addition of phytase enzyme could unbind phytate from calcium, cuprum, zinc, manganese and increase nutrient absorption in intestinal system, as reported by Junqueria et al. (2011). Studies have examined the role of phytase enzyme in species, such as Chanos chanos (Hassan et al., 2009), Oreochomis niloticus (Hassan et al., 2013, Olusola & Nwanna, 2014), Marsupenaeus japonicas (Bulbul et al., 2015), Psetta maxima (Danwitz et al.,
Pertanika J. Trop. Agric. Sci. 41 (2): 865 – 878 (2018)
Effect of Phytase Enzyme in Pangasius hypothalamus
867
2016), Penaeus monodon (Rachmawati, & Samidjan, 2016), Channos channos (Rachmawati et al., 2017). This study was conducted to evaluate the effect of adding phytase enzyme in diet and its optimal dose to enhance growth, nutrient digestibility, and survival rate in fingerlings of Pangasius hypothalamus.
MATERIALS AND METHODS
Test Animal
Catfish Fingerlings of Pangasius hypothalamus with an average weight 1.81± 0.06 g per fingerling were obtained from aquaculture fingerlings in Muntilan, Central Java, Indonesia. The fish were selected based on their size uniformity, completeness of organs, and physical performance (Rachmawati et al., 2017). The fingerlings were first adapted to the culture media and its diet for one week. Before treatment, the fingerlings were fasted for one day to clean their digestive system. The Catfish fingerlings of P. hypothalamus were raised for 42 days and fed three times a day at satiation (Rachmawati & Samidjan, 2016). They were weighed weekly.
Container Research
Containers used in this study were made of happa with the dimension of 1m x 1m x 0.6m or equal to 600 l. Density for each treatment and repetition (25 fingerlings/m3) was based on Dasuki et al. (2013).
Test Feed
The food was shaped into a pellet and dried at room temperature. It contained iso-protein (30%) and iso-energy (2720 kcal kg-1 diet) based on Hassan et al. (2013) and Debnath et al. (2005). Diet ingredients for artificial feed contained fish meal as source of animal protein, soybean meal as source of plant protein, corn meal, bran meal, wheat flour as source of carbohydrate, fish oil and corn oil as source of fat, mineral and vitamin mix as source of vitamin, CMC as binder, Cr2O3 1 % as indirect indicator to test nutrient digestibility and phytase enzyme. The soybean meal and phytase enzyme was first mixed at various doses and kept for 24 hours. It was followed by weighing of every ingredient as shown in Table 1. All the ingredients were later mixed, starting from the smallest amount to the biggest amount.
The diet treatment used proximate analysis based on the method proposed by Association of Official Analytical Chemists (AOAC, 1990). The experiment used Natuphos 5000G phytase enzyme that was produced by PT. BASF Indonesia. Natuphos 5000G form was granule which contains active materials of myo-inositol-hexakisphosphate β-phosphohydrolase (EC 3.1.3.8) which was produced by Aspergillus niger. Natuphos 5000G contains phytase enzyme 5.000 FTU/g. One unit of phytase activity (Phytase Unit/ FTU) is defined as the amount of enzyme which releases 1 micro molecule of nonorganic per minute from 0,0051 mol/l of phytase acid on pH of 5.5 and 37oC (Debnath et al., 2005). The diet composition for the study is shown in Table 1.
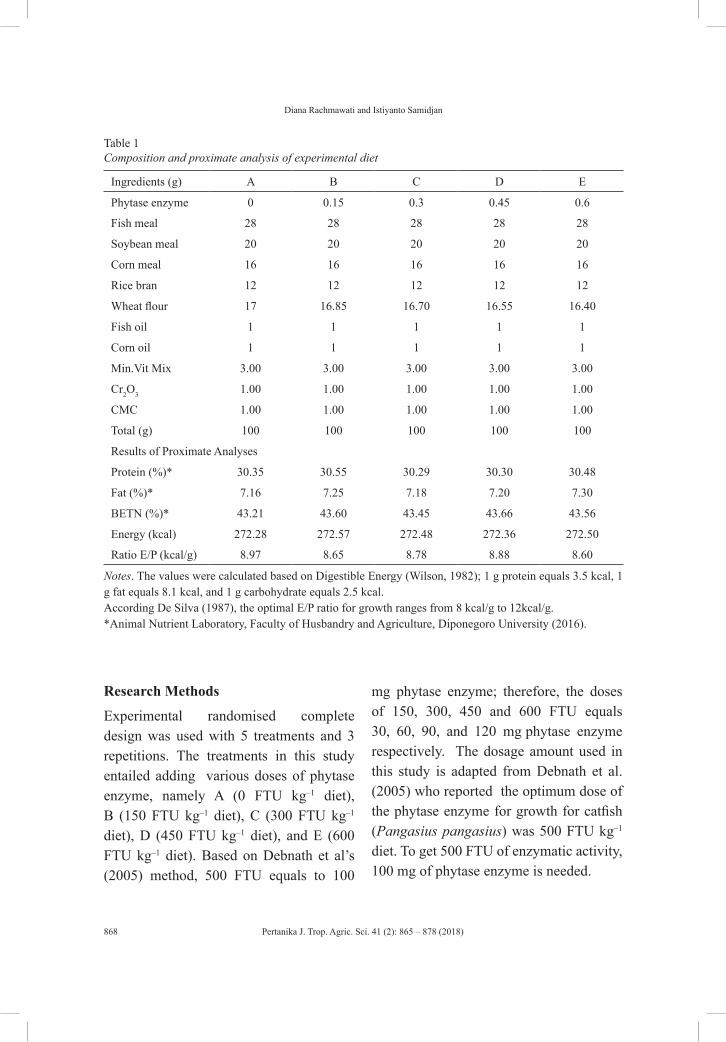
Pertanika J. Trop. Agric. Sci. 41 (2): 865 – 878 (2018)
Diana Rachmawati and Istiyanto Samidjan
868
Table 1 Composition and proximate analysis of experimental diet
Ingredients (g) A B C D E
Phytase enzyme 0 0.15 0.3 0.45 0.6
Fish meal 28 28 28 28 28
Soybean meal 20 20 20 20 20
Corn meal 16 16 16 16 16
Rice bran 12 12 12 12 12
Wheat flour 17 16.85 16.70 16.55 16.40
Fish oil 1 1 1 1 1
Corn oil 1 1 1 1 1
Min.Vit Mix 3.00 3.00 3.00 3.00 3.00
Cr2O3 1.00 1.00 1.00 1.00 1.00
CMC 1.00 1.00 1.00 1.00 1.00
Total (g) 100 100 100 100 100
Results of Proximate Analyses
Protein (%)* 30.35 30.55 30.29 30.30 30.48
Fat (%)* 7.16 7.25 7.18 7.20 7.30
BETN (%)* 43.21 43.60 43.45 43.66 43.56
Energy (kcal) 272.28 272.57 272.48 272.36 272.50
Ratio E/P (kcal/g) 8.97 8.65 8.78 8.88 8.60
Notes. The values were calculated based on Digestible Energy (Wilson, 1982); 1 g protein equals 3.5 kcal, 1 g fat equals 8.1 kcal, and 1 g carbohydrate equals 2.5 kcal.According De Silva (1987), the optimal E/P ratio for growth ranges from 8 kcal/g to 12kcal/g.*Animal Nutrient Laboratory, Faculty of Husbandry and Agriculture, Diponegoro University (2016).
Research Methods
Experimental randomised complete design was used with 5 treatments and 3 repetitions. The treatments in this study entailed adding various doses of phytase enzyme, namely A (0 FTU kg–1 diet), B (150 FTU kg–1 diet), C (300 FTU kg–1 diet), D (450 FTU kg–1 diet), and E (600 FTU kg–1 diet). Based on Debnath et al’s (2005) method, 500 FTU equals to 100
mg phytase enzyme; therefore, the doses of 150, 300, 450 and 600 FTU equals 30, 60, 90, and 120 mg phytase enzyme respectively. The dosage amount used in this study is adapted from Debnath et al. (2005) who reported the optimum dose of the phytase enzyme for growth for catfish (Pangasius pangasius) was 500 FTU kg–1 diet. To get 500 FTU of enzymatic activity, 100 mg of phytase enzyme is needed.
Pertanika J. Trop. Agric. Sci. 41 (2): 865 – 878 (2018)
Effect of Phytase Enzyme in Pangasius hypothalamus
869
Data
Data collected during this study were Specific Growth Rate (SGR) using Steffens’s method (1989), Efficiency of Feed utilization (EFU), and Protein Efficiency Ratio (PER), according to Tacon (1987), apparent digestibility content protein (ADCP) and apparent digestibility content phosphor (ADCF) according to Fenucci (1981), and Survival Rate (SR) according to NRC (1993). The chromic oxide levels in feeds and faeces were analysed using a modified colorimetric method (Fenucci, 1981). The levels were measured with a spectrophotometer (540 nm) (Shimadzu UV-2102 PC, UV-visible Scanning Spectrophotometer) after perchloric acid oxidation and forming a coloured complex with diphenylcarbazide (DPC). Samples were analysed to determine phosphorous (P) concentrations by flame atomic absorption spectrophotometry on a Shimadzu AA6800 (Shimadzu, Japan). Variables of water quality that were tested were pH (Jenway 3510), DO (Jenway 970), temperature and Ammoniac (HANNA: HI. 8633). Aerator to recirculate the water was placed in every container. The parameters were measured by the following equations:
[1]
[2]
[3]
[4]
[5]
[6]
Statistical Analysis
Analysis of Variance (ANOVA) was used to analyse data after conducting tests of normality, homogeneity, and additives. If the ANOVA shows significant (P<0.05) or very significant (P<0.01) results, Duncan test are conducted to find out whether the means are different (Steel et al., 1993). To find out the optimal dose of the enzyme, polynomial orthogonal test using Minitab version 17.0 and Maple version 12.0 was conducted.
RESULTS AND DISCUSSION
The results of study on P. hypothalamus fingerlings for specific growth rate (SGR), efficiency of feed utilization (EFU), protein efficiency ratio (PER), apparent digestibility content protein (ADCP),

Pertanika J. Trop. Agric. Sci. 41 (2): 865 – 878 (2018)
Diana Rachmawati and Istiyanto Samidjan
870
apparent digestibility content phosphorous (ADCf), survival rate (SR) Catfish (P. hypothalamus) and phytate acid content artificial feed, faeces and decreased phytate acid are shown in Table 2.
The addition of phytase enzyme on the diet significantly (p<0.01) increased the specific growth rate (SGR) of the catfish (P. hypothalamus) fingerlings as shown in Table 2. Similar studies were also conducted by Debnath et al. (2005), Tahoun et al. (2009), Olusola and Nwanna (2014) and Danwitz et al. (2016). The increase in specific growth rate is due
adding of phytase enzyme that was able to break down the phytate acid anti-nutrient. The contents of phytate acid in the diet are A (0.64%), B (0.63%), C (0.58%), D (0.68) and E (0.69%), as shown in Table 2. The existence of phytate acid can hamper the growth, as reported by NCR (1993) which stated that 0.5% phytate acid in the diet can reduce growth and diet efficiency for rainbow trout (O. mysskis). Tacon (1987) reported that 2.58% phytate acid can reduce growth, diet efficiency, protein efficiency ratio and cause mortality.
Table 2 The values of SGR, EFU, PER, ADCP, ACDF, SR of Catfish (P. hypothalamus) and phytate acid content in artificial feed, faeces and decreased phytate acid
Data Treatment
A B C D ESGR %/day) 3.07±0.37c 3.38±0.28bc 4.14±0.17a 3.85±0.11ab 3.80±0.15ab
EFU (%) 51.80±4.60b 58.43±5.15ab 66.97±1.42a 66.61±1.72a 65.86±2.93a
PER 1.73±0.16b 1.95±0.17ab 2.23±0.05a 2.22±0.06a 2.20±0.10a
ADCP (%) 75.27±0.02c 79.65±0.05bc 81.93±0.05a 77.35±0.04ab 75.35±0.04c
ADCF (%) 71.37±0.03c 73.64±0.04bc 74.89±0.06a 72.53±0.02ab 71.32±0.04c
SR (%) 82,67±4,62a 85,33±2,31a 85,33±2,31a 86,67±2,31a 86,67±2.31a
Phytate acid Artificial Feeds (%) 0,64 0,63 0,58 0,68 0,69
Phytate acid Fish Faeces (%) 0,54 0,47 0,29 0,46 0,52
Phytate Acids Decrease (%) 0,1 0,16 0,29 0,22 0,17
Note. The values with the same superscripts in the column show that there was no difference.
The contents of phytate acid in the faeces A (0.54%), B (0.47%), C (0.29%), D (0.46%) and E (0.52%) as shown in Table 2. The decrease in the phytate acid
were A (0.1%), B (0.16%), C (0.29%), D (0.22%) and E (0.17%) respectively. The decrease in phytate acid shows that it has been broken down by the phytase enzyme.
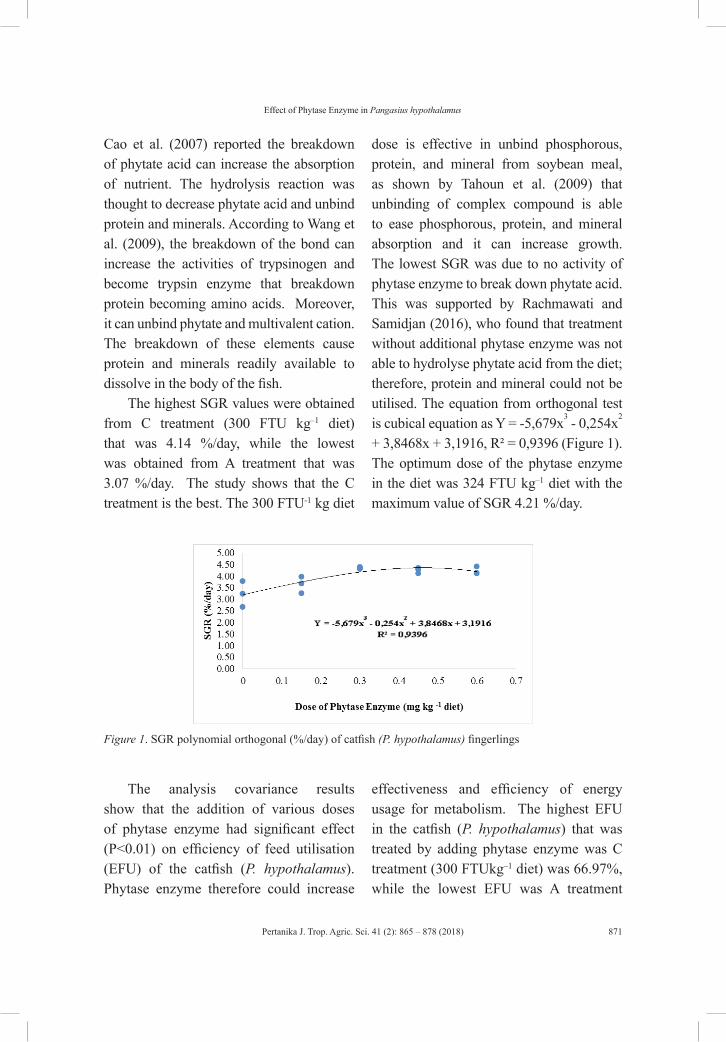
Pertanika J. Trop. Agric. Sci. 41 (2): 865 – 878 (2018)
Effect of Phytase Enzyme in Pangasius hypothalamus
871
Cao et al. (2007) reported the breakdown of phytate acid can increase the absorption of nutrient. The hydrolysis reaction was thought to decrease phytate acid and unbind protein and minerals. According to Wang et al. (2009), the breakdown of the bond can increase the activities of trypsinogen and become trypsin enzyme that breakdown protein becoming amino acids. Moreover, it can unbind phytate and multivalent cation. The breakdown of these elements cause protein and minerals readily available to dissolve in the body of the fish.
The highest SGR values were obtained from C treatment (300 FTU kg–1 diet) that was 4.14 %/day, while the lowest was obtained from A treatment that was 3.07 %/day. The study shows that the C treatment is the best. The 300 FTU-1 kg diet
dose is effective in unbind phosphorous, protein, and mineral from soybean meal, as shown by Tahoun et al. (2009) that unbinding of complex compound is able to ease phosphorous, protein, and mineral absorption and it can increase growth. The lowest SGR was due to no activity of phytase enzyme to break down phytate acid. This was supported by Rachmawati and Samidjan (2016), who found that treatment without additional phytase enzyme was not able to hydrolyse phytate acid from the diet; therefore, protein and mineral could not be utilised. The equation from orthogonal test is cubical equation as Y = -5,679x3 - 0,254x2 + 3,8468x + 3,1916, R² = 0,9396 (Figure 1). The optimum dose of the phytase enzyme in the diet was 324 FTU kg–1 diet with the maximum value of SGR 4.21 %/day.
Figure 1. SGR polynomial orthogonal (%/day) of catfish (P. hypothalamus) fingerlings
The analysis covariance results show that the addition of various doses of phytase enzyme had significant effect (P<0.01) on efficiency of feed utilisation (EFU) of the catfish (P. hypothalamus). Phytase enzyme therefore could increase
effectiveness and efficiency of energy usage for metabolism. The highest EFU in the catfish (P. hypothalamus) that was treated by adding phytase enzyme was C treatment (300 FTUkg–1 diet) was 66.97%, while the lowest EFU was A treatment
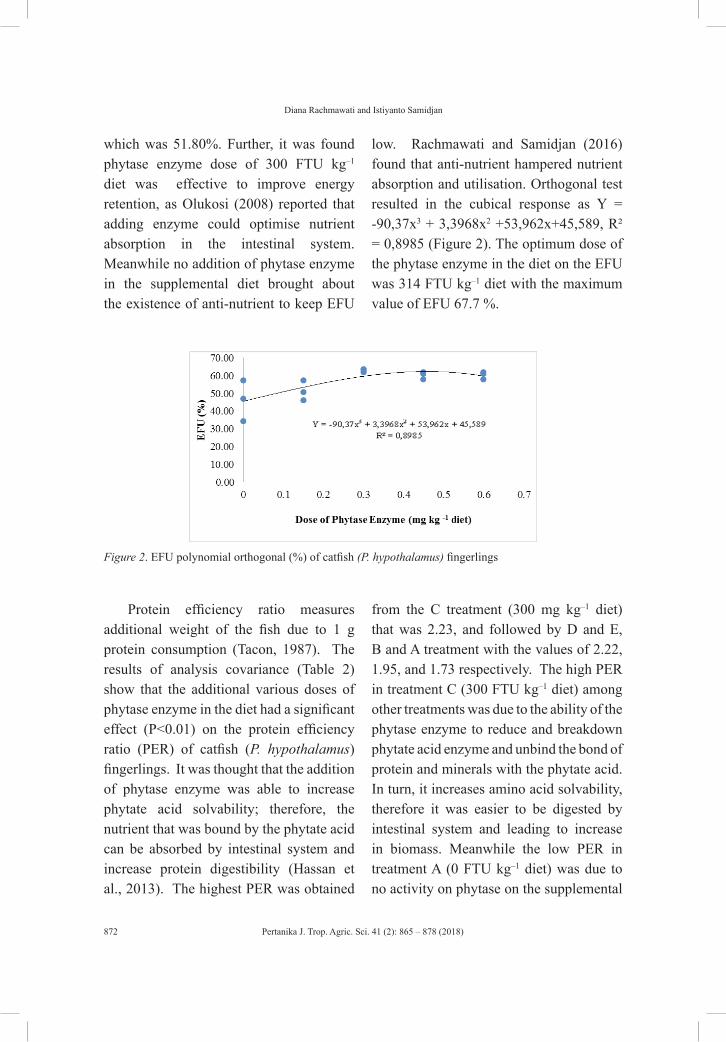
Pertanika J. Trop. Agric. Sci. 41 (2): 865 – 878 (2018)
Diana Rachmawati and Istiyanto Samidjan
872
which was 51.80%. Further, it was found phytase enzyme dose of 300 FTU kg–1 diet was effective to improve energy retention, as Olukosi (2008) reported that adding enzyme could optimise nutrient absorption in the intestinal system. Meanwhile no addition of phytase enzyme in the supplemental diet brought about the existence of anti-nutrient to keep EFU
low. Rachmawati and Samidjan (2016) found that anti-nutrient hampered nutrient absorption and utilisation. Orthogonal test resulted in the cubical response as Y = -90,37x3 + 3,3968x2 +53,962x+45,589, R² = 0,8985 (Figure 2). The optimum dose of the phytase enzyme in the diet on the EFU was 314 FTU kg–1 diet with the maximum value of EFU 67.7 %.
Figure 2. EFU polynomial orthogonal (%) of catfish (P. hypothalamus) fingerlings
Protein efficiency ratio measures additional weight of the fish due to 1 g protein consumption (Tacon, 1987). The results of analysis covariance (Table 2) show that the additional various doses of phytase enzyme in the diet had a significant effect (P<0.01) on the protein efficiency ratio (PER) of catfish (P. hypothalamus) fingerlings. It was thought that the addition of phytase enzyme was able to increase phytate acid solvability; therefore, the nutrient that was bound by the phytate acid can be absorbed by intestinal system and increase protein digestibility (Hassan et al., 2013). The highest PER was obtained
from the C treatment (300 mg kg–1 diet) that was 2.23, and followed by D and E, B and A treatment with the values of 2.22, 1.95, and 1.73 respectively. The high PER in treatment C (300 FTU kg–1 diet) among other treatments was due to the ability of the phytase enzyme to reduce and breakdown phytate acid enzyme and unbind the bond of protein and minerals with the phytate acid. In turn, it increases amino acid solvability, therefore it was easier to be digested by intestinal system and leading to increase in biomass. Meanwhile the low PER in treatment A (0 FTU kg–1 diet) was due to no activity on phytase on the supplemental
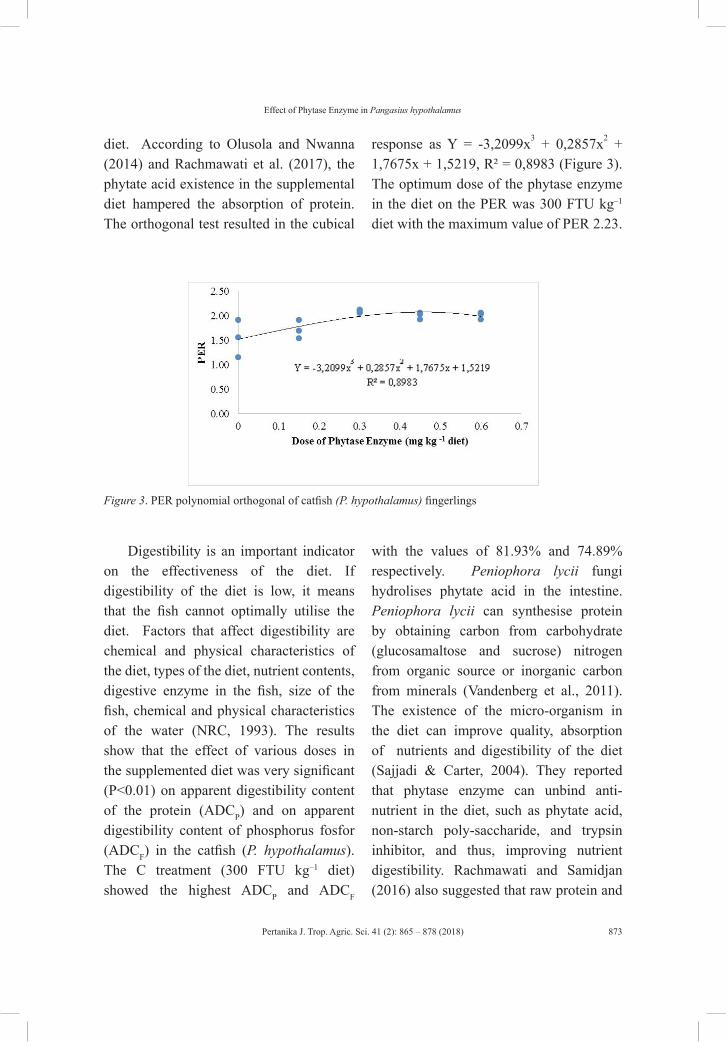
Pertanika J. Trop. Agric. Sci. 41 (2): 865 – 878 (2018)
Effect of Phytase Enzyme in Pangasius hypothalamus
873
diet. According to Olusola and Nwanna (2014) and Rachmawati et al. (2017), the phytate acid existence in the supplemental diet hampered the absorption of protein. The orthogonal test resulted in the cubical
response as Y = -3,2099x3 + 0,2857x2 + 1,7675x + 1,5219, R² = 0,8983 (Figure 3). The optimum dose of the phytase enzyme in the diet on the PER was 300 FTU kg–1 diet with the maximum value of PER 2.23.
Figure 3. PER polynomial orthogonal of catfish (P. hypothalamus) fingerlings
Digestibility is an important indicator on the effectiveness of the diet. If digestibility of the diet is low, it means that the fish cannot optimally utilise the diet. Factors that affect digestibility are chemical and physical characteristics of the diet, types of the diet, nutrient contents, digestive enzyme in the fish, size of the fish, chemical and physical characteristics of the water (NRC, 1993). The results show that the effect of various doses in the supplemented diet was very significant (P<0.01) on apparent digestibility content of the protein (ADCP) and on apparent digestibility content of phosphorus fosfor (ADCF) in the catfish (P. hypothalamus). The C treatment (300 FTU kg–1 diet) showed the highest ADCP and ADCF
with the values of 81.93% and 74.89% respectively. Peniophora lycii fungi hydrolises phytate acid in the intestine. Peniophora lycii can synthesise protein by obtaining carbon from carbohydrate (glucosamaltose and sucrose) nitrogen from organic source or inorganic carbon from minerals (Vandenberg et al., 2011). The existence of the micro-organism in the diet can improve quality, absorption of nutrients and digestibility of the diet (Sajjadi & Carter, 2004). They reported that phytase enzyme can unbind anti-nutrient in the diet, such as phytate acid, non-starch poly-saccharide, and trypsin inhibitor, and thus, improving nutrient digestibility. Rachmawati and Samidjan (2016) also suggested that raw protein and

Pertanika J. Trop. Agric. Sci. 41 (2): 865 – 878 (2018)
Diana Rachmawati and Istiyanto Samidjan
874
total protein digestibility depends on the ability of the fish to absorb the nutrients. The increase in diet digestibility was followed by the increase of PER (2.23) and EFU (66.97%). Therefore, it had a positive effect on specific growth (4.14%/day).
Digestibility test, as displayed in Table 2, shows that the addition of phytase enzyme of 150-450 FTU kg-1 diet boosts ADCP and ADCF. Similar finding was also reported by Storebakken et al. (1998) that the addition of enzyme in the diet increased protein digestibility and retention. Debnath et al. (2005) also found that Atlantic salmon increased its digestibility and retention of protein if phytase enzyme was added to its diet. Meanwhile, without addition of phytase enzyme, resulted in low digestibility and retention of protein. Hunter (2001) found that the addition of enzyme increased protein digestibility from 84.5% to 87.7%. Similar results were found in the species of carp (Vielma et al., 2004), rainbow trout (Sugiura et al., 2001; Forster et al., 1999), Labeo rohita
(Marjan et al., 2014). Other researchers, Baruah et al. (2004), Rachmawati and Samidjan (2016), and Rachmawati et al. (2017) observed that the addition of phytase enzyme in the diet made of plant ingredients increased protein digestibility due to the breakdown of phytin-protein complex. Cao et al. (2007) also reported that phytase enzyme can unbind anti-nutrient in the diet, such as phytate acid, non-starch polysaccharide, and trypsin inhibitor, and it also improved nutrient digestibility. The equation resulting from orthogonal test is Y = 115.88x3 – 166.63x2 + 58.429x + 75.051, R² = 0.9396 (Figure 4). The optimum dose of the phytase enzyme in the diet on the ACDP was 300 FTU kg- diet with the maximum value of ADCP 81.92 %.
The equation resulting from orthogonal test is Y = 14.815x3 – 49.354x2 + 24.19x + 71.314, R² = 0.85 (Figure 5). The optimum dose of the phytase enzyme in the diet on the ACDF was 300 FTU kg- diet with the maximum value of ADCF 74.89 %.
Figure 4. ADCP polynomial orthogonal (%) of catfish (P. hypothalamus) fingerlings
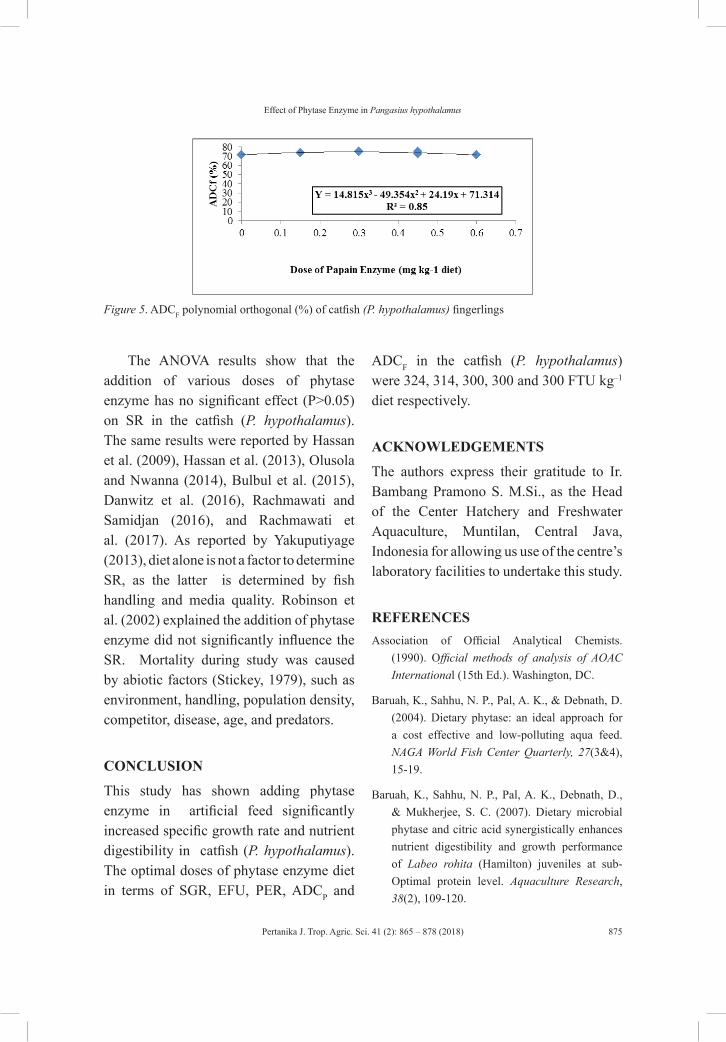
Pertanika J. Trop. Agric. Sci. 41 (2): 865 – 878 (2018)
Effect of Phytase Enzyme in Pangasius hypothalamus
875
Figure 5. ADCF polynomial orthogonal (%) of catfish (P. hypothalamus) fingerlings
The ANOVA results show that the addition of various doses of phytase enzyme has no significant effect (P>0.05) on SR in the catfish (P. hypothalamus). The same results were reported by Hassan et al. (2009), Hassan et al. (2013), Olusola and Nwanna (2014), Bulbul et al. (2015), Danwitz et al. (2016), Rachmawati and Samidjan (2016), and Rachmawati et al. (2017). As reported by Yakuputiyage (2013), diet alone is not a factor to determine SR, as the latter is determined by fish handling and media quality. Robinson et al. (2002) explained the addition of phytase enzyme did not significantly influence the SR. Mortality during study was caused by abiotic factors (Stickey, 1979), such as environment, handling, population density, competitor, disease, age, and predators.
CONCLUSION
This study has shown adding phytase enzyme in artificial feed significantly increased specific growth rate and nutrient digestibility in catfish (P. hypothalamus). The optimal doses of phytase enzyme diet in terms of SGR, EFU, PER, ADCP and
ADCF in the catfish (P. hypothalamus) were 324, 314, 300, 300 and 300 FTU kg–1 diet respectively.
ACKNOWLEDGEMENTS
The authors express their gratitude to Ir. Bambang Pramono S. M.Si., as the Head of the Center Hatchery and Freshwater Aquaculture, Muntilan, Central Java, Indonesia for allowing us use of the centre’s laboratory facilities to undertake this study.
REFERENCESAssociation of Official Analytical Chemists.
(1990). Official methods of analysis of AOAC International (15th Ed.). Washington, DC.
Baruah, K., Sahhu, N. P., Pal, A. K., & Debnath, D. (2004). Dietary phytase: an ideal approach for a cost effective and low-polluting aqua feed. NAGA World Fish Center Quarterly, 27(3&4), 15-19.
Baruah, K., Sahhu, N. P., Pal, A. K., Debnath, D., & Mukherjee, S. C. (2007). Dietary microbial phytase and citric acid synergistically enhances nutrient digestibility and growth performance of Labeo rohita (Hamilton) juveniles at sub-Optimal protein level. Aquaculture Research, 38(2), 109-120.
Pertanika J. Trop. Agric. Sci. 41 (2): 865 – 878 (2018)
Diana Rachmawati and Istiyanto Samidjan
876
Bulbul, M., Kader, M. A., Ambak, M. A., Hossain, M. S., Ishikawa, M., & Koshio, S. (2015). Effects of crystalline amino acids, phytase and fish soluble supplements in improving nutritive values of high plant protein based diets for Kuruma Shrimp, Marsupenaeus japonicus. Aquaculture Elsevier, 438, 98-104.
Cao, L., Wang, W., Yang, C., Yang, Y., Diana, J., Yakupitiyage, A., & Li, D. (2007). Application of Microbial Phytase in Fish Feed, 40(4), 497-507.
Cheng, Z. J., & Hardy, R. W. (2003). Effects of extrusion and expelling processing, and microbial phytase supplementation on apparent digestibility coefficients of nutrients in full-fat soybeans for rainbow trout (Oncorhynchus mykiss). Aquaculture, 218(1-4), 501–514.
Chung, T. K. (2001). Sustaining livestock production and environment. Singapore: Food and Agriculture Asia Pacific Development.
Danwitz, A. Von, van Bussel, C. G. J., Klatt, S. F., & Schulz, C. (2016). Dietary phytase supplementation in rapeseed protein based diets influences growth performance, digestibility and nutrient utilisation in turbot (Psetta maxima L.). Aquaculture Elsevier, 450, 405-411.
Dasuki, A., Auta, J., & Oniye, S. J. (2013). Effect of stocking density on production of Clarias gariepinus (Tuegels) in floating bamboo cages at Kubanni Reservoir, Zaria, Nigeria. Pure and Applied Sciences, 6(1), 112-117. ISSN: 2006-6996.
Debnath, D., Pal, A. K., Sahu, N. P., Yengkokpam, S., & Mukherjee, S. C. (2005). Effects of dietary microbial phytase supplementation on growth and nutrient digestibility of Pangasius pangasius (Hamilton) fingerlings. Aquaculture Research, 36(2), 180-187.
De Silva, S. S. (1987). Finfish nutrition research in Asia. In Proceeding of the Second Asian Fish Nutrition Network Meeting (Vol. 128). Heinemann, Asia, Singapore.
Fenucci, J. L. (1981). Studies on the nutrition of marine shrimp of the Penaeus. (Ph.D. Thesis). University of Houston, USA. Retrieved from https://elibrary.ru/item.asp?id=7341293
Forster, I., Higgs, D. A., Dosanjh, B. S., & Rowshandeli, M. (1999). Potential for dietary phytase to improve the nutritive value of canola protein concentrate and decrease phosphorus output in rainbow trout (Oncorhynchus mykiss) held in 11ºC fresh water. Aquaculture, 179(1), 109–125.
Hassan, S., Altaff, K., & Satyanarayana, T. (2009). Use of soybean meal supplemented with cell bound phytase for replacement of fish meal in the diet of juvenile milkfish, Chanos chanos. Pakistan Journal of Nutrition, 8(4), 341–344.
Hassan, M. S., Soltan, M. A., Agouz, H. M., & Badr, A. M. (2013). Influences of calcium/phosphorous ratio on supplemental microbial phytase efficiency for Nile tilapia. Aquatic Research, 39(3), 205–213.
Hunter, B. T. (2001). The downside of soybean consumption. NOHA NEWS, 26(4), 3.
Jegannathan, K. R., & Nielsen, P. H. (2013). Environmental assessment of enzyme use in industrial production – a literature review. Journal of cleaner production, 42, 228–240.
Jobling, M., Gomes, E., & Diaz, J. (2002). Feed types manufacture and ingredients. In D. Houlihan, T. Boujard, & M. Jobling (Eds), Food Intake in Fish (pp. 25–48). Oxford, UK: Blackwell Science.
Junqueira, O. M., Duarte, K. F., Assuena, V., Filardi, R. S., Laurentis, A. C., & Praes, M. F. F. M. (2011). Effects of phytase supplementation on performance, bone densitometry and carcass yield in broiler chicks. Animal Science, 33(3), 301–307.
Pertanika J. Trop. Agric. Sci. 41 (2): 865 – 878 (2018)
Effect of Phytase Enzyme in Pangasius hypothalamus
877
Kumar, V., Sinha, A. K., Makkar, H. P. S., De Boeck, G., & Becker, K. (2011). Phytate and phytase in fish nutrition. Journal of Animal Physiology and Animal Nutrition, 96(3), 335–364.
Marjan, S., Afzal, M., Shah, S. Z. H., Hussain, S. M., & Mubarik, M. S. (2014). Role of phytase supplementation in improving mineral digestibility of dry bread meal based diet fed to Labeo rohita fingerlings. Pakistan Journal of Life and Social Science, 12(3), 150–154.
National Research Council (1993). Nutrient requirements of fish. Washington, DC: The National Academy Press.
Olukosi, O. A. (2008). Biochemistry of phytate and phytases: Applications in monogastric nutrition. Experimental Biology, 24(2), 58-63.
Olusola, S. E., & Nwanna, L. C. (2014). Growth performance of Nile tilapia (Oreochromis niloticus) fed processed soybean meal based diets supplemented with phytase. International Journal of Aquaculture, 4(08), 48-54.
Rachmawati, D., & Samidjan, I. (2016). Effect of phytase enzyme on growth boost in the artificial feed made of plant protein to shorten production time of giant tiger prawn [Penaeus monodon, (Fabricus 1798)]. Aquatic Procedia, 7(016), 46 – 53.
Rachmawati, D., Istiyanto, S., & Maizirwan, M. (2017). Effect of phytase on growth performance, diet utilization efficiency and nutrient digestibility in fingerlings of Chanos chanos (Forsskal 1775). Philippine Journal of Science, 146(3), 237–245.
Ravindran, V. (2000). Effect of Natuphos Phytase on the bioavailability of protein and amino acids – a review (pp. 1-10.). Palmerston North, New Zealand: Monogastric Research Center Institute of Food Nutrition and Human Health Massey University
Robinson, E. H., Li, M. H., & Manning, B. B. (2002). Comparison of microbial phytase and dicalcium phosphate for growth and bone mineralization of pond-raised channel catfish, Ictalurus punctatus. Journal of Applied Aquaculture, 12(3), 81–88.
Sajjadi, M., & Carter, C. G. (2004). Effects of phytate acid and phytase on feed intake, growth, digestibility and trypsin activity in Atlantic salmon (Salmo salar, L.). Aquaculture Nutrition, 10(2), 135-142.
Steel, R. G. D., Torrie, J. H., & Dickey, D. A. (1993). Principles and procedures of Statistics (3rd Ed.). New York, USA: McGraw Hill International Book Company, Inc.
Steffens, W. (1989). Principles of fish nutrition. London, England: Elis Horwood Limited.
Stickey, R.R. (1979). Principle of warm water aquaculture. New York: John Willey and Sons.
Storebakken, T., Shearer, K. D., & Roem, A. J. (1998). Availability of protein, phosphorus and other elements in fishmeal, soy-protein concentrate and hytase-treated soy-protein concentrate-based diets to Atlantic salmon, Salmo salar. Aquaculture, 161(1), 365–379.
Sugiura, S. H., Raboy, V., Young, K. A., Dong, F. M., & Hardy, R. W. (2001). Availability of phosphorus and trace elements in low phytate varieties of barley and corn for rainbow trout Oncorhynchus mykiss. Aquaculture, 170(3-4), 285–296.
Tahoun, A. M., Abo-State, H. A., & Hamouda, Y. A. (2009). Effect of adding commercial phytase to DDGS based diets on the performance and feed utilization of Nile tilapia (Oreochromis niloticus) Fingerlings. Agriculture and Environment Science, 5(4), 550-555.
Tacon, A. G. (1987). The nutrition and feeding of farmed fish and shrimp-A training manual. Brazil: FAO of the United Nations.
Pertanika J. Trop. Agric. Sci. 41 (2): 865 – 878 (2018)
Diana Rachmawati and Istiyanto Samidjan
878
Vandenberg, G. W., Scott, S. L., Sarker, P. K., Dallaire, V., & De La Noue, J. (2011). Encapsulation of microbial phytase: Effects on phosphorous bioavailability in rainbow trout (Oncorhynchus mykiss). Agriculture and Agri-Food, 169(3-4), 230-243.
Vielma, J., Ruohonen, K., Gabauand, J., & Vogel, K. (2004). Top-spraying soybean mealbased diets with phytase improves protein and mineral digestibility but not lysine utilization in rainbow trout, Oncorhynchus mykiss (Walbaum). Aquaculture Research, 35(10), 955–964.
Wang, F., Yang, Y. H., Han, Z. Z., Dong, H. W., Yang, C. H., & You, Z. Y. (2009). Effects of pretreatment of soybean meal and phytase sprayed in diets on growth, apparent digestibility coefficient and nutrient excretion of rainbow trout (Oncorhynchus mykiss Walbaum). Aquaculture International, 17(2), 143-157.
Wilson, R. P. (1982). Energy relationships in catfish diets. In R.R. Stickney and R. T. Lovell (Eds.), Nutrition and Feeding of Channel Catfish (pp. 193-201). Southern Cooperative Series.
Yakuputiyage, A. (2013). On-Farm feeding and feed management Strategies in tropical aquaculture. In M. R. Hasan & M. B. New, (Eds.), On-Farm Feeding and Feed Management in Aquaculture (pp. 361-376). FAO Fisheries and Aquaculture Technical Paper.
Pertanika J. Trop. Agric. Sci. 41 (2): 879 – 888 (2018)
ISSN: 1511-3701 © Universiti Putra Malaysia Press
TROPICAL AGRICULTURAL SCIENCEJournal homepage: http://www.pertanika.upm.edu.my/
ARTICLE INFOArticle history:Received: 18 September 2017Accepted: 30 April 2018
E-mail addresses:[email protected] (Herry Boesono)[email protected] (Dhian Meita Hapsari)[email protected] (Aristi Dian Purnama Fitri)[email protected] (Kukuh Eko Prihantoko)*Corresponding author
Preserving Blue Swimming Crab (Portunus pelagicus): Its Conservation using Trap Modifications in Betahwalang, Demak
Herry Boesono*, Dhian Meita Hapsari, Aristi Dian Purnama Fitri and Kukuh Eko Prihantoko Faculty of Fisheries and Marine Sciences, Diponegoro University, Kota Semarang, Jawa Tengah 50275, Indonesia
ABSTRACT
Blue swimming Crab (Portunus pelagicus) is found in large numbers in the Betahwalang waters, and they are mainly caught using traps. Betahwalang fishing communities have realised the importance of preserving this commodity of blue swimming crab (Portunus pelagicus) by enlarging crab conservation zone in the territorial waters of betahwalang. However, many fishermen catch blue swimming crab and sell them. The capture of small crab egg-laying females cannot be avoided because the mouth traps folding reaches 29 cm. Modifications are made to reduce the capture of spawn female crabs by changing the shape of the mouth traps from a rectangular into a circular shape with a certain diameter. This research uses an experimental fishing method. Data is analysed using SPSS 16.0. The results indicate catching Blue Swimming Crabs using modified funnel and different baits (pony fish essence) is effective in landing a big catch. The catch was relatively bigger. This research also shows a positive link between modified trap and use of different baits to catch Blue Swimming Crabs.
Keywords: Betahwalang, Demak, traps modification
INTRODUCTION
Blue swimming crab is an expensive source of sea food and which fetches an expensive price. Most fishermen in Betahwalang use 3 fishing gear, i.e. trap, mini trawl arad and gill net. The most commonly used fishing gear in Betahwalang village is trap, because it is easy to be operated and the catch is
Pertanika J. Trop. Agric. Sci. 41 (2): 879 – 888 (2018)
Herry Boesono, Dhian Meita Hapsari, Aristi Dian Purnama Fitri and Kukuh Eko Prihantoko
880
of good quality. Based on the information from Betahwalang Village (2015), traps account for 62.26% of all fishing gears used by 159 fishermen in Betahwalang village. This high figure indicates controls should be put in place to reduce impacts of over fishing impacts and for sustainability of fisheries resources. Fishermen here have realised the importance of preserving blue swimming crab (Portunus pelagicus) which can be seen from the existence of blue swimming crab conservation zone in the village to rear caught small and young blue swimming crab and the spawn blue swimming crab. In that area, fishermen are forbidden from catching them early using arad.
The funnel of the trap is modified to increase the catch. In addition, the use of bait also affects the haul’ in the case of blue swimming crab (Portunus pelagicus), it is driven by its sense of smell rather than sight. The blue swimming crab catching activity here implies there are some spawn female blue swimming crabs that are caught and not returned to the sea. The modification to reduce catching spawn female blue swimming crabs is created by changing the form of funnel from rectangle to circle with certain diameter which was modified to fit the shell length based on previous research. Additionally, pony fish and Tetraodontidae was used as a bait (with added essence) to lure the attention of blue swimming crab (Portunus pelagicus) into the trap.
The purposes of this research are to analyse the effects of using (1) different funnels on the catch (2) of different bait on
the catch. Additionally, it aims to find out the relation between the two factors (funnel and bait) towards the catch.
MATERIAL AND METHODS
Description and location of study siteThis study is based on experimental fishing method. According to Natsir (2003), experiment relates to observing in artificial condition where the condition is created and managed by the researcher. In this study, an experimental method was used to improve the trap and bait used to catch blue swimming crab (Portunus pelagicus).
This study was conducted in Demak Regency (S 6° 43’ 26’’ - S 7° 09’ 43’’ and E 110° 27’ 58’’ – E 110° 48’ 47’’). Demak Regency borders with Kudus Regency, Grobogan Regency, Semarang, Jepara Regency and Java Sea. Four of 14 sub-districts in Demak Regency are in located along the coastal areas of Java Sea; they are Wedung, Bonang, Karang Tengah, and Sayung (Maritime and Fisheries Offices of Demak [MFOD], 2012). According to information obtained from Betahwalang Village (2015), Betahwalang village is in 0.75 to 1.70 MASL. Most of the people in Betahwalang are fishermen. The Betahwalang village borders northside of Wedung sub-district, southside of Serangan village, east side of Tridonorejo village, Purworejo village, and westside of Java Sea.
Trap
The trap used in this research is a modified version of the current one used by the
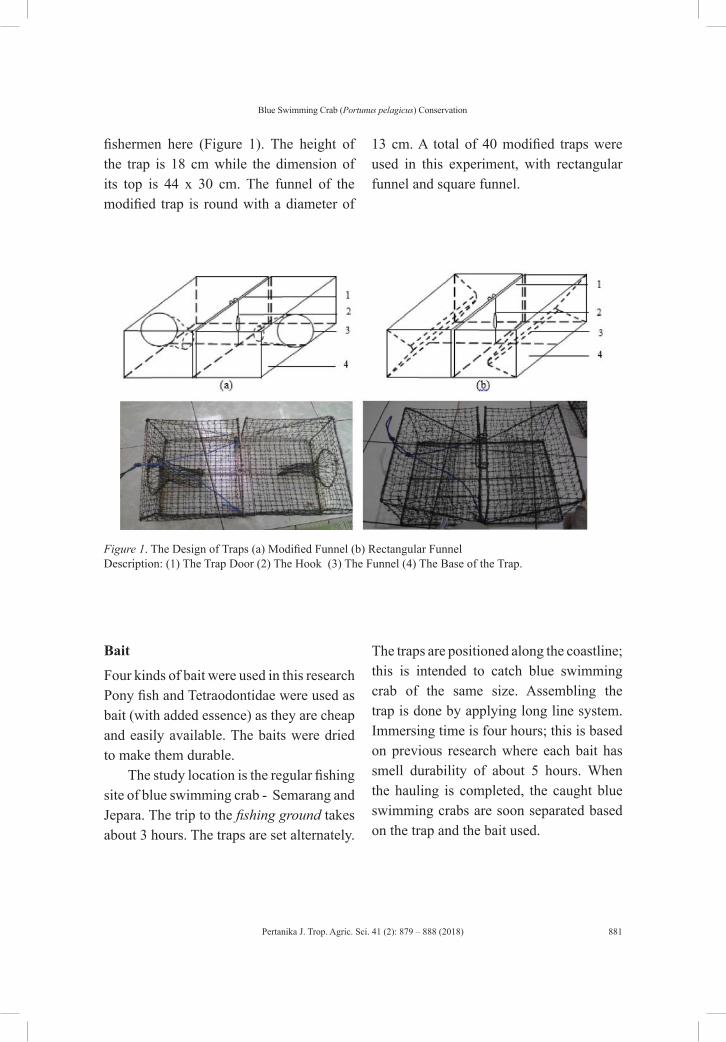
Pertanika J. Trop. Agric. Sci. 41 (2): 879 – 888 (2018)
Blue Swimming Crab (Portunus pelagicus) Conservation
881
fishermen here (Figure 1). The height of the trap is 18 cm while the dimension of its top is 44 x 30 cm. The funnel of the modified trap is round with a diameter of
13 cm. A total of 40 modified traps were used in this experiment, with rectangular funnel and square funnel.
Figure 1. The Design of Traps (a) Modified Funnel (b) Rectangular FunnelDescription: (1) The Trap Door (2) The Hook (3) The Funnel (4) The Base of the Trap.
Bait
Four kinds of bait were used in this research Pony fish and Tetraodontidae were used as bait (with added essence) as they are cheap and easily available. The baits were dried to make them durable.
The study location is the regular fishing site of blue swimming crab - Semarang and Jepara. The trip to the fishing ground takes about 3 hours. The traps are set alternately.
The traps are positioned along the coastline; this is intended to catch blue swimming crab of the same size. Assembling the trap is done by applying long line system. Immersing time is four hours; this is based on previous research where each bait has smell durability of about 5 hours. When the hauling is completed, the caught blue swimming crabs are soon separated based on the trap and the bait used.
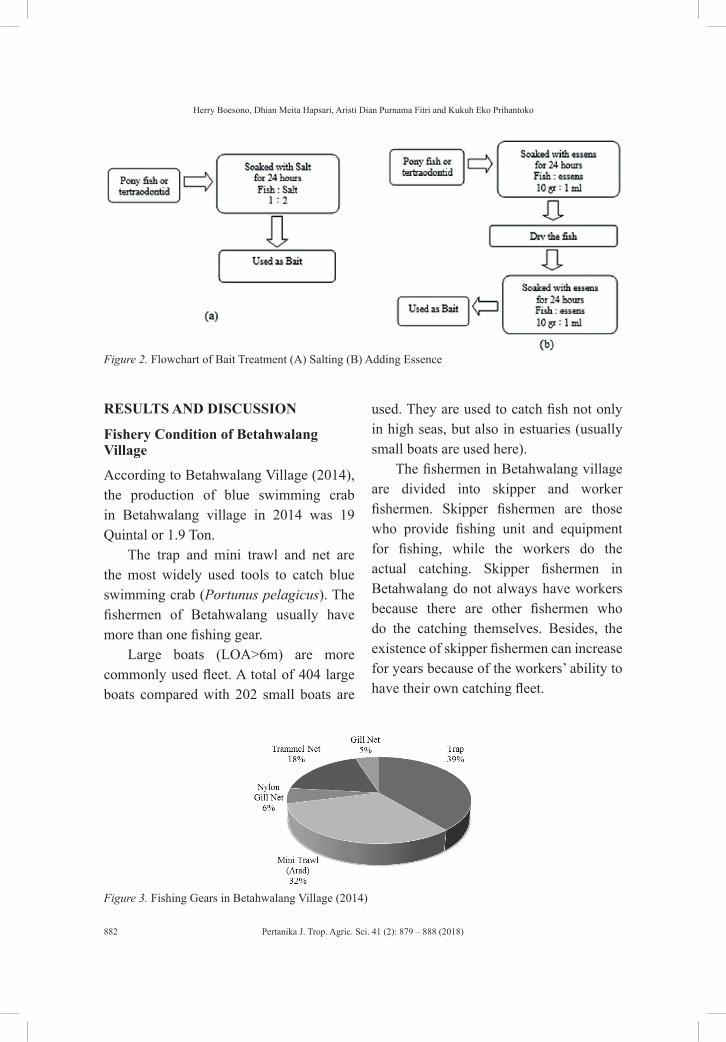
Pertanika J. Trop. Agric. Sci. 41 (2): 879 – 888 (2018)
Herry Boesono, Dhian Meita Hapsari, Aristi Dian Purnama Fitri and Kukuh Eko Prihantoko
882
Figure 2. Flowchart of Bait Treatment (A) Salting (B) Adding Essence
RESULTS AND DISCUSSION
Fishery Condition of Betahwalang Village
According to Betahwalang Village (2014), the production of blue swimming crab in Betahwalang village in 2014 was 19 Quintal or 1.9 Ton.
The trap and mini trawl and net are the most widely used tools to catch blue swimming crab (Portunus pelagicus). The fishermen of Betahwalang usually have more than one fishing gear.
Large boats (LOA>6m) are more commonly used fleet. A total of 404 large boats compared with 202 small boats are
used. They are used to catch fish not only in high seas, but also in estuaries (usually small boats are used here).
The fishermen in Betahwalang village are divided into skipper and worker fishermen. Skipper fishermen are those who provide fishing unit and equipment for fishing, while the workers do the actual catching. Skipper fishermen in Betahwalang do not always have workers because there are other fishermen who do the catching themselves. Besides, the existence of skipper fishermen can increase for years because of the workers’ ability to have their own catching fleet.
Figure 3. Fishing Gears in Betahwalang Village (2014)
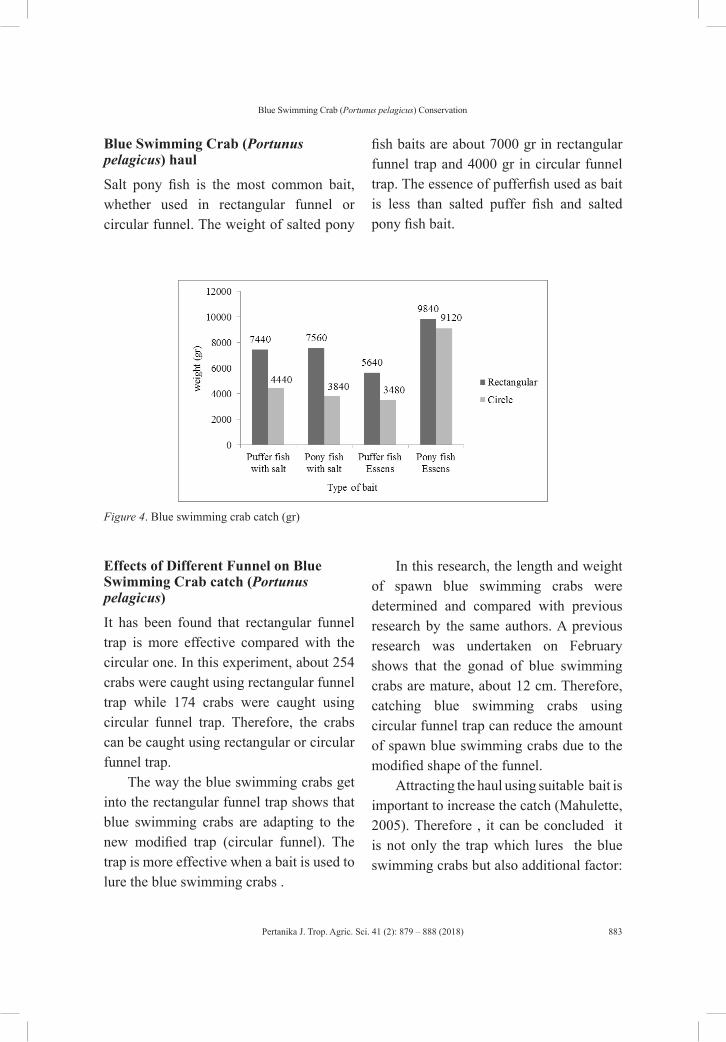
Pertanika J. Trop. Agric. Sci. 41 (2): 879 – 888 (2018)
Blue Swimming Crab (Portunus pelagicus) Conservation
883
Blue Swimming Crab (Portunus pelagicus) haul
Salt pony fish is the most common bait, whether used in rectangular funnel or circular funnel. The weight of salted pony
fish baits are about 7000 gr in rectangular funnel trap and 4000 gr in circular funnel trap. The essence of pufferfish used as bait is less than salted puffer fish and salted pony fish bait.
Figure 4. Blue swimming crab catch (gr)
Effects of Different Funnel on Blue Swimming Crab catch (Portunus pelagicus)
It has been found that rectangular funnel trap is more effective compared with the circular one. In this experiment, about 254 crabs were caught using rectangular funnel trap while 174 crabs were caught using circular funnel trap. Therefore, the crabs can be caught using rectangular or circular funnel trap.
The way the blue swimming crabs get into the rectangular funnel trap shows that blue swimming crabs are adapting to the new modified trap (circular funnel). The trap is more effective when a bait is used to lure the blue swimming crabs .
In this research, the length and weight of spawn blue swimming crabs were determined and compared with previous research by the same authors. A previous research was undertaken on February shows that the gonad of blue swimming crabs are mature, about 12 cm. Therefore, catching blue swimming crabs using circular funnel trap can reduce the amount of spawn blue swimming crabs due to the modified shape of the funnel.
Attracting the haul using suitable bait is important to increase the catch (Mahulette, 2005). Therefore , it can be concluded it is not only the trap which lures the blue swimming crabs but also additional factor:
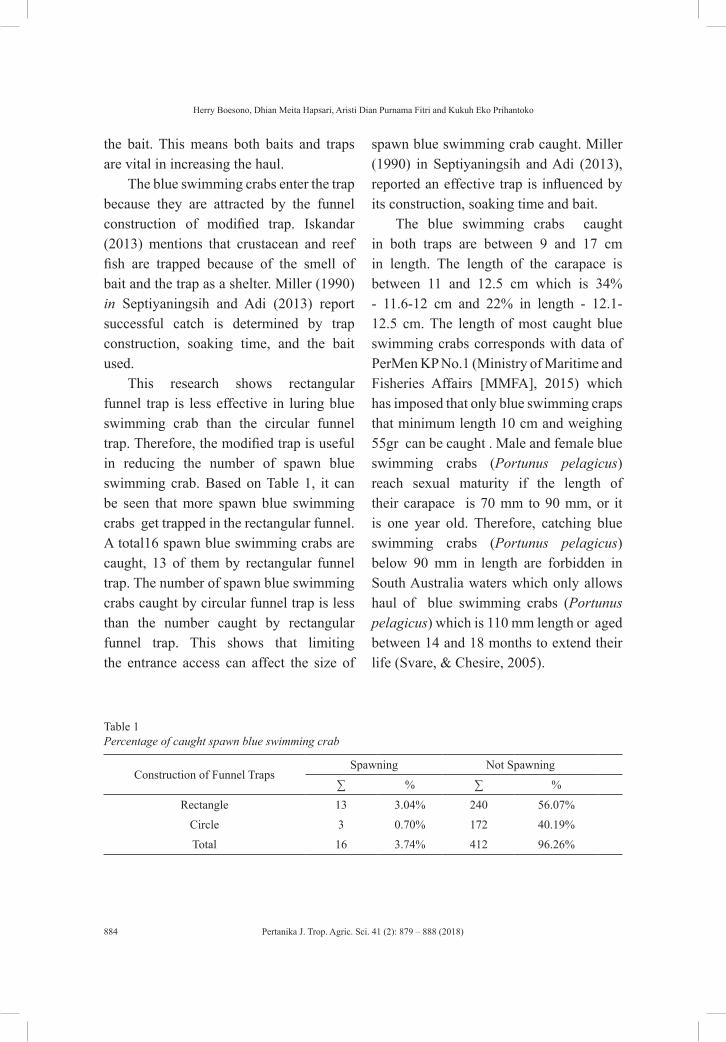
Pertanika J. Trop. Agric. Sci. 41 (2): 879 – 888 (2018)
Herry Boesono, Dhian Meita Hapsari, Aristi Dian Purnama Fitri and Kukuh Eko Prihantoko
884
the bait. This means both baits and traps are vital in increasing the haul.
The blue swimming crabs enter the trap because they are attracted by the funnel construction of modified trap. Iskandar (2013) mentions that crustacean and reef fish are trapped because of the smell of bait and the trap as a shelter. Miller (1990) in Septiyaningsih and Adi (2013) report successful catch is determined by trap construction, soaking time, and the bait used.
This research shows rectangular funnel trap is less effective in luring blue swimming crab than the circular funnel trap. Therefore, the modified trap is useful in reducing the number of spawn blue swimming crab. Based on Table 1, it can be seen that more spawn blue swimming crabs get trapped in the rectangular funnel. A total16 spawn blue swimming crabs are caught, 13 of them by rectangular funnel trap. The number of spawn blue swimming crabs caught by circular funnel trap is less than the number caught by rectangular funnel trap. This shows that limiting the entrance access can affect the size of
spawn blue swimming crab caught. Miller (1990) in Septiyaningsih and Adi (2013), reported an effective trap is influenced by its construction, soaking time and bait.
The blue swimming crabs caught in both traps are between 9 and 17 cm in length. The length of the carapace is between 11 and 12.5 cm which is 34% - 11.6-12 cm and 22% in length - 12.1-12.5 cm. The length of most caught blue swimming crabs corresponds with data of PerMen KP No.1 (Ministry of Maritime and Fisheries Affairs [MMFA], 2015) which has imposed that only blue swimming craps that minimum length 10 cm and weighing 55gr can be caught . Male and female blue swimming crabs (Portunus pelagicus) reach sexual maturity if the length of their carapace is 70 mm to 90 mm, or it is one year old. Therefore, catching blue swimming crabs (Portunus pelagicus) below 90 mm in length are forbidden in South Australia waters which only allows haul of blue swimming crabs (Portunus pelagicus) which is 110 mm length or aged between 14 and 18 months to extend their life (Svare, & Chesire, 2005).
Table 1Percentage of caught spawn blue swimming crab
Construction of Funnel TrapsSpawning Not Spawning
∑ % ∑ %
Rectangle 13 3.04% 240 56.07%
Circle 3 0.70% 172 40.19%
Total 16 3.74% 412 96.26%
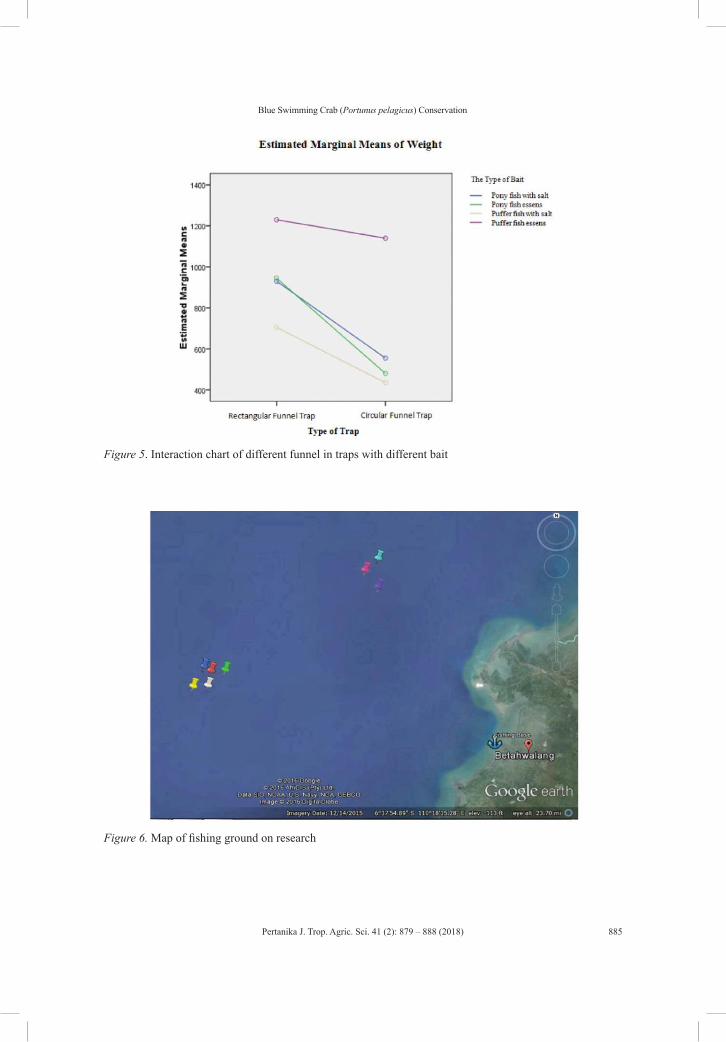
Pertanika J. Trop. Agric. Sci. 41 (2): 879 – 888 (2018)
Blue Swimming Crab (Portunus pelagicus) Conservation
885
Figure 5. Interaction chart of different funnel in traps with different bait
Figure 6. Map of fishing ground on research
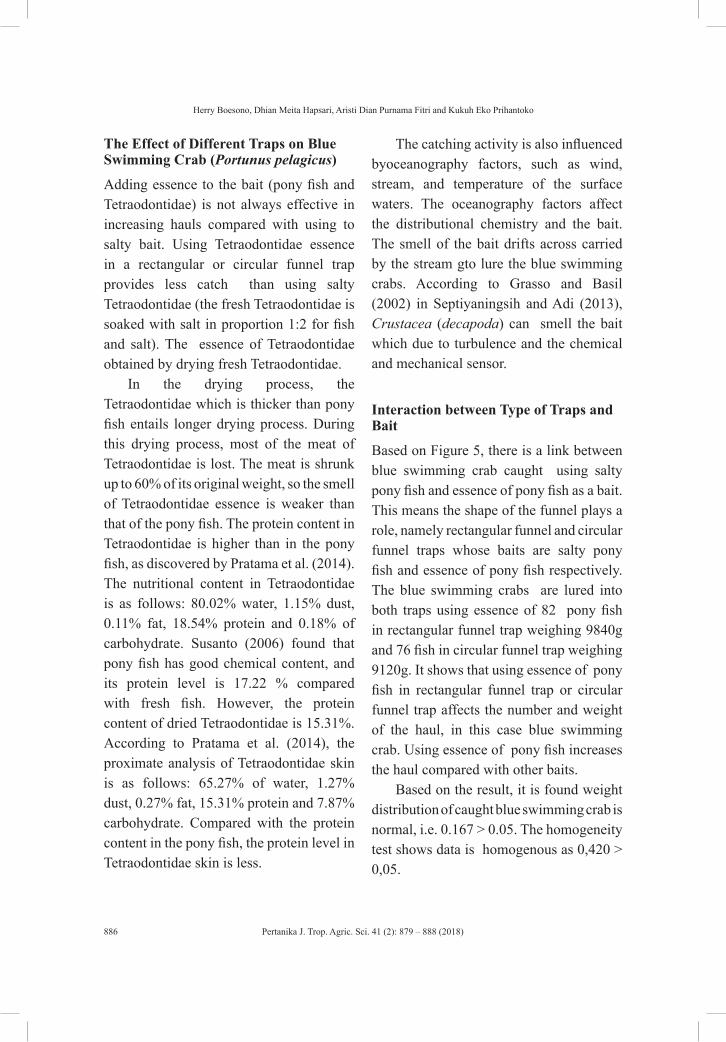
Pertanika J. Trop. Agric. Sci. 41 (2): 879 – 888 (2018)
Herry Boesono, Dhian Meita Hapsari, Aristi Dian Purnama Fitri and Kukuh Eko Prihantoko
886
The Effect of Different Traps on Blue Swimming Crab (Portunus pelagicus)
Adding essence to the bait (pony fish and Tetraodontidae) is not always effective in increasing hauls compared with using to salty bait. Using Tetraodontidae essence in a rectangular or circular funnel trap provides less catch than using salty Tetraodontidae (the fresh Tetraodontidae is soaked with salt in proportion 1:2 for fish and salt). The essence of Tetraodontidae obtained by drying fresh Tetraodontidae.
In the drying process, the Tetraodontidae which is thicker than pony fish entails longer drying process. During this drying process, most of the meat of Tetraodontidae is lost. The meat is shrunk up to 60% of its original weight, so the smell of Tetraodontidae essence is weaker than that of the pony fish. The protein content in Tetraodontidae is higher than in the pony fish, as discovered by Pratama et al. (2014). The nutritional content in Tetraodontidae is as follows: 80.02% water, 1.15% dust, 0.11% fat, 18.54% protein and 0.18% of carbohydrate. Susanto (2006) found that pony fish has good chemical content, and its protein level is 17.22 % compared with fresh fish. However, the protein content of dried Tetraodontidae is 15.31%. According to Pratama et al. (2014), the proximate analysis of Tetraodontidae skin is as follows: 65.27% of water, 1.27% dust, 0.27% fat, 15.31% protein and 7.87% carbohydrate. Compared with the protein content in the pony fish, the protein level in Tetraodontidae skin is less.
The catching activity is also influenced byoceanography factors, such as wind, stream, and temperature of the surface waters. The oceanography factors affect the distributional chemistry and the bait. The smell of the bait drifts across carried by the stream gto lure the blue swimming crabs. According to Grasso and Basil (2002) in Septiyaningsih and Adi (2013), Crustacea (decapoda) can smell the bait which due to turbulence and the chemical and mechanical sensor.
Interaction between Type of Traps and Bait
Based on Figure 5, there is a link between blue swimming crab caught using salty pony fish and essence of pony fish as a bait. This means the shape of the funnel plays a role, namely rectangular funnel and circular funnel traps whose baits are salty pony fish and essence of pony fish respectively. The blue swimming crabs are lured into both traps using essence of 82 pony fish in rectangular funnel trap weighing 9840g and 76 fish in circular funnel trap weighing 9120g. It shows that using essence of pony fish in rectangular funnel trap or circular funnel trap affects the number and weight of the haul, in this case blue swimming crab. Using essence of pony fish increases the haul compared with other baits.
Based on the result, it is found weight distribution of caught blue swimming crab is normal, i.e. 0.167 > 0.05. The homogeneity test shows data is homogenous as 0,420 > 0,05.
Pertanika J. Trop. Agric. Sci. 41 (2): 879 – 888 (2018)
Blue Swimming Crab (Portunus pelagicus) Conservation
887
Based on the data of normality and homogeneity test, the next test is two-way anova. Results show that the different construction of the funnel affects the haul, in this case the blue swimming crab. The test result shows that 0,015 < 0,05 so, H1 is accepted and therefore, there are effects toward the haul caught blue swimming crab based on different funnel construction and different bait.
CONCLUSION
The use of trap with different funnel size and shape affects the haul. In this study, the use of circular funnel trap allows the caught small blue swimming crab to be returned to its conservation area, while reducing the number of spawn blue swimming crab caught. Different bait affects the haul due different treatments of fresh bait.
There is a positive link between different funnel constructions of traps and different baits used on the catch, in this case t blue swimming crab. Baits can increase the haul, and in other words, bait and traps play a role in .
Thus, it is better for fishermen to use circular funnel trap in order to avoid catching spawn blue swimming crab. Therefore, fishermen must pay a close attention to their trap and baits because they affect the haul. Future research should focus on how pony fish and Tetraodontidae can be used as a bait increase haul.
REFERENCESBetahwalang Village (2014). Laporan tahunan
lembaga pengelola perikanan rajungan lestari [Annual report of rajungan lestari fisheries management agency]. Demak, Indonesia.
Betahwalang Village. (2015). Profil desa Betahwalang [Betahwalang village profile]. Demak, Indonesia.
Grasso, F. W., & Basil, J. A. (2002). How lobsters, crayfishes, and crabs locate sources of odor in current perspective and future directions. Current Opinion in Neurobiology, 12(6), 721-727.
Iskandar, D. (2013). Daya tangkap bubu lipat yang dioperasikan oleh nelayan tradisional di Desa Mayangan Kabupaten Subang [Foldable bubu capacity operated by traditional fishermen in Mayangan Village Subang Regency]. Fisheries Scientech Journal, 8(2), 1-5.
Mahulette, R. T. (2005). Perbandingan teknologi alat tangkap bubu dasar untuk mengetahui efektifitas penangkapan ikan demersal ekonomis penting [Comparison of basic bubu fishing technologies for knowing the effectiveness of fishing demersal economically important]. National Seminar of World Food Day XXVII (pp. 180-186). Klungkung, Bali: Fisheries Research Center.
Maritime and Fisheries Offices of Demak. (2012). Program kerja dinas kelautan dan perikanan Tahun 2012 [Work program of marine and fishery service Year 2012]. Demak, Indonesia.
Miller, R. J. (1990). Effectiveness of crab and lobster trap. Marine Fisheries Research Journal, 47, 1228-1249.
Pertanika J. Trop. Agric. Sci. 41 (2): 879 – 888 (2018)
Herry Boesono, Dhian Meita Hapsari, Aristi Dian Purnama Fitri and Kukuh Eko Prihantoko
888
Ministry of Maritime and Fisheries Affairs. (2015). Peraturan menteri tentang penangkapan lobster (Panulirus Spp), kepiting (Scylla Spp), dan rajungan (Portunus pelagicus Spp) (Nomor I/Permen-Kp/2015) [Ministerial regulation on catching lobster (Panulirus Spp), crab (Scylla Spp) and rajungan (Portunus pelagicus Spp) (No. I / Permen-Kp / 2015)]. Jakarta, Indonesia: MMFA.
Natsir, M. (2003). Metode penelitian [Research methods]. Jakarta, Indonesia: Ghali Indonesia.
Pratama, G., Nurjanah, Ruddy, S., & Agoes, M. J. (2014). Kandungan kimia, fitokimia dan toksitas ikan buntal pisang dari kabupaten Cirebon [Chemical content, phytochemical and banana toxicity from Cirebon regency]. Jurnal Pengolahan Hasil Perikanan Indonesia, 7(2), 127-133.
Septiyaningsih, R. I., & Adi, S. (2013). Penggunaan jenis dan bobot umpan yang berbeda pada bubu lipat kepiting bakau [Use of different bait types and weights on bubu foldable mangrove crabs]. Argricultural Science and Fisheries Journal, 2(1), 55-61.
Susanto, N. J. (2006). Optimalisasi pemanfaatan ikan pepetek (Leiognathus sp.) dan ubi jalar (Ipomoes batatas L.) untuk substitusi parsial tepung terigu dalam pembuatan biskuit [Optimization of pepetek fish (Leiognathus sp.) and sweet potato (Ipomoes batatas L.) for partial substitution of wheat flour in biscuit making]. (Undergraduate Thesis). Bogor Agricultural University, Indonesia.
Svare, I., & Chesire, A. (2005). Fisheries biology and spatial modelling of the blue swimmer crab (Portunus pelagicus) (Vol. 117). SARDI Aquatic Sciences.
Pertanika J. Trop. Agric. Sci. 41 (2): 889 – 896 (2018)
ISSN: 1511-3701 © Universiti Putra Malaysia Press
TROPICAL AGRICULTURAL SCIENCEJournal homepage: http://www.pertanika.upm.edu.my/
ARTICLE INFOArticle history:Received: 18 September 2017Accepted: 30 April 2018
E-mail addresses:[email protected] (Titin Herawati)[email protected] (Atikah Nurhayati)[email protected] (Sona Yudha Diliana)*Corresponding author
Growth Pattern of Barb (Barbodes balleroides) at the Period of Inundation in Jatigede Reservoir, Sumedang Regency, West Java
Titin Herawati*, Atikah Nurhayati and Sona Yudha DilianaFaculty of Fisheries and Marine Sciences, Universitas Padjadjaran, West Java 45363, Indonesia
ABSTRACT
The purpose of this research is to determine the growth pattern of Barb (Barbodes balleroides) in the Jatigede reservoir, Sumedang regency Province of West Java at the period of inundation. The research was conducted using the survey method in April and June 2016. Fish identification, and data analysis was performed at Laboratory of Aquatic Resource Management Padjadjaran University. Data analysis included: size distribution, the length and weight relationship, and the condition factor using the method of Fisheries Biology. The largest groups of Barb were caught in April (sized 128-145 mm and 146-163 mm, 25% each) and June (sized 146-160 mm, 53%). Barb growth pattern in April follow the regression equation of y = 2,8753x – 4,5568 b = 2,8753, W= 3.10-5. L2,8753, whereas in June y = 2,8105x – 4,3927, b = 2.8105, W= 4.10-5. L2,8105. The pattern of growth was allometrically negative, indicating that growth in length was greater than growth in weight. Based on the present data, it can be concluded that Barb population caught in the Reservoir at the beginning of Jatigede inundations consisted of 6 - 7 size classes. Consideration for a correct environmental management are reported.
Keywords: Barb, environmental management, growth, jatigede reservoir, length, weight
INTRODUCTION
Jatigede reservoir was built in Sumedang and inaugurated on 31 August 2015. Jatigede reservoir includes 4 subdistricts with a total area of 3 035.34 ha (Centre Research of River
Cimanuk-Cisanggarung [CRRCC], 2016). This reservoir was built with a steam flow from the Cimanuk River in Jatigede District, Sumedang Regency. Jatigede Reservoir is used for irrigation, serving a total area of 90 000 ha in the northern coast
Pertanika J. Trop. Agric. Sci. 41 (2): 889 – 896 (2018)
Titin Herawati, Atikah Nurhayati and Sona Yudha Diliana
890
of West Java, water power plant with a capacity of 110 Mega Watt, and a reservoir of fresh water with a capacity of 3,500 litre per second serving Sumedang, Indramayu, Majalengka and Cirebon (CRRCC, 2016). Jatigede reservoir is also a tourist attraction and fisheries. The fish caught and identified in the Jatigede reservoir are from 9 families and consist of 17 species of fish; Lalawak/barbs (Barbodes balleroides), Seren/seren Javanese (Cyclocheilichthys repasson), Hampal/Hampala barb (Hampala macrolepidota), Genggehek/Wader (Mystacoleucus marginatus), Nilem/Nilem Carp (Osteochilus hasseltii), Hike/Nilem Carp (Osteochilus microcephalus), Paray/ Carp (Rasbora argyrotaenia), Tawes/Barb (Barbodes gonionotus), Nila/Nile Tilapia (Oreochromis niloticus), Mujair/Nile (Oreochromis mosambicus), Sepat/Three Spot Gouramy (Trichogaster pectoralis), Gabus/Snakeheads (Channa striata), Sapu-sapu/ (Liposarcus pardalis), Patin/Strifed Catfish (Pangasius hypophthalamus), Senggal/catfishes (Mystus nemurus), Bandeng/Milkfish (Chanos chanos), Berod/ Spiny Eels (Mastacembelus erythrotaenia) (Andani 2016).
Barb is an indigenous fish species of the Cimanuk River. At the beginning of the inundation of Jatigede reservoir, this fish has adapted to changes in the ecosystem, from flowing water (lotic) to the inundated water (lentic). This species appears to be dominant, with a density of 27.50% evenly spread. The diet is mainly based on detritus (66.30%), integrated
with Chlorophyceae 19.89%, Copepoda 12.15%, and Chrysophyceae (1.66%) (Herawati et al., 2016).
Sjafei et al. (2001) indicated Barb has the potential to become a species for habitual consumption. However, even though it is not classified as an endangered species it nevertheless requires suitable environmental management measures since in some areas their numbers have declined quite rapidly. The aim of this study is to examine the growth pattern of Barb to ensure its sustainability in the Jatigede Reservoir.
MATERIALS AND METHODS
The study was conducted in April and June 2016, in the following stations of the Jatigede Reservoir, West Java Province (Figure 1):
Station I: Jatigede waters area is at coordinates 60 51’ 41” S, 1080 6’ 5” E, Station II: Jatigede waters area is at coordinates 6 0 52’22” S, 1080 6’48” E, Station III: Jatigede is at coordinates 60
52’12 S, 1080 5’10” E
Measurement and analysis of growth data were conducted in the Aquaculture Laboratory of Faculty of Fisheries and Marine Sciences, Padjadjaran University.
A survey method was used in this research using purposive sampling and census.
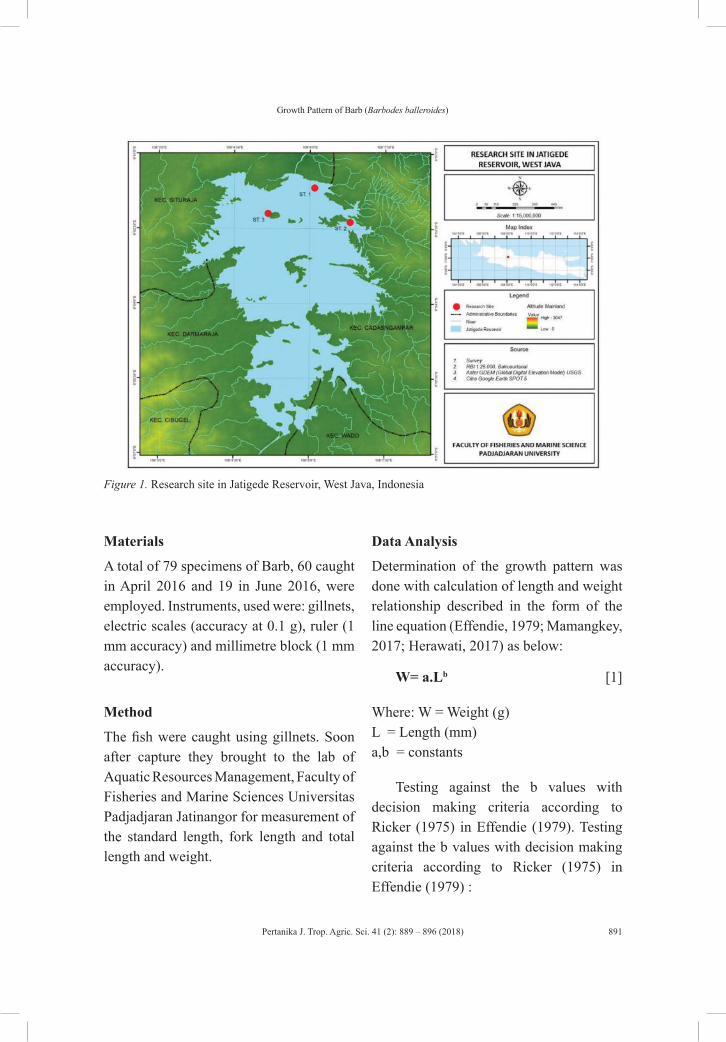
Pertanika J. Trop. Agric. Sci. 41 (2): 889 – 896 (2018)
Growth Pattern of Barb (Barbodes balleroides)
891
Figure 1. Research site in Jatigede Reservoir, West Java, Indonesia
Materials
A total of 79 specimens of Barb, 60 caught in April 2016 and 19 in June 2016, were employed. Instruments, used were: gillnets, electric scales (accuracy at 0.1 g), ruler (1 mm accuracy) and millimetre block (1 mm accuracy).
Method
The fish were caught using gillnets. Soon after capture they brought to the lab of Aquatic Resources Management, Faculty of Fisheries and Marine Sciences Universitas Padjadjaran Jatinangor for measurement of the standard length, fork length and total length and weight.
Data Analysis
Determination of the growth pattern was done with calculation of length and weight relationship described in the form of the line equation (Effendie, 1979; Mamangkey, 2017; Herawati, 2017) as below:
W= a.Lb [1]
Where: W = Weight (g)L = Length (mm)a,b = constants
Testing against the b values with decision making criteria according to Ricker (1975) in Effendie (1979). Testing against the b values with decision making criteria according to Ricker (1975) in Effendie (1979) :

Pertanika J. Trop. Agric. Sci. 41 (2): 889 – 896 (2018)
Titin Herawati, Atikah Nurhayati and Sona Yudha Diliana
892
If thit < ttab (0,05), then b = 3, Isometric growth pattern
If thit > ttab (0,05), then b ≠ 3, Allometric growth pattern
Length and weight relationship was analysed using regression equations. The influence of each variable was calculated by the coefficient of determination (R2), and the level of relationships between variables by the correlation value (r). A value correlation between 0.80 – 1.00 was considered indicative of a very strong relationships between variables (Sugiyono, 2005).
Calculation of condition factor or ponderal index was carried out using metric system (K), according to Effendie (1979), and Herawati (2017):
[2]
Where: K = Condition factorW = The average weight of the fish (g) L = The average length of the fish (mm)
RESULTS AND DISCUSSION
Weight Distribution
The total length of Barb caught in April 2016 ranged between 110 and 235 mm. According to the total length classes employed for the Sturge (Sudrajat & Achyar, 2010), 7 total length size class intervals were obtained (Figure 2a). the highest density (25%) belonging to the class intervals of 128-145 mm and 146-163 mm. Fish within the class interval of 218-235 mm showed the lowest density (2%). Fish within the class interval of 182-199 mm were not found.
Barb caught in June 2016 showed a total length ranging between 131 and 220 mm (Figure 2b). The highest density (53%) was found in the class interval of 146-160 mm. The class intervals of 131-145 and 176-190 mm showed the lowest density (5%).
(a) (b)
Figure 2. Total barb length distribution in (a) April and (b) June 2016
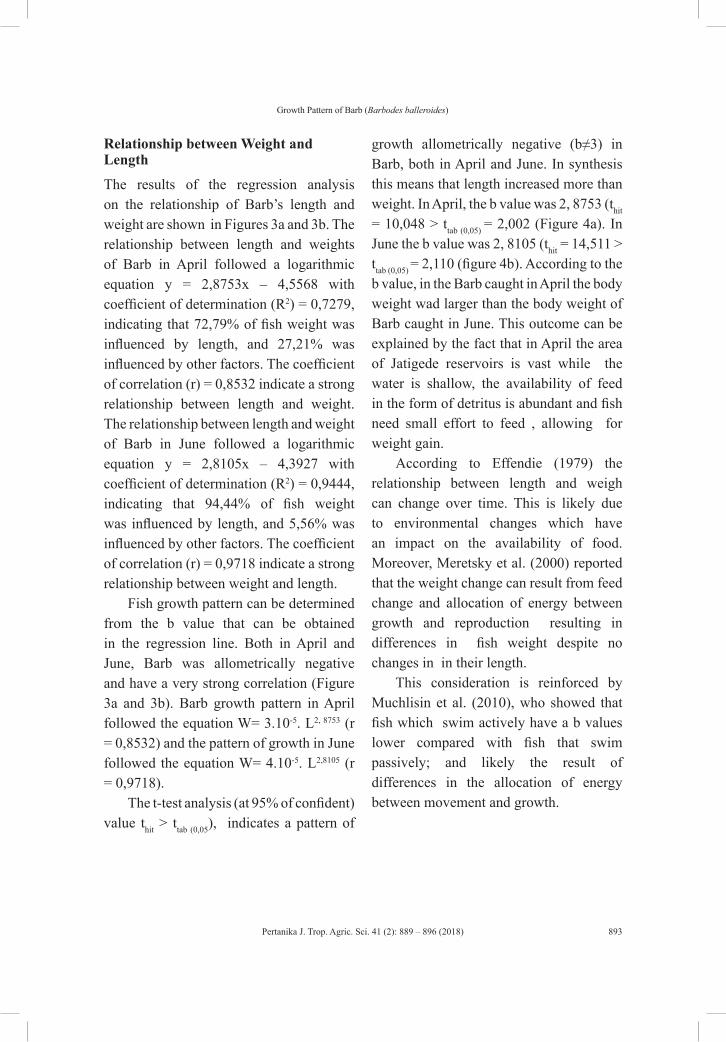
Pertanika J. Trop. Agric. Sci. 41 (2): 889 – 896 (2018)
Growth Pattern of Barb (Barbodes balleroides)
893
Relationship between Weight and Length
The results of the regression analysis on the relationship of Barb’s length and weight are shown in Figures 3a and 3b. The relationship between length and weights of Barb in April followed a logarithmic equation y = 2,8753x – 4,5568 with coefficient of determination (R2) = 0,7279, indicating that 72,79% of fish weight was influenced by length, and 27,21% was influenced by other factors. The coefficient of correlation (r) = 0,8532 indicate a strong relationship between length and weight. The relationship between length and weight of Barb in June followed a logarithmic equation y = 2,8105x – 4,3927 with coefficient of determination (R2) = 0,9444, indicating that 94,44% of fish weight was influenced by length, and 5,56% was influenced by other factors. The coefficient of correlation (r) = 0,9718 indicate a strong relationship between weight and length.
Fish growth pattern can be determined from the b value that can be obtained in the regression line. Both in April and June, Barb was allometrically negative and have a very strong correlation (Figure 3a and 3b). Barb growth pattern in April followed the equation W= 3.10-5. L2, 8753 (r = 0,8532) and the pattern of growth in June followed the equation W= 4.10-5. L2,8105 (r = 0,9718).
The t-test analysis (at 95% of confident) value thit > ttab (0,05), indicates a pattern of
growth allometrically negative (b≠3) in Barb, both in April and June. In synthesis this means that length increased more than weight. In April, the b value was 2, 8753 (thit = 10,048 > ttab (0,05) = 2,002 (Figure 4a). In June the b value was 2, 8105 (thit = 14,511 > ttab (0,05) = 2,110 (figure 4b). According to the b value, in the Barb caught in April the body weight wad larger than the body weight of Barb caught in June. This outcome can be explained by the fact that in April the area of Jatigede reservoirs is vast while the water is shallow, the availability of feed in the form of detritus is abundant and fish need small effort to feed , allowing for weight gain.
According to Effendie (1979) the relationship between length and weigh can change over time. This is likely due to environmental changes which have an impact on the availability of food. Moreover, Meretsky et al. (2000) reported that the weight change can result from feed change and allocation of energy between growth and reproduction resulting in differences in fish weight despite no changes in in their length.
This consideration is reinforced by Muchlisin et al. (2010), who showed that fish which swim actively have a b values lower compared with fish that swim passively; and likely the result of differences in the allocation of energy between movement and growth.
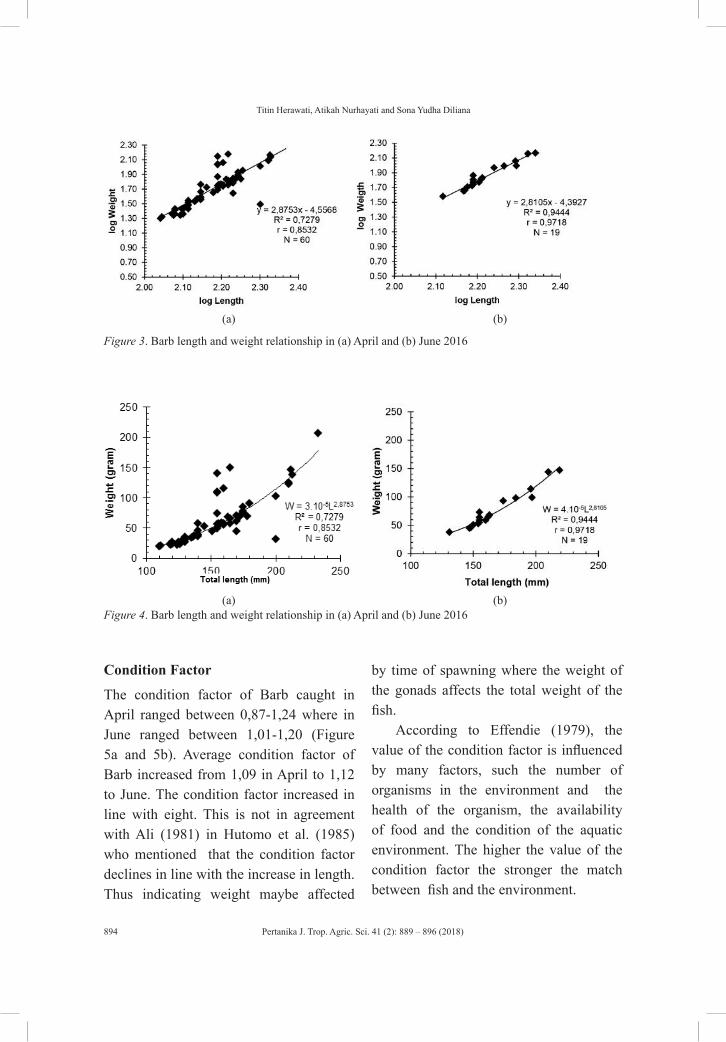
Pertanika J. Trop. Agric. Sci. 41 (2): 889 – 896 (2018)
Titin Herawati, Atikah Nurhayati and Sona Yudha Diliana
894
(a) (b)
Figure 3. Barb length and weight relationship in (a) April and (b) June 2016
(a) (b)Figure 4. Barb length and weight relationship in (a) April and (b) June 2016
Condition Factor
The condition factor of Barb caught in April ranged between 0,87-1,24 where in June ranged between 1,01-1,20 (Figure 5a and 5b). Average condition factor of Barb increased from 1,09 in April to 1,12 to June. The condition factor increased in line with eight. This is not in agreement with Ali (1981) in Hutomo et al. (1985) who mentioned that the condition factor declines in line with the increase in length. Thus indicating weight maybe affected
by time of spawning where the weight of the gonads affects the total weight of the fish.
According to Effendie (1979), the value of the condition factor is influenced by many factors, such the number of organisms in the environment and the health of the organism, the availability of food and the condition of the aquatic environment. The higher the value of the condition factor the stronger the match between fish and the environment.
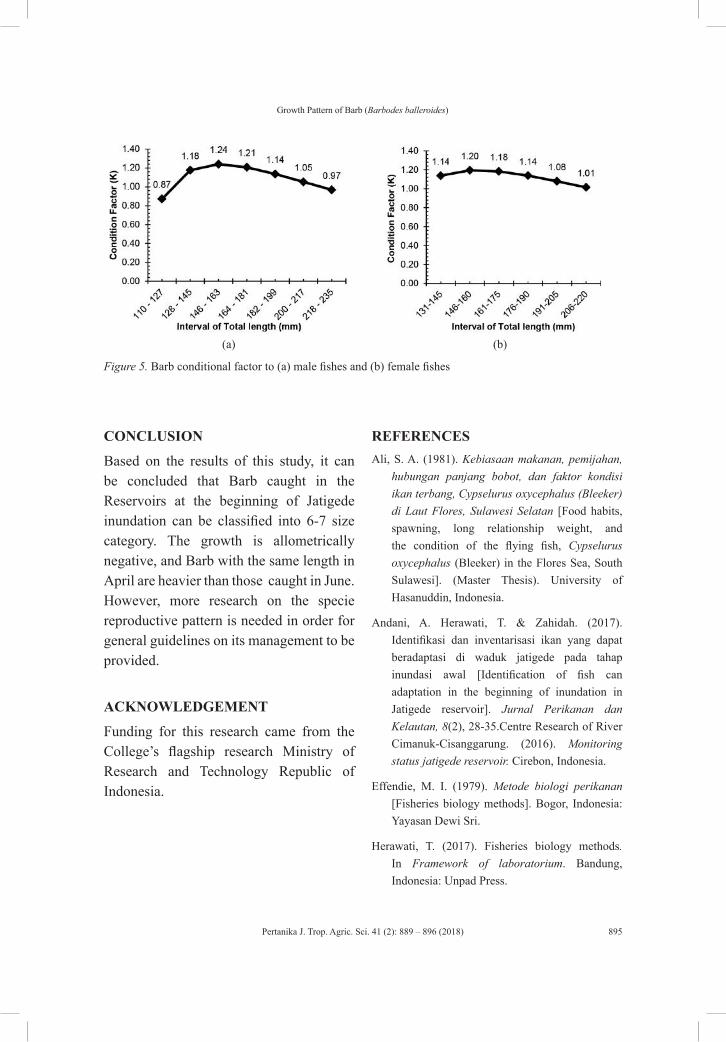
Pertanika J. Trop. Agric. Sci. 41 (2): 889 – 896 (2018)
Growth Pattern of Barb (Barbodes balleroides)
895
(a) (b)
Figure 5. Barb conditional factor to (a) male fishes and (b) female fishes
CONCLUSION
Based on the results of this study, it can be concluded that Barb caught in the Reservoirs at the beginning of Jatigede inundation can be classified into 6-7 size category. The growth is allometrically negative, and Barb with the same length in April are heavier than those caught in June. However, more research on the specie reproductive pattern is needed in order for general guidelines on its management to be provided.
ACKNOWLEDGEMENT
Funding for this research came from the College’s flagship research Ministry of Research and Technology Republic of Indonesia.
REFERENCESAli, S. A. (1981). Kebiasaan makanan, pemijahan,
hubungan panjang bobot, dan faktor kondisi ikan terbang, Cypselurus oxycephalus (Bleeker) di Laut Flores, Sulawesi Selatan [Food habits, spawning, long relationship weight, and the condition of the flying fish, Cypselurus oxycephalus (Bleeker) in the Flores Sea, South Sulawesi]. (Master Thesis). University of Hasanuddin, Indonesia.
Andani, A. Herawati, T. & Zahidah. (2017). Identifikasi dan inventarisasi ikan yang dapat beradaptasi di waduk jatigede pada tahap inundasi awal [Identification of fish can adaptation in the beginning of inundation in Jatigede reservoir]. Jurnal Perikanan dan Kelautan, 8(2), 28-35.Centre Research of River Cimanuk-Cisanggarung. (2016). Monitoring status jatigede reservoir. Cirebon, Indonesia.
Effendie, M. I. (1979). Metode biologi perikanan [Fisheries biology methods]. Bogor, Indonesia: Yayasan Dewi Sri.
Herawati, T. (2017). Fisheries biology methods. In Framework of laboratorium. Bandung, Indonesia: Unpad Press.
Pertanika J. Trop. Agric. Sci. 41 (2): 889 – 896 (2018)
Titin Herawati, Atikah Nurhayati and Sona Yudha Diliana
896
Herawati, T., Lili, W., & Rustikawati, I. (2016). Fish adaptability to ecosystem changes in Jatigede reservoir Sumedang District, West Java by the first period of inundation. International Conference of Biodiversity, Bandung. Indonesia. http://biodiversitas.mipa.uns.ac.id/S/gen/pdf/A0304aaALL.pdf
Hutomo, M., Burhanuddin, & Martosewojo S. (1985). Sumber daya ikan terbang [Fish resources of flying fish]. Jakarta, Indonesia: Lembaga Ilmu Pengetahuan Indonesia.
Mamangkey, J. J. (2017). Hubungan perkembangan otolit dengan pertumbuhan ikan terbang (Cypselurus poecilopierus) diperairan Teluk Manado [Relationship between otolith and growth of flying fish, Cypselurus poecilopierus in Manado Bay]. Jurnal Iktiologi Indonesia, 2(1), 15-19.
Meretsky, V. J., Valdez, R. A., Douglas, M. E., Brouder, M. J., Gorman, O. T., & Marsh, P. C. (2000). Spatiotemporal variation in length-weight relationships of endangered humpback chub: implications for conservation and management. Transactions of the American Fisheries Society, 129, 419428.
Muchlisin, Z. A., Musman, M., & Azizah, M. N. S. (2010). Length-weight relationships and condition factors of two threatened fishes, Rasbora tawarensis and Poropuntius tawarensis, endemic to Lake Laut Tawar, Aceh Province, Indonesia. Journal of Applied Ichthyology, 26, 949–953.
Ricker, W. E. (1975). Computation and interpretation of biological statistic of fish population. Journal of the Fisheries Research Board of Canada, 32(8), 1369-1381. https://doi.org/10.1139/f75-157
Sjafei D. S., Susilo, S. B., Rahardjo, M. F., & Sulistiono. (2001). Sustainable management and conservation based on ichthyofauna diversity in Cimanuk River Basin. Bogor, Indonesia: Bogor Agricultural University.
Sudrajat, M., & Achyar, T. S. (2010). Statistika: Basic and understanding of data analysis and conclusion. Bandung, Indonesia: Widya Padjadjaran Bandung.
Sugiyono. (2005). Statistics for research. Bandung, Indonesia: Alpabheta.
Pertanika J. Trop. Agric. Sci. 41 (2): 897 – 906 (2018)
ISSN: 1511-3701 © Universiti Putra Malaysia Press
TROPICAL AGRICULTURAL SCIENCEJournal homepage: http://www.pertanika.upm.edu.my/
ARTICLE INFOArticle history:Received: 18 September 2017Accepted: 30 April 2018
E-mail addresses:[email protected], [email protected] (Yuli Andriani)[email protected] (Yeni Mulyani)[email protected] (Irfan Zidn)[email protected] (Muhammad Yusra Sadri)[email protected] (Putra Nur Wicaksono)*Corresponding author
Effect of Proteolytic Plant-Derived Enzyme on Gourami (Osphronemus goramy Lac.) Growth Rate
Yuli Andriani*, Yeni Mulyani, Irfan Zidni, Muhammad Yusra Sadri and Putra Nur WicaksonoFaculty of Fisheries and Marine Science, Universitas Padjadjaran, West Java 45363, Indonesia
ABSTRACT
This study aims at identifying the influence of proteolytic enzymes, papain and bromelin, addition on growth rate and feed utilisation efficiency in gourami fry. Four different concentrations of papain from papaya (0%, 0.75%, 1.5% and 2.25%) and bromelin from pineapple (0%, 1%, 1.5% and 2%) were used. The parameters investigated in this study were: protease enzyme activity, daily growth rate, survival rate, feed efficiency rate and water quality. Papain and bromelin activities were 2.16 and 12.41 units/mg protein, respectively. The addition of papain and bromelin did not affect the growth rate, survival and feed efficiency in a statistically significant way. It is likely that more than 60 days is required to observe the impact of enzyme addition on growth rate and feed efficiency. Thus, more experiments are needed to validate our results.
Keywords: Bromelin, feed efficiency, gourami fry, growth parameters, papain
INTRODUCTION
Gourami (Osphronemus goramy) is a freshwater species known for high economic value and nutritive contents. However, its ineffective digestive system during the larval stages has hampered the culturing of gourami. A completely functioning digestive system in
gourami is achieved only after the fish reaches 2.4 cm at the age of forty days, after that the fry can receive artificial feed (Mokoginta et al., 1994). Before the digestive system is completely developed the production of endogen enzymes is low. Consequently, feed hydrolysation necessary for nutrients to be absorbed by
Pertanika J. Trop. Agric. Sci. 41 (2): 897 – 906 (2018)
Yuli Andriani, Yeni Mulyani, Irfan Zidn, Muhammad Yusra Sadri and Putra Nur Wicaksono
898
the body, is limited. In order to solve this problem, Aslamyah et al. (2009) added a source of exogenous enzymes, such as amylase, protease, lipase and cellulose, to the artificial feed to improve the activity of the endogenous enzymes and consequently the growth and survival rate of gourami.
Proteases can be derived from plants, such as papaya and pineapple, natural sources of papain and bromelin respectively, that are capable of hydrolysing proteins into peptides or amino acids. Both enzymes are involved in the complete breaking down of a protein in peptides through their ability to catalyse hydrolytic reactions of a substrate (Muchtadi et al.,1992).
This forms the background of this study on the effects of papain and bromelin when added to artificial feed on growth, survival, and feed efficiency parameters of gourami fry.
MATERIALS AND METHODS
Tools and Materials
Twelve aquariums with the volume of (40x20x40) cm3, DO meter digital Hanna HI-3810 with precision rate of 0,01 mg/L, pellet compactor machine, blower, pH meter Orion model 420, thermometer with precision rate of 0,1oC, digital scale AND EK-120G with precision rate of 0,01 g, Amara water heater, gourami fry as test fish weighing between 5 and 7 grams obtained from the Center of Fresh Water Fish Fry in Sukabumi, raw papayas dried into simplicia (papain enzyme), powdered
pineapple extract (bromelin enzyme) from Rumah Sehat Indonesia Jogjakarta, sprayer, and commercial feed with 36% protein content were used in this study.
Experimental design. The experimental design employed in this study is the Completely Randomized Design with four treatments and four repeats. Each treatment consisted of 10 gouramy fish fry. The experimental design was as follows: Treatment A: formulated feed without
papain Treatment B: formulated feed with 0.75%
papain Treatment C: formulated feed with 1.5 %
papain Treatment D: formulated feed with 2.25%
papain Treatment E: commercial feed without
bromelin enzyme Treatment F: commercial feed with 1%
bromelin Treatment G commercial feed with 1.5%
bromelin Treatment H: commercial feed with 2%
bromelin
Preparation of formulated Feed. The papain-containing feed and bromelin-containing feed were prepared using different methods. The formulated feed with papain enzyme contained 30% of proteins and was designed using the square method, while bromelin was added to commercial feed according to the treatment dose using the spray method. Bromelin
Pertanika J. Trop. Agric. Sci. 41 (2): 897 – 906 (2018)
Effect of Proteolytic Plant-Derived Enzymes on Growth Rate
899
was dissolved in 100 ml of distilled water and then sprayed onto the feed and dried at room temperature. After getting dried, the pellets were smashed into crumbs.
Enzyme Activity Test. Papain enzyme was made using raw papayas dried into simplicia, while bromelin enzyme was produced from Rumah Sehat Indonesia, Yogyakarta. 0.1 g of powdered papain and bromelin were dissolved in 1 ml of distilled water 1 mL of casein was then added (10mg were dissolved in 1mL of phosphate buffer 0,1M pH 8). The sample was incubated for 30 minutes at 37oC. After incubation, 3 mL of TCA 8% solution were then added and stirred until the solution became homogenous. The amount of 0.1 g of sample was then centrifuged at 10,000 rpm for 5-10 minutes and then measured using spectrophotometer at the wave length of 280 nm.
Feeding trial. The feeding trial lasted sixty days. Feed was given three times a day at5% of the fish biomass (Watanabe. 1988). It was given at 08.00, 12.00 and 16.00 local time. The remainder of the feed and fish excrement were siphoned every morning before feed was distributed. Observation of fish growth and water quality were conducted every ten days. The growth observation was conducted by weighing the biomass of fish fry, which was then noted as reference for adjustment of feed mixture stock and enzyme dosage. Measurement of water quality entailed
temperature, diluted oxygen content and pH. In the event of the death of fish fry during the observation, the mass of the dead fish was weighed and the number of the dead fish fry counted and noted.
Observation Parameter
a. Daily Growth RateGrowth rate was calculated using the
mass formula according to Effendie (1997):
[1]
where:G = Daily growth rate (%)Wt= Biomass at end of study (gr)Wo= Biomass at start of study (gr)t= Duration of observation (day)
Survival Rate
The survival rate was calculated by counting the number of dead fish every day during the feeding trial. The percentage of survival rate was calculated using the survival rate formula according to Effendi (1997):
[2]
where:SR = Survival rateNt = Number of fish at the end of observationNo = Number of fish at the end of observation
Pertanika J. Trop. Agric. Sci. 41 (2): 897 – 906 (2018)
Yuli Andriani, Yeni Mulyani, Irfan Zidn, Muhammad Yusra Sadri and Putra Nur Wicaksono
900
Efficiency of Feed Use
The efficiency of feed use was calculated using this formula:
[3]
where: EPP = Efficiency of feed use (%) Wt = Completely mass of animal at end of study (g) Wo = Completely mass of animal at start of study (g) F = Amount of fish feed consumed during study (g)
Data Analysis
Data collected during the study was analysed using the variance analysis (F test). If the analysis exhibited significantly different results, then a Duncan test with confidence interval of 95% was conducted to compare the resulting values among treatments.
RESULT AND DISCUSSION
Daily Growth Rate
The addition of different percentages of exogenous enzymes in artificial feed resulted in variable results. The addition of papain and bromelin in fish feed contributed to the growth rate.
Figure 1 shows that the average mass of fish fed with feed enriched with
enzymes was higher than the control variable. However, the variance analysis shows that the daily growth rate of gourami fry fed with papain and bromelin was not significantly different from the control (Table 1). The values of the daily growth rate can be classified as good, since the minimum acceptable growth rate is 1% (Retnosari, 2007). Our results are in agreement with Hepher (1988), reporting that the digestive ability is influenced by the existence of enzymes in the digestive system, the activity rate of the enzymes and the time needed for the feed to react with the enzymes. In this study, the activity of papain was only 2.16 unit/mg, while the bromelin activity reached 12,41 unit/mg protein. In a study by Hasan (2000), papain activity was 32.88 unit/mg protein, a value that caused more proteins to be hydrolysed into amino acids, and therefore absorbed by the body (Muchtadi, 1989). According to Suhermiyati and Setyawati (2008), bromelin is a proteolytic enzyme that functions by hydrolysing complex proteins into their constituting elements. Gantiawan’s study results (2002) show that hydrolysis using bromelin can improve the quality of fish powder and digestibility according to the parameters of amino acids and digestive ability, where the amino acids from fish powder increased for every type of fish powder hydrolysate.
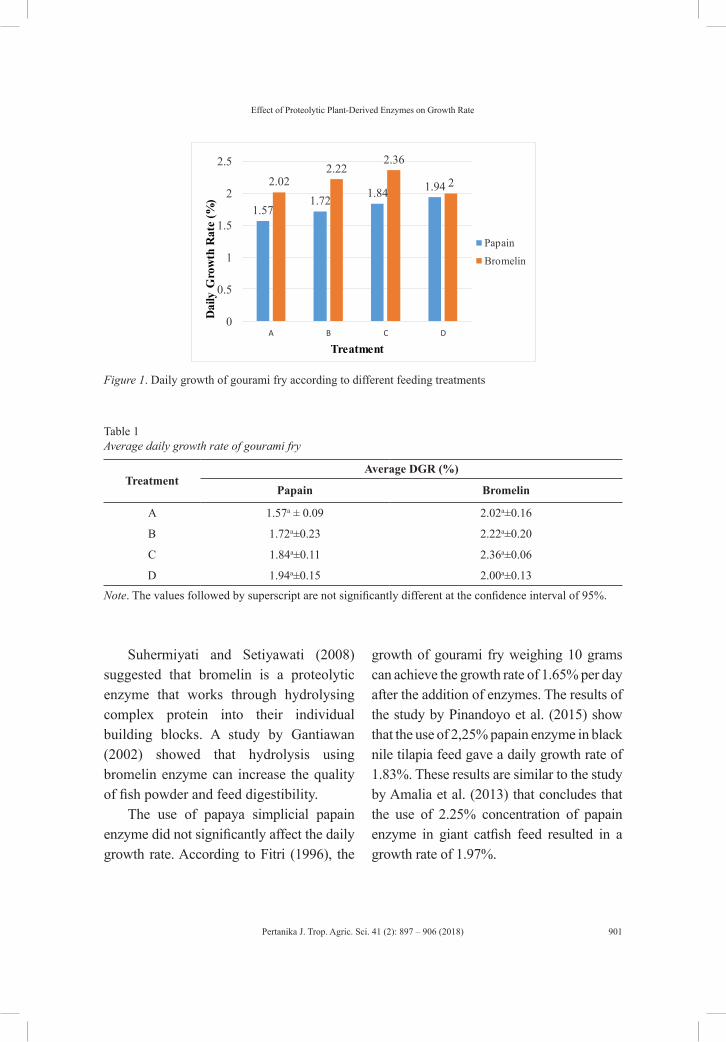
Pertanika J. Trop. Agric. Sci. 41 (2): 897 – 906 (2018)
Effect of Proteolytic Plant-Derived Enzymes on Growth Rate
901
1.57 1.72 1.84 1.94 2.02
2.22 2.36
2
0
0.5
1
1.5
2
2.5
A B C D
Dai
ly G
row
th R
ate
(%)
Treatment
Papain
Bromelin
Figure 1. Daily growth of gourami fry according to different feeding treatments
Table 1Average daily growth rate of gourami fry
TreatmentAverage DGR (%)
Papain Bromelin
A 1.57a ± 0.09 2.02a±0.16
B 1.72a±0.23 2.22a±0.20
C 1.84a±0.11 2.36a±0.06
D 1.94a±0.15 2.00a±0.13
Note. The values followed by superscript are not significantly different at the confidence interval of 95%.
Suhermiyati and Setiyawati (2008) suggested that bromelin is a proteolytic enzyme that works through hydrolysing complex protein into their individual building blocks. A study by Gantiawan (2002) showed that hydrolysis using bromelin enzyme can increase the quality of fish powder and feed digestibility.
The use of papaya simplicial papain enzyme did not significantly affect the daily growth rate. According to Fitri (1996), the
growth of gourami fry weighing 10 grams can achieve the growth rate of 1.65% per day after the addition of enzymes. The results of the study by Pinandoyo et al. (2015) show that the use of 2,25% papain enzyme in black nile tilapia feed gave a daily growth rate of 1.83%. These results are similar to the study by Amalia et al. (2013) that concludes that the use of 2.25% concentration of papain enzyme in giant catfish feed resulted in a growth rate of 1.97%.
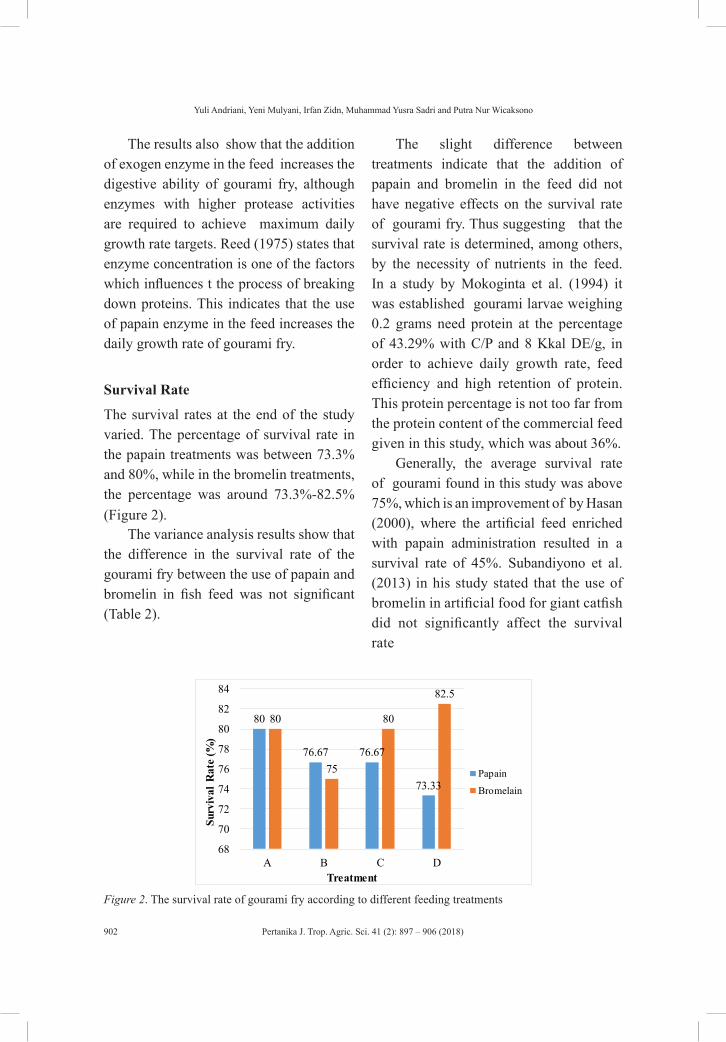
Pertanika J. Trop. Agric. Sci. 41 (2): 897 – 906 (2018)
Yuli Andriani, Yeni Mulyani, Irfan Zidn, Muhammad Yusra Sadri and Putra Nur Wicaksono
902
The results also show that the addition of exogen enzyme in the feed increases the digestive ability of gourami fry, although enzymes with higher protease activities are required to achieve maximum daily growth rate targets. Reed (1975) states that enzyme concentration is one of the factors which influences t the process of breaking down proteins. This indicates that the use of papain enzyme in the feed increases the daily growth rate of gourami fry.
Survival Rate
The survival rates at the end of the study varied. The percentage of survival rate in the papain treatments was between 73.3% and 80%, while in the bromelin treatments, the percentage was around 73.3%-82.5% (Figure 2).
The variance analysis results show that the difference in the survival rate of the gourami fry between the use of papain and bromelin in fish feed was not significant (Table 2).
The slight difference between treatments indicate that the addition of papain and bromelin in the feed did not have negative effects on the survival rate of gourami fry. Thus suggesting that the survival rate is determined, among others, by the necessity of nutrients in the feed. In a study by Mokoginta et al. (1994) it was established gourami larvae weighing 0.2 grams need protein at the percentage of 43.29% with C/P and 8 Kkal DE/g, in order to achieve daily growth rate, feed efficiency and high retention of protein. This protein percentage is not too far from the protein content of the commercial feed given in this study, which was about 36%.
Generally, the average survival rate of gourami found in this study was above 75%, which is an improvement of by Hasan (2000), where the artificial feed enriched with papain administration resulted in a survival rate of 45%. Subandiyono et al. (2013) in his study stated that the use of bromelin in artificial food for giant catfish did not significantly affect the survival rate
80
76.67 76.67
73.33
80
75
80
82.5
68
70
72
74
76
78
80
82
84
A B C D
Surv
ival
Rat
e (%
)
Treatment
Papain
Bromelain
Figure 2. The survival rate of gourami fry according to different feeding treatments

Pertanika J. Trop. Agric. Sci. 41 (2): 897 – 906 (2018)
Effect of Proteolytic Plant-Derived Enzymes on Growth Rate
903
Table 2Average survival rate of gourami fry
TreatmentAverage Survival Rate (%)
Papain Bromelin
A 80.00a±7.40 80.00a±0.63
B 76.67a±10.48 75.00a±0.30
C 76.67a±3.83 80.00a±0.77
D 73.33a±10.70 82.5a±0.82
Note. The values followed by superscript are not significantly different at confidence interval of 95%.
Feed Use Efficiency
The effect of different concentrations of papain and bromelin on feed efficiency is reported in Figure 3. The use of papain resulted in a feed rate between 27.70% and 34.88%, while the use of bromelin resulted in a feed rate between 36.19% and 40.14%.
Statistical analysis showed that the addition of papain and bromelin did not impart any significant difference in feed efficiency rate (Table 3).
Feed efficiency is used to evaluate feed quality. The higher the efficiency, the better the feed (Kordi, 2010). Feed efficiency is affected by factors such as fish size, fish physiological functions, feed quality and rate of consumption (Brown, & Bratzek, 1980). According to Affandi et al. (1992), gourami with a length between 13.5 and 15.0 cm has a ratio of intestine length to body length ranging from 1.31 to 2.31. The values indicate that the digestive system of the gourami is developing, although it structurally it remains immature. Besides, papain and bromelin used are protease of low activity, making the study sub-optimal. Indeed, the addition of high dosage to
obtain better efficiency values is influenced by the activity of protease enzymes causing hydrolysation of complex proteins into amino acids and peptide chains. The study by Handayani et al. (2000) shows the relationship between growth and activity of digestive enzymes. The increase in the activity of protease enzymes, a-amylase and lipase positively correlates with the increase in growth rate and efficiency of feed used in gourami fry. The availability of digestive enzymes influences enzyme activity in digesting the given feed and hence both growth rates and efficiency of feed use.
According to Andriani (2009), the feed efficiency value is directly proportional to the growth rate, indicating that growth occurs with the change in feed efficiency. The bigger the value of efficiency, the better the utilization of the feed in achieving the required mass. This is in line with Amalia et al. (2013) study, indicating that the addition of papain in the artificial feed for giant catfish results in higher growth rate and efficiency. Similarly, the use of bromelin (or bromelain) in a study by Putri
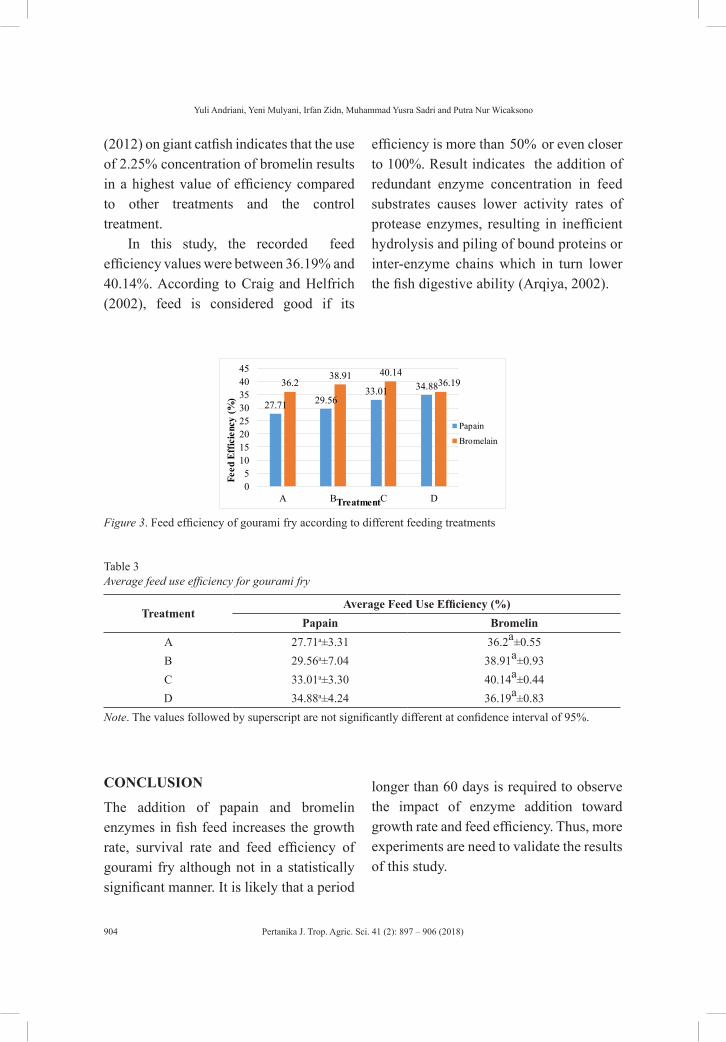
Pertanika J. Trop. Agric. Sci. 41 (2): 897 – 906 (2018)
Yuli Andriani, Yeni Mulyani, Irfan Zidn, Muhammad Yusra Sadri and Putra Nur Wicaksono
904
(2012) on giant catfish indicates that the use of 2.25% concentration of bromelin results in a highest value of efficiency compared to other treatments and the control treatment.
In this study, the recorded feed efficiency values were between 36.19% and 40.14%. According to Craig and Helfrich (2002), feed is considered good if its
efficiency is more than 50% or even closer to 100%. Result indicates the addition of redundant enzyme concentration in feed substrates causes lower activity rates of protease enzymes, resulting in inefficient hydrolysis and piling of bound proteins or inter-enzyme chains which in turn lower the fish digestive ability (Arqiya, 2002).
27.71 29.56 33.01 34.88 36.2
38.91 40.14 36.19
05
1015202530354045
A B C D
Feed
Eff
icie
ncy
(%)
Treatment
Papain
Bromelain
Figure 3. Feed efficiency of gourami fry according to different feeding treatments
Table 3Average feed use efficiency for gourami fry
TreatmentAverage Feed Use Efficiency (%)
Papain BromelinA 27.71a±3.31 36.2a±0.55B 29.56a±7.04 38.91a±0.93C 33.01a±3.30 40.14a±0.44D 34.88a±4.24 36.19a±0.83
Note. The values followed by superscript are not significantly different at confidence interval of 95%.
CONCLUSION
The addition of papain and bromelin enzymes in fish feed increases the growth rate, survival rate and feed efficiency of gourami fry although not in a statistically significant manner. It is likely that a period
longer than 60 days is required to observe the impact of enzyme addition toward growth rate and feed efficiency. Thus, more experiments are need to validate the results of this study.

Pertanika J. Trop. Agric. Sci. 41 (2): 897 – 906 (2018)
Effect of Proteolytic Plant-Derived Enzymes on Growth Rate
905
REFERENCESAffandi, R., Syafei, D. S., Rahardjo, M. F.,
& Sulistiono (1992). Fisiologi ikan [Fish physiology]. Bogor, Indonesia: Pusat Antar Universitas. Ilmu Hayat.
Amalia, R., Subandiyono, & Arini, E. (2013). Pengaruh penggunaan papain terhadap tingkat pemanfaatan protein pakan dan pertumbuhan Lele dumbo [The effect of papain use on food protein utilization rate and growth of dumbo catfish]. Journal of Aquaculture Management and Technology, 2(1), 136-143.
Andriani, Y. (2009). Reduksi asam sianida (HCN) dalam kulit singkong secara fisik dan kimiawi sebagai pra-perlakuan dalam pemanfaatannya sebagai bahan pakan ikan [Cyanide acid reduction (HCN) in cassava skin physically and chemically as pre-treatment in its utilization as fish feed material]. (Unpublished data). Padjadjaran University, Indonesia.
Arqiya, R. (2002). Pembuatan kecap manis “daging tulang leher ayam” secara hidrolisa enzim bromelin [Making sweet ketchup “chicken nail chicken meat” hydrolyzed bromelin enzyme]. (Undergraduate Thesis). Bogor Agricultural University, Indonesia.
Aslamyah, S., Azis, H. Y., Sriwulan & Wiryawan, K. G. (2009). Mikroflora saluran pencernaan ikan gurame (Osphronemus goramy lacepede) [Microflora gastrointestinal channel gurame (Osphronemus goramy lacepede]. Torani (Jurnal ilmu kelautan and perikanan), 19(1), 66-73.
Brown, E. E., & Bratzck, J.B. (1980). Fish farming hand book. New York, NY: AVI Publishing Company.
Craig, S., & Helfrich, L. A. (2002). Understanding fish nutrition, feeds, and feeding. Virginia, USA: Virginia Tech.
Effendie, M. I. (1997). Biologi perikanan. Bogor, Indonesia: Yayasan Dewi Sri.
Fitri, R. H. (1996). Pengaruh penambahan kultur khamir (yeast culture) dalam pakan buatan terhadap pertumbuhan ikan gurami [The effect of adding yeast culture in artificial feed to growing fish growth]. (Undergraduate Thesis). Padjadjaran University, Indonesia.
Gantiawan, Y. (2002). Modifikasi proses pembuatan produk hidrolisat secara enzimatik [Modification of enzymatic hydraulic product processing]. (Undergraduate Thesis). Bogor Agricultural University, Indonesia.
Handayani, R., Kokarkin, C., & Astuti, S. M. (2000). Pemanfaatan enzim bakteri remedian pada pemeliharaan larva udang windu [Utilization of remedian bacterial enzymes in maintenance of windu shrimp larva]. Jepara, Indonesia: Laporan BBAP.
Hasan O. D. S. (2000). Pengaruh pemberian enzim papain dalam pakan buatan terhadap pemanfaatan protein and pertumbuhan benih ikan gurame (Osphronemus gouramy lac.) [The effect of papain enzyme in artificial feed on protein utilization and growth of gurame fish seed (Osphronemus gouramy lac.)]. (Master Thesis). Institut Pertanian Bogor, Indonesia.
Hepher, B. (1988). Nutrition of food fisheries. New York, NY: Cambridge University.
Kordi, K. M. G. (2010). Budi daya ikan nila di kolam terpal [Cultivation of Tilapia fish in tarp pond]. Yogyakarta, Indonesia: Lily Publisher.
Mokoginta, I., Affandi, R., Suprayudi, M. A. & Setiawati, M. (1994). Kebutuhan nutrisi ikan Gurame (Osphronemus gouramy) untuk pertumbuhan and reproduksi [The need for Gurame fish nutrition (Osphronemus gouramy) for growth and reproduction]. In Laporan Penelitian Hibah Bersaing II [Competitive Grant Research Report II]. Bogor, Indonesia: Fakultas Perikanan Institut Pertanian Bogor.
Pertanika J. Trop. Agric. Sci. 41 (2): 897 – 906 (2018)
Yuli Andriani, Yeni Mulyani, Irfan Zidn, Muhammad Yusra Sadri and Putra Nur Wicaksono
906
Muchtadi, D. (1989). Evaluasi nilai gizi pangan [Evaluation of food nutrition value]. Bogor, Indonesia: Pusat Antar Universitas-Insititut Pertanian Bogor.
Muchtadi, D., Palupi, S. R., & Astawan, M. (1992). Enzim dalam industri pangan [Enzymes in the food industry]. Bogor, Indonesia: Pusat Antar Universitas-Insititut Pertanian Bogor.
Pinandoyo, Irawati, D., & Racmawati, D. (2015). Perfoma pertumbuhan benih ikan nila hitam (Oreochromis niloticus Bleeker) melalui penambahan enzim papain dalam pakan buatan [Growth perfomance of black tilapia seeds (Oreochromis niloticus Bleeker) through the enhancement of papain enzymes in artificial feed]. Journal of Aquaculture Management and Technology, 4(1), 1-9.
Putri, S. K. (2012). Penambahan enzim bromelin untuk meningkatkan pemanfaatan protein pakan dan pertumbuhan benih nila larasati (Oreochromis niloticus Var.) [Addition of bromelin enzyme to increase utilization of food protein and seed growth of nila larasati (Oreochromis niloticus Var.]. Journal of Aquaculture Management and Technology, 1(1), 63-76.
Reed, G. (1975). Enzyme in food processing (2nd Ed.). Food Science and Technology. New York, NY: Academic Press.
Retnosari, D. (2007). Pengaruh subtitusi tepung ikan oleh tepung belatung terhadap pertumbuhan benih nila (Oreochormis niloticus) [Effect of fish starch substitution by maggots on tilapia growth (Oreochormis niloticus)]. (Undergraduate Thesis). University of Padjadjaran, Indonesia.
Subandiyono, S., Nisrinah., & Elfitasari, T. (2013). Pengaruh p e n g g u n a a n bromelin terhadap tingkat pemanfaatan protein pakan dan pertumbuhan Lele dumbo (Clarias gariepinus) [The effect of bromelin usage on food protein utilization rate and growth of lamella dumbo (Clarias gariepinus)]. Journal of Aquaculture Management and Technology, 2(2), 57-63.
Suhermiyati, S., & Setyawati, S. J. (2008). Potensi limbah nanas untuk peningkatan kualitas limbah ikan tongkol sebagai bahan pakan unggas [Potential of pineapple wastes for improving the quality of waste of tongkol fish as poultry feed material]. Jurnal Animal Production, 10(3), 174 – 178.
Watanabe, T. (1988). Fish nutrition and marine culture. Tokyo, Japan: Tokyo University of Fisheries-JICA.
Pertanika J. Trop. Agric. Sci. 41 (2): 907 – 916 (2018)
ISSN: 1511-3701 © Universiti Putra Malaysia Press
TROPICAL AGRICULTURAL SCIENCEJournal homepage: http://www.pertanika.upm.edu.my/
ARTICLE INFOArticle history:Received: 26 September 2017Accepted: 25 April 2018
E-mail addresses:[email protected]; [email protected] (Didik Sulistyanto)[email protected] (Ralf-Udo Ehlers)[email protected] (Bachtiar H.Simamora)*Corresponding author
Bioinsecticide Entomopathogenic Nematodes as Biological Control Agent for Sustainable Agriculture
Didik Sulistyanto1*, Ralf-Udo Ehlers2 and Bachtiar H.Simamora3
1Plant Protection Department, Agriculture Faculty, University of Jember, 68121, Indonesia2Institute for Phytopathology, Christian-Albrecthts-University Kiel, Department for Biotechnology and Biological Control, Germany3Department of Management, BINUS Business School Undergraduate Program, Bina Nusantara University, 11480, Jakarta, Indonesia
ABSTRACT
Entomopathogenic nematodes (EPNs) of the genera Heterorhabditis and Steinernema are available in the market for use as pest control agents. They are symbiotically associated with bacteria of the genera Photorhabdus and Xenorhabdus, respectively. Mainly, media development of EPNs as biological control agents is directed towards cost reduction, and it is possible for a variety of protein sources to be metabolised by the bacteria for optimal conditions for nematode reproduction. The aim of this research is to examine the LC50 with leaf disc assays at concentrations of 0.01, 0.10, 1, 10, 100 and 1000 ppm using TUREK® (Bt var aizawai), BITE® (Bt var aizawai) and THURICIDE® (Bt var kurstaki) on larvae of P. xylostella (n=180). The results from the field trial clearly indicated that the biocontrol agent B. thuringiensis (Bt) is superior to the chemical insecticide. B. thuringiensis is accepted as safe, readily mass produced, highly susceptible and easily formulated and applied as biological control agents for sustainable agriculture. Recent scientific progress has been helpful in providing better understanding of the biological and technical parameters that influence the process, thus enabling transfer of knowledge and application to industry. As a consequence, costs for nematode-based products can be significantly reduced.
Keywords: Biological control, economic sustainable development, entomopathogenic nematodes, mass production, symbiotic bacteria
INTRODUCTION
Among antagonist insects that are found in the phylum nematoda, only the species within the genera Steinernema and
Pertanika J. Trop. Agric. Sci. 41 (2): 907 – 916 (2018)
Didik Sulistyanto, Ralf-Udo Ehlers and Bachtiar H.Simamora
908
Heterorhabditis (Rhabditida) are known to play a significant role as biocontrol agents for plants. More than 30 species of what are known as entomopathogenic nematodes (EPNs) have been analysed and it is believed there are many more species to be discovered (Hominick et al., 1997). EPNs that are closely related to Caenothabditis elegans is the current model organism used to analyse animal growth and genetics (Riddle et al., 1997) and is genome sequence has just been completed. Unique to EPNs is their close symbiotic relationship with bacteria of the genera Xenorhabdus and Photorhabdus. Techniques have been developed to use them as biological control agents in industry scale bioreactors and many small- and medium-size enterprises (SMEs) have started to produce and market EPNs.
Today in Indonesia, Heterorhabditis spp. and Steinernema spp. are the species applied in biocontrol of white grubs (Lepidiota stigma) and caterpillars (Spodoptera litura, Spodoptera exigua). Production costs for these nematodes have dropped mainly due to enhancement of production process stability and significant increase of yields. In the following sections of this paper the biological control and technical factors influencing the success of biotechnical production systems in SMEs in Indonesia will be discussed.
Not many strains of symbiotic bacteria have been analysed and studied in detail. Forst and Nealson (1996) explained their molecular biology, and this drew
significant attention to symbionts as their marketability was revealed. It has also been shown that symbiotic bacteria in insecticidal metabolites become active on ingestion by insects, causing symptoms in the gut analogue of Bacillus thuringiensis δ-endotoxin (Blackburn et al., 1998). They are a good alternative to B. thuringiensis (Bt) toxin genes for expression in transgenic plants (Guo et al., 1999).
The type of symbionts in both genera are varied. It is believed that there are two extreme phases, the primary phase and the secondary phase (Akhurst, 1980). Additional phases have been shown by Gerritsen and Smits (1997). The main phase is differentiated from the dauer juveniles (DJ) or infected insects, while the next phase appears either after or before subculturing, as the nematodes emigrate from the cadaver (Grunder, 1997). The secondary phase is not retained by the DJs of H. bacteriophora (Han & Ehlers, 2001). Krasomil-Osterfeld (1995) induced the secondary phase by cultivating a primary form of the species under stress conditions.
Subcultures that are placed under long stress conditions result in stable secondary-phase cultures. Although several metabolic functions are lost by the next form, for example, production of protease, lipase, intracellular crystalline proteins, antibiotics and pigments (Boemare & Akhurst, 1988), the negative impact is that secondary-phase bacteria can have a major and detrimental impact on nematode growth
Pertanika J. Trop. Agric. Sci. 41 (2): 907 – 916 (2018)
Bioinsecticide Entomopathogenic Nematodes as Biological Control Agent
909
and yields (Völgyi et al., 2001). Bintrim and Ensign (1998) believed that one major ingredient for nematode nutrition is crystalline inclusion protein. However, Hussein and Ehlers (2001) pointed out that this is not the only essential nutritional factor yielded in the primary phase. All necessary steps must be taken to stop phase variation.
Phase changes are usually avoided by minimising stress caused by lack of oxygen, high temperature and deviation from the optimal osmotic strength of medium during bacterial inoculum production, inoculation and pre-culture. The mechanisms during transition between phases are yet unresolved, although genetic variation has been excluded (LeClerc & Boemare, 1991; Akhurst et al., 1992; Wang & Dowds, 1993).
EPNs provide several benefits that qualify them as commercially valuable biocontrol agents. They have a high level of effectiveness as they often exceed the control outcomes achieved using chemical compounds. Unlike chemicals, which should not be displaced by water in the soil and which decay within a few days, EPNs are mobile and persistent. The use of EPNs is considered safe for both the user as well as the environment. They have little detrimental effects on non-target insect populations and neither the nematodes nor their bacterial associates cause any detrimental effects to mammals or plants (Bathon, 1996; Ehlers & Hokannen, 1996).
In most countries, EPNs are not required to be registered, and this allows small- and medium-sized enterprises to increase the development of nematode-based plant protection products. Furthermore, EPNs can be placed in safe storage for quite a long time (several months), and this makes them marketable. Dauer juveniles (DJs) are considered resistant to shear forces. Hence, they can be applied using conventional spraying equipment. As the control potential of EPNs is not limited by customary agrochemicals, they can be integrated into standard chemical control practice. Nowadays, nematodes are mainly used in environments that do not tolerate chemical compounds i.e. in soil, insect galleries or in environments developed to resist insecticides.
This study laid the basis for in-vitro production. The research was mostly focussed on the potential biocontrol of Steinernema carpocapsae (all strains) and TUREK® (Bacillus thuringiensis [Bt] var. aizawai) on Plutella xylostella and Crocidolomia binotalis in cabbage crops at Bromo Mountain, Probolinggo region, East Java, Indonesia. Only the presence of symbiotic bacteria in monoxenic cultures produced suitable conditions for nematode reproduction with high numbers of offspring. Uneven distribution of nematodes in the medium prevented systematic sampling; thus, improvement of the technique used is needed. The exploitation of the potential of EPNs in this study for plant protection required the development of liquid culture technology.
Pertanika J. Trop. Agric. Sci. 41 (2): 907 – 916 (2018)
Didik Sulistyanto, Ralf-Udo Ehlers and Bachtiar H.Simamora
910
MATERIALS AND METHODS
Evaluation of Diamont Black Moth (DBM) Resistance to Bacillus thuringiensis (Bt)
EPNs were grown on Petri dishes using different agar media (House, Welch, & Cleugh, 1965; Wouts, 1981; Dunphy & Webster, 1989). The tests were done to determine the LC50 with leaf disc assays at concentrations of 0.01, 0.10, 1, 10, 100 and 1000 ppm using TUREK® (Bt var aizawai), BITE® (Bt var aizawai) and THURICIDE® (Bt var kurstaki) on larvae of P. xylostella (n=180). The insects were collected from four regions in East Java, Malang, Probolinggo, Jember and Bondowoso, and maintained in the laboratory.
Testing Combination of Biocontrol Agents
The formulations provided by Chirstian Albrecht-University zu Kiel, Germany were field-tested in cabbage crops cultured at Bromo Mountain, Probolinggo (East Java, Indonesia). The biocontrol agents used was S. carpocapsae (all strains) at concentration of 500.000 IJ/m2 in the following formulations to control P. xylostella and C. binotalis larvae: K=EPNs in water, F1=EPNs in water with wetting agent, F2=EPNs in the BeXaRi formulation (0.3% Bevaloid, 0.3% xanthan, 0.3% Rimulgan), F3=BeXaRi supplemented with the wetting agent Agristic (0.025% alcarylpolyglykol-ether). EPNs were sprayed on Days 14 and 28 after planting of the cabbage crop. All applications were sprayed at 4 pm with a knapsack sprayer
of volume 15 L. The crop was planted with 50 x 60 cm space for each plant. Each experimental plot contained 100 plants with a number of live (Diamont Black Moth) DBM larvae in each block. The population of P. xylostella larvae from 10 cabbage plants that had been sampled randomly from each plot was counted.
Field Testing of EPNS and Novel Formulation
Field tests were done to evaluate the potential biocontrol of Steinernema carpocapsae (all strains) and TUREK® (Bt var. aizawai) on P. xylostella and C. binotalis in cabbage crops on Bromo Mountain, Probolinggo region, East Java, Indonesia. The EPNs used were S. carpocapsae (all strains) produced in liquid culture in China. The field trial was conducted from March to September, 2002 with S. carpocapsae (all strains) and TUREK® (Bt var. aizawai) to control P. xylostella and C. binotalis. The wetting agents used were Agristic®, Alkilarilpoliglikol eter (0.025% L-1). Concentration used for Bt was 1 gL-1 and S. carpocapsae 0.5 million m-2. All applications were conducted at 4 pm with a knapsack sprayer of volume 15 L after 14 days of planting cabbage crops. Three different treatments were used: W (wetting agent with water), BtW (Bt with wetting agents) and Bt (Bt with water). The EPN treatments were conducted as W (wetting agents and water), NW (nematodes with water) and NfW (nematodes with wetting agents).
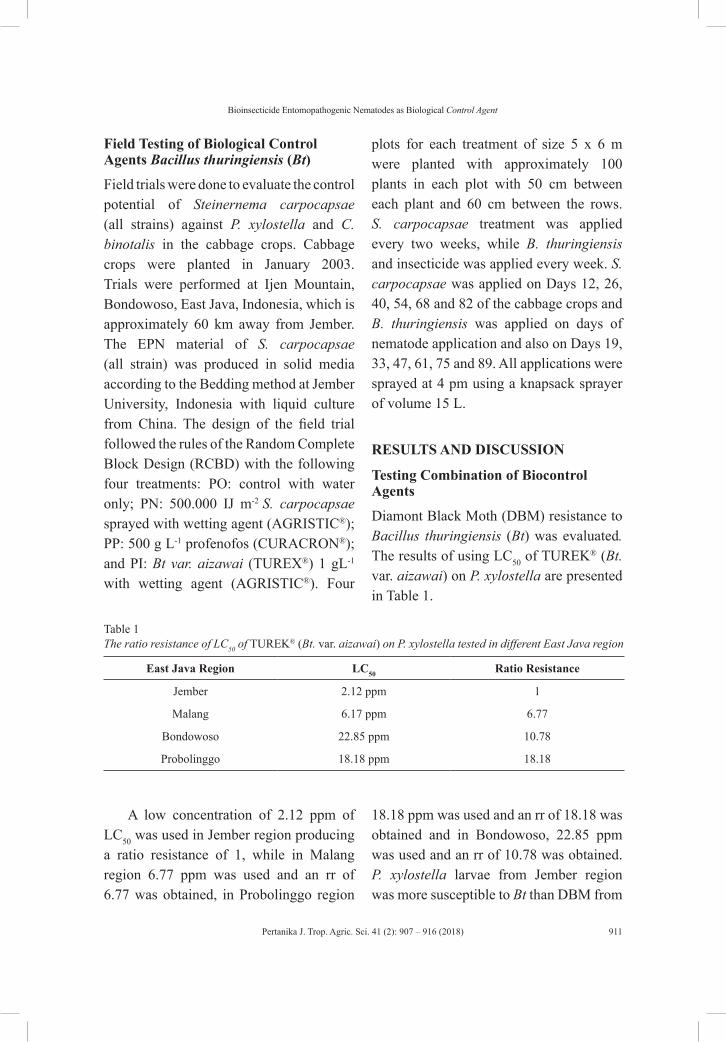
Pertanika J. Trop. Agric. Sci. 41 (2): 907 – 916 (2018)
Bioinsecticide Entomopathogenic Nematodes as Biological Control Agent
911
Field Testing of Biological Control Agents Bacillus thuringiensis (Bt)
Field trials were done to evaluate the control potential of Steinernema carpocapsae (all strains) against P. xylostella and C. binotalis in the cabbage crops. Cabbage crops were planted in January 2003. Trials were performed at Ijen Mountain, Bondowoso, East Java, Indonesia, which is approximately 60 km away from Jember. The EPN material of S. carpocapsae (all strain) was produced in solid media according to the Bedding method at Jember University, Indonesia with liquid culture from China. The design of the field trial followed the rules of the Random Complete Block Design (RCBD) with the following four treatments: PO: control with water only; PN: 500.000 IJ m-2 S. carpocapsae sprayed with wetting agent (AGRISTIC®); PP: 500 g L-1 profenofos (CURACRON®); and PI: Bt var. aizawai (TUREX®) 1 gL-1 with wetting agent (AGRISTIC®). Four
plots for each treatment of size 5 x 6 m were planted with approximately 100 plants in each plot with 50 cm between each plant and 60 cm between the rows. S. carpocapsae treatment was applied every two weeks, while B. thuringiensis and insecticide was applied every week. S. carpocapsae was applied on Days 12, 26, 40, 54, 68 and 82 of the cabbage crops and B. thuringiensis was applied on days of nematode application and also on Days 19, 33, 47, 61, 75 and 89. All applications were sprayed at 4 pm using a knapsack sprayer of volume 15 L.
RESULTS AND DISCUSSION
Testing Combination of Biocontrol Agents
Diamont Black Moth (DBM) resistance to Bacillus thuringiensis (Bt) was evaluated. The results of using LC50 of TUREK® (Bt. var. aizawai) on P. xylostella are presented in Table 1.
Table 1The ratio resistance of LC50 of TUREK® (Bt. var. aizawai) on P. xylostella tested in different East Java region
East Java Region LC50 Ratio Resistance
Jember 2.12 ppm 1
Malang 6.17 ppm 6.77
Bondowoso 22.85 ppm 10.78
Probolinggo 18.18 ppm 18.18
A low concentration of 2.12 ppm of LC50 was used in Jember region producing a ratio resistance of 1, while in Malang region 6.77 ppm was used and an rr of 6.77 was obtained, in Probolinggo region
18.18 ppm was used and an rr of 18.18 was obtained and in Bondowoso, 22.85 ppm was used and an rr of 10.78 was obtained. P. xylostella larvae from Jember region was more susceptible to Bt than DBM from
Pertanika J. Trop. Agric. Sci. 41 (2): 907 – 916 (2018)
Didik Sulistyanto, Ralf-Udo Ehlers and Bachtiar H.Simamora
912
the other three regions in East Java, namely Malang, Probolinggo and Bondowoso. The lowest LC50 was recorded for TUREK® (Bt var. aizawai) on P. xylostella population from Jember region (rr=1). The highest LC50 was concluded for TUREK® (Bt var. aizawai) on P. xylostella population from Probolinggo region (rr=18.18). The results indicated that TUREK® (Bt var. aizawai) and BITE® were more toxic than THURICIDE® (Bt var. kurstaki) on P. xylostella larvae. P. xylostella from Jember region was highly resistant (1,342.17 ppm for THURICIDE®) with a ratio resistance of about 75.50.
The best control was achieved with the BeXaRi formulation supplemented with Agristic. All treatments reduced the number of larvae compared with the control. The results showed that the wetting agents did not affect the virulence of B. thuringiensis (var. aiziwai) and Steinernema carpocapsae (all strains) as biocontrol of P. xylostella and C. binotalis after 52 days. It was obvious that the Bt treatment best reduced the population of DBM, followed by the nematode treatment and then the insecticide treatment. Thus, all the treatments kept the population at a lower density than in the untreated control.
The population of C. binotalis in the control was quite high (up to 59 per plant) between Days 26 and 75 and dropped to fewer than 10 after this period. Again, compared with the control, all the treatments were able to reduce the number of these insects. The most effective
treatment was the insecticide treatment followed by the Bt treatment. The effect of using S. carpocapsae was much less compared with using the other treatments. However, it significantly reduced the population compared with the control. It looked like pesticide resistance had not yet developed in the population of C. binotalis. We concluded that this insect might be less susceptible to EPNs than P. xylostella.
Development of Intregrated Biological Pest Management in Indonesia
The results from the field trial clearly indicated that the biocontrol agent B. thuringiensis (Bt) was superior to the chemical insecticide. The results from the trials using the entomopathogenic nematode S. carpocapsae had not reached comparable results. This might be due to the limited survival of EPNS on the foliage. Biocontrol using EPNs was able to effectively control P. xylostella larvae in the field and thus, represents a potential control measure for cabbage growers. As resistance was developed against the chemical insecticide, the same can be expected for Bt if applied 12 times in one cropping season. Alternative control measures to prevent the development of resistance are therefore urgently needed. It should be mentioned that bacterial diseases can significantly decrease yields and quality of cabbage. For that reason, resistance-inducing and plant-growth promoting microorganisms should be tested on their effect of the bacterial diseases.

Pertanika J. Trop. Agric. Sci. 41 (2): 907 – 916 (2018)
Bioinsecticide Entomopathogenic Nematodes as Biological Control Agent
913
The application of agents like Bacillus subtilis, Pseudomonas fluorescens or Trichoderma harzianum may be either by seed treatment of by spraying. Yields measured in mean weight of 10 cabbage heads were also recorded as well as damage caused by the bacteria Xanthomonas campestris pv. Campestris, Erwinia carotovora pv carotovora and by P. xylostella. The highest yields and lowest damage levels were obtained using the Bt treatment. The only treatment resulting in a significant increase in yields was the Bt treatment. Diseases in all the treatments were lower than in the controls. Damage by P. xylostella was significantly reduced by all the treatments. Compared with the other treatments, S. carpocapsae was less effective (1.75% crop damage). A strategic approach can be alternating the application of B. thuringiensis and S. carpocapsae to effectively limit outbreaks that exceed the economic threshold population of DBM larvae (currently at three larvae per plant).
Additionally, different Bt subspecies may be alternated. During the first project periods we observed resistance development against the subspecies kurstaki (trade name Thuricide) that could be reduced with the use of B. thuringiensis (Bt var. aizawai) in the products TUREX and BITE. A possible strategy could be weekly applications twice a month Bt (1 gL-1) alliterating the two subspecies and the other two applications with S. carpocapsae 500,000 IJ m-2. Both biocontrol agents should be applied in the evening to avoid damage by UV light. The treatments with
B. thuringiensis and S. carpocapsae had a positive effect on the parasitisation of Diadegma spp. and other invertebrate antagonists, and this supports the effect of the biocontrol agents. B. thuringiensis can also be used as a biological control agent of Crocidolomia binotalis.
CONCLUSION
It can be concluded that there remains major problems related to EPN liquid culture mass production that have not been completely solved. Physiological parameters that allow one DJ to respond to a bacterial food signal and another to remain in DJ stage were considered unidentified in this study. Another source of process instability was the results of the phase transition of the bacteria. Further investigation is needed for both fields with the aims of improving process stability and increasing outputs. The close relationship of EPNs to the model nematode C. elegans and the sequencing project on P. luminescens may hopefully yield some background information about the nematode-bacterium complex metabolism that is believed to be valuable for developing process technology.
Comparing the nematode process with the cultivation of Escherichia coli or other microorganisms is limited because there remains very little knowledge of nematode cultivation. Additional research into symbiosis and its genetic background should identify the essential growth factors provided by bacteria and elucidate the functions of phase transition. Recently, the use of EPNs has been expanded to outdoor
Pertanika J. Trop. Agric. Sci. 41 (2): 907 – 916 (2018)
Didik Sulistyanto, Ralf-Udo Ehlers and Bachtiar H.Simamora
914
environments such as strawberry patches and turf grass. Furthermore, EPNs can control many pests existing in vegetables and fruit.
Nevertheless, potential markets are likely to demand nematode products only when the products drop in price. Although the price has been cut by half following the introduction of liquid culture technology, it is still considered too high to permit application among low-value crops. The continuous scale-up of bioreactor volumes will bring further reduction in production costs. However, this development must be accompanied by further progress in improving process stability and downstream processing, extending EPN shelf life and improving transport logistics. If this can be achieved, EPNs will further substitute insecticides and contribute to the stabilisation of agriculture environments and crop yields.
ACKNOWLEDGEMENT
This contribution is dedicated to the Ralf-Udo Ehlers laboratory team who created a friendly and productive environment that contributed to the success of this research. Thanks are also due to the Directorate of High Education (DGHE), the Ministry of Education and Culture (MoEC), Indonesia for Research Grant MP3EI and students and colleagues, in particular Suharto, Wagiyana, Khusnul and Lilik Suyatmi, who participated in the development of entomopathogenic nematodes for use as biological control agents.
REFERENCESAkhurst, R. J. (1980). Morphological and functional
dimorphism in Xenorhabdus spp, bacteria symbiotically associated with insect pathogenic nematodes Neoaplectana and Heterorhabditis. Journal of General Microbiology, 121(2), 303–309.
Akhurst, R. J., Smigielski, A. J., Mari, J., Boemare, N., & Mourant, R. G. (1992). Restriction analysis of phase variation in Xenorhabdus spp (Enterobacteriaceae), entomopathogenic bacteria associated with nematodes. Systematic and Applied Microbiology, 15(3), 469–473.
Bathon, H. (1996). Impact of entomopathogenic nematodes on non-target hosts. Biocontrol Science and Technology, 6(3), 421–434.
Bintrim, S. B., & Ensign, J. C. (1998). Insertional inactivation of genes encoding the crystalline inclusion proteins of Photorhabdus luminescens results in mutants with pleiotropic phenotypes. Journal of Bacteriology, 180(5), 1261–1269.
Blackburn, M., Golubeva, E., Bowen, D., & Ffrench-Constant, R. H. (1998). A novel insecticidal toxin from Photorhabdus luminescens, toxin complex a (Tca), and its histopathological effects on the mitgut of Manduca sexta. Applied and Environmental Microbiology, 64(8), 3036–3041.
Boemare, N. E., & Akhurst, R. J. (1988). Biochemical and physiological characterization of colony form variants in Xenorhabdus spp (Enterobacteriaceae). Journal of General Microbiology, 134(3), 751–761.
Dunphy, G. B., & Webster, J. M. (1989). The monoxenic culture of Neoaplectana carpocapsae DD 136 and Heterorhabditis heliothidis. Review of Nematology, 12(2), 113–123.
Pertanika J. Trop. Agric. Sci. 41 (2): 907 – 916 (2018)
Bioinsecticide Entomopathogenic Nematodes as Biological Control Agent
915
Ehlers, R. U., & Hokkanen, H. M. T. (1996). Insect biocontrol with non-endemic entomopathogenic nematodes (Steinernema and Heterorhabditis spp): Conclusions and recommendations of a combined OECD and COST workshop on scientific and regulatory policy issues. Biocontrol Science and Technology, 6(3), 295–302.
Forst, S., & Nealson, K. (1996). Molecular biology of the symbiotic-pathogenic bacteria Xenorhabdus spp and Photorhabdus spp. Microbiology Reviews, 60(1), 21–43.
Gerritsen, L. J. M., & Smits, P. H. (1997). The influence of Photorhabdus luminescens strains and form variants on the reproduction and bacterial retention of Heterorhabditis megidis. Fundamental and Applied Nematology, 20(4), 317–322.
Grunder, J. M. (1997). Photorhabdus Luminescens als symbiont insekten pathogener nematoden (Photorhabdus luminescens as a symbiont insect for pathogenic nematodes). (Ph.D Thesis). ETH Zürich, Switzerland.
Guo, L., Fatig, R. O., Orr, G. L., Schafer, B. W., Strickland, J. A., Sukhapinda, K., … & Petell, J. K. (1999). Photorhabdus luminescens W-14 insecticidal activity consists of at least two similar but distinct proteins. Journal of Biological Chemistry, 274(14), 9836–9842.
Han, R., & Ehlers, R. U. (2001). Effect of Photorhabdus luminescens phase variants on the in vivo and in vitro development and reproduction of the entomopathogenic nematodes Heterorhabditis bacteriophora and Steinernema carpocapsae. FEMS Microbiology Ecology, 35(3), 239–247.
Hominick, W. M., Briscoe, B. R., del Pino, F. G., Heng, J., Hunt, D. J., Kozodoy, E., … & Yoshida, M. (1997). Biosystematics of entomopathogenic nematodes: Current status, protocols and definitions. Journal of Helminthology, 71(4), 271–298.
House, H. L., Welch, H. E., & Cleugh, T. R. (1965). Food medium of prepared dog biscuit for the mass-production of the nematode DD-136 (Nematoda: Steinernematidae). Nature, 206(4986), 847.
Hussein, M., & Ehlers, R. U. (2001). Significance of Photorhabdus Luminescens inclusion protein for the development of Heterorhabditis Bacteriophora. Luxembourg: European Community Press.
Krasomil-Osterfeld, K. C. (1995). Influence of osmolarity on phase shift in Photorhabdus luminescens. Application Environmental of and Microbiology, 61(10), 3748–3749.
Leclerc, M. C., & Boemare, N. E. (1991). Plasmids and phase variation in Xenorhabdus spp. Application Environmental and Microbiology, 57(9), 2597–2601.
Riddle, D. L., Blumenthal. T., Meyer, B. J., & Priess, J. R. (1997). Introduction to C. Elegans. New York: Cold Spring Harbor Laboratory Press.
Völgyi, A., Fodor, A., Szentirmai, A., & Forst, S. (1998). Phase variation in xenorhabdus nematophilus. Applied and Enviromental Microbiology, 64(4), 1188–1193.
Wang, H., & Dowds, B. C. (1993). Phase variation in Xenorhabdus luminescens: Cloning and sequencing of the lipase gene and analysis of its expression in primary and secondary phases of the bacterium. Journal of Bacteriology, 175(6), 1665–1673.
Wouts, W. M. (1981). Mass production of the entomogenous nematode Heterorhabditis heliothidis (Nematoda: Heterorhabditidae) on artificial media. Journal of Nematology, 13(4), 467–469.

Pertanika J. Trop. Agric. Sci. 41 (2): 917 – 924 (2018)
ISSN: 1511-3701 © Universiti Putra Malaysia Press
TROPICAL AGRICULTURAL SCIENCEJournal homepage: http://www.pertanika.upm.edu.my/
ARTICLE INFOArticle history:Received: 11 July 2017Accepted: 8 November 2017
E-mail addresses:[email protected] (Z. Zanon)[email protected] (N. Najihah)[email protected] (J. Abu)[email protected] (A. R. Mariatulqabtiah)*Corresponding author
Short Communication
Prevalence of Avian Polyomavirus in Psittacine Birds in the Klang Valley
Z. Zanon1, N. Najihah2, J. Abu1 and A. R. Mariatulqabtiah2,3*1Faculty of Veterinary Medicine, Universiti Putra Malaysia, 43400 UPM, Serdang, Selangor, Malaysia2Institute of Bioscience, Universiti Putra Malaysia, 43400 UPM, Serdang, Selangor, Malaysia3Faculty of Biotechnology and Biomolecular Sciences, Universiti Putra Malaysia, 43400 UPM, Serdang, Selangor, Malaysia
ABSTRACT
Avian polyomavirus (APV) primarily affects young birds and can cause mortality in a wide range of psittacine birds. This is the first study to detect the presence of APV in Malaysia. A total of 85 faecal samples were collected from symptom-free psittacines species from four different breeders in the Klang Valley. Upon genomic DNA extraction, the presence of APV was analysed by PCR using primers APVfull-AF (5’- ACAATGCCTAACGGAACGCC-3’) and APVfull-AR (5’-CACCGAAGCGGCGATACTATA-3’). Positive results of 3 kbp PCR amplicon were detected in six out of the 30 samples (20%), which were from yellow-collared macaws, blue-headed parrots, red-crowned macaws, sulphur-crested cockatoos, blue-throated macaws, and Pesquet’s parrots. As a conclusion, the prevalence of APV was clearly indicated.
Keywords: PCR, polyomavirus, psittacine birds
INTRODUCTION
Avian polyomavirus (APV) has been subclinically identified in numerous species of birds and is categorised under the family of Polyomaviridae. In 2016, the taxonomy developed by the International Committee on Taxonomy of Virus documented four genera within this family: Alphapolyomavirus
Pertanika J. Trop. Agric. Sci. 41 (2): 917 – 924 (2018)
Z. Zanon, N. Najihah, J. Abu and A. R. Mariatulqabtiah
918
(37 species), Betapolyomavirus (29 species), Deltapolyomavirus (4 species), Gammapolyomavirus (7 species), with three species still unassigned. APV, which is also known as Aves polyomavirus 1, is classified under the Gammapolyomavirus genus. Molecularly, it is a non-enveloped virus with icosahedral viral capsid containing circular double-stranded DNA, with a genome size of 4981 bp (Hsu et al., 2006; Johne, Jungmann, & Muller, 2000). The APV genomes consist of two regions - an early region which codes for tumour (T) antigen, and a late region which encodes for structural proteins; major structural virus protein 1 (VP1) and minor structural proteins VP2, VP3 and VP4 (Halami et al., 2010; Katoh et al., 2009). Increased mortality associated with polyomavirus infections in birds can be seen in a variety of young captive psittacine birds, namely, lovebirds, macaws, conures, ring-necked parakeets, caiques, Eclectus parrots, Amazon parrots and cockatoos (Parrish, 2011). Clinical signs and symptoms due to APV infection include cutaneous haemorrhage, abdominal distension, and feather abnormalities. APV is also associated with budgerigar fledging disease (also known as French molt, a milder disease of budgerigars that results in a chronic disorder of feather formation). Other bird species may also get affected by this virus. Subclinical APV infection was found in European raptors, zebra finches, Ross’s turaco and a kookaburra (Parrish, 2011). It is believed that only sulphur-crested cockatoos are infected in natural settings in Australia. The virus can
be stored in faeces for up to six months. Sudden death of the affected birds is usually associated with minimal clinical warnings, but weakness, pallor, subcutaneous haemorrhages, anorexia, dehydration and crop stasis are briefly manifested (Parrish, 2011). Currently, APV is still not prevalent in Malaysia and information pertaining to APV is still lacking. No study has been carried out on the disease status and virus detection among psittacine species in Malaysia. However, many birds are subclinically infected and possibly store the virus in respiratory secretions, crop secretions, feather dust and droppings in times of stress, such as during the breeding season and juvenile stage in life. Despite significant contributions by exotic birds to the Malaysian pet bird industry due to its breeding activities, to date, no study to determine the presence and/or prevalence of APV for exotic birds population in Malaysia is available. Hence, this study was undertaken to screen the presence of APV among psittacine birds, especially in parrot species, in the Klang Valley, Malaysia.
MATERIALS AND METHODS
Samples Acquisition and Preparation
A total of 85 faecal bird samples were obtained from four different breeders (Breeder A, B, C, and D) located in the Klang Valley. All the birds were classified into different groups based on their species in the Psittaciformes order. Samples which were collected from different birds of the same species from the same breeder
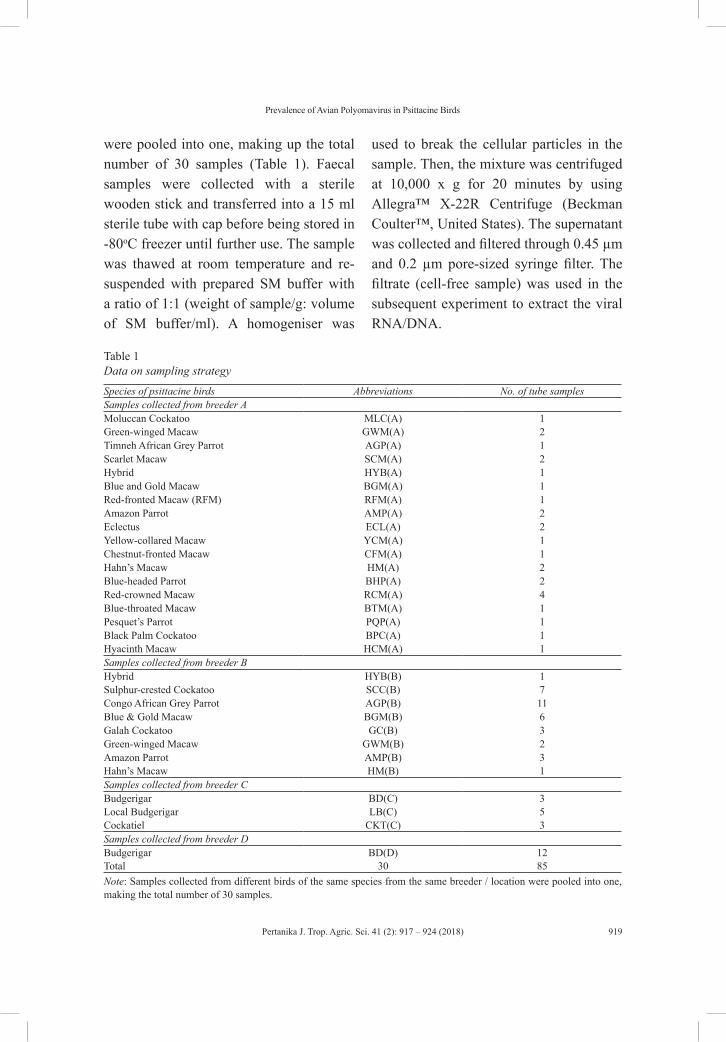
Pertanika J. Trop. Agric. Sci. 41 (2): 917 – 924 (2018)
Prevalence of Avian Polyomavirus in Psittacine Birds
919
were pooled into one, making up the total number of 30 samples (Table 1). Faecal samples were collected with a sterile wooden stick and transferred into a 15 ml sterile tube with cap before being stored in -80oC freezer until further use. The sample was thawed at room temperature and re-suspended with prepared SM buffer with a ratio of 1:1 (weight of sample/g: volume of SM buffer/ml). A homogeniser was
used to break the cellular particles in the sample. Then, the mixture was centrifuged at 10,000 x g for 20 minutes by using Allegra™ X-22R Centrifuge (Beckman Coulter™, United States). The supernatant was collected and filtered through 0.45 µm and 0.2 µm pore-sized syringe filter. The filtrate (cell-free sample) was used in the subsequent experiment to extract the viral RNA/DNA.
Table 1Data on sampling strategy
Species of psittacine birds Abbreviations No. of tube samplesSamples collected from breeder AMoluccan Cockatoo MLC(A) 1Green-winged Macaw GWM(A) 2Timneh African Grey Parrot AGP(A) 1Scarlet Macaw SCM(A) 2Hybrid HYB(A) 1Blue and Gold Macaw BGM(A) 1Red-fronted Macaw (RFM) RFM(A) 1Amazon Parrot AMP(A) 2Eclectus ECL(A) 2Yellow-collared Macaw YCM(A) 1Chestnut-fronted Macaw CFM(A) 1Hahn’s Macaw HM(A) 2Blue-headed Parrot BHP(A) 2Red-crowned Macaw RCM(A) 4Blue-throated Macaw BTM(A) 1Pesquet’s Parrot PQP(A) 1Black Palm Cockatoo BPC(A) 1Hyacinth Macaw HCM(A) 1Samples collected from breeder BHybrid HYB(B) 1Sulphur-crested Cockatoo SCC(B) 7Congo African Grey Parrot AGP(B) 11Blue & Gold Macaw BGM(B) 6Galah Cockatoo GC(B) 3Green-winged Macaw GWM(B) 2Amazon Parrot AMP(B) 3Hahn’s Macaw HM(B) 1Samples collected from breeder CBudgerigar BD(C) 3Local Budgerigar LB(C) 5Cockatiel CKT(C) 3Samples collected from breeder DBudgerigar BD(D) 12Total 30 85 Note: Samples collected from different birds of the same species from the same breeder / location were pooled into one, making the total number of 30 samples.
Pertanika J. Trop. Agric. Sci. 41 (2): 917 – 924 (2018)
Z. Zanon, N. Najihah, J. Abu and A. R. Mariatulqabtiah
920
Viral DNA Extraction and Purification
To prepare the lysate, Purelink® Viral RNA/DNA Mini Kit (Invitrogen) was used. Briefly, a 25 µl of proteinase K was added into a sterile micro-centrifuge tube followed by 200 µl of cell-free sample and 200 µl of lysis buffer. This mixture was vortexed for 15 seconds. The sample was then incubated in a water bath at 56°C for 15 minutes. After that, the sample was centrifuged at a short-spin speed for one minute. To proceed with the binding and washing procedure, 250 µl of 96-100% ethanol was added to the lysate and vortexed for 15 seconds. The lysate was then incubated with ethanol for 15 minutes at room temperature. The mixture of the lysate and ethanol was centrifuged with a short-spin speed for one minute before it was transferred into a viral spin column. The loaded-column was centrifuged again at 6800 x g for one minute. The spin column was placed in a clean wash tube and 500 µl of wash buffer (W5) was added with ethanol to the spin column before centrifugation at 6800 x g for one minute. The flow-through in the wash tube was then discarded and the spin column was transferred into another 2 ml sterile tube before being centrifuged at 10,000 x g for one minute. The flow-through was discarded. The viral spin column was transferred into a 1.5 ml
sterile recovery tube. A 10-50 µl of sterile, RNAse-free water was added to the centre of the column before incubation at room temperature for one minute. The column was centrifuged at 10,000 x g for one minute. The spin column was then removed and discarded. The collected-purified DNA sample produced was stored at -80°C until further use. Two(2) µl of the DNA extract was pipetted out into a cuvette and placed in a BioSpectrometer™ photometer (Eppendorf, Germany) for quantification.
Polymerase Chain Reaction (PCR) of Viral DNA
Information regarding the primers used in this study are listed in Table 2. PCR reaction was set in each tube by adding 10 μl of 2X MyTaq™ Red Mix, (Bioline™, United States), 0.4 μM of forward primer, 0.4 μM of reverse primer, and 200 ng of DNA template. Sterile distilled water (ddH2O) was added to a final volume of 20 μl. About 30 cycles of PCR amplification were performed using a Bio-Rad T100™ thermal cycler (Bio-Rad, United States) with the following conditions: denaturation at 95oC for 30 seconds, annealing at 54 oC or 58oC for 30 seconds, and elongation at 72oC for one minute. PCR products were resolved in agarose 1 % (w/v) gel electrophoresis.
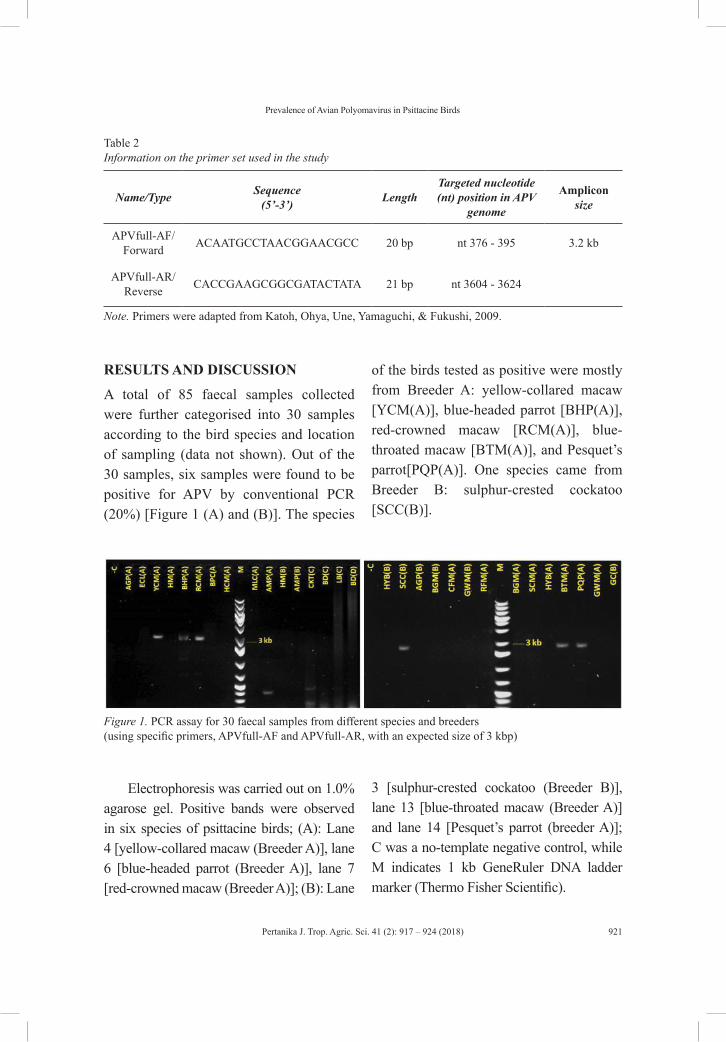
Pertanika J. Trop. Agric. Sci. 41 (2): 917 – 924 (2018)
Prevalence of Avian Polyomavirus in Psittacine Birds
921
Table 2Information on the primer set used in the study
Name/Type Sequence(5’-3’) Length
Targeted nucleotide (nt) position in APV
genome
Amplicon size
APVfull-AF/Forward ACAATGCCTAACGGAACGCC 20 bp nt 376 - 395 3.2 kb
APVfull-AR/Reverse CACCGAAGCGGCGATACTATA 21 bp nt 3604 - 3624
Note. Primers were adapted from Katoh, Ohya, Une, Yamaguchi, & Fukushi, 2009.
RESULTS AND DISCUSSION
A total of 85 faecal samples collected were further categorised into 30 samples according to the bird species and location of sampling (data not shown). Out of the 30 samples, six samples were found to be positive for APV by conventional PCR (20%) [Figure 1 (A) and (B)]. The species
of the birds tested as positive were mostly from Breeder A: yellow-collared macaw [YCM(A)], blue-headed parrot [BHP(A)], red-crowned macaw [RCM(A)], blue-throated macaw [BTM(A)], and Pesquet’s parrot[PQP(A)]. One species came from Breeder B: sulphur-crested cockatoo [SCC(B)].
Figure 1. PCR assay for 30 faecal samples from different species and breeders (using specific primers, APVfull-AF and APVfull-AR, with an expected size of 3 kbp)
Electrophoresis was carried out on 1.0% agarose gel. Positive bands were observed in six species of psittacine birds; (A): Lane 4 [yellow-collared macaw (Breeder A)], lane 6 [blue-headed parrot (Breeder A)], lane 7 [red-crowned macaw (Breeder A)]; (B): Lane
3 [sulphur-crested cockatoo (Breeder B)], lane 13 [blue-throated macaw (Breeder A)] and lane 14 [Pesquet’s parrot (breeder A)]; C was a no-template negative control, while M indicates 1 kb GeneRuler DNA ladder marker (Thermo Fisher Scientific).
Pertanika J. Trop. Agric. Sci. 41 (2): 917 – 924 (2018)
Z. Zanon, N. Najihah, J. Abu and A. R. Mariatulqabtiah
922
By using convenience sampling as a component of the methodology, various species of psittacine birds, six out of 30 faecal samples were found to be positive for APV by PCR assay, which means a positive detection rate of 20%. This finding corresponds to the expected prevalence of 22% in Poland (Piasecki & Wieliczko, 2010), but not to a prevalence study in Costa Rica with only 4.8% occurrence of APV infection based on 269 feather or blood samples (Dolz et al., 2013). In this study, APV DNA was detected in six different types of psittacine birds, including a sulphur-crested cockatoo. DNA of APV was also been detected from wild-caught sulphur-crested cockatoos in Australia by Raidal and colleagues (Raidal et al., 1998). All the birds involved in this study were healthy and did not show any signs of illness (asymptomatic). Most of the APV positive birds were from Breeder A. According to the breeder, most of the birds acquired originated from the wild environment. This might be the foundation of such an observation. Many wild birds can be found naturally infected with APV. However, infection in captive-raised birds is also widespread. According to Kahn and Line (2010), adult birds typically are resistant to infection, they are able to seroconvert and shed the virus for up to 90 days, then clear the infection. The typical presentation of APV-infected birds are well-fleshed juveniles and just before fledgling age. Most adult birds act as carriers of APV without exhibiting any clinical signs to other susceptible birds around them. There
are a few limitations in this study: i) some of the birds were kept together in a cage, such as budgerigars, or with their mating pair, for example, green-winged macaw, hence, individual faecal sample was difficult to obtain; ii) individual blood or cloacal swab sampling might offer a better surveillance analysis for APV infection. However, faecal sampling is considerably a fast, non-invasive screening technique which avoids physical contact and stress to the exotic birds. Future recommendation would be to increase the sample size and expand the prevalence parameters to specific species, breeders or location.
CONCLUSIONS
This study successfully described the prevalence of APV in psittacine birds for the first time in Malaysia. Further studies on bioinformatics analysis should be conducted to study the characteristics of locally isolated APV based on whole genome sequence and phylogenetic tree.
ACKNOWLEDGEMENTS
The authors thank pet owners and bird breeders for the source of faecal samples as well as the staff of Laboratory of Vaccines and Immunotherapeutics, Institute of Bioscience, for their kind technical assistance. This study was supported by the Ministry of Higher Education, under the Fundamental Research Grant Scheme (FRGS), with project number 02-01-15-1735FR.
Pertanika J. Trop. Agric. Sci. 41 (2): 917 – 924 (2018)
Prevalence of Avian Polyomavirus in Psittacine Birds
923
REFERENCESDolz, G., Sheleby-Elías, J., Romero-Zu, J. J., Vargas-
Leitón, B., Gutiérrez-Espeleta, G., & Madriz-Orde, K. (2013). Prevalence of psittacine beak and feather disease virus and avian polyomavirus in captivity psittacines from Costa Rica. Journal of Veterinary Medicine, Series, 3(1), 240-245.
Halami, M., Dorrestein, G., Couteel, P., Heckel, G., Muller, H., & Johne, R. (2010). Whole-genome characterization of a novel polyomavirus detected in fatally diseased canary birds. Journal of General Virology, 91(12), 3016-3022.
Hsu, C. M., Ko, C. Y., & Tsai, H. J. (2006). Detection and sequence analysis of avian polyomavirus and psittacine beak and feather disease virus from psittacine birds in Taiwan. Avian Diseases, 50(3), 348-353.
Johne, R., Jungmann, A., & Muller, H. (2000). Agnoprotein 1a andagnoprotein 1b of avian polyomavirus are apoptotic inducers. Journal of General Virology, 81(5), 1183–1190.
Kahn, C. M., & Line, S. (2010). The Merck Veterinary manual (10th Ed.). Whitehouse Station, N. J.: Merck & Co.
Katoh, H., Ohya, K., Une, Y., Yamaguchi, T., & Fukushi, H. (2009). Molecular characterization of avian polyomavirus isolated from psittacine birds based on the whole genome sequence analysis. Veterinary Microbiology, 138(1), 69-77.
Parrish, C. R. (2011), Papillomaviridae and polyomaviridae. In N. J. Maclachlan, E. J. Dubovi, & F. Fenner (Eds.), Fenner’s Veterinary Virology (4th Ed.) (pp. 213-223). Amsterdam: Elsevier/AP.
Piasecki, T., & Wieliczko, A. (2010). Detection of beak and feather disease virus and avian polyomavirus DNA in psittacine birds in Poland. Bulletin of the Veterinary Institute of Pulawy, 54, 141-146.
Raidal, S. R., Cross, G. M., Tomaszewski, E., Graham, D. L., & Phalen, D. N. (1998). A serologic survey for avian polyomavirus and pacheco’s disease virus in Australian cockatoos. Avian Pathology, 27(3), 263-268.


REFEREES FOR THE PERTANIKA JOURNAL OF TROPICAL AGRICULTURAL SCIENCE
VOL. 41 (2) May 2018
The Editorial Board of the Journal of Tropical Agricultural Science wishes to thank the following:
Abdulaziz Anas (NIO, India)
Ahmad Selamat (UPM, Malaysia)
Ahmed Jalal Khan Chowdhury (IIUM, Malaysia)
Aileen Tan Shau Hwai (USM, Malaysia)
Altanzul Khorolragchaa (MAS, Mongolia)
Aminah Abdullah (UKM, Malaysia)
Aminuddin Ab. Ghani (USM, Malaysia)
Amir Hamzah Ahmad Ghazali (USM, Malaysia)
Asnuzilawati Asari (UMT, Malaysia)
Balusamy Sri Renuka Devi (SJU, Korea)
Bolou BI Bolou Emile (IPGP, France)
Cheng Lai Hoong (USM, Malaysia)
Chong Yee Ling (UNIMAS, Malaysia)
Chuah Cheng Hock (UM, Malaysia)
Chye Fook Yee (UMS, Malaysia)
Dinesh Bharadwaj (CSAUA&T, India)
Elieser Tarigan (UBAYA, Indonesia)
Faridah Abas (UPM, Malaysia)
Farrah Aini Dahalan (UniMAP, Malaysia)
Freddy Pattiselanno (UNIPA, Indonesia)
Ghizan Saleh (UPM, Malaysia)
Hajar Fauzan Ahmad (UMP, Malaysia)
Hasliza Abu Hashim (UPM, Malaysia)
Hoang Van An (AGI, Vietnam)
Hong Sok Lai (UM, Malaysia)
Imad Ibrahim Al-Sultan (UMK, Malaysia)
Indika Herath (CRI, Sri Lanka)
Jasni Sabri (UMK, Malaysia)
Jiban Shrestha (NARC, Nepal)
Johan Sukweenadhi (UBAYA, Indonesia)
Joseph Bagyaraj (CNBRCD, India)
K. Mohanraj (SBI, India)
Kavindra Nath Tiwari (BHU, India)
Lai Jyh-Mirn (NCYU, Taiwan)
Liang Juan Boo (UPM, Malaysia)
Liew Siew Ling (UKM, Malaysia)
Lim Yau Yan (Monash University, Malaysia)
Lingan Rajendran (TNAU, India)
M. Chandrasekharaiah (NIANP, India)
Mah Siau Hui (Taylor’s University, Malaysia)
Maria Goretti M. Purwanto (UBAYA, Indonesia)
Mariana Wahjudi (UBAYA, Indonesia)
Marina Paolucci (UNISANNIO, Italy)
Mathiyalagan Ramya (KHU, Korea)
Md Kamal Uddin (UMS, Malaysia)
Md. Amirul Alam (UNiSZA, Malaysia)
Md. Monirul Islam (BARI, Bangladesh)
Micky Vincent (UNIMAS, Malaysia)
Mohd Fauzi Hj. Ramlan (UPM, Malaysia)
Mohd Monjurul Alam Mondal (BINA, Bangladesh)
Mohd Rafii Yusop (UPM, Malaysia)
Muhammad Amir Yunus (USM, Malaysia)
Muhd Danish Daniel Abdullah (UMT, Malaysia)
Muta Harah Zakaria (UPM, Malaysia)
Nesti F. Sianipar (BINUS, Indonesia)
Nguyen Ngoc-Lan (IGR, Vietnam)
Nirmala Niyegi (UAS, India)

While every effort has been made to include a complete list of referees for the period stated above, however if any name(s) have been omitted unintentionally or spelt incorrectly, please notify the Chief Executive Editor, UPM Journals at [email protected].
Any inclusion or exclusion of name(s) on this page does not commit the Pertanika Editorial Office, nor the UPM Press or the University to provide any liability for whatsoever reason.
AGI – Agricultural Genetics InstituteBARI – Bangladesh Agricultural Research InstituteBFGI – Baba Farid Group of InstitutionsBHU – Banaras Hindu UniversityBINA – Bangladesh Institute of Nuclear AgricultureBINUS – Bina Nusantara UniversityCNBRCD – Centre for Natural Biological Resources and Community DevelopmentCRI – Coconut Research InstituteCSAUA&T – Chandra Shekhar Azad University of Agriculture and TechnologyDRC – Desert Research CenterGKV – Gurukula Kangri VishwavidyalayaIGR – Institute of Genome ResearchIIUM – International Islamic University MalaysiaIPB – Bogor Agricultural UniversityIPGP – Institute of Earth Physics of ParisKAIST – Korea Advanced Institute of Science and TechnologyKHU – Kyung Hee UniversityLPU – Lovely Professional UniversityMARDI – Malaysian Agricultural Research and Development InstituteMAS – Mongolian Academy of SciencesNARC – Nepal Agricultural Research CouncilNCYU – National Chiayi UniversityNIANP – National Institute of Animal Nutrition and Physiology
NIO – National Institute of OceanographySBI – Sugarcane Breeding InstituteSJU – Sejong UniversityTNAU – Tamil Nadu Agricultural UniversityUAS – University of Agricultural SciencesUBAYA – University of Surabaya UKM – Universiti Kebangsaan MalaysiaUM – Universiti MalayaUMP – Universiti Malaysia PahangUMS – Universiti Malaysia SabahUMT – Universiti Malaysia TerengganuUNAIR – University of AirlanggaUNIBA – University of BariUniMAP – Universiti Malaysia PerlisUNIMAS – Universiti Malaysia SarawakUNIPA – University of PapuaUNISANNIO – University of SannioUNiSZA – Universiti Sultan Zainal AbidinUNPAD – Padjadjaran UniversityUPM – Universiti Putra MalaysiaUSM – Universiti Sains MalaysiaUSP – University of the South Pacific
Oeke Yunita (UBAYA, Indonesia)
Omnia Mohamed Mohamed Abdou (DRC, Egypt)
P. S. Parameswaran (NIO, India)
Popy Hartatie Hardjo (UBAYA, Indonesia)
Prathibha Vyas (LPU, India)
Purshotam Kaushik (GKV, India)
Radziah Othman (UPM, Malaysia)
Sarker Mohammad Rezaul Karim (UMK, Malaysia)
Shadi Rahimi (KAIST, Korea)
Shanmugavelu Sithambaram (MARDI, Malaysia)
Siaka Diarra (USP, Samoa)
Sreeramanan Subramaniam (USM, Malaysia)
Sudarsono (IPB, Indonesia)
Sulistyo Emantoko Dwi Putra (UBAYA, Indonesia)
Sunny Goh Eng Giap (UMT, Malaysia)
Tan Boon Chin (UM, Malaysia)
Umi Kalsom Yusuf (UPM, Malaysia)
Vincenzo Tufarelli (UNIBA, Italy)
Vishal Deshwal (BFGI, India)
Win Darmanto (UNAIR, Indonesia)
Yudi Azis (UNPAD, Indonesia)
Zaleha Kassim (IIUM, Malaysia)
Pertanika JournalsOur goal is to bring high quality research to the widest possible audience
INSTRUCTIONS TO AUTHORS(Manuscript Preparation & Submission Guide)
Revised: June 2016
Please read the Pertanika guidelines and follow these instructions carefully. Manuscripts not adhering to the instructions will be returned for revision without review. The Chief Executive Editor reserves the right to return manuscripts that are not prepared in accordance with these guidelines.
MANUSCRIPT PREPARATION
Manuscript Types Pertanika accepts submission of mainly four types of manuscripts for peer-review.
1. RegulaR aRticle
Regular articles are full-length original empirical investigations, consisting of introduction, materials and methods, results and discussion, conclusions. Original work must provide references and an explanation on research findings that contain new and significant findings.
Size: Generally, these are expected to be between 6 and 12 journal pages (excluding the abstract, references, tables and/or figures), a maximum of 80 references, and an abstract of 100–200 words.
2. Review aRticle
These report critical evaluation of materials about current research that has already been published by organizing, integrating, and evaluating previously published materials. It summarizes the status of knowledge and outline future directions of research within the journal scope. Review articles should aim to provide systemic overviews, evaluations and interpretations of research in a given field. Re-analyses as meta-analysis and systemic reviews are encouraged. The manuscript title must start with “Review Article:”.
Size: These articles do not have an expected page limit or maximum number of references, should include appropriate figures and/or tables, and an abstract of 100–200 words. Ideally, a review article should be of 7 to 8 printed pages.
3. ShoRt communicationS They are timely, peer-reviewed and brief. These are suitable for the publication of significant technical advances and may be used to:
(a) report new developments, significant advances and novel aspects of experimental and theoretical methods and techniques which are relevant for scientific investigations within the journal scope;
(b) report/discuss on significant matters of policy and perspective related to the science of the journal, including ‘personal’ commentary;
(c) disseminate information and data on topical events of significant scientific and/or social interest within the scope of the journal.
The manuscript title must start with “Brief Communication:”.
Size: These are usually between 2 and 4 journal pages and have a maximum of three figures and/or tables, from 8 to 20 references, and an abstract length not exceeding 100 words. Information must be in short but complete form and it is not intended to publish preliminary results or to be a reduced version of Regular or Rapid Papers.
4. otheRS
Brief reports, case studies, comments, concept papers, Letters to the Editor, and replies on previously published articles may be considered.
PLEASE NOTE: NO EXCEPTIONS WILL BE MADE FOR PAGE LENGTH.
Language Accuracy Pertanika emphasizes on the linguistic accuracy of every manuscript published. Articles must be in English and they must be competently written and argued in clear and concise grammatical English. Contributors are strongly advised to have the manuscript checked by a colleague with ample experience in writing English manuscripts or a competent English language editor.
Author(s) must provide a certificate confirming that their manuscripts have been adequately edited. A proof from a recognised editing service should be submitted together with the cover letter at the time of submitting a manuscript to Pertanika. All editing costs must be borne by the author(s). This step, taken by authors before submission, will greatly facilitate reviewing, and thus publication if the content is acceptable.
Linguistically hopeless manuscripts will be rejected straightaway (e.g., when the language is so poor that one cannot be sure of what the authors really mean). This process, taken by authors before submission, will greatly facilitate reviewing, and thus publication if the content is acceptable.
MANUSCRIPT FORMATThe paper should be submitted in one column format with at least 4cm margins and 1.5 line spacing throughout. Authors are advised to use Times New Roman 12-point font and MS Word format.
1. Manuscript StructureManuscripts in general should be organised in the following order:
Page 1: Running titleThis page should only contain the running title of your paper. The running title is an abbreviated title used as the running head on every page of the manuscript. The running title should not exceed 60 characters, counting letters and spaces.
Page 2: Author(s) and Corresponding author information. This page should contain the full title of your paper not exceeding 25 words, with name(s) of all the authors, institutions and corresponding author’s name, institution and full address (Street address, telephone number (including extension), hand phone number, and e-mail address) for editorial correspondence. First and corresponding authors must be clearly indicated.
The names of the authors may be abbreviated following the international naming convention. e.g. Salleh, A.B.1, Tan, S.G2*., and Sapuan, S.M3.
Authors’ addresses. Multiple authors with different addresses must indicate their respective addresses separately by superscript numbers:
George Swan1 and Nayan Kanwal2 1Department of Biology, Faculty of Science, Duke University, Durham, North Carolina, USA., 2Office of the Deputy Vice Chancellor (R&I), Universiti Putra Malaysia, Serdang, Malaysia.
A list of number of black and white / colour figures and tables should also be indicated on this page. Figures submitted in color will be printed in colour. See “5. Figures & Photographs” for details.
Page 3: AbstractThis page should repeat the full title of your paper with only the Abstract (the abstract should be less than 250 words for a Regular Paper and up to 100 words for a Short Communication), and Keywords.
Keywords: Not more than eight keywords in alphabetical order must be provided to describe the contents of the manuscript.
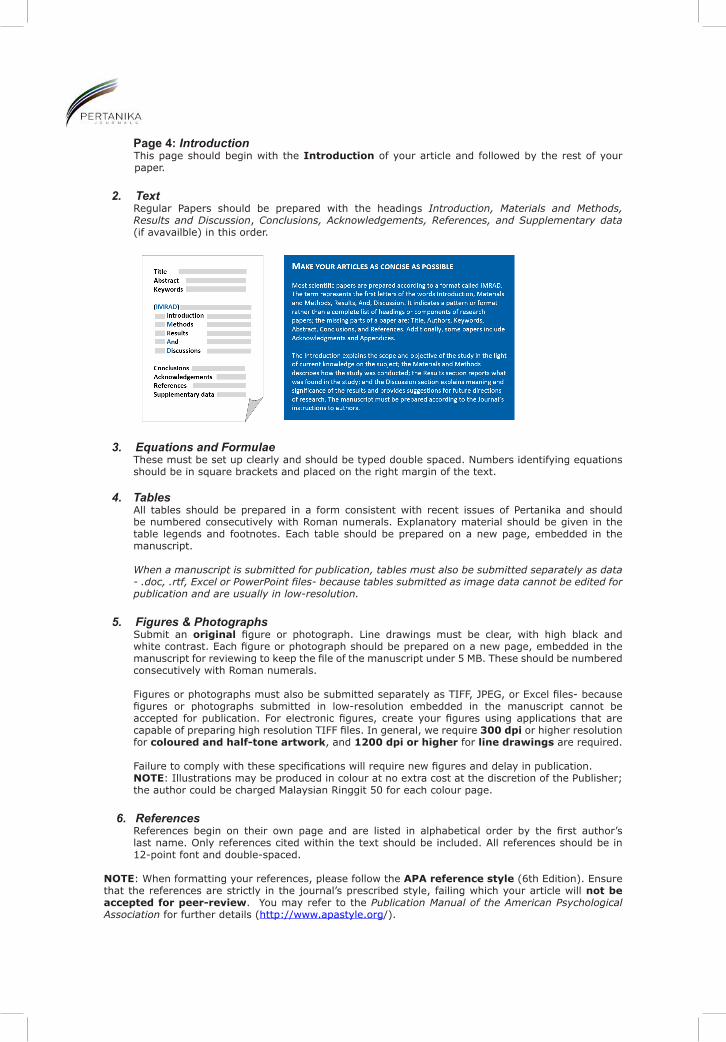
Page 4: IntroductionThis page should begin with the Introduction of your article and followed by the rest of your paper.
2. TextRegular Papers should be prepared with the headings Introduction, Materials and Methods, Results and Discussion, Conclusions, Acknowledgements, References, and Supplementary data (if avavailble) in this order.
3. Equations and Formulae These must be set up clearly and should be typed double spaced. Numbers identifying equations should be in square brackets and placed on the right margin of the text.
4. Tables All tables should be prepared in a form consistent with recent issues of Pertanika and should be numbered consecutively with Roman numerals. Explanatory material should be given in the table legends and footnotes. Each table should be prepared on a new page, embedded in the manuscript. When a manuscript is submitted for publication, tables must also be submitted separately as data - .doc, .rtf, Excel or PowerPoint files- because tables submitted as image data cannot be edited for publication and are usually in low-resolution.
5. Figures & PhotographsSubmit an original figure or photograph. Line drawings must be clear, with high black and white contrast. Each figure or photograph should be prepared on a new page, embedded in the manuscript for reviewing to keep the file of the manuscript under 5 MB. These should be numbered consecutively with Roman numerals.
Figures or photographs must also be submitted separately as TIFF, JPEG, or Excel files- because figures or photographs submitted in low-resolution embedded in the manuscript cannot be accepted for publication. For electronic figures, create your figures using applications that are capable of preparing high resolution TIFF files. In general, we require 300 dpi or higher resolution for coloured and half-tone artwork, and 1200 dpi or higher for line drawings are required.
Failure to comply with these specifications will require new figures and delay in publication. NOTE: Illustrations may be produced in colour at no extra cost at the discretion of the Publisher; the author could be charged Malaysian Ringgit 50 for each colour page.
6. References References begin on their own page and are listed in alphabetical order by the first author’s last name. Only references cited within the text should be included. All references should be in 12-point font and double-spaced.
NOTE: When formatting your references, please follow the APA reference style (6th Edition). Ensure that the references are strictly in the journal’s prescribed style, failing which your article will not be accepted for peer-review. You may refer to the Publication Manual of the American Psychological Association for further details (http://www.apastyle.org/).

7. General GuidelinesAbbreviations: Define alphabetically, other than abbreviations that can be used without definition. Words or phrases that are abbreviated in the introduction and following text should be written out in full the first time that they appear in the text, with each abbreviated form in parenthesis. Include the common name or scientific name, or both, of animal and plant materials.
Acknowledgements: Individuals and entities that have provided essential support such as research grants and fellowships and other sources of funding should be acknowledged. Contributions that do not involve researching (clerical assistance or personal acknowledgements) should not appear in acknowledgements.
Authors’ Affiliation: The primary affiliation for each author should be the institution where the majority of their work was done. If an author has subsequently moved to another institution, the current address may also be stated in the footer.
Co-Authors: The commonly accepted guideline for authorship is that one must have substantially contributed to the development of the paper and share accountability for the results. Researchers should decide who will be an author and what order they will be listed depending upon their order of importance to the study. Other contributions should be cited in the manuscript’s Acknowledgements.
Copyright Permissions: Authors should seek necessary permissions for quotations, artwork, boxes or tables taken from other publications or from other freely available sources on the Internet before submission to Pertanika. Acknowledgement must be given to the original source in the illustration legend, in a table footnote, or at the end of the quotation.
Footnotes: Current addresses of authors if different from heading may be inserted here.
Page Numbering: Every page of the manuscript, including the title page, references, tables, etc. should be numbered.
Spelling: The journal uses American or British spelling and authors may follow the latest edition of the Oxford Advanced Learner’s Dictionary for British spellings.
SUBMISSION OF MANUSCRIPTSOwing to the volume of manuscripts we receive, we must insist that all submissions be made electronically using the online submission system ScholarOne™, a web-based portal by Thomson Reuters. For more information, go to our web page and click “Online Submission”.
Submission Checklist
1. MANUSCRIPT: Ensure your MS has followed the Pertanika style particularly the first four pages as explained earlier. The article should be written in a good academic style and provide an accurate and succinct description of the contents ensuring that grammar and spelling errors have been corrected before submission. It should also not exceed the suggested length. COVER LETTER: All submissions must be accompanied by a cover letter detailing what you are submitting. Papers are accepted for publication in the journal on the understanding that the article is original and the content has not been published either in English or any other language(s) or submitted for publication elsewhere. The letter should also briefly describe the research you are reporting, why it is important, and why you think the readers of the journal would be interested in it. The cover letter must also contain an acknowledgement that all authors have contributed significantly, and that all authors have approved the paper for release and are in agreement with its content.
The cover letter of the paper should contain (i) the title; (ii) the full names of the authors; (iii) the addresses of the institutions at which the work was carried out together with (iv) the full postal and email address, plus telephone numbers and emails of all the authors. The current address of any author, if different from that where the work was carried out, should be supplied in a footnote.
The above must be stated in the cover letter. Submission of your manuscript will not be accepted until a cover letter has been received

2. COPYRIGHT: Authors publishing the Journal will be asked to sign a copyright form. In signing the form, it is assumed that authors have obtained permission to use any copyrighted or previously published material. All authors must read and agree to the conditions outlined in the form, and must sign the form or agree that the corresponding author can sign on their behalf. Articles cannot be published until a signed form (original pen-to-paper signature) has been received.
Please do not submit manuscripts to the editor-in-chief or to any other office directly. Any queries must be directed to the Chief Executive Editor’s office via email to [email protected].
Visit our Journal’s website for more details at http://www.pertanika.upm.edu.my/home.php.
HARDCOPIES OF THE JOURNALS AND OFF PRINTSUnder the Journal’s open access initiative, authors can choose to download free material (via PDF link) from any of the journal issues from Pertanika’s website. Under “Browse Journals” you will see a link, “Current Issues” or “Archives”. Here you will get access to all current and back-issues from 1978 onwards.
The corresponding author for all articles will receive one complimentary hardcopy of the journal in which his/her articles is published. In addition, 20 off prints of the full text of their article will also be provided. Additional copies of the journals may be purchased by writing to the Chief Executive Editor.


Bioinsecticide Entomopathogenic Nematodes as Biological Control Agent for Sustainable Agriculture
907
Didik Sulistyanto, Ralf-Udo Ehlers and Bachtiar H.Simamora
Short CommunicationPrevalence of Avian Polyomavirus in Psittacine Birds in the Klang Valley 917
Z. Zanon, N. Najihah, J. Abu and A. R. Mariatulqabtiah
Development and Validation of an Unsaturated Soil Water Flow Model for Oil Palm
787
Teh, C. B. S.
Anther Dehiscence, Pollen Viability and Stigma Receptivity Study on Cultivars of Black Pepper (Piper nigrum L.)
801
Chen, Y. S., Dayod, M. and Tawan, C. S.
Gene Action Mechanism for Drought Tolerance in Extra-Early Yellow Maize Inbreds
815
Shaibu, A. S.
Assessment of Soybean Resistance to Whitefly (Bemisia tabaci Genn.) Infestations
825
Kurnia Paramita Sari and Apri Sulistyo
Balance of Nitrogen in Plant-Soil System with the Presence of Compost+Charcoal
833
Erry Purnomo, Franky Sinaga, Indri P Amanda and Riverina DP Putra
Technology Assessment of Growing Superior Mungbean (Vigna radiata L.) Varieties on a Dryland in North Lombok
845
I Komang Damar Jaya, Sudirman, Aris Budianto, Abdurachman Hanafi and I Nyoman Soemeinaboedhy
Effect of Cytokinins on In Vitro Growth of Hypocotyl and Cotyledon of Tomato (Lycopersicon esculentum)
855
Wina Dian Savitri, Popy Hartatie Hardjo, Leonardo Tejo Gunawan Putra Hardianto and Steven Sutanto
Effect of Phytase Enzyme on Growth, Nutrient Digestibility and Survival Rate of Catfish (Pangasius hypothalamus) Fingerlings
865
Diana Rachmawati and Istiyanto Samidjan
Preserving Blue Swimming Crab (Portunus pelagicus): Its Conservation using Trap Modifications in Betahwalang, Demak
879
Herry Boesono, Dhian Meita Hapsari, Aristi Dian Purnama Fitri and Kukuh Eko Prihantoko
Growth Pattern of Barb (Barbodes balleroides) at the Period of Inundation in Jatigede Reservoir, Sumedang Regency, West Java
889
Titin Herawati, Atikah Nurhayati and Sona Yudha Diliana
Effect of Proteolytic Plant-Derived Enzyme on Gourami (Osphronemus goramy Lac.) Growth Rate
897
Yuli Andriani, Yeni Mulyani, Irfan Zidni, Muhammad Yusra Sadri and Putra Nur Wicaksono
Effect of Foliar Fertiliser on Banana 655Noor Asma’ Mohd Anuar Mushoddad, Nurul Syaza Abdul Latif and Suhaimi Othman@Osman
Effect of Conventional and Superheated Steam Roasting on the Total Phenolic Content, Total Flavonoid Content and DPPH Radical Scavenging Activities of Black Cumin Seeds
663
Liang, L. C., Zzaman, W., Yang, T. A. and Easa, A. M.
Effect of Antimicrobial Activities on the Various Solvents Extracts of Leaves of Scurrula Ferruginea (Jack) Danser (Loranthaceae)
677
Vanielie Terrence Justine, Muskhazli Mustafa and Rusea Go
Effect of Various Composting Methods on the Concentration and Viability of Ascaris suum Eggs in Organic Fertilisers
687
Arianne L. Andes and Vachel Gay V. Paller
Use of Bio-Chemical Surfactant Producing Endophytic Bacteria Isolated from Rice Root for Heavy Metal Bioremediation
699
Arun Karnwal
Plant Growth Promoting Rhizobacteria (PGPR) Application with Different Nitrogen Fertilizer Levels in Rice (Oryza sativa L.)
715
Hamid Ghaffari, Abdollatif Gholizadeh, Abbas Biabani, Alireza Fallah and Mohammad Mohammadian
Effects of Non-Medicated and Medicated Urea Molasses Multinutrient Blocks on Dry Matter Intake, Growth Performance, Body Condition Score and Feed Conversion Ratio of Saanen Lactating Does Fed Conventional Diets
729
Mira, P., Wan Zahari, M., Rusli, N. D. and Mat, K. 741
Deficit Irrigation for Improving the Postharvest Quality of Lowland Tomato Fruits
Mohammed, H. N., Mahmud, T. M. M. and Puteri Edaroyati, M. W. 759
Natural Products from Stem Bark of Calophyllum andersoniiKeng Hong Tee, Gwendoline Cheng Lian Ee, Ka Woong Wong, Thiruventhan Karunakaran, Vivien Yi Mian Jong and Soek Sin Teh
Influence of Maternal Dietary Energy and Protein on the Embryonic Development of FUNAAB – Alpha Chickens
769
B. Saleh, S. T. Mbap, D. J. U. Kalla and U. D. Doma
Investigative Baseline Reference on the Status of Pork pH, Shear Force, Colour, Drip and Cooking Loss in RYR1 Mutation Free, Commercial 3-way Crosses in Malaysia
777
Michelle-Fong, W. C., Ooi, P. T., Awis, Q. S. and Goh, Y. M.

Vol. 41 (2) May 2018
VOL. 41 (2) MAY 2018
Pertanika JTAS
Pertanika Editorial O�ce, Journal DivisionO�ce of the Deputy Vice Chancellor (R&I) 1st Floor, IDEA Tower II UPM-MTDC Technology CentreUniversiti Putra Malaysia43400 UPM SerdangSelangor Darul EhsanMalaysia
http://www.pertanika.upm.edu.my/E-mail: [email protected]: +603 8947 1622 / 1619
Pertanika Journal of Tropical Agricultural Science Vol. 41 (2) May 2018
Contents
ForewordNayan Deep S. Kanwal i
TributeTributes In Memory of the Life of Professor EmeritusDr. CHIN Hoong-Fong
505
Chief Executive Editor, Pertanika Journals
Review ArticlesToxicity Effects of Fish Histopathology on Copper Accumulation 519
Siti Nadzirah Padrilah, Mohd Khalizan Sabullah, Mohd Yunus Abd Shukor, Nur Adeela Yasid, Nor Aripin Shamaan and Siti Aqlima Ahmad
Mammary Gland Tumours in the Dog, a Spontaneous Tumour Model of Comparative Value to Human Breast Cancer
541
Kabiru Sahabi, Sujey Kumar Rajendren, Jia Ning Foong and Gayathri Thevi Selvarajah
Changes in Rice Physiology and Soil Conditions during Low-Water-Input Rice Production System - A Short Review
575
Jahan, M. S.
A Mini Review on Phytochemical Constituents and Pharmacological Activities of Adenium obesum
591
Koh, R. Y.
Regular ArticlesGram-positive Bacteria with Commercial Potential from the Gastrointestines of Holothuria (Mertensiothuria) Leucospilota (Timun Laut) and Stichopus Horrens (Gamat) from Malaysian Waters
605
Kamarul Rahim Kamarudin and Maryam Mohamed Rehan
The Analysis of Arbutin in Mao (Antidesma thwaitesianum Muell. Arg.) Extracts
621
Thongjuta Suwanprasert
Rice Ratooning Using the Salibu System and the System of Rice 637
Pinta Omas Pasaribu, Triadiati and Iswandi Anas