vol 4 no 2 january june 2016.pdf - sb patil institute of
TRANSCRIPT
SBPIM
Journal of Management And Administration Tomorrow
Vol. 4 No.2 January–June 2016 ISSN No. 2278-9316
CONTENTS
1. A STUDY OF COMPETENCY MAPPING AND ORGANIZATIONAL DEVELOPMENT IN INDUSTRIES 1 - 8
Ankush Joginderpal, Asha Pachpande, Manimala Puri
2. AN ANALYTICAL STUDY OF THE QUALITY OF BANKING SERVICES AND THE SATISFACTION LEVELS OF
CUSTOMERS OF THE ICICI BANK (KONDAWA BR., PUNE) USING SERQUAL MODEL 9 - 14
Daniel Penkar, Sukhdeo B. Nimangare
3. EUROPEAN SLOWDOWN AN INDIAN PERSPECTIVE 15 - 16
Narendra Patil
4. MAKE IN INDIA 17 - 18
Abhijeet B. Shah
5. MAKE IN INDIA-AN INITIATIVE FOR SUSTANABLE DEVELOPMENT 19 - 28
Harshada Thorat, Daniel Penkar
6. ORIGIN AND DEVELOPMENT OF THE INDIAN AUTOMOBILE INDUSTRY 29 - 36
Rupali Tapan Pandya
7. ORGANIZATIONAL LEARNING: CREATING, RETAINING AND TRANSFORMING LEARNING 37 - 44
Ajit Kumar Kar
8. ROLE OF FDI IN TODAY’S INDIAN FINANCIAL STRUCTURE 45 - 68
Bharti Bagul
9. THE ROLE OF M-COMMERCE IN TOURISM INDUSTRY 69 - 76
Vidula Jadhav, Rashmi Hasumnis
10. URBAN POVERTY: FACTS, FIGURES AND INDIA 77 - 80
Mukund Dongare
Abstract of Ph.D. Thesis
11. AN ANALYTICAL STUDY OF SOCIAL RESPONSIBILITY OF LIFE INSURANCE CORPORATION OF INDIA WITH SPECIAL
REFERENCE TO RAIGAD DISTRICT 81 - 90
Kamlakar E. Kamble, Janardhan P. Bhosale
���

JOMAT Vol. 4 No.2 January – June 2016 ISSN No. 2278-9316
(1)
A STUDY OF COMPETENCY MAPPING AND
ORGANIZATIONAL DEVELOPMENT IN INDUSTRIES
Puri Ankush Joginderpal
Asha Pachpande
Manimala Puri
ABSTRACT
In the phase of globalization it becomes necessary to monitor all the processes in manufacturing and service organization.
Optimization of the production and the increase in the profitability are of vital importance. This can be achieved either by cutting
the cost or boosting the efficiency of the system. The kin objective of Human Resource Management (HRM) is to develop and
monitor the Human Resource (HR) to achieve common organizational goals. In modern era the non-skilled and semi-skilled jobs
are getting replaced with high-skilled specific jobs worldwide. There is good amount of the change in the HR functions,
organizational culture and overall management attitude. Industry started preferring versatile multi-skilled persons for their
functioning. One should know the core competencies of every strategic business units (SBU) for flawless day to day monitoring
and also for planning. Competency mapping is the precise method of understanding the key competencies of every SBUs and
effectively implementing the same in various operations. This can be achieved through implementation in work assessment,
training and development and recruitment. Competencies are the expertise developed in the work and strengths of the SBUs. An
extrovert organization shall have well defined roles of their employees and competency areas of every employee with concerned
departments. Process of competency mapping identifies strength and weaknesses of each employee, better realization of
strengths, and to give acceleration to their career development in future for overall development of organization and apparently
the employees. Competency mapping test can be done for all existing employees, new identified employees, job seekers and
students. Competency mapping is a precision tool in the area of behavior and performance of any individual. Requirements for
‘center of excellence,’ amongst all employees like, knowledge, experience, expertise skills and positive attitude can be mapped
and developed through the process of competency mapping. Core competency development is the key area for six sigma
implementation in quality and efficiency management.
KEYWORDS: Globalization, Efficiency, Human Resource Management, Versatile Multi-Skilled, Core Competencies,
Monitoring, Planning, Strategic Business Units, Competency Mapping, Center of Excellence, Six Sigma.
INTRODUCTION:
Global competition has highlighted the importance of
efficiency and affectivity of every organization in meeting
global challenges like scarcity of key resources, increasing
cost of operations and excellence demanded by global
consumers. Challenge is to manage the equilibrium for better
profits [1]. Human Resource Management (HRM) is most
important area responsible for efficiency and affectivity of an
organization. The organizational goals are to be achieved with
due consideration of individual goals of employees. The
conflict is to be resolved, in-time, between two for
development of both counterparts [2]. It is difficult to record
excellent financial and operational progress without having
healthy personal relations. Globalization is replacing un-skill
job requirements with semi-skill and semi-skill with high-skill
jobs. Industries are preferring candidates with high-skills and
versatile personalities for their recruitments. This process has
increased the need of competency mapping process for
existing and future employees. There is good amount of the
change in Indian industries in HR functions, organizational
culture and overall management attitude. Now a days, the
scope of HRM is enhanced in India [3-4].
Competencies are the expertise developed in the work
and strengths of the SBUs. An extrovert organization shall
have well defined roles of their employees and competency
areas of every employee with concerned departments.
Process of competency mapping identifies strength and
weaknesses of each employee, better realization of strengths,
and to give acceleration to their career development in future
for overall development of organization and apparently the
employees [5]. The developed organizations have extensive
competency mapping system implemented for the
monitoring and decision making. It is equally important to
have well identified list of competencies and developed key
competencies as expertise area of each SBU[6]. The process
of competency mapping starts with analysis of each
employee including strength, weaknesses, opportunities and
threats analysis (as a tool), developing the core strength of
employee, providing boost for improving weaknesses,
knowledge gaining and sharing for overall development[7].
© SBPIM 1Research Scholar, IBMR, Chinchwad, Pune 411033.
Contact no.: Email Id: [email protected] 2Director, IBMR, Chinchwad, Pune
Contact no.: Email Id: [email protected] 3Director, JSPM Group of Institutes, Pune, Maharashtra, India
Contact no.: Email Id: [email protected]
JOMAT Vol. 4 No.2 January – June 2016 ISSN No. 2278-9316
2
Globalization has inculcated the phase of competitions in
India. Organizations with high efficiency and effectively will
only be serving in global market [8]. Organizations include
manufacturing and service providing agencies. Their
challenges defer as per the nature of job they perform. Key
factors and area if competencies differ and their measures to
improve the efficiency and effectiveness differs. It has
become to enhance the skill sets of all employees. The detail
study of skill sets possessed by employee will help to
understand the level of preparation and to upgrade the skill
set they have [9]. The weakness of an employee can be
indentified for father improvement by providing trainings.
Organizations are more concerned in adopting new ways in
improving efficiency [10].
In the next step of development the organizations have
preferring an employee having core skills instead of multi
skilled employee. Organizations want to know the present
level of skills of their employees so that they can improve
[11]. Competency approach includes formulation of the
policy, linking the policies with concern departments,
implementation. Competency mapping is the part of good HR
policies to be implemented, by putting together the
organization and the individual employee’s goals. The conflict
is to be avoided to provide hassle free environment [12].
Competency mapping process includes mapping the key
areas of work and the core skills developed by the employees
as per requirement. The gap between the required skills can
be identified by mapping the available skills with required
skills. Role of each employee should be well defined and
listed with areas of core competencies, so that; the tasks can
be allotted suitably. Not only existing employee is but also
forthcoming employees and students before their joining can
face the competency mapping process. Positively the
students and forthcoming employees can improve their skills
by joining specific training program. The broad view
companies do the due exercise while selecting students
during their campus placement drive. Type of skills required
changes as per the nature of the job. Competency mapping is
the most effective technique in identifying the skills and
behavior of an individual employee [13].
RELATED WORK
AryaChanakky[14] in his 3000 years old world famous
book “Arthashastra”, mentioned the terminology of
competency mapping in social and economic problem solving.
He has elaborated competency mapping models, different
human aptitude theories, human behavior theories,
importance of skills, knowledge, logics and implementation of
the same.
Woodruff[15] in his paper on “competency mapping –
different phases” explained three tiers of concept
competency. One is the competency often refer to an
employee having various behavioral perspectives and skill
sets having behind his successful image in an organization.
Two is the competence referred to the work, which mean the
exact area of work where the employee has achieved
competence. Third is competencies referred to combination
of above.
Albanese[16] in his book defined the concept of
competencies as individual characteristic contributing
towards effective managerial performance.
Haye[17] in his comprehensive research elaborated
competency in simple form. Competencies are the blend of
known skills of employees, their massive knowledge in the
area of work, characteristics, social values linked for better
performance.
Dr. Srinivasa A. Rao[18], training, research head, BITS-
Pilani, Dubai explained the term competency. According to
him it includes talent management process; conducting
awareness workshops; talent segmentation process;
competency mapping and developmental training exercise;
preparation for its implementation.
Competency: An employee with proper dimensions of
behavior supporting his competent performance.
Competency is process of underlying characteristic of each
employee which is collateral to effective performance
expected by organization in given situation.
PROBLEM STATEMENT:
It is necessary to study the difference between job
competency expectations possessed by the manufacturing
organizations for existing employees and the competency
levels required for existing form of working. Precise work
competencies required to be identified and communicated to
every decision maker in the manufacturing organization.
Present research includes the correlation of the employer
work competency expectations with the existing work
competency level of the employees. This will give improved
chance for efficiency enhancement, minimization of
wastages, development of multiple skill sets through which
employer and employees will get satisfaction of excellence.
In order to ascertain competency expectations, due
competency in work for a manufacturing organization,
supervisors and operations managers were asked to rate the
significance of particular work competencies for their
employees. The competencies include generic knowledge,
employs’ abilities (skills) and attitude towards work. The
operation managers were asked to list the necessary
competency to employees work and they were also asked to
decide the necessary levels of competencies in the particular
area.
Present study includes the study of the skill levels of the
employees, so that required training can be given.
This is attempting to identify the multi skilled employees.
A replicated model can be adopted for solving problems
of other departments also.
JOMAT Vol. 4 No.2 January – June 2016 ISSN No. 2278-9316
3
SIGNIFICANCE OF THE RESEARCH:
Competency Mapping is most demanded instrument in
growing industries taking global challenges and equally
proved important. The perspectives, where techniques of
Competency Mapping can be adopted are as follows:
• Correct identification of training needs will boost the
efficiency of the employees.
• The gaps can be bridged between actual yield and the
desired yield.
• Developed competencies are also useful for individual
career development of employees.
• Adoption of Competency Mapping process keeps
prepared employees for future challenges.
• Enable employees to change the approach of work.
• Work assignment in accordance with core competencies
can be adopted for better results and SBU can stand tall
based on their competencies.
Task of the competency mapping will help individual
employees to identify the areas of work where competencies
required and accordingly they can develop their skills which
are useful in their career planning.
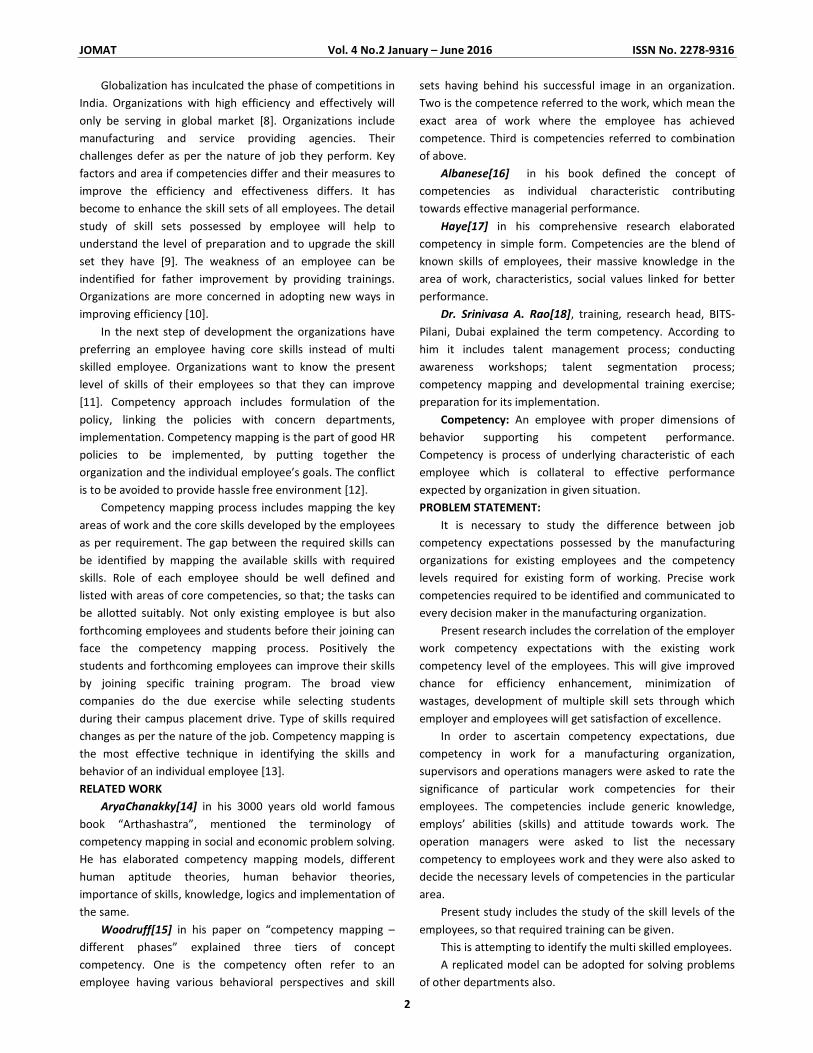
ATTRIBUTES OF THE TERM CHARACTER:
Knowledge and skills are the initial factors which can be
developed over the time. Attitude, motive and behavior are
at second level and comparatively challenging to develop.
Figure: 1. Attributes of the term character
Process
• Professional organization gives emphasis on the
individual career development through which
organizational growth can be achieved.
• Training, Learning and development are the core
areas for development.
Table 1: Table showing viewpoints of Competence and Competency
Competence Competency
Based on the results Based on employees’ behaviour
Elaborates the future of the job Elaborates future of the person
Includes skills and knowledge require to perform Includes basic character of employee, helpful for better
performance
Not transferable, since it includes individual skills Transferable by association
Measured in individual performance Measured in team/group performance
Process oriented Result oriented
OBJECTIVES OF THE STUDY:
1. To measure the technical competency of the present
employees in selected industries of Pune.
2. To provide a model for general competency estimation
model for any industry.
3. To find out requirement of training in selected industries.
4. To recommend based on the learning and observations
of present research.
JOMAT Vol. 4 No.2 January – June 2016 ISSN No. 2278-9316
4
HYPOTHESIS OF THE STUDY:
H(a)-Industry environment has significant effect on
individual employee’s competency.
H(b)-Technical competency has significant effect on individual
employee’s competency.
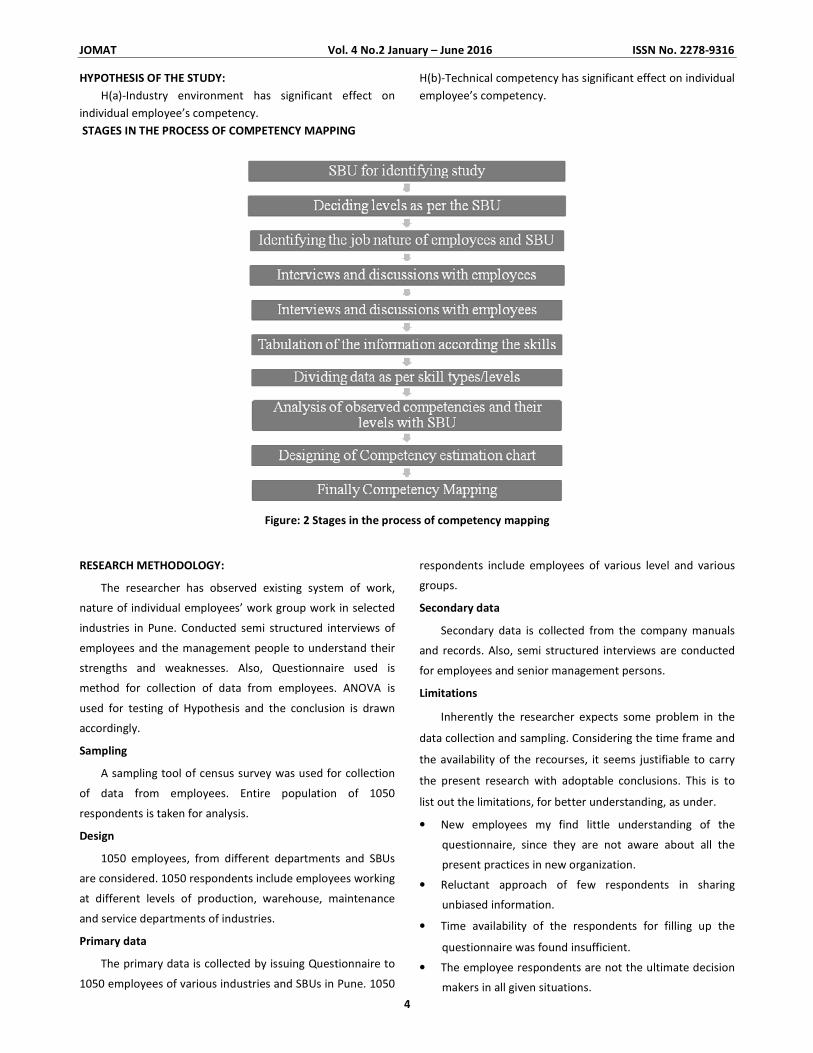
STAGES IN THE PROCESS OF COMPETENCY MAPPING
Figure: 2 Stages in the process of competency mapping
RESEARCH METHODOLOGY:
The researcher has observed existing system of work,
nature of individual employees’ work group work in selected
industries in Pune. Conducted semi structured interviews of
employees and the management people to understand their
strengths and weaknesses. Also, Questionnaire used is
method for collection of data from employees. ANOVA is
used for testing of Hypothesis and the conclusion is drawn
accordingly.
Sampling
A sampling tool of census survey was used for collection
of data from employees. Entire population of 1050
respondents is taken for analysis.
Design
1050 employees, from different departments and SBUs
are considered. 1050 respondents include employees working
at different levels of production, warehouse, maintenance
and service departments of industries.
Primary data
The primary data is collected by issuing Questionnaire to
1050 employees of various industries and SBUs in Pune. 1050
respondents include employees of various level and various
groups.
Secondary data
Secondary data is collected from the company manuals
and records. Also, semi structured interviews are conducted
for employees and senior management persons.
Limitations
Inherently the researcher expects some problem in the
data collection and sampling. Considering the time frame and
the availability of the recourses, it seems justifiable to carry
the present research with adoptable conclusions. This is to
list out the limitations, for better understanding, as under.
• New employees my find little understanding of the
questionnaire, since they are not aware about all the
present practices in new organization.
• Reluctant approach of few respondents in sharing
unbiased information.
• Time availability of the respondents for filling up the
questionnaire was found insufficient.
• The employee respondents are not the ultimate decision
makers in all given situations.
JOMAT Vol. 4 No.2 January – June 2016 ISSN No. 2278-9316
5
DATA ANALYSIS:
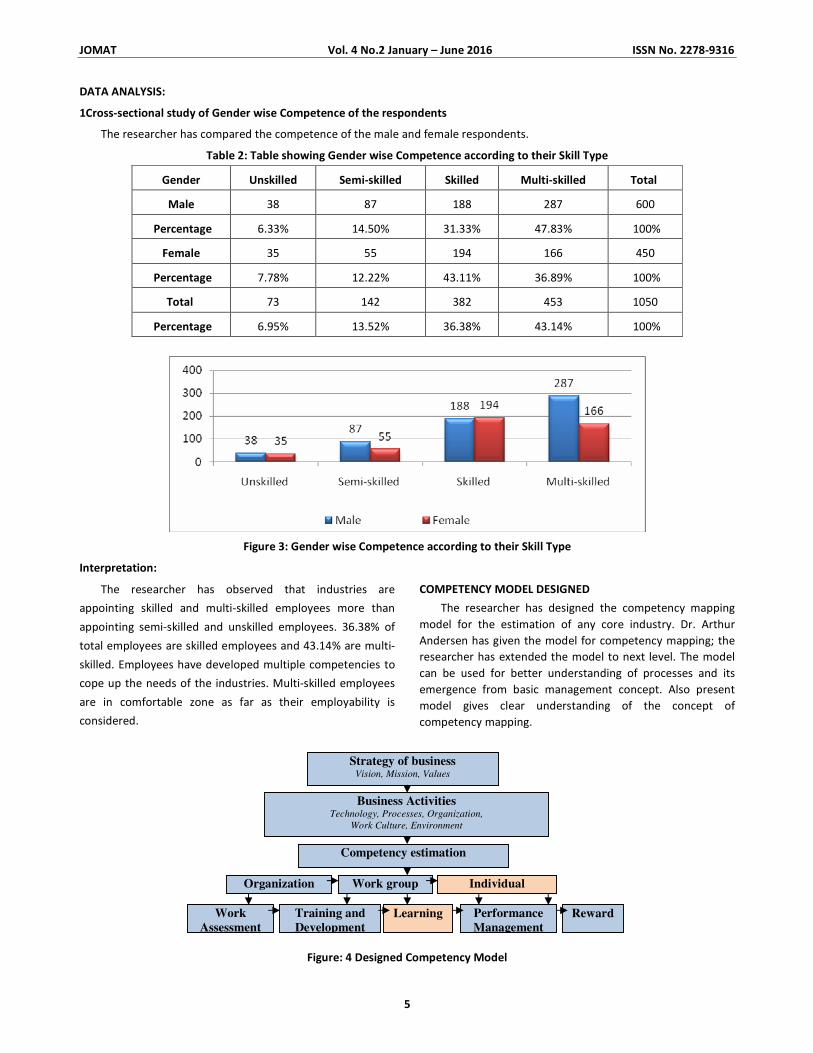
1Cross-sectional study of Gender wise Competence of the respondents
The researcher has compared the competence of the male and female respondents.
Table 2: Table showing Gender wise Competence according to their Skill Type
Gender Unskilled Semi-skilled Skilled Multi-skilled Total
Male 38 87 188 287 600
Percentage 6.33% 14.50% 31.33% 47.83% 100%
Female 35 55 194 166 450
Percentage 7.78% 12.22% 43.11% 36.89% 100%
Total 73 142 382 453 1050
Percentage 6.95% 13.52% 36.38% 43.14% 100%
Figure 3: Gender wise Competence according to their Skill Type
Interpretation:
The researcher has observed that industries are
appointing skilled and multi-skilled employees more than
appointing semi-skilled and unskilled employees. 36.38% of
total employees are skilled employees and 43.14% are multi-
skilled. Employees have developed multiple competencies to
cope up the needs of the industries. Multi-skilled employees
are in comfortable zone as far as their employability is
considered.
COMPETENCY MODEL DESIGNED
The researcher has designed the competency mapping
model for the estimation of any core industry. Dr. Arthur
Andersen has given the model for competency mapping; the
researcher has extended the model to next level. The model
can be used for better understanding of processes and its
emergence from basic management concept. Also present
model gives clear understanding of the concept of
competency mapping.
Figure: 4 Designed Competency Model
Organization Work group Individual
Work
Assessment
Training and
Development
Performance
Management
Reward
Strategy of business Vision, Mission, Values
Business Activities Technology, Processes, Organization,
Work Culture, Environment
Competency estimation
Learning
JOMAT Vol. 4 No.2 January – June 2016 ISSN No. 2278-9316
6
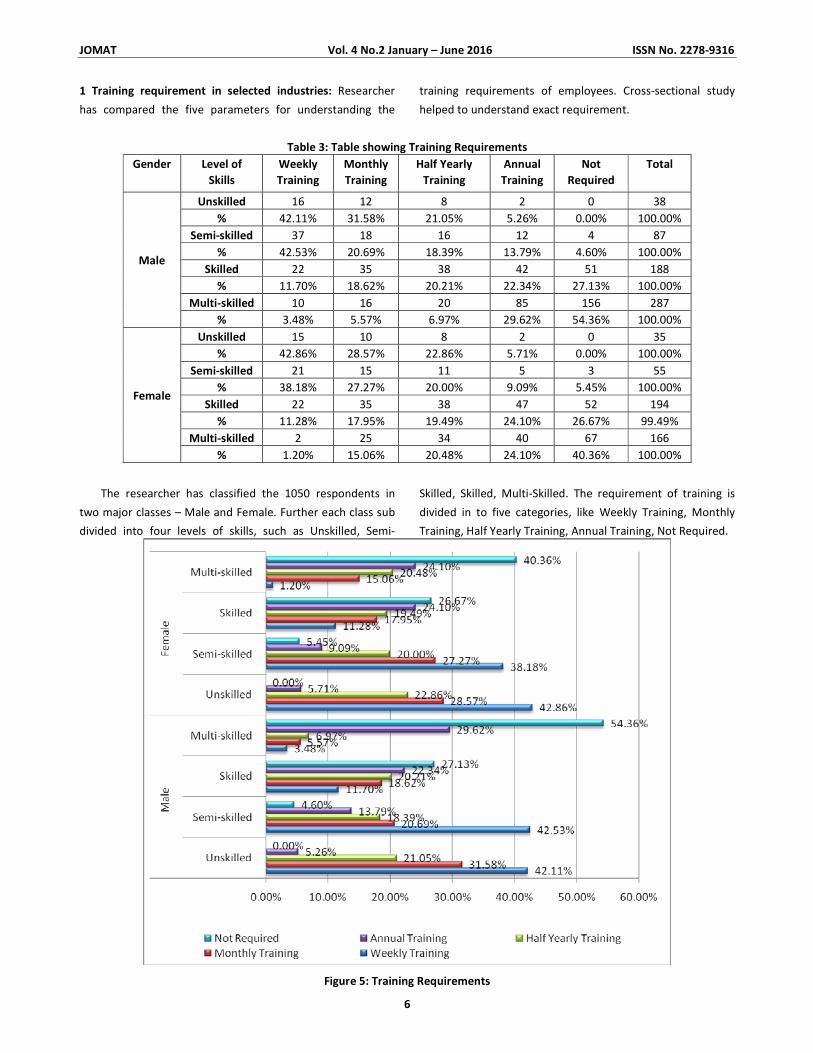
1 Training requirement in selected industries: Researcher
has compared the five parameters for understanding the
training requirements of employees. Cross-sectional study
helped to understand exact requirement.
Table 3: Table showing Training Requirements
Gender Level of
Skills
Weekly
Training
Monthly
Training
Half Yearly
Training
Annual
Training
Not
Required
Total
Unskilled 16 12 8 2 0 38
% 42.11% 31.58% 21.05% 5.26% 0.00% 100.00%
Semi-skilled 37 18 16 12 4 87
% 42.53% 20.69% 18.39% 13.79% 4.60% 100.00%
Skilled 22 35 38 42 51 188
% 11.70% 18.62% 20.21% 22.34% 27.13% 100.00%
Multi-skilled 10 16 20 85 156 287
Male
% 3.48% 5.57% 6.97% 29.62% 54.36% 100.00%
Unskilled 15 10 8 2 0 35
% 42.86% 28.57% 22.86% 5.71% 0.00% 100.00%
Semi-skilled 21 15 11 5 3 55
% 38.18% 27.27% 20.00% 9.09% 5.45% 100.00%
Skilled 22 35 38 47 52 194
% 11.28% 17.95% 19.49% 24.10% 26.67% 99.49%
Multi-skilled 2 25 34 40 67 166
Female
% 1.20% 15.06% 20.48% 24.10% 40.36% 100.00%
The researcher has classified the 1050 respondents in
two major classes – Male and Female. Further each class sub
divided into four levels of skills, such as Unskilled, Semi-
Skilled, Skilled, Multi-Skilled. The requirement of training is
divided in to five categories, like Weekly Training, Monthly
Training, Half Yearly Training, Annual Training, Not Required.
Figure 5: Training Requirements
JOMAT Vol. 4 No.2 January – June 2016 ISSN No. 2278-9316
7
Interpretation :
The cross-tabulation reveals clearly that the multi-skilled
employees have very less requirement of training. They have
already developed set of skills and competencies. Whereas
the unskilled employees required more trainings than skilled
and multi-skilled workers.
2Hypothesis testing
Ha- Industry environment has significant effect on
individual employee’s competency.
H0- Industry environment has no significant effect on
individual employee’s’ competency.
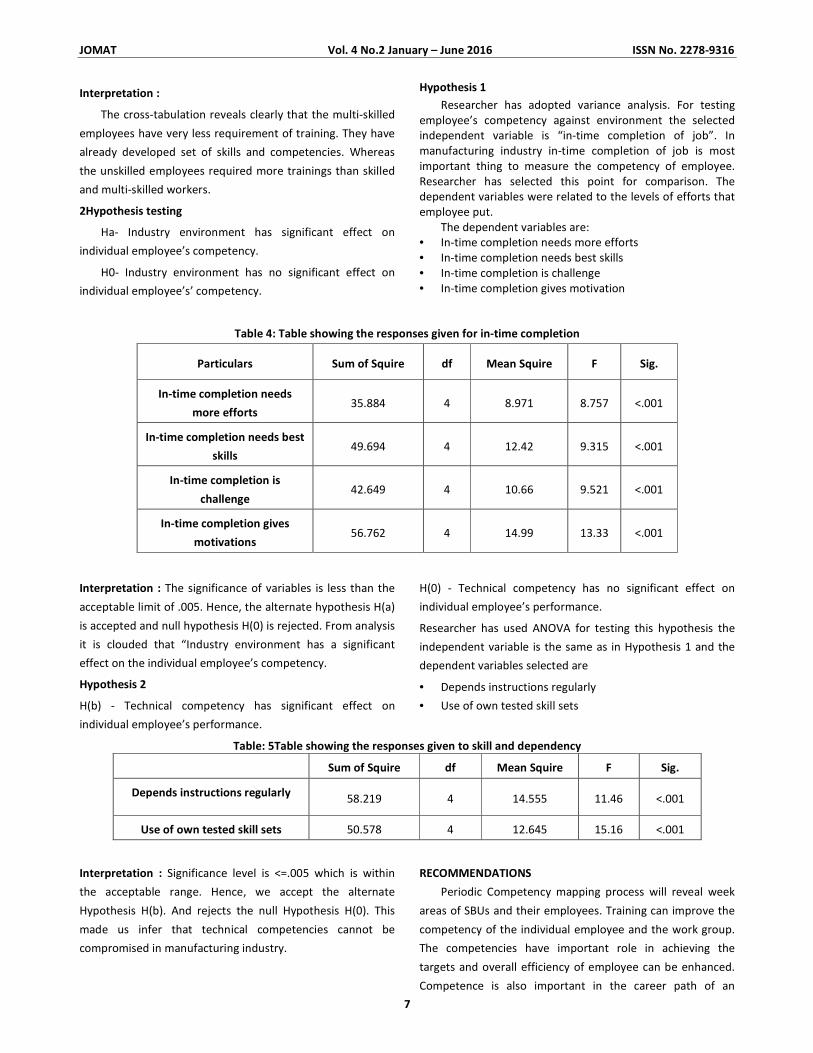
Hypothesis 1
Researcher has adopted variance analysis. For testing
employee’s competency against environment the selected
independent variable is “in-time completion of job”. In
manufacturing industry in-time completion of job is most
important thing to measure the competency of employee.
Researcher has selected this point for comparison. The
dependent variables were related to the levels of efforts that
employee put.
The dependent variables are:
• In-time completion needs more efforts
• In-time completion needs best skills
• In-time completion is challenge
• In-time completion gives motivation
Table 4: Table showing the responses given for in-time completion
Particulars Sum of Squire df Mean Squire F Sig.
In-time completion needs
more efforts 35.884 4 8.971 8.757 <.001
In-time completion needs best
skills 49.694 4 12.42 9.315 <.001
In-time completion is
challenge 42.649 4 10.66 9.521 <.001
In-time completion gives
motivations 56.762 4 14.99 13.33 <.001
Interpretation : The significance of variables is less than the
acceptable limit of .005. Hence, the alternate hypothesis H(a)
is accepted and null hypothesis H(0) is rejected. From analysis
it is clouded that “Industry environment has a significant
effect on the individual employee’s competency.
Hypothesis 2
H(b) - Technical competency has significant effect on
individual employee’s performance.
H(0) - Technical competency has no significant effect on
individual employee’s performance.
Researcher has used ANOVA for testing this hypothesis the
independent variable is the same as in Hypothesis 1 and the
dependent variables selected are
• Depends instructions regularly
• Use of own tested skill sets
Table: 5Table showing the responses given to skill and dependency
Sum of Squire df Mean Squire F Sig.
Depends instructions regularly 58.219 4 14.555 11.46 <.001
Use of own tested skill sets 50.578 4 12.645 15.16 <.001
Interpretation : Significance level is <=.005 which is within
the acceptable range. Hence, we accept the alternate
Hypothesis H(b). And rejects the null Hypothesis H(0). This
made us infer that technical competencies cannot be
compromised in manufacturing industry.
RECOMMENDATIONS
Periodic Competency mapping process will reveal week
areas of SBUs and their employees. Training can improve the
competency of the individual employee and the work group.
The competencies have important role in achieving the
targets and overall efficiency of employee can be enhanced.
Competence is also important in the career path of an
JOMAT Vol. 4 No.2 January – June 2016 ISSN No. 2278-9316
8
individual. Researcher strongly recommends adoption of
periodic competency mapping process and training process.
CONCLUSION:
Competency of employee is the lifeline of the
manufacturing industry. Competency mapping model gives
the clear outline for better understanding. Skilled and Multi-
Skilled employees are more proffered by industries, because
of their versatility. Competence is equally important in
individual’s career development and to achieve required
employability. In this regard, industry environment is also one
of the important parameter and it has significant effect on
individual employee’ competency. Technical competencies
have significant effect on individual employee’s competency.
Competency mapping is ongoing process and continuous
monitoring, training and development is required.
REFERENCES
1. Seema Sanghi, The Handbook of Competency Mapping:
Understanding, Designing and Implementing
Competency Models in Organizations
2. C Ganesh Shermon.ompetency based HRM: A strategic
resource for competency mapping, assessment and
development centres
3. Dr. Arthur Andersen’s model of competency:
www.google.co.in/webhp?sourceid= chrome-
instantandion=1andespv=2andie=UTF-
8#q=Arthur+Andersen+model+of+competency
4. Vikram Singh Chouhan and Dr. Sandeep Srivastava,
Competency Mapping For HR Professionals In IT Industry,
The International Journal of Management, ISSN 2277-
5846, Vol 2 Issue 3 (July, 2013)
5. [5]Vikram Singh Chouhan and Sandeep Srivastava,
Competency Mapping Model for HR Professionals In
India, International Journal of Human Resource
Management and Research (IJHRMR), ISSN 2249-6874,
Vol. 3, Issue 1, Mar 2013, 113-118
6. Dr. Muna Kalyani, Competency Mapping Process in
Current Scenario: A Need for Sustainable Growth,
International Journal of Research in Humanities and
Social Studies, Volume 3, Issue 3, March 2016, PP 18-28,
ISSN 2394-6288
7. Prof. (Dr.) Ritu Gandhi Arora, Relationship between
Organization Strategies and Employee Competency
Mapping Practices, working paper, Institute of
Management. Faridabad
8. Prof. Lakshmi Narayana. K. and Dr. K. Gayathri Reddy, A
Study on Competency mapping of the employees in
Textile Manufacturing Companies with reference to
Bangalore city, Acme Intellects International Journal of
Research in Management, ISSN 2320 – 2939, Vol-6 No. 6
Apr 2014
9. Competency Based Training Needs Identification and its
Impact on Individual and Organizational Performance – A
Case Study, BVIMSR, Research Centre, C.M. Siddique,
International Journal of Human Resource Management,
15:1, 219-244, February 2004
10. Mrs. B. R. Celia and Mr. M. Karthick, Competency
Mapping Of Employees in the Power Sector with Special
Reference to Chennai, ZENITH, International Journal of
Multidisciplinary Research, Vol.2 Issue 1, January 2012,
ISSN 2231 5780
11. Dr. B. Sripirabaa, Y. Benazir and V. Devipriya,
Investigating the Competency Mapping Among the
Operators in an Auto Component Organisation,
International Journal of Informative and Futuristic
Research, IJIFR/ V2/ E2/ October 2014
12. Dr. Jamnean Joungtrakul, Competency Based Skills
Development: A Case Study of a Dock Station
Management Company in the Logistics Industry in
Thailand, Rattana Bundit University (RBAC), Thailand
13. Josh Bersin, The Role of Competencies in Driving Financial
Performance, Bersin and Associates, International
Journal Human Resource Management, ISSN: 1748-8583
June 2006
14. http://www.hinduwebsite.com/history/kautilya.asp
15. https://www.ncbi.nlm.nih.gov/pubmed/27145013
16. The Practice of Social Research by Earl R. Babbie,
Wadsworth, 13th
Edition
17. Business Research Methods by William G. Zikmund, Barry
J. Babin, Jon C. Carr, Mitch Griffin, Cengage Learning, 8th
Edition
18. https://www.practo.com › Chennai › Ophthalmologist/
Eye Surgeons › Anna Nagar
19. Allen, Earl R. Babbie, Cengage, Research Methods for
Social Work, Babbie, Cengage, 7th
Edition
20. C. R. Kothari Research Methodology New Age
International Publication, 2nd
Edition
21. www.anbhf.org/pdf/moore_crampton.pdf
���
(77)
URBAN POVERTY: FACTS, FIGURES AND INDIA
Mukund Dongare
ABSTRACT
Present paper is an attempt to review methodological aspects of poverty. This research paper is an outcome of a review of
selected apex level government reports. It also reviews the parameter of urban poverty such as, (a) Urban Growth, (b) urban
ward migration in India, (c) comparative aspect of urban and rural house hold income and (d) estimates of poverty in India. The
report primarily concludes on the policy suggestion of methodological aspects while computation of term poverty. The paper
further suggest to include futuristic expected expenses while arriving at the poverty measurement because based on these
poverty lines further policy decisions are implemented. Thus measurement and implementation has certain gap in terms of time
and to accommodate this fact futuristic computation is needed.
INTRODUCTION:
India is a progressive nation, expected to become a
global leader in the world in upcoming time. This process has
already taken place after globalization. In 1991, India has
adopted open economic policy which has been accelerated
rapid growth in industrialization. The impact and the effect of
both the globalization and industrialization have been
significantly noted after year 2000. An incentive for attracting
foreign direct investments has reflected in setting up of
various manufacturing facilities in India. This industrialization
witnessed rapid growth in generating employment
opportunities in various clusters. The migration of potential
workers to these industrially developed clusters has been
called as the silent process of urbanization.
Economic growth of the nation reflected in urbanization,
implies over burden of rural to urban migration stretching
government administration for provision of basic amenities to
the civilization. Availability of ample opportunities in urban
area in terms of employment and entrepreneurship reflects
income generation activities. This aspect of opportunities
does not necessarily mean that the every population is able
to survive with a decent standard of living. Naturally,
economic imbalance has been observed and noted in
industrially urbanized area. This segment of economic
backdrop sometimes referred as Urban Poverty. Urban
Poverty is not the comparison between rural and Urban
Population to the extent of income generated by them but it
is the output of comparison between urban populations. This
urban poverty frequently referred as slum and got recent
attention to address the issues pertaining to the slum.
The phenomenon of urban poverty has been addressed
with focus on various dimensions in the present research
paper. It has to be mentioned that present research paper
has been divided into three sections, namely, in Section-(i)
methodological aspects adopted for the present study has
been addressed. The aspect of measuring poverty has been
highlighted in Section-(ii). The global view along with
highlights of Urban Poverty in Asia and review of Urban
Poverty in the context of India has been presented in
Section-(iii) of the present research paper.
Section-(i)
RESEARCH METHODOLOGY:
The present research paper is an exploratory
commentary on select literatures and reports prepared by
various eminent authors and research institutions. Thus, it
has to be significantly highlighted that the present research is
based on extensive literature review along with in depth
analytical over view of the facts addressed in select literature
at reports. For the methodological aspect researcher has
reviewed selective and appropriate literature and reports,
namely; i)The world bank group, Washington, D.C. published
a report entitled as “Urban Poverty: A global view”-edited by
Judy L. Baker in January 2008; ii)The report published by
Asian Development Bank in August 2013 entitled as “Urban
Poverty in Asia: Study prepared for the Asian Development
Bank” Authored by Om Prakash Mathur National Institute of
Urban Affairs, New Delhi; iii) Report published by Vikalp
Alternatives in December 2005 titled as Urban Poverty; iv)
Report of the working group on urban poverty, slums,, and
service delivery system published by Steering Committee on
Urbanization Planning Commission, New Delhi on 3 October
2011; and v) Report of The Expert Group to Review The
Methodology For Measurement Of Poverty, Government of
India, Planning Commission, Published in June, 2014.
© SBPIM
Head of Department (Commerce), Ramkrishna More College, Akurdi, Pune 411044.
Contact no.: Email Id:
JOMAT Vol. 4 No.2 January – June 2016 ISSN No. 2278-9316
78
All the listed material has been reviewed by the
researcher and select comments have been offered in an
analytical way.
THE ASPECTS OF MEASURING POVERTY:
This section is based on ‘Report of the expert group to
review the methodology for measurement of poverty’
prepared by Planning Commission of India in June 2014.
As has been clearly indicated in the title of the present
research paper that study of urban poverty is the core area of
investigation for present study, and naturally, conceptual
understanding on measurement of phenomena of poverty
stood essential. This aspect of measuring poverty has been
taken care with the help of present section.
There are many approaches in measuring poverty. The
basic two approaches have been mentioned in the report are,
a) consideration of deprivations, and b) consideration of
minimum consumption expenditures. The former method has
several difficulties such as; aggregation of deprivation, based
on data gathered from several sources is complicated. The
later is comparatively workable as the expenses are visible
from the perspective of measurement. Though, best
approach in measuring the consumption is based on the
expenses of entire household. These all household expenses
are classified into major two categories; namely, food
expenses and non-food expenses. Certain minimum level of
nutritional consumption has been considered in food items
while consideration of non-food items seems to be
problematic. Ultimately speaking, all these exercise meant for
arriving at certain level of poverty based on these parameters
reflecting a level of standard of living of a households.
Further, it means that measurement of poverty is as
reflection of the living standard of the certain nation and also
the status of distribution of the economic progress into the
society.
The expert group in this report considered the basic
minimum consumption criteria for food and nonfood items.
This poverty line as mentioned in report considered to be
based on certain normative levels of adequate nourishment,
clothing, house rent, conveyance and education, and a
behaviorally determined level of other non-food expenses.
Now, with reference to the nourishment, expert group
considered a level of calories, proteins and fats differentiated
by age, gender and activity for all India rural and urban
regions. Below table gives the details on this aspect.
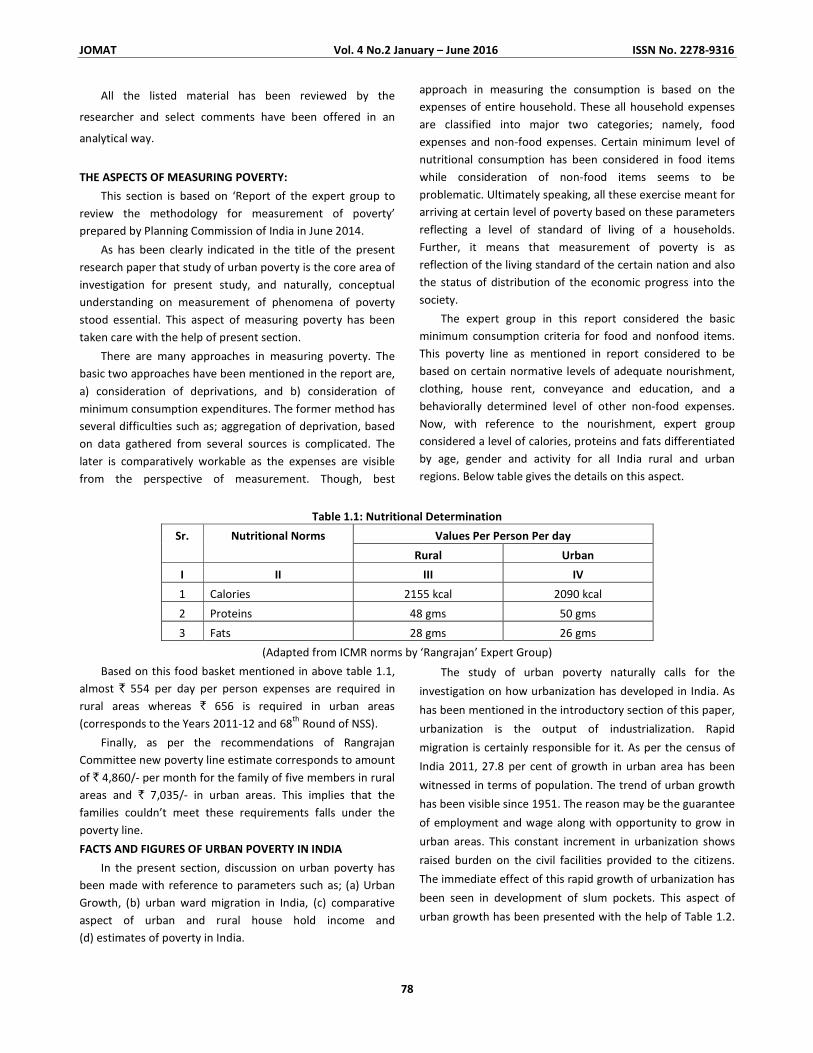
Table 1.1: Nutritional Determination
Values Per Person Per day Sr. Nutritional Norms
Rural Urban
I II III IV
1 Calories 2155 kcal 2090 kcal
2 Proteins 48 gms 50 gms
3 Fats 28 gms 26 gms
(Adapted from ICMR norms by ‘Rangrajan’ Expert Group)
Based on this food basket mentioned in above table 1.1,
almost ` 554 per day per person expenses are required in
rural areas whereas ` 656 is required in urban areas
(corresponds to the Years 2011-12 and 68th
Round of NSS).
Finally, as per the recommendations of Rangrajan
Committee new poverty line estimate corresponds to amount
of ` 4,860/- per month for the family of five members in rural
areas and ` 7,035/- in urban areas. This implies that the
families couldn’t meet these requirements falls under the
poverty line.
FACTS AND FIGURES OF URBAN POVERTY IN INDIA
In the present section, discussion on urban poverty has
been made with reference to parameters such as; (a) Urban
Growth, (b) urban ward migration in India, (c) comparative
aspect of urban and rural house hold income and
(d) estimates of poverty in India.
The study of urban poverty naturally calls for the
investigation on how urbanization has developed in India. As
has been mentioned in the introductory section of this paper,
urbanization is the output of industrialization. Rapid
migration is certainly responsible for it. As per the census of
India 2011, 27.8 per cent of growth in urban area has been
witnessed in terms of population. The trend of urban growth
has been visible since 1951. The reason may be the guarantee
of employment and wage along with opportunity to grow in
urban areas. This constant increment in urbanization shows
raised burden on the civil facilities provided to the citizens.
The immediate effect of this rapid growth of urbanization has
been seen in development of slum pockets. This aspect of
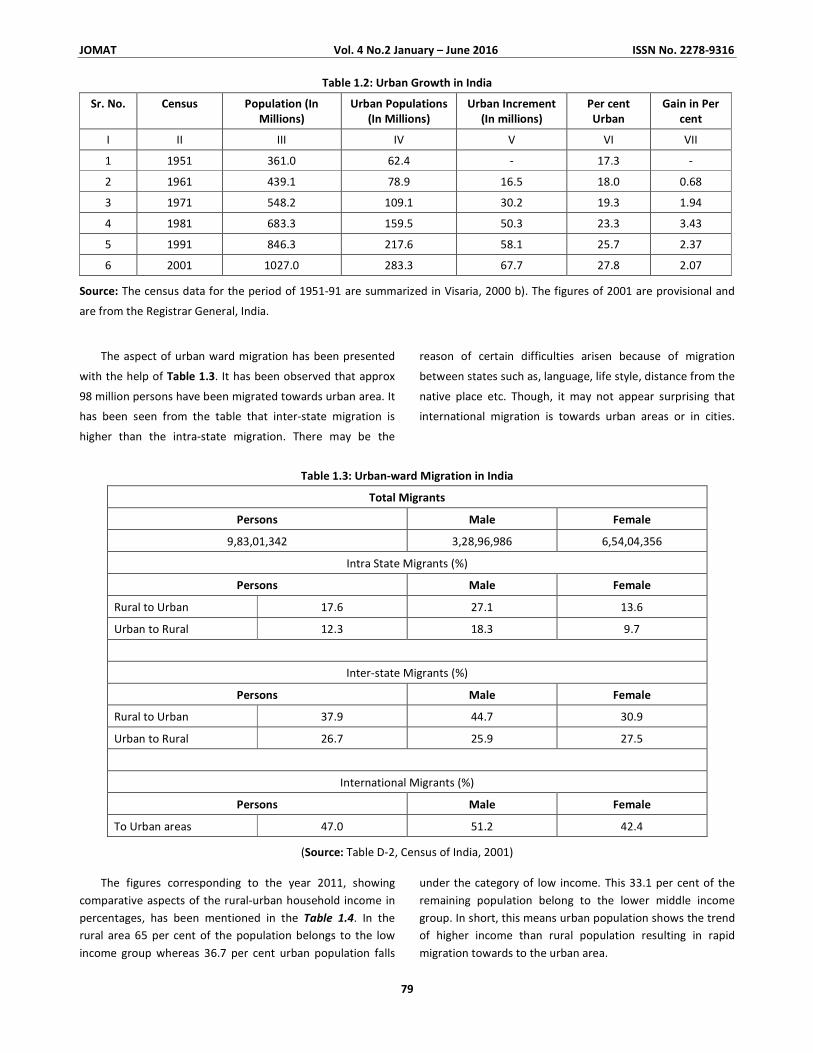
urban growth has been presented with the help of Table 1.2.
JOMAT Vol. 4 No.2 January – June 2016 ISSN No. 2278-9316
79
Table 1.2: Urban Growth in India
Sr. No. Census Population (In
Millions)
Urban Populations
(In Millions)
Urban Increment
(In millions)
Per cent
Urban
Gain in Per
cent
I II III IV V VI VII
1 1951 361.0 62.4 - 17.3 -
2 1961 439.1 78.9 16.5 18.0 0.68
3 1971 548.2 109.1 30.2 19.3 1.94
4 1981 683.3 159.5 50.3 23.3 3.43
5 1991 846.3 217.6 58.1 25.7 2.37
6 2001 1027.0 283.3 67.7 27.8 2.07
Source: The census data for the period of 1951-91 are summarized in Visaria, 2000 b). The figures of 2001 are provisional and
are from the Registrar General, India.
The aspect of urban ward migration has been presented
with the help of Table 1.3. It has been observed that approx
98 million persons have been migrated towards urban area. It
has been seen from the table that inter-state migration is
higher than the intra-state migration. There may be the
reason of certain difficulties arisen because of migration
between states such as, language, life style, distance from the
native place etc. Though, it may not appear surprising that
international migration is towards urban areas or in cities.
Table 1.3: Urban-ward Migration in India
Total Migrants
Persons Male Female
9,83,01,342 3,28,96,986 6,54,04,356
Intra State Migrants (%)
Persons Male Female
Rural to Urban 17.6 27.1 13.6
Urban to Rural 12.3 18.3 9.7
Inter-state Migrants (%)
Persons Male Female
Rural to Urban 37.9 44.7 30.9
Urban to Rural 26.7 25.9 27.5
International Migrants (%)
Persons Male Female
To Urban areas 47.0 51.2 42.4
(Source: Table D-2, Census of India, 2001)
The figures corresponding to the year 2011, showing
comparative aspects of the rural-urban household income in
percentages, has been mentioned in the Table 1.4. In the
rural area 65 per cent of the population belongs to the low
income group whereas 36.7 per cent urban population falls
under the category of low income. This 33.1 per cent of the
remaining population belong to the lower middle income
group. In short, this means urban population shows the trend
of higher income than rural population resulting in rapid
migration towards to the urban area.
JOMAT Vol. 4 No.2 January – June 2016 ISSN No. 2278-9316
80
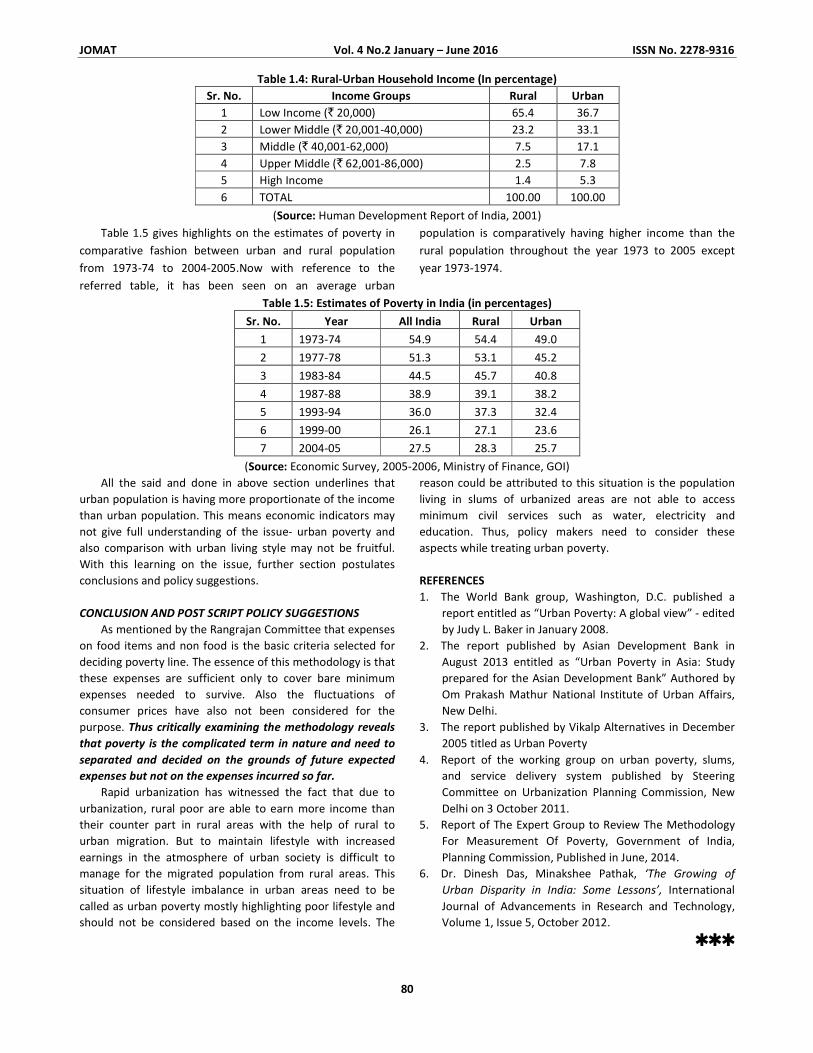
Table 1.4: Rural-Urban Household Income (In percentage)
Sr. No. Income Groups Rural Urban
1 Low Income (` 20,000) 65.4 36.7
2 Lower Middle (` 20,001-40,000) 23.2 33.1
3 Middle (` 40,001-62,000) 7.5 17.1
4 Upper Middle (` 62,001-86,000) 2.5 7.8
5 High Income 1.4 5.3
6 TOTAL 100.00 100.00
(Source: Human Development Report of India, 2001)
Table 1.5 gives highlights on the estimates of poverty in
comparative fashion between urban and rural population
from 1973-74 to 2004-2005.Now with reference to the
referred table, it has been seen on an average urban
population is comparatively having higher income than the
rural population throughout the year 1973 to 2005 except
year 1973-1974.
Table 1.5: Estimates of Poverty in India (in percentages)
Sr. No. Year All India Rural Urban
1 1973-74 54.9 54.4 49.0
2 1977-78 51.3 53.1 45.2
3 1983-84 44.5 45.7 40.8
4 1987-88 38.9 39.1 38.2
5 1993-94 36.0 37.3 32.4
6 1999-00 26.1 27.1 23.6
7 2004-05 27.5 28.3 25.7
(Source: Economic Survey, 2005-2006, Ministry of Finance, GOI)
All the said and done in above section underlines that
urban population is having more proportionate of the income
than urban population. This means economic indicators may
not give full understanding of the issue- urban poverty and
also comparison with urban living style may not be fruitful.
With this learning on the issue, further section postulates
conclusions and policy suggestions.
CONCLUSION AND POST SCRIPT POLICY SUGGESTIONS
As mentioned by the Rangrajan Committee that expenses
on food items and non food is the basic criteria selected for
deciding poverty line. The essence of this methodology is that
these expenses are sufficient only to cover bare minimum
expenses needed to survive. Also the fluctuations of
consumer prices have also not been considered for the
purpose. Thus critically examining the methodology reveals
that poverty is the complicated term in nature and need to
separated and decided on the grounds of future expected
expenses but not on the expenses incurred so far.
Rapid urbanization has witnessed the fact that due to
urbanization, rural poor are able to earn more income than
their counter part in rural areas with the help of rural to
urban migration. But to maintain lifestyle with increased
earnings in the atmosphere of urban society is difficult to
manage for the migrated population from rural areas. This
situation of lifestyle imbalance in urban areas need to be
called as urban poverty mostly highlighting poor lifestyle and
should not be considered based on the income levels. The
reason could be attributed to this situation is the population
living in slums of urbanized areas are not able to access
minimum civil services such as water, electricity and
education. Thus, policy makers need to consider these
aspects while treating urban poverty.
REFERENCES
1. The World Bank group, Washington, D.C. published a
report entitled as “Urban Poverty: A global view” - edited
by Judy L. Baker in January 2008.
2. The report published by Asian Development Bank in
August 2013 entitled as “Urban Poverty in Asia: Study
prepared for the Asian Development Bank” Authored by
Om Prakash Mathur National Institute of Urban Affairs,
New Delhi.
3. The report published by Vikalp Alternatives in December
2005 titled as Urban Poverty
4. Report of the working group on urban poverty, slums,
and service delivery system published by Steering
Committee on Urbanization Planning Commission, New
Delhi on 3 October 2011.
5. Report of The Expert Group to Review The Methodology
For Measurement Of Poverty, Government of India,
Planning Commission, Published in June, 2014.
6. Dr. Dinesh Das, Minakshee Pathak, ‘The Growing of
Urban Disparity in India: Some Lessons’, International
Journal of Advancements in Research and Technology,
Volume 1, Issue 5, October 2012.
���
JOMAT Vol. 4 No.2 January – June 2016 ISSN No. 2278-9316
(81)
AN ANALYTICAL STUDY OF SOCIAL RESPONSIBILITY OF LIFE INSURANCE CORPORATION OF
INDIA WITH SPECIAL REFERENCE TO RAIGAD DISTRICT
Kamlakar E. Kamble
Janardhan P. Bhosale
INTRODUCTION
Social Responsibility means the obligation of an
organization to be accountable to its stakeholders through all
its operations and activities. It is a holistic approach where
companies consider the impact of their decisions on
communities, environment, employees, investors and
consumers before implementing them, rather than only
counting on profits. For several years Social Responsibility
was associated with philanthropy. Philanthropy is a narrow
concept, it simply involves charitable giving. Though
Philanthropy provides the much required funds for
addressing social needs, however Social Responsibility implies
much broader corporate obligations. Lately, there has been a
paradigm shift in the thinking of the new generation
corporate leaders who consider optimization to profit as the
key rather than maximization of profits. Hence there is a shift
from shareholder accountability to stakeholder
accountability. The present day global corporations possess
the power to control and influence the equality of life of not
only their employees, but also the customers, shareholders
and the communities in which they operate. Power entails
responsibility, therefore the manages should perform
responsibilities beyond fulfilling the minimum legal
requirements or profit maximization.
As a country we face several problems and complexities.
Several villages lack primary education, health care, drinking
water and transport facility. Corers of people live below
poverty line. In such a scenario it is necessary for our
corporate to act responsibility and contribute towards social
upliftment and well-being. Government is depended upon to
allocate tax to the well being of the society. But there is
absolutely no way the Government can do enough. Since
liberalization the Indian Corporate has been lobbying for
lesser laws and investment restrictions thereby weakening
the state’s capacity to earn revenue and promote social
welfare. Hence it is imminent that organizations contribute,
as social improvement is drastically needed. Moreover,
though modern day Indian Corporates have realized the
importance of Social responsibility and are made in
increasingly contributing to social welfare. But with its
increasing size power and dimensions, business should
consider social contribution not merely as a responsibility. It
should imbibe corporate responsibility as a business strategy.
Every business should look beyond social commitment being
performed as a mere responsibility and should interview it
into its corporate strategy and let it popularly be known as
Social Strategy.
LIFE INSURANCE CORPORATION OF INDIA (LIC)
³Hindi: भारतीयजीवनबीमाiनगम´ is the largest state-
owned insurance group in India, and also the country's largest
investor. It is fully owned by the Government of India. It also
funds close to 24.6% of the Indian Government's expenses. It
has assets estimated of 13.25 trillion (US$264.34 billion). It
was founded in 1956 with the merger of 243 insurance
companies and provident societies. Headquartered in
Mumbai, financial and commercial capital of India, the Life
Insurance Corporation of India currently has 8 zonal Offices
and 113 divisional offices located in different parts of India,
around 3500 servicing offices including 2048 branches, 54
Customer Zones, 25Metro Area Service Hubs and a number of
Satellite Offices located in different cities and towns of India
and has a network of 13,37,064 individual agents, 242
Corporate Agents, 79 Referral Agents, 98 Brokers and 42
Banks (as on 31.3.2011) for soliciting life insurance business
from the public. The slogan of LIC is "Yogakshemam
Vahamyaham" - Your welfare is our responsibility.
RESEARCH STATEMENT
The research statement studied is entitled, “An
Analytical Study of Social Responsibility of Life Insurance
Corporation of India with special Reference to Raigad
District”. The Present study focuses on the analysis of the
various Corporate Social Responsibility Schemes of Life
Insurance Corporation of India with the help of percentage,
ratio, graphs, Charts, and diagram.
Before conducting any research whether it is social,
economic, political, commercial or scientific the research has
to decide the problem to be investigated. This is termed as
problem formulation. The present work is exploratory in
nature. In the present research “An Analytical Study of Social
Responsibility of Life Insurance Corporation of India”, (Special
Reference to Raigad District.) has been analyzed. LIC being
one of the largest financial institutions of India has been
contributing significantly towards the socio-economic
development of India. Any social or economic research may
have two objectives.
JOMAT Vol. 4 No.2 January – June 2016 ISSN No. 2278-9316
82
NEED OF THE STUDY
In today’s cut throat market competition the evolving
concept of Corporate Social Responsibility is gaining wide
acceptance and popularity all across the globe. Social
Responsibility is recognized as an effective tool to maintain
balance between both business and society. LIC with long
back history of more than five decades has played a very
prominent role in the society. Various CSR initiatives
undertaken by LIC has benefited a large population of India in
ways of education, health, medical, housing development,
upliftment of poor through insurance schemes. Further, this
study would help in understanding the benefits and present
situation of various CSR projects of LIC. The Research will
provided innovative ideas in designing new strategies,
policies and roadmaps which can effectively help to achieving
the main objectives of an organization through appropriate
CSR schemes.
OBJECTIVES OF RESEARCH STUDY
The objectives of the study are as follows:
1. To know and understand of policies of Life Insurance
Corporation for Social Responsibility.
2. To study the activities of Social Responsibilities
undertaken by Life Insurance Corporation of India.
3. To study the role of LIC in funding to the various projects.
4. To study the contribution of LIC and other Private
Insurance Companies in Social Responsibility Scheme.
5. To identify the customers satisfaction of LIC and other
private insurance company.
SCOPE OF THE RESEARCH
The scope of the study covers the contribution of LIC
towards the social Responsibility and develops the
components of social sectors like education, health,
electricity, water supply development etc., in India. The
contribution of LIC in the economic development like, capital
formation, contribution to GDP, investment pattern etc. has
also been covered. In addition the analysis of the growth,
development, investment pattern and various activities of LIC
also come within the scope of the work. The territorial
coverage has been taken as the country as a whole, because
specific data relating to particular zone, Divisions and
Branches are not available. The period of study spreads over
last one decade from 2000 to 2010.
HYPOTHESIS OF RESEARCH STUDY
In order to achieve the objectives of the study, the
following hypothesis are framed:
The study proposes to verify the following hypothetical
prepositions:
1. It is believed that, “Life Insurance Corporation of India
has exercised a positive contribution to society by way of
various schemes of social Responsibility to various
stakeholders”.
2. In developing economies, life insurance sector plays an
important role in supplying the funds for relatively
various projects.
3. Contribution of LIC in CSR is better than the private
Insurance companies.
4. Customers of LIC are more satisfied than the private
Insurance Company
METHODOLOGY OF STUDY
Research Methodology used for present study is both,
exploratory as well as descriptive. First section of survey
literature, while second section Primary data of LIC
Customers of sample respondents.
Sampling:
The LIC of India branches in Raigad District is located in
15 Talukas there are about 05 branches in this District. The
Researcher has selected all these branches under census
method for this study. There are about 300 policyholders
selected at random in order to obtain their opinion about
satisfaction of the services offered by LIC of India.
Sampling Method :
A Random Sampling Method is used in order to draw a
representative sample from population. It is one of the types
of Probability Sampling Method.
Tools for Data Analysis :
The present study involves calculation of different ratios
to evaluate the financial contributions and performance of
life insurance companies in India from 2000-01 to 2009-10. It
also compares the contribution of Life Insurance companies
and Private Insurance Companies. In India during the same
period. Prediction of new business and total premium of the
life insurance companies has also been done. Various
Statistical measures like ratios, Index, percentage, chart, and
diagram are used in this study.
ANALYSIS and INTERPRETATION:
LIC has always been committed to the welfare of the
economically weaker section of the society and constantly
endeavors to bring about hope and security into the lives of
those people who are struggling to make ends meet, through
its various Social Security Schemes.
Life Insurance Corporation of India has exercised a
positive contribution to society by way of various schemes
of social Responsibility to various stakeholders”.
Social Security Group Insurance Schemes
1. Social Security Group Insurance Scheme.
2. Krishi Shramik Samajik Suraksha Yojana.
3. Rural Group Life Insurance Scheme.
4. Landless Agricultural Labourers Group Insurance
Scheme.
5. Integrated Rural Development Programme.
JOMAT Vol. 4 No.2 January – June 2016 ISSN No. 2278-9316
83
6. Swarna Jayanti Gram Swarozgar Yojana.
7. National Agricultural Insurance Scheme.
8. Janshree Bima Yojana.
9. Shiksha Sahayog Yojana.
10. Universal Health Insurance Schemes.
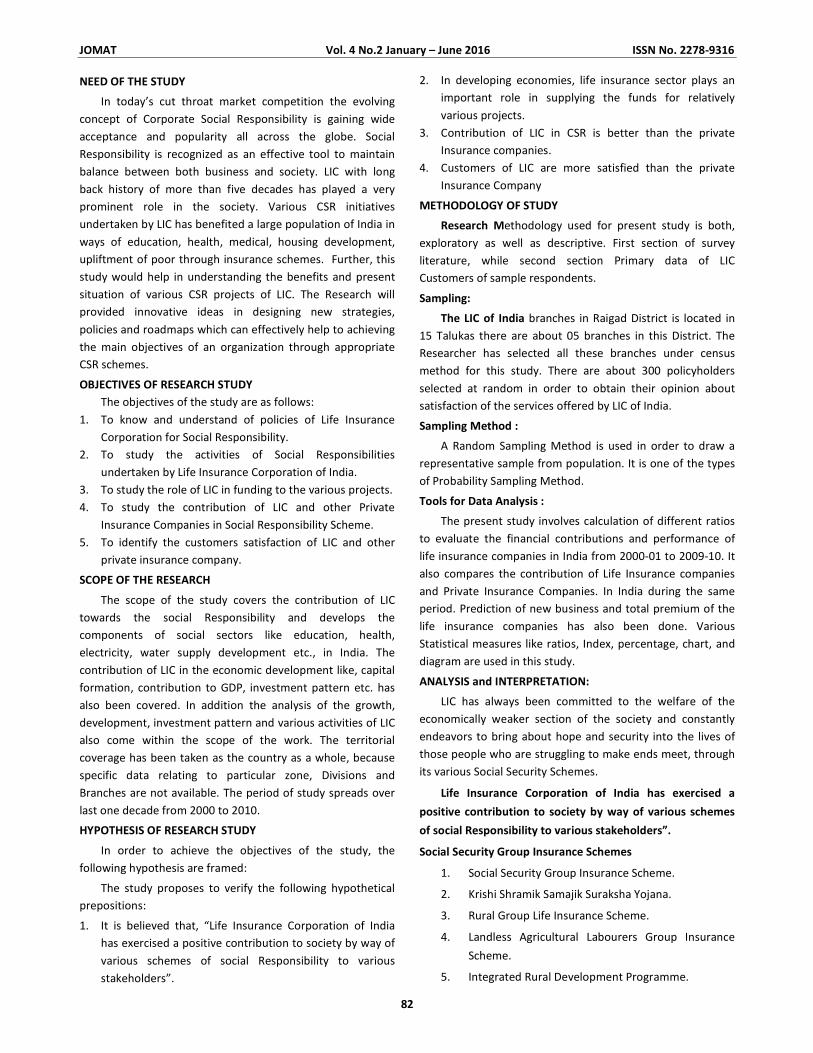
Group Schemes and Social Security
94,464 claims amounting to 252.71 crore paid under Social Security schemes. During the year 2009-10 the claims paid under
the Social Security Schemes as per the following details.
Table 1: Group Schemes and Social Security
No of claims paid Amount in thousands Scheme
Natural Accidental
Total
Claims Natural Accidental
Total
JBY 39800 1384 41184 1236821 96256 1333077
SGSY 324 2 326 2476 11 2487
SSGS 13593 750 14343 66615 19557 86172
KSSSY 80 5 85 1820 190 2010
CI RIDER 33 0 33 720 0 720
AABY 36227 2266 38493 1086000 16715 1102715
TOTAL 90057 4407 94464 2394452 132729 2527181
Source: LIC Annual Report 2010
JBY - Janashree Bima Yojana
SGSY - Swarna Jayanti Gram Swarojgar Yojana
SSGS - Social Security Group Insurance Schemes
KSSSY - Krishi Shramik Samajik Suraksha Yojana
CI RIDER - Critical Illness Rider
AABY - Aam Admi Bima Yojana
LIC SUPPLYING FUNDS FOR ECONOMIC DEVELOPMENT FOR VARIOUSPROJECTS IN INDIA
LIC as a responsible Corporate Citizen has been fulfilling its social responsibilities from time to time. In fact most of the LIC
Investment are geared towards industrial growth, infrastructural growth, and national development. Most of the nation in this
world, in one form or the other claim themselves as welfare states and have instituted certain measures for welfare of weaker
JOMAT Vol. 4 No.2 January – June 2016 ISSN No. 2278-9316
84
sections of their respective societies – whether socially or financially or physically. In advanced countries with affluent
economics, Government are playing for better role in providing “Social Security” to individuals designed to protect them against
certain type of economic insecurity, which neither individuals nor private insurance companies can afford.
Table 2: LIC’s Fund and Investment in Infrastructure Development for Various Projects
Sr.
No
Year Housing
Constr.
In Crore
Electricity
and power
Supply
In Crore
Water
Supply and
Sewerage
In Crore
Total
Sanction
Fund by
LIC
% of total Investment
H E W Total
1 2000 28731 17580 17788.52 64099.52 44.62 27.42 27.76 100%
2 2001 20967 29429 30269.55 80665.55 26.00 36.48 37.52 100%
3 2002 32249 33150 28243.00 93600.00 34.45 35.42 30.17 100%
4 2003 14207 11392 12508.15 38107.15 37.28 30.00 33.72 100%
5 2004 15885 13609 3001.15 32495.15 48.66 41.88 9.26 100%
6 2005 47998 34017 79966.48 161981.48 29.63 21.00 49.37 100%
7 2006 59054 77224 48634.81 184930.81 31.93 41.75 26.30 100%
8 2007 89944 75613 42273.14 207880.14 36.37 36.37 20.33 100%
9 2008 92694 102127 36008.47 230829.47 40.15 44.24 15.60 100%
10 2009 121436 75727 56615.81 253778.81 47.85 29.83 22.32 100%
11 2010 82963 93428 97821.64 274212.64 30.26 35.67 34.07 100%
Source: Annual Report of LIC (2000-2010)
LIC Provided Funds to the Government for House
Construction and Road Construction as a role of Social
Responsibility. In 2000 LIC has sanction funds of
` 64099.52 Crore, in between 28731 Crore in 44.62 % of total
amount. Transferred for House Construction the percentage
of the funds is 44.62. In 2003-04, 2004-05, 2006-07 constantly
LIC provided Funds to the Government for development since
2000 to 2010.
Contribution of LIC in CSR is better than the private
Insurance companies.
LIC of India plays a vital role in the growth of life
insurance sector and also to the Economic development of
the country.
Year wise data on the life insurance premium received
from the policy holders by the LIC of India and various private
life insurance companies were collected from annual reports
JOMAT Vol. 4 No.2 January – June 2016 ISSN No. 2278-9316
85
and searching the IRDA website for the years from 2000-2001
to 2009-2010 to achieve the objective, “To Study the
contribution of LIC and other Private insurance companies in
Social Responsibility”.
To achieve the objective, there was a need to study
through graphs, the behavior of the annual premiums
received by the LIC of India and that received by other private
life insurance companies and finding the Contribution of LIC
in CSR better than the Private Insurance Company.
LIC of India plays a vital role in the growth of life
insurance sector and also to the social economic
development of the country. Since economic reform the life
insurance sector is changing rapidly due to the continuous
change in the customer needs and social performance. These
changes have helped in a great number to both the urban
and rural consumers. Life insurance Corporation of India has
worked continuously hard to grow since 2000. In order to
increase its business LIC of India has increased their life
insurance offices.
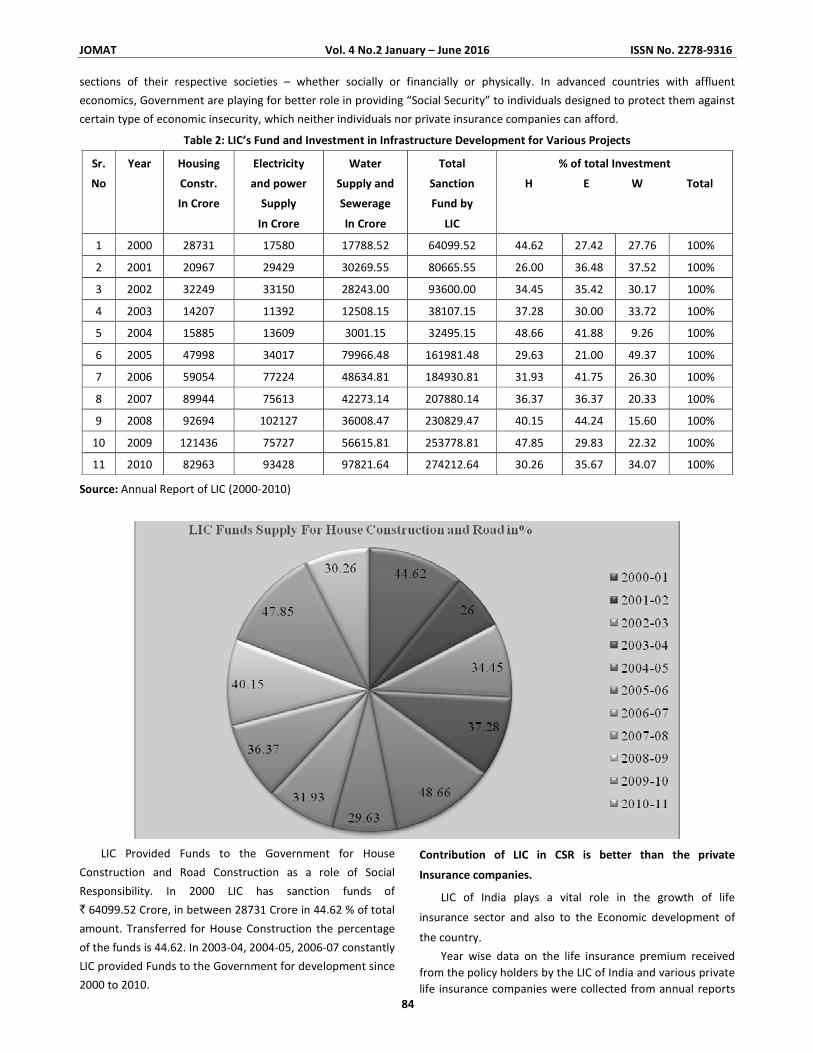
Following Table gives statistical data related to the
contribution of LIC and Private Insurance Companies of India
to total industry growth in term of Life insurance offices since
2000.
Table 3: Statistics of offices of Life Insurance Company and Private Insurance Industry in India since 2000
(as on 31st
March 2010)
Years LIC offices
In India
Private Insurance
Industry
Offices of
Total Industry
Contribution
Of LIC
(In %)
Contribution of
Private Industry
(In %)
2000-01 2186 13 2199 99.40 0.60
2001-02 2190 116 2306 94.97 5.03
2002-03 2191 234 2445 89.61 9.57
2003-04 2196 416 2612 84.07 15.93
2004-05 2197 804 3001 73.21 26.80
2005-06 2220 1645 3865 57.44 42.56
2006-07 2301 3072 5373 42.83 57.17
2007-08 2522 6391 8913 28.30 71.70
2008-09 3030 9293 11815 25.65 78.65
2009-10 3250 8768 12018 27.04 72.95
(Secondary data : IRDA Report 2000-2010)
From table no. 4.3.1 it is clear that though the life insurance offices are increasing continuously but as far as the contribution
of LIC of India it is decreasing from 2001 to 2010 from 99.41% 27.04%. This is a tremendous fall in the number of offices opening
throughout the country. This definitely has affected in the overall performance of LIC of India.
Graph No. 5.11
Graph No. 9 indicates the contribution of LIC and Private Insurance Companies are as follows. The Contribution of LIC of
India over the year since 2000 in terms of opening offices is increasing the Private Insurance Industry in India. This has a direct
JOMAT Vol. 4 No.2 January – June 2016 ISSN No. 2278-9316
86
impact on the overall performance of the Company. Thereby the purpose of the present research study is to find the
Contribution of LIC of India is positive and better than private insurance industry.
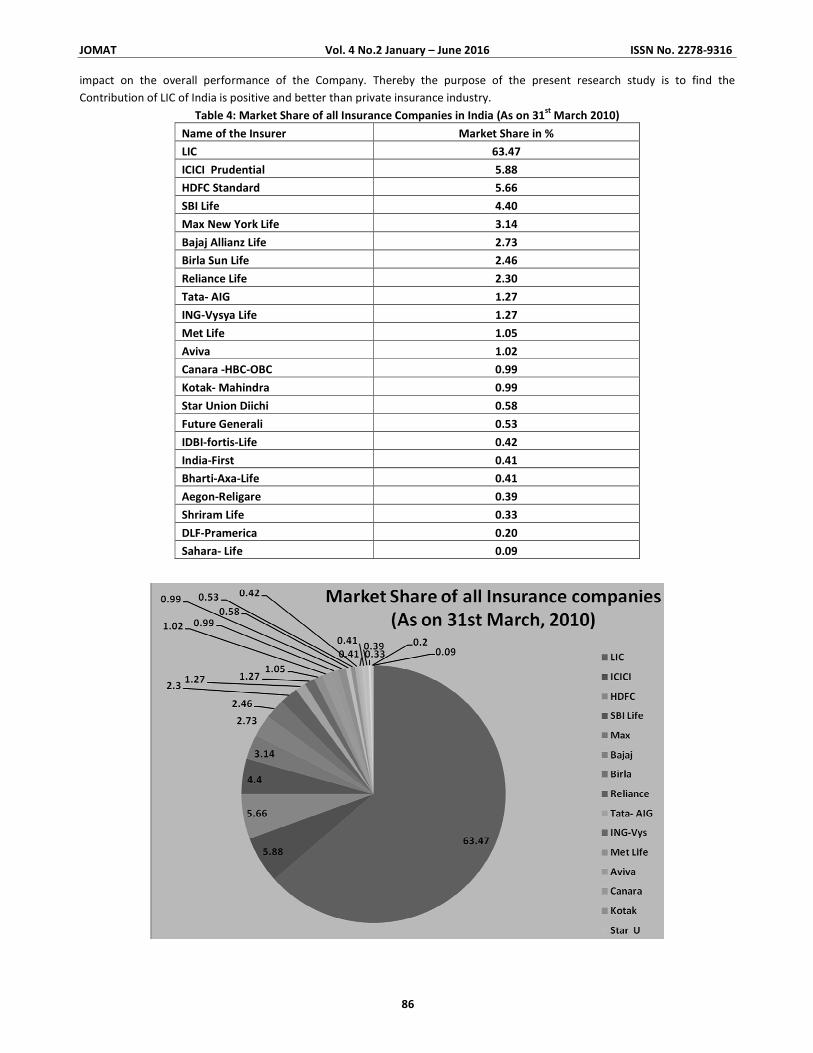
Table 4: Market Share of all Insurance Companies in India (As on 31st
March 2010)
Name of the Insurer Market Share in %
LIC 63.47
ICICI Prudential 5.88
HDFC Standard 5.66
SBI Life 4.40
Max New York Life 3.14
Bajaj Allianz Life 2.73
Birla Sun Life 2.46
Reliance Life 2.30
Tata- AIG 1.27
ING-Vysya Life 1.27
Met Life 1.05
Aviva 1.02
Canara -HBC-OBC 0.99
Kotak- Mahindra 0.99
Star Union Diichi 0.58
Future Generali 0.53
IDBI-fortis-Life 0.42
India-First 0.41
Bharti-Axa-Life 0.41
Aegon-Religare 0.39
Shriram Life 0.33
DLF-Pramerica 0.20
Sahara- Life 0.09
JOMAT Vol. 4 No.2 January – June 2016 ISSN No. 2278-9316
87
Life Insurance Sector play an important and major role in a total Insurance Industry shown as on above diagram of LICs
share in total market is a 63.47% in India. All private insurance industries play a small role in insurance sector. Contribution of
LIC in market share is better than the private Insurance companies is proved.
Customers of LIC are more satisfied than the private Insurance Company.
The respondents were knowledgeable and were giving the true information. The respondents were short listed on the basis
of their geographical location. The geographical Location is a Raigad District.
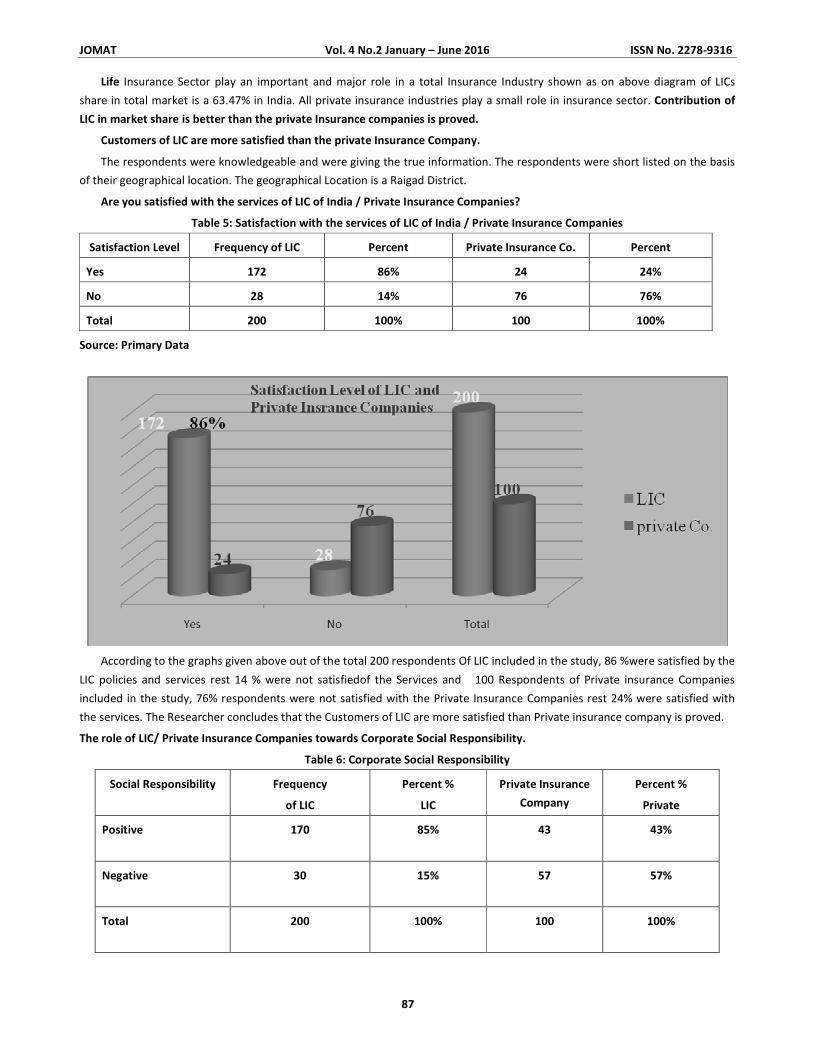
Are you satisfied with the services of LIC of India / Private Insurance Companies?
Table 5: Satisfaction with the services of LIC of India / Private Insurance Companies
Satisfaction Level Frequency of LIC Percent Private Insurance Co. Percent
Yes 172 86% 24 24%
No 28 14% 76 76%
Total 200 100% 100 100%
Source: Primary Data
According to the graphs given above out of the total 200 respondents Of LIC included in the study, 86 %were satisfied by the
LIC policies and services rest 14 % were not satisfiedof the Services and 100 Respondents of Private insurance Companies
included in the study, 76% respondents were not satisfied with the Private Insurance Companies rest 24% were satisfied with
the services. The Researcher concludes that the Customers of LIC are more satisfied than Private insurance company is proved.
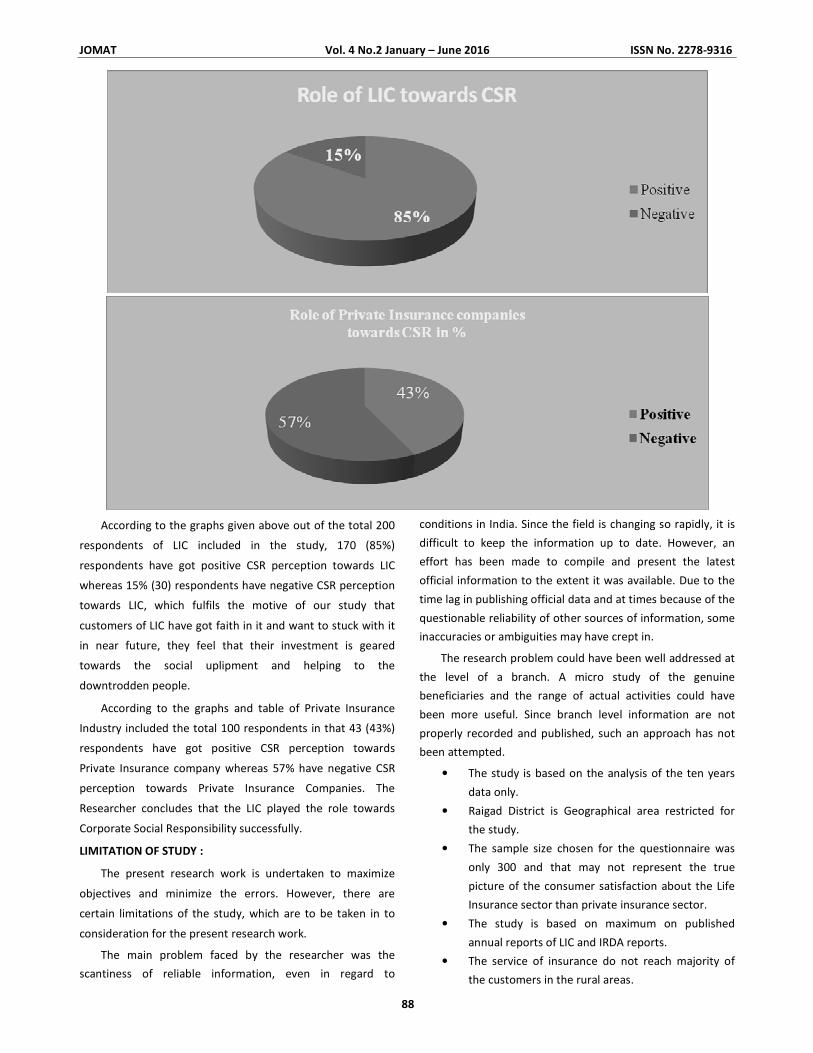
The role of LIC/ Private Insurance Companies towards Corporate Social Responsibility.
Table 6: Corporate Social Responsibility
Social Responsibility Frequency
of LIC
Percent %
LIC
Private Insurance
Company
Percent %
Private
Positive
170 85% 43 43%
Negative
30 15% 57 57%
Total
200 100% 100 100%
JOMAT Vol. 4 No.2 January – June 2016 ISSN No. 2278-9316
88
According to the graphs given above out of the total 200
respondents of LIC included in the study, 170 (85%)
respondents have got positive CSR perception towards LIC
whereas 15% (30) respondents have negative CSR perception
towards LIC, which fulfils the motive of our study that
customers of LIC have got faith in it and want to stuck with it
in near future, they feel that their investment is geared
towards the social uplipment and helping to the
downtrodden people.
According to the graphs and table of Private Insurance
Industry included the total 100 respondents in that 43 (43%)
respondents have got positive CSR perception towards
Private Insurance company whereas 57% have negative CSR
perception towards Private Insurance Companies. The
Researcher concludes that the LIC played the role towards
Corporate Social Responsibility successfully.
LIMITATION OF STUDY :
The present research work is undertaken to maximize
objectives and minimize the errors. However, there are
certain limitations of the study, which are to be taken in to
consideration for the present research work.
The main problem faced by the researcher was the
scantiness of reliable information, even in regard to
conditions in India. Since the field is changing so rapidly, it is
difficult to keep the information up to date. However, an
effort has been made to compile and present the latest
official information to the extent it was available. Due to the
time lag in publishing official data and at times because of the
questionable reliability of other sources of information, some
inaccuracies or ambiguities may have crept in.
The research problem could have been well addressed at
the level of a branch. A micro study of the genuine
beneficiaries and the range of actual activities could have
been more useful. Since branch level information are not
properly recorded and published, such an approach has not
been attempted.
• The study is based on the analysis of the ten years
data only.
• Raigad District is Geographical area restricted for
the study.
• The sample size chosen for the questionnaire was
only 300 and that may not represent the true
picture of the consumer satisfaction about the Life
Insurance sector than private insurance sector.
• The study is based on maximum on published
annual reports of LIC and IRDA reports.
• The service of insurance do not reach majority of
the customers in the rural areas.
JOMAT Vol. 4 No.2 January – June 2016 ISSN No. 2278-9316
89
Layout of Thesis
Chapter I:
This chapter gives a theoretical frame of the study. It is
an Introduction to the concept of Corporate Social
Responsibility and Life Insurance Corporation of India. Its
objectives, Principles, importance and Various Plans and
social security scheme of LIC.
Chapter II:
The Second Chapter consist is a Literature Review of
subject in which the theoretical themes, theories are
discussed.
Chapter III:
This chapter consists of Research Methodology. This
chapter contains basic information including research data,
research objectives, subject matter, research hypotheses,
methodology and population of research. In addition, some
discussion about the tools used in the research to examine
the hypotheses of the research will be explained.
Chapter IV:
These chapter discuss the Profile of Indian Insurance
Industry and Study Raigad District. Various Social Schemes
and contribution of LIC in different projects of government.
Role of LIC in towards corporate social responsibility are
discussed so that readers will understand the city and the
sample selected more easily.
Chapter V:
This Chapter focuses on the analysis of Secondary Data
Analysis, Annual Report of LIC and Contribution of LIC in
various government projects and schemes role of LIC in
development economies.
Chapter VI:
The second part of the chapter is a Primary Data Analysis
and Interpretation. There are about 300 policyholders
selected at random in order to obtain their opinion about
satisfaction of the services offered by LIC of India.
Chapter VII:
Presents topic is on Findings and Suggestions. Also a
statement of research is declared and then it deals with the
major findings of testing the hypotheses of the research. The
result of the hypotheses is tested by using statistical tools.
Objectives of the research are fulfilled. Finally, some
suggestions for next research are stated.
Research Findings :
The chapter consists of the findings of the study of the
secondary and primary data collected, analyzed and
interpreted, some important findings are enlisted. The last
section gives some suggestions to overcome problems that
have been identified from the study.
1. The Life Insurance Corporation of India has exercised a
positive contribution to society by way of various
schemes of social Responsibility to various stakeholders.
2. The life insurance corporation of India plays an important
role in supplying the funds for relatively various projects
and developing economies.
3. The agents of LIC play an important role in mobilization
funds LIC for benefit to the people living below poverty
line.
4. The satisfaction of the customers of the selected Life
Insurance Corporation of India in Raigad District was
appreciable in spite of hefty competition.
5. The customers of LIC of India reported a high level of
satisfaction relatively with other selected Private LIC
Companies.
6. The customers in general while choosing a policy from LIC
of India, give first preference to the amount of Tax
benefits, future of children. They consider the risk
benefit as least important to select a Policy.
7. Now various types of company are providing Life
insurance to all types of customers. All these schemes
were implemented to satisfy the customers and to
increase their turn over. But the customers’ expectations
are countless from Life insurance companies. They
expect a courteous service from personnel of the
insurance companies. They expect a prompt and quick
service.
8. It is observed that out of 300 respondents 72 percent
respondents were in-between age group of 18 to 40
years. And rest of respondents was above 40 years.
9. It is found that sample selected from 300 respondents
65 percent were male respondents and 35 percent were
females.
10. Out of 300 respondents77 percent was married policy
holders that are respondents and 23 percent were
unmarried respondents.
11. The researcher found that 22 percent respondents were
passed their gradation, 20 percent were learnt their post-
graduation and 4 percent were professional.
SUGGESTIONS:
1. The customer satisfaction should be the main focus of
any service firm especially to the Life Insurance
Company. This will be result in customer retention
leading to improved profitability and growth of the Life
insurance institutions.
2. The marketing personnel at all levels should appreciate
the significant components of marketing effectiveness.
The sufficient fund allocation has to be made for the
JOMAT Vol. 4 No.2 January – June 2016 ISSN No. 2278-9316
90
execution of marketing function in any life insurance
company.
3. The Life insurance companies should ensure effective
marketing information and communication facilities. The
strategic planning should be adopted deliberately to
identify and satisfy the customer' needs and wants.
4. The insurance companies should educate their personnel
for a pleasing behaviour. This can create a good image
among the insurance customers about the company. It
will be appropriate to spend lot of money for promoting
the insurance services, when the offered services do not
attract and satisfy the customers' need.
5. The service of insurance do not reach majority of the
customers in the rural areas. The rural mass should be
exposed to the availability of insurance and its benefits.
This is possible by personal selling. Most of the
customers of insurance in general do not understand the
clear and correct calculation of premium, sum assured,
benefits etc. So the Life insurance Corporation should
educate their customers clearly about the benefits of
insurance.
6. The Insurance company, if possible should invest in
advertising, conduct road shows, and spend money on
hoardings, so that it can propagate better awareness
about its various lesser known products.
7. LIC should also tie up with several other banks apart from
the existing ones to sell its products i.e. through banc
assurance.
8. The company has the option of tying up with local NGO’s
for selling its rural insurance products.
9. Customer friendly documentation i.e. it should be made
easier and faster.
10. All the hidden charges should clearly be stated in the
form and explained by the agent and LIC should provide
better training to the agents.
11. Claim settlement process should be made fast and does
not involve lengthy decision making process.
CONCLUSION:
The concept of corporate social responsibility has gained
prominence from all avenues. Organizations must realize that
governments alone will not be able to get success in its
endeavor to uplift the downtrodden of society. LIC is one of
the oldest and leading life insurance company in India has
been contributed impressively high in various socio-economic
development projects through appropriate CSR schemes.
Presently, many group insurance and social security schemes
such as Janashree Bima Yojana, Aam Aadmi Bima Yojana,
Shiksha Sahayog Yojana and many more CSR projects has
been undertaken by LIC for the welfare of poor and spreading
insurance to under penetrated rural population who cannot
afford to pay premium. In addition, the corporation provide
loans and invests huge amount of its fund in different sectors
like power, agriculture, housing, water supply, Central and
State securities etc. With the implementation of new
schemes and CSR initiatives, the performance of LIC has been
improved noticeably high in rural areas where private players
are yet not reached. CSR activities have their advantages. The
benefits are in terms of building a positive image,
encouraging social involvement of employees, which in turn
develops a sense of loyalty for the organization. CSR activities
help bond employees as a team with the organization, which
in turn helps increasing a dedicated workforce. Therefore we
can conclude that Corporate Social Responsibility is the
continuing commitment by business to behaving ethically and
contribute to economic development while improving the
quality of the workforce as well as of the local community
and society at large.
���
JOMAT Vol. 4 No.1 July – December 2015 ISSN No. 2278-9316
85
SBPIM JOMAT
(Guidelines for Contributors)
SBPIM JOMAT is a bi-annual journal brought out by the S. B. Patil Institute of Management, Pune, JOMAT aims to take on the
practices, concepts, and ideas in the field of management and administration, with a prominence to provide managerial and
administration insight, which tomorrow become a part of business functions.
SBPIM JOMAT invites manuscripts from management practitioners, researchers and academician in any managerial and
administrative function of the business. Our emphasis is on papers that focus on emerging economies and business throughout
the world. These papers improves the though process and the novel analysis provides guidance to the managers and contribute
to make a better tomorrow.
A Full length manuscript (up to 5,000 words) on all the functions, policy framing, decision making form the journal; at present
we are focusing on the research papers, articles and cases.
SBPIM JOMAT is a peer reviewed journal and follow a 'double blind' review process. All the articles, papers are initially screened
by editorial committee and those appropriate particles, papers are sent to the reviewer.
Submission of Articles:
The authors may send their manuscript on [email protected], [email protected] The whole manuscript is required to be
in ONE MSWORD FILE only.
COVER PAGE: The cover page of the manuscript containing the title, AUTHOR NAME (S) and AFFILIATIONS: The author (s) full
name, designation, affiliation (s), address, mobile/landline numbers, and email/alternate email address should be in italic and
11-point Calibri Font. It must be centered underneath the title.
ABSTRACT: Abstract should be in fully italicized text, not exceeding 250 words. The abstract must be informative and explain the
background, aims, methods, result and conclusion in a single para. Abbreviations must be mentioned in full.
KEYWORDS: Abstract must be followed by a list of keywords, subject to the maximum of five. These should be arranged in
alphabetic order separated by commas and full stop at the end.
MANUSCRIPT: Manuscript must be prepared on a standard A4 size PORTRAIT SETIING PAPER. It must be prepared on a single
space and single column with 1" margin set for top, bottom, left and right. It should be typed in 10 point Calibri Font with page
numbers at the bottom and centre of every page. It should be free from grammatical, spelling and punctuation errors and must
be thoroughly edited.
HEADINGS: All the headings should be in a 10 point Calibri Font. These must be bold-faced, aligned left and fully capitalised.
Leave a blank line before each heading.
SUB-HEADINGS: All the sub-headings should be in a 8 point Calibri Font. These must be bold-faced, aligned left and fully
capitalised.
MAIN TEXT: The main text should be in a 10 point Calibri Font, single spaced and justified. The manuscript should preferably not
exceed 5000 WORDS.
FIGURES AND TABLES: These should be simple, centered, separately numbered and self explained, and titles must be above the
table/figure.
Sources of data should be mentioned below the table/figure. It should be ensured that the tables/figures are referred to from
the main text.
REFERENCES: The authors (s) are supposed to follow the references as per the following:
1. All works cited in the text (including sources for tables and figures) should be listed alphabetically as appropriate the name
of author{s), year of publication, title of the article/book, name of the journal, details of the publisher, volume and issue
number, and starting and ending page numbers.
2. URL of online sources with access date.
SAMPLE JOURNAL REFERENCES:
• Krishnaswamy S.G., (2006), Sugar Factory Efficiency Measurement; Application of Data Envelopment Analysis - A New
insight for managers' paradigm, The research journal of Institute for Management and Technology, Vol. XNo.2, July -
December, PP. 79-82
SAMPLE BOOK REFERENCES
• Chandra Prasanna, (2008), Financial Management Theory and Practice, 7th
Edition, Tata McGraw-Hill Publishing Company
Limited, New Delhi.
COPYRIGHT: The author (s) must transfer the authority and copyright to the publisher if the manuscript accepted for publication
and certify that all the material used directly or indirectly must met the copyright requirement.
No part of the material published in SBPIM JOMAT may be reproduced, photocopied or stored in electronic form t and used for
commercial purpose. For reprint and permission to use material please send the request to editor SBPIM JOMAT or
call (+91) 020 27656900 or e-mail [email protected], [email protected]
���
JOMAT Vol. 4 No.2 January – June 2016 ISSN No. 2278-9316
(9)
AN ANALYTICAL STUDY OF THE QUALITY OF BANKING SERVICES AND THE
SATISFACTION LEVELS OF CUSTOMERS OF THE ICICI BANK (KONDAWA BR., PUNE)
USING SERQUAL MODEL
Daniel Penkar
Sukhdeo Nimangare
ABSTRACT
Private Banking is a concept which is new and fast emerging in the world of banking where changes have become
a necessity in order to survive in this competitive environment vis-à-vis not only from the public and private sector
banks but also from foreign banks. The objective of the research is to explore the various products, which a private
banker deals into and the systematic process used by the ICICI bank to make its services customer friendly. ICICI
started in Aug 2002 and since then it has been a remarkable success. Today there are enormous solutions to cater
client needs but what suits best to a client is where private banking fits in. Every client will have different needs, liking
and preferences. So, a customized portfolio for every client is the need of the day. This research will highlight more on
the products and services portfolio of the ICICI private banking, how they have changed or innovatively structured to be
attractive and competitive.
KEYWORD: Customer satisfaction, quality of banking services, Service quality, SERVQUAL.
INTRODUCTION
ICICI Bank is India's largest private sector bank with
total assets of ` 6,461.29 billion (US$ 103 billion) at
March 31, 2015 and profit after tax ` 111.75 billion (US$
1,788 million) for the year ended March 31, 2015. ICICI
Bank currently has a network of 4,450 Branches and
13,797 ATM's across India.
HISTORY:
ICICI Bank was initially advanced in 1994 by ICICI Limited,
an Indian money related establishment, and was its
entirely possessed auxiliary. ICICI's shareholding in ICICI
Bank was lessened to 46% through an open offering of
offers in India in financial 1998, a value offering as ADRs
recorded on the NYSE in monetary 2000, ICICI Bank's
obtaining of Bank of Madura Limited in an all-stock
amalgamation in financial 2001, and auxiliary market
deals by ICICI to institutional speculators in financial 2001
and financial 2002. ICICI was shaped in 1955 at the
activity of the World Bank, the Government of India and
delegates of Indian industry. The primary target was to
make an advancement money related foundation for
giving medium-term and long haul extend financing to
Indian organizations. In October 2001, the Boards of
Directors of ICICI and ICICI Bank endorsed the merger of
ICICI and two of its entirely possessed retail back
auxiliaries, ICICI Personal Financial Services Limited and
ICICI Capital Services Limited, with ICICI Bank. The merger
was endorsed by investors of ICICI and ICICI Bank in
January 2002, by the High Court of Gujarat at
Ahmedabad in March 2002, and by the High Court of
Judicature at Mumbai and the Reserve Bank of India in
April 2002. Subsequent to the merger, the ICICI
gathering's financing and managing an account
operations, both discount and retail, have been
coordinated in a solitary element.
INTRODUCTION TO BANKING IN INDIA:
The banking section will navigate through all the
aspects of the Banking System in India. It will discuss
upon the matters with the birth of the banking concept
in the country to new players adding their names in the
industry in coming few years.
© SBPIM
Director, S.B.Patil Institute of Management,Nigdi,Pune 411044
Contact no.: 9881522211 Email Id: [email protected]
Research Scholar, Tilak Maharashtra Vidyapeeth, Gultekadi Pune-37
Contact no.: 9960033555 Email Id: [email protected]
JOMAT Vol. 4 No.2 January – June 2016 ISSN No. 2278-9316
(10)
The banker of all banks, Reserve Bank of India (RBI),
the Indian Banks Association (IBA) and top 20 banks like
HDFC, AXIS, ICICI, CITI, etc. has been well defined under
three separate heads with one page dedicated to each
bank.
However, in the introduction part of the entire banking
cosmos, the past has been well explained under three
different heads namely:
• History of Banking in India
• Nationalization of Banks in India
• Scheduled Commercial Banks in India
The first deals with the history part since the dawn
of banking system in India. Government took major step
in the 1969 to put the banking sector into systems and
it nationalized 14 private banks in the mentioned year.
This has been elaborated in Nationalization Banks in
India. The last but not the least explains about the
scheduled and unscheduled banks in India. Section 42 (6)
(a) of RBI Act 1934 lays down the condition of scheduled
commercial banks.
HISTORY OF BANKING IN INDIA:
Without a sound and compelling saving money
framework in India it can't have a solid economy. The
banking arrangement of India ought be sans bother as
well as it ought to have the capacity to address new
difficulties postured by the innovation and whatever
other outer and inside factors. For the previous three
decades India's saving money framework has a few
remarkable accomplishments amazingly. The most striking
is its broad reach. It is never again kept to just
metropolitans or cosmopolitans in India. Truth be told,
Indian managing an account framework has come to try
and to the remote corners of the country. The
government's regular policy for Indian bank since 1969
has paid rich profits with the nationalization of 14 major
private banks of India. Not very far in the past, a
account holder needed to sit tight for a considerable
length of time at the bank counters for getting a draft
or for pulling back his own cash. Today, he has a
decision. Gone are days when the most productive bank
exchanged cash from one branch to other in two days.
Presently it is straightforward as texting or dials a pizza.
Cash has turned into the request of the day. The first
bank in India, however moderate, was set up in 1786.
From 1786 till today, the trip of Indian Banking System
can be segregated into three particular stages. They are
as mentioned below:
• Early phase from 1786 to 1969 of Indian Banks
• Nationalization of Indian Banks and up to 1991
prior to Indian banking sector Reforms.
• New phase of Indian Banking System with the
advent of Indian Financial and Banking Sector
Reforms after 1991.
SCHEDULED COMMERCIAL BANKS IN INDIA:
The commercial banking structure in India consists
of:
• Scheduled Commercial Banks in India
• Unscheduled Banks in India
Scheduled Banks in India constitute those banks
which have been fused into the Second Schedule of
Reserve Bank of India (RBI) Act, 1934. RBI therefore
fuses only those banks in this calendar which satisfy the
criteria set down vide fragment 42 (6) (an) of the Act.
As on 30th June, 1999, there were 300 booked banks in
India having a total system of 64,918 branches. The
planned business banks in India incorporate State bank
of India and its accomplices (8), nationalized banks (19),
outside banks (45), private division banks (32), co-agent
banks and territorial country banks. "Planned banks in
India" infers the State Bank of India constituted under
the State Bank of India Act, 1955 (23 of 1955), an
auxiliary bank as portrayed in the State Bank of India
(Subsidiary Banks) Act, 1959 (38 of 1959), a looking at
new bank constituted under fragment 3 of the Banking
Companies Act, 1970 (5 of 1970), or under region 3 of
the Banking Companies (Acquisition and Transfer of
Undertakings) Act, 1980 (40 of 1980), or whatever other
bank being a bank joined into the Second Schedule to
the Reserve Bank of India Act, 1934 (2 of 1934), yet
excludes a co-agent bank".
BANKING SERVICES IN INDIA:
With years, banks are likewise adding administrations
to their clients. The Indian keeping money industry is
going through a period of clients showcase. The clients
have more options in picking their banks. An competition
has been set up inside the banks working in India. With
hardened rivalry and headway of innovation, the
administrations given by banks have turned out to be all
the more simple and advantageous. The previous days
are observer to a hour hold up before withdrawing
money from accounts or a check from north of the
nation being cleared in one month in the south. This
segment of saving money manages the most recent
disclosure in the banking instruments alongside the
cleaned adaptation of their old systems.
BANK ACCOUNT:
The most common and first service of the banking
sector. There are different types of bank account in
Indian banking sector. The bank accounts are as follows:
• Bank Savings Account - Bank Savings Account can be
opened for eligible person / persons and certain
organizations / agencies (as advised by Reserve Bank
of India (RBI) from time to time)
• Bank Current Account - Bank Current Account can be
opened by individuals / partnership firms / Private
JOMAT Vol. 4 No.2 January – June 2016 ISSN No. 2278-9316
11
and Public Limited Companies / HUFs / Specified
Associates / Societies / Trusts, etc.
• Bank Term Deposits Account - Bank Term Deposits
Account can be opened by individuals / partnership
firms / Private and Public Limited Companies / HUFs/
Specified Associates / Societies / Trusts, etc.
• Bank Account Online - With the advancement of
technology, the major banks in the public and
private sector has facilitated their customer to open
bank account online. Bank account online is
registered through a PC with an internet connection.
The advent of bank account online has saved both
the cost of operation for banks as well as the time
taken in opening an account.
OBJECTIVES OF THE STUDY:
• To study consumer perceptions about service quality
dimensions using SERQUAL analysis.
• To develop strategies to enhance service quality
among Private Banks in ICICI Bank-Kondhawa Br
• To develop an instrument consisting of different
service quality dimensions that can be used to
measure the quality of Banking services.
• To study satisfaction levels of customers of ICICI
Bank Kondhawa Br. using Serqual model.
SCOPE OF THE STUDY:
This study is limited to the consumers with in Pune
city. The study will be able to reveal the preferences,
needs, satisfaction of the customers regarding the
banking services, It also help banks to know whether the
existing products or services they are offering are really
satisfying the customers’ needs.
II. TECHNOLOGY USED IN ICICI BANK
SERVQUAL TECHNOLOGY
Clearly, from a Best Value perspective the
measurement of service quality in the service sector
should take into account customer expectations of
service as well as perceptions of service. However, as
Robinson (1999) concludes: "It is apparent that there is
little consensus of opinion and much disagreement about
how to measure service quality". One service quality
measurement model that has been extensively applied is
the SERVQUAL model It has five generic dimensions or
factors and are stated as follows
Hypothesis 1
(1) Tangibles: Tangibility has a significant
relationship with the Kondhawa Br. customer's
satisfaction of quality services. Service quality
rating is not independent of variables such as
age, gender, employment, income, city, bank in
which account is held, type of bank, type of
account and duration of account held
Hypothesis 2
(2) Reliability: Reliability has a significant
relationship with the Kondhawa Br. customer's
satisfaction of quality of banking services
Reliability Can have a positive influence on
customer satisfaction. Ability to perform the
promised service dependably and accurately.
Hypothesis 3
(3) Responsiveness: Responsiveness has a positive
influence on customer satisfaction, Willingness to
help customers and provide prompt service.
Hypothesis 4
(4) Assurance: Assurance (including competence,
courtesy, credibility and security) has a positive
influence on customer satisfaction. Knowledge
and courtesy of employees and their ability to
inspire trust and confidence.
Hypothesis 5
(5) Empathy: Empathy has a positive influence on
customer satisfaction.
Example
In an examination directed by Bryslan and Curry (2001)
in a providing food organization, a sum of 140
questionnaires were dispersed to the greater part of the
earlier year's clients and 52 useable questionnaires were
returned, bringing about a 37 for each response rate. As
can be seen from Table I, all poll reactions were
negative and a general departmental weighted SERVQUAL
score of – 1.6 was recorded, showing a critical deficit in
meeting client desires over all administration ranges and
measurements. The rundown scores for each
measurement are appeared in Table I, with the weighted
normal scores per measurement having been totalled to
accomplish the general SERVQUAL score. As can be seen
from Table I, the most noteworthy crevice scores were
for Reliability and Responsiveness; this is genuine reason
for concern and gives a clear beginning stage to benefit
enhancements. As can be seen from the outcomes, the
client expects most from the Reliability measurement of
the providing food benefit. The generally low significance
of Tangibles could be inferable from the way that clients
know about the budgetary requirements which are run
of the mill in the neighborhood specialist financing
setting, and just don't expect much with regards to style;
rather, they connect more significance to the conveyance
parts of the administration. Clients apportioned to
Assurance the most reduced weighting, showing it to be
of slightest significance to them, yet they expect most
from this administration measurement.
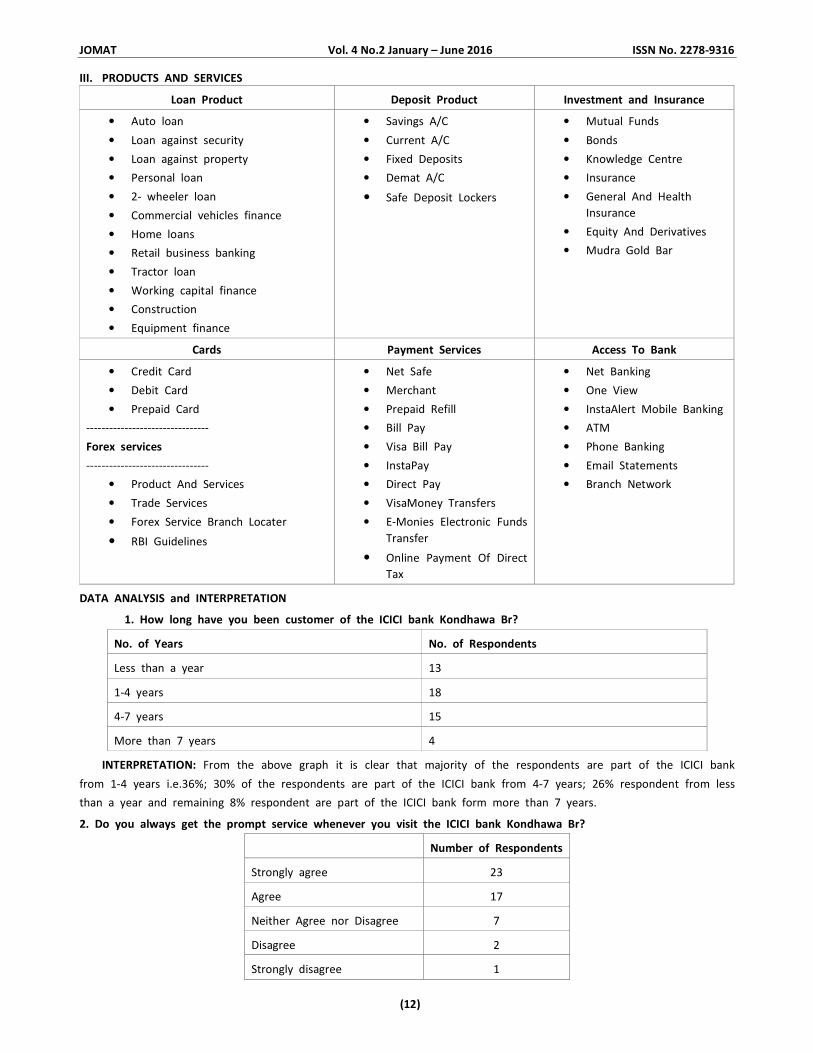
JOMAT Vol. 4 No.2 January – June 2016 ISSN No. 2278-9316
(12)
III. PRODUCTS AND SERVICES
Loan Product Deposit Product Investment and Insurance
• Auto loan
• Loan against security
• Loan against property
• Personal loan
• 2- wheeler loan
• Commercial vehicles finance
• Home loans
• Retail business banking
• Tractor loan
• Working capital finance
• Construction
• Equipment finance
• Savings A/C
• Current A/C
• Fixed Deposits
• Demat A/C
• Safe Deposit Lockers
• Mutual Funds
• Bonds
• Knowledge Centre
• Insurance
• General And Health
Insurance
• Equity And Derivatives
• Mudra Gold Bar
Cards Payment Services Access To Bank
• Credit Card
• Debit Card
• Prepaid Card
--------------------------------
Forex services
--------------------------------
• Product And Services
• Trade Services
• Forex Service Branch Locater
• RBI Guidelines
• Net Safe
• Merchant
• Prepaid Refill
• Bill Pay
• Visa Bill Pay
• InstaPay
• Direct Pay
• VisaMoney Transfers
• E-Monies Electronic Funds
Transfer
• Online Payment Of Direct
Tax
• Net Banking
• One View
• InstaAlert Mobile Banking
• ATM
• Phone Banking
• Email Statements
• Branch Network
DATA ANALYSIS and INTERPRETATION
1. How long have you been customer of the ICICI bank Kondhawa Br?
No. of Years No. of Respondents
Less than a year 13
1-4 years 18
4-7 years 15
More than 7 years 4
INTERPRETATION: From the above graph it is clear that majority of the respondents are part of the ICICI bank
from 1-4 years i.e.36%; 30% of the respondents are part of the ICICI bank from 4-7 years; 26% respondent from less
than a year and remaining 8% respondent are part of the ICICI bank form more than 7 years.
2. Do you always get the prompt service whenever you visit the ICICI bank Kondhawa Br?
Number of Respondents
Strongly agree 23
Agree 17
Neither Agree nor Disagree 7
Disagree 2
Strongly disagree 1
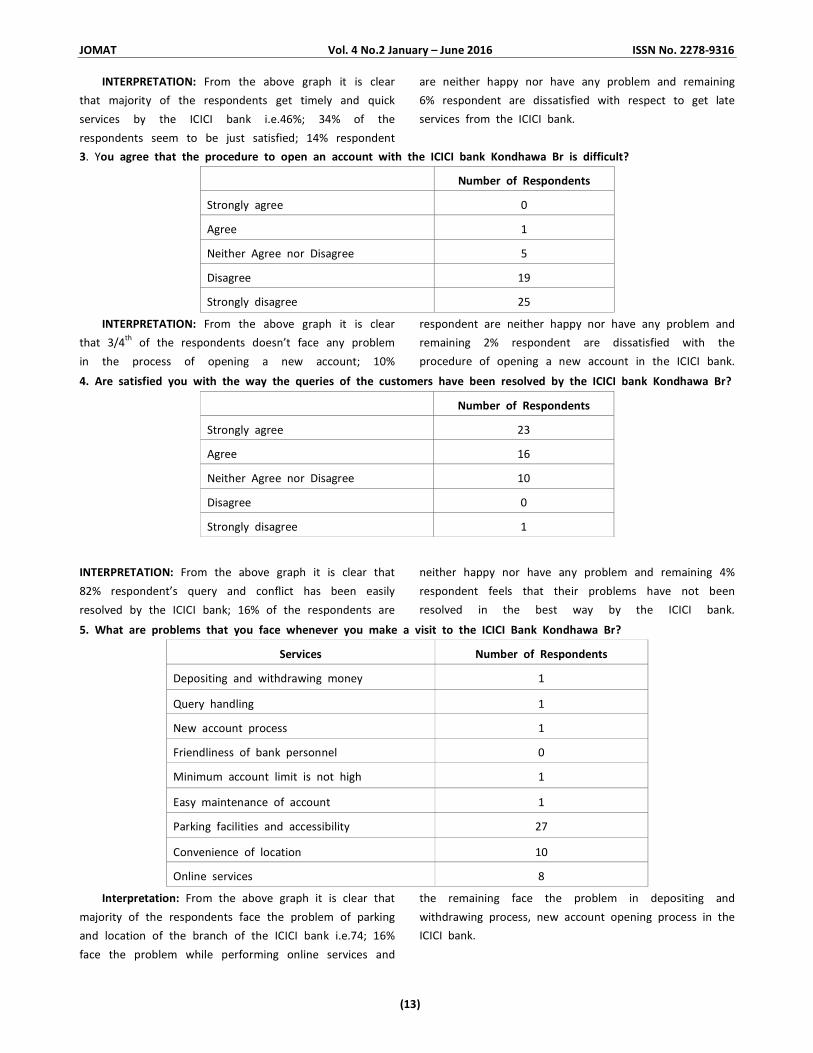
JOMAT Vol. 4 No.2 January – June 2016 ISSN No. 2278-9316
(13)
INTERPRETATION: From the above graph it is clear
that majority of the respondents get timely and quick
services by the ICICI bank i.e.46%; 34% of the
respondents seem to be just satisfied; 14% respondent
are neither happy nor have any problem and remaining
6% respondent are dissatisfied with respect to get late
services from the ICICI bank.
3. You agree that the procedure to open an account with the ICICI bank Kondhawa Br is difficult?
Number of Respondents
Strongly agree 0
Agree 1
Neither Agree nor Disagree 5
Disagree 19
Strongly disagree 25
INTERPRETATION: From the above graph it is clear
that 3/4th
of the respondents doesn’t face any problem
in the process of opening a new account; 10%
respondent are neither happy nor have any problem and
remaining 2% respondent are dissatisfied with the
procedure of opening a new account in the ICICI bank.
4. Are satisfied you with the way the queries of the customers have been resolved by the ICICI bank Kondhawa Br?
Number of Respondents
Strongly agree 23
Agree 16
Neither Agree nor Disagree 10
Disagree 0
Strongly disagree 1
INTERPRETATION: From the above graph it is clear that
82% respondent’s query and conflict has been easily
resolved by the ICICI bank; 16% of the respondents are
neither happy nor have any problem and remaining 4%
respondent feels that their problems have not been
resolved in the best way by the ICICI bank.
5. What are problems that you face whenever you make a visit to the ICICI Bank Kondhawa Br?
Services Number of Respondents
Depositing and withdrawing money 1
Query handling 1
New account process 1
Friendliness of bank personnel 0
Minimum account limit is not high 1
Easy maintenance of account 1
Parking facilities and accessibility 27
Convenience of location 10
Online services 8
Interpretation: From the above graph it is clear that
majority of the respondents face the problem of parking
and location of the branch of the ICICI bank i.e.74; 16%
face the problem while performing online services and
the remaining face the problem in depositing and
withdrawing process, new account opening process in the
ICICI bank.
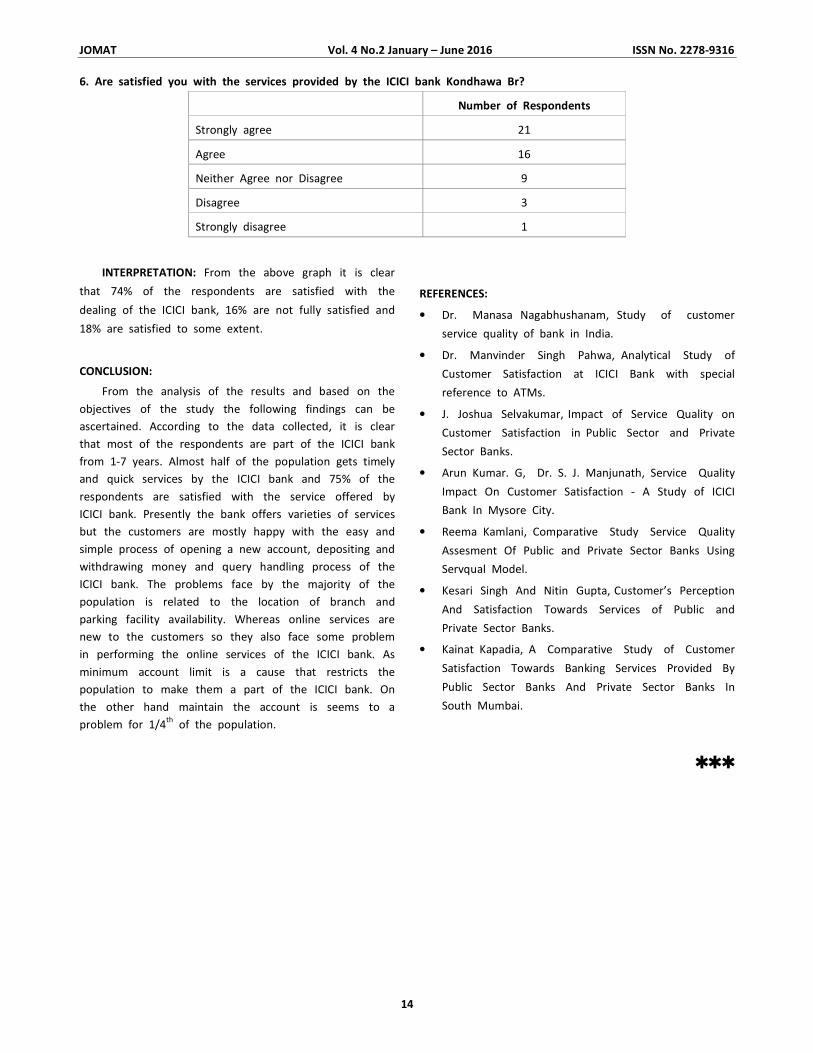
JOMAT Vol. 4 No.2 January – June 2016 ISSN No. 2278-9316
14
6. Are satisfied you with the services provided by the ICICI bank Kondhawa Br?
Number of Respondents
Strongly agree 21
Agree 16
Neither Agree nor Disagree 9
Disagree 3
Strongly disagree 1
INTERPRETATION: From the above graph it is clear
that 74% of the respondents are satisfied with the
dealing of the ICICI bank, 16% are not fully satisfied and
18% are satisfied to some extent.
CONCLUSION:
From the analysis of the results and based on the
objectives of the study the following findings can be
ascertained. According to the data collected, it is clear
that most of the respondents are part of the ICICI bank
from 1-7 years. Almost half of the population gets timely
and quick services by the ICICI bank and 75% of the
respondents are satisfied with the service offered by
ICICI bank. Presently the bank offers varieties of services
but the customers are mostly happy with the easy and
simple process of opening a new account, depositing and
withdrawing money and query handling process of the
ICICI bank. The problems face by the majority of the
population is related to the location of branch and
parking facility availability. Whereas online services are
new to the customers so they also face some problem
in performing the online services of the ICICI bank. As
minimum account limit is a cause that restricts the
population to make them a part of the ICICI bank. On
the other hand maintain the account is seems to a
problem for 1/4th
of the population.
REFERENCES:
• Dr. Manasa Nagabhushanam, Study of customer
service quality of bank in India.
• Dr. Manvinder Singh Pahwa, Analytical Study of
Customer Satisfaction at ICICI Bank with special
reference to ATMs.
• J. Joshua Selvakumar, Impact of Service Quality on
Customer Satisfaction in Public Sector and Private
Sector Banks.
• Arun Kumar. G, Dr. S. J. Manjunath, Service Quality
Impact On Customer Satisfaction - A Study of ICICI
Bank In Mysore City.
• Reema Kamlani, Comparative Study Service Quality
Assesment Of Public and Private Sector Banks Using
Servqual Model.
• Kesari Singh And Nitin Gupta, Customer’s Perception
And Satisfaction Towards Services of Public and
Private Sector Banks.
• Kainat Kapadia, A Comparative Study of Customer
Satisfaction Towards Banking Services Provided By
Public Sector Banks And Private Sector Banks In
South Mumbai.
���
JOMAT Vol. 4 No.2 January – June 2016 ISSN No. 2278-9316
(15)
EUROPEAN SLOWDOWN AN INDIAN PERSPECTIVE
Narendra Patil
ABSTRACT
With the advent of recession in the market, most of the companies have seen a dramatic change in the business world over.
The slowdown in emerging economies is posing a major threat to the recovery in euro area, the European commission quoted
that it lowered its 2016 growth forecast for the 19 nation region and warned that inflation will be much lower than expected.
Inflationary control measures may have been effective in the past, but are not suitable to respond to the rapid changes in time,
cost and delivery of Information today’s businesses requires.
European slowdown has brought following changes in global market which is listed below:
1) Deteriorating inflation outlook
2) Global financial market volatility
3) Labour market reforms.
4) Organizational competitiveness.
KEY WORDS: Deteriorating, inflation, volatility.
INTRODUCTION:
Survival of the fittest has become the norm of the day.
Our Indian society is facing complex business, political,
scientific, technological, health and environmental issues. Our
businesses are engaged in intense competition and constant
renewal. In the fast developing Information Technology world
we have tremendous opportunities and risks.
Globalization has led to diverse workplaces culture and
communities, who are force to work together in common
environment. This has resulted as turning point for social
networking. Therefore, what is crucial for employees is
ingenuity, agility and skills for facing the high level of work
competitiveness.
Our ability to compete as a nation and to attract growth
for industries and create jobs—demands a fresh approach to
education. We need to recognize that a 21st
century
education has to be very competitive for building strong
economy.
Today’s business is very sensitive. Majority nations have
agreed and adopted the liberal policies to adapt with the
needs and policies of other nations due to which an event in
one nation makes sudden impact on other nations of the
world. History has proven in past that nations develop due to
development of industries and education which leads to
economic development. The industry requires skilled and
knowledgeable manpower that will be useful for the industry.
In 21st
century, we need to build our Indian economy
which is driven by innovation and knowledge.
CHALLENGES FACED DUE TO EUROPEAN MARKET
SLOWDOWN.
Volatility of Markets
I. Customer focus: There must be focused work flow teams
for key products, customers which will be functionally
structured.
II. Best practices in organization: There must be broad
implementation of best practices for customer service
and systematic customer surveys.
III. Continuous Improvement: There must be sustainable
improvement in quality with speedy response to
customer needs.
Uncertainty in global economy
IV. Strategic planning: The organizations should be able to
make efficient and effective use of available resources
like Men, Machinery, Material and Money
V. Changes in Production Design: There must be a cross
functional teams consisting of experts and associates to
synchronize rate of demand for key product.
VI. Perrenial Training: There must be training on multi-
skilling key managers and teams on process
improvement.
Complexity of market situations
VII. Improvement of Quality / Process: There must be
training in and use of basic tools of statistical process
control, problem solving and safety.
© SBPIM
Research Scholar, Department of Management Studies (PUMBA),SavitribaiPhule Pune University, Pune 411007.
Contact no.:9890620981 Email Id: [email protected]
JOMAT Vol. 4 No.2 January – June 2016 ISSN No. 2278-9316
(16)
VIII. Control Measures: There must be alignment of
performance measures with universal customer wants.
Organizations wide focus on internal rather than
customer centric metrics.
Ambiguity of Consumer behaviour
IX. Capacity changes: There must be improvement in
present capacity before new equipment and automation
is procured. Efforts should be to seek simple, movable,
scalable, low cost, focused equipment.
X. Campaign for Promotion: There must be effort to
promote, market and sell every improvement.
FOUR PHASES FOR SUCCESSFUL IMPLEMENTATION OF
MAKE IN INDIA:
A) Anticipate the Change
One must understand the Institutional change that needs
to be implemented. This needs to be carried out from the top
of the organization where one understands the Vision of the
organization and the required changes.
Professionals across sectors should be able to find a
broad range of objectives main
- Enhancing quality of learning of employees.
- Enhancing cost-effectiveness, generating institutional
income
- Enhancing competitiveness, generating institutional
income
- Enhancing flexibility.
B) Understand the consequences of issues and action
In order to realize the strategic approach, professionals
across the sectors need to know the specific need of the
organization. It is important to know that when a change
needs to be executed in an organization, the management
must identify what are the requirements and the appropriate
needs for this change to happen.
Professionals across the various sectors can carry out the
above need analysis before introducing or implementation of
any new technology in their organizations.
C) Prepare for Alternatives Realities and Challenges
Professionals need to plan the implementation of new
system in the organization. Having a profound inside
situational context is a good basis for planning and designing
of the implementation process. In addition to planning the
technical, financial and organizational infrastructure, the
human factor is a critical success factor. An innovation will
only be achieved, if the key stakeholders are motivated and
competent to manage the change. Some planning
considerations to be taken are:
D) Appreciate the interdependent variables.
Professionals from various sectors need to understand
that the implementation of a program involves a lot of effort
and this helps in creating effective feedback mechanisms
when one can test the viability of the program.
A strong planning is good basis for the final
implementation of the new technology in any organization.
Professionals must become strategic partners.
CONCLUSION:
In current times India’s credibility in global economy is
stronger than ever before. There is a visible momentum,
energy and optimism in our workforce across sectors. Make
in India has opened investment doors. Many enterprises are
adopting the mantra. Let’s hope that the world’s largest
democracy is on the way of becoming the world’s most
powerful economy.
REFERENCES:
1. www.mea.gov.in
2. www.bis.org
3. www.eesc.europa.eu
���
JOMAT Vol. 4 No.2 January – June 2016 ISSN No. 2278-9316
(17)
MAKE IN INDIA
Abhijeet B. Shah
ABSTRACT
Make in India is a major initiative undertaken by the ruling government to boost the growth of various sectors like
manufacturing, power, mining, automotive, textile, tourism and hospitality, electronics and IT sector etc. With the advent of
globalization, most of the companies have seen a dramatic rise in the amount of data employees require for performing their
routine tasks. Traditional approaches to skill development will need to undergo change as it had been effective in the past, but
are not suitable to respond to the rapid changes in time, cost and delivery of Information today’s businesses requires.
Make in India has brought following changes which is listed below:
1) Task specific information
2) Simplicity and Accuracy
3) Efficiency
4) Facilitates high level of work performance with less human intervention.
5) Better organizational competitiveness.
KEY WORDS: Accuracy, efficiency, intervention, specific, simplicity.
INTRODUCTION
Our Indian society is facing complex business, political,
scientific, technological, health and environmental issues. Our
businesses are engaged in intense competition and constant
renewal. In the fast developing globalized world we have
tremendous opportunities and risks.
Globalization has led to diverse workplaces culture and
communities, who are force to work together in common
environment. This has resulted as turning point for Make in
India theme. Therefore, what is crucial for employees is
ingenuity, agility and skills for facing the high level of work
competitiveness.
Our ability to compete as a nation and to attract growth
for industries and create jobs—demands a fresh approach to
education is the main focus of Make in India. We need to
recognize that a Make in India initiative has given us the
platform to be very competitive for building strong economy.
Today’s business is very sensitive. Majority nations have
agreed and adopted the liberal policies to adapt with the
needs and policies of other nations due to which an event in
one nation makes sudden impact on other nations of the
world. History has proven in past that nations develop due to
development of industries and education which leads to
economic development. The industry requires skilled and
knowledgeable manpower that will be useful for the industry.
In 21st
century, we need to build our Indian economy
which is driven by innovation and knowledge for which
‘Make In India’
Make in India initiative was launched by Prime Minister
in September 2014 as part of a wider set of nation-building
initiatives. Devised to transform India into a global design and
manufacturing hub, Make in India was a timely response to a
critical situation.
SALIENT FEATURES OF MAKE IN INDIA.
Over many decades, the industrial economy has seen a
paradigm shift i.e. from manufacturing to a service economy
which is driven by information, knowledge and innovation.
For effective implementation of Make in India, it is
essential that professional understands the few dimensions
of World class practices based on Principles of Customer
focus, employee driven and data based performance as
stated below:
Steps to be followed by various sectors for achieving the
desired results:
I. Team up with customers: There must be focused work
flow teams for key products, customers which will be
functionally structured.
II. Capture / use customer, competitive, best practices
information: There must be broad implementation of
best practices for customer service and systematic
customer surveys.
III. Continual, rapid improvement in customer demands:
There must be sustainable improvement in quality with
speedy response to customer needs.
IV. Whole workforce involvement in change and strategic
planning: The organizations should be able to make
efficient and effective use of available resources like
Men, Machinery, Material and Money.
© SBPIM
Research Scholar, S. B. Patil Institute of Management, Nigdi, Pune 411044.
Contact no.8888832945 Email Id: [email protected]
JOMAT Vol. 4 No.2 January – June 2016 ISSN No. 2278-9316
18
V. Production Design and Operational change: There must
be a cross functional teams consisting of experts and
associates to synchronize rate of demand for key
product.
VI. Continually train the HR/IR professionals for new roles:
There must be training on multi-skilling key managers
and teams on process improvement.
VII. Quality and Process Improvement by focusing
continually on reducing variations and mishaps: There
must be training in and use of basic tools of statistical
process control, problem solving and safety.
VIII. Information for operations and control: There must be
alignment of performance measures with universal
customer wants. Organizations wide focus on internal
rather than customer centric metrics.
IX. Improvement in production capacity: There must be
improvement in present capacity before new equipment
and automation is procured. Efforts should be to seek
simple, movable, scalable, low cost, focused equipment.
X. Marketing and promotion of products–There must be
effort to promote, market and sell every improvement.
FOUR PHASES FOR SUCCESSFUL IMPLEMENTATION OF
MAKE IN INDIA:
A) Strategic Process
One must understand the Institutional change that needs
to be implemented. This needs to be carried out from the top
of the organization where one understands the Vision of the
organization and the required changes.
Professionals across sectors should be able to find a
broad range of objectives main
- Methodical – enhancing quality of learning of employees.
- Efficiency – enhancing cost-effectiveness, generating
institutional income
- Business – enhancing competitiveness, generating
institutional income
- Organizational – enhancing flexibility.
B) Plan Need Analysis
In order to realize the strategic approach, professionals
across the sectors need to know the specific need of the
organization. It is important to know that when a change
needs to be executed in an organization, the management
must identify what are the requirements and the appropriate
needs for this change to happen.
Professionals across the various sectors can carry out the
above need analysis before introducing or implementation of
any new technology in their organizations.
C) Design and Partnering
Professionals need to plan the implementation of new
system in the organization. Having a profound inside
situational context is a good basis for planning and designing
of the implementation process. In addition to planning the
technical, financial and organizational infrastructure, the
human factor is a critical success factor. An innovation will
only be achieved, if the key stakeholders are motivated and
competent to manage the change. Some planning
considerations to be taken are:
� Professionals need to identify new technological
implementation for the organizations.
� Provide learner development program e.g. workshops,
certificates etc.
� Professionals in various sectors need establish or adapt
quality management concept to reward good – practice
projects.
� Professionals need ensure continuous improvements
processes and sustain the same.
� Professionals need set up target-group specific
communication plan, considering various communication
vehicles and plan a two-way communication in order to
get feedback and raise commitment of the stakeholders.
� Professionals need to foster knowledge exchange across
sectors and globally.
� Professionals need to establish central support structures
to reduce technical aversions and challenges.
D) Implement, Improve and Progress
Professionals from various sectors need to understand
that the implementation of a program involves a lot of effort
and this helps in creating effective feedback mechanisms
when one can test the viability of the program.
A strong planning is good basis for the final
implementation of the new technology in any organization.
Professionals must become strategic partners.
CONCLUSION
In current times India’s credibility in global economy is
stronger than ever before. There is a visible momentum,
energy and optimism in our workforce across sectors. Make
in India has opened investment doors. Many enterprises are
adopting the mantra. Let’s hope that the world’s largest
democracy is on the way of becoming the world’s most
powerful economy.
REFERENCES:
1. Dr. Alokakumar Goyal Make In India – A long felt of the
Indian Economy.
2. www.makeinindia.com
3. www.economictimes.com
4. www.narendramodi.in
���
JOMAT Vol. 4 No.2 January – June 2016 ISSN No. 2278-9316
(19)
MAKE IN INDIA-AN INITIATIVE FOR SUSTANABLE DEVELOPMENT
Harshada Thorat
Daniel Penkar
ABSTRACT:
Experts, not only at national but at global level believe that India has potential to become super power in near future
because of demographic dividend and because of growing economy. But it has overcome and resolves certain issues like low
productivity, low performance, lack of work skills among the youths, lack of commitment and so on. To overcome these
challenges the present union government has taken certain initiatives including ‘Make in India’ initiative. The initiative Make in
India intends to develop and create favorable atmosphere in the country to motivate Indian and foreign entrepreneur to invest in
certain units of manufacturing sector to generate employment for the youths. Certain schemes are declared to improve
productivity of manufacturing and agricultural sectors and to increase contribution to gross domestic product (GDP).If Make in
India program implemented properly, it can become the right initiative of the government for sustainable development of India.
KEY WARDS: Make in India, Demographic Dividend, Manufacturing Sector, Gross Domestic Product, Manufacturing Skill,
Opportunities. Foreign Direct Investment, Key Sectors, Industrialization, Sustainable Development.
OBJECTIVES OF THE STUDY :
1. To study Make in India program of Government as an
initiative for Sustainable Development
2. To study the challenges in Make in India and to suggest
the remedies to overcome the challenges.
INTRODUCTION:
India is recognized in the world as a country of larges
young population which has enormous working capacity and
huge productivity potentials. It has the third largest higher
education system with more than 30 billion enrolment of
learners. But it has very low productivity in industrial and
agricultural sector contributing around 16 percent and 4
percent respectively to the gross domestic product (GDP).
The country has to increase its productivity in these two
important sectors and has to create its own identity at the
global level. Most productive countries in the world are able
to generate very high Gross Domestic Product (GDP) having
less population and less percentage of working population as
compared to India. As per the analysis made by the
Organization for Economic Cooperation and Development
(OECD), most productive country in the world was able to
generate 45.71 pound per hour per person with 7 hours of
working per day during the year 2014-15. Whereas, India was
able to produce only around 2.686 British pound per hour per
person for 8 hours of working in a day during the same year.
Most productive countries in the world have been giving
importance to human capital and quality education due to
which those countries have very high level of innovation and
low unemployment. India being a country of huge young
population by giving priority to quality education to
transform the youngsters into innovative working class can
become a part of most productive countries in the world.
India has huge potentials for its development with the help
of its population, particularly young population. It has huge
area of agricultural land with favorable climate for
agricultural production and two third of its population works
in agricultural industry. India is recognized as one of those
few countries who have a capacity to develop and launch
satellites in the space. Indian economy has become one of
the fastest growing in the world with a growth rate of around
6 percent per annum. Work force in India is the second
largest in the world with 486.6 million workers. It is the
second most favourable outsourcing destination in the world
after United States of America and third largest smart phone
users after China and United States. India exported around 25
million Indian intellectuals who are working in foreign
countries and contributing for economy of other countries. It
is the biggest market place for the products of developed
countries. Hence entrepreneurs and business houses from
developed countries are interested in investing their
resources in India. It is an opportunity to India to exploit the
situation to make use of foreign resources for industrial and
economic development to achieve the concept of Make in
India. Rural India is urbanizing and around one third of the
total population stays in urban areas. Standard of living and
the needs of urban middle class are improving and there is
increasing demand for quality products and services and
spending capacity of Indian urbanites has also been
increasing due to increased earnings. The significance of
foreign trade has been admitted from the inception of
modern economic thinking.
© SBPIM
Research Scholar, S.B.Patil Institute of Management, Nigdi, Pune 411007.
Contact no.:9527296561 Email Id: [email protected]
Director, S.B.Patil Institute of Management, Nigdi, Pune 411007.
Contact no.:9881522211 Email Id: [email protected]
JOMAT Vol. 4 No.2 January – June 2016 ISSN No. 2278-9316
(20)
It has gained more importance when classical economists
propounded the theory of comparative cost advantage which
tells us that international trade is favourable for the trading
partners (Mahajan, 1992). Nations can improve their
economic conditions by taking part in foreign trade. The
foreign trade policy of the country is characterized by a
continuous and creative renewal of its goals, means, and
methods in accordance with the concrete requirements of
the national economy. In a most general sense, the foreign
trade policy of a given country consists in a system of means
and methods used to achieve its basic economic goals in its
trade relations with foreign countries. This system is
determined by the existing concrete historical, socio-political,
and economic conditions (Penko, 1970).Make in India is a
major new national programme of the Government of India
designed to facilitate investment, foster innovation, enhance
skill development, protect intellectual property and build best
in class manufacturing infrastructure in the country. The
primary objective of this initiative is to attract investments
from across the globe and strengthen India’s manufacturing
sector. It is being led by the Department of Industrial Policy
and Promotion (DIPP), Ministry of Commerce and Industry,
Government of India. The Make in India programme is very
important for the economic growth of India as it aims at
utilizing the existing Indian talent base, creating additional
employment opportunities and empowering secondary and
tertiary sector. The programme also aims at improving India’s
rank on the Ease of Doing Business index by eliminating the
unnecessary laws and regulations, making bureaucratic
processes easier, making the government more transparent,
responsive and accountable. Make in India initiative is an
honest attempt to revive the fortunes of Industry /
Manufacturing sector. Revival of Industry sector is key to
revival of Indian economy. In short, we need to increase the
contribution of Industry / Manufacturing sector in Indian
GDP. It doesn’t mean that Government will loose focus in
service sector. Digital India will help to maintain contribution
of Service sector but manufacturing / industry sector has to
grow at much faster pace to out-pace service sector. It is not
an easy task. Government should target to increase
contribution of Industry /manufacturing from existing 16% to
35% in next 5 years. Make in India will help to achieve this
goal but it comes with its own set of challenges.
Manufacturing is capital and resources intensive sector which
will require conducive environment for business. Labour
issues will be major hurdle which the government is trying to
handle through labour reforms. Besides this, a major push is
required to upgrade infrastructure of country. Government
has also set up 10,000 Crore start up fund to encourage
entrepreneurship. Basically objective is to create ecosystem
of small industries in periphery of manufacturing hub similar
to Maruti model. Government will provide all the approvals
under Make in India initiate in a time bound manner through
single online portal. The logo for the Make In India campaign
is a an elegant lion, inspired by the Ashoka Chakra and
designed to represent India's success in all spheres.
REVIEW OF LITERATURE:
Since the year 2009, manufacturing sector of India is
showing reverse trend with its share of GDP falling from2.2 to
2.0 (Bhattacharya, Bruce, and Mukherjee, 2014). It is
undoubtedly true that, if India aspires to be a powerful nation
by 2030, it needs a strong sustainable growth which can only
be achieved if India creates a strong manufacturing base
(Shah, 2013).The existing labour laws are less employment
friendly and biased towards the organized labour force; they
protect employment and do not encourage employment or
employability; they give scope for illegitimate demands of the
Trade Unions and are a major cause for greater acceptance of
capital-intensive methods in the organized sector (Datta and
Milly, 2007). Employers complain of major skills gaps, and
fewer than25% of graduates are estimated to be employable
in manufacturing sector. (“The Manufacturing Plan,”). India’s
underdeveloped infrastructure is the top most issue faced by
Japanese manufacturers (“Make In India: Opportunities and
Challenges,” 2015).Senior managers of manufacturing
companies consistently rank difficulties in acquiring land as
one of the top priority areas to be tackled by the government
(Bhattacharya, Bruce, and Mukherjee, 2014). The share of
manufactured goods in total merchandise exports fell from
77% in 2003 to 65% in 2013 (Joumard, Sila, and Morgavi,
2015). As per the statement of General Dwight D. Eisenhower
the former President of USA, "What counts is not necessarily
the size of the dog in the fight – it’s the size of the fight in the
dog". ‘Make in India’ is a dream campaign launched by the
Prime Minister of India to boost this sector so that India can
present its candidature for becoming the Global Leader
(Chattopadhyay, 2015).
CONCEPPUAL BACKGROUND:
1. MAKE IN INDIA:
India in-spite of having potentials to grow and capacity to
become a developed country in the world it has not been
able to exploit it’s potentials to the fuller extent. There are
different parameters used to measure the development of a
country and the rate of Gross Domestic Product (GDP). It is
one of the important parameter to measure economic
development. Indian economy during the year 2012-13 was
growing at a rate of around 4.5 percent which was lowest in a
JOMAT Vol. 4 No.2 January – June 2016 ISSN No. 2278-9316
21
decade. This lowest growth rate was mainly due to poor
performance of manufacturing and agriculture sectors. And
such lowest economic growth rate created confusions for the
global investors whether investment in Indian is an
opportunity or risk. To remove the confusion and to create
confidence among the foreign investors and Indian
entrepreneurs India central government launched a scheme
Make in India in September 2014.It is initiative for the
sustainable development of the nation.
2. SUSTAINABLE DEVELOPMENT:
Sustainable development is defined as a process of
meeting human development goals while sustaining the
ability of natural systems to continue to provide the natural
resources and ecosystem services upon which the economy
and society depends. While the modern concept of
sustainable development is derived most strongly from 1987.
In Brundtland Report, it is rooted in earlier ideas about
sustainable forest management and twentieth century
environmental concerns. As the concept developed, it has
shifted to focus more on economic development, social
development and environmental protection for future
generations.
Sustainable development is the organizing principle for
sustaining finite resources necessary to provide for the needs
of future generations of life on the planet. It is a process that
envisions a desirable future state for human societies in
which living conditions and resource-use continue to meet
human needs without undermining the "integrity, stability
and beauty" of natural biotic systems. It was suggested that
"the term 'sustainability' should be viewed as humanity's
target goal of human-ecosystem equilibrium while
'sustainable development' refers to the holistic approach and
temporal processes that lead us to the end point of
sustainability."
OBJECTIVES OF MAKE IN INDIA:
Make in India is a scheme launched by central
government with specific objective mainly to boost
Sustainable development of India by providing certain
facilities and incentives to the Indian and foreign investors.
Some of the important objectives are given as under:
1. Encourage multi-national and national companies to
manufacture products and services in India.
2. Creation of jobs for unemployed youths and skills
enhancement for 25 identified sectors of economy which
are high employment generating sectors.
3. Aiming at production of high quality and high standard
products of global level standards and minimizing the
impact on the environment.
4. Attract foreign capital and technological investment in
industrial sector.
5. Promoting India as an investment destination and
establishing the country as a global hub for
manufacturing, design and innovation.
6. Relaxation of rules and regulations and simplification of
licensing procedure.
INITIATIVES:
1. Under Make in India scheme the central government has
taken some specific and clear initiatives to achieve the
important objective of demographic dividend.
2. Established a separate department “Department of
Industrial Policy and Promotion” (DIPP) to work out on
the initiatives for make in India.
3. Established Investor Facilitation Cell (IFC) in September
2014 to assist investors in seeking regulatory approvals,
handling services through the pre-investment phase,
execution and after care support
4. Various important sectors have been opened for
investments like Defence, Indian Railways, Space etc.
with relaxed policies to facilitate for investments and
ease of doing business
5. Opening up of Industrial corridors across various regions
of the country for better transport system to carry the
goods. Central government has already declared
development of five corridors in the country. (Delhi –
Mumbai, Amritsar – Kolkata, Bangluru – Mumbai,
Chennai - Bangulur and Vizag – Channai). Industrial
corridors buildand provide developed land and quality
infrastructure for industrial townships, creation of areas
with cluster of manufacturing or industry. These
corridors will be having rail and road connectivity for
faster movement of material at affordable cost.
6. Identified 25 industrial units which are labour intensive
and can generate more jobs for demographic dividend.
7. Simplified labour laws mainly for small and medium scale
enterprises to minimize visits of inspectors to the
factories.
MAJOR HIGHLIGHTS OF THE MAKE IN INDIA PLANS ARE AS
FOLLOW:
1. Invest India cell: An investor facilitation cell set up
by the government will act as the first reference point for
guiding foreign investors on all aspects of regulatory and
policy issues and to assist them in obtaining regulatory
clearances. The cell will also provide assistance to foreign
investors from the time of their arrival in the country to the
time of their departure. The information and facts that
potential investors need for each sector have been compiled
in the brochures.
JOMAT Vol. 4 No.2 January – June 2016 ISSN No. 2278-9316
22
2. Consolidated services and faster security
clearances: All central government services are being
integrated with an e-Biz single window online portal while
states have been advised to introduce self-certification. The
ministry of home affairs has been asked to give all security
clearances to investment proposals within 3 months.
3. Dedicated portal for business queries: A dedicated
cell has been created to answer queries from business
entities through a newly created web portal
([http://www.makeinindia.com). The back-end support team
of the cell would answer specific queries within 72 hours. The
portal also boasts of an exhaustive list of FAQs answers.
4. Interactions with the users/visitors: A pro-active
approach will be deployed to track visitors for their
geographical location, interest and real time user behaviour.
Subsequent visits will be customized for the visitor based on
the information collected. Visitors registered on the website
or raising queries will be followed up with relevant
information and newsletter.
5. Easing policies and laws: A vast number of defence
items have been de-licensed and the validity of industrial
license has been extended to three years.
6. Labour – Skill Development: With a view to
providing flexibility in working hours and increased intake of
apprentices for on the job training, the government plans to
introduce a single labour law for small industries. An advisory
has been sent to all departments/state governments to
simplify and rationalize regulatory environment (which
includes online filing of all returns in a unified form).
KEY SECTORS:
Make in India focuses on the following twenty-five
sectors of the economy:
1. Automobiles
2. Automobile Components
3. Aviation
4. Biotechnology
5. Chemicals
6. Construction
7. Defence manufacturing
8. Electrical Machinery
9. Electronic systems
10. Food Processing
11. Information Technology and Business Process
Management
12. Leather
13. Media and Entertainment
14. Mining
15. Oil and Gas
16. Pharmaceuticals
17. Ports and Shipping
18. Railways
19. Renewable Energy
20. Roads and Highways
21. Space and astronomy
22. Textiles and Garments
23. Thermal Power
24. Tourism and Hospitality
25. Wellness.
FOREIGN DIRECT INVESTMENT:
Foreign direct investment (FDI) in India is the major
monetary source for economic development in India. Foreign
companies invest directly in fast growing private Indian
businesses to take benefits of cheaper wages and changing
business environment of India. Economic liberalization
started in India in wake of the 1991 economic crisis and since
then FDI has steadily increased in India. It were Manmohan
Singh and P. V. Narasimha Rao who brought FDI in India,
which subsequently generated more than one crore jobs.
According to the Financial Times, in 2015 India overtook
China and the US as the top destination for the Foreign Direct
Investment. In first half of the 2015, India attracted
investment of $31 billion compared to $28 billion and $27
billion of China and the US respectively. As per the new Govt.
Policy 100% FDI is permitted in all the above sectors, except
for space (74%), defence (49%) and news media
(26%).Foreign direct investment (FDI) in India has received a
dramatic boost from the launch of the Make in India
initiative, according to the latest Economic Survey. After the
September 2014 launch of the initiative, which seeks to
promote manufacturing and attract foreign investment, there
was an almost 40% increase in FDI inflows from October 2014
to June 2015 over the year-ago period. Under the
programme, the government has awarded 56 defence
manufacturing permits to private sector entities in the past
one year, after allowing 49% FDI in the defence sector in
August 2014, compared with 47 granted in the preceding
three years. Entities from several countries such as Japan,
China, France and South Korea announced their intention to
invest in India in various industrial and infrastructure
projects.
The concept of Make in India has really succeeded as it
added more employment. With this, India has now become a
vibrant market for manufacturers. For the products that are
made out of the initiative, we have a strong domestic market
with increasing demand The major objectives behind the
Make in India initiative are job creation and skill
enhancement in 25 sectors of the economy, including
automobiles, aviation, biotechnology, chemicals,
construction, defence manufacturing, electrical machinery,
electronic systems and mining. According to the Department
of Industrial Policy and Promotion, FDI inflows under the
approval route (which requires prior government permission)
JOMAT Vol. 4 No.2 January – June 2016 ISSN No. 2278-9316
23
increased by 87% during 2014-15 with an inflow of $2.22
billion. More than 90% of FDI was through the automatic
route. Also in 2014-15, foreign institutional investment rose
by an unprecedented 71.7% to $40.92 billion.
SOME MAJOR SECTORS FOR FOREIGN DIRECT INVESTMENT:
During 2014–15, India received most of its FDI from
Mauritius, Singapore, Netherlands, Japan and the US. On 25
September 2014, Government of India launched Make in
India initiative in which policy statement on 25sectors were
released with relaxed norms on each sector. Following are
some of major sectors for Foreign Direct Investment.
1. Infrastructure: 10% of India's GDP is based on
construction activity. Indian government has plans to invest
$1trillion on infrastructure from 2012–2017. 40% of this $1
trillion is to be funded by private sector. 100% FDI under
automatic route is permitted in construction sector for cities
and townships.
2. Automotive: FDI in automotive sector was
increased by 89% between April 2014 to February 2015. India
is 7th
largest producer of vehicles in the world with 17.5
million vehicles annually. 100% FDI is permitted in this sector
via automatic route. Automobiles shares 7% of the India's
GDP.
3. Pharmaceuticals: Indian pharmaceutical market is
3rd largest in terms of volume and 13th largest in terms of
value. Indian pharma industry is expected to grow at 20%
compound annual growth rate from 2015 to 2020.100% FDI is
permitted in this sector.
4. Service: FDI in service sector was increased by 46%
in 2014–15. Service sector includes banking, insurance,
outsourcing, research and development, courier and
technology testing. FDI limit in insurance sector was raised
from 26% to 49% in 2014.
5. Railways: 100% FDI is allowed under automatic
route in most of areas of railway, other than the operations,
like High speed train, railway electrification, passenger
terminal, mass rapid transport systems etc. Mumbai-
Ahemdabad high speed corridor project is single largest
railway project in India, other being CSTM-Panvel suburban
corridor. Foreign investment more than 90,000 crore (US$13
billion) is expected in these projects.
6. Chemicals: Chemical industry of India earned
revenue of $155–160 billion in 2013. 100% FDI is allowed in
Chemical sector under automatic route. Except Hydrocynic
acid, Phosgene, Isocynates and their derivatives, production
of all other chemicals is de-licensed in India. India's share in
global specialty chemical industry is expected to rise from
2.8% in 2013 to 6–7% in 2023.
7. Textile: Textile is one major contributor to India's
export. Nearly 11% of India's total export is textile. This sector
has attracted about $1647 million from April 2000 to May
2015. 100% FDI is allowed under automatic route During year
2013–14, FDI in textile sector was increased by 91%. Indian
textile industry is expected to reachup to $141 billion till
2021.
8. Airlines: Foreign investment in a scheduled or
regional air transport service or domestic scheduled
passenger airline is permitted to 100, with FDI up to 49%
permitted under automatic route and beyond 49% through
government approval. For airport modernization, 100 % FDI
will be allowed for existing airport under automatic route.
THE MAKE IN INDIA VISION:
A state-wise analysis of FDI inflows by the economic
survey shows that Delhi, Haryana, Maharashtra, Karnataka,
Tamil Nadu, Gujarat and Andhra Pradesh together attracted
more than 70% of total FDI inflows to India during the last 15
years. States with vast natural resources like Jharkhand,
Bihar, Madhya Pradesh, Chhattisgarh and Odisha have lagged
behind.
“To make the recently launched Make in India initiative a
success, the states will have a critical role infacilitating FDI in
different sectors,” the survey said. Singapore, Mauritius, the
Netherlands and the US account for the major share of FDI
inflows into India. Out of FDI equity inflows of
$24.8 billion during 2015-16 (April-November), more
than 60% came from two geographically small countries—
Singapore and Mauritius. “These inflows need perhaps to be
examined more closely to determine whether they constitute
actual investment or are diversions from other sources to
avail of tax benefits under the Double Tax Avoidance
Agreement that these countries have with India,” the
economic survey said.
NEW INFRASTRUCTURE
Drive economic growth and improve the quality of life of
citizens by enabling industrial and urban infrastructure
development
Industrialization and Urbanization
1. Industrial Corridors and 21 new nodal Industrial Cities to
be developed:
− Delhi-Mumbai Industrial Corridor (DMIC), Chennai-
Bengaluru Industrial Corridor (CBIC)
JOMAT Vol. 4 No.2 January – June 2016 ISSN No. 2278-9316
24
− Bengaluru-Mumbai Economic Corridor (BMEC), Vizag-
Chennai Industrial Corridor (VCIC)
− Amritsar Kolkata Industrial Corridor (AKIC) .These 21 new
nodal cities will be having advantages like; Large land
parcels, Planned communities, ICT enabled
infrastructure, Sustainable living, Excellent connectivity-
Road, Rail etc. Delhi-Mumbai Industrial Corridor is a
mega infra-structure project of USD 100 billion with
financial and technical aids from Japan, covering an
overall length of 1,483 km. Dedicated Freight Corridor
(DFC) of 1504 km as the backbone, DMIC will intersect 7
states namely Delhi, Uttar Pradesh, Haryana, Rajasthan,
Madhya Pradesh, Gujarat and Maharashtra
2. Doubling of Network of Roads by 2020 and Construction
of 15,000 km new roads by 2017 is targeted under
various projects
3. Railway projects such as Setting up of New Railway
Stations, Modernization of Rolling stock, High Speed
Railways, Port Mine connectivity etc. have been initiated
for modernizing and better connectivity of Indian
Railways.
4. Eastern Dedicated Freight Corridor of 1840 km length
and Western Dedicated Freight Corridor of 1504 km
length is under construction as well as many projects are
under planning stage.
5. Sagar Mala project is started by the Govt. of India to
modernize India's Ports and Inland waterways so that
portal development can be augmented and coastlines
can be developed to contribute in India's growth,
providing a project outlay of US$ 10 billion
6. The Smart Cities Mission having a project outlay of
US$ 7.69 billion is progressing, with Special Purpose
Vehicles for 19 cities already set up.
7. Aviation industry with target of becoming 3rd largest by
2030 and to cater international and domestic traffic.
NEW DESIGN, INNOVATION AND RESEARCH AND
DEVELOPMENT:
Investment in Innovation and RandD offers large payoffs
in terms of economic growth and competitiveness in global
economy.
1. 3rd
largest tech driven Start-up ecosystem globally and
Tech Startups in India are expected to reach 11,500 in
2020 from 4,300 in 2015.
2. “Start-up India” initiative was launched aiming at
fostering entrepreneurship and promoting innovation by
creating an ecosystem that is conducive for growth of
Start-ups.
3. Intellectual Property Rights Policy launched in May 2016
having salient features such as : Strong TRIPS compliant
policy framework, Ease of Access using World-class IT
enabled patent offices Internationally acclaimed systems
for International Searching and Preliminary Examination
of patent applications, Augmentation of Manpower: 721
additional technically competent Patent Examiners
appointed, Time for examination of patents to come
down to 18 months from 7 years by March, 2018,and
Time for examination of trademarks to come down to 1
month from 13 months by March, 2017.
EASE OF DOING BUSINESS:
Improved business processes and procedures open up
new avenues of opportunities and create confidence among
entrepreneurs as a result of which India moved up 12 places
in the World Bank’s Doing Business ranking 2016released in
October, 2015
Main features are as follows:
• Incorporation of a company reduced to 1 day instead of
10 days.
• Power connection provided within a mandated time
frame of 15 days instead of 180 days.
• Number of documents for exports and imports reduced
from 11 to 3.
• Validity of industrial license extended to 7 years from 3
years.
• Bankruptcy Code 2015 has been changed that the new
bankruptcy law, providing for simple and time-bound
insolvency process to be operational by 2017.
• Goods and Services Tax – Single tax framework will be
implemented by July, 2017.
• Permanent Residency Status for foreign investors for 10
years is allowed.
OTHER REFORMS:
1. Online portals for Employees State Insurance
Corporation (ESIC) and Employees Provident Fund
Organization (EPFO) for: Real-time registration Payments
through 56 accredited banks
Online application process for environmental and forest
clearances etc are launched.
2. Department of Commerce, Government of India has
launched Indian Trade Portal. Important feature of this
portal is to be a single point for relevant information on
measures other than tariff called the non-tariff measures
like standards, technical regulations, conformity
assessment procedures, sanitary and Phytosanitary
measures which may affect trade adversely.
JOMAT Vol. 4 No.2 January – June 2016 ISSN No. 2278-9316
25
3. An Investor Facilitation Cell has been created in ‘Invest
India’ to guide, assist and handhold investors during the
entire life-cycle of the business.
4. The Department of Industrial Policy and Promotion has
also set up as Japan Plus and Korea Plus. They are special
management teams to facilitate and fast track
investment proposals from Japan and South Korea
respectively.
CHALLENGES OF MAKE IN INDIA:CHALLENGES OF MAKE IN
INDIA:
To make use of demographic dividend under the scheme
of Make in India, the following are the important challenges
to be resolved.
• Where is the capital?: Huge monetary recourses are
required to build and develop global level infrastructure
for attracting foreign capital. Public sector banks have
large amount of non-performing assets (NPAs) and taking
precautionary measures while sanctioning new loans to
the domestic entrepreneurs. Foreign investors are
expecting that American federal bank may increase
interest rate so that they can invest their investment in
American economy
• Reducing Jobs: Large number of manufacturing industrial
units in the emerging sector is making use of Robots on
large scale at the place of human employees. Robots are
able to give high standard products with zero defects
which is not possible by workers. Such use of Robots is
reducing manpower requirement in manufacturing units
leading to increase in jobless people.
• Unionism: An important challenge in Indian organized
industrial sector is how to handle the unionism mainly in
public sector undertakings. Unions and union leaders
have importance on self-interest rather than survival and
growth of industrial units. Even the unionism has
percolated in private organized sector and has resulted in
wastage of man hours and wastage of physical resources
• Where is skill?: Though India is the country of youngest
population in the world and around 15 percent of the
mare graduates but very few of them have the skills to
take up some productive work. There is enormous
demand for skill oriented youths in the job market and
only around 10 to 15 percent of the graduates have
certain skills for jobs. National Skills Development
Council has estimated that around 120million skilled
manpower is required for Indian job market. The present
higher education system is underperforming in
development of skills. Additional resources and institutes
are required to train and develop the skilled manpower.
• Low Research and Development: Research and
development (RandD) has become an integral activity of
any industrial unit not only for development and growth
of an organization but also for the survival in global
competition. Huge capital investment is required for
research and development in Industrial sector to sustain
in global competition. But it has become a challenge to
generate resources and make investment in research and
development in Indian industries to achieve the objective
of Make in India.
• Red-tapism: Indian bureaucracy has its own style of
working which leads in delay in getting permission, no
objection certificate from the government department. It
is a system where excessive rules, regulations,
procedures, excessive paper work etc leads delay in
decision making and de-motivates the entrepreneurs for
investments.
• Ease of Doing Business: Ease of doing business is the
major obstacle to the growth of the manufacturing
sector. The World Bank’s “Ease of doing Business 2015”
report has ranked India at 142nd out of 189 countries for
its ease of doing business. The “ease of doing business”
covers ease in starting a business, enforcing contracts,
registering property, gaining access to electricity, paying
taxes, etc. The easier and simple process gives a country
a good rank. The more the complex and time consuming
process the poorer is the rank given. It is a matter of
great concern that more than two decades have passed
since the commencement of economic reforms and still
India lags behind in providing business encouraging
environment and the other facilities as are provided by
other countries of the world. In the exports section also,
getting approvals require long time and huge cost. All
these obstacles discourage the growth of manufacturing
sector.
• Environment Clearance: Slogan of “Go Green” in the
present day requires the businesses to be
environmentally sustainable. ‘Being green’ should be the
main focus of the businesses and should be taken as a
duty by the manufacturing sector to preserve the
environment. But the situation is challenging for MSMEs
who use obsolete and inefficient technologies. There is
an urgent need to develop new techniques that help in
protecting the environment. As many as 17 highly
polluting industries have been identified by the Central
Pollution Control Board, the majority of which are
manufacturing industries. MSMEs, in particular, can
significantly affect the environment as the technology
used by them is generally obsolete and inefficient. About
70% of the total industrial pollution load of India is
attributed to MSMEs.
• Infrastructure: The growth of manufacturing sector is
highly dependent on its quality of infrastructure. The
World Economic Forum’s Global Competitiveness Report
has given 81st
rank to India out of 140 countries for its
deficiency in infrastructure. Quality infrastructure is one
of the top requirements for the success of “Make in
India”. India’s underdeveloped infrastructure is the top
most issue faced by Japanese manufacturers. Roadways
in India pose a big challenge for the growth of the
country and successive governments are continuously
JOMAT Vol. 4 No.2 January – June 2016 ISSN No. 2278-9316
26
failing to implement their electoral promises. The
projects of railways department suffer from even longer
delays as compared to road sector. Also, rail transport is
70% more expensive in India as compared to the United
States which makes it inefficient. There is a nationwide
scarcity in terms of power generation. About 48% of
firms suffer from power cuts for more than 5 hours in a
week and around 60% of firms are ready to pay more for
continuous and reliable supply. In order to promote the
foreign trade, ports play a very important role. There is a
scarcity of modernized ports and those that exist, are
using 90% of their capacity as against an average of
70%international usage.
• Labour Laws: India’s labour regulations are among the
world’s most stringent and complex, and over time have
limited the growth of the formal manufacturing sector.
The present labour laws favour the employees and
protect employment and also a big tool in the hands of
trade unions to raise their bargaining power giving a way
to go for capital intensive methods in the organized
sector. This adversely affects the expansion of
employment and generating jobs. There are more than
200 laws regarding conditions of employment, social
security, health, safety, welfare, trade unions, industrial
and labour disputes, etc. Another problem is that they
have lost relevance of most of the labour regulations in
the present day. As per the survey of CII-KPMG 2014 in
India, about 47% of the respondents stated moderate to
major difficulty in complying with labour laws.
• Land Acquisition: Land acquisition is another major issue
involving lengthy and cumbersome process. It is one of
the main reasons for delay of the projects. About 70% of
the infrastructure projects got delayed due to it. It takes
14 months on an average to acquire land. Another
difficulty is to establish the land title due to incomplete
land records which becomes a cause of litigation later.
Also the owners of the land are often inadequately
compensated which again leads to disputes and delays.
As per the survey conducted by CII-KPMG among the
various causes of difficulty in acquiring lands, the
unsecured land title is the major problem. There are
some critical issues that pose challenges to obtaining
land for industrial development. These include small
landholdings, inaccurate, outdated land records and
restrictions on usage of land, etc.
• Micro Small and Medium Enterprises: The Micro, Small
and Medium Enterprises (MSME) of India play an
important role in providing huge employment and
contributing considerably in manufacturing output. Their
presence in the rural areas checks the migration of
workforce to urban areas. They are the ancillary units to
the large industries providing them various consumables
and other services. This sector contributes nearly 45% of
manufacturing output and 40% of total exports of the
country and employs around 69 million persons in over
29million units throughout the country. Despite such a
big contribution from MSMEs there are various
challenges still suffered by them in the areas of skill,
credit, infrastructure, technology, etc. MSMEs are the
highest credit defaulters which accounts for 5% of
advances for the last three years. Even the process of
providing loans to these enterprises is costly as there is a
need of intensive field work and high levels of scrutiny
for the processing of each application.
• Exports: Exports play a major role in the growth of the
manufacturing sector. But the share of India in global
merchandise exports has been very low as compared to
other countries. Whereas the developing countries’
share in global merchandise exports rose from 24% in
1990 to 38% in 2006 and 45% in 2013. Of India’s export
basket,62% comprise of manufacturing exports (as of
2013) which is the lowest among most Asian economies
with China having 94%, Japan 88%, Philippines 77%,
Singapore.
MAKE IN INDIA AND SUSTANABLE DEVELOPMENT ;
1. India's GDP has grown at around 7.9% between 2003-
2012. This is likely to be continued for next 5 years with
an average growth rate of 7.7% p.a. till 2017. This
requires support from all types of business activities
which can be taken up under Make in India programme.
2. In spite of global financial crisis the Govt. has set up a
target of 8% growth rate during the current five year
plan2012-2017.
3. There is a shift of population of working age group from
working on farm to working in service or industrial
sector. This is stated as India's demographic dividend. At
the same time there is increase in disposable incomes
which need availability of services and industrial
products. By make in India this can be made possible.
4. The foreign investors cannot ignore the large size of
Indian market and at the same time the appropriate
industrial environment created by the new government.
5. Some industrialists have started the manufacturing of
consumer need based products in India. E.g. Nano car by
Tata Motors, in expensive hand held electro cardiogram
(ECG) by GE Health Care and Water purifiers by Tata
Chemicals. Such other productions are to be launched by
foreign investors in India.
6. The increased income of the consumer should be
properly tapped for the development of consumable
market which will result in sustainable growth.
7. Research and Innovation in industrial and services sector
will help to increase the quality and reduce the prices.
This will create the consumer friendly atmosphere in the
market. Present govt. has purposefully set aside 3% of
the total revenue on Research and Innovative activities.
8. In agricultural sector because of Make in India
programme there is a concentration of almost utilization
JOMAT Vol. 4 No.2 January – June 2016 ISSN No. 2278-9316
27
of cultivable land. This is also possible because of
efficient water and power facilities. In the new Govt.'s
planned programme special attention is given to this
aspect.
9. Because of Make in India programme there will be
removal of excess work force on agriculture and
deploying that workforce for developmental activities in
service and industrial sector.
OVERCOMMING CHALLENGES OF MAKE IN INDIA :
India has no second option other than Make in India to
grow in the emerging economy and to make the scheme
Make in India work well the challenges are to be faced with
following means :
• Improve Higher Education: First priority should be given
to improve the performance of present higher education
system and improve the performance of institutes of
higher education. This is the sector which supplies
manpower to industrial and other sectors of the
economy. If the rate of employability is increased from
15 percent to 20 percent there will create additional
manpower of around 1.5 million who will be having
employability skills and can be absorbed directly by the
employment sector. The institutes of higher education
have basic infrastructure and manpower, by adding some
modern techniques of skill development which can
create additional manpower with very low cost.
Department of higher education of both central and
state governments with the help of regulatory bodies like
UGC, Universities, AICTE can make mandatory to the
institutes of higher education to improve employability
among the learners.
• Establishment of Specialized Institutes: Well-equipped
institutes with highly specialized experts in training the
trainers can help the create a pool of trainers from the
institutes of higher education who can assist in
developing employability among the graduates. These
institutes will design the curriculum of skill development,
will develop techniques of training and conduct actual
training for the trainers
• Reforms in Rules and Regulations: Rules and regulations
are basically to bring some discipline and uniformity in
the system so that the system will work smoothly for the
welfare of the society. Rules need to be changed and
reformed based on the needs of the society and changing
conditions. The government of Telangana has recently
made a provision to penalize an officer who causes
unnecessary delays in projects on the basis of ` 1000/
per day.
• Good Governance: It is the primary responsibility of the
government and governing is to meet the needs of the
society or people. Government and governing bodies are
for the people and need to establish a system which is
transparent and for the welfare of the society as whole.
• Accountability: There is a phenomenon in Indian
organized sector who is accountable for non-
performance or underperformance. Each stake-holder of
the organization passes the buck on others for failure or
non-performance. Organizations, whether industrial and
commercial use of resources of the society, but very little
is given back to the society or nothing is given to the
society they should checked and should be punished.
Many businessmen have collected money from the
public, have taken loan from the bank for the purpose of
business and they do not repay to the money lenders.
Who is accountable for such cases? Ultimately common
citizen are the sufferer who are real source of capital.
CONCLUSION:
Make in India initiative of the Govt. is to change the
growth dynamics of the economy. Nearly 2 decades of
economic liberalization, coupled with huge domestic
demand, a growing middle class, a youth population and high
return on Investment make India an incredible Investment
destination. In conclusion, we have to accept the fact that
advancing manufacturing growth will be essential if India
wants to transform itself into a high-income economy. We
cannot rely on service sector alone to fulfill this ambition. At
the sametime, we will also have to focus on skilling our youth
population. Many governments in the past have announced
lofty policies to transform India’s manufacturing sector but
few things have changed on the ground. The ‘Make in India’
programme may have the potential to transform India into a
manufacturing hub. But if we want to achieve that potential,
the government would have to move beyond rhetoric to
actual implementation of the announced policies. A good
start has been taken by the present Government and yet has
to need few important changes to improve manufacturing
sector. These years are crucial to implement the
announcement well and seizing the opportunity to make the
right investments which will do sustainable development of
the country.
REFERENCES:
1. Bhagowaty, G. (n.d.). How can the new Government
make India a Global Manufacturing hub? Crisil Young
Thought
2. Leaders-MDI, Gurgaon. Retrieved from pdf
3. Bhattacharya, A., Bruce, A., and Mukherjee, A. (2014,
Nov.). Make in India: Turning Vision Into Reality. The
Boston Consulting Group-CII 13th Manufacturing Summit
2014.
Retrievedfromhttp://www.bcgindia.com/documents/file
176705.pdf
4. Chattopadhyay, A. (2015, May 15). For ‘Make in India’ to
Happen, Modi Govt. Must Move from Cheap Rhetoric to
Difficult Action. The Economic Times. Retrieved from
http://articles.economictimes.indiatimes.com/2015-05.
JOMAT Vol. 4 No.2 January – June 2016 ISSN No. 2278-9316
28
5. Datta, R.C., and Milly, S. (2007). Contemporary Issues on
Labour Law Reform in India: An Overview. Atlmri
Discussion Paper. Tata Institute of Social Sciences,
Mumbai. Retrieved fromhttp://skillingindia.com/pdf/
ContemporaryIssue on Labour Law .pdf
6. Doing Business in India. (2015, June). Nishith Desai
Associates. Retrieved
fromhttp://www.nishithdesai.com/fileadmin/user_uploa
d/pdfs/Research%20Papers/Doing_Business_in_India.pdf
7. Ease of Doing Business in India.(2014, May).CII-KPMG.
Retrieved
fromhttps://www.kpmg.com/IN/en/IssuesAndInsights/Ar
ticlesPublications/Documents/KP MG-CII-Ease-of-doing
business-in-India.pdf.
8. EY’s Attractiveness Survey India 2015: Ready, Set, Grow.
(2015). Retrieved fromhttp://www.ey.com/Publication/
vwLUAssets/ey-attractiveness-survey-india-2015/.pdf
9. Francis, S. (2015, May). India’s Manufacturing Sector
Export Performance: A Focus on Missing Domestic
Intersectoral Linkages. Institute for Studies in Industrial
Development, New Delhi. Retrievedfromhttp://www.isid.
org.in/pdf/WP182.pdf.
10. Gupta, H., Kapoor, T. and Asudani, J. (2015) ‘[Un]ease of
Doing Business in India – A Review of Major Pain Points
and Possible Lessons’, CIRC Working Paper No.12.
Retrieved from http://circ.in/pdf/Doing-Business-in-
India.pdf
11. India Investment Climate Statement 2015.(n.d.).
Department of State USA. Retrieved fromhttp://mays.
tamu.edu/center-for-international-business-
studies/India-Investment-Climate-Statement-2015.pdf
12. Joumard, I., Sila, U., and Morgavi, H. (2015). Challenges
and Opportunities of India's Manufacturing Sector. OECD
Economics Department Working Papers, No. 1183, OECD
Publishing.Retrievedfromhttp://dx.doi.org/10.1787/5js7t
9q14m0q-en
13. Madgavkar, A., Dobbs, R., and Mohan, R. (2012, June 14).
India Must Change the Game in Education Altogether, to
14. Let India’s Young Bridge the World’s Skill Deficit. The
Economic Times. Retrieved fromhttp://articles.economic
times.indiatimes.com/2012-06.
15. Make In India: Opportunities and Challenges. (2015,
Feb.).Deloitte. Retrieved from https://www.mof.go.jp/
pri/international_exchange/kouryu/fy2014/ncaer201502
-9.pdf
16. ‘Make in India’- Pressing the Pedal. (2015, May).
Economics Knowledge Banking, Yes Bank. Assocham
India. Retrieved fromhttp://www.assocham. org/
userfiles/YES_BANK_ASSOCHAM_Knowledge_Report_-
Make_in_India_-_Presing_the_Pedal.pdf.
17. Nam, R., and Vishnoi, A. (2014, Dec. 30). Help wanted:
"Make in India" drive lacks skilled labour. Retrieved
fromhttp://in.reuters.com/article/india-workersid
INKBN0K71E42014.
18. OECD. (2014). OECD Economic Surveys: India 2014. OECD
Publishing. Retrieved from http://dx.doiorg/10.1787/
eco_surveys-ind-2014-en
19. Shah, S. (2013, May 31). Poor Indian Industry
performance – Is Manufacturing Industry To Blame.
Green World Investor. Retrieved from http://www.green
worldinvestor.com/ 2013/05/31/poor-indian-industry-
performanceismanufacturing-industry-to-blame/
20. Skill Development in India: The Vocational Education and
Training System. (2006, Jan).The World Bank: Human
Development Unit South Asia Region Document of The
World Bank. Retrieved fromhttp://info.worldbank.org/
etools/docs/library/235724/skills
development/education/training/system.pdf
21. The Manufacturing Plan. Planning Commission
Government of India. Retrieved fromhttp://planning
commission.gov.in/aboutus/committee/strgrp12/str_ma
nu0304.pdf
22. Top 10 Challenges of Doing Business in Asia Pacific. TMF
Group. Retrieved fromhttp://www.tmf-group.com/en/
media-centre/resources/top-challenges/apac/india.
23. Raghuram Rajan. 2015. Make in India, largely for India,
Southern Economist, 54 (3), 32-36.Amitabh Kant, 2015.
24. Transforming India into a global manufacturing hub.
Yojana, 59, 18- 22.
25. Jayanta Kumar Seal and Shubhasree Bhadra, 2015. Make
in India: Employment and foreign direct investment, The
Management Account, 50 (7), 67-73. www.icmai.in
26. Navya.G.S., and Ramagopal. S. (2015). Make in India – A
major initiative of Indian government is the timing
right?Southern Economist, 54 (12), 45-48.
27. Swaminathan. S. Anklesaria Aiyar. 2015, May, 31. Make
in India and manufacture in India is two different things,
The Times of India, p.12.
28. Times News Network. 2014, December, 31. Take ROAD
to growth shun ABCD, The Times of India, p.16.
29. Vijalakshmi. V. 2014. Launch of make in India, Southern
Economists, 53 (13), 3-4.
30. http://www.makeinindia.com/about
31. https://en.wikipedia.org/wiki/Make_in_India
32. http://economictimes.indiatimes.com/news/india-
unlimited/make-in-india
33. http://www.makeinindia.com/sectors
34. http://www.makeinindia.com/live-projects-industrial-
corridor
35. http://www.hindustantimes.com/?gclid=CKun-
c6Q2tACFRQjaAodv-INxg
���
JOMAT Vol. 4 No.2 January – June 2016 ISSN No. 2278-9316
(29)
ORIGIN AND DEVELOPMENT OF THE INDIAN AUTOMOBILE INDUSTRY
Rupali Tapan Pandya
ABSTRACT
The Automobile industry of India has come a long way since 1898 when the first car rolled out on the streets of Mumbai. The
Indian auto industry is one of the largest industry in the world. The industry accounts for 7.1 per cent of the country's Gross
Domestic Product (GDP). The Two Wheelers segment with 81 per cent market share is the leader of the Indian Automobile
market owing to a growing middle class and a young population. Moreover, the growing interest of the companies in exploring
the rural markets further aided the growth of the sector. The overall Passenger Vehicle (PV) segment has 13 per cent market
share. The Economic progress of this industry is indicated by the amount of goods and services produced which give the capacity
for transportation and boost the sale of vehicles. There is a huge increase in automobile production with a catalyst effect by
indirectly increasing the demand for a number of raw materials like steel, rubber, plastics, glass, paint, electronics and services.
India has emerged as Asia’s fourth largest exporter of automobile, behind Japan, South Korea and Thailand. The country is
expected to top the world in car volumes with approximately 611 million vehicles on the nation’s roads by 2050. The industry is a
sunrise industry with huge untapped potential. The research paper intends to present the various stages of development and
growth of the Indian automobile industry and its potential and future prospects.
KEYWORDS: Automobile, FDI, SIAM.
EVOLUTION OF THE INDIAN AUTOMOBILE INDUSTRY:
The automotive industry in India has come a long way
from its nascent state at the time of India’s independence in
1947 to its present day dynamic form. As compared to the
production of mere 4,000 vehicles in 1950, the industry
produced a total 23,960,940 vehicles including passenger
vehicles, commercial vehicles, three wheelers, two wheelers
and quadricycle in April-March 2016. Today, the industry
produces a wide range of automobiles and auto-components
catering to both the domestic as well as foreign markets. The
development of the industry has been shaped by the demand
on the one hand and the government interventions on the
other; the influence of the latter being considerable.
The automotive industry in India was heavily regulated
until the 1970s. The automotive firms were obliged to obtain
licenses from the Indian government for various firm
activities. Compared to most industrializing economies, India
followed a fairly restrictive foreign private investment policy
until 1991- relying more on bilateral and multilateral loans
with long maturities. Inward foreign direct investment (FDI,
or foreign investment, or foreign capital hereafter) was
perceived essentially as a means of acquiring industrial
technology that was unavailable through licensing
agreements and capital goods import.
The 1980s witnessed some relaxation in the regulations
and the entry of Japanese firms. In the early 1990s, India
undertook historic economic reforms under which the
automotive industry was liberalized. Various government
interventions in the form of policies, existing at various points
of time, have influenced the development of India’s
automotive industry which may be studied in detail with the
help of following headings-
• First Phase - Protection of Domestic Market (1947 to
1965)
• Second Phase - Increased Regulatory Control (1966 to
1979)
• Third Phase -Limited Liberalization and Foreign
Collaborations (1980 to 1990)
• Fourth Phase
FIRST PHASE - PROTECTION OF DOMESTIC MARKET (1947 TO
1965):
After getting independence in 1947, Government of India
decided to adopt the mixed economy model for regulating
the disturbed economic growth of country in various
segments of agriculture as well as industry.
There was a vision in the eyes of leaders of that period to
build up an effective industrial setup in the country in a
controlled manner providing protection to the domestic
entrepreneurs. In line with the intentions of the State to
intervene in economic development, Industrial Policy
Resolution (IPR) was passed in the IndianParliament in 1948.
The resolution divided the nation’s industries into different
categories depending upon their strategic importance and
specified the role of State in the development of each
category of industries. Accordingly, the automotive industry
was classified under the category of ‘basic industries of
importance’. Further, the initiatives within the automotive
industry were left to the private enterprises, with State
playing only the role of a controller. However, the State
reserved its right to intervene and progressively participate in
the industry when deemed necessary.
© SBPIM
Associate Professor, Institute of International Business and Research, Pimpri-Chinchwad, Pune 411019
Contact no.: 9422559456 Email Id: [email protected]
JOMAT Vol. 4 No.2 January – June 2016 ISSN No. 2278-9316
(30)
In accordance with the objectives laid by IPR of 1948, the
Ministry of Industry prepared its first policy for the
automotive industry in 1949. As determined in the policy, the
tariff on import of fully-built vehicles was heightened the
same year, virtually banning their import into the country.
The foreign assemblers assembling CKD vehicles were
allowed to continue to operate nevertheless. Meanwhile, PAL
and HML had already commenced their operations in 1947
and 1948 respectively.
In the preliminary planned phase of Indian economy, the
commission planned the total number of vehicles (per vehicle
type) that were to be produced in the given plan period
depending upon country’s needs and the resources at
disposal. For instance, the First FYP covering the period 1951-
1956 and introduced in April 1951, targeted to raise the
production of vehicles in the country from 4,077 in 1951 to
30,000 in 1956. Accordingly, the Ministry of Industry
administered the capacity licenses to the automobile firms. In
March 1952, the government formed a Tariff Commission for
automobile sector. The Tariff Commission submitted its
report in 1953 recommending that only units with a plan for
progressive manufacture of components and complete
vehicles may be allowed to operate. It also recommended
against any price controls and advised the government to
maintain a watch on the prices. Subsequently, the
recommendations of the commission were adopted by the
government. Foreign assemblers like General Motors and
Ford who considered the domestic demand too low to
warrant a local manufacturing programme were obliged to
close down their operations within three years. Thus, the exit
of foreign assemblers by 1956 and the ban on import of fully-
built vehicles since 1949 effectively protected the Indian
automotive industry from foreign competition.
After adoption of the Constitution and the integrated
socioeconomic goals, the industrial policy was revised and
adopted in May, 1956 which signaled higher level of State
participation for accelerating industrial development. The
resolution grouped the industries into Schedule-A, Schedule-
B and the remaining. Schedule-A industries were either
exclusive monopolies of the central government or were
industries in which any new undertaking was solely reserved
for the State. Schedule-B included industries in which the
State would establish new undertakings for accelerating the
future development, and in which the private enterprises had
equal opportunity for the same. The remaining industry list,
which included the automotive industry, was left to the
initiatives and enterprise of the private sector. However, the
State reserved its right to participate in the future. Thus, the
automotive industry under IPR of 1956 had been provided
with necessary autonomy for functioning. In order to
encourage the domestic production and to keep the
automobile prices low, the government in early 1950s had
maintained lower import duties on the components still being
imported. However, a steep rise in the prices made the
government to approach the Tariff Commission for the
second time in August 1955. The commission was asked to
enquire into and recommend a price policy for the
automobiles.
In its report submitted in October 1956, the commission
maintained its initial recommendation against the price
controls, as they might undermine the development of the
industry. It also suggested reviewing the whole question of
protection granted to the automotive industry after a period
of ten years.
The situation however changed very soon with the
balance-of payments crisis that sprang up in 1956-57. As a
result, severe backlogs were generated for the production
orders in automobile sector. The decrease in supply of
automobiles resulted in steep price increases owing to
supply-demand economics. At this juncture, the government
decided to impose ‘informal price control’ on automobiles,
which was accepted by the manufacturers. The informal price
control mechanism required the customer to place the order
with the dealer and submit a partial payment to the Indian
Postal Service. The manufacturer then had to deliver the
automobiles in the sequence of the orders registered with
the Indian Postal Service. The government also fixed the
dealer commission to a maximum of 10% and asked the
manufacturers to intimate any decision of raising ex-works
prices in advance.
In summary, the Indian automotive industry in the years
1947 to 1965 was the one wherein the foreign competition
was highly restricted by means of protective rates of tariff
and foreign investment licensing requirements. Foreign
collaborations were permitted only after diligent
considerations and were subject to effective control by Indian
entities. The domestic competition was also regulated by
means of industrial licensing, foreign exchange allocations
and other governmental decrees. The nation’s overarching
goal of self-reliance was reflected in the indigenization
requirements imposed on the domestic automotive firms.
Intentions of protecting and nurturing the nascent
automotive industry were accompanied by side-effects of
high prices and low quality levels. Even though the consumer
interests were safeguarded to some extent by informal price
controls, the overall performance of the industry in terms of
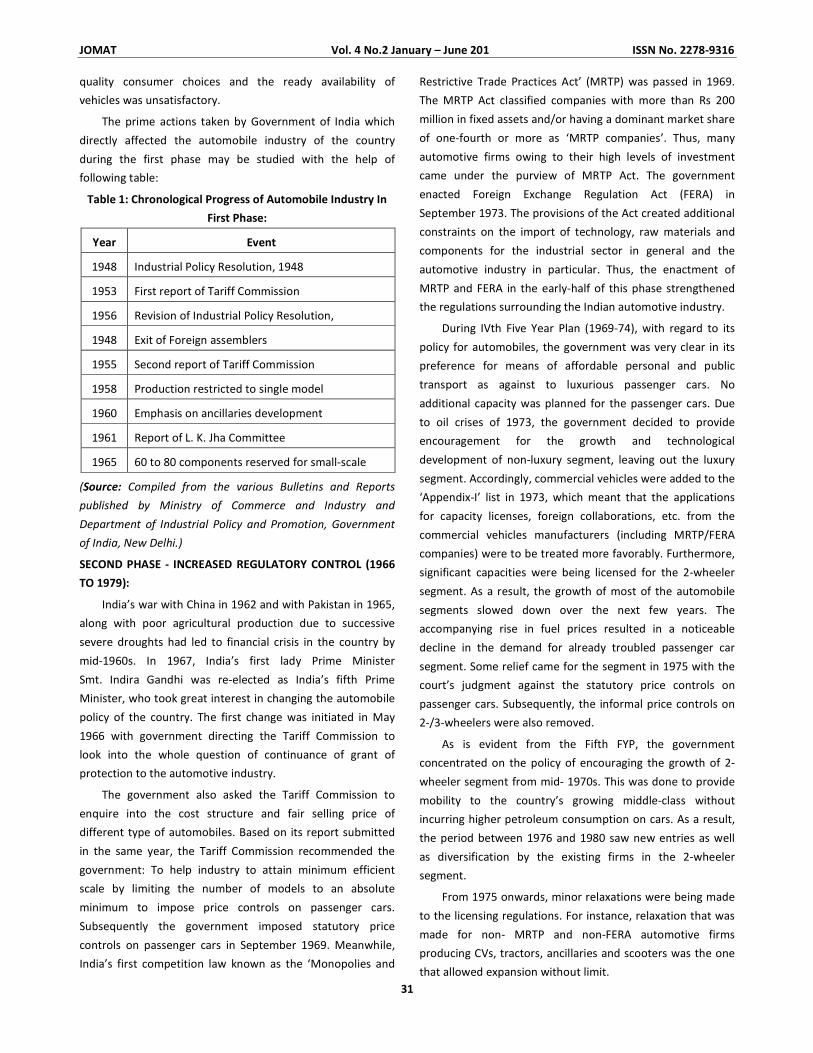
JOMAT Vol. 4 No.2 January – June 201 ISSN No. 2278-9316
31
quality consumer choices and the ready availability of
vehicles was unsatisfactory.
The prime actions taken by Government of India which
directly affected the automobile industry of the country
during the first phase may be studied with the help of
following table:
Table 1: Chronological Progress of Automobile Industry In
First Phase:
Year Event
1948 Industrial Policy Resolution, 1948
1953 First report of Tariff Commission
1956 Revision of Industrial Policy Resolution,
1948 Exit of Foreign assemblers
1955 Second report of Tariff Commission
1958 Production restricted to single model
1960 Emphasis on ancillaries development
1961 Report of L. K. Jha Committee
1965 60 to 80 components reserved for small-scale
(Source: Compiled from the various Bulletins and Reports
published by Ministry of Commerce and Industry and
Department of Industrial Policy and Promotion, Government
of India, New Delhi.)
SECOND PHASE - INCREASED REGULATORY CONTROL (1966
TO 1979):
India’s war with China in 1962 and with Pakistan in 1965,
along with poor agricultural production due to successive
severe droughts had led to financial crisis in the country by
mid-1960s. In 1967, India’s first lady Prime Minister
Smt. Indira Gandhi was re-elected as India’s fifth Prime
Minister, who took great interest in changing the automobile
policy of the country. The first change was initiated in May
1966 with government directing the Tariff Commission to
look into the whole question of continuance of grant of
protection to the automotive industry.
The government also asked the Tariff Commission to
enquire into the cost structure and fair selling price of
different type of automobiles. Based on its report submitted
in the same year, the Tariff Commission recommended the
government: To help industry to attain minimum efficient
scale by limiting the number of models to an absolute
minimum to impose price controls on passenger cars.
Subsequently the government imposed statutory price
controls on passenger cars in September 1969. Meanwhile,
India’s first competition law known as the ‘Monopolies and
Restrictive Trade Practices Act’ (MRTP) was passed in 1969.
The MRTP Act classified companies with more than Rs 200
million in fixed assets and/or having a dominant market share
of one-fourth or more as ‘MRTP companies’. Thus, many
automotive firms owing to their high levels of investment
came under the purview of MRTP Act. The government
enacted Foreign Exchange Regulation Act (FERA) in
September 1973. The provisions of the Act created additional
constraints on the import of technology, raw materials and
components for the industrial sector in general and the
automotive industry in particular. Thus, the enactment of
MRTP and FERA in the early-half of this phase strengthened
the regulations surrounding the Indian automotive industry.
During IVth Five Year Plan (1969-74), with regard to its
policy for automobiles, the government was very clear in its
preference for means of affordable personal and public
transport as against to luxurious passenger cars. No
additional capacity was planned for the passenger cars. Due
to oil crises of 1973, the government decided to provide
encouragement for the growth and technological
development of non-luxury segment, leaving out the luxury
segment. Accordingly, commercial vehicles were added to the
‘Appendix-I’ list in 1973, which meant that the applications
for capacity licenses, foreign collaborations, etc. from the
commercial vehicles manufacturers (including MRTP/FERA
companies) were to be treated more favorably. Furthermore,
significant capacities were being licensed for the 2-wheeler
segment. As a result, the growth of most of the automobile
segments slowed down over the next few years. The
accompanying rise in fuel prices resulted in a noticeable
decline in the demand for already troubled passenger car
segment. Some relief came for the segment in 1975 with the
court’s judgment against the statutory price controls on
passenger cars. Subsequently, the informal price controls on
2-/3-wheelers were also removed.
As is evident from the Fifth FYP, the government
concentrated on the policy of encouraging the growth of 2-
wheeler segment from mid- 1970s. This was done to provide
mobility to the country’s growing middle-class without
incurring higher petroleum consumption on cars. As a result,
the period between 1976 and 1980 saw new entries as well
as diversification by the existing firms in the 2-wheeler
segment.
From 1975 onwards, minor relaxations were being made
to the licensing regulations. For instance, relaxation that was
made for non- MRTP and non-FERA automotive firms
producing CVs, tractors, ancillaries and scooters was the one
that allowed expansion without limit.
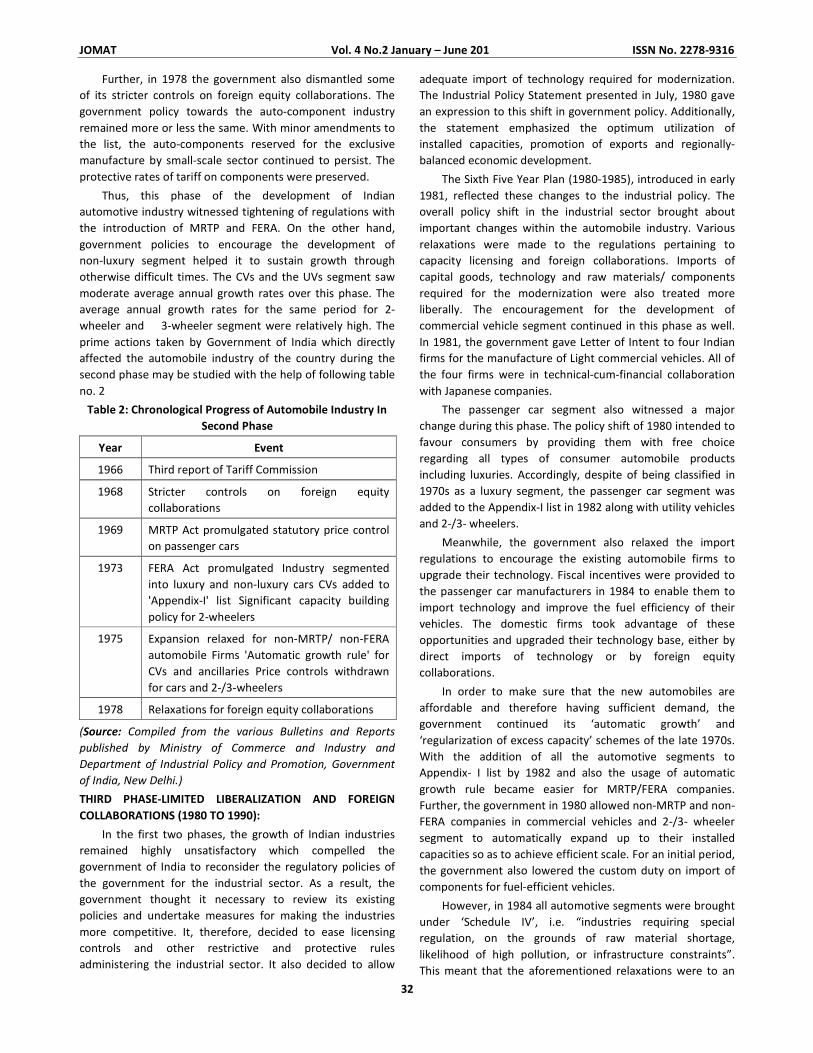
JOMAT Vol. 4 No.2 January – June 201 ISSN No. 2278-9316
32
Further, in 1978 the government also dismantled some
of its stricter controls on foreign equity collaborations. The
government policy towards the auto-component industry
remained more or less the same. With minor amendments to
the list, the auto-components reserved for the exclusive
manufacture by small-scale sector continued to persist. The
protective rates of tariff on components were preserved.
Thus, this phase of the development of Indian
automotive industry witnessed tightening of regulations with
the introduction of MRTP and FERA. On the other hand,
government policies to encourage the development of
non-luxury segment helped it to sustain growth through
otherwise difficult times. The CVs and the UVs segment saw
moderate average annual growth rates over this phase. The
average annual growth rates for the same period for 2-
wheeler and 3-wheeler segment were relatively high. The
prime actions taken by Government of India which directly
affected the automobile industry of the country during the
second phase may be studied with the help of following table
no. 2
Table 2: Chronological Progress of Automobile Industry In
Second Phase
Year Event
1966 Third report of Tariff Commission
1968 Stricter controls on foreign equity
collaborations
1969 MRTP Act promulgated statutory price control
on passenger cars
1973 FERA Act promulgated Industry segmented
into luxury and non-luxury cars CVs added to
'Appendix-I' list Significant capacity building
policy for 2-wheelers
1975 Expansion relaxed for non-MRTP/ non-FERA
automobile Firms 'Automatic growth rule' for
CVs and ancillaries Price controls withdrawn
for cars and 2-/3-wheelers
1978 Relaxations for foreign equity collaborations
(Source: Compiled from the various Bulletins and Reports
published by Ministry of Commerce and Industry and
Department of Industrial Policy and Promotion, Government
of India, New Delhi.)
THIRD PHASE-LIMITED LIBERALIZATION AND FOREIGN
COLLABORATIONS (1980 TO 1990):
In the first two phases, the growth of Indian industries
remained highly unsatisfactory which compelled the
government of India to reconsider the regulatory policies of
the government for the industrial sector. As a result, the
government thought it necessary to review its existing
policies and undertake measures for making the industries
more competitive. It, therefore, decided to ease licensing
controls and other restrictive and protective rules
administering the industrial sector. It also decided to allow
adequate import of technology required for modernization.
The Industrial Policy Statement presented in July, 1980 gave
an expression to this shift in government policy. Additionally,
the statement emphasized the optimum utilization of
installed capacities, promotion of exports and regionally-
balanced economic development.
The Sixth Five Year Plan (1980-1985), introduced in early
1981, reflected these changes to the industrial policy. The
overall policy shift in the industrial sector brought about
important changes within the automobile industry. Various
relaxations were made to the regulations pertaining to
capacity licensing and foreign collaborations. Imports of
capital goods, technology and raw materials/ components
required for the modernization were also treated more
liberally. The encouragement for the development of
commercial vehicle segment continued in this phase as well.
In 1981, the government gave Letter of Intent to four Indian
firms for the manufacture of Light commercial vehicles. All of
the four firms were in technical-cum-financial collaboration
with Japanese companies.
The passenger car segment also witnessed a major
change during this phase. The policy shift of 1980 intended to
favour consumers by providing them with free choice
regarding all types of consumer automobile products
including luxuries. Accordingly, despite of being classified in
1970s as a luxury segment, the passenger car segment was
added to the Appendix-I list in 1982 along with utility vehicles
and 2-/3- wheelers.
Meanwhile, the government also relaxed the import
regulations to encourage the existing automobile firms to
upgrade their technology. Fiscal incentives were provided to
the passenger car manufacturers in 1984 to enable them to
import technology and improve the fuel efficiency of their
vehicles. The domestic firms took advantage of these
opportunities and upgraded their technology base, either by
direct imports of technology or by foreign equity
collaborations.
In order to make sure that the new automobiles are
affordable and therefore having sufficient demand, the
government continued its ‘automatic growth’ and
‘regularization of excess capacity’ schemes of the late 1970s.
With the addition of all the automotive segments to
Appendix- I list by 1982 and also the usage of automatic
growth rule became easier for MRTP/FERA companies.
Further, the government in 1980 allowed non-MRTP and non-
FERA companies in commercial vehicles and 2-/3- wheeler
segment to automatically expand up to their installed
capacities so as to achieve efficient scale. For an initial period,
the government also lowered the custom duty on import of
components for fuel-efficient vehicles.
However, in 1984 all automotive segments were brought
under ‘Schedule IV’, i.e. “industries requiring special
regulation, on the grounds of raw material shortage,
likelihood of high pollution, or infrastructure constraints”.
This meant that the aforementioned relaxations were to an
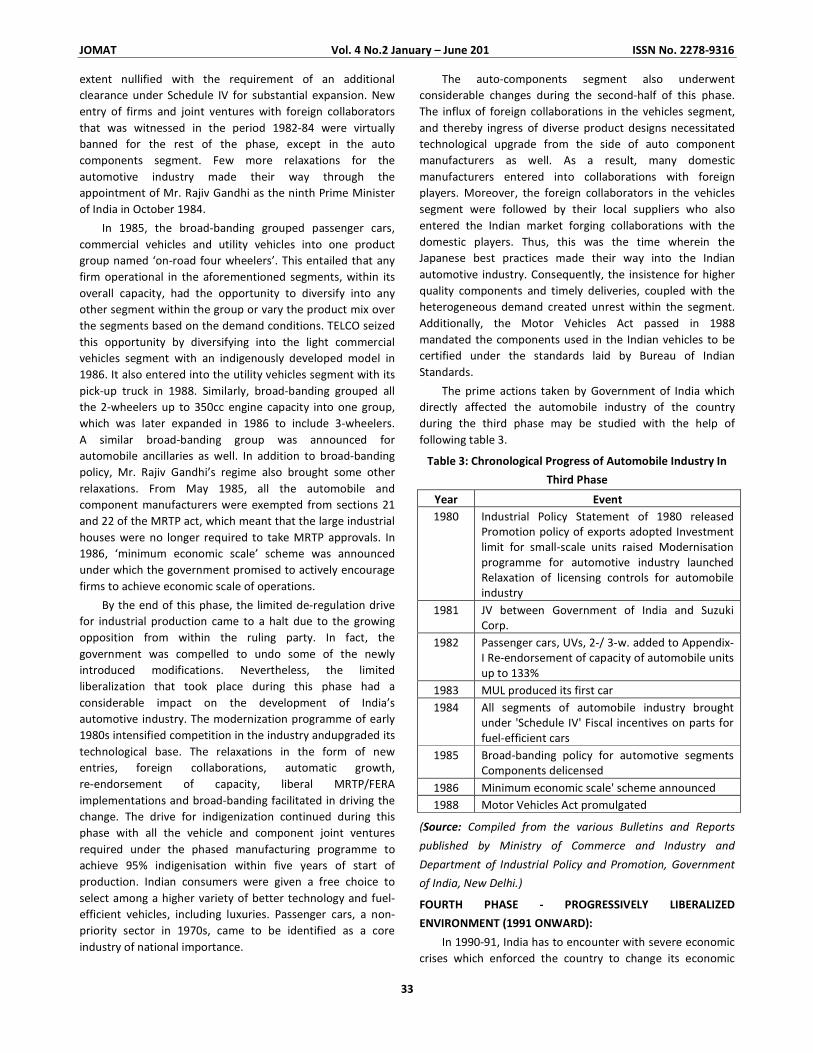
JOMAT Vol. 4 No.2 January – June 201 ISSN No. 2278-9316
33
extent nullified with the requirement of an additional
clearance under Schedule IV for substantial expansion. New
entry of firms and joint ventures with foreign collaborators
that was witnessed in the period 1982-84 were virtually
banned for the rest of the phase, except in the auto
components segment. Few more relaxations for the
automotive industry made their way through the
appointment of Mr. Rajiv Gandhi as the ninth Prime Minister
of India in October 1984.
In 1985, the broad-banding grouped passenger cars,
commercial vehicles and utility vehicles into one product
group named ‘on-road four wheelers’. This entailed that any
firm operational in the aforementioned segments, within its
overall capacity, had the opportunity to diversify into any
other segment within the group or vary the product mix over
the segments based on the demand conditions. TELCO seized
this opportunity by diversifying into the light commercial
vehicles segment with an indigenously developed model in
1986. It also entered into the utility vehicles segment with its
pick-up truck in 1988. Similarly, broad-banding grouped all
the 2-wheelers up to 350cc engine capacity into one group,
which was later expanded in 1986 to include 3-wheelers.
A similar broad-banding group was announced for
automobile ancillaries as well. In addition to broad-banding
policy, Mr. Rajiv Gandhi’s regime also brought some other
relaxations. From May 1985, all the automobile and
component manufacturers were exempted from sections 21
and 22 of the MRTP act, which meant that the large industrial
houses were no longer required to take MRTP approvals. In
1986, ‘minimum economic scale’ scheme was announced
under which the government promised to actively encourage
firms to achieve economic scale of operations.
By the end of this phase, the limited de-regulation drive
for industrial production came to a halt due to the growing
opposition from within the ruling party. In fact, the
government was compelled to undo some of the newly
introduced modifications. Nevertheless, the limited
liberalization that took place during this phase had a
considerable impact on the development of India’s
automotive industry. The modernization programme of early
1980s intensified competition in the industry andupgraded its
technological base. The relaxations in the form of new
entries, foreign collaborations, automatic growth,
re-endorsement of capacity, liberal MRTP/FERA
implementations and broad-banding facilitated in driving the
change. The drive for indigenization continued during this
phase with all the vehicle and component joint ventures
required under the phased manufacturing programme to
achieve 95% indigenisation within five years of start of
production. Indian consumers were given a free choice to
select among a higher variety of better technology and fuel-
efficient vehicles, including luxuries. Passenger cars, a non-
priority sector in 1970s, came to be identified as a core
industry of national importance.
The auto-components segment also underwent
considerable changes during the second-half of this phase.
The influx of foreign collaborations in the vehicles segment,
and thereby ingress of diverse product designs necessitated
technological upgrade from the side of auto component
manufacturers as well. As a result, many domestic
manufacturers entered into collaborations with foreign
players. Moreover, the foreign collaborators in the vehicles
segment were followed by their local suppliers who also
entered the Indian market forging collaborations with the
domestic players. Thus, this was the time wherein the
Japanese best practices made their way into the Indian
automotive industry. Consequently, the insistence for higher
quality components and timely deliveries, coupled with the
heterogeneous demand created unrest within the segment.
Additionally, the Motor Vehicles Act passed in 1988
mandated the components used in the Indian vehicles to be
certified under the standards laid by Bureau of Indian
Standards.
The prime actions taken by Government of India which
directly affected the automobile industry of the country
during the third phase may be studied with the help of
following table 3.
Table 3: Chronological Progress of Automobile Industry In
Third Phase
Year Event
1980 Industrial Policy Statement of 1980 released
Promotion policy of exports adopted Investment
limit for small-scale units raised Modernisation
programme for automotive industry launched
Relaxation of licensing controls for automobile
industry
1981 JV between Government of India and Suzuki
Corp.
1982 Passenger cars, UVs, 2-/ 3-w. added to Appendix-
I Re-endorsement of capacity of automobile units
up to 133%
1983 MUL produced its first car
1984 All segments of automobile industry brought
under 'Schedule IV' Fiscal incentives on parts for
fuel-efficient cars
1985 Broad-banding policy for automotive segments
Components delicensed
1986 Minimum economic scale' scheme announced
1988 Motor Vehicles Act promulgated
(Source: Compiled from the various Bulletins and Reports
published by Ministry of Commerce and Industry and
Department of Industrial Policy and Promotion, Government
of India, New Delhi.)
FOURTH PHASE - PROGRESSIVELY LIBERALIZED
ENVIRONMENT (1991 ONWARD):
In 1990-91, India has to encounter with severe economic
crises which enforced the country to change its economic
JOMAT Vol. 4 No.2 January – June 201 ISSN No. 2278-9316
34
policies to a large extent. In January 1991, the government
accepted a loan from International Monetary Funds
Compensatory and Contingency Financing Facility.
Subsequently in July 1991, the new government approached
IMF for another loan. The availed loan was accompanied by
conditions regarding control measures for budget deficit as
well as the implementation of economic structural reforms.
In line with its agreement to the conditions laid by the
international financial institutions, the government adopted a
new economic policy in July, 1991. The new policy proposed
wide ranging economic reforms in an attempt to liberalize
and open up the economy. Structural reforms encompassing
deregulation of industrial sector, trade and investment policy
reforms, financial sector reforms, tax reforms and foreign
exchange reforms were envisaged for this purpose.
The extensive changes in overall industrial policy had a
significant impact on the development of India’s automotive
industry also. Though a few liberalization measures had
already been introduced in 1980s, the policy reforms initiated
in 1991 were much more comprehensive. All the vehicles
segment (except passenger cars) and the auto-component
segment were delicensed in July, 1991. The passenger car
segment was also delicensed in May, 1993. Along with
abolition of the need for MRTP clearances, this meant that
the automotive firms were free to enter, expand, diversify,
merge or acquire based on their commercial judgments. The
liberalization concerning foreign investment encouraged
several global players to enter into the Indian market
establishing joint ventures with domestic players. While FDI
up to 51% was allowed on an automatic basis, the same for
more than 51% required governmental clearances which
were approved on a case-to-case basis depending upon the
projected exports, sophistication of technology brought in,
etc. The phased manufacturing programme requiring time-
bound indigenization was dropped in 1991 for the new units
and in 1994 for the existing units.
The passenger car segment with the highest untapped
growth potential saw the most hectic activities from the
foreign automotive firms. By mid-1990s, several foreign
players had entered into the Indian passenger car market by
mainly setting up joint ventures with the local firms. For
example Mercedes-Benz with TELCO (1994), General Motors
with HML (1994), Peugeot with PAL (1994), Daewoo with
acquisition of DCM-Toyota (1995), Honda Motors with Siel
Ltd. (1995), Ford with
MandM (1996), Hyundai with a 100%-owned subsidiary
(1996), Fiat with Tata Motors (1997) and Toyota with
Kirloskar Group (1997). In the commercial vehicles segment,
Tatra in collaboration with Vectra Motors (1997) and Volvo
with its 100%-owned subsidiary (1997) made their expedition
into the Indian market. Most of these new ventures proposed
to initially only assemble complete knock-down (CKD)/semi
knock-down kits (SKD). As a result, for balance-of-payments
reasons the government in 1995 asked these companies to
individually commit an equivalentamount of exports.
In 1997, the Ministry of Industry in its policy for
automotive industry placed import of capital goods and auto-
components under Open General License (OGL), but
regulated the import of automotive vehicles in Completely
Buildup (CBU) form or in SKD/CKD condition. The vehicle
manufacturing units were allowed to import vehicles only in
SKD/CKD condition and were required to obtain a license for
the same. With a vision of establishing a globally competitive
automotive industry in India and doubling its contribution to
the economy by 2010, the Ministry of Industry presented for
the first time a separate auto policy document in March, 2002
known as ‘Auto Policy-2002’. The document supersedes the
auto policy adopted in 1997 by addressing emerging
problems, being more investor friendly and ensuring
compatibility with World Trade Organisation (WTO)
commitments. Auto Policy, 2002 sets itself for making the
Indian automotive industry globally competitive. It aims at
promoting modernization and indigenous design and
development within the country as well as establishing
domestic safety and environmental standards at par with the
international ones. Furthermore, it targets at making India as
an international hub for manufacturing of small cars as well
as a key centre in the world for 2-wheelers and tractors.
Accordingly, the policy proposed various initiatives relating to
investment, tariffs, duties and imports in order to achieve
these objectives.
The detailed study of Auto Policy, 2002 is made by the
researcher in the next section of present chapter.
The policies laid by Auto Policy, 2002 have continued to
apply till date with minor modifications. Within a decade of
introducing structural reforms into the country, the
production of India’s automotive industry had increased to a
significant level. Besides, reductions in the overall tariff level
to open up India for international trade, the government has
also progressively rationalized its domestic taxation structure
to provide a fair competition ground for its domestic
manufacturers against the international competition. For
instance, the excise duty on passenger cars has been brought
down from its peak rate of 66% in 1991-92 to 24% in 2008-09.
Thus, during this phase, the increasingly investor friendly
as well as liberal trade measures adopted by the government
led to a momentous increase in the number of foreign players
active in the country. The dismantling of licensing controls
also encouraged the domestic players to undertake
entrepreneurial endeavors. This furthered competition within
all the segments of the automotive industry. The market for
automotive vehicles in India, which had earlier been virtually
a seller’s market, was transformed into a buyer’s market. The
Indian consumer benefited the most from the intensified
competition, which brought his requirements of a cost-
effective, technologically-competent, fuel-efficient and
reliable means of transport into perspective. Strong
macroeconomic base of demand growth drivers along with
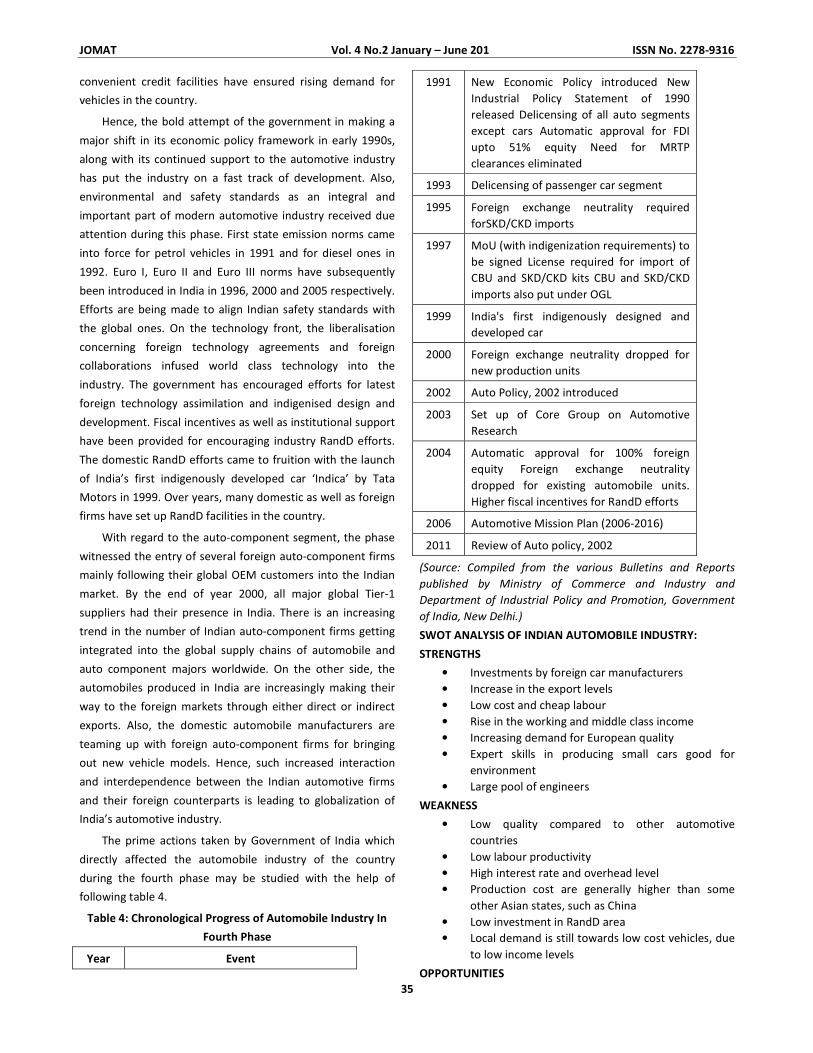
JOMAT Vol. 4 No.2 January – June 201 ISSN No. 2278-9316
35
convenient credit facilities have ensured rising demand for
vehicles in the country.
Hence, the bold attempt of the government in making a
major shift in its economic policy framework in early 1990s,
along with its continued support to the automotive industry
has put the industry on a fast track of development. Also,
environmental and safety standards as an integral and
important part of modern automotive industry received due
attention during this phase. First state emission norms came
into force for petrol vehicles in 1991 and for diesel ones in
1992. Euro I, Euro II and Euro III norms have subsequently
been introduced in India in 1996, 2000 and 2005 respectively.
Efforts are being made to align Indian safety standards with
the global ones. On the technology front, the liberalisation
concerning foreign technology agreements and foreign
collaborations infused world class technology into the
industry. The government has encouraged efforts for latest
foreign technology assimilation and indigenised design and
development. Fiscal incentives as well as institutional support
have been provided for encouraging industry RandD efforts.
The domestic RandD efforts came to fruition with the launch
of India’s first indigenously developed car ‘Indica’ by Tata
Motors in 1999. Over years, many domestic as well as foreign
firms have set up RandD facilities in the country.
With regard to the auto-component segment, the phase
witnessed the entry of several foreign auto-component firms
mainly following their global OEM customers into the Indian
market. By the end of year 2000, all major global Tier-1
suppliers had their presence in India. There is an increasing
trend in the number of Indian auto-component firms getting
integrated into the global supply chains of automobile and
auto component majors worldwide. On the other side, the
automobiles produced in India are increasingly making their
way to the foreign markets through either direct or indirect
exports. Also, the domestic automobile manufacturers are
teaming up with foreign auto-component firms for bringing
out new vehicle models. Hence, such increased interaction
and interdependence between the Indian automotive firms
and their foreign counterparts is leading to globalization of
India’s automotive industry.
The prime actions taken by Government of India which
directly affected the automobile industry of the country
during the fourth phase may be studied with the help of
following table 4.
Table 4: Chronological Progress of Automobile Industry In
Fourth Phase
Year Event
1991 New Economic Policy introduced New
Industrial Policy Statement of 1990
released Delicensing of all auto segments
except cars Automatic approval for FDI
upto 51% equity Need for MRTP
clearances eliminated
1993 Delicensing of passenger car segment
1995 Foreign exchange neutrality required
forSKD/CKD imports
1997 MoU (with indigenization requirements) to
be signed License required for import of
CBU and SKD/CKD kits CBU and SKD/CKD
imports also put under OGL
1999 India's first indigenously designed and
developed car
2000 Foreign exchange neutrality dropped for
new production units
2002 Auto Policy, 2002 introduced
2003 Set up of Core Group on Automotive
Research
2004 Automatic approval for 100% foreign
equity Foreign exchange neutrality
dropped for existing automobile units.
Higher fiscal incentives for RandD efforts
2006 Automotive Mission Plan (2006-2016)
2011 Review of Auto policy, 2002
(Source: Compiled from the various Bulletins and Reports
published by Ministry of Commerce and Industry and
Department of Industrial Policy and Promotion, Government
of India, New Delhi.)
SWOT ANALYSIS OF INDIAN AUTOMOBILE INDUSTRY:
STRENGTHS
• Investments by foreign car manufacturers
• Increase in the export levels
• Low cost and cheap labour
• Rise in the working and middle class income
• Increasing demand for European quality
• Expert skills in producing small cars good for
environment
• Large pool of engineers
WEAKNESS
• Low quality compared to other automotive
countries
• Low labour productivity
• High interest rate and overhead level
• Production cost are generally higher than some
other Asian states, such as China
• Low investment in RandD area
• Local demand is still towards low cost vehicles, due
to low income levels
OPPORTUNITIES
JOMAT Vol. 4 No.2 January – June 201 ISSN No. 2278-9316
36
• Growing population in the country
• Focus from the government in improving the road
infrastructure
• Rising living standards
• Increase in income level
• Better car technology is demanded
• Rising rural demand
• The car is a status symbol
• Women drivers have increased
THREATS
• Less skilled labour
• Lack of technologies for Indian companies
• Increase in the import tariff and technology Cost.
• Imports of two wheelers from the Chinese market
in India
• Smaller players that do not fulfil international
standards
• Increased congestion in the urban areas
CONCLUSION:
According to a survey of ASME International (American
Society of Mechanical Engineers), the automobile is the
greatest mechanical engineering achievement of the
20th
century. The automobile, airplane, Apollo, air
conditioning and other technologies made major
contributions to engineering progress and economic and
social development in the last 100 years.
Overall, the outlook for Indian automobile industry
appears to be bright. With post-liberalization reforms in place
since 1991, India has achieved remarkable development on
the overall economic front by achieving a sustained growth
rate for its economy in recent years. The world Bank and
other reliable sources state that India is set to emerge as the
second most important economic powerhouse in Asia and
the third largest economy in the world in terms of purchasing
power parity by 2020 (Kumar, 2007). As regards the
automobile sector, India has already become the world’s
seventh largest vehicles producer with a huge potential for
growth in other segments.
Exports have also started flourishing and it is expected
that Indian manufacturers can grab the global market in a big
way. However, the Indian manufacturers will have to upgrade
their technology and quality to move from good to excellent.
REFERENCES:
1. Aggarwal, R.N. 1988. “Indian Automobile Industry:
Problems and Prospects”, Indian Economic Journal,
Vol.36, No.2,Oct-Dec.
2. Ghanbari,AM.2012.http://shodhganga.inflibnet.ac.in/bits
tream/10603/3722/13/13_chapter%204.pdf
3. Henning, Dietmar 2008. http://www.wsws.org/en/
articles/2008/10/auto-o10.html
4. Humphrey, John and Memedovic, Olga 2003. “The
GlobalAutomotive Industry Value Chain: What Prospects
forUpgrading by Developing Countries”, Sectoral
StudiesSeries, UNIDO, Vienna.
5. Indian Brand Equity Foundation, 2008. “Automotive-
Marketand Opportunities”: online available at
http://www.ibef.org/download/Automotive_250608.pdf
6. Jefferson and Associates 2009. “Marketing Strategy-
MarketDiversification”: online available at http://www.
jeffersonassoc.com/mktdiversificationstrategy.htm
7. Kumar, K. 2007. “The Growth of India’s Auto Industry”,
inT.P Rajmanohar (ed.) Indian Automobile Industry-
Anintroduction, ICFAI University Press, ISBN-
8131407330,p. 42.
8. Mani, R. 2007. “The Growth of India’s Auto Industry”, in
T.PRajmanohar (ed.) Indian Automobile Industry-
Anintroduction, ICFAI University Press, ISBN-
8131407330,pp.6-7.
9. Mukherjee, A. 2000. “The Indian Automobile Industry:
Speeding into Future?”,Actes du GERPISA n° 28, pp.35-
48. Online available at http://gerpisa.org/ancien-gerpisa/
actes/28/28-4.pdf
10. Nag, B., Banerjee, S. and Chaterjee, R. 2007. “Changing
Features of the Automobile Industry in Asia: Comparison
of Production, Trade and Market Structure in Selected
Countries”, Asia-Pacific Research and Training Network
on Trade Working, Paper Series No. 37, pp.1-48.
11. Organisation Internationale des’ Constructeursd’
Automobiles (International Organization of Motor
Vehicle Manufacturers): http://www.oica.net
12. Penrose, E. 1959. “The Theory of the Growth of the
Firm”, Blackwell, Oxford, pp. 109-111.
13. Piplai, T. 2001. “Automobile Industry: Shifting Strategic
Focus”, Economic and Political Weekly, July 28, pp. 2892-
2897.
14. SIAM India 2014. http://www.siamindia.com/
15. Singh, A. and Gupta, V. 2012. “Indian Automobile
Industry: A Review”, International Journal of Research in
Mechanical Engineering and Technology, Vol.2, No.2,
May – Oct.
16. Shinde, G.P. and Dubey, M. 2011. “Automobile Industry
and Performance of Key Players”, Asian Journal of
Technology and Management Research, Vol.1, No.2, Jul-
Dec.
17. Varshney,N.2014.http://shodhganga.inflibnet.ac.in/bitstr
eam/10603/25112/5/05_chapter-1
���
JOMAT Vol. 4 No.2 January – June 2016 ISSN No. 2278-9316
(37)
ORGANIZATIONAL LEARNING: CREATING, RETAINING AND TRANSFORMING LEARNING
Ajit Kumar Kar
ABSTRACT
Changes in the workplace such as increases in technology and the increased influence and competition from international
markets have led organizations to rely increasingly on their ability to train employees on an ongoing basis to maintain the
necessary levels of knowledge, skill, and performance .Indeed, with many organizations viewing training and learning process as
a way to gain a competitive advantage, it is important that trainees learn the necessary knowledge and skills and that this
learning is successfully transferred to the job.
Traditionally, training research has focused on training design, individual differences, and the work environment to
understand the factors that affect transfer of training. Over the past 20 years, training researchers have increased efforts to
investigate transfer interventions. The majority of the interventions targeted to facilitate transfer are embedded within the
design of the training. For example, meta-analytic studies have shown that behavior modeling and error management training
can enhance training transfer. Post training interventions such as goal setting relapse prevention/self management, and verbal
Self-guidance have shown small impacts. So there is a need for learning organization where the era of monotonous training
programs can be replaced by value added learning era.
This paper deals with importance of learning in an organization, why is change required in an organization, the concept of
learning organization and its uses.
KEY WORDS: Learning organization, training transfer, organizational culture.
Introduction
In a dynamic and fast paced corporate world, learning
and development is an indispensable function.
Learning and development is one of the lowest things on
the priority list of most companies. When it's organized, it is
often at the persistence of the human resources department.
There is, however, enormous value in organizing proper
training and development sessions for employees. Training
allows employees to acquire new skills, sharpen existing ones,
perform better, increase productivity and be better leaders.
Since a company is the sum total of what employees achieve
individually, organizations should do everything in their
power to ensure that employees perform at their peak. But it
has been noticed that in spite of providing training to
employees, the result is not remarkable and the
organizational growth is still slow. Hence there is a need of
organizational change where learning should be given more
priority than only mere training.
A learning organization can be defined as the business
term that can be given to a company which facilitates the
learning of its members and continuously transforms itself.
The concept was coined through the work and research of
Peter Senge and his colleagues. The financial turmoil ignited
by the currency crisis in Thailand since mid-1997 has started a
widespread chain reaction in almost all Asian countries and
Australia as well. The Hong Kong stock market crashes in
October 1997 worsened the situation. With the benefit of
hindsight, what are the lessons we can learn from these
adversarial changes and how can we make things change for
the better. Thus, organisations today need to focus on the
various micro and marco learning elements which can help
them survive and be successful.
Management of change
There is an old saying: "the only constant is change". If
change is part of our daily life, how can we drive it under our
control rather than being driven off by it? Change in an
organization would, in the long run, lead to change in the
organizational culture. A typical example is the learning
organization, where people are excited in trying out new
ideas and recognize that failure is an important part of
success. Let us take a step back to look at the traditional
strategic change process which can broadly be summarized
by five key steps (Ho, 1998):
A new paradigm is:
In fact, the first step is nothing new. Peters and
Waterman (1982) have already found out from over 46
successful firms that most of them choose "action" as step
number one in their pursuit towards excellence. The new idea
here is that action leads to behavioral change of employees.
This arises from the learning process, and as Reg Revans
(1983) said: "There is no learning without action and no
action without learning".
© SBPIM
Head (HRD), WOMSINDIA and Institute of Management and Information Science. Bhubaneswar, Odisha
Contact No.: 9439039627 Email Id: [email protected]
JOMAT Vol. 4 No.2 January – June 2016 ISSN No. 2278-9316
(38)
If learning has been taken successfully, organizational
behavior will be lifted to a dynamic and challenge-seeking
level. This will influence the top management in defining their
mission. By then they are confident that the mission, spin-off
from a better organizational behavior, will take off once it is
announced. The chief executive will then be in a position to
develop the corporate vision which will take the organization
through to a world-class level against competition. Being built
on firm foundations, the new vision will establish a new
culture within the organization. One best known example of
this new culture is Kaizen, the Japanese word for continuous
improvement.
This new paradigm shift is not without evidence. Many
successful Japanese and American firms have emphasized the
importance of "close to the scene". Typical examples are
open office and factory plan. Sony and Hewlett Packard in
Penang (Malaysia) have their general managers sitting in the
middle of open offices which have a line of vision straight
through to the shop floor. McDonald's Restaurants have,
right from the start, made their kitchen see-through, even by
passing pedestrians.
The concept of learning organization Peter Senge [1994]
proposed the framework of the learning organization, i.e.:
1. Systems Thinking: The ability to see the big picture and
to distinguish patterns instead of conceptualizing change
as isolated events. Systems thinking need the other four
disciplines to enable a learning organization to be
realized. There must be a paradigm shift - from being
unconnected to interconnected to the whole, and from
blaming our problems on something external to a
realization that how we operate, our actions, can create
problems
2. Personal Mastery begins "by becoming committed to
lifelong learning," and is the spiritual cornerstone of a
learning organization. Personal Mastery involves being
more realistic, focusing on becoming the best person
possible, and striving for a sense of commitment and
excitement in our careers to facilitate the realization of
potential
3. Mental Models must be managed because they do
prevent new powerful insights and organizational
practices from becoming implemented. The process
begins with self-reflection; unearthing deeply held belief
structures and generalizations, and understanding how
they dramatically influence the way we operate in our
own lives. Until there is realization and a focus on
openness, real change can never take place.
4. Building Shared Visions: Visions cannot be dictated
because they always begin with the personal visions of
individual employees, who may not agree with the
leader's vision. What is needed is a genuine vision that
elicits commitment in good times and bad, and has the
power to bind an organization together. As Peter Senge
contends, "building shared vision fosters a commitment
to the long term"
5. Team Learning is important because modern
organizations operate on the basis of teamwork, which
means that organizations cannot learn if team members
do not come together and learn.
To summarize, a learning organization does away with
the mindset that it is only senior management who can and
do all the thinking for an entire corporation. Learning
organizations challenge all employees to tap into their inner
resources and potential, in hopes that they can build their
own community based on principles of liberty, humanity, and
a collective will to learn.
Way before Senge was hailed as the world's authority on
building learning organizations a number of TQM gurus had
already developed some important teaching on the learning
organization (Ho, 1995). Amongst them are:
(1) W. Edwards Deming (1993) - new management
philosophy. Ten of Deming's 14 Points are related to
learning:
- Point 2: Adopt the new philosophy, i.e. learning
organization.
- Point 6: Institute training.
- Point 7: Institute leadership.
- Point 8: Drive out fear.
- Point 9: Break down barriers between departments.
- Point 10: Eliminate slogans, exhortations and
numerical targets for the workforce.
- Point 11: Eliminate numerical quotas or work
standards.
- Point 12: Remove barriers to taking pride in
workmanship.
- Point 13: Institute a vigorous programme of
education.
- Point 14: Take action to accomplish the
transformation.
Importance of learning and development in an organization
In an ever changing and fast paced corporate world,
training and development is an indispensable function.
Training and development is one of the lowest things on
the priority list of most companies. When it's organized, it is
JOMAT Vol. 4 No.2 January – June 2016 ISSN No. 2278-9316
39
often at the persistence of the human resources department.
There is, however, enormous value in organizing proper
training and development sessions for employees. Training
allows employees to acquire new skills, sharpen existing ones,
perform better, increase productivity and be better leaders.
Since a company is the sum total of what employees achieve
individually, organizations should do everything in their
power to ensure that employees perform at their peak.
Here are a few reasons that demonstrate the importance
of training and development.
1. New Hire Orientation
Training is particularly important for new employees.
This can be conducted by someone within the company and
should serve as a platform to get new employees up to speed
with the processes of the company and address any skill gaps.
2. Tackle shortcomings
Every individual has some shortcomings and training and
development helps employees iron them out. For example, in
many organizations they divided the entire headcount in
several groups to provide focused training which is relevant
to those groups - sales training, first time managers, middle
management, senior leadership, executive leadership.
3. Improvement in performance
If shortcomings and weaknesses are addressed, it is
obvious that an employee's performance improves. Training
and development, however, also goes on to amplify your
strengths and acquire new skill sets. It is important for a
company to break down the training and development needs
to target relevant individuals. If we can draw examples from
many organizations, every department has targeted training
groups. These generally revolve around product development
training, QA training, PMP among others where internal and
external process experts facilitate various programs.
4. Employee satisfaction
A company that invests in training and development
generally tends to have satisfied employees. However, the
exercise has to be relevant to the employees and one from
which they can learn and take back something. It will be futile
if training and development become tedious and dull, and
employees attend it merely because they have to. As a
company, we stress on industry specific training and send
many employees for international seminars and conferences
that can be beneficial to them.
5. Increased productivity
In a rapidly evolving landscape, productivity is not only
dependent on employees, but also on the technology they
use. Training and development goes a long way in getting
employees up to date with new technology, use existing ones
better and then discard the outdated ones. This goes a long
way in getting things done efficiently and in the most
productive way.
6. Self driven
Employees who have attended the right trainings need
lesser supervision and guidance. Training develops necessary
skill sets in employees and enables them to address tasks
independently. This also allows supervisors and management
to focus on more pressing areas.
To transform our company into a learning organization
and encourage a culture of continual learning among
employees, we have launched a training and development
initiative called 'Rate Gain Lighthouse'. We call it lighthouse,
as it symbolizes strength, guidance and direction. We conduct
various in-house training sessions on knowledge-building and
skills and process.
The network facilitates various training sessions, based
on experiential learning methodologies. We have also
engaged globally renowned experts like Aaron Ross, author of
'Predictable revenue' and world renowned Sales coach and
trainer. His session for our sales teams have transformed the
way we are working. The results from our training and
development initiatives have been very positive and it clearly
shows that it is not a fad.
Training is not enough
It is difficult to find organizations that would say, “We
find that training has little impact on our bottom line year on
year”. Is this because organizations know exactly what return
they get from training? The answer to that question is a clear
no. The American Society for Training and Development
reported that only 3% of organizations measure what
happens to their bottom line as a result of training. Or is it
that it is politically incorrect to say in an organization that has
a high investment in training, designing training that allows
adults to learn is no simple feat in itself. A designer (once the
objectives of the training are understood) has to design
training with four major elements in mind. Participants must
recognize the need for information and rapport with the
trainer must be established early, otherwise the trainer’s
efforts will be in vain. The opening of any training effort must
provide a believable and appropriately challenging answer to
the question, “Why am I here?” and must lead to an early
engagement between the participants and the trainer. The
design must also be able to reinforce positive behavior. In
doing so, the design must not ignore negative or undesirable
behavior.
JOMAT Vol. 4 No.2 January – June 2016 ISSN No. 2278-9316
40
The design needs to include negative reinforcements to
eliminate the undesired behavior as much as it includes
positive reinforcement for desired behavior. Retention is a
key aspect of training design that is often ignored, in that very
few entities undertaking a training programme test for
retention. Participants must also have adequate an
opportunity to practice what they learn to increase levels of
retention. The fourth critical element of training design is
transference. Participants must be able to transfer what they
have learnt in to a new setting, away from the classroom. For
example, the workplace! Participants are more likely to
transfer their learning to the workplace when the learning is
critical to them doing their job or the learning revisited
familiar patterns of work or knowledge. Conversely, they
have a high probability of learning transfer when the learning
was very new and fresh. Transference is stopped cold if
participants return to a workplace which has policies,
processes and measures of processes which promote
behaviors opposite to those reinforced in the training. If
negative policies, processes and measures are well known
and expected to remain after the training, then motivation
for attending training will be severely hampered as well. Most
training is completed over a period of a day or two. In many
industries, it is difficult to allow participants the time off to
attend even a day’s training; hence the training may only be a
half day or two hours. Workplace learning happens mainly at
the workplace, not in the training room.
Why Is Change Important in a Learning Organization?
Change is important for any organization that wants to
continue to grow and prosper.
Any business in today's fast-moving environment that is
looking for the pace of change to slow is likely to be sorely
disappointed. In fact, businesses should embrace change.
Change is important for any organization because, without
change, businesses would likely lose their competitive edge
and fail to meet the needs of what most hope to be a growing
base of loyal customers. Thus, change is needed to survive
and excel and ultimately it demands learning.
1. Technology
Without change, business leaders still would be dictating
correspondence to secretaries, editing their words and
sending them back to the drawing board, wasting time for all
involved. Change that results from the adoption of new
technology is common in most organizations and while it can
be disruptive at first, ultimately the change tends to increase
productivity and service Technology also has affected how we
communicate. No longer do business people dial a rotary
phone, get a busy signal, and try again and again and again
until they get through. No longer do business people have to
laboriously contact people, in person, to find out about other
people who might be useful resources - they can search for
experts online through search engines as well as through
social media sites. Today's burgeoning communication
technology represents changes that allow organizations to
learn more, more quickly, than ever before.
2. Customer Needs
Customers who were satisfied with conventional ovens
many years ago are sometimes impatient with the microwave
today. As the world evolves, customer needs change and
grow, creating new demand for new types of products and
services -- and opening up new areas of opportunity for
companies to meet those needs.
3. The Economy
The economy can impact organizations in both positive
and negative ways and both can be stressful. A strong
economy and increasing demand for products and services
will mean that companies must consider expansion that
might involve the addition of staff and new facilities. These
changes offer opportunities for staff, but also represent new
challenges. A weak economy can create even more problems
as companies find themselves needing to make difficult
decisions that can impact employees' salaries and benefits
and even threaten their jobs. The ability to manage both ends
of the spectrum is critical for organizations that want to
maintain a strong brand and strong relationships with
customers as well as employees.
4. Growth Opportunities
Change is important in organizations to allow employees
to learn new skills, explore new opportunities and exercise
their creativity in ways that ultimately benefit the
organization through new ideas and increased commitment.
Preparing employees to deal with these changes involves an
analysis of the tools and training required to help them learn
new skills. Training can be provided through traditional
classroom settings or, increasingly, through online learning
opportunities. Importantly, organizations need to do a good
job of evaluating employees' capabilities and then taking
steps to fill the gaps between current skills and the skills
required to respond to growth.
5. Challenging the Status Quo
Simply asking the question "Why?" can lead to new ideas
and new innovations that can directly impact the bottom line.
Organizations benefit from change that results in new ways
of looking at customer needs, new ways of delivering
customer service, new ways of strengthening customer
interactions and new products that might attract new
JOMAT Vol. 4 No.2 January – June 2016 ISSN No. 2278-9316
41
markets. New employees joining an organization are
especially valuable because they can often point to areas of
opportunity for improvement that those who have been long
involved in the company might have overlooked. But even
existing employees should be encouraged to question why
things are done a certain way and look for new ways to get
work done faster, better and with higher levels of quality and
service.
IMPORTANCE OF CORPORATE LEARNING AND
DEVELOPMENT
Corporate learning and development plays a very
important role in the sustainable long term growth of an
organization. The issue of corporate learning and
development has becomes even more significant with the
increase in competition in every field of business today. The
right learning and development curve along with a
customized corporate human resource programs is needed to
give your organization that crucial edge over your
competitors in the market. Corporate learning and
development and human resource programs are crucial for
the growth of a company as:
• There is a direct link between corporate learning and
growth with the business needs of the organization
• Corporate human resource programs for management
have been identified as the most effective solution to
tackle issues of productivity.
• The objectives and outcomes of the corporate learning
and development plans are well defined and measurable.
A quantifiable goal is easier to achieve than a vague
estimation.
• Corporate learning and developments plans make it
easier to meet those objectives and outcomes in the
most cost effective way.
• Learning and development interventions held at regular
intervals helps track growth and gauge the direction of
business. They also help employees deliver exactly what
is required at each stage in the business by designing and
implementing corporate human resource programs.
Here are some reasons why your organization needs to
develop and implement a corporate learning and
development program:
Employees tend of have some weaknesses in their work
skills. A learning program allows strengthening of skills-
1. Improved Employee Performance
An employee who receives the necessary training is
better able to perform his job. Corporate learning and
development programs help build confidence and ensure that
they have a stronger understanding of the industry.
2. Consistency
A structured learning and development program ensures
that employees have a consistent experience and background
knowledge. This consistency is particularly relevant for any
company’s basic policies and procedures. All employees need
to be aware of the expectations and procedures within the
company for smooth functioning of the organization.
3. Employee Satisfaction
Employees with access to corporate learning and
development programs have an advantage over employees in
other companies who are left to learn on their own over the
course of work. Corporate learning and development
programs and human resource training programs create a
coherent work force, this is vital for any organization to
succeed in the market. ABAMI Consultancy and Training
offers many corporate learning and development programs,
and human resource training programs to help organizations
succeed in the market. Another added bonus is that,
investment in learning and development programs shows
employees they are valued and will motivate them to
perform better.
STEPS NEEDED TO CREATE A CULTURE THAT SUPPORTS A
LEARNING ORGANIZATION
To compete in this information-saturated environment
we are currently living in, it is necessary to remain dynamic,
competitive, and to continue to look for ways to improve
organizations. As David Garvin of Harvard University writes,
"continuous improvement requires a commitment to
learning" (Garvin 1994,19). Change is the only constant we
should expect in the workplace, and therefore, we must rid
ourselves of traditional, hierarchal organizational structures
that are often change-averse, or undergo change only as a
reaction to external events (Johnson 1993). Learning
organizations embrace change and constantly create
reference points to precipitate an ever-evolving structure
that has a vision of the future built-in. According to Richard
Karash, learning organizations are healthier places to work
because they:
• Garner Independent Thought
• Increase Ability to Manage Change
• Improve Quality
• Develop a More Committed Work Force
• Give People Hope that Things Can Get Better
• Stretch Perceived Limits
JOMAT Vol. 4 No.2 January – June 2016 ISSN No. 2278-9316
42
• Are in Touch with a Fundamental Part of Our Humanity:
The Need to Learn, To Improve Our Environment, and To
Be Active Actors, Not Passive Recipients (Karash 1995).
HOW TO ACHIEVE THE PRINCIPLES OF A LEARNING
ORGANIZATION
The first step is to create a timeline to initiate the types
of changes necessary to achieve the principles of a learning
organization.
Timeline: In Order of Appearance
• Stage One is to create a communications system to
facilitate the exchange of information, the basis on which
any learning organization is built (Gephart 1996,40). The
use of technology has and will continue to alter the
workplace by enabling information to flow freely, and to
"provide universal access to business and strategic
information" (Gephart 1996,41). It is also important in
clarifying the more complex concepts into more precise
language that is understandable across departments
(Kaplan 1996,24).
• Stage Two is to organize a readiness questionnaire, a tool
that assesses the distance between where an organization is
and where it would like to be, in terms of the following seven
dimensions. "Providing continuous learning, providing
strategic leadership, promoting inquiry and dialogue,
encouraging collaboration and team learning, creating
embedded structures for capturing and sharing learning,
empowering people toward a shared vision, and making
systems connections" (Gephart 1996,43). The questionnaire
is administered to all employees or a sample of them, and is
used to develop an assessment profile to design the learning
organization initiative (Gephart 1996,43).
• Stage Three is to commit to developing, maintaining, and
facilitating an atmosphere that garners learning.
• Stage Four is to create a vision of the organization and
write a mission statement with the help of all employees
(Gephart 1996, 44).
• Stage Five is to use training and awareness programs to
develop skills and understanding attitudes that are
needed to reach the goals of the mission statement,
including the ability to work well with others, become
more verbal, and network with people across all
departments within the organization (Navran 1993).
• Stage Six is to "communicate a change in the company's
culture by integrating human and technical systems"
(Gephart 1996, 44).
• Stage Seven is to initiate the new practices by
emphasizing team learning and contributions. As a result,
employees will become more interested in self-
regulation and management, and be more prepared to
meet the challenges of an ever-changing workplace
(Gephart 1996, 44).
• Stage Eight is to allow employees to question key
business practices and assumptions.
• Stage Nine is to develop workable expectations for
future actions (Navran 1993).
• Stage Ten is to remember that becoming a learning
organization is a long process and that small setbacks
should be expected. It is the journey that is the most
important thing because it brings everyone together to
work as one large team. In addition, it has inherent
financial benefits by turning the workplace into a well-
run and interesting place to work; a place which truly
values its employees.
ROLE OF LEADERS IN KNOWLEDGE SHARING and
ORGANIZATIONAL LEARNING PROCESS
Leaders must champion a knowledge sharing and
organizational learning process. They need to demonstrate
their commitment by setting a vision and goals for learning
connected to furthering the mission. And they must act as
role models by participating in learning activities. Second,
leaders need to foster a culture of continuous improvement
that values organizational learning. The culture reinforces
learning by providing incentives for learning behaviors and by
measuring and communicating results of learning. Third, the
organization needs to define a learning structure that
specifies the people who are accountable for capturing,
distilling, applying, and sharing knowledge. The structure also
should include networks and coordinating tactics that help
information flow among the people who need it, when they
need it.
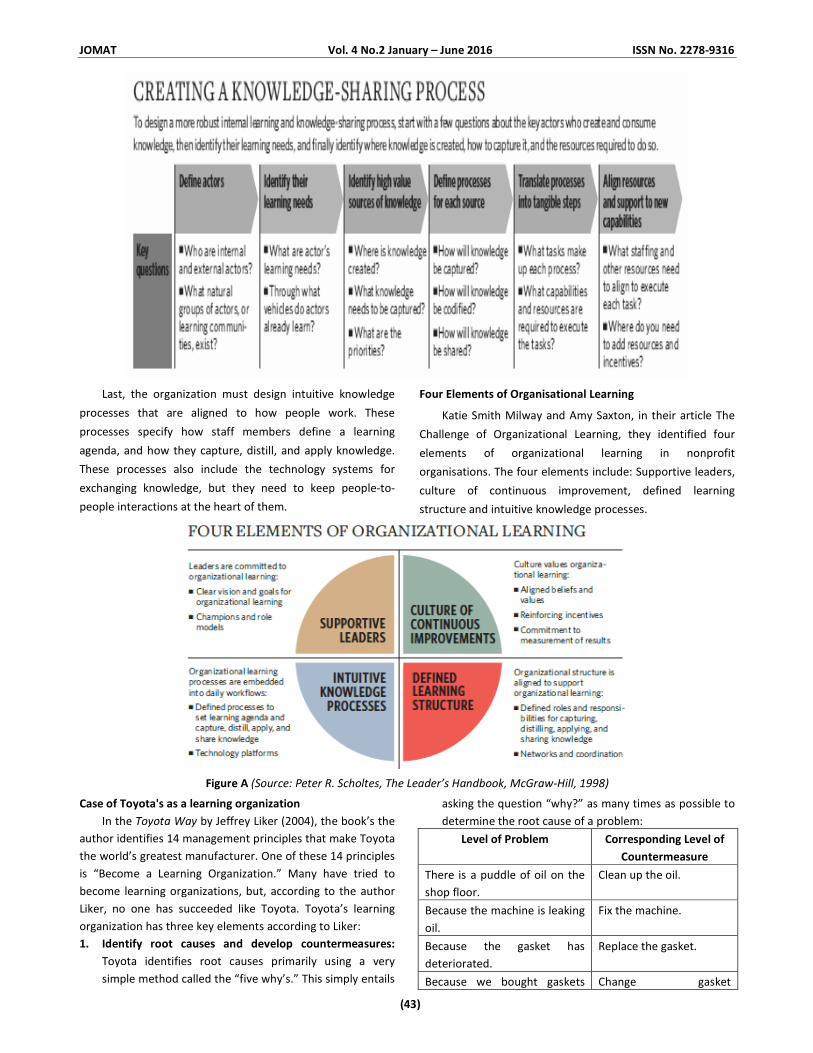
JOMAT Vol. 4 No.2 January – June 2016 ISSN No. 2278-9316
(43)
Last, the organization must design intuitive knowledge
processes that are aligned to how people work. These
processes specify how staff members define a learning
agenda, and how they capture, distill, and apply knowledge.
These processes also include the technology systems for
exchanging knowledge, but they need to keep people-to-
people interactions at the heart of them.
Four Elements of Organisational Learning
Katie Smith Milway and Amy Saxton, in their article The
Challenge of Organizational Learning, they identified four
elements of organizational learning in nonprofit
organisations. The four elements include: Supportive leaders,
culture of continuous improvement, defined learning
structure and intuitive knowledge processes.
Figure A (Source: Peter R. Scholtes, The Leader’s Handbook, McGraw-Hill, 1998)
Case of Toyota's as a learning organization
In the Toyota Way by Jeffrey Liker (2004), the book’s the
author identifies 14 management principles that make Toyota
the world’s greatest manufacturer. One of these 14 principles
is “Become a Learning Organization.” Many have tried to
become learning organizations, but, according to the author
Liker, no one has succeeded like Toyota. Toyota’s learning
organization has three key elements according to Liker:
1. Identify root causes and develop countermeasures:
Toyota identifies root causes primarily using a very
simple method called the “five why’s.” This simply entails
asking the question “why?” as many times as possible to
determine the root cause of a problem:
Level of Problem Corresponding Level of
Countermeasure
There is a puddle of oil on the
shop floor.
Clean up the oil.
Because the machine is leaking
oil.
Fix the machine.
Because the gasket has
deteriorated.
Replace the gasket.
Because we bought gaskets Change gasket
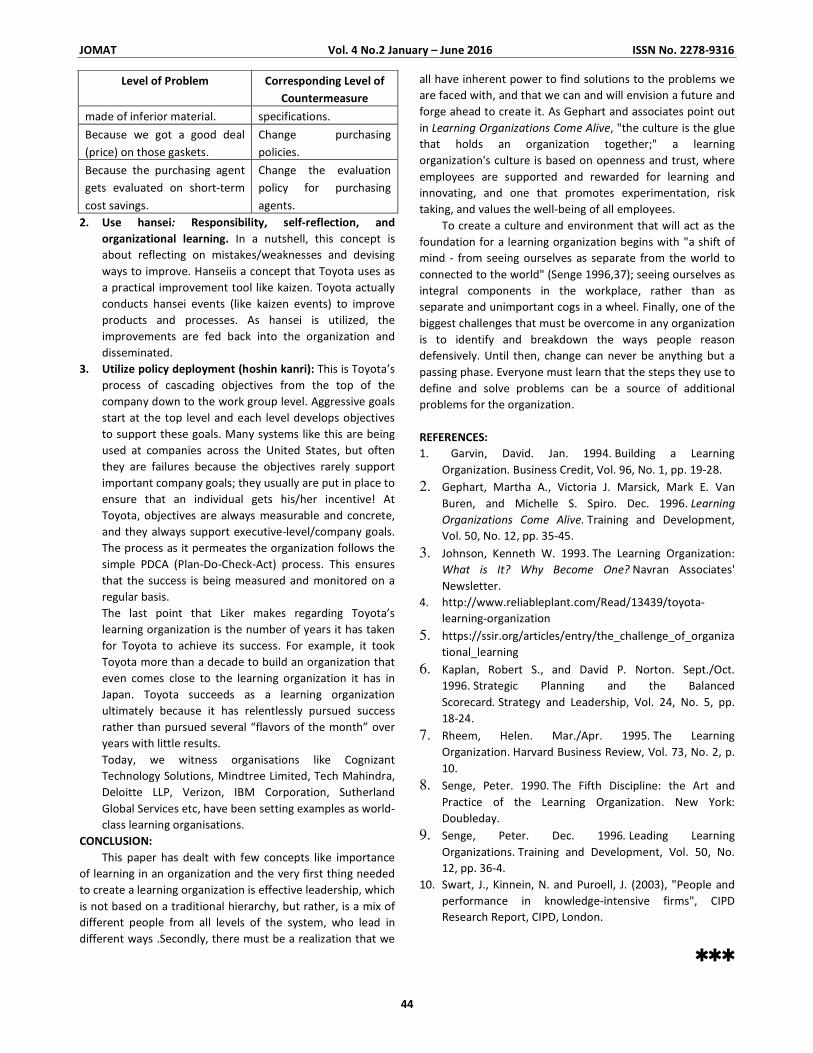
JOMAT Vol. 4 No.2 January – June 2016 ISSN No. 2278-9316
44
Level of Problem Corresponding Level of
Countermeasure
made of inferior material. specifications.
Because we got a good deal
(price) on those gaskets.
Change purchasing
policies.
Because the purchasing agent
gets evaluated on short-term
cost savings.
Change the evaluation
policy for purchasing
agents.
2. Use hansei: Responsibility, self-reflection, and
organizational learning. In a nutshell, this concept is
about reflecting on mistakes/weaknesses and devising
ways to improve. Hanseiis a concept that Toyota uses as
a practical improvement tool like kaizen. Toyota actually
conducts hansei events (like kaizen events) to improve
products and processes. As hansei is utilized, the
improvements are fed back into the organization and
disseminated.
3. Utilize policy deployment (hoshin kanri): This is Toyota’s
process of cascading objectives from the top of the
company down to the work group level. Aggressive goals
start at the top level and each level develops objectives
to support these goals. Many systems like this are being
used at companies across the United States, but often
they are failures because the objectives rarely support
important company goals; they usually are put in place to
ensure that an individual gets his/her incentive! At
Toyota, objectives are always measurable and concrete,
and they always support executive-level/company goals.
The process as it permeates the organization follows the
simple PDCA (Plan-Do-Check-Act) process. This ensures
that the success is being measured and monitored on a
regular basis.
The last point that Liker makes regarding Toyota’s
learning organization is the number of years it has taken
for Toyota to achieve its success. For example, it took
Toyota more than a decade to build an organization that
even comes close to the learning organization it has in
Japan. Toyota succeeds as a learning organization
ultimately because it has relentlessly pursued success
rather than pursued several “flavors of the month” over
years with little results.
Today, we witness organisations like Cognizant
Technology Solutions, Mindtree Limited, Tech Mahindra,
Deloitte LLP, Verizon, IBM Corporation, Sutherland
Global Services etc, have been setting examples as world-
class learning organisations.
CONCLUSION:
This paper has dealt with few concepts like importance
of learning in an organization and the very first thing needed
to create a learning organization is effective leadership, which
is not based on a traditional hierarchy, but rather, is a mix of
different people from all levels of the system, who lead in
different ways .Secondly, there must be a realization that we
all have inherent power to find solutions to the problems we
are faced with, and that we can and will envision a future and
forge ahead to create it. As Gephart and associates point out
in Learning Organizations Come Alive, "the culture is the glue
that holds an organization together;" a learning
organization's culture is based on openness and trust, where
employees are supported and rewarded for learning and
innovating, and one that promotes experimentation, risk
taking, and values the well-being of all employees.
To create a culture and environment that will act as the
foundation for a learning organization begins with "a shift of
mind - from seeing ourselves as separate from the world to
connected to the world" (Senge 1996,37); seeing ourselves as
integral components in the workplace, rather than as
separate and unimportant cogs in a wheel. Finally, one of the
biggest challenges that must be overcome in any organization
is to identify and breakdown the ways people reason
defensively. Until then, change can never be anything but a
passing phase. Everyone must learn that the steps they use to
define and solve problems can be a source of additional
problems for the organization.
REFERENCES:
1. Garvin, David. Jan. 1994. Building a Learning
Organization. Business Credit, Vol. 96, No. 1, pp. 19-28.
2. Gephart, Martha A., Victoria J. Marsick, Mark E. Van
Buren, and Michelle S. Spiro. Dec. 1996. Learning
Organizations Come Alive. Training and Development,
Vol. 50, No. 12, pp. 35-45.
3. Johnson, Kenneth W. 1993. The Learning Organization:
What is It? Why Become One? Navran Associates'
Newsletter.
4. http://www.reliableplant.com/Read/13439/toyota-
learning-organization
5. https://ssir.org/articles/entry/the_challenge_of_organiza
tional_learning
6. Kaplan, Robert S., and David P. Norton. Sept./Oct.
1996. Strategic Planning and the Balanced
Scorecard. Strategy and Leadership, Vol. 24, No. 5, pp.
18-24.
7. Rheem, Helen. Mar./Apr. 1995. The Learning
Organization. Harvard Business Review, Vol. 73, No. 2, p.
10.
8. Senge, Peter. 1990. The Fifth Discipline: the Art and
Practice of the Learning Organization. New York:
Doubleday.
9. Senge, Peter. Dec. 1996. Leading Learning
Organizations. Training and Development, Vol. 50, No.
12, pp. 36-4.
10. Swart, J., Kinnein, N. and Puroell, J. (2003), "People and
performance in knowledge-intensive firms", CIPD
Research Report, CIPD, London.
���
JOMAT Vol. 4 No.2 January – June 2016 ISSN No. 2278-9316
(45)
ROLE OF FDI IN TODAY’S INDIAN FINANCIAL STRUCTURE
Bharti Bagul
ABSTRACT
In the 1990s, foreign direct investment (FDI) became the largest single source of external finance for many developing
countries. Most discussions on the causes and effects of FDI have focused on flows into manufacturing and real production
sectors, where this type of investment has traditionally been concentrated. More recently, however, FDI into the financial sector
has soared, and the sector is being reshaped dramatically.
Financial sector FDI, a relatively new phenomenon, typically takes the form of banks in industrialized countries establishing
branches and facilities in developing countries.
Following the dissolution of the Soviet Union, bank entry into Central and Eastern Europe in the early 1990s led to foreign
ownership in local banking systems. Today, such ownership often exceeds 80 percent of local banking assets. In addition, the
liberalization of financial sectors in Latin America was likely spurred in part by foreign direct investment, especially in countries
facing potential competitive losses to Asian economies. Within Latin America, the financial crises of the mid-to-late 1990s
provided additional opportunities for foreign entry, as countries sought to recapitalize their banks and improve the efficiency of
their financial systems.
During the period October 2014 to September 2016, total FDI equity inflows of $77.86 billion was recorded as against $48.47
billion received during the preceding 24 months with an increase of 60 per cent. Make in India was launched with an aim to
promote India as an important investment destination and a global hub for manufacturing.
Foreign direct investment (FDI) into the country grew by over 30 per cent to $21.62 billion during the first half of 2016-
17.During April-September of 2015-16. India received FDI worth $16.63 billion. Ease of doing business and relaxation in the FDI
policy are helping attract more and more FDI. The recent easing in sectors such as civil aviation and construction will help in
attracting more overseas funds. The sectors that receive maximum inflows include computer hardware and software, trading
business, the automobile industry and chemicals. India receives maximum FDI from countries including Mauritius, Singapore, the
Netherlands and Japan. In 2015-16, FDI went up 29 per cent to $40 billion as against $30.93 billion in the previous fiscal. Foreign
investment is considered crucial for India, which needs around $1 trillion to overhaul its infrastructure such as ports, airports and
highways to put growth on a higher trajectory.
Growth in foreign investments helps improve the country’s balance of payments (BoP) situation and strengthens the rupee.
Foreign direct investment into the country grew by over 30 per cent to $21.62 billion during the first half of 2016-17. During April-
September of 2015-16, India received FDI worth $16.63 billion, an official said. Ease of doing business and relaxation in the FDI
policy are helping attract more FDI. The recent easing in sectors like civil aviation and construction will help in attracting more
overseas funds. The sectors that receive maximum inflows include computer hardware and software, trading business,
automobile industry and chemicals.
KEYWORDS: FDI, financial sector, liberalization, BOP, economic growth etc.
© SBPIM
Assistant Professor, Siddhant Institute of Business Management, Sadumbare, Pune - 412109
Contact no.:9850900598 Email Id: [email protected]
JOMAT Vol. 4 No.2 January – June 2016 ISSN No. 2278-9316
(46)
INTRODUCTION
India has received over US $300 billion US Foreign Direct
Investment (FDI) milestone between April 2000 and
September 2016. The cumulative FDI inflows during the
period amounted to US $310.26 billion. With this, India firmly
established its credentials as a safe investment destination in
the world.
Key Facts:
1. 33% of the FDI came through the Mauritius route. India
received US $101.76 billion dollar from Mauritius
between April 2000 and September 2016.
2. Top Destinations: Mauritius route is preferred by
investors because they wanted to take advantage of
India’s double taxation avoidance treaty (DTAA) with the
island nation.
3. Besides Mauritius, other big investors have been from
Singapore, US, UK and the Netherlands.
4. Sector wise: India’s services sector received maximum
18% of the cumulative equity FDI inflows. It was followed
by construction development, computer software and
hardware, telecommunication and automobile.
5. Liberalisation of the FDI policy framework supplemented
by major national development programmes such as
Make in India, Skill India and Digital India besides
increasing competitiveness, have made India the
preferred choice for investors globally.
Global FDI Status: According to the World Investment Report
2016 released by UNCTAD, global FDI flows rose by 38% to
$ 1.76 trillion. It is the highest level since the global economic
and financial crisis began in 2008. However, it still remains
some 10% short of the 2007 peak. The FDI flows in 2016 are
expected to decline by 10-15%, reflecting fragility of global
economy, persistent weakness of aggregate demand,
effective policy measures to curb tax inversion deals. Besides,
elevated geopolitical risks and regional tensions may further
amplify the expected downturn of FDI flows.
As per the International Monetary Fund (IMF), Foreign
Direct Investment, commonly referred to as FDI is an
investment made to acquire lasting or long-term interest in
enterprises operating outside of the economy of the investor.
It is not 'portfolio foreign investment (supine investment in
another country's securities like bonds and stocks).
Inorganically or organically done investment in
Investments in India during 2015-16: The ruling NDA
government in the centre has announced a lot of relaxations
for FDI and the business done under the FDI umbrella in
India. From now onwards, there will hardly be any difference
between 'Portfolio Foreign Investment' and 'Foreign Direct
Investment'. The composite cap has replaced the concept of
individual cap; for instance, there is now a composite cap of
49 percent foreign investors allowed in the insurance sector.
The Indian government, during the 2014-15 fiscal years,
announced that it would allow FDI worth US$ 14.65 billion
into the railways infrastructure. The company plans to
enhance RandD and manufacturing facilities in India to grow
at a better rate than the current industry growth rate.
Hundred percent FDI into the health sector will be allowed by
the Department of Industrial Policy and Promotion (DIPP) to
enable indigenous manufacturing and reduce imports of
medical devices. By the next fiscal year, the value of medical
devices in the world market will be worth US$ 400 billion. The
equity investment in the real estate is expected to go twofold
as the Indian government has allowed 100 percent FDI into
the construction sector. As per the real estate experts'
beliefs, the demand from foreign property buyers will rise.
Currently valued at US$ 1.5 billion, the real estate equity will
reach a value of US$ 3 billion in a few years, the experts and
analysts opine.
The present policy prohibits FDI in the following sectors:
• Gambling and Betting.
• Lottery business (including government/ private lottery,
online lotteries etc).
• Activities /sectors not open to private sector investment
(e.g., atomic energy /railways).
• Retails trading (expect single-brand product retailing).
• Business of chit fund.
• Nidhi company.
• Real estate business or construction of farm houses.
• Trading in transferable development rights (TDRs).
• Manufacturing of tobacco, cigars, cheroots, cigarallos,
cigarettes and other tobacco substitutes.
• Agriculture (excluding floriculture, horticulture,
apiculture and cultivation of vegetables and mushrooms
under controlled conditions, the development and
production of seeds and planting materials, animals
husbandry including the breeding of dogs, viniculture and
aquaculture under controlled conditions and services
related to the agro and allied sector).
JOMAT Vol. 4 No.2 January – June 2016 ISSN No. 2278-9316
47
PROCEDURE FOR RECEIVING FDI IN AN INDIAN COMPANY
An Indian company may receive Foreign Direct
Investment under the two routes as given under:
1. Automatic Route: FDI in sectors /activities to the extent
permitted under the automatic route does not require
any prior approval either of the Government or the
Reserve Bank of India.
2. Government Route: FDI in activities not covered under
the automatic route requires prior approval of the
Government which are considered by the Foreign
Investment Promotion Board (FIPB), Department of
Economic Affairs, and Ministry of Finance.
REVIEW OF LITERATURE
Saini A., Law S. H., Ahmad A. H. (2010), “FDI and
economic growth: New evidence on the role of financial
markets”, it was proved that the positive impact of FDI on
growth “kicks in” only after financial market development
exceeds a threshold level. Until then, the benefit of FDI is
non-existent. There have been studies in the past on sectoral
inflows but they do not conduct study on impact on sectors
share in GDP and hence called for research on the same.
Further the role of government has Always been Changing
new suggestions have always Emerged to increase the FDI
flows in India and hence calls for research. The researcher has
undertaken a comparative study of BRICS nations as a group
with each nation which is not done so far.
Singh J. (2010), “Economic Reforms and Foreign Direct
Investment in India: Policy, Trends and Patterns”, in the
context of increasing competition among nations and sub-
national entities to attract Foreign Direct Investment (FDI),
the present paper tries to analyze the emerging trends and
patterns of FDI inflows into Indian response to various policy
measures announced by the Government of India since mid-
1980 and later. The empirical analysis tends to suggest that
the FDI inflows, in general, show an increasing trend during
the post-reform period. Furthermore, country-wise
comparison of FDI inflow also indicates that FDI inflow into
India has increased considerably in comparison to other
developing economies in the recent years. Thus, the study
indicates that the FDI inflows into India responded positively
to the liberalization measures introduced in the early 1990s.
Chee Y. L., Nair M. (2010), “The Impact of FDI and Financial
Sector Development on Economic Growth: Empirical
Evidence from Asia and Oceania”
The empirical analysis showed that financial sector
development enhances the contribution of FDI on economic
growth in the region. It also showed that the complementary
role of FDI and financial sector development on economic
growth is most important for least developed economies in
the region. Key strategies to enhance the role of FDI and
financial development on economic growth in developing and
least developed Asia and Oceania countries are also discussed
in the paper.
John W. (2010), “China's FDI and non-FDI economies
and the sustainability of future high Chinese growth”, this
study found that foreign Invested Enterprises (FIEs),
enterprises account for over 50% of China's exports and 60%
of China's imports. Their share in Chinese GDP has been over
20% in the last two years, but they employ only 3% of the
workforce, since their average labor productivity exceeds that
of Non-FIEs by around 9:1. Their production is more heavily
for export rather than the domestic market because FIEs
provide access to both distribution systems abroad and
product design for export markets. China's FIEs may have
contributed over 40% of China's economic growth in 2003
and 2004, and without this inward FDI, China's overall GDP
growth rate could have been around 3.4 percentage points
lower.
Kumar G. L., Karthika S. (2010) “Sectoral Performance
Through Inflows of Foreign Direct Investment (FDI)”, the
study revealed that Foreign Direct Investment has a major
role to play in the economic development of the host
country. Most of the countries have been making use of
foreign investment and foreign technology to accelerate the
place of their economic growth. Over the years, foreign direct
investment has helped the economies of the host countries
to obtain a launching pad from where they can make further
improvements. Any forms of foreign direct investment pumps
in a lot of capital knowledge and technological resources into
the economy of the country. This helps in taking the
particular host economy ahead.
Rajalakshmi K. and Ramachandran F., (2011), “Impact of
FDI in India’s automobile sector with reference to passenger
car segment.” The author has studied the foreign investment
flows through the automobile sector with special reference to
passenger cars. The research methodology used for analysis
includes the use of ARIMA, coefficient, linear and compound
model. The period of study is from 1991to 2011. This paper is
an empirical study of FDI flows after post liberalisation
period. The author has also examined the trend ad
composition of FDI flow and the effect of FDI on economic
growth. The author has also identified the problems faced by
India in FDI growth of automobile sector through suggestions
of policy implications.
JOMAT Vol. 4 No.2 January – June 2016 ISSN No. 2278-9316
48
Singh Kr. Arun and Agarwal P.K., (2012) “Foreign direct
investment: The big bang in Indian retail”. In this article they
have studied the relation of foreign investment and Indian
retail business. The study is based on different literatures,
case studies and analysis of organised retail market. The
author discusses the policy development for FDI in the two
retail categories: single brand and multi brand. The author
concludes that FDI in multi brand retail should be considered,
better technology and employment. The paper also concludes
that openness of FDI in India would help India to integrate
into worldwide market.
Dr. Mamata Jain and Mrs. Meenal Lodhana Sukhlecha,
(2012), “FDI in multibrand retail: Is it the need of the hour?”
The paper studies the need of the retail community to invite
FDI in retailing. The study is under taken through analysis of
positive and negative impacts of reforms. The study shows
various advantages of FDI, which suggests for foreign
participation in retailing, but the author also suggests that
the ceiling should not exceed 51% even for single brands to
ensure check and control on business operations.
Devajit (2012) conducted the study to find out the
impact of foreign direct investments on Indian economy and
concluded that Foreign Direct Investment (FDI) as a strategic
component of investment is needed by India for its sustained
economic growth and development through creation of jobs,
expansion of existing manufacturing industries, short and
long term project in the field of healthcare, education,
research and development.
Narayana (2012) explained that one of the major
concerns of planners and policy makers in India is attracting
more and more Foreign Direct Investment. He analysed the
Foreign Direct Investment and its flows into India. He
highlighted the basic constraints to investment in general and
Foreign Direct Investment in particular.
Sharma Reetu and Khurana Nikita (2013) in their study
on the sector-wise distribution of FDI inflow to know about
which has concerned with the chief share, used a data from
1991-92 to 2011-2012 (post-liberalization period). This paper
also discusses the various problems about the foreign direct
investment and suggests the some recommendations for the
same. In this study found that, Indian economy is mostly
based on agriculture. So, there is a most important scope of
agriculture services. Therefore, the foreign direct investment
in this sector should be encouraged.
Singh and Gupta (2013) discussed India’s foreign capital
policy since 1947. They concluded that the policy framework
in India dealing with foreign private investment has changed
from cautious welcome policy during 1948-66 to selective
and restrictive policy during 1967 to 1979. In the decade of
eighties, it was the policy having partial liberalization with
many regulations. Liberal investment climate has been
created only since 1991.
Boopath (2013) revealed that the Press Council of India
has commented on synergic alliance or equity participation
by way of Foreign Direct Investment. The council opined that
Foreign Direct Investment should be allowed to break or halt
the growing Monopoly of a few media giants in India who
offer uneven playground and unhealthy competition to small
and medium papers.
OBJECTIVES AND METHODOLOGY
(i) To discuss the FDI policy framework in India.
(ii) To identify the various determinants of FDI.
(iii) To understand the need for FDI in India.
(iv) To Study the trends of FDI Flow in India during
2000-01 to 2015-16 (Up to March, 2016).
(v) To analysis the FDI flows as to identify country wise
approvals of FDI inflows to India.
(vi) To analysis sector wise inflow of FDI in India.
(vii) To identify the problems relating to low inflow of
FDI and to make suitable suggestions for attracting
more FDI inflow to India.
RESEARCH METHODOLOGY:
Type of research: Quantitative and Analytical Research.
Data: Data of Manufacturing, Services and Construction,
Real estate, mining sectors etc. from year April 2000 to June
2016 is considered for the study.
Data Collection Method: Secondary data from different
web sites and reports of RBI, CEDAR -USIBC report on FDI,
reports of Asian development bank. Sources of data
collection:
The study is based on published sources of data collected
from various sources. The data was extracted from the
following sources:
1. Handbook of Statistics on the Indian economy, RBI.
2. Economic Survey, Government of India.
3. Department of Industrial Policy and Promotion (DIPP).
4. Secretariat of Industrial Assistance (SIA).
5. Central Statistical Organization (CSO).
JOMAT Vol. 4 No.2 January – June 2016 ISSN No. 2278-9316
49
This research is a descriptive study in nature. The
secondary data was collected from various journals,
magazines, and websites particularly from the Department of
Industrial Policy and Promotion, Ministry of Commerce and
Industry, India stat etc. Simple percentages have been used
to defect the growth rate of India. Graphs and tables have
also been used where ever required to depict statistical data
of FDI during the study period. The time period of the study
has been taken from the April 2000 to March 2016.
CURRENT STATUS OF FDI IN INDIA:
1. Budget 2016: Retailers like Wal-Mart, Tesco to gain as
government allows 100% FDI in multi-brand processed
food retailing.
2. Economic Survey 2015-16: Services Sector remains the
Key Driver of Economic Growth contributing almost
66.1%. India’s Services Import at 81.1 billion US$ grew by
3.3% in 2014-15. The Government has taken policy
initiatives to promote services exports which include the
Service Export from India Scheme (SEIS) and organizing
Global Exhibition on Services (GES).
3. India's food grain production has increased marginally to
252.23 million tonnes (MT) in the 2015-16 crop year.
Production of pulses is estimated at 17.06 million tonnes.
According to the Department of Industrial Policy and
Promotion (DIPP), the Indian agricultural services and
agricultural machinery sectors have cumulatively
attracted Foreign Direct Investment (FDI) equity inflow of
about US$ 2,278.3 million from April 2000 to March
2016.
4. In FY 2015-16, the education market was worth about
US$ 100 billion and is expected to reach US$ 116.4 billion
in FY 2016-17. Currently, higher education contributes
59.7 per cent of the market size, school education 38.1
per cent, pre-school segment 1.6 per cent, and
technology and multi-media the remaining 0.6 per cent.
The total amount of Foreign Direct Investments (FDI)
inflow into the education sector in India stood at US$
1,256 million from April 2000 to March 2016.
5. Government allows 49% FDI in insurance under
automatic route.
6. Fm radio sectors with 20% FDI limits.
7. India has decided to allow up to 100% foreign direct
investment (FDI) in multi-brand retail for food products,
a move aimed at reducing wastage, helping farm
diversification and encouraging global giants to produce
locally rather than importing items. India currently allows
up to 51% FDI in multi-brand retail as part of policy.
8. The government on 21st
June 2016 allowed foreign
investors to pick up to 74 per cent equity in domestic
Pharmaceuticals companies through the automatic route
— a change aimed at making the investment process
easier. The existing FDI policy allows 100 per cent FDI
under automatic route in Greenfield pharmaceuticals
and up to 100 per cent FDI under government approval
in Brownfield pharmaceutical, With the objective of
promoting the development of this sector, it has been
decided to permit up to 74 per cent FDI under automatic
route in Brownfield pharmaceuticals and government
approval route beyond 74 per cent will continue.
9. Maintaining the 49 percent foreign direct investment
(FDI) cap for power exchanges and the petroleum and
natural gas refining sector, the government Tuesday
changed the investment route for companies to
automatic. In petroleum and natural gas refining, FDI up
to 49 percent is allowed in case of public sector
undertakings without involving any divestment or
dilution of domestic equity. For power exchanges also,
the 49 percent cap remains but approvals now will be
through the automatic route.
10. Foreign Direct Investment (FDI) inflows into Railways
related components from April 2000 to March 2016 were
US$ 710.98 million.
11. The Indian real estate sector has witnessed high growth
in recent times with the rise in demand for office as well
as residential spaces. According to data released by
Department of Industrial Policy and Promotion (DIPP),
the construction development sector in India has
received Foreign Direct Investment (FDI) equity inflows
to the tune of US$ 24.19 billion in the period April 2000-
March 2016.
12. The government is considering increasing the foreign
direct investment (FDI) limit in private banks to 100%,
from the existing 74%.Currently, 74%FDI is permitted in
the private sector banking, of which up to 49% is allowed
under the automatic route and beyond that through the
approval of the Foreign Investment Promotion Board
(FIPB).
However, portfolio investments in the banking sector can
go up to 49%. FDI ceiling is still capped at 20% for PSB.
13. Government on Monday said it has approved 89
proposals for foreign investment in single brand retail
JOMAT Vol. 4 No.2 January – June 2016 ISSN No. 2278-9316
50
trading (SBRT) and one in the multi-brand sector up to
March 2016.In February 2006, the government permitted
51 per cent FDI in the single brand sector. In 2012, it
raised the cap to 100 percentages. Government relaxed
Foreign Direct Investment (FDI) norms in a host of
sectors including civil aviation, single-brand retail,
defence, e-commerce, and pharmaceuticals by
permitting more investments under automatic route.
14. The tourism and hospitality sector is among the top 10
sectors in India to attract the highest Foreign Direct
Investment (FDI). During the period April 2000-March
2016, the hotel and tourism sector attracted around US$
9.23 billion of FDI, according to the data released by
Department of Industrial Policy and Promotion (DIPP).
The first Incredible India Tourism Investment Summit
2016, which was organised from September 21-23, 2016,
witnessed signing of 86 Memoranda of Understanding
(MoUs) worth around ` 15,000 crore (US$ 2.24 billion),
for the development of tourism and hospitality projects.
PROBLEMS FOR LOW FDI FLOW TO INDIA:
India, the largest democratic country with the second
largest population in the world, with rule of law and a highly
educated English speaking work force, the country is
considered as a safe haven for foreign investors. Yet, India
seems to be suffering from a host of self imposed restrictions
and problems regarding opening its markets completely too
global investors by implementing full scale economic reforms.
Some of the major impediments for India’s poor performance
in the area of FDI are: political instability, poor infrastructure,
and confusing tax and tariff policies, Draconian labour laws,
well entrenched corruption and governmental regulations.
1. Lack of adequate infrastructure: It is cited as a
major hurdle for FDI inflows into India. This
bottleneck in the form of poor infrastructure
discourages foreign investors in investing in India.
India’s age old and biggest infrastructure problem is
the supply of electricity. Power cuts are considered
as a common problem and many industries are
forced to close their business.
2. Stringent labour laws: Large firms in India are not
allowed to retrench or layoff any workers, or close
down the unit without the permission of the state
government. These laws protect the workers and
thwart legitimate attempts to restructure business.
To retrench unnecessary workers, firms require
approval from both employees and state
governments-approval that is rarely given. Further,
Trade Unions extort huge sums from companies
through over-generous voluntary retirement
schemes.
3. Corruption: Corruption is found in nearly every
public service, from defence to distribution of
subsidized food to the poor people, to the
generation and transmission of electric power. The
combination of legal hurdles, lack of institutional
reforms, bureaucratic decision-making and the
allegations of corruption at the top have turned
foreign investors away from India.
4. Lack of decision making authority with the state
governments: The reform process of liberalizing the
economy is concentrated mainly in the Centre and
the State Governments are not given much power.
In most key infrastructure areas, the central
government remains in control. Brazil, China, and
Russia are examples where regional governments
take the lead in pushing reforms and prompting
further actions by the central government.
5. Limited scale of export processing zones: India’s
export processing zones have lacked dynamism
because of several reasons, such as their relatively
limited scale; the Government’s general
ambivalence about attracting FDI; the unclear and
changing incentive packages attached to the zones;
and the power of the central government in the
regulation of the zones. India which established its
first Export Processing Zone (EPZ) in 1965 has failed
to develop the zones when compared to China
which took initiative for establishment only in 1980.
6. High corporate tax rates: Corporate tax rates in
East Asia are generally in the range of 15 to 30
percent, compared with a rate of 48 percent for
foreign companies in India. High corporate tax rate
is definitely a major disincentive to foreign
corporate investment in India.
7. Indecisive government and political instability:
There were too many anomalies on the government
side during past two decades and they are still
affecting the direct inflow of FDI in India such as
mismanagement and oppression by the different
company, which affect the image of the country
and also deject the prospective investor, who is
very much conscious about safety and constant
return on their investment.
JOMAT Vol. 4 No.2 January – June 2016 ISSN No. 2278-9316
51
NEED FOR FDI IN INDIA
As India is a developing country, capital has been one of
the scare resources that are usually required for economic
development. Capital is limited and there are many issues
such as Health, poverty, employment, education, research
and development, technology obsolesce, global competition.
The flow of FDI in India from across the world will help in
acquiring the funds at cheaper cost, better technology,
employment generation, and upgraded technology transfer,
scope for more trade, linkages and spill over to domestic
firms. The following arguments are advanced in favour of
foreign capital.
1) Sustaining a high level of investment: As all the
under-developed and the developing countries
want to industrialize and develop themselves,
therefore it becomes necessary to raise the level to
investment substantially. Due to poverty and low
GDP the saving are low. Therefore there is a need to
fill the gap between income and savings through
foreign direct investments.
2) Technological gap: In Indian scenario we need
technical assistance from foreign source for
provision if expert services, training of Indian
personnel and educational, research and training
institutions in the industry. It only comes through
private foreign investment or foreign collaborations
3) Exploitation of natural resources: In India we have
abundant natural resources such as coal, iron and
steel but to extract the resources we require
foreign collaboration.
4) Understanding the initial risk: In developing
countries as capital is a scare resource, the risk of
investments in new ventures or projects for
industrialization is high. Therefore foreign capital
helps in these investments which require high risk.
5) Development of basic economic infrastructure: In
the recent years foreign financial institutions and
government of advanced countries have made
substantial capital available to the under developed
countries. FDI will help in developing the
infrastructure by establishing firm’s different parts
of the country.
There are special economic zones which have been
developed by government for improvising the
industrial growth.
6) Improvement in the balance of payments position:
The inflow FDI will help in improving the balance of
payment. Firms which feel that the goods produced
in India will have a low cost, will produce the goods
and export the same to other country. This helps in
increasing the exports.
7) Foreign firm’s helps in increasing the competition:
Foreign firms have always come up with better
technology, process, and innovations comparing
with the domestic firms. They develop a completion
in which the domestic firms will perform better it
survive in the market.
VI. DATA ANALYSIS AND INTERPRETATION
Table No. 3: FDI EQUITY INFLOWS (MONTH-WISE) DURING THE FINANCIAL YEAR 2015-16:
Financial Year 2015-16( April-March )
Amount of FDI Equity
inflows: (In `̀̀̀ Crore)
Amount of FDI Equity
inflows: (In US $ mn)
April 2015 22,620 3,605
May 2015 24,564 3,850
June 2015 13,115 2,054
July 2015 12,769 2,007
August 2015 14,446 2,220
September 2015 19,181 2,897
October 2015 34,105 5,242
November 2015 19,399 2,934
December 2015 30,865 4,635
January 2016 33,461 4,975
February 2016 21,268 3,117
March 2016 16,530 2,466
2015-16 (form April, 2015to March,2016) 262,322 40,001
2014-15 (form April, 2014 to March, 2015) 189,107 30,931
%age growth over last year ( + ) 39% ( + ) 29%
Source: FDI Statistics, Department of Industrial Policyand Promotion, Ministry of Commerce and Industry, Government of India,
2016.
JOMAT Vol. 4 No.2 January – June 2016 ISSN No. 2278-9316
(52)
Table 3 shows the amount of FDI inflows during Financial
Year from April, 2015 to March, 2016 (up to June, 2015). It
shows the amount in ` Crore and in US $ mn. The highest FDI
inflows in the country is in the month of May 2015 i.e. 24,564
in ` Crore and 3,850 in US $ mn. Followed by April, 2015 and
June, 2015 with inflows 22,620 in ` Crore (3,605 in US$ mn)
and 13,115 in ` Crore (2,045 in US$ mn) respectively. It can
also be observed that there is 40% growth over last year.
Table No. 6: Sectors Attracting Highest FDI Equity Inflows
Amount in `̀̀̀ crores (US$ in millions)
Ranks Sector 2013-14 2014-15 2015-16 Cumulative % age to total
Inflows
(April - (April- (April, 15 – Inflows (In terms of
US$)
March) March) March, 16 ) (April ’00 -
March ‘16)
1. SERVICES SECTOR 13,294 27,369 45,415 258,354
18%
(2,225) (4,443) (6,889) (50,792)
2. CONSTRUCTION DEVELOPMENT: 7,508 4,652 727 113,936
TOWNSHIPS, HOUSING, BUILT-UP (1,226) (769) (113) (24,188) 8%
INFRASTRUCTURE
3. COMPUTER SOFTWARE and 6,896 14,162 38,351 112,184
7%
HARDWARE
(1,126) (2,296) (5,904) (21,018)
4. TELECOMMUNICATIONS 7,987 17,372 8,637 92,729
6%
(radio paging, cellular mobile, basic (1,307) (2,895) (1,324) (18,382)
telephone services)
5. AUTOMOBILE INDUSTRY 9,027 16,760 16,437 81,394
5%
(1,517) (2,726) (2,527) (15,065)
6. DRUGS and PHARMACEUTICALS 7,191 9,052 4,975 70,097
5%
(1,498)
(1,279)
(754) (13,849)
7. CHEMICALS (OTHER THAN 4,738 4,658 9,664 59,555
4%
FERTILIZERS) (878) (763) (1,470) (11,900)
8. 8,191 16,755 25,244 68,837 4%
TRADING
(1,343) (2,728) (3,845) (11,872)
9. POWER 6,519 4,296 5,662 52,613
4%
(1,066) (707) (869) (10,476)
10 2,949 4,740 8,761 49,710
HOTEL and TOURISM
(486) (777) (1,333) (9,227)
3%
Source: FDI Statistics, Department of Industrial Policy and Promotion, Ministry of Commerce and Industry, Government of India,
2016.
JOMAT Vol. 4 No.2 January – June 2016 ISSN No. 2278-9316
(53)
Table No.6 depicts the sector having the highest FDI
equity inflow in India. The report shows that Service sector
has the highest FDI Equity inflow 18%, followed by
Construction development, Computer Software and
Hardware, Telecommunication, Automobile Industry sector
having 8%, 7%, 6%, and 5% respectively. Other sectors like
Drugs and Pharmaceuticals carries 5% and Chemicals, Power,
Trading Industries carries 4% FDI inflow each, whereas the
least is of Metallurgical industries is 3%
Table No. 8
a. DIPP’s –Financial Year-wise FDI Equity Inflows: (As per DIPP’s FDI data base – equity capital components only):
Sr. No. Financial Year Amount of FDI
Inflows
%age growth
(April – March) over previous
FINANCIAL YEARS 2000-01 to 2015-16 year (in terms of US $)
In `̀̀̀ crores
In US $
million
1. 2000-01 10,733 2,463 -
2. 2001-02 18,654 4,065 ( + ) 65 %
3. 2002-03 12,871 2,705 ( - ) 33 %
4. 2003-04 10,064 2,188 ( - ) 19 %
5. 2004-05 14,653 3,219 ( + ) 47 %
6. 2005-06 24,584 5,540 ( + ) 72 %
7. 2006-07 56,390 12,492 (+ )125 %
8. 2007-08 98,642 24,575 ( + ) 97 %
9. 2008-09 142,829 31,396 ( + ) 28 %
10. 2009-10 123,120 25,834 ( - ) 18 %
11. 2010-11 97,320 21,383 ( - ) 17 %
12. 2011-12 165,146 35,121 (+) 64 %
13. 2012-13 121,907 22,423 (-) 36 %
14. 2013-14 147,518 24,299 (+) 8%
15. 2014-15 189,107 30,931 (+) 27%
16. 2015-16 262,322 40,001 (+) 29%
CUMULATIVE TOTAL (from April, 2000 to March, 2016)
1,495,860
288,635
-
Source: RBI’s Bulletin July, 2016 dt.10.08.2016 (Table No. 8 –FOREIGN INVESTMENT INFLOWS).
The above Table No. 8 shows the total amount of FDI
inflows in India during the last 15 years i.e. 2000 to 2016. The
FDI inflow from 2000-2001 i.e. 10,733 Crore ` in 2001-02 it
was 18,654 Crore rupees. It shows the Good result in the FDI
inflows in India. Little bit ups and downs in FDI inflows up to
2005-06, but after that great hike in the year 2007-08 i.e.
98,642crore rupees as compare to earlier years. In 2008-2009
there was a huge investment in FDI in 142,829 Crore Rupees
and so on. But again there were some fluctuations in inflow
of FDI in the years between 2010-2014, soon giving the
highest figures in last 15 years 262,322Crore Rupees FDI in
2015-2016.
JOMAT Vol. 4 No.2 January – June 2016 ISSN No. 2278-9316
(54)
Table No. 9
b. RBI’s Regional Offices (With State Covered) Received FDI Equity Inflows (From April, 2000 To March, 2016)
Sr. RBI’s - Regional State covered 2013-14 2014-15 2015-16 Cumulative %age to total
No. Office2 (April - (April - (April, 15 Inflows Inflows
March) March) –March, 16) (April ’00-March ‘16) (in terms of US$)
1 MUMBAI MAHARASHTRA, 20,595 38,933 62,731 415,753 29
DADRA and (3,420) (6,361) (9,511) (82,629)
NAGAR HAVELI,
DAMAN and DIU
2 NEW DELHI DELHI, PART OF 38,190 42,252 83,288 332,312 22
UP AND (6,242) (6,875) (12,743) (62,154)
HARYANA
3 CHENNAI TAMIL NADU, 12,595 23,361 29,781 118,547 7
PONDICHERRY (2,116) (3,818) (4,528) (21,542)
4 BANGALORE KARNATAKA 11,422 21,255 26,791 108,912 7
(1,892) (3,444) (4,121) (20,241)
5 AHMEDABAD GUJARAT 5,282 9,416 14,667 68,464 5
(860) (1,531) (2,244) (13,285)
6 HYDERABAD ANDHRA 4,024 8,326 10,315 59,556 4
PRADESH (678) (1,369) (1,556) (11,571)
7 KOLKATA WEST BENGAL, 2,659 1,464 6,220 20,847 1
SIKKIM, (436) (239) (955) (3,936)
ANDAMAN and
NICOBAR
ISLANDS
8 CHANDIGARH CHANDIGARH, 562 234 177 6,538 0.5
PUNJAB, (91) (39) (27) (1,358)
HARYANA,
HIMACHAL
PRADESH
9 JAIPUR RAJASTHAN 233 3,237 332 7,126 0.5
(38) (541) (50) (1,315)
10. KOCHI KERALA, 411 1,418 589 6,739 0.5
LAKSHADWEEP (70) (230) (90) (1,301)
11 BHOPAL MADHYA 708 601 518 6,614 0.5
PRADESH, (119) (100) (80) (1,296)
CHATTISGARH
12 PANAJI GOA 103 211 117 3,984 0.3
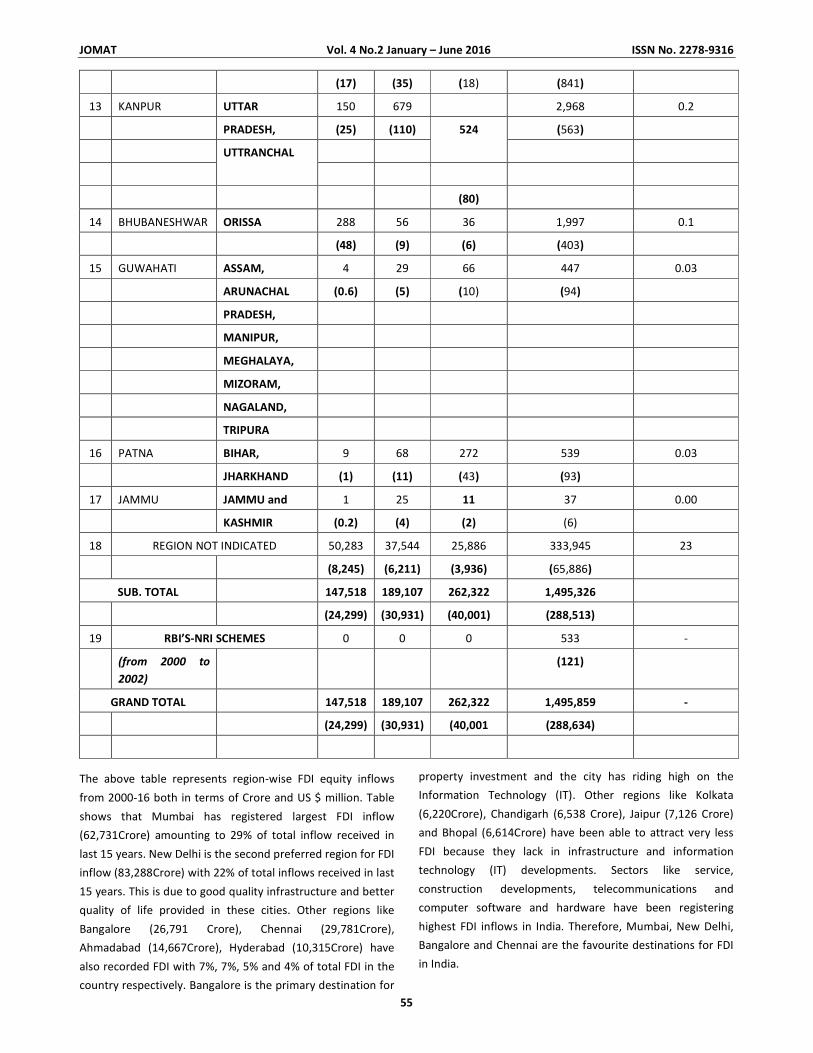
JOMAT Vol. 4 No.2 January – June 2016 ISSN No. 2278-9316
55
(17) (35) (18) (841)
13 KANPUR UTTAR 150 679 2,968 0.2
PRADESH, (25) (110) (563)
524
UTTRANCHAL
(80)
14 BHUBANESHWAR ORISSA 288 56 36 1,997 0.1
(48) (9) (6) (403)
15 GUWAHATI ASSAM, 4 29 66 447 0.03
ARUNACHAL (0.6) (5) (10) (94)
PRADESH,
MANIPUR,
MEGHALAYA,
MIZORAM,
NAGALAND,
TRIPURA
16 PATNA BIHAR, 9 68 272 539 0.03
JHARKHAND (1) (11) (43) (93)
17 JAMMU JAMMU and 1 25 11 37 0.00
KASHMIR (0.2) (4) (2) (6)
18 REGION NOT INDICATED 50,283 37,544 25,886 333,945 23
(8,245) (6,211) (3,936) (65,886)
SUB. TOTAL 147,518 189,107 262,322 1,495,326
(24,299) (30,931) (40,001) (288,513)
19 RBI’S-NRI SCHEMES 0 0 0 533 -
(from 2000 to
2002)
(121)
GRAND TOTAL 147,518 189,107 262,322 1,495,859 -
(24,299) (30,931) (40,001 (288,634)
The above table represents region-wise FDI equity inflows
from 2000-16 both in terms of Crore and US $ million. Table
shows that Mumbai has registered largest FDI inflow
(62,731Crore) amounting to 29% of total inflow received in
last 15 years. New Delhi is the second preferred region for FDI
inflow (83,288Crore) with 22% of total inflows received in last
15 years. This is due to good quality infrastructure and better
quality of life provided in these cities. Other regions like
Bangalore (26,791 Crore), Chennai (29,781Crore),
Ahmadabad (14,667Crore), Hyderabad (10,315Crore) have
also recorded FDI with 7%, 7%, 5% and 4% of total FDI in the
country respectively. Bangalore is the primary destination for
property investment and the city has riding high on the
Information Technology (IT). Other regions like Kolkata
(6,220Crore), Chandigarh (6,538 Crore), Jaipur (7,126 Crore)
and Bhopal (6,614Crore) have been able to attract very less
FDI because they lack in infrastructure and information
technology (IT) developments. Sectors like service,
construction developments, telecommunications and
computer software and hardware have been registering
highest FDI inflows in India. Therefore, Mumbai, New Delhi,
Bangalore and Chennai are the favourite destinations for FDI
in India.
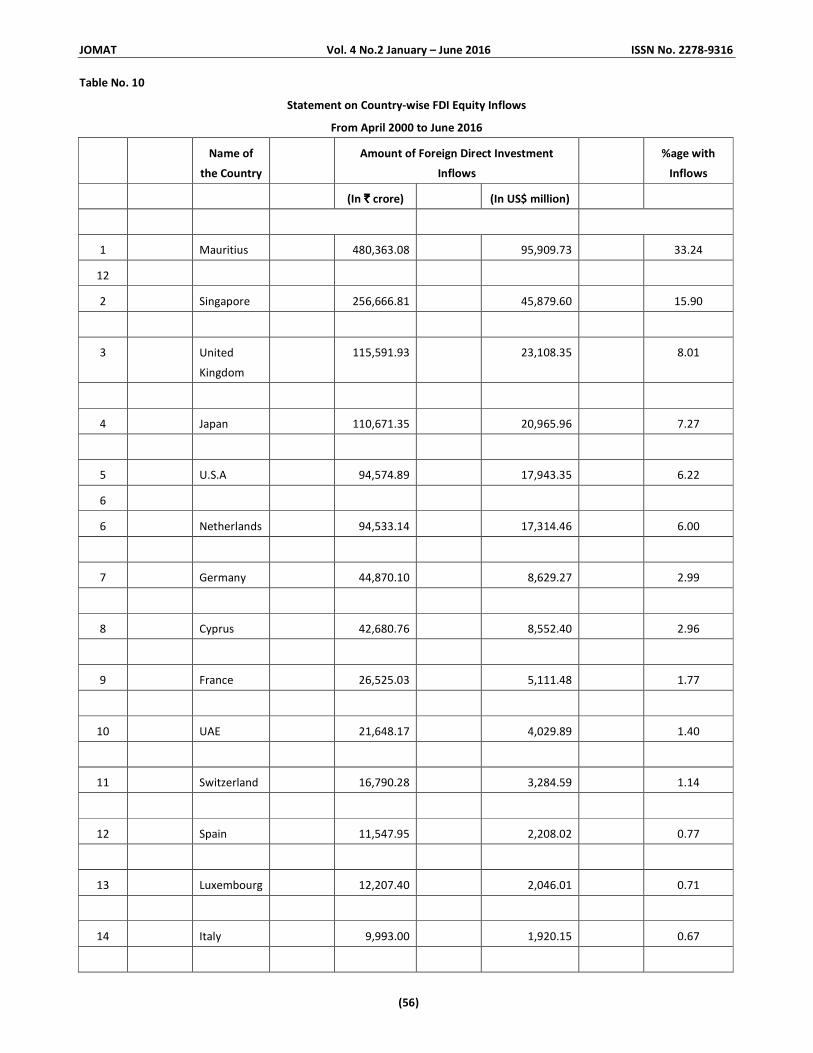
JOMAT Vol. 4 No.2 January – June 2016 ISSN No. 2278-9316
(56)
Table No. 10
Statement on Country-wise FDI Equity Inflows
From April 2000 to June 2016
Name of
the Country
Amount of Foreign Direct Investment
Inflows
%age with
Inflows
(In `̀̀̀ crore) (In US$ million)
1 Mauritius 480,363.08 95,909.73 33.24
12
2 Singapore 256,666.81 45,879.60 15.90
3 United
Kingdom
115,591.93 23,108.35 8.01
4 Japan 110,671.35 20,965.96 7.27
5 U.S.A 94,574.89 17,943.35 6.22
6
6 Netherlands 94,533.14 17,314.46 6.00
7 Germany 44,870.10 8,629.27 2.99
8 Cyprus 42,680.76 8,552.40 2.96
9 France 26,525.03 5,111.48 1.77
10 UAE 21,648.17 4,029.89 1.40
11 Switzerland 16,790.28 3,284.59 1.14
12 Spain 11,547.95 2,208.02 0.77
13 Luxembourg 12,207.40 2,046.01 0.71
14 Italy 9,993.00 1,920.15 0.67
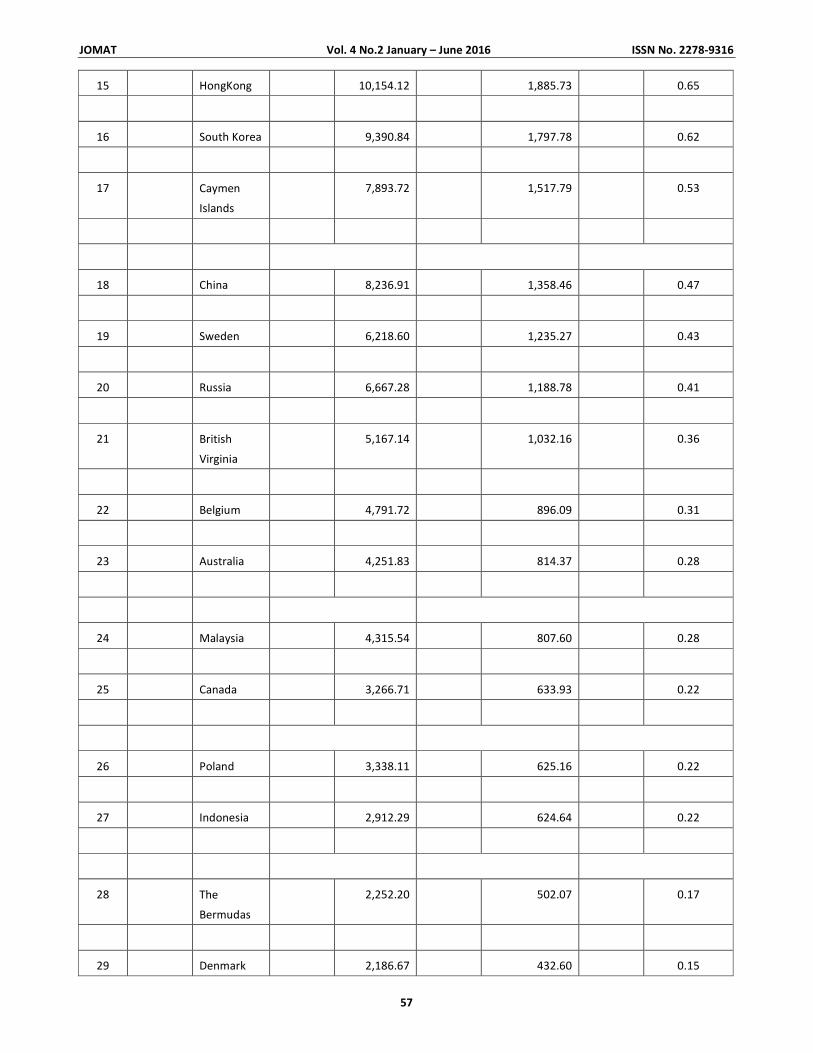
JOMAT Vol. 4 No.2 January – June 2016 ISSN No. 2278-9316
57
15 HongKong 10,154.12 1,885.73 0.65
16 South Korea 9,390.84 1,797.78 0.62
17 Caymen
Islands
7,893.72 1,517.79 0.53
18 China 8,236.91 1,358.46 0.47
19 Sweden 6,218.60 1,235.27 0.43
20 Russia 6,667.28 1,188.78 0.41
21 British
Virginia
5,167.14 1,032.16 0.36
22 Belgium 4,791.72 896.09 0.31
23 Australia 4,251.83 814.37 0.28
24 Malaysia 4,315.54 807.60 0.28
25 Canada 3,266.71 633.93 0.22
26 Poland 3,338.11 625.16 0.22
27 Indonesia 2,912.29 624.64 0.22
28 The
Bermudas
2,252.20 502.07 0.17
29 Denmark 2,186.67 432.60 0.15
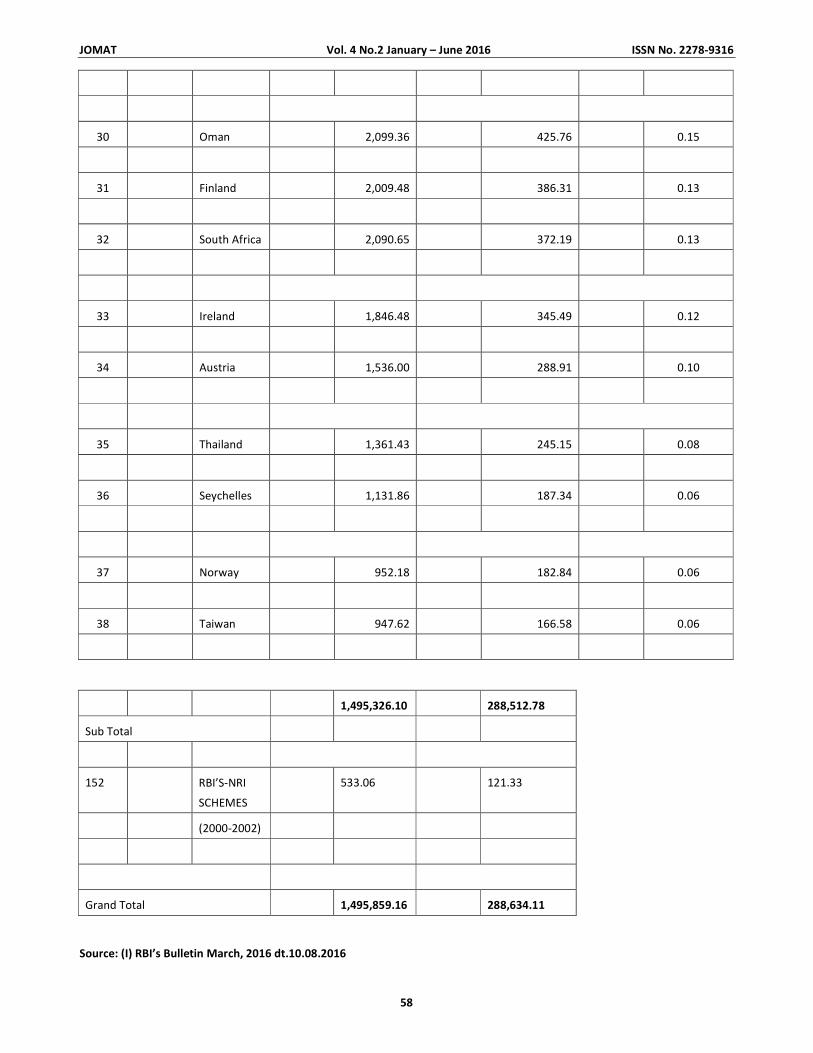
JOMAT Vol. 4 No.2 January – June 2016 ISSN No. 2278-9316
58
30 Oman 2,099.36 425.76 0.15
31 Finland 2,009.48 386.31 0.13
32 South Africa 2,090.65 372.19 0.13
33 Ireland 1,846.48 345.49 0.12
34 Austria 1,536.00 288.91 0.10
35 Thailand 1,361.43 245.15 0.08
36 Seychelles 1,131.86 187.34 0.06
37 Norway 952.18 182.84 0.06
38 Taiwan 947.62 166.58 0.06
1,495,326.10 288,512.78
Sub Total
152 RBI’S-NRI
SCHEMES
533.06 121.33
(2000-2002)
Grand Total 1,495,859.16 288,634.11
Source: (I) RBI’s Bulletin March, 2016 dt.10.08.2016
JOMAT Vol. 4 No.2 January – June 2016 ISSN No. 2278-9316
59
Table No. 11
STATEMENT ON SECTOR-WISE FDI EQUITY INFLOWS
FROM APRIL 2000 TO MARCH 2016
Sr. Sector Amount of FDI Inflows %age of
No. (In `̀̀̀
crore)
(In US$ million) Total Inflows
1 SERVICES SECTOR 258,354.2
2
50,792.42 17.60
2 CONSTRUCTION DEVELOPMENT:
Townships, housing,
113,936.3
5
24,187.94 8.38
built-up infrastructure and
construction-development projects
3 COMPUTER SOFTWARE and
HARDWARE
112,183.9
2
21,017.77 7.28
4 TELECOMMUNICATIONS 92,728.71 18,382.35 6.37
5 AUTOMOBILE INDUSTRY 81,394.21 15,064.59 5.22
6 DRUGS and PHARMACEUTICALS 70,097.36 13,849.50 4.80
7 CHEMICALS (OTHER THAN
FERTILIZERS)
59,555.37 11,900.29 4.12
8 TRADING 68,836.54 11,872.47 4.12
9 POWER 52,613.34 10,476.15 3.63
10 HOTEL and TOURISM 49,709.68 9,227.33 3.20
11 METALLURGICAL INDUSTRIES 43,427.34 8,890.34 3.08
12 CONSTRUCTION
(INFRASTRUCTURE) ACTIVITIES
47,897.17 7,956.75 2.76
JOMAT Vol. 4 No.2 January – June 2016 ISSN No. 2278-9316
60
13 FOOD PROCESSING INDUSTRIES 40,264.87 6,815.69 2.36
14 PETROLEUM and NATURAL GAS 32,659.51 6,675.76 2.31
15 INFORMATION and
BROADCASTING (INCLUDING PRINT
26,336.17 4,977.02 1.73
MEDIA)
16 NON-CONVENTIONAL ENERGY 24,260.55 4,397.94 1.52
17 ELECTRICAL EQUIPMENTS 21,864.52 4,336.72 1.50
18 INDUSTRIAL MACHINERY 22,042.84 4,064.57 1.41
19 HOSPITAL and DIAGNOSTIC
CENTRES
19,783.21 3,592.11 1.25
20 CONSULTANCY SERVICES 17,619.11 3,356.58 1.16
21 CEMENT AND GYPSUM PRODUCTS 14,776.62 3,109.11 1.08
22 MISCELLANEOUS MECHANICAL and
ENGINEERING
15,182.50 3,068.10 1.06
INDUSTRIES
23 FERMENTATION INDUSTRIES 12,894.51 2,376.96 0.82
24 MINING 12,026.96 2,216.09 0.77
25 RUBBER GOODS 11,772.91 2,084.26 0.72
26 SEA TRANSPORT 10,435.27 1,977.50 0.69
27 TEXTILES (INCLUDING DYED, 9,610.46 1,852.47 0.64
JOMAT Vol. 4 No.2 January – June 2016 ISSN No. 2278-9316
61
PRINTED)
28 AGRICULTURE SERVICES 9,275.85 1,844.31 0.64
29 PORTS 6,730.91 1,637.30 0.57
30 ELECTRONICS 8,171.00 1,636.03 0.57
31 PRIME MOVER (OTHER THAN
ELECTRICAL
7,914.27 1,451.29 0.50
GENERATORS)
32 EDUCATION 6,870.77 1,256.08 0.44
33 SOAPS, COSMETICS and TOILET
PREPARATIONS
6,086.00 1,111.32 0.39
34 MEDICAL AND SURGICAL
APPLIANCES
5,971.26 1,097.13 0.38
35 PAPER AND PULP (INCLUDING
PAPER PRODUCTS)
5,498.68 1,093.82 0.38
36 AIR TRANSPORT (INCLUDING AIR FREIGHT) 5,184.29 931.05 0.32
37 MACHINE TOOLS 4,346.88 837.96 0.29
38 DIAMOND,GOLD ORNAMENTS 4,183.70 772.05 0.27
39 CERAMICS 3,617.40 744.72 0.26
40 RAILWAY RELATED COMPONENTS 3,925.80 710.98 0.25
41 VEGETABLE OILS AND VANASPATI 3,165.41 589.06 0.20
JOMAT Vol. 4 No.2 January – June 2016 ISSN No. 2278-9316
62
42 PRINTING OF BOOKS (INCLUDING LITHO
PRINTING INDUSTRY)
3,208.09 581.49 0.20
43 FERTILIZERS 3,060.09 564.80 0.20
44 RETAIL TRADING 3,275.28 537.61 0.19
45 GLASS 2,623.90 499.77 0.17
46 AGRICULTURAL MACHINERY 2,259.34 433.99 0.15
47 COMMERCIAL, OFFICE and HOUSEHOLD
EQUIPMENTS
1,761.39 346.03 0.12
48 EARTH-MOVING MACHINERY 1,799.11 337.16 0.12
49 SUGAR 1,110.62 188.51 0.07
50 SCIENTIFIC INSTRUMENTS 1,002.49 178.27 0.06
51 LEATHER,LEATHER GOODS AND PICKERS 883.07 164.91 0.06
52 TIMBER PRODUCTS 838.15 147.46 0.05
53 BOILERS AND STEAM GENERATING PLANTS 823.55 141.24 0.05
54 TEA AND COFFEE (PROCESSING and
WAREHOUSING
505.49 109.62 0.04
COFFEE and RUBBER)
55 DYE-STUFFS 438.88 77.71 0.03
56 INDUSTRIAL INSTRUMENTS 363.80 75.34 0.03
57 PHOTOGRAPHIC RAW FILM AND PAPER 273.76 67.29 0.02
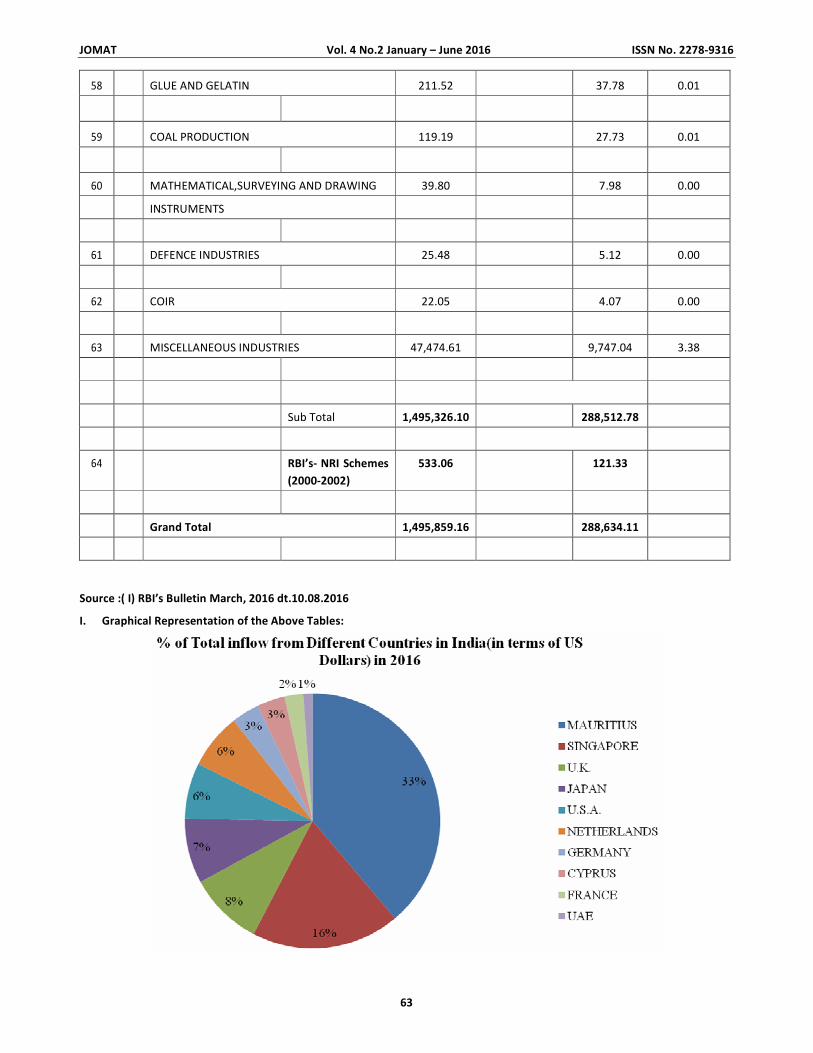
JOMAT Vol. 4 No.2 January – June 2016 ISSN No. 2278-9316
63
58 GLUE AND GELATIN 211.52 37.78 0.01
59 COAL PRODUCTION 119.19 27.73 0.01
60 MATHEMATICAL,SURVEYING AND DRAWING 39.80 7.98 0.00
INSTRUMENTS
61 DEFENCE INDUSTRIES 25.48 5.12 0.00
62 COIR 22.05 4.07 0.00
63 MISCELLANEOUS INDUSTRIES 47,474.61 9,747.04 3.38
Sub Total 1,495,326.10 288,512.78
64 RBI’s- NRI Schemes
(2000-2002)
533.06 121.33
Grand Total 1,495,859.16 288,634.11
Source :( I) RBI’s Bulletin March, 2016 dt.10.08.2016
I. Graphical Representation of the Above Tables:
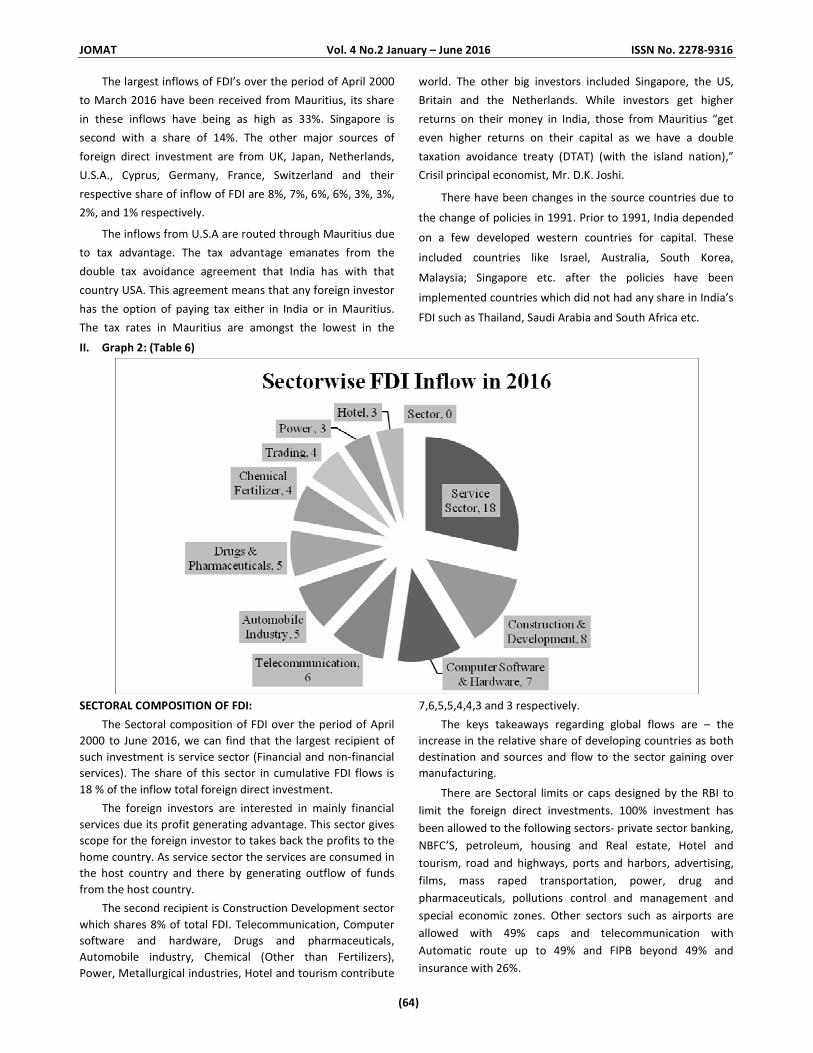
JOMAT Vol. 4 No.2 January – June 2016 ISSN No. 2278-9316
(64)
The largest inflows of FDI’s over the period of April 2000
to March 2016 have been received from Mauritius, its share
in these inflows have being as high as 33%. Singapore is
second with a share of 14%. The other major sources of
foreign direct investment are from UK, Japan, Netherlands,
U.S.A., Cyprus, Germany, France, Switzerland and their
respective share of inflow of FDI are 8%, 7%, 6%, 6%, 3%, 3%,
2%, and 1% respectively.
The inflows from U.S.A are routed through Mauritius due
to tax advantage. The tax advantage emanates from the
double tax avoidance agreement that India has with that
country USA. This agreement means that any foreign investor
has the option of paying tax either in India or in Mauritius.
The tax rates in Mauritius are amongst the lowest in the
world. The other big investors included Singapore, the US,
Britain and the Netherlands. While investors get higher
returns on their money in India, those from Mauritius “get
even higher returns on their capital as we have a double
taxation avoidance treaty (DTAT) (with the island nation),”
Crisil principal economist, Mr. D.K. Joshi.
There have been changes in the source countries due to
the change of policies in 1991. Prior to 1991, India depended
on a few developed western countries for capital. These
included countries like Israel, Australia, South Korea,
Malaysia; Singapore etc. after the policies have been
implemented countries which did not had any share in India’s
FDI such as Thailand, Saudi Arabia and South Africa etc.
II. Graph 2: (Table 6)
SECTORAL COMPOSITION OF FDI:
The Sectoral composition of FDI over the period of April
2000 to June 2016, we can find that the largest recipient of
such investment is service sector (Financial and non-financial
services). The share of this sector in cumulative FDI flows is
18 % of the inflow total foreign direct investment.
The foreign investors are interested in mainly financial
services due its profit generating advantage. This sector gives
scope for the foreign investor to takes back the profits to the
home country. As service sector the services are consumed in
the host country and there by generating outflow of funds
from the host country.
The second recipient is Construction Development sector
which shares 8% of total FDI. Telecommunication, Computer
software and hardware, Drugs and pharmaceuticals,
Automobile industry, Chemical (Other than Fertilizers),
Power, Metallurgical industries, Hotel and tourism contribute
7,6,5,5,4,4,3 and 3 respectively.
The keys takeaways regarding global flows are – the
increase in the relative share of developing countries as both
destination and sources and flow to the sector gaining over
manufacturing.
There are Sectoral limits or caps designed by the RBI to
limit the foreign direct investments. 100% investment has
been allowed to the following sectors- private sector banking,
NBFC’S, petroleum, housing and Real estate, Hotel and
tourism, road and highways, ports and harbors, advertising,
films, mass raped transportation, power, drug and
pharmaceuticals, pollutions control and management and
special economic zones. Other sectors such as airports are
allowed with 49% caps and telecommunication with
Automatic route up to 49% and FIPB beyond 49% and
insurance with 26%.
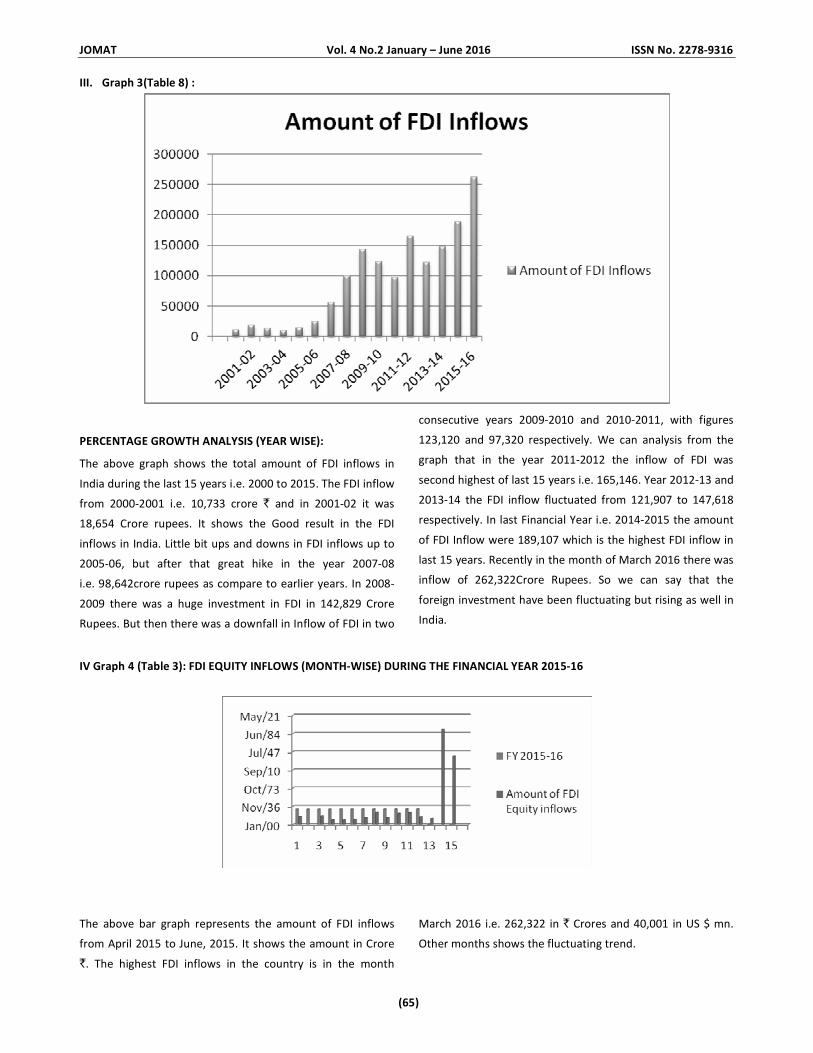
JOMAT Vol. 4 No.2 January – June 2016 ISSN No. 2278-9316
(65)
III. Graph 3(Table 8) :
PERCENTAGE GROWTH ANALYSIS (YEAR WISE):
The above graph shows the total amount of FDI inflows in
India during the last 15 years i.e. 2000 to 2015. The FDI inflow
from 2000-2001 i.e. 10,733 crore ` and in 2001-02 it was
18,654 Crore rupees. It shows the Good result in the FDI
inflows in India. Little bit ups and downs in FDI inflows up to
2005-06, but after that great hike in the year 2007-08
i.e. 98,642crore rupees as compare to earlier years. In 2008-
2009 there was a huge investment in FDI in 142,829 Crore
Rupees. But then there was a downfall in Inflow of FDI in two
consecutive years 2009-2010 and 2010-2011, with figures
123,120 and 97,320 respectively. We can analysis from the
graph that in the year 2011-2012 the inflow of FDI was
second highest of last 15 years i.e. 165,146. Year 2012-13 and
2013-14 the FDI inflow fluctuated from 121,907 to 147,618
respectively. In last Financial Year i.e. 2014-2015 the amount
of FDI Inflow were 189,107 which is the highest FDI inflow in
last 15 years. Recently in the month of March 2016 there was
inflow of 262,322Crore Rupees. So we can say that the
foreign investment have been fluctuating but rising as well in
India.
IV Graph 4 (Table 3): FDI EQUITY INFLOWS (MONTH-WISE) DURING THE FINANCIAL YEAR 2015-16
The above bar graph represents the amount of FDI inflows
from April 2015 to June, 2015. It shows the amount in Crore
`. The highest FDI inflows in the country is in the month
March 2016 i.e. 262,322 in ` Crores and 40,001 in US $ mn.
Other months shows the fluctuating trend.
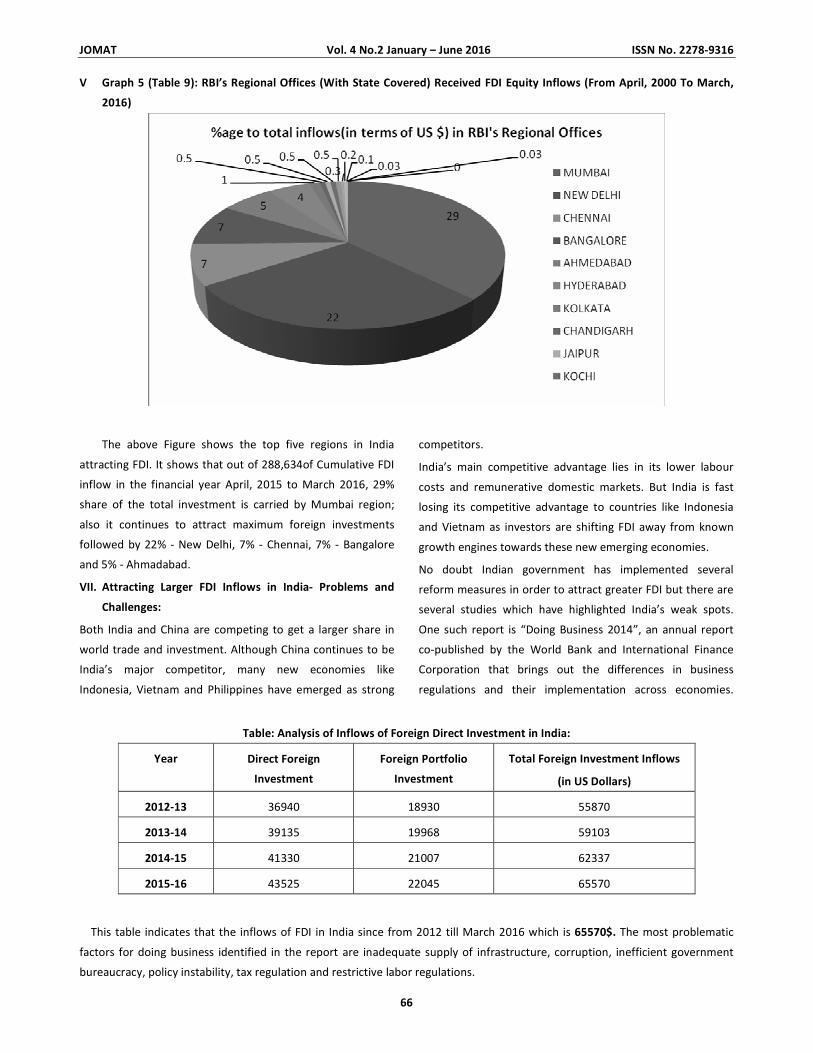
JOMAT Vol. 4 No.2 January – June 2016 ISSN No. 2278-9316
66
V Graph 5 (Table 9): RBI’s Regional Offices (With State Covered) Received FDI Equity Inflows (From April, 2000 To March,
2016)
The above Figure shows the top five regions in India
attracting FDI. It shows that out of 288,634of Cumulative FDI
inflow in the financial year April, 2015 to March 2016, 29%
share of the total investment is carried by Mumbai region;
also it continues to attract maximum foreign investments
followed by 22% - New Delhi, 7% - Chennai, 7% - Bangalore
and 5% - Ahmadabad.
VII. Attracting Larger FDI Inflows in India- Problems and
Challenges:
Both India and China are competing to get a larger share in
world trade and investment. Although China continues to be
India’s major competitor, many new economies like
Indonesia, Vietnam and Philippines have emerged as strong
competitors.
India’s main competitive advantage lies in its lower labour
costs and remunerative domestic markets. But India is fast
losing its competitive advantage to countries like Indonesia
and Vietnam as investors are shifting FDI away from known
growth engines towards these new emerging economies.
No doubt Indian government has implemented several
reform measures in order to attract greater FDI but there are
several studies which have highlighted India’s weak spots.
One such report is “Doing Business 2014”, an annual report
co-published by the World Bank and International Finance
Corporation that brings out the differences in business
regulations and their implementation across economies.
Table: Analysis of Inflows of Foreign Direct Investment in India:
Year Direct Foreign
Investment
Foreign Portfolio
Investment
Total Foreign Investment Inflows
(in US Dollars)
2012-13 36940 18930 55870
2013-14 39135 19968 59103
2014-15 41330 21007 62337
2015-16 43525 22045 65570
This table indicates that the inflows of FDI in India since from 2012 till March 2016 which is 65570$. The most problematic
factors for doing business identified in the report are inadequate supply of infrastructure, corruption, inefficient government
bureaucracy, policy instability, tax regulation and restrictive labor regulations.
JOMAT Vol. 4 No.2 January – June 2016 ISSN No. 2278-9316
(67)
SUGGESTIONS FOR INCREASED FLOW OF FDI INTO THE
COUNTRY:
1) Flexible labour laws needed:
China gets maximum FDI in the manufacturing sector,
which has helped the country become the manufacturing hub
of the world. In India the manufacturing sector can grow if
infrastructure facilities are improved and labour reforms take
place. The country should take initiatives to adopt more
flexible labour laws.
2) Re look at sectoral caps:
Though the Government has hiked the sectoral cap for
FDI over the years, it is time to revisit issues pertaining to
limits in such sectors as coal mining, insurance, real estate,
and retail trade, apart from the small-scale sector.
Government should allow more investment into the country
under automatic route.
Reforms like bringing more sectors under the automatic
route, increasing the FDI cap and simplifying the procedural
delays has to be initiated. There is need to improve SEZs in
terms of their size, road and port connectivity, assured power
supply and decentralized decision-making.
3) Geographical disparities of fdi should be removed:
The issues of geographical disparities of FDI in India need
to address on priority. Many states are making serious efforts
to simplify regulations for setting up and operating the
industrial units. However, efforts by many state governments
are still not encouraging. Even the state like West Bengal
which was once called Manchester of India attracts only 1%
of FDI inflow in the country. West Bengal, Bihar, Jharkhand,
Chhattisgarh are endowed with rich minerals but due to lack
of proper initiatives by governments of these states, they fail
to attract FDI.
4) Promote Greenfield projects:
India’s volume of FDI has increased largely due to Merger
and Acquisitions (MandAs) rather than large Greenfields
projects.
MandA’s not necessarily imply infusion of new capital
into a country if it is through reinvested earnings and intra
company loans. Business friendly environment must be
created on priority to attract large Greenfields projects.
Regulations should be simplified so that realization ratio is
improved (Percentage of FDI approvals to actual flows). To
maximize the benefits of FDI persistently, India should also
focus on developing human capital and technology.
5) Develop debt market:
India has a well developed equity market but does not
have a well developed debt market. Steps should be taken to
improve the depth and liquidity of debt market as many
companies may prefer leveraged investment rather than
investing their own cash. Therefore it is said that countries
with well-developed financial markets tend to benefits
significantly from FDI inflows.
6) Education sector should be opened to FDI:
India has a huge pool of working population. However,
due to poor quality primary education and higher education,
there is still an acute shortage of talent. FDI in Education
Sector is lesser than one percent.
By giving the status of primary and higher education in
the country, FDI in this sector must be encouraged. However,
appropriate measure must be taken to ensure quality
education. The issues of commercialization of education,
regional gap and structural gap have to be addressed on
priority.
7) Strengthen research and development in the country:
India should consciously work towards attracting greater
FDI into RandD as a means of strengthening the country’s
technological prowess and competitiveness.
FINDINGS:
1) FDI is an important stimulus for the economic growth of
India.
2) Service sector is first and banking and insurance sector is
second segment of which pick the growth in second
decade of reforms.
3) FDI create high perks jobs for skilled employee in Indian
service sector.
4) Mauritius and Singapore is the 2 top countries which has
maximum FDI in India.
5) FDI plays an important role in the development of
infrastructure because many countries invest in the
infrastructure sector and service and banking finance
sectors.
6) Atomic Energy and Railway Transport are some
important and life line of any country. Therefore India
also restricted FDI in this sector.
7) After above analysis, we can say that FDI has good future
growth in Retailing and Real estate sector in India.
A. India is attracting foreign investment at a good rapid rate
of growth. The growth rate of FDI over last year was
JOMAT Vol. 4 No.2 January – June 2016 ISSN No. 2278-9316
68
found to be 40 %. The main reason for this substantial
growth in FDI was opening up of Indian economy to
foreign investment, relaxation of norms for foreign
investments and enhancing sector wise limit.
B. In region wise analysis, Mumbai was on the top with 29%
to total FDI of India. The reason behind this was the
availability of service sector, infrastructure and
construction development. Six regions offices which are
at the top contribute 71% to the total FDI while rest of
the regions add 29% to total FDI.
C. As per the data, the sectors that attracted higher inflows
were Services (17%), Construction activities (9%),
Telecommunications (7%) and Computer Software and
Hardware (7%).
D. A country wise FDI inflows show that Mauritius is the
country that has invested highly in India followed by
Singapore, UK, Japan Netherland and USA and so on.
Nine countries contribute 83% to cumulative FDI in India
while remaining contributes only 17%.
E. FDI plays an important role in the development of
infrastructure because many countries invest in the
infrastructure sector and banking finance sector.
CONCLUSION
FDI in India has a significant role in the economic growth
and development of India. FDI in India to various sectors can
attain sustained economic growth and development through
creation of jobs, expansion of existing manufacturing
industries. The inflow of FDI in service sectors and
construction and development sector, from April, 2000 to
June, 2015 attained substantial sustained economic growth
and development through creation of jobs in India.
Computer, Software and Hardware and Drugs and
Pharmaceuticals sector were the other sectors to which
attention was shown by Foreign Direct Investors (FDI). The
other sectors in Indian economy the Foreign Direct Investors
interest was, in fact has been quite poor.
FDI has helped to raise the output, productivity and
employment in some sectors especially in service sector.
Indian service sector is generating the proper employment
options for skilled worker with high perks. On the other side
banking and insurance sector help in providing the strength
to the Indian economic condition and develop the foreign
exchange system in country.
So, we can conclude that FDI is always helps to create
employment in the country and also support the small scale
industries also and helps country to put an impression on the
world wide level through liberalization and globalization.
REFERENCES
1. Aggrawal, S., Singla, A., Aggrawal, R. (2012). Foreign
direct investment in India. International Journal of
Computational Engineering and Management, 15 (5), 93-
105.
2. Azhar, S., Marimuthu, K.N. (2012). An overview of foreign
direct Investment in India. International Journal of
Multidisciplinary Management studies, 2 (1), 202-214.
3. Department of Industrial Policy and Promotion, (April
2000 to June 2015) Annual Report.
4. Devajit, M. (2012). Impact of foreign direct investment
on Indian economy. Research Journal of management
Sciences, 1(2), 29-31.
5. Kumar, P. (2011). FDI in India and its impact- “A critical
evaluation”. VRSD International Journal of Business and
Management Research, 1(3), 185-196.
6. Manual on Foreign Direct Investment in India by
Secretariat for Industrial Assistance (SIA) DIPP.
7. Mahajan, D. (2008). FDI in India not as per her potential.
The Economic Challenger, 41 (11), 59-63.
8. Press notes of Department of Industrial Policy and
Promotion (DIPP) (2010-15).
9. Ramachandran, A., Kavitha, N., Veni, N.K. (2008). Foreign
direct investment and the economic scenario. The
Economic Challenger, 39 (10), 43-49.
10. Reserve Bank of India (2015), Monthly Bulletin, July.
11. Sahni, P. (2012). Trends and determinants of foreign
direct investment in India: An empirical investigation.
International Journal of Marketing and Technology, 2 (8),
144-161.
12. UNCTAD (2015), World Investment Report.
���
JOMAT Vol. 4 No.2 January – June 2016 ISSN No. 2278-9316
(69)
THE ROLE OF M-COMMERCE IN TOURISM INDUSTRY
Vidula Jadhav
Rashmi Hasumnis
ABSTRACT
The M-Commerce plays a major role in tourism, travel and hospitality industry. The Integration of M-Commerce in the
tourism industry is an essential for success of tourism. M-Commerce facilitates an individual to access the tourism products
information from anywhere any time. Tourism industry can also reach the targeted customers across the globe in a single click on
the keypad after emergence of M-Commerce, mobile computers, web technologies etc. The purposive sample of 150 managers of
tourism, travel and hospitality enterprises in India were surveyed through a questionnaire with the Managing Directors,
Directors, General Managers, Team Leaders and Senior Managers. The present study explores the business development,
revenue generation, minimisation of cost and reaching the customers. The paper explains the gaps between tourism business and
M-Commerce influence and suggests measures to fill the gaps in tourism industry. The main goal is to integrate M-Commerce
with tourism that will enable more accessibility, visibility of information, availability of variety of products and satisfaction.
KEY WORDS: M-Commerce; Tourism; Integration; e-Tourism.
INTRODUCTION:
M-Commerce have been transforming tourism globally.
The M-Commerce driven re-engineering has gradually
generated a new paradigm-shift, altering the industry
structure and developing a whole range of opportunities and
threats. M-Commerce empower consumers to identify,
customize and purchase tourism products and support the
globalization of the industry by providing tools for
developing, managing and distributing offerings worldwide.
Increasingly M-Commerce play a critical role for the
competitiveness of tourism organizations and destinations.
M-Commerce are becoming a key determinant of
organizational competitiveness. The enhancements in
M-Commerce capabilities, in combination with the decrease
of the size of equipment and M-Commerce costs, improved
the reliability, compatibility and inter- connectivity of
numerous terminals and applications. M-Commerce provide a
powerful tool that can bring advantages in promoting and
strengthening the tourism industry’s strategy and operations.
BACKGROUND THEORY:
Compared to other sectors of the global economy, the
tourism industry is one of the fastest growing, accounting for
more than one third of the total global services trade.
International tourist arrivals have grown by 4.3% between
1995 and 2008. In recent years, air transport has increased
more than surface transport and the expansion of low-cost
air travel has greatly altered the industry in many regions.
The Role of M-Commerce in Tourism
Effective and high-speed M-Commerce infrastructure and
software applications in the tourism and hospitality industry
are crucial for tourism development. M-Commerce’s allow
customer - management relations and supply chain
management to be combined into a single source that
facilitates a variety of operations - product selection,
ordering, fulfillment, tracking, payment and reporting to be
performed with one easy-to use tool. M-Commerce’s
ultimately cut costs by enabling the provider to be in direct
contact with the consumer and also impact employment
through the need for required maintenance of M-Commerce
equipment. Management within tourism companies use M-
Commerce’s to undertake a range of tasks that enhance the
efficiency of employees in the workplace, notably online
reservations.
The development of M-Commerce’s has also led to
changes in demand and supply. A higher demand for flexible,
individualized options and quality of information has
personalized leisure and tourism behavior, a consequence of
increased M-Commerce use. Through new technology and
social and economic ratings (e.g., social media platforms like
Facebook, Twitter, blogs) customers have the ability to share
information and research ratings on destination, quality of
service in hotels and restaurants and environmental and
social conditions. Number of hotels (e.g., Marriot Hotels and
Resorts, Ritz Carlton Hotels, Hyatt Hotels and Resorts) have
strengthened their brand image and communicate directly
with their customers by posting links to a press release or
promoting new package through Twitter.
© SBPIM 1.
Research Scholar, Department of Commerce, S.N.D.T. Women’s University, Pune-411 038.
Contact no.:9860551175 Email Id:
2. Research Guide, Department of Commerce, S.N.D.T. Women’s University, Pune-411 038.
Contact no.:9860551175 Email Id:
JOMAT Vol. 4 No.2 January – June 2016 ISSN No. 2278-9316
(70)
E-Tourism - Demand and Technology-driven Revolution
The Internet revolutionizes flexibility in both consumer
choice and service delivery processes. Customers have
become much more sophisticated and discerning. This is
because they have experienced high levels of service and
because the standard of living has grown considerably. As a
result, tourists have become more demanding, requesting
high-quality products and value for their money and,
perhaps more importantly, value for time. This reflects
people’s shortage of time. Having been exposed to several
tourism products and destinations, experienced,
sophisticated; demanding travelers rely totally on electronic
media to obtain information about destinations, as well as to
be able to communicate their needs and wishes to suppliers
rapidly.
E-Tourism Impacts on Marketing Mix
M-Commerce’s provide unique opportunities for
innovative organizations to redesign tourism products to
address individual needs and to satisfy consumer wants.
M-Commerce’s have also become part of the core product,
especially for business travelers who now expect certain
facilities to be available during their trip. The internet and the
World Wide Web have revolutionized the promotion and
communication functions of tourism. M-Commerce’s can
reduce commission costs. Expedia, eBookers, to emerge and
gain a significant market share, propelling a reintermediation
in the distribution channel. E-Airlines
In 1962, American Airlines introduced its SABRE
Computerized Reservations Systems (CRS) to in the place of
manual reservations on display boards where passengers
were listed and travel agencies had to locate the best routes
and fares for their customers in a manual and then telephone
for availability, reservation and confirmation before issuing a
ticket manually.
The lodging industry is the most under-automated
segment of the international travel industry. Property
Management Systems (PMSs) were introduced to facilitate
the front office, sales, planning and operation functions. This
was achieved by administering a database with all
reservations, rates, occupancy and cancellations, thus
managing the hotel inventory. Hospitality organizations
increasingly use computerized systems to improve their
inventory management, communicate with their interaction
with consumers and reduce some of their operational costs.
E-Hospitality
M-Commerce’s have penetrated hospitality management
at a fast pace, integrating the hotel operations, reshaping the
marketing function, improving total efficiency, providing tools
for marketing research and partnership building, and
enhancing customer services, while also providing strategic
opportunities. In addition, consumers increasingly expect M-
Commerce facilities in their rooms; internet access via the
television set and data ports have become standard for
higher hotel categories. The Internet has improved the hotel
representation and reservation processes dramatically.
Bookings through the web is particularly convenient for
customers who frequent the hotel as that provides an
efficient and effective communication mechanism. The
greater the capacity, number of departments, transactions,
arrivals, departures and reservations, the greater the need
for technologies to facilitate the processes. Further
integration between PMSs and Hotel CRSs can improve
efficiency, facilitate control, reduce personnel and minimize
the response time to both customers and management
requests.
E-Tour Operators
Tour operators need constantly to interact with all their
partners, including accommodation and transportation
principals, M-Commerce’s are also critical for the distribution
of tour operators’ packages. The introduction of the Internet,
Intranets and Extranets as strategic tools has as strategic tool
has a number of benefits for tour operators. The
co-ordination and exchange of timely information is
important because it allows tour operators to co-ordinate
activities, to resolve potential problems and to ensure that
customer requirements are communicated to all principals
delivering the tourism product. Strategically, M-Commerce’s
play a critical role for tour operators. For example, Kuoni
allows consumers to alter their tourism package online and to
build their own itinerary by making it possible to extend the
trip, change accommodation, meal plans and add value –
added services such as car rentals, scuba-driving lessons.
However, it is quite evident that tour operators will need
to shift their focus from the information provision and the
reservation mechanism to a strategic role of adding value to
the product and the process. Tour operators will therefore
need to re-assess their core values and identify specific
market segments that they can satisfy in the future.
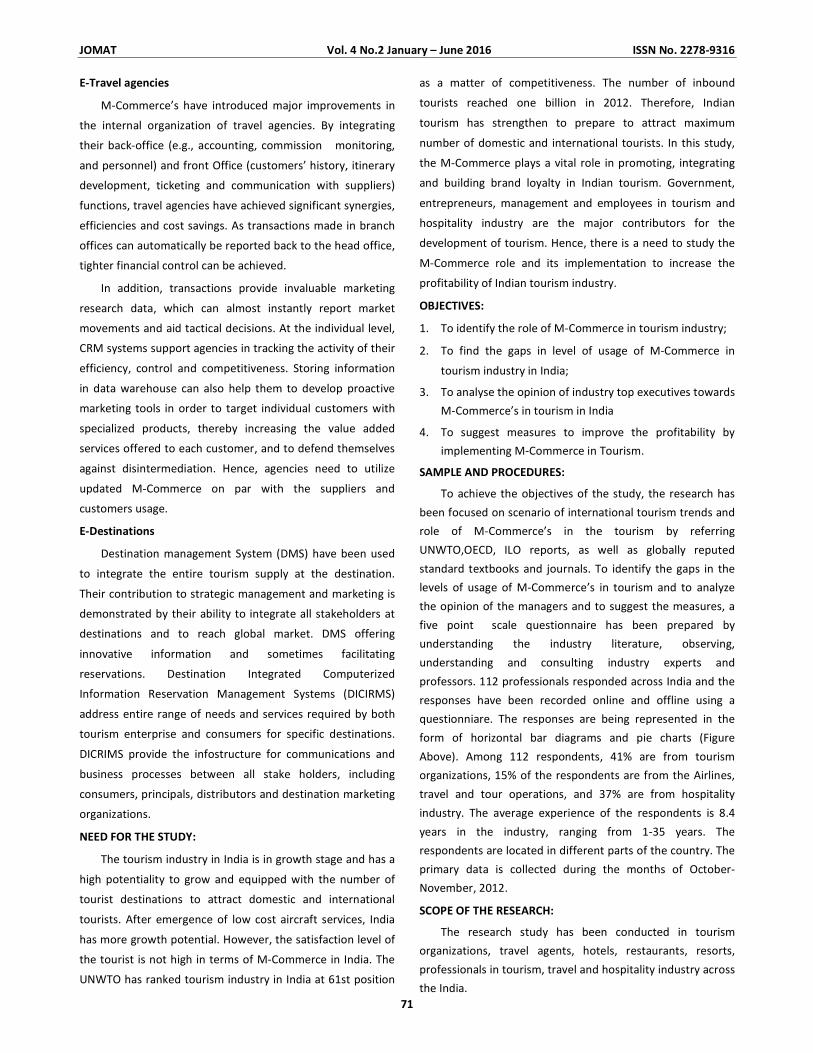
JOMAT Vol. 4 No.2 January – June 2016 ISSN No. 2278-9316
71
E-Travel agencies
M-Commerce’s have introduced major improvements in
the internal organization of travel agencies. By integrating
their back-office (e.g., accounting, commission monitoring,
and personnel) and front Office (customers’ history, itinerary
development, ticketing and communication with suppliers)
functions, travel agencies have achieved significant synergies,
efficiencies and cost savings. As transactions made in branch
offices can automatically be reported back to the head office,
tighter financial control can be achieved.
In addition, transactions provide invaluable marketing
research data, which can almost instantly report market
movements and aid tactical decisions. At the individual level,
CRM systems support agencies in tracking the activity of their
efficiency, control and competitiveness. Storing information
in data warehouse can also help them to develop proactive
marketing tools in order to target individual customers with
specialized products, thereby increasing the value added
services offered to each customer, and to defend themselves
against disintermediation. Hence, agencies need to utilize
updated M-Commerce on par with the suppliers and
customers usage.
E-Destinations
Destination management System (DMS) have been used
to integrate the entire tourism supply at the destination.
Their contribution to strategic management and marketing is
demonstrated by their ability to integrate all stakeholders at
destinations and to reach global market. DMS offering
innovative information and sometimes facilitating
reservations. Destination Integrated Computerized
Information Reservation Management Systems (DICIRMS)
address entire range of needs and services required by both
tourism enterprise and consumers for specific destinations.
DICRIMS provide the infostructure for communications and
business processes between all stake holders, including
consumers, principals, distributors and destination marketing
organizations.
NEED FOR THE STUDY:
The tourism industry in India is in growth stage and has a
high potentiality to grow and equipped with the number of
tourist destinations to attract domestic and international
tourists. After emergence of low cost aircraft services, India
has more growth potential. However, the satisfaction level of
the tourist is not high in terms of M-Commerce in India. The
UNWTO has ranked tourism industry in India at 61st position
as a matter of competitiveness. The number of inbound
tourists reached one billion in 2012. Therefore, Indian
tourism has strengthen to prepare to attract maximum
number of domestic and international tourists. In this study,
the M-Commerce plays a vital role in promoting, integrating
and building brand loyalty in Indian tourism. Government,
entrepreneurs, management and employees in tourism and
hospitality industry are the major contributors for the
development of tourism. Hence, there is a need to study the
M-Commerce role and its implementation to increase the
profitability of Indian tourism industry.
OBJECTIVES:
1. To identify the role of M-Commerce in tourism industry;
2. To find the gaps in level of usage of M-Commerce in
tourism industry in India;
3. To analyse the opinion of industry top executives towards
M-Commerce’s in tourism in India
4. To suggest measures to improve the profitability by
implementing M-Commerce in Tourism.
SAMPLE AND PROCEDURES:
To achieve the objectives of the study, the research has
been focused on scenario of international tourism trends and
role of M-Commerce’s in the tourism by referring
UNWTO,OECD, ILO reports, as well as globally reputed
standard textbooks and journals. To identify the gaps in the
levels of usage of M-Commerce’s in tourism and to analyze
the opinion of the managers and to suggest the measures, a
five point scale questionnaire has been prepared by
understanding the industry literature, observing,
understanding and consulting industry experts and
professors. 112 professionals responded across India and the
responses have been recorded online and offline using a
questionniare. The responses are being represented in the
form of horizontal bar diagrams and pie charts (Figure
Above). Among 112 respondents, 41% are from tourism
organizations, 15% of the respondents are from the Airlines,
travel and tour operations, and 37% are from hospitality
industry. The average experience of the respondents is 8.4
years in the industry, ranging from 1-35 years. The
respondents are located in different parts of the country. The
primary data is collected during the months of October-
November, 2012.
SCOPE OF THE RESEARCH:
The research study has been conducted in tourism
organizations, travel agents, hotels, restaurants, resorts,
professionals in tourism, travel and hospitality industry across
the India.
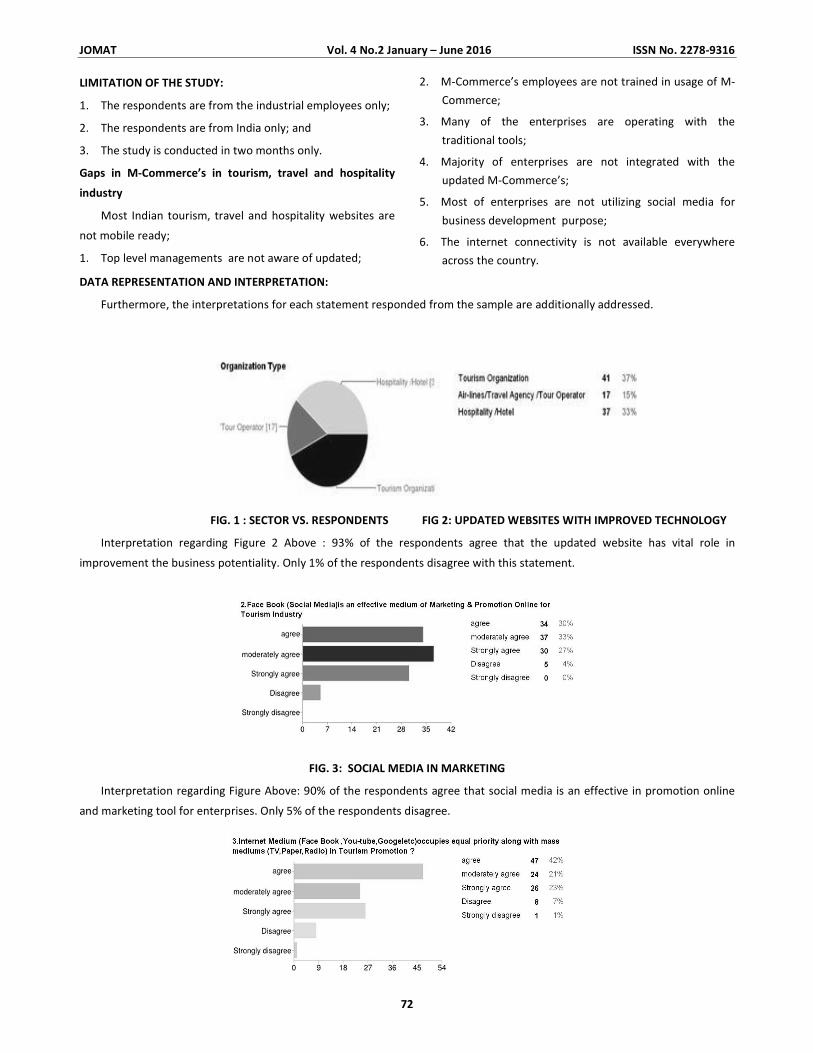
JOMAT Vol. 4 No.2 January – June 2016 ISSN No. 2278-9316
72
LIMITATION OF THE STUDY:
1. The respondents are from the industrial employees only;
2. The respondents are from India only; and
3. The study is conducted in two months only.
Gaps in M-Commerce’s in tourism, travel and hospitality
industry
Most Indian tourism, travel and hospitality websites are
not mobile ready;
1. Top level managements are not aware of updated;
2. M-Commerce’s employees are not trained in usage of M-
Commerce;
3. Many of the enterprises are operating with the
traditional tools;
4. Majority of enterprises are not integrated with the
updated M-Commerce’s;
5. Most of enterprises are not utilizing social media for
business development purpose;
6. The internet connectivity is not available everywhere
across the country.
DATA REPRESENTATION AND INTERPRETATION:
Furthermore, the interpretations for each statement responded from the sample are additionally addressed.
FIG. 1 : SECTOR VS. RESPONDENTS FIG 2: UPDATED WEBSITES WITH IMPROVED TECHNOLOGY
Interpretation regarding Figure 2 Above : 93% of the respondents agree that the updated website has vital role in
improvement the business potentiality. Only 1% of the respondents disagree with this statement.
FIG. 3: SOCIAL MEDIA IN MARKETING
Interpretation regarding Figure Above: 90% of the respondents agree that social media is an effective in promotion online
and marketing tool for enterprises. Only 5% of the respondents disagree.
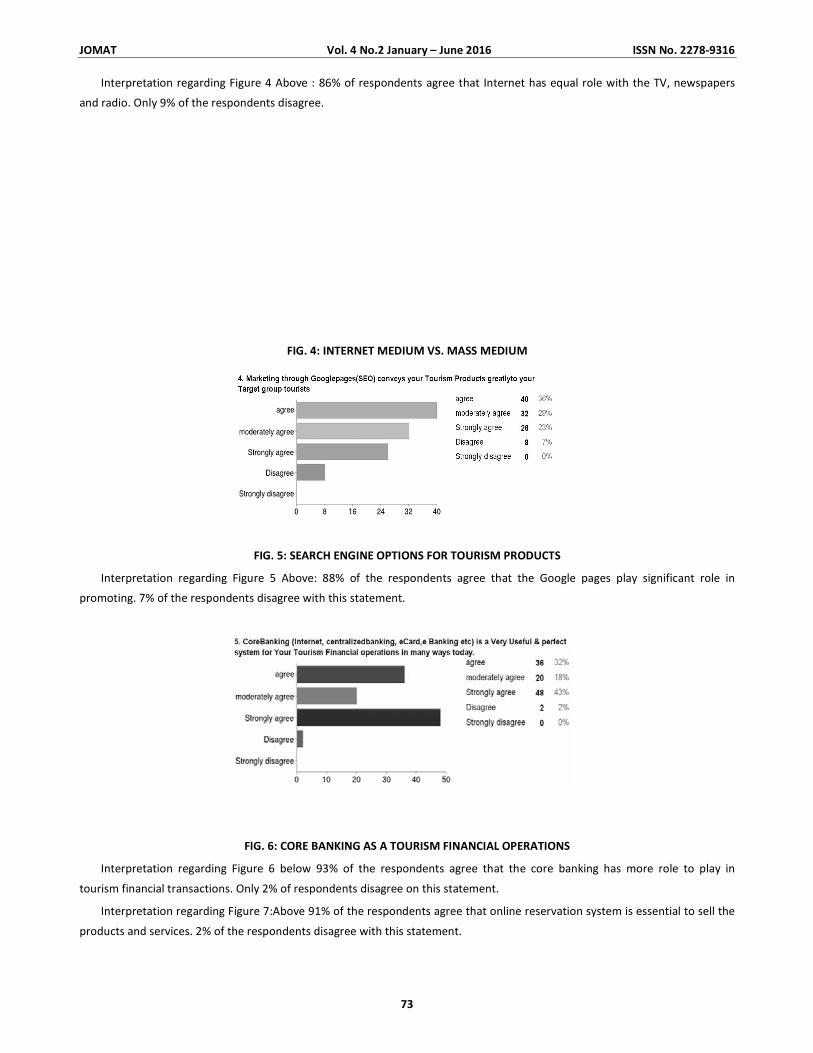
JOMAT Vol. 4 No.2 January – June 2016 ISSN No. 2278-9316
73
Interpretation regarding Figure 4 Above : 86% of respondents agree that Internet has equal role with the TV, newspapers
and radio. Only 9% of the respondents disagree.
FIG. 4: INTERNET MEDIUM VS. MASS MEDIUM
FIG. 5: SEARCH ENGINE OPTIONS FOR TOURISM PRODUCTS
Interpretation regarding Figure 5 Above: 88% of the respondents agree that the Google pages play significant role in
promoting. 7% of the respondents disagree with this statement.
FIG. 6: CORE BANKING AS A TOURISM FINANCIAL OPERATIONS
Interpretation regarding Figure 6 below 93% of the respondents agree that the core banking has more role to play in
tourism financial transactions. Only 2% of respondents disagree on this statement.
Interpretation regarding Figure 7:Above 91% of the respondents agree that online reservation system is essential to sell the
products and services. 2% of the respondents disagree with this statement.
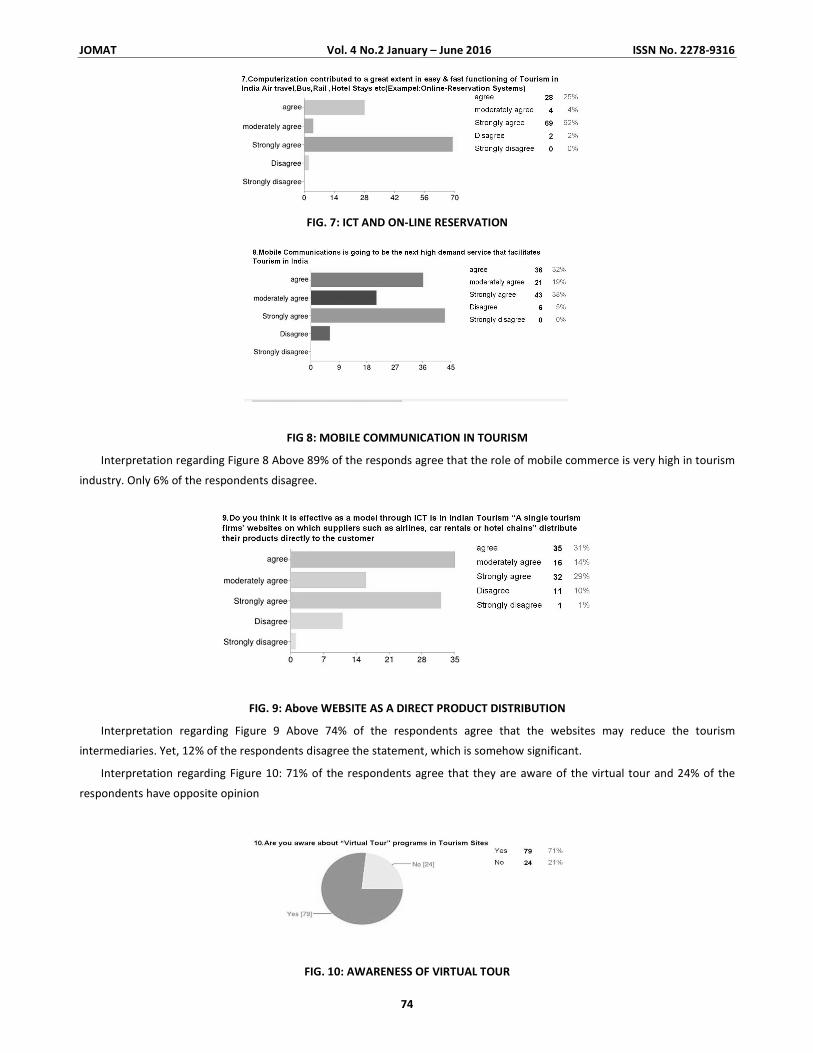
JOMAT Vol. 4 No.2 January – June 2016 ISSN No. 2278-9316
74
FIG. 7: ICT AND ON-LINE RESERVATION
FIG 8: MOBILE COMMUNICATION IN TOURISM
Interpretation regarding Figure 8 Above 89% of the responds agree that the role of mobile commerce is very high in tourism
industry. Only 6% of the respondents disagree.
FIG. 9: Above WEBSITE AS A DIRECT PRODUCT DISTRIBUTION
Interpretation regarding Figure 9 Above 74% of the respondents agree that the websites may reduce the tourism
intermediaries. Yet, 12% of the respondents disagree the statement, which is somehow significant.
Interpretation regarding Figure 10: 71% of the respondents agree that they are aware of the virtual tour and 24% of the
respondents have opposite opinion
FIG. 10: AWARENESS OF VIRTUAL TOUR
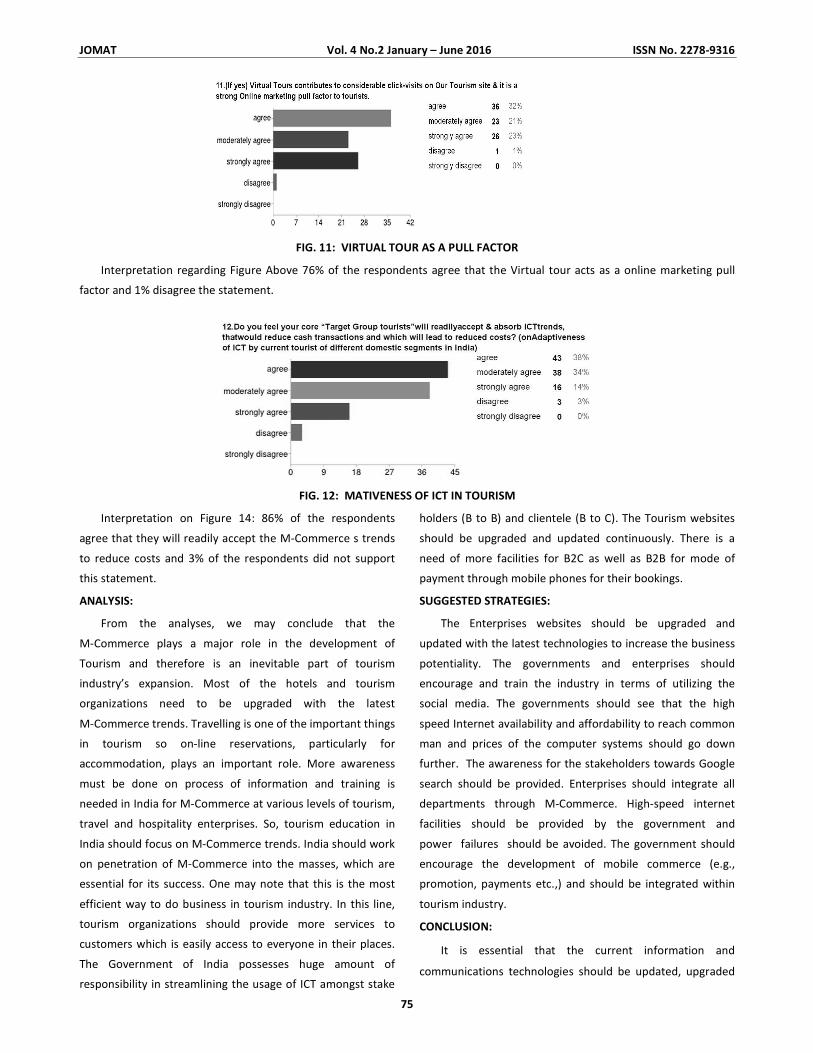
JOMAT Vol. 4 No.2 January – June 2016 ISSN No. 2278-9316
75
FIG. 11: VIRTUAL TOUR AS A PULL FACTOR
Interpretation regarding Figure Above 76% of the respondents agree that the Virtual tour acts as a online marketing pull
factor and 1% disagree the statement.
FIG. 12: MATIVENESS OF ICT IN TOURISM
Interpretation on Figure 14: 86% of the respondents
agree that they will readily accept the M-Commerce s trends
to reduce costs and 3% of the respondents did not support
this statement.
ANALYSIS:
From the analyses, we may conclude that the
M-Commerce plays a major role in the development of
Tourism and therefore is an inevitable part of tourism
industry’s expansion. Most of the hotels and tourism
organizations need to be upgraded with the latest
M-Commerce trends. Travelling is one of the important things
in tourism so on-line reservations, particularly for
accommodation, plays an important role. More awareness
must be done on process of information and training is
needed in India for M-Commerce at various levels of tourism,
travel and hospitality enterprises. So, tourism education in
India should focus on M-Commerce trends. India should work
on penetration of M-Commerce into the masses, which are
essential for its success. One may note that this is the most
efficient way to do business in tourism industry. In this line,
tourism organizations should provide more services to
customers which is easily access to everyone in their places.
The Government of India possesses huge amount of
responsibility in streamlining the usage of ICT amongst stake
holders (B to B) and clientele (B to C). The Tourism websites
should be upgraded and updated continuously. There is a
need of more facilities for B2C as well as B2B for mode of
payment through mobile phones for their bookings.
SUGGESTED STRATEGIES:
The Enterprises websites should be upgraded and
updated with the latest technologies to increase the business
potentiality. The governments and enterprises should
encourage and train the industry in terms of utilizing the
social media. The governments should see that the high
speed Internet availability and affordability to reach common
man and prices of the computer systems should go down
further. The awareness for the stakeholders towards Google
search should be provided. Enterprises should integrate all
departments through M-Commerce. High-speed internet
facilities should be provided by the government and
power failures should be avoided. The government should
encourage the development of mobile commerce (e.g.,
promotion, payments etc.,) and should be integrated within
tourism industry.
CONCLUSION:
It is essential that the current information and
communications technologies should be updated, upgraded
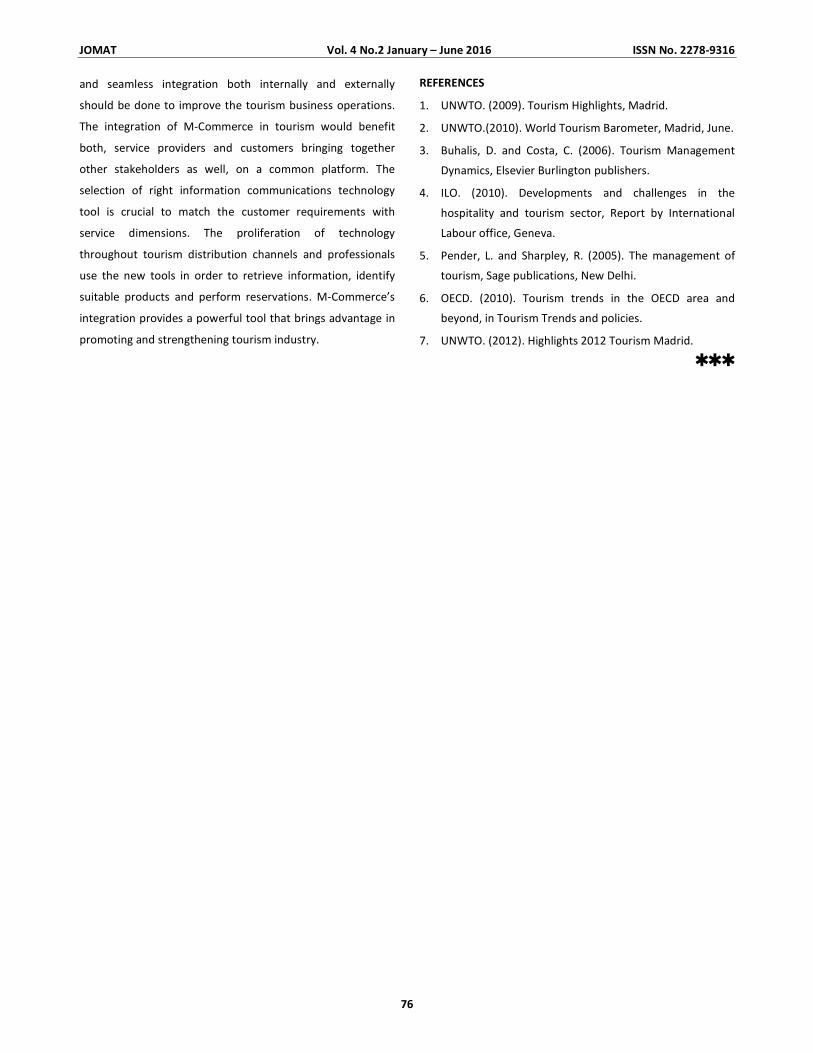
JOMAT Vol. 4 No.2 January – June 2016 ISSN No. 2278-9316
76
and seamless integration both internally and externally
should be done to improve the tourism business operations.
The integration of M-Commerce in tourism would benefit
both, service providers and customers bringing together
other stakeholders as well, on a common platform. The
selection of right information communications technology
tool is crucial to match the customer requirements with
service dimensions. The proliferation of technology
throughout tourism distribution channels and professionals
use the new tools in order to retrieve information, identify
suitable products and perform reservations. M-Commerce’s
integration provides a powerful tool that brings advantage in
promoting and strengthening tourism industry.
REFERENCES
1. UNWTO. (2009). Tourism Highlights, Madrid.
2. UNWTO.(2010). World Tourism Barometer, Madrid, June.
3. Buhalis, D. and Costa, C. (2006). Tourism Management
Dynamics, Elsevier Burlington publishers.
4. ILO. (2010). Developments and challenges in the
hospitality and tourism sector, Report by International
Labour office, Geneva.
5. Pender, L. and Sharpley, R. (2005). The management of
tourism, Sage publications, New Delhi.
6. OECD. (2010). Tourism trends in the OECD area and
beyond, in Tourism Trends and policies.
7. UNWTO. (2012). Highlights 2012 Tourism Madrid.
���