vlf emissions associated with enhanced magnetospheric electrons
TRANSCRIPT
VOL. 82, NO. I JOURNAL OF GEOPHYSICAL RESEARCH JANUARY 1, 1977
VLF Emissions Associated With Enhanced Magnetospheric Electrons
ROGER R. ANDERSON
Department of Physics and Astronomy, University of Iowa, Iowa City, Iowa 52242
KAICHI MAEDA
NASA Goddard Space Flight Center, Greenbelt, Maryland 20771
During periods of geomagnetic disturbances, VLF emissions and enhancements of low-energy electrons are simultaneously observed by the equatorial orbiting Sa-A (Explorer 45) satellite. These events are characterized by the following features. (1) The VLF emissions occur outside the plasmasphere in the nightside of the magnetosphere. (2) The VLF emissions consist of two frequency regimes, one below the local electron gyrofrequency fg and the other above fg. (3) The VLF emissions below fg are relatively broadband whistler mode waves characteristic of chorus and frequently have a conspicuous band of 'missing emissions' near fs/2. (4) The emissions above fs are electrostatic and typically have components near 3f•/2. Occasionally, higher-frequency components are also observed. (5) The onset of the emissions coincides with abrupt increases outside the plasmasphere (L >• 4) in 1- to 10-keV electrons to intensities of the order of 11Y el cm -•' s -• sr -• keV -•. Less pronounced enhancements sometimes occur for electrons with energies as high as 70 keV. (6) The cessation of the emissions coincides with a drop in the electron intensities to their preenhancement levels, which are of the order of 11Y el cm -2 s -• sr -• keV-• or less. This drop in low-energy electron intensities occurs before or when the satellite crosses the plasmapause back into the plasmasphere. These observed features indicate that the ¾LF emissions are produced by low- energy (1- to 10-keY) electrons which penetrate into the dusk-midnight sector of the magnetosphere from the geomagnetic tail during magnetic storms and substorms and drift eastward outside the plasmasphere. In this paper, events observed during geomagnetically disturbed periods in December 1971 and January 1972 are discussed.
INTRODUCTION
The first high-altitude satellite VLF experiment (Ogo 1) indicated that the source of whistler mode emissions in the
magnetosphere lies close to the equatorial plane [Dunckel and Helliwell, 1969]. The equatorial enhancement of whistler mode wave emissions has also been shown by Tsurutani and Smith [ 1974] by investigating the ELF data obtained by Ogo 5. These investigations were, however, limited only to wave data. In this study, data from both the plasma wave experiment and the particle detector experiments on the equatorial orbiting Sa-A satellite are used to examine wave-particle interactions in the magnetosphere. The orbit of Sa-A (initial apogee is 5.24 Rs, perigee 222 km, inclination 3.6 ø, and orbital period 7 hours 49 min) plus an extensive set of field and particle experiments makes the satellite particularly favorable for studies of wave- particle interactions in the magnetosphere [Longanecker and Hoffman, 1973]. The plasma wave experiment instrumentation consists of a 16-channel spectrum analyzer which covers the frequency range from 3 5 Hz to 100 kHz and a wideband AGC (automatic gain control) receiver with a band pass from 100 Hz to 10 kHz [Anderson and Gurnett, 1973]. Both units are connected to a 5.08-m tip-to-tip electric dipole antenna. The electron detection instrumentation used in this analysis con- sists of a cylindrical electrostatic analyzer-channel electron multiplier system measuring mean energies from 1.2 to 26 keV in eight energy intervals [Longanecker and Hoffman, 1973] and a solid state detector with four levels having mean energies from 55 to 400 keV [Williams et al., 1974]. Supplementary data from the flux gate and search coil magnetometer experiments and the static electric field experiment are also used.
Plasma waves in the magnetosphere, their characteristics and occurrence as a function of location and geomagnetic activity, and their interactions with energetic particles have
Copyright ̧ 1977 by the American Geophysical Union.
Paper number 6A0689.
been extensively studied by past experiments. First, we shall briefly review past investigations of chorus and electrostatic (f > fg) emissions, the two types of emissions with which this study is most concerned. Chorus is an electromagnetic emis- sion with f < fg that consists of many randomly occurring discrete tones lasting a few tenths of a second that either rise or fall in frequency. In a morphological survey of VLF emissions observed with the low-altitude In jun 3 satellite, Taylor and Gurnett [1968] found that for VLF emissions (primarily ELF hiss, chorus, and VLF hiss) the region of most intense emis- sions moved to lower latitudes (which correspond to lower L shells at the equator) during geomagnetically disturbed times. The Injun 3 VLF experiment used a magnetic loop antenna as a sensor. Similar results were obtained by Barrington et al. [1971] using Alouette 2 data. The Alouette 2 data were ob- tained by using an electric dipole antenna as a sensor. Taylor and Gurnett [1968] also found that chorus was often confined to lower latitudes than ELF hiss was. Russell et al. [1969] conducted a morphological study of ELF noise by using data from the search coil magnetometer experiment on Ogo 3. They concluded that the source of burstlike noise was near the
equator. Burtis and Helliwell [1969] reported observations of banded chorus in data from experiments using magnetic loop antennas on Ogo 1 and Ogo 3. Banded chorus is chorus that occurs in well-defined frequency bands. The banded chorus was usually observed at L shells of 4 or greater, which sug- gested that the noise was observed primarily outside the plas- masphere. Occurrence of the banded chorus was positively correlated with magnetic activity. In a companion study of magnetospheric whistler mode emissions with the Ogo 1 satel- lite, Dunckel and Helliwell [1969] found that the upper-fre- quency limit of most of the observed emissions was propor- tional to the minimum electron gyrofrequency along the magnetic field line passing through the satellite. This was interpreted to mean that the source of the emissions lies close to the equatorial plane. Using Ogo 5 search coil magnetometer
135
136 ANDERSON AND MAEDA: VLF EMISSIONS, MAGNETOSPHERIC ELECTRONS
1972 JANUARY OST tN Y
21 22 23 24 25
O h 12h O h 12h O h 12h O h 12 h
+20Z • I • I I I • I 0 I• I
-20 • 211 21• -40 • -60
-80 -
-100
26
O h 12 h I
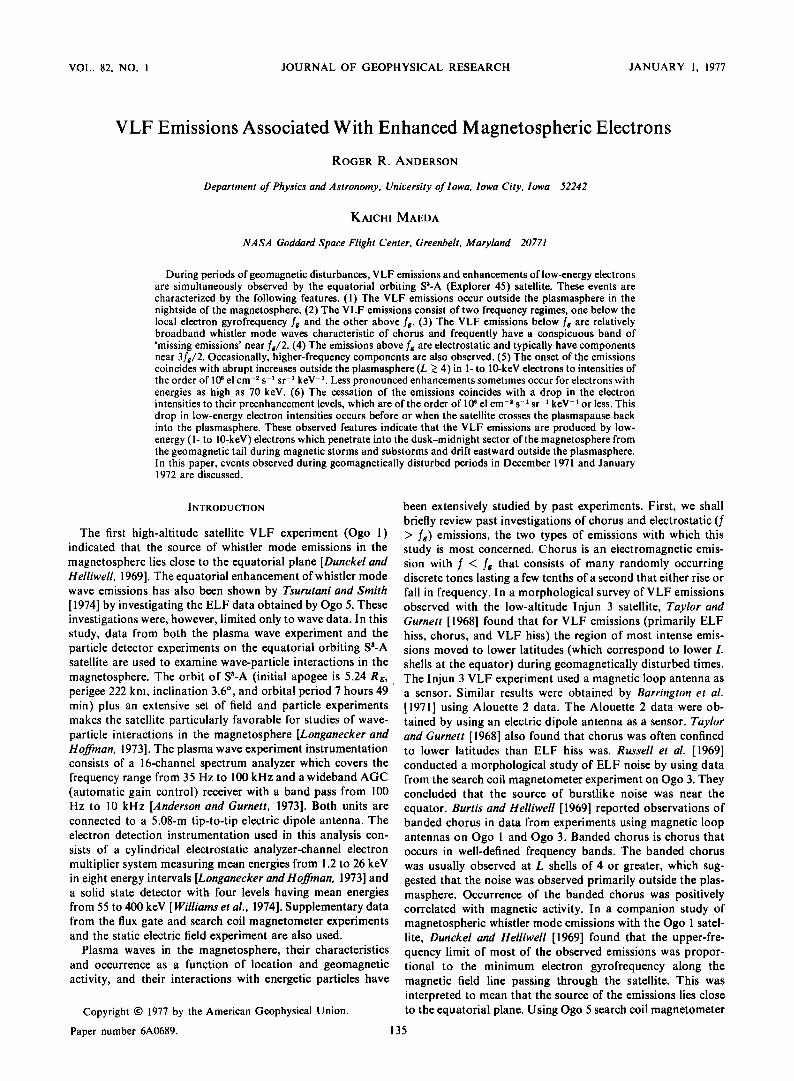
Fig. 1. Hourly values of the equatorial Dst (in gammas) for the period from 1200 UT on January 21, 1972, to 1200 UT on January 26, 1972 [Sugiura and Poros. 1973]. The three shaded marks on the zero line indicate the duration of the VLF emissions as observed by the S 3- A satellite during the orbits indicated.
data, Tsurutani and Smith [1974] studied ELF electromagnetic emissions in the midnight sector of the outer magnetosphere. They detected chorus in conjunction with magnetospheric sub- storms throughout the region from L = 5 to L = 9 but only during postmidnight hours. This chorus occurred most fre- quently at the geomagnetic equator and did not extend beyond +15 ø geomagnetic latitude. They found the distribution of chorus as a function of L and local time to be strikingly similar to the distribution of enhanced, trapped, and precipitated substorm electrons with energies of >40 keV. The post- midnight occurrence of the chorus was attributed to the east- ward curvature and gradient drift of the injected electrons.
The first direct associations between whistler mode waves
and energetic particles were made at low altitudes. Oliven and Gurnett [1968] observed that microbursts of E > 40 keV elec- trons detected by the Injun 3 satellite were always accom- panied by VLF chorus emissions. Using high-altitude balloons launched from Siple station, Antarctica (L = 4.2), Rosenberg et al. [1971] observed one-to-one correlations between short bursts of E > 30 keV X rays and bursts of VLF emissions at 2.5 kHz. The energy of the electrons contributing to the X-ray bursts was estimated to be 30-100 keV. In a study of chorus in the outer magnetosphere, Burton and Holzer [1974] reported experimental support for the necessity of a critical pitch angle anisotropy for whistler mode wave generation as proposed by
Kennel and Petschek [1966]. On an Ogo 5 pass through the nightside outer magnetosphere, Burton and Holzer [1974] ob- served that the region of maximum pitch angle anisotropy for 50- to 100-keV electrons coincided with the region of origin of chorus as identified by their wave normal analysis. Fredricks [1975] reviews some of the recent theoretical and experimental research regarding the association of chorus emissions and wave-particle interactions in the outer magnetosphere.
Intense magnetospheric electric field emissions near 3fg/2 were first observed by Kennel et al. [1970] on the Ogo 5 satellite. These emissions were localized near the equator and were observed from 2100 to 1200 LT for 4 < L < 10. Because
of their high frequency and high electric field amplitudes (typi- cally 1-10 mV m-l), Kennel et al. [1970] suggested that these emissions could be the source of strong pitch angle diffusion and energization of 1- to 10-keV auroral zone electrons. Scarf et al. [1973] showed that enhanced levels for f •> 3f•/2 electric field emissions were associated with substorm expansions. They found postexpansion f -• 3f•/2 waves to be intense enough to provide strong diffusion for E > 50-80 keV elec- trons, and changes in the local pitch angle distributions were correlated with variations in wave amplitude levels. Electro- magnetic chorus emissions were also observed during the sub- storm expansion phase, but they occurred later and with lower wave intensities than the f -• 3f•/2 waves. Fredricks and Scarf [ 1973], using a more expanded set of Ogo 5 data than Kennel et al. [ 1970] did, found that in the local time region from 1900 to 0700 LT the occurrence of emissions tended to be concentrated
in the 5 •< L •< 7 region. The emissions were also found to occur from +40 ø to-50 ø geomagnetic latitude. However, the most intense 3f•/2 emissions were found near the geomagnetic equator and near local midnight, which is the area at the base of the plasma sheet. Shaw and Gurnett [1975] have also ob- served (n + •)f• electrostatic waves in the outer magneto- sphere in data acquired by using the long electric dipole an- tennas on Imp 6. Shaw and Gurnett [1975] suggested that the electrostatic noise bands they observed near the plasmapause were related to the upper hybrid resonance noise observed inside the plasmasphere and the (n + •)fg waves observed in the outer magnetosphere.
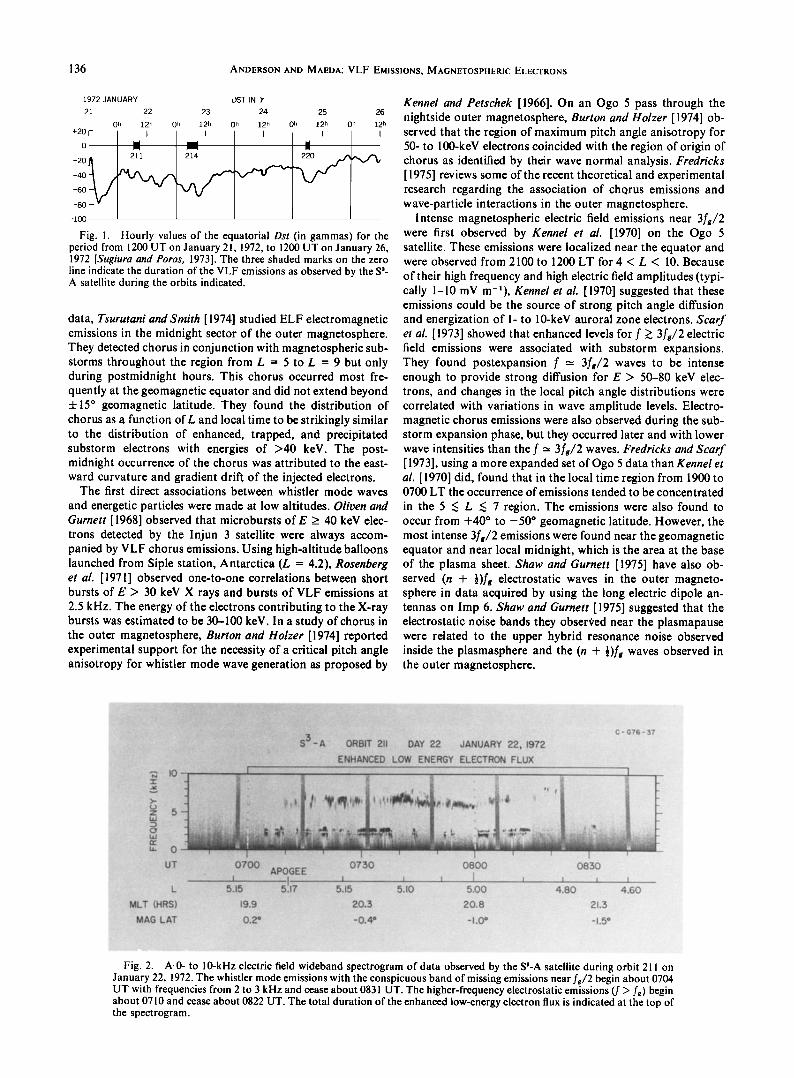
Fig. 2. A, 0- to 10-kHz electric field wideband spectrogram of data observed by the S3-A satellite during orbit 211 on January 22, 1972. The whistler mode emissions with the conspicuous band of missing emissions near fg/2 begin about 0704 UT with frequencies from 2 to 3 kHz and cease about 0831 UT. The higher-frequency electrostatic emissions (f > fg) begin about 0710 and cease about 0822 UT. The total duration of the enhanced low-energy electron flux is indicated at the top of the spectrogram.
ANDERSON AND MAEDA.' VLF EMISSIONS, MAGNETOSPHERIC ELECTRONS 137
MAGNETOSPHERIC VLF EMISSION EVENTS IN JANUARY 1972
The hourly values of equatorial Dst [Sugiura and Poros, 1973] are plotted in Figure 1 for the period January 21-26, 1972. Three shaded marks on the top of this figure indicate the duration of the VLF emission events observed by the SS-A satellite during this geomagnetically disturbed period which are discussed in this paper.
Orbit 211, January 22, 1972
On orbit 211 the satellite exited the plasmasphere at about 0514 UT (.L = 4.19, MLT = 18.0 hours)and reentered-the plasmasphere at about 0903 UT (L = 4.26, MLT = 21.9 hours). The times of plasmapause crossings used in this paper are all determined by the saturation of the on-board static electric field instrument [Maynard and Cauffman, 1973]. The VLF emission event began near apogee, well outside the main body of the plasmasphere. As shown in Figure 2, a whistler mode emission known as chorus was first observed at 0704 UT
(L = 5.16, MLT = 20.0 hours) and continued, although some- times intermittently, until 0831 UT (L = 4.71, MLT = 21.3 hours). Figure 2 is a 0- to 10-kHz spectrogram of the electric field wideband data. This record displays the sharp band of 'missing emissions' in the chorus near half the local electron gyrofrequency fg/2. Since the orbit is close to the magnetic equatorial plane, fg can be regarded as being nearly equal to the equatorial electron gyrofrequency. In this paper the values for fs are computed from the local magnetic field measured by the on-board flux gate magnetometer (L. J. Cahill, Jr., private communication, 1975). Also evident in Figure 2 are the VLF emissions above fs. A band of emissions whose frequency range extends from • 1.25f• to • 1.50fs is present from 0710 to 0822 UT. It will be shown in cases discussed later that these
emissions with frequencies above fg are electrostatic. Electron intensities (cm -ø' s -x sr -x keV -x) for electrons with
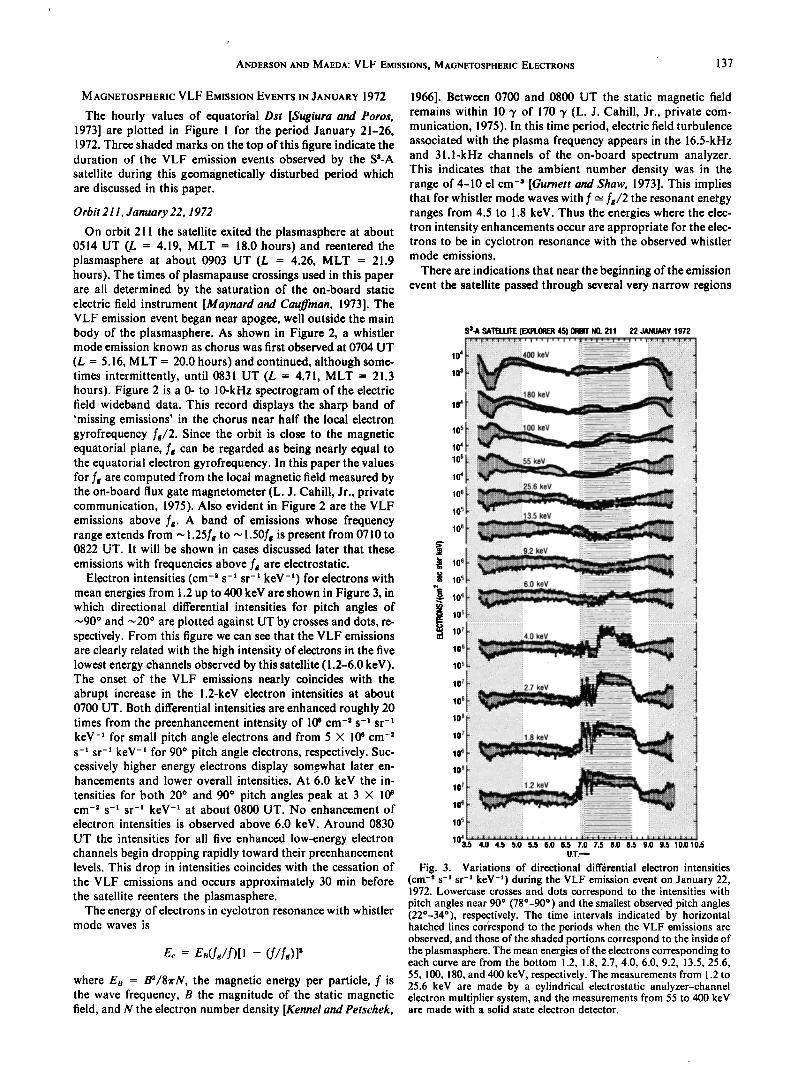
mean energies from 1.2 up to 400 keV are shown in Figure 3, in which directional differential intensities for pitch angles of •90 ø and •20 ø are plotted against UT by crosses and dots, re- spectively. From this figure we can see that the VLF emissions are clearly related with the high intensity of electrons in the five lowest energy channels observed by this satellite (1.2-6.0 keV). The onset of the VLF emissions nearly coincides with the abrupt increase in the 1.2-keV electron intensities at about 0700 UT. Both differential intensities are enhanced roughly 20 times from the preenhancement intensity of 10 • cm -ø' s -• sr -• keV -• for small pitch angle electrons and from 5 X l0 • cm -ø' s -a sr -a keV -a for 90 ø pitch angle electrons, respectively. Suc- cessively higher energy electrons display som9what later en- hancements and lower overall intensities. At 6.0 keV the in-
tensities for both 20 ø and 90 ø pitch angles peak at 3 X l0 • cm -ø' s -• sr -• keV -• at about 0800 UT. No enhancement of
electron intensities is observed above 6.0 keV. Around 0830
UT the intensities for all five enhanced low-energy electron channels begin dropping rapidly toward their preenhancement levels. This drop in intensities coincides with the cessation of the VLF emissions and occurs approximately 30 min before the satellite reenters the plasmasphere.
The energy of electrons in cyclotron resonance with whistler mode waves is
Wc -- Ea(fe/f)[l -
where E• = B•'/8•rN, the magnetic energy per particle, f is the wave frequency, B the magnitude of the static magnetic field, and N the electron number density [Kennel and Petschek,
1966]. Between 0700 and 0800 UT the static magnetic field remains within 10 '7 of 170 '7 (L. J. Cahill, Jr., private com- munication, 1975). In this time period, electric field turbulence associated with the plasma frequency appears in the 16.5-kHz and 31.1-kHz channels of the on-board spectrum analyzer. This indicates that the ambient number density was in the range of 4-10 el cm -• [Gurnett and Shaw, 1973]. This implies that for whistler mode waves with f -• fs/2 the resonant energy ranges from 4.5 to 1.8 keV. Thus the energies where the elec- tron intensity enhancements occur are appropriate for the elec- trons to be in cyclotron resonance with the observed whistler mode emissions.
There are indications that near the beginning of the emission event the satellite passed through several very narrow regions
Sa-A SATELLITE (EXPLORER 45) ORBIT NO. 211 22 JANUARY 1972
a o • •3 ,l•[•!$tal•latlli•l•[t•t•11111•,,,,,, ............... ,,C ...............
I •:':•• '•2.7 keV
;;4;;: ;; .... ..... ,;;, • • i •111•11111111 II III
10 6 • • '•½ •"=' "- ;•;•.• '
'-3.5 4.0 4.5 5.0 5.5 6.0 6.5 7.0 7.5 8.0 8.5 9.0 9.5 10.010.5 U .T.•
Fig. 3. Variations of directional differential electron intensities (cm -2 s -z sr -z keV -z) during the VLF emission event on January 22, 1972. Lowercase crosses and dots correspond to the intensities with pitch angles near 90 ø (78o-90 ø ) and the smallest observed pitch angles (22ø-34ø), respectively. The time intervals indicated by horizontal hatched lines correspond to the periods when the VLF emissions are observed, and those of the shaded portions correspond to the inside of the plasmasphere. The mean energies of the electrons corresponding to each curve are from the bottom 1.2, 1.8, 2.7, 4.0, 6.0, 9.2, 13.5, 25.6, 55, 100, 180, and 400 keV, respectively. The measurements from 1.2 to 25.6 keV are made by a cylindrical electrostatic analyzer-channel electron multiplier system, and the measurements from 55 to 400 keV are made with a solid state electron detector.
138 ANDERSON AND MAEDA: VLF EMISSIONS, MAGNETOSPHERIC ELECTRONS
18 h
19 h
20 h
h 21
S3-A ORBIT 211 12 h
JAN. 22, 1972 ••
i L= .. .
fg=
Fig. 4. Orbit 211 of the S3-A satellite. The hatched section along the orbit corresponds to the location where the VLF emissions are observed. The domain shaded in gray indicates the probable configu- ration of the evening plasmasphere. The satellite exited the plasma- sphere at 0514 UT (L = 4.19, MLT = 18.0 hours) and reentered the plasmasphere at 0903 UT (L = 4.26, MLT = 21.9 hours) as deter- mined by the saturation of the on-board static electric field instrument. From 0658 to 0718 UT the satellite passed through several very narrow regions of plasma with densities comparable to the plasma- sphere.
of plasma with densities comparable to the plasmasphere. From 0658 to 0704, 0705:30 to 0707:30, and 0718 to 0719 UT, the static electric field instrument briefly came out of satura- tion, indicating that the local number density exceeded 40 cm -3 (N. C. Maynard, private communication, 1975). VLF emis- sions associated with enhanced low-energy electron intensities were not present for these time periods. Instead, a narrow electromagnetic band of hiss from 200 to 500 Hz was observed. This ELF hiss band is characteristic of 'plasmaspheric hiss' [Russell and Holzer, 1970; Carpenter et al., 1969], which fills the plasmasphere but is believed to be generated just inside the plasmapause [Thorne et al., 1973]. In the low-energy electron
data the intensities briefly dropped an order of magnitude near 0707 and 0718 UT. A diagram of the probable configuration of the evening plasmasphere for orbit 211 is shown in Figure 4. Because of the presence of the plasmaspheric hiss we believe that the high-density cold plasma encountered around 0700 UT could be a taillike extension from the main body of the plasmasphere. This narrow high-density region shields the re- gion outside the outbound plasmapause crossing from the enhanced low-energy electrons. Possible taillike extensions of the plasmasphere have been observed during geomagnetically disturbed times by Barfield et al. [ 1975] and Maynard and Chen [ 1975]. The location of the VLF emission event is indicated by the hatched line.
As shown in Figure 2, most of the wave energy from 0738 to 0801 UT is concentrated in the emissions above fg, which is •4.8 kHz. From 0740 to 0750 UT the emissions appear in the spectrum analyzer channels up to 16.5 kHz. This indicates emissions up to 7f•/2. The enhancement in the intensities of electrons with mean energies from 2.7 to 6.0 keV begins around 0730 UT and continues until about 0830 UT. The wave
energy shifts to the whistler mode emissions near fs/2 at 0801 UT. At about the same time, as shown in Figure 3, the 90 ø pitch angle intensities for the 4.0-keV electrons drop aroundl order of magnitude. For the 6.0-keV electrons the 20 ø pitch angle intensities rise to a level slightly above 90 ø pitch angle intensities. Prior to this time and for all lower energies the 20 ø pitch angles were usually • Order of magnitude below the 90 ø pitch angle intensities. At the termination of this emission event a?ound 0831 UT the 90 ø pitch angle intensities for all energies of electrons were greater than the corresponding 20 ø pitch angle intensities. The peak chorus amplitude measured during the period of the nearly isotropic pitch angle distribu- tions was •250 #V/m.
Orbit 214, January 23, 1972
The VLF emission event and low-energy electron enhance- ment for orbit 214 begin and end nearly coincidently with the outbound and inbound plasmapause crossings. As determined by the saturation of the on-board static electric field in- strument, the outbound plasmapause crossing occurs at 0424
.-. OUTBOUND PLASMAPAUSE
.-;•: • .; . •:: ...... .:
'L •,0 4,$- ':' 5i'0• ............. :.:$:1;8 .... **-* *:* * '" -g• .......... -•.-'•;*•: ':' -:'•;.O:.-':' ":""
sa.•: ..;c-•.• 5,5 ø .:':3.:.4• '•'•* .-':•':;::•', ;'C.• ....
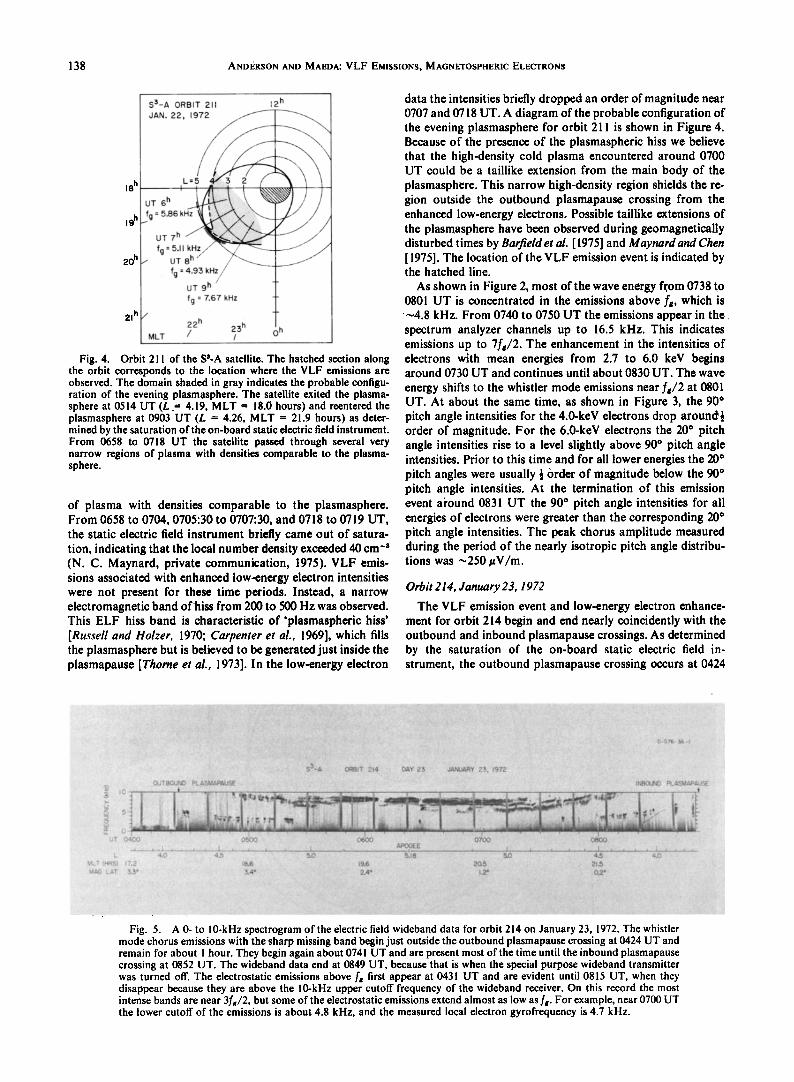
Fig. 5. A 0- to 10-kHz spectrogram o[ the electric field wideband data for orbit 214 on January 23, 1972. The whistler mode chorus emissions with the sharp missing band begin just outside the outbound plasmapause crossing at 0424 UT and remain for about I hour. They begin again about 0741 UT and are present most of the time until the inbound plasmapause crossing at 0852 UT. The wideband data end at 0849 UT, because that is when the special purpose wideband transmitter was turned off. The electrostatic emissions above f, first appear at 0431 UT and are evident until 0815 UT, when they disappear because they are above the 10-kHz upper cutoff frequency of the wideband receiver. On this record the most intense bands are near 3f,/2, but some of the electrostatic emissions extend almost as low as f,. For example, near 0700 UT the lower cutoff of the emissions is about 4.8 kHz, and the measured local electron gyrofrequency is 4.7 kHz.
ANDERSON AND MAEDA.' VLF EMISSIONS, MAGNETOSPHERIC ELECTRONS 139
18 h
19 h
20 h
21 h
S 3- A ORBIT 214 JAN. 23, 1972
L =
UT 6h E •'•'"•--"--' '"':•:'•':•••••i:.'x%..•. I • /
/' UT 8" fg= 7.32
22 h MLT / 0 h
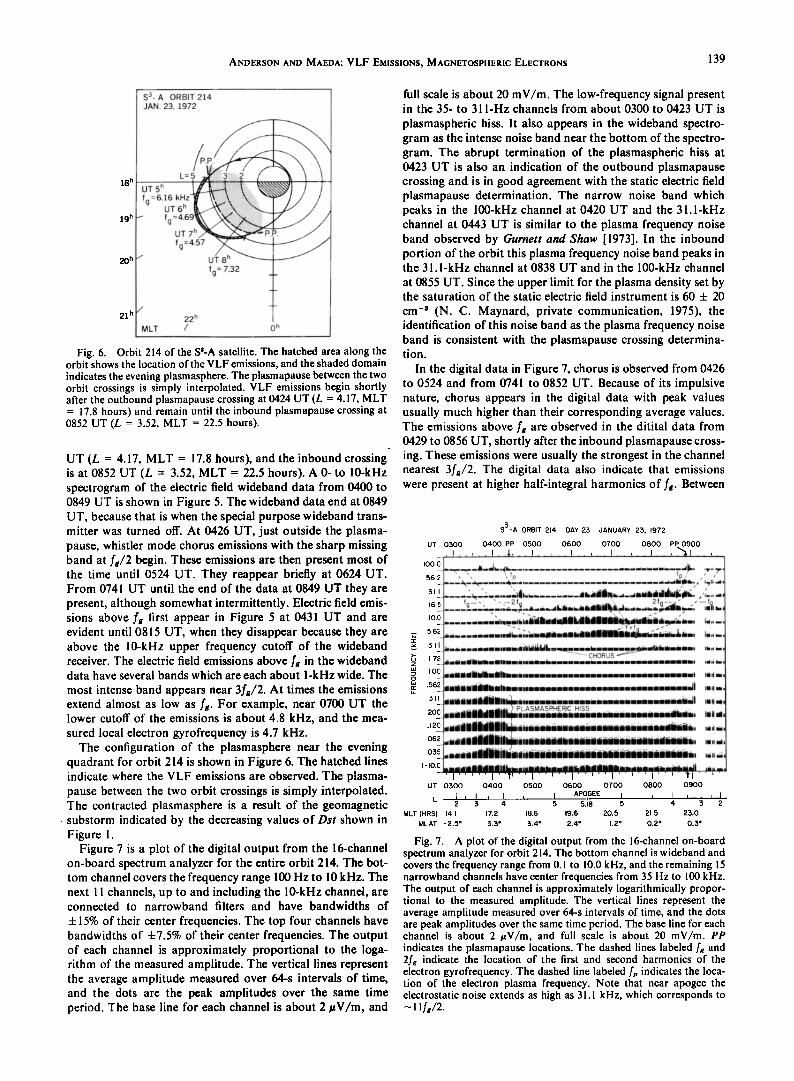
Fig. 6. Orbit 214 of the Sa-A satellite. The hatched area along the orbit shows the location of the VLF emissions, and the shaded domain indicates the evening plasmasphere. The plasmapause between the two orbit crossings is simply interpolated. VLF emissions begin shortly after the outbound plasmapause crossing at 0424 UT (L - 4.17, MLT = 17.8 hours) and remain until the inbound plasmapause crossing at 0852 UT (L = 3.52, MLT = 22.5 hours).
UT (L = 4.17, MLT = 17.8 hours), and the inbound crossing is at 0852 UT (L = 3.52, MLT = 22.5 hours). A 0- to 10-kHz spectrogram of the electric field wideband data from 0400 to 0849 UT is shown in Figure 5. The wideband data end at 0849 UT, because that is when the special purpose wideband trans- mitter was turned off. At 0426 UT, just outside the plasma- pause, whistler mode chorus emissions with the sharp missing band at fg/2 begin. These emissions are then present most of the time until 0524 UT. They reappear briefly at 0624 UT. From 0741 UT until the end of the data at 0849 UT they are present, although somewhat intermittently. Electric field emis- sions above fg first appear in Figure 5 at 0431 UT and are evident until 0815 UT, when they disappear because they are above the 10-kHz upper frequency cutoff of the wideband receiver. The electric field emissions above f• in the wideband data have several bands which are each about l-kHz wide. The
most intense band appears near 3f•/2. At times the emissions extend almost as low as f•. For example, near 0700 UT the lower cutoff of the emissions is about 4.8 kHz, and the mea- sured local electron gyrofrequency is 4.7 kHz.
The configuration of the plasmasphere near the evening quadrant for orbit 214 is shown in Figure 6. The hatched lines indicate where the VLF emissions are observed. The plasma- pause between the two orbit crossings is simply interpolated. The contracted plasmasphere is a result of the geomagnetic substorm indicated by the decreasing values of Dst shown in Figure 1.
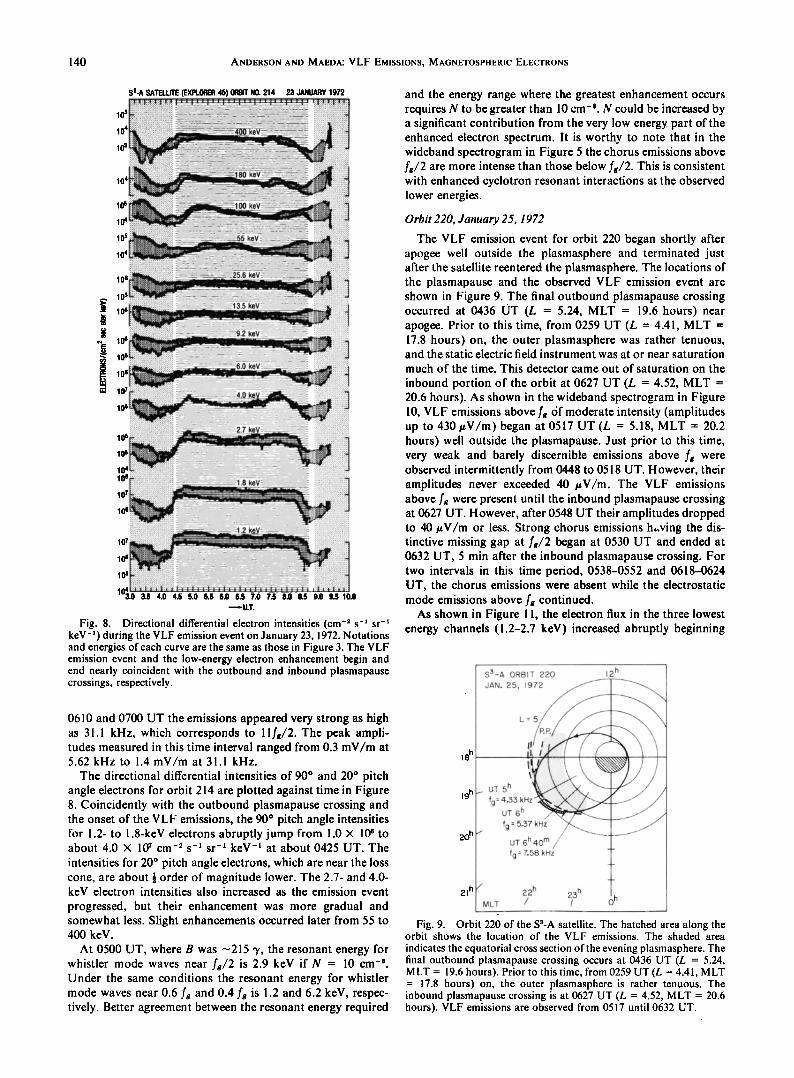
Figure 7 is a plot of the digital output from the 16-channel on-board spectrum analyzer for the entire orbit 214. The bot- tom channel covers the frequency range 100 Hz to 10 kHz. The next 11 channels, up to and including the 10-kHz channel, are connected to narrowband filters and have bandwidths of
ñ15% of their center frequencies. The top four channels have bandwidths of ñ7.5% of their center frequencies. The output of each channel is approximately proportional to the loga- rithm of the measured amplitude. The vertical lines represent the average amplitude measured over 64-s intervals of time, and the dots are the peak amplitudes over the same time period. The base line for each channel is about 2 #V/m, and
full scale is about 20 mV/m. The low-frequency signal present in the 35- to 31 l-Hz channels from about 0300 to 0423 UT is
plasmaspheric hiss. It also appears in the wideband spectro- gram as the intense noise band near the bottom of the spectro- gram. The abrupt termination of the plasmaspheric hiss at 0423 UT is also an indication of the outbound plasmapause crossing and is in good agreement with the static electric field plasmapause determination. The narrow noise band which peaks in the 100-kHz channel at 0420 UT and the 31.l-kHz channel at 0443 UT is similar to the plasma frequency noise band observed by Gurnett and Shaw [1973]. In the inbound portion of the orbit this plasma frequency noise band peaks in the 31.l-kHz channel at 0838 UT and in the 100-kHz channel
at 0855 UT. Since the upper limit for the plasma density set by the saturation of the static electric field instrument is 60 + 20
cm -3 (N. C. Maynard, private communication, 1975), the identification of this noise band as the plasma frequency noise band is consistent with the plasmapause crossing determina- tion.
In the digital data in Figure 7, chorus is observed from 0426 to 0524 and from 0741 to 0852 UT. Because of its impulsive nature, chorus appears in the digital data with peak values usually much higher than their corresponding average values. The emissions above f• are observed in the ditital data from 0429 to 0856 UT, shortly after the inbound plasmapause cross- ing. These emissions were usually the strongest in the channel nearest 3fg/2. The digital data also indicate that emissions were present at higher half-integral harmonics of fg. Between
S3-A ORBIT 214 DAY 23 JANUARY 23, 1972 UT 0:300 0400 PP 0500 0600 0700 0800 PP 0900
I00.0. _&_A,...4,._ ........................ .,..,_..._,___ _.,•,,, -- %'•, ',fp fp/ 56.•.__.•;.•. ..... *.- ............................. ..,,,,,•.., ;.,.,,'.,
,6.•- .... o-..;.r.,;_..,,•..?_..•.4.a.•,•.ia a ,o.• ......... '-•,._.i•,,{•-mlm•m. k•ll,m•,li•, ,l.•{{•--'.., •'• ....
• :3.• ,. ....... ...,.=.,.i•&••...i_ ..... •i.-.•,,.=. •,. .... • 1.78 • CHORUS
"' .562 "
.:3 I/ditJallililll•m,mimmmm/mmmlmmlmmmmmmmtBmmmmmmmiiiil ß 20o elidilldlllm•mimmiiP'•iiilmmtlg,,,mdilmm•/lim•aii laWif .• 2o,,iiiillillii•ii/iii.,tBi-iiiiiiiiiiiiiii-iilidiii% .062 ,.,liiiiiliiilk•dkimi•iiiii#iiiiiiiiii-dliiiiiiik -0:35 .•illildiiill/•i•idiii•imi/liiiiiiiiiiiiiiiiii-• ,,,,•
.I -IO.O ..m,i/iJll,dilllll/,..,.itllilliMiildlllllllilllldJl,..ii•-diii 'j" ''' I"•''' I'''''1''''' I'''''I'''' •1''''
UT 0:300 0400 0500 0600 0700 0800 0900
I , I , I , I APOGEE I L 2 :3 4 5 5.18 5 4 :3 2
MLT (HRS) 14.1 17.2 18.6 19.6 20.5 21.5 23.0 MLAT - 2.5 ø 3.3 ø :3.4 ø 2.4 ø 1.2 ø 0.2 ø 0-:3 ø
Fig. 7. A plot of the digital output from the 16-channel on-board spectrum analyzer for orbit 214. The bottom channel is wideband and covers the frequency range from 0.1 to 10.0 kHz, and the remaining 15 narrowband channels have center frequencies from 35 Hz to 100 kHz. The output of each channel is approximately logarithmically propor- tional to the measured amplitude. The vertical lines represent the average amplitude measured over 64-s intervals of time, and the dots are peak amplitudes over the same time period. The base line for each channel is about 2 t•V/m, and full scale is about 20 mV/m. PP indicates the plasmapause locations. The dashed lines labeled f, and 2fg indicate the location of the first and second harmonics of the electron gyrofrequenc, y. The dashed line labeled fv indicates the loca- tion of the electron plasma frequency. Note that near apogee the electrostatic noise extends as high as 31.1 kHz, which corresponds to ,-,i lf•/2.
140 ANDERSON AND MAEDA: VLF EMISSIONS, MAGNETOSPHERIC ELECTRONS
S3-A SATELLITE (EXPLORER 45) ORBIT NO. 214 23 JANUARY 1972
,,, i!!,i,,::;::.-. % •i ...... .-
........ ...............
.................
'111';'!iiii ";'""?: ' 10 4 '"' '"l•!l;":li•;' ,,I;l:1ti i,:" .-',-'.,' :% :';.::: :..-. ,• ................. :;-;;;•;:::;:;:;:::½: .................
.................. i55 key ii.•:'!?i•:•-;/':'
,0. ?:li'k'li'l"lit't½ ,*"'"":'. ........... ' .................. =' ., =,., --;;•:::-- _ ..._ ;;: .,[i I :%;- ........ '-: .................... :,=,,•!11 ]!l•,•[i'
._. 10 • .]ii-; ...... Z.:,,-'2.-' > '"-;":;"--;-;';'"•-"-"•-;• 13.5 key
•0• ]ili f, :•: '• • - - ?......,;•,; ..... ..; .:?.:. :½ ,' .... : •: .%:;, -'. :' '
106 ;:;,i::i i•i i•!i-;,i!iiiii .... ",_•..:'-.':i• ......... . ......... =•...•==.-.•:;=• ....... ........................ . ........... ..,,.,.,. ....... ,.?.,.:;, -:
................. .................
"•l,l:,, '"'r ,,: .... , 10 5 '.":.,:':;=[;[;;;:', . ,
107 ';';';"•i::i'?,"ii•i•" ? ;""•"';;,"'-';;;L:'.,'",]•ii!ii!;;!'..;;•',;,ii;?•.,œ+,'=, ""'.,..-.":•;;;;i;;;L.,.,iiii:= ,- i,;,.,,:•.
......................................
10 7 '..":.;.i.'.'..'•.ii!i• i •,;=½'-'.•E:i','ir=i,r,'==,'..,,,,,,=,, ß .......... ............ . =,•,•, ,.'_•
................
;-: ;-:- ,---,,-,--,,-,--,.-i ............
---'--U.T.
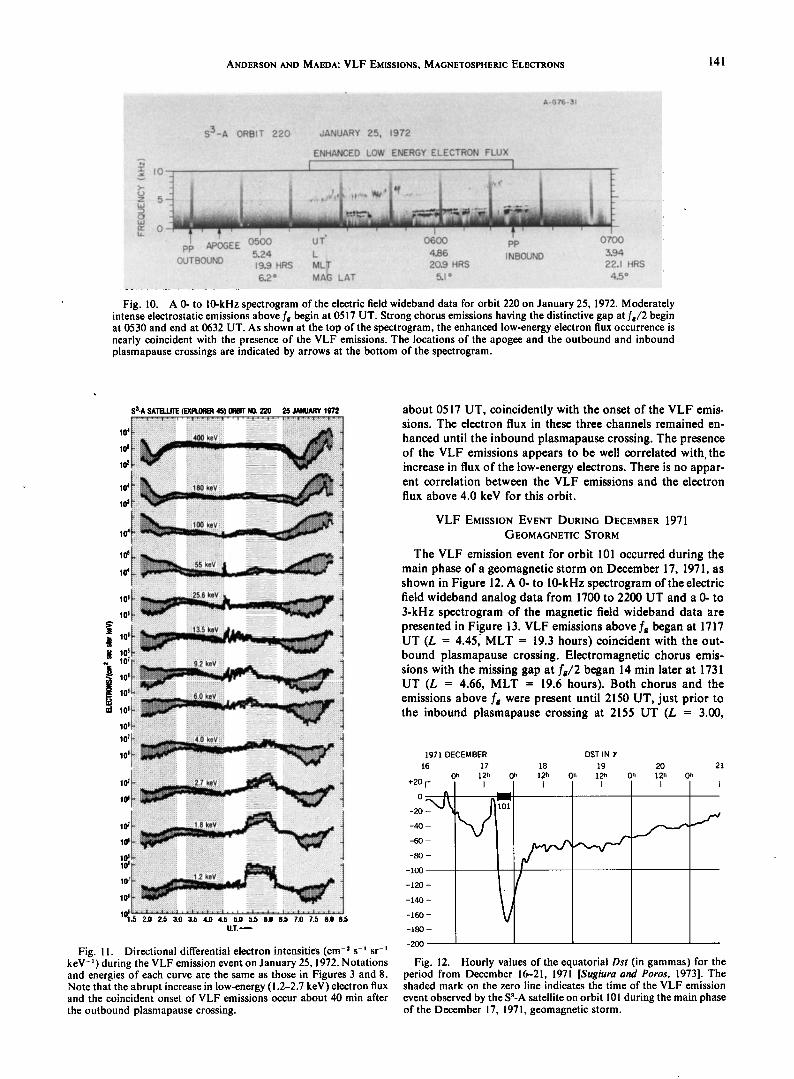
Fig. 8. Directional differential electron intensities (cm -• s-' sr -• keV -•) during the VLF emission event on January 23, 1972. Notations and energies of each curve are the same as those in Figure 3. The VLF emission event and the low-energy electron enhancement begin and end nearly coincident with the outbound and inbound plasmapause crossings, respectively.
0610 and 0700 UT the emissions appeared very strong as high as 31.1 kHz, which corresponds to 11fs/2. The peak ampli- tudes measured in this time interval ranged from 0.3 mV/m at 5.62 kHz to 1.4 mV/m at 31.1 kHz.
The directional differential intensities of 90 ø and 20 ø pitch angle electrons for orbit 214 are plotted against time in Figure 8. Coincidently with the outbound plasmapause crossing and the onset of the VLF emissions, the 90 ø pitch angle intensities for 1.2- to 1.8-keV electrons abruptly jump from 1.0 X 10 • to about 4.0 X 10 7 cm -•' s -• sr -• keV -• at about 0425 UT. The
intensities for 20 ø pitch angle electrons, which are near the loss cone, are about « order of magnitude lower. The 2.7- and 4.0- keV electron intensities also increased as the emission event
progressed, but their enhancement was more gradual and somewhat less. Slight enhancements occurred later from 55 to 400 keV.
At 0500 UT, where B was •215 3', the resonant energy for whistler mode waves near fs/2 is 2.9 keV if N = 10 cm -a. Under the same conditions the resonant energy for whistler mode waves near 0.6 fs and 0.4 fs is 1.2 and 6.2 keV, respec- tively. Better agreement between the resonant energy required
and the energy range where the greatest enhancement occurs requires N to be greater than 10 cm -a. N could be increased by a significant contribution from the very low energy part of the enhanced electron spectrum. It is worthy to note that in the wideband spectrogram in Figure 5 the chorus emissions above f•/2 are more intense than those below f•/2. This is consistent with enhanced cyclotron resonant interactions at the observed lower energies.
Orbit 220, January 25, 1972
The VLF emission event for orbit 220 began shortly after apogee well outside the plasmasphere and terminated just after the satellite reentered the plasmasphere. The locations of the plasmapause and the observed VLF emission event are shown in Figure 9. The final outbound plasmapause crossing occurred at 0436 UT (L = 5.24, MLT = 19.6 hours) near apogee. Prior to this time, from 0259 UT (L = 4.41, MLT = 17.8 hours) on, the outer plasmasphere was rather tenuous, and the static electric field instrument was at or near saturation
much of the time. This detector came out of saturation on the
inbound portion of the orbit at 0627 UT (L = 4.52, MLT = 20.6 hours). As shown in the wideband spectrogram in Figure 10, VLF emissions above fg of moderate intensity (amplitudes up to 430 #V/m) began at 0517 UT (L = 5.18, MLT = 20.2 hours) well outside the plasmapause. Just prior to this time, very weak and barely discernible emissions above fg were observed intermittently from 0448 to 0518 UT. However, their amplitudes never exceeded 40 #V/m. The VLF emissions above fg were present until the inbound plasmapause crossing at 0627 UT. However, after 0548 UT their amplitudes dropped to 40 #V/m or less. Strong chorus emissions h,,ving the dis- tinctive missing gap at f•/2 began at 0530 UT and ended at 0632 UT, 5 min after the inbound plasmapause crossing. For two intervals in this time period, 0538-0552 and 0618-0624 UT, the chorus emissions were absent while the electrostatic mode emissions above f• continued.
As shown in Figure 11, the electron flux in the three lowest energy channels (1.2-2.7 keV) increased abruptly beginning
18 h
19 h
20 h
S m-A ORBIT 220 JAN. 25, 1972
UT 5 h .• fg: 4.33 kHz',,• ,Lz
UT 6 h •
22 h MLT /
fg: 5.37 kHz
UT 6 h 40 m / fg = 7.58 kHz
21h 23 h /
12 h
Fig. 9. Orbit 220 of the Sa-A satellite. The hatched area along the orbit shows the location of the VLF emissions. The shaded area
indicates the equatorial cross section of the evening plasmasphere The final outbound plasmapause crossing occurs at 0436 UT (L = 5.24, MLT = 19.6 hours). Prior to this time, from 0259 UT (L = 4.41, MLT - 17.'8 hours) on, the outer plasmasphere is rather tenuous. The inbound plasmapause crossing is at 0627 UT (L = 4.52, MLT = 20.6 hours). VLF emissions are observed from 0517 until 0632 UT.
ANDERSON AND MAEDA.' VLF EMISSIONS, MAGNETOSPHERIC ELECTRONS 141
.pp ...ApO:G.E.E. 0500 - 5.24
E'::N::H"A•NLOE'D-;:b'o-'W ::E:/:NER6':-Y EL;:E.C'T;'RO..N:.: F.EU:..-.X
. ...,.;, ...... ::X•,;,...-.--.;•- -::;,.::.: :-:**-:r:-'*', -".. .-:, "-
. ..:.::• -:.:::: :. :... : . .:...-::..•. - ..... . . ...: -::.
'U:; "T:*" 060:0 pp. '0700 .L ......... 4,86. iNBOUND -'OUT.BOU-ND::' I:9.9' :.HRS "M'L::-i•: 2;:'•:-9 FiRS 2:2.J. HRS
6'2...•: .' :M;.-..A•;G .L:AT :5,1: "• .... .4;5 '•:
Fig. 10. A 0- to 10-kHz spectrogram of the electric field wideband data for orbit 220 on January 25, 1972. Moderately intense electrostatic emissions above fg begin at 0517 UT. Strong chorus emissions having the distinctive gap at •/2 begin at 0530 and end at 0632 UT. As shown at the top oœ the spectrogram, the enhanced low-energy electron flux occurrence is nearly coincident with the presence oœ the ¾LF emissions. The locations oœ the apogee and the outbound and inbound plasmapause crossings are indicated by arrows at the bottom oœ the spectrogram.
S3-A SATELLITE (EXPLORER 45) ORBIT NO. 220 25 JANUARY 1972
• lO • '• •,, ..... !•."• ..... " 'Z?"F - •P•,,•; d'
"•"•'"• .... •' •;6.0
6'• ;lqil•il;I;l•i$½ ½•"*" ..... :;'"': ..... '""• .... ";';'"" 't '
•.s zo zs a.o a.s •.o •.s s.o s.s 6.o 6.s •.o •.s &o •.s U.T.•
Fig. 11. Directional differential electron intensities (cm -2 s -x sr -x keV -x) during the VLF emission event on January 25, 1972. Notations and energies of each curve are the same as those in Figures 3 and 8. Note that the abrupt increase in low-energy (1.2-2.7 keV) electron flux and the coincident onset of VLF emissions occur about 40 min after
the outbound plasmapause crossing.
about 0517 UT, coincidently with the onset of the VLF emis- sions. The electron flux in these three channels remained en-
hanced until the inbound plasmapause crossing. The presence of the VLF emissions appears to be well correlated with the increase in flux of the low-energy electrons. There is no appar- ent correlation between the VLF emissions and the electron
flux above 4.0 keV for this orbit.
VLF EMISSION EVENT DURING DECEMBER 1971
GEOMAGNETIC STORM
The VLF emission event for orbit 101 occurred during the main phase of a geomagnetic storm on December 17, 1971, as shown in Figure 12. A 0- to 10-kHz spectrogram of the electric field wideband analog data from 1700 to 2200 UT and a 0- to 3-kHz spectrogram of the magnetic field wideband data are presented in Figure 13. VLF emissions above fg began at 1717 UT (L = 4.45, MLT = 19.3 hours)coincident with the out- bound plasmapause crossing. Electromagnetic chorus emis- sions with the missing gap at f•/2 began 14 min later at 1731 UT (L = 4.66, MLT = 19.6 hours). Both chorus and the emissions above f• were present until 2150 UT, just prior to the inbound plasmapause crossing at 2155 UT (L = 3.00,
1971 DECEMBER
16 17
+20
0
-20
-40
-60
-80
-100
-120
-140
-160
-180
-200
DST IN ¾
18 19 20 21
Oh 12h Oh 12h Oh 12h Oh 12h Oh
Fig. 12. Hourly values of the equatorial Dst (in gammas) for the period from December 16-21, 1971 [Sugiura and Poros, 1973]. The shaded mark on the zero line indicates the time of the VLF emission
event observed by the S3-A satellite on orbit 101 during the main phase of the December 17, 1971, geomagnetic storm.
142 ANDERSON AND MAEDA: VLF EMISSIONS, MAGNETOSPHERIC ELECTRONS
• •'-•-•"•""•:•;'•,•'." :'•:'c"•--•:,'..:•:-•?-•"•'•":•½• :• •:½•ii •?•Z• • .....
•.•.. :-:--•..•- :•). ........................... • ............ , ............................ :• ............................. • ...................................... • ...................... :•:.: .-.
.::•.. ::: ..... ... • ....... .... ...:•;: :•,• ..... :•::: ½:•;:::;•;:::': :: •:-:• ........ ' ...... :•:;::;-*': ':'•:':•?:::-;:-•: '"'":: ß ...... ":- '--::-:-•-:;.•:•.: ......................... •: :-v.:,..•- '"G':-;" -';E ............... a.. :.•,",• .... '. ' .... ,:,' ..... '•::' '.. '""'"'•,•::•,, ....... ' ........... :• .......... ....,•;..': •: :•:•:• " ::•; .... .•. ' :•g ...... • :. ....... •g:: . ::g ................. • •.-::-•:•: •-
-.•.•:: ::::/ .-. •,: .-....--.......-.::• ................ :•.:...:,•..:•.?..:.:•.:.:?. -.......:•:...-,::: .:?:.' :.:.:•. ,,: ?•?.•;:•:• .:•:?:::?•?:• , "-•:•g ;.:;?. :?:g.• :.•;i :•-: :•j -•224g;•:•.:•::• :,:,:.:...:• • '.•.? •"•:.:•:.•:•:.•. •-:.: :;-.
• .•-"-'::-•:-::" :-..•[. ?• g •:•:d•b.½,Zd4•"•'"'"'•'""•:•;• :::,.. •½•?.•:.:•---*.: .... :•f::.•?•:;:.::?:•-•.::::•'-.:--•:-: '"•:•::• ?•½-•'•::;g•:,::•:.•?"::•::•:;-'..?•½-.-.•g•:•:?•'•:•:..•;':; ?•??•:-:•:•:"";:'•?• •:.•:-'• •:•::/•'.•...•.•...•%•`•..•g::::::;.•.:.•:•.•fg:•L•::?..•.•:•:•:•:;•g•.•.;:•:•:.•:•::?g '•:g•:;::':?.::• ..;:•-. :•:• ?;•:::•?:g:,::::•:• .-•' '• ....... ..' ........... • .............. :'-. ........... ::'• ....... ..'.'..'2:•::•z-'-'- - g ..... .'.:•g•:::L'.".'..'..';? ......... ,"""g:•:•-d•.:•" :'2' .......
- "• '":74;-•"' ::.-:5';'0:- ...... --:5,26 ...m•"-:u•---:::•;;•:• ½;'0• :½•6,.: :.:--2...o•o '2:e;'4::. •o:8" •.L-z
;'i'NB'O -•flD P'LAs•APAUSE
:::'•:• ::::•:.:?.;•:-•;-• ............. ' ................ ':; ......... ::?•;;:•;½;•;;•;f;•:.;•;Z ................ ;??:;;C; ........ :½, ............................... ' ..... • .............. ' .......................... :• :½• ........ :.½:;•::½•::•;:..•, ;;-•,•:•,,•::,:;:•:. .......... ...•:•;•:•::::.,•:•:: ............... . ................. •½•;•;½•g•; .................. ?;;[:•:•?•;• ...... ;•;:.;:f;;;,•::• ...... :,:,:;;;•::•½½ ......... .... " :?;:; ....... •;•:•:•-.-.:;'•----'- • ............................... •-'--'-'-'•:•:'•:'•:;•:;:-•::•;f• -------•-•¾•::'--;:*.• .............. •:'•:;::•::•'•-*-•'.• •:::•?•:•:;?;•:• •:•::•::•:•::::•::'•-•-•::b-;Z•;•;:::•:•:•: ;'•i"•:½•7•;,•g::-•-•½::;i•:•?:•:Z4'• ....... •:-:-:•-:-,:f•:•½•:• ........... ' .......
•:: ::..•;•: -...•;::...7%'::'":;•.%• ............. :";•*';' :t:•;.?:..::.::::::.::t:.:.?•.?;7.:;:;:•.•.•r•:.%m•;t•:•:.%•.•:•:•::•:;•r•:•%•;•:•:.%•;f•:•:.•?•f;•..•..:•??•.:.• ........ ::.:, ............. j:•...:..•-."+" :: .::::t::..:.•.:.:: .................. •j::...:: ..... :.::::'::.':::" ...:.t::::.•...•.'.... • ........ ........ •.•:: ....... . .............. •.:.:•:.t.:. •.;..:.: .... •:*'•:¾•:...:•.:.•::: ............ :: .... . ....:...:.•mq..• .... - 'E:LE"6•:•RIC FtEL•B:
ß :,::8::.... :'• ................................................. '•:'• •:;"-O.::'3• ...... ;..::•::.::?:½.:½•.: .......... ' ......... •;r,, ,:•;•;•:::?• • ...... .• ...................... •::.::.'.•.;: ...... ..... :•e-•,•':•-'½•-'•::'• ....... • •-•'::'•"• -•::•:,•v::::•:•. ""::' .:•:•:• ?- ¾•::-:.•---..;...¾• ............ r.• -•...•,..•-•...:.•.. - ........ :•.•::.:?•::•?...•;•..`:•::.•.•`•..•::;:.•.:::...;.:•.•:•?:•:•:•:•::::• ::::.:.....•:•:•?;:•-•-•:.•:• :•:.•-•?•.•:.....• •-c•.• •:•.• ........... -----..
-'•::-•;; 19:-•0 ': '2--• :./: ::;•:'-•' •O :' .-:-:•'•.-O0 . . ........ . ............ .... •.•::.:• .
.... " •..-:: • .... -•-:-::::: :• L .......... - ..... .- L_. ... .••:Z.%•:.:::..:.... .: ' ..•:..,.:.:•., • ....... •:. :. I .-•-...•..r • :: - ..... :::•,.:' '-•:• ......... •:::•::::'-----•-• :'• •: .•: :::: :-::'•"•::-:----• ----•"•:• .......
:L. •0' 4.5 -.4.O .... •.5 ::• --0.:...• '• LT :(:•:R S'S'-: '2i.."2' :•!,6 '.•g:-:! --•.2•,6. 2 :•-• MAG.. L. AT I..5 -• 1'.4 • •:],::.•* -0;..6•: -&6 • ..... ;3;?
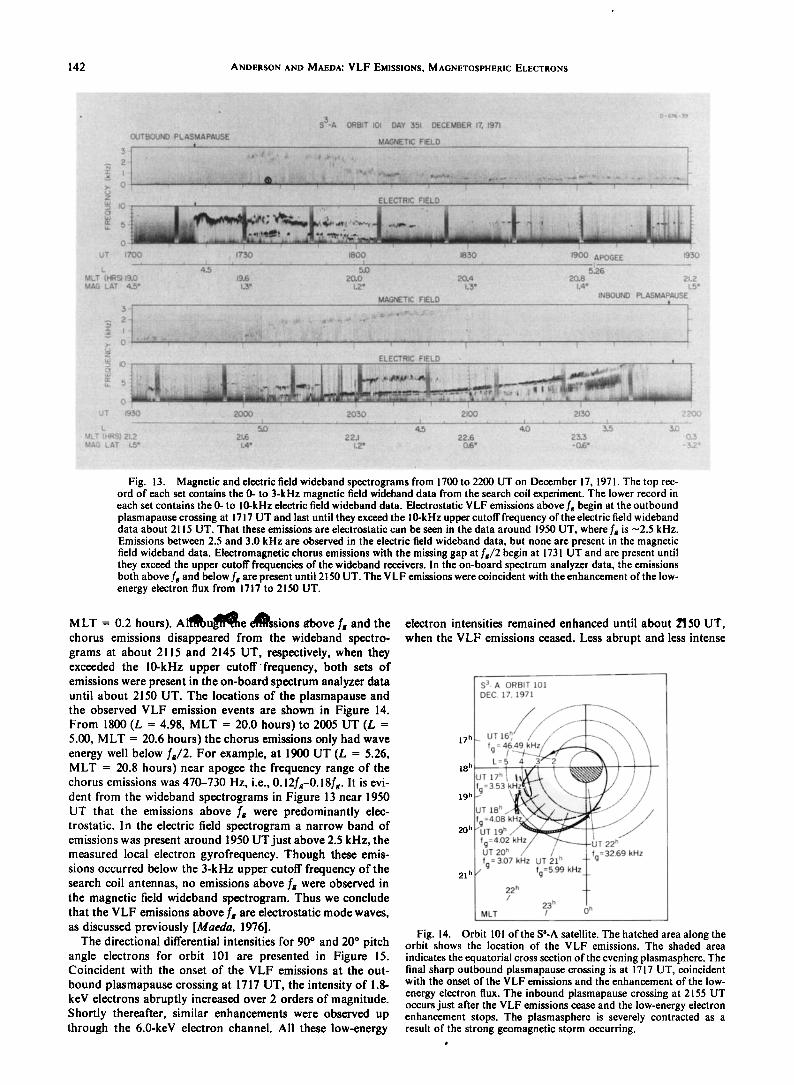
Fig. 13. Magnetic and electric field wideband spectrograms from 1700 to 2200 UT on December 17, 1971. The top rec- ord of each set contains the 0- to 3-kHz magnetic field wideband data from the search coil experiment. The lower record in each set contains the 0- to 10-kHz electric field wideband data. Electrostatic VLF emissions above fg begin at the outbound plasmapause crossing at 1717 UT and last until they exceed the 10-kHz upper cutoff frequency of the electric field wideband data about 2115 UT. That these emissions are electrostatic can be seen in the data around 1950 UT, where f• is •2.5 kHz. Emissions between 2.5 and 3.0 kHz are observed in the electric field wideband data, but none are present in the magnetic field wideband data. Electromagnetic chorus emissions with the missing gap at f•/2 begin at 1731 UT and are present until they exceed the upper cutoff frequencies of the wideband receivers. In the on-board spectrum analyzer data, the emissions both above f• and below f• are present until 2150 UT. The VLF emissions were coincident with the enhancement of the low- energy electron flux from 1717 to 2150 UT.
M LT = 0.2 hours). Altitude c•ssions above fs and the chorus emissions disappeared from the wideband spectro- grams at about 2115 and 2145 UT, respectively, when they exceeded the 10-kHz upper cutoff frequency, both sets of emissions were present in the on-board spectrum analyzer data until about 2150 UT. The locations of the plasmapause and the observed VLF emission events are shown in Figure 14. From 1800 (L = 4.98, MLT = 20.0 hours)to 2005 UT (L = 5.00, MLT = 20.6 hours) the chorus emissions only had wave energy well below rs/2. For example, at 1900 UT (L = 5.26, MLT - 20.8 hours) near apogee the frequency range of the chorus emissions was 470-730 Hz, i.e., 0.12fg-0.18fg. It is evi- dent from the wideband spectrograms in Figure 13 near 1950 UT that the emissions above fg were predominantly elec- trostatic. In the electric field spectrogram a narrow band of emissions was present around 1950 UT just above 2.5 kHz, the measured local electron gyrofrequency. Though these emis- sions occurred below the 3-kHz upper cutoff frequency of the search coil antennas, no emissions above f• were observed in the magnetic field wideband spectrogram. Thus we conclude that the VLF emissions above fs are electrostatic mode waves, as discussed previously 'Maeda, 1976].
The directional differential intensities for 90 ̧ and 20 ̧ pitch angle electrons for orbit 101 are presented in Figure 15. Coincident with the onset of the VLF emissions at the out-
bound plasmapause crossing at 1717 UT, the intensity of 1.8- keV electrons abruptly increased over 2 orders of magnitude. Shortly thereafter, similar enhancements were observed up through the 6.0-keV electron channel. All these low-energy
electron intensities remained enhanced until about ZI50 UT, when the VLF emissions ceased. Less abrupt and less intense
17 h
18 h
19 h
20 h
21 h
S 3- A ORBIT 101 DEC. 17, 1971
22 h - _ /
23 h MLT / oh
-UT 22 h
_ fg=32.69 kHz
Fig. 14. Orbit 101 of the S3-A satellite. The hatched area along the orbit shows the location of the VLF emissions. The shaded area
indicates the equatorial cross section of the evening plasmasphere. The final sharp outbound plasmapause crossing is at 1717 UT, coincident with the onset of the VLF emissions and the enhancement of the low-
energy electron flux. The inbound plasmapause crossing at 2155 UT occurs just after the VLF emissions cease and the low-energy electron enhancement stops. The plasmasphere is severely contracted as a result of the strong geomagnetic storm occurring.
ANDERSON AND MAEDA: VLF EMISSIONS, MAGNETOSPHERIC ELECTRONS 143 ß
S3-A SATELLITE (EXPLORER 45) ORBIT NO. 101 17 DECEMBER 1971
104
• 103, :: ....... __
•o 10 2. z --
103
102
105
10 4
6.0 keV
10 4
.103
10 2
10'•.•?.;!•i'•,, ....,.._..._ 2.7 keV - ?..'• 10'
10 5 .... ;" •;• 10 5
.1.8 key . i",: -d, 10 8 108 •-!i•i' f•:.......,:,.,•:,:: ........................ . .......... ....... • .... • ...... , ..... .. _. ;;; 10 ? 5;;•!i• :; .................... "",,.',.': ........ : ........ ;,a,,.;;:,, i•;. 10 z
.... :==.. .......
; ....
105 .... •,-;i 105
17.0 17.5 18.0 18.5 lg.0 19.5 20.0 20.5 21.0 21.5 22.0
-'-•U.T.
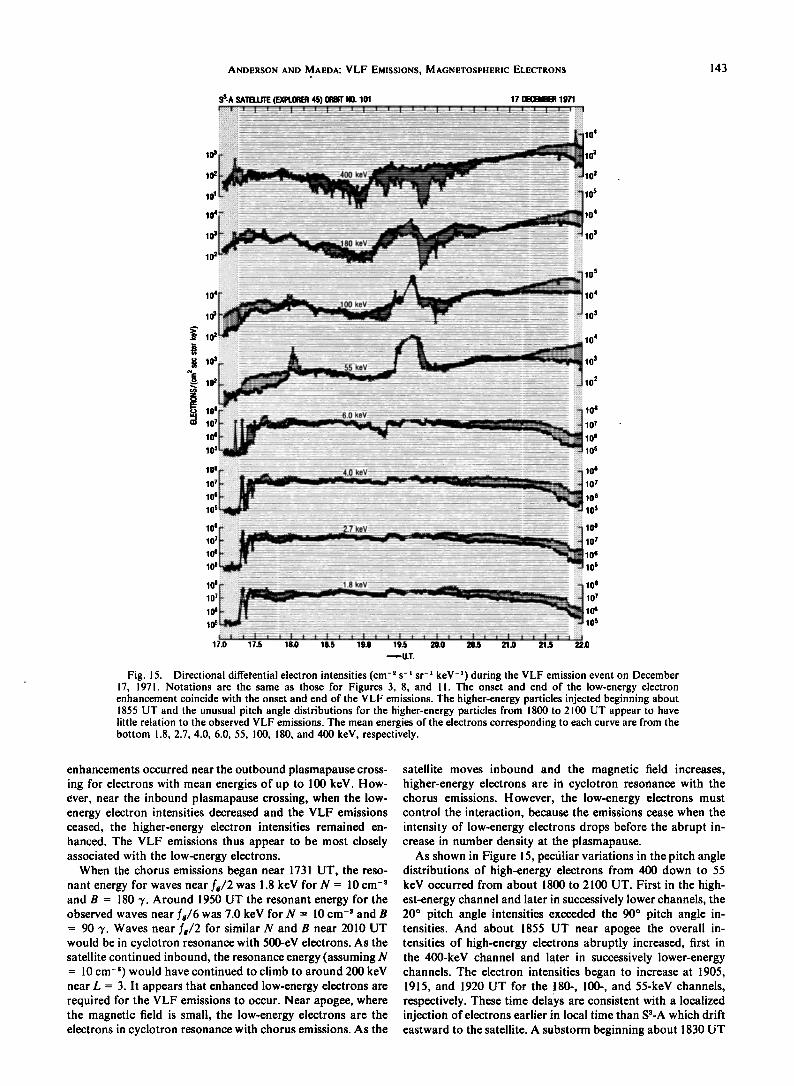
Fig. !:5. Directional differential electron intensities (cm -• s -• sr -• keV -•) during the VLF emission event on December 17, 1971. Notations are the same as those [or Figures 3, 8, and 11. The onset and end of' the low-energy electron enhancement coincide with the onset and end of' the VLF emissions. The higher-energy particles injected beginning about 18:55 UT and the unusual pitch angle distributions for the higher-energy particles from 1800 to 2100 UT appear to have little relation to the observed VLF emissions. The mean energies of. the electrons corresponding to each curve are from the bottom 1.8, 2.?, 4.0, 6.0, 55, 100, 180, and 400 keV, respectively.
enhancements occurred near the outbound plasmapause cross- ing for electrons with mean energies of up to 100 keV. How- ever, near the inbound plasmapause crossing, when the low- energy electron intensities decreased and the VLF emissions ceased, the higher-energy electron intensities remained en- hanced. The VLF emissions thus appear to be most closely associated with the low-energy electrons.
When the chorus emissions began near 1731 UT, the reso- nant energy for waves near f•/2 was 1.8 keV for N = 10 cm -• and B - 180 •,. Around 1950 UT the resonant energy for the observed waves near rs/6 was 7.0 key for N = 10 cm -s and B = 90 •,. Waves near re/2 for similar N and B near 2010 UT would be in cyclotron resonance with 500-eV electrons. As the satellite continued inbound, the resonance energy (assuming N = 10 cm -•) would have continued to climb to around 200 key near L - 3. It appears that enhanced low-energy electrons are required for the VLF emissions to occur. Near apogee, where the magnetic field is small, the low-energy electrons are the electrons in cyclotron resonance with chorus emissions. As the
satellite moves inbound and the magnetic field increases, higher-energy electrons are in cyclotron resonance with the chorus emissions. However, the low-energy electrons must control the interaction, because the emissions cease when the intensity of low-energy electrons drops before the abrupt in- crease in number density at the plasmapause.
As shown in Figure 15, pecfiliar variations in the pitch angle distributions of high-energy electrons from 400 down to 55 keV occurred from about 1800 to 2100 UT. First in the high- est-energy channel and later in successively lower channels, the 20 ø pitch angle intensities exceeded the 90 ø pitch angle in- tensities. And about 1855 UT near apogee the overall in- tensities of high-energy electrons abruptly increased, first in the 400-keV channel and later in successively lower-energy channels. The electron intensities began to increase at 1905, 1915, and 1920 UT for the 180-, 100-, and 55-keV channels,
respectively. These time delays are consistent with a localized injection of electrons earlier in local time than SS-A which drift eastward to the satellite. A substorm beginning about 1830 UT
144 ANDERSON AND MAEDA: VLF EMISSIONS, MAGNETOSPHERIC ELECTRONS
is indicated in the College magnetograms shown by Cahill [1973]. The time delays observed here are consistent with previous observations of Williams et al. [1974]. In the 1800-2000 UT time period the only noticeable change in the VLF emissions was that the chorus changed from having two bands near fg/2 to a single emission band near fg/6. This lower wave frequency requires a higher resonance energy, one at about 7 keV for the measured B field and assumed number
density. The unusual pitch angle distribution and abrupt in- crease in high-energy electron intensities do not appear to affect the observed VLF emissions.
DISCUSSION AND SUMMARY
This study has shown that magnetospheric VLF emissions with the characteristics listed below are clearly associated with enhanced intensities of low-energy electrons which penetrate into the dusk-midnight sector of the magnetosphere from the geomagnetic tail during geomagnetic storms and substorms. The characteristics of the emissions are the following. (1) The VLF emissions occur outside the plasmasphere in the nightside of the magnetosphere. (2) The VLF emissions consist of two frequency regimes, one below fg and the other above fg. (3) The VLF emissions below fs are relatively broadband whistler mode waves characteristic of chorus and frequently have a conspicuous band of 'missing emissions' near rs/2. (4) The emissions above fs are electrostatic and typically have com- ponents near 3f•/2. Occasionally, higher-frequency com- ponents are also observed. (5) The onset of the emissions coincides with abrupt increases outside the plasmasphere (L >• 4) in 1- to 10-keV electron intensities to the order of 10 8 el cm-: s -• sr -• key -•. Less pronounced enhancements sometimes occur for electrons with energies as high as 70 keY. (6) The cessation of the emissions coincides with a drop in the electron intensities to their preenhancement levels, which are of the order of lff • el cm -ø' s -• sr -• key -• or less. This drop in low- energy electron intensities occurs before or when the satellite crosses the plasmapause back into the plasmasphere.
Calculations using the measured static magnetic field and a number density determined either by observed plasma fre- quency noise band or upper limits set by the static electric field instrument showed that the enhancements occurred at energies appropriate for electrons in cyclotron resonance with the ob- served whistler mode wave frequencies. Little correlation was observed for electrons with energies above 70 keV and the observed VLF emissions.
Tsurutani and Smith [1974] suggested that a possible ex- planation for the 'missing emissions' near fg/2 might be Landau damping. For electrons in cyclotron resonance with waves at f = fa/2 the parallel velocity of the electrons equals the wave phase velocity, but the electrons are moving in the opposite direction. Assuming that the electrons are moving along the field not bunched and in both directions, they noted that there would be electrons also moving in the same direc- tion as the wave and with a velocity equal to the wave phase velocity. These electrons will Landau damp the wave, provided they lie on a portion of the particle distribution function that is decreasing with energy.
Another possible explanation for the missing emission band that considers separate sources for the f < fe/2 and f > fe/2 has been proposed by Maeda et al. [1976]. They suggest that the f > fs/2 emissions are generated locally near the satellite, while the f < fg/2 emissions are generated in a similar way but slightly outside the observing location where the local electron gyrofrequency would be lower. When these lower-frequency
emissions ultimately propagate to the observing location via the ducted mode, their upper frequency cutoff will be one-half the equatorial gyrofrequency of the observing location.
On a macroscopic scale, both chorus and the f > fg electro- static emissions tended to occur coincidently with the en- hancement of the low-energy electron intensities. However, on a microscopic scale the presence of one type of noise tended to quench the other type. For example, on orbit 214 from 0510 to 0525 UT in Figures 5 and 7 the chorus bursts oc- curred when the f > f• amplitudes decreased, and chorus was absent when the strongest f > fs emissions occurred. This quenching effect was evident in the wideband spectro- grams in Figures 2 and 10 also. However, some of the apparent quenching could have been due to the AGC of the wideband receiver. The amplitude at one frequency would appear weaker if a stronger signal at a different frequency occurred and controlled the receiver AGC. For orbit 214 we
were able to verify the quenching because it was also evident in the digital data. This verification is not usually possible or reliable unless the quenching effects are present for several sampling periods of the digital data. The interaction between the chorus and the electrostatic waves with f > fs will also be studied in future research.
On a given orbit the chorus amplitudes tended to peak near where the maximum intensity of resonant electrons occurred. For instance, on orbit 220 the chorus amplitudes peaked at about 12.5 mV/m about 0555 UT, approximately the same time that the flux of 1.8-keV electrons peaked at 7.0 X l07 (cm •' s sr) -• and the flux of 2.7-keV electrons peaked at 4.3 X l07 (cm •' s sr) -•. Similarly, on orbit 214 the chorus amplitudes peaked at about 160 #V/m when the flux of 4-keV electrons peaked at about 1.0 X 10⁷ (cm •' s sr) -•. On orbit 220 the f > fe emissions had peak amplitudes of about 350 #V/m around 0530 UT when the lowest-energy electrons (1.2 keV) had a peak flux of 1.0 X 11Y (cm •' s sr) -x. However, for orbit 214 the f > fg emissions had peak amplitudes of up to 1.4 mV/m, but the low-energy electrons had peak fluxes of about 4.8 and 7.2 X l0 -7 (cm ø' S sr) -• for the 1.2-keV and 1.8-keV channels, slightly less than for orbit 220. Quite possibly, the f > f• emission amplitudes might be controlled by the electron spec- trum below the lowest energy that could be measured on S3-A.
To further test the plausibility of the low-energy electrons interacting with the chorus via cyclotron resonance inter- actions, we examined the relationship of the upper cutoff frequency of the chorus and anisotropy of the enhanced low- energy electrons. For cyclotron resonance the growth rate is proportional to a term A - [1/(fg/f - 1)] [Kennel and Pet- schek, 1966], where A is a measure of the pitch angle an- isotropy. From this expression we see that the growth rate goes to zero at A = 1/(fs/fc - 1), where fc is the upper cutoff frequency. For the cases we have examined in this study, f• varied from about 0.55fs to 0.66fs. This corresponds to an- isotropies of 1.22-1.94. The pitch angle plots of the resonant low-energy electrons during periods of enhancement typically showed that the electron intensity varied from about sin •' a to sin 4 a, where a is the pitch angle. This indicates that A ranges from 1 to 2, since for a pitch angle distribution proportional to sin" a, A = m/2. Occasionally, the low-energy electrons dis- played pitch angle distributions proportional to sin a. The typical pitch angle distributions for the higher-energy electrons varied from sin •/•' a to sin a during the VLF emission events discussed in this study.
Kennel and Petschek [1966] calculated the maximum stably trapped omnidirectional flux J* for electrons above the reso-
ANDERSON AND MAEDA: VLF EMISSIONS, MAGNETOSPHERIC ELECTRONS 145
nance energy ER in steady state weak diffusion to be (within a factor of about 3)
{ [I-(f/rs)] } B 10•o J*(>ER) • A - [1/--•_-•Tf)] '•-' 3 X (cm •' s) -• where B is the equatorial field strength in gauss. For f = fg/2, A - 3/2, B=0.002G, L=5, andN= 10cm -a,E•2.5keV and J* ( >2.5 keV) • 1.2 X lff (cm •' s) -•. The low-energy electron fluxes we observe during the VLF emission events are well above this level. However, as A approaches 1, the stably trapped flux limit increases dramatically. Near A = 1.1 the stably trapped flux limit is comparable to the low-energy elec- tron flux we have observed. Had the fluxes been less or had the
anisotropies been smaller, we probably would not have ob- served chorus emissions.
Kennel et al. [1970] calculated the pitch angle diffusion coefficient D,• associated with an electric field E to be •(eE/mv) 2. l/f, where v is the particle velocity and e and m are the charge and mass of electron. For 2-keV electrons and a 1-mV/m electric field, D,• • 10:/f. For processes localized near the equator, Kennel et al. [1970] estimated that the electron encountered the wave electric field about 1% of the time. Thus
the overall diffusion coefficient for a 1-mV/m electric field is
--• 1/f(Hz) raW' s -•. In the examples we have discussed, fg was typically around 5 kHz. Thus the diffusion coefficients would be 4 X 10 -4 raW' s -• and 1.3 X 10 -4 rad •' s -• for f•/2 and 3f•/2 waves, respectively, with 1-mV/m amplitudes. Scarf et al. [1973] loosely define strong diffusion to beabove 10 -a raW' s -•, Our calculations show that the observed 1-mV/m waves are
around «-1 order of magnitude below that level. These calcu- lations admittedly are fairly crude because of the assumptions on which they are based. However, the weaker waves with amplitudes of a few hundred microvolts per meter most prob- ably are in the weak diffusion regime.
Fredricks [1971], using a 'ring' distribution, showed that electrostatic fluctuations in the magnetosphere near (n + «)re could be produced by a peak in the perpendicular velocity distribution of the ambient electrons. Young et al. [1973] theo- retically analyzed the generation of electrostatic waves in the magnetosphere by using a more realistic distribution contain- ing both a cold and a warm species of electrons. They found that the observed electrostatic spectra could be produced if the warm component had a nonzero peak in the perpendicular velocity distribution, if the density of the cold component was greater than about 1% of the warm, and, for high density regions, if the cold to warm temperature ratio was not less than 0.1. Using differential energy flux data from DeForest and Mcllwain [1971] from the geostationary ATS 5 satellite, Young et al. [1973] showed that a nonzero peak did exist in the perpendicular velocity distribution for electrons with energy around 100 eV. Schield and Frank [1970] showed that at the inner edge of the plasma sheet around local midnight and near the equator, there existed a peak in the differential energy spectra for electrons with energy of about 1 keV. Although we did not observe a peak in the low-energy electron per- pendicular velocity distribution associated with the elec- trostatic waves, the previous observations indicate that such a peak probably existed for electrons with less than the 1-keV minimum energy level that we could detect.
Acknowledgments. We wish to thank R. A. Hoffman, D. J. Wil- liams, D. A. Gurnett, L. J. Cahill, Jr., and N. C. Maynard for the use of their data in this study. We also wish to thank Chris Gloeckler of GSFC, N. K. Bewtra of Computer Sciences Corporation, and Larry
Lyons, Joe Barfield, and Linda Bath of NOAA for their help in the computer analysis and preparation of the electron data. This research was supported at the University of Iowa in part by the National Aeronautics and Space Administration under contract NAS5-11167 and grant NGL-16-001-043 and the Office of Naval Research.
The Editor thanks J. M. Cornwall and B. Tsurutani for their assist-
ance in evaluating this paper.
REFERENCES
Anderson, R. R., and D. A. Gurnett, Plasma wave observations near the plasmapause with the S3-A satellite, J. Geophys. Res., 78, 4756-4764, 1973.
Barfield, J. N., J. L. Burch, and D. J. Williams, Substorm-associated reconfiguration of the duskside equatorial magnetosphere: A pos- sible source mechanism for isolated plasma regions, J. Geophys. Res., 80, 47-55, 1975.
Barrington, R. E., T. R. Hartz, and R. W. Harvey, Diurnal distribu- tion of ELF, VLF, and LF noise at high latitudes as observed by Alouette 2, J. Geophys. Res., 76, 5278-5291, 1971.
Burtis, W. J., and R. A. Helliwell, Banded chorus: A new type of VLF radiation observed in the magnetosphere by Ogo 1 and Ogo 3, J. Geophys. Res., 74, 3002-3010, 1969.
Burton, R. K., and R. E. Holzer, The origin and propagation of chorus in the outer magnetosphere, J. Geophys. Res., 79, 1014-1023, 1974.
Cahill, L. J., Jr., Magnetic storm inflation in the evening sector, J. Geophys. Res., 78, 4724-4730, 1973.
Carpenter, D. L., C. G. Park, H. A. Taylor, Jr., and H. C. Brinton, Multiexperiment detection of the plasmapause from Eogo satellites and antarctic ground stations, J. Geophys. Res., 74, 1837-1847, 1969.
DeForest, S. E., and C. E. McIlwain, Plasma ,clouds in the magneto- sphere, J. Geophys. Res., 76, 3587-3611, 1971.
Dunckel, N., and R. A. Helliwell, Whistler mode emissions on the Ogo 1 satellite, J. Geophys. Res., 74, 6371-6385, 1969.
Fredricks, R. W., Plasma instability at (n + •)fc and its relationship to some satellite observations, J. Geophys. Res., 76, 5344-5348, 1971.
Fredricks, R. W., Wave-particle interactions in the outer magneto- sphere: A review, in The Magnetospheres of the Earth and Jupiter. edited by V. Formisano, pp. 1'13-152, D. Reidel, Dordrecht, Neth- erlands, 1975.
Fredricks, R. W., and F. L. Scarf, Recent studies of magnetospheric electric field emissions above the electron gyrofrequency, J. Geophys. Res., 78, 310-314, 1973.
Gurnett, D. A., and R. R. Shaw, Electromagnetic radiation trapped in the magnetosphere above the plasma frequency, J. Geophys. Res., 78, 8136-8149, 1973.
Kennel, C. F., and H. E. Petschek, Limit on stably trapped particle fluxes, J. Geophys. Res., 71, 1-28, 1966.
Kennel, C. F., F. L. Scarf, R. W. Fredricks, J. H. McGehee, and F. V. Coroniti, VLF electric field observations in the magnetosphere. J. Geophys. Res., 75, 6136-6152, 1970.
Longanecker, G. W., and R. A. Hoffman, S3-A spacecraft and experi- ment description, J. Geophys.•Res., 78, 4711-4717, 1973.
Maeda, K., Cyclotron side-band emissions from magnetospheric elec- trons, Planet. Space Sci., 24, 341-347, 1976.
Maeda, K., P. H. Smith, and R. R. Anderson, VLF-emissions from ring current electrons, Nature, 263, 37-41, 1976.
Maynard, N. C., and D. P. Cauffman, Double floating probe measure- ments on S•-A, J. Geophys. Res., 78, 4745-4750, 1973.
Maynard, N. C., and A. J. Chen, Isolated cold plasma regions: Obser- vations and their relation to possible production mechanisms, J. Geophys. Res., 80, 1009-1013, 1975.
Oliven, M. N., and D. A. Gurnett, Microburst phenomena, 3, An association between microbursts and VLF chorus, J. Geophys. Res., 73, 2355-2362, 1968.
Rosenberg, T. J., R. A. Helliwell, and J.P. Katsufrakis, Electron precipitation associated with discrete very low frequency emissions, J. Geophys. Res., 76, 8445-8452, 1971.
Russell, C. T., and R. E. Holzer, AC magnetic fields, in Particles and Fields in the Magnetosphere, edited by B. M. McCormac, pp. 195-212, D. Reidel, Dordrecht, Netherlands, 1970.
Russell, C. T., R. E. Holzer, and E. J. Smith, Ogo 3 observations of ELF noise in the magnetosphere, 1, Spatial extent and frequency of occurrence, J. Geophys. Res., 74, 755-777, 1969.
Scarf, F. L., R. W. Fredricks, C. F. Kennel, and F. V. Coroniti, Satellite studies of magnetospheric substorms on August 15, 1968, J. Geophys. Res., 78, 3119-3130, 1973.
146 ANDERSON AND MAEDA: VLF EMISSIONS, MAGNETOSPHERIC ELECTRONS
Schield, M. A., and L. A. Frank, Electron observations between the inner edge of the plasma sheet and the plasmasphere, J. Geophys. Res., 75, 5401-5414, 1970.
Shaw, R. R., and D. A. Gurnett, Electrostatic noise bands associated with the electron gyrofrequency and plasma frequency in the outer magnetosphere, J. Geophys. Res., 80, 4259-4271, 1975.
Sugiura, M., and D. J. Poros, Dst for 1971 and 1972, NASA/Goddard Space Flight Center, Greenbelt, Md., April 1973.
Taylor, W. W. L., and D. A. Gurnett, Morphology of VLF emissions observed with the Injun 3 satellite, J. Geophys. Res., 73, 5615-5626, 1968.
Thorne, R. M., E. J. Smith, R.' K. Burton, and R. E. Holzer, Plasma- spheric hiss, J. Geophys. Res., 78, 1581-1596, 1973.
Tsurutani, B. T., and E. J. Smith, Postmidnight chorus: A substorm phenomenon, J. Geophys. Res., 79, 118-127, 1974.
Williams, D. J., J. N. Barfield, and T. A. Fritz, Initial Explorer 45 substorm observations and electric field considerations, J. Geophys. Res., 79, 554-564, 1974.
Young, T. S. T., J. D. Callen, and J. E. McCune, High-frequency electrostatic waves in the magnetosphere, J. Geophys. Res., 78, 1082-1099, 1973.
(Received February 26, 1976; accepted September 8, 1976.)