visual-field-specific heterogeneity within the tecto-rotundal projection of the pigeon
TRANSCRIPT

Visual-®eld-speci®c heterogeneity within the tecto-rotundalprojection of the pigeon
Burkhard Hellmann and Onur GuÈntuÈrkuÈnRuhr-UniversitaÈ t Bochum, FakultaÈ t fuÈr Psychology, AE Biopsychologie, D-44780 Bochum, Germany
Keywords: ascending tectofugal pathway, birds, extrageniculocortical pathway, rotundus, tectum opticum, visual system
Abstract
The organization of the tecto-rotundal projection of the pigeon was investigated by means of anterograde and retrograde tracingtechniques. Besides the known organization in tecto-rotundal connectivity, this study additionally demonstrates major variations inthe ascending projections of different tectal sub®elds. We show that the ventral tectum opticum (TO) has signi®cantly moreprojections onto the nucleus rotundus (Rt) than dorsal tectal areas. This difference coincides with differential innervation densities ofafferent ®bres within rotundal subregions. While ventral tectal efferents project onto the ventral and central Rt, dorsal tectal efferentsmainly arborize within limited areas between the central Rt and its dorsal cap, the nucleus triangularis. Thus, the ventral TO,representing the lower and frontal ®eld of view, exhibits a quantitatively and spatially enhanced projection onto the Rt, as comparedwith the dorsal TO. The data presented here demonstrate a visual ®eld-dependent projection pattern of ascending tectal outputs ontodifferent rotundal domains. The data are consistent with behavioural studies, demonstrating tectofugal lesions to suppress visualstimulus analysis mainly within the frontal ®eld of view.
Introduction
In all amniotes studied so far, visual input ascends via two parallel
pathways to the forebrain. In birds, these are the thalamo- and
tectofugal pathways which are probably homologous to the genicu-
locortical and extrageniculocortical systems in mammals (Shimizu &
Karten, 1993). Within the thalamofugal pathway, visual input is
represented in the contralateral nucleus geniculatus lateralis, pars
dorsalis (GLd). This nucleus predominately projects to the ipsilateral
telencephalic visual wulst (Karten et al., 1973; Nixdorf & Bischof,
1982; Bagnoli & Burkhalter, 1983; Miceli et al., 1990).
In pigeons, » 90% of the retinal ganglion cells project onto the
contralateral tectum opticum (TO), the ®rst centre of the tectofugal
pathway. In super®cial tectal layers, visual input is represented
topographically. Neurons of the deep tectal layer 13 (nomenclature
according to Ramon y Cajal, 1911) project bilaterally onto the
nucleus rotundus (Rt). The Rt is connected to the ipsilateral
ectostriatal core of the forebrain, from where efferent ®bres ascend
into the surrounding belt (Karten & Revzin, 1966; Nixdorf & Bischof,
1982; Watanabe et al., 1985; Bischof & Niemann, 1990; GuÈntuÈrkuÈn
et al., 1993a).
Studies with Rt and ectostriatum lesions revealed the involvement
of the tectofugal system in pattern, luminance, colour and movement
discrimination in pigeons (Hodos & Karten, 1966; Hodos, 1969;
Bessette & Hodos, 1989; Watanabe, 1991). Electrophysiological data
on the properties of tectal and rotundal neurons are in accordance
with these behavioural ®ndings, as different aspects of visual stimuli,
e.g. luminance, colour, pattern and object motion in two- and three-
dimensional space are processed within the tectofugal pathway, and
these different stimulus features are represented in regional subdivi-
sions within the Rt (Granda & Yazulla, 1971; Jassik-Gerschenfeld &
Guichard, 1972; Yazulla & Granda, 1973; Frost & DiFranco, 1976;
Revzin, 1979; Wang et al., 1993).
Visually driven units within the pigeon GLd and wulst were shown
to be sensitive for moving and stationary stimuli with low adaption to
stimulus repetition (Britto et al., 1975; Jassik-Gerschenfeld et al.,
1976; Maxwell & Granda, 1979; Miceli et al., 1979; Britten, 1987). In
contrast to the tectofugal system, thalamofugal neurons exhibit more
narrowly tuned receptive ®elds of partly complex shape. There-
fore, Britto et al. (1975) suggested that the thalamofugal pathway
might be involved in pattern analysis. Unfortunately, these predic-
tions on the functional role of the thalamofugal pathway could not be
con®rmed in behavioural experiments yet. Lesion studies showed
only minor impairments in visually related tasks, if any (Pritz et al.,
1970; Hodos & Bonbright, 1974; Hodos, 1976; Mulvanny, 1979;
GuÈntuÈrkuÈn et al., 1993b).
A new approach in understanding the functional architecture of the
two visual pathways in birds followed the observation of regional
variations in retinal output patterns. In owls and falcons as well as in
the pigeon, only parts of the retina project onto the GLd (Bravo &
Pettigrew, 1981; Bravo & Inzunza, 1983; Remy & GuÈntuÈrkuÈn, 1991).
In the pigeon, the retina has two regions of enhanced ganglion cell
density: the central fovea receives input from the lateral ®eld of view,
while the area dorsalis, which is located within the superior-temporal
retina, processes stimuli in the frontal visual ®eld (Hayes et al., 1987).
While the central fovea is strongly represented within the
thalamofugal pathway, only a few retinal ganglion cells of the area
dorsalis innervate the GLd (Remy & GuÈntuÈrkuÈn, 1991). Therefore,
the authors suggested the thalamofugal pathway to be specialized for
lateral visual ®eld analysis. Recent behavioural studies support this
view demonstrating visual ®eld-dependent processing within the two
ascending visual pathways. GLd lesions cause massive impairments
in acuity performance exclusively in the lateral visual ®eld, while
Correspondence: Dr B. Hellmann, as above.E-mail: [email protected]
Received 26 August 1998, revised 18 March 1999, accepted 22 March 1999
European Journal of Neuroscience, Vol. 11, pp. 2635±2650, 1999 ã European Neuroscience Association

rotundal lesions lead to similar effects in spatial resolution
performance restricted to the frontal ®eld of view (GuÈntuÈrkuÈn &
Hahmann, 1998). With regard to the thalamofugal pathway, the
behavioural data are in accordance with the speci®c pattern of
sensory input. However, these ®ndings on visual ®eld-dependent
processing raise new questions about the functional organization
within the tectofugal pathway.
Because the frontal as well as the lateral visual ®eld are
represented within the TO, it could be expected that de®cits in
lateral acuity after GLd lesions are compensated for by tectofugal
mechanisms. However, behavioural compensation could not be
observed (GuÈntuÈrkuÈn & Hahmann, 1998). Taken together with the
behavioural effects of Rt lesions which are limited to frontal
acuity performance, the data suggest a visual ®eld-speci®c mode
of processing in the tectofugal system. The retino-tectal projection
is organized topographically, in that the superio-temporal retina,
including the area dorsalis, projects onto the rostro-ventral TO,
while the central retina is represented at the lateral tectal pole
(Hamdi & Whitteridge, 1954; Jassik-Gerschenfeld & Hardy, 1984;
Remy & GuÈntuÈrkuÈn, 1991).
With this background of behavioural data, it is conceivable that the
organization of the tecto-rotundal projection differs for tectal areas
representing different ®elds of view. To test this hypothesis, we
analysed the tecto-rotundal system using anterograde and retrograde
neuronal tracers.
Materials and methods
Surgery and preparation
Sixty-four adult pigeons (Columba livia) of unknown sex from
local breeding stocks were used in this study. Fifty-eight animals
received injections of tracers into the tectum. To con®rm the
anterograde tracing data, six animals were injected with retrograde
tracers into the Rt. All experiments were carried out according to
the speci®cations of the German law for the prevention of cruelty
to animals.
Prior to surgery, the pigeons were anaesthetized with equithesin
(0.33 mL per 100 g body weight), and the animals were placed
into a stereotaxic apparatus (Karten & Hodos, 1967). For tectal
tracer injections, a modi®ed device was used which allowed
lateral rotation of the head along the longitudinal axis over 100 °to the left and right. The scalps were in®ltrated with xylocaine,
and subsequently incised either between eye and ear hole (tectal
injections) or dorsally (rotundal injections). Next the scull was
opened with a dental drill, and a glass micropipette (outer tip
diameter 20±25 mm) mounted to a mechanic pressure device (WPI
Nanoliterinjector, WPI, USA) was inserted into the Rt or the deep
tectal layers according to stereotaxic coordinates of the pigeon
brain atlas by Karten & Hodos (1967). The different tracers were
injected in steps of 2 nL over a period of 20±30 min.
Subsequently, the pipette was removed and the skin was
in®ltrated again with xylocaine and sutured.
After survival times ranging from 30 h to 10 days, depending on the
tracer used, the animals received an injection of 200 units sodium
heparin and were then deeply anaesthetized with an overdose of
equithesin (0.55 mL per 100 g body weight). The pigeons were
perfused through the heart with 100 mL 0.9% (w/v) sodium chloride
and 800 mL ice-cold 4% paraformaldehyde in 0.12 M phosphate
buffer (PB), pH 7.4. The brains were removed and stored for 4 h in
®xative with supplement of 15% sucrose (w/v). Subsequently, the
brains were stored overnight in a solution of 30% sucrose in 0.12 M
PB. On the following day the brains were cut in the frontal plane at
35 mm on a freezing microtome and the slices were collected in PB
containing 0.1% sodium azide (w/v).
Tracers and their histochemical demonstration
Five different tracers were used in the experiments. Four of them
were lysine-coupled dextranamines (Molecular Probes, Leiden, The
Netherlands), additionally, choleratoxin subunit B (CtB) was used
(Sigma, Deisenhofen, Germany). Most tectal injections were carried
out with biotinylated dextran amines (BDA) with molecular weights
of 3000 or 10 000 MW. For double-labelling experiments with tracer
injections into the dorsal as well as the ventral tectum, Texas Red
dextran amine- (TDA) and ¯uorescein dextran amine- (FDA) labelled
dextrans with 10 000 MW were used. Either BDA (10 000 MW) or
CtB was injected into the nucleus rotundus.
All dextrans were pressure injected as 8% (FDA) or 12% (BDA,
TDA) solutions (w/v) in 0.12 M phosphate-buffered saline (PBS) with
an addition of 2% dimethylsulphoxide. The injection volume ranged
from 60 to 120 nL (tectal delivery) or 40±60 nL (Rt). The animals
were killed after survival times of 1±10 days (8 days being most
common). CtB was injected as a 1% solution (w/v) in distilled water.
Applied volumes ranged between 20 and 40 nL. The survival times
were 48±72 h.
The cryosectioned brain slices of animals that had received
¯uorescent tracer injections were mounted on gelatine-coated slides,
air-dried and coverslipped with Fluoromount (Serva, Heidelberg,
Germany) or ProLong Antifade Kit (Molecular Probes). Sections
were viewed with an Olympus BH2 epi¯uorescence microscope with
the following ®lter settings. FDA: Olympus IB-set with additional
shortpass emission ®lter G520, TDA: Chroma ®lters (Brattleboro,
USA) with excitation ®lter HQ-577/10, dichroic mirror Q-585LP and
emission ®lter HQ-645/75.
Brain slices containing BDA were reacted free-¯oating accord-
ing to the streptavidin±peroxidase technique. The sections were
placed for 35 min in 1% hydrogen peroxidase/50% ethanol to
reduce endogenous peroxidase activity. After rinsing, slices were
incubated for 60 min in streptavidin solution at room temperature
[Jackson, West Grove, USA; 1/800 in 0.12 M PBS with the
addition of 1.1% NaCl (w/v) and 0.3% Triton X-100 (v/v)]. After
additional rinsing, the peroxidase activity was detected using a
heavy metal-intensi®ed 3,3¢-diaminobenzidine (DAB; Sigma)
reaction (Adams, 1981), modi®ed by the use of b-D-glucose/
glucose-oxidase (Sigma) instead of hydrogen peroxidase (Shu
et al., 1988). The sections were mounted on gelatine-coated slides,
dehydrated and coverslipped with DPX (Fluka, Neu-Ulm,
Germany) or Permount (Fisher Scienti®c, New Jersey, USA).
Some sections were counterstained with cresyl violet.
CtB-labelled sections were reacted free-¯oating according to the
immuno-ABC technique. After reduction of endogenous perox-
idase activity (see above), sections were incubated overnight at
4 °C in the primary antibody [goat anti-choleragenoid; Camon,
Wiesbaden, Germany; 1/20 000 in 0.12 M PBS after the addition
of 1.1% NaCl (w/v), 0.3% Triton-X 100 (v/v) and 5% normal
rabbit serum]. After being rinsed, the sections were incubated for
60 min at room temperature in the biotinylated secondary antibody
(rabbit antigoat; Vectastain, Vector, Camon, Wiesbaden, Germany;
1/500 in 0.12 M PBS + 1.1% NaCl + 0.3% Triton X-100). After
additional rinsing, the sections were incubated for 60 min in
avidin±biotin±peroxidase solution (Vectastain ABC-Elite kit,
Vector; 1/100 in 0.12 M PBS + 1.1% NaCl + 0.3% Triton X-100).
After washing, a heavy metal-intensi®ed DAB reaction was
performed, and slices were mounted and coverslipped (see BDA
section).
2636 B. Hellmann and O. GuÈntuÈrkuÈn
Ó 1999 European Neuroscience Association, European Journal of Neuroscience, 11, 2635±2650

Evaluation
The tracer injection sites and the resulting neuronal labelling were
reconstructed using an Olympus BH2 microscope. Structures were
drawn using PC software Designer 3.1 (Micrografx, USA). Often a
digitized picture of the section was displayed on a second computer
monitor, using a b/w video camera (Kappa CF 8, Gleichen, Germany)
attached to the microscope and PC-based computer hardware
con®guration (Soft Imaging System, MuÈnster, Germany). Photo-
graphic documentation was carried out with a 35-mm camera system
attached to the microscope using Agfa APX 25, Ilford HP5, Agfa
RSX 50 or Kodak Ectachrome 200 ®lms.
After some tectal BDA injections, three-dimensional reconstruc-
tions of variations in intrarotundal labelling intensities were carried
out with the image analysis systems `analySIS' and `3dSIS' (SIS,
MuÈnster, Germany). For this purpose, images of every third section of
the ipsilateral Rt were digitized. After additive shading correction
using a correction image without specimen, rotundal labelling
intensities were normalized by subtracting the average grey level of
non-speci®c background labelling from every image. Subsequently,
the grey levels of both weak and strong intrarotundal labelling were
determined for every section as the average of three measurements.
The threshold between differently labelled rotundal areas was de®ned
as the mean of these two grey values, and the Rt was subdivided into
regions of either low or high ®bre densities. Finally, subdivisions
were reconstructed as three-dimensional models.
Quantitative analyses of anterograde rotundal ®bre densities were
performed in 21 animals which received tectal BDA injections with
postoperative survival times ranging from 8 to 10 days. The number
of labelled layer 13 neurons was estimated by counting the DAB-
labelled cells in Nissl-counterstained sections of the TO. Every third
section of the TO was used. To quantify the amount of anterograde
axonal labelling within the Rt (ipsilateral to the tracer injection site),
®ve randomly chosen areas of three different sections along the
rostro-caudal axis of the ipsilateral Rt (A5.75, A6.25 and\ A6.75
according to the pigeon brain atlas by Karten & Hodos, 1967) were
quanti®ed. This was done with an ocular micrometer-plate
(10 3 10 mm) with 10 horizontal and 10 vertical subdivisions of
1 mm distance at a magni®cation of 3 1250, resulting in a
measurement area of 64 mm2. The crossing points of micrometer-
plate subdivisions with labelled intrarotundal axonal processes were
counted, and the average of the 15 measurements per animal was
multiplied by 100 and divided by the estimated total number of
retrogradely labelled layer 13 cell bodies within the TO (density
index).
Reconstruction of tectal tracer injection sites or retrogradely
labelled tectal somata after rotundal BDA applications was performed
on a two-dimensional reconstruction of tectal layer 13 surface.
Results
Tectal tracer injections
The nucleus rotundus is the largest cellular complex within the
thalamus of the pigeon. It extends over a rostro-caudal distance of
almost 2 mm (A5.3±A7.2) in the central to lateral aspects of the
thalamus. In Nissl-stained material, the Rt is easily distinguishable
from neighbouring cell groups by the presence of big ovoid to round
neuronal somata. These principal neurons (Figs 1 and 2a; mean
diameter of 22 mm in DAB/cresyl violet double-labelled frozen
sections) are distributed throughout its entire extent. They are also
common in the nucleus triangularis (T), which is located dorso-
medial to Rt (Fig. 1).
Focal BDA injections into different sites of the deep layers of
the TO frequently resulted in anterograde labelling of axonal
processes throughout the ipsi- and contralateral Rt and T. Within
the TO, ®bres ran within layers 13 and 14 before they entered the
brachium where they ascended rostrally. At caudal and medial
rotundal levels, the axons took a more and more dorsal route, to
enter the Rt ventrally. Fibres arborizing within T ran along the
lateral borders of the Rt and entered the T either from its lateral
or medial margin. Within the Rt and T, thick tecto-rotundal ®bres
ran in bundles of up to 10 axons. They often gave rise to
perpendicularly orientated collaterals. Thin axonal branches with
terminal-like swellings were frequently arranged within restricted
areas, each receiving input from several axon collaterals. In
cresyl violet-counterstained sections, these termination areas were
surrounded by four to 10 rotundal neurons with a mean dia-
meter of 22 mm (Fig. 2a). Thin ®bres with terminal-like swellings
were never seen to enclose somata of rotundal neurons (Fig. 2a
and b).
Although tracer injections into the tectum always resulted in ®bre
as well as terminal-like labelling throughout nearly the entire
ipsilateral Rt and T, profound variations in intrarotundal labelling
intensity were observed. Two different patterns could be distin-
guished (Fig. 3).
Irrespective of their rostro-caudal placement, tracer injections
situated in the ventral third of the TO resulted in labelling of a
dense ®bre network within the ventral half of the Rt along almost
its entire rostro-caudal extent. The most caudal region was spared
in its peripheral aspects (A5.30±A5.50). The region adjoining
directly rostrally received a reversed termination pattern with high
®bre densities in the marginal rotundal aspects, sparing a dorso-
lateral and central area. The dorsally adjoining T exhibited strong
labelling within its ventral, medial and dorsal regions, while the
central and lateral aspects were spared. At rostro-caudal levels
between A5.7 and A6.35, the rotundal area of high ®bre and
terminal densities gradually increased in that the borderline to
regions of weak label shifted more and more centrally and then
dorsally. The T extends rostrally up to A6.5. A gradual increase
of ®bre density was obvious within the dorso-lateral division. The
central T remained weakly labelled with the exception of small
spots of extremely high termination densities at A6.0. Within the
rostral Rt (A6.5±A7.2), ventrally located tectal BDA injections
resulted in a comparatively homogeneous tracing pattern with
generally high ®bre densities. Tectal input slightly declined within
the dorsal Rt. This was apparent in the sharp medio-laterally
arranged borderline between differing termination densities within
the rostral Rt (Fig. 4).
The second rotundal labelling pattern resulted from tracer
injections into the lateral and dorsal TO. Again, no variations
were observed depending on the rostro-caudal extent of the tectal
injection site. The intrarotundal labelling pattern was roughly
opposite to that observed after ventral tectal applications. High
®bre densities were present within the most caudal 250 mm of the
Rt, where only a central part of the Rt was spared. More
rostrally, but within the caudal two-thirds of the Rt, overall ®bre
densities decreased. Strong labelling was restricted to a medio-
laterally arranged band with decreasing thickness from lateral to
medial. While the most dorsal aspects of the Rt received weak
input from the dorsal tectum, high ®bre and termination densities
occurred within the ventro-lateral and the most dorsal regions of
the T. In all other regions, including the entire rostral third of the
Rt, only very few ®bres and terminal-like swellings were
observed. The two different anterograde labelling patterns were
Heterogeneity of the pigeon's visual system 2637
Ó 1999 European Neuroscience Association, European Journal of Neuroscience, 11, 2635±2650

accompanied by characteristic regional variations in rotundal ®bre
densities (Fig. 5).
Double injections of TDA and FDA into the dorsal and ventral TO
revealed an intrarotundal segregation of ventral versus dorso-lateral
tectal projections onto the Rt (Fig. 6a and b). Regions of enhanced
dorsal tectal projections received comparatively weak input from the
ventral TO. Only in the most dorsal regions of the rostral T did
relatively high densities of both tracers seem to intermingle (Fig. 7a
and b).
Beyond these regional variations in tecto-rotundal connectivity,
overall rotundal projections of the lateral and dorsal TO were
signi®cantly weaker compared with those of the ventral TO
(P < 0.001, n = 21, Z = 3.873, Mann±Whitney test). The ®bre
density index indicated a 15-fold increase of anterogradely
labelled rotundal ®bres per layer 13 neuron after ventral tectal
BDA injections (Fig. 8).
Projections of the ventral TO onto the contralateral Rt and T were
generally less numerous compared with ipsilateral labelling. Aside
from this quantitative difference, intrarotundal segregation in
termination density corresponded with the ipsilateral variation. After
dorsal and lateral tectal tracer placements, labelling within the
contralateral Rt was observed in only nine out of 19 animals. In four
cases, traced ®bres were restricted to the caudo-lateral Rt. The
remaining ®ve pigeons exhibited similar regional variations in ®bre
density within the ipsi- and contralateral Rt.
Rotundal tracer injections
Injections of BDA and CtB into the Rt resulted in retrograde labelling
of somata within both tecta predominantly ipsilateral to the injection
site. The great majority of neurons were located within tectal layer
13. Few additional cells were traced within layers 6±12. Generally,
CtB injections resulted in labelling of 15 times more somata than
BDA injections. Moreover, lateral and radial dendritic processes of
layer 13 neurons were ®lled over long distances only after CtB
injections (Fig. 9a and b).
Irrespectively of the tracer in use, a dorso-ventral shift in the
number of retrogradely labelled cells occurred. The highest cell
numbers were counted within the ventral third of tectal layer 13,
containing on average 52.5% of all labelled tecto-rotundal
neurons, 18.9% of labelled cells were located within the dorsal
third (Fig. 10).
The relative amount of tectal cells labelled within the ventral third
ranged from 43.3 to 64.9% (Fig. 11). The lowest proportion of
ventrally located layer 13 neurons was observed within the two
animals which exhibited predominantly dorsal and latero-central
rotundal tracer spread (both 43.3%). In contrast, more ventrally or
rostrally situated injections resulted in enhanced proportions of
FIG. 1. Cresyl violet-stained transversal section of the pigeon thalamus at A5.9(Karten & Hodos, 1967) with Rt and the dorso-medially adjoining T. Bothnuclei are easily distinguishable from surrounding tissue by the occurrence ofbig ovoid to round somata. The extension of both nuclei is indicated by thestippled line. Bar, 500 mm.
FIG. 2. (a) Section of the nucleus rotundus after injection of BDA into theipsilateral ventral tectum opticum. Thin axonal processes with terminal-likeswellings were frequently arranged as rotundal ®bre webs (arrows), innervatedby several tecto-rotundal axons and surrounded by cresyl violet-stainedprincipal neurons (arrowheads). Axosomatic contacts as seen in theneighbouring nucleus posteroventralis thalami (PV; b) were not observed.Bar, 50 mm. (b) In contrast to Rt, within the medially adjoining PV, ®nesidebranches of ascending tectal axons often surrounded somata of PV neurons(arrows). Bar, 50 mm.
2638 B. Hellmann and O. GuÈntuÈrkuÈn
Ó 1999 European Neuroscience Association, European Journal of Neuroscience, 11, 2635±2650
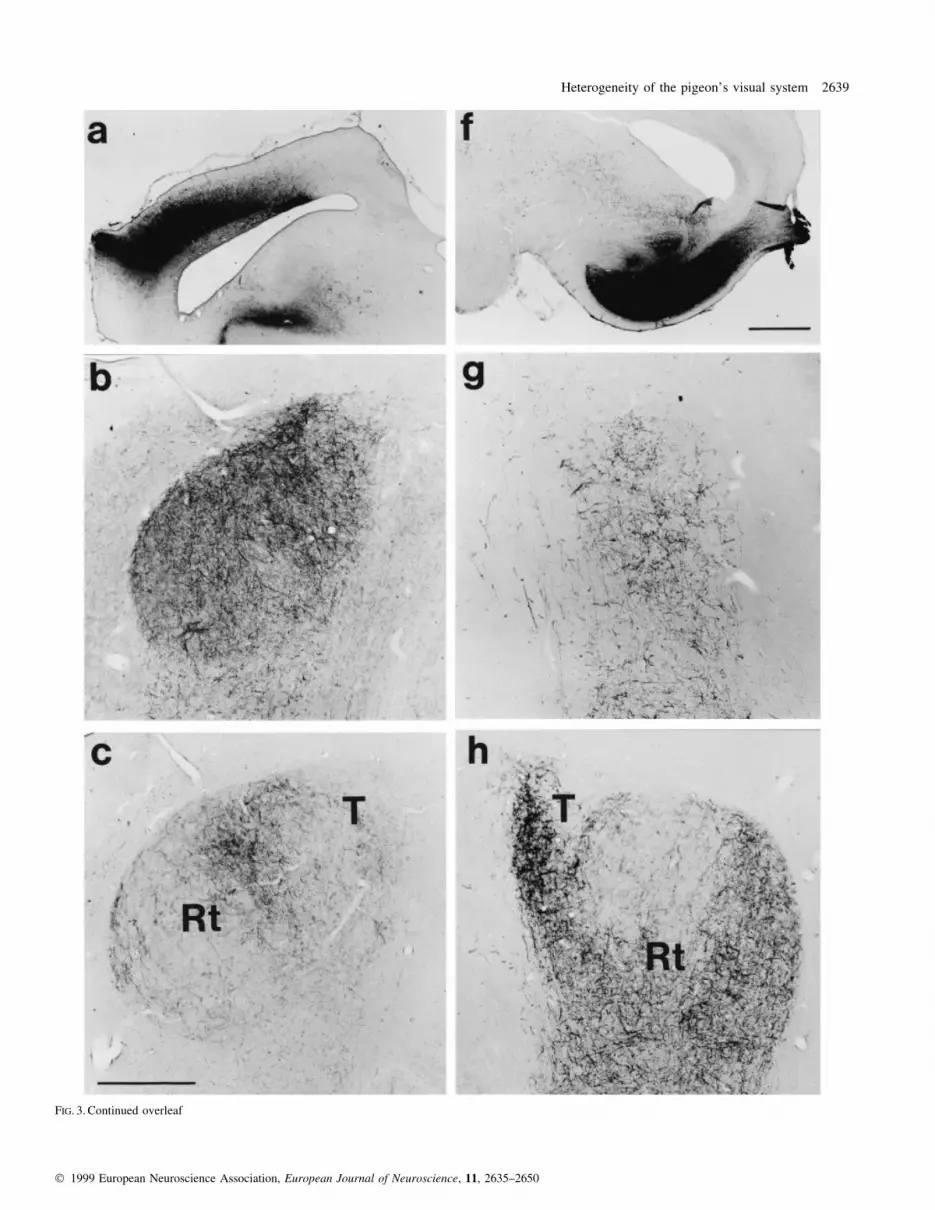
FIG. 3. Continued overleaf
Heterogeneity of the pigeon's visual system 2639
Ó 1999 European Neuroscience Association, European Journal of Neuroscience, 11, 2635±2650

retrogradely labelled ventral layer 13 neurons (51.0±64.9%, mean
57.2%).
Besides this dorso-ventral shift in relative cell number, retro-
gradely labelled tectal cells varied with respect to their position in
different depths of layer 13 as well as their dendritic rami®cations
within the outer retinorecipient layers. Rostro- and caudo-ventral
rotundal CtB injections resulted in labelling of somata located mostly
within the outer layer 13 and strong dendritic labelling within layer 5
(Fig. 12a and c). In contrast, dorso-lateral CtB injection resulted in a
heterogeneous distribution of somata in different depths of layer 13
(Fig. 12b). Dendritic labelling was densest within layer 4, while layer
5 exhibited negligible labelling (Fig. 12d).
In three cases with rotundal BDA injections, the relative position of
labelled tecto-rotundal neurons was mapped onto a two-dimensional
reconstruction of the layer 13 surface. This was done independently
for cells in three different depths of layer 13 by estimating the radial
extension of layer 13 using differential interference contrast, as no
cresyl violet counterstain was performed because of the weak
labelling intensity of BDA-labelled somata (Fig. 9b). A sublamina-
speci®c distribution of cell bodies was observed (Fig. 13). Somata
within the inner layer 13 were always concentrated in the ventral half,
while intermediate and outer layer 13 neurons showed a variable
distribution within the ventral, rostral or dorsal TO, depending on
rotundal application site.
FIG. 3. (a±j) Transversal sections through TO (a and f) and Rt (b±e and g±j) after BDA injections into the dorsal (a±e) and ventral TO (f±j). On the top of eachcolumn, tracer injection sites are shown either within the dorsal (left, a) or ventral TO (right, f). Bar, 1000 mm. Below each tectum, four photographs represent theresulting anterograde ®bre labelling within Rt and T from caudal to more rostral diencephalic levels (b and g: A5.3; c and h: A5.8; d and i: A6.1; e and j: A6.5).Bar, 500 mm.
2640 B. Hellmann and O. GuÈntuÈrkuÈn
Ó 1999 European Neuroscience Association, European Journal of Neuroscience, 11, 2635±2650

Besides retrograde labelling of tectal layer 13 neurons, rotundal
tracer injections labelled ®bres within the contralateral Rt. These
®bres displayed a regional distribution which re¯ected exactly the
extent of tracer spread within the injected Rt.
Discussion
The present study shows that the tecto-rotundal projection of the
pigeon is much more heterogeneous than previously known.
Although all regions of the TO participate in processing ascending
tectofugal information, the projection of the dorsal TO is much
weaker compared with the ventral TO. Moreover, dorsal and ventral
TO exhibit regional variations in their termination densities within
different rotundal and triangular subdivisions.
The Rt, together with its dorsal cap, the T, is the most extensive
nuclear complex in the thalamus of birds. Golgi studies have shown
two different types of rotundal neurons. Besides the small
GABAergic interneurons, nearly 95% of the cells are of the big
multiangular type (ToÈmboÈl et al., 1992). These cells are the source of
the ascending telencephalic projection within the tectofugal pathway
(Karten & Hodos, 1970; Hunt & KuÈnzle, 1976; Nixdorf & Bischof,
1982; Bagnoli & Burkhalter, 1983, 1990). In chicks, several rotundal
relay neurons develop extensive dendritic rami®cations within
common `termination ®elds', where they probably receive axo-
dendritic input via the ascending tectal projection (Thin et al., 1992;
Ngo et al., 1994). Tectal BDA injections resulted in labelling of
axonal processes within the entire Rt. In regions of high ®bre
densities, thin ®bre processes and terminal-like swellings were
clustered in restricted areas of the intercellular space, surrounded by
rotundal relay neurons. Each cluster received input from several
axonal processes as it was shown for the termination ®elds in chicks.
It is very likely that these anterogradely labelled rotundal termination
clusters match with the termination ®elds of rotundal relay neurons
shown in golgi studies. These data indicate two different principles in
the connectivity of tectal layer 13 and rotundal relay neurons, as
previously suggested by ToÈmboÈl et al. (1992). (i) As each termination
®eld receives input from several axonal processes, each ®eld seems to
integrate input from different layer 13 neurons, indicating conver-
gence of afferent information ¯ow. (ii) As several rotundal relay
neurons share access to this input within a given termination ®eld,
afferent input seems to diverge onto different rotundal cells. This
arrangement of divergence and convergence in tecto-rotundal
connectivity might be further complicated by the assumption that
dendritic processes of individual relay neurons contact different
termination ®elds, and axon collaterals of individual layer 13 neurons
could also innervate several termination areas (ToÈmboÈl et al., 1992).
Termination ®elds were labelled throughout the entire Rt, suggesting
that the basic characteristics of the tecto-rotundal connectivity pattern
are common to different intrarotundal functional domains, observed
in electrophysiological studies (Maxwell & Granda, 1979; Revzin,
1979; Wang et al., 1993).
Topology of the tecto-rotundal projection
Several studies demonstrated intrarotundal differentiations on the
basis of histochemical (Martinez-de-la-Torre et al., 1990) electro-
physiological and tract-tracing techniques. Benowitz & Karten
(1976) were the ®rst to describe the topographic nature of the
tectofugal pathway in the pigeon, based on horseradish peroxidase
(HRP) injections into Rt and ectostriatum. T and subdivisions of
the Rt receive input from neurons of different depths within tectal
layer 13 and, in turn, project onto restricted regions of the
ectostriatum. The present study supports this view, as the depth of
retrogradely labelled layer 13 somata varied with rotundal tracer
injection site. A similar pattern of connectivity was shown for
zebra ®nches and chicks, subdividing Rt into posterior, medial,
ventral and anterior-dorsal divisions (Nixdorf & Bischof, 1982;
Deng & Rogers, 1998).
Depending on their depth location in tectal layer 13, neurons
exhibit characteristic morphological features including varying
dendritic termination patterns in different retinorecipient layers of
the outer TO (Luksch et al., 1998). In pigeons, two populations of
tectal layer 13 neurons were shown to exhibit distinct dendritic
rami®cations (Karten et al., 1997). Dendrites of type I neurons ramify
within retinorecipient layer 5, while distal processes of type II
neurons end up in layer 8 and probably receive no direct input from
retinal ganglion cells. Furthermore, the present study demonstrates
the existence of a third type of layer 13 neurons projecting to Rt.
These neurons are characterized by their dendritic branching within
tectal layer 4 (Fig. 12). A similar cell type was previously shown in
the chick (Luksch et al., 1998). As dendritic labelling within tectal
layer 4 occurred exclusively after dorso-lateral rotundal tracer
injections, we conclude that type III cells are also speci®ed with
regard to their ascending projection onto a de®ned rotundal
subdivision. A similar speci®cation of rotundal target regions was
shown for type I and II neurons (Karten et al., 1997). Combining
these data with those from electrophysiological studies revealing
different functional domains within the Rt (Maxwell & Granda, 1979;
Revzin, 1979; Wang & Frost, 1992; Wang et al., 1993), we assume
that within the tectofugal pathway, different aspects of visual
information are processed in parallel functional channels (see also
Deng & Rogers, 1998). Moreover, on the basis of corresponding
FIG. 4. Distribution of anterogradely labelled ®bres within the rostral Rt (A6.8)after BDA injection into the ventral tectum. Dorsal areas exhibit slighter ®bredensities than ventral regions. Arrow points to the transition zone. Bar,500 mm.
Heterogeneity of the pigeon's visual system 2641
Ó 1999 European Neuroscience Association, European Journal of Neuroscience, 11, 2635±2650
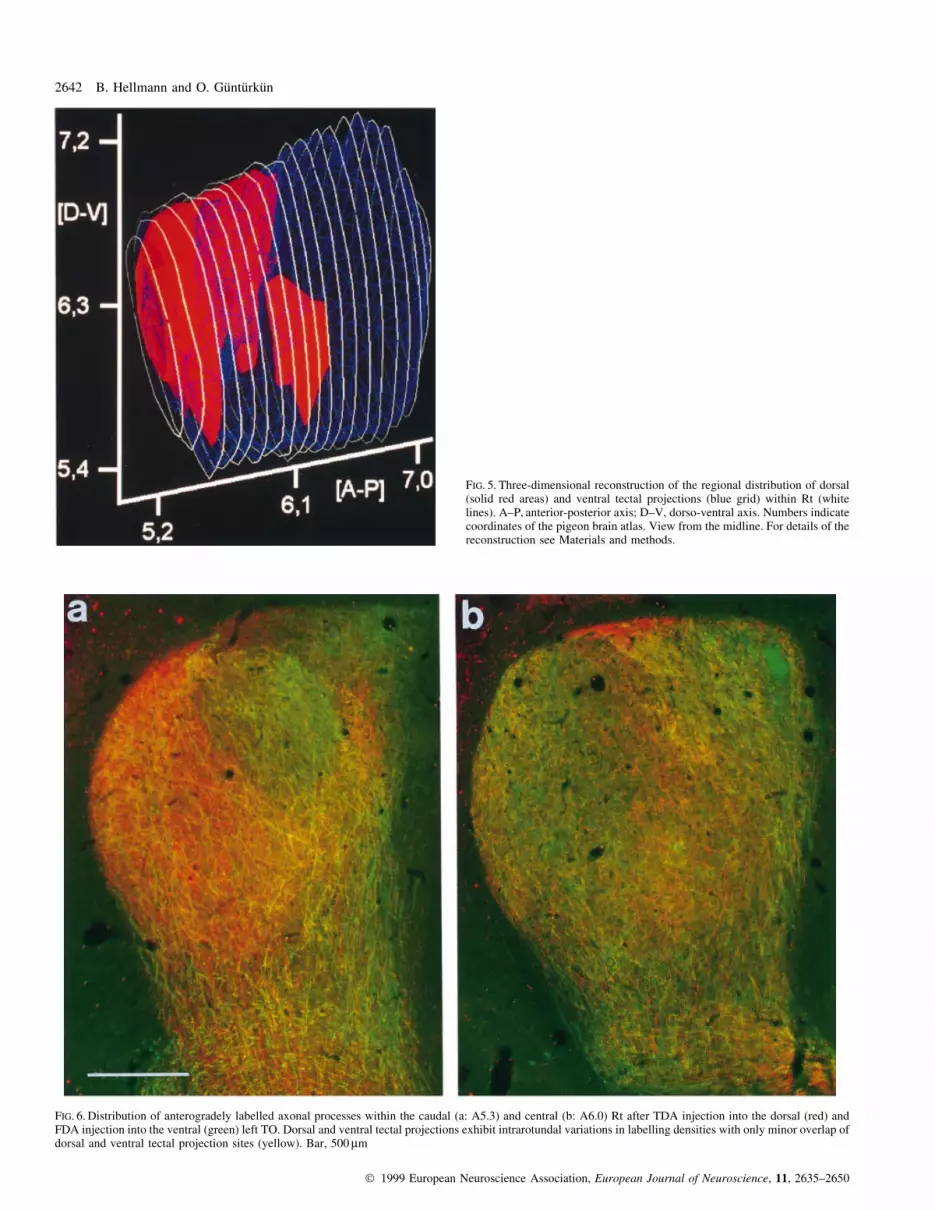
FIG. 5. Three-dimensional reconstruction of the regional distribution of dorsal(solid red areas) and ventral tectal projections (blue grid) within Rt (whitelines). A±P, anterior-posterior axis; D±V, dorso-ventral axis. Numbers indicatecoordinates of the pigeon brain atlas. View from the midline. For details of thereconstruction see Materials and methods.
FIG. 6. Distribution of anterogradely labelled axonal processes within the caudal (a: A5.3) and central (b: A6.0) Rt after TDA injection into the dorsal (red) andFDA injection into the ventral (green) left TO. Dorsal and ventral tectal projections exhibit intrarotundal variations in labelling densities with only minor overlap ofdorsal and ventral tectal projection sites (yellow). Bar, 500 mm
2642 B. Hellmann and O. GuÈntuÈrkuÈn
Ó 1999 European Neuroscience Association, European Journal of Neuroscience, 11, 2635±2650

®ndings on the topography of the tecto-rotundal connectivity pattern
in different avian species, we suggest that this organization re¯ects a
fundamental differentiation within the tectofugal pathway at least in
granivorous birds.
The main ®nding of the present study is that supplementary to the
above-mentioned speci®cation in tecto-rotundal connectivity, an
additional topography is obvious in the tecto-rotundal projection of
the pigeon. After tectal BDA injections, two different anterograde
labelling patterns were observed within the Rt. Ventral tectal BDA
injections resulted on average in a 15-fold overall increase in
anterogradely labelled intrarotundal ®bre densities (Fig. 6), compared
with dorsal or lateral tectal injections. This difference was
accompanied by characteristic regional variations in rotundal ®bre
densities. Typically, rotundal areas with strong input from the ventral
TO received comparatively weak projections from the dorsal TO and
vice versa, indicating rotundal domains with predominantly ventral or
dorsal tectal input. Because the rostro-caudal extent of tectal tracer
injection site apparently did not cause variations in intrarotundal
labelling pattern, the two different tectofugal projection patterns do
not correspond directly to the tectal representation of speci®ed retinal
areas, e.g. the area dorsalis or fovea centralis (Hamdi & Whitteridge,
1954; Remy & GuÈntuÈrkuÈn, 1991), but they point to a fundamental
dorso-ventral differentiation in tectofugal information processing.
Meanwhile, there is a broad database concerning morphological
and cytoarchitectonic peculiarities as well as differential connectivity
patterns of the dorsal and ventral TO in the pigeon. The two regions
differ in their contribution to centrifugal visual information proces-
sing (Woodson et al., 1995), their connectivity pattern with the
pretectal nuclear complex (Gamlin et al., 1996) and their projections
onto the thalamofugal GLd of the dorsal thalamus (Wild, 1988).
Moreover, dorsal and ventral TO differ concerning the morphology of
the outer retinorecipient as well as the deep output layers (Angaut &
RepeÂrant, 1976; RepeÂrant & Angaut, 1977). Hayes & Webster (1985)
described a shift in the thickness of the retinorecipient layers 2 to 7,
most obvious in layer 5 with an increase in thickness from dorsal to
ventral parts. Additionally, dorso-ventral differences in the optic
terminal density in layers 2 to 7, as well as in the number of synaptic
contacts per terminal were reported (Acheson et al., 1980; Duff et al.,
1981). Recent experiments indicate that the retinal input to tectal
layer 5 arises almost exclusively from very small retinal ganglion
cells, which were shown to terminate predominantly within the
ventral TO (Karten et al., 1997). A dorso-ventral differentiation was
also demonstrated for the efferent layer 13 with the ventral TO
exhibiting a twofold increase in cell number compared with the dorsal
TO (Theiss et al., 1998). This difference might be caused by the
uneven distribution of a subclass of layer 13 neurons (type I),
characterized by extensive dendritic rami®cations within retinoreci-
pient layer 5 (Karten et al., 1997). Thickness differences of layer 5 do
not increase continuously from dorsal to ventral areas. Instead, they
arise in a small transition zone within the lateral TO. When mapped
onto a two-dimensional reconstruction of the tectal surface, it is
obvious that this transition zone almost exactly corresponds to the
borderline of tectal tracer spread, resulting in either the ®rst or second
anterograde rotundal labelling pattern (Fig. 14). Tectal injections
resulting in weak rotundal labelling were always located dorsally to
the transition zone, while strong rotundal projections resulted from
injections, situated below this region or including the transition area.
Thus, the differential contribution of the dorsal and ventral TO to the
tectofugal projection coincides with the distinct projection of small
retinal ganglion cells onto the TO and the differential distribution of
one subclass of tectofugal neurons, receiving probably monosynaptic
input from these retinal afferents.
As the dorso-ventral shift in the distribution of one subclass of
tectal layer 13 neurons in the pigeon generally coincides with the
FIG. 7. Distribution of anterogradely ®lled ®bres within the T (A6.1) of ananimal which received FDA injections into the ventral and TDA injectionsinto the dorsal tectum. Note the regional increase of projections from theventral TO (a, FDA), which is surrounded by less intense projections from thedorsal TO (b, TDA). Bar, 200 mm.
FIG. 8. Comparison of the intrarotundal ®bre densities after dorsal (n = 11)versus ventral (n = 10) tectal BDA applications. The density index wascalculated for each animal as the average number of ®bres within 15 rotundalmeasurement regions multiplied by 100 and divided through the estimatednumber of labelled tectal layer 13 neurons (see also Materials and methods).Bars, standard deviations. Ventral tectal BDA applications resulted in 15 3higher intrarotundal ®bre densities as compared with dorsal injections.
Heterogeneity of the pigeon's visual system 2643
Ó 1999 European Neuroscience Association, European Journal of Neuroscience, 11, 2635±2650

slighter contribution of the dorsal TO to tectofugal output, this cannot
account for the clear intrarotundal regionalization of afferent input
from the dorsal and ventral TO. While the most caudal tenth of the Rt
was characterized by a central region of projections from the ventral
TO which was surrounded by strong dorsal tectal input, this pattern
reversed in the directly rostrally adjoining Rt. Here, the area of strong
input from the dorsal TO gradually decreased and the rostral third
was almost entirely dominated by ventral tectal input. Rotundal CtB
injections revealed the neurons projecting to the central and anterior
Rt to be located within the outer tectal layer 13 (Benowitz & Karten,
1976). These cells appear to constitute the type I population (Karten
et al., 1997). In contrast, neurons of the inner sublayer project onto
the T and caudal Rt (Benowitz & Karten, 1976; Deng & Rogers,
1998). These cells were shown to be equally distributed along the
dorso-ventral extent of TO (Karten et al., 1997). The anterograde
rotundal tracing data presented in this study clearly show that the
intrarotundal segregation of dorsal and ventral tectal projections does
not follow the regionalization in the distribution of different
subclasses of layer 13 neurons in the pigeon TO. This is due to the
fact that rotundal regions, de®ned by input from speci®ed layer 13
sublaminae (e.g. caudal-most Rt, central Rt as well as T) exhibit
internal segregation with domains of dorsal versus ventral tectal
input.
The complex pattern of intrarotundal segregation, observed in
the anterograde tracing experiments, might be explained by each
layer 13 sublamina exhibiting an internal topography in its
projection onto Rt. The retrograde tracing pattern resulting after
rotundal tracer injections partly supports this view. CtB injections
FIG. 9. Retrograde labelling of tectal layer 13 neurons after rotundal CtB (a: A2.2) and BDA (b: A2.5) injections. Retrograde CtB tracing was generally strongercompared with BDA (arrows in b), apparent in many more labelled somata and additional tracing of dendritic processes within layer 5 (arrow in a). Cell numbergenerally increased from dorsal to ventral. After BDA applications, lateral and dorsal layer 13 neurons exhibited only very weak somatic labelling. Bar, 1000 mm.
FIG. 10. Relative amount of retrogradely labelled tectal layer 13 somata withinthree tectal subdivisions after rotundal tracer injections (n = 6). Bars, standarddeviations.
2644 B. Hellmann and O. GuÈntuÈrkuÈn
Ó 1999 European Neuroscience Association, European Journal of Neuroscience, 11, 2635±2650

into different rotundal locations resulted in labelling of tectal
layer 13 neurons, concentrated to particular sublayers, depending
on the respective injection site (Fig. 12). Additionally, a dorso-
ventral shift in the number of traced somata was observed. So far,
the results con®rm earlier ®ndings from rotundal HRP (Benowitz
& Karten, 1976) or CtB injections (Karten et al., 1997). BDA
FIG. 11. Reconstruction of rotundal tracer spread (black areas) in six birds which received either CtB or BDA injections, and respective percentage of retrogradelylabelled layer 13 neurons within the ventral third of the TO. The lowest percentages (both 43%) occurred in animals with tracer spread concentrated to regionswhich were shown to receive predominately dorsal tectal input.
Heterogeneity of the pigeon's visual system 2645
Ó 1999 European Neuroscience Association, European Journal of Neuroscience, 11, 2635±2650

injections into Rt resulted in a qualitatively corresponding
labelling pattern. On the other hand, the number of retrogradely
labelled layer 13 somata was remarkably reduced (to 1/15)
compared with CtB injections. This reduction in cell number
made it possible to plot the location of BDA-labelled somata onto
a two-dimensional reconstruction of the tectal layer 13 surface. In
doing so, distinct regional variations in the distribution of
neurons, depending on their location in different layer 13
sublaminae, were observed (Fig. 13). This arrangement occurred
in all BDA-injected animals despite varying application sites. This
classi®cation of layer 13 neurons is based exclusively on their
position in different depths and does not take into account any
morphological peculiarities, as morphological characterization of
different lamina 13 subclasses is far from complete (Karten et al.,
1997; Luksch et al., 1998), and retrograde neuronal labelling with
BDA poorly reveals details, e.g. cellular processes in comparison
with CtB (see above). Nevertheless, retrograde tracing data
support the assumption, initially based on the anterograde tracing
experiments, that different tectal layer 13 sublaminae exhibit
independent topographies in their projection onto Rt.
The quantitative difference in overall rotundal ®bre densities,
observed after ventral in comparison with dorso-lateral tectal BDA
FIG. 12. Tectal coronal sections of pigeons which received CtB injections into either the rostral (a and c) or caudo-dorsal (b and d) Rt. Black to brown labellingindicates the reaction product of retrogradely transported CtB, while blue/red colour is due to cresyl violet staining of somata. Numbers indicate classi®cation oftectal laminae according to Ramon y Cajal (1911). Rostral rotundal CtB injections resulted in tracing of tectal somata concentrated within the outer regions of layer13 (a: 13). Dendritic tracing within the outer retinorecipient layers was concentrated to layer 5 (a and c: 5). In contrast, caudo-dorsal rotundal tracer injectionresulted in somatic labelling throughout the entire layer 13 (b: 13), and dendritic staining which was concentrated in the thin lamina 4 (d: 4), while layer 5 exhibitedonly very weak label (d: 5). Bars, 200 mm (a and b) and 50 mm (c and d), respectively.
FIG. 13. Reconstructions of the distribution of retrogradely labelled tectal layer 13 neurons after three BDA injections (a±c) into Rt. On the left side, serial re-constructions of coronal sections indicate the location of rotundal BDA spread (black areas). The middle and left side show reconstructions of the correspond-ing ipsilateral tectal layer 13 surface, drawn as two-dimensional ¯at mounts independently for inner, central and outer layer 13. X-axis numbers indicaterostro-caudal location corresponding to the pigeon brain atlas (Karten & Hodos, 1967). Y-axis numbers indicate the dorso-ventral extension of the sublaminae.Here, only D±V 5.0 corresponds to the pigeon brain atlas, while all other numbers indicate the dorsal (positive) or ventral (negative) position relative to thisanchor point. Dots drawn within these reconstructions indicate locations of layer 13 neurons. Stippled lines indicate the proposed tectal representation of theretinal central fovea (middle) and red ®eld (lower right). Solid lines within the two-dimensional reconstructions indicate the location of the layer 5 transitionzone (see arrow in Fig. 9a). The diagram indicates sublamina-speci®c distributions of layer 13 neurons. Cells within the inner layer were always concentratedwithin the ventral TO, while layer 13 neurons within the intermediate and outer sublaminae exhibited varying distributions depending on rotundal injectionsite. D, dorsal; V, ventral; A, anterior; P, posterior.
2646 B. Hellmann and O. GuÈntuÈrkuÈn
Ó 1999 European Neuroscience Association, European Journal of Neuroscience, 11, 2635±2650

Heterogeneity of the pigeon's visual system 2647
Ó 1999 European Neuroscience Association, European Journal of Neuroscience, 11, 2635±2650

injections corresponds qualitatively to the dorso-ventral shift in
tectal layer 13 cell number after rotundal BDA or CtB injections.
However, the rotundal ®bre density index indicates that the
ventral tecto-rotundal projection is 15 times larger than the dorso-
lateral one, while the retrograde tracing data only indicate a
twofold increase in rotundal neurons projecting from ventral TO
compared with lateral and dorsal ones. This difference could be
caused by a differential amount of axonal branching of layer 13
neurons, depending on their tectal location. The results from
rotundal BDA injections support this point of view, as retro-
gradely labelled neurons within the dorsal TO always exhibited
only very weak labelling just above background levels, while
ventrally located somata showed clearly enhanced labelling. The
difference in magnitude of retrogradely transported BDA is
probably due to a dissimilar rate of tracer uptake, depending on
the overall surface of axonal processes of individual neurons in
the area of tracer spread. This surface-dependent effect on somatic
labelling amount should be less dramatic when using more
sensitive tracers with increased uptake rates or higher af®nity to
active axonal transport (GuÈntuÈrkuÈn et al., 1993a). Compared to
BDA, CtB is much more effective in retrograde neuronal
labelling, as rotundal applications resulted in a 15-fold increase
in the number of labelled tectal somata. Indeed, dorsally located
layer 13 neurons do not obviously differ in CtB labelling intensity
from ventral cells. Thus, the comparison of retrograde labelling
with different neuronal tracers supports the assumption of
enhanced axonal branching and/or the terminal surface of ventral
tectal layer 13 neurons within the Rt.
Functional considerations
Rotundal neurons show region-speci®c variations in their physiolo-
gical properties in terms of the shape of receptive ®elds (Maxwell &
Granda, 1979), the directional tuning (Kimberly et al., 1971; Maxwell
& Granda, 1979; Revzin, 1979), and the general discharge patterns
(Granda & Yazulla, 1971). Intrarotundal functional subdivisions were
observed for wavelength preferences and colour-opponent units
(Yazulla & Granda, 1973), as well as for luminance, colour, looming
and motion processing (Wang & Frost, 1992; Wang et al., 1993). The
latter authors subdivided the Rt into a ventral motion-sensitive region,
a caudo-dorsal area with most units sensitive for object motion in
three dimensions, and a rostro-dorsal region with a majority of
luminance- and colour-sensitive cells. Because the Rt exhibits
functional domains, the regionalized projections of the dorsal and
ventral TO might point to visual ®eld-dependent processing of
stimulus features within the tectofugal pathway. Comparing the
electrophysiologically de®ned subdivisions with the anterograde
labelling pattern after tectal tracer injections, it is obvious that one
region of strong dorsal tectal input, the dorso-central region within
the caudal two-thirds of the Rt, ®ts with parts of the rotundal looming
domain. In contrast, ventral as well as rostro-dorsal subdivisions,
characterized by processing mainly motion in two dimensions,
luminance and colour, receive only very weak input from the dorsal
TO. Our retrograde CtB data indicate a speci®c projection of type III
layer 13 neurons onto the dorso-central Rt, while ventral adjoining
rotundal regions, possibly two-dimensional motion sensitive, receive
in particular type I input (Karten et al., 1997). Type I as well as type
III neurons share features in their morphology, e.g. large dendritic
®elds in combination with wide-interval dendritic endings, which suit
them both to constitute elements in object motion detection networks
(Luksch et al., 1998). Therefore, the distinct projection of these two
cell types onto neighbouring rotundal areas indeed indicate that: (i)
these regions are principally involved in motion processing; and (ii)
there is a differential functional role of these areas in motion
processing, e.g two-dimensional versus three-dimensional motion
analysis. In this respect it is noteworthy that our anterograde tracing
data indicate a contribution of the dorsal TO only to one rotundal
motion domain, while the ventral TO projects onto both regions.
As yet, there seems to exist no physiological characterization of the
caudal-most part of the Rt. Compared to the directly rostral adjoining
Rt, this region receives a mirror-image-like input from tectal
sub®elds. Moreover, Karten et al. (1997) suggested that the caudal
Rt is innervated by type II layer 13 afferents, while the rostral
adjoining Rt receives input from type I and type III neurons (see
above). On the basis of the distinct innervation patterns, we suppose
that the caudal Rt differs functionally from neighbouring regions. As
this is the only rotundal sub®eld which is dominated by dorsal tectal
input, its physiological characterization might help to elucidate the
functional signi®cance of visual ®eld-speci®c processing within the
ascending tectofugal pathway.
The T is characterized by a complex pattern of segregated input
from the dorsal and ventral TO. In contrast to the rotundo-
telencephalic projection, the ascending triangular projection is not
organized topographically as it covers all parts of the ectostriatum
(Benowitz & Karten, 1976; Nixdorf & Bischof, 1982). Therefore, we
suggest a modulatory role for the nucleus triangularis in tectofugal
information processing, depending on inputs from the dorsal as well
as ventral TO.
FIG. 14. Summary of tectal tracer injections and the resulting anterograderotundal tracing patterns. For each tectal injection, the area of labelled layer 13neurons is drawn grey onto two-dimensional reconstructions of the TO (forpreparation of reconstruction see Fig. 13 legend). The left side summarizesinjections which resulted in the ®rst (strong) rotundal labelling pattern (seeFig. 3), while the right side shows the extent of injections which lead to thesecond (weaker) rotundal labelling pattern. Weak rotundal projections werealways observed when injections were situated above the layer 5 transitionzone (solid lines). In contrast, strong rotundal projections always enclosedregions below the transition zone.
2648 B. Hellmann and O. GuÈntuÈrkuÈn
Ó 1999 European Neuroscience Association, European Journal of Neuroscience, 11, 2635±2650

The anterograde tracing data presented in this paper reveal a
differential contribution of different tectal regions in tectofugal
information processing. Because of the topographic arrangement of
the retino-tectal projection, they also indicate visual ®eld-speci®c
alterations in tectofugal information processing. As the Rt is
characterized by the formation of various functional domains, the
regionalized and segregated projections of dorsal and ventral TO
additionally indicate visual ®eld-dependent analysis of stimulus
features. The borderline between the two tectal projection patterns
exactly matches the transition zone of retinorecipient layer 5,
indicating that the dorso-ventral distinction within the tectofugal
pathway runs along the horizontal meridian of the visual ®eld (Hamdi
& Whitteridge, 1954; Remy & GuÈntuÈrkuÈn, 1991). On the other hand,
Karten et al. (1997) stated that small retinal ganglion cells, which seem
to terminate speci®cally within tectal layer 5, are predominantly
concentrated within the retinal area dorsalis, the frontal visual ®eld
representation. Karten et al. concluded that tectal layer 5 regionaliza-
tion re¯ects the retinal red/yellow ®eld differentiation, which indicates
a somehow different retino-tectal topography (see also Jassik-
Gerschenfeld & Hardy, 1984). Irrespective of whether the differentia-
tion in tectofugal information processing concerns the horizontal
meridian or more speci®cally the frontal/lateral visual ®eld distinction,
it points to a quantitatively strongly enhanced contribution of the lower
frontal visual ®eld within ascending tectofugal processes. Thus, the
anatomical data on tecto-rotundal connectivities presented here,
indeed constitute a possible anatomical basis for the recent observation
of visual ®eld-speci®c behavioural effects of Rt and GLd lesions
(GuÈntuÈrkuÈn & Hahmann, 1998), discussed in the Introduction. The
thalamofugal and tectofugal pathway seem to be organized in a
complementary pattern, with the GLd receiving visual input mainly
from retinal ganglion cells of the lateral (yellow) visual ®eld (Remy &
GuÈntuÈrkuÈn, 1991) and the Rt, being dominated by inputs from the
frontal (red) visual ®eld. This fundamental dichotomy in visual
information processing within the pigeon is ®rst notable within the eye,
with the differentiation in the myopic lower visual ®eld (Bloch &
Martinoya, 1983; Fitzke et al., 1985), the differential distribution of
wavelength-sensitive photoreceptors (Remy & Emmerton, 1989), the
uneven and cell type-speci®c distribution of retinal ganglion cells
(Hayes et al., 1987; Karten et al., 1997), and the differential rates of
intraocular transfer between red and yellow ®eld (Remy & Emmerton,
1991). So, visual ®eld-dependent specializations, as shown here for the
tecto-rotundal projection, seem to be a general principle in the
pigeon's visual system.
Acknowledgements
We wish to thank Ariane Schwarz for excellent technical assistance, MartinaManns for many helpful discussions, and Drs Helmut Prior and Markus M.Schugens for critical reading of the manuscript. This research was supportedby grants from the Deutsche Forschungsgemeinschaft (Gu 227/4-2/3 andSonderforschungsbereich 509 NEUROVISION) and the Alfried Krupp-Stiftung.
Abbreviations
BDA, biotinylated dextran amine; CtB, choleratoxin subunit B; DAB, 3,3¢-diaminobenzidine; FDA, ¯uorescein dextran amine; GLd, nucleus geniculatuslateralis, pars dorsalis; HRP, horseradish peroxidase; PB, phosphate buffer;PBS, phosphate-buffered saline; PV, nucleus posteroventralis thalami; Rt,nucleus rotundus; T, nucleus triangularis; TDA, Texas Red dextran amine;TO, tectum opticum.
References
Acheson, D.W., Kemplay, S.K. & Webster, K.E. (1980) Quantitative analysis
of optic terminal pro®le distribution within the pigeon optic tectum.Neuroscience, 5, 1067±1084.
Adams, J.C. (1981) Heavy metal intensi®cation of DAB-based HRP reactionproduct. J. Histochem. Cytochem., 29, 775.
Angaut, P. & RepeÂrant, J. (1976) Fine structure of the optic ®bre terminationlayers in the pigeon optic tectum: a Golgi and electron microscope study.Neuroscience, 1, 93±105.
Bagnoli, P. & Burkhalter, A. (1983) Organization of the afferent projections tothe wulst in the pigeon. J. Comp. Neurol. 214, 103±113.
Benowitz, L.I. & Karten, H.J. (1976) Organization of tectofugal visualpathway in pigeon: retrograde transport study. J. Comp. Neurol., 167, 503±520.
Bessette, B.B. & Hodos, W. (1989) Intensity, color, and pattern discriminationde®cits after lesions of the core and the belt regions of the ectostriatum. Vis.Neurosci., 2, 27±34.
Bischof, H.J. & Niemann, J. (1990) Contralateral projection of the optictectum in the zebra ®nch (Taenopygia guttata castanotis). Cell Tissue Res.,262, 307±313.
Bloch, S. & Martinoya, C. (1983) Specialization of visual functions fordifferent retinal areas in the pigeon. In Ewert, J.-P., Capranica, R.R. &Ingle, D.J. (eds), Advances in Vertebrate Neuroethology. Plenum Press,New York, pp. 359±368.
Bravo, H. & Inzunza, O. (1983) Estudio anatomico en las vias visualesparallelas en falconiformes. Arch. Bio. Med. Exp., 16, 283±289.
Bravo, H. & Pettigrew, J. (1981) The distribution of neurons projecting fromthe retina and visual cortex to the thalamus and tectum opticum of the barnowl, Tyto alba, and the burrowing owl, Speotyto cunicularia. J. Comp.Neurol., 199, 419±441.
Britten, K.H. (1987) Receptive Fields of Neurons of the Principal OpticNucleus of the Pigeon (Columba livia). Sunny, Stony Brook.
Britto, L.R., Brunelli, G., Francesconi, W. & Magni, F. (1975) Visual responsepattern of thalamic neurons in the pigeon. Brain Res., 97, 337±343.
Deng, C. & Rogers, L.J. (1998) Organisation of the tectorotundal and SP/IPS-rotundal projections in the chick. J. Comp. Neurol., 394, 171±185.
Duff, T.A., Scott, G. & Mai, R. (1981) Regional differences in pigeon optictract, chiasm, and retino-receptive layers of optic tectum. J. Comp. Neurol.,198, 231±247.
Fitzke, F.W., Hayes, B.P., Hodos, W., Holden, A.L. & Low, J.C. (1985)Refractive sectors in the visual ®eld of the pigeon eye. J. Physiol., (Lond.),369, 33±44.
Frost, B.J. & DiFranco, D.E. (1976) Motion characteristics of single units inthe pigeon optic tectum. Vision Res., 16, 1229±1234.
Gamlin, P.D., Reiner, A., Keyser, K.T., Brecha, N. & Karten, H.J. (1996)Projection of the nucleus pretectalis to a retinorecipient tectal layer in thepigeon (Columba livia). J. Comp. Neurol., 368, 424±438.
Granda, A.M. & Yazulla, S. (1971) The spectral sensitivity of single units inthe nucleus rotundus of pigeon, Columba livia. J. Gen. Physiol., 57, 363±384.
GuÈntuÈrkuÈn, O. & Hahmann, U. (1999) Functional subdivisions of theascending visual pathways in the pigeon. Brain Res. (in press).
GuÈntuÈrkuÈn, O., Melsbach, G., HoÈrster, W. & Daniel, S. (1993a) Different setsof afferents are demonstrated by the two ¯uorescent tracers Fast Blue andRhodamine. J. Neurosci. Meth., 49, 103±111.
GuÈntuÈrkuÈn, O., Miceli, D. & Watanabe, M. (1993b) Anatomy of the avianthalamofugal pathway. In Zeigler, H.P. & Bischof, H.-J. (eds), Vision, Brainand Behavior in Birds. MIT press, Cambridge, MA, pp. 115±135.
Hamdi, F.A. & Whitteridge, D. (1954) The representation of the retina on theoptic tectum of the pigeon. Q. J. Exp. Psychol., 39, 111±119.
Hayes, B.P., Hodos, W., Holden, A.L. & Low, A.L. (1987) The projection ofthe visual ®eld upon the retina of the pigeon. Vision Res., 27, 31±40.
Hayes, B.P. & Webster, K.E. (1985) Cytoarchitectural ®elds and retinaltermination: an axonal transport study of laminar organization in the avianoptic tectum. Neuroscience, 16, 641±657.
Hodos, W. (1969) Color-discrimination de®cits after lesions of the nucleusrotundus in pigeons. Brain Behav. Evol., 2, 185±200.
Hodos, W. (1976) Vision and the visual system: A bird's eye view. In Sprague,J.M. & Epstein, A.N. (eds), Progress in Psychobiology and PhysiologicalPsychology, Vol. 6. Academic Press, New York, pp. 29±62.
Hodos, W. & Bonbright, J.C. (1974) Intensity difference thresholds in pigeonsafter lesions of the tectofugal and thalamofugal visual pathways. J. Comp.Physiol. Psychol., 87, 1013±1031.
Hodos, W. & Karten, H.J. (1966) Brightness and pattern discriminationde®cits after lesions of nucleus rotundus in the pigeon. Exp. Brain Res., 2,151±167.
Hunt, S.P. & KuÈnzle, H. (1976) Observations on the projections and intrinsic
Heterogeneity of the pigeon's visual system 2649
Ó 1999 European Neuroscience Association, European Journal of Neuroscience, 11, 2635±2650

organization of the pigeon optic tectum: an autoradiographic study based onanterograde and retrograde, axonal and dendritic ¯ow. J. Comp. Neurol.,170, 153±172.
Jassik-Gerschenfeld, D. & Guichard, J. (1972) Visual receptive ®elds of singlecells in the pigeon's optic tectum. Brain Res., 40, 303±317.
Jassik-Gerschenfeld, D. & Hardy, O. (1984) The avian optic tectum:neurophysiology and behavioural correlations. In Vanegas, H. (ed.),Comparative Neurology of the Optic Tectum. Plenum Press, New York,pp. 649±686.
Jassik-Gerschenfeld, D., Teulon, J. & Ropert, N. (1976) Visual receptive ®eldtypes in the nucleus dorsolateralis anterior of the pigeon's thalamus. BrainRes., 108, 295±306.
Karten, H.J., Cox, K. & Mpodozis, J. (1997) Two distinct populations of tectalneurons have unique connections within the retinotectorotundal pathway ofthe pigeon (Columba livia). J. Comp. Neurol., 387, 449±465.
Karten, H.J. & Hodos, W. (1967) A Stereotaxic Atlas of the Brain of thePigeon. The Johns Hopkins Press, Baltimore.
Karten, H.J. & Hodos, W. (1970) Telencephalic projections of the nucleusrotundus in the pigeon (Columba livia). J. Comp. Neurol., 140, 35±52.
Karten, H.J., Nauta, W.J.H. & Revzin, A.M. (1973) Neural connections of the`visual wulst' of the avian telencephalon. Experimental studies in the pigeon(Columba livia) and owl (Speotyto cunicularia). J. Comp. Neurol., 150,253±278.
Karten, H.J. & Revzin, A.M. (1966) The afferent connections of the nucleusrotundus in the pigeon. Brain Res., 2, 368±377.
Kimberly, R.P., Holden, A.L. & Bamborough, P. (1971) Responsecharacteristics of pigeon forebrain cells to visual stimulation. Vision Res.,11, 475±478.
Luksch, H., Cox, K. & Karten, H.J. (1998) Bottlebrush dendritic endings andlarge dendritic ®elds: Motion-detecting neurons in the tectofugal pathway.J. Comp. Neurol., 396, 399±414.
Martinez-de-la-Torre, M., Martinez, S. & Puelles, L. (1990)Acetylcholinesterase-histochemical differential staining of subdivisionswithin the nucleus rotundus in the chick. Anat. Embryol., 181, 129±135.
Maxwell, J.H. & Granda, A.M. (1979) Functional localization in the nucleusrotundus. In Granda, A.M. & Maxwell, J.H. (eds), Neural Mechanisms ofBehavior in the Pigeon. Plenum Press, New York, pp. 177±197.
Miceli, D., Gioanni, H., RepeÂrant, J. & Peyrichoux, J. (1979) The avian visualwulst: I. An anatomical study of afferent and efferent pathways. II. Anelectrophysiological study of the functional properties of single neurons. InGranda, A.M. & Maxwell, J.H. (eds), Neural Mechanisms of Behavior in thePigeon. Plenum Press, New York, pp. 223±254.
Miceli, D., Marchand, L., RepeÂrant, J. & Rio, J.-P. (1990) Projections of thedorsolateral anterior complex and adjacent thalamic nuclei upon the visualwulst in the pigeon. Brain Res., 518, 317±323.
Mulvanny, P. (1979) Discrimination of the line orientation by visual nuclei. InGranda, A.M. & Maxwell, J.H. (eds), Neural Mechanisms of Behavior in thePigeon. Plenum Press, New York, pp. 199±222.
Ngo, T.D., Davies, D.C., Egedi, G.Y. & ToÈmboÈl, T. (1994) A phaseolus lectinanterograde tracing study of the tectorotundal projections in the domesticchick. J. Anat., 184, 129±136.
Nixdorf, B.E. & Bischof, H.J. (1982) Afferent connections of the ectostriatum
and visual wulst in the zebra®nch (Taeniopygia guttata castanotis Gould) ±an HRP study. Brain Res., 248, 9±17.
Pritz, M.B., Mead, W.R. & Northcut, R.G. (1970) The effects of wulstablations on color, pattern and brightness discrimination in the pigeon. J.Comp. Neurol., 140, 81±100.
Ramon y Cajal, S. (1911) Histologie du SysteÁme Neveux de l'Homme et desVerteÂbreÂs, Vol. 2. Maloine, Paris.
Remy, M. & Emmerton, J. (1989) Behavioral spectral sensitivities of differentretinal areas in the pigeon. Behav. Neurosci., 103, 170±177.
Remy, M. & Emmerton, J. (1991) Directional dependence of intraoculartransfer of stimulus detection in pigeons (Columba livia). Behav. Neurosci.,105, 647±652.
Remy, M. & GuÈntuÈrkuÈn, O. (1991) Retinal afferents to the tectum opticum andthe n.opticus principalis thalami in the pigeon. J. Comp. Neurol., 305, 57±70.
RepeÂrant, J. & Angaut, P. (1977) The retinotectal projections in the pigeon. Anexperimental optical and electron microscope study. Neuroscience, 2, 119±140.
Revzin, A.M. (1979). Functional localization in the nucleus rotundus. InGranda, A.M. & Maxwell, J.H. (eds), Neural Mechanisms of Behavior in thePigeon. Plenum Press, New York, pp. 165±176.
Shimizu, T. & Karten, H.J. (1993) The avian visual system and the evolutionof the neocortex. In Zeigler, H.P. & Bischof, H.-J. (eds), Vision, Brain andBehavior in Birds. MIT Press, Cambridge, MA, pp. 104±114.
Shu, S.Y. (1988) The glucose oxidase-DAB-nickel method in peroxidasehistochemistry of the nervous system. Neurosci. Lett., 85, 169±171.
Theiss, C., Hellmann, B. & GuÈntuÈrkuÈn, O. (1998) The differential distributionof AMPA-receptor subunits in the tectofugal system of the pigeon. BrainRes., 785, 114±128.
Thin, N.D., Egedy, G. & ToÈmboÈl, T. (1992) Golgi study on neurons and ®bersin nucl. rotundus of the thalamus in chicks. J. Hirnforsch., 33, 203±214.
ToÈmboÈl, T., Ngo, T.D. & Egedy, G. (1992) EM and EM golgi study onstructure of nucleus rotundus in chicks. J. Hirnforsch., 33, 215±234.
Wang, Y. & Frost, B.J. (1992) Time to collision is signalled by neurons in thenucleus rotundus of pigeons. Nature, 356, 236±238.
Wang, Y., Jiang, S. & Frost, B.J. (1993) Visual processing in pigeon nucleusrotundus: luminance, color, motion, and looming subdivisions. Vis.Neurosci., 10, 21±30.
Watanabe, S. (1991) Effects of ectostriatal lesions on natural concept,pseudoconcept, and arti®cial pattern discrimination in pigeons. VisualNeurosci., 6, 497±506.
Watanabe, M., Ito, H. & Ikushima, M. (1985) Cytoarchitecture andultrastructure of the avian ectostriatum: afferent terminals from the dorsaltelencephalon and some nuclei in the thalamus. J. Comp. Neurol., 236, 241±257.
Wild, J.M. (1988) Vestibular projections to the thalamus of the pigeon: ananatomical study. J. Comp. Neurol., 271, 451±460.
Woodson, W., Shimizu, T., Wild, J.M., Schimke, J., Cox, K. & Karten, H.J.(1995) Centrifugal projections upon the retina: an anterograde tracing studyin the pigeon (Columba livia). J. Comp. Neurol., 362, 489±509.
Yazulla, S. & Granda, A.M. (1973) Opponent-color units in the thalamus ofthe pigeon (Columba livia). Vision Res., 13, 1555±1563.
2650 B. Hellmann and O. GuÈntuÈrkuÈn
Ó 1999 European Neuroscience Association, European Journal of Neuroscience, 11, 2635±2650