visual data analytics for an event city
TRANSCRIPT

,I
7 th Ajman International Urban Planning Conference - Event City
Visual Data Analytics for an Event City
AbstractAn event city must attract visitors, and this can be done strategically, propagated through marketingstrategies. However, this paper focuses on what makes an event city successful beyond theInitial attraction and marketing efforts. We propose to analyze and visualize Big Data to assessthe state of technological readiness and responsiveness of a city to various events. The use ofvisual dashboards has been explored and utilized by many cities and here we propose targetingvisualization to track and monitor events. Most importantly, events need to be studied andunderstood as bursts in demand for the city infrastructure. Currently, visitors and organizers expecthigh level 0 mobile connectivity supporting audio, video and data, all with seamless coverage.Provisioning for such demand requires various layers of infrastructure to support visitors, eventmanagers and city support personnel. Data collection and analytics has to provide hree views tosupport various layers and include interaction among layers.
Let us imagine a simplified architectura l model that highlights the transportation, communications,(voice, data, and video) and services (such as conference halls, hotels, restaurants. amusementparks and the like). In this model, a physical layer can be readily available with an overlay of themobile commun ication layer. Sensor data and usage data can be merged to provide a dashboardview of the city status. The dashboard could use predictive analytics and may be used to dispatchadditional transportation , alert communication providers and even restaurant owners. Such adashboard could be overplayed on the city map but requires visual displays that include currentstatus and predictive data as well.
Visual analytics are convenient for direct m :lement, which is necessary, but not enough toensure a positive visitor experience. Analytics need to be expanded and include a post-eventanalysis. Relevant il" rmation could be obtained from social media to capture positive and negativeexperiences of visitors and organizers. Such monitoring guarantees that the investment and effortin attracting events does not " ni' for what may be trivial and easy to fix reasons.

IntroductionTourism has been recognized for many centuries as an economic contributor to many communities.-More and more authors and practitioners are focusing on the competit ive destination and notcompetitive countries .. .Tourists are interested in regions and towns, such as .. .ft according toNorbert Vanhove [1]. which is creating a competitive cul ture among destinat ion cit ies such asSeville and And alusia in Spain, Algarve in Portugal and New York City in the USA. Vanhove alsoadap ts the concept of c lusters to tourism and defines it as a group of tourist att ractions and supportinstitutions concentrated in a geographic area. These support inst itut ions can be directly relatedsuch as transportation and custom er service Of otherwis e ind irect ly related such as technology andhuman resource development.
In a study on tour ism competitiveness (21. the authors compare a) external forces suc h as theregional and country overall environ ment and state of compet itiveness with b) the internallactorssuch as resources, capabilities and strategies . They report that their results demonstrate thatinternal cacacnrnes are more important than environmental factors and tang ible resources. Th is setsthe basis for calling on cit ies to bu ild the ir internal capabilities and set the ir competitive strategiesfor success.
It has been clea r that events attract tourism and therefore cities compete for the hosting of eventssuch as the World Expos, The Olympic Games and FIFA World Cup, ArtFesti vals and Film Fest ivals.These competitions result in massive amounts of marketing and infrastruc ture investment that wiUcertainly not pay-off in the sho rt term. Andrew Zlmbaust ( 4] high lights that host ing the Olympicsis a los ing game because (1) the bidd ing process is hijacked by private interests, (2) it createsmassive over- building. and (3) there's little evidence that it rneamnqfully inc reases tourism. He goeson 10 explai n that there is little evidence that tourism increases duri ng a large event and that thoseOlympic tourists rep lace normal tourist s who prefer to stay away from the increased crowd andexpense during the Games. His article ends on a positive note highlighting that "aproactive, efficientgovernment in a potent ial-laden, burgeoning city could use the Olympics to boos t its fortunes.Barcelona ran up a reported $6 b illion debt to host the 1992 Games, but the city's image gainedenormously and tourism has since flourished. The stars all aligned and Barcelona is arguably a casein point for Olympics promoters. Whether or not Barcelona would have experienced its favorabledevelopment without the Games, we 'll never know. ~
Expanding The Architectural PerspectiveMost urban planners would conside r the most important architectural elements of the event cityto include are icons symbolizing spectacular and sup erlative urbanism. Additionally, we needto expand th is arch itectural perspect ive to include information, communication and technology(ICT). Such an underlying infrastructure can be percei ved at various levels and some examples willdemonstrate the applications of specific vend ors and event spaces as compared to that of the city.However, a shared investment in infrastructure is necessary, and the result s cannot be achieved ifit is lacking .
The 2012 London Summer Olympics demonstrated the value of leT and according to publ ishedreports (3), it demonstrated the strength of the UK into matoo and Communication Technolog ies(leT) sector and its ab ility to deliver the necessary phone calls , pictu res, texts, and video requiredfor broadcast ing the games and to ensure smooth co mmunication and efficient org anization andsmooth soc ial interact ions. The 20 12 Olympics were the first -ever social media Games and notablywww.London20 12.com became among "the most visited sport s websi te in the world with 431million visits , 109 million uniqu e users, 15 million app downloads and 4.73 billion page views." The
2
7th Ajman International Urban Planning Conference - Event City
8T Group was able 0 design and deliver a successful convergence of a shared communicationsnetwork carrying voice, data, broadcas • mobile, and wireless internet traffic in a seamless way.The ne1 ork design allowed for improved energy efficiency with the possibility for reuse after theGames. Events are known to create bursts in demand and a peak times. this network was able tocarry 60 GigabitslS of information with 80,000 connections across 94 locations.
We know that during such events people also consume physical products that require a goodlogistic support. For this purpose, Coca-Cola Enterprises conceived, developed and rolled outits iPad order-entry solution for the London 2012 Olympics [5]. The Coca-Cola system targeted500 or so sales reps at the stalls that needed to be served. Finding the right device for adopt ionand decided on the IPad as the target device and decided to use agile development process astraditional development methodologies were not suitable. Challenges are to adopt the traditionalmethodologies and adapt SAP messaging to be responsive. These are lessons learned that canbenefit other developers.
VisualizingThe DataMost c ities invested in an ICT infrastructure. and with cities going smart, most of the data sourcesare becoming digital and automated which leads to a need of visualizing and interpreting the data.This is sometimes challenging as data is explod ing and becoming W8ig" with addit ional challenges.However, many cities already are addressing this issue in various ways.
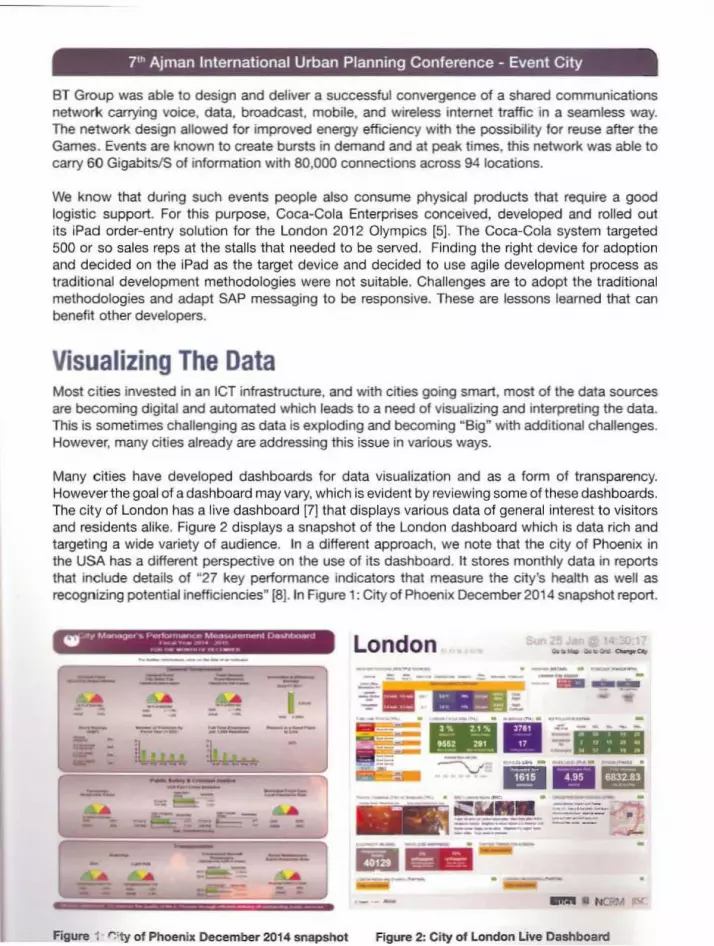
Many cities have developed dashboards for data visualization and as a form of transparency.However the goal of a dashboard may vary,which is evident by reviewing someof these dashboards.The city of London has a live dashboard [7] that displays various data of general Interest to visitorsand residents alike. Figure 2 displays a snapshot of the London dashboard which is data rich andtargeting a wide variety of audience. In a different approach. we note that the city of Phoenix inthe USA has a different perspective on the use of its dashboard. It stores monthly data in reportsthat include details of w27 key performance indicators that measure the city 's health as well asrecogniZing potential inefficiencies" [8]. In Figure 1: City of Phoenix December 2014 snapshot report.
W~.d" u.n.'9!' . ~~~:.~ement~••• t r • • • _ . London
II----- ---....- ---
:.: :
Figure ~ " 'ty of Phoenix December 2014 snapshot Figure 2: City of London Uve Dashboa rd

• _ _ . • • . r--- ....... - f"""-- " ~ "'"'''' ..... ''''' 'I1IVII\ 'O;iV LV II I ,:) UI C l,.rdl l~tJdJ t: 11L:Y- ~
of information as a vehicle for its economic development. It has developed a public dashboard [6]that includes the follow ing tabs:
• Character of the city• Economic Vitality Tourism
• Transportation• Public Safety• Human Services• Recreation and Cui ure• Environmental Sustainability• Citizen Engagement Governance• Public Reporting
In Figure 3 we show a screen shot from the "Economic Vitalityrrourism" tab. This includes data onrevenue items such as room and meal taxes. tourism return on investment. and business in thecity. We note that the dashboard displays monthly data in a comp arative way spanning from 2012onwards. Another tab that is worth considering is the Transport ation one which includes data onpublic transport ridership, street cleaning and amount of debris collected in addition to survey dataon ease of walking and ease of bicycling in the city.
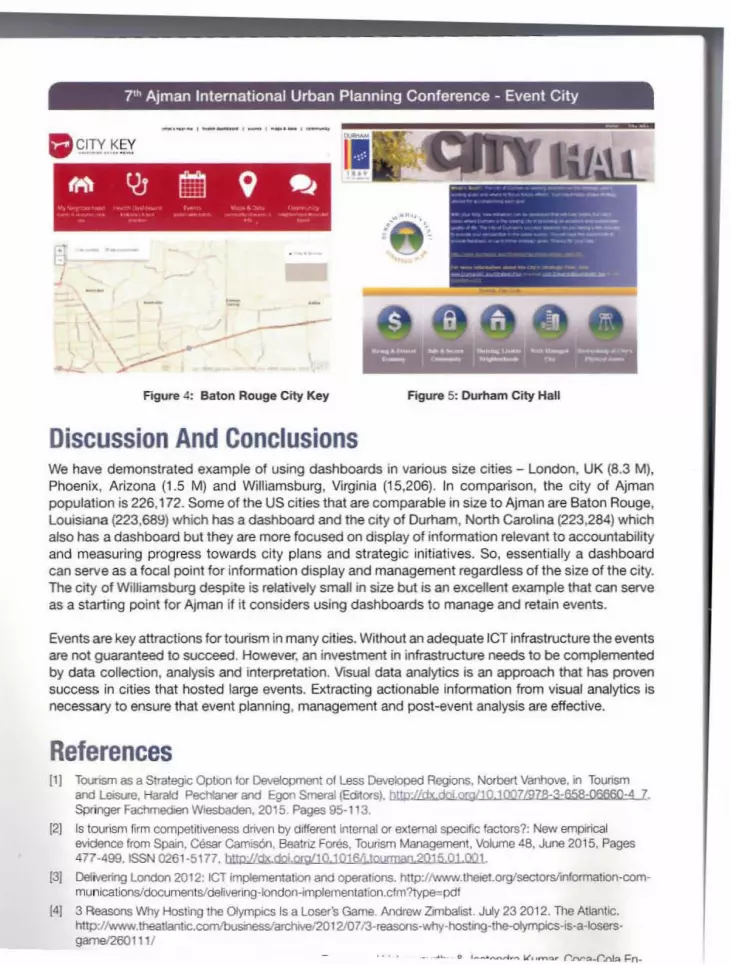
Baton Rouge, Louisiana which has multiple dashboards [10] that are included as part of the "citykey" and they include a Health Dashboard. a Commun ity Dashboard and several displays of keyindicators Figure 4 displays main web page. The city of Durham, North Carolina which also has adashboard [11] uses it mainly as tracking tool for its strategic plans and it is displayed in Figure 5.
The use of social media to understand sentiments of event attendees during and after the event canutilize streaming analysis techniques such as those presented by Bifet and Frank [9]. By viewingsocial media analysis during and post event. it is possible to create an adapt ive system that canrespond to the sentiments of attendees .
I 1111111
Figure 3: City of Will iamsburg - Economic VitalityfTourism
4
T" Ajman International Urban Planning Conference - Event City
f...' Cb rmilqtll".,,,,,,"t lIa "\1& r. ,... £..... ~ (fJ..,~.. .. t.· - . _~.. .. _.. -......- .... .._.
-Figure 4: Baton Rouge City Key Figure 5: Durham City Hall
Discussion And ConclusionsWe have demonstrated example of using dashboards in various size cities - London . UK (8.3 MI.Phoenix, Arizona (1 .5 M) and Williamsburg, Virginia (15,206). In comparison, the city of Ajmanpopulation is 226,172. Some of the US cit ies that are comparable in size to Ajman are Baton Rouge,Louisiana (223,68~1 which has a dashboard and the city of Durham. North Carolina (223,28 I whichalso has a dashboard but they are more focused on display of infonnation relevant to accountabilityand measur ing progress towards city plans and strategic initiativ es. So, essentially a dashboardcan serve as a focal point for information display and management regardless of the size of the city.The city of Williamsburg despite is relatively small in size but is an excellent examp le that can serveas a start ing point for Ajman if it cons iders using dashboards to manage and retain events.
Events are key attractions for tourism in many cities. Without an adequate ICT infrastructure the eventsare not guaranteed to succeed . However, an investment in infrastructure needs to be comp lementedby data collection . analysis and interpretation. Visual data analytics is an approach that has provensuccess in cities that hosted large events. Extracting actionable information from visual analytics isnecessary to ensure that event planning, management and post-event analysis are effective.
References[1) Tounsm as a S rategic Option lor Deve!opmen 01 Less Developed Regions. orbert Vanhove. in Tourism
and Leisu"e, Harald PedlIaner and Egan Smeral (Ed ors). htlD'lIdx doi.orgI 0.1007/9 78-3-658-06660-4 7Springer Fachmed en Wiesbaden , 2015. Pages 95 - 1 3.
[2] Is tourism firm competitiveness driven by different Internal or external spec ific factors?: ew empiricalevidence from Spain, Cesar Camis6n. Beatriz Fares, Tourism Management, Volume 48 , June 20 15, Pages47 -499 , 188 026 1-5177. htlp:/ldx .doi org/l0 10 6Ij tourmao .2015 01 ooi.
[31 Del" ering London 20 12: ICT imp/emen atoo and opera tions. http://www.theiet.OI.glsectorsli n Ql.ma iOn-communications/documents/d elivenng-Iondon-Implernentation.cfrn?type=pdf
14) 3 Reasons Why Hosting he Olympics Is a Loser's Game. Andrew Zimbalist. July 23 2012. The A lantic.h tp:/lwww. ealantic.com!busIlessIarchrvel20 12J0713-reasons-why-hosllng- he-olympics-js-a -IosersgameJ260 11 I

[7) ))tlp ,/lcjtydashboilrd .org/london/
(8) btl ps·1Iwww phoenix.Qov/cityrnanagerl dashboard
[9] htl p·1Iwww brcitykey.com/ index.pbp.
[10J http·/twww.dLJrhamnc.gov/strategjcPlanlg oalslindex cfm
(11] Sentiment Knowledge Discovery in Twitter Streaming Data, Albert. Bilet and Eibe Frank, in Discovery Science, Bernhard Ptahrinqer, Geoff Holmes and Achim Hoffmann (Editors). Lecture Notes in Computer ScienceIY 6332). Springer Bertin Heidelberg. 2010 . Pages 1- 15.
6