visual abnormalities associated with enhanced optic nerve myelination
TRANSCRIPT

B R A I N R E S E A R C H 1 3 7 4 ( 2 0 1 1 ) 3 6 – 4 2
ava i l ab l e a t www.sc i enced i r ec t . com
www.e l sev i e r . com/ loca te /b ra i n res
Research Report
Visual abnormalities associated with enhanced opticnerve myelination
Minzhong Yua,⁎, S. Priyadarshini Narayananb,1, Feng Wangb, Emily Morseb,Wendy B. Macklinb,2, Neal S. Peacheya,c,d
aDepartment of Ophthalmic Research, Cole Eye Institute, Cleveland Clinic Foundation, Cleveland, OH, USAbDepartment of Neurosciences, Lerner Research Institute, Cleveland Clinic Foundation, Cleveland, OH, USAcLouis Stokes Cleveland Department of Veterans Affairs Medical Center, Cleveland, OH, USAdDepartment of Ophthalmology, Cleveland Clinic Lerner College of Medicine of Case Western Reserve University, Cleveland, OH, USA
A R T I C L E I N F O
⁎ Corresponding author. Cole Eye Institute (I-3445 3670.
E-mail address: [email protected] (M. Yu).1 Current address: Vascular Biology Center,2 Current address: Department of Cell and
USA.
0006-8993/$ – see front matter © 2010 Elsevidoi:10.1016/j.brainres.2010.12.043
A B S T R A C T
Article history:Accepted 13 December 2010Available online 21 December 2010
Expression of the constitutively active serine/threonine kinase Akt in oligodendrocytesresults in enhanced myelination in the CNS. Here, we have examined the effects of this Aktoverexpression on optic nerve structure and on optic nerve function, assessed using thevisual evoked potential (VEP). Transgenic mice have been generated with the Plp promoterdriving expression of a modified form of Akt, in which aspartic acids are substituted forThr308 and Ser473. These Plp-Akt-DD (Akt-DD) mice, and littermate controls, were studiedat different ages. Optic nerves were examined anatomically at 2 and 6 months of age. At2 months of age, optic nerves were substantially thicker in Akt-DD mice, reflecting anincrease in myelination of optic nerve axons. By electron microscopy, myelin thickness wasincreased in Akt-DD optic nerve, with extended paranodal domains having excessparanodal loops, and the density of nodes of Ranvier was reduced, relative to controlmice. We recorded VEPs in response to strobe flash ganzfeld stimuli presented afterovernight dark- and light-adapted conditions at ages ranging from 1 to 10 months. It waspossible to record a clear VEP fromAkt-DDmice at all ages examined. At 1 month of age, VEPimplicit times were somewhat shorter in Akt-DD transgenic mice than in control animals.Beyond 6 months of age, VEP latencies were consistently delayed in Akt-DD transgenicmice.These abnormalities did not reflect an alteration in retinal function as there were nosignificant differences between ERGs obtained from control or Akt-DD transgenic mice. Inyoung mice, the somewhat faster responses may reflect improved transmission due toincreased myelination of optic nerve axons. In older mice, where the Akt-DD optic nerve ismarkedly thicker than control, it is remarkable that optic nerves continue to function.
© 2010 Elsevier B.V. All rights reserved.
Keywords:Visual evoked potentialElectroretinographyMyelinationOptic nerveAkt
1), Cleveland Clinic Foundation, 9500 Euclid Avenue, Cleveland, OH 44195, USA. Fax: +1 216
Medical College of Georgia, Augusta, GA 30912, USA.Developmental Biology, University of Colorado Anschutz Medical Center, Aurora, CO 80045,
er B.V. All rights reserved.

37B R A I N R E S E A R C H 1 3 7 4 ( 2 0 1 1 ) 3 6 – 4 2
1. Introduction
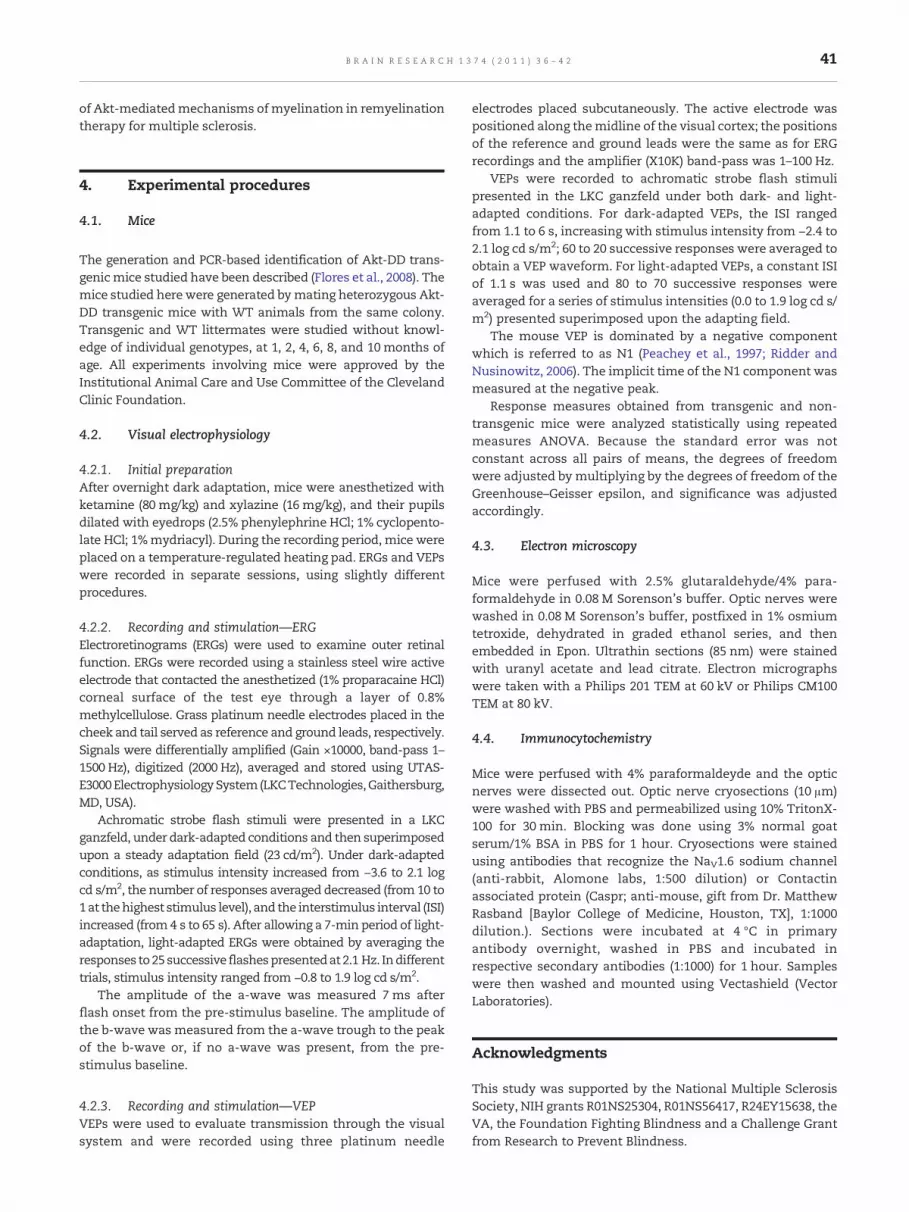
Fig. 1 – Representative electron micrographs of optic nervecross-sections obtained from WT (A, C) or Akt-DD (B, D) miceat two (A, B) or 6 months of age (C, D). The myelin sheathssurrounding optic nerve axons are thicker in 2-month-oldAkt-DD mice than in WT animals. The myelination processcontinues, and the myelin sheaths of 6-month-old Akt-DDmice are excessive and only loosely organized around someaxons. Three animals were studied for each genotype.Magnification: 10,000×.
Visual sensation requires the relay of signals generated in theretina to the visual cortex via the optic nerve. Normal opticnerve function requires that individual nerve axons beensheathed bymyelin laid downby oligodendrocytes (WaxmanandBangalore, 2004).Asa corollary, demyelination isassociatedwith functional and structural abnormalities of the optic nerve(e.g., Tremain and Ikeda, 1983; Bjartmar and Trapp, 2003;Shindler et al., 2006, 2008; Zandian et al., 2009).
Akt (v-akt murine thymoma viral oncogene homolog) is aserine/threonine kinase, also known as protein kinase B,which we have shown contributes to the regulation of CNSmyelination (Flores et al., 2008). This contribution wasdemonstrated by studying mice in which oligodendrocytesexpress a transgene encoding a constitutively active form ofAkt (Akt-DD), in which the phosphorylation sites used toregulate Akt activity (Thr308, Ser473) have been replaced byaspartic acids (Hutchinson et al., 2001). This constitutivelyactive form of Akt was ideal for these studies, as it wasconsistently activated, whereas a non-mutated form of theAkt would have been regulated as the endogenous Akt in theoligodendrocyte, and less likely to produce a phenotype.Additionally, this transgene had been used to generatetransgenic mice in earlier studies, where it had induced aphenotype, without inducing tumors (Hutchinson et al., 2001),which would be an undesirable outcome for analyzing theimpact of Akt regulation of oligodendrocyte function, makingsuch studies uninterpretable. These transgenic mice over-express Akt in oligodendrocytes, at levels that are several foldsabove normal and that increase with age (cf., Flores et al.,2008). Although Akt-DD mice maintain a normal number ofoligodendrocytes, myelination of the optic nerve and CNSwhite matter is enhanced, and in fact becomes pathologicallyover produced at older ages and thesemice die prematurely, atapproximately 14 months of age. The hypermyelination inAkt-DD mice is mediated through increased activation of themTOR pathway in oligodendrocytes (Narayanan et al., 2009).The increase inmyelin thickness has been quantified by X-raydiffraction, and was shown to increase significantly with age,but this could not be quantified from electron micrographs,where fixatives altered the hypermyelinated membranestructure during processing in older animals (Flores et al.,2008). The increasedmyelin thicknesswith age is likely a feed-forward regulation, as the Akt is driven by the myelinproteolipid protein (Plp) promoter. Thus, as the Plp promoteractivity increases with myelination, increased Akt isexpressed, which in turn increases Plp promoter activity todrive increasing levels of Akt indefinitely. As a consequence,the overall thickness of the optic nerve increases with age,although the periodicity of the myelin remains normal, asmeasured by X ray diffraction (Flores et al., 2008).
The purpose of the present study was to evaluate neuraltransmission in the presence of hypermyelination. This wasaccomplished using visual evoked potentials (VEPs) recordedover the visual cortex (Ridder and Nusinowitz, 2006). We reportthat optic nerve transmission to the visual cortex ismaintainedin Akt-DD mice, despite a wide array of optic nerve anatomicdefects.
2. Results
Fig. 1 presents representative electron microscope images ofoptic nerve cross-sections obtained from non-transgenic (WT)(Fig. 1A, C) or Akt-DD (Fig. 1B, D) mice at 2 months (Fig. 1A, B) or6 months (Fig. 1C, D) of age. As noted previously (Flores et al.,2008), Akt-DD mice retain a normal number of axons at2 months of age, but the average thickness of themyelin sheathsurrounding each axon is greater than in non-transgenicanimals. In comparison to WT, AKT-DD mice continue togenerate increasing amounts of myelin (Flores et al., 2008),and inoldermice it appears that the excessmyelinbecomes lesstightly associated with compact myelin, although the periodic-ity ofmyelin appears normal (Flores et al., 2008), suggesting thatthere is some compact myelin present. Thus excess myelin ispresent at 6 months of age, and there is excess myelinmembrane, which appears more loosely compacted than in 2-month-old Akt-DD mice, when fixed and analyzed by electronmicroscopy.
The nodal organization of the optic nerve appeared some-what altered in theAkt-DDmice. Fig. 2Apresents representativefieldsof view (FOV) fornodesofRanvier in2-month-oldWT (left)and Akt-DD (right) mice identified using antibodies againstsodiumchannels (green) andcaspr (red).Nodedensity appeareddecreased in Akt-DDmice, and this was confirmed statisticallyby quantifying nodes of Ranvier per FOV (Fig. 2B). This reduced

Fig. 2 – Density of nodes of Ranvier. (A) Representative images of nodes of Ranvier in optic nerve sections of WT (left) or Akt-DD(right) mice aged 2 months. Sections were stained using antibodies against sodium channel NaV1.6 to label nodes (green) andagainst Caspr (red) to label paranodes. (B) Quantification of the number of nodes in the optic nerve. Confocalmicroscope images(40×) were taken and the number of nodes having paranodes on both sides were quantified manually per field of view (FOV).There was a significant decrease (p<0.001) in the nodal density in Akt-DD mice, relative to WT. A minimum of three sectionswere measured per animal. Bars indicate average (± s.d.) results for three animals for each genotype.
38 B R A I N R E S E A R C H 1 3 7 4 ( 2 0 1 1 ) 3 6 – 4 2
density was likely secondary to excess myelination (Fig. 1B),which increased the size of the internode.
In order to assess whether any changes in optic nervephysiology resulted from altered retinal cell function, wetested ERGs of WT and Akt-DDmice, and found no differencesat any age examined. Fig. 3 presents representative ERGsobtained from 10-month-old mice, the oldest age studied.Under both dark- (Fig. 3A) and light-adapted (Fig. 3B) condi-tions, ERG waveforms of Akt-DD mice were comparable tothose of WT littermates. This indicates that hypermyelinationdoes not impair responses of photoreceptors or depolarizingbipolar cells, which provide the primary activity reflected inthe a-wave and b-wave, respectively (Robson et al., 2004), andthat any abnormality noted in central visual function does notoriginate in the outer retina. Intensity-response functions forthe major ERG components of WT and Akt-DD mice wereclosely matched at 10 months of age (Fig. 3C, D) and at theyounger ages examined (data not shown).
Fig. 4A presents representative VEPs obtained from 8-month-old WT and Akt-DD mice under dark- and light-adapted conditions. Under all stimulus conditions, VEPs ofWT and Akt-DD mice were similar in waveform and weredominated by a negative polarity component (N1) that peaked50–80 ms following stimulus presentation (Peachey et al.,1997; Ren et al., 2000; Ridder and Nusinowitz, 2006). Although
VEP amplitude changed little across stimulus intensity, N1latency shortened with increasing flash intensity (Ren et al.,2000). Fig. 4 B–E plots average N1 latency-response functions,for dark-adapted (Fig. 4B, D) and light-adapted (Fig. 4C, E)stimulus conditions. At the ages illustrated (Fig. 4B, C:1 month; Fig. 4D, E: 8 months), and the other ages examined,N1 implicit time gradually shortened as flash intensityincreased. At 1 month of age, the latency functions of Akt-DD mice were shorter than those of WT mice, although thedifference was significant for light-adapted (df=1, F=7.87,P=0.010) but not dark-adapted (df=1, F=1.002, P=0.325) VEPlatency. At 8 months of age, the situation had reversed, andN1latencies were consistently delayed in Akt-DD mice, ascompared to WT littermates (Dark-adapted df=1, F=6.93,P=0.012; Light-adapted df=1, F=9.53, P=0.004). Fig. 4F sum-marizes how the implicit time difference between Akt-DD andWT mice changed with age. Because the implicit timedifference was not intensity dependent, this figure plots theaverage latency difference across all stimulus intensitiesbetween Akt-DD and WT mice as a function of age. At1 month of age, N1 latency is shorter in Akt-DD mice than inWT littermates. This likely reflects a speeding of the responsethrough the optic nerve due to the additional myelinationpresent at this age (Flores et al., 2008). By 2–4 months of age,this difference had diminished. At later ages, N1 latency was

Fig. 3 – Representative ERGs obtained from representative 10-month-old mice under dark-adapted (A) and light-adapted(B) conditions. Intensity–response functions for dark-adapted a- and b-wave (C) or light-adapted ERG (D). Data points indicateaverage (± s.d.) for 12 WT and 17 Akt-DD mice.
39B R A I N R E S E A R C H 1 3 7 4 ( 2 0 1 1 ) 3 6 – 4 2
consistently delayed in Akt-DD mice as compared to WTanimals.
3. Discussion
The serine/threonine kinase Akt regulates CNS myelination(Flores et al., 2008; Meikle et al., 2008; Narayanan et al., 2009),and reduced CNS myelin has been shown to impact motoractivities and cognitive functions in different mouse models(Tanaka et al., 2009; Hu et al., 2006). Visual function is clearlydependent on myelination. For example, VEP latencies ofshiverer mice, which have little or no CNS myelin, aresignificantly delayed (Lehman and Harrison, 2002; Martinet al., 2006). This pattern matches that seen in patients withoptic neuritis (Klistorner et al., 2008; Samsen et al., 2007; Parisiet al., 1999) ormultiple sclerosis (Andrade et al., 2007;Watanabeet al., 2009; Papathanasiou et al., 2010; Lascano et al., 2009).
Far less information is available on the impact of enhancedoptic nerve myelination on visual function. Our present dataindicate that the hypermyelination seen in Akt-DD transgenicmice has a complex influence on transmission through theoptic nerve. At younger ages, early in the hypermyelination
process, there is a modest decrease in VEP latency, indicativeof a faster than normal transmission through the optic nerve.This does not appear to reflect a difference in input into theoptic nerve as the function of the outer retina, as reflected inERG activity, was comparable between WT and Akt-DD mice.Instead, it seems more likely that hypermyelination speedsconduction through the post-retinal visual system.
VEP latency is delayed in older Akt-DDmice. At these ages,the hypermyelination process has advanced and anatomicabnormalities are more severe than that in younger mice: thedensity of nodes of Ranvier remains decreased and the packingofmyelin sheathsaround theoptic nerve is loose.Although therelationship between nodal density and VEP timing has notbeendefined, it seems likely that this change, alongwith loosermyelin sheath packing, may act to delay VEP timing. At2 months of age, VEP latencies of Akt-DD mice were close tonormal. At this age, any increase in optic nerve conductionmay be compensated for by the decreased density in nodes ofRanvier. Despite the documented anatomical changes in opticnerve structure induced by hypermyelination, a clear albeitdelayed signal is still transmitted through the optic nerve up toat least 10 months of age. These results further demonstratethe impact ofmyelination onVEP, and support the significance

Fig. 4 – (A) Representative VEPs obtained from representative 8-month-old WT and Akt-DD mice under dark-adapted (left) andlight-adapted (right) conditions. (B–E) Intensity-response functions for N1 implicit times obtained under dark-adapted (B, D) orlight-adapted (C, E) conditions from1-month old (B, C) or 8-month old (D, E)mice. In (B, C), data points indicate average (± s.d.) for30WT and 19 Akt-DDmice tested at 1 month of age. In (D, E), data points indicate average (± s.d.) for 19WT and 20 Akt-DDmicetested at 8 months of age. (F) Summary of age-related N1 implicit time changes in Akt-DD mice. Each data point indicates thedifference between the average N1 implicit times for Akt-DD mice relative to that for WT mice. Dark-adapted data arerepresented by open symbols; light-adapted data are represented by filled symbols. Asterisks indicate ages where significantdifferences in implicit times were noted between AKT and WT mice.
40 B R A I N R E S E A R C H 1 3 7 4 ( 2 0 1 1 ) 3 6 – 4 2
41B R A I N R E S E A R C H 1 3 7 4 ( 2 0 1 1 ) 3 6 – 4 2
of Akt-mediatedmechanisms ofmyelination in remyelinationtherapy for multiple sclerosis.
4. Experimental procedures
4.1. Mice
The generation and PCR-based identification of Akt-DD trans-genicmice studied have been described (Flores et al., 2008). Themice studied herewere generated bymating heterozygous Akt-DD transgenic mice with WT animals from the same colony.Transgenic and WT littermates were studied without knowl-edge of individual genotypes, at 1, 2, 4, 6, 8, and 10months ofage. All experiments involving mice were approved by theInstitutional Animal Care and Use Committee of the ClevelandClinic Foundation.
4.2. Visual electrophysiology
4.2.1. Initial preparationAfter overnight dark adaptation, mice were anesthetized withketamine (80 mg/kg) and xylazine (16 mg/kg), and their pupilsdilated with eyedrops (2.5% phenylephrine HCl; 1% cyclopento-late HCl; 1%mydriacyl). During the recording period, mice wereplaced on a temperature-regulated heating pad. ERGs and VEPswere recorded in separate sessions, using slightly differentprocedures.
4.2.2. Recording and stimulation—ERGElectroretinograms (ERGs) were used to examine outer retinalfunction. ERGs were recorded using a stainless steel wire activeelectrode that contacted the anesthetized (1% proparacaine HCl)corneal surface of the test eye through a layer of 0.8%methylcellulose. Grass platinum needle electrodes placed in thecheek and tail served as reference and ground leads, respectively.Signals were differentially amplified (Gain ×10000, band-pass 1–1500 Hz), digitized (2000 Hz), averaged and stored using UTAS-E3000ElectrophysiologySystem(LKCTechnologies,Gaithersburg,MD, USA).
Achromatic strobe flash stimuli were presented in a LKCganzfeld, under dark-adapted conditions and then superimposedupon a steady adaptation field (23 cd/m2). Under dark-adaptedconditions, as stimulus intensity increased from −3.6 to 2.1 logcd s/m2, the number of responses averaged decreased (from 10 to1at thehighest stimulus level), and the interstimulus interval (ISI)increased (from 4 s to 65 s). After allowing a 7-min period of light-adaptation, light-adapted ERGs were obtained by averaging theresponses to25successive flashespresentedat 2.1 Hz. Indifferenttrials, stimulus intensity ranged from −0.8 to 1.9 log cd s/m2.
The amplitude of the a-wave was measured 7 ms afterflash onset from the pre-stimulus baseline. The amplitude ofthe b-wave was measured from the a-wave trough to the peakof the b-wave or, if no a-wave was present, from the pre-stimulus baseline.
4.2.3. Recording and stimulation—VEPVEPs were used to evaluate transmission through the visualsystem and were recorded using three platinum needle
electrodes placed subcutaneously. The active electrode waspositioned along themidline of the visual cortex; the positionsof the reference and ground leads were the same as for ERGrecordings and the amplifier (X10K) band-pass was 1–100 Hz.
VEPs were recorded to achromatic strobe flash stimulipresented in the LKC ganzfeld under both dark- and light-adapted conditions. For dark-adapted VEPs, the ISI rangedfrom 1.1 to 6 s, increasing with stimulus intensity from −2.4 to2.1 log cd s/m2; 60 to 20 successive responses were averaged toobtain a VEP waveform. For light-adapted VEPs, a constant ISIof 1.1 s was used and 80 to 70 successive responses wereaveraged for a series of stimulus intensities (0.0 to 1.9 log cd s/m2) presented superimposed upon the adapting field.
The mouse VEP is dominated by a negative componentwhich is referred to as N1 (Peachey et al., 1997; Ridder andNusinowitz, 2006). The implicit time of the N1 component wasmeasured at the negative peak.
Response measures obtained from transgenic and non-transgenic mice were analyzed statistically using repeatedmeasures ANOVA. Because the standard error was notconstant across all pairs of means, the degrees of freedomwere adjusted by multiplying by the degrees of freedom of theGreenhouse–Geisser epsilon, and significance was adjustedaccordingly.
4.3. Electron microscopy
Mice were perfused with 2.5% glutaraldehyde/4% para-formaldehyde in 0.08 M Sorenson's buffer. Optic nerves werewashed in 0.08 M Sorenson's buffer, postfixed in 1% osmiumtetroxide, dehydrated in graded ethanol series, and thenembedded in Epon. Ultrathin sections (85 nm) were stainedwith uranyl acetate and lead citrate. Electron micrographswere taken with a Philips 201 TEM at 60 kV or Philips CM100TEM at 80 kV.
4.4. Immunocytochemistry
Mice were perfused with 4% paraformaldeyde and the opticnerves were dissected out. Optic nerve cryosections (10 μm)were washed with PBS and permeabilized using 10% TritonX-100 for 30 min. Blocking was done using 3% normal goatserum/1% BSA in PBS for 1 hour. Cryosections were stainedusing antibodies that recognize the NaV1.6 sodium channel(anti-rabbit, Alomone labs, 1:500 dilution) or Contactinassociated protein (Caspr; anti-mouse, gift from Dr. MatthewRasband [Baylor College of Medicine, Houston, TX], 1:1000dilution.). Sections were incubated at 4 °C in primaryantibody overnight, washed in PBS and incubated inrespective secondary antibodies (1:1000) for 1 hour. Sampleswere then washed and mounted using Vectashield (VectorLaboratories).
Acknowledgments
This study was supported by the National Multiple SclerosisSociety, NIH grants R01NS25304, R01NS56417, R24EY15638, theVA, the Foundation Fighting Blindness and a Challenge Grantfrom Research to Prevent Blindness.

42 B R A I N R E S E A R C H 1 3 7 4 ( 2 0 1 1 ) 3 6 – 4 2
R E F E R E N C E S
Andrade, E.P., Sacai, P.Y., Berezovsky, A., Salomão, S.R., 2007.Pattern-reversal visual evoked potential abnormalities inpatients with defined multiple sclerosis. Arq. Bras. Oftalmol.70, 943–948.
Bjartmar, C., Trapp, B.D., 2003. Axonal degeneration and progressiveneurologic disability in multiple sclerosis. Neurotox. Res. 5,157–164.
Flores, A.I., Narayanan, S.P., Morse, E.N., Shick, H.E., Yin, X., Kidd,G., Avila, R.L., Kirschner, D.A., Macklin, W.B., 2008.Constitutively active Akt induces enhanced myelination in theCNS. J. Neurosci. 28, 7174–7183.
Hu, X., Hicks, C.W., He, W., Wong, P., Macklin, W.B., Trapp, B.D.,Yan, R., 2006. Bace1 modulates myelination in the central andperipheral nervous system. Nat. Neurosci. 9, 1520–1525.
Hutchinson, J., Jin, J., Cardiff, R.D., Woodgett, J.R., Muller, W.J.,2001. Activation of Akt (Protein Kinase B) in mammaryepithelium provides a critical cell survival signal required fortumor progression. Mol. Cell. Biol. 21, 2203–2212.
Klistorner, A., Arvind, H., Nguyen, T., Garrick, R., Paine, M.,Graham, S., O'Day, J., Grigg, J., Billson, F., Yiannikas, C., 2008.Axonal loss and myelin in early ON loss in postacute opticneuritis. Ann. Neurol. 64, 325–331.
Lascano, A.M., Brodbeck, V., Lalive, P.H., Chofflon, M., Seeck, M.,Michel, C.M., 2009. Increasing the diagnostic value of evokedpotentials in multiple sclerosis by quantitative topographicanalysis of multichannel recordings. J. Clin. Neurophysiol. 26,316–325.
Lehman, D.M., Harrison, J.M., 2002. Flash visual evoked potentials inthe hypomyelinated mutant mouse shiverer. Doc. Ophthalmol.104, 83–95.
Martin, M., Hiltner, T.D., Wood, J.C., Fraser, S.E., Jacobs, R.E.,Readhead, C., 2006. Myelin deficiencies visualized in vivo:visually evoked potentials and T2-weighted magneticresonance images of shiverer mutant and wild-type mice. J.Neurosci. Res. 84, 1716–1726.
Meikle, L.K., Meikle, L., Pollizzi, K., Egnor, A., Kramvis, I., Lane, H.,Sahin, M., Kwiatkowski, D.J., 2008. Response of a neuronalmodel of tuberous sclerosis to mammalian target ofrapamycin (mTOR) inhibitors: effects on mTORC1 and Aktsignaling lead to improved survival and function. J. Neurosci.28, 5422–5432.
Narayanan, S.P., Flores, A.I., Wang, F., Macklin, W.B., 2009. Aktsignals through the mammalian target of rapamycin pathwayto regulate CNS myelination. J. Neurosci. 29, 6860–6870.
Papathanasiou, E.S., Pantzaris, M., Myrianthopoulou, P., Kkolou, E.,Papacostas, S.S., 2010. Brainstem lesions may be important inthe development of epilepsy in multiple sclerosis patients: Anevoked potential study. Clin. Neurophysiol. 121, 2104–2110.
Parisi, V., Manni, G., Spadaro, M., Colacino, G., Restuccia, R.,Marchi, S., Bucci, M.G., Pierelli, F., 1999. Correlation betweenmorphological and functional retinal impairment in multiplesclerosis patients. Invest. Ophthalmol. Vis. Sci. 40, 2520–2527.
Peachey, N.S., Roveri, L., Messing, A., McCall, M.A., 1997.Functional consequences of oncogene-induced horizontal celldegeneration in the retinas of transgenic mice. Vis. Neurosci.14, 627–632.
Ren, J.C., LaVail, M.M., Peachey, N.S., 2000. Retinal degeneration inthe nervous mutant mouse. III. Electrophysiological studies ofthe visual pathway. Exp. Eye Res. 70, 467–473.
Ridder III, W.H., Nusinowitz, S., 2006. The visual evoked potentialin the mouse—origins and response characteristics. Vis. Res.46, 902–913.
Robson, J.G., Maeda, H., Saszik, S.M., Frishman, L.J., 2004. In vivostudies of signaling in rod pathways of the mouse using theelectroretinogram. Vis. Res. 44, 3253–3268.
Samsen, P., Chuenkongkaew, W.L., Masayaanon, P., Chirapapaisan,N., Ruangvaravate, N., Loket, S., 2007. A comparative study ofvisual evoked potentials in optic neuritis and optic neuritis withmultiple sclerosis. J. Med. Assoc. Thai. 90, 313–318.
Shindler, K.S., Guan, Y., Ventura, E., Bennett, J., Rostami, A., 2006.Retinal ganglion cell loss induced by acute optic neuritisin a relapsing model of multiple sclerosis. Mult. Scler. 12,526–532.
Shindler, K.S., Kenyon, L.C., Dutt, M., Hingley, S.T., Das Sarma, J.,2008. Experimental optic neuritis induced by a demyelinatingstrain of mouse hepatitis virus. J. Virol. 82, 8882–8886.
Tanaka, H.J., Ma, J., Tanaka, K.F., Takao, K., Komada, M., Tanda, K.,Suzuki, A., Ishibashi, T., Baba, H., Isa, T., Shigemoto, R., Ono, K.,Miyakawa, T., Ikenaka, K., 2009. Mice with altered myelinproteolipid protein gene expression display cognitive deficitsaccompanied by abnormal neuron–glia interactions anddecreased conduction velocities. J. Neurosci. 29, 8363–8371.
Tremain, K.E., Ikeda, H., 1983. Physiological deficits in the visualsystem of mice infected with Semliki Forest virus and theircorrelation with those seen in patients with demyelinatingdisease. Brain 106, 879–895.
Watanabe, A., Matsushita, T., Doi, H., Matsuoka, T., Shigeto, H.,Isobe, N., Kawano, Y., Tobimatsu, S., Kira, J., 2009.Multimodality-evoked potential study of anti-aquaporin-4antibody-positive and -negative multiple sclerosis patients.J. Neurol. Sci. 281, 34–40.
Waxman, S.G., Bangalore, L., 2004. Electrophysiologicalconsequences of myelination. In: Lazzarini, R.A. (Ed.), MyelinBiology and Disorders. Elsevier Academic Press, San Diego, CA,pp. 117–141.
Zandian, M., Belisle, R., Mott, K.R., Nusinowitz, S., Hofman, F.M.,Ghiasi, H., 2009. A recombinant HSV-1 expressing murineinterleukin-2 induces optic neuritis in different strains of mice.Invest. Ophthalmol. Vis. Sci. 50, 3275–3282.