vibrational mode analysis of 2-aminoadenine and its deuterated species from raman and ultraviolet...
TRANSCRIPT

Eur Biophys J (1994) 23:95-104 European Biophysics Journal © Springer-Verlag 1994
Vibrational mode analysis of 2-aminoadenine and its deuterated species from Raman and ultraviolet resonance Raman data Z. Dhaouadi 1, M. Ghomi 1, p. Mojzes 2 p. y. Turpin 3, L. Chinsky 3
1 Physique Th~orique des Macromol~cules Biologiques, UFR Sant~-M~decine-Biologie Humaine, Universit~ Paris XIII, 74 rue Marcel Cachin, F-93012 Bobigny Cedex, France 2 Institute of Physics, Charles University, Ke Karlovu 5, 12116 Prague, Czech Republic 3 Laboratoire de Physique et Chimie Biomol~culaires, CNRS URA 198, lnstitut Curie et Universit~ Paris VI, 11 rue Pierre et Marie Curie, F-75231 Paris Cedex 05, France
Received: 15 July 1993 / Accepted in revised form: 10 January 1994
Abstract. Resonance Raman spectroscopy data of 2- aminoadenine and its deuterated species (C8-deuterated, N-deuterated and C8-, N-deuterated derivatives) in aqueous solution have been collected in the spectral re- gion between 400 and 1800 cm -a, by using ultraviolet excitation wavelengths (2ex~ = 222, 257 and 281 nm) lo- cated in the three main UV absorption bands corre- sponding to the strongly allowed electronic transitions of the molecule of interest. Moreover, a Raman spectrum has been recorded under off-resonance conditions with a visible excitation (2~xo =- 488 nm). In order to assign the 2-aminoadenine in-plane vibrational bands displayed in the RRS spectra, a normal coordinate analysis has been performed by means of an empirical internal valence force field. These calculations are based on our recent normal mode analysis of adenine and guanine nucleic bases and their deuterated species, which was based on the joint use of resonance Raman spectroscopy and neu- tron inelastic scattering data. In the 2-aminoadenine force field proposed here, the diagonal force constants have been directly transferred from those recently ob- tained for adenine (and from guanine as concerns the 2-amino group), the interaction force constants (off-diag- onal) then being adjusted on the basis of the actual exper- imental data from 2-aminoadenine and its deuterated species. The current force field is also able to assign in- frared and Raman data obtained by other authors from polycrystalline samples of the pure species.
Key words: Resonance Raman spectroscopy - Vibra- tional mode analysis - 2-Aminoadenine - Nucleic acids - Molecular force field
I. Introduction
2-aminoadenine (2,6-diaminopurine: 2NH2A ) is a minor purine base whose biological significance was demon-
Correspondence to." M. Ghomi
strated some time ago by various investigators (Kirnos etal. /977; Khudyakov et al. 1978). As compared to adenine (A), the C2-hydrogen atom is replaced in 2NH2A by an amino-group (Fig. 1): such a change in a chemical function enables a third hydrogen bond between 2NH2A and its complementary base (thymine T or uracil U) to be formed in the Watson-Crick base pairing model of dou- ble-helical nucleic acids. This additional hydrogen bond considerably increases the melting temperature of the he- lical duplex and makes it comparable to that of a gua- nine-cytosine (G-C) duplex (Gaffney et al. 1982). This property of 2NH2A has given rise to a series of spectro- scopic investigations on various compounds containing this purine base: conformational transitions of DNA double-helices containing 2NH2A-T (or 2NHzA-U ) base pairs have been monitored by means of 31p NMR (Howard et al. 1984), 2D 1H NMR (Borah et al. 1985, 1986), circular dichroism (Gaffney et al. 1982; Howard et al. 1984; Borah et al. 1986; Vorlickowa et al. 1988), in- frared (Howard et al. 1984; Taboury et al. 1984; Garriga et al. 1992) and ultraviolet resonance Raman (Mojzes et al. 1992) spectroscopies. Finally, the crystal structure of Z-DNA hexamers containing 2NH2A-T base pairs has been obtained at a 1.3 ~ resolution (Coll et al. 1986) and X-ray diffraction patterns of poly(d2NH2A-dT ) fibers at 98% relative humidity have also been recently studied (Alexeev et al. 1990).
A complete vibrational mode analysis of 2NH2A and its associated nucleoside and nucleotide is necessary for a better assignment of the conformational marker modes observed in the vibrational spectra of oligo- and polynu- eleotides containing this purine base. Until now, only one paper has reported ab initio vibrational analysis of 2NHzA, based only on IR and Raman data of the pure polycrystalline species (Florian et al. 1992). No experi- mental data has yet been produced for the isotopic derivatives of this molecule: this lack of experimental data makes it difficult to reliably assign the molecular vibrational modes.
Here we report resonance Raman (RRS) and off-reso- nance Raman spectra of 2NHaA and its deuterated spe-
96
? ?
NH, \ H \ H H
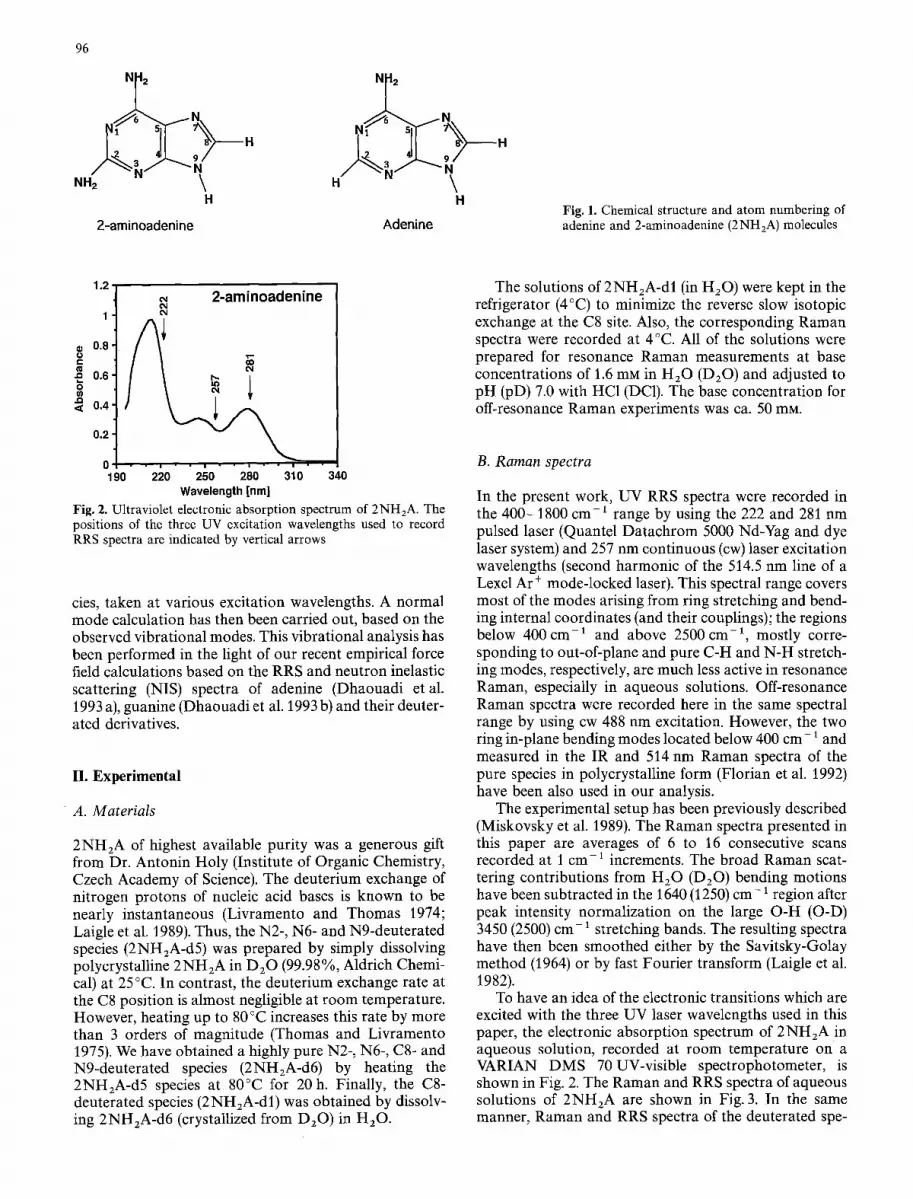
2-arninoadenine Adenine Fig. 1. Chemical structure and atom numbering of adenine and 2-aminoadenine (2NH2A) molecules
1.2 o4 2 - a m i n o a d e n i n e O4
1 O4
¢ 0.8 ~ u~
0.6 g
0.2
0 • • | . . | , . i , - • • • 190 220 250 280 310 340
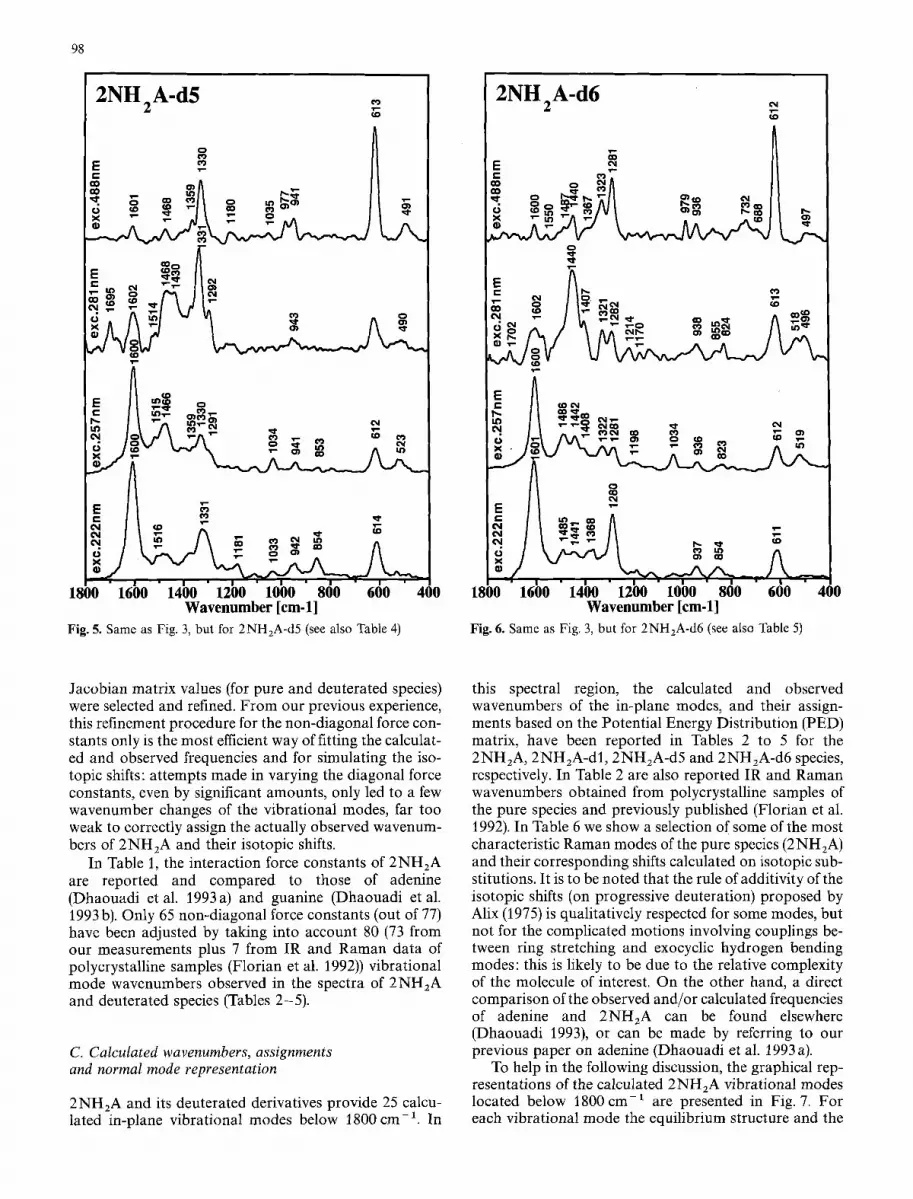
Wavelength [nm] Fig. 2. Ultraviolet electronic absorption spectrum of 2NH2A. The positions of the three UV excitation wavelengths used to record RRS spectra are indicated by vertical arrows
cies, taken at various excitation wavelengths, A normal mode calculation has then been carried out, based on the observed vibrational modes. This vibrational analysis has been performed in the light of our recent empirical force field calculations based on the RRS and neutron inelastic scattering (NIS) spectra of adenine (Dhaouadi et al. 1993 a), guanine (Dhaouadi et al. 1993 b) and their deuter- ated derivatives.
II. Experimental
• A. M a t e r i a l s
2NH2A of highest available purity was a generous gift from Dr. Antonin Holy (Institute of Organic Chemistry, Czech Academy of Science). The deuterium exchange of nitrogen protons of nucleic acid bases is known to be nearly instantaneous (Livramento and Thomas 1974; Laigle et al. 1989). Thus, the N2-, N6- and N9-deuterated species (2NHzA-d5) was prepared by simply dissolving polycrystalline 2NHzA in D20 (99.98%, Aldrich Chemi- cal) at 25 °C. In contrast, the deuterium exchange rate at the C8 position is almost negligible at room temperature. However, heating up to 80 °C increases this rate by more than 3 orders of magnitude (Thomas and Livramento 1975). We have obtained a highly pure N2-, N6-, C8- and N9-deuterated species (2NHzA-d6) by heating the 2NHEA-d5 species at 80°C for 20h. Finally, the C8- deuterated species (2NH2A-dl) was obtained by dissolv- ing 2NH2A-d6 (crystallized from D20 ) in H20.
The solutions of 2NH2A-dl (in H20 ) were kept in the refrigerator (4°C) to minimize the reverse slow isotopic exchange at the C8 site. Also, the corresponding Raman spectra were recorded at 4°C. All of the solutions were prepared for resonance Raman measurements at base concentrations of 1.6 mM in H20 (D20) and adjusted to pH (pD) 7.0 with HC1 (DC1). The base concentration for off-resonance Raman experiments was ca. 50 mM.
B. R a m a n spectra
In the present work, UV RRS spectra were recorded in the 400-1800 cm -1 range by using the 222 and 281 nm pulsed laser (Quantel Datachrom 5000 Nd-Yag and dye laser system) and 257 nm continuous (cw) laser excitation wavelengths (second harmonic of the 514.5 nm line of a Lexel Ar ÷ mode-locked laser). This spectral range covers most of the modes arising from ring stretching and bend- ing internal coordinates (and their couplings); the regions below 400 cm -1 and above 2500 cm -1, mostly corre- sponding to out-of-plane and pure C-H and N-H stretch- ing modes, respectively, are much less active in resonance Raman, especially in aqueous solutions. Off-resonance Raman spectra were recorded here in the same spectral range by using cw 488 nm excitation. However, the two ring in-plane bending modes located below 400 cm- 1 and measured in the IR and 514 nm Raman spectra of the pure species in polycrystalline form (Florian et al. 1992) have been also used in our analysis.
The experimental setup has been previously described (Miskovsky et al. 1989). The Raman spectra presented in this paper are averages of 6 to 16 consecutive scans recorded at 1 cm-1 increments. The broad Raman scat- tering contributions from H20 (D20) bending motions have been subtracted in the 1640 (1250) cm- 1 region after peak intensity normalization on the large O-H (O-D) 3450 (2500) cm- a stretching bands. The resulting spectra have then been smoothed either by the Savitsky-Golay method (1964) or by fast Fourier transform (Laigle et al. 1982).
To have an idea of the electronic transitions which are excited with the three UV laser wavelengths used in this paper, the electronic absorption spectrum of 2NH2 A in aqueous solution, recorded at room temperature on a VARIAN DMS 70UV-visible spectrophotometer, is shown in Fig. 2. The Raman and RRS spectra of aqueous solutions of 2NH2A are shown in Fig. 3. In the same manner, Raman and RRS spectra of the deuterated spe-

97
2NH :A (o
- / _
o o ~ r,~ Co Go
T
CO ~ O O E o , , ~ ,.n
• - CM ~ 1 CO
<,, A : _ , , / I A .> CO . > °
I
IE ~ ... I - , . ~ CO
~- l ~ l I I ~ ^ ~ ~ Co ~ ~ ~
. ] 1= i i ,.-<~ ° , . l
(%1 OCO ll~ ¢q O 1 ;m,~ l %...1 \ . , J " k , . I k ao I I /
1800 1600 1400 1200 1000 800 600 4{10 Wavenumber [cm-1]
Fig. 3. Off- and on-resonance Raman spectra (taken at 4°C) from aqueous solutions of 2NH~A in the spectral region between 1800 and 400 cm- ~. The excitation wavelengths (2o~ = 222, 257, 281 and 488 nm) are indicated on each spectrum, See also Table 2
2NH2A-dl CO I.D
° / x ~ ~ ,. ,. oCO° - - o
CO
E mg ~N
CO T- CO ~
o ~ 1 ~ / U I ^ CO ~ o . - - ^ . . o
i
i 1800 1600 1400 1200 1000 800 600
Wavenumber [cm-1]
Fig. 4. Same as Fig. 3, but for 2NH,A-d l (see also Table 3)
,t-
,e-- ,r-- '~" L'~ LI)
I • i • l • I l I " I "
4 0 0
cies are shown in Fig. 4 (2NH2A-dl), Fig. 5 (2NH2A-d5), and Fig. 6 (2NH2A-d6).
III. Normal mode calculations
A. Computational details
2NH2A base (Fig. J) and deuterated species (2NH2A-dl , 2NHzA-d5 and 2NHzA-d6) are supposed to be planar (Cs symmetry). 31 in-plane (2N-3) and 14 out-of-plane (N-3) vibrational modes are expected from these molecules. Only the in-plane motions have been con- sidered in our current analysis of the vibrational modes actually observed in the Raman and RRS spectra. To simulate the molecular vibrations, 18 stretching and 27 angular bending internal coordinates have to be used, of which 14 are redundant. The 14 redundant internal va- lence coordinates have been removed by a diagonalisa- tion procedure of the G-matrix (Gusoni and Zerbi 1968). The vibrational mode wavenumbers and atomic displace- ments were computed using a home-made calculation code (named BORNS for "BObigny Raman and Neutron Scatterings") developed within the framework of the
Wilson GF-method (Wilson et al. 1955). All of the numer- ical computations were carried out on a SUN 4 sparc server.
B. Empirical harmonic internal valence force field of 2-aminoadenine
In the adenine in-plane valence force field reported in our previous papers based on NIS and RRS data (Dhaouadi etal, 1993a), the diagonal force constants were the same as Majoube's (1985), since he proposed very sound assignments from IR and Raman data of 15N and D substituted species. Owing to the structural resemblance of adenine and 2NH2A (Fig. J), we have transferred, as they are, the adenine diagonal force constants to 2NH2 A. In addition, the diagonal force constants of the C2- aminogroup have merely been transferred from those of guanine (Dhaouadi et al. 1993b) for the corresponding group of 2NH2A. Then, we have only refined some of the interaction (non-diagonal) force constants of A (and G for the 2-amino group) by a least-squares method, in using the following criterion: in each of the refinement cycles, only the force constants providing the most important
98
2 N H 2 A - d 5 ~,
_E GO o )
_E ---, g
~ j . _ ° "* .
400 1800 "1600 "1400 "1200 "1000 800 600 Wavenumber [cm-1]
Fig. 5. Same as Fig. 3, but for 2NHzA-d5 (see also Table 4)
2 N H 2 A - d 6 ~4
E ¢" , ,r,- I
• o o ~ " ~ ~ ~©
~" '~1" ¢,4 ,e-
E '-
e ~ I | ' q ' ~ ~ I | 4--
d I k ~-,-~'~J I ~,, ~ t~ / x , . . / - v v ~ ~' ® 11
1800 1600 1400 1200 1000 800 600 400 Wavenumber [cm-l]
Fig. 6. Same as Fig. 3, but for 2NH2A-d6 (see also Table 5)
Jacobian matrix values (for pure and deuterated species) were selected and refined. From our previous experience, this refinement procedure for the non-diagonal force con- stants only is the most efficient way of fitting the calculat- ed and observed frequencies and for simulating the iso- topic shifts: attempts made in varying the diagonal force constants, even by significant amounts, only led to a few wavenumber changes of the vibrational modes, far too weak to correctly assign the actually observed wavenum- bets of 2NH2A and their isotopic shifts.
In Table 1, the interaction force constants of 2NHzA are reported and compared to those of adenine (Dhaouadi et al. 1993a) and guanine (Dhaouadi et al. 1993 b). Only 65 non-diagonal force constants (out of 77) have been adjusted by taking into account 80 (73 from our measurements plus 7 from IR and Raman data of polycrystalline samples (Florian et al. 1992)) vibrational mode wavenumbers observed in the spectra of 2NH2A and deuterated species (Tables 2-5).
C. Calculated wavenumbers, assignments and normal mode representation
2NH2A and its deuterated derivatives provide 25 calcu- lated in-plane vibrational modes below 1800 c m - 1 In
this spectral region, the calculated and observed wavenumbers of the in-plane modes, and their assign- ments based on the Potential Energy Distribution (PED) matrix, have been reported in Tables 2 to 5 for the 2NHzA, 2NH2A-dl, 2NHzA-d5 and 2NH2A-d6 species, respectively. In Table 2 are also reported IR and Raman wavenumbers obtained from polycrystalline samples of the pure species and previously published (Florian et al. 1992). In Table 6 we show a selection of some of the most characteristic Raman modes of the pure species (2NH2A) and their corresponding shifts calculated on isotopic sub- stitutions. It is to be noted that the rule of additivity of the isotopic shifts (on progressive deuteration) proposed by Alix (1975) is qualitatively respected for some modes, but not for the complicated motions involving couplings be- tween ring stretching and exocyclic hydrogen bending modes: this is likely to be due to the relative complexity of the molecule of interest. On the other hand, a direct comparison of the observed and/or calculated frequencies of adenine and 2NH2A can be found elsewhere (Dhaouadi 1993), or can be made by referring to our previous paper on adenine (Dhaouadi et al. 1993 a).
To help in the following discussion, the graphical rep- resentations of the calculated 2NH2A vibrational modes located below 1800 cm-1 are presented in Fig. 7. For each vibrational mode the equilibrium structure and the

99
~, . - ' ~ . . ~ --~ <. ,
\ \
. ~ 304
Fig. 7. Graphical representation of the calculat- ed in-plane vibrational modes of 2-amino- adenine in the spectral region below 1800 cm 1. For the assignment of these modes in terms of internal coordinates, see Table 2

100
mos t dis tor ted conf igurat ion have been drawn on the same figure.
IV. Discussion
On the basis of the current normal mode analysis (Tables 2 -5) , we now want to discuss four distinct spectral re- gions associated with various categories of vibrat ional mot ions which give rise to some of the mos t intense bands experimental ly observed; at the same time we review the recent assignments obta ined f rom a q u a n t u m mechanical calculat ion at the S T O - 3 G level (Flor ian et al. 1992), based on IR and R a m a n data obta ined on the pure spe- cies only.
1800- i650 cm- 1 spectral region
Three modes (1690, 1678 and 1664 c m - 1 , see Table 2) are calculated in this spectral region. The first two mainly involve NH2-scissor ing mot ions in the 6- and 2-positions, respectively, while the last mode corresponds to their cou- pling (Fig. 7). R a m a n spectra generally provide only weak bands in this spectral region (Fig. 3). However , two bands at 1715 and 1661 cm -1 have been observed in the IR spectra of a polycrystall ine sample, which are assignable to these vibrat ional motions.
1650-1340 cm- 1 spectral region
Six vibrat ional modes have been calculated in this range. All of them are assigned to ring single- or doub le -bond stretching mot ions (some of them are slightly coupled with exocyclic hydrogen bendings), and all but one (1550 c m - 1 ) give rise to RRS, off-resonance R a m a n and IR bands. A m o n g them, the m o d e calculated at 1617 c m - 1 (and observed here at 1612 c m - 1 in the Raman spectra of aqueous sample) mainly arises f rom pyrimidine ring stretching mot ions (Table 6). The relative intensity of this R a m a n b a n d depends strongly on the excitation wavelength (Fig. 3). O n the other hand, its wavenumber is completely insensitive to selective deutera t ion at the C8- posi t ion (Fig. 4 and Table 3). This experimental observa- t ion does no t suppor t the assignment recently made by Flor ian et al, (1992), who assumed for this mode an im- por t an t cont r ibut ion f rom imidazole ring vibrations, and especially N7 = C8 bond-s t re tching motions. Our current R a m a n spectra show the insensitivity of this mode to C8 deuterat ion, in going f rom 2 N H z A to 2 N H 2 A - d l , or f rom 2 N H z A - d 5 to 2 N H z A - d 6 (Tables 2 to 5): thus, this rules out possible contr ibut ions of N7 = C8 bond-s t re tch- ing mot ions in this vibrat ional mode.
Ano the r intense RRS b a n d observed here at 1 508 c m - ~ (and calculated at 1507 c m - 1), whose intensi- ty varies significantly with the excitat ion wavelength, is mainly assigned to N 7 = C 8 bond-s t re tching mot ions (Fig. 3 and Tables 2, 6). This is suppor ted by an experi- menta l 23 c m - 1 wavenumber downshif t u p o n C8-deuter- a t ion (Fig. 4 and Table 3). Again, the previous assignment
Table 1. Non diagonal (interaction) valence force constants of 2NH2A and its deuterated species. The values of these force con- stants are compared to those of adenine (A) (Dhaouadi et al. 1993 a) and guanine (G) (Dhaouadi et al. 1993 b) for the 2-aminogroup (in parentheses). Diagonal force constants (not shown here) were the same as those used in our previous calculations on adenine and guanine bases (see text). Units: Stretch-Stretch force constants: mdyn/,~; Bend-Bend force constants: mdyn. ~; Stretch-Bend force constans: mdyn. For atom numbering, see also Fig. 1
Interactions Values Interactions Values
Stretch-Stretch N9C8, C4N9 0.200 (0.200 A) N7C5, C4C5 0.200 (0.000 A) C4N3, C4C5 0.750 (0.350 A) C4C5, C6C5 0.750 (0.440 A) C6C5, N1C6 0.950 (0.650 A) C6C5, N7C5 0.500 (-0.150 A) C4N3, C4N9 0.300 (0.200 A) C6N6, C6C5 0.450 (0.750 A) C8N7, C2N3 0.100 (-0,170 A) C8N7, C4C5 0.400 (0.150 A) C2N3, C4C5 0.200 (-0,150 A) C8N7, C5N7 0.900 (0.900 A) C8N7, C8N9 0.900 (0.900 A) C8N7, C4N9 -0.400 (-0.710 A) N3C2, N1C2 0.700 (0.500 A) N3C2, N3C4 0.100 (0.250 A) C6N6, N1C6 0.700 (0.801 A) C5C4, C4N9 0.150 (0.150 A) N9C4, C6C5 0.100 (0.150 A) N1C2, C2N2 0.200 (0.450 G) C2N2, C2N3 0.300 (0.450 G) N1C6, N1C2 0.200 (0.641 A) NIC6, N3C2 -0.200 (0.150 A) N1C6, N7N8 0,150 (0.220 A)
Bend-Bend C4N9C8,C4N9H -0.350 (0.220A) C4N9C8,C8N9H -0.150 (-0.220A) N9C8N7,N7C8H -0.050 (0.550A) N9C8N7,N9C8H -0.550 (-0.550A) N1 C6N6, C6N6H -0.600 (0.250 A) C5C6N6, C6N6H 0.200 (0.200 A) N1C2N2,C2N2H -0.150 (-0.05G) N3C2N2, C2N2H -0.150 (-0.05 G) HN6H, C6N6H -0.010 (0.000 A) HN2H, C2N2H -0.005 (-0.013 A) N1C6N6,N1C6C5 0.650 (0.390 A) C5C6N6,N1C6C5 -0.100 (-0.100 A) C5C6N6, N7C5C6 0.600 (-0.450 A)
Stretch-Bend N9C8, C8N9H 0.500 (0.000 A) N9C4, C4N9H 0.500 (0.270 A) C8N7, N7C8H 0.550 (0.000 A) N9C8, N9C8H 0.050 (0.760 A) C6N6, C6N6H -0.050 (0.000 A) C2N2, C2N2H 0.100 (0.350 G) N9C8, N9C8N7 0.200 (0.000 A) N9C8, N9C8C4 0.800 (0.800 A) C8N7, N9C8N7 0.250 (0.580 A) C8N7, C8N7C5 0.200 (0.580 A) C4N9, C4N9C8 0.900 (0.900 A) C4N9, N9C4C5 0.900 (0.900 A) C4N9, N3C4N9 0.850 (0.550 A) N7C5, N7C5C4 0.900 (0.000 A) N7C5, C8N7C5 0.400 (0.750 A) N7C5, N7C5C6 0.500 (0.750 A) C5C6, C5C6N6 0.400 (0.200 A) C5C6, N1C6C5 0.400 (0.200 A) C5C6, N7C5C6 0.300 (-0.300 A) C5C6, C6C5C4 0.750 (0.200 A) C5C4, N7C5C4 0,500 (0.000 A) C5C4, N9C4C5 0,500 (0.300 A) C5C4, C6C5C4 0.750 (0.750 A) C5C4, N3C4C5 0.750 (0.300 A) C4N3, N3C4C5 0.900 (0.701 A) C4N3, C4N3C2 0.100 (0.701 A) C4N3, N3C4N9 0.750 (0.550 A) C2N1, N3C2N1 0.200 (0.701 A) C2N1, C2NIC6 0.300 (0.701 A) C2N1, N1C2N2 0.300 (0.907 G) N3C2, N3C2N2 0.300 (0.907 G) N3C2, C4N3C2 0.300 (0.750 A) N3C2, N3C2N1 0.100 (0.750 A) N1C6, N1C6N6 0.600 (0.780 A) N1C6, N1C6C5 0.600 (0.620 A) N1C6, C2N1C6 0.300 (0.400 A) C6N6, N1C6N6 0.400 (0.901 A) C6N6, C5C6N6 0.400 (0.901 A) C2N2, N1C2N2 0.400 (0.000 G) C2N2, N3C2N2 0.400 (0.000G)
made of this band by Flor ian et al. (1992) is in contradic- t ion with the present experimental evidence. I t should also be ment ioned that our assignment of this mode re- sembles that of the intense adenine R a m a n mode ob- served at 1483 c m - 1 (Dhaouad i et al. 1993 a).
Finally, the intense RRS b a n d observed here at 1349 cm -1 (and calculated at 1348 cm -1) shows an evi- dent resonance character (Figs. 3 and 7) and contains contr ibut ions f rom bo th the pyrimidine and imidazole moieties of the molecule, with s t rong bond-s t re tching characters (Table 2).
1300-800 c m - 1 spectral region
The vibrat ional modes are calculated in this spectral re- gion: all of them are mainly assigned to angular deforma-

Table 2. Comparison of experimental wavenumbers (cm- 1) (Raman spectra fom aqueous solutions obtained with the 488, 281,257 and 222 nm excitation wavelengths) and calculated wavenumbers for 2NH 2 A in-plane modes, in the spectral region below 1800 cm- x (see also Fig. 3). The assignments are based on the internal coordinates for which the potential energy distribution (PED) is reported in %
i01
(PED contributions < 7% are not reported). Abbreviations: (vs): very strong, (s): strong, (m): medium, (w): weak, (sh): shoulder. IR and R stand for previously published polycrystalline infrared and Raman peaks (obtained with the 514.5 nm excitation wavelength), respectively (Florian et al. 1992)
Poly- crystal IR
Solution
R R RRS RRS RRS 514,5 nm 488 nm 281 nm 257 nm 222 nm
Calc. Assigments (PED)
1715
1661
1620
1508 1445 1402 1358
1286
1244 1155 1092 1007
937
843
1680 1667
1614
1510 1451 1400 1355
1289
1169 1097 998
940 890
1611(m) 1612(m) 1613(s) 1612(s)
1508(m) 1508(s) 1506(sh) 1507(m) 1462 (sh) 1461 (w) 1463 (sh) 1402 (w) 1402 (sh) 1401 (w) 1349 (s) 1349 (vs) 1348 (m) 1350 (m)
1290 (m) 1290 (s) 1291 (w) 1289 (s)
1235 (w) 1237 (vw) 1235 (w) 1157(sh) 1158(m) 1158(m) 1156(vw) 1086 (sh) 1085 (vw) 1086 (w)
982 (w) 981 (w) 982 (m) 948 (w) 948 (w) 947 (w) 949 (sh)
831 (vw) 832 (vw)
658 659 638 637
563 550 507 508
366 376
650(sh) 650(w) 636(vs) 638 (m) 639 (sh) 638 (m)
552(w) 552(w) 500(w) 500 (vw)
307
1690 1678 1664
1617 1550 1507 1454 1400 1348
1292 1279
1223 1145 1064 1013 989 927 876 831
652 623
569 503
366
304
H-N6-H scissoring (21%), C2N2 (/7%), N1C6 (9%), C6N6H (8%) H-N2-H scissoring (47%), C2N2 (24%), C2N2H (21%) H-N6-H scissoring (23%), C2N2 (15%), C6N6 (8%)
N3C2 (30%), C2N1 (25%) C5C4 (22%), C6C5 (20%), C6N6 (9%) C8N7 (26%), N9C8N (12%), C6N6 (9%), C6C5 (8%) C4N3 (35%), C4N9 (24%) C8N7 (16%), C6N6 (16%), NgC8H (11%), C5C4 (10%) N1C6 (31%), C6C5 (12%), N7C5 (11%), C5C6N6 (9%)
N7C5 (17%), N7CSH (15%), N9C8 (14%), N9C8H (10%) NgC8H (22%), N7C8H (15%), C8N7 (16%), N7C5 (11%), N/C6 (11%) N9C8 (46%), C4N3 (11%) C4NgH (25%), C8N9H (16%), C6N6 (20%) C6N6 (27%), C2N1 (18%), C6N6H (11%), C2N2 (10%) C4N9H (29%), C8N9H (22%), C4N9 (17%), C2N2 (9%) C2N2H (22%), N3C2 (21%), C4N9 (8%) C2N2H (28%), N9C8 (10%), C5C4 (8%) C2N2H (23%), C6N6H (15%), C2N1 (8%) C8N9H (16%), N7C5 (12%), C4N9C8 (10%), C8N7 (9%), N7C8H (8%)
C5C6N6 (13%), C6N6 (11%), C2N1 (10%) C4N9 (19%), N3C4C5 (11%), C6C5 (9%), C2NIC6 (8%), N3C2 (8%) C6C5 (13%), C2N1C6 (10%), C6N6H (9%), N3C2N2 (9%) C4N3C2 (12%), N1C6C5 (11%), C5C6N6 (9%), C4N3 (9%), N1C6 (8%), N3C2NI (8%) N3C2N2 (14%), C6C5 (13%), NIC2N2 (12%), N3C4N9 (11%), N7C5C6 (10%) N1C6N6 (32%), C6N6H (17%), C5C6N6 (14%)
tions, especially those involving exocyclic hydrogens. This is also evident from the examination of Fig. 7. Exper- imentally, nine of them give spectral contributions in IR, off-resonance and resonance Raman spectra (see Table 2). The most intense RRS band observed in this region is located at 1290 cm -1 (Fig. 3); it is mainly assigned to N C 8 H angular bending motions and calculated at 1292 cm-1 (Table 2). Its experimental shift to 1274 cm-1 upon C8-deuteration (Fig. 4) supports well the calculated downshift to 1285 cm -1 (Table 3).
On the other hand, the present calculation mainly as- signs the 1158 c m - 1 Raman band to C4N9H and C8N9H angular bending coupled with bond-stretch motions (Table 2 and Fig. 3). Selective deuteration on labile hy- drogens considerably modifies this mode, which actually vanishes in the spectra for the deuterated species (Fig. 5 and 6). It is again difficult to interpret this experimental observation on the basis of the assignment previously proposed (Florian et al. 1992).
700 cm 1 and below
The present calculations propose six in-plane vibrational modes in this spectral region. They are generally assigned to ring angular deformations coupled with ring stretching motions (Table2). Under off-resonance conditions (Fig. 3), as well as in resonance with the 222 nm excitation wavelength, an intense band is observed at 638 cm-1. Under the other two resonance conditions, two badly resolved RRS bands are observed at 650 and 638 cm-1. These modes are highly affected by N-deuterat ions (Figs. 5 and 6, Table 6): they are calculated at 652 and 623 cm-1, respectively (Table 2). Figure 7 shows that the latter mode bears a strong ring-breathing character. The importance of the purine breathing modes as D N A secondary struc- ture conformational markers has been underlined in sev- eral experimental and theoretical investigations (Thamann et al. 1981; Ghomi et al. 1988). It should be stressed that, for the major purine nucleic bases, the most prominent

102
Table 3. Same as Table 2, but for 2NH2A-dl (C8-deuterated derivative of 2NHzA ). See also Fig. 4
Solution Calc. Assignments (PED)
R RRS RRS RRS 488 nm 281 nm 257 nm 222 nm
1704(w) 1690 1678 1664
1611 (w) 1613 (m) 1612(vs) 1612 (vs) 1617 1540(w) 1544
1484(w) 1485(s) 1484(s) 1484(w) 1487 1438(vs) 1438(w) 1439(w) 1442
1374(w) 1375(sh) 1375(sh) 1383 1338 (s) 1338 (vs) 1339 (sh) 1340 (sh) 1345 1274(m) 1274 (vs) 1273(w) 1275 (vs) 1285 1183 (sh) 1184 (sh) 1184 (w) 1214 1147(m) 1148(m) 1148(w) 1149(w) 1147
1082(w) 1082(w) 1069 1055
981 (s) 982(w) 981 (s) 1001 948 (m) 950 (w) 948(w) 949 (sh) 985 900(w) 901(w) 900(w) 916 867 (w) 860 815(w) 814(w) 817(w) 785
648(m) 649(sh) 649 636(vs) 637 (m) 636 (s) 616 547(w) 546(w) 546(m) 567
501 (w) 502 (w) 501
361
303
Table 4. Same as Table 2, but for 2NHzA-d5 (N2-, N6- and N9-deuterated derivative of 2NHzA). See also Fig. 5
Solution Calc. Assignments (PED)
H-N6-H scissoring (21%), C2N2 (17%), C2N2H (9%), NIC6 (9%) H-N2-H scissoring (47%), C2N2 (24%), C2N2H (21%) H-N6-H scissoring (23%), C2N2 (16%), C6N6 (8%) N3C2 (30%), C2N1 (25%) C6C5 (24%), C5C4 (20%), C6N6 (12%) C8N7 (18%), C4N3 (13%), C5C4 (8%) C4N9 (33%), C4N3 (25%), N3C4C5 (7%) C8N7 (34%), C6N6 (12%) N1C6 (33%), N7C5 (10%), C6C5 (10%), C5C6N6 (9%) N7C5 (31%), NIC6 (13%), C2N2 (10%) N9C8 (57%), C4N3 (8%) C4N9H (26%), C6N6 (21%), C8N9H (17%) C6N6 (18%), C2N2 (13%), C2N1 (13%), N9C8-D (8%), C6N6H (8%) N9C8D (15%), C8N9H (12%), C4N9H (10%), C6N6 (10%), C8N7 (10%), C4N9 (8%) C4N9H (23%), C8N9H (15%) N3C2 (19%), C2N2H (16%), C4N9 (14%) C2N2H (35%) C2N2H (16%), C6N6H (13%), N9C8 (8%) N7C8-D (26%), N9C8-D (18%), CSN9H (10%) C5C6N6 (12%), C6N6 (10%), C2N1 (10%) C4N9 (20%), N3C4C5 (9%), C6C5 (8%) C6C5 (12%), C2N1C6 (10%), C6N6H (9%), N3C2N2 (9%), NIC6N6 (9%) C4N3C2 (11%), NIC6C5 (11%), C5C6N6 (10%), C4N3 (9%), N1C6 (8%), C2N2 (8%), N3C2N1 (8%) N3C2N2 (13%), N1C2N2 (12%), C6C5 (12%), N3C4N9 (11%), N7C5C6 (9%), C4N3 (8%) NIC6N6 (32%), C6N6H (16%), C5C6N6 (14%)
R RRS RRS RRS 488 nm 281 nm 257 nm 222 nm
1695 (s) 1671 1601 (w) 1602 (s) 1600 (vs) 1600 (vs) 1611
1543 1514 (sh) 1515 (sh) 1516 (sh) 1501
1468 (w) 1468 (sh) 1466 (s) 1458 1430 (sh) 1425
1359 (w) 1357 (sh) 1359 (sh) 1367 1330 (s) 1331 (vs) 1330 (m) 1331 (s) 1318
1292 (s) 1291 (sh) 1283 1276 1216
1180 (w) 1178 (w) 1181 (w) 1182 1035 (w) 1034 (w) 1033 (w) 1059 977 (w) 993 941 (w) 943 (w) 941 (w) 942 (w) 921
896 853 (w) 854 (w) 849
740 725
613 (vs) 613 (m) 612 (m) 614 (s) 594 586
523 (w) 513 491 (w) 490 (w) 478
337 263
C2N2 (39%), N3C2NI (12%), C4N3 (8%) N3C2 (32%), C2N1 (29%) C5C4 (22%), C6C5 (19%), C6N6 (14%) C8N7 (24%), C6N6 (15%), N9C8H (10%) C4N3 (26%), C4N9 (18%) N1C6 (20%), C6N6 (15%), C8N7 (11%), N9C8H (10%) C6C5 (14%), N7C5 (12%), C8N7 (9%), C5C4 (8%) D-N2-D scissoring (20%), N7C5 (21%), C2N2 (17%) N9C8H (33%), N7C8H (23%), C8N7 (14%) N9C8 (18%), N7C8H (9%), D-N2-D scissoring (8%) N9C8 (31%), NIC6 (13%), D-N6-D (10%) D-N2-D scissoring (18%), NIC6 (16%), N9C8 (14%), N7C5 (13%) C4N9 (28%), C6N6 (17%) C2N1 (20%), N3C2 (17%), C6N6 (10%), D-N6-D scissoring (10%) C6N6-D (12%), C5C6N6 (10%) C4N9-D (14%), N7C5 (11%), C2N2 (10%), N3C2N2 (8%) C4N9-D (10%), N7C8H (10%), C6N6-D (8%) C8N9-D (33%), C4N9-D (29%) CEN2-D (30%), C8N9-D (12%), C4N9-D (8%), C2N1C6 (8%) C6N6-D (16%), C6C5 (14%), N1C6 (9%) C6N6 (20%), C4N9 (8%) C6C5 (17%), C6N6-D (9%), N3C2N2 (8%) NIC6C5 (12%), C4N3C2 (10%), N1C2N2 (9%) N3C2N2 (15%), N1C2N2 (14%), C6C5 (11%), N3C4N9 (10%), N7C5C6 (9%) N1C6N6 (31%), C6N6-D (27%), C5C6N6 (15%)
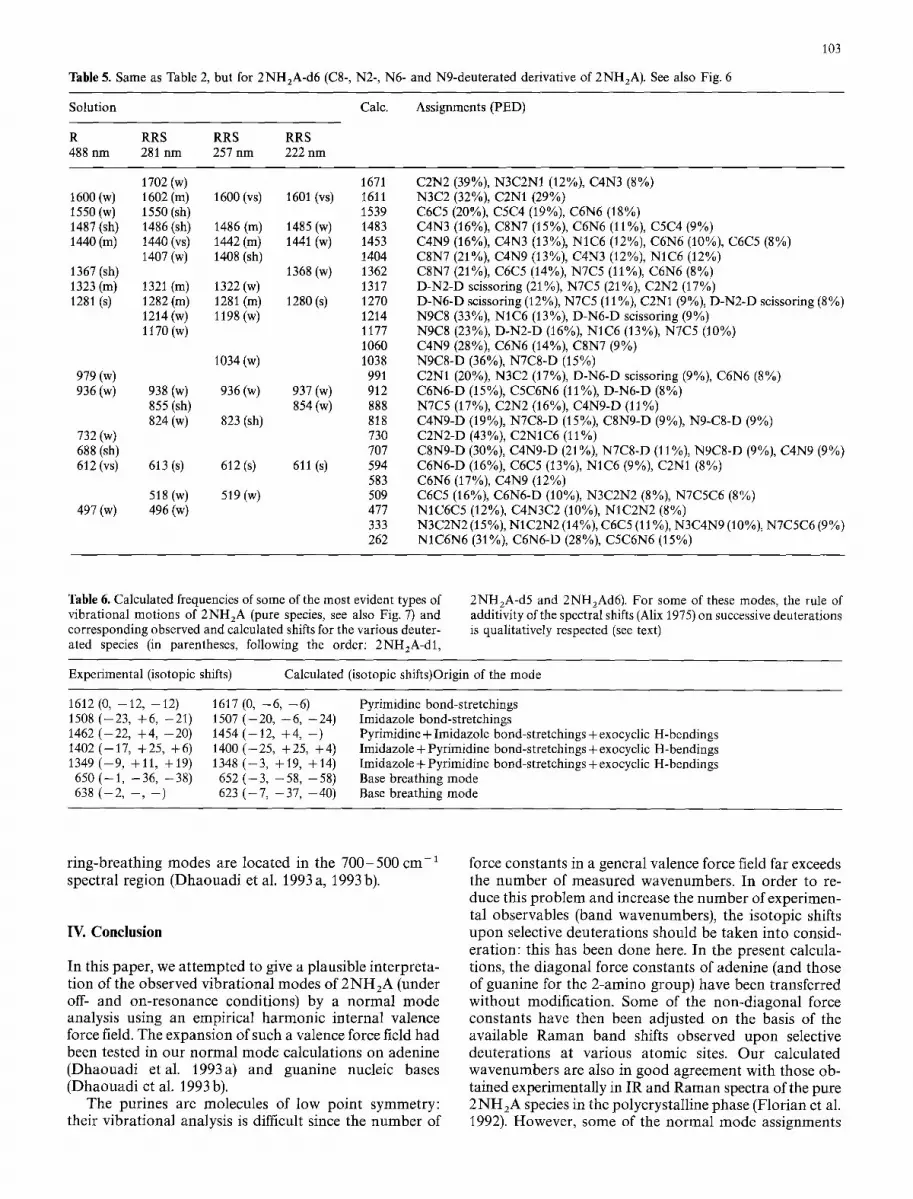
Table 5. Same as Table 2, but for 2NH2A-d6 (C8-, N2-, N6- and N9-deuterated derivative of 2NHzA ). See also Fig. 6
103
Solution Calc. Assignments (PED)
R RRS RRS RRS 488 nm 281 nm 257 nm 222 nm
1702(w) 1600(w) 1602 (m) 1550(w) t550(sh) 1487 (sh) 1486 (sh) 1440(m) 1440 (vs)
1407 (w) 1367(sh) 1323(m) 1281(s)
979 (w) 936(w)
732 (w) 688 (sh) 612 (vs)
497(w)
1321(m) 1282(m) 1214(w) l170(w)
1600 (vs) 1601 (vs)
1486 (m) t485(w) 1442(m) 1441(w) 1408(sh)
1368(w) 1322(w) 1281(m) 1280(s) 1198(w)
1034(w)
938(w) 936(w) 937(w) 855(sh) 854(w) 824 (w) 823 (sh)
613 (s) 612 (s) 611 (s)
518 (w) 519 (w) 496(w)
1671 1611 1539 1483 1453 1404 1362 1317 1270 1214 1177 1060 1038 991 912 888 818 730 707 594 583 509 477 333 262
C2N2 (39%), N3C2NI (12%), C4N3 (8%) N3C2 (32%), C2Nt (29%) C6C5 (20%), C5C4 (19%), C6N6 (18%) C4N3 (16%), C8N7 (15%), C6N6 (11%), C5C4 (9%) C4N9 (16%), C4N3 (13%), N1C6 (12%), C6N6 (10%), C6C5 (8%) C8N7 (21%), C4N9 (13%), C4N3 (12%), N1C6 (12%) C8N7 (21%), C6C5 (14%), N7C5 (11%), C6N6 (8%) D-N2-D scissoring (21%), N7C5 (21%), C2N2 (17%) D-N6-D scissoring (12%), N7C5 (11%), C2N1 (9%), D-N2-D scissoring (8%) N9C8 (33%), N1C6 (13%), D-N6-D scissoring (9%) N9C8 (23%), D-N2-D (16%), N1C6 (13%), N7C5 (10%) C4N9 (28%), C6N6 (14%), C8N7 (9%) N9C8-D (36%), N7C8-D (15%) C2NI (20%), N3C2 (17%), D-N6-D scissoring (9%), C6N6 (8%) C6N6-D (15%), C5C6N6 (11%), D-N6-D (8%) N7C5 (17%), C2N2 (16%), C4N9-D (11%) C4N9-D (19%), N7C8-D (15%), C8N9-D (9%), N9-C8-D (9%) C2N2-D (43%), C2N1C6 (11%) C8N9-D (30%), C4N9-D (21%), N7C8-D (11%), N9C8-D (9%), C4N9 (9%) C6N6-D (16%), C6C5 (13%), NIC6 (9%), C2N1 (8%) C6N6 (17%), C4N9 (12%) C6C5 (16%), C6N6-D (10%), N3C2N2 (8%), N7C5C6 (8%) NIC6C5 (12%), C4N3C2 (10%), NIC2N2 (8%) N3C2N2 (15%), N1C2N2 (14%), C6C5 (11%), N3C4N9 (10%), N7C5C6 (9%) N1C6N6 (31%), C6N6-D (28%), C5C6N6 (15%)
Table 6. Calculated frequencies of some of the most evident types of vibrational motions of 2NH2A (pure species, see also Fig. 7) and corresponding observed and calculated shifts for the various deuter- ated species (in parentheses, following the order: 2NH2A-dl,
2NHzA-d5 and 2NH2Ad6 ). For some of these modes, the rule of additivity of the spectral shifts (Alix 1975) on successive deuterations is qualitatively respected (see text)
Experimental (isotopic sh i f t s ) Calculated (isotopic shifts)Origin of the mode
1612 (0, --12, --12) 1508 (--23, +6, -21) 1462 (-22, +4, --20) 1402 (--17, +25, +6) 1349 (--9, +11, +19) 650 ( - 1, - 36, - 38) 638 ( -2 , - , - )
1617 (0, -6 , -6) 1507 ( - 20, - 6, - 24) 1454 (-12, +4, - ) 1400 (-25, +25, +4) 1348 (-3, +19, +14) 652 ( -3 , -58, -58) 623 (-7, --37, --40)
Pyrimidine bond-stretchings Imidazole bond-stretchings Pyrimidine + Imidazole bond-stretchings + exocyclic H-bendings Imidazole + Pyrimidine bond-stretchings + exocyclic H-bendings Imidazole + Pyrimidine bond-stretchings + exocyclic H-bendings Base breathing mode Base breathing mode
ring-breathing modes are located in the 700-500 cm-1 spectral region (Dhaouadi et al. 1993 a, 1993 b).
IV. Conclusion
In this paper, we a t tempted to give a plausible interpreta- tion of the observed vibrational modes of 2NH2A (under off- and on-resonance conditions) by a normal mode analysis using an empirical harmonic internal valence force field. The expansion of such a valence force field had been tested in our normal mode calculations on adenine (Dhaouadi etal . 1993a) and guanine nucleic bases (Dhaouadi et al. 1993 b).
The purines are molecules of low point symmetry: their vibrational analysis is difficult since the number of
force constants in a general valence force field far exceeds the number of measured wavenumbers. In order to re- duce this problem and increase the number of experimen- tal observables (band wavenumbers), the isotopic shifts upon selective deuterations should be taken into consid- eration: this has been done here. In the present calcula- tions, the diagonal force constants of adenine (and those of guanine for the 2-amino group) have been transferred without modification. Some of the non-diagonal force constants have then been adjusted on the basis of the available Raman band shifts observed upon selective deuterations at various atomic sites. Our calculated wavenumbers are also in good agreement with those ob- tained experimentally in IR and Raman spectra of the pure 2NH2A species in the polycrystalline phase (Florian et al. 1992). However, some of the normal mode assignments

104
(e.g. those c o r r e s p o n d i n g to the obse rved 1612-, 1508- and 1158 cm -1 bands) p r o p o s e d by F l o r i a n and coau- thors wi th in the f r a m e w o r k of thei r ab ini t io force field are i n c o m p a t i b l e wi th the R a m a n b a n d i so top ic shifts expe r imen ta l ly obse rved in the presen t work . This is p r o b a b l y due to the fact tha t the c o r r e s p o n d i n g scal ing factors had been fi t ted by t ak ing into accoun t only the expe r imen ta l d a t a f rom the pu re 2 N H 2 A species. Thus, it w o u l d be of in teres t to test these scal ing factors on the basis of the expe r imen ta l i so top ic shifts p resen t ly r epor t - ed. If this c o n d i t i o n is fulfilled, the t ransfe rab i l i ty of these factors migh t be recognized as va luab le (see also G h o m i 1993).
The p resen t work also shows tha t the b a n d intensi t ies of the R a m a n spec t ra of 2 N H 2 A and deu t e r a t ed species are s t rong ly d e p e n d e n t on the exc i ta t ion wavelength . Ex- c i ta t ions in the three a p p a r e n t u l t r av io le t e lec t ronic ab- s o r p t i o n b a n d s of the molecu le are of in teres t for the fo r thcoming theore t ica l specu la t ions which conce rn the d e t e r m i n a t i o n of its exci ted s tate geometr ies .
Supplementary material available. Tables 2 to 5 wi th c o m p l e t e d po ten t i a l energy d i s t r i bu t ion (PED) d o w n to 5% con t r i bu t i ons can be o b t a i n e d f rom M. G h o m i on request .
Acknowledgements. During his stay at the Institute Curie P. Mojzes was supported by a grant from the MICECO programme (French Foreign Office).
References
Alexeev G, Akimento NM, Volkova LI, Skuratovskii Y, Vorlickova M, Kypr J, Sagi J (1990) X form of poly(aminoZdA-dT): poly- (aminoadA-dT). Preliminary results of an X-ray fiber diffraction study. Studia Biophys 136:189-192
Alix AJP (1975) Th6orie des perturbations g6n6rales des constantes mol~culaires A, ~2, S, F~, Ai: r~gles d'isotropie correspondant ~t la solution (L -1 L*)= diag. Comptes Rendus Acad Sci Paris 281B:497-499
Borah B, Cohen JS, Howard FB, Miles HT (1985) Poly(d2NH2A- dT): Two-dimensional NMR shows a B to A conversion in high salt. Biochemistry 24:7456-7462
Borah B, Howard FB, Miles HT, Cohen JS (1986) Conversion of poly(2-aminodeoxyadenylate-5-halodeoxyuridylate) from B to A forms in high salt. An NMR and circular dichroism study. Biochemistry 25:7464 7470
Coil M, Wang AHJ, van der Marel GA, van Boom JH, Rich A (1986) Crystal structure of a Z-DNA fragment containing thymine/2- aminoadenine base pairs. J Biomol Struct Dyn 4:157-172
Dhaouadi Z (1993) PhD dissertation, University Paris XIII Dhaouadi Z, Ghomi M, Austin JC, Girling RB, Hester RE, Mojzes
P, Chinsky L, Turpin PY, Coulombeau C, Jobic H, Tomkinson J (1993 a) Vibrational motions of bases of Nucleic acids as re- vealed by neutron inelastic scattering and resonance Raman scattering. 1. Adenine and its deuterated species. J Phys Chem 97:1074 1084
Dhaouadi Z, Ghomi M, Coulombeau Ce, Coulombeau C, Jobic H, Mojzes P, Chinsky L, Turpin PY (1993 b) The molecular force field of guanine and its deuterated species as determined from neutron inelastic scattering and resonance Raman measure- ments, Eur Biophys J 22:225-236
Florian J, Mojzes P, Stepanek J (1992) Scaled quantum mechanical force fields and vibrational spectra of solid-state nucleic acid constituents. 3.2-aminoadenine. J Phys Chem 96:9278-9282
Gaffney BL, Marky LA, Jones RA (1982) The influence of purine 2-amino group on DNA conformation and stability. Synthesis and conformational analysis of d [T(amino A)] 3 . Nucl Acids Res 10:4351 4361
Garriga P, Sagi J, Garcia-Quintana D, Manyosa J (1992) FT-IR spectroscopic study of the poly(amino2dA-dT) duplex in Mg 2+ containing solutions and in films. J Biomol Struct Dyn 9:899- 910
Ghomi M (1993) Reply to comments on "Vibrational motions of nucleic acids as revealed by neutron inelastic scattering and resonance Raman spectroscopy. 1. Adenine and its deuterated species". J Chem Phys 97:10890
Ghomi M, Letellier R, Taillandier E (1988) A critical review of nucleosidic vibration modes appearing in the 800 500 cm spectral region, based on new harmonic dynamics calculations. Biopolymers 27:605 616
Gusoni M, Zerbi G (1968) Symmetry coordinates in molecular vi- brations. J Mol Spectrosc 26:485-488
Howard FB, Chen CW, Cohen JS, Miles HT (1984) Poly(d2NH2A- dT): Effect of 2-amino substituted on the B to Z transition. Biochem Biophys Res Commun 118:848-853
Kirnos MD, Khudyalov IY, Alexandrushkina NI, Vanyushin BF (1977) 2-aminoadenine is an adenine substituting for a base in S-2L cyanophage DNA. Nature 270:369-370
Khudyalov IY, Kirnos MD, Alexandrushkina NI, Vanyushin BF (1978) Cyanophage S-2L contains DNA with 2,6-diaminopurine substituted for adenine. Virology 88:8-18
Laigle A, Chinsky L, Turpin PY (1982) Resonance Raman spectros- copy of biomolecules in low concentrated solutions: signal/noise ratio improvement and background rejection by a fast Fourier transform treatment. Studia Biophys 89: 99-105
Laigle A, Chinsky L, Turpin PY, Jolles B (1989) Kinetics of ex- changeable protons in Z DNA: a UV resonance Raman study. Nucl Acids Res 17:2493-2502
Livramento J, Thomas GJ Jr (1974) Detection of hydrogen-deuteri- um exchange in purines by laser-Raman spectroscopy. Adenine 5'-monophosphate and polyriboadenylic acid. J Am Chem Soc 96:6529 6531
Majoube M (1985) Vibrational spectra of adenine and deuterium- substituted analogues. J Raman Spectrosc 16:98-110
Miskovsky P, Chinsky L, Laigle A, Turpin PY (1989) The Z confor- mation of poly(dA-dT), poly(dA-dT) in solution as studied by ultraviolet resonance Raman spectroscopy. J Biomol Struct Dyn 7:623-637
Mojzes P, Chinsky L, Turpin PY, Miskovsky P (1992) Salt-induced conformational transition of poly(d2NH2A-dT ) studied by ul- traviolet resonance spectroscopy. J Biomol Struct Dyn 10:181- 194
Savitsky A, Golay MJ (1964) Smoothing and differentiation of data by simplified least square method. Annal Chem 36:1627 1638
Taboury JA, Adam S, Taillandier E, Neumann JM, Tranh-Dinh S, Langlois d'Estaintot B, Conti M, Igolen J (1984) The B to Z transition in two synthetic oligonucleotides: d(C-2amino- ACGCG) and d(mSCGCAmSCGTGCG) studied by IR, NMR and CD spectroscopies. Nucl Acids Res 122:6291 6305
Thamann TJ, Lord RC, Wang AHJ, Rich A (1981) The high salt form of poly(dG-dC) - poly(dG-dC) is left-handed Z-DNA: Raman spectra of crystal and solutions. Nucl Acids Res 20:5443-5457
Thomas GJ Jr, Livramento J (1975) Kinetics of hydrogen-deuterium exchange in adenosine 5'-monophosphate, adenosine 3':5' monophosphate and poly(riboadenylic acid) determined by laser-Raman spectroscopy. Biochemistry 14:5210-5218
Vorlickova M, Sagi G, Szabolcs A, Otvos L, Kypr J (1988) Confor- mation of the synthetic DNA poly(aminoZdA-dT) duplex in high-salt and aqueous alcohol solutions. Nucl Acids Res 16: 279-289
Wilson EB, Decius JC, Cross PC (1955) Molecular vibrations. McGraw-Hill, New York