vertical integration and r\u0026d information flow: is there a need for ‘firewalls’?
TRANSCRIPT

www.elsevier.com/locate/econbase
International Journal of Industrial Organization
22 (2004) 25–43
Vertical integration and R&D information flow:
is there a need for ‘firewalls’?
Chrysovalantou Millioua,b,*
aDepartment of Economics, European University Institute, Via della Piazzuola 43, 50133 Florence, ItalybDepartment of Economics, Universidad Carlos III de Madrid, Calle Madrid 126,
28903 Getafe Madrid, Spain
Received 23 January 2002; received in revised form 30 December 2002; accepted 24 April 2003
Abstract
We examine the impact of R&D information flow on innovation incentives and welfare. In
particular, we consider the case in which the information flows from a downstream nonintegrated
firm to the downstream division of a vertically integrated firm via its upstream subsidiary. In a
setting where both the integrated and nonintegrated firm engage in cost-reducing R&D and compete
in the product market, we show that the impact of the R&D information flow on innovation, output,
and profits is positive for the integrated firm, and negative for the nonintegrated firm. Unless
information spillovers are high, goods are close substitutes, and R&D is very costly, ‘firewalls’
decrease welfare.
D 2003 Elsevier B.V. All rights reserved.
JEL classification: L22; L11; L49; K21
Keywords: Vertical integration; Information flow; Firewalls; R&D spillovers
1. Introduction
There has been a recent resurgence of interest in the potential anticompetitive effects of
vertical mergers. The Antitrust Division of the Department of Justice (DOJ) and the
Federal Trade Commission (FTC) of the United States have intervened in a series of
vertical merger cases and issued consent decrees placing various behavioral restrictions on
0167-7187/$ - see front matter D 2003 Elsevier B.V. All rights reserved.
doi:10.1016/S0167-7187(03)00090-0
* Tel.: +39-055-468-5378.
E-mail address: [email protected] (C. Milliou).

C. Milliou / Int. J. Ind. Organ. 22 (2004) 25–4326
the postacquisition firms. These behavioral restrictions are motivated by the Antitrust
Authorities’ concern that the nonpublic information obtained by a vertically integrated
firm could be used anticompetitively.1
Consider a market structure in which an upstream firm is supplying an intermediate
good to a number of downstream firms and at the same time is vertically integrated with
one of these downstream firms. In this setting, the Antitrust Authorities are concerned
that the information derived by the upstream supplier through its vertical relations with
its downstream customers will be shared with its downstream integrated subsidiary,
leading to a reduction in innovation incentives and downstream competition.
These concerns become relevant when important information, particularly information
about the technology, the design or the specific characteristics of the products must be
shared between the upstream and the downstream firms. This is typical in R&D intensive
industries, where the exchange of information about the upstream and downstream
products, is necessary in order for the products to be compatible, to avoid extra costs of
adjustment, and to increase functionality.
In practice, concerns regarding the effects of the information flow were raised in a
series of vertical merger cases which took place in a number of different R&D intensive
industry sectors: defense (Raytheon/Chrysler, Boeing/Rockwell, Alliant/Hercules,
Lockheed/Loral), pharmaceuticals (Merc/Medco), telecommunications (AT&T/McCaw,
MCI/BT), satellites (Boeing/General Motors, Martin Marietta/General Dynamics), and
energy (PacifiCorp/Energy Group).2 In all these merger cases, the upstream and
downstream firms were working closely together, and the upstream division of the
vertically integrated firm was receiving nonpublic information about the products of its
downstream customers in its capacity as an upstream input supplier. Hence, the
upstream division of the vertically integrated firm could transfer this nonpublic
information to its own downstream subsidiary. In all these cases, the DOJ and the
FTC assumed that such information transfer, among other things, would reduce
competition and firms’ innovation incentives. Thus, although they allowed the vertical
mergers to take place, they required the establishment of a ‘firewall’ between the
merging parties.
A ‘firewall’ is a behavioral requirement that prohibits the different divisions of a
vertically integrated firm from communicating about nonpublic information received by
one of the divisions from outside parties. In the implementation of a ‘firewall’, the
upstream division of the integrated firm is asked to use the downstream competitor’s
proprietary information only in its capacity as its supplier, and not to provide it, disclose
it or otherwise make it available to its downstream subsidiary. It is also asked to inform
its nonintegrated downstream customers about this nondisclosure requirement before
obtaining any information from them that is outside the public domain. Finally, the
integrated firm is required to permit the authorized representatives of the Antitrust
1 Nonpublic information in this context includes any information not available in the public domain. For
example, information about design and technological specifications, private costs, bids, marketing strategies.2 FTC Docket N.C-3681, 9/1996; FTC File N.9710006, 12/1996; FTC File N.9410123, 11/1994; FTC
Docket N.C-3685, 9/1996; Civil Action N.94-01555; Civil Action N.94-1317; FTC File N.9510097, 8/1998; File
N.0010092, 9/2000; Martin Marietta Decree in 59 Federal Regulation; FTC File N.9710091, 2/1998.

C. Milliou / Int. J. Ind. Organ. 22 (2004) 25–43 27
Authorities to have access to all its books, documents, correspondence, reports,
memoranda, and accounts and to interview officers and employees in order to determine
compliance with the ‘firewall’ requirement.
It is questionable whether or not the implementation of ‘firewalls’ can be successful.
However, a more essential and unanswered question is if there is a need for ‘firewalls’ or
not, in other words if the information flow does actually reduce innovation incentives and
social welfare.
To answer this question, we use a simple model in which a vertically integrated firm
has the monopoly in the upstream market and at the same time competes in the
downstream market with a nonintegrated downstream firm. A three-stage game is
analyzed. In the first stage, both the integrated and the nonintegrated firm choose their
level of cost-reducing R&D. In the second stage, the integrated firm chooses the
wholesale price of the input. Finally, in the third stage, the two firms produce
differentiated goods and compete in the final goods market in quantities. The R&D paths
of the two firms are assumed to be complementary as in d’Aspremont and Jacquemin
(1988), but in an extension of the basic model we also consider the case in which the
firms’ R&D paths are substitutes.3
Our main finding is that the information flow does not necessarily reduce R&D
incentives and welfare. In particular, we show that the information flow leads to lower
innovation incentives for the nonintegrated firm, but to higher incentives for the integrated
firm, at least when firms’ R&D paths are complementary. In contrast, when firms are
involved in an R&D race, the R&D incentives of the integrated firm decrease with
information flow. However, under both R&D specifications, the effective R&D of the
integrated firm is higher under information flow than under a ‘firewall’. Under comple-
mentary R&D paths, welfare is higher under information flow than under a ‘firewall’,
unless spillovers are very high, goods are very close substitutes, and R&D is too costly.
Moreover, under substitute R&D paths, welfare seems to be higher under information
flow. Thus, our analysis provides insights against the policy intervention and the
implementation of ‘firewalls’.
There is little economic research regarding the competitive effects of ‘firewalls’
following vertical integration. Thomas (1996) considers a market in which a vertically
integrated firm co-exists with a nonintegrated upstream and downstream firm, and
examines the impact of information flow regarding the opponent’s bids on firms’ profits.
He finds that although both divisions of the integrated firm are indifferent about the
information flow, the nonintegrated downstream firm prefers a ‘firewall’, while the
nonintegrated upstream firm prefers information flow.
In a more recent paper, Hughes and Kao (2001) assess the impact of ‘firewalls’ on
welfare, showing that they decrease both consumer surplus and overall welfare. However,
they find that ‘firewalls’ increase the integrated firm’s profits, which means that the
3 When firms’ research paths are substitutes, firms follow exactly the same research line and thus they
essentially make the same discovery. When firms’ research paths are complements, firms follow different research
lines leading them to different discoveries (see Katsoulacos and Ulph, 1998).
C. Milliou / Int. J. Ind. Organ. 22 (2004) 25–4328
upstream division of the integrated firm has no incentives to reveal information to its
downstream subsidiary in the first place. Hence, in their framework, there is no reason for
information transmission concerns to be raised.
In both of these papers there is competition in the upstream market, which affects the
firms’ market decisions and hence their conclusions. The present paper instead
concentrates on the case of an upstream monopoly in order to focus on the
consequences of the information flow and to be closer to the market structures in
which the Antitrust Authorities concerns were raised. Notice also that Thomas’ paper
refers to information about the opponent’s bids and Hughes and Kao’s to information
about the rival’s private demand. Neither paper considers R&D investments and the
flow of R&D information, hence they do not capture the latter’s effect on innovation
incentives and welfare.
The rest of the paper has the following structure. In Section 2, the basic model is
described in detail. In Section 3, the equilibrium analysis is presented. In Section 4,
‘firewalls’ are compared with information flow. In Section 5, our welfare findings are
provided. In Section 6, the analysis is extended to the case of an R&D race model with
substitute research paths. Finally, in Section 7, our main results are summarized and
possible policy implications as well as extensions of our model are discussed. All the
proofs of the Propositions are included in the Appendix.
2. The basic model
We consider an industry consisting of two firms, a vertically integrated firm, denoted by
U-D1, and an independent downstream firm, denoted by D2 (see Fig. 1). The upstream
division of the integrated firm, U, is a monopolist, and produces an input, which is
essential for the production of the final goods.
For simplicity, we assume that the input monopolist, or ‘bottleneck owner’ U, has no
fixed costs, no capacity constraints, and faces a constant marginal cost, which without loss
of generality we set equal to zero.4 The downstream division of the integrated firm D1
obtains the input from U at marginal cost, while the nonintegrated downstream firm D2
obtains it at an endogenously determined wholesale price w. The two downstream firms
transform the input into the final good on a one-to-one basis.
We analyze a full information three-stage game. In the first stage, firms simultaneously
and independently choose their R&D effort levels. In the second stage, U-D1 makes a
‘‘take-it-or-leave-it’’ offer to D2 regarding the wholesale price w of the input. Finally, in
the third stage, firms produce differentiated goods and compete in quantities.5 We assume
subgame perfection throughout the paper.
4 ‘‘A ‘bottleneck’ firm’s product cannot be cheaply duplicated by users who are denied access to it’’ (Rey and
Tirole, forthcoming). We assume that the possibility of bypassing the ‘bottleneck’ is so costly that it does not
exist.5 In an appendix, which is available upon request, we analyze the case of price competition and find that all
the qualitative results of the basic model are confirmed.

C. Milliou / Int. J. Ind. Organ. 22 (2004) 25–43 29
Inverse demand and cost functions
The inverse demand functions for firms U-D1 and D2 are, respectively:
p1 ¼ a� q1 � dq2; p2 ¼ a� q2 � dq1; a > 0; 0\d < 1 ð1Þ
where q1 and q2 are the final good quantities of firms U-D1 and D2 and d is the degree of
product differentiation.6
Following d’Aspremont and Jacquemin (1988), we assume that the cost functions for
firms U-D1 and D2 are:7
C1ðx1; x2; k; q1Þ ¼ ðA� x1 � kx2Þq1; C2ðx2; w; q2Þ ¼ ðAþ w� x2Þq2 ð2Þ
x1[0; x2[0; A[x1 þ kx2; A[x2 � w; 0\k\1
where x1 and x2 are the R&D investments of firm U-D1 and D2, respectively. If no R&D
investments are undertaken, the unit cost of both firms is given by A. The parameter k
represents the degree of R&D spillovers. It reflects the extent to which a downstream firm
absorbs technological knowledge from the R&D investments of its competitor, as well as
the productivity of the acquired knowledge in decreasing the production cost of its final
product.
In order to incorporate the effect of the information flow between the two divisions of
the integrated firm, it is assumed that the nonintegrated downstream firm does not enjoy
any spillovers (k = 0), while the integrated firm enjoys spillovers (k > 0) only when there is
flow of information about the R&D undertaken by D2, between the different divisions of
U-D1. In other words, we set k = 0 in Eq. (2) when there is a ‘firewall’, while in the
absence of a ‘firewall’, k > 0. Note that even in the absence of R&D investments, the
Fig. 1. Partially vertically integrated industry.
6 The demand functions are derived from the representative consumer’s utility, which depends on the
quantities of the final products and the numeraire good m and takes the following form (see Singh and Vives,
1984): U = a( q1 + q2)� (1/2)( q12 + q2
2 + 2dq1q2) +m.7 In Section 6, we extend the analysis to the case of substitute research paths.
C. Milliou / Int. J. Ind. Organ. 22 (2004) 25–4330
nonintegrated firm D2 faces an extra cost w, the wholesale price that it has to pay in order
to obtain the input from the upstream supplier U.
The R&D investments are subject to diminishing returns, as captured by the quadratic
form of the cost of R&D:
GðxiÞ ¼ lx2i2; l > 0; i ¼ 1; 2 ð3Þ
Eq. (3) implies that the cost per unit of R&D increases with the size of the research lab.
That is, higher R&D levels require proportionally higher costs of lab operation. Moreover,
a higher cost parameter l reflects a lower efficiency of the R&D expenditures.
In order to guarantee that the second order conditions are satisfied and that the firms
choose strictly positive quantities and R&D levels, we assume the following throughout
the paper:
Assumption 1. The degree of product differentiation d is lower than d, where
d = 1� (1/2A).8
3. Equilibrium analysis
The profit functions of U-D1 and D2 are:
pVI ¼ wq2 þ ða� q1 � dq2Þq1 � ðA� x1 � kx2Þq1 � lx212
ð4Þ
and
p2 ¼ ða� q2 � dq1Þq2 � ðAþ w� x2Þq2 � lx222; ð5Þ
respectively. Note that the profits of the integrated firm include both its revenue from the
input sales and from the final good sales.
In the last stage of the game, each firm chooses its output in order to maximize its
profits. The first order conditions give rise to the following quantity reaction functions:
R1ðq2Þ ¼vþ ðx1 þ kx2Þ � dq2
2; R2ðq1Þ ¼
vþ ðx2 � wÞ � dq1
2ð6Þ
where v= a�A>0 denotes the market size. Observe that the terms within the parentheses
represent the ‘effective’ unit cost reduction of each firm. Solving for the Cournot–Nash
equilibrium quantities of the final goods, we obtain:
qC1 ðw; x1; x2Þ ¼vð2� dÞ � dðx2 � wÞ þ 2ðx1 þ kx2Þ
4� d2ð7Þ
8 As can be seen from Eq. (18) below, when d is too high (d > d), market foreclosure arises.

C. Milliou / Int. J. Ind. Organ. 22 (2004) 25–43 31
qC2 ðw; x2; x1Þ ¼vð2� dÞ þ 2ðx2 � wÞ � dðx1 þ kx2Þ
4� d2ð8Þ
In the second stage of the game, U-D1 chooses the wholesale price in order to maximize
its profits. Substituting (7) and (8) into (4) and taking the first order condition with respect
to w, we obtain:
wðx1; x2; kÞ ¼vð8� 4d2 þ d3Þ þ d3x1 þ x2ðkd3 þ 4ð2� d2ÞÞ
2ð8� 3d2Þ ð9Þ
An inspection of (9) reveals that the wholesale price of the input is always positive; hence,
D2 always faces a cost disadvantage relative to U-D1.
Substituting (9) into (7) and (8), we obtain the firms’ output as a function of their R&D
investments:
q1ðx1; x2; kÞ ¼vð8� 2d � d2Þ þ x1ð8� d2Þ � x2ð2d � kð8� d2ÞÞ
2ð8� 3d2Þ ð10Þ
q2ðx1; x2; kÞ ¼ 2vð1� dÞ � dx1 þ x2ð1� dkÞ
ð8� 3d2Þ ð11Þ
In the first stage of the game, firms choose their R&D levels in order to maximize their
profits. Substituting the wholesale price and quantities given by Eqs. (9)–(11) in the
profits functions (4) and (5), and differentiating the profits of U-D1 with respect to x1 and
of D2 with respect to x2, we obtain the firms’ R&D reaction functions:
R1ðx2; kÞ ¼vð8� 4d þ d2Þ � x2ð4d � kð8þ d2ÞÞ
2lð8� 3d2Þ � ð8þ d2Þ ð12Þ
R2ðx1; kÞ ¼8ð1� dkÞðvð1� dÞ � dx1Þ
lð8� 3d2Þ2 þ 8dkð2� dkÞ � 8
ð13Þ
Given that the denominators of both reaction functions are positive, it is clear from
(13) that the reaction function R2 has a negative slope, i.e. R&D efforts are strategic
substitutes from D2’s point of view. That is, an increase in U-D1’s effort reduces the
incentives of D2 to invest in R&D, both in the case of a ‘firewall’ (k = 0) and in the case
of information flow (k>0). In contrast, R&D efforts can be either strategic substitutes or
complements from U-D1’s point of view. This is reflected in (12) where the slope of the
reaction function depends on the sign of the term in the numerator that multiplies x2. As

Fig. 2. R&D reaction functions.
C. Milliou / Int. J. Ind. Organ. 22 (2004) 25–4332
in d’Aspremont and Jacquemin (1988), R&D investments are strategic substitutes
(complements) only for low (high) degree of spillovers, in particular when k is smaller
(greater) than
kcr ¼ 4d=ð8þ d2Þ:
Fig. 2(a) depicts the case in which R&D investments are strategic substitutes for both
firms. In this case, when the nonintegrated firm decreases its R&D investments, the
integrated firm increases its own investments. However, in the case that the R&D
investments are strategic complements only from the integrated firm’s point of view—
see Fig. 2(b)—the integrated firm reacts to a decrease in the R&D investments of the
nonintegrated firm by decreasing its own R&D expenses. The arrows indicate how the
reaction curves move as k increases (see the next section for an extensive analysis of the
R&D reaction functions).
From Eqs. (12) and (13), it follows that the equilibrium R&D effort levels are:
x1*ðkÞ ¼ vBþ K
Dþ Lð14Þ
x2*ðkÞ ¼ 8vð1� dkÞEDþ L
ð15Þ
where
B ¼ lð16ð4� 2d � d2Þ þ 3d3ð4� dÞÞ � 8 > 0; K ¼ 8kð1þ dð1� kÞÞ > 0
9
9 See De Bondt et al. (1992) for a similar relation between the critical value of k and d with two-way
spillovers.
C. Milliou / Int. J. Ind. Organ. 22 (2004) 25–43 33
D ¼ lð2lð8� 3d2Þ2 � 16ð5� d2Þ þ 3d4Þ þ 8 > 0
L ¼ 8dkð2lð2� dkÞ � 1Þ > 0; E ¼ 2lð1� dÞ � 1 > 0
Finally, substituting the equilibrium R&D effort levels (14) and (15) into (9), (10) and
(11), we obtain the equilibrium wholesale price and quantities:
w*ðkÞ ¼ lvF þ dK
Dþ Lð16Þ
q1*ðkÞ ¼ lvGþ K
Dþ Lð17Þ
q2*ðkÞ ¼ lv2H
Dþ Lð18Þ
where
F ¼ lð8ð8� 7d2 þ d3Þ þ 3d4ð4� dÞÞ � 4ð8þ 2d � 3d2Þ > 0
G ¼ lð16ð4� d � 2d2Þ þ 3d3ð2þ dÞÞ � 8ð1þ dÞ þ 3d3 > 0
H ¼ ð8� 3d2Þ 2lð1� dÞ � 1ð Þ > 0
Before turning to the comparison between information flow and ‘firewall’, it is worth
mentioning that the integrated firm undertakes higher R&D investments and produces
more output than the nonintegrated firm both in the case of a ‘firewall’ (k = 0) and in the
case of information flow (k > 0). This result reflects its competitive advantage relative to
the nonintegrated firm, which has to pay a higher price for obtaining the input.
Proposition 1. For all the values of k, 0\ k\ 1,
(i) the R&D investments of the integrated firm exceed the R&D investments of the
nonintegrated firm: x1*(k) > x2*(k),
(ii) the output of the integrated firm exceeds the output of the nonintegrated firm:
q1*(k)>q2*(k).
4. ‘Firewall’ versus information flow
In this part of the paper we compare the case of a ‘firewall’ with that of information
flow, and we discuss the effect of information flow on innovation, wholesale price, output,
and profits. We start by specifying how the R&D efforts of each firm behave with the
degree of information flow, taking into account that a ‘firewall’ requirement corresponds

C. Milliou / Int. J. Ind. Organ. 22 (2004) 25–4334
to the case of zero spillovers.10 Our main findings are summarized in the following
Proposition:
Proposition 2.
(i) The R&D investments of the nonintegrated firm decrease as the degree of spillovers k
increases, for 0\ k\ 1.
(ii) The R&D investments of the integrated firm increase as the degree of spillovers k
increases, for all k\max{1, k}, where k > kcr, and are always higher under information
flow (k > 0) than under a ‘firewall’ (k = 0).
In accordance with the expectations of the Antitrust Authorities, we find that the
information flow has a negative impact on the nonintegrated firm’s incentives to
innovate. That is, D2 undertakes lower R&D investments when there is information
flow than when there is a ‘firewall’. This is due to the lack of full appropriability of its
innovations under information flow, which reduces its incentives to carry out research
projects. In contrast with the expectations of the Antitrust Authorities, however, we find
that U-D1 undertakes higher R&D levels under information flow than under a ‘firewall’
requirement. Intuitively, the R&D spillovers reduce the costs of U-D1; this leads to an
increase in output which in turn reinforces the value of any cost reduction, inducing an
increase in its own R&D investments. A straightforward consequence is that the
‘effective’ R&D of U-D1, x1 + kx2, is also higher under information flow than under a
‘firewall’.11
Proposition 2 also states that an increase in the degree of spillovers k leads to a
decrease in the R&D efforts of D2. This can also be seen in Fig. 2(a and b) where the
arrows indicate the direction in which the reaction functions move when k increases. An
increase in k rotates counter-clockwise the reaction function of D2 around its intersection
with the horizontal axis in both graphs. Intuitively, an increase in the one-way spillovers
from D2 to U-D1 further discourages D2 from investing in R&D, since a larger part of its
inventions is now exploited by its rival.
On the other hand, an increase in k rotates clockwise the reaction function of the
integrated firm around its intersection with the x1 axis. In particular, if k is such that the
R&D investments are strategic substitutes for firm U-D1 (see Fig. 2(a)), an increase in k
makes the R1 curve steeper, with negative slope. Intuitively, an increase in the degree of
spillovers, given that the R&D investments are strategic substitutes, reinforces the output
effect of the R&D spillovers mentioned above, thus inducing a further increase in the
integrated firm’s R&D investments.
In the case that the R&D investments are strategic complements for the integrated
firm, inspection of Fig. 2(b) reveals that the impact of an increase in k on the
integrated firm’s R&D expenses is positive for values of k above and close enough to
10 For an analysis of the information flow’s impact on the aggregate effective R&D, see an earlier version of
the paper in Milliou (2001).11 The term ‘effective’ R&D refers to a firm’s total unit cost reduction that consists of both the firm’s own
R&D and its benefit from its rivals’ investments due to spillovers (see Kamien et al., 1992; De Bondt et al., 1992).
C. Milliou / Int. J. Ind. Organ. 22 (2004) 25–43 35
kcr, while for higher values of k it may be negative. The intuition for the latter case is
simple. If the R&D investments are strategic complements for the integrated firm, an
increase in the degree of spillovers makes the R&D efforts stronger strategic comple-
ments for U-D1. We know that D2 will react to an increase in k by decreasing its R&D
efforts. If the R&D investments are too costly (i.e. l is high enough), U-D1 also has an
incentive to reduce its R&D efforts in order to save on R&D costs. The latter positive
effect more than compensates the negative effect on profits due to the smaller unit cost
reduction.
Next we examine the effect of the information flow on firms’ output. Since the
investments in R&D allow firms to reduce their unit production costs, an increase
(decrease) in the effective R&D investments of a firm, should lead to an increase
(decrease) in the firm’s output. Note, however, that the effective unit cost reduction of
D2, and hence its output, also depends on the change in the input price charged by U-
D1. Comparing the wholesale price under a ‘firewall’ with that under information flow,
we find not only that the former exceeds the latter, but also that the wholesale price
decreases with k (see Proposition 3 below). The intuition behind this lies in the
information flow’s impact on the derived demand of the input. In particular, information
flow discourages D2 from conducting R&D and thus decreases its demand for the input,
leading U-D1 to charge a lower input price to avoid losing too much in profits from its
input sales.12
Proposition 3. The wholesale price of the input decreases as the degree of spillovers k
increases, for 0\ k\ 1.
The decrease in the wholesale price in the absence of a ‘firewall’, ceteris paribus,
reduces the cost advantage of the integrated firm’s downstream division and improves the
competitive position of the nonintegrated downstream firm. However, the R&D effect
dominates the wholesale price effect, and hence, information flow leads to an increase in
the output of the integrated firm and a decrease in the output of the nonintegrated firm. The
following Proposition summarizes:
Proposition 4.
(i) The output of the nonintegrated firm decreases as the degree of spillovers k increases,
for 0\ k\ 1.
(ii) The output of the integrated firm increases as the degree of spillovers k increases, for
all k\max{1, k}, where k > kcr, and is always higher under information flow (k >0) than
under a ‘firewall’ (k = 0).
Before turning to the welfare analysis, it is important to examine whether the integrated
firm does indeed have incentives to let information flow. In other words, it is important to
investigate whether or not the integrated firm has incentives to set up a ‘firewall’ on its
12 For an explanation along these lines see Banerjee and Lin (2003).

C. Milliou / Int. J. Ind. Organ. 22 (2004) 25–4336
own without the intervention of the Antitrust Authorities. To do so we compare its profits
with and without a ‘firewall’.
Proposition 5.
(i) The profits of the nonintegrated firm decrease as the degree of spillovers k increases,
for 0\ k\ 1.
(ii) The profits of the integrated firm increase as the degree of spillovers k increases, for
all k\max{1, k}, and are always higher under information flow (k > 0) than under a
‘firewall ’ (k = 0).
In the absence of a ‘firewall’, there are two different forces at work. On the one hand,
information flow allows U-D1 to free-ride on the investments of its competitor, enabling
it to increase its effective R&D and thus to expand its downstream business and increase
its profits from the final product sales. On the other hand, information flow hinders the
R&D incentives of D2, thereby reducing its demand for the input, leading to a lower
wholesale price and hence to lower profits from the upstream market for the integrated
firm. As Proposition 5 states, the former positive effect dominates the latter negative
effect. The net effect is thus an increase in the profits of the integrated firm due to the
information flow. This finding, which contrasts with the result of Hughes and Kao
(2001), confirms that in the absence of government intervention the upstream firm does
have incentives to transfer to its downstream subsidiary the information that it possesses
about its downstream rival. Regarding the nonintegrated firm, the decrease in its profits
when the spillovers increase is a straightforward consequence of the decrease in its R&D
investments and output (Proposition 2 and Proposition 4).
5. Welfare analysis
In order to answer the question whether or not the Antitrust Authorities should use
‘firewalls’, we turn to a welfare analysis. In particular, we compare the total welfare under
information flow with that under a ‘firewall’. We define total welfare as the sum of
producers’ and consumers’ surplus:
W ðkÞ ¼ ða� AÞðq1 þ q2Þ �1
2ðq21 þ q22 þ 2dq1q2Þ þ ðx1 þ kx2Þq1 þ x2q2
� l2ðx21 þ x22Þ ð19Þ
As it turns out, the net effect of the information flow on social welfare depends on the
efficiency of the R&D technology l, the degree of product differentiation d, and the rate of
spillovers k.
Proposition 6. For small and moderate values of l, as well as for large values of l when d
is sufficiently low, welfare is always higher under information flow (k > 0) than under a

Fig. 3. Welfare comparison for v= 1, l= 8 (—), l= 9 (– – ) and l= 10 (- -).
C. Milliou / Int. J. Ind. Organ. 22 (2004) 25–43 37
‘firewall’ (k = 0). For large values of l and d high enough, there exists a k such that for all
k > k welfare is higher under a ‘firewall’ (k = 0) than under information flow (k > 0), and
vice versa for all k < k. Moreover, k is decreasing in l.
In other words, for small or moderate cost of R&D, welfare under information flow
always exceeds that under a ‘firewall’. To gain some intuition, recall from Proposition
1 that U-D1 enjoys a larger market share than D2 both in the absence and in the
presence of information flow since it does not face the double mark-up problem faced
by D2.13 In other words, the two firms are asymmetric even in the absence of the
R&D investments, and obviously the integrated firm is the most efficient one since it
faces a lower marginal production cost. According to Proposition 2 and Proposition 4,
the presence of information flow increases the cost advantage of U-D1 as well as its
market share. Thus, under information flow output shifts to the more efficient firm,
entailing an increase in social welfare. Note that the same welfare result holds for
higher values of R&D cost, provided that the firms’ products are sufficiently
differentiated.
However, when the cost of R&D is quite high and the goods are very close
substitutes, the above result could be reversed, provided that the degree of spillovers
is high enough, i.e. k > k. As Fig. 3 shows, welfare under a ‘firewall’ is higher than under
information flow if e.g. l = 10 and d = 0.84 for all k > 0.99, while if l = 10 and d = 0.949
for all k > 0.926. The intuition is as follows. If R&D is very costly, even the integrated
firm will only undertake minimal amounts of R&D and hence the extra cost reduction
due to information flow plays a rather insignificant role in the welfare comparison.
Furthermore, when k is very high, the appropriability problem of the nonintegrated firm
is so severe that D2 undertakes very low investments in R&D and in turn U-D1 benefits
less from the information flow. Note also that the appropriability problem of D2
becomes stronger the closer substitutes the final goods are, since the fiercer the
competition, the stronger the negative impact of the lack of full appropriability on
D2’s R&D investments. The combination of all these effects may lead to a reversal of
13 We are grateful to an anonymous referee for pointing this out.
C. Milliou / Int. J. Ind. Organ. 22 (2004) 25–4338
the welfare result. For this reversal to occur, it is required that the goods are close
substitutes, R&D is quite costly, and the degree of spillovers is high.
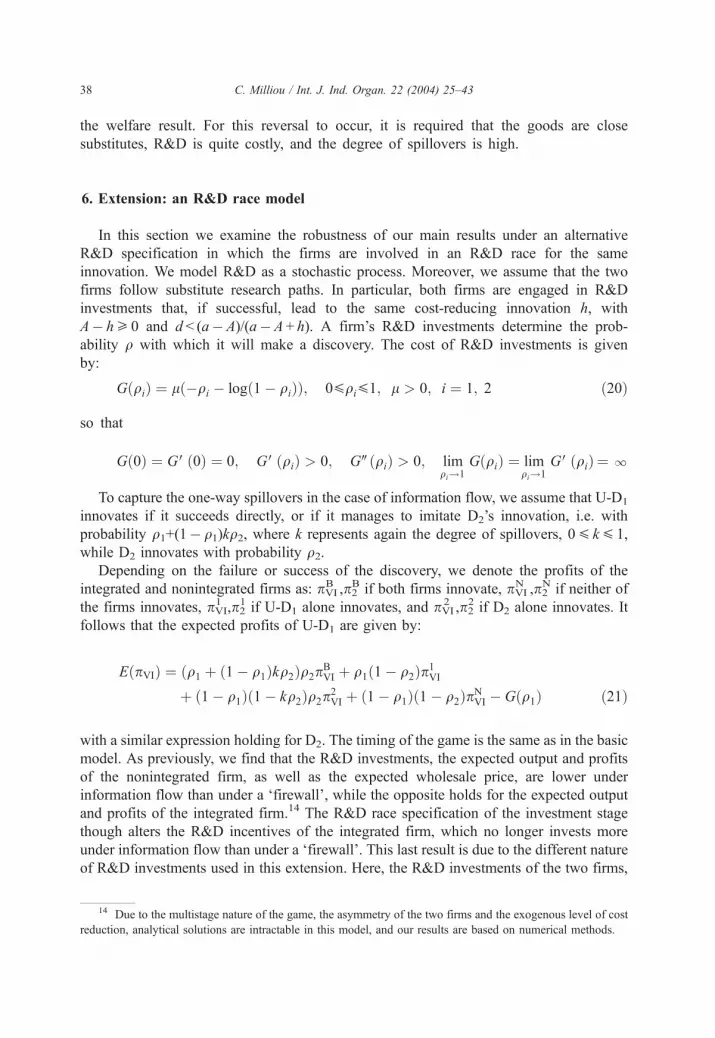
6. Extension: an R&D race model
In this section we examine the robustness of our main results under an alternative
R&D specification in which the firms are involved in an R&D race for the same
innovation. We model R&D as a stochastic process. Moreover, we assume that the two
firms follow substitute research paths. In particular, both firms are engaged in R&D
investments that, if successful, lead to the same cost-reducing innovation h, with
A� h[ 0 and d < (a�A)/(a�A + h). A firm’s R&D investments determine the prob-
ability q with which it will make a discovery. The cost of R&D investments is given
by:
GðqiÞ ¼ lð�qi � logð1� qiÞÞ; 0\qi\1; l > 0; i ¼ 1; 2 ð20Þ
so that
Gð0Þ ¼ GVð0Þ ¼ 0; GVðqiÞ > 0; GWðqiÞ > 0; limqi!1
GðqiÞ ¼ limqi!1
GVðqiÞ ¼ l
To capture the one-way spillovers in the case of information flow, we assume that U-D1
innovates if it succeeds directly, or if it manages to imitate D2’s innovation, i.e. with
probability q1+(1� q1)kq2, where k represents again the degree of spillovers, 0\ k\ 1,
while D2 innovates with probability q2.Depending on the failure or success of the discovery, we denote the profits of the
integrated and nonintegrated firms as: pVIB ,p2
B if both firms innovate, pVIN ,p2
N if neither of
the firms innovates, pVI1 ,p2
1 if U-D1 alone innovates, and pVI2 ,p2
2 if D2 alone innovates. It
follows that the expected profits of U-D1 are given by:
EðpVIÞ ¼ ðq1 þ ð1� q1Þkq2Þq2pBVI þ q1ð1� q2Þp1
VI
þ ð1� q1Þð1� kq2Þq2p2VI þ ð1� q1Þð1� q2ÞpN
VI � Gðq1Þ ð21Þ
with a similar expression holding for D2. The timing of the game is the same as in the basic
model. As previously, we find that the R&D investments, the expected output and profits
of the nonintegrated firm, as well as the expected wholesale price, are lower under
information flow than under a ‘firewall’, while the opposite holds for the expected output
and profits of the integrated firm.14 The R&D race specification of the investment stage
though alters the R&D incentives of the integrated firm, which no longer invests more
under information flow than under a ‘firewall’. This last result is due to the different nature
of R&D investments used in this extension. Here, the R&D investments of the two firms,
14 Due to the multistage nature of the game, the asymmetry of the two firms and the exogenous level of cost
reduction, analytical solutions are intractable in this model, and our results are based on numerical methods.

C. Milliou / Int. J. Ind. Organ. 22 (2004) 25–43 39
if successful, lead to the same level of cost reduction. For instance, in the case that U-D1
succeeds on its own in achieving the cost reduction h, the spillovers from D2 in case it
succeeds as well, do not lead to a greater cost reduction, and hence they do not increase the
incentives for further investments in R&D. Moreover, due to the existence of the
spillovers, U-D1 can achieve the same cost reduction by incurring fewer expenses in
R&D, thus enjoying higher profits than under a ‘firewall’. What is important to notice
though is that the expected effective R&D of the integrated firm, that is its expected total
cost reduction x = q1+(1� q1)kq2, is higher under information flow than under a ‘firewall’,
just as in the basic model.
As regards welfare, numerical calculations indicate that when firms race for a unique
cost-reducing innovation, information flow is preferable to a ‘firewall’. The main intuition
behind this result does not only come from the asymmetric market shares effect mentioned
above, but also from the fact that spillovers now contribute to reducing the duplication of
the R&D investment costs. In the absence of spillovers there exists duplication of R&D
expenses. Information flow reduces the R&D investments and thus the duplication of the
expenses, without, however, necessarily decreasing the total cost reduction, and hence it
leads to an increase in welfare.
7. Conclusions
We have investigated the impact of information flow on firms’ R&D incentives and
welfare in a partially vertically integrated industry. We have used a simple model, in which
a vertically integrated firm has the monopoly in the upstream market and competes with a
nonintegrated firm in the downstream market. Both firms undertake cost-reducing R&D
investments, produce differentiated goods and compete in the final goods market.
We have shown that if information regarding the R&D of the nonintegrated down-
stream firm flows between the different divisions of the vertically integrated firm, the
nonintegrated firm’s incentives to innovate are reduced, but those of the integrated firm
may be increased. The latter occurs when the firms’ research paths are complementary (as
in d’Aspremont and Jacquemin, 1988). In contrast, when firms are involved in an R&D
race for a unique cost-reducing innovation, the R&D incentives of the integrated firm
decrease with the information flow. However, under both R&D specifications, the
effective R&D of the integrated firm is higher under information flow than under a
‘firewall’. Our findings thus cast some doubt on the concerns of the Antitrust Authorities
that information flow is detrimental to the firms’ innovation activities.
Our welfare results also provide insights against the implementation of ‘firewalls’ in a
wide set of circumstances. In particular, we have shown that under complementary
research paths welfare is higher under information flow than under a ‘firewall’, unless
information spillovers are high, goods are close substitutes and R&D is quite costly.
Moreover, under substitute research paths, welfare is also typically higher under infor-
mation flow.
Nevertheless, before any policy conclusions be taken too literally, one has to recall that
our results are based upon a number of simplified assumptions. Future research should
consider a more general set of assumptions, as well as alternative market structures with
C. Milliou / Int. J. Ind. Organ. 22 (2004) 25–4340
more downstream firms and an upstream oligopoly, in order to examine the impact of the
information flow in different industry settings.
8. Further reading
De Bondt, 1996; Delbono and Denicolo, 1991; Katz and Ordover, 1990; Klass and
Salinger, 1995; Krattenmaker and Salop, 1986; Motta, 1992; Reiffen and Vita, 1995;
Willcox, 1995.
Acknowledgements
I am grateful to Massimo Motta for his valuable comments and suggestions. I wish also
to thank the editor Vincenzo Denicolo, Bruno Jullien, Emmanuel Petrakis, Karl Schlag,
and two anonymous referees for contributing substantially to the improvement of the
paper. I am of course responsible for any errors or omissions.
Appendix
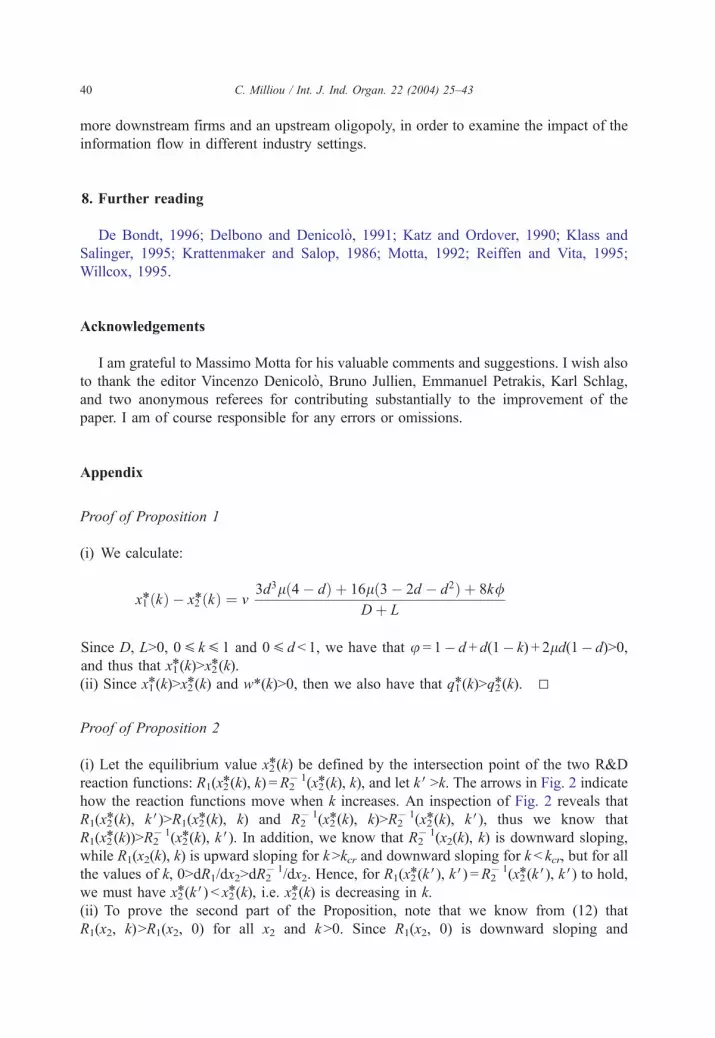
Proof of Proposition 1
(i) We calculate:
x1*ðkÞ � x2*ðkÞ ¼ v3d3lð4� dÞ þ 16lð3� 2d � d2Þ þ 8k/
Dþ L
Since D, L>0, 0\ k\ 1 and 0\ d< 1, we have that u = 1� d+ d(1� k) + 2ld(1� d)>0,
and thus that x1*(k)>x2*(k).
(ii) Since x1*(k)>x2*(k) and w*(k)>0, then we also have that q1*(k)>q2*(k). 5
Proof of Proposition 2
(i) Let the equilibrium value x2*(k) be defined by the intersection point of the two R&D
reaction functions: R1(x2*(k), k) =R2� 1(x2*(k), k), and let kV>k. The arrows in Fig. 2 indicate
how the reaction functions move when k increases. An inspection of Fig. 2 reveals that
R1(x2*(k), k V)>R1(x2*(k), k) and R2� 1(x2*(k), k)>R2
� 1(x2*(k), k V), thus we know that
R1(x2*(k))>R2� 1(x2*(k), k V). In addition, we know that R2
� 1(x2(k), k) is downward sloping,
while R1(x2(k), k) is upward sloping for k>kcr and downward sloping for k < kcr, but for all
the values of k, 0>dR1/dx2>dR2� 1/dx2. Hence, for R1(x2*(kV), kV) =R2
� 1(x2*(k V), k V) to hold,
we must have x2*(kV) < x2*(k), i.e. x2*(k) is decreasing in k.
(ii) To prove the second part of the Proposition, note that we know from (12) that
R1(x2, k)>R1(x2, 0) for all x2 and k>0. Since R1(x2, 0) is downward sloping and

C. Milliou / Int. J. Ind. Organ. 22 (2004) 25–43 41
x2(0)>x2(k), we have R1(x2(k), 0)>R1(x2(0), 0). It follows that R1(x2(k),
k)>R1(x2(k), 0)>R1(x2(0), 0), i.e. x1(k)>x1(0).15 Letting again kV>k, we know
from (12) that R1(x2(k), kV)>R1(x2(k), k) for all x2 and k, kV < kcr. In addition,
we know that R1(x2(k), k) is downward sloping for k < kcr and that x2(k)>x2(kV).Hence, the following inequality R1(x2(kV), k)>R1(x2(k), k) holds. From these two
inequalities, it follows that R1(x2(kV), kV)>R1(x2(k), kV)>R1(x2(k), k), i.e. x1(k) is
increasing in k for k < kcr. In order to show that x1*(k) is increasing in k, for
kVmax{1, k}, we differentiate x1*(k) with respect to k. Setting the derivative
equal to zero, and solving for k, k ¼ ð1=8dÞfð8� 3d2Þffiffiffiffiffiffiffiffiffiffiffiffiffiffiffiffiffiffiffiffiffiffiffiffiffiffiffiffiffiffiffiffiffiffiffiffi½ð8þ d2Þ2A� 8A
pþ 8þ
ð3d4þ 16d2� 64ÞAg is obtained. It can be checked that k > kcr for all d and land that k>1 for some parameter values (e.g. for d small enough). In this latter
case x1*(k) increases with k for all the values of k. 5
Proof of Proposition 3
Differentiating Eq. (16) with respect to k we obtain:
Aw*ðkÞAk
¼ 8lvð2lð1� dÞ � 1Þ
� 8dkð2� dkÞ þ 12ð2� d2Þ � lð8� 3d2Þð2kd3 � 5d2 þ 8ÞðDþ LÞ2
The denominator of the above expression is always positive. The first part of the
numerator, 8lv[2l(1� d)� 1], is positive under Assumption 1. As for the second part, it
decreases with l. Hence, it takes its highest value for the lowest possible l, which from
Assumption 1, equals 1/[2(1� d)]. Substituting l = 1/[2(1� d)] into the second part of the
numerator we obtain:
2dk½16ð1� dÞ þ d4 � 8dðd � dk þ kÞ � 16� 5d4 � 24ð2þ dÞð1� dÞ2ð1� dÞ
This expression is always negative for 0V kV 1 and 0V d < 1, i.e. w*(k) decreases
with k. 5
Proof of Proposition 4
(i) Differentiate Eq. (18) with respect to k and follow the same procedure as in
Proposition 3.
(ii) For the first part, it is easy to check that the partial derivative of q1*(k) with respect to k
at k = 0 is positive. In order to show that q1*(k) is increasing in k, for kVmax{1, k}, we
differentiate q1*(k) with respect to k. Setting the derivative equal to zero and solving for k,
we obtain the following: k= (1 / 8 d ) (8� ( 64� 32 d 2 + 3 d 4 ) l +ffiffiffiffiffiffiffiffiffiffiffiffiffiffiffiffiffiffiffiffiffiffiffiffiffið8� 3 d 2Þ S
p, where
S = 8d 2� 8(8� 3d2)l+(8� d2)2(8� 3d2)l2. It can be checked that k>kcr for all d and l.Moreover, it can be checked that k>1 for some parameter values (e.g. for d small enough),
15 We thank an anonymous referee for suggesting this part of the proof.

C. Milliou / Int. J. Ind. Organ. 22 (2004) 25–4342
in which case q1*(k) increases with k for all values of k. To prove the second part, we
calculate, for 0 < kV 1:
q1ðkÞ � q1ð0Þ ¼ð8� d2Þðx1ðkÞ � x1ð0ÞÞ þ 2dðx2ð0Þ � x2ðkÞÞ þ kð8� d2Þx2ðkÞ
2ð8� 3d2Þ
Since from Proposition 2 we have x1*(k)>x1*(0) and x2*(0)>x2*(k), it follows
q1*(k)>q1*(0). 5
Proof of Proposition 5
(i) We obtain the equilibrium profits of D2, p2*(k), by substituting the equilibrium values,
(14), (15), (16), (17), and (18), into (5). Differentiating p2*(k) with respect to k the result
follows.
(ii) Outline of the proof: we obtain the equilibrium profits of U-D1, pVI* (k), by substituting
the equilibrium values, (14), (15), (16), (17), (18), into (4). Our task is to show that pVI* (k)
is a quasi-concave function of k for 0\ k\ 1. For this purpose, we take the derivative of
pVI* (k) with respect to k, which is given by the ratio N/D1, where D1>0. The first step is to
check that this derivative is positive at k = 0, which implies that N(0)>0. The second step is
to show that the second derivative of N with respect to k, denoted by Nkk, is negative for all
k. To show this, we demonstrate that it is negative for the minimum value of l given by
Assumption 1, we then show that the first derivative of Nkk with respect to l is negative at
the minimum value of l, and finally that the second derivative of Nkk with respect to l is
negative for all l. This implies that Nkk is initially negative and that it decreases, at an
increasing rate, with l. Hence, its maximum value is attained at the minimum value of l,at which we already know that it is negative. This establishes that pVI* (k) is quasi-concave
in k. The next step is to check whether N(1) is positive or negative. When N(1) is positive,
a result which holds for small values of d, pVI* (k) is increasing in k for all 0\ k\ 1; hence,
pVI* (k)>pVI* (0), with 0 < k\ 1. On the other hand, when N(1) is negative, we know that
pVI* (k) is initially increasing and then decreasing in k. The final step is to show that
pVI* (1)>pVI* (0), which again implies that pVI* (k)>pVI* (0), with 0 < k\ 1. 5
Proof of Proposition 6
Outline of the proof.16 We follow the same steps as in the proof of Proposition 5, part (ii),
in order to show that W(k) is quasi-concave in k for all 0\ k\ 1. Proceeding then in a
similar manner, we find that, contrary to the above case, when l and d are sufficiently high,
W(0)>W(1), while the opposite is true for all the other values. It follows that ifW(0) <W(1),
welfare is higher under information flow. While ifW(0)>W(1), quasi-concavity implies that
there exists a unique k such that for all k < k welfare is higher under information flow (k>0)
than under a ‘firewall’ (k = 0) and vice versa for all k>k, where k solvesW(0) =W(k). Finally,
in order to show that k is decreasing in l we proceed as follows. We show that both the first
derivative of W(k) with respect to l, denoted by Wl, at the minimum value of l, and the
16 The detailed proofs of Proposition 5 and Proposition 6 are available from the author upon request.
C. Milliou / Int. J. Ind. Organ. 22 (2004) 25–43 43
second derivative of W(k) with respect to l, denoted by Wll, are negative. The former can
be checked directly. For the latter, we first prove that it is negative for the minimum value of
l and then that the third derivative of W(k) with respect to l, denoted by Wlll, is negative.
These two results imply that W(k) is decreasing, at an increasing rate in l, hence its
maximum value is obtained at the minimum value of l. 5
References
d’Aspremont, C., Jacquemin, A., 1988. Cooperative and non-cooperative R&D in duopoly with spillovers.
American Economic Review 78, 1133–1137.
Banerjee, S., Lin, P., 2003. Downstream R&D, rising rivals’ costs, and input price contracts. International Journal
of Industrial Organization 21, 79–96.
De Bondt, R., 1996. Spillovers and innovative activities. International Journal of Industrial Organization 15,
1–28.
De Bondt, R., Slaets, P., Cassiman, B., 1992. The degree of spillovers and the number of rivals for maximum
effective R&D. International Journal of Industrial Organization 10, 35–54.
Delbono, F., Denicolo, V., 1991. Incentives to innovate in a Cournot oligopoly. Quarterly Journal of Economics
106, 951–961.
Hughes, S.J., Kao, L.J., 2001. Vertical integration and proprietary information transmission. Journal of Econom-
ics and Management Strategy 10, 277–299.
Kamien, M.I., Muller, E., Zang, I., 1992. Research joint ventures and R&D cartels. American Economic Review
82, 1293–1306.
Katsoulacos, Y., Ulph, D., 1998. Endogenous spillovers and the performance of research joint ventures. Journal
of Industrial Economics 46, 333–357.
Katz, M.L., Ordover, J.A., 1990. R&D cooperation and competition. Brookings Papers of Economic Activity
Microeconomics 137–203.
Klass, M.W., Salinger, M., 1995. Do new theories of vertical foreclosure provide sound guidance for consent
agreements in vertical merger cases? The Antitrust Bulletin Fall 667–694.
Krattenmaker, T.G., Salop, S.C., 1986. Anticompetitive exclusion: raising rivals’ costs to achieve power over
price. The Yale Law Journal 96, 209–293.
Milliou, C., 2001. Vertical integration and R&D spillovers: is there a need for ‘firewalls’? European University
Institute Working Paper No. 2001/17.
Motta, M., 1992. Cooperative R&D and vertical product differentiation. International Journal of Industrial
Organization 10, 643–662.
Reiffen, D., Vita, M., 1995. Comment: is there new thinking on vertical mergers? Antitrust Law Journal 63,
917–941.
Rey, P., Tirole, J., forthcoming. A primer on foreclosure. In: Armstrong, M., Porter, R.H. (Eds.), Handbook of
Industrial Organization, vol. 3. North Holland, Amsterdam.
Singh, N., Vives, X., 1984. Price and quantity competition in a differentiated duopoly. Rand Journal of Eco-
nomics 15, 546–554.
Thomas, C.J., 1996. Market structure and the flow of information in repeated auctions. Bureau of Economics
Working Paper No. 213.
Willcox, T.C., 1995, Behavioral remedies in a post-Chicago world: it’s time to revise the merger guidelines. The
Antitrust Bulletin Spring 227–256.