vertical-axis rotations determined from paleomagnetism of mesozoic and cenozoic strata of the...
TRANSCRIPT
Vertical-axis rotations determined from paleomagnetism of Mesozoic
and Cenozoic strata of the Bolivian Andes
David R. Richards1 and Robert F. Butler2
Department of Geosciences, University of Arizona, Tucson, Arizona, USA
Thierry Sempere3
Institut de Recherche pour le Developpement (IRD), Lima, Peru
Received 16 January 2004; revised 15 April 2004; accepted 6 May 2004; published 17 July 2004.
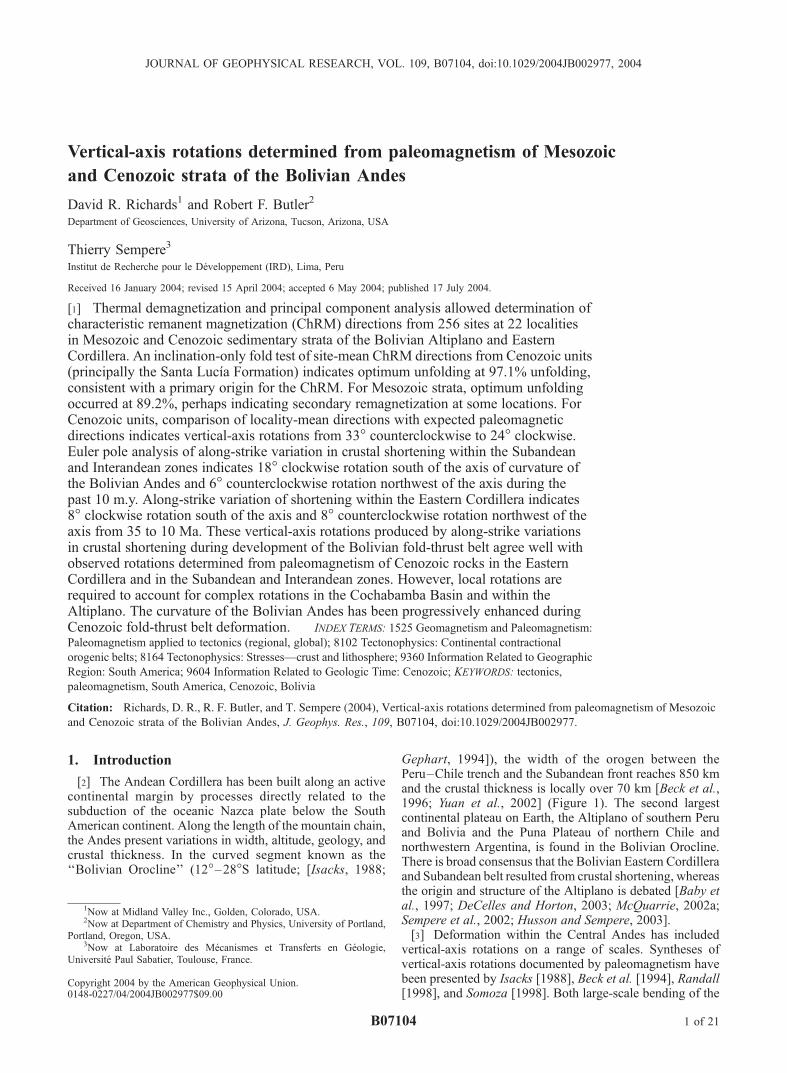
[1] Thermal demagnetization and principal component analysis allowed determination ofcharacteristic remanent magnetization (ChRM) directions from 256 sites at 22 localitiesin Mesozoic and Cenozoic sedimentary strata of the Bolivian Altiplano and EasternCordillera. An inclination-only fold test of site-mean ChRM directions from Cenozoic units(principally the Santa Lucıa Formation) indicates optimum unfolding at 97.1% unfolding,consistent with a primary origin for the ChRM. For Mesozoic strata, optimum unfoldingoccurred at 89.2%, perhaps indicating secondary remagnetization at some locations. ForCenozoic units, comparison of locality-mean directions with expected paleomagneticdirections indicates vertical-axis rotations from 33� counterclockwise to 24� clockwise.Euler pole analysis of along-strike variation in crustal shortening within the Subandeanand Interandean zones indicates 18� clockwise rotation south of the axis of curvature ofthe Bolivian Andes and 6� counterclockwise rotation northwest of the axis during thepast 10 m.y. Along-strike variation of shortening within the Eastern Cordillera indicates8� clockwise rotation south of the axis and 8� counterclockwise rotation northwest of theaxis from 35 to 10 Ma. These vertical-axis rotations produced by along-strike variationsin crustal shortening during development of the Bolivian fold-thrust belt agree well withobserved rotations determined from paleomagnetism of Cenozoic rocks in the EasternCordillera and in the Subandean and Interandean zones. However, local rotations arerequired to account for complex rotations in the Cochabamba Basin and within theAltiplano. The curvature of the Bolivian Andes has been progressively enhanced duringCenozoic fold-thrust belt deformation. INDEX TERMS: 1525 Geomagnetism and Paleomagnetism:
Paleomagnetism applied to tectonics (regional, global); 8102 Tectonophysics: Continental contractional
orogenic belts; 8164 Tectonophysics: Stresses—crust and lithosphere; 9360 Information Related to Geographic
Region: South America; 9604 Information Related to Geologic Time: Cenozoic; KEYWORDS: tectonics,
paleomagnetism, South America, Cenozoic, Bolivia
Citation: Richards, D. R., R. F. Butler, and T. Sempere (2004), Vertical-axis rotations determined from paleomagnetism of Mesozoic
and Cenozoic strata of the Bolivian Andes, J. Geophys. Res., 109, B07104, doi:10.1029/2004JB002977.
1. Introduction
[2] The Andean Cordillera has been built along an activecontinental margin by processes directly related to thesubduction of the oceanic Nazca plate below the SouthAmerican continent. Along the length of the mountain chain,the Andes present variations in width, altitude, geology, andcrustal thickness. In the curved segment known as the‘‘Bolivian Orocline’’ (12�–28�S latitude; [Isacks, 1988;
Gephart, 1994]), the width of the orogen between thePeru–Chile trench and the Subandean front reaches 850 kmand the crustal thickness is locally over 70 km [Beck et al.,1996; Yuan et al., 2002] (Figure 1). The second largestcontinental plateau on Earth, the Altiplano of southern Peruand Bolivia and the Puna Plateau of northern Chile andnorthwestern Argentina, is found in the Bolivian Orocline.There is broad consensus that the Bolivian Eastern Cordilleraand Subandean belt resulted from crustal shortening, whereasthe origin and structure of the Altiplano is debated [Baby etal., 1997; DeCelles and Horton, 2003; McQuarrie, 2002a;Sempere et al., 2002; Husson and Sempere, 2003].[3] Deformation within the Central Andes has included
vertical-axis rotations on a range of scales. Syntheses ofvertical-axis rotations documented by paleomagnetism havebeen presented by Isacks [1988], Beck et al. [1994], Randall[1998], and Somoza [1998]. Both large-scale bending of the
JOURNAL OF GEOPHYSICAL RESEARCH, VOL. 109, B07104, doi:10.1029/2004JB002977, 2004
1Now at Midland Valley Inc., Golden, Colorado, USA.2Now at Department of Chemistry and Physics, University of Portland,
Portland, Oregon, USA.3Now at Laboratoire des Mecanismes et Transferts en Geologie,
Universite Paul Sabatier, Toulouse, France.
Copyright 2004 by the American Geophysical Union.0148-0227/04/2004JB002977$09.00
B07104 1 of 21
Central Andes and ball-bearing or rotating-panel vertical-axis rotations of crustal blocks (10–20 km dimensions) haveaffected the forearc region of southern Peru and northernChile [Beck et al., 1994; May and Butler, 1985]. Recentstudies of vertical-axis rotations in these coastal regionsinclude Beck [1987, 1988, 1998], Randall [1998], Randallet al. [2001], Rousse et al. [2002], Somoza et al. [1996, 1999]
and Somoza and Tomlinson [2002]. The number of paleo-magnetic results from the forearc region has increasedsubstantially during the past decade. These data clearlyindicate the importance of local block rotations perhapsresulting from distributed shear of the South Americancontinental margin by oblique subduction [McQuarrie,2002a].
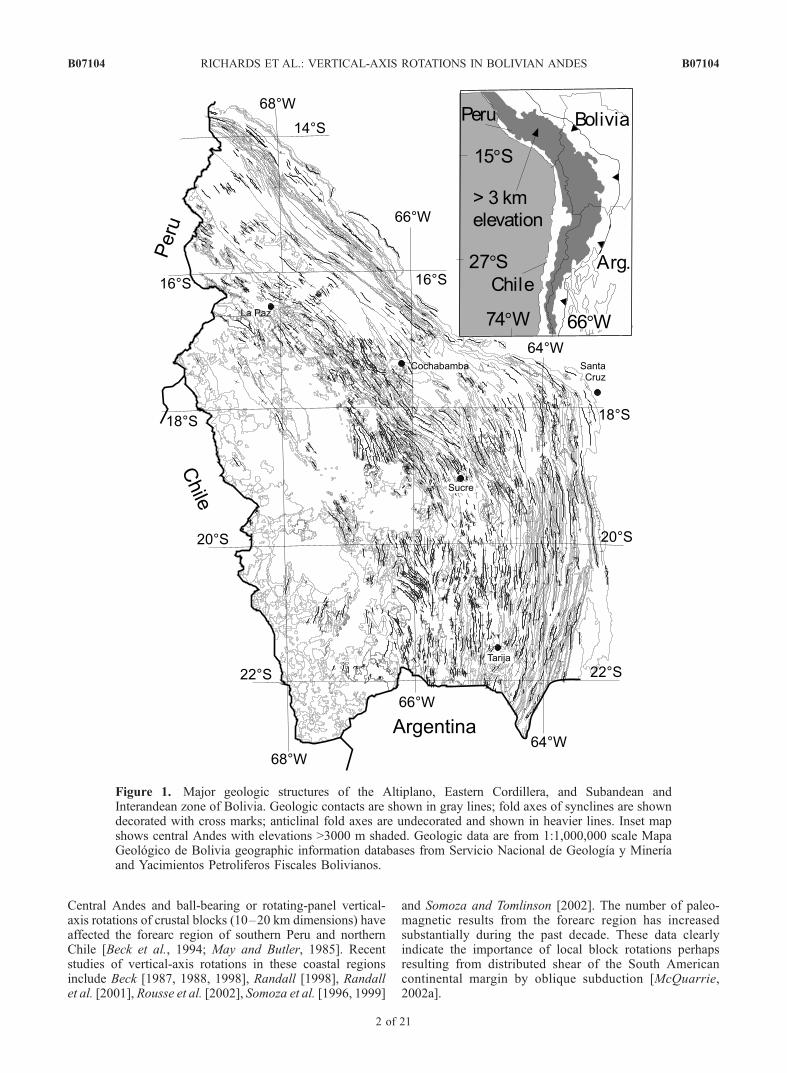
Figure 1. Major geologic structures of the Altiplano, Eastern Cordillera, and Subandean andInterandean zone of Bolivia. Geologic contacts are shown in gray lines; fold axes of synclines are showndecorated with cross marks; anticlinal fold axes are undecorated and shown in heavier lines. Inset mapshows central Andes with elevations >3000 m shaded. Geologic data are from 1:1,000,000 scale MapaGeologico de Bolivia geographic information databases from Servicio Nacional de Geologıa y Minerıaand Yacimientos Petroliferos Fiscales Bolivianos.
B07104 RICHARDS ET AL.: VERTICAL-AXIS ROTATIONS IN BOLIVIAN ANDES
2 of 21
B07104
[4] A complete analysis of the Central Andes of Bolivia,northern Chile, northwest Argentina, and Peru is beyond thescope of this paper. Instead we focus on the Bolivian Andes.The Bolivian Orocline is not an orocline in the sense of anoriginally straight mountain system that has been bent into acurved map pattern as discussed by Carey [1955]. TheBolivian Orocline is essentially a megasalient in the orogenthat displays along-strike variations in the amount of crustalshortening [Marshak, 1988]. Analysis of vertical-axis rota-tions in the Bolivian Orocline as the result of enhancedcurvature of the mountain belt associated with crustalshortening and building of the Altiplano and Puna plateauswas initiated by Isacks [1988]. Analyses of paleomagneti-cally determined vertical-axis rotations within the BolivianAndes have been presented by MacFadden et al. [1990,1995], Butler et al. [1995], Roperch et al. [2000], and Lamb[2001a, 2001b]. In this paper, we present paleomagneticdata from Paleogene and Mesozoic sedimentary rocks at alarge number of localities within the Altiplano and EasternCordillera of Bolivia. We then analyze resulting determi-nations of vertical-axis rotations within the Bolivian fold-thrust belt using recent structural geologic studies thatestimate along-strike variations in crustal shortening [Babyet al., 1997; Kley, 1999; Kley and Monaldi, 1998; Kley etal., 1999; McQuarrie, 2002a, 2002b].
2. Paleomagnetic Sampling and Methods
[5] Paleomagnetic samples were collected from numer-ous outcrops of Mesozoic and Cenozoic red sedimentarystrata within the Eastern Cordillera and the eastern portionof the Altiplano of Bolivia. Lithostratigraphy and geochro-nology of the sampled formations are taken from Sempere etal. [1997, 2002]. Uncertainties in age assignments of thesampled formations do not have major impact on interpre-tations of the paleomagnetic data. For example, the Potoco(Camargo) Formation is considered by Sempere et al.[1997] to be latest Paleocene-Oligocene on the basis ofthe paleontological data, whereas DeCelles and Horton[2003] suggest that its base is not older than Oligocene.Using reference paleomagnetic poles from Besse andCourtillot [2002], the expected paleomagnetic declinationat Camargo changes by only 2.2� between 50 Ma and 30 Maso vertical-axis rotation inferred from the observed paleo-magnetic declination of the Potoco (Camargo) Formation islittle affected by the age uncertainty.[6] We use the term ‘‘paleomagnetic locality’’ to indicate
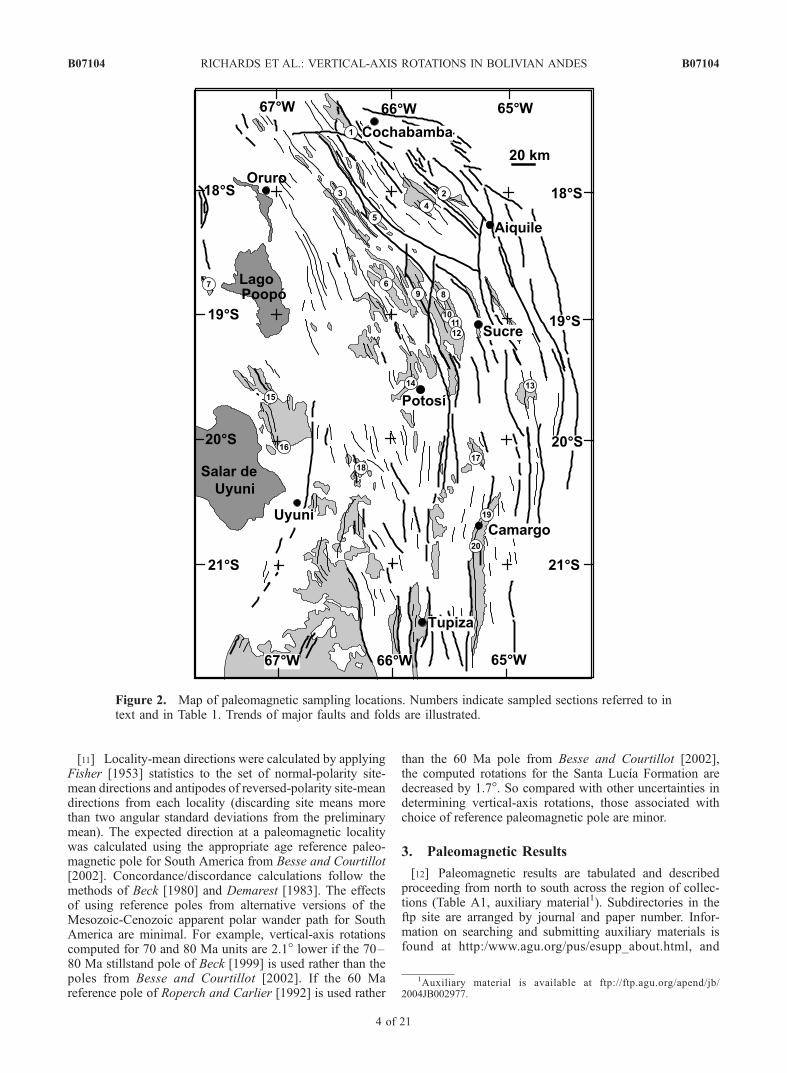
an area (dimensions usually <10 km) from which one orseveral stratigraphic sections were sampled. Localities areillustrated on the map in Figure 2. Localities were carefullyselected with two major considerations: (1) Sampled strati-graphic sections were 10s to 100s of meters in stratigraphicthickness so that the multiple paleomagnetic sites wouldprovide adequate sampling of geomagnetic secular varia-tion. (2) Recognizing the potential difficulty accounting forplunge of folds and attendant uncertainty in locality-meanpaleomagnetic declination, sampling localities favored thecentral portions of large folds remote from the noses ofthese structures where plunge correction is critical. Accord-ingly no plunge corrections have been applied to observedpaleomagnetic directions. Despite careful selection of sam-pling localities, it is not always possible to know with
certainty whether plunge corrections are required even inwhat appear to be straightforward structural geologic set-tings. In presentation of paleomagnetic data and discussionof results below, we provide cautionary notes about vertical-axis rotations determined from localities with steeply dip-ping strata.[7] Paleomagnetic sampling was done using methods
described by Butler [1992]. At each paleomagnetic site,oriented samples were collected either from a single sedi-mentary bed or several adjacent beds with cumulativestratigraphic thickness <1 m. At most sites, at least eightoriented samples (mostly cored samples) were collected ateach site. Exceptions include the four localities collectedduring magnetostratigraphic studies (Laguna Umayo, LaPalca, Sucusuma, and Tiupampa) where four orientedsamples were collected at each site [Butler et al., 1995;Sempere et al., 1997; Sige et al., 2004]. Site-mean direc-tions from those localities were illustrated by Butler et al.[1995] but were not tabulated in that publication; site-meandirections from Laguna Umayo have subsequently beentabulated by Sige et al. [2004]. For the La Palca, Sucusuma,and Tiupampa localities, site-mean directions that pass theselection criteria outlined below are tabulated here forcompleteness.[8] All samples were stored, thermally demagnetized and
measured in a magnetically shielded room with average fieldintensity below 200 nannoTesla (nT). After initial measure-ment of natural remanent magnetization (NRM), sampleswere thermally demagnetized at 10 to 20 temperatures from50�C to 700�C in furnaces with magnetic field <20 nT in thesample region. Representative behaviors during thermaldemagnetization are illustrated in Figure 3. As anticipatedfor red sedimentary rocks, unblocking temperatures are oftenconcentrated near the 680�C Neel temperature for hematite.For sites that failed to provide an acceptable site-mean ChRMdirection, erratic direction and intensity changes were oftenobserved at demagnetization temperatures above 500�C(Figure 3g). For sites yielding an acceptable site-mean ChRMdirection, sample ChRM directions were usually isolated inthe 550�C to 680�C interval.[9] Results from at least four successive temperatures were
analyzed by principal component analysis [Kirschvink, 1980]to determine sample characteristic remanent magnetization(ChRM) directions. Samples yielding maximum angulardeviation (MAD) >15� were rejected from further analysis.Site-mean ChRM directions were calculated using methodsof Fisher [1953] and sample ChRM directions more than twoangular standard deviations from the initial site-mean direc-tion were rejected prior to final site-mean calculation. Siteswith less than four sample ChRM directions and site-meandirections with a95 > 25� were rejected. Only two includedsites have a95 > 20� and the vast majority of sites have a95 <10�. When both normal and reverse polarity site-meandirections are present from a locality, the reversals test ofMcFadden and McElhinny [1990] was applied.[10] Almost all strata are in homoclinal sections or in
outcrops where bedding attitude changes are minor. Withonly one exception described below, the fold test wasindeterminate using either the methods described byMcFadden [1990] or Watson and Enkin [1993]. Followingpresentation of results from each locality, results of regionalinclination-only fold tests are presented.
B07104 RICHARDS ET AL.: VERTICAL-AXIS ROTATIONS IN BOLIVIAN ANDES
3 of 21
B07104
[11] Locality-mean directions were calculated by applyingFisher [1953] statistics to the set of normal-polarity site-mean directions and antipodes of reversed-polarity site-meandirections from each locality (discarding site means morethan two angular standard deviations from the preliminarymean). The expected direction at a paleomagnetic localitywas calculated using the appropriate age reference paleo-magnetic pole for South America from Besse and Courtillot[2002]. Concordance/discordance calculations follow themethods of Beck [1980] and Demarest [1983]. The effectsof using reference poles from alternative versions of theMesozoic-Cenozoic apparent polar wander path for SouthAmerica are minimal. For example, vertical-axis rotationscomputed for 70 and 80 Ma units are 2.1� lower if the 70–80 Ma stillstand pole of Beck [1999] is used rather than thepoles from Besse and Courtillot [2002]. If the 60 Mareference pole of Roperch and Carlier [1992] is used rather
than the 60 Ma pole from Besse and Courtillot [2002],the computed rotations for the Santa Lucıa Formation aredecreased by 1.7�. So compared with other uncertainties indetermining vertical-axis rotations, those associated withchoice of reference paleomagnetic pole are minor.
3. Paleomagnetic Results
[12] Paleomagnetic results are tabulated and describedproceeding from north to south across the region of collec-tions (Table A1, auxiliary material1). Subdirectories in theftp site are arranged by journal and paper number. Infor-mation on searching and submitting auxiliary materials isfound at http:/www.agu.org/pus/esupp_about.html, and
Figure 2. Map of paleomagnetic sampling locations. Numbers indicate sampled sections referred to intext and in Table 1. Trends of major faults and folds are illustrated.
1Auxiliary material is available at ftp://ftp.agu.org/apend/jb/2004JB002977.
B07104 RICHARDS ET AL.: VERTICAL-AXIS ROTATIONS IN BOLIVIAN ANDES
4 of 21
B07104
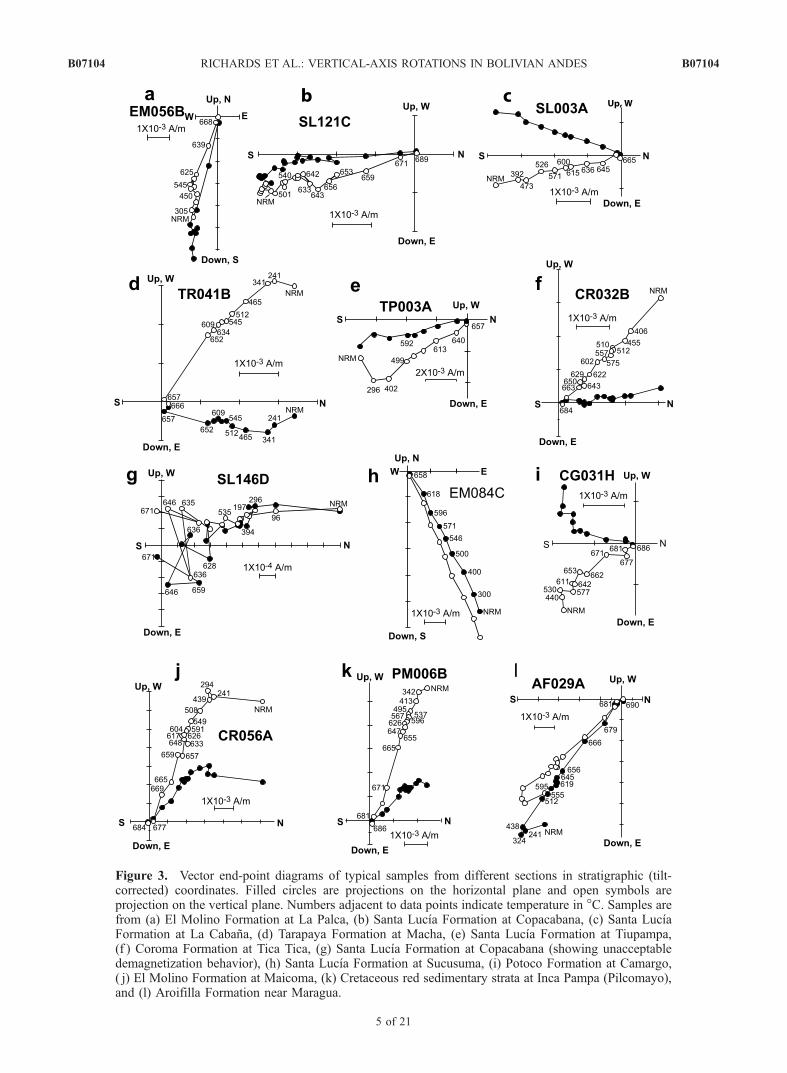
Figure 3. Vector end-point diagrams of typical samples from different sections in stratigraphic (tilt-corrected) coordinates. Filled circles are projections on the horizontal plane and open symbols areprojection on the vertical plane. Numbers adjacent to data points indicate temperature in �C. Samples arefrom (a) El Molino Formation at La Palca, (b) Santa Lucıa Formation at Copacabana, (c) Santa LucıaFormation at La Cabana, (d) Tarapaya Formation at Macha, (e) Santa Lucıa Formation at Tiupampa,(f ) Coroma Formation at Tica Tica, (g) Santa Lucıa Formation at Copacabana (showing unacceptabledemagnetization behavior), (h) Santa Lucıa Formation at Sucusuma, (i) Potoco Formation at Camargo,( j) El Molino Formation at Maicoma, (k) Cretaceous red sedimentary strata at Inca Pampa (Pilcomayo),and (l) Aroifilla Formation near Maragua.
B07104 RICHARDS ET AL.: VERTICAL-AXIS ROTATIONS IN BOLIVIAN ANDES
5 of 21
B07104
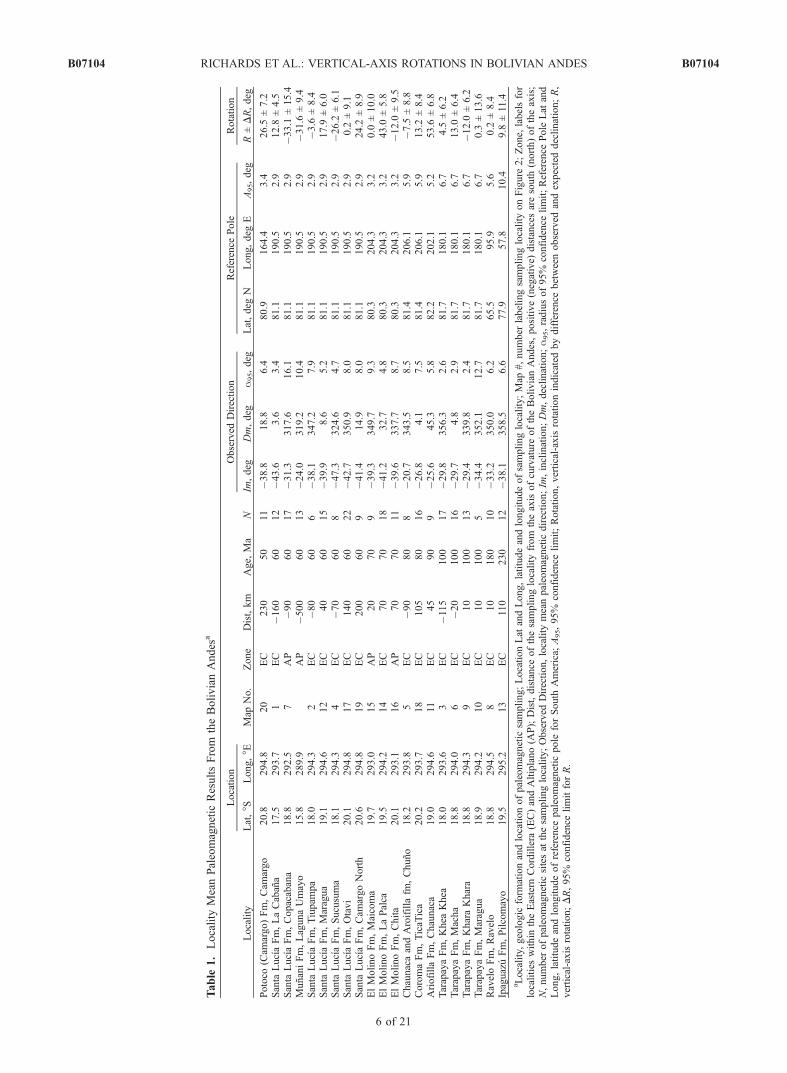
Table
1.Locality
MeanPaleomagnetic
ResultsFrom
theBolivianAndes
a
Locality
Location
Map
No.
Zone
Dist,km
Age,
Ma
N
Observed
Direction
Reference
Pole
Rotation
Lat,�S
Long,�E
Im,deg
Dm,deg
a95,deg
Lat,deg
NLong,deg
EA95,deg
R±DR,deg
Potoco
(Cam
argo)Fm,Cam
argo
20.8
294.8
20
EC
230
50
11
�38.8
18.8
6.4
80.9
164.4
3.4
26.5
±7.2
Santa
LucıaFm,LaCabana
17.5
293.7
1EC
�160
60
12
�43.6
3.6
3.4
81.1
190.5
2.9
12.8
±4.5
Santa
LucıaFm,Copacabana
18.8
292.5
7AP
�90
60
17
�31.3
317.6
16.1
81.1
190.5
2.9
�33.1
±15.4
MunaniFm,LagunaUmayo
15.8
289.9
AP
�500
60
13
�24.0
319.2
10.4
81.1
190.5
2.9
�31.6
±9.4
Santa
LucıaFm,Tiupam
pa
18.0
294.3
2EC
�80
60
6�38.1
347.2
7.9
81.1
190.5
2.9
�3.6
±8.4
Santa
LucıaFm,Maragua
19.1
294.6
12
EC
40
60
15
�39.9
8.6
5.2
81.1
190.5
2.9
17.9
±6.0
Santa
LucıaFm,Sucusuma
18.1
294.3
4EC
�70
60
8�47.3
324.6
4.7
81.1
190.5
2.9
�26.2
±6.1
Santa
LucıaFm,Otavi
20.1
294.8
17
EC
140
60
22
�42.7
350.9
8.0
81.1
190.5
2.9
0.2
±9.1
Santa
LucıaFm,Cam
argoNorth
20.6
294.8
19
EC
200
60
9�41.4
14.9
8.0
81.1
190.5
2.9
24.2
±8.9
ElMolinoFm,Maicoma
19.7
293.0
15
AP
20
70
9�39.3
349.7
9.3
80.3
204.3
3.2
0.0
±10.0
ElMolinoFm,LaPalca
19.5
294.2
14
EC
70
70
18
�41.2
32.7
4.8
80.3
204.3
3.2
43.0
±5.8
ElMolinoFm,Chita
20.1
293.1
16
AP
70
70
11
�39.6
337.7
8.7
80.3
204.3
3.2
�12.0
±9.5
ChaunacaandAroifilla
fm,Chuno
18.2
293.8
5EC
�90
80
8�20.7
343.5
8.5
81.4
206.1
5.9
�7.5
±8.8
CoromaFm,TicaT
ica
20.2
293.7
18
EC
105
80
16
�26.8
4.1
7.5
81.4
206.1
5.9
13.2
±8.4
AriofillaFm,Chaunaca
19.0
294.6
11
EC
45
90
9�25.6
45.3
5.8
82.2
202.1
5.2
53.6
±6.8
TarapayaFm,Khea
Khea
18.0
293.6
3EC
�115
100
17
�29.8
356.3
2.6
81.7
180.1
6.7
4.5
±6.2
TarapayaFm,Macha
18.8
294.0
6EC
�20
100
16
�29.7
4.8
2.9
81.7
180.1
6.7
13.0
±6.4
TarapayaFm,KharaKhara
18.8
294.3
9EC
10
100
13
�29.4
339.8
2.4
81.7
180.1
6.7
�12.0
±6.2
TarapayaFm,Maragua
18.9
294.2
10
EC
10
100
5�34.4
352.1
12.7
81.7
180.1
6.7
0.3
±13.6
RaveloFm,Ravelo
18.8
294.5
8EC
10
180
10
�33.2
350.0
6.2
65.5
95.9
5.6
0.2
±8.4
IpaguazuFm,Pilcomayo
19.5
295.2
13
EC
110
230
12
�38.1
358.5
6.6
77.9
57.8
10.4
9.8
±11.4
aLocality,geologic
form
ationandlocationofpaleomagnetic
sampling;LocationLat
andLong,latitudeandlongitudeofsamplinglocality;Map
#,number
labelingsamplinglocality
onFigure
2;Zone,labelsfor
localities
within
theEastern
Cordillera
(EC)andAltiplano(A
P);Dist,distance
ofthesamplinglocality
from
theaxisofcurvature
oftheBolivianAndes,positive(negative)
distancesaresouth
(north)oftheaxis;
N,number
ofpaleomagnetic
sitesat
thesamplinglocality;Observed
Direction,locality
meanpaleomagnetic
direction;Im
,inclination;Dm,declination;a95,radiusof95%
confidence
limit;Reference
Pole
Lat
and
Long,latitudeandlongitudeofreference
paleomagnetic
pole
forSouth
America;
A95,95%
confidence
limit;Rotation,vertical-axis
rotationindicated
bydifference
betweenobserved
andexpecteddeclination;R,
vertical-axisrotation;DR,95%
confidence
limitforR.
B07104 RICHARDS ET AL.: VERTICAL-AXIS ROTATIONS IN BOLIVIAN ANDES
6 of 21
B07104
Figure 2). Results from the Munani Formation at LagunaUmayo (15�450S; 70�90W) are tabulated and described bySige et al. [2004]. Forty-two sites were collected at thislocality for magnetostratigraphic analysis. Thirteen site-mean directions from Laguna Umayo pass the selectioncriteria and all are of reverse polarity. The locality-meandirection is included in Table 1. Comparison with theexpected direction determined from the 60 Ma paleomag-netic pole for South America indicates a large counterclock-wise rotation R ± DR = �31.6� ± 9.4� (Table 1).
3.1. La Cabana
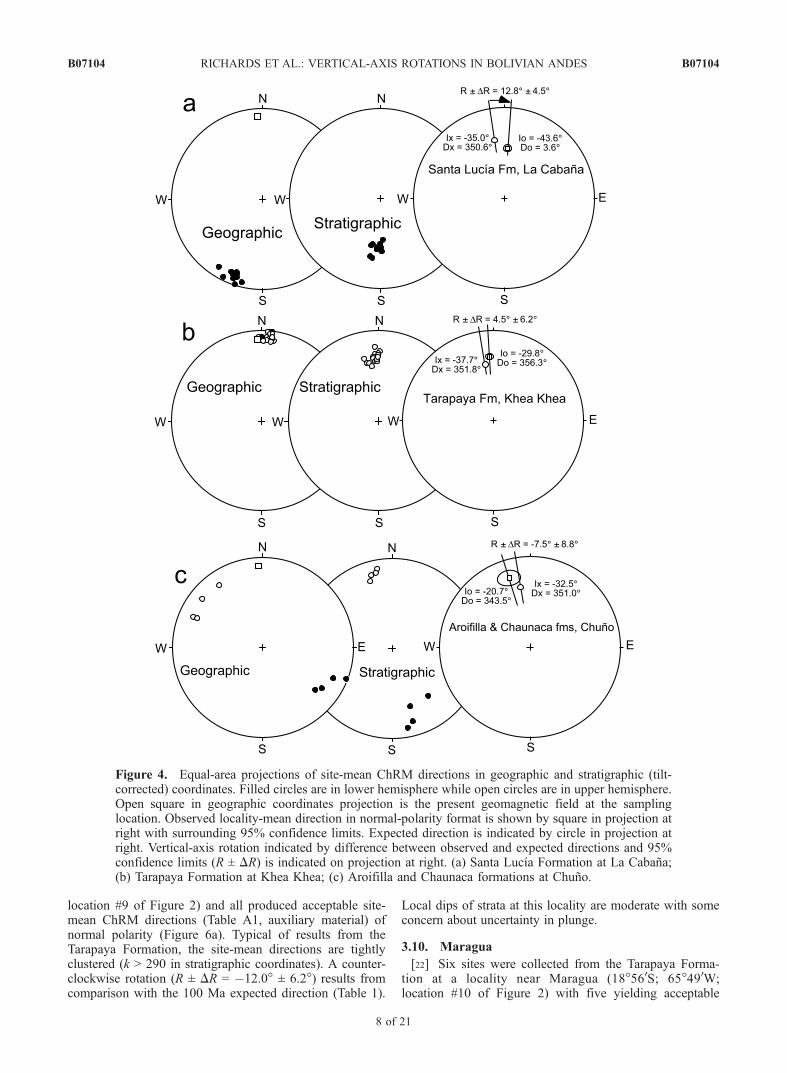
[13] Twelve sites were collected from the Paleocene SantaLucıa Formation at La Cabana (17�300S, 66�200W). All12 sites yielded acceptable site-mean ChRM directions fromthis location labeled #1 in Figure 2. All site-mean directionsare of reverse polarity (Table A1, auxiliary material). Thepaleomagnetic directions in geographic and stratigraphic(tilt corrected) coordinates are illustrated in Figure 4a.Comparison with the 60 Ma expected direction at LaCabana indicates clockwise rotation R ± DR = 12.8� ±4.5� (Table 1). It is important to note that local dip of strataat this locality exceeds 40� with attendant concern regardinguncertainty of plunge.
3.2. Tiupampa
[14] At Tiupampa (18�00S; 65�300W; location #2 ofFigure 2), paleomagnetic samples were collected at 17 sitesin the Santa Lucıa Formation, with six yielding acceptablesite-mean ChRM directions [Butler et al., 1995] (Table A1,auxiliary material). All site-mean directions are of reversepolarity. An insignificant rotation (R ± DR = �3.6� ± 8.4�)results from comparison with the 60 Ma expected direction(Table 1).
3.3. Khea Khea
[15] Eighteen sites from the Albian Tarapaya Formationwere collected at Khea Khea (18�10S; 66�260W; location #3of Figure 2) and all but one site yielding acceptable site-mean ChRM directions (Table A1, auxiliary material). Allsite-mean directions are normal polarity (Figure 4b). Aninsignificant rotation (R ± DR = 4.5� ± 6.2�) results fromcomparison with the 100 Ma expected direction (Table 1).We speculate that the small dispersion of site-mean ChRMdirections is due to averaging of geomagnetic secularvariation over 103 to 104 year intervals of post-depositionaloxidation during which a chemical remanent magnetizationwas acquired.
3.4. Sucusuma
[16] At Sucusuma (18�50S; 65�450W), 28 sites were col-lected from the Late Cretaceous to Early Paleocene ElMolinoFormation and the Paleocene Santa Lucıa Formation [Butleret al., 1995]. Eight sites from the Santa Lucıa Formationyielded acceptable site-mean ChRM directions from thislocation (#4 in Figure 2). All site-mean directions are ofreverse polarity (Table A1, auxiliary material). Comparisonwith the 60 Ma expected direction at Sucusuma indicates acounterclockwise rotation R ± DR =�26.2� ± 6.1� (Table 1).
3.5. Chuno Ridge
[17] Fourteen sites were collected from the Latest Turonianto Coniacian age Aroifilla Formation and the Santonian to
Campanian Chaunaca Formation at Chuno Ridge (18�90S;66�130W; location #5 of Figure 2). Eight sites yieldingacceptable site-mean ChRM directions equally divided be-tween normal and reverse polarity (Figure 4c; Table A1,auxiliary material). The reservals test of McFadden andMcElhinny [1990] is positive with Class C result. Thereversed polarity sites are within a stratigraphic packagedefining a reversed polarity zone that may correlate withChron C33r of the geomagnetic polarity timescale [Candeand Kent, 1992, 1995]. An insignificant rotation (R ± DR =�7.5� ± 8.8�) results from comparison of the locality-meandirection with the 80 Ma expected direction (Table 1). Localdips of strata at this locality are very large with resultantconcern about uncertainty in plunge of structures.
3.6. Macha
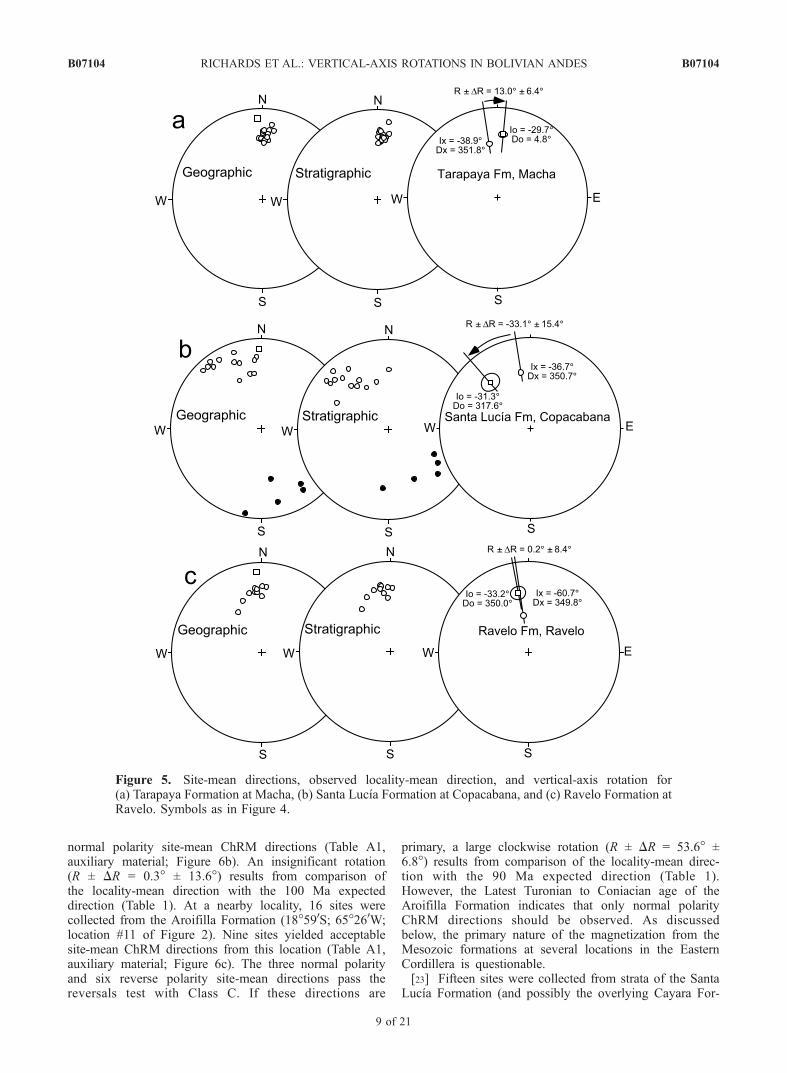
[18] Sixteen sites from the Albian Tarapaya Formationwere collected at Macha (18�460S; 66�10W; location #6 ofFigure 2) and all yield acceptable site-mean ChRMdirections(Table A1, auxiliary material). All site-mean directions arenormal polarity (Figure 5a). As with results from theTarapaya Formation at Khea Khea, the site-mean directionsare tightly clustered (k > 160) probably because of timeintegration of geomagnetic secular variation during post-depositional acquisition of a chemical remanent magnetiza-tion.A clockwise rotation (R±DR= 13.0�± 6.4�) results fromcomparison with the 100 Ma expected direction (Table 1).
3.7. Copacabana
[19] At Copacabana in the central Altiplano (18�460S;67�330W), 27 sites were collected from the Paleocene UpperMember of the El Molino Formation and Santa LucıaFormation. Seventeen sites yielded acceptable site-meanChRM directions from this location (#7 in Figure 2).Twelve site-mean directions are normal polarity and fiveare reverse polarity (Table A1, auxiliary material; Figure 5b)but the reversals test is indeterminate. Comparison with the60 Ma expected direction at Copacabana indicates a coun-terclockwise rotation R ± DR = �33.1� ± 15.4� (Table 1).The observation that site-mean declinations are more dis-persed than the inclinations probably indicates differentialvertical-axis rotation within the sampled section.
3.8. Ravelo
[20] Eighteen sites from the Jurassic Ravelo Formationwere collected at Ravelo (18�490S; 65�320W; location #8 ofFigure 2) and 10 sites yield acceptable site-mean ChRMdirections (Table A1, auxiliary material). All site-meandirections are normal polarity (Figure 5c). An insignificantrotation (R ± DR = 0.2� ± 8.4�) results from comparison ofthe locality-mean direction with the 180 Ma expecteddirection (Table 1). It is noteworthy that the Ravelo For-mation yields only normal polarity ChRM directions eventhough the Middle-Late Jurassic polarity history containsmany geomagnetic reversals. We also note that the observeddirection has a discordant inclination (F ± DF = �27.5� ±6.3�). These unexpected features of the magnetization of theRavelo Formation are discussed below.
3.9. Khara Khara
[21] Thirteen sites from the Albian Tarapaya Forma-tion were collected at Khara Khara (18�490S; 65�450W;
B07104 RICHARDS ET AL.: VERTICAL-AXIS ROTATIONS IN BOLIVIAN ANDES
7 of 21
B07104
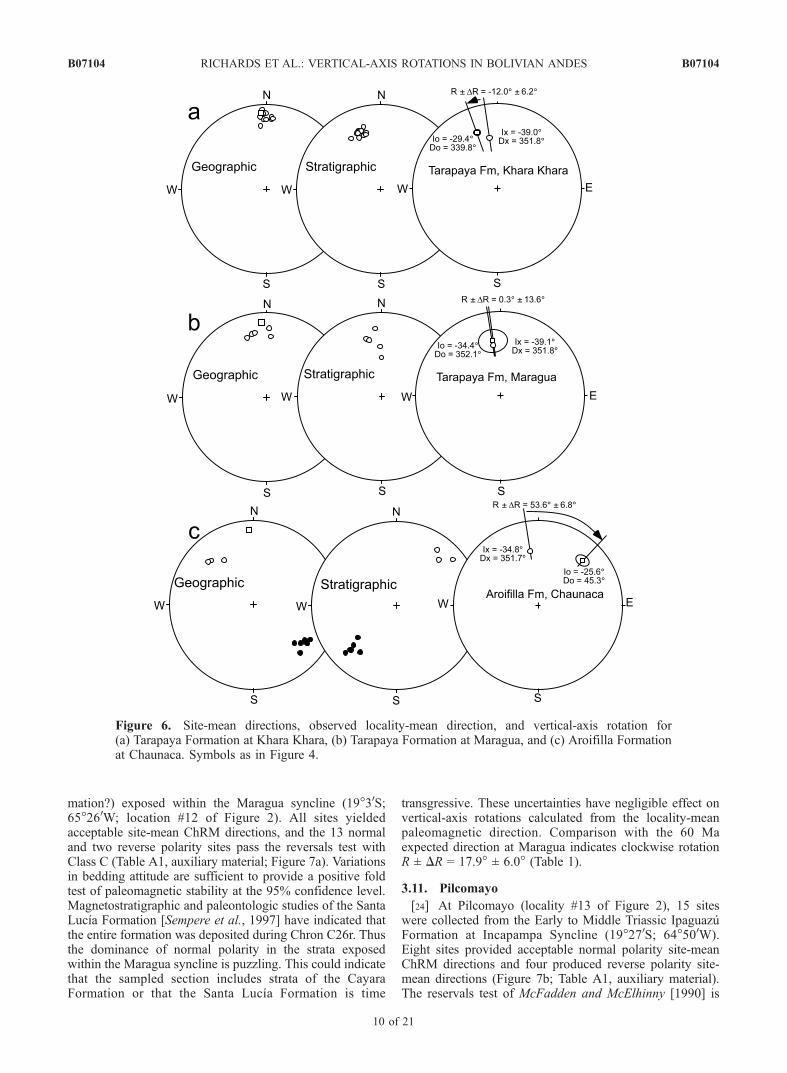
location #9 of Figure 2) and all produced acceptable site-mean ChRM directions (Table A1, auxiliary material) ofnormal polarity (Figure 6a). Typical of results from theTarapaya Formation, the site-mean directions are tightlyclustered (k > 290 in stratigraphic coordinates). A counter-clockwise rotation (R ± DR = �12.0� ± 6.2�) results fromcomparison with the 100 Ma expected direction (Table 1).
Local dips of strata at this locality are moderate with someconcern about uncertainty in plunge.
3.10. Maragua
[22] Six sites were collected from the Tarapaya Forma-tion at a locality near Maragua (18�560S; 65�490W;location #10 of Figure 2) with five yielding acceptable
Figure 4. Equal-area projections of site-mean ChRM directions in geographic and stratigraphic (tilt-corrected) coordinates. Filled circles are in lower hemisphere while open circles are in upper hemisphere.Open square in geographic coordinates projection is the present geomagnetic field at the samplinglocation. Observed locality-mean direction in normal-polarity format is shown by square in projection atright with surrounding 95% confidence limits. Expected direction is indicated by circle in projection atright. Vertical-axis rotation indicated by difference between observed and expected directions and 95%confidence limits (R ± DR) is indicated on projection at right. (a) Santa Lucıa Formation at La Cabana;(b) Tarapaya Formation at Khea Khea; (c) Aroifilla and Chaunaca formations at Chuno.
B07104 RICHARDS ET AL.: VERTICAL-AXIS ROTATIONS IN BOLIVIAN ANDES
8 of 21
B07104
normal polarity site-mean ChRM directions (Table A1,auxiliary material; Figure 6b). An insignificant rotation(R ± DR = 0.3� ± 13.6�) results from comparison ofthe locality-mean direction with the 100 Ma expecteddirection (Table 1). At a nearby locality, 16 sites werecollected from the Aroifilla Formation (18�590S; 65�260W;location #11 of Figure 2). Nine sites yielded acceptablesite-mean ChRM directions from this location (Table A1,auxiliary material; Figure 6c). The three normal polarityand six reverse polarity site-mean directions pass thereversals test with Class C. If these directions are
primary, a large clockwise rotation (R ± DR = 53.6� ±6.8�) results from comparison of the locality-mean direc-tion with the 90 Ma expected direction (Table 1).However, the Latest Turonian to Coniacian age of theAroifilla Formation indicates that only normal polarityChRM directions should be observed. As discussedbelow, the primary nature of the magnetization from theMesozoic formations at several locations in the EasternCordillera is questionable.[23] Fifteen sites were collected from strata of the Santa
Lucıa Formation (and possibly the overlying Cayara For-
Figure 5. Site-mean directions, observed locality-mean direction, and vertical-axis rotation for(a) Tarapaya Formation at Macha, (b) Santa Lucıa Formation at Copacabana, and (c) Ravelo Formation atRavelo. Symbols as in Figure 4.
B07104 RICHARDS ET AL.: VERTICAL-AXIS ROTATIONS IN BOLIVIAN ANDES
9 of 21
B07104
mation?) exposed within the Maragua syncline (19�30S;65�260W; location #12 of Figure 2). All sites yieldedacceptable site-mean ChRM directions, and the 13 normaland two reverse polarity sites pass the reversals test withClass C (Table A1, auxiliary material; Figure 7a). Variationsin bedding attitude are sufficient to provide a positive foldtest of paleomagnetic stability at the 95% confidence level.Magnetostratigraphic and paleontologic studies of the SantaLucıa Formation [Sempere et al., 1997] have indicated thatthe entire formation was deposited during Chron C26r. Thusthe dominance of normal polarity in the strata exposedwithin the Maragua syncline is puzzling. This could indicatethat the sampled section includes strata of the CayaraFormation or that the Santa Lucıa Formation is time
transgressive. These uncertainties have negligible effect onvertical-axis rotations calculated from the locality-meanpaleomagnetic direction. Comparison with the 60 Maexpected direction at Maragua indicates clockwise rotationR ± DR = 17.9� ± 6.0� (Table 1).
3.11. Pilcomayo
[24] At Pilcomayo (locality #13 of Figure 2), 15 siteswere collected from the Early to Middle Triassic IpaguazuFormation at Incapampa Syncline (19�270S; 64�500W).Eight sites provided acceptable normal polarity site-meanChRM directions and four produced reverse polarity site-mean directions (Figure 7b; Table A1, auxiliary material).The reservals test of McFadden and McElhinny [1990] is
Figure 6. Site-mean directions, observed locality-mean direction, and vertical-axis rotation for(a) Tarapaya Formation at Khara Khara, (b) Tarapaya Formation at Maragua, and (c) Aroifilla Formationat Chaunaca. Symbols as in Figure 4.
B07104 RICHARDS ET AL.: VERTICAL-AXIS ROTATIONS IN BOLIVIAN ANDES
10 of 21
B07104
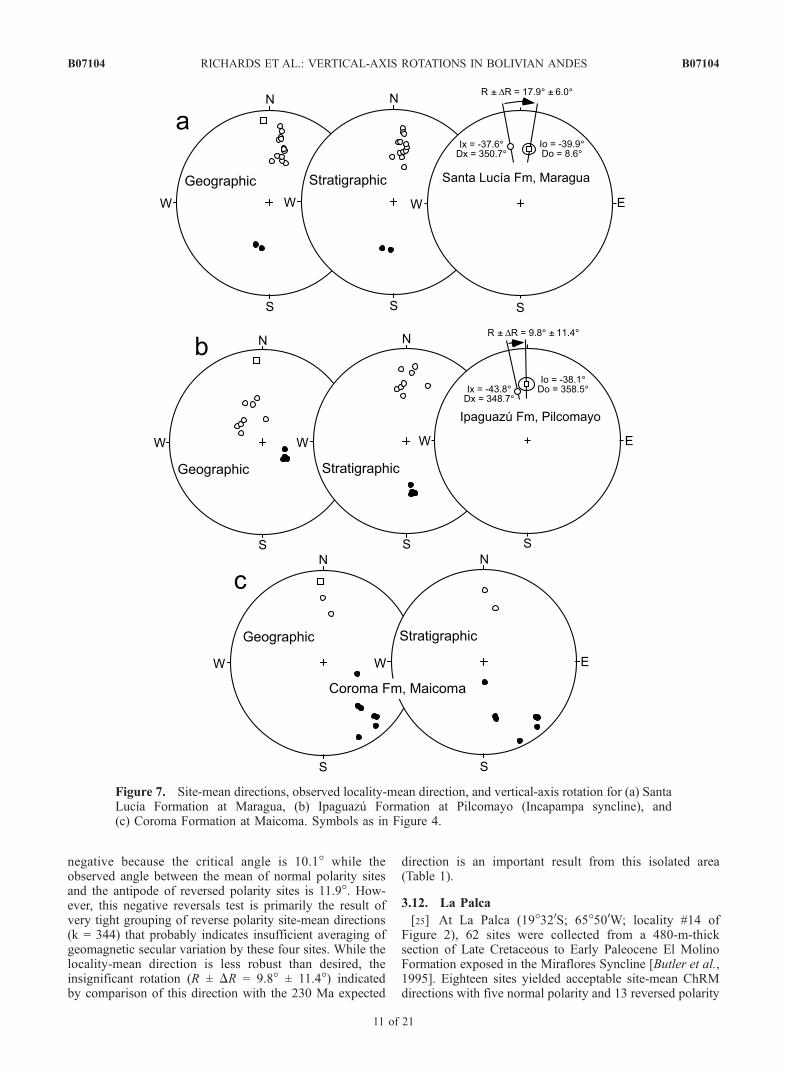
negative because the critical angle is 10.1� while theobserved angle between the mean of normal polarity sitesand the antipode of reversed polarity sites is 11.9�. How-ever, this negative reversals test is primarily the result ofvery tight grouping of reverse polarity site-mean directions(k = 344) that probably indicates insufficient averaging ofgeomagnetic secular variation by these four sites. While thelocality-mean direction is less robust than desired, theinsignificant rotation (R ± DR = 9.8� ± 11.4�) indicatedby comparison of this direction with the 230 Ma expected
direction is an important result from this isolated area(Table 1).
3.12. La Palca
[25] At La Palca (19�320S; 65�500W; locality #14 ofFigure 2), 62 sites were collected from a 480-m-thicksection of Late Cretaceous to Early Paleocene El MolinoFormation exposed in the Miraflores Syncline [Butler et al.,1995]. Eighteen sites yielded acceptable site-mean ChRMdirections with five normal polarity and 13 reversed polarity
Figure 7. Site-mean directions, observed locality-mean direction, and vertical-axis rotation for (a) SantaLucıa Formation at Maragua, (b) Ipaguazu Formation at Pilcomayo (Incapampa syncline), and(c) Coroma Formation at Maicoma. Symbols as in Figure 4.
B07104 RICHARDS ET AL.: VERTICAL-AXIS ROTATIONS IN BOLIVIAN ANDES
11 of 21
B07104
directions passing the reversals test with C classification(Table A1, auxiliary material). Comparison with the 70 Maexpected direction at La Palca indicates a large clockwiserotation R ± DR = 43.0� ± 5.8� (Table 1).
3.13. Maicoma
[26] Twenty-three sites were collected from the Campa-nian Coroma Formation at a locality near Maicoma(19�400S; 67�30W; location #15 of Figure 2). Seven accept-able reverse polarity site-mean directions and two normalpolarity directions were observed (Table A1, auxiliary
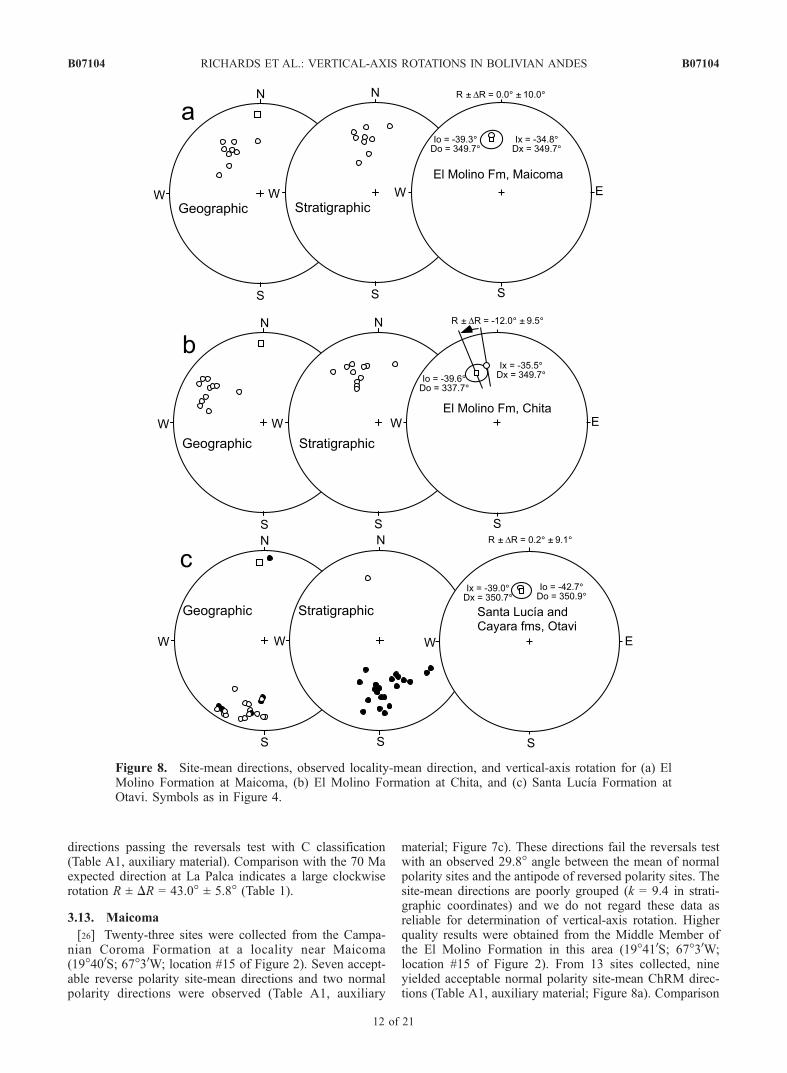
material; Figure 7c). These directions fail the reversals testwith an observed 29.8� angle between the mean of normalpolarity sites and the antipode of reversed polarity sites. Thesite-mean directions are poorly grouped (k = 9.4 in strati-graphic coordinates) and we do not regard these data asreliable for determination of vertical-axis rotation. Higherquality results were obtained from the Middle Member ofthe El Molino Formation in this area (19�410S; 67�30W;location #15 of Figure 2). From 13 sites collected, nineyielded acceptable normal polarity site-mean ChRM direc-tions (Table A1, auxiliary material; Figure 8a). Comparison
Figure 8. Site-mean directions, observed locality-mean direction, and vertical-axis rotation for (a) ElMolino Formation at Maicoma, (b) El Molino Formation at Chita, and (c) Santa Lucıa Formation atOtavi. Symbols as in Figure 4.
B07104 RICHARDS ET AL.: VERTICAL-AXIS ROTATIONS IN BOLIVIAN ANDES
12 of 21
B07104
with the 70 Ma expected direction at Maicoma indicates norotation (R ± DR = 0.0� ± 10.0�; Table 1).
3.14. Chita
[27] Thirteen sites were collected from the Middle Mem-ber of El Molino Formation at Chita (20�50S; 66�530W;location #16 of Figure 2). Eleven normal polarity site-meandirections passed the acceptability criteria. Comparison withthe 70 Ma expected direction at Chita indicates a counter-clockwise rotation R ± DR = �12.0� ± 9.5� (Figure 8b;Table 1). Local dips of strata at this locality exceed 40� withattendant uncertainty in plunge and resulting uncertainty inderived vertical-axis rotation.
3.15. Otavi
[28] Twenty-nine sites were collected from strata of theSanta Lucıa Formation and the overlying Cayara Formationin the center of the Otavi syncline (20�60S; 65�140W;location #17 of Figure 2). One acceptable normal polarityand 21 reverse polarity site-mean directions were observed(Table A1, auxiliary material; Figure 8c). With only a singlenormal polarity direction, the reversals test is indeterminate.Comparison with the 60 Ma expected direction at Otaviindicates no rotation (R ± DR = 0.2� ± 9.1�; Table 1). Localdips of strata at this locality are very large (locally over-turned) with attendant concern about plunge of structuresand the derived vertical-axis rotation.
3.16. Tica Tica
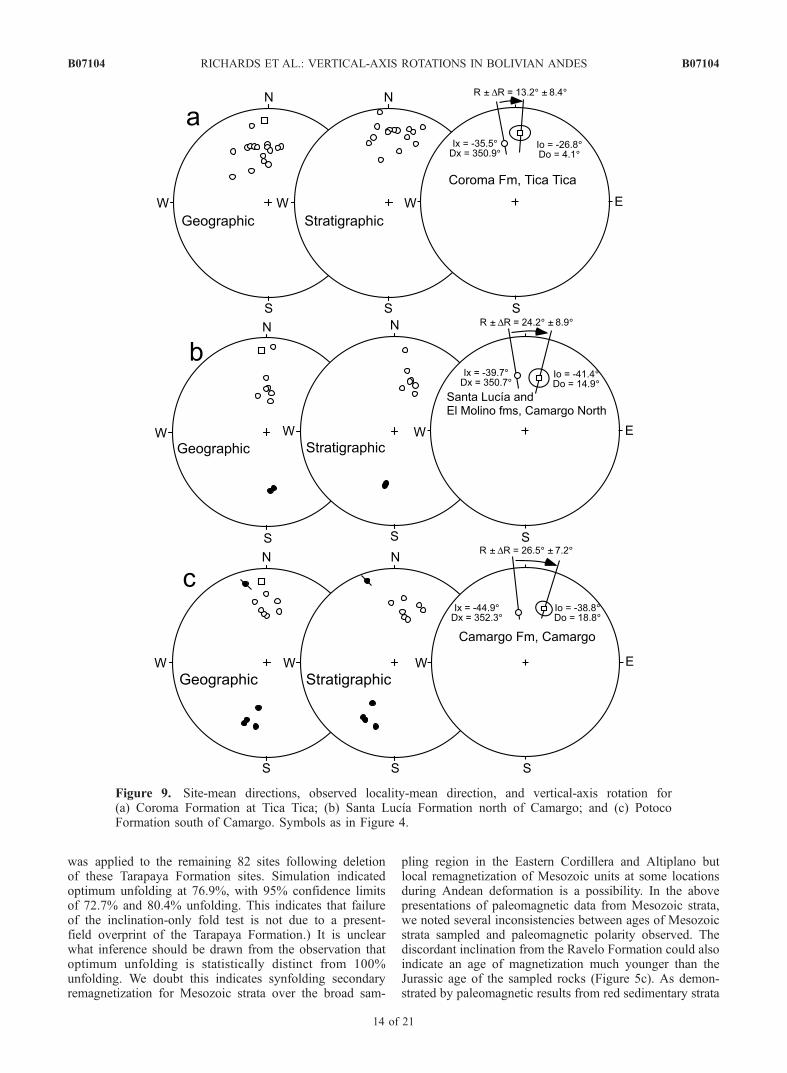
[29] At Tica Tica (20�110S; 66�190W; locality #18 ofFigure 2), 21 sites were collected from the Coroma Forma-tion. Sixteen sites yielded acceptable normal polarity site-mean ChRM directions (Table A1, auxiliary material;Figure 9a). Comparison with the 80 Ma expected directionindicates a significant clockwise rotation R ± DR = 13.2� ±8.4� (Table 1).
3.17. Camargo
[30] A few kilometers north of Camargo (20�360S;65�100W; locality #19 of Figure 2), 14 sites were collectedfrom the El Molino and Santa Lucıa formations. Sevenacceptable normal polarity and two reversed polarity site-mean ChRM directions were observed (Table A1, auxiliarymaterial; Figure 9b). These directions pass the reversals testwith C classification [McFadden and McElhinny, 1990].Comparison with the 60 Ma expected direction at Camargoindicates clockwise rotation R ± DR = 24.2� ± 8.9� (Table 1).A few kilometers south of Camargo (20�450S; 65�140W;locality #20 of Figure 2), 57 sites were collected from astratigraphic sequence of the Camargo Formation that onpaleontological grounds may correlate with the Potoco For-mation (see Sempere et al. [1997] and DeCelles and Horton[2003] for discussions). Following rejection of one outliersite-mean direction, eight acceptable normal polarity and fourreverse polarity site-mean directions pass the reversals testwith class C (Table A1, auxiliary material; Figure 9c).Comparison with the 60 Ma expected direction at Camargoindicates a clockwise rotationR ±DR = 26.5� ± 7.2� (Table 1).
4. Regional Fold Tests
[31] With the exception of the positive fold test for theSanta Lucıa Formation at Maragua, variations in bedding
attitude within sampling locations are insufficient to yielddefinitive local fold tests. The relative timing of magneti-zation and folding must be assessed through regional foldtests. Because variations in locality-mean declinationsare clearly evident in the data, the most effective fieldtest of stability of the characteristic magnetization is theinclination-only fold test. The inclination-only statisticalmethods described by Watson and Enkin [1993] and Enkinand Watson [1996] were used.[32] Block-rotation Fisher analysis is useful for sample
collections from several rigid blocks that have undergonedifferential rotation but are not internally deformed. How-ever, this internally undeformed condition is questionable inthe case of outcrops in the Altiplano and Eastern Cordilleraof Bolivia. Indeed site-mean directions from within severalsampling localities show a spread of declinations suggest-ing differential vertical-axis rotation within sampled strati-graphic sections, perhaps by slip on bedding planes.Accordingly we did not use the block-rotation version ofthe inclination-only fold test. As described by Watson andEnkin [1993] and Enkin and Watson [1996], the parameter-estimation method of performing the inclination-only foldtest determines the degree of untilting that produces min-imum dispersion of site-mean paleomagnetic inclinations todetermine whether the magnetization is pre-tilting, post-tilting, or intermediate. If the optimum unfolding includes100% but excludes 0% unfolding, the inclination-only foldtest is positive.[33] Figures 10a and 10b illustrate site-mean directions
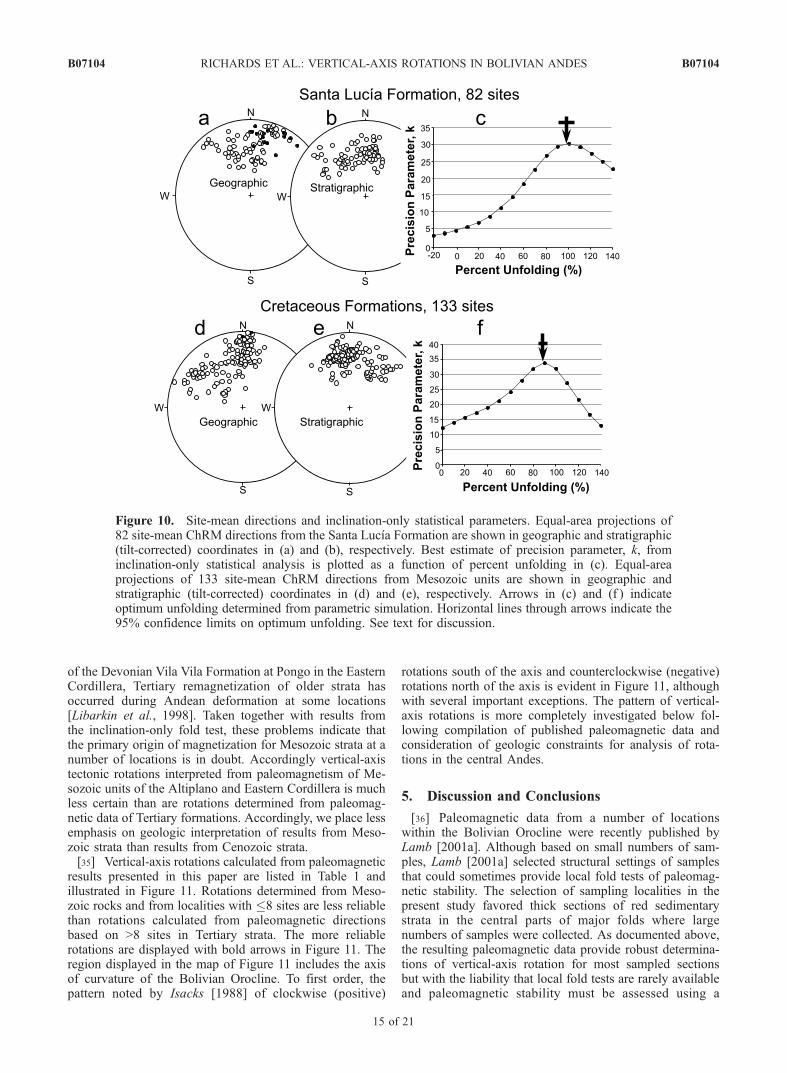
obtained from 82 sites in Tertiary strata of the Altiplano andEastern Cordillera in geographic and corrected (stratigraphic)coordinates, respectively (Table A1, auxiliary material).Results from Laguna Umayo were excluded from this anal-ysis because of complexities described by Sige et al. [2004].As is apparent in Figure 10b, the clustering of site-meaninclinations is improved by restoring bedding to horizontal;the best estimate of precision parameter, k, increases from5.0 in geographic coordinates to 30.2 in corrected coordi-nates. Illustrated in Figure 10c is k as a function of percentunfolding. Optimum unfolding occurs at 97.1% with 95%confidence limits of 89.9% and 104.0% unfolding. Thussite-mean directions from these Tertiary strata pass theinclination-only fold test consistent with a primary originfor the characteristic remanent magnetization acquiredwhen bedding was horizontal.[34] Paleomagnetic directions reported herein from
133 sites in Mesozoic rocks are illustrated in Figures 10dand 10e in geographic and corrected (stratigraphic) coordi-nates, respectively (Table A1, auxiliary material). The bestestimate of the precision parameter, k, increases from 12.4 ingeographic coordinates to 32.0 in stratigraphic coordinatesand is plotted as function of percent unfolding in Figure 10f.There is a broad maximum in k value between 80% and100% unfolding. Simulation indicates optimum unfoldingat 89.2%, with 95% confidence limits of 86.4% and92.2% unfolding. The optimum percent unfolding is thusdistinct from 100% and these Mesozoic data fail theinclination-only fold test. (Site-mean directions from theTarapaya Formation at KharaKhara, Maragua, Macha, andKheaKhea are near the present geomagnetic field directionin geographic coordinates and could therefore be affectedby recent remagnetization. The inclination-only analysis
B07104 RICHARDS ET AL.: VERTICAL-AXIS ROTATIONS IN BOLIVIAN ANDES
13 of 21
B07104
was applied to the remaining 82 sites following deletionof these Tarapaya Formation sites. Simulation indicatedoptimum unfolding at 76.9%, with 95% confidence limitsof 72.7% and 80.4% unfolding. This indicates that failureof the inclination-only fold test is not due to a present-field overprint of the Tarapaya Formation.) It is unclearwhat inference should be drawn from the observation thatoptimum unfolding is statistically distinct from 100%unfolding. We doubt this indicates synfolding secondaryremagnetization for Mesozoic strata over the broad sam-
pling region in the Eastern Cordillera and Altiplano butlocal remagnetization of Mesozoic units at some locationsduring Andean deformation is a possibility. In the abovepresentations of paleomagnetic data from Mesozoic strata,we noted several inconsistencies between ages of Mesozoicstrata sampled and paleomagnetic polarity observed. Thediscordant inclination from the Ravelo Formation could alsoindicate an age of magnetization much younger than theJurassic age of the sampled rocks (Figure 5c). As demon-strated by paleomagnetic results from red sedimentary strata
Figure 9. Site-mean directions, observed locality-mean direction, and vertical-axis rotation for(a) Coroma Formation at Tica Tica; (b) Santa Lucıa Formation north of Camargo; and (c) PotocoFormation south of Camargo. Symbols as in Figure 4.
B07104 RICHARDS ET AL.: VERTICAL-AXIS ROTATIONS IN BOLIVIAN ANDES
14 of 21
B07104
of the Devonian Vila Vila Formation at Pongo in the EasternCordillera, Tertiary remagnetization of older strata hasoccurred during Andean deformation at some locations[Libarkin et al., 1998]. Taken together with results fromthe inclination-only fold test, these problems indicate thatthe primary origin of magnetization for Mesozoic strata at anumber of locations is in doubt. Accordingly vertical-axistectonic rotations interpreted from paleomagnetism of Me-sozoic units of the Altiplano and Eastern Cordillera is muchless certain than are rotations determined from paleomag-netic data of Tertiary formations. Accordingly, we place lessemphasis on geologic interpretation of results from Meso-zoic strata than results from Cenozoic strata.[35] Vertical-axis rotations calculated from paleomagnetic
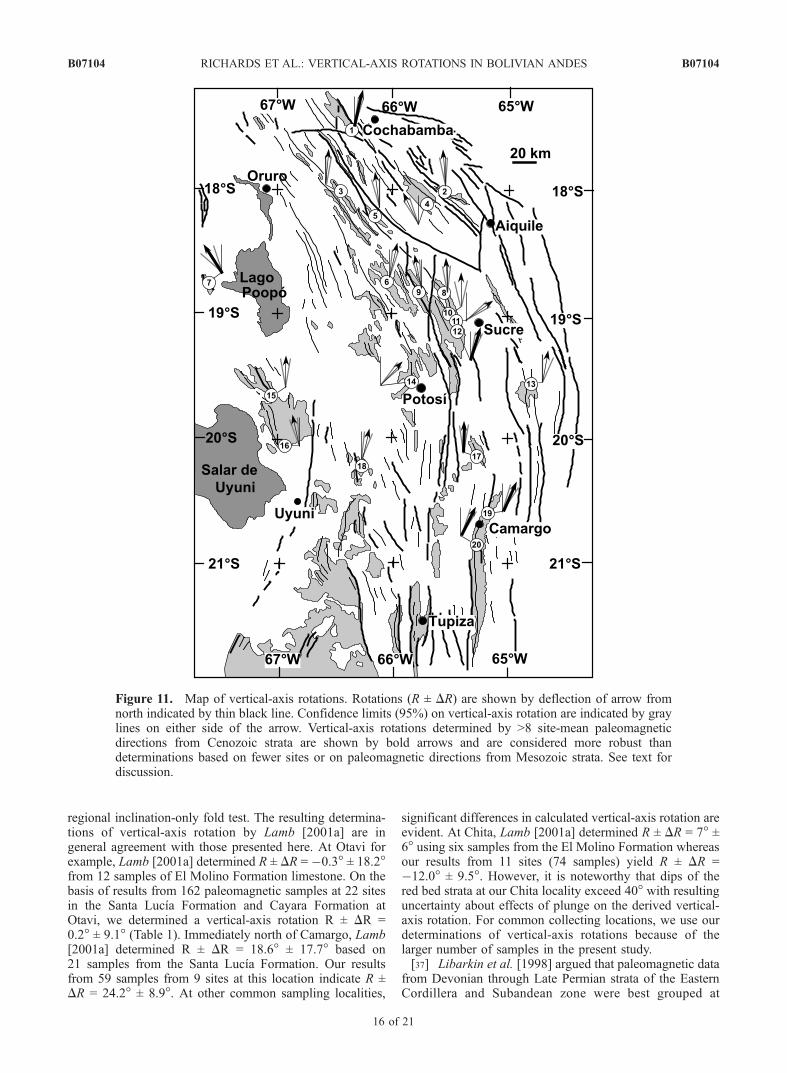
results presented in this paper are listed in Table 1 andillustrated in Figure 11. Rotations determined from Meso-zoic rocks and from localities with �8 sites are less reliablethan rotations calculated from paleomagnetic directionsbased on >8 sites in Tertiary strata. The more reliablerotations are displayed with bold arrows in Figure 11. Theregion displayed in the map of Figure 11 includes the axisof curvature of the Bolivian Orocline. To first order, thepattern noted by Isacks [1988] of clockwise (positive)
rotations south of the axis and counterclockwise (negative)rotations north of the axis is evident in Figure 11, althoughwith several important exceptions. The pattern of vertical-axis rotations is more completely investigated below fol-lowing compilation of published paleomagnetic data andconsideration of geologic constraints for analysis of rota-tions in the central Andes.
5. Discussion and Conclusions
[36] Paleomagnetic data from a number of locationswithin the Bolivian Orocline were recently published byLamb [2001a]. Although based on small numbers of sam-ples, Lamb [2001a] selected structural settings of samplesthat could sometimes provide local fold tests of paleomag-netic stability. The selection of sampling localities in thepresent study favored thick sections of red sedimentarystrata in the central parts of major folds where largenumbers of samples were collected. As documented above,the resulting paleomagnetic data provide robust determina-tions of vertical-axis rotation for most sampled sectionsbut with the liability that local fold tests are rarely availableand paleomagnetic stability must be assessed using a
Figure 10. Site-mean directions and inclination-only statistical parameters. Equal-area projections of82 site-mean ChRM directions from the Santa Lucıa Formation are shown in geographic and stratigraphic(tilt-corrected) coordinates in (a) and (b), respectively. Best estimate of precision parameter, k, frominclination-only statistical analysis is plotted as a function of percent unfolding in (c). Equal-areaprojections of 133 site-mean ChRM directions from Mesozoic units are shown in geographic andstratigraphic (tilt-corrected) coordinates in (d) and (e), respectively. Arrows in (c) and (f ) indicateoptimum unfolding determined from parametric simulation. Horizontal lines through arrows indicate the95% confidence limits on optimum unfolding. See text for discussion.
B07104 RICHARDS ET AL.: VERTICAL-AXIS ROTATIONS IN BOLIVIAN ANDES
15 of 21
B07104
regional inclination-only fold test. The resulting determina-tions of vertical-axis rotation by Lamb [2001a] are ingeneral agreement with those presented here. At Otavi forexample, Lamb [2001a] determined R ± DR = �0.3� ± 18.2�from 12 samples of El Molino Formation limestone. On thebasis of results from 162 paleomagnetic samples at 22 sitesin the Santa Lucıa Formation and Cayara Formation atOtavi, we determined a vertical-axis rotation R ± DR =0.2� ± 9.1� (Table 1). Immediately north of Camargo, Lamb[2001a] determined R ± DR = 18.6� ± 17.7� based on21 samples from the Santa Lucıa Formation. Our resultsfrom 59 samples from 9 sites at this location indicate R ±DR = 24.2� ± 8.9�. At other common sampling localities,
significant differences in calculated vertical-axis rotation areevident. At Chita, Lamb [2001a] determined R ± DR = 7� ±6� using six samples from the El Molino Formation whereasour results from 11 sites (74 samples) yield R ± DR =�12.0� ± 9.5�. However, it is noteworthy that dips of thered bed strata at our Chita locality exceed 40� with resultinguncertainty about effects of plunge on the derived vertical-axis rotation. For common collecting locations, we use ourdeterminations of vertical-axis rotations because of thelarger number of samples in the present study.[37] Libarkin et al. [1998] argued that paleomagnetic data
from Devonian through Late Permian strata of the EasternCordillera and Subandean zone were best grouped at
Figure 11. Map of vertical-axis rotations. Rotations (R ± DR) are shown by deflection of arrow fromnorth indicated by thin black line. Confidence limits (95%) on vertical-axis rotation are indicated by graylines on either side of the arrow. Vertical-axis rotations determined by >8 site-mean paleomagneticdirections from Cenozoic strata are shown by bold arrows and are considered more robust thandeterminations based on fewer sites or on paleomagnetic directions from Mesozoic strata. See text fordiscussion.
B07104 RICHARDS ET AL.: VERTICAL-AXIS ROTATIONS IN BOLIVIAN ANDES
16 of 21
B07104
80% unfolding indicating remagnetization during Tertiaryfolding. While accepting a Tertiary origin for magnetizationof the Devonian Vila Vila Formation at Pongo, Roperchet al. [2000] reinterpreted the paleomagnetic directionsof Libarkin et al. [1998] as acquired during the Permo-Carboniferous Reversed-Polarity Superchron. Roperch et al.[2000] then used these directions to determine Tertiaryvertical-axis rotations of the Subandean zone. Followingexclusion of results from one locality of Libarkin et al.[1998], Roperch et al. [2000] and Gilder et al. [2003]correctly observed that maximum clustering of paleomag-netic directions from Paleozoic rocks in the southern Sub-andean zone occurs at 100% unfolding. This indicates thatthe Paleozoic strata acquired the characteristic magnetiza-tion prior to folding. Ages of the sampled formations areMississippian and Late Permian, preceding and followingthe Permo-Carboniferous Reversed-Polarity Superchron.Indeed Libarkin et al. [1998] observed normal-polaritymagnetization in the Mississippian Tupambi and Taiguatiformations. Thus assigning the age of (re)magnetizationto the reversed-polarity superchron is at best highly specu-lative. Additionally there are major uncertainties in deter-mining the Late Carboniferous reference pole either directlyfrom South American paleomagnetic data or by rotatingpaleomagnetic poles from Gondwana continents into SouthAmerican coordinates. Because of these uncertainties, de-termining Neogene vertical-axis rotation of the Subandeanzone using the paleomagnetic data reported by Libarkinet al. [1998] is unjustified. Fortunately, Lamb [2001a]published a critical paleomagnetic determination of verti-cal-axis rotation from Oligo-Miocene sedimentary strata ofthe Subandean Zone. This result is included in Table 2 andfeatures in the discussion below.[38] Most analyses of vertical-axis rotations have exam-
ined paleomagnetic data in latitudinal belts across the entirewidth of the Andes [Isacks, 1988]. This is a potentiallyeffective method for deciphering major latitudinal varia-tions. However, it is now reasonably established that theBolivian Andes have undergone a west-to-east progressionof fold-thrust development that was dominantly but notexclusively within the Eastern Cordillera between �35 Ma
and �10 Ma. From �10 Ma to present, thin-skinneddeformation occurred mostly within the Subandean andInterandean zones with minor crustal shortening internalto the Altiplano. We thus analyze crustal shortening esti-mates and attendant vertical-axis rotations in the BolivianAndes by analyzing these zones that experienced deforma-tion during different time intervals. When analyzing activedeformation in the Central Andes determined from GPSnetworks, Bevis et al. [2001] developed a model includingan Andean microplate between the Nazca and South Amer-ican plates. These authors also noted the importance ofalong-strike variations in convergence between this Andeanmicroplate and interior South America. Bevis et al. [2001]specifically noted a decrease in modern shortening rate ofthe Subandean zone southward from the orocline axis.[39] If along-strike variations in crustal shortening have
occurred systematically during Andean deformation, theamount of shortening along different profiles across theBolivian Andes can be used to calculate the Euler rotationsdescribing those variations. Although kinematics of fold-thrust belts on continents are intrinsically more complexthan motions of oceanic lithospheric plates for which Eulerrotation analyses were introduced to geology, useful quan-tification of vertical-axis rotations within shortened beltscan be derived. The utility of Euler pole analysis is thatshortening estimates along two or more profiles can be usedto determine an ‘‘effective’’ Euler rotation that predictsshortening along any profile within that part of the fold-thrust belt. Paleomagnetically determined vertical-axisrotations from that region can then be compared to thecomputed Euler rotation to determine how well along-strikevariations of shortening within the fold-thrust belt accountfor the observed vertical-axis rotations. We cannot calculateconfidence limits on these Euler rotations as is done forrotations of oceanic plates determined from analyses ofmarine magnetic anomalies because: (1) there are too fewshortening estimates to effectively use statistical methods;and (2) individual shortening estimates from balanced crosssections have uncertainties that are difficult to quantify.Nevertheless Euler rotation analysis has not previously beenapplied to the Bolivian fold-thrust belt and the results
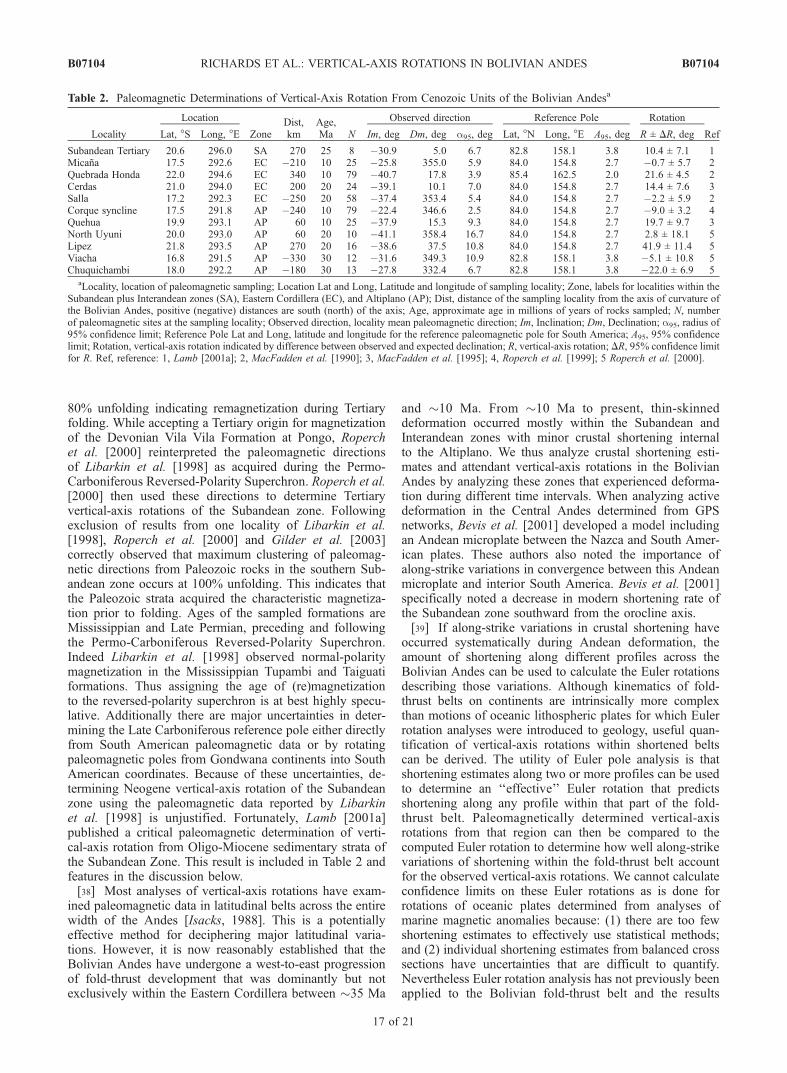
Table 2. Paleomagnetic Determinations of Vertical-Axis Rotation From Cenozoic Units of the Bolivian Andesa
Locality
Location
ZoneDist,km
Age,Ma N
Observed direction Reference Pole Rotation
RefLat, �S Long, �E Im, deg Dm, deg a95, deg Lat, �N Long, �E A95, deg R ± DR, deg
Subandean Tertiary 20.6 296.0 SA 270 25 8 �30.9 5.0 6.7 82.8 158.1 3.8 10.4 ± 7.1 1Micana 17.5 292.6 EC �210 10 25 �25.8 355.0 5.9 84.0 154.8 2.7 �0.7 ± 5.7 2Quebrada Honda 22.0 294.6 EC 340 10 79 �40.7 17.8 3.9 85.4 162.5 2.0 21.6 ± 4.5 2Cerdas 21.0 294.0 EC 200 20 24 �39.1 10.1 7.0 84.0 154.8 2.7 14.4 ± 7.6 3Salla 17.2 292.3 EC �250 20 58 �37.4 353.4 5.4 84.0 154.8 2.7 �2.2 ± 5.9 2Corque syncline 17.5 291.8 AP �240 10 79 �22.4 346.6 2.5 84.0 154.8 2.7 �9.0 ± 3.2 4Quehua 19.9 293.1 AP 60 10 25 �37.9 15.3 9.3 84.0 154.8 2.7 19.7 ± 9.7 3North Uyuni 20.0 293.0 AP 60 20 10 �41.1 358.4 16.7 84.0 154.8 2.7 2.8 ± 18.1 5Lipez 21.8 293.5 AP 270 20 16 �38.6 37.5 10.8 84.0 154.8 2.7 41.9 ± 11.4 5Viacha 16.8 291.5 AP �330 30 12 �31.6 349.3 10.9 82.8 158.1 3.8 �5.1 ± 10.8 5Chuquichambi 18.0 292.2 AP �180 30 13 �27.8 332.4 6.7 82.8 158.1 3.8 �22.0 ± 6.9 5
aLocality, location of paleomagnetic sampling; Location Lat and Long, Latitude and longitude of sampling locality; Zone, labels for localities within theSubandean plus Interandean zones (SA), Eastern Cordillera (EC), and Altiplano (AP); Dist, distance of the sampling locality from the axis of curvature ofthe Bolivian Andes, positive (negative) distances are south (north) of the axis; Age, approximate age in millions of years of rocks sampled; N, numberof paleomagnetic sites at the sampling locality; Observed direction, locality mean paleomagnetic direction; Im, Inclination; Dm, Declination; a95, radius of95% confidence limit; Reference Pole Lat and Long, latitude and longitude for the reference paleomagnetic pole for South America; A95, 95% confidencelimit; Rotation, vertical-axis rotation indicated by difference between observed and expected declination; R, vertical-axis rotation; DR, 95% confidence limitfor R. Ref, reference: 1, Lamb [2001a]; 2, MacFadden et al. [1990]; 3, MacFadden et al. [1995]; 4, Roperch et al. [1999]; 5 Roperch et al. [2000].
B07104 RICHARDS ET AL.: VERTICAL-AXIS ROTATIONS IN BOLIVIAN ANDES
17 of 21
B07104
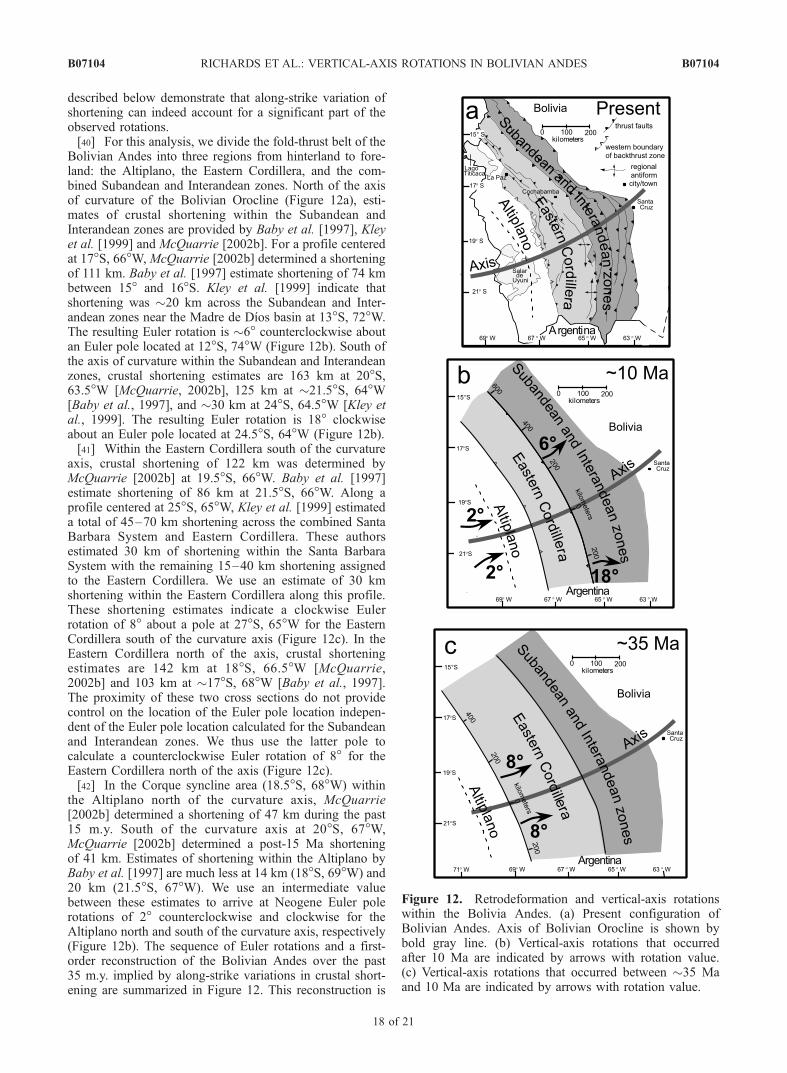
described below demonstrate that along-strike variation ofshortening can indeed account for a significant part of theobserved rotations.[40] For this analysis, we divide the fold-thrust belt of the
Bolivian Andes into three regions from hinterland to fore-land: the Altiplano, the Eastern Cordillera, and the com-bined Subandean and Interandean zones. North of the axisof curvature of the Bolivian Orocline (Figure 12a), esti-mates of crustal shortening within the Subandean andInterandean zones are provided by Baby et al. [1997], Kleyet al. [1999] and McQuarrie [2002b]. For a profile centeredat 17�S, 66�W, McQuarrie [2002b] determined a shorteningof 111 km. Baby et al. [1997] estimate shortening of 74 kmbetween 15� and 16�S. Kley et al. [1999] indicate thatshortening was �20 km across the Subandean and Inter-andean zones near the Madre de Dıos basin at 13�S, 72�W.The resulting Euler rotation is �6� counterclockwise aboutan Euler pole located at 12�S, 74�W (Figure 12b). South ofthe axis of curvature within the Subandean and Interandeanzones, crustal shortening estimates are 163 km at 20�S,63.5�W [McQuarrie, 2002b], 125 km at �21.5�S, 64�W[Baby et al., 1997], and �30 km at 24�S, 64.5�W [Kley etal., 1999]. The resulting Euler rotation is 18� clockwiseabout an Euler pole located at 24.5�S, 64�W (Figure 12b).[41] Within the Eastern Cordillera south of the curvature
axis, crustal shortening of 122 km was determined byMcQuarrie [2002b] at 19.5�S, 66�W. Baby et al. [1997]estimate shortening of 86 km at 21.5�S, 66�W. Along aprofile centered at 25�S, 65�W, Kley et al. [1999] estimateda total of 45–70 km shortening across the combined SantaBarbara System and Eastern Cordillera. These authorsestimated 30 km of shortening within the Santa BarbaraSystem with the remaining 15–40 km shortening assignedto the Eastern Cordillera. We use an estimate of 30 kmshortening within the Eastern Cordillera along this profile.These shortening estimates indicate a clockwise Eulerrotation of 8� about a pole at 27�S, 65�W for the EasternCordillera south of the curvature axis (Figure 12c). In theEastern Cordillera north of the axis, crustal shorteningestimates are 142 km at 18�S, 66.5�W [McQuarrie,2002b] and 103 km at �17�S, 68�W [Baby et al., 1997].The proximity of these two cross sections do not providecontrol on the location of the Euler pole location indepen-dent of the Euler pole location calculated for the Subandeanand Interandean zones. We thus use the latter pole tocalculate a counterclockwise Euler rotation of 8� for theEastern Cordillera north of the axis (Figure 12c).[42] In the Corque syncline area (18.5�S, 68�W) within
the Altiplano north of the curvature axis, McQuarrie[2002b] determined a shortening of 47 km during the past15 m.y. South of the curvature axis at 20�S, 67�W,McQuarrie [2002b] determined a post-15 Ma shorteningof 41 km. Estimates of shortening within the Altiplano byBaby et al. [1997] are much less at 14 km (18�S, 69�W) and20 km (21.5�S, 67�W). We use an intermediate valuebetween these estimates to arrive at Neogene Euler polerotations of 2� counterclockwise and clockwise for theAltiplano north and south of the curvature axis, respectively(Figure 12b). The sequence of Euler rotations and a first-order reconstruction of the Bolivian Andes over the past35 m.y. implied by along-strike variations in crustal short-ening are summarized in Figure 12. This reconstruction is
Figure 12. Retrodeformation and vertical-axis rotationswithin the Bolivia Andes. (a) Present configuration ofBolivian Andes. Axis of Bolivian Orocline is shown bybold gray line. (b) Vertical-axis rotations that occurredafter 10 Ma are indicated by arrows with rotation value.(c) Vertical-axis rotations that occurred between �35 Maand 10 Ma are indicated by arrows with rotation value.
B07104 RICHARDS ET AL.: VERTICAL-AXIS ROTATIONS IN BOLIVIAN ANDES
18 of 21
B07104
admittedly crude. In detail, crustal shortening within theEastern Cordillera overlaps in time with shortening in theSubandean and Interandean zones. Also shortening androtations vary within these belts such that the amount ofrotation experienced by a particular rock unit depends on ageof rock and location within each belt. In addition, rotationsare surely segmented into smaller crustal domains separatedby transfer zones as suggested by Muller et al. [2002].However, given the substantial uncertainties in amountsand timing of crustal shortening, the predictions of verti-cal-axis rotations from the simple Euler rotation modeldescribed here are useful for comparison to paleomagneticdeterminations of vertical-axis rotation (Figure 13).[43] The Euler pole analysis described above was used to
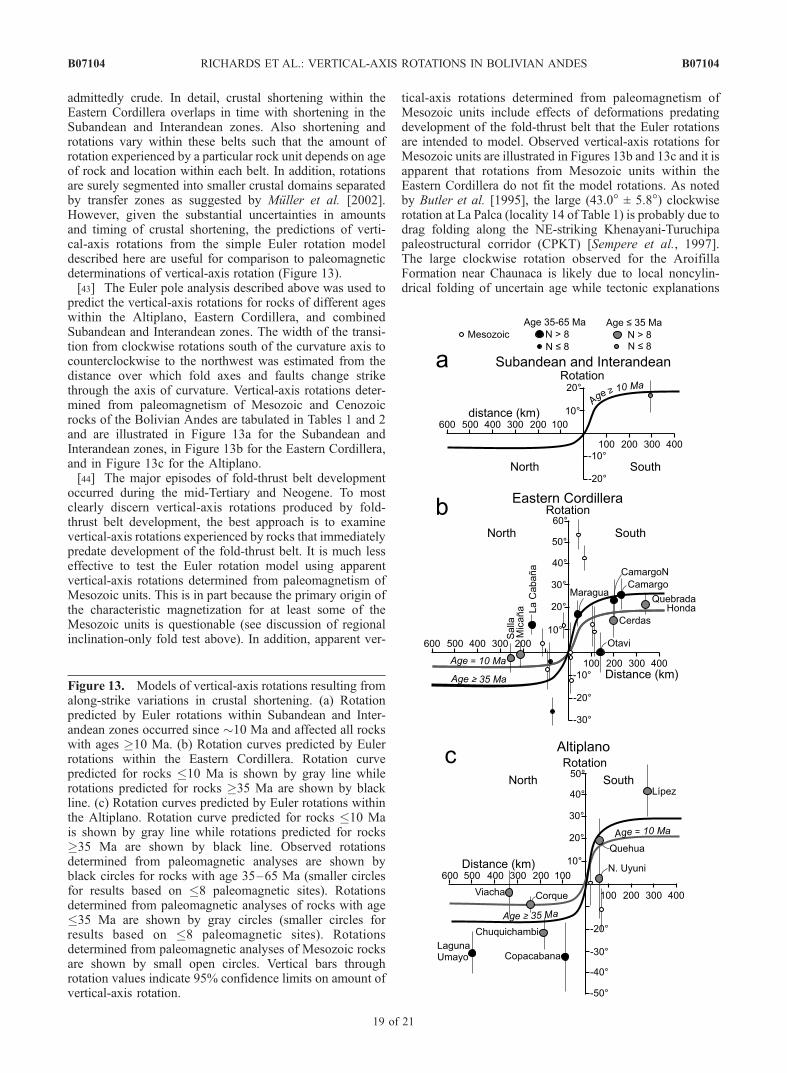
predict the vertical-axis rotations for rocks of different ageswithin the Altiplano, Eastern Cordillera, and combinedSubandean and Interandean zones. The width of the transi-tion from clockwise rotations south of the curvature axis tocounterclockwise to the northwest was estimated from thedistance over which fold axes and faults change strikethrough the axis of curvature. Vertical-axis rotations deter-mined from paleomagnetism of Mesozoic and Cenozoicrocks of the Bolivian Andes are tabulated in Tables 1 and 2and are illustrated in Figure 13a for the Subandean andInterandean zones, in Figure 13b for the Eastern Cordillera,and in Figure 13c for the Altiplano.[44] The major episodes of fold-thrust belt development
occurred during the mid-Tertiary and Neogene. To mostclearly discern vertical-axis rotations produced by fold-thrust belt development, the best approach is to examinevertical-axis rotations experienced by rocks that immediatelypredate development of the fold-thrust belt. It is much lesseffective to test the Euler rotation model using apparentvertical-axis rotations determined from paleomagnetism ofMesozoic units. This is in part because the primary origin ofthe characteristic magnetization for at least some of theMesozoic units is questionable (see discussion of regionalinclination-only fold test above). In addition, apparent ver-
tical-axis rotations determined from paleomagnetism ofMesozoic units include effects of deformations predatingdevelopment of the fold-thrust belt that the Euler rotationsare intended to model. Observed vertical-axis rotations forMesozoic units are illustrated in Figures 13b and 13c and it isapparent that rotations from Mesozoic units within theEastern Cordillera do not fit the model rotations. As notedby Butler et al. [1995], the large (43.0� ± 5.8�) clockwiserotation at La Palca (locality 14 of Table 1) is probably due todrag folding along the NE-striking Khenayani-Turuchipapaleostructural corridor (CPKT) [Sempere et al., 1997].The large clockwise rotation observed for the AroifillaFormation near Chaunaca is likely due to local noncylin-drical folding of uncertain age while tectonic explanations
Figure 13. Models of vertical-axis rotations resulting fromalong-strike variations in crustal shortening. (a) Rotationpredicted by Euler rotations within Subandean and Inter-andean zones occurred since �10 Ma and affected all rockswith ages �10 Ma. (b) Rotation curves predicted by Eulerrotations within the Eastern Cordillera. Rotation curvepredicted for rocks �10 Ma is shown by gray line whilerotations predicted for rocks �35 Ma are shown by blackline. (c) Rotation curves predicted by Euler rotations withinthe Altiplano. Rotation curve predicted for rocks �10 Mais shown by gray line while rotations predicted for rocks�35 Ma are shown by black line. Observed rotationsdetermined from paleomagnetic analyses are shown byblack circles for rocks with age 35–65 Ma (smaller circlesfor results based on �8 paleomagnetic sites). Rotationsdetermined from paleomagnetic analyses of rocks with age�35 Ma are shown by gray circles (smaller circles forresults based on �8 paleomagnetic sites). Rotationsdetermined from paleomagnetic analyses of Mesozoic rocksare shown by small open circles. Vertical bars throughrotation values indicate 95% confidence limits on amount ofvertical-axis rotation.
B07104 RICHARDS ET AL.: VERTICAL-AXIS ROTATIONS IN BOLIVIAN ANDES
19 of 21
B07104
for rotations experienced at other Mesozoic localities are notreadily apparent.[45] Comparing paleomagnetic determinations of vertical-
axis rotations from Cenozoic rocks with the model rotationsprovide the best opportunity to test the Euler rotation model.Cenozoic strata from which N > 8 sites were used tocompute the rotation provide the most reliable determina-tions of vertical-axis rotation and larger symbols are used inFigure 13 to illustrate these rotations. Certainly any modelfor vertical-axis rotations should at least accurately predictthe most reliable observed rotations in the region of themost straightforward geology. As shown in Figure 13a, thesingle determination of vertical-axis rotation from Neogenerocks of the southern Subandean zone does fit the modelprediction of �18� clockwise rotation. The important resultis that a clockwise rotation of almost 20� is predicted forthe southern Subandean and Interandean zones by along-strike variation in crustal shortening and the predicted senseand amount of rotation is in fact observed in this region ofthe Bolivian Andes. Unfortunately there are no reliablepaleomagnetic results available for the Subandean andInterandean zones north of the axis of curvature.[46] There are four paleomagnetic results from Neogene
rocks of the Eastern Cordillera that provide tests of theEuler rotation model (Table 2). These observed vertical-axisrotations reasonably fit the rotations predicted to haveoccurred since 10 Ma (Figure 13b). The paleomagneticresults from Cerdas and Quebrada Honda are consistentwith the predicted 18� clockwise rotation produced byalong-strike variation in crustal shortening within the in-board Subandean and Interandean zones. Observed rota-tions at Salla and Micana in the northern part of the EasternCordillera are less than but not significant from the pre-dicted 6� counterclockwise rotation.[47] There are seven paleomagnetic results from Paleo-
gene rocks of the Eastern Cordillera and five of theobserved rotation values are based on N > 8 sites (Table 1).Results from Camargo (localities 19 and 20) and Maragua(locality 12) match the predicted rotations for this beltsouth of the curvature axis (Figure 13b). The CamargoSyncline is a prominent structure in southern Bolivia and isaligned with the regional strike over a north-south distance>100 km. The predicted clockwise rotation of 26� ismatched by the observed rotations of 26.5� ± 7.2� and24.2� ± 8.9� from Camargo and Camargo North, respec-tively. The observed clockwise rotation of 17.9� ± 6.0� forthe Maragua Syncline agrees with the predicted rotationin this area 50 km south of the axis of curvature of theBolivian Andes.[48] Two reliably determined rotations of 35–65 Ma
rocks within the Eastern Cordillera do not fit the patternpredicted by the Euler rotation model (Figure 13b). Thestrike of the Otavi Syncline fold axis is �30� counterclock-wise from the regional trend; compare the orientation ofthe Otavi and Camargo synclines (localities 17 and 20 inFigure 11). The observed Otavi Syncline rotation (0.2� ±9.1�) is �26� counterclockwise from the predicted rotation.We interpret the incongruent orientation of the Otavi Syn-cline and the mismatch between observed and predictedvertical-axis rotations to be the result of a local counter-clockwise rotation that affected an area of 10 to 20 kmdimension. Similarly, a local clockwise rotation is required
to explain the mismatch between the observed 12.8� ± 4.5�clockwise rotation and the predicted 15� counterclockwiserotation at La Cabana (locality 1) near Cochabamba. Weagree with Lamb [2001a] that the Cochabamba Basin andadjacent areas are probably complicated by local rotations inboth clockwise and counterclockwise directions. Apparently,along-strike variations of fold-thrust shortening within theEastern Cordillera are sufficient to explain vertical-axisrotations of areas with relatively uncomplicated deformationhistories but additional local block rotations are required inmore complex areas.[49] Deformations of a wide range of ages have affected
the Altiplano and complexities of the deformation historyare hidden beneath Neogene deposits. Not surprisingly, theEuler rotation model largely fails to explain the observedvertical-axis rotations within the Altiplano (Table 2). Rota-tions for the �30 Ma units at Quehua, Viacha, and theCorque Syncline are reasonably fit by Euler rotations since10 Ma (Figure 13c). However, rotations at Lıpez, NorthUyuni, and Chuquichambi require additional local rotationsas interpreted by Roperch et al. [2000]. The paleomagneticdeterminations of vertical-axis rotations for �60 Ma rocksat Laguna Umayo and Copacabana (Table 1 and Figure 13c)far exceed those predicted by the Euler rotation model.While the Euler rotation model of along-strike variations incrustal shortening within the Bolivian fold-thrust belt rea-sonably explains the paleomagnetic determinations of ver-tical-axis rotation within the Eastern Cordillera and theSubandean and Interandean zones, vertical-axis rotationswithin the Altiplano are dominated by local rotations ofcrustal blocks.
[50] Acknowledgments. This project was supported by NationalScience Foundation grant EAR-9706193 and by a grant from the PetroleumResearch Fund of the American Chemical Society. We thank LarryMarshall, Orestes Morfın, Brian Horton, Peter DeCelles, Julie Libarkin,Alex Benavides, and our Bolivian driver Nestor for assistance during fieldwork. Ramiro Suarez provided invaluable logistical support and geologicalexpertise. Bill Hart and Orestes Morfın were very effective laboratorytechnical assistants, and Nadine McQuarrie provided expertise on crustalshortening within the Bolivian Andes. We thank Randy Enkin for makingfreely available his software for statistical analyses of paleomagneticdata. The manuscript was improved by careful reviews by Stuart Gilderand Associate Editor Carlo Laj. Steve Sorenson provided much helpwith computer analyses, and David Steinke’s expertise with laboratoryelectronics was essential to this project.
ReferencesBaby, P., P. Rochat, G. Mascle, and G. Herail (1997), Neogene shorteningcontribution to crustal thickening in the back arc of the Central Andes,Geology, 25, 883–886.
Beck, M. E. (1980), Paleomagnetic record of plate-margin tectonics pro-cesses along the western edge of North America, J. Geophys. Res., 85,7115–7131.
Beck, M. E., Jr. (1987), Tectonic rotations on the leading edge of SouthAmerica: The Bolivian orocline revisited, Geology, 15, 806–808.
Beck, M. E., Jr. (1988), Analysis of Late Jurassic-Recent paleomagnetic datafrom active plate margins of SouthAmerica, J. S. Am. Earth Sci., 1, 39–52.
Beck, M. E., Jr. (1998), On the mechanism of crustal block rotations in thecentral Andes, Tectonophysics, 299, 75–92.
Beck, M. E., Jr. (1999), Jurassic and Cretaceous apparent polar wanderrelative to South America: Some tectonic implications, J. Geophys.Res., 104, 5063–5067.
Beck, M. E., Jr., R. F. Burmester, R. E. Drake, and P. D. Riley (1994), Atale of two continents: Some tectonic contrasts between the central Andesand the North American Cordillera, as illustrated by their paleomagneticsignatures, Tectonics, 13, 215–224.
Beck, S., G. Zandt, S. C. Myers, T. C. Wallace, P. G. Silver, and L. Drake(1996), Crustal-thickness variations in the central Andes, Geology, 24,407–410.
B07104 RICHARDS ET AL.: VERTICAL-AXIS ROTATIONS IN BOLIVIAN ANDES
20 of 21
B07104
Besse, J., and V. Courtillot (2002), Apparent and true polar wander and thegeometry of the geomagnetic field over the past 200 Myr, J. Geophys.Res., 107(B11), 2300, doi:10.1029/2000JB000050.
Bevis, S., E. Kendrick, R. Smalley Jr., B. Brooks, R. Allmendinger, andB. Isacks (2001), On the strength of interplate coupling and the rate ofback arc convergence in the central Andes: An analysis of the interseis-mic velocity field, Geochem. Geophys. Geosyst., 2, paper number2001GC000198.
Butler, R. F. (1992), Paleomagnetism: Magnetic Domains to GeologicTerranes, 319 pp., Blackwell Sci., Malden, Mass.
Butler, R. F., D. R. Richards, T. Sempere, and L. G. Marshall (1995),Paleomagnetic determinations of vertical-axis tectonic rotations fromLate Cretaceous and Paleocene strata of Bolivia, Geology, 23, 799–802.
Cande, S. C., and D. V. Kent (1992), A new geomagnetic polarity timescale for the Late Cretaceous and Cenozoic, J. Geophys. Res., 97,13,917–13,951.
Cande, S. C., and D. V. Kent (1995), Revised calibration of the geomag-netic polarity timescale for the Late Cretaceous and Cenozoic, J. Geo-phys. Res, 100, 6093–6095.
Carey, S. W. (1955), The orocline concept in geotectonics, Proc. R. Soc.Tasmania, 89, 255–288.
DeCelles, P. G., and B. K. Horton (2003), Early to middle Tertiary forelandbasin development and the history of Andean crustal shortening inBolivia, Geol. Soc. Am. Bull., 115, 58–77.
Demarest, H. H. (1983), Error analysis of the determination of tectonicrotation from paleomagnetic data, J. Geophys. Res., 88, 4321–4328.
Enkin, R. J., and G. S. Watson (1996), Statistical analysis of palaeomag-netic inclination data, Geophys. J. Int., 126, 495–504.
Fisher, R. A. (1953), Dispersion on a sphere, Proc. R. Soc. London, Ser. A,217, 295–305.
Gephart, J. (1994), Topography and subduction geometry in the centralAndes: Clues to the mechanics of a noncollisional orogen, J. Geophys.Res., 99, 12,279–12,288.
Gilder, S., S. Rousse, D. Farber, B. McNulty, T. Sempere, V. Torres, andO. Palacios (2003), Post-Middle Oligocene origin of paleomagnetic rota-tions in Upper Permian to Lower Jurassic rocks from northern and south-ern Peru, Earth Planet. Sci. Lett., 210, 233–248.
Husson, L., and T. Sempere (2003), Thickening the Altiplano crust bygravity-driven crustal channel flow, Geophys. Res. Lett., 30(5), 1243,doi:10.1029/2002GL016877.
Isacks, B. L. (1988), Uplift of the central Andean plateau and bending ofthe Bolivian orocline, J. Geophys. Res., 93, 3211–3231.
Kirschvink, J. L. (1980), The least-squares line and plane and the analysisof paleomagnetic data, Geophys. J. R. Astron. Soc., 62, 699–718.
Kley, J. (1999), Geologic and geometric constraints on a kinematic modelof the Bolivian orocline, J. South Am. Earth Sci., 12, 221–235.
Kley, J., and C. R. Monaldi (1998), Tectonic shortening and crustal thick-ening in the Central Andes: How good is the correlation?, Geology, 26,723–726.
Kley, J., C. R. Monaldi, and J. A. Salfity (1999b), Along-strike segmenta-tion of the Andean foreland: Causes and consequences, Tectonophysics,301, 75–94.
Lamb, S. (2001a), Vertical axis rotation in the Bolivian orocline, SouthAmerica. 1. Paleomagnetic analysis of Cretaceous and Cenozoic rocks,J. Geophys. Res., 106, 26,605–26,632.
Lamb, S. (2001b), Vertical axis rotation in the Bolivian orocline, SouthAmerica. 2. Kinematic and dynamical implications, J. Geophys. Res.,106, 26,633–26,653.
Libarkin, J. C., R. F. Butler, D. R. Richards, and T. Sempere (1998),Tertiary remagnetization of Paleozoic rocks from the Eastern Cordilleraand Sub-Andean Belt of Bolivia, J. Geophys. Res., 103, 30,417–30,429.
MacFadden, B. J., F. Anaya, H. Perez, C. W. Naeser, P. K. Zeitler, andK. E. Campbell (1990), Late Cenozoic paleomagnetism and chronologyof Andean basins of Bolivia: Evidence for possible oroclinal bending,J. Geol., 94, 541–555.
MacFadden, B. J., F. Anaya, and C. C. Swisher III (1995), Neogenepaleomagnetism and oroclinal bending of the central Andes of Bolivia,J. Geophys. Res., 100, 8153–8167.
Marshak, S. (1988), Kinematics of orocline and arc formation in thin-skinned orogens, Tectonics, 7, 73–86.
May, S. R., and R. F. Butler (1985), Paleomagnetism of the Puente PiedraFormation, central Peru, Earth Planet. Sci. Lett., 72, 205–218.
McFadden, P. L. (1990), A new fold test for palaeomagnetic studies, Geo-phys. J. Int., 103, 163–169.
McFadden, P. L., and M. W. McElhinny (1990), Classification of thereversal test in palaeomagnetism, Geophys. J. Int., 103, 725–729.
McQuarrie, N. (2002a), Initial plate geometry, shortening variations, andevolution of the Bolivian orocline, Geology, 30, 867–870.
McQuarrie, N. (2002b), The kinematic history of the central Andean fold-thrust belt, Bolivia: Implications for building a high plateau, Geol. Soc.Am. Bull., 114, 950–963.
Muller, J. P., J. Kley, and V. Jacobshagen (2002), Structure and Cenozoickinematics of the Eastern Cordillera, southern Bolivia (21�S), Tectonics,21(5), 1037, doi:10.1029/2001TC001340.
Randall, D. E. (1998), A new Jurassic-Recent apparent polar wander pathfor South America and a review of central Andean tectonic models,Tectonophysics, 299, 49–74.
Randall, D. E., A. J. Tomlinson, and G. K. Taylor (2001), Paleomagneti-cally defined rotations from the Precordillera of northern Chile: Evidenceof localized in situ fault-controlled rotations, Tectonics, 20, 235–254.
Roperch, P., and G. Carlier (1992), Paleomagnetism of Mesozoic rocksfrom the central Andes of southern Peru: Importance of rotations in thedevelopment of the Bolivian Orocline, J. Geophys. Res., 97, 17,233–17,249.
Roperch, P., G. Herail, and M. Fornari (1999), Magnetostratigraphy ofthe Miocene Corque basin, Bolivia: Implications for the geodynamicevolution of the Altiplano during the late Tertiary, J. Geophys. Res.,104, 20,415–20,429.
Roperch, P., M. Fornari, G. Herail, and G. V. Parraguez (2000), Tectonicrotations within the Bolivian Altiplano: Implications for the geodynamicevolution of the central Andes during the late Tertiary, J. Geophys. Res.,105, 795–820.
Rousse, S., S. Gilder, D. Farber, B. McNulty, and V. R. Torres (2002),Paleomagnetic evidence for rapid vertical-axis rotation in the PeruvianCordillera ca. 8 Ma, Geology, 30, 75–78.
Sempere, T., R. F. Butler, D. R. Richards, L. G. Marshall, W. Sharp,and C. C. Swisher III (1997), Stratigraphy and chronology of UpperCretaceous-lower Paleogene strata in Bolivia and northwest Argentina,Geol. Soc. Am. Bull., 109, 709–727.
Sempere, T., et al. (2002), Late Permian-Middle Jurassic lithospheric thin-ning in Peru and Bolivia, and its bearing on Andean-age tectonics, Tec-tonophysics, 345, 153–181.
Sige, B., T. Sempere, R. F. Butler, L. G. Marshall, and J.-Y. Crochet (2004),Age and stratigraphic reassessment of the fossil-bearing Laguna Umayored mudstone unit, SE Peru, from regional stratigraphy, fossil record, andpaleomagnetism, Geobios, in press.
Somoza, R. (1998), Updated Nazca (Farallon)-South America relativemotions during the last 40 My; implications for mountain building inthe Central Andean region, J. S. Am. Earth Sci., 11, 211–215.
Somoza, R., and A. J. Tomlinson (2002), Paleomagnetism in the Precor-dillera of northern Chile (22�300S); implications for the history of tectonicrotations in the Central Andes, Earth Planet. Sci. Lett., 194, 369–381.
Somoza, R., S. Singer, and B. Coira (1996), Paleomagnetism of upperMiocene ignimbrites at the Puna: An analysis of vertical-axis rotationsin the Central Andes, J. Geophys. Res., 101, 11,387–11,400.
Somoza, R., S. Singer, and A. J. Tomlinson (1999), Paleomagnetic study ofupper Miocene rocks from northern Chile: Implications for the origin oflate Miocene-Recent tectonic rotations in the southern Central Andes,J. Geophys. Res., 104, 22,923–22,936.
Watson, G. S., and R. J. Enkin (1993), The fold test in paleomagnetism as aparameter estimation problem, Geophys. Res. Lett., 20, 2135–2137.
Yuan, X., S. V. Sobolev, and R. Kind (2002), Moho topography in thecentral Andes and its geodynamic implications, Earth Planet. Sci. Lett.,199, 389–402.
�����������������������R. F. Butler, Department of Chemistry and Physics, University of
Portland, Portland, OR 97203, USA. ([email protected])D. R. Richards, Midland Valley Inc., 1767A Denver West Blvd, #39,
Golden, CO 80401, USA.T. Sempere, Laboratoire des Mecanismes et Transferts en Geologie,
Universite Paul Sabatier, Toulouse III, 118, Route de Narbonne, F-31062Toulouse cedex 4, France. ([email protected])
B07104 RICHARDS ET AL.: VERTICAL-AXIS ROTATIONS IN BOLIVIAN ANDES
21 of 21
B07104