variation of vitamin d in cow’s milk and interaction with β-lactoglobulin
TRANSCRIPT
Molecules 2013, 18, 10122-10131; doi:10.3390/molecules180910122
molecules ISSN 1420-3049
www.mdpi.com/journal/molecules
Article
Variation of Vitamin D in Cow’s Milk and Interaction with β-Lactoglobulin
Omar Bulgari 1, Anna Maria Caroli 1,*, Stefania Chessa 2, Rita Rizzi 3 and Carmen Gigliotti 1
1 Department of Molecular and Translational Medicine, University of Brescia, Brescia 25123, Italy;
E-Mails: [email protected] (O.B.); [email protected] (C.G.) 2 Institute of Agricultural Biology and Biotechnology—National Research Council, Milano 20133,
Italy; E-Mail: [email protected] 3 Department of Veterinary Science and Public Health (DIVET), Milano 20133, Italy;
E-Mail: [email protected]
* Author to whom correspondence should be addressed; E-Mail: [email protected];
Tel.: +39-030-371-7710; Fax: +39-030-371-747.
Received: 1 July 2013; in revised form: 14 August 2013 / Accepted: 15 August 2013 / Published: 22 August 2013
Abstract: Vitamin D is the collective name for a group of closely related lipids, whose
main biological function is to maintain serum calcium and phosphorus concentrations
within the normal range by enhancing the efficiency of the small intestine to absorb these
minerals from the diet. We used a commercially available ELISA method for the
determination of vitamin D in bovine milk. Individual milk samples from two different
Italian Friesian herds were analysed. The enzyme immunoassay method used was
confirmed as a useful tool to measure the vitamin D in the milk as it greatly reduces the
time required to perform the conventional HPLC analysis. An interesting variation was
found among individual animals that may be associated with management factors and
specific genetic effects. A relationship was highlighted between vitamin D and the genetic
polymorphism of β-lactoglobulin, the main bovine whey protein which is involved in the
transport of small hydrophobic molecules such as retinol and vitamin D. The relatively
high content of vitamin D in most milk samples suggests an opportunity to improve the
natural content of vitamin D in milk either by acting on the herd management or selecting
individuals genetically predisposed to produce milk with a higher vitamin D content.
Keywords: vitamin D; bovine milk; β-lactoglobulin
OPEN ACCESS

Molecules 2013, 18 10123
1. Introduction
Vitamin D is the collective name for a group of lipids which are closely related. The two major
forms are vitamin D3, or cholecalciferol, synthesized by the skin of vertebrates following exposure to
ultraviolet radiation (UV) B, and the vitamin D2 or ergocalciferol, produced in various plants, yeasts
and fungi, always due to exposure to UV B radiation [1].
In the presence of sufficient light, the vitamin D3 is formed in a non-enzymatic way in the skin from
7-dehydrocholesterol. Vitamin D2 has an additional methyl group with respect to the D3 and is formed
from ergosterol, following a biochemical process similar to that of vitamin D3 [1]. The active form of
vitamin D3, the 1,25-dihydroxycholecalciferol [1,25(OH)2D3] or calcitriol, is formed from vitamin D3
through two independent hydroxylation reactions, in the liver and in the kidneys; vitamin D2 is
activated in a similar way.
In temperate latitudes, sun exposure can guarantee 80% of the human requirement of vitamin D,
while the remaining 20% is obtained through the diet [2]. Vitamin D3 is contained almost exclusively
in animal fats, while the proportion of vitamin D2 present in some vegetable fats is negligible. Vitamin D
introduced with food is rapidly absorbed in the duodenum and jejunum and, subsequently, distributed,
through the lymphatic circulation, almost completely to the adipose tissue, from which is released in
small quantities compared to the stored portion [3].
The importance of an adequate intake of vitamin D for bone health is well known [4]. The main
function of the active vitamin D is to maintain the concentrations of calcium and phosphorus in the
blood within a normal range of variability by improving the efficiency of the small intestine to absorb
these minerals from the diet [5,6].
In the kidney, 1,25(OH)2D increases the resorption of calcium from the distal renal tubules.
In addition to these consolidated actions associated with the metabolism of calcium, 1,25(OH)2D and
similar synthetic compounds are increasingly recognized for their potent anti-proliferative,
pro-differentiation and immuno-modulatory action [7]. In addition, vitamin D plays important roles in
promoting oral health and preventing colon cancer [8]. In recent years increasing attention has been
paid to its requirements, in order to optimise important aspects of health such as the neuromuscular and
immune function [1,9].
The Fourteenth Vitamin D Workshop (Brugge, Belgium) consensus on vitamin D nutritional
guidelines established that an absolute minimum 25(OH)D level of 20 ng/mL is necessary in all
individuals to support and maintain all of the classic actions of vitamin D on bone and mineral
health. Less consensus exists on the proposal that plasma levels <30 ng/mL would indicate a
vitamin D deficiency [10].
As already highlighted, the main portion of vitamin D3 derives from the conversion of
7-dehydrocholesterol upon exposure to ultraviolet rays. Several factors may reduce the exposure of
an individual to sunlight [10,11]. Therefore, vitamin D derived from the diet and/or specific
supplements plays a crucial role in obtaining optimal physiological levels [12]. The recommended
dietary allowance (RDA) for vitamin D is 600 IU/day for individuals aged between 1 and 70 years, and
800 IU/day for ages above 70 years [13].
Vitamin D naturally present in the diet in larger quantities is cholecalciferol (vitamin D3) contained
in foods such as oily fish [14]. Lower quantities of vitamin D3 and its metabolite, 25-hydroxyvitamin
Molecules 2013, 18 10124
D3, are found in meat, eggs [15,16] and other foods of animal origin, including milk and dairy
products. In many countries milk is fortified, mainly by adding vitamin D3. Most of the milk sold at
retail in the United States is fortified, while the fortification is less common in Europe. The final
concentration of vitamin D3 in fortified milk in the United States is 400 IU (10 µg) per quart
(qt, 1 qt = 946.4 mL) [17]. Because of its high consumption, the fortified milk is the major dietary
source of vitamin D [14,18].
The aim of this paper was to quantify the vitamin D3 naturally occurring in individual milk samples
with a commercial ELISA kit, analysing the main causes of variability of its content. The special
attention given to individual milk arises from the interest to identify animals genetically predisposed to
produce milk naturally associated with higher levels of vitamin D3. Moreover, some commercial milk
samples were analysed as a reference test for the use of the kit.
2. Results and Discussion
2.1. Content of Vitamin D in Commercial Milk Samples
The following commercial milk samples were analysed: A raw milk sample, two unfortified Ultra
High Temperature (UHT) milk samples, and one fortified UHT milk sample. The raw milk sample
contained 0.57 IU/mL of vitamin D3, a higher value, as expected, than the activity observed in two
samples of unfortified UHT milk, which contained respectively 0.34 IU/mL and 0.44 IU/mL of
vitamin D. The content of vitamin D in the fortified milk was equal to 0.80 IU/mL, a value slightly
greater than the upper limit of sensitivity (0.75 IU/mL) of the method.
The difference between the vitamin D in the fortified UHT sample (0.80 IU/mL) and the average of
the two unfortified UHT milks (0.39 IU/mL) was equal to 0.41 IU/mL. Since 40 IU of vitamin D
correspond to 1 μg of the compound, the difference found corresponds to 0.011 µg/mL of vitamin D
and is comparable to the quantity of vitamin D added to milk and declared on the packaging, equal
to 10 µg/L. The enzyme immunoassay method used was confirmed as a useful tool to measure the
vitamin D in the milk as it greatly reduces the time required to perform the conventional HPLC analysis.
2.2. Content of Vitamin D3 in Individual Milk Samples: Differences between Herds
An interesting variation was found among individuals that may be associated with management
factors as well as physiological and genetic effects. The difference in the distribution of the milk
activity of vitamin D3 between the two sampled herds is shown in Figure 1.
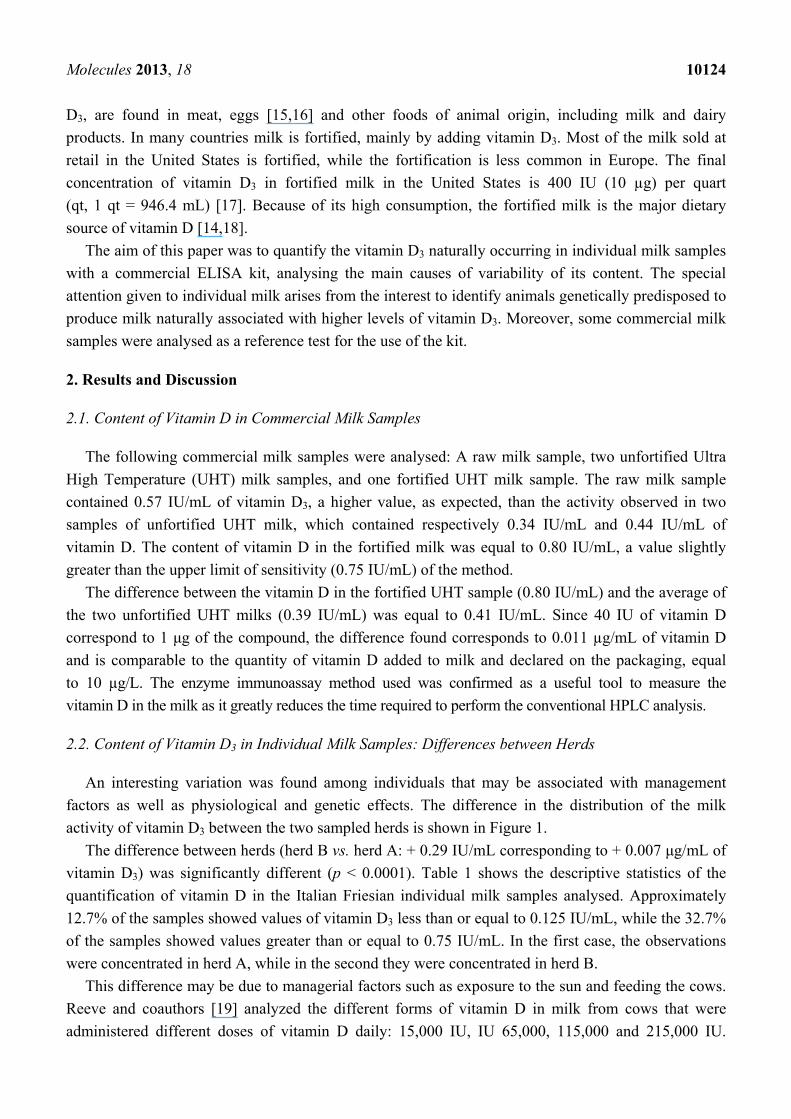
The difference between herds (herd B vs. herd A: + 0.29 IU/mL corresponding to + 0.007 μg/mL of
vitamin D3) was significantly different (p < 0.0001). Table 1 shows the descriptive statistics of the
quantification of vitamin D in the Italian Friesian individual milk samples analysed. Approximately
12.7% of the samples showed values of vitamin D3 less than or equal to 0.125 IU/mL, while the 32.7%
of the samples showed values greater than or equal to 0.75 IU/mL. In the first case, the observations
were concentrated in herd A, while in the second they were concentrated in herd B.
This difference may be due to managerial factors such as exposure to the sun and feeding the cows.
Reeve and coauthors [19] analyzed the different forms of vitamin D in milk from cows that were
administered different doses of vitamin D daily: 15,000 IU, IU 65,000, 115,000 and 215,000 IU.
Molecules 2013, 18 10125
A higher nutritional intake of vitamin D corresponded to an increase of vitamin D in the milk,
however, the authors observed that a 14-fold increase of vitamin D in the diet only corresponded to a
two-fold increase in the activity of vitamin D in the milk.
Figure 1. Frequency distribution of the activity of vitamin D3 in 55 individual milk samples
from Italian Friesian cows as a function of the two different herds (blue and cyan).
Table 1. Descriptive statistics of the content of vitamin D3 in milk individual samples of
the 55 Italian Friesian cows.
Vitamin D3 Herd A Herd B Herd A + B n = 27 n = 28 n = 55
Measure unit IU/mL µg/mL IU/mL µg/mL IU/mL µg/mL Mean 0.341 0.008 0.629 0.016 0.487 0.012 Standard Deviation 0.192 0.005 0.184 0.005 0.237 0.006 Median 0.311 0.008 0.750 0.019 0.505 0.013 Minimum value 0.125 0.0031 0.125 0.0031 0.125 0.0031 Maximum value 0.750 0.0187 0.750 0.0187 0.750 0.0187
Samples ≤ 0.125 IU/mL 10.91% 1.82% 12.73% Samples within the range of sensibility 34.55% 20.00% 54.55% Samples ≥ 0.75 IU/mL 3.64% 29.09% 32.73%
For lactating cows, dietary intake of vitamin D equal to 15,000 IU/day, which was considered
adequate in 1978 [20], but was later revised [21]. In fact, the definition of the appropriate dietary
intake of vitamin D is difficult to define, since animals exposed to sunlight, at certain latitudes, rather
than animals fed with hay exposed to the sun, may not require dietary supplements of this vitamin [21].
Horst and coauthors [22] defined a plasma concentration of 25-hydroxyvitamin D of less than 5 ng/mL
as indicative of a deficiency of vitamin D, while levels of 25 (OH) D between 200 and 300 ng/mL
indicative of toxicity. Normal cows have concentrations of 25-hydroxyvitamin D in plasma between
20 and 50 ng/mL [22]. In most cases, a daily intake of 10,000 IU (16 IU vitamin D/kg live weight)
should provide an adequate level of vitamin D in cows in late lactation. On the basis of all available

Molecules 2013, 18 10126
data, the requirement of 30 IU/kg body weight was established in 1989 [23] seems justified [21]. This
requirement is approximately equivalent to a daily intake of vitamin D equal to 18,750 IU.
In cattle, hypovitaminosis D, reducing the ability to maintain homeostasis of calcium and phosphorus,
has resulted in a decline in the blood level of phosphorus and, less frequently, a decrease in the level of
plasma calcium. Hypovitaminosis D is therefore eventually associated with rickets in young animals
and osteomalacia in adults [21]. Conversely, vitamin D intoxication is associated with a reduced food
intake, to polyuria followed by anuria, to dehydration of the faeces and reduced milk production.
At necropsy calcification occurs at the level of kidneys, aorta, abomasum, and bronchioles [24].
2.3. Content of Vitamin D3 in Individual Milk Samples: Physiological and Genetic Differences
Among the other sources of variability considered, the level of somatic cells of the milk expressed
as Somatic Cell Score (SCS) and the genotype of β-lactoglobulin presented a statistically significant
effect on the vitamin D content. The SCS is a logarithmic transformation of the somatic cell count
(SCC) of milk per mL [SCS = log base 2 (SCC/100,000) + 3] which aims to normalize the distribution
of SCC [25].
With an increase of SCS, the content in vitamin D decreases in a statistically significant way
(p < 0.05), with a linear regression coefficient equal to −0.027 IU/mL of vitamin D3 per point of SCS.
Since milk somatic cells are closely associated with the state of health of the mammary gland [26], the
observed effect can be explained by the fact that a higher content of vitamin D is presumably
associated with a better state of health of the animal and, in particular, of the mammary gland.
No significant effect was found for lactation number and days in milk. An interesting relationship
was highlighted between vitamin D3 content and the genetic polymorphism of β-lactoglobulin (β-LG),
the main whey protein of cow's milk which is involved in the transport of small hydrophobic
molecules such as retinol and vitamin D [27]. The AA genotype was associated to a content of vitamin
D3 significantly higher (p < 0.01) than the pool of the other two genotypes, the heterozygous AB and
the homozygous BB (Table 2).
Table 2. Effects of β-lactoglobulin (β-LG) genotype on the content of vitamin D3 in bovine
individual milk samples. Least-square means (LSM) with different letters are significantly
different (p < 0.01).
β-LG genotype Measure unit Number LSM Standard error
AA μg/mL 19 0.015 a 0.001 AB + BB μg/mL 36 0.011 b 0.001
AA IU/mL 19 0.602 a 0.051 AB + BB IU/mL 36 0.427 b 0.037
This result is not surprising. The two main genetic variants of bovine β-lactoglobulin are A and B,
differing for two amino acid substitutions only. The higher expression of variant A is well known [28].
In several studies, starting from Cerbulis and Farrell [29], a greater protein expression level of the
β-LG A variant compared with the B variant has been reported. The functional reason for differences
in expression between the two alleles has been investigated by several authors who highlighted
significant differences within the non coding region of the gene coding for β-lactoglobulin [28].
Molecules 2013, 18 10127
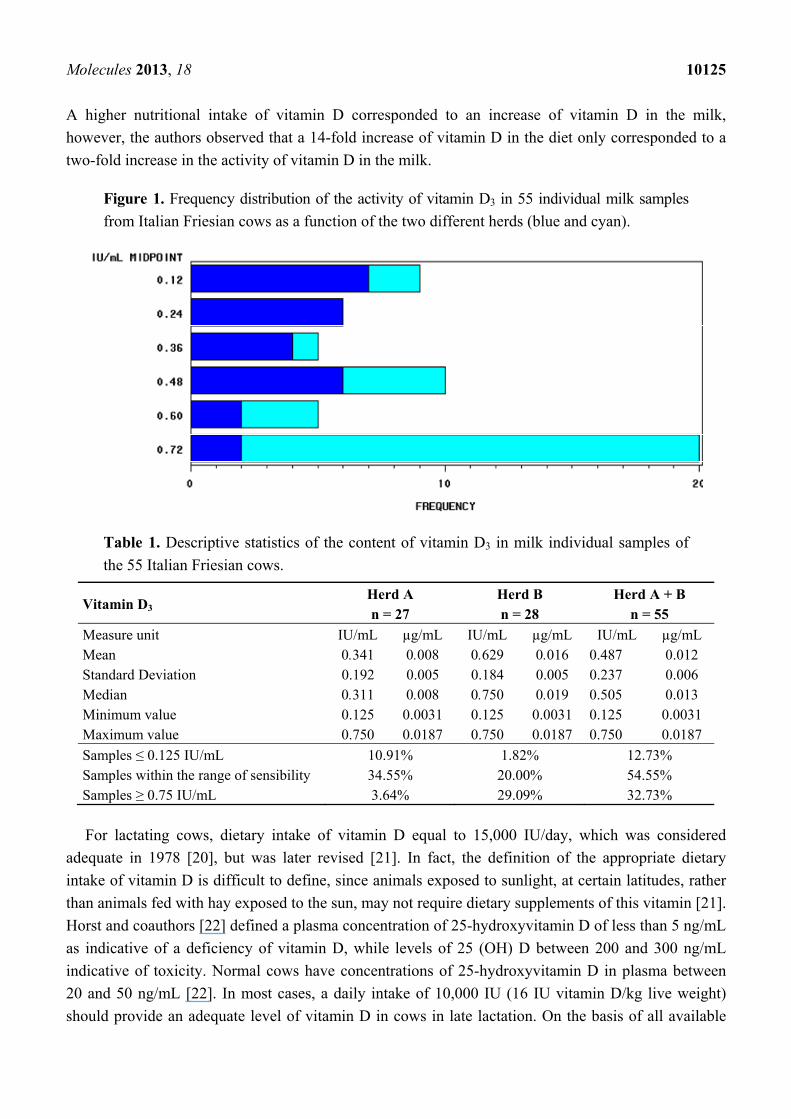
Figure 2 shows the different expression associated with the two variants of β-lactoglobulin and the
resulting genotypes.
Figure 2. Isoelectrofocusing of individual milk samples from Italian Friesian cows.
A particular showing the three most common bovine β-lactoglobulin (β-LG) genotypes is
highlighted, showing the higher expression of β-LG A variant.
The ability of β-LG, a protein that belongs to the lipocalin family, to bind the vitamin D has long
since been demonstrated [30]. Forrest and coauthors [31] have further characterized the interaction
between vitamin D3 and milk proteins choosing, among these, the β-LG A and β-casein which
represent, respectively, the most abundant whey protein and casein. Both proteins bind strongly to
vitamin D; this fact can greatly affect the stability and therefore the bioavailability of this vitamin in
dairy products. The same authors suggest that vitamin D3 can bind to β-lactoglobulin A in the
production of fermented milk-based products (cheese, yoghurt) or in the acid environment of the
stomach. The greater amount of β-LG expressed by the A variant [28] can justify the higher content of
vitamin D3 associated with the homozygous AA genotype.
The relatively high content of vitamin D3 in the samples analysed justifies the limited use of the
fortification of milk in Italy and suggests an opportunity to improve the content of vitamin D naturally
present in milk, either by acting on the herd management or evaluating the possibility to select
individuals predisposed to produce milk with a higher vitamin D content.
3. Experimental
A total of 55 individual samples of unfortified cow’s milk from two different herds were analysed
as well as different types of milk for human consumption available on the market: A sample of raw
milk, two samples of UTH milk, and a sample of fortified UHT milk (the content of vitamin D stated
on the label was equal to 10 µg/L).
Molecules 2013, 18 10128
In collaboration with the Provincial Breeders Association (APA) of Brescia, 55 individual milk
samples were collected from Italian Friesian cows belonging to two different farms in the province of
Brescia (northern Italy). Milk samples were taken in the second half of the month of May, 2012,
during the morning milking and immediately frozen at −20 °C for subsequent analyses.
The samples were analysed with the VitaKit DTM (SciMed Technologies Inc., Edmonton, Alberta,
Canada). The Life DTM Kit is a competitive enzyme immunoassay ELISA developed for the
determination of vitamin D3 after extraction. The assay uses a known amount of vitamin D
immobilized in solid phase present in the ELISA plate. Vitamin D acts as a competitive substrate with
the unknown amount of vitamin D3 extracted from milk samples of a fixed number of sites of the
labeled monoclonal antibodies that recognise vitamin D3 specifically. The absorbance was measured
by a microplate reader (Model 680, Bio-Rad Lab Inc., Hercules, CA, USA) at 450 nm. A calibration
curve was obtained in order to relate the absorbance of the standard samples provided in the kit with
the respective known concentrations of vitamin D3 (Figure 3).
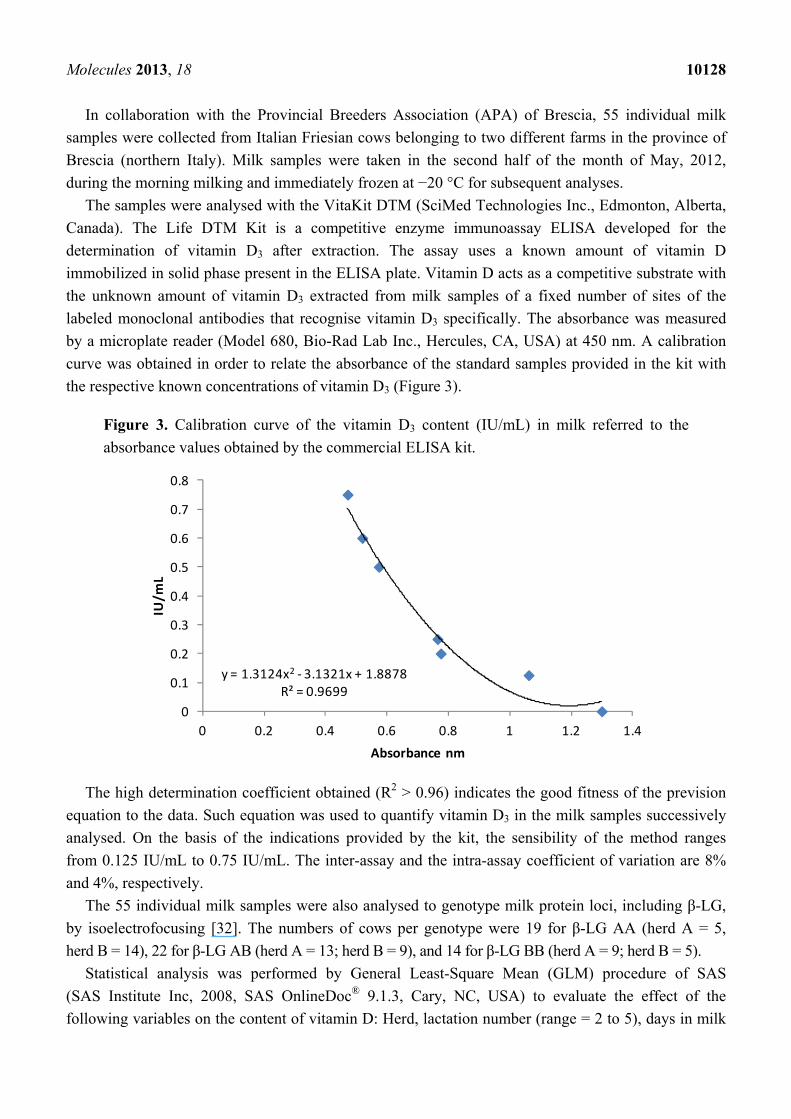
Figure 3. Calibration curve of the vitamin D3 content (IU/mL) in milk referred to the
absorbance values obtained by the commercial ELISA kit.
The high determination coefficient obtained (R2 > 0.96) indicates the good fitness of the prevision
equation to the data. Such equation was used to quantify vitamin D3 in the milk samples successively
analysed. On the basis of the indications provided by the kit, the sensibility of the method ranges
from 0.125 IU/mL to 0.75 IU/mL. The inter-assay and the intra-assay coefficient of variation are 8%
and 4%, respectively.
The 55 individual milk samples were also analysed to genotype milk protein loci, including β-LG,
by isoelectrofocusing [32]. The numbers of cows per genotype were 19 for β-LG AA (herd A = 5,
herd B = 14), 22 for β-LG AB (herd A = 13; herd B = 9), and 14 for β-LG BB (herd A = 9; herd B = 5).
Statistical analysis was performed by General Least-Square Mean (GLM) procedure of SAS
(SAS Institute Inc, 2008, SAS OnlineDoc® 9.1.3, Cary, NC, USA) to evaluate the effect of the
following variables on the content of vitamin D: Herd, lactation number (range = 2 to 5), days in milk
y = 1.3124x2 - 3.1321x + 1.8878R² = 0.9699
0
0.1
0.2
0.3
0.4
0.5
0.6
0.7
0.8
0 0.2 0.4 0.6 0.8 1 1.2 1.4
IU/m
L
Absorbance nm
Molecules 2013, 18 10129
(range = 100 to 269), milk somatic cell score (range = 0.06 to 8.83), as well as the genotype at
β-lactoglobulin locus.
4. Conclusions
First, from a methodological point of view, the enzyme immunoassay used is a useful tool to
measure vitamin D3 in milk by greatly reducing the time required to perform the conventional analysis
by HPLC. Secondly, an interesting variation was found between individuals. The two herds analysed
showed a considerable variability that may be associated with factors to corporate management, as
well as to specific genetic effects. In this respect, interesting was the relationship emerged between
vitamin D and genetic polymorphism of β-lactoglobulin, which was also found to be unbalanced in the
two herds. Other candidate genes as well as Single Nucleotide Polymorphisms (SNP) along the bovine
genome should be investigated within a wider study in order to highlight the significant effects of their
variability on the amount of vitamin D naturally present in milk for human consumption.
Acknowledgments
This study was supported by MiPAAF (INNOVAGEN contract). We thank Gianpietro Trebeschi
and the Provincial Breeders Association (APA) of Brescia for their support in collecting milk samples
and the necessary information.
Conflicts of Interest
The authors declare no conflict of interest.
References
1. Gombart, A.F. The vitamin D-antimicrobial peptide pathway and its role in protection against
infection. Future Microbiol. 2009, 4, 1151–1165.
2. Webb, A.R.; Pilbeam, C.; Hanafin, N.; Holick, M.F. An evaluation of the relative contributions of
exposure to sunlight and of diet to the circulating concentrations of 25-hydroxyvitamin D in an
elderly nursing home population in Boston. Am. J. Clin. Nutr. 1990, 51, 1075–1081.
3. Adami, S.; Romagnoli, E.; Carnevale, V.; Scillitani, A.; Giusti, A.; Rossini, M.; Gatti, D.;
Nuti, R.; Minisola, S. Guidelines on prevention and treatment of vitamin D deficiency.
Reumatismo 2011, 63, 129–147.
4. Caroli, A.; Poli, A.; Ricotta, D.; Banfi, G.; Cocchi, D. Invited review: Dairy intake and bone
health: A viewpoint from the state of the art. J. Dairy Sci. 2011, 94, 5249–5262.
5. DeLuca, H.F. The vitamin D story: A collaborative effort of basic science and clinical medicine.
FASEB J. 1988, 2, 224–236.
6. Reichel, H.; Koeffler, H.P.; Norman, A.W. The role of vitamin D endocrine system in health and
disease. N. Engl. J. Med. 1989, 320, 980–991.
7. Nagpal, S.; Na, S.; Rathnachalam, R. Noncalcemic actions of vitamin D receptor ligands.
Endocr. Rev. 2005, 26, 662–687.

Molecules 2013, 18 10130
8. Bischoff-Ferrari, H.A.; Giovannucci, E.; Willett, W.C.; Dietrich, T.; Dawson-Hughes, B.
Estimation of optimal serum concentrations of 25-hydroxyvitamin D for multiple health
outcomes. Am. J. Clin. Nutr. 2006, 84, 18–28.
9. Stroud, M.L.; Stilgoe, S.; Stott, V.E.; Alhabian, O.; Salman, K. Vitamin D—A review. Aust. Fam. Physician 2008, 37, 1002–1005.
10. Holick, M.F. Vitamin D deficiency. N. Engl. J. Med. 2007, 357, 266–281.
11. Calvo, M.S.; Whiting, S.J.; Barton, C.N. Vitamin D intake: A global perspective of current status.
J. Nutr. 2005, 135, 310–316.
12. Chen, T.C.; Chimeh, F.; Lu, Z.; Mathieu, J.; Person, K.S.; Zhang, A.; Kohn, N.; Martinello, S.;
Berkowitz, R.; Holick, M.F. Factors that influence the cutaneous synthesis and dietary sources of
vitamin D. Arch. Biochem. Biophys. 2007, 460, 213–217.
13. Ross, A.C.; Manson, J.E.; Abrams, S.A.; Aloia, J.F.; Brannon, P.M.; Clinton, S.K.;
Durazo-Arvizu, R.A.; Gallagher, J.C.; Gallo, R.L.; Jones, G.; et al. The 2011 report on dietary
reference intakes for calcium and vitamin D from the Institute of Medicine: What clinicians need
to know. J. Clin. Endocrinol. Metab. 2011, 96, 53–58.
14. Moore, C.; Murphy, M.M.; Keast, D.R.; Holick, M.F. Vitamin D intake in the United States. J. Am. Diet. Assoc. 2004, 104, 980–983.
15. Mattila, P.H.; Piironen, V.I.; Uusi-Rauva, E.J.; Koivistoinen, P.E. Contents of cholecalciferol,
ergocalciferol, and their 25-hydroxylated metabolites in milk products and raw meat and liver as
determined by HPLC. J. Agric. Food Chem. 1995, 43, 2394–2399.
16. Jakobsen, J. Bioavailability and bioactivity of vitamin D3 active compounds—Which potency
should be used for 25-hydroxyvitamin D3? Int. Congr. Ser. 2007, 1297, 133–142.
17. FDA. PMO 2007: Appendix O: Vitamin fortification of fluid milk products. Available online:
http://www.fda.gov/Food/GuidanceRegulation/GuidanceDocumentsRegulatoryInformation/Milk/
ucm089032.htm (accessed on 24 June 2013).
18. Fulgoni, V., III; Nicholls, J.; Reed, A.; Buckley, R.; Kafer, K.; Huth, P.; Dirienzo, D.; Miller, G.
Dairy consumption and related nutrient intake in African-American adults and children in the
United States: Continuing survey of food intakes by individuals 1994–1996, 1998, and the
National Health and Nutrition Examination Survey 1999–2000. J. Am. Diet. Assoc. 2007, 107,
256–264.
19. Reeve, L.E.; Jorgensen, N.A.; DeLuca, H.F. Vitamin D compounds in cows’ milk. J. Nutr. 1982,
112, 667–672.
20. National Research Council. Nutrient Requirements of Dairy Cattle, 5th ed.; National Academy of
Sciences: Washington, DC, USA, 1978.
21. National Research Council. Nutrient Requirements of Dairy Cattle, 7th ed.; National Academy of
Sciences: Washington, DC, USA, 2001.
22. Horst, R.L.; Goff, J.P.; Reinhardt, T.A. Calcium and vitamin D metabolism in the dairy cow.
J. Dairy Sci. 1994, 77, 1936–1951.
23. National Research Council. Nutrient Requirements of Dairy Cattle, 6th ed.; National Academy of
Sciences: Washington, DC, USA, 1989.
24. Littledike, E.T.; Horst, R.L. Problems with vitamin D injections for prevention of milk fever:
Toxicity of large doses and increased incidence of small doses. J. Dairy Sci. 1980, 63, 89.
Molecules 2013, 18 10131
25. Ali, A.K.A.; Shook, G.E. An optimum transformation for somatic cell concentration in milk. J. Dairy Sci. 1980, 63, 487–490.
26. Zecconi, A. Le cellule somatiche nel latte influenzano sanità e qualità. L’Informatore Agrario
2007, 8, 66–69.
27. Farrell, H.M., Jr; Jimenez-Flores, R.; Bleck, G.T.; Brown, E.M.; Butler, J.E.; Creamer, L.K.;
Hicks, C.L.; Hollar, C.M.; Ng-Kwai-Hang, F.; Swaisgood, H.E. Nomenclature of the proteins of
cows’ milk-sixth edition. J. Dairy Sci. 2004, 87, 1641–1674.
28. Caroli, A.M.; Chessa, S.; Erhardt, G.J. Milk protein polymorphisms in cattle: Effect on animal
breeding and human nutrition. J. Dairy Sci. 2009, 92, 5335–5352.
29. Cerbulis, J.; Farrell, H.M., Jr. Composition of milks of dairy cattle. I. Protein, lactose, and fat
contents and distribution of protein fraction. J. Dairy Sci. 1975, 58, 817–827.
30. Wang, Q.; Allen, J.C.; Swaisgood, H.E. Binding of vitamin D and cholesterol to beta-lactoglobulin.
J. Dairy Sci. 1997, 80, 1054–1059.
31. Forrest, S.A.; Yada, R.Y.; Rousseau, D. Interactions of vitamin D3 with bovine β-lactoglobulin A
and β-casein. J. Agric. Food Chem. 2005, 53, 8003–8009.
32. Erhardt, G.; Juszczak, J.; Panicke, L.; Krick-Saleck, H. Genetic polymorphism of milk proteins in
Polish Red Cattle: A new genetic variant of beta-lactoglobulin. J. Anim. Breed. Genet. 1998, 115,
63–71.
Sample Availability: Not available.
© 2013 by the authors; licensee MDPI, Basel, Switzerland. This article is an open access article
distributed under the terms and conditions of the Creative Commons Attribution license
(http://creativecommons.org/licenses/by/3.0/).