value of marine ecosystems on the atlantic and pacific coasts
TRANSCRIPT
Pauly, D., A. Beattie, A. Bundy, N. Newlands, M. Power and S. Wallace. 2000. Not Just Fish:Value of Marine Ecosystems on the. Atlantic and Pacific Coasts. In: H. Coward, R. Ommer andT. Pitcher (editors), Social and Economic Papers No. 23, Institute of Social and EconomicResearch, Memorial University of Newfoundland (publishers). Just Fish: Ethics andCanadian Marine Fisheries. pp. 34-46.
2Not Just Fish
Value of Marine Ecosystems on the Atlanticand Pacific Coasts
Daniel Pauly, Alasdair Beattie, Alida Bundy, NathanielNewlands, Melanie Power, and Scott Wallace
INTRODUCTION
This chapter demonstrates that the ecosystems supporting the ma-rine fisheries on Canada's east and west coasts have greatlychanged under exploitation by industrial fisheries. These changes,reflected in the decline in the abundance of key species and the com-position of the fisheries' landings, imply changes in the supportprovided by the ecosystems in which the fisheries are embedded.This further implies that ecosystem changes contribute sufficiently tothe dynamics of fisheries to require their being considered explicitlyin assessment and predictions, along with the within-specieschanges (e.g., of population structure or abundance) that have so farbeen the almost exclusive object of attention for fisheries scientistsand managers.
Some longer-term economic and ethical implications of thetrends presented here are discussed, following a presentation of theecosystems and of an index of fisheries impacts on them, from thebeginning of the century to the present, for both the eastern andwestern coasts of Canada.
MATERIAL AND METHODS
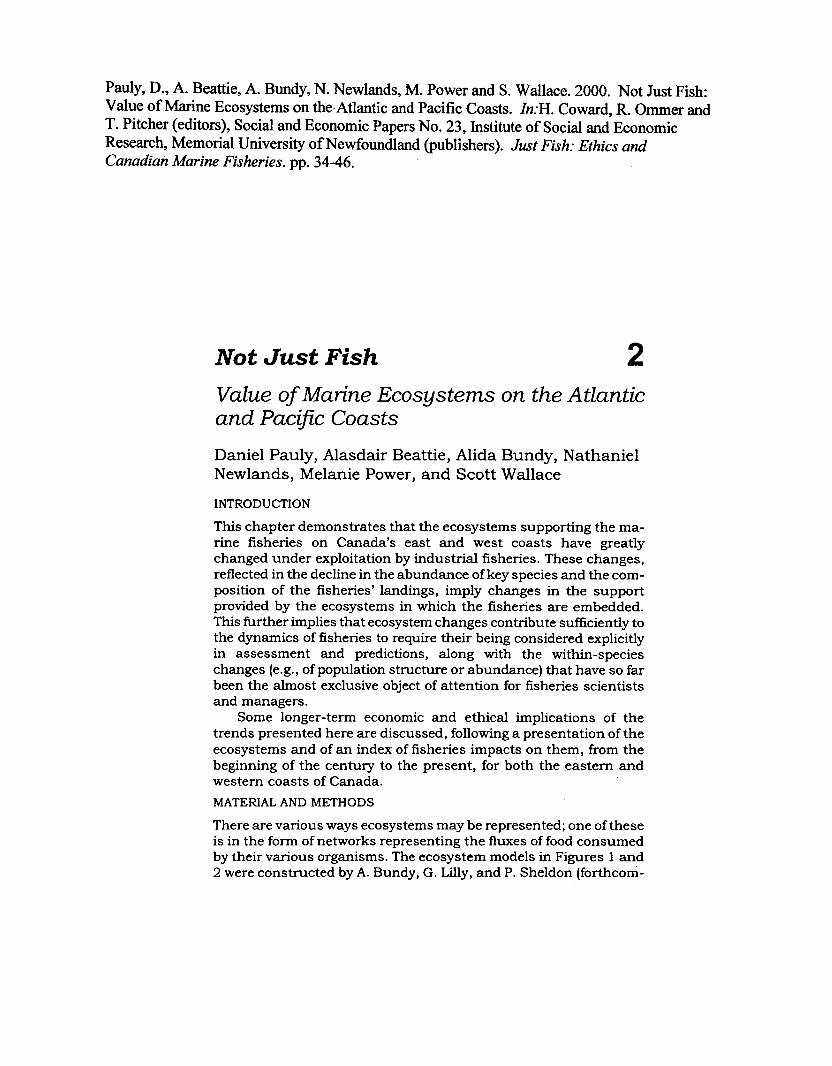
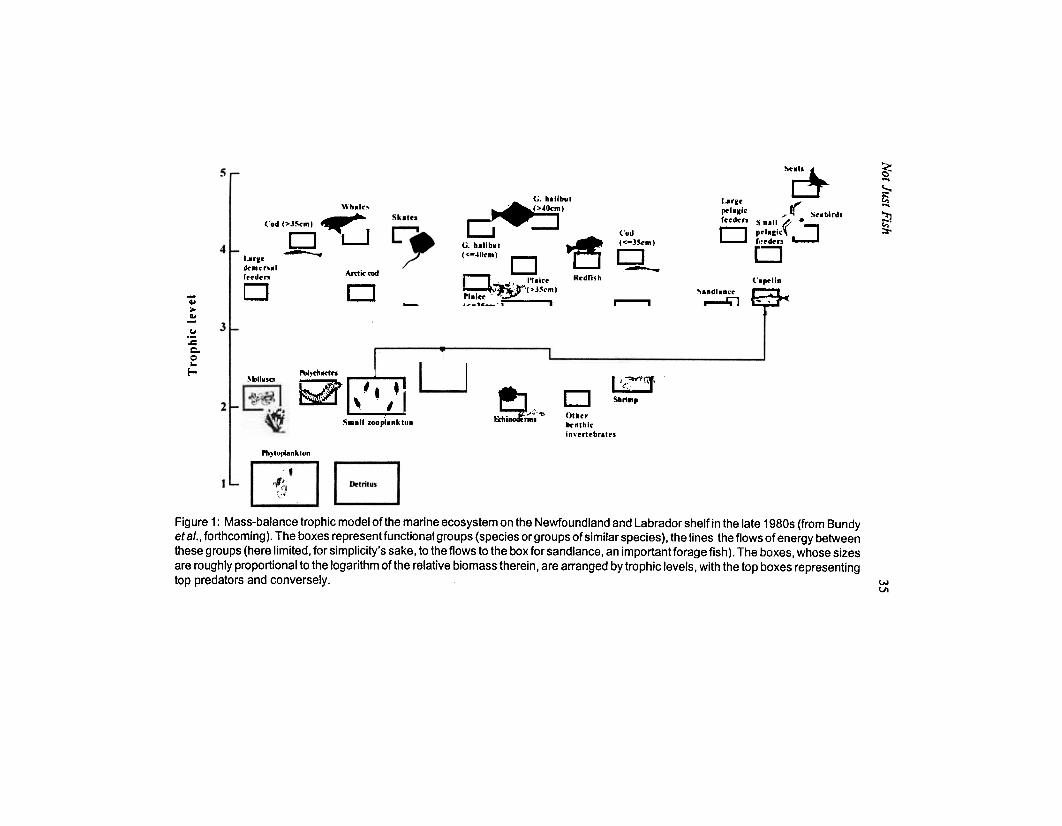
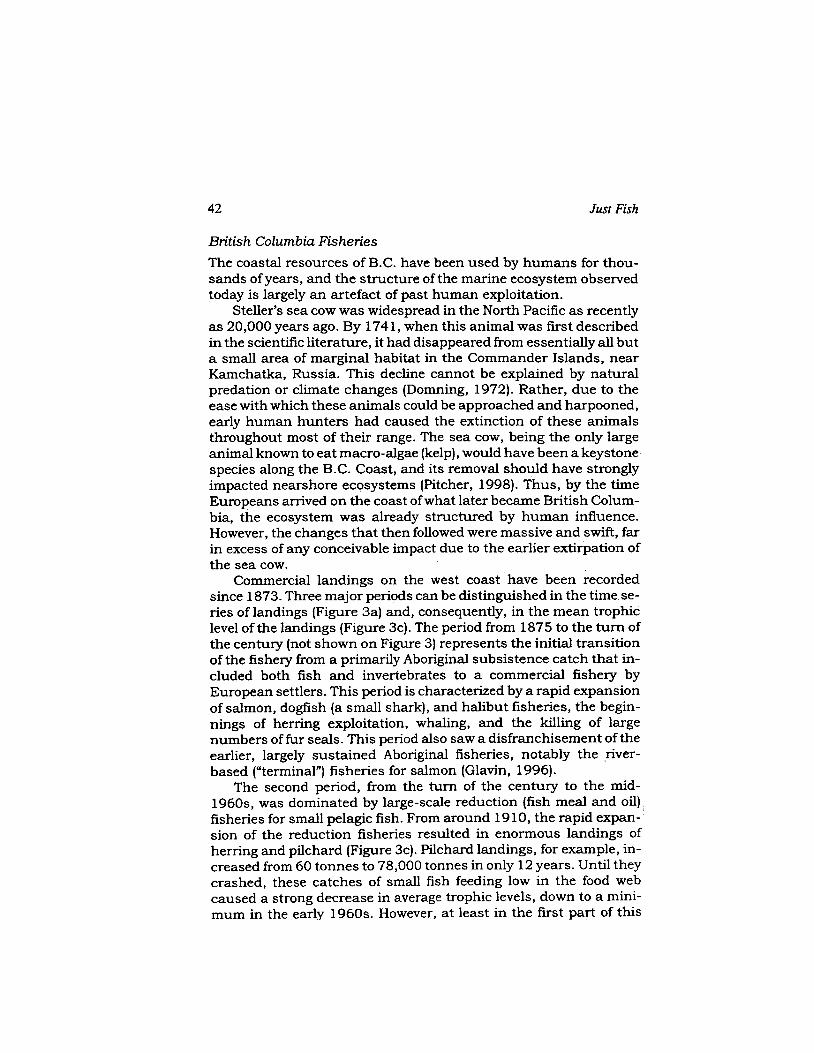
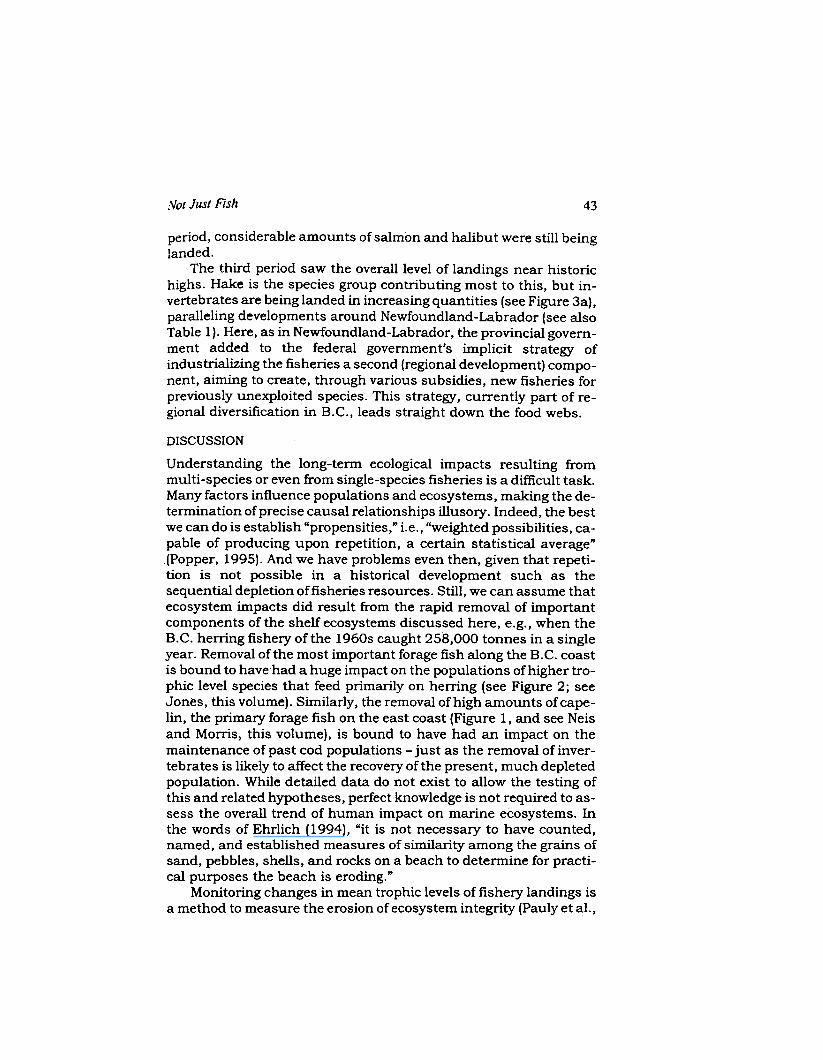
There are various ways ecosystems may be represented; one of theseis in the form of networks representing the fluxes of food consumedby their various organisms. The ecosystem models in Figures 1 and2 were constructed by A. Bundy, G. Lilly, and P. Sheldon (forthcom-
Not Just F
ish
.;:!
, ;. ~
~u""',
rn:
'~:n
~
" =
".. '
..~
=-~
e-" .
""~;"D"~
;"t
~I..:~
=
~
-.. .
."" -
.;J =--
~=.."
\D~
:- E
=f"..
.~
~...
.c.. ...,
-", D
£:~
"'-
0~
En~
i -.."...-c
--..
...
.a -y
.A.-
;;~
~tl!o(
~.0'" ~~
D(-eo
..S ..
t"i~~
~~
I~A
~I
J!qdoJ.L
O"i
-: :
-E'a
a ""a~
~D
lot
-f"-=c~0;;:
I
~.a-
S,iJ".c'~
M
'" ;~
D~
~~
-..~o~
-
~:a,.
c
f-'
Ji -~
0
,- ..
, :;E
1r1
'"
].l
J'C
o.'.\~
t:r!
ryl~
c~~i~~f
>-c:(/)0)
"CQ
)Q)C
:C
:Q)N
~:J
~
.-c:~
~(/)Q
)""Q
)Q)(/)
E.c(/)Q
)0>
-0,-,-0).J::c.~
,-~Q
)(/)Q
)rn":i;oC
:Q)Q
)C
X)Q
)xx0')-00.-0.0.0
.s~Q
)c...!20.J::.9Q
)~f-:Q
).J::Q
)~.J::
-.J::.J::-C
:-(/).J::.-(/)tt::
~:!::Q
)Q)~
Q)c:0)
-.J::=
ro(/)(/)Q
)'--'-.J::°Q
)0_->"C
-:.c.9?ro(/)rou
.c Q
) t .-
ro .-0.J::-.J~
c.g-"C
c.E~
c: (/).-
>-
ro'-C:.o
"C~
ro_"CC
:EQ
)Q)
ro.- u
0)'5(/)c:c:c:-roro:Jo-t:o~
-gro~
:JroQ)
Q)o(/)ro
zc,o -
Q)'--C
:.J::
0 X
'Q
j-(/)
0 '-
C:Q
).oQ)
O'u
Q)
£
EQ
)£(/)Q
)c.o(/)-(/)_ro(/)---(/)E>
-(/)~o
(/) c.
0'-0:J_.cU
O-Q
)Q
)'-Q»
Q) O
).J:: .-c:"'ffi-ro.-
c:O-
'- -Q)
roo .,-
E'-
Q)
-~Q
)
Q)gro£
.J:::J(/)---(/)0--.O
C:.?;oE
-Q)
Q)
.-.J::(/)U
-"C
Q
) =
.;::
o'-c.roE
c.EO
)Q
) .-0U
'-(/)-:C
(/)'-Q»-
g-~.,Q
£-a;'-
.o°-oo~
-Q
)-Q
)Q
) -
U
Q) .~
ro
>c:.J::E
C:C
:rol-=
oo-"":'Q
):eu~
0)'-0"CI
c:Q)c.C
:(/) .-.J::
0 ro
(/)E---,-
roO(/)
c.c.~
~U
~>
-O~
.J::---..t
0.J:: ro
'-0'-0)"CQ
) O
):JQ)
'- :Q
)eo.:J-(/)O
)roQ)Q
)c.'-"".J::
'- 0
U-Q
)_ro-
35
36 Just Fish
ing) for the Newfoundland-Labrador shelf, and by A. Beattie (1999)for the British Columbia shelf, using the Ecopath mass-balance ap-proach and secondary data from a variety of sources.! In thesemodels, biological production (a flow of biological matter, or "bio-mass"). for each species or functional group (i.e., a "box:" in Figures 1and 2) is set equal to its consumption by other groups in the system,plus its fisheries catches and other losses from the ecosystem. Suchmass-balance is achieved only when a good understanding of thefeeding (or "trophic") interactions in the system has been reached. Atthis stage, the outputs of the models can be used for several infer-ences, notably on the position of each group within the food web,expressed by their "trophic level" (Y-axis in Figures 1 and 2).
Historical landing data were gathered by N. Newlands and M.Power for the Newfoundland-Labrador shelf (representing the eastcoast) and by S. Wallace for British Columbia. Both data sets rely onstatistics assembled by the Department of Fisheries and Oceans(DFO), complemented with historic data from provincial records andvarious publications documenting specific fisheries.2 An effort wasmade to include catches from small-scale fisheries, and thus to workagainst a widespread bias, which tends to undervalue their contribu-tion (Pauly, 1997). Note that we differentiate, where appropriate,"landings," i.e., fish and invertebrates landed by fishing vessels, from"catches," which also includes fish killed and discarded by the fishingoperation and for which time series usually are lacking.
The present nominal "value" of the fisheries was obtained bymultiplying the landings by current prices, by species groups. Ouranalysis does not aim to establish how the fisheries compared withother sectors in the past, but to examine earlier catch compositionsin terms of the commercial values they would currently obtain.
The impacts of the fishery on the ecosystem were evaluated withreference to the mean trophic level of the species groups in fisherieslandings (t LI) using t LI = L(Yj oTLj) / Yi where Yi is the catch of spe-cies group j in year i, t Lj is the trophic level of species group j,obtained from the Ecopath model of the appropriate coasts (Figures1,2), and Yi is the total catch of all species groups in year i. A few es.,.timates were taken from FishBase 98 {Froese and Pauly, 1998)3 forgroups whose trophic levels were not estimated by one of the twomodels in Figures 1 and 2.
RESULTS
While similar in their basic architecture, the models in Figures 1 and2, representing the east and west coast ecosystems, respectively,differ in two important attributes:
jg~
iVat Just F
ish
In
[.a
.t..l'1
~'Ii
0: -U
,":cj ~.;[:t
D~
: t
...I0
;.; ~
b~
.. ~
~
~
iD
';l~~
f).. C
." ~
~
5i
::J -
-D
. .t':0
~E
"
~~
\J ~
.;.:
]~~
~
!...!U
"...
i~~
~'
1~
.p ..~
~~
D~
j..~
.
...~~D
~!
.., ~~D
: "..
De
-~
~
~~
~:
.;;.~
~~
i ;
:~."
-'. .0
~
,t".S
-:
.: e.
: "-'~
.~~
t'l"
~.
"i. ~
~,
~~
fU~
1'=
~
~-
tJ~
:
f.;.
~:
~ ~
...~
~.
or' -.
~-=
~;
i~
2 ~
~
i ~
~,-.
: o
-..~
-
..J~
~.
.i.: [ln~
i \
t"'~
~
: I'"
..,
13"~1 J!lJdo.lJ.
t.
.~.
...
iD
,~ Ea:>(I)C
1) -
OO
1~O
J~U
01
.-CO
C
1)
>,
a;O>
.0 :-.c-.S
J."C
"Cij-cU
C1)",,-::,C
O:C
>
C1) (I)-
a..-C
1)""Q
j "C
.-0
0
"Cro~
a.~_co
a.E
>,
(I) O
J (I)
.-.0
0 (I)
C"C
O1""iijC
OC
OC
1)010=
-O
JT
-~E
OJc
;2;:- CO
.-.5 C
O'-
.-(I) C
O OJ-""""
C1),-oC
1)CO
~,
0 (I)
.c C
1)
..,C1)a.""""
:5~:JE
co.5'0
e x
c:"co:'=
O
J 0
'Q5
.-CO
'-
.0 .oE
'- 0
C1)
C1)
7n(l).c.c:J ",
C1) --
->,'5
0 (I)
OC
OC
1)-(I)()
"C
a. (I)
ECO
.c.!.(I)=>
(l)C~
:>o
,., C
1) (I).Q .-
.t: (I)
a. -.0C
D
C1)
:J C
1) C
1)
-c.e:5~.8C
1)OJO
~(I).c--C
1)co_co
-'-
8 -g .§ ~ ~C
1) cot) (I)-
:5wC
(I)'OO
J 01 .2 ->
, EC
O1-:'=
o..-cu.c-C
1) .--
CO
c:"
(I) "Q
.'~E
C1)~
EO
J .
C1)
(I) a.'-
0 >
,
_cC1)(I)--
(I)$""'-C1)C
1)>
, (I)
.~
O.c
(I)
(1)'- v,
--'-0
'- C
1) -C
1)u.c
x"O.9
>
C1)()O
C1)_C
C1) "C
.o.~
C
O
0
ccC1)E
Cu
.-CO
.c =
0"0
ro>,I-C
1)'ecE
-.,-oCO
:J~
C1)a.
C1)cog>
.co~.c
a.. .-~
0
-~E
(I)a.-
-~oa.>
,~
5!.C1)u:J:t:C
1)C
1).c.ceOJ'-
"CU
)tOJ:Ja.
0,'; E
C
1) 0
a.E
'-J~
""0.(I)
C1) -
u C
D.~
C
1) O
J
:cc~:5C
Oc
a.Qj
CO
C
(I),.,
e.cC1)C
1)~c
--CD
C
1) .-C
1)
C1):J-~
(I)(I)0
0"", ~
, C
1)u
(I) -~,
C
C1)-(I)a.
coC1)"C
.cOC
1)""iij.co>
'.c"".c'::E
~~
~(l)O
C1)C
1)CI>
"X(I)(I)_C
C1)O
CO
""Q5C
OC
1)x.c~
"C~
'O.8a.
C,.j~
I(I)C1).9
~O
J~~
~C
1):Jc-.Q
.:5
.-.c -~
.2>.5.~
C
1) .c :5
u-.c =
> .c
(1)'-:>
-ro::~
37
Just Fish38
a The top predators on the west coast are transient killer whales,feeding on other marine mammals. Such predatory control of,for example, the seal population is lacking on the east coast.
b. The fisheries on the west coast exploit a larger variety of com-mercial species than the east coast fishery, which reliedpredominantly on cod during the period covered by the modelin Figure 2.
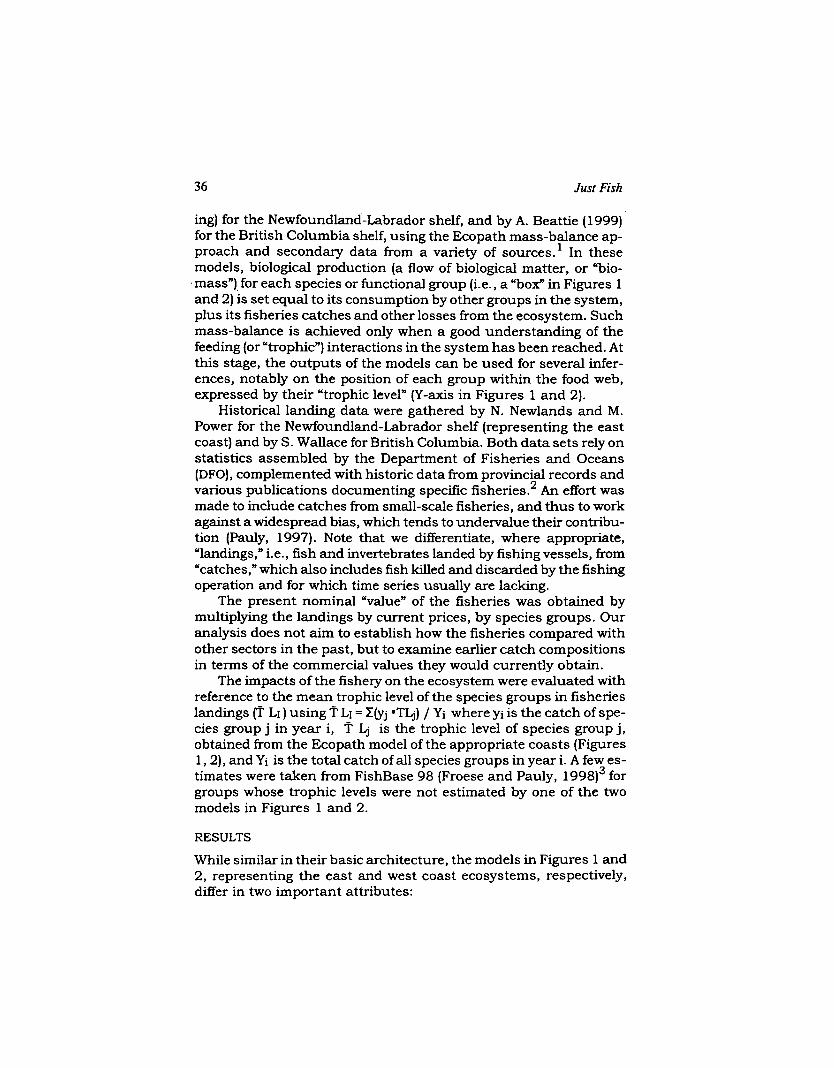
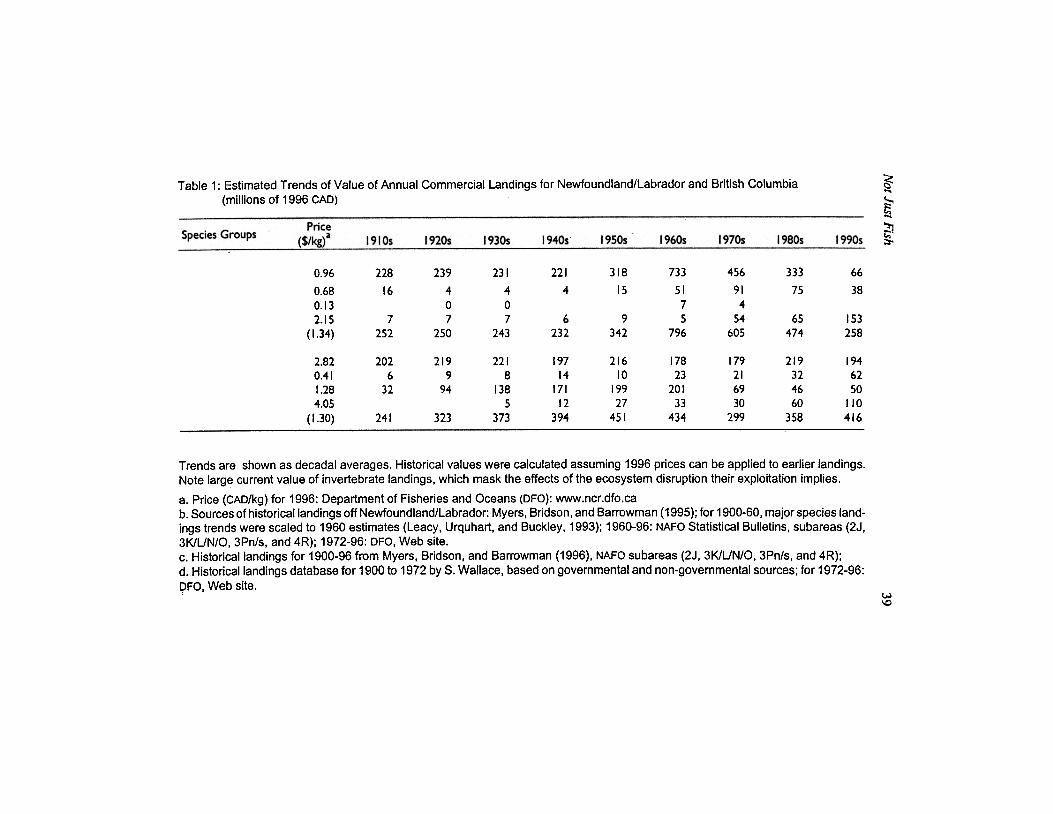
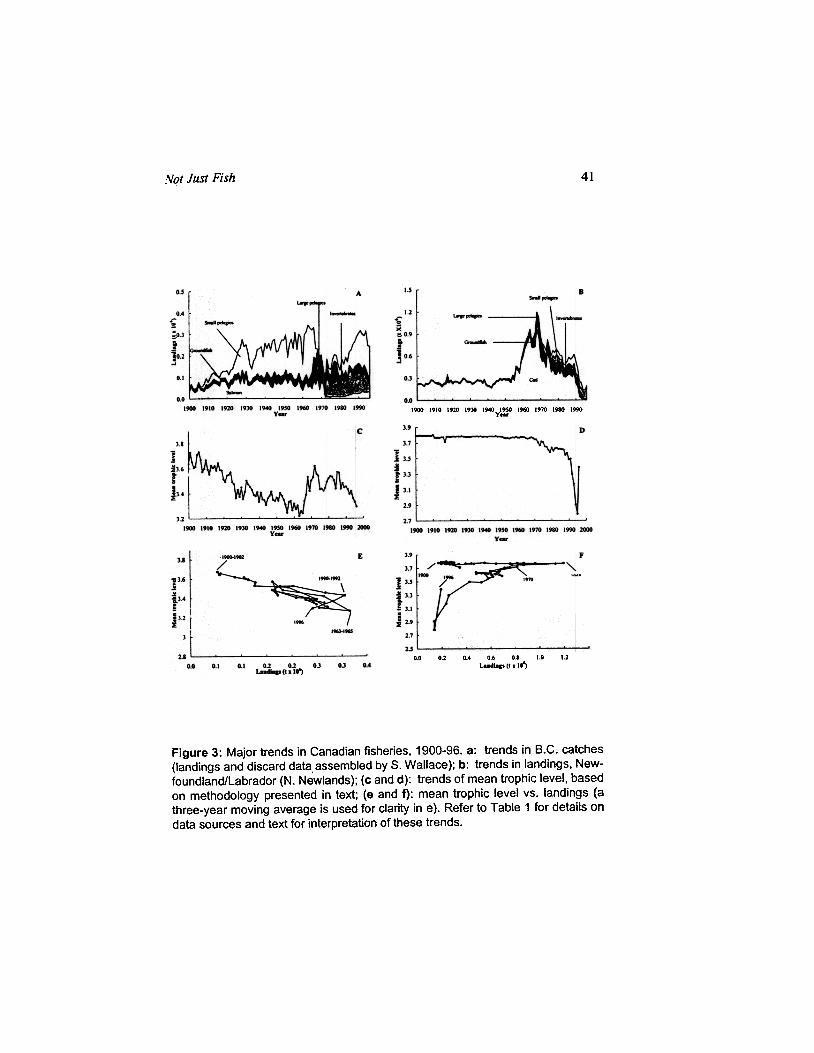
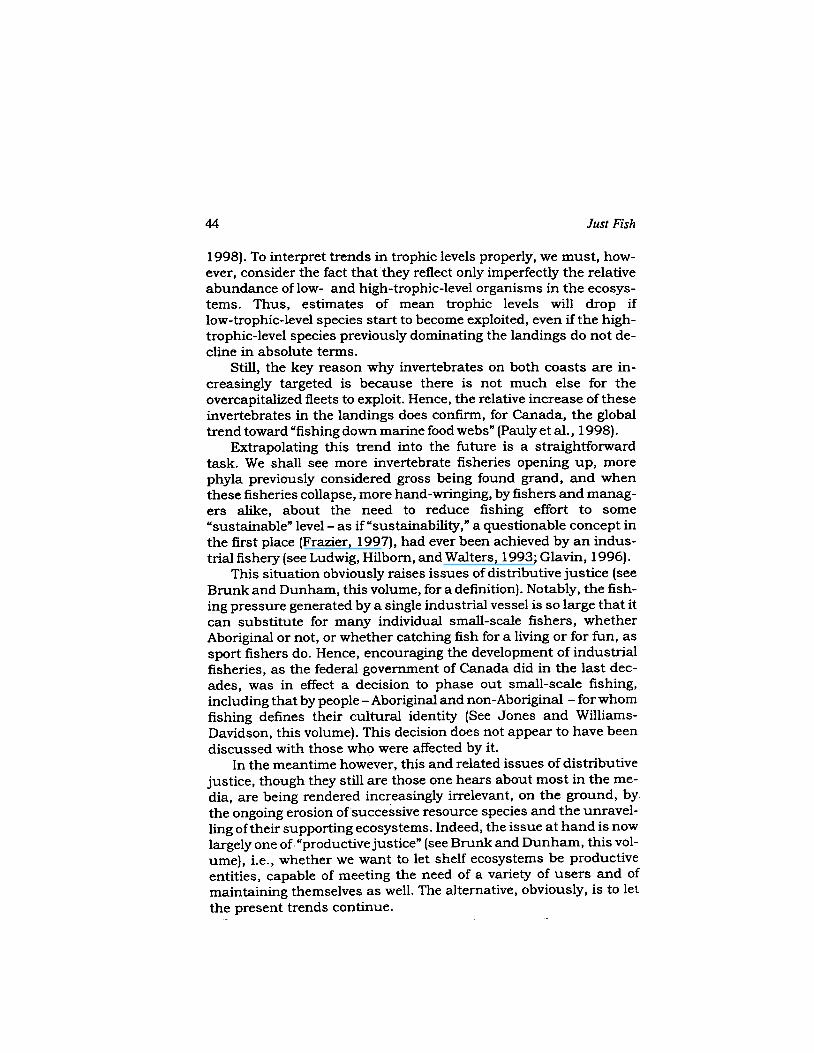
The state of both of these ecosystems, as represented in Figures1 and 2, is much modified from their previous configurations. This isdue to industrial fisheries that saw, in this century, enormous in-crease of their catching power and on both coasts overwhelmed thesmall (artisanal) fisheries. Also, we see a shift by the Canadian-based industrial fisheries from species formerly abundant to otherspecies (small fishes, invertebrates) that they had previouslyspumed (see Table 1). (Note that some of these species may havebeen important in the past, e.g., to Aboriginal communities.) How-ever, the time series in Figures 3a and 3b also reflect managementinterventions (notably federal govemment support for industrialfisheries development), and not only changes in market conditions.Thus, to enable interpretation of these time series, brief narrativeson the history of these fisheries are given below. These narrativesalso allow the reader to interpret the trends in Table 1, and Figures3c-3f, representing changes of mean trophic level of landings fromthe waters around Newfoundland-Labrador and along the B.C.coast, from the tum of the century to the present. As will be seen,these changes raise serious issues of ecosystem justice, as definedby Brunk and Dunham (this volume).
Newfoundland Fisheries
As might be seen from Figure 3b, the fishery was more or less stableuntil mid-century, with only small changes in the mean trophic levelof the landings (Figure 3d), driven mainly by changes in the (small)landings of fish other than cod, the dominant species in New-foundland-Labrador (Table 1). Indeed, all the fishery did, in the firsthalf of the century, was continue with its relatively sustainable formof exploitation, established hundreds of years earlier (see Ommer,this volume), which involved access only to the shallow part of thecod stock, using traps, a very selective artisanal gear.
Then after World War II, an increase in fishing and the 1948; in-troduction of pair trawling (an industrial gear) led to the firstnoticeable decline in mean trophic level, due to an increase in thelandings of species other than cod (Figures 3d, 3b).
Not Just Fish
ro:cE:I"0().c-2.;::m-0Cro...0-0ro....0ro~=
cCro'6C:I
~IJ)z...0-(I)Q
)C'6Cro~ro.(3...IJ)
EE0()ro:ICC«-0IJ):Iro>~
-00«(1)(.)
-0(0C
o>~
O>
1-"--002(1)ro
CE
.Q
".i:';:(I) Ew
.-IJ):croI-
00 U
'I
M M-r-..",-o
M'"
0-r-..
r-..
-D-'t-'t-~
~O
' ~
O't-
-D
M
'"M
t-.
M-.oOO
MU
'I=-
a o--~
MO
OO
N~
~
CI)
-0N
-
N O"ot"O
I"-OM
~
-VO
r--MM
V
N
N
-VNN -0 a)
-0 M
r-..M'"M
-ON,.,N
o-M'f"M
""'"-D
r-.""
Ma)
111111-N
N-D
N0
MN 0-0-"'--0-N -~
~~
...,N
...,
N
,
I"-""-M""
<1'-1"--<
1'--,..,
-Doa
--a-N~
N
-V
00""-""""M
O,.."..,
-M
..,.
0'-0'00'I'-.M
,o.-.O'
-M O'N
-oOO
O-"""--0""N
'"
"f"NO
O-o
0"-01/'1----"ot"
M-O
O&
l'l---~
"f:"!C!~
MO
-V-:'
~ MNMTN
cn ,.
..0)
-g~
~c:
ro~
I--c.
-I/) ..('1
c:~
~ro
~b;
ro Q
) ---u'-
"T-
'-~
Q)~
"0'-
.g?; .-0. ~
c:
..Q"i::
c: I/)
I/) ro..
roo 0..,;1/)
Q) .-.~
I/)
-Q)
0-roc:
c:uro
E'-
0..'-
.-Q)
~"00
'- M
0
Q)""5.
0":5 .1/)
=X
C
O
0-0.
Q)
, ro
0. 0-
Z--'-
oro c:
'u .-0>
U
:J
Q)
Q).f:.
T-:;::;
:--.E.c
-'- .~
~
c:
c:c: °ro
M'-
roO
--.Q)
U
'- .;.:.
(/)-,
>-It)
('10I/)§-
0>0
~O
)~
'- o>
u. I/)c:
": .~
~
<
ro
00."0
c:Z
~c:
tOE
rocO
ro"O
O>
Q)
EO
>
.cc:o>
-ro I
~ro
T-~
u~
o 1/)-
0)1/) ()
eo>co
o$.
c:o-'- u.c:
'- U
"0
ro T
- <
Q
)E
Q)
..:ro.;.:. zE
~Q
) g"O
M
.c:I/).c:
.c:o>
<0"-
~.:::::
~ro.~
0>
g?
"00 C
:. ~
oQ
)I/) 0>
' ~
O)
I/) Q
)c:
c:rou
~"O
--Q
) O
":.:I! ro
0
B~
u.rog
E"O
roQ)
e..,;ro ~
~U
Q)
1/)'-"0 oro
Q):5
c:g?,c: t:.c
05.:1! ro~
ro ~
~>
1/) Q
)~.
""u;>
ro u;.:t
"Oro
I/)E
Oo~
c:=
Q)
"O"O
~
roro.2-£
c:~C
" oS
:ro.-
ro.c '-
c:>
.c: I/)ro:J
.~C
J:i
ro~
Q)~
,2"0>
'u
.":"0 >
..- ":
.c.-I/)
Q)
c: U
I/)
rooO
).c:roro.c ('I
_c:1/)
-Q)
Q)
-r---1/)'-
.-"0 -.J
I/) 0>
.--g LL
c: ~
s:
05 T-
:l:ro -~
I/) ->
'0cn-
0020~-
Q)Q
)_'t=rou.
0O
)ro ~
~E
aEo
ro '-E
Z00>
'-.c ii5co'-T
-Q
)Q)
t~Q
)O>
-'-
~"55 ~
OO
N~
..Q->
Q
)l/)cor Q
)roc:,...O
)o>o>
OI/)
"0.- "".5
T-
T-
0 ro
ro- ..~
O
>~
uoco~O
';':'T-~
Q)
O>
c:_,.". ro
"OQ
)o>$."O
~'-ro
~
-Q
)'-t'~
q~1/)-
T-ro
-~
roro '-uro"O
1/)1/)>
0',:
U
c: 0)
0)
C:_-O
l/)roc:c:~
~-O
;ii5Q)";--C
--C0,-
.:I!.-'--C:C
:'.c:,-_.c:Q
)C:roroQ
)I/)~
a-~
o ~
u <
0 M
--I/)Q
)1/)
1/) roro
,-Q)
U
"0 'U
u.cro
e>
~
~
c: 0
":": Q
)I/)ro
Q)'-Q
)z-oo>
~-
u~'-
-->~
I/)
I/)c:
Q)
'- 0
-J Q
)- 0..(/)1/):--.:1::1:0
'- 0
..~~
..u.
I- Z
ro.c.-
M
U"O
()
39
40 Just Fish
With Confederation (1949), Canada took control of marine fish-eries. Offshore foreign fishing fleets greatly expanded their capacity,especially from 1960 on. Radar and other electronic navigationalaids, echo sounders, and nylon multifilament and monofilamentnets were developed and put into use. This was a time when it wasthought technology not only held all the answers, but was the an-swer. Consequently, with the establishment of the 200-mile exclusiveeconomic zone (EEZ), Canada created, largely through federal subsi-dies, a new Canadian offshore factory-freezer trawler fleet, and beganto catch previouslyunexploited species (often the prey of traditional re-source species).
These new fisheries, targeting groups tending to have low tro-phic levels, led to a strong decline in mean trophic level throughoutthe 1980s. This continued in the 1990s, e.g., through the opening in1993 of a fishery for Icelandic scallops. Cod landings were initiallyhigh in both the inshore and offshore sectors, but declined, espe-cially in the inshore sector, as the 1980s wore on. When the groundfishery collapsed at last in the early 1990s and the commercial At-lantic salmon fishery was closed in 1995, only the fisheries targetingorganisms low in the food web -especially invertebrates -remainedactive (Table 1; Figure 3d), while thousands of small- scale operatorsand fish workers lost their jobs.
The dominant trend here is one of "modernization and develop-ment" driving the traditional resource species (cod) down, and new,previously neglected, non-commercial species low in the food webbeing turned into "resources." As fishers increased their debt load tofinance the new technologies deployed in this process, they needednot only to maintain their incomes, but even to increase them so asto meet payments. Governments, through various subsidizationschemes, encouraged this development of "underutilized" species,seeing them as a solution to the problem posed by decreasing in-comes, "excessive" numbers of fishers, and processing plantsoperating below capacity. This was intensified by demand in theJapanese market for roe, met by new capelin and lumpfish fisheries,and by the 1980s craze for fish-as-health-food, which caused mar-ket prices to rise. Market forces, thus, were another strong incentiveto exploit new species.
What has been overlooked is that these "new" species had, infact, always been part of the resource system, but as part of the dietof the traditional species. Thus, having first competed with marinemammals for their fish prey, we are now competing with cod andsimilar fish for their invertebrate prey.
,Vot Just Fish 41
1900 1910 1920 1930 "" 1950 1960 1970 1910 1990y..,
0.2 0.4 06 OJ 1.0
~(I'It')1.%0.0
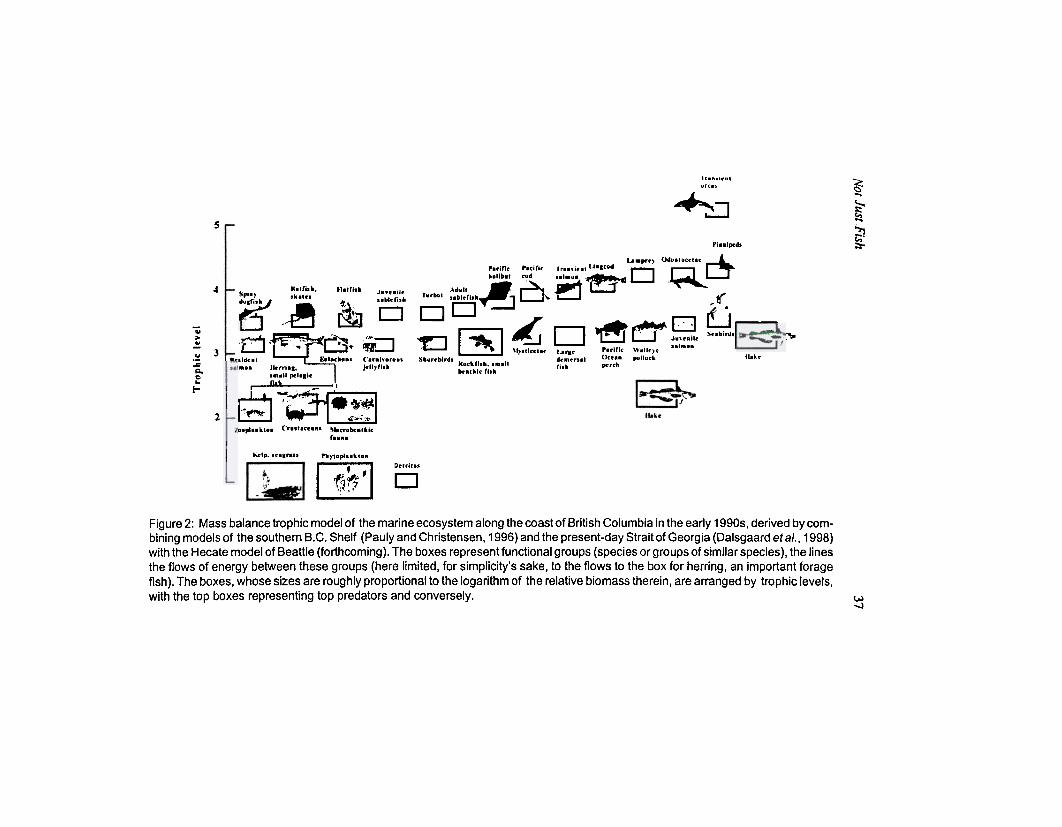
Figure 3: Major trends in Canadian fisheries. 1900-96. a: trends in B.C. catches(landings and discard data, assembled by S. Wallace); b: trends in landings, New-foundland/Labrador (N. Newlands); (c and d): trends of mean trophic level, basedon methodology presented in text; (e and f): mean trophic level vs. landings (athree-year moving average is used for clarity in e). Refer to Table 1 for details ondata sources and text for interpretation of these trends.
42 Just Fish
British Columbia Fisheries
The coastal resources of B.C. have been used by humans for thou-sands of years, and the structure of the marine ecosystem observedtoday is largely an artefact of past human exploitation.
Steller's sea cow was widespread in the North Pacific as recentlyas 20,000 years ago. By 1741, when this animal was first describedin the scientific literature, it had disappeared from essentially all buta small area of marginal habitat in the Commander Islands, nearKamchatka, Russia. This decline cannot be explained by naturalpredation or climate changes (Domning, 1972). Rather, due to theease with which these animals could be approached and harpooned,early human hunters had caused the extinction of these animalsthroughout most of their range. The sea cow, being the only largeanimal known to eat macro-algae (kelp), would have been a keystonespecies along the B.C. Coast, and its removal should have stronglyimpacted nearshore ecosystems (Pitcher, 1998). Thus, by the timeEuropeans arrived on the coast of what later became British Colum-bia, the ecosystem was already structured by human influence.However, the changes that then followed were massive and swift, farin excess of any conceivable impact due to the earlier extirpation ofthe sea cow.
Commercial landings on the west coast have been recordedsince 1873. Three major periods can be distinguished in the timese-ries of landings (Figure 3a) and, consequently, in the mean trophiclevel of the landings (Figure 3c). The period from 1875 to the turn ofthe century (not shown on Figure 3) represents the initial transitionof the fishery from a primarily Aboriginal subsistence catch that in-cluded both fish and invertebrates to a commercial fishery byEuropean settlers. This period is characterized by a rapid expansionof salmon, dogfish (a small shark), and halibut fisheries, the begin-nings of herring exploitation, whaling, and the killing of largenumbers of fur seals. This period also saw a disfranchisement of theearlier, largely sustained Aboriginal fisheries, notably the river-based ("terminal") fisheries for salmon (Glavin, 1996).
The second period, from the turn of the century to the mid-1960s, was dominated by large-scale reduction (fish meal and oil)fisheries for small pelagic fish. From around 1910, the rapid expan-sion of the reduction fisheries resulted in enormous landings ofherring and pilchard (Figure 3c). Pilchard landings, for example, in-creased from 60 tonnes to 78,000 tonnes in only 12 years. Until theycrashed, these catches of small fish feeding low in the food webcaused a strong decrease in average trophic levels, down to a mini-mum in the early 1960s. However, at least in the first part of this
Not Just Fish 43
period, considerable amounts of salmon and halibut were still beinglanded.
The third period saw the overall level of landings near historichighs. Hake is the species group contributing most to this, but in-vertebrates are being landed in increasing quantities (see Figure 3a),paralleling developments around Newfoundland-Labrador (see alsoTable 1). Here, as in Newfoundland-Labrador, the provincial govern-ment added to the federal government's implicit strategy ofindustrializing the fisheries a second (regional development) compo-nent, aiming to create, through various subsidies, new fisheries forpreviously unexploited species. This strategy, currently part of re-gional diversification in B.C., leads straight down the food webs.
DISCUSSION
Understanding the long-term ecological impacts resulting frommulti-species or even from single-species fisheries is a difficult task.Many factors influence populations and ecosystems, making the de-termination of precise causal relationships illusory. Indeed, the bestwe can do is establish "propensities," i.e., "weighted possibilities, ca-pable of producing upon repetition, a certain statistical average"(Popper, 1995). And we have problems even then, given that repeti-tion is not possible in a historical development such as thesequential depletion of fisheries resources. Still, we can assume thatecosystem impacts did result from the rapid removal of importantcomponents of the shelf ecosystems discussed here, e.g., when theB.C. herring fishery of the 1960s caught 258,000 tonnes in a singleyear. Removal of the most important forage fish along the B.C. coastis bound to have had a huge impact on the populations of higher tro-phic level species that feed primarily on herring (see Figure 2; seeJones, this volume). Similarly, the removal of high amounts of cape-tin, the primary forage fish on the east coast (Figure 1, and see Neisand Morris, this volume), is bound to have had an impact on themaintenance of past cod populations -just as the removal of inver-tebrates is likely to affect the recovery of the present, much depletedpopulation. While detailed data do not exist to allow the testing ofthis and related hypotheses, perfect knowledge is not required to as-sess the overall trend of human impact on marine ecosystems. Inthe words of Ehrlich (1994), "it is not necessary to have counted,named, and established measures of similarity among the grains ofsand, pebbles, shells, and rocks on a beach to determine for practi-cal purposes the beach is eroding."
Monitoring changes in mean trophic levels of fishery landings isa method to measure the erosion of ecosystem integrity (Pauly et al.,
44 Just Fish
1998). To interpret trends in trophic levels properly, we must, how-ever, consider the fact that they reflect only imperfectly the relativeabundance of low- and high-trophic-level organisms in the ecosys-tems. Thus, estimates of mean trophic levels will drop iflow-trophic-level species start to become exploited, even if the high-trophic-level species previously dominating the landings do not de-cline in absolute terms.
Still, the key reason why invertebrates on both coasts are in-creasingly targeted is because there is not much else for theovercapitalized fleets to exploit. Hence, the relative increase of theseinvertebrates in the landings does confirm, for Canada, the globaltrend toward "fishing down marine food webs" (Pauly et al., 1998).
Extrapolating this trend into the future is a straightforwardtask. We shall see more invertebrate fisheries opening up, morephyla previously considered gross being found grand, and whenthese fisheries collapse, more hand-wringing, by fishers and manag-ers alike, about the need to reduce fishing effort to some"sustainable" level- as if "sustainability ," a questionable concept inthe first place (Frazier, 1997), had ever been achieved by an indus-trial fishery (see Ludwig, Hilborn, and Walters, 1993; Glavin, 1996).
This situation obviously raises issues of distributive justice (seeBrunk and Dunham, this volume, for a definition). Notably, the fish-ing pressure generated by a single industrial vessel is so large that itcan substitute for many individual small-scale fishers, whetherAboriginal or not, or whether catching fish for a living or for fun, assport fishers do. Hence, encouraging the development of industrialfisheries, as the federal government of Canada did in the last dec-ades, was in effect a decision to phase out small-scale fishing,including that by people -Aboriginal and non -Aboriginal -for whomfishing defines their cultural identity (See Jones and Williams-Davidson, this volume). This decision does not appear to have beendiscussed with those who were affected by it.
In the meantime however, this and related issues of distrib'Utivejustice, though they still are those one hears about most in the me-dia, are being rendered increasingly irrelevant, on the ground, bythe ongoing erosion of successive resource species and the unravel-ling of their supporting ecosystems. Indeed, the issue at hand is nowlargely one of. "productive justice" (see Brunk and Dunham, this vol-ume), i.e., whether we want to let shelf ecosystems be productiveentities, capable of meeting the need of a variety of users and ofmaintaining themselves as well. The alternative, obviously, is to letthe present trends continue.
Not Just.Fish 45
The former choice implies a serious attempt to rebuild stocks byclosing parts of the ecosystems to all fishing (Guenette, Lauck, andClark, 1998; Pitcher and Pauly, 1998) and being serious about ourstewardship of their exploited parts (see Roach, this volume). Wehave no delusions of this happening in the near future. However,values do change, and the Canadian public at large may wonder whytheir government, as a signatory to various conventions meant toprotect marine biodiversity, not only allows these trends to con-tinue, but blesses them with subsidies. Moreover, the countries thatwill manage to maintain the integrity of their coastal ecosystems,i.e., to practise "ecosystem justice" (Brunk and Dunham, this vol-ume), may end up as economic winners when the others, having letthese trends erode their resources, find themselves surrounded byseas empty offish.
NOTES1.. The Ecopath mass-balance approach and software are documented in
Christensen and Pauly (1992); further references and applicationsmay be obtained at http:/ /www.ecopath.org, from which the softwaremay also be downloaded. The Ecopath home page contains, as well, thefiles used to generate Figures 1 and 2 and information on their datasources.
2. These catch data are available fromS. Wallace (B.C. coast) and N. New-lands (Newfoundland-Labrador coast) (see www.fisheries.com forfurther information).
3. The FishBase home page (www.fishbase.org) may be visited for detailson trophic level estimation and for biological information on species offishes included in the models and/or exploited by Canada's marinefisheries.
REFERENCESBeattie, A. 1999. "The Hecate Strait: a preliminary present-day model," in N.
Haggan and A.I. Beattie, eds., Back to the Future: the Hecate Strait.Fisheries Centre Research Reports.
Blades, K. 1995. Net Destruction: The Death of Atlantic Canada's Fishery.Halifax: Nimbus.
Bundy, A., G. Lily, and P. Sheldon. forthcoming. A bulk biomass model of theNewfoundland-Labrador shelf Canadian Technical Reports in Fisher-ies and Aquatic Sciences.
Christensen, V., and D. Pauly. 1992. "Ecopath II -a software for balancingsteady-state ecosystem models and calculating network characteris-tics," &ological Modelling 61: 169-85.
Domning, D.P. 1972. "Steller's sea cow and the origin of North Pacific Abo-riginal whaling," Syesis 5: 187-89.
Just Fish46
Ehrlich, P.R. 1994. "Energy use and biodiversity loss," Philosophical Trans-actions of the Royal Society, London B. 344: 99-104.
Frazier,J.G. 1997. "Sustainable development: modern elixir or sack dress?"Environmental Conservation 24: 182-93.
Froese, R., and D. Pauly, eds. 1998. FishBase 98: Concepts, Design andData Sources. Manila: ICLARM.
Glavin, T. 1996. Dead Reckoning: Confronting the Crisis of Pacific Fisheries.Vancouver: Greystone Books.
Guenette, S., T. Lauck, and C. Clark. 1998. "Marine reserves: fi"omBevertonand Holt to the present," Reviews in Fish Biology and Fisheries 8: 251-72.
Leacy, F.H., M.C. Urquhart, and K.A.H. Buckley, eds. 1983. Historical Sta-tistics of Canada, 2nd ed. Ottawa: Statistics Canada.
Ludwig, D., R. Hilborn, and C. Walters. 1993. "Uncertainty, resource exploi-tation and conservation: lessons fi"om history," Science 260: 1 7-18.
Mackenzie, D. 1986. Inside the Atlantic Triangle: Canada and the Entranceof Newfoundland into CoTtfederation 1939-49. Toronto: University of To-ronto Press.
Myers, R.A., J. Bridson and N.J. Barrowman. 1995. Summary ofworldwidestock and recruitment data. Canadian Technical Reports in Fisheriesand Aquatic Sciences, No. 2024.
Pauly, D. 1997. "Small-scale fisheries in the tropics: marginality, marginali-zation and some implication for fisheries management," in E.K. Pikitch,D.D. Huppert, and M.P. Sissenwine, eds., Global Trends: Fisheries Man-agement. Bethesda, Md.: American Fisheries Society, 40-49.
and V. Christensen, eds. 1996. Mass-Balance Models of North-eastern Pac~c Ecosystems. Fisheries Centre Research Reports 4, 1.
, V. Christensen, J. Dalsgaard, R. Froese, and F. Torres, Jr. 1998."Fishing down marine food webs," Science 279: 860-63.
Pitcher, T. 1998. "Pleistocene pastures: Steller's sea cow and sea otters inthe Strait of Georgia," in D. Pauly, T. Pitcher, and D. Preikshot, eds.,Back to the Future: reconstructing the Strait of Georgia ecosystem, Fish-eries Centre Research Reports 6, 5: 48-51.
and D. Pauly. 1998. "Rebuilding ecosystems, not sustainability,as the proper goal of fishery management," in T. Pitcher, D. Pauly, andP. Hart, eds., Reinventing Fisheries Management. London: Chapmanand Hall, 311-29.
Popper, K.R. 1995. A World of Propensities. Bristol: Thoemmes.Rowe, F. W. 1980. A History of Newfoundland and Labrador. Toronto:
McGraw-Hill Ryerson.