using satellite remote sensing to estimate winter cover crop nutrient uptake efficiency
TRANSCRIPT
303sept/oct 2009—vol. 64, no. 5journal of soil and water conservation
Using satellite remote sensing to estimate winter cover crop nutrient uptake efficiencyW.D. Hively, M. Lang, G.W. McCarty, J. Keppler, A. Sadeghi, and L.L. McConnell
Abstract: Winter cover crops are recognized as an important agricultural conservation prac-tice for reducing nitrogen (N) losses to groundwater following the summer growing season. Accordingly, cost-share programs have been established to promote winter cover crops for water quality on farms throughout the Chesapeake Bay watershed. However, current esti-mates of cover crop nutrient uptake are largely calculated from plot-scale studies extrapolated to watershed-scale based solely on enrollment acreage. Remote sensing provides a tool for rapid estimation of cover crop biomass production on working farms throughout the land-scape. This project combined cost-share program enrollment data with satellite imagery and on-farm sampling to evaluate cover crop N uptake on 136 fields within the Choptank River watershed, on Maryland’s eastern shore. The Normalized Difference Vegetation Index was a successful predictor of aboveground biomass for fields with >210 kg ha–1 (>187 lb ac–1) of vegetation (corresponding to 4.2 kg ha–1 [3.7 lb ac–1] of plant N ), below which the back-ground reflectance of soils and crop residues obstructed the cover crop signal. Cover crops planted in the two weeks prior to the regional average first frost date (October 15) exhibited average fall aboveground N uptake rates of 18, 13, and 5 kg ha–1 (16, 12, 4 lb ac–1) for rye, barley, and wheat, respectively, corresponding to 1,260, 725, and 311 kg ha–1 (1,124, 647, 277 lb ac–1) of aboveground biomass, with associated cost-share implementation costs of $5.49, $7.60, and $19.77 kg–1 N ($2.50, $3.46, and $8.99 lb–1 N). Cover crops planted after October 15 exhibited significantly reduced biomass and nutrient uptake, with associated program costs of $15.44 to $20.59 kg–1 N ($7.02 to $9.36 lb–1 N). Agronomic factors influencing cover crop performance included species, planting date, planting method, and previous crop. Field sam-pling locations with >1,000 kg ha–1 (>890 lb ac–1) of springtime cover crop biomass exhibited greatly reduced soil nitrate (<3 mg kg–1 [<3 ppm]) in comparison to fields with low cover crop biomass (up to 14 mg kg–1 soil nitrate), indicating a target biomass threshold for maxi-mum water quality impact. Additional sampling years will be necessary to account for cover crop response to climate variability. Combining remote sensing with farm program data can provide important information to scientists and regulators working to improve conservation programs. Results can be used to more effectively utilize scarce conservation resources and increase water quality protection.
Key words: Conservation Effects Assessment Project (CEAP)—Chesapeake Bay—Choptank River—cover crop—nitrogen—remote sensing
W. Dean Hively is an associate soil scientist, Megan Lang is an associate physical scientist, and Gregory W. McCarty is a soil scientist for the USDA Agricultural Research Service (ARS) Hydrology and Remote Sensing Laboratory (HRSL), Beltsville, Maryland. Jason Keppler is a computer information specialist for Resource Conservation Operations, Maryland Department of Agriculture, Annapolis, Maryland. Ali Sadeghi is a soil scientist for the USDA ARS HRSL, Belts-ville, Maryland. Laura L. McConnell is a research chemist, USDA ARS Environmental Management and Byproduct Utilization Laboratory, Beltsville, Maryland.
The use of winter cover crops on agri-cultural lands has been identified as an important management practice with potential to positively impact water qual-ity by reducing nitrogen (N) leaching and sediment transport. Throughout the Chesapeake Bay watershed, a strong empha-sis has been placed on the use of winter cover crops for sequestration of residual agricul-tural N following the summer cropping sea-son (Staver 2001; Staver and Brinsfield 1998; MDA 2005a). Federal and state cost-share
funds are being provided to farmers (MDA 2005a, 2005b) to compensate for the costs of planting winter cover crops such as wheat (Triticum aestivum L.), rye (Secale cereale L.), and barley (Hordeum vulgare L.).
Winter cover crops serve to capture excess agricultural nutrients following the harvest of summer crops such as corn (Zea mays L.), soybean (Glycine max L.), and vegetables and sequester the nutrients until springtime when they can be returned to the soil at the start of the summer growing season. Rye cover crops
have been shown to decrease leaching of soil N by up to 80% by reducing available soil nitrate concentrations during winter months (Staver and Brinsfield 1998; Shipley et al. 1991; Strock et al. 2004). Cover crops have also been shown to have beneficial effects on soil aggregate stability and mycorrhizal colonization (Kabir and Koide 2002), soil phosphorus management (Cavagielle and Thien 2003), winter ground cover (Hively and Cox 2001), erosion prevention (Kaspar et al. 2001), farm profitability (Watkins et al. 2002), pest control (Staver and Brinsfield 1998), and yield of following crops (Hively and Cox 2001; Kabir and Koide 2002; Snapp et al. 2005). These positive environmental effects, however, can be limited if the cover crops are not established in a manner that promotes the growth of abundant biomass prior to the winter season. Rye is a common choice for winter cover cropping, often out-performing other small grains in terms of fall biomass production due to its cold har-diness and capacity for cold-season growth (MAWP 2008; Snapp et al. 2005; Staver and Brinsfield 1998).
Current estimates of cover crop effec-tiveness and nutrient uptake efficiency rely heavily upon small-plot (e.g., Shipley et al. 1991) and small-catchment (Staver and Brinsfield 1998) experimental data extrapo-lated to match implementation acreages. In practice, however, landscape-scale variability in physical, environmental, and farm man-agement parameters makes estimation of the actual magnitude of cover crop N uptake complex. Remote sensing analysis using sat-ellite imagery can provide a viable solution for rapid estimation of cover crop growth and nutrient uptake at the watershed scale.
Remotely sensed data have long been used to estimate vegetation abundance in the landscape (Lu 2006; Pinter et al. 2003).
doi:10.2489/jswc.64.5.303
Copyright ©
2009 Soil and Water C
onservation Society. All rights reserved.
w
ww
.swcs.org
64(5):303-313 Journal of Soil and W
ater Conservation
304 journal of soil and water conservationsept/oct 2009—vol. 64, no. 5
A commonly used measure (Tucker 1979), the Normalized Difference Vegetation Index (NDVI), is calculated as a ratio of red and near-infrared (NIR) reflectance: [NDVI = (NIR – red) / (NIR + red)]. The NDVI, which correlates closely to plant leaf area index (Weigland et al. 1992), has been used successfully to measure the biomass, yield, N status, chlorophyll content, and photo-synthetic capacity of wheat crops (Bendetti and Rossini 1993; Hansen and Schjoerring 2003; Reyniers and Vrindts 2006; Weigland et al. 1992). While remote sensing has proved to be a valuable tool for landscape analysis of vegetation characteristics, considerable untapped potential exists for the augmen-tation of remotely sensed parameters with site-specific agronomic data–derived con-servation practice implementation records, allowing researchers to use the remotely sensed data as response variables to evaluate the efficacy of best management practices.
Farmers who enrolled in the 2005 to 2006 Maryland Agricultural Water Quality Cost-Share Winter Cover Crop Program (MDA 2005b) were compensated at a variable rate that paid $98 ha–1 ($40 ac–1) for early-planting (September 7 to September 30) and standard-planting dates (October 1 to October 15) and $62 ha–1 ($25 ac–1) for late-planting dates (October 16 to November 5). Nutrient application is prohibited prior to March 1st of the following year, and the cover crop may not be harvested for sale. Additional cost-share programs (MDA 2005b) support the implementation of commodity cover crops (grain crops grown for market without fall fertilizer application); cultivation of hul-less barley commodity cover crops with the secondary benefit of renewable biofuels pro-duction; and legume-grass cover crop mixes for use on certified organic farms. This com-bination of cover crop cost-share programs receives considerable annual funding and is expected to make a significant contribution to the reduction of nonpoint source agricul-tural nutrient pollution to the Chesapeake Bay.
The current study derived estimates of cover crop N uptake efficiencies at the landscape scale by using a combination of satellite remote sensing imagery, on-farm sampling, and acquisition of agronomic data from cost-share program implementa-tion records. This innovative methodology allowed the direct evaluation of the effect of agronomic factors (species choice, plant-
ing date, planting method, previous crop) on cover crop productivity using satellite observation of actual practices employed on farms. Continued efforts to combine remote sensing tools with farm program data will provide important information to scientists and regulators working to improve con-servation programs. Results can be used to more effectively utilize scarce conservation resources, derive maximum water quality benefits, calculate watershed nutrient uptake totals, and support regionally effective cover cropping practices.
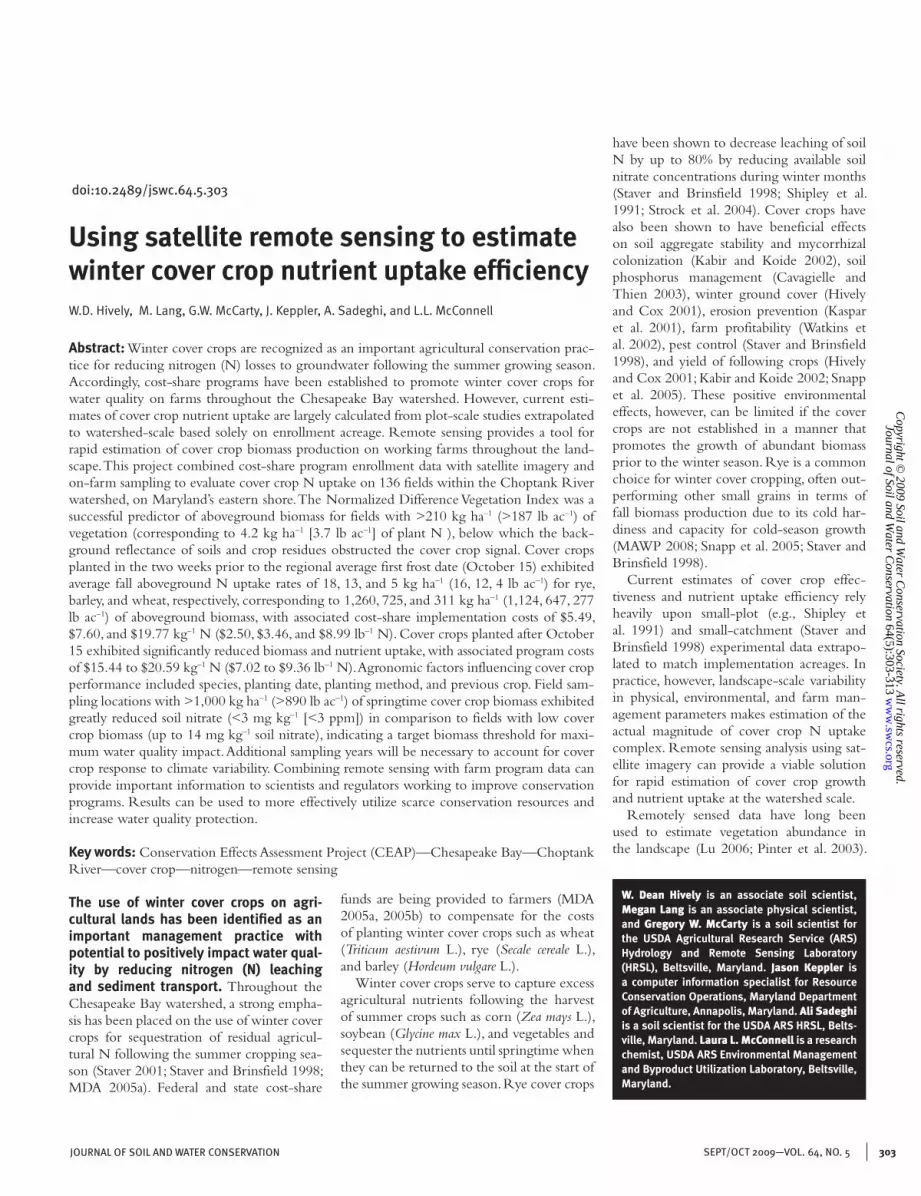
Materials and MethodsThis study focused on cover crop implemen-tation within a 60 × 60 km [37.3 × 37.3 mi] area of the Delmarva Peninsula (figure 1) located just east of the Chesapeake Bay Bridge in Maryland. The area includes the Tuckahoe Creek watershed (a subbasin of the Choptank River), along with the Corsica
Figure 1The Tuckahoe Creek subbasin (outlined in white) of the Choptank River watershed on the Delmarva Peninsula. False-color infrared SPOT satellite image collected March 31, 2006, with distribution of 136 digitized fields (yellow) participating in Maryland cover crop cost-share programs. Blue dots identify on-farm field sampling locations.
AtlanticOcean
Chesapeake Bay
Delm
arva
Penninsula0 40
0 5
River watershed and portions of the lower Chester River watershed, encompassing parts of Talbot, Queen Anne’s, Caroline, and Kent counties. Land use is 68% cropland (typically a corn–wheat/soybean rotation) with a large concentration of poultry production and scattered dairy and horse farms. The remain-der of land use is forest (26%); water (1%); wetlands (15%); and residential development (4%), with increasing pressure from subur-banization. The major soil types found under cropland in the Choptank River watershed are typified by the Othello soil series (fine-silty, mixed, active, mesic typic endoaquults) and the Mattapex soil series (fine-silty, mixed, active, mesic aquic hapludults). These soils were formed from parent material consisting of silty eolin sediments underlain by coarser marine, eolin, fluvial, or alluvial sediments. Othello soils are poorly drained with mod-erately slow permeability, and Mattapex soils are moderately well drained with moderate
km
Tuckahoekm
N
Copyright ©
2009 Soil and Water C
onservation Society. All rights reserved.
w
ww
.swcs.org
64(5):303-313 Journal of Soil and W
ater Conservation
305sept/oct 2009—vol. 64, no. 5journal of soil and water conservation
or moderately slow permeability. The land-scape is nearly flat (most slopes <2%), much of the cropland is ditch-drained, and the use of center pivot irrigation is widespread. Infiltration rates are high, and overland flow is minimal. The regional average annual tem-perature is 15.4°C (59.7°F), with an average annual precipitation of 88.4 cm (35 in). The Choptank River is listed as an impaired water body due to excessive nutrients and sediment, and agriculture has been identified as a pri-mary source of nutrient loading to drainage waters (Fisher et al. 2006; MDNR 2002). Accordingly, a variety of state and federal cost-share programs have been promoted to imple-ment agricultural best management practices for nonpoint source pollution control.
Cover Crop Implementation Data. Cover crop implementation data, including digi-tized field boundaries, cover crop species, planting date, planting method, and previ-ous crop were obtained from the Maryland Department of Agriculture. These data were transcribed from cover crop cost-share pro-gram enrollment documents that were filled out by participating farmers in the fall of 2005. A total of 136 cover-cropped fields located within the study area were included in the evaluation (figure 1). Accumulated growing degree days (GDD) were calculated for each field based on weather records from Wye, Maryland, by summing daily GDD (4°C [39 °F] base temperature) (McMaster et al. 2003) from the field-specific cover crop planting date to the dates of satellite image acquisition.
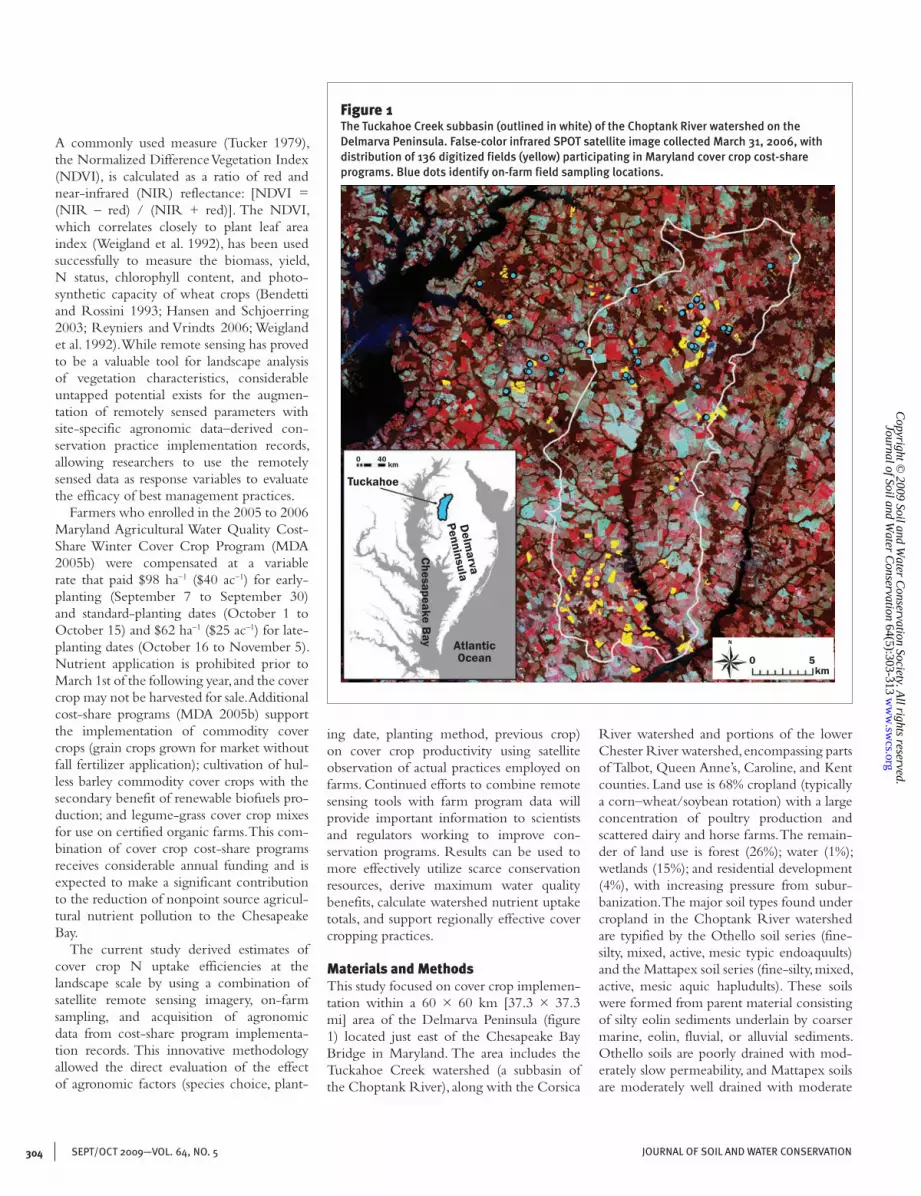
A digitized boundary polygon delineat-ing each cover-cropped field was provided by the MDA, based on USDA Farm Service Administration Common Land Use bound-aries and field-specific Soil Conservation District farm planning documents. The initial digitized field boundaries, when superim-posed on the satellite imagery, included some field irregularities that were not representative of cover crop performance, including hedge-row shadows, vegetated drainage ditches, and inundated areas. A second polygon encom-passing uniform in-field terrain was therefore digitized within each field boundary (figure 2), and these representative areas were used to calculate average NDVI based on the satellite imagery. Shapefile digitization was managed using ArcMap 9.2 (ESRI 2005), and imagery data extraction was performed using ENVI (www.ittvis.com/ENVI).
On-Farm Sampling. On-farm sampling was performed on a subset of cover-cropped fields (figure 1) within a week of each satel-lite image acquisition. The collected data were used to provide calibration of satellite image interpretation (correlation of NDVI to bio-mass), to estimate cover crop tissue N content for use in calculating nutrient uptake and to monitor residual soil nitrate. Sampled fields were chosen to encompass a range of cover crop species, above-ground biomass, soil types, and spatial distribution throughout the study area. Access to farm fields was obtained via the MDA and county Soil Conservation District offices. Sampling occurred on December 22 and 23, January 6 (five rye cover crops, three wheat commodity cover crops, one conven-tional wheat field) and March 20, 23, and 28 (twenty-two cover crops, eight commod-ity cover crops, and two conventional grain fields). Three sampling locations were estab-lished within each field, located at least 30 m (98.4 ft) apart and 30 m from any field edge or nonuniform area. Global positioning system (GPS) coordinates (North American Datum 1983 Universal Transverse Mercator Zone 18) were recorded as the average of >20 measure-ments using a Trimble GeoXT handheld GPS unit with submeter accuracy.
At each sampling location, above-ground cover crop biomass was measured by cutting all plants at ground level from within a 0.5 m2 (5.4 ft2) quadrat. Biomass samples were transported to the laboratory where fresh weight was recorded; samples were dried for 48+ hours at 60°C (140°F); dry weight was recorded; samples were ground in a small ham-mer mill (Thomas Scientific, #20 screen); and N content was measured by dry combustion (LECO Truespec C/N Analyzer). Above-ground biomass for each sampling location was calculated from measured cover crop dry weights by multiplying the sampling area by appropriate conversion factors to derive esti-mates in kilogram per hectare.
Soil samples (0 to 20 cm [0 to 7.9 in]) were collected at each sampling location by bulking three 5 cm (2 in) diameter soil cores collected from within the biomass sampling area. The soil samples were weighed, dried (48+ hours at 50°C [122°F]), reweighed, and colorimetrically analyzed for nitrate-N con-tent by flow injection (Lachat autoanalyzer) following extraction with 2M potassium chloride (KCl) solution (extraction ratio of 5 g soil per 25 ml KCl [0.176 oz soil per 0.84 fl oz KCl]).
Figure 2Cover crop biomass estimates were derived from average normalized difference vegetation index (NDVI) values calculated for representative areas within each cover crop field. This figure shows a false-color infrared SPOT satellite image (December 22, 2005, acquisition, 100 m2 pixels) of an example field, with the inner representative area (blue) digitized within the outer field boundary (green) so as to exclude irregular features such as grassed waterways (bright red pixels), field edges (dark brown pixels), and inundated areas (black pixels) that would have been included if the full field boundary had been used.
N
0 100m
Copyright ©
2009 Soil and Water C
onservation Society. All rights reserved.
w
ww
.swcs.org
64(5):303-313 Journal of Soil and W
ater Conservation
306 journal of soil and water conservationsept/oct 2009—vol. 64, no. 5
In-field measurements of cover crop reflectance were also made at each sam-pling location, using an Analytical Spectral Devices FieldSpec HandHeld reflectom-eter (Analytical Spectral Devices, Boulder, Colorado, USA). This instrument, mounted on a pole and held 2 m (6.56 ft) above the soil surface, provided hyperspectral reflec-tance spectrums (400 to 1,100 nm, 1 nm resolution) associated with solar radia-tion reflecting from the crop-soil surface. Reflectance data were collected under cloud-less conditions on the days of field sampling, from five areas (2 m incidence extent) imme-diately adjacent to each biomass sampling location. Measurements were made between 10 a.m. and 2 p.m. to minimize variation in solar angle, and calibration of reflectance to a Spectralon reference standard was made under ambient light conditions immediately prior to sampling each field.
Remote Sensing Imagery. Multispectral satellite images of the study area (SPOT 5, >90% cloud-free, <20° incidence angle, 10 m [32.8 ft] resolution, four spectral bands, 60 × 60 km [37.3 × 37.3 mi] coverage) were acquired on December 22, 2005, and March 31, 2006. These image acquisition dates were respectively selected to represent total fall and total springtime cover crop nutrient seques-tration. The images were obtained with “Level 2A” preprocessing (radiometric and geometric correction) in the UTM WGS84 projection, with nearest neighbor resampling. Digital number values for each spectral band (Green: 0.50 to 0.59 µm; Red: 0.61 to 0.68 µm; Near infrared [NIR]: 0.78 to 0.89 µm; and Mid infrared: 1.58 to 1.75 µm) were subsequently converted to exoatmospheric reflectance using the following equation sup-plied by SPOT Image Corporation (SPOT 2005):
ρ = π L/[E cos (θs) d–2] , (1)
where ρ is reflectance in the spectral band (%); L is the observed irradiance in the spec-tral band (watts m–2); E is solar equivalent irradiance in the spectral band (watts m–2); d is the sun-earth distance on viewing day (m); and θs is the solar angle (degrees).
After conversion to exoatmospheric reflectance, all four image bands were layer stacked, and georegistration was modi-fied in the image header to optimize spatial agreement between the SPOT imagery and ancillary vector data, including field bound-
aries, roads, and streams. The red and NIR bands (exoatmospheric reflectance) were then used to calculate the normalized dif-ference vegetation index (NDVI = [NIR – red]/ [NIR + red]) for each of the image acquisition dates.
For each field sampling location, the NDVI values associated with the nine pixels surrounding the GPS coordinate (3 × 3 kernel) were averaged together, and log-linear correlations were developed between observed NDVI and sampled biomass using the R statistical package (http://www.r-project.org/) as described below. Biomass estimates for the population of 136 cover-cropped fields were subsequently derived from the satellite imagery by calculating the average NDVI of all pixels falling within the interior cover crop field boundary (figure 2) and applying the appropriate correlation equation. These biomass estimates were then converted to estimates of nutrient uptake by multiplication with species-specific tissue N contents observed during field sampling. Statistical differentiation among species and planting date groupings was performed using ANOVA followed by Tukey’s HSD in the R statistical package. Cost-share program data associated with each enrolled field were then
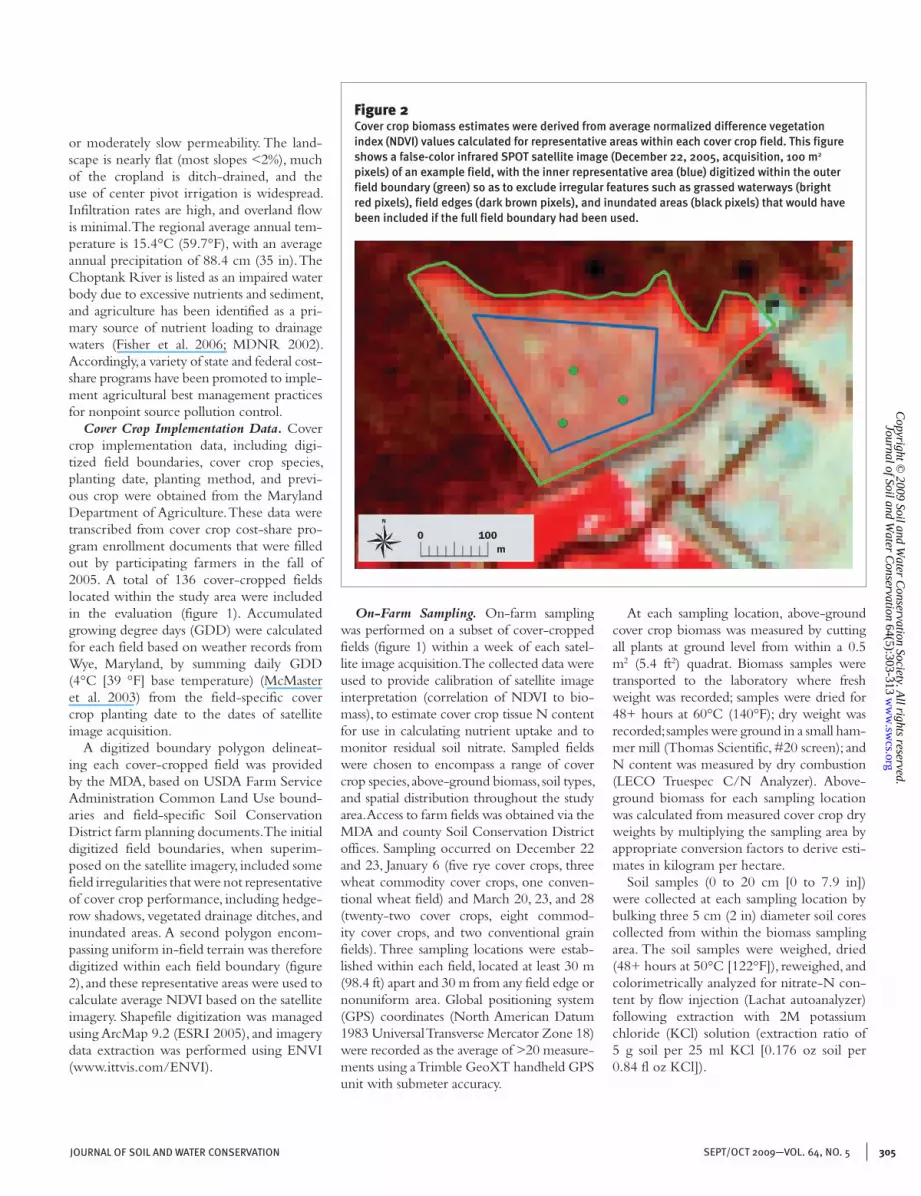
Figure 3Cover crop field reflectance data collected on December 23, 2005, with a handheld spectrometer showed a strong relationship between cover crop aboveground biomass and visible-near in-frared (NIR) spectral reflectance, with higher biomass rye cover crops demonstrating increased reflectance in the near infrared and increased absorption in the red wavelengths. Note that earlier planting dates were associated with increased biomass at the time of December sampling. Vertical dashed lines indicate SPOT satellite wavebands (green, red, NIR).
Planting Biomass(kgha–1) date on12/23/2005
Sept.24 2,673Sept.28 2,013 Oct.16 665 Oct.12 540 Nov.2 87
Baresoil(moldboardplow) Pavement
Green Red
NIR60
50
40
30
20
10
Ref
lect
ance
(%)
400 500 600 700 800 900 1,000 1,100
Wavelength (nm)
used to correlate estimated biomass produc-tion and nutrient uptake with agronomic factors (cover crop species, GDD, planting method, and previous crop).
Results and DiscussionWithin the study area, 136 fields (2,951 ha [7,292 ac] of cropland) were evaluated for cover crop performance in the fall of 2005 (figure 1). Of the cover-cropped land, 61% was planted to wheat, 18% to rye, 19% to barley, and 2% to triticale (×Triticosecale).
Correlation of Normalized Difference Vegetation Index with Field Measurements. In-field hyperspectral measurements of cover crop reflectance at the December on-farm sampling locations (figure 3) depicted the expected relationship (Bendetti and Rossini 1993; Tucker 1979; Weigand et al. 1992) between vegetation and visible-NIR spec-tral reflectance, with higher biomass cover crops (earlier planting dates) demonstrat-ing increased reflectance in the NIR and increased absorption in the red wavelengths. Observed NDVI values calculated from the field-sampled reflectance data showed a strong relationship (r2 = 0.86) with cover crop biomass measured in the nine reflec-tance-sampled fields (87 to 2,673 kg biomass
Copyright ©
2009 Soil and Water C
onservation Society. All rights reserved.
w
ww
.swcs.org
64(5):303-313 Journal of Soil and W
ater Conservation
307sept/oct 2009—vol. 64, no. 5journal of soil and water conservation
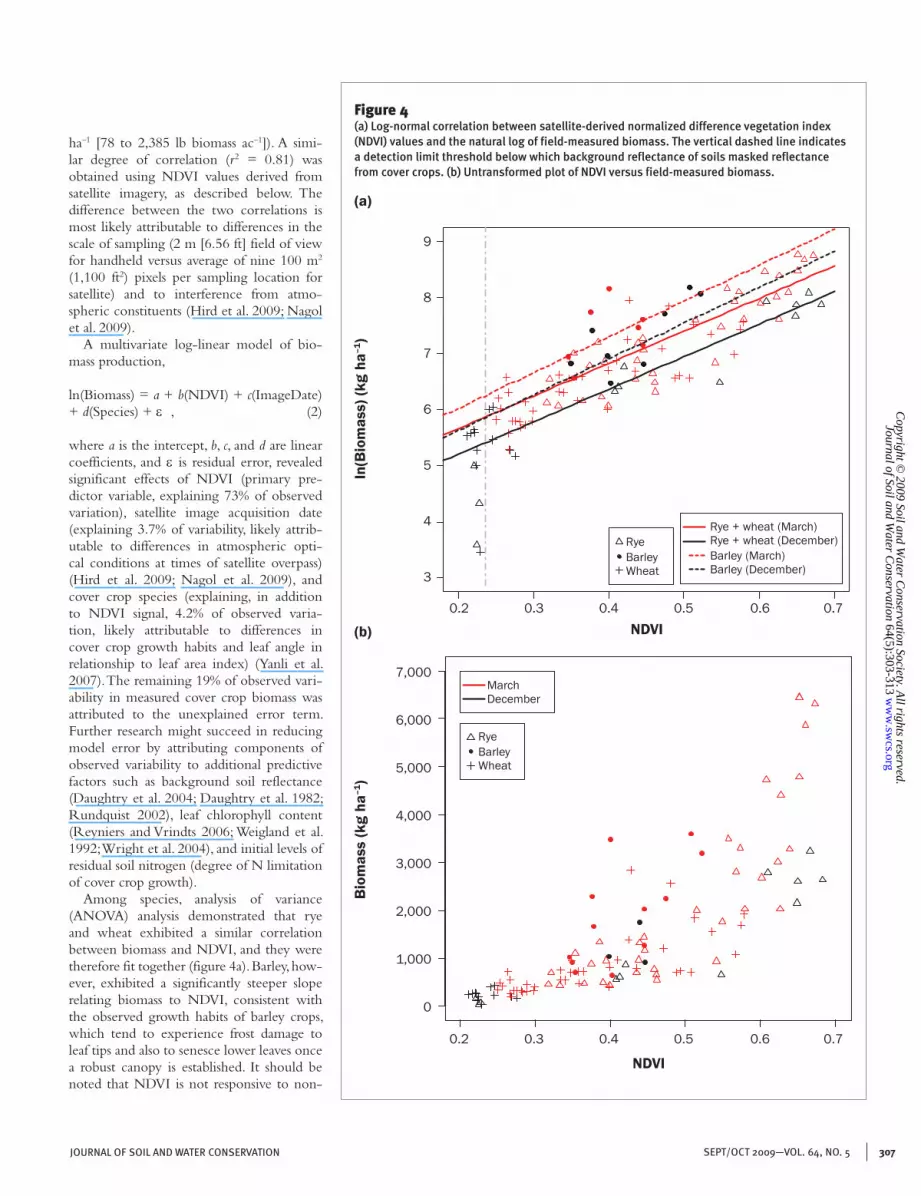
ha–1 [78 to 2,385 lb biomass ac–1]). A simi-lar degree of correlation (r2 = 0.81) was obtained using NDVI values derived from satellite imagery, as described below. The difference between the two correlations is most likely attributable to differences in the scale of sampling (2 m [6.56 ft] field of view for handheld versus average of nine 100 m2 (1,100 ft2) pixels per sampling location for satellite) and to interference from atmo-spheric constituents (Hird et al. 2009; Nagol et al. 2009).
A multivariate log-linear model of bio-mass production,
ln(Biomass) = a + b(NDVI) + c(ImageDate) + d(Species) + ε , (2)
where a is the intercept, b, c, and d are linear coefficients, and ε is residual error, revealed significant effects of NDVI (primary pre-dictor variable, explaining 73% of observed variation), satellite image acquisition date (explaining 3.7% of variability, likely attrib-utable to differences in atmospheric opti-cal conditions at times of satellite overpass) (Hird et al. 2009; Nagol et al. 2009), and cover crop species (explaining, in addition to NDVI signal, 4.2% of observed varia-tion, likely attributable to differences in cover crop growth habits and leaf angle in relationship to leaf area index) (Yanli et al. 2007). The remaining 19% of observed vari-ability in measured cover crop biomass was attributed to the unexplained error term. Further research might succeed in reducing model error by attributing components of observed variability to additional predictive factors such as background soil reflectance (Daughtry et al. 2004; Daughtry et al. 1982; Rundquist 2002), leaf chlorophyll content (Reyniers and Vrindts 2006; Weigland et al. 1992; Wright et al. 2004), and initial levels of residual soil nitrogen (degree of N limitation of cover crop growth).
Among species, analysis of variance (ANOVA) analysis demonstrated that rye and wheat exhibited a similar correlation between biomass and NDVI, and they were therefore fit together (figure 4a). Barley, how-ever, exhibited a significantly steeper slope relating biomass to NDVI, consistent with the observed growth habits of barley crops, which tend to experience frost damage to leaf tips and also to senesce lower leaves once a robust canopy is established. It should be noted that NDVI is not responsive to non-
In(B
iom
ass)
(kg
ha–1
)B
iom
ass
(kg
ha–1
)
Figure 4(a) Log-normal correlation between satellite-derived normalized difference vegetation index (NDVI) values and the natural log of field-measured biomass. The vertical dashed line indicates a detection limit threshold below which background reflectance of soils masked reflectance from cover crops. (b) Untransformed plot of NDVI versus field-measured biomass.
9
8
7
6
5
4
3
0.2 0.3 0.4 0.5 0.6 0.7
(a)
RyeBarleyWheat
Rye+wheat(March)Rye+wheat(December)Barley(March)Barley(December)
7,000
6,000
5,000
4,000
3,000
2,000
1,000
0
0.2 0.3 0.4 0.5 0.6 0.7
(b)
NDVI
MarchDecember
RyeBarleyWheat
NDVI
Copyright ©
2009 Soil and Water C
onservation Society. All rights reserved.
w
ww
.swcs.org
64(5):303-313 Journal of Soil and W
ater Conservation

308 journal of soil and water conservationsept/oct 2009—vol. 64, no. 5
green vegetation (Bendetti and Rossini 1993; Rundquist 2002), of which the field biomass samples collected for barley contained a sub-stantial portion. The log-linear fit for barley was therefore derived separately from the log-linear fit for wheat and rye in combina-tion (figure 4a).
A detection limit of approximately 210 kg ha–1 (187 lb biomass ac–1) was identified below which the calibration was inaccu-rate, most likely because NDVI of the cover crops, with minimal biomass and very little groundcover (<10% groundcover by visual
Figure 5Distribution of observed normalized difference vegetation index (NDVI) values and calculated biomass estimates derived for 136 cover crop fields from December and March satellite imagery.
Freq
uenc
y
25
20
15
10
5
0
0.1 0.2 0.3 0.4 0.5 0.6 0.7
December NDVIFr
eque
ncy
25
20
15
10
5
0
0.1 0.2 0.3 0.4 0.5 0.6 0.7
March NDVI
Freq
uenc
y
100
80
60
40
20
0
0 500 1,000 1,500 2,000 2,500 3,000 3,500
December biomass (kg ha–1)
Freq
uenc
y
50
40
30
20
10
0
0 1,000 2,000 3,000 4,000
March biomass (kg ha–1)
inspection of field samples), was masked by the background reflectance of the soil and crop residues present in the field (Daughtry et al. 2004; Daughtry et al. 1982; Rundquist 2002). Ten December field samples fell below this limit (vertical dashed line in figure 4a), which corresponded to an NDVI of 0.232 in the December calibration and were therefore excluded from the calculation. These samples (seven wheat, three rye) had all been late-planted (October 24 to November 4) and had experienced a maximum of 227 GDD heat units, resulting in the growth of fewer
than three leaves by the time of December sampling. Spectral response in NDVI also tends to saturate above a leaf area index of 2, corresponding to an NDVI value of 0.7 to 0.8 (Gitelson 2004), but signal saturation did not appear to be an issue in this study.
Cover Crop Biomass Production. For anal-ysis of the 136 cost-share enrolled cover crop fields, a minimum detection limit threshold was set at 0.232 for the December image and at 0.176 in the March image, corresponding in both cases to a calculated biomass of 210 kg ha–1 (187 lb ac–1). In December, 45 fields
Copyright ©
2009 Soil and Water C
onservation Society. All rights reserved.
w
ww
.swcs.org
64(5):303-313 Journal of Soil and W
ater Conservation

309sept/oct 2009—vol. 64, no. 5journal of soil and water conservation
fell below this limit (figure 5), 35 of which had been late-planted and had not had suf-ficient growing weather to accumulate significant biomass and ten of which exhib-ited crop failure due to unidentified causes. In March, eight fields fell below the detec-tion limit. As is shown in figure 5, cover crop performance was skewed toward low-pro-ductivity fields, indicating that there is room
Table 1Above-ground biomass and nitrogen (N) uptake associated with cover cropped fields. Biomass estimates were derived from satellite images acquired on December 22, 2005, and March 31, 2006. Nitrogen uptake was determined by multiplying biomass estimates by field-measured average N contents for each species.
December 22nd Nitrogen uptake Planting 2005 biomass (kg ha–1) (kg ha–1)Species date* n† Min Avg Max P‡ S§ N (%)# Min Avg Max $ kg–1 N ($ lb–1)
Rye Overall 27 148 561 3,119 — c 1.5 2 8 46 Early 9 244 888 2,832 a c 4 13 41 $7.60($3.46) Standard 6 451 1,260 3,119 a c 7 18 46 $5.49($2.50) Late 12 148 265 1,792 b c 2 4 26 $15.44($7.02)
Barley Overall 25 385 810 2,804 — c 1.8 7 14 50 Early 17 388 853 2,804 a c 7 15 50 $6.59($3.00) Standard 8 385 725 1,381 a d 7 13 24 $7.60($3.46) Late 0 na na — — — 7 na na
Wheat Overall 84 106 242 896 — d 2.2 2 4 16 Early 34 138 308 896 a d 2 5 16 $19.77($8.99) Standard 19 176 311 781 a e 3 5 14 $19.77($8.99) Late 31 na 159 243 b d 2 3 4 $20.59($9.36)
March 31st 2006 Nitrogen uptake Planting biomass (kg ha–1) (kg ha–1)Species date* n† Min Avg Max P‡ S§ N (%)# Min Avg Max $ kg–1 N ($ lb–1)
Rye Overall 25 176 985 3,757 — c 2.3 3 19 71 Early 9 258 1,293 3,599 a c 5 25 68 $3.95($1.80) Standard 4 1,041 1,491 3,757 a c 20 28 71 $3.53($1.60) Late 12 176 699 1,075 a c 3 13 32 $4.75($2.16)
Barley Overall 24 344 1,145 3,552 — c 2.9 7 22 67 Early 17 344 1,010 3,552 a c 7 19 67 $5.20($2.36) Standard 7 946 1,552 2,508 a c 18 29 48 $3.41($1.55) Late 0 na na na — — na na na
Wheat Overall 84 189 534 2,275 — d 3.1 4 10 43 Early 34 189 575 2,275 a d 4 11 43 $8.99($4.08) Standard 19 200 554 1,449 a d 4 11 28 $8.99($4.08) Late 31 228 482 1,727 a d 4 9 33 $6.86($3.12)* Planting date categories, as defined by the Maryland Cover Crop Program, are as follows: Early: September 7 to 30; Standard: October 1 to 15; Late: October 15 to November 5. Average first frost date in the region is October 15.† Number of fields in each category.‡ Within species, planting date categories with different letters have significantly different average biomass at α = 0.05.§ Among species, identical planting date categories with different letters have significantly different average biomass at α = 0.05.# Species/date specific N content estimated from field samples.
for improvement in increasing the efficiency of cover crop implementation.
Twenty-six fields were identified that lost biomass between the December and March observation dates. Three of them exhib-ited high estimated biomass in December (>1,300 kg ha–1 [>1,160 lb ac–1]) but neg-ligible biomass in March (<315 ha–1 [778 lb ac–1]), indicating that they had been killed, through plowing or herbicide application,
prior to the March 31 satellite acquisition date. These fields were removed from the March cover crop biomass calculations pre-sented in table 1. Of the remaining fields, twelve (six barley, six rye) exhibited mod-erate biomass in December and March and were presumed to have experienced frost damage or other processes resulting in leaf senescence or tissue loss, and eleven (seven wheat, three rye, one barley) displayed mini-
Copyright ©
2009 Soil and Water C
onservation Society. All rights reserved.
w
ww
.swcs.org
64(5):303-313 Journal of Soil and W
ater Conservation

310 journal of soil and water conservationsept/oct 2009—vol. 64, no. 5
mal biomass in both December and March imagery. In the case of routine evaluation, these last eleven would be recommended for field inspection to determine whether they had failed to establish, been eaten by geese, or been subjected to other causes of crop failure. The remaining 110 fields showed significant biomass accumulation between December 22 and March 31.
Significant differences in cover crop bio-mass production were observed (table 1) among planting date categories established by the Maryland cover crop program. At the time of the December 22 imagery acquisi-tion, rye and wheat fields in the late planting date category (October 15 to November 5) had produced significantly less biomass than their early (prior to October 1) and Standard (October 1 to 15) counterparts. There was no distinction between Early and Standard planting date categories for any species, per-haps due to the effect of observed drought conditions during the Early planting period (observed precipitation in September, 4.2 cm [1.7 in], was 4.1 cm [1.6 in] below the long term average monthly precipitation). By the time of the March 31 imagery acquisi-tion, the late-planted crops had compensated somewhat, and the observed differences between planting date categories were not significant (p = 0.11 to 0.25). It should be noted that early-planted cover crops may have underperformed due to drought con-ditions experienced in late September 2005, and late-planted cover crops may have underperformed due to overly wet weather conditions during late October (observed precipitation in October, 18.6 cm [7.3 in], was 9.9 cm [4 in] above the long term average monthly precipitation). Additional sampling years will be required to improve the assessment of weather impacts on cover crop growth and nutrient uptake.
A multivariate analysis of agronomic fac-tors affecting observed biomass,
Biomass = a + b(Species) + c(GDD) + d(PlantingMethod) + f(PreviousCrop) + ε , (3)
(where a is the intercept, b, c, d, and f are linear coefficients, and ε is residual error), revealed significant effects of species, accumulated GDD between planting date and satellite imagery acquisition dates, planting method (no-till, conventional-drilled, broadcast-disked, broadcast/stalk-chopped, aerial seed-
ing), and previous crop (corn, soy, vegetables). Due to covariation among factors, sample size was not sufficient to characterize differences between groupings of planting methods and previous crop types. Planting methods asso-ciated with better seed-soil contact (no-till drilling, conventional drilling, and broadcast followed by disking) have been shown to increase germination and cover crop estab-lishment relative to broadcast/stalkchop and aerial seeding methods (MAWP 2008). In 2005 to 2006, aerial seeded wheat crops did not appear to perform as well as would be expected from their early planting date, likely due to a combination of poor seed-soil contact and dry conditions during the first two weeks of September. Further research over several cropping seasons is warranted to develop a sufficient dataset to evaluate the effects of particular planting methods and previous crop categories on biomass production.
Overall, one-third of cover-cropped fields failed to achieve N uptake of greater than 10 kg ha–1 (8.9 lb ac–1) (an arbitrary definition of success equivalent to 500 kg ha–1 (446 lb ac–1) of aboveground biomass) in December or March. Out of these 44 fields, 19 were late-planted wheat fields, 3 were late-planted rye, and 16 were aerial or broadcast seedings of wheat in the early or standard planting date categories. Only five out of 29 no-till fields within the early and standard planting date categories failed to produce >500 kg ha–1 of biomass, and all of the 18 conven-tional drilled cover crops achieved this level of production.
Cover Crop Nutrient Content. In December 2005, tissue N content of field biomass samples varied from 1.3% to 2.3% for rye cover crops, 1.4% to 1.6% for barley, and 1.8% to 2.6% for wheat, and the aver-age tissue N content of wheat (2.15%) was significantly higher than the average N con-tents of rye (1.77%) and barley (1.46%). In March 2006, N content of field biomass sam-ples varied from 1.7% to 4.6% for rye cover crops, 1.6% to 3.2% for barley, and 1.7% to 4.4% for wheat, and the observed tissue N contents were greater for wheat (3.13%) and rye (2.88%) than for barley (2.31%). These N contents are similar to other results for unfer-tilized grains (Dean and Weil 2009; DeBruin et al. 2005; Staver and Brinsfield 1998). The increased variability during the springtime sampling may be attributable to fertilization of some fields in the three weeks prior to
sampling, since farmers enrolled in the cover crop cost-share program are allowed to apply fertility amendments after March 1. For purposes of calculation, species- and date-specific N contents were assumed to equal the average values described above. In prac-tice, leaf N content varies according to the amount of available soil N and the degree of crop N limitation (Reyniers and Vrindts 2006; Wright et al. 2004). Further research is warranted to improve understanding of site-specific and regional variability in cover crop N content and to determine the pos-sibility of directly measuring cover crop N and chlorophyll content using hyperspectral remote sensing techniques (Beeri and Peled 2006; Haboudane et al. 2004; Thenkabail et al. 2000).
Cover Crop Nitrogen Sequestration. NDVI-derived estimates of aboveground biomass for each cover crop field were mul-tiplied by the species- and date-specific tissue N contents derived from field measurements, and regional average cover crop nitrogen sequestration (136 fields) was estimated to 9.7 kg ha–1 (8.7 lb ac–1) of N by December 2005, increasing to an overall average of 14.6 kg ha–1 (13.0 lb ac–1) by March 31, 2006. The greatest average N uptake (table 1) was pro-duced by barley cover crops (fall: 14 kg N ha–1 [12.5 lb N ac–1]; spring: 22 kg N ha–1 [19.6 lb N ac–1]), followed by rye (fall: 8 kg N ha–1 [7.1 lb N ac–1]; spring: 19 kg N ha–1 [17 lb N ac–1]) and wheat (fall: 4 kg N ha–1 [3.6 lb N –1]; spring: 10 kg N ha–1 [8.9 lb N ac–1]), although the predominance of barley in this case was attributable to the ban on late-planted barley crops established by the Maryland cost-share program, and rye out-produced barley within the standard and early planting date categories (table 1). The 2005 to 2006 Maryland cover crop cost-share program paid $98 ha–1 ($40 ac–1) for early-planting (September 7 to September 30) and standard-planting dates (October 1 to October 15) and $62 ha–1 ($25 ac–1) for late-planting dates (October 16 to November 5) Resulting costs per kilogram of N seques-tration are depicted in table 1.
The 39,770 ha (98,274 ac) Tuckahoe drainage basin contains approximately 26,600 ha (65,730 ac) of cropland, of which 1,705 ha (4,213 ac) (6.4%) were enrolled in cover crop programs in the 2005 to 2006 cover crop season. Satellite remote sens-ing was used to evaluate 2,951 ha (7,292 ac) of regional cover crops (136 fields),
Copyright ©
2009 Soil and Water C
onservation Society. All rights reserved.
w
ww
.swcs.org
64(5):303-313 Journal of Soil and W
ater Conservation

311sept/oct 2009—vol. 64, no. 5journal of soil and water conservation
1,583 ha (3,912 ac) of which fell within the Tuckahoe watershed. Extrapolating results to all Tuckahoe-enrolled cover crop acres, based on recorded agronomic information and estimated N sequestration rates associated with each species and planting date (table 1), N uptake attributable to cover crop imple-mentation on 1,705 ha of cropland within the Tuckahoe watershed totaled 15,039 kg (33,155 lb) in December 2005, increasing to 27,717 kg (61,106 lb) in March 2006. This came at an overall cost to the cost share program of $10.47 kg–1 N ($4.76 lb–1 N) in December and $5.68 kg–1 N ($2.58 lb–1 N) in March. In practice, analytical accuracy would be improved by digitizing and analyzing all enrolled fields on an annual basis.
Additional N sequestration can be attrib-uted to belowground cover crop biomass, which was not measured in this study. Research has shown that belowground bio-mass makes up 40% to 50% of total wheat biomass, depending on the growth stage and plant variety (Siddique et al. 1990). Although few researchers have accurately estimated belowground N content of winter small grains due to the difficulty of measuring fine root distribution and rhizosphere effects, rough calculations estimate that 20% of total plant N is contained in the root. Therefore, the N sequestration estimates for rye, barley, and wheat, respectively, could perhaps be increased to averages of 10, 17, and 5 kg N ha–1 (8.9, 15.2, 4.5 lb N ac–1) (December) and 22, 26, and 12 kg N ha–1 (19.6, 23.2, 10.7 lb N ac–1) (March). It should be noted that throughout the calculations made in this study, conservative values have been adopted for such factors as NDVI-biomass correla-tions and belowground N sequestration. The derived values should therefore be considered the minimum verifiable N uptake attribut-able to cover crops grown in the study area.
Residual Soil Nitrogen. Soil samples (0 to 20 cm [0 to 7.9 in]) collected at each of the on-farm sampling locations exhib-ited March soil nitrate concentrations of <3 mg N kg–1 (<3 ppm) on most high bio-mass fields (>1,327 kg ha–1 [>1,184 lb ac–1] aboveground biomass; change-point deter-mined from bilinear statistical fit), while soil nitrate was observed to be as high as 14 mg N kg–1 on low-biomass fields (figure 6). The higher soil N concentrations (>3 mg N kg–1) observed for seven fields above the 1,327 kg ha–1 threshold might indicate release of N from senescent barley tissue or the effect of
Figure 6On-farm sampling results showed that springtime soil nitrate (0 to 20 cm, KCl extraction) was generally less than 3 mg kg–1 on fields with cover crop biomass exceeding ~1,000 kg ha–1, while soil nitrate was observed to be as high as 14 mg kg–1 on low-biomass fields. A bilinear fit estab-lished a “change-point” separating high and low-biomass fields, based on rye and wheat data, equal to 979 kg ha–1 of biomass production (dashed line).
RyeBarleyWheat
6,000
5,000
4,000
3,000
2,000
1,000
0
0 5 10 15
Soil nitrate (mg kg–1)
Cove
r cro
p bi
omas
s (k
g ha
–1)
manure or fertilizer applications in the month prior to observation (the Maryland cover crop program allows nutrient application after March 1). If barley data was removed from the change-point analysis, the biomass threshold for rye and wheat was determined to be 979 kg ha–1 (873 lb ac–1), below which soil N concentrations were reduced to <3 mg kg–1. Out of the 136 observed fields, 38 met this “very successful” springtime biomass threshold, including 15 barley, 14 rye, and 9 wheat crops. These included 20 early-planted, 11 standard-planted, and seven late-planted fields, with planting methods dominated by no-till (13), conventional-drilled (11), and broadcast-disked (11) fields. Only two broadcast-stalkchopped fields and one aerial seeded field produced >1,000 kg ha–1 (>890 lb ac–1) of biomass.
Plot-scale research has shown that robust cover crops in the Mid-Atlantic region can decrease leaching of residual soil N by 60% to 67% (Shipley et al. 1991; Staver and Brinsfield 2000). Direct calculation of the proportion of soil N loss that was attribut-able to cover crop uptake versus leaching and
denitrification was not possible in this study because different locations were sampled in December and March and initial residual soil nitrate concentrations were not known. It will be advisable in future research efforts to sample identical locations in fall (residual soil N just prior to cover crop planting), win-ter (December imagery), and spring (March imagery) to better understand the effect of cover crops on overall soil N mass balance.
Summary and ConclusionsThe use of winter cover crops can reduce the potential for leaching of residual agricultural nitrogen to groundwater following the sum-mer growing season. Accordingly, cover crops play a central role in efforts to reduce agri-cultural nonpoint source pollution inputs to the Chesapeake Bay. Cover crops also provide additional cropping-system benefits such as erosion prevention, carbon sequestration, bioenergy production, and nutrient cycling (N and organic matter contribution to the following crop).
The combination of remote sensing, field sampling, and access to farm program docu-
Copyright ©
2009 Soil and Water C
onservation Society. All rights reserved.
w
ww
.swcs.org
64(5):303-313 Journal of Soil and W
ater Conservation

312 journal of soil and water conservationsept/oct 2009—vol. 64, no. 5
ments employed by this project proved to be a successful and powerful method for rapid evaluation of cover crop performance at the landscape scale. The study analyzed cover crop growth on 136 fields in the Choptank River area that were enrolled in Maryland cover crop programs during the 2005 to 2006 growing season. These cover crops sequestered an estimated overall average of 9.7 kg ha–1 (8.7 lb ac–1) of N by December 22, 2005, increasing to an average of 14.6 kg ha–1 by March 31, 2006. Results revealed trends in biomass production and nutrient uptake that were linked to cover crop spe-cies choice, planting methods, and previous crop type and confirmed that cover crops planted prior to average first frost date are significantly more effective at fall nutrient sequestration than late planted crops.
Cover crops planted in the two weeks prior to the regional average first frost date (October 15) exhibited average fall aboveg-round N uptake rates of 18, 13, and 5 kg ha–1 (16, 12, 4 lb ac–1) for rye, barley, and wheat, respectively, corresponding to 1,260, 725, and 311 kg ha–1 (1,124, 647, 277 lb ac–1) of aboveground biomass, with associated cost-share implementation costs of $5.49, $7.60, and $19.77 kg–1 N ($2.50, $3.46, and $8.99 lb–1 N). Cover crops planted after October 15 exhibited significantly reduced biomass and nutrient uptake (table 1), with associ-ated program costs of $15.44 to $20.59 kg–1 N ($7.02 to $9.36 lb–1 N). Field sampling locations with >1,000 kg ha–1 (>890 lb ac–1) of springtime cover crop bio-mass exhibited greatly reduced soil nitrate (<3 mg kg–1) in comparison to fields with low cover crop biomass (up to 14 mg kg–1 soil nitrate), indicating a target biomass threshold for maximum water quality impacts.
Cover crop nutrient sequestration rates determined in regional plot and small-catchment studies (Dean and Weil 2009; Staver and Brinsfield 1998) have docu-mented aboveground cover crop nutrient uptake rates regularly in excess of 20 kg N ha–1 (17.8 lb ac–1), and often exceeding 40 kg N ha–1 (35.7 lb ac–1), in line with the maximum values observed in table 1. The discrepancy between maximum and aver-age observed cover crop productivity makes it clear that nutrient sequestration at the watershed scale currently falls short of cover crop growth potential. Much of the shortfall can be attributed to late planting dates, since accumulated growing degree totals have
direct influence on leaf emergence, tiller-ing, and biomass production in winter grains (McMaster et al. 2003; Cao and Moss 1989), and late-planted cover crops clearly under-performed in 2005 (table 1). There was also a wide range of productivity observed within planting date categories, attributable to vari-ations in planting method (better seed-soil contact promotes better establishment, and aerially seeded cover crops clearly underper-formed in 2005), causes of crop failure (e.g., wildlife damage), and perhaps N limitation on cover crop growth (better uptake rates could be achieved by targeting cover crops to fields with high levels of residual soil nitrate). Finally, it was clear that rye and barley greatly outperformed wheat in terms of biomass pro-duction and nutrient uptake. Although wheat was planted on 62% of cover crop fields, it was only half as effective at N sequestration. Future cover crop implementation strategies should clearly target early planting of barley and rye. Brassicas may also provide a useful alternative, although the number of enrolled fields was too low to include in this analysis. Improvement of cover crop genetics through selective breeding for rapid fall growth and nutrient uptake would also improve the potential for water quality benefit.
Using remotely sensed satellite imagery, cover crop nutrient uptake efficiencies can be derived at the landscape scale, account-ing for the effects of spatial variability and providing insight into agronomic factors affecting cover crop productivity. The results of this study, although they must be cor-roborated over several growing seasons to account for the effects of climate variability, have strong implications for evaluating and improving the success of cover crop pro-grams and promoting effective water quality protection strategies. Continued efforts to combine remote sensing tools with farm program data will provide important infor-mation to scientists and regulators working to improve conservation programs. Results can be used to more effectively utilize scarce conservation resources and derive maximum water quality protection benefits.
AcknowledgementsThe authors would like to thank Dr. Charlie Walthall, Dr. Craig Daughtry, and Dr. Ray Hunt of the USDA Agricultural Research Service Hydrology and Remote Sensing Laboratory for their advice on experimental design, sampling, and image processing methods. Thank you to Dr. Beth Gardner for assistance with statistical programming with the R package, Ms. Kusuma Prabhakara for various GIS processing, and to the numerous interns and technicians who assisted with data
collection. We very much appreciate the collaboration with the Maryland Department of Agriculture and are indebted to Mr. John Rhoderick for program support and to Mr. Paul Biddle for assistance with fieldwork. We are also grateful to the many farmers enrolled in the Maryland cover crop cost-share programs for allowing us access to their fields, and we would like to thank the Caroline, Talbot, and Queen Anne’s Soil Conservation Districts for coordinating research activi-ties with program participants. This project was funded in part by the USDA Natural Resources Conservation Service Conservation Effects Assessment Project (Choptank River watershed) and by a Chesapeake Bay Targeted Watershed grant administered through the National Fish and Wildlife Foundation.
References Beeri, O., and A. Peled. 2006. Spectral indices for
precise agricultural monitoring. International Journal of Remote Sensing 27(10):2039-2047, doi:10.1080/01431160612331392950.
Bendetti R., and P. Rossini. 1993. On the use of NDVI profiles as a tool for agricultural statistics: The case study of wheat yield estimate and forecast in Emilia Romagna. Remote Sensing of Environment 45:311-326, doi:10.1016/0034-4257(93)90113-C.
Cavagielli, M.A., and S.J. Thien. 2003. Phosphorus bioavailability following incorporation of green manure cover crop. Soil Science Society of America Journal 67:1186-1194.
Daughtry, C.S.T., E.R. Hunt, and J.E. McMurtrey III. 2004. Assessing crop residue cover using shortwave infrared reflectance. Remote Sensing of Environment 90:126-134, doi:10.1016/j.rse.2003.10.023.
Daughtry, C.S.T., V.C. Vanderbilt, and V.J. Polara. 1982. Variability of reflectance measurements with sensor altitude and canopy type. Agronomy Journal 74:744-751.
Dean, J.E., and R.R. Weil. 2009. Brassica cover crops for nitrogen retention in the Mid-Atlantic Coastal Plain. Journal of Environmental Quality 38:520-528.
De Bruin, J.L., P.M. Porter, and N.R. Jordan. 2005. Use of a rye cover crop following corn in rotation with soybean in the Upper Midwest. Agronomy Journal 97:587-598.
ESRI (Environmental Systems Research Institute). 2005. ArcGIS 9.2 Users Manual. Redlands, CA: Environmental Systems Research Institute.
Fisher, T.R., J.D. Hagy III, W.R. Boynton, and M.R. Williams. 2006, Cultural eutrophication in the Choptank and Pautuxent estuaries of Chesapeake Bay. Limnology and Oceanography 51(1):435-447.
Gittleson, A.A. 2004. Wide dynamic range vegetation index for remote quantification of biophysical characteristics of vegetation. Journal of Plant Physiology 161:165-173.
Haboudane, D., J.R. Miller, E. Pattey, P.J. Zarco-Tejada, and I.B. Strachan. 2004. Hyperspectral vegetation indices and novel algorithms for predicting green LAI of crop canopies: Modeling and validation in the context of precision agriculture. Remote Sensing of Environment 90:337-352, doi:10.1016/j.rse.2003.12.013.
Hansen, P.M., and J.K. Schjoerring. 2003. Reflectance measurement of canopy biomass and nitrogen status in wheat crops using normalized difference vegetation indices and partial least squares regression. Remote Sensing of Environment 86:542-553, doi:10.1016/S0034-4257(03)00131-7.
Hird, J.N., G.J. McDermid, and J. Gregory. 2009. Noise reduction of NDVI time series: An empirical comparison of selected techniques. Remote Sensing of Environment 113(1):248-258.
Copyright ©
2009 Soil and Water C
onservation Society. All rights reserved.
w
ww
.swcs.org
64(5):303-313 Journal of Soil and W
ater Conservation
313sept/oct 2009—vol. 64, no. 5journal of soil and water conservation
Hively, W.D., and W.J. Cox. 2001.Interseeding cover crops into soybean and subsequent corn yields. Agronomy Journal 93(2):308-313.
Kabir, Z., and R.T. Koide. 2002. Effect of autumn and winter mycorrhizal cover crops on soil properties, nutrient uptake, and yield of sweet corn in Pennsylvania, USA. Plant Soil 238:205-215, doi:10.1023/A:1014408723664.
Kaspar, T.C., J.K. Radke, and J.M. Laflen. 2001. Small grain cover crops and wheel traffic effects on infiltration, runoff, and erosion. Journal of Soil and Water Conservation 56(2):160-165.
Lu, D. 2006. The potential and challenge of remote sensing-based biomass estimation (review article). International Journal of Remote Sensing 27(7):1297-1328, doi:10.1080/01431160500486732.
MAWP (Mid-Atlantic Water Quality Program). 2008. Cover Crop Practices: Definition and Nutrient and Sediment Reduction Efficiencies for Use in the Phase 5.0 of the Chesapeake Bay Program Watershed Model. College Park, MD: Mid-Atlantic Water Quality Program, University of Maryland.
McMaster, G.S., W.W. Wilhelm, D.B. Palic, J.R. Porter, and P.D. Jamieson. 2003. Spring wheat leaf appearance and temperature: Extending the paradigm? Annals of Botany 91:697-705.
MDA (Maryland Department of Agriculture) Office of Resource Conservation. 2005a. Maryland Farmers’ Winter Cover Crop Participation: Report on a mail survey and four focus groups of Maryland farmers. Annapolis, MD.
MDA Office of Resource Conservation. 2005b. Maryland’s Winter Cover Crop Program. Annapolis, MD. http://www.mda.state.md.us/resource_conservation/financial_assistance/cover_crop/index.php.
MDNR (Maryland Department of Natural Resources). 2002. Upper Choptank River Watershed Characterization. Annapolis, MD. http://dnrweb.dnr.state.md.us/download/bays/ucr_char.pdf.
Nagol, J.R., E.F. Vermote, and S.D. Prince. 2009. Effects of atmospheric variation on AVHRR NDVI data. Remote Sensing of Environment 113(2):392-397.
Pinter, P.J., J.L. Hatfield, J.R. Schepers, E.M. Barnes, M.S. Moran, C.S. Daughtry, and D.R. Upchurch. 2003. Remote sensing for crop management. Photogrammetric Engineering and Remote Sensing 69(6):647-664.
Reyniers, M., and E. Vrindts. 2006. Measuring wheat nitrogen status from space and ground-based platforms. International Journal of Remote Sensing 27(3):549-567, doi:10.1080/01431160500117907.
Rundquist, B.R. 2002. The influence of canopy green vegetation fraction on spectral measurements over native tallgrass prairie. Remote Sensing of Environment 81:129-135.
Shipley, P.R., J.J. Meisinger, and A.M. Decker. 1991. Conserving residual corn fertilizer nitrogen with winter cover crops. Agronomy Journal 84:869-876.
Siddique, K.H.M., R.K. Belford, and D. Tennant. 1990. Root: Shoot ratios of old and modern, tall and semi-dwarf wheats in a Mediterranean environment. Plant Soil 121:89-98, doi:10.1007/BF00013101.
Snapp, S.S., S.M. Swinton, P. Labarta, D. Mutch, J.R. Black, R. Leep, J. Nyiraneza, and K. O’Neil. 2005. Evaluating cover crops for benefits, costs, and performance within cropping system niches. Agronomy Journal 97:322-332.
SPOT Image Corp. 2005. Technical Note 01: From count to irradiance. Technical Note V1-RO 22/12/2005, SNTT-CA8-01-SI.
Staver, K.W. 2001. Increasing N retention in Coastal Plain agricultural watersheds. The Scientific World 1:207-215.
Staver, K.W., and R.B. Brinsfield. 1998. Using cereal grain winter cover crops to reduce groundwater nitrate contamination in the mid-Atlantic Coastal Plain. Journal of Soil and Water Conservation 53(3):230-240.
Staver, K.W., and R.B. Brinsfield. 2000. Evaluating changes in subsurface nitrogen discharge from an agricultural watershed into Chesapeake Bay after implementation of a groundwater protection strategy. Final report to Maryland Department of Natural Resources. Section 319 Grant Project 14-98-340-EPA-Q29. University of Maryland, College of Agriculture and Natural Resources, Agricultural Experiment Station, Wye Res. Ed. Ctr. Queenstown, Maryland.
Strock, J.S., P.M. Porter, and M.P. Russelle. 2004. Cover cropping to reduce nitrate loss through subsurface drainage in the Northern U.S. corn belt. Journal of Environmental Quality 33:1010-1016.
Thenkabail, P.S., R.B. Smith, and E. DePauw. 2000. Hyperspectral vegetation indices and their relationship with agricultural crop characteristics. Remote Sensing of Environment 71:158-182, doi:10.1016/S0034-4257(99)00067-X.
Tucker, C. 1979. Red and photographic infrared linear combinations for monitoring vegetation. Remote Sensing of Environment 8:127-150, doi:10.1016/0034-4257(79)90013-0.
Watkins, K.B., C. Lu, and J.R. Teasdale. 2002. Long-term environmental and economic simulation of alternative cropping systems in Maryland. Journal of Sustainable Agriculture 20(4):61-82, doi:10.1300/J064v20n04_05.
Weigand, C.L., S.J. Maas, J.K. Aase, J.L. Hatfield, P.J. Pinter, R.D. Jackson, E.T. Kanemasu, and R.L. Lapitan.1992. Multi-site analyses of spectral-biophysical data for wheat. Remote Sensing of Environment 42:1-21, doi:10.1016/0034-4257(92)90064-Q.
Weixing, C., and D.N. Moss. 1989. Temperature effect on leaf emergence and phyllochron in wheat and barley. Crop Science 29:1018-1021.
Wright, D.L., V.P. Rasmussen, R.D. Ramsey, D.J. Baker, and J.W. Ellsworth. 2004. Canopy reflectance estimation of wheat nitrogen content for grain protein management. GIScience and Remote Sensing 41(4):287-300.
Yanli, L., L. Shaokun, W. Jihua, J. Carol, X. Ruizhi, and W. Zhijie. 2007. Differentiating wheat varieties with different leaf angle distributions using NDVI and canopy cover. New Zealand Journal of Agricultural Research 50(5):1149-1156.
Copyright ©
2009 Soil and Water C
onservation Society. All rights reserved.
w
ww
.swcs.org
64(5):303-313 Journal of Soil and W
ater Conservation