using human data to protect the public's health
TRANSCRIPT
Regulatory Toxicology and Pharmacology 33, 234–256 (2001)doi:10.1006/rtph.2001.1469, available online at http://www.idealibrary.com on
Using Human Data to Protect the Public’s Health
Michael L. Dourson,∗,1 Melvin E. Andersen,† Linda S. Erdreich,‡ and Judith A. MacGregor§∗Toxicology Excellence for Risk Assessment, Cincinnati, Ohio 45223; †Colorado State University; ‡Exponent;
and §Toxicology Consulting Services
Received February 26, 2001
The value of using human data in the assessmentand management of risk is evaluated. Although the useof such data has a long and successful history withenvironmental contaminants and the development ofdrugs and commercial chemicals, recent deliberationswithin the Environmental Protection Agency (EPA)have questioned this practice in part. Specifically, weevaluate the degree to which reference doses (RfDs)and reference concentrations (RfCs) derived fromhuman data on EPA’s Integrated Risk InformationSystem (IRIS) differ with RfDs and RfCs that we es-timate from experimental animal data. We also useseveral minimal risk levels of the Agency for Toxic Sub-stances and Disease Registry (ATSDR) and tolerableintakes of Health Canada in this comparison. Human-based RfDs are more than threefold lower than thecorresponding animal-based RfDs for 23% of the com-parisons. Human- based RfDs or RfCs are lower thancorresponding animal-based RfDs or RfCs for 36% ofthe comparisons. Furthermore, for 10 of 43 possiblecomparisons, insufficient experimental animal dataare readily available or data are inappropriate to es-timate either RfDs or RfCs. We also discuss humanpharmacokinetic data from volunteer studies andmechanistic studies with human tissues in vitro anddemonstrate through a series of case discussions thatutilization of such data is important when making de-cisions to protect exposed individuals. Moreover, phys-iologically based pharmacokinetic (PBPK) modelingevaluates critical information in assessing interindi-vidual variability and identifying at-risk populations.Within the limits of our analysis, we conclude that thedirect use and interpretation of human data, in con-junction with data gathered from experimental ani-mals, are public health protective policies that shouldbe encouraged. C© 2001 Academic Press
Key Words: dose response; human; reference dose;reference concentration; risk; pharmacokinetics;pharmacodynamics; uncertainty factor.
1 To whom correspondence and reprint requests should beaddressed at Toxicology Excellence for Risk Assessment, 1757Chase Avenue, Cincinnati, OH 45223. Fax: 513-542-7487. E-mail:[email protected].
INTRODUCTION
230273-2300/01 $35.00Copyright C© 2001 by Academic PressAll rights of reproduction in any form reserved.
Is information from human studies the best way tojudge the potential public health risk from chemicals inour environment? Should public health agencies striveto resolve the ethical questions and identify criteria tofoster the conduct of human studies that might lead tobetter protection of the public’s health? Should scien-tists ignore available human data that might suggest alower or higher risk value? What is a risk value?
These issues have been a subject of much recent dis-cussion (e.g., EPA, 2000a; Russo, 2000; SOT, 2000) anda topic of increased attention among both scientists andpolicy makers. Answers to these questions are compli-cated and not necessarily straightforward. Perhaps theeasiest question to answer is the last because it coversa narrower part of the NAS (1983, 1994) risk assess-ment and risk management paradigm—that of hazardidentification and dose–response assessment. Conceiv-ably it should be the first question answered, since itsresponse lays the foundation for the other questions in-volving more than the underlying science. We attemptto answer this question directly below. Other questionsare discussed later.
What Is a Risk Value?
In its simplest form, a risk value is a given point onthe dose–response curve associated with some probabil-ity of an outcome. In many cases, risk values are cho-sen to be associated with a level of zero or very smallrisk, usually referred to as “no appreciable risk.” A com-mon example of a risk value is a reference dose (RfD).A RfD is a point on the dose–response curve for a chem-ical of interest that is believed to be in the region ofno adverse effect and is often used by risk managersto distinguish between the region of no adverse effectand the region of adverse effect. With either interpre-tation, however, the RfD does not distinguish betweenthe region of any effect and that of no effect, becausescientists often distinguish between a chemical’s abil-ity to cause an adverse effect and its ability to cause ef-fects that are not considered adverse. For example, riskassessors often distinguish among adaptive, adverse,
4
USING HUMAN DATA TO PROTECT THE PUBLIC’S HEALTH 235
compensatory, and critical effects.2 In this process theconcepts of severity of effect, homeostasis, and hormesisare often discussed.
Specifically, a RfD is defined as “an estimate (withuncertainty spanning perhaps an order of magnitude)of a daily exposure to the human population (includ-ing sensitive subgroups) that is likely to be withoutan appreciable risk of deleterious effects during a life-time” (Barnes and Dourson, 1988). The reference con-centration (RfC), where dose is expressed as a concen-tration, is similarly defined and applies to inhalationexposures (Jarabek, 1994, 1995). A measure or esti-mate of human exposure is often integrated with arisk value such as a RfD or RfC to develop a simplerisk characterization, such as a maximum contaminantlevel goal (MCLG) in drinking water. This MCLG isthen considered with other information in developinga risk management position, such as a maximum con-taminant level (MCL). This MCL is enforceable and isdesigned to protect the public’s health. EPA developsother risk characterizations and risk management de-cisions for other media. Such characterizations mightinvolve more complex dose–response assessments andexposure assessments. Health organizations aroundthe world use risk values and their associated ex-posure measures in similar fashion when conductingrisk characterizations and arriving at risk managementdecisions.
In some cases, scientists postulate that a chemicalmay not have a distinguishable region of adverse ef-fect and no adverse effect in the dose–response curve.In such cases, the adverse effect might occur at anydose, with more and more individuals being affected atgreater doses (such as what might occur with cancer), orthe adverse effect will not occur at any dose. With manychemicals this distinction is debated, because the scien-
tific data are insufficient to provide certainty in conclu-2 Below are common definitions of types of effects. These effects arenot always clear-cut categories, but often represent a continuum. Dif-ferent individuals are expected to have different capacities for adap-tive and compensatory effects.
• Adaptive effects are not considered to be adverse. They enhancean organism’s performance as a whole and/or its ability to withstanda challenge. An increase in hepatic smooth endoplasmic reticulum isan example of an adaptive effect, if hepatic metabolism reduces thechemical’s toxicity.• Adverse effects are biochemical changes, functional impair-
ments, or pathologic lesions that affect the performance of the wholeorganism or reduce an organism’s ability to respond to additional en-vironmental challenges (EPA, 2000b).• Compensatory effects are not considered to be adverse. They
maintain overall function without enhancement or significant cost.Increased respiration due to metabolic acidosis is an example of acompensatory effect.• Critical effects are the first adverse effects or their known pre-
cursors that occur as dose rate increases (EPA, 2000b).• Severity is the degree to which an effect changes and impairs the
functional capacity of an organ system.
sions in the area of the dose–response curve used forinference.
How Are Human Data Used?
Human data can be used in several ways in a haz-ard identification and dose–response assessment. Forhazard identification, human data can be used alone toevaluate a finding or it may be used in concert with ex-perimental animal data to provide weight-of-evidencethat an observed association between exposure and re-sponse is actually caused by the exposure. In general,when used alone, human epidemiological data are in-sufficient evidence to strongly support causality (thereare notable exceptions to this rule such as arsenic). Inthe case of human data associated with clinical stud-ies or clinical interventions (such as for tamoxifen), thestrength of the causal association is higher than withenvironmental epidemiological data. The main reasonsfor this difference pertain to limitations in the mea-surement of exposures in environmental epidemiologi-cal studies and the inability to control or include con-founding variables that could also be associated withthe observed toxicity.
In dose–response assessment, human data regard-ing the no-observed-adverse-effect level (NOAEL) canbe used directly as the basis of a RfD or RfC. The pres-ence of human data obviates the necessity of extrapo-lating from animals to humans; therefore, human stud-ies, when available, are given first priority, with animaltoxicity studies serving to complement them (Barnesand Dourson, 1988). However, using human data in thisfashion requires that the human study be judged to beof at least comparable quality to an animal study thatmight be used to determine such a risk value. Moreover,the human study must conform to the highest stan-dards associated with the conduct and evaluation of sci-entific data and include informed consent. Human datathat are not directly useful as the basis of the NOAELvalue can also be compared with animal data to de-termine the most appropriate interspecies uncertaintyfactor, rather than a default factor of 10 (Dourson et al.,1996).
Human data can also be used as a guide to determinethe appropriate toxicological end point to be consideredfor use in the hazard identification. In this regard,human case studies and incident reporting systemsor other in vivo or in vitro experiments could bevaluable when coupled with the more quantitative andbetter-controlled experimental animal toxicity studies.Used in this fashion, the human data can be seen toadd mechanistic understanding of the critical effectdetermined from animals or to otherwise limit or boundthe likely estimates of risk determined from the animalwork in the dose–response assessment. They can alsoidentify human effects that are not detected in animal
studies, such as with the cardiac valvular defects
236 DOURSON ET AL.
associated with the use of the drugs for weight loss(FDA, 1997).
What Are the Types of Human Data?
To date, the human data that have been used in riskassessments include a wide variety of types, based pri-marily on the different ways in which health data onhumans can be obtained. Human data range from anec-dotal case reports to systematically designed epidemi-ological studies of an exposed cohort. Epidemiologicalstudies use several different approaches for collectingdata, including surveillance, public health statistics, ge-ographic correlation studies, and the cohort and case–control studies designed to identify associations andsometimes to support inferences about cause and effect.Human data also include experimental exposures of in-dividuals; these are typically short-term studies thatinvolve doses below a hypothesized threshold of adverseeffect.
Epidemiological studies are routinely based on in-advertent exposures that may occur in the workplace,by unusual natural contamination, or as the after-math of an accident such as an explosion or indus-trial release. However, deliberate exposure to humanshas been used for centuries to test therapeutic proce-dures (Lee, 1980). Human studies are routinely usedin drug development to evaluate the efficacy or safetyof a therapeutic or diagnostic regimen. Clinical stud-ies, or phase I clinical trials, are designed to identifya safe dose of a potential therapeutic or preventiveagent. These studies are an intrinsic part of medicine,and methods for the design and statistical analysis ofthese studies are discussed in most statistical textbooks(Elwood, 1998).
The human experimental studies used for agents inthe environment generally measure biochemical and/orphysiological changes related to the anticipated adverseresponse in order to obtain quantitative information,usually for comparison with animal data. Criteria forboth Phase I clinical trials and experimental studiesin humans of environmental exposures include volun-tary participation. Exposures to environmental chem-icals are intended to produce minimal or no immedi-ate adverse effects and no irreversible adverse effects(e.g., these studies usually examine an end point in theadaptive or compensatory response range). In the caseof environmental exposures, studies are designed formultiple reasons such as to aid in understanding howexposures might be measured in a general populationor to provide additional information for species com-parisons and reduce uncertainty. In both cases, thesestudies are aimed at improving health. In the case ofPhase I clinical trials for drugs, studies are designed toidentify dosing levels that can be tolerated without anyserious or unacceptable side effects and to serve as a
guide for dose selection for future studies.Approximately 7 of 8 potential drugs fail duringclinical development and are subsequently not used(DeGeorge, 1999). For the 1 of 8 that are commerciallydeveloped, it is somewhat unlikely that a healthy vol-unteer would subsequently develop a need for the samepharmaceutical. In contrast, experimental studies forenvironmental contaminants have the potential for im-proving the risk estimates for chemicals for which thevolunteers and the rest of the general public may morelikely be exposed. Such improvement may have an indi-rect public health benefit. For example, the use of her-bicides and pesticides may indirectly benefit health ifthe agents reduce organisms that are disease vectors,or increase accessibility to foods needed for a healthydiet.
For evaluation in this paper all RfDs and RfCs basedon human data were selected from EPA’s IRIS (EPA,2000b). The human data that formed the basis of theseRfDs and RfCs were of all types, for example: case re-ports of argyria from exposure to silver, epidemiologicalstudies of populations exposed to natural arsenic or tomethyl mercury from environmental contamination, asurveillance epidemiology study for methemoglobine-mia from nitrate exposure, population studies of flu-orosis, and experimental studies of aldicarb, barium,warfarin, and zinc.
Purpose of This Research
The purpose of this research is to compare establishedRfDs and RfCs based on human data with those we esti-mate based on experimental animal data, and to showthe use of human toxicokinetic and toxicodynamic in-formation for estimating noncancer and cancer risk. Wealso briefly discuss the use and interpretation of humandata, in conjunction with data gathered from experi-mental animals, as a public health protective policy.
METHODS
Methods Used for Comparison of RfDs and RfCs
We chose to use the complete listing of noncancer riskvalues, that is RfDs and RfCs, based on human data asfound in EPA’s IRIS database (EPA, 2000b). RfDs andRfCs found in IRIS have gone through an extensive andrigorous development process, including internal peerreview and unanimous acceptance within EPA. IRIS isnot the only source of such information, of course (see forexample www.tera.org/iter), but we used IRIS becauseit is convenient, reasonably robust, objective and re-spected (although many of the risk values are outdated).We compared these human-based RfDs and RfCs withRfDs and RfCs we estimate from readily available ex-perimental animal data, mainly from IRIS, based onEPA dose–response assessment methods (Barnes andDourson, 1988; Dourson, 1994; Jarabek, 1994, 1995;
EPA, 1994). We chose not to do a similar comparison
USING HUMAN DATA TO PROTECT THE PUBLIC’S HEALTH 237
for cancer risk values because of the added complex-ity of developing risk values from experimental animaldata, although such work may be pursued in the future.
Our choice of appropriate experimental animal toxic-ity data to develop a RfD or RfC for comparison with anexisting human value depended primarily on the avail-ability of the experimental animal data. Confidence inthe resulting comparison depends in part on the confi-dence one has in the human-based RfD or RfC (see Ta-bles 1 and 2, which present confidence statements forrisk values on IRIS), and on the relevance of the resultsin animals to the critical effect shown in humans. In de-scending order of importance, we selected experimentalanimal data to match:
• The dose–response curve of the critical effect inthe human study [e.g., comparison of the dose–responsecurves of red blood cell cholinesterase (RBC) inhibition];or• The benchmark dose (BMD), no-observed-adverse-
effect level (NOAEL), or lowest-observed-adverse-effectlevel (LOAEL) of the critical effect in the humanstudy (e.g., comparison of RBC cholinesterase inhibi-tion NOAELs).
If matching data were not available, we then selec-ted:
• A BMD, NOAEL or LOAEL of a closely related ef-fect found in animals and compared it to the criticaleffect in humans (e.g., comparison of any clinical signsof cholinesterase inhibition); or• The most sensitive effect found in animals and com-
pared it to the critical effect in humans (e.g., comparisonof cholinesterase inhibition with liver toxicity).
We recognized that pharmacokinetics and pharma-codynamics (discussed later) may impact such compar-isons and conclusions drawn from these comparisons.Furthermore, the available experimental animal datamay not include a species relevant to humans, and anysuch comparisons of these animal data with the hu-man data may not be sufficiently predictive of effectsin humans. Therefore, these comparisons of establishedhuman-based RfDs and RfCs with those we estimatedfrom available animal data should be considered alongwith information on pharmacokinetics and pharmaco-dynamics in determining the usefulness of human data.
We developed animal-based RfDs and RfCs directlyfrom the existing information on EPA’s IRIS, and notfrom a thorough review of the original literature. Insome cases, EPA’s IRIS states an alternative RfD orRfC based on animal studies, and we used these alterna-tive values instead of estimating them. Occasionally, wecompared animal versus human risk values of ATSDR,EPA, and Health Canada as described on Toxicol-ogy Excellence for Risk Assessment’s (TERA) Interna-tional Toxicity Estimates for Risk (ITER) database (see
TERA, 2000). Please note that the animal-based RfDsand RfCs that we derived have not undergone a rigor-ous peer review. Thus, the animal-based RfDs and RfCsthat we provide should only be considered as interim,subject to change with additional data and/or analysis.
In all cases, we developed the experimental animal-based RfDs and RfCs assuming no relevant human datawere available. Therefore, we used the default uncer-tainty factor of 10-fold (for RfDs) or 3-fold (for RfCs)for experimental animal to human extrapolation. Re-cent data and analysis by the EPA and others allow theuse of specific human and animal toxicity, toxicokineticand toxicodynamic data to affect the value of this andother uncertainty factors (Renwick, 1993; IPCS, 1994;Dourson, 1994; Dourson et al., 1996; see also discussionbelow).
In the development of the animal-based RfDs andRfCs, we used the same database uncertainty factor andmodifying factor as found in EPA’s IRIS with one ex-ception (the footnote for nitrite in Table 1 explains thisexception). This decision is reasonable because the useof these factors, and the choice of other potential factorssuch as that recommended under the Food Quality Pro-tection Act, reflects confidence in the overall database(EPA, 1999), which is the basis of both animal- andhuman-based RfDs and RfCs.
Methods for Pharmacokinetic Modeling
Making adjustments to animal results. Chemicalrisk assessments for cancer and noncancer end pointsare moving toward a common, harmonized methodology(Barton et al., 1998). The basic steps in the approachare the establishment of a point of departure that maybe a NOAEL, a LOAEL, or a BMD estimated from ex-perimental data as described above. In the inhalationreference concentration methodology (EPA, 1994), thepoint of departure value is adjusted for differences inexposure duration to account for the fact that animalsare exposed for less than 24 h per day while the expo-sure of interest for humans is continuous lifetime ex-posures. This duration-adjusted value is then correctedto take into account dosimetry differences expected be-tween animals and human in order to provide a humanequivalent concentration (HEC). These steps affect thenumerator in the RfC equation. Several uncertainty fac-tors are then applied to account for interspecies differ-ences between test animals and humans and interindi-vidual differences among humans. The HEC is dividedby these uncertainty factors. Human pharmacokineticand dosimetry data play potentially important roles inestimating the HEC and in assessing the magnitude ofthe uncertainty factors.
Mode of action and target tissue dose. The modeof action for a chemical entails the set of steps thatare involved in causing toxicity following exposure tothat particular chemical. Target tissue dose is the form
of the chemical, i.e., parent compound, metabolite, peak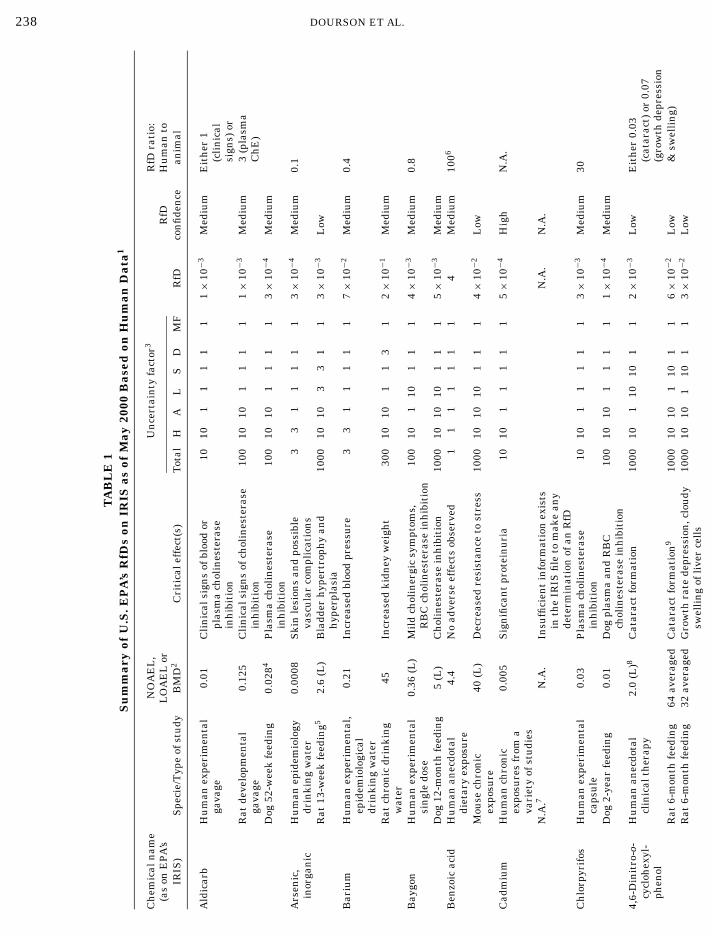
238 DOURSON ET AL.
TA
BL
E1
Su
mm
ary
ofU
.S.E
PA
’sR
fDs
onIR
ISas
ofM
ay20
00B
ased
onH
um
anD
ata1
Ch
emic
aln
ame
NO
AE
L,
Un
cert
ain
tyfa
ctor
3R
fDra
tio:
(as
onE
PA
’sL
OA
EL
orR
fDH
um
anto
IRIS
)S
peci
e/T
ype
ofst
udy
BM
D2
Cri
tica
leff
ect(
s)T
otal
HA
LS
DM
FR
fDco
nfi
den
cean
imal
Ald
icar
bH
um
anex
peri
men
tal
0.01
Cli
nic
alsi
gns
ofbl
ood
or10
101
11
11
1×
10−3
Med
ium
Eit
her
1ga
vage
plas
ma
chol
ines
tera
se(c
lin
ical
inh
ibit
ion
sign
s)or
Rat
deve
lopm
enta
l0.
125
Cli
nic
alsi
gns
ofch
olin
este
rase
100
1010
11
11
1×
10−3
Med
ium
3(p
lasm
aga
vage
inh
ibit
ion
Ch
E)
Dog
52-w
eek
feed
ing
0.02
84P
lasm
ach
olin
este
rase
100
1010
11
11
3×
10−4
Med
ium
inh
ibit
ion
Ars
enic
,H
um
anep
idem
iolo
gy0.
0008
Ski
nle
sion
san
dpo
ssib
le3
31
11
11
3×
10−4
Med
ium
0.1
inor
gan
icdr
inki
ng
wat
erva
scu
lar
com
plic
atio
ns
Rat
13-w
eek
feed
ing5
2.6
(L)
Bla
dder
hyp
ertr
oph
yan
d10
0010
103
31
13×
10−3
Low
hyp
erpl
asia
Bar
ium
Hu
man
expe
rim
enta
l,0.
21In
crea
sed
bloo
dpr
essu
re3
31
11
11
7×
10−2
Med
ium
0.4
epid
emio
logi
cal
drin
kin
gw
ater
Rat
chro
nic
drin
kin
g45
Incr
ease
dki
dney
wei
ght
300
1010
11
31
2×
10−1
Med
ium
wat
erB
aygo
nH
um
anex
peri
men
tal
0.36
(L)
Mil
dch
olin
ergi
csy
mpt
oms,
100
101
101
11
4×
10−3
Med
ium
0.8
sin
gle
dose
RB
Cch
olin
este
rase
inh
ibit
ion
Dog
12-m
onth
feed
ing
5(L
)C
hol
ines
tera
sein
hib
itio
n10
0010
1010
11
15×
10−3
Med
ium
Ben
zoic
acid
Hu
man
anec
dota
l4.
4N
oad
vers
eef
fect
sob
serv
ed1
11
11
11
4M
ediu
m10
06
diet
ary
expo
sure
Mou
sech
ron
ic40
(L)
Dec
reas
edre
sist
ance
tost
ress
1000
1010
101
11
4×
10−2
Low
expo
sure
Cad
miu
mH
um
anch
ron
ic0.
005
Sig
nifi
can
tpr
otei
nu
ria
1010
11
11
15×
10−4
Hig
hN
.A.
expo
sure
sfr
oma
vari
ety
ofst
udi
esN
.A.7
N.A
.In
suffi
cien
tin
form
atio
nex
ists
N.A
.N
.A.
inth
eIR
ISfi
leto
mak
ean
yde
term
inat
ion
ofan
RfD
Ch
lorp
yrif
osH
um
anex
peri
men
tal
0.03
Pla
sma
chol
ines
tera
se10
101
11
11
3×
10−3
Med
ium
30ca
psu
lein
hib
itio
nD
og2-
year
feed
ing
0.01
Dog
plas
ma
and
RB
C10
010
101
11
11×
10−4
Med
ium
chol
ines
tera
sein
hib
itio
n4,
6-D
init
ro-o
-H
um
anan
ecdo
tal
2.0
(L)8
Cat
arac
tfo
rmat
ion
1000
101
1010
11
2×
10−3
Low
Eit
her
0.03
cycl
ohex
yl-
clin
ical
ther
apy
(cat
arac
t)or
0.07
phen
ol(g
row
thde
pres
sion
Rat
6-m
onth
feed
ing
64av
erag
edC
atar
act
form
atio
n9
1000
1010
110
11
6×
10−2
Low
&sw
elli
ng)
Rat
6-m
onth
feed
ing
32av
erag
edG
row
thra
tede
pres
sion
,clo
udy
1000
1010
110
11
3×
10−2
Low
swel
lin
gof
live
rce
lls
USING HUMAN DATA TO PROTECT THE PUBLIC’S HEALTH 239
,4-Din
itro
phen
olH
um
anan
ecdo
tal
2.0
(L)
Cat
arac
tfo
rmat
ion
1000
101
1010
11
2×
10−3
Low
Eit
her
0.02
clin
ical
ther
apy
(cat
arac
t)or
0.4
Rat
6-m
onth
feed
ing
130
Cat
arac
tfo
rmat
ion
1000
1010
110
11
1×
10−1
Low
(gro
wth
depr
essi
onav
erag
ed&
swel
lin
g)
Rat
6-m
onth
feed
ing
5G
row
thra
tede
pres
sion
,clo
udy
1000
1010
110
11
5×
10−3
10L
owsw
elli
ng
ofli
ver
cell
sth
eph
onH
um
anex
peri
men
tal
0.5
(L)
Pla
sma
chol
ines
tera
se10
010
110
11
15×
10−3
Low
6or
alex
posu
rein
hib
itio
nD
og2-
year
feed
ing
0.75
(L)
Pla
sma
chol
ines
tera
se10
0010
1010
11
18×
10−4
Low
inh
ibit
ion
thio
nH
um
anex
peri
men
tal
0.05
11P
lasm
ach
olin
este
rase
100
101
101
11
5×
10−4
Med
ium
8sh
ort
term
inh
ibit
ion
Dog
90-d
ayor
alex
posu
re0.
06(L
)P
lasm
ach
olin
este
rase
1000
1010
101
11
6×
10−5
Med
ium
inh
ibit
ion
luor
ine
Hu
man
epid
emio
logy
0.06
Obj
ecti
onab
lede
nta
lflu
oros
is1
11
11
11
6×
10−2
Hig
hN
.A.
(sol
ubl
eN
.A.
N.A
.In
suffi
cien
tin
form
atio
nex
ists
N.A
.N
.A.
flu
orid
e)in
the
IRIS
file
tom
ake
any
dete
rmin
atio
nof
RfD
alat
hio
nH
um
anex
peri
men
tal
0.23
Ery
thro
cyte
chol
ines
tera
se10
101
11
11
2×
10−2
Med
ium
0.4
feed
ing
inh
ibit
ion
Rat
2-ye
arfe
edin
g5
Dec
reas
edbr
ain
chol
ines
tera
se10
010
101
11
15×
10−2
Med
ium
and
decr
ease
dbo
dyw
eigh
tan
gan
ese
Hu
man
data
ofse
vera
l0.
14N
oL
OA
EL
give
n,C
NS
effe
cts
11
11
11
11.
4×
10−3
Med
ium
N.A
.ty
pes
appe
arto
occu
rat
hig
her
dose
sN
.A.
N.A
.IR
ISst
ates
that
hu
man
data
are
N.A
.N
.A.
supe
rior
toan
yda
taob
tain
edfr
oman
imal
toxi
city
stu
dies
asth
eba
sis
ofan
RfD
,sin
ceth
eph
ysio
logi
cre
quir
emen
tsfo
rm
anga
nes
eva
ryam
ong
spec
ies
eth
ylm
ercu
ryH
um
anep
idem
iolo
gica
l0.
0011
(B)
Infa
nt
deve
lopm
enta
l10
31
11
31
1×
10−4
Med
ium
5po
ison
ing
neu
rolo
gica
labn
orm
alit
ies
Rat
deve
lopm
enta
l0.
005
Dec
reas
ein
oper
ant
beh
avio
r30
010
101
13
12×
10−5
Med
ium
gava
gean
d26
-mon
thpe
rfor
man
ce,r
edu
ced
body
feed
ing
stu
dyw
eigh
tga
ins,
min
imal
clin
ical
sign
sof
neu
roto
xici
ty,k
idn
eyda
mag
eol
ybde
nu
mH
um
an0.
14(L
)In
crea
sed
uri
cac
id30
31
101
11
5×
10−3
Med
ium
2ep
idem
iolo
gica
ldi
etar
yR
at13
-wee
kfe
edin
g2.
5(L
)R
etar
ded
wei
ght
gain
1000
1010
33
11
3×
10−3
Low
itra
teH
um
anep
idem
iolo
gy1.
6E
arly
clin
ical
sign
sof
11
11
11
11.
6H
igh
8su
rvey
sm
eth
emog
lobi
nem
ia<
10%
Rat
24-m
onth
drin
kin
g20
12D
ilat
edbr
onch
i,fi
bros
is,a
nd
100
1010
11
11
2×
10−1
Med
ium
wat
erem
phys
ema
2 E E F M M M M N
240
DOURSON ET AL.TA
BL
E1–
Con
tin
ued
Ch
emic
aln
ame
NO
AE
L,
Un
cert
ain
tyfa
ctor
3R
fDra
tio:
(as
onE
PA
’sL
OA
EL
orR
fDH
um
anto
IRIS
)S
peci
e/T
ype
ofst
udy
BM
D2
Cri
tica
leff
ect(
s)T
otal
HA
LS
DM
FR
fDco
nfi
den
cean
imal
Nit
rite
Hu
man
epid
emio
logy
1.013
Ear
lycl
inic
alsi
gns
of1
11
11
110
1×
10−1
Hig
h5
surv
eys
met
hem
oglo
bin
emia
l<10
%R
at24
-mon
thdr
inki
ng
2D
ilat
edbr
onch
i,fi
bros
is,a
nd
100
1010
11
11
2×
10−2
Med
ium
wat
erem
phys
ema
Pir
imip
hos
-H
um
an56
-day
0.25
Tra
nsi
ent
plas
ma
2510
12.
51
11
1×
10−2
Hig
hE
ith
er2
met
hyl
expe
rim
enta
lfee
din
gch
olin
este
rase
inh
ibit
ion
(rat
)or
20R
at2-
year
feed
ing
0.5
Pla
sma
chol
ines
tera
se10
010
101
11
15×
10−3
Hig
h(d
og)
inh
ibit
ion
Dog
2-ye
arfe
edin
g0.
5(L
)B
rain
chol
ines
tera
sein
hib
itio
n10
0010
1010
11
15×
10−4
Med
ium
Sel
eniu
man
dH
um
anfo
odan
dso
il0.
015
Cli
nic
alse
len
osis
33
11
11
15×
10−3
Hig
h6
com
pou
nds
epid
emio
logy
Rat
deve
lopm
enta
l0.
075
50%
redu
ctio
nin
nu
mbe
rof
100
1010
11
11
8×
10−4
Hig
hto
xici
tyyo
un
gre
ared
Sil
ver
Hu
man
anec
dota
l0.
014
Arg
yria
33
11
11
15×
10−3
Low
0.2
stu
dies
Rat
218-
day
drin
kin
g89
(L)
Ven
tric
ula
rh
yper
trop
hy
3000
1010
103
11
3×
10−2
Low
wat
erex
posu
re1,
1,2-
Tri
chlo
ro-
Hu
man
occu
pati
onal
273
Psy
chom
otor
impa
imen
t10
101
11
11
3×
101
Low
N.A
.1,
2,2-
trifl
uor
o-ex
posu
reet
han
eN
.A.
N.A
.In
suffi
cien
tin
form
atio
nex
ists
N.A
.N
.A.
inth
eIR
ISfi
leto
mak
ean
yde
term
inat
ion
ofR
fDW
arfa
rin
Hu
man
expe
rim
enta
l0.
029
Incr
ease
dpr
oth
rom
bin
tim
e10
010
110
11
13×
10−4
Low
N.A
.In
appr
opri
ate
N.A
.IR
ISst
ates
‘Bec
ause
ofN
.A.
N.A
.m
arke
ddi
ffer
ence
sin
the
susc
epti
bili
tyof
diff
eren
tsp
ecie
sto
the
effe
cts
ofw
arfa
rin
,it
wou
ldbe
inap
prop
riat
eto
deri
vean
RfD
from
stu
dies
onlo
wer
anim
als”
E PUBLIC’S HEALTH 241
USING HUMAN DATA TO PROTECT THZinc
and
Hu
man
expe
rim
enta
l59
.7(L
)D
ecre
ase
iner
yth
rocy
te3
11
31
11
3×
10−1
Med
ium
N.A
.co
mpo
un
dsdi
etsu
pple
men
tsu
pero
xide
dism
uta
seco
nce
ntr
atio
nin
adu
lts
N.A
.N
.A.
Insu
ffici
ent
info
rmat
ion
exis
tsN
.A.
N.A
.in
the
IRIS
file
tom
ake
any
dete
rmin
atio
nof
RfD
1A
llda
tafr
omw
hic
hw
ees
tim
ate
anim
al-b
ased
RfD
sar
eta
ken
from
EP
A’s
IRIS
un
less
oth
erw
ise
stat
ed.J
udg
men
tsof
con
fide
nce
leve
lsfo
ran
imal
-bas
edri
skva
lues
wer
eba
sed
onM
.Dou
rson
’sex
peri
ence
wit
hth
eR
fD/R
fCW
ork
Gro
up
ofE
PA
.2
All
valu
esar
ein
mg/
kg-d
ayan
dar
eN
OA
EL
su
nle
ssot
her
wis
est
ated
:(L
),L
OA
EL
;(B
),be
nch
mar
kdo
se(B
MD
).3
Un
cert
ain
tyfa
ctor
sar
eH
,ave
rage
hu
man
tose
nsi
tive
hu
man
;A,a
nim
alto
hu
man
;L,L
OA
EL
toN
OA
EL
:S,s
ubc
hro
nic
expo
sure
toch
ron
ic;D
,dat
abas
ein
suffi
cien
cy;M
F,m
odif
yin
gfa
ctor
toac
cou
nt
for
un
cert
ain
itie
sn
otco
vere
dby
the
trad
itio
nal
fact
ors.
Not
eth
atfo
rth
isex
erci
se,t
he
Dan
dM
Ffa
ctor
sw
ere
con
side
red
tobe
the
sam
ebe
twee
nth
ean
imal
-bas
edR
fDan
dth
eh
um
an-b
ased
RfD
,sin
ceth
eyor
igin
ated
from
the
sam
eda
taba
sew
ith
one
exce
ptio
n(n
itri
te)
sin
cein
form
atio
non
IRIS
allo
wed
adi
ffer
ence
.Th
ese
fact
ors
may
orm
ayn
otbe
the
sam
eu
pon
reev
alu
atio
nof
new
erto
xici
tyda
tan
oton
IRIS
.4
Bot
hth
edo
gan
dh
um
anst
udi
essh
owed
plas
ma
chol
ines
tera
sein
hib
itio
nat
the
low
est
dose
.F
orth
isco
mpa
riso
n,
both
low
dose
sw
ere
con
side
ras
NO
AE
Ls;
ifth
eyar
eco
nsi
dere
das
LO
AE
Ls,
the
RfD
sm
igh
tbe
low
erfo
rbo
th,b
ut
the
rati
obe
twee
nth
ese
RfD
sw
ould
beth
esa
me.
5D
ata
deri
ved
from
Oko
jiet
al.(
1999
).6
IRIS
stat
es“t
hat
labo
rato
ryan
imal
sar
ein
appr
opri
ate
mod
els
for
stu
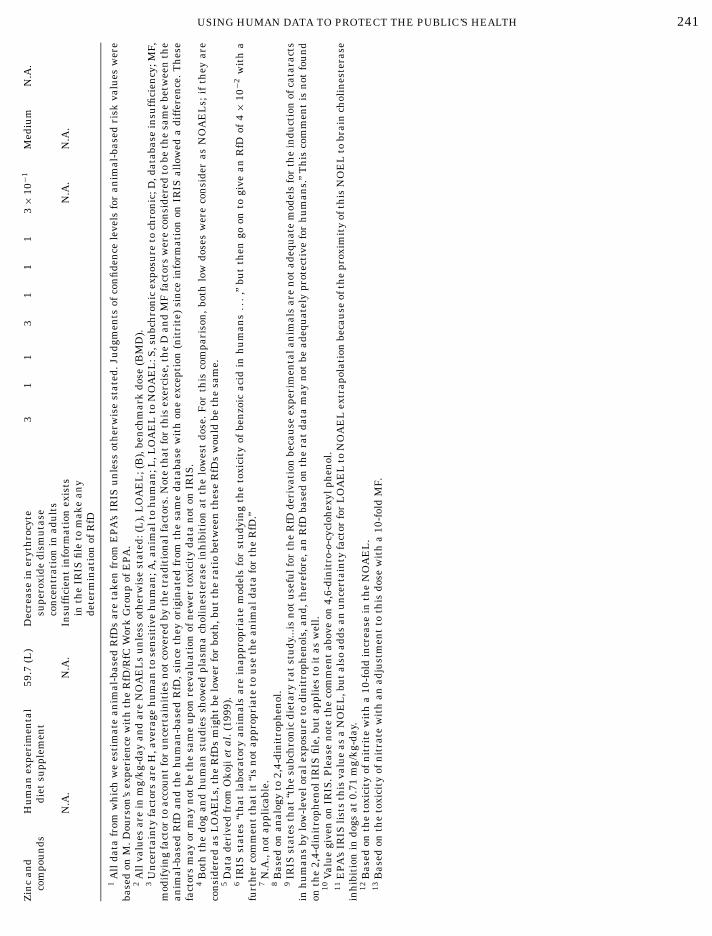
dyin
gth
eto
xici
tyof
ben
zoic
acid
inh
um
ans...
,”bu
tth
engo
onto
give
anR
fDof
4×
10−2
wit
ha
furt
her
com
men
tth
atit
“is
not
appr
opri
ate
tou
seth
ean
imal
data
for
the
RfD
.”7
N.A
.,n
otap
plic
able
.8
Bas
edon
anal
ogy
to2,
4-di
nit
roph
enol
.9
IRIS
stat
esth
at“t
he
subc
hro
nic
diet
ary
rat
stu
dy...
isn
otu
sefu
lfor
the
RfD
deri
vati
onbe
cau
seex
peri
men
tala
nim
als
are
not
adeq
uat
em
odel
sfo
rth
ein
duct
ion
ofca
tara
cts
inh
um
ans
bylo
w-l
evel
oral
expo
sure
todi
nit
roph
enol
s,an
d,th
eref
ore,
anR
fDba
sed
onth
era
tda
tam
ayn
otbe
adeq
uat
ely
prot
ecti
vefo
rh
um
ans.
”T
his
com
men
tis
not
fou
nd
onth
e2,
4-di
nit
roph
enol
IRIS
file
,bu
tap
plie
sto
itas
wel
l.10
Val
ue
give
non
IRIS
.Ple
ase
not
eth
eco
mm
ent
abov
eon
4,6-
din
itro
-o-c
yclo
hex
ylph
enol
.11
EP
A’s
IRIS
list
sth
isva
lue
asa
NO
EL
,bu
tal
soad
dsan
un
cert
ain
tyfa
ctor
for
LO
AE
Lto
NO
AE
Lex
trap
olat
ion
beca
use
ofth
epr
oxim
ity
ofth
isN
OE
Lto
brai
nch
olin
este
rase
inh
ibit
ion
indo
gsat
0.71
mg/
kg-d
ay.
12B
ased
onth
eto
xici
tyof
nit
rite
wit
ha
10-f
old
incr
ease
inth
eN
OA
EL
.13
Bas
edon
the
toxi
city
ofn
itra
tew
ith
anad
just
men
tto
this
dose
wit
ha
10-f
old
MF.
242 DOURSON ET AL.
responding animal-based RfD or RfC.
3 These frequency values are based on ratios that fall within a 10-fold range of each other, for example 0.3 mg/kg-day≤RfD≤ 0.3 mg/kg-day. The use of such a range is consistent with the definition of RfDsand RfCs in that “uncertainty spans perhaps an order of magnitude”and thus their expected level of precision. However, the precision ofrisk values has never been explicitly addressed in EPA risk values (seeFelter and Dourson, 1998, for more discussion of this), and thereforethe range we use here is only for demonstration. Other equally valid
concentrations, net exposures as area under the concen-tration curves, that is believed to be most closely asso-ciated with the toxic effects. Any narrative describingthe mode of action of a compound should also convey theform of the chemical believed to be responsible for initi-ating the cascade of steps leading to the toxic responses.Similarly, extrapolation between species should be con-ducted using a dose metric that reflects this under-standing of the mode of action of the compound.
For example, a mode of action statement for vinylchloride would be: tumors associated with vinyl chlo-ride are caused by mutational effects arising from thereaction of epoxide metabolites with DNA resulting inincreases in the mutational frequency in specific cells.The dose metric for this mode of action would be a mea-sure of the net tissue exposure of the epoxide metabo-lites (EPA, 2000b). For chloroform, the mode of actionstatement would read: tumors in the liver and kidneyinduced by chloroform arise due to mutations duringrecurrent episodes of cytotoxicity and cell proliferationassociated with metabolism of chloroform to phosgenein cells with high CYP 2E1 activity. Here the dose metricwould be related to peak rates of metabolism of chloro-form in liver and in kidney cortex (ILSI, 1997).
Pharmacokinetic and dosimetry data in risk assess-ment. Several advances in dose–response assessmenthave occurred over the past 20 years due to increasedemphasis on understanding modes of action and on de-termining the major biological determinants that con-tribute to pharmacokinetic behavior in animals andhumans. Before 1980, it was common to simply col-lect pharmacokinetic data and analyze it empiricallywith mathematical models to evaluate the correspon-dence of the data with specific compartmental models.Sometimes the data were not analyzed at all. A diffi-culty with these compartmental approaches was in ex-trapolation of the results to important untested situ-ations. Even when impressive fits to animal data wereobtained, how confident could we be that the compoundswould have similar kinetic behavior in humans? If hu-man data were actually obtained from volunteers, howconfident could we be that the data obtained from asmall group of healthy individuals were representativeof pharmacokinetic behaviors expected in a larger hu-man population? These two questions led to increasedemphasis on development of physiologically based phar-macokinetic (PBPK) models in which the organism isdescribed realistically in terms of anatomy, physiol-ogy, biochemical parameters of distribution, and thephysical-chemical characteristics of the test compound(Gerlowski and Jain, 1983). These particular models aremore amenable to extrapolation from test animals tohumans and are also amenable to establishing the im-portance of variability within the human population by
Monte Carlo methods.RESULTS
Comparison of Human- and ExperimentalAnimal-Based RfDs and RfCs
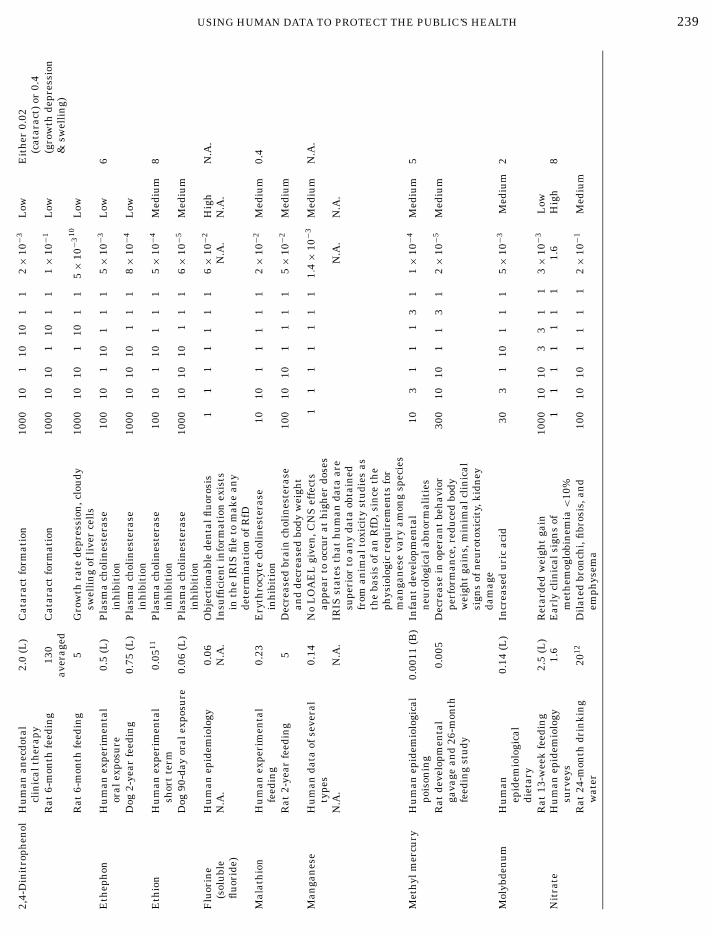
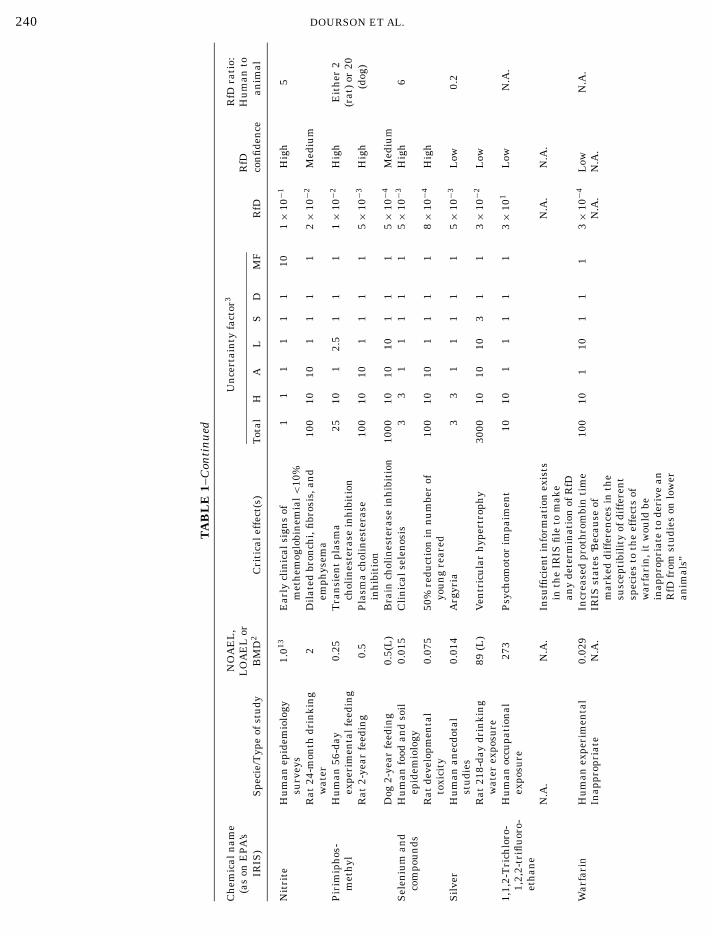
Table 1 shows a comparison of all RfDs based on hu-man data as found on IRIS (EPA, 2000b) or for sev-eral chemicals on ITER (TERA, 2000), and those weestimate from experimental animal data found on IRISusing the criteria defined above. For 36% (8 of 22 com-parisons), the human- and animal-based RfDs are com-parable, that is within the limits of their correspond-ing precision.3 For 23% (5 of 22 comparisons), the RfDsbased on human data are lower than the correspondingRfDs based on animal data. For 41% (9 of 22 compar-isons), RfDs based on animal data are lower than thosebased on human data. An animal-based RfD could notbe estimated in 6 of 28 possible comparisons, since ani-mal information was judged to be either insufficient orirrelevant.
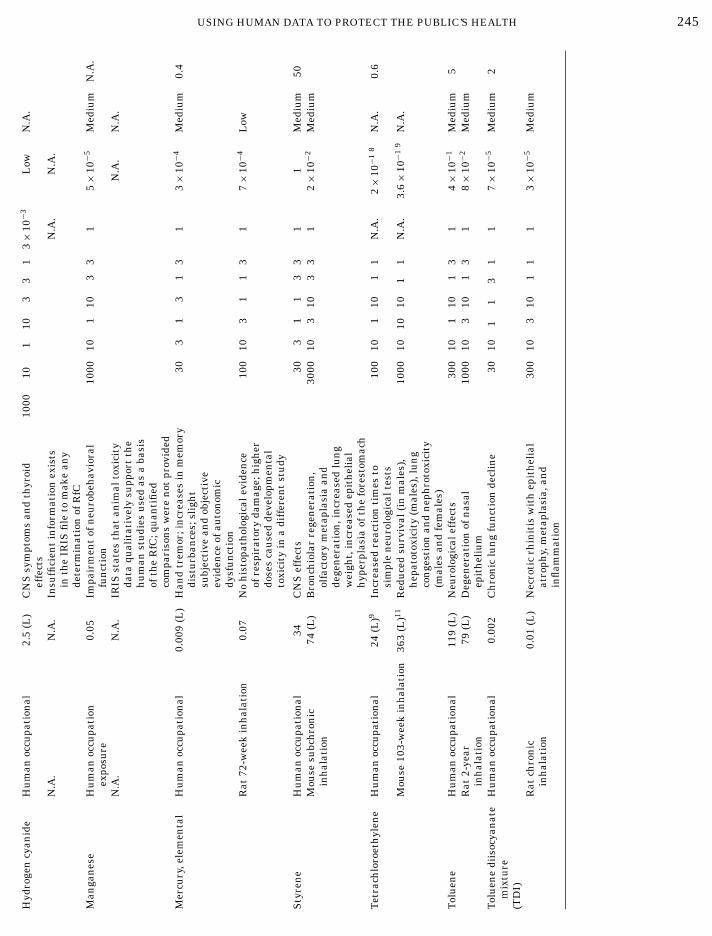
Table 2 shows a comparison of all RfCs based on hu-man data as found on IRIS (EPA, 2000b) or for sev-eral chemicals on ITER (TERA, 2000), and those weestimate from experimental animal data found on IRISusing criteria defined above. For 45% (5 of 11 compar-isons), the RfCs are comparable, that is within the lim-its of their corresponding precision.3 In no cases werethe RfCs based on human data lower than the corre-sponding RfCs based on animal data within the limitsof precision being assumed. For 55% (6 of 11 compar-isons), RfCs based on animal data are lower than thosebased on human data. An animal-based RfC could notbe estimated for 4 of 15 times, since animal informationwas judged to be either insufficient or irrelevant.
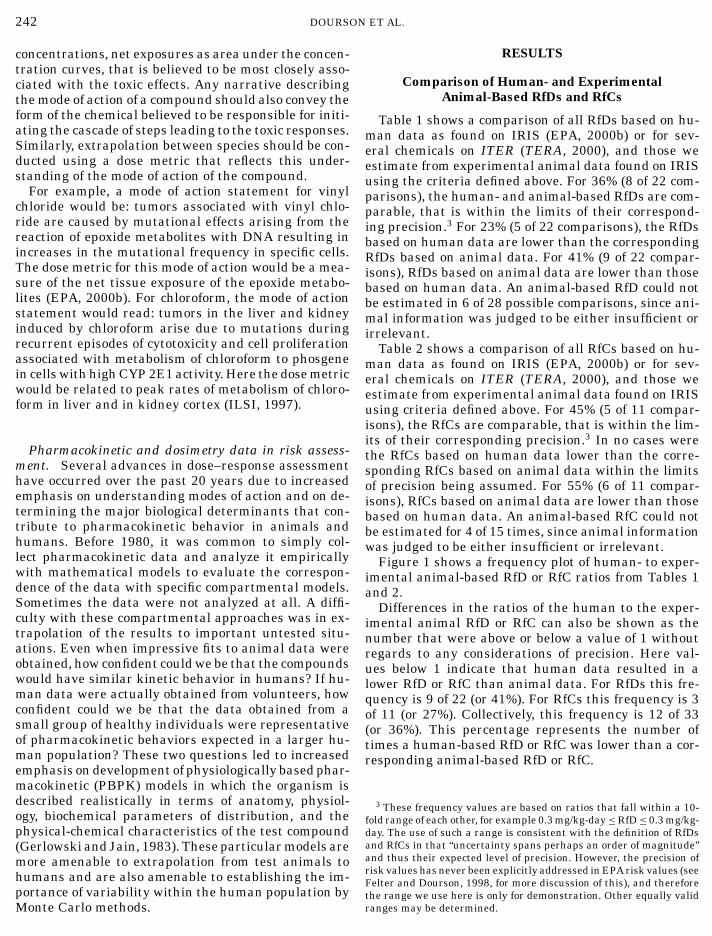
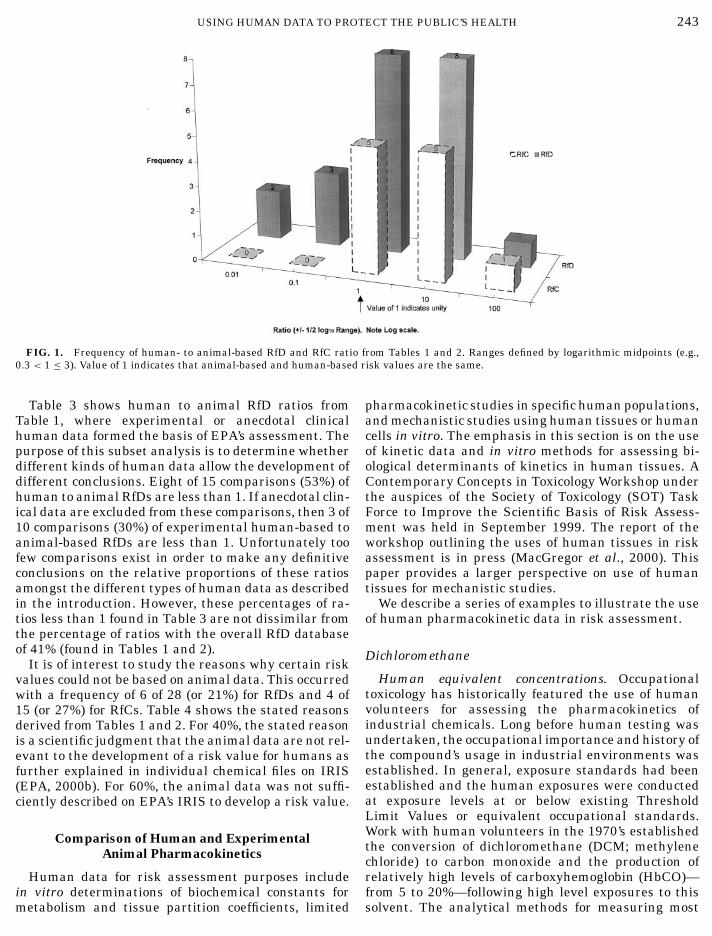
Figure 1 shows a frequency plot of human- to exper-imental animal-based RfD or RfC ratios from Tables 1and 2.
Differences in the ratios of the human to the exper-imental animal RfD or RfC can also be shown as thenumber that were above or below a value of 1 withoutregards to any considerations of precision. Here val-ues below 1 indicate that human data resulted in alower RfD or RfC than animal data. For RfDs this fre-quency is 9 of 22 (or 41%). For RfCs this frequency is 3of 11 (or 27%). Collectively, this frequency is 12 of 33(or 36%). This percentage represents the number oftimes a human-based RfD or RfC was lower than a cor-
ranges may be determined.
USING HUMAN DATA TO PROTECT THE PUBLIC’S HEALTH 243
FIG. 1. Frequency of human- to animal-based RfD and RfC ratio from Tables 1 and 2. Ranges defined by logarithmic midpoints (e.g.,0.3 < 1 ≤ 3). Value of 1 indicates that animal-based and human-based risk values are the same.
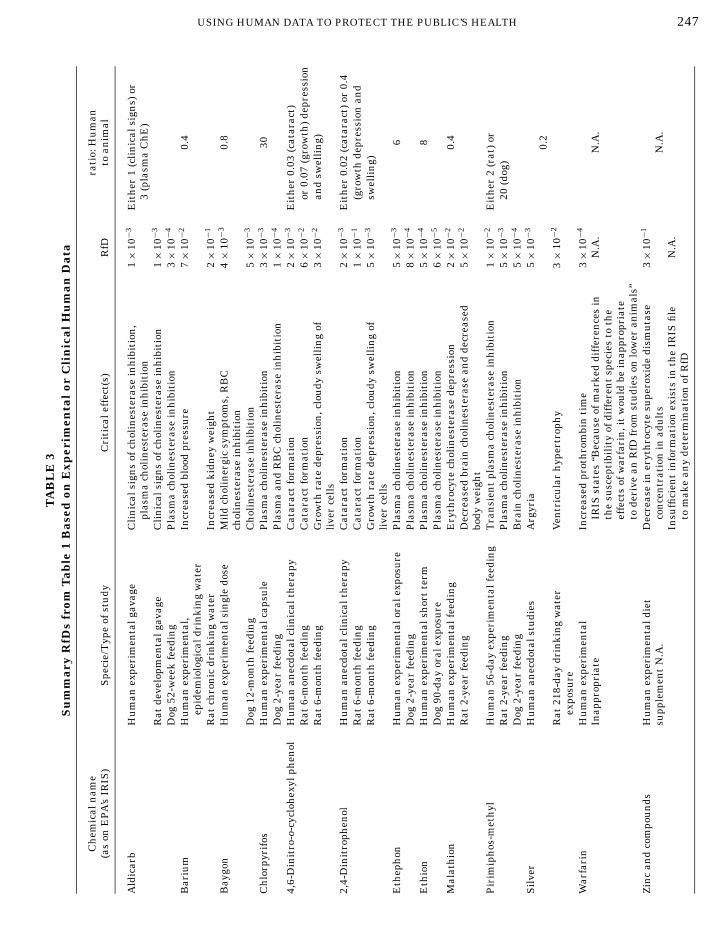
Table 3 shows human to animal RfD ratios fromTable 1, where experimental or anecdotal clinicalhuman data formed the basis of EPA’s assessment. Thepurpose of this subset analysis is to determine whetherdifferent kinds of human data allow the development ofdifferent conclusions. Eight of 15 comparisons (53%) ofhuman to animal RfDs are less than 1. If anecdotal clin-ical data are excluded from these comparisons, then 3 of10 comparisons (30%) of experimental human-based toanimal-based RfDs are less than 1. Unfortunately toofew comparisons exist in order to make any definitiveconclusions on the relative proportions of these ratiosamongst the different types of human data as describedin the introduction. However, these percentages of ra-tios less than 1 found in Table 3 are not dissimilar fromthe percentage of ratios with the overall RfD databaseof 41% (found in Tables 1 and 2).
It is of interest to study the reasons why certain riskvalues could not be based on animal data. This occurredwith a frequency of 6 of 28 (or 21%) for RfDs and 4 of15 (or 27%) for RfCs. Table 4 shows the stated reasonsderived from Tables 1 and 2. For 40%, the stated reasonis a scientific judgment that the animal data are not rel-evant to the development of a risk value for humans asfurther explained in individual chemical files on IRIS(EPA, 2000b). For 60%, the animal data was not suffi-ciently described on EPA’s IRIS to develop a risk value.
Comparison of Human and ExperimentalAnimal Pharmacokinetics
Human data for risk assessment purposes includein vitro determinations of biochemical constants for
metabolism and tissue partition coefficients, limitedpharmacokinetic studies in specific human populations,and mechanistic studies using human tissues or humancells in vitro. The emphasis in this section is on the useof kinetic data and in vitro methods for assessing bi-ological determinants of kinetics in human tissues. AContemporary Concepts in Toxicology Workshop underthe auspices of the Society of Toxicology (SOT) TaskForce to Improve the Scientific Basis of Risk Assess-ment was held in September 1999. The report of theworkshop outlining the uses of human tissues in riskassessment is in press (MacGregor et al., 2000). Thispaper provides a larger perspective on use of humantissues for mechanistic studies.
We describe a series of examples to illustrate the useof human pharmacokinetic data in risk assessment.
Dichloromethane
Human equivalent concentrations. Occupationaltoxicology has historically featured the use of humanvolunteers for assessing the pharmacokinetics ofindustrial chemicals. Long before human testing wasundertaken, the occupational importance and history ofthe compound’s usage in industrial environments wasestablished. In general, exposure standards had beenestablished and the human exposures were conductedat exposure levels at or below existing ThresholdLimit Values or equivalent occupational standards.Work with human volunteers in the 1970’s establishedthe conversion of dichloromethane (DCM; methylenechloride) to carbon monoxide and the production ofrelatively high levels of carboxyhemoglobin (HbCO)—from 5 to 20%—following high level exposures to this
solvent. The analytical methods for measuring most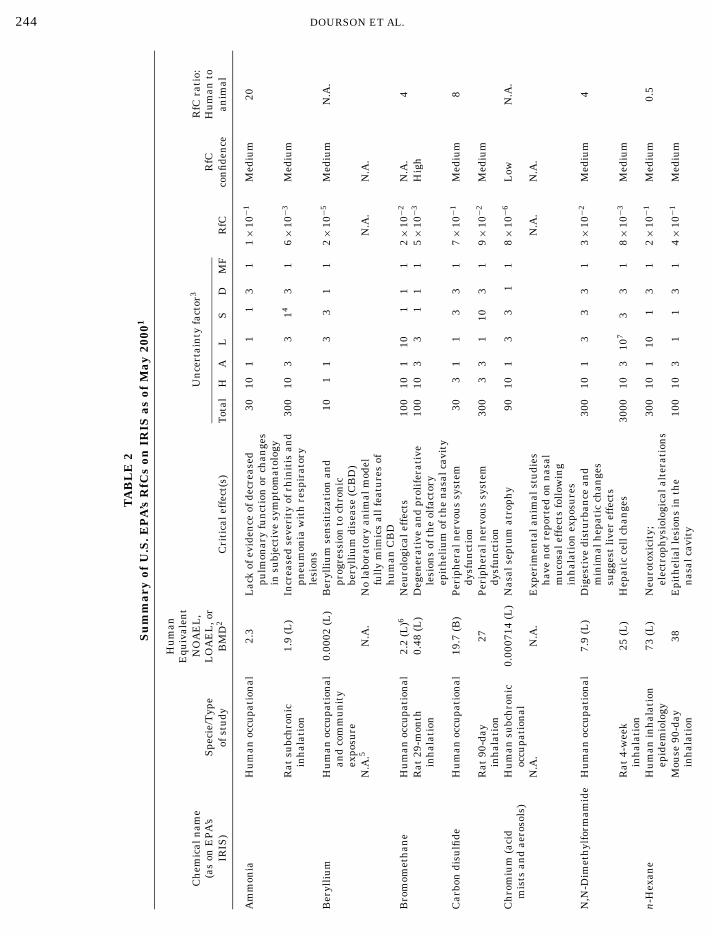
244 DOURSON ET AL.
TA
BL
E2
Su
mm
ary
ofU
.S.E
PA
’sR
fCs
onIR
ISas
ofM
ay20
001
Hu
man
Equ
ival
ent
Ch
emic
aln
ame
NO
AE
L,
Un
cert
ain
tyfa
ctor
3R
fCra
tio:
(as
onE
PA
’sS
peci
e/T
ype
LO
AE
L,o
rR
fCH
um
anto
IRIS
)of
stu
dyB
MD
2C
riti
cale
ffec
t(s)
Tot
alH
AL
SD
MF
RfC
con
fide
nce
anim
al
Am
mon
iaH
um
anoc
cupa
tion
al2.
3L
ack
ofev
iden
ceof
decr
ease
d30
101
11
31
1×
10−1
Med
ium
20pu
lmon
ary
fun
ctio
nor
chan
ges
insu
bjec
tive
sym
ptom
atol
ogy
Rat
subc
hro
nic
1.9
(L)
Incr
ease
dse
veri
tyof
rhin
itis
and
300
103
314
31
6×
10−3
Med
ium
inh
alat
ion
pneu
mon
iaw
ith
resp
irat
ory
lesi
ons
Ber
ylli
um
Hu
man
occu
pati
onal
0.00
02(L
)B
eryl
liu
mse
nsi
tiza
tion
and
101
13
31
12×
10−5
Med
ium
N.A
.an
dco
mm
un
ity
prog
ress
ion
toch
ron
icex
posu
rebe
ryll
ium
dise
ase
(CB
D)
N.A
.5N
.A.
No
labo
rato
ryan
imal
mod
elN
.A.
N.A
.fu
lly
mim
ics
allf
eatu
res
ofh
um
anC
BD
Bro
mom
eth
ane
Hu
man
occu
pati
onal
2.2
(L)6
Neu
rolo
gica
leff
ects
100
101
101
11
2×
10−2
N.A
.4
Rat
29-m
onth
0.48
(L)
Deg
ener
ativ
ean
dpr
olif
erat
ive
100
103
31
11
5×
10−3
Hig
hin
hal
atio
nle
sion
sof
the
olfa
ctor
yep
ith
eliu
mof
the
nas
alca
vity
Car
bon
disu
lfide
Hu
man
occu
pati
onal
19.7
(B)
Per
iph
eral
ner
vou
ssy
stem
303
11
33
17×
10−1
Med
ium
8dy
sfu
nct
ion
Rat
90-d
ay27
Per
iph
eral
ner
vou
ssy
stem
300
33
110
31
9×
10−2
Med
ium
inh
alat
ion
dysf
un
ctio
nC
hro
miu
m(a
cid
Hu
man
subc
hro
nic
0.00
0714
(L)
Nas
alse
ptu
mat
roph
y90
101
33
11
8×
10−6
Low
N.A
.m
ists
and
aero
sols
)oc
cupa
tion
alN
.A.
N.A
.E
xper
imen
tala
nim
alst
udi
esN
.A.
N.A
.h
ave
not
repo
rted
onn
asal
mu
cosa
leff
ects
foll
owin
gin
hal
atio
nex
posu
res
N,N
-Dim
eth
ylfo
rmam
ide
Hu
man
occu
pati
onal
7.9
(L)
Dig
esti
vedi
stu
rban
cean
d30
010
13
33
13×
10−2
Med
ium
4m
inim
alh
epat
icch
ange
ssu
gges
tli
ver
effe
cts
Rat
4-w
eek
25(L
)H
epat
icce
llch
ange
s30
0010
310
73
31
8×
10−3
Med
ium
inh
alat
ion
n-H
exan
eH
um
anin
hal
atio
n73
(L)
Neu
roto
xici
ty;
300
101
101
31
2×
10−1
Med
ium
0.5
epid
emio
logy
elec
trop
hys
iolo
gica
lalt
erat
ion
sM
ouse
90-d
ay38
Epi
thel
iall
esio
ns
inth
e10
010
31
13
14×
10−1
Med
ium
inh
alat
ion
nas
alca
vity
245
USING HUMAN DATA TO PROTECT THE PUBLIC’S HEALTHydroge
ncy
anid
eH
um
anoc
cupa
tion
al2.
5(L
)C
NS
sym
ptom
san
dth
yroi
d10
0010
110
33
13×
10−3
Low
N.A
.ef
fect
sN
.A.
N.A
.In
suffi
cien
tin
form
atio
nex
ists
N.A
.N
.A.
inth
eIR
ISfi
leto
mak
ean
yde
term
inat
ion
ofR
fCan
gan
ese
Hu
man
occu
pati
on0.
05Im
pair
men
tof
neu
robe
hav
iora
l10
0010
110
33
15×
10−5
Med
ium
N.A
.ex
posu
refu
nct
ion
N.A
.N
.A.
IRIS
stat
esth
atan
imal
toxi
city
N.A
.N
.A.
data
qual
itat
ivel
ysu
ppor
tth
eh
um
anst
udi
esu
sed
asa
basi
sof
the
RfC
;qu
anti
fied
com
pari
son
sw
ere
not
prov
ided
ercu
ry,e
lem
enta
lH
um
anoc
cupa
tion
al0.
009
(L)
Han
dtr
emor
;in
crea
ses
inm
emor
y30
31
31
31
3×
10−4
Med
ium
0.4
dist
urb
ance
s;sl
igh
tsu
bjec
tive
and
obje
ctiv
eev
iden
ceof
auto
nom
icdy
sfu
nct
ion
Rat
72-w
eek
inh
alat
ion
0.07
No
his
topa
thol
ogic
alev
iden
ce10
010
31
13
17×
10−4
Low
ofre
spir
ator
yda
mag
e;h
igh
erdo
ses
cau
sed
deve
lopm
enta
lto
xici
tyin
adi
ffer
ent
stu
dy
tyre
ne
Hu
man
occu
pati
onal
34C
NS
effe
cts
303
11
33
11
Med
ium
50M
ouse
subc
hro
nic
74(L
)B
ron
chio
lar
rege
ner
atio
n,
3000
103
103
31
2×
10−2
Med
ium
inh
alat
ion
olfa
ctor
ym
etap
lasi
aan
dde
gen
erat
ion
,in
crea
sed
lun
gw
eigh
t,in
crea
sed
epit
hel
ial
hyp
erpl
asia
ofth
efo
rest
omac
het
rach
loro
eth
ylen
eH
um
anoc
cupa
tion
al24
(L)9
Incr
ease
dre
acti
onti
mes
to10
010
110
11
N.A
.2×
10−1
8N
.A.
0.6
sim
ple
neu
rolo
gica
ltes
tsM
ouse
103-
wee
kin
hal
atio
n36
3(L
)11R
edu
ced
surv
ival
(in
mal
es),
1000
1010
101
1N
.A.
3.6×
10−1
9N
.A.
hep
atot
oxic
ity
(mal
es),
lun
gco
nge
stio
nan
dn
eph
roto
xici
ty(m
ales
and
fem
ales
)ol
uen
eH
um
anoc
cupa
tion
al11
9(L
)N
euro
logi
cale
ffec
ts30
010
110
13
14×
10−1
Med
ium
5R
at2-
year
79(L
)D
egen
erat
ion
ofn
asal
1000
103
101
31
8×
10−2
Med
ium
inh
alat
ion
epit
hel
ium
olu
ene
diis
ocya
nat
eH
um
anoc
cupa
tion
al0.
002
Ch
ron
iclu
ng
fun
ctio
nde
clin
e30
101
13
11
7×
10−5
Med
ium
2m
ixtu
reT
DI)
Rat
chro
nic
0.01
(L)
Nec
roti
crh
init
isw
ith
epit
hel
ial
300
103
101
11
3×
10−5
Med
ium
inh
alat
ion
atro
phy,
met
apla
sia,
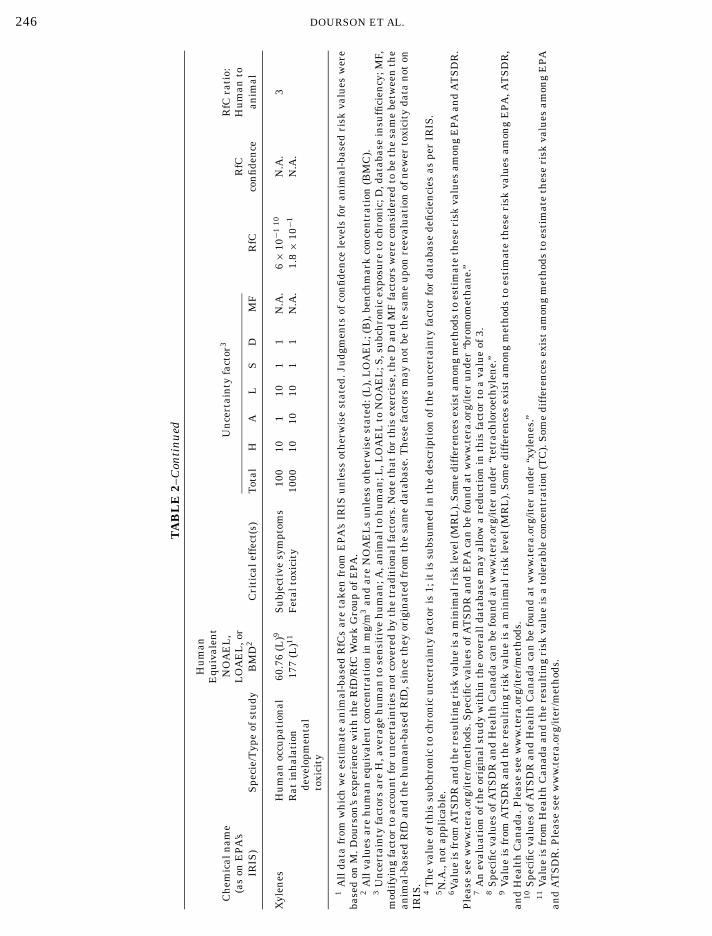
and
infl
amm
atio
n
H M M S T T T (
246 DOURSON ET AL.
TA
BL
E2–
Con
tin
ued
Hu
man
Equ
ival
ent
Ch
emic
aln
ame
NO
AE
L,
Un
cert
ain
tyfa
ctor
3R
fCra
tio:
(as
onE
PA
’sL
OA
EL
,or
RfC
Hu
man
toIR
IS)
Spe
cie/
Typ
eof
stu
dyB
MD
2C
riti
cale
ffec
t(s)
Tot
alH
AL
SD
MF
RfC
con
fide
nce
anim
al
Xyl
enes
Hu
man
occu
pati
onal
60.7
6(L
)9S
ubj
ecti
vesy
mpt
oms
100
101
101
1N
.A.
6×
10−1
10N
.A.
3R
atin
hal
atio
n17
7(L
)11F
etal
toxi
city
1000
1010
101
1N
.A.
1.8×
10−1
N.A
.de
velo
pmen
tal
toxi
city
1A
llda
tafr
omw
hic
hw
ees
tim
ate
anim
al-b
ased
RfC
sar
eta
ken
from
EP
A’s
IRIS
un
less
oth
erw
ise
stat
ed.J
udg
men
tsof
con
fide
nce
leve
lsfo
ran
imal
-bas
edri
skva
lues
wer
eba
sed
onM
.Dou
rson
’sex
peri
ence
wit
hth
eR
fD/R
fCW
ork
Gro
up
ofE
PA
.2
All
valu
esar
eh
um
aneq
uiv
alen
tco
nce
ntr
atio
nin
mg/
m3
and
are
NO
AE
Ls
un
less
oth
erw
ise
stat
ed:(
L),
LO
AE
L;(
B),
ben
chm
ark
con
cen
trat
ion
(BM
C).
3U
nce
rtai
nty
fact
ors
are
H,a
vera
geh
um
anto
sen
siti
veh
um
an;A
,an
imal
toh
um
an;L
,LO
AE
Lto
NO
AE
L;S
,su
bch
ron
icex
posu
reto
chro
nic
;D,d
atab
ase
insu
ffici
ency
;MF,
mod
ifyi
ng
fact
orto
acco
un
tfo
ru
nce
rtai
nti
esn
otco
vere
dby
the
trad
itio
nal
fact
ors.
Not
eth
atfo
rth
isex
erci
se,t
he
Dan
dM
Ffa
ctor
sw
ere
con
side
red
tobe
the
sam
ebe
twee
nth
ean
imal
-bas
edR
fDan
dth
eh
um
an-b
ased
RfD
,sin
ceth
eyor
igin
ated
from
the
sam
eda
taba
se.T
hes
efa
ctor
sm
ayn
otbe
the
sam
eu
pon
reev
alu
atio
nof
new
erto
xici
tyda
tan
oton
IRIS
.4
Th
eva
lue
ofth
issu
bch
ron
icto
chro
nic
un
cert
ain
tyfa
ctor
is1;
itis
subs
um
edin
the
desc
ript
ion
ofth
eu
nce
rtai
nty
fact
orfo
rda
taba
sede
fici
enci
esas
per
IRIS
.5N
.A.,
not
appl
icab
le.
6V
alu
eis
from
AT
SD
Ran
dth
ere
sult
ing
risk
valu
eis
am
inim
alri
skle
vel(
MR
L).
Som
edi
ffer
ence
sex
ist
amon
gm
eth
ods
toes
tim
ate
thes
eri
skva
lues
amon
gE
PA
and
AT
SD
R.
Ple
ase
see
ww
w.t
era.
org/
iter
/met
hod
s.S
peci
fic
valu
esof
AT
SD
Ran
dE
PA
can
befo
un
dat
ww
w.t
era.
org/
iter
un
der
“bro
mom
eth
ane.
”7
An
eval
uat
ion
ofth
eor
igin
alst
udy
wit
hin
the
over
alld
atab
ase
may
allo
wa
redu
ctio
nin
this
fact
orto
ava
lue
of3.
8S
peci
fic
valu
esof
AT
SD
Ran
dH
ealt
hC
anad
aca
nbe
fou
nd
atw
ww
.ter
a.or
g/it
eru
nde
r“t
etra
chlo
roet
hyl
ene.
”9
Val
ue
isfr
omA
TS
DR
and
the
resu
ltin
gri
skva
lue
isa
min
imal
risk
leve
l(M
RL
).S
ome
diff
eren
ces
exis
tam
ong
met
hod
sto
esti
mat
eth
ese
risk
valu
esam
ong
EP
A,A
TS
DR
,an
dH
ealt
hC
anad
a.P
leas
ese
ew
ww
.ter
a.or
g/it
er/m
eth
ods.
10S
peci
fic
valu
esof
AT
SD
Ran
dH
ealt
hC
anad
aca
nbe
fou
nd
atw
ww
.ter
a.or
g/it
eru
nde
r“x
ylen
es.”
11V
alu
eis
from
Hea
lth
Can
ada
and
the
resu
ltin
gri
skva
lue
isa
tole
rabl
eco
nce
ntr
atio
n(T
C).
Som
edi
ffer
ence
sex
ist
amon
gm
eth
ods
toes
tim
ate
thes
eri
skva
lues
amon
gE
PA
and
AT
SD
R.P
leas
ese
ew
ww
.ter
a.or
g/it
er/m
eth
ods.
USING HUMAN DATA TO PROTECT THE PUBLIC’S HEALTH 247
TA
BL
E3
Su
mm
ary
RfD
sfr
omT
able
1B
ased
onE
xper
imen
tal
orC
lin
ical
Hu
man
Dat
a
Ch
emic
aln
ame
rati
o:H
um
an(a
son
EP
A’s
IRIS
)S
peci
e/T
ype
ofst
udy
Cri
tica
leff
ect(
s)R
fDto
anim
al
Ald
icar
bH
um
anex
peri
men
talg
avag
eC
lin
ical
sign
sof
chol
ines
tera
sein
hib
itio
n,
1×
10−3
Eit
her
1(c
lin
ical
sign
s)or
plas
ma
chol
ines
tera
sein
hib
itio
n3
(pla
sma
Ch
E)
Rat
deve
lopm
enta
lgav
age
Cli
nic
alsi
gns
ofch
olin
este
rase
inh
ibit
ion
1×
10−3
Dog
52-w
eek
feed
ing
Pla
sma
chol
ines
tera
sein
hib
itio
n3×
10−4
Bar
ium
Hu
man
expe
rim
enta
l,In
crea
sed
bloo
dpr
essu
re7×
10−2
0.4
epid
emio
logi
cald
rin
kin
gw
ater
Rat
chro
nic
drin
kin
gw
ater
Incr
ease
dki
dney
wei
ght
2×
10−1
Bay
gon
Hu
man
expe
rim
enta
lsin
gle
dose
Mil
dch
olin
ergi
csy
mpt
oms,
RB
C4×
10−3
0.8
chol
ines
tera
sein
hib
itio
nD
og12
-mon
thfe
edin
gC
hol
ines
tera
sein
hib
itio
n5×
10−3
Ch
lorp
yrif
osH
um
anex
peri
men
talc
apsu
leP
lasm
ach
olin
este
rase
inh
ibit
ion
3×
10−3
30D
og2-
year
feed
ing
Pla
sma
and
RB
Cch
olin
este
rase
inh
ibit
ion
1×
10−4
4,6-
Din
itro
-o-c
yclo
hex
ylph
enol
Hu
man
anec
dota
lcli
nic
alth
erap
yC
atar
act
form
atio
n2×
10−3
Eit
her
0.03
(cat
arac
t)R
at6-
mon
thfe
edin
gC
atar
act
form
atio
n6×
10−2
or0.
07(g
row
th)
depr
essi
onR
at6-
mon
thfe
edin
gG
row
thra
tede
pres
sion
,clo
udy
swel
lin
gof
3×
10−2
and
swel
lin
g)li
ver
cell
s2,
4-D
init
roph
enol
Hu
man
anec
dota
lcli
nic
alth
erap
yC
atar
act
form
atio
n2×
10−3
Eit
her
0.02
(cat
arac
t)or
0.4
Rat
6-m
onth
feed
ing
Cat
arac
tfo
rmat
ion
1×
10−1
(gro
wth
depr
essi
onan
dR
at6-
mon
thfe
edin
gG
row
thra
tede
pres
sion
,clo
udy
swel
lin
gof
5×
10−3
swel
lin
g)li
ver
cell
sE
thep
hon
Hu
man
expe
rim
enta
lora
lexp
osu
reP
lasm
ach
olin
este
rase
inh
ibit
ion
5×
10−3
6D
og2-
year
feed
ing
Pla
sma
chol
ines
tera
sein
hib
itio
n8×
10−4
Eth
ion
Hu
man
expe
rim
enta
lsh
ort
term
Pla
sma
chol
ines
tera
sein
hib
itio
n5×
10−4
8D
og90
-day
oral
expo
sure
Pla
sma
chol
ines
tera
sein
hib
itio
n6×
10−5
Mal
ath
ion
Hu
man
expe
rim
enta
lfee
din
gE
ryth
rocy
tech
olin
este
rase
depr
essi
on2×
10−2
0.4
Rat
2-ye
arfe
edin
gD
ecre
ased
brai
nch
olin
este
rase
and
decr
ease
d5×
10−2
body
wei
ght
Pir
imip
hos
-met
hyl
Hu
man
56-d
ayex
peri
men
talf
eedi
ng
Tra
nsi
ent
plas
ma
chol
ines
tera
sein
hib
itio
n1×
10−2
Eit
her
2(r
at)
orR
at2-
year
feed
ing
Pla
sma
chol
ines
tera
sein
hib
itio
n5×
10−3
20(d
og)
Dog
2-ye
arfe
edin
gB
rain
chol
ines
tera
sein
hib
itio
n5×
10−4
Sil
ver
Hu
man
anec
dota
lstu
dies
Arg
yria
5×
10−3
0.2
Rat
218-
day
drin
kin
gw
ater
Ven
tric
ula
rh
yper
trop
hy
3×
10−2
expo
sure
War
fari
nH
um
anex
peri
men
tal
Incr
ease
dpr
oth
rom
bin
tim
e3×
10−4
Inap
prop
riat
eIR
ISst
ates
“Bec
ause
ofm
arke
ddi
ffer
ence
sin
N.A
.N
.A.
the
susc
epti
bili
tyof
diff
eren
tsp
ecie
sto
the
effe
cts
ofw
arfa
rin
,it
wou
ldbe
inap
prop
riat
eto
deri
vean
RfD
from
stu
dies
onlo
wer
anim
als”
Zin
can
dco
mpo
un
dsH
um
anex
peri
men
tald
iet
Dec
reas
ein
eryt
hro
cyte
supe
roxi
dedi
smu
tase
3×
10−1
supp
lem
ent
N.A
.co
nce
ntr
atio
nin
adu
lts
N.A
.In
suffi
cien
tin
form
atio
nex
ists
inth
eIR
ISfi
leN
.A.
tom
ake
any
dete
rmin
atio
nof
RfD
248 DOURSON ET AL.
compounds in blood and excreta were new and manyhad only moderate sensitivity. The work with DCM es-tablished the exposure concentrations associated withspecific increases in HbCO and led to strategies for con-trolling DCM that insured no more than a 5% increasein blood HbCO. This early work with DCM, while quan-titative, provided simple mathematical relationships tocorrelate specific exposures with increased HbCO; theydid not really allow prediction of these values fromknowledge of human metabolism, physiology, and ac-tivity levels.
In the 1980s, DCM was found to be carcinogenic inmice, shifting the end point from HbCO to the pos-sibility that DCM might cause cancer in exposed in-dividuals. A risk assessment for DCM was proposed,based on a PBPK model, that estimated the tissueexposures in lung and liver to metabolites of DCM(Andersen et al., 1987). A variety of data indicatedthat the carcinogenicity in mice was most likely as-sociated with metabolites formed by conjugation ofDCM with glutathione, catalyzed by glutathione S-transferase (GST). This metabolic clearance pathwaycompetes with a higher affinity, though lower ca-pacity oxidation of DCM by cytochrome P450. Theisozyme involved is now recognized to be CYP2E1.The dose metric used for analysis in the region of ob-servation was the integrated production of the glu-tathione conjugate per volume tissue per day. Thissame dose metric was estimated for humans by usinga PBPK model that included physiological parametersfor humans and kinetic constants for the glutathione-S-transferase enzyme in lung and liver for both themouse and the human. Using model substrates, ac-tivities for the human liver and lung enzymes wereestimated in studies using microsomes obtained fromaccident victim’s tissues. Later work established theactivities of these enzymes toward DCM itself (Reitzet al., 1989).
Controlled pharmacokinetic studies had been con-ducted in human volunteers using several different con-centrations of DCM (Andersen et al., 1991). These stud-ies were evaluated with a PBPK model to assess theconsistency of predictions based on scaling the rodentPBPK model to predict actual human data. The ear-lier risk assessment had simply used a model with hu-man parameters to make predictions of the dose met-rics. With moderate refinements to the portion of themodel describing carbon monoxide distribution after itsformation by DCM oxidation, the model predicted theblood and exhaled air time-course for DCM. For CO,the model adequately predicted blood HbCO and ex-haled CO. The ability to match concentrations of DCM,HbCO, and CO in humans provides confidence that thescale-up from rats to humans is feasible. These resultscollectively and individually provide evidence for thecorrection in the numerator of the RfC, for example,
that which is required for developing a human equiva-lent concentration. The dose metric used is the amountof HbCO formed for an occupational concern for car-boxyhemoglobin or the amount metabolized in lung orliver by the glutathione-S- transferase reactions. Thislatter dose metric is estimated from an accurate predic-tion of the blood concentrations of DCM and the enzymeactivities in the target tissues. These PBPK modelsallow estimation of the human exposure concentrationsthat are required to provide a tissue dose similar to thatassociated with the point of departure concentration inthe test animal.
Human variability. The denominator of the RfC andRfD includes uncertainty factors for interspecies and in-traindividual differences. The RfC methodology (EPA,1994) indicates that the interspecies factor can be re-duced when compound specific kinetic data are used toderive the human equivalent concentration. A secondapplication of these kinetic models is to estimate theimpact of variability in physiology, metabolism, etc. inpharmacokinetic variability within the human popula-tion. For this application, ranges of model parameters,such as breathing and blood flow rates, body compo-sition, and metabolic parameters, are introduced intothe model specification. The PBPK model is run mul-tiple times during which the parameters are selectedfrom these distributions by a sampling algorithm. Theresultant output is a distribution for target tissue doseexpected for a diverse population at the specified ex-posure concentration. By assessing the variability inthis distribution of tissue doses, it becomes possibleto decide if the factor of 10 for intraindividual differ-ences is adequate or if it needs to be adjusted. Ex-amples of use of Monte Carlo sampling of parameterdistributions to assess tissue dose with DCM have fo-cussed on standard setting for the workplace (Thomaset al., 1998) and for environmental exposures (Clewell,1996).
The work with DCM provides a template for applica-tions of human data in risk assessment based on tox-icity results in animals. Mechanistic studies usuallyset the foundation for assessing the dose metric thatis important to estimate as a measure of tissue dose.The PBPK model indicates the important parametersthat determine the dose of active forms of the com-pound at target tissues. Studies with human tissues,coupled with knowledge of human physiology/anatomy,provide a method to estimate human tissue doses ofactive compounds and a method to derive the HEC.Focused, limited, human-volunteer studies, develop invivo data that allows refinement and validation of thepredictions of the human PBPK model. The completedPBPK description lends itself to a refined, quantita-tive analysis of variability in pharmacokinetic behav-ior in the human population. This paradigm for useof human studies would be applicable to RfC, RfD or
cancer assessments for various end points. In contrast
USING HUMAN DATA TO PROTECT THE PUBLIC’S HEALTH 249
to the state-of-the-art in analytical chemistry in the1970s, many of the pharmacokinetic studies in humanscan now be conducted at much lower, almost tracer (ortrace) levels of contaminants mitigating concerns aboutpossible adverse effects of compounds in the humanvolunteers.
Vinyl Chloride
Pharmacokinetic (PK) modeling plays an increas-ingly accepted role in many of the efforts in the newIRIS Pilot project activities to integrate the risk as-sessment process for specific compounds. Vinyl chlo-ride (VC) documentation has been completed within thelast year (EPA, 2000b). The critical end points with VCare liver toxicity and liver cancer—hemangiosarcoma.VC is an animal and human carcinogen with strongsite-concordance between species. Mechanistic workhas firmly established a central role for an epox-ide, metabolite in causing DNA adducts, mutations,and tumors. Pharmacokinetic and disposition stud-ies have been conducted in multiple species of lab-oratory animals and limited pharmacokinetic uptakestudies were conducted with human volunteers at lowconcentrations. The IRIS document with VC includesa PBPK model to assess the consistency in dosime-try between animals and humans, and provides meth-ods for extrapolating across dose routes and betweenspecies. The human data provides a test of modelpredictions and reassurance that the standards setbased on these model estimates of dose are likely to besound.
Inhaled Acids and Esters
A wide variety of organic acids and esters have re-cently been associated with degeneration and toxicity inthe nasal olfactory epithelium in rats and mice. It wasunclear whether these compounds would have similareffects in humans. Within the past two to three years,PBPK models have been completed and published forseveral of these compounds—vinyl acetate (Plowchalket al., 1997), acrylic acid (Frederick et al., 1998), andmethyl methacrylate (Andersen et al., 1999). Dosime-try model development with these compounds has in-cluded evaluation of uptake from the rodent airstream,parameterization of nasal models for airflow and tissueuptake, and measurement of metabolizing enzymes inepithelial tissues throughout the nose. These dosime-try models predict differences between humans and ro-dents and support estimation of HECs for these com-pounds. A workshop was held in Research TrianglePark, North Carolina, in February 1998. Participantsdiscussed the utility of these dosimetry models for nasaldosimetry and risk assessment and continuing dataneeds. A major continuing data need enumerated was
for human studies of scrubbing of compounds from thenasal airstream using specific breathing patterns andsampling strategies (Andersen and Jarabek, 2000). Thevalidation of existing models by selective, carefully de-signed human studies was recognized as an importantresearch priority.
Boric Acid
The most sensitive end point with boric acid in labora-tory animals is developmental toxicity in the offspringof Sprague–Dawley rats (Dourson et al., 1998). Thisinorganic acid has fairly straightforward pharmacoki-netic behavior. It is not metabolized to any appreciableextent; it is primarily excreted into the urine via the kid-neys; and it does not accumulate anywhere in the body.The main issue in assessing the uncertainty factors forthis compound is estimation of the net tissue exposureto fetuses in rats and any differences in exposure forequivalent doses in humans. General arguments canbe offered regarding the expected kinetic behavior. Forinstance, the volume of distribution should follow bodyweight (or at least lean body weight) and renal clear-ance should follow body weight raised to the 2/3 power(see, for example, NRC, 1986). These are theoretical ar-guments for generic compounds. It would be best to esti-mate these differences by direct determination of boricacid clearance studies in pregnant and nonpregnantfemales.
These renal clearance studies have recently been con-ducted by the University of California, Irvine (Vaziriet al., 2000). Murray and Andersen (2000) provide apreliminary outline of the results of these studies, in-cluding relative areas under the blood curve and thevariability observed in renal boric acid clearance in bothrats and women. These studies provide data to clearlyobtain compound-specific adjustment factors to replacedefault or rule of thumb interspecies adjustments. Thework focussed attention on the need to define a dosemetric for interspecies adjustment. Two possibilitiesare peak maternal blood levels or net fetal exposureduring the critical period, which should be proportionalto net area under the boric acid blood curve in maternalplasma.
Criteria Pollutants
Chemicals with extensive history of controlled hu-man experimentation are the criteria pollutants, in-cluding ozone, sulfur dioxide, nitrogen oxides, and car-bon monoxide. These byproducts of commerce and ofthe internal combustion engines that fuel our techni-cal society achieve airborne concentrations quite closeto frank effect levels. Human studies of dosimetry, theamounts retained in the lungs, and pulmonary func-tion in healthy and in compromised individuals havebeen important in setting acceptable ambient levels forthese compounds that strike a balance between safety
and continuing economic activity.
250 DOURSON ET AL.
Organophosphates (OPs)
In adults, at least, the main risks posed from acute ex-posures to OPs are associated with inhibition of tissuecholinesterases and impaired cholinergic transmission.For the thiophosphorate compounds, toxicity is com-plexly related to activation to the active oxon, a pro-cess that has to compete with metabolism, includinghydrolysis to inactive products. How do these variousprocesses work together in target pest species or in in-advertent target species that may be exposed to thesecompounds?
PBPK models have been developed for organophos-phate compounds in order to integrate knowledge ofvarious pathways in both causing toxicity or in inac-tivating the compounds before they can exert their bi-ological effects (Gearhart et al., 1990). The possibilityexists to collect in vitro data with human tissues, blood,etc., to assess kinetic constants for various pathwaysand develop a predictive model for production and dis-tribution of the oxon. The time course of the oxon inblood and tissues would be directly related to inhibitionof the target macromolecules. These predictive modelsshould be validated by limited studies in human vol-unteers. With current analytical methods, these stud-ies can be done at dosages where there are minimalchanges in any of the esterase activities in the body. Themain goal of such work is not simply to assess dosesthat cause some minimal change in blood or plasmacholinesterase. Instead, they fulfill multiple objectivesby assessing the major biological determinants of thekinetics of parent compound and oxon. As with all hu-man studies, doses of these materials have to be care-fully selected and the dosing closely supervised by aphysician. However, human data are critical for makingsound judgements about the use of these compounds, in-suring protection of all exposed individuals, and avoid-ing overreliance of default approaches for animal tohuman extrapolation for such a widely used group ofcompounds.
With this information, it is possible to examine ex-pected differences among individuals associated withmetabolic polymorphisms and to ascertain if the phar-macokinetics seen in other species are expected in hu-mans. In addition, these mechanistic PBPK models canexplore whether there may be specific populations—aged, youth, or compromised individuals—who may beat greater risk. This evaluation is conducted by provid-ing distributions of critical parameters for metabolism,physiological parameters or tissue clearance and seeif particular combinations of parameters give rise topredictions of unusually large tissue doses. The distri-butions entered into the models could include physi-ological and metabolic profiles for children or for theelderly. Often the limiting factor in applying these mod-els with distributions of parameters to estimate tissue
dose/responses is our limited knowledge of parametervalues in the general population or in specific groups inthe general population.
DISCUSSION
Do Human Data Produce More AccurateEstimates of Risk?
This paper focuses on the dose–response assessmentdifferences between humans and experimental ani-mals. At first examination, a significant number of RfDsor RfCs, that we calculate from experimental animaldata and where we use a 10-fold uncertainty factorfor experimental animal to human extrapolation, arehigher than EPA’s human based values. This observa-tion leads us to question whether the 10-fold factor issufficient to protect human health for those animal-based RfDs and RfCs for which we lack human data tocorroborate the nature or dose–response pattern of thecritical effect. The data in Tables 1 and 2 and shown inFig. 1 can be used to address this question, in part. In do-ing so, however, we suggest a more rigorous evaluationof the animal-based RfDs and RfCs that we calculate.This is because our estimations of RfDs or RfCs from ex-perimental animal data have not undergone the samerigor in development and review as those made withthe human data on IRIS (EPA, 2000b).
However, our analysis also show that a significantnumber of RfDs or RfCs, that we calculate from ex-perimental animal data and where we use a 10-folduncertainty factor for experimental animal to humanextrapolation, are lower than the human based values.This observation leads us to question whether, for thoseanimal-based RfDs and RfCs for which we lack hu-man data to corroborate the nature or dose–responsepattern of the critical effect, how many of these RfDsand RfCs err in a direction that overly protects humanhealth? Unfortunately, because our work did not includein-depth and direct comparison of any dose–responsecurves of the critical effect between humans and exper-imental animals because of the general unavailabilityof such data, answers to such questions await additionalanalysis.
Although our analysis indicates that animal data canlead to either a higher or a lower risk value than hu-man data, human data often have provided informationthat reduces uncertainty or identifies a completely dif-ferent end point. For example, it is generally recognizedthat in developing RfDs or RfCs from animal data, theavailability of adequate human data reduces or even ob-viates the need of uncertainty factors for extrapolatingfrom animals to humans. This is based on the presump-tion that such adequate human data are more accuratepredictors of human toxicity than animal data. In addi-tion, EPA (2000b) notes several times when animal dataare deemed inappropriate (e.g., warfarin, manganese,
see Table 4), or the effect is different in at least some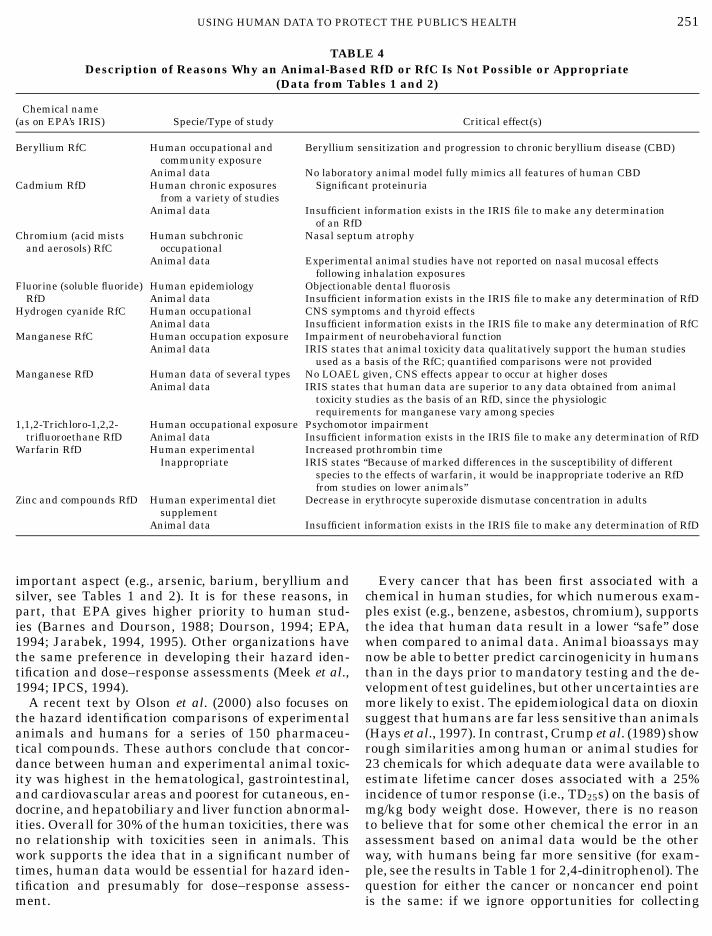
USING HUMAN DATA TO PROTECT THE PUBLIC’S HEALTH 251
TABLE 4Description of Reasons Why an Animal-Based RfD or RfC Is Not Possible or Appropriate
(Data from Tables 1 and 2)
Chemical name(as on EPA’s IRIS) Specie/Type of study Critical effect(s)
Beryllium RfC Human occupational and Beryllium sensitization and progression to chronic beryllium disease (CBD)community exposure
Animal data No laboratory animal model fully mimics all features of human CBDCadmium RfD Human chronic exposures Significant proteinuria
from a variety of studiesAnimal data Insufficient information exists in the IRIS file to make any determination
of an RfDChromium (acid mists Human subchronic Nasal septum atrophy
and aerosols) RfC occupationalAnimal data Experimental animal studies have not reported on nasal mucosal effects
following inhalation exposuresFluorine (soluble fluoride) Human epidemiology Objectionable dental fluorosis
RfD Animal data Insufficient information exists in the IRIS file to make any determination of RfDHydrogen cyanide RfC Human occupational CNS symptoms and thyroid effects
Animal data Insufficient information exists in the IRIS file to make any determination of RfCManganese RfC Human occupation exposure Impairment of neurobehavioral function
Animal data IRIS states that animal toxicity data qualitatively support the human studiesused as a basis of the RfC; quantified comparisons were not provided
Manganese RfD Human data of several types No LOAEL given, CNS effects appear to occur at higher dosesAnimal data IRIS states that human data are superior to any data obtained from animal
toxicity studies as the basis of an RfD, since the physiologicrequirements for manganese vary among species
1,1,2-Trichloro-1,2,2- Human occupational exposure Psychomotor impairmenttrifluoroethane RfD Animal data Insufficient information exists in the IRIS file to make any determination of RfD
Warfarin RfD Human experimental Increased prothrombin timeInappropriate IRIS states “Because of marked differences in the susceptibility of different
species to the effects of warfarin, it would be inappropriate toderive an RfDfrom studies on lower animals”
Zinc and compounds RfD Human experimental diet Decrease in erythrocyte superoxide dismutase concentration in adultssupplement
Animal data Insufficient information exists in the IRIS file to make any determination of RfD
important aspect (e.g., arsenic, barium, beryllium andsilver, see Tables 1 and 2). It is for these reasons, inpart, that EPA gives higher priority to human stud-ies (Barnes and Dourson, 1988; Dourson, 1994; EPA,1994; Jarabek, 1994, 1995). Other organizations havethe same preference in developing their hazard iden-tification and dose–response assessments (Meek et al.,1994; IPCS, 1994).
A recent text by Olson et al. (2000) also focuses onthe hazard identification comparisons of experimentalanimals and humans for a series of 150 pharmaceu-tical compounds. These authors conclude that concor-dance between human and experimental animal toxic-ity was highest in the hematological, gastrointestinal,and cardiovascular areas and poorest for cutaneous, en-docrine, and hepatobiliary and liver function abnormal-ities. Overall for 30% of the human toxicities, there wasno relationship with toxicities seen in animals. Thiswork supports the idea that in a significant number oftimes, human data would be essential for hazard iden-tification and presumably for dose–response assess-
ment.Every cancer that has been first associated with achemical in human studies, for which numerous exam-ples exist (e.g., benzene, asbestos, chromium), supportsthe idea that human data result in a lower “safe” dosewhen compared to animal data. Animal bioassays maynow be able to better predict carcinogenicity in humansthan in the days prior to mandatory testing and the de-velopment of test guidelines, but other uncertainties aremore likely to exist. The epidemiological data on dioxinsuggest that humans are far less sensitive than animals(Hays et al., 1997). In contrast, Crump et al. (1989) showrough similarities among human or animal studies for23 chemicals for which adequate data were available toestimate lifetime cancer doses associated with a 25%incidence of tumor response (i.e., TD25s) on the basis ofmg/kg body weight dose. However, there is no reasonto believe that for some other chemical the error in anassessment based on animal data would be the otherway, with humans being far more sensitive (for exam-ple, see the results in Table 1 for 2,4-dinitrophenol). Thequestion for either the cancer or noncancer end point
is the same: if we ignore opportunities for collecting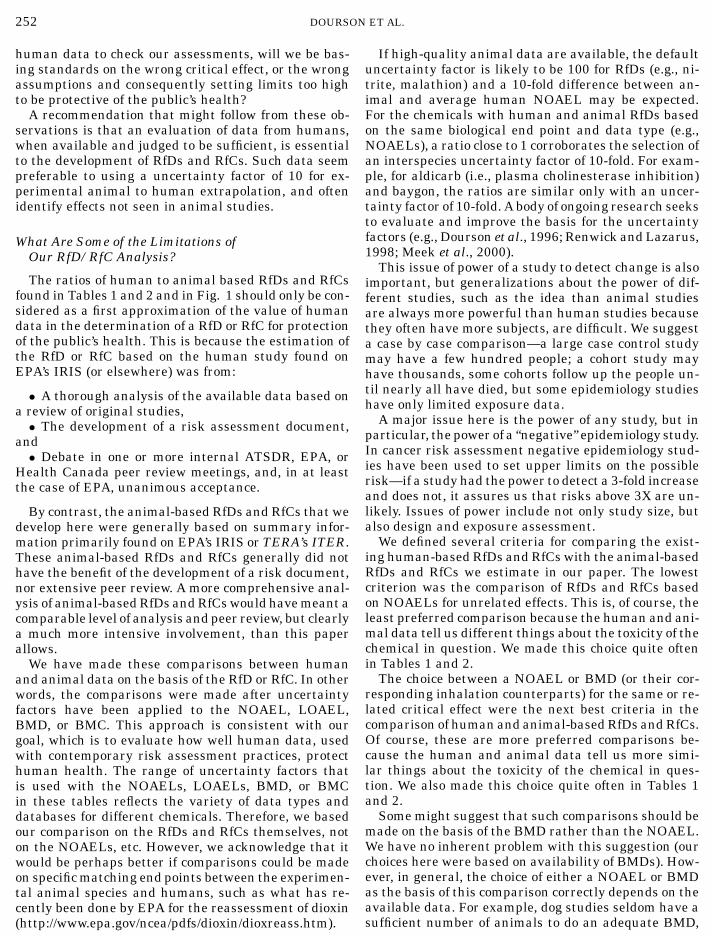
252 DOURSON ET AL.
human data to check our assessments, will we be bas-ing standards on the wrong critical effect, or the wrongassumptions and consequently setting limits too highto be protective of the public’s health?
A recommendation that might follow from these ob-servations is that an evaluation of data from humans,when available and judged to be sufficient, is essentialto the development of RfDs and RfCs. Such data seempreferable to using a uncertainty factor of 10 for ex-perimental animal to human extrapolation, and oftenidentify effects not seen in animal studies.
What Are Some of the Limitations ofOur RfD/RfC Analysis?
The ratios of human to animal based RfDs and RfCsfound in Tables 1 and 2 and in Fig. 1 should only be con-sidered as a first approximation of the value of humandata in the determination of a RfD or RfC for protectionof the public’s health. This is because the estimation ofthe RfD or RfC based on the human study found onEPA’s IRIS (or elsewhere) was from:
• A thorough analysis of the available data based ona review of original studies,• The development of a risk assessment document,
and• Debate in one or more internal ATSDR, EPA, or
Health Canada peer review meetings, and, in at leastthe case of EPA, unanimous acceptance.
By contrast, the animal-based RfDs and RfCs that wedevelop here were generally based on summary infor-mation primarily found on EPA’s IRIS or TERA’s ITER.These animal-based RfDs and RfCs generally did nothave the benefit of the development of a risk document,nor extensive peer review. A more comprehensive anal-ysis of animal-based RfDs and RfCs would have meant acomparable level of analysis and peer review, but clearlya much more intensive involvement, than this paperallows.
We have made these comparisons between humanand animal data on the basis of the RfD or RfC. In otherwords, the comparisons were made after uncertaintyfactors have been applied to the NOAEL, LOAEL,BMD, or BMC. This approach is consistent with ourgoal, which is to evaluate how well human data, usedwith contemporary risk assessment practices, protecthuman health. The range of uncertainty factors thatis used with the NOAELs, LOAELs, BMD, or BMCin these tables reflects the variety of data types anddatabases for different chemicals. Therefore, we basedour comparison on the RfDs and RfCs themselves, noton the NOAELs, etc. However, we acknowledge that itwould be perhaps better if comparisons could be madeon specific matching end points between the experimen-tal animal species and humans, such as what has re-cently been done by EPA for the reassessment of dioxin
(http://www.epa.gov/ncea/pdfs/dioxin/dioxreass.htm).If high-quality animal data are available, the defaultuncertainty factor is likely to be 100 for RfDs (e.g., ni-trite, malathion) and a 10-fold difference between an-imal and average human NOAEL may be expected.For the chemicals with human and animal RfDs basedon the same biological end point and data type (e.g.,NOAELs), a ratio close to 1 corroborates the selection ofan interspecies uncertainty factor of 10-fold. For exam-ple, for aldicarb (i.e., plasma cholinesterase inhibition)and baygon, the ratios are similar only with an uncer-tainty factor of 10-fold. A body of ongoing research seeksto evaluate and improve the basis for the uncertaintyfactors (e.g., Dourson et al., 1996; Renwick and Lazarus,1998; Meek et al., 2000).
This issue of power of a study to detect change is alsoimportant, but generalizations about the power of dif-ferent studies, such as the idea than animal studiesare always more powerful than human studies becausethey often have more subjects, are difficult. We suggesta case by case comparison—a large case control studymay have a few hundred people; a cohort study mayhave thousands, some cohorts follow up the people un-til nearly all have died, but some epidemiology studieshave only limited exposure data.
A major issue here is the power of any study, but inparticular, the power of a “negative” epidemiology study.In cancer risk assessment negative epidemiology stud-ies have been used to set upper limits on the possiblerisk—if a study had the power to detect a 3-fold increaseand does not, it assures us that risks above 3X are un-likely. Issues of power include not only study size, butalso design and exposure assessment.
We defined several criteria for comparing the exist-ing human-based RfDs and RfCs with the animal-basedRfDs and RfCs we estimate in our paper. The lowestcriterion was the comparison of RfDs and RfCs basedon NOAELs for unrelated effects. This is, of course, theleast preferred comparison because the human and ani-mal data tell us different things about the toxicity of thechemical in question. We made this choice quite oftenin Tables 1 and 2.
The choice between a NOAEL or BMD (or their cor-responding inhalation counterparts) for the same or re-lated critical effect were the next best criteria in thecomparison of human and animal-based RfDs and RfCs.Of course, these are more preferred comparisons be-cause the human and animal data tell us more simi-lar things about the toxicity of the chemical in ques-tion. We also made this choice quite often in Tables 1and 2.
Some might suggest that such comparisons should bemade on the basis of the BMD rather than the NOAEL.We have no inherent problem with this suggestion (ourchoices here were based on availability of BMDs). How-ever, in general, the choice of either a NOAEL or BMDas the basis of this comparison correctly depends on theavailable data. For example, dog studies seldom have a
sufficient number of animals to do an adequate BMD,
USING HUMAN DATA TO PROTECT THE PUBLIC’S HEALTH 253
but the value in exploring different types of effects witha larger animal should not be underestimated. NOAELsfrom dogs might be vastly superior to a BMD from ro-dents, if blood pressure was the critical effect, for ex-ample. In addition, not all effects model well. Numer-ous examples exist of critical effects that are masked athigher doses by effects of greater severity. The BMDcan often not adequately model these critical effectsand risk assessors need to depend on the NOAEL orLOAEL for guidance. Risk assessors often analyze theeffects of different severity at every dose of a chemical,and recall their experiences in evaluating the resultsof other experiments with similar chemicals, beforethey make judgments of critical effect. Such judgementcannot depend only on the estimation of BMDs, norNOAELs.4
Unfortunately, we did not have sufficient data in or-der to match any dose–response curves of the criticaleffect between human- and experimental animal-basedRfDs and RfCs. Matching such curves is recognized asbeing an almost ideal criterion, but because many dataare needed for such comparison, it is also the least likelycriterion to be fulfilled.
Do Alternatives to Human Clinical Designs Existin Reference to Pharmacokinetics?
The goal of standard setting is to establish exposurelevels that are protective of human health in a va-riety of situations—environmental exposures, occupa-tional exposures, and exposures to by-products of ourmodern society. The intellectual tools for all these ex-ercises are similar. These exercises require interpreta-tion of a body of data on effects in animals or in ex-posed individuals to assess minimally toxic levels andto apply specific factors to insure that all members ofexposed populations receive adequate protection. Theperceived safe level may vary for criteria pollutants,essential nutrients, and occupational toxicants. How-ever, in all cases, considerations of similar factors be-come important. Pharmacokinetic models or tools aredesigned to determine conditions where similar doses totissues would be attained for different species or expo-sure situations. These affect the numerator in the RfDor RfC process. PBPK modeling evaluates critical deter-minants for the pharmacokinetics and aids in assessinginterindividual variability and identifying at-risk popu-lations. These considerations affect the denominator inthe RfD or RfD determination. These PK tools togetherwith human pharmacokinetic data from volunteerstudies and in vitro mechanistic studies with humantissues provide an optimal data set from which sounddecisions can be reached for protection of exposed indi-
viduals.4 This is why the BMD and NOAEL need to be somewhat compara-ble; if they are not comparable, then the risk assessors’ job of criticaleffect judgment becomes exceedingly difficult with data sets havingboth BMD and NOAEL.
PBPK approaches are important because they use sci-entific methods to as accurately as possible estimateand understand potential risk to humans and providegreater scientific certainty in risk characterization. Thealternatives to PBPK are default assumptions, whichhave greater uncertainty.
If Human Data Are the Preferred Basis to ProtectHuman Health, Then What Does One Conclude ifHuman Data Lead to a Higher Risk Value ThanOne Based on Animal Data?
All ratios in Tables 1 and 2 that have a value greaterthan 1 demonstrate that the human based RfD or RfCis greater than the animal-based value. Ratios aboutequal to 10 would be expected if animals and humanswere shown to be about equally sensitive, that is ifNOAELs or LOAELs were similar (e.g., see chlorpyri-fos or ethephon in Table 1). This is because the use ofa 10-fold interspecies uncertainty factor with the an-imal NOAEL or LOAEL would result in a RfD or RfCthat was about 10 times lower than a human-based RfD(and thus the ratio of human to animal-based risk valuewould be greater than 1). Even if the NOAEL in hu-mans were lower than in animals, but by a factor of∼10 or less, the use of an interspecies uncertainty fac-tor of 10-fold could result in a lower RfD or RfC basedon animal data than the RfD or RfC based on humandata.
Such a situation would also occur if the human datawere suggesting a critical effect that the animal datawere not. Table 1 shows several examples of this (e.g.,nitrate, nitrite and selenium and compounds). In somecases, EPA and others judge that the animal data arenot a reliable basis of the RfD or RfC and a ready com-parison is not available or recommended (e.g., man-ganese, warfarin). This is an example of the importantrole of data other than whole animal bioassays, such aspharmacokinetics and pharmacodynamics, in the over-all determination of RfDs and RfCs.
What is more problematic, and potentially much moreserious, is when the human data suggest a lower RfDor RfC than the animal data, either because of greatersensitivity to the critical effect, or different critical ef-fect. This occurs in 36% (12 of 33 comparisons) of thecomparisons we performed, if no precision issues areconsidered, and occurs in 15% (5 of 33 comparisons) ifprecision is considered to be ”perhaps an order of magni-tude.” In either case, the use of animal-based RfDs andRfCs, rather than those based on human data mightbe considered inappropriate because the public’s healthdoes not appear to be protected.
If we accept the premise that human data are morereliable and relevant for a human risk assessment, thenit follows that human data should be used without biasas to whether their use results in a higher or lower RfDor RfC. Replacement of animal data with human data
should be dependent on the quality of the human data
254 DOURSON ET AL.
being at a minimum comparable to the animal data itwill replace. Focus should be placed on a comparisonof the quality of the human data to the animal dataand the relevance and uncertainty for human health ofeach.
CONCLUSIONS AND FUTURE DIRECTIONS
At the outset we asked a series of questions regardingthe use of human data for risk assessment.
• Is information from human studies the best way tojudge the potential health risk from chemicals in ourenvironment?
The answer is perhaps given best by the many healthorganizations that address this question. For exam-ple, Health Canada (Meek et al., 1994), IPCS (1994),and EPA (Barnes and Dourson, 1988; EPA, 1994) eachprefers the use of human data rather than animal datain the development of risk values. Based on our analy-sis we also agree. For example, the use of human datahas led to the estimation of RfDs and RfCs on EPA’sIRIS that are often lower than animal-based RfDs andRfCs that we estimate in this paper. Especially in thesecases, the use of these human-based RfDs and RfCs maybe better protective of the public’s health.• Should public health agencies strive to resolve the
ethical questions and identify criteria to foster the con-duct of human studies that might lead to better protec-tion of the public’s health?
We hope that the answer to this question is a resound-ing yes. Our analysis, although limited, suggests a highpercentage of comparisons where the exclusive use ofanimal data would lead to RfDs and RfCs that do notprotect the public’s health. Moreover, in many cases theanimal data were recognized as having greater limita-tions than the existing human data, as reflected in gen-erally larger uncertainty factors than those used withthe existing human data.
Perhaps what we really should be asking is how goodare our best-qualified animal data for protecting humanhealth? How can we determine when it would be betterto use or develop human data rather than conductinganother 2- year animal study?• Should scientists ignore available human data that
might suggest a lower or higher risk value?
The obvious answer here is no. Protecting the public’shealth is why we all do this work. However, it seems rea-sonable for scientists and regulatory agencies to furtherevaluate the use of human data in the development ofrisk values, such as RfDs and RfCs. Perhaps new cri-teria could be developed so that such data can be used
with greater confidence.Additional analysis of the results we present herecould be done. For example, we were able to use thecomplete listing of RfDs and RfCs based on human datafrom EPA’s IRIS. Other organizations also have simi-lar risk values based on human data, and these valuesmight also be compared with those based on experimen-tal animal data. In addition, further research might ex-plore whether commonalties exist among target tissueor mode of action for those chemicals for which animal-and human-based RfDs and RfCs differ quantitatively.None of the animal-based RfCs that we estimated wasbelow the human-based one found on IRIS, within thelimits of precision being assumed. Was this deficiencydue to a small sample size or was it related to the useof dosimetry for RfCs, but not yet for RfDs? Similarly,what are the implications for the health protective-ness of the vast majority of the RfDs and RfCs basedon animal data, without any human data to act as acheck?
We look toward future collaborations with other in-terested scientists for resolution of these and otherissues.
ACKNOWLEDGMENTS
We thank Lynne Haber of Toxicology Excellence for Risk Assess-ment, Ruthann Rudel of Silent Spring Institute, Russ Savage of theNational Institute for Occupational Safety and Health, and BernSchwetz of the Food and Drug Administration for insightful com-ments. We also thank Meg Poehlmann for editing and administra-tive assistance. Support for this research was provided through theuse of developmental reserve funds of Toxicology Excellence for RiskAssessment (TERA), Cincinnati, Ohio, a 501(c) (3) nonprofit organi-zation.
REFERENCES
Andersen, M. E., and Jarabek, A. M. (2000). Nasal tissue dosimetry—Issues and approaches for “Category I” gases: A report on a meetingheld in Research Triangle Park, NC, February 11–12, 1998. Inhal.Toxicol., in press.
Andersen, M. E., Sarangapani, R., Frederick, C. B., and Kimbell,J. S. (1999). Dosimetric adjustment factors for methylmethacry-late derived from a steady-state analysis of a physiologically basedclearance-extraction model. Inhal. Toxicol. 11, 899–926.
Andersen, M. E., Clewell, H. J., III, Gargas, M. L., MacNaughton,M. G., Reitz, R. H., Nolan, R., and McKenna, M. (1991). Physio-logically based pharmacokinetic modeling with dichloromethane,its metabolite, carbon monoxide, and blood carboxyhemoglobinin rats and humans. Toxicol. Appl. Pharmacol. 108, 14–27.
Andersen, M. E., Clewell, H. J., III, Gargas, M. L., Smith, F. A., andReitz, R. H. (1987). Physiologically-based pharmacokinetics and therisk assessment process for methylene chloride. Toxicol. Appl. Phar-macol. 87, 185–205.
Barnes, D. G., and Dourson, M. L. (1988). Reference dose (RfD): De-scription and use in health risk assessments. Regul. Toxicol. Phar-macol. 8, 471–486.
Barton, H. A., Andersen, M. E., and Clewell, H. J., III (1998). Har-monization: Developing consistent guidelines for applying mode of
USING HUMAN DATA TO PROTECT THE PUBLIC’S HEALTH 255
action and dosimetry information to cancer and noncancer risk as-sessment. Hum. Ecol. Risk Assess. 4, 75–115.
Clewell, H. J. (1995). Incorporating biological information in quanti-tative risk assessment: An example with methylene chloride. Tox-icology 102, 83–94.
Crump, K., Allen, B., and Shipp, A. (1989). Choice of dose mea-sure for extrapolating carcinogenic risk from animals to humans:An empirical investigation of 23 chemicals. Health Phys. 57, 387–393.
DeGeorge, J. (1999). Transcript of the USEPA Joint Science Advi-sory Board/Science Advisory Panel, Data from Testing on HumanSubjects Subcommittee, November 30, 1999.
Dourson, M. L. (1994). Methods for establishing oral reference doses(RfDs). In Risk Assessment of Essential Elements. (W. Mertz, C. O.Abernathy, and S. S. Olin, Eds.), pp. 51–61. ILSI Press, Washington,DC.
Dourson, M. L., Felter, S. P., and Robinson, D. (1996). Evolution ofscience-based uncertainty factors in noncancer risk assessment.Regul. Toxicol. Pharmacol. 24, 108–120.
Dourson, M. L., Meier, A., Meek, B., Renwick, A., Ohanian, E., andPoirier, K. (1998). Boron tolerable intake: Re-evaluation of toxicoki-netics for data-derived uncertainty factors. Biol. Trace Elem. Res.66(1–3), 453–463.
Elwood, J. M. (1998). Critical Appraisal of Epidemiological Studiesand Clinical Trials, Oxford Univ. Press, Oxford.
EPA (Environmental Protection Agency) (1994). Methods for Deriva-tion of Inhalation Reference Concentrations and Application of In-halation Dosimetry, EPA/600/8-90-066F, October. Office of Healthand Environmental Assessment, Washington, DC.
EPA (Environmental Protection Agency) (1999). The Office Of Pes-ticide Programs’ Policy on Determination of the Appropriate FQPASafety Factor(s) for Use in the Tolerance-Setting Process. May. Officeof Pesticide Programs.
EPA (Environmental Protection Agency) (2000a). Science AdvisoryBoard. Executive Committee Review Draft Report of the JointSAB/SAP Subcommittee on Data from Testing of Human Subjects.Available at http://www.epa.gov/sab/Reports/2000report/2000dra-fts/Humandata. May 31, draft.
EPA (Environmental Protection Agency) (2000b). Integrated Risk In-formation System (IRIS). National Center for Environmental As-sessment. See listing for individual chemicals and the glossaryfor risk assessment terms. Available online at http://www.epa.gov/iris.
Felter, S. F., and Dourson, M. L. (1998). The inexact science of riskassessment (and implications for risk management). Human Ecol.Risk Assess 2, 245–251.
Frederick, C., Bush, M. L., Subramaniam, R. P., Black, K. A., Finch,L., Kimbell, J. S., Morgan, K. T., Morris, J. B., and Ultman, J. S.(1998). Application of a hybrid computational fluid dynamics andphysiologically based inhalation model for interspecies dosimetryextrapolation of acidic vapors in the upper airways. Toxicol. Appl.Pharmacol. 152, 211–231.
FDA (Food and Drug Administration) (1997). FDA Public Health Ad-visory, Reports of Valvular Heath Disease in Patients Receiving Con-comitant Fenfluramine and Phentermine. July.
Gearhart, J. M., Jepson, G. W., Clewell, H. J., III, Andersen, M. E.,and Conolly, R. B. (1990). A physiologically based model for in vivoinhibition of acetylcholinesterase by diisopropyl fluorophosphate.Toxicol. Appl. Pharmacol. 106, 295–310.
Gerlowski, L. E., and Jain, R. K. (1983). Physiologically based phar-macokinetic modeling: Principles and applications. J. Pharm. Sci.72, 103–1127.
Hays, S., Aylward, L., Karch, N., and Paustenbach, D. (1997). The
relative susceptibility of animals and humans to the carcinogenichazard posed by exposure to 2,3,7,8-TCDD: An analysis using stan-dard and internal measures of dose. Chemosphere 34(5–7), 1507–1522.
ILSI (International Life Sciences Institute) (1997). An evaluation ofEPA’s proposed guidelines for carcinogen risk assessment usingchloroform and dichloroacetate as case studies: Report of an expertpanel. November. Washington, D.C.
IPCS (International Programme on Chemical Safety) (1994). Deriva-tion of guidance values for health-based exposure limits. Environ-mental Health Criteria No. 170: Assessing Human Health Risks ofChemicals. World Health Organization, Geneva.
Jarabek, A. M. (1994). Inhalation RfC methodology: Dosimetricadjustments and dose-response estimation of noncancer toxicityin the upper respiratory tract. Inhal. Toxicol. 6(Suppl.), 301–325.
Jarabek, A. M. (1995). The application of dosimetry models to iden-tify key processes and parameters for default dose–response as-sessment approaches. Toxicol. Lett. 79, 171–184.
Lee, ET. (1980). Statistical Methods for Survival Data Analysis. Life-time Learning Publications, CA.
MacGregor, J. T., Collins, J. M., Sugiyama, Y., Tyson, C. A., Dean, J.,Smith, L., Andersen, M., Curren, R., Houston, J. B., Kadlubar, F. K.,Kedderis, G. L., Krishnan, K., Li, A., Parchment, R. E., Thummel,K., Tomaszewski, J. E., Ulrich, R., Vickers, A. E. M., and Wrighton,S. A. (2000). In vitro Human tissue models in risk assessment: Re-port of a consensus-building workshop In vitro human tissue mod-els in risk assessment. Toxicol. Sci., in press.
Meek, M. E., Newhook, R., Liteplo, R. G., and V. C. Armstrong. (1994).Approach to assessment of risk to human health for priority sub-stances under the Canadian Environmental Protection Act. Envi-ron. Carcinogen. Ecotoxicol. Rev. C12(2), 105–134.
Meek, B., Renwick, A., Ohanian, E., Dourson, M., Lake, B., Naumann,B., and Vu, V. (2001). Guidelines for application of compound spe-cific adjustment factors (CSAF) in dose/concentration response as-sessment. In press.
Murray, F. J., and Andersen, M. E. (2000). Data-derived uncertaintyfactors: Boric acid (BA) as a case study. Hum. Ecol. Risk Assess., inpress.
NAS (National Academy of Sciences) (1983). Risk Assessment in theFederal Government: Managing the Process. National AcademyPress, Washington, DC.
NAS (National Academy of Sciences) (1994). Science and Judg-ment in Risk Assessment, National Academy Press, Washington,DC.
NCEA (National Center for Environmental Assessment) (2000).Exposure and Human Health Reassessment of 2,3,7,8-Tetrachlorodibenzo-p-dioxin (TCDD) and Related Compounds.Online at http://www.epa.gov/ncea/pdfs/dioxin/dioxreass.htm.
NRC (National Research Council) (1986). Dose-Route Extrapolations:Using Inhalation Toxicity Data to Set Drinking Water Limits.Chapter 6, Drinking Water and Health, Volume 6: NationalAcademy Press, Washington, DC.
Okoji, R., Leininger, J., and Froines, J. (1999). Subchronic toxicitystudy of sodium arsenite in methyl-deficient male C57BL/6 mice.In: Arsenic Exposure and Health Effects (W. Chappell, C. Abernathy,and R. Calderon, Eds.), pp. 225–232. Elsevier, Amsterdam, TheNetherland.
Olson, H., Betton, G., Robinson, D., et al. (2000). Concordance of thetoxicity of pharmaceuticals in humans and in animals. Regul. Tox-icol. Pharmacol. 32, 56–67.
Plowchalk, D. R., Andersen, M. E., and Bogdanffy, M. S. (1997).Physiologically-based modeling of vinyl acetate uptake, metabolismand intracellular pH changes in the rat nasal cavity. Toxicol. Appl.
Pharmacol. 142, 386–400.
256 DOURSON ET AL.
Reitz, R. H., Mendrela, A. L., and Guengerich, F. P. (1989).In vitro metabolism of methylene chloride in humanand animal tissues: Use in physiologically based phar-macokinetic models. Toxicol. Appl. Pharmacol. 97, 230–246.
Renwick, A. G. (1993). Data derived safety factors for the evaluation offood additives and environmental contaminants. Food Addit. Con-tam. 10(3), 275–305.
Renwick, A., and Lazarus, N. R. (1998). Human variability and non-cancer risk assessment–An analysis of the default uncertainty fac-tor. Regul. Toxicol. Pharmacol. 27, 3–20.
Russo, E. (2000). Monitoring human subjects and clinical trials. Sci-
entist May 15, p. 6.SOT (Society of Toxicology) (2000). The Value and Ethics of UsingHuman Data for the Registration of Pesticides. 39th Annual Meet-ing, March 23.
TERA (Toxicology Excellence for Risk Assessment) (2000). Inter-national Toxicity Estimates for Risk (ITER) Database. Online atwww.tera.org.
Thomas, R. S., Bigelow, P. L., Keefe, T. J., and Yang, R. S. H.(1996). Variability in biological exposure indices using physiologi-cally based pharmacokinetic modeling and Monte Carlo simulation.Amer. Ind. Hyg. Assoc. J. 57, 23–32.
Vaziri, N. D., and Oveisi, F. (2000). Evaluation of Renal Clearance ofBoric Acid in Non-pregnant and Pregnant Sprague–Dawley Rats.
Final Report. Univ. California, Irvine, April.