using contingent valuation to estimate the willingness of tourists to pay for urban forests: a study...
TRANSCRIPT
Uu
Sa
b
a
KADNTU
I
tstaroahcmbt1C
af(i
1d
Urban Forestry & Urban Greening 10 (2011) 275– 280
Contents lists available at ScienceDirect
Urban Forestry & Urban Greening
jou rn al h omepage: www.elsev ier .de /ufug
sing contingent valuation to estimate the willingness of tourists to pay forrban forests: A study in Savannah, Georgia
uman Majumdara,∗, Jinyang Dengb, Yaoqi Zhanga, Chad Pierskallab
Forest Policy Center, School of Forestry and Wildlife Sciences, Auburn University, AL 36849, USADivision of Forestry and Natural Resources, West Virginia University, Morgantown, WV 26506, USA
r t i c l e i n f o
eywords:esthetic valueestination loyaltyonmarket valuationourism benefitsrban green spaces
a b s t r a c t
This study estimated the monetary value of urban forests’ non-priced benefits to tourists. Data collectedby a face-to-face self-administered survey of urban tourists in Savannah, Georgia, USA were used to esti-mate tourists’ willingness to pay (WTP) for urban forests by the contingent valuation method. IndividualWTP was found higher among tourists with graduate school education. Results suggested that WTP forurban forests also increased significantly with income and destination loyalty of the tourists. Estimatedmean and median WTP values were $11.25 (95% confidence interval: $7.34, $15.16) and $2.10 (95% con-
fidence interval: $1.38, $2.82), respectively. Based on the estimated mean WTP, annual value of urbanforests to tourists in Savanna in 2009 ranged from a minimum of $81 million to a maximum of $167 mil-lion with a 95% confidence interval. The annual value was $11.55 million (95% confidence interval: $7.59million, $15.51 million) based on the estimated median WTP and assuming at least 50% of the tourists inSavannah would pay the median amount. As the mean was greatly influenced by extreme WTP values inthe data, the annual value based on the median value was a more conservative estimate.ntroduction
Most United States (US) cities today embrace and encourageourism as an important economic sector (Judd, 1995). Many cities,uch as Las Vegas, Los Angeles, Orlando, New York City, Washing-on, DC and San Francisco, are visited by millions of internationalnd domestic tourists annually (Law, 2002). Urban recreationesources play a significant role in satisfying recreational demandsf both urban residents and tourists. Although tourism in urbanreas is frequently considered as “gray tourism” because of theighly developed nature of the typical recreational resources ofities (Deng et al., 2010), such tourism often includes some ele-ents of the ‘green’ (Ashworth, 2004). Urban green spaces have
een identified as an important source of recreational opportuni-ies in previous research (Smardon, 1988; Botkin and Beveridge,997; Tyrväinen and Väänänen, 1998; Lorenzo et al., 2000; Jim andhen, 2006).
Urban forests are defined as “the sum of all woody and associ-ted vegetation in and around dense human settlements, ranging
rom small communities in rural settings to metropolitan regions”Miller, 1988, p. 24). Urban forests include natural and planted treesn streets, domestic yards, recreational areas, parks and gardens,∗ Corresponding author. Tel.: +1 334 844 8058; fax: +1 334 844 1084.E-mail address: [email protected] (S. Majumdar).
618-8667/$ – see front matter © 2011 Elsevier GmbH. All rights reserved.oi:10.1016/j.ufug.2011.07.006
© 2011 Elsevier GmbH. All rights reserved.
unused public and private lands, transportation and utility corri-dors, and watershed lands around urban areas. According to Denget al. (2010), urban forests have the ability to significantly add tothe beauty of urban areas and improve the experience of urbantourists. Urban forests function both as a major factor in attractingtourists and as a complement of other urban tourism magnets.
Urban forest resource managers and planners are confrontedby the challenge of equilibrating the benefits and costs associatedwith those resources (Dwyer et al., 1992). In the city of Savan-nah, Georgia, for example, urban forests are one of the top tourismattractions (Deng et al., 2010). But new development and urbanrenewal resulting from population growth in Georgia are continu-ous threats to the city’s trees (Savannah Park and Tree Department(SPTD), 2010). Information about the extent and magnitude of thebenefits from urban forests can significantly help land-use plan-ning and forest resource management in urban areas (Dwyer et al.,1992).
Several empirical studies have examined and estimated themonetary value of non-priced benefits from urban forests.Tyrväinen and Väänänen (1998), for example, used the contin-gent valuation method (CVM) to estimate the values of urbanforest recreation areas and residents’ willingness to pay (WTP) forsmall forest parks in Joensuu, Finland. Another study by Lorenzo
et al. (2000) examined residents’ WTP for community urban for-est preservation in Mandeville, Louisiana, US. Jim and Chen (2006)estimated the value of urban green spaces to the residents ofGuangzhou, China using the CVM. The above studies found that
276 S. Majumdar et al. / Urban Forestry & Urban Greening 10 (2011) 275– 280
of Sav
atAg(tsotem
ncr(hroaettehimrK
ttGpttlsctT
M
S
G8
Fig. 1. Location
majority of their survey respondents were willing to pay forhe use, protection and preservation of urban forest resources.ll these studies, however, focused on estimating value of urbanreen spaces solely to urban residents. Recently, Notaro and Salvo2010) estimated tourists’ value for ornamental cypress trees onhe Trentino region’s shore of Lake Garda, Italy using the CVM. Theirtudy was important in terms of policy regarding the maintenancef a specific species in a region. However, for a city with significantourism income, evaluating the overall contribution of urban for-st resources to tourism can provide useful information for efficientanagement of those resources by local government and agencies.The importance of linking urban forests and tourism is gaining
ational recognition in the US (Neamtzu, 2003). In spite of theirrucial contribution to enhance urban tourism, however, sufficientesearch on urban forests as the basis of urban tourism is lackingDeng et al., 2010). According to Buhyoff et al. (1984, p. 71), “per-aps because it is so well accepted that people like trees, very littleesearch has been conducted regarding the visual aesthetic valuesf urban trees and forests.” Very recently, Deng et al. (2010) maden attempt to study tourists’ perceptions about urban forests’ role innhancing tourism experience. They developed a structural equa-ion model using data collected from Savannah, Georgia to examinehe links between urban forest appeals, city beauty, and tourismxperience and satisfaction. However, to our knowledge, no studyas estimated the value of the non-priced benefits of urban forests
n a city to tourists, although a number of studies have explored theental and physical benefits of visual pleasure from natural envi-
onment (see for example, Ulrich, 1984; Kaplan and Kaplan, 1989;aplan et al., 1998; Ode and Fry, 2002; Price, 2003).
The primary objective of this study was to assess the mone-ary value of non-priced urban forest benefits to tourists. We usedhe CVM to estimate tourists’ value for urban forests in Savannah,eorgia. Urban forest resources were represented by roadside trees,ublic squares, gardens and parks, in Savannah. The influences ofourists’ demographic characteristics and destination loyalty onheir valuation of urban forests were examined. A maximum like-ihood technique was used for econometric estimation. The nextection describes study methodologies including study area, dataollection procedures, econometric approach and model specifica-ions. In the following section we present and discuss the findings.he paper ends with a brief conclusion section.
ethods
tudy area and data collection
This study focused on urban tourism in the city of Savannah,eorgia, USA. Established in 1733, Savannah is located at 32◦3′3′′N,1◦6′14′′W with a total area of 202.3 square kilometers (Deng et al.,
annah, Georgia.
2010). It is the fourth largest city in Georgia and the largest cityin Chatham County (Fig. 1) with an estimated population of 135thousand in 2009 (United States Bureau of the Census (USBOC),2010).
Savannah’s rich historical and cultural amenities and naturalbeauty attracted more than 50 million visitors during the 1990s(New Georgia Encyclopedia (NGE), 2010). In 2009, total number oftourist visits in Savannah was about 11 million with direct spendingof $1.63 billion in the city (Jenny Dent, Visit Savannah, Savannah,Georgia, personal communication, April 2011). The majority of thetourists visit Savannah for the historic and cultural experience.However, components of urban forests in Savannah, such as botan-ical gardens, city parks and gardens, tree-lined streets and publicsquares, are also popular nature-based attractions to visitors (Denget al., 2010). These resources are an important part of the charac-ter, charm, and beauty of Savannah (SPTD, 2010). The urban forestresources of the city are a result of continuous efforts in planning,planting and maintenance of trees for more than a century. Savan-nah has been recognized by the National Arbor Day Foundation asa Tree City USA since 1985 and has received Tree City USA GrowthAwards eight times for its advancements in urban forest programs.The City also received the Outstanding Community Award from theGeorgia Urban Forest Council in 2007.
The data used in this study were from a survey of visitors toSavannah conducted in July 2008 and January, July and August2009. The questionnaire used in the survey was designed toextract information on visitors’ perceptions of tourism attributeimportance and performance, destination loyalty, expenditures,willingness to pay for urban forest resources in Savannah, tripcharacteristics and background information. The questionnaire wasreviewed by staff from the SPTD and other project collaborators.Face-to-face onsite self-administered survey was conducted at theRiver Street, one of the most popular outdoor relaxing and sight-seeing places in the city.
Tourists were approached by a surveyor who introduced him-self/herself and the study first and then asked them if they werewilling to participate in the survey. If a visitor was not willing to par-ticipate, the surveyor then approached the next available visitor. Ifa visitor was willing to participate in the survey, the questionnaireon a clip board was given to him or her to fill out. The question-naire was collected by the surveyor once it was done onsite. Similaronsite survey method has been used by recent contingent valuationstudies (Goffe, 1995; Lee, 1997; Lee and Han, 2002; Togridou et al.,2006).
A payment card technique was used for CVM elicitation. This
method has been used in several recent contingent valuation stud-ies (see for example, Legget et al., 2003; Jim and Chen, 2006; Notaroand Salvo, 2010). In the payment card method, the respondents areasked to go through a range of values and to circle the amount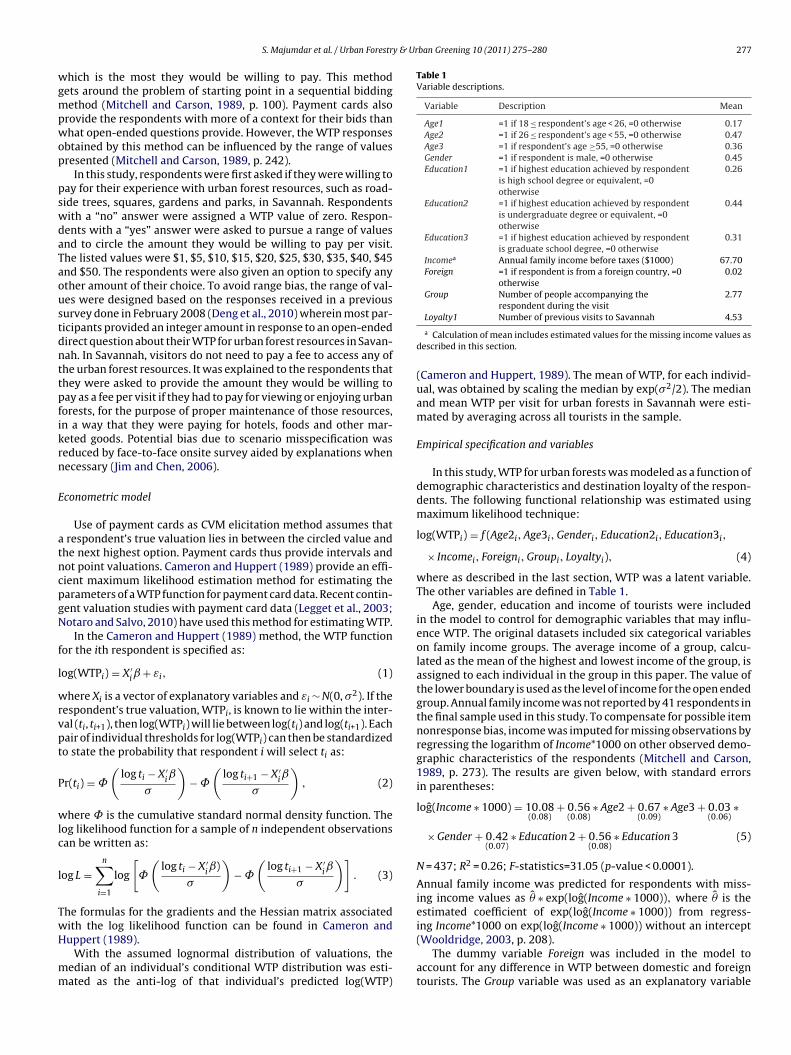
y & Urban Greening 10 (2011) 275– 280 277
wgmpwop
pswdaTaoustdnttpfikrn
E
atncpgN
f
l
wrvpt
P
wlc
l
TwH
mm
Table 1Variable descriptions.
Variable Description Mean
Age1 =1 if 18 ≤ respondent’s age < 26, =0 otherwise 0.17Age2 =1 if 26 ≤ respondent’s age < 55, =0 otherwise 0.47Age3 =1 if respondent’s age ≥55, =0 otherwise 0.36Gender =1 if respondent is male, =0 otherwise 0.45Education1 =1 if highest education achieved by respondent
is high school degree or equivalent, =0otherwise
0.26
Education2 =1 if highest education achieved by respondentis undergraduate degree or equivalent, =0otherwise
0.44
Education3 =1 if highest education achieved by respondentis graduate school degree, =0 otherwise
0.31
Incomea Annual family income before taxes ($1000) 67.70Foreign =1 if respondent is from a foreign country, =0
otherwise0.02
Group Number of people accompanying therespondent during the visit
2.77
S. Majumdar et al. / Urban Forestr
hich is the most they would be willing to pay. This methodets around the problem of starting point in a sequential biddingethod (Mitchell and Carson, 1989, p. 100). Payment cards also
rovide the respondents with more of a context for their bids thanhat open-ended questions provide. However, the WTP responses
btained by this method can be influenced by the range of valuesresented (Mitchell and Carson, 1989, p. 242).
In this study, respondents were first asked if they were willing toay for their experience with urban forest resources, such as road-ide trees, squares, gardens and parks, in Savannah. Respondentsith a “no” answer were assigned a WTP value of zero. Respon-ents with a “yes” answer were asked to pursue a range of valuesnd to circle the amount they would be willing to pay per visit.he listed values were $1, $5, $10, $15, $20, $25, $30, $35, $40, $45nd $50. The respondents were also given an option to specify anyther amount of their choice. To avoid range bias, the range of val-es were designed based on the responses received in a previousurvey done in February 2008 (Deng et al., 2010) wherein most par-icipants provided an integer amount in response to an open-endedirect question about their WTP for urban forest resources in Savan-ah. In Savannah, visitors do not need to pay a fee to access any ofhe urban forest resources. It was explained to the respondents thathey were asked to provide the amount they would be willing toay as a fee per visit if they had to pay for viewing or enjoying urbanorests, for the purpose of proper maintenance of those resources,n a way that they were paying for hotels, foods and other mar-eted goods. Potential bias due to scenario misspecification waseduced by face-to-face onsite survey aided by explanations whenecessary (Jim and Chen, 2006).
conometric model
Use of payment cards as CVM elicitation method assumes that respondent’s true valuation lies in between the circled value andhe next highest option. Payment cards thus provide intervals andot point valuations. Cameron and Huppert (1989) provide an effi-ient maximum likelihood estimation method for estimating thearameters of a WTP function for payment card data. Recent contin-ent valuation studies with payment card data (Legget et al., 2003;otaro and Salvo, 2010) have used this method for estimating WTP.
In the Cameron and Huppert (1989) method, the WTP functionor the ith respondent is specified as:
og(WTPi) = X ′i + εi, (1)
here Xi is a vector of explanatory variables and εi ∼ N(0, �2). If theespondent’s true valuation, WTPi, is known to lie within the inter-al (ti, ti+1), then log(WTPi) will lie between log(ti) and log(ti+1). Eachair of individual thresholds for log(WTPi) can then be standardizedo state the probability that respondent i will select ti as:
r(ti) = ˚
(log ti − X ′
iˇ
�
)− ˚
(log ti+1 − X ′
iˇ
�
), (2)
here is the cumulative standard normal density function. Theog likelihood function for a sample of n independent observationsan be written as:
og L =n∑
i=1
log
[˚
(log ti − X ′
iˇ)
�
)− ˚
(log ti+1 − X ′
iˇ
�
)]. (3)
he formulas for the gradients and the Hessian matrix associatedith the log likelihood function can be found in Cameron and
uppert (1989).With the assumed lognormal distribution of valuations, theedian of an individual’s conditional WTP distribution was esti-ated as the anti-log of that individual’s predicted log(WTP)
Loyalty1 Number of previous visits to Savannah 4.53
a Calculation of mean includes estimated values for the missing income values asdescribed in this section.
(Cameron and Huppert, 1989). The mean of WTP, for each individ-ual, was obtained by scaling the median by exp(�2/2). The medianand mean WTP per visit for urban forests in Savannah were esti-mated by averaging across all tourists in the sample.
Empirical specification and variables
In this study, WTP for urban forests was modeled as a function ofdemographic characteristics and destination loyalty of the respon-dents. The following functional relationship was estimated usingmaximum likelihood technique:
log(WTPi) = f (Age2i, Age3i, Genderi, Education2i, Education3i,
× Incomei, Foreigni, Groupi, Loyaltyi), (4)
where as described in the last section, WTP was a latent variable.The other variables are defined in Table 1.
Age, gender, education and income of tourists were includedin the model to control for demographic variables that may influ-ence WTP. The original datasets included six categorical variableson family income groups. The average income of a group, calcu-lated as the mean of the highest and lowest income of the group, isassigned to each individual in the group in this paper. The value ofthe lower boundary is used as the level of income for the open endedgroup. Annual family income was not reported by 41 respondents inthe final sample used in this study. To compensate for possible itemnonresponse bias, income was imputed for missing observations byregressing the logarithm of Income*1000 on other observed demo-graphic characteristics of the respondents (Mitchell and Carson,1989, p. 273). The results are given below, with standard errorsin parentheses:
log(Income ∗ 1000) = 10.08(0.08)
+ 0.56(0.08)
∗ Age2 + 0.67(0.09)
∗ Age3 + 0.03(0.06)
∗
× Gender + 0.42(0.07)
∗ Education 2 + 0.56(0.08)
∗ Education 3 (5)
N = 437; R2 = 0.26; F-statistics=31.05 (p-value < 0.0001).
Annual family income was predicted for respondents with miss-ing income values as � ∗ exp(log(Income ∗ 1000)), where � is theestimated coefficient of exp(log(Income ∗ 1000)) from regress-ing Income*1000 on exp(log(Income ∗ 1000)) without an intercept
(Wooldridge, 2003, p. 208).The dummy variable Foreign was included in the model toaccount for any difference in WTP between domestic and foreigntourists. The Group variable was used as an explanatory variable
278 S. Majumdar et al. / Urban Forestry & Urban Greening 10 (2011) 275– 280
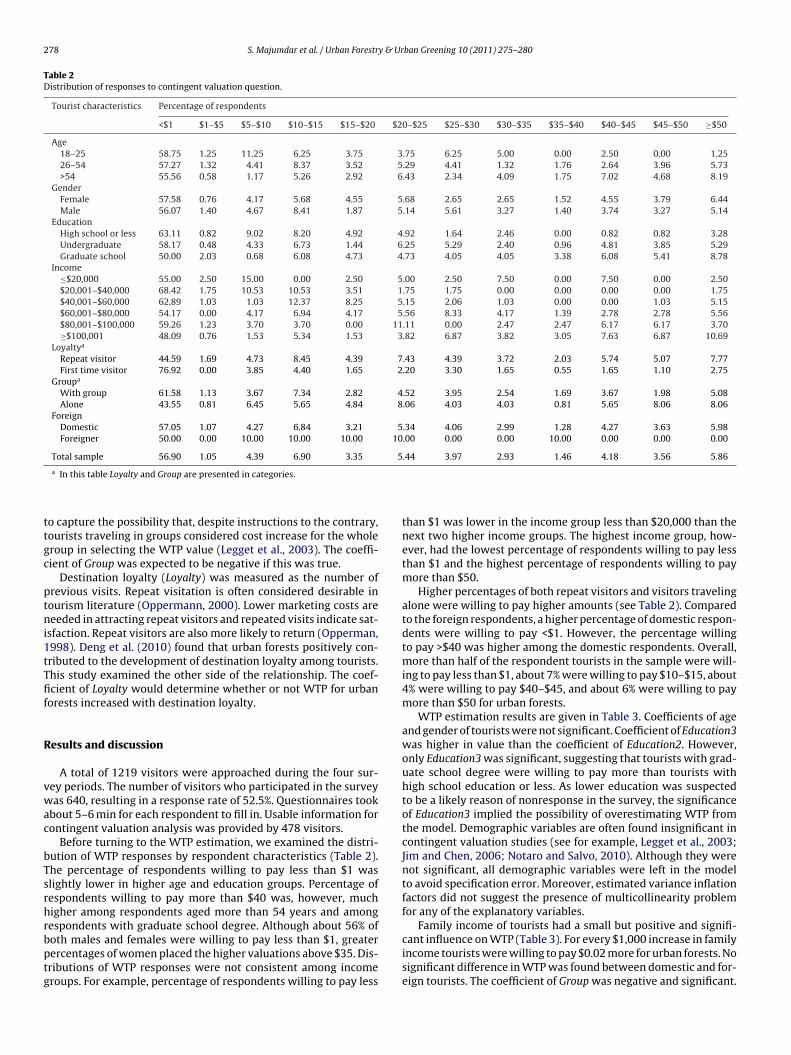
Table 2Distribution of responses to contingent valuation question.
Tourist characteristics Percentage of respondents
<$1 $1–$5 $5–$10 $10–$15 $15–$20 $20–$25 $25–$30 $30–$35 $35–$40 $40–$45 $45–$50 ≥$50
Age18–25 58.75 1.25 11.25 6.25 3.75 3.75 6.25 5.00 0.00 2.50 0.00 1.2526–54 57.27 1.32 4.41 8.37 3.52 5.29 4.41 1.32 1.76 2.64 3.96 5.73>54 55.56 0.58 1.17 5.26 2.92 6.43 2.34 4.09 1.75 7.02 4.68 8.19
GenderFemale 57.58 0.76 4.17 5.68 4.55 5.68 2.65 2.65 1.52 4.55 3.79 6.44Male 56.07 1.40 4.67 8.41 1.87 5.14 5.61 3.27 1.40 3.74 3.27 5.14
EducationHigh school or less 63.11 0.82 9.02 8.20 4.92 4.92 1.64 2.46 0.00 0.82 0.82 3.28Undergraduate 58.17 0.48 4.33 6.73 1.44 6.25 5.29 2.40 0.96 4.81 3.85 5.29Graduate school 50.00 2.03 0.68 6.08 4.73 4.73 4.05 4.05 3.38 6.08 5.41 8.78
Income≤$20,000 55.00 2.50 15.00 0.00 2.50 5.00 2.50 7.50 0.00 7.50 0.00 2.50$20,001–$40,000 68.42 1.75 10.53 10.53 3.51 1.75 1.75 0.00 0.00 0.00 0.00 1.75$40,001–$60,000 62.89 1.03 1.03 12.37 8.25 5.15 2.06 1.03 0.00 0.00 1.03 5.15$60,001–$80,000 54.17 0.00 4.17 6.94 4.17 5.56 8.33 4.17 1.39 2.78 2.78 5.56$80,001–$100,000 59.26 1.23 3.70 3.70 0.00 11.11 0.00 2.47 2.47 6.17 6.17 3.70≥$100,001 48.09 0.76 1.53 5.34 1.53 3.82 6.87 3.82 3.05 7.63 6.87 10.69
Loyaltya
Repeat visitor 44.59 1.69 4.73 8.45 4.39 7.43 4.39 3.72 2.03 5.74 5.07 7.77First time visitor 76.92 0.00 3.85 4.40 1.65 2.20 3.30 1.65 0.55 1.65 1.10 2.75
Groupa
With group 61.58 1.13 3.67 7.34 2.82 4.52 3.95 2.54 1.69 3.67 1.98 5.08Alone 43.55 0.81 6.45 5.65 4.84 8.06 4.03 4.03 0.81 5.65 8.06 8.06
ForeignDomestic 57.05 1.07 4.27 6.84 3.21 5.34 4.06 2.99 1.28 4.27 3.63 5.98Foreigner 50.00 0.00 10.00 10.00 10.00 10.00 0.00 0.00 10.00 0.00 0.00 0.00
Total sample 56.90 1.05 4.39 6.90 3.35 5.44 3.97 2.93 1.46 4.18 3.56 5.86
ttgc
ptni1tTfif
R
vwac
bTsrhrbptg
a In this table Loyalty and Group are presented in categories.
o capture the possibility that, despite instructions to the contrary,ourists traveling in groups considered cost increase for the wholeroup in selecting the WTP value (Legget et al., 2003). The coeffi-ient of Group was expected to be negative if this was true.
Destination loyalty (Loyalty) was measured as the number ofrevious visits. Repeat visitation is often considered desirable inourism literature (Oppermann, 2000). Lower marketing costs areeeded in attracting repeat visitors and repeated visits indicate sat-
sfaction. Repeat visitors are also more likely to return (Opperman,998). Deng et al. (2010) found that urban forests positively con-ributed to the development of destination loyalty among tourists.his study examined the other side of the relationship. The coef-cient of Loyalty would determine whether or not WTP for urban
orests increased with destination loyalty.
esults and discussion
A total of 1219 visitors were approached during the four sur-ey periods. The number of visitors who participated in the surveyas 640, resulting in a response rate of 52.5%. Questionnaires took
bout 5–6 min for each respondent to fill in. Usable information forontingent valuation analysis was provided by 478 visitors.
Before turning to the WTP estimation, we examined the distri-ution of WTP responses by respondent characteristics (Table 2).he percentage of respondents willing to pay less than $1 waslightly lower in higher age and education groups. Percentage ofespondents willing to pay more than $40 was, however, muchigher among respondents aged more than 54 years and amongespondents with graduate school degree. Although about 56% of
oth males and females were willing to pay less than $1, greaterercentages of women placed the higher valuations above $35. Dis-ributions of WTP responses were not consistent among incomeroups. For example, percentage of respondents willing to pay lessthan $1 was lower in the income group less than $20,000 than thenext two higher income groups. The highest income group, how-ever, had the lowest percentage of respondents willing to pay lessthan $1 and the highest percentage of respondents willing to paymore than $50.
Higher percentages of both repeat visitors and visitors travelingalone were willing to pay higher amounts (see Table 2). Comparedto the foreign respondents, a higher percentage of domestic respon-dents were willing to pay <$1. However, the percentage willingto pay >$40 was higher among the domestic respondents. Overall,more than half of the respondent tourists in the sample were will-ing to pay less than $1, about 7% were willing to pay $10–$15, about4% were willing to pay $40–$45, and about 6% were willing to paymore than $50 for urban forests.
WTP estimation results are given in Table 3. Coefficients of ageand gender of tourists were not significant. Coefficient of Education3was higher in value than the coefficient of Education2. However,only Education3 was significant, suggesting that tourists with grad-uate school degree were willing to pay more than tourists withhigh school education or less. As lower education was suspectedto be a likely reason of nonresponse in the survey, the significanceof Education3 implied the possibility of overestimating WTP fromthe model. Demographic variables are often found insignificant incontingent valuation studies (see for example, Legget et al., 2003;Jim and Chen, 2006; Notaro and Salvo, 2010). Although they werenot significant, all demographic variables were left in the modelto avoid specification error. Moreover, estimated variance inflationfactors did not suggest the presence of multicollinearity problemfor any of the explanatory variables.
Family income of tourists had a small but positive and signifi-
cant influence on WTP (Table 3). For every $1,000 increase in familyincome tourists were willing to pay $0.02 more for urban forests. Nosignificant difference in WTP was found between domestic and for-eign tourists. The coefficient of Group was negative and significant.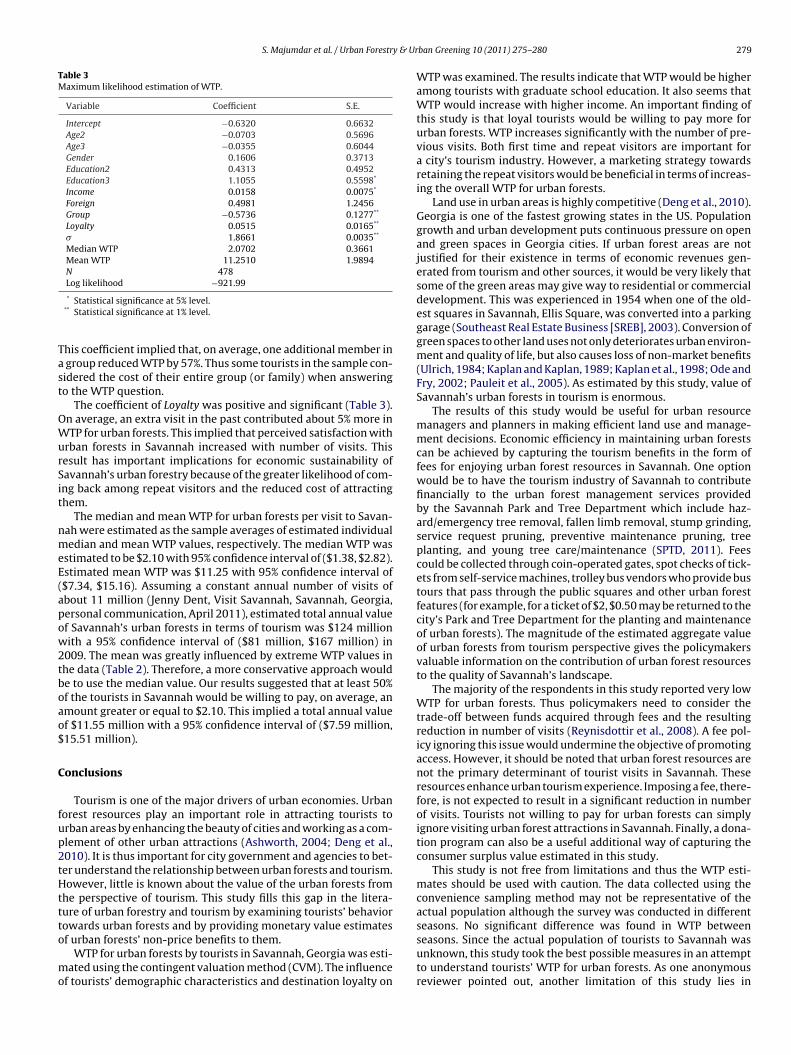
S. Majumdar et al. / Urban Forestry & Ur
Table 3Maximum likelihood estimation of WTP.
Variable Coefficient S.E.
Intercept −0.6320 0.6632Age2 −0.0703 0.5696Age3 −0.0355 0.6044Gender 0.1606 0.3713Education2 0.4313 0.4952Education3 1.1055 0.5598*
Income 0.0158 0.0075*
Foreign 0.4981 1.2456Group −0.5736 0.1277**
Loyalty 0.0515 0.0165**
� 1.8661 0.0035**
Median WTP 2.0702 0.3661Mean WTP 11.2510 1.9894N 478Log likelihood −921.99
Tast
OWurSit
nmeE(apow2tboao$
C
fup2tHttto
mo
* Statistical significance at 5% level.** Statistical significance at 1% level.
his coefficient implied that, on average, one additional member in group reduced WTP by 57%. Thus some tourists in the sample con-idered the cost of their entire group (or family) when answeringo the WTP question.
The coefficient of Loyalty was positive and significant (Table 3).n average, an extra visit in the past contributed about 5% more inTP for urban forests. This implied that perceived satisfaction with
rban forests in Savannah increased with number of visits. Thisesult has important implications for economic sustainability ofavannah’s urban forestry because of the greater likelihood of com-ng back among repeat visitors and the reduced cost of attractinghem.
The median and mean WTP for urban forests per visit to Savan-ah were estimated as the sample averages of estimated individualedian and mean WTP values, respectively. The median WTP was
stimated to be $2.10 with 95% confidence interval of ($1.38, $2.82).stimated mean WTP was $11.25 with 95% confidence interval of$7.34, $15.16). Assuming a constant annual number of visits ofbout 11 million (Jenny Dent, Visit Savannah, Savannah, Georgia,ersonal communication, April 2011), estimated total annual valuef Savannah’s urban forests in terms of tourism was $124 millionith a 95% confidence interval of ($81 million, $167 million) in
009. The mean was greatly influenced by extreme WTP values inhe data (Table 2). Therefore, a more conservative approach woulde to use the median value. Our results suggested that at least 50%f the tourists in Savannah would be willing to pay, on average, anmount greater or equal to $2.10. This implied a total annual valuef $11.55 million with a 95% confidence interval of ($7.59 million,15.51 million).
onclusions
Tourism is one of the major drivers of urban economies. Urbanorest resources play an important role in attracting tourists torban areas by enhancing the beauty of cities and working as a com-lement of other urban attractions (Ashworth, 2004; Deng et al.,010). It is thus important for city government and agencies to bet-er understand the relationship between urban forests and tourism.owever, little is known about the value of the urban forests from
he perspective of tourism. This study fills this gap in the litera-ure of urban forestry and tourism by examining tourists’ behaviorowards urban forests and by providing monetary value estimates
f urban forests’ non-price benefits to them.WTP for urban forests by tourists in Savannah, Georgia was esti-ated using the contingent valuation method (CVM). The influence
f tourists’ demographic characteristics and destination loyalty on
ban Greening 10 (2011) 275– 280 279
WTP was examined. The results indicate that WTP would be higheramong tourists with graduate school education. It also seems thatWTP would increase with higher income. An important finding ofthis study is that loyal tourists would be willing to pay more forurban forests. WTP increases significantly with the number of pre-vious visits. Both first time and repeat visitors are important fora city’s tourism industry. However, a marketing strategy towardsretaining the repeat visitors would be beneficial in terms of increas-ing the overall WTP for urban forests.
Land use in urban areas is highly competitive (Deng et al., 2010).Georgia is one of the fastest growing states in the US. Populationgrowth and urban development puts continuous pressure on openand green spaces in Georgia cities. If urban forest areas are notjustified for their existence in terms of economic revenues gen-erated from tourism and other sources, it would be very likely thatsome of the green areas may give way to residential or commercialdevelopment. This was experienced in 1954 when one of the old-est squares in Savannah, Ellis Square, was converted into a parkinggarage (Southeast Real Estate Business [SREB], 2003). Conversion ofgreen spaces to other land uses not only deteriorates urban environ-ment and quality of life, but also causes loss of non-market benefits(Ulrich, 1984; Kaplan and Kaplan, 1989; Kaplan et al., 1998; Ode andFry, 2002; Pauleit et al., 2005). As estimated by this study, value ofSavannah’s urban forests in tourism is enormous.
The results of this study would be useful for urban resourcemanagers and planners in making efficient land use and manage-ment decisions. Economic efficiency in maintaining urban forestscan be achieved by capturing the tourism benefits in the form offees for enjoying urban forest resources in Savannah. One optionwould be to have the tourism industry of Savannah to contributefinancially to the urban forest management services providedby the Savannah Park and Tree Department which include haz-ard/emergency tree removal, fallen limb removal, stump grinding,service request pruning, preventive maintenance pruning, treeplanting, and young tree care/maintenance (SPTD, 2011). Feescould be collected through coin-operated gates, spot checks of tick-ets from self-service machines, trolley bus vendors who provide bustours that pass through the public squares and other urban forestfeatures (for example, for a ticket of $2, $0.50 may be returned to thecity’s Park and Tree Department for the planting and maintenanceof urban forests). The magnitude of the estimated aggregate valueof urban forests from tourism perspective gives the policymakersvaluable information on the contribution of urban forest resourcesto the quality of Savannah’s landscape.
The majority of the respondents in this study reported very lowWTP for urban forests. Thus policymakers need to consider thetrade-off between funds acquired through fees and the resultingreduction in number of visits (Reynisdottir et al., 2008). A fee pol-icy ignoring this issue would undermine the objective of promotingaccess. However, it should be noted that urban forest resources arenot the primary determinant of tourist visits in Savannah. Theseresources enhance urban tourism experience. Imposing a fee, there-fore, is not expected to result in a significant reduction in numberof visits. Tourists not willing to pay for urban forests can simplyignore visiting urban forest attractions in Savannah. Finally, a dona-tion program can also be a useful additional way of capturing theconsumer surplus value estimated in this study.
This study is not free from limitations and thus the WTP esti-mates should be used with caution. The data collected using theconvenience sampling method may not be representative of theactual population although the survey was conducted in differentseasons. No significant difference was found in WTP between
seasons. Since the actual population of tourists to Savannah wasunknown, this study took the best possible measures in an attemptto understand tourists’ WTP for urban forests. As one anonymousreviewer pointed out, another limitation of this study lies in
2 y & Ur
tqWfiaVAmpafauerf
A
oURCrvwftHdoa
R
A
BB
C
D
D
G
J
J
80 S. Majumdar et al. / Urban Forestr
he definition of “visits.” The respondents answered the surveyuestions in terms of a trip, which could be one or more days.e were unable to obtain the definition used by the consultant
rm who estimated the total number of tourist visits in Savannahs the formula used by the firm was “proprietary” (Jenny Dent,isit Savannah, Savannah, Georgia, personal communication,pril 2011). A consultant firm working with hotel records, etc.ight have estimated tourist days and called them visits. This
ossible difference in the definition of visits may have affected theggregate value estimated in this study. Finally, the value of urbanorests to local residents and the indirect impact on job creationnd related sectors were not included in our study. The value ofrban trees is very much dependent on the context (e.g., social vs.nvironmental) and the type of stakeholders (e.g., tourists vs. localesidents). A more holistic valuation approach is needed in theuture towards understanding the value of urban forests.
cknowledgements
This research was funded by the USDA Forest Service to the sec-nd author of this article under the recommendation of the Nationalrban & Community Forestry Advisory Council. We thank Susaneisch (Urban & Community Forestry Coordinator, Georgia Forestryommission) and Kacey Ratterree for their interest in this study andeview of the survey questionnaire. Thanks go to West Virginia Uni-ersity graduate students David Dyre and Stacy Casinelli for helpith the survey, and and Rogelio Andrada II and Ishwar Dhami
or data entry and cleaning. Special thanks to David White (Direc-or of Savannah Park and Tree Department) and his colleagues Billaws and Ronald Kevin Brown for their assistance and coordinationuring the survey. We also gratefully acknowledge the commentsf Diane Hite and Peng Zeng of Auburn University, and the twononymous reviewers.
eferences
shworth, G.J., 2004. The Blue-grey Transition: Heritage in the Reinventionof the Tourism Resort, Retrieved September 20th, 2010 from http://www.thebestinheritage.com/files/pdf/the blue-grey transition.pdf.
otkin, D.B., Beveridge, C.E., 1997. Cities as environments. Urban Ecosystems 1, 3–19.uhyoff, G.J., Gauthier, L., Wellman, J.D., 1984. Predicting scenic quality for urban
forest using vegetation measurements. Forest Science 30, 71–82.ameron, T.A., Huppert, D.D., 1989. OLS versus ML estimation of non-market
resource values with payment card interval data. Journal of Environmental Eco-nomics and Management 17 (3), 230–246.
eng, J., Arano, K.G., Pierskalla, C., McNeel, J., 2010. Linking urban forests and urbantourism: a case of Savannah, Georgia. Tourism Analysis 15 (2), 167–181.
wyer, J., McPherson, E., Schroeder, H., Rowntree, R., 1992. Assessing the benefitsand costs of the urban forest. Journal of Arboriculture 18, 227–234.
offe, P.L., 1995. The benefits of improvements in coastal water quality: a contingentapproach. Journal of Environmental Management 45, 305–317.
im, C.Y., Chen, W.Y., 2006. Recreation—amenity use and contingent valuation ofurban green spaces in Guangzhou, China. Landscape and Urban Planning 75,81–96.
udd, D., 1995. Promoting tourism in US cities. Tourism Management 16 (3),175–187.
ban Greening 10 (2011) 275– 280
Kaplan, R., Kaplan, S., 1989. The Experience of Nature: A Psychological Perspective.Cambridge University Press, Cambridge, UK.
Kaplan, R., Kaplan, S., Ryan, R.L., 1998. With People in Mind. Island Press, Washington,DC.
Law, C.M., 2002. Urban Tourism: The Visitor Economy and the Growth of Large Cities.Continuum, New York.
Lee, C.-K., 1997. Valuation of nature-based tourism resources using dichotomouschoice contingent valuation method. Tourism Management 18 (8), 587–591.
Lee, C.-K., Han, S.-Y., 2002. Estimating the use and preservation values of nationalparks’ tourism resources using a contingent valuation method. Tourism Man-agement 23, 531–540.
Legget, C.G., Kleckner, N.S., Boyle, K.G., Duffield, J.W., Mitchell, R.C., 2003. Socialdesirability bias in contingent valuation surveys administered through in-person interviews. Land Economics 79, 561–575.
Lorenzo, A.B., Blanche, C.A., Qi, Y., Guidry, M.M., 2000. Assessing residents’willingness-to-pay to preserve the community urban forest: a small-city casestudy. Journal of Arboriculture 26 (6), 319–325.
Miller, R.W., 1988. Urban Forestry: Planning and Managing Urban Greenspaces.Prentice-Hall, Englewood Cliffs, NJ.
Mitchell, R.C., Carson, R.T., 1989. Using Surveys to Value Public Goods: The Contin-gent Valuation Method. Resources for the Future, Washington, DC.
Neamtzu, C., 2003. Oregon urban forestry on the map. Oregon Community Tree News13 (2), 1–12.
New Georgia Encyclopedia (NGE), 2010. Savannah, Retrieved September 17th, 2010from http://www.georgiaencyclopedia.org/nge/Article.jsp?id=h-1056&hl=y.
Notaro, S., Salvo, M.D., 2010. Estimating the economic benefits of the landscapefunction of ornamental trees in a sub-Mediterranean area. Urban Forestry &Urban Greening 9, 71–81.
Ode Åsa, K., Fry, G.L.A., 2002. Visual aspects in urban woodland management. UrbanForestry & Urban Greening 1 (1), 15–24.
Opperman, M., 1998. Destination threshold potential and the law of repeat visitation.Journal of Travel Research 37, 131–137.
Oppermann, M., 2000. Tourism destination loyalty. Journal of Travel Research 39(1), 78–84.
Pauleit, S., Ennos, R., Golding, Y., 2005. Modeling the environmental impacts of urbanland use and land cover change—a study in Merseyside, UK. Landscape and UrbanPlanning 71, 295–310.
Price, C., 2003. Quantifying the aesthetic benefits of urban forestry. Urban Forestry& Urban Greening 1 (3), 123–133.
Reynisdottir, M., Song, H., Agrusa, J., 2008. Willingness to pay entrance fees to naturalattractions: an Icelandic study. Tourism Management 29 (6), 1076–1083.
Savannah Park and Tree Department (SPTD), 2010. Introduction to Savannah’s UrbanForest, Retrieved September 17th, 2010 from http://www.ci.savannah.ga.us/cityweb/p&tweb.nsf/950e01f292e02b9c852568ab00686f30/e32fed55a733a87085256c5a004a73c4?OpenDocument.
Savannah Park and Tree Department (SPTD), 2011. Tree Services provided by theDepartment, Retrieved February 17th, 2011 from http://www.savannahga.gov/cityweb/p&tweb.nsf/3f8306be7ac3fe6f85256c06004e912c/bebfeffde507f11b85256c5a004a73c6?OpenDocument.
Smardon, R.C., 1988. Perception and aesthetics of the urban environment: review ofthe role of vegetation. Landscape and Urban Planning 15, 85–106.
Southeast Real Estate Business (SREB), 2003. Strong Infrastructure DevelopmentHelps Savannah, Retrieved February 17th, 2011 from http://www. southeastre-business.com/articles/FEB03/highlight1.html.
Togridou, A., Hovardas, T., Pantis, J.D., 2006. Determinants of visitors’ willingness topay for the National Marine Park of Zakynthos, Greece. Ecological Economics 60,308–319.
Tyrväinen, L., Väänänen, H., 1998. The economic value of urban forest amenities: anapplication of the contingent valuation method. Landscape and Urban Planning43, 105–118.
United States Bureau of the Census (USBOC), 2010. Population Estimates: Incorpo-rated Places and Minor Civil Divisions, Retrieved September 17th, 2010 from
http://www.census.gov/popest/cities/SUB-EST2009-4.html.Ulrich, R.S., 1984. View through a window may influence recovery from surgery.Science 224, 420–421.
Wooldridge, J., 2003. Introductory Econometrics: A Modern Approach. Thompsonand Southwestern Publisher, Cincinnati, OH.