using calculated chemical potential relationships to account for coronas around kyanite: an example...
TRANSCRIPT
Using calculated chemical potential relationships to account forcoronas around kyanite: an example from the Bohemian Massif
P. ST IPSKA ,1 R. POWELL,2 R. W. WHITE3 AND J. A. BALDWIN4
1Ecole et Observatoire des Sciences de la Terre, IPGS (CNRS UMR7516), Universite de Strasbourg, 1 rue Blessig, 67084Strasbourg, France ([email protected])2School of Earth Sciences, The University of Melbourne, Melbourne, Vic. 3010, Australia3Institute for Geosciences, University of Mainz, D-55099 Mainz, Germany4Department of Geosciences, University of Montana, Missoula, MT 59812, USA
ABSTRACT Corona textures around kyanite, involving for example zoned plagioclase separating kyanite from thematrix, reflect the instability of kyanite with the matrix on changing P–T conditions, commonly relatedto decompression. The chemical potential gradients set up between the kyanite and the matrix as aconsequence of slow Al diffusion drive corona development, with the zoning of the plagioclase reflectingthe gradients. Calculated mineral equilibria are used to account for corona textures involvingplagioclase ± garnet around kyanite, and replacement of kyanite by plagioclase + spinel symplectite,in quartz + plagioclase + K-feldspar + garnet + kyanite granulite facies gneiss from the Blansky lesmassif in the Bohemian massif, Czech Republic. In the garnet-bearing coronas, a commonlydiscontinuous garnet layer lies between the kyanite and the continuous plagioclase layer in the corona,with both the garnet and the plagioclase appearing mainly to replace matrix rather than kyanite. Thegarnet layer commonly extends around kyanite from original matrix garnet adjacent to the kyanite.Where garnet is missing in the corona, the kyanite itself may be replaced by a spinel–plagioclase corona.In a local equilibrium model, the mineral and mineral compositional spatial relationships are shown tocorrespond to paths in l(Na2O)–l(CaO)–l(K2O)–l(FeO)–l(MgO)–l(SiO2) in the model chemicalsystem, Na2O–CaO–K2O–FeO–MgO–Al2O3–SiO2 (NCKFMAS). The discontinuous nature of thegarnet layer in coronas is accounted for by the effect of the adjacent original garnet on the chemicalpotential relationships. The replacement of kyanite by spinel + plagioclase appears to be metastablewith respect to replacement by corundum + plagioclase, possibly reflecting the difficulty of nucleatingcorundum.
Key words: Bohemian massif; chemical potential; ky–K-feldspar granulite; plagioclase ± garnet aroundkyanite; plagioclase–spinel symplectite.
INTRODUCTION
In an equilibrium model of metamorphism, a mineralassemblage and the mineral compositions are atequilibrium on some length scale at the prevailingpressure–temperature (P–T) conditions (e.g. Powellet al., 2005), building on the idea of local or mosaicequilibrium (Korzhinskii, 1959; Thompson, 1959). If anew mineral does not nucleate with changing condi-tions, the equilibrium will be a metastable one, ratherthan the stable one. If the scale of equilibration isvanishingly small, no visible change occurs. Equili-bration itself is dependent on rates of intergranular (i.e.grain boundary, or intercrystalline) and intracrystal-line diffusion, which in turn depend on temperature,rate of change of temperature with time, fluid ⁄meltpresence ⁄ absence, grain size, strain in the minerals, etc.
Assuming equalized P–T between the different partsof a mineral assemblage, equilibration involves equal-izing of chemical potentials. If, with changing P–T,
minerals in an assemblage are no longer in equilibriumwith each other, chemical potential gradients areestablished between them. Reaction will then occur inan attempt to flatten out the gradients. As discussed inWhite et al. (2008), such reaction may proceed tocompletion, with chemical potential gradientsremoved, while still leaving spatial and compositionalconsequences of the reaction path, particularly forreaction in the prograde history. Reaction in theretrograde history commonly does not proceed tocompletion, with effective reaction ceasing duringcooling because the rate of equilibration becomes tooslow even though chemical potential gradients are stillpresent. This, combined with the coarser-grained nat-ure of higher temperature mineral assemblages, resultsin the characteristic feature of retrograde reaction inhigher grade rocks: the development of coronas.
A situation in which corona development may occuris in response to chemical potential gradients estab-lished between a mineral and other parts of a mineral
J. metamorphic Geol., 2010, 28, 97–116 doi:10.1111/j.1525-1314.2009.00857.x
� 2009 Blackwell Publishing Ltd 9 7
assemblage when they are no longer in equilibriumwith each other with changed P–T. This appears to becommonly the case for kyanite. With the assumptionof local equilibrium in the corona around the mineral,the minerals and their compositions will be the (stableor metastable) equilibrium ones at the chemicalpotentials that exist at that position along the spatiallydeveloped chemical potential gradients.
There are two lineages for considering the conse-quences of chemical potential gradients to account forreaction textures in a local equilibrium context thatstart with Korzhinskii, as outlined by White et al.(2008). One lineage runs through Thompson (1959,1970), Brady (1977) and Rumble (1982) to the presentday. In this lineage, the chemical potential relation-ships are the primary focus, but, for example, the pathsacross chemical potential diagrams are essentiallyqualitative. The other, with a focus on physicalmodelling of coronas, starts with Fisher (1973), andproceeds through Joesten (1977), and for exampleAshworth & Birdi (1990) to the present day. In thislineage, in principle, the paths across chemical poten-tial diagrams should be able to be calculated, but theinformation is not available to do that currently,except in simple situations. So, for example, systemsinvolving solid solutions cannot be handled in a gen-eral way, yet most coronas of interest do involve solidsolutions, as do the ones under consideration here. Inaccord with White et al. (2008), this study follows thefirst lineage by calculating chemical potential rela-tionships for phase equilibria involving solid solutions,accepting that the paths in chemical potential will beessentially qualitative. Here we use calculated chemicalpotential relationships to account for corona texturesaround kyanite in felsic granulite from the Blansky lesmassif in the Bohemian massif, Czech Republic(Fig. 1).
GEOLOGICAL BACKGROUND
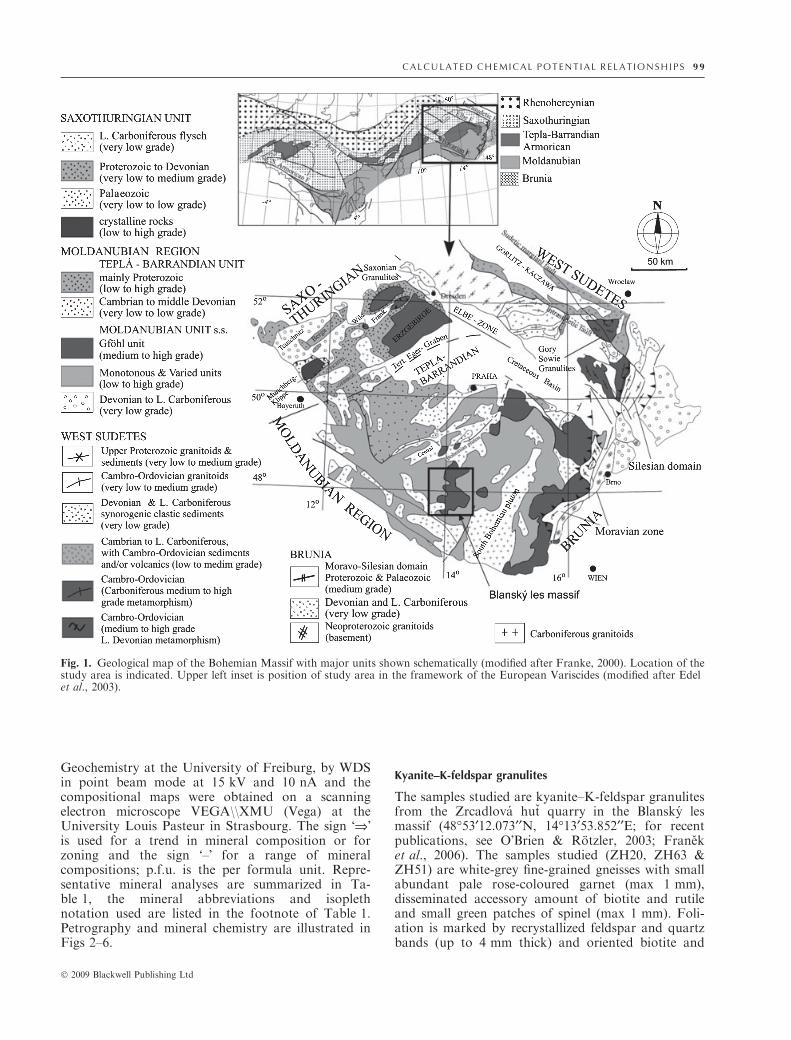
The classical lithological division of the VariscanMoldanubian internal orogenic zone in the BohemianMassif includes the Gfohl unit and Monotonous andVaried groups (e.g. Fuchs, 1986; Fig. 1). The Gfohlunit is characterized by high-grade rocks, interpretedas orogenic lower crust (Schulmann et al., 2005, 2008),that typically includes kyanite–K-feldspar granu-lite and migmatite orthogneiss, hosting mafic andintermediate granulite, peridotite and eclogite (e.g.Carswell, 1991; Medaris et al., 1995, 2005; O�Brien &Rotzler, 2003; Hasalova et al., 2008; Stıpska et al.,2008). The Monotonous and Varied groups aredominated by paragneisses that generally underwentupper amphibolite facies metamorphism and anatexis(Petrakakis, 1997; Schulmann et al., 2008) and areinterpreted as an orogenic middle crust (Schulmannet al., 2008; Stıpska et al., 2008). The kyanite–K-feld-spar granulites form bodies up to several kilometreslong that appear in two N–S-trending belts, one in the
middle of the Bohemian massif that includes thelocality studied, and the other along its eastern margin(Fig. 1).Kyanite–K-feldspar granulites commonly contain
kyanite, garnet, K-feldspar, plagioclase, quartz±perthite and ⁄ or antiperthite ±biotite ±sillimaniteand rutile. The prograde path and peak conditions ofthe granulite massifs are disputed, with some authorspreferring a high-pressure and high-temperature peak�16–18 kbar and 800–850 �C, whereas others preferultrahigh pressure and ⁄ or ultrahigh temperature con-ditions (for recent discussions, see O�Brien & Rotzler,2003; Stıpska & Powell, 2005; O�Brien, 2008; Raceket al., 2008). The retrograde path involves decom-pression to at least 10 kbar and in some areas mayhave continued to as low as 4 kbar almost isothermallyor associated with some cooling, followed by strongcooling with moderate or minor decompression(Petrakakis, 1997; O�Brien & Rotzler, 2003; Raceket al., 2006; Tajcmanova et al., 2006; Schulmann et al.,2008; Stıpska et al., 2008). The metamorphic peak isdated to c. 340 Ma (van Breemen et al., 1982; Kroneret al., 1988; Schulmann et al., 2005; Janousek et al.,2006) and amphibolite facies retrogression to 335–325 Ma (Matte et al., 1985; Brueckner et al., 1991;Beard et al., 1992; Dallmayer et al., 1992; Friedl et al.,2003; Schulmann et al., 2008).One of the major petrological features associated
with the retrograde path is the transition of kyanite tosillimanite, with kyanite being commonly associatedwith the steep fabric and growth of abundant sillima-nite in the areas of late intense flat fabric reworking(Tajcmanova et al., 2006; Stıpska et al., 2008). Kyaniteis commonly surrounded by plagioclase coronas insamples that may or may not contain sillimanite(O�Brien & Rotzler, 2003), and their progressivedevelopment has been described by Tajcmanova et al.(2007). In some areas there are also abundant coroniticstructures around kyanite that involve other mineralssuch as spinel, garnet, sapphirine or corundum inaddition to plagioclase (O�Brien & Rotzler, 2003).Some textural features, such as spinel-rich cores insome garnet, are also interpreted as pseudomorphsafter kyanite (O�Brien & Rotzler, 2003). Analogousoccurrences of plagioclase–around–kyanite coronasare described in the literature, that may also involvevarious other minerals such as corundum, spinel,sapphirine, garnet and cordierite (e.g. Dasgupta et al.,1995; Okay, 1995; Owen & Dostal, 1996; Moller, 1998;O�Brien, 1999; Nakamura & Hirajima, 2000;Nakamura, 2002; O�Brien & Rotzler, 2003; Baldwinet al., 2007).
PETROGRAPHY
Analytical procedures
The minerals were analysed using the Cameca SX100at the Institute of Mineralogy, Petrology and
9 8 P . S T I P S K A E T A L .
� 2009 Blackwell Publishing Ltd
Geochemistry at the University of Freiburg, by WDSin point beam mode at 15 kV and 10 nA and thecompositional maps were obtained on a scanningelectron microscope VEGA\\XMU (Vega) at theUniversity Louis Pasteur in Strasbourg. The sign ���is used for a trend in mineral composition or forzoning and the sign �–� for a range of mineralcompositions; p.f.u. is the per formula unit. Repre-sentative mineral analyses are summarized in Ta-ble 1, the mineral abbreviations and isoplethnotation used are listed in the footnote of Table 1.Petrography and mineral chemistry are illustrated inFigs 2–6.
Kyanite–K-feldspar granulites
The samples studied are kyanite–K-feldspar granulitesfrom the Zrcadlova hut quarry in the Blansky lesmassif (48�53¢12.073¢¢N, 14�13¢53.852¢¢E; for recentpublications, see O�Brien & Rotzler, 2003; Franeket al., 2006). The samples studied (ZH20, ZH63 &ZH51) are white-grey fine-grained gneisses with smallabundant pale rose-coloured garnet (max 1 mm),disseminated accessory amount of biotite and rutileand small green patches of spinel (max 1 mm). Foli-ation is marked by recrystallized feldspar and quartzbands (up to 4 mm thick) and oriented biotite and
Fig. 1. Geological map of the Bohemian Massif with major units shown schematically (modified after Franke, 2000). Location of thestudy area is indicated. Upper left inset is position of study area in the framework of the European Variscides (modified after Edelet al., 2003).
C A L C U L AT E D C H E MI CA L P O T E N T I A L R E L A T I O N S H I P S 9 9
� 2009 Blackwell Publishing Ltd
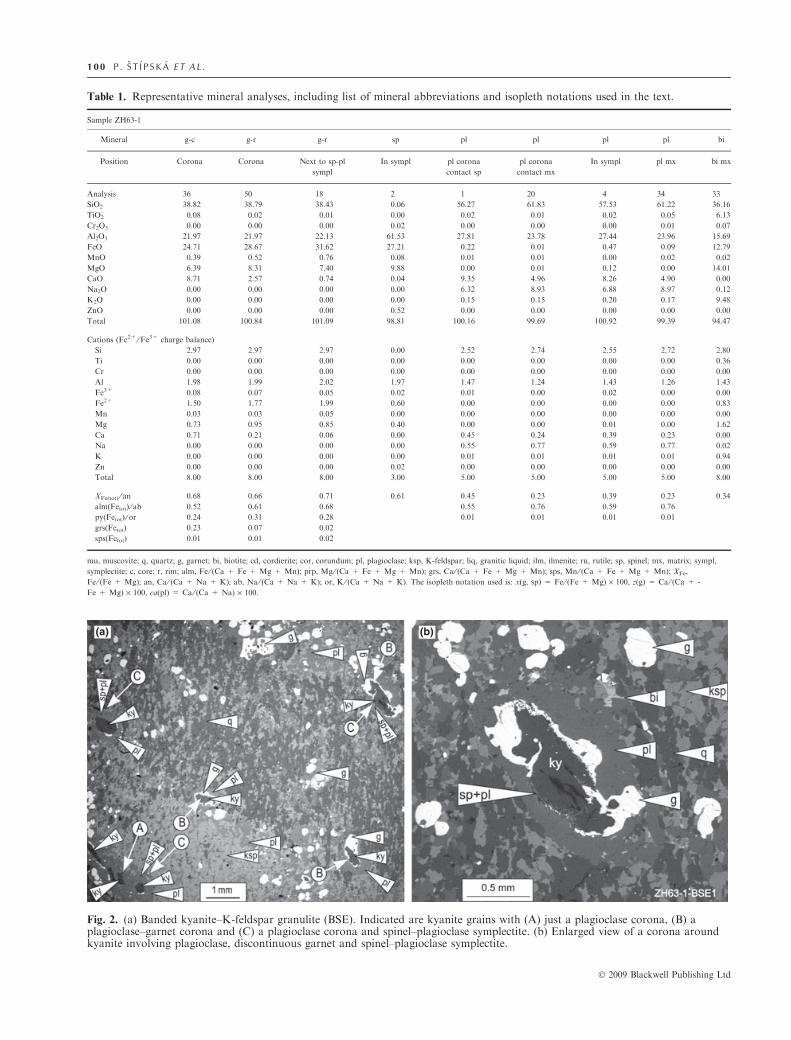
Table 1. Representative mineral analyses, including list of mineral abbreviations and isopleth notations used in the text.
Sample ZH63-1
Mineral g-c g-r g-r sp pl pl pl pl bi
Position Corona Corona Next to sp-pl
sympl
In sympl pl corona
contact sp
pl corona
contact mx
In sympl pl mx bi mx
Analysis 36 50 18 2 1 20 4 34 33
SiO2 38.82 38.79 38.43 0.06 56.27 61.83 57.53 61.22 36.16
TiO2 0.08 0.02 0.01 0.00 0.02 0.01 0.02 0.05 6.13
Cr2O3 0.00 0.00 0.00 0.02 0.00 0.00 0.00 0.01 0.07
Al2O3 21.97 21.97 22.13 61.53 27.81 23.78 27.44 23.96 15.69
FeO 24.71 28.67 31.62 27.21 0.22 0.01 0.47 0.09 12.79
MnO 0.39 0.52 0.76 0.08 0.01 0.01 0.00 0.02 0.02
MgO 6.39 8.31 7.40 9.88 0.00 0.01 0.12 0.00 14.01
CaO 8.71 2.57 0.74 0.04 9.35 4.96 8.26 4.90 0.00
Na2O 0.00 0.00 0.00 0.00 6.32 8.93 6.88 8.97 0.12
K2O 0.00 0.00 0.00 0.00 0.15 0.15 0.20 0.17 9.48
ZnO 0.00 0.00 0.00 0.52 0.00 0.00 0.00 0.00 0.00
Total 101.08 100.84 101.09 98.81 100.16 99.69 100.92 99.39 94.47
Cations (Fe2+ ⁄Fe3+ charge balance)
Si 2.97 2.97 2.97 0.00 2.52 2.74 2.55 2.72 2.80
Ti 0.00 0.00 0.00 0.00 0.00 0.00 0.00 0.00 0.36
Cr 0.00 0.00 0.00 0.00 0.00 0.00 0.00 0.00 0.00
Al 1.98 1.99 2.02 1.97 1.47 1.24 1.43 1.26 1.43
Fe3+ 0.08 0.07 0.05 0.02 0.01 0.00 0.02 0.00 0.00
Fe2+ 1.50 1.77 1.99 0.60 0.00 0.00 0.00 0.00 0.83
Mn 0.03 0.03 0.05 0.00 0.00 0.00 0.00 0.00 0.00
Mg 0.73 0.95 0.85 0.40 0.00 0.00 0.01 0.00 1.62
Ca 0.71 0.21 0.06 0.00 0.45 0.24 0.39 0.23 0.00
Na 0.00 0.00 0.00 0.00 0.55 0.77 0.59 0.77 0.02
K 0.00 0.00 0.00 0.00 0.01 0.01 0.01 0.01 0.94
Zn 0.00 0.00 0.00 0.02 0.00 0.00 0.00 0.00 0.00
Total 8.00 8.00 8.00 3.00 5.00 5.00 5.00 5.00 8.00
XFe(tot) ⁄ an 0.68 0.66 0.71 0.61 0.45 0.23 0.39 0.23 0.34
alm(Fetot) ⁄ ab 0.52 0.61 0.68 0.55 0.76 0.59 0.76
py(Fetot) ⁄ or 0.24 0.31 0.28 0.01 0.01 0.01 0.01
grs(Fetot) 0.23 0.07 0.02
sps(Fetot) 0.01 0.01 0.02
mu, muscovite; q, quartz; g, garnet; bi, biotite; cd, cordierite; cor, corundum; pl, plagioclase; ksp, K-feldspar; liq, granitic liquid; ilm, ilmenite; ru, rutile; sp, spinel; mx, matrix; sympl,
symplectite; c, core; r, rim; alm, Fe ⁄ (Ca + Fe + Mg + Mn); prp, Mg ⁄ (Ca + Fe + Mg + Mn); grs, Ca ⁄ (Ca + Fe + Mg + Mn); sps, Mn ⁄ (Ca + Fe + Mg + Mn); XFe,
Fe ⁄ (Fe + Mg); an, Ca ⁄ (Ca + Na + K); ab, Na ⁄ (Ca + Na + K); or, K ⁄ (Ca + Na + K). The isopleth notation used is: x(g, sp) = Fe ⁄ (Fe + Mg) · 100, z(g) = Ca ⁄ (Ca + -
Fe + Mg) · 100, ca(pl) = Ca ⁄ (Ca + Na) · 100.
(a) (b)
Fig. 2. (a) Banded kyanite–K-feldspar granulite (BSE). Indicated are kyanite grains with (A) just a plagioclase corona, (B) aplagioclase–garnet corona and (C) a plagioclase corona and spinel–plagioclase symplectite. (b) Enlarged view of a corona aroundkyanite involving plagioclase, discontinuous garnet and spinel–plagioclase symplectite.
1 00 P . S T I P S K A E T A L .
� 2009 Blackwell Publishing Ltd
(a) (b)
(c) (d)
(e) (f)
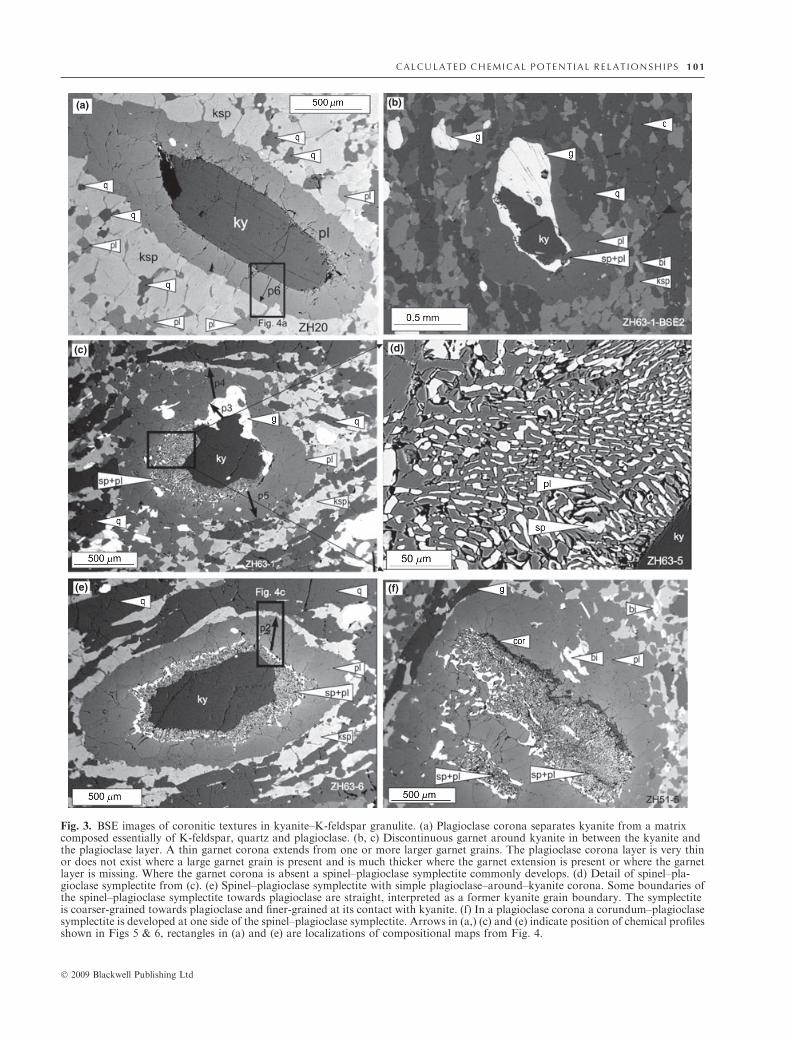
Fig. 3. BSE images of coronitic textures in kyanite–K-feldspar granulite. (a) Plagioclase corona separates kyanite from a matrixcomposed essentially of K-feldspar, quartz and plagioclase. (b, c) Discontinuous garnet around kyanite in between the kyanite andthe plagioclase layer. A thin garnet corona extends from one or more larger garnet grains. The plagioclase corona layer is very thinor does not exist where a large garnet grain is present and is much thicker where the garnet extension is present or where the garnetlayer is missing. Where the garnet corona is absent a spinel–plagioclase symplectite commonly develops. (d) Detail of spinel–pla-gioclase symplectite from (c). (e) Spinel–plagioclase symplectite with simple plagioclase–around–kyanite corona. Some boundaries ofthe spinel–plagioclase symplectite towards plagioclase are straight, interpreted as a former kyanite grain boundary. The symplectiteis coarser-grained towards plagioclase and finer-grained at its contact with kyanite. (f) In a plagioclase corona a corundum–plagioclasesymplectite is developed at one side of the spinel–plagioclase symplectite. Arrows in (a,) (c) and (e) indicate position of chemical profilesshown in Figs 5 & 6, rectangles in (a) and (e) are localizations of compositional maps from Fig. 4.
C AL C U L A TE D C H E M I C A L PO TE N T I A L R E L A T I O N S H I P S 10 1
� 2009 Blackwell Publishing Ltd
spinel patches. Kyanite is only rarely visible macro-scopically.
A back-scattered electron image of half a thin sec-tion is shown in Fig. 2a. This shows that the rock islayered with respect to the proportions of quartz andfeldspar, and that there is a well-developed secondfabric defined by quartz grain shape. The samplescontain characteristic coronas around kyanite thatinvolve plagioclase and, variously, garnet and spinel–plagioclase and corundum–plagioclase symplectites
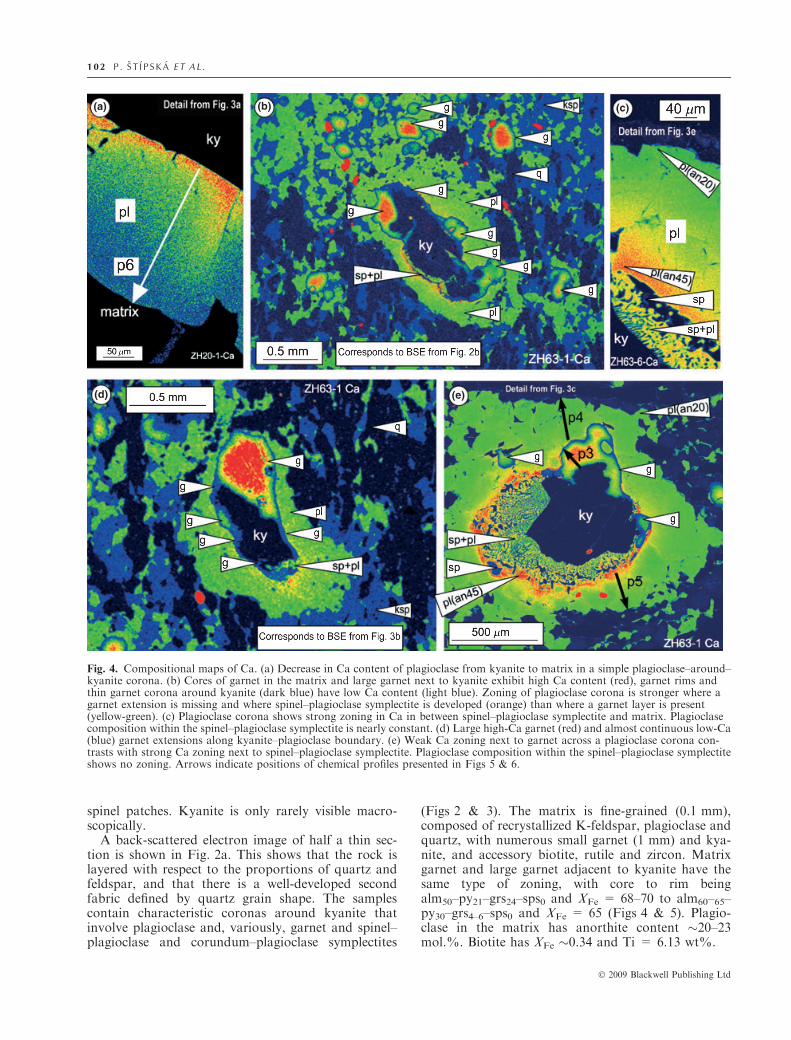
(Figs 2 & 3). The matrix is fine-grained (0.1 mm),composed of recrystallized K-feldspar, plagioclase andquartz, with numerous small garnet (1 mm) and kya-nite, and accessory biotite, rutile and zircon. Matrixgarnet and large garnet adjacent to kyanite have thesame type of zoning, with core to rim beingalm50–py21–grs24–sps0 and XFe = 68–70 to alm60–65–py30–grs4–6–sps0 and XFe = 65 (Figs 4 & 5). Plagio-clase in the matrix has anorthite content �20–23mol.%. Biotite has XFe �0.34 and Ti = 6.13 wt%.
(c)
(d)
(a) (b)
(e)
Fig. 4. Compositional maps of Ca. (a) Decrease in Ca content of plagioclase from kyanite to matrix in a simple plagioclase–around–kyanite corona. (b) Cores of garnet in the matrix and large garnet next to kyanite exhibit high Ca content (red), garnet rims andthin garnet corona around kyanite (dark blue) have low Ca content (light blue). Zoning of plagioclase corona is stronger where agarnet extension is missing and where spinel–plagioclase symplectite is developed (orange) than where a garnet layer is present(yellow-green). (c) Plagioclase corona shows strong zoning in Ca in between spinel–plagioclase symplectite and matrix. Plagioclasecomposition within the spinel–plagioclase symplectite is nearly constant. (d) Large high-Ca garnet (red) and almost continuous low-Ca(blue) garnet extensions along kyanite–plagioclase boundary. (e) Weak Ca zoning next to garnet across a plagioclase corona con-trasts with strong Ca zoning next to spinel–plagioclase symplectite. Plagioclase composition within the spinel–plagioclase symplectiteshows no zoning. Arrows indicate positions of chemical profiles presented in Figs 5 & 6.
1 02 P . S T I P S K A E T A L .
� 2009 Blackwell Publishing Ltd
Plagioclase–around–kyanite coronas
Kyanite in the kyanite–K-feldspar granulites of theBlansky les massif is commonly surrounded by apolycrystalline but monomineralic plagioclase coronathat separates kyanite from a matrix that is composedessentially of K-feldspar, quartz and plagioclase
(Fig. 3a). Texturally the kyanite appears not to besubstantially replaced (e.g. not greatly embayed), sothe plagioclase corona is considered to have grownmainly at the expense of the matrix. The plagioclase isstrongly zoned, with anorthite content increasing from20–23 mol.% at the contact with the matrix to38–45 mol.% at the kyanite–plagioclase boundary
(a) (b) (c) (d) (e) (f)
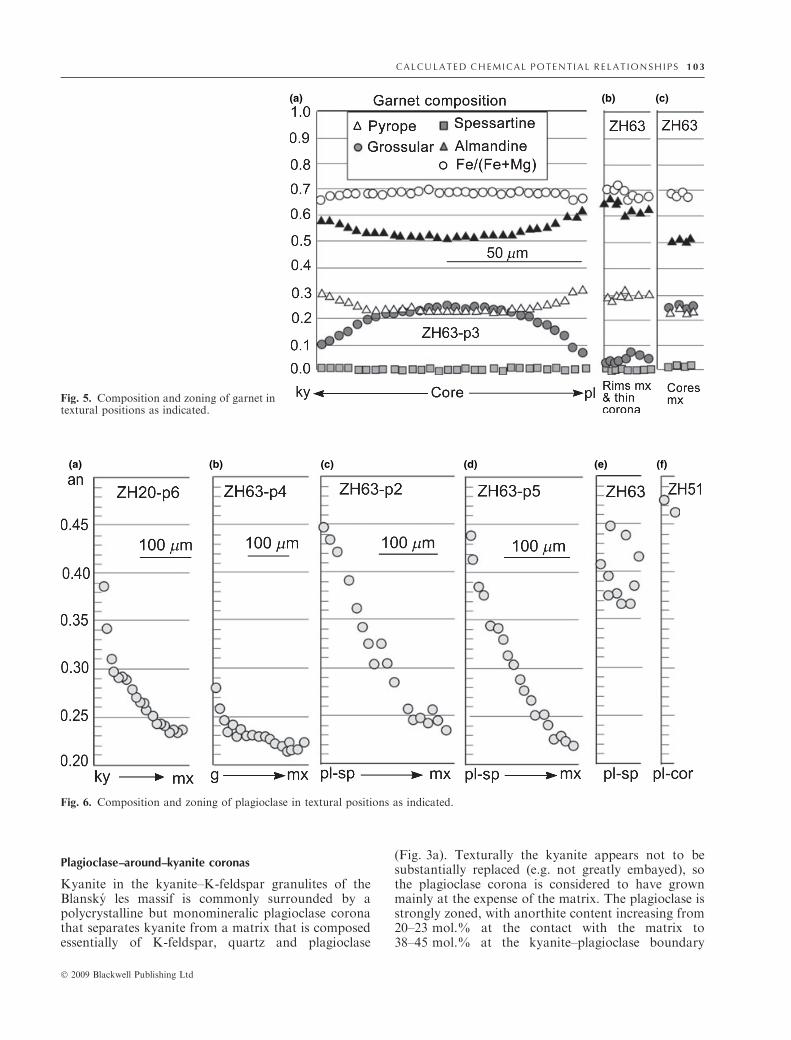
Fig. 6. Composition and zoning of plagioclase in textural positions as indicated.
(a) (b) (c)
Fig. 5. Composition and zoning of garnet intextural positions as indicated.
C AL C U L A TE D C H E M I C A L PO TE N T I A L R E L A T I O N S H I P S 10 3
� 2009 Blackwell Publishing Ltd
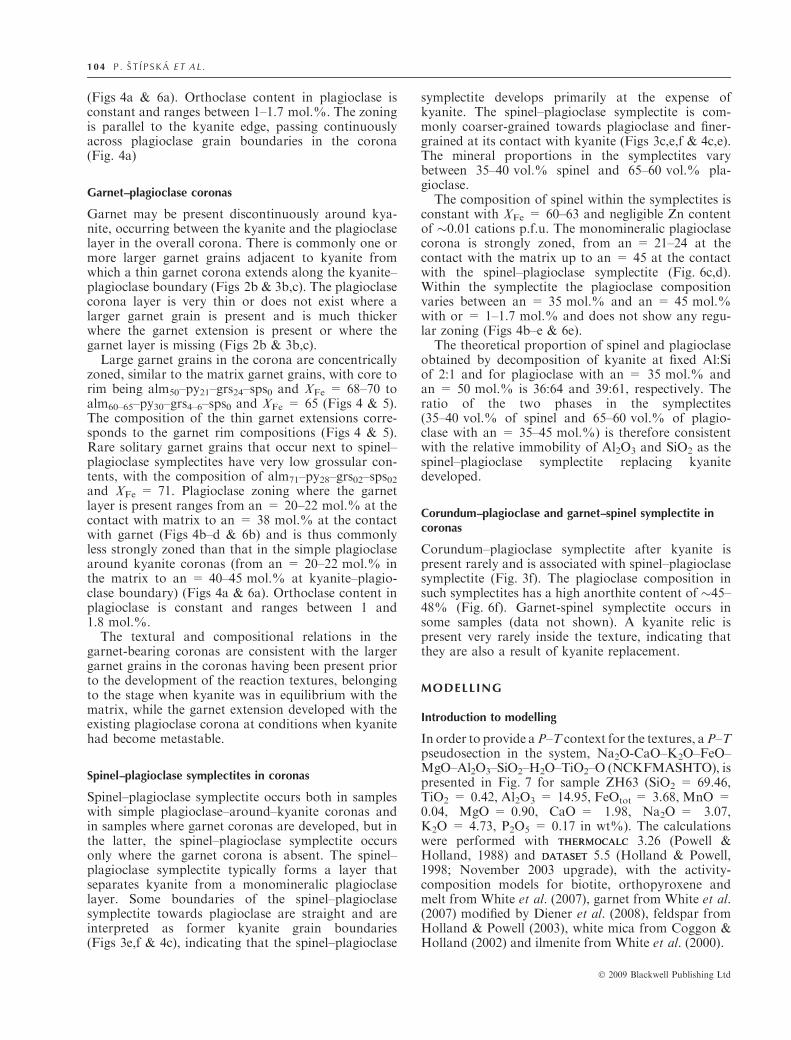
(Figs 4a & 6a). Orthoclase content in plagioclase isconstant and ranges between 1–1.7 mol.%. The zoningis parallel to the kyanite edge, passing continuouslyacross plagioclase grain boundaries in the corona(Fig. 4a)
Garnet–plagioclase coronas
Garnet may be present discontinuously around kya-nite, occurring between the kyanite and the plagioclaselayer in the overall corona. There is commonly one ormore larger garnet grains adjacent to kyanite fromwhich a thin garnet corona extends along the kyanite–plagioclase boundary (Figs 2b & 3b,c). The plagioclasecorona layer is very thin or does not exist where alarger garnet grain is present and is much thickerwhere the garnet extension is present or where thegarnet layer is missing (Figs 2b & 3b,c).
Large garnet grains in the corona are concentricallyzoned, similar to the matrix garnet grains, with core torim being alm50–py21–grs24–sps0 and XFe = 68–70 toalm60–65–py30–grs4–6–sps0 and XFe = 65 (Figs 4 & 5).The composition of the thin garnet extensions corre-sponds to the garnet rim compositions (Figs 4 & 5).Rare solitary garnet grains that occur next to spinel–plagioclase symplectites have very low grossular con-tents, with the composition of alm71–py28–grs02–sps02and XFe = 71. Plagioclase zoning where the garnetlayer is present ranges from an = 20–22 mol.% at thecontact with matrix to an = 38 mol.% at the contactwith garnet (Figs 4b–d & 6b) and is thus commonlyless strongly zoned than that in the simple plagioclasearound kyanite coronas (from an = 20–22 mol.% inthe matrix to an = 40–45 mol.% at kyanite–plagio-clase boundary) (Figs 4a & 6a). Orthoclase content inplagioclase is constant and ranges between 1 and1.8 mol.%.
The textural and compositional relations in thegarnet-bearing coronas are consistent with the largergarnet grains in the coronas having been present priorto the development of the reaction textures, belongingto the stage when kyanite was in equilibrium with thematrix, while the garnet extension developed with theexisting plagioclase corona at conditions when kyanitehad become metastable.
Spinel–plagioclase symplectites in coronas
Spinel–plagioclase symplectite occurs both in sampleswith simple plagioclase–around–kyanite coronas andin samples where garnet coronas are developed, but inthe latter, the spinel–plagioclase symplectite occursonly where the garnet corona is absent. The spinel–plagioclase symplectite typically forms a layer thatseparates kyanite from a monomineralic plagioclaselayer. Some boundaries of the spinel–plagioclasesymplectite towards plagioclase are straight and areinterpreted as former kyanite grain boundaries(Figs 3e,f & 4c), indicating that the spinel–plagioclase
symplectite develops primarily at the expense ofkyanite. The spinel–plagioclase symplectite is com-monly coarser-grained towards plagioclase and finer-grained at its contact with kyanite (Figs 3c,e,f & 4c,e).The mineral proportions in the symplectites varybetween 35–40 vol.% spinel and 65–60 vol.% pla-gioclase.The composition of spinel within the symplectites is
constant with XFe = 60–63 and negligible Zn contentof �0.01 cations p.f.u. The monomineralic plagioclasecorona is strongly zoned, from an = 21–24 at thecontact with the matrix up to an = 45 at the contactwith the spinel–plagioclase symplectite (Fig. 6c,d).Within the symplectite the plagioclase compositionvaries between an = 35 mol.% and an = 45 mol.%with or = 1–1.7 mol.% and does not show any regu-lar zoning (Figs 4b–e & 6e).The theoretical proportion of spinel and plagioclase
obtained by decomposition of kyanite at fixed Al:Siof 2:1 and for plagioclase with an = 35 mol.% andan = 50 mol.% is 36:64 and 39:61, respectively. Theratio of the two phases in the symplectites(35–40 vol.% of spinel and 65–60 vol.% of plagio-clase with an = 35–45 mol.%) is therefore consistentwith the relative immobility of Al2O3 and SiO2 as thespinel–plagioclase symplectite replacing kyanitedeveloped.
Corundum–plagioclase and garnet–spinel symplectite incoronas
Corundum–plagioclase symplectite after kyanite ispresent rarely and is associated with spinel–plagioclasesymplectite (Fig. 3f). The plagioclase composition insuch symplectites has a high anorthite content of �45–48% (Fig. 6f). Garnet-spinel symplectite occurs insome samples (data not shown). A kyanite relic ispresent very rarely inside the texture, indicating thatthey are also a result of kyanite replacement.
MODELLING
Introduction to modelling
In order to provide aP–T context for the textures, aP–Tpseudosection in the system, Na2O-CaO–K2O–FeO–MgO–Al2O3–SiO2–H2O–TiO2–O (NCKFMASHTO), ispresented in Fig. 7 for sample ZH63 (SiO2 = 69.46,TiO2 = 0.42, Al2O3 = 14.95, FeOtot = 3.68, MnO =0.04, MgO = 0.90, CaO = 1.98, Na2O = 3.07,K2O = 4.73, P2O5 = 0.17 in wt%). The calculationswere performed with THERMOCALCTHERMOCALC 3.26 (Powell &Holland, 1988) and DATASETDATASET 5.5 (Holland & Powell,1998; November 2003 upgrade), with the activity-composition models for biotite, orthopyroxene andmelt from White et al. (2007), garnet from White et al.(2007) modified by Diener et al. (2008), feldspar fromHolland & Powell (2003), white mica from Coggon &Holland (2002) and ilmenite from White et al. (2000).
1 04 P . S T I P S K A E T A L .
� 2009 Blackwell Publishing Ltd
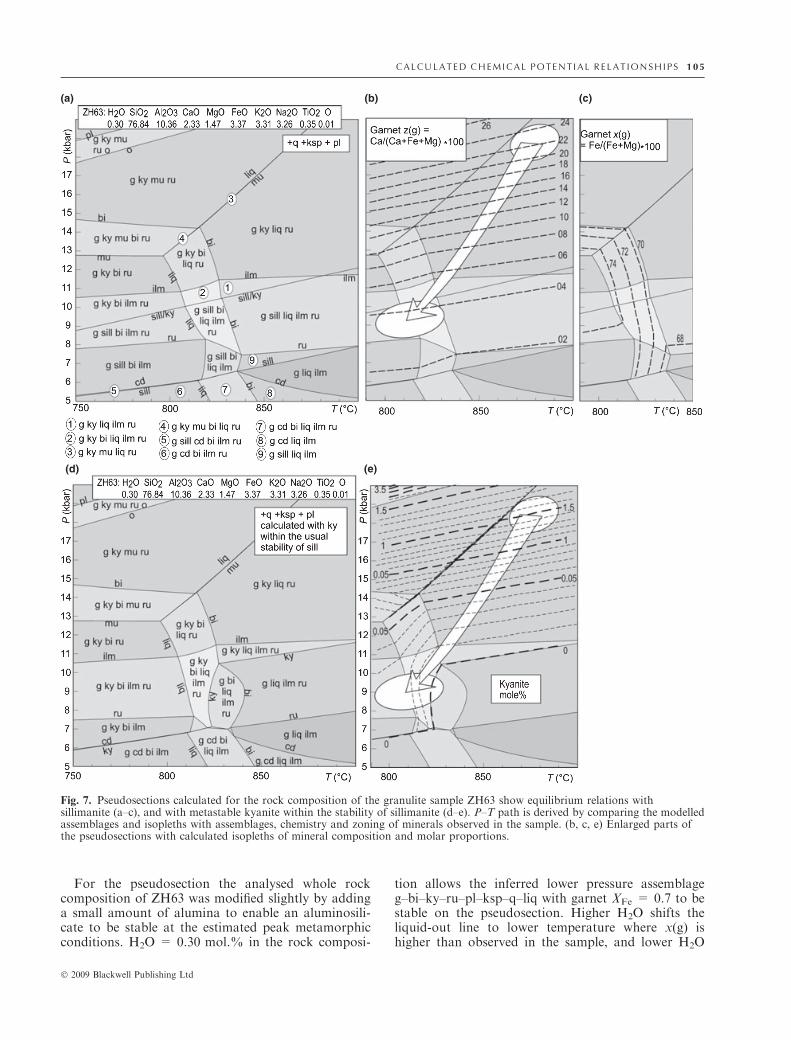
For the pseudosection the analysed whole rockcomposition of ZH63 was modified slightly by addinga small amount of alumina to enable an aluminosili-cate to be stable at the estimated peak metamorphicconditions. H2O = 0.30 mol.% in the rock composi-
tion allows the inferred lower pressure assemblageg–bi–ky–ru–pl–ksp–q–liq with garnet XFe = 0.7 to bestable on the pseudosection. Higher H2O shifts theliquid-out line to lower temperature where x(g) ishigher than observed in the sample, and lower H2O
(a) (b) (c)
(d) (e)
Fig. 7. Pseudosections calculated for the rock composition of the granulite sample ZH63 show equilibrium relations withsillimanite (a–c), and with metastable kyanite within the stability of sillimanite (d–e). P–T path is derived by comparing the modelledassemblages and isopleths with assemblages, chemistry and zoning of minerals observed in the sample. (b, c, e) Enlarged parts ofthe pseudosections with calculated isopleths of mineral composition and molar proportions.
C AL C U L A TE D C H E M I C A L PO TE N T I A L R E L A T I O N S H I P S 10 5
� 2009 Blackwell Publishing Ltd
moves the liquid-out line to higher temperature wherex(g) is lower than observed. The mineral compositionand molar proportion isopleths (abbreviations listed inTable 1) were plotted for the phases of interest.
Equilibrium relations with sillimanite are shown inFig. 7a–c, and relations with metastable kyanite withinthe stability of sillimanite in Fig. 7d–e. The position ofthe garnet compositional isopleths for assemblageswith sillimanite (Fig. 7b,c) is similar to those ofmetastable kyanite-bearing assemblages (data notshown). With the original minerals inferred to havebeen quartz, K-feldspar, plagioclase, garnet, kyanite,rutile and melt and using the garnet core compositionwith 22–24 mol.% of grossular, the peak metamorphicP–T conditions are estimated to have been �19 kbarand 880 �C. On the basis of the garnet rim compositionwith 3–4 mol.% of grossular, XFe = 0.7, and thepresence of biotite, the P–T conditions of the coronadevelopment, at least that involving garnet, is consis-tent with formation at �8.5 kbar and 800 �C, and thisP–T is used in the modelling below. The pseudosectionpredicts that sillimanite would be stable at pressuresless than �10 kbar. Given that it is not present in thesample studied, the kyanite observed is considered tobe metastable with respect to sillimanite and the cal-culations in the following sections are performed withkyanite rather than sillimanite.
Following equilibration of the mineral assemblage at19 kbar, decompression to 8.5 kbar occurred, with thematrix mineral assemblage, including the rim compo-sition of garnet, reflecting these conditions (Fig. 7e).Whereas in the calculations in the next section, inNCKAS rather than in NCKFMASHTO, kyanite isindeed not stable with the matrix at 8.5 kbar, in thepseudosection kyanite is still present at 8.5 kbar and800 �C, admittedly at very small molar content(<0.03 mol.%, Fig. 7e). This apparent inconsistencycan be ascribed to the bulk composition used for thepseudosection being slightly too aluminous, or thethermodynamic models of the minerals allowing alu-mina to be left over resulting in a small amount ofkyanite being made. Similarly, a small variation inH2O can move the solidus down through 800 �C.
Modelling the observed corona textures involvessuperimposing on such a P–T history an idea of whenand how the corona developed. Although it is possiblethat the corona developed continuously duringdecompression, it is plausible that little happenedduring decompression, and that corona developmentinitiated at lower pressure. This then could beconsidered, in the first instance, to have occurred atone P–T; this simplification is adopted here as it con-siderably simplifies the analysis. The original mineralassemblage in which kyanite was an equilibrium par-ticipant is considered to have decompressed to8.5 kbar and 800 �C with little or no reaction, and onlythen did the mineral assemblage attempt to re-equili-brate. If at these new conditions, with kyanite notstable with the matrix, all elements are sufficiently
mobile then the kyanite will simply be consumed, thekey elements being the slowest diffusers, which plau-sibly are Al, followed by Si (Carlson, 2002). Thepresence of a corona around kyanite indicates that Aldiffusion has been sufficiently slow to not allow simpleconsumption.Coronas consist of a layer or layers between the
reacting mineral and the matrix, each involving oneor more phases that reflect the chemical potentialgradients that existed then. In order to understand thedevelopment of such coronas it is necessary to con-sider how and why the gradients were initiated.Consumption of kyanite involves Al diffusing away,and at the same time other elements diffusing in.Clearly, the existence of the plagioclase coronareflects that the diffusion of Al could not occur fastenough. The start of the attempted flattening of thechemical potential of Al occurred by growth of moreanorthitic plagioclase on the kyanite, presumablyinitially grown on the less anorthitic plagioclase in thematrix (garnet could also be involved, as discussedbelow). In this way a monomineralic plagioclasecorona developed, in which the plagioclase is zonedfrom an anorthite content typical of the matrix, to amuch higher value in contact with the kyanite. Con-tinued corona growth, trying to flatten the chemicalpotential gradient of Al, involved replacement ofmatrix and, to a much lesser extent, kyanite byplagioclase. The stoichiometry and zoning of theplagioclase will have at least partially constrained thechemical potential gradients of other oxides betweenthe kyanite and the matrix.The number of phases in each layer of a corona
contains information about the effective mobilityof the elements involved. In this limiting case of amonomineralic layer (plagioclase) all components needto be mobile on the time and length scale of interest.But if a layer is bimineralic (as occurs with kyanitebeing replaced by spinel + plagioclase), then twocomponents are effectively immobile on the time andlength scale of interest. In fact, there is a hierarchy ofmobilities, or more strictly diffusivities, from theslowest (Al) to the fastest (K in NCKMAS?) in thiscase. For the purpose of phase equilibria modelling, itis convenient to subdivide the elements on the basis oftheir mobilities (on the time and length scale), to beeffectively immobile, mobile (but having chemicalpotentials that vary on the scale of the corona) andcompletely mobile (whose chemical potentials areconstant and superimposed on the corona), asdiscussed in White et al. (2008). This is an arbitrarydevice given that the diffusivities of the various com-ponents are in a continuum (i.e. nothing is likely to becompletely mobile or completely immobile), but itallows the modelling to be undertaken. In the contextof intensive v. extensive variables (e.g. Powell et al.,2005), mobile elements are considered in terms of theirchemical potentials (intensive variables), whereas theimmobile ones are considered in terms of composition
1 06 P . S T I P S K A E T A L .
� 2009 Blackwell Publishing Ltd
(extensive variables) (see Powell et al., 2005; Whiteet al., 2008, based on Munster, 1970; Callen, 1985).
Although the initial calculations to place the rocks inan overall P–T context have been performed inNCKFMASHTO (see above), the modelling of thecorona texture can be performed in Na2O–CaO–K2O–FeO–MgO–Al2O3–SiO2 (NCKFMAS). But even in thissmaller system there are considerable issues regard-ing representation of the mineral equilibria. A mono-mineralic zone of plagioclase occurring around kyaniteimplies that six oxides in this system need to be handledas chemical potential variables that change across thecorona, rather than composition variables, the seventhbeing dependent on the other chemical potentials viathe Gibbs-Duhem equation. Fortunately, prior toconsidering ferromagnesian minerals, the system can bereduced further to NCKAS, and, with an assumptionabout the mobility of K2O (taken to be completelymobile), the mineral equilibria can be representedcompletely in l(CaO)–l(Na2O)–l(SiO2) at fixed P–T.With a line representing the chemical potential gradi-ents in the corresponding 3D diagram, variations inl(MgO) and l(FeO) can then be addressed in order toconsider the stability of ferromagnesian minerals. Thisis the approach followed below.
In the modelling, the equilibria in the matrix areused to set the values of the chemical potentials thatare superimposed on the edge of the corona. It isassumed that the reacting mineral (kyanite) makes up aminority of the rock, so reaction is focused on thatmineral (in the form of the corona), the matrix actingeffectively as an infinite reservoir, changing little as aconsequence of the reaction except immediately adja-cent to the mineral. Thus, the superimposed chemical
potentials are not considered to vary as the coronadevelops.
The calculations in NCKFMAS were performedwith THERMOCALCTHERMOCALC 3.31 (Powell & Holland, 1988) andDATASETDATASET 5.5 (Holland & Powell, 1998; November 2003upgrade), with the activity-composition relationshipsof garnet, biotite and orthopyroxene used in Whiteet al. (2001), feldspar from Holland & Powell (2003),white mica from Coggon & Holland (2002) and meltfrom White et al. (2007).
Plagioclase–around–kyanite coronas in the system NCKAS
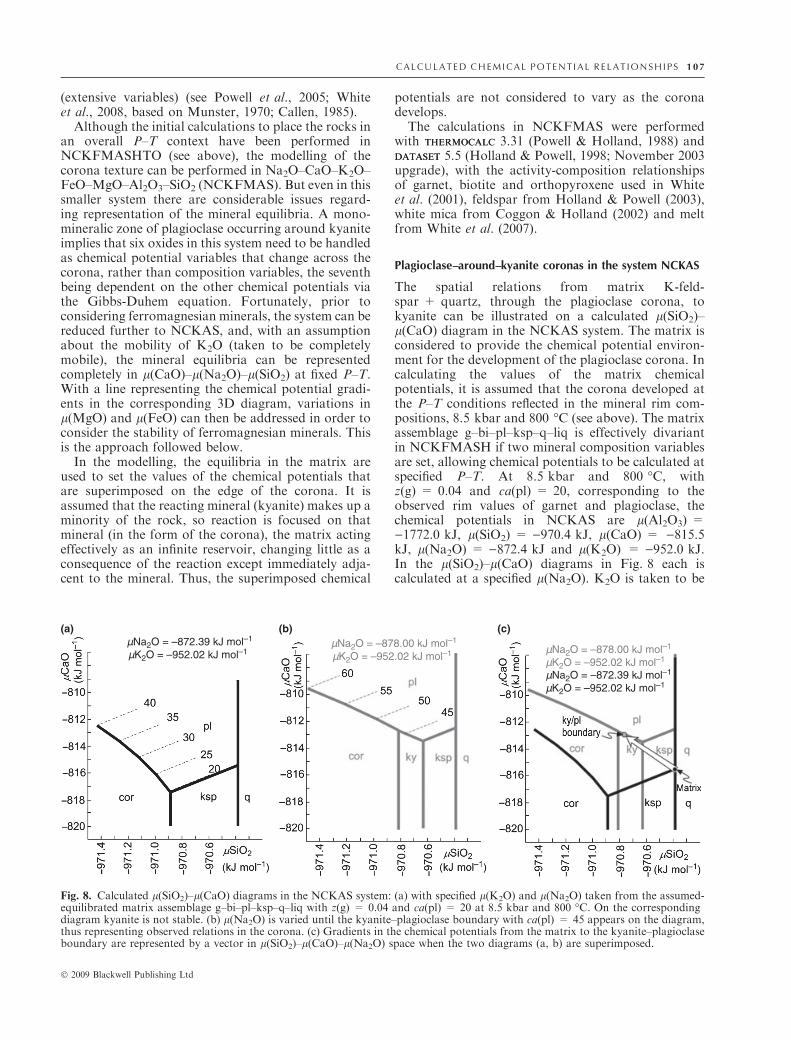
The spatial relations from matrix K-feld-spar + quartz, through the plagioclase corona, tokyanite can be illustrated on a calculated l(SiO2)–l(CaO) diagram in the NCKAS system. The matrix isconsidered to provide the chemical potential environ-ment for the development of the plagioclase corona. Incalculating the values of the matrix chemicalpotentials, it is assumed that the corona developed atthe P–T conditions reflected in the mineral rim com-positions, 8.5 kbar and 800 �C (see above). The matrixassemblage g–bi–pl–ksp–q–liq is effectively divariantin NCKFMASH if two mineral composition variablesare set, allowing chemical potentials to be calculated atspecified P–T. At 8.5 kbar and 800 �C, withz(g) = 0.04 and ca(pl) = 20, corresponding to theobserved rim values of garnet and plagioclase, thechemical potentials in NCKAS are l(Al2O3) =)1772.0 kJ, l(SiO2) = )970.4 kJ, l(CaO) = )815.5kJ, l(Na2O) = )872.4 kJ and l(K2O) = )952.0 kJ.In the l(SiO2)–l(CaO) diagrams in Fig. 8 each iscalculated at a specified l(Na2O). K2O is taken to be
(a) (b) (c) µNa2O = –872.39 kJ mol–1
µK2O = –952.02 kJ mol–1
µNa2O = –872.39 kJ mol–1
µK2O = –952.02 kJ mol–1
µNa2O = –878.00 kJ mol–1
µK2O = –952.02 kJ mol–1 µNa2O = –878.00 kJ mol–1
µK2O = –952.02 kJ mol–1
Fig. 8. Calculated l(SiO2)–l(CaO) diagrams in the NCKAS system: (a) with specified l(K2O) and l(Na2O) taken from the assumed-equilibrated matrix assemblage g–bi–pl–ksp–q–liq with z(g) = 0.04 and ca(pl) = 20 at 8.5 kbar and 800 �C. On the correspondingdiagram kyanite is not stable. (b) l(Na2O) is varied until the kyanite–plagioclase boundary with ca(pl) = 45 appears on the diagram,thus representing observed relations in the corona. (c) Gradients in the chemical potentials from the matrix to the kyanite–plagioclaseboundary are represented by a vector in l(SiO2)–l(CaO)–l(Na2O) space when the two diagrams (a, b) are superimposed.
C AL C U L A TE D C H E M I C A L PO TE N T I A L R E L A T I O N S H I P S 10 7
� 2009 Blackwell Publishing Ltd
completely mobile, with l(K2O) held constant on allthe l(SiO2)–l(CaO) diagrams, and so considered to bespecified and superimposed on the corona as it devel-ops (see Appendix for the calculation approach).
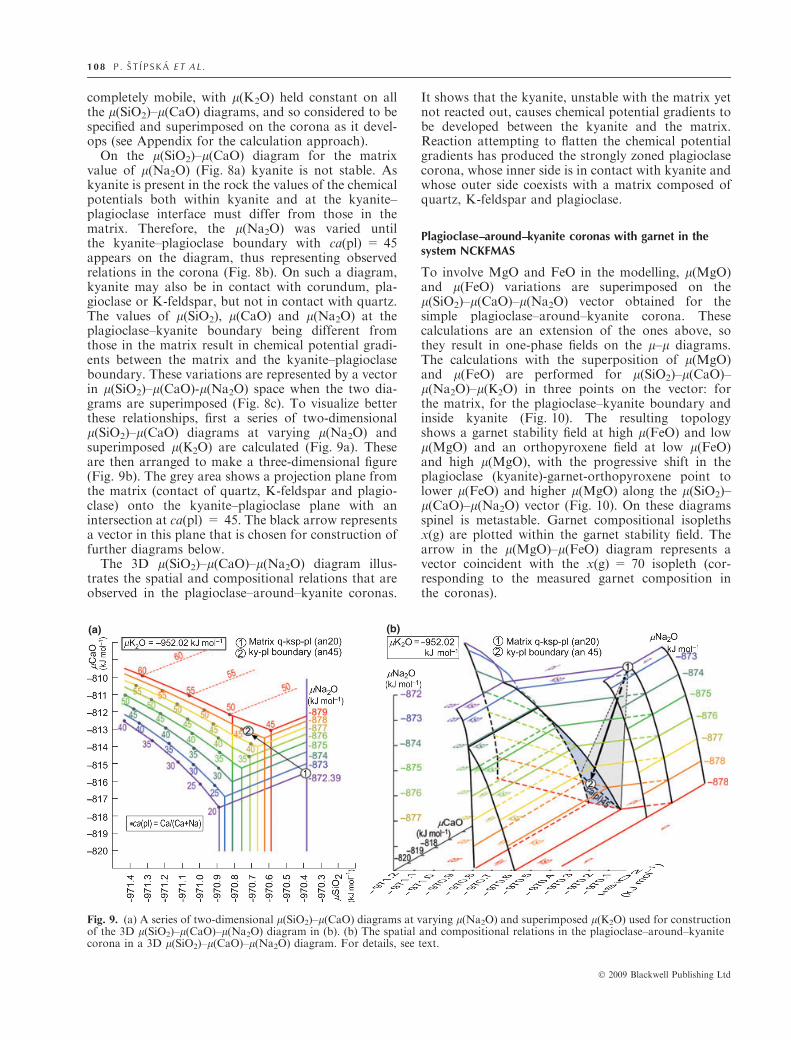
On the l(SiO2)–l(CaO) diagram for the matrixvalue of l(Na2O) (Fig. 8a) kyanite is not stable. Askyanite is present in the rock the values of the chemicalpotentials both within kyanite and at the kyanite–plagioclase interface must differ from those in thematrix. Therefore, the l(Na2O) was varied untilthe kyanite–plagioclase boundary with ca(pl) = 45appears on the diagram, thus representing observedrelations in the corona (Fig. 8b). On such a diagram,kyanite may also be in contact with corundum, pla-gioclase or K-feldspar, but not in contact with quartz.The values of l(SiO2), l(CaO) and l(Na2O) at theplagioclase–kyanite boundary being different fromthose in the matrix result in chemical potential gradi-ents between the matrix and the kyanite–plagioclaseboundary. These variations are represented by a vectorin l(SiO2)–l(CaO)-l(Na2O) space when the two dia-grams are superimposed (Fig. 8c). To visualize betterthese relationships, first a series of two-dimensionall(SiO2)–l(CaO) diagrams at varying l(Na2O) andsuperimposed l(K2O) are calculated (Fig. 9a). Theseare then arranged to make a three-dimensional figure(Fig. 9b). The grey area shows a projection plane fromthe matrix (contact of quartz, K-feldspar and plagio-clase) onto the kyanite–plagioclase plane with anintersection at ca(pl) = 45. The black arrow representsa vector in this plane that is chosen for construction offurther diagrams below.
The 3D l(SiO2)–l(CaO)–l(Na2O) diagram illus-trates the spatial and compositional relations that areobserved in the plagioclase–around–kyanite coronas.
It shows that the kyanite, unstable with the matrix yetnot reacted out, causes chemical potential gradients tobe developed between the kyanite and the matrix.Reaction attempting to flatten the chemical potentialgradients has produced the strongly zoned plagioclasecorona, whose inner side is in contact with kyanite andwhose outer side coexists with a matrix composed ofquartz, K-feldspar and plagioclase.
Plagioclase–around–kyanite coronas with garnet in thesystem NCKFMAS
To involve MgO and FeO in the modelling, l(MgO)and l(FeO) variations are superimposed on thel(SiO2)–l(CaO)–l(Na2O) vector obtained for thesimple plagioclase–around–kyanite corona. Thesecalculations are an extension of the ones above, sothey result in one-phase fields on the l–l diagrams.The calculations with the superposition of l(MgO)and l(FeO) are performed for l(SiO2)–l(CaO)–l(Na2O)–l(K2O) in three points on the vector: forthe matrix, for the plagioclase–kyanite boundary andinside kyanite (Fig. 10). The resulting topologyshows a garnet stability field at high l(FeO) and lowl(MgO) and an orthopyroxene field at low l(FeO)and high l(MgO), with the progressive shift in theplagioclase (kyanite)-garnet-orthopyroxene point tolower l(FeO) and higher l(MgO) along the l(SiO2)–l(CaO)–l(Na2O) vector (Fig. 10). On these diagramsspinel is metastable. Garnet compositional isoplethsx(g) are plotted within the garnet stability field. Thearrow in the l(MgO)–l(FeO) diagram represents avector coincident with the x(g) = 70 isopleth (cor-responding to the measured garnet composition inthe coronas).
(a) (b)
Fig. 9. (a) A series of two-dimensional l(SiO2)–l(CaO) diagrams at varying l(Na2O) and superimposed l(K2O) used for constructionof the 3D l(SiO2)–l(CaO)–l(Na2O) diagram in (b). (b) The spatial and compositional relations in the plagioclase–around–kyanitecorona in a 3D l(SiO2)–l(CaO)–l(Na2O) diagram. For details, see text.
1 08 P . S T I P S K A E T A L .
� 2009 Blackwell Publishing Ltd
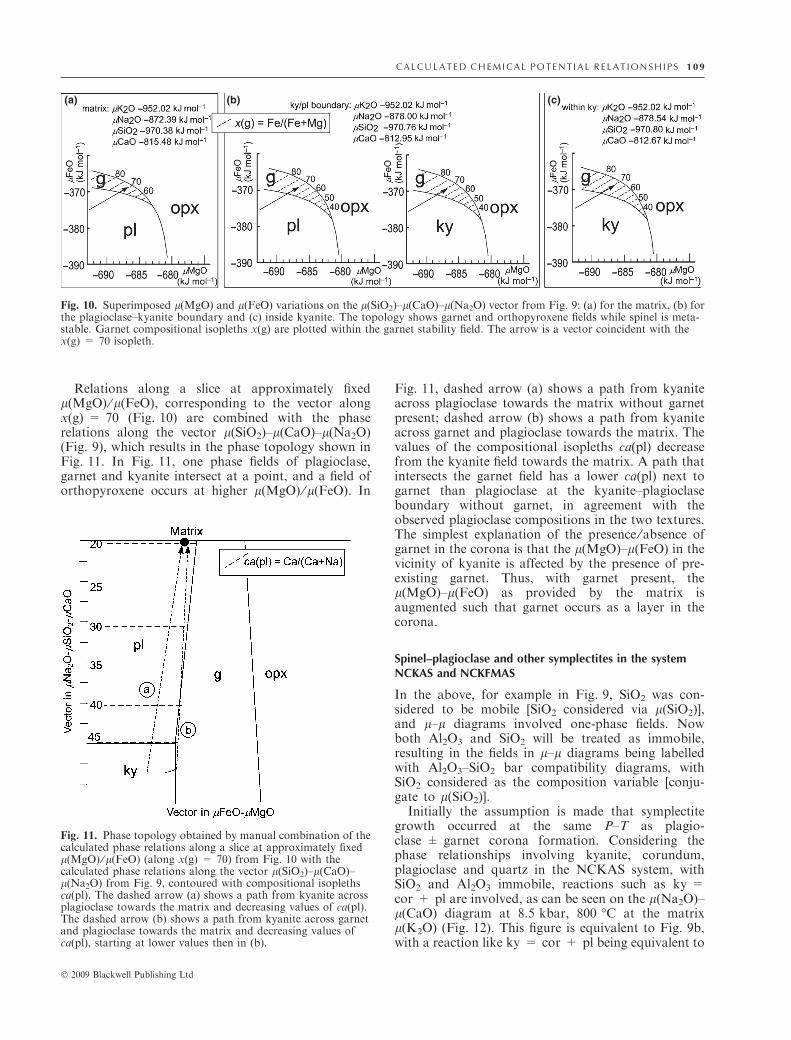
Relations along a slice at approximately fixedl(MgO) ⁄ l(FeO), corresponding to the vector alongx(g) = 70 (Fig. 10) are combined with the phaserelations along the vector l(SiO2)–l(CaO)–l(Na2O)(Fig. 9), which results in the phase topology shown inFig. 11. In Fig. 11, one phase fields of plagioclase,garnet and kyanite intersect at a point, and a field oforthopyroxene occurs at higher l(MgO) ⁄ l(FeO). In
Fig. 11, dashed arrow (a) shows a path from kyaniteacross plagioclase towards the matrix without garnetpresent; dashed arrow (b) shows a path from kyaniteacross garnet and plagioclase towards the matrix. Thevalues of the compositional isopleths ca(pl) decreasefrom the kyanite field towards the matrix. A path thatintersects the garnet field has a lower ca(pl) next togarnet than plagioclase at the kyanite–plagioclaseboundary without garnet, in agreement with theobserved plagioclase compositions in the two textures.The simplest explanation of the presence ⁄ absence ofgarnet in the corona is that the l(MgO)–l(FeO) in thevicinity of kyanite is affected by the presence of pre-existing garnet. Thus, with garnet present, thel(MgO)–l(FeO) as provided by the matrix isaugmented such that garnet occurs as a layer in thecorona.
Spinel–plagioclase and other symplectites in the systemNCKAS and NCKFMAS
In the above, for example in Fig. 9, SiO2 was con-sidered to be mobile [SiO2 considered via l(SiO2)],and l–l diagrams involved one-phase fields. Nowboth Al2O3 and SiO2 will be treated as immobile,resulting in the fields in l–l diagrams being labelledwith Al2O3–SiO2 bar compatibility diagrams, withSiO2 considered as the composition variable [conju-gate to l(SiO2)].
Initially the assumption is made that symplectitegrowth occurred at the same P–T as plagio-clase ± garnet corona formation. Considering thephase relationships involving kyanite, corundum,plagioclase and quartz in the NCKAS system, withSiO2 and Al2O3 immobile, reactions such as ky =cor + pl are involved, as can be seen on the l(Na2O)–l(CaO) diagram at 8.5 kbar, 800 �C at the matrixl(K2O) (Fig. 12). This figure is equivalent to Fig. 9b,with a reaction like ky = cor + pl being equivalent to
(a) (b) (c)
Fig. 10. Superimposed l(MgO) and l(FeO) variations on the l(SiO2)–l(CaO)–l(Na2O) vector from Fig. 9: (a) for the matrix, (b) forthe plagioclase–kyanite boundary and (c) inside kyanite. The topology shows garnet and orthopyroxene fields while spinel is meta-stable. Garnet compositional isopleths x(g) are plotted within the garnet stability field. The arrow is a vector coincident with thex(g) = 70 isopleth.
Fig. 11. Phase topology obtained by manual combination of thecalculated phase relations along a slice at approximately fixedl(MgO) ⁄ l(FeO) (along x(g) = 70) from Fig. 10 with thecalculated phase relations along the vector l(SiO2)–l(CaO)–l(Na2O) from Fig. 9, contoured with compositional isoplethsca(pl). The dashed arrow (a) shows a path from kyanite acrossplagioclase towards the matrix and decreasing values of ca(pl).The dashed arrow (b) shows a path from kyanite across garnetand plagioclase towards the matrix and decreasing values ofca(pl), starting at lower values then in (b).
C AL C U L A TE D C H E M I C A L PO TE N T I A L R E L A T I O N S H I P S 10 9
� 2009 Blackwell Publishing Ltd
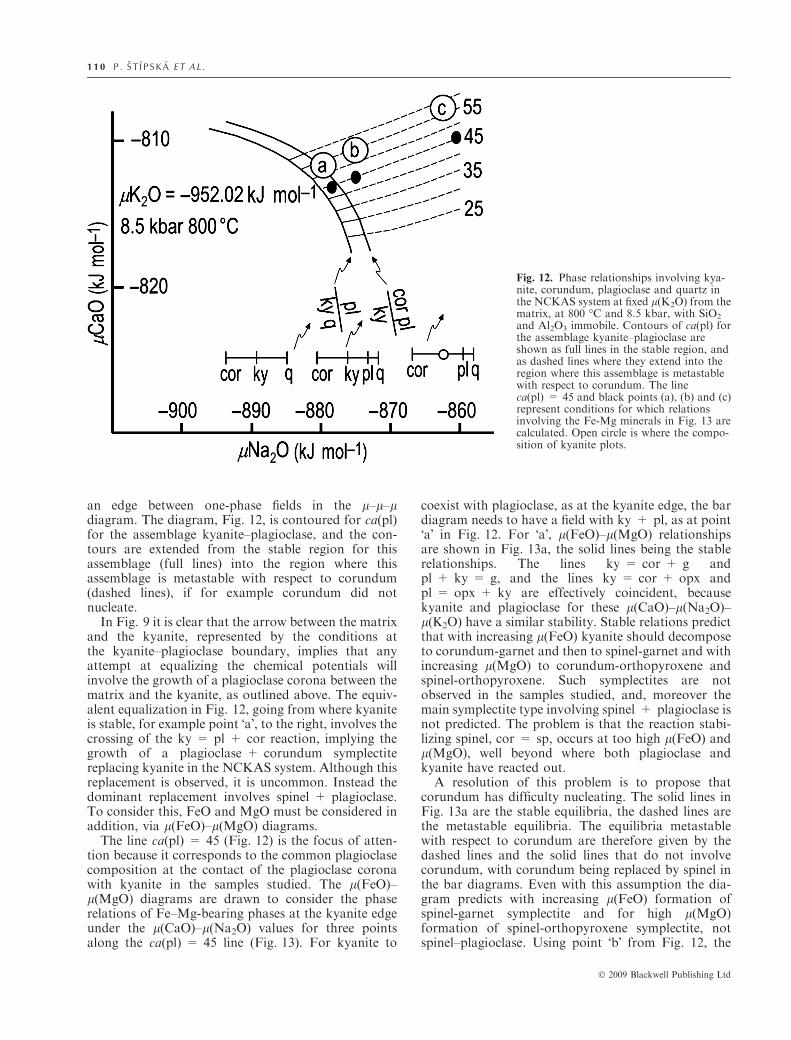
an edge between one-phase fields in the l–l–ldiagram. The diagram, Fig. 12, is contoured for ca(pl)for the assemblage kyanite–plagioclase, and the con-tours are extended from the stable region for thisassemblage (full lines) into the region where thisassemblage is metastable with respect to corundum(dashed lines), if for example corundum did notnucleate.
In Fig. 9 it is clear that the arrow between the matrixand the kyanite, represented by the conditions atthe kyanite–plagioclase boundary, implies that anyattempt at equalizing the chemical potentials willinvolve the growth of a plagioclase corona between thematrix and the kyanite, as outlined above. The equiv-alent equalization in Fig. 12, going from where kyaniteis stable, for example point �a�, to the right, involves thecrossing of the ky = pl + cor reaction, implying thegrowth of a plagioclase + corundum symplectitereplacing kyanite in the NCKAS system. Although thisreplacement is observed, it is uncommon. Instead thedominant replacement involves spinel + plagioclase.To consider this, FeO and MgO must be considered inaddition, via l(FeO)–l(MgO) diagrams.
The line ca(pl) = 45 (Fig. 12) is the focus of atten-tion because it corresponds to the common plagioclasecomposition at the contact of the plagioclase coronawith kyanite in the samples studied. The l(FeO)–l(MgO) diagrams are drawn to consider the phaserelations of Fe–Mg-bearing phases at the kyanite edgeunder the l(CaO)–l(Na2O) values for three pointsalong the ca(pl) = 45 line (Fig. 13). For kyanite to
coexist with plagioclase, as at the kyanite edge, the bardiagram needs to have a field with ky + pl, as at point�a� in Fig. 12. For �a�, l(FeO)–l(MgO) relationshipsare shown in Fig. 13a, the solid lines being the stablerelationships. The lines ky = cor + g andpl + ky = g, and the lines ky = cor + opx andpl = opx + ky are effectively coincident, becausekyanite and plagioclase for these l(CaO)–l(Na2O)–l(K2O) have a similar stability. Stable relations predictthat with increasing l(FeO) kyanite should decomposeto corundum-garnet and then to spinel-garnet and withincreasing l(MgO) to corundum-orthopyroxene andspinel-orthopyroxene. Such symplectites are notobserved in the samples studied, and, moreover themain symplectite type involving spinel + plagioclase isnot predicted. The problem is that the reaction stabi-lizing spinel, cor = sp, occurs at too high l(FeO) andl(MgO), well beyond where both plagioclase andkyanite have reacted out.A resolution of this problem is to propose that
corundum has difficulty nucleating. The solid lines inFig. 13a are the stable equilibria, the dashed lines arethe metastable equilibria. The equilibria metastablewith respect to corundum are therefore given by thedashed lines and the solid lines that do not involvecorundum, with corundum being replaced by spinel inthe bar diagrams. Even with this assumption the dia-gram predicts with increasing l(FeO) formation ofspinel-garnet symplectite and for high l(MgO)formation of spinel-orthopyroxene symplectite, notspinel–plagioclase. Using point �b� from Fig. 12, the
Fig. 12. Phase relationships involving kya-nite, corundum, plagioclase and quartz inthe NCKAS system at fixed l(K2O) from thematrix, at 800 �C and 8.5 kbar, with SiO2
and Al2O3 immobile. Contours of ca(pl) forthe assemblage kyanite–plagioclase areshown as full lines in the stable region, andas dashed lines where they extend into theregion where this assemblage is metastablewith respect to corundum. The lineca(pl) = 45 and black points (a), (b) and (c)represent conditions for which relationsinvolving the Fe-Mg minerals in Fig. 13 arecalculated. Open circle is where the compo-sition of kyanite plots.
1 10 P . S T I P S K A E T A L .
� 2009 Blackwell Publishing Ltd
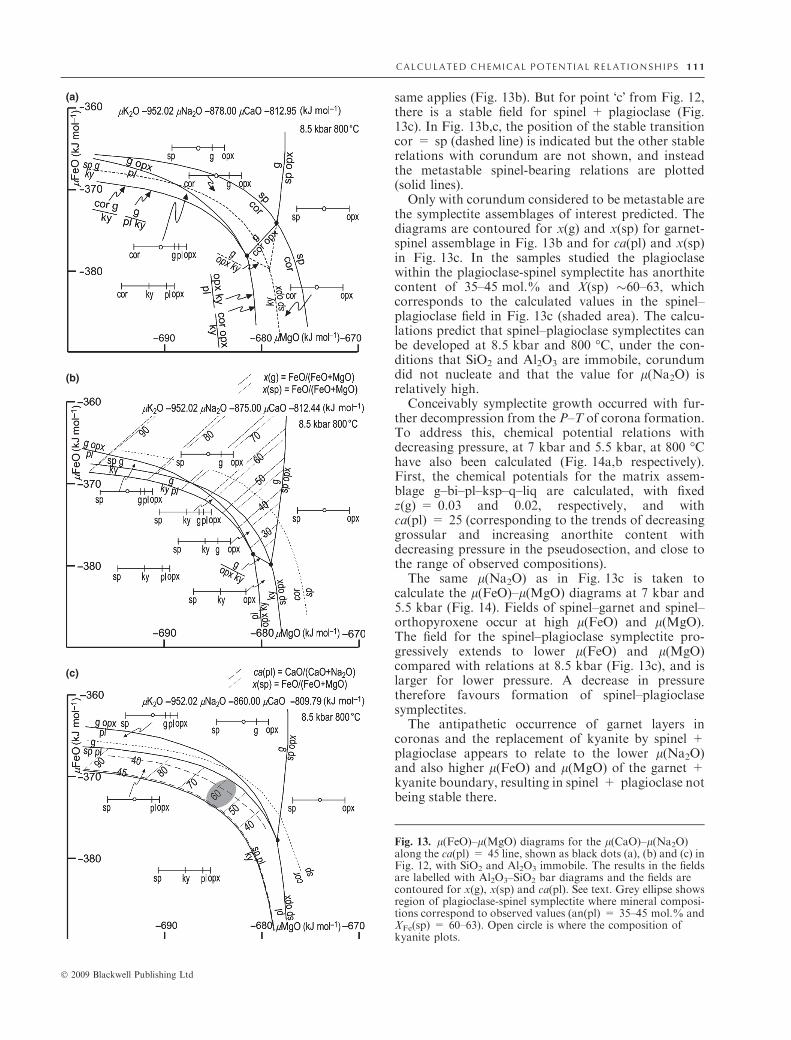
same applies (Fig. 13b). But for point �c� from Fig. 12,there is a stable field for spinel + plagioclase (Fig.13c). In Fig. 13b,c, the position of the stable transitioncor = sp (dashed line) is indicated but the other stablerelations with corundum are not shown, and insteadthe metastable spinel-bearing relations are plotted(solid lines).
Only with corundum considered to be metastable arethe symplectite assemblages of interest predicted. Thediagrams are contoured for x(g) and x(sp) for garnet-spinel assemblage in Fig. 13b and for ca(pl) and x(sp)in Fig. 13c. In the samples studied the plagioclasewithin the plagioclase-spinel symplectite has anorthitecontent of 35–45 mol.% and X(sp) �60–63, whichcorresponds to the calculated values in the spinel–plagioclase field in Fig. 13c (shaded area). The calcu-lations predict that spinel–plagioclase symplectites canbe developed at 8.5 kbar and 800 �C, under the con-ditions that SiO2 and Al2O3 are immobile, corundumdid not nucleate and that the value for l(Na2O) isrelatively high.
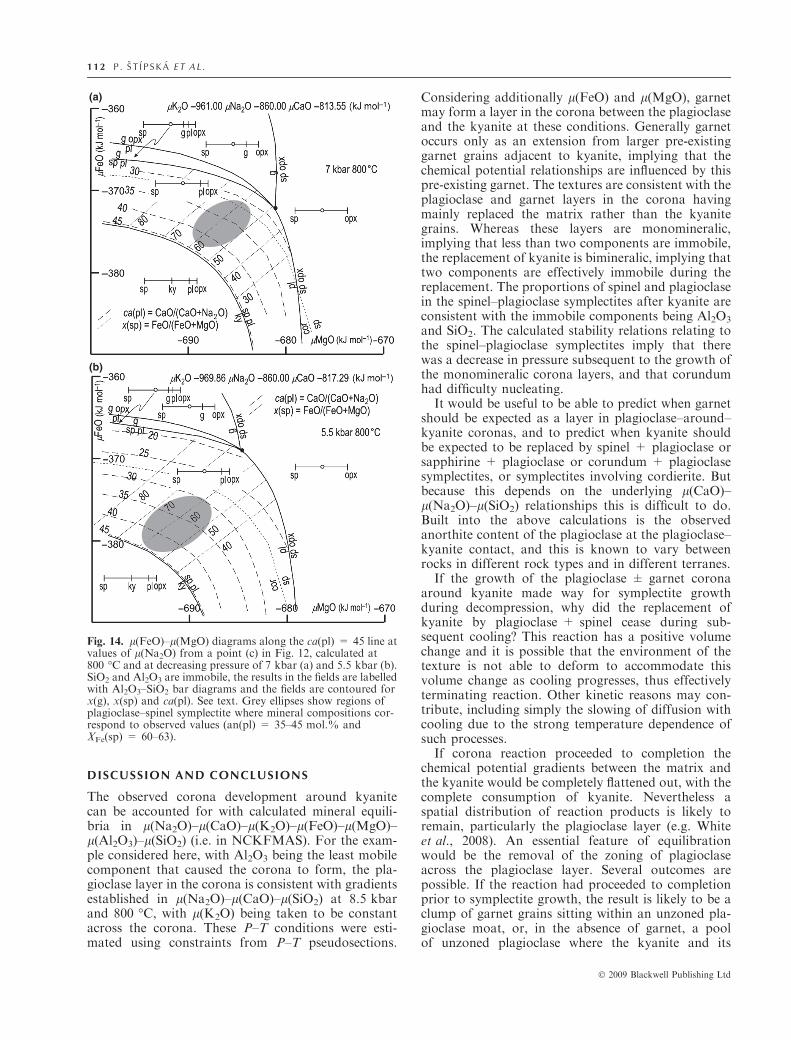
Conceivably symplectite growth occurred with fur-ther decompression from the P–T of corona formation.To address this, chemical potential relations withdecreasing pressure, at 7 kbar and 5.5 kbar, at 800 �Chave also been calculated (Fig. 14a,b respectively).First, the chemical potentials for the matrix assem-blage g–bi–pl–ksp–q–liq are calculated, with fixedz(g) = 0.03 and 0.02, respectively, and withca(pl) = 25 (corresponding to the trends of decreasinggrossular and increasing anorthite content withdecreasing pressure in the pseudosection, and close tothe range of observed compositions).
The same l(Na2O) as in Fig. 13c is taken tocalculate the l(FeO)–l(MgO) diagrams at 7 kbar and5.5 kbar (Fig. 14). Fields of spinel–garnet and spinel–orthopyroxene occur at high l(FeO) and l(MgO).The field for the spinel–plagioclase symplectite pro-gressively extends to lower l(FeO) and l(MgO)compared with relations at 8.5 kbar (Fig. 13c), and islarger for lower pressure. A decrease in pressuretherefore favours formation of spinel–plagioclasesymplectites.
The antipathetic occurrence of garnet layers incoronas and the replacement of kyanite by spinel +plagioclase appears to relate to the lower l(Na2O)and also higher l(FeO) and l(MgO) of the garnet +kyanite boundary, resulting in spinel + plagioclase notbeing stable there.
(a)
(b)
(c)
Fig. 13. l(FeO)–l(MgO) diagrams for the l(CaO)–l(Na2O)along the ca(pl) = 45 line, shown as black dots (a), (b) and (c) inFig. 12, with SiO2 and Al2O3 immobile. The results in the fieldsare labelled with Al2O3–SiO2 bar diagrams and the fields arecontoured for x(g), x(sp) and ca(pl). See text. Grey ellipse showsregion of plagioclase-spinel symplectite where mineral composi-tions correspond to observed values (an(pl) = 35–45 mol.% andXFe(sp) = 60–63). Open circle is where the composition ofkyanite plots.
C AL C U L A TE D C H E M I C A L PO TE N T I A L R E L A T I O N S H I P S 11 1
� 2009 Blackwell Publishing Ltd
DISCUSSION AND CONCLUSIONS
The observed corona development around kyanitecan be accounted for with calculated mineral equili-bria in l(Na2O)–l(CaO)–l(K2O)–l(FeO)–l(MgO)–l(Al2O3)–l(SiO2) (i.e. in NCKFMAS). For the exam-ple considered here, with Al2O3 being the least mobilecomponent that caused the corona to form, the pla-gioclase layer in the corona is consistent with gradientsestablished in l(Na2O)–l(CaO)–l(SiO2) at 8.5 kbarand 800 �C, with l(K2O) being taken to be constantacross the corona. These P–T conditions were esti-mated using constraints from P–T pseudosections.
Considering additionally l(FeO) and l(MgO), garnetmay form a layer in the corona between the plagioclaseand the kyanite at these conditions. Generally garnetoccurs only as an extension from larger pre-existinggarnet grains adjacent to kyanite, implying that thechemical potential relationships are influenced by thispre-existing garnet. The textures are consistent with theplagioclase and garnet layers in the corona havingmainly replaced the matrix rather than the kyanitegrains. Whereas these layers are monomineralic,implying that less than two components are immobile,the replacement of kyanite is bimineralic, implying thattwo components are effectively immobile during thereplacement. The proportions of spinel and plagioclasein the spinel–plagioclase symplectites after kyanite areconsistent with the immobile components being Al2O3
and SiO2. The calculated stability relations relating tothe spinel–plagioclase symplectites imply that therewas a decrease in pressure subsequent to the growth ofthe monomineralic corona layers, and that corundumhad difficulty nucleating.It would be useful to be able to predict when garnet
should be expected as a layer in plagioclase–around–kyanite coronas, and to predict when kyanite shouldbe expected to be replaced by spinel + plagioclase orsapphirine + plagioclase or corundum + plagioclasesymplectites, or symplectites involving cordierite. Butbecause this depends on the underlying l(CaO)–l(Na2O)–l(SiO2) relationships this is difficult to do.Built into the above calculations is the observedanorthite content of the plagioclase at the plagioclase–kyanite contact, and this is known to vary betweenrocks in different rock types and in different terranes.If the growth of the plagioclase ± garnet corona
around kyanite made way for symplectite growthduring decompression, why did the replacement ofkyanite by plagioclase + spinel cease during sub-sequent cooling? This reaction has a positive volumechange and it is possible that the environment of thetexture is not able to deform to accommodate thisvolume change as cooling progresses, thus effectivelyterminating reaction. Other kinetic reasons may con-tribute, including simply the slowing of diffusion withcooling due to the strong temperature dependence ofsuch processes.If corona reaction proceeded to completion the
chemical potential gradients between the matrix andthe kyanite would be completely flattened out, with thecomplete consumption of kyanite. Nevertheless aspatial distribution of reaction products is likely toremain, particularly the plagioclase layer (e.g. Whiteet al., 2008). An essential feature of equilibrationwould be the removal of the zoning of plagioclaseacross the plagioclase layer. Several outcomes arepossible. If the reaction had proceeded to completionprior to symplectite growth, the result is likely to be aclump of garnet grains sitting within an unzoned pla-gioclase moat, or, in the absence of garnet, a poolof unzoned plagioclase where the kyanite and its
(a)
(b)
Fig. 14. l(FeO)–l(MgO) diagrams along the ca(pl) = 45 line atvalues of l(Na2O) from a point (c) in Fig. 12, calculated at800 �C and at decreasing pressure of 7 kbar (a) and 5.5 kbar (b).SiO2 and Al2O3 are immobile, the results in the fields are labelledwith Al2O3–SiO2 bar diagrams and the fields are contoured forx(g), x(sp) and ca(pl). See text. Grey ellipses show regions ofplagioclase–spinel symplectite where mineral compositions cor-respond to observed values (an(pl) = 35–45 mol.% andXFe(sp) = 60–63).
1 12 P . S T I P S K A E T A L .
� 2009 Blackwell Publishing Ltd
plagioclase moat had been. However, if chemicalpotential gradients for those components considered tobe mobile were flattened during the stage of the sym-plectite growth, by implication this would not involveflattening the chemical potential gradients of Al2O3
and SiO2 both of which by this stage are effectivelyimmobile. Thus the plagioclase zoning is preserved,reflecting the fact that a fractionation from the matrixthrough into the kyanite with respect to Al2O3 andSiO2 had already taken place prior to the start ofsymplectite growth, and diffusion at that stage wastoo slow to change them. As a consequence the matrixis quartz-saturated whereas the environment of thekyanite is SiO2-undersaturated. In the absence ofcorundum nucleation the result would be a spinel +plagioclase aggregate located within a moat of zonedplagioclase, the zoning reflecting equalized chemicalpotentials for all components except Al2O3 and SiO2.If corundum did nucleate the result would be acorundum + plagioclase aggregate located within amoat of zoned plagioclase. Interestingly, if this waspreceded by replacement of kyanite by spinel + pla-gioclase, it would involve FeO and MgO diffusingthrough the plagioclase to make the spinel, then dif-fusing out again when the texture was replaced bycorundum + plagioclase.
An alternative logic for the development of theobserved coronas is that kyanite is consumed by acorona as a consequence of sillimanite growing in anadjacent part of the rock, so that kyanite is primarilyunstable with the matrix due to the presence of silli-manite there. In this case the overall reaction maysimply be kyanite = sillimanite, as in Carmichael(1969) who considered the appearance of sillimanite inkyanite-bearing metapelites in Barrovian-type meta-morphism. Indeed slightly more aluminous gneiss doesdevelop sillimanite. In this case the chemical potentialrelationships will be different to those in Fig. 9, withthe chemical potential differences established betweena sillimanite-bearing matrix assemblage and the kya-nite. Developing this is beyond the scope of this paper,but the logic should be analogous to that in Whiteet al. (2008).
Complex reaction textures on aluminosilicate por-phyroblasts are a reasonably common feature (e.g.Pitra & de Waal, 2001; White et al., 2002; Marschallet al., 2003; Johnson et al., 2004; Tajcmanova et al.,2007) and have been interpreted using a range ofqualitative and quantitative methods. Plagioclase–around–kyanite textures similar to those consideredhere have been investigated using calculated mineralequilibria in a recent study by Tajcmanova et al.(2007), but without explicit consideration of chemicalpotential relationships. The idea followed in Tajcma-nova et al. (2007) is to choose a volume of rockincluding the texture that can be considered to beeffectively a closed system during texture development.That development then involves a redistribution ofmaterial within the volume. A pseudosection is drawn
for this overall rock volume which is then used tointerpret the texture. In the case of some simpletextures, for example the orthopyroxene and sillima-nite layers in the corona texture developed betweensapphirine and quartz discussed in White et al. (2008),the reaction corresponds to passage across a univariantline in P–T in the system FMAS: sapphirine +quartz = orthopyroxene + sillimanite.
Whereas the reaction accounts for the minerals inthe corona, it cannot account for the spatial relation-ships. In this case, fortuitously, the chemical potentialgradients that do account for the spatial relationshipsinvolve only the minerals in this reaction. In contrast,the occurrence of corundum in a part of this texturecannot be predicted by the pseudosection for the wholevolume (which is quartz-saturated). Tajcmanova et al.(2007) tried to surmount this type of problem bymaking a T–x pseudosection, with the x-axisattempting to represent the composition change acrossthe texture. It is simply not possible to do this andreproduce the mineral assemblages other than in a verygeneralized way, not least because variance consider-ations force too many minerals to be involved in eachpseudosection field, some of which will commonly notoccur in the corona. The point is that the componentsthat are mobile involve chemical potential gradientsacross the corona within the overall volume, and thesecomponents in being treated as chemical potentialsmust then not be present in the bulk composition usedto draw the pseudosections (see also White et al.,2008). Moreover, the way in which the chemicalpotentials change within the corona control whichminerals are stable, and these may well be ones notstable in the pseudosections (although an arbitrarychoice of the bulk compositions to use in the T–xpseudosection may allow them to appear). In general,such a pseudosection approach will be unsuccessful inaccounting for corona textures, and mineral equilibriacalculations explicitly involving chemical potentials arerequired.
ACKNOWLEDGEMENTS
This work was financially supported by the FrenchNational agency (No. 06-1 148784 to K. Schulmann).R.P. and R.W.W. thank the Australian ResearchCouncil for support from ARC DP0451770 andDP0557013. We gratefully acknowledge H. Muller-Sigmund from the Institute of Mineralogy, Petrologyand Geochemistry at the University of Freiburg foroperating the microprobe. We thank B. Carlson,F. Spear and P. Pitra for their interesting and helpfulreviews. M. Brown is thanked for his editorial work.
REFERENCES
Ashworth, J.R. & Birdi, J.J., 1990. Diffusion modelling ofcoronas around olivine in an open system. Geochimica etCosmochimica Acta, 54, 2389–2401.
C AL C U L A TE D C H E M I C A L PO TE N T I A L R E L A T I O N S H I P S 11 3
� 2009 Blackwell Publishing Ltd
Baldwin, J.A., Powell, R., Williams, M.L. & Goncalves, P.,2007. Formation of eclogite, and reaction during exhumationto mid-crustal levels, Snowbird tectonic zone, western Cana-dian Shield. Journal of Metamorphic Geology, 25, 953–974.
Beard, B.L., Medaris, L.G., Johnson, C.M., Brueckner, H.K. &Mısar, Z., 1992. Petrogenesis of Variscan high-temperaturegroup A eclogites from the Moldanubian Zone of the Bohe-mian Massif, Czechoslovakia. Contributions to Mineralogy andPetrology, 111, 468–483.
Brady, J.B., 1977. Metasomatic zones in metamorphic rocks.Geochimica et Cosmochimica Acta, 41, 113–125.
van Breemen, O., Aftalion, M., Bowes, D.R. et al., 1982. Geo-chronological studies of the Bohemian Massif, Czechoslova-kia, and their significance in the evolution of Central Europe.Transactions of the Royal Society of Edinburgh, Earth Sciences,73, 89–108.
Brueckner, H.K., Medaris, L.G. & Bakun-Czubarow, N., 1991.Nd and Sr age and isotope patterns from Variscan eclogites ofthe eastern Bohemian Massif. Neues Jahrbuch fur Mineralogie,Abhandlungen, 163, 169–196.
Callen, H.B., 1985. Thermodynamics and an introduction tothermostatistics. John Wiley & Sons, New York, 493 pp.
Carlson, W.D., 2002. Scales of disequilibrium and rates ofequilibration during metamorphism. American Mineralogist,87, 185–204.
Carmichael, D.M., 1969. On the mechanism of prograde meta-morphic reactions in quartz-bearing pelitic rocks. Contribu-tions to Mineralogy and Petrology, 20, 244–267.
Carswell, D.A., 1991. Variscan high P–T metamorphism anduplift history in the Moldanubian Zone of the BohemianMassif in Lower Austria. European Journal of Mineralogy, 3,323–342.
Coggon, R. & Holland, T.J.B., 2002. Mixing properties ofphengitic micas and revised garnet-phengite thermobarome-ters. Journal of Metamorphic Geology, 20, 683–696.
Dallmayer, R.D., Neubauer, F. & Hock, V., 1992. Chronologyof late Paleozoic tectonothermal activity in the southeasternBohemian Massif, Austria (Moldanubian and Moravo-Silesian zones): 40Ar ⁄ 39Ar mineral age controls. Tectono-physics, 210, 135–153.
Dasgupta, S., Sengupta, P., Ehl, J., Raith, M. & Bardhan, S.,1995. Reaction textures in a suite of spinel granulites from theEastern-Ghats Belt, India – evidence for polymetamorphism,a partial petrogenetic grid in the system KFMASH and theroles of ZnO and Fe2O3. Journal of Petrology, 36, 435–461.
Diener, J.F.A., White, R.W. & Powell, R., 2008. Granulite faciesmetamorphism and subsolidus fluid-absent reworking,Strangways Range, Arunta Block, central Australia. Journalof Metamorphic Geology, 26, 603–622.
Edel, J.B., Schulmann,K.&Holub,F.V., 2003.Anticlockwise andclockwise rotations of the EasternVariscides accommodated bydextral lithospheric wrenching: palaeomagnetic and structuralevidence. Journal of the Geological Society, 160, 209–218.
Fisher, G.W., 1973. Nonequilibrium thermodynamics as a modelfor diffusion-controlled metamorphic processes. AmericanJournal of Science, 273, 897–924.
Franek, J., Schulmann, K. & Lexa, O., 2006. Kinematic andrheological model of exhumation of high pressure granulites inthe Variscan orogenic root: example of the Blansky les gran-ulite, Bohemian Massif, Czech Republic. Mineralogy andPetrology, 86, 253–276.
Franke, W., 2000. The mid-European segment of the Variscides:tectonostratigraphic units, terrane boundaries and kinematicevolution. In: Orogenic Processes: Quantification and Model-ling in the Variscan Belt, Special Publications, 179 (eds Franke,W., Haak, V., Oncken, O. & Tanner, D.), pp. 35–63, TheGeological Society of London, London.
Friedl, G., Cooke, R., Finger, F., McNaughton, N.J. & Fletcher,I., 2003. U-Pb shrimp dating and trace element investigationson multiple zircons from a South-Bohemian granulite. Journalof the Czech Geological Society, 48, 51.
Fuchs, G., 1986. Zur Diskussion um den Deckenbau der Boh-mischen Masse. Jahrbuch der Geologischen Bundesanstalt, 129,41–49.
Hasalova, P., Stıpska, P., Powell, R., Schulmann, K., Janousek,V. & Lexa, O., 2008. Transforming mylonitic metagranite byopen-system interactions during melt flow. Journal of Meta-morphic Geology, 26, 55–80.
Holland, T.J.B. & Powell, R., 1998. An internally consistentthermodynamic data set for phases of petrological interest.Journal of Metamorphic Geology, 16, 309–343.
Holland, T. & Powell, R., 2003. Activity–composition relationsfor phases in petrological calculations: an asymmetric multi-component formulation. Contributions to Mineralogy andPetrology, 145, 492–501.
Janousek, V., Gerdes, A., Vrana, S. et al., 2006. Low-pressuregranulites of the Lısov Massif, Southern Bohemia: Viseanmetamorphism of Late Devonian plutonic arc rocks. Journalof Petrology, 47, 705–744.
Joesten, R., 1977. Evolution of mineral assemblage zoning indiffusion metasomatism. Geochimica et Cosmochimica Acta,41, 649–670.
Johnson, T., Brown, M., Gibson, R. & Wing, B., 2004. Spinel-cordierite symplectites replacing andalusite: evidence for melt-assisted diapirism in the Bushveld Complex, South Africa.Journal of Metamorphic Geology, 22, 529–545.
Korzhinskii, D.S., 1959. Physicochemical Basis of the Analysis ofthe Paragenesis of Minerals. Consultants Bureau, New York,142 pp.
Kroner, A., Wendt, I., Liew, T.C. et al., 1988. U-Pb zircon andSm-Nd model ages of high grade Moldanubian metasedi-ments, Bohemian Massif, Czechoslovakia. Contributions toMineralogy and Petrology, 99, 257–266.
Marschall, H.R., Kalt, A. & Hanel, M., 2003. P–T evolution of aVariscan lower-crustal segment: a study of granulites from theSchwarzwald, Germany. Journal of Petrology, 44, 227–253.
Matte, P., Maluski, H. & Echtler, H., 1985. Cissaillementsductiles varisques vers l�Est - Sud-Est dans les nappes duWaldviertel (Sud-Est du Massif de Boheme, Autriche).Donnees microtectoniques et radiometriques 39Ar ⁄ 40Ar.Comptes rendus de l�Academie des Sciences Paris, serie II, 301,721–726.
Medaris, L.G., Jelınek, E. & Mısar, Z., 1995. Czech eclogites:terrane settings and implications for Variscan tectonic evolu-tion of the Bohemian Massif. European Journal of Mineralogy,7, 7–28.
Medaris, G., Wang, H., Jelınek, E., Mihaljevic, M. & Jakes, P.,2005. Characteristics and origins of diverse Variscan perido-tites in the Gfohl Nappe, Bohemian Massif, Czech Republic.Lithos, 82, 1–23.
Moller, C., 1998. Decompressed eclogites in the Sveconorwegian(-Grenvillian) orogen of SW Sweden: petrology and tectonicimplications. Journal of Metamorphic Geology, 16, 641–656.
Munster, A., 1970. Classical Thermodynamics. Wiley Inter-Science, London.
Nakamura, D., 2002. Kinetics of decompressional reactions ineclogitic rocks - formation of plagioclase coronas aroundkyanite. Journal of Metamorphic Geology, 20, 325–333.
Nakamura, D. & Hirajima, T., 2000. Granulite-facies overprint-ing of ultrahigh-pressure metamorphic rocks, northeastern Su-Lu region, eastern China. Journal of Petrology, 41, 563–582.
O�Brien, P.J., 1999. Asymmetric zoning profiles in garnet fromHP-HT granulite and implications for volume and grain-boundary diffusion. Mineralogical Magazine, 63, 227–238.
O�Brien, P.J., 2008. Challenges in high-pressure granulite meta-morphism in the era of pseudosections: reaction textures,compositional zoning and tectonic interpretation with exam-ples from the Bohemian Massif. Journal of MetamorphicGeology, 26, 235–251.
O�Brien, P.J. & Rotzler, J., 2003. High-pressure granulites: for-mation, recovery of peak conditions and implications fortectonics. Journal of Metamorphic Geology, 21, 3–20.
1 14 P . S T I P S K A E T A L .
� 2009 Blackwell Publishing Ltd
Okay, A.I., 1995. Paragonite eclogites from Dabie-Shan, China –re-equilibration during exhumation. Journal of MetamorphicGeology, 13, 449–460.
Owen, J.V. & Dostal, J., 1996. Contrasting corona structures inmafic granulite from the Blansky Les Complex, BohemianMassif, Czech Republic. Canadian Mineralogist, 34, 959–966.
Petrakakis, K., 1997. Evolution of Moldanubian rocks inAustria: review and synthesis. Journal of MetamorphicGeology, 15, 203–222.
Pitra, P. & de Waal, S.A., 2001. High-temperature, low-pressuremetamorphism and development of prograde symplectites,Marble Hall Fragment, Bushveld Complex (South Africa).Journal of Metamorphic Geology, 19, 311–325.
Powell, R. & Holland, T.J.B., 1988. An internally consistentdataset with uncertainties and correlations: 3. Applications togeobarometry, worked examples and a computer program.Journal of Metamorphic Geology, 6, 173–204.
Powell, R., Guiraud, M. & White, R.W., 2005. Truth and beautyin metamorphic phase equilibria: conjugate variables andphase diagrams. Canadian Mineralogist, 43, 21–33.
Racek, M., Stıpska, P., Pitra, P., Schulmann, K. & Lexa, O.,2006. Metamorphic record of burial and exhumation oforogenic lower and middle crust: a new tectonothermal modelfor the Drosendorf window (Bohemian Massif, Austria).Mineralogy and Petrology, 86, 221–251.
Racek, M., Stıpska, P. & Powell, R., 2008. Garnet-clinopyroxeneintermediate granulites in the St. Leonhard massif of the Bohe-mian Massif: ultrahigh-temperature metamorphism at highpressure or not? Journal of Metamorphic Geology, 26, 253–271.
Rumble, D., 1982. The role of perfectly mobile components inmetamorphism. Annual Review of Earth and PlanetarySciences, 109, 221–233.
Schulmann, K., Kroner, A., Hegner, E. et al., 2005. Chrono-logical constraints on the pre-orogenic history, burial andexhumation of deep-seated rocks along the eastern margin ofthe Variscan orogen, Bohemian Massif, Czech Republic.American Journal of Science, 305, 407–448.
Schulmann, K., Lexa, O., Stıpska, P. et al., 2008. Verticalextrusion and horizontal channel flow of orogenic lower crust:key exhumation mechanisms in large hot orogens? Journal ofMetamorphic Geology, 26, 273–297.
Stıpska, P. & Powell, R., 2005. Does ternary feldspar constrainthe metamorphic conditions of high-grade meta-igneousrocks? Evidence from orthopyroxene granulites, BohemianMassif. Journal of Metamorphic Geology, 23, 627–647.
Stıpska, P., Schulmann, K. & Powell, R., 2008. Contrastingmetamorphic histories of lenses of high-pressure rocks andhost migmatites with a flat orogenic fabric (BohemianMassif, Czech Republic): a result of tectonic mixing within
horizontal crustal flow? Journal of Metamorphic Geology, 26,623–646.
Tajcmanova, L., Konopasek, J. & Schulmann, K., 2006.Thermal evolution of the orogenic lower crust during exhu-mation within a thickened Moldanubian root of the Variscanbelt of Central Europe. Journal of Metamorphic Geology, 24,119–134.
Tajcmanova, L., Konopasek, J. & Connolly, J.A.D., 2007.Diffusion-controlled development of silica-undersaturateddomains in felsic granulites of the Bohemian Massif (Variscanbelt of Central Europe). Contributions to Mineralogy andPetrology, 153, 237–250.
Thompson, J.B., 1959. Local equilibrium in metasomatic pro-cesses. In: Researches in Geochemistry (ed. Abelson, P.H.), pp.427–457. Wiley, New York.
Thompson, J.B., 1970. Geochemical reaction and open systems.Geochimica et Cosmochimica Acta, 34, 529–551.
White, R.W., Powell, R., Holland, T.J.B. & Worley, B.A., 2000.The effect of TiO2 and Fe2O3 on metapelitic assemblages atgreenschist and amphibolite facies conditions: mineral equi-libria calculations in the system K2O-FeO-MgO-Al2O3-SiO2-H2O-TiO2-Fe2O3. Journal of Metamorphic Geology, 18, 497–511.
White, R.W., Powell, R. & Holland, T.J.B., 2001. Calculation ofpartial melting equilibria in the system Na2O-CaO- K2O-FeO-MgO-Al2O3-SiO2-H2O (NCKFMASH). Journal of Metamor-phic Geology, 19, 139–153.
White, R.W., Powell, R. & Clarke, G.L., 2002. The interpreta-tion of reaction textures in Fe-rich metapelitic granulites of theMusgrave Block, central Australia: constraints from mineralequilibria calculations in the system K2O-FeO-MgO-Al2O3-SiO2-H2O-TiO2-Fe2O3. Journal of Metamorphic Geology, 20,41–55.
White, R.W., Powell, R. & Holland, T.J.B., 2007. Progressrelating to calculation of partial melting equilibria formetapelites. Journal of Metamorphic Geology, 25, 511–527.
White, R.W., Powell, R. & Baldwin, J.A., 2008. Calculatedphase equilibria involving chemical potentials to investigatethe textural evolution of metamorphic rocks. Journal ofMetamorphic Geology, 26, 181–198.
APPENDIX: CALCULATING l–l DIAGRAMS WITHTHERMOCALCTHERMOCALC
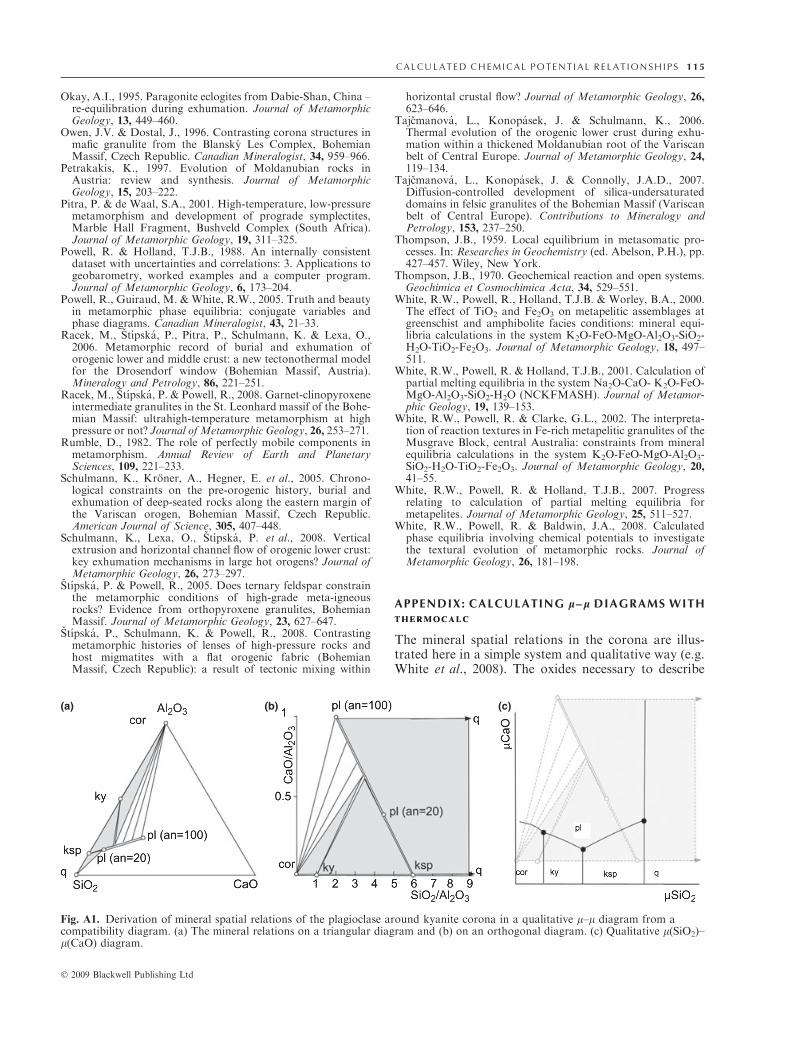
The mineral spatial relations in the corona are illus-trated here in a simple system and qualitative way (e.g.White et al., 2008). The oxides necessary to describe
(a) (b) (c)
Fig. A1. Derivation of mineral spatial relations of the plagioclase around kyanite corona in a qualitative l–l diagram from acompatibility diagram. (a) The mineral relations on a triangular diagram and (b) on an orthogonal diagram. (c) Qualitative l(SiO2)–l(CaO) diagram.
C AL C U L A TE D C H E M I C A L PO TE N T I A L R E L A T I O N S H I P S 11 5
� 2009 Blackwell Publishing Ltd
the observed sequence kyanite to plagioclase toK-feldspar + quartz involve Na2O, CaO, K2O, Al2O3
and SiO2. In this the chemical potentials of K2O andNa2O are considered as constant, in order to draw aqualitative l(CaO)–l(SiO2) diagram. Al2O3 is consid-ered to be the least mobile component. The mineralrelations can be then plotted on a triangular diagramwith CaO–SiO2–Al2O3 apices or on an orthogonalphase diagram with SiO2 ⁄Al2O3 and CaO ⁄Al2O3 asthe axes (Fig. A1a,b). Because the tie-lines in a com-patibility diagram are orthogonal to the lines in thecorresponding l–l diagram, the relations in the com-patibility diagram in Fig. A1b can be used to constructthe qualitative l(SiO2)–l(CaO) diagram (Fig. A1).Phase points in the compatibility diagram occur asfields in the l–l diagram, tie lines as reaction lines andtie triangles as intersections.
This relationship between a compatibility diagramand a corresponding l–l diagram, provides a con-
nection with how THERMOCALCTHERMOCALC is used to calculate l–ldiagrams. Whereas it can work at specified l values(via the setmu script, see http://www.metamorph.geo.uni-mainz.de/thermocalc/), the information forl–l diagrams is calculated indirectly. With the calcmuscript, THERMOCALCTHERMOCALC will calculate the chemical poten-tials of the components for any equilibrium. So, in thiscase, with the chemical potentials of K2O and Na2O setvia setmu, THERMOCALCTHERMOCALC would be used to calculate thedivariant equilibrium, pl–ksp–ky, for example, givingthe composition of the phases at the specified P–T. Inaddition, it gives the chemical potentials that define thecoordinates of the invariant point in the l–l diagram.In the same way trivariants are calculated to providethe information for the univariant lines in the l–ldiagram.
Received 26 May 2009; revision accepted 6 October 2009.
1 16 P . S T I P S K A E T A L .
� 2009 Blackwell Publishing Ltd