use of a concentrated enteral nutrition solution to increase calorie delivery to critically ill...
TRANSCRIPT
delivery to critically ill patients: a randomized double-blind clinical trial Use of a concentrated enteral nutrition solution to increase calorie
Version 1 AJCN/2014/086322
The American Journal of Clinical Nutrition
Marianne J Chapman Stephanie N O'Connor, Emma J Ridley, Patricia J Williams, and
Peake, Andrew R Davies, Adam M Deane, Kylie Lange, John L Moran, TARGET Investigators and the ANZICS Clinical Trials Group, Sandra L
. Active ReviewsReviewer Area and click on , and log in to your account. Enter the http://submit.ajcn.orgview, go to
available in the Full MS Info view of the manuscript. To reach this manuscript link[Download Supplemental Files]additional materials, click on the
This paper includes additional materials for review purposes. To view
http://www.ajcn.org/site/misc/ifa.xhtmlInformation for Authors:
The American Journal of Clinical Nutrition AJCN/2014/086322 Version 1 The American Journal of Clinical Nutrition AJCN/2014/086322 Version 1
1
Use of a concentrated enteral nutrition solution to increase calorie delivery to critically ill patients: a randomized double-blind clinical trial
Authors
TARGET Investigators and the ANZICS Clinical Trials Group
Sandra L Peake, Andrew R Davies, Adam M Deane, Kylie Lange, John L Moran,
Stephanie N O’Connor, Emma J Ridley, Patricia J Williams and Marianne J
Chapman.
Department of Intensive Care, Queen Elizabeth Hospital, Adelaide, SA. (SLP, JLM,
PJW)
School of Medicine, University of Adelaide, Adelaide, SA (SLP)
Department of Epidemiology & Preventive Medicine, Monash University, The Alfred
Centre, Melbourne, VIC (SLP, ARD, EJR)
Intensive Care Unit, Royal Adelaide Hospital, Adelaide, SA. (AMD, SNOC MJC)
Discipline of Acute Care Medicine, University of Adelaide, Adelaide, SA (AMD,
SNOC, PJW, MJC)
Centre of Research Excellence (CRE) in Translating Nutritional Science to Good
Health, Discipline of Medicine, The University of Adelaide, Adelaide, SA. (KL)
Corresponding Author
Assoc Prof Marianne Chapman
Director of ICU Research,
Intensive Care Unit,
Royal Adelaide Hospital,
The American Journal of Clinical Nutrition AJCN/2014/086322 Version 1

2
North Terrace, Adelaide, SA 5000
AUSTRALIA
Ph: +61 8 8222 4624
Fax: +61 8 8222 2367
Email: [email protected]
Financial Support
This study was supported by the Royal Adelaide Hospital and the Australian and
New Zealand College of Anaesthetists. Provision and blinding of the study feed and
importation and delivery to the sites was provided by Fresenius Kabi (Germany).
Fresenius Kabi had no influence over the study protocol or the analysis or
interpretation of the results.
Short Running title
Increased calorie delivery to the critically ill
MeSH terms
Intensive Care, nutritional support, enteral feeding, critical illness, energy delivery,
outcome.
List of Abbreviations:
APACHE II: Acute Physiology and Chronic Health Evaluation II
ANZICS: Australia & New Zealand Intensive Care Society
BMI: Body Mass Index
The American Journal of Clinical Nutrition AJCN/2014/086322 Version 1
3
CI: Confidence Interval
EN: Enteral Nutrition
GRV: Gastric Residual Volume
IBW: Ideal Body Weight
ICU: Intensive Care Unit
IQR: Inter Quartile Range
PN: Parenteral Nutrition
SD: Standard Deviation
SE: Standard Error
SI: Small Intestine
TARGET: The Augmented versus Routine approach to Giving Energy Trial
Trial Registration
Australian New Zealand Clinical Trials Registry number ACTRN 12611000793910
http://www.anzctr.org.au/
The American Journal of Clinical Nutrition AJCN/2014/086322 Version 1

4
Abstract: 300 words 1
Background: Critically ill patients usually only receive about 60% of estimated 2
calorie requirements. 3
Objectives: (1) To determine if the substitution of a 1.5 kcal/ml liquid enteral 4
nutrition solution for a 1.0 kcal/ml solution resulted in greater calorie delivery to 5
critically ill patients. (2) To establish the feasibility of conducting a multicenter, 6
double-blind, randomized trial evaluating the effect of increased calorie delivery on 7
clinical outcomes. 8
Design: Prospective, randomized, double-blind, parallel-group, multicenter study. 9
Setting: Five Australian intensive care units. 10
Patients: One hundred and twelve mechanically ventilated patients expected to 11
receive enteral nutrition for at least two days. 12
Interventions: Patients were randomized to receive 1.5 (n=57) or 1.0 (n=55) kcal/ml 13
enteral nutrition solution at a rate of 1ml/kg/hour (ideal body weight) for up to 10 14
days. Protein and fiber content in the two solutions were equivalent. 15
Results: The two study groups had similar baseline characteristics (1.5 versus 1.0 16
kcal/ml): mean [SD]: 56.4[16.8] versus 56.5[16.1] years; 74% versus 75% male, 17
APACHE II score 23[9.1] versus 22[8.9]; NS). The groups received similar mean 18
volumes of enteral nutrition solution (1221[95% CI (1120, 1322)] versus 1259[95% 19
CI (1143, 1374)] ml/day; P=0.628) leading to a 46% increase in daily calories in the 20
group given the 1.5 kcal/ml solution (1832[95% CI (1681, 1984)] versus 1259[95% CI 21
(1143, 1374)] kcal/day; P<0.001). The 1.5 kcal/ml solution was not associated with 22
larger gastric residual volumes or diarrhea. In this pilot study there was a trend to 23
fewer deaths in those given 1.5 kcal/ml (11 [20%] versus 20 [37%] patients; 24
P=0.057) ninety days after enrolment. 25
The American Journal of Clinical Nutrition AJCN/2014/086322 Version 1
5
Conclusions: Substitution of a 1.0 kcal/ml with a 1.5 kcal/ml enteral nutrition 26
solution administered at the same rate resulted in a 46% increase in calorie delivery 27
without adverse effects. These pilot data suggest that increased calorie delivery may 28
influence outcome in the critically ill and warrant further investigation.29
The American Journal of Clinical Nutrition AJCN/2014/086322 Version 1

6
Introduction 30
The optimal calorie delivery for critically ill patients is unclear. While some authors 31
recommend matching energy delivery to expenditure (measured using calorimetry) 32
(1), this strategy has not been conclusively associated with better clinical outcomes. 33
In the absence of convincing evidence, many guidelines recommend a calorie goal 34
of 25 kcal/kg/day (2-4). There is controversy in the literature on how calorie delivery 35
influences outcomes during acute critical illness. Some authors recommend 36
intentional underfeeding (5-7), some suggest that the amount of calories delivered 37
makes no difference (8), and some propose that increasing calorie delivery can 38
improve survival (9, 10). Unfortunately, there is little robust evidence regarding 39
optimal calorie delivery for the critically ill. The few randomized studies conducted 40
have all been open label, making interpretation difficult. Finally, while the enteral 41
route is preferred, most investigators have failed to achieve caloric goals in critically 42
ill patients using enteral delivery alone (10, 11). Most studies report delivery of 43
around 50-60% of caloric goals despite measures to improve delivery; thus 44
compromising the ability to determine the relationship between enteral calorie 45
delivery and survival. 46
47
The primary aim of this study was to determine if the substitution of a 1.0 kcal/ml 48
enteral nutrition solution with a 1.5 kcal/ml solution resulted in the delivery of more 49
calories to critically ill patients over the first 10 days of their enteral nutrition therapy. 50
Secondary aims were to determine the feasibility of delivering masked enteral 51
nutrition solutions to allow blinding and to determine baseline data necessary for the 52
planning of an adequately powered randomized controlled study to investigate 53
The American Journal of Clinical Nutrition AJCN/2014/086322 Version 1

7
whether additional enteral calorie delivery to critically ill adults affects clinically 54
important outcomes. 55
56
Subjects and Methods 57
Setting 58
This study was conducted in five, Australian university-affiliated, tertiary-referral, 59
intensive care units (ICUs). 60
61
Patients 62
Patients aged 18 years or over, undergoing invasive mechanical ventilation and 63
expected to receive enteral nutrition for at least two days, were randomized to 64
receive either a 1.5 or 1.0 kcal/ml enteral nutrition solution. Patients were excluded if 65
they had already received more than 12 hours of enteral or parenteral nutrition 66
during their ICU stay or for whom the study goal rate was contraindicated (e.g. 67
requirement for fluid restriction), or there was a requirement for a specific enteral 68
nutrition solution (as determined by the treating clinician). Eligible patients were 69
randomized in a 1:1 ratio using a permuted block method with variable block sizes, 70
stratified by site. Allocation concealment was maintained using a centralized, web-71
based randomization schedule accessible 24 hours a day. 72
73
Patients were recruited between January 23rd and May 4th 2013 and the study was 74
carried out in accordance with the Helsinki Declaration of 1975 as revised in 1983. 75
All participating institutional ethics committees approved the study and allowed 76
delayed consent to be sought from either the next-of-kin or the patient . (Australian 77
and New Zealand Clinical Trials Registry 12611000793910). 78
The American Journal of Clinical Nutrition AJCN/2014/086322 Version 1

8
79
Study Design 80
This was a multicenter, randomized controlled, parallel group, clinical feasibility trial. 81
The patients, clinicians and all study personnel were blinded to the caloric content of 82
the study enteral nutrition solutions. 83
84
Intervention 85
The blinded enteral nutrition solutions were supplied by Fresenius Kabi in identical 86
1L bags, differing only in terms of caloric concentration (“Fresubin 2250 Complete” 87
1.5 kcal/ml versus “Fresubin 1000 Complete” 1.0 kcal/ml; Fresenius Kabi 88
Deutschland GmbH) (Appendix 2). This difference in caloric concentration was 89
shared between fat (0.058 g/ml versus 0.027 g/ml – a 114% difference) and 90
carbohydrate (0.18 g/ml versus 0.125 g/ml – a 44% difference). Protein and fiber 91
content in the study solutions were similar: 0.056 g/ml versus 0.055 g/ml and 0.015 92
g/ml versus 0.02 g/ml for the 1.5 and 1.0 kcal/ml solutions respectively. The two 93
study interventions were clinically indistinguishable in color and packaging. The 94
effectiveness of the blind was confirmed in a formal study. In addition, to confirm 95
successful delivery of allocated enteral nutrition solutions, independent analysis of 96
the osmolality of the 1.5 kcal/ml (430 mOsm/kg H2O) and 1.0 kcal/ml (360 mOsm/kg 97
H2O) solutions was obtained for a random sample of 261 study bags using freezing 98
point depression osmometry. 99
100
Study enteral nutrition was delivered at a goal rate of 1 ml/kg ideal body weight 101
(IBW) per hour in both groups. IBW was calculated from measured height as: IBW 102
men = (height (in cm) – 152.4) x 0.9 + 50; IBW women = (height (in cm) – 152.4) x 103
The American Journal of Clinical Nutrition AJCN/2014/086322 Version 1

9
0.9 + 45.5 (8). Patients received study enteral nutrition for the duration of their ICU 104
stay up to a maximum of 10 days, unless enteral nutrition was ceased earlier. To 105
reduce the risk of potential over-nutrition (3, 4, 12), the maximum goal rate was 100 106
ml/h for all patients; and at the discretion of treating clinicians, study enteral nutrition 107
could be ceased if the goal rate was achieved for 5 consecutive days. Patients for 108
whom consent to continue the study intervention was withdrawn were analyzed 109
according to the intention-to-treat principle, unless consent for data collection was 110
refused. 111
112
Other than goal rate, the duration and method of enteral nutrition delivery was at the 113
discretion of the treating clinician according to the usual unit nutrition protocols, 114
including commencement rate, increments, the use of promotility drugs and small 115
intestinal feeding tubes. It was recommended that goal rate be achieved within 48 116
hours of the commencement of enteral nutrition. If supplemental parenteral nutrition 117
was deemed necessary (e.g. enteral nutrition intolerance), it was assumed that 118
patients were receiving a 1.25 kcal/ml enteral nutrition solution in order to calculate 119
total calorie delivery and to determine the amount of parenteral nutrition to 120
administer. Stool samples were obtained from all patients with diarrhea during the 121
intervention period and screened for infectious causes and Clostridium difficile toxin. 122
Diarrhea was defined as 4 or more loose bowel actions within a 24-hour period or 123
the use of a fecal management system for diarrhea control. 124
The American Journal of Clinical Nutrition AJCN/2014/086322 Version 1

10
125
Blood glucose management was standardized, aiming for a blood glucose level less 126
than or equal to 10 mmol/L. Blood glucose levels less than or equal to 2.2 mmol/L 127
were defined as a serious adverse event. 128
129
Data collection 130
Baseline data included: patient demographics (age, sex, ideal and actual weight); 131
ICU admission diagnosis, category (elective or emergency surgical, medical) and 132
Acute Physiology and Chronic Health Evaluation (APACHE) II score; chronic co-133
morbidities (including diabetes mellitus); and dietitian assessment of nutritional 134
requirements. Data were collected daily for up to 14 days post-randomization for: 135
study enteral nutrition and non-study nutrition administration (parenteral nutrition, 136
incidental calories e.g. 50% dextrose, propofol); intolerance to enteral nutrition 137
(gastric residual volumes, diarrhea, promotility agents), highest and lowest blood 138
glucose concentrations and insulin administration. 139
140
Outcomes 141
The primary outcome was daily calorie delivery (kcal/day) from study enteral 142
nutrition. Secondary outcomes were: 1) daily total calorie delivery from enteral 143
nutrition, parenteral nutrition and incidental calories; 2) daily enteral and total calorie 144
delivery calculated per unit of ideal body weight (kcal/kg/day); 3) ICU and hospital 145
length of stay; 4) ventilator-free days (defined as the number of days between 146
successful weaning from mechanical ventilation and day 28 after study enrolment in 147
patients who survive to 28 days) and; 5) ICU, hospital and 28- and 90-day mortality. 148
149
The American Journal of Clinical Nutrition AJCN/2014/086322 Version 1

11
Statistical analysis 150
The sample size of 112 patients for the feasibility trial was based on data from 151
previous studies by our group and from other nutrition studies conducted in Australia 152
and New Zealand (13). Assuming a mean (standard deviation) daily calorie delivery 153
with enteral nutrition of 1300 (400) kcal/day in the 1.0 kcal/ml (usual treatment) group 154
and expecting at least a 20% increase in calorie delivery with the higher 155
concentration 1.5 kcal/ml solution, using a 2-groups t-test at 5% significance and 156
80% power, the estimated minimum required sample size was 38 per group (i.e. 76 157
in total). To allow for more reliable estimates of recruitment rate and baseline 158
mortality and to compensate for some recruited patients receiving less than the 159
anticipated two days of enteral nutrition, 112 patients (56 per group) were enrolled. 160
161
All analyses were conducted according to the intention-to-treat principle. No stopping 162
rules or interim analyses were planned. For missing data, the number of available 163
observations is reported and missing values were not imputed. Continuous variables 164
are reported as mean (standard deviation) or median (interquartile range). 165
Proportions are reported as percentages with 95% confidence intervals (CI). 166
Differences between groups were analyzed, as appropriate, using Student’s t-test or 167
Mann-Whitney U tests for continuous variables and Pearson chi-square or Fisher’s 168
exact test for categorical variables. Overall calorie delivery was calculated as total 169
intake divided by the number of days fed and expressed as intake per 24 hours. 170
Daily intakes were analyzed in linear mixed effects models with fixed effects for 171
group, day and the group by day interaction, with a heterogeneous first-order 172
autoregressive covariance structure for repeated measurements. 173
174
The American Journal of Clinical Nutrition AJCN/2014/086322 Version 1
12
Ventilator-free days to day 28 were calculated as previously described (14). Patients 175
who died prior to day 28 were assigned zero ventilator-free days. Absolute risk 176
differences with 95% CI for 90-day all-cause mortality are reported. Survival time 177
from randomization to Day 90 was compared using Kaplan-Meier analysis and the 178
log-rank test. Length of stay was analyzed using log rank tests with deaths 179
considered a competing event that precluded discharge. Deaths were censored at 180
values after the last observed discharge for ICU and hospital stay. 181
182
Statistical analyses were performed with IBM SPSS Statistics version 20 (IBM Inc; 183
2011). Statistical significance was defined as a P value <0.05. 184
185
Results 186
Study patients 187
Of 415 patients assessed for eligibility, 112 were enrolled and randomized to receive 188
1.5 kcal/ml (57 patients) or 1.0 kcal/ml (55 patients) enteral nutrition solution (Figure 189
1). All patients were assessed for the primary outcome. One patient in the 1.5 190
kcal/ml group requested to be withdrawn from the study on day 4 and one patient in 191
the 1.0 kcal/ml group was lost to follow-up by day 90. 192
193
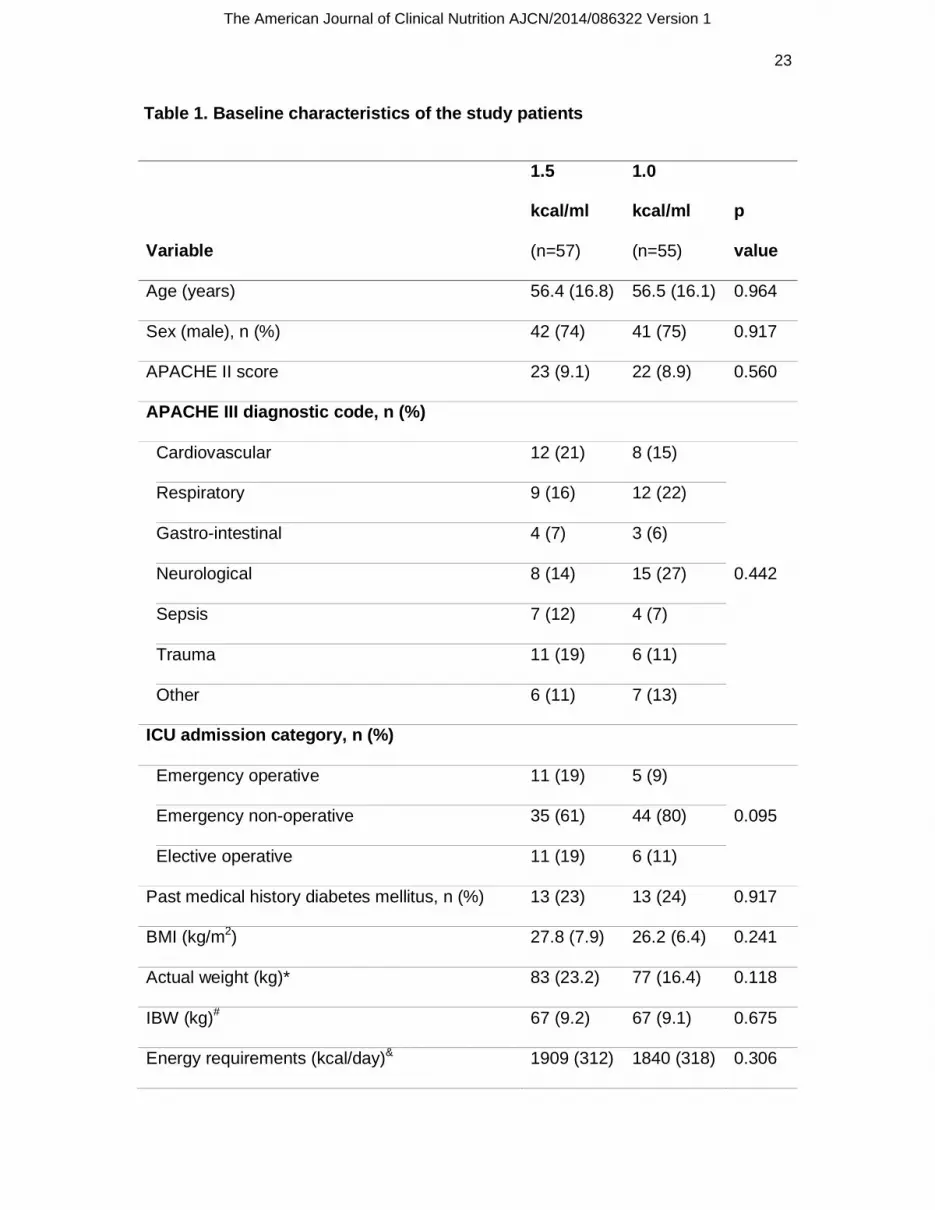
Baseline characteristics 194
The mean age was 56.4(16.4) years and the majority were male (74%) with an 195
APACHE II score of 23(9.0). Seventy one percent had a medical and 14% an 196
emergency surgical condition. No differences in baseline characteristics were 197
observed between the two groups (Table 1). The time from ICU admission to 198
randomization was not different (21 hours for both). A dietitian assessment of calorie 199
The American Journal of Clinical Nutrition AJCN/2014/086322 Version 1
13
requirements was performed on 88 (79%) patients, most commonly using a fixed 200
prescription of 20-25kcal/kg in 43 patients (48%) or the Schofield equation (with or 201
without a stress factor) in 40 patients (45%). The dietitian-estimated daily calorie 202
requirements for the 1.5 kcal/ml and 1.0 kcal/ml groups were 1909(312) and 203
1840(318) kcal/day (P=0.306). 204
205
Primary outcome 206
The number of days study enteral nutrition was delivered over the 10-day 207
intervention period was 7(4-9) and 4(3-9) for the 1.5 and 1.0 kcal/ml groups 208
respectively (P=0.245). On day 10, 15 (27%) and 14 (25%) patients were still 209
receiving study enteral nutrition in the 1.5 and 1.0 kcal/ml groups respectively. 210
Between days 11 and 14, 33 patients continued to receive enteral nutrition: 17 211
patients (30%) in the 1.5 kcal/ml group; 16 patients (29%) in the 1.0 kcal/ml group. 212
213
The daily volume of study enteral nutrition delivered in the two groups was similar: 214
(1.5 kcal/ml,1221 [95% CI (1120, 1322)] ml versus 1.0 kcal/ml, 1259 [95% CI (1143, 215
1374)] ml; P=0.628) (Table 2). Overall, there were a total of 364 feeding days in the 216
1.5 kcal/ml group and daily goal rate (based on 1 ml/kgIBW/hr) was achieved on 136 217
days (37%). In the 1.0 kcal/ml group, there were a total of 311 feeding days and daily 218
goal rate was achieved on 137 days (44%). The number of patients achieving goal 219
rate on one or more days was 45 (82%) and 47 (85%) in the 1.5 and 1.0 kcal/ml 220
groups respectively. The time to achieving goal rate was the same for both groups, 2 221
(1-3) days. Reasons for not achieving the goal rate on any day were similar between 222
the 2 groups, and included planned endotracheal extubation or procedure outside 223
The American Journal of Clinical Nutrition AJCN/2014/086322 Version 1
14
the ICU (63%), vomiting or regurgitation (22%), large gastric residual volumes (26%) 224
and enteral tube removal or blockage (16%). 225
226
Administration of the 1.5 kcal/ml enteral nutrition formula resulted in a 46% increase 227
in daily calorie delivery (1832 [95% CI (1681, 1984)] kcal versus 1259 [95% CI 228
(1143, 1374)] kcal; P<0.001) (Figure 2). The proportion of estimated daily calorie 229
requirements (based on the dietitian’s assessment) delivered by the study enteral 230
nutrition was 102% and 72% for the 1.5 and 1.0 kcal/ml groups respectively 231
(P<0.001). The number of patients achieving their estimated daily caloric 232
requirements on one or more study feeding days was 40 (89%) and 7 (16%) for the 233
1.5 and 1.0 kcal/ml groups (Figure 3). Protein delivery was the same for both groups 234
(Table 2); 75% of that estimated by the dietitian in the 1.5 kcal/ml group and 79% of 235
estimated in the 1.0 kcal/ml group. 236
237
Independent analysis of the osmolality of a random sample of study bags confirmed 238
delivery of the allocated solutions (1.5kcal/ml [n=147]; 496[488-507] mOsm/kg H2O 239
vs. 1.0 kcal/ml [n=114]; 383[377-388] mOsm/kg H2O; P<0.001). 240
241
Secondary outcomes 242
Enteral nutrition calories delivered per kilogram of ideal body weight was 243
substantially greater in the group given 1.5 kcal/ml compared to those receiving 244
1.0kcal/ml; (27.3[7.4] kcal/kg/day versus 19.0[6.0] kcal/kg/day; P<0.001) (Table 2). 245
Total daily calorie delivery from study, parenteral nutrition and other calorie sources 246
combined was also higher for the 1.5 kcal/ml group (P<0.001). 247
248
The American Journal of Clinical Nutrition AJCN/2014/086322 Version 1
15
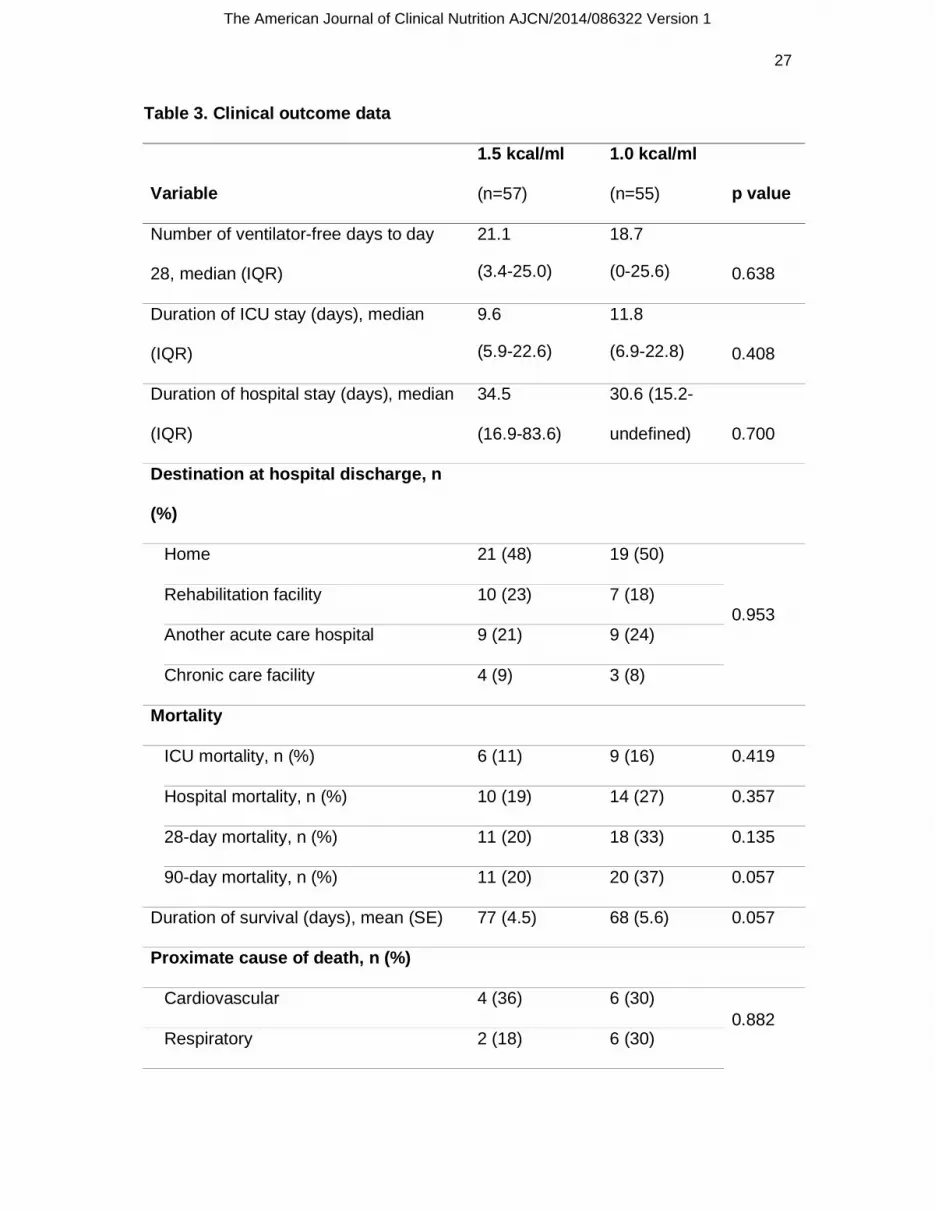
At 90 days, 11 patients (20%) in the 1.5 kcal/ml and 20 patients (37%) in the 1.0 249
kcal/ml group had died (P=0.057) (Table 3). The absolute risk reduction in mortality 250
for the 1.5 kcal group as compared to the 1.0 kcal/ml group was 17% (95% CI 0.6-251
33%). The survival time from randomization to day 90 tended to be longer in patients 252
receiving 1.5kcal/ml formula (P=0.057) (Figure 4) and there was no difference in the 253
proximate cause of death (P=0.882) (Table 3). ICU, hospital and 28-day mortality 254
were not different between the two treatment groups. One patient in the 1.5 kcal/ml 255
group and 6 patients in the 1.0 kcal/ml group died after hospital discharge. The 256
number of mechanical ventilation-free days to day 28, ICU and hospital length of 257
stay (for survivors only) and destination at hospital discharge were also not different 258
(Table 3). 259
260
Complications of therapy 261
Enteral nutrition was never ceased because of treating clinician concerns of over-262
nutrition. Supplemental parenteral nutrition was administered to 4 patients (1.5 263
kcal/ml, 2; 1.0 kcal/ml, 2). There was no difference between the groups in terms of 264
gastrointestinal intolerance (large gastric residual volumes, use of promotility or 265
laxative agents, diarrhea) (Table 2). Two of 40 patients with diarrhea had Clostridium 266
difficile toxin detected. The increased calorie delivery in the 1.5 kcal/ml group was 267
associated with a trend to a slightly higher peak blood glucose concentration over 268
the 10-day study period (1.5 kcal/ml; 12.4[3.9] versus 1.0 kcal/ml; 12.0[3.9] mmol/L; 269
P=0.056); but the number of patients requiring insulin on one or more days was no 270
greater in the 1.5 kcal/ml group (1.5 kcal/ml; 54% versus1.0 kcal/ml; 42%; P=0.183). 271
No episodes of hypoglycemia (≤ 2.2 mmol/L) were reported. 272
273
The American Journal of Clinical Nutrition AJCN/2014/086322 Version 1

16
Discussion 274
In this multicenter, randomized, double-blind study, the administration of a 1.5 275
kcal/ml enteral nutrition formula resulted in a near 50% increase in calorie delivery 276
compared to a 1.0 kcal/ml formula in mechanically ventilated patients. This is the first 277
study to our knowledge in this patient population to describe the use of a 278
concentrated enteral nutrition formula to deliver more calories to patients in a double-279
blind fashion. Furthermore, in this feasibility study the inclusion criteria have 280
successfully identified a cohort of critically ill patients whose outcome may be 281
improved by increased calorie delivery (i.e. longer stay, mechanically ventilated 282
patients with a 90 day mortality of around 28%). 283
284
Previous studies designed to deliver more calories to critically ill patients have used 285
techniques including nutrition protocols (13, 15-17) and small intestinal feeding 286
catheters (18-20). Both these strategies have had small effects on calorie delivery. 287
The administration of promotility drugs and/or supplemental parenteral nutrition have 288
resulted in greater calorie delivery, but it is unclear if this offers advantages in terms 289
of clinically-meaningful outcomes (7, 10, 21, 22). It is also possible that potential 290
benefits from increased calorie delivery may be outweighed by adverse effects from 291
the method used. In the EDEN study, a difference in enteral calorie delivery was 292
achieved, but in the ‘full feeding’ group only around 1300 kcal/day were delivered, a 293
similar amount of calories as was given to our 1.0 kcal/ml (standard care) group 294
(1259 kcal/day or 19.0 kcal/kg/day) (8). In contrast, we have demonstrated that over 295
1800 kcal/day (27 kcal/kgIBW/day) was delivered to a heterogeneous population of 296
critically ill patients using a 1.5 kcal/ml enteral nutrition solution. While the results 297
from the EDEN study suggested there was no difference in clinical outcomes when 298
The American Journal of Clinical Nutrition AJCN/2014/086322 Version 1

17
comparing the administration of 1300 versus 400 kcal/day for the first week of ICU 299
nutrition therapy, it remains a plausible hypothesis that the delivery of 1800 kcal/day 300
(being closer to the expected requirements) could be associated with improved 301
clinical outcomes. 302
303
The use of concentrated enteral nutrition solutions has become popular in recent 304
years in ICU patients (23). Concentrated solutions may be prescribed when a patient 305
is intolerant to enteral nutrition on the assumption that delivery of a lower volume, 306
greater caloric content solutions may be better tolerated to allow increased calorie 307
delivery (23). This premise has never been proven. Conversely, it is possible that 308
concentrated enteral nutrition solutions may be less well tolerated due to the 309
concentrated formula being emptied more slowly from the stomach into the small 310
intestine, leading to increased gastric residual volumes (24). There have also been 311
concerns that concentrated enteral nutrition solutions may be associated with 312
increased osmotic diarrhea (25) although studies have refuted this (26). The effects 313
of concentrated enteral nutrition solutions on clinical outcomes, including mortality, 314
has also been questioned in an observational study of critically ill trauma and 315
surgical patients (22). This current study has demonstrated that the use of a 316
concentrated solution is both safe and effective in delivering more calories. There 317
was no increase in either gastric residual volumes or diarrhea and there was also a 318
suggestion of improved survival at 90-days (although the study was not powered to 319
detect this). 320
321
This study is the first enteral nutrition study looking at the effect of calorie delivery on 322
outcome to successfully blind the study intervention, thus eliminating a potential 323
The American Journal of Clinical Nutrition AJCN/2014/086322 Version 1
18
source of bias associated with other enteral nutrition studies in this patient population 324
(6, 8). Concealment of the intervention is important to prevent inadvertent bias (27). 325
In previous studies, blinding of the intervention has not been undertaken which 326
raises concerns about reported differences in outcomes particularly when outcomes 327
are subject to ascertainment bias (e.g. nosocomial infections, functional outcomes) 328
(1, 10, 21). We were able to overcome the substantial logistical problems of 329
designing a double-blind enteral nutrition study by using two commercially-available 330
enteral nutrition solutions which were similar in color, indistinguishable at the bedside 331
and delivered at the same flow rate and volume to both study groups. 332
333
This feasibility study has several limitations. It was not powered to demonstrate an 334
effect on survival. Nevertheless it is of interest to note that less deaths after hospital 335
discharge contributed to a perceived improvement in survival at 90 days in the group 336
receiving more calories. It is possible, given the small sample size, that there was an 337
undetected baseline imbalance which may have resulted in an apparent strong trend 338
for improved survival in patients given more calories. On the other hand, if calorie 339
delivery affects outcomes, it is likely to be late, possibly after ICU discharge. Our 340
findings suggest that the effects of nutritional interventions on post-ICU discharge 341
mortality should be rigorously sought. A further limitation of our study is that we did 342
not assess functional outcomes. Functional outcomes are likely to be important in 343
studies of calorie delivery. There was no difference between the two groups in 344
destination after hospital discharge which could possibly be considered a crude 345
measure of functional outcome. The ARDSnet group looked at functional outcomes 346
in a subset of patients enrolled in the EDEN study and determined that there was no 347
benefit in the administration of 1300 compared to 400kcal/day on functional 348
The American Journal of Clinical Nutrition AJCN/2014/086322 Version 1

19
outcomes out to 12 months; but as only 174 patients were included in this analysis 349
this sub-study may have been underpowered to show an effect (28). Future studies 350
investigating the effect of nutrition in this population should also include functional 351
outcomes. 352
353
Finally it is important to emphasize that in this study the aim was to isolate the likely 354
differing effects of calorie and protein delivery. Hence protein delivery in terms of 355
gm/kg/day was standardized in the two groups. The optimal dose of protein 356
administration in critical illness is unclear. The patients in this study received around 357
1gm/kg/day. The difference in calorie delivery in this study reflects a difference in 358
carbohydrate and lipid concentrations in the two formulae. The effect of 359
macronutrient composition on clinical outcomes is an area that needs further 360
attention. 361
362
Conclusions 363
Substitution of a standard 1.0 kcal/ml enteral nutrition solution with a concentrated 364
1.5 kcal/ml solution, administered at the same rate, resulted in an almost 50% 365
increase in calorie delivery. The delivery of more calories was achieved in a blinded 366
fashion and was also associated with a trend to improved survival. These data 367
support the conduct of a large, multicenter, randomized, double-blind trial to 368
determine whether the delivery of more calories using a concentrated enteral 369
nutrition solution can result in improved survival and functional outcomes for critically 370
ill patients. 371
372
373
The American Journal of Clinical Nutrition AJCN/2014/086322 Version 1

20
Acknowledgements 374
The authors have no conflict of interest to disclose. All authors who contributed to 375
the manuscript are listed in Appendix 1. The authors are grateful for the assistance 376
provided by Ms Donna Goldsmith for unblinded management of the study formulae 377
distribution.378
The American Journal of Clinical Nutrition AJCN/2014/086322 Version 1

21
References
1. Singer P, Anbar R, Cohen J, Shapiro H, Shalita-Chesner M, Lev S, Grozovski E, Theilla M, Frishman S, Madar Z. The tight calorie control study (TICACOS): a prospective, randomized, controlled pilot study of nutritional support in critically ill patients. Intensive care medicine 2011;37(4):601-9.
2. Singer P, Berger MM, Van den Berghe G, Biolo G, Calder P, Forbes A, Griffiths R, Kreyman G, Leverve X, Pichard C, et al. ESPEN Guidelines on Parenteral Nutrition: intensive care. Clin Nutr 2009;28(4):387-400.
3. Kreymann KG, Berger MM, Deutz NE, Hiesmayr M, Jolliet P, Kazandjiev G, Nitenberg G, van den Berghe G, Wernerman J, Ebner C, et al. ESPEN Guidelines on Enteral Nutrition: Intensive care. Clin Nutr 2006;25(2):210-23.
4. Martindale RG, McClave SA, Vanek VW, McCarthy M, Roberts P, Taylor B, Ochoa JB, Napolitano L, Cresci G. Guidelines for the provision and assessment of nutrition support therapy in the adult critically ill patient: Society of Critical Care Medicine and American Society for Parenteral and Enteral Nutrition: Executive Summary. Crit Care Med 2009;37(5):1757-61. doi: 10.1097/CCM.0b013e3181a4011600003246-200905000-00031 [pii].
5. Krishnan JA, Parce PB, Martinez A, Diette GB, Brower RG. Caloric intake in medical ICU patients: consistency of care with guidelines and relationship to clinical outcomes. Chest 2003;124(1):297-305.
6. Arabi YM, Tamim HM, Dhar GS, Al-Dawood A, Al-Sultan M, Sakkijha MH, Kahoul SH, Brits R. Permissive underfeeding and intensive insulin therapy in critically ill patients: a randomized controlled trial. Am J Clin Nutr 2011;93(3):569-77.
7. Casaer MP, Mesotten D, Hermans G, Wouters PJ, Schetz M, Meyfroidt G, Van Cromphaut S, Ingels C, Meersseman P, Muller J, et al. Early versus late parenteral nutrition in critically ill adults. The New England journal of medicine 2011;365(6):506-17.
8. Rice TW, Wheeler AP, Thompson BT, Steingrub J, Hite RD, Moss M, Morris A, Dong N, Rock P. Initial trophic vs full enteral feeding in patients with acute lung injury: the EDEN randomized trial. JAMA 2012;307(8):795-803.
9. Alberda C, Gramlich L, Jones N, Jeejeebhoy K, Day AG, Dhaliwal R, Heyland DK. The relationship between nutritional intake and clinical outcomes in critically ill patients: results of an international multicenter observational study. Intensive care medicine 2009;35(10):1728-37.
10. Heidegger CP, Berger MM, Graf S, Zingg W, Darmon P, Costanza MC, Thibault R, Pichard C. Optimisation of energy provision with supplemental parenteral nutrition in critically ill patients: a randomised controlled clinical trial. Lancet 2013;381(9864):385-93. doi: 10.1016/S0140-6736(12)61351-8S0140-6736(12)61351-8 [pii].
11. De Beaux I, Chapman M, Fraser R, Finnis M, De Keulenaer B, Liberalli D, Satanek M. Enteral nutrition in the critically ill: a prospective survey in an Australian intensive care unit. Anaesth Intensive Care 2001;29(6):619-22.
12. Heyland DK, Dhaliwal R, Drover JW, Gramlich L, Dodek P. Canadian clinical practice guidelines for nutrition support in mechanically ventilated, critically ill adult patients. JPEN J Parenter Enteral Nutr 2003;27(5):355-73.
13. Doig GS, Simpson F, Finfer S, Delaney A, Davies AR, Mitchell I, Dobb G. Effect of evidence-based feeding guidelines on mortality of critically ill adults: a cluster randomized controlled trial. JAMA 2008;300(23):2731-41.
14. Schoenfeld DA, Bernard GR. Statistical evaluation of ventilator-free days as an efficacy measure in clinical trials of treatments for acute respiratory distress syndrome. Crit Care Med 2002;30(8):1772-7.
The American Journal of Clinical Nutrition AJCN/2014/086322 Version 1

22
15. Martin CM, Doig GS, Heyland DK, Morrison T, Sibbald WJ. Multicentre, cluster-randomized clinical trial of algorithms for critical-care enteral and parenteral therapy (ACCEPT). Cmaj 2004;170(2):197-204.
16. Heyland DK, Cahill NE, Dhaliwal R, Wang M, Day AG, Alenzi A, Aris F, Muscedere J, Drover JW, McClave SA. Enhanced protein-energy provision via the enteral route in critically ill patients: a single center feasibility trial of the PEP uP protocol. Crit Care 2010;14(2):R78. doi: 10.1186/cc8991cc8991 [pii].
17. Heyland DK, Murch L, Cahill N, McCall M, Muscedere J, Stelfox HT, Bray T, Tanguay T, Jiang X, Day AG. Enhanced protein-energy provision via the enteral route feeding protocol in critically ill patients: results of a cluster randomized trial. Crit Care Med 2013;41(12):2743-53. doi: 10.1097/CCM.0b013e31829efef5.
18. White H, Sosnowski K, Tran K, Reeves A, Jones M. A randomised controlled comparison of early post-pyloric versus early gastric feeding to meet nutritional targets in ventilated intensive care patients. Crit Care 2009;13(6):R187.
19. Davies AR, Morrison SS, Bailey MJ, Bellomo R, Cooper DJ, Doig GS, Finfer SR, Heyland DK. A multicenter, randomized controlled trial comparing early nasojejunal with nasogastric nutrition in critical illness. Crit Care Med 2012;40(8):2342-8.
20. Deane AM, Dhaliwal R, Day AG, Ridley EJ, Davies AR, Heyland DK. Comparisons between intragastric and small intestinal delivery of enteral nutrition in the critically ill: a systematic review and meta-analysis. Crit Care 2013;17(3):R125. doi: cc12800 [pii]10.1186/cc12800.
21. Doig GS, Simpson F, Sweetman EA, Finfer SR, Cooper DJ, Heighes PT, Davies AR, O'Leary M, Solano T, Peake S. Early parenteral nutrition in critically ill patients with short-term relative contraindications to early enteral nutrition: a randomized controlled trial. JAMA 2013;309(20):2130-8. doi: 10.1001/jama.2013.51241689534 [pii].
22. Nguyen NQ, Chapman M, Fraser RJ, Bryant LK, Burgstad C, Holloway RH. Prokinetic therapy for feed intolerance in critical illness: One drug or two? Crit Care Med 2007.
23. Peake SL, Chapman MJ, Davies AR, Moran JL, O'Connor S, Ridley E, Williams P. Enteral nutrition in Australian and New Zealand intensive care units: a point-prevalence study of prescription practices. Crit Care Resusc 2012;14(2):148-53.
24. Chapman M, Fraser R, Vozzo R, Bryant L, Tam W, Nguyen N, Zacharakis B, Butler R, Davidson G, Horowitz M. Antro-pyloro-duodenal motor responses to gastric and duodenal nutrient in critically ill patients. Gut 2005;54(10):1384-90.
25. Montejo JC. Enteral nutrition-related gastrointestinal complications in critically ill patients: a multicenter study. The Nutritional and Metabolic Working Group of the Spanish Society of Intensive Care Medicine and Coronary Units. Crit Care Med 1999;27(8):1447-53.
26. Edes TE, Walk BE, Austin JL. Diarrhea in tube-fed patients: feeding formula not necessarily the cause. Am J Med 1990;88(2):91-3. doi: 0002-9343(90)90454-L [pii].
27. Crossley NA, Sena E, Goehler J, Horn J, van der Worp B, Bath PM, Macleod M, Dirnagl U. Empirical evidence of bias in the design of experimental stroke studies: a metaepidemiologic approach. Stroke 2008;39(3):929-34. doi: 10.1161/STROKEAHA.107.498725STROKEAHA.107.498725 [pii].
28. Needham DM, Dinglas VD, Morris PE, Jackson JC, Hough CL, Mendez-Tellez PA, Wozniak AW, Colantuoni E, Ely EW, Rice TW, et al. Physical and Cognitive Performance of Patients with Acute Lung Injury 1 Year after Initial Trophic versus Full Enteral Feeding. EDEN Trial Follow-up. Am J Respir Crit Care Med 2013;188(5):567-76. doi: 10.1164/rccm.201304-0651OC.
The American Journal of Clinical Nutrition AJCN/2014/086322 Version 1
23
Table 1. Baseline characteristics of the study patients
Variable
1.5
kcal/ml
(n=57)
1.0
kcal/ml
(n=55)
p
value
Age (years) 56.4 (16.8) 56.5 (16.1) 0.964
Sex (male), n (%) 42 (74) 41 (75) 0.917
APACHE II score 23 (9.1) 22 (8.9) 0.560
APACHE III diagnostic code, n (%)
Cardiovascular 12 (21) 8 (15)
0.442
Respiratory 9 (16) 12 (22)
Gastro-intestinal 4 (7) 3 (6)
Neurological 8 (14) 15 (27)
Sepsis 7 (12) 4 (7)
Trauma 11 (19) 6 (11)
Other 6 (11) 7 (13)
ICU admission category, n (%)
Emergency operative 11 (19) 5 (9)
0.095 Emergency non-operative 35 (61) 44 (80)
Elective operative 11 (19) 6 (11)
Past medical history diabetes mellitus, n (%) 13 (23) 13 (24) 0.917
BMI (kg/m2) 27.8 (7.9) 26.2 (6.4) 0.241
Actual weight (kg)* 83 (23.2) 77 (16.4) 0.118
IBW (kg)# 67 (9.2) 67 (9.1) 0.675
Energy requirements (kcal/day)& 1909 (312) 1840 (318) 0.306
The American Journal of Clinical Nutrition AJCN/2014/086322 Version 1

24
Data are mean and standard deviation (in parentheses) unless otherwise stated.
* Actual weight was measured or estimated if not possible.
# IBW was calculated using measured height and the following formulae: IBW for men = (height (cm) – 152.4) x 0.9 + 50; IBW for women = (height (cm) – 152.4) x 0.9 + 45.5).
& Energy and protein requirements were estimated by the dietitians at the site at study entry.
kcal: kilocalorie; ml: milliliter; n: number; BMI: body mass index; kg: kilogram; m: meter; IBW: ideal body weight; ICU: intensive care unit; IQR: interquartile range; SI: small intestinal; cm: centimeter.
Protein requirements (gram/day)& 91 (16) 87 (12) 0.178
Time from ICU admission to randomization
(hrs), median (IQR) 21 (13-36) 21 (13-41) 0.836
SI tube, n (%) 4 (7) 1 (2) 0.364
The American Journal of Clinical Nutrition AJCN/2014/086322 Version 1

25
Table 2. Nutrition data
Variable
1.5
kcal/ml
(n=57)
1.0
kcal/ml
(n=55) p value
Calories Overall, per 24 hours of
study period
Study EN (kcal) 1832
(381)
1259
(428) < 0.001
Study EN/kg (kcal/kg) 27.3 (7.4) 19.0 (6.0) < 0.001
Study EN minus GRV (kcal) 1699 (682)
1194
(454) <0.001
(EN + PN + other) (kcal) 2040 (578)
1504
(573) < 0.001
(EN + PN + other) minus GRV (kcal) 1617 (740)
1291
(623) 0.014
Protein Overall, per 24 hours of
study period
Study EN (g) 68 (21) 69 (24) 0.847
Study EN/kg (g/kg) 1.02
(0.28)
1.05 (0.33)
0.618
(EN + PN + other) (g) 70 (20) 74 (30) 0.395
Volume Overall, per 24 hours of
study period
Study EN (ml) 1221 1259 0.628
The American Journal of Clinical Nutrition AJCN/2014/086322 Version 1

26
Data are mean and standard deviation (in parentheses) unless otherwise stated.
“other” refers to incidental calorie intake provided by propofol and dextrose infusions
kcal: kilocalorie; ml: milliliter; n: number; kg: kilogram; GRV: gastric residual volume; EN: enteral nutrition; PN: parenteral nutrition; g: gram; ml: milliliter; IQR: interquartile range; UI: international units; mmol: millimole; l:litre”
(381) (428)
Gastric residual
volume (ml), median (IQR)
Total volume, per 24 hours 166 (48-324)
80 (37-261)
0.260
Returned, per 24 hours 126 (41-262)
70 (29-145)
0.050
Largest individual measurement 200 (50-360)
105 (40-278)
0.129
Regurgitation (over study period), n (%) 12 (21) 13 (24) 0.743
Promotility drugs (over study period), n (%) 28 (49) 25 (46) 0.697
Laxative drugs (over study period), n (%) 36 (63) 29 (53) 0.263
Fecal management system, n (%)
(over study period)
8 (14) 13 (24) 0.193
Diarrhea, n(%) 20 (35) 20 (36) 0.888
Day first had diarrhea, median (IQR) 5 (3-8) 4 (2-6) 0.369
Insulin dose, mean dose/day (UI), median (IQR)
55 (22-131)
43 (24-67) 0.308
Blood glucose level ≤2.2 mmol/l, n (%)
0 (0) 0 (0)
The American Journal of Clinical Nutrition AJCN/2014/086322 Version 1
27
Table 3. Clinical outcome data
Variable
1.5 kcal/ml
(n=57)
1.0 kcal/ml
(n=55) p value
Number of ventilator-free days to day
28, median (IQR)
21.1
(3.4-25.0)
18.7
(0-25.6) 0.638
Duration of ICU stay (days), median
(IQR)
9.6
(5.9-22.6)
11.8
(6.9-22.8) 0.408
Duration of hospital stay (days), median
(IQR)
34.5
(16.9-83.6)
30.6 (15.2-
undefined) 0.700
Destination at hospital discharge, n
(%)
Home 21 (48) 19 (50)
0.953 Rehabilitation facility 10 (23) 7 (18)
Another acute care hospital 9 (21) 9 (24)
Chronic care facility 4 (9) 3 (8)
Mortality
ICU mortality, n (%) 6 (11) 9 (16) 0.419
Hospital mortality, n (%) 10 (19) 14 (27) 0.357
28-day mortality, n (%) 11 (20) 18 (33) 0.135
90-day mortality, n (%) 11 (20) 20 (37) 0.057
Duration of survival (days), mean (SE) 77 (4.5) 68 (5.6) 0.057
Proximate cause of death, n (%)
Cardiovascular 4 (36) 6 (30) 0.882
Respiratory 2 (18) 6 (30)
The American Journal of Clinical Nutrition AJCN/2014/086322 Version 1

28
Neurological 4 (36) 7 (35)
Other 1 (9) 1 (5)
The interquartile range is undefined when more than 25% of patients died or were
not discharged from the primary hospital.
kcal: kilocalorie; ml: milliliter; n: number; IQR: interquartile range; ICU: intensive care
unit; SE: standard error.
The American Journal of Clinical Nutrition AJCN/2014/086322 Version 1

29
Figure Legends
Figure 1. Patient Flow Diagram
Number of patients enrolled in the study, randomly assigned to 1.5kcal/ml or
1.0kcal/ml enteral nutrition solution and included in the final analysis.
EN: enteral nutrition; PN: parenteral nutrition; kcal: kilocalorie; ml: milliliter.
*1. n=1 lost to follow-up excluded from secondary outcome analysis: 90 day
mortality.
*2. n=1 withdrawal of consent study day 4. (Included in intention-to-treat analysis of
primary endpoint but data not available beyond study day 4 for secondary
outcomes.)
Figure 2. Daily calorie delivery over the 10-day study intervention period
Figure 2A. Calories provided by study enteral solution (kcal), mean (SD)
Figure 2B. Calories per kilogram ideal body weight provided by study enteral solution (kcal/kg), mean (SD)
Figure 2C. Calories provided by study enteral solution (kcal) minus gastric residual volume (kcal), mean (SD)
Figure 2D. Total calories provided by study enteral solution (kcal) plus intravenous nutrition, propofol and glucose infusions (kcal), mean (SD)
Kcal: kilocalorie; ml: milliliter; kg: kilogram; SD: standard deviation.
Figure 3. Estimated goal calories* delivered per day from the 1.5 and 1.0 kcal/ml enteral nutrition solutions
Kcal: kilocalorie; ml: milliliter; SD: standard deviation.
*estimated daily caloric requirements based on the dietitian’s assessment at study entry (available in 88 patients [79%])
The American Journal of Clinical Nutrition AJCN/2014/086322 Version 1

30
Figure 4. Kaplan-Meier estimates of survival time to day 90
Kcal: kilocalorie; ml: milliliter;
The American Journal of Clinical Nutrition AJCN/2014/086322 Version 1

31
Appendix 1.
Writing Committee
Co-Chairs – Marianne J Chapman, Sandra L Peake
Members – Andrew R Davies, Adam M Deane, Kylie Lange, John L Moran,
Stephanie N O’Connor, Emma J Ridley, Patricia J Williams
Department of Intensive Care, Royal Adelaide Hospital, Adelaide, SA. (MJC, AMD,
SNOC)
Department of Intensive Care, Queen Elizabeth Hospital, Adelaide, SA. (SLP, JLM,
PJW)
Department of Intensive Care, The Alfred Hospital, Melbourne, VIC (ARD, EJR)
Discipline of Medicine, The University of Adelaide, Adelaide, SA. (KL)
Management Committee members (alphabetical order)
Co-chairs: Marianne J Chapman, Sandra L Peake
Committee members: Andrew R Davies, Adam M Deane, Stephanie N O’Connor,
Emma J Ridley, Patricia J Williams
Participating site investigators: Austin Health; Rinaldo Bellomo, Leah Peck,
Helen Young; Royal Adelaide Hospital, Stephanie N O’Connor, Justine A Rivett,
Sonya L Kloeden, Royal Prince Alfred Hospital; Suzie Ferrie, Heidi Buhr, Megan
Keir; The Canberra Hospital; Sumeet S Rai, Helen Rodgers, Louise Herlihy; The
Queen Elizabeth Hospital; Sandra L Peake, Joanne McIntyre, Jennie Phillips-
Hughes.
Appendix 2. Study enteral nutrition product information
The American Journal of Clinical Nutrition AJCN/2014/086322 Version 1

32
1.0kcal/ml enteral nutrition solution (“Fresubin 1000 Complete Tube Feed”)
1.5kcal/ml Enteral Nutrition Solution (“Fresubin 2250 Complete Tube Feed”)
The American Journal of Clinical Nutrition AJCN/2014/086322 Version 1

33
The American Journal of Clinical Nutrition AJCN/2014/086322 Version 1

Screened
(n=415)
Excluded (n=303)
Not meeting inclusion criteria (n=141)
EN or PN >12 hours already (n=115)
Specific nutrition therapy (n=27)
Study goal rate contraindicated (n=19)
Previously enrolled (n=3)
Other reasons (n=15)
o Not expected to survive
o Study EN unavailable
o Refused consent
Primary outcome analysed (n=55)
1.0 kcal/ml solution
(n=55)
1.5 kcal/ml solution
(n=57)
Primary outcome analysed (n=57)
Secondary outcomes analysed
(n=54) *1
Secondary outcomes analysed
(n=56) *2
Randomized
(n=112)
The American Journal of Clinical Nutrition AJCN/2014/086322 Version 1

0
500
1000
1500
2500
3000
2000
Study Day
Cal
ori
es p
er D
ay
0 1 2 3 4 5 6 7 8 9 10
Study Day
Cal
ori
es p
er D
ay
0 1 2 3 4 5 6 7 8 9 10
Study Day
Cal
ori
es p
er D
ay
0 1 2 3 4 5 6 7 8 9 1005
10
15
20
3035
40
25
Study Day
Cal
ori
es/k
g/d
ay
1.0 Kcal/ml 1.5 Kcal/mlA B
C D
0
500
1000
1500
2500
3000
2000
0
500
1000
1500
2500
3000
2000
0 1 2 3 4 5 6 7 8 9 10
No. of patients1.0 kcal/ml1.5 kcal/ml
5557
5155
4450
3644
2837
2636
2331
2025
1719
1415
No. of patients1.0 kcal/ml1.5 kcal/ml
5557
5155
4450
3644
2837
2636
2331
2025
1719
1415
The American Journal of Clinical Nutrition AJCN/2014/086322 Version 1

Group
1.5 kcal/ml1.0 kcal/ml
140
120
100
80
60
40
20
01 2 3 4 5 6 7 8 9 10
Study Day
%
The American Journal of Clinical Nutrition AJCN/2014/086322 Version 1

Group
1.5 kcal/ml1.0 kcal/ml
0.8
0.6
0.4
0.2
0.0
1.0
CummulativeSurvival
Duration of survival (days)
0 10 20 30 40 50 60 70 80 90
The American Journal of Clinical Nutrition AJCN/2014/086322 Version 1