urban waters in costa rica
TRANSCRIPT
A perspective from the Academies of Sciences
URBAN WATERCHALLENGES IN THE AMERICAS
A perspective from the Academies of Sciences
URBAN WATERCHALLENGES IN THE AMERICAS
2 URBAN WATER CHALLENGES IN THE AMERICAS
Published by The Inter-American Network of Academies of Sciences (IANAS), Calle Cipreses s/n, Km 23.5 de la Carretera Federal
México-Cuernavaca, 14400 Tlalpan, Distrito Federal, Mexico and the United Nations Educational, Scientific and Cultural
Organization (UNESCO), 7, place de Fontenoy, 75352 Paris 07 SP, France, the UNESCO Office in Montevideo, Edificio Mercosur,
Luis Pereira 1992, 2o piso, casilla de correo 859, 11200 Montevideo, Uruguay
© IANAS and UNESCO 2015
IANAS ISBN Pending
Printed in Mexico
This publication is available in http://www.ianas.org/index.php/books and Open Access under the Attribution-ShareAlike 3.0 IGO (CC-BY-SA 3.0
IGO) license (http://creativecommons.org/licenses/by-sa/3.0/igo/). By using the content of this publication, the users accept to be bound by the
terms of use of the UNESCO Open Access Repository (http://www.unesco.org/open-access/terms-use-ccbysa-en). For the printed book the present
license applies exclusively to the text content of the publication. For the use of any material not clearly identified as belonging to UNESCO, prior
permission shall be requested from: [email protected] or UNESCO Publishing, 7, place de Fontenoy, 75352 Paris 07 SP France.
The designations employed and the presentation of material throughout this publication do not imply the expression of any
opinion whatsoever on the part of UNESCO concerning the legal status of any country, territory, city or area or of its authorities,
or concerning the delimitation of its frontiers or boundaries. The ideas and opinions expressed in this publication are those of the
authors; they are not necessarily those of IANAS-IAP or UNESCO and do not commit the Organization.
This publication has been printed on ecological paper (FSC Certification): one part of the fibers is from recycled material and the
other from forests exploited in a sustainable manner. Also this paper is chlorine free (ECF Certification) in order to contribute to
the conservation of water resources.
IANAS The Inter-American Network of Academies of SciencesIANAS is a regional network of Academies of Sciences created to support cooperation in order to strengthen science and technology as tools for advancing research and development, prosperity and equity in the Americas.
IANAS
Co-Chairs: Michael Clegg (United States) and Juan Asenjo (Chile).
Executive Director: Adriana de la Cruz Molina
Editorial Coordination
Katherine Vammen and Adriana de la Cruz Molina
IANAS Water Program
Co-Chairs: Katherine Vammen (Nicaragua), Blanca Jiménez
(Mexico) and Honorary Co-Chair: Jose Tundisi (Brazil)
Editorial Committee
Gabriel Roldán (Colombia), María Luisa Torregrosa (Mexico),
Katherine Vammen (Nicaragua), Ernesto J. González (Venezuela),
Claudia Campuzano (Colombia), Hugo Hidalgo (Costa Rica) and
Adriana de la Cruz Molina (Mexico)
Proof Reading
Ma. Areli Montes Suárez and authors of the chapters
Translation
Suzanne D. Stephens (Argentina, Chile, Mexico, Canada,
Honduras, Panama, Costa Rica, Dominican Republic, Peru
and Toronto) and Alejandra Huete (Cuba and El Salvador)
Graphic Design
Víctor Daniel Moreno Alanís
Francisco Ibraham Meza Blanco
Original Cover Design
Francisco Ibraham Meza Blanco
Graphic Design Support
Osiris López Aguilar, Mariana Guerrero del Cueto,
Tania Zaldivar Martínez, and Roberto Flores Angulo
Administrative Support
Verónica Barroso
3URBAN WATER CHALLENGES IN THE AMERICAS
A perspective from the Academies of Sciences
URBAN WATERCHALLENGES IN THE AMERICAS
4 URBAN WATER CHALLENGES IN THE AMERICAS
Academies of Sciences Members
Argentina
National Academy of Exact, Physical and Natural
Sciences of Argentinawww.ancefn.org.ar
Roberto L.O. Cignoli President
Brazil
Brazilian Academy of Sciences www.abc.org.br
Jacob Palis, President
Bolivia
National Academy of Sciences of Boliviawww.aciencias.org.bo
Gonzalo Taboada López, President
Canada
The Royal Society of Canada: The Academies of
Arts, Humanities and Sciences of Canada https://rsc-src.ca/en/
Graham Bell, President
Caribbean
Caribbean Academy of Sciences
(Regional Networks) www.caswi.org
Trevor Alleyne, President
Chile
Chilean Academy of Science
www.academia-ciencias.cl
Juan Asenjo, President
Colombia
Colombian Academy of Exact, Physical
and Natural Sciences
www.accefyn.org.co
Enrique Forero, President
Costa Rica
National Academy of Sciences of Costa Rica www.anc.cr
Pedro León Azofeita, President
Cuba
Cuban Academy of Science www.academiaciencias.cu
Ismael Clark Arxer, President
Dominican Republic
Academy of Sciences of the Dominican Republic www.academiadecienciasrd.org
Milcíades Mejía, President
Ecuador
Academy of Sciences of Ecuadorhttp://www.academiadecienciasecuador.org
Carlos Alberto Soria, President
Guatemala
Academy of Medical, Physical and
Natural Sciences of Guatemala
www.interacademies.net/Academies/ByRegion/
LatinAmericaCarribbean/Guatemala/
Enrique Acevedo, President
Honduras
National Academy of Sciences of Honduraswww.guspepper.net/academia.htm
Gustavo A. Pérez, President
Mexico
Mexican Academy of Sciences www.amc.unam.mx
Jaime Urrutia, President
Nicaragua
Nicaraguan Academy of Sciences www.cienciasdenicaragua.org
Manuel Ortega, President
Panama
Panamanian Association for the
Advancement of Science www.apanac.org.edu.pa
Jorge Motta, President
Peru
National Academy of Sciences of Peru www.ancperu.org
Ronald Woodman Pollitt, President
United States of America
US National Academy of Scienceswww.nasonline.org
Ralph J. Cicerone, President
Uruguay
The National Academy of Sciences of the Oriental
Republic of Uruguaywww.anciu.org.uy
Rodolfo Gambini, President
Venezuela
Academy of Physical, Mathematical and Natural
Sciences of Venezuela www.acfiman.org.ve
Claudio Bifano, President
5URBAN WATER CHALLENGES IN THE AMERICAS
Argentina
Dr. Raúl A. Lopardo
National Water Institute
Bolivia
Dr.Fernando Urquídi
National Academy of Sciences of Bolivia
Brazil
Dr. José Galizia Tundisi
International Institute of Ecology
Canada
Dra. Banu Ormeci
Carleton University
Grenada
Dr. Martín ST. Clair Forde
St. George’s University, Grenada
Chile
Dr. James McPhee
Advanced Mining Technology Center
University of Chile
Colombia
Dr. Gabriel Roldán
Colombian Academy of Exact,
Physical and Natural Sciences
Costa Rica
Dr. Hugo Hidalgo
University of Costa Rica
Cuba
Dra. Daniela Mercedes Arellano Acosta
National Institute of Hygiene, Epidemiology
and Microbiology, Havana, Cuba
Dominican Republic
Ing. Osiris de León
Comission of Natural Sciences and
Environment of the Science Academy
El Salvador
Dr. Julio Cesar Quiñones Basagoitia
Member of the Global Water Partnership
Guatemala
Ing. Manuel Bastarrechea
Academy of Medical, Physical
and Natural Sciences of Guatemala
Honduras
Dr. Marco Blair
National Academy of Sciences of Honduras
Mexico
Dra. María Luisa Torregrosa
Latin American Faculty of Social Sciences
Nicaragua
Dra. Katherine Vammen
Nicaraguan Research Center for Aquatic Resources
National Autonomus of Nicaragua
Panama
Dr. José R. Fábrega
Faculties of Civil and Mechanical Engineering
at the Technological University of Panama
Peru
Dra. Nicole Bernex
Geography Research Center Pontifical Catholic
University of Peru
Uruguay
Dr. Daniel Conde
Sciences Faculty
Universidad de la República
USA
Dr. Henry Vaux
Univesity of California
Venezuela
Dr. Ernesto J. González
Sciences Faculty
Central University of Venezuela
IANAS Water Focal Points
6 URBAN WATER CHALLENGES IN THE AMERICAS
ArgentinaRaúl Antonio Lopardo
National Water Institute
Jorge Daniel Bacchiega
National Water Institute
Luis E. Higa
National Water Institute
BoliviaFernando Urquidi-Barrau
National Academy of Sciences of Bolivia
BrazilJosé Galizia Tundisi
International Institute of Technology
Carlos Eduardo Morelli Tucci
Universidade Federal do Rio Grande do Sul
Fernando Rosado Spilki
Centro Universitário Feevale
Ivanildo Hespanhol
Universidade de São Paulo
José Almir Cirilo
Universidade Federal de Pernambuco
Marcos Cortesão Barnsley Scheuenstuhl
Brazilian Academy of Sciences
Natalia Andricioli Periotto
Centro de Ciências Biológicas e da Saúde
Canada
Banu Örmeci
Carleton University
Michael D’Andrea
Water Infrastructure Management Toronto
ChileJames McPhee
Advanced Mining Technology Center
University of Chile
Jorge Gironás
School of Engineering
Pontifical Catholic University of Chile
Bonifacio Fernández
School of Engineering
Pontifical Catholic University of Chile
Pablo Pastén
Department of Hydraulic and Environmental
Pontifical Catholic University of Chile
José Vargas
Chilean Hydraulic Engineering Society
Alejandra Vega
Pontifical Catholic University of Chile
Sebastián Vicuña
UC Global Change Center
ColombiaGabriel Roldán
Colombian Academy of Exact
Physical and Natural Sciences
Claudia Patricia Campuzano Ochoa
Antioquia Science and Technology Center
Luis Javier Montoya Jaramillo
National University of Colombia-Medellin
Carlos Daniel Ruiz Carrascal
School of Engineering of Antioquia
Andrés Torres
Javeriana Pontifical University-Bogota
Jaime Lara-Borrero
Javeriana Pontifical University-Bogota
Coordinators and Authors
7URBAN WATER CHALLENGES IN THE AMERICAS
Sandra Lorena Galarza-Molina
Javeriana Pontifical University-Bogota
Juan Diego Giraldo Osorio
Javeriana Pontifical University-Bogota
Milton Duarte
Science and Engineering Research Group
Sandra Méndez-Fajardo
Javeriana Pontifical University-Bogota
Costa RicaHugo G. Hidalgo
University of Costa Rica
Ángel G. Muñoz
International Research Institute for Climate and
Society at Columbia University
Carolina Herrero
Ph-C Ingenieros Consultores
Eric J. Alfaro
University of Costa Rica, School of Physics
Natalie Mora
University of Costa Rica, School of Physics
Víctor H. Chacón
Municipality of Perez Zeledon, C.N.E.
Darner A. Mora
National Waters Laboratory
Mary L. Moreno
International Center for Economic Policy for
Sustainable Development at the National
University of Costa Rica
CubaDaniela de las Mercedes Arellano Acosta
Agency of Environment, Ministry of Science,
Technology and Environment, Havana, Cuba
L.F. Molerio-León MSc.
GRANIK HOLDINGS Ltd
(Dominican Republic)
Eduardo O. Planos Gutiérrez
Cuban Meteorology Institute
Dominican RepublicOsiris de León
Comission of Natural Sciences and
Environment of the Science Academy
El SalvadorJulio Cesar Quiñones Basagoitia
Member of the GWP
GrenadaMartin ST. Clair Forde
St. George’s University, Grenada
Brian P. Neff
St. George’s University, Grenada
GuatemalaManuel Basterrechea
Academy of Medical
Physical and Natural Sciences of Guatemala
Carlos Roberto Cobos
Engineering Research Center
Juan Carlos Fuentes
National Electrification Institute
Norma Edith Gil Rodas de Castillo
Oceans and Aquiculture Studies Center CEMA
University of San Carlos, Guatemala-USAC
Jeanette Herrera de Noack
Environmental Law Alliance Worldwide
Ana Beatriz Suárez
Ecological and Chemical Laboratory, S.A.
12 URBAN WATER CHALLENGES IN THE AMERICAS
Preface
Michael Clegg and Juan Asenjo, IANAS Co-Chairs
Urban Waters in the Americas
Blanca Jiménez-Cisneros, UNESCO International Hydrological Programme
Water in Urban Regions
José Galizia Tundisi, International Institute of Ecology São Carlos, Brazil
A Quick Look
Katherine Vammen, Co-Chair of the IANAS Water Program
Urban Water on the American Continent: the Case of Argentina
Raúl Antonio Lopardo, Jorge Daniel Bacchiega and Luis E. Higa
Compendium of the Water Resources in the Capital Cities of the Departments of Bolivia
Fernando Urquidi-Barrau
Urban Waters in Brazil
José Galizia Tundisi, Carlos Eduardo Morelli Tucci, Fernando Rosado Spilki, Ivanildo Hespanhol,
José Almir Cirilo, Marcos Cortesão Barnsley Scheuenstuhl and Natalia Andricioli Periotto
An Overview of Water Supply, Use and Treatment in Canada
Banu Örmeci
Urban Water Management: City of Toronto a Case Study
Michael D’Andrea
Water Security in Chile’s Cities: Advances and Pending Challenges
James McPhee, Jorge Gironás, Bonifacio Fernández, Pablo Pastén, José Vargas, Alejandra Vega
and Sebastián Vicuña
Urban Water in Colombia
Coordinators: Claudia P. Campuzano Ochoa and Gabriel Roldán. Authors. Claudia P. Campuzano
Ochoa, Gabriel Roldán, Andrés E. Torres Abello, Jaime A. Lara Borrero, Sandra Galarza Molina,
Juan Diego Giraldo Osorio, Milton Duarte, Sandra Méndez Fajardo, Luis Javier Montoya
Jaramillo and Carlos Daniel Ruiz
Urban Waters in Costa Rica
Hugo G. Hidalgo León, Carolina Herrero Madriz, Eric J. Alfaro Martínez, Ángel G. Muñoz,
Natalie P. Mora Sandí, Darner A. Mora Alvarado and Víctor H. Chacón Salazar
Singularities of Island Aquifer Management in the Humid Tropics:
the urban water cycle in Havana, Cuba
Coordinator: Daniela de las Mercedes Arellano Acosta. Authors: L.F. Molerio-León,
Ma. I. González González and E.O. Planos Gutiérrez
15
16
19
21
26
52
84
112
128
146
168
202
226
Index
13URBAN WATER CHALLENGES IN THE AMERICAS
Urban Waters in the Dominican Republic
Rafael Osiris de León
The Perspective of Urban Waters in El Salvador
Julio César Quiñonez Basagoitia
Impact of Development on Water Supply and Treatment in Grenada
Martin S. Forde and Brian Neff
Urban Water in Guatemala
Claudia Velásquez, Norma de Castillo, Jeanette de Noack, Ana Beatriz Suárez, Carlos Cobos,
Juan Carlos Fuentes and Manuel Basterrechea
Urban Water Management in Honduras: the case of Tegucigalpa
Marco Antonio Blair Chávez and Manuel Figueroa
Urban Water in Mexico
Coordinator: María Luisa Torregrosa. Contributing Authors: Ismael Aguilar Barajas, Blanca
Jiménez Cisneros, Karina Kloster, Polioptro Martínez, Jacinta Palerm, Ricardo Sandoval and
Jordi Vera
Urban Water in Nicaragua
Katherine Vammen, Selvia Flores, Francisco Picado, Iris Hurtado, Mario Jiménez, Gustavo
Sequeira and Yelba Flores
Urban Waters. Panama
José R. Fábrega D., Miroslava Morán M., Elsa L. Flores H., Icela I. Márquez de Rojas, Argentina
Ying, Casilda Saavedra, Berta Olmedo and Pilar López
Urban Water Supply in Peru
Nicole Bernex Weiss, Víctor Carlotto Caillaux, César Cabezas Sánchez, Ruth Shady Solís,
Fernando Roca Alcázar, Mathieu Durand, Eduardo Ismodes Cascón and Julio Kuroiwa Zevallos
An Overview of Urban Water Management and Ploblems in the United States of America
Henry Vaux, Jr.
Urban Waters in Uruguay: Progresses and Challenges to Integrated Management
Coordination and editing: Adriana Piperno, Federico Quintans and Daniel Conde. Authors:
Álvaro Capandeguy, Adriana Piperno, Federico Quintans, Pablo Sierra, Julieta Alonso, Christian
Chreties, Alejandra Cuadrado, Andrea Gamarra, Pablo Guido, Juan Pablo Martínez, Néstor
Mazzeo, María Mena, Nicolás Rezzano, Gabriela Sanguinet, Javier Taks, Guillermo Goyenola,
Elizabeth González, Julieta López, Amancay Matos, Osvaldo Sabaño, Carlos Santos, Matilde
Saravia, Luis Silveira, Rafael Arocena and Luis Aubriot
Urban Water in Venezuela
Ernesto José González, María Leny Matos, Eduardo Buroz, José Ochoa-Iturbe, Antonio Machado-
Allison, Róger Martínez and Ramón Montero
Biographies
248
268
308
332
350
382
414
448
474
504
524
556
603
202 URBAN WATER CHALLENGES IN THE AMERICAS
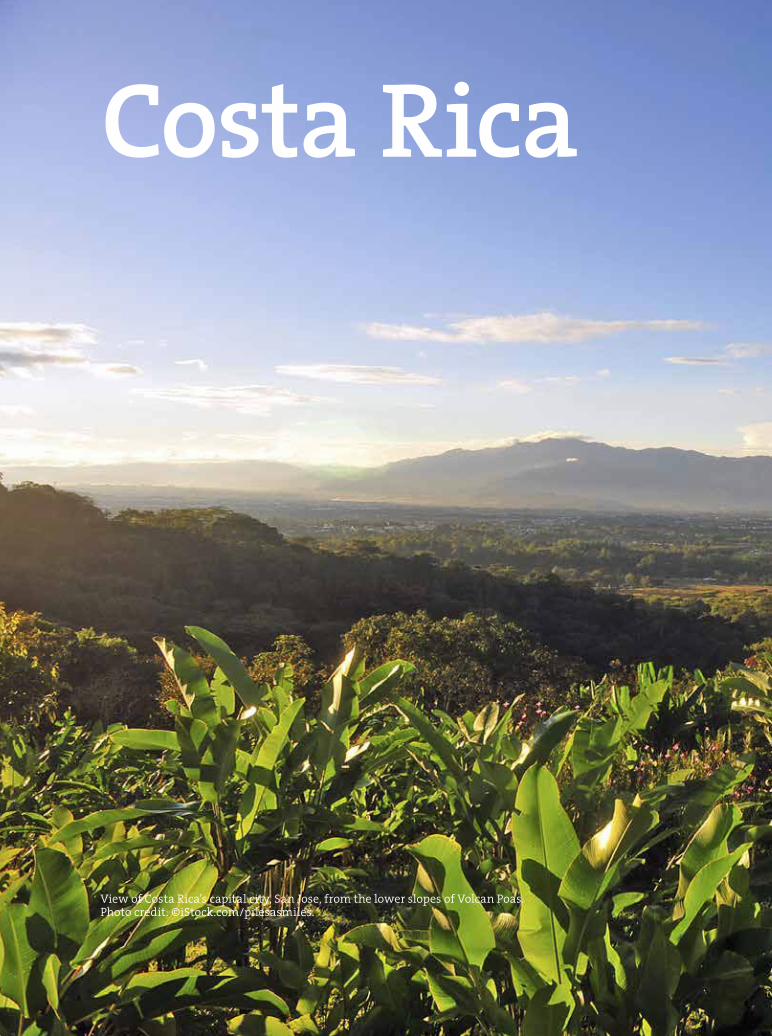
Costa Rica
View of Costa Rica’s capital city, San Jose, from the lower slopes of Volcan Poas.Photo credit: ©iStock.com/pilesasmiles.
203URBAN WATERS IN COSTA RICA
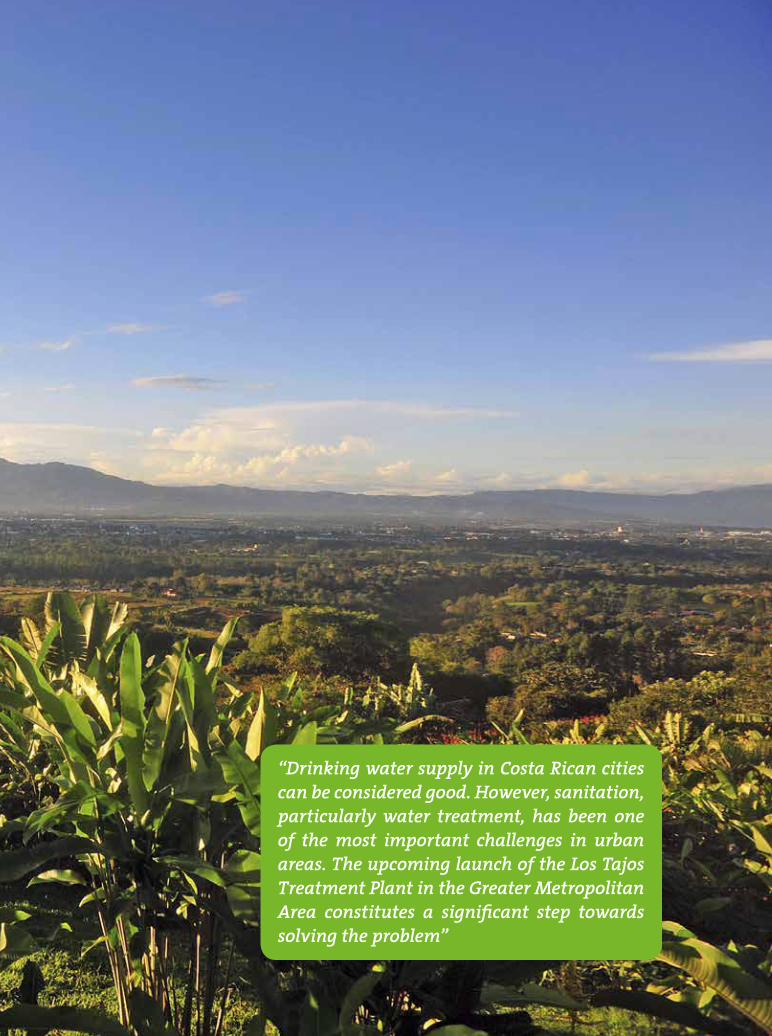
“Drinking water supply in Costa Rican cities
can be considered good. However, sanitation,
particularly water treatment, has been one
of the most important challenges in urban
areas. The upcoming launch of the Los Tajos
Treatment Plant in the Greater Metropolitan
Area constitutes a significant step towards
solving the problem”
204 URBAN WATER CHALLENGES IN THE AMERICAS
Summary
This chapter provides a summary of the main issues related to urban water
such as supply, sanitation, health, physical and human dimensions, floods and
climate variability and change affecting cities. In general, it was found that
except for some cities that have problems, water supply in Costa Rica is fairly
good. However, sanitation (especially related to sewage treatment) is an issue
that is only just beginning to be addressed. In 2000, sewerage coverage in urban
areas was 96%, comprising 34% with sewerage facilities and 62% with septic
tank availability. In 2009, the amount of urban water collected and treated
remained below 4%. As for health, much of the explanation for the relatively
positive indicators in this regard is linked to the integral social health system,
although credit must also be given to the effect of the widespread availability
of potable water in the majority of urban areas. In Costa Rica, progress has been
extremely satisfactory, with 98% coverage of indoor piped water and 99% of
improved drinking water sources being achieved in 2012.
Costa Rica is influenced by several large-scale natural climate phenomena
such as El Niño-Southern Oscillation, Atlantic climatic variations, the influence of
the Intertropical Convergence Zone and the Caribbean Low Level Jet. Likewise, in
recent decades, Central America has experienced changes in hydrometeorological
variables that suggest anthropogenic origins. Temperature trends towards hotter
nights and days are fairly consistent, while precipitation trends (rain) have been
less consistent and clear (in some locations there have been positive trends and,
in others, negative ones). Moreover, in the capitals of Costa Rica (San José) and
Honduras (Tegucigalpa), significant reductions in surface runoff have been found
from the 1980s onwards, possibly associated with increased evapotranspiration
Urban Watersin Costa Rica
Hugo G. Hidalgo León, Carolina Herrero Madriz,Eric J. Alfaro Martínez, Ángel G. Muñoz,
Natalie P. Mora Sandí, Darner A. Mora Alvarado and Víctor H. Chacón Salazar
205URBAN WATERS IN COSTA RICA
losses due to temperature increases. Projections
with models point to a drier Central America at the
end of the century, especially in the northern part
(with runoff reductions of about 30%), and less so
in the south (with 10% reductions in runoff). These
changes become more significant when examined
in light of the socioeconomic differences between
northern and southern Central America, and when
the vulnerabilities characteristics of countries in
the region are considered, such as dependence on
subsistence agriculture in some regions or society’s
vulnerability to extreme hydro-climatic events.
Analysis and forecasting systems can help reduce
these risks.
1. Introduction
Although Costa Rica has a fairly good potable
water supply in general, Costa Rican cities have the
problems typical of major Latin American cities,
such as: a water supply deficit in specific regions,
river pollution and floods. In Costa Rica, water is a
relatively abundant resource, since it is a country
with generally low water stress. These national
figures mask the problem of water availability in
some areas, however, especially in the western
region of the Greater Metropolitan Area (GMA),
which includes San José and the surrounding cities
(Hidalgo, 2012). River pollution is a worrying aspect
linked to urban sanitation, since rivers in the GMA
have concentrations of pollutants several orders of
magnitude above recommended levels. Many of
these problems have persisted over time, and it has
been difficult to make improvements in the system
due to lack of funding and the costs that would
be involved in its modernization. It is important,
however, to highlight positive aspects, such as the
low incidence of diseases caused by contaminated
water and certain efforts being made, such as the
construction of a treatment plant in the GMA.
This study will address some of these issues, as
well as evaluating the potential effects of climate
change on the future of cities. It also includes a
section stating the need to comprehensively assess
physical and social aspects in order to determine the
vulnerability of populations to climate variability
and change.
2. Water Sources in Urban Areas and the Impacts of
Urbanization
Drinking Water Service in Urban Zones
The water service provided by the Costa Rican
Institute of Aqueducts and Sewers (AyA), the
government body responsible for water supply and
sanitation, can generally be regarded as good. For
example, the specific case of urban coverage, with
values of approximately 99%, is an indicator that
confirms this condition. Some of the positive health
indices, in comparison with other countries in the
region, may be partly attributed to the availability
of drinking water. Aqueduct infrastructure and
technology is generally good, particularly as regards
capture and production systems.
Drinking water quality is monitored
throughout the process by AyA through the National
Water Laboratory (NWL), reaching significant levels
of purification (AyA, 2002). Although the percentage
of coverage of the water distribution network of
drinking water is high, however, there is little
confidence in the system in some areas (AyA, 2002).
This is paradoxical given that, on average, Costa
Rica has low water stress, but these supply problems
exist at a local level (Hidalgo, 2012). For example,
although in the Metropolitan Area of San José (the
capital) water production was slightly lower than
demand in 2002, this deficit has grown over time
and mainly affects the upper parts of the city (AyA,
2002). These problems are accentuated in certain
cities where production capacity is very close to or
below demand, as a result of which they already
have serious problems during the dry season. As part
of the solution, the outlet valves of tanks have been
closed overnight and their use rationed (AyA, 2002).
This proves that the water supply is insufficient in
some sectors, there are significant leaks or that there
are insufficient reserve tanks.
AyA (2002) mentions that one of the main short-
comings of the service is not the water supply per se,
but the distribution system, as borne out by the high
level of unaccounted for water, estimated at approx-
imately 59% for the San José Metropolitan Aqueduct
(and at 50% for the country as whole). Of this 59%, it
206 URBAN WATER CHALLENGES IN THE AMERICAS
is estimated that commercial losses are in the order
of 29%, divided into cadastral deficiencies (unreg-
istered connections) accounting for about 13%, lack
of metering (unmetered connections) in the region
of 7% and micrometering deficiencies (unrecorded
consumption in meters) totaling approximately 7%
(AyA, 2002). In short, the system’s shortcomings are
caused by several aspects such as deficiencies in the
structure of the networks due to their type and age,
visible leaks in the networks and connections, invis-
ible leaks, network operation management, reserve
tank overflow coupled with the lack of a register of
users and networks, micrometering, and pressure
control (AyA, 2002). As will be seen later, Costa Rica
fares less well as regards sanitation than water sup-
ply; public sewerage coverage is relatively low, rely-
ing heavily on septic tanks, while wastewater treat-
ment is virtually non-existent.
Table 1. Urban coverage of water and sanitation services, 2013
Area ServicesPopulation Served
(Thousands of inhab.)
Coverage
(%)
AyA Urban Area*Aqueducts 950 99.00%**
Sewerage 97 6.80%**
Urban Water Municipalities and ESPHAqueducts N.D. N.D.
Sewerage N.D. N.D.
*AyA: Costa Rican Institute of Aqueducts and Sewers. Only the population with available water service is considered through a connec-
tion to public supply systems or aqueducts. Source: Jorge Aguilar Barboza, AyA (personal communication, 2014). ** Data from Peripheral
Systems
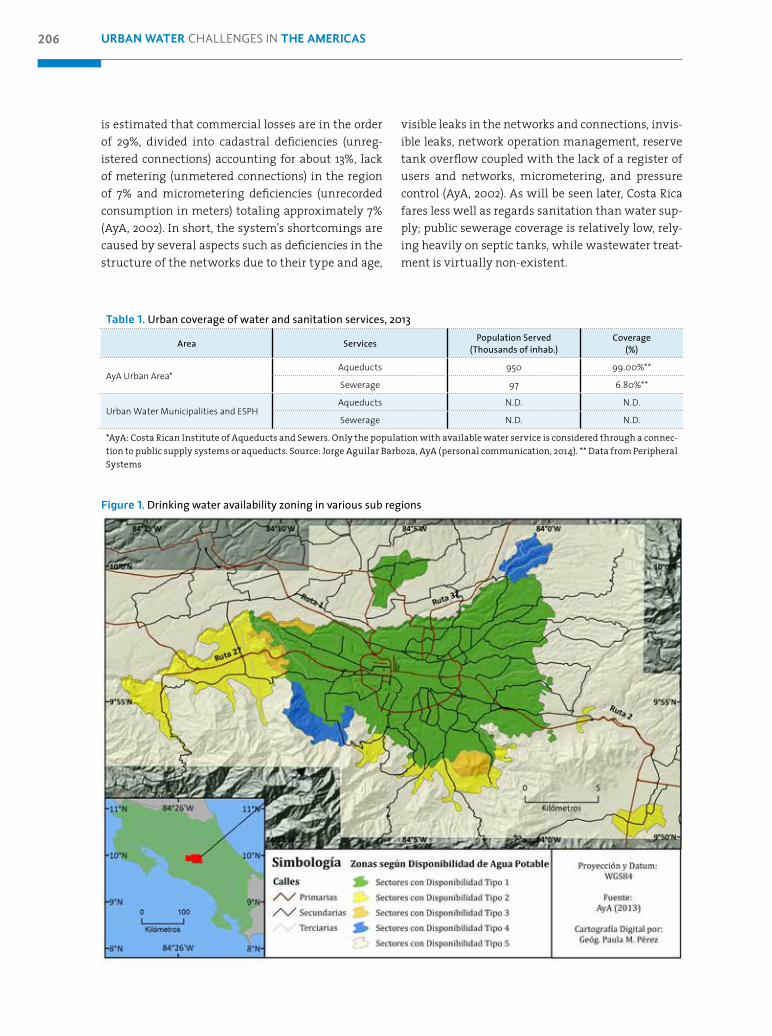
Figure 1. Drinking water availability zoning in various sub regions
207URBAN WATERS IN COSTA RICA
In Costa Rica, by 2000, water coverage at the
urban level (an area served by the AyA and Heredia
Public Service Company (ESPH) was approximately
98.5% (AyA, 2004), reaching 99.5% in 2009 (Arias,
2010). In 2000, sanitation coverage in urban areas
was 96%, comprising 34% with sewerage facilities
and 62% with septic tanks (AyA, 2004). The treatment
rate for urban waters of under 4% (Arias, 2010)
remained constant in 2009. In terms of the total
population (urban plus rural), in Costa Rica, only
25% have sewerage, with 80% using septic tanks or
latrines (Arias, 2010). Table 1 shows aqueduct and
sewerage coverage for urban regions in 2013. As
one can see, in Costa Rica, water supply coverage
in urban areas is high, while sewerage coverage is
low. Moreover, the problem of using septic tanks is
more serious than one would think, since there are
operating problems linked to soil type (such as low
permeability), climate, the characteristics of the
water to be treated and water volume (Arias, 2010).
The production system barely covers demand
in some seasons and in some cases, fails to do so.
However, attempts to secure major investments in
infrastructure to increase the production capacity
of aqueducts could be challenged by international
lending agencies, unless losses are reduced to
acceptable levels (AyA, 2002).
In order to plan the development of new
buildings, the AyA has proposed zoning based on
the availability of drinking water in several GMA
subregions (Figure 1) (AyA, 2013). The various areas in
Figure 1 are listed below (see also AyA, 2013):
• Availability Type 1: Supply Sectors of the
Metropolitan Aqueduct without restrictions for
new services, housing developments, residential
condominiums, commercial condominiums,
apartment buildings, shopping malls,
schools, hotels and housing developments.
Infrastructure installation or additional
improvements by developers or stakeholders
may be required.
• Availability Type 2: Supply Sectors for the
Metropolitan Aqueduct, which, due to their
location and topographic elevation, and the
lack of sufficient infrastructure for drinking
water production, storage and distribution,
do not permit the development of housing
developments, residential condominiums,
commercial condominiums, apartment
buildings, shopping centers, schools or hotels.
They only permit the vegetative growth of
individual new services allowed for single-
family residential housing or new subdivisions
with six or fewer lots, with public road frontage,
and piped drinking water, supplied by AyA.
For these cases, infrastructure installation
or additional improvements by developers or
stakeholders may be necessary.
• Availability Type 3: Sectors currently supplied
with drinking water by the Metropolitan
Aqueduct, which, due to the lack of sufficient
infrastructure for drinking water production,
storage and distribution, do not accept
individual applications for new services
or new housing developments, residential
condominiums, commercial condominiums,
apartment buildings, shopping centers, schools
or hotels.
• Availability Type 4: Areas with water supply
restrictions as stated in the AyA Board
Agreement from 2005-1012, and subsequent
modifications. Drinking water availability
will only be provided for residential, single-
family housing on existing plots of land or
in new housing developments with existing
public frontage, which also have piped water.
Drinking water will not be supplied to housing
developments without public road frontage,
or condominiums, urban developments or
apartment buildings.
• Availability Type 5: Areas outside the boundaries
of the Metropolitan Aqueduct supply, where
there are water supply systems administered
by the Aqueduct and Sewerage Administrators’
Associations (ASADAS), municipal aqueducts,
other associations or EPSH. According to the
latest data for 2013, there were a total of 163
ASADAS with an average flow rate of 769.6
liters per second
Service delivery in the GMA can be divided into two
types of sources: springs and wells (Table 2). There
are also 19 water treatment plants. Moreover, the
urban area contains three water supply treatment
plants in Tarbaca, San Gabriel Aserrí and Higuito
de San Miguel de Desamparados, where private
wastewater operating regulations have been
established.
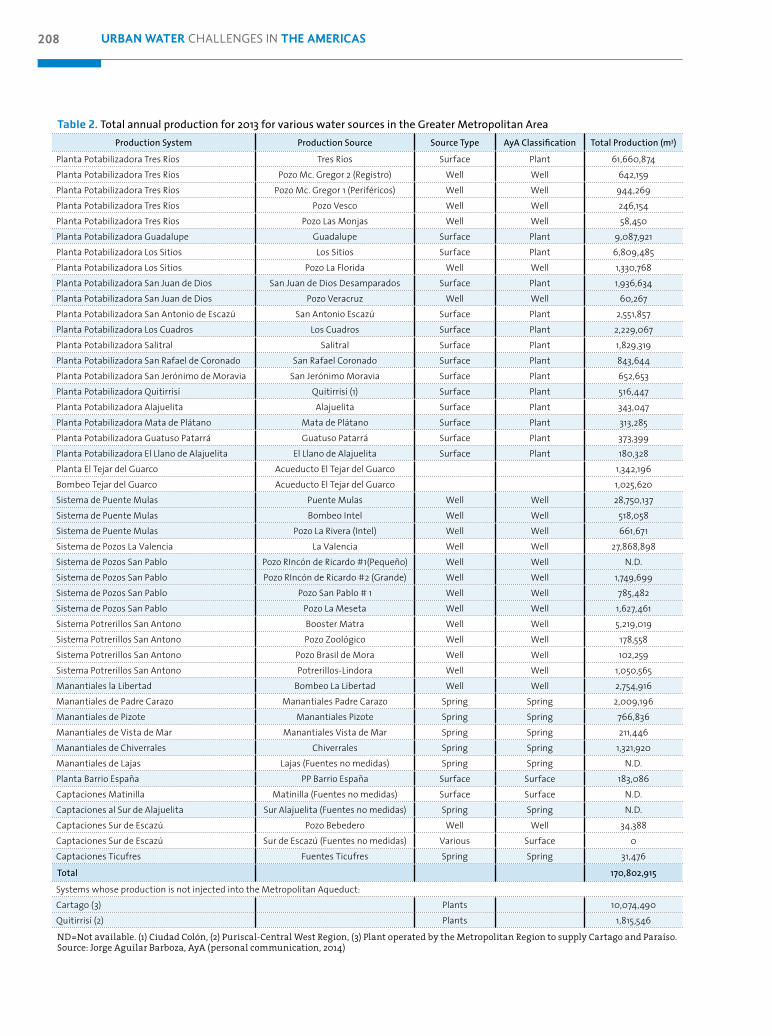
208 URBAN WATER CHALLENGES IN THE AMERICAS
Table 2. Total annual production for 2013 for various water sources in the Greater Metropolitan Area
Production System Production Source Source Type AyA Classification Total Production (m3)
Planta Potabilizadora Tres Ríos Tres Ríos Surface Plant 61,660,874
Planta Potabilizadora Tres Ríos Pozo Mc. Gregor 2 (Registro) Well Well 642,159
Planta Potabilizadora Tres Ríos Pozo Mc. Gregor 1 (Periféricos) Well Well 944,269
Planta Potabilizadora Tres Ríos Pozo Vesco Well Well 246,154
Planta Potabilizadora Tres Ríos Pozo Las Monjas Well Well 58,450
Planta Potabilizadora Guadalupe Guadalupe Surface Plant 9,087,921
Planta Potabilizadora Los Sitios Los Sitios Surface Plant 6,809,485
Planta Potabilizadora Los Sitios Pozo La Florida Well Well 1,330,768
Planta Potabilizadora San Juan de Dios San Juan de Dios Desamparados Surface Plant 1,936,634
Planta Potabilizadora San Juan de Dios Pozo Veracruz Well Well 60,267
Planta Potabilizadora San Antonio de Escazú San Antonio Escazú Surface Plant 2,551,857
Planta Potabilizadora Los Cuadros Los Cuadros Surface Plant 2,229,067
Planta Potabilizadora Salitral Salitral Surface Plant 1,829,319
Planta Potabilizadora San Rafael de Coronado San Rafael Coronado Surface Plant 843,644
Planta Potabilizadora San Jerónimo de Moravia San Jerónimo Moravia Surface Plant 652,653
Planta Potabilizadora Quitirrisí Quitirrisí (1) Surface Plant 516,447
Planta Potabilizadora Alajuelita Alajuelita Surface Plant 343,047
Planta Potabilizadora Mata de Plátano Mata de Plátano Surface Plant 313,285
Planta Potabilizadora Guatuso Patarrá Guatuso Patarrá Surface Plant 373,399
Planta Potabilizadora El Llano de Alajuelita El Llano de Alajuelita Surface Plant 180,328
Planta El Tejar del Guarco Acueducto El Tejar del Guarco 1,342,196
Bombeo Tejar del Guarco Acueducto El Tejar del Guarco 1,025,620
Sistema de Puente Mulas Puente Mulas Well Well 28,750,137
Sistema de Puente Mulas Bombeo Intel Well Well 518,058
Sistema de Puente Mulas Pozo La Rivera (Intel) Well Well 661,671
Sistema de Pozos La Valencia La Valencia Well Well 27,868,898
Sistema de Pozos San Pablo Pozo RIncón de Ricardo #1(Pequeño) Well Well N.D.
Sistema de Pozos San Pablo Pozo RIncón de Ricardo #2 (Grande) Well Well 1,749,699
Sistema de Pozos San Pablo Pozo San Pablo # 1 Well Well 785,482
Sistema de Pozos San Pablo Pozo La Meseta Well Well 1,627,461
Sistema Potrerillos San Antono Booster Matra Well Well 5,219,019
Sistema Potrerillos San Antono Pozo Zoológico Well Well 178,558
Sistema Potrerillos San Antono Pozo Brasil de Mora Well Well 102,259
Sistema Potrerillos San Antono Potrerillos-Lindora Well Well 1,050,565
Manantiales la Libertad Bombeo La Libertad Well Well 2,754,916
Manantiales de Padre Carazo Manantiales Padre Carazo Spring Spring 2,009,196
Manantiales de Pizote Manantiales Pizote Spring Spring 766,836
Manantiales de Vista de Mar Manantiales Vista de Mar Spring Spring 211,446
Manantiales de Chiverrales Chiverrales Spring Spring 1,321,920
Manantiales de Lajas Lajas (Fuentes no medidas) Spring Spring N.D.
Planta Barrio España PP Barrio España Surface Surface 183,086
Captaciones Matinilla Matinilla (Fuentes no medidas) Surface Surface N.D.
Captaciones al Sur de Alajuelita Sur Alajuelita (Fuentes no medidas) Spring Spring N.D.
Captaciones Sur de Escazú Pozo Bebedero Well Well 34,388
Captaciones Sur de Escazú Sur de Escazú (Fuentes no medidas) Various Surface 0
Captaciones Ticufres Fuentes Ticufres Spring Spring 31,476
Total 170,802,915
Systems whose production is not injected into the Metropolitan Aqueduct:
Cartago (3) Plants 10,074,490
Quitirrisí (2) Plants 1,815,546
ND=Not available. (1) Ciudad Colón, (2) Puriscal-Central West Region, (3) Plant operated by the Metropolitan Region to supply Cartago and Paraíso. Source: Jorge Aguilar Barboza, AyA (personal communication, 2014)
209URBAN WATERS IN COSTA RICA
As can be seen from Table 2, installed capacity
in springs is approximately 4.3 million m3 per year,
whereas in wells, it is in the order of 74.5 million
m3 per year, Heredia being one of the provinces
with most groundwater contributions (AyA, 2013).
In the GMA, groundwater therefore constitutes
68% of drinking water sources, with surface water
accounting for 32% (AyA, 2002). The most important
aquifers in the country are: Colima Superior, Colima
Inferior, Barba, Liberia, Bagaces, Barranca, La Bomba
(Limón), Zapandí and the coastal aquifers: Jacó,
Playas del Coco, Brasilito and Flamingo. With regard
to surface water, Hidalgo (2012) provides a table
showing the characteristics of the main rivers.
Water Treatment in Cities
The cities with sewerage networks are San José,
Liberia, Nicoya, Santa Cruz, Cañas, San Isidro de El
General, Puntarenas, Limón, Heredia, Cartago and
Alajuela, which together account for 33.8% coverage
in the urban area. The only ones providing treatment
through stabilization are the cities of Liberia, Nicoya,
Santa Cruz, Cañas and San Isidro de El General,
while a portion of the water collected in Puntarenas
is treated at an activated sludge plant. It is estimated
that only 4% of the wastewater generated by the
urban population with sewerage (AyA, 2002; Arias,
2010) is treated.
If the country wishes to redress the imbalance
in water and sewerage coverage, it must be prepared
to make major investments in the urban area
(AyA, 2002). It was estimated that the amount of
investment required in 2002 to build a treatment
plant for the GMA was approximately $289 million
USD and at some point it was thought that the
project could be implemented through a concession
(AyA, 2002). In 2014, costs were revised and is now
estimated that the final figure would be $344
million USD (La Nación, 2014). On September 12, 2012,
a contract was signed with the Spanish company
Acciona Agua, responsible for developing the Los
Tajos treatment plant in La Uruca, which will
receive wastewater from 11 cantons in the GMA,
serving 1,070,000 inhabitants. The contract with the
Spanish company stipulates that a master plan will
be designed for the first, intermediate and second
stages of the plant but only the first one will be
built. AyA is seeking funding sources for secondary
treatment. The plant is currently under construction
(in February 2014, the plant was 10.65% complete)
and is scheduled to begin operating in May 2015
(La Nación, 2014). Half of the cost will be covered
by the Japan International Cooperation Agency
(JICA). The Los Tajos Wastewater Treatment Plant is
a component of the Project for the Environmental
Improvement of the Metropolitan Area of San José,
which incorporated the construction of a sewerage
facility that will collect the water to be treated (EF,
2012). Over the next 14 years, other plants are to be
built in the provinces of Heredia and Cartago (La
Nación, 2014).
At present, 96% of urban wastewater collected
by sewerage facilities is discharged untreated into
rivers. Two of the country’s major basins, those of the
Grande de Tárcoles and Reventazón rivers, inhabited
by approximately 70% of the population, receive raw
sewage from the cities of San José, Heredia, Alajuela
and Cartago (AyA, 2002). Hidalgo (2012) shows some
of the average concentrations of certain water
quality indicators in two of the most polluted rivers
in the Greater Metropolitan Area (GMA) (San José
and the surrounding cities) such as the Tárcoles River
and Virilla River (a tributary of the Río Grande de
Tarcoles). This situation shows how concentrations of
pollutants far exceed recommended concentrations.
The degradation of the country’s environment
and water bodies, particularly in the GMA, over the
past three decades, has become increasingly costly
in human and economic terms. In fact, it has been
estimated that the annual cost of pollution in terms
of lost productivity and the treatment of associated
diseases totals approximately $325 million USD,
divided into $122 million USD in the areas of cities
connected to the sewerage system and $203 million
USD in areas with septic tanks (Moreno Díaz, 2009).
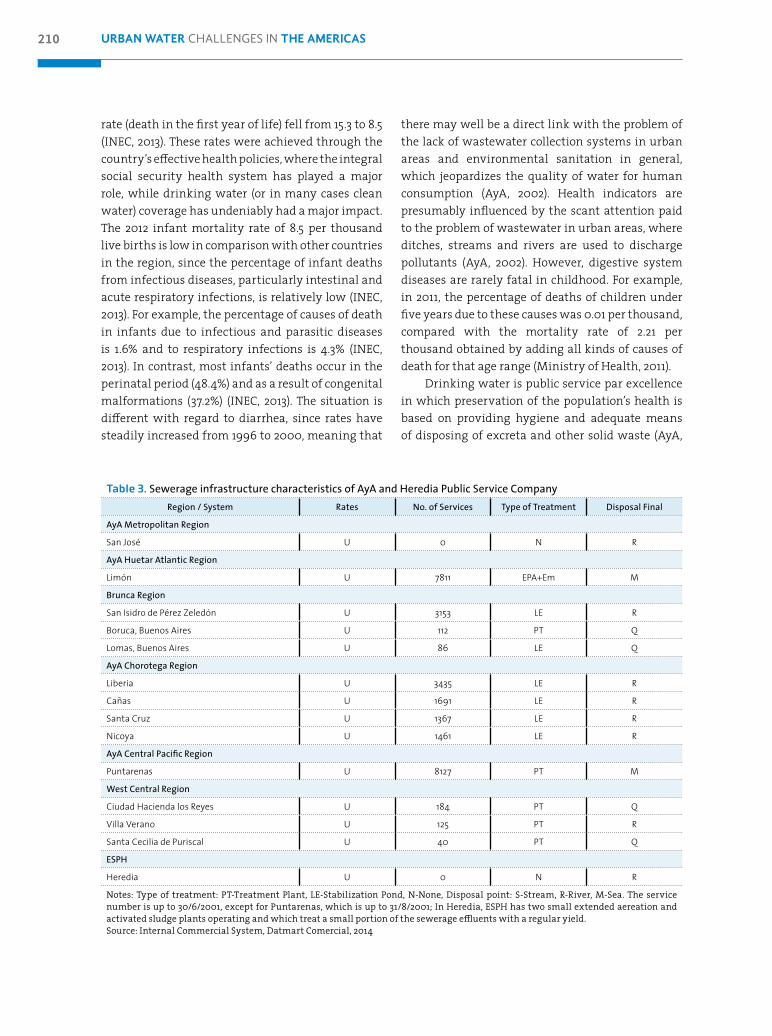
Table 3 shows the characteristics of the AyA and
ESPH (the company responsible for the water supply
and sewerage in the province of Heredia) sewerage
systems.
3. Water and Health in Cities
Overall health rates for the country reflect good
progress in the global context. Life expectancy at
birth rose from 76.7 in 1990 to 80.0 in 2012 (World Bank,
2014). During the same period, the infant mortality
210 URBAN WATER CHALLENGES IN THE AMERICAS
rate (death in the first year of life) fell from 15.3 to 8.5
(INEC, 2013). These rates were achieved through the
country’s effective health policies, where the integral
social security health system has played a major
role, while drinking water (or in many cases clean
water) coverage has undeniably had a major impact.
The 2012 infant mortality rate of 8.5 per thousand
live births is low in comparison with other countries
in the region, since the percentage of infant deaths
from infectious diseases, particularly intestinal and
acute respiratory infections, is relatively low (INEC,
2013). For example, the percentage of causes of death
in infants due to infectious and parasitic diseases
is 1.6% and to respiratory infections is 4.3% (INEC,
2013). In contrast, most infants’ deaths occur in the
perinatal period (48.4%) and as a result of congenital
malformations (37.2%) (INEC, 2013). The situation is
different with regard to diarrhea, since rates have
steadily increased from 1996 to 2000, meaning that
there may well be a direct link with the problem of
the lack of wastewater collection systems in urban
areas and environmental sanitation in general,
which jeopardizes the quality of water for human
consumption (AyA, 2002). Health indicators are
presumably influenced by the scant attention paid
to the problem of wastewater in urban areas, where
ditches, streams and rivers are used to discharge
pollutants (AyA, 2002). However, digestive system
diseases are rarely fatal in childhood. For example,
in 2011, the percentage of deaths of children under
five years due to these causes was 0.01 per thousand,
compared with the mortality rate of 2.21 per
thousand obtained by adding all kinds of causes of
death for that age range (Ministry of Health, 2011).
Drinking water is public service par excellence
in which preservation of the population’s health is
based on providing hygiene and adequate means
of disposing of excreta and other solid waste (AyA,
Table 3. Sewerage infrastructure characteristics of AyA and Heredia Public Service Company
Region / System Rates No. of Services Type of Treatment Disposal Final
AyA Metropolitan Region
San José U 0 N R
AyA Huetar Atlantic Region
Limón U 7811 EPA+Em M
Brunca Region
San Isidro de Pérez Zeledón U 3153 LE R
Boruca, Buenos Aires U 112 PT Q
Lomas, Buenos Aires U 86 LE Q
AyA Chorotega Region
Liberia U 3435 LE R
Cañas U 1691 LE R
Santa Cruz U 1367 LE R
Nicoya U 1461 LE R
AyA Central Pacific Region
Puntarenas U 8127 PT M
West Central Region
Ciudad Hacienda los Reyes U 184 PT Q
Villa Verano U 125 PT R
Santa Cecilia de Puriscal U 40 PT Q
ESPH
Heredia U 0 N R
Notes: Type of treatment: PT-Treatment Plant, LE-Stabilization Pond, N-None, Disposal point: S-Stream, R-River, M-Sea. The service number is up to 30/6/2001, except for Puntarenas, which is up to 31/8/2001; In Heredia, ESPH has two small extended aereation and activated sludge plants operating and which treat a small portion of the sewerage effluents with a regular yield.Source: Internal Commercial System, Datmart Comercial, 2014
211URBAN WATERS IN COSTA RICA
2002). The link between drinking-water and health
has been proven, since without this service, society
cannot develop healthily. Since colonial times,
Costa Rica has been concerned with providing this
service to all areas. This element is also essential to
development, since there can be no development
without drinking water (AyA, 2002).
Lack of potable water and sewerage
infrastructure or the deterioration thereof, has
undoubtedly led to the presence of communicable
diseases in certain parts of the country, such as
cholera, typhoid fever, salmonellosis, shighelosis,
amebiasis, giardisis, other intestinal infections and
viral hepatitis (AyA, 2002). Diseases related to water
that have been detected in the country include the
following: amoebic dysentery, bacillary dysentery,
diarrhea (including the previous two), cholera,
hepatitis A, typhoid and paratyphoid fever, polio,
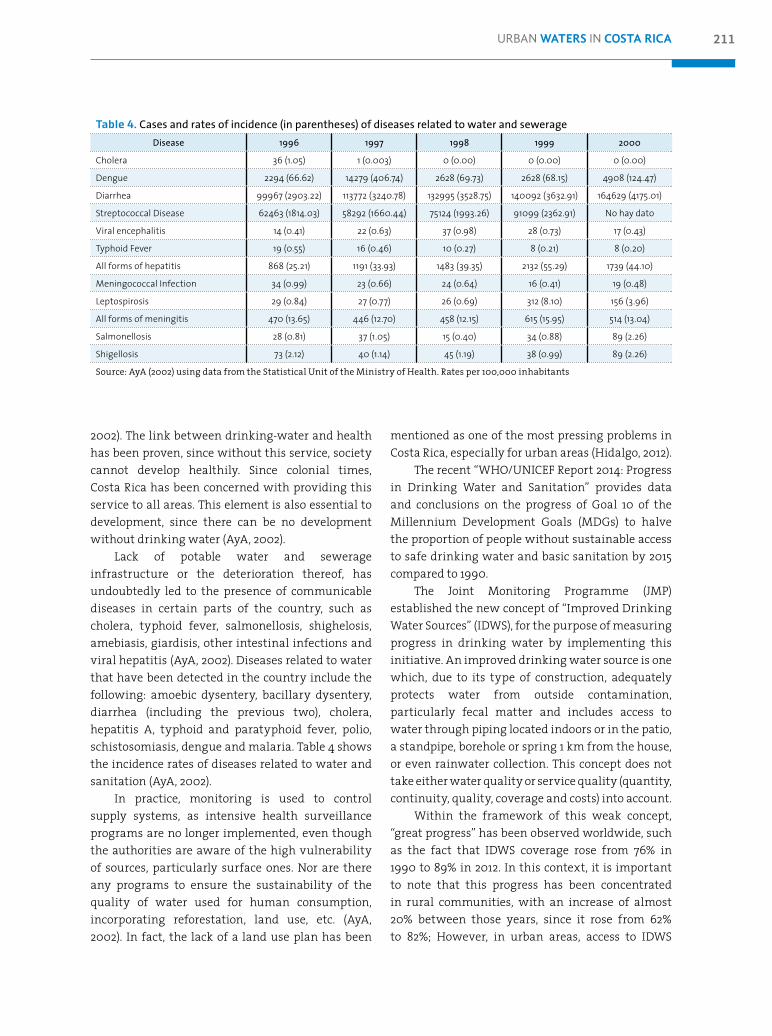
schistosomiasis, dengue and malaria. Table 4 shows
the incidence rates of diseases related to water and
sanitation (AyA, 2002).
In practice, monitoring is used to control
supply systems, as intensive health surveillance
programs are no longer implemented, even though
the authorities are aware of the high vulnerability
of sources, particularly surface ones. Nor are there
any programs to ensure the sustainability of the
quality of water used for human consumption,
incorporating reforestation, land use, etc. (AyA,
2002). In fact, the lack of a land use plan has been
mentioned as one of the most pressing problems in
Costa Rica, especially for urban areas (Hidalgo, 2012).
The recent “WHO/UNICEF Report 2014: Progress
in Drinking Water and Sanitation” provides data
and conclusions on the progress of Goal 10 of the
Millennium Development Goals (MDGs) to halve
the proportion of people without sustainable access
to safe drinking water and basic sanitation by 2015
compared to 1990.
The Joint Monitoring Programme (JMP)
established the new concept of “Improved Drinking
Water Sources” (IDWS), for the purpose of measuring
progress in drinking water by implementing this
initiative. An improved drinking water source is one
which, due to its type of construction, adequately
protects water from outside contamination,
particularly fecal matter and includes access to
water through piping located indoors or in the patio,
a standpipe, borehole or spring 1 km from the house,
or even rainwater collection. This concept does not
take either water quality or service quality (quantity,
continuity, quality, coverage and costs) into account.
Within the framework of this weak concept,
“great progress” has been observed worldwide, such
as the fact that IDWS coverage rose from 76% in
1990 to 89% in 2012. In this context, it is important
to note that this progress has been concentrated
in rural communities, with an increase of almost
20% between those years, since it rose from 62%
to 82%; However, in urban areas, access to IDWS
Table 4. Cases and rates of incidence (in parentheses) of diseases related to water and sewerage
Disease 1996 1997 1998 1999 2000
Cholera 36 (1.05) 1 (0.003) 0 (0.00) 0 (0.00) 0 (0.00)
Dengue 2294 (66.62) 14279 (406.74) 2628 (69.73) 2628 (68.15) 4908 (124.47)
Diarrhea 99967 (2903.22) 113772 (3240.78) 132995 (3528.75) 140092 (3632.91) 164629 (4175.01)
Streptococcal Disease 62463 (1814.03) 58292 (1660.44) 75124 (1993.26) 91099 (2362.91) No hay dato
Viral encephalitis 14 (0.41) 22 (0.63) 37 (0.98) 28 (0.73) 17 (0.43)
Typhoid Fever 19 (0.55) 16 (0.46) 10 (0.27) 8 (0.21) 8 (0.20)
All forms of hepatitis 868 (25.21) 1191 (33.93) 1483 (39.35) 2132 (55.29) 1739 (44.10)
Meningococcal Infection 34 (0.99) 23 (0.66) 24 (0.64) 16 (0.41) 19 (0.48)
Leptospirosis 29 (0.84) 27 (0.77) 26 (0.69) 312 (8.10) 156 (3.96)
All forms of meningitis 470 (13.65) 446 (12.70) 458 (12.15) 615 (15.95) 514 (13.04)
Salmonellosis 28 (0.81) 37 (1.05) 15 (0.40) 34 (0.88) 89 (2.26)
Shigellosis 73 (2.12) 40 (1.14) 45 (1.19) 38 (0.99) 89 (2.26)
Source: AyA (2002) using data from the Statistical Unit of the Ministry of Health. Rates per 100,000 inhabitants
212 URBAN WATER CHALLENGES IN THE AMERICAS
decreased because the piped water supply fell by 1%
in comparison with the 81% reported in 1990 to 80%.
In general, 23 out of the 222 countries evaluated
have seen a decline in access to piped water, among
which some African and Asian countries. In the
Americas, coverage in the United States dropped
from 100% to 99% and in Dominican Republic from
95% to 74%. During the 22 years of the study, in most
of these countries, the decrease in access to improved
drinking water sources is due to economic decline
and poverty, migration of the rural population
to urban cities and the consumption of packaged
water, to the detriment of supply systems. This
means that many countries have achieved MDGs
within the concept of IDWS, setting standpipes or
using water from wells and springs, rather than
building aqueducts as has happened in most Central
American countries.
Costa Rica has achieved highly satisfactory
progress, including 98% water coverage of indoor
piping and 99% coverage of IDWS in 2012. However, it
is necessary to address water service quality and the
universalization of potable water in order for these
services to reach the most marginalized villages in
the country.
4. Climate Variability
Costa Rica’s climate is influenced by natural factors,
such as the following: El Niño-Southern Oscillation
(ENSO), latitudinal movements of the Intertropical
Convergence Zone, the Caribbean Low Level Jet,
the Mid-Summer Drought, tropical storms and
hurricanes, the influence of the Atlantic and cold
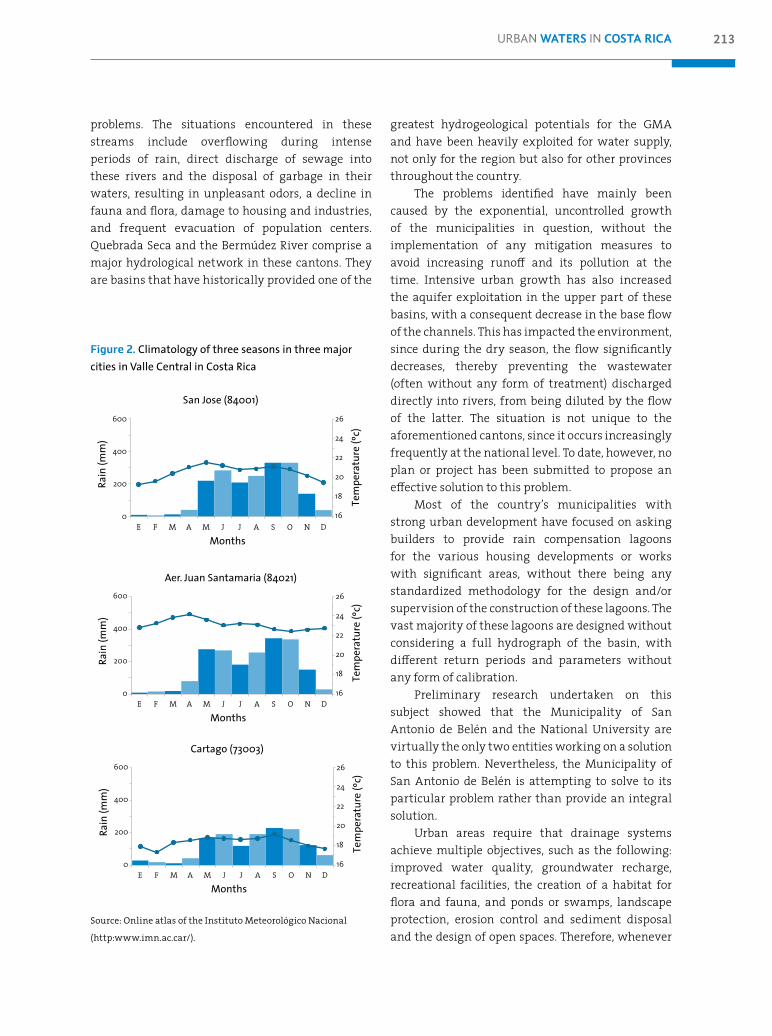
fronts. Valle Central de San José, where large urban
centers are located, has a climatology typical of the
Pacific region, with a dry season from December to
April and a rainy season from May to November,
with a secondary minimum in July known as
Mid-Summer Drought (Figure 2). Average monthly
temperature changes very little throughout the year.
High precipitation extremes cause severe
flooding and damage to infrastructure in urban
areas. The problem is not only caused by possible
positive trends in storm intensity (see section on
climate change below), but is compounded by
constructions near unstable slopes or river beds,
lack of maintenance of storm sewers and channels,
and rapidly increasing urbanization in some areas.
Frequent flooding in much of the country, such as
during 2010 (classified as a La Niña year), serve as a
reminder that it is essential to make efforts in other
areas such as road and sewer maintenance, river care
and cleaning, the conservation and strengthening
of the network of hydrometeorological observations,
the establishment of design standards for slopes
incorporating hydrometeorological criteria, the
need to update and respect land use planning and
investment in education and training at all levels.
These actions to ensure the maintenance, planning
and development of civil protection systems are
less expensive in the long run than the cost of lost
infrastructure and human lives after a disaster
(Hidalgo, 2010).
Urban Flooding, Some Case Studies
Urbanization triggered by population growth
impacts on watersheds, causing: an increase in
water discharge peaks and runoff and its frequency,
increased verticality of channel walls, increased
sediment in basins and the erosion and degradation
of rivers when a basin is already well waterproofed.
This phenomenon has occurred in the basins
of the cantons south of Heredia, which have
been severely affected over the past 30 years.
On 15 April, 2005 the Constitutional Court (the
legal body responsible for issuing rulings linked
to the interpretation of the Constitution) issued
Resolution 2005-04050 in which the following
public institutions were convicted of issuing
building permits and the mismanagement of
municipal water and storm sewers, within the
watersheds of Quebrada Seca and the Burío River:
the Ministry of Environment and Energy, Costa
Rican Institute of Aqueducts and Sewers, Central
Region of the Ministry of Health, Heredia Public
Services Company, Municipality of San Rafael de
Heredia, Municipality of San Antonio de Belen,
Municipality of Heredia, Municipality of Barva, and
Municipality of Flores.
The report concludes that environmental
damage has been caused and obliges these
institutions to prepare a joint interim report
together with the actions taken to solve the above
213URBAN WATERS IN COSTA RICA
Figure 2. Climatology of three seasons in three major
cities in Valle Central in Costa Rica
Source: Online atlas of the Instituto Meteorológico Nacional
(http:www.imn.ac.car/).
problems. The situations encountered in these
streams include overflowing during intense
periods of rain, direct discharge of sewage into
these rivers and the disposal of garbage in their
waters, resulting in unpleasant odors, a decline in
fauna and flora, damage to housing and industries,
and frequent evacuation of population centers.
Quebrada Seca and the Bermúdez River comprise a
major hydrological network in these cantons. They
are basins that have historically provided one of the
greatest hydrogeological potentials for the GMA
and have been heavily exploited for water supply,
not only for the region but also for other provinces
throughout the country.
The problems identified have mainly been
caused by the exponential, uncontrolled growth
of the municipalities in question, without the
implementation of any mitigation measures to
avoid increasing runoff and its pollution at the
time. Intensive urban growth has also increased
the aquifer exploitation in the upper part of these
basins, with a consequent decrease in the base flow
of the channels. This has impacted the environment,
since during the dry season, the flow significantly
decreases, thereby preventing the wastewater
(often without any form of treatment) discharged
directly into rivers, from being diluted by the flow
of the latter. The situation is not unique to the
aforementioned cantons, since it occurs increasingly
frequently at the national level. To date, however, no
plan or project has been submitted to propose an
effective solution to this problem.
Most of the country’s municipalities with
strong urban development have focused on asking
builders to provide rain compensation lagoons
for the various housing developments or works
with significant areas, without there being any
standardized methodology for the design and/or
supervision of the construction of these lagoons. The
vast majority of these lagoons are designed without
considering a full hydrograph of the basin, with
different return periods and parameters without
any form of calibration.
Preliminary research undertaken on this
subject showed that the Municipality of San
Antonio de Belén and the National University are
virtually the only two entities working on a solution
to this problem. Nevertheless, the Municipality of
San Antonio de Belén is attempting to solve to its
particular problem rather than provide an integral
solution.
Urban areas require that drainage systems
achieve multiple objectives, such as the following:
improved water quality, groundwater recharge,
recreational facilities, the creation of a habitat for
flora and fauna, and ponds or swamps, landscape
protection, erosion control and sediment disposal
and the design of open spaces. Therefore, whenever
E F M A M J J A S O N D
Months
Ra
in (
mm
)
Tem
per
atu
re (
ºc)
200
0
600
400
18
16
22
20
26
24
San Jose (84001)
E F M A M J J A S O N D
Months
Ra
in (
mm
)
Tem
per
atu
re (
ºc)
200
0
600
400
18
16
22
20
26
24
Aer. Juan Santamaria (84021)
E F M A M J J A S O N D
Months
Ra
in (
mm
)
Tem
per
atu
re (
ºc)
200
0
600
400
18
16
22
20
26
24
Cartago (73003)
214 URBAN WATER CHALLENGES IN THE AMERICAS
possible, it is always recommended that existing
systems be used. Urban development in areas
without adequate drainage provision multiplies
public spending, since the problems caused must
subsequently be solved using taxpayers’ money.
The southeast of San José also presents problems
of urban flooding, particularly in the cantons of
Desamparados Aserrí and Curridabat.
5. Climate Change
Observations of Climate Change
in Records of Recent Decades
In Central America, the average annual temperature
increased by approximately 1°C during the period
from 1900 to 2010, with the number of hot days and
nights growing by 2.5% and 1.7% per decade, while
the number of cold nights and days has declined
by 2.2% and 2.4% respectively (Corrales, 2010).
Temperature extremes show an increase of between
0.2 and 0.3°C per decade (Corrales, 2010). These trends
are consistent with the results of the temperature
and precipitation extremes encountered by
Alexander et al. (2006) in a set of approximately
600 stations across the world. According to this
study’s maps of Central America, reductions from
1951 to 2003 in the number of cold nights (below the
10th percentile, TN10) total approximately 3-6 days
per decade. Hot nights (above the 90th percentile,
TN90) have increased from 4 to 8 days per decade,
cold days (TX10) have decreased by 0 to 3 days per
decade, while hot days (TX90) have increased
from 4 to 8 days per decade. Trends in extreme
temperature events (TN10, TN90, TX10 and TX90)
are consistent with the study by Aguilar et al. (2005)
using stations in Central America and the Alianza,
Clima y Desarrollo (2012). However, this same report
indicates that trends observed in heat waves show a
wide spatial variation (with increases in some areas
and reductions in others).
Temperature and precipitation analysis reveals
a variety of changes over the past 40 years in Central
America and northern South America. While this is
true for both variables, temperature changes have a
greater degree of coherence. This is not surprising,
since precipitation in the region varies more than
temperature (Aguilar et al., 2005). In the Central
American region, there are no significant trends in
overall annual precipitation (Figure 9 in Aguilar et
al., 2005). In general, trends in average rainfall rates
and extremes show no sign coherence in Central
America. In other words, some of the precipitation
stations show positive trends and others negative
ones, most of which are insignificant (Aguilar et al.,
2005; Alianza, Clima y Desarrollo, 2012). However, at
least one study (Neelin et al., 2006) found negative
trends in the northern part of Central America using
station (1950-2002) and satellite (1979-2003) data.
Corrales (2010) and Aguilar et al. (2005) mention
that although there is significant spatial variability,
precipitation indices indicate that while there have
not been significant increases in the amount of
precipitation, there has been an intensification of
the latter. This means that rainfall patterns have
changed so that now it rains more intensely in a
shorter time. Some regions have seen an increased
proportion of very severe storms since 1970,
which is much higher than that recorded in the
simulation using current models for this period.
The frequency of occurrence of extreme weather
and climate phenomena is likely to increase in the
future, together with the frequency and intensity
of hurricanes in the Caribbean Basin (Corrales,
2010). This last statement should be viewed with
caution, however, since, although some modeling
studies have shown there is likely to be an increase
in the number of intense hurricanes in the future
(Kerr, 2010), there is evidence that historically, there
have not been significant increases in the number
of tropical cyclones and hurricanes (Alfaro, 2007;
Alfaro et al., 2010;. Alfaro and Quesada, 2010).
Hidalgo et al. (2013) changed the scale for the
precipitation and temperature data from the NCEP-
NCAR Reanalysis (Kalnay et al., 1996), using it as
input in a hydrological model for two sites in Central
America: Tegucigalpa (Honduras) and San José (Costa
Rica), and thereby obtain annual runoff estimates.
The results show significant negative trends in
annual runoff from 1980 to 2012. These “observed”
trends are relatively stronger in the case of San José
(south of the isthmus) than in Tegucigalpa (northern
part of the isthmus). These trends are consistent
with studies in other parts of the world, which have
215URBAN WATERS IN COSTA RICA
found that in the 1980s, there were particularly
significant climate changes in hydrometeorological
variables (Barnett et al., 2008 and Meehl et al., 2007).
However, other reports on the trends in dryness
observed are varied and inconsistent (Alianza,
Clima y Desarrollo, 2012).
In the particular case of Costa Rica, the
differences between the climate from 1961 to 1990
and from 1991 to 2005 in weather station data show
some changes in the North Pacific (with trends
towards a drier climate), the Central Pacific (with
trends towards more humid climates) and the
Southern Caribbean (with trends towards more
humid climates) (MINAET, 2009). In particular, the
North Pacific area has experienced a significant
decrease in rainfall from May to September. Some of
these changes may partly be due to natural climate
changes, since, for example, phenomena such as the
El Niño-Southern Oscillation (ENSO) have changed
in recent years toward higher frequencies of warm
events and fewer cold events. Although it is difficult
to know whether these changes are a response to
anthropogenic climate change, there are large-scale,
low-frequency natural phenomena, such as the
Pacific Decadal Oscillation (PDO; Mantua et al., 1997)
that can modulate the frequency of ENSO.
Hydro-Climatic Projections
for Central America and Costa Rica
Climate projections are generally based on General
Circulation Models (GCMs) or Global Climate Models.
These models are mathematical representations of
the factors and processes that govern the Earth’s
climate, considering various forcings such as solar
and volcanic influence and greenhouse gases. There
are several series of runs of these models, the most
recent being the Coupled Model Intercomparison
Project 5 (CMIP5). However, because they are
relatively new, CMIP5 model runs have yet to be
evaluated in great detail as regards their ability
to model large-scale climate factors affecting the
climate in Central America. Moreover, there are
very few published studies with projections of these
models. For this reason, the most recent results
mentioned here are based on CMIP3 runs. There are
limitations in the CMIP3 models, but they usually
approximately reproduce some weather patterns
associated with the Central American climate (Pierce
et al., 2008 and 2009; Delworth et al., 2012; Hirota et
al., 2011; Liu et al., 2012; Rauscher et al., 2008; Martin
and Schumacher, 2011; Jiang et al., 2012; Hidalgo and
Alfaro, 2012).
For annual temperature, the average warming
in the Central American region projected for the late
21st century is approximately 2.5 to 3.5ºC depending
on the location (Hidalgo and Alfaro, 2012), although
projections for southern Central America can
be as high as 4.5ºC in some months. The GCM
consensus on the CMIP3 is that Central America
will experience a reduction in rainfall in the order
of 10-20% and of runoff by 20-40% by the end of the
century (see Figures 3.3 and 3.5 respectively from the
IPCC report, 2007). End of the century projections in
the models, using the A2/A1B emission scenarios,
indicate that warmer days are likely to increase,
while cold days are likely to decrease. Hot nights
are likely to rise and cold nights to fall. There will
probably be heat waves and longer, more frequent
and/or more intense periods in most of the region.
Heavy precipitation trends are inconsistent, and
there will be an increase in dryness, with less
confidence in the trend in the southern end of the
region (Alianza, Clima y Desarrollo, 2012). Using
a regional model, Karmalkar et al. (2011) found
significant reductions in future rainfall in the dry
season in Central America in the A2 emissions
scenario. Neelin et al. (2006) found an agreement
between the models, showing a dry pattern over
the Central American and Caribbean region at the
end of the century (2077-2099). Using 17 GCMs,
Rausher et al. (2008) cite a decrease in precipitation
in summer (JJA), an intensification of “Mid-Summer
Drought” or “veranillo” and a shift towards the
south of Inter-Tropical Convergence Zone (ITCZ) in
the Tropical Eastern Pacific as responses to climate
change in the region. Using a vegetation model
(rather than a hydrological one), Imbach et al.
(2012) studied changes in vegetation and runoff in
Central America using 136 GCM runs. These authors
concluded that runoff will decrease since higher
temperatures encourage evapotranspiration.
Hidalgo et al. (2013) confirmed the projections for
the northern part of Central America in particular,
reductions at the end of the century were found
of approximately 30% in some months during the
216 URBAN WATER CHALLENGES IN THE AMERICAS
summer. Hidalgo et al. also (2013) confirmed a trend
towards a more pronounced Mid-Summer Drought,
previously mentioned in Rausher et al. (2008). There
is a significant trend (especially in the northern
part of Central America) toward greater prevalence
of extreme drought (years when runoff is less than
the 10th percentile from 1950 to 1999) at the end of
the century, and although there is a high degree
of variability between the models regarding the
magnitude of the predominance of the percentage
of dry areas, it is clear that there will be a significant
increase in the future (Hidalgo et al., 2013).
MINAET (2012) and Alvarado et al. (2011 and
2012) state that Costa Rica in particular and Central
America in general are the most prominent “hot
spots” in the Tropics as regards the issue of climate
change due to the decrease in rainfall in JJA,
consistent with results found in other previously
mentioned studies (see, for example, Hidalgo et al.,
2013 and Imbach et al., 2012) as well as historical
records and the results of 20 global models using
different emission scenarios (Neelin et al., 2006;
Trenberth et al., 2007).
Although the results of many studies imply
a general decrease in precipitation and runoff in
Costa Rica, according to MINAET (2012), the climate
in Costa Rica is not expected to respond uniformly
but rather to be subjected to wet and dry extremes.
Thus, projections for a high emissions scenario
indicate that for the period from 2011 to 2040 in the
Caribbean, increases in precipitation are estimated
in the order of 35-75% for the period from May to
July due to the reduced activity of cold fronts during
winter. On the Pacific slope and the Northern Zone,
the model estimates less precipitation than at
present, and an intensified Mid-Summer Drought,
which is consistent with Hidalgo et al. (2013) and
Rauscher et al. (2008).
Table 8.2 of the “Second National Communication
to the United Nations Framework Convention on
Climate Change” (MINAET, 2009) contains a list
of references related to climate change studies in
Costa Rica, while Table 1.3 of this document lists
recent evidence of climate change in Costa Rica.
In this study, expected changes in precipitation at
the end of the century (2071-2100) relative to the
baseline scenario (1961-1990), obtained through the
PRECIS model forced with the HadAM3P model in
the A2 low emissions scenario, are negative on the
Pacific coast with reductions of up to -56% in the
Nicoya Peninsula, and positive on the Caribbean
slope, with increases of up to 49% on the north coast
of Limón city. The maximum temperature will
increase from 2.4 to 7.9°C depending on location,
while the minimum temperature will rise by 1.4
to 3.8°C depending on location. Similar conclusions
are reached in Alvarado et al. (2012) with respect to
precipitation, although the authors show regions of
the South Caribbean where temperatures will fall.
Seasonal Climate Forecast in
Central America for Urban Areas,
Including Physical and Human Dimensions
Recent analyses in Central America show that trends
associated with the annual number of impacts and
disasters related to hydrometeorological events
cannot solely be explained by climate trends. This
means that other variables, such as those associated
with socioeconomic aspects, should be included in
this type of analysis to explain these variations and
their associated impacts (e.g. Alfaro et al., 2010).
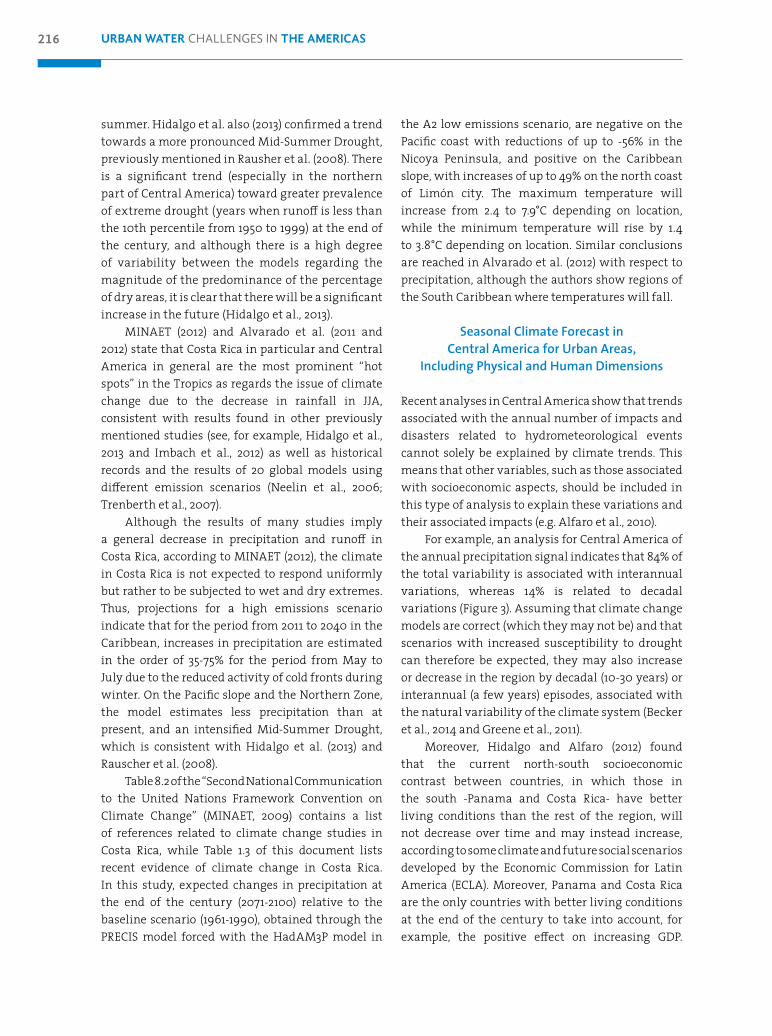
For example, an analysis for Central America of
the annual precipitation signal indicates that 84% of
the total variability is associated with interannual
variations, whereas 14% is related to decadal
variations (Figure 3). Assuming that climate change
models are correct (which they may not be) and that
scenarios with increased susceptibility to drought
can therefore be expected, they may also increase
or decrease in the region by decadal (10-30 years) or
interannual (a few years) episodes, associated with
the natural variability of the climate system (Becker
et al., 2014 and Greene et al., 2011).
Moreover, Hidalgo and Alfaro (2012) found
that the current north-south socioeconomic
contrast between countries, in which those in
the south -Panama and Costa Rica- have better
living conditions than the rest of the region, will
not decrease over time and may instead increase,
according to some climate and future social scenarios
developed by the Economic Commission for Latin
America (ECLA). Moreover, Panama and Costa Rica
are the only countries with better living conditions
at the end of the century to take into account, for
example, the positive effect on increasing GDP.
217URBAN WATERS IN COSTA RICA
Consequently, north-south differences in living
standards will probably increase in the region,
meaning that attention should be paid to both the
physical and socioeconomic effects which could play
an important role in increasing these differences
(Hidalgo and Alfaro, 2012).
Given the scenario mentioned above, seasonal
climate prediction for urban areas would play a
crucial role, especially in the fields of watershed
planning and integrated management. These
predictions should not only cover matters related to
the measures of a central tendency of a particular
variable, but also aspects of their variability and
extreme events. An important factor to consider
when studying extreme events in urban areas is
land use (such as territorial planning associated
with urbanization), including the maintenance of
hydraulic structures in relation to the influence of
climatic aspects and their impacts such as flooding
and/or landslides. All these aspects should be
considered when designing a system of individual
forecasting for cities.
Since 1997, various parts of Latin America
have organized Regional Climate Outlook Forums
(RCOFs), in an effort to produce climate prediction
products (IRI, 2001). They have been funded by
several international agencies with the assistance of
various entities such as the Regional Committee for
Water Resources (CRRH) in Central America (Donoso
and Ramírez, 2001; García-Solera and Ramírez, 2012)
as one of the committees affiliated to the Central
American Integration System, SICA, which also
participates in other regional initiatives such as
the Latin American Observatory of Extraordinary
Events, OLE² (Muñoz et al., 2010; Muñoz et al., 2012).
Alfaro et al. (2003) add that these forums usually
bring together representatives of meteorological
and hydrological services and members of the
scientific and academic community, who work
with the development of local and regional climate
perspectives. The purpose of these forums is to use
national climate experience to develop a climate
perspective with a regional consensus, usually on
precipitation in the coming months, to present it
Figure 3. Total annual precipitation in Central American region
Time breakdown of annual rainfall in inter-annual scales (left), decadal (center) and long-term trend (right). The upper panels show the
spatial distribution of the total explained variance by each scale in relation to the total variance, while the lower ones show the time
series associated with the corresponding time scale for the entire spatial domain considered. The explained variances for each scale are
84%, 14% and 2% respectively. Spatial resolution is 0.5%, using CRUV 3.21. For details, see Greene et al. (2011).
218 URBAN WATER CHALLENGES IN THE AMERICAS
in a useful way for the various agencies involved.
The recommended methodology is simple and this
perspective is then integrated regionally to help the
various meteorological services with their activities,
as well as the decision-makers and stakeholders
involved.
Maldonado et al. (2013) reported that Climate
Applications Forums were recently held, after the
Central America RCOFs, to translate the potential
impacts associated with climate predictions for users
and to compensate for the fact that this information
is not necessarily used by decision-makers. Feedback
from these meetings raised the need for seasonal
predictions on aspects related to extreme events
and days with precipitation (in other words, how
it rains in addition to how much it rains). These
issues may be addressed using different variables,
tools and scale tuning techniques (Maldonado and
Alfaro, 2011; Amador and Alfaro, 2009; Alfaro et al.,
1998). However, Alfaro and Pérez-Briceño (2014) and
Maldonado et al. (2013) in an analysis of the seasonal
geographical distribution of reports of disasters,
found that it is not necessarily consistent with the
geographical distribution of extreme precipitation
events, reinforcing the ideas presented earlier that
social variables such as population vulnerability,
should be included in the analysis of the impacts
of extreme events, highlighting the need to include
aspects related to the seasonal prediction of extreme
events and their variability in urban areas of Central
America.
The use of a standardized precipitation index
(SPI) has recently been suggested as a way to address
the need for the monitoring or surveillance and
forecasting of extreme events (WMO, 2012).
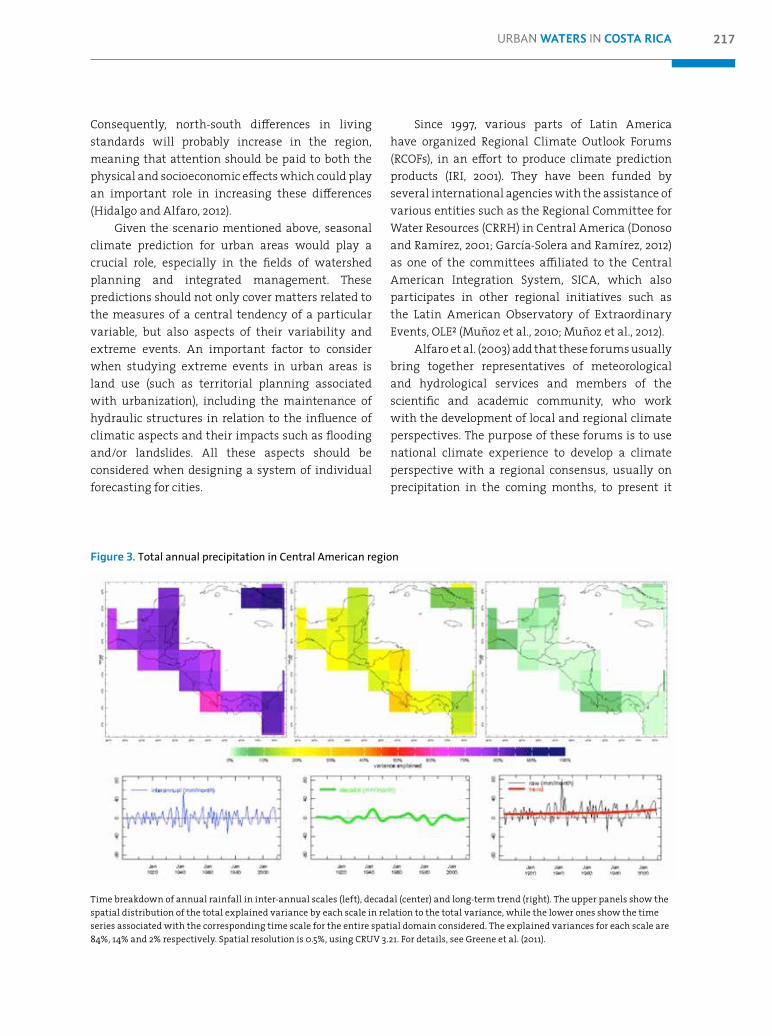
Figure 4 shows the SPI values for various
weather stations in Costa Rica, by comparing periods
of 6, 12 and 36 months working backwards from June
2014. Several of these weather stations are located
in major urban areas such as San José, Alajuela,
Cartago, Limón and Liberia. Note that in Figure
4, precipitation deficit conditions have prevailed
for over six months and up to three years in some
stations, such as the urban area of Limón and the
Figure 4. Spatial distribution for SPI values in different seasons in Costa Rica
for time scales of a) 6 b) 12 and c) 36 months.
Figure 5. SPI values for the season located in CIGEFI.UCR (9º 56’ 10’’ N, 84º 2’ 42’’ W, 1236 masl, San José, Costa Rica)
219URBAN WATERS IN COSTA RICA
The Environmental Service PaymentProgram (ESPP) in Costa Rica
by Mary Luz Moreno Díaz*
The ESPP process responded to the problem of deforestation that emerged in the mid-50s in Costa Rica.
Deforestation in Costa Rica rose from 46,500 ha/year in 1950 to approximately 16,000 ha/year in 1997
(De Camino, Segura, Arias and Pérez, 2000). It began with a series of forestry incentives and evolved
into the ESPP.
Costa Rica established the basis of an ESPP as a policy instrument to “strengthen the development
of the natural resources sector” (Art. 46) through the Forestry Act No. 7575 (1996). Environmental
services are defined in Article 3, section k of the Forest Act as “those provided by forests and forest
plantations, which directly affect the protection and improvement of the environment. The following
environmental services are recognized: mitigation of greenhouse gas emissions (fixation, reduction,
sequestration, storage and absorption), protection of water for urban, rural or hydroelectric use,
protection of biodiversity to conserve it and sustainable, scientific and pharmaceutical use, research
and genetic improvement, protection of ecosystems, livelihoods and natural scenic beauty for tourism
and scientific purposes (Act No.7575, 1996, Art.3, section k) .
ESP stakeholders can be classified into two categories: public and private. Actors in the public sphere
representing various state and non-state organizations that have direct influence on ESP (National
System of Conservation Areas-SINAC, National Forestry Financing Fund-FONAFIFO, among others).
Stakeholders in the non-public area include mostly private organizations such as non-
governmental organizations (NGOs), County Agricultural Centers (CAC), associations and private
companies, which perform activities directed towards the development and benefit of the owners
of the forest resource receiving ESP. They also comprise the owners of forest resources, which in turn
include private owners and indigenous territories.
The main sources of financing for ESPP have come from the 3.5% tax on fuel, loans from
International Bank for Reconstruction and Development (IBRD), financial support from the German
KfW Bank, the water use canon and contributions from companies and organizations. In total, the
ESPP paid $27.2 million USD in its various modalities during the period from 1997 to 2012.
Since its inception in 1997 and until 2012, the ESPP contracted 934.274.60 hectares nationwide
in the categories of: forest protection (89.7%), reforestation (6.1%), forest management (3.1%), natural
regeneration (1%) and established plantations (0.1%). The last three modalities have been intermittently
used during this period. In 2003, the Agroforestry System was established, whereby owners were
compensated according to the number of trees recognized; the total number of trees recognized by
2012 being 4,677.135 (Fonafifo, 2014).
References
De Camino, R.; Segura, O.; Arias, L. G. & Pérez, I. (2000). Costa Rica Forest Strategy and the Evolution of
Land Use.Washington, DC: World Bank.
Fonafifo (2014). Estadísticas del Pago por Servicios Ambientales. Fondo Nacional de Financiamiento For-
estal. Date August 14, 2014. Accessed at: http://www.fonafifo.go.cr/psa/estadisticas/distribucion_
hectareas_contratadas_psa_anno_modalidad_1997_2012.pdf
* Research fellow. International Center for Economic Policy for Sustainable Development (CINPE)
Universidad Nacional, Costa Rica ([email protected]).
Bo
x 5
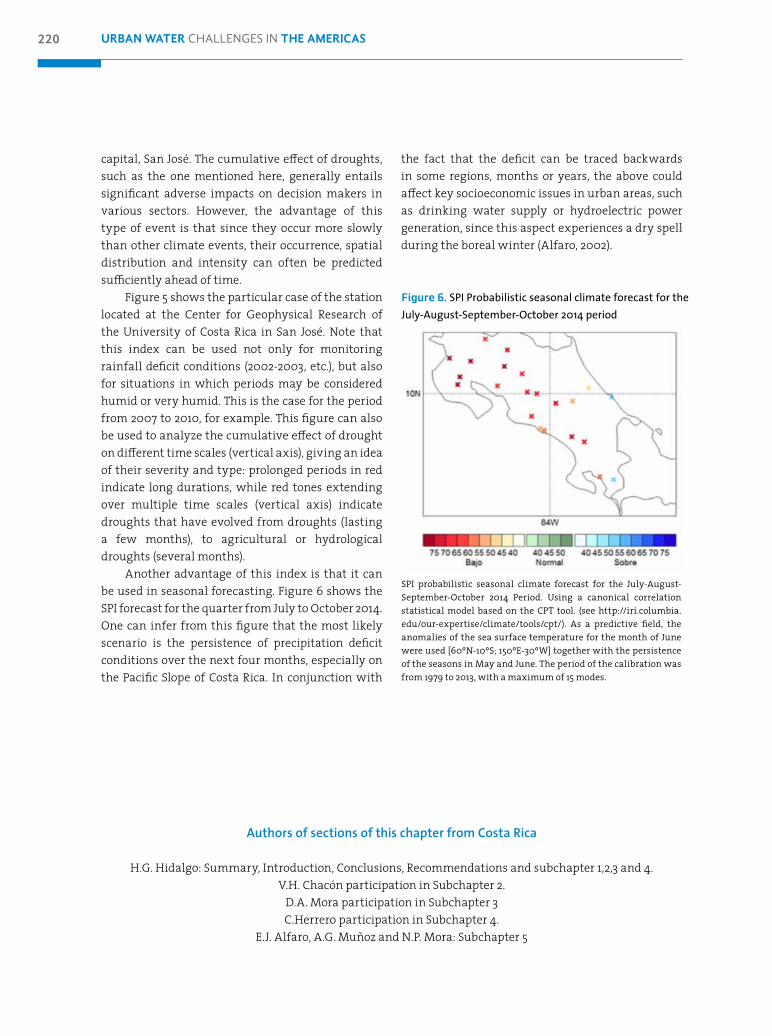
220 URBAN WATER CHALLENGES IN THE AMERICAS
Authors of sections of this chapter from Costa Rica
H.G. Hidalgo: Summary, Introduction, Conclusions, Recommendations and subchapter 1,2,3 and 4.
V.H. Chacón participation in Subchapter 2.
D.A. Mora participation in Subchapter 3
C.Herrero participation in Subchapter 4.
E.J. Alfaro, A.G. Muñoz and N.P. Mora: Subchapter 5
capital, San José. The cumulative effect of droughts,
such as the one mentioned here, generally entails
significant adverse impacts on decision makers in
various sectors. However, the advantage of this
type of event is that since they occur more slowly
than other climate events, their occurrence, spatial
distribution and intensity can often be predicted
sufficiently ahead of time.
Figure 5 shows the particular case of the station
located at the Center for Geophysical Research of
the University of Costa Rica in San José. Note that
this index can be used not only for monitoring
rainfall deficit conditions (2002-2003, etc.), but also
for situations in which periods may be considered
humid or very humid. This is the case for the period
from 2007 to 2010, for example. This figure can also
be used to analyze the cumulative effect of drought
on different time scales (vertical axis), giving an idea
of their severity and type: prolonged periods in red
indicate long durations, while red tones extending
over multiple time scales (vertical axis) indicate
droughts that have evolved from droughts (lasting
a few months), to agricultural or hydrological
droughts (several months).
Another advantage of this index is that it can
be used in seasonal forecasting. Figure 6 shows the
SPI forecast for the quarter from July to October 2014.
One can infer from this figure that the most likely
scenario is the persistence of precipitation deficit
conditions over the next four months, especially on
the Pacific Slope of Costa Rica. In conjunction with
the fact that the deficit can be traced backwards
in some regions, months or years, the above could
affect key socioeconomic issues in urban areas, such
as drinking water supply or hydroelectric power
generation, since this aspect experiences a dry spell
during the boreal winter (Alfaro, 2002).
Figure 6. SPI Probabilistic seasonal climate forecast for the
July-August-September-October 2014 period
SPI probabilistic seasonal climate forecast for the July-August-
September-October 2014 Period. Using a canonical correlation
statistical model based on the CPT tool. (see http://iri.columbia.
edu/our-expertise/climate/tools/cpt/). As a predictive field, the
anomalies of the sea surface temperature for the month of June
were used [60ºN-10ºS; 150ºE-30ºW] together with the persistence
of the seasons in May and June. The period of the calibration was
from 1979 to 2013, with a maximum of 15 modes.
221URBAN WATERS IN COSTA RICA
6. Conclusions
Drinking water coverage in Costa Rica’s major cities
is generally quite high. In certain cities, however,
water is rationed in the dry season. Although over-
exploitation of water resources in some regions is
the main cause of the problem, water availability
could be improved if the amount of losses in the
supply system were reduced. Water losses are quite
significant and limit the amount of credit that can
be obtained to improve the system from financial
institutions that demand the reduction of these
losses as a pre-requisite. It has also been argued that
there is a need to create land use plans to protect
surface and groundwater sources.
The greatest challenge in terms of water supply
and sanitation in the country, however, involves
the low sewerage coverage, particularly the low
percentage of water treated before being discharged
into rivers. The construction of a new treatment
plant in the GMA is a step in the right direction
towards increasing this percentage. However, much
remains to be done. Septic tanks are widely used
in the country, albeit less so in urban areas. Their
use has been criticized, since in many cases, they
are not given proper maintenance, and sometimes
these tanks have been constructed with drains into
soils with low permeability. There is also a lack of
studies measuring the contamination of aquifers
used for water supply by this type of tank.
The lack of potable water and sewerage
infrastructure or the deterioration thereof, has
undoubtedly led to the presence of communicable
diseases in certain parts of the country, such as
cholera, typhoid fever, salmonellosis, shighelosis,
amebiasis, giardisis, other intestinal infections and
viral hepatitis (AyA, 2002). Diseases related to water
that have been detected in the country include the
following: amoebic dysentery, bacillary dysentery,
diarrhoeal diseases (including the previous two),
cholera, hepatitis A, paratyphoid fever and typhoid,
polio, schistosomiasis, dengue and malaria.
Variability and climate change as well as land use
changes, such as urbanization, have resulted in
severe flooding in the country’s major cities. In fact,
the Constitutional Court has ruled in relation to the
need to seek a solution to some of the most serious
problems of flooding in certain cities.
Recent studies have indicated that runoff
reductions are expected in Costa Rica in the
coming decades. It is worth noting, however, that
these climatic reductions could paradoxically be
accompanied by a trend toward larger, positive
extreme events. This is because runoff reductions
occur in monthly or annual time scales, whereas
weather events are in the order of hours or days.
Urban flooding in Costa Rica is related to three
origin factors: 1) inadequate capacity of stormwater
works and rivers, 2) changes in land use (e.g.
urbanization), and 3) climate change (e.g. increase
in extreme events). It is essential to determine the
relative contribution of these factors.
7. Recommendations
Greater awareness of the problem of sewage
treatment is required and more resources must be
invested in treatment plants in urban areas. Urban
river pollution is perhaps the most serious problem
related to urban water.
As for urban flooding, more studies are required
to determine the solution to these problems. Each
basin has specific characteristics, making it difficult
to find a “one size fits all” solution. In some places,
builders of new housing developments are being
obliged to provide a system for rainwater disposal.
This is usually done through infiltration lagoons.
Unfortunately, there have been cases where the
lagoons are abandoned once the building permits
have been approved, meaning that better control is
required through municipalities and ministries to
ensure the correct functioning of these lagoons.
It is essential to incorporate aspects related to
projected climate change into water planning. Due
to the uncertainty of climate change, it is essential
to have a planning mechanism that includes
adaptive water management, in which long-
term climate projections will guide shorter term
planning and after a number of years, short-term
climate projections and planning must be reviewed
in order to move forward.
221URBAN WATERS IN COSTA RICA
222 URBAN WATER CHALLENGES IN THE AMERICAS
8. References
Aguilar, E. et al. (2005). Changes in precipitation and
temperature extremes in Central America and
northern South America, 1961–2003. J Geophys Res
Atmos, 110 (D23). doi:10.1029/2005JD006119.
Alexander, L.V. et al. (2006). Global observed chang-
es in daily climate extremes of temperature and
precipitation. Journal of Geophysical Research, 111,
D05109, doi:10.1029/2005JD006290.
Alfaro, E. y A. Quesada (2010). Ocurrencia de ciclones
tropicales en el Mar Caribe y sus impactos sobre
Centroamérica. Revista Intersedes, 11(22), 136-153.
Alfaro, E. y P. M. Pérez-Briceño (2014). Análisis del
impacto de fenómenos meteorológicos en Costa
Rica, América Central, originados en los mares
circundantes. Revista de Climatología, 14, 1-11.
Alfaro, E. (2002). Some Characteristics of the An-
nual Precipitation Cycle in Central America and
their Relationships with its Surrounding Tropical
Oceans. Tópicos Meteorológicos y Oceanográficos,
9(2), 88-103.
Alfaro, E.; A. Quesada y F. Solano (2010). Análisis del
impacto en Costa Rica de los ciclones tropicales
ocurridos en el Mar Caribe desde 1968 al 2007
(Analysis of Caribbean Sea tropical cyclones oc-
currences from 1968 to 2007 and their impact in
Costa Rica). Revista Diálogos, 11(2), 22-38. http://his
toria.fcs.ucr.ac.cr/).
Alfaro, E.; J. Soley y D. Enfield (2003). Uso de una Tabla
de Contingencia para Aplicaciones Climáticas (Use
of a Contingency Table for Climatic Applications).
Guayaquil, Ecuador: ESPOL y FUNDESPOL. 51pp.
ISBN 9978-310-00-2.
Alfaro, E.; L. Cid y D. Enfield (1998). Relaciones entre
el inicio y el término de la estación lluviosa en
Centroamérica y los Océanos Pacífico y Atlántico
Tropical. Investigaciones Marinas, 26, 59-69.
Alfaro, E. (2007). Escenarios climáticos para tempo-
radas con alto y bajo número de huracanes en el
Atlántico. Revista de Climatología, 7, 1-13.
Alianza Clima y Desarrollo (2012). La Gestión de Ries-
gos de Eventos Extremos y Desastres en América
Latina y el Caribe: Aprendizajes del Informe Es-
pecial (SREX) del IPCC, disponible en www.cdkn.
org/srex
Alvarado, L.; Contreras, W.; Alfaro M. y Jiménez, S.
(2011 y 2012). Escenarios de cambio climático re-
gionalizados para Costa Rica. San José, Costa Rica:
Departamento de Climatología e Investigación
Aplicada. Instituto Meteorológico Nacional (IMN).
Ministerio de Ambiente y Energía (MINAET).
Amador, J. y E. Alfaro (2009). Métodos de reducción
de escala: Aplicaciones al clima, variabilidad y
cambio climático. Revista REVIBEC, 11, 39-52.
Arias, A.L. (2010). “Situación de Potabilización y Sa-
neamiento en Costa Rica”. En: Decimosexto In-
forme Estado de la Nación en Desarrollo Humano
Sostenible. 36 pp.
AyA (2002). Análisis Sectorial Agua Potable y San-
eamiento de Costa Rica. Informe Final 2002. San
José, Costa Rica: Instituto Costarricense de Acue-
ductos y Alcantarillados. 420 pp.
AyA (2004). Información estadística, Servicios, Con-
sumo, Producción, Facturación, Cobranza y Co-
bertura 1992-2002. San José, Costa Rica: Instituto
Costarricense de Acueductos y Alcantarillados,
Dirección de Planificación. 84 pp.
AyA (2013). Zonificación para disponibilidad de agua
potable para el Acueducto Metropolitano. Subge-
rencia Gestión de Sistemas-Gran Área Metropoli-
tana. San José, Costa Rica: Instituto Costarricense
de Acueductos y Alcantarillados. 3 pp.
Barnett, T.P. et al. (2008). Human-induced changes
in the hydrology of the western US. Science, 319:
1080-1083.
Becker, B.; C. Buontempo y Á.G. Muñoz (2014). Drivers
of weather and climate risk in El Salvador. Tech-
nical Report. UK MetOffice – Hadley Centre. 40
pp. Disponible en https://www.researchgate.net/
publication/264079006_Drivers_of_weather_
and_climate_risk_in_El_Salvador?ev=prf_pub.
(Recuperado el 11 de agosto de 2014).
Brekke, L.D.; M.D. Dettinger; E.P. Maurer y M. Ander-
son (2008). Significance of model credibility in
estimating climate projection distributions for
regional hydroclimatological risk assessments.
Clim. Change, 89: 371-394.
Corrales L. (2010, diciembre). “Informe final Efectos
del Cambio Climático para Centro América”. En:
Cuarto Informe Estado de la Región. 53 pp.
Delworth, T.L. et al. (2012). Simulated Climate and
Climate Change in the GFDL CM2.5 High-Resolu-
tion Coupled Climate Model. Journal of Climate,
25: 2755-2781.
223URBAN WATERS IN COSTA RICA
Donoso, M. and P. Ramirez (2001). Latin America
and the Caribbean: Report on the Climate Out-
look Forums for Mesoamerica. In: Coping with
the climate: A step Forward. Workshop Report
“A multi-stakeholder review of Regional Climate
Outlook Forums”, October 16-20 (2000), Pretoria,
South Africa. Publication IRI-CW/01/1, pp. 11-18.
EF (2012). “Planta de tratamiento de la GAM entrará
en operación parcialmente”. El Financiero. http://
www.elfinancierocr.com (Recuperado el 28 de
septiembre de 2012).
García-Solera, I. y P. Ramírez (2012). Central Amer-
ica’s Seasonal Climate Outlook Forum. The Cli-
mate Services Partnership, 8 pp. http://www.
climate-services.org/sites/default/files/CRRH_
Case_Study.pdf (Recuperado el 16 de enero de
2014).
Greene, A.; L. Goddard y R. Cousin (2011). Web Tool
Deconstructs Variability in Twentieth-Century
Climate. EOS 92, 45, 397-408.
Hidalgo H.G. (2011). Los recursos hídricos en Costa
Rica: un enfoque estratégico. En Diagnóstico del
Agua en Las Américas. Interamerican Network of
Academies of Sciences, pp. 203-219.
Hidalgo H.G. (2010). Impactos de la variabilidad y
cambio hidro-climático en sistemas humanos y
ambientales: preparación de desastres, manejo de
recursos hídricos y planeamiento. Estrategia 2050.
3:12-14.
Hidalgo H.G. y E.J. Alfaro (2012). Global Model selec-
tion for evaluation of Climate Change projections
in the Eastern Tropical Pacific Seascape. Interna-
tional Journal of Tropical Biology and Conserva-
tion, 60:67-81.
Hidalgo H.G.; J.A. Amador; E.J. Alfaro y B. Quesada
(2013). Hydrological climate change projections for
Central America. Journal of Hydrology, 495: 94-112.
Hidalgo, H.G. and E.J. Alfaro (2012). Some Physical
and Socio-economical Aspects of Climate Change
in Central America. Progress in Physical Geogra-
phy, 36(3), 380-399.
Hirota, N., Y.N. Takayabu, M. Watanabe, and M.
Kimoto (2011). “Precipitation Reproducibility over
Tropical Oceans and Its Relationship to the Dou-
ble ITCZ Problem in CMIP3 and MIROC5 Climate
Models”. Journal of Climate, 24: 4859-4873.
Imbach, P. et al. (2012). Modeling Potential Equilib-
rium States of Vegetation and Terrestrial Water
Cycle of Mesoamerica under Climate Change Sce-
narios. Journal of Hydrometeorology, 13: 665-680.
INEC (2013). Mortalidad infantil y evolución reciente.
Gobierno de Costa Rica, Instituto Nacional de Es-
tadística y Censos. 8 pp.
IPCC (2007). Climate Change 2007: Impacts, Adap-
tation and Vulnerability. M. Parry, O. Canziani, J.
Palutikof, P. Van der Linden, C. Hanson (Eds). Cam-
bridge: Cambridge University Press. 841pp.
IRI (2001). Latin America Regional Report. In: Cop-
ing with the climate: A step Forward. Workshop
Report “A multi-stakeholder review of Regional
Climate Outlook Forums”, October 16-20 (2000),
Pretoria, South Africa. Publication IRI-CW/01/1,
pp. 136-138.
Jiang X. et al. (2012). Simulation of the intraseason-
al variability over the Eastern Pacific ITCZ in cli-
mate models. Climate Dynamics, 39: 617-636.
Kalnay, E. et al. (1996). The NCEP/NCAR 40-Year Re-
analysis Project. Bull. Amer. Meteor. Soc., 77: 437-471.
Karmalkar, A. V., R. S. Bradley y H. F. Díaz (2011). Cli-
mate change in Central America and Mexico:
regional climate model validation and climate
change projections. Climate Dynamics, 37: 605-629,
doi: 10.1007/s00382-011-1099-9.
Kerr R.A. (2010). Models Foresee More-Intense Hurri-
canes in the Greenhouse. Science, 327: 399-399.
La Nación (2014). “Costa Rica invertirá ¢750.000 mil-
lones para tratar las aguas negras y sanear ríos”.
Periódico La Nación. http://www.nación.com (Re-
cuperado el 8 de febrero de 2014).
Liu, H.L.; M.H. Zhang y W.Y. Lin (2012). An Investi-
gation of the Initial Development of the Dou-
ble-ITCZ Warm SST Biases in the CCSM. Journal of
Climate, 25: 140-155.
Maldonado, T. y E. Alfaro (2011). Predicción estacional
para ASO de eventos extremos y días con precip-
itación sobre las vertientes Pacífico y Caribe de
América Central, utilizando análisis de correl-
ación canónica. Revista Intersedes, 13 (24), 78-108.
Maldonado, T.; E. Alfaro; B. Fallas and L. Alvarado
(2013). Seasonal prediction of extreme precipita-
tion events and frequency of rainy days over Cos-
ta Rica, Central America, using Canonical Correla-
tion Analysis. Advances in Geosciences, 33, 41-52.
224 URBAN WATER CHALLENGES IN THE AMERICAS
Mantua, N.J.; S.R. Hare; Y. Zhang, J.M. Wallace y R.C.
Francis (1997). A Pacific decadal climate oscillation
with impacts on salmon. Bulletin of the American
Meteorological Society, Vol. 78, pp 1069-1079.
Martin, E. R. y C. Schumacher (2011). The Caribbean
low-level jet and its relationship with precipita-
tion in IPCC AR4 models. J. Climate, 24:5935-5950.
Meehl, G.A.; J.M. Arblaster y C. Tebaldi (2007). Contri-
butions of natural and anthropogenic forcing to
changes in temperature extremes over the Unit-
ed States. Geophysical Research Letters, L19709,
doi:10.1029/2007GL030948.
MINAET (2000). Primera Comunicación Nacional
ante la Convención Marco de las Naciones Unidas
sobre cambio climático. Gobierno de Costa Rica,
Ministerio de Ambiente y Energía. Producción y
edición: Instituto Meteorológico Nacional. 116 pp.
MINAET (2009). Segunda Comunicación Nacional
ante la Convención Marco de las Naciones Unidas
sobre cambio climático. Gobierno de Costa Rica,
Ministerio de Ambiente y Energía. Producción y
edición: Instituto Meteorológico Nacional. 264 pp.
MINAET. Informe final del Proyecto: Mejoramiento
de las capacidades nacionales para la evaluación
de la vulnerabilidad y adaptación del sistema
hídrico al cambio climático en Costa Rica, como
mecanismo para disminuir el riesgo al cambio
climático y aumentar el índice de desarrollo hu-
mano. Ministerio de Ambiente y Energía. Produc-
ción y edición: Instituto Meteorológico Nacional.
46 pp.
Moreno Díaz, M. L. (2009). Valoración económica del
uso de tecnologías de saneamiento ecológico para
aguas residuales domiciliares. Revista Iberoamer-
icana de Economía Ecológica, 13, 1-13.
Muñoz, Á.G. et al. (2010). An Environmental Watch
system for the Andean countries: El Observatorio
Andino. Bulletin of the American Meteorological
Society-BAMS, 91, 1645–1652.
Muñoz, Á.G. (2012). Risk Management at the Latin
American Observatory. Chapter 22 in Risk Man-
agement - Current Issues and Challenges. ISBN:
978-953-51-0747-7, 24 pp.
Neelin, J.D.; M. Munnich; H. Su; J.E. Meyerson y C.E.
Holloway (2006). Tropical drying trends in global
warming models and observations. Proceedings
of the National Academy of Sciences of the United
States of America, 103:6110-6115.
OLADE (2013). Vulnerabilidad al cambio climático de
los sistemas de producción hidroeléctrica en Cen-
troamérica y sus opciones de adaptación. Informe
de consultoría. Organización Latinoamericana de
Energía.
Organización Meteorológica Mundial (OMM) (2012).
Guía del usuario sobre el índice estandarizado
de precipitación (OMM-Nº 1090). M. Svoboda, M.
Hayes y D. Wood (eds.). Ginebra. 15 pp.
Pierce, D.W. et al. (2008). Attribution of declining
western US snowpack to human effects. Journal
of Climate, 21: 6425-6444.
Pierce, D.W.; T.P. Barnett; B.D. Santer & P.J. Gleckler
(2009). Selecting global climate models for re-
gional climate change studies. Proc. Nat. Acad. Sci.
USA, 106: 8441-8446.
Rauscher S.A.; F. Giorgi; N.S. Diffenbaugh and A. Seth
(2008). Extension and Intensification of the Me-
so-American mid-summer drought in the twen-
ty-first century. Climate Dynamics, 31:551-571.
Trenberth, K.E. et al. (2007). “Observations: surface
and atmospheric climate change”. In: Solomon S,
Qin D, Manning M, Chen Z, Marquis M, Averyt
K, Tignor M, Miller H (eds.). Climate change 2007:
the physical science basis. Contribution of Working
Group I to the Fourth Assessment Report of the In-
tergovernmental Panel on Climate Change. Chap 3.
New York: Cambridge University Press, pp. 235–336.
Ministerio de Salud (2011). Análisis y determinantes
sociales de la situación de salud. Memoria insti-
tucional, pp. 26-84. Ministerio de salud.
225URBAN WATERS IN COSTA RICA
9. Acronyms
ASADAS: Aqueduct and Sewerage Administrators’
Associations
AyA: Costa Rican Institute of Aqueducts and Sewers.
ECLA: Economic Commission for Latin America
CMIP3: Coupled Model Intercomparison Project 3.
CMIP5: Coupled Model Intercomparison Project 5.
GMA: Greater Metropolitan Area.
EF: El Financiero (Newspaper).
ENSO: El Niño-Southern Oscillation.
ESPH: Heredia Public Service Company
IDWS Improved drinking water sources.
INEC: National Institute of Statistics and Censuses.
IPCC: Intergovernmental Climate Change Panel.
IRI: International Research Institute for Climate and
Society.
JICA: Japan International Cooperation Agency.
LNA: National Water Laboratory.
GCM: General Circulation (climate) Models
MINAET: Costa Rican Ministry of Environment,
Energy and Seas
NCEP-NCAR Reanalysis: Meteorological database of
the US National Center for Environmental Prediction/
National Center for Atmospheric Research.
PDO: Pacific Decadal Oscillation
OLE: Latin American Observatory of Extraordinary
Events.
WMO: World Meteorological Organization
WHO: World Health Organization.
PCM: Joint Monitoring Programme.
RCOF Regional Climate Outlook Fora.
SPI: Standardized precipitation index.
TN10: Number of cold nights (below the 10th
percentile).
TN90: Number of warm nights (above the 90th
percentile).
TX10: Number of cold days.
TX90: Number of hot days.
UNICEF: United Nations International Children’s
Emergency Fund.
ITCZ: Intertropical Convergence Zone.
Contributors
Roberto Villalobos Herrera
Student, Escuela de Ingeniería Civil, Universidad de
Costa Rica
Jorge Aguilar Barboza
Unidad de Gestión de Información, Instituto
Costarricense de Acueductos y Alcantarillados
Javier Valverde Hernández
Systems Management Subsystem, GMA, Instituto
Costarricense de Acueductos y Alcantarillados
Marcos Quesada Sanabria
Systems Management Subsystem, GMA, Instituto
Costarricense de Acueductos y Alcantarillados
Ana L. Arias Zúñiga
Environmental Engineering, Instituto Tecnológico
de Costa Rica
Alejandra Rojas González
School of Agricultural Engineering, Universidad de
Costa Rica
Matías A. Chaves Herrera
School of Agricultural Engineering, Universidad de
Costa Rica
608 URBAN WATER CHALLENGES IN THE AMERICAS
Sandra Lorena Galarza MolinaMS in civil engineering (2005) with a master’s degree in hydro-systems (2011) from the Javeriana Pontifical
University in Bogotá, Colombia. She began her doctoral degree studies in 2011 at the same university with
research related to environmental evaluation of the Urban Sustainable Drainage System (SUDS) using the
element of rainwater capture in a pilot basin. Email: [email protected] or [email protected]
Juan Diego Giraldo OsorioAssistant Professor at the Javeriana Pontifical University – Bogotá campus. BS in civil engineering from the
National University of Colombia – Medellín campus. MS in civil engineering with specialty in water resource
management from the University of the Andes. PhD in water resources management from the Polytechnical
University of Cartagena (Spain). Currently Director of the Water and Environment Science and Engineering
Research Group. Research interests focus on topics of climate change and adaptation, assimilation of remote
sensing data in modeling, and hydrology. Email: [email protected]
Costa Rica
Hugo G. Hidalgo (Chapter Coordinator)Research fellow in surface water hydrology, with a special interest in hydro-climatology. BS in civil engineering
from the University of Costa Rica (1992). MS in science (1998) and PhD in Civil and Environmental Engineering
with speciality in Water Resources (2001) from the University of California, Los Angeles. Currently a professor
at the University of Costa Rica, School of Physics. He coordinates the Master’s Degree Program in Hydrology
and is the National Focal Point for the Inter American Network of Academies of Sciences Water Program and
deputy director of the Geophysics Research Center at the University of Costa Rica. Dr. Hidalgo is the author of
more than thirty publications and has participated in more than 100 conferences, seminars and workshops.
Email: [email protected]
Ángel G. MuñozResearcher in climate sciences at the International Research Institute for Climate and Society (IRI) at Columbia
University. Doctoral degree student in the Department of Earth and Environmental Engineering at Columbia
University. After graduating from the University of Zulia with a BS in physics, Mr. Muñoz received a MS in
earth and environmental engineering from Columbia University. His research focuses on extreme climate
phenomenon in Latin America. Previously, associate professor in the Physics Department at the University of
Zulia and coordinator of the Geo-sciences Area in the Scientific Modeling Center in Venezuela.
Email: ude.aibmuloc.iri@zonumga
Carolina HerreroBS in civil engineering from the Isaac Newton University. Currently a master’s degree student in hydrology
at the University of Costa Rica. Professional background includes work in infrastructure in the Urbasco
construction company and in the Franz Sauter and Associates company as a designer of outdoor works. She
subsequently set up her own business, Ph-C Ingenieros Consultores, which provides project designs and
inspections of infrastructure including hydrological studies and rainwater retention tanks.
Eric J. AlfaroBS in meteorology from the University of Costa Rica. PhD in oceanography from the University of Concepción,
Chile. Previously a meteorologist in the National Meteorological Institute. Currently Assistant Professor at
609URBAN WATER CHALLENGES IN THE AMERICAS
the University of Costa Rica, School of Physics where he began teaching in 1989. Member of the Graduate
Commission on Atmospheric Sciences and Member of the Graduate Commission on Comprehensive
Management of Tropical Coastal Areas, both of which are within the Graduate Studies System of the
University of Costa Rica. Dr. Alfaro has also been a researcher at the Geophysics Research Center since 1992,
where he is currently director, and a researcher at the Ocean Sciences and Limnology Research Center at the
University of Costa Rica, since 2000. Email: [email protected]
Natalie MoraCurrently a student of meteorology at the University of Costa Rica, School of Physics and has collaborated as
an assistant in various research projects at the Center for Geophysical Research at the University of Costa
Rica. Email: [email protected]
Víctor H. ChacónSystems analyst (Informatics Division), support analyst (AyA Auditing System), trainer and instructor for the
Aya–Regional Technical Committee for Community Participation, Sanitary Education and Personal Hygiene
– CAPRE, systems analyst in Watershed Basins – CARE, Rural Aqueducts Process – administrative technical
advice promoter – WKF, environmental director for the Municipality of Pérez Zeledon, C.N.E. Planning Area,
National Coordinator in CONIFOR of AyA, specialist in communal systems during disasters, specialist in
socio-environmental communal systems.
Darner A. MoraAffiliated to the Costa Rican Institute for Aqueducts and Sewers since 1977 and director of the National
Waters Laboratory since 1989. He studied at the Republic of Nicaragua School and Nuevo Colegio in San JosÉ.
BS in microbiology and clinical chemistry from the University of Costa Rica. MS in public health from the
University of Costa Rica. Mr. Mora has published three books, approximately 150 opinion articles in various
national newspapers and has conducted more than 100 research projects on water, the environment and
health, making him an authority on these topics, which are crucial to Costa Rica’s public health.
Mary L. Moreno (Box Environmental Services)MA in economics of natural resources and the environment from the University of Concepción, Chile.
Her research at the International Center on Economic Policy for Sustainable Development (CINPE) at the
National University of Costa Rica (CINPE) concerns the evaluation of the economics of natural resources
and environmental policies. Specific areas of research include protected wilderness areas, private forest
areas and coastal zones. She teaches courses at the National University of Costa Rica in economic evaluation;
economics, ecology and sustainable development; and microeconomics in the Master’s Degree Program in
Economic Policy with specialty in ecological economics. Email: [email protected]
Cuba
Daniela Mercedes Arellano (Chapter Coordinator)BS in Geophysical Engineering from the Technical Institute, José A. Echevarría, La Habana. PhD in geological
sciences from the University of Carolina in Prague, Czech Republic. Research Assistant. Director of project
UNEP/GEF Sabana Camagüey, Cuba. Agency of Environment, Ministry of Science, Techology and Environment.
Focal Point for Cuba of the InterAmerican Network for Academies of Science (IANAS). Email: [email protected]
620 URBAN WATER CHALLENGES IN THE AMERICAS
This book was printed in March 2015
with a print run of 800 at Surtidora
Gráfica, SA de CV workshops
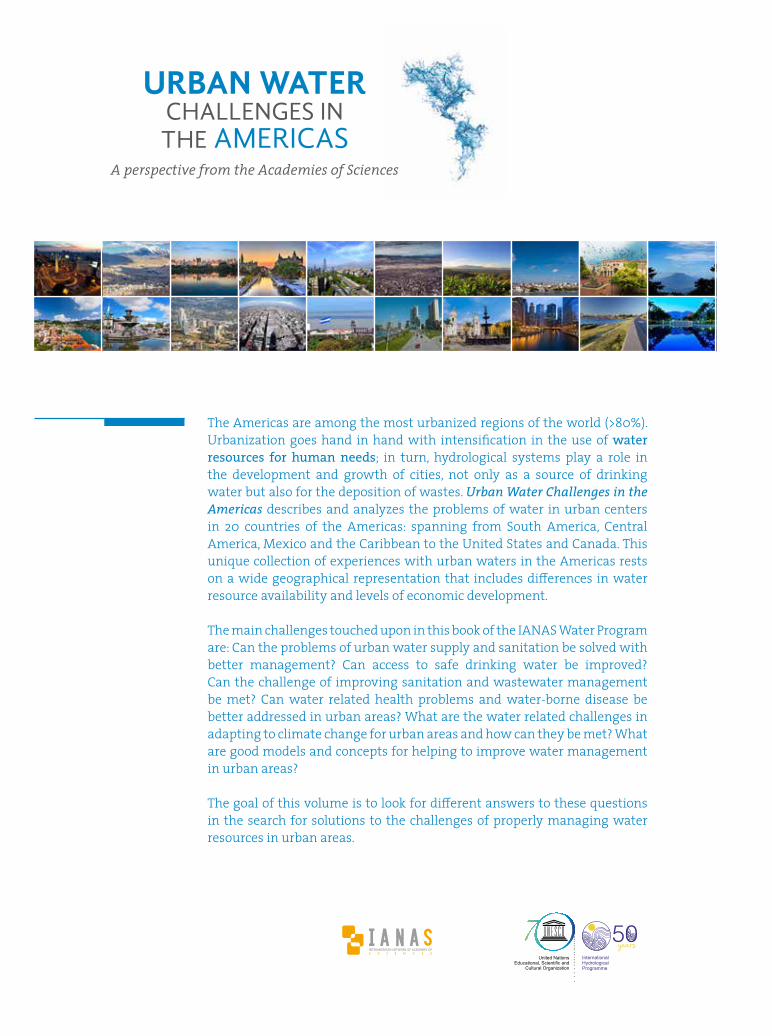
The Americas are among the most urbanized regions of the world (>80%).
Urbanization goes hand in hand with intensifi cation in the use of water
resources for human needs; in turn, hydrological systems play a role in
the development and growth of cities, not only as a source of drinking
water but also for the deposition of wastes. Urban Water Challenges in the
Americas describes and analyzes the problems of water in urban centers
in 20 countries of the Americas: spanning from South America, Central
America, Mexico and the Caribbean to the United States and Canada. This
unique collection of experiences with urban waters in the Americas rests
on a wide geographical representation that includes diff erences in water
resource availability and levels of economic development.
The main challenges touched upon in this book of the IANAS Water Program
are: Can the problems of urban water supply and sanitation be solved with
better management? Can access to safe drinking water be improved?
Can the challenge of improving sanitation and wastewater management
be met? Can water related health problems and water-borne disease be
better addressed in urban areas? What are the water related challenges in
adapting to climate change for urban areas and how can they be met? What
are good models and concepts for helping to improve water management
in urban areas?
The goal of this volume is to look for diff erent answers to these questions
in the search for solutions to the challenges of properly managing water
resources in urban areas.
A perspective from the Academies of Sciences
URBAN WATER
THE AMERICAS
CHALLENGES IN