untitled - digital library
TRANSCRIPT


A NOVEL TECHNIQUE FOR THE RETRIEVAL OF
COMPRESSED IMAGE AND VIDEO DATABASES
by
Pomvit Saksobhavivat
A Thesis Submitted to the Faculty of
The College ofEngineering
in Partial Fulfillment of the Requirements for the Degree of
Master of Science in Computer Engineering
Florida Atlantic University
Boca Raton, Florida
August 1997

A NOVEL TECHNIQUE FOR THE RETRIEVAL OF COMPRESSED IMAGE
AND VIDEO DATABASES
by
Pomvit Saksobhavivat
This thesis was prepared under the direction of the candidate' s thesis advisor, Dr. Borko Furht, Department of Computer Science and Engineering, and has been approved by the members of his supervisory committee. It was submitted to the faculty of The College of Engineering and was accepted in partial fulfillment of the requirements for the degree of Master of Science in Computer Engineering.
SUPERVISORY COMMITTEE:
c
Chairperson, Department of Computer Sci ce and Engineeljng ,:;;
'
7 -!& -97 Date
ii

ACKNOWLEDGEMENTS
First of all, I would like to thank my mom, dad, and Uncle Noi ' s family who support
me thoughout the duration of my study. Special thanks to Dr. Borko Furht, my thesis advisor,
for his direction and useful comments to improve my thesis. Finally, I would like to thank
Farah for her kind supports .
iii

Author:
Title:
Institution:
Thesis Advisor:
Degree:
Year:
ABSTRACT
Pornvit Saksob}lavivat
A Novel Technique for The Retrieval of Compressed Image and Video
Databases
Florida Atlantic University
Dr. Borko Furht
Master of Science
1997
The classic methods in indexing image and video databases are either using keywords
or analysis of color distribution. In the recent year, there are a new standard in image and
video compression standard called JPEG and MPEG respectively. One of the basic operations
of JPEG and MPEG is Discrete Cosine Transform (DCT). The human visual system is known
to be very dependent on spatial frequency . The DCT has capability to provide a good
approximation of the images ' spatial frequency that is sensitive to human eyes . We take this
advantage of DCT in indexing image and video databases. However, the two-dimensional
DCT can give us 64 coefficients per block of 8x8 pixels . These numbers are too many to
calculate to receive fast indexing results . We use only first coefficient of DCT called DC
coefficient to represent a 8x8 block of transformed data. This representation yields
satisfactory indexing results .
iv

TABLE OF CONTENTS
ACKNOWLEDGEMENTS . .. . . . . . . . . . . . . . . . . . . . . . . . . . . . . . . . . . . . . .. . . . . . . ........ .. . . . . . . ... . . . . . . . . . . . . . . . . . . . . . . m
LIST OF TABLES . . . . ..... ..... ...................... .. . . .. ....... .. . . . . . . . . . . . . . . . .. .. . . . . . . .. . . . . . . . . . . . . . . . . . . . . . . . . . Vlll
LIST OF ILLUSTRATIONS IX
Chapter
1. INTRODUCTION
2. PROBLEMS IN INDEXING OF IMAGE AND VIDEO DATABASES ....... 3
2. 1 Problems in Indexing of Image Databases ...... .. ..... ................................. .. 3
2.2 Problems in Indexing of Video Databases ............... .. .............. ...... .......... 6
3. PREVIOUS WORK IN INDEXING IMAGE AND VIDEO DATABASES .. 9
3. 1 The QBIC System .................... ...... ..... ...................... .... ......... .... .......... 11
3.1. 1 Image and Object Features for Content-Based Queries in QBIC .. 12
3 .1.2 Queries and Similarity Measures in QBIC System .. .. .. ...... .... ...... 15
3.2 ISS Image Indexing Work ................. .. ................................................... 18
3.2.1 Features Acquisition .......... ..................... .. .. .......................... ..... . 18
3.2.2 Image Indexing ............................. ..... ........ .. ............ ... .. .............. 20
3.3 Vision Texture Annotation, Photobook and FourEyes System ................ . 26
3.3 .1 Model in Current System [Pi95] .. .. .. .. .. .. . .. .. .. .. .. ... ..... . .. .. .. . .... .. .. .. 27
3.3.2 Photobook System ..................................................................... 28
3.3.3 FourEyes System [Pi95], [Pi96] .......................... :....................... 29
v

3.4 Using Texture Features for Images Retrieval .... ...... ............................... 32
3.4.1 Texture Models 33
3.5 Similar Shape Retrieval in Shape Data Management . . . . . . . . . . . . . . . . . . . . . . . . . . . . . . . 40
3.6 Chabot: Retrieval from a Relational Database of Images ........................ 44
3.7 Piction System: Automatic Indexing and Content-Based Retrieval of
Captioned Images . . . . . . . . . . . . . . . . . . . . . . . . . . . . . . . . . . . . . . . . . . . . . . . . . . . . . . . . . . . . . . . . . . . . . . . . . . . . . . . . 4 7
3. 7.1 Visual Semantics . . . . . . . . . . . . . . . . . . . . . . . . . . . . . . . . . . . . . . . . . . . . . . . . . . . . . . . . . . . . . . . . . . . . . . . . 4 7
3.7.2 Architecture for Collateral Text-Based Vision ........ .. ... ................ 48
3.7.3 Evaluation ofthe System .......... .................................. ..... ... ....... . 51
3.8 CORE: A Content-Based Retrieval Engine .... ..... .......................... ........ . 51
3.9 Map Retrieval by Content: MARCO System and Alexandria Project ... .... 55
3 .1 0 Video Manipulation Works 57
3. 10. I Difference Metrics for Video Partitioning . . . . . . . . . . . . . . . . . . . . . . . .. .. .. . . . . . 58
3. I0.2 Case Study in Video Parsing: News Video ........ .......... ..... .......... 66
4. THE DISCRETE COSINE TRANSFORM . .. . . ..... .... .. . . . . . . . . . . . . . . . . . . . . . . . . . .. . . .... . 68
4.1 Basic DCT Concepts .......... ................ .. .. .............. ... ......................... .... 68
4.1.1 The One-Dimensional DCT
4. I .2 The Two-Dimensional DCT
69
74
4.2 Mathematical Definition ofFDCT and IDCT ..... ..... ......... ...... .... ... ...... ... 74
4.2 .1 One-Dimensional FDCT and IDCT .. . . . ......... .. ...... . ....... .............. 74
4.2.2 Two-Dimensional Reference FDCT and IDCT ......... ......... .. ....... 75
5. IMAGE INDEXING USING THE DC COEFFICIENT ................... ...... ...... 77
5 . I The Histogram of DCT Coefficients . . . . . . . .. .. . . . . . . . . . . . . . . . . . . . . . . .. .. .. . .. .. .. .. .. .. .. 78
vi

5.2 Histogram Similarity Measures
5.3 Implementation: Alpha Program
79
81
5.4 The Experiment Resufts . . . . . . . . . . . . . . . . . . . . . . . . . . . . . . . . . . . . . . . . . . . . . . . . . . . . . . . . . . . . . . . . . . . . . . . . 86
5.5 Experiment Results Analysis ....... ............... ...... ......... ... ..... ...... .. ..... ....... 99
6. CONCLUSIONS ....... .... ........ ............. ... ...... .. ........ .. ........ ........ .... .. ... ... ... ........ 102
BIBLIOGRAPHY .............. ...... ........ ......... .... ....... ..... ... .. .. .......................... ....... .......... 104
vii

LIST OF TABLES
Table Page
3. 1 Object size group definition . . . . . . . . . . . . . . . . . . . . . . . . . . . . . . . . . . . . . . . . . . . . . . . . . . . . . . . . . . . . . . . . . . . . . . . . . . . . . . . . 22
3.2 Models known in the system .. ...... ..... .. .............. .. ... ... .. ... .. ..... .. ...... .............. ........ 27
3.3 Query "find yellow flowers" (total relevant images = 22) .. ..... ... ........ .. ...... .... .. ..... 46
3.4 ~ J?:xperiment results . N: number of news items manually identified by watching ·the programs; N,: news items identified by the system; Nm: news items missed by the system; and Nr: news items falsely identified by the system . . . . . . . . . . . . . . . . . . . . . . . 67
5.1 Results of indexing "elephant1.jpg" using 1024 bins ofDC histogram .. .. ......... ... 87
5.2 Results of indexing "elkl.jpg" using 1024 bins ofDC histogram .. .... ...... .. ... .... .... 89
5.3 Results of indexing "flower3 .jpg" using 1024 bins of DC histogram . . . . . . . . ... . . . ...... 91
5.4 Results of indexing "football2.jpg" using 1024 bins of DC histogram . . . . . . . . . . . . . . . . . . 93
5.5 Results of indexing "nemesis 1.jpg" using 1024 bins of DC histogram . . . . . . . . . . . . . . . . . . 95
5.6 Results of indexing "sd1.jpg" using 1024 bins ofDC histogram .......................... 97
VIII

LIST OF ILLUSTRATIONS
Figure Page
3.1 The format ofthe index key (for image indexing by content) ....................... .. .. ... . 23
3.2 The calculation ofWP and WA .................................. ..... .. ... ... .......... .. .............. 24
3.3 The format ofthe index key (for image indexing by histogram) ........................... 25
3.4 ~screen shot of FouEyes during the labeling of examples of building, car and street 29
.... r 3.5 Results after labeling data in FourEyes. "Computer, go find scenes like this one
(upper left), with building or street" ........... ............ ... .................. .. ...... .. ........ ...... 31
3.6 A society of models. Although, some of these can model any signal, each has different strengths and weaknesses . . . . . . . . . . . . . . . . . . . . .. .. .. . . . . . . . . . .. . . . . . . . . . . . . . . . . . . . . . . .. .. . . . . . . . 3 3
3.7 Top row: 256 by 256 patches used to train cluster-based probability models Bottom row: deterministic multiresolution synthesis. The textures are, from left to right, Dl (aluminum wire mesh), Dl5 (straw), D20 (magnified French canvas, D22 (reptile skin), and D 103 (loose burlap) .. .. .. .. .. .. .. .. .. .. .. .. .. .. .. .. .. .. .. .. .. 36
3.8 Two examples of using Wold features for pattern retrieval, searching for patterns similar to the pattern at upper left .. .. .. .. .. .. .. .. .. .. .. .. .. .. .. .. .. .. .. .. .. .. .. .. . .. .. .. .. . 3 7
3.9 Feature encoding example: (left) image coordinate system; (right) normalize coordinate system ....................... ............. ...... ................. .. .. .................. .. ........... 42
3.10 Good feature match . . . . . . . . .. .. .. . . . . . . . . . . . . . . . . . . . . . . .. .. .. . . . . . . . . . . . . . . . .. .. .. . . . . . . . . . . . . . . . . . . . . . . . . . . . . 43
3. 11 Bad feature match .. . . . . . . .. . . . . . . . . . . . . . . . . . . . . . . .. . . . . . . . . . . . . . . . . . . . . . . . . . . . . . . . . . . . . . . . . . . . . . . . . . . . . . . . . . . . 44
ix

3.12 Results of combining text and image information to satisfy queries : Top two "hits" in response to "find pictures of military personnel with Clinton" (Top row) . "find pictures of Clinton with military personnel" (middle) . "find pictures of Clinton" (bottom) . . . . . . . . . . . . . . . . . . . . . . . . . . . . . . . . . . . . . . . . . . . . . . . . . . . . . . . . . . . . . . . . . . . . . . . . . . . . 50
3.13a, b Illustration of twin-comparison . . . . . . . . . . . . . . . . . . . . . . . . . . . . . . . . . . . . . . . . . . . . . . . .. .. . . . . . . . . . . . . . . . . . . . . . . 64
4.1 1-D DCT decomposition (a) Eight arbitrary grayscale samples (b) level shift of(a) by 128 (c) coefficients for decomposition into waveforms ...... .... ..... .. ....... ........ .. ....... ..... 70
4.2 Eight cosine basis function waveforms. The waveform for u=O is constant. The other waveforms show an alternating behavior at progressively higher frequencies . . . . . . . . . . . . . . . . . . . . . . . . . . . . . . . . . . . . . . . . . . . . . . . . . . . . . . . . . . . . . . . . . . . . . . . . . . . . . . . . . . . . . . . . . . . . . . . . . . . . . . 71
4.3 Eight cosine waveforms progressively summed ... .. ........ ...... ...... .. ....... .......... .. ..... 73
5.1 Alpha's main window .......... ........................... ...... ...... ..... .... ......... .. .. ........ ..... ... .. 83
5.2 Alpha display results window . . . . . . . . . . . . . . . . . . . . . . . . . . . . . . . . . . . . . . . . . . . . . . . . . . . . . ... . . . . . . . . . . . . . . . . . . . . . . 84
5.3 a) query image (elephant1.jpg) b) best 20 matches indexing results ... ...................... ..... .................. .. .... .............. 88
5.4 a) query image (elk 1.jpg) b) best 20 matches indexing results . . . . .. .... ..... ...... .. ... ....... .. ..... .......... .. .. .... . . . . . . . . . . 90
5.5 a) query image (flower3.jpg) b) best 20 matches indexing results . . . . . . . . . .. . . . . . . . . . . . . . .. . .. . . . . . . . . . . . . . . . . . . . . . . . . . . . . . . . . . . . . . . . 92
5.6 a) query image (football2.jpg) b) best 20 matches indexing results . . . . . . . . . . . . . . . . . . . . . . . . . . . . . . . . . . . .. . . . . . . . . . . . . . . . . . . . . . . . . . . . . . . . 94
5. 7 a) query image (nemesis 1.jpg) b) best 20 matches indexing results . . . . . . . . . . . . . . . . . . . . . . . . . . . . . . . . . . . . . . .. . .. .. . . . .. . .. . . . . . . . . . . . . . . . 96
5.8 a) query image (sd1.jpg) b) best 20 matches indexing results . . . . . . . . . . . . . . . . . . . . . . . . . . . . . . . . . . . . . . . . . . . . . . . . . . . . . . . . . .. . . . . . . . . . 98
X

CHAPTER 1
I NTRODU.CTION
In the last few years, multimedia systems have play the important roles in computing
technology; both in software and hardware. The modem multimedia systems use large volume
··~·
and complexity of data, which placing demand on microprocessor performance and storage
capacity. These volumes of data and their complexity are increased exponentially. The
examples of these data include the emerging of Internet, graphic applications, animations,
audios, videos, interactive videos, 3D graphics, etc. Fortunately, today 's technologies allow us
to store, retrieve, and manipulate these databases. On the hardware side, Intel, the largest
manufacturer of PC microprocessor chips, has introduced the extension of the architecture of
Pentium microprocessors in the early of 1997. This extension is called MMX (MultiMedia
eXtension) technology [Pe97]. The MMX technology is claimed to help boost performance of
multimedia applications.
Digital images and video databases have become important components in multimedia
systems. The digital images seem to be the most familiar and popular media besides text.
They can be found everywhere in today computing from entertainment games, word processors
documents, GUis, world wide web pages, etc. In today computing, some PC manufacturers

have also equipped their PCs with scanners as standard accessories along with diskette and CD
ROM drives. Along with the enhancing of the hardware technology, the future PCs may also
equipped with digital camera to recou:Lvideos as their standard equipments .
As the media databases' sizes grow bigger, we have to have a management method to
get fast indexing and retrieval of these data. In the case of images, people try to understand the
images in natural ways . Unfortunately, the image understanding is considered hard for the
current computing technology. The problems such as find the image that has dog(s) in it, by
using only their stream of bit values, is nearly impossible today. The previous researches try
to use the image content, which may associated with some keyword(s) to describe images it-
self. UnJi~e text only document, we cannot search internally of the media for the exact
matches of wanted patterns. However, the indexing and retrieval methods can be done by us-
ing text associated with these data, or by using extracted features of the images and video in
indexing. These methods of indexing are introduced and discussed in chapter 2.
In this thesis, it will be the proposal of using DC coefficient in indexing image. We
can get DC coefficient by applying two dimensional Discrete Cosine Transform (DCT). The
basic of DCT, benefits, and mathematical definitions are provided in chapter 4. The experi-
ments ' results are provided in chapter 5. Finally, we conclude and discuss the advantage and
disadvantage ofthis method in chapter 6.
2

CHAPTER 2
PROBLEMS IN INDEXING OF IMAGE AND VIDEO DATABASES
There are two main approaches in indexing of image and video databases, Keyword
based indexing and Content-based indexing. The keyword-based indexing uses keywords in
indexing. The content-based indexing uses the extracted image contents in indexing. Some
indexing systems integrate both techniques to increase indexing and retrieval capabilities . Since
indexing image and video shares some common problems, we will introduce the problems with
image indexing first and then expand it to the indexing of video databases.
2.1 Problems in Indexing of Image Databases
In the first approach, keyword-based method, the keywords and/or description texts
are associated with each image in databases. The indexing and retrieval are exclusively depend
on descriptive keywords associated with the images and no visual properties of the image are
employed.[Go94] ,[0g95] These descriptions may be probed by standard Boolean database
queries; and retrieval may be based on either exact or probabilistic match of the query text.
The query text may be enhanced by the thesaurus support, and logical semantic hierarchies
3

(for example, collie IS-A dog IS-A animal) [Ca93]. Moreover, topical or hierarchies may be
used to classify or describe image using knowledge-based classification. Some indexing works
such as in [Sr95] use WordNet[Be91], [GA90], a large-scale ontology of words, to find the
meaning and synonyms for given words. WordNet also has capability to access part-o.f and is-
part-o.f hierarchies (for example, word "operating room" will retrieves "hospital" with the
semantic relation "part of''). The works of [Sr95] also use the machine-readable version of
Longman 's Dictionary of Contemporary English (LDOCE). LDOCE provides syntactic
information for parsing and "box codes," which are semantic categories for words that have
been manually assigned. A good survey of keyword-based query and matching techniques may
be founa ~in [AN93].
However, there are several problems inherent in systems that are exclusively keyword-
based. First, the automatic generation of the descriptive keywords or extraction of semantic
information to build classification hierarchy for broad varieties of images is beyond the
capability of current machine vision techniques. Thus, these descriptive keywords must be
entered manually by human operators. These tasks are time and money-consuming when
dealing with large amount of database. Second, in general, there are no commonly agreed-
upon vocabulary for describing images. The descriptions of images by human are quite hard to
predict and may be fickle (that is, we may annotate quite similar images with different
keywords, or different images with the same keywords). Third, it does not provide queries for
images similar to a given image. In [Pi95], they point out that the way human measure
similarity in images may come from the following influences:
4

Visual features : Regions may look similar at a quick glance, e.g., dense leafY treetops
and grass.
View Point: Images may be-:of the same scene, but differ in camera viewpoint or
lighting.
Semantics: Regions may be similar because they contain similar objects, e.g.,
windows of an office building and windows of a car.
Culture and Past.
As a result, the query for images will fail if a user forms a query refers to elements of
image con.tents that were not described by the operators. Misspelled keyword will thwart
successful retrieval, even when close matches can be culled from dictionary. Moreover,
dictionary cannot help with inaccurate descriptions, and some textures and shapes are difficult
or nearly impossible to describe with text.
The alternative approach in image indexing is the content-based indexing. This
method extracts the characteristics or features of images themselves. The idea of this approach
is behind the fact that the natural way to retrieve visual data is by a query based on visual data
itself. The features that normally extracted are colors, textures, shape, motion, prominent
regions, location of information, etc. Because this method focuses on the features that come
from images themselves, it is often called content-based image retrieval.
The content-based retrieval has taken two directions [Ve95]. In the first direction,
image contents are modeled as a set of attributes extracted manually and managed within the
framework of conventional database-management systems. Queries are specified using these
attributes. Attribute-based representation of images entails a high level of image abstraction .
5
Generally, the higher the level of abstraction, the lesser is the scope for posing ad hoc queries
to the image database. The second approach depends on an integrated feature-extraction and
object recognition subsystem. This .subsystem automates the feature-extraction and object
recognition tasks. However, automated approaches to object recognition are computationally
expensive, difficult or almost impossible with current technologies to apply to general purpose
cases, and tend to be domain specific.
Queries based on image content require a paradigm that differs significantly from the
traditional databases and text-based image understanding systems. First, such a search cannot
logically rigorous as those expressed by text. Instead, queries tend to be based on similarity;
and resemol.e of extracted featured than perfectly matched in bit patterns. On the other hand,
this lead to some problems, on the fact that, the similarity is not necessary correct. So, this
paradigm tends to entail the retrieval by false positive that must be discarded by users .
Consequently, as opposed to the usual artificial intelligence approach to scene analysis, there
are no well-defined procedures that automatically identify objects and assign them to a small
number of pre-defined classes [Ni93].
2.2 Problems in Indexing of Video Databases
Video is another common form of media in multimedia systems. We can model video
as series of images that may be associated with audio. Unlike the images, the video is a
dynamic media, which change along with time. Currently, the manipulation of video databases
consists of three main operations, partitioning (or segmentation), representation and
classification, indexing and retrieval.
Partitioning (or segmentation) is dealing with finding the single, uninterrupted camera
6

shot. The partition task is finding the boundary of camera shots. The simplest transition is the
camera break, which images change to another shot in the consecutive frame . If we can
express the qualitative different between-frames, then the segment boundary can be declared
when the difference exceeds a given threshold. However, in some situation such as abruptly
change in illumination (by flash or lightning), fast movement of object(s) between frame or
large object(s) movement between frame, etc. , can cause the different measures exceeds the
selected threshold. We will get false positive partitioning when these alruptly changes occur.
While the camera break is the simplest boundary between shots, there are more
sophisticate transition techniques include dissolve, wipe, fade-in and fade-out. Such special
effects invo~ye much more gradual changes between consecutive frames than does camera
break.
Representation and classification . Once the camera shots have been defined, the next
task is the representation of the shots. The representation may be in term of text descriptions,
mathematical transform, or images. In the video databases system, when the shot has been
detected, this task includes the choosing one or more frames that represents that shot, called
r-frame. The simple method is using single frame to represent the shot. The selected r-frame
may be the first, the middle, or even the last frame of the shot. These selected r-frames will be
represented in the visual browsing tools. The more sophisticate method use the mean measure
metric in the shot and find frame that the most close to that mean value. Moreover, some shots
have long camera pan and/or zoom that may cause the image change so much. QBIC system
[FI95] attacks these problems by using synthesize r-frame created by seamlessly mosaicking
all the frames in a given shot using the computed motion transformation of the dominant
background.
7

Indexing and retrieval This operation is tagging the video clips when the system
inserts them into the database for user to access it. The tag includes information based on
knowledge model that guides the classification according to the semantic primitives of the
unages .
The complicate part of manipulating video is the partitioning part. We have to
implement partition techniques for finding shot boundaries. The difference metrics that
determining the camera shot in video has to be more complicate than in measuring "static"
image. Transition technique, camera motion, object(s) movement can cause undesirable false
shot detections . The other operations (representation, indexing and retrieval) can share and
actually ha~e the same nature problems as indexing and retrieval images. We will review these
problems and issue some solutions in section 3.10.
8

"' • -·
CHAPTER 3
PREVIOUS WORK IN INDEXING IMAGE AND VIDEO
DATABASES
In this chapter, we will review some of previous works in indexing image and video
database. First, we introduce query classes, which the indexing and retrieval engine used to
index their databases by regardless of which approaches are used. It should be noticed that not
all the systems support all of these queries. In fact, most systems only support some specific
query classes of their own interested. For example, work of [Me95] supports retrieval by
shape. Texture features are used to index and retrieve image in [Ma96] , etc. The query class
[Gu95b] facilitate CBIR through retrieving by
• color, • texture, • sketch, • shape, • volume, • spatial constraint, • browsing, • objective attribute, • subjective attribute, • motion, • text, and • domain concept
9

Color and texture quenes let users select images containing objects specified
accordingly. Retrieval by sketch lets users outline an image and then retrieves like images
from the database. This cia~ .can· be thought of retrieval by matching the dominant edges .
The shape class of queries has a counterpart in 3D images referred to as retrieval by volume.
The spatial constraint category deals with a class of queries based on spatial and topological
relationships among the objects in an image. These relationships may span broad spectrum
ranging from directional relationships to adjacency, overlap, and containment involving a pair
of objects or multiple objects. Retrieval by browsing is performed when users are vague about
their retrieval needs or are unfamiliar with the structure and types of information available in
the :jjpage database. The objective attribute query uses attributes as the date of image
acquisition or the number of bedrooms in a residential floor-plan image and is similar to
Structured Query Language (SQL) retrieval in conventional databases. Retrieval is based on
exact matches of attribute values. Retrieval by motion facilitates retrieving spatiotemporal
image sequences depicting a domain phenomenon that varies in time or geographic space.
Some applications require retrieving images based on associated text. Such a need is modeled
by retrieval by text.
The above query classes can be used as fundamental operations in formulating a class
of complex queries referred to as retrieval by domain concepts. An example of this is
"Retrieve images of snow-covered mountains."
The coming section is the review of some previous works in indexing image and video
databases . We will start with three most outstanding systems in indexing image, QBIC (Query
10

By Image Contents) by IBM, the work from ISS (Institute of Systems Science, Singapore) and
work from MIT. (PhotoBook and Foureyes).
3.1 The QBIC System
QBIC (Query by Image Content) system [Ni93], [Ba94] , [Fl95] is developed by IBM.
The purpose is to explore the content-based retrieval methods . QBIC [Fl95] allows queries on
large image and video databases based on :
• example images • user-constructed sketches and drawings • selected color and texture patterns • camera and object motion • other graphical information.
To achieve these functionality ' s, QBIC has two main components: database population
(the process of creating an image database) and database query. Images and videos are
processed to extract features describing their content during the population, when finished they
are stored in a database. During the query, the user composes a query graphically. Features
are generated from the graphical query and then input to a matching engine that finds images
or videos from the database with similar features .
For both population and query, the QBIC data model has
• still images or scenes (full images) that contains objects (subsets of an image, e.g. a person, in a beach scene), and
• video shots that consist of sets of contiguous frames and contain motion objects .
11

For still image database population, features are extracted from images and objects
and stored in a database. In video cases, first videos are broken into clips called shots .
Representative frames (r-frame) are generated for each extracted shot. R-frames are treated as
still images, and features are extracted and stored in the database. Further processing of shots
generates motion objects -- for example, a car moving across the scene.
3.1.1 Image and Object Features for Content-Based Queries in QBIC
In QBIC, similarity queries are done against the database of pre-extracted features
using .distance functions between features . These functions are intended to mimic human
perception. The features , which are extracted from the scenes and objects, are outlined as
following.
Color f eatures: They compute the average (R, G, B), (Y, i, q), (L, a, b), and MTM
(Mathematical Transform to Munsell [Mi88]) coordinates of each object and each image.
They also quantize color histogram from 16 M colors into k user-settable (the default value
of k is 64). The final step is normalize the histogram to equalize the sum of histogram.
Texture features : Their texture features are based on modified versions of the coarse-
ness, contrast, and directionality features proposed in [Ta78]. The color images are first
converted to gray scale before the texture features are computed. The coarseness features
measure the scale of the texture (such as pebbles vs . boulders), and is efficiently calculated
using moving windows of different sizes. The contrast feature describes the vividness of the
pattern, and is a function of the variance of the gray-level histogram. The directionality
12

feature describes whether the image has a favored direction (like grass), or whether it is
isotropic (like a smooth object) . It is a measure of the distribution ' s "peakedness" of gradient
directions in the images . ~ . "
Shape features: Shape features in QBIC are based on a combination of heuristic shape
features such as area, circularity, eccentricity, major axis orientation, and a set of algebraic
moment invariant. All shapes are assumed to be non-occluded planar shapes (that is each
shape is represent separately) . The area is computed as the number of pixels set in the binary
image, and circularity is computed as perimeter2/area.
Locationfoatures: The centroid ofthe binary mask are used to describe the object to
locate the an object in a full image. The x andy coordinates of the centroid are normalized by
the image width and height, so the location (0.5, 0.5) corresponds to the center of any image,
regardless of its size or aspect ratio.
Sketch features : To support this feature, each image has to be computed its reduced
resolution edge map by (I) convert each color image to a single band luminance; (2) compute
the binary edge image using a Canny edge operator; and (3) reduce the edge image to size 64 x
64. To do the reduction, they partition the image into blocks of size w/64 x h/64, when w is
width of the image and h is height of image in pixel. If any pixel in a partition of the full size
edge image is an edge pixel, the corresponding pixel in the reduced edge map is set to an edge
pixel. Finally, they thin this reduced image. This gives the reduced edge map or "image
abstraction" on which the retrieval by sketch is performed.
13

Video data
For video data, database population has three major components:
• shot detection • representative frame creation for each shot, and • derivation of a layered representation of coherently moving structures/object.
Shot detection: Gross scene change or scene cuts are the first indicators of shot
boundaries . Methods for detecting scene cuts proposed in the literature essentially fall into two
classes . First method is based on global representations like color/intensity histograms without
any spatial information. The second method is based on measuring difference between .,;.:4.
spatially registered features like intensity differences . The former are relatively insensitive to
motion but can miss cuts when scenes look quite different but have similar distributions. The
latter are sensitive to moving objects and camera. In QBIC, they developed a method that
combines the strengths of the two classes of detection . They use a robust normalized
correlation measure that allows for small motions and combines this with a histogram distance
measure. They claim the results on a few videos containing from 2,000 to 5,000 frames show
no misses and only a few false cuts. They are developing the algorithms for signaling edit
effects like fades and dissolves [FI95].
Representative frame generation: Once the shot boundaries have been detected, each
shot is represented using and r-frame. In QBIC, r-frames are used for several purposes. First,
during database population, r-frames are treated as still images in which objects can be
identified by using the previously described methods. Secondly, during query, they are the
14

basic units initially returned in a video query. The choice of an r-frame could be as simple as a
particular frame in the shot: the first, the last, or the middle. However, in situations such as a
long panning shot, no single frame -may be representative of the entire shot. So, they use a
synthesized r-frame created by seamlessly mosaicking all the frames in a given shot using the
computed motion transformation of the dominant background. This frame is an authentic
depiction of all background captured in the whole shot. Any foreground object can be
superimposed on the background to create a single, static visual representation of the shot.
Layered representation: The QBIC system takes advantage of the time-varying
nature of video data to derive what is called a layered representation of video. The different
!aye~- are used to identify significant objects in the scene for feature computations and
querying. They used algorithm that divides a shot into a number of layers, each with its own
20 affine motion parameters and regions of support in each frame .
3.1.2 Queries and Similarity Measures in QBIC System
Once the set of features for objects and images has been computed, queries may be
run. The queries in QBIC system are designed to be flexible. User can select an object or set
of object 's attributes and requesting images with objects "like the query object." For example,
images can be requested that contain objects whose color is similar to the color of an indicated
object, or the color selected from the color picker. In addition, QBIC supports "full scene"
queries, such as queries based on the global set of color features occurring in an image. For
15

example, images can be retrieve that are globally similar to a given image, say in term of color
distribution.
.... _-:::.
Retrievals on the image features are done based on similarity, not exact match, and the
system thus displays a set of best matches ordered by similarity function. To support this, the
system has defined similarity functions . These functions are defined one or more for each
features or features set. Typically, similarity functions range from 1 for perfect similarity to 0
for no similarity. While the distance (error cost) of similarity is 0 for perfect match and large
value for low similarity, they convert and normalize the distance value as necessary to obtain
consistent measures. They selected the following method for measure similarity [Ba94].
.. ~.
Color: For average color, the distance between a query object and database object is
weighted Euclidean distance. The weights are user adjustable. The best results, as judged by
their subjective evaluation in ongoing experiments, are obtained by representing the average
color in the MTM color space, and by inversely weighting each component by its standard
deviation over the samples in the database. They also found that it useful for the user to be
able to request images with x% of color 1, y% of color 2, etc., where both the percentages and
the colors are explicitly specified by users.
Texture: Texture distance is computed as weighted Euclidean distance in the three
dimensional texture spaces. The most common weighting (i.e. , normalization) factors are the
inverse variances for each component, computed over the samples in the databases . For
example, when only querying on texture, the distance between object i and object j is computed
as
16

+ (C-C/
"" . .::
+ 2
(J D
(3.1)
where 0 , C, and D re\)resent the texture features coarseness, contrast and direct\ona\\ty
respectively.
Shape: The matching on the shape features is done similarly to that for texture, as
weighted Euclidean distance where the weights are the inverse variances for each features .
Any subset of the features can be selected by the user, enabling queries that are sensitive/
insensitive to selected shape properties, in particular, to object size and object orientation.
Sketch: A user roughly draws a set of dominant lines or edges in a drawing area. The
method works by matching the user drawn edges to automatically extracted edges from the
images in the databases . The main steps ofthe algorithm are: (1) reduce the user sketch, which
is a binary image, to size 64 by 64; (2) partition this into an 8 by 8 set of blocks, each block
being 8 by 8 pixels; (3) for each image in the database, correlate each block of the sketch with
a corresponding search area of size 16 x 16 in the database image; ( 4) compute a score for
each database image as the sum of the correlation scores of each local block. Because each 8
by 8 block is spatially correlated separately, the method allows for some spatial warping
between the sketch and database images .
17

3.2155 Image Indexing Work
In this section, we will introduce-the content-based indexing works from ISS (Institute
of Systems Science, National University of Singapore)[Go94] . The system use features such
as color, location, and size of object(s) in the images to help indexing by means of comparing
extracted features' histogram. The system (as the image database system) consists of three
major components: (a) features acquisition for capturing primitive image properties; (b) image
indexing for creating the numerical index keys based on the extracted features ; and (c) user
interface. Three indexing methods support in this system, namely, indexing by image contents,
indexing by Jllstogram and indexing by keywords . We now will discuss the issue on (a) in
section 3.2.1 and (b) in section 3.2.2.
3.2.1 Features Acquisition
Three image analysis techniques are used in features acquisition, image segmentation,
regwn detection, and image histogram. Image segmentation auns to automatically detect
prominent regions and their associated geometrical properties . However, image segmentation
may not be able to handle images with complicated color distribution, whereby erroneous
segmentation results will be obtained. Region detection based on pre-defined object colors is
employed to supplement image segmentation. Image histogram technique is used to handle
texture areas and images with dominant high frequency components that are beyond the
capability of both image segmentation and region detection. It is also used for supporting
image retrieval by examples .
18

3.2.1.1 Image Segmentation
The purpose of image segmentation is to group adjacent pixels with similar color
properties into one region and segment the pixels with distinct color properties into different
regions. Researches in [Go93] and [Ts92] have shown that the HVC color space gives many
advantages over others in image segmentation. The image segmentation used in their system is
similar to the one described in [Ts92]. The image is first segmented into achromatic and
chromatic areas based on the chroma component of each pixel. The histogram thresholding
te~hnique is then applied to chromatic areas to further segment the image into a set of uniform '
regltms based on the hue component. Finally, post processing is carried out to recover over-
segmentation.
3.2.1.2 Region Detection
Due to influence of shade, highlight and other complicated illumination conditions,
pixels belonging to the same region may show complex color distribution whereby many
erroneous segm~nts will be obtained when image segmentation methods are applied. The
system used an algorithm defined in [Go93] to detect regions based on a small set of pre-
defined object colors is applied to supplement the segmentation algorithms. It is found that the
hue of each of these objects falls into a narrow range unique to itself despite the different
illumination and photographing conditions. For example, they found that the hue of sunny sky
is 3.5-4.0, and chroma is > 20.0. Unfortunately, this method also has some drawbacks. Since
19

different objects may have the same color (such as a blue shirt may have the same color as a
blue car), unwanted image having the same color range may be retrieved using this method.
-" _ --:
3.2.1.3 Indexing by using Histogram
They used color histogram to indicate texture area. The color histogram holds
information on color distribution, but lacks information on color locations. They overcome
this problem by dividing an image into sub-areas and creating a histogram for each area. The
more sub-areas we have, the more accurate hit locality information is; but more memory would
be consumed in holding the histograms. In their system, they divide the image into 9 sub-areas
(3x3), which are numbered 0 to 8 in left-right, top-down sequence. Then create one histogram ;.."4_
for each of these sub-areas, and one for the whole image. Another factor to considered in
image histogram is how many color bins? In their experiments, they showed that histogram
with 512 bins (8 x 8 x 8) is sufficient to obtain satisfactory performance.
3.2.2 Image Indexing
As mentio!led earlier, this system supports three types of image indexing: indexing by
image content, indexing by histogram and indexing by keyword. It has to be noted that the
indexing by image content and indexing by histogram is content-based indexing as described in
section 2.1, since both methods use the content in creating indexing key.
20
3.2.2.1 Image Indexing by Content
The system applies the ~age segmentation and region detection methods described in
3 .2.1.1 and 3 .2.1.2 to the input image. Regions are detected along with their locations, sizes,
colors and shapes. These features are used to create the numerical index keys . They divide the
above mentioned features into groups as follows :
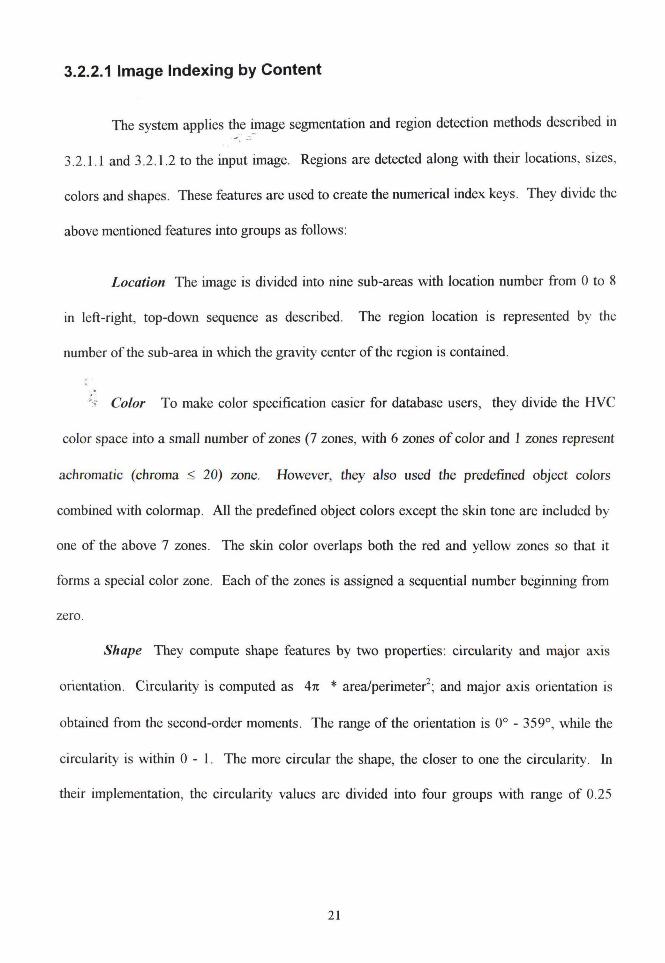
Location The image is divided into nine sub-areas with location number from 0 to 8
in left-right, top-down sequence as described. The region location is represented by the
number of the sub-area in which the gravity center of the region is contained.
"~· Color To make color specification easier for database users, they divide the HVC
color space into a small number of zones (7 zones, with 6 zones of color and I zones represent
achromatic (chroma ~ 20) zone. However, they also used the predefined object colors
combined with colormap. All the ·predefined object colors except the skin tone are included by
one of the above 7 zones . The skin color overlaps both the red and yellow zones so that it
forms a special color zone. Each of the zones is assigned a sequential number beginning from
zero.
Shape They compute shape features by two properties: circularity and major axis
orientation. Circularity is computed as 47t * area/perimeter2; and major axis orientation is
obtained from the second-order moments . The range of the orientation is 0° - 359°, while the
circularity is within 0 - 1. The more circular the shape, the closer to one the circularity. In
their implementation, the circularity values are divided into four groups with range of 0.25
21

each, and orientation values into eight groups with range of 45° each. Both of them are
sequentially numbered.
Size Only the regions more than one-fourth of the sub-area are registered. The size
range is divide into the following I 0 groups, and a region ' s size is represented by the
corresponding group number.
Group Number Size Range
1 114 Asub < S S 112 Asub
2 1/2 Asub < S S Asub
3 Asub < S S 2 Asub
4 2Asub < S S 3 Asub
5 3 Asub < S S 4 Asub
6 4Asub< S s 5Asub
7 5 Asub < S S 6 Asub
8 6Asub < Ss7Asub
9 7Asub < S s 8Asub
10 8Asub < Ss9Asub
Table 3.1 Object size group definition
Where S is object size, Asub is the size of the sub-area defined above.
22

For each region detected from the input image, they use a 20-bit index key to represent
the above features of the region. The important factor to be considered when creating the
index key is to decide which bit-represents what features . It is noted that not all features
specified by the user would have the same precision. For example, user's specification of the
location might be more accurate and reliable than that of the shape. This persuades them to
use most significant bit to the more reliable features. The index key used in this system is
display in figure 3 .1.
3 bits (Location) 8 bits (Colors) 4 bits (Size)
Figure 3.1 The format of the index key (for image indexing by content) .
3.2.2.2 Image Indexing by Histogram
From the experiment indicate that most histogram bins are sparsely-populated, with
only a small number of bins capturing the majority of pixel counts. They take advantage of
this by using only the largest twenty bins (in term of pixel counts) as the representative of the
whole histogram. The color distribution of an image can be approximated by its representative
histogram bins . Each set of the representative bins form a hyper-polygons using a numerical
number, then they tum the problem of histogram matching into the matching of numerical
23

index keys . They use two parameters to represent this hyperpolygon, namely, Weighted
Perimeter (WP) and Weight Angle (W A) which are defined as follows :
WP (3 .2)
WA (3 .3)
where n is the number of the representative bins (in this system= 20), di-J, i is distance between
bin i - 1 and i, ci is the percentage of pixel count within bin i, and ai is the angle between the
two joint lines connecting bin i with i -1 , and bin i with i + 1 respectively. The O'th bin
reptesents the origin of the color space.
g
b
••• (1,3,0)
(3,1,3) •• .... !ti ·· ...
• • (6,1,0)
• (8,2,~
Figure 3.2 The calculation ofWP and WA
24

To make the this representative hyper-polygon unique, it has to sort the bins in certain
order. The simple way is sort by th~ir pixel count, but this will lead to problems that the
similar image may have diff~rent pixel count in the bins that make WP and W A values
different. The system avoids this by sorting the histogram bin in ascending order by their
distance from the origin of the color space.
Since the system has ten histograms for each image, it has ten pairs of the perimeter
and angle. Each histogram is indexed by the combination of its WP and W A, together with
their sub-area number.
4 bits (Area- No.)
Figure 3.3 The format of the index key (for image indexing by histogram)
3.2.2.3 Image Indexing by Keywords
Although this system can extract the image features , the system also provides the
retrieval by keywords that provided by users. The reason behind this is the high level
abstraction such as indicate the particular things such as person name, place, time, event, etc. ,
have to be provided by users . The image retrieval by keywords is implement in similar fashion
as current commercial systems. It allows keyword queries including logical combinations such
as ANDs, ORs, and NOTs. In addition, semantic hierarchy (e.g., John IS-A man IS-A human
IS-A living-things) is also implemented to improve the performance.
25

3.3 Vision Texture Annotation, Photobook and FourEyes System
This section is the revieW-of works from MIT media lab about using vision texture
[Pi95] to help annotate and retrieve image and video databases. In [Pi95], they introduce the
concept of using texture for help annotation the contents of images. The concept is, for
example, when the user label a piece of image as water, a texture model can be used to
propagate this label to other "visually similar" region. However, they found that there is no
single model (comparison type) that is good enough to match reliably human perception of
similarity in pictures. Rather than rely on only single model, the systems (PhotoBook and
' FourEyes) know several texture models, and are equipped with the ability to choose the one
":~·
that "best explains" the regions selected by the user for annotating. If none of these models
suffices, then it creates new explanations by combining the existing models. The vision texture
is used to extend Photobook system to a system called FourEyes. The FourEyes is the
"interactive annotation extension to Photo book." The Photobook system will be reviewed in
section 3.3.2 and FourEyes is in section 3.3.3.
Their researches focus on the uses of collective visual properties, or "vision texture"
for annotation . Texture models extract features such as directionality, periodicity,
randomness, roughness, regularity, coarseness, color distribution, contrast, and complexity.
These features are hypothesized to be important for human perception and attention . A study
in [Pi94] demonstrated that features based on texture orientation closely matched human high-
level classifications on 91 out of 98 photos .
26

3.3.1 Model in Current System [Pi95]
They assume that neither_ one model will be optimal for recognizing and annotating all
kinds of "stuff' in pictures, nor will there be a unique non-overlapping arrangement of labels
that users will want to use to annotate a picture. Instead, they assume that a user might assign
multiple labels to possibly overlapping regions. They also assume that models will tend to be
specialize, and that they can work alone or together to model regions in the images. They
expect only about a dozen models might be needed. The current system uses six models and
they are listed in table 3.2. They include four models that consider color, two models that do
not,_ three models based on first-order statistics, and three models based on second-order
stati~flcs or filtering.
Model Description Reference
HIST-D Color Histogram Difference
HIST-EE Color histogram energy and entropy [Ta93l
HIST-I Color histogram invariant features fHe94]
EV Eigenvectors of RGB covariance fTh891
MSAR Multiscale simultaneous autoregressive fMa94)
TSW Tree-structured wavelet transform fCh93]
Table 3.2 Models known in the system
27

3.3.2 Photobook System
Photobook is the first syste~ developed at MIT Media Laboratory that assist users in ... - --:
navigating through digital imagery[Pi95J, [Pi96]. Photobook is an interface that displays still
images and video keyframes, and offers access to a variety of tools for browsing and retrieval.
Photobook currently interfaces to databases including faces, animals, artwork, tools, fabric
samples, brain-ventricles, and vacation photos. Depending on the category of images, different
algorithms are available for assisting in retrieval. Each image has precomputed (off-line)
features associated with it, so that when a user selects an image of interest, the system instantly
updates ~e screen showing other images in the database most similar to the selected image.
The problems of what models to use for image representation and how to measure
unage similarity are challenging research problems for the image processing community.
Photobook allows the user to select manually from a variety of models and associated feature
combinations. As a research tool, Photobook assists in rapid benchmarking of new pattern
recognition and computer vision algorithms.
The model combination in Photobook and similar industrial systems is features-based,
and tends to be limited to linear combinations of features, for example, "Use 60 percent of
texture model A, 20 percent of texture model D, I 0 percent of color model B, and 10 percent
of shape model A". Unfortunately the real users do not naturally sort images by similarity
using this kind of language. The need to determine all the weightings for multiple features , and
hence for the society of modes, is a problem that plagues all existing retrieval systems . A
solution to this harder problem was a key motivation for the FourEyes system.
28

3.3.3 FourEyes System [Pi95], [Pi96]
Figure 3.4
_, . --:
Screen shot of FourEyes during the labeling of examples of building, car and street.
People have different goals when they interact with a digital library retrieval system.
Even if they are nominally interested only in annotation, or only in retrieval , they are likely to
29

have different criteria for the labels they would give images and the associations they would
like retrieved. These criteria tend, as earlier mention in section 2.1, to be data-dependent, goal
dependent, culture-dependent,- at.a even mood-dependent. On top of this unpredictability, the
average user has no idea how to set all the system knobs to provide the right balance of color,
texture, shape, and other model features to retrieve the desired data.
FourEyes system has designed to overcome these problems in retrieval images. It has
developed with (1) the ability to figure out how to combine models (in section 3.3.1 and future
models) to get the best results, and (2) can learn to recognize, remember and refine best model
choices and combinations, by looking both at the data features and at the user interaction, and
thereby increase its speed and knowledge with continuous use. In FourEyes, the user can give
the system examples of data in which the user is interested, e.g ., by clicking on some buildings
and then on the "positive" examples, providing corrective feedback to the system.
Giving a set of positive and negative examples, FourEyes looks at all the models and
determines which model or combination of models best describes the positive examples chosen
by the user, while satisfying the constraints of the negative examples . FourEyes is able to
choose or combine models in interactive time with each set of positive and negative examples,
allowing the features used by the system to change with each query.
It is important to emphasize that FourEyes is a learning system; it learns which
methods of combination best solve a particular problem, and remembers these combinations.
Current research on FourEyes aims to improve its abilities as a continuous learner, using
30

knowledge from problems it has been trained on to improve its performance across new
problems for which it has not been trained.
-: --:
Figure 3.5. Results after labeling data in FourEyes. "Computer, go find scenes like this one (upper left), with building or street"
It is worth mentioning that no one model available to FourEyes was able to represent
the variety of building and street shown in Figure 3.5. Instead, FourEyes constructed a
31

concept of building and a concept of street by combining groupings found by several different
models. The exact combinations are transparent to the user, but are learned by the system for
speeding up future similar requests.
3.4 Using Texture Features for Images Retrieval
This section is focus on using texture analysis features for images and video indexing
and retrieval. Texture is determined to be a low-level feature of the digital images. Several
sys!ems such as QBIC, Photobook, etc., exploited texture features in their image retrieval
engilie along with other abilities . This section will illustrate several texture models, discussion
of the strength of some of these models.
Texture has three properties according to works of [Pi96]. These three properties are
not mutually exclusive.
Property 1: Lack of specific complexity. That is no specific definition for texture.
Property 2: High frequency. This property is perhaps most important. Note that
extreme smoothness can still be considered to be a texture, especially in the tactile domain, but
in digital imagery, smooth regions generally are considered as nontextured.
Property 3: Restricted range of scale. Textures, unless they are true fractal , tend to
exist over a finite range of scales .
32

3.4.1 Texture Models
FRACTALS
~~
(3~
EIGEN-PATIERNS
·SOCIETY OF MODELS"
D I CO-OCCURRENCE I r-
r RANDOM FIELD l
'--
-bOCs-hBOMBING PROCESSESCX
~(E.G . POISSON)
~x9-
GABOR FILTERS
PARTICLE SYSTEMS
WAVELETS
Figure 3.6 A society of models. Although, some of these can model any signal, each has different strengths and weaknesses.
33

Figure 3.6 contains sev_eral models that have been used in computer vision, image pro-
cessing, and computer graphics . Some of these are general enough to represent arbitrary
signals and may be used for synthesizing data. Other models only capture some features of a
given signal that are useful for recognition or query.
Reaction-diffusion models [Pi96] : beyond zebra stripes and leopard spots. Nature
appears to use simple nonlinear mechanisms for pattern formation, or morphogenesis . For
example, butterfly wings exhibit a great variety of patterns, all of which must be produced
within a simple, light-weight, insect structure. The spots and stripes on Iepidoptera are also
found on brightly-colors tropical fish, zebras, leopards, tigers, cheetahs, birds, and more. In a
digital library of such imagery, one might expect a reaction-diffusion model to be powerful for
both representation and retrieval. In particular, reaction-diffusion models may be used for
efficient description of most natural patterns involving spots and stripes.
The reaction-diffusion model has found applications in image processing, computer
vision, and computer graphics. The effectiveness of reaction-diffusion as a biological model is
not just for animal coat pattern formation, but also for emergence of structure of all kinds . In
the digital area, the model has been most successful in the synthesis of textures or images com-
prised of spots and stripes. However, the model is still new and largely unexplored.
34

Markov random field models [Pi96]: from grass and sand to monkey fur. The
reaction-diffusion model is determini_stic. However, there is another class of models that bears - .- .::
a resemblance to reaction-diffusion but which is stochastic -- the class of Markov random
field (MRF) models. Unlike most texture models, an MRF is capable of generating random,
regular, and even highly structured patterns. In theory, it can produce any pattern. It does not
just describe some characteristics for distinguishing textures, but it can be used for both
texture analysis and synthesis.
The MRF has simultaneous roots in the Gibbs distribution of statistical mechanics and
the M(!rkov modes of probability. In computer vision and image processing, the MRF is
touted for its ability to relate the Markov conditional probabilities to the Gibbs joint
probability. It can be easily incorporated into a Bayesian framework, making it flexible for a
variety of applications.
The strength of the MRF appears to lie with homogeneous microtextures and simple
attractive-repulsive interaction, and it is not typically successful on nonhomogeneous or non
microtextures. To summarize, in theory, the MRF can represent all patterns. However, in
practice, its strengths make it suitable to only certain kinds of imagery that might occur in a
digital library, and its utility depends greatly on the contents of the digital library.
Cluster-based probability modeling [Pi96]: audiovisual patterns. As prev1ous
mentioned, the MRF can theoretically represent any pattern, but is typically only good at
capturing low-order interactions due to the complexity of its parameter estimation. The MRF
35

fails at capturing patterns like those shown in the top row of Figure 3.7 (from the Brodatz
[Br66] album) . To capture more complicated structures than in rnicrotextures, we now
consider higher-order probabilistic model .
The key problem with increasing the order of a probabilistic model is that it
exponentially increases the space of possibilities. For example, considering joint interactions
among a set of 14 pixels in a 256 gray level image results in 2112 possibilities . Clearly, a
model dealing with these many possibilities will run into practical problems.
:."'4.
Figure 3.7
~~ · } • e~ i t,r,, le.W4 i••ntil ii!lt i t ll t jtoo ii<IU.Jtl! • ;iu•;JII:_f t fhtt). lf,tWU~ ftt~.M.t -U'~ ·t~'-lUttlfJJ:fWH
:~~·!:~! ~!~ ~~ ~ ~ !
Top row: 256 by 256 patches used to train cluster-based probability models .
Bottom row: deterministic multiresolution synthesis. The textures are, from left to right, Dl (aluminum wire mesh), Dl5 (straw),D20 (magnified French canvas), D22 (reptile skin), and D103 (loose burlap).
The approach taken to make this model practical is described in [Po93]. To illustrate
its power at capturing both rnicrotexture features and higher-structured features , its parameters
36

have been trained on five patterns shown in figure 3. 7, usmg 14th order joint probability
statistics. One of the drawbacks of the model is that it presently requires a lot of parameters
compared to other texture m6d6ls. The model has recently been shown to be capable of
realistic sound texture synthesis, and to perform well on certain perceptual similarity
comparisons of sounds.
Wold model for perceptual pattern matching [Pi96].
Figure 3.8 Two examples of using Wold features for pattern retrieval , searching for patterns similar to the pattern at upper left
37

A perceptual study by Rao and Lohse [Ra92] has shown that the top three features
may be described by (1) periodiciry, (2) directionality, and (3) randomness . In statistic, there - .-.;:
is a theorem by Wold that provides for the decomposition of regular lD stochastic processes
into mutually orthogonal deterministic and stochastic components . For images, this results in a
decomposition into three components, which approximately correspond to periodicity,
directionality, and randomness. An implementation ofthis model for analysis and synthesis of
homogeneous textures can be found in [Fr93].
The strength of Wold model appears to lie in natural pattern similarity, especially
wnep. periodicity, directionality, and randomness are distinguishing features. One of the weak-,;.-4.
nesses can be seen in the second row of figure 3.8, in the right-most image, where round stones
were retrieved, due largely to the presence of high contrast horizontal edges near the center of
this image.
Stochastic model for temporal textures [Pi96]. Video is full of motion, providing a
new challenge for texture models. Some motions are rigid, like a car moving across a scene,
and can be captured by simple non-textural models . However, motions such as blowing leaves
and wavy water are nonrigid, and require models that exploit local collective properties
temporal texture models.
Temporal texture is a relatively new research area. Only in the last few years have
researchers been able to deal with the growth in computational complexity and storage caused
by an ex1:ra dimension of raw data. To formulate a general temporal texture model, a linear
38

auto-regressive model (of the auto-regressive moving average [ARMA] family in figure 3.6)
was extended for stochastic temporal textures. The standard 20 model was augmented to form
a linear spatio-temporal aulQ-:~egressive (STAR) model, which predicts new image values
based on a volume of values lagged in space and time. Using the STAR model, parameters for
stochastic temporal textures were estimated, and the motions were resynthesized from the
parameters. Resynthesis of motion textures such as steam, river water, and boiling water was
found to look natural. Although the STAR model was found to be strong at characterizing
such homogeneous temporal textures, it was not found to be able to capture the structure in
less homogeneous temporal patterns, such as swirling water going down a drain . Such
pa~ems, like their spatial counterparts, seem to require either a larger joint interpixel
characterization, or coupling with some global structure, as provided by the MRF external
field.
Gabor filters model for pattern matching. The Gabor representation has been
shown to be optimal in the sense of minimizing the joint two-dimensional uncertainty in space
and frequency . These filters can be considered as orientation and scale tunable edge and line
detectors, and the statistics of these rnicrofeatures in a given region are often used to
characterize the underlying texture information. Gabor features have been used in several
image analysis applications including texture classification and segmentation, rmage
recognition, image registration and motion tracking. The Gabor functions, filter designs and
features representation can be found in [Ma96].
39

Experiment in [Ma96] is performed by using Gabor features to retrieve image in
Brodatz [Br66]. The experiments are made by comparison the retrieval accuracy among
Gabor filters, conventional _-pyramid structured wavelet transform (PWT) features , tree
structured wavelet transform (TWT) features , and the multiresolution simultaneous
autoregressive model (MR-SAR) features. The results, in term of retrieval accuracy for each
of 116 texture classes in the database, show that Gabor features give the best performance at
close to 74%, MR-SAR 73%, TWT 69.4%, and PWT 68.7%.
3.~ Similar Shape Retrieval in Shape Data Management
This section will address the problem of similar-shape retrieval, where shapes or
images in a shape database that satisfy the specified shape-similarity constraints with respect
to the query shape or image must be retrieved from the database. Purpose of the shape
representation and retrieval technique are based on [Me95]. Note that in this section the word
"object" and "shape" are interchangeable.
The designing of shape retrieval techniques involves three prunary Issues, shape
representation, similarity measure method, and retrieval method. The existing shape retrieval
techniques resolve these design issues in various ways. In model-based object recognition
system, two types of features are commonly employed to build the object models:
• Global. These properties depend on the entire shape. Examples are area, perimeter,
and a set of rectangles or triangles that cover the entire shape. This technique cannot handle
images containing partially visible, overlapping, or touching objects.
40
• Local. Use primitive, structural features to compute a shape's local regions .
Examples are boundary segments and points of maximal curvature change. This technique can
handle images containing pariratly visible, overlapping, or touching objects .
In the model-based approach, each model is used as a test model, for which the input
image is searched to find a match . Model-driven techniques are not well suited for shape
retrieval because of their linear time complexity with respect to the number of models .
Another approach is the data-driven approach. Given an unknown object, the index is
searched to find matching models. The data driven technique is suited for shape matching
tecJ;nique.
A few similar-shape retrieval approaches have been proposed. Grosky and Mehrotra
[Gr90] have proposed a technique that represents a shape in terms of its boundary's local
structural features. A boundary features is represented by a property vector, and a string edit
distance-based similarity measure is employed. This technique can handle images of occluded
and touching objects, but the index structure is very complex.
Jagadish 's technique [Ja91] represents a shape with the properties of a fixed number
of the largest rectangles covering the shape. A shape is represented as a point in multi
dimensional space, so that any multidimensional point-access method (PAM) can be used for
indexing. QBIC project also uses a simple global feature-based shape representation by using
multidimensional PAM for similar shape retrieval.
In Mehrotra and Gary method [Me95] a shape is processed to obtain the shape bound
ary, and boundary points, also called interested points. The vertices of the shape boundary 's
41

polygonal approximation are used to represent that shape. Each boundary feature is encoded
for scale, rotation, and translation invariance. Given a feature F with n interest points, a pair
is chosen to form a basis vector as a unit vector along the x-axis. All other interest points of
the feature are transformed to this coordinate system, as shown in Figure 3. 9. In their
implementation, they select every adjacent interest-point pair as a basis vector for the
transformation-invariance feature encoding. Thus, the feature F is characterized by the set
((x1 , y1 ), ... , (xn, Yn)), where (xi, Yi) is the normalized coordinate of the ith interest point in
feature F; and the transformation parameter vector P = (S, Tx, Ty, 9), where S is the scale (or
length) of the basis vector, T x and Ty are the translation parameters or location of base vector's
'
tail: and e is the angle that the basis vector forms with the x-axis. A rigid object is thus "'-4·
represented by a collection of these features .
y
(x4, y4)
(x3~
(xS.~ Basis pair
.,_ __ _._ __ _.,X (0,0) (1,0)
Figure 3.9 Feature encoding example: (left) image coordinate system; (right) normalized coordinate system.
An articulated shape is represented in terms of its rigid components and articulation
points. Specially, an articulated shape with n user-identified rigid components is represented
42

by a collection of its rigid components (C1, . •• , Cn), its identifier, and its articulated model type.
The representation of an articulated shape' s rigid component is similar to that of a rigid object
but augmented with a Jist cOntaining the identifiers of associated components and the locations
of the articulation points shared with each component.
The similarity between two features is defined as the Euclidean distance between the
two vectors . Given this feature representation and similarity measures, their index can make
the form of any multidimensional PAM.
Several experiments have extensively tested their prototype system. In Figure 3.10 a
soi~sors shape (displayed on the left-hand side) is supplied as an input query . This is an arti-
culated object, but the input query contains no information about individual components or
articulation point. A feature is selected from the handle (bold line in the figure) , and a
database search produces the correct component (displayed on the right hand side) .
lNer1 Ft11urel ~ lPrtv FucurellNert Malcnl lPrev Maccn I Soura: 12r2. I Mllches: 3. I Oisp4ayed: 1
jsun:n! lOve~avl . ~
Figure 3.10 Good feature match
43

They are evaluating several multidimensional P AMs with vanous feature sizes,
database sizes, and other shape representations and similarity measures . They are also
investigating the extension oftlie proposed technique for retrieval of three-dimensional shapes.
J'4•r. F•a:u"l ~ jPr!V F~atur~ jNtxt Match! jPrtv Matcnj Souru: 12r2. I Mo1Ches: 3. I Displayed: 2
I Star:;, i I Ovenay j ·. _~ ~
Figure 3.11 Bad feature match.
3.6 Chabot: Retrieval from a Relational Database of Images
The Chabot project was initiated at UC Berkeley to study storage and retrieval of a
vast collection of digitize images. The images are from the State of California Department of
Water Resources (DWR). The Chabot project is an example of combining keywords (actually
several data include date and place of images) and content-based (color histogram) with the
technique of database system to help retrieval images. In 1995, the image databases have more
than 15,000 digitize images in PhotoCD format and keep increasing [Og95].
44

Chabot's design was influenced by DWR's existing system of metadata storage, the
types of requests it receives, and the query and update methods currently used. Each image is
accompanied by extensive metadata. This is a sample for one image from DWR's existing
database.
0162 A-9-98 6/l/69 SWP Lake Davis Lahontan Region (6) Grizzly Dam, spillway and Lake Davis, a scenic image. DWR 35 mm slide Aerial2013 0556 18
This example includes the first four digits of the CD number (0162), the DWR ID (A-
9-98}· followed by the date the photo was taken (6/1/69), the category (SWP), the subject
(Lake Davis), the location (Lahontan Region (6)), the image description, the source of the
image (DWR), the type of film used, the perspective of the photo, the last eight digits of the
Photo CD, and the image number on the Photo CD.
Chabot includes a top-level user interface that handles both queries and updates to the
database. The querying mechanism retrieves images on the basis of stored textual data and
complex relations among that data. They, also, have implemented a method for image color
analysis into their retrieval system. To store the images and textual data, they use Postgres (a
DBMS system), which provides features not found in traditional relational DBMSs.
The search criteria in Chabot have many options -- for example, region, film type,
category, colors (use color histogram), and concepts (such as find images which contain snow).
User can select one of these options or combine several options for search criteria.
45

To test the Chabot system, they measure the recall and precision of some concepts
queries. Recall is the proportion of relevant materials retrieved, while precision quantified the
proportion of retrieved materials that are relevant to the search. Some of the results are shown
in table 3.3. Note that, in this test, two different methods for finding yellow were tried. "Some
Yellow (2)" means at least two colors in a 20 element histogram are yellow. "Some Yellow
( 1 )" means only one yellow color is needed for the picture to be counted as having some
yellow.
No . Keywords Color Content Retrieved Relevant Recall(%) Precision (%) . 1
.;.-4. "flower" 55 13 59.1 23 .6 -
2 "yellow" - 11 5 22.7 45.4
3 "flower" and - 5 4 18.1 80.0 "yellow"
4 - Some Yell ow (2) 235 16 72.7 6.8
5 - Some Yell ow ( 1) 377 22 100.0 5.8
6 "flower" Some Yellow (2) 7 7 31.8 100.0
7 "flower" Some Yell ow ( 1) 15 14 63 .6 93 .3
Table 3.3 Query "Find yellow flowers" (total relevant images = 22)
They conclude that retrieving images on the basis of keywords or content alone will
produce unsatisfactory results . For example, if they retrieve a high percentage of the relevant
images, such as retrieving all "Mostly Red" to find sunset images, the system also retrieves
46

many more images that are not sunsets. If they restrict the search criteria more closely so that
precision increases, fewer relevant images are retrieved. For their application, the best results
were achieved when both content and some other search criteria were used.
3. 7 Piction System: Automatic Indexing and Content-Based Retrieval of
Captioned Images
The Piction system was developed by the center of Excellence for Document Analysis
and Recognition (CEDAR), at State University of New York (SUNY), Buffalo[Sr95). The
pulllPse of the system is to identify human faces in newspaper photographs based on the infor
mation contained in the associated caption. Most newspaper photographs have factual ,
descriptive captions, which are necessary qualities for this task. There are two issues of
problem in caption-aided face identification. The first area is the dealing with the processing
of language input. The second area is the design of an architecture that exploits this
information efficiently and that incorporates existing image-understanding technology.
3.7.1 Visual Semantics
They have defined a new theory, called visual semantics, which describes a systematic
method for extracting and representing useful information from text pertaining to an accom
panying picture. This information is represented as a set of constraints .
47
Visual information in collateral text tells who or what is present in the accompanying
scene and provides valuable information to locate and identifY these people or objects. When
combine with a priori knowfecfie about the appearance of objects and the composition of
typical scenes, visual information conveys the semantics of the associated scene. The resulting
semantics provides the basis for top-down scene understanding.
Visual semantics leads to a set of constraints on the accompanying scene. The set is
divided into three types of constraints: spatial, characteristics, and contextual. Spatial con
straints are geometric constraints, such as left-of, above, and inside. They can be binary or
n-ary and can describe either relative, interobject relationships or absolute relationships rela
tive (6 the image. Characteristic constraints, which describe object properties, are unary in
nature. Examples include gender and hair color. Contextual constraints describe the picture's
setting and the objects that are expected. For example, the people present (explicitly mentioned
in the caption), whether it is an iridoor or outdoor scene, and general scene context (apartment,
airport and so on) .
3.7.2 Architecture for Collateral Text-Based Vision
The architecture for collateral text-based image interpretation consists of four main
components: a natural-language processing (NLP) module, and image understanding (IU)
module, a control module, and an integrated language/vision knowledge base.
The NLP module task is to derive constraints from text. The input to the module is the
original newspaper caption; the output is a set of constraints on the picture enabling the system
48

to identify the people. The NLP module has three phases: {1) syntactic parsing, (2) semantic
processing, and {3) constraint generation. The control module is for exploiting constraints in
image interpretation. The system, like the traditional image-understanding systems, employs
mixed top-down and bottom-up control strategies. To detect low-level features such as edges
and surfaces, they incorporate inexact graph matching, rule-based system, and relaxation
techniques. They also employ high-level relational model verification, for example, a model of
a house or a typical neighborhood scene. Since exact image content is not known a priori,
significant bottom-up computation is necessary before the appropriate high-level model can be
invoked. The IU module performs two basic functions: locating and segmenting objects and <
extr¥:ting visual properties. Currently, the only object class it handles is human faces . The "'"'4'
face-location process begins with the application of a Marr-Hildreth edge operator. This tech-
nique does not rely on internal features such as eyes, it can detect faces in non-frontal
orientations. This technique s~ill has some problems such as : {1) sensitivity to scale,
(2) accuracy of location, and (3) generation of false candidates due to incidental alignment of
edges.
Integrated language/vision knowledge base is essential for extracting visual inform-
ation from text. The model calls for four types of knowledge bases . Lexical KB models word
syntax, semantics, and interconnections. Visual KB contains object schemas (declarative and
procedural modeling of an object' s shape designed to facilitate object detection) along with a
hierarchy of these schemas. World KB contains facts about people, places, events, and general
domain constraints . Picture-Specific KB contains facts specific to previously processed
pictures and captions. An integrated knowledge base is necessary to solve, example, where
people are identified by phrases such as "Tom Smith, wearing striped shirt."
49

Presrdent Clinton, right, talks wi th Colin Powell, left, during a ceremony at the White House marking the retu rn of soldrers from Somalia on May 4 .
PresidPnt Bill Clinton. rig ht, talks with Colin Powell, left. during d ceremony at the Whrte House markmg the ret urn o f soldiers from Somalia on May 4
Presiden t Bil l Clinton g ives a speech to a group of eleventh graders at Limoln High School on tm visit there April 2.
Four ai ruoft performing daredevil stunts on US Armed Forces Day open house . President Bill Clinton took part in the celebrations and g. ave away awards to the best cadets from the US m ilitary and armed forces .
President Bill Clinton and Vice President AI Gore walk bad~ to the White House aher they welcomed back US troops returning from Somalia at the W hite House May 5.
President Bill Cli nton, ce nter. responds to ques t iom put forth lJy inter rogators .
Figure 3.12 Results of combining text and image information to satisfy queries: Top two "hits" in response to "find pictures of military personnel with Clinton".(Top row). "find pictures of Clinton with military personnel" (middle). "find pictures of Clinton" (bottom)
50

3.7.3 Evaluation of the System
The Piction system w~s }esfed on a data set of 50 pictures and captions obtained from
the Buffalo News and the New York Times. They used three success codes to evaluate results .
SU (success) indicated that the system correctly and uniquely identified everyone in the
caption. PS (partial success) indicated multiple possibilities of one or more people where the
actual face was included. E (error) indicated incorrect identification of one or more people
(that is, true face not included) .. The overall success rate (SU only) was 65 percent. However,
they also stated that the test image is still too small to be consider statistical valid. The most
common reason for a PS or E was the failure of the face locator to find one or more of the
.;:.-4.
identified faces . Other reasons included the failure of spatial heuristics and an inability to
properly characterize faces (for example, male/female or young/old) .
3.8 CORE: A Content-Based Retrieval Engine
The CORE (content-based retrieval engine) has been developed by ISS (International
of System Science, National University of Singapore, to be a powerful retrieval engine for
multimedia applications[Wu95]. The efficiency of CORE is demonstrated in the development
of two multimedia systems, a computer-aided facial image inference and retrieval (CAFIR)
system and a system for trademark archival and retrieval (STAR), which have been developed
at ISS .
51

The paper defmes multimedia object with six-tuple Omob { U, F, M, A, OP, S} ,
where
- U is a multimedia data component. It can be null, or may have one or more multimedia
components, such as image and video.
- F = { F1, F2, ... } represents a set of features derived from data. A feature p i can be either
numerically characterized by feature measures in feature space Fi1 x Fi2 x .... x Fin, or
conceptually described by their interpretations.
- Mi = {Mi1 , Mi2, .. . } represents the interpretation of feature Fi .
- A;~tands for a set of attributes or particulars of Omob· For example, a trademark can have
attributes like a trademark number, trademark owner, and date of registration.
- OP is a Set Of pointerS Or links, and is expressed aS, OP = { OP sup, OP sub, OP other } . There are
three types of pointers, pointing to superobjects, subobjects, and other objects, respectively.
- S represents a set of states of Omob· It takes values Sp - persistence, Snp - nonpersistent, Sc -
completely defined, Sue incomplete.
When given a query object, the CORE engine supports retrieval of several types as
following .
Similarity retrieval. The query object is given as Oqmob = { U, 0, 0, A•, 0, Snp },
where A • represents a partially defined set of attributes. The similarity is evaluated via feature
measures in features space. For example, CORE represent the color features by f = ( /..1,
52

A.2, ... , A,) where A.1 is the relative pixel frequency (with respect to the total number of pixels)
for the ith reference table color in image. For computing similarity, they use a weighted
- .:: distance measure:
(3.4)
which leads to
(3.5) i= l
where ro 1 ') Q if ') Q ') { > 0 Az At ' AI 1 if A P or A { = 0.
Where fq and fi are the color features of the query image and database image
respectively . They also have the similarity measures for words and phonetics . It is measured
by the number of same-ordered characters in the two words normalized by the total number of
characters in these two words. The formula is:
(3 .6)
Where Sw is the similarity measure, lk is the length of the kth common factor between two
words, lword is taken to be the average length of two words, and Wk is a weight factor.
53

Fuzzy retrieval. When the query object is given as Oq = { 0, 0, M*, A*, 0, Snp } , where
M• represents partially defined interpretations in terms of concepts . For example, in a facial
image, M* are visual features' .siich as hair, eyes, eyebrows, nose, mouth, etc. TheM* is given
by the user to specify the query and are usually fuzzy and incomplete. The implementation
exploits fuzzy retrieval can be found in [Wu95].
Text retrieval. When the interpretation is given in terms of text in the query object as
Oq = {0, 0, M*, A*, 0, Snp} , a text retrieval method, such as free text retrieval, can be applied.
The method used in CORE is adopted from the free text retrieval technique by Lim J. J [Li92].
Applications Developed with CORE
Two applications have been developed with CORE. One is computer-aided facial
unage inference and retrieval (CAFIR) [Wu94a], and the other system is the system for
trademark archival and registration (STAR) [Wu94b] .
CAFIR system was developed for a mugshot (police) application. The system is
designed to be used by investigating officers . Users are enable to compose an image ac
cording to a description given by a witness. The composed image is then submitted to retrieve
the most similar images from the database.
STAR system is intended for trademark applications . The problem faced by the
trademark office is finding similar trademarks in the database when a request for registration
of a trademark is submitted. Traditionally, text-based searches have been used for such
54

applications . STAR provides search methods for "word in mark" (text, phonetics, graphics,
etc.), and "composite mark" (combination of both text and patterns) .
3.9 Map Retrieval by Content: MARCO System and Alexandria Project
This section will present a survey of two map retrieval systems, MARCO (denoted
MAp Retrieval by COntent) and Alexandria Project. The map retrieval system is a good
example of retrieval by spatial data, which user can request for the spatial relationship . For
exa.n:tple, in MARCO, user can request such as "display all layer and composite tiles that
contalh a site of interest within 15 miles of a hotel."
MARCO project [Sa96] is a system for acquisition, storage, indexing, and retrieval of
map image. The input to MARCO is raster images of separate map layers and raster images
of map composite (the maps that result from composing the separate map layers) . Map layer
images are processed with a system named MAGELLAN (denoting Map Acquisition of
GEographic Labels by Legend ANalysis)[Sa94]. MARCO uses the logical representation of a
map image that is output by MAGELLAN to automatically index both the composite and layer
illlages.
The MARCO system was tested on the red sign layer and the composite of the GT3
map of Finland. This map is one of a series of 19GT maps that cover the whole area of
Finland. The red sign layer contains geographic symbols that mostly denote tourist sites . The
map layer was scanned at 240 dpi. This layer was split into 425 tiles of size 512 x 512. The
55

map composite was scanned at 160 dpi . The layer was split into tiles of size 256x 256. The
composites were scanned at a lower resolution to reduce the space required to store these tiles .
----:
The MARCO system has been test by two performance measures. The first is
accuracy of the retrieval. The accuracy error has been divided into two categories, type I error
and type II error. Type I error is error when the specification was not retrieved by the system
(a miss). Type II error occurs when an image that the system retrieved for a given query does
not meet the query specification (a false hit). For the test image, the total type I error was 6%
(which imply that 94% of the tiles that should have been retrieved were in fact retrieved by the
system). Note that this error is vary for the different symbols. Type II error is vary from I%
for the "beach" symbols to 33% for the "service station" symbols. The second performance
issue is the retrieval time used. This measure is vary to the number of image (more images use
more time) and vary among algorithm to process the queries.
The Alexandria Project[Sm96] is aim to build a distributed digital library for materials
that are referenced in geographic term, such as by the names of communities or type of
geological features . The Alexandria project is a consortium of universities, public institutions,
and private corporations headed by UCSB (University of California, Santa Barbara) .
The ADL (Alexandria Digital Library) will g1ve users internet access to allow
information extraction from broad classes of geographically referenced materials . As a geo-
graphical retrieval system, the ADL is capable of queries by the spatial data. Moreover, it
has capabilities to display geographically referenced materials in raster and vector formats ,
56

browse search results, employ user-configurable defaults and options, and retrieve data holding
in various native formats .
ADL is being Beta-tested by numerous government agencies (in May 1996) (including
the US Geological Survey and the Library of Congress), universities (including several
University of California campuses, Stanford University, and the University of Colorado), and
corporations (including Sun Microsystems and Digital Equipment Corp.). More information
about Alexandria project can obtain from Web site at http://alexandria.sdc.ucsb .edu .
3.1~~ Video Manipulation Works
As mentioned in chapter 2, the general main works for manipulating video falls into
three groups of works, partitioning, representation, indexing and retrieval. Since video ac-
tually is a series of images, which may be associated with audio data. The main purpose of
video manipulation is partition the given video data to groups of camera shot, find the
representation frame(s) of the shot, and insert to the database for future indexing and retrieval.
The representative frames (r-frame) are use for represent the camera shot. Indexing and
retrieval of those video shot are done on the basis of the r-frames The current interested
researches are dealing with how to partitioning the video into groups of camera shots . This
section will review works in partitioning video databases and some representation techniques .
57

3.1 0.1 Difference Metrics for Video Partitioning
The detection of trarisitfons involves the quantification of the difference between two
image frames in a video sequence. To archive this, we need to define a suitable metric, so that
a segment boundary can be declared whenever that metric exceeds a given threshold.
Difference measures used in partition video can be divided into two major types: the pair-wise
comparison of pixels or blocks, and the comparison ofthe histograms of pixel values .
a) ~air-Wise Comparison. [Zh93J[Zh94a] ,;.~.
This method is the simple approach that counts the number of pixels that change
between two frames. This metric can be represented as a binary function DP; (k, l) over the
domain oftwo dimensional coordinates of pixels, (k, 1), where the subscript i denotes the index
ofthe frame being compared with its successor. If P; (k, I) denotes the intensity value of the
pixel at coordinates (k, I) in frame i , then DP; (k, l) may be defined as follows:
DP; (k, l) { 0
1 ifiP;(k,l)-P; +I(k,l)l>t
otherwise (3.7)
58

A segment boundary is declared if more than a given percentage of the total number of
pixels have changed. In frame size of M by N pixels, this condition may be represent by the
following inequality: -. ---
"' M.N DPi(k l) L....k.i= l ' *100 > T (3 .8)
M*N
A major problem with this metric is its sensitivity to camera movement. This effect
may be reduced by using a smoothing filter: before comparison each pixel in a frame is
replaced with the mean value of its nearest neighbors .
b) Likelihood Ratio. [Zh93][Ka91]
Instead of companng individual pixels, we can compare corresponding regions
(blocks) in two successive frames . One such metric is called likelihood ratio. Let m; and m;+J
denote the mean intensity values for a given region in two consecutive frames, and let S; and
S;+1 denote the corresponding variances. The following formula computes the likelihood ratio
and determines whether it exceeds a given threshold t:
>t (3.9)
Camera break can now be detected by first partitioning the frame into a set of sample
areas . Then a camera break can be declared whenever the total number of sample areas whose
59

likelihood ratio exceeds the threshold is sufficiently large. An advantage that sample areas
have over individual pixels is the likelihood ratio raises the level of tolerance to slow and small
object motion from frame to ±Ta.Ine.
c) Histogram Comparison{Zh93j{Zh94a]
An alternative way to comparing corresponding pixels or regions in successive frames
IS to compare some feature of the entire image. One such feature that can be used in
segmentation algorithm is a histogram of intensity levels.
-~· Let H;(j) denote the histogram value for the ith frame, where j is one of the G possible
gray levels . (The number of histogram bins can be chosen on the basis of the available gray-
level resolution and desired computation time.) Then the difference between the ith frame and
its successor will be given by the following formula:
G
SD; I IH;(j)- Hi+ I (J)I (3 . l 0) } =I
If the overall difference SD; is larger than a given threshold T, a segment boundary is
declared. To select a suitable threshold, SD; can be normalize by dividing it by the product of
G and M*N, the number of pixels in the frame .
60

d) Image Difference V [Ki94]
ln [Ki94], they. define image difference as V. They use four values to define V:
IDsum, IDarea, HDsum, and CCblock. IDsum is the absolute sum of the interframe
difference. When In (t) is the intensity of pixel nat timet, each pixel ' s absolute difference ~In
(t) and IDsum are:
jfn(t + !!J)- fn(t)j
I
N
where N is the total pixel number.
N
L 11/n(t) n= O
(3 .11)
(3.12)
This is an alternative form of the pair-wise comparison introduced above. The value
1s large at a cut. Intermediate values yielded by object motion and camera operation.
Unfortunately, usmg these metrics seem to rnisdetect cuts when a small part of frames
undergoes a large, rapid change.
IDarea is the size of the area in which the inter frame difference occurs . It is defined
as:
Darea(l) (3.13)
C is the group of pixels that undergo interframe changes, and IS defined with a
threshold ~Ith
61

C = { 11Jn ( t) / 11fth < fn ( t)} (3 .14)
IDarea has a high stable value at a cut because the threshold L\Ith filters out irrelevant
interframe differences .
HDsum is the absolute difference of the intensity histogram. This is a modified
version of histogram difference introduced by [Zh93].
N
h(t,b)= Ll if Lb3fn(l) (3 .15) n=O
"-:· Lb is the group of In (t) with some intensity level.
{ b b+1} Lb = fn(f) B ~ fn(f) < J3 (3 .16)
HDsum is defined as follows:
B
HDsum(l) = L/h(t+L'lt,b)-h(t,b)) (3 .17) b=O
This is the measurement of the brightness distribution of the image. If image change,
the brightness distribution change. In the situation that object moves within the frame, these
changes are small . As a result, HDsum experiences only slight dispersion within a slot.
The CCblock (block based color correlation) is using the correlation between two
frames based on limited N colors for cut break detection. First, a frame is divided into blocks,
62

This process aims to reduce motion and camera operation effects .
-_1_ N~or (H(t,f)- H(t _-l,i))
2
CCk(t)= L Nco/or i=O H ( f - 1, I)
(3 .18)
Where k is a label ofthe block.
In the larger view, V is classified in two groups. One covers the motion-sensitive
attributes, and the other group is insensitive to motion. For instance, IDsum and IDarea are
moti_on sensitive, while HDsum is insensitive. CCblock has both characteristics. The results
ofusdig V in video cut detection can be found in [Ki94] .
e) Twin Comparison for Detect Gradual Transition.[Zh93]
The twin comparison is applied to solve the problem of gradual-transition, which is the
break spread along several frames. A similar approach can be applied to transitions imple-
mented by other types of special effects.
Twin-comparison requires the use of two cutoff thresholds : Tb is used for camera
break detection . In addition, a second, lower threshold Ts is used for special effect detection .
The detection process begins by comparing consecutive frames using a difference metric.
Whenever the difference value exceeds threshold Tb, a camera break is declared. However, the
twin-comparison also detects differences that are smaller than Tb but larger than Ts. Any
frame that exhibits such a difference value is marked as the potential start (F.) of a gradual
63
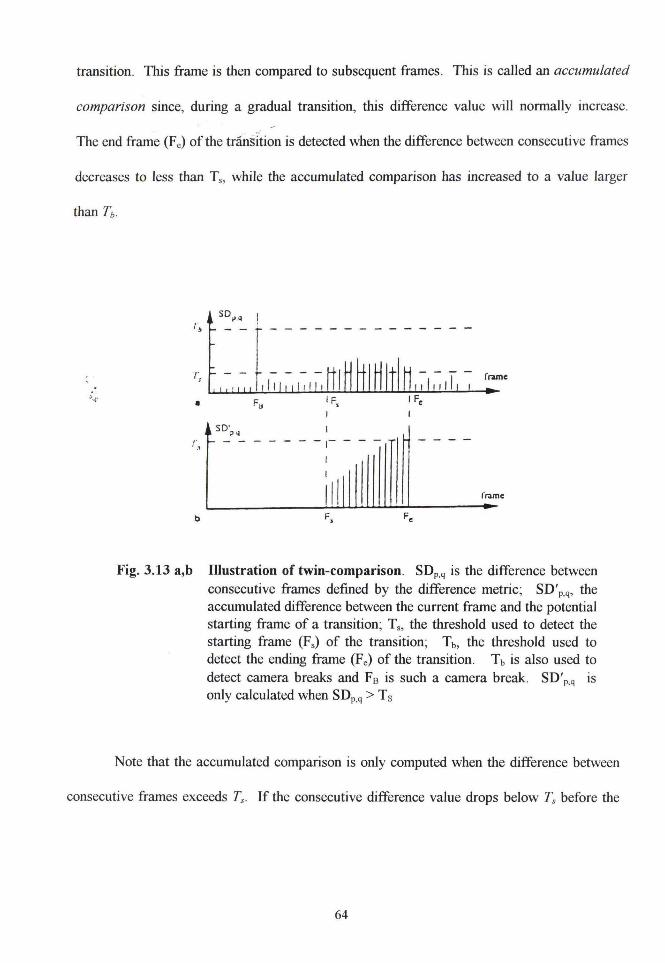
transition. This frame is then compared to subsequent frames. This is called an accumulated
comparison since, during a gradual transition, this difference value will normally increase.
The end frame (F.) of the transition is detected when the difference between consecutive frames
decreases to less than T5 , while the accumulated comparison has increased to a value larger
.;.~.
SD~q r !>
r s frame
• F~
so·~q I ,. - - - - -,- - - - -'·'
I
ill i"rame
b F, Fe
Fig. 3.13 a,b Illustration of twin-comparison. SDp,q is the difference between consecutive frames defined by the difference metric; SD' p,q, the accumulated difference between the current frame and the potential starting frame of a transition; Ts, the threshold used to detect the starting frame (F s) of the transition; T b, the threshold used to detect the ending frame (F.) of the transition. Tb is also used to detect camera breaks and F8 is such a camera break. SD' p,q is only calculated when SDp,q > T s
Note that the accumulated comparison is only computed when the difference between
consecutive frames exceeds Ts. If the consecutive difference value drops below Ts before the
64
accumulated comparison value exceeds Tb, then the potential start point is dropped and the
search continues for other gradual transitions .
----:
A problem with twin-comparison is that there are some gradual transitions during
which the consecutive difference value does fall below T8 • This problem is solved by per
mitting the user to set a tolerance value that allows a number of consecutive frames with low
difference values before rejecting the transition candidate. This approach has proven to be
effective when tested on real video examples .
f) Other Approach in Shot Detection
The cut detection approaches in 3 . I 0.1 a) through 3.10 .I e) are purposed and have
been test to be effective for shot detection. However there are some other approaches as well.
ln QBIC project[Fl95], they use the method that combines the strength of the two classes of
detection (those based on global representation like color/intensity histogram, and those based
on measuring differences between spatially registered features like intensity difference). They
conclude that the algorithm shows no misses and only a few false cuts .
ln [Zh94b] and [Ar94], they try to take advantage of MPEG video data. They use
DCT (Discrete Cosine Transform) to detect change in camera break. The experiment yields
satisfactory results. Motion vectors are used to help finding cut-detection in [Zh94b]. ln
[Zh94a] they propose the extension of their work by using audio data to complement in video
65
cut. Using sound may help in parsing news video [Zh94a] but it may be extended to general
video parsing.
3.10.2 Case Study in Video Parsing: News Video
The news video parsing is purposed and experiment in [Zh94a]. They use a priori
model of video's structure based on domain knowledge. The reason behind this is that the
temporal syntax of a news video is usually very straightforward. The news video items have a
simple sequence (possibly interleaved with commercials), each of which may include an
'
ari((horperson shot at its beginning and/or end. Parsing thus relies on classifying each camera .;.-!•
shot according to these relatively coarse categories . The partition of the shots is perform by
using suitable metric purposed by [Zh93] in section 3.10.1.
Once a given news video has been partitioned into individual shots, the next step in
parsing is to classify the shots into anchorperson shots and news shots. For the purposes of
this experiment, they consider mainly these two types of shots; and the anchorperson shots may
be further distinguished by their spatial structure. A typical anchorperson shot is usually
consists of a sequence of frames containing an anchorperson with a picture news icon in the
upper left or right part of the frames . The news video samples usually use two anchor-
persons. The shots may also include a sequence of frames containing one or two anchorpersons
with a bar oftheir names and, sometimes, with the title of the program. On the other hand, the
news shots do not have fixed temporal and spatial structure. Thus, news shots may be
identified as those which do not conform to the anchorperson model.
66

Programs N N. Nm Nr ~
Program 1 - ..-:- 20 18 2 0
Program 2 19 18 1 0
Table 3.4. Experiment results. N: number of news items manually identified by watching the programs; N.: news items identified by the system; Nm: news items missed by the system; and Nr: news items falsely identified by the system
The test data for evaluation of their technique consists of two half-hour SBC news
programs and a half-hour CNN international news programs. Table 3.4 lists the numbers of
news items identified by the system and the numbers manually identified by watching the
programs.
It is seen that the system has identified the news items with a very high accuracy
(higher than 90%), which shows that the algorithms are effective and accurate. From the
experiments, they found that the no anchorperson shots is missed or falsely detected. The
missed news items resulted from the assumption that each news program starts with an
anchorperson shot followed by a sequence of news shots. However, there are a few cases in
the news programs they used where the news items are only read by an anchorperson without
news shots; or a news item starts without an anchorperson shot. They also proposed using
audio analysis technique to identifying a change of news items within a single anchorperson
sequence.
67

CHAPTER 4
THE DISCRETE COSINE TRANSFORM
The discrete cosine transform (DCT) is one of the basic block of JPEG operations.
The. ~discrete cosine transform was first applied to image compression in Ahmed, Natarajan, .;:.~.
and Rao 's work. [Ah74]. The discrete cosine transform produces uncorrelated coefficients.
Decorrelation of the coefficients is very important for compression, because each coefficient
can then be treated independently without loss of compression efficiency. Another important
aspect of the DCT is the ability to quantize the DCT coefficients using visually-weighted
quantization values. [Pe93]
4.1 Basic OCT Concepts
The human visual system response is very dependent on spatial frequency. If we could
decompose the image into a set of waveforms, each with a particular spatial frequency, we
might be able to separate the image structure the eye can see from the structure that ts
imperceptible. The DCT can provide a good approximation to this decomposition.
68

4.1.1 The One-Dimensional OCT
To understand how an image can be decomposed into its underlying spatial
- .:: frequencies , we first consider a one-dimensional case. We start with a set of eight arbitrary
grayscale samples such as is shown in Figure 4-la. The samples have values in the range 0 to
255, but after a level shift by 128 (as is done by JPEG), we get the value f(x) in Figure 4-lb.
We want to decompose these eight sample values into a set of waveforms of different spatial
frequencies .
Figure 4-2 shows a set of eight different cosine waveforms of uniform amplitude, each
sampled at eight points . The top-left waveform (u=O) is simply a constant, whereas the other
'
severt waveforms (u = I, ... , 7) show an alternating behavior at progressively higher ... -.!.
frequencies .
These waveforms (which are called cosine basis functions) are said to be orthogonal.
A set of waveforms is orthogonal if it has the following interesting properties . If we take the
product of any two waveforms in the set at each sampling point, and sum these products over
all sampling points, the result is zero. If the waveform is multiplied by itself and summed, the
result is a constant. For example, if we take the product of waveform 0 and waveform I, and
sum over all sample points, the result is zero. On the other hand, if we take the product of
waveform I with itself, the product at each sample point is the square of the waveform value.
Therefore, the sum ofthe products over all sample points is a positive constant (which is used
to define a scale factor for the waveforms).
69

,;.-.!,
Figure 4.1
Gl 250
:J (ij 200 > QJ 150 a. E
100 "' (J)
50
0
f(x)
-so -100
...
r-
.,..... . . , · · r
n 0 1 2 3 4 5 6 7
X
0 1 2 3 4 5 6 7 X
150
100
50
S(u) 0
-50
-100
-150 0 1 2 3 4 5 6 7
u
1-D DCT decomposition (a) Eight arbitrary grayscale samples. (b) level shift of(a) by 128
(a)
(b)
(c)
(c) coefficients for decomposition into waveforms.
70

,;.~.
1.0
Q) "0 ::l
== 0 0 a. . E <(
-1.0
1.0 Q) "0 ::l
'5_o.o E <(
-1.0
1.0 Q) "0 ::l
'5_o.o E <(
Q) "0 ::l
-1.0
1.0
=3. 0 .0 E <(
-1.0
n n p I
I ! I '
u=O
n ... .. u = 1
I inn . ' ' I I n
uuu ....
! n I
U=2
I I
n U=3
n ij !/ L.c u L
. I...
0 1 2 3 4 5 6 7 X
Q) "0 ::l
1.0
'5. 0. 0 1-J-L...,-~.,..-L..L-1....1....,-r-r-r.........,
E <(
-1 .0 L..-------~--'
Q) "0 ::l
1.0
'5. 0.0 J-L-~.,.....L....L....J....J.....--.-~..J....J.""T'""1rl E <(
-1 .0
1.0 Q) "0 ::l
=3. 0 .0 E <(
-1 .0
Q) '0 ::l
1.0
~~~------------~
=3. 0. 0 J-1-.L-.-.......-1-~,...,.....L..J...T'"T"....L..J-r"ri E <(
-1.0 ~---------------~ 01234567
X
Figure 4.2 . Eight cosine basis function waveforms. The waveform for u=O
is constant. The other waveforms show an alternating behavior at
progressively higher frequencies.
71

Orthogonal waveforms are independent. That is, there is no way that a giVen
waveform can be represented by any combination of the other waveforms. However, the
complete set of eight wavef~~s, when scaled by numbers called coefficients and added
together, can be used to represent any eight sample values such as those in Figure 4-lb . The
coefficients S(u) are plotted in Figure 4-lc. Figure 4-3 shows a sequence in which the eight
scaled waveforms are progressively summed, starting with the lowest frequency (adding one
more each time), until finally the original set of samples is reconstructed. The coefficients
plotted in Figure 4-1 c are the output of an 8-point DCT for the eight sample values in Figure
4-Ib .
;..~. The coefficient that scales the constant basis function (u = 0) is called the DC
coefficient. The other coefficients are called AC coefficients . Note that the DC term gives the
average over the set of samples.
The process of decomposing a set of samples into a scaled set of cosine basis functions
is called the forward discrete cosine transform (FDCT). The process of reconstruction the set
of samples from the scaled set of cosine basis functions is called the inverse discrete cosine
transform (IDCT). If the sample sequence is longer than eight samples, it can be divided into
eight-sample groups and the DCT can be computed independently for each group. Because the
cosine basis functions always have the same set of values at each of the discrete sampling
points, only the coefficient values change from one group of samples to the next.
72

100
100
Q) 50 "'0 ~ a~~~~~~~~~~ a. E -50 <{
-100
100
Q) 50 "C
u = 0 to 1
~ 0~~~~~~~~~~
a. E -so <{-100 .
u = 0 to 2
0 1 2 3 4 5 6 7 X
100
<PSO "C ~ o~~~~-r~~~~~ a. E -50 <{ u=Oto4
-100 . .. ·······
100
(I) 50 . "C ~ o~~~~~~~~~ a. E -so <{
-100
100
Q) 50 "'0 ~ a~~~~~~~~~
a. E -so · <(-100
100 .
(I) 50 "C ~ o~~~~~~~~~
a. E -50 · <(-100
0 1 2 3 4 5 6 7 X
Figure 4-3 Eight cosine waveforms progressively summed
73

4.1.2 The Two-Dimensional OCT
The 1-D DCT can be extended to apply to 2-D image arrays . Figure 4-4 shows a set
of 64 2-D cosine basis fimctio~s that are created by multiplying a horizontally oriented set of
1-D 8-point basis functions (shown in figure 4-2) by a vertically oriented set of the same
fimctions. The horizontally oriented set of basis fimctions represents horizontal frequencies
and the other set of basis fimctions represents vertical frequencies . By convention, the DC
term of the horizontal basis fimctions is to the left, and the DC term for the vertical basis
functions is at the top . Consequently, the top row and left column have 1-D intensity
variations, which, if plotted, would be the same as in Figure 4-2.
Because the 2-D DCT basis fimctions are products of two 1-D DCT basis functions,
the only constant basis fimction is in the upper left comer of the array. The coefficient for this
basis function is called the DC coefficient, whereas the rest of the coefficients are called AC
coefficients.
4.2 Mathematical Definition of FDCT and IDCT
This section will provide mathematical definitions of the FDCT and IDCT both in one
dimensional and two-dimensional.
4.2.1 One-Dimensional FDCT and IDCT
The 1-D DCT appropriate for using in JPEG is defined in Rao and Yip ' s book [Ra90]
74

FOCT:
C(u) 7
S(u) = --___ ,Ls(x)cos[(2x + l)uJr I 16] 2 -· x=O
(4 .1)
IDCT:
7 C(u) s(x) = I-S(u)cos[(2x + l)u.1r I 16]
u=O 2 (4-2)
where
C(u) u..fi for u = 0
C(u) for u > 0
-.:.-.4. s(x) 1-0 sample value
S(u) 1-0 OCT coefficient.
4.2.2 Two-Dimensional Reference FDCT and IDCT
The 2-0 FOCT and IDCT can be constructed from products of the terms of a
horizontal 1-0 OCT (using u and x) and a vertical 1-0 OCT (using v andy), where v
represents vertical frequencies andy represents vertical displacements) . This leads us to the
reference 2-D FDCT and IDCT as defined by JPEG, but cast in a slightly different form to
emphasize the connection with the 1-D DCT.
FOCT:
S(v,u) =
C(v) C(u) ~ ~ L..J L..J s(y ,x) cos[(2x + 1)uJr I 16] cos[(2y + 1)vtr I 16]
2 2 y = O x = O
(4.3)
75

IDCT:
s(y,x) =
7 C(v) 7 C(u) L --2: --S(u, v) cos[(2x + l)u1r /16] cos[(2 y + l)v1r /16) v=O 2 u=O 2
(4.4)
where
C(u) v..fi for u = 0
C(u) for u > 0
C(v) v..fi for u = 0
.;.~. C(v) for u > 0
s(y,x) 2-0 sample value
S(v,u) 2-0 OCT coefficient
There are quite a few FOCT and IDCT implementations that use algorithms designed
to reduce the number of multiplication and addition in the transformation. Some aspects of
these fast OCT algorithms along with using OCT in JPEG image coding can be found in
[Pe93]. The comprehensive comparison of fast inverse discrete cosine transform can be found
in [Hu94].
76

CHAPTER 5
IMAGE INDEXING USING THE DC COEFFICIENT
: . The DCT is introduced in chapter 4. The main application to date is using for image ;.-..!.
compression as in JPEG image compression standard. However, due to its capability to
represent features that relate to human visual response system, the DCT coefficients can be
used in indexing images. The implementation of using DCT in image indexing can be
categorized into two major classes . The first class is block comparison (which performs
comparison in the same manner of pair-wise comparison, but the DCT is a block transform,
then the comparison is performed to the correspond blocks). The second class is using the
histogram. Using block comparison is, as the pair-wise comparison, sensitive to the objects '
movements in the images. However, the effect of the objects ' movements is lesser than using
the pixels' values in comparison. This approach is hard to handle in the situation that the
images in the databases have different resolutions. The histogram comparison approach seems
to eliminate the mentioned problems. In this following section, an indexing method using
histogram of DC coefficient will be introduced.
77

5.1 The Histogram of OCT Coefficients ., _-..::.
In theory the OCT can be used to transform any color code (such as R G, or B
channel of RGB color representation, or Y, Cr, Cb, channel). However, our implementation
chooses to use the OCT of Y (luminance) channel. The OCT can produce 64 coefficients per
blocks. We select only DC coefficient to create histograms that represent the images.
The reasons in using Y channel are based on two reasons: a) the fact that human visual
system is much more sensitive to Y (luminance) than any individual color (R G, or B) [Pe95];
and b) JPEG also using YCrCb in compression standard. The JPEG has the data density of Y
(lu~ce) more than Cr or Cb (which hold the information of colors) . TheY channel used is
8 bits and can hold value in the range ofO to 255. TheY channel is then shifted to the value of
-128 to 127 as is done by JPEG then transform by OCT. The results of the transformation
give extra 3 bits to the size of 11 bits, and can have the values in range -1024 to 1023 . Now
the histogram of the transforms can be created. Since the OCT can give us 64 coefficients,
which is computational expensive, and high frequency coefficients' values tend to be 0 (or they
are quantized later in the case of JPEG compression and most of the high frequency
coefficients are 0 after quantization). The implementation in this thesis using only DC
coefficients ofthe transforms in creating histograms. It should be noted that the most accurate
results can be received by using all 64 coefficients. However, the experiment shows that using
the DC coefficients can yield satisfactory results. Moreover, the histogram of DC coefficient
can be reduced to smaller number of histogram bins . In the implementation, the number of
histogram bins is user selectable in the size of 2048 bins (full range of values in the range of
78

-1024 to 1023), 1024, 512, 256 bins. The experiment shows that the histogram with 512 bins
does not perform much worse than comparing all2048 histogram bins .
5.2 Histogram Similarity Measures
The histogram similarity measures can be gotten from comparing all histogram bins,
or comparing only the representative bins that contain high values. In the case of the OCT
histogram, the histogram bins usually hold small values and the histogram 's population are
spread along their range. It should be noted that the result obtains from the sample images
used in the experiment, which are generally scenic images . The biggest size of the image used
in the ;§xperiment has the resolution of 768 by 512 or 512 by 768, depend on which one is
portrait or landscape format. Such that resolution of images will contain 393,216 pixels and
give us only 6,144 DC coefficients . These DC coefficients have the value between -1024 and
1023, then the average number of population is about 3 per histogram bin. That is the main
reason why the histogram bins usually contain small values. There are some exceptions in the
case that the image has large and uniform background. This type of images will give us a
large value in histogram bins.
There are three histogram companson metrics m the program's implementation,
namely, Weighted Euclidean Distance, Square Difference, and Absolute Difference. These
metrics are arranged in the order of the strength of enhancing the difference of the histograms.
The Weighted Euclidean Distance is the strongest when the weighted factor has value more
than l, Square Difference is in the middle, the Absolute Difference is the least strong. The
mathematical definition is as follows :
79

Weighted Euclidean Distance:
where
OWE
N
W;
Square Difference:
where
N
is the Weighted Euclidean Distance.
is the ith histogram bin.
is the total histogram bins .
is weighted in bin i and defined as
if FQ -:f::. 0 I
otherwise
is the ith histogram bin value of query image.
is the ith histogram bin value of database image.
is the square difference of the histogram.
is the ith histogram bin.
is the total histogram bins.
80
(5.1)
(5 .2)
(5 .3)

is the ith histogram bin value of query image.
is the ith histogram bin value of database image.
Absolute Difference:
N
Dab L: IFiQ- r:DI (5.4) i = I
where
D ab is the absolute difference of the histogram. ;.-..!.
is the ith histogram bin.
N is the total histogram bins .
FQ I
is the ith histogram bin value of query image.
FD I
is the ith histogram bin value of database image.
5.3 Implementation: Alpha Program
In the implementation, the program name Alpha has been written to complete the
purpose. The Alpha will perform the indexing and retrieval of query image by examples.
When Alpha gets an example image, it will index and retrieve the most similar images in the
database based on comparison metrics, cost functions, and DC histogram reducing bins
(effective when use DC histogram as the comparison metric). Alpha will also return visual
results on the best 20 matches and displays them as thumbnail images (maximum resolution
!50 x 150 pixels).
81

Language and Operating System
All module in Alpha is written using C programming language. We choose X/Motif
as the Graphical User Interfa~e unit due to its outstanding capabilities in display. We use
version 2.0 (the most recent version during the time of developing) of Motifs library in the
program. Linux, a variety of UNIX that run on PC, is chosen as the operating system on
Pentium PC as the platform.
Display Depth
In Linux, we can set the depth of display as in the other systems. It can run X
windqws in either 8 bits display mode (default mode for Linux) or in 16 bits mode. In 8 bits
mode, the color scheme supports is called PseudoColor. By using this scheme, users can
allocate the colorcells and change it to any colors you want. The total colorcells in 8 bits mode
is 256 cells . This 256 colorcells can hold any value at anytime, and it can share among
applications . However, it 's not recommended to allocate all 256 colors for one application
alone, or the other application will not display proper color or can not run at all. In the
implementation, we allocate only 128 colorcells and quantize TrueColor scheme (24 bits RGB
color) into 128 colors (7 bits) by using 2/3/2 RGB weighted (Red 2 bits, Green 3 bits, and
Blue 2 bits) . Users may detect the distribution of color display in this mode is not smooth.
In the 16 bits mode (TrueColor Scheme), the colorcells is pre-defined color and can
not change by users. The color supports in this mode is 64K colors. In the implementation,
we use all of the 64K color to display images. The color is also quantize with the same
technique used in 8 bits mode but with weighted 5/6/5 (Red 5 bits, Green 6 bits, and Blue 5
bits) . The image display in this mode is nearly indistinguishable from 24 bits mode.
82

Graphical Interfaces
Figure 5.1 shows the program's main window. The main window contains menubar,
option menu, and main display area. Figure 5.2 shows the results ' window that can display
image of the best 20 matches .
Figure 5.1 Alpha' s main window.
The menu bar consists of Image menu. The Image 's pulldown menu contains preview,
indexing and quit. Preview, as its name implies, is for selecting images to be viewed. User
can preview image before adding into database or before indexing. The preview area has the
83

resolution of 300 x 300 pixels . If the images are bigger than the display resolution, the image
will be zoomed to fit .the display a_rea automatically. It supports displaying JPEG images .
Figure 5.2 Alpha display results window
Indexing is for selecting file to index. When selected, it will prompt users with file
selection menu. Users can select file to index in this menu. After an image file has been
selected, the program starts indexing and will display indexing results in the results window.
The results from indexing are depend on comparison methods, cost functions , and number of
histogram bins used in indexing.
84

The last pulldown selection in Image menubar is Quit. When it is selected, the
program will free all allocation memory, free colorcell allocation, and then exit.
In the Databases ~e~u, there is only Add Image available. By selecting Add Image,
users will be prompted with file selection menu. Users have to select a file to be added in the
databases . When an image file is selected, the image will be computed to obtain histogram of
DC coefficient. The histogram will be stored in database after finishing computation.
In the Option menu, there are two options available: cost junction, and DC reducing
range. The cost functions are user selectable among three cost functions (histogram similarity
measures) : Weighted Euclidean Distance, Square Difference, and Absolute difference. The
disc.llssion and mathematical definitions of these metrics are defined in section 5 .1 . The DC ""-.!·
reducing range is user selectable of DC coefficient histogram bins in range of 2048 bins ( -1024
to 1023), 1024 bins (-512 to 511), 512 bins (-256 to 255), and 256 bins (-128 to 127). The
more histogram bins used, the more accurate results we will get. The computational time is
almost the same in all case of number of bins. lfthe histogram bins are reduced to only 1 bin,
all the images seem to have the same representation (since the sum of population in all bins is
the same for all image resolutions). In that case, the image indexing system has no effect. In
our implementation, we offer the reducing of bins down to 256 bins from original 2048 bins .
The option menu (below the menubar) let you choose the method for indexing images .
The current version supports DC coefficient histogram, Y (luminance) histogram, and RGB
histogram. The default method is DC coefficient histogram. The Y histogram and RGB
histogram bins are fixed to 256 only.
85

5.4 The Experiment Results
We have performed exp__eriments in indexing using DC coefficient histogram. The
experiments are trying to search for the combination settings that yield the overall best
indexing results . There are over 170 images in the experiment database. From the experiment,
we will obtain best overall results when using absolute difference measure along with 1024
bins of DC coefficient histogram.
Among the three cost functions available in Alpha program, the Weighted Euclidean
Distance performs worst. The Weighted Euclidean Distance is over-enhance the differences
between images. The weighted factor in equation 5.2 is the compromise weighted factor. We
onde· use the maximum number in the i th bin as its weighted factor, that give us a negative
results. The negative results are the misses in retrieval relevant images. However, even use
the current weighted in equation 5.2.,we still get some negative results . In some cases, such as
the nemesis series (shown below), when using Weighted Euclidean distance, the relevant
images (nemesis 1- 7) are not in top 20 of the best matches. The square difference and
absolute difference performance are close, but the absolute difference can outperform the
square difference in some cases.
We also found that reducing the histogram bins from 2048 to 1024 will help getting
better retrieval images . The smaller number of bins will lessen the sensitivity of indexing due
to noise, object or camera movement, and so on. This is only true when we use 1024
histogram bins . When we reduce histogram further, say 512 bins and 256 bins, the indexing
results will be deteriorated.
We will present some indexing results of the query images with the optimize setting
options (Absolute histogram difference, and I 024 histogram bins) as following .
86

Table 5.1 Results of indexing "elephantl.jpg" using 1024 bins of DC histogram.
Weighted Euclidean Distance Square Difference Absolute Difference
Image Name Difference Image Name Difference Image Name Difference
Value Value Value
1. elephant1.jpg 0.30 1. elephant1.jpg 0.00 1. elephant1.jpg 0.00 2. elephant3.jpg 1649.91 2. elephant3.jpg 9.35 2. elephant3 .jpg 0.50 3. oregon-sunset.jpg 2424.92 3. icefieldl.jpg 28.81 3. elephant2.jpg 0.83 4. icefield 1.jpg 2507.69 4. oregon-sunset.jpg 28 .99 4. flower3.jpg 1.04 5. icefield2.jpg 2531.65 5. nemesis2.jpg 29.87 5. goatl.jpg 1.07 6. cllimber.jpg 2545.54 6. icefield2.jpg 29.96 6. flower7.jpg 1.09 7. nemesis2.jpg 2548.26 7. nemesis3 .jpg 30.21 7. surfl.jpg 1.11 8. porcelain.jpg 2567.53 8. nemesisl.jpg 31.09 8. flower6.jpg 1.12 9. woman.jpg 2573.45 9. nemesis4.jpg 31.19 9. flower4.jpg 1.16 10. nemesis3.jpg 2582.65 10. nemesis6.jpg 31 .44 10. sd5.jpg 1.20 11 . nemesis6.jpg 2592.52 11. lake-goat.jpg 32.32 11. elk1.jpg 1.22 12. building-545 .jpg 2600.87 12. hol-log.jpg 32.81 12. surf3.jpg 1.23 13 . flood1.jpg 2601.90 13. wolf.jpg 33 .13 13 . sd3.jpg 1.23 14. camera.jpg 2603 .01 14. nemesis7.jpg 33.42 14. surf2.jpg 1.24 15 . nemesis4.jpg 2616.57 15. keiko2.jpg 33.52 15. surf4.jpg 1.25 16. mileO.jpg 2619.37 16. berman.jpg 33.68 16. land3.jpg 1.25 17. nemesis 1.jpg 2619 .. 97 17. building-545.jpg 33.73 17. hol1.jpg 1.26 18 . lake-goat.jpg 2632.34 18 . flood1.jpg 33.87 18. flower8.jpg 1.27 19. keiko2.jpg 2634.48 19. head-smash.jpg 34.14 19. icefieldl.jpg 1.27 20. berman.jpg 2648.00 20. jps-diner.jpg 34.29 20. elk2.jpg 1.28 21. head-smash.jpg 2662.88 21. porcelain.jpg 34.44 21. hol2.jpg 1.28 22. hoh-log.jpg 2666.87 22. vancouver.jpg 34.60 22. susie4.jpg 1.29 23 . boulder.jpg 2670.60 23. house-moat.jpg 34.84 23 . susieO.jpg 1.29 24. nemesis7.jpg 2673.30 24. mil eO .jpg 35 .19 24. sd1.jpg 1.29 25. house-moat.jpg 2680.21 25 . boulder.jpg 35 .20 25. susie? .jpg 1.30
87

Figure 5.3 a) query image (elephantl.jpg) .
b) best 20 matches indexing results
b)
88

Table 5.2 Results of indexing "elkl.jpg" using 1024 bins ofDC histogram.
Weighted Euclidean Distance Square Difference Absolute Difference
Image Name Difference Image Name Difference Image Name Difference
Value Value Value
1. elkl.jpg 0.28 l. elk1.jpg 0.00 l. elkl.jpg 0.00 2. flower6.jpg 5165 .32 2. flower6.jpg 47.28 2. land1.jpg 0.90 3. landl.jpg 5650.92 3. land1.jpg 50.01 3. goat1.jpg 0.92 4. land3.jpg 6777.94 4. land3 .jpg 64.16 4. flower6.jpg 0.94 5. sc;l5.jpg 7200.58 5. goat1.jpg 67.65 5. elk2.jpg 1.00 6. goat1.jpg 7970.77 6. sd5.jpg 72.91 6. land2.jpg 1.04 7. yeli~wstone-snow.jpg 7983 .31 7. elk2.jpg 79.03 7. sd5.jpg 1.11 8. elk2.jpg 8496.03 8. yellowstone-snow.jpg 82.03 8. land3 .jpg 1.12 9. homer -distance.jpg 8593 .99 9. wolf.jpg 87.72 9. surf3 .jpg 1.14 10. wolf.jpg 8921.98 10. homer-distance.jpg 88 .21 10. elephntl.jpg 1.22 11. elephntl.jpg 8931.35 11. land2.jpg 88 .80 11 . elephnt3 .jpg 1.23 12. flower7 .jpg 8969.86 12. elephntl.jpg 90.66 12. sd3.jpg 1.27 13 . alberta.jpg 9205 .29 13. elephnt3 .jpg 92.30 13. flower? .jpg 1.31 14. elephnt3.jpg 9214.84 14. head-smash.jpg 97.20 14. flowerS .jpg 1.34 15 . missouri.jpg 9272.82 15. missouri .jpg 97.30 15. sdl.jpg 1.40 16. camera.jpg 9324.31 16. oregon-silllset.j pg 98.45 16. sunset3.jpg 1.41 17. elephnt2.jpg 9355 .71 17. keiko2.jpg 99.33 17. flower3 .jpg 1.42 18. head-smash.jpg 9380.08 18. mileO.jpg 99.68 18 . elephnt2.jpg 1.44 19. sd3.jpg 9492.17 19. camera.jpg 99.79 19. flower 1.jpg 1.45 20. mileO.jpg 9520.00 20. pjs-diner.jpg 99.86 20. wolf.jpg 1.46 21. susieO.jpg 9562.94 21 . lake-goat.jpg 99.98 21 . susieO .jpg 1.46 22. snoopy.jpg 9566.92 22.floodl.jpg 100.32 22. surfl.jpg 1.47 23 . icefield 1.jpg 9573 .96 23 . porcelain.jpg 100.87 23 . sd2.jpg 1.48 24. house-moat.jpg 9613 .72 24. nemesis4.jpg 101.18 24. susie4 .jpg 1.48 25 . kissing.jpg 9614.69 25 . hoh-log.jpg 101.18 25 . susie7.jpg 1.48
89

Ji1 l!!i'9o D•t<J!l.a.. ~tt!ln :''.
Figure 5.4 a) query image (elkl.jpg) .
b) best 20 matches indexing results
b)
90

Table 5.3 Results of indexing "flower3 .jpg" using I 024 bins of DC histogram.
Weighted Euclidean Distance Square Difference Absolute Difference
Image Name Difference Image Name Difference Image Name Difference
Value Value Value
I . flower3 .jpg 0.29 l. flower3 .jpg 0.00 l. flower3 .jpg 0.00 2. elephant2.jpg 4214.99 2. icefield1.jpg 39.37 2. flower4.jpg 0.90 3. icefield l.jpg 4757.91 3. icefield2.jpg 40.40 3. elephant1.jpg 1.04 4. elephantl.jpg 4767.98 4. nemesis3.jpg 43 .11 4. elephant3 .jpg 1.1 1 5. icefield2 .jpg 4844.07 5. nemesis4.jpg 43 .28 5. ho11.jpg 1.13 6. h~l2.jpg 4852.96 6. elephant1.jpg 43.67 6. ho12.jpg 1.1 9 7. nemesis4.jpg 4928.09 7. nemesis2.jpg 44.06 7. flower6 .jpg 1.19 8. nemesis3.jpg 4954.71 8. nemesis1.jpg 44.57 8. fJower7.jpg 1. 22
9. nemesis2.jpg 4969.69 9. nemesis6.jpg 45.93 9. surf3.jpg 1.23
10. nemesisl.jpg 4988.18 1 0. oregon-sunset.jpg 46.08 10. elephant2.jpg 1.24
11. nemesis6.jpg 5017.47 11. 1ake-goat.jpg 46.26 11 . icefie1d1 .jpg 1.27
12. oregon-sw1set.j pg 5090.83 12. nemesis7.jpg 46.76 12. goatl.jpg 1.28
13 . nemesis7 .jpg 5114.81 13 . wolf.jpg 48 .14 13 . icefield2 .jpg 1.28
14. head-smash.jpg 5119.04 14. nemesis5.jpg 48 .15 14. land3.jpg 1.31
15 . wolf.jpg 5136.29 15 . head-smash.jpg 48 .39 15. sunset3.jpg 1.34
16. lake-goat.jpg 5143 .16 16. pjs-diner.jpg 48.59 16. flower8 .jpg 1.34
17. vancouver.jpg 5152.27 17. vancouver.jpg 48.62 17. wolf.jpg 1.35
18 . nemesis5.jpg 5153 .81 18. berman.jpg 48 .88 18 . flower5.jpg 1.36
19. erika.jpg 5158 .61 19. hoh-log.jpg 49.41 1 9. nemesis3 .jpg 1.38
20. minneapolis.jpg 5164.26 20. icetop.jpg 49.68 2 0. oregon-sWlset.j pg 1.38
21 . denali-moWltain.jpg 5170.09 21 . hallmark.jpg 50.10 21 . nemesis4 .jpg 1.38
22. chamber.jpg 5172.36 22. house-moat.jpg 50.11 22. surfl .jpg 1.39
23. snoopy.jpg 5175 .52 23 . building-545 .jpg 50.18 23. nemesis7 .jpg 1.39
24. berman.jpg 5182.17 24. keiko2.jpg 50.37 24. bear.jpg 1.40
25 . way-end.jpg 5182.18 25. snoopy.jpg 50.40 25 . nemesis5 .jpg 1.40
91

Figure 5.5 a) query image (flower3 .jpg).
b) best 20 matches indexing results
b)
92

.,., _-.;:
Table 5.4 Results of indexing "football2.jpg" using 1024 bins of DC histogram.
Weighted Euclidean Distance Square Difference Absolute Difference
Image Name Difference Image Name Difference Image Name Difference
Value Value Value
1. football2 .jpg 0.32 1. football2.jpg 0.00 1. football2 .jpg 0.00 2. football3.jpg 686.86 2. football3.jpg 1.82 2. football3.jpg 0.26 3. football1.jpg 745.57 3. football1.jpg 2.06 3. footballl.jpg 0.27 4. football6.jpg 754.49 4. football5.jpg 2.19 4. football5.jpg 0.27 5. footballS .jpg 796.22 5. football6 .jpg 2.24 5. football6 .jpg 0.28 6. football4.jpg 831.49 6. football4.jpg 2.40 6. football4.jpg 0.29 7. fodiball7.jpg 834.73 7. football7.jpg 2.55 7. football7.jpg 0.29 8. footballO.jpg 948.45 8. footballO.jpg 2.67 8. footballO.jpg 0.29 9. young-moose.jpg 3244.05 9. bison-nuzzling.jpg 30.10 9. susie7 .jpg 1.00 10. bison-nuzzling.jpg 3275.48 1 0. young-moose.jpg 30.11 10. susie4.jpg 1.02 11 . cedars.jpg 3660.36 11 . vancouver.jpg 33 .16 11 . young-moose.jpg 1.03 12. woman.jpg 3728.93 12. bou1der.jpg 34.25 12. susieO.jpg 1.04 13 . porce1ain.jpg 3736.14 13 . cedars.jpg 34.35 13 . snag.jpg 1.07 14. marcia-tony.jpg 3761.46 14. moraine-lake.jpg 34.77 14. woman.jpg 1.07 15 . moraine-lake.jpg 3764.80 15 . snag.jpg 34.82 15 . moraine-lake.jpg 1.07 16. oregon-beach.jpg 3776.98 16. oregon-beach.jpg 35.00 16. porcelain.jpg 1.07 17. bou1der.jpg 3792.25 17. marcia-tony.jpg 35.45 17. bou1der.jpg 1.08 18. vancouver.jpg 3794.23 18. arch-classic.jpg 35 .61 18. vancouver.jpg 1.08 19. snag.jpg 3796.18 19. woman.jpg 35 .62 19. alberta.jpg 1.08 20. easy-rider.jpg 3799.80 20. porcelain.jpg 35 .72 20. arch-classic.jpg 1.10 21 . bison-herd.jpg 3810.11 21 . easy-rider.jpg 36.25 21 . minneapolis.jpg 1.10 22. arch-classic.jpg 3820.18 22. hoh-broad.jpg 36.98 22. hoh-broad.jpg 1.11 23 . minneapolis.jpg 3839.74 23 . floodl.jpg 36.98 23 . bison-nuzzling.jpg 1.12 24. hoh-broad.jpg 3870.09 24. lake-goat.jpg 37.32 24. floodl.jpg 1.12 25 . ferry-sunset.jpg 3895 .93 25. house-moat.jpg 37.64 25 . oregon-beach.jpg 1.12
93

Figure 5.6 a) query image (football2.jpg).
b) best 20 matches indexing results
b)
94

Table 5.5 Results of indexing "nemesis l.jpg" using I 024 bins of DC histogram
Weighted Euclidean Distance Square Difference Absolute Difference
Image Name Difference Image Name Difference Image Name Difference
Value Value Value
1. nemesis l.jpg 0.00 1. nemesis 1.jpg 0.00 1. nemesis 1.jpg 0.00
2. nemesis2.jpg 437.15 2. nemesis2.jpg 2.27 2. nemesis2.jpg 0.44
3. nemesis4 .jpg 554.40 3. nemesis4.jpg 3.19 3. nemesis3 .jpg 0.51
4. nemesis6.jpg 631.42 4 . nemesis6.jpg 3.54 4. nemesis4 .jpg 0.52
5. fi.~mesis7 .jpg 674.96 5. nemesis3 .jpg 3.87 5. nemesis6.jpg 0.53
6. nemesis5.jpg 784.49 6. nemesis7.jpg 4.46 6. nemesis7.jpg 0.59
7. oregon-sunset.jpg 797.28 7. nemesis5 .jpg 4.73 7. nemesis5 .jpg 0.60
8. nemesis3.jpg 853 .24 8. snoopy.jpg 6.40 8. snoopy.jpg 0.73
9.snoopy.jpg 858 .36 9. oregon-sunset.jpg 7.70 9. way-end.jpg 0.78
10. lake-goat.jpg 870.47 10. lake-goat.jpg 7.87 10. lake-goat.jpg 0.79
11. flood2.jpg 1014.38 11 . berman.jpg 8.00 11 . oregon-sunset.jpg 0.79
12. river.jpg 1034.96 12. vancouver.jpg 8.37 12. taquarnenon-falls.jpg 0.80
13. vail.jpg 1060.92 13. yukon-river.jpg 8.56 13 . berman.jpg 0.81
14. gamet.jpg 1065 .07 14. flood2.jpg 8.77 14. donjek-river.jpg 0.81
15. woman.jpg 1098.73 15 . lea-missoula.jpg 9.24 15 . yukon-river.jpg 0.81
16. lea-missoula.jpg 1102.03 16. pjs-diner.jpg 9.43 16. vancouver.jpg 0.82
17. berman.jpg 1130.90 17. river.jpg 9.46 17. chamber.jpg 0.83
18. hallmark.jpg 1132.37 18. vail.jpg 9.90 18. pjs-diner.jpg 0.86
19. pjs-diner.jpg 1151.39 19. gamet.jpg 10.01 19. hiromi.jpg 0.86
20. vancouver.jpg 1154.26 20. hallmark.jpg 10.24 20. minneapo1is.jpg 0.87
21 . yukon-river.jpg 1170.42 21 . erika.jpg 10.27 21. lea-missoula.jpg 0.88
22. emma.jpg 1195.08 22. chamber.jpg 10.28 22 . icetop.jpg 0.89
23. erika.jpg 1206.57 23 . icetop.jpg 10.88 23 . kissing.jpg 0.89
24. porcelain.jpg 1289.71 24. house-moat.jpg 11.18 24. brooks.jpg 0.89
25 . boulder.jpg 1296.98 25 . hiromi.jpg 11.66 25.flood2.jpg 0.91
95

Figure 5.7 a) query image (nemesisl.jpg) .
b) best 20 matches indexing results
b)
96

Table 5.6 Results -d{ indexing "sd l.jpg" using I 024 bins of DC histogram.
Weighted Euclidean Distance Square Difference Absolute Difference
Image Name Difference Image Name Difference Image Name Difference
Value Value Value
I. sd 1.jpg 0.26 1. sd1.jpg 0.00 1. sdl.jpg 0.00 2. sd3.jpg 4357.68 2. sd2.jpg 34.69 2. sd2.jpg 0.65 3. susieO.jpg 4424.14 3. sd3.jpg 37.45 3. sd3 .jpg 0.66 4. susie7.jpg 4480.39 4. sd4.jpg 43 .96 4. sd4.jpg 0.67 5. susie4 .jpg 4537.69 5. susieO.jpg 48 .53 5. elephant3 .jpg 1.1 5 6. ele[!hant3.jpg 4686.53 6. susie7.jpg 49.52 6. surfl.jpg 1.15 7. flower5 .jpg 4863 .93 7. elephant3 .jpg 49.95 7. flower? .jpg 1.1 5 8. elephant2.jpg 4934.07 8. susie4.jpg 50.47 8. sd5.jpg 1.15 9. rnileO.jpg 5054.86 9. flower7.jpg 55 .04 9. land3 .jpg 1.17 10. sd2.jpg 5058 .00 10. homer-distance.jpg 59.60 10. surf3.jpg 1.19 11 . surfl.jpg 5068.68 11. rnileO.jpg 60.42 11. goatl.jpg 1.21 12. flower7.jpg 5142.61 12. flood1.jpg 60.71 12. susieO.jpg 1.24 13. elephantl.jpg 5203 .50 13 . porcelain.jpg 61.63 13 . susie? .jpg 1.26 14. flood1.jpg 5212.51 14. elephantl.jpg 63 .25 14. susie4.jpg 1.27 15 . rafting.jpg 5217.02 15 . hoh-log.jpg 64.61 15 . elephantl.jpg 1.29 16. porcelain.jpg 5261.14 16. keiko2.jpg 64.82 16. flower5.jpg 1. 30 17. downtown.jpg 5298.54 17. oregon-sunset.jpg 64.82 17. land1.jpg 1.31 18 . homer-distance.jpg 5314.95 18 . camera.jpg 67.37 18 . surf2 .jpg 1.33 19. sunset3.jpg 5448 .29 19. goatl.jpg 68.26 19. elephant2.jpg 1.34 20. camera.jpg 5475.30 20. yellowstone-snow.jpg 68.40 20. flower8.jpg 1.39 21. oregon-sunset.jpg 5499.03 21. land3 .jpg 68.43 21 . flower 1.jpg 1.39 22. border.jpg 5509.78 22. woman.jpg 68 .63 22. elkl.jpg 1.40 23. keiko2.jpg 5511.46 23 . rnissouri .jpg 69.97 23 . homer -distance.jpg 1.41 24. woman.jpg 5546.88 24. pjs-diner.jpg 69.98 24. flower2.jpg 1.42 25 . flower3 .jpg 5548 .39 25 . border.jpg 70.37 25 . elk2jp_g_ 1.42
97

Figure 5.8 a) query image (sdl .jpg).
b) best 20 matches indexing results
a)
b)
98

5.5 Experiment Results Analysis
In section 5 .4, we present_ six examples of indexing by using I 024 bins DC coefficient. ...... _-.:::
The results are performed by using three different cost functions to find the best perform cost
function using with DC coefficient. From the experiments, it is obvious that the Weighted
Euclidean Distance is the strongest among the three different cost functions , but not the best.
The image difference values tell us how far the images are from the query image. The smaller
numbers mean the closer images are, but it can not compare between different cost functions .
The results in table 5.1-5 .6 show the first 25 best matches of the query image. The best
matches are rank number 1 in all cases.
;.-.!_
The image difference values for Weighted Euclidean Distance are in range of several
hundreds for close images' series, such as in table 5.4 and 5.5, to several thousands in general
images with no close visual matches. We should notice that the difference values of the first
match, which is the same as query images in all cases, are not always zero. There are some
small difference values exists. We believe that these difference values are from the difference
from the database histogram values and the real time histogram values of query images. The
database histogram values have precision up to 0.01 (two decimal points) after normalization,
but the histogram of query image has higher precision (up to six decimal points). These very
small errors are enhanced by strong weighed factor and accumulated. However, these errors
are very small compare to other difference values. These error values are very small and not
shown in case of Square Difference and Absolute Difference. In term of accuracy, the
Weighted Euclidean Distance shows several misses in the test results. For example, in
99

example 1 (table 5.1), image "elephant2.jpg" are not in the first 25 best matches. In example 6
(table 5.6), image "sd4.jpg" and "sd5.jpg" are missing from the first 25 best matches .
The Square Difference can give us the indexing results in between using Weighted
Euclidean Distance and Absolute Difference. The image difference values are usually in range
of 10.00 to 100.00 for the first 25 best matches. This cost function also gives us some misses,
such as in example 1 (table 5.1), example 3 (table 5.3), and example 6 (table 5.6) . In table
5.1, image "elephant2.jpg" is missing. In table 5.3, image "flower4.jpg" is missing. In table
5.6, the image "sd5.jpg" is missing.
Desprite the implementation of the Absolute Difference is simple, it can give us the
best"fesults among the difference metrics used. The example results show no miss and usually
give better ranks of relevant images . In example 1 (table 5.1), Absolute Difference is the only
cost function that can retrieves image "elephant2.jpg." In example 2, the visually best match
"elk2.jpg" (the image "elld .jpg" is not count because it is the query image itself) is retrieved in
the fifth place. This is the best rank among the three cost functions (8th by Weighted Euclidean
Distance, and 7th by Square Difference).
In the obvious cases, such as in example 4 (table 5.4) and example 5 (table 5.5), all
cost functions performances are about the same.
In fact, the DC coefficient cannot and will not detect the texture grain, but will capture
the rough overall block's characteristics . For example, this method cannot tell us the different
between fme grain texture and rough texture that has the same DC coefficient value. The
situation such as sand texture images, and pebble images that have close DC coefficient values
will be retrieved.
100

While the implementation of the algorithm uses the overall images to consider the
different of the images, the background and object size have the effect on the retrieved images .
If the object size is small and-'6ackground is close in term of DC coefficient, the algorithm will
retrieve the close images no matter how the main object is. This problem may be corrected by
giving more weight to main object during histogram creation. However, this kind of
implementation is complex and it has not been used in the current version of Alpha.
;.-.!.
101

-' .-.::.
Chapter 6
CONCLUSIONS
This thesis introduces an alternative method of image indexing and retrieval , the
indexing image by using DC coefficient. The implementation is using normalized histogram of
the DC coefficient. The normalization allows us to create histogram without restriction about
the pliysical size of the images or their orientation. After applying OCT, the DC coefficients
can have 2048 different values in range of -1024 to 1023 . We have to create histogram with
2048 bins to hold these values . However, with their large number of bins, most bins have
small number of population. In the experiments, we try to find the best overall results by
changing number of histogram bins and cost functions. The best combination we found is by
using I 024 histogram bins and Absolute Difference cost function. This combination is proved
to be effective in indexing by using DC histogram.
The experiments have been done on over 170 sample images. Most of the images are
general scenic images. Desprite the algorithm has proved to be effective in indexing general
images, it also has some drawbacks. First, we found that DC coefficient is best suited in
indexing general images . It can not use in indexing texture image, because it lacks the
capabilities to capture the fine grain texture.
102

The second drawback is from its block transformation. If we create histogram of the
similar image but with very different resolution, we can get some different DC coefficients in
the histogram. The differences in histogram can cause misses in indexing.
According to the algorithm, it uses overall image in indexing. This leads to the third
drawback. When we have the relatively small object in the image, the background will have
higher influence in indexing than the main interested objects. However, we believe that this
problem can be correct. We propose the method of adding information about the object
location and give high weight to the object during histogram creation.
Despite its drawback, it also has its strength also. When usmg the Absolute
Difference with 1024 histogram bins, it can retrieve some tmages that close m term of .. -..!.
luminance distributions. The example in table 5.6 proves its strength. The image "sd5.jpg" is
not very close to the query image (sdl.jpg) but it can still be retrieved.
103

[Ah74]
[An93]
[Ar94]
[Ba94]
[Be91]
[Br66]
[Ca93]
[Ch93]
[FI95]
Ahmed, N., T. Natarajan, and K.R. Rao. 1974. Discrete Cosine Transform. IEEE Transaction on Computers. C-23 :90-3 .
Ang ,Y.H, A.D. Narasirnhalu, and S. Al-Hawamdeh. 1993 . Image Information Retrieval Systems. C.H. Chen, L. F . Pau. and P.S.P . Wang, editors. Handbook of Pattern Recogintion and Computer Vision, World Scientific, Singapore. Chapter 4 .2, 719-39.
Arman, F. , A. Hsu, and M. Y Chiu . 1994. Image Processing on Encoded Video Sequences. ACM Multimedia Systems. (January): 211-9.
Barber, R. , et al. 1994. Query By Content for Large On-Line Image Collections. Company' s Research Report, IDM Research Division, Almaden Research Center. March 21 , 1994
Beckwith, R, et al. 1991. WordNet: A lexical Database Organized on Psycholinguistic Principles. Lexicons: Using On-Line Resources to Build a Lexicon , Lawrence Erlbaum, Hillsdale, N.J., 211-32.
Brodatz, P . 1966. Textures: A Photographic Album for Artists and Designers. Dover, New York.
Cawkill, A.E. 1993 . The British Library's Picture Research Projects: Image, Word and Retrieval. Advanced Imaging, Vol 8, NolO (October) :38-40.
Chang, T, and C.C.J Kuo. 1993 Texture Analysis and Classification with Tree-Structure Wavelet Transform. IEEE Transaction on Image Processing. 2: 429-41.
Flickner, M, et al. 1995 . Query by Image and Video Content: The QBIC System. IEEE Computer, September 1995, pp 23-32.
104

[Fr93]
[Go93]
[Go94]
[Gr90]
[GuQ5]
[Gu95b]
[He94]
[Hu94]
[Ja91]
[Ka91]
[Li92]
Francos, J.M., A Z. Meiri, and B.Porat. 1993 . A Unified Texture Model Based on a 2-D Wold Like Decomposition. IEEE Transactions on Signal Processing. (August) :2665-78 .
Gong, Y.H. , and M. Sakauchi. 1993 . A Method of Detecting Regions with Specified Chromatic Features. ACCV 93, Japan.
Gong, Y.H. , H.J. Zhang, H .C. Chuan and M. Sakauchi. 1994. An Image Database System with Content Capturing and Fast Image Indexing Abilities. Proceeding of the International Conference on Multimedia Computing and Systems. Boston, MA. May 1994. IEEE. , 121-30
Grosky, W.I., and R. Mehrotra. 1990. Index-Based Object Recognition. in Pictorial Data Management. Proceedings on Computer Vision, Graphics, and Image. Vol. 52, No.3: 416-36.
Gudivada, V.N., and V.V. Raghavan. 1995. Content-Based Image Retrieval Systems. IEEE Computer., September: 18-22.
Gudivada, V.N ., V.V. Raghavan, and K. Vanpipat. 1995 . A Unified Approach to Data Modeling and Retrieval for a Class of Image Database Application. Multimedia Database Systems: Issues and Research Directions. S. Jajodia and V. Subrahmanian, editors. Springer-Verlag, New York.
Healey, G. , and D . Slater. 1994. Using Illumination Invariant Color Histogram Descriptors for Recognition. Proceedings of Conference in Computer Vision and Pattern Recognition. Seattle, Wash., 355-60
Hung, A.C., and Teresa H. Meng. 1994. A Comparison of fast inverse discrete cosine transform algorithms. ACM Multimedia Systems. 2 :204-17.
Jagadish, H.V. 1991. A Retrieval Technique for Similar Shapes. Proc. ACM SIGMOD Conf Management of Data. ACM, New York. 208-17.
Kasturi, R. , and R. Jain 1991. Dynamic Vision Computer Vision : Principles, IEEE Computer Society Press, 469-480.
Lim, J.J. 1992. Free Text Databases. Technical Report Institute of Systems Science, National University of Singapore, Singapore.
105

[Ma94]
[Ma96]
[Me95]
[Mi88]
[Mi-90]
[Ni93]
[Og95]
[Ot94]
[Pe93]
[Pe97]
[Pi94]
Mao, J. , and A.K Jain. 1992. Texture Classification and Segmentation Using Multiresolution Simultaneous Autoregressive Models. Pattern Reco~nition., 25 :173-88.
-' . .::
Manjunath, B.S. , and W.Y. Ma. 1996. Texture Features for Browsing and Retrieval of Image Data. IEEE Transaction on Pattern Analysis and Machine Intelligence, Vol 18, No. 8, August 1996., 837-42.
Mehrotra, R. , and J.E. Gary. 1995. Similar-Shape Retrieval In Shape Data Management. IEEE Computer, September 1995., 57-62.
Miyahara, M., and Y. Yoshida. 1988. Mathematical Transform of (R, G, B) Color Data to Munsell (H, V, C) Color Data. Visual Communication and Image Processing, SPIE, 100: 650-7.
Miller, G.A. 1990. Noun in WordNet: A Lexical Inheritance System. International Journal ofLexicograhpy. 3: 245-64.
Niblack,W. 1993 .The QBIC project: Querying Images By Content Using Color, Texture and Shape. In Symposium on Electronic Imaging Science and Technology: Storage and Retrieval for Image Video Databases. San Jose, CA. February 1993 . IS&T/SPIE
Ogle, V.E ., and M. StoneBraker. 1995 . Chabot: Retrieval from a Relational Database of Images. IEEE Computer, September 1995, 40-8 .
Otsuji, K. , and Y. Tonomura. 1994. Projection-Detection Filter for Video Cut Detection. ACM Multimedia System (January 1994), 205-10.
Pennebaker, W.B., and 1. L. Mitchell. 1993 . JPEG Still Image Data Compression Standard. Van Nostrand Reinhold .
Peleg, A , S. Wilkie, and U.Weiser. 1997. Intel MMX for Multimedia PCs. Communication of the ACM, (January 1997) vol40, no.1: 25-38.
Picard, R.W., and M.M. Gorkani . 1994. Texture orientation for sorting photos at a glance. Proceedings of the International Conference on Pattern Recognition, Jerusalem, 676-86.
106

[Pi95]
[Pi96]
[Po93]
[Ra90]
[Ra92]
.:.-.!.
[Sa94]
[Sa96]
[Sm94]
[Sm96]
[Sr95]
[Ta78]
[Ta93]
Picard, R.W., and T.P. Minka. 1995 . Vision texture for annotation. IEEE Multimedia Systems, No 3: 3-14.
Picard, .R.W~ 1996. A Society of Models for Video and Image Libraries. IBM Systems Journal, Vol 35, No 3&4., 292-312.
Popat, K. , and R.W. Picard. 1993 . Novel Cluster-Based Probability Models for Texture Synthesis, Classification, and Compression. Proceedings of the SPIE Visual Communication and Image Processing. November 1993 ., 2094 :. 756-68 .
Rao, K.R., and P . Yip. 1990. Discrete Cosine Transform. New York, Academic Press.
Rao AR., and J. Lohse. 1992. Identifying High Level Features of Texture Perception. Computer Science RC17629 #77673 , IBM Corporation, Yorktown Heights, NY.
Samet, H., and A Soffer. 1994. Magellan : Map Acquisition of Geographic Labels by Legend Analysis. Proc. 12th International Conf. Pattern Recogniton. Vol 2 (October 1994): 350-5 .
Samet, H. , and A Soffer. 1996. MARCO: MAp Retrieval by COntent. IEEE Transactions on Pattern Analysis and Machine Intelligence. Vol 18, No. 8 (August 1996): 783-98 .
Smoliar, S.W., and HJ. Zhang. 1994. Content-Based Video Indexing and Retrieval. IEEE Multimedia Systems, Summer 1994, 62-72.
Smith, T.R. 1996. A Digital Library for Geographically Refereced Materials. IEEE Computer. Vol29, No. 5 (May 1996): 54-60.
Srihart, R.K. 1995. Automatic Indexing and Content-Based Retrieval of Captioned Images. IEEE Computer. Vol 28, No. 9 (September 1995): 49-56.
Tamura, H., S. Mori, and T. Yamawaki. 1978. Texture Features Corresponding to Visual Perception. IEEE Transactions on Systems, Man, and Cybernatics. SMC-8(6):460-73.
Tan, T.S.C, and J. Kittler. 1993. Colour Texture Classification Using Features from Colour Histogram. SCIA Conference on Image Analysis. Tromso, Norway. 2:807-13 .
107

[Th89]
[Ts92]
[Wu94a]
[Wu94b]]
[Wu95]
[Zh93]
[Zh94a]
[Zh94b]
Therrien, C. W. 1989. Decision Estimation and Classification. Wiley, New York, 1989.
Tseng, D._c ., and C.H.Chang. 1992. Color Segmentation Using Perceptual Attributes. 11th IAPR International Conference on Pattern Recogintion, Netherlands, September 1992.
Wu, J.K., et al. 1994. Inference and Retrieval of Facial Images. ACM Multimedia Systems. 2: 1-14.
Wu, J.K., et al. 1994. STAR - A Multimedia Database System for Trademark Registeration. Applications of Databases, Lecture Notes in Computer Science, Vol 819. In: W. Litwin and T. Risch editors. Proceedings of the 1st International Conference(1994), ADB-94, Vadstena, Sweden. Springer Berlin Heidleberg New York, 109-122
Wu, J.K. , et al. 1995. CORE: A Content-Based Retrieval Engine for Multimedia Information Systems. IEEE Multimedia Systems, 3:25-41.
Zhang, HJ. , A Kankanhalli, and Stephen W. Smoliar 1993. Automatic Partitioning of Full-Motion Video. IEEE Multimedia Systems, 1: 10-28.
Zhang, HJ. , et al. 1994. Automatic Parsing of News Video . Proceedings of the International Conference on Multimedia Computing and Systems, IEEE. May 1994., 45-54.
Zhang, HJ., C.Y. Low and S.W. Smoliar. 1994. Video Parsing and Browsing Using Compressed Data. Symposium on Electronic Imaging Science and Technology: Image and Video Processing II, IS&T/SPIE, February 1994, 142-9.
108
