university of california los angeles seismic
TRANSCRIPT
UNIVERSITY OF CALIFORNIA
Los Angeles
Seismic Performance and Design of
Steel Plate Shear Walls
with Low Yield Point Steel Infill Plates
A dissertation submitted in partial satisfaction of the
requirements for the degree Doctor of Philosophy
in Civil Engineering
by
Tadeh Zirakian
2013

© Copyright by
Tadeh Zirakian
2013
ii
ABSTRACT OF THE DISSERTATION
Seismic Performance and Design of
Steel Plate Shear Walls
with Low Yield Point Steel Infill Plates
by
Tadeh Zirakian
Doctor of Philosophy in Civil Engineering
University of California, Los Angeles, 2013
Professor Jian Zhang, Chair
Steel plate shear walls (SPSWs) have been frequently used as the primary or part of the
primary lateral force-resisting system in design of low-, medium-, and high-rise buildings. Their
application has been based on two different design philosophies as well as detailing strategies.
Stiffened and/or stocky-web SPSWs with improved buckling stability and high seismic
performance have been mostly used in Japan, which is one of the pioneering countries in design
and application of these systems. Unstiffened and slender-web SPSWs with relatively lower
buckling and energy dissipation capacities, on the other hand, have been deemed as a rather
economical alternative and accordingly widely used in the United States and Canada.
Development and use of low yield point (LYP) steel with considerably low yield stress and high
elongation capacity provides the possibility to combine merits of these two distinctive design
strategies, and consequently result in rather cost-effective and high-performing SPSW systems.

iii
Although some reported studies have demonstrated the advantages of LYP steel shear
walls, various aspects of structural and seismic characteristics of these systems have not been
investigated thoroughly. In particular, the linkage between structural specifications and seismic
performance and pathway to performance-based design of these systems are largely
undeveloped. Hence, systematic investigations are required to facilitate the seismic design and
prevalent application of such promising lateral force-resisting and energy dissipating systems.
The main objectives of this research are to evaluate the structural behavior and seismic
performance of unstiffened LYP steel shear wall systems in a rather comprehensive manner. To
achieve these objectives, element-level investigations on steel plates, component-level
investigations on SPSW panels, and system-level investigations on multi-story steel frame-shear
wall structures are performed in a hierarchical and systematic manner.
Through detailed element- and component-level investigations, it is shown that
employment of LYP steel infill plates in SPSW systems facilitates the design and effectively
improves the buckling stability, serviceability, and energy absorption capacity of such lateral
force-resisting systems. Some practical design tools and recommendations are also provided
through analytical and numerical studies. In system-level investigations, the effectiveness of use
of LYP steel material in design and retrofit construction is demonstrated through nonlinear time-
history analysis as well as seismic response and performance assessment of multi-story structures
subjected to earthquake ground motions representing various hazard levels. Ultimately, the
fragility methodology is utilized by developing appropriate fragility functions for probabilistic
seismic performance and vulnerability assessment of structures designed and retrofitted with
conventional and LYP steel infill plates. The results of this study are indicative of relatively
lower damage probability and superior seismic performance of LYP steel shear wall systems.
iv
The dissertation of Tadeh Zirakian is approved.
Jiann-Wen Woody Ju
Ertugrul Taciroglu
Christopher S. Lynch
Jian Zhang, Committee Chair
University of California, Los Angeles
2013

v
To my loving parents
GGrriisshh && MMaarryy
for their endless
love, support, and patience…
vi
TABLE OF CONTENTS
ABSTRACT OF THE DISSERTATION ……………………………………………........... ii
COMMITTEE APPROVAL ………………………………………………………………... iv
DEDICATION ……………………………………………………………………………… v
TABLE OF CONTENTS ………………………………………………………………….... vi
LIST OF FIGURES ………………………………………………………………………..... ix
LIST OF TABLES ………………………………………………………………………….. xiii
ACKNOWLEDGMENTS …………………………………………………………………... xv
VITA ………………………………………………………………………………………... xvi
1. INTRODUCTION …………………………………..……………………...………............... 1
1.1 General …………………………………………………………..………………….. 1
1.2 Applications ………………………………………………………..……..………… 2
1.3 Wall Types………………………………………………….………..……………… 4
1.4 Advantages, Disadvantages and Limitations ……………………………………….. 7
1.5 Scope and Objectives …………………………………………………..…………… 9
1.6 Organization ……………………………………………………………..….............. 11
2. PAST RESEARCH AND RECENT DEVELOPMENTS ………….………………...…………….. 14
2.1 General …………………………………………………………………..………….. 14
2.2 Development of Analytical Modeling Techniques of SPSW Systems .….…………. 15
2.3 Prior Analytical and Experimental Research on SPSWs ………………...…………. 20
2.4 Recent Developments …………………………………………………...…............... 25
2.5 Low Yield Point Steel ……………………………………………………................. 30
3. BEHAVIOR AND DESIGN OF SPSW SYSTEMS ……………........................…..…................. 33
3.1 General ………………………………………………………………..…………….. 33
3.2 Fundamental Mechanics of Unstiffened SPSWs ………………………...…………. 33
3.3 NEHRP Recommended Provisions (FEMA 450) …………..………………………. 39
3.4 AISC 341 Seismic Provisions ………………………………………………………. 41
3.5 Performance-Based Design …………………………………..……………............... 44
4. STUDY OF BUCKLING, YIELDING, AND CYCLIC BEHAVIORS OF STEEL SHEAR PANELS …... 48
4.1 Introduction …………………………………………………..……………............... 48
4.2 Determination of Limiting Plate Thickness …………………....…………………… 49
4.3 Finite Element Analysis and Discussion of Results ……………..………………….. 54
4.3.1 Elastic Buckling Analysis and Convergence Studies ………...………............. 54
4.3.2 Nonlinear Buckling Analysis ……………………………….………………... 56
4.3.3 Cyclic Analysis of Plates with Two and Four Restrained Edges …….............. 62
4.4 Effects of Use of LYP Steel and Aspect Ratio on Limiting Plate Thickness ………. 65
4.5 Buckling of Plates and Application of Extrapolation Techniques ……..…................ 67
4.6 Determination of Limiting Shear Panel Thickness in SPSW Systems …..…………. 70
vii
4.7 Concluding Remarks ……………………………………………………................... 77
5. STUDY OF MONOTONIC AND CYCLIC BEHAVIORS OF SPSWS WITH LYP STEEL INFILL
PLATES …………………………………………………………………………………... 79
5.1 Introduction ………………………………………………………………................. 79
5.2 Design and Properties of SPSW Models ………………………………..…............... 80
5.3 Finite Element Modeling and Analysis …………………………………..…………. 81
5.4 Advantages of Use of LYP Steel Infill Plates in SPSW Systems ………..…………. 83
5.5 Performance of SPSWs with Slender, Moderate, and Stocky LYP Steel Infill Plates 90
5.6 Modified Plate-Frame Interaction Model for SPSWs with Moderate and Stocky
Infill Plates ……………………………………..……………...……………………. 95
5.7 Concluding Remarks ……………………………………………..…………………. 105
6. STUDY ON SEISMIC DESIGN AND STRUCTURAL PERFORMANCE OF SPSWS WITH LYP
STEEL INFILL PLATES ……………………………………………………………………. 107
6.1 Introduction ………………………………………………………………................. 107
6.2 Design of SPSW Models ………………………………..…....................................... 108
6.3 Finite Element Modeling and Verification …………………………………..……… 111
6.4 Strength, Stiffness, and Cyclic Performances of Code-Designed SPSW Models ….. 113
6.5 Design Considerations and Structural Performance ………………………………… 118
6.5.1 Diagonal Tension Field and Angle of Inclination ……………………………. 118
6.5.2 Performance of Reduced Beam Section (RBS) Connections ………………… 120
6.5.3 Performance of Panel Zones …………………………………………………. 123
6.5.4 Lateral Bracing of Frame Members ………………………………………….. 126
6.6 Prediction of SPSW Behavior Using Modified PFI Method ……………………….. 128
6.7 Concluding Remarks ………………………………………………………………... 131
7. STUDY ON SEISMIC RETROFIT OF STRUCTURES USING SPSW SYSTEMS AND LYP STEEL
MATERIAL ……………………………………………………………………………….. 134
7.1 Introduction …………………………………………………………………………. 134
7.2 Design and Properties of Structural Systems ……………………………………….. 135
7.3 Finite Element Modeling and Verification ………………………………..………… 141
7.4 Modal Analysis and Elastic Behavior ………………………………..………...…… 149
7.5 Nonlinear Time-History Analysis and Selection of Ground Motions ………………. 154
7.6 Nonlinear Time-History Analysis Results …………….……………………………. 157
7.6.1 Story and Interstory Drift Ratios …………………………………..…………. 157
7.6.2 Story Acceleration ………………………………………..………..…………. 164
7.6.3 Base Shear ………………………………………..………………..…………. 168
7.6.4 Base Moment ………………………………………..………………..………. 171
7.6.5 VBE Axial Loads at Column Bases ………………………………………….. 173
7.6.6 Web Plate Ductility Ratio and Energy Dissipation Mechanism ……………... 175
7.7 Concluding Remarks ………………………………………………………………... 181
8. PROBABILISTIC ASSESSMENT OF SEISMIC RETROFIT OF STRUCTURES USING FRAGILITY
FUNCTION METHOD ............................................................................................................ 184
8.1 Introduction …………………………………………………………………………. 184

viii
8.2 Fragility Function Methodology ……………………………………………………. 186
8.3 Specifications and Modeling of Structural Systems ………………………………... 188
8.3.1 Selected Structural Systems …………………………………..…………........ 188
8.3.2 Finite Element Modeling and Analysis ……………………………………..... 189
8.3.3 Ground Motion Suite …………………………………..……………………... 189
8.3.4 Seismic Response of Structural Models ……………………………………… 191
8.4 Fragility Analysis of Structural Systems ……………………………….…………… 194
8.4.1 Selection of Appropriate EDP-IM Data Pairs ………………………………... 194
8.4.2 Determination of Lognormal Distribution Parameters ……………………….. 200
8.4.3 Considered Damage and Repair States ………………………………………. 203
8.4.4 Fragility Curves of Structural Models …………..……………………………. 205
8.5 Discussion of Results ……………………………………………………………….. 209
8.6 Concluding Remarks ………………………………………………………………... 213
9. SUMMARY, CONCLUSIONS, AND FUTURE WORK …………………………………………. 216
9.1 Summary …………………………………………………..…………………........... 216
9.2 Conclusions …………………………………………………..………………........... 218
9.3 Recommendations for Future Work ………………………………………………… 222
References …………………...……………………...……………..………………………... 225
ix
LIST OF FIGURES
Fig. 1.1 A typical SPSW system …………………………………………………………… 1
Fig. 1.2 SPSW configurations and applications in Japan (Sabelli and Bruneau, 2006) …… 3
Fig. 1.3 Application of SPSW systems in United States (Sabelli and Bruneau, 2006) ……. 4
Fig. 1.4 Typical SPSW systems (Sabelli and Bruneau, 2006) ……………………………... 4
Fig. 1.5 SPSWs with composite shear panels (Astaneh-Asl, 2002) ……………………….. 6
Fig. 1.6 SPSWs with steel slit walls (Hitaka and Matsui, 2003) …………………………... 6
Fig. 2.1 Hysteresis model proposed by Mimura and Akiyama (1977) …………………….. 15
Fig. 2.2 Multi-strip model proposed by Thorburn et al. (1983) ……………………………. 16
Fig. 2.3 Equivalent brace model proposed by Thorburn et al. (1983) ……………………... 16
Fig. 2.4 Diagonal strip model proposed by Elgaaly et al. (1993) ………………………….. 17
Fig. 2.5 Multi-angle strip model proposed by Rezai (1999) ……………………………….. 17
Fig. 2.6 Plate-frame interaction method proposed by Sabouri-Ghomi et al. (2005) ……….. 18
Fig. 2.7 Modified strip model proposed by Shishkin et al. (2009) ………………………… 19
Fig. 2.8 Examples of finite element models ………………………………………………... 20
Fig. 2.9 Single-story SPSW specimens tested by Lubell et al. (2000) …………………….. 21
Fig. 2.10 Buckled LYP steel panels of SPSW specimens tested by Tsai and Lin (2005) …. 22
Fig. 2.11 Deformations of SPSW specimens at ultimate stage tested by Chen and Jhang
(2006) ……………………………………………………………………………. 23
Fig. 2.12 Buckling-yielding and deformations of SPSWs tested by Chen and Jhang (2011) 24
Fig. 2.13 Various SPSW configurations tested by Bruneau and his research associates ….. 26
Fig. 2.14 SPSW systems with beam-attached infill plates …………………………………. 27
Fig. 2.15 Recommended SPSW fragility functions by Baldvins et al. (2012) …………….. 29
Fig. 2.16 Stress-strain curves of the LYP steel (Yamaguchi et al., 1998) …………………. 31
Fig. 3.1 Idealized steel shear wall behavior ………………………………………………... 33
Fig. 3.2 Braced frame and stiffened plate girder analogies (Sabelli and Bruneau, 2006) …. 34
Fig. 3.3 Free-body diagrams of the web plate and boundary elements in SPSWs (Sabelli
and Bruneau, 2006) ……………………………………………………………….. 36
Fig. 3.4 Details of stresses imposed on SPSW boundary frame members (Sabelli and
Bruneau, 2006) ……………………………………………………………………. 38
Fig. 3.5 Performance limit states in Ghosh et al.’s (2009) proposed PBD method ………... 46
Fig. 3.6 Selected yield mechanisms in Bayat’s (2010) proposed PBD method ……………. 47
Fig. 4.1 Plates under different in-plane loading conditions ………………………………... 50
Fig. 4.2 Plate under combined shear and compressive loads as per Chen et al. (2009) …… 51
Fig. 4.3 Plate support conditions …………………………………………………………… 54
Fig. 4.4 Convergence study and validity of results ………………………………………… 55
Fig. 4.5 Typical first buckling mode shapes ……………………………………………….. 56
Fig. 4.6 Load vs. out-of-plane displacement curves of plates ……………………………… 58
Fig. 4.7 Load vs. in-plane lateral displacement curves of plates …………………………... 59
Fig. 4.8 von Mises stress contour plots at ultimate strengths of various plates: external 61

x
face (left) and internal face (right) ………………………………………………...
Fig. 4.9 Cyclic loading and hysteresis behaviors of plates with two and four clamped
edges ………………………………………………………………………………. 63
Fig. 4.10 Cumulative dissipated energy ……………………………………………………. 64
Fig. 4.11 Out-of-plane displacement contour plots of PL 3000×3000×14.0 at 8.00 mm in-
plane lateral displacement ……………………………………………………….. 65
Fig. 4.12 Effect of use of LYP steel on the required limiting plate thickness ……………... 66
Fig. 4.13 Effect of aspect ratio on the required limiting plate thickness …………………... 67
Fig. 4.14 Data points and application of the extrapolation techniques …………………….. 68
Fig. 4.15 Typical Southwell, Massey, and Modified Plots (Model P20) …………………... 69
Fig. 4.16 Material properties of the steel used in SPSWs ………………………………….. 72
Fig. 4.17 SPSW finite element model validation by Lubell’s (1997) test results ………….. 72
Fig. 4.18 SPSW finite element model validation by Chen and Jhang’s (2006) test results ... 73
Fig. 4.19 Finite element models and buckling mode shapes of SPSWs …………………… 73
Fig. 4.20 Simultaneous geometrical buckling and material yielding of SPSW models with
exact limiting plate thicknesses ………………………………………………….. 76
Fig. 4.21 Geometrical buckling and material yielding of SPSW models with limiting plate
thicknesses corresponding to clamped support condition ……………………….. 77
Fig. 5.1 Finite element models ……………………………………………………………... 81
Fig. 5.2 Material properties of the steel used in SPSWs …………………………………… 82
Fig. 5.3 Behavior of SPSW2 model with various infill plate thicknesses and steel types …. 85
Fig. 5.4 Structural strength and behavior …………………………………………………... 87
Fig. 5.5 Stiffness performance ……………………………………………………………... 87
Fig. 5.6 von Mises stress contour plots of SPSW2 model with various infill plate
thicknesses and steel types at 0.01 and 0.02 drift ratios …………………………... 88
Fig. 5.7 Comparison of the developed column axial loads ………………………………… 89
Fig. 5.8 Comparison of the hysteretic behaviors …………………………………………... 89
Fig. 5.9 Buckling stability of SPSWs with various infill plate slenderness ratios …………. 91
Fig. 5.10 Load-drift ratio curves of SPSWs with various infill plate slenderness ratios …... 91
Fig. 5.11 Stiffness-drift ratio curves of SPSWs with various infill plate thicknesses ……... 91
Fig. 5.12 von Mises stress contour plot of SPSW4 model at 0.03 drift ratio ………………. 91
Fig. 5.13 Hysteresis curves of the LYP steel shear wall models with various infill plate
slenderness ratios ………………………………………………………………… 93
Fig. 5.14 Cumulative dissipated energy at various cycles …………………………………. 93
Fig. 5.15 Comparison with Chen and Jhang’s (2006) experimental results ……………….. 98
Fig. 5.16 Comparison with Tsai and Lin’s (2005) experimental results …………………… 98
Fig. 5.17 Buckling and yielding behavior of the modeled experimental SPSW specimens .. 101
Fig. 5.18 Comparison of the modified PFI model predictions with numerical results of
Lubell’s (1997) SPSW2 specimen model ……………………………………….. 102
Fig. 5.19 Comparison of the modified PFI model predictions with numerical results of
Chen and Jhang’s (2006) specimen no. 1 model ………………………………… 102
Fig. 5.20 Comparison of the modified PFI model predictions with numerical results of
full-scale and code-designed SPSW models with various aspect ratios and under
lateral load ……………………………………………………………………….. 103
Fig. 6.1 Consideration of compressive load ………………………………………………... 109
xi
Fig. 6.2 Finite element models ……………………………………………………………... 112
Fig. 6.3 Monotonic behaviors of SPSW models …………………………………………… 114
Fig. 6.4 Cyclic behaviors of SPSW models ………………………………………………... 115
Fig. 6.5 Normalized responses of SPSW models for different aspect ratios ………………. 117
Fig. 6.6 Angle of inclination of the principal tensile stresses developed in the infill plate of
SPSW2 model at 0.03 drift ratio ………………………………………………….. 119
Fig. 6.7 von Mises stress (MPa) contour plots at 0.05 drift ratio …………………………... 121
Fig. 6.8 Frame out-of-plane displacement (mm) contour plots at 0.05 drift ratio …………. 121
Fig. 6.9 Web local instability at the RBS portion of the upper beam ……………………… 122
Fig. 6.10 Performance of upper left and right panel zones in SPSW1 model ……………... 124
Fig. 6.11 Performance of upper left and right panel zones in SPSW2 model ……………... 124
Fig. 6.12 Performance of upper left and right panel zones in SPSW3 model ……………... 125
Fig. 6.13 Performance of SPSW3 model with and without beam midspan lateral brace ….. 127
Fig. 6.14 Out-of-plane displacements at mid-length of SPSW3 model without beam lateral
brace ……………………………………………………………………………... 127
Fig. 6.15 Deformation modes in SPSWs with fixed joints ………………………………… 129
Fig. 6.16 Comparison of the modified PFI model predictions with numerical results of
full-scale and code-designed SPSW models with various aspect ratios and under
gravity and lateral loads …………………………………………………………. 130
Fig. 7.1 Floor plan and elevation for the modified Los Angeles 9-story SAC building
model ……………………………………………………………………………… 136
Fig. 7.2 Evaluation of buckling and yielding behavior of web plates in the structural
models …………………………………………………………………………….. 140
Fig. 7.3 Bare frame and wall-frame structural models …………………………………….. 141
Fig. 7.4 Modeling details and results for Lubell’s (1997) SPSW2 specimen ……………… 144
Fig. 7.5 Modeling details and results for Chen and Jhang’s (2006) specimen no. 1 ………. 145
Fig. 7.6 Modeling details and results for Park et al.’s (2007) SC2T specimen ……………. 146
Fig. 7.7 Modeling details and results for a 3D finite element slender-web SPSW model …. 147
Fig. 7.8 Modeling details and results for a 3D finite element stocky-web SPSW model ….. 148
Fig. 7.9 Mode shapes of MRF model ………………………………………………………. 149
Fig. 7.10 Mode shapes of GF-CSPSW model ……………………………………………... 149
Fig. 7.11 Initial stiffnesses of the considered structural models …………………………… 153
Fig. 7.12 Time histories of selected Los Angeles ground motions for seismic performance
evaluation ………………………………………………………………………... 156
Fig. 7.13 Maximum story and interstory drift ratios induced by three sample ground
motions …………………………………………………………………………... 158
Fig. 7.14 Maximum story and interstory drift ratios induced by the considered ground
motions …………………………………………………………………………... 159
Fig. 7.15 Variations of seismic-induced peak story and interstory drift ratios due to retrofit
of structures using SPSW systems and LYP steel material ……………………... 161
Fig. 7.16 Comparison of 9th story drift ratio time histories of MRF, GF-CSPSW, and
GF-LYPSPSW2 models …………………………………………………………. 163
Fig. 7.17 Maximum story accelerations induced by the considered ground motions ……… 165
Fig. 7.18 Variations of seismic-induced peak floor accelerations due to retrofit of
structures using SPSW systems and LYP steel material ………………………… 166
Fig. 7.19 Comparison of 9th story acceleration time histories of MRF, GF-CSPSW, and 167
xii
GF-LYPSPSW2 models ………………………………………………………….
Fig. 7.20 Variations of seismic-induced normalized maximum base shear demands due to
retrofit of structures using SPSW systems and LYP steel material ……………... 169
Fig. 7.21 Comparison of base shear time histories of MRF, GF-CSPSW, and
GF-LYPSPSW2 models …………………………………………………………. 170
Fig. 7.22 Variations of seismic-induced normalized maximum base moment demands due
to retrofit of structures using SPSW systems and LYP steel material …………... 171
Fig. 7.23 Comparison of base moment time histories of MRF, GF-CSPSW, and
GF-LYPSPSW2 models …………………………………………………………. 172
Fig. 7.24 Variations of seismic-induced normalized maximum VBE axial load demands at
column bases due to retrofit of SPSWs using LYP steel material ………………. 174
Fig. 7.25 Average web plate ductility ratios of GF-CSPSW and GF-LYPSPSW2 models .. 177
Fig. 7.26 Strain energy contour plots for MRF, GF-CSPSW (frame only), and
GF-LYPSPSW2 (frame only) models at the end of application of LA28 ground
motion showing the plastification zones in beam/HBE and column/VBE frame
members …………………………………………………………………………. 179
Fig. 7.27 Deformed shapes (×15) of MRF, GF-CSPSW, and GF-LYPSPSW2 models at
the end of application of LA28 ground motion ………………………………….. 180
Fig. 8.1 Characteristics of selected earthquake records for probabilistic seismic demand
analysis ……………………………………………………………………………. 191
Fig. 8.2 Average PIDR (%) and PFA (g) values for MRF, GF-CSPSW, and
GF-LYPSPSW2 models …………………………………………………………... 193
Fig. 8.3 Relationship between ln[EDP = PIDR] and ln[IM = PGV (m/s)] ………………… 196
Fig. 8.4 Relationship between ln[EDP = PFA (g)] and ln[IM = PGV (m/s)] ……………… 197
Fig. 8.5 Relationship between ln[EDP = PIDR] and ln[IM = PGA (g)] …………………… 198
Fig. 8.6 Relationship between ln[EDP = PFA (g)] and ln[IM = PGA (g)] ………………… 199
Fig. 8.7 Selected EDP-IM data sets and the corresponding power trendlines for MRF,
GF-CSPSW, and GF-LYPSPSW2 models ………………………………………... 202
Fig. 8.8 Fragility curves for predicting the probability of reaching or exceeding the
damage states of MRF and repair states of GF-CSPSW and GF-LYPSPSW2
structural systems …………………………………………………………………. 206
Fig. 8.9 Fragility curves for predicting the probability of reaching or exceeding the
nonstructural damage states for drift-sensitive components of buildings ………… 207
Fig. 8.10 Fragility curves for predicting the probability of reaching or exceeding the
nonstructural damage states for acceleration-sensitive components/contents of
buildings …………………………………………………………………………. 208
Fig. 8.11 Schematic illustration of the PEER-developed performance-based earthquake
engineering methodology adopted in this study (Baker and Cornell, 2006) …….. 209
Fig. 8.12 Median values of PGA from the fragility curves for the damage/repair states of
structural systems ………………………………………………………………... 210
Fig. 8.13 Median values of PGA from the fragility curves for the damage states of
nonstructural drift-sensitive components ………………………………………... 211
Fig. 8.14 Median values of PGA from the fragility curves for the damage states of
nonstructural acceleration-sensitive components/contents ……………………… 212
xiii
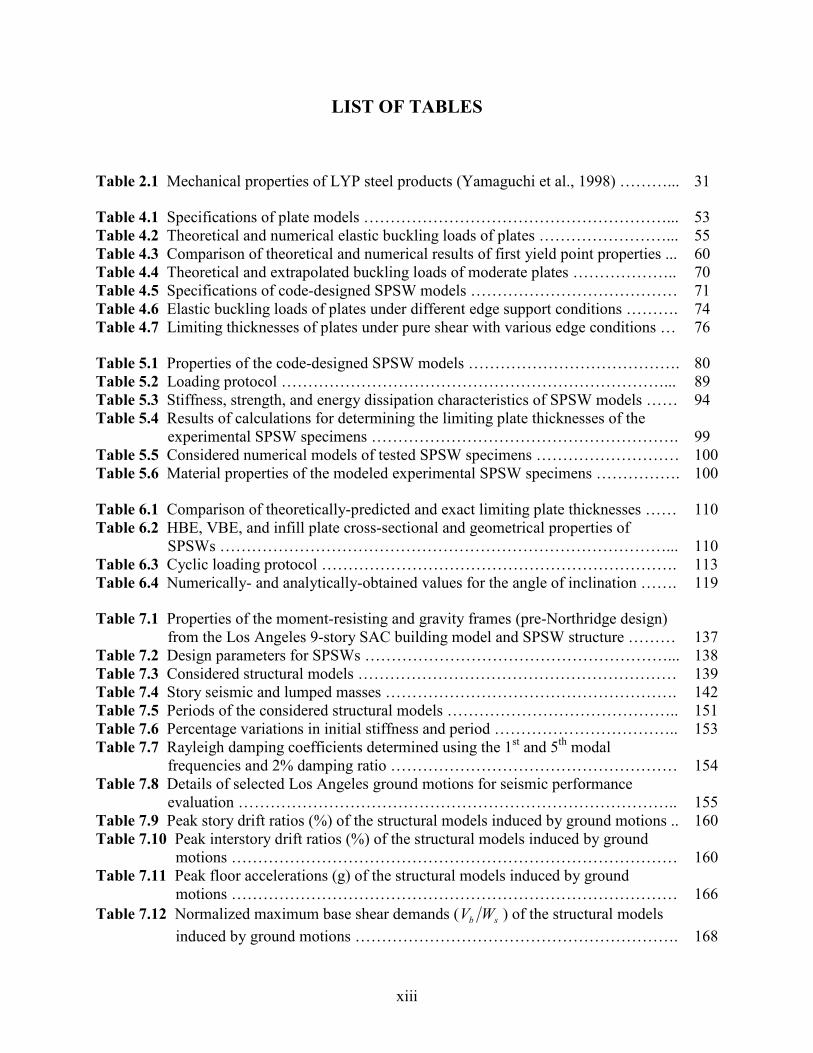
LIST OF TABLES
Table 2.1 Mechanical properties of LYP steel products (Yamaguchi et al., 1998) ………... 31
Table 4.1 Specifications of plate models …………………………………………………... 53
Table 4.2 Theoretical and numerical elastic buckling loads of plates ……………………... 55
Table 4.3 Comparison of theoretical and numerical results of first yield point properties ... 60
Table 4.4 Theoretical and extrapolated buckling loads of moderate plates ……………….. 70
Table 4.5 Specifications of code-designed SPSW models ………………………………… 71
Table 4.6 Elastic buckling loads of plates under different edge support conditions ………. 74
Table 4.7 Limiting thicknesses of plates under pure shear with various edge conditions … 76
Table 5.1 Properties of the code-designed SPSW models …………………………………. 80
Table 5.2 Loading protocol ………………………………………………………………... 89
Table 5.3 Stiffness, strength, and energy dissipation characteristics of SPSW models …… 94
Table 5.4 Results of calculations for determining the limiting plate thicknesses of the
experimental SPSW specimens …………………………………………………. 99
Table 5.5 Considered numerical models of tested SPSW specimens ……………………… 100
Table 5.6 Material properties of the modeled experimental SPSW specimens ……………. 100
Table 6.1 Comparison of theoretically-predicted and exact limiting plate thicknesses …… 110
Table 6.2 HBE, VBE, and infill plate cross-sectional and geometrical properties of
SPSWs …………………………………………………………………………... 110
Table 6.3 Cyclic loading protocol …………………………………………………………. 113
Table 6.4 Numerically- and analytically-obtained values for the angle of inclination ……. 119
Table 7.1 Properties of the moment-resisting and gravity frames (pre-Northridge design)
from the Los Angeles 9-story SAC building model and SPSW structure ……… 137
Table 7.2 Design parameters for SPSWs …………………………………………………... 138
Table 7.3 Considered structural models …………………………………………………… 139
Table 7.4 Story seismic and lumped masses ………………………………………………. 142
Table 7.5 Periods of the considered structural models …………………………………….. 151
Table 7.6 Percentage variations in initial stiffness and period …………………………….. 153
Table 7.7 Rayleigh damping coefficients determined using the 1st and 5
th modal
frequencies and 2% damping ratio ……………………………………………… 154
Table 7.8 Details of selected Los Angeles ground motions for seismic performance
evaluation ……………………………………………………………………….. 155
Table 7.9 Peak story drift ratios (%) of the structural models induced by ground motions .. 160
Table 7.10 Peak interstory drift ratios (%) of the structural models induced by ground
motions ………………………………………………………………………… 160
Table 7.11 Peak floor accelerations (g) of the structural models induced by ground
motions ………………………………………………………………………… 166
Table 7.12 Normalized maximum base shear demands ( sb WV ) of the structural models
induced by ground motions ……………………………………………………. 168
xiv
Table 7.13 Normalized maximum base moment demands ( 100)( ×× tsb HWM ) of the
structural models induced by ground motions ………………………………… 171
Table 7.14 Normalized maximum VBE axial load demands ( ybaseVBE PP−
) at column bases
of the SPSW models induced by ground motions ……………………………... 174
Table 7.15 Maximum web plate ductility ratios of GF-CSPSW and GF-LYPSPSW2
models …………………………………………………………………………. 176
Table 8.1 Details of selected Los Angeles ground motions for probabilistic seismic
demand analysis ………………………………………………………………… 190
Table 8.2 Summary of ground motion intensity measure and seismic response parameter
values ……………................................................................................................. 193
Table 8.3 R2 values obtained from linear regression of ln[EDP] and ln[IM] variables …… 199
Table 8.4 Regression coefficients, standard deviation, and functional relation for selected
EDP-IM data sets ……………………………………………………………….. 201
Table 8.5 HAZUS-MH MR5 (2010) interstory drift ratios of structural damage states for
high-rise steel moment frames with high-code design level ……………………. 204
Table 8.6 Baldvins et al.’s (2012) recommended story drift ratios of structural repair
states for SPSWs that meet certain seismic criteria …………………………….. 204
Table 8.7 HAZUS-MH MR5 (2010) interstory drift ratios of nonstructural damage states
for drift-sensitive components of all building types …………………………….. 205
Table 8.8 HAZUS-MH MR5 (2010) peak floor accelerations of nonstructural damage
states for acceleration-sensitive components/contents of all building types with
high-code design level …………………………………………………………... 205

xv
ACKNOWLEDGMENTS
First and foremost, my deepest acknowledgement is given to my Lord and Savior, JESUS
CHRIST The Only Answer, for His mercy, plan, and giving me strength to overcome various
challenges and difficulties, and achieve my educational goals.
Next, I want to express my boundless gratefulness to my parents and family for their
endless love and continual prayers, support as well as encouragement throughout my studies.
I would like to offer my utmost gratitude to my academic advisor, Prof. Jian Zhang, for her
precious and continual guidance, support, and encouragement during the course of my graduate
studies at UCLA. Also, I wish to extend my wholehearted and profound appreciation to the
members of my doctoral committee, Prof. Jiann-Wen Woody Ju, Prof. Ertugrul Taciroglu, and
Prof. Christopher S. Lynch, who have taught me invaluable lessons and always provided me with
their great and precious support.
My special thanks go to Prof. Qiuhong Zhao from Tianjin University in China, Prof.
Carlos Estuardo Ventura from The University of British Columbia in Canada, Prof. Sheng-Jin
Chen from National Taiwan University of Science and Technology in Taiwan, Dr. Chyuan Jhang
from the Sinotech Engineering Consultants in Taiwan, and Dr. In-Rak Choi from the Research
Institute of Industrial Science and Technology in South Korea, for their great and precious
support in providing me with experimental data and details.
Finally, I would like to thank all my friends, fellow students, researchers, and professionals
from all over the world, who supported me with their helpful and constructive comments, ideas,
and feedback regarding various aspects of this research work.

xvi
VITA
EEDDUUCCAATTIIOONN
• M.Sc. in Structural Engineering, Urmia University, Iran (2003-2005)
• B.Sc. in Civil Engineering, Azad University - Urmia Branch, Iran (1998-2002)
TTEEAACCHHIINNGG AANNDD RREESSEEAARRCCHH AACCTTIIVVIITTIIEESS ((SSEELLEECCTTEEDD))
• Graduate Research and Teaching Assistant, Department of Civil and Environmental
Engineering, University of California, Los Angeles, U.S.A. (2009-2013)
• Lecturer, Department of Civil Engineering, California State Polytechnic University, Pomona,
U.S.A. (2012-2013)
• Graduate Research and Teaching Assistant, Department of Civil and Environmental
Engineering, University of California, Irvine, U.S.A. (2007-2009)
• Graduate Teaching Assistant, Department of Civil Engineering, Azad University - Urmia
Branch, Iran (2004-2005)
• Graduate Research Assistant, Department of Civil Engineering, Urmia University, Iran
(2003-2005)
HHOONNOORRSS AANNDD AAWWAARRDDSS ((SSEELLEECCTTEEDD))
• UCLA Outstanding Civil Engineering Ph.D. Award, CA, U.S.A. (2012-2013)
• UCLA Graduate Division, Fellowship Award, CA, U.S.A. (2010-2013)
• ASCE-IECC’5 Conference Best Student Paper Award, Irvine, CA, U.S.A. (2008)
• Urmia University, Highest G.P.A. of Graduates, Top Student, Urmia, Iran (2005)
• Azad University - Urmia Branch, Highest G.P.A. of Graduates, Top Student, Urmia, Iran
(2002)
PPRROOFFEESSSSIIOONNAALL AACCTTIIVVIITTIIEESS ((SSEELLEECCTTEEDD))
• Journal Paper Reviewer: The Structural Design of Tall and Special Buildings; Ain Shams
Engineering Journal; Structural Engineering and Mechanics, An international Journal; Steel
and Composite Structures, An International Journal; Journal of Civil Engineering and
Architecture; Mathematical Problems in Engineering; World Applied Sciences Journal
• Conference Paper Reviewer: CSCE 2007 Annual General Meeting & Conference, Canada
JJOOUURRNNAALL PPUUBBLLIICCAATTIIOONNSS ((SSEELLEECCTTEEDD))
Zirakian T. (2008). “Lateral-Distortional Buckling of I-Beams and the Extrapolation
Techniques”, Journal of Constructional Steel Research, 64(1), 1-11.
Zirakian T. (2008). “Elastic Distortional Buckling of Doubly Symmetric I-Shaped Flexural
Members with Slender Webs”, Thin-Walled Structures, 46(5), 466-475.
Zirakian T. (2010). “On the Application of the Extrapolation Techniques in Elastic Buckling”,
Journal of Constructional Steel Research, 66(3), 335-341.
xvii
Zirakian T. and Zhang J. (2012). “Elastic Distortional Buckling of Singly Symmetric I-Shaped
Flexural Members with Slender Webs”, International Journal of Structural Stability and
Dynamics, 12(2), 359-376.
Zhang J. and Zirakian T. (2013). “Buckling and Yielding Behavior of Unstiffened Slender,
Moderate, and Stocky Low Yield Point Steel Plates”. (To Be Submitted)
Zirakian T. and Zhang J. (2013). “Structural Behavior of Shear Wall Systems with Unstiffened
Slender, Moderate, and Stocky Low Yield Point Steel Infill Plates”. (To Be Submitted)
Zirakian T. and Zhang J. (2013). “Seismic Design and Behavior of Low Yield Point Steel Plate
Shear Walls”. (To Be Submitted)
Zhang J. and Zirakian T. (2013). “Study on Seismic Retrofit of Structures Using Steel Plate Shear
Wall Systems and Low Yield Point Steel Material”. (Under Preparation)
Zhang J. and Zirakian T. (2013). “Probabilistic Assessment of Seismic Retrofit of Structures by
SPSW Systems and LYP Steel Material Using Fragility Function Method”. (Under
Preparation)
CCOONNFFEERREENNCCEE PPRREESSEENNTTAATTIIOONNSS ((SSEELLEECCTTEEDD))
Zirakian T. (2007). “Elastic Distortional Buckling Analysis of Steel I-Beams Using CUFSM”,
Proc., 2007 Annual Conference of the Canadian Society for Civil Engineering (CSCE),
Yellowknife, Northwest Territories, Canada.
Zirakian T. (2008). “Elastic Lateral-Distortional Buckling of Doubly Symmetric I-Beams: The
2005 AISC Specification”, ASCE 5th International Engineering and Construction
Conference, University of California, Irvine, U.S.A.
Zirakian T. (2010). “Further Results on the Application of the Extrapolation Techniques”, 2010
International Colloquium on Stability and Ductility of Steel Structures, Rio de Janeiro,
Brazil.
Zirakian T. and Zhang J. (2010). “Elastic Lateral-Distortional Buckling of Singly Symmetric I-
Beams: The 2005 AISC Specification”, 2010 International Colloquium on Stability and
Ductility of Steel Structures, Rio de Janeiro, Brazil.
Zirakian T. (2011). “On the Application of the Meck Plot in Elastic Buckling”, ASCE
Conference Proceedings of the 2011 Structures Congress, Las Vegas, Nevada, U.S.A.
Zirakian T. and Zhang J. (2012). “Modified PFI Model for SPSWs with Moderate and Stocky
LYP Steel Infill Plates”, Joint SSRC Annual Stability and AISC Steel Conference,
Grapevine, Texas, U.S.A.
Zirakian T. and Zhang J. (2012). “Structural Performance of SPSWs with Unstiffened Slender,
Moderate, and Stocky LYP Steel Infill Plates”, 15th World Conference of Earthquake
Engineering, Lisbon, Portugal.
Zirakian T. and Zhang J. (2013). “Study on Seismic Design and Performance of SPSWs with
Unstiffened LYP Steel Infill Plates”, 2013 Conference of the ASCE Engineering Mechanics
Institute, Northwestern University, Evanston, Illinois, U.S.A.
Zirakian T. and Zhang J. (2013). “Assessment of Seismic Behavior of Structures Retrofitted with
Conventional and LYP Steel Infill Plates Using the Fragility Function Method”, 2013
Conference of the ASCE Engineering Mechanics Institute, Northwestern University,
Evanston, Illinois, U.S.A.
Zhang J. and Zirakian T. (2013). “Dynamic Response of Structures Retrofitted with SPSW
Systems and LYP Steel Material”, 10th U.S. National Conference on Earthquake
Engineering, Anchorage, Alaska, U.S.A. (To Be Submitted)
1
1. INTRODUCTION
1.1 General
Rigid frames, shear walls, and braced frames are three typical types of structural systems
which are used to resist the lateral loads and limit the drift in buildings. Among the lateral force-
resisting systems, steel plate shear walls (SPSWs) are relatively new systems which offer many
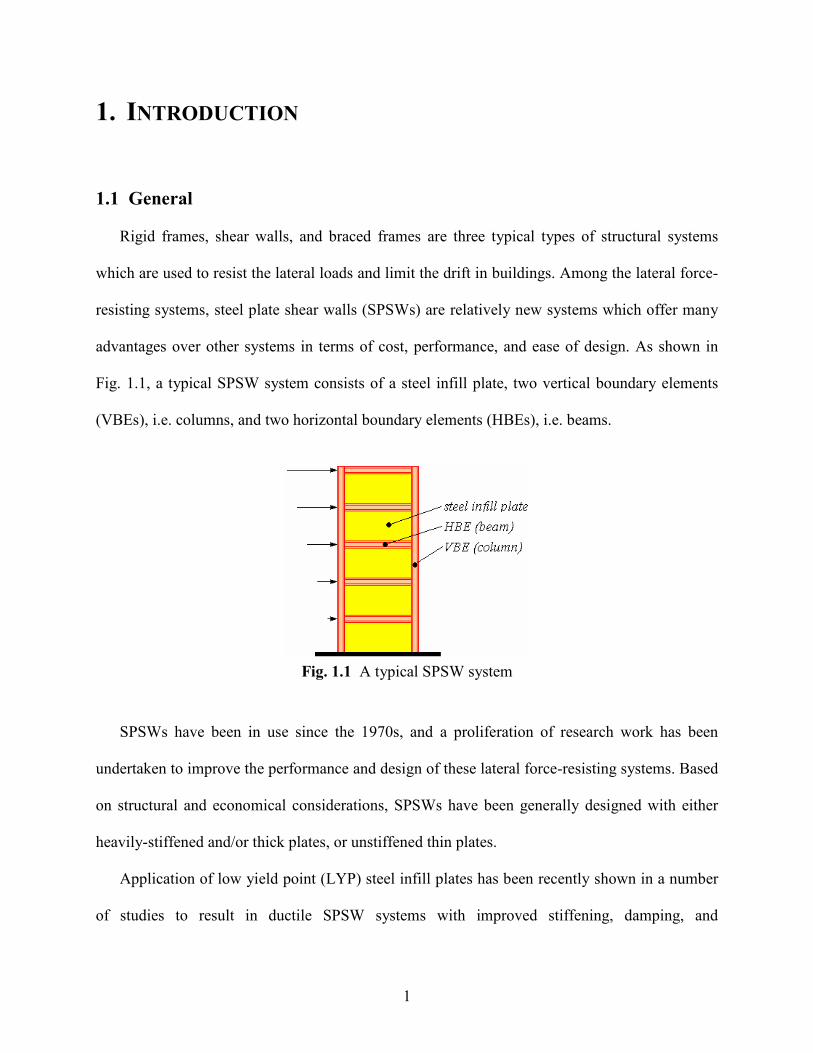
advantages over other systems in terms of cost, performance, and ease of design. As shown in
Fig. 1.1, a typical SPSW system consists of a steel infill plate, two vertical boundary elements
(VBEs), i.e. columns, and two horizontal boundary elements (HBEs), i.e. beams.
Fig. 1.1 A typical SPSW system
SPSWs have been in use since the 1970s, and a proliferation of research work has been
undertaken to improve the performance and design of these lateral force-resisting systems. Based
on structural and economical considerations, SPSWs have been generally designed with either
heavily-stiffened and/or thick plates, or unstiffened thin plates.
Application of low yield point (LYP) steel infill plates has been recently shown in a number
of studies to result in ductile SPSW systems with improved stiffening, damping, and
2
serviceability characteristics. Considering the various advantages of use of LYP steel infill plates
in SPSWs and limited number of studies on this subject, more research is required to identify the
structural characteristics and evaluate the seismic performance of LYP steel shear wall systems.
Hence, the main objective of this research program is to perform a rather comprehensive and
systematic study on the structural behavior and seismic performance of SPSWs employing
unstiffened LYP steel infill plates.
1.2 Applications
Since 1970s, SPSWs have been used as the primary and/or part of the primary lateral force-
resisting system in a number of buildings ranging from single-family residential to high-rise
construction mainly in highly-seismic areas in Japan and North America. Initially, and during
1970s, stiffened SPSWs were used in Japan in new construction and in the United States for
seismic retrofit of the existing and construction of new buildings. Later on, in 1980s and 90s,
unstiffened steel shear walls were used in buildings in the United States and Canada (Astaneh-
Asl, 2000).
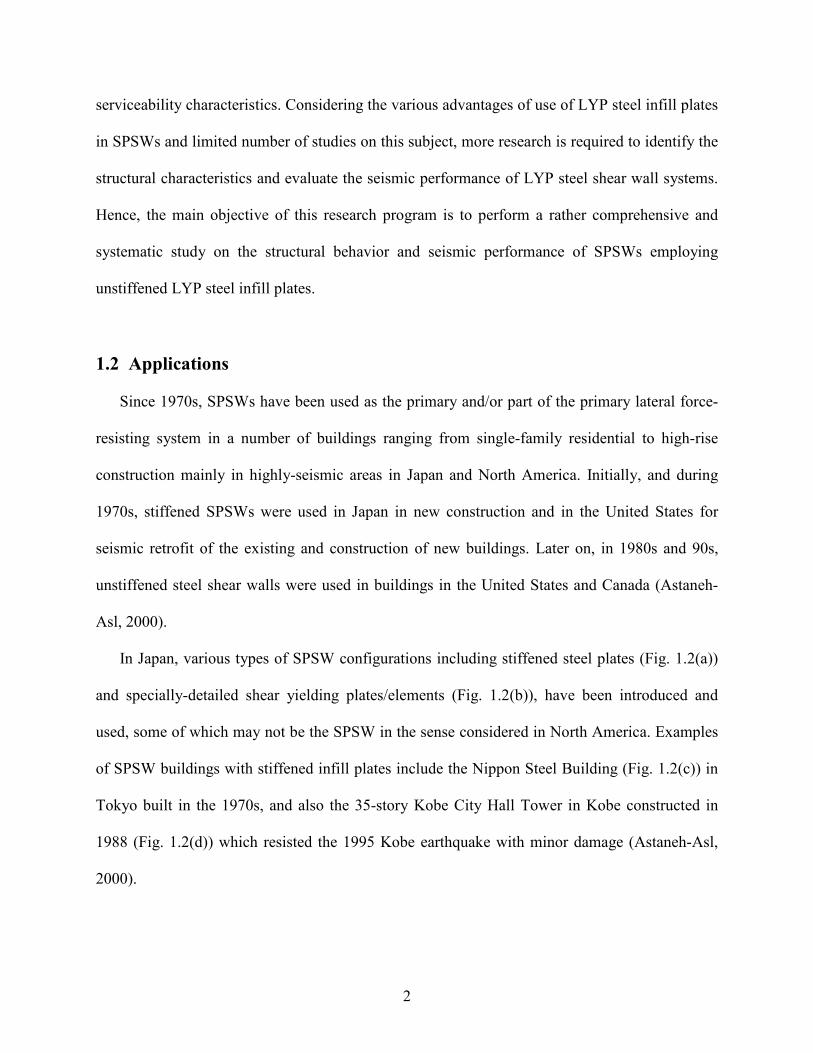
In Japan, various types of SPSW configurations including stiffened steel plates (Fig. 1.2(a))
and specially-detailed shear yielding plates/elements (Fig. 1.2(b)), have been introduced and
used, some of which may not be the SPSW in the sense considered in North America. Examples
of SPSW buildings with stiffened infill plates include the Nippon Steel Building (Fig. 1.2(c)) in
Tokyo built in the 1970s, and also the 35-story Kobe City Hall Tower in Kobe constructed in
1988 (Fig. 1.2(d)) which resisted the 1995 Kobe earthquake with minor damage (Astaneh-Asl,
2000).
3
(a) SPSW with stiffened infill plate (b) Shear yielding plates/elements
(c) Nippon Steel Building (d) Kobe City Hall Tower
Fig. 1.2 SPSW configurations and applications in Japan (Sabelli and Bruneau, 2006)
Following the development of LYP steel by Nippon Steel in Japan, some LYP steel shear
wall projects included LYP plates to dissipate energy (Yamaguchi et al., 1998). The Saitama
Wide-Area Joint Agency Buildings, 31 and 26 stories, provide an example of implementation of
a stiffened SPSW with LYP100 steel. In these structures, thicknesses of plates varied from 25 to
6 mm (1 to 1/4 in.) along the height of the building, with panels of up to 4.5×3.0 m (15×10 ft) in
size (Sabelli and Bruneau, 2006).
In early applications of SPSWs in United States, shear walls were designed with relatively
closely-spaced horizontal and vertical stiffeners to prevent buckling of the plate, and used for
seismic retrofit of low and medium-rise existing structures. However, the current North
American practice is to use unstiffened plates, since considering today’s construction and labor
costs in North America, welding stiffeners to steel wall are costly and time-consuming and the
4
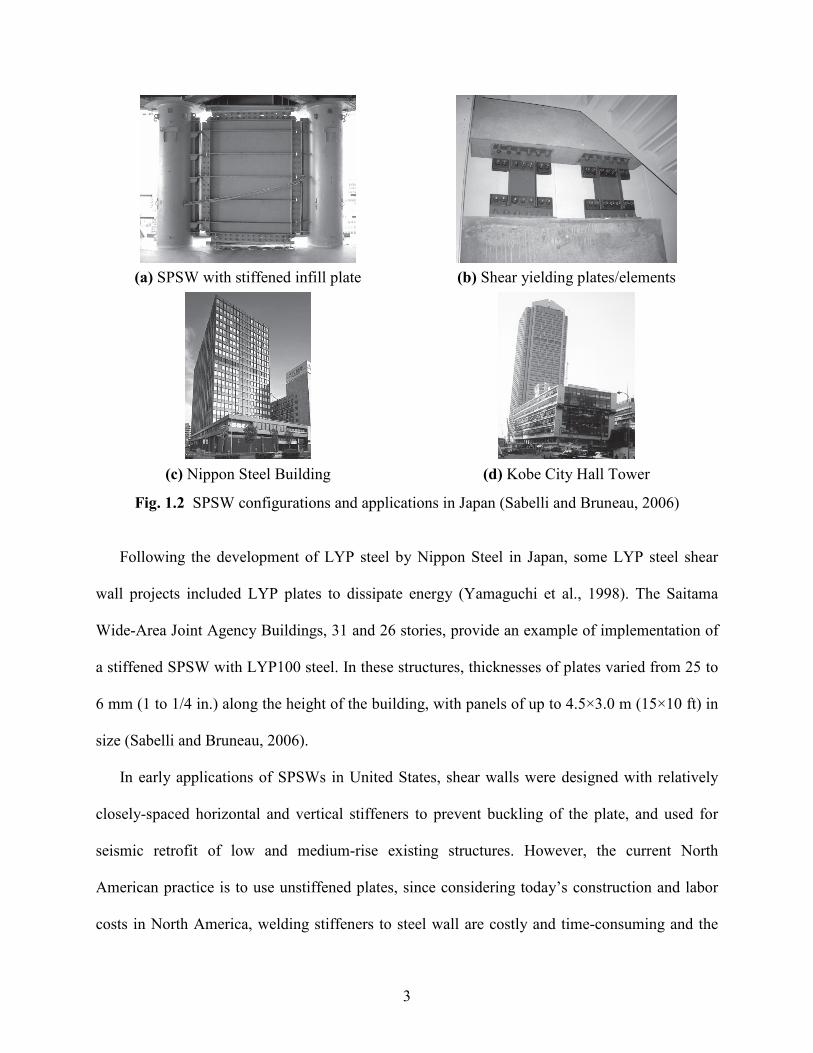
research undertaken in recent years has indicated that the steel plate alone, without stiffeners,
performs in a very ductile, desirable, and efficient manner. Fig. 1.3 shows some of the buildings
with such SPSW systems.
SPSW systems have been used in other countries such as Canada, Mexico, etc. as well. In
particular, since the early 1980s, unstiffened SPSWs have been used in Canada, as these were the
types of SPSWs on which Canadian research focused.
(a) U.S. Federal Courthouse, Seattle, WA
(b) Four-story residence
in San Francisco, CA
Fig. 1.3 Application of SPSW systems in United States (Sabelli and Bruneau, 2006)
1.3 Wall Types
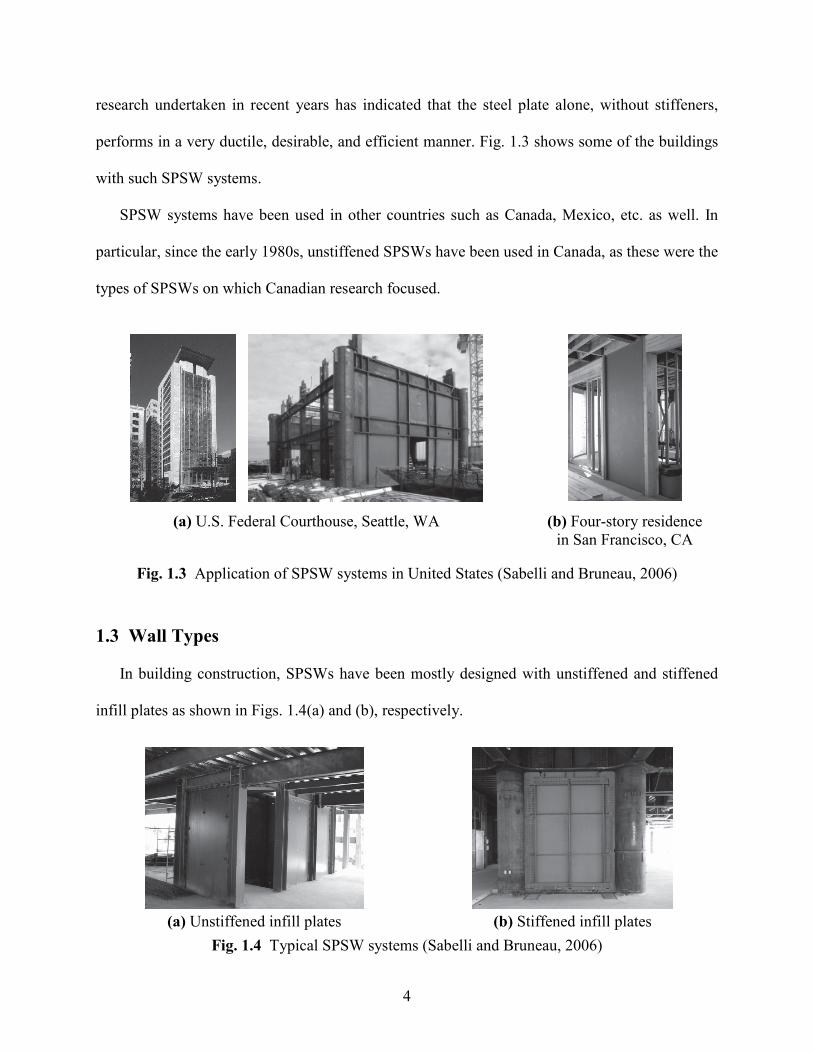
In building construction, SPSWs have been mostly designed with unstiffened and stiffened
infill plates as shown in Figs. 1.4(a) and (b), respectively.
(a) Unstiffened infill plates (b) Stiffened infill plates
Fig. 1.4 Typical SPSW systems (Sabelli and Bruneau, 2006)

5
Unstiffened and slender-web SPSWs have been the most popular type used in the United
States and Canada. Such SPSW systems have negligible compression strength and thus, shear
buckling occurs at low levels of loading. Hence, the main disadvantage of such systems is the
premature buckling of the compression zone of the wall, which results in reduced shear strength,
stiffness, and energy dissipation capacity (Zhao and Astaneh-Asl, 2004). Nonetheless, extensive
research work in Canada undertaken by Kulak, Thorburn, Driver, Grondin, and others has
resulted in development of a design methodology to utilize the post-buckling capacity of the web
plates and the usefulness of a web plate has not been limited to its buckling capacity.
Stiffeners are primarily provided to increase the buckling strength of infill plates in SPSWs.
In fact, stiffeners limit the plate out-of-plane deflections, increase their elastic buckling strength,
and extend yielding throughout the plate (Alinia and Sarraf Shirazi, 2009). Sufficient stiffening
will permit the web plate to achieve its full plastic strength and avoid overall buckling.
Another approach to mitigate most disadvantages of unstiffened and slender-web shear walls
is to employ composite infill plates in which the steel infill plate is connected to thin concrete
panels on one or both sides, as shown in Fig. 1.5. The concrete wall restrains the steel plate and
prevents its buckling before it yields. In addition, the reinforced concrete wall provides sound
and temperature insulation as well as fire proofing to steel shear walls (Astaneh-Asl, 2002).
Composite shear walls have been used in buildings in recent years even though not as frequently
as the unstiffened and stiffened shear walls. As shown in Fig. 1.5, composite shear walls may be
of either traditional or innovative type. In an innovative system, as proposed by Astaneh-Asl
(2002), there is a gap between the concrete wall and the boundary frame elements to prevent the
concrete wall from engaging in resisting the lateral forces too early during small and moderate
6
earthquakes, otherwise the concrete wall is seriously damaged and can not prevent the plate
buckling.
Fig. 1.5 SPSWs with composite shear panels (Astaneh-Asl, 2002)
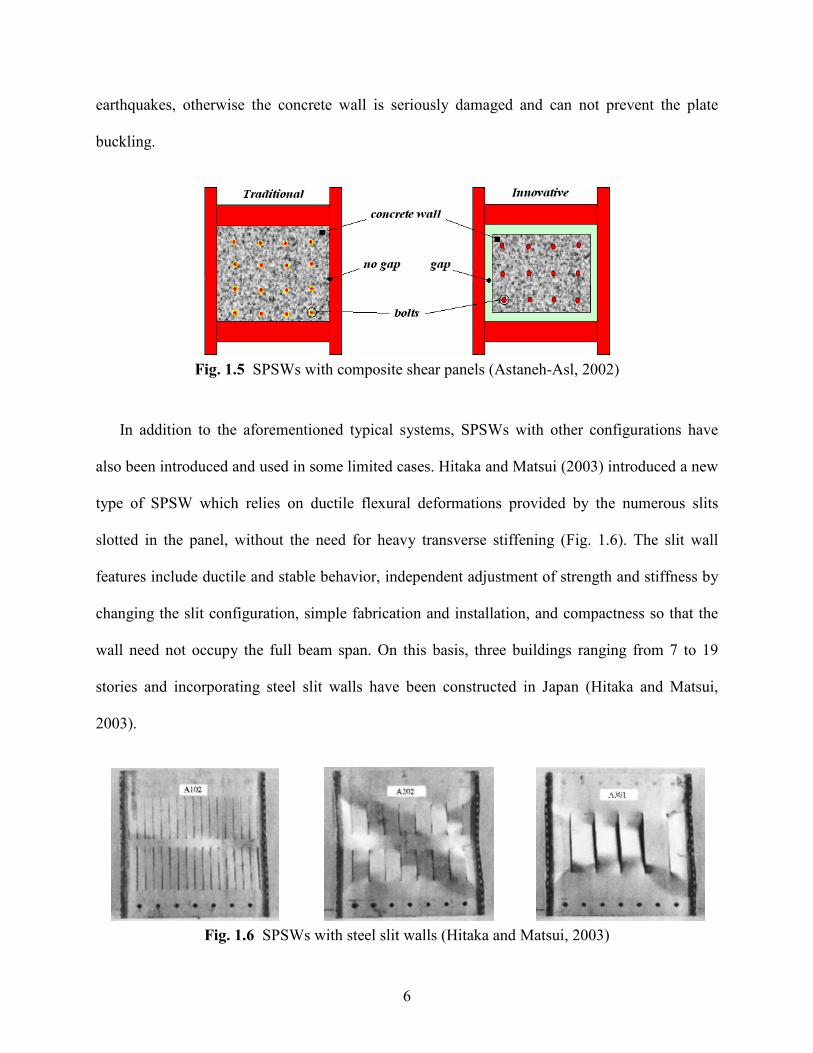
In addition to the aforementioned typical systems, SPSWs with other configurations have
also been introduced and used in some limited cases. Hitaka and Matsui (2003) introduced a new
type of SPSW which relies on ductile flexural deformations provided by the numerous slits
slotted in the panel, without the need for heavy transverse stiffening (Fig. 1.6). The slit wall
features include ductile and stable behavior, independent adjustment of strength and stiffness by
changing the slit configuration, simple fabrication and installation, and compactness so that the
wall need not occupy the full beam span. On this basis, three buildings ranging from 7 to 19
stories and incorporating steel slit walls have been constructed in Japan (Hitaka and Matsui,
2003).
Fig. 1.6 SPSWs with steel slit walls (Hitaka and Matsui, 2003)
7
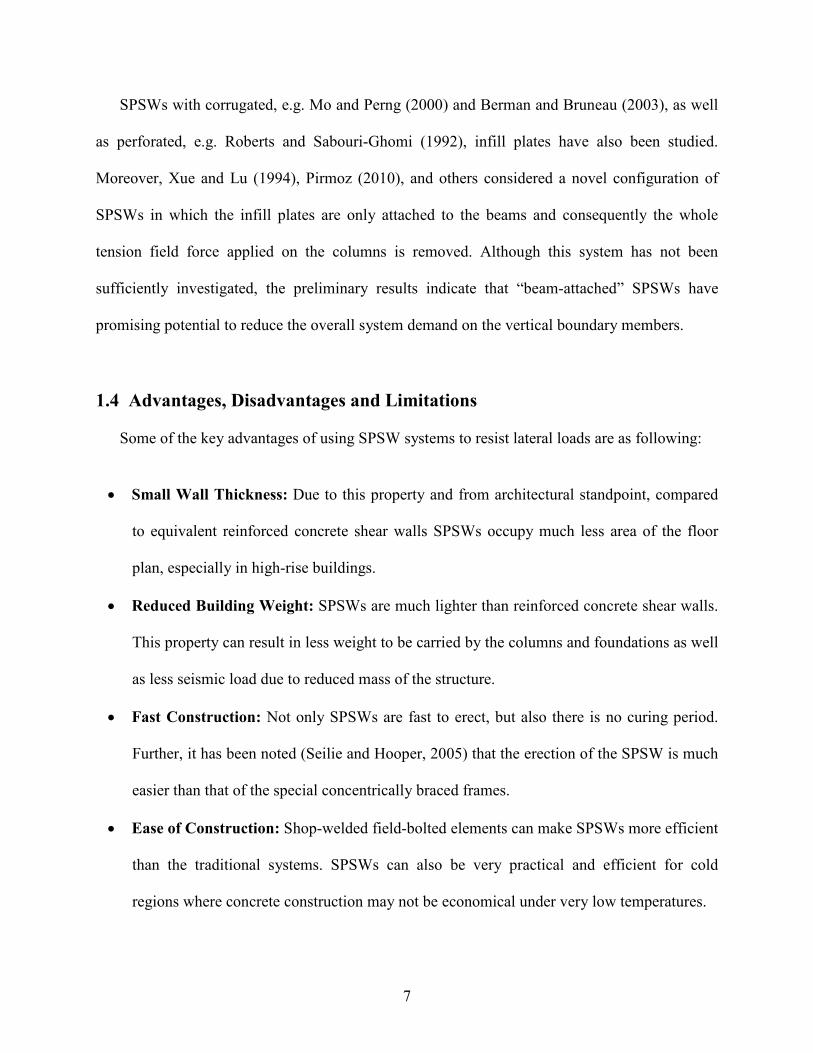
SPSWs with corrugated, e.g. Mo and Perng (2000) and Berman and Bruneau (2003), as well
as perforated, e.g. Roberts and Sabouri-Ghomi (1992), infill plates have also been studied.
Moreover, Xue and Lu (1994), Pirmoz (2010), and others considered a novel configuration of
SPSWs in which the infill plates are only attached to the beams and consequently the whole
tension field force applied on the columns is removed. Although this system has not been
sufficiently investigated, the preliminary results indicate that “beam-attached” SPSWs have
promising potential to reduce the overall system demand on the vertical boundary members.
1.4 Advantages, Disadvantages and Limitations
Some of the key advantages of using SPSW systems to resist lateral loads are as following:
• Small Wall Thickness: Due to this property and from architectural standpoint, compared
to equivalent reinforced concrete shear walls SPSWs occupy much less area of the floor
plan, especially in high-rise buildings.
• Reduced Building Weight: SPSWs are much lighter than reinforced concrete shear walls.
This property can result in less weight to be carried by the columns and foundations as well
as less seismic load due to reduced mass of the structure.
• Fast Construction: Not only SPSWs are fast to erect, but also there is no curing period.
Further, it has been noted (Seilie and Hooper, 2005) that the erection of the SPSW is much
easier than that of the special concentrically braced frames.
• Ease of Construction: Shop-welded field-bolted elements can make SPSWs more efficient
than the traditional systems. SPSWs can also be very practical and efficient for cold
regions where concrete construction may not be economical under very low temperatures.
8
• High Stiffness and Strength: Due to their relatively high initial stiffness, SPSWs can
effectively limit the drift. Also, due to their high stiffness and strength, shorter bays may be
used in construction, which can result in greater flexibility for use of the space.
• High Ductility and Energy Dissipation Capacity: Past research shows that properly-
designed and detailed SPSWs are very ductile and can have relatively large energy
dissipation capability.
• Tested System: Some buildings with SPSW systems have undergone significant
earthquake ground shaking in the past, and have survived with insignificant structural
damage (Astaneh-Asl, 2000).
In spite of considerable advantages of the SPSW systems, according to Seilie and Hooper
(2005) they may also have some disadvantages as noted in the following:
• Lower Stiffness due to Flexural Flexibility: Compared to the reinforced concrete shear
walls, SPSWs are usually more flexible primarily due to their flexural flexibility, which has
to be properly addressed in design of tall buildings.
• Construction Sequence: Excessive initial compressive force may delay the development
of tension-field action in SPSWs. So, it is important that the construction sequence be
designed to avoid excessive compression in the panel. For instance, in the U.S. Federal
Courthouse project, the welding of the plate splice connections was delayed until most of
the dead load deformation occurred in order to relieve the pre-compression within the
SPSW panel.
9
• New System: Due to unfamiliarity with such a relatively new lateral force-resisting system,
a contractor may typically estimate a high erected cost. This may be solved by engaging the
contractor early in the design phase.
In addition to the above-mentioned advantages and disadvantages of SPSWs, there may be
some limitations in use of such systems in practice. Although this system is viable for both small
and large structures, according to Sabelli and Bruneau (2006) aspects of the design vary with
building size. For instance, compliance with some design requirements of AISC 341 for seismic
design may be more difficult or at least more tedious than typical detailing practice for smaller
structures. As another example, SPSW bays with long horizontal proportions may be needed in
taller buildings to control the drift. However, because of lack of research and knowledge on the
behavior of SPSWs with both shorter and longer bays, use of such systems may be restricted.
1.5 Scope and Objectives
SPSWs, in general, have been utilized based on two different design philosophies and
detailing strategies. Stiffened and/or stocky-web SPSWs with high structural and seismic
performance have been mostly designed and used in Japan. Unstiffened and slender-web SPSWs
with relatively lower buckling and energy dissipation capacities, on the other hand, have been
deemed as a rather economical alternative and accordingly widely used in the United States and
Canada. Development and use of LYP steel with exclusive material properties for seismic
applications nowadays makes it possible to take advantage of merits of the two design strategies
and consequently design relatively cost-effective SPSW systems with improved buckling
stability, serviceability, and energy absorption capacity. Nevertheless, in order to promote and
encourage the employment of LYP steel shear wall systems in practice, a thorough and sound
10
understanding of their structural characteristics and seismic performance is crucial which, of
course, requires detailed and systematic theoretical as well as experimental investigations.
Despite some experimental and numerical studies on the behavior of LYP steel shear walls,
the structural and seismic characteristics of these systems have not been fully explored and still
lots of questions and concerns regarding various aspects of application of such lateral force-
resisting systems remain unaddressed. It is also important to note that currently LYP steel is only
produced in a limited number of countries such as Japan and China, and it is believed that
sufficient research and broad knowledge on structural characteristics and effective practical
application of LYP steel material in lateral force-resisting and energy dissipating systems will, in
turn, result in mass production and economical use of such efficient steel material in other parts
of the world, especially in the United States.
On this basis, this research aims at reaching a deep understanding of behavioral
characteristics of unstiffened SPSW systems employing LYP steel infill plates through detailed
element-, component-, and system-level investigations on their structural behavior and seismic
performance using analytical, numerical, and probabilistic approaches. It also intends to provide
effective and practical design tools and recommendations for efficient design and application of
LYP steel shear wall systems. The major tasks of this comprehensive research program are
summarized in the following:
1. Element-Level Investigations on Steel Plates: Analytical and numerical studies on
determination of limiting thicknesses corresponding to simultaneous buckling and
yielding of steel plates. Evaluation of buckling, yielding, and hysteresis behaviors of LYP
steel plates. Assessment of effects of using LYP steel and plate aspect ratio on limiting
thickness.

11
2. Component-Level Investigations on SPSW Panels: Study on behaviors of code-
designed SPSWs with slender, moderate, and stocky LYP steel infill plates via nonlinear
pushover and cyclic analyses. Evaluation of advantages of using LYP steel infill plates in
design and retrofit of SPSW systems. Development and verification of a modified plate-
frame interaction (PFI) model for predicting the behaviors of SPSWs with low yielding
and high bucking capacities. Evaluation of effectiveness of some AISC 341 code-
specified design requirements and recommendations.
3. System-Level Investigations on Multi-Story SPSW Frames: Selection and verification
of an efficient modeling approach for representing the behavior of SPSWs employed in
multi-story structures. Seismic response and performance assessment of code-designed
and retrofitted structures employing conventional and LYP steel infill plates via nonlinear
time-history analyses.
4. Probabilistic Seismic Vulnerability Assessment Using Fragility Function Method:
Determination of proper engineering demand parameter (EDP) and seismic intensity
measure (IM) pairs with less variation and good linear correlation. Development of
structural and nonstructural fragility functions by considering appropriate damage and
repair states. Probabilistic seismic performance and vulnerability assessment of code-
designed and retrofitted SPSW frames through fragility analyses.
1.6 Organization
This dissertation includes a total of 9 chapters in order to address the key issues and achieve
the considered objectives of this research presented in the previous section.
12
A general description of SPSW systems along with the motivations and objectives of this
research are provided in Chapter 1.
Chapter 2 includes a survey of the past analytical and experimental research and recent
developments on the analysis, design, and application of SPSW systems as well as production
and properties of the LYP steel material.
Chapter 3 provides a general discussion of the fundamental mechanics of unstiffened
SPSWs, and also addresses the AISC 341 code-specified design requirements as well as
performance-based design of SPSW systems.
In Chapter 4, element-level investigations on the buckling, yielding, and cyclic behaviors of
steel plates are presented. This chapter also focuses on the determination of the limiting
thickness corresponding to concurrent geometrical buckling and material yielding of steel plates,
which serves as the guiding parameter quantifying the behavior of steel plates.
Chapter 5 presents component-level studies on the pushover and cyclic behaviors of SPSWs
with slender, moderate, and stocky infill plates. In this chapter, a modified PFI method is also
proposed and its efficiency in predicting the behaviors of SPSWs with moderate and stocky infill
plates is evaluated.
In Chapter 6, component-level investigations are continued by evaluating the structural
behavior and performance of further sophisticated LYP steel shear walls designed for high-
seismic applications. Accordingly, the effectiveness of some AISC 341 code design requirements
and recommendations are evaluated through detailed numerical simulations.
Chapter 7 includes system-level investigations on the seismic response assessment of multi-
story SPSW frames under the action of earthquake ground motions. The effectiveness of the strip
model in representing the behaviors of SPSWs with various buckling and yielding behaviors is
13
primarily evaluated. Subsequently, the seismic performances of code-designed and retrofitted
SPSW frames with conventional and LYP steel infill plates are investigated by considering
various seismic response parameters from nonlinear dynamic analyses.
In Chapter 8, the seismic performance and vulnerability of code-designed and retrofitted
structures employing SPSW systems and LYP steel material are evaluated through probabilistic
seismic demand analysis (PSDA) method by developing appropriate fragility functions.
Ultimately, Chapter 9 provides the major findings and conclusions of this research along with
the recommendations for the future work.

14
2. PAST RESEARCH AND RECENT DEVELOPMENTS
2.1 General
Early designs for SPSWs were based on the premise that out-of-plane buckling constituted
the limit of usefulness of the infill plates. To prevent buckling, either stiffeners were needed or
the plate had to be relatively thick in order to fulfill this philosophy (Kulak et al., 2001). In
addition, it was demonstrated (Takahashi et al., 1973) that substantial stiffening of a plate could
increase the energy dissipation capacity of the system under cyclic loading, which was, of
course, accompanied by enhanced construction costs.
On the other hand, Wagner (1931) showed that buckling did not necessarily represent the
limit of useful behavior and that there was considerable post-buckling strength in an unstiffened
shear panel. Consideration of the post-buckling strength of plates was accepted in the design of
plate girder webs based largely on the work of Basler (1961). The appropriateness of post-
buckling stiffness and strength characteristics of SPSW to resist lateral loads was analytically
predicted by Thorburn et al. (1983) and experimentally confirmed by Timler and Kulak (1983).
Thus, the key research on unstiffened SPSWs was performed in the 1980s and since then such
SPSW systems have been studied and widely used particularly in the United States and Canada.
In recent years, LYP steel plates have been developed in Japan and used successfully in steel
shear wall systems in some projects. It has been demonstrated in Japan that LYP steel can be
used in energy dissipating elements of a structure (Astaneh-Asl, 2000). Recent studies have also
shown that LYP steel shear walls with improved structural and hysteretic characteristics can be
effectively utilized as the primary and/or part of the primary lateral force-resisting and energy
dissipating systems in buildings.
15
This chapter presents a brief summary of the prior and recent theoretical and experimental
investigations as well as developments on the application and performance of SPSW systems, in
particular, those with LYP steel infill plates.
2.2 Development of Analytical Modeling Techniques of SPSW Systems
This section deals with analytical research which includes theoretical works primarily
focusing on the behavioral aspects of the SPSW. In fact, the main purpose of the analytical
works has been to facilitate the analysis and design of SPSW systems without introducing much
complexity.
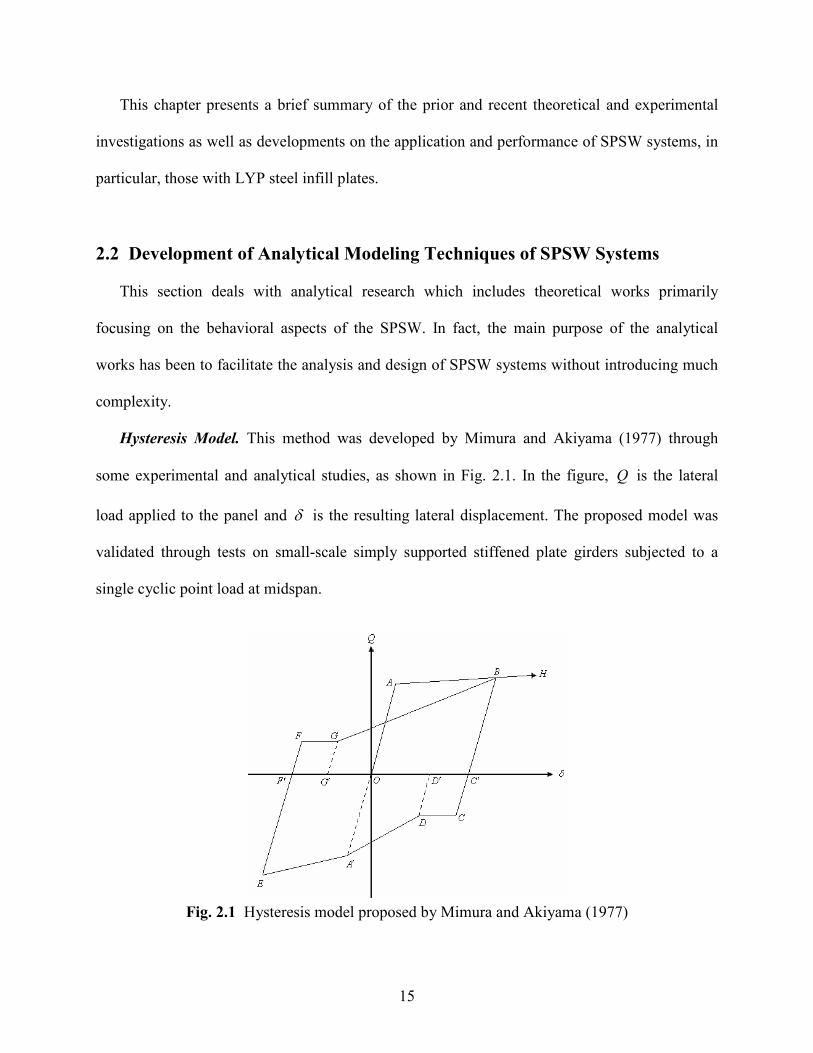
Hysteresis Model. This method was developed by Mimura and Akiyama (1977) through
some experimental and analytical studies, as shown in Fig. 2.1. In the figure, Q is the lateral
load applied to the panel and δ is the resulting lateral displacement. The proposed model was
validated through tests on small-scale simply supported stiffened plate girders subjected to a
single cyclic point load at midspan.
Fig. 2.1 Hysteresis model proposed by Mimura and Akiyama (1977)
16
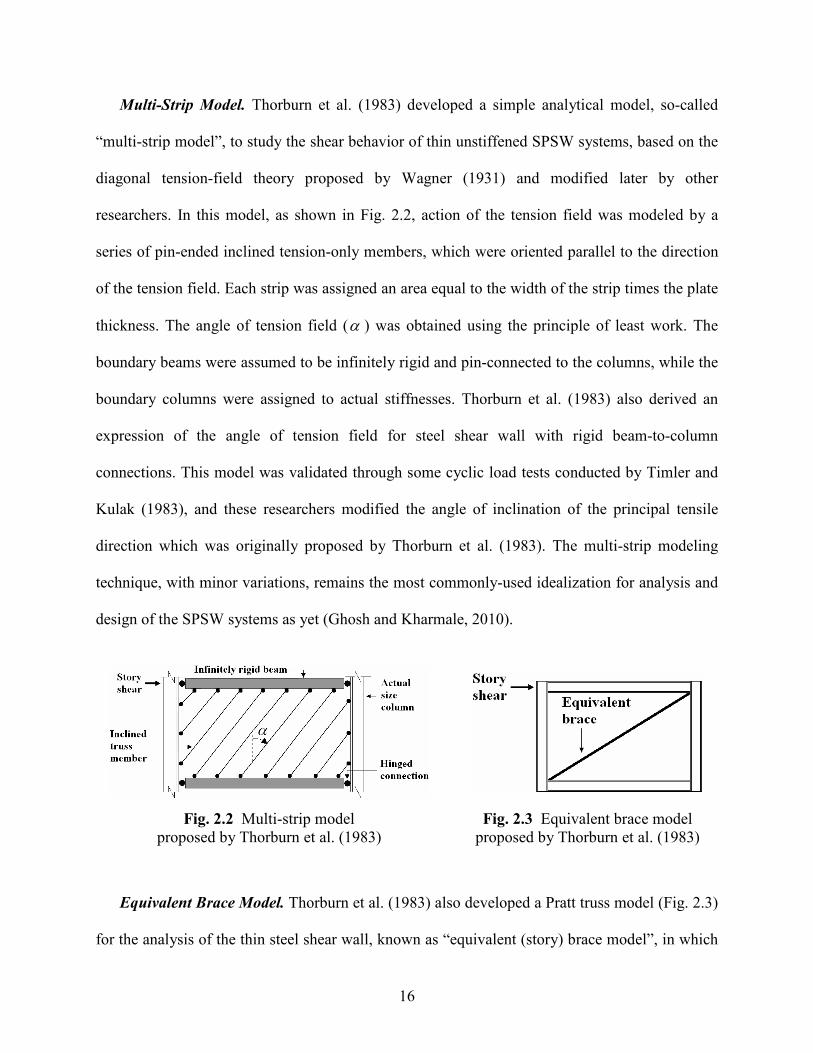
Multi-Strip Model. Thorburn et al. (1983) developed a simple analytical model, so-called
“multi-strip model”, to study the shear behavior of thin unstiffened SPSW systems, based on the
diagonal tension-field theory proposed by Wagner (1931) and modified later by other
researchers. In this model, as shown in Fig. 2.2, action of the tension field was modeled by a
series of pin-ended inclined tension-only members, which were oriented parallel to the direction
of the tension field. Each strip was assigned an area equal to the width of the strip times the plate
thickness. The angle of tension field (α ) was obtained using the principle of least work. The
boundary beams were assumed to be infinitely rigid and pin-connected to the columns, while the
boundary columns were assigned to actual stiffnesses. Thorburn et al. (1983) also derived an
expression of the angle of tension field for steel shear wall with rigid beam-to-column
connections. This model was validated through some cyclic load tests conducted by Timler and
Kulak (1983), and these researchers modified the angle of inclination of the principal tensile
direction which was originally proposed by Thorburn et al. (1983). The multi-strip modeling
technique, with minor variations, remains the most commonly-used idealization for analysis and
design of the SPSW systems as yet (Ghosh and Kharmale, 2010).
Fig. 2.2 Multi-strip model
proposed by Thorburn et al. (1983)
Fig. 2.3 Equivalent brace model
proposed by Thorburn et al. (1983)
Equivalent Brace Model. Thorburn et al. (1983) also developed a Pratt truss model (Fig. 2.3)
for the analysis of the thin steel shear wall, known as “equivalent (story) brace model”, in which

17
stiffness of the infill plate is equal to that derived from the multi-strip model of the panel. In spite
of relative simplicity of this model, the multi-strip modeling technique is preferred by most users
since its results are of relatively higher accuracy.
Cross (Diagonal) Strip Model. This model was developed by Elgaaly et al. (1993) to predict
the hysteretic behavior of SPSWs. As shown in Fig. 2.4, the cross truss members are used to
model the tension-field action in opposite directions during cyclic load reversals and a hysteretic
stress-strain relationship for these truss members was developed based on test results. Although
this modeling technique is a little more computation intensive compared to the multi-strip
technique, for obvious advantages it has gained acceptance over the years, particularly for
nonlinear response/time-history analyses of SPSW systems (Ghosh and Kharmale, 2010).
Fig. 2.4 Diagonal strip model
proposed by Elgaaly et al. (1993)
Fig. 2.5 Multi-angle strip model
proposed by Rezai (1999)
Multi-Angle Strip Model. Based on experimental studies conducted in the University of
British Columbia, it was found that the angle of the tension strips in steel shear wall was closer
to vertical at the corners and more horizontal around the mid-point of the plate, which was
primarily related to the interaction of the infill plate and boundary elements (Rezai, 1999). On
this basis and in order to overcome this deficiency of the multi-strip model, Rezai (1999)
proposed a “multi-angle strip model” as shown in Fig. 2.5, and also presented the respective

18
equations for calculating the cross-sectional area of each strip. As seen in Fig. 2.5, the five strips
oriented at various angles, account for the variation in the angle of tension field across the panel.
In spite of reasonable predictions of this model, the model was found to be conservative in
predicting the ultimate capacity, besides being a complex one to handle without any significant
gain in accuracy when compared to the multi-strip model (Ghosh and Kharmale, 2010).
Plate-Frame Interaction (PFI) Model. This general modeling technique was developed by
Sabouri-Ghomi et al. (2005) to analyze and design SPSW systems with different configurations.
In this method, the behaviors of the infill plate and boundary frame are considered separately,
and the interaction of these structural components is taken into account, as shown in Fig. 2.6.
Hence, it was named as the “plate-frame interaction” model. This modeling technique was also
modified to include the effect of overturning moments on the steel shear wall response. The
accuracy of this method has been verified through comparison with experimental and numerical
results and good agreement has been observed for the stiffness and strength of the SPSW
systems (Ghosh and Kharmale, 2010).
(a) Plate and frame idealization (b) Components of PFI method
Fig. 2.6 Plate-frame interaction method proposed by Sabouri-Ghomi et al. (2005)
Modified Strip Model. The multi-strip model originally developed by Thorburn et al. (1983)
neglected the pre-buckling compression resistance of infill panel. Later on, Driver et al. (1997)
19
found that the original model underestimated both elastic stiffness and ultimate capacity of the
SPSW, since it neglected the small contribution from the compression diagonal (pre-buckling) to
the strength and stiffness of the infill panel. Also, it did not account for the gradual strength
degradation of SPSW system at large inelastic displacement cycles. In order to overcome these
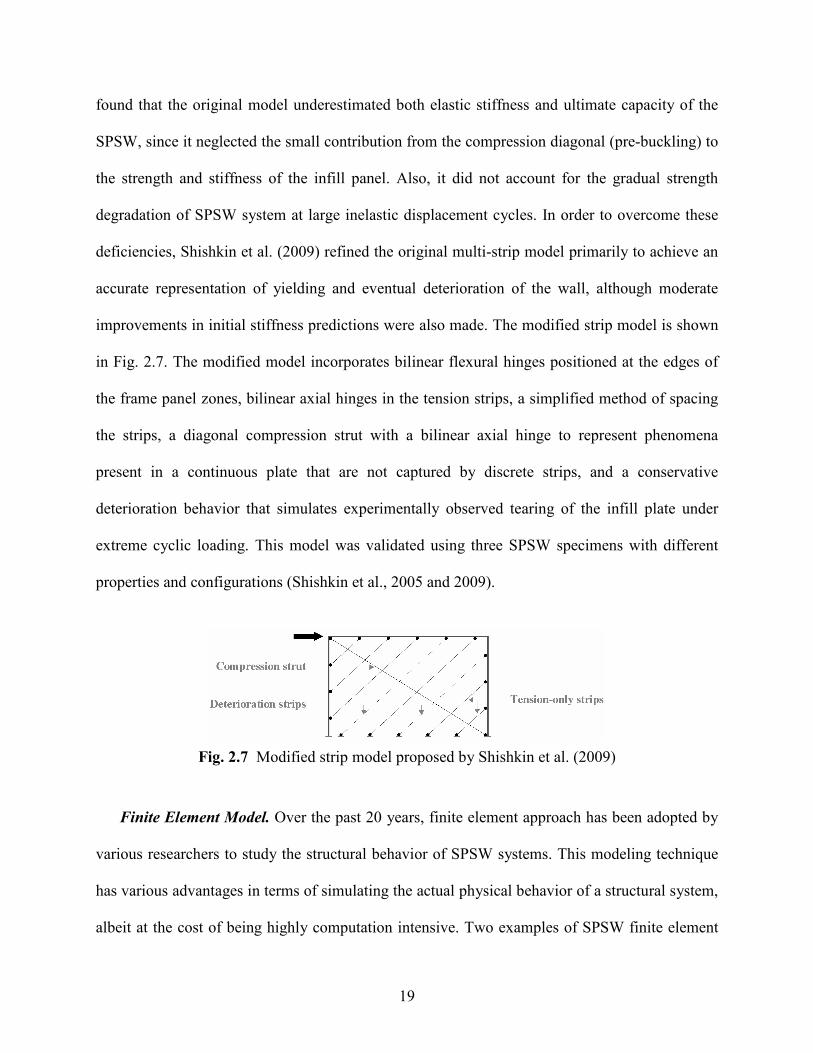
deficiencies, Shishkin et al. (2009) refined the original multi-strip model primarily to achieve an
accurate representation of yielding and eventual deterioration of the wall, although moderate
improvements in initial stiffness predictions were also made. The modified strip model is shown
in Fig. 2.7. The modified model incorporates bilinear flexural hinges positioned at the edges of
the frame panel zones, bilinear axial hinges in the tension strips, a simplified method of spacing
the strips, a diagonal compression strut with a bilinear axial hinge to represent phenomena
present in a continuous plate that are not captured by discrete strips, and a conservative
deterioration behavior that simulates experimentally observed tearing of the infill plate under
extreme cyclic loading. This model was validated using three SPSW specimens with different
properties and configurations (Shishkin et al., 2005 and 2009).
Fig. 2.7 Modified strip model proposed by Shishkin et al. (2009)
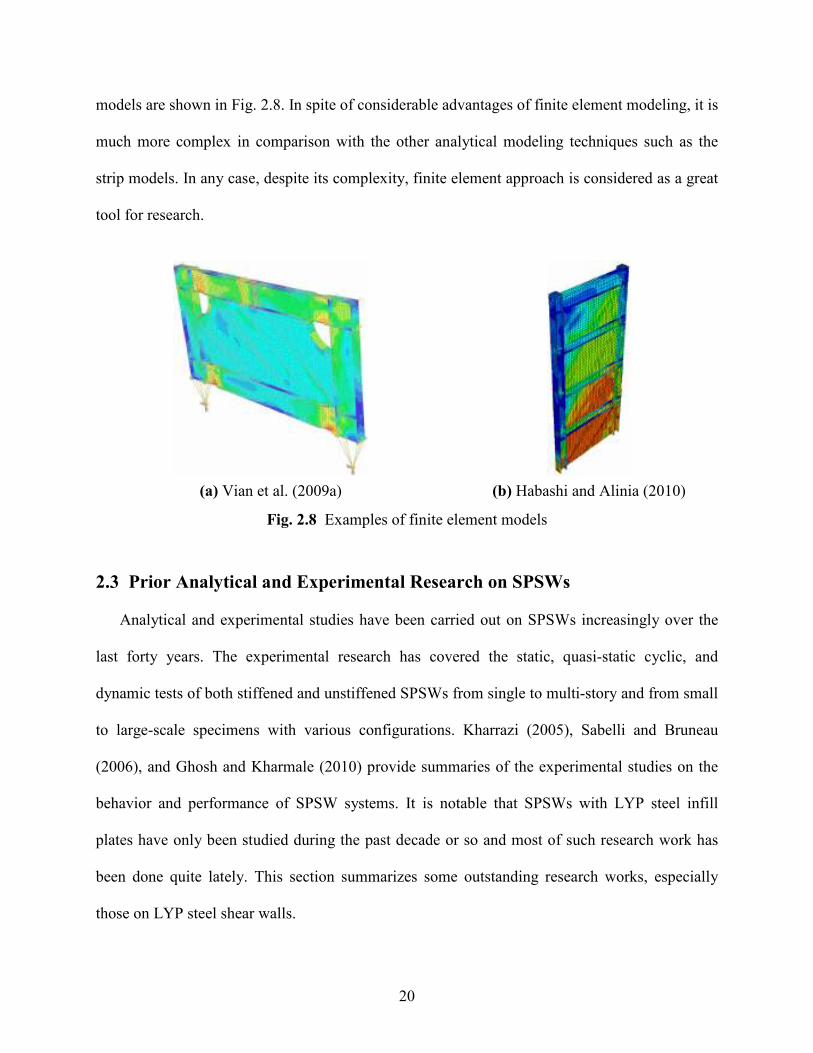
Finite Element Model. Over the past 20 years, finite element approach has been adopted by
various researchers to study the structural behavior of SPSW systems. This modeling technique
has various advantages in terms of simulating the actual physical behavior of a structural system,
albeit at the cost of being highly computation intensive. Two examples of SPSW finite element
20
models are shown in Fig. 2.8. In spite of considerable advantages of finite element modeling, it is
much more complex in comparison with the other analytical modeling techniques such as the
strip models. In any case, despite its complexity, finite element approach is considered as a great
tool for research.
(a) Vian et al. (2009a) (b) Habashi and Alinia (2010)
Fig. 2.8 Examples of finite element models
2.3 Prior Analytical and Experimental Research on SPSWs
Analytical and experimental studies have been carried out on SPSWs increasingly over the
last forty years. The experimental research has covered the static, quasi-static cyclic, and
dynamic tests of both stiffened and unstiffened SPSWs from single to multi-story and from small
to large-scale specimens with various configurations. Kharrazi (2005), Sabelli and Bruneau
(2006), and Ghosh and Kharmale (2010) provide summaries of the experimental studies on the
behavior and performance of SPSW systems. It is notable that SPSWs with LYP steel infill
plates have only been studied during the past decade or so and most of such research work has
been done quite lately. This section summarizes some outstanding research works, especially
those on LYP steel shear walls.
21
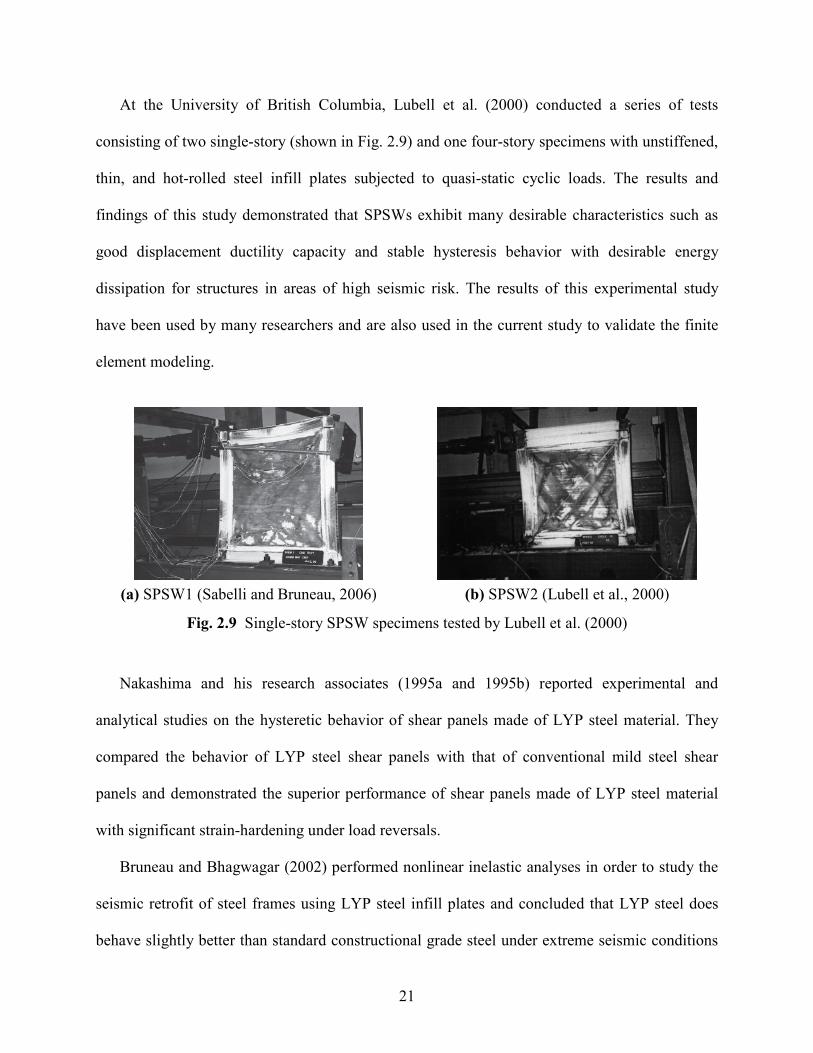
At the University of British Columbia, Lubell et al. (2000) conducted a series of tests
consisting of two single-story (shown in Fig. 2.9) and one four-story specimens with unstiffened,
thin, and hot-rolled steel infill plates subjected to quasi-static cyclic loads. The results and
findings of this study demonstrated that SPSWs exhibit many desirable characteristics such as
good displacement ductility capacity and stable hysteresis behavior with desirable energy
dissipation for structures in areas of high seismic risk. The results of this experimental study
have been used by many researchers and are also used in the current study to validate the finite
element modeling.
(a) SPSW1 (Sabelli and Bruneau, 2006) (b) SPSW2 (Lubell et al., 2000)
Fig. 2.9 Single-story SPSW specimens tested by Lubell et al. (2000)
Nakashima and his research associates (1995a and 1995b) reported experimental and
analytical studies on the hysteretic behavior of shear panels made of LYP steel material. They
compared the behavior of LYP steel shear panels with that of conventional mild steel shear
panels and demonstrated the superior performance of shear panels made of LYP steel material
with significant strain-hardening under load reversals.
Bruneau and Bhagwagar (2002) performed nonlinear inelastic analyses in order to study the
seismic retrofit of steel frames using LYP steel infill plates and concluded that LYP steel does
behave slightly better than standard constructional grade steel under extreme seismic conditions
22
but at the cost of some extra material. In addition, as a result of some nonlinear dynamic
analyses, De Matteis et al. (2003) showed that LYP steel shear panels act as efficient stiffening
and damping devices which are capable of strongly enhancing the seismic performance of steel
frames. As well, they supply a large source of energy dissipation, which results in limiting the
plastic deformation demand to the primary structure.
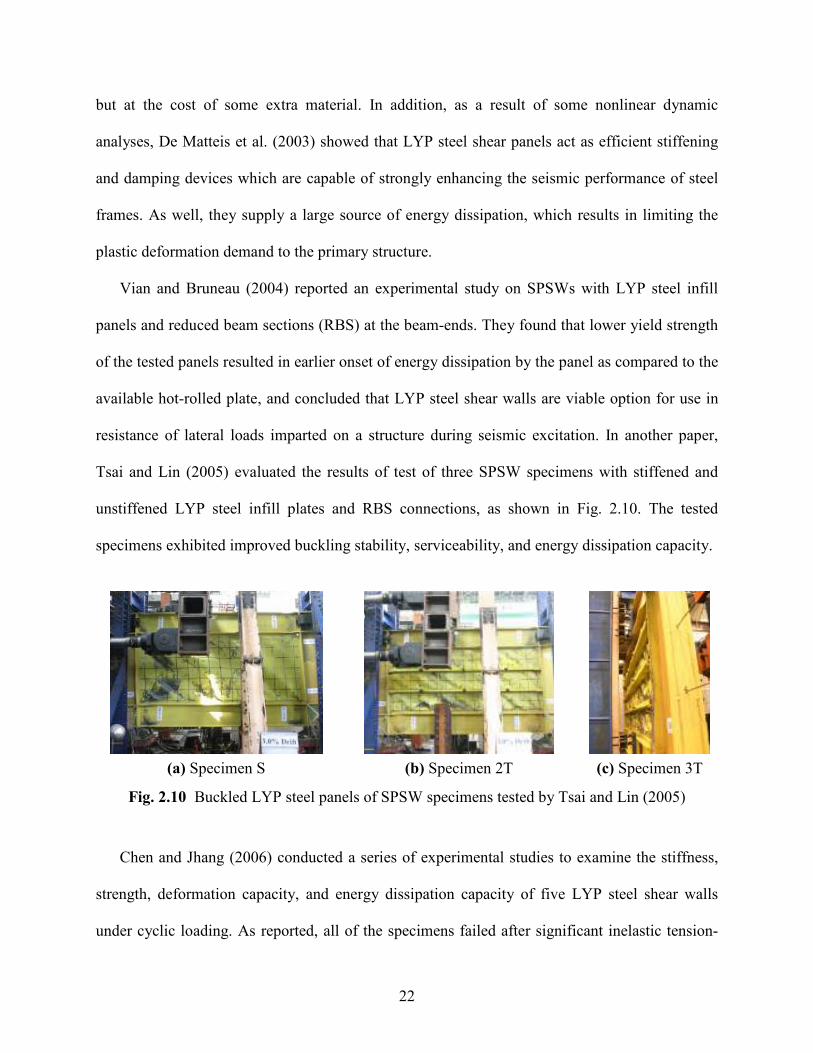
Vian and Bruneau (2004) reported an experimental study on SPSWs with LYP steel infill
panels and reduced beam sections (RBS) at the beam-ends. They found that lower yield strength
of the tested panels resulted in earlier onset of energy dissipation by the panel as compared to the
available hot-rolled plate, and concluded that LYP steel shear walls are viable option for use in
resistance of lateral loads imparted on a structure during seismic excitation. In another paper,
Tsai and Lin (2005) evaluated the results of test of three SPSW specimens with stiffened and
unstiffened LYP steel infill plates and RBS connections, as shown in Fig. 2.10. The tested
specimens exhibited improved buckling stability, serviceability, and energy dissipation capacity.
(a) Specimen S (b) Specimen 2T (c) Specimen 3T
Fig. 2.10 Buckled LYP steel panels of SPSW specimens tested by Tsai and Lin (2005)
Chen and Jhang (2006) conducted a series of experimental studies to examine the stiffness,
strength, deformation capacity, and energy dissipation capacity of five LYP steel shear walls
under cyclic loading. As reported, all of the specimens failed after significant inelastic tension-
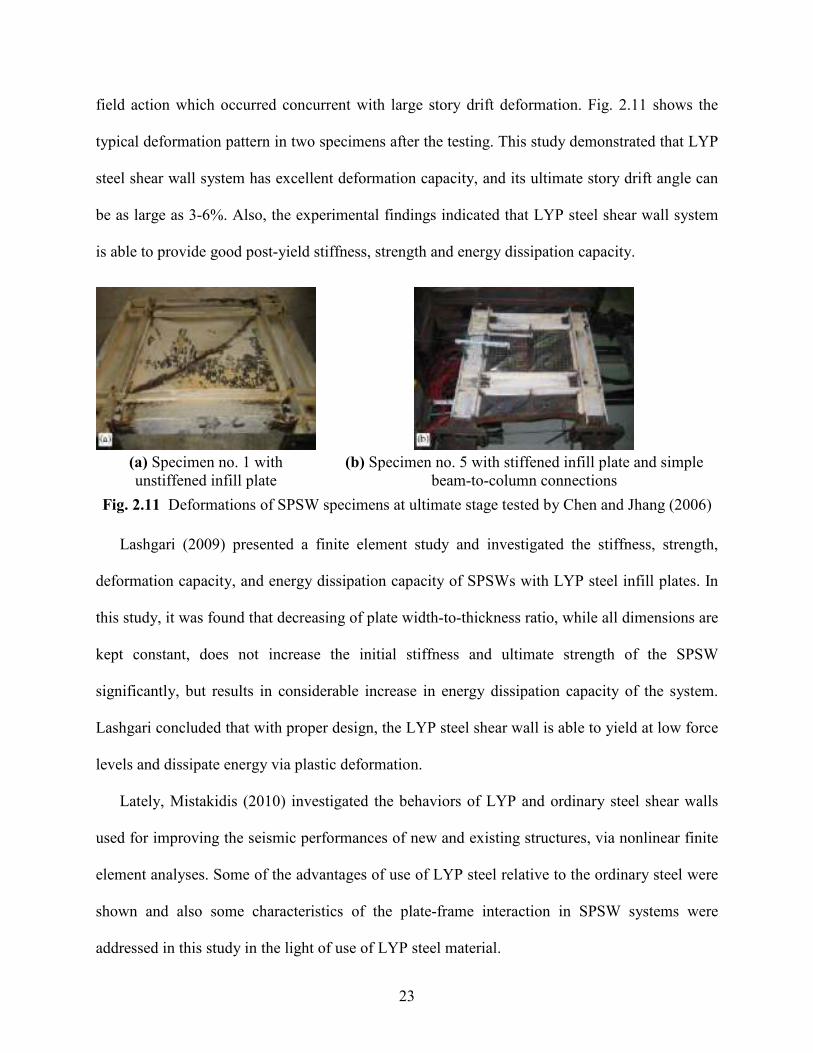
23
field action which occurred concurrent with large story drift deformation. Fig. 2.11 shows the
typical deformation pattern in two specimens after the testing. This study demonstrated that LYP
steel shear wall system has excellent deformation capacity, and its ultimate story drift angle can
be as large as 3-6%. Also, the experimental findings indicated that LYP steel shear wall system
is able to provide good post-yield stiffness, strength and energy dissipation capacity.
(a) Specimen no. 1 with
unstiffened infill plate
(b) Specimen no. 5 with stiffened infill plate and simple
beam-to-column connections
Fig. 2.11 Deformations of SPSW specimens at ultimate stage tested by Chen and Jhang (2006)
Lashgari (2009) presented a finite element study and investigated the stiffness, strength,
deformation capacity, and energy dissipation capacity of SPSWs with LYP steel infill plates. In
this study, it was found that decreasing of plate width-to-thickness ratio, while all dimensions are
kept constant, does not increase the initial stiffness and ultimate strength of the SPSW
significantly, but results in considerable increase in energy dissipation capacity of the system.
Lashgari concluded that with proper design, the LYP steel shear wall is able to yield at low force
levels and dissipate energy via plastic deformation.
Lately, Mistakidis (2010) investigated the behaviors of LYP and ordinary steel shear walls
used for improving the seismic performances of new and existing structures, via nonlinear finite
element analyses. Some of the advantages of use of LYP steel relative to the ordinary steel were
shown and also some characteristics of the plate-frame interaction in SPSW systems were
addressed in this study in the light of use of LYP steel material.
24
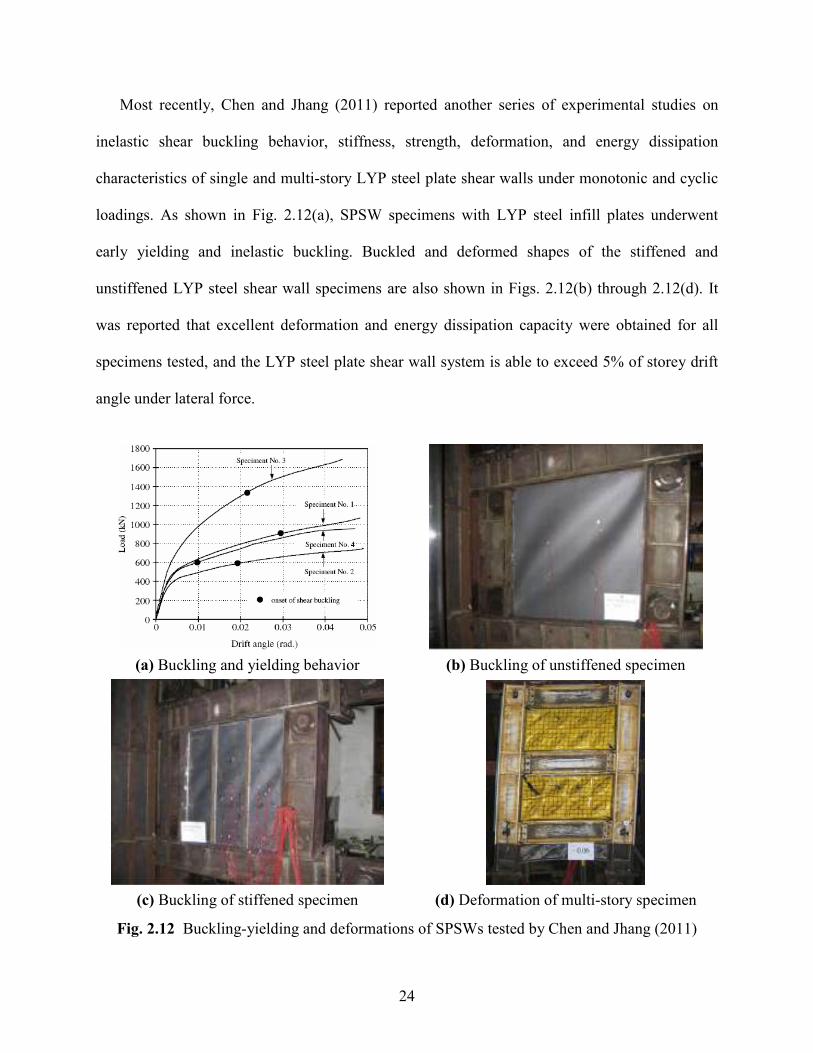
Most recently, Chen and Jhang (2011) reported another series of experimental studies on
inelastic shear buckling behavior, stiffness, strength, deformation, and energy dissipation
characteristics of single and multi-story LYP steel plate shear walls under monotonic and cyclic
loadings. As shown in Fig. 2.12(a), SPSW specimens with LYP steel infill plates underwent
early yielding and inelastic buckling. Buckled and deformed shapes of the stiffened and
unstiffened LYP steel shear wall specimens are also shown in Figs. 2.12(b) through 2.12(d). It
was reported that excellent deformation and energy dissipation capacity were obtained for all
specimens tested, and the LYP steel plate shear wall system is able to exceed 5% of storey drift
angle under lateral force.
(a) Buckling and yielding behavior (b) Buckling of unstiffened specimen
(c) Buckling of stiffened specimen (d) Deformation of multi-story specimen
Fig. 2.12 Buckling-yielding and deformations of SPSWs tested by Chen and Jhang (2011)

25
2.4 Recent Developments
In recent years, considerable research on various aspects of analysis, design, and application
of SPSW systems has been carried out in different countries around the world, such as United
States, Canada, Japan, Iran, Taiwan, United Kingdom, Korea, India, China, and Turkey. In
addition to the research publications, some studies have also been reported which focus more on
engineering practice. Some of the recent significant developments in research and application of
steel shear wall systems are summarized in this section.
Some approaches have been introduced and investigated by Bruneau and his research
associates, e.g. Berman and Bruneau (2003), Vian and Bruneau (2004), and Vian et al. (2009b),
in order to decrease the strength and stiffness of the shear panel for consequently reducing the
burden on the horizontal and vertical boundary members as well as the foundation demands,
which include: i) use of light-gauge, cold-rolled, and LYP steel for infill plate (Fig. 2.13(a)), ii)
placement of a pattern of perforations in the infill plate (Fig. 2.13(b)), iii) use of RBS
connections at the ends of HBE members (Fig. 2.13(c)), and iv) use of steel panels with
reinforced cut-out corners (Fig. 2.13(d)).
The lower yield strength of the infill plates can result in a reduced stiffness and earlier onset
of energy dissipation by the panel as compared to currently available hot-rolled plates. The
special perforated panel SPSW specimens with multiple regularly spaced holes have already
exhibited ductile behavior during testing and are viable alternative to solid panel SPSWs which
not only allow utility access through the panel but also alleviate stiffness and over-strength
concerns using conventional hot-rolled plates. In addition, RBS connection is an effective detail
for SPSW anchor beams which can control boundary frame yielding during a significant
earthquake. Finally, the cut-out reinforced corner configuration appears to be a design option that
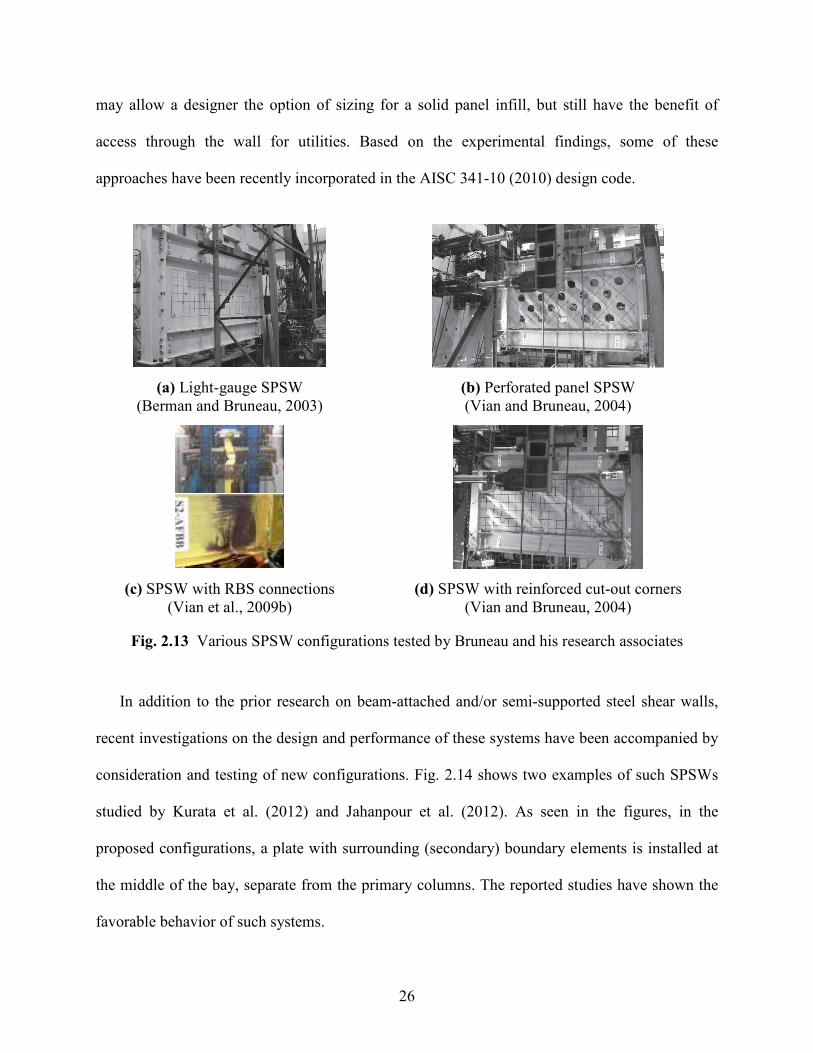
26
may allow a designer the option of sizing for a solid panel infill, but still have the benefit of
access through the wall for utilities. Based on the experimental findings, some of these
approaches have been recently incorporated in the AISC 341-10 (2010) design code.
(a) Light-gauge SPSW
(Berman and Bruneau, 2003)
(b) Perforated panel SPSW
(Vian and Bruneau, 2004)
(c) SPSW with RBS connections
(Vian et al., 2009b)
(d) SPSW with reinforced cut-out corners
(Vian and Bruneau, 2004)
Fig. 2.13 Various SPSW configurations tested by Bruneau and his research associates
In addition to the prior research on beam-attached and/or semi-supported steel shear walls,
recent investigations on the design and performance of these systems have been accompanied by
consideration and testing of new configurations. Fig. 2.14 shows two examples of such SPSWs
studied by Kurata et al. (2012) and Jahanpour et al. (2012). As seen in the figures, in the
proposed configurations, a plate with surrounding (secondary) boundary elements is installed at
the middle of the bay, separate from the primary columns. The reported studies have shown the
favorable behavior of such systems.
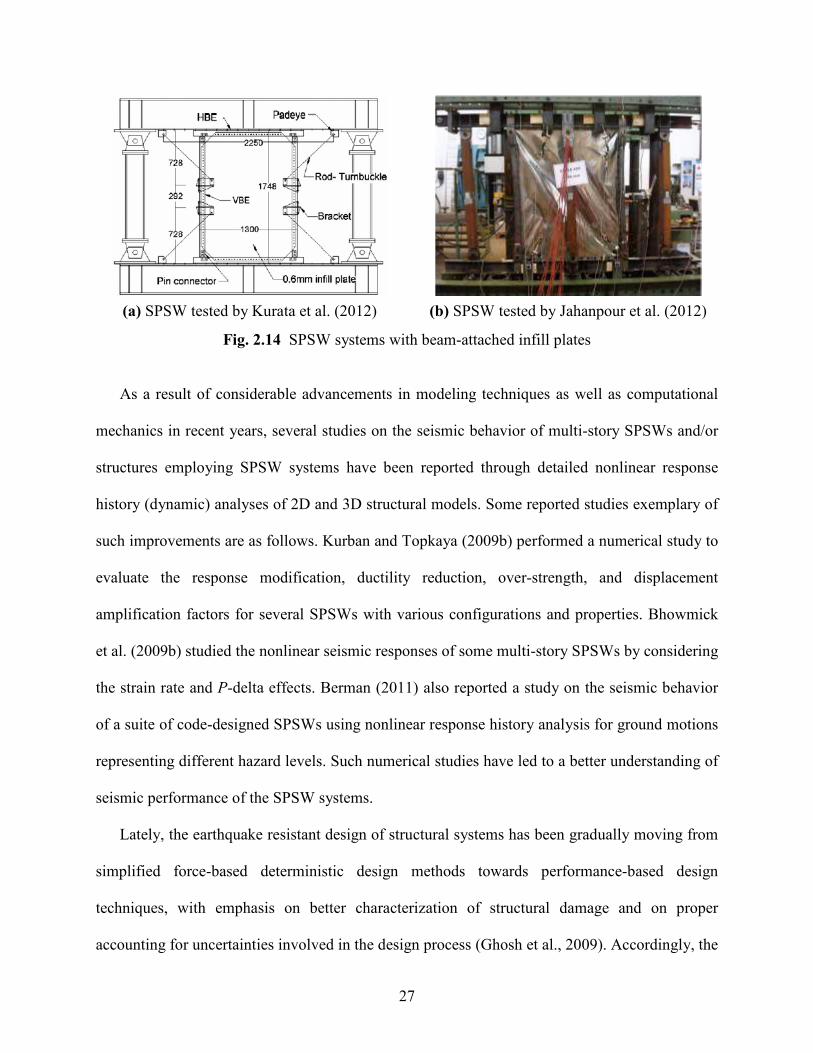
27
(a) SPSW tested by Kurata et al. (2012) (b) SPSW tested by Jahanpour et al. (2012)
Fig. 2.14 SPSW systems with beam-attached infill plates
As a result of considerable advancements in modeling techniques as well as computational
mechanics in recent years, several studies on the seismic behavior of multi-story SPSWs and/or
structures employing SPSW systems have been reported through detailed nonlinear response
history (dynamic) analyses of 2D and 3D structural models. Some reported studies exemplary of
such improvements are as follows. Kurban and Topkaya (2009b) performed a numerical study to
evaluate the response modification, ductility reduction, over-strength, and displacement
amplification factors for several SPSWs with various configurations and properties. Bhowmick
et al. (2009b) studied the nonlinear seismic responses of some multi-story SPSWs by considering
the strain rate and P-delta effects. Berman (2011) also reported a study on the seismic behavior
of a suite of code-designed SPSWs using nonlinear response history analysis for ground motions
representing different hazard levels. Such numerical studies have led to a better understanding of
seismic performance of the SPSW systems.
Lately, the earthquake resistant design of structural systems has been gradually moving from
simplified force-based deterministic design methods towards performance-based design
techniques, with emphasis on better characterization of structural damage and on proper
accounting for uncertainties involved in the design process (Ghosh et al., 2009). Accordingly, the
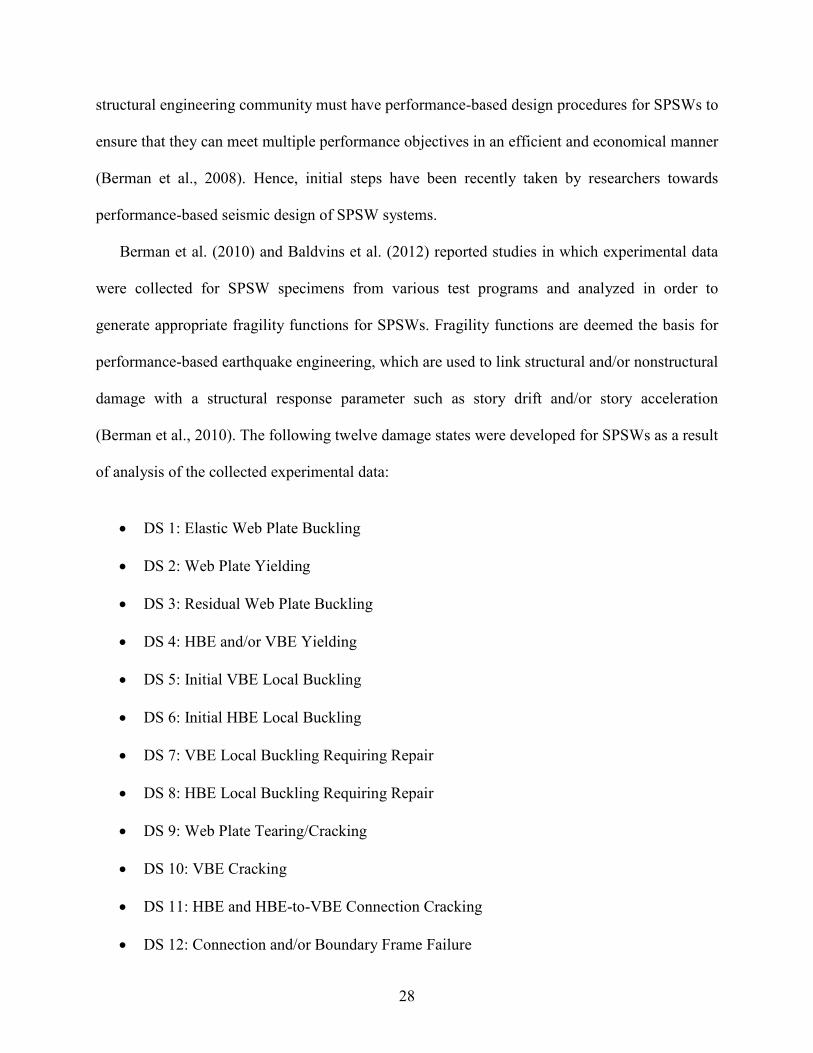
28
structural engineering community must have performance-based design procedures for SPSWs to
ensure that they can meet multiple performance objectives in an efficient and economical manner
(Berman et al., 2008). Hence, initial steps have been recently taken by researchers towards
performance-based seismic design of SPSW systems.
Berman et al. (2010) and Baldvins et al. (2012) reported studies in which experimental data
were collected for SPSW specimens from various test programs and analyzed in order to
generate appropriate fragility functions for SPSWs. Fragility functions are deemed the basis for
performance-based earthquake engineering, which are used to link structural and/or nonstructural
damage with a structural response parameter such as story drift and/or story acceleration
(Berman et al., 2010). The following twelve damage states were developed for SPSWs as a result
of analysis of the collected experimental data:
• DS 1: Elastic Web Plate Buckling
• DS 2: Web Plate Yielding
• DS 3: Residual Web Plate Buckling
• DS 4: HBE and/or VBE Yielding
• DS 5: Initial VBE Local Buckling
• DS 6: Initial HBE Local Buckling
• DS 7: VBE Local Buckling Requiring Repair
• DS 8: HBE Local Buckling Requiring Repair
• DS 9: Web Plate Tearing/Cracking
• DS 10: VBE Cracking
• DS 11: HBE and HBE-to-VBE Connection Cracking
• DS 12: Connection and/or Boundary Frame Failure
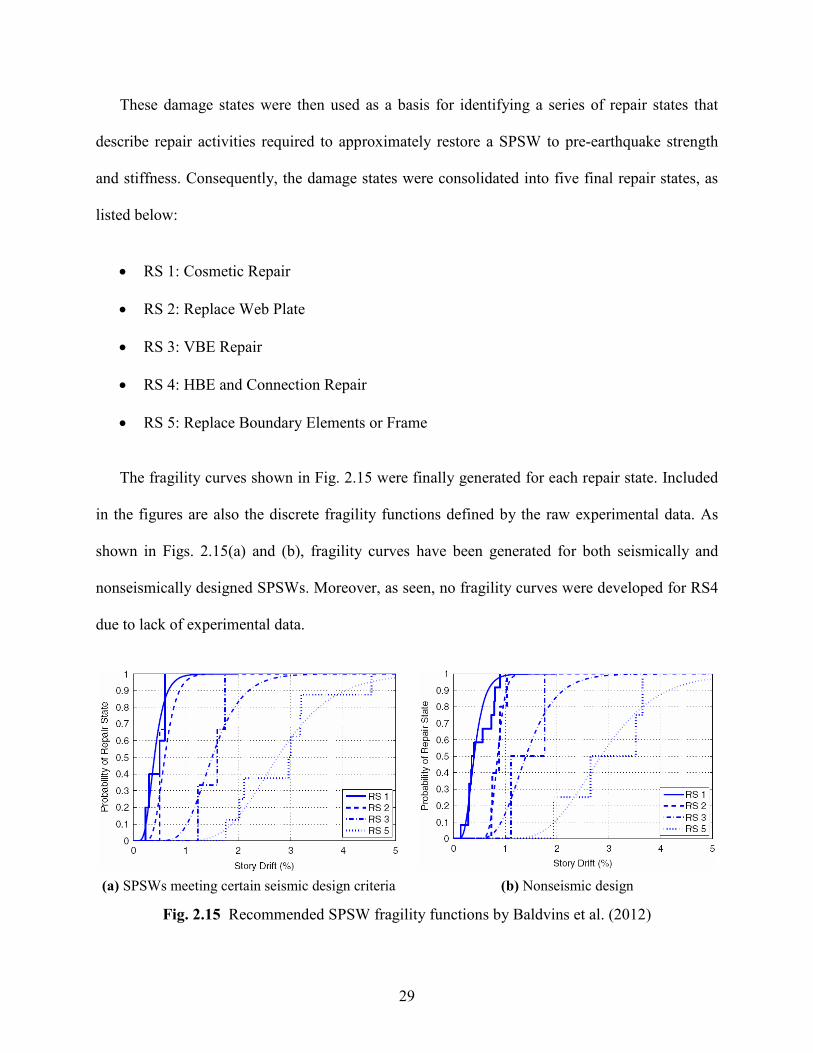
29
These damage states were then used as a basis for identifying a series of repair states that
describe repair activities required to approximately restore a SPSW to pre-earthquake strength
and stiffness. Consequently, the damage states were consolidated into five final repair states, as
listed below:
• RS 1: Cosmetic Repair
• RS 2: Replace Web Plate
• RS 3: VBE Repair
• RS 4: HBE and Connection Repair
• RS 5: Replace Boundary Elements or Frame
The fragility curves shown in Fig. 2.15 were finally generated for each repair state. Included
in the figures are also the discrete fragility functions defined by the raw experimental data. As
shown in Figs. 2.15(a) and (b), fragility curves have been generated for both seismically and
nonseismically designed SPSWs. Moreover, as seen, no fragility curves were developed for RS4
due to lack of experimental data.
(a) SPSWs meeting certain seismic design criteria (b) Nonseismic design
Fig. 2.15 Recommended SPSW fragility functions by Baldvins et al. (2012)
30
In addition to the development of fragility functions, Ghosh et al. (2009) and Bayat (2010)
has also proposed two distinct performance-based design methods for SPSW systems, whose
applicability have been verified as well. Further details on these methods will be provided in
Chapter 3.
2.5 Low Yield Point Steel
Vibration of buildings due to earthquake and/or wind loads can be reduced by two major
methods, including i) adjusting the stiffness, and ii) improving the damping performance.
Improving the damping performance of a building means fitting the building with a mechanism
that artificially absorbs vibration energy, and LYP steel has been shown to be one of the most
efficient damping materials (Saeki et al., 1998). Considering the main objectives of this research
on the seismic performance and design of SPSWs with LYP steel infill plates, an introduction to
the development and properties of LYP steel material is provided in this section.
After the 1995 Kobe earthquake in Japan, the design philosophy of structures started to
switch from the conventional design to the design of seismic control structures with seismic
control devices to absorb the seismic energy in a further efficient and economical manner.
Nippon Steel Corporation was the first to conduct studies on seismic control structures and
develop a new steel product for this application. Considering the need for workable and weldable
steel products with excellent elongation as well as low cycle fatigue characteristics in devices
undergoing great repeated deformations in the plastic region, LYP100 and LYP235 steel material
were produced by the Nippon Steel Corporation, whose mechanical properties are given in Table
2.1. The two types of LYP steel products were developed to provide the designers with some
freedom in selecting the design strength in seismic control devices. Moreover, the characteristic

31
of the chemical composition is that both of the LYP steels have a composition system that is
nearly pure iron with very negligible carbon and alloy elements (Yamaguchi et al., 1998).
Table 2.1 Mechanical properties of LYP steel products (Yamaguchi et al., 1998)
Steel
type
Yield point
(MPa)
0.2% offset proof
stress (MPa)
Tensile strength
(MPa)
Elongation at fracture
(%)
LYP100 - 80-120 200-300 ≥50%
LYP235 215-245 - 300-400 ≥40%
The stress-strain curves of the LYP steel along with other steel products are shown in Fig.
2.16. As seen in the figure, pure iron and LYP235 steel show clear yield points, whereas LYP100
steel shows no yield point and is low in yield strength. The yield elongation of LYP235 steel is
much greater than that of SS400. Additionally, LYP steel and pure iron possess great elongation
capacities.
Fig. 2.16 Stress-strain curves of the LYP steel (Yamaguchi et al., 1998)
It is notable that yield strength of LYP100 steel is about one-third of the conventional
structural steel such as ASTM A36 steel. Its elongation properties can exceed 40% which is more
than two times of the conventional structural steel. In addition, the LYP steel possesses low yield
ratio, i.e. the ratio between yield stress to ultimate stress, which is only 0.34. With such a low
32
yield ratio, the structure is able to redistribute the plastic stress and provide a larger inelastic
zone (Chen and Jhang, 2006).
The characteristics of the base materials that affect the performance of seismic control
devices using LYP steel include hysteresis characteristics, strain-rate effect, and the
characteristic of low cycle fatigue since in an earthquake, the damper is repeatedly exposed to
high plastic strain. Yamaguchi et al. (1998) and Saeki et al. (1998) addressed the above-
mentioned characteristics and demonstrated the advantages of application of LYP steel as
compared to the conventional steel material.
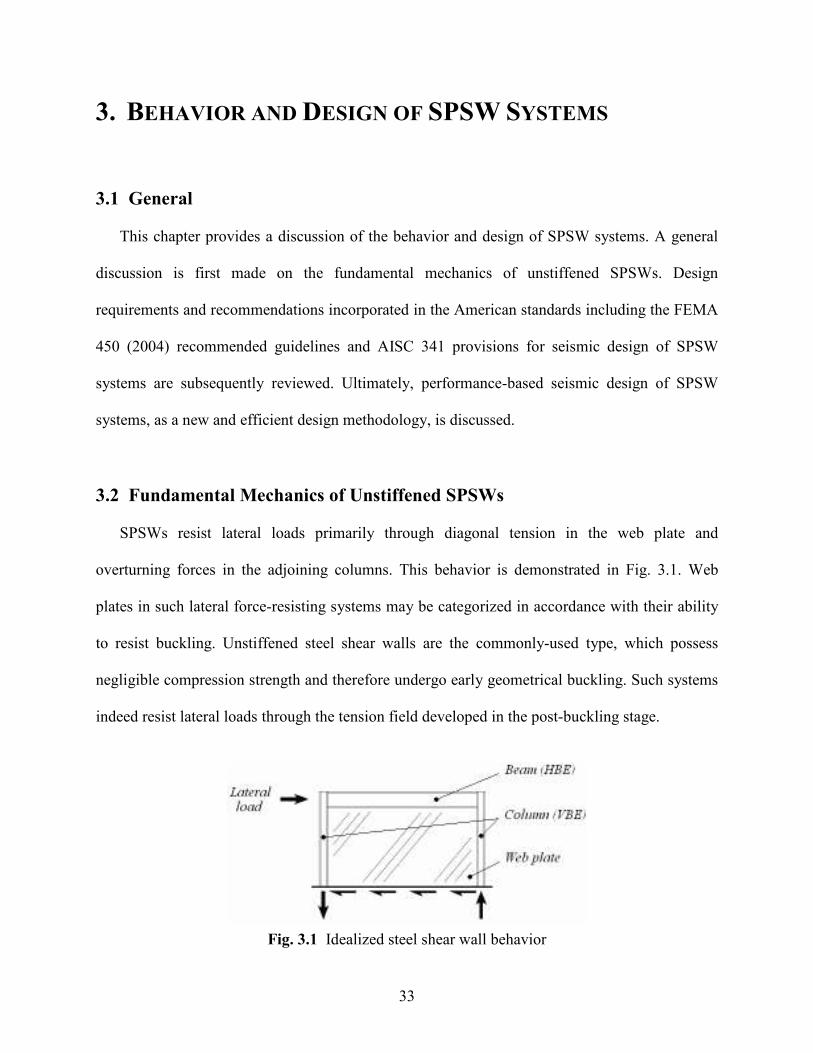
33
3. BEHAVIOR AND DESIGN OF SPSW SYSTEMS
3.1 General
This chapter provides a discussion of the behavior and design of SPSW systems. A general
discussion is first made on the fundamental mechanics of unstiffened SPSWs. Design
requirements and recommendations incorporated in the American standards including the FEMA
450 (2004) recommended guidelines and AISC 341 provisions for seismic design of SPSW
systems are subsequently reviewed. Ultimately, performance-based seismic design of SPSW
systems, as a new and efficient design methodology, is discussed.
3.2 Fundamental Mechanics of Unstiffened SPSWs
SPSWs resist lateral loads primarily through diagonal tension in the web plate and
overturning forces in the adjoining columns. This behavior is demonstrated in Fig. 3.1. Web
plates in such lateral force-resisting systems may be categorized in accordance with their ability
to resist buckling. Unstiffened steel shear walls are the commonly-used type, which possess
negligible compression strength and therefore undergo early geometrical buckling. Such systems
indeed resist lateral loads through the tension field developed in the post-buckling stage.
Fig. 3.1 Idealized steel shear wall behavior
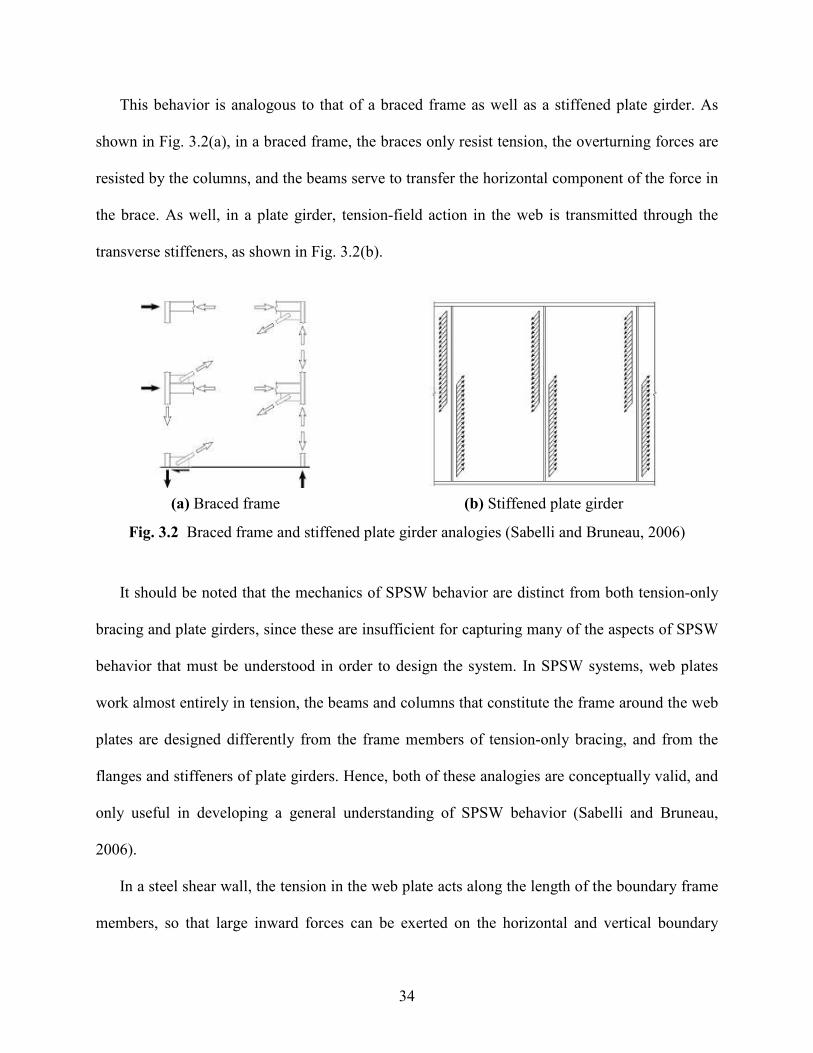
34
This behavior is analogous to that of a braced frame as well as a stiffened plate girder. As
shown in Fig. 3.2(a), in a braced frame, the braces only resist tension, the overturning forces are
resisted by the columns, and the beams serve to transfer the horizontal component of the force in
the brace. As well, in a plate girder, tension-field action in the web is transmitted through the
transverse stiffeners, as shown in Fig. 3.2(b).
(a) Braced frame (b) Stiffened plate girder
Fig. 3.2 Braced frame and stiffened plate girder analogies (Sabelli and Bruneau, 2006)
It should be noted that the mechanics of SPSW behavior are distinct from both tension-only
bracing and plate girders, since these are insufficient for capturing many of the aspects of SPSW
behavior that must be understood in order to design the system. In SPSW systems, web plates
work almost entirely in tension, the beams and columns that constitute the frame around the web
plates are designed differently from the frame members of tension-only bracing, and from the
flanges and stiffeners of plate girders. Hence, both of these analogies are conceptually valid, and
only useful in developing a general understanding of SPSW behavior (Sabelli and Bruneau,
2006).
In a steel shear wall, the tension in the web plate acts along the length of the boundary frame
members, so that large inward forces can be exerted on the horizontal and vertical boundary

35
frame members. Hence, the boundary frame members are designed to resist web-plate tension
forces through flexure. These forces act inward on the steel shear wall at an angle determined
from the frame and member section geometrical properties.
The effect of the inward forces acting on the beam in a SPSW is typically counteracted to a
large degree by similar tensile forces in the web plate of the adjacent story, although these are
often of different magnitudes. However, such counteracting tensile forces are not present at the
top and foundation beams of a SPSW, and the design of these horizontal boundary members
must include consideration of the inward forces. Thus, these members at the top story and at the
foundation of a steel shear wall are typically deep with sufficient strength to anchor the tension
in the web plates. Fig. 3.3 illustrates the free-body diagrams of the steel shear wall and boundary
frame members, and shows the effects of web-plate tension.
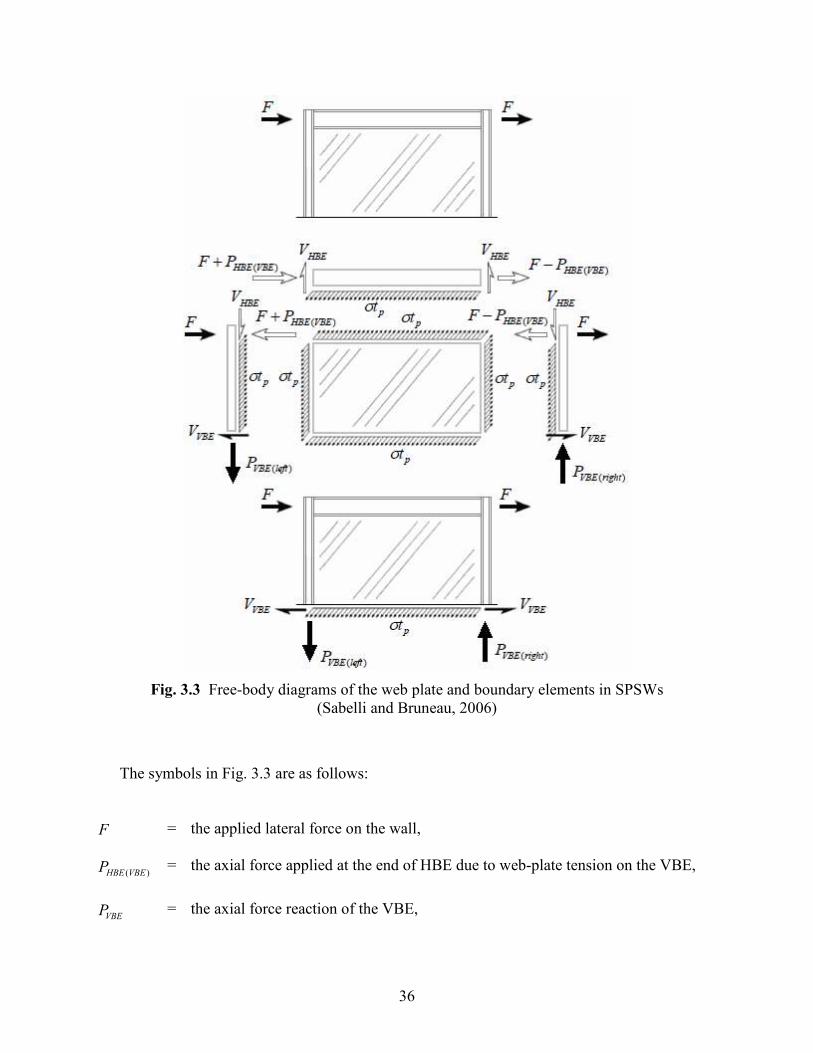
36
Fig. 3.3 Free-body diagrams of the web plate and boundary elements in SPSWs
(Sabelli and Bruneau, 2006)
The symbols in Fig. 3.3 are as follows:
F = the applied lateral force on the wall,
)(VBEHBEP = the axial force applied at the end of HBE due to web-plate tension on the VBE,
VBEP = the axial force reaction of the VBE,

37
HBEV = the shear reaction of the HBE due to the web-plate tension,
VBEV = the shear reaction of the VBE due to the web-plate tension,
pt = web-plate thickness, and
σ = web-plate tension stress.
In high-seismic design of steel shear walls, it is assumed that lateral loads will be sufficient
to cause tension yielding of the web plate along its full height. Thus, the web plate forces are
uniform, as shown in Fig 3.3 (Sabelli and Bruneau, 2006).
As it is seen in Fig. 3.3, the tensile forces in the web plate induce flexure in the columns, in
addition to the axial forces due to overturning of the wall. Therefore, in order to develop a
uniform tension across the web plate and also let the web plate develop its full tension strength at
the vertical interfaces with the columns, the vertical boundary frame members need to have
sufficient transverse stiffness.
In addition, from Fig. 3.3 it is evident that the inward flexure of the columns is resisted by
the beams at the top and bottom of the vertical boundary frame members segment. Therefore, the
beams are required to resist significant compression in conjunction with the flexural forces
induced by tension in the web plates.
In Fig. 3.3, it is also observed that the force at the upper-right connection is the difference
between the collector force ( F ) and the inward reaction from the vertical boundary frame
member ( )(VBEHBEP ). In some conditions this will be in tension, in others it will be in
compression. It is typically in tension at the top story and at levels at which the web-plate
thickness is reduced by a large percentage, while in compression elsewhere. At the vertical

38
boundary frame member in tension, the connection is in compression and the two components
are additive.
Consideration of rigid beam-to-column connections in a SPSW system will introduce
additional flexural forces in the boundary frame members, which should be taken into
consideration in the design of the horizontal and vertical boundary frame members.
The tension stress in the web plate is used, in conjunction with gravity loads, to define the
required strength of the boundary frame members. To achieve this, the diagonal tension stress in
the web plate is decomposed. Fig. 3.4 shows the stresses acting on the vertical and horizontal
interfaces of the web plate. In this analysis of stresses, it is assumed that the web plate is in pure
tension and that no shear or compression stresses exist on sections cut in the direction of the
tension stress (Sabelli and Bruneau, 2006).
Fig. 3.4 Details of stresses imposed on SPSW boundary frame members
(Sabelli and Bruneau, 2006)
Following symbols are used in Fig. 3.4:
α = angle of tension stress (measured from vertical),
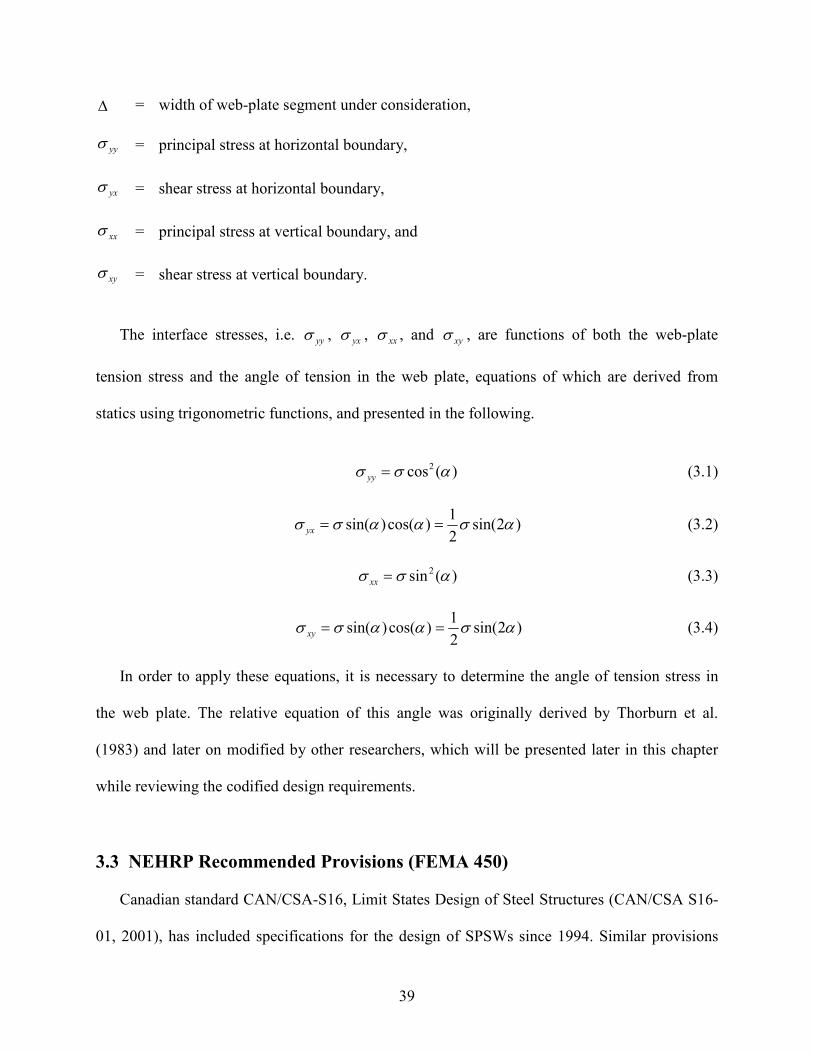
39
∆ = width of web-plate segment under consideration,
yyσ = principal stress at horizontal boundary,
yxσ = shear stress at horizontal boundary,
xxσ = principal stress at vertical boundary, and
xyσ = shear stress at vertical boundary.
The interface stresses, i.e. yyσ , yxσ , xxσ , and xyσ , are functions of both the web-plate
tension stress and the angle of tension in the web plate, equations of which are derived from
statics using trigonometric functions, and presented in the following.
)(cos2 ασσ =yy (3.1)
)2sin(2
1)cos()sin( ασαασσ ==yx (3.2)
)(sin 2 ασσ =xx (3.3)
)2sin(2
1)cos()sin( ασαασσ ==xy (3.4)
In order to apply these equations, it is necessary to determine the angle of tension stress in
the web plate. The relative equation of this angle was originally derived by Thorburn et al.
(1983) and later on modified by other researchers, which will be presented later in this chapter
while reviewing the codified design requirements.
3.3 NEHRP Recommended Provisions (FEMA 450)
Canadian standard CAN/CSA-S16, Limit States Design of Steel Structures (CAN/CSA S16-
01, 2001), has included specifications for the design of SPSWs since 1994. Similar provisions

40
were subsequently included in the American standard FEMA 450, NEHRP Recommended
Provisions for Seismic Regulations for New Buildings and Other Structures, for the first time in
2004, in which steel shear walls are denoted as Special Steel Plate Walls (SSPWs).
FEMA 450 (2004) provides design coefficients and factors for various types of seismic-
force-resisting systems, including special and composite steel shear wall systems. Accordingly,
seismic response modification coefficient, R , is recommended to be taken as 7 and 6½ for
respective special and composite steel shear walls. The seismic response modification coefficient
reflects the degree of inelastic response expected for design-level ground motions, as well as the
ductility capacity of the system. Thus, SSPWs, permitted to be designed using a value of 7=R ,
are expected to sustain multiple cycles of significant inelastic response when subjected to design-
level ground motion.
According to FEMA 450 (2004), SSPWs are expected to withstand significant inelastic
deformations in the webs when subjected to the forces resulting from the motions of the design
earthquake. In fact, the slender unstiffened steel infill plates connected to surrounding horizontal
and vertical boundary elements are designed to yield and behave in a ductile hysteretic manner
during earthquakes. Also, it is noted that FEMA 450 (2004) recognizes the use of special highly
ductile low yield steel having specified minimum yield in the range of 82.7 to 227.5 MPa (12 to
33 ksi) for the web plates in SSPWs.
The HBEs and VBEs adjacent to the webs shall be designed per capacity design principles to
remain essentially elastic under the maximum forces that can be generated by the fully yielded
webs, except that plastic hinging at the ends of HBEs is permitted. Plastic hinging at the ends of
HBEs is needed to develop the plastic collapse mechanism of the system, whereas plastic
hinging in the middle of HBEs, which could partly prevent yielding of the webs, is deemed
41
undesirable. Also, all HBEs are expected to be rigidly connected to the VBEs with moment-
resisting connections able to develop the expected plastic moment of the HBEs.
Considering the similarity between FEMA 450 and AISC 341 specifications and also the
focus of the current study on AISC 341 seismic provisions, the specified design requirements
and recommendations are discussed in further detail in the next section.
3.4 AISC 341 Seismic Provisions
In this section, the steel shear wall seismic design provisions included in the AISC 341-05
(2005) and AISC 341-10 (2010), mostly pertaining to the subject of the current research are
reviewed. It should be noted that in AISC 341, “unstiffened” and “slender-web” steel shear
walls, denoted as Special Plate Shear Walls (SPSWs), are considered as the basis for the SPSW
system and addressed accordingly.
Provisions for seismic design of SPSW systems were initially included in AISC 341 in 2005,
which were pretty similar to those included in FEMA 450 (2004). However, in the newer version
of AISC 341, i.e. AISC 341-10 (2010), these seismic provisions have been reorganized and
modified in some cases. These changes have been made based on recent research works as well
as the experiences gained from design of such systems, in order for further clarification of
several identified aspects of the design methodology and also for efficient design of SPSW
systems. In a paper, Sabelli et al. (2008) discussed the proposed changes in the seismic
provisions for inclusion in AISC 341-10 (2010).
On the basis of the specifications of AISC 341-10 (2010), code-designed SPSWs are
expected to provide significant inelastic deformation capacity primarily through web plate
yielding and as plastic-hinge formation in the ends of HBEs. It is time and again noted that
42
boundary frame members in SPSWs are designed according to capacity design principles, with
plate yielding providing the “fuse”. In addition, webs in SPSWs shall not be considered as
resisting gravity forces. HBE, VBE and intermediate boundary elements shall satisfy the ductility
requirements specified for “highly ductile members”, since these are anticipated to undergo
significant plastic rotation (more than 0.02 rad.).
The panel design shear strength, nVφ (LRFD), according to the limit state of shear yielding,
is determined as follows:
ασ 2sin42.0 ltV pypn = (3.5)
where, 90.0=φ (LRFD), ypσ is the yield stress of the infill plate, and l is the length of infill
plate (clear distance between column flanges). It is noted that plastic shear strength of a panel is
given by ασ 2sin)(50.0 ltR pypy (see Eq. (3.2)), and the nominal strength (Eq. (3.5)) is obtained
by dividing this value by a system over-strength factor taken as 1.2 for steel shear walls. In the
aforementioned equation, yR is the ratio of the expected plate yield stress to the specified
minimum plate yield stress, ypσ . Angle of web yielding/inclination (α ), which is measured
relative to the vertical, can be determined by
++
+=
sc
s
b
sp
c
sp
lI
h
Aht
A
lt
360
11
21
tan3
4α (3.6)
in which, sl is the distance between VBE centerlines, cA is the cross-sectional area of a VBE, sh
is the distance between HBE centerlines, bA is the cross-sectional area of a HBE, and cI is the

43
moment of inertia of a VBE taken perpendicular to the direction of the web plate line. It has been
demonstrated (Dastfan and Driver, 2008) that the strength of a code-designed SPSW is not
substantially sensitive to the angle of inclination, and that using a single value of 40° throughout
the design will generally lead to slightly conservative results.
In AISC 341-05 (2005), only VBEs were required to satisfy a certain stiffness requirement,
while in AISC 341-10 (2010), both VBEs and HBEs shall meet stiffness requirements.
Accordingly, VBEs shall have moments of inertia ( cI ) about an axis taken perpendicular to the
plane of the web, that
sspc lhtI 40031.0≥ , (3.7)
and HBEs shall have moments of inertia ( bI ) about an axis taken perpendicular to the plane of
the web, that
sspb hltI 40031.0 ∆≥ , (3.8)
where pt∆ is the difference in web plate thicknesses above and below the horizontal boundary
frame element.
Providing the stability of SPSW boundary elements is necessary for proper performance of
the system. In order to fulfill this requirement, AISC 341-10 (2010) design provisions stipulate
that HBEs shall be laterally braced to meet the requirements for “moderately ductile members”.
As defined, moderately ductile members are expected to undergo moderate plastic rotation (0.02
rad. or less) under the design earthquake. In addition, all intersections of HBE and VBE must be
braced to ensure stability of the entire panel.
44
In AISC 341-10 (2010) no lower and upper bounds are specified for the panel aspect ratio,
ss hl , while FEMA 450 (2004) and AISC 341-05 (2005) provisions limited the SPSW
applicability to wall panels having aspect ratios of 5.28.0 ≤< ss hl .
Ultimately, in addition to the six subsections included in AISC 341-10 (2010) that follow the
typical pattern, there is a newly-added section which addresses the design of two variations on
the SPSW system including web plates with regular layout of circular perforations and
reinforced corner cut-outs, which is of course out of scope of this research.
3.5 Performance-Based Design
Performance-based design (PBD) is a novel design methodology which offers many
advantages over current code-based design methodologies. It considers the uncertainties in
hazard demand and structural capacity, reliability of existing structures against future hazards,
and accounts for the nonlinear and inelastic structural response. Furthermore, this design
methodology can enable the engineers to balance between costs and benefits in design and
construction of structures.
According to the capacity-design requirements of AISC 341, the seismic design of SPSW is
based on confining ductility demands to the web plates and plastic hinges in the HBE at the VBE
face. In a capacity-design method, boundary elements are designed for forces corresponding to
the expected strength of the web plate. However, SPSWs have significant inelastic deformation
capacity which is not utilized properly using the elastic force-based or even the capacity design
provisions, available in current seismic design codes and guidelines that only implicitly
incorporate this deformation capacity. In the performance-based seismic design methodology,
the inelastic behavior of a lateral force-resisting system is directly and properly taken into

45
consideration by using pre-selected target drift and yield mechanism as key performance limit
states.
In PBD methodology, performance objectives must be identified and a procedure for reliably
achieving those objectives for various levels of seismic hazard must be developed. Since SPSW
systems are inherently dual systems (infill plates within moment-resisting frames), yielding in
different elements can be used as performance objectives for various levels of seismic demand
(Berman et al., 2008). According to Berman et al. (2008), in order to develop PBD procedures
for SPSWs, a full account of failure modes for conventional and innovative SPSW
configurations must be taken primarily. Then, the design approach must establish a yielding
hierarchy and balance the more desirable yielding mechanisms, e.g. web plates and then beams
followed by columns, while restricting undesirable mechanisms from forming, e.g. beam
buckling, plate tearing, etc.
One of the few developed PBD methods is an inelastic displacement-based design procedure
propounded by Ghosh et al. (2009) for SPSWs with pin-connected beams. In this method, the
design formulation considers the inelastic energy demand on a structural system, which is
equated with the inelastic work done through the plastic deformations for a monotonic loading
up to the target drift. In fact, this design procedure is based on selected “target inelastic drift” and
“yield mechanism”, as shown in Fig. 3.5, in which pθ is the target plastic drift based on an
assumed yield drift ( yθ ), iF is the portion of the seismic base shear induced at i-th level, and
pcM is the base column moment capacity. In development of this method, it is considered that
all steel plates reach their plastic shear capacity and that plastic hinges form at both the column
bases. In addition, it is also assumed that the plates and the column bases become fully plastic
simultaneously, and the story drift ratios are uniform along the height of the building.
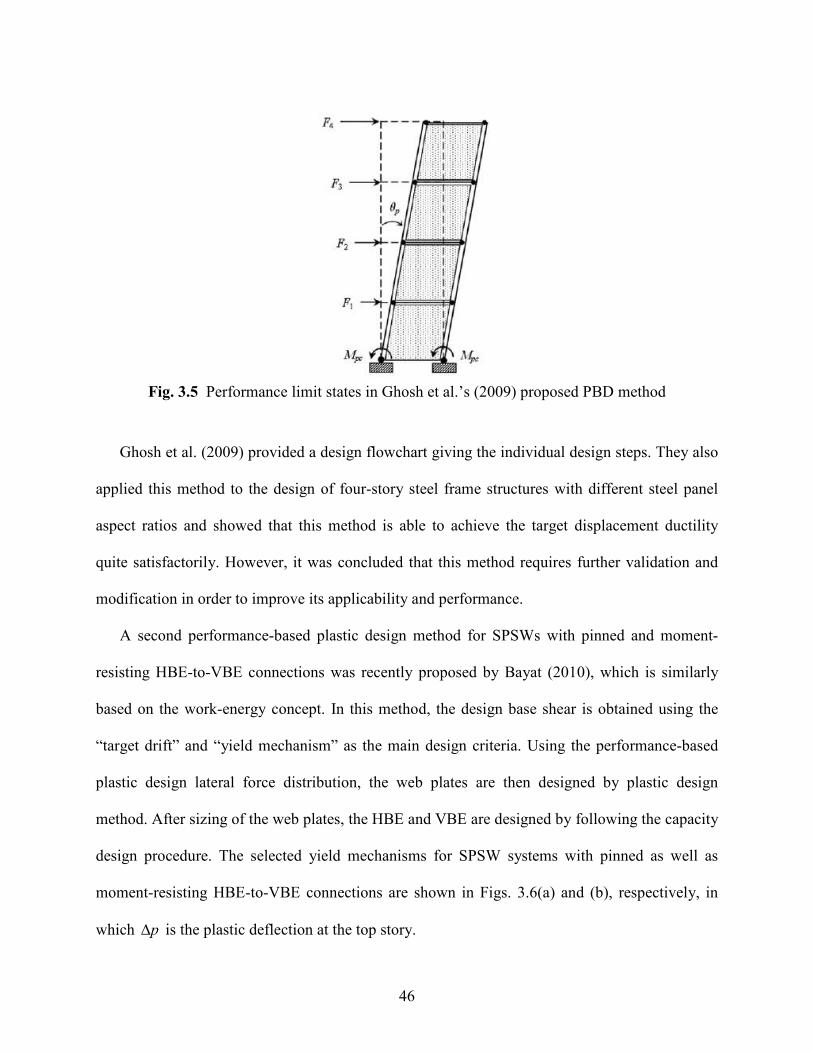
46
Fig. 3.5 Performance limit states in Ghosh et al.’s (2009) proposed PBD method
Ghosh et al. (2009) provided a design flowchart giving the individual design steps. They also
applied this method to the design of four-story steel frame structures with different steel panel
aspect ratios and showed that this method is able to achieve the target displacement ductility
quite satisfactorily. However, it was concluded that this method requires further validation and
modification in order to improve its applicability and performance.
A second performance-based plastic design method for SPSWs with pinned and moment-
resisting HBE-to-VBE connections was recently proposed by Bayat (2010), which is similarly
based on the work-energy concept. In this method, the design base shear is obtained using the
“target drift” and “yield mechanism” as the main design criteria. Using the performance-based
plastic design lateral force distribution, the web plates are then designed by plastic design
method. After sizing of the web plates, the HBE and VBE are designed by following the capacity
design procedure. The selected yield mechanisms for SPSW systems with pinned as well as
moment-resisting HBE-to-VBE connections are shown in Figs. 3.6(a) and (b), respectively, in
which p∆ is the plastic deflection at the top story.
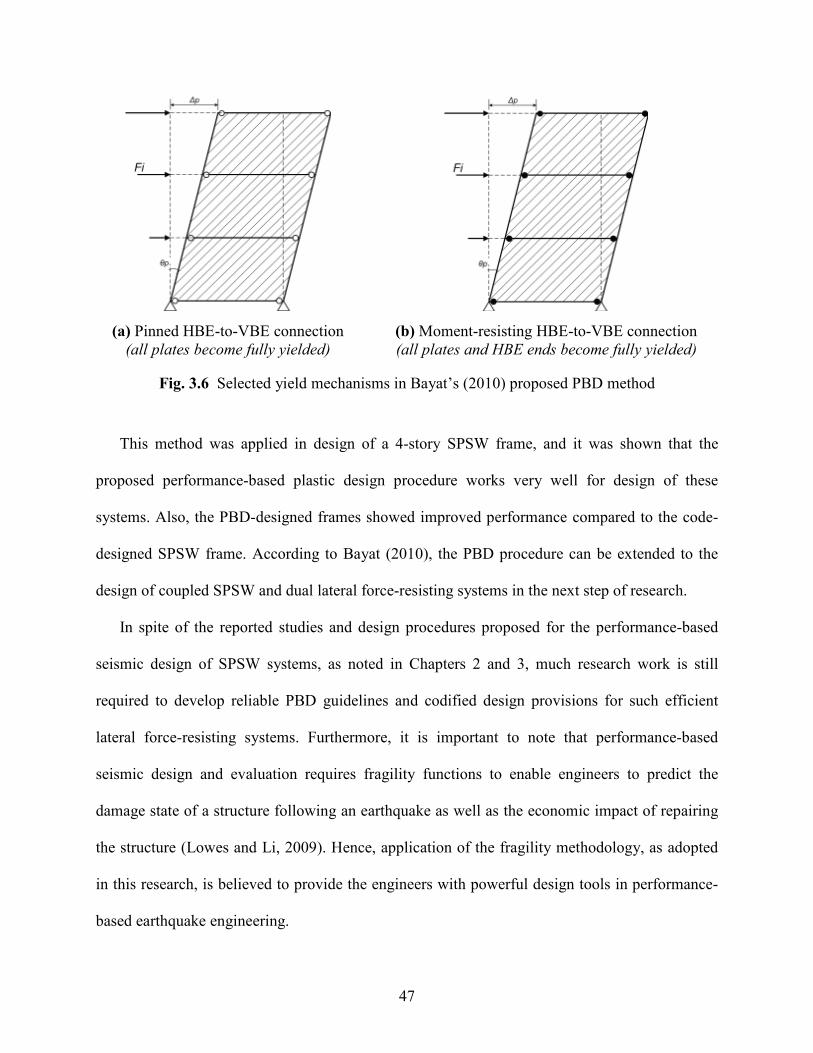
47
(a) Pinned HBE-to-VBE connection
(all plates become fully yielded)
(b) Moment-resisting HBE-to-VBE connection
(all plates and HBE ends become fully yielded)
Fig. 3.6 Selected yield mechanisms in Bayat’s (2010) proposed PBD method
This method was applied in design of a 4-story SPSW frame, and it was shown that the
proposed performance-based plastic design procedure works very well for design of these
systems. Also, the PBD-designed frames showed improved performance compared to the code-
designed SPSW frame. According to Bayat (2010), the PBD procedure can be extended to the
design of coupled SPSW and dual lateral force-resisting systems in the next step of research.
In spite of the reported studies and design procedures proposed for the performance-based
seismic design of SPSW systems, as noted in Chapters 2 and 3, much research work is still
required to develop reliable PBD guidelines and codified design provisions for such efficient
lateral force-resisting systems. Furthermore, it is important to note that performance-based
seismic design and evaluation requires fragility functions to enable engineers to predict the
damage state of a structure following an earthquake as well as the economic impact of repairing
the structure (Lowes and Li, 2009). Hence, application of the fragility methodology, as adopted
in this research, is believed to provide the engineers with powerful design tools in performance-
based earthquake engineering.
48
4. STUDY OF BUCKLING, YIELDING, AND CYCLIC
BEHAVIORS OF STEEL SHEAR PANELS
4.1 Introduction
Structural stability and performance of steel plates are characterized by geometrical buckling
and material yielding, which are two independent phenomena that may interact with each other.
Based on the material and geometrical properties, material yielding may occur either before or
after or even at the same time as buckling (Alinia et al., 2009).
Based on their slenderness parameter as well as buckling and yielding behavior, steel plates
may be quantitatively and qualitatively divided into slender, moderate, and stocky categories.
Slender plates undergo elastic buckling and then yield in post-buckling stage. These type of
plates have low buckling capacity and large post-buckling reserve. Stocky plates, on the other
hand, yield first and then undergo inelastic buckling and have some post-yield reserve, while
moderate plates undergo simultaneous buckling and yielding, and neither have post-buckling nor
post-yield reserves (Gheitasi and Alinia, 2010).
From point of view of their application in SPSW systems and also by considering their
buckling and yielding behavior, thin and thick plates offer essentially disparate structural and
economical characteristics. Thin plates are economically viable components; however, they
possess relatively low buckling strength and weak energy absorption as well as serviceability
characteristics. Thick plates, on the other hand, have comparatively higher buckling as well as
energy dissipation capacities and improved serviceability characteristics, while economically are
considered to be disadvantageous. Nowadays, use of LYP steel plates with extremely low yield
strength as well as high ductility and elongation properties makes it possible to somewhat

49
balance between structural and economical considerations and consequently design relatively
cost-effective SPSWs with high buckling and energy dissipation capacities and also improved
serviceability characteristics. LYP steel shear panels may indeed undergo early material yielding
followed by inelastic geometrical buckling. Such efficient stiffening and damping components
have been demonstrated to be quite favorable based on their superior characteristics and
performance.
In order for efficient design and application of LYP steel shear panels, it is important to
determine the limiting thickness corresponding to simultaneous geometrical buckling and
material yielding. In fact, this is believed to consequently serve as an effective parameter in
seismic design of infill plates as the primary lateral force-resisting and energy dissipating
components in SPSW systems. On this basis, the limiting thicknesses of LYP steel plates with
various support and loading conditions are determined theoretically in this chapter, which is, in
turn, followed by numerical verification of the theoretical predictions. In addition, advantages of
use of LYP steel as compared to the conventional steel are also addressed along with other case
studies. Ultimately, the limiting plate thicknesses in SPSW systems are determined and the
accuracy of the results is verified via nonlinear finite element analyses.
4.2 Determination of Limiting Plate Thickness
Theoretical determination of the limiting thicknesses of simply supported and clamped plates
subjected to shear and/or compressive loads is discussed in this section. Fig. 4.1 shows flat plates
under pure shear, pure and uniform compression as well as combination of the two in-plane
loadings, where l and h are the respective length and height of the plates.

50
(a) Pure shear (b) Pure compression (c) Combined shear and compression
Fig. 4.1 Plates under different in-plane loading conditions
The critical stress of rectangular plates under the action of shearing stresses uniformly
distributed along the edges (Fig. 4.1(a)) is given by
2
2
2
)1(12
×
−=
b
t
v
Ek pscr
πτ (4.1)
where, E and v are Young’s modulus and Poisson’s ratio, respectively, pt is the plate
thickness, and sk is the elastic shear buckling coefficient which is 2)/(0.434.5 baks += for
simple and 2)/(6.598.8 baks += for clamped support conditions. It should be noted that
),max( hla = and ),min( hlb = .
The critical stress of rectangular plates uniformly compressed in one direction (Fig. 4.1(b)) is
also expressed by
2
2
2
)1(12
×
−=
l
t
v
Ek pccr
πσ . (4.2)
ck in Eq. (4.2) can be determined from the figures and tables presented in stability books for
various support conditions, e.g. Timoshenko and Gere (1961) and Brush and Almroth (1975).
However, for simply supported plates 2)]/()/[( mlhhmlkc += may also be applied, in which m
is the wavelength parameter.
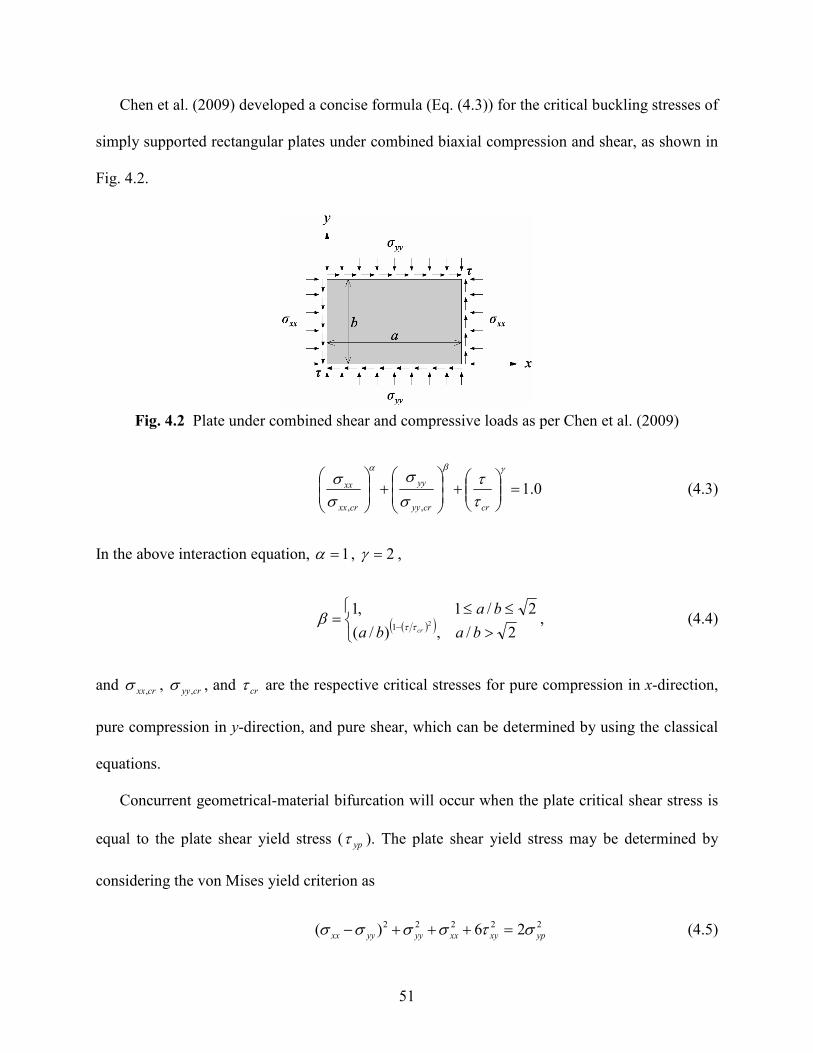
51
Chen et al. (2009) developed a concise formula (Eq. (4.3)) for the critical buckling stresses of
simply supported rectangular plates under combined biaxial compression and shear, as shown in
Fig. 4.2.
Fig. 4.2 Plate under combined shear and compressive loads as per Chen et al. (2009)
0.1,,
=
+
+
γβα
ττ
σ
σ
σσ
crcryy
yy
crxx
xx (4.3)
In the above interaction equation, 1=α , 2=γ ,
( )( )
>
≤≤=
−2/,)/(
2/1,12
1baba
ba
crττβ , (4.4)
and crxx,σ , cryy,σ , and crτ are the respective critical stresses for pure compression in x-direction,
pure compression in y-direction, and pure shear, which can be determined by using the classical
equations.
Concurrent geometrical-material bifurcation will occur when the plate critical shear stress is
equal to the plate shear yield stress ( ypτ ). The plate shear yield stress may be determined by
considering the von Mises yield criterion as
22222 26)( ypxyxxyyyyxx στσσσσ =+++− (4.5)
52
in which, xxσ , yyσ , and xyτ are the in-plane normal and shear stresses, and also ypσ is the plate
yield stress. In order to obtain a general expression for the shear yield stress of a plate subjected
to shear and uniaxial compressive loads representing the effects of lateral as well as vertical
ground motion and/or gravity loads while used as a lateral force-resisting element in SPSW
systems and as shown in Fig. 4.1(c), it is assumed that 0=xxσ and cyy σσ = , and also ypxy ττ = ,
where cσ denotes the vertical uniformly-distributed compressive stress. By substituting the
corresponding stress components into Eq. (4.5), ypτ can be generally expressed as
3
22
cyp
yp
σστ
−= . (4.6)
In this study, two cases are considered as follows. First, plates are assumed to be subjected to
pure shear, i.e. 0=cσ , which results in
3
yp
yp
στ = . (4.7)
Second, plates are also assumed to be subjected to combined shear and compressive loads, where
compressive load is considered to be proportional and literally 50% of the shear load, i.e.
ypc τσ 5.0= , which in turn results in
25.3
yp
yp
στ = . (4.8)
Ultimately, in order to obtain the limiting thickness of a plate under pure shear, Eq. (4.1) is
set equal to Eq. (4.7), while for a plate subjected to combined shear and compressive loads τ in
Eq. (4.3) is substituted by the ypτ expression in Eq. (4.8). Properties of the LYP steel plates
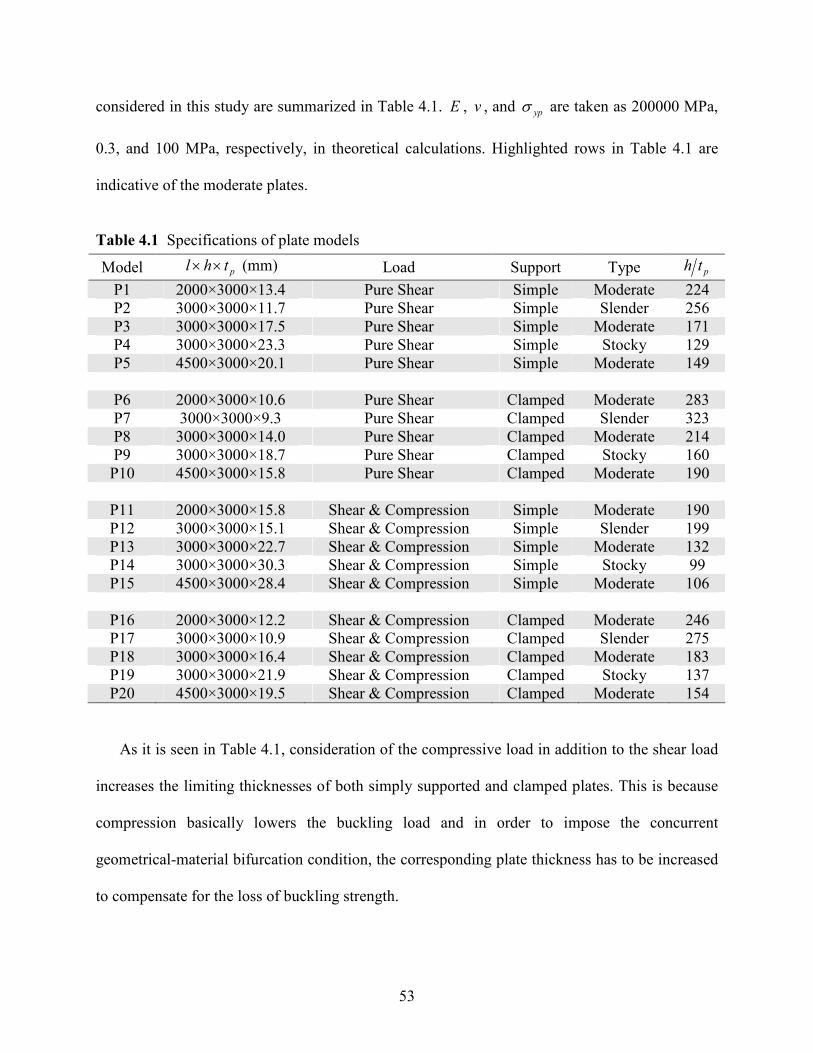
53
considered in this study are summarized in Table 4.1. E , v , and ypσ are taken as 200000 MPa,
0.3, and 100 MPa, respectively, in theoretical calculations. Highlighted rows in Table 4.1 are
indicative of the moderate plates.
Table 4.1 Specifications of plate models
Model pthl ×× (mm) Load Support Type pth
P1 2000×3000×13.4 Pure Shear Simple Moderate 224
P2 3000×3000×11.7 Pure Shear Simple Slender 256
P3 3000×3000×17.5 Pure Shear Simple Moderate 171
P4 3000×3000×23.3 Pure Shear Simple Stocky 129
P5 4500×3000×20.1 Pure Shear Simple Moderate 149
P6 2000×3000×10.6 Pure Shear Clamped Moderate 283
P7 3000×3000×9.3 Pure Shear Clamped Slender 323
P8 3000×3000×14.0 Pure Shear Clamped Moderate 214
P9 3000×3000×18.7 Pure Shear Clamped Stocky 160
P10 4500×3000×15.8 Pure Shear Clamped Moderate 190
P11 2000×3000×15.8 Shear & Compression Simple Moderate 190
P12 3000×3000×15.1 Shear & Compression Simple Slender 199
P13 3000×3000×22.7 Shear & Compression Simple Moderate 132
P14 3000×3000×30.3 Shear & Compression Simple Stocky 99
P15 4500×3000×28.4 Shear & Compression Simple Moderate 106
P16 2000×3000×12.2 Shear & Compression Clamped Moderate 246
P17 3000×3000×10.9 Shear & Compression Clamped Slender 275
P18 3000×3000×16.4 Shear & Compression Clamped Moderate 183
P19 3000×3000×21.9 Shear & Compression Clamped Stocky 137
P20 4500×3000×19.5 Shear & Compression Clamped Moderate 154
As it is seen in Table 4.1, consideration of the compressive load in addition to the shear load
increases the limiting thicknesses of both simply supported and clamped plates. This is because
compression basically lowers the buckling load and in order to impose the concurrent
geometrical-material bifurcation condition, the corresponding plate thickness has to be increased
to compensate for the loss of buckling strength.
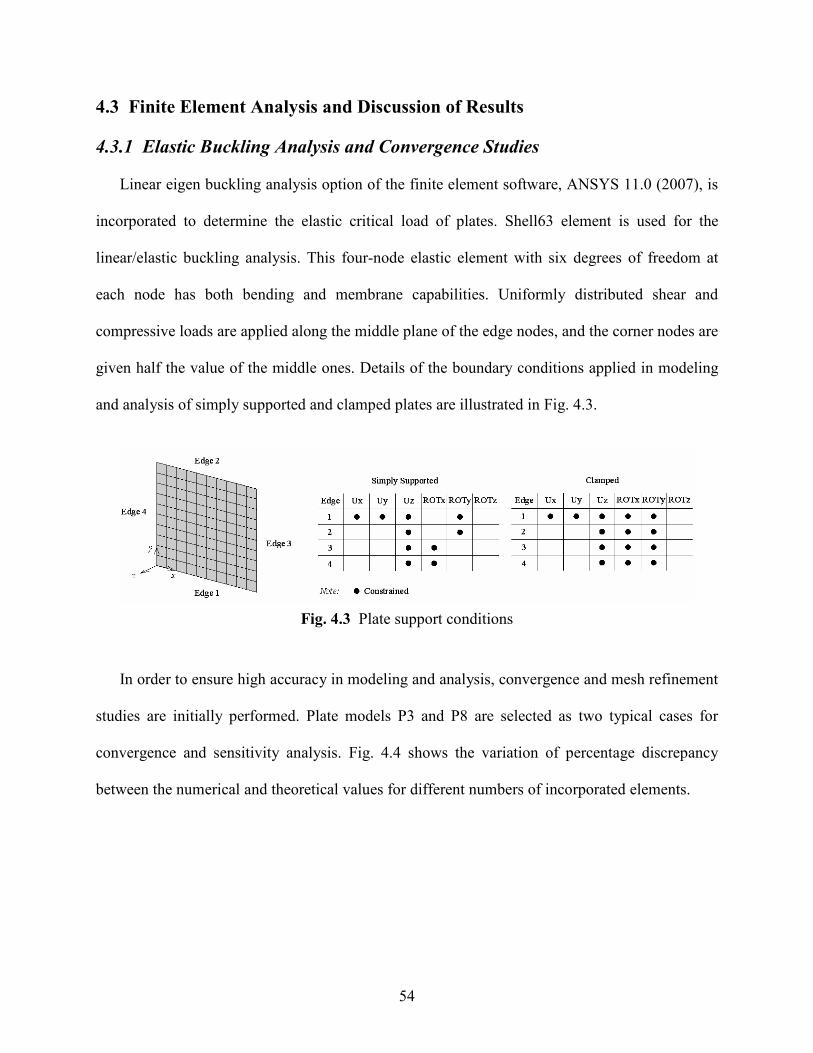
54
4.3 Finite Element Analysis and Discussion of Results
4.3.1 Elastic Buckling Analysis and Convergence Studies
Linear eigen buckling analysis option of the finite element software, ANSYS 11.0 (2007), is
incorporated to determine the elastic critical load of plates. Shell63 element is used for the
linear/elastic buckling analysis. This four-node elastic element with six degrees of freedom at
each node has both bending and membrane capabilities. Uniformly distributed shear and
compressive loads are applied along the middle plane of the edge nodes, and the corner nodes are
given half the value of the middle ones. Details of the boundary conditions applied in modeling
and analysis of simply supported and clamped plates are illustrated in Fig. 4.3.
Fig. 4.3 Plate support conditions
In order to ensure high accuracy in modeling and analysis, convergence and mesh refinement
studies are initially performed. Plate models P3 and P8 are selected as two typical cases for
convergence and sensitivity analysis. Fig. 4.4 shows the variation of percentage discrepancy
between the numerical and theoretical values for different numbers of incorporated elements.
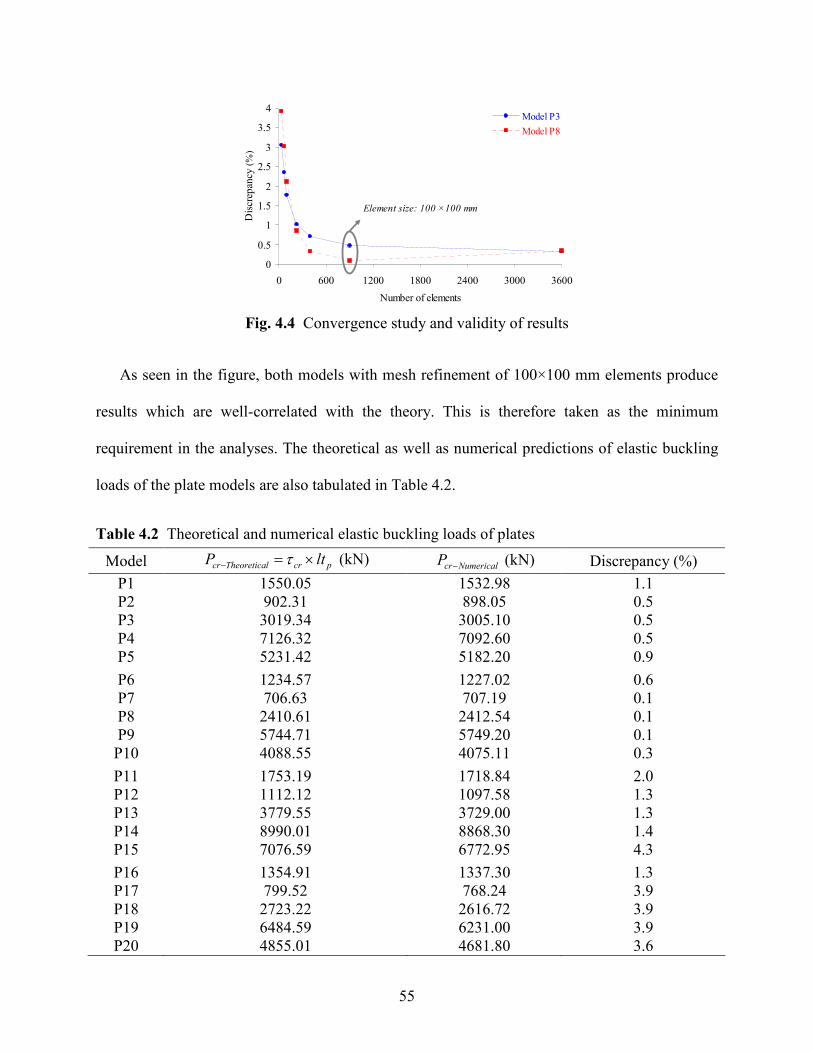
55
0
0.5
1
1.5
2
2.5
3
3.5
4
0 600 1200 1800 2400 3000 3600
Number of elements
Dis
crep
ancy
(%
)
Model P3
Model P8
Element size: 100 ×100 mm
Fig. 4.4 Convergence study and validity of results
As seen in the figure, both models with mesh refinement of 100×100 mm elements produce
results which are well-correlated with the theory. This is therefore taken as the minimum
requirement in the analyses. The theoretical as well as numerical predictions of elastic buckling
loads of the plate models are also tabulated in Table 4.2.
Table 4.2 Theoretical and numerical elastic buckling loads of plates
Model pcrlTheoreticacr ltP ×=− τ (kN) NumericalcrP − (kN) Discrepancy (%)
P1 1550.05 1532.98 1.1
P2 902.31 898.05 0.5
P3 3019.34 3005.10 0.5
P4 7126.32 7092.60 0.5
P5 5231.42 5182.20 0.9
P6 1234.57 1227.02 0.6
P7 706.63 707.19 0.1
P8 2410.61 2412.54 0.1
P9 5744.71 5749.20 0.1
P10 4088.55 4075.11 0.3
P11 1753.19 1718.84 2.0
P12 1112.12 1097.58 1.3
P13 3779.55 3729.00 1.3
P14 8990.01 8868.30 1.4
P15 7076.59 6772.95 4.3
P16 1354.91 1337.30 1.3
P17 799.52 768.24 3.9
P18 2723.22 2616.72 3.9
P19 6484.59 6231.00 3.9
P20 4855.01 4681.80 3.6
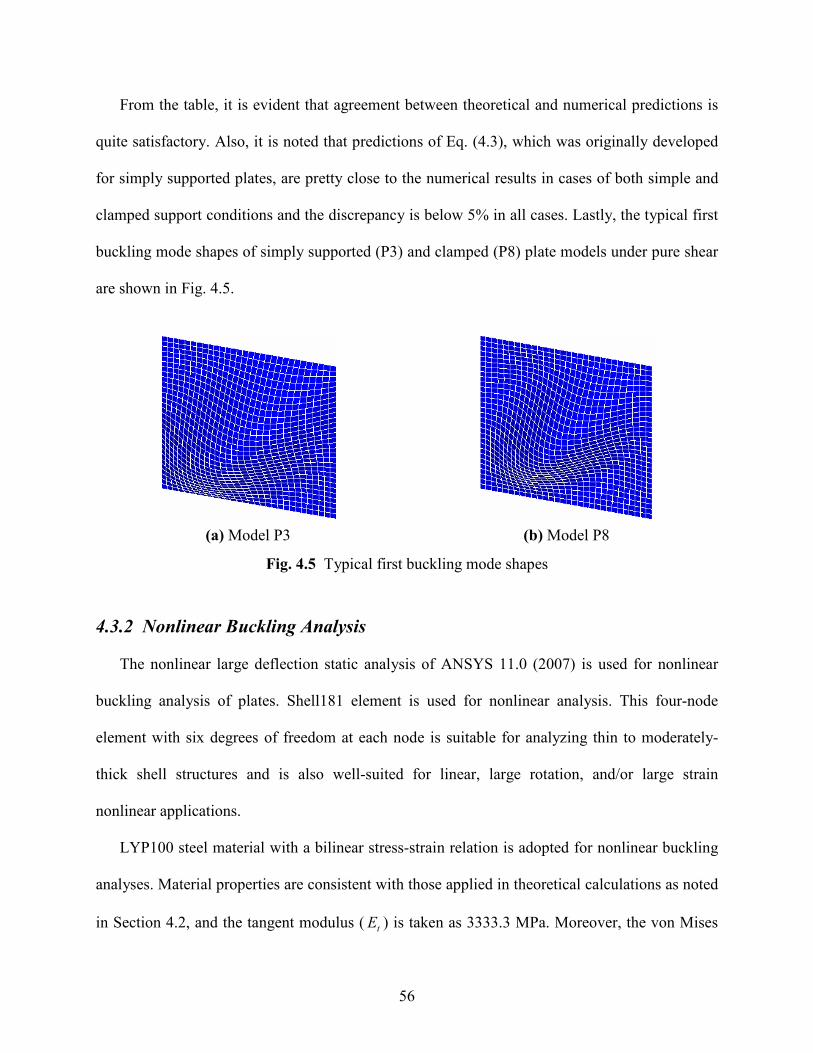
56
From the table, it is evident that agreement between theoretical and numerical predictions is
quite satisfactory. Also, it is noted that predictions of Eq. (4.3), which was originally developed
for simply supported plates, are pretty close to the numerical results in cases of both simple and
clamped support conditions and the discrepancy is below 5% in all cases. Lastly, the typical first
buckling mode shapes of simply supported (P3) and clamped (P8) plate models under pure shear
are shown in Fig. 4.5.
(a) Model P3 (b) Model P8
Fig. 4.5 Typical first buckling mode shapes
4.3.2 Nonlinear Buckling Analysis
The nonlinear large deflection static analysis of ANSYS 11.0 (2007) is used for nonlinear
buckling analysis of plates. Shell181 element is used for nonlinear analysis. This four-node
element with six degrees of freedom at each node is suitable for analyzing thin to moderately-
thick shell structures and is also well-suited for linear, large rotation, and/or large strain
nonlinear applications.
LYP100 steel material with a bilinear stress-strain relation is adopted for nonlinear buckling
analyses. Material properties are consistent with those applied in theoretical calculations as noted
in Section 4.2, and the tangent modulus ( tE ) is taken as 3333.3 MPa. Moreover, the von Mises
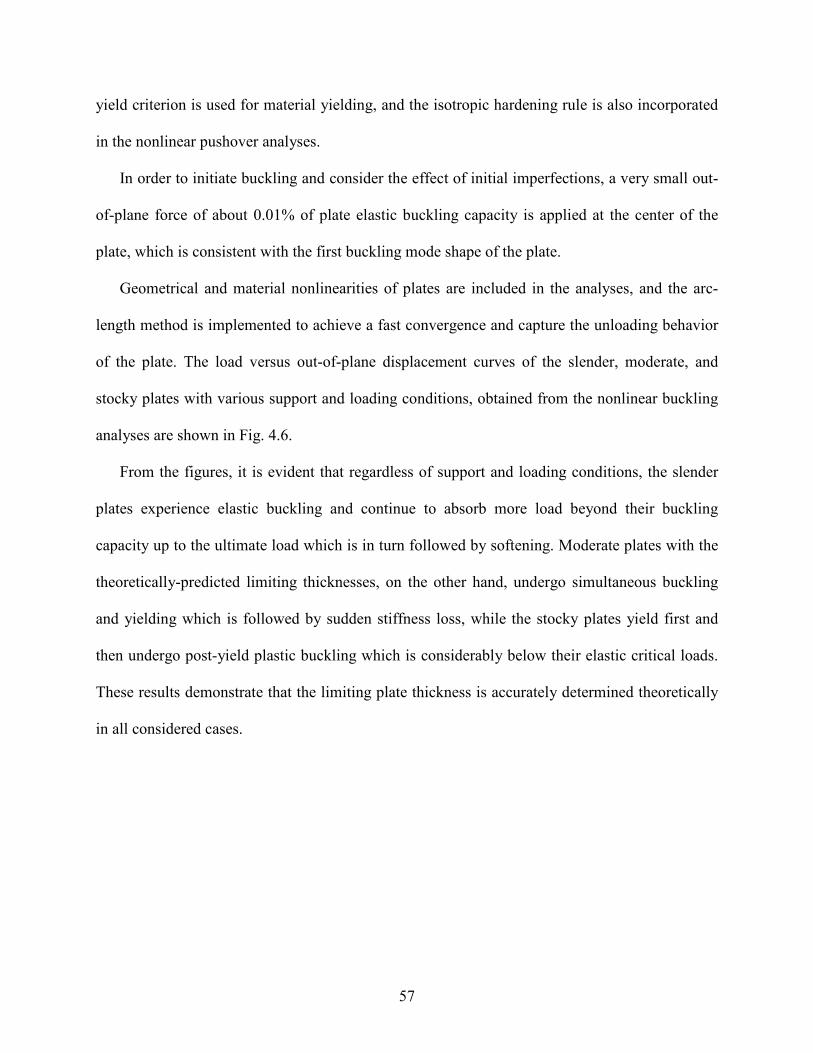
57
yield criterion is used for material yielding, and the isotropic hardening rule is also incorporated
in the nonlinear pushover analyses.
In order to initiate buckling and consider the effect of initial imperfections, a very small out-
of-plane force of about 0.01% of plate elastic buckling capacity is applied at the center of the
plate, which is consistent with the first buckling mode shape of the plate.
Geometrical and material nonlinearities of plates are included in the analyses, and the arc-
length method is implemented to achieve a fast convergence and capture the unloading behavior
of the plate. The load versus out-of-plane displacement curves of the slender, moderate, and
stocky plates with various support and loading conditions, obtained from the nonlinear buckling
analyses are shown in Fig. 4.6.
From the figures, it is evident that regardless of support and loading conditions, the slender
plates experience elastic buckling and continue to absorb more load beyond their buckling
capacity up to the ultimate load which is in turn followed by softening. Moderate plates with the
theoretically-predicted limiting thicknesses, on the other hand, undergo simultaneous buckling
and yielding which is followed by sudden stiffness loss, while the stocky plates yield first and
then undergo post-yield plastic buckling which is considerably below their elastic critical loads.
These results demonstrate that the limiting plate thickness is accurately determined theoretically
in all considered cases.
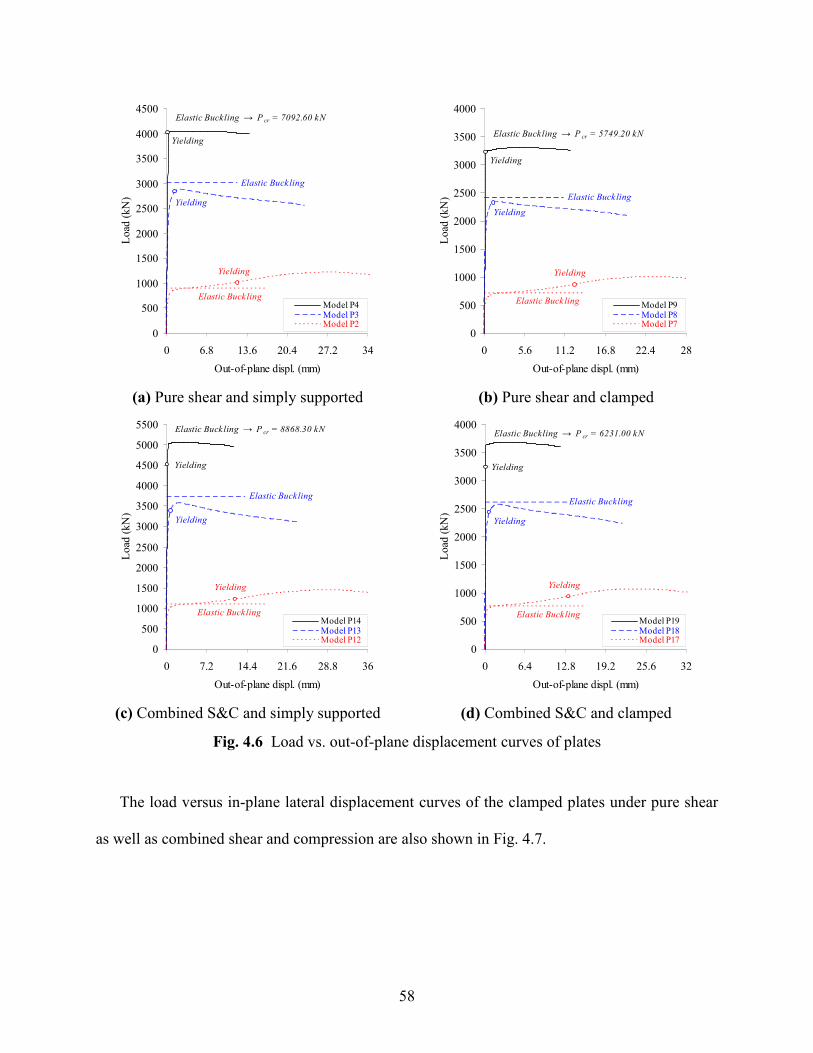
58
0
500
1000
1500
2000
2500
3000
3500
4000
4500
0 6.8 13.6 20.4 27.2 34
Out-of-plane displ. (mm)
Load
(kN
)
Model P4Model P3Model P2
Elastic Buckling
Yielding
Elastic Buckling
Yielding
Elastic Buckling → P cr = 7092.60 kN
Yielding
0
500
1000
1500
2000
2500
3000
3500
4000
0 5.6 11.2 16.8 22.4 28
Out-of-plane displ. (mm)
Load
(kN
)
Model P9Model P8Model P7
Elastic Buckling
Yielding
Elastic Buckling
Yielding
Elastic Buckling → P cr = 5749.20 kN
Yielding
(a) Pure shear and simply supported (b) Pure shear and clamped
0
500
1000
1500
2000
2500
3000
3500
4000
4500
5000
5500
0 7.2 14.4 21.6 28.8 36
Out-of-plane displ. (mm)
Load
(kN
)
Model P14Model P13Model P12
Elastic Buckling
Yielding
Elastic Buckling
Yielding
Elastic Buckling → P cr = 8868.30 kN
Yielding
0
500
1000
1500
2000
2500
3000
3500
4000
0 6.4 12.8 19.2 25.6 32
Out-of-plane displ. (mm)
Load
(kN
)
Model P19Model P18Model P17
Elastic Buckling
Yielding
Elastic Buckling
Yielding
Elastic Buckling → P cr = 6231.00 kN
Yielding
(c) Combined S&C and simply supported (d) Combined S&C and clamped
Fig. 4.6 Load vs. out-of-plane displacement curves of plates
The load versus in-plane lateral displacement curves of the clamped plates under pure shear
as well as combined shear and compression are also shown in Fig. 4.7.
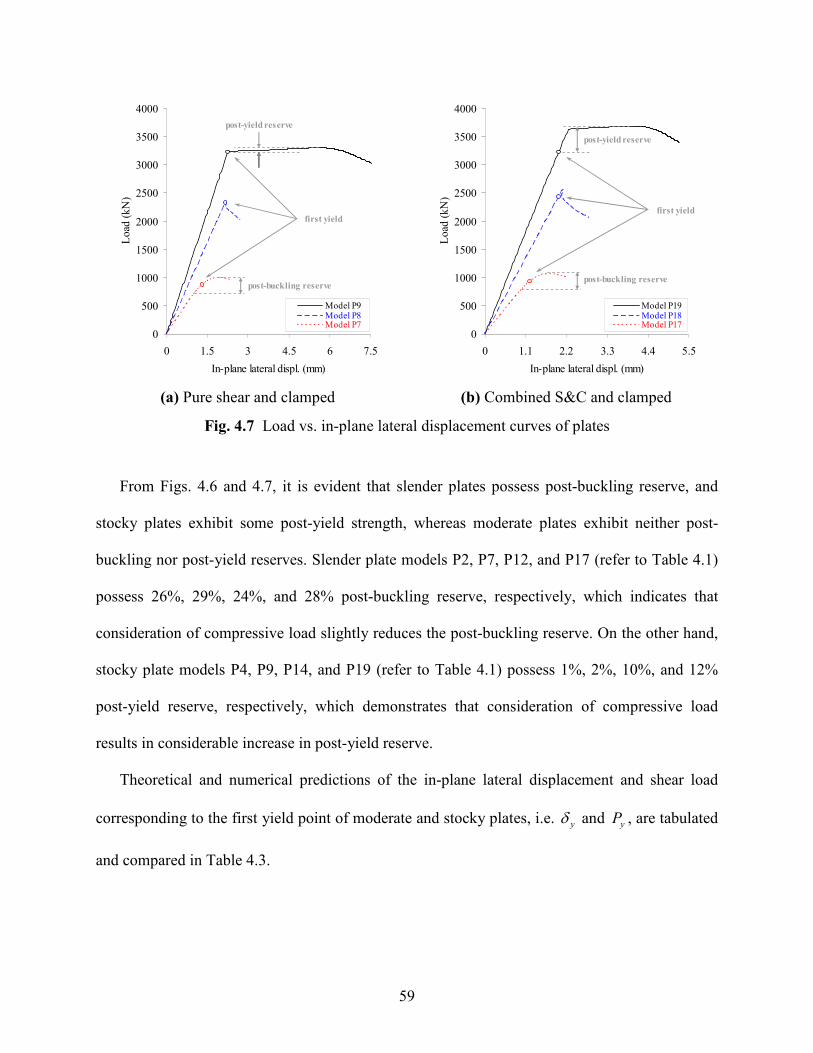
59
0
500
1000
1500
2000
2500
3000
3500
4000
0 1.5 3 4.5 6 7.5
In-plane lateral displ. (mm)
Load
(kN
)
Model P9Model P8Model P7
post-buckling reserve
post-yield reserve
first yield
0
500
1000
1500
2000
2500
3000
3500
4000
0 1.1 2.2 3.3 4.4 5.5
In-plane lateral displ. (mm)
Load
(kN
)
Model P19Model P18Model P17
post-yield reserve
first yield
post-buckling reserve
(a) Pure shear and clamped (b) Combined S&C and clamped
Fig. 4.7 Load vs. in-plane lateral displacement curves of plates
From Figs. 4.6 and 4.7, it is evident that slender plates possess post-buckling reserve, and
stocky plates exhibit some post-yield strength, whereas moderate plates exhibit neither post-
buckling nor post-yield reserves. Slender plate models P2, P7, P12, and P17 (refer to Table 4.1)
possess 26%, 29%, 24%, and 28% post-buckling reserve, respectively, which indicates that
consideration of compressive load slightly reduces the post-buckling reserve. On the other hand,
stocky plate models P4, P9, P14, and P19 (refer to Table 4.1) possess 1%, 2%, 10%, and 12%
post-yield reserve, respectively, which demonstrates that consideration of compressive load
results in considerable increase in post-yield reserve.
Theoretical and numerical predictions of the in-plane lateral displacement and shear load
corresponding to the first yield point of moderate and stocky plates, i.e. yδ and yP , are tabulated
and compared in Table 4.3.

60
Table 4.3 Comparison of theoretical and numerical results of first yield point properties
Theoretical Numerical
hGypy ×= )(τδ pypy ltP ×= τ yδ yP Num. / Theo.
Ratio Plate
(mm) (kN) (mm) (kN) Displ. Load
P1 2.252 1547.30 2.138 1468.68 0.95 0.95
P3 2.252 3031.09 2.111 2841.32 0.94 0.94
P4 2.252 4035.68 2.242 4018.83 1.00 1.00
P5 2.252 5222.13 2.098 4864.85 0.93 0.93
P6 2.252 1223.98 2.197 1193.73 0.98 0.98
P8 2.252 2424.87 2.162 2327.41 0.96 0.96
P9 2.252 3238.94 2.242 3224.92 1.00 1.00
P10 2.252 4104.96 2.148 3915.11 0.95 0.95
P11 2.163 1752.85 1.998 1586.93 0.92 0.91
P13 2.163 3777.51 1.993 3378.36 0.92 0.89
P14 2.163 5042.22 2.002 4528.75 0.93 0.90
P15 2.163 7089.07 1.960 6133.29 0.91 0.87
P16 2.163 1353.47 2.023 1240.77 0.94 0.92
P18 2.163 2729.12 1.987 2433.54 0.92 0.89
P19 2.163 3644.38 1.939 3171.30 0.90 0.87
P20 2.163 4867.49 1.980 4254.03 0.92 0.87
Despite the presence of the nonlinearities in finite element analyses and also the
approximations in theoretical calculations, theoretical and numerical predictions of the plate first
yield point characteristics match fairly closely in almost all cases, as shown in Table 4.3. It is
noted that the accentuated discrepancy between the theoretical and numerical results in case of
plates under combined shear and compression is because of presence of the compressive load
which results in higher geometrical nonlinearities by augmenting the out-of-plane deformations.
Ultimately, the von Mises stress contour plots of the clamped plates under pure shear at their
respective ultimate strengths are shown in Fig. 4.8. In the figure, the plate side facing the positive
z-direction (refer to Fig. 4.3) is called as the “external” face, and the other side is alternatively
called as the “internal” face.
61
(a) Model P6 (2000×3000×10.6, Moderate)
(b) Model P7 (3000×3000×9.3, Slender)
(c) Model P8 (3000×3000×14.0, Moderate)
(d) Model P9 (3000×3000×18.7, Stocky)
(e) Model P10 (4500×3000×15.8, Moderate)
Fig. 4.8 von Mises stress contour plots at ultimate strengths of various plates:
external face (left) and internal face (right)
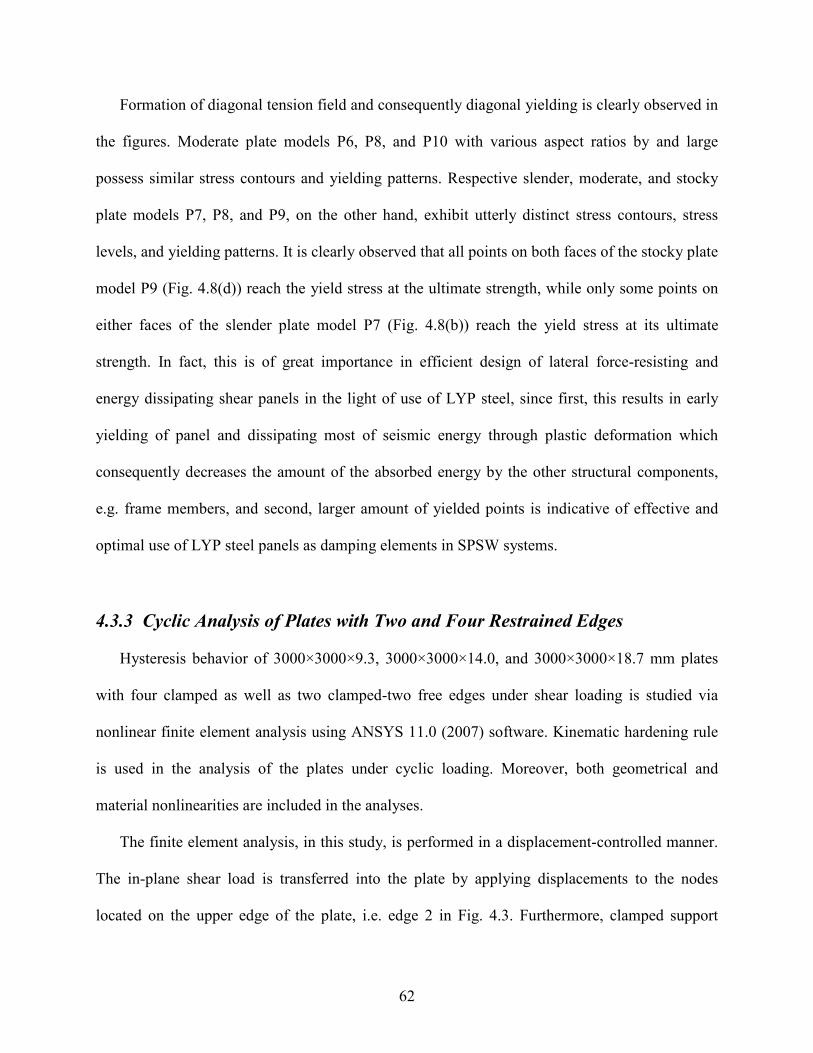
62
Formation of diagonal tension field and consequently diagonal yielding is clearly observed in
the figures. Moderate plate models P6, P8, and P10 with various aspect ratios by and large
possess similar stress contours and yielding patterns. Respective slender, moderate, and stocky
plate models P7, P8, and P9, on the other hand, exhibit utterly distinct stress contours, stress
levels, and yielding patterns. It is clearly observed that all points on both faces of the stocky plate
model P9 (Fig. 4.8(d)) reach the yield stress at the ultimate strength, while only some points on
either faces of the slender plate model P7 (Fig. 4.8(b)) reach the yield stress at its ultimate
strength. In fact, this is of great importance in efficient design of lateral force-resisting and
energy dissipating shear panels in the light of use of LYP steel, since first, this results in early
yielding of panel and dissipating most of seismic energy through plastic deformation which
consequently decreases the amount of the absorbed energy by the other structural components,
e.g. frame members, and second, larger amount of yielded points is indicative of effective and
optimal use of LYP steel panels as damping elements in SPSW systems.
4.3.3 Cyclic Analysis of Plates with Two and Four Restrained Edges
Hysteresis behavior of 3000×3000×9.3, 3000×3000×14.0, and 3000×3000×18.7 mm plates
with four clamped as well as two clamped-two free edges under shear loading is studied via
nonlinear finite element analysis using ANSYS 11.0 (2007) software. Kinematic hardening rule
is used in the analysis of the plates under cyclic loading. Moreover, both geometrical and
material nonlinearities are included in the analyses.
The finite element analysis, in this study, is performed in a displacement-controlled manner.
The in-plane shear load is transferred into the plate by applying displacements to the nodes
located on the upper edge of the plate, i.e. edge 2 in Fig. 4.3. Furthermore, clamped support

63
conditions are applied on either all four edges or just two upper and lower edges, i.e. edges 1 and
2 in Fig. 4.3, while the other two edges are left unrestrained.
The time history of displacement applied to the models as well as the hysteresis shear load-
displacement curves of the three plates with the two different support conditions are shown in
Fig. 4.9.
-8
-6
-4
-2
0
2
4
6
8
0 1 2 3 4 5 6
Time (sec.)
Dis
pl. (
mm
)
-600
-300
0
300
600
-8 -4 0 4 8
In-plane lateral displ. (mm)
Lo
ad
(k
N)
(a) Loading protocol (b) PL 3000×3000×9.3
-1200
-600
0
600
1200
-8 -4 0 4 8
In-plane lateral displ. (mm)
Lo
ad
(k
N)
-1600
-800
0
800
1600
-8 -4 0 4 8
In-plane lateral displ. (mm)
Lo
ad
(k
N)
(c) PL 3000×3000×14.0 (d) PL 3000×3000×18.7
Fig. 4.9 Cyclic loading and hysteresis behaviors of plates with two and four clamped edges
As seen in Fig. 4.9, despite the identical initial stiffnesses of plates with equal thicknesses
and different support conditions, stiffness and strength of plates with two clamped edges tend to

64
diminish considerably at higher levels of loading. Furthermore, compared to plates with all four
clamped edges, plates with two clamped edges exhibit relatively weak cyclic behavior
accompanied by pinching of the hysteresis loops, which is of course remarkably pronounced as
the slenderness of the plate increases. Cumulative dissipated energy (CDE) curves of the plate
models are also given in Fig. 4.10.
0
6
12
18
24
30
36
42
48
0 1 2 3 4 5 6
Cycle number
CD
E (
kN
.m)
PL 3000×3000×9.3 - 4 edges clamped
PL 3000×3000×9.3 - 2 edges clamped
PL 3000×3000×14.0 - 4 edges clamped
PL 3000×3000×14.0 - 2 edges clamped
PL 3000×3000×18.7 - 4 edges clamped
PL 3000×3000×18.7 - 2 edges clamped
Fig. 4.10 Cumulative dissipated energy
From the figure, it is quite evident that dissipated energy increases as the plate thickness
increases and results in better inelastic performance with less pinching effect. However, it is
observed that plates with two clamped edges possess relatively lower energy absorption capacity
in comparison with those clamped at all four edges.
Weak stiffness and strength performance, and reduced energy dissipation capacity of plates
with two clamped edges is directly related to the large out-of-plane deformations which occur
from early stages of loading and increase considerably at higher levels of loading due to the
presence of the two unrestrained edges. This is clearly illustrated in Fig. 4.11, where out-of-plane
displacement contour plots of 3000×3000×14.0 mm plate with the two support conditions are
compared at 8.00 mm in-plane lateral displacement.
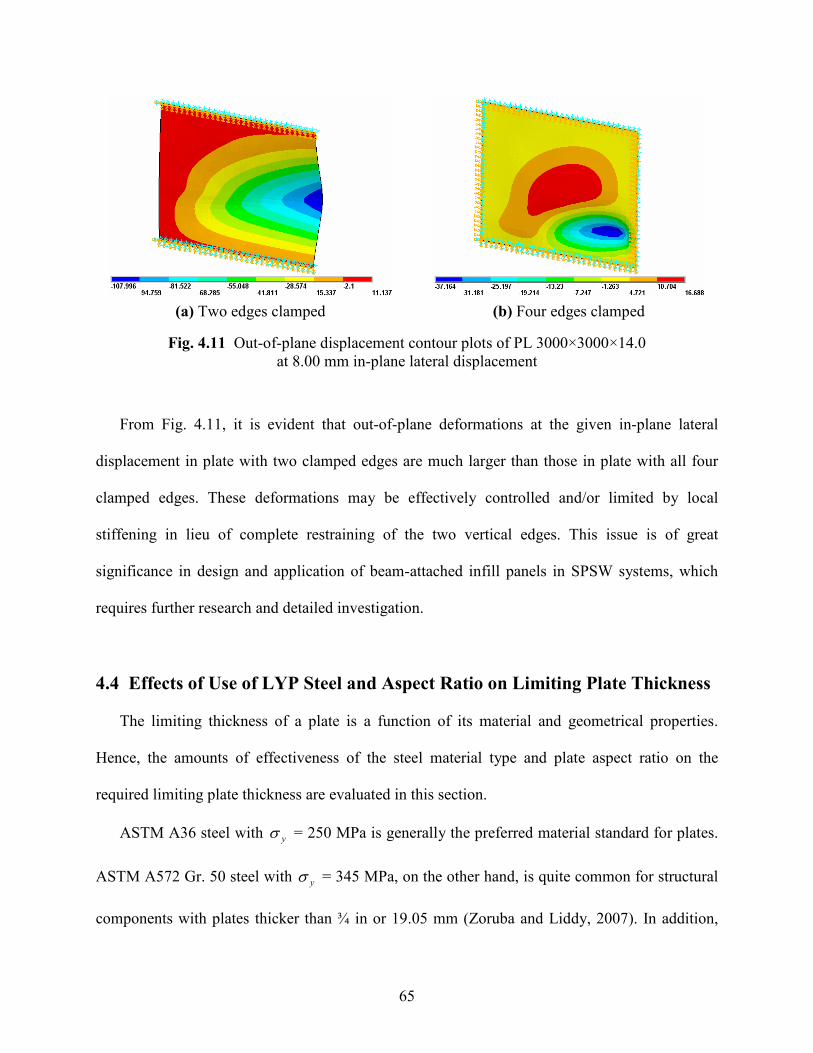
65
(a) Two edges clamped (b) Four edges clamped
Fig. 4.11 Out-of-plane displacement contour plots of PL 3000×3000×14.0
at 8.00 mm in-plane lateral displacement
From Fig. 4.11, it is evident that out-of-plane deformations at the given in-plane lateral
displacement in plate with two clamped edges are much larger than those in plate with all four
clamped edges. These deformations may be effectively controlled and/or limited by local
stiffening in lieu of complete restraining of the two vertical edges. This issue is of great
significance in design and application of beam-attached infill panels in SPSW systems, which
requires further research and detailed investigation.
4.4 Effects of Use of LYP Steel and Aspect Ratio on Limiting Plate Thickness
The limiting thickness of a plate is a function of its material and geometrical properties.
Hence, the amounts of effectiveness of the steel material type and plate aspect ratio on the
required limiting plate thickness are evaluated in this section.
ASTM A36 steel with yσ = 250 MPa is generally the preferred material standard for plates.
ASTM A572 Gr. 50 steel with yσ = 345 MPa, on the other hand, is quite common for structural
components with plates thicker than ¾ in or 19.05 mm (Zoruba and Liddy, 2007). In addition,

66
LYP100 steel with yσ ≈ 100 MPa is developed for seismic control structures with high energy
absorption capacity. The advantages of use of LYP100 steel compared to the two aforementioned
conventional steel types are demonstrated in Fig. 4.12. As shown in the figure, limitptb −/
slenderness ratios of simply supported and clamped plates are calculated for broad range of ba /
aspect ratios for the three steel material types, where limitpt − is the limiting plate thickness.
60
75
90
105
120
135
150
165
180
0.5 1 1.5 2 2.5 3 3.5 4 4.5 5 5.5
a/b
b/t
p-l
imit
LYP100
ASTM A36
ASTM A572 Gr. 50
86% larger 58% larger
80
100
120
140
160
180
200
220
240
0.5 1 1.5 2 2.5 3 3.5 4 4.5 5 5.5
a/b
b/t
p-l
imit
LYP100
ASTM A36
ASTM A572 Gr. 50
58% larger86% larger
(a) Simply supported (b) Clamped
Fig. 4.12 Effect of use of LYP steel on the required limiting plate thickness
As seen, application of LYP100 steel in both support conditions results in 58% and 86%
larger limitptb −/ slenderness ratios relative to the application of ASTM A36 and A572 Gr. 50 steel
material, respectively. Larger limitptb −/ slenderness ratio implies smaller limiting plate thickness
required to impose the concurrent geometrical-material bifurcation condition. Thus, it may be
concluded that use of LYP100 steel substantially reduces the required limiting plate thickness
compared to the conventional steel material.
The effect of aspect ratio on the required limiting thickness of simply supported as well as
clamped plates is also demonstrated in Fig. 4.13, in which limitpth −/ slenderness ratios
determined by considering LYP100 steel material are plotted against the length-to-height ( hl / )
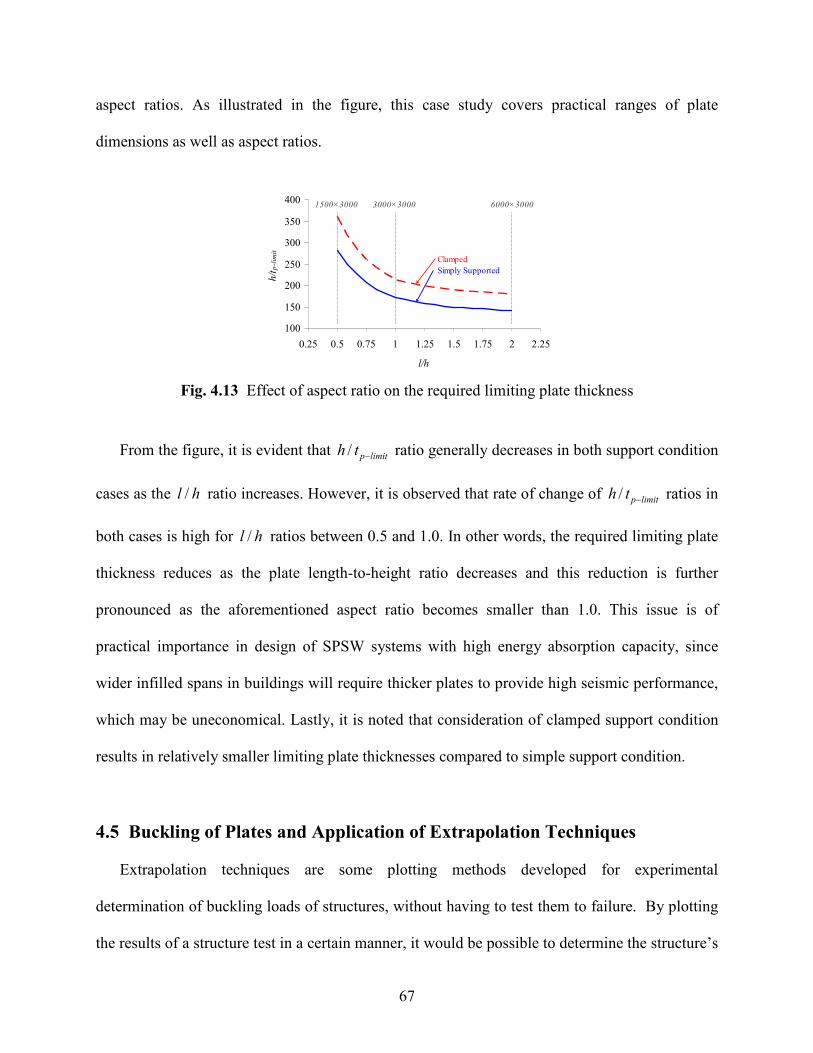
67
aspect ratios. As illustrated in the figure, this case study covers practical ranges of plate
dimensions as well as aspect ratios.
100
150
200
250
300
350
400
0.25 0.5 0.75 1 1.25 1.5 1.75 2 2.25
l/h
h/t
p-l
imit
1500×3000 3000×3000 6000×3000
Clamped
Simply Supported
Fig. 4.13 Effect of aspect ratio on the required limiting plate thickness
From the figure, it is evident that limitpth −/ ratio generally decreases in both support condition
cases as the hl / ratio increases. However, it is observed that rate of change of limitpth −/ ratios in
both cases is high for hl / ratios between 0.5 and 1.0. In other words, the required limiting plate
thickness reduces as the plate length-to-height ratio decreases and this reduction is further
pronounced as the aforementioned aspect ratio becomes smaller than 1.0. This issue is of
practical importance in design of SPSW systems with high energy absorption capacity, since
wider infilled spans in buildings will require thicker plates to provide high seismic performance,
which may be uneconomical. Lastly, it is noted that consideration of clamped support condition
results in relatively smaller limiting plate thicknesses compared to simple support condition.
4.5 Buckling of Plates and Application of Extrapolation Techniques
Extrapolation techniques are some plotting methods developed for experimental
determination of buckling loads of structures, without having to test them to failure. By plotting
the results of a structure test in a certain manner, it would be possible to determine the structure’s
68
buckling load (Zirakian, 2010). These methods have been mostly used to determine the lateral
buckling loads of beams, columns, and frames. This study aims at evaluating the applicability of
these methods in case of buckling of plates.
Southwell, Massey, and Modified Plots developed by Southwell (1932), Massey (1963), and
Trahair (1969), respectively, are utilized in here to predict the critical loads of moderate plates.
These plotting methods are applied on the initial portions of the load versus out-of-plane
displacement curves in all cases, as illustrated in Fig. 4.14, and the unloading portions of the
curves are ignored. In fact, the considered initial portions of the curves have a parabolic shape
and contain all data points up to the ultimate strength.
0
500
1000
1500
2000
2500
3000
3500
4000
4500
0 1 2 3 4 5 6
Out-of-plane displ. (mm)
Lo
ad
(k
N)
Theoretical critical load
Ultimate strengthFirst yield
Drop in load
This portion is ignored.
Increase in load
Extrapolation techniques
are applied on this portion.Model P10
Fig. 4.14 Data points and application of the extrapolation techniques
As discussed before, failure of a moderate plate becomes evident when the plate undergoes
simultaneous buckling and yielding, and once the plate reaches its ultimate strength, unloading
takes place. The load at the ultimate strength is considered to be an inaccurate measure of the
critical load, and the extrapolation techniques are used to obtain the buckling load corresponding
to the theoretical critical load.

69
Southwell Plot graphs P/δ against δ , where δ is the out-of-plane displacement. Massey
Plot, on the other hand, graphs 2/ Pδ against δ , while Modified Plot graphs P×δ against δ .
The critical load may be obtained from relevant straight lines of best fit from these. For the
Southwell Plot, the slope of the linear relationship between P/δ and δ is the reciprocal of the
critical load. For the Massey Plot, the slope of the straight line is the square of the reciprocal of
the critical load, while for the Modified Plot, this load is given by the slope of the P×δ against
δ plot. As an example, Fig. 4.15 provides the Southwell, Massey, and Modified plots obtained
for plate model P20 (refer to Table 4.1). From the figure it is evident that Southwell and
Modified Plots are in general superior to Massey Plot because of their relatively extended range
of linearity. Nevertheless, Modified Plot exhibits the most extended range of linearity. The
extrapolated as well as theoretical critical load predictions of the moderate plate models are also
tabulated in Table 4.4.
As seen in the table, the three plotting techniques have quite successfully predicted the
critical loads in all cases as compared to the theoretical predictions, and the smallest discrepancy
between the extrapolated and theoretical estimates is found in case of the Modified Plot.
δ/P = 0.0002δ + 2E-05
R2 = 1
0.0E+00
1.0E-04
2.0E-04
3.0E-04
4.0E-04
5.0E-04
6.0E-04
7.0E-04
0 0.5 1 1.5 2 2.5 3
δ (mm)
δ/P
(m
m/k
N)
δ/P2 = 5E-08δ + 3E-09
R2 = 1
0.0E+00
2.0E-08
4.0E-08
6.0E-08
8.0E-08
1.0E-07
1.2E-07
1.4E-07
1.6E-07
0 0.5 1 1.5 2 2.5 3
δ (mm)
δ/P
2
(mm
/kN
2 )
δ×P = 4689.3δ - 309.25
R2 = 1
0.0E+00
2.0E+03
4.0E+03
6.0E+03
8.0E+03
1.0E+04
1.2E+04
1.4E+04
0 0.5 1 1.5 2 2.5 3
δ (mm)
δ×
P
(mm
.kN
)
(a) Southwell Plot (b) Massey Plot (c) Modified Plot
Fig. 4.15 Typical Southwell, Massey, and Modified Plots (Model P20)
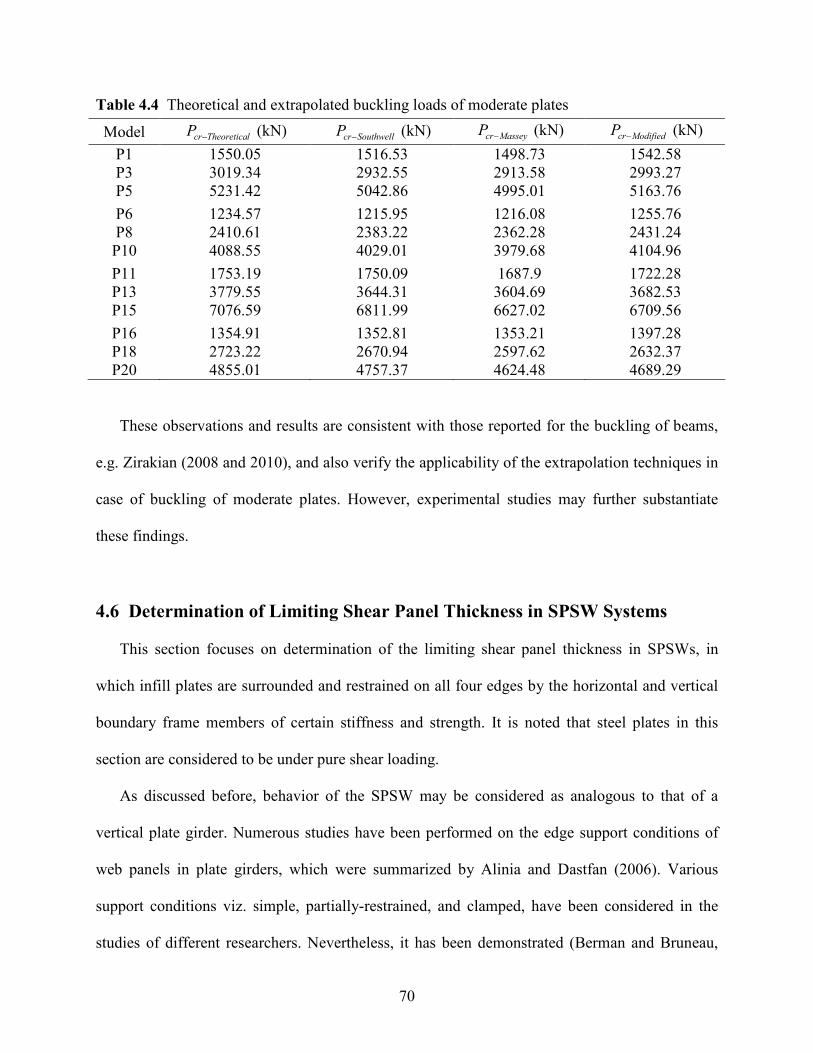
70
Table 4.4 Theoretical and extrapolated buckling loads of moderate plates
Model lTheoreticacrP − (kN) SouthwellcrP − (kN) MasseycrP − (kN) ModifiedcrP − (kN)
P1 1550.05 1516.53 1498.73 1542.58
P3 3019.34 2932.55 2913.58 2993.27
P5 5231.42 5042.86 4995.01 5163.76
P6 1234.57 1215.95 1216.08 1255.76
P8 2410.61 2383.22 2362.28 2431.24
P10 4088.55 4029.01 3979.68 4104.96
P11 1753.19 1750.09 1687.9 1722.28
P13 3779.55 3644.31 3604.69 3682.53
P15 7076.59 6811.99 6627.02 6709.56
P16 1354.91 1352.81 1353.21 1397.28
P18 2723.22 2670.94 2597.62 2632.37
P20 4855.01 4757.37 4624.48 4689.29
These observations and results are consistent with those reported for the buckling of beams,
e.g. Zirakian (2008 and 2010), and also verify the applicability of the extrapolation techniques in
case of buckling of moderate plates. However, experimental studies may further substantiate
these findings.
4.6 Determination of Limiting Shear Panel Thickness in SPSW Systems
This section focuses on determination of the limiting shear panel thickness in SPSWs, in
which infill plates are surrounded and restrained on all four edges by the horizontal and vertical
boundary frame members of certain stiffness and strength. It is noted that steel plates in this
section are considered to be under pure shear loading.
As discussed before, behavior of the SPSW may be considered as analogous to that of a
vertical plate girder. Numerous studies have been performed on the edge support conditions of
web panels in plate girders, which were summarized by Alinia and Dastfan (2006). Various
support conditions viz. simple, partially-restrained, and clamped, have been considered in the
studies of different researchers. Nevertheless, it has been demonstrated (Berman and Bruneau,
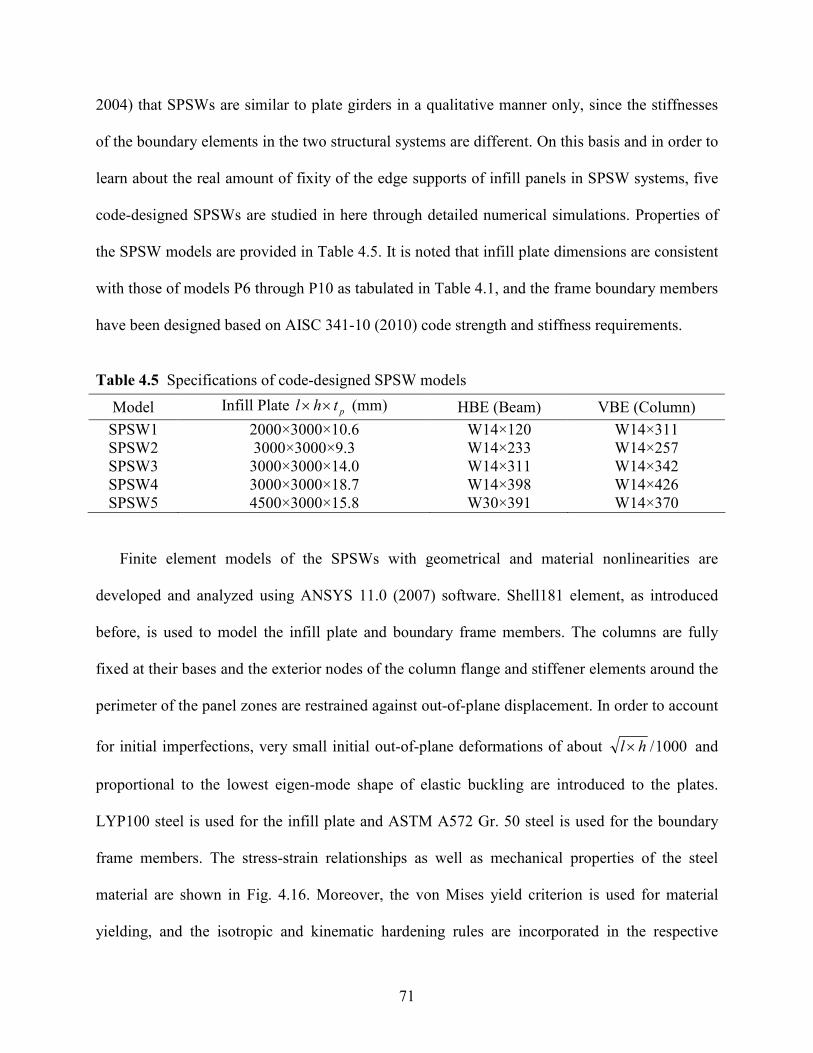
71
2004) that SPSWs are similar to plate girders in a qualitative manner only, since the stiffnesses
of the boundary elements in the two structural systems are different. On this basis and in order to
learn about the real amount of fixity of the edge supports of infill panels in SPSW systems, five
code-designed SPSWs are studied in here through detailed numerical simulations. Properties of
the SPSW models are provided in Table 4.5. It is noted that infill plate dimensions are consistent
with those of models P6 through P10 as tabulated in Table 4.1, and the frame boundary members
have been designed based on AISC 341-10 (2010) code strength and stiffness requirements.
Table 4.5 Specifications of code-designed SPSW models
Model Infill Plate pthl ×× (mm) HBE (Beam) VBE (Column)
SPSW1 2000×3000×10.6 W14×120 W14×311
SPSW2 3000×3000×9.3 W14×233 W14×257
SPSW3 3000×3000×14.0 W14×311 W14×342
SPSW4 3000×3000×18.7 W14×398 W14×426
SPSW5 4500×3000×15.8 W30×391 W14×370
Finite element models of the SPSWs with geometrical and material nonlinearities are
developed and analyzed using ANSYS 11.0 (2007) software. Shell181 element, as introduced
before, is used to model the infill plate and boundary frame members. The columns are fully
fixed at their bases and the exterior nodes of the column flange and stiffener elements around the
perimeter of the panel zones are restrained against out-of-plane displacement. In order to account
for initial imperfections, very small initial out-of-plane deformations of about 1000/hl× and
proportional to the lowest eigen-mode shape of elastic buckling are introduced to the plates.
LYP100 steel is used for the infill plate and ASTM A572 Gr. 50 steel is used for the boundary
frame members. The stress-strain relationships as well as mechanical properties of the steel
material are shown in Fig. 4.16. Moreover, the von Mises yield criterion is used for material
yielding, and the isotropic and kinematic hardening rules are incorporated in the respective

72
nonlinear pushover and cyclic analyses. Lastly, in-plane lateral load is applied to the beam-
column connection in a displacement-controlled and incremental manner.
0
50
100
150
200
250
300
350
400
450
500
0 0.05 0.1 0.15 0.2 0.25 0.3 0.35 0.4 0.45 0.5
Strain
Str
ess
(M
Pa)
E = 200000 MPa
v = 0.3
ASTM A572 Gr. 50 Steel
σ y = 345 MPa
LYP100 Steel
σ y = 100 MPa
Fig. 4.16 Material properties of the steel used in SPSWs
Numerical modeling of SPSWs is validated by considering the experimental results of two
specimens tested by Lubell (1997) and Chen and Jhang (2006) representing SPSWs with
respective slender conventional steel and stocky LYP steel infill plates. The comparison details
and results are illustrated in Figs 4.17 and 4.18.
-270
-180
-90
0
90
180
270
-50 -40 -30 -20 -10 0 10 20 30 40 50
Lateral Displacement (mm)
Lo
ad
(k
N)
ExperimentalNum. (Cyclic)Num. (Pushover)
(a) SPSW2 specimen FE model (b) Experimental vs. numerical results
Fig. 4.17 SPSW finite element model validation by Lubell’s (1997) test results
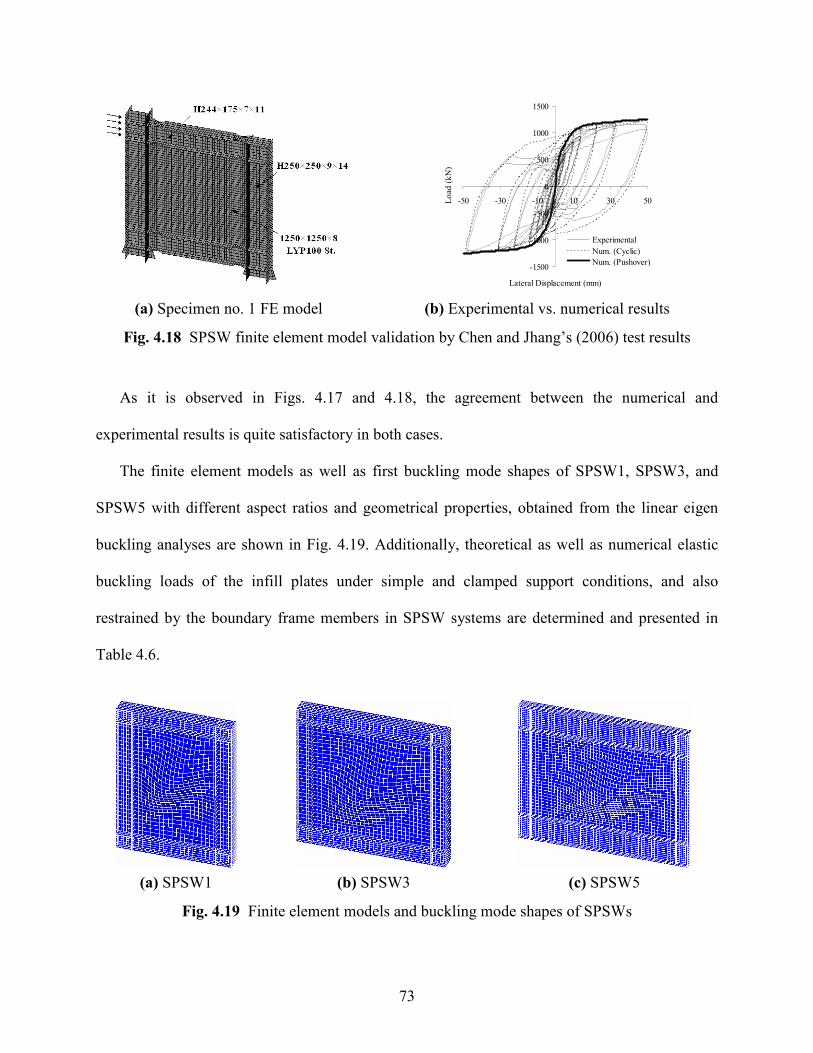
73
-1500
-1000
-500
0
500
1000
1500
-50 -30 -10 10 30 50
Lateral Displacement (mm)
Lo
ad (
kN
)
Experimental
Num. (Cyclic)
Num. (Pushover)
(a) Specimen no. 1 FE model (b) Experimental vs. numerical results
Fig. 4.18 SPSW finite element model validation by Chen and Jhang’s (2006) test results
As it is observed in Figs. 4.17 and 4.18, the agreement between the numerical and
experimental results is quite satisfactory in both cases.
The finite element models as well as first buckling mode shapes of SPSW1, SPSW3, and
SPSW5 with different aspect ratios and geometrical properties, obtained from the linear eigen
buckling analyses are shown in Fig. 4.19. Additionally, theoretical as well as numerical elastic
buckling loads of the infill plates under simple and clamped support conditions, and also
restrained by the boundary frame members in SPSW systems are determined and presented in
Table 4.6.
(a) SPSW1 (b) SPSW3 (c) SPSW5
Fig. 4.19 Finite element models and buckling mode shapes of SPSWs

74
Table 4.6 Elastic buckling loads of plates under different edge support conditions
lTheoreticacrP − (kN) Plate pthl ×× (mm)
Simply Supported Clamped Model NunericalcrP − (kN)
2000×3000×10.6 767.27 1234.57 SPSW1 1456.90
3000×3000×9.3 453.15 706.63 SPSW2 772.58
3000×3000×14.0 1545.90 2410.61 SPSW3 2598.10
3000×3000×18.7 3684.02 5744.71 SPSW4 6174.40
4500×3000×15.8 2540.99 4088.55 SPSW5 3801.70
As seen in the table, numerical buckling loads of the plates in SPSW1 through SPSW4
models are larger than the corresponding buckling loads for clamped support condition, while
numerical buckling load of the infill plate in SPSW5 model lies between those calculated for
simple and clamped support conditions and is pretty close to that of clamped support condition.
It should be noted that by considering the edge deformation compatibility conditions between
infill plates and boundary frame members in SPSW systems, infill plates in these structural
systems are restrained against translations and rotations in all directions and the amount of
effectiveness of these restraints in particular and fixity of plate edge supports in general is
directly related to the relative stiffness of the boundary frame members. On this basis, it is
observed that the buckling loads of infill plates in most of the code-designed SPSW models are
beyond those predicted for clamped support condition. In any case, in spite of the scatter in
results, these findings demonstrate that the support conditions of infill plates in SPSW systems
are very close to the clamped support condition.
In this study, the limiting thicknesses of infill plates in the SPSW models are determined
through two different approaches, whose results are compared with theoretical predictions for
clamped support condition. The exact values of the limiting thicknesses of infill plates in SPSW
models are obtained through an iterative process to reach a concurrent geometrical-material
bifurcation condition where 0.1/ =cry PP . This approach is quite cumbersome and time-
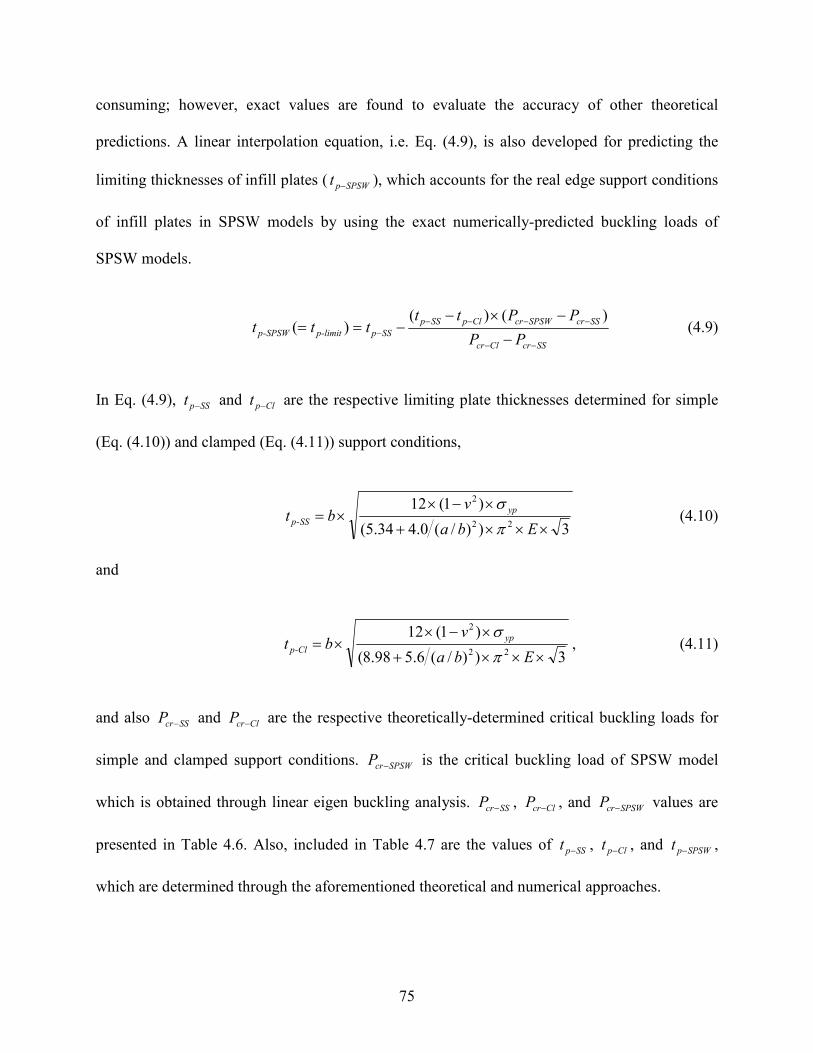
75
consuming; however, exact values are found to evaluate the accuracy of other theoretical
predictions. A linear interpolation equation, i.e. Eq. (4.9), is also developed for predicting the
limiting thicknesses of infill plates ( SPSWpt − ), which accounts for the real edge support conditions
of infill plates in SPSW models by using the exact numerically-predicted buckling loads of
SPSW models.
SScrClcr
SScrSPSWcrClpSSp
SSp-limitpSPSW-pPP
PPttttt
−−
−−−−− −
−×−−==
)()()( (4.9)
In Eq. (4.9), SSpt − and Clpt − are the respective limiting plate thicknesses determined for simple
(Eq. (4.10)) and clamped (Eq. (4.11)) support conditions,
3))/(0.434.5(
)1(12
22
2
×××+
×−××=
Eba
vbt
yp
SS-p π
σ (4.10)
and
3))/(6.598.8(
)1(12
22
2
×××+
×−××=
Eba
vbt
yp
Cl-p π
σ, (4.11)
and also SScrP − and ClcrP − are the respective theoretically-determined critical buckling loads for
simple and clamped support conditions. SPSWcrP − is the critical buckling load of SPSW model
which is obtained through linear eigen buckling analysis. SScrP − , ClcrP − , and SPSWcrP − values are
presented in Table 4.6. Also, included in Table 4.7 are the values of SSpt − , Clpt − , and SPSWpt − ,
which are determined through the aforementioned theoretical and numerical approaches.
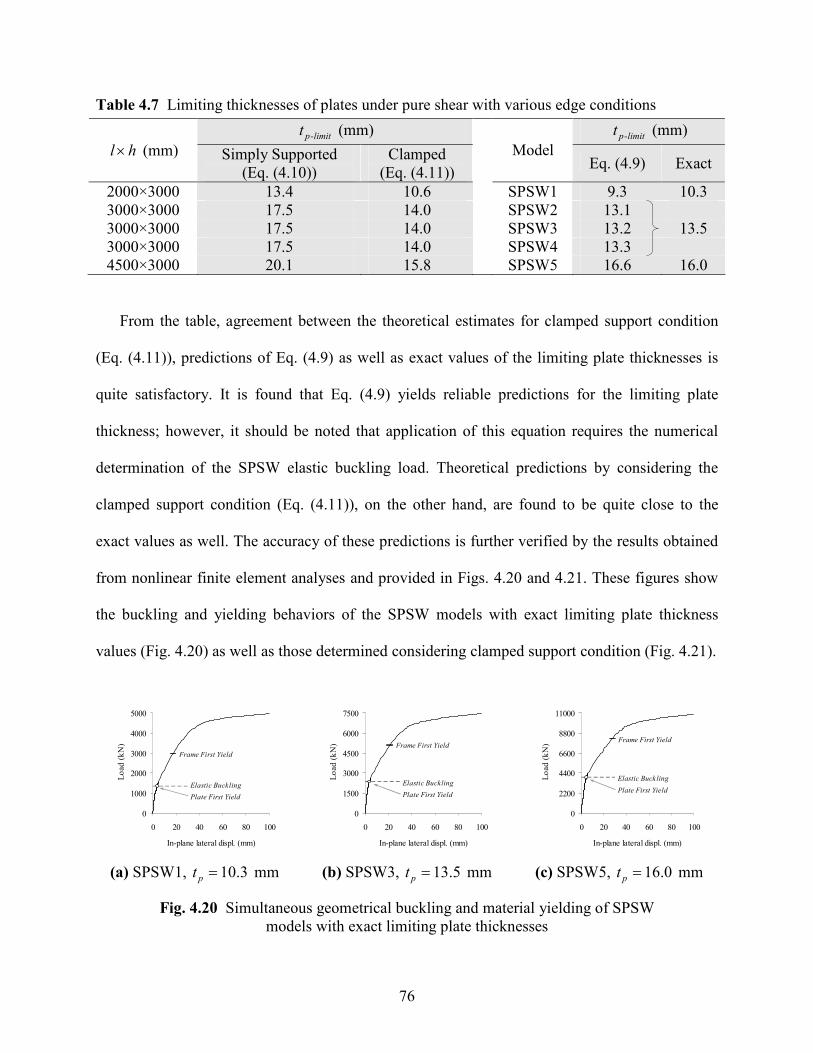
76
Table 4.7 Limiting thicknesses of plates under pure shear with various edge conditions
limit-pt (mm) limit-pt (mm)
hl× (mm) Simply Supported
(Eq. (4.10))
Clamped
(Eq. (4.11))
Model Eq. (4.9) Exact
2000×3000 13.4 10.6 SPSW1 9.3 10.3
3000×3000 17.5 14.0 SPSW2 13.1
3000×3000 17.5 14.0 SPSW3 13.2 13.5
3000×3000 17.5 14.0 SPSW4 13.3
4500×3000 20.1 15.8 SPSW5 16.6 16.0
From the table, agreement between the theoretical estimates for clamped support condition
(Eq. (4.11)), predictions of Eq. (4.9) as well as exact values of the limiting plate thicknesses is
quite satisfactory. It is found that Eq. (4.9) yields reliable predictions for the limiting plate
thickness; however, it should be noted that application of this equation requires the numerical
determination of the SPSW elastic buckling load. Theoretical predictions by considering the
clamped support condition (Eq. (4.11)), on the other hand, are found to be quite close to the
exact values as well. The accuracy of these predictions is further verified by the results obtained
from nonlinear finite element analyses and provided in Figs. 4.20 and 4.21. These figures show
the buckling and yielding behaviors of the SPSW models with exact limiting plate thickness
values (Fig. 4.20) as well as those determined considering clamped support condition (Fig. 4.21).
0
1000
2000
3000
4000
5000
0 20 40 60 80 100
In-plane lateral displ. (mm)
Lo
ad
(k
N)
Elastic Buckling
Plate First Yield
Frame First Yield
0
1500
3000
4500
6000
7500
0 20 40 60 80 100
In-plane lateral displ. (mm)
Lo
ad
(k
N)
Elastic Buckling
Plate First Yield
Frame First Yield
0
2200
4400
6600
8800
11000
0 20 40 60 80 100
In-plane lateral displ. (mm)
Lo
ad
(k
N)
Elastic Buckling
Plate First Yield
Frame First Yield
(a) SPSW1, 3.10=pt mm (b) SPSW3, 5.13=pt mm (c) SPSW5, 0.16=pt mm
Fig. 4.20 Simultaneous geometrical buckling and material yielding of SPSW
models with exact limiting plate thicknesses
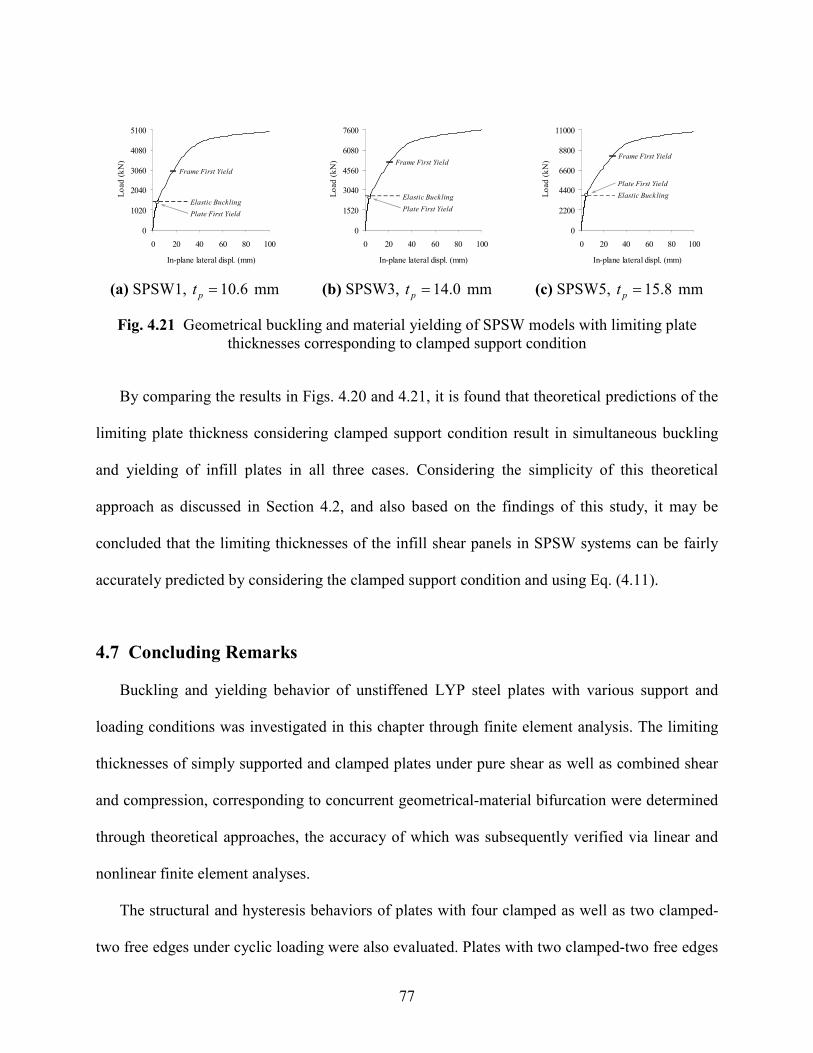
77
0
1020
2040
3060
4080
5100
0 20 40 60 80 100
In-plane lateral displ. (mm)
Lo
ad
(k
N)
Elastic Buckling
Plate First Yield
Frame First Yield
0
1520
3040
4560
6080
7600
0 20 40 60 80 100
In-plane lateral displ. (mm)
Lo
ad
(k
N)
Elastic Buckling
Plate First Yield
Frame First Yield
0
2200
4400
6600
8800
11000
0 20 40 60 80 100
In-plane lateral displ. (mm)
Lo
ad
(k
N)
Elastic Buckling
Plate First Yield
Frame First Yield
(a) SPSW1, 6.10=pt mm (b) SPSW3, 0.14=pt mm (c) SPSW5, 8.15=pt mm
Fig. 4.21 Geometrical buckling and material yielding of SPSW models with limiting plate
thicknesses corresponding to clamped support condition
By comparing the results in Figs. 4.20 and 4.21, it is found that theoretical predictions of the
limiting plate thickness considering clamped support condition result in simultaneous buckling
and yielding of infill plates in all three cases. Considering the simplicity of this theoretical
approach as discussed in Section 4.2, and also based on the findings of this study, it may be
concluded that the limiting thicknesses of the infill shear panels in SPSW systems can be fairly
accurately predicted by considering the clamped support condition and using Eq. (4.11).
4.7 Concluding Remarks
Buckling and yielding behavior of unstiffened LYP steel plates with various support and
loading conditions was investigated in this chapter through finite element analysis. The limiting
thicknesses of simply supported and clamped plates under pure shear as well as combined shear
and compression, corresponding to concurrent geometrical-material bifurcation were determined
through theoretical approaches, the accuracy of which was subsequently verified via linear and
nonlinear finite element analyses.
The structural and hysteresis behaviors of plates with four clamped as well as two clamped-
two free edges under cyclic loading were also evaluated. Plates with two clamped-two free edges
78
exhibited relatively weak performance as a result of excessive out-of-plane deformations due to
the presence of two unrestrained edges. Optimal local stiffening of the unrestrained edges is
believed to effectively control the deformations and increase the performance of such plates.
This issue is of great importance in design and application of beam-attached infill panels in
SPSW systems, which of course requires further investigation.
It was shown that use of LYP steel with low yield strength compared to the conventional
steel, considerably reduces the required limiting plate thickness. Moreover, it was found that
larger plate length-to-height ( hl / ) ratio unfavorably results in larger required limiting plate
thickness. These issues may be of great importance in economical design of SPSW systems with
high structural and energy absorption characteristics.
The critical buckling loads of moderate plates were predicted using the Southwell, Massey,
and Modified plotting techniques, and the extrapolated loads were compared with theoretical
predictions. Based on the findings of this study, the critical buckling loads of moderate plates
were accurately predicted by the extrapolation techniques.
Finally, the limiting thicknesses of infill shear panels in five code-designed SPSW models
with various aspect ratios were successfully determined through theoretical and numerical
approaches. Accordingly, it was concluded that the limiting thicknesses of infill plates in SPSW
systems can be easily and fairly accurately determined in practice by considering the clamped
support condition. Determination of the limiting plate thickness corresponding to simultaneous
geometrical buckling and material yielding will enable the efficient design of SPSW systems
with high structural, energy dissipation, and serviceability characteristics, which is of course
made economically possible in the light of use of LYP steel.
79
5. STUDY OF MONOTONIC AND CYCLIC BEHAVIORS
OF SPSWS WITH LYP STEEL INFILL PLATES
5.1 Introduction
As it was mentioned before, SPSWs have been used with two different design strategies. The
common practice in Japan has been to employ stiffened and/or stocky-web SPSWs to ensure that
the wall panel achieves its full plastic strength prior to out-of-plane buckling. The current North
American practice, on the other hand, is to use unstiffened and slender-web SPSWs which
exhibit nonlinear behavior at relatively small story drifts as they buckle out of plane, and lateral
forces are consequently resisted through development of tension-field action in the post-buckling
stage. It is notable that the labor/fabrication costs in North America indicate that unstiffened
panels are preferable (Kulak et al., 2001).
By considering the previously-discussed advantages and disadvantages of the two
configurations, efficient and practical adjustment of stiffening and damping characteristics of
SPSW systems requires proper addressing of both structural and economical considerations.
Application of LYP steel with desirable material properties is believed to provide the possibility
to design relatively cost-effective SPSW systems with high structural and seismic performance.
In this chapter, the behavior of some code-designed and unstiffened LYP steel shear wall
systems under monotonic and cyclic loadings is studied via finite element analysis. The
advantages of use of LYP steel material in SPSW systems as compared to the conventional steel
material are demonstrated through detailed case studies. Additionally, the performance of SPSW
models with slender, moderate, and stocky LYP steel infill plates is investigated as well. Lastly,
the effectiveness of a modified PFI model in predicting the response of SPSW systems with

80
moderate and stocky infill plates is evaluated through comparison with some experimental as
well as experimentally-verified numerical results.
5.2 Design and Properties of SPSW Models
Six single-story, single-bay, and full-scale steel shear walls with 2000×3000, 3000×3000,
and 4500×3000 mm infill plates of various slenderness ratios and steel material are designed in
accordance with the AISC 341-10 (2010) seismic provisions for the purpose of this study.
Properties of the SPSW models are provided in Table 5.1. As it is seen in the table, ASTM A572
Gr. 50 steel with 345 MPa yield stress is selected for the boundary frame, and LYP100 and
ASTM A36 steel with respective 100 and 250 MPa yield stresses are selected for the infill plates.
Table 5.1 Properties of the code-designed SPSW models
Infill Plate Design Steel Type Model
pthl ×× (mm) Type
HBE
(Beam)
VBE
(Column) Frame Plate
SPSW1 2000×3000×10.6 Moderate W14×120 W14×311 ASTM A572 Gr. 50 LYP100
SPSW2 3000×3000×4.7 Slender W14×120 W14×132 ASTM A572 Gr. 50 ASTM A36, LYP100
SPSW3 3000×3000×9.3 Slender W14×233 W14×257 ASTM A572 Gr. 50 LYP100
SPSW4 3000×3000×14.0 Moderate W14×311 W14×342 ASTM A572 Gr. 50 LYP100
SPSW5 3000×3000×18.7 Stocky W14×398 W14×426 ASTM A572 Gr. 50 LYP100
SPSW6 4500×3000×15.8 Moderate W30×391 W14×370 ASTM A572 Gr. 50 LYP100
In order to design the boundary frame members in SPSWs, respective infill plate thicknesses
are initially determined. The limiting thicknesses corresponding to simultaneous buckling and
yielding of infill plates in SPSW1, SPSW4, and SPSW6 models are determined by considering
clamped edge condition and using Eq. (4.11). In theoretical calculations, Young’s modulus ( E )
and Poisson’s ratio ( v ) are taken as 200000 MPa and 0.3, respectively.
Following the determination of the infill plate thickness of SPSW4 model, infill plate
thicknesses of SPSW2-3 and SPSW5 models are selected in a manner to represent the behaviors
of slender-web and stocky-web steel shear wall systems, respectively.
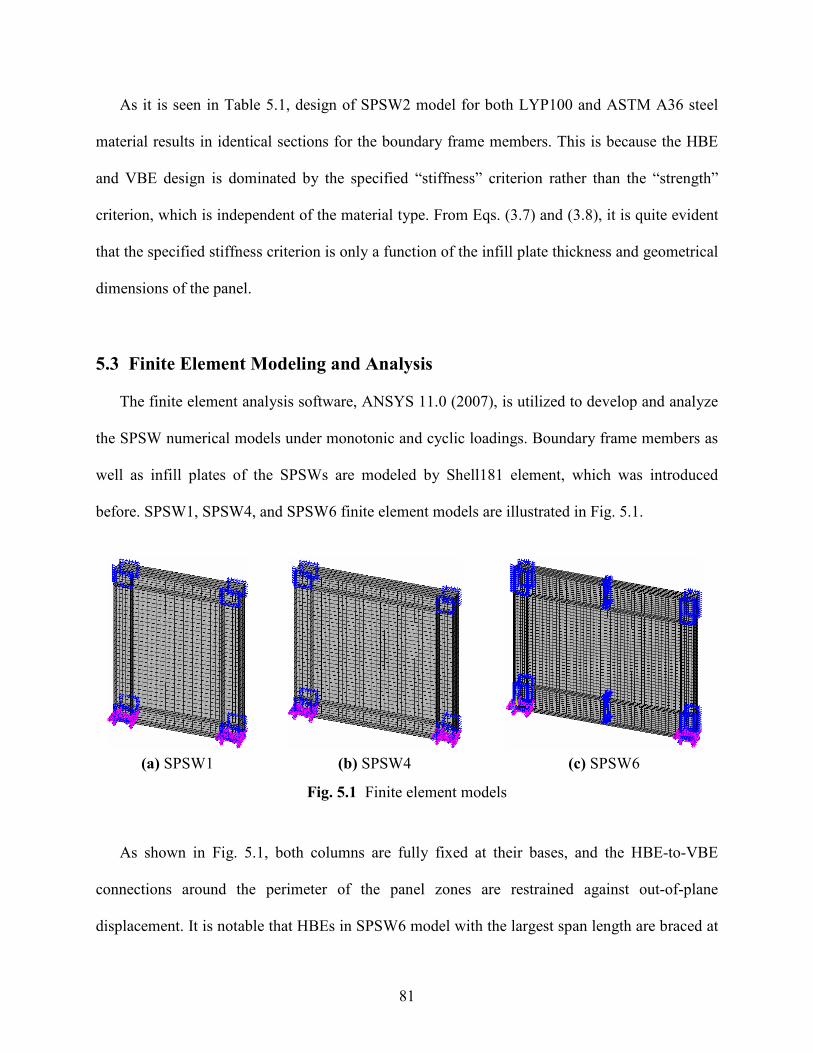
81
As it is seen in Table 5.1, design of SPSW2 model for both LYP100 and ASTM A36 steel
material results in identical sections for the boundary frame members. This is because the HBE
and VBE design is dominated by the specified “stiffness” criterion rather than the “strength”
criterion, which is independent of the material type. From Eqs. (3.7) and (3.8), it is quite evident
that the specified stiffness criterion is only a function of the infill plate thickness and geometrical
dimensions of the panel.
5.3 Finite Element Modeling and Analysis
The finite element analysis software, ANSYS 11.0 (2007), is utilized to develop and analyze
the SPSW numerical models under monotonic and cyclic loadings. Boundary frame members as
well as infill plates of the SPSWs are modeled by Shell181 element, which was introduced
before. SPSW1, SPSW4, and SPSW6 finite element models are illustrated in Fig. 5.1.
(a) SPSW1 (b) SPSW4 (c) SPSW6
Fig. 5.1 Finite element models
As shown in Fig. 5.1, both columns are fully fixed at their bases, and the HBE-to-VBE
connections around the perimeter of the panel zones are restrained against out-of-plane
displacement. It is notable that HBEs in SPSW6 model with the largest span length are braced at
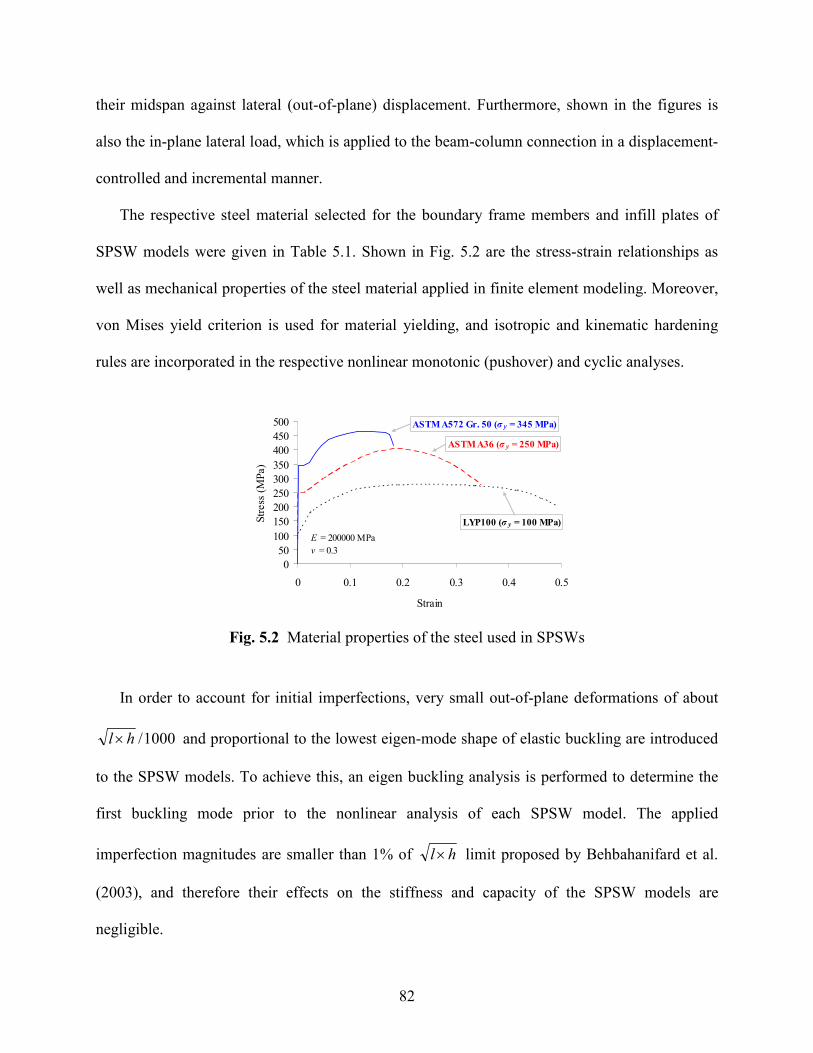
82
their midspan against lateral (out-of-plane) displacement. Furthermore, shown in the figures is
also the in-plane lateral load, which is applied to the beam-column connection in a displacement-
controlled and incremental manner.
The respective steel material selected for the boundary frame members and infill plates of
SPSW models were given in Table 5.1. Shown in Fig. 5.2 are the stress-strain relationships as
well as mechanical properties of the steel material applied in finite element modeling. Moreover,
von Mises yield criterion is used for material yielding, and isotropic and kinematic hardening
rules are incorporated in the respective nonlinear monotonic (pushover) and cyclic analyses.
0
50
100
150
200
250
300
350
400
450
500
0 0.1 0.2 0.3 0.4 0.5
Strain
Str
ess
(M
Pa)
E = 200000 MPa
v = 0.3
ASTM A572 Gr. 50 (σ y = 345 MPa)
ASTM A36 (σ y = 250 MPa)
LYP100 (σ y = 100 MPa)
Fig. 5.2 Material properties of the steel used in SPSWs
In order to account for initial imperfections, very small out-of-plane deformations of about
1000/hl× and proportional to the lowest eigen-mode shape of elastic buckling are introduced
to the SPSW models. To achieve this, an eigen buckling analysis is performed to determine the
first buckling mode prior to the nonlinear analysis of each SPSW model. The applied
imperfection magnitudes are smaller than 1% of hl× limit proposed by Behbahanifard et al.
(2003), and therefore their effects on the stiffness and capacity of the SPSW models are
negligible.

83
Both geometrical and material nonlinearities are considered in the finite element analyses.
Finally, as it was discussed in Chapter 4 and Section 4.6, finite element modeling of the SPSWs
is validated by considering two sets of experimental results, and the comparison details were
given in Figs. 4.17 and 4.18.
5.4 Advantages of Use of LYP Steel Infill Plates in SPSW Systems
One of the significant advantages of LYP steel is its low yield stress of about 90-120 MPa,
which is approximately 1/3 of that of ASTM A36 steel. Use of such a low-yield steel in lieu of
the conventional mild steels as the material for lateral force-resisting and energy dissipating
elements in buildings ensures early yielding of such structural elements, and consequently
reduces forces imposed on frame members. In fact, by employing LYP steel infill plates, it is
easier to design the system in such a manner to let the infill plate yield prior to that of the
surrounding frame and to ensure that the frame would not collapse before the infill plate reaches
its ultimate strength (Chen and Jhang, 2006). LYP steel shear walls, in addition, may be utilized
to retrofit the existing frame buildings requiring additional strength and stiffness. Moreover,
buckled and/or damaged infill plates of existing SPSW systems after an earthquake may be
properly replaced by LYP steel plates. Such retrofits and/or replacements not only may increase
the seismic performance, but also may enhance the structural characteristics of the existing
buildings in the light of use of LYP steel.
In this section, it is attempted to scrutinize the effects and advantages of use of LYP steel
infill plates by addressing the above-mentioned issues. In order to achieve the objectives of this
study, infill plate thickness in SPSW2 model is increased from 4.7 mm to 18.7 mm and the
structural behavior and performance of the SPSW system and its components are investigated
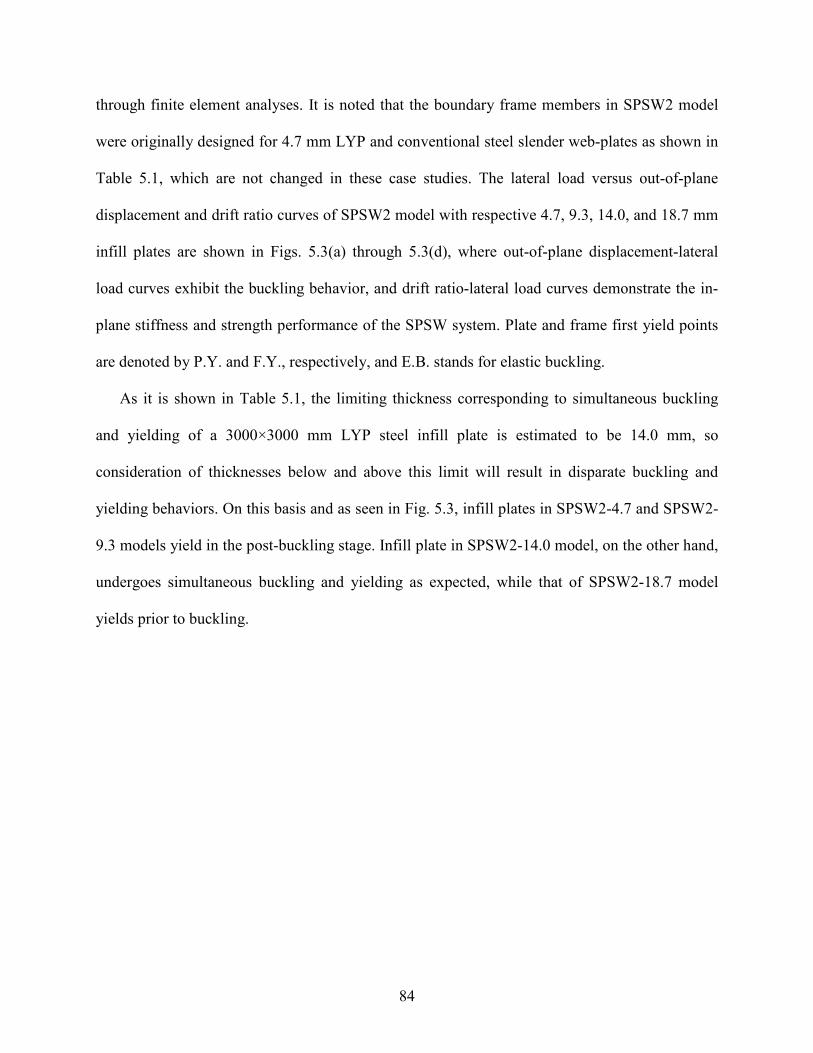
84
through finite element analyses. It is noted that the boundary frame members in SPSW2 model
were originally designed for 4.7 mm LYP and conventional steel slender web-plates as shown in
Table 5.1, which are not changed in these case studies. The lateral load versus out-of-plane
displacement and drift ratio curves of SPSW2 model with respective 4.7, 9.3, 14.0, and 18.7 mm
infill plates are shown in Figs. 5.3(a) through 5.3(d), where out-of-plane displacement-lateral
load curves exhibit the buckling behavior, and drift ratio-lateral load curves demonstrate the in-
plane stiffness and strength performance of the SPSW system. Plate and frame first yield points
are denoted by P.Y. and F.Y., respectively, and E.B. stands for elastic buckling.
As it is shown in Table 5.1, the limiting thickness corresponding to simultaneous buckling
and yielding of a 3000×3000 mm LYP steel infill plate is estimated to be 14.0 mm, so
consideration of thicknesses below and above this limit will result in disparate buckling and
yielding behaviors. On this basis and as seen in Fig. 5.3, infill plates in SPSW2-4.7 and SPSW2-
9.3 models yield in the post-buckling stage. Infill plate in SPSW2-14.0 model, on the other hand,
undergoes simultaneous buckling and yielding as expected, while that of SPSW2-18.7 model
yields prior to buckling.

85
0
640
1280
1920
2560
3200
0 16 32 48 64 80
Out-of-plane displ. (mm)
Lo
ad
(k
N)
ASTM A36 Steel
LYP100 Steel
P.Y.
P.Y.
F.Y.
F.Y.
E.B.
0
650
1300
1950
2600
3250
0 0.01 0.02 0.03 0.04 0.05
Drift ratio
Lo
ad
(k
N)
ASTM A36 Steel
LYP100 Steel
P.Y.
F.Y.
P.Y.
F.Y.
(a) SPSW2-4.7
0
760
1520
2280
3040
3800
0 16 32 48 64 80
Out-of-plane displ. (mm)
Lo
ad
(k
N)
ASTM A36 Steel
LYP100 Steel
P.Y.
P.Y.
F.Y.
F.Y.
E.B.
0
870
1740
2610
3480
4350
0 0.01 0.02 0.03 0.04 0.05
Drift ratio
Lo
ad
(k
N)
ASTM A36 Steel
LYP100 Steel
P.Y.
P.Y.
F.Y.
F.Y.
(b) SPSW2-9.3
0
1020
2040
3060
4080
5100
0 16 32 48 64 80
Out-of-plane displ. (mm)
Lo
ad
(k
N)
ASTM A36 Steel
LYP100 Steel
P.Y.
P.Y.
F.Y.
F.Y.
E.B.
0
1040
2080
3120
4160
5200
0 0.01 0.02 0.03 0.04 0.05
Drift ratio
Lo
ad
(k
N)
ASTM A36 Steel
LYP100 Steel
F.Y.
P.Y.
P.Y.
F.Y.
(c) SPSW2-14.0
0
1360
2720
4080
5440
6800
0 16 32 48 64 80
Out-of-plane displ. (mm)
Lo
ad
(k
N)
ASTM A36 Steel
LYP100 Steel
P.Y.
P.Y.F.Y.
F.Y.E.B.
0
1340
2680
4020
5360
6700
0 0.01 0.02 0.03 0.04 0.05
Drift ratio
Lo
ad
(k
N)
ASTM A36 Steel
LYP100 Steel
F.Y.
P.Y.
P.Y.
F.Y.
(d) SPSW2-18.7
Fig. 5.3 Behavior of SPSW2 model with various infill plate thicknesses and steel types

86
It is clearly observed that increase of the infill plate thickness reduces the interval between
plate and frame first yield points. However, yielding of the LYP steel infill plates in all cases
occurs in advance of frame yielding due to low yield stress of this steel material, while yielding
of the conventional steel infill plates in SPSW2-14.0 (Fig. 5.3(c)) and SPSW2-18.7 (Fig. 5.3(d))
models occurs unfavorably after frame yielding. As seen in Figs. 5.3(c) and 5.3(d), early yielding
of the frame members, especially columns, results in significant stiffness and strength
degradation and relatively weak performance of the structural system. In addition, it is evident
that LYP steel shear walls undergo early yielding and consequently large inelastic deformations
compared to conventional steel shear walls with identical infill plate thicknesses. This can be of
great importance in seismic design of SPSW systems since the earthquake input energy can be
absorbed through plastic deformations of LYP steel infill plates, which will consequently result
in the limitation of the plastic deformation demand to the frame structure.
Replaceability of conventional steel infill plates and employment of LYP steel plates with
improved structural and seismic characteristics are investigated in further detail by taking a
closer look at behaviors and performances of SPSW-4.7 and SPSW-9.3 models. SPSW2 model
with 4.7 mm infill plate made of ASTM A36 steel denoted by SPSW2-4.7-ASTM A36, is
considered as a typical slender-web SPSW system, infill plate of which is required to be replaced
after an earthquake. This infill plate may be replaced by either 9.3 mm ASTM A36 or LYP100
steel plates. The structural behavior as well as stiffness performance of the SPSW system with
the original and two alternative infill plates are shown in Figs. 5.4 and 5.5, respectively.
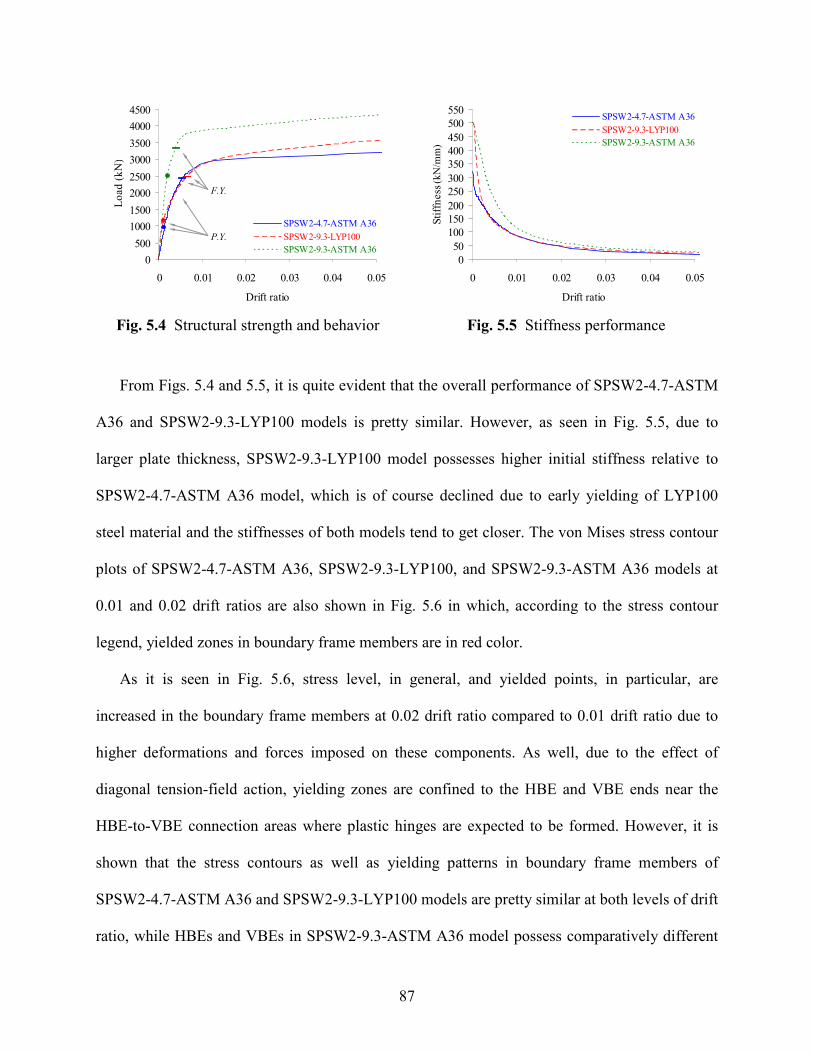
87
0
500
1000
1500
2000
2500
3000
3500
4000
4500
0 0.01 0.02 0.03 0.04 0.05
Drift ratio
Lo
ad
(k
N)
SPSW2-4.7-ASTM A36
SPSW2-9.3-LYP100
SPSW2-9.3-ASTM A36
P.Y.
F.Y.
0
50
100
150
200
250
300
350
400
450
500
550
0 0.01 0.02 0.03 0.04 0.05
Drift ratio
Sti
ffn
ess
(k
N/m
m)
SPSW2-4.7-ASTM A36
SPSW2-9.3-LYP100
SPSW2-9.3-ASTM A36
Fig. 5.4 Structural strength and behavior Fig. 5.5 Stiffness performance
From Figs. 5.4 and 5.5, it is quite evident that the overall performance of SPSW2-4.7-ASTM
A36 and SPSW2-9.3-LYP100 models is pretty similar. However, as seen in Fig. 5.5, due to
larger plate thickness, SPSW2-9.3-LYP100 model possesses higher initial stiffness relative to
SPSW2-4.7-ASTM A36 model, which is of course declined due to early yielding of LYP100
steel material and the stiffnesses of both models tend to get closer. The von Mises stress contour
plots of SPSW2-4.7-ASTM A36, SPSW2-9.3-LYP100, and SPSW2-9.3-ASTM A36 models at
0.01 and 0.02 drift ratios are also shown in Fig. 5.6 in which, according to the stress contour
legend, yielded zones in boundary frame members are in red color.
As it is seen in Fig. 5.6, stress level, in general, and yielded points, in particular, are
increased in the boundary frame members at 0.02 drift ratio compared to 0.01 drift ratio due to
higher deformations and forces imposed on these components. As well, due to the effect of
diagonal tension-field action, yielding zones are confined to the HBE and VBE ends near the
HBE-to-VBE connection areas where plastic hinges are expected to be formed. However, it is
shown that the stress contours as well as yielding patterns in boundary frame members of
SPSW2-4.7-ASTM A36 and SPSW2-9.3-LYP100 models are pretty similar at both levels of drift
ratio, while HBEs and VBEs in SPSW2-9.3-ASTM A36 model possess comparatively different
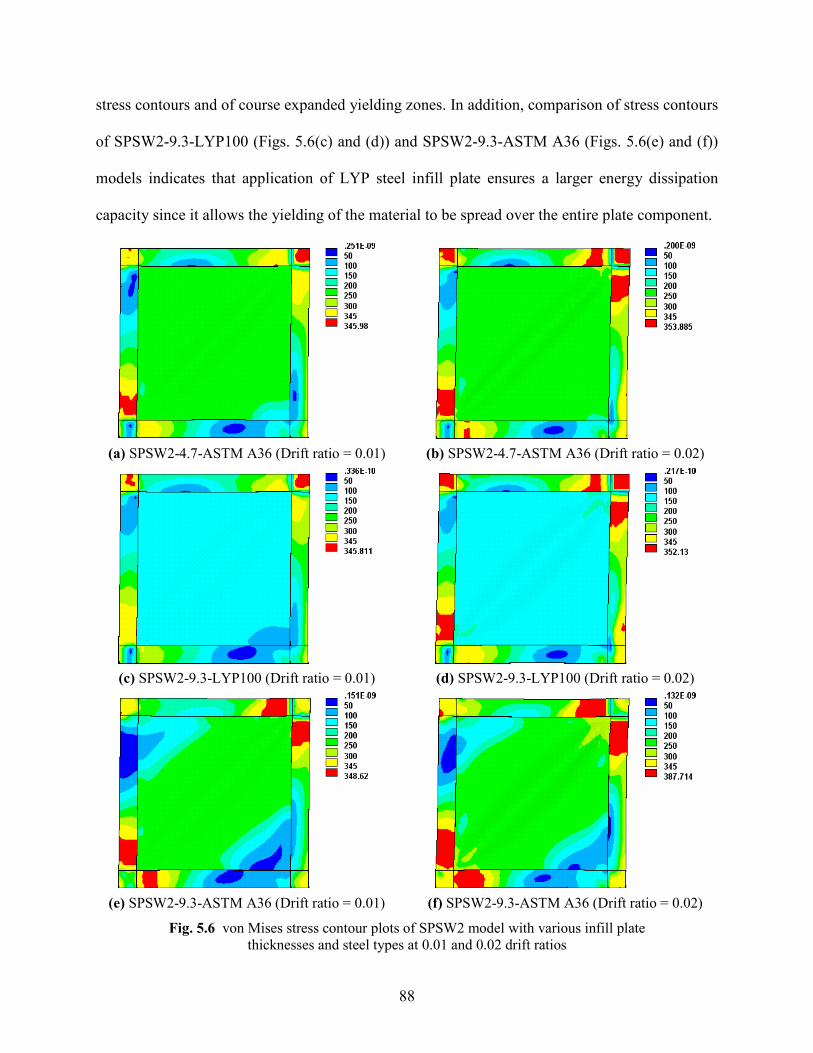
88
stress contours and of course expanded yielding zones. In addition, comparison of stress contours
of SPSW2-9.3-LYP100 (Figs. 5.6(c) and (d)) and SPSW2-9.3-ASTM A36 (Figs. 5.6(e) and (f))
models indicates that application of LYP steel infill plate ensures a larger energy dissipation
capacity since it allows the yielding of the material to be spread over the entire plate component.
(a) SPSW2-4.7-ASTM A36 (Drift ratio = 0.01) (b) SPSW2-4.7-ASTM A36 (Drift ratio = 0.02)
(c) SPSW2-9.3-LYP100 (Drift ratio = 0.01) (d) SPSW2-9.3-LYP100 (Drift ratio = 0.02)
(e) SPSW2-9.3-ASTM A36 (Drift ratio = 0.01) (f) SPSW2-9.3-ASTM A36 (Drift ratio = 0.02)
Fig. 5.6 von Mises stress contour plots of SPSW2 model with various infill plate
thicknesses and steel types at 0.01 and 0.02 drift ratios
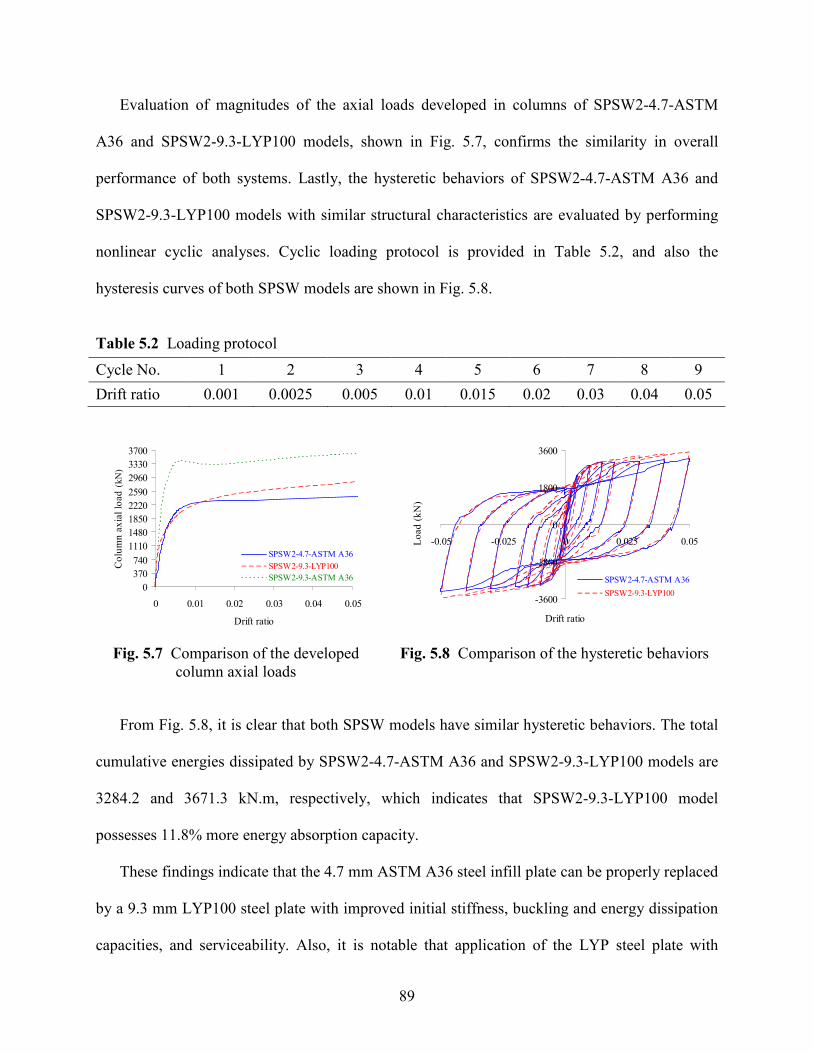
89
Evaluation of magnitudes of the axial loads developed in columns of SPSW2-4.7-ASTM
A36 and SPSW2-9.3-LYP100 models, shown in Fig. 5.7, confirms the similarity in overall
performance of both systems. Lastly, the hysteretic behaviors of SPSW2-4.7-ASTM A36 and
SPSW2-9.3-LYP100 models with similar structural characteristics are evaluated by performing
nonlinear cyclic analyses. Cyclic loading protocol is provided in Table 5.2, and also the
hysteresis curves of both SPSW models are shown in Fig. 5.8.
Table 5.2 Loading protocol
Cycle No. 1 2 3 4 5 6 7 8 9
Drift ratio 0.001 0.0025 0.005 0.01 0.015 0.02 0.03 0.04 0.05
0
370
740
1110
1480
1850
2220
2590
2960
3330
3700
0 0.01 0.02 0.03 0.04 0.05
Drift ratio
Co
lum
n a
xia
l lo
ad
(k
N)
SPSW2-4.7-ASTM A36
SPSW2-9.3-LYP100
SPSW2-9.3-ASTM A36
-3600
-1800
0
1800
3600
-0.05 -0.025 0 0.025 0.05
Drift ratio
Lo
ad
(k
N)
SPSW2-4.7-ASTM A36
SPSW2-9.3-LYP100
Fig. 5.7 Comparison of the developed
column axial loads
Fig. 5.8 Comparison of the hysteretic behaviors
From Fig. 5.8, it is clear that both SPSW models have similar hysteretic behaviors. The total
cumulative energies dissipated by SPSW2-4.7-ASTM A36 and SPSW2-9.3-LYP100 models are
3284.2 and 3671.3 kN.m, respectively, which indicates that SPSW2-9.3-LYP100 model
possesses 11.8% more energy absorption capacity.
These findings indicate that the 4.7 mm ASTM A36 steel infill plate can be properly replaced
by a 9.3 mm LYP100 steel plate with improved initial stiffness, buckling and energy dissipation
capacities, and serviceability. Also, it is notable that application of the LYP steel plate with
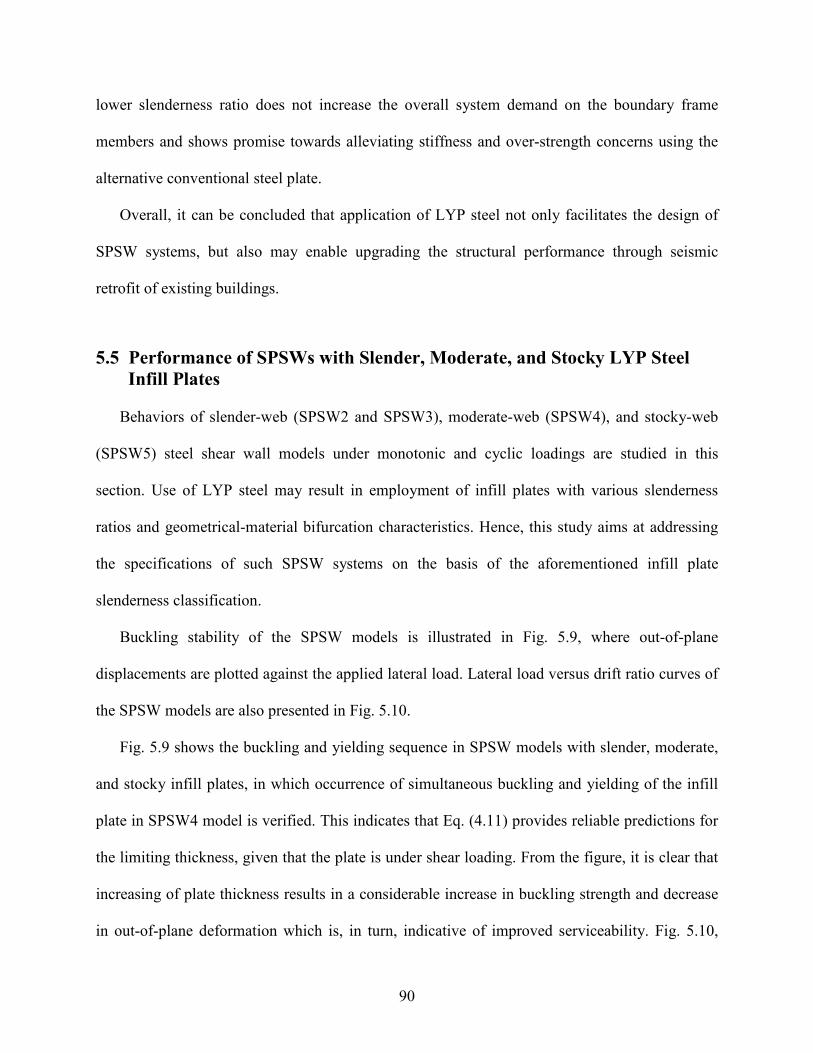
90
lower slenderness ratio does not increase the overall system demand on the boundary frame
members and shows promise towards alleviating stiffness and over-strength concerns using the
alternative conventional steel plate.
Overall, it can be concluded that application of LYP steel not only facilitates the design of
SPSW systems, but also may enable upgrading the structural performance through seismic
retrofit of existing buildings.
5.5 Performance of SPSWs with Slender, Moderate, and Stocky LYP Steel
Infill Plates
Behaviors of slender-web (SPSW2 and SPSW3), moderate-web (SPSW4), and stocky-web
(SPSW5) steel shear wall models under monotonic and cyclic loadings are studied in this
section. Use of LYP steel may result in employment of infill plates with various slenderness
ratios and geometrical-material bifurcation characteristics. Hence, this study aims at addressing
the specifications of such SPSW systems on the basis of the aforementioned infill plate
slenderness classification.
Buckling stability of the SPSW models is illustrated in Fig. 5.9, where out-of-plane
displacements are plotted against the applied lateral load. Lateral load versus drift ratio curves of
the SPSW models are also presented in Fig. 5.10.
Fig. 5.9 shows the buckling and yielding sequence in SPSW models with slender, moderate,
and stocky infill plates, in which occurrence of simultaneous buckling and yielding of the infill
plate in SPSW4 model is verified. This indicates that Eq. (4.11) provides reliable predictions for
the limiting thickness, given that the plate is under shear loading. From the figure, it is clear that
increasing of plate thickness results in a considerable increase in buckling strength and decrease
in out-of-plane deformation which is, in turn, indicative of improved serviceability. Fig. 5.10,
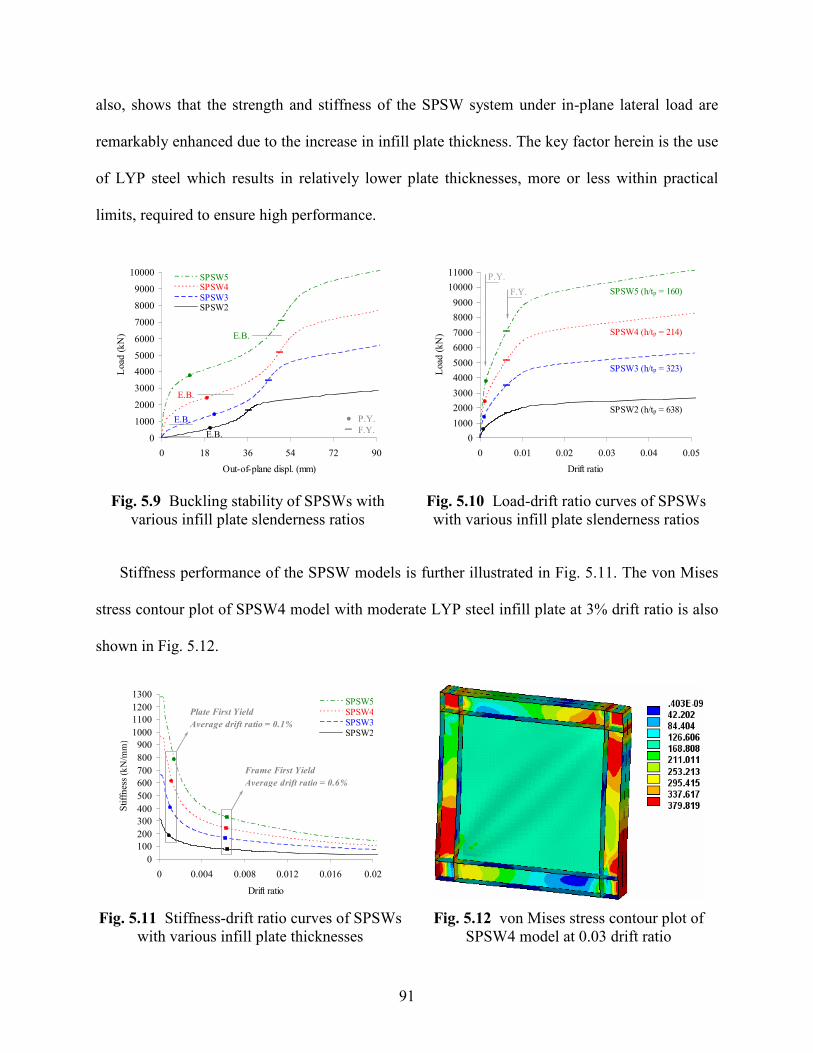
91
also, shows that the strength and stiffness of the SPSW system under in-plane lateral load are
remarkably enhanced due to the increase in infill plate thickness. The key factor herein is the use
of LYP steel which results in relatively lower plate thicknesses, more or less within practical
limits, required to ensure high performance.
0
1000
2000
3000
4000
5000
6000
7000
8000
9000
10000
0 18 36 54 72 90
Out-of-plane displ. (mm)
Load
(k
N)
SPSW5SPSW4
SPSW3SPSW2
•−
P.Y.
E.B.
E.B.
E.B.
E.B.F.Y.
0
1000
2000
3000
4000
5000
6000
7000
8000
9000
10000
11000
0 0.01 0.02 0.03 0.04 0.05
Drift ratio
Load
(k
N)
SPSW2 (h/tp = 638)
SPSW3 (h/tp = 323)
SPSW4 (h/tp = 214)
SPSW5 (h/tp = 160)
P.Y.
F.Y.
Fig. 5.9 Buckling stability of SPSWs with
various infill plate slenderness ratios
Fig. 5.10 Load-drift ratio curves of SPSWs
with various infill plate slenderness ratios
Stiffness performance of the SPSW models is further illustrated in Fig. 5.11. The von Mises
stress contour plot of SPSW4 model with moderate LYP steel infill plate at 3% drift ratio is also
shown in Fig. 5.12.
0
100
200
300
400
500
600
700
800
900
1000
1100
1200
1300
0 0.004 0.008 0.012 0.016 0.02
Drift ratio
Sti
ffn
ess
(kN
/mm
)
SPSW5
SPSW4SPSW3
SPSW2
Plate First Yield
Average drift ratio = 0.1%
Frame First Yield
Average drift ratio = 0.6%
Fig. 5.11 Stiffness-drift ratio curves of SPSWs
with various infill plate thicknesses
Fig. 5.12 von Mises stress contour plot of
SPSW4 model at 0.03 drift ratio
92
As seen in Fig. 5.11, all four LYP steel shear wall models have similar and stable stiffness
performance in the elastic and inelastic ranges of structural response. The stiffness of the SPSW
models gradually diminishes as the drift ratio increases. However, most of the stiffness reduction
occurs at lower drift ratios due to yielding and buckling of the LYP steel infill plate. Also, as
shown in Figs. 5.10 and 5.11, the plate and frame first yields in the SPSW models occur at 0.1%
and 0.6% average drift ratios, respectively. It is believed that the stable stiffness performance and
the desirable plate-frame yielding sequence in all four SPSW models are mainly contributed by
the LYP steel material properties and also proper design of the boundary frame members. These
findings are consistent with those reported by Habashi and Alinia (2010). In addition, as seen in
Fig. 5.12, the infill plate of SPSW4 model is fully yielded at 3% drift ratio which is accompanied
by partial yielding of the boundary frame members due to the effect of diagonal tension-field
action within the web-plate.
Hysteresis plots of the SPSW lateral load versus drift ratio are shown in Fig. 5.13. SPSW
models are loaded cyclically according to the history given in Table 5.2. From the figure, it is
found that the code-designed LYP steel shear wall models in general exhibit reliable cyclic
performance by dissipating the energy with stable hysteresis loops. Increasing of infill plate
thickness betters the hysteretic behavior of the SPSW system by improving the buckling stability
and decreasing the severity of pinching effect in the hysteresis loops resulting in the change of
shape of the hysteresis loops from “S” shape to “spindle” shape, as seen in Fig. 5.13. Fig. 5.14,
also, shows the variations of cumulative dissipated energy of the SPSW models.

93
-2700
-1350
0
1350
2700
-0.05 -0.025 0 0.025 0.05
Drift ratio
Lo
ad (
kN
)
-5700
-2850
0
2850
5700
-0.05 -0.025 0 0.025 0.05
Drift ratio
Lo
ad (
kN
)
(a) SPSW2 (b) SPSW3
-8300
-4150
0
4150
8300
-0.05 -0.025 0 0.025 0.05
Drift ratio
Lo
ad (
kN
)
-11500
-5750
0
5750
11500
-0.05 -0.025 0 0.025 0.05
Drift ratio
Lo
ad (
kN
)
(c) SPSW4 (d) SPSW5
Fig. 5.13 Hysteresis curves of the LYP steel shear wall models
with various infill plate slenderness ratios
0
1000
2000
3000
4000
5000
6000
7000
8000
9000
10000
11000
12000
13000
1 2 3 4 5 6 7 8 9
Cycle number
CD
E (
kN
.m)
SPSW5
SPSW4
SPSW3
SPSW2
Fig. 5.14 Cumulative dissipated energy at various cycles

94
From this figure, it is apparent that energy dissipation capacity of the SPSW system increases
substantially as the infill plate slenderness decreases. Also, it is clearly observed that application
of LYP steel infill plates results in early yielding and energy dissipation of the SPSW system
from the initial stages of loading process.
Stiffness, strength, and energy dissipation capacity are three important characteristics of a
SPSW system which affect its structural and seismic performance. On this basis and in order to
provide an overall quantitative assessment of the current findings, the infill plate thickness ( pt ),
initial stiffness ( iK ), strength at 0.05 drift ratio ( 05.0=DRP ), and total cumulative dissipated energy
( tCDE)( ) values of the LYP steel shear wall models are captured and summarized in Table 5.3.
These quantities are also presented in a normalized manner by dividing each by the
corresponding quantities of SPSW2 model.
Table 5.3 Stiffness, strength, and energy dissipation characteristics of SPSW models
tp Ki PDR=0.05 (CDE)t Model (mm)
tp / tp-SPSW2 (kN/mm)
Ki / Ki-SPSW2 (kN)
P / PSPSW2 (kN.m)
(CDE)t / (CDE)t-SPSW2
SPSW2 4.7 1.00 322.5 1.00 2653.2 1.00 2756.2 1.00
SPSW3 9.3 1.98 664.7 2.06 5606.4 2.11 6074.6 2.20
SPSW4 14.0 2.98 967.7 3.00 8198.9 3.09 9111.5 3.31
SPSW5 18.7 3.98 1275.2 3.95 11042.1 4.16 12563.0 4.56
From the tabulated results, it is found that stiffness, strength, and energy dissipation capacity
values increase almost proportionally with the increase in infill plate thickness. It is also noted
that CDE ratios possess the highest rate of increase compared to stiffness and strength ratios.
These findings demonstrate the stiffening and damping characteristics and capabilities of LYP
steel shear wall systems.

95
5.6 Modified Plate-Frame Interaction Model for SPSWs with Moderate and
Stocky Infill Plates
Sabouri-Ghomi et al. (2005) introduced the PFI model and demonstrated that this modeling
technique is able to predict the behavior of different SPSW configurations with thin or thick
infill plates, and with or without stiffeners and openings. This analytical method provides the
designers with a powerful tool to efficiently design SPSW systems by evaluating the individual
properties of the plate and frame components and their interaction as well as contribution to the
overall performance of the system. The purpose of this section is to present a slightly-modified
PFI model for predicting the response of SPSW systems with moderate and stocky infill plates,
and also to evaluate its effectiveness through detailed comparison with some experimental and
numerical results.
This method considers the behavior of the infill plate and surrounding frame separately, and
accounts for the interaction of these two structural components. A schematic representation of
the PFI method was provided in Fig. 2.6(b). As illustrated in the figure, the shear load-
displacement diagrams for the infill plate and for the surrounding frame are obtained separately,
and by superimposing these two diagrams, that of the steel shear wall panel is obtained
consequently.
It was demonstrated that moderate plates reach their ultimate strength immediately after
geometrical-material bifurcation and neither possess post-buckling nor post-yield reserves, while
stocky plates exhibit some post-yield capacity prior to failure due to plastic buckling. This
indicates that stability and resistance of such plates are highly influenced by material bifurcation.
Accordingly, it is assumed that the limit state of moderate and stocky infill plates under shear
loading is reached when the shear stress acting on the plate attains the shear yield stress, i.e.
3ypyp στ = , and hence the effects of geometrical buckling are neglected. Point A in Fig.
96
2.6(b) corresponds to the plate material bifurcation limit. The shear yield strength ( pP ) and the
corresponding lateral displacement ( pU ) of the plate may be obtained from
pypp ltP ×= τ (5.1)
and
p
pyp
pEI
hPh
GU
3
3×+×
=
τ (5.2)
in which, G is the elastic shear modulus of the plate steel material and pI is the moment of
inertia of the infill plate. It is noted that pU in Eq. (5.2) is determined by considering the
deflection due to both shear and bending, since the deformation of a SPSW system is a
combination of shear and bending deformations.
The shear load-displacement diagram of a frame may also be reasonably defined by
assuming that the beam-column connections are fixed and the beams behave as rigid elements
(Fig. 2.6(a)). Accordingly, the ultimate shear strength ( fP ) and the corresponding lateral
displacement ( fU ) of the frame, defining point B in Fig. 2.6(b), may be determined by
s
pc
fh
MP
×=
4 (5.3)
and
c
spc
fEI
hMU
6
2×= (5.4)
where, pcM and cI are respective plastic moment and moment of inertia of the column.

97
It is evident that the behavior of steel infill plate and frame are assumed to be elastic-
perfectly plastic in this method. Once the idealized shear load-displacement diagrams of the infill
plate and surrounding frame are defined using the above equations, the shear load-displacement
diagram of the SPSW system can be obtained by superposition of the two diagrams. It should be
noted that in accordance with Sabouri-Ghomi et al.’s (2005) recommendation, pf UU >
requirement has to be satisfied, since this will ensure that the plate dissipates more energy than
the frame. Moreover, boundary frame members have to be strong and stiff enough to ensure full
development of tension field in the web plate.
The effectiveness of the modified PFI model is demonstrated by comparing the predicted
response with experimental and numerical results. The analytical results are initially compared
with the experimental results obtained from tests performed by Chen and Jhang (2006) as well as
Tsai and Lin (2005), as shown in Figs. 5.15 and 5.16, respectively. The first test specimen, i.e.
specimen no. 2 in Chen and Jhang (2006), is an unstiffened steel shear wall with stocky LYP
steel infill plate and an extension of 15 cm steel plate added to the bottom of the boundary beam,
whose details are illustrated in Fig. 5.15(a). The second specimen, i.e. specimen 3T in Tsai and
Lin (2005), is a stiffened LYP steel shear wall with 3.0 mm thick and stocky sub-panels as
shown in Fig. 5.16(a).
As shown in Fig. 5.15(b), the ultimate strength of the first test specimen is closely predicted
by the modified PFI model; however, the initial stiffness is overestimated by this model. Fig.
5.16(b), on the other hand, shows that the analytical model closely predicts both initial stiffness
and ultimate strength from the envelope of the cyclic response of the second test specimen.
Regardless of theoretical considerations, the stiffness performance of the test specimens is
believed to be largely influenced by the LYP and conventional steel material nonlinearities

98
present in both elastic and inelastic ranges which are not captured by the analytical model. In any
case, the agreement between the analytical and experimental results is found to be by and large
satisfactory in both cases.
-1500
-1000
-500
0
500
1000
1500
-75 -50 -25 0 25 50 75
In-plane lateral displ. (mm)
Lo
ad
(k
N)
Plate
Frame
Panel
(a) Specimen no. 2 (b) Analytical vs. experimental results
Fig. 5.15 Comparison with Chen and Jhang’s (2006) experimental results
-2700
-1800
-900
0
900
1800
2700
-80 -60 -40 -20 0 20 40 60 80
In-plane lateral displ. (mm)
Lo
ad
(k
N) Plate
Frame
Panel
(a) Specimen 3T (b) Analytical vs. experimental results
Fig. 5.16 Comparison with Tsai and Lin’s (2005) experimental results
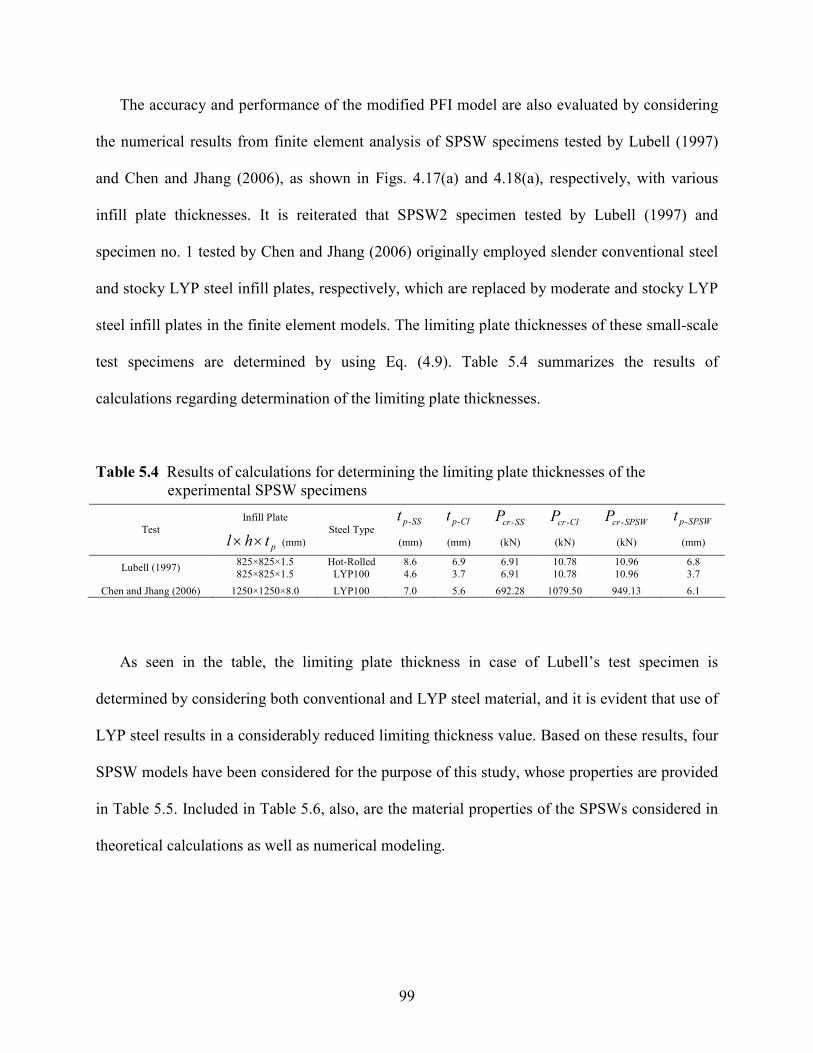
99
The accuracy and performance of the modified PFI model are also evaluated by considering
the numerical results from finite element analysis of SPSW specimens tested by Lubell (1997)
and Chen and Jhang (2006), as shown in Figs. 4.17(a) and 4.18(a), respectively, with various
infill plate thicknesses. It is reiterated that SPSW2 specimen tested by Lubell (1997) and
specimen no. 1 tested by Chen and Jhang (2006) originally employed slender conventional steel
and stocky LYP steel infill plates, respectively, which are replaced by moderate and stocky LYP
steel infill plates in the finite element models. The limiting plate thicknesses of these small-scale
test specimens are determined by using Eq. (4.9). Table 5.4 summarizes the results of
calculations regarding determination of the limiting plate thicknesses.
Table 5.4 Results of calculations for determining the limiting plate thicknesses of the
experimental SPSW specimens
Infill Plate SS-pt Cl-pt SS-crP Cl-crP SPSW-crP SPSW-pt
Test
pthl ×× (mm)
Steel Type
(mm) (mm) (kN) (kN) (kN) (mm)
825×825×1.5 Hot-Rolled 8.6 6.9 6.91 10.78 10.96 6.8 Lubell (1997)
825×825×1.5 LYP100 4.6 3.7 6.91 10.78 10.96 3.7
Chen and Jhang (2006) 1250×1250×8.0 LYP100 7.0 5.6 692.28 1079.50 949.13 6.1
As seen in the table, the limiting plate thickness in case of Lubell’s test specimen is
determined by considering both conventional and LYP steel material, and it is evident that use of
LYP steel results in a considerably reduced limiting thickness value. Based on these results, four
SPSW models have been considered for the purpose of this study, whose properties are provided
in Table 5.5. Included in Table 5.6, also, are the material properties of the SPSWs considered in
theoretical calculations as well as numerical modeling.
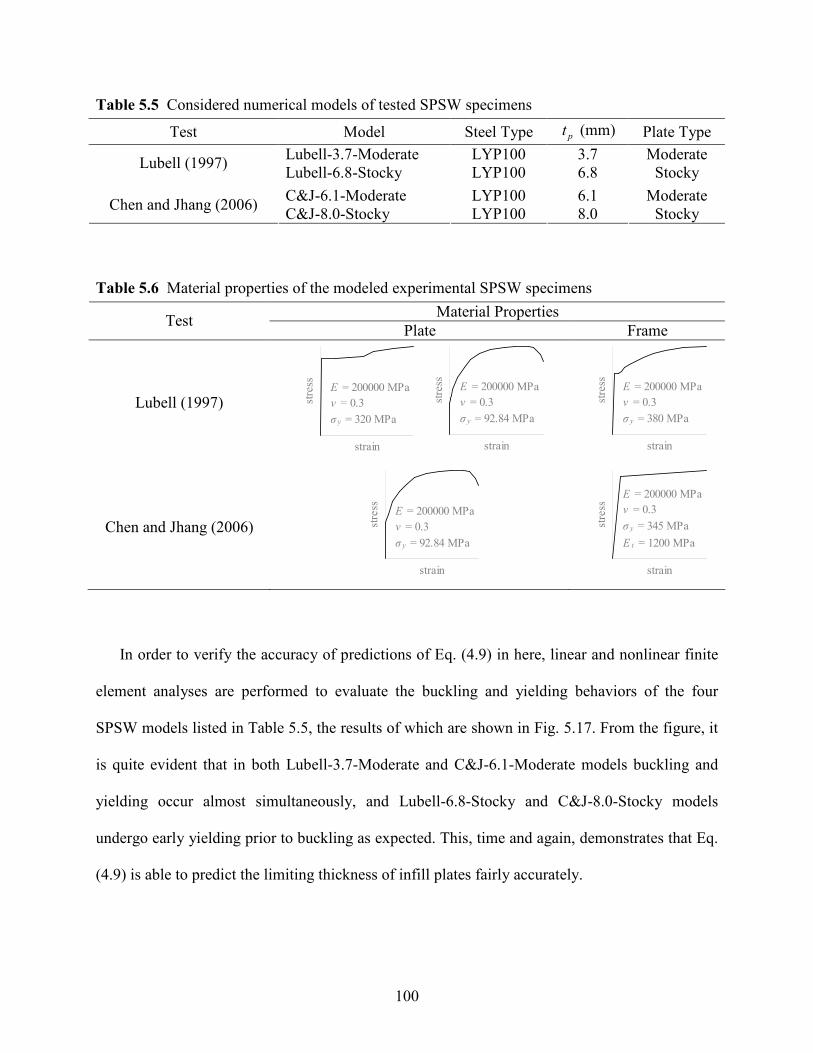
100
Table 5.5 Considered numerical models of tested SPSW specimens
Test Model Steel Type pt (mm) Plate Type
Lubell-3.7-Moderate LYP100 3.7 Moderate Lubell (1997)
Lubell-6.8-Stocky LYP100 6.8 Stocky
C&J-6.1-Moderate LYP100 6.1 Moderate Chen and Jhang (2006)
C&J-8.0-Stocky LYP100 8.0 Stocky
Table 5.6 Material properties of the modeled experimental SPSW specimens
Material Properties Test
Plate Frame
Lubell (1997)
strain
stre
ss E = 200000 MPa
v = 0.3
σ y = 320 MPa
strain
stre
ss E = 200000 MPa
v = 0.3
σ y = 92.84 MPa
strain
stre
ss E = 200000 MPa
v = 0.3
σ y = 380 MPa
Chen and Jhang (2006)
strain
stre
ss E = 200000 MPa
v = 0.3
σ y = 92.84 MPa
strain
stre
ss
E = 200000 MPa
v = 0.3
σ y = 345 MPa
E t = 1200 MPa
In order to verify the accuracy of predictions of Eq. (4.9) in here, linear and nonlinear finite
element analyses are performed to evaluate the buckling and yielding behaviors of the four
SPSW models listed in Table 5.5, the results of which are shown in Fig. 5.17. From the figure, it
is quite evident that in both Lubell-3.7-Moderate and C&J-6.1-Moderate models buckling and
yielding occur almost simultaneously, and Lubell-6.8-Stocky and C&J-8.0-Stocky models
undergo early yielding prior to buckling as expected. This, time and again, demonstrates that Eq.
(4.9) is able to predict the limiting thickness of infill plates fairly accurately.
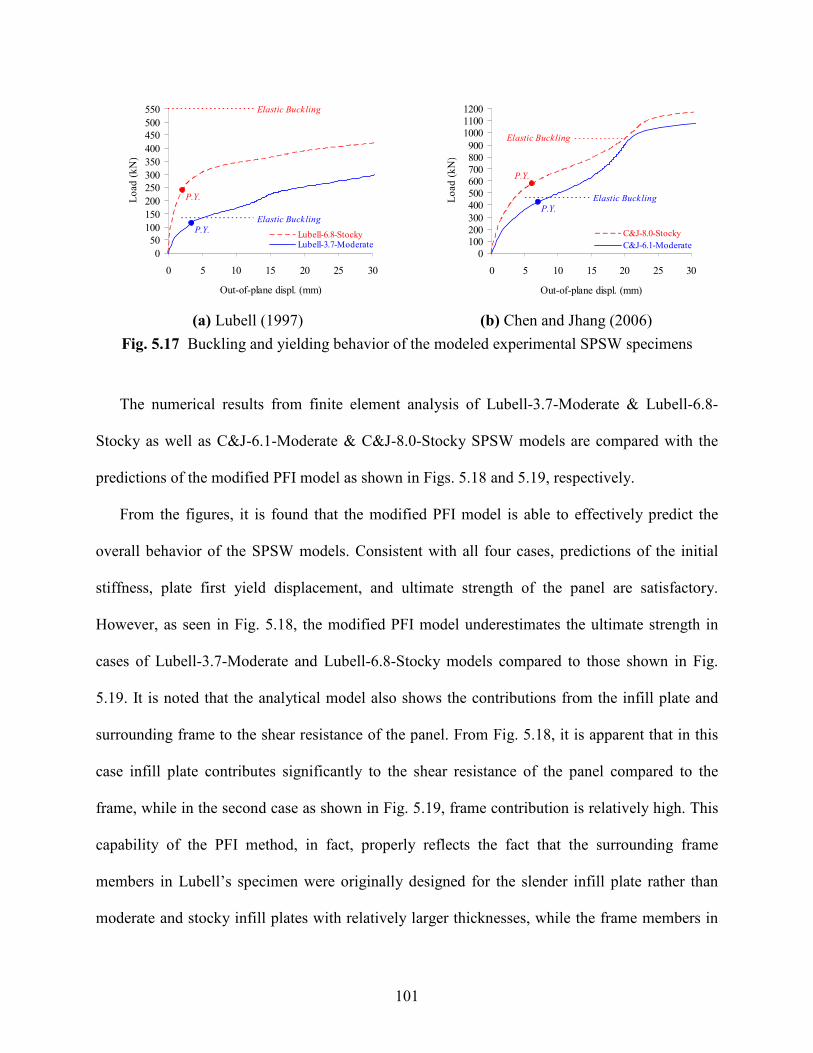
101
0
50
100
150
200
250
300
350
400
450
500
550
0 5 10 15 20 25 30
Out-of-plane displ. (mm)
Lo
ad
(k
N)
Lubell-6.8-StockyLubell-3.7-Moderate
Elastic Buckling
Elastic Buckling
P.Y.
P.Y.
0
100200
300
400
500
600700
800
900
1000
1100
1200
0 5 10 15 20 25 30
Out-of-plane displ. (mm)
Lo
ad
(k
N)
C&J-8.0-Stocky
C&J-6.1-Moderate
Elastic Buckling
Elastic Buckling
P.Y.
P.Y.
(a) Lubell (1997) (b) Chen and Jhang (2006)
Fig. 5.17 Buckling and yielding behavior of the modeled experimental SPSW specimens
The numerical results from finite element analysis of Lubell-3.7-Moderate & Lubell-6.8-
Stocky as well as C&J-6.1-Moderate & C&J-8.0-Stocky SPSW models are compared with the
predictions of the modified PFI model as shown in Figs. 5.18 and 5.19, respectively.
From the figures, it is found that the modified PFI model is able to effectively predict the
overall behavior of the SPSW models. Consistent with all four cases, predictions of the initial
stiffness, plate first yield displacement, and ultimate strength of the panel are satisfactory.
However, as seen in Fig. 5.18, the modified PFI model underestimates the ultimate strength in
cases of Lubell-3.7-Moderate and Lubell-6.8-Stocky models compared to those shown in Fig.
5.19. It is noted that the analytical model also shows the contributions from the infill plate and
surrounding frame to the shear resistance of the panel. From Fig. 5.18, it is apparent that in this
case infill plate contributes significantly to the shear resistance of the panel compared to the
frame, while in the second case as shown in Fig. 5.19, frame contribution is relatively high. This
capability of the PFI method, in fact, properly reflects the fact that the surrounding frame
members in Lubell’s specimen were originally designed for the slender infill plate rather than
moderate and stocky infill plates with relatively larger thicknesses, while the frame members in

102
Chen and Jhang’s specimen were properly designed for the stocky infill plate and hence exhibit
higher contribution and performance.
0
25
50
75
100
125
150
175
200
225
250
275
0 5 10 15 20 25
In-plane lateral displ. (mm)
Lo
ad
(k
N) Plate
Frame
PanelC.Y.
P.Y.
0
50
100
150
200
250
300
350
400
450
0 5 10 15 20 25
In-plane lateral displ. (mm)
Lo
ad
(k
N)
Plate
Frame
Panel
C.Y.
P.Y.
(a) Lubell-3.7-Moderate (b) Lubell-6.8-Stocky
Fig. 5.18 Comparison of the modified PFI model predictions with numerical
results of Lubell’s (1997) SPSW2 specimen model
0
125
250
375
500
625
750
875
1000
1125
1250
0 15 30 45 60 75
In-plane lateral displ. (mm)
Lo
ad
(k
N)
Plate
Frame
Panel
C.Y.
P.Y.
0
140
280
420
560
700
840
980
1120
1260
1400
0 15 30 45 60 75
In-plane lateral displ. (mm)
Lo
ad
(k
N)
Plate
Frame
Panel
C.Y.
P.Y.
(a) C&J-6.1-Moderate (b) C&J-8.0-Stocky
Fig. 5.19 Comparison of the modified PFI model predictions with numerical
results of Chen and Jhang’s (2006) specimen no. 1 model
Finally, finite element results of SPSW1, SPSW4, SPSW5, and SPSW6 models with various
aspect ratios are compared with the predicted response by the modified PFI model. Comparison
results are given in Fig. 5.20.

103
0
1660
3320
4980
6640
8300
0 0.01 0.02 0.03 0.04 0.05
Drift ratio
Lo
ad
(k
N)
Plate
Frame
Panel
P.Y.
C.Y.
-8300
-4150
0
4150
8300
-0.05 -0.025 0 0.025 0.05
Drift ratio
Lo
ad
(k
N)
Numerical
Modified PFI
(a) SPSW4
0
2300
4600
6900
9200
11500
0 0.01 0.02 0.03 0.04 0.05
Drift ratio
Lo
ad
(k
N)
Frame
Panel
P.Y.
C.Y.
Plate
-11500
-5750
0
5750
11500
-0.05 -0.025 0 0.025 0.05
Drift ratio
Lo
ad
(k
N)
Numerical
Modified PFI
(b) SPSW5
0
1140
2280
3420
4560
5700
0 0.01 0.02 0.03 0.04 0.05
Drift ratio
Lo
ad
(k
N)
Frame
Panel
P.Y.
C.Y.
Plate
0
2500
5000
7500
10000
12500
0 0.01 0.02 0.03 0.04 0.05
Drift ratio
Lo
ad
(k
N)
Frame
Panel
P.Y.
C.Y.
Plate
(c) SPSW1 (d) SPSW6
Fig. 5.20 Comparison of the modified PFI model predictions with numerical results of full-scale
and code-designed SPSW models with various aspect ratios and under lateral load

104
As it is seen in Figs. 5.20(a) and (b), the modified PFI model has successfully captured the
overall performance of SPSW4 and SPSW5 models with 00.1/ =hl . Initial stiffness and plate
first yield displacement of these models have been closely predicted by the analytical model,
while the ultimate capacity is underestimated in both cases. On the other hand, analytical
predictions for SPSW1 and SPSW6 models with respective hl / ratios of 0.67 and 1.50, exhibit
various degrees of accuracy as shown in Figs. 5.20(c) and (d). Good agreement is observed
between the finite element results and analytical predictions of the initial stiffness in both cases.
However, the modified PFI model overestimates the plate first yield displacement of SPSW1
model as shown in Fig. 5.20(c), while provides acceptable predictions in case of SPSW6 model
as shown in Fig. 5.20(d). This implies that the modified parameter, pU , may require further
refinement by considering the panel aspect ratio and also amount of contribution of each
deformation, i.e. bending and shear, to the ultimate deformation of the panel, which of course
needs more investigation. Additionally, analytical predictions of the ultimate strength seem to be
overly conservative in case of SPSW6 model (Fig. 5.20(d)), while these are reasonably
consistent with the finite element results of SPSW1 model (Fig. 5.20(c)), which may be
attributed to the relative lower (SPSW6) and higher (SPSW1) contribution of the frame to the
ultimate strength of the system.
All in all, it is concluded that the PFI model is in general a powerful tool which can be
effectively used to predict the overall behavior of a SPSW system and also characterize the
performance and interaction of the plate and frame components. The findings of this study also
demonstrate that the modified PFI model is capable of predicting the behaviors of LYP steel
shear walls with moderate and stocky infill plates. However, further experimental and parametric
studies are still needed for improving this model which will eventually result in accurate

105
prediction of the behavioral properties of such efficient lateral force-resisting and damping
structural elements.
5.7 Concluding Remarks
Application of LYP steel shear walls has been shown in a number of studies to be highly
promising towards improving the stiffening as well as damping characteristics of SPSW systems.
However, for efficient design and prevalent use of such systems, further research work is still
required to balance between structural demands and economical considerations. On this basis,
the advantages as well as structural behavior and performance of some code-designed LYP steel
shear wall systems with unstiffened slender, moderate, and stocky infill plates were identified
and investigated in this chapter via finite element and analytical methods.
It was demonstrated that application of LYP steel infill plates results in reduced forces
imposed on the boundary frame members as compared to the conventional steel infill plates, and
also offers the possibility of repair and retrofit of existing structures.
Application of unstiffened steel shear wall systems with relatively high buckling and low
yielding capacities, enhanced serviceability as well as energy dissipation capacity is made
possible in the light of use of LYP steel material. This was addressed by evaluating the
monotonic and cyclic behaviors of LYP steel shear wall models with slender, moderate, and
stocky infill plates. The limiting thicknesses corresponding to concurrent geometrical-material
bifurcation of moderate infill plates were successfully predicted through two approaches, i.e.
Eqs. (4.9) and (4.11). This limiting thickness is believed to serve as an effective criterion in
seismic design of SPSW systems with high stiffening and damping performance.

106
Ultimately, the well-known PFI method was modified to account for bending and shear
deformations, which was subsequently used to predict the behaviors of SPSW systems with
moderate and stocky infill plates. The effectiveness of this modified analytical model was
verified through detailed comparison with various experimental and numerical results. In spite of
the overall acceptable performance of the model, further experimental results and parametric
studies are required in order to improve the accuracy of the predicted response.
107
6. STUDY ON SEISMIC DESIGN AND STRUCTURAL
PERFORMANCE OF SPSWS WITH LYP STEEL INFILL
PLATES
6.1 Introduction
In general, SPSWs have been demonstrated to be promising and efficient lateral force-
resisting systems and accordingly increasingly used in the construction of buildings. However,
the priorities of high structural performance in Japan and economical considerations in North
America have resulted in design and use of stiffened and/or stocky-web as well as unstiffened
and slender-web systems, respectively, in these countries.
SPSWs were introduced into the U.S. codes as “special plate shear walls” in 2005 edition of
the AISC Seismic Provisions for Structural Steel Buildings (AISC 341-05, 2005). Continuous
research has led to specifying refined design requirements in 2010 edition of the AISC code
(AISC 341-10, 2010). The AISC 341 seismic design provisions require capacity design of
SPSWs, which implies that HBEs must be designed to resist demands resulting from tension
field yielding of the infill plates and VBEs must be designed to resist the tension field yielding of
the infill plates and flexural yielding of the HBEs (Berman, 2011). It is noted that the AISC 341
seismic design provisions typically address SPSWs with unstiffened and slender infill plates
which buckle first and subsequently undergo material yielding in the post-buckling stage.
However, SPSWs with LYP steel infill plates may possess relatively low yielding and high
buckling capacities, and consequently undergo material yielding prior to buckling due to early
yielding of the steel material.
108
The objective of the research presented in this chapter is to investigate the structural behavior
and performance of SPSWs with unstiffened LYP steel infill plates under the action of combined
shear and compressive forces, designed for high-seismic loading. Specifically, nonlinear
pushover and cyclic analyses of SPSWs are performed to investigate: i) the strength, stiffness,
and cyclic performances of the code-designed LYP steel shear walls with different aspect ratios,
ii) the effectiveness of some AISC 341 code-specified design requirements and considerations,
and iii) the performance of the modified PFI model in predicting and characterizing the
behaviors of SPSWs with low yielding and high buckling capacities and different aspect ratios.
6.2 Design of SPSW Models
Three single-story, single-bay, and full-scale SPSWs with 2100×3100, 3100×3100, and
4600×3100 mm unstiffened LYP steel infill plates under gravity and in-plane lateral loads are
designed based on AISC 341-10 (2010) seismic provisions and recommendations provided in
AISC Steel Design Guide 20 (Sabelli and Bruneau, 2006) for high-seismic loading.
Buildings are generally subjected to gravity and lateral loads. As the primary lateral force-
resisting components, infill plates in SPSW systems resist the lateral loads, and hence are
typically subjected to shear forces. On the other hand, the building frames, including the SPSW
boundary elements, should be designed to carry gravity loads while neglecting the contribution
of the SPSW panels (Seilie and Hooper, 2005). Per AISC 341-10 (2010) provisions, the webs of
SPSW shall not be considered as resisting gravity forces. However, due to the effects of vertical
ground motion, construction sequence, etc., infill plates in SPSWs may be subjected to some
levels of compressive forces in addition to the shear forces. In this study, in order to account for
the effects of combined shear and compressive forces, as illustrated in Fig. 6.1, the sum of the
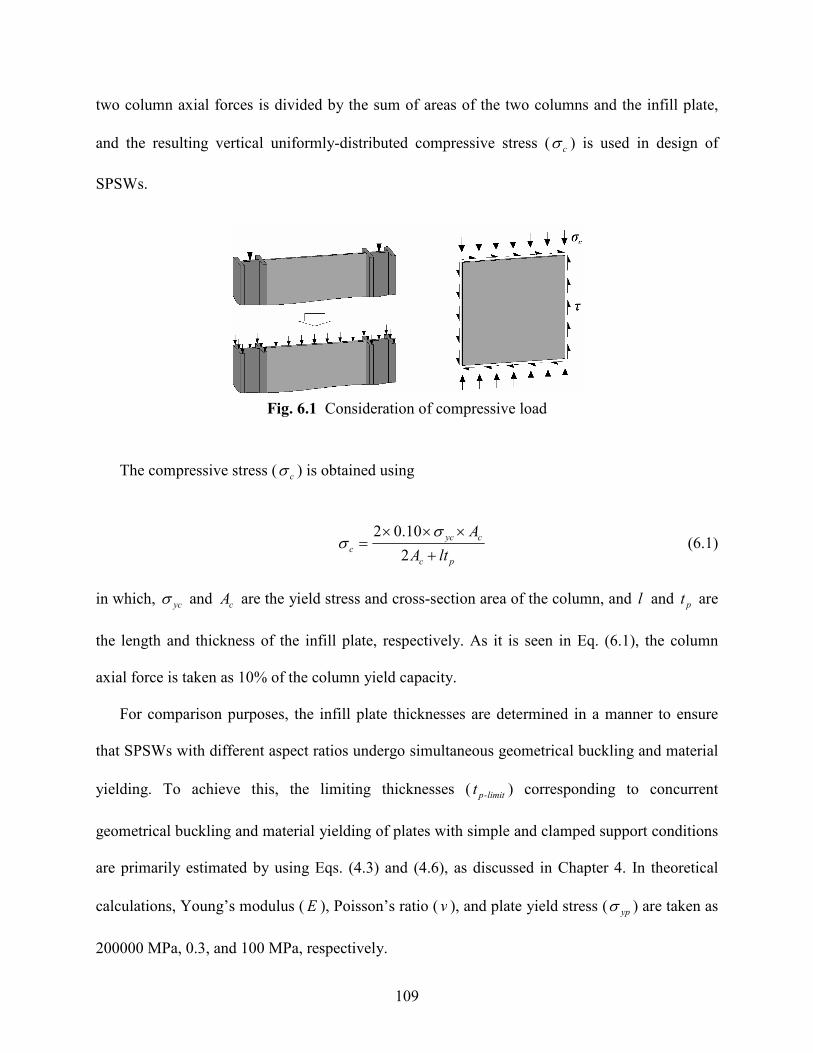
109
two column axial forces is divided by the sum of areas of the two columns and the infill plate,
and the resulting vertical uniformly-distributed compressive stress ( cσ ) is used in design of
SPSWs.
Fig. 6.1 Consideration of compressive load
The compressive stress ( cσ ) is obtained using
pc
cyc
cltA
A
+
×××=
2
10.02 σσ (6.1)
in which, ycσ and cA are the yield stress and cross-section area of the column, and l and pt are
the length and thickness of the infill plate, respectively. As it is seen in Eq. (6.1), the column
axial force is taken as 10% of the column yield capacity.
For comparison purposes, the infill plate thicknesses are determined in a manner to ensure
that SPSWs with different aspect ratios undergo simultaneous geometrical buckling and material
yielding. To achieve this, the limiting thicknesses ( limit-pt ) corresponding to concurrent
geometrical buckling and material yielding of plates with simple and clamped support conditions
are primarily estimated by using Eqs. (4.3) and (4.6), as discussed in Chapter 4. In theoretical
calculations, Young’s modulus ( E ), Poisson’s ratio ( v ), and plate yield stress ( ypσ ) are taken as
200000 MPa, 0.3, and 100 MPa, respectively.
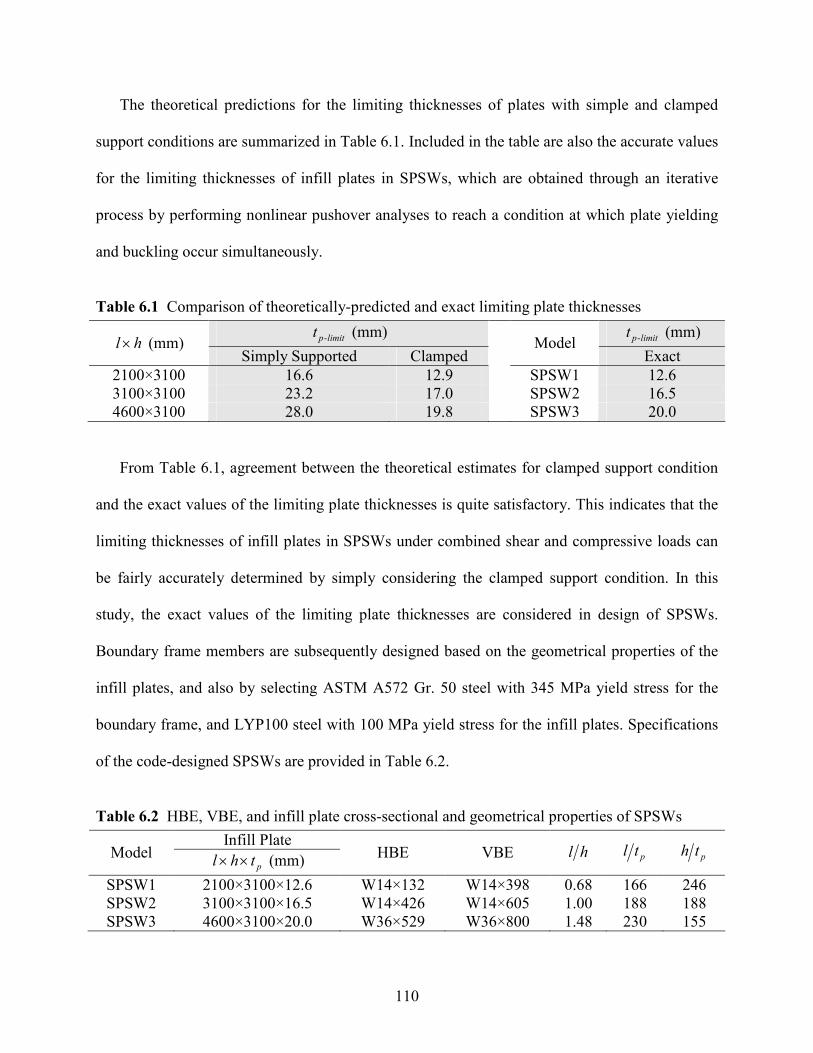
110
The theoretical predictions for the limiting thicknesses of plates with simple and clamped
support conditions are summarized in Table 6.1. Included in the table are also the accurate values
for the limiting thicknesses of infill plates in SPSWs, which are obtained through an iterative
process by performing nonlinear pushover analyses to reach a condition at which plate yielding
and buckling occur simultaneously.
Table 6.1 Comparison of theoretically-predicted and exact limiting plate thicknesses
limit-pt (mm) limit-pt (mm) hl× (mm)
Simply Supported Clamped Model
Exact
2100×3100 16.6 12.9 SPSW1 12.6
3100×3100 23.2 17.0 SPSW2 16.5
4600×3100 28.0 19.8 SPSW3 20.0
From Table 6.1, agreement between the theoretical estimates for clamped support condition
and the exact values of the limiting plate thicknesses is quite satisfactory. This indicates that the
limiting thicknesses of infill plates in SPSWs under combined shear and compressive loads can
be fairly accurately determined by simply considering the clamped support condition. In this
study, the exact values of the limiting plate thicknesses are considered in design of SPSWs.
Boundary frame members are subsequently designed based on the geometrical properties of the
infill plates, and also by selecting ASTM A572 Gr. 50 steel with 345 MPa yield stress for the
boundary frame, and LYP100 steel with 100 MPa yield stress for the infill plates. Specifications
of the code-designed SPSWs are provided in Table 6.2.
Table 6.2 HBE, VBE, and infill plate cross-sectional and geometrical properties of SPSWs
Infill Plate Model
pthl ×× (mm) HBE VBE hl ptl pth
SPSW1 2100×3100×12.6 W14×132 W14×398 0.68 166 246
SPSW2 3100×3100×16.5 W14×426 W14×605 1.00 188 188
SPSW3 4600×3100×20.0 W36×529 W36×800 1.48 230 155
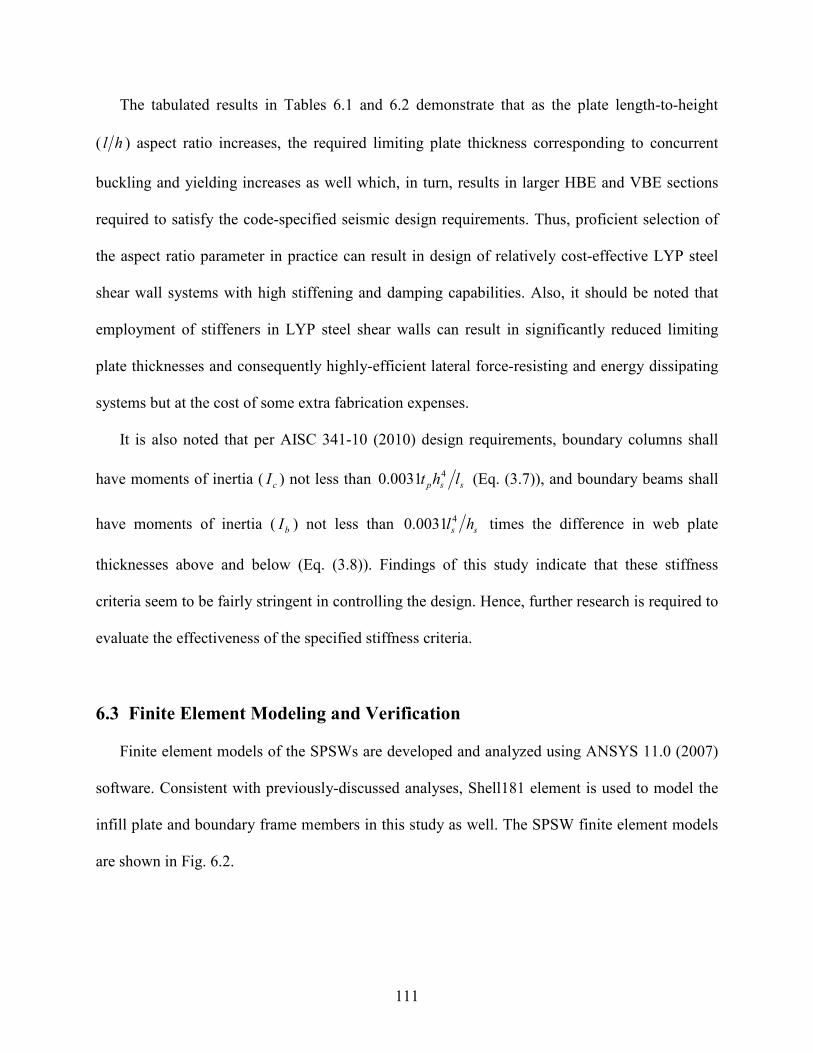
111
The tabulated results in Tables 6.1 and 6.2 demonstrate that as the plate length-to-height
( hl ) aspect ratio increases, the required limiting plate thickness corresponding to concurrent
buckling and yielding increases as well which, in turn, results in larger HBE and VBE sections
required to satisfy the code-specified seismic design requirements. Thus, proficient selection of
the aspect ratio parameter in practice can result in design of relatively cost-effective LYP steel
shear wall systems with high stiffening and damping capabilities. Also, it should be noted that
employment of stiffeners in LYP steel shear walls can result in significantly reduced limiting
plate thicknesses and consequently highly-efficient lateral force-resisting and energy dissipating
systems but at the cost of some extra fabrication expenses.
It is also noted that per AISC 341-10 (2010) design requirements, boundary columns shall
have moments of inertia ( cI ) not less than ssp lht 40031.0 (Eq. (3.7)), and boundary beams shall
have moments of inertia ( bI ) not less than ss hl 40031.0 times the difference in web plate
thicknesses above and below (Eq. (3.8)). Findings of this study indicate that these stiffness
criteria seem to be fairly stringent in controlling the design. Hence, further research is required to
evaluate the effectiveness of the specified stiffness criteria.
6.3 Finite Element Modeling and Verification
Finite element models of the SPSWs are developed and analyzed using ANSYS 11.0 (2007)
software. Consistent with previously-discussed analyses, Shell181 element is used to model the
infill plate and boundary frame members in this study as well. The SPSW finite element models
are shown in Fig. 6.2.
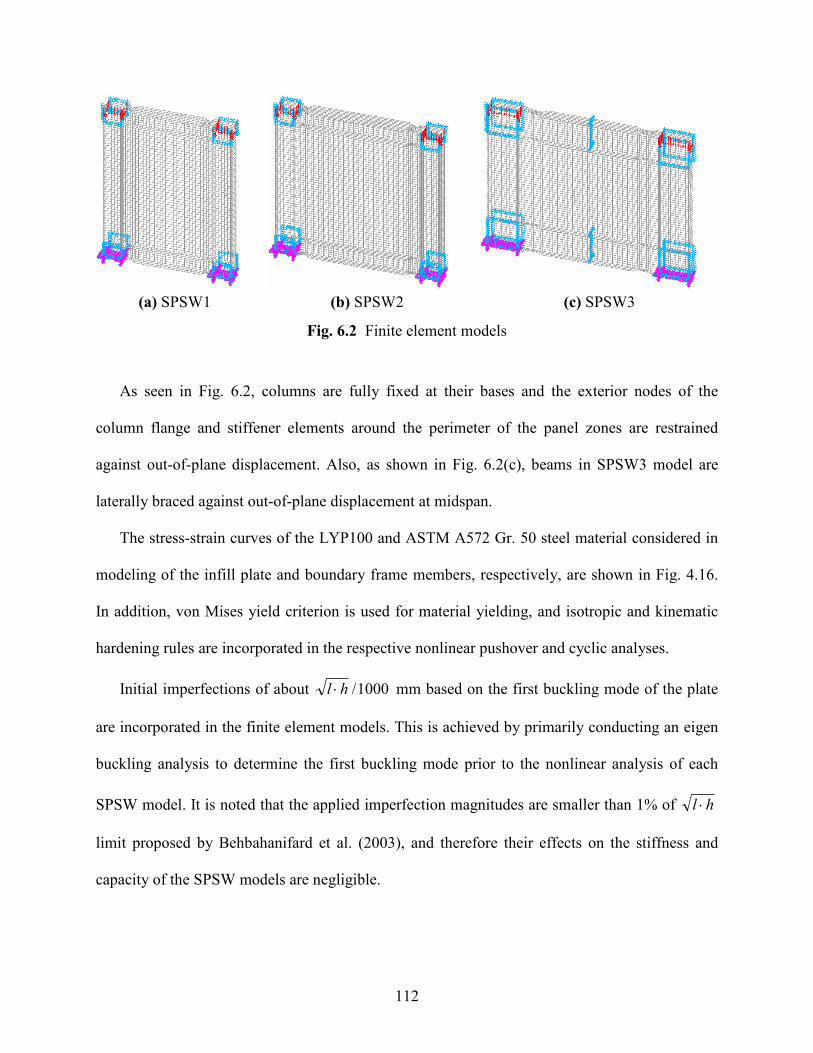
112
(a) SPSW1 (b) SPSW2 (c) SPSW3
Fig. 6.2 Finite element models
As seen in Fig. 6.2, columns are fully fixed at their bases and the exterior nodes of the
column flange and stiffener elements around the perimeter of the panel zones are restrained
against out-of-plane displacement. Also, as shown in Fig. 6.2(c), beams in SPSW3 model are
laterally braced against out-of-plane displacement at midspan.
The stress-strain curves of the LYP100 and ASTM A572 Gr. 50 steel material considered in
modeling of the infill plate and boundary frame members, respectively, are shown in Fig. 4.16.
In addition, von Mises yield criterion is used for material yielding, and isotropic and kinematic
hardening rules are incorporated in the respective nonlinear pushover and cyclic analyses.
Initial imperfections of about 1000/hl ⋅ mm based on the first buckling mode of the plate
are incorporated in the finite element models. This is achieved by primarily conducting an eigen
buckling analysis to determine the first buckling mode prior to the nonlinear analysis of each
SPSW model. It is noted that the applied imperfection magnitudes are smaller than 1% of hl ⋅
limit proposed by Behbahanifard et al. (2003), and therefore their effects on the stiffness and
capacity of the SPSW models are negligible.
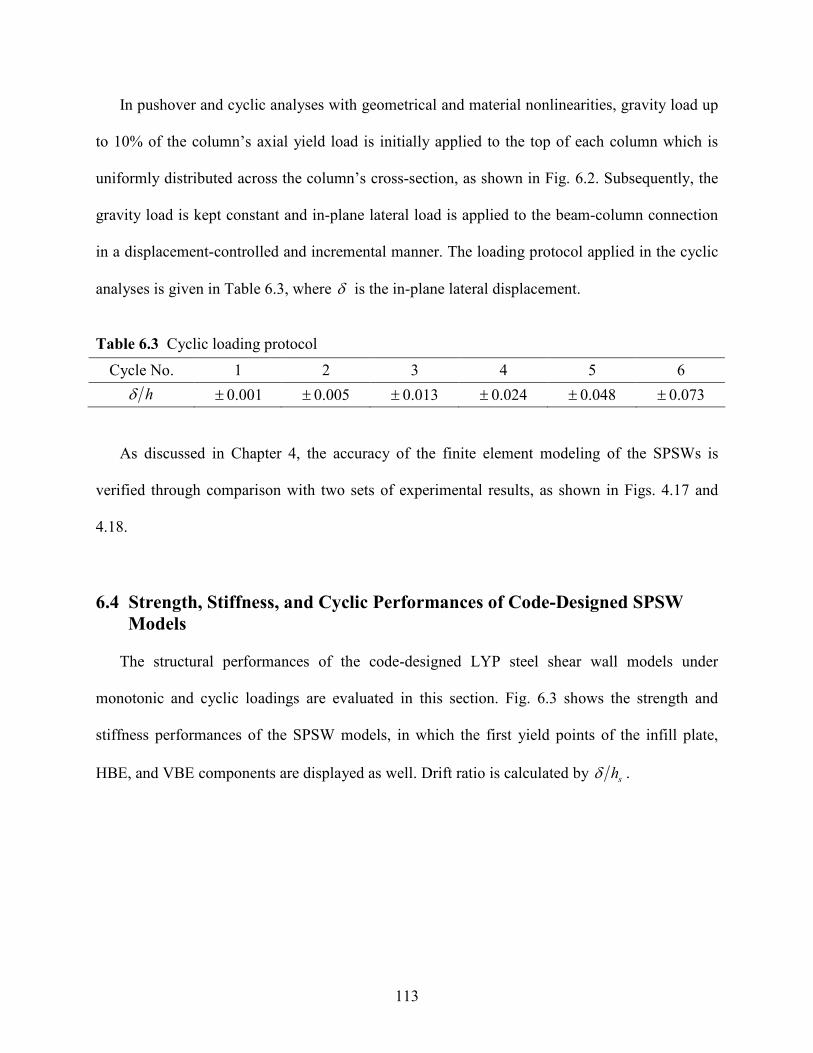
113
In pushover and cyclic analyses with geometrical and material nonlinearities, gravity load up
to 10% of the column’s axial yield load is initially applied to the top of each column which is
uniformly distributed across the column’s cross-section, as shown in Fig. 6.2. Subsequently, the
gravity load is kept constant and in-plane lateral load is applied to the beam-column connection
in a displacement-controlled and incremental manner. The loading protocol applied in the cyclic
analyses is given in Table 6.3, where δ is the in-plane lateral displacement.
Table 6.3 Cyclic loading protocol
Cycle No. 1 2 3 4 5 6
hδ 001.0± 005.0± 013.0± 024.0± 048.0± 073.0±
As discussed in Chapter 4, the accuracy of the finite element modeling of the SPSWs is
verified through comparison with two sets of experimental results, as shown in Figs. 4.17 and
4.18.
6.4 Strength, Stiffness, and Cyclic Performances of Code-Designed SPSW
Models
The structural performances of the code-designed LYP steel shear wall models under
monotonic and cyclic loadings are evaluated in this section. Fig. 6.3 shows the strength and
stiffness performances of the SPSW models, in which the first yield points of the infill plate,
HBE, and VBE components are displayed as well. Drift ratio is calculated by shδ .
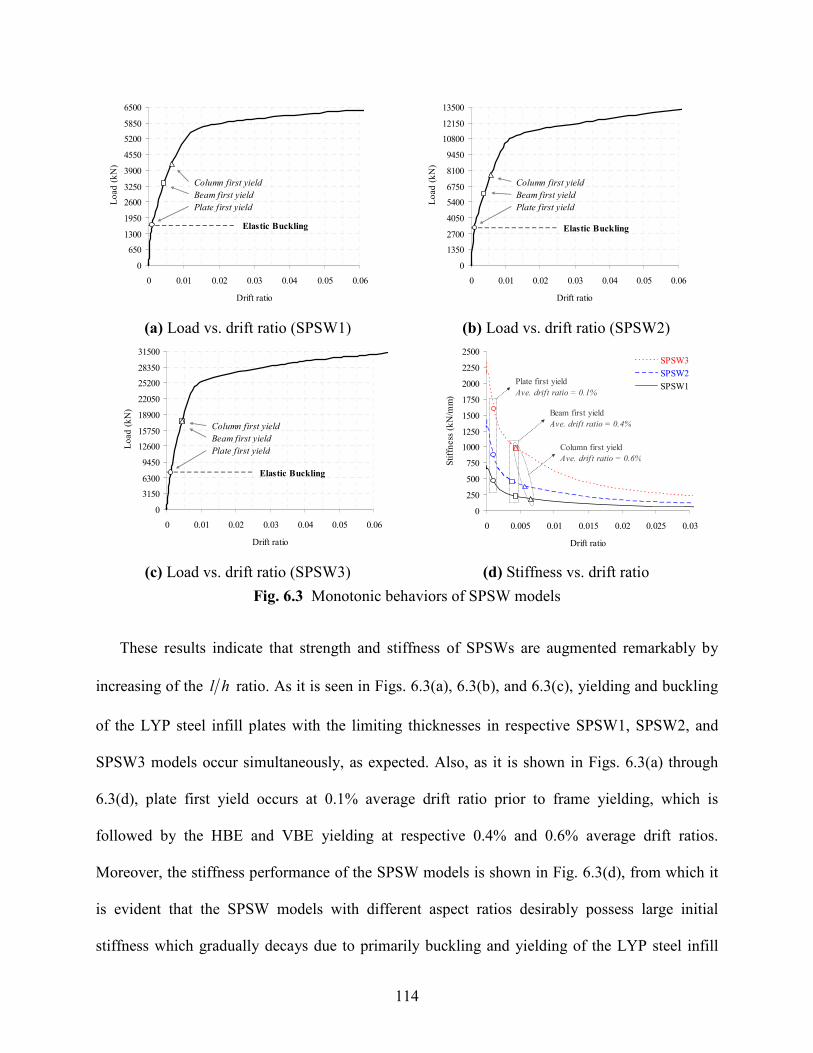
114
0
650
1300
1950
2600
3250
3900
4550
5200
5850
6500
0 0.01 0.02 0.03 0.04 0.05 0.06
Drift ratio
Lo
ad
(k
N)
Column first yield
Beam first yield
Plate first yield
Elastic Buckling
0
1350
2700
4050
5400
6750
8100
9450
10800
12150
13500
0 0.01 0.02 0.03 0.04 0.05 0.06
Drift ratio
Lo
ad
(k
N)
Elastic Buckling
Column first yield
Beam first yield
Plate first yield
(a) Load vs. drift ratio (SPSW1) (b) Load vs. drift ratio (SPSW2)
0
3150
6300
9450
12600
15750
18900
22050
25200
28350
31500
0 0.01 0.02 0.03 0.04 0.05 0.06
Drift ratio
Lo
ad
(k
N)
Elastic Buckling
Column first yield
Beam first yield
Plate first yield
0
250
500
750
1000
1250
1500
1750
2000
2250
2500
0 0.005 0.01 0.015 0.02 0.025 0.03
Drift ratio
Sti
ffn
ess
(k
N/m
m )
SPSW3
SPSW2
SPSW1Plate first yield
Ave. drift ratio = 0.1%
Beam first yield
Ave. drift ratio = 0.4%
Column first yield
Ave. drif t ratio = 0.6%
(c) Load vs. drift ratio (SPSW3) (d) Stiffness vs. drift ratio
Fig. 6.3 Monotonic behaviors of SPSW models
These results indicate that strength and stiffness of SPSWs are augmented remarkably by
increasing of the hl ratio. As it is seen in Figs. 6.3(a), 6.3(b), and 6.3(c), yielding and buckling
of the LYP steel infill plates with the limiting thicknesses in respective SPSW1, SPSW2, and
SPSW3 models occur simultaneously, as expected. Also, as it is shown in Figs. 6.3(a) through
6.3(d), plate first yield occurs at 0.1% average drift ratio prior to frame yielding, which is
followed by the HBE and VBE yielding at respective 0.4% and 0.6% average drift ratios.
Moreover, the stiffness performance of the SPSW models is shown in Fig. 6.3(d), from which it
is evident that the SPSW models with different aspect ratios desirably possess large initial
stiffness which gradually decays due to primarily buckling and yielding of the LYP steel infill
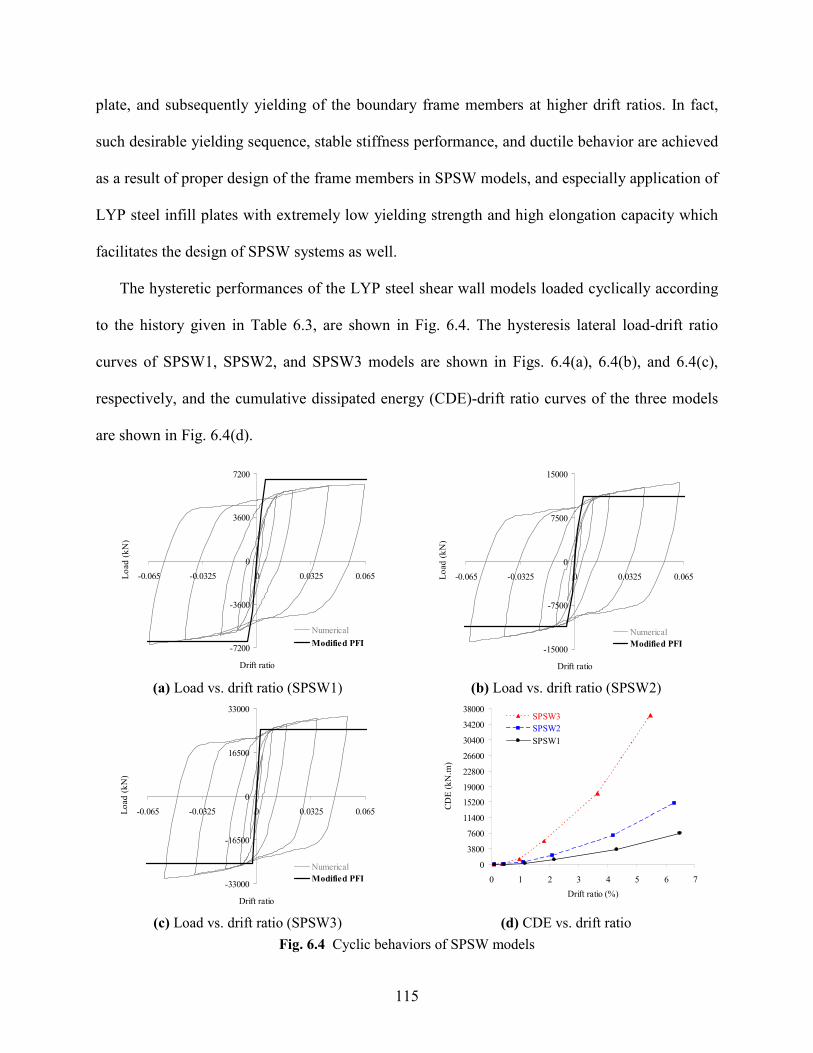
115
plate, and subsequently yielding of the boundary frame members at higher drift ratios. In fact,
such desirable yielding sequence, stable stiffness performance, and ductile behavior are achieved
as a result of proper design of the frame members in SPSW models, and especially application of
LYP steel infill plates with extremely low yielding strength and high elongation capacity which
facilitates the design of SPSW systems as well.
The hysteretic performances of the LYP steel shear wall models loaded cyclically according
to the history given in Table 6.3, are shown in Fig. 6.4. The hysteresis lateral load-drift ratio
curves of SPSW1, SPSW2, and SPSW3 models are shown in Figs. 6.4(a), 6.4(b), and 6.4(c),
respectively, and the cumulative dissipated energy (CDE)-drift ratio curves of the three models
are shown in Fig. 6.4(d).
-7200
-3600
0
3600
7200
-0.065 -0.0325 0 0.0325 0.065
Drift ratio
Lo
ad
(k
N)
Numerical
Modified PFI
-15000
-7500
0
7500
15000
-0.065 -0.0325 0 0.0325 0.065
Drift ratio
Lo
ad
(k
N)
Numerical
Modified PFI
(a) Load vs. drift ratio (SPSW1) (b) Load vs. drift ratio (SPSW2)
-33000
-16500
0
16500
33000
-0.065 -0.0325 0 0.0325 0.065
Drift ratio
Lo
ad
(k
N)
Numerical
Modified PFI
0
3800
7600
11400
15200
19000
22800
26600
30400
34200
38000
0 1 2 3 4 5 6 7
Drift ratio (%)
CD
E (
kN
.m)
SPSW3
SPSW2
SPSW1
(c) Load vs. drift ratio (SPSW3) (d) CDE vs. drift ratio
Fig. 6.4 Cyclic behaviors of SPSW models

116
Results presented in Figs. 6.4(a) through 6.4(c) demonstrate that the code-designed SPSW
models dissipate the energy through stable hysteresis loops with relatively small pinching effect
due to improved buckling stability of the LYP steel infill plate with the limiting thickness. From
Fig. 6.4(d), it is apparent that larger hl ratio results in increased energy dissipation capacity,
and also application of LYP steel infill plates results in early yielding and energy dissipation of
the SPSW systems from the initial stages of the loading process.
Stiffness, strength, and energy dissipation capacity are three important characteristics of a
lateral force-resisting system which are directly related to the aspect ratio of a SPSW system.
The responses of the SPSW models with different aspect ratios are evaluated by considering non-
dimensional stiffness ( *K ), strength ( *P ), and energy dissipation capacity ( *E ) parameters, as
given in Eq. (6.2). Non-dimensional stiffness is defined as the ratio of SPSW initial stiffness
( iK ) to shear stiffness of infill plate. Non-dimensional strength, on the other hand, is defined as
the ratio of SPSW strength at 0.05 drift ratio ( 05.0=DRP ) to shear yield (buckling) capacity of infill
plate, while non-dimensional energy dissipation capacity is defined as the ratio of SPSW total
cumulative dissipated energy ( tCDE)( ) to energy dissipation capacity of infill plate up to shear
yielding (buckling) limit.
( )( ) p
i
thlE
vKK
⋅⋅+⋅
=12* ,
pyp
DR
lt
PP
⋅= =
τ05.0* ,
( )( )vV
ECDEE
pyp
t
+⋅⋅⋅
=12
*
τ (6.2)
In Eq. (6.2), pV is the volume of the infill plate. Fig. 6.5 shows the normalized responses of
the three SPSW models with different aspect ratios. From Fig. 6.5(a), it is found that in spite of
minor increasing/decreasing trends, variations of the non-dimensional stiffness are not
significant, and the normalized stiffness parameter possesses a relatively constant performance
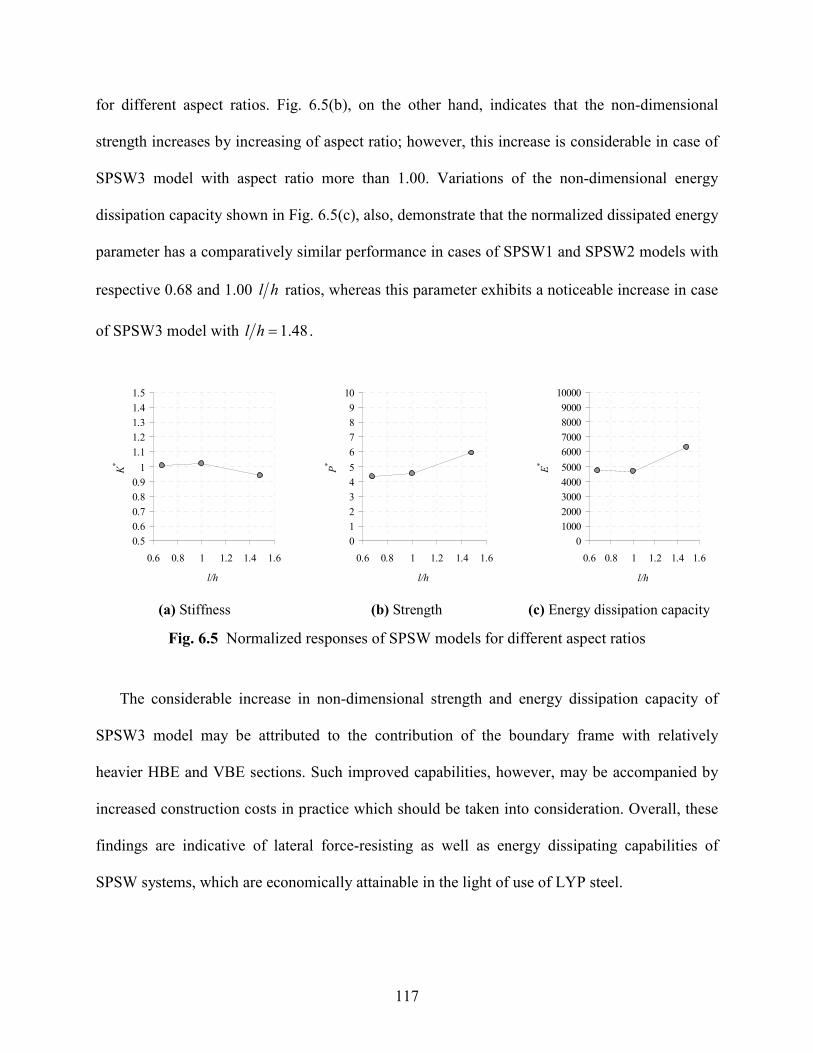
117
for different aspect ratios. Fig. 6.5(b), on the other hand, indicates that the non-dimensional
strength increases by increasing of aspect ratio; however, this increase is considerable in case of
SPSW3 model with aspect ratio more than 1.00. Variations of the non-dimensional energy
dissipation capacity shown in Fig. 6.5(c), also, demonstrate that the normalized dissipated energy
parameter has a comparatively similar performance in cases of SPSW1 and SPSW2 models with
respective 0.68 and 1.00 hl ratios, whereas this parameter exhibits a noticeable increase in case
of SPSW3 model with 48.1=hl .
0.5
0.6
0.7
0.8
0.9
1
1.1
1.2
1.3
1.4
1.5
0.6 0.8 1 1.2 1.4 1.6
l/h
K*
0
1
2
3
4
5
6
7
8
9
10
0.6 0.8 1 1.2 1.4 1.6
l/h
P*
0
1000
2000
3000
4000
5000
6000
7000
8000
9000
10000
0.6 0.8 1 1.2 1.4 1.6
l/h
E*
(a) Stiffness (b) Strength (c) Energy dissipation capacity
Fig. 6.5 Normalized responses of SPSW models for different aspect ratios
The considerable increase in non-dimensional strength and energy dissipation capacity of
SPSW3 model may be attributed to the contribution of the boundary frame with relatively
heavier HBE and VBE sections. Such improved capabilities, however, may be accompanied by
increased construction costs in practice which should be taken into consideration. Overall, these
findings are indicative of lateral force-resisting as well as energy dissipating capabilities of
SPSW systems, which are economically attainable in the light of use of LYP steel.

118
6.5 Design Considerations and Structural Performance
6.5.1 Diagonal Tension Field and Angle of Inclination
In SPSWs, lateral shears are carried by tension fields that develop in the infill plates stressing
in the direction α , defined as the inclination angle of the tension field and measured by the angle
between the direction of the tension field and the vertical direction.
As mentioned before, Thorburn et al. (1983) developed an analytical model, known as the
strip model, in which the infill plates were represented by a series of pin-ended, tension-only
strips oriented at angle α , and proposed an equation for estimating α . The inclination angle of
the tension field was obtained using the principle of least work and considering only the energy
of the tension field and axial energy in the beams and columns. Based on experimental
investigations, Timler and Kulak (1983) modified the angle of inclination of the tension field
proposed by Thorburn et al. (1983), and added the bending strain energy of the columns to the
energy calculation, and consequently came up with a revised equation for α , i.e. Eq. (3.6),
which was shown to yield reasonable predictions compared to the test results (Behbahanifard et
al., 2003). It is noted that this equation is based on the assumption that the infill plate has no
compression strength. Per AISC 341-10 (2010) provisions, the angle of inclination, α , is
permitted to be calculated using Eq. (3.6), or to be taken as 40°.
The inclination angles of the tension fields developed in LYP steel infill plates of the SPSW
models with relatively low yielding and high buckling capacities are determined in this study and
compared with predictions of Eq. (3.6). To achieve this, as shown in Fig. 6.6, the angles of
inclination of the principal tensile stresses in the infill plates are measured at 0.01, 0.03, and 0.05
drift ratios and the average values are provided in Table 6.4. Included in the table are also the
analytical predictions of Eq. (3.6). It should be noted that the angle of principal stresses is

119
representative of the formation of tension-field action, and principal stresses act at the angle of
inclination.
Fig. 6.6 Angle of inclination of the principal tensile stresses developed
in the infill plate of SPSW2 model at 0.03 drift ratio
Table 6.4 Numerically- and analytically-obtained values for the angle of inclination
Angle of Inclination (α ) Model
Finite Element Analysis Prediction of Eq. (3.6)
SPSW1 o45 o4.37
SPSW2 o44 o1.41
SPSW3 o46 o6.42
Despite the simplifying assumptions in the derivation of Eq. (3.6), e.g. elastic behavior of the
infill plate and the boundary members as well as simple beam-to-column connections, from
Table 6.4 the agreement between the finite element and analytical estimates of the orientation of
the tension field is fairly satisfactory. These results indicate that using a single value of 40° for
the angle of inclination, per AISC 341-10 (2010) provisions, throughout the design of LYP steel
shear walls with relatively low yielding and high buckling capacities will usually suffice. In
addition, the orientation of the principal tensile stresses developed in the LYP steel infill plates
as summarized in Table 6.4, confirms that for the purposes of analysis using the strip model,
120
these components with low yielding strength can be modeled as a series of pin-ended inclined
strips oriented at 45° relative to the vertical.
6.5.2 Performance of Reduced Beam Section (RBS) Connections
SPSWs designed in accordance with the AISC 341-10 (2010) provisions are expected to
provide significant inelastic deformation capacity primarily through infill plate yielding and as
plastic-hinge formation at the ends of HBEs. Hence, plastic hinging at the beam ends is needed
to develop the plastic collapse mechanism of the SPSW system.
RBS beam-to-column connections have been suggested to be used in SPSWs in order to
ensure that frame plastic hinging occurs at beam ends, and not within beam span or in columns.
The use of RBSs at the ends of the horizontal boundary members has been investigated by Vian
and Bruneau (2004) and Vian et al. (2009) as a means of reducing the overall system demand on
the vertical boundary members, and also has been recommended to control boundary frame
yielding during a significant earthquake.
On the other hand, one major problem with the RBS type of connection is the deterioration of
the load-carrying capacity owing to lateral and local buckling in beams. Reduction of the beam
flange section degrades the restraints against out-of-plane deformations (Moslehi Tabar and
Deylami, 2005). RBS connection web and flange local buckling as well as HBE out-of-plane
distortions were observed in the experiments conducted by Vian and Bruneau (2004) and Vian et
al. (2009).
In this study, the buckling stability as well as performance of RBS connections in developing
the plastic collapse mechanism of the SPSW models with LYP steel infill plates are evaluated. It
is noticeable that the frame members in SPSW models are designed to meet the AISC 341-10
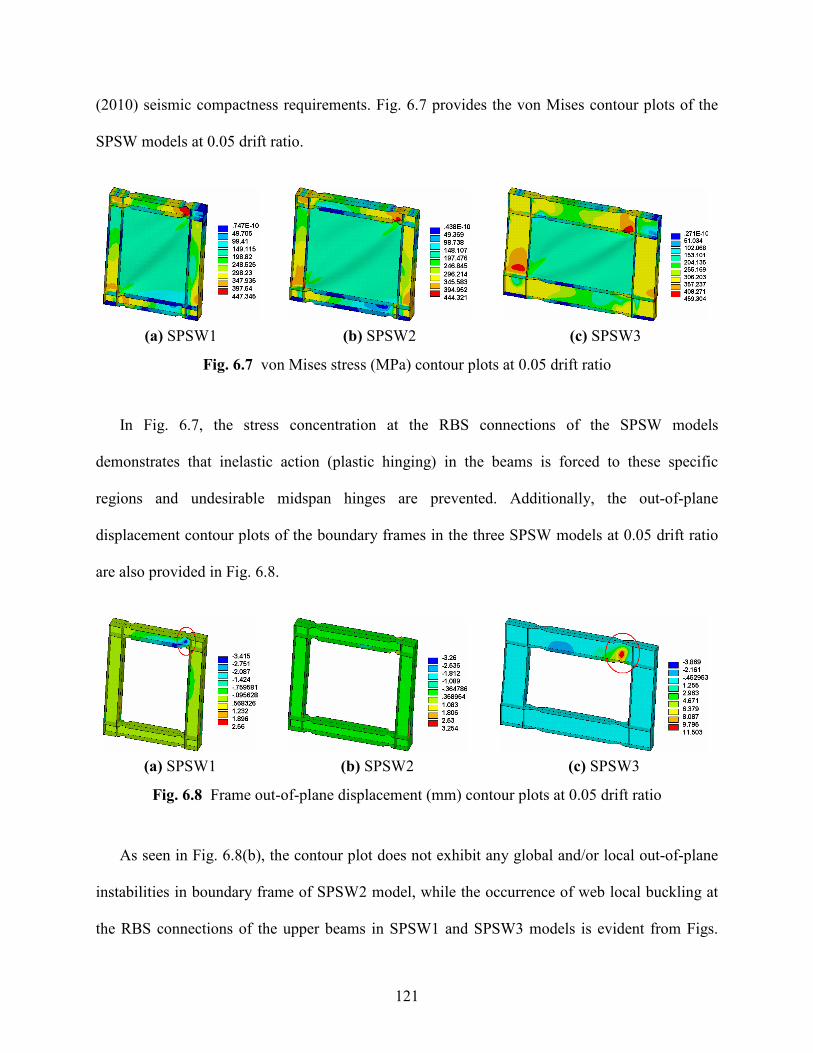
121
(2010) seismic compactness requirements. Fig. 6.7 provides the von Mises contour plots of the
SPSW models at 0.05 drift ratio.
(a) SPSW1 (b) SPSW2 (c) SPSW3
Fig. 6.7 von Mises stress (MPa) contour plots at 0.05 drift ratio
In Fig. 6.7, the stress concentration at the RBS connections of the SPSW models
demonstrates that inelastic action (plastic hinging) in the beams is forced to these specific
regions and undesirable midspan hinges are prevented. Additionally, the out-of-plane
displacement contour plots of the boundary frames in the three SPSW models at 0.05 drift ratio
are also provided in Fig. 6.8.
(a) SPSW1 (b) SPSW2 (c) SPSW3
Fig. 6.8 Frame out-of-plane displacement (mm) contour plots at 0.05 drift ratio
As seen in Fig. 6.8(b), the contour plot does not exhibit any global and/or local out-of-plane
instabilities in boundary frame of SPSW2 model, while the occurrence of web local buckling at
the RBS connections of the upper beams in SPSW1 and SPSW3 models is evident from Figs.
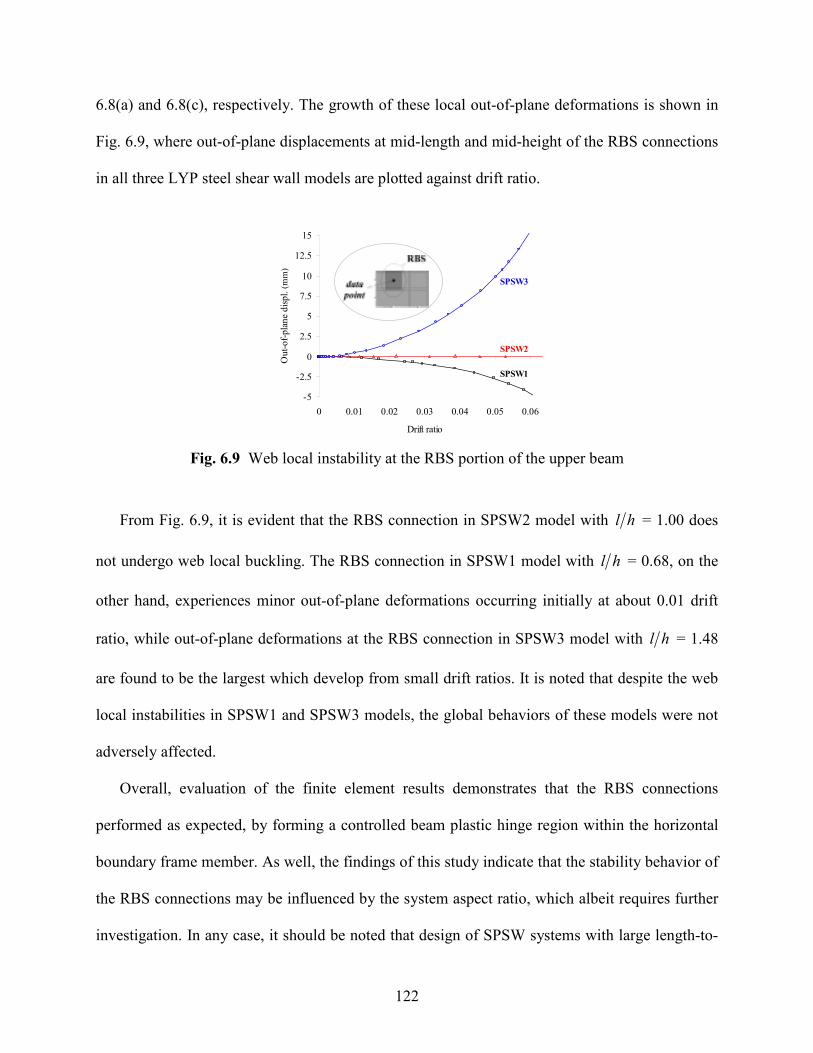
122
6.8(a) and 6.8(c), respectively. The growth of these local out-of-plane deformations is shown in
Fig. 6.9, where out-of-plane displacements at mid-length and mid-height of the RBS connections
in all three LYP steel shear wall models are plotted against drift ratio.
-5
-2.5
0
2.5
5
7.5
10
12.5
15
0 0.01 0.02 0.03 0.04 0.05 0.06
Drift ratio
Out-
of-
pla
ne
dis
pl.
(m
m)
SPSW1
SPSW2
SPSW3
Fig. 6.9 Web local instability at the RBS portion of the upper beam
From Fig. 6.9, it is evident that the RBS connection in SPSW2 model with hl = 1.00 does
not undergo web local buckling. The RBS connection in SPSW1 model with hl = 0.68, on the
other hand, experiences minor out-of-plane deformations occurring initially at about 0.01 drift
ratio, while out-of-plane deformations at the RBS connection in SPSW3 model with hl = 1.48
are found to be the largest which develop from small drift ratios. It is noted that despite the web
local instabilities in SPSW1 and SPSW3 models, the global behaviors of these models were not
adversely affected.
Overall, evaluation of the finite element results demonstrates that the RBS connections
performed as expected, by forming a controlled beam plastic hinge region within the horizontal
boundary frame member. As well, the findings of this study indicate that the stability behavior of
the RBS connections may be influenced by the system aspect ratio, which albeit requires further
investigation. In any case, it should be noted that design of SPSW systems with large length-to-
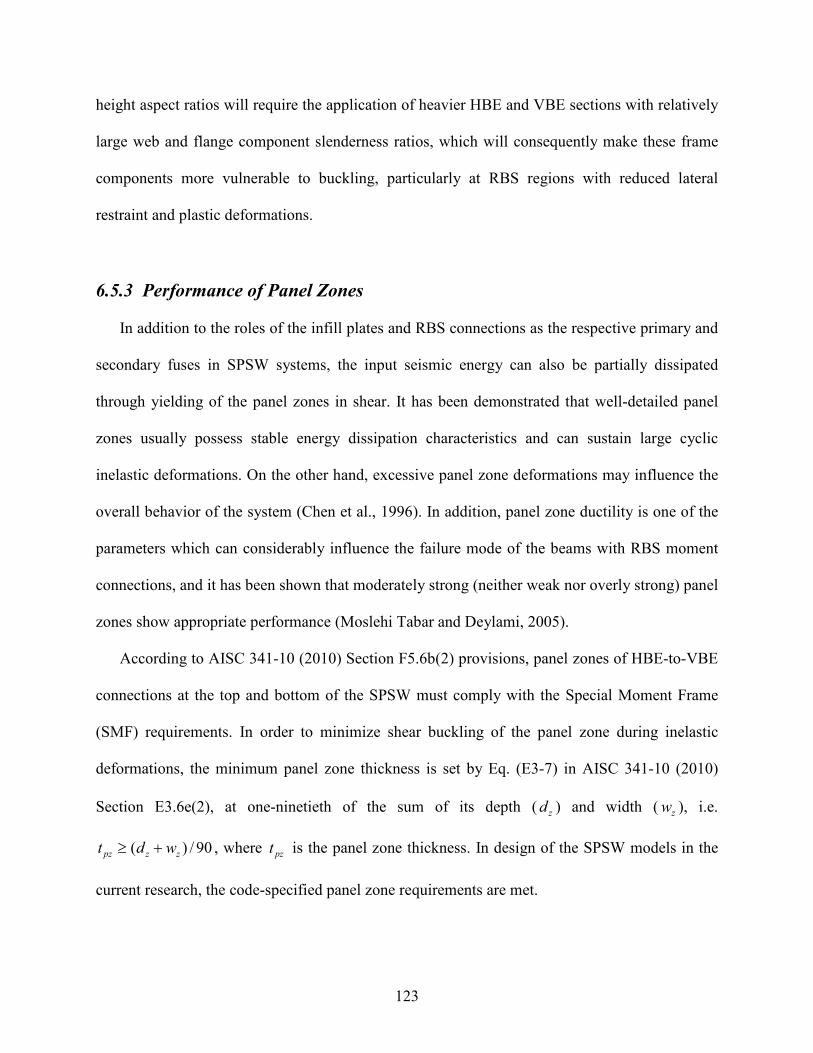
123
height aspect ratios will require the application of heavier HBE and VBE sections with relatively
large web and flange component slenderness ratios, which will consequently make these frame
components more vulnerable to buckling, particularly at RBS regions with reduced lateral
restraint and plastic deformations.
6.5.3 Performance of Panel Zones
In addition to the roles of the infill plates and RBS connections as the respective primary and
secondary fuses in SPSW systems, the input seismic energy can also be partially dissipated
through yielding of the panel zones in shear. It has been demonstrated that well-detailed panel
zones usually possess stable energy dissipation characteristics and can sustain large cyclic
inelastic deformations. On the other hand, excessive panel zone deformations may influence the
overall behavior of the system (Chen et al., 1996). In addition, panel zone ductility is one of the
parameters which can considerably influence the failure mode of the beams with RBS moment
connections, and it has been shown that moderately strong (neither weak nor overly strong) panel
zones show appropriate performance (Moslehi Tabar and Deylami, 2005).
According to AISC 341-10 (2010) Section F5.6b(2) provisions, panel zones of HBE-to-VBE
connections at the top and bottom of the SPSW must comply with the Special Moment Frame
(SMF) requirements. In order to minimize shear buckling of the panel zone during inelastic
deformations, the minimum panel zone thickness is set by Eq. (E3-7) in AISC 341-10 (2010)
Section E3.6e(2), at one-ninetieth of the sum of its depth ( zd ) and width ( zw ), i.e.
90/)( zzpz wdt +≥ , where pzt is the panel zone thickness. In design of the SPSW models in the
current research, the code-specified panel zone requirements are met.
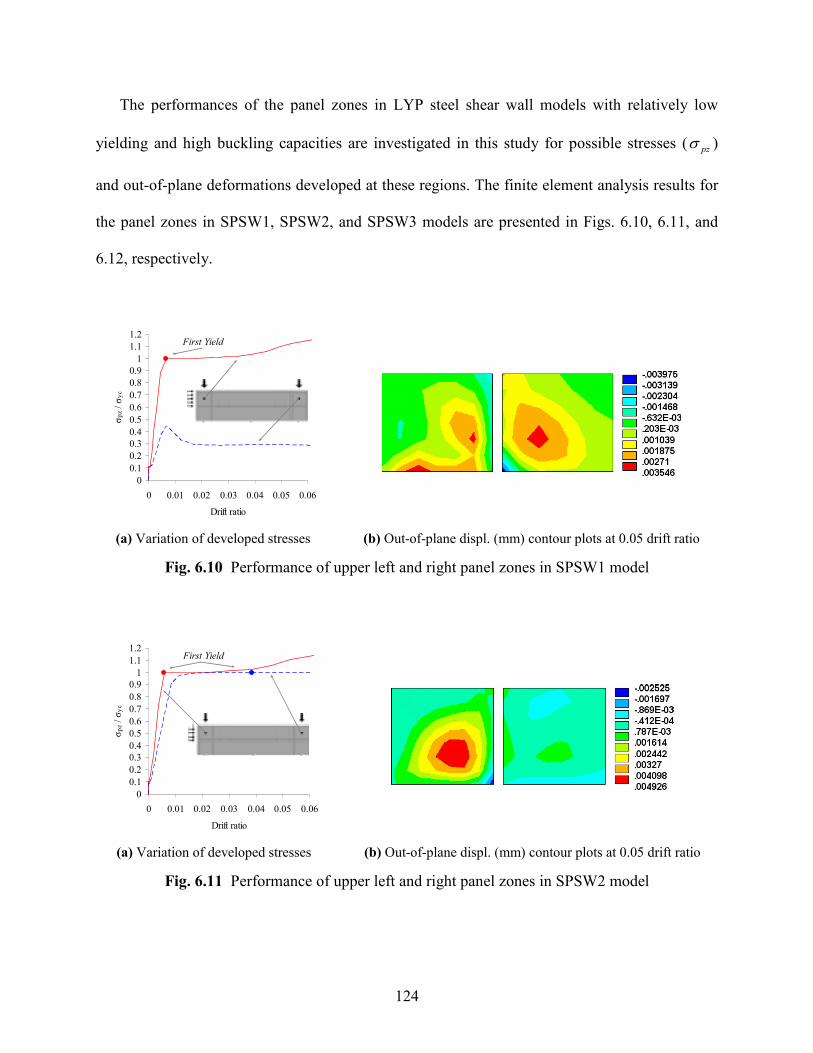
124
The performances of the panel zones in LYP steel shear wall models with relatively low
yielding and high buckling capacities are investigated in this study for possible stresses ( pzσ )
and out-of-plane deformations developed at these regions. The finite element analysis results for
the panel zones in SPSW1, SPSW2, and SPSW3 models are presented in Figs. 6.10, 6.11, and
6.12, respectively.
0
0.1
0.2
0.3
0.4
0.5
0.6
0.7
0.8
0.9
1
1.1
1.2
0 0.01 0.02 0.03 0.04 0.05 0.06
Drift ratio
σp
z /
σy
c
First Yield
(a) Variation of developed stresses (b) Out-of-plane displ. (mm) contour plots at 0.05 drift ratio
Fig. 6.10 Performance of upper left and right panel zones in SPSW1 model
0
0.1
0.2
0.3
0.4
0.5
0.6
0.7
0.8
0.9
1
1.1
1.2
0 0.01 0.02 0.03 0.04 0.05 0.06
Drift ratio
σp
z /
σy
c
First Yield
(a) Variation of developed stresses (b) Out-of-plane displ. (mm) contour plots at 0.05 drift ratio
Fig. 6.11 Performance of upper left and right panel zones in SPSW2 model
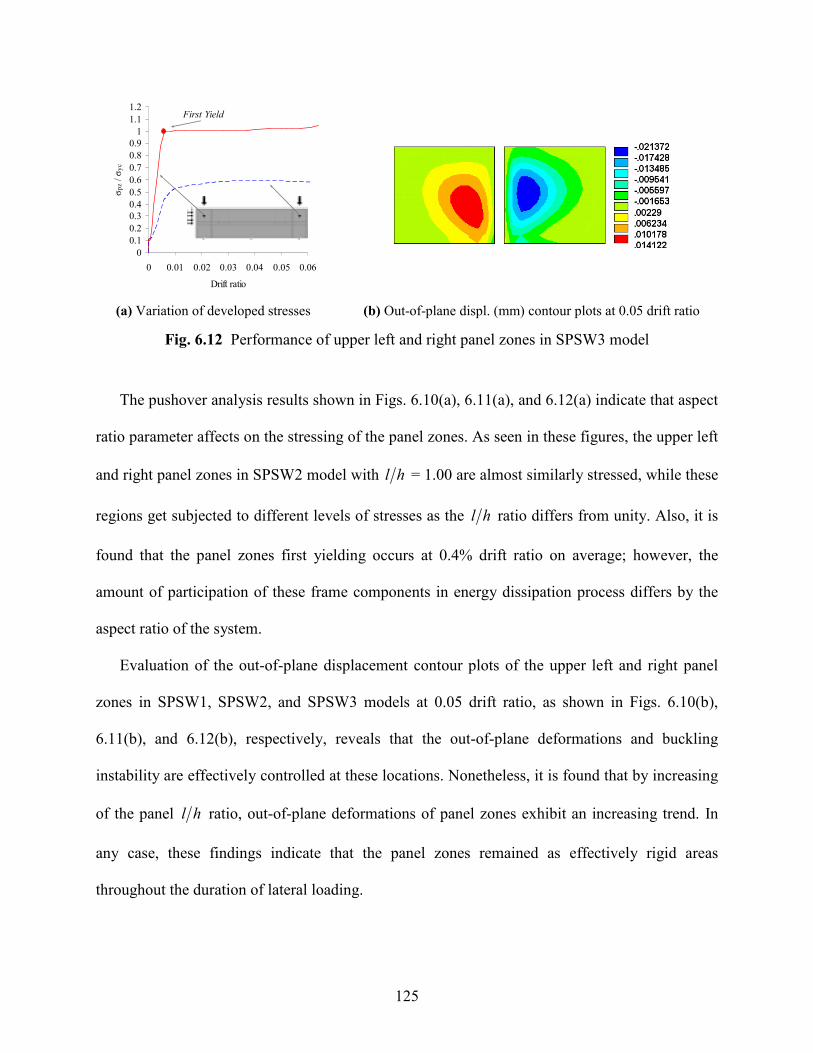
125
0
0.1
0.2
0.3
0.4
0.5
0.6
0.7
0.8
0.9
1
1.1
1.2
0 0.01 0.02 0.03 0.04 0.05 0.06
Drift ratio
σp
z / σ
yc
First Yield
(a) Variation of developed stresses (b) Out-of-plane displ. (mm) contour plots at 0.05 drift ratio
Fig. 6.12 Performance of upper left and right panel zones in SPSW3 model
The pushover analysis results shown in Figs. 6.10(a), 6.11(a), and 6.12(a) indicate that aspect
ratio parameter affects on the stressing of the panel zones. As seen in these figures, the upper left
and right panel zones in SPSW2 model with hl = 1.00 are almost similarly stressed, while these
regions get subjected to different levels of stresses as the hl ratio differs from unity. Also, it is
found that the panel zones first yielding occurs at 0.4% drift ratio on average; however, the
amount of participation of these frame components in energy dissipation process differs by the
aspect ratio of the system.
Evaluation of the out-of-plane displacement contour plots of the upper left and right panel
zones in SPSW1, SPSW2, and SPSW3 models at 0.05 drift ratio, as shown in Figs. 6.10(b),
6.11(b), and 6.12(b), respectively, reveals that the out-of-plane deformations and buckling
instability are effectively controlled at these locations. Nonetheless, it is found that by increasing
of the panel hl ratio, out-of-plane deformations of panel zones exhibit an increasing trend. In
any case, these findings indicate that the panel zones remained as effectively rigid areas
throughout the duration of lateral loading.

126
Based on the findings of this study, it may be concluded that the panel zones fully compliant
with the AISC 341-10 (2010) design requirements perform stably and desirably by yielding and
participating in the energy dissipation process of the LYP steel shear wall models. However,
aspect ratio parameter seems to be somewhat effective on the performance of these frame
components.
6.5.4 Lateral Bracing of Frame Members
Providing stability of SPSW boundary elements is necessary for proper performance and
ductile behavior of the system. Hence, stability bracing shall be provided in order to restrain
lateral buckling of structural steel beams subject to flexure with specified levels of ductility
demand. Per AISC 341-10 (2010) Section F5.4c, HBE shall be braced to satisfy the requirements
for moderately ductile members in Section D1.2a. It is noted that in AISC 341-10 (2010),
members of the seismic force resisting system that are anticipated to undergo inelastic
deformation have been classified as either moderately ductile or highly ductile members. During
the design earthquake, moderately ductile members are anticipated to undergo moderate plastic
rotation of 0.02 rad. or less, whereas highly ductile members are anticipated to undergo
significant plastic rotation of more than 0.02 rad..
According to AISC 341-05 (2005) provisions, HBEs were required to be laterally braced at a
spacing not to exceed yyEr σ/086.0 in which yr is the radius of gyration about y-axis and yσ is
the specified minimum yield stress of the steel material, while per AISC 341-10 (2010) bracing
requirements of moderately ductile members, beam bracing shall have a maximum spacing of
yy Er σ/17.0 . It is noted that in AISC 341-10 (2010), maximum spacing of yyEr σ/086.0 is only
specified for highly ductile beam members.
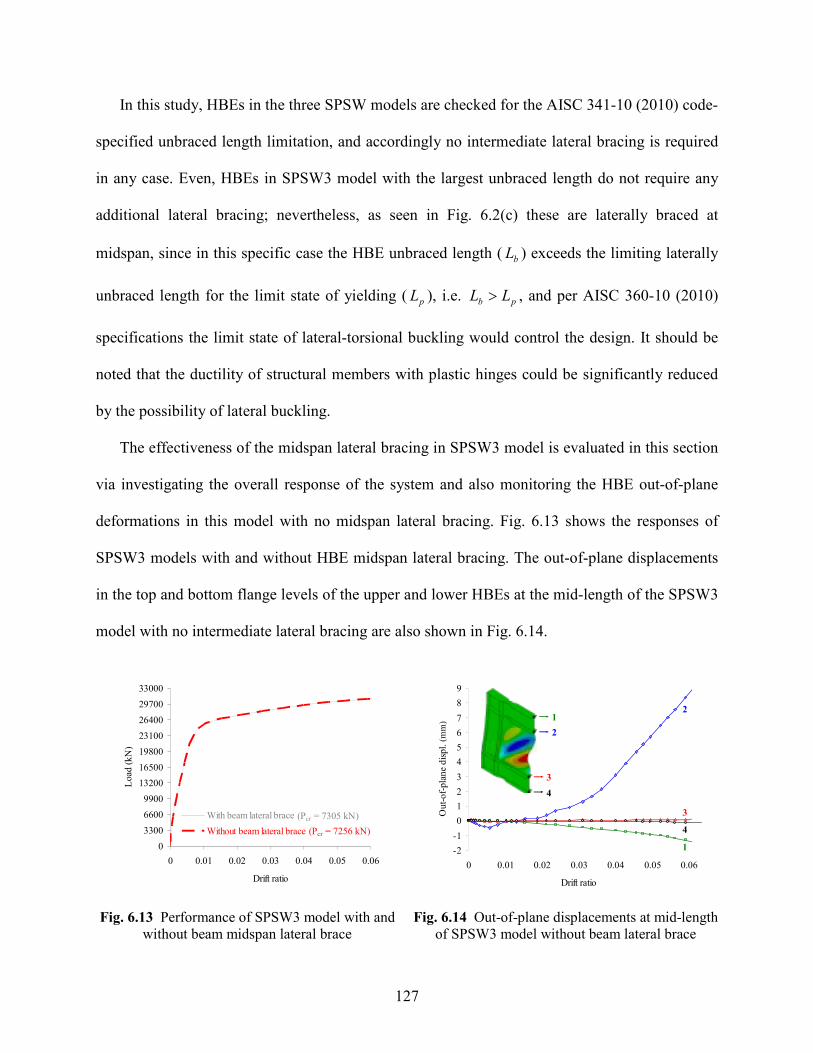
127
In this study, HBEs in the three SPSW models are checked for the AISC 341-10 (2010) code-
specified unbraced length limitation, and accordingly no intermediate lateral bracing is required
in any case. Even, HBEs in SPSW3 model with the largest unbraced length do not require any
additional lateral bracing; nevertheless, as seen in Fig. 6.2(c) these are laterally braced at
midspan, since in this specific case the HBE unbraced length ( bL ) exceeds the limiting laterally
unbraced length for the limit state of yielding ( pL ), i.e. pb LL > , and per AISC 360-10 (2010)
specifications the limit state of lateral-torsional buckling would control the design. It should be
noted that the ductility of structural members with plastic hinges could be significantly reduced
by the possibility of lateral buckling.
The effectiveness of the midspan lateral bracing in SPSW3 model is evaluated in this section
via investigating the overall response of the system and also monitoring the HBE out-of-plane
deformations in this model with no midspan lateral bracing. Fig. 6.13 shows the responses of
SPSW3 models with and without HBE midspan lateral bracing. The out-of-plane displacements
in the top and bottom flange levels of the upper and lower HBEs at the mid-length of the SPSW3
model with no intermediate lateral bracing are also shown in Fig. 6.14.
0
3300
6600
9900
13200
16500
19800
23100
26400
29700
33000
0 0.01 0.02 0.03 0.04 0.05 0.06
Drift ratio
Load
(k
N)
With beam lateral brace
Without beam lateral brace
(Pcr = 7305 kN)
(Pcr = 7256 kN)
-2
-1
0
1
2
3
4
5
6
7
8
9
0 0.01 0.02 0.03 0.04 0.05 0.06
Drift ratio
Out-
of-
pla
ne
dis
pl.
(m
m)
2
3
4
1
1
2
3
4
Fig. 6.13 Performance of SPSW3 model with and
without beam midspan lateral brace
Fig. 6.14 Out-of-plane displacements at mid-length
of SPSW3 model without beam lateral brace
128
As it is observed in Fig. 6.13, HBE midspan lateral bracing has little effect on the elastic
buckling capacity of the system and consideration of the restraint increases the buckling load by
only 0.7%. Moreover, Fig. 6.13 shows that the overall responses of the two systems with and
without HBE midspan lateral bracing are quite similar. On the other hand, Fig. 6.14 demonstrates
the partial effectiveness of the midspan lateral braces in controlling the HBE out-of-plane
deformations. Developed displacements at points 1 and 2 in Fig. 6.14 are indicative of out-of-
plane deformation of the upper HBE in SPSW3 model with no intermediate lateral bracing,
while the out-of-plane displacements at points 3 and 4 located on the lower beam are pretty
small. Specifically, the rate of increase of the out-of-plane displacement at point 2 located in the
bottom flange level of the upper HBE rises at about 0.03 drift ratio, and this frame member
undergoes larger out-of-plane deformations.
In all, the findings of this study demonstrate the effectiveness of the intermediate lateral
bracing in controlling the out-of-plane deformations of the upper horizontal boundary frame
member in SPSW3 model. It is important to note that various and inevitable construction defects
and imperfections in practice can result in accentuated out-of-plane deformations of the frame
members, which may consequently result in undesirable and weak performance of SPSW
systems. Hence, more research is required to evaluate the effectiveness of the respective codified
requirements and also address the potential challenges in design of SPSW systems.
6.6 Prediction of SPSW Behavior Using Modified PFI Method
In this section, the structural responses of the code-designed and real-size LYP steel shear
wall models under gravity and lateral loads with different aspect ratios and concurrent
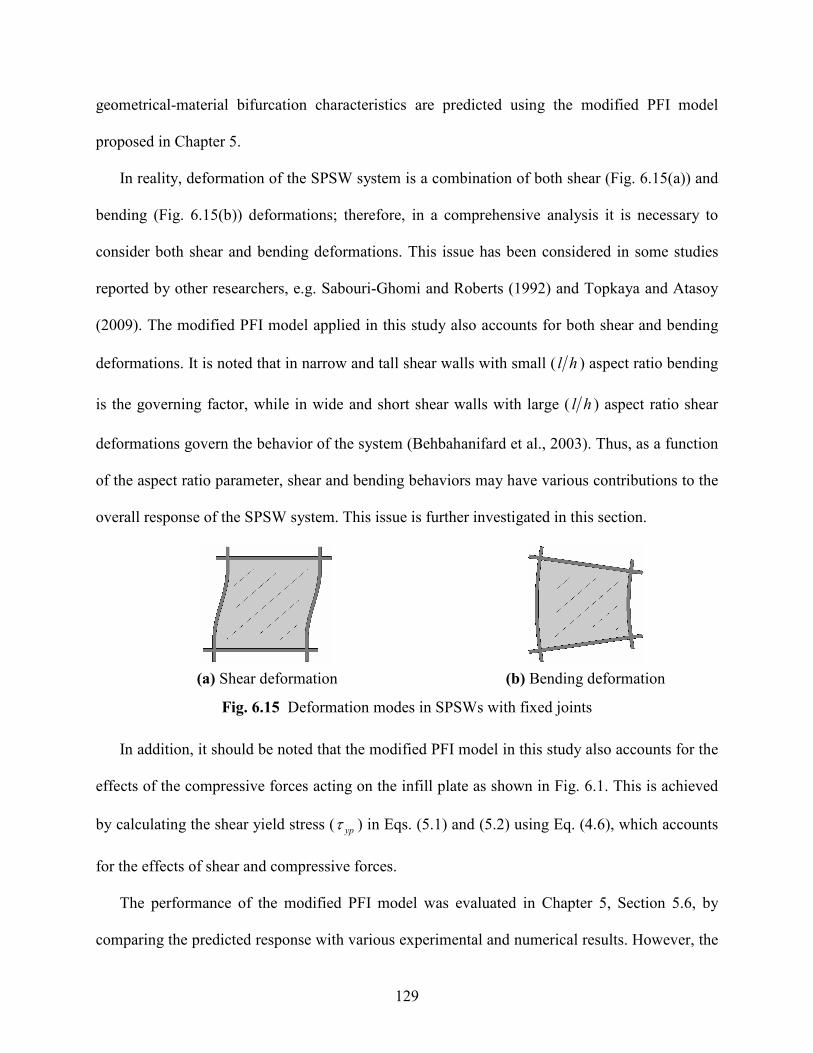
129
geometrical-material bifurcation characteristics are predicted using the modified PFI model
proposed in Chapter 5.
In reality, deformation of the SPSW system is a combination of both shear (Fig. 6.15(a)) and
bending (Fig. 6.15(b)) deformations; therefore, in a comprehensive analysis it is necessary to
consider both shear and bending deformations. This issue has been considered in some studies
reported by other researchers, e.g. Sabouri-Ghomi and Roberts (1992) and Topkaya and Atasoy
(2009). The modified PFI model applied in this study also accounts for both shear and bending
deformations. It is noted that in narrow and tall shear walls with small ( hl ) aspect ratio bending
is the governing factor, while in wide and short shear walls with large ( hl ) aspect ratio shear
deformations govern the behavior of the system (Behbahanifard et al., 2003). Thus, as a function
of the aspect ratio parameter, shear and bending behaviors may have various contributions to the
overall response of the SPSW system. This issue is further investigated in this section.
(a) Shear deformation (b) Bending deformation
Fig. 6.15 Deformation modes in SPSWs with fixed joints
In addition, it should be noted that the modified PFI model in this study also accounts for the
effects of the compressive forces acting on the infill plate as shown in Fig. 6.1. This is achieved
by calculating the shear yield stress ( ypτ ) in Eqs. (5.1) and (5.2) using Eq. (4.6), which accounts
for the effects of shear and compressive forces.
The performance of the modified PFI model was evaluated in Chapter 5, Section 5.6, by
comparing the predicted response with various experimental and numerical results. However, the

130
SPSWs considered in the previous study were only subjected to lateral load and the effects of
compressive (gravity and/or vertical) forces were not taken into account. In this study, the
behaviors of further sophisticated and code-designed LYP steel shear wall models under the
action of lateral (horizontal) and gravity (vertical) loads are predicted by the modified PFI
model, and the comparison results are shown in Figs. 6.4 and 6.16.
As it is shown in Figs. 6.4(a) through 6.4(c), the analytical model has successfully captured
the overall responses of the three SPSW models with different aspect ratios and accordingly
disparate shear and bending behaviors. Detailed comparisons are made based on the analytical
and numerical results provided in Fig. 6.16.
0
1440
2880
4320
5760
7200
0 0.01 0.02 0.03 0.04 0.05 0.06
Drift ratio
Lo
ad
(k
N)
P.Y.
B.Y.
C.Y.
Plate
Frame
Panel
0
3000
6000
9000
12000
15000
0 0.01 0.02 0.03 0.04 0.05 0.06
Drift ratio
Lo
ad
(k
N)
P.Y.
B.Y.
C.Y.
Plate
Frame
Panel
(a) SPSW1 (b) SPSW2
0
6600
13200
19800
26400
33000
0 0.01 0.02 0.03 0.04 0.05 0.06
Drift ratio
Lo
ad
(k
N)
P.Y.
B.Y. & C.Y.
Plate
Frame
Panel
(c) SPSW3
Fig. 6.16 Comparison of the modified PFI model predictions with numerical results of full-scale
and code-designed SPSW models with various aspect ratios and under gravity and lateral loads
131
Comparison results indicate that the initial stiffness of the SPSW model is satisfactorily
predicted by the analytical method in all cases. Predictions of the infill plate first yield point, on
the other hand, show various degrees of accuracy as the aspect ratio parameter changes and
results in various shear and bending behaviors and contributions to the overall response of the
system. The column yielding point is fairly satisfactorily predicted in case of SPSW2 model with
hl = 1.0, while change of aspect ratio results in some discrepancy between the analytical and
numerical predictions. It is noted that geometrical and material nonlinearities as well as strain
hardening are not considered in the analytical model. However, despite some scatter in results,
agreement between the analytical predictions of the ultimate strength and numerical results up to
0.06 drift ratio is by and large satisfactory.
A significant advantage of the PFI method is that many design parameters, such as SPSW
initial stiffness, performance and interaction of the plate and frame components and their
contribution to the overall system capacity can be evaluated. This can consequently provide the
designer with great flexibility for the efficient design of the SPSW systems. The results of this
study demonstrate that the behaviors and responses of the LYP steel shear walls with desirable
lateral force-resisting and energy dissipating capabilities can be effectively predicted and
characterized using the modified PFI model. Lastly, consideration of further results from
experimental and numerical studies addressing the effects of the system aspect ratio and
interaction of the shear and bending behaviors can improve the performance and accuracy of this
method.
6.7 Concluding Remarks
In this chapter, the seismic design and behaviors of SPSWs with unstiffened LYP steel infill
plates under the action of gravity and lateral loads were evaluated through detailed numerical
132
simulations. Three real-size LYP steel shear walls with different aspect ratios and concurrent
geometrical-material bifurcation characteristics were designed per AISC 341 seismic provisions
for high-seismic applications, and their behaviors were studied through nonlinear pushover and
cyclic analyses and predicted using the modified PFI method. Effects of both shear and
compressive forces acting on the web plate were taken into consideration in design of SPSWs,
and the effectiveness of some code-specified design requirements was also evaluated in this
study.
It was shown that use of LYP steel facilitates the design of SPSWs and results in a desirable
plate and frame yielding sequence by ensuring the early yielding of the infill plate compared to
those of HBE and VBE components. The variations in the initial stiffness, strength, and energy
absorption capacity of SPSWs due to the changes in the panel aspect ratio were also investigated.
The results of this study showed that as the aspect ratio gets larger than unity, relatively heavier
HBE and VBE sections are needed to meet the design requirements, which in turn contribute to
the considerable increase in strength and energy dissipation capacity of the system.
It was found that consideration of 40° inclination angle in design and 45° orientation in strip
modeling of LYP steel plate shear walls with different aspect ratios will usually suffice in
analysis and design of such systems. Application of RBS beam-to-column connections resulted
in development of a desirable plastic collapse mechanism in LYP steel plate shear walls;
however, findings of this study indicate that buckling stability of RBS connections may be
influenced by the system aspect ratio, which requires further investigation. Panel zones of HBE-
to-VBE connections fully compliant with the AISC 341 seismic design requirements were also
found to perform stably in all three SPSWs; nonetheless, aspect ratio parameter seems to be
effective on the behavior of these regions. Evaluation of influence of the HBE intermediate

133
lateral bracing in SPSW3 model with the largest length-to-height ratio revealed that application
of lateral bracing resulted in effective controlling of the out-of-plane deformations of the upper
HBE component in this model, while such additional lateral bracing was not required in
accordance with the AISC 341-10 (2010) seismic provisions.
The modified PFI model which accounted for the effects of both shear and compressive
forces as well as shear and bending deformations, was also demonstrated to satisfactorily predict
and characterize the behaviors of the LYP steel plate shear walls with different aspect ratios.
This simplified analytical model can be effectively used in analysis and design of SPSWs with
relatively low yielding and high buckling capacities. Nevertheless, further experimental and
numerical studies can improve the performance and accuracy of this method.
Desirable behavior and performance of SPSWs are primarily provided by proper design of
such structures and also use of LYP steel infill plates as the primary lateral force-resisting and
energy dissipating components in such systems. The AISC 341 seismic provisions based on a
capacity-based design methodology ensure that these systems have adequate ductility and
seismic performance. However, more research is still required to address some potential design
challenges and aspects such as the effectiveness of the code-specified frame stiffness criteria,
effects of panel aspect ratio, and lateral bracing of the boundary frame members, which may
eventually lead to the refinement of some codified design requirements.

134
7. STUDY ON SEISMIC RETROFIT OF STRUCTURES
USING SPSW SYSTEMS AND LYP STEEL MATERIAL
7.1 Introduction
There are many seismically vulnerable existing buildings which are not designed in
accordance with the modern seismic codes, and hence are susceptible to exhibit weak
performance and undergo failure when subjected to earthquake excitations. The lateral force-
resisting systems of such buildings are typically retrofitted using steel braces, steel plates, and
reinforced concrete shear walls for improved structural and seismic performance.
Some retrofitting systems are becoming more favorable based on their performance,
construction and implementation costs, ease of implementation, availability of material, and
minimum disruption to the function as well as occupants of the building. On this basis, the use of
bulky retrofitting systems, e.g. reinforced concrete shear walls, becomes more limited due to the
complications in erection and high costs for foundation, while the application of lighter
retrofitting systems such as steel braces and shear walls has become relatively more favorable
(Dung, 2011).
In addition to new construction, SPSW systems have been increasingly used in the seismic
retrofit of existing building structures due to the various advantages they offer compared to other
lateral force-resisting systems. Mahtab and Zahedi (2008) have demonstrated the relative
superiority of steel shear walls to steel cross braces in retrofitting of a 10-story structure.
Moreover, Park et al.’s (2007) test results have shown that unlike conventional reinforced
concrete walls and braced frames, well-designed steel plate walls exhibit high strength and large
ductility as well as energy dissipation capacity. In addition, due to the exceptional hysteretic
135
behavior and the capability to early undergo plastic deformations, low yield metal shear panels
have also been conceived as hysteretic dampers which could be profitably used as new
methodology for the seismic retrofitting of existing steel and concrete structures (Mistakidis et
al., 2007).
In addition to the reported studies on the subject of seismic retrofit of structures using SPSW
systems especially with LYP steel infill plates, nonlinear and inelastic dynamic response of
SPSW systems has also been investigated by some researchers. For instance, Rezai (1999)
reported experimental and analytical studies on the behavior of SPSWs under cyclic and
dynamic loadings. In addition, Bhowmick et al. (2009a and 2009b), Kurban and Topkaya (2009a
and 2009b), and Berman (2011) studied the dynamic response and characteristics of SPSW
systems through nonlinear time-history analyses and provided interesting and effective results.
However, a search of the literature reveals that apart from the aforementioned studies and also
some additional scattered investigations, the dynamic response and seismic retrofit of structures
using SPSW systems and LYP steel material have not been studied systematically and
adequately, and most of the reported studies have emerged in the recent years.
Considering the importance of assessment of dynamic response as well as seismic retrofit of
structures using SPSW systems and LYP steel material, system-level investigations are made via
nonlinear time-history analysis of multi-story structures subjected to earthquake ground motions
and the results and findings of this study are presented and discussed in this chapter.
7.2 Design and Properties of Structural Systems
In order to investigate the seismic retrofit and behavior of structures employing SPSW
systems and LYP steel material, a modified version of the 9-story SAC building (FEMA 355C,
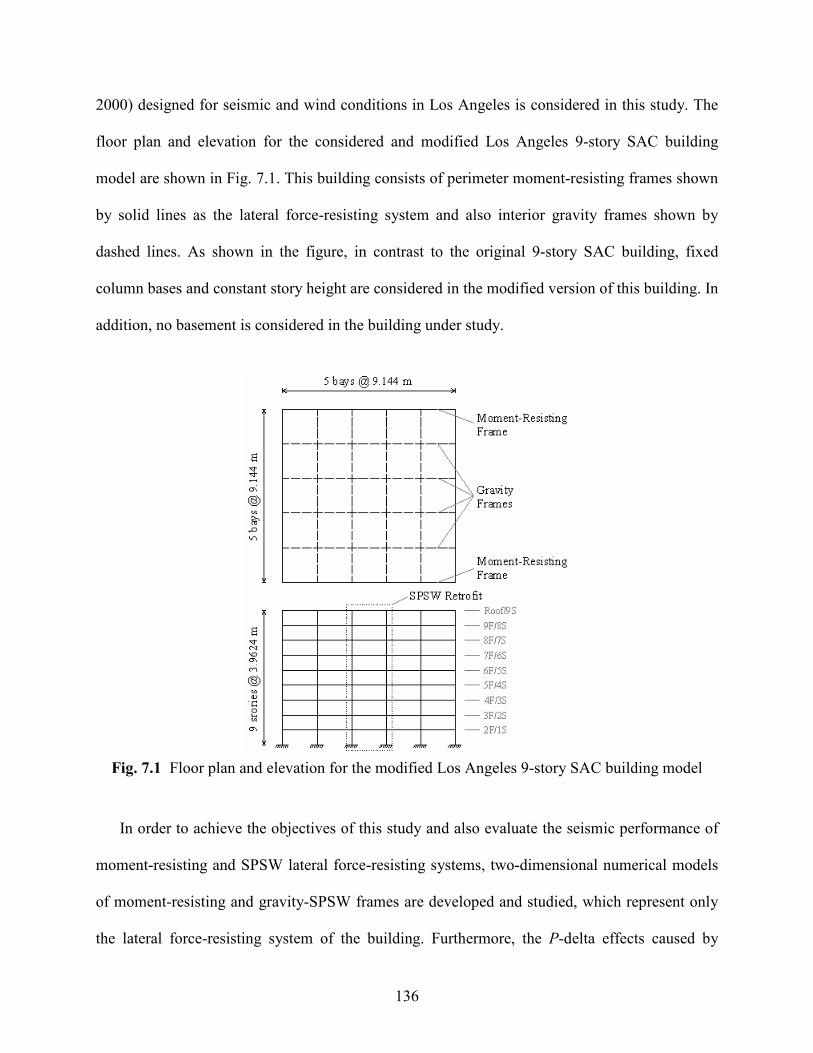
136
2000) designed for seismic and wind conditions in Los Angeles is considered in this study. The
floor plan and elevation for the considered and modified Los Angeles 9-story SAC building
model are shown in Fig. 7.1. This building consists of perimeter moment-resisting frames shown
by solid lines as the lateral force-resisting system and also interior gravity frames shown by
dashed lines. As shown in the figure, in contrast to the original 9-story SAC building, fixed
column bases and constant story height are considered in the modified version of this building. In
addition, no basement is considered in the building under study.
Fig. 7.1 Floor plan and elevation for the modified Los Angeles 9-story SAC building model
In order to achieve the objectives of this study and also evaluate the seismic performance of
moment-resisting and SPSW lateral force-resisting systems, two-dimensional numerical models
of moment-resisting and gravity-SPSW frames are developed and studied, which represent only
the lateral force-resisting system of the building. Furthermore, the P-delta effects caused by
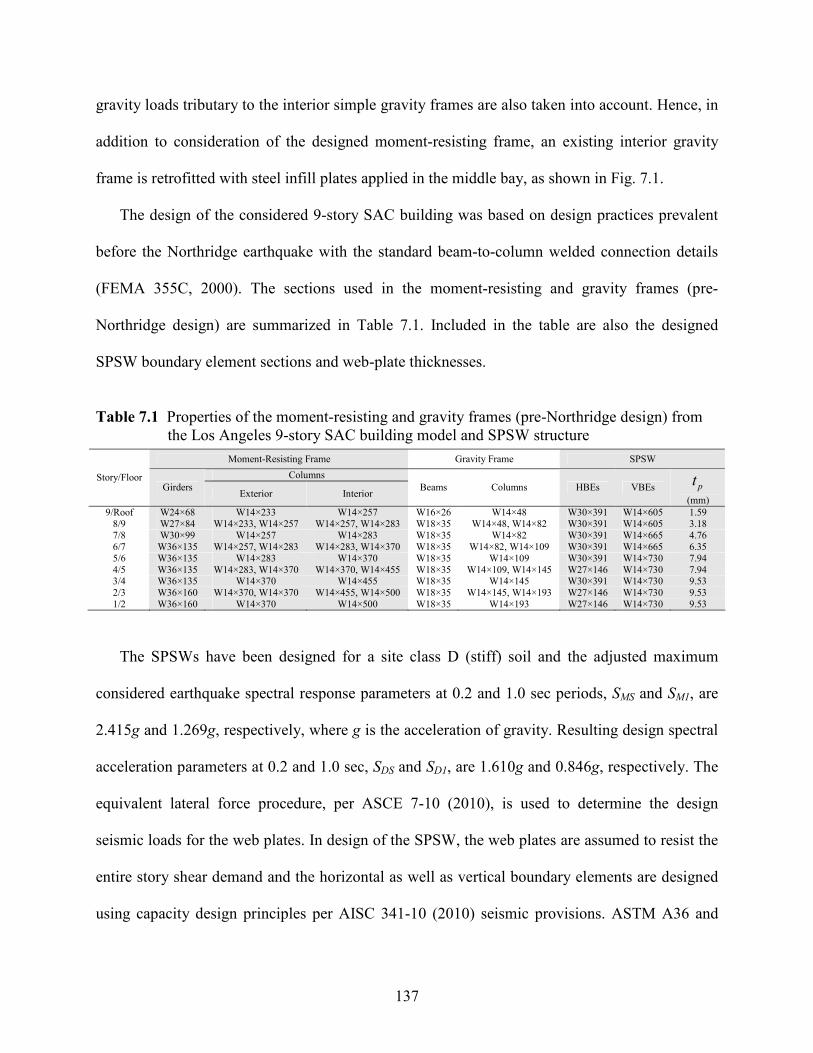
137
gravity loads tributary to the interior simple gravity frames are also taken into account. Hence, in
addition to consideration of the designed moment-resisting frame, an existing interior gravity
frame is retrofitted with steel infill plates applied in the middle bay, as shown in Fig. 7.1.
The design of the considered 9-story SAC building was based on design practices prevalent
before the Northridge earthquake with the standard beam-to-column welded connection details
(FEMA 355C, 2000). The sections used in the moment-resisting and gravity frames (pre-
Northridge design) are summarized in Table 7.1. Included in the table are also the designed
SPSW boundary element sections and web-plate thicknesses.
Table 7.1 Properties of the moment-resisting and gravity frames (pre-Northridge design) from
the Los Angeles 9-story SAC building model and SPSW structure
Moment-Resisting Frame Gravity Frame SPSW
Columns Story/Floor Girders
Exterior Interior Beams Columns HBEs VBEs pt
(mm)
9/Roof W24×68 W14×233 W14×257 W16×26 W14×48 W30×391 W14×605 1.59
8/9 W27×84 W14×233, W14×257 W14×257, W14×283 W18×35 W14×48, W14×82 W30×391 W14×605 3.18
7/8 W30×99 W14×257 W14×283 W18×35 W14×82 W30×391 W14×665 4.76
6/7 W36×135 W14×257, W14×283 W14×283, W14×370 W18×35 W14×82, W14×109 W30×391 W14×665 6.35
5/6 W36×135 W14×283 W14×370 W18×35 W14×109 W30×391 W14×730 7.94
4/5 W36×135 W14×283, W14×370 W14×370, W14×455 W18×35 W14×109, W14×145 W27×146 W14×730 7.94 3/4 W36×135 W14×370 W14×455 W18×35 W14×145 W30×391 W14×730 9.53
2/3 W36×160 W14×370, W14×370 W14×455, W14×500 W18×35 W14×145, W14×193 W27×146 W14×730 9.53
1/2 W36×160 W14×370 W14×500 W18×35 W14×193 W27×146 W14×730 9.53
The SPSWs have been designed for a site class D (stiff) soil and the adjusted maximum
considered earthquake spectral response parameters at 0.2 and 1.0 sec periods, SMS and SM1, are
2.415g and 1.269g, respectively, where g is the acceleration of gravity. Resulting design spectral
acceleration parameters at 0.2 and 1.0 sec, SDS and SD1, are 1.610g and 0.846g, respectively. The
equivalent lateral force procedure, per ASCE 7-10 (2010), is used to determine the design
seismic loads for the web plates. In design of the SPSW, the web plates are assumed to resist the
entire story shear demand and the horizontal as well as vertical boundary elements are designed
using capacity design principles per AISC 341-10 (2010) seismic provisions. ASTM A36 and
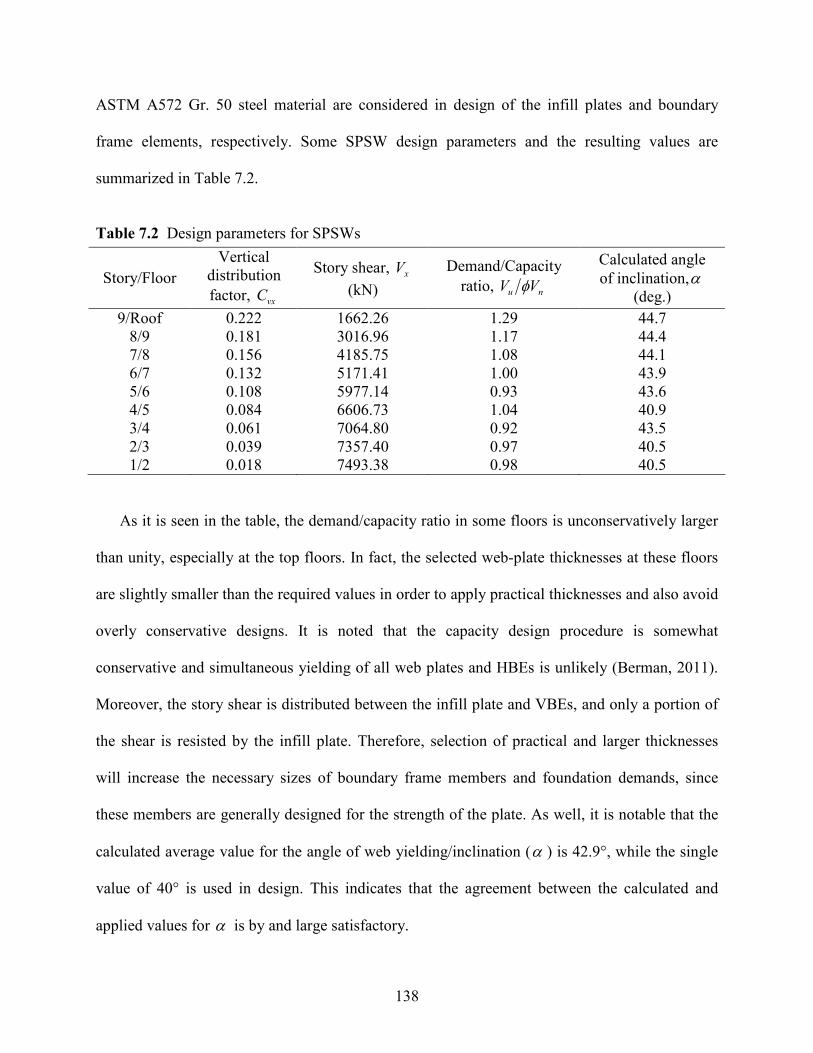
138
ASTM A572 Gr. 50 steel material are considered in design of the infill plates and boundary
frame elements, respectively. Some SPSW design parameters and the resulting values are
summarized in Table 7.2.
Table 7.2 Design parameters for SPSWs
Story/Floor
Vertical
distribution
factor, vxC
Story shear, xV
(kN)
Demand/Capacity
ratio, nu VV φ
Calculated angle
of inclination,α
(deg.)
9/Roof 0.222 1662.26 1.29 44.7
8/9 0.181 3016.96 1.17 44.4
7/8 0.156 4185.75 1.08 44.1
6/7 0.132 5171.41 1.00 43.9
5/6 0.108 5977.14 0.93 43.6
4/5 0.084 6606.73 1.04 40.9
3/4 0.061 7064.80 0.92 43.5
2/3 0.039 7357.40 0.97 40.5
1/2 0.018 7493.38 0.98 40.5
As it is seen in the table, the demand/capacity ratio in some floors is unconservatively larger
than unity, especially at the top floors. In fact, the selected web-plate thicknesses at these floors
are slightly smaller than the required values in order to apply practical thicknesses and also avoid
overly conservative designs. It is noted that the capacity design procedure is somewhat
conservative and simultaneous yielding of all web plates and HBEs is unlikely (Berman, 2011).
Moreover, the story shear is distributed between the infill plate and VBEs, and only a portion of
the shear is resisted by the infill plate. Therefore, selection of practical and larger thicknesses
will increase the necessary sizes of boundary frame members and foundation demands, since
these members are generally designed for the strength of the plate. As well, it is notable that the
calculated average value for the angle of web yielding/inclination (α ) is 42.9°, while the single
value of 40° is used in design. This indicates that the agreement between the calculated and
applied values for α is by and large satisfactory.
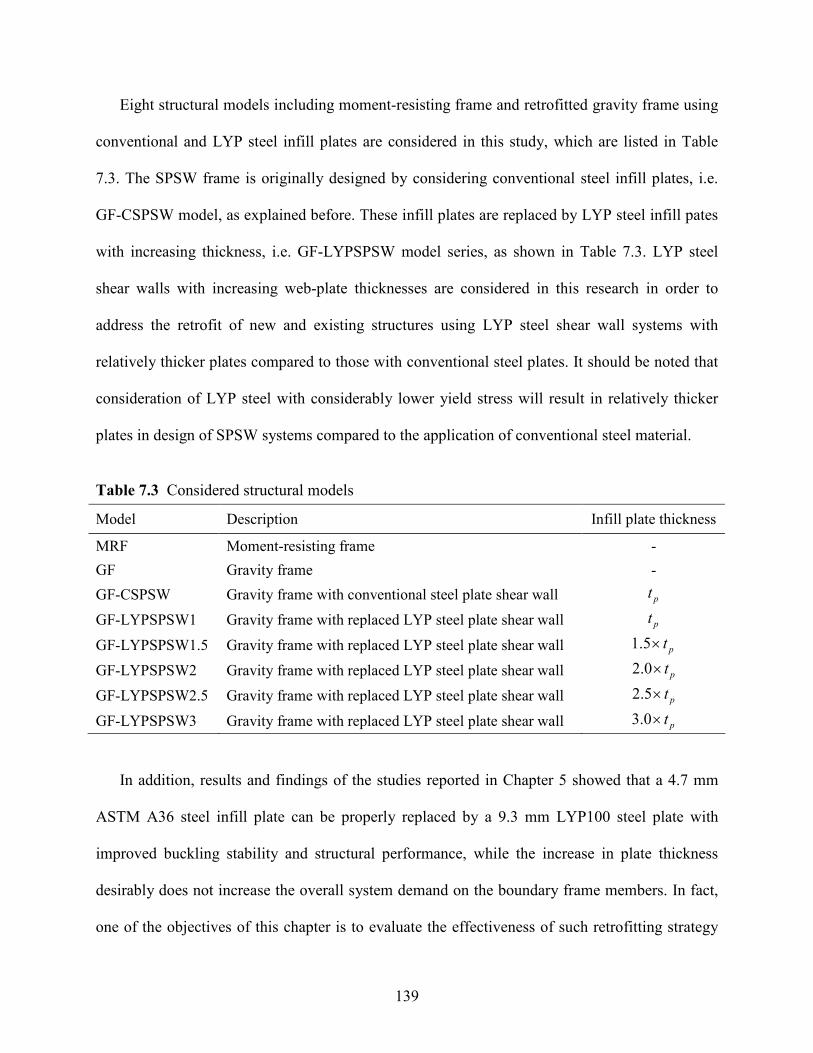
139
Eight structural models including moment-resisting frame and retrofitted gravity frame using
conventional and LYP steel infill plates are considered in this study, which are listed in Table
7.3. The SPSW frame is originally designed by considering conventional steel infill plates, i.e.
GF-CSPSW model, as explained before. These infill plates are replaced by LYP steel infill pates
with increasing thickness, i.e. GF-LYPSPSW model series, as shown in Table 7.3. LYP steel
shear walls with increasing web-plate thicknesses are considered in this research in order to
address the retrofit of new and existing structures using LYP steel shear wall systems with
relatively thicker plates compared to those with conventional steel plates. It should be noted that
consideration of LYP steel with considerably lower yield stress will result in relatively thicker
plates in design of SPSW systems compared to the application of conventional steel material.
Table 7.3 Considered structural models
Model Description Infill plate thickness
MRF Moment-resisting frame -
GF Gravity frame -
GF-CSPSW Gravity frame with conventional steel plate shear wall pt
GF-LYPSPSW1 Gravity frame with replaced LYP steel plate shear wall pt
GF-LYPSPSW1.5 Gravity frame with replaced LYP steel plate shear wall pt×5.1
GF-LYPSPSW2 Gravity frame with replaced LYP steel plate shear wall pt×0.2
GF-LYPSPSW2.5 Gravity frame with replaced LYP steel plate shear wall pt×5.2
GF-LYPSPSW3 Gravity frame with replaced LYP steel plate shear wall pt×0.3
In addition, results and findings of the studies reported in Chapter 5 showed that a 4.7 mm
ASTM A36 steel infill plate can be properly replaced by a 9.3 mm LYP100 steel plate with
improved buckling stability and structural performance, while the increase in plate thickness
desirably does not increase the overall system demand on the boundary frame members. In fact,
one of the objectives of this chapter is to evaluate the effectiveness of such retrofitting strategy
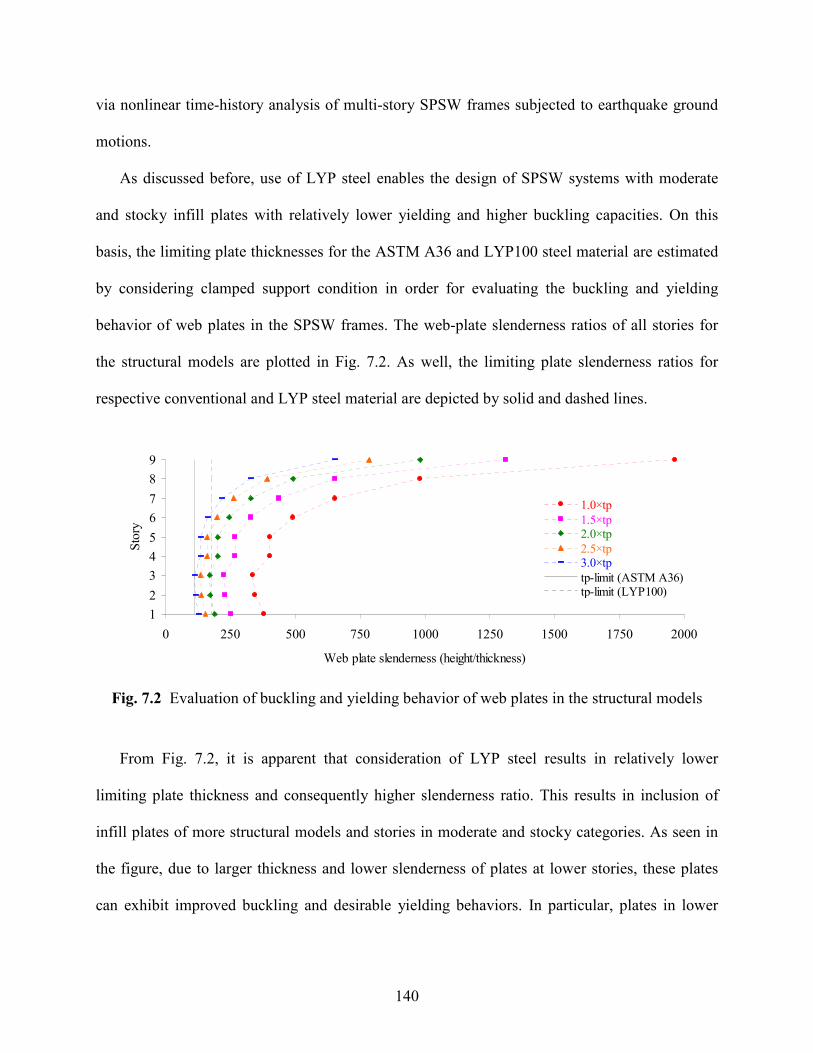
140
via nonlinear time-history analysis of multi-story SPSW frames subjected to earthquake ground
motions.
As discussed before, use of LYP steel enables the design of SPSW systems with moderate
and stocky infill plates with relatively lower yielding and higher buckling capacities. On this
basis, the limiting plate thicknesses for the ASTM A36 and LYP100 steel material are estimated
by considering clamped support condition in order for evaluating the buckling and yielding
behavior of web plates in the SPSW frames. The web-plate slenderness ratios of all stories for
the structural models are plotted in Fig. 7.2. As well, the limiting plate slenderness ratios for
respective conventional and LYP steel material are depicted by solid and dashed lines.
1
2
3
4
5
6
7
8
9
0 250 500 750 1000 1250 1500 1750 2000
Web plate slenderness (height/thickness)
Sto
ry
1.0×tp
1.5×tp2.0×tp
2.5×tp3.0×tp
tp-limit (ASTM A36)tp-limit (LYP100)
Fig. 7.2 Evaluation of buckling and yielding behavior of web plates in the structural models
From Fig. 7.2, it is apparent that consideration of LYP steel results in relatively lower
limiting plate thickness and consequently higher slenderness ratio. This results in inclusion of
infill plates of more structural models and stories in moderate and stocky categories. As seen in
the figure, due to larger thickness and lower slenderness of plates at lower stories, these plates
can exhibit improved buckling and desirable yielding behaviors. In particular, plates in lower
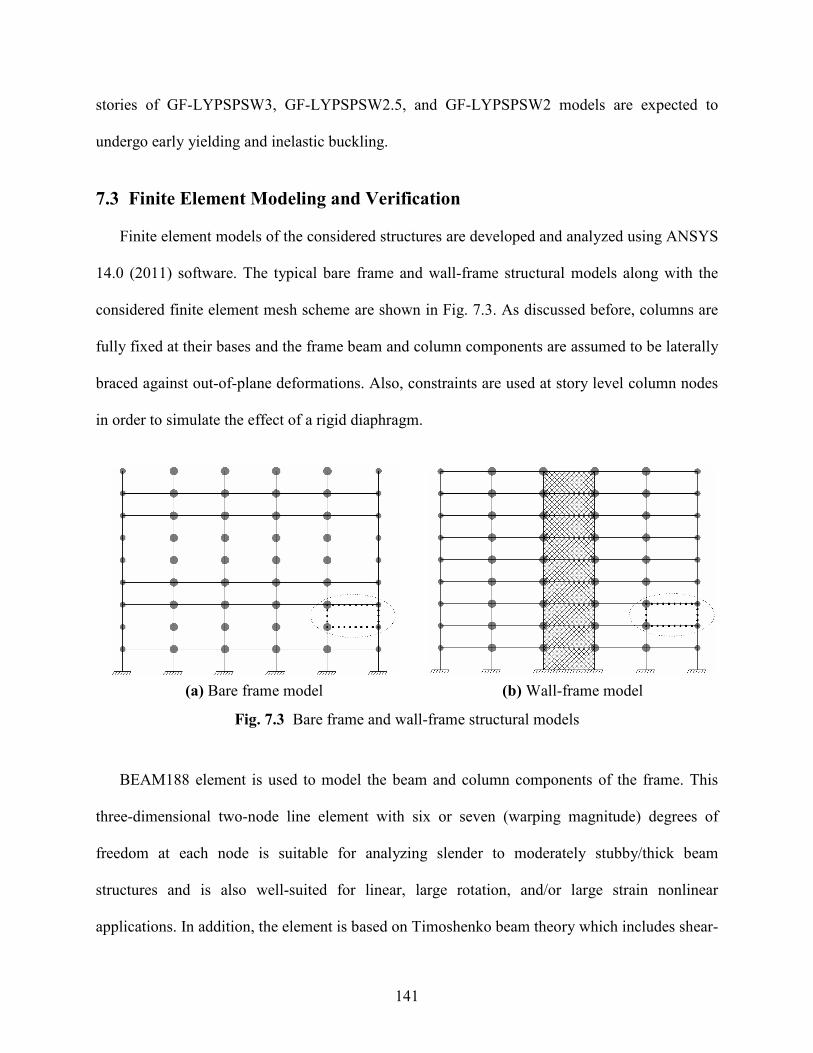
141
stories of GF-LYPSPSW3, GF-LYPSPSW2.5, and GF-LYPSPSW2 models are expected to
undergo early yielding and inelastic buckling.
7.3 Finite Element Modeling and Verification
Finite element models of the considered structures are developed and analyzed using ANSYS
14.0 (2011) software. The typical bare frame and wall-frame structural models along with the
considered finite element mesh scheme are shown in Fig. 7.3. As discussed before, columns are
fully fixed at their bases and the frame beam and column components are assumed to be laterally
braced against out-of-plane deformations. Also, constraints are used at story level column nodes
in order to simulate the effect of a rigid diaphragm.
(a) Bare frame model (b) Wall-frame model
Fig. 7.3 Bare frame and wall-frame structural models
BEAM188 element is used to model the beam and column components of the frame. This
three-dimensional two-node line element with six or seven (warping magnitude) degrees of
freedom at each node is suitable for analyzing slender to moderately stubby/thick beam
structures and is also well-suited for linear, large rotation, and/or large strain nonlinear
applications. In addition, the element is based on Timoshenko beam theory which includes shear-
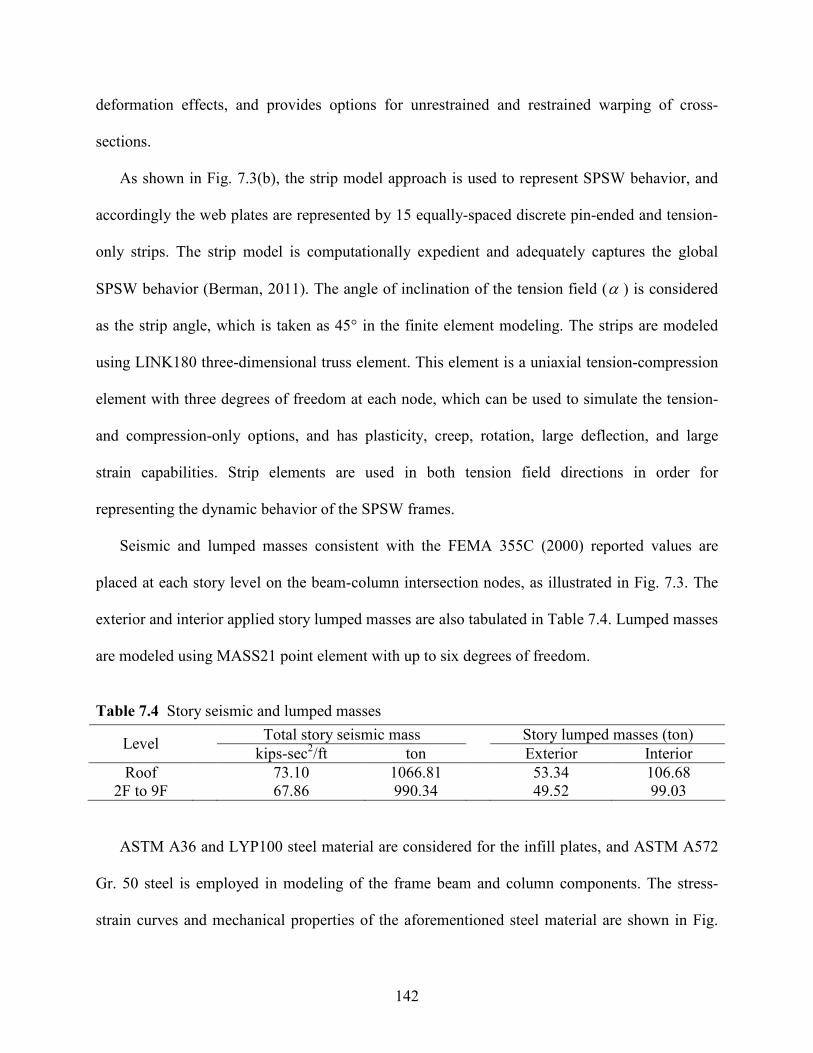
142
deformation effects, and provides options for unrestrained and restrained warping of cross-
sections.
As shown in Fig. 7.3(b), the strip model approach is used to represent SPSW behavior, and
accordingly the web plates are represented by 15 equally-spaced discrete pin-ended and tension-
only strips. The strip model is computationally expedient and adequately captures the global
SPSW behavior (Berman, 2011). The angle of inclination of the tension field (α ) is considered
as the strip angle, which is taken as 45° in the finite element modeling. The strips are modeled
using LINK180 three-dimensional truss element. This element is a uniaxial tension-compression
element with three degrees of freedom at each node, which can be used to simulate the tension-
and compression-only options, and has plasticity, creep, rotation, large deflection, and large
strain capabilities. Strip elements are used in both tension field directions in order for
representing the dynamic behavior of the SPSW frames.
Seismic and lumped masses consistent with the FEMA 355C (2000) reported values are
placed at each story level on the beam-column intersection nodes, as illustrated in Fig. 7.3. The
exterior and interior applied story lumped masses are also tabulated in Table 7.4. Lumped masses
are modeled using MASS21 point element with up to six degrees of freedom.
Table 7.4 Story seismic and lumped masses
Total story seismic mass Story lumped masses (ton) Level
kips-sec2/ft ton
Exterior Interior
Roof 73.10 1066.81 53.34 106.68
2F to 9F 67.86 990.34 49.52 99.03
ASTM A36 and LYP100 steel material are considered for the infill plates, and ASTM A572
Gr. 50 steel is employed in modeling of the frame beam and column components. The stress-
strain curves and mechanical properties of the aforementioned steel material are shown in Fig.
143
5.2. The von Mises yield criterion is adopted for material yielding, and kinematic hardening rule
is incorporated in the nonlinear time-history analyses.
Rayleigh proportional damping with a damping ratio of 2% is selected and applied in all
seismic analyses, which is consistent with the level of damping used in studies on the
performance of moment-resisting and SPSW frames by Gupta and Krawinkler (1999) and
Berman (2011), respectively.
Modal and nonlinear time-history analyses with geometrical and material nonlinearities have
been conducted in this study, which are discussed in the subsequent sections.
In order to verify the adequacy of the finite element strip modeling approach in capturing the
dynamic behaviors of the structures with various material and geometrical properties, finite
element results are validated through comparison with published experimental as well as
additional experimentally-verified numerical results. To achieve this, single- and multi-story
reference SPSWs with slender and stocky infill plates employing conventional and LYP steel
material have been considered.
First, the one-story one-bay SPSW2 specimen employing slender and conventional steel infill
plate tested by Lubell (1997) has been modeled using the strip modeling approach. The infill
plate is represented by 12 equally-spaced pin-ended and tension-only strips. The geometrical and
modeling details along with the experimental and numerical results are presented in Fig. 7.4.
Figs. 7.4(b) and (c) show that the finite element strip model provides good results in both
pushover and cyclic cases by predicting the response of the tested specimen in a quite
satisfactory manner.
144
(a) Test specimen and strip model
0
50
100
150
200
250
300
0 10 20 30 40 50
In-plane lateral displacement (mm)
Load
(k
N)
ExperimentalStrip Model
-260
-130
0
130
260
-50 -30 -10 10 30 50
In-plane lateral displacement (mm)
Load
(k
N)
Experimental
Strip Model
(b) Pushover analysis results (c) Cyclic analysis results
Fig. 7.4 Modeling details and results for Lubell’s (1997) SPSW2 specimen
Chen and Jhang’s (2006) specimen no. 1 with stocky and LYP100 steel infill plate has
subsequently been modeled through strip modeling approach. The infill plate is modeled by 12
equally-spaced pin-ended and tension-only strips. As illustrated in Fig. 7.5(a), the strips are
inclined at 45° with the vertical in accordance with Chen and Jhang’s (2006) proposed model,
and the RBS connections are properly considered in finite element modeling. The comparison
results presented in Figs. 7.5(b) and (c) indicate that the agreement between the numerical and
experimental results is very good in both pushover and cyclic cases.

145
(a) Test specimen and strip model
0
200
400
600
800
1000
1200
1400
0 10 20 30 40 50
In-plane lateral displacement (mm)
Load
(k
N)
ExperimentalStrip Model
-1300
-650
0
650
1300
-50 -30 -10 10 30 50
In-plane lateral displacement (mm)
Load
(k
N)
Experimental
Strip Model
(b) Pushover analysis results (c) Cyclic analysis results
Fig. 7.5 Modeling details and results for Chen and Jhang’s (2006) specimen no. 1
In addition to the two single-story SPSW test specimens, the three-story SC2T specimen with
thin infill plates and strong columns tested by Park et al. (2007) has also been modeled for
verification purposes. The infill plates and frame members of this specimen were made of SS400
and SM490 steel material (Korean Standard) with 240 and 330 MPa yield stresses, respectively.
The geometrical and modeling details of the test specimen and developed finite element model
are provided in Fig. 7.6(a). As seen, each infill plate is represented by 12 equally-spaced pin-
ended and tension-only strips inclined at 45° with the vertical. The numerical predictions and test
results are compared in Figs. 7.6(b) through 7.6(e). From the figures, it is quite evident that the
predictions of the strip model agree well with the test results. This indicates the adequacy and
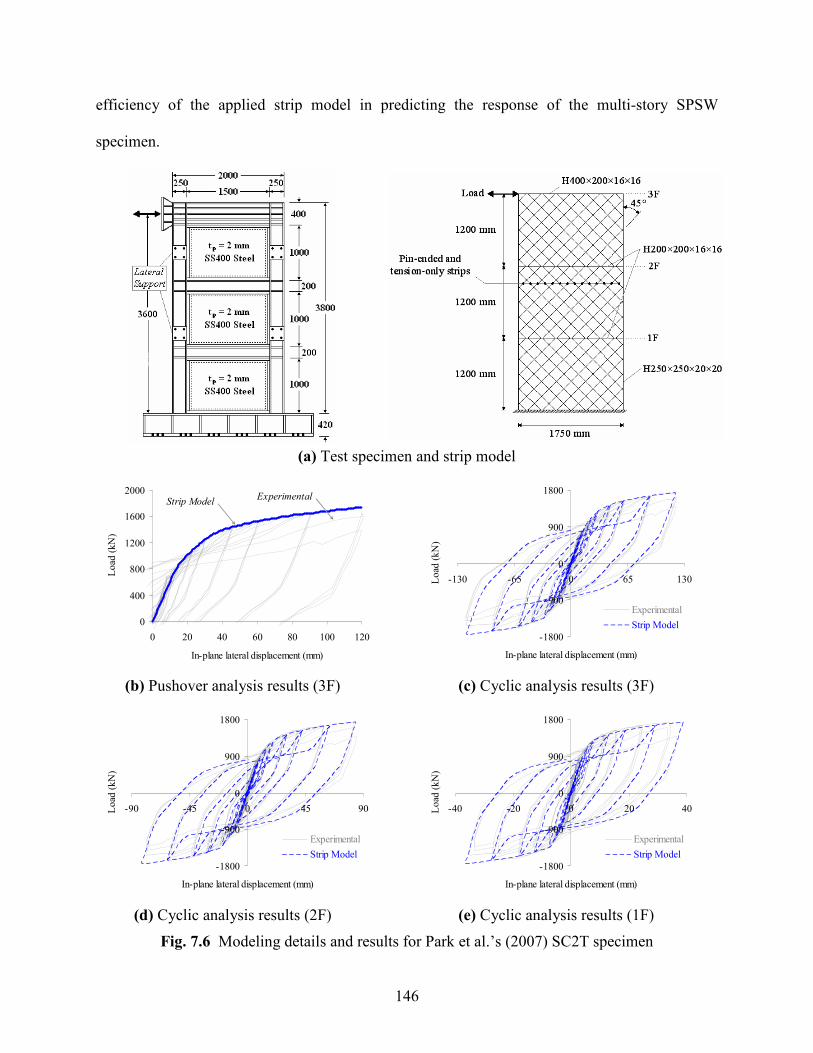
146
efficiency of the applied strip model in predicting the response of the multi-story SPSW
specimen.
(a) Test specimen and strip model
0
400
800
1200
1600
2000
0 20 40 60 80 100 120
In-plane lateral displacement (mm)
Lo
ad (
kN
)
ExperimentalStrip Model
-1800
-900
0
900
1800
-130 -65 0 65 130
In-plane lateral displacement (mm)
Lo
ad (
kN
)
Experimental
Strip Model
(b) Pushover analysis results (3F) (c) Cyclic analysis results (3F)
-1800
-900
0
900
1800
-90 -45 0 45 90
In-plane lateral displacement (mm)
Lo
ad (
kN
)
Experimental
Strip Model
-1800
-900
0
900
1800
-40 -20 0 20 40
In-plane lateral displacement (mm)
Lo
ad (
kN
)
Experimental
Strip Model
(d) Cyclic analysis results (2F) (e) Cyclic analysis results (1F)
Fig. 7.6 Modeling details and results for Park et al.’s (2007) SC2T specimen

147
Two single-story, single-bay, and full-scale steel shear walls, i.e. SPSW2 and SPSW5 models
studied in Chapter 5 and defined in Table 5.1, are also modeled in this study, and the strip
modeling results have been compared with those from the analysis of three-dimensional finite
element models. It is noted that SPSW2 and SPSW5 models employ slender and stocky LYP
steel infill plates, respectively. In the strip model, the web plates are represented by 12 equally-
spaced pin-ended and tension-only strips inclined at 40.5° with the vertical. The modeling details
as well as comparison results for SPSW2 and SPSW5 models are presented in Figs. 7.7 and 7.8,
respectively.
(a) 3D finite element and strip models
0
500
1000
1500
2000
2500
3000
0 0.01 0.02 0.03 0.04 0.05
Drift ratio
Load
(k
N)
3D FE Model
Strip Model
-3000
-1500
0
1500
3000
-0.06 -0.03 0 0.03 0.06
Drift ratio
Load
(k
N)
3D FE Model
Strip Model
(b) Pushover analysis results (c) Cyclic analysis results
Fig. 7.7 Modeling details and results for a 3D finite element slender-web SPSW model
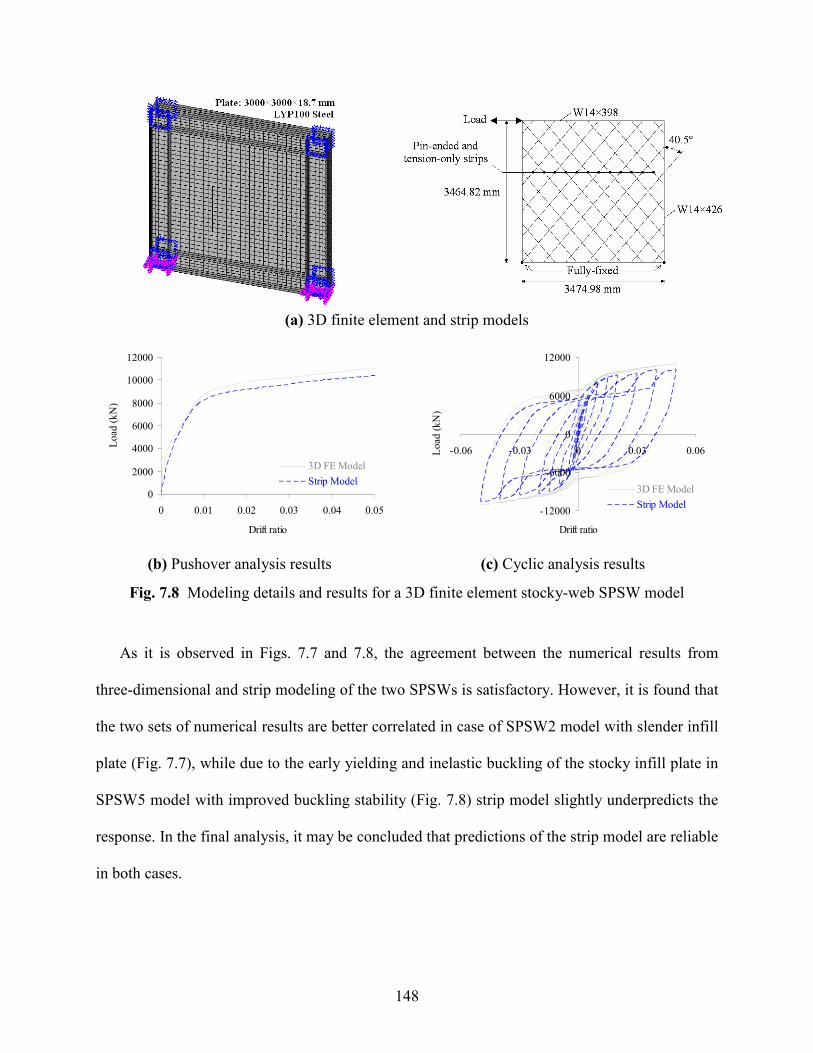
148
(a) 3D finite element and strip models
0
2000
4000
6000
8000
10000
12000
0 0.01 0.02 0.03 0.04 0.05
Drift ratio
Load
(k
N)
3D FE Model
Strip Model
-12000
-6000
0
6000
12000
-0.06 -0.03 0 0.03 0.06
Drift ratio
Load
(k
N)
3D FE Model
Strip Model
(b) Pushover analysis results (c) Cyclic analysis results
Fig. 7.8 Modeling details and results for a 3D finite element stocky-web SPSW model
As it is observed in Figs. 7.7 and 7.8, the agreement between the numerical results from
three-dimensional and strip modeling of the two SPSWs is satisfactory. However, it is found that
the two sets of numerical results are better correlated in case of SPSW2 model with slender infill
plate (Fig. 7.7), while due to the early yielding and inelastic buckling of the stocky infill plate in
SPSW5 model with improved buckling stability (Fig. 7.8) strip model slightly underpredicts the
response. In the final analysis, it may be concluded that predictions of the strip model are reliable
in both cases.
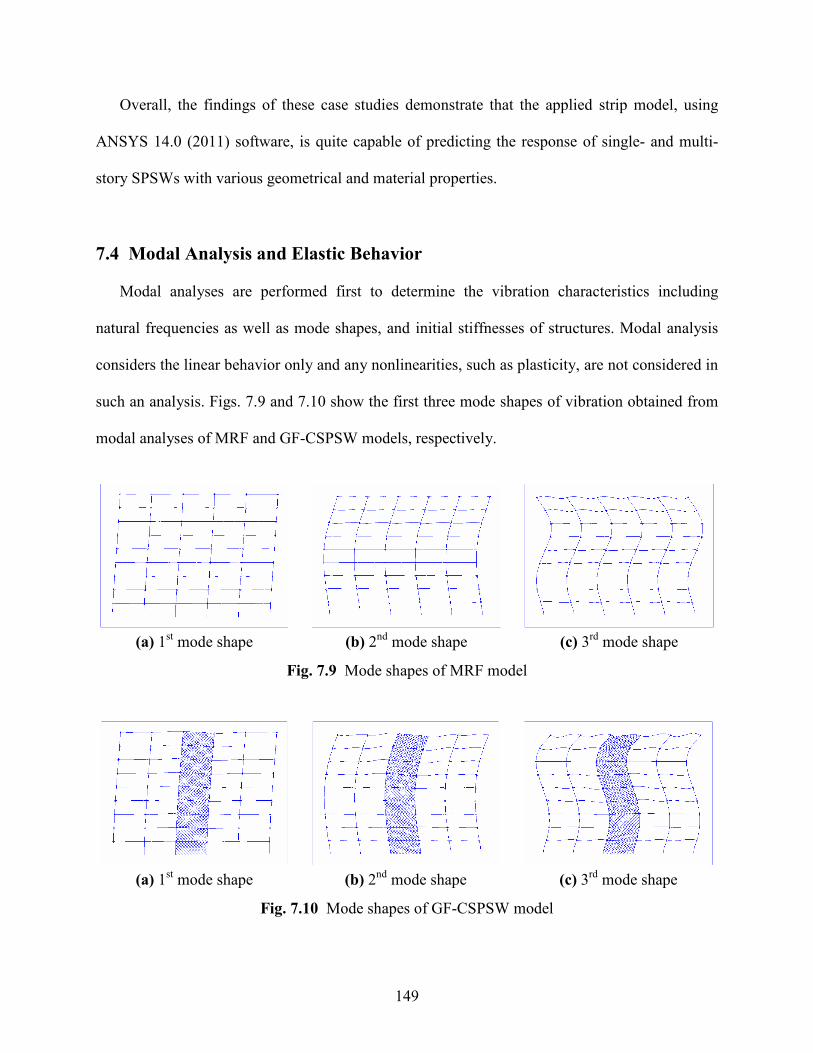
149
Overall, the findings of these case studies demonstrate that the applied strip model, using
ANSYS 14.0 (2011) software, is quite capable of predicting the response of single- and multi-
story SPSWs with various geometrical and material properties.
7.4 Modal Analysis and Elastic Behavior
Modal analyses are performed first to determine the vibration characteristics including
natural frequencies as well as mode shapes, and initial stiffnesses of structures. Modal analysis
considers the linear behavior only and any nonlinearities, such as plasticity, are not considered in
such an analysis. Figs. 7.9 and 7.10 show the first three mode shapes of vibration obtained from
modal analyses of MRF and GF-CSPSW models, respectively.
(a) 1st mode shape (b) 2
nd mode shape (c) 3
rd mode shape
Fig. 7.9 Mode shapes of MRF model
(a) 1st mode shape (b) 2
nd mode shape (c) 3
rd mode shape
Fig. 7.10 Mode shapes of GF-CSPSW model

150
Accurate determination of vibration characteristics, in particular, the fundamental period of
vibration is of great importance in calculating the lateral forces and seismic design of a structure.
Most building codes propose simple empirical expressions to evaluate the fundamental period of
vibration. According to ASCE 7-10 (2010), the approximate fundamental period ( aT ), in
seconds, can be determined from the following equation:
x
nta hCT = (7.1)
in which nh is the height of the structure above the base, 0.0724=tC and 0.8=x for steel
moment-resisting frames, and 0.0488=tC and 0.75=x for other structural systems including
SPSWs. The accuracy of the code predictions for the fundamental periods of SPSW systems has
been evaluated through numerical analyses by Topkaya and Kurban (2009), Berman (2011), and
Bhowmick et al. (2011). These studies have demonstrated that, in general, the code-specified
formulae fail in providing accurate estimates for the fundamental periods of SPSWs, and
accordingly simple and relatively accurate methods and formulae have been proposed by
Topkaya and Kurban (2009) and Bhowmick et al. (2011) for predicting the fundamental period
of SPSW systems. In this study, the periods of first five modes of vibration for the considered
structural models are determined from the modal analyses and tabulated in Table 7.5. These
numerical estimates are compared with the period values reported in FEMA 355C (2000) and
predicted by the ASCE 7-10 (2010) specified equation, i.e. Eq. (7.1), in Table 7.5, as appropriate.

151
Table 7.5 Periods of the considered structural models
Model AnalysisT (sec) SACT (sec) ASCET (sec) ASCEAnalysis TT
MRF T1 = 2.097 T1 = 2.34 1.264 1.66
T2 = 0.789 T2 = 0.88
T3 = 0.456 T3 = 0.50
T4 = 0.309
T5 = 0.231
GF T1 = 6.286 - 1.264 4.97
T2 = 2.071
T3 = 1.162
T4 = 0.760
T5 = 0.549
GF-CSPSW T1 = 1.036 - 0.711 1.46
T2 = 0.300
T3 = 0.169
T4 = 0.121
T5 = 0.096
GF-LYPSPSW1 T1 = 1.036 - 0.711 1.46
T2 = 0.300
T3 = 0.169
T4 = 0.121
T5 = 0.096
GF-LYPSPSW1.5 T1 = 0.976 - 0.711 1.37
T2 = 0.263
T3 = 0.146
T4 = 0.105
T5 = 0.083
GF-LYPSPSW2 T1 = 0.944 - 0.711 1.33
T2 = 0.241
T3 = 0.131
T4 = 0.094
T5 = 0.075
GF-LYPSPSW2.5 T1 = 0.923 - 0.711 1.30
T2 = 0.226
T3 = 0.121
T4 = 0.087
T5 = 0.070
GF-LYPSPSW3 T1 = 0.909 - 0.711 1.28
T2 = 0.215
T3 = 0.114
T4 = 0.081
T5 = 0.066

152
As seen in the table, in spite of the modifications made in the original 9-story SAC building,
the first three periods of the considered MRF model obtained from the modal analysis are found
to be in good agreement with the values reported in FEMA 355C (2000). Nevertheless, the two
values of the fundamental period for this structural system, i.e. T1,Analysis and T1,SAC, are
considerably larger than that predicted by Eq. (7.1). Also, it is evident that the GF model, which
is not considered as a lateral force-resisting system, possesses overly large period values due to
its flexibility.
Table 7.5, also, shows that Eq. (7.1) specified by the ASCE 7-10 (2010) code provides a
constant value for the fundamental periods of SPSWs with increasing infill plate thicknesses,
while the fundamental periods obtained from modal analyses exhibit a decreasing trend, as
expected, due to the increase in stiffness. In addition, consistent with the results of the
aforementioned studies on the periods of SPSW systems, ASCE 7-10 (2010) code-specified
equation, i.e. Eq. (7.1), is found to yield lower estimates for the fundamental periods of SPSW
systems compared to numerical predictions. This discrepancy diminishes slightly as the infill
plate thickness increases and the system gains more stiffness.
The values of initial stiffness of the considered structural models determined from the modal
analyses are shown in Fig. 7.11. As seen in the figure, the GF model possesses a very low initial
stiffness, and also the GF-SPSW models in general exhibit a considerably higher initial stiffness
compared to the MRF model. It is also evident that the initial stiffness of a GF-LYPSPSW model
increases due to the increase in the infill plate thickness. Table 7.6, also, shows the percentage
variations in initial stiffness and fundamental period due to the retrofit of structures in this study.

153
42042
4548
171585 171585193633
207561217325 224541
0
50000
100000
150000
200000
250000
MRF
GF
GF-C
SPSW
GF-
LYPSPS
W1
GF-L
YPSPS
W1.
5
GF-
LYPS
PSW2
GF-
LYPS
PSW
2.5
GF-
LYPS
PSW
3
Init
ial
Sti
ffn
ess
(k
N/m
)
Fig. 7.11 Initial stiffnesses of the considered structural models
Table 7.6 Percentage variations in initial stiffness and period
Structural models (Retrofit) Increase in initial stiffness Decrease in period
MRF → GF-CSPSW 308 % 51 %
GF-CSPSW → GF-LYPSPSW1 0 % 0 %
GF-CSPSW → GF-LYPSPSW1.5 13 % 6 %
GF-CSPSW → GF-LYPSPSW2 21 % 9 %
GF-CSPSW → GF-LYPSPSW2.5 27 % 11 %
GF-CSPSW → GF-LYPSPSW3 31 % 12 %
These results indicate that GF-CSPSW model possesses much higher initial stiffness and
lower fundamental period compared to the MRF model. Furthermore, retrofit of the GF-CSPSW
model with thicker and LYP steel infill plates results in increasing of the initial stiffness by
maximum 30% and decreasing of the fundamental period by maximum 10% approximately in
the extreme considered case, i.e. GF-LYPSPSW3 model. In spite of the fact that higher initial
stiffness can effectively control the drift and damages to the structural system and drift-sensitive
nonstructural components, it may make the structure shake at higher acceleration levels and more
damage may be expected to acceleration-sensitive nonstructural components and contents
(HAZUS-MH MR5, 2010). Therefore, evaluation of seismic performance and level of induced

154
floor accelerations due to ground motion excitations is essential in efficient seismic design and
retrofit of structures.
Lastly, modal analysis results have been utilized to determine the Rayleigh damping
coefficients, i.e. the mass and stiffness matrix multipliers, by considering the 1st and 5
th modal
frequencies in order to set the damping ratio at 2%. The obtained values of the Rayleigh damping
coefficients for the considered structural models are provided in Table 7.7. These tabulated
values have been applied in the nonlinear time-history dynamic analyses.
Table 7.7 Rayleigh damping coefficients determined using the 1st and 5
th modal frequencies and
2% damping ratio
Model Mass matrix multiplier Stiffness matrix multiplier
MRF 0.10795 0.00133
GF 0.03677 0.00321
GF-CSPSW 0.22208 0.00056
GF-LYPSPSW1 0.22208 0.00056
GF-LYPSPSW1.5 0.23728 0.00049
GF-LYPSPSW2 0.24670 0.00044
GF-LYPSPSW2.5 0.25318 0.00041
GF-LYPSPSW3 0.25794 0.00039
7.5 Nonlinear Time-History Analysis and Selection of Ground Motions
In order to evaluate the seismic drifts, accelerations, and other behavioral characteristics,
nonlinear time-history dynamic analyses are performed for the structural models considered in
this study. In order to account for the P-delta effects on the seismic response, gravity loads are
initially applied on the two-dimensional structural models prior to the time-history dynamic
analysis, and then these loads are kept constant while ground accelerations are applied to the
base of the structure. P-delta effects are usually critical in either flexible or tall structures which
may be subjected to relatively large lateral displacements. The results of the studies reported by
Bhowmick et al. (2009b) have shown that P-delta effects for low- and mid-rise structures are not
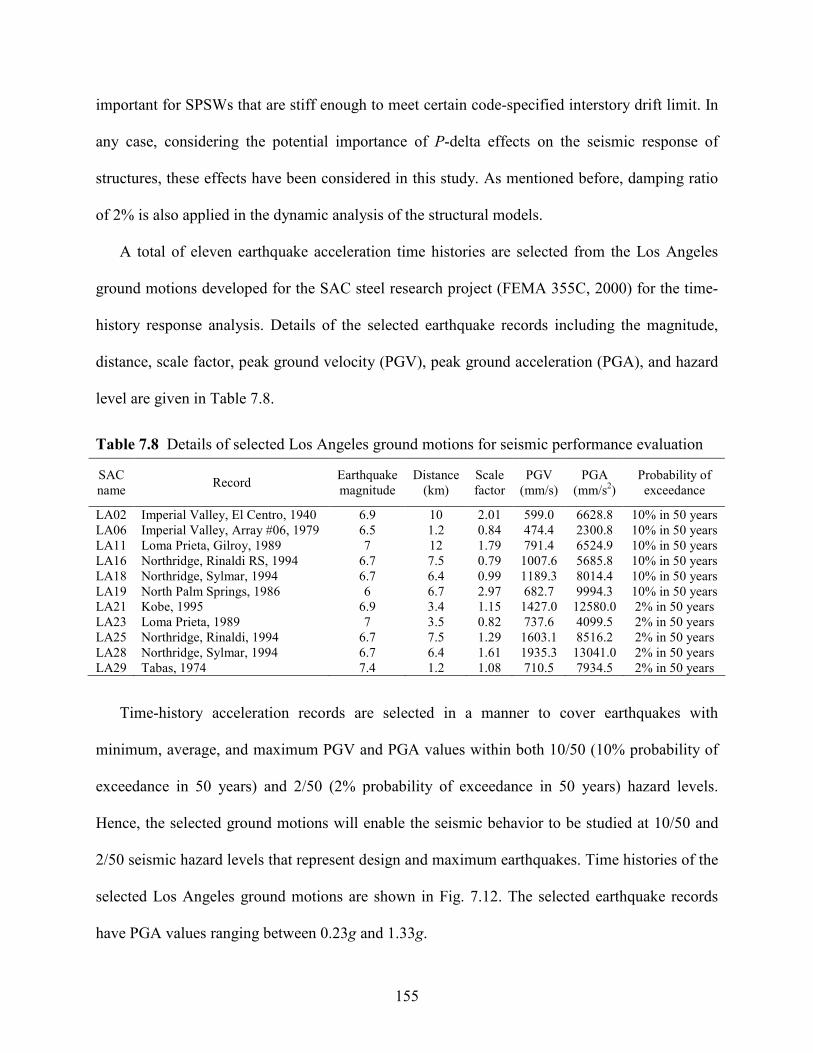
155
important for SPSWs that are stiff enough to meet certain code-specified interstory drift limit. In
any case, considering the potential importance of P-delta effects on the seismic response of
structures, these effects have been considered in this study. As mentioned before, damping ratio
of 2% is also applied in the dynamic analysis of the structural models.
A total of eleven earthquake acceleration time histories are selected from the Los Angeles
ground motions developed for the SAC steel research project (FEMA 355C, 2000) for the time-
history response analysis. Details of the selected earthquake records including the magnitude,
distance, scale factor, peak ground velocity (PGV), peak ground acceleration (PGA), and hazard
level are given in Table 7.8.
Table 7.8 Details of selected Los Angeles ground motions for seismic performance evaluation
SAC
name Record
Earthquake
magnitude
Distance
(km)
Scale
factor
PGV
(mm/s)
PGA
(mm/s2)
Probability of
exceedance
LA02 Imperial Valley, El Centro, 1940 6.9 10 2.01 599.0 6628.8 10% in 50 years
LA06 Imperial Valley, Array #06, 1979 6.5 1.2 0.84 474.4 2300.8 10% in 50 years
LA11 Loma Prieta, Gilroy, 1989 7 12 1.79 791.4 6524.9 10% in 50 years
LA16 Northridge, Rinaldi RS, 1994 6.7 7.5 0.79 1007.6 5685.8 10% in 50 years
LA18 Northridge, Sylmar, 1994 6.7 6.4 0.99 1189.3 8014.4 10% in 50 years
LA19 North Palm Springs, 1986 6 6.7 2.97 682.7 9994.3 10% in 50 years
LA21 Kobe, 1995 6.9 3.4 1.15 1427.0 12580.0 2% in 50 years
LA23 Loma Prieta, 1989 7 3.5 0.82 737.6 4099.5 2% in 50 years
LA25 Northridge, Rinaldi, 1994 6.7 7.5 1.29 1603.1 8516.2 2% in 50 years
LA28 Northridge, Sylmar, 1994 6.7 6.4 1.61 1935.3 13041.0 2% in 50 years
LA29 Tabas, 1974 7.4 1.2 1.08 710.5 7934.5 2% in 50 years
Time-history acceleration records are selected in a manner to cover earthquakes with
minimum, average, and maximum PGV and PGA values within both 10/50 (10% probability of
exceedance in 50 years) and 2/50 (2% probability of exceedance in 50 years) hazard levels.
Hence, the selected ground motions will enable the seismic behavior to be studied at 10/50 and
2/50 seismic hazard levels that represent design and maximum earthquakes. Time histories of the
selected Los Angeles ground motions are shown in Fig. 7.12. The selected earthquake records
have PGA values ranging between 0.23g and 1.33g.

156
-0.7
0
0.7
0 54
Time (sec)
Accele
rati
on
(g
) PGA = 0.68g
-0.25
0
0.25
0 40
Time (sec)
Accele
rati
on
(g
) PGA = 0.23g
(a) LA02 (b) LA06
-0.7
0
0.7
0 40
Time (sec)
Accele
rati
on
(g
) PGA = 0.67g
-0.6
0
0.6
0 15
Time (sec)
Accele
rati
on
(g
) PGA = 0.58g
(c) LA11 (d) LA16
-0.84
0
0.84
0 60
Time (sec)
Accele
rati
on
(g
) PGA = 0.82g
-1.1
0
1.1
0 60
Time (sec)A
ccele
rati
on
(g
) PGA = 1.02g
(e) LA18 (f) LA19
-1.3
0
1.3
0 60
Time (sec)
Accele
rati
on
(g
) PGA = 1.28g
-0.44
0
0.44
0 25
Time (sec)
Accele
rati
on
(g
) PGA = 0.42g
(g) LA21 (h) LA23
-0.9
0
0.9
0 15
Time (sec)
Accele
rati
on
(g
) PGA = 0.87g
-1.4
0
1.4
0 60
Time (sec)
Accele
rati
on
(g
) PGA = 1.33g
(i) LA25 (j) LA28
-0.84
0
0.84
0 50
Time (sec)
Accele
rati
on
(g
) PGA = 0.81g
(k) LA29
Fig. 7.12 Time histories of selected Los Angeles ground motions
for seismic performance evaluation
157
The results of the nonlinear time-history dynamic analyses are discussed in the subsequent
sections.
7.6 Nonlinear Time-History Analysis Results
7.6.1 Story and Interstory Drift Ratios
Lateral displacement or drift is one of the important parameters in design of structures, and
structures should be designed to accommodate the displacements imposed by lateral forces since
excessive drift may constitute unacceptable performance. Hence, design codes, e.g. ASCE 7-10
(2010), specify certain limitations on displacements of structures which should be appropriately
met especially when drift is the governing criterion in design.
Among the lateral force-resisting systems, SPSWs are deemed to be highly-efficient systems
which can be considered for many retrofit applications and are very effective in controlling the
drift as one of the important seismic design criteria. According to Seilie and Hooper (2005),
SPSW systems are capable of surviving up to 4% drift ratio. Similar conclusion may be drawn
from the study reported by Baldvins et al. (2012). LYP steel shear walls, in particular, have been
shown to reach even larger drift ratios up to 5-6% through stable deformation. Despite these
findings, widespread use of SPSW systems particularly with LYP steel infill plates requires
further investigation of various design and performance aspects.
As part of the dynamic response assessment, “story” and “interstory” drift ratios of the
considered structural models induced by seismic excitations are evaluated in this section. It is
noted that story drift ratio is the horizontal deflection at the top of the story relative to the base of
the structure divided by the height above the base to the same level, while interstory drift ratio is
the horizontal deflection at the top of the story relative to the bottom of the story divided by the

158
story height. The maximum story and interstory drift ratios induced by three sample ground
motions with small, average, and large PGV and PGA values are shown in Fig. 7.13.
0
1
2
3
4
5
6
7
8
9
0 0.005 0.01 0.015 0.02 0.025
Maximum story drift ratio
Sto
ry
0
1
2
3
4
5
6
7
8
9
0 0.01 0.02 0.03 0.04
Maximum interstory drift ratio
Sto
ry
MRF
GF
GF-CSPSW
GF-LYPSPSW1
GF-LYPSPSW1.5
GF-LYPSPSW2
GF-LYPSPSW2.5
GF-LYPSPSW3
Allowable (ASCE 7-10)
(a) LA06 (small PGV and PGA)
0
1
2
3
4
5
6
7
8
9
0 0.01 0.02 0.03 0.04
Maximum story drift ratio
Sto
ry
0
1
2
3
4
5
6
7
8
9
0 0.01 0.02 0.03 0.04 0.05
Maximum interstory drift ratio
Sto
ry
MRF
GF
GF-CSPSW
GF-LYPSPSW1
GF-LYPSPSW1.5
GF-LYPSPSW2
GF-LYPSPSW2.5
GF-LYPSPSW3
Allowable (ASCE 7-10)
(b) LA18 (average PGV and PGA)
0
1
2
3
4
5
6
7
8
9
0 0.01 0.02 0.03 0.04 0.05 0.06 0.07
Maximum story drift ratio
Sto
ry
0
1
2
3
4
5
6
7
8
9
0 0.01 0.02 0.03 0.04 0.05 0.06 0.07 0.08
Maximum interstory drift ratio
Sto
ry
MRF
GF
GF-CSPSW
GF-LYPSPSW1
GF-LYPSPSW1.5
GF-LYPSPSW2
GF-LYPSPSW2.5
GF-LYPSPSW3
Allowable (ASCE 7-10)
(c) LA28 (large PGV and PGA)
Fig. 7.13 Maximum story and interstory drift ratios induced by three sample ground motions
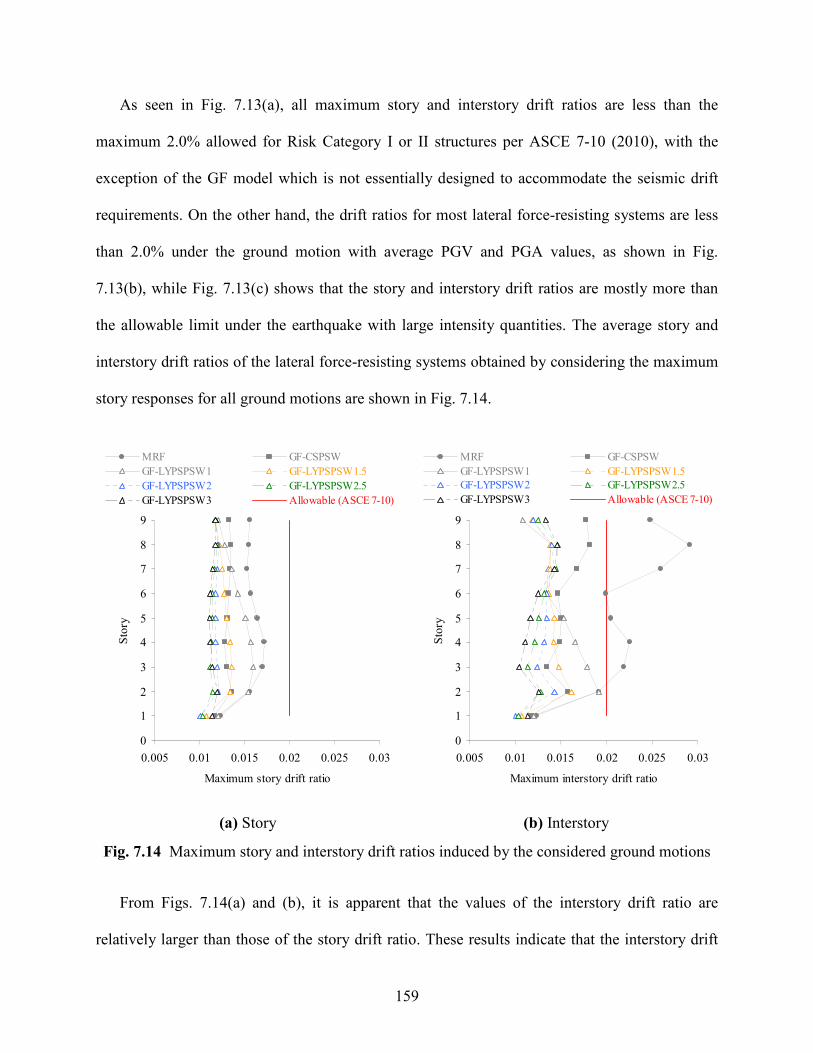
159
As seen in Fig. 7.13(a), all maximum story and interstory drift ratios are less than the
maximum 2.0% allowed for Risk Category I or II structures per ASCE 7-10 (2010), with the
exception of the GF model which is not essentially designed to accommodate the seismic drift
requirements. On the other hand, the drift ratios for most lateral force-resisting systems are less
than 2.0% under the ground motion with average PGV and PGA values, as shown in Fig.
7.13(b), while Fig. 7.13(c) shows that the story and interstory drift ratios are mostly more than
the allowable limit under the earthquake with large intensity quantities. The average story and
interstory drift ratios of the lateral force-resisting systems obtained by considering the maximum
story responses for all ground motions are shown in Fig. 7.14.
0
1
2
3
4
5
6
7
8
9
0.005 0.01 0.015 0.02 0.025 0.03
Maximum story drift ratio
Sto
ry
MRF GF-CSPSW
GF-LYPSPSW1 GF-LYPSPSW1.5
GF-LYPSPSW2 GF-LYPSPSW2.5
GF-LYPSPSW3 Allowable (ASCE 7-10)
0
1
2
3
4
5
6
7
8
9
0.005 0.01 0.015 0.02 0.025 0.03
Maximum interstory drift ratio
Sto
ry
MRF GF-CSPSW
GF-LYPSPSW1 GF-LYPSPSW1.5
GF-LYPSPSW2 GF-LYPSPSW2.5
GF-LYPSPSW3 Allowable (ASCE 7-10)
(a) Story (b) Interstory
Fig. 7.14 Maximum story and interstory drift ratios induced by the considered ground motions
From Figs. 7.14(a) and (b), it is apparent that the values of the interstory drift ratio are
relatively larger than those of the story drift ratio. These results indicate that the interstory drift
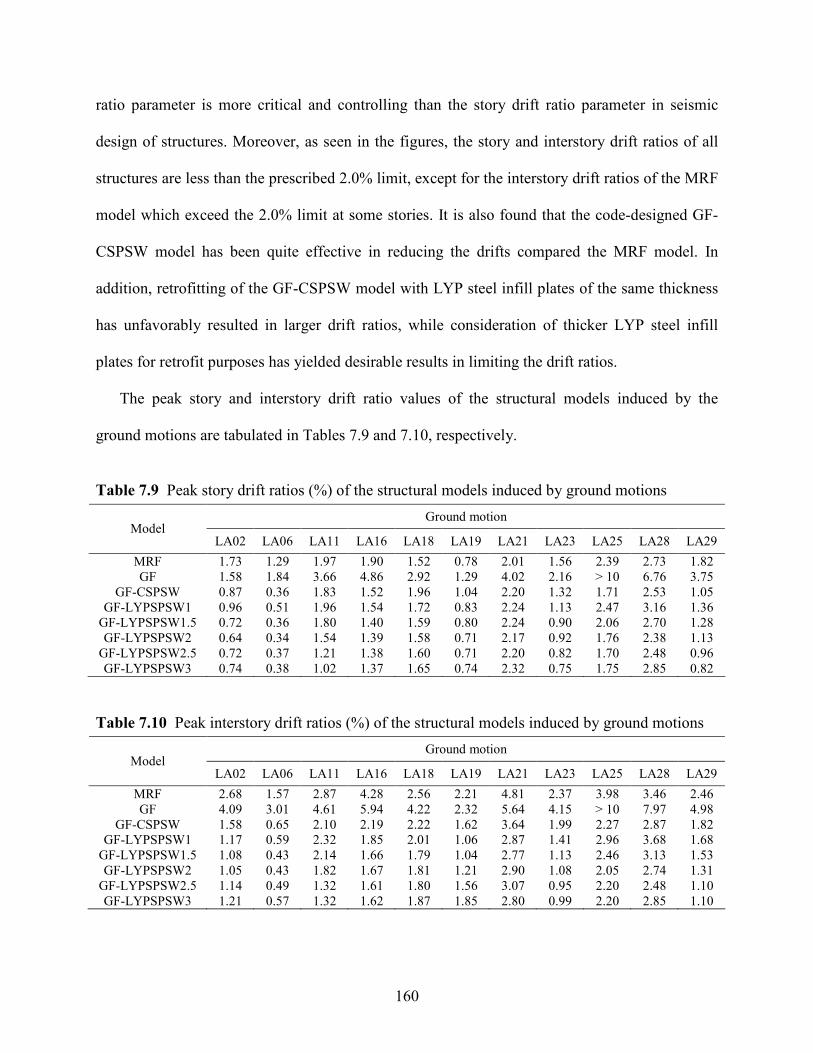
160
ratio parameter is more critical and controlling than the story drift ratio parameter in seismic
design of structures. Moreover, as seen in the figures, the story and interstory drift ratios of all
structures are less than the prescribed 2.0% limit, except for the interstory drift ratios of the MRF
model which exceed the 2.0% limit at some stories. It is also found that the code-designed GF-
CSPSW model has been quite effective in reducing the drifts compared the MRF model. In
addition, retrofitting of the GF-CSPSW model with LYP steel infill plates of the same thickness
has unfavorably resulted in larger drift ratios, while consideration of thicker LYP steel infill
plates for retrofit purposes has yielded desirable results in limiting the drift ratios.
The peak story and interstory drift ratio values of the structural models induced by the
ground motions are tabulated in Tables 7.9 and 7.10, respectively.
Table 7.9 Peak story drift ratios (%) of the structural models induced by ground motions
Ground motion Model
LA02 LA06 LA11 LA16 LA18 LA19 LA21 LA23 LA25 LA28 LA29
MRF 1.73 1.29 1.97 1.90 1.52 0.78 2.01 1.56 2.39 2.73 1.82
GF 1.58 1.84 3.66 4.86 2.92 1.29 4.02 2.16 > 10 6.76 3.75
GF-CSPSW 0.87 0.36 1.83 1.52 1.96 1.04 2.20 1.32 1.71 2.53 1.05
GF-LYPSPSW1 0.96 0.51 1.96 1.54 1.72 0.83 2.24 1.13 2.47 3.16 1.36
GF-LYPSPSW1.5 0.72 0.36 1.80 1.40 1.59 0.80 2.24 0.90 2.06 2.70 1.28
GF-LYPSPSW2 0.64 0.34 1.54 1.39 1.58 0.71 2.17 0.92 1.76 2.38 1.13
GF-LYPSPSW2.5 0.72 0.37 1.21 1.38 1.60 0.71 2.20 0.82 1.70 2.48 0.96
GF-LYPSPSW3 0.74 0.38 1.02 1.37 1.65 0.74 2.32 0.75 1.75 2.85 0.82
Table 7.10 Peak interstory drift ratios (%) of the structural models induced by ground motions
Ground motion Model
LA02 LA06 LA11 LA16 LA18 LA19 LA21 LA23 LA25 LA28 LA29
MRF 2.68 1.57 2.87 4.28 2.56 2.21 4.81 2.37 3.98 3.46 2.46
GF 4.09 3.01 4.61 5.94 4.22 2.32 5.64 4.15 > 10 7.97 4.98
GF-CSPSW 1.58 0.65 2.10 2.19 2.22 1.62 3.64 1.99 2.27 2.87 1.82
GF-LYPSPSW1 1.17 0.59 2.32 1.85 2.01 1.06 2.87 1.41 2.96 3.68 1.68
GF-LYPSPSW1.5 1.08 0.43 2.14 1.66 1.79 1.04 2.77 1.13 2.46 3.13 1.53
GF-LYPSPSW2 1.05 0.43 1.82 1.67 1.81 1.21 2.90 1.08 2.05 2.74 1.31
GF-LYPSPSW2.5 1.14 0.49 1.32 1.61 1.80 1.56 3.07 0.95 2.20 2.48 1.10
GF-LYPSPSW3 1.21 0.57 1.32 1.62 1.87 1.85 2.80 0.99 2.20 2.85 1.10

161
From the tabulated results, it is found that the GF model has comparatively large peak story
and interstory drift ratios in almost all considered cases, and even in some cases, e.g. ground
motion LA25, the peak drift ratios are dramatically large which is indicative of failure of the
structure. Variations of the seismic-induced peak story and interstory drift ratios as a result of
retrofit of structures using SPSW systems and LYP steel material are shown in Fig. 7.15. These
average values for the peak drift ratios are obtained by considering the peak drift responses for
all ground motions as summarized in Tables 7.9 and 7.10.
1.79
1.491.63
1.441.32 1.29 1.31
3.02
2.091.96
1.741.64 1.61 1.67
0
0.5
1
1.5
2
2.5
3
3.5
MRF GF-CSPSW GF-LYPSPSW1 GF-LYPSPSW1.5 GF-LYPSPSW2 GF-LYPSPSW2.5 GF-LYPSPSW3
Pea
k d
rift
rat
io (
%)
Story Interstory
Fig. 7.15 Variations of seismic-induced peak story and interstory drift ratios
due to retrofit of structures using SPSW systems and LYP steel material
These results demonstrate that the peak interstory drift ratios are larger than the peak story
drift ratios in all cases which is, in turn, indicative of importance of the interstory drift ratio as an
effective design criterion. Discrepancy between the two peak drift ratio parameters is the largest
in case of the MRF model, while this discrepancy is decreased in cases of the GF-SPSW models
especially those with LYP steel infill plates. From the figure, it is evident that the peak interstory
drift ratio for the MRF model is close to 3.0% and for the GF-CSPSW model is slightly larger
than 2.0%, while SPSW systems retrofitted with LYP steel infill plates have been effective at
limiting the peak drift ratios to less that 2.0%. Even, it is interesting to note that retrofitting of the
162
GF-CSPSW model with LYP steel infill plates of the same thickness, i.e. GF-LYPSPSW1
model, has resulted in a slight decrease in the peak interstory drift ratio from 2.09% to 1.96%.
What is indeed important here is not the slight decrease in the peak interstory drift ratio, but no
increase in the peak interstory drift ratio due to the use of LYP steel infill plates with the same
thickness and considerably lower yield stress relative to the conventional ASTM A36 steel. One
important finding which requires attention is the slight increase in the peak story and interstory
drift ratios in case of the GF-LYPSPSW3 model in spite of the decreasing trend in the peak drift
ratios due to the increase in thicknesses of the LYP steel infill plates. Based on the results of the
studies reported by Caccese et al. (1993) and Habashi and Alinia (2010), the increase in peak
drift ratios in this case may be attributed to the fact that large plate thicknesses increase the
overall system demand on the adjacent frame particularly vertical boundary members and the
performance and failure of the structure may be governed by the column instability.
The assessment of the drift response of the 9-story GF-CSPSW and GF-LYPSPSW2 models
under seismic loading, also, shows that retrofit of a conventional steel shear wall system with
LYP steel infill plates having twice the existing plate thickness, as addressed in Chapter 5,
results in a desirable drift performance as the story and interstory drifts are effectively decreased
due to such a retrofitting strategy. The 9th
story drift ratio time histories of the MRF, GF-
CSPSW, and GF-LYPSPSW2 models for three sample ground motions are shown in Fig. 7.16.
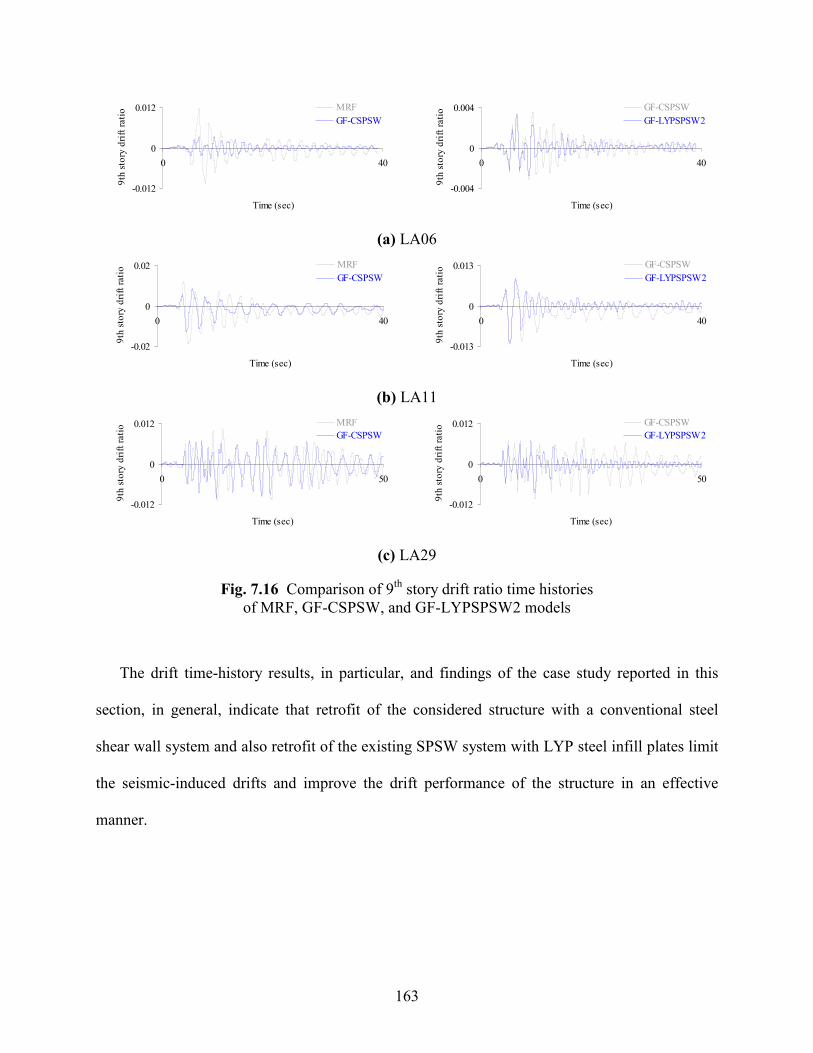
163
-0.012
0
0.012
0 40
Time (sec)
9th
sto
ry d
rift
rati
o MRF
GF-CSPSW
-0.004
0
0.004
0 40
Time (sec)
9th
sto
ry d
rift
rati
o GF-CSPSW
GF-LYPSPSW2
(a) LA06
-0.02
0
0.02
0 40
Time (sec)
9th
sto
ry d
rift
rati
o MRF
GF-CSPSW
-0.013
0
0.013
0 40
Time (sec)
9th
sto
ry d
rift
rati
o GF-CSPSW
GF-LYPSPSW2
(b) LA11
-0.012
0
0.012
0 50
Time (sec)
9th
sto
ry d
rift
rati
o MRF
GF-CSPSW
-0.012
0
0.012
0 50
Time (sec)
9th
sto
ry d
rift
rati
o GF-CSPSW
GF-LYPSPSW2
(c) LA29
Fig. 7.16 Comparison of 9th
story drift ratio time histories
of MRF, GF-CSPSW, and GF-LYPSPSW2 models
The drift time-history results, in particular, and findings of the case study reported in this
section, in general, indicate that retrofit of the considered structure with a conventional steel
shear wall system and also retrofit of the existing SPSW system with LYP steel infill plates limit
the seismic-induced drifts and improve the drift performance of the structure in an effective
manner.

164
7.6.2 Story Acceleration
Acceleration is another important criterion in seismic design and retrofit of structures which
may cause damages to the structural and especially nonstructural systems as well as contents and
consequently result in considerable economic loss. While damage to the structural system is the
most important measure of building damage affecting casualties and catastrophic loss of
function, damage to nonstructural systems and contents tends to dominate economic loss
(HAZUS-MH MR5, 2010).
Considering the relatively high stiffness of SPSW systems and its effectiveness in controlling
the lateral displacements, the seismic-induced accelerations also have to be taken into
consideration in efficient seismic design and retrofit of buildings using such lateral force-
resisting systems. In fact, high stiffness may result in elastic behavior of SPSW systems and
amplify the acceleration response of the structures. If the SPSW infill plate thicknesses,
boundary frame members, and configuration are properly designed to meet the seismic
provisions without significant design over-strength, then nonlinearities in the seismic response
will reduce expected accelerations (Eatherton, 2006).
A well-known example of the acceleration-related damages is the Olive View Medical
Center building in Sylmar, California, which employed stiffened SPSWs as part of its lateral
force-resisting system. During the Northridge earthquake, this building experienced peak
acceleration of 2.31g at the roof level due to the high stiffness while its peak ground floor
acceleration was 0.82g. This building suffered minor structural damage but considerable
nonstructural damage during the earthquake (Çelebi, 1997).
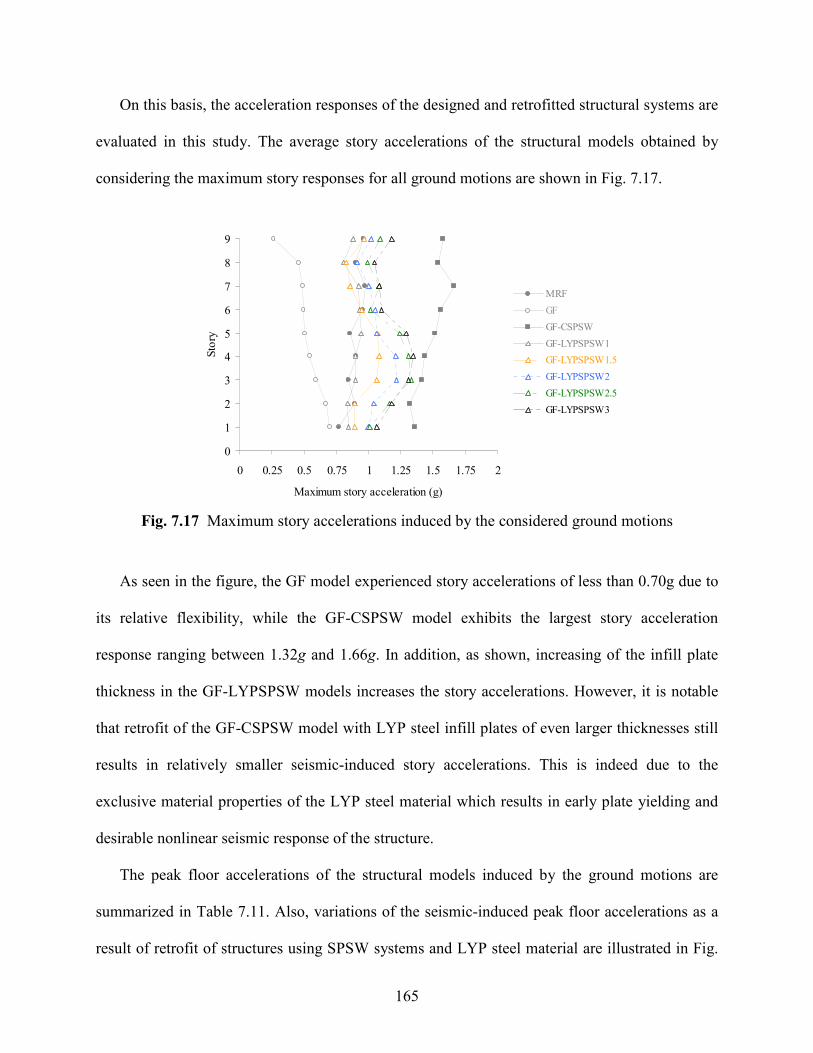
165
On this basis, the acceleration responses of the designed and retrofitted structural systems are
evaluated in this study. The average story accelerations of the structural models obtained by
considering the maximum story responses for all ground motions are shown in Fig. 7.17.
0
1
2
3
4
5
6
7
8
9
0 0.25 0.5 0.75 1 1.25 1.5 1.75 2
Maximum story acceleration (g)
Sto
ry
MRF
GF
GF-CSPSW
GF-LYPSPSW1
GF-LYPSPSW1.5
GF-LYPSPSW2
GF-LYPSPSW2.5
GF-LYPSPSW3
Fig. 7.17 Maximum story accelerations induced by the considered ground motions
As seen in the figure, the GF model experienced story accelerations of less than 0.70g due to
its relative flexibility, while the GF-CSPSW model exhibits the largest story acceleration
response ranging between 1.32g and 1.66g. In addition, as shown, increasing of the infill plate
thickness in the GF-LYPSPSW models increases the story accelerations. However, it is notable
that retrofit of the GF-CSPSW model with LYP steel infill plates of even larger thicknesses still
results in relatively smaller seismic-induced story accelerations. This is indeed due to the
exclusive material properties of the LYP steel material which results in early plate yielding and
desirable nonlinear seismic response of the structure.
The peak floor accelerations of the structural models induced by the ground motions are
summarized in Table 7.11. Also, variations of the seismic-induced peak floor accelerations as a
result of retrofit of structures using SPSW systems and LYP steel material are illustrated in Fig.

166
7.18. The average values for the peak floor acceleration shown in Fig. 7.18 are obtained by
considering the peak acceleration responses for all ground motions as provided in Table 7.11.
Table 7.11 Peak floor accelerations (g) of the structural models induced by ground motions
Ground motion Model
LA02 LA06 LA11 LA16 LA18 LA19 LA21 LA23 LA25 LA28 LA29
MRF 1.158 0.586 0.887 0.775 1.185 1.205 1.388 0.872 1.173 1.549 1.273
GF 0.586 0.287 0.546 0.546 0.661 0.871 1.042 0.872 0.785 1.281 0.809
GF-CSPSW 1.847 0.762 1.562 2.066 1.659 1.764 2.664 2.087 1.965 2.208 2.169
GF-LYPSPSW1 0.807 0.463 1.061 1.349 1.266 1.040 1.355 1.046 1.052 1.625 0.919
GF-LYPSPSW1.5 0.863 0.475 1.366 1.323 1.352 1.043 1.650 0.758 1.365 1.880 0.868
GF-LYPSPSW2 1.181 0.574 1.296 1.399 1.202 1.419 2.215 0.820 1.442 2.110 1.029
GF-LYPSPSW2.5 1.109 0.555 1.243 1.459 1.695 1.603 2.533 1.030 1.487 2.351 1.125
GF-LYPSPSW3 1.067 0.745 1.017 1.397 1.509 1.765 2.695 0.977 1.731 2.571 1.195
1.096
0.753
1.887
1.0891.177
1.335
1.472 1.515
0
0.2
0.4
0.6
0.8
1
1.2
1.4
1.6
1.8
2
MRF GF GF-CSPSW GF-LYPSPSW1 GF-LYPSPSW1.5 GF-LYPSPSW2 GF-LYPSPSW2.5 GF-LYPSPSW3
Pea
k f
loor
acce
lera
tion
(g)
Fig. 7.18 Variations of seismic-induced peak floor accelerations due to
retrofit of structures using SPSW systems and LYP steel material
These results indicate that employment of LYP steel material in design and retrofit of
structures in areas with high seismicity would result in desirable seismic performance with
limited earthquake-induced peak floor accelerations. From the figure, it is evident that
employment of conventional steel infill plates significantly amplifies the peak floor acceleration
of the GF-CSPSW model relative to that of the MRF model, whereas retrofitting of the GF-
CSPSW model with LYP steel infill plates effectively controls the seismic-induced peak floor
acceleration. Even in the extreme case, i.e. GF-LYPSPSW3 model with the largest infill plate
thickness, the peak floor acceleration is still below that of the GF-CSPSW model.
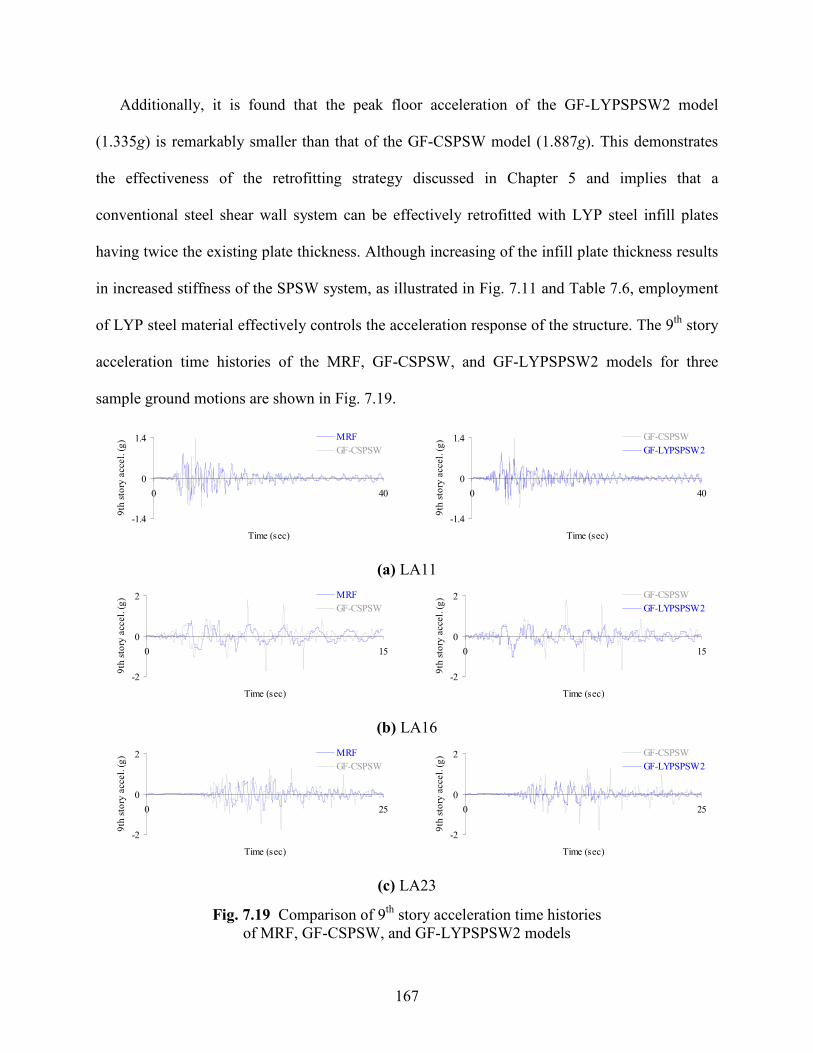
167
Additionally, it is found that the peak floor acceleration of the GF-LYPSPSW2 model
(1.335g) is remarkably smaller than that of the GF-CSPSW model (1.887g). This demonstrates
the effectiveness of the retrofitting strategy discussed in Chapter 5 and implies that a
conventional steel shear wall system can be effectively retrofitted with LYP steel infill plates
having twice the existing plate thickness. Although increasing of the infill plate thickness results
in increased stiffness of the SPSW system, as illustrated in Fig. 7.11 and Table 7.6, employment
of LYP steel material effectively controls the acceleration response of the structure. The 9th
story
acceleration time histories of the MRF, GF-CSPSW, and GF-LYPSPSW2 models for three
sample ground motions are shown in Fig. 7.19.
-1.4
0
1.4
0 40
Time (sec)
9th
sto
ry a
ccel.
(g
) MRF
GF-CSPSW
-1.4
0
1.4
0 40
Time (sec)
9th
sto
ry a
ccel.
(g
) GF-CSPSW
GF-LYPSPSW2
(a) LA11
-2
0
2
0 15
Time (sec)
9th
sto
ry a
ccel.
(g
) MRF
GF-CSPSW
-2
0
2
0 15
Time (sec)
9th
sto
ry a
ccel.
(g
) GF-CSPSW
GF-LYPSPSW2
(b) LA16
-2
0
2
0 25
Time (sec)
9th
sto
ry a
ccel.
(g
) MRF
GF-CSPSW
-2
0
2
0 25
Time (sec)
9th
sto
ry a
ccel.
(g
) GF-CSPSW
GF-LYPSPSW2
(c) LA23
Fig. 7.19 Comparison of 9th
story acceleration time histories
of MRF, GF-CSPSW, and GF-LYPSPSW2 models
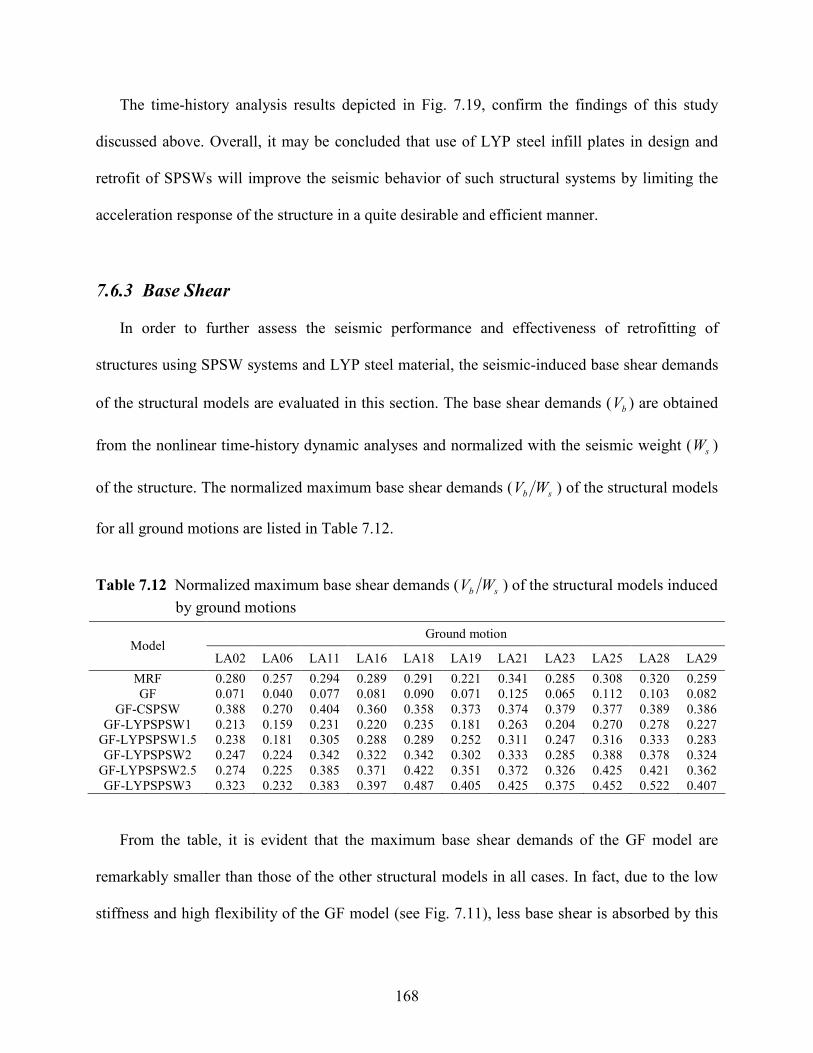
168
The time-history analysis results depicted in Fig. 7.19, confirm the findings of this study
discussed above. Overall, it may be concluded that use of LYP steel infill plates in design and
retrofit of SPSWs will improve the seismic behavior of such structural systems by limiting the
acceleration response of the structure in a quite desirable and efficient manner.
7.6.3 Base Shear
In order to further assess the seismic performance and effectiveness of retrofitting of
structures using SPSW systems and LYP steel material, the seismic-induced base shear demands
of the structural models are evaluated in this section. The base shear demands ( bV ) are obtained
from the nonlinear time-history dynamic analyses and normalized with the seismic weight ( sW )
of the structure. The normalized maximum base shear demands ( sb WV ) of the structural models
for all ground motions are listed in Table 7.12.
Table 7.12 Normalized maximum base shear demands ( sb WV ) of the structural models induced
by ground motions
Ground motion Model
LA02 LA06 LA11 LA16 LA18 LA19 LA21 LA23 LA25 LA28 LA29
MRF 0.280 0.257 0.294 0.289 0.291 0.221 0.341 0.285 0.308 0.320 0.259
GF 0.071 0.040 0.077 0.081 0.090 0.071 0.125 0.065 0.112 0.103 0.082
GF-CSPSW 0.388 0.270 0.404 0.360 0.358 0.373 0.374 0.379 0.377 0.389 0.386
GF-LYPSPSW1 0.213 0.159 0.231 0.220 0.235 0.181 0.263 0.204 0.270 0.278 0.227
GF-LYPSPSW1.5 0.238 0.181 0.305 0.288 0.289 0.252 0.311 0.247 0.316 0.333 0.283
GF-LYPSPSW2 0.247 0.224 0.342 0.322 0.342 0.302 0.333 0.285 0.388 0.378 0.324
GF-LYPSPSW2.5 0.274 0.225 0.385 0.371 0.422 0.351 0.372 0.326 0.425 0.421 0.362
GF-LYPSPSW3 0.323 0.232 0.383 0.397 0.487 0.405 0.425 0.375 0.452 0.522 0.407
From the table, it is evident that the maximum base shear demands of the GF model are
remarkably smaller than those of the other structural models in all cases. In fact, due to the low
stiffness and high flexibility of the GF model (see Fig. 7.11), less base shear is absorbed by this
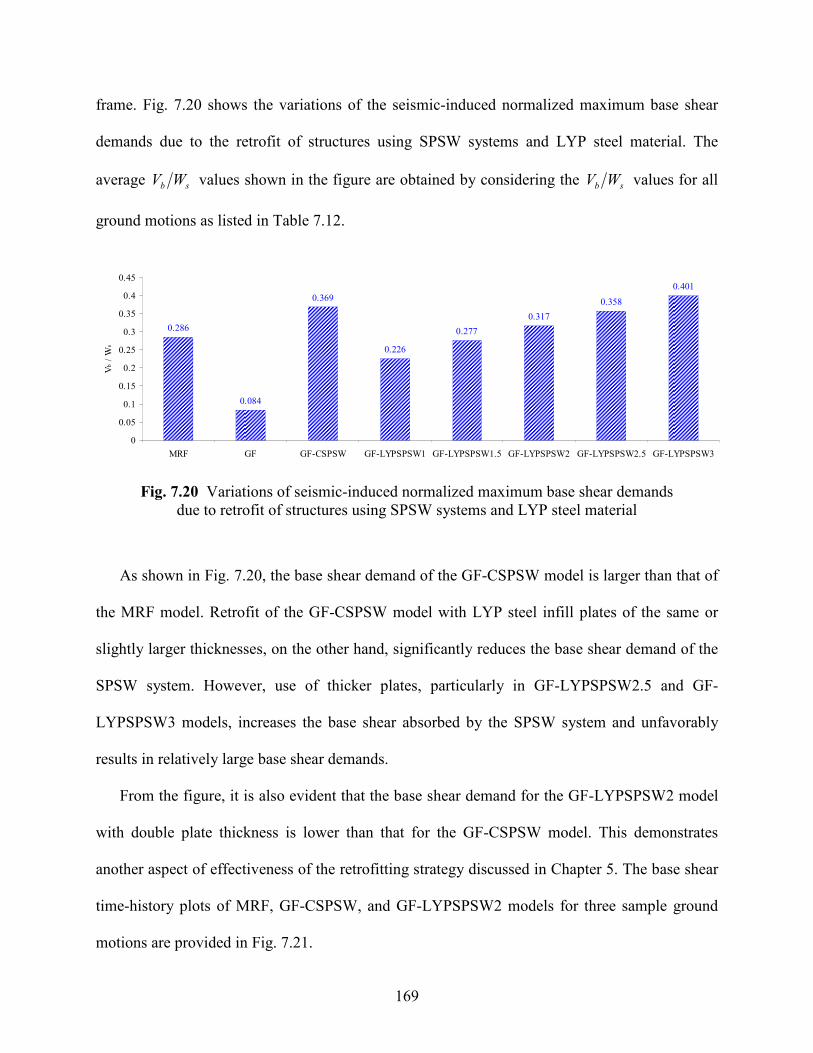
169
frame. Fig. 7.20 shows the variations of the seismic-induced normalized maximum base shear
demands due to the retrofit of structures using SPSW systems and LYP steel material. The
average sb WV values shown in the figure are obtained by considering the sb WV values for all
ground motions as listed in Table 7.12.
0.286
0.084
0.369
0.226
0.277
0.317
0.358
0.401
0
0.05
0.1
0.15
0.2
0.25
0.3
0.35
0.4
0.45
MRF GF GF-CSPSW GF-LYPSPSW1 GF-LYPSPSW1.5 GF-LYPSPSW2 GF-LYPSPSW2.5 GF-LYPSPSW3
Vb /
Ws
Fig. 7.20 Variations of seismic-induced normalized maximum base shear demands
due to retrofit of structures using SPSW systems and LYP steel material
As shown in Fig. 7.20, the base shear demand of the GF-CSPSW model is larger than that of
the MRF model. Retrofit of the GF-CSPSW model with LYP steel infill plates of the same or
slightly larger thicknesses, on the other hand, significantly reduces the base shear demand of the
SPSW system. However, use of thicker plates, particularly in GF-LYPSPSW2.5 and GF-
LYPSPSW3 models, increases the base shear absorbed by the SPSW system and unfavorably
results in relatively large base shear demands.
From the figure, it is also evident that the base shear demand for the GF-LYPSPSW2 model
with double plate thickness is lower than that for the GF-CSPSW model. This demonstrates
another aspect of effectiveness of the retrofitting strategy discussed in Chapter 5. The base shear
time-history plots of MRF, GF-CSPSW, and GF-LYPSPSW2 models for three sample ground
motions are provided in Fig. 7.21.
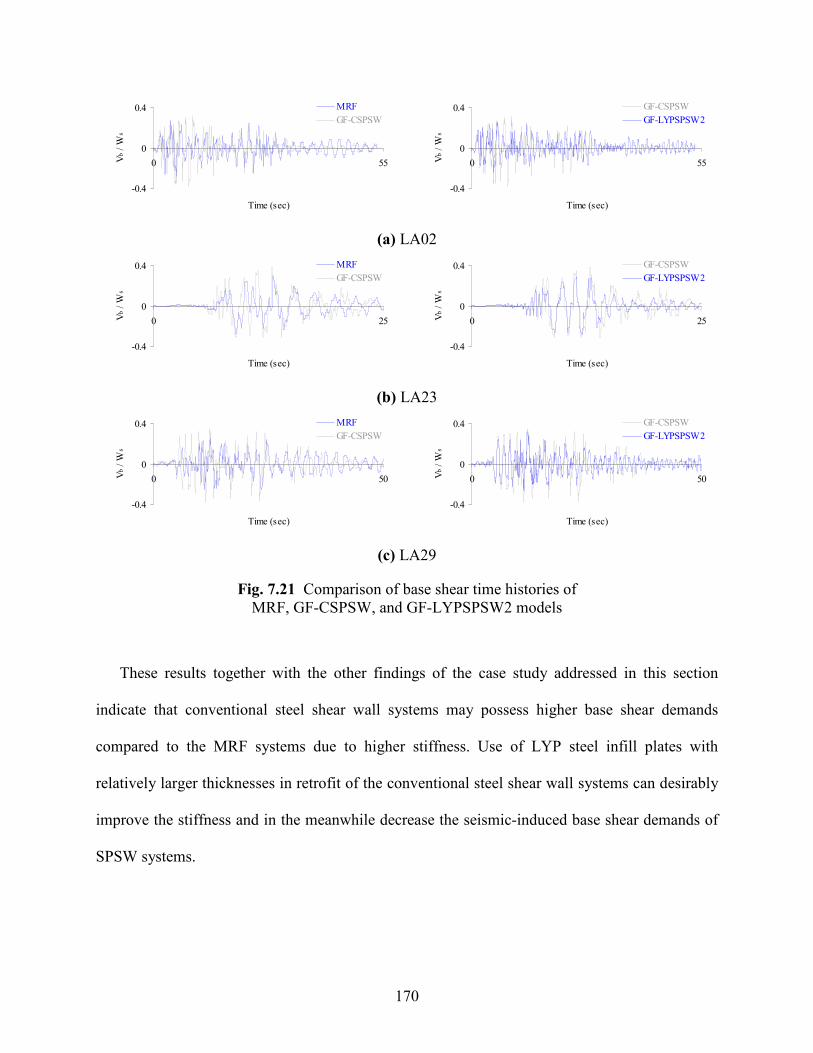
170
-0.4
0
0.4
0 55
Time (sec)
Vb /
Ws
MRF
GF-CSPSW
-0.4
0
0.4
0 55
Time (sec)
Vb /
Ws
GF-CSPSW
GF-LYPSPSW2
(a) LA02
-0.4
0
0.4
0 25
Time (sec)
Vb /
Ws
MRF
GF-CSPSW
-0.4
0
0.4
0 25
Time (sec)
Vb /
Ws
GF-CSPSW
GF-LYPSPSW2
(b) LA23
-0.4
0
0.4
0 50
Time (sec)
Vb /
Ws
MRF
GF-CSPSW
-0.4
0
0.4
0 50
Time (sec)
Vb /
Ws
GF-CSPSW
GF-LYPSPSW2
(c) LA29
Fig. 7.21 Comparison of base shear time histories of
MRF, GF-CSPSW, and GF-LYPSPSW2 models
These results together with the other findings of the case study addressed in this section
indicate that conventional steel shear wall systems may possess higher base shear demands
compared to the MRF systems due to higher stiffness. Use of LYP steel infill plates with
relatively larger thicknesses in retrofit of the conventional steel shear wall systems can desirably
improve the stiffness and in the meanwhile decrease the seismic-induced base shear demands of
SPSW systems.
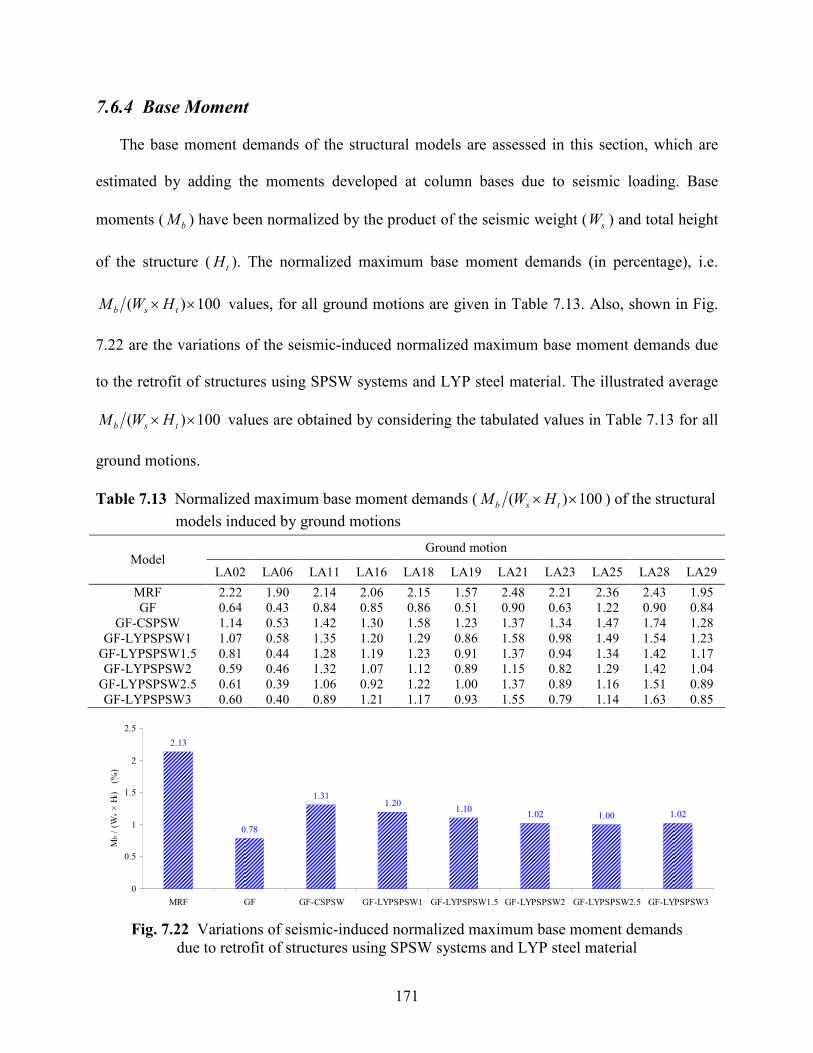
171
7.6.4 Base Moment
The base moment demands of the structural models are assessed in this section, which are
estimated by adding the moments developed at column bases due to seismic loading. Base
moments ( bM ) have been normalized by the product of the seismic weight ( sW ) and total height
of the structure ( tH ). The normalized maximum base moment demands (in percentage), i.e.
100)( ×× tsb HWM values, for all ground motions are given in Table 7.13. Also, shown in Fig.
7.22 are the variations of the seismic-induced normalized maximum base moment demands due
to the retrofit of structures using SPSW systems and LYP steel material. The illustrated average
100)( ×× tsb HWM values are obtained by considering the tabulated values in Table 7.13 for all
ground motions.
Table 7.13 Normalized maximum base moment demands ( 100)( ×× tsb HWM ) of the structural
models induced by ground motions
Ground motion Model
LA02 LA06 LA11 LA16 LA18 LA19 LA21 LA23 LA25 LA28 LA29
MRF 2.22 1.90 2.14 2.06 2.15 1.57 2.48 2.21 2.36 2.43 1.95
GF 0.64 0.43 0.84 0.85 0.86 0.51 0.90 0.63 1.22 0.90 0.84
GF-CSPSW 1.14 0.53 1.42 1.30 1.58 1.23 1.37 1.34 1.47 1.74 1.28
GF-LYPSPSW1 1.07 0.58 1.35 1.20 1.29 0.86 1.58 0.98 1.49 1.54 1.23
GF-LYPSPSW1.5 0.81 0.44 1.28 1.19 1.23 0.91 1.37 0.94 1.34 1.42 1.17
GF-LYPSPSW2 0.59 0.46 1.32 1.07 1.12 0.89 1.15 0.82 1.29 1.42 1.04
GF-LYPSPSW2.5 0.61 0.39 1.06 0.92 1.22 1.00 1.37 0.89 1.16 1.51 0.89
GF-LYPSPSW3 0.60 0.40 0.89 1.21 1.17 0.93 1.55 0.79 1.14 1.63 0.85
2.13
0.78
1.311.20
1.101.02 1.00 1.02
0
0.5
1
1.5
2
2.5
MRF GF GF-CSPSW GF-LYPSPSW1 GF-LYPSPSW1.5 GF-LYPSPSW2 GF-LYPSPSW2.5 GF-LYPSPSW3
Mb /
(W
s ×
Ht )
(
%)
Fig. 7.22 Variations of seismic-induced normalized maximum base moment demands
due to retrofit of structures using SPSW systems and LYP steel material
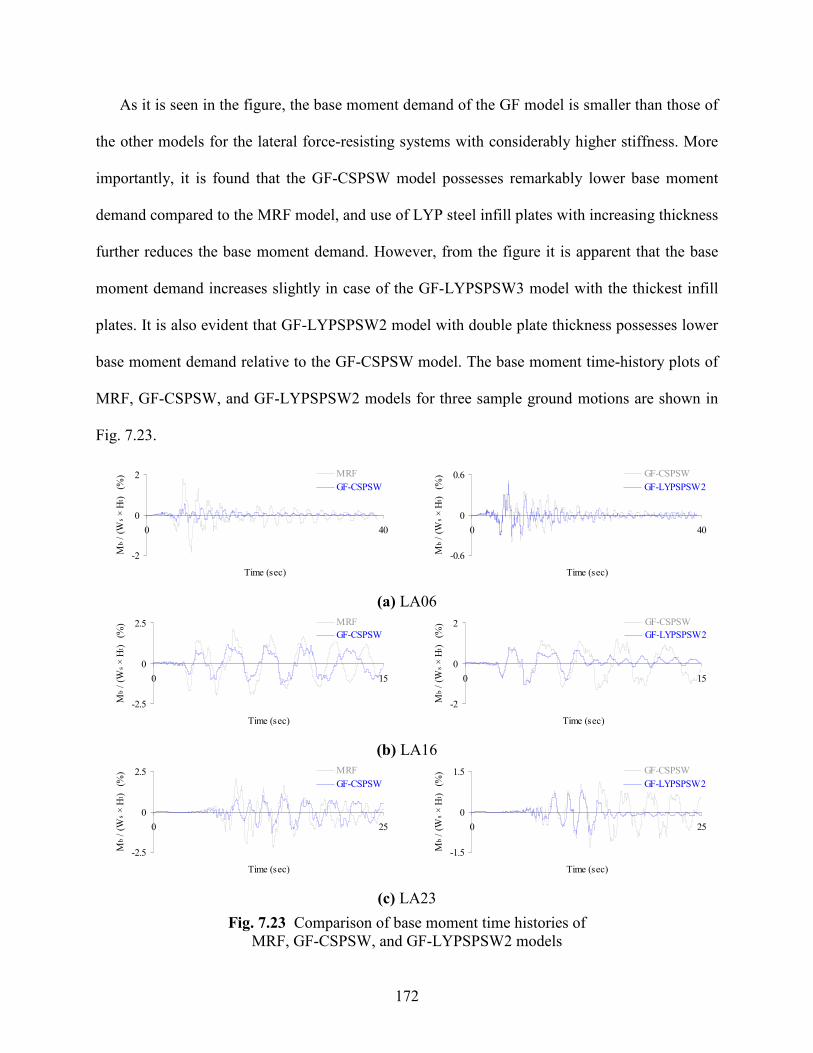
172
As it is seen in the figure, the base moment demand of the GF model is smaller than those of
the other models for the lateral force-resisting systems with considerably higher stiffness. More
importantly, it is found that the GF-CSPSW model possesses remarkably lower base moment
demand compared to the MRF model, and use of LYP steel infill plates with increasing thickness
further reduces the base moment demand. However, from the figure it is apparent that the base
moment demand increases slightly in case of the GF-LYPSPSW3 model with the thickest infill
plates. It is also evident that GF-LYPSPSW2 model with double plate thickness possesses lower
base moment demand relative to the GF-CSPSW model. The base moment time-history plots of
MRF, GF-CSPSW, and GF-LYPSPSW2 models for three sample ground motions are shown in
Fig. 7.23.
-2
0
2
0 40
Time (sec)
Mb /
(W
s ×
Ht )
(
%) MRF
GF-CSPSW
-0.6
0
0.6
0 40
Time (sec)
Mb /
(W
s ×
Ht )
(
%) GF-CSPSW
GF-LYPSPSW2
(a) LA06
-2.5
0
2.5
0 15
Time (sec)
Mb /
(W
s ×
Ht )
(
%) MRF
GF-CSPSW
-2
0
2
0 15
Time (sec)
Mb /
(W
s ×
Ht )
(
%) GF-CSPSW
GF-LYPSPSW2
(b) LA16
-2.5
0
2.5
0 25
Time (sec)
Mb /
(W
s ×
Ht )
(
%) MRF
GF-CSPSW
-1.5
0
1.5
0 25
Time (sec)
Mb /
(W
s ×
Ht )
(
%) GF-CSPSW
GF-LYPSPSW2
(c) LA23
Fig. 7.23 Comparison of base moment time histories of
MRF, GF-CSPSW, and GF-LYPSPSW2 models
173
Consistent with the other findings of this case study, the time-history plots clearly show that
the base moment demands of the GF-CSPSW model are lower than those of the MRF model.
Also, employment of LYP steel infill plates with double thickness in the GF-LYPSPSW2 model
effectively reduces the base moment demands in comparison with the response of the GF-
CSPSW model.
On the whole, these results indicate the relative effectiveness of SPSW systems in limiting
the base moment demands compared to the moment-resisting frames, and also retrofit of SPSW
systems with LYP steel infill plates results in reduced base moment demands due to early
yielding and energy absorption capacity of the LYP steel material as the plate thicknesses
increase up to a certain limit.
7.6.5 VBE Axial Loads at Column Bases
According to the fundamental mechanics of SPSWs, VBEs are subjected to combined axial
force and transverse force developed by the tension-field action of the infill plates. Therefore,
changes in web-plate thickness as well as material properties can have a significant impact on the
design and performance of the surrounding column members in such systems. On this basis, in
order to evaluate the effects of retrofitting of SPSW systems with LYP steel infill plates having
relatively larger thicknesses on the VBE axial load demands, the maximum VBE axial load
demands at the column bases of the SPSW models are evaluated in this section. The maximum
VBE axial loads at the column bases ( baseVBEP − ) have been normalized by the axial yield strength
( yP ) of the first story VBE, i.e. W14×730 as shown in Table 7.1. The normalized maximum
VBE axial load demands at column bases, i.e. ybaseVBE PP − values, from nonlinear time-history

174
analyses for all ground motions are provided in Table 7.14. The average ybaseVBE PP − values are
also shown in Fig. 7.24.
Table 7.14 Normalized maximum VBE axial load demands ( ybaseVBE PP − ) at column bases of
the SPSW models induced by ground motions
Ground motion Model
LA02 LA06 LA11 LA16 LA18 LA19 LA21 LA23 LA25 LA28 LA29
GF-CSPSW 0.71 0.49 0.87 0.89 0.81 0.59 0.86 0.81 0.87 0.90 0.75
GF-LYPSPSW1 0.41 0.35 0.53 0.55 0.55 0.32 0.58 0.46 0.49 0.58 0.48
GF-LYPSPSW1.5 0.51 0.41 0.69 0.71 0.69 0.40 0.75 0.58 0.62 0.76 0.61
GF-LYPSPSW2 0.63 0.50 0.82 0.84 0.80 0.52 0.88 0.73 0.79 0.92 0.69
GF-LYPSPSW2.5 0.75 0.55 0.91 0.95 0.87 0.56 0.98 0.84 0.97 0.97 0.76
GF-LYPSPSW3 0.87 0.62 0.98 0.98 0.94 0.62 1.00 0.91 0.99 0.97 0.85
0.78
0.48
0.61
0.74
0.830.89
0
0.1
0.2
0.3
0.4
0.5
0.6
0.7
0.8
0.9
1
GF-CSPSW GF-LYPSPSW1 GF-LYPSPSW1.5 GF-LYPSPSW2 GF-LYPSPSW2.5 GF-LYPSPSW3
PV
BE
-bas
e /
Py
Fig. 7.24 Variations of seismic-induced normalized maximum VBE axial load demands
at column bases due to retrofit of SPSWs using LYP steel material
From the analysis results in Table 7.14, it is found that all ybaseVBE PP − values are below 1.00.
This indicates that the seismic-induced axial loads at the column bases of the SPSW frames did
not exceed the axial yield strength of the first story VBE designed in accordance with the AISC
341-10 (2010) seismic provisions. Additionally, Fig. 7.24 shows that increasing of the infill plate
thickness increases the VBE axial load demand. Also, retrofit of the GF-CSPSW model using
LYP steel infill plates with 1.0, 1.5, and 2.0 times (larger) thicknesses results in relatively
175
smaller VBE axial load demands, while the GF-LYPSPSW2.5 and GF-LYPSPSW3 models
possess larger VBE axial load demands compared to the GF-CSPSW model. This interesting
finding clearly shows that the GF-LYPSPSW2 model can be a desirable retrofit option for the
GF-CSPSW model. It is important to note that such a favorable seismic response is provided as a
result of impact of the beneficial LYP steel material properties.
7.6.6 Web Plate Ductility Ratio and Energy Dissipation Mechanism
Structural systems designed for high-seismic loading are expected to undergo multiple cycles
of loading into the inelastic range with controlled damage accepted as a means of dissipating the
energy of the earthquake. The ability of a system to withstand such loading is termed “system
ductility”. In the case of SPSW systems, the web plates are the locations where inelastic strain
demands are primarily expected to occur, and hence ductility of steel web plates in such lateral
force-resisting systems will result in good performance under severe seismic loading. On this
basis, the high-seismic design of SPSW systems is based on confining ductility demands
primarily to the web plates and also to plastic hinges in the HBE at the VBE face (Sabelli and
Bruneau, 2006).
Based on various reported experimental and analytical studies on SPSWs, as partly listed by
Sabelli and Bruneau (2006), properly-designed systems have by and large exhibited significant
ductility. For instance, some conventional and LYP steel shear walls tested by Berman and
Bruneau (2005) and Chen and Jhang (2006 and 2011), respectively, reached a web plate ductility
ratio of 12 prior to failure. Also, recent analytical studies reported by Berman (2011) on seismic
behavior of code-designed SPSWs using nonlinear response history analysis for ground motions
representing different hazard levels have demonstrated that web plate ductility demands are
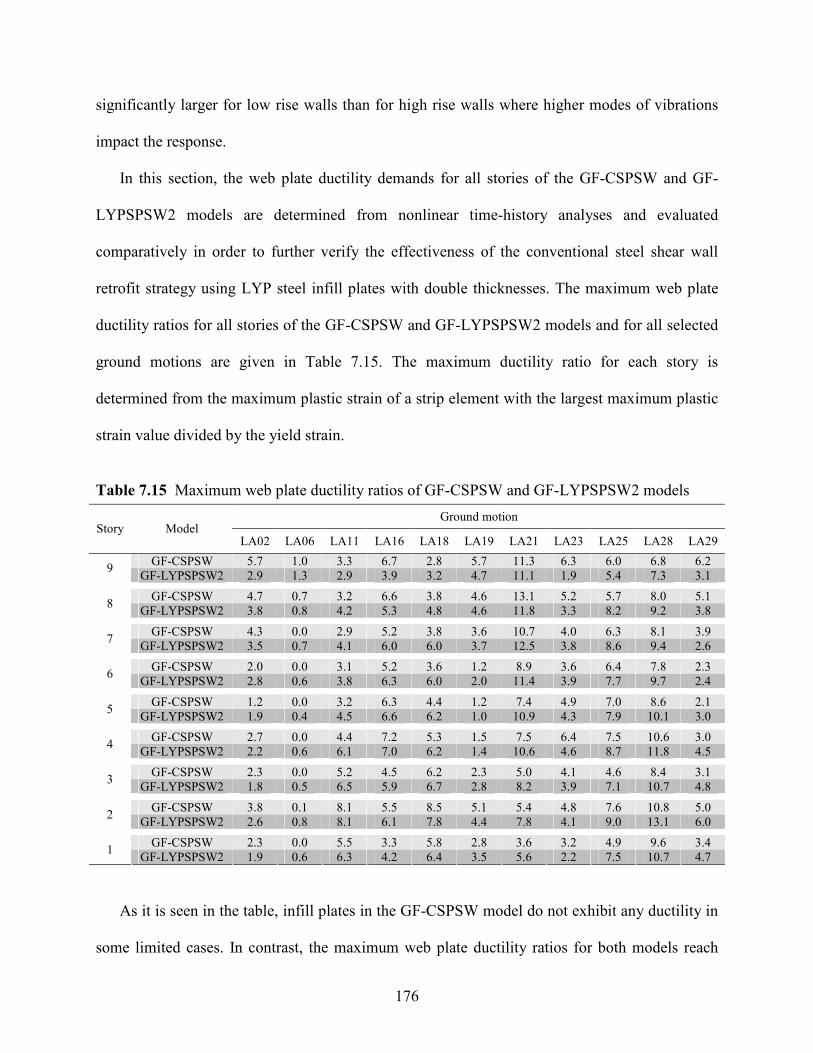
176
significantly larger for low rise walls than for high rise walls where higher modes of vibrations
impact the response.
In this section, the web plate ductility demands for all stories of the GF-CSPSW and GF-
LYPSPSW2 models are determined from nonlinear time-history analyses and evaluated
comparatively in order to further verify the effectiveness of the conventional steel shear wall
retrofit strategy using LYP steel infill plates with double thicknesses. The maximum web plate
ductility ratios for all stories of the GF-CSPSW and GF-LYPSPSW2 models and for all selected
ground motions are given in Table 7.15. The maximum ductility ratio for each story is
determined from the maximum plastic strain of a strip element with the largest maximum plastic
strain value divided by the yield strain.
Table 7.15 Maximum web plate ductility ratios of GF-CSPSW and GF-LYPSPSW2 models
Ground motion Story Model
LA02 LA06 LA11 LA16 LA18 LA19 LA21 LA23 LA25 LA28 LA29
GF-CSPSW 5.7 1.0 3.3 6.7 2.8 5.7 11.3 6.3 6.0 6.8 6.2 9
GF-LYPSPSW2 2.9 1.3 2.9 3.9 3.2 4.7 11.1 1.9 5.4 7.3 3.1
GF-CSPSW 4.7 0.7 3.2 6.6 3.8 4.6 13.1 5.2 5.7 8.0 5.1 8
GF-LYPSPSW2 3.8 0.8 4.2 5.3 4.8 4.6 11.8 3.3 8.2 9.2 3.8
GF-CSPSW 4.3 0.0 2.9 5.2 3.8 3.6 10.7 4.0 6.3 8.1 3.9 7
GF-LYPSPSW2 3.5 0.7 4.1 6.0 6.0 3.7 12.5 3.8 8.6 9.4 2.6
GF-CSPSW 2.0 0.0 3.1 5.2 3.6 1.2 8.9 3.6 6.4 7.8 2.3 6
GF-LYPSPSW2 2.8 0.6 3.8 6.3 6.0 2.0 11.4 3.9 7.7 9.7 2.4
GF-CSPSW 1.2 0.0 3.2 6.3 4.4 1.2 7.4 4.9 7.0 8.6 2.1 5
GF-LYPSPSW2 1.9 0.4 4.5 6.6 6.2 1.0 10.9 4.3 7.9 10.1 3.0
GF-CSPSW 2.7 0.0 4.4 7.2 5.3 1.5 7.5 6.4 7.5 10.6 3.0 4
GF-LYPSPSW2 2.2 0.6 6.1 7.0 6.2 1.4 10.6 4.6 8.7 11.8 4.5
GF-CSPSW 2.3 0.0 5.2 4.5 6.2 2.3 5.0 4.1 4.6 8.4 3.1 3
GF-LYPSPSW2 1.8 0.5 6.5 5.9 6.7 2.8 8.2 3.9 7.1 10.7 4.8
GF-CSPSW 3.8 0.1 8.1 5.5 8.5 5.1 5.4 4.8 7.6 10.8 5.0 2
GF-LYPSPSW2 2.6 0.8 8.1 6.1 7.8 4.4 7.8 4.1 9.0 13.1 6.0
GF-CSPSW 2.3 0.0 5.5 3.3 5.8 2.8 3.6 3.2 4.9 9.6 3.4 1
GF-LYPSPSW2 1.9 0.6 6.3 4.2 6.4 3.5 5.6 2.2 7.5 10.7 4.7
As it is seen in the table, infill plates in the GF-CSPSW model do not exhibit any ductility in
some limited cases. In contrast, the maximum web plate ductility ratios for both models reach
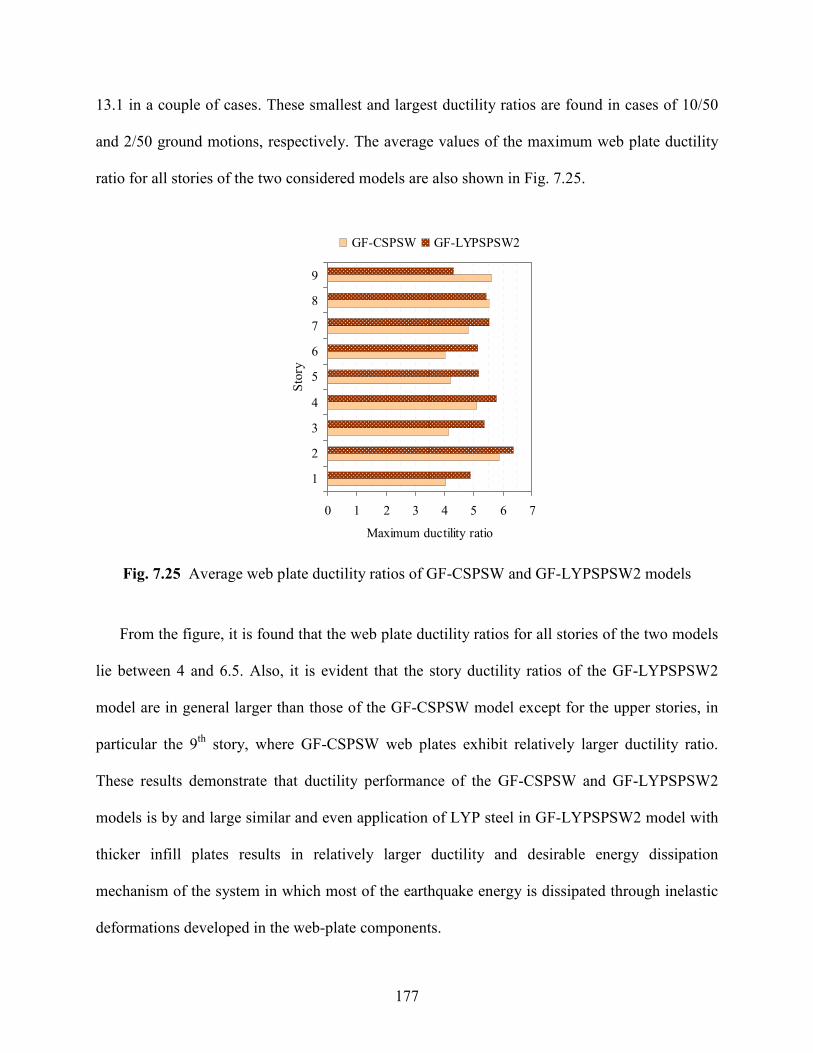
177
13.1 in a couple of cases. These smallest and largest ductility ratios are found in cases of 10/50
and 2/50 ground motions, respectively. The average values of the maximum web plate ductility
ratio for all stories of the two considered models are also shown in Fig. 7.25.
0 1 2 3 4 5 6 7
1
2
3
4
5
6
7
8
9
Sto
ry
Maximum ductility ratio
GF-CSPSW GF-LYPSPSW2
Fig. 7.25 Average web plate ductility ratios of GF-CSPSW and GF-LYPSPSW2 models
From the figure, it is found that the web plate ductility ratios for all stories of the two models
lie between 4 and 6.5. Also, it is evident that the story ductility ratios of the GF-LYPSPSW2
model are in general larger than those of the GF-CSPSW model except for the upper stories, in
particular the 9th
story, where GF-CSPSW web plates exhibit relatively larger ductility ratio.
These results demonstrate that ductility performance of the GF-CSPSW and GF-LYPSPSW2
models is by and large similar and even application of LYP steel in GF-LYPSPSW2 model with
thicker infill plates results in relatively larger ductility and desirable energy dissipation
mechanism of the system in which most of the earthquake energy is dissipated through inelastic
deformations developed in the web-plate components.
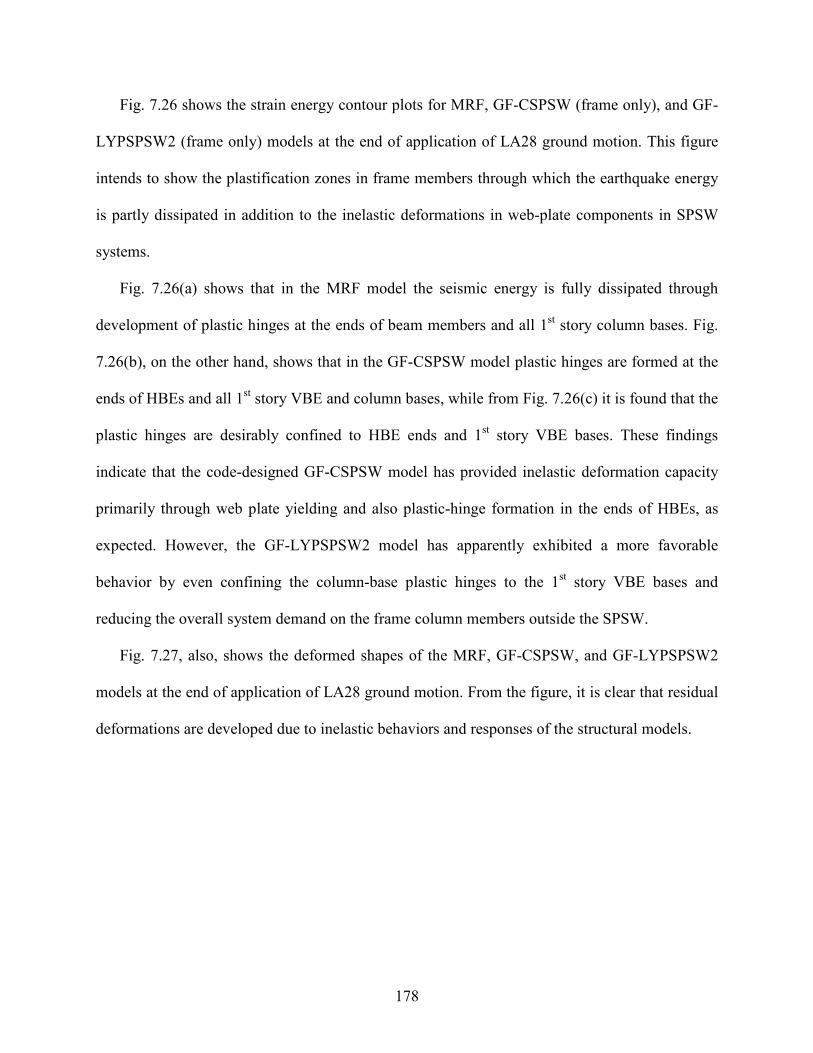
178
Fig. 7.26 shows the strain energy contour plots for MRF, GF-CSPSW (frame only), and GF-
LYPSPSW2 (frame only) models at the end of application of LA28 ground motion. This figure
intends to show the plastification zones in frame members through which the earthquake energy
is partly dissipated in addition to the inelastic deformations in web-plate components in SPSW
systems.
Fig. 7.26(a) shows that in the MRF model the seismic energy is fully dissipated through
development of plastic hinges at the ends of beam members and all 1st story column bases. Fig.
7.26(b), on the other hand, shows that in the GF-CSPSW model plastic hinges are formed at the
ends of HBEs and all 1st story VBE and column bases, while from Fig. 7.26(c) it is found that the
plastic hinges are desirably confined to HBE ends and 1st story VBE bases. These findings
indicate that the code-designed GF-CSPSW model has provided inelastic deformation capacity
primarily through web plate yielding and also plastic-hinge formation in the ends of HBEs, as
expected. However, the GF-LYPSPSW2 model has apparently exhibited a more favorable
behavior by even confining the column-base plastic hinges to the 1st story VBE bases and
reducing the overall system demand on the frame column members outside the SPSW.
Fig. 7.27, also, shows the deformed shapes of the MRF, GF-CSPSW, and GF-LYPSPSW2
models at the end of application of LA28 ground motion. From the figure, it is clear that residual
deformations are developed due to inelastic behaviors and responses of the structural models.
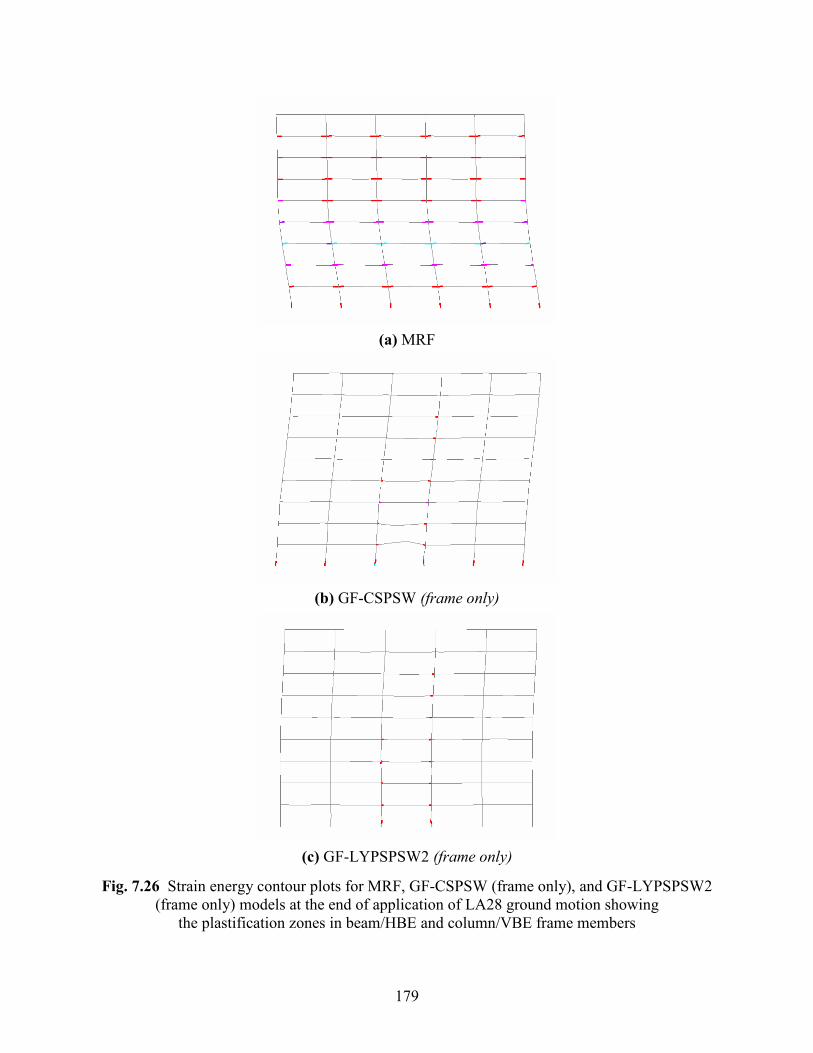
179
(a) MRF
(b) GF-CSPSW (frame only)
(c) GF-LYPSPSW2 (frame only)
Fig. 7.26 Strain energy contour plots for MRF, GF-CSPSW (frame only), and GF-LYPSPSW2
(frame only) models at the end of application of LA28 ground motion showing
the plastification zones in beam/HBE and column/VBE frame members
180
(a) MRF
(b) GF-CSPSW
(c) GF-LYPSPSW2
Fig. 7.27 Deformed shapes (×15) of MRF, GF-CSPSW, and GF-LYPSPSW2 models
at the end of application of LA28 ground motion
181
As a result, it may be concluded that both the GF-CSPSW and GF-LYPSPSW2 models have
provided a desirable energy dissipation mechanism. Nevertheless, the GF-LYPSPSW2 model
seems to provide a superior energy dissipation mechanism as a result of employment of LYP
steel material with relatively higher energy absorption capacity.
7.7 Concluding Remarks
In this chapter, the seismic behavior of code-designed and retrofitted lateral force-resisting
systems including 9-story moment-resisting and SPSW frames has been investigated using
nonlinear time-history analysis of a suite of structural models originally designed for seismic
conditions in Los Angeles, California. The conventional and LYP steel shear walls were
modeled using the strip model which was shown to adequately represent the behavior of single-
and multi-story SPSWs with different geometrical-material bifurcation characteristics. Modal
analyses were initially performed to determine the vibration characteristics of the structural
models. These models were then analyzed under eleven earthquake acceleration time histories
selected to represent Los Angeles ground motions with minimum, average, and maximum PGV
and PGA values within 10/50 and 2/50 hazard levels.
Fundamental periods obtained from the ASCE 7-10 (2010) code-specified formula were
found to be lower than those obtained from modal analysis of the moment-resisting and SPSW
frames. Such lower estimates of the fundamental period may lead to conservative estimates of
the design seismic forces. Based on the modal analysis results, the considered SPSW-frame
models possessed remarkably higher initial stiffness and lower period values compared to the
MRF model. Moreover, retrofitting of the GF-CSPSW model in the extreme case, i.e. with LYP
steel infill plates of triple thickness, resulted in maximum 30% increase in initial stiffness and

182
10% decrease in the fundamental period values approximately. In addition to the assessment of
the elastic behavior through modal analyses, different seismic response parameters were
considered and investigated through nonlinear time-history analyses in order to evaluate the
seismic performance of the structural models and also the effectiveness of retrofit of structures
using LYP steel infill plates with relatively larger thicknesses.
Results of the nonlinear time-history analyses showed that “interstory” drift ratio parameter
is more controlling and of further significance relative to “story” drift ratio parameter in seismic
design of structures. The SPSW systems were found to be quite effective in limiting the drifts of
the structural models, and LYP steel shear walls, in particular, exhibited good performance in
improving the drift response of the structures. Acceleration response assessment of the designed
and retrofitted structural models revealed that employment of LYP steel infill plates with even
larger thicknesses in retrofitting of the GF-CSPSW model results in relatively smaller floor
accelerations. The LYP steel shear wall frames, also, showed a good performance in reducing the
base shear and moment demands compared to the GF-CSPSW model. Furthermore, retrofit of
the conventional steel SPSW using LYP steel infill plates was found to be effective in lowering
the VBE axial load demands at column bases as the web-plate thicknesses increased up to a
certain limit. Consistent with all case studies, it was found that employment of overly thick LYP
steel infill plates in retrofit of the GF-CSPSW model may adversely affect the seismic response
and result in weak or undesirable performance of the SPSW system.
In a comparative case study, it was also shown that the GF-LYPSPSW2 model possesses
relatively larger ductility and energy dissipation capability compared to the GF-CSPSW model.
All in all, evaluation of different seismic response parameters demonstrates that the GF-
LYPSPSW2 model with LYP steel web-plates of double thickness seems to be a desirable
183
retrofit option for the code-designed and conventional steel GF-CSPSW model. These findings
verify the effectiveness of the conventional steel shear wall retrofit strategy using LYP steel infill
plates of double thickness discussed in Chapter 5. More experimental and analytical
investigations are required to further substantiate the integrity of the considered retrofit strategy.
To this end, Chapter 8 will further address the subject of retrofit of structures and evaluate the
effectiveness of the considered retrofit strategy using the fragility function method.
Ultimately, the effectiveness of use of LYP steel with superior material properties compared
to conventional steel in improving the seismic performance through either design of new or
retrofit of existing structures is demonstrated through system-level investigations presented in
this chapter. The results and findings of the present and previous chapters are all indicative of
various advantages of use of LYP steel material in efficient seismic design and retrofit of
structures. It is believed that application of such steel material will result in creation of more
reliable, high-performing, and sustainable structures.

184
8. PROBABILISTIC ASSESSMENT OF SEISMIC RETROFIT
OF STRUCTURES USING FRAGILITY FUNCTION
METHOD
8.1 Introduction
Based on the lessons learned from the past and recent catastrophic seismic events with
considerable casualties, structural damages, and economic losses along with the major
advancements in the fields of structural and earthquake engineering, design methodology for
structures is gradually moving from prescriptive design approaches based on code-specified
minimum requirements to performance-based seismic design which explicitly evaluates how a
building is likely to perform, given the potential hazard it is likely to experience, considering
uncertainties inherent in the quantification of potential hazard and uncertainties in assessment of
the actual building response (FEMA 445, 2006).
Performance-based seismic design is a seismic design methodology that permits design of
new buildings or upgrade of existing buildings with a realistic understanding of the risk of
casualties, occupancy interruption, and economic loss that may occur as a result of future
earthquakes (FEMA 445, 2006). Also, according to Gould’s (2003) definition, such seismic
design methodology can provide a cost-effective means to i) reduce earthquake financial loss due
to structural and nonstructural damage, ii) design a structure for a range of performance levels
when subjected to different levels of ground motion, iii) obtain minimum structural and
nonstructural damage in a moderate seismic event, and iv) allow for continued operations in a
structure following a design level seismic event.

185
Fragility curves/functions are the basis for performance-based earthquake engineering and
development of such functions for structural systems is a key component of the performance-
based seismic design. Fragility functions are performance-prediction models that relate the
probability of reaching, or exceeding, structural and nonstructural damage/repair states with a
intensity measure of the earthquake input motions. They can be generated either empirically
using experimental data or analytically through seismic response assessment using numerical
simulations.
Development of such statistical models, i.e. fragility functions, for SPSWs is essential to
enable the performance-based seismic design of such lateral force-resisting systems. In order to
meet this need, damage and repair states based on the observations from experiments and an
understanding of the SPSW system’s behavior have been developed and proposed in studies
reported by Berman et al. (2010) and Baldvins et al. (2012), and consequently fragility functions
have been developed for the considered repair states (Baldvins et al., 2012). To the author’s
knowledge, apart from the aforementioned studies as well as a couple of studies reported by
Ghosh et al. (2009) and Bayat (2010), the performance-based seismic design and probabilistic
assessment of seismic response and retrofit of SPSW systems have not been addressed
adequately, and in fact only initial steps have been taken towards the performance-based seismic
design of SPSW systems through these studies.
In this chapter, the seismic performance of the 9-story moment-resisting and code-designed
as well as retrofitted SPSW frames employing conventional and LYP steel infill plates will be
primarily investigated through nonlinear time-history analyses. Drift and acceleration responses
as two effective seismic demand parameters of structures will be considered for the seismic
performance assessment. Proper and effective analytical fragility functions will be developed
186
using the numerical simulation results by considering various damage and repair states specified
for the structural and nonstructural systems and components, and ultimately the seismic retrofit
of new and existing structures using SPSW systems as well as LYP steel material will be
addressed using the fragility function method.
8.2 Fragility Function Methodology
A major step in performance-based earthquake engineering assessments is to estimate the
probabilistic structural response as a function of ground motion intensity. The objective of this
step is to estimate the probability distribution of a structural response parameter, herein termed
as the Engineering Demand Parameter (EDP), as a function of earthquake ground motion
intensity, herein termed as the Intensity Measure (IM). There are several methods available for
obtaining such an estimate, which have been discussed by Baker and Cornell (2006).
The ground motions are characterized by the intensity measure which can be selected from
the peak ground velocity (PGV), peak ground acceleration (PGA), and other characteristics of
the earthquake recordings. The structural responses of buildings, on the other hand, may be
represented by various parameters such as interstory drift and/or floor acceleration. In any case,
the choice of the intensity measure (IM) and the structural response parameter (EDP) plays an
important and effective role in running the fragility analysis and also evaluating the seismic
performance of the structures.
In this study, the Probabilistic Seismic Demand Model (PSDM) has been employed to derive
analytical fragility functions using nonlinear time-history responses of the structural models. The
PSDM is developed using a “cloud” approach for relating EDPs to IMs, which uses a set of un-
scaled ground motions (Baker and Cornell, 2006) and is termed as the Probabilistic Seismic
Demand Analysis (PSDA) in here. It is noted that the PSDM can be also developed using a
187
“scaling” approach, termed as the Incremental Dynamic Analysis (IDA), in which all motions
are scaled to selective intensity levels corresponding to a prescribed seismic hazard level and
incremental dynamic analysis is performed at different hazard levels (Zhang and Huo, 2009).
The PSDA method uses regression analysis in order to estimate the conditional mean and
standard deviation of EDP given IM. Accordingly, the mean EDP can be related to the IM using
bIMaEDP )(= or )ln()ln()ln( aIMbEDP += (8.1)
where a and b are constant coefficients to be estimated from linear regression of the response
data of nonlinear time-history analyses, which are referred to as the regression coefficients. If the
remaining variability in ln(EDP) for a given IM is assumed to have a constant variance for all
IM, then its standard deviation can be estimated using (Baker and Cornell, 2006)
2
)])(ln()[ln(1
2
−
−=∑=
N
IMaEDPN
i
b
ii
IM|EDPζ , (8.2)
in which N is the number of EDP-IM data pairs, and EDPi and IMi are the values of the i-th data
pair. Ultimately, by assuming a lognormal distribution of EDP for a given IM, the fragility
functions defining the probability of EDP reaching or exceeding a specified limit state (LS) for a
given IM can be represented using
)(2
11)IM|(
0
))(ln()ln(
2
1
IM|
2
IM|
EDPdeEDP
LSEDPPLS
IMaEDP
EDP
EDP
b
⋅⋅⋅⋅
−=≥ ∫
−−
ζ
ζπ. (8.3)
When it is assumed that the EDP variable has a lognormal distribution, then ln(EDP) can be
considered to be normally distributed. Accordingly, the probability that EDP attains or exceeds
LS for a given IM can be alternatively calculated using the standard normal cumulative
distribution function, denoted by ( )•Φ , as
188
−Φ−=≥
IM|EDP
bIMaLSIM|LSEDPP
ζ))(ln()ln(
1)( . (8.4)
8.3 Specifications and Modeling of Structural Systems
8.3.1 Selected Structural Systems
By considering the main objective of this research, i.e. probabilistic assessment of seismic
response and vulnerability of code-designed and retrofitted SPSW systems employing
conventional and LYP steel infill plates, the modified Los Angeles 9-story pre-Northridge
moment-resisting frame (MRF model), code-designed and conventional steel SPSW frame (GF-
CSPSW model), and retrofitted SPSW frame using LYP steel infill plates of double thickness
(GF-LYPSPSW2 model) are selected in here. According to the findings from the studies
discussed in previous chapters, the GF-LYPSPSW2 model is considered to be a proper and
desirable retrofit option for the GF-CSPSW model; therefore, this particular retrofitted SPSW
model, i.e. the GF-LYPSPSW2 model, is selected for the purpose of the current study.
The specifications of the MRF, GF-CSPSW, and GF-LYPSPSW2 structural models are
shown in Tables 7.1 through 7.3 in Chapter 7, and their seismic performance was studied by
evaluating different seismic response parameters from nonlinear time-history analyses. It is noted
that the fragility methodology adopted in this chapter makes it possible to probabilistically deal
with the uncertainties in ground motions as well as variability of structural properties and offer a
system-level evaluation of the damage and/or repair potential for the considered lateral force-
resisting systems under earthquakes.
189
8.3.2 Finite Element Modeling and Analysis
The finite element modeling and analysis details for the three considered lateral force-
resisting systems, i.e. the MRF, GF-CSPSW, and GF-LYPSPSW2 models, were provided in
Chapter 7. The bare frame and wall-frame structural models are shown in Fig. 7.3. These models
were developed and analyzed in ANSYS 14.0 (2011), and analysis results were verified through
comparison with experimental results. The strip model approach was utilized to represent SPSW
behavior. The frame beam and column and also the SPSW web-plate components were
represented using beam and discrete tension-only strip elements, respectively, and lumped
masses were modeled using point mass elements. ASTM A572 Gr. 50 steel was employed in
modeling of the frame components, and ASTM A36 and LYP100 steel material were considered
for the infill plates in the respective GF-CSPSW and GF-LYPSPSW2 models. The vibration
characteristics and initial stiffnesses of the structural models were primarily determined through
modal analyses. A series of nonlinear time-history analyses with geometrical as well as material
nonlinearities and consideration of a 2% damping ratio were subsequently performed for the
moment-resisting and SPSW frames, which included P-delta effects as well.
8.3.3 Ground Motion Suite
In the PSDA method, it is important to select a sufficient number of earthquake records and
accordingly perform nonlinear time-history analyses in order to generate reliable fragility
functions and obtain a conceptually and statistically acceptable and good prediction of the
seismic response. On this basis, a suite of thirty Los Angeles ground motion records considered
in the SAC steel research project (FEMA 355C, 2000) having probabilities of exceedance of
50% in 50 years, 10% in 50 years, 2% in 50 years are used in this study in order for developing
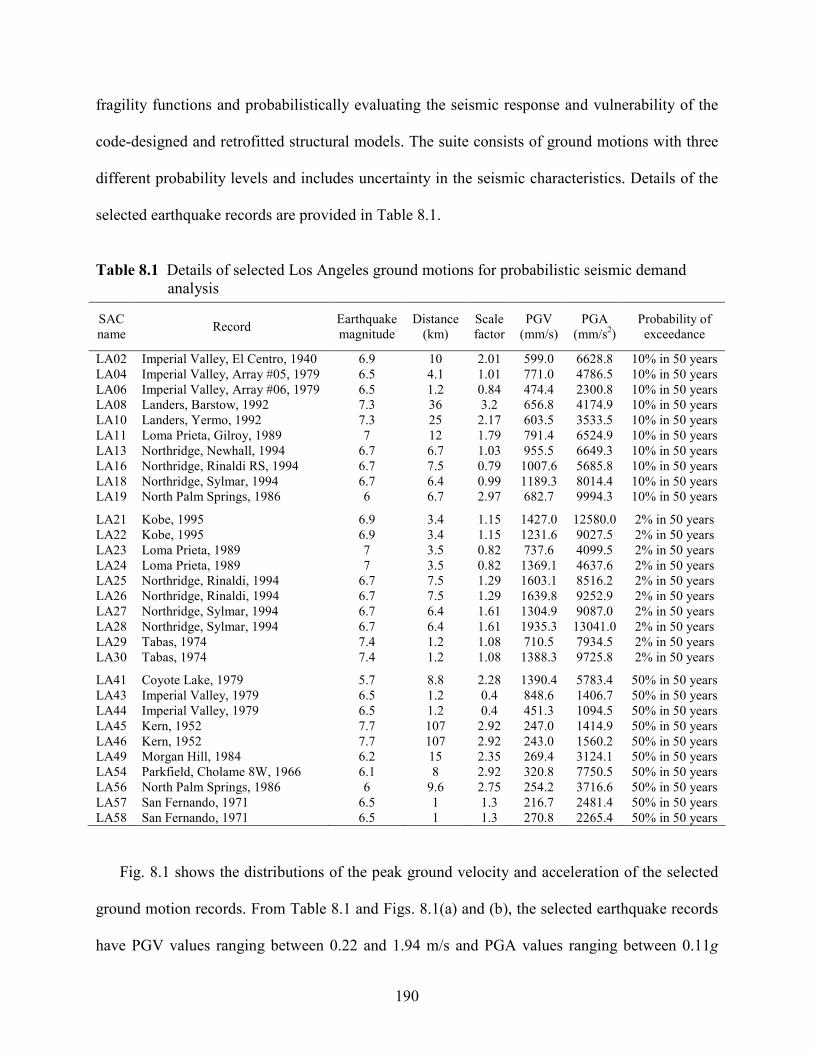
190
fragility functions and probabilistically evaluating the seismic response and vulnerability of the
code-designed and retrofitted structural models. The suite consists of ground motions with three
different probability levels and includes uncertainty in the seismic characteristics. Details of the
selected earthquake records are provided in Table 8.1.
Table 8.1 Details of selected Los Angeles ground motions for probabilistic seismic demand
analysis
SAC
name Record
Earthquake
magnitude
Distance
(km)
Scale
factor
PGV
(mm/s)
PGA
(mm/s2)
Probability of
exceedance
LA02 Imperial Valley, El Centro, 1940 6.9 10 2.01 599.0 6628.8 10% in 50 years
LA04 Imperial Valley, Array #05, 1979 6.5 4.1 1.01 771.0 4786.5 10% in 50 years
LA06 Imperial Valley, Array #06, 1979 6.5 1.2 0.84 474.4 2300.8 10% in 50 years
LA08 Landers, Barstow, 1992 7.3 36 3.2 656.8 4174.9 10% in 50 years
LA10 Landers, Yermo, 1992 7.3 25 2.17 603.5 3533.5 10% in 50 years
LA11 Loma Prieta, Gilroy, 1989 7 12 1.79 791.4 6524.9 10% in 50 years
LA13 Northridge, Newhall, 1994 6.7 6.7 1.03 955.5 6649.3 10% in 50 years
LA16 Northridge, Rinaldi RS, 1994 6.7 7.5 0.79 1007.6 5685.8 10% in 50 years
LA18 Northridge, Sylmar, 1994 6.7 6.4 0.99 1189.3 8014.4 10% in 50 years
LA19 North Palm Springs, 1986 6 6.7 2.97 682.7 9994.3 10% in 50 years
LA21 Kobe, 1995 6.9 3.4 1.15 1427.0 12580.0 2% in 50 years
LA22 Kobe, 1995 6.9 3.4 1.15 1231.6 9027.5 2% in 50 years
LA23 Loma Prieta, 1989 7 3.5 0.82 737.6 4099.5 2% in 50 years
LA24 Loma Prieta, 1989 7 3.5 0.82 1369.1 4637.6 2% in 50 years
LA25 Northridge, Rinaldi, 1994 6.7 7.5 1.29 1603.1 8516.2 2% in 50 years
LA26 Northridge, Rinaldi, 1994 6.7 7.5 1.29 1639.8 9252.9 2% in 50 years
LA27 Northridge, Sylmar, 1994 6.7 6.4 1.61 1304.9 9087.0 2% in 50 years
LA28 Northridge, Sylmar, 1994 6.7 6.4 1.61 1935.3 13041.0 2% in 50 years
LA29 Tabas, 1974 7.4 1.2 1.08 710.5 7934.5 2% in 50 years
LA30 Tabas, 1974 7.4 1.2 1.08 1388.3 9725.8 2% in 50 years
LA41 Coyote Lake, 1979 5.7 8.8 2.28 1390.4 5783.4 50% in 50 years
LA43 Imperial Valley, 1979 6.5 1.2 0.4 848.6 1406.7 50% in 50 years
LA44 Imperial Valley, 1979 6.5 1.2 0.4 451.3 1094.5 50% in 50 years
LA45 Kern, 1952 7.7 107 2.92 247.0 1414.9 50% in 50 years
LA46 Kern, 1952 7.7 107 2.92 243.0 1560.2 50% in 50 years
LA49 Morgan Hill, 1984 6.2 15 2.35 269.4 3124.1 50% in 50 years
LA54 Parkfield, Cholame 8W, 1966 6.1 8 2.92 320.8 7750.5 50% in 50 years
LA56 North Palm Springs, 1986 6 9.6 2.75 254.2 3716.6 50% in 50 years
LA57 San Fernando, 1971 6.5 1 1.3 216.7 2481.4 50% in 50 years
LA58 San Fernando, 1971 6.5 1 1.3 270.8 2265.4 50% in 50 years
Fig. 8.1 shows the distributions of the peak ground velocity and acceleration of the selected
ground motion records. From Table 8.1 and Figs. 8.1(a) and (b), the selected earthquake records
have PGV values ranging between 0.22 and 1.94 m/s and PGA values ranging between 0.11g
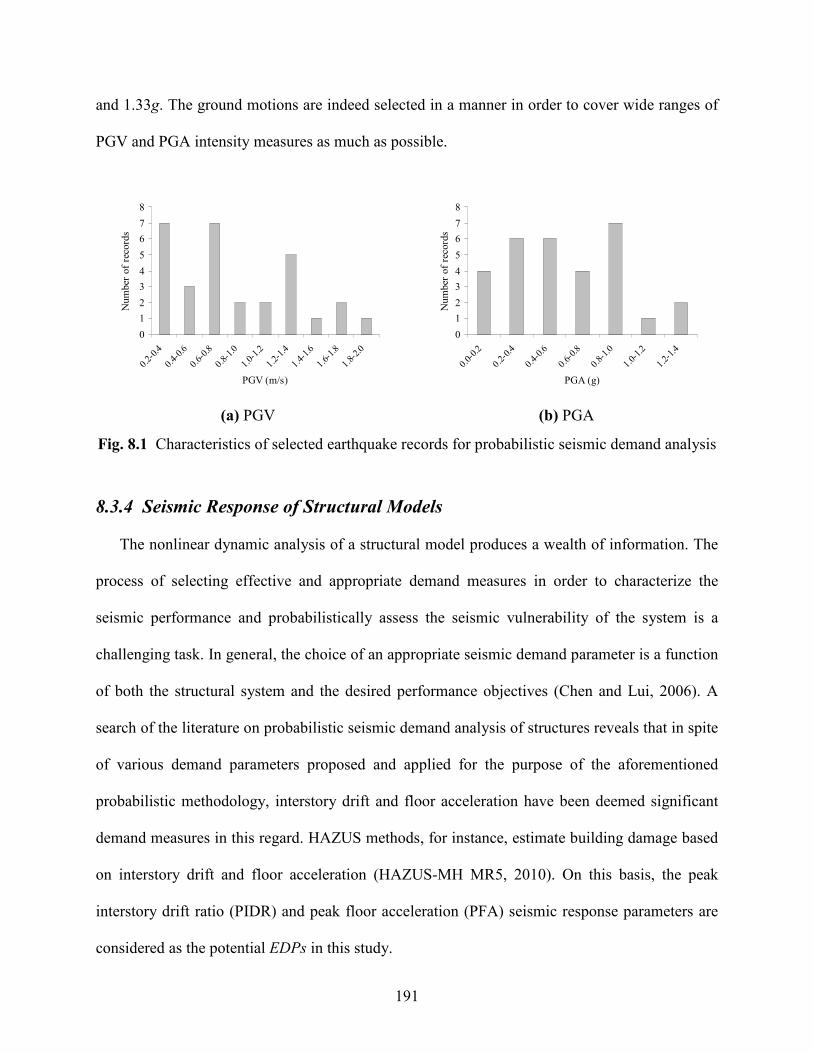
191
and 1.33g. The ground motions are indeed selected in a manner in order to cover wide ranges of
PGV and PGA intensity measures as much as possible.
0
1
2
3
4
5
6
7
8
0.2-0
.4
0.4-
0.6
0.6-0
.8
0.8-1
.0
1.0-1
.2
1.2-1
.4
1.4-1
.6
1.6-1
.8
1.8-2
.0
PGV (m/s)
Num
ber
of
reco
rds
0
1
2
3
4
5
6
7
8
0.0-0
.2
0.2-0
.4
0.4-0
.6
0.6-0
.8
0.8-1
.0
1.0-1
.2
1.2-1
.4
PGA (g)
Num
ber
of
reco
rds
(a) PGV (b) PGA
Fig. 8.1 Characteristics of selected earthquake records for probabilistic seismic demand analysis
8.3.4 Seismic Response of Structural Models
The nonlinear dynamic analysis of a structural model produces a wealth of information. The
process of selecting effective and appropriate demand measures in order to characterize the
seismic performance and probabilistically assess the seismic vulnerability of the system is a
challenging task. In general, the choice of an appropriate seismic demand parameter is a function
of both the structural system and the desired performance objectives (Chen and Lui, 2006). A
search of the literature on probabilistic seismic demand analysis of structures reveals that in spite
of various demand parameters proposed and applied for the purpose of the aforementioned
probabilistic methodology, interstory drift and floor acceleration have been deemed significant
demand measures in this regard. HAZUS methods, for instance, estimate building damage based
on interstory drift and floor acceleration (HAZUS-MH MR5, 2010). On this basis, the peak
interstory drift ratio (PIDR) and peak floor acceleration (PFA) seismic response parameters are
considered as the potential EDPs in this study.
192
On the other hand, various ground motion intensity parameters have been considered by
different researchers and their relative reliability and superiority in investigating the seismic
response and performance of structures have been examined through comparative studies.
Among various ground motion intensity measures, PGV and PGA can be considered as fairly
robust and easy to compute (Akkar et al., 2005), which have been employed by many researchers
in the development of fragility curves (Yakut and Yilmaz, 2008). Accordingly, PGV and PGA
are taken as the potential IMs for the probabilistic seismic demand analysis of the considered
structural systems.
PIDR and PFA demand parameters are obtained from the nonlinear dynamic analyses of the
structural models under the considered suite of Los Angeles earthquake records. The values of
the seismic response and ground motion intensity parameters, i.e. respective EDP and IM values,
for all earthquake records and the three structural models are summarized in Table 8.2.
In order to evaluate the peak drift and acceleration responses of the moment-resisting and
code-designed as well as retrofitted SPSW frames under seismic loading, the average PIDR (%)
and PFA (g) values are computed from the corresponding values tabulated in Table 8.2 and
shown in Fig. 8.2.
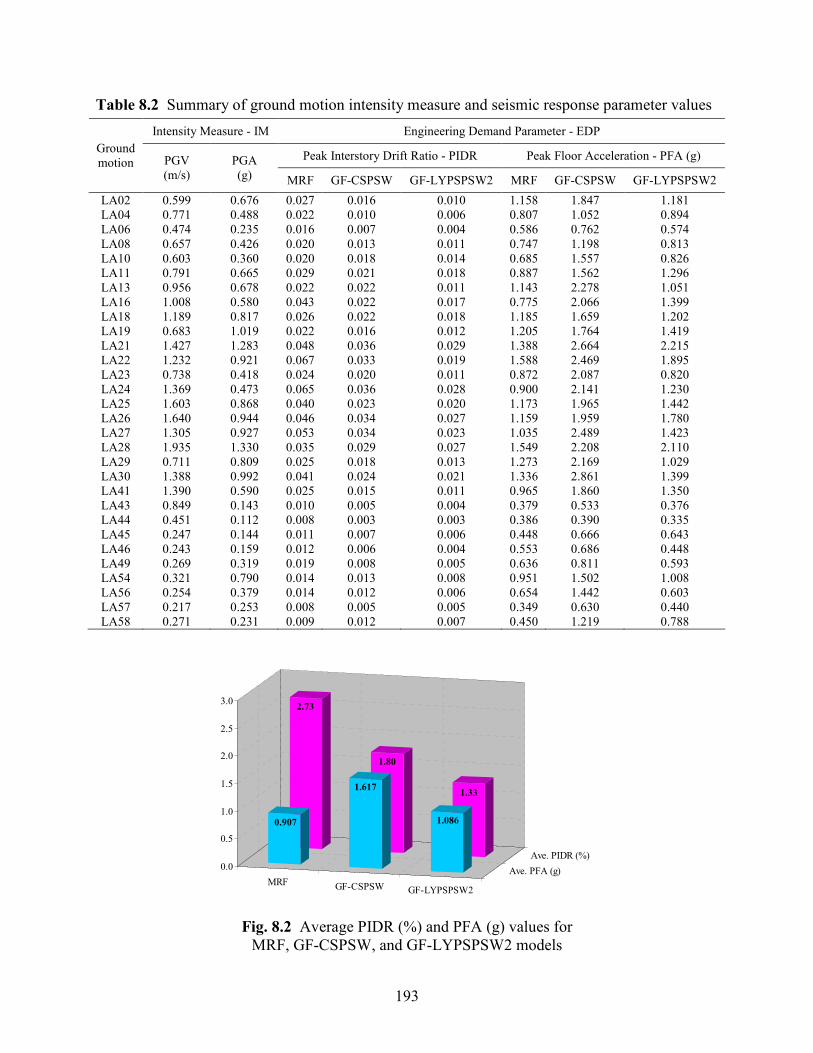
193
Table 8.2 Summary of ground motion intensity measure and seismic response parameter values
Intensity Measure - IM Engineering Demand Parameter - EDP
Peak Interstory Drift Ratio - PIDR Peak Floor Acceleration - PFA (g) Ground
motion PGV
(m/s)
PGA
(g) MRF GF-CSPSW GF-LYPSPSW2 MRF GF-CSPSW GF-LYPSPSW2
LA02 0.599 0.676 0.027 0.016 0.010 1.158 1.847 1.181
LA04 0.771 0.488 0.022 0.010 0.006 0.807 1.052 0.894
LA06 0.474 0.235 0.016 0.007 0.004 0.586 0.762 0.574
LA08 0.657 0.426 0.020 0.013 0.011 0.747 1.198 0.813
LA10 0.603 0.360 0.020 0.018 0.014 0.685 1.557 0.826
LA11 0.791 0.665 0.029 0.021 0.018 0.887 1.562 1.296
LA13 0.956 0.678 0.022 0.022 0.011 1.143 2.278 1.051
LA16 1.008 0.580 0.043 0.022 0.017 0.775 2.066 1.399
LA18 1.189 0.817 0.026 0.022 0.018 1.185 1.659 1.202
LA19 0.683 1.019 0.022 0.016 0.012 1.205 1.764 1.419
LA21 1.427 1.283 0.048 0.036 0.029 1.388 2.664 2.215
LA22 1.232 0.921 0.067 0.033 0.019 1.588 2.469 1.895
LA23 0.738 0.418 0.024 0.020 0.011 0.872 2.087 0.820
LA24 1.369 0.473 0.065 0.036 0.028 0.900 2.141 1.230
LA25 1.603 0.868 0.040 0.023 0.020 1.173 1.965 1.442
LA26 1.640 0.944 0.046 0.034 0.027 1.159 1.959 1.780
LA27 1.305 0.927 0.053 0.034 0.023 1.035 2.489 1.423
LA28 1.935 1.330 0.035 0.029 0.027 1.549 2.208 2.110
LA29 0.711 0.809 0.025 0.018 0.013 1.273 2.169 1.029
LA30 1.388 0.992 0.041 0.024 0.021 1.336 2.861 1.399
LA41 1.390 0.590 0.025 0.015 0.011 0.965 1.860 1.350
LA43 0.849 0.143 0.010 0.005 0.004 0.379 0.533 0.376
LA44 0.451 0.112 0.008 0.003 0.003 0.386 0.390 0.335
LA45 0.247 0.144 0.011 0.007 0.006 0.448 0.666 0.643
LA46 0.243 0.159 0.012 0.006 0.004 0.553 0.686 0.448
LA49 0.269 0.319 0.019 0.008 0.005 0.636 0.811 0.593
LA54 0.321 0.790 0.014 0.013 0.008 0.951 1.502 1.008
LA56 0.254 0.379 0.014 0.012 0.006 0.654 1.442 0.603
LA57 0.217 0.253 0.008 0.005 0.005 0.349 0.630 0.440
LA58 0.271 0.231 0.009 0.012 0.007 0.450 1.219 0.788
MRF GF-CSPSW GF-LYPSPSW2
Ave. PFA (g)
Ave. PIDR (%)
2.73
1.80
1.33
0.907
1.617
1.086
0.0
0.5
1.0
1.5
2.0
2.5
3.0
Fig. 8.2 Average PIDR (%) and PFA (g) values for
MRF, GF-CSPSW, and GF-LYPSPSW2 models
194
As it is seen in the figure, the GF-LYPSPSW2 model by and large exhibits relatively
desirable drift and acceleration performances. In case of the peak drift response, the GF-
LYPSPSW2 model with the lowest average PIDR (%) value shows the best performance
compared to the MRF and GF-CSPSW models in reducing the seismic-induced interstory drift.
In case of the peak acceleration response, it is found that the GF-CSPSW model possesses a
larger average PFA (g) value compared to the MRF model due to its considerably higher
stiffness, while retrofitting the GF-CSPSW model with LYP steel infill plates of double
thickness favorably results in a relatively lower average PFA (g) value. These findings are quite
consistent with the results of the studies discussed in the previous chapter, and time and again
demonstrate the superior seismic performance of the GF-LYPSPSW2 model with LYP steel
infill plates of double thickness which is considered as a desirable retrofit option for the code-
designed and conventional steel GF-CSPSW model. It is notable that in the current study a large
number of earthquake records are considered compared to those applied in Chapter 7.
8.4 Fragility Analysis of Structural Systems
8.4.1 Selection of Appropriate EDP-IM Data Pairs
A PSDM relates IMs to EDPs, and hence the choice of EDP-IM pairs in the demand model is
critical for a successful PSDA. An optimal PSDM is required to be practical, effective, sufficient,
and efficient, and selection of an appropriate EDP-IM pair for such a PSDM is not easy (Mackie
and Stojadinović, 2001).
An EDP-IM pair in a demand model is practical if it makes engineering sense and also can be
easily derived from available ground motion measurements and nonlinear analysis response
quantities. Effectiveness of a PSDM is a measure of how readily it yields itself to use in a
195
deaggregated performance-based design framework. For example, assuming lognormally-
distributed ground motion IMs, an effective demand model should have an exponential form as
shown in Eq. (8.1) (Mackie and Stojadinović, 2001). As well, PSDM is considered to be
sufficient when EDP is conditionally independent, given IM, of earthquake magnitude and the
source-to-site distance, and lastly efficiency implies a smaller dispersion of EDP results for a
given IM, making fewer nonlinear dynamic analyses necessary to evaluate a PSDM with the
same confidence (Janković and Stojadinović, 2004).
In this section, it is tried to search for appropriate EDP-IM pairs from the four potential
PIDR-PGV, PIDR-PGA, PFA-PGV, and PFA-PGA data pairs for optimal PSDMs with lower
degrees of scatter. To achieve this objective, ln[EDP] and ln[IM] are plotted against each other
for the three considered structural models, with ln[IM] on the abscissa and ln[EDP] on the
ordinate as shown in Figs. 8.3 through 8.6. As seen in the figures, a linear regression analysis of
the ln[EDP] and ln[IM] data in each case has produced a line through the cloud of the EDP-IM
data points, and the corresponding linear equation and R2 value are provided in each individual
case.
The coefficient of determination, i.e. R2 value, is a statistic which is considered as a measure
of variation in this study. This statistic is an estimate of the goodness-of-fit of the line that
describes how well a regression line fits the set of data. An R2 value near 1.0 indicates that a
regression line fits the data well, while an R2 value closer to 0.0 indicates a regression line does
not fit the data very well. The R2 values obtained from the linear regression analyses of the data
pairs are given in Table 8.3.

196
ln[EDP ] = 0.7436ln[IM ] - 3.5117
R2 = 0.6725
-6
-5
-4
-3
-2
-2 -1.5 -1 -0.5 0 0.5 1
ln[IM = PGV (m/s)]
ln[E
DP
= P
IDR
]
ln[EDP ] = 0.7493ln[IM ] - 3.9401
R2 = 0.5506
-6
-5
-4
-3
-2
-2 -1.5 -1 -0.5 0 0.5 1
ln[IM = PGV (m/s)]
ln[E
DP
= P
IDR
]
(a) MRF (b) GF-CSPSW
ln[EDP ] = 0.8006ln[IM ] - 4.2375
R2 = 0.6239
-6
-5
-4
-3
-2
-2 -1.5 -1 -0.5 0 0.5 1
ln[IM = PGV (m/s)]
ln[E
DP
= P
IDR
]
(c) GF-LYPSPSW2
Fig. 8.3 Relationship between ln[EDP = PIDR] and ln[IM = PGV (m/s)]

197
ln[EDP ] = 0.4745ln[IM ] - 0.0139
R2 = 0.5369
-2
-1
0
1
2
-2 -1.5 -1 -0.5 0 0.5 1
ln[IM = PGV (m/s)]
ln[E
DP
= P
FA
(g)]
ln[EDP ] = 0.5456ln[IM ] + 0.5558
R2 = 0.4714
-2
-1
0
1
2
-2 -1.5 -1 -0.5 0 0.5 1
ln[IM = PGV (m/s)]
ln[E
DP
= P
FA
(g)]
(a) MRF (b) GF-CSPSW
ln[EDP ] = 0.5782ln[IM ] + 0.1715
R2 = 0.5844
-2
-1
0
1
2
-2 -1.5 -1 -0.5 0 0.5 1
ln[IM = PGV (m/s)]
ln[E
DP
= P
FA
(g)]
(c) GF-LYPSPSW2
Fig. 8.4 Relationship between ln[EDP = PFA (g)] and ln[IM = PGV (m/s)]
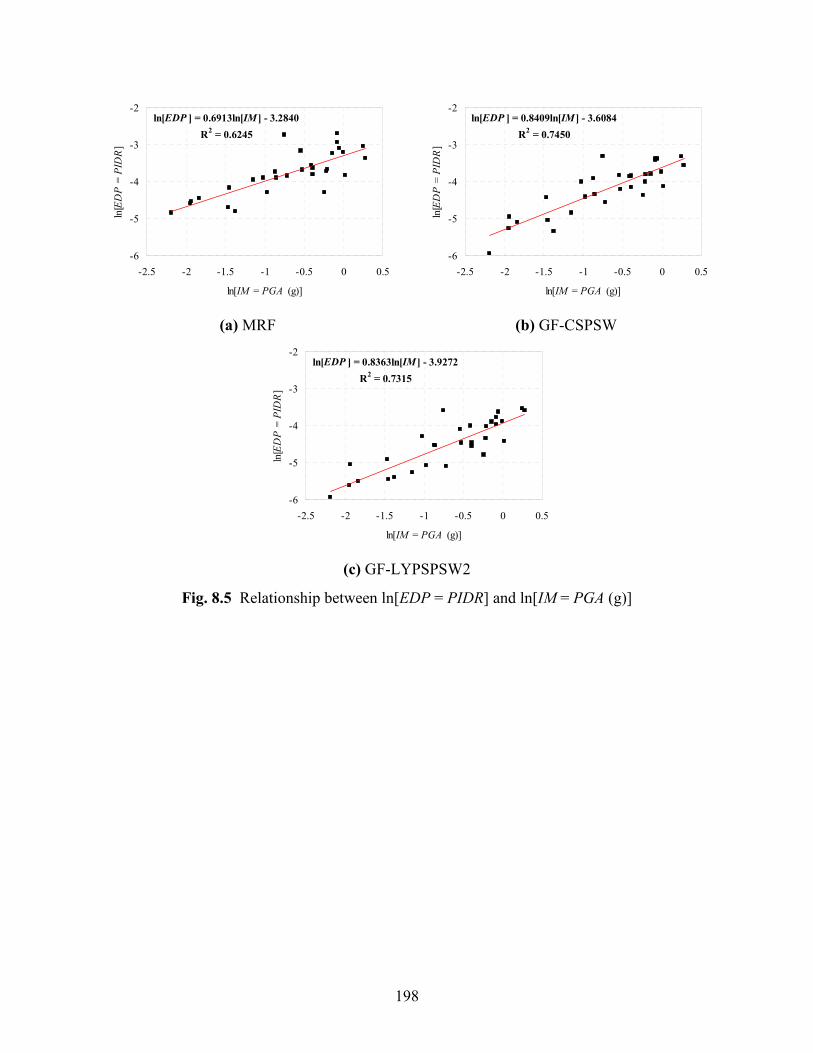
198
ln[EDP ] = 0.6913ln[IM ] - 3.2840
R2 = 0.6245
-6
-5
-4
-3
-2
-2.5 -2 -1.5 -1 -0.5 0 0.5
ln[IM = PGA (g)]
ln[E
DP
= P
IDR
]
ln[EDP ] = 0.8409ln[IM ] - 3.6084
R2 = 0.7450
-6
-5
-4
-3
-2
-2.5 -2 -1.5 -1 -0.5 0 0.5
ln[IM = PGA (g)]
ln[E
DP
= P
IDR
]
(a) MRF (b) GF-CSPSW
ln[EDP ] = 0.8363ln[IM ] - 3.9272
R2 = 0.7315
-6
-5
-4
-3
-2
-2.5 -2 -1.5 -1 -0.5 0 0.5
ln[IM = PGA (g)]
ln[E
DP
= P
IDR
]
(c) GF-LYPSPSW2
Fig. 8.5 Relationship between ln[EDP = PIDR] and ln[IM = PGA (g)]

199
ln[EDP ] = 0.5876ln[IM ] + 0.2352
R2 = 0.8846
-2
-1
0
1
2
-2.5 -2 -1.5 -1 -0.5 0 0.5
ln[IM = PGA (g)]
ln[E
DP
= P
FA
(g)]
ln[EDP ] = 0.6869ln[IM ] + 0.8501
R2 = 0.8028
-2
-1
0
1
2
-2.5 -2 -1.5 -1 -0.5 0 0.5
ln[IM = PGA (g)]
ln[E
DP
= P
FA
(g)]
(a) MRF (b) GF-CSPSW
ln[EDP ] = 0.6748ln[IM ] + 0.4458
R2 = 0.8551
-2
-1
0
1
2
-2.5 -2 -1.5 -1 -0.5 0 0.5
ln[IM = PGA (g)]
ln[E
DP
= P
FA
(g)]
(c) GF-LYPSPSW2
Fig. 8.6 Relationship between ln[EDP = PFA (g)] and ln[IM = PGA (g)]
Table 8.3 R2 values obtained from linear regression of ln[EDP] and ln[IM] variables
ln[IM] ln[EDP] Model
ln[PGV (m/s)] ln[PGA (g)]
MRF 0.6725 0.6245
GF-CSPSW 0.5506 0.7450 ln[PIDR]
GF-LYPSPSW2 0.6239 0.7315
MRF 0.5369 0.8846
GF-CSPSW 0.4714 0.8028 ln[PFA (g)]
GF-LYPSPSW2 0.5844 0.8551
200
From the tabulated results, PGA appears to have a stronger correlation with both considered
EDPs relative to PGV. This IM, i.e. PGA, is found to be better correlated with PFA where R2
values are in the range of 0.80-0.88, as compared to PIDR with R2 values between 0.62 and 0.75.
In comparison, R2 values in cases of PFA-PGV and PIDR-PGV data pairs are in the ranges of
0.47 to 0.58 and 0.55 to 0.67, respectively. Based on these results, fragility curves developed
based on PFA-PGA and PIDR-PGA data pairs are believed to be more reliable and provide a
better representation of probability of the structural damage and/or repair.
8.4.2 Determination of Lognormal Distribution Parameters
Based on the satisfactory and relatively higher levels of linear correlation between PFA-PGA
and PIDR-PGA data pairs, as discussed in the previous section, these EDP and IM parameters
are selected for development of fragility curves and seismic vulnerability assessment of the
structural models in this study. Accordingly, the values of the a and b constant coefficients
determined from the linear regression analyses of the selected data pairs, and the standard
deviations calculated using Eq. (8.2) for the selected EDP-IM pairs and the structural models, are
given in Table 8.4. Included in the table are also the functional relations between the EDP and
IM parameters, which have been determined using the regression coefficients and the power
model in Eq. (8.1).
The tabulated PSDM parameters will be utilized in generating various fragility curves for the
considered structural models. Different damage and repair states will also be considered in this
regard, which will be addressed in the next section.

201
Table 8.4 Regression coefficients, standard deviation, and functional relation for selected EDP-
IM data sets
Selected Regression coefficients Model
EDP IM a b IM|EDPζ Functional relation
MRF PIDR PGA (g) 0.0375 0.6913 0.3792 0.6913)(0.0375 PGAPIDR =
GF-CSPSW PIDR PGA (g) 0.0271 0.8409 0.3481 0.8409)(0.0271 PGAPIDR =
GF-LYPSPSW2 PIDR PGA (g) 0.0197 0.8363 0.3585 0.8363)(0.0197 PGAPIDR =
MRF PFA (g) PGA (g) 1.2651 0.5876 0.1501 0.5876)(1.2651 PGAPFA =
GF-CSPSW PFA (g) PGA (g) 2.3400 0.6869 0.2409 0.6869)(2.3400 PGAPFA =
GF-LYPSPSW2 PFA (g) PGA (g) 1.5618 0.6748 0.1965 0.6748)(1.5618 PGAPFA =
The EDP-IM data plots along with the corresponding power trendlines for the selected data
pairs as well as the structural models are illustrated in Figs. 8.7(a) through 8.7(f). The
corresponding power function as well as the R2 value are also shown in each figure, which are
directly obtained from regression analysis in Microsoft Excel. It is noted that these results are
quite consistent with those provided in Tables 8.3 and 8.4.
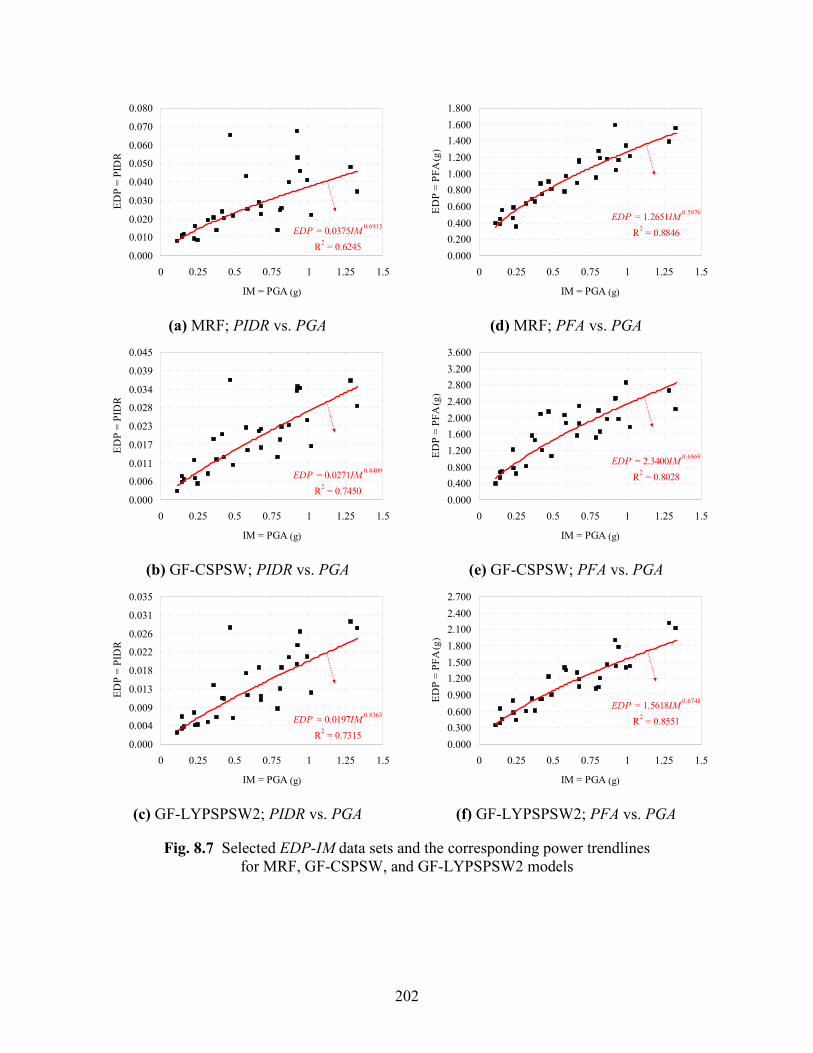
202
EDP = 0.0375IM0.6913
R2 = 0.6245
0.000
0.010
0.020
0.030
0.040
0.050
0.060
0.070
0.080
0 0.25 0.5 0.75 1 1.25 1.5
IM = PGA (g)
ED
P =
PID
R
EDP = 1.2651IM0.5876
R2 = 0.8846
0.000
0.200
0.400
0.600
0.800
1.000
1.200
1.400
1.600
1.800
0 0.25 0.5 0.75 1 1.25 1.5
IM = PGA (g)
ED
P =
PF
A (g
)
(a) MRF; PIDR vs. PGA (d) MRF; PFA vs. PGA
EDP = 0.0271IM0.8409
R2 = 0.7450
0.000
0.006
0.011
0.017
0.023
0.028
0.034
0.039
0.045
0 0.25 0.5 0.75 1 1.25 1.5
IM = PGA (g)
ED
P =
PID
R
EDP = 2.3400IM0.6869
R2 = 0.8028
0.000
0.400
0.800
1.200
1.600
2.000
2.400
2.800
3.200
3.600
0 0.25 0.5 0.75 1 1.25 1.5
IM = PGA (g)
ED
P =
PF
A (g
)
(b) GF-CSPSW; PIDR vs. PGA (e) GF-CSPSW; PFA vs. PGA
EDP = 0.0197IM0.8363
R2 = 0.7315
0.000
0.004
0.009
0.013
0.018
0.022
0.026
0.031
0.035
0 0.25 0.5 0.75 1 1.25 1.5
IM = PGA (g)
ED
P =
PID
R
EDP = 1.5618IM0.6748
R2 = 0.8551
0.000
0.300
0.600
0.900
1.200
1.500
1.800
2.100
2.400
2.700
0 0.25 0.5 0.75 1 1.25 1.5
IM = PGA (g)
ED
P =
PF
A (g
)
(c) GF-LYPSPSW2; PIDR vs. PGA (f) GF-LYPSPSW2; PFA vs. PGA
Fig. 8.7 Selected EDP-IM data sets and the corresponding power trendlines
for MRF, GF-CSPSW, and GF-LYPSPSW2 models

203
8.4.3 Considered Damage and Repair States
One of the important issues in performance-based earthquake engineering methodology is the
definition of meaningful damage states in relation to repair actions. For economic loss
estimation, understanding the type of damages is of great significance to establish if repair would
be required and what the nature and cost of such repairs would be. Building damage is estimated
based on threshold values of structural response parameters, e.g. interstory drift and floor
acceleration, that initiate different states of damage, and discrete damage states provide the user
with an understanding of the building’s physical condition (HAZUS-MH MR5, 2010). These
threshold values of damage (or associated repair) states are referred to as the “limit states”, as
denoted by LS in Eqs. (8.3) and (8.4). It is noted that damage and/or repair models are often
developed based on experimental observations and engineering judgment.
According to the HAZUS-MH MR5 (2010) definition, fragility curves describe the
probability of damage to the building’s structural system, drift-sensitive nonstructural
components, and acceleration-sensitive nonstructural components and contents. On this basis,
damage states can be defined separately for structural and nonstructural systems of a building.
By considering the importance of structural and nonstructural systems performance in
performance-based seismic design and response assessment of buildings, separate fragility
curves are developed in this study for the three aforementioned structural/nonstructural
categories by adopting appropriate damage and repair states as provided in the following.
In HAZUS-MH MR5 (2010), damage is described by one of four discrete damage states:
Slight, Moderate, Extensive or Complete, and Collapse as subset of Complete structural damage,
and average interstory drift ratios of structural damage states for generic building types and
different seismic design levels are provided. Table 8.5 lists the interstory drift ratios of structural
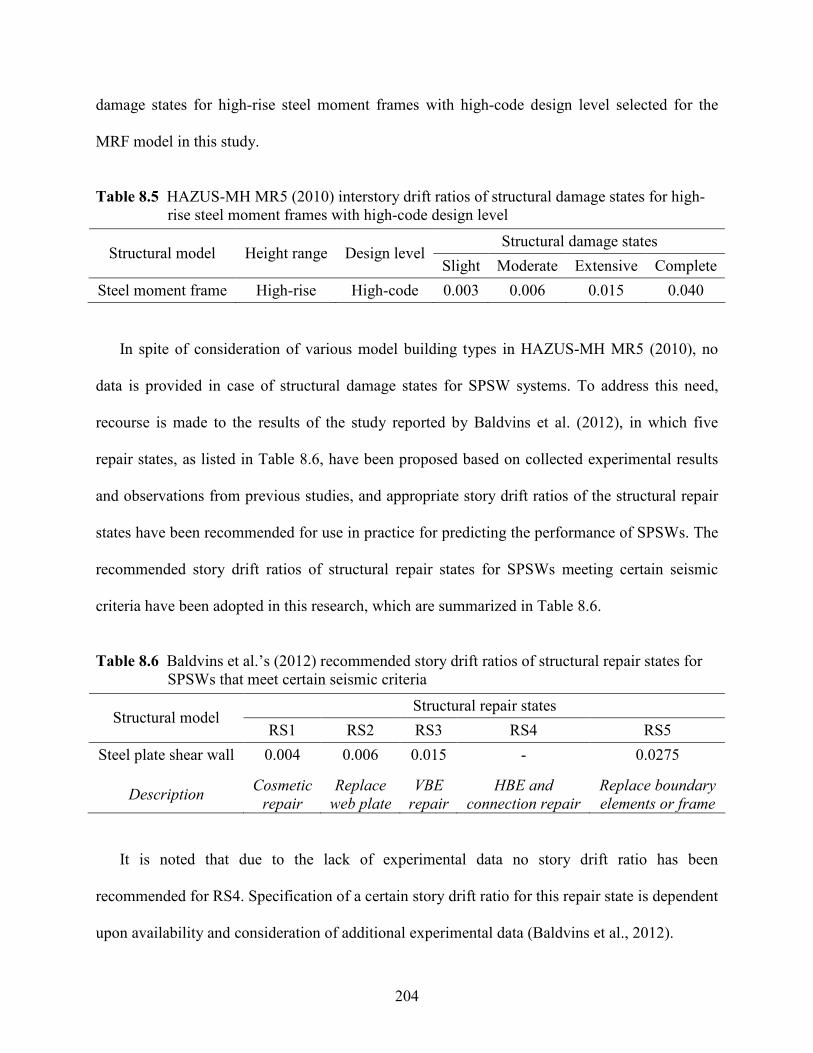
204
damage states for high-rise steel moment frames with high-code design level selected for the
MRF model in this study.
Table 8.5 HAZUS-MH MR5 (2010) interstory drift ratios of structural damage states for high-
rise steel moment frames with high-code design level
Structural damage states Structural model Height range Design level
Slight Moderate Extensive Complete
Steel moment frame High-rise High-code 0.003 0.006 0.015 0.040
In spite of consideration of various model building types in HAZUS-MH MR5 (2010), no
data is provided in case of structural damage states for SPSW systems. To address this need,
recourse is made to the results of the study reported by Baldvins et al. (2012), in which five
repair states, as listed in Table 8.6, have been proposed based on collected experimental results
and observations from previous studies, and appropriate story drift ratios of the structural repair
states have been recommended for use in practice for predicting the performance of SPSWs. The
recommended story drift ratios of structural repair states for SPSWs meeting certain seismic
criteria have been adopted in this research, which are summarized in Table 8.6.
Table 8.6 Baldvins et al.’s (2012) recommended story drift ratios of structural repair states for
SPSWs that meet certain seismic criteria
Structural repair states Structural model
RS1 RS2 RS3 RS4 RS5
Steel plate shear wall 0.004 0.006 0.015 - 0.0275
Description Cosmetic
repair
Replace
web plate
VBE
repair
HBE and
connection repair
Replace boundary
elements or frame
It is noted that due to the lack of experimental data no story drift ratio has been
recommended for RS4. Specification of a certain story drift ratio for this repair state is dependent
upon availability and consideration of additional experimental data (Baldvins et al., 2012).

205
In addition to the damage and repair states of structural systems discussed above, the
HAZUS-MH MR5 (2010) damage-state criteria for drift- and acceleration-sensitive nonstructural
components and contents are adopted in the current study, which are provided in Tables 8.7 and
8.8, respectively. These tabulated limit states are applied in development of fragility curves for
all three structural models.
Table 8.7 HAZUS-MH MR5 (2010) interstory drift ratios of nonstructural damage states for
drift-sensitive components of all building types
Nonstructural damage states Structural model Design level
Slight Moderate Extensive Complete
All All 0.004 0.008 0.025 0.050
Table 8.8 HAZUS-MH MR5 (2010) peak floor accelerations of nonstructural damage states for
acceleration-sensitive components/contents of all building types with high-code
design level
Nonstructural damage states Structural model Design level
Slight Moderate Extensive Complete
All High-code 0.3g 0.6g 1.2g 2.4g
8.4.4 Fragility Curves of Structural Models
By selecting the effective EDP-IM data pairs, determining lognormal distribution parameters,
and also considering the appropriate damage and repair states, fragility curves are developed for
the MRF, GF-CSPSW, and GF-LYPSPSW2 models, which are presented in this section.
Structural and nonstructural drift as well as acceleration fragility curves generated using the
PSDA method are shown in Figs. 8.8 through 8.10, respectively.
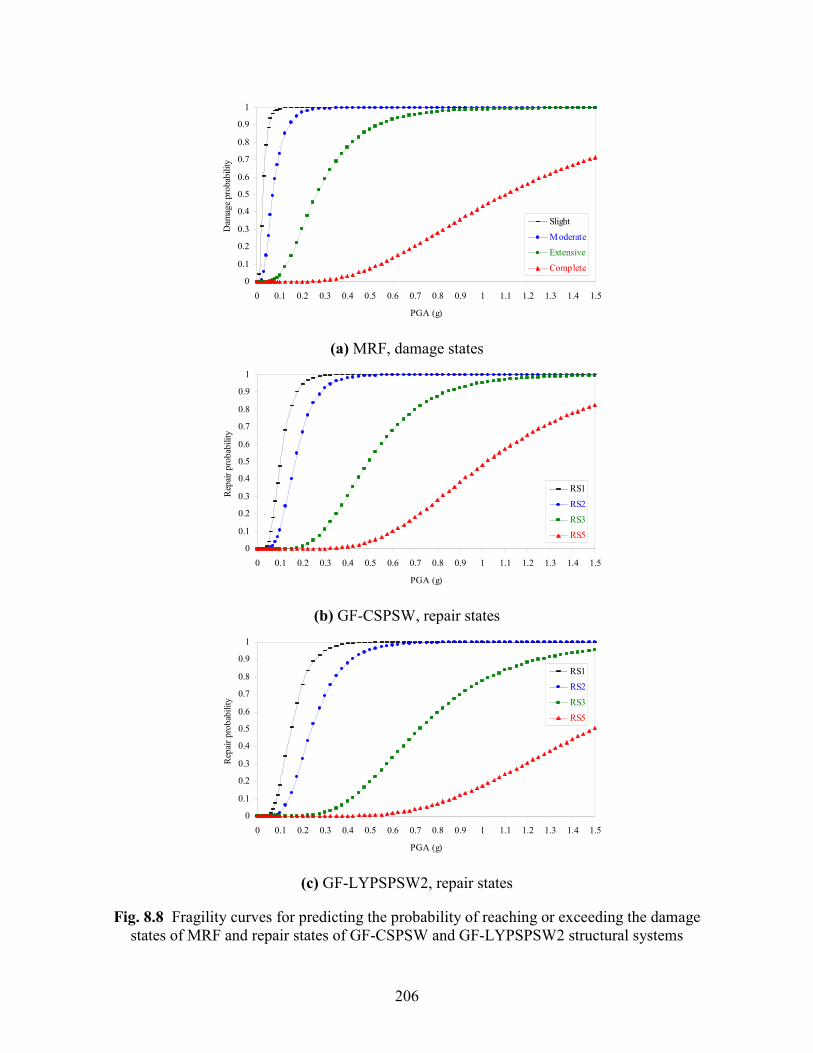
206
0
0.1
0.2
0.3
0.4
0.5
0.6
0.7
0.8
0.9
1
0 0.1 0.2 0.3 0.4 0.5 0.6 0.7 0.8 0.9 1 1.1 1.2 1.3 1.4 1.5
PGA (g)
Dam
age
pro
bab
ility
Slight
Moderate
Extensive
Complete
(a) MRF, damage states
0
0.1
0.2
0.3
0.4
0.5
0.6
0.7
0.8
0.9
1
0 0.1 0.2 0.3 0.4 0.5 0.6 0.7 0.8 0.9 1 1.1 1.2 1.3 1.4 1.5
PGA (g)
Rep
air
pro
bab
ilit
y
RS1
RS2
RS3
RS5
(b) GF-CSPSW, repair states
0
0.1
0.2
0.3
0.4
0.5
0.6
0.7
0.8
0.9
1
0 0.1 0.2 0.3 0.4 0.5 0.6 0.7 0.8 0.9 1 1.1 1.2 1.3 1.4 1.5
PGA (g)
Rep
air
pro
bab
ilit
y
RS1
RS2
RS3
RS5
(c) GF-LYPSPSW2, repair states
Fig. 8.8 Fragility curves for predicting the probability of reaching or exceeding the damage
states of MRF and repair states of GF-CSPSW and GF-LYPSPSW2 structural systems
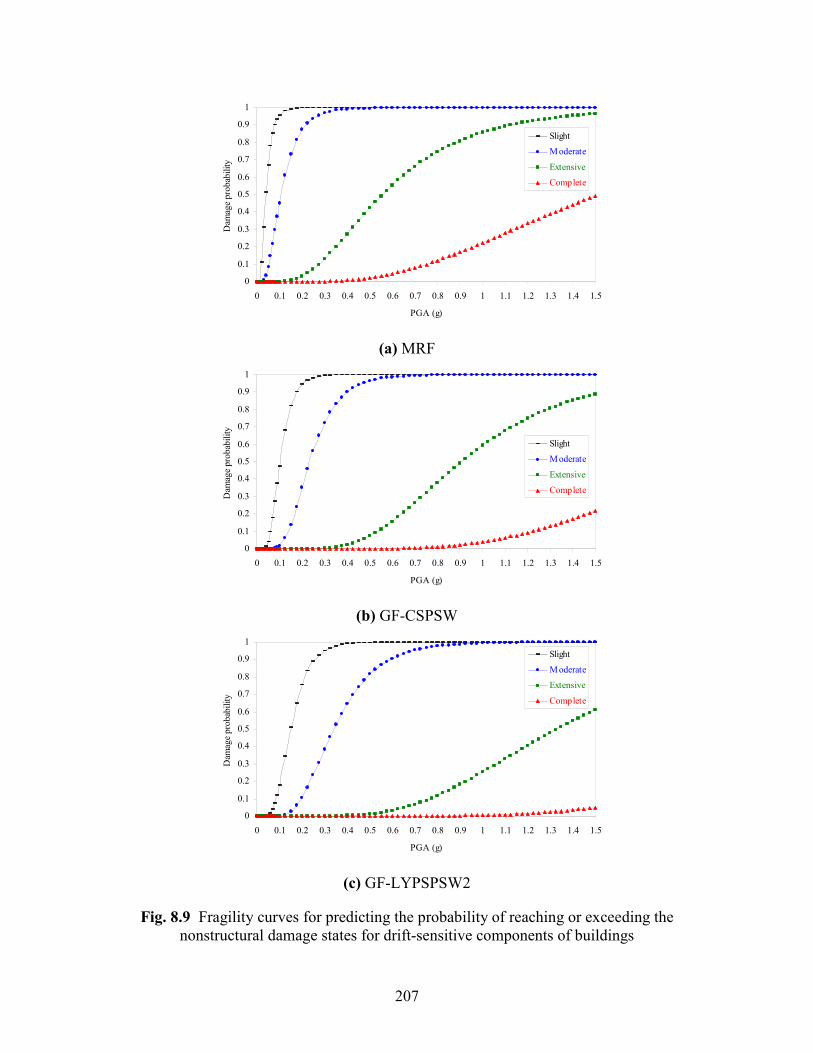
207
0
0.1
0.2
0.3
0.4
0.5
0.6
0.7
0.8
0.9
1
0 0.1 0.2 0.3 0.4 0.5 0.6 0.7 0.8 0.9 1 1.1 1.2 1.3 1.4 1.5
PGA (g)
Dam
age
pro
bab
ility
Slight
Moderate
Extensive
Complete
(a) MRF
0
0.1
0.2
0.3
0.4
0.5
0.6
0.7
0.8
0.9
1
0 0.1 0.2 0.3 0.4 0.5 0.6 0.7 0.8 0.9 1 1.1 1.2 1.3 1.4 1.5
PGA (g)
Dam
age
pro
bab
ility
Slight
Moderate
Extensive
Complete
(b) GF-CSPSW
0
0.1
0.2
0.3
0.4
0.5
0.6
0.7
0.8
0.9
1
0 0.1 0.2 0.3 0.4 0.5 0.6 0.7 0.8 0.9 1 1.1 1.2 1.3 1.4 1.5
PGA (g)
Dam
age
pro
bab
ility
Slight
Moderate
Extensive
Complete
(c) GF-LYPSPSW2
Fig. 8.9 Fragility curves for predicting the probability of reaching or exceeding the
nonstructural damage states for drift-sensitive components of buildings
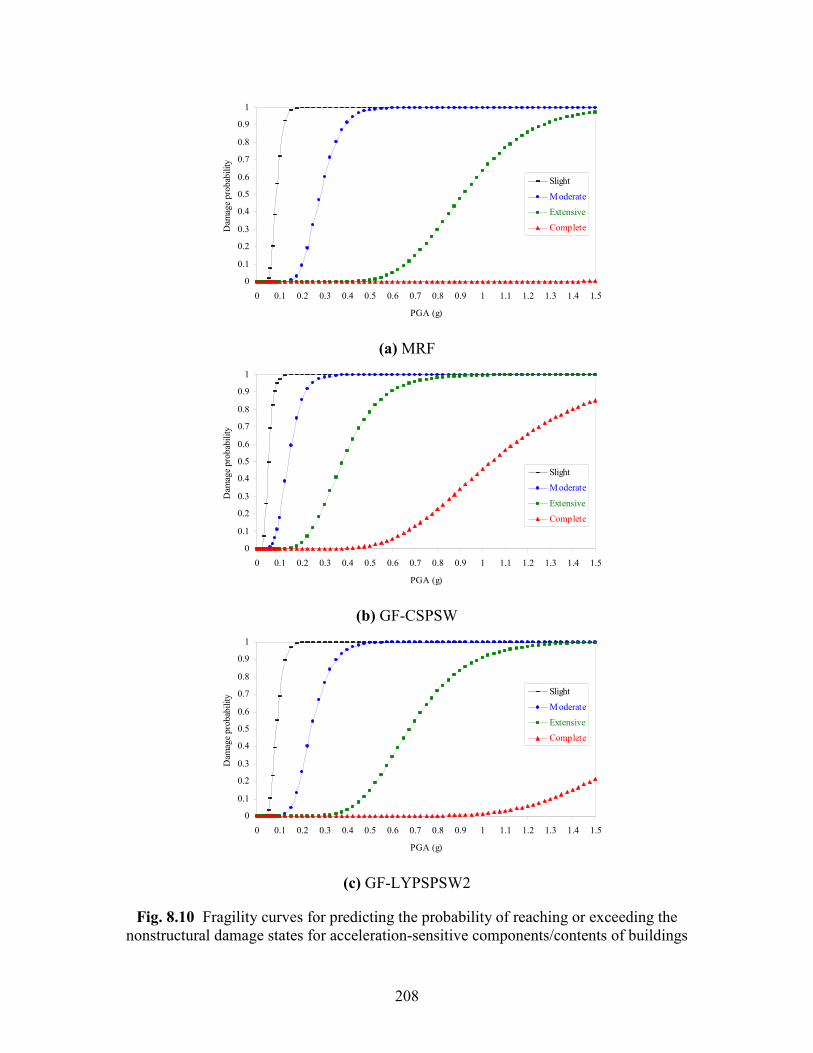
208
0
0.1
0.2
0.3
0.4
0.5
0.6
0.7
0.8
0.9
1
0 0.1 0.2 0.3 0.4 0.5 0.6 0.7 0.8 0.9 1 1.1 1.2 1.3 1.4 1.5
PGA (g)
Dam
age
pro
bab
ility
Slight
Moderate
Extensive
Complete
(a) MRF
0
0.1
0.2
0.3
0.4
0.5
0.6
0.7
0.8
0.9
1
0 0.1 0.2 0.3 0.4 0.5 0.6 0.7 0.8 0.9 1 1.1 1.2 1.3 1.4 1.5
PGA (g)
Dam
age
pro
bab
ility
Slight
Moderate
Extensive
Complete
(b) GF-CSPSW
0
0.1
0.2
0.3
0.4
0.5
0.6
0.7
0.8
0.9
1
0 0.1 0.2 0.3 0.4 0.5 0.6 0.7 0.8 0.9 1 1.1 1.2 1.3 1.4 1.5
PGA (g)
Dam
age
pro
bab
ility
Slight
Moderate
Extensive
Complete
(c) GF-LYPSPSW2
Fig. 8.10 Fragility curves for predicting the probability of reaching or exceeding the
nonstructural damage states for acceleration-sensitive components/contents of buildings
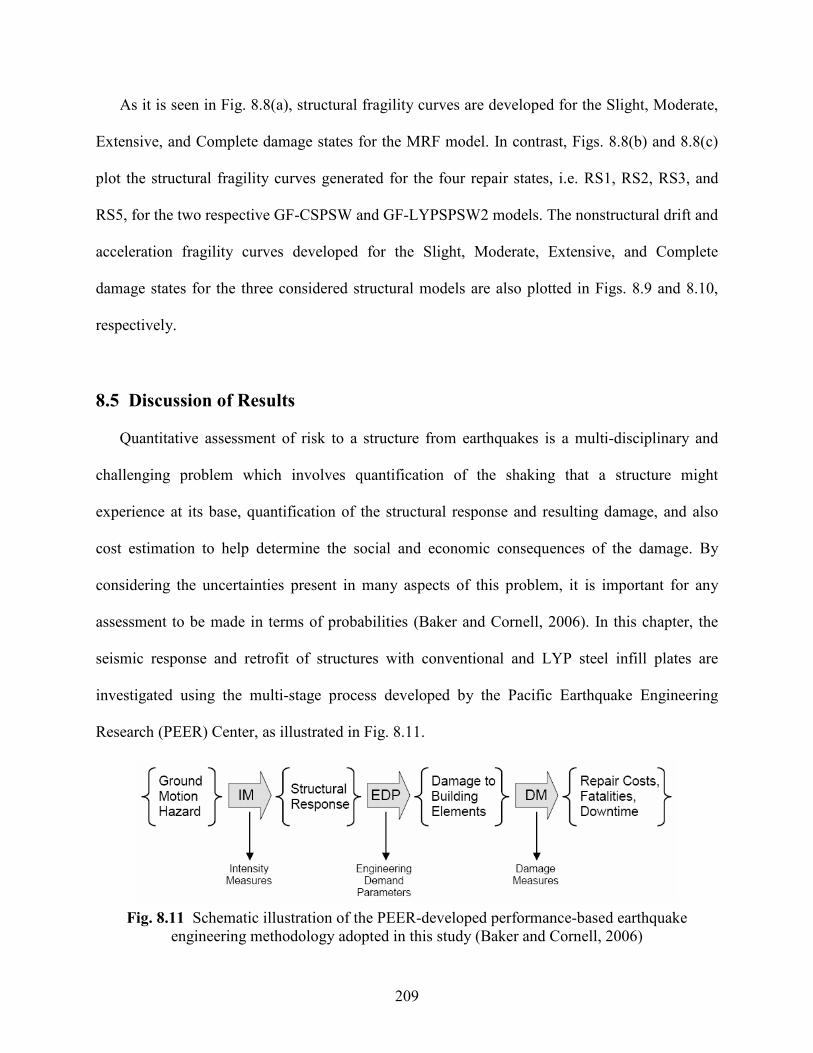
209
As it is seen in Fig. 8.8(a), structural fragility curves are developed for the Slight, Moderate,
Extensive, and Complete damage states for the MRF model. In contrast, Figs. 8.8(b) and 8.8(c)
plot the structural fragility curves generated for the four repair states, i.e. RS1, RS2, RS3, and
RS5, for the two respective GF-CSPSW and GF-LYPSPSW2 models. The nonstructural drift and
acceleration fragility curves developed for the Slight, Moderate, Extensive, and Complete
damage states for the three considered structural models are also plotted in Figs. 8.9 and 8.10,
respectively.
8.5 Discussion of Results
Quantitative assessment of risk to a structure from earthquakes is a multi-disciplinary and
challenging problem which involves quantification of the shaking that a structure might
experience at its base, quantification of the structural response and resulting damage, and also
cost estimation to help determine the social and economic consequences of the damage. By
considering the uncertainties present in many aspects of this problem, it is important for any
assessment to be made in terms of probabilities (Baker and Cornell, 2006). In this chapter, the
seismic response and retrofit of structures with conventional and LYP steel infill plates are
investigated using the multi-stage process developed by the Pacific Earthquake Engineering
Research (PEER) Center, as illustrated in Fig. 8.11.
Fig. 8.11 Schematic illustration of the PEER-developed performance-based earthquake
engineering methodology adopted in this study (Baker and Cornell, 2006)
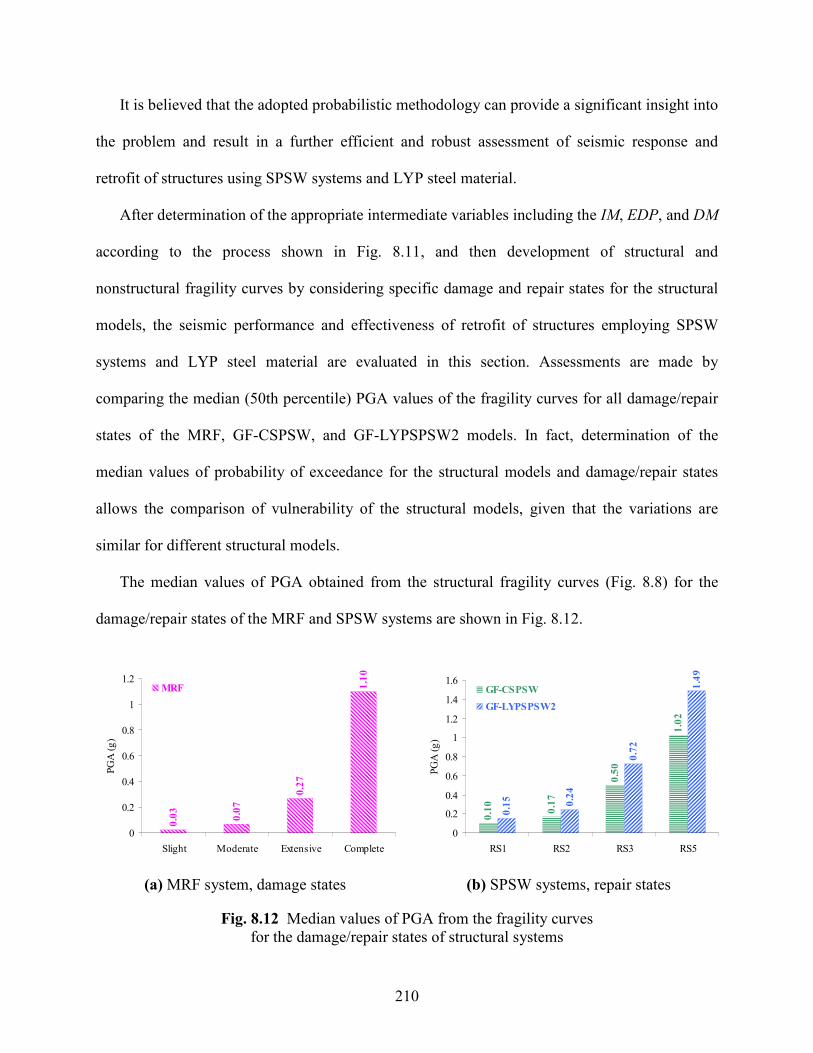
210
It is believed that the adopted probabilistic methodology can provide a significant insight into
the problem and result in a further efficient and robust assessment of seismic response and
retrofit of structures using SPSW systems and LYP steel material.
After determination of the appropriate intermediate variables including the IM, EDP, and DM
according to the process shown in Fig. 8.11, and then development of structural and
nonstructural fragility curves by considering specific damage and repair states for the structural
models, the seismic performance and effectiveness of retrofit of structures employing SPSW
systems and LYP steel material are evaluated in this section. Assessments are made by
comparing the median (50th percentile) PGA values of the fragility curves for all damage/repair
states of the MRF, GF-CSPSW, and GF-LYPSPSW2 models. In fact, determination of the
median values of probability of exceedance for the structural models and damage/repair states
allows the comparison of vulnerability of the structural models, given that the variations are
similar for different structural models.
The median values of PGA obtained from the structural fragility curves (Fig. 8.8) for the
damage/repair states of the MRF and SPSW systems are shown in Fig. 8.12.
0.03
0.07
0.27
1.10
0
0.2
0.4
0.6
0.8
1
1.2
Slight Moderate Extensive Complete
PG
A (
g)
MRF
0.10
0.17
0.50
1.02
0.15
0.24
0.72
1.49
0
0.2
0.4
0.6
0.8
1
1.2
1.4
1.6
RS1 RS2 RS3 RS5
PG
A (
g)
GF-CSPSW
GF-LYPSPSW2
(a) MRF system, damage states (b) SPSW systems, repair states
Fig. 8.12 Median values of PGA from the fragility curves
for the damage/repair states of structural systems
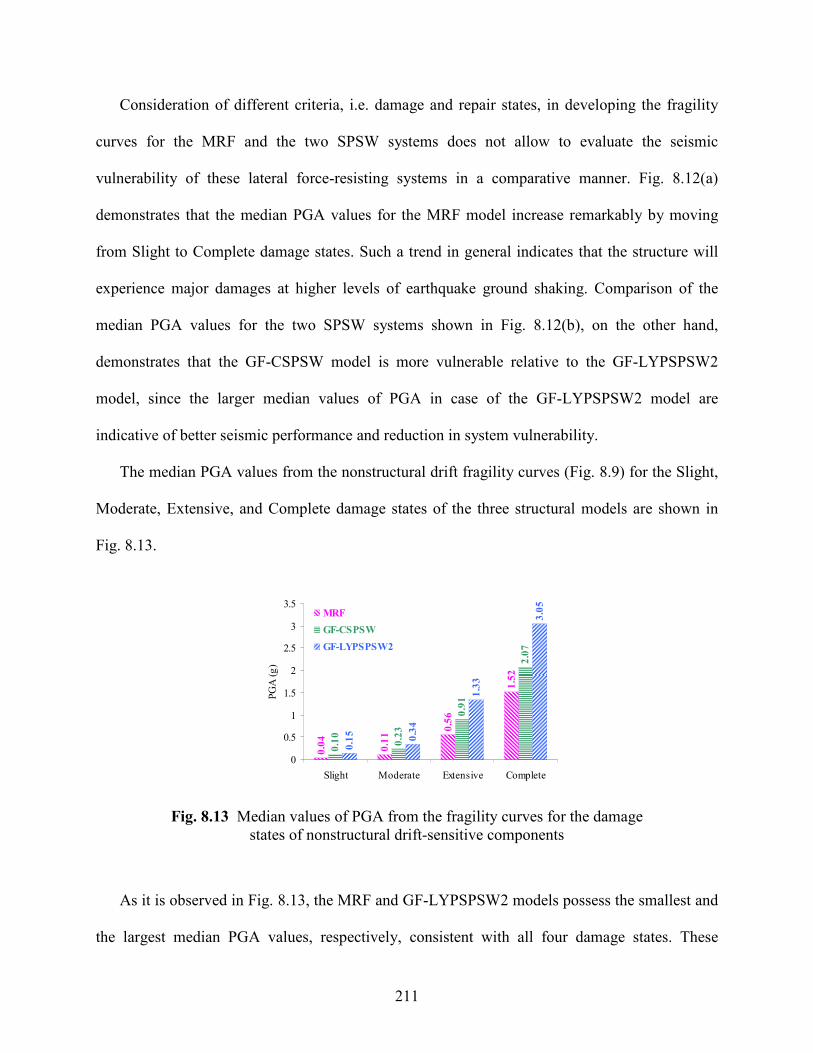
211
Consideration of different criteria, i.e. damage and repair states, in developing the fragility
curves for the MRF and the two SPSW systems does not allow to evaluate the seismic
vulnerability of these lateral force-resisting systems in a comparative manner. Fig. 8.12(a)
demonstrates that the median PGA values for the MRF model increase remarkably by moving
from Slight to Complete damage states. Such a trend in general indicates that the structure will
experience major damages at higher levels of earthquake ground shaking. Comparison of the
median PGA values for the two SPSW systems shown in Fig. 8.12(b), on the other hand,
demonstrates that the GF-CSPSW model is more vulnerable relative to the GF-LYPSPSW2
model, since the larger median values of PGA in case of the GF-LYPSPSW2 model are
indicative of better seismic performance and reduction in system vulnerability.
The median PGA values from the nonstructural drift fragility curves (Fig. 8.9) for the Slight,
Moderate, Extensive, and Complete damage states of the three structural models are shown in
Fig. 8.13.
0.04
0.11
0.56
1.52
0.10
0.23
0.91
2.07
0.15
0.34
1.33
3.05
0
0.5
1
1.5
2
2.5
3
3.5
Slight Moderate Extensive Complete
PG
A (
g)
MRF
GF-CSPSW
GF-LYPSPSW2
Fig. 8.13 Median values of PGA from the fragility curves for the damage
states of nonstructural drift-sensitive components
As it is observed in Fig. 8.13, the MRF and GF-LYPSPSW2 models possess the smallest and
the largest median PGA values, respectively, consistent with all four damage states. These
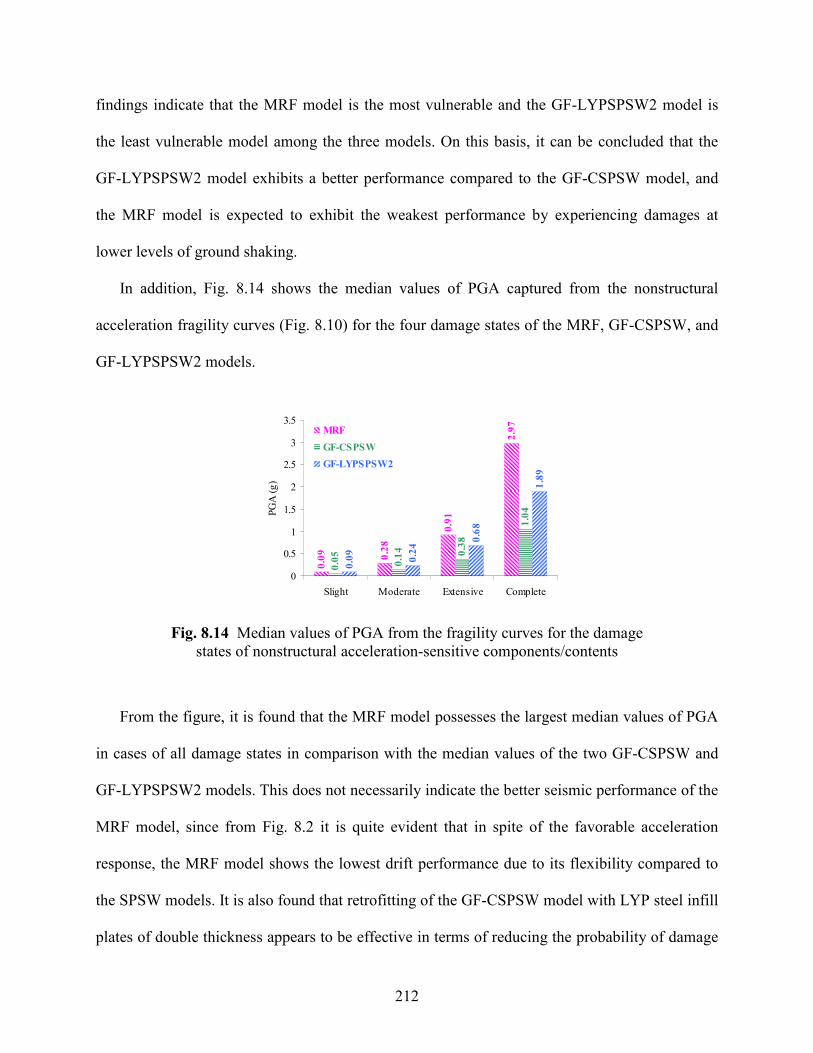
212
findings indicate that the MRF model is the most vulnerable and the GF-LYPSPSW2 model is
the least vulnerable model among the three models. On this basis, it can be concluded that the
GF-LYPSPSW2 model exhibits a better performance compared to the GF-CSPSW model, and
the MRF model is expected to exhibit the weakest performance by experiencing damages at
lower levels of ground shaking.
In addition, Fig. 8.14 shows the median values of PGA captured from the nonstructural
acceleration fragility curves (Fig. 8.10) for the four damage states of the MRF, GF-CSPSW, and
GF-LYPSPSW2 models.
0.09
0.28
0.91
2.97
0.05
0.14 0.38
1.04
0.09
0.24
0.68
1.89
0
0.5
1
1.5
2
2.5
3
3.5
Slight Moderate Extensive Complete
PG
A (
g)
MRF
GF-CSPSW
GF-LYPSPSW2
Fig. 8.14 Median values of PGA from the fragility curves for the damage
states of nonstructural acceleration-sensitive components/contents
From the figure, it is found that the MRF model possesses the largest median values of PGA
in cases of all damage states in comparison with the median values of the two GF-CSPSW and
GF-LYPSPSW2 models. This does not necessarily indicate the better seismic performance of the
MRF model, since from Fig. 8.2 it is quite evident that in spite of the favorable acceleration
response, the MRF model shows the lowest drift performance due to its flexibility compared to
the SPSW models. It is also found that retrofitting of the GF-CSPSW model with LYP steel infill
plates of double thickness appears to be effective in terms of reducing the probability of damage

213
to the nonstructural acceleration-sensitive components and contents. The larger median PGA
values of the GF-LYPSPSW2 model compared to those of the GF-CSPSW model in cases of all
four damage states are indeed indicative of superior seismic performance of the GF-LYPSPSW2
model, since for a given damage state, the GF-LYPSPSW2 model is required to undergo higher
levels of ground shaking in order to experience the same amount of damage as experienced by
the GF-CSPSW model.
In summary, the results of the probabilistic methodology adopted in this study show that
SPSW systems in general and LYP steel shear walls in particular are high-performing and
efficient lateral force-resisting systems which can be effectively used in controlling the seismic
response of structures. Application of LYP steel in lieu of the conventional structural steel is
found to be quite effective in improving the buckling stability and seismic performance of SPSW
systems, and consequently reducing the seismic vulnerability of buildings employing such lateral
force-resisting and energy dissipating systems.
8.6 Concluding Remarks
The fragility function method was used in this chapter in order to evaluate the seismic
performance and vulnerability of structures employing SPSW systems and LYP steel material. In
spite of importance of fragility methodology in performance-based earthquake engineering, a
search of the literature reveals that little steps have been taken towards application of this
methodology in analysis, design, and retrofit of SPSW systems. On this basis, the main objective
of this study was to take an effective step towards addressing this need by developing
appropriate fragility functions and evaluating the seismic performance and vulnerability of code-
designed and retrofitted SPSW systems through fragility analysis.

214
Nonlinear time-history analyses were performed in order to determine the peak interstory
drift and peak floor acceleration responses of a moment-resisting and two code-designed and
retrofitted SPSW frames, i.e. the MRF, GF-CSPSW, and GF-LYPSPSW2 models, subjected to a
suite of thirty earthquake ground motions representing 50/50, 10/50, and 2/50 hazard levels.
Evaluation of seismic performances of the structural models revealed that retrofitting of the
code-designed and conventional steel SPSW frame with LYP steel infill plates of double
thickness improves the drift and acceleration performances of the system through limiting the
seismic responses in an effective manner.
Attempts were made in order to determine the most appropriate engineering demand
parameter (EDP) and intensity measure (IM) pairs for optimal probabilistic seismic demand
models (PSDMs) with lower degrees of scatter. Through consideration of a proper variability
measure and regression analyses, the peak interstory drift ratio (PIDR) and peak floor
acceleration (PFA) demand parameters were shown to have a good linear correlation with the
PGA intensity measure. Accordingly, PFA-PGA and PIDR-PGA pairs were selected to generate
fragility curves for the purpose of this study.
The probabilistic seismic demand analysis (PSDA) method was used in order to develop
structural, nonstructural drift, and nonstructural acceleration fragility curves of the structural
models by considering code-specified damage and some proposed repair states. The seismic
performance and vulnerability of the structural models were then evaluated by comparing the
median (50th percentile) values of PGA obtained from the fragility curves for all considered
damage and repair states.
Based on the results of this study, SPSW systems in general appear to be more effective in
controlling the seismic response and reducing the vulnerability of buildings compared to the
215
moment-resisting frames. It was shown that the retrofitted GF-LYPSPSW2 model with LYP
steel infill plates of double thickness is less vulnerable compared to the original code-designed
and conventional steel GF-CSPSW model. These findings indicate that retrofitting of SPSW
systems with LYP steel infill plates of double thickness reduces the damage probability of
SPSWs and results in a smaller damage potential and better seismic performance. Ultimately, it
is quite important to note that such an improvement in structural behavior and seismic
performance of SPSW systems is directly related to the application of LYP steel with superb
material properties beneficial for seismic hazard mitigation of structures.
216
9. SUMMARY, CONCLUSIONS, AND FUTURE WORK
9.1 Summary
SPSWs are relatively new and efficient lateral force-resisting systems which have been
designed and used with either stiffened and stocky or unstiffened and slender web plates based
on disparate structural and economical considerations. Application of LYP steel material
essentially developed for seismic control devices provides the possibility to design cost-effective
and high-performing SPSW systems. Considering the novelty of SPSW systems and their recent
introduction into the design codes, on one hand, and growth in development as well as use of
LYP steel material, on the other hand, detailed and systematic investigations are required for
confident and prevalent application of LYP steel material is seismic design and retrofit of SPSW
systems. This research aims at taking effective steps towards addressing this need through
comprehensive and systematic investigations on structural behavior and seismic performance of
SPSWs employing LYP steel infill plates.
A general introduction and background of the SPSW systems along with the scope and
objectives of this research were initially provided in Chapter 1. A summary of the past
theoretical and experimental research works along with most recent developments on the
analysis, design, and application of SPSW systems as well as LYP steel material were presented
in Chapter 2. In Chapter 3, the fundamental mechanics, codified design provisions based on
capacity-design requirements, and improvements made toward the performance-based seismic
design of SPSW systems were discussed. The various advantages of application of LYP steel
material in seismic design and retrofit of SPSW systems were shown through detailed and
systematic analytical and numerical studies in the subsequent chapters.
217
The accurate determination of the limiting plate thickness corresponding to simultaneous
buckling and yielding, which can serve as an effective parameter in seismic design of LYP steel
shear wall systems was addressed through element-level investigations in Chapter 4. The
structural characteristics of unstiffened LYP steel shear walls with slender, moderate, and stocky
infill plates were then identified using nonlinear pushover and cyclic analyses through
component-level investigations in Chapters 5 and 6, and a modified PFI method was proposed
for predicting and characterizing the behavior of LYP steel shear walls with low yielding and
high buckling capacities. In addition, the effectiveness of some AISC 341-10 (2010) code-
specified design requirements and considerations was evaluated in Chapter 6, and proper
recommendations were made for efficient analysis and design of LYP steel shear wall systems.
The seismic performances of code-designed and retrofitted SPSW frames with conventional and
LYP steel infill plates were evaluated using nonlinear dynamic analyses in Chapter 7, and the
effectiveness of use of LYP steel material in improving the seismic response and performance of
SPSW systems was demonstrated through system-level investigations. Finally, the effectiveness
of design and retrofit of structures using SPSW systems and LYP steel material was verified in
Chapter 8, through development of appropriate fragility functions and detailed probabilistic
assessments. Overall, based on the findings of this comprehensive research work and results of
the other published studies, it can be concluded that application of LYP steel with superb
material properties suitable for seismic applications, can efficiently improve the structural
behavior, seismic performance, and serviceability of SPSW systems in both new and retrofit
construction.

218
9.2 Conclusions
The various advantages and characteristics of application of LYP steel material in seismic
design and retrofit of SPSW systems were demonstrated and evaluated in this research through
comprehensive element-, component-, and system-level investigations as well as probabilistic
approaches. The major findings of this research work are provided in this section.
The following conclusions are drawn from the element-level investigations:
• Application of LYP steel with relatively low yield stress compared to the conventional
steel can considerably reduce the required limiting plate thickness corresponding to
concurrent geometrical-material bifurcation. Smaller limiting infill plate thickness can
result in early yielding, absorption of more input energy, and consequently improved
seismic performance of the system. Hence, accurate determination of the limiting plate
thickness is important in seismic design of LYP steel shear wall systems.
• In practice, consideration of clamped support condition can provide reliable estimates for
the limiting plate thickness in SPSWs, given that the boundary frame members are
properly designed.
• Larger plate length-to-height ratios can unfavorably result in larger limiting plate
thicknesses. Accordingly, as a design consideration, selection of optimal plate length-to-
height ratios can result in desirable seismic performance of the SPSW systems.
• According to element-level investigations, beam-attached infill plates in SPSW systems
can exhibit relatively weak cyclic performance as a result of excessive out-of-plane
deformations due to the presence of two unrestrained edges, if not stiffened properly.

219
The following conclusions are drawn from the component-level investigations:
• Application of LYP steel infill plates in SPSWs can facilitate the design of such systems
by setting a desirable plate-frame yielding sequence. This can also result in reduced
forces imposed on the boundary frame members as compared to the conventional steel
infill plates.
• Based on a detailed case study, application of LYP steel material offers the possibility of
retrofit of existing conventional steel SPSWs with LYP steel infill plates of double
thickness in a desirable and efficient manner. In fact, such a retrofit strategy can improve
the initial stiffness and buckling as well as energy dissipation capacities of the SPSW
system and also alleviate the high stiffness and over-strength concerns.
• Properly-designed SPSWs with unstiffened LYP steel infill plates can possess desirable
stiffening and damping performances, i.e. improved initial stiffness, strength, and energy
absorption capacity, which is indicative of superior lateral force-resisting and energy
dissipating capabilities of such structural systems.
• Increasing of the panel aspect ratio can favorably increase the initial stiffness, strength,
and energy absorption capacity of SPSWs. However, as the aspect ratio increases and
especially gets larger than unity, relatively heavier HBE and VBE sections may be
needed to meet the design requirements due to relatively larger thicknesses of LYP steel
infill plates, which in turn may impose additional construction costs. Thus, selection of an
optimal panel aspect ratio in design process can be quite effective in adjusting the
construction costs and designing high-performing LYP steel shear wall systems.
220
• Evaluation of performances of RBS connections and panel zones as well as effectiveness
of lateral bracing of frame members in the code-designed SPSW models revealed that
behaviors of the frame components in LYP steel shear walls is somewhat influenced by
the panel aspect ratio parameter, which necessitates the re-assessment of some respective
design requirements.
• The modified PFI model, proposed in this research, can be effectively used for predicting
and characterizing the behavior of LYP steel shear walls with moderate and stocky infill
plates of different aspect ratios. In addition, this analytical model can serve as effective
and simple design tool in structural design of LYP steel shear walls with relatively low
yielding and high buckling capacities.
The following conclusions are drawn from the system-level investigations:
• The ASCE 7-10 (2010) code-specified formula underestimates the fundamental periods
of SPSW frames. Consideration of more efficient approaches and/or proper modification
of this formula is believed to result in further optimal designs.
• The “interstory” drift ratio is found to be more controlling than the “story” drift ratio in
seismic design of structures, and SPSW frames have been demonstrated to be quite
efficacious in limiting the drift demands.
• Retrofitting of the code-designed and conventional steel SPSW frame with LYP steel
infill plates of relatively larger thicknesses is shown to be quite effective in improving the
drift and acceleration responses of the structure. The LYP steel shear wall frames, also,

221
exhibit better performance in reducing the base shear, base moment, and VBE axial load
demands compared to the conventional steel SPSW frame. Nonetheless, employment of
overly thick LYP steel plates in retrofit of the code-designed SPSW frame with
conventional steel infill plates is found to be disadvantageous which may result in
undesirable performance of the structure.
• According to the findings of the system-level investigations, employment of LYP steel
infill plates of double thickness is considered to be the most desirable and optimal option
for retrofitting of the code-designed and conventional steel SPSW frame, which also
results in enhanced ductility and energy dissipation capability of the system. This finding
is consistent with the results of the case study on the retrofit of the SPSW systems
performed through component-level investigations.
The following conclusions are drawn from the fragility analyses of the structural systems:
• A search of the most appropriate EDP-IM pairs for optimal PSDMs with lower variation
degrees showed that PIDR (peak interstory drift ratio) and PFA (peak floor acceleration)
parameters had a good linear correlation with the PGA (peak ground acceleration)
intensity measure, and hence PIDR-PGA and PFA-PGA pairs were chosen for generating
fragility functions in this research.
• Comparison of the median PGA values of the fragility curves, obtained for different
structural models as well as damage/repair states, in this research, demonstrates the
relative superiority of SPSW systems in controlling the seismic response and reducing the
vulnerability of buildings.
222
• Fragility analyses also show that the retrofitted SPSW frame with LYP steel infill plates
of double thickness is less vulnerable compared to the original code-designed and
conventional steel SPSW frame. Accordingly, such a retrofit strategy lowers the damage
potential and results in better seismic performance of the structure.
9.3 Recommendations for Future Work
Through the findings of this research program, a number of high-impact areas related to the
design and application of SPSW systems in general and LYP steel shear walls in particular have
been identified which need further attention and investigation in future studies. The research
needs presented below are believed to make this promising lateral force-resisting system easier
to design, more economical, and structurally more efficient. Recommendations for future
research directions are as follows:
• From various strategies proposed to reduce column demands in SPSWs, application of
LYP steel shear walls with RBS connections and beam-attached infill plates seems to
have promising potential towards lowering the overall system demand on the vertical and
horizontal boundary members. However, detailed investigations are required for
development of cost-effective and structurally sound systems by effective limiting of the
infill plate out-of-plane deformations through strategic placement of optimal stiffeners.
• Experimental investigations are required to further substantiate the findings of this
research on analytical determination of the limiting web-plate thickness in SPSWs with
LYP steel infill plates and also to identify and establish the structural characteristics of
SPSWs with slender, moderate, and stocky LYP steel infill plates.

223
• Further experimental research is also required in order to verify the effectiveness of the
proposed PFI model in predicting the behaviors of SPSWs with moderate and stocky
infill plates. In particular, study on quantification of the shear and bending deformation
contributions to the overall response of the SPSW system and its incorporation into the
modified PFI model can improve the accuracy of this analytical model.
• Panel aspect ratio parameter has been shown to be effective on the limiting plate
thickness magnitude as well as structural and seismic behaviors of unstiffened LYP steel
shear wall systems. Further investigations on the effectiveness of this design parameter
on structural and economical considerations, and development of practical design
recommendations can result in design of high-performing and cost-effective structures.
• Based on the findings of this research, the effectiveness of the AISC 341-10 (2010) code-
specified requirements on the stiffness and lateral bracing of frame members needs to be
examined through further experimental and numerical investigations.
• In this research, the dynamic behaviors of 9-story and 5-bay structures subjected to a
number of earthquake ground motions were studied though system-level investigations.
For a further comprehensive seismic response and performance evaluation, it is suggested
to consider multi-story structures with various numbers of stories and bays as well as
span length-to-story height aspect ratios subjected to a large number of ground motions
representing a wide range of hazard levels. This will develop a vast knowledge on the
design, retrofit, and application of SPSW systems employed in low-, mid-, and high-rise
buildings.
224
• This research, along with a few reported studies in the literature, has taken the initial
steps towards the performance-based seismic design of SPSW systems. However, much
research work is still required in this regard. Effective application of the fragility
methodology relies on development and analysis of more experimental data, generation
and codification of SPSW-specific damage and/or repair states, and studies on the
selection of more efficient EDP and IM parameters in order for developing appropriate
fragility functions for probabilistic seismic response and vulnerability assessment of
SPSW systems in an efficient manner. Moreover, effective combination of different types
of fragility curves for developing the overall fragility of the structure is an important
subject which needs to be considered in the future work.
225
References
AISC 341-05 (2005). Seismic Provisions for Structural Steel Buildings. American Institute of
Steel Construction, Chicago, IL.
AISC 341-10 (2010). Seismic Provisions for Structural Steel Buildings. American Institute of
Steel Construction, Chicago, IL.
AISC 360-10 (2010). Specification for Structural Steel Buildings. American Institute of Steel
Construction, Chicago, IL.
Akkar S., Sucuoğlu H. and Yakut A. (2005). “Displacement-based fragility functions for low-
and mid-rise ordinary concrete buildings”, Earthquake Spectra, 21(4), 901-927.
Alinia M.M. and Dastfan M. (2006). “Behaviour of thin steel plate shear walls regarding frame
members”, Journal of Constructional Steel Research, 62(7), 730-738.
Alinia M.M., Gheitasi A. and Erfani S. (2009). “Plastic shear buckling of unstiffened stocky
plates”, Journal of Constructional Steel Research, 65(8-9) 1631-1643.
Alinia M.M. and Sarraf Shirazi R. (2009). “On the design of stiffeners in steel plate shear walls”,
Journal of Constructional Steel Research, 65, 2069-2077.
ANSYS 11.0 (2007). ANSYS 11.0 documentation, ANSYS Inc.
ANSYS 14.0 (2011). ANSYS 14.0 documentation, ANSYS Inc.
ASCE 7-10 (2010). Minimum Design Loads for Buildings and Other Structures. American
Society of Civil Engineers, Reston, VA.
Astaneh-Asl A. (2000). Seismic Behavior and Design of Steel Shear Walls. Steel TIPS Report,
Structural Steel Educational Council, Moraga, CA.
Astaneh-Asl A. (2002). Seismic Behavior and Design of Composite Steel Plate Shear Walls.
Steel TIPS Report, Structural Steel Educational Council, Moraga, CA.
Baker J.W. and Cornell C.A. (2006). Vector-Valued Ground Motion Intensity Measures for
Probabilistic Seismic Demand Analysis. PEER Report 2006/08, Pacific Earthquake
Engineering Research Center, College of Engineering, University of California, Berkeley.
Baldvins N.M., Berman J.W., Lowes L.N., Janes T.M. and Low N.A. (2012). “Fragility
functions for steel plate shear walls”, Earthquake Spectra, 28(2), 405-426.
Basler K. (1961). “Strength of plate girders in shear”, Journal of the Structural Division, ASCE,

226
87(7), 150-180.
Bayat M.R. (2010). Performance-Based Plastic Design of Earthquake Resistant Steel Structures:
Concentrically Braced frames, Tall Moment Frames, Plate Shear Wall Frames. Ph.D.
Dissertation, The Faculty of Graduate School, The University of Texas at Arlington.
Behbahanifard M.R., Grondin G.Y. and Elwi A.E. (2003). Experimental and Numerical
Investigation of Steel Plate Shear Wall. Structural Engineering Report 254, Department of
Civil and Environmental Engineering, University of Alberta, Canada.
Berman J.W. (2011). “Seismic behavior of code designed steel plate shear walls”, Engineering
Structures, 33(1), 230-244.
Berman J.W. and Bruneau M. (2003). Experimental Investigation of Light-Gauge Steel Plate
Shear Walls for the Seismic Retrofit of Buildings. Technical Report MCEER-03-0001,
Multidisciplinary Center for Earthquake Engineering Research, Buffalo, NY.
Berman J.W. and Bruneau M. (2004). “Steel plate shear walls are not plate girders”, Engineering
Journal, AISC, 41(3), 95-106.
Berman J.W. and Bruneau M. (2005). “Experimental investigation of light-gauge steel plate
shear walls”, Journal of Structural Engineering, ASCE, 131(2), 259-267.
Berman J.W., Lowes L.N., Baldvins N.M., Low N.A. and Janes T.N. (2010). “Performance
based design tools for steel plate shear walls”, Structures Congress, ASCE, 3443-3454.
Berman J.W., Lowes L.N., Okazaki T., Bruneau M., Tsai K.C., Driver R.G. and Sabelli R.
(2008). “Research needs and future directions for steel plate shear walls”, Structures
Congress, Vancouver, Canada.
Bhowmick A.K. (2009a). Seismic Analysis and Design of Steel Plate Shear Walls. Ph.D.
Dissertation, Department of Civil and Environmental Engineering, University of Alberta.
Bhowmick A.K., Driver R.G. and Grondin G.Y. (2009b). “Seismic analysis of steel plate shear
walls considering strain rate and P-delta effects”, Journal of Constructional Steel Research,
65(5), 1149-1159.
Bhowmick A.K., Grondin G.Y. and Driver R.G. (2011). “Estimating fundamental periods of
steel plate shear walls”, Engineering Structures, 33(6), 1883-1893.
Bruneau M. and Bhagwagar T. (2002). “Seismic retrofit of flexible steel frames using thin infill
panels”, Engineering Structures, 24, 443-453.
Brush D.O. and Almroth B.O. (1975). Buckling of Bars, Plates and Shells. McGraw-Hill, New
York.
227
Caccese V., Elgaaly M. and Chen R. (1993). “Experimental study of thin steel-plate shear walls
under cyclic load”, Journal of Structural Engineering, ASCE, 119(2), 573-587.
CAN/CSA S16-01 (2001). Limit States Design of Steel Structures. Canadian Standards
Association, Toronto, Ontario, Canada.
Çelebi M. (1997). “Response of Olive View Hospital to Northridge and Whittier earthquakes”,
Journal of Structural Engineering, ASCE, 123(4), 389-396.
Chen S.J. and Jhang C. (2006). “Cyclic behavior of low yield point steel shear walls”, Thin-
Walled Structures, 44(7), 730-738.
Chen S.J. and Jhang C. (2011). “Experimental study of low-yield-point steel plate shear wall
under in-plane load”, Journal of Constructional Steel Research, 67(6), 977-985.
Chen W.F. and Lui E.M. (2006). Earthquake Engineering for Structural Design. CRC Press,
Taylor & Francis Group, LLC.
Chen W.F., Yoshiaki G. and Liew J.Y.R. (1996). Stability Design of Semi-Rigid Frames. Vol. 1,
John Wiley & Sons, Inc.
Chen Y.Z., Lee Y.Y., Li Q.S. and Guo Y.J. (2009). “Concise formula for the critical buckling
stresses of an elastic plate under biaxial compression and shear”, Journal of Constructional
Steel Research, 65(7), 1507-1510.
Dastfan M. and Driver R.G. (2008). “Flexural stiffness limits for frame members of steel plate
shear wall systems”, Proceedings of Annual Stability Conference, Nashville, Structural
Stability Research Council, Rolla, MO.
De Matteis G., Landolfo R. and Mazzolani F.M. (2003). “Seismic response of MR steel frames
with low-yield steel shear panels”, Engineering Structures, 25(2), 155-168.
Driver R.G., Kulak G.L., Kennedy D.J. L. and Elwi A.E. (1997). Seismic Behaviour of Steel
Plate Shear Walls. Structural Engineering Report No. 215, Department of Civil and
Environmental Engineering, University of Alberta, Edmonton, Alberta, Canada.
Dung P.N. (2011). Seismically Retrofitting Reinforced Concrete Moment Resisting Frames by
Using Expanded Metal Panels. Ph.D. Dissertation, Structural Engineering Sector,
Department of Architecture, Geology, Environment and Constructions, Faculty of Applied
Sciences, University of Liege.
Eatherton M. (2006). “Design and construction of steel plate shear walls”, Proceedings of the 8th
U.S. National Conference on Earthquake Engineering, Paper No. 588, San Francisco,
California, U.S.A.
Elgaaly M., Caccese V. and Du C. (1993). “Post-buckling behavior of steel-plate shear walls
228
under cyclic loads”, Journal of Structural Engineering, ASCE, 119(2), 588-605.
FEMA 355C (2000). State of the Art Report on Systems Performance of Steel Moment Frames
Subject to Earthquake Ground Shaking. Prepared by the SAC Joint Venture for the Federal
Emergency Management Agency, Washington, D.C.
FEMA 445 (2006). Next-Generation Performance-Based Seismic Design Guidelines: Program
Plan For New And Existing Buildings. Prepared by the Applied Technology Council for
the Federal Emergency Management Agency, Washington, D.C.
FEMA 450 (2004). NEHRP Recommended Provisions for Seismic Regulations for New
Buildings and Other Structures. Prepared by the Building Seismic Safety Council for the
Federal Emergency Management Agency, Washington, D.C.
Gheitasi A. and Alinia M.M. (2010). “Slenderness classification of unstiffened metal plates
under shear loading”, Thin-Walled Structures, 48(7), 508-518.
Ghosh S., Adam F. and Das A. (2009). “Design of steel plate shear walls considering inelastic
drift demand”, Journal of Constructional Steel Research, 65, 1431-1437.
Ghosh S. and Kharmale S.B. (2010). Research on Steel Plate Shear Wall: Past, Present and
Future. Structural Steel and Castings, Chapter 2, Nova Science Publishers, Inc., 57-106.
Gould N.C. (2003). Performance Based Seismic Design. International Risk Management
Institute Online Articles, October.(http://www.irmi.com/expert/articles/2003/gould10.aspx)
Gupta A. and Krawinkler H. (1999). Seismic Demands for Performance Evaluation of Steel
Moment Resisting Frame Structures. Report No. 132, The John A. Blume Earthquake
Engineering Center, Department of Civil and Environmental Engineering, Stanford
University.
Habashi H.R. and Alinia M.M. (2010). “Characteristics of the wall-frame interaction in steel
plate shear walls”, Journal of Constructional Steel Research, 66(2), 150-158.
HAZUS-MH MR5 (2010). Earthquake Loss Estimation Methodology. Technical and User’s
Manual, Department of Homeland Security, Federal Emergency Management Agency,
Mitigation Division, Washington, D.C.
Hitaka T. and Matsui C. (2003). “Experimental study on steel shear wall with slits”, Journal of
Structural Engineering, ASCE, 129(5), 586-595.
Jahanpour A., Jönsson J. and Moharrami H. (2012). “Seismic behavior of semi-supported steel
shear walls”, Journal of Constructional Steel Research, 74, July, 118-133.
Janković S. and Stojadinović B. (2004). “Probabilistic performance-based seismic demand
model for R/C frame buildings”, Proceedings of the 13th
World Conference on Earthquake

229
Engineering, Paper No. 1547, Vancouver, B.C., Canada.
Kharrazi M.H.K. (2005). Rational Method for Analysis and Design of Steel Plate Walls. Ph.D.
Dissertation, The Faculty of Graduate Studies (Civil Engineering), The University of
British Columbia, Canada.
Kulak G.L., Kennedy D.J.L., Driver R.G. and Medhekar M. (2001). “Steel plate shear walls - An
overview”, Engineering Journal, AISC, First Quarter, 50-62.
Kurata M., Leon R.T., DesRoches R. and Nakashima M. (2012). “Steel plate shear wall with
tension-bracing for seismic rehabilitation of steel frames”, Journal of Constructional Steel
Research, 71, April, 92-103.
Kurban C.O. (2009a). A numerical study on response factors for steel plate shear wall systems.
M.Sc. Thesis, The Graduate School of Natural and Applied Sciences, Middle East
Technical University.
Kurban C.O. and Topkaya C. (2009b). “A numerical study on response modification,
overstrength, and displacement amplification factors for steel plate shear wall systems”,
Earthquake Engineering and Structural Dynamics, 38, 497-516.
Lashgari M. (2009). “Finite element analysis of thin steel plate shear walls”, World Academy of
Science, Engineering and Technology, 58, 436-440.
Lowes L.N. and Li J. (2009). “Fragility curves for reinforced concrete moment frames”,
Proceedings of the 2009 ATC & SEI Conference on Improving the Seismic Performance of
Existing Buildings and Other Structures, San Francisco, California, 403-414.
Lubell A.S. (1997). Performance of Unstiffened Steel Plate Shear Walls Under Cyclic
Quasi-Static Loading. M.A.Sc. Thesis, Department of Civil Engineering, University of
British Columbia, Canada.
Lubell A.S., Prion H.G.L., Ventura C.E. and Rezai M. (2000). “Unstiffened steel plate shear wall
performance under cyclic loading”, Journal of Structural Engineering, ASCE, 126(4), 453-
460.
Mackie K. and Stojadinović B. (2001). “Probabilistic seismic demand model for California
highway bridges”, Journal of Bridge Engineering, ASCE, 6(6), 468-481.
Mahtab M. and Zahedi M. (2008). “Seismic retrofit of steel frames using steel plate shear walls”,
Asian Journal of Applied Sciences, 1(4), 316-326.
Massey C. (1963). “Elastic and inelastic lateral instability of I-beams”, The Engineer, 216, 672-
674.
Mimura H. and Akiyama H. (1977). “Load-deflection relationship of earthquake-resistant steel
230
shear walls with a developed diagonal tension field”, Transactions of the Architectural
Institute of Japan, 260, 109-114.
Mistakidis E. (2010). “Numerical study of low-yield point steel shear walls used for seismic
applications”, Engineering Computations: International Journal for Computer-Aided
Engineering and Software, 27(2), 257-279.
Mistakidis E.S., De Matteis G. and Formisano A. (2007). “Low yield metal shear panels as an
alternative for the seismic upgrading of concrete structures”, Advances in Engineering
Software, 38(8-9), 626-636.
Mo Y.L. and Perng S.F. (2000). “Seismic performance of framed shear walls made of corrugated
steel”, Proceedings of the 6th
ASCCS International Conference on Steel Concrete
Composite Structures, Los Angeles, CA, 1057-1064.
Moslehi Tabar A. and Deylami A. (2005). “Instability of beams with reduced beam section
moment connections emphasizing the effect of column panel zone ductility”, Journal of
Constructional Steel Research, 61(11), 1475-1491.
Nakagawa S., Kihara H., Torii S., Nakata Y., Iwata M., Fujisawa K. and Fukuda K. (1996).
“Hysteretic behavior of low yield strength steel panel shear wall - experimental
investigation”, Proceedings of the 11th
World Conference on Earthquake Engineering,
Paper No. 171.
Nakashima M. (1995a). “Strain-hardening behavior of shear panels made of low-yield steel. I:
Test”, Journal of Structural Engineering, ASCE, 121(12), 1742-1749.
Nakashima M., Akazawa T. and Tsuji B. (1995b). “Strain-hardening behavior of shear panels
made of low-yield steel. II: Model”, Journal of Structural Engineering, ASCE, 121(12),
1750-1757.
Park H.G., Kwack J.H., Jeon S.W., Kim W.K. and Choi I.R. (2007). “Framed steel plate wall
behavior under cyclic lateral loading”, Journal of Structural Engineering, ASCE, 133(3),
378-388.
Pirmoz A. (2010). “Beam-attached steel plate shear walls”, The Structural Design of Tall and
Special Buildings. doi: 10.1002/tal.651.
Rezai M. (1999). Seismic Behaviour of Steel Plate Shear Walls by Shake Table Testing. Ph.D.
Dissertation, Department of Civil Engineering, The University of British Columbia,
Vancouver, Canada.
Roberts T.M. and Sabouri-Ghomi S. (1992). “Hysteretic characteristics of unstiffened perforated
steel plate shear walls”, Thin-Walled Structures, 14(2), 139-151.
Sabelli R. and Bruneau M. (2006). Steel Plate Shear Walls. Steel Design Guide 20, American
231
Institute of Steel Construction, Chicago, IL.
Sabelli R., Bruneau M. and Driver R.G. (2008). “Steel plate shear walls in the upcoming 2010
AISC seismic provisions and 2009 Canadian Standard S16”, Structures Congress,
Vancouver, Canada.
Sabouri-Ghomi S. and Roberts T.M. (1992). “Nonlinear dynamic analysis of steel plate shear
walls including shear and bending deformations”, Engineering Structures, 14(5), 309-317.
Sabouri-Ghomi S., Ventura C.E. and Kharrazi M.H.K. (2005). “Shear analysis and design of
ductile steel plate walls”, Journal of Structural Engineering, ASCE, 131(6), 878-889.
Saeki E., Sugisawa M., Yamaguchi T. and Wada A. (1998). “Mechanical properties of low-yield
point steels”, Journal of Materials in Civil Engineering, ASCE, 10(3), 143-152.
Seilie I.F. and Hooper J.D. (2005). “Steel plate shear walls: Practical design and construction”,
North American Steel Construction Conference, Modern Steel Construction, April.
Shishkin J.J., Driver R.G. and Grondin G.Y. (2005). Analysis of Steel Plate Shear Walls Using
the Modified Strip Model. Structural Engineering Report No. 261, Department of Civil and
Environmental Engineering, University of Alberta, Edmonton, Alberta, Canada.
Shishkin J.J., Driver R.G. and Grondin G.Y. (2009). “Analysis of steel plate shear walls using
the modified strip model”, Journal of Structural Engineering, ASCE, 135(11), 1357-1366.
Southwell R.V. (1932). “On the analysis of experimental observations in problems of elastic
stability”, Proceedings of the Royal Society of London, Series A, 135(828), 601-616.
Takahashi Y., Takemoto Y., Takeda T. and Takagi M. (1973). “Experimental study on thin steel
shear walls and particular bracings under alternative horizontal load”, Preliminary Report,
IABSE Symposium on Resistance and Ultimate Deformability of Structures Acted on by
Well-Defined Repeated Loads, Lisbon, Portugal, 185-191.
Thorburn L.J., Kulak G.L. and Montgomery C.J. (1983). Analysis of Steel Plate Shear Walls.
Structural Engineering Report No. 107, Department of Civil Engineering, University of
Alberta, Edmonton, Alberta, Canada.
Timler P.A. and Kulak G.L. (1983). Experimental Study of Steel Plate Shear Walls. Structural
Engineering Report No. 114, Department of Civil Engineering, University of Alberta,
Edmonton, Alberta, Canada.
Timoshenko S.P. and Gere J.M. (1961). Theory of Elastic Stability. McGraw-Hill, New York.
Topkaya C. and Atasoy M. (2009). “Lateral stiffness of steel plate shear wall systems”, Thin-
Walled Structures, 47(8-9), 827-835.
232
Topkaya C. and Kurban C.O. (2009). “Natural periods of steel plate shear wall systems”, Journal
of Constructional Steel Research, 65(3), 542-551.
Torii S., Teramoto T., Kihara H. and Kitamura H. (1996). “The response control design of high-
rise building with low yield steel wall”, Proceedings of the 11th
World Conference on
Earthquake Engineering, Paper No. 97.
Trahair N.S. (1969). “Deformations of geometrically imperfect beams”, Journal of the Structural
Division, ASCE, 95(7), 1475-1496.
Tsai K.C. and Lin Y.C. (2005). “Seismic performance of steel plate shear wall frames”,
Proceedings of the 4th
International Conference on Advances in Steel Structures, 13-15
June, Shanghai, China.
Vian D. and Bruneau M. (2004). “Testing of special LYS steel plate shear walls”, Proceedings of
the 13th
World Conference on Earthquake Engineering, August 1-6, Vancouver, B.C.,
Canada.
Vian D., Bruneau M. and Purba R. (2009a). “Special perforated steel plate shear walls with
reduced beam section anchor beams. II: Analysis and design recommendations”, Journal of
Structural Engineering, ASCE, 135(3), 221-228.
Vian D., Bruneau M., Tsai K.C. and Lin Y.C. (2009b). “Special perforated steel plate shear walls
with reduced beam section anchor beams. I: Experimental investigation”, Journal of
Structural Engineering, ASCE, 135(3), 211-220.
Wagner H. (1931). Flat Sheet Metal Girders with Very Thin Webs, Part I - General Theories and
Assumptions. Technical Memorandum No. 604, National Advisory Committee for
Aeronautics, Washington, DC.
Xue M. and Lu L.W. (1994). “Interaction of infilled steel shear wall panels with surrounding
frame members”, Proceedings of the Structural Stability Research Council Annual
Technical Session, Bethlehem, PA, 339-354.
Yakut A. and Yilmaz H. (2008). “Correlation of deformation demands with ground motion
intensity”, Journal of Structural Engineering, ASCE, 134(12), 1818-1828.
Yamaguchi T., Nakata Y., Takeuchi T., Ikebe T., Nagao T., Minami A. and Suzuki T. (1998).
Seismic Control Devices Using Low-Yield-Point Steel. Nippon Steel Technical Report No.
77, 78 July, 65-72.
Zhang J. and Huo Y. (2009). “Evaluating effectiveness and optimum design of isolation devices
for highway bridges using the fragility function method”, Engineering Structures, 31(8),
1648-1660.
Zhao Q. and Astaneh-Asl A. (2004). “Cyclic behavior of traditional and innovative composite

233
shear walls”, Journal of Structural Engineering, ASCE, 130(2), 271-284.
Zirakian T. (2008). “Lateral-distortional buckling of I-beams and the extrapolation techniques”,
Journal of Constructional Steel Research, 64(1), 1-11.
Zirakian T. (2010). “On the application of the extrapolation techniques in elastic buckling”,
Journal of Constructional Steel Research, 66(3), 335-341.
Zoruba S. and Liddy W. (2007). “Steelwise: Structural steel materials update”, Modern Steel
Construction Magazine, AISC, March issue.