understanding demographics - konrad-adenauer-stiftung
TRANSCRIPT
UnderstandingDemographicsand Politics in Kenya
Oscar Otele.Elijah Ambasa.Jan Cernicky.Edwin Adoga Ottichilo.
Copyright © Konrad Adenauer Stiftung 2020.

UnderstandingDemographicsand Politics in Kenya
IV
UnderstandingDemographicsand Politics in Kenya
A publication of the Konrad Adenauer Stiftung, 2020.
Referencing: Otele, O., Ambasa, E., Cernicky, J., and Adoga, E. (2020). Understanding Demographics and Politics in Kenya. Konrad Adenauer Stiftung.
Disclaimer
This document has been produced with the supervision and financial assistance of the Konrad Adenauer Stiftung. The views expressed herein should however not be taken, in any way, to reflect the official opinion of the organization.
A catalogue record for this book is available from the Kenya National Library Services.
ISBN:
Layouted, Printed and Bound in Nairobi, Kenya by Colour House Limited.
V
TABLE OF CONTENTS
LIST OF TABLES VI
LIST OF FIGURES VII
FORWARD IX
ACKNOWLEDGEMENT X
EXECUTIVE SUMMARY XI
CHAPTER ONE: INTRODUCTION 1
1.1 Background of the Study 11.2 Objectives of the Study 31.3 Definitions of Key Concepts 41.4 Literature Review 4
1.4.1 Population Projections 51.4.2 Implication of Demographic Changes on Political Process 61.4.3 Implication of Demographic Changes on Economic Growth 81.4.4 Demographic changes, social policies and Inequalities 91.4.5 Gaps in the Literature 10
1.5 Methodology 10
CHAPTER TWO: KENYANS PERCEPTION OF DEMOGRAPHIC CHANGES 13
2.1 Introduction 132.2 Perception of National Population Projections 132.3 Perception of Population Projections in Counties 16
2.3.1 Population Projections in Rift Valley Region 162.3.2 Population Projections in Coastal Region 182.3.3 Population Projections in the North Eastern Region 182.3.4 Population Projections in Eastern Region 202.3.5 Population Projections in Central Region 222.3.6 Population Projections in Western Region 242.3.7 Population Projection in Nyanza Region 252.3.8 Population Projection of Nairobi Region 25
2.4 Perceptions on Implications of Demographic Changes 272.4.1 Perceptions of Demographic Changes on Economics 272.4.2 Perceptions of Demographic Changes on Politics 282.4.3 Perceptions of Demographic Changes on Social Policies 30
CHAPTER THREE: SOCIAL GROUPS AND THEIR DIFFERENCES ON POPULATION GROWTH 31
3.1 Introduction 313.2 Social Groups in Urban Areas 31
3.2.1 Population’s Level of Education and Population Growth 323.2.2 Income Sources and Population Growth 353.2.3 Ethnic Affiliations and Population Growth 38
3.3 Social Groups in Rural Areas 40
VI
3.3.2 Income Sources and Population Growth 453.3.3 Ethnic Affiliations and Population Growth 49
3.4 Differences in Urban and Rural Areas 513.5 Population and Poverty Distribution 53
CHAPTER FOUR: REGIONAL DIFFERENCES AND THEIR PERCEPTION ON POPULATIONGROWTH 55
4.1 Introduction 554.2 Regional Differences in Urban Areas 56
4.2.1 Population’s Level of Education and Population Growth 564.2.2 Income Sources and Population Growth 594.2.3 Ethnic Affiliations and Population Growth 63
4.3 Regional Differences in Rural Areas 654.3.1 Population’s Level of Education and Population Growth 654.3.2 Income Sources and Population Growth 694.3.3 Ethnic Affiliations and Population Growth 73
CHAPTER FIVE: POLITICAL INTERVENTIONS AND POPULATION GROWTH 75
5.1 Introduction 755.1.1 Political Intervention(s) by the National Government and their Impact on Population Growth 755.1.2 Political Intervention by County Governments and their Impact on Population Growth 795.1.3 Political Intervention by Political Parties in Kenya and their Impact on Population Growth 805.1.4 Political Intervention by Individual Members of Parliament, Members of County Assemblies and their Impact on Population Growth 80
CHAPTER SIX: SUMMARY AND RECOMMENDATIONS 83
6.1 Summary 836.2 Recommendations 86
REFERENCES 89
LIST OF TABLES
Table 1: 2019 Population and Housing Census and Projected Population (2020-2030) ............. 13Table 2: 2019 Population and Housing Census and Projected Populations forNorthern Eastern Region, 2020-2030 ................................................................................................. 19Table 3.1: Population Projections and Population Growth in 2020 ............................................... 31Table 3.2.1: Population’s Level of Education and Population Growth ........................................... 32Table 3.3: Distribution of Population by Economic Status in Urban Areas ................................... 35Table 3.4: Ethnic Groups in Sampled Urban Counties .................................................................... 38Table 3.5: Distribution of Population by Highest Level of Education Completed inRural Areas ............................................................................................................................................ 41Table 3.6: Distribution of Population by Economic Status in Rural Areas .................................... 46
VII
Table 3.7: Ethnic Groups in Sampled Rural Counties ...................................................................... 49Table 3.8: Food poverty Estimates (Individuals) ............................................................................... 53Table 3.9: Overall poverty Estimates (Individuals) ........................................................................... 54Table 3.10: Extreme poverty Estimates (Individuals) ....................................................................... 54Table 4.1: Distribution of Population by Highest Level of Education Completed in Urban Areas ........................................................................................................................................... 57Table 4.2: Distribution of Population by Activity Status in Urban Areas ....................................... 60Table 4.3: Ethnic Groups in Sampled Regions in Urban Counties ................................................. 64Table 4.4: Distribution of Population by Highest Level of Education Completed in Rural Areas ............................................................................................................................................ 66Table 4.5: Distribution of Population by Economic Status in Rural Areas .................................... 70Table 5.1: Overall Allocation and Actual Expenditure from 2003/04—2006/07(Ks. Millions) ........................................................................................................................................... 76Table 5.2: Policy documents that provides for policy intervention in the area ofdemography................................................................................................................................................................. 77
LIST OF FIGURES
Figure 2.1: Projected population in Counties in Rift Valley Region ................................................ 17Figure 2.2: Projected 10-year population growth (2020-2030) in Counties in Rift ValleyRegion..................................................................................................................................................... 17Figure 2.3: Projected population in Counties in Coastal Region .................................................... 18Figure 2.4: Projected 10-year population growth (2020-2030) in Counties in Coastal Region ... 19Figure 2.5: Projected population in Counties in North Eastern Region ........................................ 20Figure 2.6: Projected 10-year population growth (2020-2030) in Counties in North EasternRegion..................................................................................................................................................... 20Figure 2.7: Projected population in Counties in Eastern Region .................................................... 21Figure 2.8: Projected 10-year population growth (2020-2030) in Counties in Eastern Region... 22Figure 2.9: Projected population in Counties in Central Region .................................................... 23Figure 2.10: Projected 10-year population growth (2020-2030) in Counties in Central Region . 23Figure 2.11: Projected population in Counties in Western Region ................................................ 24Figure 2.12: Projected 10-year population growth (2020-2030) in Counties inWestern Region ..................................................................................................................................... 25Figure 2.13: Projected population in Counties in Nyanza Region .................................................. 26Figure 2.14: Projected 10-year population growth (2020-2030) in Nyanza Region ..................... 26Figure 3.1: Distribution of Population’s Level of Education in Nairobi .......................................... 33Figure 3.2: Distribution of Population’s Level of Education in Mombasa ..................................... 33Figure 3.3: Distribution of Population’s Level of Education in Kisumu ......................................... 34Figure 3.4: Distribution of Population’s Level of Education in Nakuru .......................................... 34Figure 3.5: Distribution of Employed Population versus Unemployed Population in Nairobi ... 36Figure 3.6: Distribution of Employed Population versus Unemployed Population inMombasa ............................................................................................................................................... 36Figure 3.7: Distribution of Employed Population versus Unemployed Population in Kisumu... 37Figure 3.8: Distribution of Employed Population versus Unemployed Population in Nakuru ... 37Figure 3.9: Distribution of Population of Level of Education in Taita-Taveta ............................... 42
VIII
Figure 3.10: Distribution of Population’s Level of Education in Garissa ....................................... 42Figure 3.11: Distribution of Population’s Level of Education in Embu .......................................... 44Figure 3.12: Distribution of Population’s Level of Education in Uasin Gishu................................ 44Figure 3.13: Distribution of Population’s Level of Education in Bungoma ................................... 45Figure 3.14: Distribution of Employed Population versus Unemployed Population inTaita-Taveta ........................................................................................................................................... 46Figure 3.15: Distribution of Employed Population versus Unemployed Population in Garissa ............................................................................................................................................... 47Figure 3.16: Distribution of Employed Population versus Unemployed Population in Embu ... 47Figure 3.17: Distribution of Employed Population versus Unemployed Population inUasin Gishu ............................................................................................................................................ 48Figure 3.18: Distribution of Employed Population versus Unemployed Population inBungoma ................................................................................................................................................ 48Figure 4.1: Distribution of Population’s Level of Education Kibra versus Westlands .................. 57Figure 4.2: Distribution of Population’s Level of Education in Kisauni versus Nyali .................... 58Figure 4.3: Distribution of Population’s Level of Education Gilgil versus Molo ............................ 59Figure 4.4: Distribution of Population’s Level of Education Kisumu Central versusKisumu East ........................................................................................................................................... 59Figure 4.5: Distribution of Employed population versus Unemployed Population Kibra versus Westlands .............................................................................................................................................. 61Figure 4.6: Distribution of Employed population versus Unemployed Population inKisauni versus Nyali .............................................................................................................................. 61Figure 4.7: Distribution of Employed population versus Unemployed Population inKisumu Central versus Kisumu East ................................................................................................... 62Figure 4.8: Distribution of Employed population versus Unemployed Population Gilgil versus Molo ........................................................................................................................................................ 62Figure 4.9: Distribution of Population’s Level of Education in Mwatate versus Taveta .............. 67Figure 4.10: Distribution of Population’s Level of Education in Balambala versus Hulugho ...... 68Figure 4.11: Distribution of Population’s Level of Education Embu West versusMbeere North ........................................................................................................................................ 68Figure 4.12: Distribution of Population’s Level of Education Ainabkoi Versus Soy...................... 69Figure 4.13: Distribution of Population’s Level of Education in Bumula versus Tongaren ......... 69Figure 4.14: Distribution of employed population versus unemployed population in Mwatate versus Taveta ......................................................................................................................................... 71Figure 4.15: Distribution of employed population versus unemployed population in Balambala versus Hulugho ..................................................................................................................................... 71Figure 4.16: Distribution of employed population versus unemployed population in Embu West and Mbeere North ................................................................................................................................ 72Figure 4.17: Distribution of employed population versus unemployed population in Ainabkoi and Soy .................................................................................................................................. 72Figure 4.18: Distribution of employed population versus unemployed Population inBumula and Tongaren .......................................................................................................................... 73
IX
FOREWARD
Starting this year 2020 to 2022, Konrad Adenauer Stiftung has decided to focus a part of her initiatives on engaging the Kenyan political space and society on internalising challenges that come with population growth as well as developing counter measures which the country may warrant important. This initiative is in line with the main aim of KAS globally and in Kenya, which is to promote and consolidate tenets and values of democracy. It is by generating research and providing platforms for policy and political conversations on demography that the organisation contributes towards a meaningful democratic environment in Kenya.
The study on politics and demography in Kenya is therefore meant to understand the relationship between politics and population dynamics and how the various elements and variables relate. I hope that the information generated by the study will not just be important to the organisation, but also to experts working in the field of demography, state and county departments of planning, finance and agencies tasked with the implementation of policies and programs. The study will provide them with realistic snippets on perceptions and trends that are significant for sound development planning.
Politicians have a tool at their disposal which they can now use to interrogate development and investment priorities notwithstanding the nature and quality of safety nets that they oversight in their respective constituency. The idea behind this study is to interrogate our decisions, understand existing perspectives and synthesize options that can be key to providing the needed insights to make the right policy decisions. As an organization, we are looking forward to breaking down some of the study findings into discussions that can deliberated in the next 2-3 years.
Last but not least, the youth should likewise make this document a priority on their reading list. This is because, as the book indicates, approximately 80% of the Kenyan population are below the age of 35 years and this group should consequently be a key factor in shaping policy decisions. I welcome you to read and make your own judgement call but at the same time share widely the online versions of this publication especially with your networks and friends.
Dr. Jan Cernicky,Country Director,Konrad Adenauer Stiftung,Kenya Office.

X
ACKNOWLEDGEMENT
This book, Understanding Demographics and Politics in Kenya was prepared with support from many organizations and individual stakeholders. We would like to express our sincere appreciation to all those who supported in ways of granting us interviews, interview referrals and providing reading
materials. Specifically, we wish to thank over 30 key informants and more than 50 participants in Focused Group Discussions (FGDs). We also recognize the KAS Country Director Dr. Jan Cernicky and team leader Mr. Edwin Adoga Ottichilo for supervising, coordinating, editing and helping to input, both on scholarly and technical aspects of this project.
XI
KAS: Understanding Demographics and Politics in Kenya
EXECUTIVE SUMMARY
This study sets to understand demographics and politics in Kenya. It examines how Kenyans value demographic change and proceeds to look at the existing differences in social groups and whether they consider population growth a positive or negative trajectory. It also assesses the regional differences and their perception on demography in urban and rural areas and whether they consider population growth a positive or negative trajectory, and finally establishes the kind of political measures being taken at the national and county levels to support or slow down population growth. Empirically, the paper is anchored on secondary and primary data. The secondary data was derived from documentary analysis of the existing literature on the subject matter, while primary data was obtained through focus group discussions (FGDs) and key informants drawn from relevant government agencies, academia and civil society organizations.
The data was analyzed qualitatively and reveals that a majority of Kenyans believe that the annual population growth is generally good as it allows the government to adequately plan with available resources. A majority of believe that 70 percent of the population below 24 years of age is likely to remain unchanged in next five to ten years. It is anticipated that the projected population change would increase population density to about 831 persons per square kilometer by 2050. The study established that, Nairobi and Mombasa cities have more residents who have completed secondary education than primary education, while Kisumu City and Nakuru Municipality have more residents who have completed pre-primary and primary education than those who have completed secondary, thereby informing the difference in perception about the population trajectory in urban areas. In rural areas, a majority of residents have completed primary education,
consequently impacting on fertility and infant mortality rates. With regard to labor force and income sources, data indicate that urban areas host many unemployed population than rural areas, consequently impacting on the access to education and health services. As for ethnic affiliation, the numerical strength of majority ethnic groups is higher in rural areas than urban areas, further heightening the importance of ethnic identity in rural politics than in urban politics. These differences are also visible between regions in urban and rural areas with implications on perception on population growth. The study found that the national government has come up with political interventions to manage population growth. County governments have also enacted a number of policy measures meant to support the establishment of agro-based industries, trade and entrepreneurship policies at the county level to provide job opportunities to both skilled and semi-skilled labor/work force
The study makes several recommendations to manage population dynamics in the country. Firstly, in allocating funds to the counties, the Commission on Revenue Allocation (CRA) should disaggregate demographic features for the country to be able to invest more on different segments of population. More redistributive effect to the country’s economic growth and development can be achieved when more resources are directed to counties with more youthful age structure than those with elderly populations. Secondly, the national government should adopt specific approaches directed at children (0-15years) and youth (15-34years) so as to develop human capital, create jobs and reduce the dependency ratio. Thirdly, the high number of youth in some counties calls upon county planners to rethink about appropriate strategies for job creation (both in the private and public sectors) because population growth among the youth would increase competition for scarce positions leaving many young people behind, leading to widespread grievance
XII
which may result them to turning into political violence in future. Fourthly, politicians should be persuaded to adopt a political stance where they tailor debates on family planning programs that are likely to be of more value to lower income groups than to higher income groups, who may have better access to private services. Fifthly, there is need for deliberate effort by both levels of government to review policies that eradicate social discrimination and exclusion. This should also address discriminatory and exclusionary practices, so as to ensure that all citizens are included in socio-economic and political development processes. Sixthly, both levels of government should design pro-poor fiscal and safety net policies. Implementation of population segment specific fiscal policies should be closely monitored and reviewed based on the changing times, to ensure that the funds are gaining positive and maximum impact on intended beneficiaries.
Seventhly, the national and the county governments should review the coordination and implementation guidelines of the current cash transfer programs. These reviews should consider principles of devolution and different segments of population. Eighthly, to address transition rates to secondary schools in rural areas, the government should implement subsidized secondary education by improving infrastructural facilities. Finally, to address, challenges at different income levels in both urban and rural areas, the governments at both levels should formulate income and social policies which include among others; the registration and protection of informal employment/sectors which has the largest number of population segment residing in urban area slums.
1
CHAPTER ONE:INTRODUCTION
1.1 Background of the study Kenya is a multi-ethnic society primarily inhabited by people of Bantu and Nilotic extraction and origin, with some Cushitic-speaking ethnic minorities in the north and north eastern part of the country. The present broad distribution of three different linguistic groups is partly a reflection of the location of Kenya in one of the major culture-contact areas of Africa (Trapman, 1974, p.10-11). Specifically, the Bantu-related group includes, among others, the Kikuyu (the largest single ethnic group) and the Luhya (second largest ethnic group). The Luo are the largest single Nilotic group and are concentrated in the western region of Kenya. The smaller tribes making up the other language groups tend to be concentrated in the north, the northeast, and the coastal regions, with smaller enclaves scattered elsewhere in the country. On religious front, Kenya is religiously diverse comprising Christians, Muslims, Hindus and indigenous religions. There have been decades of missionary activities in Kenya except among nomadic pastoralists in the northernmost regions, and centuries of Islamic influence resulting from trade in the coastal region. Most Kenyans practice a combination of one of these three religions, along with an indigenous religion. Most pastoral groups adhere primarily to indigenous religious beliefs (Nelson, 1983).
The state of Kenya’s population is well documented in recent population policy reports and documents (KNBS, 2009; 2019; NCPD, 2017, 2018). The documents are in harmony that against a backdrop of “relatively high fertility and mortality rates” (RoK, 2013, p.8), Kenya’s rapid population that began in 1960s would continue with this progression in the future. With the rapid population growth, it is anticipated that the country will increasingly continue to face demographic challenges
such as high number of unemployed youth population, resulting to high dependency ratio. It is predicated that Kenya’s population “would increase even if [the country] were to attain an immediate reduction of its current total fertility rate (TFR) of 4.5 births per women to the replacement level of about 2.2 births per woman” (RoK, 2013, p.8). It is argued by the National Council for Population and Development that the birthrate policy per woman will reduce elementary school enrollment with the resulting savings being invested in improving the quality of education and creation of employment opportunities for youths (NCPD, 2013, p.9). Despite the rapid population growth, the country also experienced demographic transition beginning from late 1980s (Cross, Obungu & Kitizo, 1991), a change that has resulted to alteration in age structure with a large number of youthful working population enough to sustain the dependent population. The rapid population growth has increased population densities in some areas like Kiambu, Kakamega, Vihiga, Kisii and Kisumu to over 500 persons per square kilometer far above the national average of 68 persons per square kilometer. Consequently, these population densities have placed considerable strain on scarce resources with potential political and environmental risks. Notably, increased population density is likely to increase pressure on natural resources resulting to adverse environmental impact such as global warming and climate change exceeding the ability of the affected population to cope on normal resources. Similarly, the age structure of a population has implication for
2
political characteristics. According to Leahy, Engelman, Vogel, Haddock and Preston, (2007), countries with high population density of youth in 1990’s were three times more likely to experience civil conflicts than countries with more mature age structures. As a result, high population densities are likely to cause nature-induced or human-induced unrests such as political upheavals and resource conflicts. Over the years, the country’s population has also experienced rapid urbanization seeing almost a third of the population settling in urban areas. Subsequently, urbanization has placed considerable pressure on the available public infrastructure and service delivery, leading to a number of negative outcomes including the emergence and expansion of informal settlements in urban areas, poor development planning as well as an overwhelmed public service delivery system.
At independence in 1963, Kenya adopted a Westminster model of governance with multi-party democracy. There was a semi-federal system of government, popularly known as Majimbo1, comprising eight autonomous regions whose boundaries were largely coterminous with ethnic territories and settlement patterns. The Constitution granted regional governments mandate to carry out selected functions in line with national policies (The 1963 Constitution of Kenya). However, regionalism was short-lived following a series of constitutional amendments that centralized power in the presidency- a governance system that would characterize Kenya’s political process for close to five decades. The ruling elite consolidated power by filling key governance institutions with people predominantly from their own ethnic groups. Regions which produced the governing elite were way far ahead of others in terms of access to education, health and transport infrastructure (Kanyinga, 2006, p. 345). The 2010 Constitution introduced a devolved system of government, consisting of one national government and forty-seven
1 Kiswahili word for regions.
county governments, effectively restructuring Kenya’s governance ecosystem into two levels: National and County Governments. The two levels of government are inter-dependent and distinct in accordance with Article (6) (2) of the Constitution. The Constitution distributes functions between the two levels of government as either exclusive, concurrent or residual under Article 186 and the Fourth Schedule. National statistics and data on population is classified as an exclusive function of the national government undertaken by Kenya National Bureau of Statistics (KNBS). With the advent of multipartyism in early 1990s, electoral competition has always found expression in the ethnic groups in the country. As such, instrumentalization of ethnicity has been appropriated by political parties to gain support in different parts of the country as well as in coalition formation. With the requirement that the winning presidential candidate must win at least half of the 47 counties, population size of these administrative units has become important force in the electoral politics.
Turning to economic context, since independence, the country’s economy has been dominated by the agricultural sector. It contributes to almost 50 percent of Gross Domestic Product (GDP), 65 percent of exports and 18 percent of formal employment. Tourism, wholesale and retail trade, manufacturing and financial services contribute the remaining proportion. In the first two decades of independence, Kenya recorded impressive economic growth of above 6 percent. However, this was curtailed by general poor governance in 1980s and 1990s. The National Rainbow Alliance Coalition (NARC) triumph in 2002 December elections resuscitated the ailing economy from a paltry 0.5 to 7 percent in 2007. By this time Kenya’s population was almost 35 million and the main driver of economic growth was enabling infrastructure that opened up productive sectors. With disruptions in between, the growth has however remained below 10 percent anticipated in Kenya’s Vision
KAS: Understanding Demographics and Politics in Kenya
3
2030 (National Council for Population and Development[NCPD], 2017, 2018; RoK, 2013).
The economic growth has been consistent with overall Human Development Index (HDI)2. In 1960s and 1970s, the country’s HDI was high compared to periods between 1990 and 2000. Significant regional disparities are profound features within the country with Central and Nairobi regions performing far better than Nyanza and Northern Eastern regions. In recent years, even though the percentage of population below the poverty line has declined, the absolute numbers are still high. Similarly, there are significant regional and residential differences in terms of poverty levels. Poverty levels are lower in Central and Nairobi regions, and higher in rural areas compared to urban areas (NCPD, 2017, 2018; RoK, 2013)
On education front, since 2004 the country has reported almost 100 percent in gross enrolment rate, increasing by 10 percent in 2010. Both completion rates at primary level and transition from primary to secondary have improved substantially. However, transition to the university remains low despite expansion in university education. In general terms increased access to education by girls has substantially lowered fertility reducing population growth especially in urban areas.3 In terms of health, despite the government’s effort to improve health services, they remain inaccessible to a majority of the population. It is estimated that almost half of the population is within a distance of five kilometer to the location of a health facility (RoK, 2013). Finally, there are certain cultural practices such as polygamy, social status of women, early marriage, wife inheritance, large family and circumcision that influence population dynamics. For example, polygamy a common practice among communities in Western and
2 A measure that captures the country’s achievements with regard to per capital income, education and life expectancy at birth (UNDP, 2008). 3 Personal interview, Demographers, 5 to 8 June 2020.
Coastal regions is connected to low usage of contraceptive (Kimani, Njeru & Ndirangu,2000). Early marriage common among pastoral communities undermines women social status and education.
Against this background of the country’s political and socio-economic and cultural contexts, population dynamics therefore plays an important role in the country’s development trajectory, and democracy in particular. It is within this context that KAS situates this study on demographics and politics in Kenya with a view of informing unbiased and fact-driven policy formulation and implementation mechanisms addressing demographic changes. The significance of the study is more pronounced given the approaching 2022 electoral cycle expected to usher in change in leadership amid continues changing demographic facets. In its engagement with political parties and other stakeholders in the country’s political space, the findings of the study will be useful in developing better counter-measures on demographic trend.
1.2 Objectives of the study The study therefore seeks to:
i. Assess how Kenyans value demographic change;
ii. Understand the existing differences in social groups and whether they consider population growth a positive or negative trajectory;
iii. Assess the regional differences and their perception on demography especially the rural and urban areas and whether they consider population growth a positive or negative trajectory;
iv. Establish the kind of political measures being taken at the national and county levels to support or slow down population growth;
4
1.3 Definitions of key concepts Some of the key concepts in this study include the following: Demographics is broadly viewed as the study of social and economic characteristics of populations (Shryock & Seigel, 1976, p. 1). These characteristics include sex, age, marital status, ethnic composition, family structure, educational attainments, labor force characteristics, and patterns of health and morbidity. Fertility, mortality and life expectancy are the three main drivers of demographics.4 Women’s fertility influences the number of children in the population; improved medical care, hygiene and nutrition have led to decrease in mortality rates in recent history, and overall life expectancy has been increasing since 1950 (Yenilmez, 2004).Demographic Transition, shaped by demographic drivers is viewed as “a specific change in the reproductive behavior of a population…[the] change is from near equality of birth and death rates at high levels to near equality of birth and death rates at low levels ” (Coale, 1989, p. 16). Demographic dividend, or “demographic bonus”, or “demographic window of opportunity” (Gribble, 2012), arises when the population is predominantly made up of people of working age, leading to reduced dependency ratio (of those below and above the working age to those of working age), and this is normally expressed in the final stage of demographic transition (Mason, 2005). Extreme poverty is where households and individual monthly adult equivalent total consumption expenditure per person is less than Ksh. 1,954 in rural and less than Ksh. 2,551 in urban areas (KNBS, 2018, p.44). Food poverty is where households and individuals monthly food consumption expenditure per person is less than Ksh. 1,954 in rural areas and less than Ksh. 2,551 in urban areas (KNBS, 2018, p.44). Overall poverty is where households and individuals monthly adult equivalent total
4 Migration is another variable.
expenditure per person is less than Ksh. 3,252 in rural and less than Ksh. 5,995 in urban areas (KNBS, 2018, p.44). Politics, widely understood as authoritative allocation of resources (Easton, 1957).Political intervention is individual or collective action intended to influence public discourse, the structure and policies of government (Mayer, 2013). Social group is commonly defined as “two or more individuals who share a common social identification of themselves or, which is nearly the same thing, perceive themselves to be members of the same category” (Turner, 1982, p. 15). The study focuses on social groups as defined by level of education, income sources and ethnic affiliations Urban area, means a municipality or a town, and that a town is eligible for the conferment of municipal status if it “has a population of at least two hundred and fifty thousand residents according to the final gazetted results of the population census” (Urban & Cities Act 2011).
1.4 Literature reviewModern theoretical writings on
demographics and politics are rooted in European political economy thoughts from 16th century that linked demographic trends and patterns on economic prosperity to political stability. Classical economists (Thomas Malthus and David Ricardo), “advocated free markets which they anticipated would also regulate population increase” (Teitelbaum 1988, p. 183; Heady & Hodge, 2009, pp. 222-3). Malthus, for instance, contributed greatly on population projections by focusing on the effects of population growth on poverty. By 1930s, political economists explained the Great Depression using low fertility rates, foresaw the potential of political instability arising from the possibility of the younger people continuing to be smaller than older ones. From 1945, scholars popularized economic, political and social consequences of population growth in least developed countries (Teitelbaum, 2005, p.721).
KAS: Understanding Demographics and Politics in Kenya
5
The corollary of the above is now existence of influential topics useful for the current study. These topics include but not limited to the following: Population projections (see Lutz & Goldstein, 2004; Lutz & Samir, 2010; Lutz, Butz & Samir, 2014); impact of demographic change on economic growth (see Bloom, Canning & Sevilla, 2003, 2004; Bucci 2003; Phang, 2005; Thuku, Gachanja & Obere, 2013); impact of demographic change on political process (see Goldstone, 2002; Lutz, Cuaresma & Shavazi, 2010; Webes, 2013; Resnick & Casale, 2014; Wilson & Dyson, 2017); impact of demographic change on social policy (see, Crampton, 2011; Lutz & Samir, 2010; Sakamoto & Power, 2005; Yenilmez, 2014).
1.4.1 Population projections Two dominant threads have emerged
in the discussions on population projections: its dimensions and uncertainty. The dimensions of populations are synonymous with the demographic characteristics and their importance may be considered independently or jointly with others (Lutz & Samir, 2010). Perhaps the most thorough and informative analysis of the dimensions of population projections is provided by Lutz, et al. (2014) focusing on the influences of the projections of age, sex and education attainment on socio-economic aspects. Age-group projections disaggregate behavioral elements (such as fertility, mortality and migration) and other inherent structural changes accompanying the age. Population projections by age have centered on concerns ranging from future school to labor market enrolment to sustainability of pension schemes. Other policy concerns look at the implications of healthcare of the ageing population (Lutz & Samir, 2010, p.2782). The significance of sex in population projections has to content with the fact that fertility rates are wholly linked to women because their reproductive age range is much shorter than men and follows partly defined biological age pattern. The other
reason is that mortality rate varies greatly between men and women, as male mortality tends to be higher at every single age. In addition to these demographic reasons, there is also labor market and consumer preferences considerations. With regard to rural/urban place of residence, it is generally acknowledged that women living in rural areas have higher fertility than women in urban areas. Generally, urban areas attract new immigrants except in cases where immigrant labor is required in agricultural farms in rural areas. Traditionally, there is higher mortality in cities especially in urban slums due to high risks of infectious disease.
As for educational attainment, it is widely acknowledged that more uneducated people have higher mortality (Lutz & Samir, 2010; Lutz et al., 2014). It is also acknowledged that in all populations undergoing demographic transition, more uneducated women have higher fertility. A demographic and health survey conducted in Ethiopia established that uneducated women had six children on average, while those with intermediate education had only two children.5 In a demographic transition, the assumption that higher education results to lower fertility is reinforced by the view that education attainment would facilitate access to information concerning family planning which subsequently reinforce the notion of having fewer children with bright future than having many children with uncertain future. Given the strong relationship between female education and fertility, therefore understanding population changes in terms of the composition of the female population by educational attainment becomes an important undertaking. Because many developing countries have spent considerable resources on enhancing girls’ enrolment rates, the future women of reproductive age would probably be more empowered educationally. Finally in terms of parity status (the distribution of women by the number of children they have
5 http://www.measuredhs.com, (Accessed 24 May 2020).
6
already given birth to) is an important factor in determining the fertility in the future (Lutz & Samir, 2010, p. 2783).
Turning to uncertainty in population projections, Lutz and Goldstein (2004) present four commonly used approaches: ignoring uncertainty and publishing only projections; defining alternative probability-free scenarios; publishing high, medium and low variants aimed at covering ‘plausible range’, and producing fully probabilistic projections that give quantitative information about the range of uncertainty (Lutz & Goldstein, 2004). The first approach utilizes available knowledge to present the probable population trajectory giving a clue of how things are moving. Such a projection can give some orientation about the direction into which things are moving. It is applicable in situations with relatively short period of time and where cost implications of deviating from the projected mean are insignificant. The study utilizes this approach relying on statistical data produced by KNBS in 2012. In the second approach the user is presented with numerous potential future trajectories guided by internal consistency. However, the user is provided with broad range possibilities without being told what is likely to happen and the probability distance between the lowest and highest scenario considered. In the third approach the user is provided with some range of uncertainty that can be construed instinctively. In the production of three variants, three alternative fertility trajectories are assumed by combining migration trajectories and identical mortality. Although this approach has been hailed as presenting the user with ‘plausible range’ of population projections, what entails plausible is not clear. In addition, the approach ignores uncertainties linked to future migration and mortality. The United Nations Department of Economics and Social Affairs/Population Division (UNDESA/PD, 2011) used this approach to project Kenya’s population at 53.4 million and 67.8 million by 2020 and 2030 respectively.
In the last approach, a pre-defined uncertainty distribution over long period of time of the three components are randomly combined in large numbers of cohort-component projections with the individuals random draws subjected to assumed autocorrelations. This approach has been lauded as being comprehensive and detailed in terms of the demographic ‘risks’ that can be combined with costs function.
1.4.2 Implication of demographic changes on political process
There are exemplar researches on the impact of demographics changes on political process offering valuable analyses and insights. Nichiporuk’s (2000) and the edited volume by Weiner and Russell (2001) draw a nexus between demographic trends and security; Anderson and Fienberg’s (2001) examine the politics of conducting census; and Weiner and Teitelbaum’s (2001) analyze demographic engineering and political demography. These oeuvres have been influential in shaping early general discourses on demographics and politics ranging from the effects of aggregate population growth on military manpower to the political consequences of migration within states to policies formulated to influence the size, composition, distribution and growth rate of population.
Recently, there have been attempts to examine political consequences of demographic variables in general (see Ngau & Mbathi, 2010; Wilson & Dyson, 2017). Ngau and Mbathi (2010), for instance examine the geography of voting in Kenya using a case of 2007 presidential, parliamentary and civic voting patterns. They concluded that population’s social-economic factors are strong indicators of voting patterns in Kenya with strong spatial correlation in voting patterns. Areas that viewed incumbent government as not having done enough voted for opposition candidates compared to areas that backed the government. The study observed low levels of representation of women at parliamentary and civil levels
KAS: Understanding Demographics and Politics in Kenya
7
especially in Northern Eastern and Western regions. More specifically, the effects of single demographic variable such as educational attainment (see Lutz & Mohammad, 2010; Lutz & Samir, 2014) age structure (see Leahy et al. 2010; Resnick & Casale, 2014; Webes, 2013) on political process have also been examined. Using data for 77 previously non-democratic countries for the period 1970-2005, Wilson and Dyson (2017) examine the contribution of demographic factors on the emergence of democracy, arguing that other factors being constant, demographic transition promotes democratization. The author considered the effects of interrelated changes in morality, fertility, population’s education attainment and population age structure on the emergence of democracy. More specifically, Lutz and Mohammad (2010), and Lutz and Samir (2014) draw a link between the population’s level of education and democracy. They argue that educated people are more likely to be interested in public affairs, thereby participating more in politics than uneducated people. In addition, the educated people are likely to be familiar with democratic institutions within and outside the country. Therefore, expansion of education programme is key in promoting democracy. Countries which have invested heavily in education facilities have equally reported democratic gains. The government of Kenya has invested heavily in primary and secondary education since 2003, and it would be of interest to this study to gauge the effect of increased number of educated citizen on political process, especially their perceptions on demographic change.
On the age structure, a study conducted in Germany, Mexico, Nigeria, Pakistan, South Korea and Tunisia found evidence that a particular age structure could reinforce government efforts at stabilizing the country. The study observed that political systems with youthful age structures are more likely to experience security challenges, and are three times more likely to suffer from
civil war than the systems with mature age structure (Leahy et al. 2010). Advancing this line of argument, Webes (2013) used data from 110 countries between 1972 and 2009 to predicate that democratic states with a large share of large male youth cohorts are more likely to become dictatorships than countries with proportionally small male youth cohorts, because young men tend to participate more in violent political action and political extremism, thereby threatening democracy. In Africa, Resnick and Casale (2014) interrogate why youth participate less in elections than old people. They found that youth’s participation in election is determined by the extent to which they access political knowledge and information and how they perceive electoral context and party system. In the former it is one’s socio-economic status, access to communication platforms, engagement in community and civic organizations that determine youth participation. Youth who engage more in community groups and access information participate more in elections. Those above 25-35, participation is more among employed than unemployed and those searching for work.
Kenya Population Situation Analysis (2013) observed that a notable feature of the population structure is the high number of the youth, popularly referred to as a “youth bulge” (Urdal, 2006). Similarly, a recent study by Kenya Institute for Public Policy Research and Analysis (2017) observes that almost 80 per cent of Kenya’s population is below 35 years. The high population of youth is not consistent with job creation resulting to high unemployment among them of age 15-35 years. Consequently, unemployment in the country has increased instances of youth radicalization, terrorism and drug abuse. The study recommends that the government needs to formulate comprehensive age-specific approaches directed at children (0-15years) and youth (15-34years) so as to develop human capital, create jobs and reduce the
8
dependency ratio. The government can also leverage on policy opportunity articulated in, Article 55 of the Constitution of Kenya (2010) which requires “the state to stake measures including affirmative action programme, to ensure that the youth: (I) access relevant education and training; II) have opportunities to associate, be represented and participate in political, socio-economic and other spheres of life; III) access employment”. Apart from early analysis by Weinreb (2001) on ethnic differences on demographic behavior in Kenya, Ngau and Mbathi (2010) on the geography of voting in Kenya and KIPPRA (2017), we are yet to fully understand the knowledge and attitude Kenyans have on different variables of demographic changes on political process.
1.4.3 Implication of demographic changes on economic growth
The nexus between population growth and economic growth features three dominant arguments. The first argument holds that population growth has negative effect on economic growth (Malthus 1798), the second argument opines that population growth has positive effect on economic growth (Bloom, Canning & Sevilla, 2003) and the third argument postulates that population growth has a neutral force on economic growth. These scenarios are reflected in some of the existing studies across the world. Bucci (2003), for instance, analyzed a possibility of a long-run relationship between population growth and per capital income with special attention on physical and human capital as “reproducible inputs”. Like Malthus, Bucci found negative effect of the population growth on economic growth. Disaggregating the findings, the study however noted that when individuals choose how much to save, a neutral effect on economic growth is observed.
In the Republic of Korea, Phang (2005) looked at the transformative role of the labor force in realizing demographic dividend. The study established that the country experienced rapid demographic changes which saw
fertility fall by almost 67 per cent from 1950s to 1990s resulting to economic growth and social development. The economic and social consequences of demographic transition was felt in expanded labor force, adequate saving mechanism, high-quality education and good health leading to delays in delays in marriage, increased saving, investment and decline in dependency ratio.
In Thailand, Wongboonsin (2007) examined demographic changes and demographic dividend, noting that the capacity to leverage on democratic situation is linked to economic policies. When the fertility rate declined in the country, the government puts in place strategies that enhanced productivity such as appropriate macroeconomic policies, quality education, encouraging older people to remain in labor force, financial system reforms and promoting regional labor market. The economic policies contributed to productivity and savings while reducing the dependency ration leading to demographic dividend.
Carvellati (2009) examined the impact of life expectancy on economic growth. The study found that life expectancy influenced individuals’ education and fertility. While the country’s demographic transition progresses, enhancement in life expectancy lowers population growth and improves human capital accumulation, increasing human capital and per capital income. It was predicted that prior to population transition, increase in life expectancy is proportional to population growth subsequently reducing per capita income. But the moment population transition begins; life expectancy causes reduction in population growth, thus reducing per-capital income.
In Kenya, Thuku et al. (2013) examined the effects of population growth on economic growth from 1963 to 2009. Using vector auto regression estimation on annual time series data, the study established a long-term relationship with positive correlation between
KAS: Understanding Demographics and Politics in Kenya
9
the two variables, implying that population growth has positive impact on economic growth. The study also found a mutually reinforcing causality between population growth and economic growth with causality running in both directions. The study observes that Kenya is in the second stage of demographic transition where population growth is a key determinant of economic growth even though there is need for appropriate policy that would allow population and economy to complement each other.
KIPPRA (2017) also paid considerable attention on how increase in population growth may increase economic growth leading to demographic dividend, and in similar breadth as Gribble (2012), the study argues that the current youth bulge in Kenya has resulted to a high dependency ratio constraining savings and investments, thereby slowing economic growth. This has caused the government to commit funding to non-productive sectors of economy, mainly health and education.
1.4.4 Demographic changes, social policies and Inequalities
Discussions on the impact of demographic changes on social policies have centered on changing socio-demographics changes, population aging, social policy and dependency rations. In light of the changing socio-demographic changes in the United States, scholars focus their analyses on the changing trends, economic inequality and healthy inequality. A comparison is made between European and US policies to demonstrate how social insurance welfare-state policies were being replaced by enabling welfare-state policies that promote work, privatized benefits and services, and the directing of benefits to only the needy people (Quadagno & Street, 2006). One of the remarkable trends in old-age income has been the shift in private pensions from defined-benefit to defined-contribution plans. Shuey and O’Rand (2006) examine the impact of this phenomenon by gender, race
and class. They find that increasing reliance on individualized pension plans for older women as part of the wider social group, have heightened their economic risk. Older women receive smaller pensions because of lower wages, more frequent interruptions in employment, and, if divorced, a greater tendency to cash out their pensions. Debates about population ageing have largely focused on social pension programmes (see Lutz & Samir, 2010; Yenilmez, 2014). As a response to the problems faced by elderly people, there is need for a comprehensive social protection programme specifically addressing the requirements of older people. In the Global North, retirement and social insurance policies were implemented to remove higher-paid, older workers from the labor forced and to make room for younger workers (Crampton, 2011, pp.321-2).
Inequality is central in drawing the link between population and poverty, through measuring “the proportion of households whose income falls below some specified poverty threshold” (Sakamoto & Power, 2005, p. 403). Early works on this issue like Bumpass and Sweet (1981), observe that given that poverty thresholds is determined by household size and family formation, demographic changes influence levels of poverty. Households may experience poverty because of demographic changes such as childbirth, death, retirement, departure of children from the household, marital dissolution, remarriage and formation of new households. Family structure is one of the demographic variables predominant in poverty literature, we are yet to fully understand the contribution of other variables and how they aggregate to influence the distribution of poverty.
In Kenya, Kanyinga (2006) examines governance institutions and inequality from independence to 2002. Significant to this study, the author illustrates distribution of population by province since 1969 and regional disparities
10
in terms of access to basic services like water, education and health. The author draws two important observations with regard to ethnicity and resource distribution in different regions in the country. First, is that political power is linked to issues in ethno-regional regional development. Second and perhaps important is that the colonial state laid foundation for ethno-regional inequalities. Roads, schools and hospital were gradually built in Central Kenya, Rift Valley and Nairobi to address the needs of settlers than other parts of the country. Post-colonial regimes adopted this kind of this thinking seeing the reinforcement of infrastructural development in Central and Rift Valley because the two regions produced ruling elites between 1963 and 2002.
In 2013, a study by KNBS and Society for International Development (SID) on the status of inequalities in 47 counties established a number of striking features. One, Kenyans living in different counties have different lifestyles and access to services. Two, Kenyans living within the same county have different lifestyles and access to services. Three, despite past policy interventions such as Free Primary Education (FPE), Secondary Schools Bursary Fund (SSBF), Constituency Development Fund (CDF), levels of deprivation remain extremely high in some counties compared to others. Four, geographical location is a major determinant of vulnerability and deprivation levels. Five, some counties are deprived of some things and others well endowed. Six, lack of access to essential services like education leads to continued poverty and vulnerability. On poverty, Chronic Poverty Advisory Network (2018) explored how individuals and households are poor based on their resources, opportunities and choice, power and voice and security. While observing that poverty is not only about the lack of material resources, but also political decision making capacity, the study found that a majority of Kenyans are either income poor or near poverty line with extreme regional differences. For instance,
Turkana County had the highest poverty rate in 2015/2016, while in Mandera County almost 98 percent of residents were either living in poverty or near the poverty line. Reinforcing these findings, Basic Report on Well-Being in Kenya highlighted that the “welfare of Kenyans has shown significant improvements with overall headcount poverty recording a 10.5 percentage point drop” (p.9), implying that “while headcount poverty declined across the country since 2005/2006, there remain few geographic areas with high pockets of the population living below the poverty line” (p, 9).
1.4.5 Gaps in the LiteratureThe arguments presented in the
studies above support the current study in understanding the impact of population growth on socio-economic and political aspects. The studies also help in understanding how socio-economic and political determinants influence different social groups and whether these groups consider population growth a positive or negative trajectory. A majority of the existing studies relies on statistical models with less emphasis on the qualitative aspects, especially how the population growth is perceived by policy makers and how different social groups consider the effect of population growth on economic growth and development planning. This is the gap that this study seeks to fill. Doing so, will make a contribution in light of the existing scenarios on the effects of population growth on economic growth and political decisions.
1.5 MethodologyThe study utilized qualitative
approaches to collect primary and secondary data (document review). The tools used for primary data collection were namely: focus group discussions (FGDs) and key informant interviews. Statistical data on Kenya’s population and projections across the 47 counties was collected from KNBS. Recent studies conducted by KIPPRA on demographics and its socio-economic and political
KAS: Understanding Demographics and Politics in Kenya
11
consequences informed the literature review for the Kenya’s part. This was preceded with literature from other contexts. We positioned this study among other studies and the study questions to help bring out partly the gaps and address the study objectives.
The FGDs and key informant interviews were guided by sampling techniques, criteria and sample size. Purposive sampling technique was used to select 10 sample counties for purposes of triangulating the data and gaining depth through qualitative data. The selection of these counties was guided by the following criteria. First, to guide analysis in chapter three, nine counties: Nairobi6, Mombasa, Kisumu and Nakuru as counties hosting cities and urban towns and Taita-Taveta, Garissa, Embu, Uasin Gishu and Bungoma as counties with smaller or peri-urban towns were purposively selected to harness fair representation of all social groups in the counties. While some of the counties are peri-urban and urban, we were guided by the Urban Areas and Cities Act, 2011 to purposively select four areas designated as big towns, municipalities and cities and those identified as small towns at least to gain insights on the different views regarding population growth. In addition to the stated rationale, the selection was to provide ideas on the challenges and opportunities of demographic changes to political planning. Second, in addition to the selected counties, we added Kiambu County for comparative analysis of the highest and lowest populated counties. In this case, comparison was specifically be made between Kiambu and Taita-Taveta to answer objectives two and four. Selected counties and distribution of participants is annexed.
Four Members of County Assembly (MCAs) and three representatives of civil society organizations selected from the counties via referral sampling participated
6 Nairobi County was selected because of hosting the capital city of Kenya. Mombasa, Nakuru and Kisumu were selected because of hosting different social groups.
in FGDs lasting approximately one hour. We conducted seven FGDs in total cutting across all objectives of the study. Due to the Corona Virus Disease (COVID-19) situation in the country7, we conducted these FGDs through Google Meet. We interviewed 35 key informants. Using purposive and referral techniques the sample was drawn from knowledgeable stakeholders such as political parties, MPs from selected committees of Finance and (National) Planning, Education and Research, Devolution and Intergovernmental Relations, selected Parliamentary Caucuses like Parliamentary Network on Population and Development, Kenya Women Parliamentarians Association and Kenya Young Parliamentarians Association, University of Nairobi’s Population Studies and Research Institute, key government organs (the Kenya National Bureau for Statistics, Kenya Institute for Public Policy, Research and Analysis, National Treasury and Planning, National Council of Population and Development, National Government Action Affirmative Fund, Ministry of Devolution, Council of Governors, Gender and Migration). Similar sampling technique was utilized in selecting stakeholders from civil society organizations like the Centre for Multi-Party Democracy, Society for International Development and African Migration and Development Policy Centre. The interviews were conducted through the following technologies listed as per preference: zoom, cisco WebEx and jitsy. Also, phone interviews, email communication or where appropriate, personal interview were employed.
To ensure the reliability and validity of the data collected, data was collected from a wide range of interviewees including relevant parliamentary and county assembly committee members and parliamentary caucuses. The study conducted regular item analysis to weed out ambiguous or poor performing questions.
7 In Kenya the first case was reported in mid-March, and shortly the government implemented travel restrictions among other measures.
12
Two reviewers from the University of Nairobi Population and Research Department and Institute for Development Studies were outsourced to look into draft research output to further enhance the reliability of the data collected. The study also relied on verification of data to obtain reliable and objective information. Deductive approach was used to analyze data using a predetermined structure informed by the study objectives. The data collected was structured and organized in line with objectives and questions for ease of analysis. The study utilized ethical research standards such as request for consent and confidentiality of information provided.
This study is organized into six chapters as follows: This introductory chapter has presented the background of the study, objectives of the study, literature review, methodology and ethical consideration. Chapter Two presents Kenyans Perception of Demographic Change. Chapter Three will analyze Social Groups and their Differences on Population Growth. Chapter Four analyzes Regional Differences and their Perception on Demography and Chapter Five presents Political Interventions and Population Growth. Chapter Six presents Summary and recommendations.
13
CHAPTER TWO:KENYANS PERCEPTION OF DEMOGRAPHIC CHANGES
2.1 Introduction This chapter discusses how Kenyans perceive demographic changes. As Weiner (1971, p.597) observes, in understanding demographics and politics, “it is not just enough to know the facts and figures of population…it is also necessary to consider the knowledge and attitudes that people and their governments have toward [demographic] issues.” Hence, this chapter takes up the challenge by first presenting perception of national population projections. It uses KNBS to gauge the perception of Kenyans. It then presents projected population in 47 counties for the next five to ten years and perception in some sampled counties. It finally presents socio-economic and political consequences of demographic changes. This chapter utilizes Population Projections obtained from KNBS and uses 2020 as the base year, however for the purposes of comparison, the 2019 census results are also included.
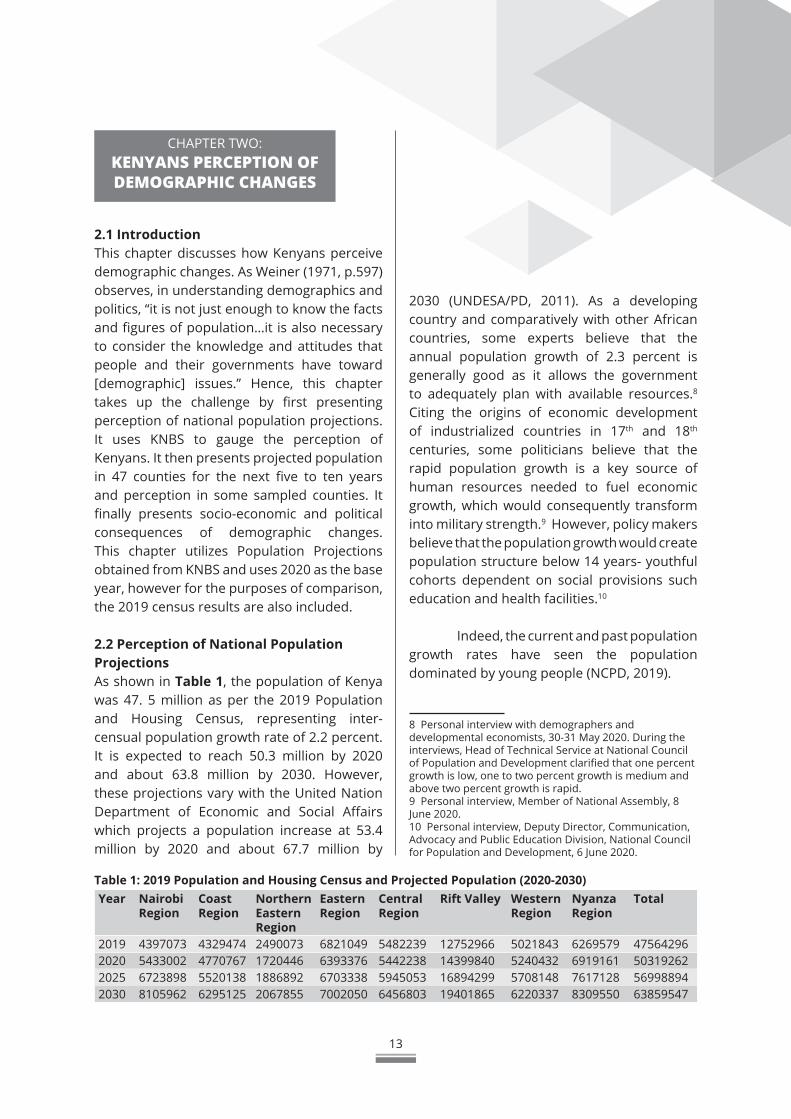
2.2 Perception of National Population ProjectionsAs shown in Table 1, the population of Kenya was 47. 5 million as per the 2019 Population and Housing Census, representing inter-censual population growth rate of 2.2 percent. It is expected to reach 50.3 million by 2020 and about 63.8 million by 2030. However, these projections vary with the United Nation Department of Economic and Social Affairs which projects a population increase at 53.4 million by 2020 and about 67.7 million by
2030 (UNDESA/PD, 2011). As a developing country and comparatively with other African countries, some experts believe that the annual population growth of 2.3 percent is generally good as it allows the government to adequately plan with available resources.8 Citing the origins of economic development of industrialized countries in 17th and 18th centuries, some politicians believe that the rapid population growth is a key source of human resources needed to fuel economic growth, which would consequently transform into military strength.9 However, policy makers believe that the population growth would create population structure below 14 years- youthful cohorts dependent on social provisions such education and health facilities.10
Indeed, the current and past population growth rates have seen the population dominated by young people (NCPD, 2019).
8 Personal interview with demographers and developmental economists, 30-31 May 2020. During the interviews, Head of Technical Service at National Council of Population and Development clarified that one percent growth is low, one to two percent growth is medium and above two percent growth is rapid. 9 Personal interview, Member of National Assembly, 8 June 2020.10 Personal interview, Deputy Director, Communication, Advocacy and Public Education Division, National Council for Population and Development, 6 June 2020.
Table 1: 2019 Population and Housing Census and Projected Population (2020-2030)Year Nairobi
Region Coast Region
Northern Eastern Region
EasternRegion
Central Region
Rift Valley Western Region
Nyanza Region
Total
2019 4397073 4329474 2490073 6821049 5482239 12752966 5021843 6269579 475642962020 5433002 4770767 1720446 6393376 5442238 14399840 5240432 6919161 503192622025 6723898 5520138 1886892 6703338 5945053 16894299 5708148 7617128 569988942030 8105962 6295125 2067855 7002050 6456803 19401865 6220337 8309550 63859547
14
According to 2019 Census, almost 70 percent of the population comprises people of below 24 years of age, and 28 percent are youth from age 15 to 24. Those of age 60 and above are about 5 percent of the total population. Interviewed demographic experts observed that this age structure is likely to remain unchanged in the next five to ten years. The working age population (15-60 years old) is projected to increase in the country until 2030. This implies that the country is likely to have relatively low ratios of dependent to working populations, which means they would have the possibility of benefitting from demographic dividend. However, this would be reliant on whether this group would be in gainful employment.11 A majority of Kenyans believe that the current population comprises more females than males and the proportion would remain so in the next five to ten years. This proportion is attributable to biological occurrences that place females ahead of males. Females tend to live longer than male and not to mention that male are more engaged in risk activities than female.12 Other respondents attributed this to high frequencies of travel among males than females that predispose males to early deaths.13
In terms of educational attainments, a policy implementer observed that free primary education policy that commenced in early 2000shas significantly impacted on access to education and subsequently on literacy level. As such literacy level and generally human development index would go high in the next five to ten years.14 Free primary and secondary education have particularly benefitted girls more than boys and this has significant implication on population growth.
11 Personal interview, Director Technical Service, National Council for Population and Development, 8 June 2020.
12 Ibid. 13 Personal interview, Member of National Assembly, 8 June 2020.14 Personal interview, Director Technical Service, National Council for Population and Development, 8 June 2020.
Unlike in the past in some communities where uneducated girls would get married at early age, access to education has now caused many girls to spend more years in schools, thereby getting married late in their life. Delayed marriage tends to lower fertility rates and therefore slower population growth. As girls get empowered through education, this has improved their communication, confidence and self-esteem to the extent that they can be able to sustain marital discourse with their spouses regarding family planning like spacing from one child to another and the number of children. Still access to education has opened doors to economic opportunities that come with different attitudes towards population growth. With effects of globalization, education is increasingly socializing Kenyans into western lifestyle of having small family structures. With regards to economic opportunities, a policy implementer observed that graduate women would prefer employment in formal sector which would influence the number of births in preference to fewer children. This is largely because of divided commitment between child care and career ambitions. Most of the interviewed respondents believe that increased literacy levels are likely to reduce household size hence reduced population. This is also likely to increase the productive age and reduce government investment on social benefits and increase investment on industrialization and physical infrastructures. Generally, from those perspectives literacy is a good thing.
Currently, Kenya’s population density at 239 persons per square kilometer (RoK, 2019, p.5), and is anticipated that the projected population change would increase the density to about 831 persons per square kilometer by 2050 (NCPD, 2018). As will be elaborated in the subsequent section, there are projected significant spatial differences in terms of the distribution of population by size, age structure and gender. Policy planners and politicians believe that counties with high population
KAS: Understanding Demographics and Politics in Kenya
15
density like Kiambu, Nairobi and Nyeri would register low population growth, while counties in Arid and Semi-Arid Lands (ASALs) like Isiolo, Marsabit and Turkana would record high population growth in the next five to ten years because of high fertility as elaborated below. Counties in Western and Nyanza regions like Bungoma, Kakamega and Kisii are likely to be dominated by young population in the next five to ten years. The elderly will dominate Nyeri County, and the number of females will slightly be ahead of men in counties in Central region.15
Turning to the main drivers of population growth, the study observes that there has been significant decline in fertility at the national level. However there are regional variations with an average of 2.3 births per women in Kirinyaga County and 7.8 births per women in Wajir County. Counties with lowest fertility level include Kirinyaga, Kiambu, Nyeri, Nairobi and Murang’a, while counties with highest fertility level include Wajir, West Pokot, Turkana, Samburu and Garissa. Almost 50 percent of the 47 counties have fertility rate ranging from 3.5 to 5.1, generally fertility has been on the rise in counties in ASALs.16 Opinion is divided on which counties in terms of size are likely to see significant number of population growth. One group of Kenyans believe the population would remain high in traditional urban centers like Nairobi, Mombasa, Kisumu and Nakuru because of constant rural-urban migration in search of job opportunities and illusion of staying in towns.17 Another group of Kenyans believe that counties in ASALs would register high population. Because of socio-cultural practices like having many children, new opportunities created by devolved system of governance and the increasing availability and accessibility of land among members of communities, population would remain high
15 Personal interview, Researcher, Population Studies and Research Institute, University of Nairobi, 5 June 2020. 16 Ibid.17 Ibid.
or grow high in rural areas.18 In addition, more girls in ASALs counties would have access to education, thereby empowering them on matters, reproductive health.19 Still, others believe the “high fertility belt zone” of western counties like Bungoma and Kakamega and Rift Valley counties with youthful population of reproductive age between 20 and 35 would also register high numbers in the next five to ten years.20 According to KNBS data Bungoma, Nairobi and Turkana counties are projected to have a population increase of 1,973,615; 8,105, 962 and 1,653,462 people respectively in the next ten years.
Currently, male life expectancy at birth is estimated at 61.1 years, compared to 65.8 years for female. Compared to life expectancy at the turn of this century, there has been an increase by almost 1.3 percent annually. The increase has been associated with decline in both child and adult mortality- probability of dying between the age of 15 and 60. Interviewed experts observed that female are more likely to live longer than men, sentiments consistent with United Nations (2017) report that estimated men are 14 percent more likely to die before reaching age 60 having reached age 15 compared to women.
One prominent variable in the distribution of the population in Kenya is urbanization. This process has seen the rise in the number of people living in the urban areas in Nairobi, Mombasa and Kisumu city and Nakuru municipality and mushrooming of other urban centers. Common reasons cited by many respondents for urbanization include rural-urban migration and expansion of the boundaries of urban areas. Globally, in 2016, it was estimated that fifty five percent of the 18 Personal interview, Member of National Assembly, 8 June 2020. 19 Personal interview, Director Technical Service, National Council for Population and Development, 8 June 2020.
20 Personal interview, Deputy Director, Communication, Advocacy and Public Education Division, National Council for Population and Development, 6 June 2020.
16
world population lived in urban area, and the proportion is estimated to increase by ten percent. In Kenya, the proportion of the urban population is projected to reach 46 percent by 2030 up from 31 percent in 2016 (NCPD, 2018, p.11). To further analyze demographic trends, the discussion that follows classifies all the 47 counties into eight regions according to former eight provincial administrative areas. Whereas 2019 census is sometimes used as basis for comparison, the main focus are projections in the next five to ten years.
2.3 Perception of Population Projections in CountiesPopulation projections of all counties is presented and perceptions of demographics trends in some sampled co07/27/20unties elaborated.
2.3.1 Population Projections in Rift Valley Region According to the projected population size, Rift Valley will be the most populated region in the country with its fourteen counties namely; Baringo, Bomet, Elgeyo-Marakwet, Kajiado, Kericho, Laikipia, Nakuru, Nandi, Narok, Samburu, Trans-Nzoia, Turkana, Uasin-Gishu and West Pokot. By the end of 2020, the population in the region is estimated to reach 14.3 million, and 16.8 million and 19.4 million in 2025 and 2030 respectively. The population will be dominated by young people with approximately 50 percent of the population being below 19 years, and 25 percent between age 20 and 34. The elderly (age 60 and above) will constitute about 5 percent of the total population. The working age population (15-60 years old) is projected to increase in all counties until 2030 (KNBS, 2012). This implies that all counties in the region would have relatively low ratios of dependent to working populations, which means they would have the possibility of benefitting from demographic dividend. The assumption is that the young population will provide the needed workforce and resource that in turn, can take care of the larger society’s
needs including the needs of the dependents (old). In this case, demographic change is likely to be deemed as a positive element of change.
In this region, according to 2020 population projections, Nakuru County will record the largest population increase (with a total of more than 2.3 million) followed by Uasin Gishu and Narok each with more than 1.2 million as indicated in Figure 2.1 These counties are projected to record population increase of about 16.6 percent and 14.8 percent between 2020-2025 and 2025-2030 respectively as indicated in Figure 2.2 Nakuru would remain the most populated county in the Rift Valley region with projected population of more than three million in 2030. From FGDs it was observed that in the next five to ten years, the county’s population is likely to increase by 20 percent attributed to devolution gains in rural areas where 60 percent of the population lives. The county’s population is likely to be dominated by the youths more than any other social groups, especially those in the ages of 14-18, 19-24 and 25-35.
Nakuru’s high population has to be understood within the historical context and its status as an urban center. Although the number of farm laborer has declined in recent past, since independence, Nakuru District’s population growth has benefited from migration occasioned by casual laborer working in horticultural and wheat farms and those in fishing around Lake Naivasha.21 The current high number is centered in urban areas like Nakuru town and its surrounding; Gilgil, Naivasha, Njoro, settlement schemes in Olengurooni and Molo and absorption of migrants from neighboring counties with high population density like Nyandarua, Kiambu and Nyeri.22 It is also anticipated that Naivasha town and its environs will record significant increase upon the completion of dry port. Although it
21 Personal interview, Policy Maker, The National Treasury and Planning, 5 June 2020. 22 Personal interview, Member Nakuru County Assembly, 5 June 2020.
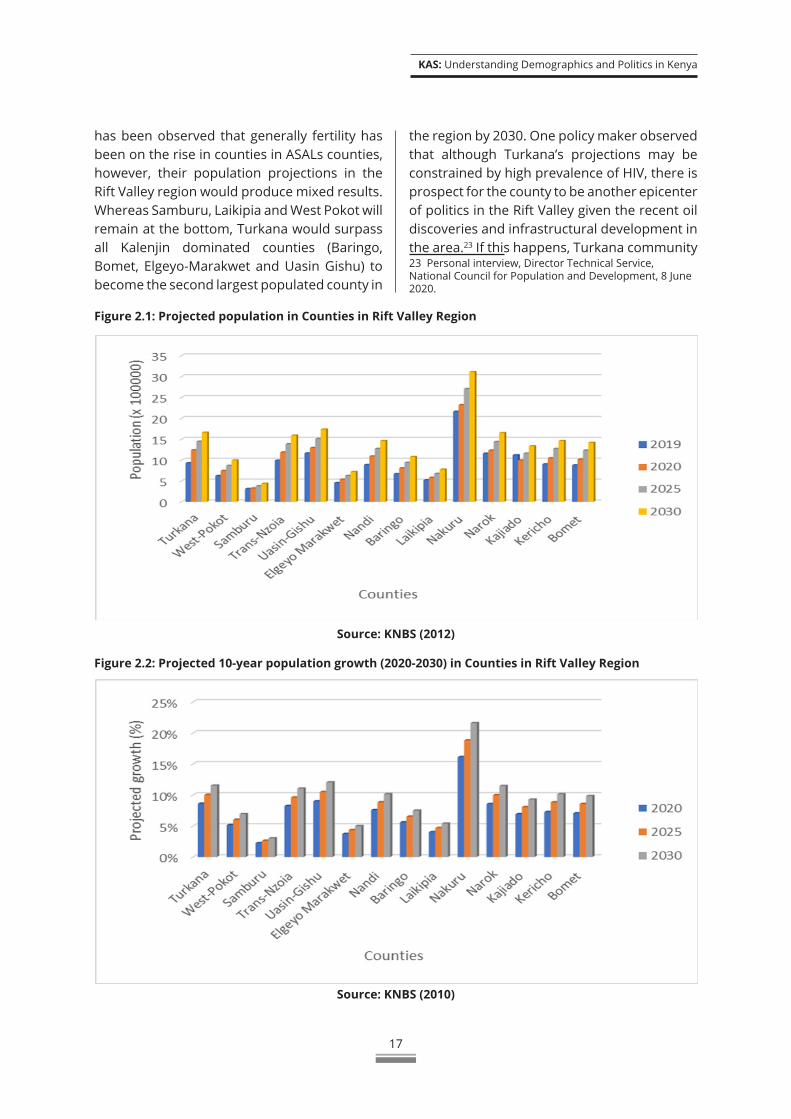
KAS: Understanding Demographics and Politics in Kenya
17
has been observed that generally fertility has been on the rise in counties in ASALs counties, however, their population projections in the Rift Valley region would produce mixed results. Whereas Samburu, Laikipia and West Pokot will remain at the bottom, Turkana would surpass all Kalenjin dominated counties (Baringo, Bomet, Elgeyo-Marakwet and Uasin Gishu) to become the second largest populated county in
the region by 2030. One policy maker observed that although Turkana’s projections may be constrained by high prevalence of HIV, there is prospect for the county to be another epicenter of politics in the Rift Valley given the recent oil discoveries and infrastructural development in the area.23 If this happens, Turkana community 23 Personal interview, Director Technical Service, National Council for Population and Development, 8 June 2020.
Figure 2.1: Projected population in Counties in Rift Valley Region
Figure 2.2: Projected 10-year population growth (2020-2030) in Counties in Rift Valley Region
Source: KNBS (2012)
Source: KNBS (2010)
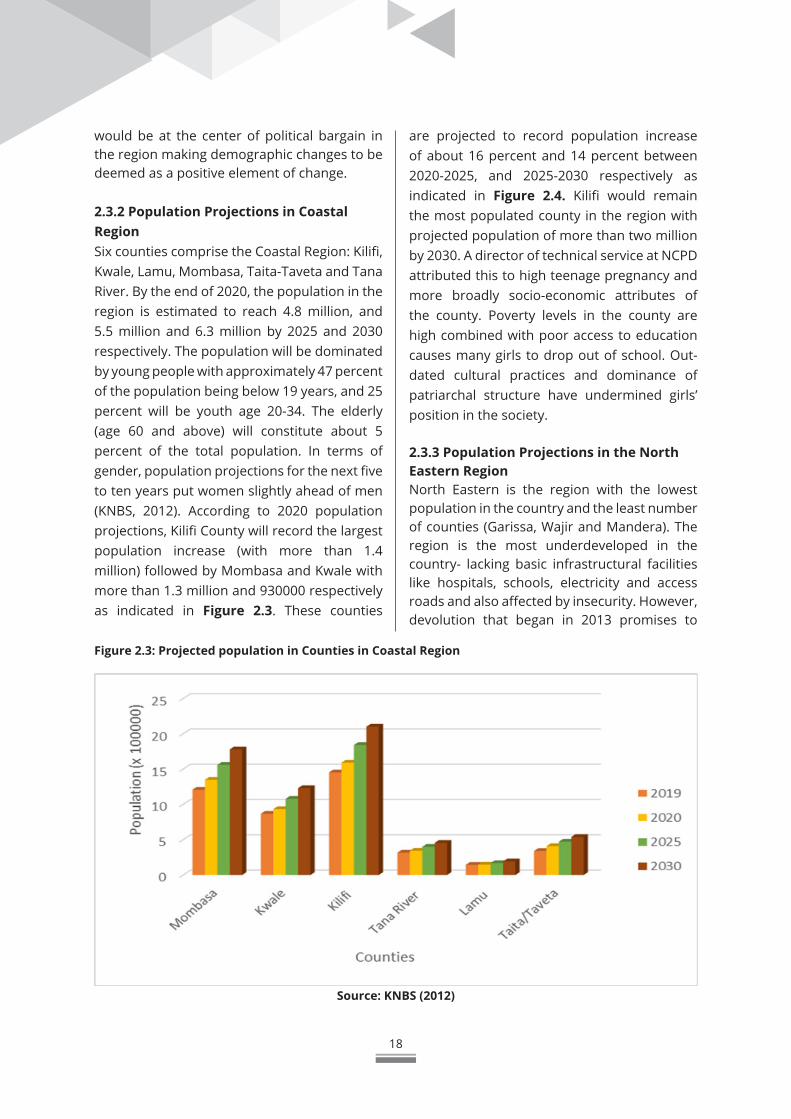
18
would be at the center of political bargain in the region making demographic changes to be deemed as a positive element of change.
2.3.2 Population Projections in Coastal Region Six counties comprise the Coastal Region: Kilifi, Kwale, Lamu, Mombasa, Taita-Taveta and Tana River. By the end of 2020, the population in the region is estimated to reach 4.8 million, and 5.5 million and 6.3 million by 2025 and 2030 respectively. The population will be dominated by young people with approximately 47 percent of the population being below 19 years, and 25 percent will be youth age 20-34. The elderly (age 60 and above) will constitute about 5 percent of the total population. In terms of gender, population projections for the next five to ten years put women slightly ahead of men (KNBS, 2012). According to 2020 population projections, Kilifi County will record the largest population increase (with more than 1.4 million) followed by Mombasa and Kwale with more than 1.3 million and 930000 respectively as indicated in Figure 2.3. These counties
are projected to record population increase of about 16 percent and 14 percent between 2020-2025, and 2025-2030 respectively as indicated in Figure 2.4. Kilifi would remain the most populated county in the region with projected population of more than two million by 2030. A director of technical service at NCPD attributed this to high teenage pregnancy and more broadly socio-economic attributes of the county. Poverty levels in the county are high combined with poor access to education causes many girls to drop out of school. Out-dated cultural practices and dominance of patriarchal structure have undermined girls’ position in the society.
2.3.3 Population Projections in the North Eastern Region North Eastern is the region with the lowest population in the country and the least number of counties (Garissa, Wajir and Mandera). The region is the most underdeveloped in the country- lacking basic infrastructural facilities like hospitals, schools, electricity and access roads and also affected by insecurity. However, devolution that began in 2013 promises to
Figure 2.3: Projected population in Counties in Coastal Region
Source: KNBS (2012)
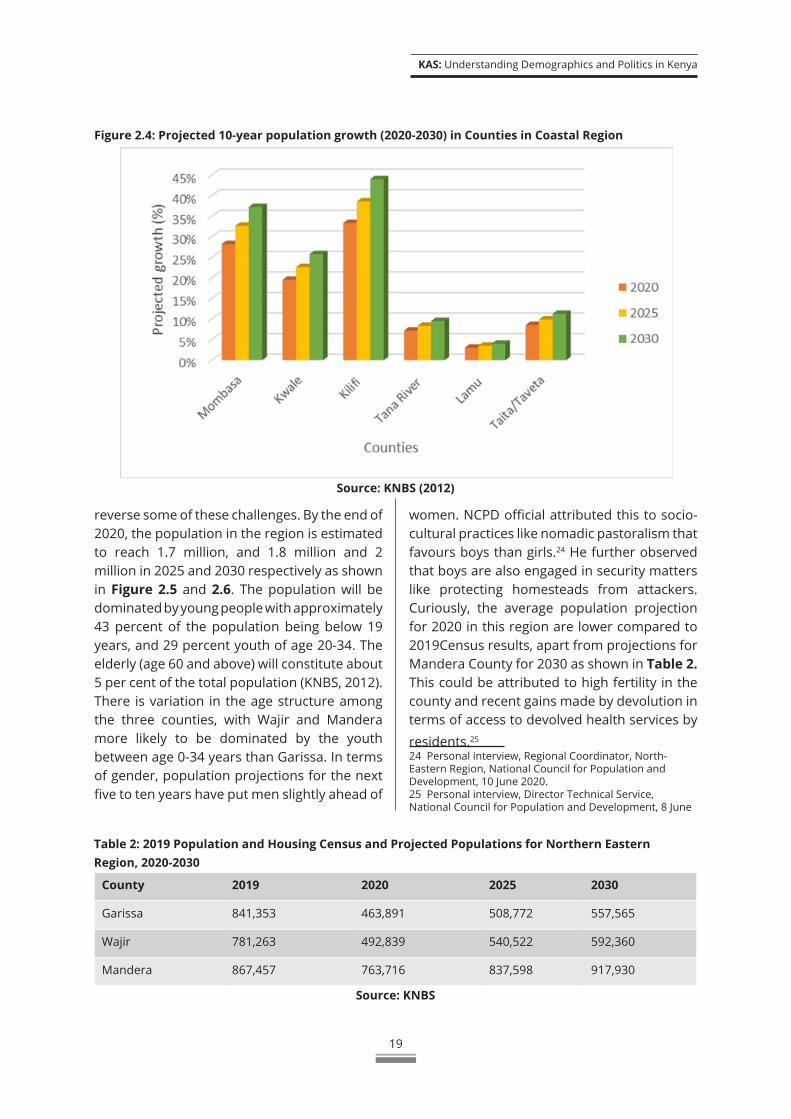
KAS: Understanding Demographics and Politics in Kenya
19
Figure 2.4: Projected 10-year population growth (2020-2030) in Counties in Coastal Region
Source: KNBS (2012)
reverse some of these challenges. By the end of 2020, the population in the region is estimated to reach 1.7 million, and 1.8 million and 2 million in 2025 and 2030 respectively as shown in Figure 2.5 and 2.6. The population will be dominated by young people with approximately 43 percent of the population being below 19 years, and 29 percent youth of age 20-34. The elderly (age 60 and above) will constitute about 5 per cent of the total population (KNBS, 2012). There is variation in the age structure among the three counties, with Wajir and Mandera more likely to be dominated by the youth between age 0-34 years than Garissa. In terms of gender, population projections for the next five to ten years have put men slightly ahead of
women. NCPD official attributed this to socio-cultural practices like nomadic pastoralism that favours boys than girls.24 He further observed that boys are also engaged in security matters like protecting homesteads from attackers. Curiously, the average population projection for 2020 in this region are lower compared to 2019Census results, apart from projections for Mandera County for 2030 as shown in Table 2. This could be attributed to high fertility in the county and recent gains made by devolution in terms of access to devolved health services by
residents.25 24 Personal interview, Regional Coordinator, North-Eastern Region, National Council for Population and Development, 10 June 2020.25 Personal interview, Director Technical Service, National Council for Population and Development, 8 June
Table 2: 2019 Population and Housing Census and Projected Populations for Northern Eastern Region, 2020-2030
County 2019 2020 2025 2030
Garissa 841,353 463,891 508,772 557,565
Wajir 781,263 492,839 540,522 592,360
Mandera 867,457 763,716 837,598 917,930
Source: KNBS
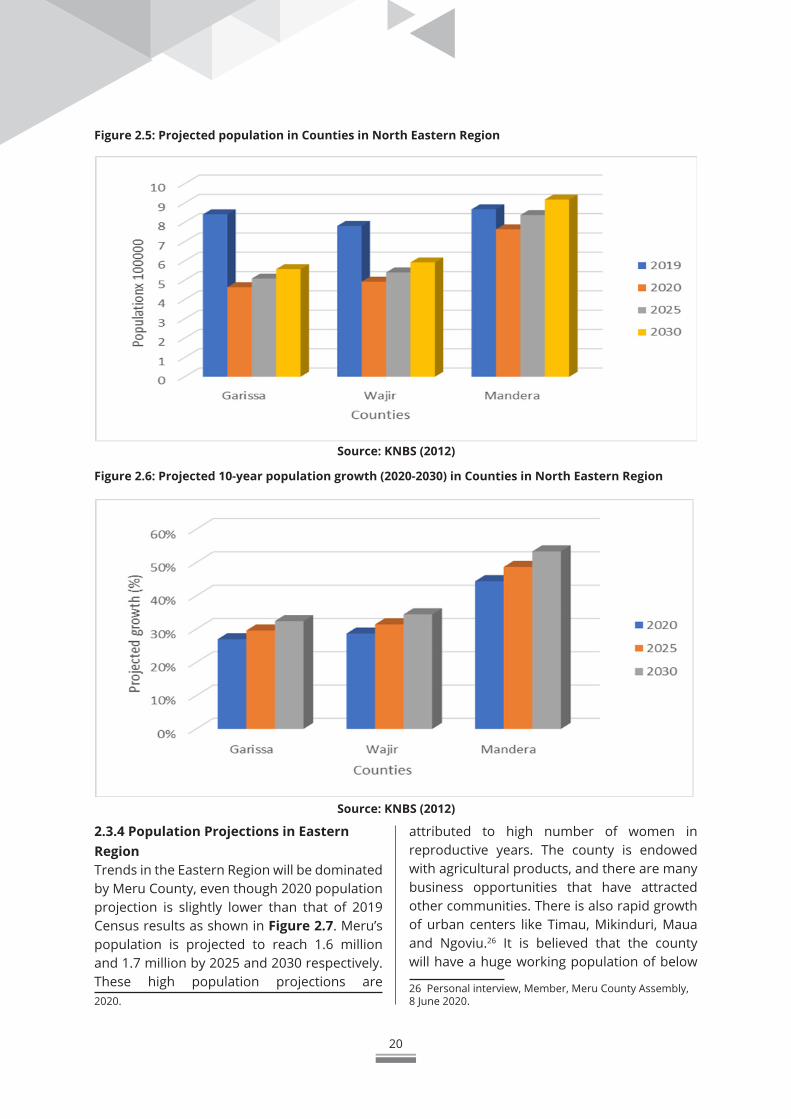
20
2.3.4 Population Projections in Eastern Region Trends in the Eastern Region will be dominated by Meru County, even though 2020 population projection is slightly lower than that of 2019 Census results as shown in Figure 2.7. Meru’s population is projected to reach 1.6 million and 1.7 million by 2025 and 2030 respectively. These high population projections are 2020.
attributed to high number of women in reproductive years. The county is endowed with agricultural products, and there are many business opportunities that have attracted other communities. There is also rapid growth of urban centers like Timau, Mikinduri, Maua and Ngoviu.26 It is believed that the county will have a huge working population of below
26 Personal interview, Member, Meru County Assembly, 8 June 2020.
Figure 2.5: Projected population in Counties in North Eastern Region
Figure 2.6: Projected 10-year population growth (2020-2030) in Counties in North Eastern Region
Source: KNBS (2012)
Source: KNBS (2012)
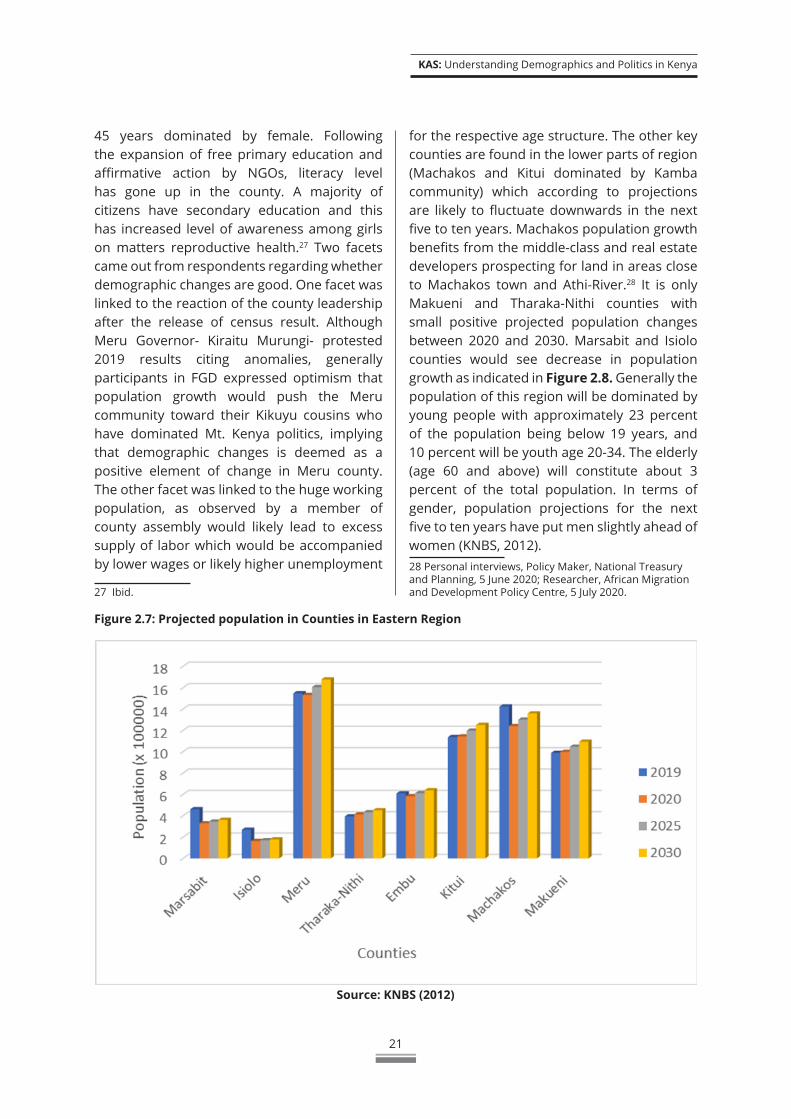
KAS: Understanding Demographics and Politics in Kenya
21
Figure 2.7: Projected population in Counties in Eastern Region
Source: KNBS (2012)
45 years dominated by female. Following the expansion of free primary education and affirmative action by NGOs, literacy level has gone up in the county. A majority of citizens have secondary education and this has increased level of awareness among girls on matters reproductive health.27 Two facets came out from respondents regarding whether demographic changes are good. One facet was linked to the reaction of the county leadership after the release of census result. Although Meru Governor- Kiraitu Murungi- protested 2019 results citing anomalies, generally participants in FGD expressed optimism that population growth would push the Meru community toward their Kikuyu cousins who have dominated Mt. Kenya politics, implying that demographic changes is deemed as a positive element of change in Meru county. The other facet was linked to the huge working population, as observed by a member of county assembly would likely lead to excess supply of labor which would be accompanied by lower wages or likely higher unemployment
27 Ibid.
for the respective age structure. The other key counties are found in the lower parts of region (Machakos and Kitui dominated by Kamba community) which according to projections are likely to fluctuate downwards in the next five to ten years. Machakos population growth benefits from the middle-class and real estate developers prospecting for land in areas close to Machakos town and Athi-River.28 It is only Makueni and Tharaka-Nithi counties with small positive projected population changes between 2020 and 2030. Marsabit and Isiolo counties would see decrease in population growth as indicated in Figure 2.8. Generally the population of this region will be dominated by young people with approximately 23 percent of the population being below 19 years, and 10 percent will be youth age 20-34. The elderly (age 60 and above) will constitute about 3 percent of the total population. In terms of gender, population projections for the next five to ten years have put men slightly ahead of women (KNBS, 2012).28 Personal interviews, Policy Maker, National Treasury and Planning, 5 June 2020; Researcher, African Migration and Development Policy Centre, 5 July 2020.
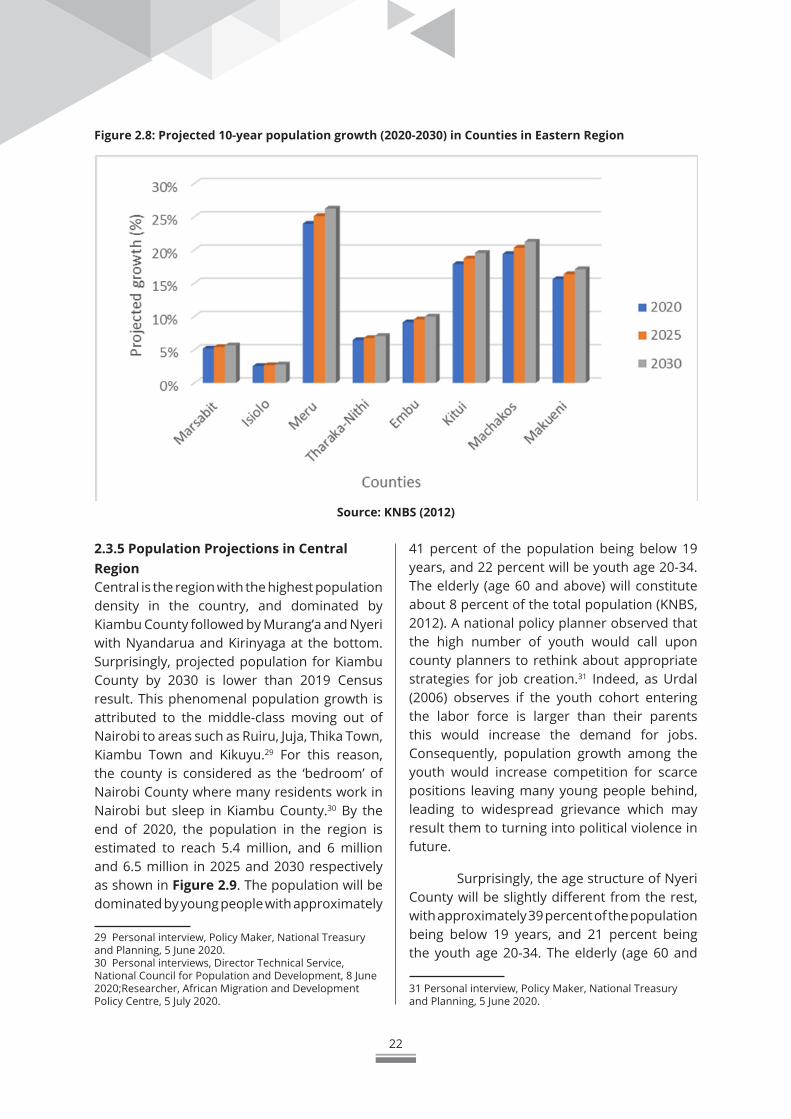
22
2.3.5 Population Projections in Central RegionCentral is the region with the highest population density in the country, and dominated by Kiambu County followed by Murang’a and Nyeri with Nyandarua and Kirinyaga at the bottom. Surprisingly, projected population for Kiambu County by 2030 is lower than 2019 Census result. This phenomenal population growth is attributed to the middle-class moving out of Nairobi to areas such as Ruiru, Juja, Thika Town, Kiambu Town and Kikuyu.29 For this reason, the county is considered as the ‘bedroom’ of Nairobi County where many residents work in Nairobi but sleep in Kiambu County.30 By the end of 2020, the population in the region is estimated to reach 5.4 million, and 6 million and 6.5 million in 2025 and 2030 respectively as shown in Figure 2.9. The population will be dominated by young people with approximately
29 Personal interview, Policy Maker, National Treasury and Planning, 5 June 2020.30 Personal interviews, Director Technical Service, National Council for Population and Development, 8 June 2020;Researcher, African Migration and Development Policy Centre, 5 July 2020.
Figure 2.8: Projected 10-year population growth (2020-2030) in Counties in Eastern Region
Source: KNBS (2012)
41 percent of the population being below 19 years, and 22 percent will be youth age 20-34. The elderly (age 60 and above) will constitute about 8 percent of the total population (KNBS, 2012). A national policy planner observed that the high number of youth would call upon county planners to rethink about appropriate strategies for job creation.31 Indeed, as Urdal (2006) observes if the youth cohort entering the labor force is larger than their parents this would increase the demand for jobs. Consequently, population growth among the youth would increase competition for scarce positions leaving many young people behind, leading to widespread grievance which may result them to turning into political violence in future.
Surprisingly, the age structure of Nyeri County will be slightly different from the rest, with approximately 39 percent of the population being below 19 years, and 21 percent being the youth age 20-34. The elderly (age 60 and
31 Personal interview, Policy Maker, National Treasury and Planning, 5 June 2020.
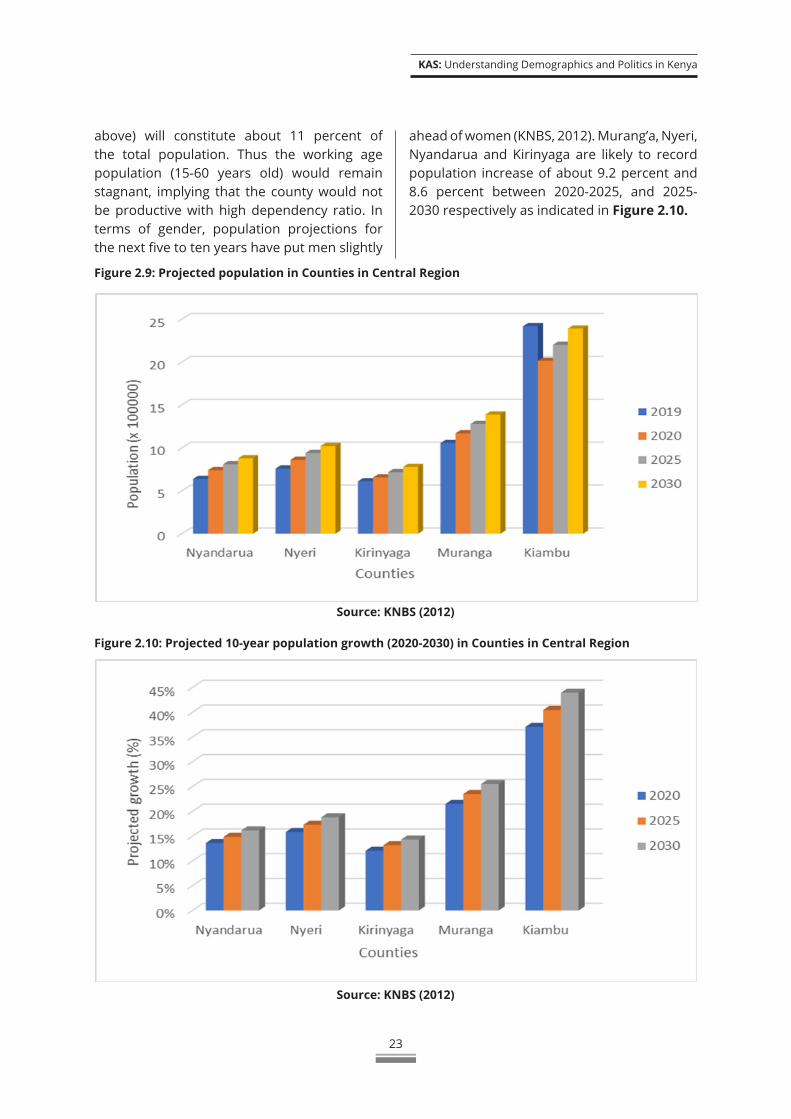
KAS: Understanding Demographics and Politics in Kenya
23
Figure 2.9: Projected population in Counties in Central Region
Figure 2.10: Projected 10-year population growth (2020-2030) in Counties in Central Region
Source: KNBS (2012)
Source: KNBS (2012)
above) will constitute about 11 percent of the total population. Thus the working age population (15-60 years old) would remain stagnant, implying that the county would not be productive with high dependency ratio. In terms of gender, population projections for the next five to ten years have put men slightly
ahead of women (KNBS, 2012). Murang’a, Nyeri, Nyandarua and Kirinyaga are likely to record population increase of about 9.2 percent and 8.6 percent between 2020-2025, and 2025-2030 respectively as indicated in Figure 2.10.
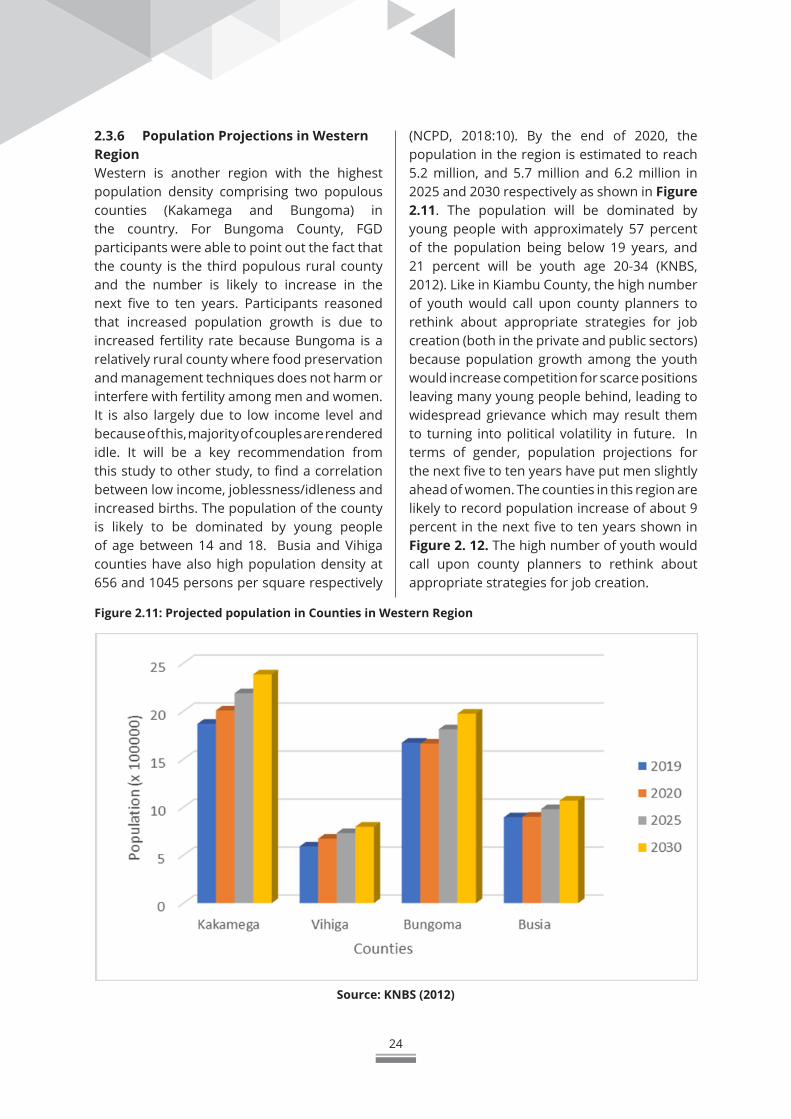
24
2.3.6 Population Projections in Western RegionWestern is another region with the highest population density comprising two populous counties (Kakamega and Bungoma) in the country. For Bungoma County, FGD participants were able to point out the fact that the county is the third populous rural county and the number is likely to increase in the next five to ten years. Participants reasoned that increased population growth is due to increased fertility rate because Bungoma is a relatively rural county where food preservation and management techniques does not harm or interfere with fertility among men and women. It is also largely due to low income level and because of this, majority of couples are rendered idle. It will be a key recommendation from this study to other study, to find a correlation between low income, joblessness/idleness and increased births. The population of the county is likely to be dominated by young people of age between 14 and 18. Busia and Vihiga counties have also high population density at 656 and 1045 persons per square respectively
(NCPD, 2018:10). By the end of 2020, the population in the region is estimated to reach 5.2 million, and 5.7 million and 6.2 million in 2025 and 2030 respectively as shown in Figure 2.11. The population will be dominated by young people with approximately 57 percent of the population being below 19 years, and 21 percent will be youth age 20-34 (KNBS, 2012). Like in Kiambu County, the high number of youth would call upon county planners to rethink about appropriate strategies for job creation (both in the private and public sectors) because population growth among the youth would increase competition for scarce positions leaving many young people behind, leading to widespread grievance which may result them to turning into political volatility in future. In terms of gender, population projections for the next five to ten years have put men slightly ahead of women. The counties in this region are likely to record population increase of about 9 percent in the next five to ten years shown in Figure 2. 12. The high number of youth would call upon county planners to rethink about appropriate strategies for job creation.
Figure 2.11: Projected population in Counties in Western Region
Source: KNBS (2012)
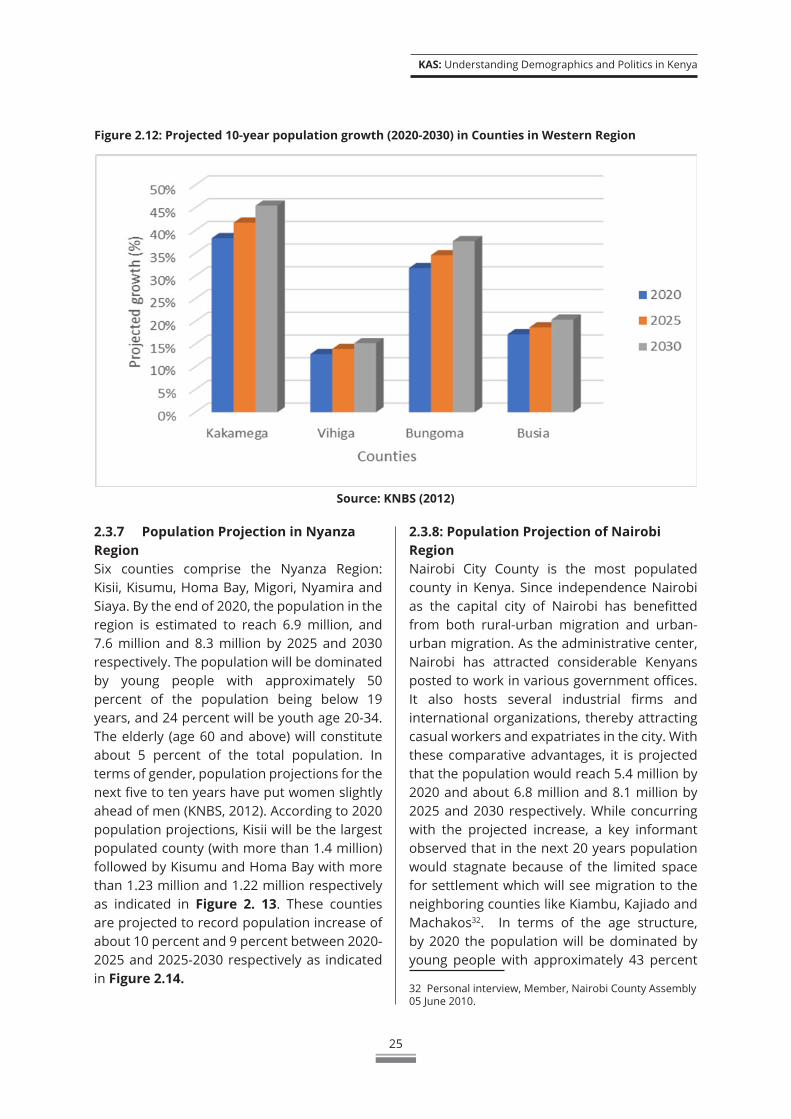
KAS: Understanding Demographics and Politics in Kenya
25
Figure 2.12: Projected 10-year population growth (2020-2030) in Counties in Western Region
Source: KNBS (2012)
2.3.7 Population Projection in Nyanza RegionSix counties comprise the Nyanza Region: Kisii, Kisumu, Homa Bay, Migori, Nyamira and Siaya. By the end of 2020, the population in the region is estimated to reach 6.9 million, and 7.6 million and 8.3 million by 2025 and 2030 respectively. The population will be dominated by young people with approximately 50 percent of the population being below 19 years, and 24 percent will be youth age 20-34. The elderly (age 60 and above) will constitute about 5 percent of the total population. In terms of gender, population projections for the next five to ten years have put women slightly ahead of men (KNBS, 2012). According to 2020 population projections, Kisii will be the largest populated county (with more than 1.4 million) followed by Kisumu and Homa Bay with more than 1.23 million and 1.22 million respectively as indicated in Figure 2. 13. These counties are projected to record population increase of about 10 percent and 9 percent between 2020-2025 and 2025-2030 respectively as indicated in Figure 2.14.
2.3.8: Population Projection of Nairobi RegionNairobi City County is the most populated county in Kenya. Since independence Nairobi as the capital city of Nairobi has benefitted from both rural-urban migration and urban-urban migration. As the administrative center, Nairobi has attracted considerable Kenyans posted to work in various government offices. It also hosts several industrial firms and international organizations, thereby attracting casual workers and expatriates in the city. With these comparative advantages, it is projected that the population would reach 5.4 million by 2020 and about 6.8 million and 8.1 million by 2025 and 2030 respectively. While concurring with the projected increase, a key informant observed that in the next 20 years population would stagnate because of the limited space for settlement which will see migration to the neighboring counties like Kiambu, Kajiado and Machakos32. In terms of the age structure, by 2020 the population will be dominated by young people with approximately 43 percent
32 Personal interview, Member, Nairobi County Assembly 05 June 2010.
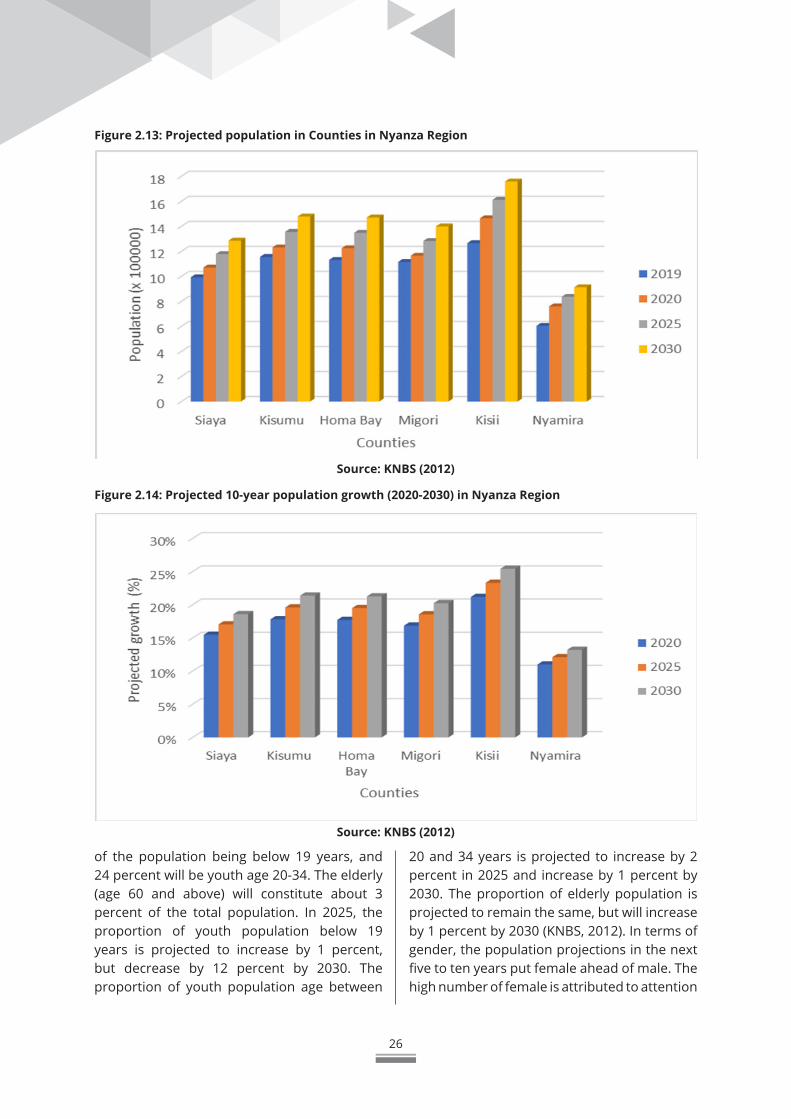
26
Figure 2.13: Projected population in Counties in Nyanza Region
Figure 2.14: Projected 10-year population growth (2020-2030) in Nyanza Region
Source: KNBS (2012)
Source: KNBS (2012)
of the population being below 19 years, and 24 percent will be youth age 20-34. The elderly (age 60 and above) will constitute about 3 percent of the total population. In 2025, the proportion of youth population below 19 years is projected to increase by 1 percent, but decrease by 12 percent by 2030. The proportion of youth population age between
20 and 34 years is projected to increase by 2 percent in 2025 and increase by 1 percent by 2030. The proportion of elderly population is projected to remain the same, but will increase by 1 percent by 2030 (KNBS, 2012). In terms of gender, the population projections in the next five to ten years put female ahead of male. The high number of female is attributed to attention
KAS: Understanding Demographics and Politics in Kenya
27
directed toward girl child empowerment at the expense of boy child who are neglected and victims of homicide.33
2.4 Perceptions on Implications of Demographic Changes The study sought perceptions of Kenyans on the impact of demographic changes on economics, political and social spheres. To guide analysis the main variables of demographics such as size, age structure, gender and educational attainment were qualitatively associated with various dimensions of economic, political and social aspects.
2.4.1 Perceptions of Demographic Changes on EconomicsOne of the remarkable features in any demographic change is the size of the population. With projected increase in the size of population, opinion is divided on the effects of population size of economic growth and development. One strand of argument believes that high population would potentially lead to high supply of labor. If this labor were to be absorbed, that would likely spur economy through revenues. High population would also provide ready markets for finished goods and services thereby stimulating economic growth.34 Another popular strand of argument believes that population size exerts significant pressure on the available resources consequently influencing the level of development. Due to bad governance some respondents believed that previous regimes in the country failed to plan for scarce resources leading to skewed distribution of resources with some sections of the population benefitting more than the other. Cognizance of this economic marginalization, Articles 201, 202, 203 and 204 of the Constitution of Kenya were cited by respondents as anchoring the principles of public finance likely to address in a progressive manner, the problem of economic
33 Ibid. 34 Personal interview, Director Technical Service, National Council for Population and Development, 8 June 2020.
marginalization. These principles include fair and equitable tax system, equitable distribution of revenue raised nationally among counties, promotion of equitable development and even equity between generations. Article 216 of the Constitution establishes the Commission on Revenue Allocation (CRA) to provide technical advice and input on the vertical and horizon division of resources. Although the elements used by CRA such as population, geographical size, poverty level have the potential redistributive effect to the country’s economic growth and development, one key informant, observed that element such as population size needs to be disaggregated further. Comparing Nyeri and Wajir Counties, he observed that the former comprises elderly population while the latter comprises youthful population, yet these realities are not considered. The outcome is that some counties are given a lot of resources based on population criteria yet the productivity is very low, and this is likely to impact on their levels of economic development.
Another key feature of demographic change is the age structure of the population. Nationally, it is projected that the population will be dominated by young people in the next five to ten years. Approximately 70 percent of the population will be below 24 years of age, and 28 percent will be youth age 15-24. The elderly will constitute about 5 percent of the total population. As observed above, the working age population (15-60 years old) is projected to increase in the country until 2030. This implies that all counties in the region would have relatively low ratios of dependent to working populations, which means they would have the possibility of benefitting from demographic dividend. However, this may not be automatic as this would imply availability of job opportunities. According to local experts, the implication of this youthful population is that government would have to invest heavily on human capital sectors like education and health. Education would be a key asset to equip the young population with prerequisite

28
skills and knowledge for the labor market. Health would also be important in ensuring the wellbeing and fitness of the mind of young citizens. Since the youthful population largely consumes, there would be little savings, thereby slowing economic growth. The economy would further be strained by low productivity because the youth are not engaged in the labor market. In sum, a majority of Kenyans believed that the negative effects of the age structure on investments, savings, and production would shrink the economy of the country.
Changes in population gender have also been cited as likely to influence economic growth. Whereas some counties have placed the number of women slightly ahead of men, other counties have placed men slightly ahead of women. When asked how this distribution is likely to impact on economic growth, some respondents observed that naturally men are highly predisposed to health risk factors than women. These factors may curtail them from actively participating in labor market and generation of revenue needed to fuel economy. With robust labor laws, employers are increasingly preferring women in service sector and this is likely to reverse previous trends where women have lowly participated in labor market. Respondents were also asked to share their views regarding population’s educational attainment and economic growth. A dominant view on the relationship between the two variables was linked to the influence of globalization. Social dimensions of globalizations have given education new meaning as people change their forms of interactions and adapt to new realities. The desire to be more educated, urbanized and more cosmopolitan is now pushing many people to spend more years in institutions of higher learning. More education implies awareness of contraceptive use and lower desires of having many children. What matters to some educated Kenyans is not the quantity but quality of children being brought up. It is assumed that few children
with quality education may translate into higher prospects of job opportunities, thereby reducing dependency trap in most families. Yet, as another group of observers averred this perspective may benefit the economy in the short run if what is happening in the industrialized economies is anything to go by. As more women become more educated, the country is likely to record low birth rates stagnating population growth with fewer entries to labor market thereby impacting negatively on economic growth.
2.4.2 Perceptions of Demographic Changes on Political Processes The population size continues to influence politics in Kenya though informal and formal processes. As multiethnic society, instrumentalization of ethnicity by politicians in Kenya has given population size of ethnic groups significant meaning in political process. Scholars are in harmony that since the return of multipartyism in early 1990s formation of political parties and coalition building have been informed by ethnic logic (see Oyugi, Wanyande & Odhiambo-Mbai, 2003). Main political parties in the country are associated with politicians from the five main ethnic groups (Kikuyu, Luhya, Kalenjin, Luo and Kamba) in terms of sizes. Similarly, in recent years coalition building has been influenced by affiliation and support main political parties draw from these ethnic groups. It was held in one FGD that, ethnicity in Kenya has been the driving force of politics of exclusion and bad governance in the country, and that is why presidential elections in the eyes of many Kenyan is ethnic contests. As such politicians have been at the forefront in encouraging members of their ethnic groups not to practice family planning because that is likely to deny them chances of winning presidential elections. A senator from Nandi County for instance, urged his supporters “to seriously give birth…[calling upon men to be]…going home early…[and further calling upon women]... to also offer a conducive environment for men.
KAS: Understanding Demographics and Politics in Kenya
29
Let’s not put them under a lot of pressure so that they go back home early”35. This was the rhetoric that greeted the release of 2019 census as politicians threatened to sue KNBS alleging malpractice in enumeration. This thinking has also been cascaded to the county level especially in those counties dominated by more than one ethnic group like Bungoma, Trans-Nzoia, Nakuru, Meru, Migori and Busia as exemplified by one key informant:
Politics is driven along demographic statistics in Kenya. For a politician like me I would love to see increased population especially in area where I have political support. The same happen nationally. However, I contend that this needs to happen with proper planning at both levels of government.36
In counties dominated by one ethnic group, identities within ethnic groups such as linguistic and clannism have been appropriated by politicians in propagating the increase in birth rates among members of their sub-groups for political ends. In Baringo County, for example, elated with increment of his supporters Tiaty MP, Hon. William Kamket observed that “we shall never again play second fiddle [in the election of the governor]. We shall have a bigger role in election37”. Given that ethnic politics is informed by competition over the distribution of resources, the Constitution establishes formal mechanisms that would provide for fair distribution of resources. In addition to the CRA as discussed above, the Senate as the political institution established to safeguard and protect the interests of the county governments, has special power (though the National Assembly can override it vide a special majority) to set up the basis for the division of revenue between
35 “Kiraitu threatens suit as census results elicit mixed reactions”, 18 March 2020, https://www.nation.co.ke/dailynation/news/kiraitu-threatens-suit-as-census-results-elicit-mixed-reactions-219866 (Accessed 08 June 2020). 36 Personal interview, Member Bungoma County Assembly, 5 June 2020. 37 “Kiraitu threatens suit as census results elicit mixed reactions”, 18 March 2020, https://www.nation.co.ke/dailynation/news/kiraitu-threatens-suit-as-census-results-elicit-mixed-reactions-219866 (Accessed 08 June 2020).
counties. The Senate debates and passes the County Allocation of Revenue Bill which does the horizontal allocation of resources and the National Assembly needs a two-thirds majority in order to overturn this Bill. The passage of this Bill may be influenced by political parties representation in the two Houses with numerically strong parties determining the final content of the Bill.
The age structure of the population was also cited as likely to influence political process. The high rate and pressure of unemployment among the youth is likely to predispose them into joining what one expert called “dirty business” like being recruited to join terrorist activities with potential effect of destabilizing political system. A recent study observes that Al-Shabaab militant group has been keen at recruiting Kenyan youth by exploiting their socioeconomic, political, and cultural grievance (Speckhard &Shajkovci, 2019, p.7). The group has been successful in recruiting Muslim youth in the coastal counties such as Mombasa, Kwale and Lamu. But opinion is divided among policy makers on whether education and meaningful political engagement are likely to mitigate terrorism. Some believe that education, more so higher education lowers propensity of violence through increased tolerance, interaction, objective judgement and more cooperation and teamwork spirit- key for peaceful political processes.38 Others in reference to 2011 Arab Spring and its aftermath argued that access to education is actually likely to increase terrorist activities through two channels. One, education emancipates the masses to the realities of marginalization. Thus, when we have many educated and unemployed Kenyans due to discrimination, oppression or ethnicity, they are likely to collectively come together and rebel against the system. In the second channel, it is believed that education catalyzes grievances. When expected benefits as a result
38 Personal interview, Policy Maker, National Treasury and Planning, 5 June 2020.
30
of education are not meet this is likely to result into disillusionment and frustrations leading to violent political action.39 The idea of meaningful political engagement therefore can create a balance and lessen the radical tendencies that the youth adapt to for political survival. Majorly because this class of politicking provide room for decision making and development platform that is sensitive to the different social groups.
2.4.3 Perceptions of Demographic Changes on Social PoliciesPerceptions of demographic changes on social policies were viewed in the sense in which the changes influence “distribution in the household size, composition and living arrangement” (NCPD, 2018, p.18). According to 2019 census data the average household size stands at 3.9 persons, while UNDESA (2017) puts the average number of children per household among households with children at 2.6. The latter report further notes that households with children under age stand at 66 percent, while households with an adult member age 60 and above is 19 percent. Almost 11 percent of households are made up of children aged below 15 as well as adult aged above 60. Approximately, 16 percent of women and 10 percent of men aged 60 and above are more likely to be living alone. A policy implementer was emphatic that both household size and composition, and living arrangement do not independently influence the social-welfare, but the relationship has to be understood within the broader context of household income because that determines the extent of consumption and poverty levels. Therefore, putting household income as the intervening variable key informants noted that in terms of size, households with small compositions
39 Personal interview, Director Technical Service, National Council for Population and Development, 8 June 2020.
are easier to manage in terms of meeting health needs and food nutrition. Conversely, because of so many demands, managing big households is very complicated. In terms of living arrangement, households with many children spent more on health needs and food nutrition than households with fewer numbers of children. In households with elderly persons, the situation becomes even dire because of their special needs.40 The influences of these variables get more compounded when we compare the setting in rural and urban areas. In rural areas, as observed by a key informant, host a number of elderly persons without pensions and because some have been neglected by their children, accessing health and food nutrition is a problem. In the same setting, it is also common to find that most chores are carried out by girls and her absence would imply disruption of access to water and food. Those in urban areas may fair well if they have some sources of income but the greatest challenge to them is how to walk and buy what they want. Because of this, they are constrained from accessing health care and foods.41 These challenges facing elderly and other vulnerable groups in society informed the government of Kenya to formulate a national policy on social protection. However, as observed by one demographic expert, the idea of how best to sustain social protection is not well thought out. Even at present, the policy mechanisms appear contradictory and have not integrated all vulnerable groups amid also their context and realities.42
40 Personal interview, Regional Coordinator, North-Eastern Region, National Council for Population and Development, 10 June 2020.41 Personal interview, Deputy Director, Communication, Advocacy and Public Education Division, National Council for Population and Development, 6 June 2020.42 Personal interview, Researcher, Population Studies and Research Institute, University of Nairobi, 5 June 2020.
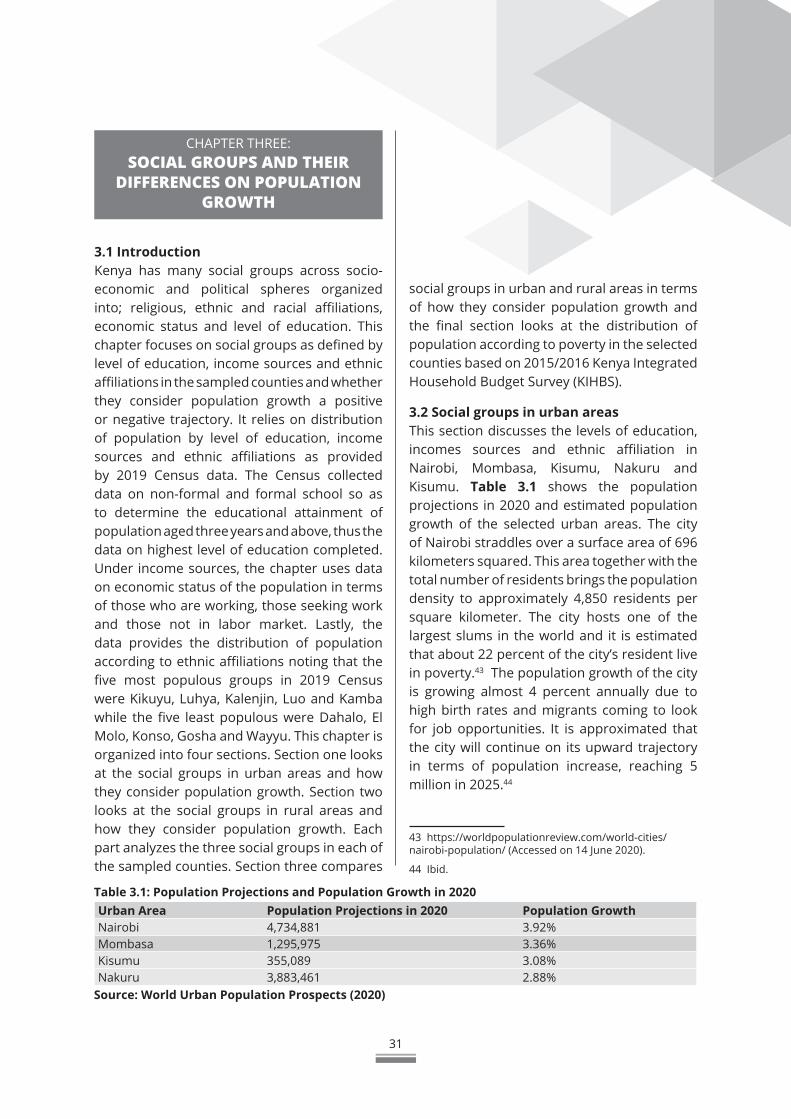
31
CHAPTER THREE:SOCIAL GROUPS AND THEIR
DIFFERENCES ON POPULATION GROWTH
3.1 IntroductionKenya has many social groups across socio-economic and political spheres organized into; religious, ethnic and racial affiliations, economic status and level of education. This chapter focuses on social groups as defined by level of education, income sources and ethnic affiliations in the sampled counties and whether they consider population growth a positive or negative trajectory. It relies on distribution of population by level of education, income sources and ethnic affiliations as provided by 2019 Census data. The Census collected data on non-formal and formal school so as to determine the educational attainment of population aged three years and above, thus the data on highest level of education completed. Under income sources, the chapter uses data on economic status of the population in terms of those who are working, those seeking work and those not in labor market. Lastly, the data provides the distribution of population according to ethnic affiliations noting that the five most populous groups in 2019 Census were Kikuyu, Luhya, Kalenjin, Luo and Kamba while the five least populous were Dahalo, El Molo, Konso, Gosha and Wayyu. This chapter is organized into four sections. Section one looks at the social groups in urban areas and how they consider population growth. Section two looks at the social groups in rural areas and how they consider population growth. Each part analyzes the three social groups in each of the sampled counties. Section three compares
social groups in urban and rural areas in terms of how they consider population growth and the final section looks at the distribution of population according to poverty in the selected counties based on 2015/2016 Kenya Integrated Household Budget Survey (KIHBS).
3.2 Social groups in urban areas This section discusses the levels of education, incomes sources and ethnic affiliation in Nairobi, Mombasa, Kisumu, Nakuru and Kisumu. Table 3.1 shows the population projections in 2020 and estimated population growth of the selected urban areas. The city of Nairobi straddles over a surface area of 696 kilometers squared. This area together with the total number of residents brings the population density to approximately 4,850 residents per square kilometer. The city hosts one of the largest slums in the world and it is estimated that about 22 percent of the city’s resident live in poverty.43 The population growth of the city is growing almost 4 percent annually due to high birth rates and migrants coming to look for job opportunities. It is approximated that the city will continue on its upward trajectory in terms of population increase, reaching 5 million in 2025.44
43 https://worldpopulationreview.com/world-cities/nairobi-population/ (Accessed on 14 June 2020).
44 Ibid. Table 3.1: Population Projections and Population Growth in 2020Urban Area Population Projections in 2020 Population GrowthNairobi 4,734,881 3.92%Mombasa 1,295,975 3.36%Kisumu 355,089 3.08%Nakuru 3,883,461 2.88%
Source: World Urban Population Prospects (2020)
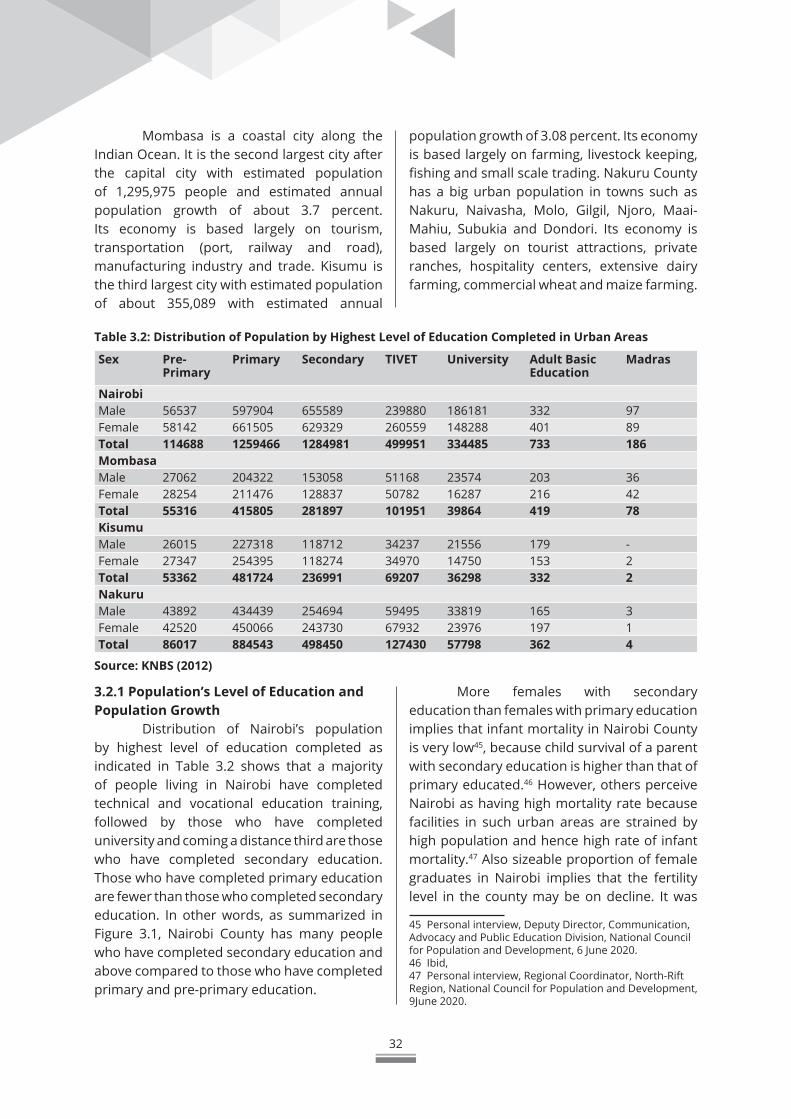
32
Mombasa is a coastal city along the Indian Ocean. It is the second largest city after the capital city with estimated population of 1,295,975 people and estimated annual population growth of about 3.7 percent. Its economy is based largely on tourism, transportation (port, railway and road), manufacturing industry and trade. Kisumu is the third largest city with estimated population of about 355,089 with estimated annual
population growth of 3.08 percent. Its economy is based largely on farming, livestock keeping, fishing and small scale trading. Nakuru County has a big urban population in towns such as Nakuru, Naivasha, Molo, Gilgil, Njoro, Maai-Mahiu, Subukia and Dondori. Its economy is based largely on tourist attractions, private ranches, hospitality centers, extensive dairy farming, commercial wheat and maize farming.
3.2.1 Population’s Level of Education and Population Growth
Distribution of Nairobi’s population by highest level of education completed as indicated in Table 3.2 shows that a majority of people living in Nairobi have completed technical and vocational education training, followed by those who have completed university and coming a distance third are those who have completed secondary education. Those who have completed primary education are fewer than those who completed secondary education. In other words, as summarized in Figure 3.1, Nairobi County has many people who have completed secondary education and above compared to those who have completed primary and pre-primary education.
More females with secondary education than females with primary education implies that infant mortality in Nairobi County is very low45, because child survival of a parent with secondary education is higher than that of primary educated.46 However, others perceive Nairobi as having high mortality rate because facilities in such urban areas are strained by high population and hence high rate of infant mortality.47 Also sizeable proportion of female graduates in Nairobi implies that the fertility level in the county may be on decline. It was
45 Personal interview, Deputy Director, Communication, Advocacy and Public Education Division, National Council for Population and Development, 6 June 2020.46 Ibid, 47 Personal interview, Regional Coordinator, North-Rift Region, National Council for Population and Development, 9June 2020.
Table 3.2: Distribution of Population by Highest Level of Education Completed in Urban Areas
Sex Pre-Primary
Primary Secondary TIVET University Adult Basic Education
Madras
Nairobi Male 56537 597904 655589 239880 186181 332 97Female 58142 661505 629329 260559 148288 401 89Total 114688 1259466 1284981 499951 334485 733 186Mombasa Male 27062 204322 153058 51168 23574 203 36Female 28254 211476 128837 50782 16287 216 42Total 55316 415805 281897 101951 39864 419 78KisumuMale 26015 227318 118712 34237 21556 179 -Female 27347 254395 118274 34970 14750 153 2Total 53362 481724 236991 69207 36298 332 2Nakuru Male 43892 434439 254694 59495 33819 165 3Female 42520 450066 243730 67932 23976 197 1Total 86017 884543 498450 127430 57798 362 4
Source: KNBS (2012)
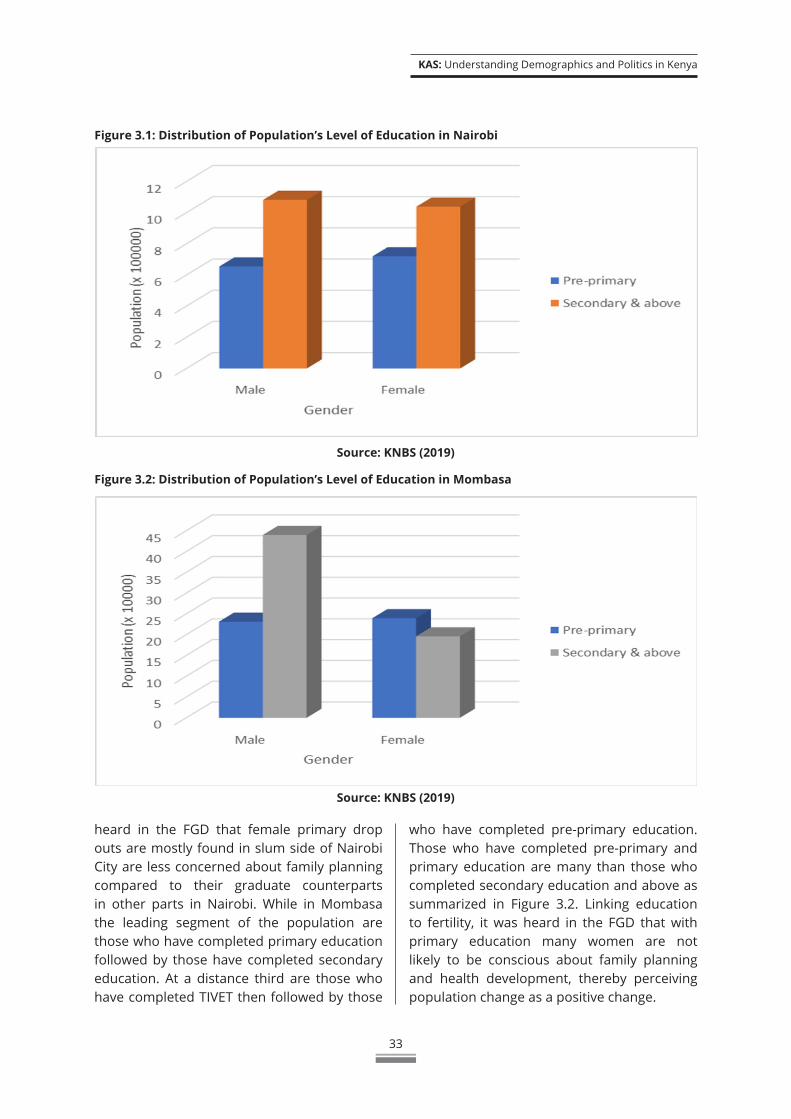
KAS: Understanding Demographics and Politics in Kenya
33
heard in the FGD that female primary drop outs are mostly found in slum side of Nairobi City are less concerned about family planning compared to their graduate counterparts in other parts in Nairobi. While in Mombasa the leading segment of the population are those who have completed primary education followed by those have completed secondary education. At a distance third are those who have completed TIVET then followed by those
Figure 3.2: Distribution of Population’s Level of Education in Mombasa
Figure 3.1: Distribution of Population’s Level of Education in Nairobi
Source: KNBS (2019)
Source: KNBS (2019)
who have completed pre-primary education. Those who have completed pre-primary and primary education are many than those who completed secondary education and above as summarized in Figure 3.2. Linking education to fertility, it was heard in the FGD that with primary education many women are not likely to be conscious about family planning and health development, thereby perceiving population change as a positive change.
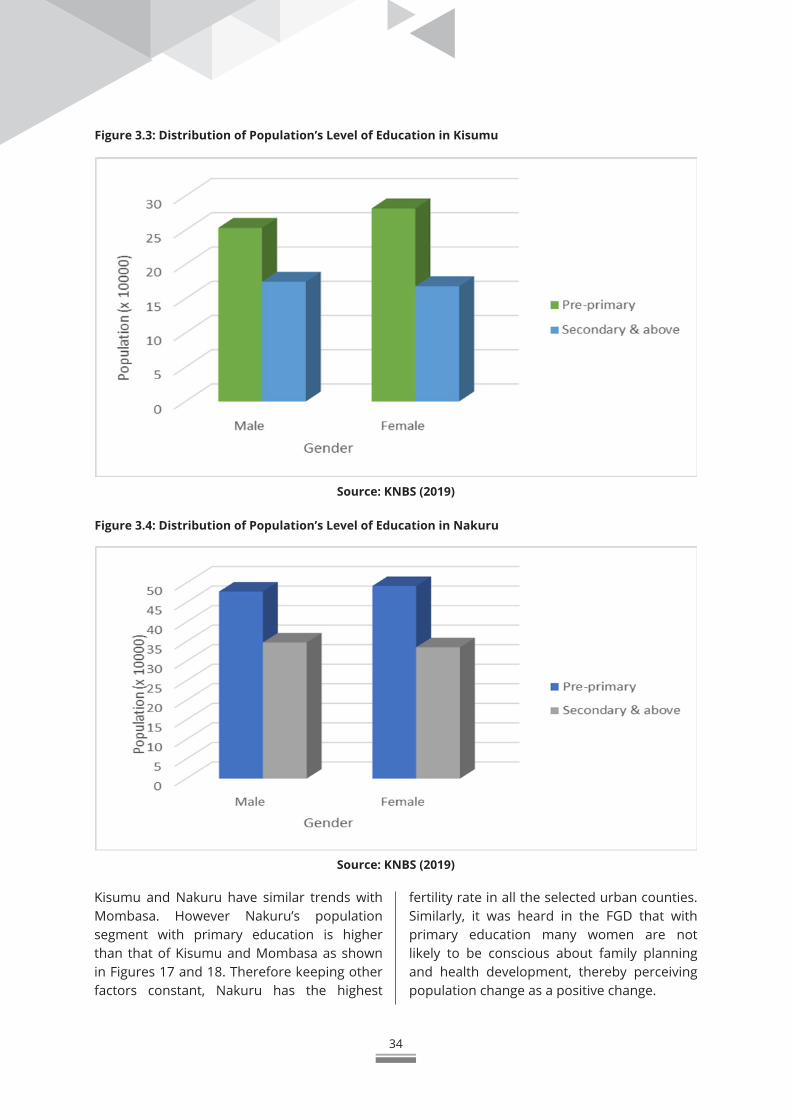
34
Kisumu and Nakuru have similar trends with Mombasa. However Nakuru’s population segment with primary education is higher than that of Kisumu and Mombasa as shown in Figures 17 and 18. Therefore keeping other factors constant, Nakuru has the highest
fertility rate in all the selected urban counties. Similarly, it was heard in the FGD that with primary education many women are not likely to be conscious about family planning and health development, thereby perceiving population change as a positive change.
Figure 3.3: Distribution of Population’s Level of Education in Kisumu
Figure 3.4: Distribution of Population’s Level of Education in Nakuru
Source: KNBS (2019)
Source: KNBS (2019)
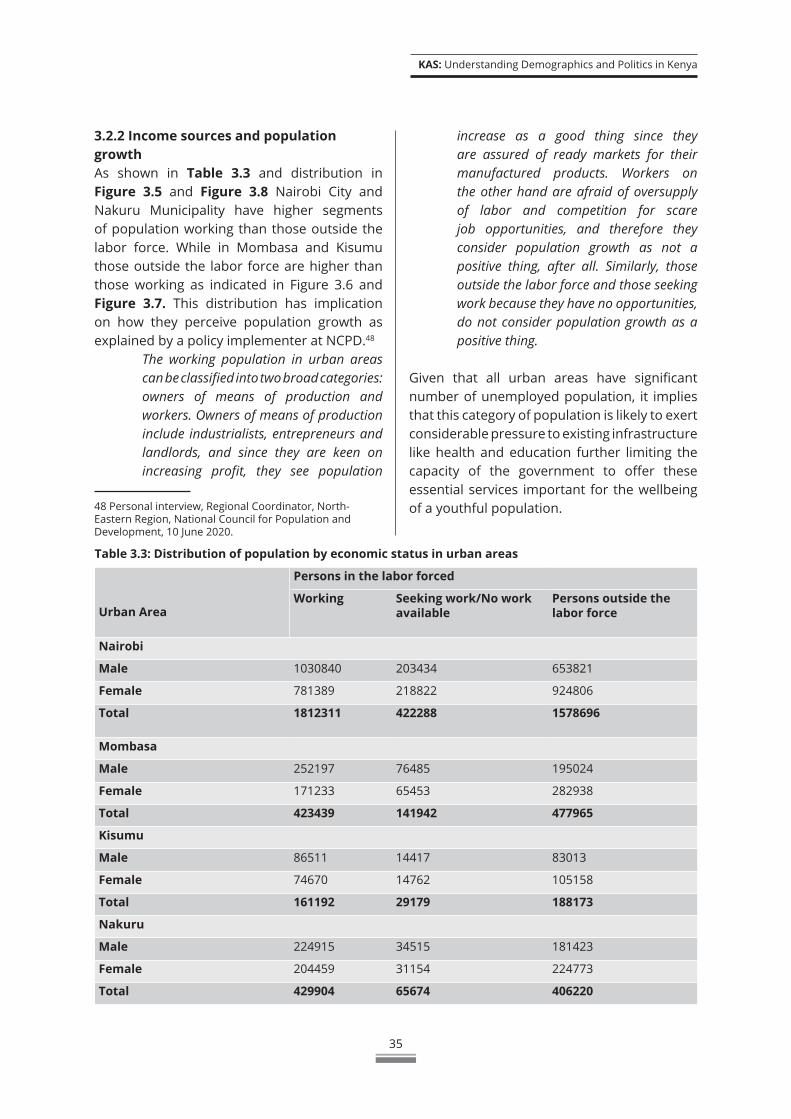
KAS: Understanding Demographics and Politics in Kenya
35
3.2.2 Income sources and population growthAs shown in Table 3.3 and distribution in Figure 3.5 and Figure 3.8 Nairobi City and Nakuru Municipality have higher segments of population working than those outside the labor force. While in Mombasa and Kisumu those outside the labor force are higher than those working as indicated in Figure 3.6 and Figure 3.7. This distribution has implication on how they perceive population growth as explained by a policy implementer at NCPD.48
The working population in urban areas can be classified into two broad categories: owners of means of production and workers. Owners of means of production include industrialists, entrepreneurs and landlords, and since they are keen on increasing profit, they see population
48 Personal interview, Regional Coordinator, North-Eastern Region, National Council for Population and Development, 10 June 2020.
increase as a good thing since they are assured of ready markets for their manufactured products. Workers on the other hand are afraid of oversupply of labor and competition for scare job opportunities, and therefore they consider population growth as not a positive thing, after all. Similarly, those outside the labor force and those seeking work because they have no opportunities, do not consider population growth as a positive thing.
Given that all urban areas have significant number of unemployed population, it implies that this category of population is likely to exert considerable pressure to existing infrastructure like health and education further limiting the capacity of the government to offer these essential services important for the wellbeing of a youthful population.
Table 3.3: Distribution of population by economic status in urban areas
Urban Area
Persons in the labor forced
Working Seeking work/No work available
Persons outside the labor force
Nairobi
Male 1030840 203434 653821
Female 781389 218822 924806
Total 1812311 422288 1578696
Mombasa
Male 252197 76485 195024
Female 171233 65453 282938
Total 423439 141942 477965
Kisumu
Male 86511 14417 83013
Female 74670 14762 105158
Total 161192 29179 188173
Nakuru
Male 224915 34515 181423
Female 204459 31154 224773
Total 429904 65674 406220
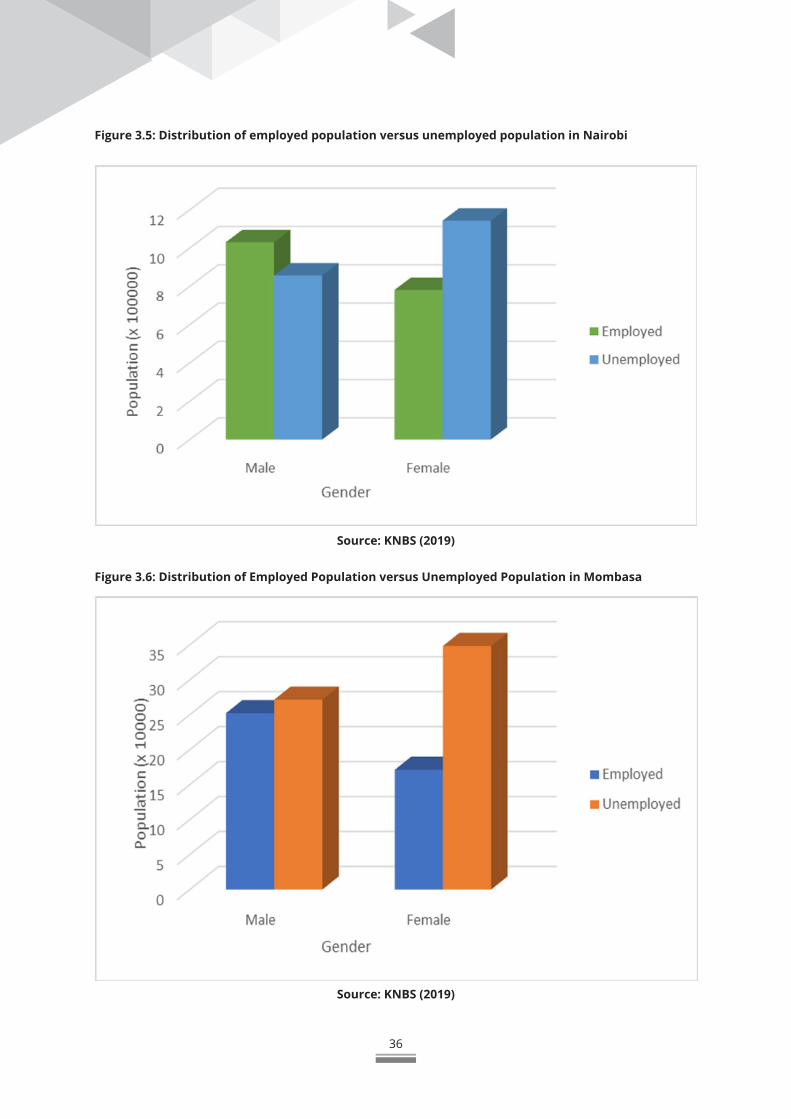
36
Figure 3.5: Distribution of employed population versus unemployed population in Nairobi
Figure 3.6: Distribution of Employed Population versus Unemployed Population in Mombasa
Source: KNBS (2019)
Source: KNBS (2019)
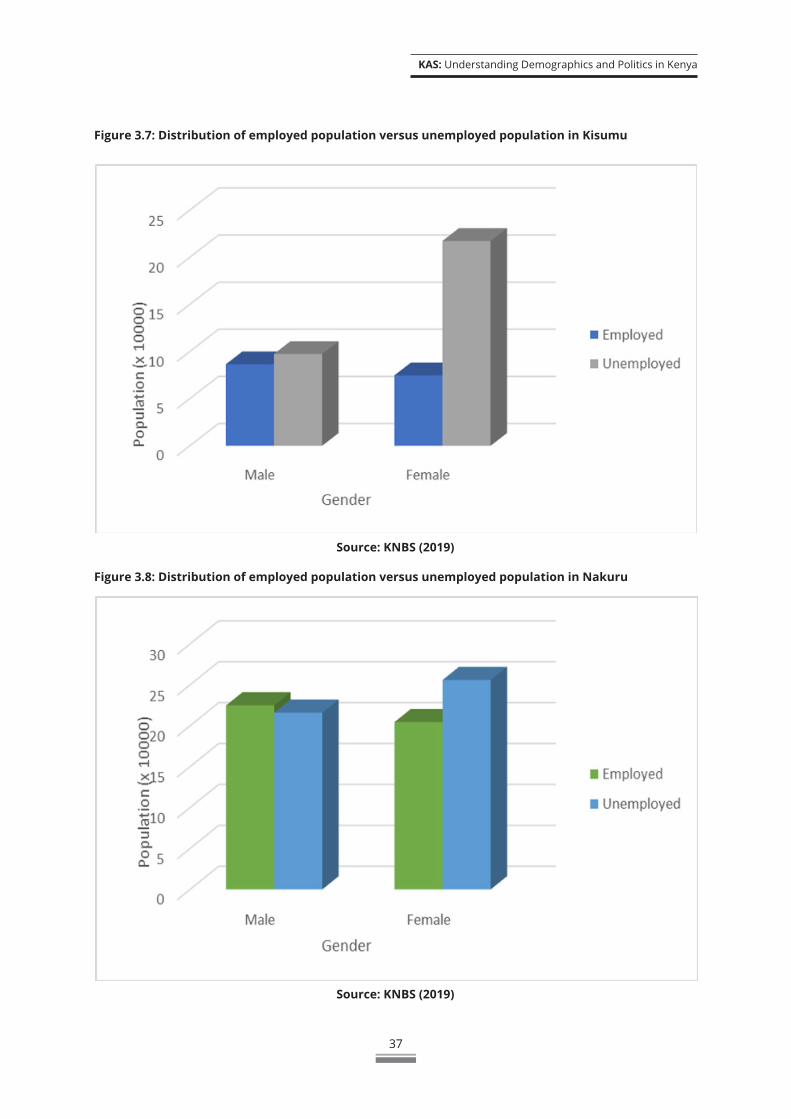
KAS: Understanding Demographics and Politics in Kenya
37
Figure 3.7: Distribution of employed population versus unemployed population in Kisumu
Figure 3.8: Distribution of employed population versus unemployed population in Nakuru
Source: KNBS (2019)
Source: KNBS (2019)
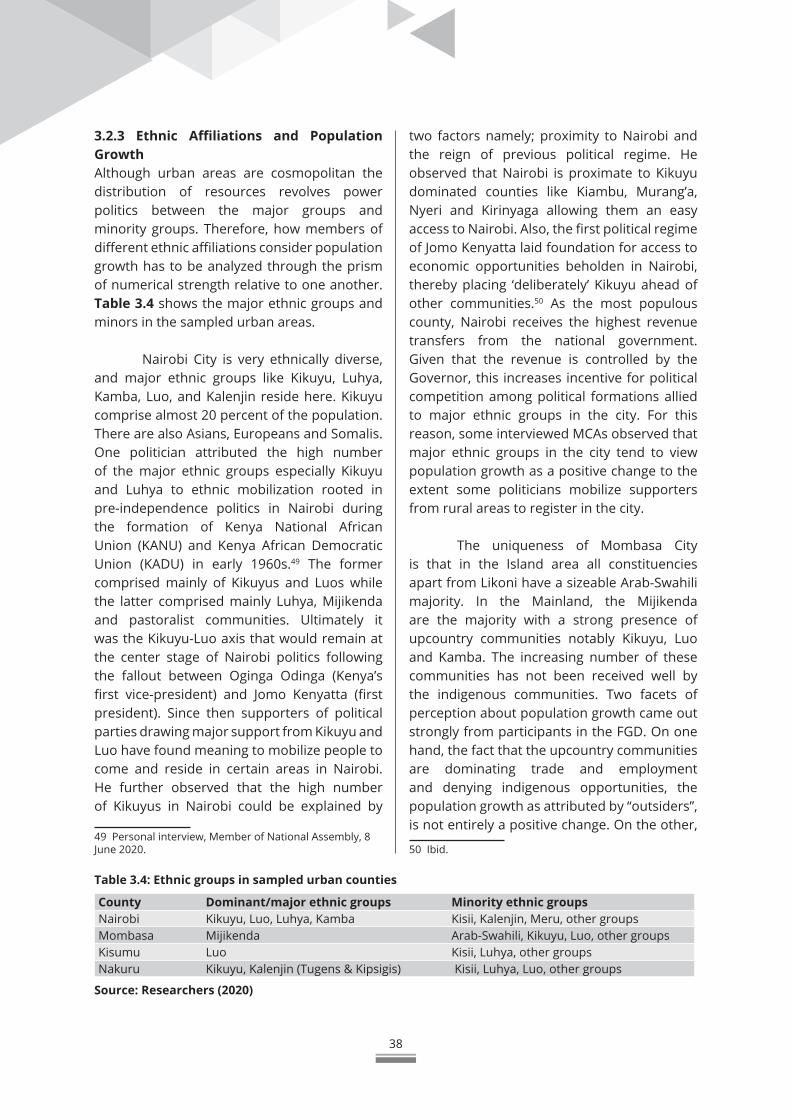
38
3.2.3 Ethnic Affiliations and Population GrowthAlthough urban areas are cosmopolitan the distribution of resources revolves power politics between the major groups and minority groups. Therefore, how members of different ethnic affiliations consider population growth has to be analyzed through the prism of numerical strength relative to one another. Table 3.4 shows the major ethnic groups and minors in the sampled urban areas.
Nairobi City is very ethnically diverse, and major ethnic groups like Kikuyu, Luhya, Kamba, Luo, and Kalenjin reside here. Kikuyu comprise almost 20 percent of the population. There are also Asians, Europeans and Somalis. One politician attributed the high number of the major ethnic groups especially Kikuyu and Luhya to ethnic mobilization rooted in pre-independence politics in Nairobi during the formation of Kenya National African Union (KANU) and Kenya African Democratic Union (KADU) in early 1960s.49 The former comprised mainly of Kikuyus and Luos while the latter comprised mainly Luhya, Mijikenda and pastoralist communities. Ultimately it was the Kikuyu-Luo axis that would remain at the center stage of Nairobi politics following the fallout between Oginga Odinga (Kenya’s first vice-president) and Jomo Kenyatta (first president). Since then supporters of political parties drawing major support from Kikuyu and Luo have found meaning to mobilize people to come and reside in certain areas in Nairobi. He further observed that the high number of Kikuyus in Nairobi could be explained by
49 Personal interview, Member of National Assembly, 8 June 2020.
two factors namely; proximity to Nairobi and the reign of previous political regime. He observed that Nairobi is proximate to Kikuyu dominated counties like Kiambu, Murang’a, Nyeri and Kirinyaga allowing them an easy access to Nairobi. Also, the first political regime of Jomo Kenyatta laid foundation for access to economic opportunities beholden in Nairobi, thereby placing ‘deliberately’ Kikuyu ahead of other communities.50 As the most populous county, Nairobi receives the highest revenue transfers from the national government. Given that the revenue is controlled by the Governor, this increases incentive for political competition among political formations allied to major ethnic groups in the city. For this reason, some interviewed MCAs observed that major ethnic groups in the city tend to view population growth as a positive change to the extent some politicians mobilize supporters from rural areas to register in the city.
The uniqueness of Mombasa City is that in the Island area all constituencies apart from Likoni have a sizeable Arab-Swahili majority. In the Mainland, the Mijikenda are the majority with a strong presence of upcountry communities notably Kikuyu, Luo and Kamba. The increasing number of these communities has not been received well by the indigenous communities. Two facets of perception about population growth came out strongly from participants in the FGD. On one hand, the fact that the upcountry communities are dominating trade and employment and denying indigenous opportunities, the population growth as attributed by “outsiders”, is not entirely a positive change. On the other,
50 Ibid.
Table 3.4: Ethnic groups in sampled urban counties
County Dominant/major ethnic groups Minority ethnic groups Nairobi Kikuyu, Luo, Luhya, Kamba Kisii, Kalenjin, Meru, other groups Mombasa Mijikenda Arab-Swahili, Kikuyu, Luo, other groups Kisumu Luo Kisii, Luhya, other groupsNakuru Kikuyu, Kalenjin (Tugens & Kipsigis) Kisii, Luhya, Luo, other groups
Source: Researchers (2020)
KAS: Understanding Demographics and Politics in Kenya
39
aware that the upcountry communities may in future aspire to join politics and protect their interests in trade, the indigenous communities would want to increase their number to remain politically relevant. Therefore this political argument allows the indigenous communities to perceive population growth as a positive change. There also exists an uneasy relationship between the Arab-Swahili and Mijikenda communities which finds expression in electoral politics leading to framing one group versus the other (CRECO, 2012). Given that hostilities have emerged between these two communities during elections, each group traded its importance to their numerical strength. As such, both communities would tend to view population growth as something positive.
In Kisumu City, the dominant ethnic group is Luo with significant pockets of Kisii, Luhya, Nubians and Asians. Whereas the dominance of Luo is evident in politics, trade and employment, the minorities are equally competing for the scarce economic and political opportunities. Perspectives on population growth differ depending on its implications on the sphere of society. On politics, Luo would want to continue having greater influence over other minorities, and would therefore see population growth as a positive component of the political arithmetic. With regard to employment, population increase leads to oversupply of labor therefore leading to reduction of wages and eventually underemployment and unemployment. Consequently from this perspective, the social group fighting unemployment and joblessness would perceive population growth as negative change. However, within the Luo community living in Kisumu there is a sharp divide between immigrants from neighboring counties and the native. Revolving around the clan identity, the immigrants are perceived as outsiders and largely discouraged from actively participating in elective politics. Because of the threats from outsiders and the desire to consolidate
themselves within the political leadership structure of the city, the natives in this line of thought perceive population growth as a positive change. Conversely, marginalization and underrepresentation in the city predispose the minority communities to aspire to increase their sizes so that they can complete with the dominant group. Therefore Luhya, Nubians and Asian living in Kisumu would perceive population growth as something positive.
Nakuru municipality is also ethnically cosmopolitan with groups such as Kikuyu, Kalenjin, Luo, Luhya, Kisii and Maasai. Kikuyu community is the largest in terms of size followed by Kalenjin. The numerical strength of Kikuyu and Kalenjin has given them upper hand in the politics, trade and employment in the country. As one of populous counties, political dynamics mirror that of Nairobi County with implication on how ethnic affiliations perceive population growth. Nakuru County also receives the high revenue transfers from the national government with implication for political competition of the County leadership. Comparative advantage of Kikuyu predispose them to perceive population growth as a positive change since that is likely to guarantee them the control of resources. Similarly marginalization and underrepresentation of other groups would predispose them to perceive population growth as a positive change in their pursuit to shove their numbers and make them politically relevant. Overally, looking through the population growth of different ethnic affiliations in urban areas, a key informant tied their behaviors to kinship and diffusion theories of population growth as explained below
In reference to kinship theory, urban dwellers tend to carry along their communal belief and practices to towns. Women would argue that in my village we give this number of children and therefore when I go back I would be asked what I have been doing in town. Ethnic groups from Western and Nyanza regions, mainly
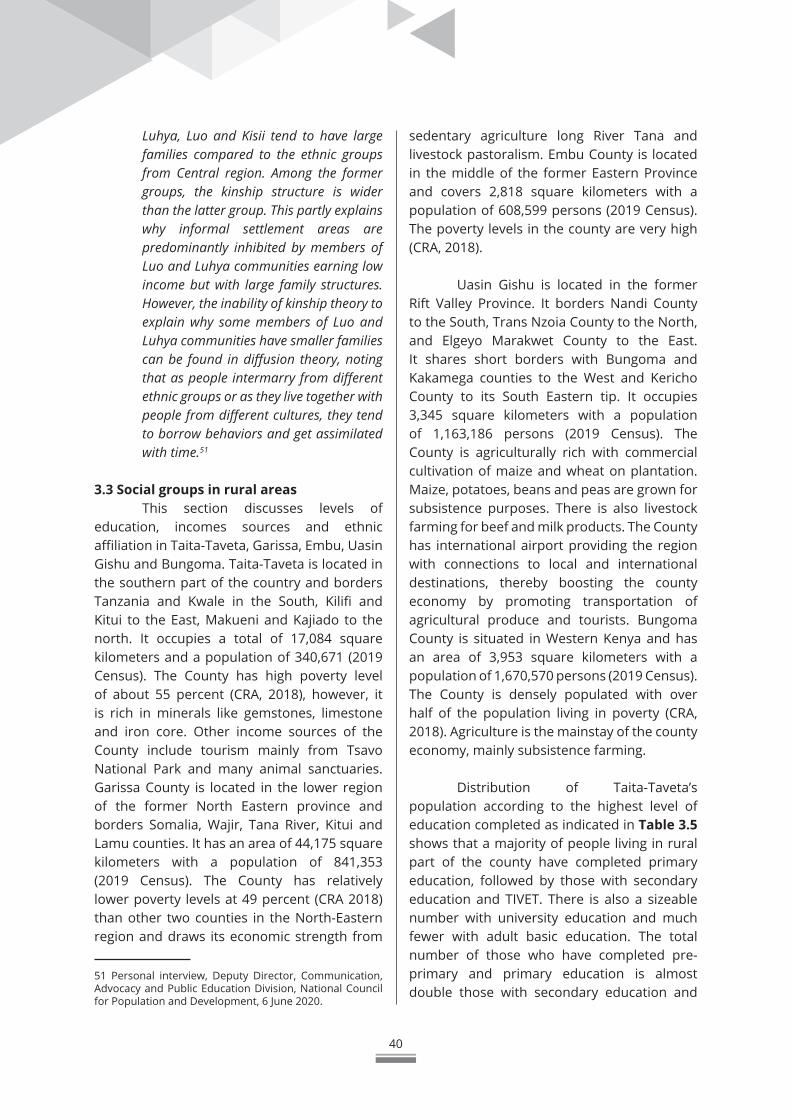
40
Luhya, Luo and Kisii tend to have large families compared to the ethnic groups from Central region. Among the former groups, the kinship structure is wider than the latter group. This partly explains why informal settlement areas are predominantly inhibited by members of Luo and Luhya communities earning low income but with large family structures. However, the inability of kinship theory to explain why some members of Luo and Luhya communities have smaller families can be found in diffusion theory, noting that as people intermarry from different ethnic groups or as they live together with people from different cultures, they tend to borrow behaviors and get assimilated with time.51
3.3 Social groups in rural areas This section discusses levels of
education, incomes sources and ethnic affiliation in Taita-Taveta, Garissa, Embu, Uasin Gishu and Bungoma. Taita-Taveta is located in the southern part of the country and borders Tanzania and Kwale in the South, Kilifi and Kitui to the East, Makueni and Kajiado to the north. It occupies a total of 17,084 square kilometers and a population of 340,671 (2019 Census). The County has high poverty level of about 55 percent (CRA, 2018), however, it is rich in minerals like gemstones, limestone and iron core. Other income sources of the County include tourism mainly from Tsavo National Park and many animal sanctuaries. Garissa County is located in the lower region of the former North Eastern province and borders Somalia, Wajir, Tana River, Kitui and Lamu counties. It has an area of 44,175 square kilometers with a population of 841,353 (2019 Census). The County has relatively lower poverty levels at 49 percent (CRA 2018) than other two counties in the North-Eastern region and draws its economic strength from
51 Personal interview, Deputy Director, Communication, Advocacy and Public Education Division, National Council for Population and Development, 6 June 2020.
sedentary agriculture long River Tana and livestock pastoralism. Embu County is located in the middle of the former Eastern Province and covers 2,818 square kilometers with a population of 608,599 persons (2019 Census). The poverty levels in the county are very high (CRA, 2018).
Uasin Gishu is located in the former Rift Valley Province. It borders Nandi County to the South, Trans Nzoia County to the North, and Elgeyo Marakwet County to the East. It shares short borders with Bungoma and Kakamega counties to the West and Kericho County to its South Eastern tip. It occupies 3,345 square kilometers with a population of 1,163,186 persons (2019 Census). The County is agriculturally rich with commercial cultivation of maize and wheat on plantation. Maize, potatoes, beans and peas are grown for subsistence purposes. There is also livestock farming for beef and milk products. The County has international airport providing the region with connections to local and international destinations, thereby boosting the county economy by promoting transportation of agricultural produce and tourists. Bungoma County is situated in Western Kenya and has an area of 3,953 square kilometers with a population of 1,670,570 persons (2019 Census). The County is densely populated with over half of the population living in poverty (CRA, 2018). Agriculture is the mainstay of the county economy, mainly subsistence farming.
Distribution of Taita-Taveta’s population according to the highest level of education completed as indicated in Table 3.5 shows that a majority of people living in rural part of the county have completed primary education, followed by those with secondary education and TIVET. There is also a sizeable number with university education and much fewer with adult basic education. The total number of those who have completed pre-primary and primary education is almost double those with secondary education and
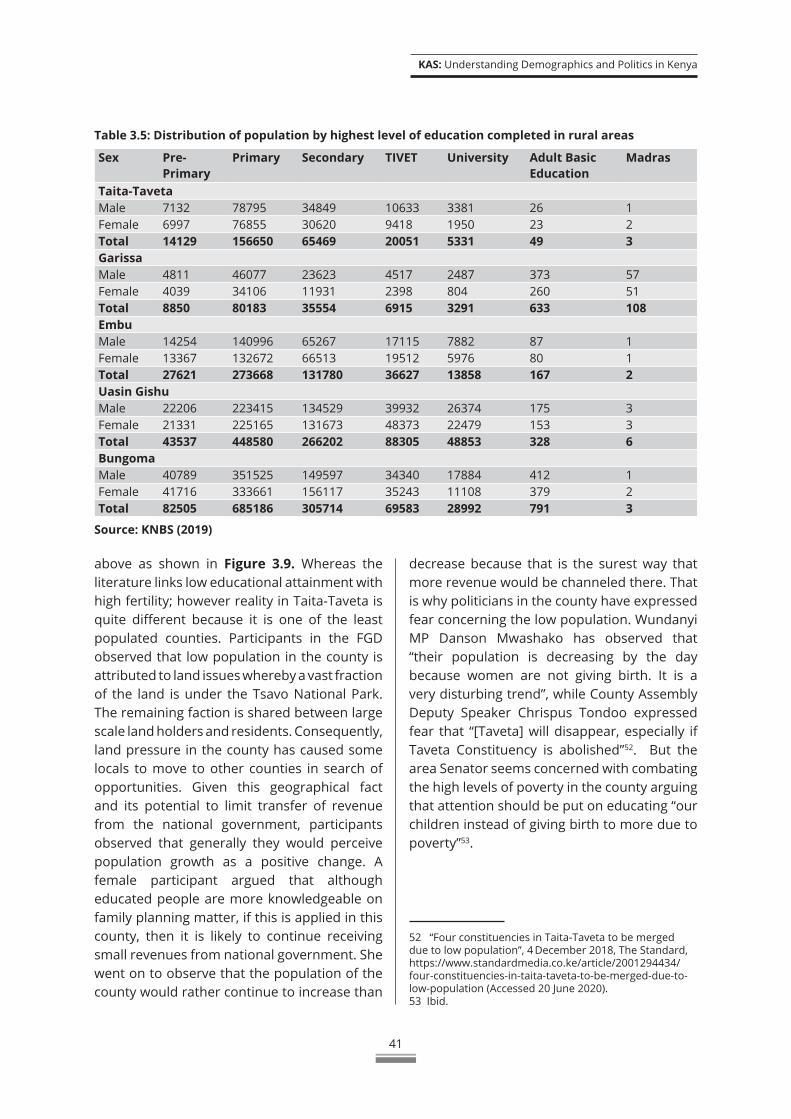
KAS: Understanding Demographics and Politics in Kenya
41
Table 3.5: Distribution of population by highest level of education completed in rural areas
Sex Pre-Primary
Primary Secondary TIVET University Adult Basic Education
Madras
Taita-TavetaMale 7132 78795 34849 10633 3381 26 1Female 6997 76855 30620 9418 1950 23 2Total 14129 156650 65469 20051 5331 49 3Garissa Male 4811 46077 23623 4517 2487 373 57Female 4039 34106 11931 2398 804 260 51Total 8850 80183 35554 6915 3291 633 108Embu Male 14254 140996 65267 17115 7882 87 1Female 13367 132672 66513 19512 5976 80 1Total 27621 273668 131780 36627 13858 167 2Uasin Gishu Male 22206 223415 134529 39932 26374 175 3Female 21331 225165 131673 48373 22479 153 3Total 43537 448580 266202 88305 48853 328 6Bungoma Male 40789 351525 149597 34340 17884 412 1Female 41716 333661 156117 35243 11108 379 2Total 82505 685186 305714 69583 28992 791 3
Source: KNBS (2019)
above as shown in Figure 3.9. Whereas the literature links low educational attainment with high fertility; however reality in Taita-Taveta is quite different because it is one of the least populated counties. Participants in the FGD observed that low population in the county is attributed to land issues whereby a vast fraction of the land is under the Tsavo National Park. The remaining faction is shared between large scale land holders and residents. Consequently, land pressure in the county has caused some locals to move to other counties in search of opportunities. Given this geographical fact and its potential to limit transfer of revenue from the national government, participants observed that generally they would perceive population growth as a positive change. A female participant argued that although educated people are more knowledgeable on family planning matter, if this is applied in this county, then it is likely to continue receiving small revenues from national government. She went on to observe that the population of the county would rather continue to increase than
decrease because that is the surest way that more revenue would be channeled there. That is why politicians in the county have expressed fear concerning the low population. Wundanyi MP Danson Mwashako has observed that “their population is decreasing by the day because women are not giving birth. It is a very disturbing trend”, while County Assembly Deputy Speaker Chrispus Tondoo expressed fear that “[Taveta] will disappear, especially if Taveta Constituency is abolished”52. But the area Senator seems concerned with combating the high levels of poverty in the county arguing that attention should be put on educating “our children instead of giving birth to more due to poverty”53.
52 “Four constituencies in Taita-Taveta to be merged due to low population”, 4 December 2018, The Standard, https://www.standardmedia.co.ke/article/2001294434/four-constituencies-in-taita-taveta-to-be-merged-due-to-low-population (Accessed 20 June 2020). 53 Ibid.
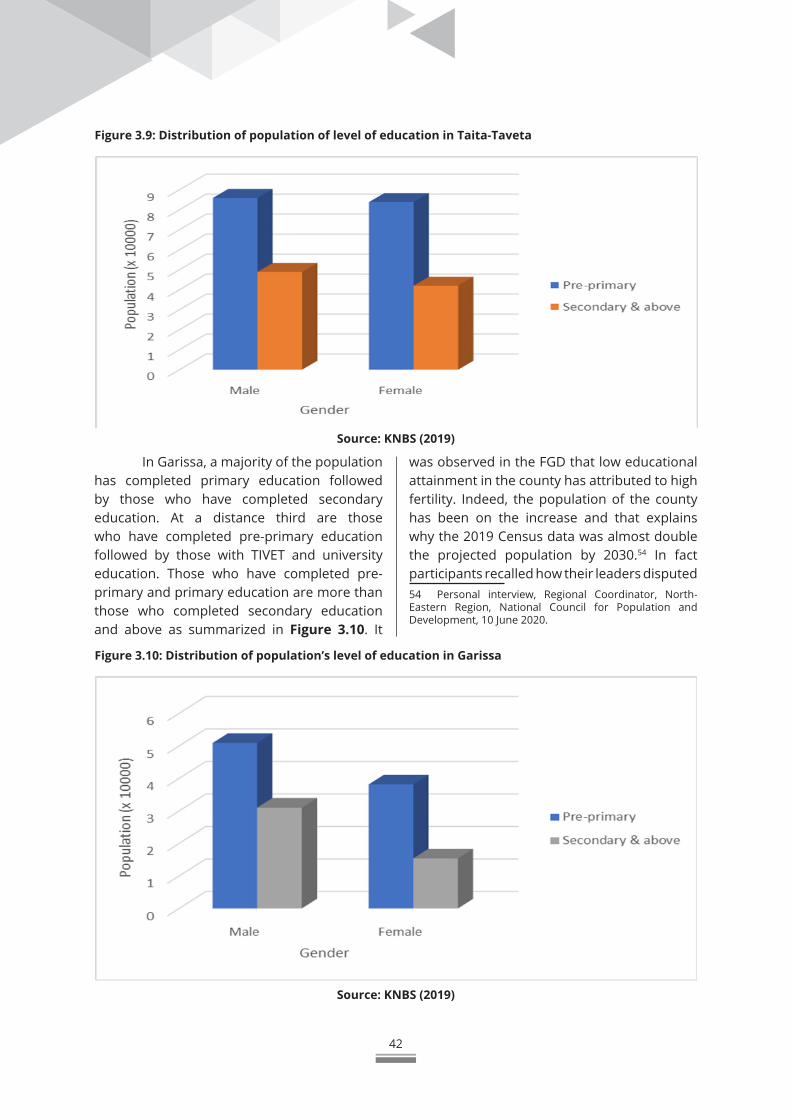
42
In Garissa, a majority of the population has completed primary education followed by those who have completed secondary education. At a distance third are those who have completed pre-primary education followed by those with TIVET and university education. Those who have completed pre-primary and primary education are more than those who completed secondary education and above as summarized in Figure 3.10. It
was observed in the FGD that low educational attainment in the county has attributed to high fertility. Indeed, the population of the county has been on the increase and that explains why the 2019 Census data was almost double the projected population by 2030.54 In fact participants recalled how their leaders disputed 54 Personal interview, Regional Coordinator, North-Eastern Region, National Council for Population and Development, 10 June 2020.
Figure 3.9: Distribution of population of level of education in Taita-Taveta
Figure 3.10: Distribution of population’s level of education in Garissa
Source: KNBS (2019)
Source: KNBS (2019)
KAS: Understanding Demographics and Politics in Kenya
43
the 2019 census results citing malpractices. North-Eastern leaders among them Governors of Garissa, Wajir and Mandera, and Immediate former National Assembly Majority Leader Aden Duale strongly disputed the results.55 Given that high fertility promises to benefit the county in terms of the allocation of the national revenue, participants believe that population growth is a positive change. Like Taita-Taveta the reality of low educational attainment and high fertility is different.
The pattern in Embu mirrors that of Garissa with a majority of the population having completed primary education followed by those who have completed secondary education. There is substantial number of people with TIVET followed by those who have completed pre-primary education. A sizeable number of the population has completed university education while fewer have attained adult basic education. Those who have completed pre-primary and primary education are almost double than those who completed secondary education and above as summarized in Figure 3.11. Embu County Government Annual Development Plan 2015/2016 identifies poor physical infrastructure and inadequate social amenities like schools as one of the challenges facing the county.
Whereas the literature links low educational attainment and high fertility thereby expecting high population, the reality of Embu is just like in Taita-Taveta. Participants in FGD attributed low population to the geographical location of the county, and generally perceived the low number as negative change. Those with low educational attainment generally perceived population growth as a positive change. As corroborated by opinion leader in the area, the concept of family among the uneducated people is different from educated. The former tend to prefer large
55 “Balambala MP protests over disputed census results”, 29 December 2019 The Star, https://www.the-star.co.ke/counties/eastern/2019-12-29-balambala-mp-protests-over-disputed-census-results/ (accessed 20 June 2020).
family structure compared to the latter. He further noted that, however there are pockets in the rural area where even the educated people have more than five children, and this is influenced by other variables such as religion, morality and sources of income.56He went on to note that the Embu people have been bundled with their Kikuyu and Meru cousins and there is a political narrative that they should increase their numbers, thus this narrative tends to erode the influence of education to the extent that even the educated are drifting towards the idea of having many children to meet political ends of the entire Mt. Kenya region. The high population density in the county is mostly concentrated in agriculturally productive sub-counties of Runyenjes and Manyatta. The two sub-counties of Mbeere North and Mbeere South are largely semi-arid. One local administrator informed the study that these two semi-arid sub-counties promise to have high population in future as they have recently benefitted from rural-rural migrations.57
In Uasin Gishu, a majority of the population has completed primary education followed by those with secondary education and TIVET. There is also a significant number of population with university education followed by those with pre-primary education. Those who have completed pre-primary and primary education is slightly ahead of those who have completed secondary education and above as summarized in Figure 3.12. High transition rate from primary to secondary in Uasin Gishu has been attributed to the implementation of subsidized education (Magak et al., 2014). Perspectives from both segments of the population indicate that they perceive population growth as a positive change, even though those with secondary education and above especially the graduate tend to have the opposite view.
56 Personal interview, a resident of rural Embu, 20 June 2020.57 Personal interview, Local Administrator, Embu County, 18 June 2020.
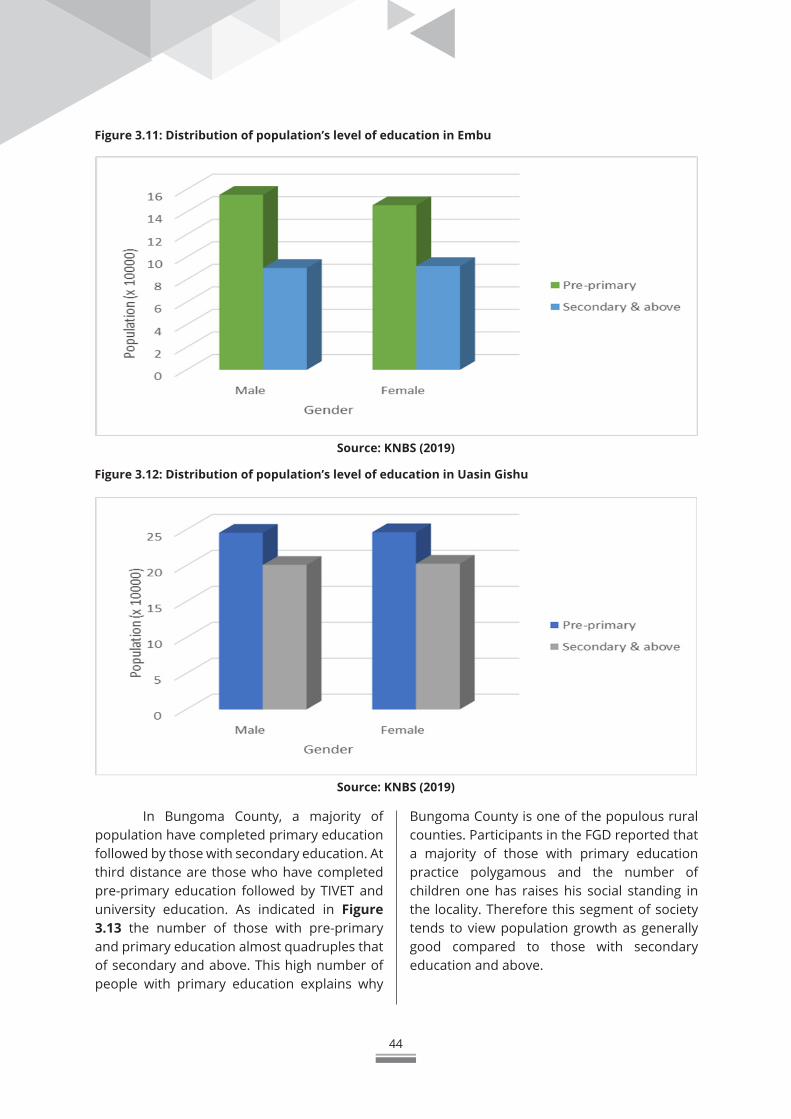
44
Figure 3.11: Distribution of population’s level of education in Embu
Figure 3.12: Distribution of population’s level of education in Uasin Gishu
Source: KNBS (2019)
Source: KNBS (2019)
In Bungoma County, a majority of population have completed primary education followed by those with secondary education. At third distance are those who have completed pre-primary education followed by TIVET and university education. As indicated in Figure 3.13 the number of those with pre-primary and primary education almost quadruples that of secondary and above. This high number of people with primary education explains why
Bungoma County is one of the populous rural counties. Participants in the FGD reported that a majority of those with primary education practice polygamous and the number of children one has raises his social standing in the locality. Therefore this segment of society tends to view population growth as generally good compared to those with secondary education and above.
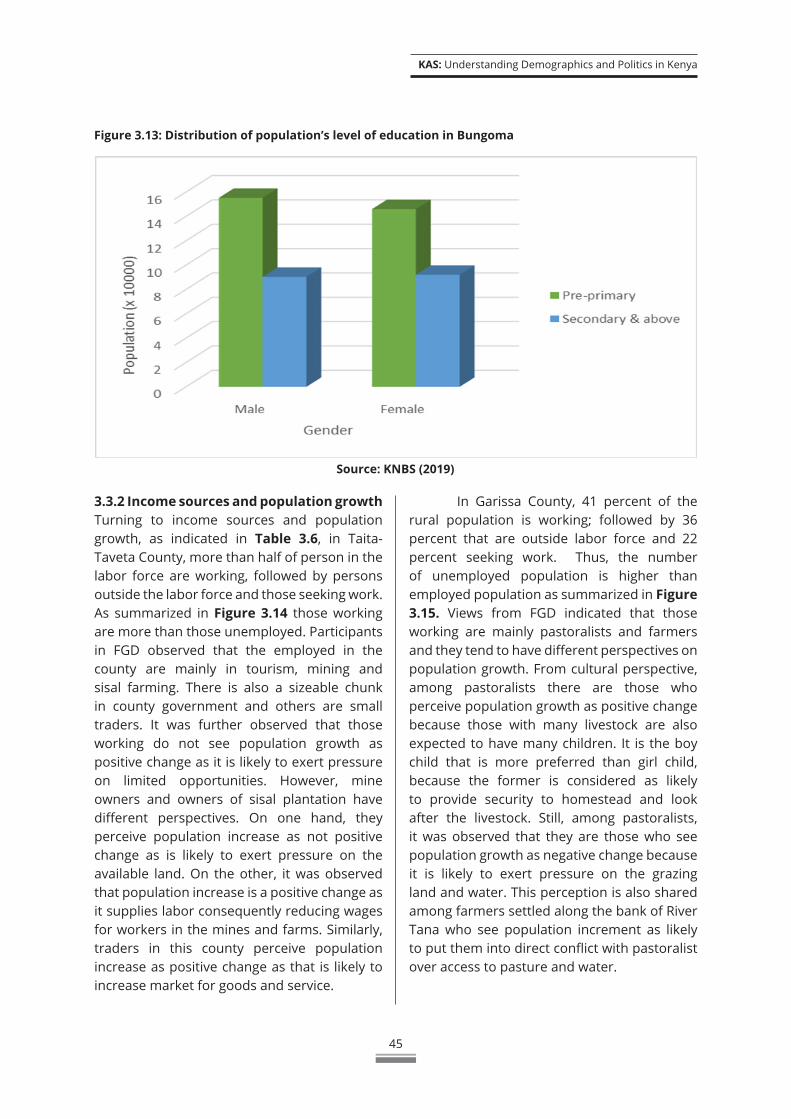
KAS: Understanding Demographics and Politics in Kenya
45
Figure 3.13: Distribution of population’s level of education in Bungoma
Source: KNBS (2019)
3.3.2 Income sources and population growthTurning to income sources and population growth, as indicated in Table 3.6, in Taita-Taveta County, more than half of person in the labor force are working, followed by persons outside the labor force and those seeking work. As summarized in Figure 3.14 those working are more than those unemployed. Participants in FGD observed that the employed in the county are mainly in tourism, mining and sisal farming. There is also a sizeable chunk in county government and others are small traders. It was further observed that those working do not see population growth as positive change as it is likely to exert pressure on limited opportunities. However, mine owners and owners of sisal plantation have different perspectives. On one hand, they perceive population increase as not positive change as is likely to exert pressure on the available land. On the other, it was observed that population increase is a positive change as it supplies labor consequently reducing wages for workers in the mines and farms. Similarly, traders in this county perceive population increase as positive change as that is likely to increase market for goods and service.
In Garissa County, 41 percent of the rural population is working; followed by 36 percent that are outside labor force and 22 percent seeking work. Thus, the number of unemployed population is higher than employed population as summarized in Figure 3.15. Views from FGD indicated that those working are mainly pastoralists and farmers and they tend to have different perspectives on population growth. From cultural perspective, among pastoralists there are those who perceive population growth as positive change because those with many livestock are also expected to have many children. It is the boy child that is more preferred than girl child, because the former is considered as likely to provide security to homestead and look after the livestock. Still, among pastoralists, it was observed that they are those who see population growth as negative change because it is likely to exert pressure on the grazing land and water. This perception is also shared among farmers settled along the bank of River Tana who see population increment as likely to put them into direct conflict with pastoralist over access to pasture and water.
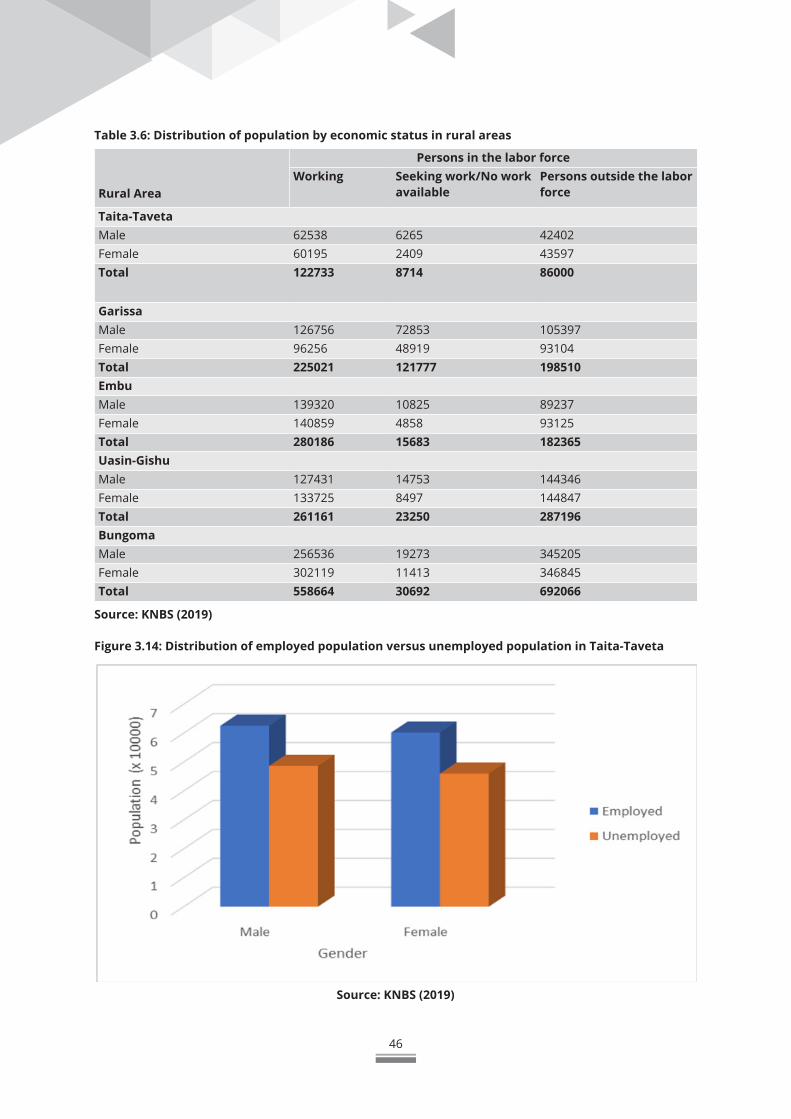
46
Table 3.6: Distribution of population by economic status in rural areas
Rural Area
Persons in the labor forceWorking Seeking work/No work
availablePersons outside the labor force
Taita-TavetaMale 62538 6265 42402Female 60195 2409 43597Total 122733 8714 86000
Garissa Male 126756 72853 105397Female 96256 48919 93104Total 225021 121777 198510Embu Male 139320 10825 89237Female 140859 4858 93125Total 280186 15683 182365Uasin-Gishu Male 127431 14753 144346Female 133725 8497 144847Total 261161 23250 287196Bungoma Male 256536 19273 345205Female 302119 11413 346845Total 558664 30692 692066
Source: KNBS (2019)
Figure 3.14: Distribution of employed population versus unemployed population in Taita-Taveta
Source: KNBS (2019)
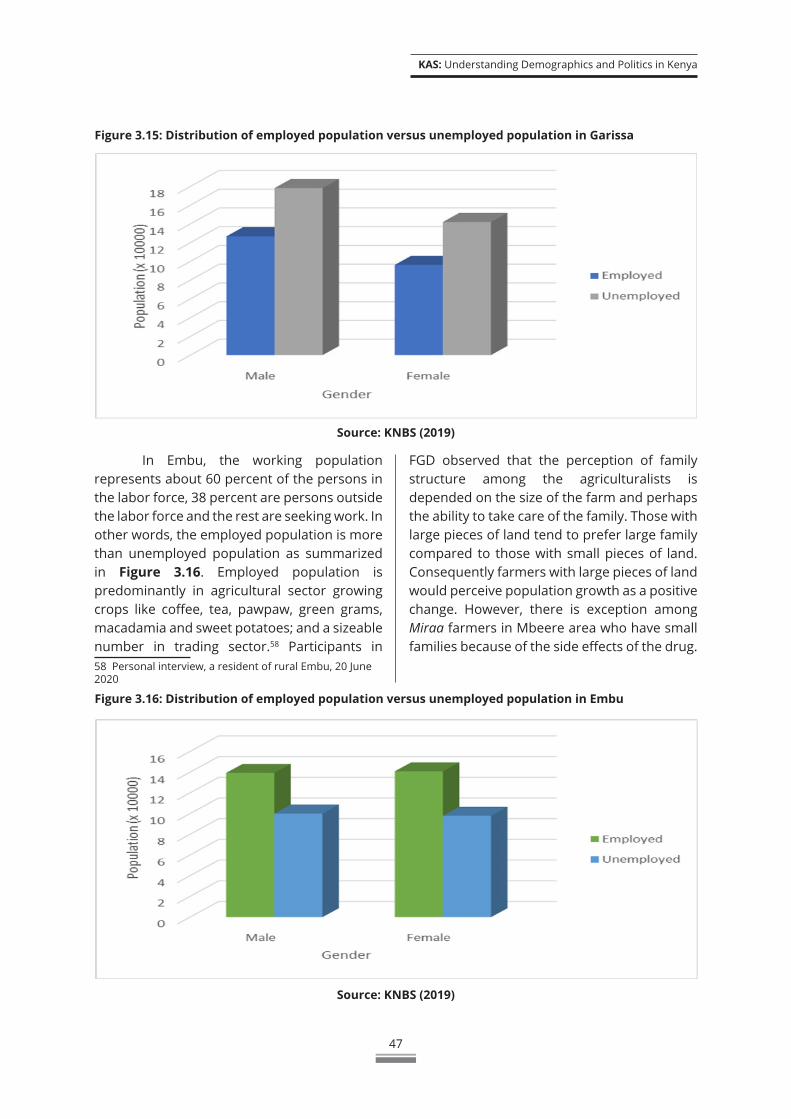
KAS: Understanding Demographics and Politics in Kenya
47
Figure 3.15: Distribution of employed population versus unemployed population in Garissa
Figure 3.16: Distribution of employed population versus unemployed population in Embu
Source: KNBS (2019)
Source: KNBS (2019)
In Embu, the working population represents about 60 percent of the persons in the labor force, 38 percent are persons outside the labor force and the rest are seeking work. In other words, the employed population is more than unemployed population as summarized in Figure 3.16. Employed population is predominantly in agricultural sector growing crops like coffee, tea, pawpaw, green grams, macadamia and sweet potatoes; and a sizeable number in trading sector.58 Participants in 58 Personal interview, a resident of rural Embu, 20 June 2020
FGD observed that the perception of family structure among the agriculturalists is depended on the size of the farm and perhaps the ability to take care of the family. Those with large pieces of land tend to prefer large family compared to those with small pieces of land. Consequently farmers with large pieces of land would perceive population growth as a positive change. However, there is exception among Miraa farmers in Mbeere area who have small families because of the side effects of the drug.
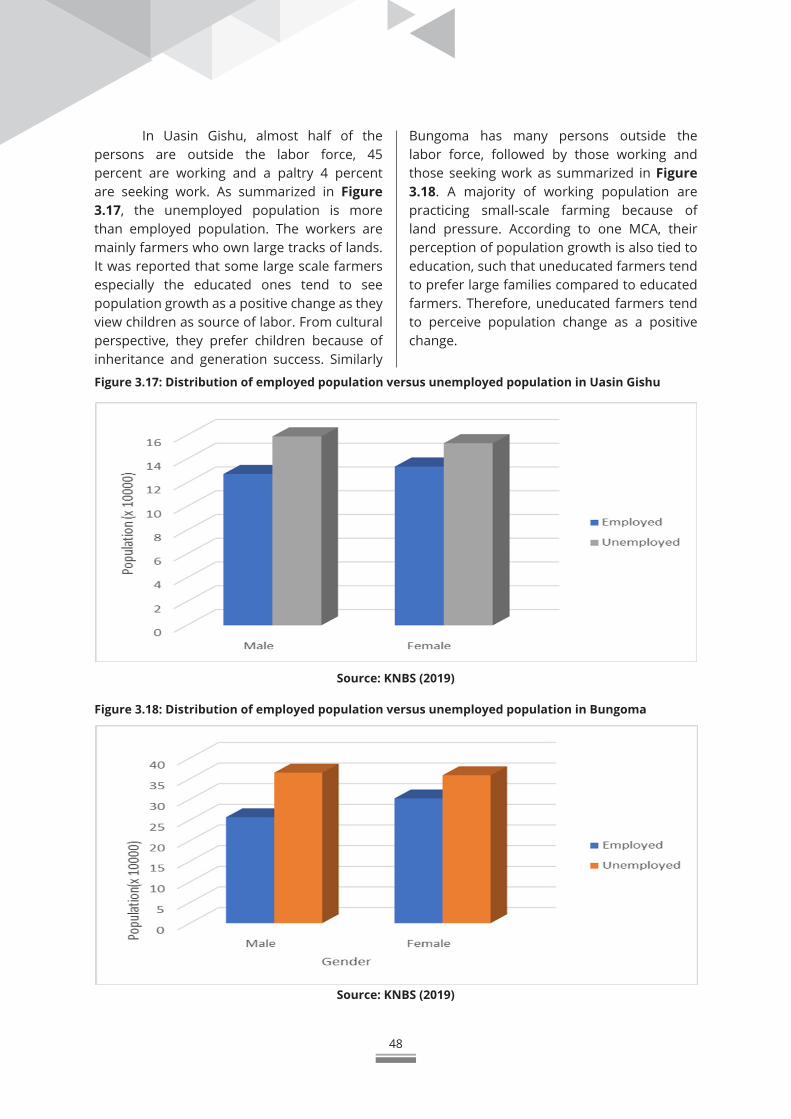
48
In Uasin Gishu, almost half of the persons are outside the labor force, 45 percent are working and a paltry 4 percent are seeking work. As summarized in Figure 3.17, the unemployed population is more than employed population. The workers are mainly farmers who own large tracks of lands. It was reported that some large scale farmers especially the educated ones tend to see population growth as a positive change as they view children as source of labor. From cultural perspective, they prefer children because of inheritance and generation success. Similarly
Bungoma has many persons outside the labor force, followed by those working and those seeking work as summarized in Figure 3.18. A majority of working population are practicing small-scale farming because of land pressure. According to one MCA, their perception of population growth is also tied to education, such that uneducated farmers tend to prefer large families compared to educated farmers. Therefore, uneducated farmers tend to perceive population change as a positive change.
Figure 3.17: Distribution of employed population versus unemployed population in Uasin Gishu
Figure 3.18: Distribution of employed population versus unemployed population in Bungoma
Source: KNBS (2019)
Source: KNBS (2019)
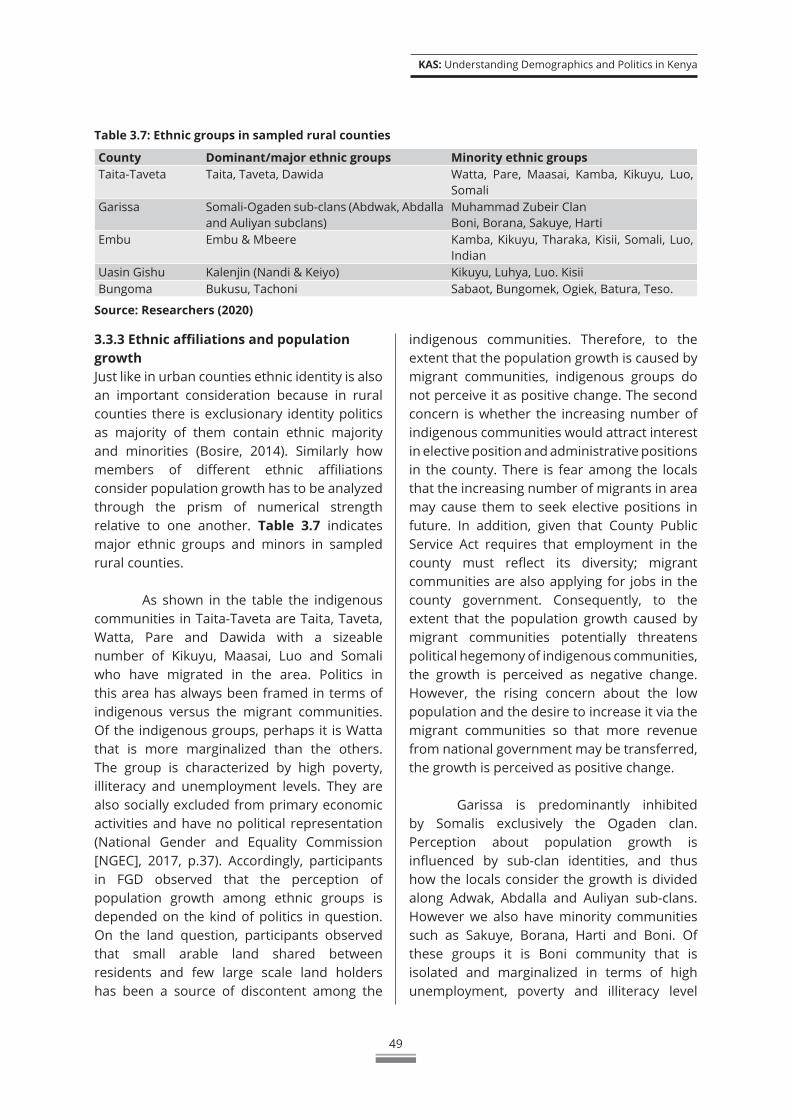
KAS: Understanding Demographics and Politics in Kenya
49
3.3.3 Ethnic affiliations and population growthJust like in urban counties ethnic identity is also an important consideration because in rural counties there is exclusionary identity politics as majority of them contain ethnic majority and minorities (Bosire, 2014). Similarly how members of different ethnic affiliations consider population growth has to be analyzed through the prism of numerical strength relative to one another. Table 3.7 indicates major ethnic groups and minors in sampled rural counties.
As shown in the table the indigenous communities in Taita-Taveta are Taita, Taveta, Watta, Pare and Dawida with a sizeable number of Kikuyu, Maasai, Luo and Somali who have migrated in the area. Politics in this area has always been framed in terms of indigenous versus the migrant communities. Of the indigenous groups, perhaps it is Watta that is more marginalized than the others. The group is characterized by high poverty, illiteracy and unemployment levels. They are also socially excluded from primary economic activities and have no political representation (National Gender and Equality Commission [NGEC], 2017, p.37). Accordingly, participants in FGD observed that the perception of population growth among ethnic groups is depended on the kind of politics in question. On the land question, participants observed that small arable land shared between residents and few large scale land holders has been a source of discontent among the
Table 3.7: Ethnic groups in sampled rural counties
County Dominant/major ethnic groups Minority ethnic groups Taita-Taveta Taita, Taveta, Dawida Watta, Pare, Maasai, Kamba, Kikuyu, Luo,
SomaliGarissa Somali-Ogaden sub-clans (Abdwak, Abdalla
and Auliyan subclans) Muhammad Zubeir Clan Boni, Borana, Sakuye, Harti
Embu Embu & Mbeere Kamba, Kikuyu, Tharaka, Kisii, Somali, Luo, Indian
Uasin Gishu Kalenjin (Nandi & Keiyo) Kikuyu, Luhya, Luo. Kisii Bungoma Bukusu, Tachoni Sabaot, Bungomek, Ogiek, Batura, Teso.
Source: Researchers (2020)
indigenous communities. Therefore, to the extent that the population growth is caused by migrant communities, indigenous groups do not perceive it as positive change. The second concern is whether the increasing number of indigenous communities would attract interest in elective position and administrative positions in the county. There is fear among the locals that the increasing number of migrants in area may cause them to seek elective positions in future. In addition, given that County Public Service Act requires that employment in the county must reflect its diversity; migrant communities are also applying for jobs in the county government. Consequently, to the extent that the population growth caused by migrant communities potentially threatens political hegemony of indigenous communities, the growth is perceived as negative change. However, the rising concern about the low population and the desire to increase it via the migrant communities so that more revenue from national government may be transferred, the growth is perceived as positive change.
Garissa is predominantly inhibited by Somalis exclusively the Ogaden clan. Perception about population growth is influenced by sub-clan identities, and thus how the locals consider the growth is divided along Adwak, Abdalla and Auliyan sub-clans. However we also have minority communities such as Sakuye, Borana, Harti and Boni. Of these groups it is Boni community that is isolated and marginalized in terms of high unemployment, poverty and illiteracy level
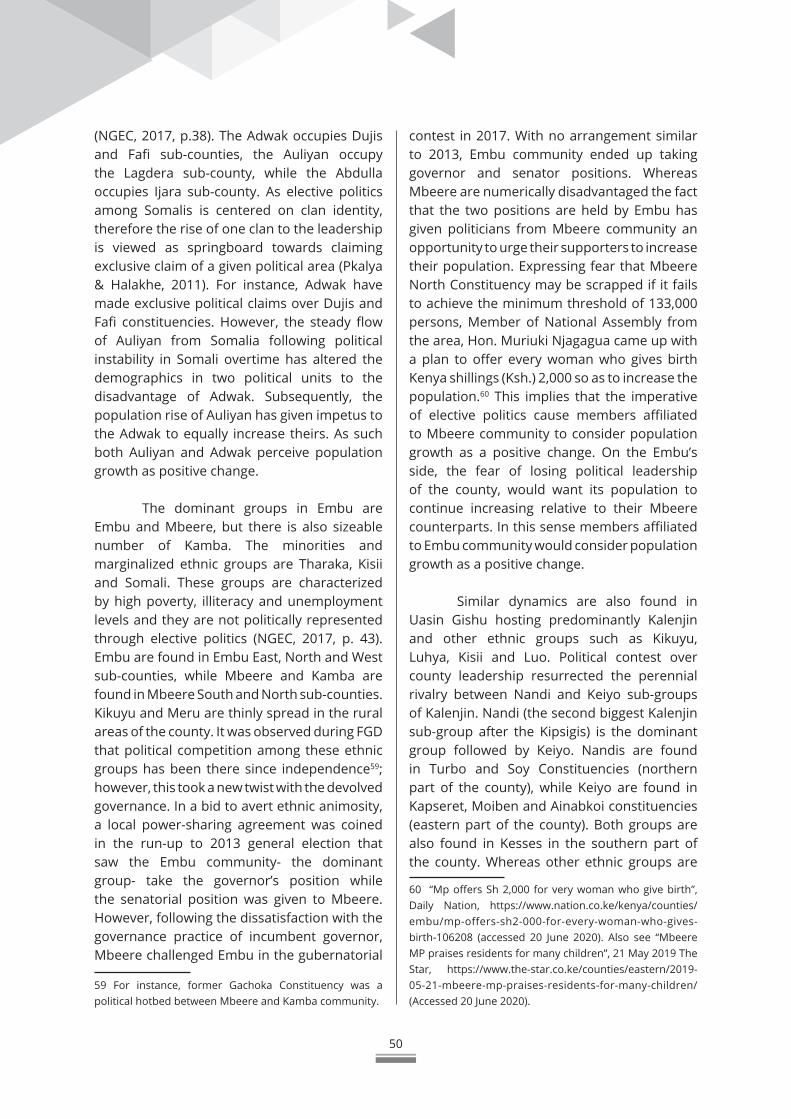
50
(NGEC, 2017, p.38). The Adwak occupies Dujis and Fafi sub-counties, the Auliyan occupy the Lagdera sub-county, while the Abdulla occupies Ijara sub-county. As elective politics among Somalis is centered on clan identity, therefore the rise of one clan to the leadership is viewed as springboard towards claiming exclusive claim of a given political area (Pkalya & Halakhe, 2011). For instance, Adwak have made exclusive political claims over Dujis and Fafi constituencies. However, the steady flow of Auliyan from Somalia following political instability in Somali overtime has altered the demographics in two political units to the disadvantage of Adwak. Subsequently, the population rise of Auliyan has given impetus to the Adwak to equally increase theirs. As such both Auliyan and Adwak perceive population growth as positive change.
The dominant groups in Embu are Embu and Mbeere, but there is also sizeable number of Kamba. The minorities and marginalized ethnic groups are Tharaka, Kisii and Somali. These groups are characterized by high poverty, illiteracy and unemployment levels and they are not politically represented through elective politics (NGEC, 2017, p. 43). Embu are found in Embu East, North and West sub-counties, while Mbeere and Kamba are found in Mbeere South and North sub-counties. Kikuyu and Meru are thinly spread in the rural areas of the county. It was observed during FGD that political competition among these ethnic groups has been there since independence59; however, this took a new twist with the devolved governance. In a bid to avert ethnic animosity, a local power-sharing agreement was coined in the run-up to 2013 general election that saw the Embu community- the dominant group- take the governor’s position while the senatorial position was given to Mbeere. However, following the dissatisfaction with the governance practice of incumbent governor, Mbeere challenged Embu in the gubernatorial
59 For instance, former Gachoka Constituency was a political hotbed between Mbeere and Kamba community.
contest in 2017. With no arrangement similar to 2013, Embu community ended up taking governor and senator positions. Whereas Mbeere are numerically disadvantaged the fact that the two positions are held by Embu has given politicians from Mbeere community an opportunity to urge their supporters to increase their population. Expressing fear that Mbeere North Constituency may be scrapped if it fails to achieve the minimum threshold of 133,000 persons, Member of National Assembly from the area, Hon. Muriuki Njagagua came up with a plan to offer every woman who gives birth Kenya shillings (Ksh.) 2,000 so as to increase the population.60 This implies that the imperative of elective politics cause members affiliated to Mbeere community to consider population growth as a positive change. On the Embu’s side, the fear of losing political leadership of the county, would want its population to continue increasing relative to their Mbeere counterparts. In this sense members affiliated to Embu community would consider population growth as a positive change.
Similar dynamics are also found in Uasin Gishu hosting predominantly Kalenjin and other ethnic groups such as Kikuyu, Luhya, Kisii and Luo. Political contest over county leadership resurrected the perennial rivalry between Nandi and Keiyo sub-groups of Kalenjin. Nandi (the second biggest Kalenjin sub-group after the Kipsigis) is the dominant group followed by Keiyo. Nandis are found in Turbo and Soy Constituencies (northern part of the county), while Keiyo are found in Kapseret, Moiben and Ainabkoi constituencies (eastern part of the county). Both groups are also found in Kesses in the southern part of the county. Whereas other ethnic groups are
60 “Mp offers Sh 2,000 for very woman who give birth”, Daily Nation, https://www.nation.co.ke/kenya/counties/embu/mp-offers-sh2-000-for-every-woman-who-gives-birth-106208 (accessed 20 June 2020). Also see “Mbeere MP praises residents for many children”, 21 May 2019 The Star, https://www.the-star.co.ke/counties/eastern/2019-05-21-mbeere-mp-praises-residents-for-many-children/ (Accessed 20 June 2020).
KAS: Understanding Demographics and Politics in Kenya
51
predominantly found in areas close to Eldoret town, Kikuyu are found both in urban and rural areas. Kikuyu are approximated to be about 10 percent of the county population, and their location in rural areas has been a subject of contestation by Kalenjin traceable to colonial and post-independent land appropriation schemes (Elfeversson & Sjőgren, 2020). Thus although the numerical weakness of other ethnic groups has not been a source of threat to Nandi and Keiyo at sub-county level, it is the role they play in reinforcing the rivalry between the two Kalenjin groups in the struggle for county leadership that we can understand the extent to which each group considers population growth. In 2013 general election, Jackson Mandago, a Nandi, clinched the coveted governor’s position, however his position was challenged in 2017 by Zedekiah Bundotich, a Keiyo with report indicating that he was being supported by other ethnic group in the county.61 Although the Keiyo community lost gubernatorial seat, they clinched County women representative seat and Senatorial position. Nandis as a community have always perceived themselves as the majority in the county62 as exemplified by a statement by Soy Member of National Assembly Caleb Kositany:
I implore you as Kalenjins that we all belong to Uasin Gishu, with Nandis in the lead followed by others. Anyone who wants to be governor in Uasin Gishu should not disturb us until we Nandis decide. Let us keep to our lanes when it comes to leadership. I plead with the people of Nandi, if Nandis have not spoken, no one should tell us where the seat should go’.63
61 “Maize politics at play in battle for Uasin Gishu governorship seat”, Daily Nation https://www.nation.co.ke/kenya/news/politics/maize-politics-at-play-in-battle-for-uasin-gishu-governorship-seat-407882 (Accessed 19 June 2020). 62 “Maize politics at play in battle for Uasin Gishu governorship seat”. 63 “Uasin Gishu politics: Mandago succession stirs ethnic contests”, 20 August 2018, https://www.standardmedia.co.ke/article/2001292597/uasin-gishu-politics-mandago-
The political challenge from Keiyos is likely to reinforce their desire of retaining this dominance through clamor for population increase.64 Consequently the political competition is likely to inform members of both groups to consider population growth as a positive change.
Finally Bungoma appears to follow Embu and Uasin Gishu patterns albeit in different version. Bukusu is the indigenous dominant group followed by Tachoni and both are found in Bungoma East, South, North, Kimilili, Tongaren and Webuye sub-counties. Sabaot are found in Lwandanyi and Mt. Elgon, while Batura are found in Khasako. Bungomek are spread across the rural parts like Malakisi, Kabuchai and Bukembe, while Teso are found in Mianga and Kimaiti areas. The near absolute majority of Bukusu has allowed them to dominate the political leadership of the county at will. For example, in both 2013 and 2017 elections, Bukusu took positions of governor, senator and women representative. This dominance has created a sense of exclusion by minorities groups in terms of employment opportunities and access to social amenities. Thus, for these group population increase promises to reverse this exclusionary politics, as such members affiliated to these minorities group would tend to consider population growth as positive change more than members affiliated to Bukusu. 3.4 Differences in urban and rural Areas
From the above discussion, there are some remarkable differences in social groups in urban and rural areas and how they
succession-stirs-ethnic-contests (Accessed 19 June 2020). 64 “Governor Mandago faces strong challenge for Jubilee ticket”, 20 April 2017, The Standard https://www.standardmedia .co .ke/art ic le/2001230157/governor-mandago-faces-strong-challenge-for-jubilee-ticket (accessed 19 June 2020). See also, “Chaos as Buzeki, Mandago supporters clash in Eldoret”, 23 July 2017 The Standard, https://www.standardmedia.co.ke/article/2001248717/chaos-as-buzeki-mandago-supporters-clash-in-eldoret (Accessed 19 June 2020).
52
consider population growth. In terms of level of education, Nairobi and Mombasa cities have more residents who have completed secondary education than primary education. Our data shows that Kisumu City and Nakuru Municipality have more residents who have completed pre-primary and primary education than those who have completed secondary. Following the literature, our expectation was that the two urban areas would have many residents who have completed secondary education than those with pre-primary and primary.65 Magak et al. (2014) found that the implementation of subsidized secondary education increased enrolment in secondary schools in urban areas because of accessibility and availability of physical and human resources compared to rural schools. High numbers in urban areas is also attributed to socio-economic indicators of parents. Parents in urban areas tend to be more exposed to information and advocacy campaign with regard to children education as compared to those in rural areas. Indeed Birdsall, Levine and Ibrahim (2005) observe that poverty and rural residence strongly influence the enrolment rate in rural schools. Linking low educational attainment to high fertility, therefore a majority of rural population are likely to consider population growth as a positive change than their counterparts in urban areas.
Turning to labor force and income sources, data indicates that urban areas host many unemployed population than rural areas. The employed segment in urban areas is predominantly found in informal sector, while in rural areas the employed ones draw their income mainly from subsistence and a few large-scale farming. This income sources is also intermediated by other variables such as level of education having decisive perception on population growth. Those in informal sector in urban areas are mostly primary and secondary
65 This could be a statistical issue as KNSB did not disaggregate level of education according to urban and rural population.
drop-outs who perceive family in terms of many children and would tend to consider population growth as a positive change. Their perception would also be similar to farmers in rural areas with large pieces of land who would prefer to have many children as a source of labor. But literature also observes that generally educated employed people in urban areas would prefer to have small families than employed in rural areas because of cost of living. In urban areas the consumption and expenditure per household is higher than in the rural areas.
With regard to ethnic affiliation, the numerical strength of majority ethnic groups is higher in rural areas than urban areas, further heightening the importance of ethnic identity in rural politics than in urban politics. With devolved governance structure, political competition to a large extent has been fairly managed in urban areas like Nakuru, Nairobi and Mombasa more than in rural areas like Taita-Taveta, Uasin Gishu and Bungoma. However, the extent of management depends on the local-center relations and role of national elites in local- power sharing agreement (Elfeversson & Sjőgren, 2020). In Nakuru municipality, power-sharing agreement mollified the relations between the Kikuyu and the Kalenjin communities but did not erode ethnic hostility. A relatively stable pact between Uhuru Kenyatta and his running mate William Ruto influenced cohesion and predictability. Embu adopted similar arrangement only in 2013 elections, however in Uasin Gishu and Bungoma calls for similar arrangement was ignored by local politicians rendering minority communities to experience marginalization in representation and access to social amenities. The discontent among the minority groups has found expression in clamor for increase in their population. Therefore the inter-linkage between dominance and population increase is more pronounced in rural areas than urban areas.
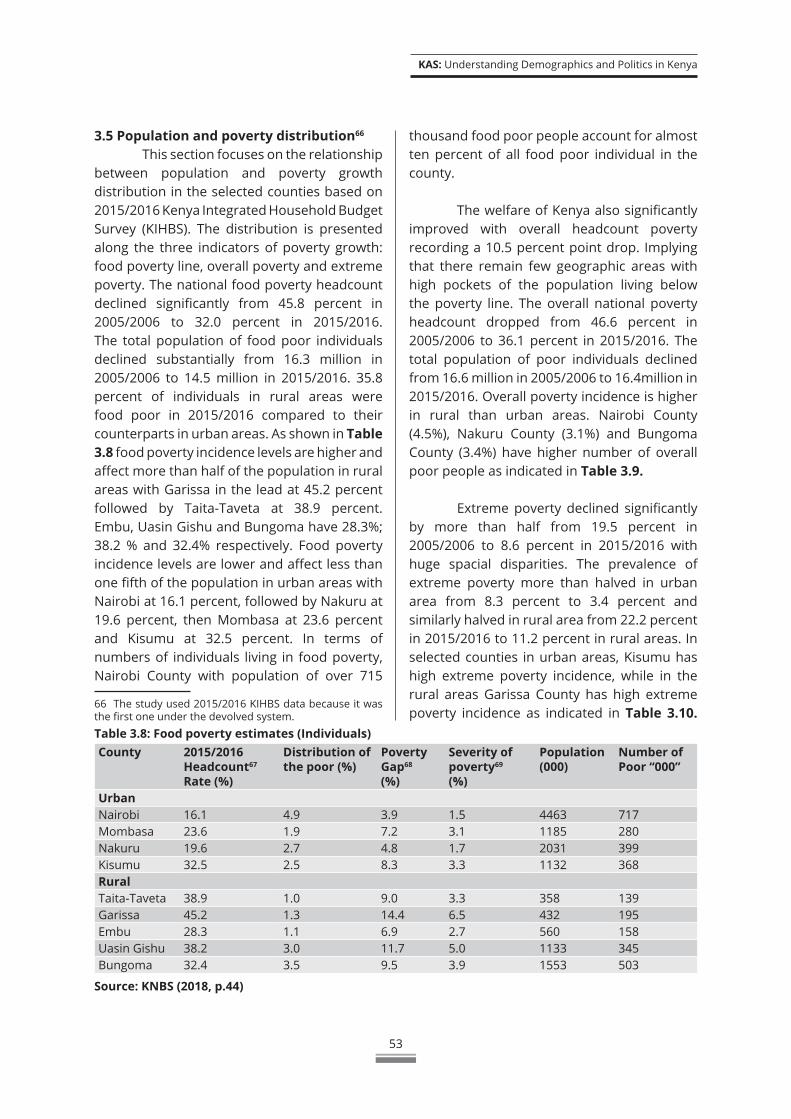
KAS: Understanding Demographics and Politics in Kenya
53
3.5 Population and poverty distribution66
This section focuses on the relationship between population and poverty growth distribution in the selected counties based on 2015/2016 Kenya Integrated Household Budget Survey (KIHBS). The distribution is presented along the three indicators of poverty growth: food poverty line, overall poverty and extreme poverty. The national food poverty headcount declined significantly from 45.8 percent in 2005/2006 to 32.0 percent in 2015/2016. The total population of food poor individuals declined substantially from 16.3 million in 2005/2006 to 14.5 million in 2015/2016. 35.8 percent of individuals in rural areas were food poor in 2015/2016 compared to their counterparts in urban areas. As shown in Table 3.8 food poverty incidence levels are higher and affect more than half of the population in rural areas with Garissa in the lead at 45.2 percent followed by Taita-Taveta at 38.9 percent. Embu, Uasin Gishu and Bungoma have 28.3%; 38.2 % and 32.4% respectively. Food poverty incidence levels are lower and affect less than one fifth of the population in urban areas with Nairobi at 16.1 percent, followed by Nakuru at 19.6 percent, then Mombasa at 23.6 percent and Kisumu at 32.5 percent. In terms of numbers of individuals living in food poverty, Nairobi County with population of over 715
66 The study used 2015/2016 KIHBS data because it was the first one under the devolved system.
thousand food poor people account for almost ten percent of all food poor individual in the county.
The welfare of Kenya also significantly improved with overall headcount poverty recording a 10.5 percent point drop. Implying that there remain few geographic areas with high pockets of the population living below the poverty line. The overall national poverty headcount dropped from 46.6 percent in 2005/2006 to 36.1 percent in 2015/2016. The total population of poor individuals declined from 16.6 million in 2005/2006 to 16.4million in 2015/2016. Overall poverty incidence is higher in rural than urban areas. Nairobi County (4.5%), Nakuru County (3.1%) and Bungoma County (3.4%) have higher number of overall poor people as indicated in Table 3.9.
Extreme poverty declined significantly by more than half from 19.5 percent in 2005/2006 to 8.6 percent in 2015/2016 with huge spacial disparities. The prevalence of extreme poverty more than halved in urban area from 8.3 percent to 3.4 percent and similarly halved in rural area from 22.2 percent in 2015/2016 to 11.2 percent in rural areas. In selected counties in urban areas, Kisumu has high extreme poverty incidence, while in the rural areas Garissa County has high extreme poverty incidence as indicated in Table 3.10.
Table 3.8: Food poverty estimates (Individuals)County 2015/2016
Headcount67 Rate (%)
Distribution of the poor (%)
Poverty Gap68
(%)
Severity of poverty69 (%)
Population (000)
Number of Poor “000”
Urban Nairobi 16.1 4.9 3.9 1.5 4463 717Mombasa 23.6 1.9 7.2 3.1 1185 280Nakuru 19.6 2.7 4.8 1.7 2031 399Kisumu 32.5 2.5 8.3 3.3 1132 368Rural Taita-Taveta 38.9 1.0 9.0 3.3 358 139Garissa 45.2 1.3 14.4 6.5 432 195Embu 28.3 1.1 6.9 2.7 560 158Uasin Gishu 38.2 3.0 11.7 5.0 1133 345Bungoma 32.4 3.5 9.5 3.9 1553 503
Source: KNBS (2018, p.44)
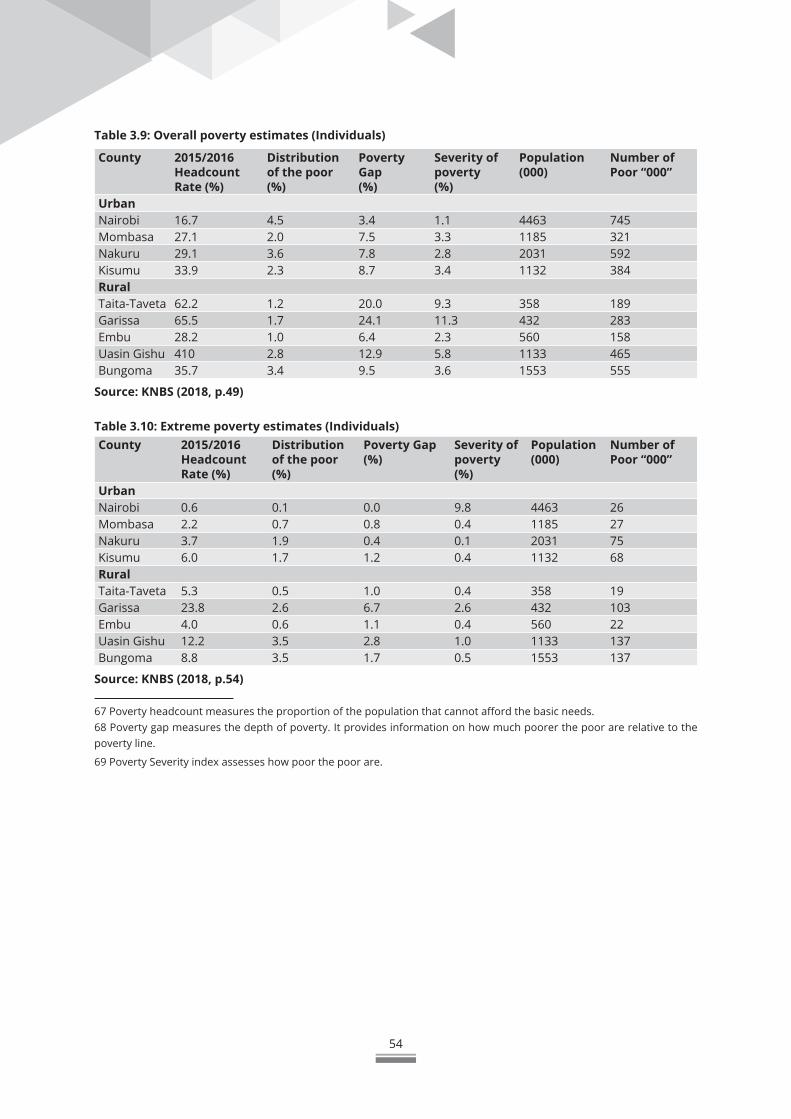
54
Table 3.9: Overall poverty estimates (Individuals)
County 2015/2016Headcount Rate (%)
Distribution of the poor (%)
Poverty Gap(%)
Severity of poverty (%)
Population (000)
Number of Poor “000”
Urban Nairobi 16.7 4.5 3.4 1.1 4463 745Mombasa 27.1 2.0 7.5 3.3 1185 321Nakuru 29.1 3.6 7.8 2.8 2031 592Kisumu 33.9 2.3 8.7 3.4 1132 384Rural Taita-Taveta 62.2 1.2 20.0 9.3 358 189Garissa 65.5 1.7 24.1 11.3 432 283Embu 28.2 1.0 6.4 2.3 560 158Uasin Gishu 410 2.8 12.9 5.8 1133 465Bungoma 35.7 3.4 9.5 3.6 1553 555
Source: KNBS (2018, p.49)
Table 3.10: Extreme poverty estimates (Individuals) County 2015/2016
Headcount Rate (%)
Distribution of the poor (%)
Poverty Gap(%)
Severity of poverty (%)
Population (000)
Number of Poor “000”
Urban Nairobi 0.6 0.1 0.0 9.8 4463 26Mombasa 2.2 0.7 0.8 0.4 1185 27Nakuru 3.7 1.9 0.4 0.1 2031 75Kisumu 6.0 1.7 1.2 0.4 1132 68Rural Taita-Taveta 5.3 0.5 1.0 0.4 358 19Garissa 23.8 2.6 6.7 2.6 432 103Embu 4.0 0.6 1.1 0.4 560 22Uasin Gishu 12.2 3.5 2.8 1.0 1133 137Bungoma 8.8 3.5 1.7 0.5 1553 137
Source: KNBS (2018, p.54)
67 Poverty headcount measures the proportion of the population that cannot afford the basic needs. 68 Poverty gap measures the depth of poverty. It provides information on how much poorer the poor are relative to the poverty line.
69 Poverty Severity index assesses how poor the poor are.
55
CHAPTER FOUR:REGIONAL DIFFERENCES
AND THEIR PERCEPTION ON POPULATION GROWTH
IntroductionThis chapter advances the previous
one in terms of exposing regional differences in urban and rural areas, and how these differences influence perception on population growth. Addressed as disparities or inequality in the literature (Kanyinga, 2006; Fredrich Ebert Stiftung [FES], 2012; Wanyande, 2016), regional differences are “characterized by the existence of unequal opportunities or life chances and unequal conditions…usually structured and recurrent, results into an unfair or unjust gap between individuals, groups or households relative to others within a population” (KNSB/SID, 2013a, p.6). In this chapter, we consider inequality along the three social groups discussed in previous chapter: population’s level of education, income sources (employment) and ethnic affiliation.
Generally education has been viewed as an instrument of enhancing society’s welfare. Literature has revealed that disparities decline as the levels of education go high, with girls benefitting more as they attain secondary education (Cornia & Court, 2001). As indicated in previous chapters, children of educated mothers stand better chances of surviving than those of uneducated mothers even in environment where families may be deprived of essential services like water and sanitation. In this sense, education is understood as a determinant in leveling the playing ground as it offers opportunity for earning higher income and improving standards of living. However, education can also be a mean through which inequality may be perpetuated. Unequal access to education translates into stratification in employment, income, residence and social class. These stratifications tend to be passed on from one generation to another inherently sustaining exclusion in society (KNBS/SID, 2013a).
Employment is typically seen as a means of overcoming inequality and reducing poverty levels. People outside labor market and those seeking work typically are not in a position to meet their basic needs because they lack purchasing power. This segment of the population is the most vulnerable and subject to poverty. More importantly, trends and patterns of employment and wage are key in understanding inequality in any society. This may be supplemented with socio-welfare indicators which in most cases are associated with incomes derived from employment.
How ethnic affiliations perpetuate inequality has to be understood within the broader context of Kenya as a multi-ethnic society. Based on the expediencies of colonial authority, many ethnic groups were lumped together and assigned a particular territory, a pattern that was sustained by post-colonial governments. The first group to have settled in a particular place has tended to make territorial claims which have been subjects of contestation by other groups subsequently causing ethnic tensions as groups compete to access resources (Kanyinga, 2006, p.353).Politicians have been at the core in instrumentalization of ethnicity as a basis of allocation of resources, thereby allowing others to gain as others are denied the same resources consequently creating regional differences.
This chapter focuses on how access to education, employment and ethnic relations are manifested in different regions within the selected counties. Building on the analysis in
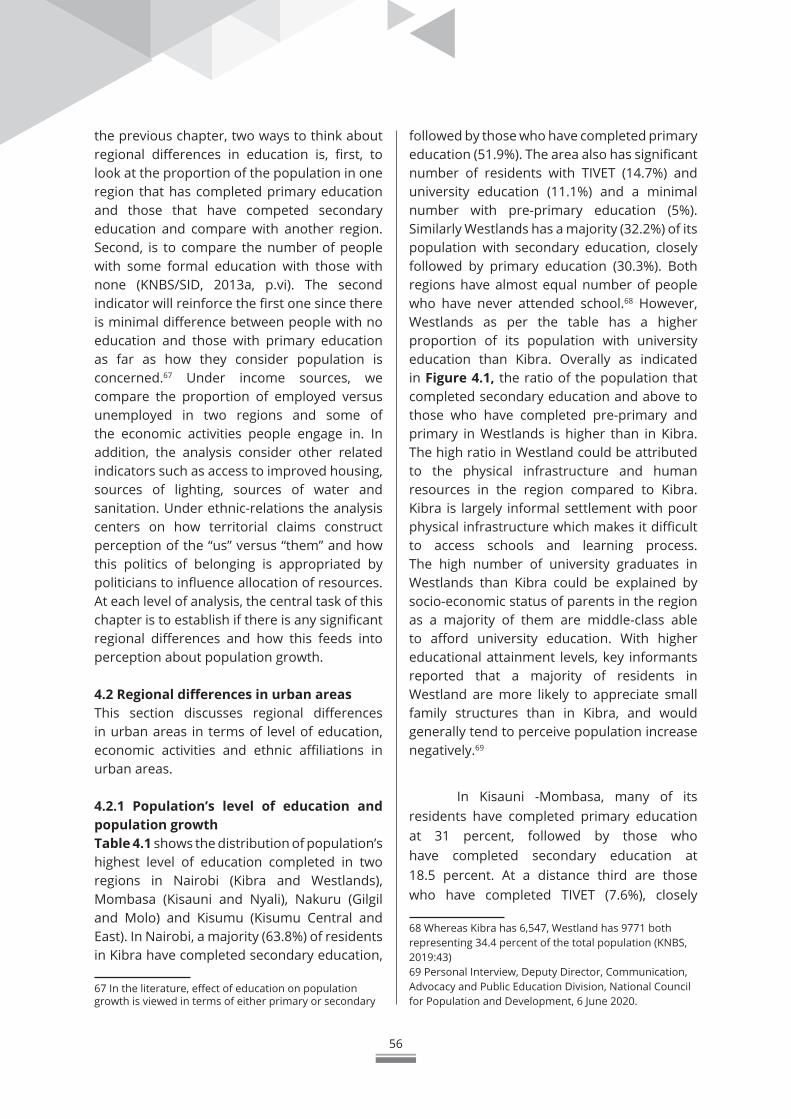
56
the previous chapter, two ways to think about regional differences in education is, first, to look at the proportion of the population in one region that has completed primary education and those that have competed secondary education and compare with another region. Second, is to compare the number of people with some formal education with those with none (KNBS/SID, 2013a, p.vi). The second indicator will reinforce the first one since there is minimal difference between people with no education and those with primary education as far as how they consider population is concerned.67 Under income sources, we compare the proportion of employed versus unemployed in two regions and some of the economic activities people engage in. In addition, the analysis consider other related indicators such as access to improved housing, sources of lighting, sources of water and sanitation. Under ethnic-relations the analysis centers on how territorial claims construct perception of the “us” versus “them” and how this politics of belonging is appropriated by politicians to influence allocation of resources. At each level of analysis, the central task of this chapter is to establish if there is any significant regional differences and how this feeds into perception about population growth.
4.2 Regional differences in urban areasThis section discusses regional differences in urban areas in terms of level of education, economic activities and ethnic affiliations in urban areas. 4.2.1 Population’s level of education and population growth Table 4.1 shows the distribution of population’s highest level of education completed in two regions in Nairobi (Kibra and Westlands), Mombasa (Kisauni and Nyali), Nakuru (Gilgil and Molo) and Kisumu (Kisumu Central and East). In Nairobi, a majority (63.8%) of residents in Kibra have completed secondary education,
67 In the literature, effect of education on population growth is viewed in terms of either primary or secondary
followed by those who have completed primary education (51.9%). The area also has significant number of residents with TIVET (14.7%) and university education (11.1%) and a minimal number with pre-primary education (5%). Similarly Westlands has a majority (32.2%) of its population with secondary education, closely followed by primary education (30.3%). Both regions have almost equal number of people who have never attended school.68 However, Westlands as per the table has a higher proportion of its population with university education than Kibra. Overally as indicated in Figure 4.1, the ratio of the population that completed secondary education and above to those who have completed pre-primary and primary in Westlands is higher than in Kibra. The high ratio in Westland could be attributed to the physical infrastructure and human resources in the region compared to Kibra. Kibra is largely informal settlement with poor physical infrastructure which makes it difficult to access schools and learning process. The high number of university graduates in Westlands than Kibra could be explained by socio-economic status of parents in the region as a majority of them are middle-class able to afford university education. With higher educational attainment levels, key informants reported that a majority of residents in Westland are more likely to appreciate small family structures than in Kibra, and would generally tend to perceive population increase negatively.69
In Kisauni -Mombasa, many of its residents have completed primary education at 31 percent, followed by those who have completed secondary education at 18.5 percent. At a distance third are those who have completed TIVET (7.6%), closely
68 Whereas Kibra has 6,547, Westland has 9771 both representing 34.4 percent of the total population (KNBS, 2019:43)69 Personal Interview, Deputy Director, Communication, Advocacy and Public Education Division, National Council for Population and Development, 6 June 2020.
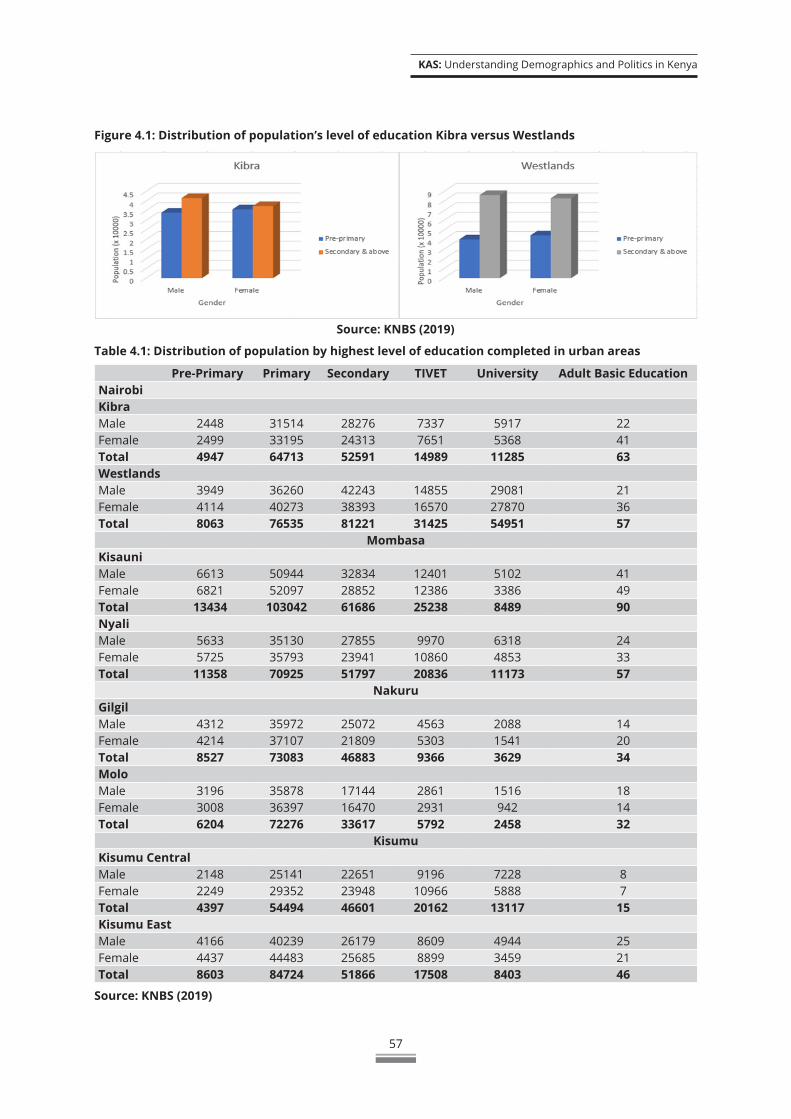
KAS: Understanding Demographics and Politics in Kenya
57
Figure 4.1: Distribution of population’s level of education Kibra versus Westlands
Source: KNBS (2019)
Table 4.1: Distribution of population by highest level of education completed in urban areas
Pre-Primary Primary Secondary TIVET University Adult Basic Education Nairobi Kibra Male 2448 31514 28276 7337 5917 22Female 2499 33195 24313 7651 5368 41Total 4947 64713 52591 14989 11285 63Westlands Male 3949 36260 42243 14855 29081 21Female 4114 40273 38393 16570 27870 36Total 8063 76535 81221 31425 54951 57
MombasaKisauni Male 6613 50944 32834 12401 5102 41Female 6821 52097 28852 12386 3386 49Total 13434 103042 61686 25238 8489 90Nyali Male 5633 35130 27855 9970 6318 24Female 5725 35793 23941 10860 4853 33Total 11358 70925 51797 20836 11173 57
NakuruGilgil Male 4312 35972 25072 4563 2088 14Female 4214 37107 21809 5303 1541 20Total 8527 73083 46883 9366 3629 34MoloMale 3196 35878 17144 2861 1516 18Female 3008 36397 16470 2931 942 14Total 6204 72276 33617 5792 2458 32
KisumuKisumu Central Male 2148 25141 22651 9196 7228 8Female 2249 29352 23948 10966 5888 7Total 4397 54494 46601 20162 13117 15Kisumu EastMale 4166 40239 26179 8609 4944 25Female 4437 44483 25685 8899 3459 21Total 8603 84724 51866 17508 8403 46
Source: KNBS (2019)
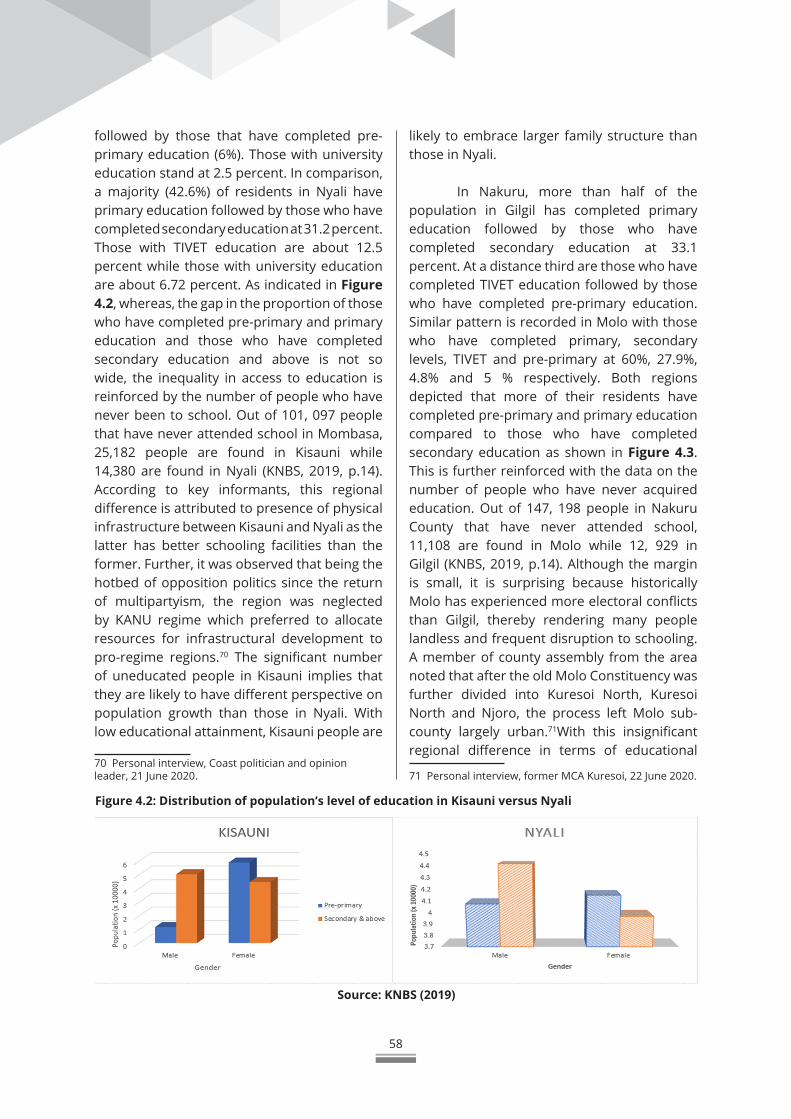
58
followed by those that have completed pre-primary education (6%). Those with university education stand at 2.5 percent. In comparison, a majority (42.6%) of residents in Nyali have primary education followed by those who have completed secondary education at 31.2 percent. Those with TIVET education are about 12.5 percent while those with university education are about 6.72 percent. As indicated in Figure 4.2, whereas, the gap in the proportion of those who have completed pre-primary and primary education and those who have completed secondary education and above is not so wide, the inequality in access to education is reinforced by the number of people who have never been to school. Out of 101, 097 people that have never attended school in Mombasa, 25,182 people are found in Kisauni while 14,380 are found in Nyali (KNBS, 2019, p.14). According to key informants, this regional difference is attributed to presence of physical infrastructure between Kisauni and Nyali as the latter has better schooling facilities than the former. Further, it was observed that being the hotbed of opposition politics since the return of multipartyism, the region was neglected by KANU regime which preferred to allocate resources for infrastructural development to pro-regime regions.70 The significant number of uneducated people in Kisauni implies that they are likely to have different perspective on population growth than those in Nyali. With low educational attainment, Kisauni people are
70 Personal interview, Coast politician and opinion leader, 21 June 2020.
likely to embrace larger family structure than those in Nyali.
In Nakuru, more than half of the population in Gilgil has completed primary education followed by those who have completed secondary education at 33.1 percent. At a distance third are those who have completed TIVET education followed by those who have completed pre-primary education. Similar pattern is recorded in Molo with those who have completed primary, secondary levels, TIVET and pre-primary at 60%, 27.9%, 4.8% and 5 % respectively. Both regions depicted that more of their residents have completed pre-primary and primary education compared to those who have completed secondary education as shown in Figure 4.3. This is further reinforced with the data on the number of people who have never acquired education. Out of 147, 198 people in Nakuru County that have never attended school, 11,108 are found in Molo while 12, 929 in Gilgil (KNBS, 2019, p.14). Although the margin is small, it is surprising because historically Molo has experienced more electoral conflicts than Gilgil, thereby rendering many people landless and frequent disruption to schooling. A member of county assembly from the area noted that after the old Molo Constituency was further divided into Kuresoi North, Kuresoi North and Njoro, the process left Molo sub-county largely urban.71With this insignificant regional difference in terms of educational
71 Personal interview, former MCA Kuresoi, 22 June 2020. Figure 4.2: Distribution of population’s level of education in Kisauni versus Nyali
Source: KNBS (2019)
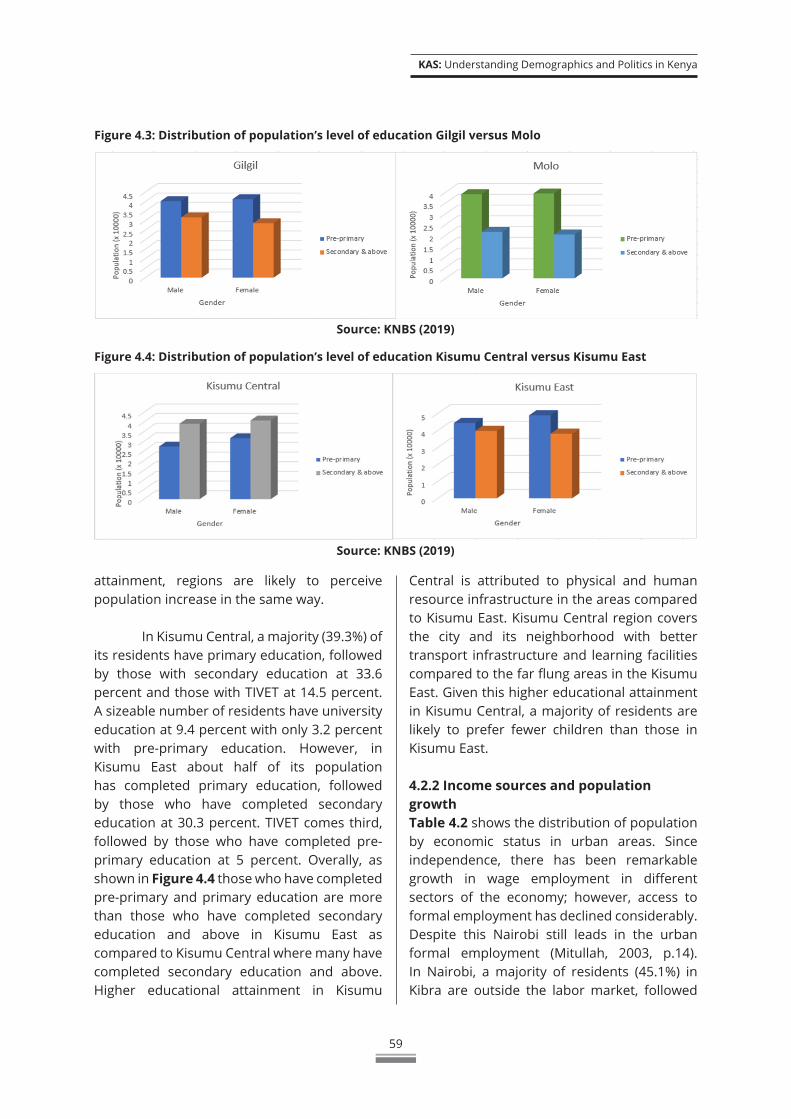
KAS: Understanding Demographics and Politics in Kenya
59
Figure 4.3: Distribution of population’s level of education Gilgil versus Molo
Figure 4.4: Distribution of population’s level of education Kisumu Central versus Kisumu East
Source: KNBS (2019)
Source: KNBS (2019)
attainment, regions are likely to perceive population increase in the same way.
In Kisumu Central, a majority (39.3%) of its residents have primary education, followed by those with secondary education at 33.6 percent and those with TIVET at 14.5 percent. A sizeable number of residents have university education at 9.4 percent with only 3.2 percent with pre-primary education. However, in Kisumu East about half of its population has completed primary education, followed by those who have completed secondary education at 30.3 percent. TIVET comes third, followed by those who have completed pre-primary education at 5 percent. Overally, as shown in Figure 4.4 those who have completed pre-primary and primary education are more than those who have completed secondary education and above in Kisumu East as compared to Kisumu Central where many have completed secondary education and above. Higher educational attainment in Kisumu
Central is attributed to physical and human resource infrastructure in the areas compared to Kisumu East. Kisumu Central region covers the city and its neighborhood with better transport infrastructure and learning facilities compared to the far flung areas in the Kisumu East. Given this higher educational attainment in Kisumu Central, a majority of residents are likely to prefer fewer children than those in Kisumu East.
4.2.2 Income sources and population growthTable 4.2 shows the distribution of population by economic status in urban areas. Since independence, there has been remarkable growth in wage employment in different sectors of the economy; however, access to formal employment has declined considerably. Despite this Nairobi still leads in the urban formal employment (Mitullah, 2003, p.14). In Nairobi, a majority of residents (45.1%) in Kibra are outside the labor market, followed
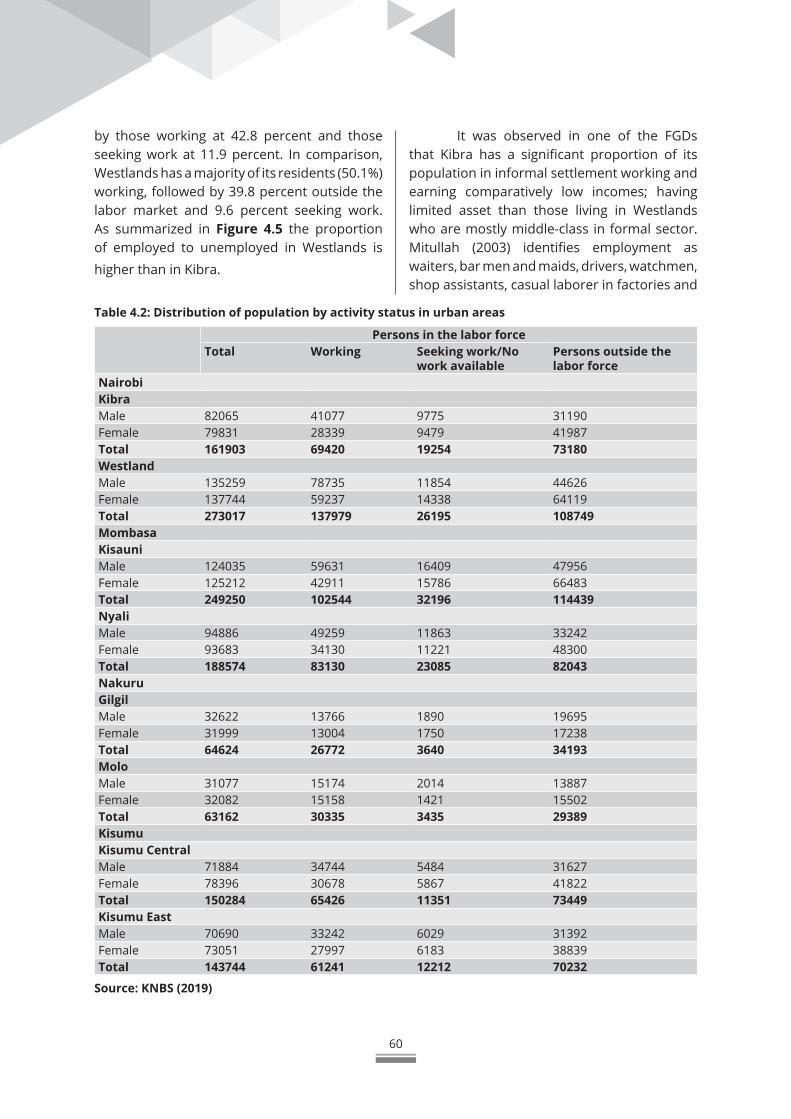
60
by those working at 42.8 percent and those seeking work at 11.9 percent. In comparison, Westlands has a majority of its residents (50.1%) working, followed by 39.8 percent outside the labor market and 9.6 percent seeking work. As summarized in Figure 4.5 the proportion of employed to unemployed in Westlands is
higher than in Kibra.
Table 4.2: Distribution of population by activity status in urban areas
Persons in the labor forceTotal Working Seeking work/No
work availablePersons outside the labor force
Nairobi KibraMale 82065 41077 9775 31190Female 79831 28339 9479 41987Total 161903 69420 19254 73180Westland Male 135259 78735 11854 44626Female 137744 59237 14338 64119Total 273017 137979 26195 108749Mombasa KisauniMale 124035 59631 16409 47956Female 125212 42911 15786 66483Total 249250 102544 32196 114439Nyali Male 94886 49259 11863 33242Female 93683 34130 11221 48300Total 188574 83130 23085 82043Nakuru Gilgil Male 32622 13766 1890 19695Female 31999 13004 1750 17238Total 64624 26772 3640 34193MoloMale 31077 15174 2014 13887Female 32082 15158 1421 15502Total 63162 30335 3435 29389Kisumu Kisumu Central Male 71884 34744 5484 31627Female 78396 30678 5867 41822Total 150284 65426 11351 73449Kisumu East Male 70690 33242 6029 31392Female 73051 27997 6183 38839Total 143744 61241 12212 70232
Source: KNBS (2019)
It was observed in one of the FGDs that Kibra has a significant proportion of its population in informal settlement working and earning comparatively low incomes; having limited asset than those living in Westlands who are mostly middle-class in formal sector. Mitullah (2003) identifies employment as waiters, bar men and maids, drivers, watchmen, shop assistants, casual laborer in factories and
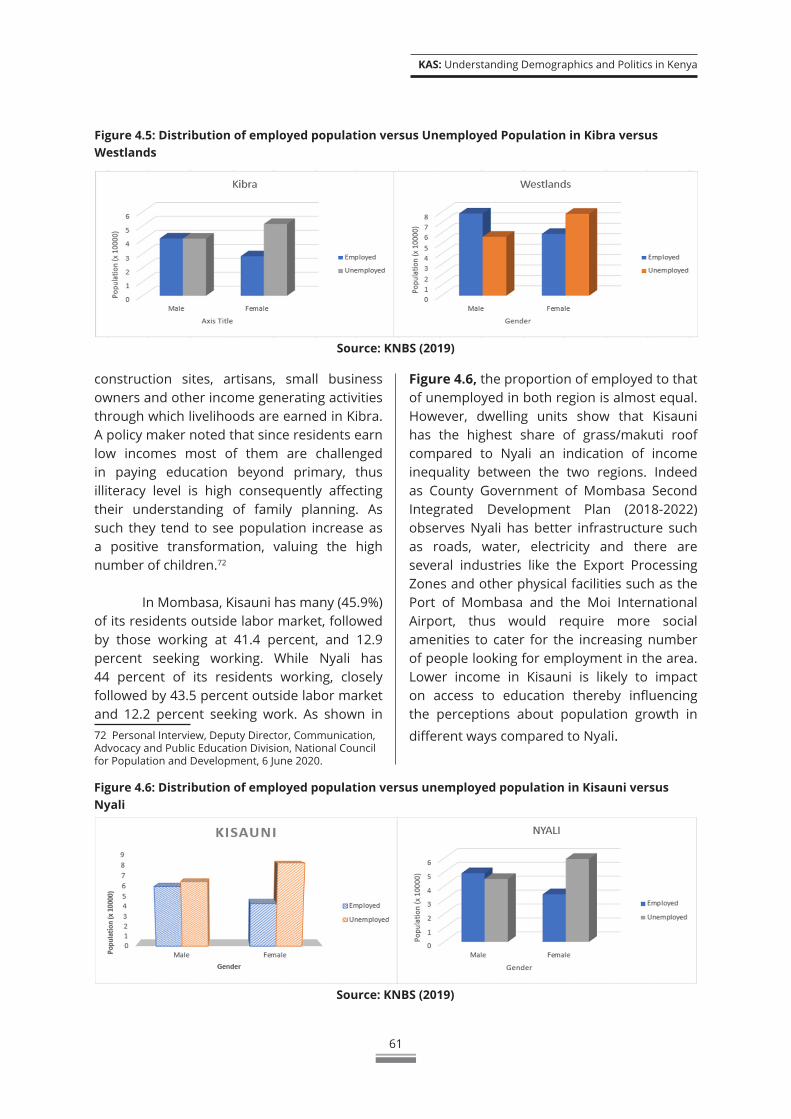
KAS: Understanding Demographics and Politics in Kenya
61
Figure 4.5: Distribution of employed population versus Unemployed Population in Kibra versus Westlands
Source: KNBS (2019)
construction sites, artisans, small business owners and other income generating activities through which livelihoods are earned in Kibra. A policy maker noted that since residents earn low incomes most of them are challenged in paying education beyond primary, thus illiteracy level is high consequently affecting their understanding of family planning. As such they tend to see population increase as a positive transformation, valuing the high number of children.72
In Mombasa, Kisauni has many (45.9%) of its residents outside labor market, followed by those working at 41.4 percent, and 12.9 percent seeking working. While Nyali has 44 percent of its residents working, closely followed by 43.5 percent outside labor market and 12.2 percent seeking work. As shown in 72 Personal Interview, Deputy Director, Communication, Advocacy and Public Education Division, National Council for Population and Development, 6 June 2020.
Figure 4.6, the proportion of employed to that of unemployed in both region is almost equal. However, dwelling units show that Kisauni has the highest share of grass/makuti roof compared to Nyali an indication of income inequality between the two regions. Indeed as County Government of Mombasa Second Integrated Development Plan (2018-2022) observes Nyali has better infrastructure such as roads, water, electricity and there are several industries like the Export Processing Zones and other physical facilities such as the Port of Mombasa and the Moi International Airport, thus would require more social amenities to cater for the increasing number of people looking for employment in the area. Lower income in Kisauni is likely to impact on access to education thereby influencing the perceptions about population growth in
different ways compared to Nyali.
Figure 4.6: Distribution of employed population versus unemployed population in Kisauni versus Nyali
Source: KNBS (2019)
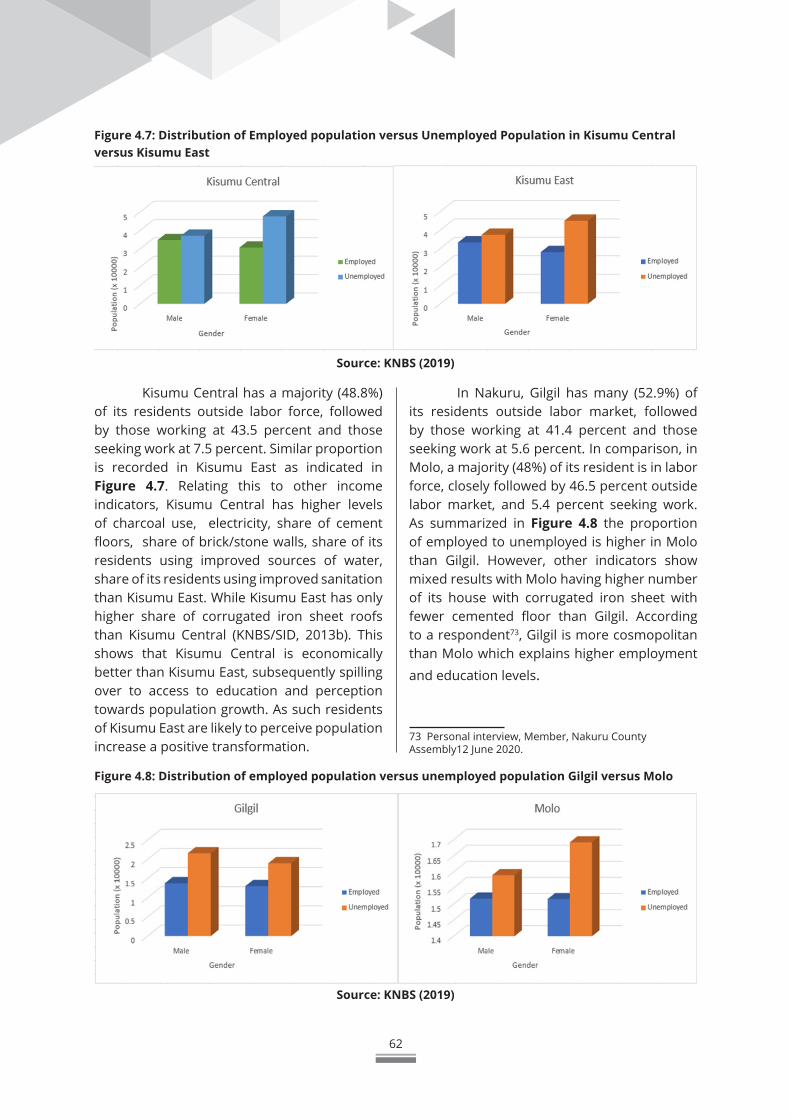
62
Kisumu Central has a majority (48.8%) of its residents outside labor force, followed by those working at 43.5 percent and those seeking work at 7.5 percent. Similar proportion is recorded in Kisumu East as indicated in Figure 4.7. Relating this to other income indicators, Kisumu Central has higher levels of charcoal use, electricity, share of cement floors, share of brick/stone walls, share of its residents using improved sources of water, share of its residents using improved sanitation than Kisumu East. While Kisumu East has only higher share of corrugated iron sheet roofs than Kisumu Central (KNBS/SID, 2013b). This shows that Kisumu Central is economically better than Kisumu East, subsequently spilling over to access to education and perception towards population growth. As such residents of Kisumu East are likely to perceive population increase a positive transformation.
Figure 4.7: Distribution of Employed population versus Unemployed Population in Kisumu Central versus Kisumu East
Figure 4.8: Distribution of employed population versus unemployed population Gilgil versus Molo
Source: KNBS (2019)
Source: KNBS (2019)
In Nakuru, Gilgil has many (52.9%) of its residents outside labor market, followed by those working at 41.4 percent and those seeking work at 5.6 percent. In comparison, in Molo, a majority (48%) of its resident is in labor force, closely followed by 46.5 percent outside labor market, and 5.4 percent seeking work. As summarized in Figure 4.8 the proportion of employed to unemployed is higher in Molo than Gilgil. However, other indicators show mixed results with Molo having higher number of its house with corrugated iron sheet with fewer cemented floor than Gilgil. According to a respondent73, Gilgil is more cosmopolitan than Molo which explains higher employment
and education levels.
73 Personal interview, Member, Nakuru County Assembly12 June 2020.
KAS: Understanding Demographics and Politics in Kenya
63
4.2.3 Ethnic affiliations and population growth
As pointed out in the introduction, the growth of urban areas has been influenced by colonial practices that bundled ethnic groups in one locality and further reinforced by post-colonial regimes. Indeed, as Olima (2001, p.10) observes “the forces that have contributed to…spatial segregation in [urban centers] are many and varied. Some are legal and economic whereas others are cultural. During the colonial period, the people of Kenya witnessed a large-scale government sanctioned spatial segregation based on race and reinforced by planning laws as well as exclusionary zoning regulations. In case of Nairobi, Olima points out that the segregation/division along racial lines divided the city into four distinct sectors; North and East defined as the Asian Sector (Parklands, Pangani and Eastleigh); East and South East defined the African Sector (Pumwani, Kariokor, Donholm); South East to South marked another small Asian enclave before it was bounded by the Game Park (Nairobi South, Nairobi West). Finally, the line North and West marked the European area”. This colonial heritage is important in understanding regional differences in urban centers and implications on population growth.
Kibra originated as settlement for Sudanese soldiers retiring from the British colonial forces. In order to promote their rights in an ethnicized political system, the Sudanese ex-soldiers and their followers adopted the Nubian identity in post-independent Kenya (Elfversson & Höglund, 2019). As the first settlers in the area, their claims on the land went unrecognized and the area unregulated status over the years attracted a large influx of migrants from all other parts of the country. Today, Kibra is ethnically divided, largely poor and densely populated, causing tension between the Nubian community on one hand and the government or other ethnic groups in the area on the other, as well as between landlords (from the Nubian and other
communities) and tenants- mainly from Luo, Luhya and Kisii communities.
Although the Nubian community has dominated the housing structure, Kikuyu landlords have surpassed them in numbers. Tensions between tenants and landlords, largely interpreted along ethnic affiliations of the parties concerned have severally escalated into inter-communal violence, often linked to the national political dynamics. Since many local and national politicians own structures in Kibra and the residents make up important electoral constituencies (Elfversson & Höglund, 2019), there lies the important of ethnic numerical strength built around the concept of population growth of the ethnic groups in the area. For a very long time, the area became a key electoral mobilization ground for Raila Odinga, the party leader of the Orange Democratic Party (ODM) in Kenya who is said to have relied on his Luo patronage networks to consolidate Kibra as his political stronghold in the city. Thus to remain relevant within the political formation, members affiliated to Luo tend to perceive their increase in number as a positive transformation. In comparison, at independence Westlands was inhibited by Europeans and Asian who formed small portion of the population of Nairobi’s population. However, this changed with time as Kenyan middle-class moved to places like Runda, Lakeview, Muthaiga, Kitisuru and Highridge. But there are also informal settlements in Kangemi, Githogoro, Kibagare, Kaptagat and Mji wa Huruma. Unlike in Kibra where land has defined politics, these slums emerged as a result of workers in the suburb looking for alternative housing units close to their working place. As a result, the symbiotic employer-employee relationship has minimized the tension thereby reducing the importance of ethnicity in Westlands compared to Kibra.
The ethnic politics in Kisauni and Nyali appear to follow similar pattern in Mombasa that of pitting the indigenous Mijikenda community
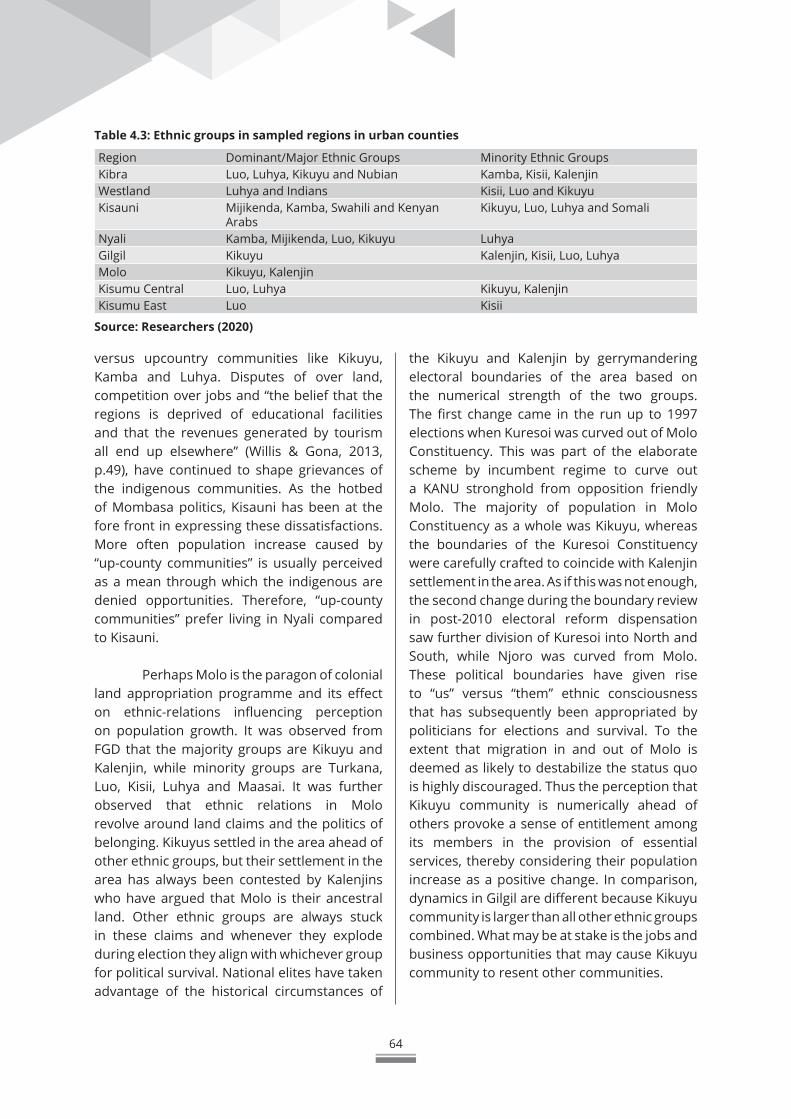
64
Table 4.3: Ethnic groups in sampled regions in urban counties
Region Dominant/Major Ethnic Groups Minority Ethnic Groups Kibra Luo, Luhya, Kikuyu and Nubian Kamba, Kisii, Kalenjin Westland Luhya and Indians Kisii, Luo and KikuyuKisauni Mijikenda, Kamba, Swahili and Kenyan
Arabs Kikuyu, Luo, Luhya and Somali
Nyali Kamba, Mijikenda, Luo, Kikuyu LuhyaGilgil Kikuyu Kalenjin, Kisii, Luo, LuhyaMolo Kikuyu, KalenjinKisumu Central Luo, Luhya Kikuyu, Kalenjin Kisumu East Luo Kisii
Source: Researchers (2020)
versus upcountry communities like Kikuyu, Kamba and Luhya. Disputes of over land, competition over jobs and “the belief that the regions is deprived of educational facilities and that the revenues generated by tourism all end up elsewhere” (Willis & Gona, 2013, p.49), have continued to shape grievances of the indigenous communities. As the hotbed of Mombasa politics, Kisauni has been at the fore front in expressing these dissatisfactions. More often population increase caused by “up-county communities” is usually perceived as a mean through which the indigenous are denied opportunities. Therefore, “up-county communities” prefer living in Nyali compared to Kisauni.
Perhaps Molo is the paragon of colonial land appropriation programme and its effect on ethnic-relations influencing perception on population growth. It was observed from FGD that the majority groups are Kikuyu and Kalenjin, while minority groups are Turkana, Luo, Kisii, Luhya and Maasai. It was further observed that ethnic relations in Molo revolve around land claims and the politics of belonging. Kikuyus settled in the area ahead of other ethnic groups, but their settlement in the area has always been contested by Kalenjins who have argued that Molo is their ancestral land. Other ethnic groups are always stuck in these claims and whenever they explode during election they align with whichever group for political survival. National elites have taken advantage of the historical circumstances of
the Kikuyu and Kalenjin by gerrymandering electoral boundaries of the area based on the numerical strength of the two groups. The first change came in the run up to 1997 elections when Kuresoi was curved out of Molo Constituency. This was part of the elaborate scheme by incumbent regime to curve out a KANU stronghold from opposition friendly Molo. The majority of population in Molo Constituency as a whole was Kikuyu, whereas the boundaries of the Kuresoi Constituency were carefully crafted to coincide with Kalenjin settlement in the area. As if this was not enough, the second change during the boundary review in post-2010 electoral reform dispensation saw further division of Kuresoi into North and South, while Njoro was curved from Molo. These political boundaries have given rise to “us” versus “them” ethnic consciousness that has subsequently been appropriated by politicians for elections and survival. To the extent that migration in and out of Molo is deemed as likely to destabilize the status quo is highly discouraged. Thus the perception that Kikuyu community is numerically ahead of others provoke a sense of entitlement among its members in the provision of essential services, thereby considering their population increase as a positive change. In comparison, dynamics in Gilgil are different because Kikuyu community is larger than all other ethnic groups combined. What may be at stake is the jobs and business opportunities that may cause Kikuyu community to resent other communities.
KAS: Understanding Demographics and Politics in Kenya
65
Finally, regional differences between Kisumu Central and Kisumu East largely mirror the broader dynamics in Kisumu as discussed in chapter three. Suffice to note that the difference may be noticed in the extent to which the native Luo perceive immigrant communities in the two regions. On one hand, Kisumu Central is more cosmopolitan than Kisumu East, thus it is the potential threats of other ethnic groups that define political interaction between the native Luo and the migrants. On the other, in Kisumu East because of near absence of other ethnic groups the internal rivalry within the Luo community is more pronounced. 4.3 Regional differences in rural areasThis section discusses regional differences along level of population, income sources and ethnic affiliations in rural areas.
4.3.1 Population’s level of education and population growthTable 4.3 illustrates distribution of population’s level of education in two regions in rural areas of Taita-Taveta (Mwatate and Taveta), Garissa (Balambala and Hulugho), Embu (Embu West and Mbeere North), Uasin Gishu (Ainabkoi and Soy) and Bungoma (Bumula and Tongaren). In Mwatate, a majority (43.5%) of its residents have completed primary education, followed by those who have completed secondary education. Those who have completed TIVET education stand at 10.4 percent followed by those who have completed university education. In comparison, Taveta has a majority (32.2%) of its residents completed secondary education, followed by those who have completed primary education at 30.3 percent. A distance third is those who have completed TIVET education then followed by those who have completed university education at 21.8 percent. The proportion of those who have completed pre-primary and primary education to those who have completed secondary education is higher in Mwatate than Taveta as shown in Figure 4.9. But this gap is reduced when we compare the number of the people
who have never attended school in the two regions. Out of the total number of those who have never been to school in Taita-Taveta, 32 percent are found in Taveta, while 24 percent are found in Mwatate. According to a key informant the findings are interesting because geographical reality and physical infrastructure favor Taveta more than Mwatate, but they could be other variables at play. He observed that Mwatate is poorer, semi-arid, straddles Tsavo National Park, with its residents facing serious wildlife threats, while Taveta is more agriculturally endowed, though with its own share of land ownership problem. Ordinarily, one would expect low enrolment in school; however, given that Mwatate is nearer Voi, it could be that the effect of rapid urbanization is having spillover effect in Mwatate as you would find that many people are working in Voi but staying in Mwatate. Other variable that could explain mixed results is the sociological factors in Mwatate like high levels of alcoholism and high number of broken families.74 He concluded by observing that the comparison has to be seen in the broader context of the overall population size especially the age structure of the two regions. Thus based on higher educational attainment than Mwatate, Taveta residents would be more conscious as far as population increase is concerned. However, this may be limited by the sizeable number of those who have not attained formal education.
In Garissa, Balambala has many (47.9%) of its residents with primary education followed by those who have completed secondary education at 32.2 percent. At a distance third is those who have completed university education followed by those who have completed TIVET education. While in Hulugho, a majority (52.6%) of its residents have completed primary education, followed by almost equal share of those who have completed secondary education and pre-primary education. Garissa County has a 74 Personal interview, a Lecturer, Department of Political Science and Public Administration, University of Nairobi, and resident of Taita-Taveta County, 24 June 2020.
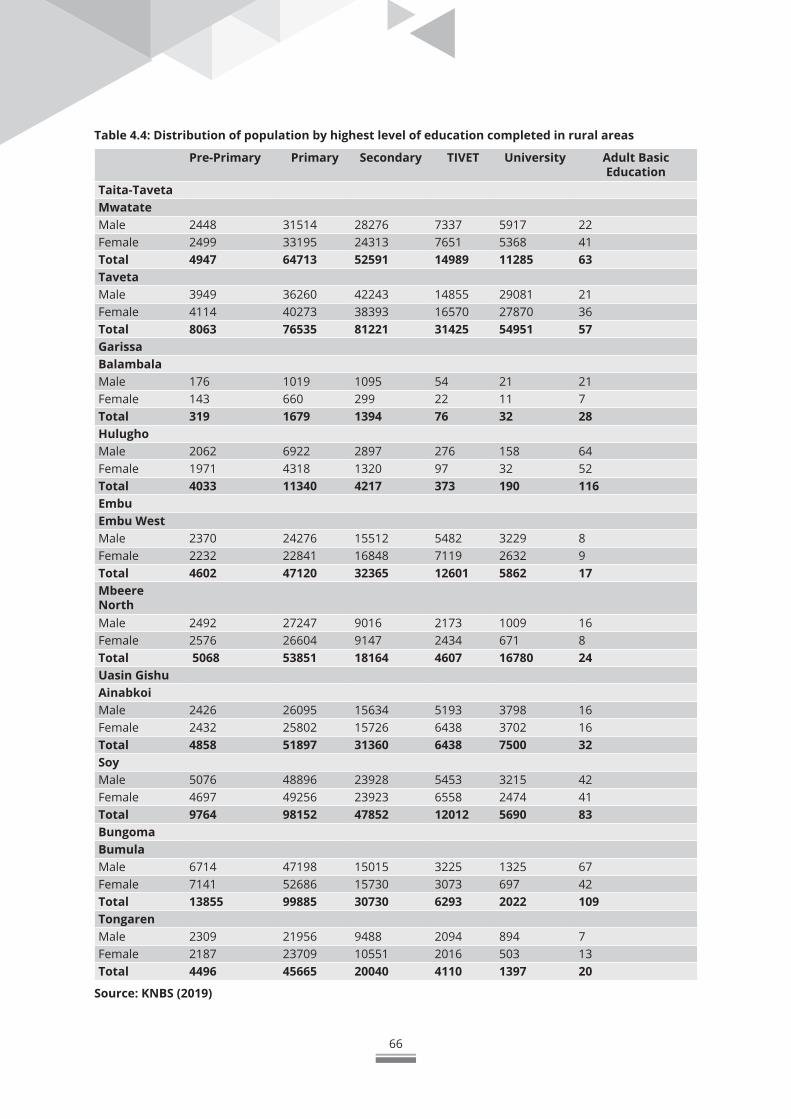
66
Table 4.4: Distribution of population by highest level of education completed in rural areas
Pre-Primary Primary Secondary TIVET University Adult Basic Education
Taita-Taveta Mwatate Male 2448 31514 28276 7337 5917 22Female 2499 33195 24313 7651 5368 41Total 4947 64713 52591 14989 11285 63Taveta Male 3949 36260 42243 14855 29081 21Female 4114 40273 38393 16570 27870 36Total 8063 76535 81221 31425 54951 57Garissa Balambala Male 176 1019 1095 54 21 21Female 143 660 299 22 11 7Total 319 1679 1394 76 32 28HulughoMale 2062 6922 2897 276 158 64Female 1971 4318 1320 97 32 52Total 4033 11340 4217 373 190 116Embu Embu West Male 2370 24276 15512 5482 3229 8Female 2232 22841 16848 7119 2632 9Total 4602 47120 32365 12601 5862 17Mbeere North Male 2492 27247 9016 2173 1009 16Female 2576 26604 9147 2434 671 8Total 5068 53851 18164 4607 16780 24Uasin Gishu Ainabkoi Male 2426 26095 15634 5193 3798 16Female 2432 25802 15726 6438 3702 16Total 4858 51897 31360 6438 7500 32Soy Male 5076 48896 23928 5453 3215 42Female 4697 49256 23923 6558 2474 41Total 9764 98152 47852 12012 5690 83Bungoma Bumula Male 6714 47198 15015 3225 1325 67Female 7141 52686 15730 3073 697 42Total 13855 99885 30730 6293 2022 109Tongaren Male 2309 21956 9488 2094 894 7Female 2187 23709 10551 2016 503 13Total 4496 45665 20040 4110 1397 20
Source: KNBS (2019)
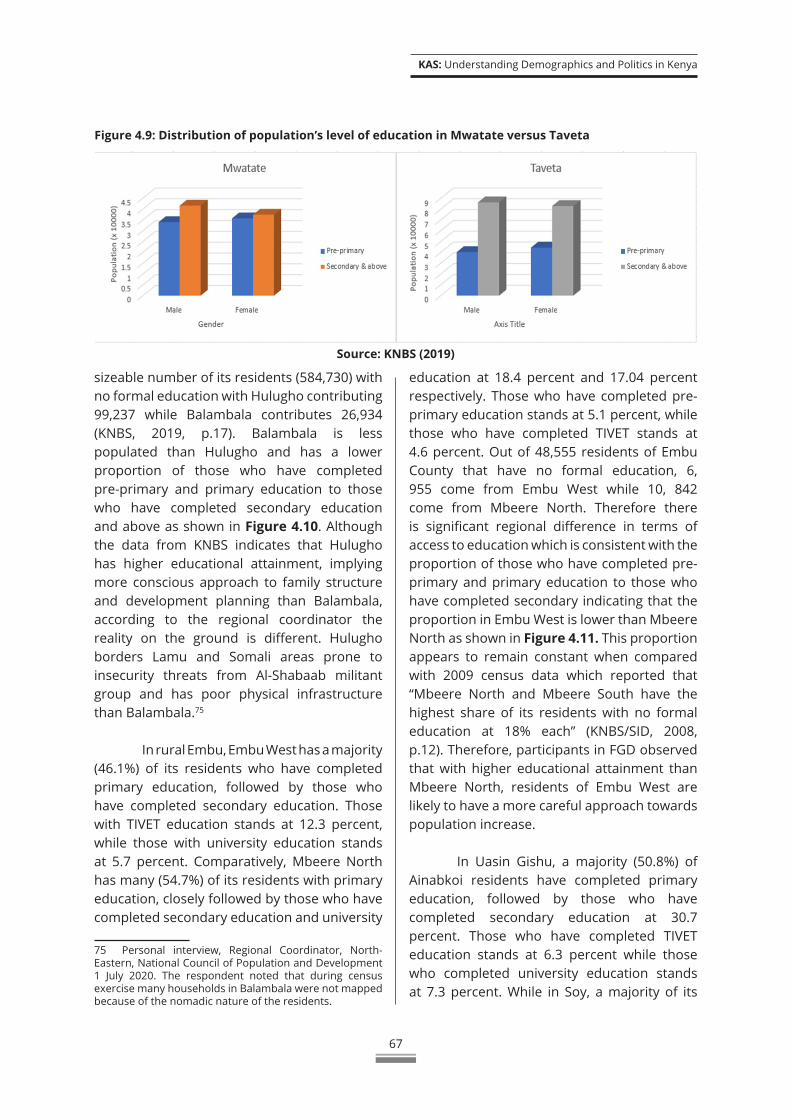
KAS: Understanding Demographics and Politics in Kenya
67
Figure 4.9: Distribution of population’s level of education in Mwatate versus Taveta
Source: KNBS (2019)
sizeable number of its residents (584,730) with no formal education with Hulugho contributing 99,237 while Balambala contributes 26,934 (KNBS, 2019, p.17). Balambala is less populated than Hulugho and has a lower proportion of those who have completed pre-primary and primary education to those who have completed secondary education and above as shown in Figure 4.10. Although the data from KNBS indicates that Hulugho has higher educational attainment, implying more conscious approach to family structure and development planning than Balambala, according to the regional coordinator the reality on the ground is different. Hulugho borders Lamu and Somali areas prone to insecurity threats from Al-Shabaab militant group and has poor physical infrastructure than Balambala.75
In rural Embu, Embu West has a majority (46.1%) of its residents who have completed primary education, followed by those who have completed secondary education. Those with TIVET education stands at 12.3 percent, while those with university education stands at 5.7 percent. Comparatively, Mbeere North has many (54.7%) of its residents with primary education, closely followed by those who have completed secondary education and university
75 Personal interview, Regional Coordinator, North-Eastern, National Council of Population and Development 1 July 2020. The respondent noted that during census exercise many households in Balambala were not mapped because of the nomadic nature of the residents.
education at 18.4 percent and 17.04 percent respectively. Those who have completed pre-primary education stands at 5.1 percent, while those who have completed TIVET stands at 4.6 percent. Out of 48,555 residents of Embu County that have no formal education, 6, 955 come from Embu West while 10, 842 come from Mbeere North. Therefore there is significant regional difference in terms of access to education which is consistent with the proportion of those who have completed pre-primary and primary education to those who have completed secondary indicating that the proportion in Embu West is lower than Mbeere North as shown in Figure 4.11. This proportion appears to remain constant when compared with 2009 census data which reported that “Mbeere North and Mbeere South have the highest share of its residents with no formal education at 18% each” (KNBS/SID, 2008, p.12). Therefore, participants in FGD observed that with higher educational attainment than Mbeere North, residents of Embu West are likely to have a more careful approach towards population increase.
In Uasin Gishu, a majority (50.8%) of Ainabkoi residents have completed primary education, followed by those who have completed secondary education at 30.7 percent. Those who have completed TIVET education stands at 6.3 percent while those who completed university education stands at 7.3 percent. While in Soy, a majority of its
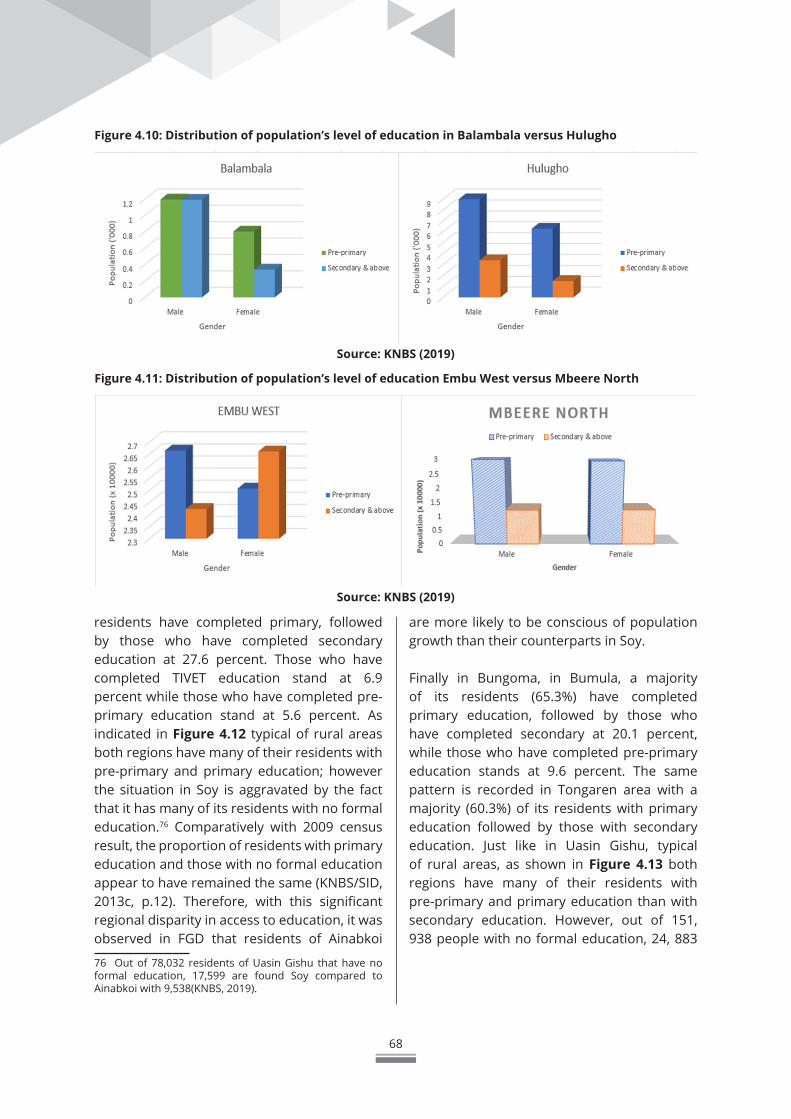
68
Figure 4.10: Distribution of population’s level of education in Balambala versus Hulugho
Figure 4.11: Distribution of population’s level of education Embu West versus Mbeere North
Source: KNBS (2019)
Source: KNBS (2019)
residents have completed primary, followed by those who have completed secondary education at 27.6 percent. Those who have completed TIVET education stand at 6.9 percent while those who have completed pre-primary education stand at 5.6 percent. As indicated in Figure 4.12 typical of rural areas both regions have many of their residents with pre-primary and primary education; however the situation in Soy is aggravated by the fact that it has many of its residents with no formal education.76 Comparatively with 2009 census result, the proportion of residents with primary education and those with no formal education appear to have remained the same (KNBS/SID, 2013c, p.12). Therefore, with this significant regional disparity in access to education, it was observed in FGD that residents of Ainabkoi
76 Out of 78,032 residents of Uasin Gishu that have no formal education, 17,599 are found Soy compared to Ainabkoi with 9,538(KNBS, 2019).
are more likely to be conscious of population growth than their counterparts in Soy.
Finally in Bungoma, in Bumula, a majority of its residents (65.3%) have completed primary education, followed by those who have completed secondary at 20.1 percent, while those who have completed pre-primary education stands at 9.6 percent. The same pattern is recorded in Tongaren area with a majority (60.3%) of its residents with primary education followed by those with secondary education. Just like in Uasin Gishu, typical of rural areas, as shown in Figure 4.13 both regions have many of their residents with pre-primary and primary education than with secondary education. However, out of 151, 938 people with no formal education, 24, 883
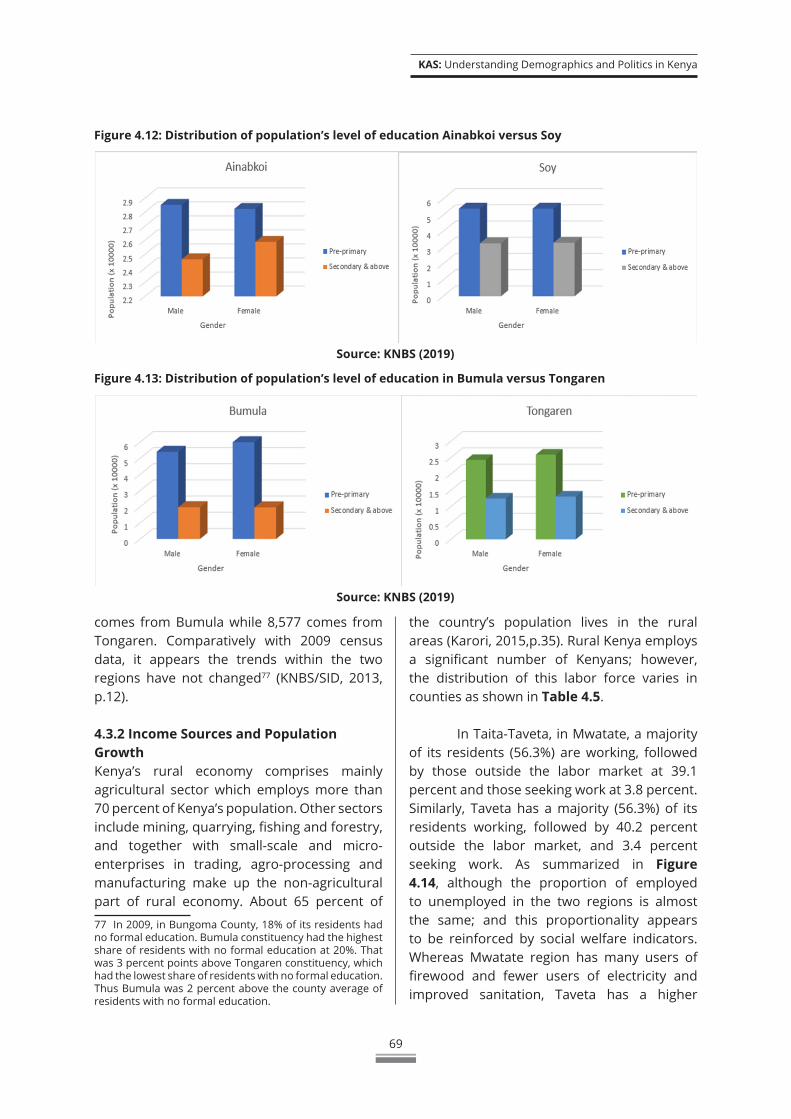
KAS: Understanding Demographics and Politics in Kenya
69
Figure 4.12: Distribution of population’s level of education Ainabkoi versus Soy
Figure 4.13: Distribution of population’s level of education in Bumula versus Tongaren
Source: KNBS (2019)
Source: KNBS (2019)
comes from Bumula while 8,577 comes from Tongaren. Comparatively with 2009 census data, it appears the trends within the two regions have not changed77 (KNBS/SID, 2013, p.12).
4.3.2 Income Sources and Population GrowthKenya’s rural economy comprises mainly agricultural sector which employs more than 70 percent of Kenya’s population. Other sectors include mining, quarrying, fishing and forestry, and together with small-scale and micro-enterprises in trading, agro-processing and manufacturing make up the non-agricultural part of rural economy. About 65 percent of
77 In 2009, in Bungoma County, 18% of its residents had no formal education. Bumula constituency had the highest share of residents with no formal education at 20%. That was 3 percent points above Tongaren constituency, which had the lowest share of residents with no formal education. Thus Bumula was 2 percent above the county average of residents with no formal education.
the country’s population lives in the rural areas (Karori, 2015,p.35). Rural Kenya employs a significant number of Kenyans; however, the distribution of this labor force varies in counties as shown in Table 4.5.
In Taita-Taveta, in Mwatate, a majority of its residents (56.3%) are working, followed by those outside the labor market at 39.1 percent and those seeking work at 3.8 percent. Similarly, Taveta has a majority (56.3%) of its residents working, followed by 40.2 percent outside the labor market, and 3.4 percent seeking work. As summarized in Figure 4.14, although the proportion of employed to unemployed in the two regions is almost the same; and this proportionality appears to be reinforced by social welfare indicators. Whereas Mwatate region has many users of firewood and fewer users of electricity and improved sanitation, Taveta has a higher
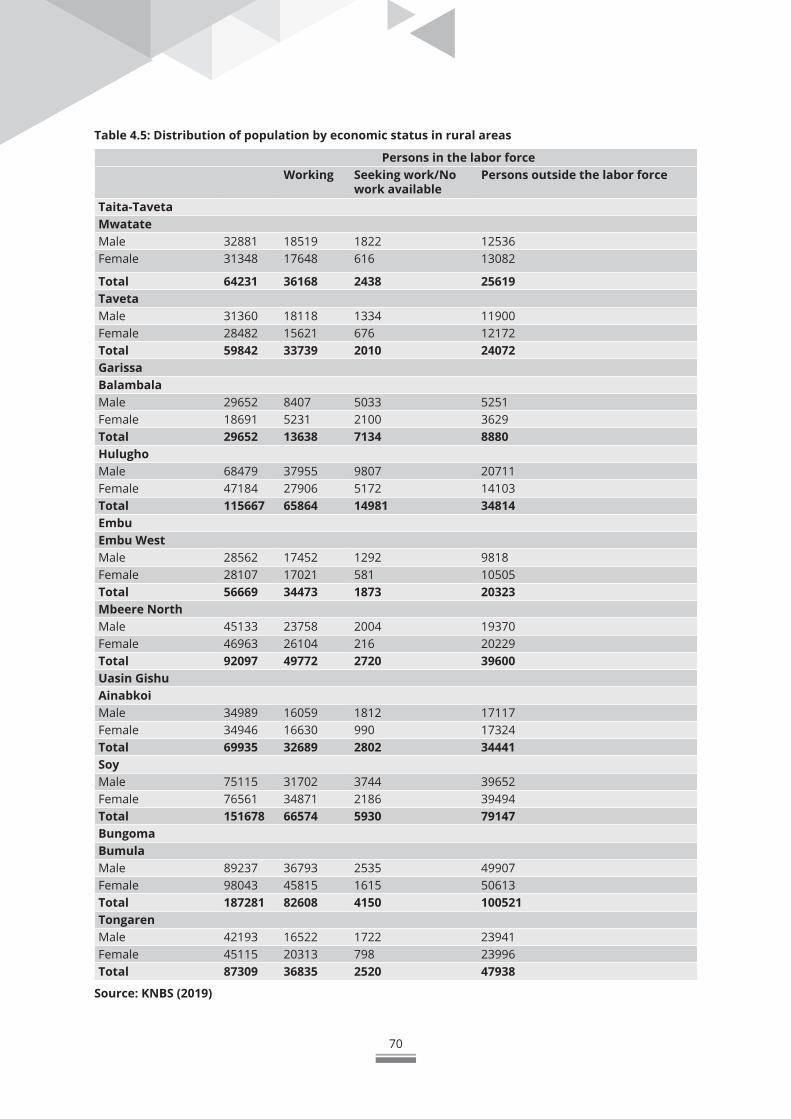
70
Table 4.5: Distribution of population by economic status in rural areas
Persons in the labor forceWorking Seeking work/No
work availablePersons outside the labor force
Taita-TavetaMwatateMale 32881 18519 1822 12536Female 31348 17648 616 13082
Total 64231 36168 2438 25619Taveta Male 31360 18118 1334 11900Female 28482 15621 676 12172Total 59842 33739 2010 24072Garissa BalambalaMale 29652 8407 5033 5251Female 18691 5231 2100 3629Total 29652 13638 7134 8880Hulugho Male 68479 37955 9807 20711Female 47184 27906 5172 14103Total 115667 65864 14981 34814Embu Embu West Male 28562 17452 1292 9818Female 28107 17021 581 10505Total 56669 34473 1873 20323Mbeere North Male 45133 23758 2004 19370Female 46963 26104 216 20229Total 92097 49772 2720 39600Uasin Gishu AinabkoiMale 34989 16059 1812 17117Female 34946 16630 990 17324Total 69935 32689 2802 34441Soy Male 75115 31702 3744 39652Female 76561 34871 2186 39494Total 151678 66574 5930 79147Bungoma Bumula Male 89237 36793 2535 49907Female 98043 45815 1615 50613Total 187281 82608 4150 100521Tongaren Male 42193 16522 1722 23941Female 45115 20313 798 23996Total 87309 36835 2520 47938
Source: KNBS (2019)
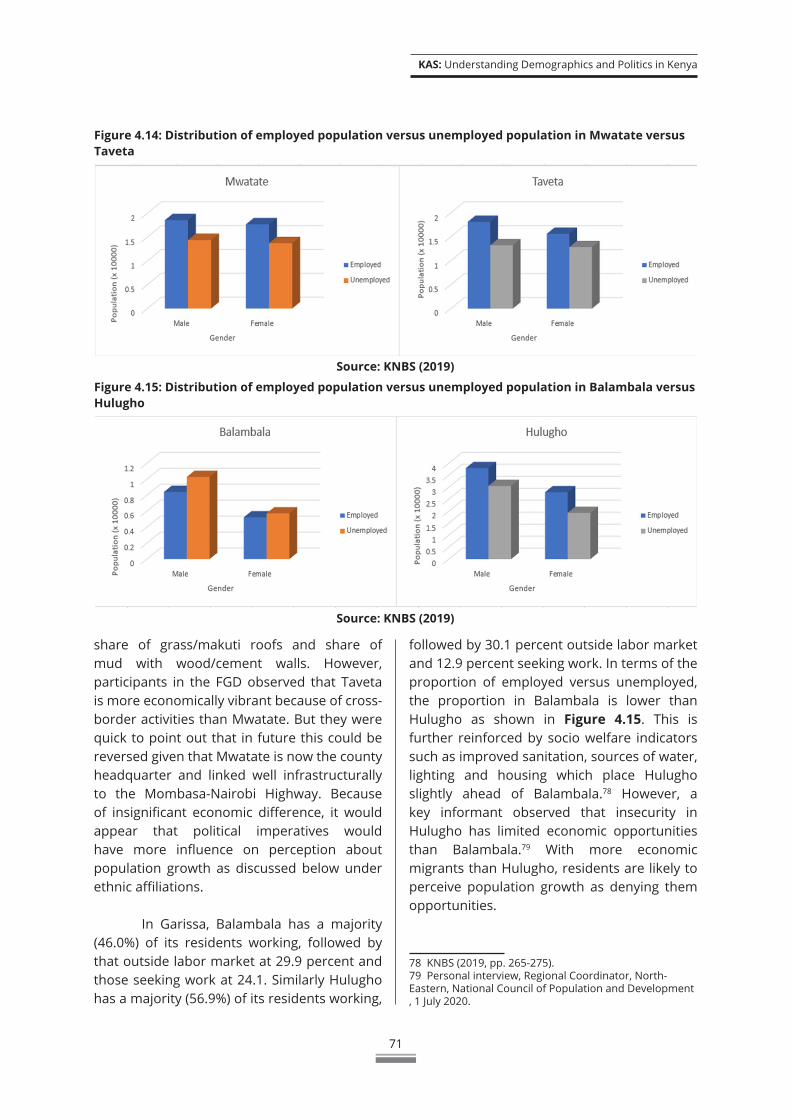
KAS: Understanding Demographics and Politics in Kenya
71
Figure 4.14: Distribution of employed population versus unemployed population in Mwatate versus Taveta
Figure 4.15: Distribution of employed population versus unemployed population in Balambala versus Hulugho
Source: KNBS (2019)
Source: KNBS (2019)
share of grass/makuti roofs and share of mud with wood/cement walls. However, participants in the FGD observed that Taveta is more economically vibrant because of cross-border activities than Mwatate. But they were quick to point out that in future this could be reversed given that Mwatate is now the county headquarter and linked well infrastructurally to the Mombasa-Nairobi Highway. Because of insignificant economic difference, it would appear that political imperatives would have more influence on perception about population growth as discussed below under ethnic affiliations.
In Garissa, Balambala has a majority (46.0%) of its residents working, followed by that outside labor market at 29.9 percent and those seeking work at 24.1. Similarly Hulugho has a majority (56.9%) of its residents working,
followed by 30.1 percent outside labor market and 12.9 percent seeking work. In terms of the proportion of employed versus unemployed, the proportion in Balambala is lower than Hulugho as shown in Figure 4.15. This is further reinforced by socio welfare indicators such as improved sanitation, sources of water, lighting and housing which place Hulugho slightly ahead of Balambala.78 However, a key informant observed that insecurity in Hulugho has limited economic opportunities than Balambala.79 With more economic migrants than Hulugho, residents are likely to perceive population growth as denying them opportunities.
78 KNBS (2019, pp. 265-275). 79 Personal interview, Regional Coordinator, North-Eastern, National Council of Population and Development , 1 July 2020.
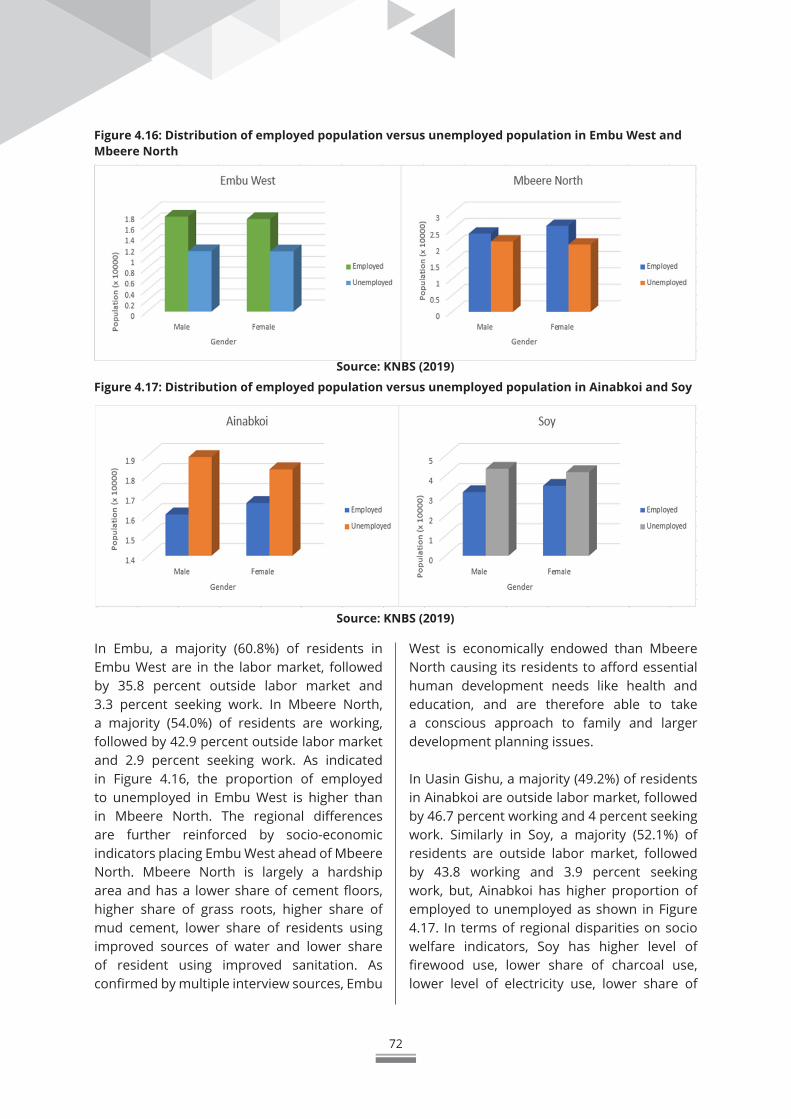
72
In Embu, a majority (60.8%) of residents in Embu West are in the labor market, followed by 35.8 percent outside labor market and 3.3 percent seeking work. In Mbeere North, a majority (54.0%) of residents are working, followed by 42.9 percent outside labor market and 2.9 percent seeking work. As indicated in Figure 4.16, the proportion of employed to unemployed in Embu West is higher than in Mbeere North. The regional differences are further reinforced by socio-economic indicators placing Embu West ahead of Mbeere North. Mbeere North is largely a hardship area and has a lower share of cement floors, higher share of grass roots, higher share of mud cement, lower share of residents using improved sources of water and lower share of resident using improved sanitation. As confirmed by multiple interview sources, Embu
Figure 4.16: Distribution of employed population versus unemployed population in Embu West and Mbeere North
Figure 4.17: Distribution of employed population versus unemployed population in Ainabkoi and Soy
Source: KNBS (2019)
Source: KNBS (2019)
West is economically endowed than Mbeere North causing its residents to afford essential human development needs like health and education, and are therefore able to take a conscious approach to family and larger development planning issues.
In Uasin Gishu, a majority (49.2%) of residents in Ainabkoi are outside labor market, followed by 46.7 percent working and 4 percent seeking work. Similarly in Soy, a majority (52.1%) of residents are outside labor market, followed by 43.8 working and 3.9 percent seeking work, but, Ainabkoi has higher proportion of employed to unemployed as shown in Figure 4.17. In terms of regional disparities on socio welfare indicators, Soy has higher level of firewood use, lower share of charcoal use, lower level of electricity use, lower share of
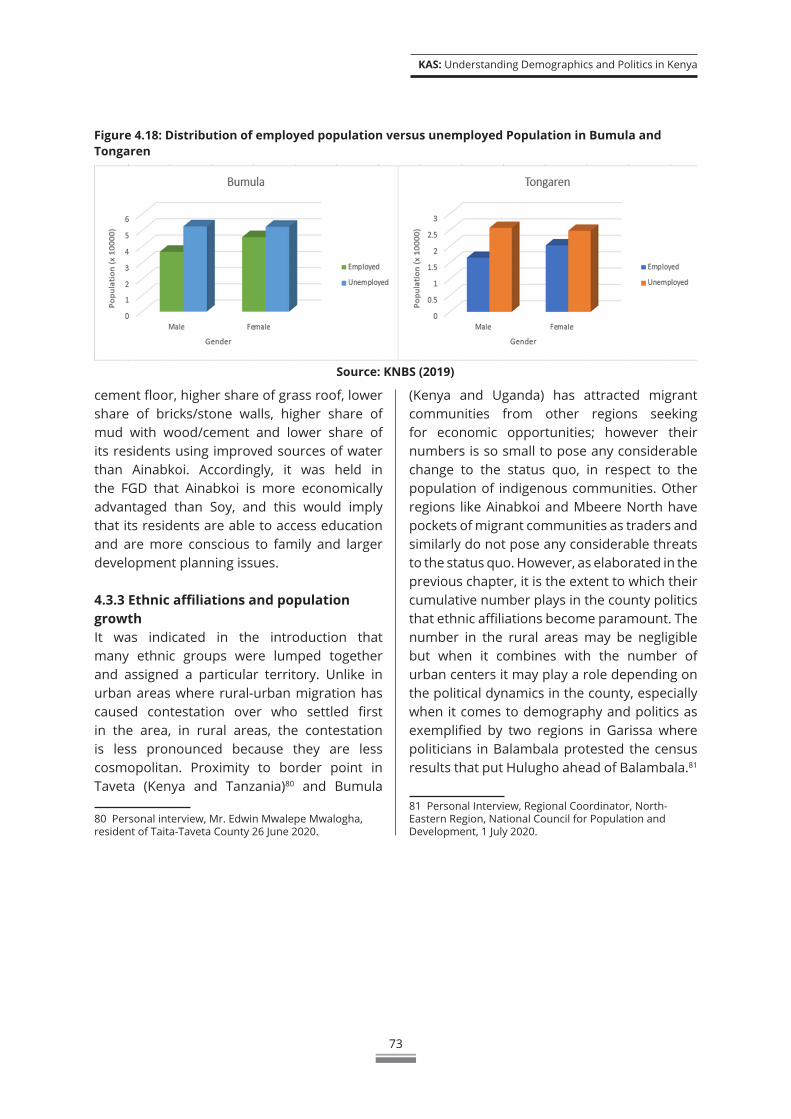
KAS: Understanding Demographics and Politics in Kenya
73
Figure 4.18: Distribution of employed population versus unemployed Population in Bumula and Tongaren
Source: KNBS (2019)
cement floor, higher share of grass roof, lower share of bricks/stone walls, higher share of mud with wood/cement and lower share of its residents using improved sources of water than Ainabkoi. Accordingly, it was held in the FGD that Ainabkoi is more economically advantaged than Soy, and this would imply that its residents are able to access education and are more conscious to family and larger development planning issues.
4.3.3 Ethnic affiliations and population growthIt was indicated in the introduction that many ethnic groups were lumped together and assigned a particular territory. Unlike in urban areas where rural-urban migration has caused contestation over who settled first in the area, in rural areas, the contestation is less pronounced because they are less cosmopolitan. Proximity to border point in Taveta (Kenya and Tanzania)80 and Bumula
80 Personal interview, Mr. Edwin Mwalepe Mwalogha, resident of Taita-Taveta County 26 June 2020.
(Kenya and Uganda) has attracted migrant communities from other regions seeking for economic opportunities; however their numbers is so small to pose any considerable change to the status quo, in respect to the population of indigenous communities. Other regions like Ainabkoi and Mbeere North have pockets of migrant communities as traders and similarly do not pose any considerable threats to the status quo. However, as elaborated in the previous chapter, it is the extent to which their cumulative number plays in the county politics that ethnic affiliations become paramount. The number in the rural areas may be negligible but when it combines with the number of urban centers it may play a role depending on the political dynamics in the county, especially when it comes to demography and politics as exemplified by two regions in Garissa where politicians in Balambala protested the census results that put Hulugho ahead of Balambala.81
81 Personal Interview, Regional Coordinator, North-Eastern Region, National Council for Population and Development, 1 July 2020.

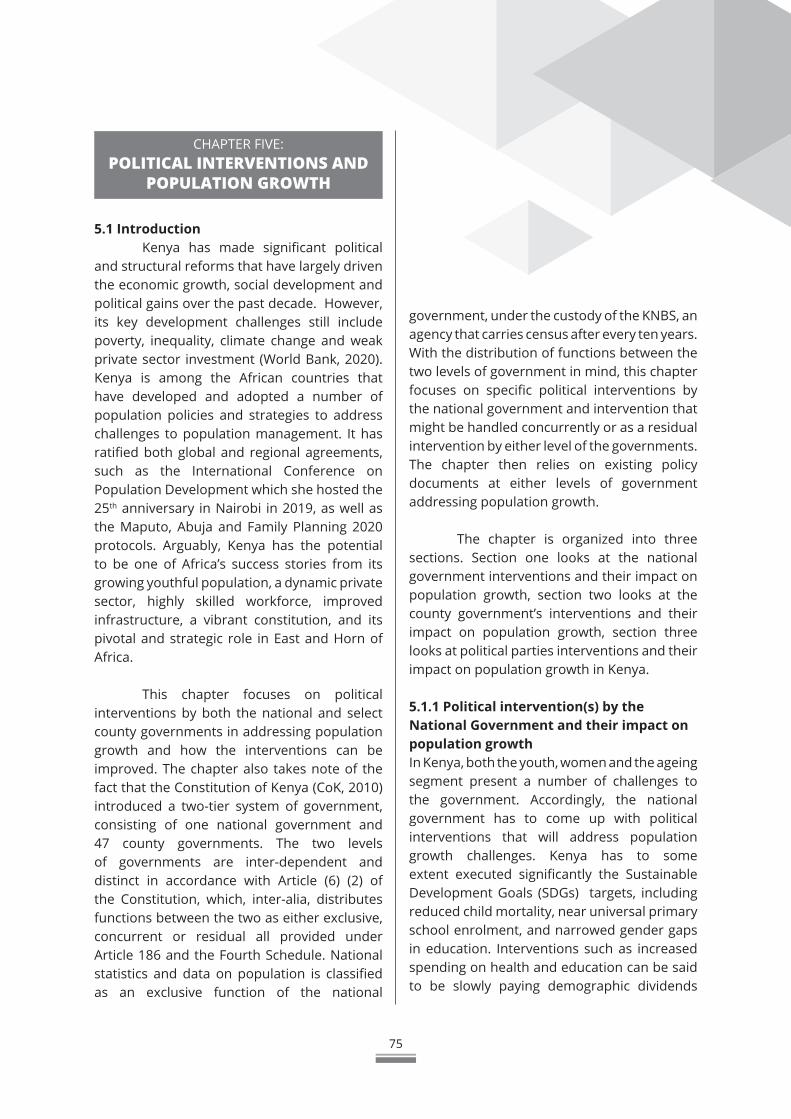
75
CHAPTER FIVE:POLITICAL INTERVENTIONS AND
POPULATION GROWTH
5.1 IntroductionKenya has made significant political
and structural reforms that have largely driven the economic growth, social development and political gains over the past decade. However, its key development challenges still include poverty, inequality, climate change and weak private sector investment (World Bank, 2020). Kenya is among the African countries that have developed and adopted a number of population policies and strategies to address challenges to population management. It has ratified both global and regional agreements, such as the International Conference on Population Development which she hosted the 25th anniversary in Nairobi in 2019, as well as the Maputo, Abuja and Family Planning 2020 protocols. Arguably, Kenya has the potential to be one of Africa’s success stories from its growing youthful population, a dynamic private sector, highly skilled workforce, improved infrastructure, a vibrant constitution, and its pivotal and strategic role in East and Horn of Africa.
This chapter focuses on political interventions by both the national and select county governments in addressing population growth and how the interventions can be improved. The chapter also takes note of the fact that the Constitution of Kenya (CoK, 2010) introduced a two-tier system of government, consisting of one national government and 47 county governments. The two levels of governments are inter-dependent and distinct in accordance with Article (6) (2) of the Constitution, which, inter-alia, distributes functions between the two as either exclusive, concurrent or residual all provided under Article 186 and the Fourth Schedule. National statistics and data on population is classified as an exclusive function of the national
government, under the custody of the KNBS, an agency that carries census after every ten years. With the distribution of functions between the two levels of government in mind, this chapter focuses on specific political interventions by the national government and intervention that might be handled concurrently or as a residual intervention by either level of the governments. The chapter then relies on existing policy documents at either levels of government addressing population growth.
The chapter is organized into three sections. Section one looks at the national government interventions and their impact on population growth, section two looks at the county government’s interventions and their impact on population growth, section three looks at political parties interventions and their impact on population growth in Kenya.
5.1.1 Political intervention(s) by the National Government and their impact on population growthIn Kenya, both the youth, women and the ageing segment present a number of challenges to the government. Accordingly, the national government has to come up with political interventions that will address population growth challenges. Kenya has to some extent executed significantly the Sustainable Development Goals (SDGs) targets, including reduced child mortality, near universal primary school enrolment, and narrowed gender gaps in education. Interventions such as increased spending on health and education can be said to be slowly paying demographic dividends
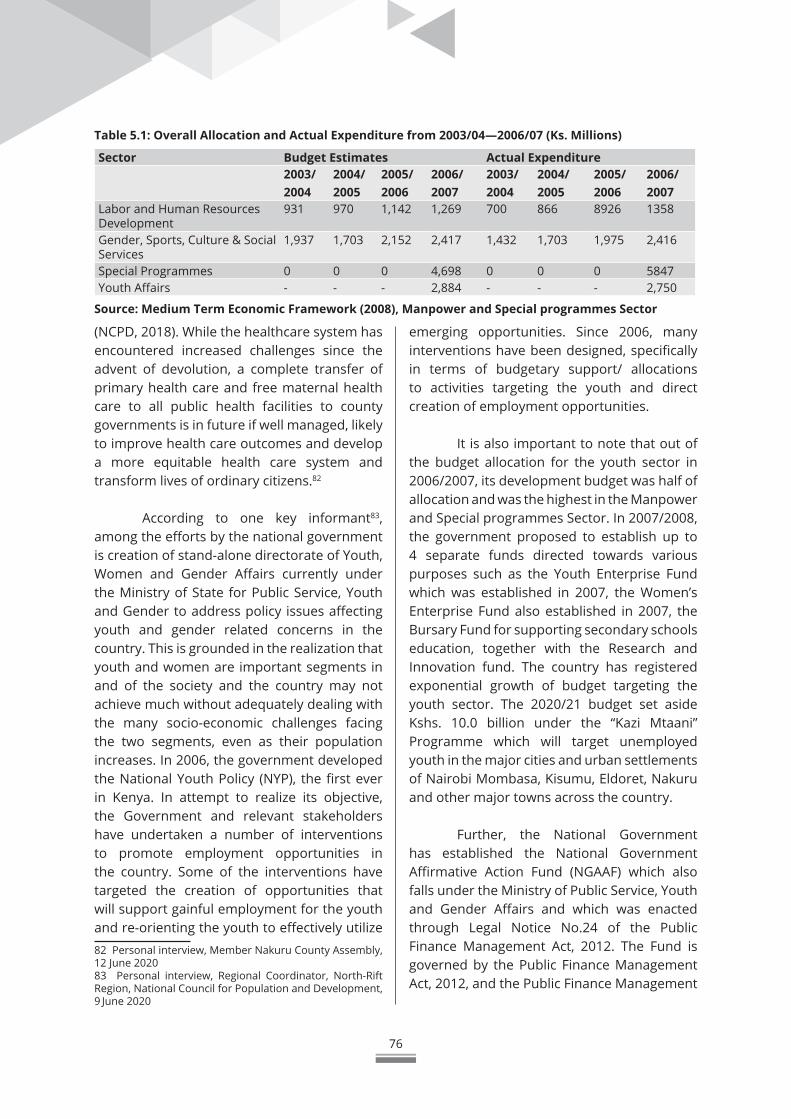
76
(NCPD, 2018). While the healthcare system has encountered increased challenges since the advent of devolution, a complete transfer of primary health care and free maternal health care to all public health facilities to county governments is in future if well managed, likely to improve health care outcomes and develop a more equitable health care system and transform lives of ordinary citizens.82
According to one key informant83, among the efforts by the national government is creation of stand-alone directorate of Youth, Women and Gender Affairs currently under the Ministry of State for Public Service, Youth and Gender to address policy issues affecting youth and gender related concerns in the country. This is grounded in the realization that youth and women are important segments in and of the society and the country may not achieve much without adequately dealing with the many socio-economic challenges facing the two segments, even as their population increases. In 2006, the government developed the National Youth Policy (NYP), the first ever in Kenya. In attempt to realize its objective, the Government and relevant stakeholders have undertaken a number of interventions to promote employment opportunities in the country. Some of the interventions have targeted the creation of opportunities that will support gainful employment for the youth and re-orienting the youth to effectively utilize 82 Personal interview, Member Nakuru County Assembly, 12 June 202083 Personal interview, Regional Coordinator, North-Rift Region, National Council for Population and Development, 9 June 2020
emerging opportunities. Since 2006, many interventions have been designed, specifically in terms of budgetary support/ allocations to activities targeting the youth and direct creation of employment opportunities.
It is also important to note that out of the budget allocation for the youth sector in 2006/2007, its development budget was half of allocation and was the highest in the Manpower and Special programmes Sector. In 2007/2008, the government proposed to establish up to 4 separate funds directed towards various purposes such as the Youth Enterprise Fund which was established in 2007, the Women’s Enterprise Fund also established in 2007, the Bursary Fund for supporting secondary schools education, together with the Research and Innovation fund. The country has registered exponential growth of budget targeting the youth sector. The 2020/21 budget set aside Kshs. 10.0 billion under the “Kazi Mtaani” Programme which will target unemployed youth in the major cities and urban settlements of Nairobi Mombasa, Kisumu, Eldoret, Nakuru and other major towns across the country.
Further, the National Government has established the National Government Affirmative Action Fund (NGAAF) which also falls under the Ministry of Public Service, Youth and Gender Affairs and which was enacted through Legal Notice No.24 of the Public Finance Management Act, 2012. The Fund is governed by the Public Finance Management Act, 2012, and the Public Finance Management
Table 5.1: Overall Allocation and Actual Expenditure from 2003/04—2006/07 (Ks. Millions)
Sector Budget Estimates Actual Expenditure2003/ 2004
2004/ 2005
2005/ 2006
2006/ 2007
2003/ 2004
2004/ 2005
2005/ 2006
2006/ 2007
Labor and Human Resources Development
931 970 1,142 1,269 700 866 8926 1358
Gender, Sports, Culture & Social Services
1,937 1,703 2,152 2,417 1,432 1,703 1,975 2,416
Special Programmes 0 0 0 4,698 0 0 0 5847Youth Affairs - - - 2,884 - - - 2,750
Source: Medium Term Economic Framework (2008), Manpower and Special programmes Sector
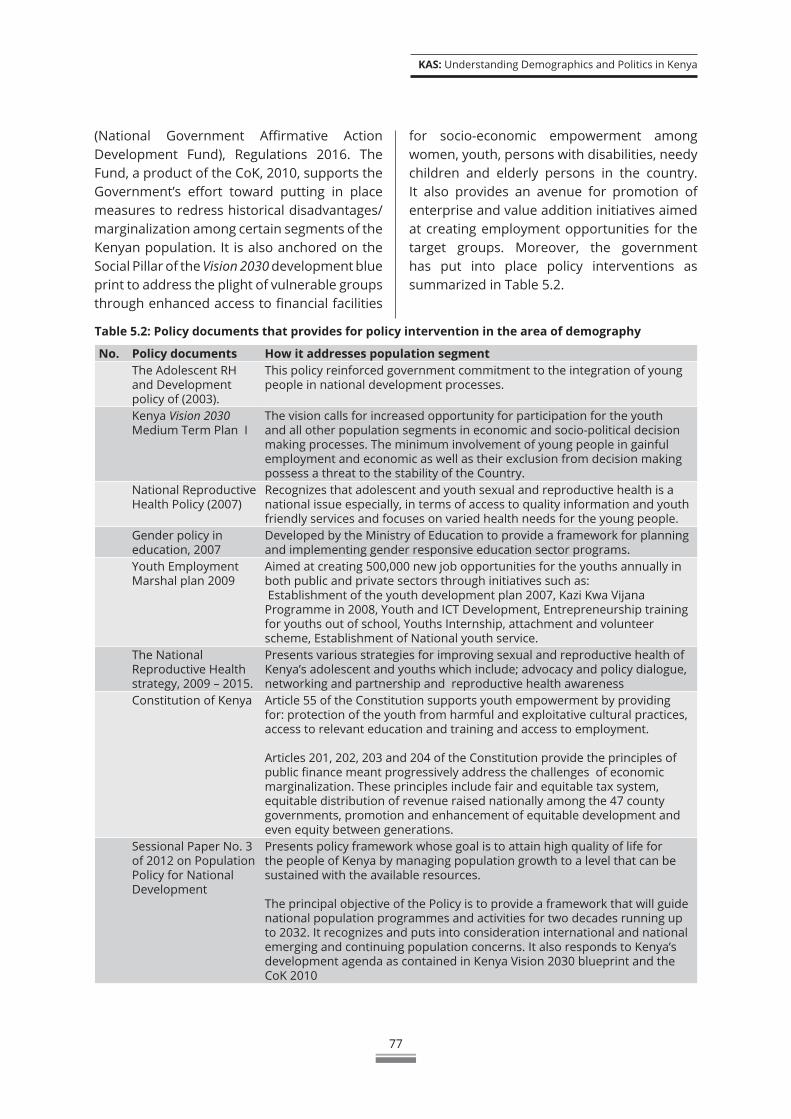
KAS: Understanding Demographics and Politics in Kenya
77
Table 5.2: Policy documents that provides for policy intervention in the area of demography
No. Policy documents How it addresses population segmentThe Adolescent RH and Development policy of (2003).
This policy reinforced government commitment to the integration of young people in national development processes.
Kenya Vision 2030 Medium Term Plan I
The vision calls for increased opportunity for participation for the youth and all other population segments in economic and socio-political decision making processes. The minimum involvement of young people in gainful employment and economic as well as their exclusion from decision making possess a threat to the stability of the Country.
National Reproductive Health Policy (2007)
Recognizes that adolescent and youth sexual and reproductive health is a national issue especially, in terms of access to quality information and youth friendly services and focuses on varied health needs for the young people.
Gender policy in education, 2007
Developed by the Ministry of Education to provide a framework for planning and implementing gender responsive education sector programs.
Youth Employment Marshal plan 2009
Aimed at creating 500,000 new job opportunities for the youths annually in both public and private sectors through initiatives such as: Establishment of the youth development plan 2007, Kazi Kwa Vijana Programme in 2008, Youth and ICT Development, Entrepreneurship training for youths out of school, Youths Internship, attachment and volunteer scheme, Establishment of National youth service.
The National Reproductive Health strategy, 2009 – 2015.
Presents various strategies for improving sexual and reproductive health of Kenya’s adolescent and youths which include; advocacy and policy dialogue, networking and partnership and reproductive health awareness
Constitution of Kenya Article 55 of the Constitution supports youth empowerment by providing for: protection of the youth from harmful and exploitative cultural practices, access to relevant education and training and access to employment.
Articles 201, 202, 203 and 204 of the Constitution provide the principles of public finance meant progressively address the challenges of economic marginalization. These principles include fair and equitable tax system, equitable distribution of revenue raised nationally among the 47 county governments, promotion and enhancement of equitable development and even equity between generations.
Sessional Paper No. 3 of 2012 on Population Policy for National Development
Presents policy framework whose goal is to attain high quality of life for the people of Kenya by managing population growth to a level that can be sustained with the available resources.
The principal objective of the Policy is to provide a framework that will guide national population programmes and activities for two decades running up to 2032. It recognizes and puts into consideration international and national emerging and continuing population concerns. It also responds to Kenya’s development agenda as contained in Kenya Vision 2030 blueprint and the CoK 2010
(National Government Affirmative Action Development Fund), Regulations 2016. The Fund, a product of the CoK, 2010, supports the Government’s effort toward putting in place measures to redress historical disadvantages/marginalization among certain segments of the Kenyan population. It is also anchored on the Social Pillar of the Vision 2030 development blue print to address the plight of vulnerable groups through enhanced access to financial facilities
for socio-economic empowerment among women, youth, persons with disabilities, needy children and elderly persons in the country. It also provides an avenue for promotion of enterprise and value addition initiatives aimed at creating employment opportunities for the target groups. Moreover, the government has put into place policy interventions as summarized in Table 5.2.
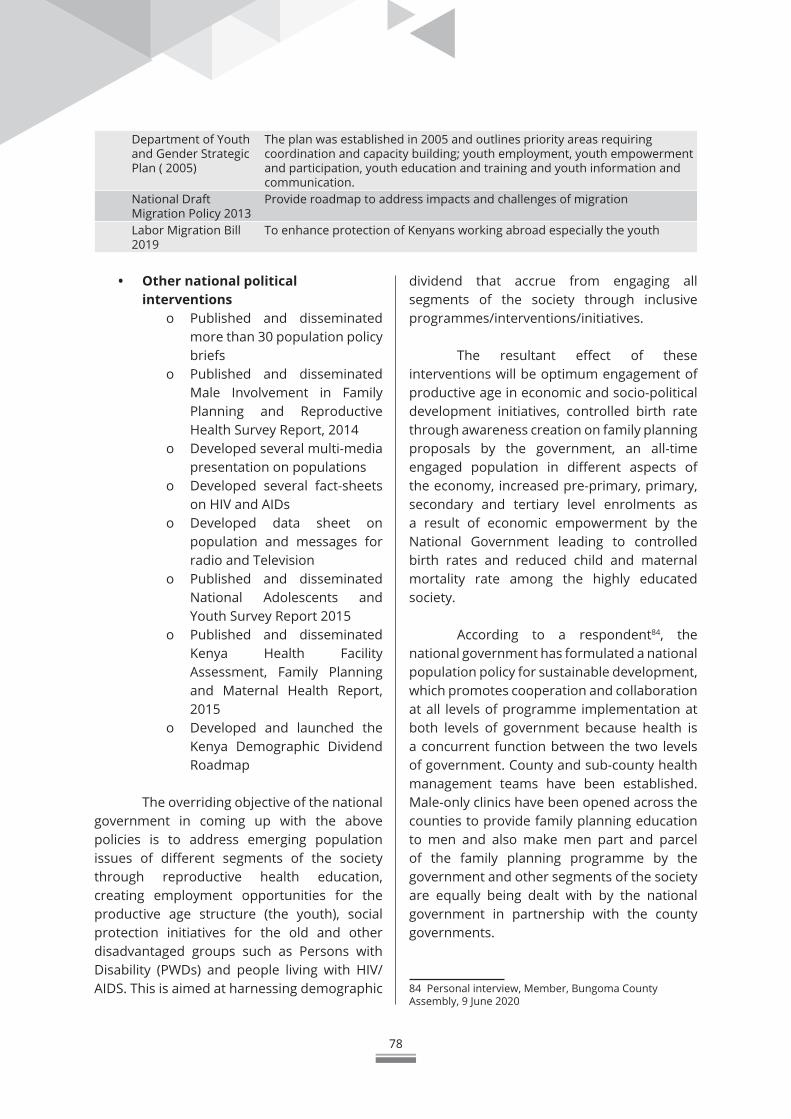
78
Department of Youth and Gender Strategic Plan ( 2005)
The plan was established in 2005 and outlines priority areas requiring coordination and capacity building; youth employment, youth empowerment and participation, youth education and training and youth information and communication.
National Draft Migration Policy 2013
Provide roadmap to address impacts and challenges of migration
Labor Migration Bill 2019
To enhance protection of Kenyans working abroad especially the youth
• Other national political interventions
o Published and disseminated more than 30 population policy briefs
o Published and disseminated Male Involvement in Family Planning and Reproductive Health Survey Report, 2014
o Developed several multi-media presentation on populations
o Developed several fact-sheets on HIV and AIDs
o Developed data sheet on population and messages for radio and Television
o Published and disseminated National Adolescents and Youth Survey Report 2015
o Published and disseminated Kenya Health Facility Assessment, Family Planning and Maternal Health Report, 2015
o Developed and launched the Kenya Demographic Dividend Roadmap
The overriding objective of the national government in coming up with the above policies is to address emerging population issues of different segments of the society through reproductive health education, creating employment opportunities for the productive age structure (the youth), social protection initiatives for the old and other disadvantaged groups such as Persons with Disability (PWDs) and people living with HIV/AIDS. This is aimed at harnessing demographic
dividend that accrue from engaging all segments of the society through inclusive programmes/interventions/initiatives.
The resultant effect of these interventions will be optimum engagement of productive age in economic and socio-political development initiatives, controlled birth rate through awareness creation on family planning proposals by the government, an all-time engaged population in different aspects of the economy, increased pre-primary, primary, secondary and tertiary level enrolments as a result of economic empowerment by the National Government leading to controlled birth rates and reduced child and maternal mortality rate among the highly educated society.
According to a respondent84, the national government has formulated a national population policy for sustainable development, which promotes cooperation and collaboration at all levels of programme implementation at both levels of government because health is a concurrent function between the two levels of government. County and sub-county health management teams have been established. Male-only clinics have been opened across the counties to provide family planning education to men and also make men part and parcel of the family planning programme by the government and other segments of the society are equally being dealt with by the national government in partnership with the county governments.
84 Personal interview, Member, Bungoma County Assembly, 9 June 2020
KAS: Understanding Demographics and Politics in Kenya
79
5.1.2 Political intervention by county governments and their impact on population growthAs discussed in the previous section, national statistics and data on population is a national government function and Kenya’s population policy emphasizes a multi-sectoral approach in implementation (NCPD, 2012). However, there are aspects of implementation of national government policy that would require cooperation and partnership with county governments. For instance, health function is devolved, meaning that any intervention by the national government towards regulating population growth through the health sector will naturally invite the involvement of the devolved units. Essentially, county governments are heavily involved in the implementation of political interventions by the national government.
According to a respondent85, population has a huge bearing on many county government decisions and policies on social, economic and political facets which has prompted them to come up with policies and legal framework such as the Ward Development Fund (WDF) whose focus is to address challenges faced by different segments of the society. The respondent noted that the purpose of WDF is to support establishment of youth and women enterprises and capacity building initiatives on population growth at the ward level. However, not all counties allocate the WDF to MCAs like in the case of Nakuru County Assembly as revealed by further interviews with the MCAs.
Another respondent 86 noted that county governments have positively contributed to managing pressure relating to population growth through enactment of trade and investment policies supporting establishment of industries and trade at the county level, which has provided job opportunities to both
85 Personal interview, Member, Nakuru, County Assembly, 10 June 202086 Personal interview, Member, Kisumu County Assembly, 11 June 2020
skilled and semi-skilled labor/work force. The respondent further observed that both productive and disadvantaged groups in the county have had an opportunity to be engaged in skilled and unskilled labor, thanks to a favorable investment environment created by most of the target counties. The respondent relied on part II of the fourth schedule of the COK 2010 to substantiate the role the county governments are playing toward managing population growth and the impacts of demography at large, noting that trade development and regulation, including markets; trade licenses; fair trading practices; local tourism; and cooperative societies are exclusive functions of the county governments that have bearing on strengthening the quality of life amid the rising population growth. Fair trading policies at the county level have presented opportunities for the youth, women, PWDs and the aged to be involved in income generating activities in various markets and towns, enabling them to earn livelihood and meet their daily basic needs; food and school fees with the latter increasing enrollment levels at different stages of education87.
Several counties have set up motorbike shades in several transit routes as incentive to attract unemployed youth in boda sector. To manage the sector, in 2018 Vihiga County developed Boda Policy to promote skills training, entrepreneurship, employment and skill development. The policy further aims to increase visibility and image of boda service, promote code of conduct and ensure measures to prevent unethical behavior in the industry, create public awareness on safety measures for boda operators and ensure adequate funding/investment in the industry.
Other counties are also engaged in agro-business and value addition of farm 87 Rita, Damary, “Assembly passes Trade Bill 2019 to unlock opportunities in local economic and private sector” Nakuru County Assembly Blog, “December, 6, 2019”.Accessed on 29th June, 2020. URL https://assembly.nakuru.go.ke/web/assembly-passes-trade-bill-2019-to-unlock-opportunities-in-local-economic-and-private-sector/.
80
produces. For instance, Makueni County has established two fruit juice processing lines to stem wastage and raise income for fruit farmers in the County. More than 12,000 farmers have benefitted from this initiative.
5.1.3 Political interventions by political parties in Kenya and their impact on population growth
From the respondents, political parties have done the least to directly contribute positively to the debate on population growth. A review of the Orange Democratic Movement (ODM) party shows that the party profiled to address wealth creation through an income distribution that will address income inequality which they say is more pronounced in rural areas. Their manifesto further provides that top 10 percent of the population in Urban Areas earns about 43.5 percent of the total income, with the bottom 10 percent earning only 1.2 percent. In rural areas, the top 10 percent of the population earns 42.2 percent of the total income, while the bottom 10 per cent earns only 0.8 per cent. The party proposes to design tax policies for redistribution of income and wealth by focusing on counties with limited capacity and expanding the social assistance programmes in the social protection policy. According to the COK 2010, political parties are under obligation to involve different segments of the society in political party affairs. Further, they are also required to nominate youth, women and PWDs to Parliament (RoK, 2010, Article 98c).This is then, a necessary evil that political parties have been obligated to accord with in their nomination procedures. The essence of the nomination requirement is to involve different segments of the society in decision making at both levels of government which is likely to inspire segment specific interventions thereby increasing inclusive ownership of policies.
5.1.4 Political Intervention by individual MPs, MCAs and their impact on population growth
A majority of respondents noted that the political scene in Kenya is always jolted with demographic trends every census year. Increase in88 population in any political constituency is good news to politicians because it offers them the “tyranny of numbers” to defeat political opponents at the ballot. A respondent admitted to be encouraging increased birth rate among the Luo, Luhya and Kisii communities who form majority of his support base in the ward he is currently representing. Similar views were held by another respondent89 who admitted that it was common for politicians to facilitate the ferrying of voters from one ward to another to provide the needed number or votes enough to win a ward election, all one needed was the financial resources.
However, it was a different scenario with another respondent90. “As an advocate of managed population growth, the need to manage population growth is key as it is the only way to address poverty, illiteracy, joblessness. This is because with a manageable population, you can plan well with the meager resources. Children can go to school, access health care, and the elderly can have safety nets that are more dignified”. The respondent also claimed that she had been elected on the platform of advocating for the right of women and the disadvantaged population segments in the society and hence a strong advocate of government policies on population growth.
Taita-Taveta county leadership have always been quoted urging their people to give birth, claiming that low birth rate and sparse population are to blame for the allocation of limited funds to Taita-Taveta County. According
88 Personal interview, Member, Nairobi County Assembly12 June 202089 Personal interview, Member Nairobi County Assembly 12 June 202090 Personal interview, Member Kisumu County Assembly 8 June 2020
KAS: Understanding Demographics and Politics in Kenya
81
to the former Governor, Hon. John Mruttu residents need to “boost their numbers” in order to have more voters and receive more money from the national government. The former Governor was further quoted saying, “We should abandon family planning and instead bear more children to boost the population”, (“Taita Taveta to get more children”, 2015). This is the same view held by one respondent91 who faulted religion (Christianity) as the reason why Taita-Taveta residents are not giving birth to many children. The respondent observed that politicians have unanimously agreed to use ‘all means possible under the sun’ to encourage residents to give birth. The perception about population growth in Kiambu County which is densely populated is not different from Taita Taveta County. In the run up to Building Bridges Initiatives (BBI) draft report launch in November 2019, a vocal Kiambu county MP was quoted saying that “ If the BBI does not
91 Personal interview, Member, Taita-Taveta County Assembly 18 June 2020.
address the challenges of equalization of the vote under the universal suffrage principle of one-man, one-vote, then we will sit down and advise our electorate accordingly,”. From the statement, one can infer the high premium placed on population by the Kiambu legislator and the resource target based on demographic strength equally canvassed by the Taita Taveta political leadership.
From the responses above, two things stand out on individual political interventions on population growth; first is the idiosyncratic variable in a political leader dictating convictions and stand on population growth policies and second, is the obvious regional difference of the wards. The urban area wards (two cases in Nairobi) are motivated by increased population for political reasons as a result of cosmopolitan nature of their constituencies as opposed to the rural constituencies with predominantly single ethnic composition such as Central Seme in Kisumu County.

83
CHAPTER SIX:SUMMARY AND
RECOMMENDATIONS
6.1 Summary The study was undertaken with the
background that KAS intends to understand the current population trend and demographic change in Kenya in view of developing political counter-measures. This chapter presents summary and recommendations based of the preceding chapters. The study sought to analyze the trends in most important demographic components of Kenya’s population in terms of their social groups and regional differentials with special reference to urban and rural areas. The refore, the chapter presents summary and recommendations straddling perception of demographic change, social groups and their differences on population growth; regional differences and their perception on demography; political interventions and population growth.
From the interviews, a majority of experts believe that annual population growth of 2.3 percent is generally good as it allows the government to adequately plan with available resources. On the age structure, experts interviewed noted that the Kenyan age structure which comprises 70 percent of the population below 24 years of age is likely to remain unchanged in next five to ten years. It is anticipated that the projected population change would increase population density to about 831 persons per square kilometer by 2050. The expansion of the market, in its turn, encourages entrepreneurs or a population segments to set up new investments and businesses (Simon, 1992). A huge population growth on the other hand is not only associated with food insecurity but also imposes constraints on the development of savings, foreign exchange and human resources. The increase in demand for food leads to a decrease in natural resources, which
are needed for a nation to survive. Other negative effects of population growth include poverty caused by low income per capita, hunger, and disease since rapid population growth complicates the task of providing and maintaining the infrastructure, education and health care needed in modern economies (Barro, 1991; Mankiw, Romer & Weil, 1992).
One prominent variable in the distribution of the population in Kenya among respondents is urbanization. This process has led to the increase in the number of people living in the urban areas in Nairobi, Mombasa, Nakuru and Kisumu and other urban areas in Kenya. This is only good to the extent that the urbanization process leads to increase in availability of labor but bad to the extent that resources such as health infrastructures are strained leading to increased infant mortality among other things. Cross cutting views from respondents cite rural-urban migration and expansion of the boundaries of urban areas as primary reasons for urbanization in Kenya. Proper planning and priority premised on socio-economic factors of production were cited as vital in regulating urbanization and curbing proliferation of population levels in urban areas. Hopefully, devolution as an aspect of decentralization will help to pacify this trend.
The study observes that there has been significant decline in fertility at the national level. However there are regional variations with an average of 2.3 births per woman in Kirinyaga County and 7.8 births per woman in Wajir County. Counties with lowest fertility level
84
include Kirinyaga, Kiambu, Nyeri, Nairobi and Murang’a, while counties with highest fertility level include Wajir, West Pokot, Turkana, Samburu and Garissa. From the foregoing, fertility rate is generally on the rise among counties in ASALs. The population growth play in the former Central Province indicates that the concept of “tyranny of numbers” might no longer be tenable as population figures shift in different regions. While Central region still remain the most populous in the country, it might not remain as densely populated as it has been in future. Not only is the population of the former Central Province declining as fertility rate dips, the people who have previously lived there are also increasingly being attracted to other parts of the country as a result of devolution. Other parts of the country such as the former Northeastern Province, which have been sparsely populated, experienced population increase in 2019 census due to their increased fertility, with their numbers further bolstered by improved healthcare occasioned by devolution. This has consequently led to a drastic drop in infant mortality.
A majority of respondents observed that population size puts significant pressure on the available resources consequently influencing the level of development. Many respondents believed that previous regimes failed to plan with scarce resources, tolerated mega corruption and skewed distribution of resources to certain regions. The outcome of not planning well, compounded by public wastage meant that for a long time, certain population in different regions defiant of science to inform resource allocation, benefited more on public resource than others, thanks to the then political regimes. This explains the essence of Articles 201, 202 and 203 of the Constitution of Kenya which was an attempt to anchor principles of public finance such as fair and equitable distribution of national revenue raised between the 47 counties. Accompanying equitable distribution was component on affirmative action that was actualized by the
establishment of the equalization fund. All these efforts were to correct the mistakes made by past regimes in cognizance of the threat posed by rapid population growth. Nonetheless, population experts faulted Commission on Revenue Allocation (CRA) in using the criteria they establish as a basis of resource distribution because they perpetrate regional disparity. According to the CRA criteria for resource allocation, much emphasis is placed on population but fails to take into account the county’s age structure which is likely to work against productivity levels required for the local economy. The study also found that politicians have continuously appropriated ethnic agenda in advocating for increase in birth among members of their sub-groups for political ends. Competition for scarce resources nationally was also cited as the reason for political pronouncements.
According to 2019 National Population and Housing Census the average household size stands at 3.9 persons, while UNDESA (2017) puts the average number of children per household among households with children at 2.6. The report further notes that households with children under age stands at 66 percent, while households with an adult member age 60 and above is 19 percent. Almost 11 percent of households are made up of children aged below 15 as well as adult aged above 60. Approximately, 16 percent of women and 10 percent of males aged 60 and above more likely to be living alone. This shows that the average house hold size in Kenya is high and the distribution in the size, composition and living arrangement has implication on social protection. A population expert noted that the idea of social protection is not well thought out in Kenya citing its weakness such as being contradictory and not integrating all aspects of population segments.
Turning to social groups in urban and rural areas, the study established that, Nairobi and Mombasa cities have more residents who
KAS: Understanding Demographics and Politics in Kenya
85
have completed secondary education than primary education. Data shows that Kisumu City and Nakuru Municipality have more residents who have completed pre-primary and primary education than those who have completed secondary. With regard to labor force and income sources, data indicates that urban areas host many unemployed population than rural areas. The employed segment in urban areas is predominantly found in informal sector, while in rural areas the employed ones draw their income mainly from subsistence and a few large-scale farming. This income sources is also intermediated by other variables such as level of education having decisive perception on population growth. Those in informal sector in urban areas are mostly primary and secondary drop-outs who perceive family in terms of many children and would tend to consider population growth as a positive change. Their perception would also be similar to farmers in rural areas with large pieces of land who would prefer to have many children as a source of labor. But literature also observes that generally educated employed people in urban areas would prefer to have small families than employed in rural areas because of cost of living. In urban areas the consumption and expenditure per household is higher than in the rural areas. As for ethnic affiliation, the numerical strength of majority ethnic groups is higher in rural areas than urban areas, further heightening the importance of ethnic identity in rural politics than in urban politics. With devolved governance structure, political competition to a large extent has been fairly managed in urban areas like Nakuru, Nairobi and Mombasa more than in rural areas like Taita-Taveta, Uasin Gishu and Bungoma. However, the extent of management depends on the local-center relations and role of national elites in local- power sharing agreement. In Nakuru municipality, power-sharing agreement mollified the relations between the Kikuyu and the Kalenjin communities but did not erode ethnic hostility. A relatively stable pact between Uhuru Kenyatta and his running mate William
Ruto influenced cohesion and predictability. Embu adopted similar arrangement only in 2013 elections, however in Uasin Gishu and Bungoma calls for similar arrangement was ignored by local politicians rendering minority communities to experience marginalization in representation and access to social amenities. The discontent among the minority groups has found expression in clamor for increase in their population. Therefore the inter-linkage between dominance and population increase is more pronounced in rural areas than urban areas.
Population and poverty distribution indicates that food poverty incidence levels are higher and affect more than half of the population in rural areas with Garissa in the lead at 45.2 percent followed by Taita-Taveta at 38.9 percent Embu, Uasin Gishu and Bungoma have 28.3%; 38.2 % and 32.4% respectively. Food poverty incidence levels are lower and affect less than one fifth of the population in urban areas with Nairobi at 16.1 percent, followed by Nakuru at 19.6 percent, then Mombasa at 23.6 percent and Kisumu at 32.5 percent. Overall poverty incidence is higher in rural than urban areas. Nairobi County (4.5%), Nakuru County (3.1%) and Bungoma County (3.4%) have higher number of overall poor people. Extreme poverty declined significantly by more than half from 19.5 percent in 2005/2006 to 8.6 percent in 2015/2016 with huge spacial disparities. The prevalence of extreme poverty more than halved in urban area from 8.3 percent to 3.4 percent and similarly halved in rural area from 22.2 percent in 2015/2016 to 11.2 percent in rural areas. In selected counties in urban areas, Kisumu has high extreme poverty incidence, while in the rural areas Garissa County has high extreme poverty incidence.
Finally, in terms of political intervention on population growth, successive regimes in Kenya have come up with various policy documents targeting different segments of the population. The study found that the national
86
government has come up with political interventions which are slowly managing population growth. Among policy interventions have ended up creating institutions to address the challenges of demographic change. One of these institutions is the Directorate of Youth, Women and Gender Affairs currently under the Ministry of State for Public Service, Youth and Gender which is designed to address policy issues affecting youth and gender related concerns in the country. These directorates design interventions intended to economically cushion different population segments in terms of wealth distribution and social protection among other things.
As a result of a huge bearing of population on many county government decisions and policies on social, economic and political facets, County governments have come up with policies and legal framework such as the Ward Development Fund (WDF) whose focus is to address challenges faced by different social groups. County governments have also enacted a number of policy measures meant to support the establishment of industries and trade at the county level, which has provided job opportunities to both skilled and semi-skilled labor/work force.
6.2 Recommendations Governments, both at the national and county levels have an immediate responsibility for ensuring that conscious, targeted measures are put in place to secure substantive equality and that population growth is properly planned. Fundamental solution to population challenges lies in better policies and implementation of those policies. However, as was noted by the majority of the respondents, some population policy interventions are not in sync with demographic changes over time in Kenya.
� The CRA established under Article 216 of the Constitution has placed a lot of emphasis on population, poverty index and geographical size in the criteria for horizontal allocation,
however allocation criteria does not disaggregate demographic features. This aspect needs to be part of the CRA criteria for the country to be able to invest more on population segment. More redistributive effect to the country’s economic growth and development can be achieved when more resources are directed to counties with more youthful age structure than those with elderly populations. Elderly populations have very low productivity compared to youthful population yet safety nets can best be applied on them.
� Still on the age, the government should formulate comprehensive age-specific approaches directed at children (0-15years) and youth (15-34years) so as to develop human capital, create jobs and reduce the dependency ratio.
� The high number of youth in some counties would call upon county planners to rethink about appropriate strategies for job creation (both in the private and public sectors) because population growth among the youth would increase competition for scarce positions leaving many young people behind, leading to widespread grievance which may result them to turning into political volatility in future.
� Lack of information about reproduction services and other services was cited as a constrain to population segments of reproductive age from achieving their desired number and spacing of children. It is obvious that it is not a priority to most politicians as well as their political parties. Politicians can be persuaded to adopt a political stance where they tailor debates on family planning programs that are likely to be of more value to lower income groups than to higher income groups, who may have better access to private services.
� Discrimination of various population
KAS: Understanding Demographics and Politics in Kenya
87
segments during the implementation of social protection policies was cited as a challenge in addressing population growth. There is need for deliberate effort by both levels of government to review policies that eradicate social discrimination and exclusion. This should also address discriminatory and exclusionary practices, so as to ensure that all citizens are included in socio-economic and political development processes.
� Both levels of government should design pro-poor fiscal and safety net policies. Implementation of population segment specific fiscal policies such as National Government Affirmation Action Fund (NGAAF), Older Persons Cash Transfer (OPCT), Persons with Severe Disabilities Cash Transfer Program (PWSD-CT, Cash Transfer for Orphans and Vulnerable Children (CT-OVC), Uwezo Fund, Youth Fund, Women Enterprise Development Fund should be closely monitored and reviewed based on the changing times, to ensure that the funds are gaining positive and maximum impact on intended beneficiaries.
� The national and the county governments to review the coordination and implementation guidelines of the current cash transfer programs. These reviews should consider principles of devolution and different segments of population. This should include review of Social Assistance Act of 2013 to inform the scale up phase and establishment of a comprehensive, affordable and sustainable social safety network program in national and county levels.
� To address transition rates to secondary schools in rural areas, the government should implement subsidized secondary education by improving infrastructural facilities.
� To address, challenges at different income levels in both urban and rural areas, the governments at both levels should formulate income and social policies which include among others; the registration and protection of informal employment/sectors which has the largest number of population segment residing in urban area slums.

REFERENCES
Anderson, M. J., & Fienberg, S. (2001). Who counts? The politics of census-taking in contemporary America. New York: Russell Sage.
Barro, R.J. (1991). Economic Growth in a Cross Section of Countries. Quarterly Journal of Economics, 106(2): 407-443.
Birdsall, N., Levine, R & Ibrahim, A. (2005). Toward universal primary education: Investments, incentives and institutions: Task Force on achieving Universal Primary Education, New York: United Nations Millennium Project.
Bloom, D.E., Canning, D & Sevilla, J. (2013). The demographic dividend: A new perspective on the economic consequences of population change. Santa Monica: CA: Rand.
Bosire, C.M. (2014). Kenya’s ethno-politics and the implementation of devolution under the Constitution of Kenya, 2010, Nairobi: International Centre for Local Democracy.
Bucci, A. (2003). Population growth in a model of economic growth with human capital accumulation and horizontal R & D, University of Milan: Milan
Bumpass, L.A., & Sweet, J. (1981). A
demographic perspective on the poverty population. Institute for Research on Poverty Discussion Paper No. 669–81. Madison: University of Wisconsin.
Chronic Poverty in Kenya (2018). Understanding poverty in Kenya: A multidimensional analysis. London: Overseas Development Institute.
Constitution and Reform Education Consortium (CRECO). (2012). Building a culture of peace in Kenya baseline report on conflict mapping and profiles of 47 counties in Kenya. Nairobi: CRECO.
Crampton, A. (2011). Population aging and social work practice with older adults: Demographic and policy challenges, International Social Work, 54(3):313-329.
Cervellati, M. (2009). Life expectancy and economic growth: The role of the demographic transition, Discussion Paper No. 4,160.
Cross, A, R., Obungu, W & Kitizo, P. (1991). Evidence of a transition to lower fertility in Kenya International Family Planning Perspective, 17, 1:4-7.
Damary, R. (2019). “Assembly passes Trade Bill 2019 to unlock opportunities in local economic and private sector” Nakuru County Assembly Blog, “December, 6, 2019”.Accessed on 29th June, 2020. URL https://assembly.nakuru.go.ke/web/assembly-passes-trade-bill-2019-to- unlock-opportunities-in-local-economic-and-private-sector/ (Accessed on 7 June 2020).
Easton, D. (1957). An Approach to the Analysis
of Political System, World Politics, 9,3:383-400.
Elfversson, E & Höglund, K. (2019). Violence in the city that belongs to no one: Urban distinctiveness and interconnected insecurities in Nairobi (Kenya). Conflict, Security & Development,19,4: 347-370.
Elfeversson, E & Sjögren, A. (2020). Do local power-sharing deals reduce ethno political hostility? The effects of negotiated democracy in a devolved Kenya, Ethnopolitics, 19, 1:45-63.
Embu County Government. (2014). Annual Development Plan 2015/2016.
Friedrich Ebert Stiftung. (2012). Regional Disparities and Marginalization in Kenya, Nairobi: FES.
89
90
Headey, D & Hodge, A. (2009). The effect of population growth on economic growth: A meta-regression analysis of the macroeconomic literature, Population and Development Review, 35,2:221-248.
Gribble, J. (2012). South Korea’s demographic dividend, http://www.prb.org/articles/2012/south-korea-population.aspx (accessed 5 June 2020).
Kanyinga, K. (2006). Governance institutions and inequality. In Society for International Development, Reading on Inequality in Kenya: Sectoral Dynamics and Perspectives (pp. 345-397). Nairobi: Society for International Development.
Karoli, G. (2015). Rural development policies in Kenya: A descriptive Analysis, over 1970- 2001 period, European Journal of Business, Economics and Accountancy, 3(1):35-53.
Kempe, R.H. (2012). Engaging the youth in Kenya: Empowerment, education, and employment. International Journal of Adolescence and Youth, 17,4, 221.
Kenya Institute for Public Policy Research and Analysis. (2017). Harnessing Kenya’s demographic dividend: Effects of population dynamics’, KIPPRA Discussion Paper No. 191.
Kenya National Bureau of Statistics. (2009). Kenya 2009 Population and Housing Census Analytical Report on Kenya Population Atlas VOLUME XV. Nairobi: KNBS.
Kenya National Bureau of Statistics. (2012). 2009 Kenya Population and Housing Census: Analytical report on population projections. Ministry of State for Planning, National Development and Vision 2030.
Kenya National Bureau of Statistics /Society for International Development (2013a). Exploring Kenya’s Inequality: Pulling Apart or Pooling Together? Abridged Report, KNBS.
Kenya National Bureau of Statistics /Society for International Development (2013b). Exploring Kenya’s Inequality: Pulling Apart or Pooling Together? Kisumu County, KNBS.
Kenya National Bureau of Statistics /Society for International Development KNBS/SID (2013c). Exploring Kenya’s Inequality: Pulling Apart or Pooling Together? Uasin Gishu County, KNBS.
Kenya National Bureau of Statistics /Society for International Development (2013d). Exploring Kenya’s Inequality: Pulling Apart or Pooling Together? Bungoma County, KNBS.
Kenya National Bureau of Statistics. (2018). Basic Report on Well-Being in Kenya. Based on the 2015/2016, Kenya Integrated Household Budget Survey (KIHBS), KNBS.
Kenya National Bureau of Statistics (2019). 2019 Kenya Population and Housing Census, Volume IV: Distribution of Population by Socio-Economic Characteristics, Kenya National Bureau of Statistics.
Kimani, MM., Njeru, M., & Ndirangu, G. (2012). Regional variations in contraceptive use in Kenya: Comparison of Nyanza, Coast and Central Provinces: NCPD Working Paper.
Leahy, E., Engelman, R., Vogel, CB., Haddock, S., & Preston, T. (2010). The shape of thing to come, why age structure matters to a safer, more equitable world, Washington DC: Population Action International.
Lutz, W & Samir, K.C. (2010). Dimensions of global population projections: What do we know about the future population trends and structure, Philosophical Transactions of the Royal Society, 365:2779-2791.
Lutz. W & Goldstein, J. (2004). Special issue on ‘how to deal with uncertainty in population Forecasting? International Statistical Review, 72, 1-106; 157-208.
Lutz, W., Butz, WP & Samir, K.C. (2014). World Population and Human Capital in the Twenty-first Century, Oxford: Oxford University Press.
KAS: Understanding Demographics and Politics in Kenya
91
Lutz, W., Cuaresma, J,C., & Abbasi-Shavazi, M.J. (2010). Demography, education and democracy: Global trends and the case of Iran, Population and Development Review, 36,2: 253–281.
Magak, B., Cherui, R., Oloibe, J & Kosgei, Z. (2014). Access to secondary schools education in Uasin Gishu County in Kenya before and after the Implementation of subsidized secondary education (SSE), International Journal of Current Research, 6, 109: 8564-8568.
Mankiw, G., Roemer, D & Weil, P. (1992). A contribution to the empirics of economic growth. Quarterly Journal of Economics, May, 407-437.
Malthus, T.R. (1798). An essay on the principles of population, Cambridge University Press: Cambridge.
Mason, A. (2005). Democratic transition and demographic dividends in developed and developing Countries, United Nations Expert Group Meeting on Social and Economic Implications Of Changing Population Age Structure, UNDESA/PD.
Meyer, M. (2013). Ethics and values, macro practice, policy and advocacy, social justice and human Rights Online Publication Date: Jun 2013 DOI:10.1093/9780199975839.013.293
Mitullah, W. (2003). Understanding slums: Case studies for the global report on human settlement, The Case of Nairobi.
Mombasa County Government (2018). County Integrated Development Plan.
National Council for Population and Development (2013). Kenya Population Situation Analysis 2013.Nairobi:NCPD
National Council for Population and Development. (2012). Sessional Paper No. 3 of 2012. Nairobi: NCPD.
National Council for Population and Development. (2017). State of the Kenya Population Report 2016. Nairobi: NCPD.
National Council for Population and Development (2018). State of the Kenya Population Report 2017. Nairobi: NCPD.
National Gender and Equality Commission [NGEC] (2018). Unmasking ethnic minorities and marginalized communities in Kenya, who and where? NGEC
Nelson, H.D. (Ed.).(1983). Kenya, A country study. Washington, D.C.: Foreign Area Studies, American University.
Nichiporuk, B. (2000). The Security Dynamics of Demographic Factors. Document MR-1088 WFHF/RF/DLPF/A. Santa Monica: RAND Corporation.
Ngau, P., & Mbathi, M. (2010). The geography of voting in Kenya: An analysis of the 2007 presidential, parliamentary and civil voting patterns. In K. Kanyinga & D. Okello (Eds.), Tensions and reversals in democratic transitions: The Kenya 2007 general elections (pp.139-175), Society for International Development (SID) and Institute for Development Studies (IDS), University of Nairobi.
Olima, WHO (2001) “The Dynamics and Implications of Sustaining Urban Spatial Segregation in Kenya – Experiences from Nairobi Metropolis” A Paper Presented at the International Seminar on Segregation in the City Held at Lincoln Institute of Land Policy in Cambridge, MA, USA, July 25-28, 2001 http//wwwlincolninstedu/courses/segreg/olimadoc on Wednesday, June 12, 2002.
Oyugi, W., Wanyande, P., & Odhiambo-Mbai, C (Eds.). (2003). The Politics of transition in Kenya from KANU to NARC. Nairobi: Heinrich Boll Foundation.
Phang S. (2005), Demographic dividend and labor force transformation in Asia: The case of the Republic of Korea. Paper prepared for UN expert group meeting on social and economic implications of changing population age structures, Mexico City, UN/POP/PD/2005/5, Population Division, United Nations, Available at http://www.un.org/esa/population/meetings/Proceedings_EGM_Mex_2005/phang.pdf (Accessed 17 June 2020).
92
Quadagno, J & Street, D. (2006). Recent trends in US social welfare policy: Minor retrenchment or major transformation? Research on Aging, 28, 3: 303-316.
Republic of Kenya. (2006). Kenya National Youth Policy. Nairobi: Ministry of Youth Affairs and Sports
Republic of Kenya (2013). Kenya Population Situation Analysis. United Nations Population Fund (UNPF), Kenya County Office.
Resnick, D & Casale, D. (2014). Young populations in young democracies: Generational voting behavior in sub-Saharan Africa, Democratization, 21, 6: 1172-1194.
Sakamoto, A & Powers, D. (2005). In Dudley Poston and Micheal Micklin (Eds.), Handbook of population (pp.383-418) Klumer Academic/Plenum Publishers: New York. Shryock, H. S. & Siegel, J.S. (1976) The methods and materials of demography, New York:
Academic Press.
Shuey, K & Rand’ O. (2006). Changing demographics and new pension risks, Research on Aging, 28,3: 317-340.
Simon, J.L. (1992). Population and Developing Countries, Princeton University Press: Princeton, New. Jersey
Teitelbaum, M. (1988). Demographic change through the lenses of science and politics, Proceedings of the American Philosophical Society, 132(2):173-184.
Teitelbaum, M. (2005). Political demography’, In Dudley Poston and Micheal Micklin (Eds.), Handbook of population (pp.719-730), Klumer Academic/Plenum Publishers: New York.
Thuku, G.K., Gachanja, P., & Obere, A. (2013). The impact of population change on economic growth in Kenya’, International Journal of Economics and Management Sciences, 2, 6: 43-60.
The 1963 Constitution of Kenya (1963). Government Printers. Nairobi.
The 2010 Constitution of Kenya (2010). Government Printers. Nairobi.
The World Bank. Government Interventions. https://www.worldbank.org/en/country/kenya/overview (accessed on 22 June 2020).
Trapman, C. (1974). Change in administrative structures: A case study of Kenyan agricultural development. London: Overseas Development Institute
United Nations Department of Economic and Social Affairs, Population Division. (2011). World Population Prospects. The 2010 Revision, CD-ROM Edition.
Urdal, H (2016). A clash of generation? Youth bulges and political violence, International Studies Quarterly, 50, 3:609-629.
Weber, H. (2013). Demography and democracy: The impact of youth cohort size on democratic stability in the world, Democratization, 20,2: 335-357.
Weiner, M., & S. S. Russell, S.S (eds.). (2001). Demography and national security. New York: Berghahn Books.
Weiner, M., & Teitelbaum. M.S. (2001) Political demography, demographic engineering. New York: Berghahn Books.
Weinreb. A (2001). First politics, then culture: Accounting for ethnic differences in demographics behavior in Kenya, Population and Development Review, 27,3: 437-467.
Wilson, B., & Dyson, T. (2017). Democracy and the demographic transition, Democratization, 24, 4:594-612.
Willis, J., & Gona, G. (2013). Pwani C Kenya? memory, documents and secessionist politics in Coastal Kenya”, African Affairs, 112, 446:48-71.
KAS: Understanding Demographics and Politics in Kenya
93
Wongboonsin, P. (2007). Impact of the changing demographic structure on lifestyles and
saving Behaviour of the Population, Bangkok: Government Provident Fund.
World Urban Population (2012). https://www.google.com/search?client=firefox-b-d&q=World+Urban+Population+2020 (Accessed on 13 May 2020).
Yenilmez, M. I. (2014). Economic and social consequences of population aging the dilemmas and opportunities in the twenty-first century, Applied Research Quality Life, 1-8.


Thigiri Hilltop, off Thigiri Ridge Road,P.O. Box 66471 - 00800,
Nairobi, KenyaTel: +254 261 0021, 261 0022
Email: [email protected]