unctad manual for the production of statistics on ... - apcict
TRANSCRIPT
UNEDITED DRAFT FOR INFORMATION – NOT TO BE CITED – 13 OCTOBER 2020
1
UNITED NATIONS CONFERENCE ON TRADE AND DEVELOPMENT
NON-PAPER Trade and Development Board Intergovernmental Group of Experts on E-commerce and the Digital Economy Fourth session Geneva, 14-16 October 2020 Item 4 of the provisional agenda Working Group on Measuring E-commerce and the Digital Economy
The first meeting of the Working Group on Measuring E-commerce and the Digital Economy, held at the Palais des Nations in Geneva from 3 to 4 December 2019, discussed the revision of the 2009 edition of the UNCTAD Manual for the Production of Statistics on the Information Economy. This document is the current version of the draft of the Manual that considers the inputs received from the Working Group. This draft is provided to the Intergovernmental Group of Experts for information purposes only. The Manual will be finalized, edited and published before year-end 2020.
UNEDITED DRAFT FOR INFORMATION – NOT TO BE CITED – 13 OCTOBER 2020
2
UNITED NATIONS CONFERENCE ON TRADE AND DEVELOPMENT
UNEDITED DRAFT
UNCTAD Manual for the Production of
Statistics on the Digital Economy 2020
UNEDITED DRAFT FOR INFORMATION – NOT TO BE CITED – 13 OCTOBER 2020
3
Note Symbols of United Nations documents are composed of capital letters with figures. Mention of such a symbol indicates a reference to a United Nations document. The designations employed and the presentation of the material in this publication do not imply the expression of any opinion whatsoever on the part of the Secretariat of the United Nations concerning the legal status of any country, territory, city or area, or of its authorities, or concerning the delimitation of its frontiers or boundaries. Material in this publication may be freely quoted or reprinted, but full acknowledgement is requested, together with a reference to the document number. A copy of the publication containing the quotation or reprint should be sent to the UNCTAD secretariat at: Palais des Nations, CH-1211, Geneva 10, Switzerland.

UNEDITED DRAFT FOR INFORMATION – NOT TO BE CITED – 13 OCTOBER 2020
4
Preface TO BE ADDED
UNEDITED DRAFT FOR INFORMATION – NOT TO BE CITED – 13 OCTOBER 2020
5
Acronyms ABS Australian Bureau of Statistics AI Artificial Intelligence API Application Programming Interface BEE Behavioural Economics Experiments BOP Balance of Payments C&SD Census and Statistics Department (Hong Kong) CAPI Computer Assisted Personal Interviewing CATI Computer Assisted Telephoning Interviewing CDMA Code Division Multiple Access CGI.br Brazilian Internet Steering Committee CNAE National Classification of Economic Activities CPC Central Product Classification CRM Customer Relationship Management DQAF Data Quality Assessment Framework DHS Demographic and Health Surveys DSL Digital Subscriber Line EBOPS Extended Balance of Payments Services EC European Commission ECOSOC United Nations Economic and Social Council EDI Electronic Data Interchange ERP Enterprise resource planning
EU European Union G20 Group of Twenty
GAMSO Generic Activity Model for Statistical Organisations GDP Gross Domestic Product GPRS General Packet Radio Service GPS Global Positioning System GSBPM Generic Statistical Business Process Model HLG-MOS High-Level Group for the Modernization of Statistics HS Harmonized System HSDPA High-speed Downlink Packet Access HSIC Hong Kong Standard Industrial Classification HSUPA High-Speed Uplink Packet Access HTTP Hypertext Transfer Protocol IBGE National Statistical and Geographical Institute of Brazil ICT Information and Communications Technologies IGE Intergovernmental Group of Experts ILO International Labour Organization IMF International Monetary Fund’s INDEC National Statistical Institute of Argentina IP Internet Protocol IPPI International Public Procurement ISDN Integrated Services Digital Network
UNEDITED DRAFT FOR INFORMATION – NOT TO BE CITED – 13 OCTOBER 2020
6
ISIC International Standard Industrial Classification of All Economic Activities ISP Internet Service Provider IT Information Technology ITES ICT-enabled services ITRS International Transaction Reporting System ITU International Telecommunication Union LAN Local Area Network LDC Least Developed Countries LED Light Emitting Diode LSS Living Standard Surveys MICS Multiple Indicator Cluster Surveys MMS Multimedia Messaging Service MSITS Manual on Statistics of International Trade in Services
NACE Statistical classification of economic activities in the European Community (European Union)
NAICS North American Industry Classification System NIC.br Brazilian Network Information Centre NSDS National Strategy for the Development of Statistics NSO National Statistical Office OCR Optical Character Recognition OECD Organisation for Economic Co-operation and Development PARIS21 Partnership for Statistics in the 21st Century PSTN Public Switched Telecommunications Network PWLAN Public Wireless Local Area Network RAIS Relaçao Annual de Informaçoes Sociais SDG Sustainable Development Goals SITC Standard International Trade Classification SMES Superconducting Magnetic Energy Storage SMS Short Message Service SNA System of National Accounts TCP Transmission Control Protocol UIS UNESCO Institute for Statistics
UMTS Universal Mobile Telecommunications System UN United Nations UN COMTRADE United Nations International Trade Statistics Database UNCTAD United Nations Conference on Trade and Development UNDESA United Nations Department of Economic and Social Affairs UNECA United Nations Economic Commission for Africa UNECE United Nations Economic Commission for Europe
UNECLAC United Nations Economic Commission for Latin America and the Caribbean
UNEP United Nations Environment Program
UNESCAP United Nations Economic and Social Commission for Asia and the Pacific
UNESCWA United Nations Economic and Social Commission for West Asia
UNEDITED DRAFT FOR INFORMATION – NOT TO BE CITED – 13 OCTOBER 2020
7
UNSC United Nations Statistical Commission UNSD United Nations Statistics Division UNU-ISP United Nations University Institute for Sustainability and Peace URL Uniform Resource Locator VAT Value Added Tax WAP Wireless Application Protocol
W-CDMA Wideband CDMA WCO World Customs Organization’s WPIIS Working Party on Indicators for the Information Society WPMADE Working Party on Measurement and Analysis of the Digital Economy WSIS World Summit on the Information Society WTO World Trade Organization
UNEDITED DRAFT FOR INFORMATION – NOT TO BE CITED – 13 OCTOBER 2020
8
Contents
Note .......................................................................................................................................... 3
Preface ..................................................................................................................................... 4
Acronyms .................................................................................................................................. 5
List of Boxes, Examples, Figures and Tables .......................................................................... 11
Boxes .................................................................................................................................. 11
Examples ............................................................................................................................ 12
Figures ................................................................................................................................ 13
Tables ................................................................................................................................. 13
PART A. INTRODUCTION ...................................................................................................... 15
Chapter 1 - Objectives and overview of the Manual ............................................................. 15
Chapter 2 – Background ...................................................................................................... 18
2.1 ICT indicators for policymaking .............................................................................. 18
2.2 UNCTAD work on measuring e-commerce and the digital economy ...................... 19
2.3 Work by other institutions on measuring the digital economy ................................. 20
PART B. METHODOLOGICAL ISSUES .................................................................................. 24
Chapter 3 - Conceptual frameworks for measurement of the digital economy ..................... 24
3.1 A conceptual framework for the measurement of the digital economy ................... 24
3.2 Concepts of e-business ......................................................................................... 28
3.3 ICT goods production ................................................................................................ 30
3.4 ICT services production ............................................................................................. 31
3.5 Trade in ICT goods and services ............................................................................... 31
3.6 Digital trade ............................................................................................................... 31
Chapter 4 - Statistical standards selected indicators on the digital economy ....................... 35
4.1 Measuring ICT demand (use) ................................................................................ 35
4.2 Measuring the ICT sector (supply of ICT goods and services) ............................... 50
4.3 Measuring trade in ICT goods ................................................................................ 55
4.4 Measuring trade in ICT services ............................................................................ 57
UNEDITED DRAFT FOR INFORMATION – NOT TO BE CITED – 13 OCTOBER 2020
9
4.5 Measuring trade in ICT-enabled (digitally delivered) services ................................ 60
4.6 Measuring the value of e-commerce ...................................................................... 64
Chapter 5 - Data sources and data collection methods........................................................ 67
5.1 The General Statistical Business Process Model (GSBPM) ................................... 68
5.2 Sources for business ICT data ............................................................................... 70
5.3 Modules and stand-alone surveys on the use of ICT by businesses ...................... 75
5.4 Data collection methods and quality control ........................................................... 84
Chapter 6 - Model questions and questionnaires for measuring ICT use in businesses ...... 89
6.1 Model questions for a module on use of ICT by businesses .................................. 89
6.2 Model questionnaires for a stand-alone ICT use survey ........................................ 92
6.3 Model questions on exports of ICT-enabled services ............................................. 95
Chapter 7 - Designing ICT business surveys and processing data ...................................... 97
7.1 Business surveys on the digital economy .............................................................. 97
7.2 Data processing ................................................................................................... 108
Chapter 8 - Dissemination ................................................................................................. 117
8.1. Tabulation plan .................................................................................................... 118
8.2 Dissemination of metadata at the indicator level .................................................. 124
8.3 Dissemination of metadata for surveys ................................................................ 126
8.4 Metadata reports ................................................................................................. 128
Part C. INSTITUTIONAL ISSUES ......................................................................................... 131
Chapter 9 - Cooperation and coordination ......................................................................... 131
9.1 Cooperation among stakeholders of the national statistical system ..................... 131
9.2 Statistical work programmes ................................................................................ 138
9.3 International data collection and methodological work ......................................... 139
9.4 Capacity-building issues ...................................................................................... 140
Annex 1: Revised core list of ICT indicators (as of 2019) ...................................................... 143
Core indicators on ICT infrastructure and access .............................................................. 143
Core indicators on access to, and use of, ICT by households and individuals ................... 143
UNEDITED DRAFT FOR INFORMATION – NOT TO BE CITED – 13 OCTOBER 2020
10
Core indicators on use of ICT by enterprises ..................................................................... 144
Core indicators on the ICT sector and trade in ICT goods ................................................. 144
Core indicators on ICT in education................................................................................... 145
Core indicators on e-government ...................................................................................... 145
Annex 2. UNCTAD model questionnaire for business surveys on the use of ICT .................. 146
Annex 3. UNCTAD model questionnaire on exports of ICT-enabled services ........................ 146
Annex 4. OECD model questionnaire for ICT use by businesses ......................................... 146
Annex 5. Eurostat model questionnaire on ICT usage and e-commerce in enterprises ......... 146
Annex 6. Estimation of a proportion under different sampling schemes ................................ 146
Annex 7. Imputation of missing data in ICT surveys ............................................................. 146
Annex 8. UNCTAD list of ICT goods (based on HS 2017) ..................................................... 146
Annex 9. Definition of ICT sector (ISIC Rev. 4)...................................................................... 146
Annex 10. Potentially ICT-enabled services sub-groupings with the corresponding CPC Ver.2.1
products codes ...................................................................................................................... 146
Annex 11. UNCTAD country data collection questionnaire .................................................... 146
References ............................................................................................................................ 147
UNEDITED DRAFT FOR INFORMATION – NOT TO BE CITED – 13 OCTOBER 2020
11
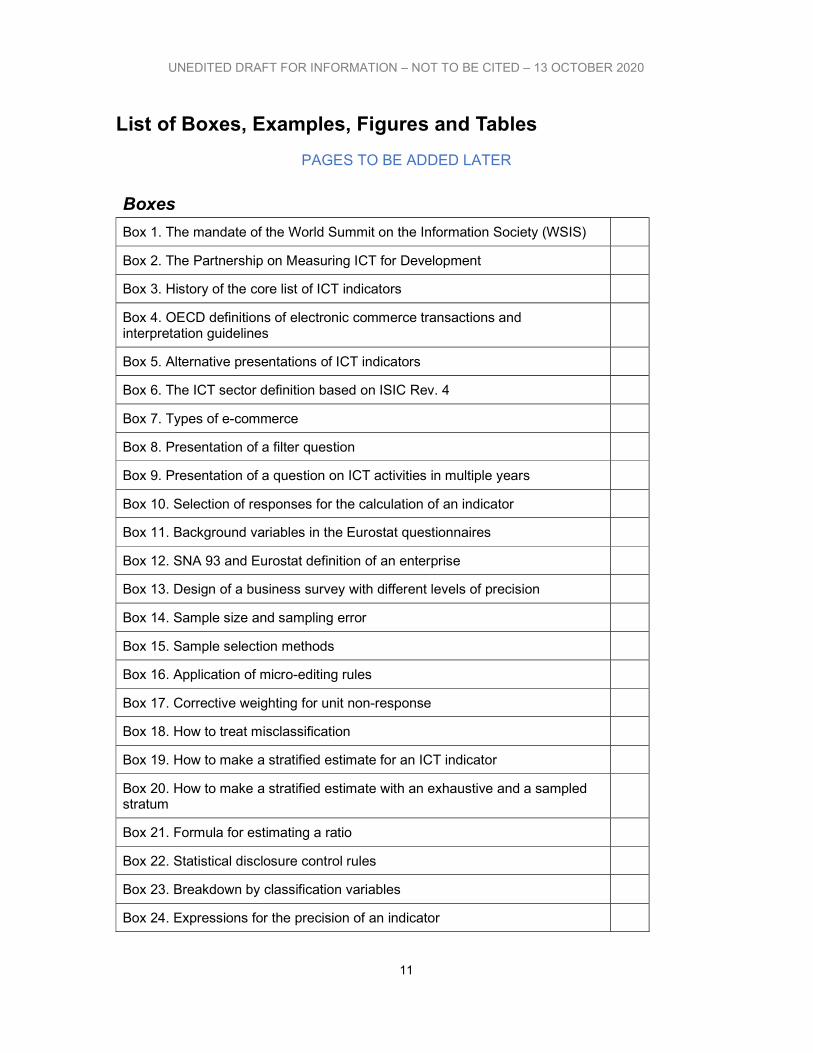
List of Boxes, Examples, Figures and Tables
PAGES TO BE ADDED LATER
Boxes
Box 1. The mandate of the World Summit on the Information Society (WSIS)
Box 2. The Partnership on Measuring ICT for Development
Box 3. History of the core list of ICT indicators
Box 4. OECD definitions of electronic commerce transactions and interpretation guidelines
Box 5. Alternative presentations of ICT indicators
Box 6. The ICT sector definition based on ISIC Rev. 4
Box 7. Types of e-commerce
Box 8. Presentation of a filter question
Box 9. Presentation of a question on ICT activities in multiple years
Box 10. Selection of responses for the calculation of an indicator
Box 11. Background variables in the Eurostat questionnaires
Box 12. SNA 93 and Eurostat definition of an enterprise
Box 13. Design of a business survey with different levels of precision
Box 14. Sample size and sampling error
Box 15. Sample selection methods
Box 16. Application of micro-editing rules
Box 17. Corrective weighting for unit non-response
Box 18. How to treat misclassification
Box 19. How to make a stratified estimate for an ICT indicator
Box 20. How to make a stratified estimate with an exhaustive and a sampled stratum
Box 21. Formula for estimating a ratio
Box 22. Statistical disclosure control rules
Box 23. Breakdown by classification variables
Box 24. Expressions for the precision of an indicator
UNEDITED DRAFT FOR INFORMATION – NOT TO BE CITED – 13 OCTOBER 2020
12
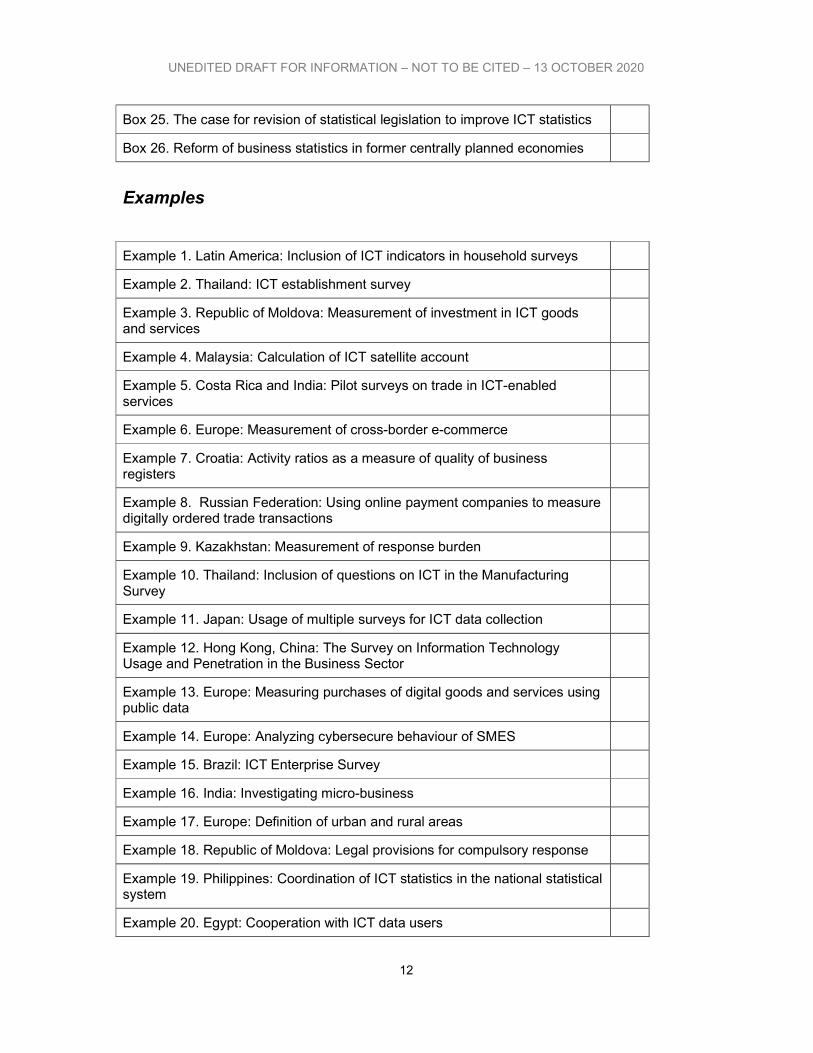
Box 25. The case for revision of statistical legislation to improve ICT statistics
Box 26. Reform of business statistics in former centrally planned economies
Examples
Example 1. Latin America: Inclusion of ICT indicators in household surveys
Example 2. Thailand: ICT establishment survey
Example 3. Republic of Moldova: Measurement of investment in ICT goods and services
Example 4. Malaysia: Calculation of ICT satellite account
Example 5. Costa Rica and India: Pilot surveys on trade in ICT-enabled services
Example 6. Europe: Measurement of cross-border e-commerce
Example 7. Croatia: Activity ratios as a measure of quality of business registers
Example 8. Russian Federation: Using online payment companies to measure digitally ordered trade transactions
Example 9. Kazakhstan: Measurement of response burden
Example 10. Thailand: Inclusion of questions on ICT in the Manufacturing Survey
Example 11. Japan: Usage of multiple surveys for ICT data collection
Example 12. Hong Kong, China: The Survey on Information Technology Usage and Penetration in the Business Sector
Example 13. Europe: Measuring purchases of digital goods and services using public data
Example 14. Europe: Analyzing cybersecure behaviour of SMES
Example 15. Brazil: ICT Enterprise Survey
Example 16. India: Investigating micro-business
Example 17. Europe: Definition of urban and rural areas
Example 18. Republic of Moldova: Legal provisions for compulsory response
Example 19. Philippines: Coordination of ICT statistics in the national statistical system
Example 20. Egypt: Cooperation with ICT data users
UNEDITED DRAFT FOR INFORMATION – NOT TO BE CITED – 13 OCTOBER 2020
13
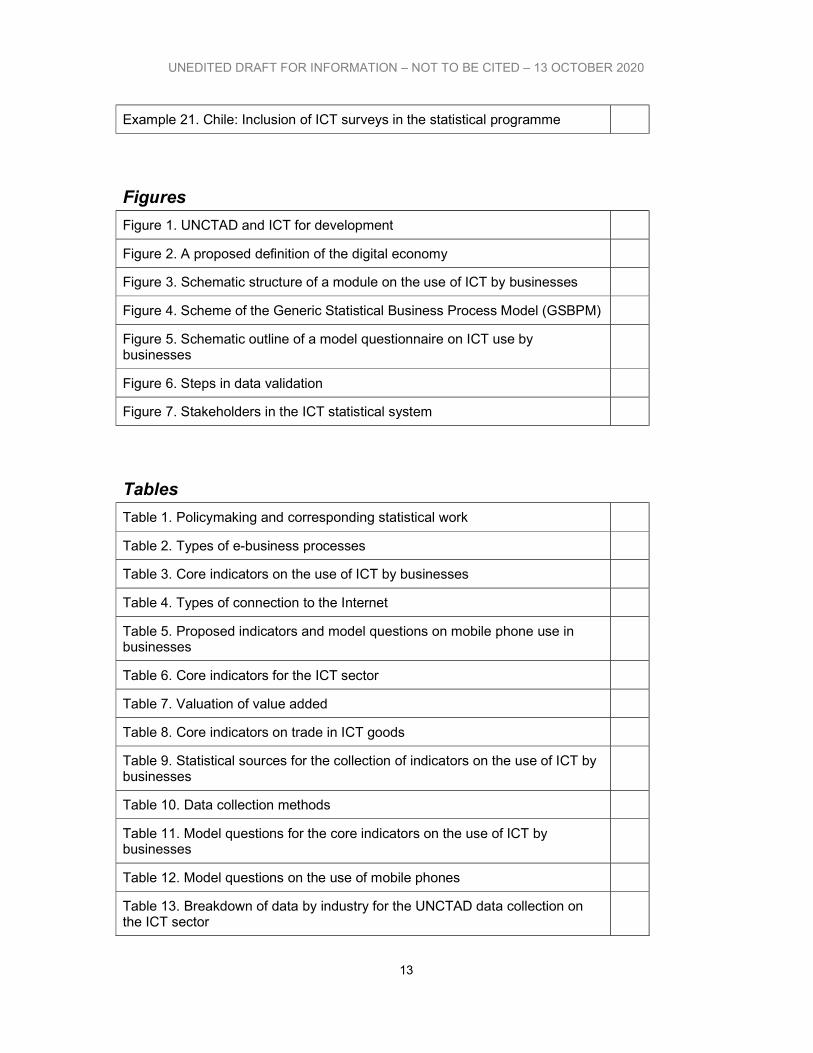
Example 21. Chile: Inclusion of ICT surveys in the statistical programme
Figures
Figure 1. UNCTAD and ICT for development
Figure 2. A proposed definition of the digital economy
Figure 3. Schematic structure of a module on the use of ICT by businesses
Figure 4. Scheme of the Generic Statistical Business Process Model (GSBPM)
Figure 5. Schematic outline of a model questionnaire on ICT use by businesses
Figure 6. Steps in data validation
Figure 7. Stakeholders in the ICT statistical system
Tables
Table 1. Policymaking and corresponding statistical work
Table 2. Types of e-business processes
Table 3. Core indicators on the use of ICT by businesses
Table 4. Types of connection to the Internet
Table 5. Proposed indicators and model questions on mobile phone use in businesses
Table 6. Core indicators for the ICT sector
Table 7. Valuation of value added
Table 8. Core indicators on trade in ICT goods
Table 9. Statistical sources for the collection of indicators on the use of ICT by businesses
Table 10. Data collection methods
Table 11. Model questions for the core indicators on the use of ICT by businesses
Table 12. Model questions on the use of mobile phones
Table 13. Breakdown of data by industry for the UNCTAD data collection on the ICT sector

UNEDITED DRAFT FOR INFORMATION – NOT TO BE CITED – 13 OCTOBER 2020
14
Table 14. Model table for the publication of core ICT indicators broken down by business size
Table 15. Model table for the publication of core ICT indicators broken down by economic activity
Table 16. Suggested topics to be included in metadata reporting for ICT use surveys
UNEDITED DRAFT FOR INFORMATION – NOT TO BE CITED – 13 OCTOBER 2020
15
PART A. INTRODUCTION
Chapter 1 - Objectives and overview of the Manual
1. The Manual for the Production of Statistics on the Digital Economy has been prepared for the benefit of statistical agencies, in particular in developing and transition economies.1 The Manual is an update of the United Nations Conference on Trade and Development (UNCTAD) Manual for the Production of Statistics on the Information Economy 2009, enlarging its thematic contents, adapting the new statistical standards approved since 2009, and including new model questionnaires.
2. It is directed towards those responsible for producing official statistics on the digital economy, particularly in national statistical offices (NSOs). The main aim of the Manual is to support the production of digital economy statistics that are internationally comparable – more specifically, statistics on the information and communications technologies (ICT) sector, trade of ICT goods and services (including of ICT-enabled services) and use of ICT by businesses. The Manual does not cover household statistics.2 The Manual has been prepared by UNCTAD and reflects its mandate to assist developing economies in measuring and monitoring e-commerce and the digital economy.
3. The Manual is intended to be a practical tool for producing digital economy statistics at the national level; these, in turn, serve as key inputs to countries’ national ICT and digital economy policies and strategies. The Manual explains the international standards that guide work in this area and offers advice on collecting, processing and disseminating digital economy statistics and associated metadata.
4. Statistical systems in developing economies are diverse and reflect, among other things, a country’s wealth, culture, and legal and political frameworks. Understandably, the level of statistical capacity is unequal with respect to adherence to internationally recommended standards and methods, data collection systems and collection frequency, and the availability of key social and economic indicators. The Manual takes the differing practices and capabilities of NSOs into account and highlights specific challenges that some developing economies face in their production of ICT statistics. Its contents are based largely on the work of the members of the Partnership on Measuring ICT for Development.3
5. In 2005, the Partnership on Measuring ICT for Development developed a core list of ICT indicators, which was endorsed by the UN Statistical Commission (UNSC) at its 2007 meeting, and progress in the development of ICT statistics and indicators has been presented to the Commission every two years since then.4 The Commission encouraged countries to use the list as a basis for their ICT measurement activity. The Manual presents the Partnership core indicators on ICT use by business and the ICT sector, and provides associated definitions, classifications, methodologies and model questions.
6. In addition to international standards, the Manual addresses statistical issues that are of
1 Henceforth referred to as “developing economies”. 2 For the latest Manual on household ICT statistics, see ITU (2020) in References. 3 https://www.itu.int/en/ITU-D/Statistics/Pages/intlcoop/partnership/default.aspx 4 For the latest report of the Partnership to the UNSC in 2020, see https://undocs.org/en/E/CN.3/2020/23
UNEDITED DRAFT FOR INFORMATION – NOT TO BE CITED – 13 OCTOBER 2020
16
particular interest to developing economies and provides relevant methodological advice, for instance, on the construction of business frames, data collection methods and use of existing surveys where resources are insufficient for carrying out stand-alone ICT surveys. In addition to the technical aspects of digital economy statistics, the Manual reviews important institutional features of the statistical process, such as collaboration with data providers, and cooperation with data users and producers.
7. The Manual is organized as follows:
Part A (this one) introduces the Manual and describes the background to the measurement of the digital economy (chapters 1 and 2).
Part B covers the methodological and practical aspects of the production of ICT statistics on the digital economy, including:
- Digital economy measurement concepts (chapter 3);
- The core indicators and associated statistical standards (chapter 4);
- Data sources for digital economy statistics (chapter 5);
- Model questions and questionnaires (chapter 6);
- Methodological issues relating to data collection, survey design and processing (chapter 7); and
- The dissemination of data and metadata (chapter 8).
Part C deals with institutional issues such as coordination between actors in the national statistical system, the work of international organizations and capacity-building (chapter 9).
8. The Manual is supported by 11 annexes that provide further technical advice and useful references.
9. The material presented in this Manual also serves as the basis for UNCTAD capacity building on measuring the digital economy. A training course, which is based on the UNCTAD TrainForTrade methodology, is broadly organized around modules following the content of the Manual.5
10. ICT play an increasingly important role in the economic and social development of countries, and governments formulate policies on ICT for development in order to seize the opportunities offered by these technologies. ICT statistics are essential to plan, monitor and evaluate these policies. This is a new area of measurement for many developing countries, as is the development of the necessary statistical standards and collection methodologies. Rapid technological change requires that new indicators be introduced, and old ones discarded more frequently than in other areas of statistics. The UNCTAD secretariat intends to periodically update and revise this Manual, with the objective of keeping member States informed of the most recent
5 Countries interested in such a course should contact the UNCTAD secretariat at [email protected].
UNEDITED DRAFT FOR INFORMATION – NOT TO BE CITED – 13 OCTOBER 2020
17
developments on the subject matter.
11. The Manual complements UNCTAD work on collecting data, conducting research, and discussing methodological aspects of digital economy statistics through its Working Group on Measuring E-Commerce and the Digital Economy.6
6 https://unctad.org/meeting/working-group-measuring-e-commerce-and-digital-economy-first-meeting
UNEDITED DRAFT FOR INFORMATION – NOT TO BE CITED – 13 OCTOBER 2020
18
Chapter 2 – Background
2.1 ICT indicators for policymaking 12. The potential for ICT to increase economic growth and reduce poverty is receiving increasing attention from Governments and the international community. Designing and implementing ICT policies and strategies requires proper knowledge of the state of ICT in a country and its use by organizations (government as well as business) and individuals (and often, the main barriers to such use). Consequently, calls for better ICT statistics have become more frequent, both at the national and the international level (see Box 1). Furthermore, the measurement of ICT access, use and impact enables assessment and monitoring of the digital divide within a country and between countries.
Box 1. The mandate of the World Summit on the Information Society (WSIS)
The measurement of ICT has been an important part of international debates on ICT for development. While ICT can present opportunities for economic and social development for developing economies, the digital divide between developed and developing economies also presents new challenges. ICT has a growing role in the implementation of the 2030 Agenda for Sustainable Development. In its overall review of the implementation of the outcomes of the WSIS, the General Assembly of the United Nations committed to harnessing the potential of ICT to achieve the 2030 Agenda, noting that such technologies could accelerate progress in achieving all 17 Sustainable Development Goals (SDG). The digitalization of economic activities and trade is of direct relevance to several of the Goals. While none of the goals is specifically about ICTs, several targets refer to digital technology. For example, SDG 9 on industrialization, innovation and infrastructure, recognizes the importance of ICT and establishes Target 9.c, to “significantly increase access to information and communications technology and strive to provide universal and affordable access to the Internet in least developed countries by 2020.”
Measuring ICT for development was a principal concern of the WSIS when it was held in Geneva in 2003 and Tunis in 2005. The Geneva Summit highlighted the importance of benchmarking and measuring progress towards the information society through internationally comparable statistical indicators. The Tunis Summit recognized that the development of ICT indicators is important for measuring the digital divide, and called upon countries and international organizations to allocate appropriate resources for the provision of ICT statistics, and to develop effective measurement methodologies including basic ICT indicators and an analysis of the state of the information society. Member States called for periodic evaluation, using an agreed methodology, such as described in paragraphs 113–120 of the Tunis Agenda for the Information Society.7
In 2008, the UN Economic and Social Council (ECOSOC) recommended the creation of benchmarks and indicators, including impact indicators, for further consideration and decision by the UN Statistical Commission, in order to track progress towards the attainment of the specific goals and targets set out in the outcome documents of the WSIS.8
13. Since 2005, several countries have made efforts to collect data on ICT in their economies and societies. As a result, they are now in a better position to assess the impact of ICT on their economies; benchmark their economies and social situation against those of other countries;
7 Tunis Agenda for the Information Society (2005), WSIS-05/TUNIS/DOC/6(Rev.1)-E. Available at https://www.itu.int/net/wsis/docs2/tunis/off/6rev1.html 8 Commission on Science and Technology for Development Report on the eleventh session (26-30 May 2008), Economic and Social Council Official Records, 2008 Supplement No. 11, E/2008/31 - E/CN.16/2008/5 https://www.undocs.org/E/2008/31(SUPP)
UNEDITED DRAFT FOR INFORMATION – NOT TO BE CITED – 13 OCTOBER 2020
19
identify the type of qualified people needed to advance their country’s information economy; and calculate the investment needed to provide businesses with access to different ICTs. In short, ICT statistics have helped policymakers and businesspeople to make informed decisions about public policy measures and private investment in ICT.
14. The evolving digital economy also raises new policy issues. Governments need to consider the implications of digitalization for policies related to areas such as the labour market (including potential job creation and destruction), education and skills development, innovation, sectoral development, competition, consumer protection, taxation, trade, environmental protection and energy efficiency, as well as regulation related to security, privacy and data protection.
15. Among developed economies, the NSOs of the countries in the Organisation for Economic Co-operation and Development (OECD) and the European Union have been producing statistics on the ICT sector and use of ICT by businesses in a reasonably harmonized way, and a comparable set of such statistics is available for most of these countries.9 However, in developing economies data on many aspects of the digital economy are non-existent. In turn, the lack of data makes it difficult for policymakers to formulate and implement evidence-based policies and hampers the ability of countries to take advantage of opportunities offered by the digital economy. Nonetheless, Governments, civil society and the business sector explicitly recognize the urgent need for such information.
16. Many developing economies are preparing ICT-related policies, e-commerce and digital transformation strategies without access to relevant statistical evidence. As observed by the Argentinean Group of Twenty (G20) Presidency in its Toolkit for Measuring the Digital Economy: “Even if we only consider existing measurement efforts, there is ample room for improvement, as data are far from being comprehensive, country coverage is limited, timeliness is often an issue, and differences in data collection methodologies and approaches across countries persist.”10 The lack of data is particularly stark in least developed countries.
17. In many cases, developing economies need to increase their awareness about measurement efforts of other countries and may require assistance to incorporate ICT topics into their statistical programmes. With the increasing use of ICT by governments, businesses and households, it is essential to start measuring ICT now, for at least two reasons. First, the development and growth of the digital economy is irreversible – organizations and individuals all over the world are increasingly demanding and using ICT. Second, the experience of countries that have started to collect digital economy statistics shows that it takes years to design and implement a good national strategy for measuring the digital economy and to incorporate ICT statistics into national strategies for the development of statistics (NSDS). Hence, the earlier that countries begin work on measuring access and use of various ICTs, the greater the chances that they will be able to formulate, implement and monitor relevant policies adopted to harness new technologies.
2.2 UNCTAD work on measuring e-commerce and the digital economy
18. With the aim of improving the ability of developing economies to formulate policies that will enable them to seize the benefits of ICT, UNCTAD collects and publishes data on ICT use by businesses and on the state of the ICT sector. It also provides technical assistance, undertakes research and analysis, and provides an intergovernmental forum to discuss current and emerging
9 This statistical development is currently facilitated by the OECD’s Working Party on Measurement and Analysis in the Digital Economy (WPMADE). See https://oecdgroups.oecd.org/Bodies/ShowBodyView.aspx?BodyID=5291&Lang=en&Book=True 10 https://www.oecd.org/g20/summits/buenos-aires/G20-Toolkit-for-measuring-digital-economy.pdf
UNEDITED DRAFT FOR INFORMATION – NOT TO BE CITED – 13 OCTOBER 2020
20
issues related to e-commerce and the digital economy (see Figure 1).
Figure 1. UNCTAD work on e-commerce and the digital economy
TO BE ADDED
19. Since 2004, UNCTAD has been collecting statistics on a core list of indicators related to ICT use by businesses and to the ICT sector through an annual survey (see Annex 1). Results from the annual survey are published in the UNCTAD statistical portal (UNCTADstat)11 and support UNCTAD advisory work such as its eTrade Readiness Assessments, e-commerce and law reform, ICT Policy Reviews and national e-commerce strategies.12 In addition, ICT statistics inform the research published through UNCTAD’s flagship Digital Economy Report and the related intergovernmental discussions.
20. UNCTAD technical assistance to developing economies on the measurement of e-commerce and the digital economy focuses on:
Assisting NSOs in undertaking data collection, analysis and dissemination, including through advisory missions;
Organizing expert meetings and conducting technical workshops for practitioners in developing economies to enable exchanges of experiences and discussions of methodological, analytical and dissemination issues; and
Conducting training courses and developing training material, guidelines and other technical documentation on the collection of ICT statistics and the production of indicators.
21. The UNCTAD Intergovernmental Group of Experts (IGE) on E-commerce and the Digital Economy convened aims to build international consensus on issues to do with relevant statistics. Reporting to the IGE, a Working Group on Measuring E-commerce and the Digital Economy helps improve the availability of relevant statistics, particularly in developing countries. It also seeks to identify specific measurement opportunities and challenges for developing countries.
2.3 Work by other institutions on measuring the digital economy
22. UNCTAD’s work on measuring the digital economy also contributes to the international development of ICT statistics, including through UNCTAD’s role as a founding member of the Partnership on Measuring ICT for Development and in its Steering Committee (see Box 2). The Partnership is a multi-stakeholder initiative consisting of 14 international and regional organizations involved in ICT measurement, which aims to increase the availability and quality of internationally comparable official ICT statistics. It provides an open framework for coordinating ongoing and future activities, and for developing a coherent and structured approach to advancing the development of ICT indicators globally. The collaboration between Partner agencies ensures that there is no duplication of work and that resources are used efficiently.
Box 2. The Partnership on Measuring ICT for Development13
11 See the “Information Economy” tables at https://unctadstat.unctad.org/ 12 See https://unctad.org/topic/ecommerce-and-digital-economy 13 For more information on the Partnership and its activities see http://www.itu.int/ITU-D/ict/partnership/index.html.
UNEDITED DRAFT FOR INFORMATION – NOT TO BE CITED – 13 OCTOBER 2020
21
In 2008, the UN Economic and Social Council (ECOSOC) in its resolution E/2008/31 noted the lack of indicators to measure progress made towards achieving the targets of the WSIS and acknowledged the work of the Partnership on Measuring ICT for Development to develop such indicators. The ECOSOC thus recommended that the Partnership consider the creation of benchmarks and indicators for further consideration and decision by the UN Statistical Commission, in order to track progress towards the attainment of the goals and targets in the WSIS outcome documents. Since then, the Partnership has harnessed the work of its members and made it available through awareness raising in international and regional fora, as well as through capacity building activities.
Capacity building: The capacity-building work of the Partnership is undertaken by its members independently but coordinated through the Partnership. Activities include the conduct of training courses and workshops, as well as the production of technical material (including this Manual). Other methodological manuals include those on ICT use by households and individuals (ITU, 2020), on e-government (Partnership and UNECA, 2013), on e-waste, and on use of ICT in education (UIS, 2009). OECD (2011) and Eurostat (2013) cover broader areas of information society measurement. All capacity building materials designed for NSOs are available online.
Current members (as of 2020):
International Telecommunication Union (ITU), the Organisation of Economic Co-operation and Development (OECD), Eurostat, UNCTAD, UNESCO Institute of Statistics (UIS), ILO, four UN Regional Commissions (UNECLAC, UNESCWA, UNESCAP, UNECA), the World Bank, UNDESA, UNEP/Secretariat of the Basel Convention, and the United Nations University Institute for Sustainability and Peace (UNU-ISP).
23. One of the main achievements of the Partnership was the development of a core list of ICT indicators, with their corresponding definitions and other metadata, in close consultation with other stakeholders, mainly NSOs (see Box 3). The core list, with the revisions and additions presented in this manual, includes more than 60 indicators, covering ICT infrastructure and access, ICT access and use by households and businesses, the ICT (producing) sector, trade in ICT goods and services, ICT in education, e-government and electronic waste. The main purpose of the core list is to help countries produce high quality and internationally comparable ICT statistics. The indicators have associated statistical standards, including concepts, definitions, model questions, classificatory variables, and guidance on scope and statistical units. The complete core list can be found in Annex 1.
Box 3. Historical development of the core list of ICT indicators
Following the stocktaking exercise carried out by the Partnership in 2004, the United Nations Regional Commissions hosted several regional statistical workshops on ICT measurement. At these workshops, NSOs discussed the status of ICT statistics in their respective regions and proposed regional core lists of indicators. The regional lists of indicators were presented for information to the United Nations Statistical Commission (UNSC) at its thirty-sixth session (New York, March 2005). Based on the regional lists, and feedback received from NSOs, the Partnership consolidated a core list of ICT indicators. The list was circulated to all NSOs for further comments and suggestions. A final list was discussed, and agreed upon, at the WSIS Thematic Meeting on Measuring the Information Society (Geneva, February 2005). The core list was endorsed by the UNSC at its thirty-eighth session (New York, March 2007). The core list was subsequently revised, including the addition of new indicators on ICT in education, and discussed by countries at the Partnership's Global Event on Measuring the Information Society (Geneva, May 2008). The work of the Partnership has been recognized by the ECOSOC in several resolutions. The UNSC validates the statistical development work of the Partnership, thus guaranteeing that standards are coherent with those of other areas of official statistics. Every two years, the Partnership reports to the UNSC
UNEDITED DRAFT FOR INFORMATION – NOT TO BE CITED – 13 OCTOBER 2020
22
progress in the area of ICT statistics and any revisions to the core list of ICT indicators. In 2020, the core list served as the basis for a thematic list to support the monitoring of progress towards the 2030 Agenda proposed by the Partnership and presented at both the WSIS Forum and the UNSC.
24. Establishing international benchmarks is necessary for producing comparable sets of statistics across countries. The core list of ICT indicators is recommended as the basis for the collection of internationally comparable ICT statistics. The development of ICT indicators is a continuous process, and the Partnership will continue to review the list periodically to address evolving policy needs.
25. The core list is not mandatory and nor is it intended to be limiting. National ICT policies may require larger numbers of (and country-specific) indicators for planning, monitoring and evaluation (see Example 1). It is also expected that countries with different levels of development will have different priorities to produce indicators.
Example 1. Latin America: ICT indicators and data collection vehicles
The current Partnership core list of ICT indicators for businesses and the ICT sector, covers mostly basic access and use of ICT, as well as exports and imports of ICT goods and services. However, many developing countries may wish to measure additional indicators related to other aspects of their digital economies, including the activity of digital platforms for work and e-commerce, the digital financial inclusion of microenterprises and SMEs, or the adoption of cryptocurrencies. For example, the UN Economic Commission for Latin America and the Caribbean (ECLAC) is using big data to measure the digital footprint in the region; in Brazil, interest in the impact of COVID-19 led to surveys related to e-commerce, including the online trading of cultural goods and services; and in Costa Rica, specific surveys were conducted to measure exports in ICT-enabled services.
In addition, Latin America and Caribbean countries use different types of surveys to measure household access to, and individual use of, ICT. These include stand-alone ICT surveys, multipurpose household surveys, life conditions surveys, and labour force surveys. In countries with low statistical capacity, other surveys have been used as vehicles for ICT-related questions, such as Demographic and Health Surveys (DHS), Multiple Indicator Cluster Surveys (MICS), Living Standards Surveys (LSS) and Family Budget Surveys. Also, the UN Statistical Division suggests that ICT access indicators be included in population and housing censuses. Indicators collected through these surveys may provide a complementary picture of the demand side of e-commerce and online services, as well as of the use of ICT by micro-businesses and entrepreneurs.
Sources: BCCR (2018), CETIC.br (2020), ECLAC (2020), ITU (2020), UN (2017)
26. The Partnership studied the integration of ICT statistics into the monitoring framework of the 2030 Agenda for Sustainable Development and issued a thematic list of ICT indicators that could be used to track progress in the SDGs and that is complementary to the monitoring framework.
27. Among the members of the Partnership, the ITU is responsible for the measurement of ICT infrastructure, ICT access and use by households and individuals (including demand-side e-commerce and ICT skills). In many countries, the economic activity of micro-enterprises in the informal sector can be partly measured through household surveys. The main methodological manuals by ITU are its Telecommunication Indicators Handbook14 and its Manual on Measuring ICT Access and Use by Households and Indicators (ITU, 2020).
14 https://www.itu.int/ITU-D/ict/publications/world/material/handbook.html
UNEDITED DRAFT FOR INFORMATION – NOT TO BE CITED – 13 OCTOBER 2020
23
28. The OECD, another member of the Partnership, has often conducted pioneering work in harmonized methodological approaches to measuring the digital economy, particularly through its Working Party on Measurement and Analysis of the Digital Economy (WPMADE) and its Committee on Statistics and Statistical Policy. Two key contributions by OECD to digital economy measurement are the OECD Guidelines for Supply-Use tables for the Digital Economy (OECD, 2020b) and the OECD-WTO-IMF Handbook on Measuring Digital Trade (OECD, WTO, IMF 2020), which will help to make the digital transformation visible in economic statistics. In addition, its wide-ranging work aims to understand digital transformation in OECD countries and has a clear link to policy, covering areas such as artificial intelligence (AI), the Internet of Things, digital security and privacy, consumer trust in online environments, skills in the digital age, barriers to trade in digital services, and the future of work.15
29. The Statistical Directorate of the European Commission, Eurostat, is also a member of the Partnership and is a best practice in harmonizing regional statistics. In order to produce internationally comparable indicators, Eurostat and the European NSOs developed a Methodological Manual for its surveys on ICT usage in enterprises and households,16 including model questionnaires (see Annex 5).17 The production of digital economy statistics by Eurostat is directly linked to supporting and monitoring the implementation of Europe’s digital strategy, including its aim to build a European digital single market. Eurostat has also promoted applied research projects with advanced use of survey data, such as the ESS LAIT project18 that sought to link data from enterprise surveys (including on the use of ICT) and econometric models to measure the impact of ICT on business performance.
30. The G20 is an international forum for the governments and central bank governors from 19 countries and the European Union, which in 2017 established a Digital Economy Task Force (DETF). The DETF collaborated closely with the OECD, UNCTAD and other international organizations to produce a Toolkit for Measuring the Digital Economy in 2018, which outlined a measurement agenda for the digital economy and analyses the situation in G20 countries with reference to 35 indicators. It also highlighted statistical gaps and suggests actions for improvement.19 The Toolkit was then expanded and developed into A roadmap toward a common framework for measuring the Digital Economy published in 2020 (OECD, 2020a). The Roadmap has significantly advanced the conceptual work around defining the digital economy and its components, since agreed definitions are at the basis of accurate and comparable measurement.
15 In support of digital economy measurement, the OECD Going Digital Toolkit (www.oecd.org/going-digital-toolkit) presents 33 key indicators giving an overview of countries’ digital development. The indicators are aligned with the OECD Going Digital Policy Framework (OECD, 2020a) which guides the integrated approach to policy making for an inclusive digital future. The OECD report Measuring the Digital Transformation: A Roadmap for the Future (OECD, 2019a) benchmarked member countries and key partner economies across over 180 indicators, identified measurement gaps, and developed the medium-term Going Digital measurement roadmap. 16 https://ec.europa.eu/eurostat/web/digital-economy-and-society/methodology 17 Based on Eurostat’s data, the European Commission has a digital scoreboard that measures the performance of member States in areas ranging from connectivity and digital skills to the digitization of businesses and public services. It also produces the Digital Economy and Society Index and established a Monitoring Framework for the Digital Economy and Society. See https://digital-agenda-data.eu/ 18 https://ec.europa.eu/eurostat/cros/content/esslait_en 19 http://www.oecd.org/g20/summits/buenos-aires/G20-Toolkit-for-measuring-digital-economy.pdf
UNEDITED DRAFT FOR INFORMATION – NOT TO BE CITED – 13 OCTOBER 2020
24
PART B. METHODOLOGICAL ISSUES
Chapter 3 - Conceptual frameworks for measurement of the digital economy 31. This chapter presents the concepts underlying certain aspects of the statistical measurement of the digital economy, with the objective of providing official statisticians, and others with an interest in such statistics, with a basic framework for measuring e-commerce and the digital economy.
3.1 A conceptual framework for the measurement of the digital economy 32. A distinctive characteristic of the digital economy is the intensive use by businesses of ICT for the collection, storage, processing and transmission of information. Business data from some industrialized countries show that improvements in productivity can be explained, at least partly, by use of ICT, which in turn is supported by supply of goods and services produced by the ICT sector and through trade. Additionally, a robust ICT sector can contribute to aggregate labour productivity growth.
33. The notion of the digital economy has become commonplace to describe how digital technology is changing patterns of production (supply) and consumption (demand). The different technologies and economic aspects of the digital economy can be broken down into three broad components (UNCTAD, 2019):
Core aspects or foundational aspects of the digital economy, which comprise fundamental innovations (semiconductors, processors), core technologies (computers, telecommunication devices) and enabling infrastructures (Internet and telecoms networks).
Digital and information technology (IT) sectors, which produce key products or services that rely on core digital technologies, including digital platforms, mobile applications and payment services. The digital economy is to a high degree affected by innovative services in these sectors, which are making a growing contribution to economies, as well as enabling potential spillover effects to other sectors.
A wider set of digitalizing sectors, which includes those where digital products and services are being increasingly used (e.g. for e-commerce). Even if change is incremental, many sectors of the economy are being digitalized in this way. This includes digitally enabled sectors in which new activities or business models have emerged and are being transformed as a result of digital technologies. Examples include finance, media, tourism and transportation. Moreover, although less often highlighted, digitally literate or skilled workers, consumers, buyers and users are crucial for the growth of the digitalized economy.
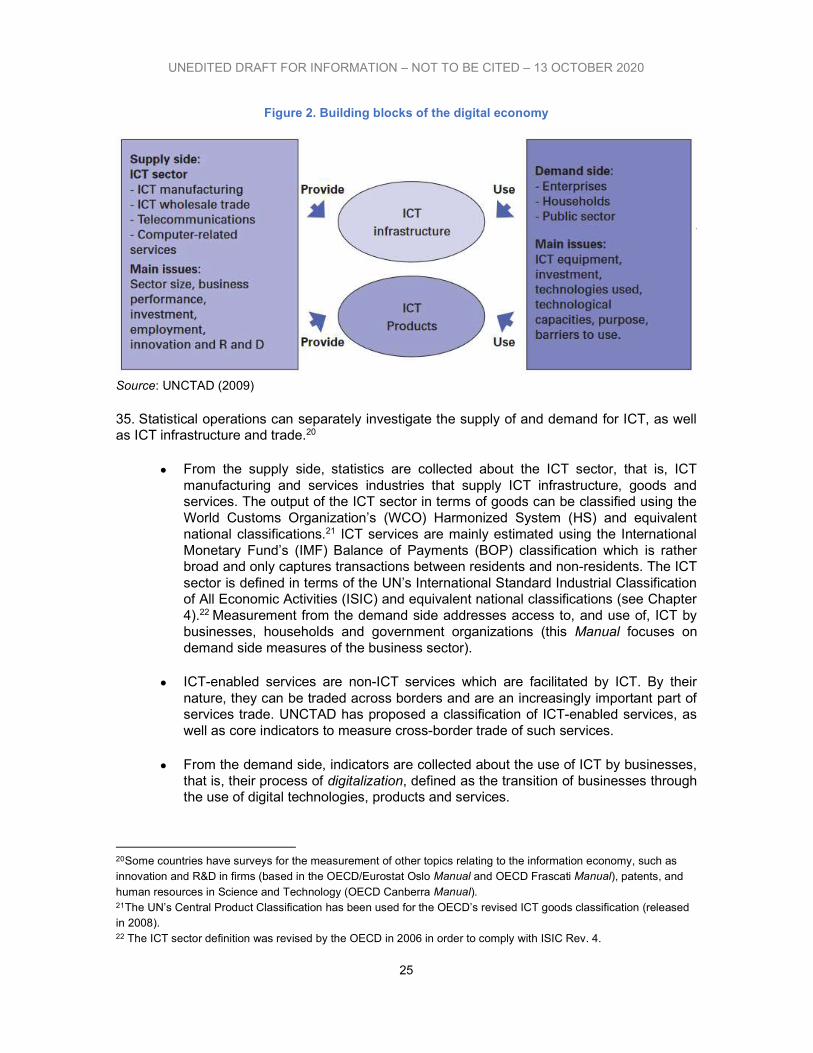
34. Currently, certain aspects of the digital economy can be measured based on the components or ‘building blocks’ of supply and demand (see Figure 2). Statistical measurement instruments (surveys and other statistical operations) can cover these ‘blocks’ or conceptual areas.
UNEDITED DRAFT FOR INFORMATION – NOT TO BE CITED – 13 OCTOBER 2020
25
Figure 2. Building blocks of the digital economy
Source: UNCTAD (2009)
35. Statistical operations can separately investigate the supply of and demand for ICT, as well as ICT infrastructure and trade.20
From the supply side, statistics are collected about the ICT sector, that is, ICT manufacturing and services industries that supply ICT infrastructure, goods and services. The output of the ICT sector in terms of goods can be classified using the World Customs Organization’s (WCO) Harmonized System (HS) and equivalent national classifications.21 ICT services are mainly estimated using the International Monetary Fund’s (IMF) Balance of Payments (BOP) classification which is rather broad and only captures transactions between residents and non-residents. The ICT sector is defined in terms of the UN’s International Standard Industrial Classification of All Economic Activities (ISIC) and equivalent national classifications (see Chapter 4).22 Measurement from the demand side addresses access to, and use of, ICT by businesses, households and government organizations (this Manual focuses on demand side measures of the business sector).
ICT-enabled services are non-ICT services which are facilitated by ICT. By their nature, they can be traded across borders and are an increasingly important part of services trade. UNCTAD has proposed a classification of ICT-enabled services, as well as core indicators to measure cross-border trade of such services.
From the demand side, indicators are collected about the use of ICT by businesses, that is, their process of digitalization, defined as the transition of businesses through the use of digital technologies, products and services.
20 Some countries have surveys for the measurement of other topics relating to the information economy, such as innovation and R&D in firms (based in the OECD/Eurostat Oslo Manual and OECD Frascati Manual), patents, and human resources in Science and Technology (OECD Canberra Manual). 21 The UN’s Central Product Classification has been used for the OECD’s revised ICT goods classification (released in 2008). 22 The ICT sector definition was revised by the OECD in 2006 in order to comply with ISIC Rev. 4.
UNEDITED DRAFT FOR INFORMATION – NOT TO BE CITED – 13 OCTOBER 2020
26
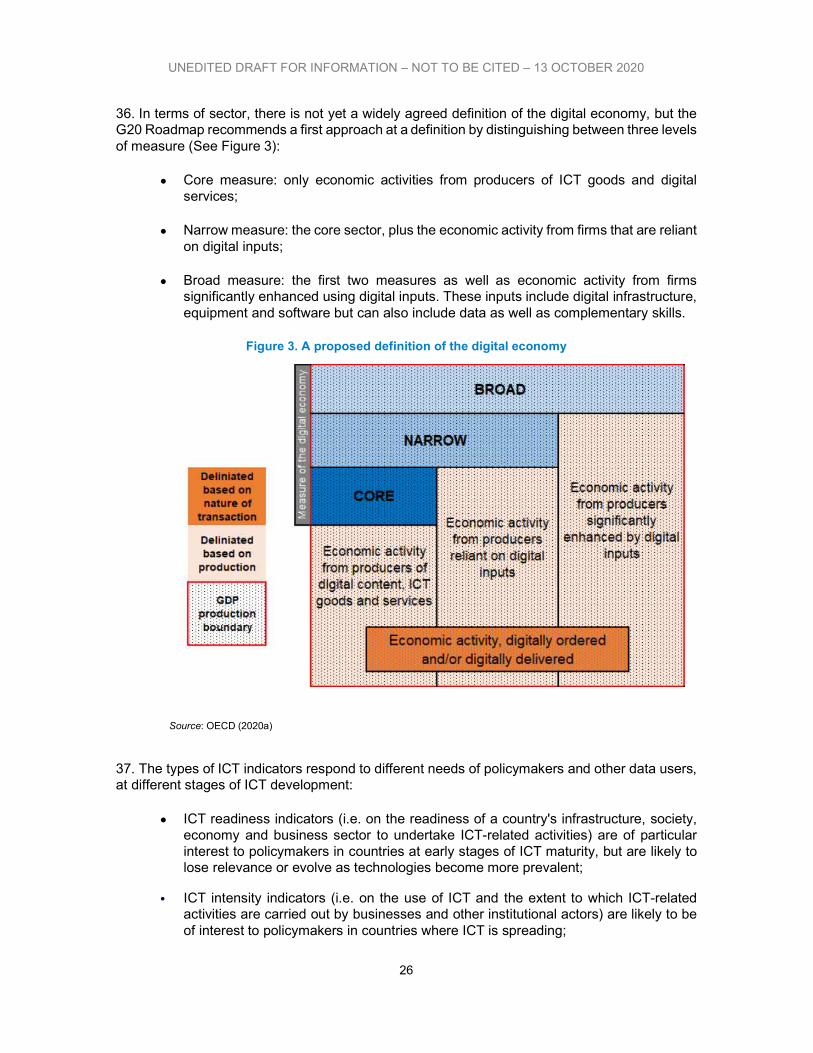
36. In terms of sector, there is not yet a widely agreed definition of the digital economy, but the G20 Roadmap recommends a first approach at a definition by distinguishing between three levels of measure (See Figure 3):
Core measure: only economic activities from producers of ICT goods and digital services;
Narrow measure: the core sector, plus the economic activity from firms that are reliant on digital inputs;
Broad measure: the first two measures as well as economic activity from firms significantly enhanced using digital inputs. These inputs include digital infrastructure, equipment and software but can also include data as well as complementary skills.
Figure 3. A proposed definition of the digital economy
Source: OECD (2020a)
37. The types of ICT indicators respond to different needs of policymakers and other data users, at different stages of ICT development:
ICT readiness indicators (i.e. on the readiness of a country's infrastructure, society, economy and business sector to undertake ICT-related activities) are of particular interest to policymakers in countries at early stages of ICT maturity, but are likely to lose relevance or evolve as technologies become more prevalent;
ICT intensity indicators (i.e. on the use of ICT and the extent to which ICT-related activities are carried out by businesses and other institutional actors) are likely to be of interest to policymakers in countries where ICT is spreading;
UNEDITED DRAFT FOR INFORMATION – NOT TO BE CITED – 13 OCTOBER 2020
27
Indicators on the outcomes and impacts of ICT on business activities and economic growth are likely to be of interest in countries with a relatively high level of ICT development.
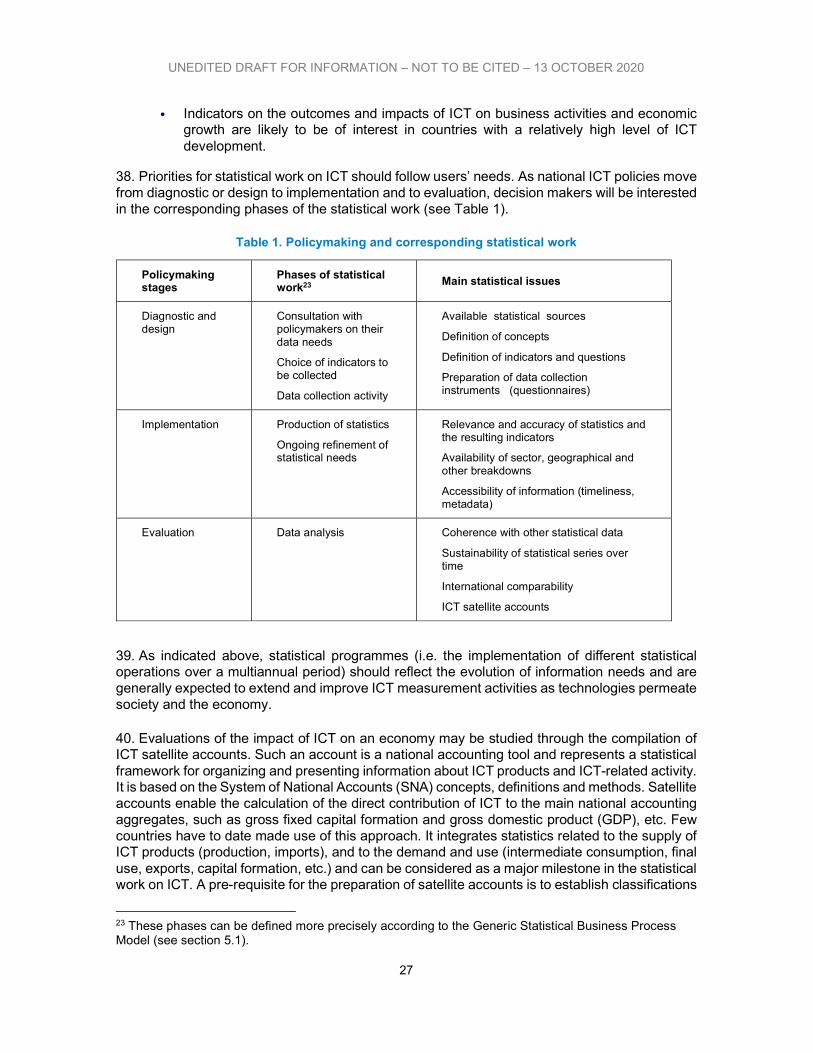
38. Priorities for statistical work on ICT should follow users’ needs. As national ICT policies move from diagnostic or design to implementation and to evaluation, decision makers will be interested in the corresponding phases of the statistical work (see Table 1).
Table 1. Policymaking and corresponding statistical work
Policymaking stages
Phases of statistical work23
Main statistical issues
Diagnostic and design
Consultation with policymakers on their data needs
Choice of indicators to be collected
Data collection activity
Available statistical sources
Definition of concepts
Definition of indicators and questions
Preparation of data collection instruments (questionnaires)
Implementation
Production of statistics
Ongoing refinement of statistical needs
Relevance and accuracy of statistics and the resulting indicators
Availability of sector, geographical and other breakdowns
Accessibility of information (timeliness, metadata)
Evaluation
Data analysis
Coherence with other statistical data
Sustainability of statistical series over time
International comparability
ICT satellite accounts
39. As indicated above, statistical programmes (i.e. the implementation of different statistical operations over a multiannual period) should reflect the evolution of information needs and are generally expected to extend and improve ICT measurement activities as technologies permeate society and the economy.
40. Evaluations of the impact of ICT on an economy may be studied through the compilation of ICT satellite accounts. Such an account is a national accounting tool and represents a statistical framework for organizing and presenting information about ICT products and ICT-related activity. It is based on the System of National Accounts (SNA) concepts, definitions and methods. Satellite accounts enable the calculation of the direct contribution of ICT to the main national accounting aggregates, such as gross fixed capital formation and gross domestic product (GDP), etc. Few countries have to date made use of this approach. It integrates statistics related to the supply of ICT products (production, imports), and to the demand and use (intermediate consumption, final use, exports, capital formation, etc.) and can be considered as a major milestone in the statistical work on ICT. A pre-requisite for the preparation of satellite accounts is to establish classifications
23 These phases can be defined more precisely according to the Generic Statistical Business Process Model (see section 5.1).
UNEDITED DRAFT FOR INFORMATION – NOT TO BE CITED – 13 OCTOBER 2020
28
on industries and products used in all ICT-related surveys. It helps also to identify areas where deficiencies may exist in the collection of ICT statistics.
41. In developing economies, especially the least developed countries (LDC), ICT infrastructure, supply and use may be at a low level. Data on ICT are therefore likely to be scarce and measurement programmes will probably need to be prioritized. The internationally agreed core list of ICT indicators (see Annex 1) should provide guidance on the choice of priorities, while this Manual will help countries by providing guidance on the collection of relevant statistics.
3.2 Concepts of e-business
E-business
42. E-business refers to the use of ICT to facilitate business processes. It is also referred as digitalization. Businesses can use ICT to communicate with government organizations, suppliers and clients (via email, for example) or to purchase and sell goods and services online (e-commerce). ICT can also be used to automate business processes, to manage resources and to implement business policies (in marketing, human resources, finance, etc.). A diversity of business processes as well as barriers that hamper their use can be investigated in statistical surveys.
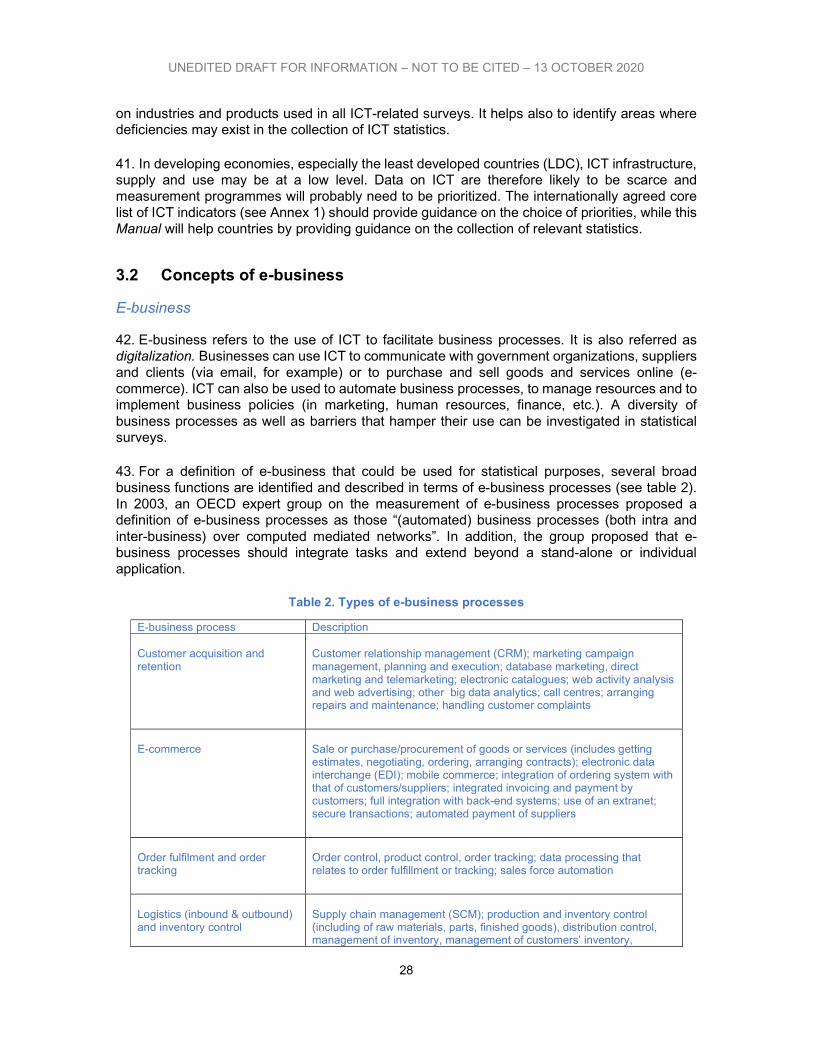
43. For a definition of e-business that could be used for statistical purposes, several broad business functions are identified and described in terms of e-business processes (see table 2). In 2003, an OECD expert group on the measurement of e-business processes proposed a definition of e-business processes as those “(automated) business processes (both intra and inter-business) over computed mediated networks”. In addition, the group proposed that e-business processes should integrate tasks and extend beyond a stand-alone or individual application.
Table 2. Types of e-business processes
E-business process Description Customer acquisition and retention
Customer relationship management (CRM); marketing campaign management, planning and execution; database marketing, direct marketing and telemarketing; electronic catalogues; web activity analysis and web advertising; other big data analytics; call centres; arranging repairs and maintenance; handling customer complaints
E-commerce
Sale or purchase/procurement of goods or services (includes getting estimates, negotiating, ordering, arranging contracts); electronic data interchange (EDI); mobile commerce; integration of ordering system with that of customers/suppliers; integrated invoicing and payment by customers; full integration with back-end systems; use of an extranet; secure transactions; automated payment of suppliers
Order fulfilment and order tracking
Order control, product control, order tracking; data processing that relates to order fulfillment or tracking; sales force automation
Logistics (inbound & outbound) and inventory control
Supply chain management (SCM); production and inventory control (including of raw materials, parts, finished goods), distribution control, management of inventory, management of customers’ inventory,
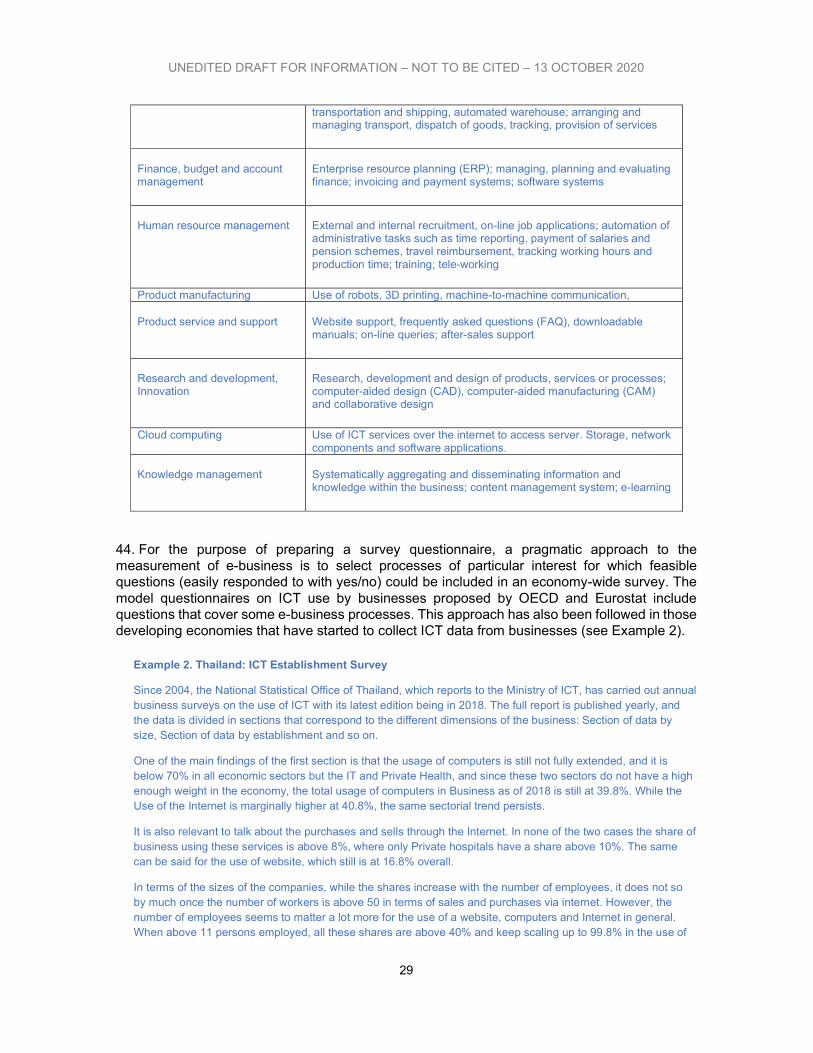
UNEDITED DRAFT FOR INFORMATION – NOT TO BE CITED – 13 OCTOBER 2020
29
transportation and shipping, automated warehouse; arranging and managing transport, dispatch of goods, tracking, provision of services
Finance, budget and account management
Enterprise resource planning (ERP); managing, planning and evaluating finance; invoicing and payment systems; software systems
Human resource management
External and internal recruitment, on-line job applications; automation of administrative tasks such as time reporting, payment of salaries and pension schemes, travel reimbursement, tracking working hours and production time; training; tele-working
Product manufacturing Use of robots, 3D printing, machine-to-machine communication, Product service and support
Website support, frequently asked questions (FAQ), downloadable manuals; on-line queries; after-sales support
Research and development, Innovation
Research, development and design of products, services or processes; computer-aided design (CAD), computer-aided manufacturing (CAM) and collaborative design
Cloud computing Use of ICT services over the internet to access server. Storage, network
components and software applications. Knowledge management
Systematically aggregating and disseminating information and knowledge within the business; content management system; e-learning
44. For the purpose of preparing a survey questionnaire, a pragmatic approach to the measurement of e-business is to select processes of particular interest for which feasible questions (easily responded to with yes/no) could be included in an economy-wide survey. The model questionnaires on ICT use by businesses proposed by OECD and Eurostat include questions that cover some e-business processes. This approach has also been followed in those developing economies that have started to collect ICT data from businesses (see Example 2).
Example 2. Thailand: ICT Establishment Survey
Since 2004, the National Statistical Office of Thailand, which reports to the Ministry of ICT, has carried out annual business surveys on the use of ICT with its latest edition being in 2018. The full report is published yearly, and the data is divided in sections that correspond to the different dimensions of the business: Section of data by size, Section of data by establishment and so on.
One of the main findings of the first section is that the usage of computers is still not fully extended, and it is below 70% in all economic sectors but the IT and Private Health, and since these two sectors do not have a high enough weight in the economy, the total usage of computers in Business as of 2018 is still at 39.8%. While the Use of the Internet is marginally higher at 40.8%, the same sectorial trend persists.
It is also relevant to talk about the purchases and sells through the Internet. In none of the two cases the share of business using these services is above 8%, where only Private hospitals have a share above 10%. The same can be said for the use of website, which still is at 16.8% overall.
In terms of the sizes of the companies, while the shares increase with the number of employees, it does not so by much once the number of workers is above 50 in terms of sales and purchases via internet. However, the number of employees seems to matter a lot more for the use of a website, computers and Internet in general. When above 11 persons employed, all these shares are above 40% and keep scaling up to 99.8% in the use of
UNEDITED DRAFT FOR INFORMATION – NOT TO BE CITED – 13 OCTOBER 2020
30
computers and almost 80% in the use of a website.
Source: http://www.nso.go.th/sites/2014en/Survey/ICT/The%202012%20Establishment%20Survey%20On%20Use%20Of%20Information%20And%20Communication%20Technology/2018/Full%20Report.pdf
45. Analyses of the impact of e-business on business performance and growth have so far been supported by statistical evidence consisting of aggregate indicators and business micro-data from developed countries. Developing economies should consider their requirements for further data analysis when planning investigations on e-business and determining a particular form of data collection. In particular, the need for linking data on e-business from stand-alone ICT surveys with other information on the business’ performance (such as information from taxation records and general business surveys) should be considered.
46. Developing economies could also consider the possibility of including a module on e-business in current business surveys, thereby enabling the linkage of ICT with economic variables in order to analyze the impact of e-business processes on business performance. These options are further discussed in Chapter 5.
3.3 ICT goods production
47. ICT goods are defined by their function: they must either be intended to fulfil the function of information processing and communication by electronic means, including transmission and display, or use electronic processing to detect, measure and/or record physical phenomena, or to control a physical process.
48. Based on international classifications of products, ICT goods are classified into the following categories:
Computers and peripheral equipment, such as printers, monitors, etc.
Communication equipment, such as telephones, radio transmission devices, etc.
Consumer electronic equipment, such as sound or video devices
Electronic components, such as circuits, valves and tubes, transistors, etc.
Other (miscellaneous) such as semiconductors, lasers, etc.
49. For statistical purposes, the World Customs Organization’s classification known as Harmonized System is used to define ICT goods. More detail is given in section 4.3, with special emphasis in cross-border trade of ICT goods.
50. Based on the ICT goods definition, economic activities can be selected as being part of the “ICT manufacturing sector”. Details on the statistical classification is given in section 4.2. This constitutes part of the “core measure” of the digital economy.
UNEDITED DRAFT FOR INFORMATION – NOT TO BE CITED – 13 OCTOBER 2020
31
3.4 ICT services production
51. The Partnership adopted the OECD definition of ICT services, which includes all activities intended to enable and/or fulfil the function of information processing and communication.
52. To facilitate its statistical measurement, the ICT services sector is defined as an aggregation of the ISIC Rev.4. This includes:
Software publishing
Telecommunications
Computer services (programming, consultancy and related activities)
Data processing, hosting and related activities
Repair of computers and communication equipment.
3.5 Trade in ICT goods and services
53. Global demand for ICT goods and services through international trade and investment can drive the activities of many upstream domestic ICT and non-ICT industries. Trade data, combined with statistical information about the supplying sectors (value added, jobs, input-output tables) can eventually provide insight into the “extended footprint” of the ICT and this in a cross-border perspective (OECD, 2020a). Internationally comparable statistics on foreign trade in ICT goods are therefore crucial to understand the supply and demand at global and national levels. Details on indicators on trade of goods and services is given in sections 4.3 and 4.4.
3.6 Digital trade
54. Digital cross-border trade includes import and export of goods and services using ICT. The initial measurement effort of WPIIS targeted the trade of goods (including ICT goods) via e-commerce, and more recent initiatives have considered the statistical definition and measurement of trade in services, including ICT services and other which can be delivered remotely.
3.6.1 E-commerce
55. Electronic transactions (or e-commerce) are at the core of the statistical measurement of e-business. The great policy interest in measuring the volume and characteristics of e-commerce has driven theoretical work in expert groups (such as the OECD’s WPIIS) and practice by statistical offices and other institutions.
56. The need for an operational definition of e-commerce, suitable as a basis for items in statistical questionnaires, was recognized early by expert groups. In 2000, OECD member
UNEDITED DRAFT FOR INFORMATION – NOT TO BE CITED – 13 OCTOBER 2020
32
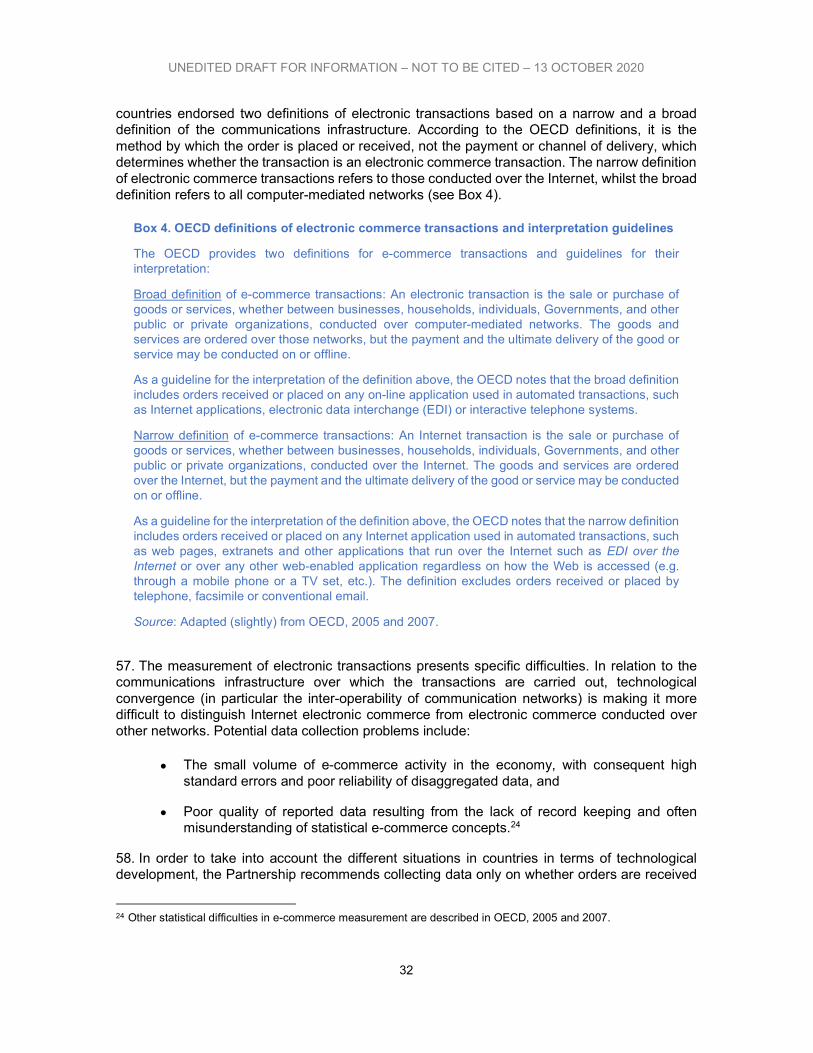
countries endorsed two definitions of electronic transactions based on a narrow and a broad definition of the communications infrastructure. According to the OECD definitions, it is the method by which the order is placed or received, not the payment or channel of delivery, which determines whether the transaction is an electronic commerce transaction. The narrow definition of electronic commerce transactions refers to those conducted over the Internet, whilst the broad definition refers to all computer-mediated networks (see Box 4).
Box 4. OECD definitions of electronic commerce transactions and interpretation guidelines
The OECD provides two definitions for e-commerce transactions and guidelines for their interpretation:
Broad definition of e-commerce transactions: An electronic transaction is the sale or purchase of goods or services, whether between businesses, households, individuals, Governments, and other public or private organizations, conducted over computer-mediated networks. The goods and services are ordered over those networks, but the payment and the ultimate delivery of the good or service may be conducted on or offline.
As a guideline for the interpretation of the definition above, the OECD notes that the broad definition includes orders received or placed on any on-line application used in automated transactions, such as Internet applications, electronic data interchange (EDI) or interactive telephone systems.
Narrow definition of e-commerce transactions: An Internet transaction is the sale or purchase of goods or services, whether between businesses, households, individuals, Governments, and other public or private organizations, conducted over the Internet. The goods and services are ordered over the Internet, but the payment and the ultimate delivery of the good or service may be conducted on or offline.
As a guideline for the interpretation of the definition above, the OECD notes that the narrow definition includes orders received or placed on any Internet application used in automated transactions, such as web pages, extranets and other applications that run over the Internet such as EDI over the Internet or over any other web-enabled application regardless on how the Web is accessed (e.g. through a mobile phone or a TV set, etc.). The definition excludes orders received or placed by telephone, facsimile or conventional email.
Source: Adapted (slightly) from OECD, 2005 and 2007.
57. The measurement of electronic transactions presents specific difficulties. In relation to the communications infrastructure over which the transactions are carried out, technological convergence (in particular the inter-operability of communication networks) is making it more difficult to distinguish Internet electronic commerce from electronic commerce conducted over other networks. Potential data collection problems include:
The small volume of e-commerce activity in the economy, with consequent high standard errors and poor reliability of disaggregated data, and
Poor quality of reported data resulting from the lack of record keeping and often misunderstanding of statistical e-commerce concepts.24
58. In order to take into account the different situations in countries in terms of technological development, the Partnership recommends collecting data only on whether orders are received
24 Other statistical difficulties in e-commerce measurement are described in OECD, 2005 and 2007.
UNEDITED DRAFT FOR INFORMATION – NOT TO BE CITED – 13 OCTOBER 2020
33
or placed over the Internet, including by email (the latter is excluded from the OECD definitions).
59. Some countries have collected data on e-commerce by relevant breakdowns such as the nature of products or location of the buyer/seller. The reliability of these splits has been questioned (for instance, a business may not know or have recorded the destination of its on-line sales) and therefore such a breakdown is not recommended for countries starting data collection on the use of ICT by businesses.
3.6.2 ICT-enabled services (digitally delivered services)
60. A growing number of countries and industries are embracing the opportunities offered by ICT to deliver and receive services as exporters or importers. Services trade is evolving from ICT services (call centers, software coding, generation of digital content, etc.) to more complex business process such as human resource management, payroll, accounting, architectural design, R&D, editing, education and so on. Services that may be delivered remotely via ICT are referred to as ICT-enabled services (ITES).
61. The difficulty of measuring ICT-enabled services is compounded by the increasing complexity of technologies (e.g. business platforms) and business models (e.g. increasing trade within components and affiliates of multinational enterprises). In 2013, the Partnership formed a Task Group on Measuring Trade in ICT Services and ICT-enabled Services that developed recommendations for statistical indicators for these components of services trade.
62. The concept of ITES is less straightforward than ICT services. ITES are defined as those services that are delivered remotely over ICT networks (i.e. over voice or data networks, including the Internet). ITES include activities that can be specified, performed, delivered, evaluated and consumed electronically.
63. Trade in ITES would thus essentially encompass all services transactions delivered remotely over ICT networks via cross-border supply. Excluded are those services that involve the movement of physical objects or people, such as transport, or those that require face-to-face contact, such as personal services, even if they make use ICT for purposes other than remote delivery. Since a subset of potentially ITES will certainly be delivered remotely over ICT networks, the Partnership recommended to focus measurement efforts on the broader, more inclusive complementary grouping of ICT-enabled services (rather than on those which are actually traded).
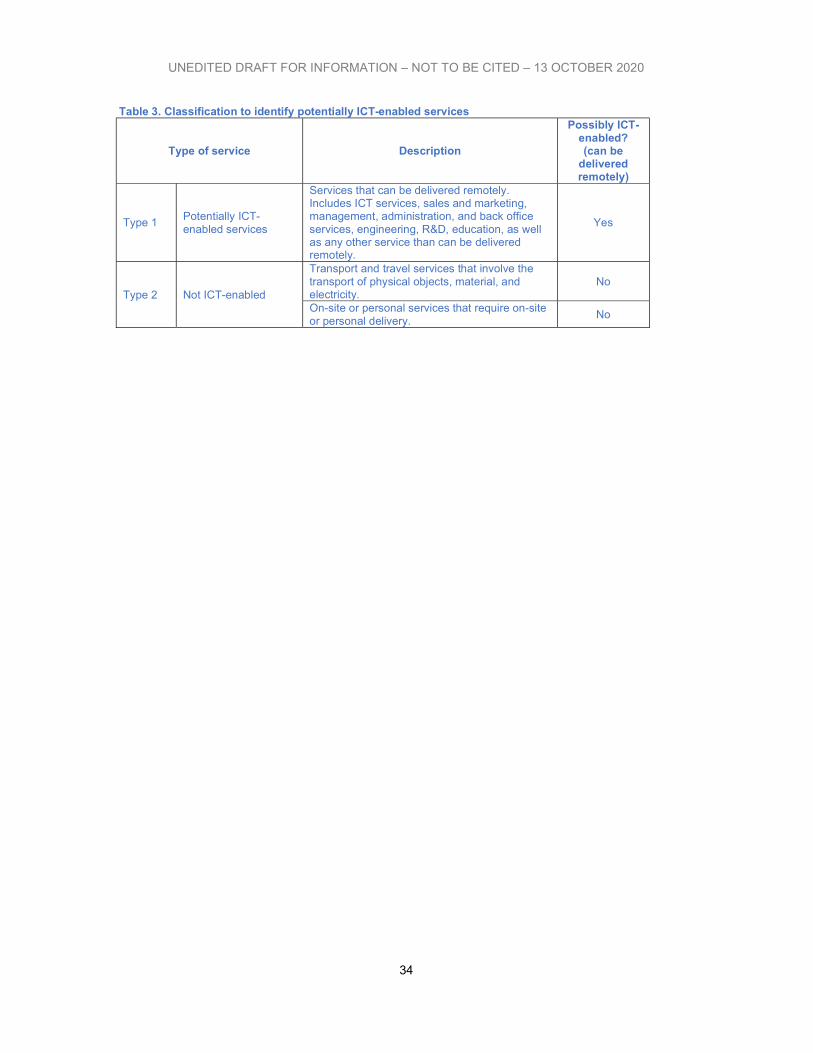
64. For statistical purposes, the ITES concept relates to existing international classifications of services such as EBOPS 2010 and CPC Ver.2.1 and the standard statistical frameworks for measuring international trade in services developed in BPM6 and MSITS (2010). To provide a systematic taxonomy for ICT-enabled services a classification of services is proposed to distinguish between those services categories that can potentially be delivered remotely over ICT networks and those that cannot (see table 3). This represents the first systematic and detailed attempt to define and classify ICT-enabled services using existing classifications. See Chapter 4 for the statistical standards related to measuring ITES.
UNEDITED DRAFT FOR INFORMATION – NOT TO BE CITED – 13 OCTOBER 2020
34
Table 3. Classification to identify potentially ICT-enabled services
Type of service Description
Possibly ICT-enabled? (can be
delivered remotely)
Type 1 Potentially ICT-enabled services
Services that can be delivered remotely. Includes ICT services, sales and marketing, management, administration, and back office services, engineering, R&D, education, as well as any other service than can be delivered remotely.
Yes
Type 2 Not ICT-enabled
Transport and travel services that involve the transport of physical objects, material, and electricity.
No
On-site or personal services that require on-site or personal delivery.
No
UNEDITED DRAFT FOR INFORMATION – NOT TO BE CITED – 13 OCTOBER 2020
35
Chapter 4 - Statistical standards selected indicators on the digital economy 65. This chapter reflects work carried out by UNCTAD and other international organisations (OECD, G20, WTO) in relation to topics in the statistical measurement of the digital economy since 2009. It describes the main statistical standards covering the calculation of the core ICT indicators on: use of ICT by businesses, the ICT sector, trade in ICT goods and services, trade in ICT-enabled services and e-commerce. It also presents metadata associated to the Partnership’s core ICT indicators, such as methods of calculation and definitions of terms. Related information can be found in Chapter 6 (model questions and questionnaires for relevant business surveys) and Chapter 7 (designing business ICT surveys, including questions of scope, coverage, units, sampling and data processing) as well as in annexes 8 (classification of ICT goods), 9 (classification of ICT services) and 10 (classification of ICT-enabled services). The most recent model questionnaires of OECD and Eurostat are included in Annexes 5 and 4 respectively.
66. Besides the core list of indicators, other measurement areas are briefly mentioned in the chapter regarding the access to and use of ICT by businesses. These include the use of mobile phones, investment in ICT, cybersecurity measures, gender issues in the use of ICT in businesses, as well as advanced topics related to e-commerce. It is likely that these topics will be of interest of countries with high penetration of ICT in the business sector, but the inclusion of ICT related questions in business survey modules (rather than stand-alone surveys, see Chapter 5). OECD and Eurostat model questionnaires can be adapted for investigating these topics.
4.1 Measuring ICT demand (use)
4.1.1. Core indicators on the use of ICT by businesses
67. There are 12 core indicators on the use of ICT by businesses. Two of the core indicators (indicators B9 and B12) are breakdowns of another indicator (B3). For each indicator, Table 4 shows a definition of the main concepts involved, the method of calculation, and model questions. Chapter 6 further develops the questionnaire to collect the necessary information to compute the indicators based on such model questions. A model questionnaire provided in Annex 2 shows a logical sequence for the model questions.
68. For each indicator, a short reference to policy relevance has been included, so that statisticians in charge of compiling ICT indicators get familiar with the origin of the information needs.
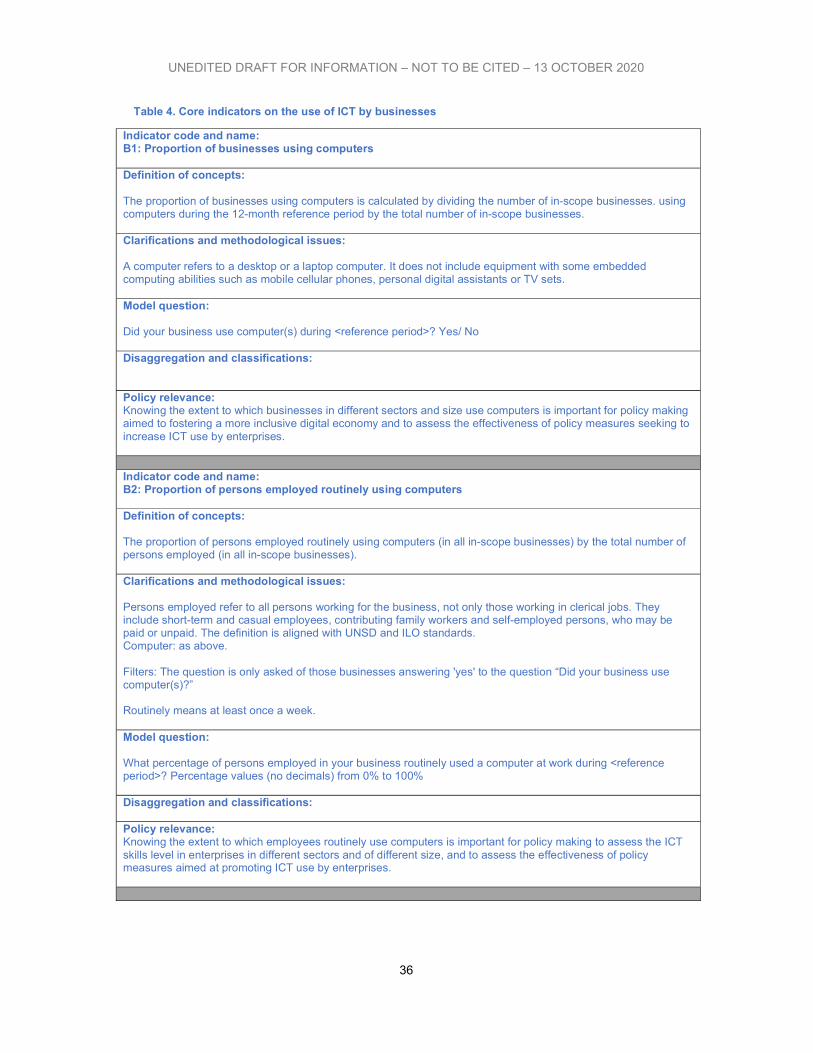
UNEDITED DRAFT FOR INFORMATION – NOT TO BE CITED – 13 OCTOBER 2020
36
Table 4. Core indicators on the use of ICT by businesses
Indicator code and name: B1: Proportion of businesses using computers Definition of concepts: The proportion of businesses using computers is calculated by dividing the number of in-scope businesses. using computers during the 12-month reference period by the total number of in-scope businesses. Clarifications and methodological issues: A computer refers to a desktop or a laptop computer. It does not include equipment with some embedded computing abilities such as mobile cellular phones, personal digital assistants or TV sets. Model question: Did your business use computer(s) during <reference period>? Yes/ No Disaggregation and classifications: Policy relevance: Knowing the extent to which businesses in different sectors and size use computers is important for policy making aimed to fostering a more inclusive digital economy and to assess the effectiveness of policy measures seeking to increase ICT use by enterprises. Indicator code and name: B2: Proportion of persons employed routinely using computers Definition of concepts: The proportion of persons employed routinely using computers (in all in-scope businesses) by the total number of persons employed (in all in-scope businesses). Clarifications and methodological issues: Persons employed refer to all persons working for the business, not only those working in clerical jobs. They include short-term and casual employees, contributing family workers and self-employed persons, who may be paid or unpaid. The definition is aligned with UNSD and ILO standards. Computer: as above. Filters: The question is only asked of those businesses answering 'yes' to the question “Did your business use computer(s)?” Routinely means at least once a week. Model question: What percentage of persons employed in your business routinely used a computer at work during <reference period>? Percentage values (no decimals) from 0% to 100% Disaggregation and classifications: Policy relevance: Knowing the extent to which employees routinely use computers is important for policy making to assess the ICT skills level in enterprises in different sectors and of different size, and to assess the effectiveness of policy measures aimed at promoting ICT use by enterprises.
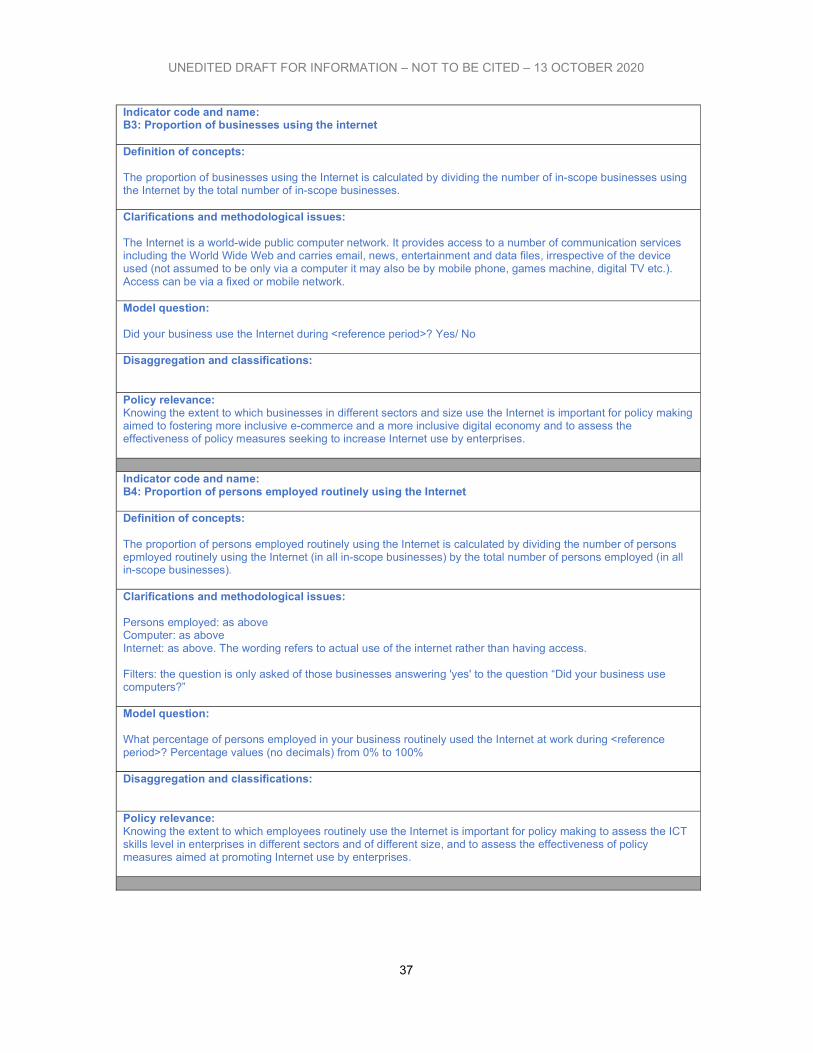
UNEDITED DRAFT FOR INFORMATION – NOT TO BE CITED – 13 OCTOBER 2020
37
Indicator code and name: B3: Proportion of businesses using the internet Definition of concepts: The proportion of businesses using the Internet is calculated by dividing the number of in-scope businesses using the Internet by the total number of in-scope businesses. Clarifications and methodological issues: The Internet is a world-wide public computer network. It provides access to a number of communication services including the World Wide Web and carries email, news, entertainment and data files, irrespective of the device used (not assumed to be only via a computer it may also be by mobile phone, games machine, digital TV etc.). Access can be via a fixed or mobile network. Model question: Did your business use the Internet during <reference period>? Yes/ No Disaggregation and classifications: Policy relevance: Knowing the extent to which businesses in different sectors and size use the Internet is important for policy making aimed to fostering more inclusive e-commerce and a more inclusive digital economy and to assess the effectiveness of policy measures seeking to increase Internet use by enterprises. Indicator code and name: B4: Proportion of persons employed routinely using the Internet Definition of concepts: The proportion of persons employed routinely using the Internet is calculated by dividing the number of persons epmloyed routinely using the Internet (in all in-scope businesses) by the total number of persons employed (in all in-scope businesses). Clarifications and methodological issues: Persons employed: as above Computer: as above Internet: as above. The wording refers to actual use of the internet rather than having access. Filters: the question is only asked of those businesses answering 'yes' to the question “Did your business use computers?” Model question: What percentage of persons employed in your business routinely used the Internet at work during <reference period>? Percentage values (no decimals) from 0% to 100% Disaggregation and classifications: Policy relevance: Knowing the extent to which employees routinely use the Internet is important for policy making to assess the ICT skills level in enterprises in different sectors and of different size, and to assess the effectiveness of policy measures aimed at promoting Internet use by enterprises.
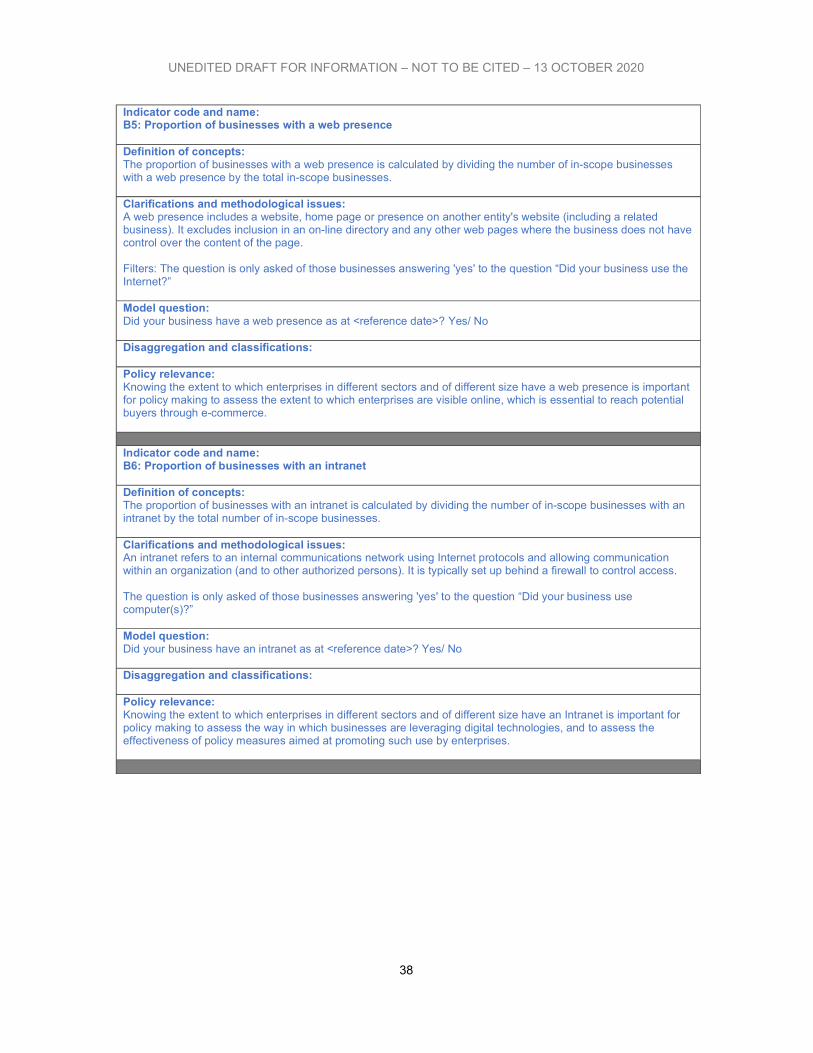
UNEDITED DRAFT FOR INFORMATION – NOT TO BE CITED – 13 OCTOBER 2020
38
Indicator code and name: B5: Proportion of businesses with a web presence Definition of concepts: The proportion of businesses with a web presence is calculated by dividing the number of in-scope businesses with a web presence by the total in-scope businesses. Clarifications and methodological issues: A web presence includes a website, home page or presence on another entity's website (including a related business). It excludes inclusion in an on-line directory and any other web pages where the business does not have control over the content of the page. Filters: The question is only asked of those businesses answering 'yes' to the question “Did your business use the Internet?” Model question: Did your business have a web presence as at <reference date>? Yes/ No Disaggregation and classifications: Policy relevance: Knowing the extent to which enterprises in different sectors and of different size have a web presence is important for policy making to assess the extent to which enterprises are visible online, which is essential to reach potential buyers through e-commerce. Indicator code and name: B6: Proportion of businesses with an intranet Definition of concepts: The proportion of businesses with an intranet is calculated by dividing the number of in-scope businesses with an intranet by the total number of in-scope businesses. Clarifications and methodological issues: An intranet refers to an internal communications network using Internet protocols and allowing communication within an organization (and to other authorized persons). It is typically set up behind a firewall to control access. The question is only asked of those businesses answering 'yes' to the question “Did your business use computer(s)?” Model question: Did your business have an intranet as at <reference date>? Yes/ No Disaggregation and classifications: Policy relevance: Knowing the extent to which enterprises in different sectors and of different size have an Intranet is important for policy making to assess the way in which businesses are leveraging digital technologies, and to assess the effectiveness of policy measures aimed at promoting such use by enterprises.
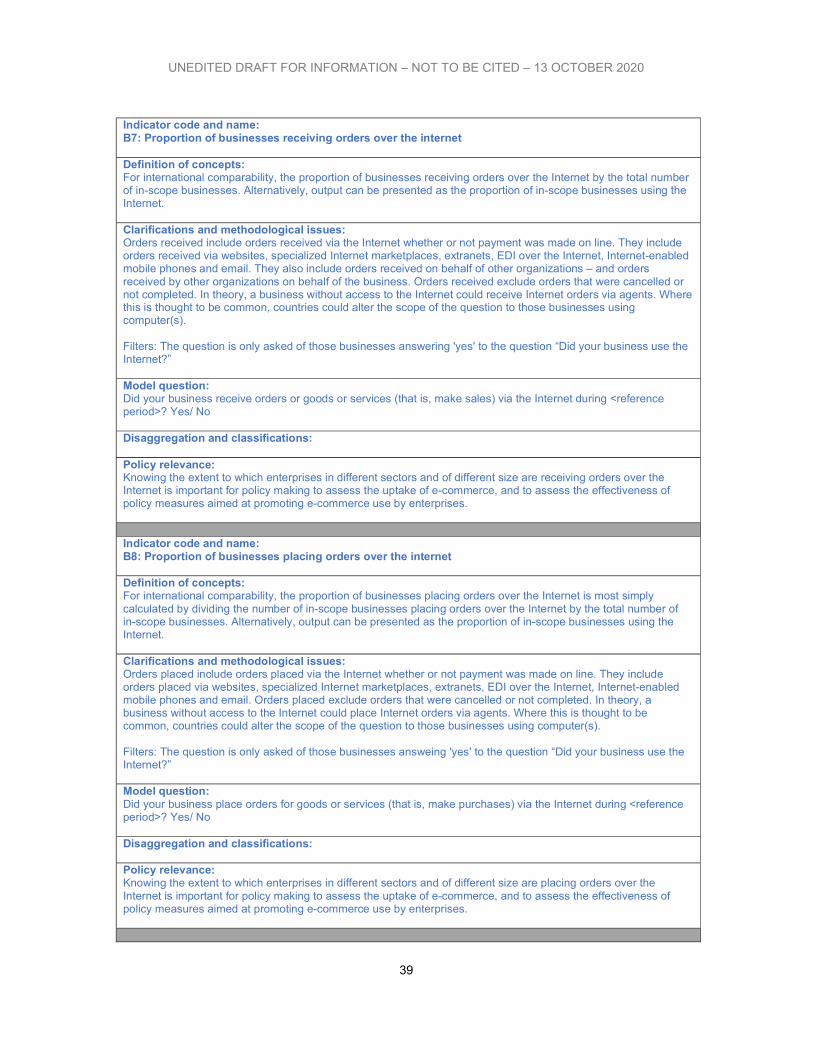
UNEDITED DRAFT FOR INFORMATION – NOT TO BE CITED – 13 OCTOBER 2020
39
Indicator code and name: B7: Proportion of businesses receiving orders over the internet Definition of concepts: For international comparability, the proportion of businesses receiving orders over the Internet by the total number of in-scope businesses. Alternatively, output can be presented as the proportion of in-scope businesses using the Internet. Clarifications and methodological issues: Orders received include orders received via the Internet whether or not payment was made on line. They include orders received via websites, specialized Internet marketplaces, extranets, EDI over the Internet, Internet-enabled mobile phones and email. They also include orders received on behalf of other organizations – and orders received by other organizations on behalf of the business. Orders received exclude orders that were cancelled or not completed. In theory, a business without access to the Internet could receive Internet orders via agents. Where this is thought to be common, countries could alter the scope of the question to those businesses using computer(s). Filters: The question is only asked of those businesses answering 'yes' to the question “Did your business use the Internet?” Model question: Did your business receive orders or goods or services (that is, make sales) via the Internet during <reference period>? Yes/ No Disaggregation and classifications: Policy relevance: Knowing the extent to which enterprises in different sectors and of different size are receiving orders over the Internet is important for policy making to assess the uptake of e-commerce, and to assess the effectiveness of policy measures aimed at promoting e-commerce use by enterprises. Indicator code and name: B8: Proportion of businesses placing orders over the internet Definition of concepts: For international comparability, the proportion of businesses placing orders over the Internet is most simply calculated by dividing the number of in-scope businesses placing orders over the Internet by the total number of in-scope businesses. Alternatively, output can be presented as the proportion of in-scope businesses using the Internet. Clarifications and methodological issues: Orders placed include orders placed via the Internet whether or not payment was made on line. They include orders placed via websites, specialized Internet marketplaces, extranets, EDI over the Internet, Internet-enabled mobile phones and email. Orders placed exclude orders that were cancelled or not completed. In theory, a business without access to the Internet could place Internet orders via agents. Where this is thought to be common, countries could alter the scope of the question to those businesses using computer(s). Filters: The question is only asked of those businesses answeing 'yes' to the question “Did your business use the Internet?” Model question: Did your business place orders for goods or services (that is, make purchases) via the Internet during <reference period>? Yes/ No Disaggregation and classifications: Policy relevance: Knowing the extent to which enterprises in different sectors and of different size are placing orders over the Internet is important for policy making to assess the uptake of e-commerce, and to assess the effectiveness of policy measures aimed at promoting e-commerce use by enterprises.
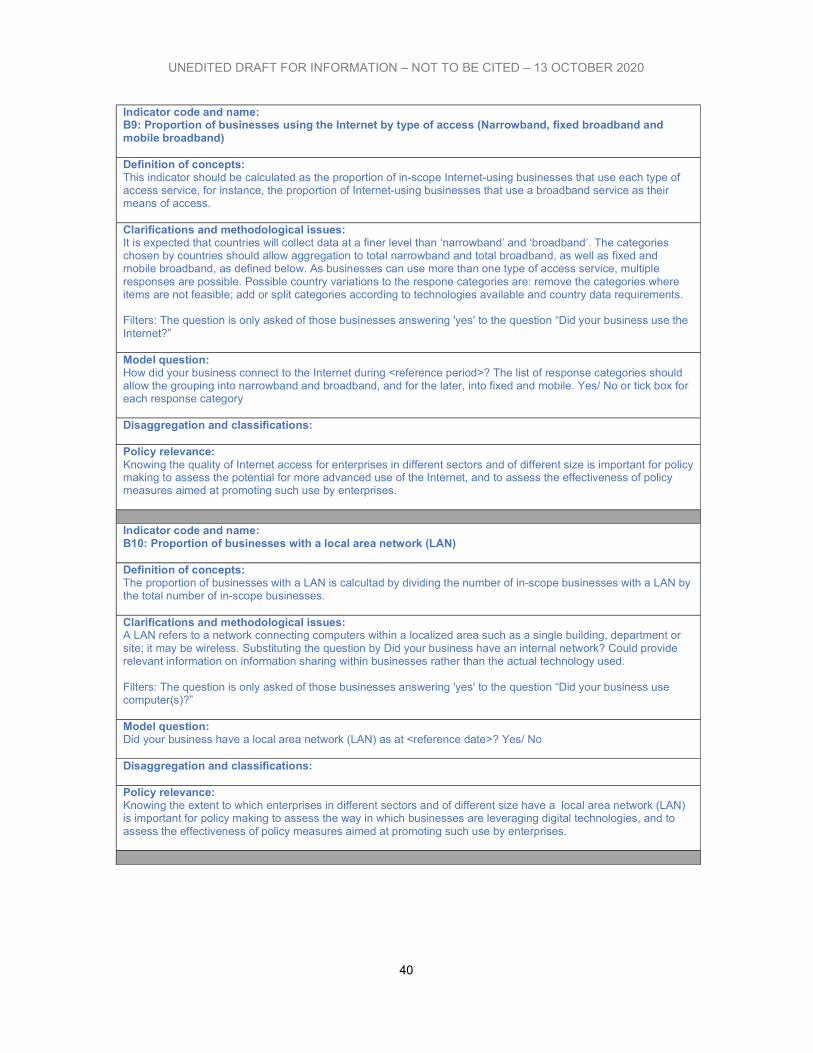
UNEDITED DRAFT FOR INFORMATION – NOT TO BE CITED – 13 OCTOBER 2020
40
Indicator code and name: B9: Proportion of businesses using the Internet by type of access (Narrowband, fixed broadband and mobile broadband) Definition of concepts: This indicator should be calculated as the proportion of in-scope Internet-using businesses that use each type of access service, for instance, the proportion of Internet-using businesses that use a broadband service as their means of access. Clarifications and methodological issues: It is expected that countries will collect data at a finer level than ‘narrowband’ and ‘broadband’. The categories chosen by countries should allow aggregation to total narrowband and total broadband, as well as fixed and mobile broadband, as defined below. As businesses can use more than one type of access service, multiple responses are possible. Possible country variations to the respone categories are: remove the categories where items are not feasible; add or split categories according to technologies available and country data requirements. Filters: The question is only asked of those businesses answering 'yes' to the question “Did your business use the Internet?” Model question: How did your business connect to the Internet during <reference period>? The list of response categories should allow the grouping into narrowband and broadband, and for the later, into fixed and mobile. Yes/ No or tick box for each response category Disaggregation and classifications: Policy relevance: Knowing the quality of Internet access for enterprises in different sectors and of different size is important for policy making to assess the potential for more advanced use of the Internet, and to assess the effectiveness of policy measures aimed at promoting such use by enterprises. Indicator code and name: B10: Proportion of businesses with a local area network (LAN) Definition of concepts: The proportion of businesses with a LAN is calcultad by dividing the number of in-scope businesses with a LAN by the total number of in-scope businesses. Clarifications and methodological issues: A LAN refers to a network connecting computers within a localized area such as a single building, department or site; it may be wireless. Substituting the question by Did your business have an internal network? Could provide relevant information on information sharing within businesses rather than the actual technology used. Filters: The question is only asked of those businesses answering 'yes' to the question “Did your business use computer(s)?” Model question: Did your business have a local area network (LAN) as at <reference date>? Yes/ No Disaggregation and classifications: Policy relevance: Knowing the extent to which enterprises in different sectors and of different size have a local area network (LAN) is important for policy making to assess the way in which businesses are leveraging digital technologies, and to assess the effectiveness of policy measures aimed at promoting such use by enterprises.
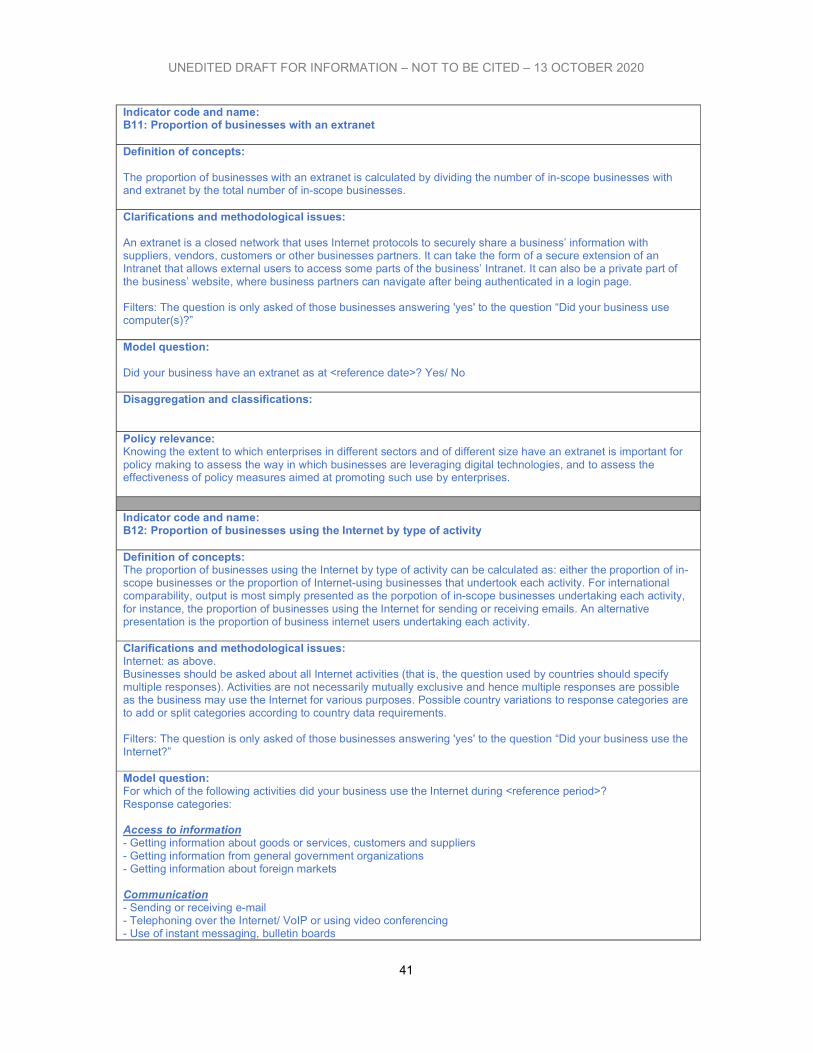
UNEDITED DRAFT FOR INFORMATION – NOT TO BE CITED – 13 OCTOBER 2020
41
Indicator code and name: B11: Proportion of businesses with an extranet Definition of concepts: The proportion of businesses with an extranet is calculated by dividing the number of in-scope businesses with and extranet by the total number of in-scope businesses. Clarifications and methodological issues: An extranet is a closed network that uses Internet protocols to securely share a business’ information with suppliers, vendors, customers or other businesses partners. It can take the form of a secure extension of an Intranet that allows external users to access some parts of the business’ Intranet. It can also be a private part of the business’ website, where business partners can navigate after being authenticated in a login page. Filters: The question is only asked of those businesses answering 'yes' to the question “Did your business use computer(s)?” Model question: Did your business have an extranet as at <reference date>? Yes/ No Disaggregation and classifications: Policy relevance: Knowing the extent to which enterprises in different sectors and of different size have an extranet is important for policy making to assess the way in which businesses are leveraging digital technologies, and to assess the effectiveness of policy measures aimed at promoting such use by enterprises. Indicator code and name: B12: Proportion of businesses using the Internet by type of activity Definition of concepts: The proportion of businesses using the Internet by type of activity can be calculated as: either the proportion of in-scope businesses or the proportion of Internet-using businesses that undertook each activity. For international comparability, output is most simply presented as the porpotion of in-scope businesses undertaking each activity, for instance, the proportion of businesses using the Internet for sending or receiving emails. An alternative presentation is the proportion of business internet users undertaking each activity. Clarifications and methodological issues: Internet: as above. Businesses should be asked about all Internet activities (that is, the question used by countries should specify multiple responses). Activities are not necessarily mutually exclusive and hence multiple responses are possible as the business may use the Internet for various purposes. Possible country variations to response categories are to add or split categories according to country data requirements. Filters: The question is only asked of those businesses answering 'yes' to the question “Did your business use the Internet?” Model question: For which of the following activities did your business use the Internet during <reference period>? Response categories: Access to information - Getting information about goods or services, customers and suppliers - Getting information from general government organizations - Getting information about foreign markets Communication - Sending or receiving e-mail - Telephoning over the Internet/ VoIP or using video conferencing - Use of instant messaging, bulletin boards
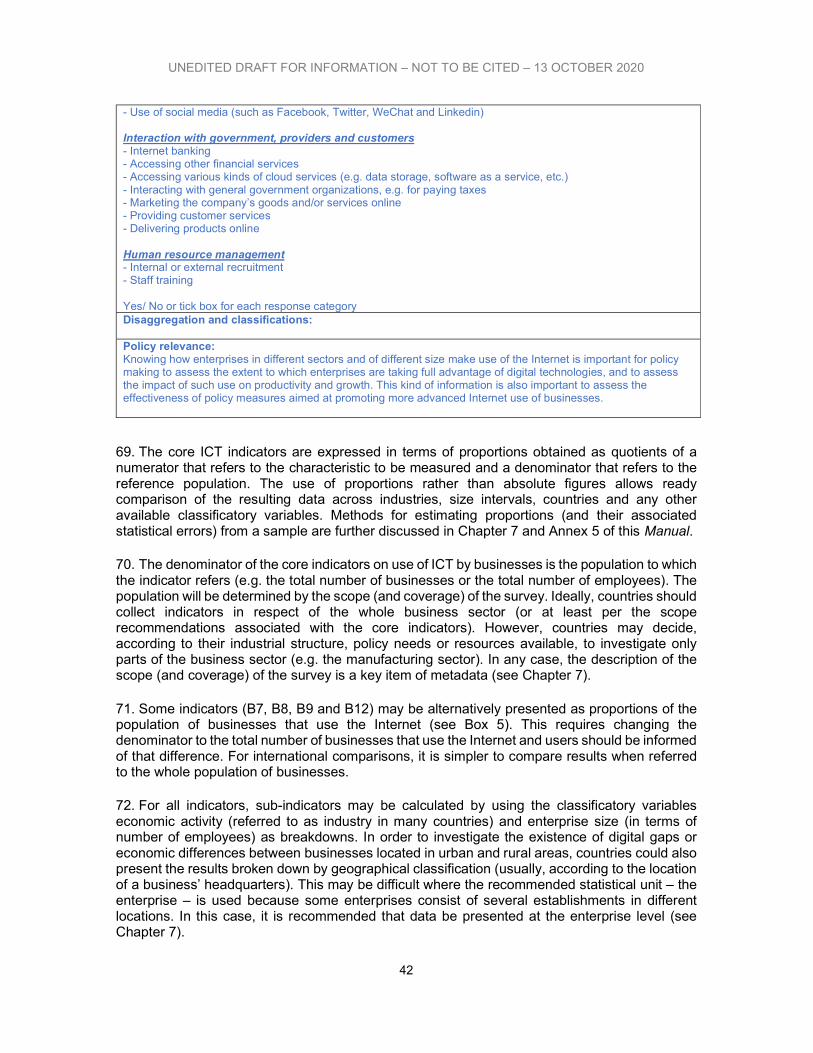
UNEDITED DRAFT FOR INFORMATION – NOT TO BE CITED – 13 OCTOBER 2020
42
- Use of social media (such as Facebook, Twitter, WeChat and Linkedin) Interaction with government, providers and customers - Internet banking - Accessing other financial services - Accessing various kinds of cloud services (e.g. data storage, software as a service, etc.) - Interacting with general government organizations, e.g. for paying taxes - Marketing the company’s goods and/or services online - Providing customer services - Delivering products online Human resource management - Internal or external recruitment - Staff training Yes/ No or tick box for each response category Disaggregation and classifications: Policy relevance: Knowing how enterprises in different sectors and of different size make use of the Internet is important for policy making to assess the extent to which enterprises are taking full advantage of digital technologies, and to assess the impact of such use on productivity and growth. This kind of information is also important to assess the effectiveness of policy measures aimed at promoting more advanced Internet use of businesses.
69. The core ICT indicators are expressed in terms of proportions obtained as quotients of a numerator that refers to the characteristic to be measured and a denominator that refers to the reference population. The use of proportions rather than absolute figures allows ready comparison of the resulting data across industries, size intervals, countries and any other available classificatory variables. Methods for estimating proportions (and their associated statistical errors) from a sample are further discussed in Chapter 7 and Annex 5 of this Manual.
70. The denominator of the core indicators on use of ICT by businesses is the population to which the indicator refers (e.g. the total number of businesses or the total number of employees). The population will be determined by the scope (and coverage) of the survey. Ideally, countries should collect indicators in respect of the whole business sector (or at least per the scope recommendations associated with the core indicators). However, countries may decide, according to their industrial structure, policy needs or resources available, to investigate only parts of the business sector (e.g. the manufacturing sector). In any case, the description of the scope (and coverage) of the survey is a key item of metadata (see Chapter 7).
71. Some indicators (B7, B8, B9 and B12) may be alternatively presented as proportions of the population of businesses that use the Internet (see Box 5). This requires changing the denominator to the total number of businesses that use the Internet and users should be informed of that difference. For international comparisons, it is simpler to compare results when referred to the whole population of businesses.
72. For all indicators, sub-indicators may be calculated by using the classificatory variables economic activity (referred to as industry in many countries) and enterprise size (in terms of number of employees) as breakdowns. In order to investigate the existence of digital gaps or economic differences between businesses located in urban and rural areas, countries could also present the results broken down by geographical classification (usually, according to the location of a business’ headquarters). This may be difficult where the recommended statistical unit – the enterprise – is used because some enterprises consist of several establishments in different locations. In this case, it is recommended that data be presented at the enterprise level (see Chapter 7).
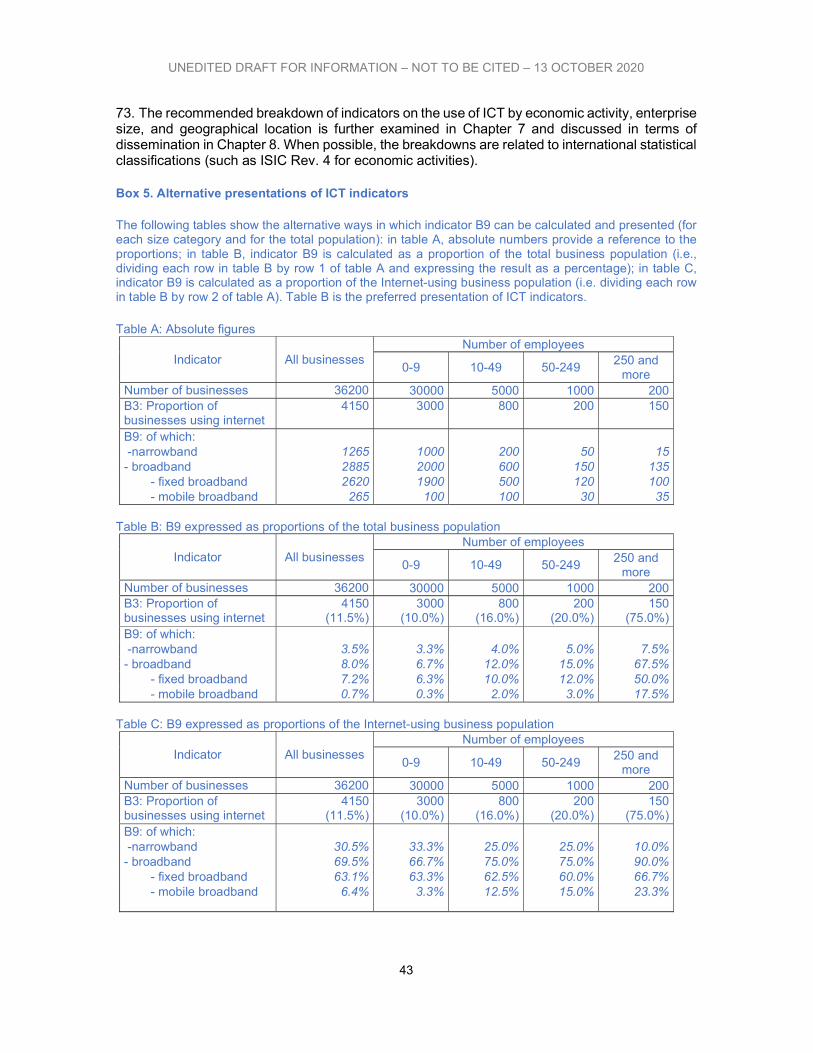
UNEDITED DRAFT FOR INFORMATION – NOT TO BE CITED – 13 OCTOBER 2020
43
73. The recommended breakdown of indicators on the use of ICT by economic activity, enterprise size, and geographical location is further examined in Chapter 7 and discussed in terms of dissemination in Chapter 8. When possible, the breakdowns are related to international statistical classifications (such as ISIC Rev. 4 for economic activities).
Box 5. Alternative presentations of ICT indicators
The following tables show the alternative ways in which indicator B9 can be calculated and presented (for each size category and for the total population): in table A, absolute numbers provide a reference to the proportions; in table B, indicator B9 is calculated as a proportion of the total business population (i.e., dividing each row in table B by row 1 of table A and expressing the result as a percentage); in table C, indicator B9 is calculated as a proportion of the Internet-using business population (i.e. dividing each row in table B by row 2 of table A). Table B is the preferred presentation of ICT indicators.
Table A: Absolute figures
Indicator All businesses Number of employees
0-9 10-49 50-249 250 and
more Number of businesses 36200 30000 5000 1000 200 B3: Proportion of businesses using internet
4150 3000 800 200 150
B9: of which: -narrowband 1265 1000 200 50 15 - broadband 2885 2000 600 150 135
- fixed broadband 2620 1900 500 120 100 - mobile broadband 265 100 100 30 35
Table B: B9 expressed as proportions of the total business population
Indicator All businesses Number of employees
0-9 10-49 50-249 250 and
more Number of businesses 36200 30000 5000 1000 200 B3: Proportion of businesses using internet
4150 (11.5%)
3000 (10.0%)
800 (16.0%)
200 (20.0%)
150 (75.0%)
B9: of which: -narrowband 3.5% 3.3% 4.0% 5.0% 7.5% - broadband 8.0% 6.7% 12.0% 15.0% 67.5%
- fixed broadband 7.2% 6.3% 10.0% 12.0% 50.0% - mobile broadband 0.7% 0.3% 2.0% 3.0% 17.5%
Table C: B9 expressed as proportions of the Internet-using business population
Indicator All businesses Number of employees
0-9 10-49 50-249 250 and
more Number of businesses 36200 30000 5000 1000 200 B3: Proportion of businesses using internet
4150 (11.5%)
3000 (10.0%)
800 (16.0%)
200 (20.0%)
150 (75.0%)
B9: of which: -narrowband 30.5% 33.3% 25.0% 25.0% 10.0% - broadband 69.5% 66.7% 75.0% 75.0% 90.0%
- fixed broadband 63.1% 63.3% 62.5% 60.0% 66.7% - mobile broadband 6.4% 3.3% 12.5% 15.0% 23.3%
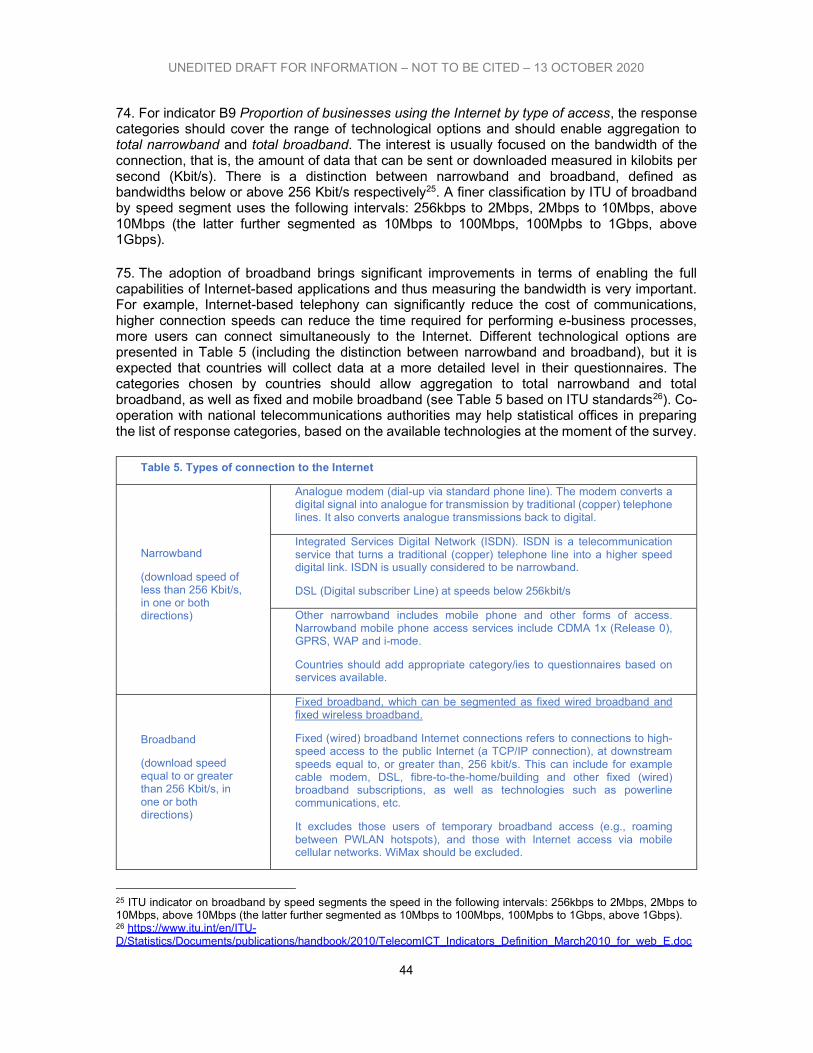
UNEDITED DRAFT FOR INFORMATION – NOT TO BE CITED – 13 OCTOBER 2020
44
74. For indicator B9 Proportion of businesses using the Internet by type of access, the response categories should cover the range of technological options and should enable aggregation to total narrowband and total broadband. The interest is usually focused on the bandwidth of the connection, that is, the amount of data that can be sent or downloaded measured in kilobits per second (Kbit/s). There is a distinction between narrowband and broadband, defined as bandwidths below or above 256 Kbit/s respectively25. A finer classification by ITU of broadband by speed segment uses the following intervals: 256kbps to 2Mbps, 2Mbps to 10Mbps, above 10Mbps (the latter further segmented as 10Mbps to 100Mbps, 100Mpbs to 1Gbps, above 1Gbps).
75. The adoption of broadband brings significant improvements in terms of enabling the full capabilities of Internet-based applications and thus measuring the bandwidth is very important. For example, Internet-based telephony can significantly reduce the cost of communications, higher connection speeds can reduce the time required for performing e-business processes, more users can connect simultaneously to the Internet. Different technological options are presented in Table 5 (including the distinction between narrowband and broadband), but it is expected that countries will collect data at a more detailed level in their questionnaires. The categories chosen by countries should allow aggregation to total narrowband and total broadband, as well as fixed and mobile broadband (see Table 5 based on ITU standards26). Co-operation with national telecommunications authorities may help statistical offices in preparing the list of response categories, based on the available technologies at the moment of the survey.
Table 5. Types of connection to the Internet
Narrowband
(download speed of less than 256 Kbit/s, in one or both directions)
Analogue modem (dial-up via standard phone line). The modem converts a digital signal into analogue for transmission by traditional (copper) telephone lines. It also converts analogue transmissions back to digital.
Integrated Services Digital Network (ISDN). ISDN is a telecommunication service that turns a traditional (copper) telephone line into a higher speed digital link. ISDN is usually considered to be narrowband.
DSL (Digital subscriber Line) at speeds below 256kbit/s
Other narrowband includes mobile phone and other forms of access. Narrowband mobile phone access services include CDMA 1x (Release 0), GPRS, WAP and i-mode.
Countries should add appropriate category/ies to questionnaires based on services available.
Broadband
(download speed equal to or greater than 256 Kbit/s, in one or both directions)
Fixed broadband, which can be segmented as fixed wired broadband and fixed wireless broadband.
Fixed (wired) broadband Internet connections refers to connections to high-speed access to the public Internet (a TCP/IP connection), at downstream speeds equal to, or greater than, 256 kbit/s. This can include for example cable modem, DSL, fibre-to-the-home/building and other fixed (wired) broadband subscriptions, as well as technologies such as powerline communications, etc.
It excludes those users of temporary broadband access (e.g., roaming between PWLAN hotspots), and those with Internet access via mobile cellular networks. WiMax should be excluded.
25 ITU indicator on broadband by speed segments the speed in the following intervals: 256kbps to 2Mbps, 2Mbps to 10Mbps, above 10Mbps (the latter further segmented as 10Mbps to 100Mbps, 100Mpbs to 1Gbps, above 1Gbps). 26 https://www.itu.int/en/ITU-D/Statistics/Documents/publications/handbook/2010/TelecomICT_Indicators_Definition_March2010_for_web_E.doc
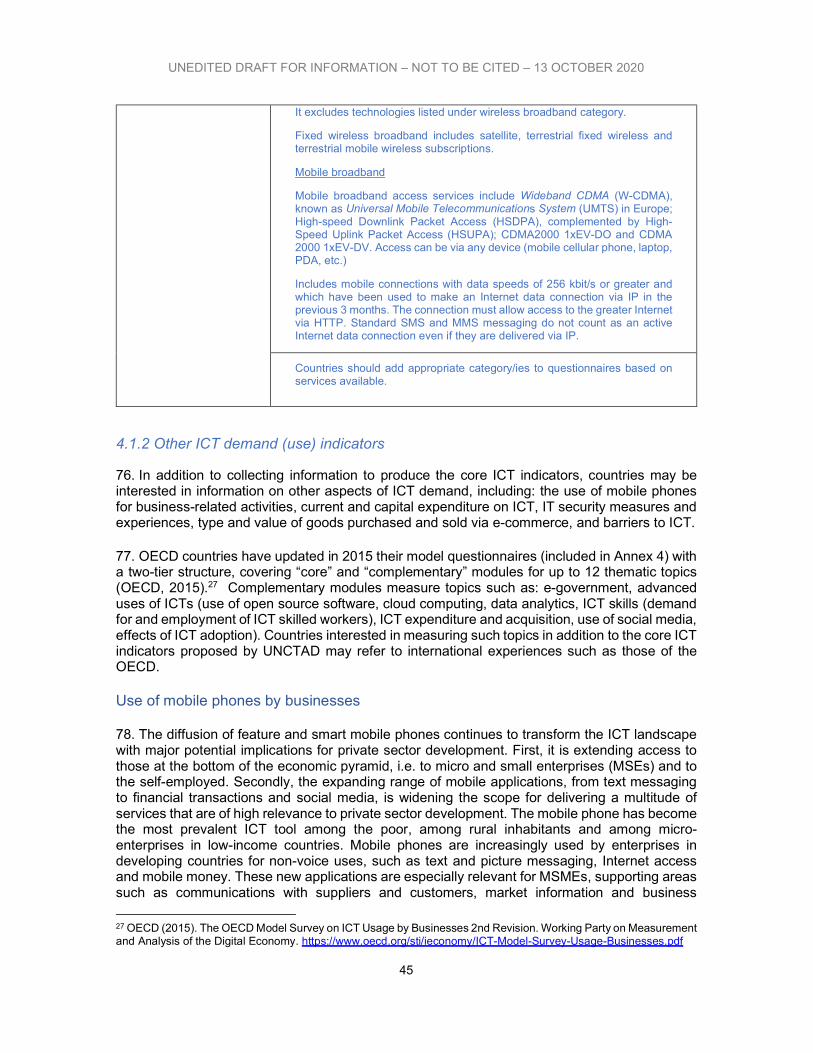
UNEDITED DRAFT FOR INFORMATION – NOT TO BE CITED – 13 OCTOBER 2020
45
It excludes technologies listed under wireless broadband category.
Fixed wireless broadband includes satellite, terrestrial fixed wireless and terrestrial mobile wireless subscriptions.
Mobile broadband
Mobile broadband access services include Wideband CDMA (W-CDMA), known as Universal Mobile Telecommunications System (UMTS) in Europe; High-speed Downlink Packet Access (HSDPA), complemented by High-Speed Uplink Packet Access (HSUPA); CDMA2000 1xEV-DO and CDMA 2000 1xEV-DV. Access can be via any device (mobile cellular phone, laptop, PDA, etc.)
Includes mobile connections with data speeds of 256 kbit/s or greater and which have been used to make an Internet data connection via IP in the previous 3 months. The connection must allow access to the greater Internet via HTTP. Standard SMS and MMS messaging do not count as an active Internet data connection even if they are delivered via IP.
Countries should add appropriate category/ies to questionnaires based on services available.
4.1.2 Other ICT demand (use) indicators
76. In addition to collecting information to produce the core ICT indicators, countries may be interested in information on other aspects of ICT demand, including: the use of mobile phones for business-related activities, current and capital expenditure on ICT, IT security measures and experiences, type and value of goods purchased and sold via e-commerce, and barriers to ICT.
77. OECD countries have updated in 2015 their model questionnaires (included in Annex 4) with a two-tier structure, covering “core” and “complementary” modules for up to 12 thematic topics (OECD, 2015).27 Complementary modules measure topics such as: e-government, advanced uses of ICTs (use of open source software, cloud computing, data analytics, ICT skills (demand for and employment of ICT skilled workers), ICT expenditure and acquisition, use of social media, effects of ICT adoption). Countries interested in measuring such topics in addition to the core ICT indicators proposed by UNCTAD may refer to international experiences such as those of the OECD. Use of mobile phones by businesses 78. The diffusion of feature and smart mobile phones continues to transform the ICT landscape with major potential implications for private sector development. First, it is extending access to those at the bottom of the economic pyramid, i.e. to micro and small enterprises (MSEs) and to the self-employed. Secondly, the expanding range of mobile applications, from text messaging to financial transactions and social media, is widening the scope for delivering a multitude of services that are of high relevance to private sector development. The mobile phone has become the most prevalent ICT tool among the poor, among rural inhabitants and among micro-enterprises in low-income countries. Mobile phones are increasingly used by enterprises in developing countries for non-voice uses, such as text and picture messaging, Internet access and mobile money. These new applications are especially relevant for MSMEs, supporting areas such as communications with suppliers and customers, market information and business
27 OECD (2015). The OECD Model Survey on ICT Usage by Businesses 2nd Revision. Working Party on Measurement and Analysis of the Digital Economy. https://www.oecd.org/sti/ieconomy/ICT-Model-Survey-Usage-Businesses.pdf
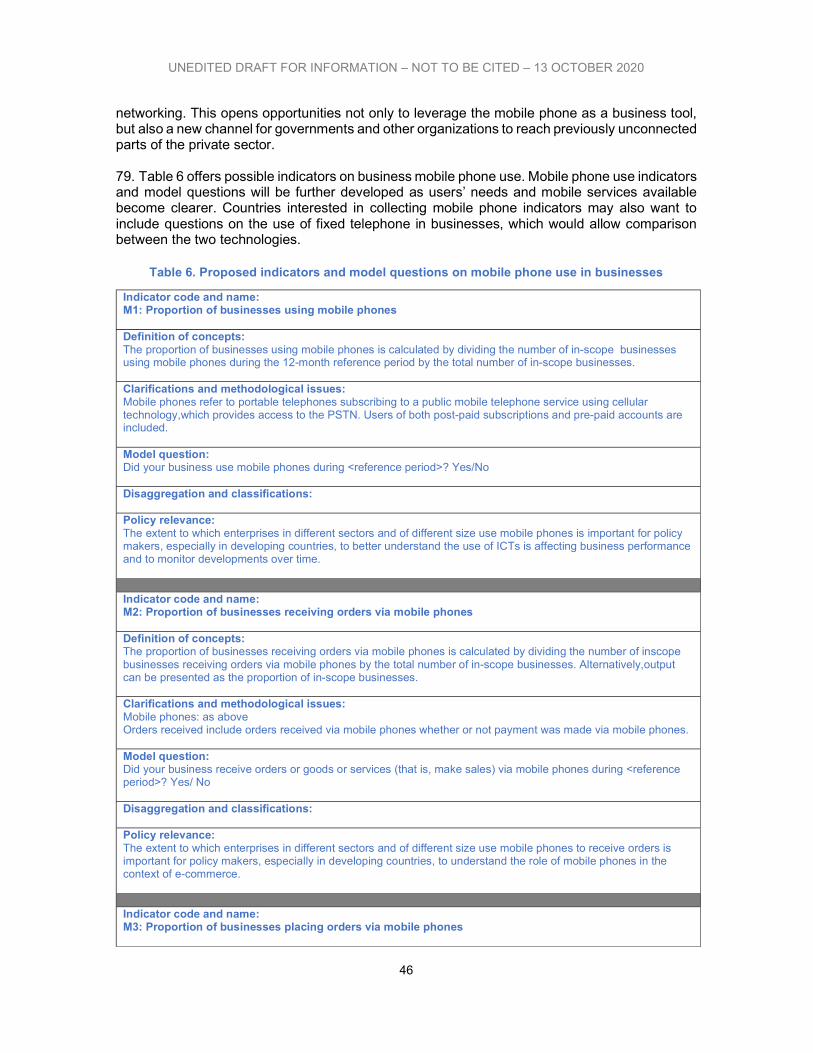
UNEDITED DRAFT FOR INFORMATION – NOT TO BE CITED – 13 OCTOBER 2020
46
networking. This opens opportunities not only to leverage the mobile phone as a business tool, but also a new channel for governments and other organizations to reach previously unconnected parts of the private sector. 79. Table 6 offers possible indicators on business mobile phone use. Mobile phone use indicators and model questions will be further developed as users’ needs and mobile services available become clearer. Countries interested in collecting mobile phone indicators may also want to include questions on the use of fixed telephone in businesses, which would allow comparison between the two technologies.
Table 6. Proposed indicators and model questions on mobile phone use in businesses
Indicator code and name: M1: Proportion of businesses using mobile phones Definition of concepts: The proportion of businesses using mobile phones is calculated by dividing the number of in-scope businesses using mobile phones during the 12-month reference period by the total number of in-scope businesses. Clarifications and methodological issues: Mobile phones refer to portable telephones subscribing to a public mobile telephone service using cellular technology,which provides access to the PSTN. Users of both post-paid subscriptions and pre-paid accounts are included. Model question: Did your business use mobile phones during <reference period>? Yes/No Disaggregation and classifications: Policy relevance: The extent to which enterprises in different sectors and of different size use mobile phones is important for policy makers, especially in developing countries, to better understand the use of ICTs is affecting business performance and to monitor developments over time. Indicator code and name: M2: Proportion of businesses receiving orders via mobile phones Definition of concepts: The proportion of businesses receiving orders via mobile phones is calculated by dividing the number of inscope businesses receiving orders via mobile phones by the total number of in-scope businesses. Alternatively,output can be presented as the proportion of in-scope businesses. Clarifications and methodological issues: Mobile phones: as above Orders received include orders received via mobile phones whether or not payment was made via mobile phones. Model question: Did your business receive orders or goods or services (that is, make sales) via mobile phones during <reference period>? Yes/ No Disaggregation and classifications: Policy relevance: The extent to which enterprises in different sectors and of different size use mobile phones to receive orders is important for policy makers, especially in developing countries, to understand the role of mobile phones in the context of e-commerce. Indicator code and name: M3: Proportion of businesses placing orders via mobile phones
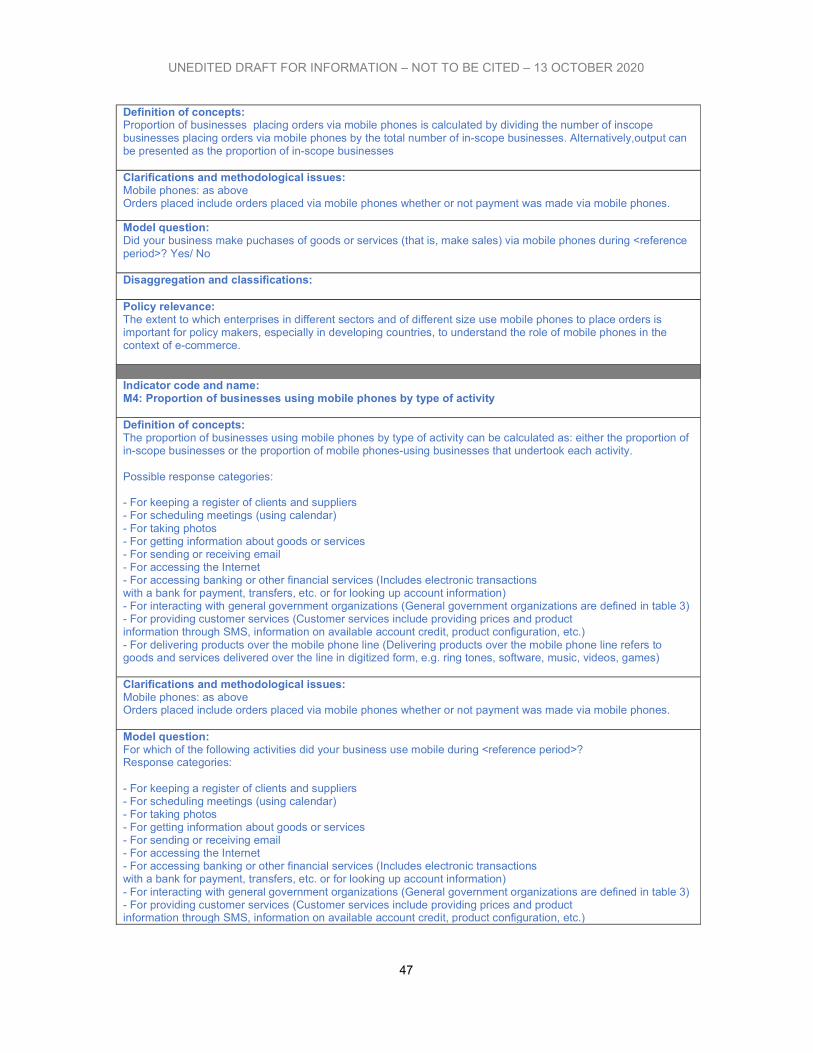
UNEDITED DRAFT FOR INFORMATION – NOT TO BE CITED – 13 OCTOBER 2020
47
Definition of concepts: Proportion of businesses placing orders via mobile phones is calculated by dividing the number of inscope businesses placing orders via mobile phones by the total number of in-scope businesses. Alternatively,output can be presented as the proportion of in-scope businesses Clarifications and methodological issues: Mobile phones: as above Orders placed include orders placed via mobile phones whether or not payment was made via mobile phones.
Model question: Did your business make puchases of goods or services (that is, make sales) via mobile phones during <reference period>? Yes/ No Disaggregation and classifications: Policy relevance: The extent to which enterprises in different sectors and of different size use mobile phones to place orders is important for policy makers, especially in developing countries, to understand the role of mobile phones in the context of e-commerce. Indicator code and name: M4: Proportion of businesses using mobile phones by type of activity Definition of concepts: The proportion of businesses using mobile phones by type of activity can be calculated as: either the proportion of in-scope businesses or the proportion of mobile phones-using businesses that undertook each activity. Possible response categories: - For keeping a register of clients and suppliers - For scheduling meetings (using calendar) - For taking photos - For getting information about goods or services - For sending or receiving email - For accessing the Internet - For accessing banking or other financial services (Includes electronic transactions with a bank for payment, transfers, etc. or for looking up account information) - For interacting with general government organizations (General government organizations are defined in table 3) - For providing customer services (Customer services include providing prices and product information through SMS, information on available account credit, product configuration, etc.) - For delivering products over the mobile phone line (Delivering products over the mobile phone line refers to goods and services delivered over the line in digitized form, e.g. ring tones, software, music, videos, games) Clarifications and methodological issues: Mobile phones: as above Orders placed include orders placed via mobile phones whether or not payment was made via mobile phones. Model question: For which of the following activities did your business use mobile during <reference period>? Response categories: - For keeping a register of clients and suppliers - For scheduling meetings (using calendar) - For taking photos - For getting information about goods or services - For sending or receiving email - For accessing the Internet - For accessing banking or other financial services (Includes electronic transactions with a bank for payment, transfers, etc. or for looking up account information) - For interacting with general government organizations (General government organizations are defined in table 3) - For providing customer services (Customer services include providing prices and product information through SMS, information on available account credit, product configuration, etc.)
UNEDITED DRAFT FOR INFORMATION – NOT TO BE CITED – 13 OCTOBER 2020
48
- For delivering products over the mobile phone line (Delivering products over the mobile phone line refers to goods and services delivered over the line in digitized form, e.g. ring tones, software, music, videos, games) Yes/No for each response category. Disaggregation and classifications: Policy relevance: How enterprises in different sectors and of different size use mobile phones is important for policy makers, especially in developing countries, to understand the role of mobile phones in supporting a more inclusive digital economy and for assessing the effectiveness of relevant policy measures.
Investment in ICT by businesses 80. Investment in ICT by businesses indicates the effort to update operations of the business sector and can also provide a partial measure of the size of the national ICT market (see Example 3). In many countries, national policies to foster the use of ICT also provide fiscal benefits to businesses adopting technologies.
Example 3. Republic of Moldova: Measurement of investment in ICT goods and services
The National Bureau of Statistics of the Republic of Moldova oversees data collection for the ICT sector in the country through the annual survey “Situation on the computerization and Internet connection”. For each economic activity, consumption and expenditure on information technologies is disaggregated into four categories: Designing and development of informational systems; Procurement of electronic and communication equipment including computers; Software procurement of software products; and Other consumptions and expenditures.
Source: National Bureau of Statistics, Republic of Moldova. 1. Reference metadata: Information technology and communications 2. Statistical Yearbook, 2019
81. As an example of measurement of ICT investment, countries can use the OECD list of indicators:
1. Purchase of ICT hardware, software or services (% of enterprises, by type of expenditure);
2. Expenditures on hardware, software or services (values and % relevance of expenditure by type);
3. Channels used to acquire ICT goods and services (% relevance of each channel); and
4. Purchase of selected ICT services (% of enterprises and expenditure on each type of service).
The proposed indicators can be calculated by categories of equipment and services: ICT equipment (divided into Information Technologies and Communication Technologies); software (divided into pre-packaged and custom), and consultancy services. They can also be calculated by channel: (a) purchase, (b) lease, (c) own account, and/or (y) capitalized vs. (z) non-capitalized expenditures, split into lease and other purchases.
Cybersecurity and privacy
UNEDITED DRAFT FOR INFORMATION – NOT TO BE CITED – 13 OCTOBER 2020
49
82. IT security measures are included in the OECD 2015 model questionnaires (annex 4) via the inclusion of specific yes/no questions on security and privacy protection measures in place.
83. The OECD model includes a module on security and privacy proposing the following indicators, which can be adapted by countries interested in this topic.
Existence of a formal policy to manage ICT security risks (% of all enterprises);
Risks addressed by the ICT security policy of the enterprise (% of enterprise, by occurrence). Risks include ICT failures, external attacks / security breaches;
ICT incidents (security breaches) encountered by the enterprise (% of enterprises, by occurrence). Incidents encountered include loss or disclosure of data or service unavailability, graded according to their seriousness;
Security facilities or procedures in place (% of all enterprises). A taxonomy of facilities /procedures in place may include: Identification and authentication (Strong password, Hardware tokens (e.g. smart cards), Biometric methods); Intrusion detection systems (e.g. antivirus, antispyware, firewall, etc.); Spam filter / Web filter; Offsite data backup; Staff awareness on their obligations on ICT security related issues (by training, information, contractual obligation); Other aspects related to security policy management (Security manager, specific resources, regular review and audit plans);
Collection or storage of personal information on end customers for analytical purposes (% of all enterprises);
Methods of obtaining or collecting personal information on end customers (% of enterprises using each method). Methods may include: (a) Social media (e.g. Facebook, Twitter), (b) third party (e.g. Marketing firm), (c) directly from customers and loyalty or reward programmes;
Formal policy to manage ICT privacy risks (% of all enterprises); and
Methods of protecting digital personal information (% of enterprises collecting information). Methods may include: (a) Storing data offline, (b) control to limit access (e.g. security clearances, sharing agreements), (c) encryption of data and (d) protection by a third party.
ICT use in businesses and gender 84. Gender-disaggregated data may be relevant for policy purposes (see UNCTAD (2012)28 for a discussion). The analysis of gender-disaggregated data could permit an analysis of, for example, whether male-dominated enterprises tend to use the Internet more for interacting with the government or for making online payments than female-dominated ones. Another question could be if, within a given industry, female-dominated enterprises are more likely to have a website than male-dominated ones. Whether female-dominated workforces have less access to computer and the Internet and whether they use the Internet in different ways could also be examined. As the ICT sector is a major driver of the economy in many countries, and developing
28 UNCTAD (2014). Measuring ICT and gender: an assessment. https://unctad.org/en/PublicationsLibrary/webdtlstict2014d1_en.pdf
UNEDITED DRAFT FOR INFORMATION – NOT TO BE CITED – 13 OCTOBER 2020
50
countries may seek to promote it in order to foster a more inclusive digital economy, the degree of participation of women in this sector is important to document in order to determine whether a country is making full use of its human resources potential.
85. Two major gender issues that could be addressed by internationally comparable statistics are the use of ICTs by women working in businesses and ICTs in women’s entrepreneurship. A distinction needs to be made between “business use indicators” and “entrepreneurship” indicators. The first category is aimed at measuring the use of ICTs by the business sector in a country. The second category aims at measuring ICT use by entrepreneurs and/or micro and small businesses (including in the informal sector). The two related but distinct areas of measurement may differ in terms of questions asked and policy issues monitored. Ideally, data for the first category of indicators should be collected through enterprise surveys. Data for the second category would need to be collected through surveys of business owners or entrepreneurs
86. At present, there are no sex-disaggregated indicators among the 12 core indicators on ICT use in business. The basic question to be addressed is whether there are gender differentials in the way companies with male and female-dominant workforces, respectively, use ICTs. Possible data sources (ICT surveys and business registers) can be improved by breaking down questions on the use of ICT by employees or by gender of owner (especially in the case of small-business owners/managers where property or management can be easily defined).
87. Indicators that of potential interest include:
Proportion of small-business owners using the Internet, by sex of owner;
Proportion of small-business owners using mobile phones, by sex of owner;
Proportion of small-business owners using mobile phones, by type of activity and by sex of owner;
Proportion of small business owners using the Internet by type of activity and by sex of owner
4.2 Measuring the ICT sector (supply of ICT goods and services)
88. Central to the ICT statistical system is the measurement of the supply side, that is, the ICT sector and its products (goods and services). The production of ICT goods and services is providing new opportunities for private firms to start up and grow, create jobs, and spur innovation, thereby contributing to overall economic growth. Moreover, greater emphasis on digital technologies in the delivery of business, government, health care, education and other services is also raising the need for domestic capabilities to provide relevant software applications and ICT services.
89. Measuring the ICT sector requires the statistical coverage of economic activities such as ICT manufacturing, wholesale trade of ICT goods, telecommunications and computer-related services. As for any other economic activity, key statistical information about the ICT sector includes indicators on the production of goods and services, labour force and business performance (income, value added and productivity measures). This section deals with the statistical definition of the ICT sector and the relevant core indicators.
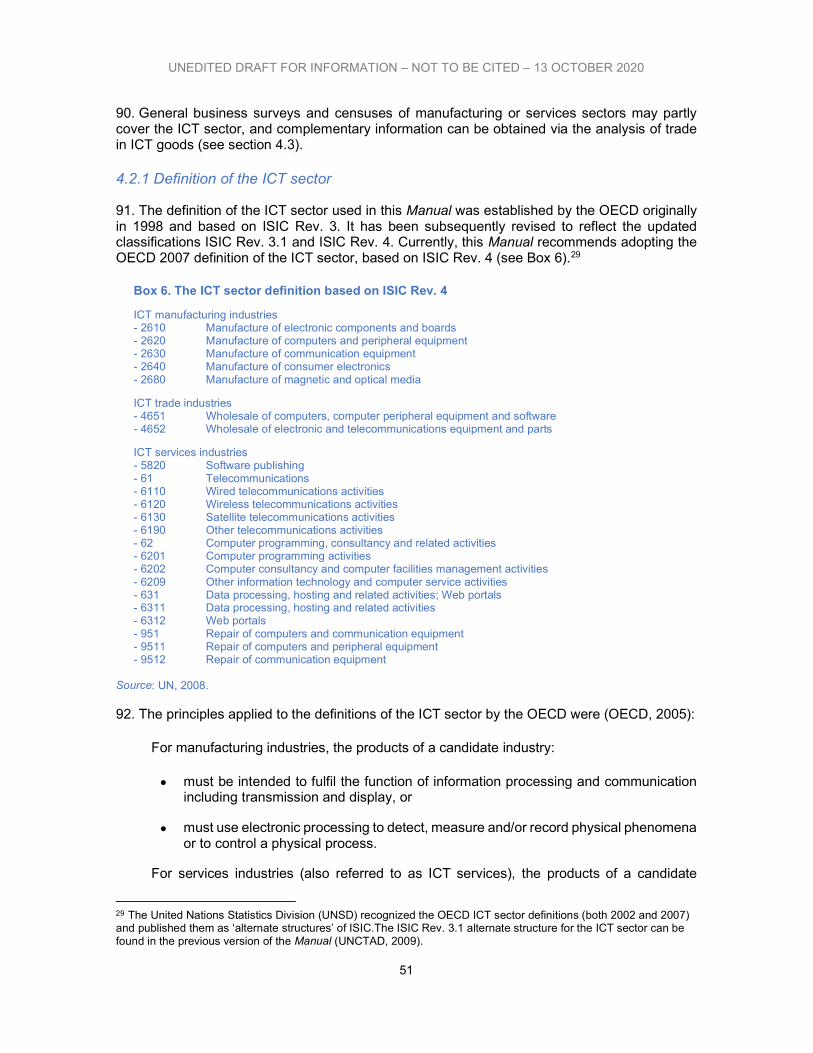
UNEDITED DRAFT FOR INFORMATION – NOT TO BE CITED – 13 OCTOBER 2020
51
90. General business surveys and censuses of manufacturing or services sectors may partly cover the ICT sector, and complementary information can be obtained via the analysis of trade in ICT goods (see section 4.3).
4.2.1 Definition of the ICT sector
91. The definition of the ICT sector used in this Manual was established by the OECD originally in 1998 and based on ISIC Rev. 3. It has been subsequently revised to reflect the updated classifications ISIC Rev. 3.1 and ISIC Rev. 4. Currently, this Manual recommends adopting the OECD 2007 definition of the ICT sector, based on ISIC Rev. 4 (see Box 6).29
Box 6. The ICT sector definition based on ISIC Rev. 4
ICT manufacturing industries - 2610 Manufacture of electronic components and boards - 2620 Manufacture of computers and peripheral equipment - 2630 Manufacture of communication equipment - 2640 Manufacture of consumer electronics - 2680 Manufacture of magnetic and optical media
ICT trade industries - 4651 Wholesale of computers, computer peripheral equipment and software - 4652 Wholesale of electronic and telecommunications equipment and parts
ICT services industries - 5820 Software publishing - 61 Telecommunications - 6110 Wired telecommunications activities - 6120 Wireless telecommunications activities - 6130 Satellite telecommunications activities - 6190 Other telecommunications activities - 62 Computer programming, consultancy and related activities - 6201 Computer programming activities - 6202 Computer consultancy and computer facilities management activities - 6209 Other information technology and computer service activities - 631 Data processing, hosting and related activities; Web portals - 6311 Data processing, hosting and related activities - 6312 Web portals - 951 Repair of computers and communication equipment - 9511 Repair of computers and peripheral equipment - 9512 Repair of communication equipment
Source: UN, 2008.
92. The principles applied to the definitions of the ICT sector by the OECD were (OECD, 2005):
For manufacturing industries, the products of a candidate industry:
must be intended to fulfil the function of information processing and communication including transmission and display, or
must use electronic processing to detect, measure and/or record physical phenomena or to control a physical process.
For services industries (also referred to as ICT services), the products of a candidate
29 The United Nations Statistics Division (UNSD) recognized the OECD ICT sector definitions (both 2002 and 2007) and published them as ‘alternate structures’ of ISIC.The ISIC Rev. 3.1 alternate structure for the ICT sector can be found in the previous version of the Manual (UNCTAD, 2009).
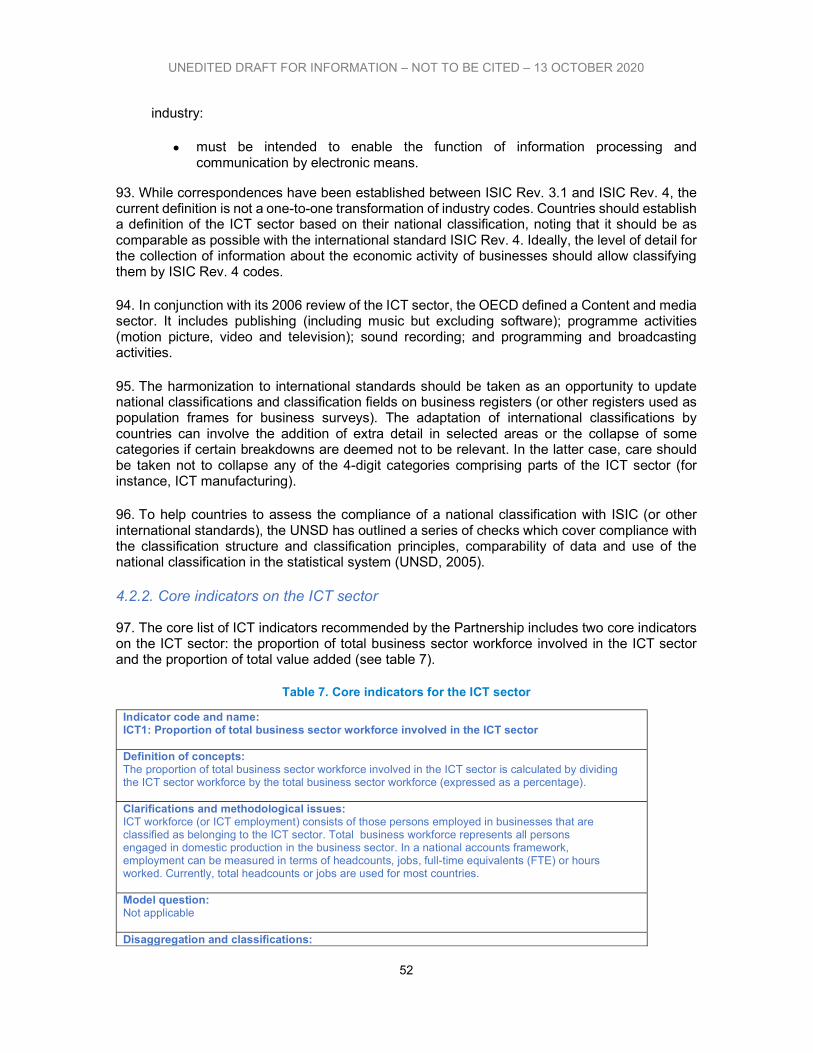
UNEDITED DRAFT FOR INFORMATION – NOT TO BE CITED – 13 OCTOBER 2020
52
industry:
must be intended to enable the function of information processing and communication by electronic means.
93. While correspondences have been established between ISIC Rev. 3.1 and ISIC Rev. 4, the current definition is not a one-to-one transformation of industry codes. Countries should establish a definition of the ICT sector based on their national classification, noting that it should be as comparable as possible with the international standard ISIC Rev. 4. Ideally, the level of detail for the collection of information about the economic activity of businesses should allow classifying them by ISIC Rev. 4 codes.
94. In conjunction with its 2006 review of the ICT sector, the OECD defined a Content and media sector. It includes publishing (including music but excluding software); programme activities (motion picture, video and television); sound recording; and programming and broadcasting activities.
95. The harmonization to international standards should be taken as an opportunity to update national classifications and classification fields on business registers (or other registers used as population frames for business surveys). The adaptation of international classifications by countries can involve the addition of extra detail in selected areas or the collapse of some categories if certain breakdowns are deemed not to be relevant. In the latter case, care should be taken not to collapse any of the 4-digit categories comprising parts of the ICT sector (for instance, ICT manufacturing).
96. To help countries to assess the compliance of a national classification with ISIC (or other international standards), the UNSD has outlined a series of checks which cover compliance with the classification structure and classification principles, comparability of data and use of the national classification in the statistical system (UNSD, 2005).
4.2.2. Core indicators on the ICT sector
97. The core list of ICT indicators recommended by the Partnership includes two core indicators on the ICT sector: the proportion of total business sector workforce involved in the ICT sector and the proportion of total value added (see table 7).
Table 7. Core indicators for the ICT sector
Indicator code and name: ICT1: Proportion of total business sector workforce involved in the ICT sector Definition of concepts: The proportion of total business sector workforce involved in the ICT sector is calculated by dividing the ICT sector workforce by the total business sector workforce (expressed as a percentage). Clarifications and methodological issues: ICT workforce (or ICT employment) consists of those persons employed in businesses that are classified as belonging to the ICT sector. Total business workforce represents all persons engaged in domestic production in the business sector. In a national accounts framework, employment can be measured in terms of headcounts, jobs, full-time equivalents (FTE) or hours worked. Currently, total headcounts or jobs are used for most countries. Model question: Not applicable Disaggregation and classifications:
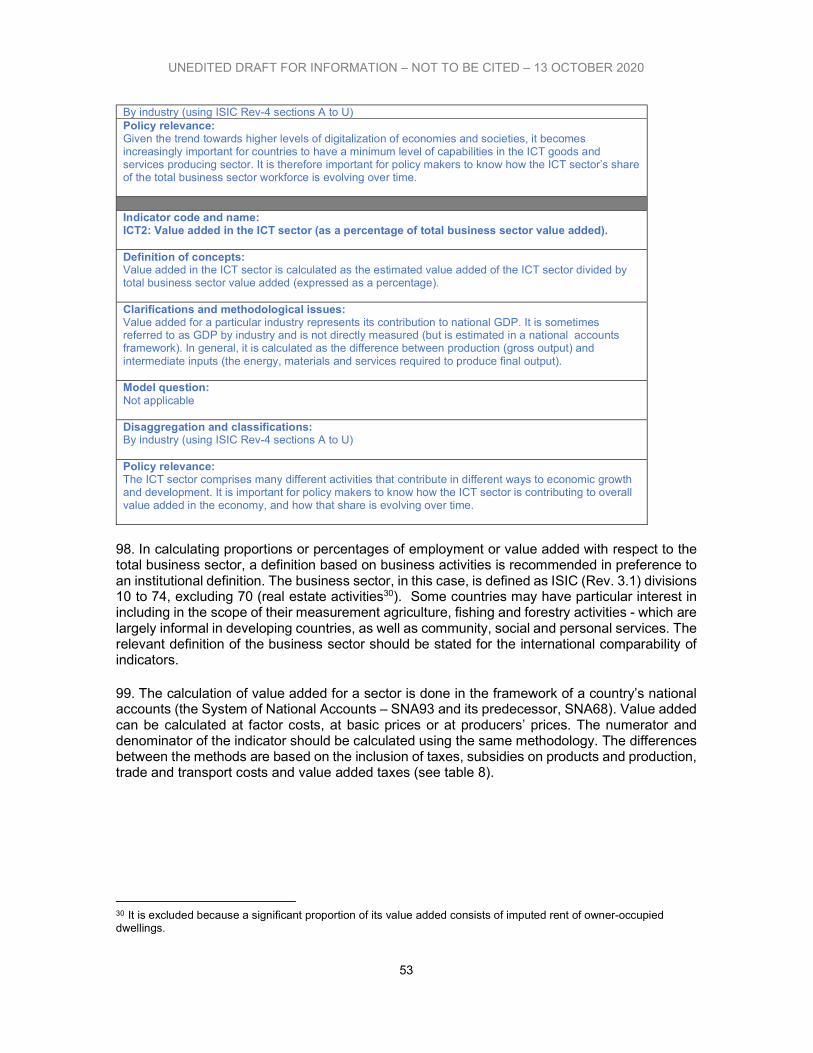
UNEDITED DRAFT FOR INFORMATION – NOT TO BE CITED – 13 OCTOBER 2020
53
By industry (using ISIC Rev-4 sections A to U) Policy relevance: Given the trend towards higher levels of digitalization of economies and societies, it becomes increasingly important for countries to have a minimum level of capabilities in the ICT goods and services producing sector. It is therefore important for policy makers to know how the ICT sector’s share of the total business sector workforce is evolving over time. Indicator code and name: ICT2: Value added in the ICT sector (as a percentage of total business sector value added). Definition of concepts: Value added in the ICT sector is calculated as the estimated value added of the ICT sector divided by total business sector value added (expressed as a percentage). Clarifications and methodological issues: Value added for a particular industry represents its contribution to national GDP. It is sometimes referred to as GDP by industry and is not directly measured (but is estimated in a national accounts framework). In general, it is calculated as the difference between production (gross output) and intermediate inputs (the energy, materials and services required to produce final output). Model question: Not applicable Disaggregation and classifications: By industry (using ISIC Rev-4 sections A to U) Policy relevance: The ICT sector comprises many different activities that contribute in different ways to economic growth and development. It is important for policy makers to know how the ICT sector is contributing to overall value added in the economy, and how that share is evolving over time.
98. In calculating proportions or percentages of employment or value added with respect to the total business sector, a definition based on business activities is recommended in preference to an institutional definition. The business sector, in this case, is defined as ISIC (Rev. 3.1) divisions 10 to 74, excluding 70 (real estate activities30). Some countries may have particular interest in including in the scope of their measurement agriculture, fishing and forestry activities - which are largely informal in developing countries, as well as community, social and personal services. The relevant definition of the business sector should be stated for the international comparability of indicators.
99. The calculation of value added for a sector is done in the framework of a country’s national accounts (the System of National Accounts – SNA93 and its predecessor, SNA68). Value added can be calculated at factor costs, at basic prices or at producers’ prices. The numerator and denominator of the indicator should be calculated using the same methodology. The differences between the methods are based on the inclusion of taxes, subsidies on products and production, trade and transport costs and value added taxes (see table 8).
30 It is excluded because a significant proportion of its value added consists of imputed rent of owner-occupied dwellings.
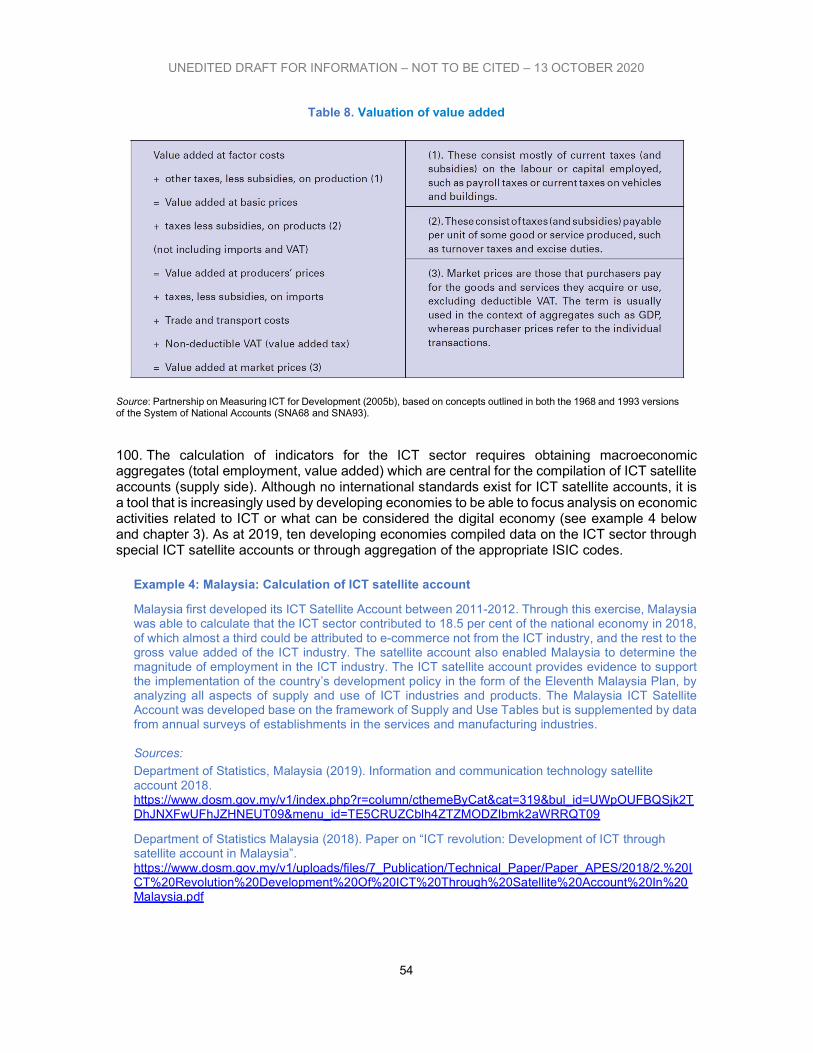
UNEDITED DRAFT FOR INFORMATION – NOT TO BE CITED – 13 OCTOBER 2020
54
Table 8. Valuation of value added
Source: Partnership on Measuring ICT for Development (2005b), based on concepts outlined in both the 1968 and 1993 versions of the System of National Accounts (SNA68 and SNA93).
100. The calculation of indicators for the ICT sector requires obtaining macroeconomic aggregates (total employment, value added) which are central for the compilation of ICT satellite accounts (supply side). Although no international standards exist for ICT satellite accounts, it is a tool that is increasingly used by developing economies to be able to focus analysis on economic activities related to ICT or what can be considered the digital economy (see example 4 below and chapter 3). As at 2019, ten developing economies compiled data on the ICT sector through special ICT satellite accounts or through aggregation of the appropriate ISIC codes.
Example 4: Malaysia: Calculation of ICT satellite account
Malaysia first developed its ICT Satellite Account between 2011-2012. Through this exercise, Malaysia was able to calculate that the ICT sector contributed to 18.5 per cent of the national economy in 2018, of which almost a third could be attributed to e-commerce not from the ICT industry, and the rest to the gross value added of the ICT industry. The satellite account also enabled Malaysia to determine the magnitude of employment in the ICT industry. The ICT satellite account provides evidence to support the implementation of the country’s development policy in the form of the Eleventh Malaysia Plan, by analyzing all aspects of supply and use of ICT industries and products. The Malaysia ICT Satellite Account was developed base on the framework of Supply and Use Tables but is supplemented by data from annual surveys of establishments in the services and manufacturing industries. Sources:
Department of Statistics, Malaysia (2019). Information and communication technology satellite account 2018. https://www.dosm.gov.my/v1/index.php?r=column/cthemeByCat&cat=319&bul_id=UWpOUFBQSjk2TDhJNXFwUFhJZHNEUT09&menu_id=TE5CRUZCblh4ZTZMODZIbmk2aWRRQT09
Department of Statistics Malaysia (2018). Paper on “ICT revolution: Development of ICT through satellite account in Malaysia”. https://www.dosm.gov.my/v1/uploads/files/7_Publication/Technical_Paper/Paper_APES/2018/2.%20ICT%20Revolution%20Development%20Of%20ICT%20Through%20Satellite%20Account%20In%20Malaysia.pdf
UNEDITED DRAFT FOR INFORMATION – NOT TO BE CITED – 13 OCTOBER 2020
55
4.3 Measuring trade in ICT goods
101. Global demand for ICT goods and services through international trade and investment can drive the activities of many upstream domestic ICT and non-ICT industries. Trade data, combined with statistical information about the supplying sectors (value added, jobs, input-output tables) can eventually provide insight into the “extended footprint” of the ICT and this in a cross-border perspective.31 Internationally comparable statistics on foreign trade in ICT goods are therefore crucial to understand the supply and demand at global and national levels.
4.3.1 Definition of ICT goods
102. The ICT goods classification used in the 2009 edition of this Manual was based on the work of the OECD through its Working Party on Indicators for the Information Society (WPIIS). . WPIIS developed the classification in accordance with the guiding principle that ICT goods “must either be intended to fulfil the function of information processing and communication by electronic means, including transmission and display, or use electronic processing to detect, measure and/or record physical phenomena, or to control a physical process”.
103. When the definition was first released in 2003 it was based on a list of 6-digit items according to the World Customs Organization (WCO) Harmonized System (HS) classification, the HS 1996 and HS 2002 editions. Since then the definition of ICT goods has been revised (2008) and the transition from HS 2002 to HS 2007, and later to HS 2012 resulted in breaks in time series.
104. In 2018, UNCTAD released a technical note32 focusing on the transition from HS 2012 to HS 2017, establishing the necessary correspondences between HS codes. The definition of ICT goods has been updated with respect to the previous edition of the Manual to reflect the adoption of the new revision of the HS classification and to enable the use of data reported under HS 2017 for describing recent trends. UNCTAD requested the United Nations Statistics Division (UNSD) to establish the exact correspondence between HS 2012 and HS 2017 as regards the current definition of ICT goods. The correspondence table covers the five categories of ICT goods:
Electronic components
Computers and peripheral equipment
Communication equipment
Consumer electronic equipment
Miscellaneous.
105. Using this definition, UNCTAD publishes annually trade in ICT goods data in UNCTADStat33.
106. The list based on HS 2017 is available in at Annex 8
31 G20 Toolkit for Measuring the Digital Economy. Draft Version, November 2018. 32 UNCTAD (2018), TECHNICAL NOTE NO10 UNEDITED. TN/UNCTAD/ICT4D/10. MAY 2018 “Updating the Partnership Definition of ICT Goods From HS 2012 to HS 2017” 33 https://unctadstat.unctad.org
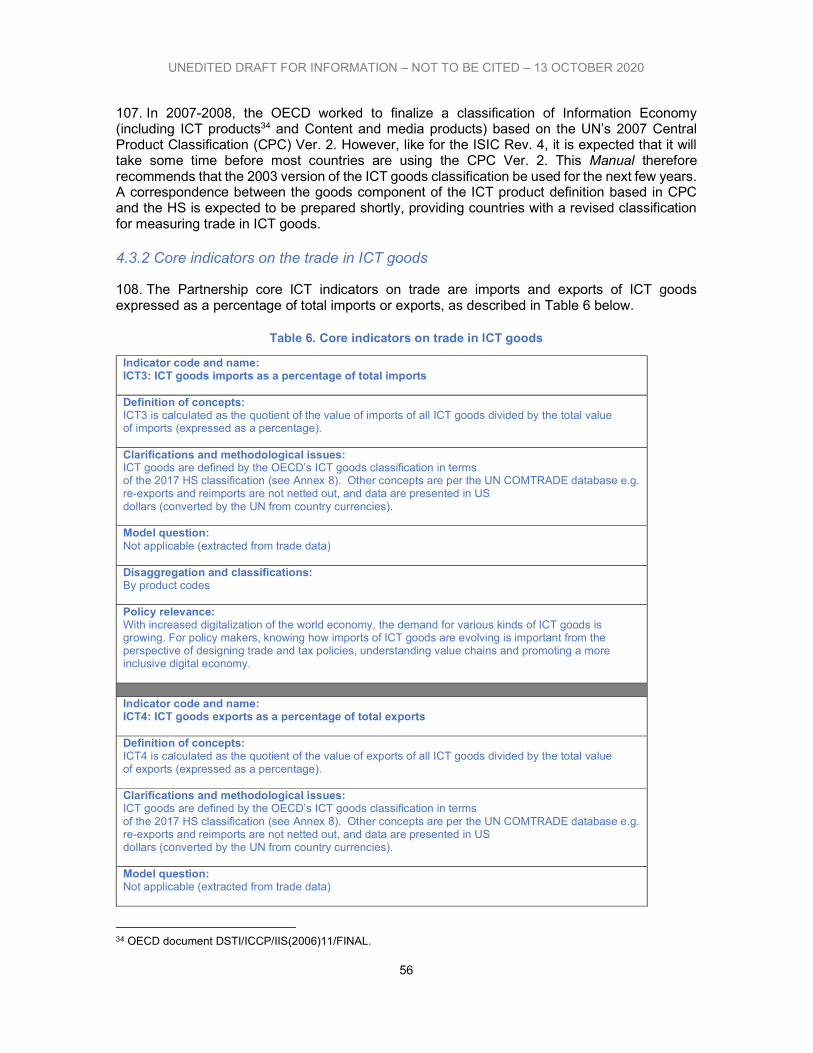
UNEDITED DRAFT FOR INFORMATION – NOT TO BE CITED – 13 OCTOBER 2020
56
107. In 2007-2008, the OECD worked to finalize a classification of Information Economy (including ICT products34 and Content and media products) based on the UN’s 2007 Central Product Classification (CPC) Ver. 2. However, like for the ISIC Rev. 4, it is expected that it will take some time before most countries are using the CPC Ver. 2. This Manual therefore recommends that the 2003 version of the ICT goods classification be used for the next few years. A correspondence between the goods component of the ICT product definition based in CPC and the HS is expected to be prepared shortly, providing countries with a revised classification for measuring trade in ICT goods.
4.3.2 Core indicators on the trade in ICT goods
108. The Partnership core ICT indicators on trade are imports and exports of ICT goods expressed as a percentage of total imports or exports, as described in Table 6 below.
Table 6. Core indicators on trade in ICT goods
Indicator code and name: ICT3: ICT goods imports as a percentage of total imports Definition of concepts: ICT3 is calculated as the quotient of the value of imports of all ICT goods divided by the total value of imports (expressed as a percentage). Clarifications and methodological issues: ICT goods are defined by the OECD’s ICT goods classification in terms of the 2017 HS classification (see Annex 8). Other concepts are per the UN COMTRADE database e.g. re-exports and reimports are not netted out, and data are presented in US dollars (converted by the UN from country currencies). Model question: Not applicable (extracted from trade data) Disaggregation and classifications: By product codes Policy relevance: With increased digitalization of the world economy, the demand for various kinds of ICT goods is growing. For policy makers, knowing how imports of ICT goods are evolving is important from the perspective of designing trade and tax policies, understanding value chains and promoting a more inclusive digital economy. Indicator code and name: ICT4: ICT goods exports as a percentage of total exports Definition of concepts: ICT4 is calculated as the quotient of the value of exports of all ICT goods divided by the total value of exports (expressed as a percentage). Clarifications and methodological issues: ICT goods are defined by the OECD’s ICT goods classification in terms of the 2017 HS classification (see Annex 8). Other concepts are per the UN COMTRADE database e.g. re-exports and reimports are not netted out, and data are presented in US dollars (converted by the UN from country currencies). Model question: Not applicable (extracted from trade data)
34 OECD document DSTI/ICCP/IIS(2006)11/FINAL.
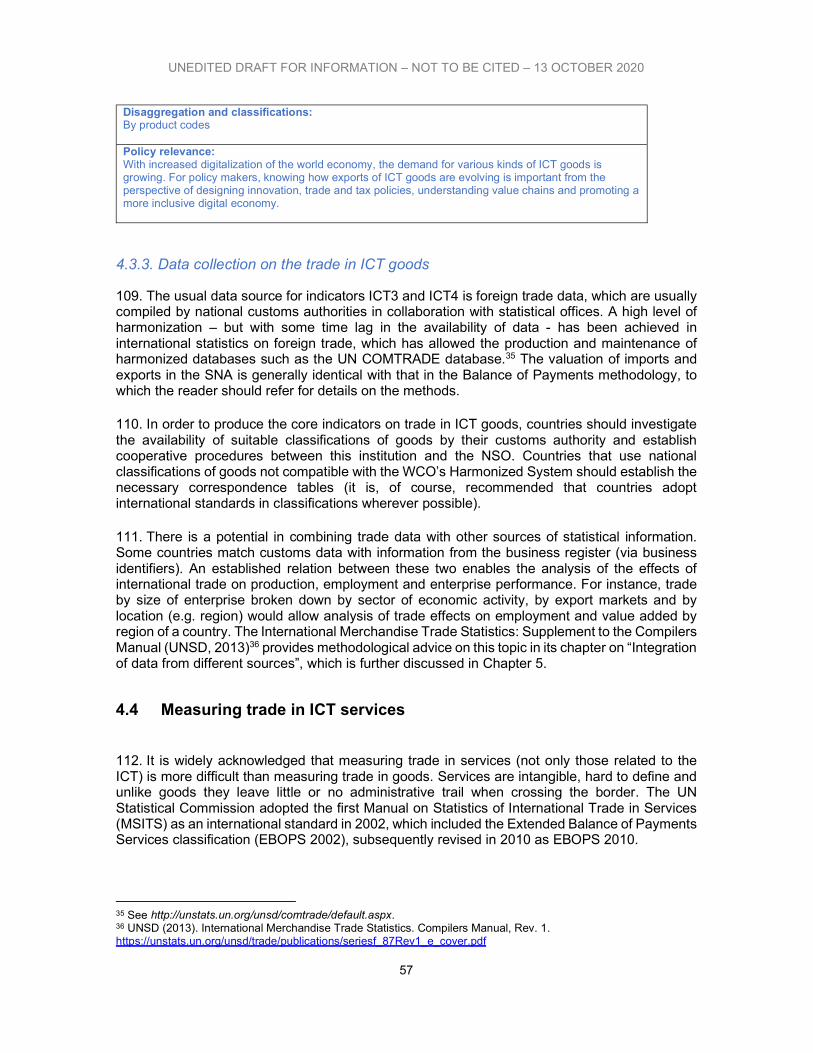
UNEDITED DRAFT FOR INFORMATION – NOT TO BE CITED – 13 OCTOBER 2020
57
Disaggregation and classifications: By product codes Policy relevance: With increased digitalization of the world economy, the demand for various kinds of ICT goods is growing. For policy makers, knowing how exports of ICT goods are evolving is important from the perspective of designing innovation, trade and tax policies, understanding value chains and promoting a more inclusive digital economy.
4.3.3. Data collection on the trade in ICT goods
109. The usual data source for indicators ICT3 and ICT4 is foreign trade data, which are usually compiled by national customs authorities in collaboration with statistical offices. A high level of harmonization – but with some time lag in the availability of data - has been achieved in international statistics on foreign trade, which has allowed the production and maintenance of harmonized databases such as the UN COMTRADE database.35 The valuation of imports and exports in the SNA is generally identical with that in the Balance of Payments methodology, to which the reader should refer for details on the methods.
110. In order to produce the core indicators on trade in ICT goods, countries should investigate the availability of suitable classifications of goods by their customs authority and establish cooperative procedures between this institution and the NSO. Countries that use national classifications of goods not compatible with the WCO’s Harmonized System should establish the necessary correspondence tables (it is, of course, recommended that countries adopt international standards in classifications wherever possible).
111. There is a potential in combining trade data with other sources of statistical information. Some countries match customs data with information from the business register (via business identifiers). An established relation between these two enables the analysis of the effects of international trade on production, employment and enterprise performance. For instance, trade by size of enterprise broken down by sector of economic activity, by export markets and by location (e.g. region) would allow analysis of trade effects on employment and value added by region of a country. The International Merchandise Trade Statistics: Supplement to the Compilers Manual (UNSD, 2013)36 provides methodological advice on this topic in its chapter on “Integration of data from different sources”, which is further discussed in Chapter 5.
4.4 Measuring trade in ICT services
112. It is widely acknowledged that measuring trade in services (not only those related to the ICT) is more difficult than measuring trade in goods. Services are intangible, hard to define and unlike goods they leave little or no administrative trail when crossing the border. The UN Statistical Commission adopted the first Manual on Statistics of International Trade in Services (MSITS) as an international standard in 2002, which included the Extended Balance of Payments Services classification (EBOPS 2002), subsequently revised in 2010 as EBOPS 2010.
35 See http://unstats.un.org/unsd/comtrade/default.aspx. 36 UNSD (2013). International Merchandise Trade Statistics. Compilers Manual, Rev. 1. https://unstats.un.org/unsd/trade/publications/seriesf_87Rev1_e_cover.pdf
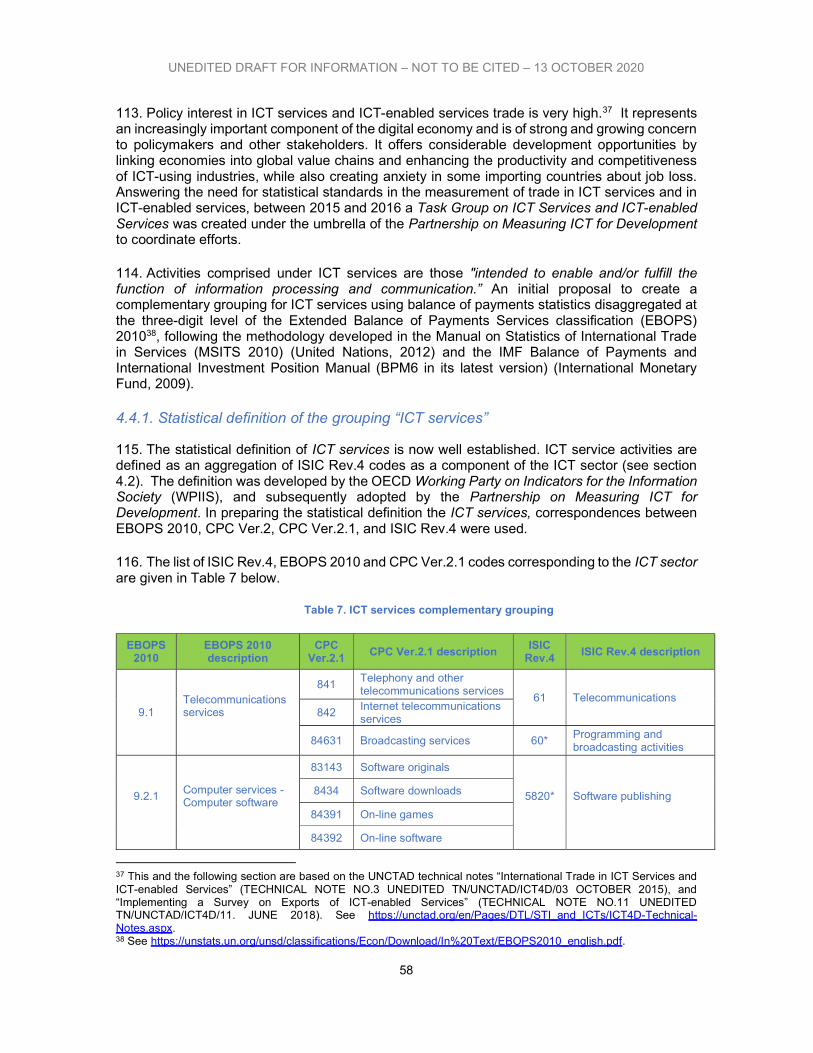
UNEDITED DRAFT FOR INFORMATION – NOT TO BE CITED – 13 OCTOBER 2020
58
113. Policy interest in ICT services and ICT-enabled services trade is very high.37 It represents an increasingly important component of the digital economy and is of strong and growing concern to policymakers and other stakeholders. It offers considerable development opportunities by linking economies into global value chains and enhancing the productivity and competitiveness of ICT-using industries, while also creating anxiety in some importing countries about job loss. Answering the need for statistical standards in the measurement of trade in ICT services and in ICT-enabled services, between 2015 and 2016 a Task Group on ICT Services and ICT-enabled Services was created under the umbrella of the Partnership on Measuring ICT for Development to coordinate efforts.
114. Activities comprised under ICT services are those "intended to enable and/or fulfill the function of information processing and communication.” An initial proposal to create a complementary grouping for ICT services using balance of payments statistics disaggregated at the three-digit level of the Extended Balance of Payments Services classification (EBOPS) 201038, following the methodology developed in the Manual on Statistics of International Trade in Services (MSITS 2010) (United Nations, 2012) and the IMF Balance of Payments and International Investment Position Manual (BPM6 in its latest version) (International Monetary Fund, 2009).
4.4.1. Statistical definition of the grouping “ICT services”
115. The statistical definition of ICT services is now well established. ICT service activities are defined as an aggregation of ISIC Rev.4 codes as a component of the ICT sector (see section 4.2). The definition was developed by the OECD Working Party on Indicators for the Information Society (WPIIS), and subsequently adopted by the Partnership on Measuring ICT for Development. In preparing the statistical definition the ICT services, correspondences between EBOPS 2010, CPC Ver.2, CPC Ver.2.1, and ISIC Rev.4 were used.
116. The list of ISIC Rev.4, EBOPS 2010 and CPC Ver.2.1 codes corresponding to the ICT sector are given in Table 7 below.
Table 7. ICT services complementary grouping
EBOPS
2010 EBOPS 2010 description
CPC Ver.2.1
CPC Ver.2.1 description ISIC
Rev.4 ISIC Rev.4 description
9.1 Telecommunications services
841 Telephony and other telecommunications services
61 Telecommunications 842
Internet telecommunications services
84631 Broadcasting services 60* Programming and broadcasting activities
9.2.1
Computer services - Computer software
83143 Software originals
5820*
Software publishing
8434 Software downloads
84391 On-line games
84392 On-line software
37 This and the following section are based on the UNCTAD technical notes “International Trade in ICT Services and ICT-enabled Services” (TECHNICAL NOTE NO.3 UNEDITED TN/UNCTAD/ICT4D/03 OCTOBER 2015), and “Implementing a Survey on Exports of ICT-enabled Services” (TECHNICAL NOTE NO.11 UNEDITED TN/UNCTAD/ICT4D/11. JUNE 2018). See https://unctad.org/en/Pages/DTL/STI_and_ICTs/ICT4D-Technical-Notes.aspx. 38 See https://unstats.un.org/unsd/classifications/Econ/Download/In%20Text/EBOPS2010_english.pdf.
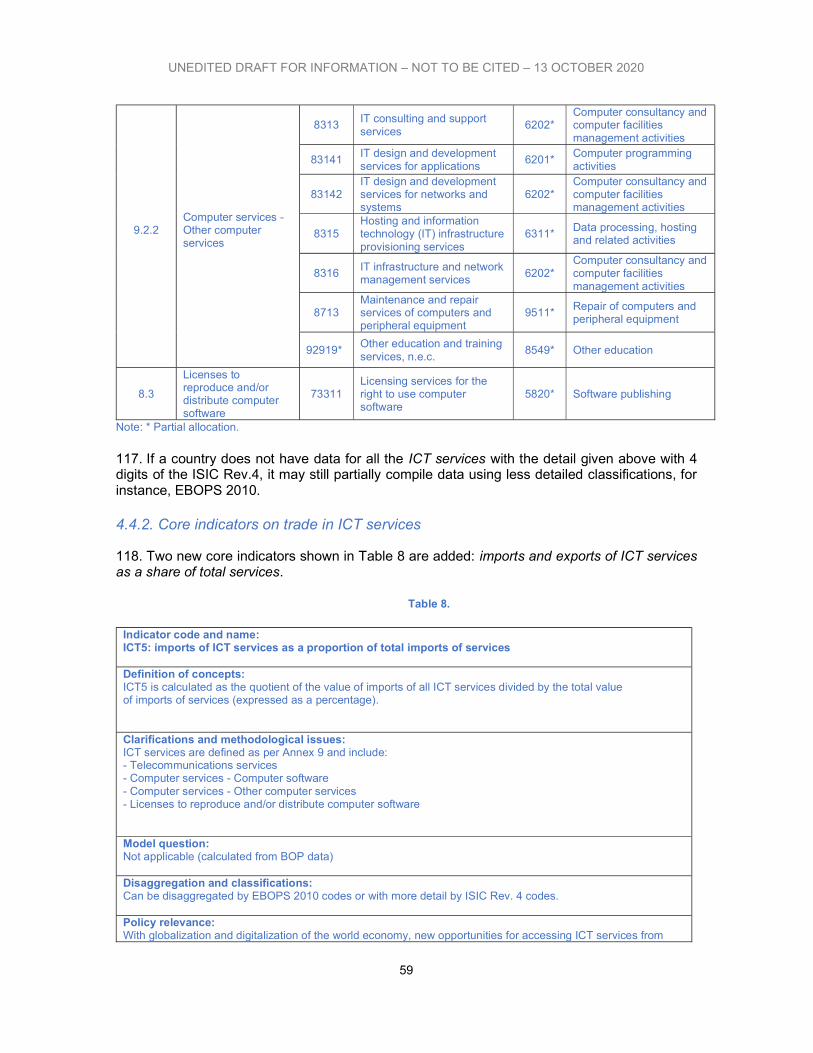
UNEDITED DRAFT FOR INFORMATION – NOT TO BE CITED – 13 OCTOBER 2020
59
9.2.2
Computer services - Other computer services
8313 IT consulting and support services
6202* Computer consultancy and computer facilities management activities
83141 IT design and development services for applications
6201* Computer programming activities
83142 IT design and development services for networks and systems
6202* Computer consultancy and computer facilities management activities
8315 Hosting and information technology (IT) infrastructure provisioning services
6311* Data processing, hosting and related activities
8316 IT infrastructure and network management services
6202* Computer consultancy and computer facilities management activities
8713 Maintenance and repair services of computers and peripheral equipment
9511* Repair of computers and peripheral equipment
92919* Other education and training services, n.e.c.
8549* Other education
8.3
Licenses to reproduce and/or distribute computer software
73311 Licensing services for the right to use computer software
5820* Software publishing
Note: * Partial allocation.
117. If a country does not have data for all the ICT services with the detail given above with 4 digits of the ISIC Rev.4, it may still partially compile data using less detailed classifications, for instance, EBOPS 2010.
4.4.2. Core indicators on trade in ICT services
118. Two new core indicators shown in Table 8 are added: imports and exports of ICT services as a share of total services.
Table 8.
Indicator code and name: ICT5: imports of ICT services as a proportion of total imports of services Definition of concepts: ICT5 is calculated as the quotient of the value of imports of all ICT services divided by the total value of imports of services (expressed as a percentage). Clarifications and methodological issues: ICT services are defined as per Annex 9 and include: - Telecommunications services - Computer services - Computer software - Computer services - Other computer services - Licenses to reproduce and/or distribute computer software Model question: Not applicable (calculated from BOP data) Disaggregation and classifications: Can be disaggregated by EBOPS 2010 codes or with more detail by ISIC Rev. 4 codes. Policy relevance: With globalization and digitalization of the world economy, new opportunities for accessing ICT services from
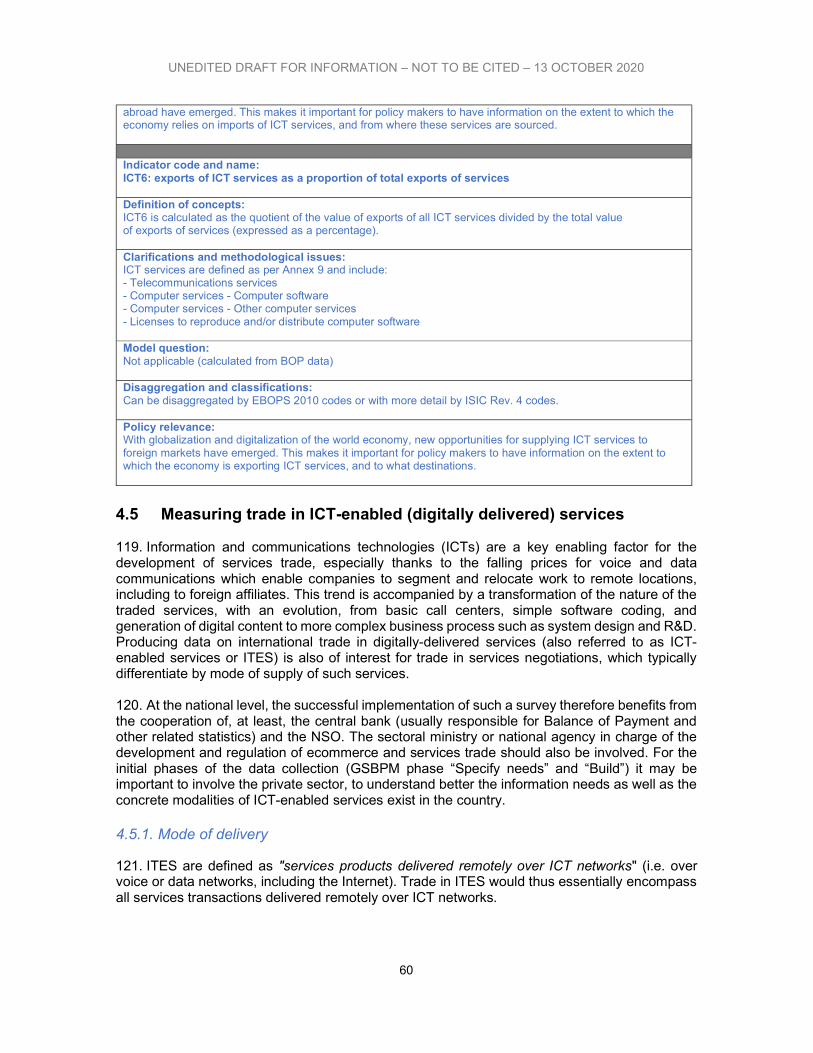
UNEDITED DRAFT FOR INFORMATION – NOT TO BE CITED – 13 OCTOBER 2020
60
abroad have emerged. This makes it important for policy makers to have information on the extent to which the economy relies on imports of ICT services, and from where these services are sourced. Indicator code and name: ICT6: exports of ICT services as a proportion of total exports of services Definition of concepts: ICT6 is calculated as the quotient of the value of exports of all ICT services divided by the total value of exports of services (expressed as a percentage). Clarifications and methodological issues: ICT services are defined as per Annex 9 and include: - Telecommunications services - Computer services - Computer software - Computer services - Other computer services - Licenses to reproduce and/or distribute computer software Model question: Not applicable (calculated from BOP data) Disaggregation and classifications: Can be disaggregated by EBOPS 2010 codes or with more detail by ISIC Rev. 4 codes. Policy relevance: With globalization and digitalization of the world economy, new opportunities for supplying ICT services to foreign markets have emerged. This makes it important for policy makers to have information on the extent to which the economy is exporting ICT services, and to what destinations.
4.5 Measuring trade in ICT-enabled (digitally delivered) services 119. Information and communications technologies (ICTs) are a key enabling factor for the development of services trade, especially thanks to the falling prices for voice and data communications which enable companies to segment and relocate work to remote locations, including to foreign affiliates. This trend is accompanied by a transformation of the nature of the traded services, with an evolution, from basic call centers, simple software coding, and generation of digital content to more complex business process such as system design and R&D. Producing data on international trade in digitally-delivered services (also referred to as ICT-enabled services or ITES) is also of interest for trade in services negotiations, which typically differentiate by mode of supply of such services. 120. At the national level, the successful implementation of such a survey therefore benefits from the cooperation of, at least, the central bank (usually responsible for Balance of Payment and other related statistics) and the NSO. The sectoral ministry or national agency in charge of the development and regulation of ecommerce and services trade should also be involved. For the initial phases of the data collection (GSBPM phase “Specify needs” and “Build”) it may be important to involve the private sector, to understand better the information needs as well as the concrete modalities of ICT-enabled services exist in the country.
4.5.1. Mode of delivery
121. ITES are defined as "services products delivered remotely over ICT networks" (i.e. over voice or data networks, including the Internet). Trade in ITES would thus essentially encompass all services transactions delivered remotely over ICT networks.
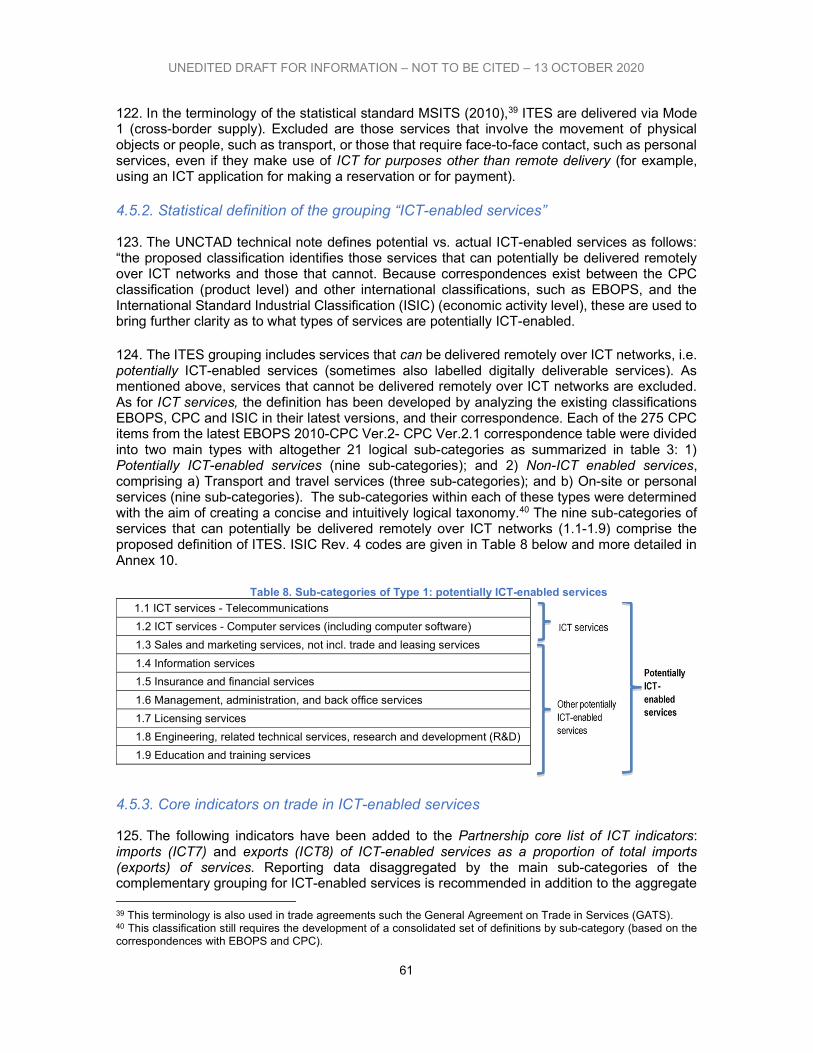
UNEDITED DRAFT FOR INFORMATION – NOT TO BE CITED – 13 OCTOBER 2020
61
122. In the terminology of the statistical standard MSITS (2010),39 ITES are delivered via Mode 1 (cross-border supply). Excluded are those services that involve the movement of physical objects or people, such as transport, or those that require face-to-face contact, such as personal services, even if they make use of ICT for purposes other than remote delivery (for example, using an ICT application for making a reservation or for payment).
4.5.2. Statistical definition of the grouping “ICT-enabled services”
123. The UNCTAD technical note defines potential vs. actual ICT-enabled services as follows: “the proposed classification identifies those services that can potentially be delivered remotely over ICT networks and those that cannot. Because correspondences exist between the CPC classification (product level) and other international classifications, such as EBOPS, and the International Standard Industrial Classification (ISIC) (economic activity level), these are used to bring further clarity as to what types of services are potentially ICT-enabled.
124. The ITES grouping includes services that can be delivered remotely over ICT networks, i.e. potentially ICT-enabled services (sometimes also labelled digitally deliverable services). As mentioned above, services that cannot be delivered remotely over ICT networks are excluded. As for ICT services, the definition has been developed by analyzing the existing classifications EBOPS, CPC and ISIC in their latest versions, and their correspondence. Each of the 275 CPC items from the latest EBOPS 2010-CPC Ver.2- CPC Ver.2.1 correspondence table were divided into two main types with altogether 21 logical sub-categories as summarized in table 3: 1) Potentially ICT-enabled services (nine sub-categories); and 2) Non-ICT enabled services, comprising a) Transport and travel services (three sub-categories); and b) On-site or personal services (nine sub-categories). The sub-categories within each of these types were determined with the aim of creating a concise and intuitively logical taxonomy.40 The nine sub-categories of services that can potentially be delivered remotely over ICT networks (1.1-1.9) comprise the proposed definition of ITES. ISIC Rev. 4 codes are given in Table 8 below and more detailed in Annex 10.
Table 8. Sub-categories of Type 1: potentially ICT-enabled services
1.1 ICT services - Telecommunications
1.2 ICT services - Computer services (including computer software)
1.3 Sales and marketing services, not incl. trade and leasing services
1.4 Information services
1.5 Insurance and financial services
1.6 Management, administration, and back office services
1.7 Licensing services
1.8 Engineering, related technical services, research and development (R&D)
1.9 Education and training services
4.5.3. Core indicators on trade in ICT-enabled services
125. The following indicators have been added to the Partnership core list of ICT indicators: imports (ICT7) and exports (ICT8) of ICT-enabled services as a proportion of total imports (exports) of services. Reporting data disaggregated by the main sub-categories of the complementary grouping for ICT-enabled services is recommended in addition to the aggregate
39 This terminology is also used in trade agreements such the General Agreement on Trade in Services (GATS). 40 This classification still requires the development of a consolidated set of definitions by sub-category (based on the correspondences with EBOPS and CPC).
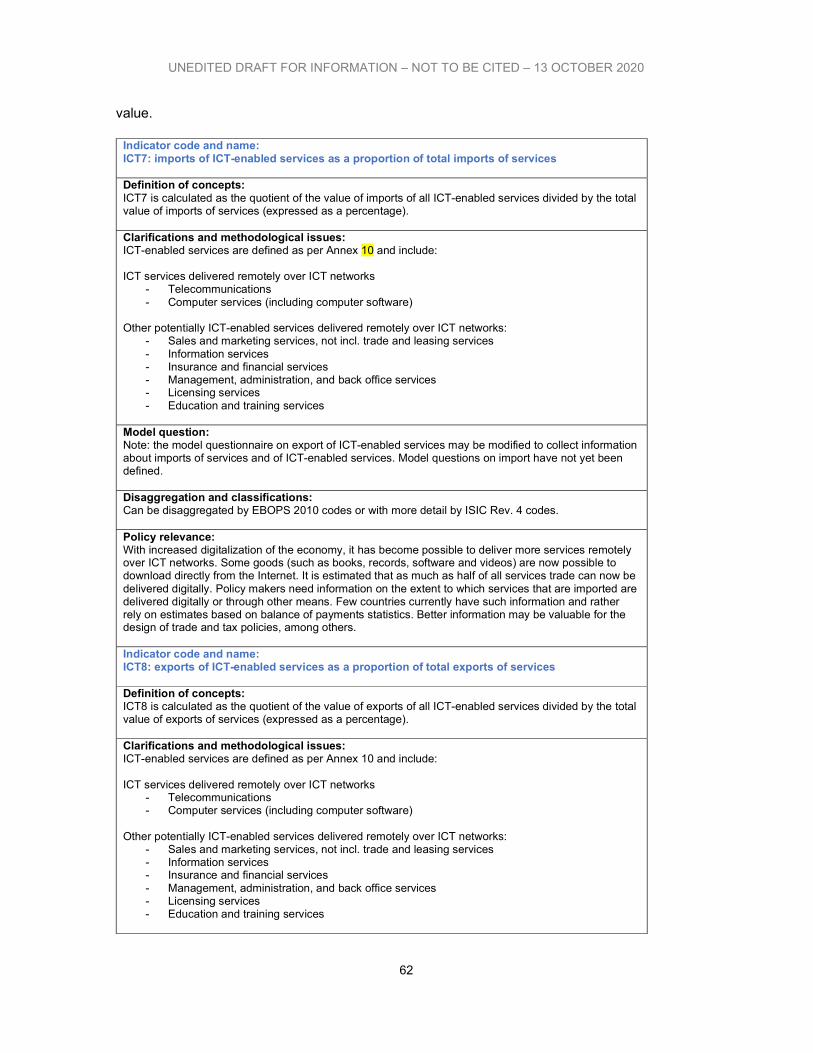
UNEDITED DRAFT FOR INFORMATION – NOT TO BE CITED – 13 OCTOBER 2020
62
value.
Indicator code and name: ICT7: imports of ICT-enabled services as a proportion of total imports of services Definition of concepts: ICT7 is calculated as the quotient of the value of imports of all ICT-enabled services divided by the total value of imports of services (expressed as a percentage). Clarifications and methodological issues: ICT-enabled services are defined as per Annex 10 and include: ICT services delivered remotely over ICT networks
- Telecommunications - Computer services (including computer software)
Other potentially ICT-enabled services delivered remotely over ICT networks:
- Sales and marketing services, not incl. trade and leasing services - Information services - Insurance and financial services - Management, administration, and back office services - Licensing services - Education and training services
Model question: Note: the model questionnaire on export of ICT-enabled services may be modified to collect information about imports of services and of ICT-enabled services. Model questions on import have not yet been defined. Disaggregation and classifications: Can be disaggregated by EBOPS 2010 codes or with more detail by ISIC Rev. 4 codes. Policy relevance: With increased digitalization of the economy, it has become possible to deliver more services remotely over ICT networks. Some goods (such as books, records, software and videos) are now possible to download directly from the Internet. It is estimated that as much as half of all services trade can now be delivered digitally. Policy makers need information on the extent to which services that are imported are delivered digitally or through other means. Few countries currently have such information and rather rely on estimates based on balance of payments statistics. Better information may be valuable for the design of trade and tax policies, among others. Indicator code and name: ICT8: exports of ICT-enabled services as a proportion of total exports of services Definition of concepts: ICT8 is calculated as the quotient of the value of exports of all ICT-enabled services divided by the total value of exports of services (expressed as a percentage). Clarifications and methodological issues: ICT-enabled services are defined as per Annex 10 and include: ICT services delivered remotely over ICT networks
- Telecommunications - Computer services (including computer software)
Other potentially ICT-enabled services delivered remotely over ICT networks:
- Sales and marketing services, not incl. trade and leasing services - Information services - Insurance and financial services - Management, administration, and back office services - Licensing services - Education and training services
UNEDITED DRAFT FOR INFORMATION – NOT TO BE CITED – 13 OCTOBER 2020
63
Model question: Refer to model questionnaire on export of ICT-enabled services in Annex 3. Disaggregation and classifications: Can be disaggregated by EBOPS 2010 codes or with more detail by ISIC Rev. 4 codes. Policy relevance: With increased digitalization of the economy, it has become possible to deliver more services remotely over ICT networks. Some goods (such as books, records, software and videos) are now possible to download directly from the Internet. It is estimated that as much as half of all services trade can now be delivered digitally. Policy makers need information on the extent to which services that are exported are delivered digitally or through other means. Better information may be valuable for the design of industrial, innovation, trade and tax policies, among others.
Data collection on Trade in ITES
126. In terms of collecting data on trade in ITES, two methods may be considered. A first approach is to measure the value of services delivered via Mode 1 (cross-border supply) following the survey methodology developed in MSITS (2010) for the list of potentially ICT-enabled services. ICT-enabled services can only be supplied across borders (Mode 1) without travel by natural persons (Mode 4) or consumers (Mode 2). Most services deemed to be supplied cross-border (Mode 1), without people also crossing borders, are ICT-enabled. In this approach, the compiling agency (central bank and/or statistical office) needs to identify modes of supply in collection and compilation. If only administrative records are used (such as ITRS) then these records need to be examined for clues about the mode of supply employed. If business surveys are used, then questions can be added to identify modes of supply and, by extension, ITES.
127. Pilot surveys on exports of ICT-enabled services (see example 5) were implemented to test a draft questionnaire. The recommended questionnaire after piloting is presented in Annex 3. The questionnaire comprises three parts. Part A aims at collecting basic information about the enterprise. Part B identifies exports of services that were delivered by the enterprise remotely over ICT networks (so-called ICT-enabled services) during the reporting period. Part C allows detailing these ICT-enabled exports by type of service, mode of delivery and partner economy.
128. The collection of data on imports of ICT-enabled services can be carried out in a similar way, adapting the model questionnaire on exports. The selection of the target population should reflect the fact that while exporters of ICT-enabled services are not represented in many industries in developing countries, importers can include firms across the entire economy (e.g. users of business process outsourcing, travel booking services for business purpose, buyers of software licenses, e-payment platforms). Thus, a sample should likely cover most industries in an economy, with higher data collection costs than for exports.
129. Alternatively, a specific question can be included in a business survey. This option is further developed when presenting the UNCTAD model questionnaire on trade in ITES. The result of pilot tests suggested however the removal of any references to the concepts of modes 1, 2, 3 and 4, while keeping the description of the different modes of supply defined as: cross-border supply, consumption abroad, supply through a commercial presence and through the presence of natural persons.
130. For the collection of data, countries should use as sample frame the statistical business register, or ideally, the balance of payments (BOP) register of services exporting firms if one is available. Usually the BOP register is managed by the central bank and it includes details about the exporting or importing resident enterprises. A BOP register should include not only the basic
UNEDITED DRAFT FOR INFORMATION – NOT TO BE CITED – 13 OCTOBER 2020
64
identification variables, such as name, postal address of the company, name of managers, but also key economic variables regarding, in particular, the nature and type of exports and imports performed over the last few years.
Example 5. Costa Rica and India: Pilot surveys on trade in ICT-enabled services During 2017, UNCTAD piloted a new model survey questionnaire in three countries: Costa Rica, India and Thailand. Results are available for Costa Rica and India for both “digitally deliverable” and digitally delivered services (ICT-enabled services), while in Thailand the survey was implemented in the telecommunications sector only. Costa Rica has followed up with a second survey for 2017 (Banco Central de Costa Rica, 2019). In Costa Rica, digitally deliverable services represented 41 per cent of total exports of services in 2017. Almost all (95 per cent) of the digitally deliverable services were found to have been digitally delivered. Most of these exports were by large foreign-owned enterprises that were providing management, administrative and back office services to the United States. Meanwhile, micro and small enterprises accounted for 7.5 per cent of the total exports of digitally delivered services. The workforce of the companies exporting services via ICT networks comprised 58 per cent men and 42 per cent women. In India, 70 per cent of the total services exports were digitally deliverable in 2016 (reference period was April 2016 to April 2017). In their case, 81 per cent were digitally delivered, while the remainder were being exported via the dispatch of ICT experts from India to the destination market. Thus, 57 per cent of India’s total exports of services were digitally delivered. Computer services were the biggest contributor, representing almost two thirds of the total amount. For services-exporting SMEs, delivery over ICT networks constituted the predominant mode of supply (more than 99 per cent), while for larger enterprises, many complemented remote ICT delivery with other modes of supply, notably sending experts to provide the services on-site. Sources: UNCTAD, based on Indian DG of Commercial Intelligence and Statistics and Costa Rica Central Bank.
4.6 Measuring the value of e-commerce 131. E-commerce is defined as the sale or purchase/procurement of goods or services (includes getting estimates, negotiating, ordering, arranging contracts); electronic data interchange (EDI); mobile commerce; integration of ordering system with that of customers/suppliers; integrated invoicing and payment by customers; full integration with back-end systems; use of an extranet; secure transactions; automated payment of suppliers. 132. The core indicators on e-commerce B7 and B8 refer to the receipt or placement of orders. However, the measurement of the value of e-commerce is not part of the definition of B7 and B8. Business-to-Business (B2B) e-commerce accounts for the dominant share of global e-commerce and is therefore also likely to be the most important component of cross-border sales online (UNCTAD 2015a).41 However, as data on B2B e-commerce are generally scarce, attention is also given to consumer-oriented shopping (i.e. Business to Consumer (B2C) and Consumer-to-Consumer (C2C) (see Box 7). A topic of particular interest is the measurement of cross-border e-commerce to understand the role of e-commerce in international trade.42
41 https://unctad.org/en/PublicationsLibrary/tn_unctad_ict4d06_en.pdf 42 The measurement of e-commerce from the viewpoint of demand by households and individuals is considered in the framework of household surveys (see the ITU Manual on Measuring Access and Use of ICT by Households and Individuals).
UNEDITED DRAFT FOR INFORMATION – NOT TO BE CITED – 13 OCTOBER 2020
65
Box 7. Types of e-commerce
Business-to-business (B2B). B2B accounts for the bulk of the value of e-commerce. It can involve online versions of traditional transactions related to goods that are subsequently sold to consumers via retail outlets. It can also involve the provision of goods and services to support other businesses, for example because of outsourcing and offshoring. There are various specialized B2B platforms, typically catering to certain industries or value chains.
Business-to-consumer (B2C). B2C involves sales by "pure play" e-commerce enterprises to consumers and by traditional bricks-and-mortar retail or manufacturing firms that add an online sales channel. There is a wide range of channels to reach consumers, including social networks, crowdsourcing platforms, dedicated e-commerce websites, mobile applications and more. The products sold may be physical goods as well as digital products and services.
Consumer-to-consumer (C2C). C2C e-commerce can be seen as a modern version of the classified advertising section in a newspaper or an auction. It covers online marketplace platforms (e.g. eBay or Taobao), and sales within online communities, consumer blogs and chat rooms.
Business-to-government (B2G): B2G transactions are similar to B2B, except that the buyer in this case is a government entity, such as when it makes requests to bid through public e-procurement.
Source: UNCTAD, 2015a.
133. Countries wishing to further explore the extent of e-commerce can include questions on the type and value of goods purchased or sold via e-commerce. In order to overcome the difficulty of recording exact values, questionnaires could include a question on the percentage of total purchases and/or sales attributable to e-commerce, in intervals (e.g. less than 1 per cent, 1 per cent to 5 per cent, 6 per cent to 10 per cent, 11 per cent to 25 per cent, more than 25 per cent). An alternative that enables aggregation of values for the business sector is to include questions asking for the percentage of the value of e-commerce (purchases and/or sales) and the total value of all purchases and/or sales, so that e-commerce values are obtained, at the business level, by multiplication. The resulting values can then be aggregated for the business sector.
134. Ideally, enterprise surveys including questions or modules on e-commerce would include the amount of sales broken down by B2B and B2C, as well as distinguishing between domestic and cross-border orders.
4.6.1. Cross-border e-commerce
135. Unfortunately, most countries that collect data on business e-commerce sales do not include questions about the share or value of cross-border transactions. This is especially the case among developing countries. Given that B2B accounts for the bulk of e-commerce worldwide and is likely to have the greatest impact on international trade, enterprise surveys may offer the greatest potential for improving the availability of more reliable estimates of cross-border e-commerce. Europe implements surveys on ICT usage and e-commerce that attempt to measure the turnover and flow of e-commerce sales (see Example 6).
Example 6. Europe: Measurement of cross-border e-commerce
Eurostat disseminates every two years data on whether enterprises have carried out sales overseas using the Internet. The data refer to the proportion of enterprises that has conducted such sales (received such orders). The data shows that European enterprises sell mostly via their own website or apps, that online sales are mostly to other enterprises (B2B) and public authorities (B2G), and that online sales are mostly in-country rather than cross-border (to other EU countries).
UNEDITED DRAFT FOR INFORMATION – NOT TO BE CITED – 13 OCTOBER 2020
66
The Eurostat model questionnaire for the community survey on ICT usage and e-commerce in enterprises provides guidance on how to collect such data on “Web sales” (see Annex 5). For example, the 2019 questionnaire included two alternative questions to measure the value of purchases (orders placed via computer networks):
Please state the value of the turnover resulting from orders received that were placed via a website or apps (in monetary terms, excluding VAT), in 2018. (National currency)
If you can't provide this value, please indicate an estimate of the percentage of the total turnover resulting from orders received that were placed via a website or apps, in 2018.
To measure cross-border e-commerce, the model questionnaire proposed a filter question and a follow-up question:
During 2018, did your enterprise receive orders placed via a website or apps by customers located in the following geographic areas? a) Own country, b) Other EU countries, c) Rest of the world
What was the percentage breakdown of the turnover from orders received that were placed via a website or apps in 2018 by customers located in the following geographic areas? (estimates in percentage of the monetary values, excluding VAT) If you cannot provide the exact percentages an approximation will suffice (Optional) a) Own country, b) Other EU countries, c) Rest of the world
Sources:
"E-commerce statistics" at https://ec.europa.eu/eurostat/statistics-explained/index.php?title=E-commerce_statistics
Eurostat COMMUNITY SURVEY ON ICT USAGE AND E-COMMERCE IN ENTERPRISES2019 Model Questionnaire version 2.0 https://circabc.europa.eu/sd/a/d9b1ab6e-a38f-485b-aeb5-8f7e2ce8d153/MQ_2019_ICT_ENT.pdf
136. Enterprise surveys should offer the opportunity to compare data on cross-border
ecommerce with data on enterprise exports (by all channels). This could be achieved by either including e-commerce-related questions in surveys on trade by enterprises or by including a question related to trade in existing e-commerce surveys.
137. In order to measure the value of e-commerce, the OECD proposes the following indicators con cross-border e-commerce:
E-sales value by platform and type of customer (as % of total turnover),
E-purchase value by platform (as a % of total purchases)
where platforms include (a) EDI and (b) web, and customers include end consumers and other enterprises and government: these two latter categories might need being joined, where separate data are unavailable. As survey practice showed that respondents find it difficult to report their total e-sales (e-purchases), these figures might be better obtained by summing up components. Also, values can be collected in absolute terms.
UNEDITED DRAFT FOR INFORMATION – NOT TO BE CITED – 13 OCTOBER 2020
67
Chapter 5 - Data sources and data collection methods
138. This chapter describes and compares potential sources of ICT statistics and explores various data collection methodologies. The major topics covered by the chapter are:
Presentation of the General Statistic Business Process Model (GSBPM), developed by UNECE as a conceptual framework that could support the countries to manage their statistical operations and generate data sources of the Digital Economy.
Administrative data (such as, telecommunications regulatory information and customs data) and business registers;
Ongoing economic surveys and censuses which may collect a small amount of ICT use data and often cover at least some of the ICT sector;
Stand-alone ICT surveys and substantial ICT modules included in other surveys; and
New data sources and collection methods, such as Big Data, web scraping and behavioural experiments.
139. Administrative sources and ongoing collections can be useful but are unlikely to satisfy policymakers’ needs (or deliver all the core ICT indicators). This leaves stand-alone ICT collections or substantial ICT modules included in ‘host’ survey vehicles as the main sources of business ICT data (especially for the demand side). The choice of a particular source or survey vehicle for the collection of business ICT data should take into account international practices and standards, as well as national specificities (such as the functioning of the national statistical system), the needs of policymakers, and available technical and financial resources.
140. The activities in the Digital Economy produces large amounts of data (Big Data) that, properly captured and analyzed, may become a relevant source for ICT statistics. The use of Big Data is a possible way of improving the timeliness and granularity of ICT statistics, as well as reducing their production cost by replacing ad-hoc surveys. However, beyond technical issues coming from the amount of information and its lack of structure, the use of such Big Data presents challenges related to, for example, data capture, data use regulation, availability and representativeness. Realizing the synergies between these new Big Data and other type of sources (administrative registers, sample surveys or censuses) is a critical point in the agenda of NSO of OECD and developing countries.
141. The data collection methodologies presented in this chapter are based on country practices (in OECD as well as in developing economies) and on best practice recommendations that are broadly applicable to business statistics. Several data collection methodologies are described and compared in terms of cost and effectiveness, from a development point of view. They include face-to-face interviews, personal telephone interviews, questionnaires sent by ordinary mail,forms posted on web pages, automatic data collection using web scraping methods and behavioural experiments. Countries’ practices depend very much on the costs (of interviewers, transports and communication) and the existing infrastructure (call centres, regional or municipal offices, etc.).
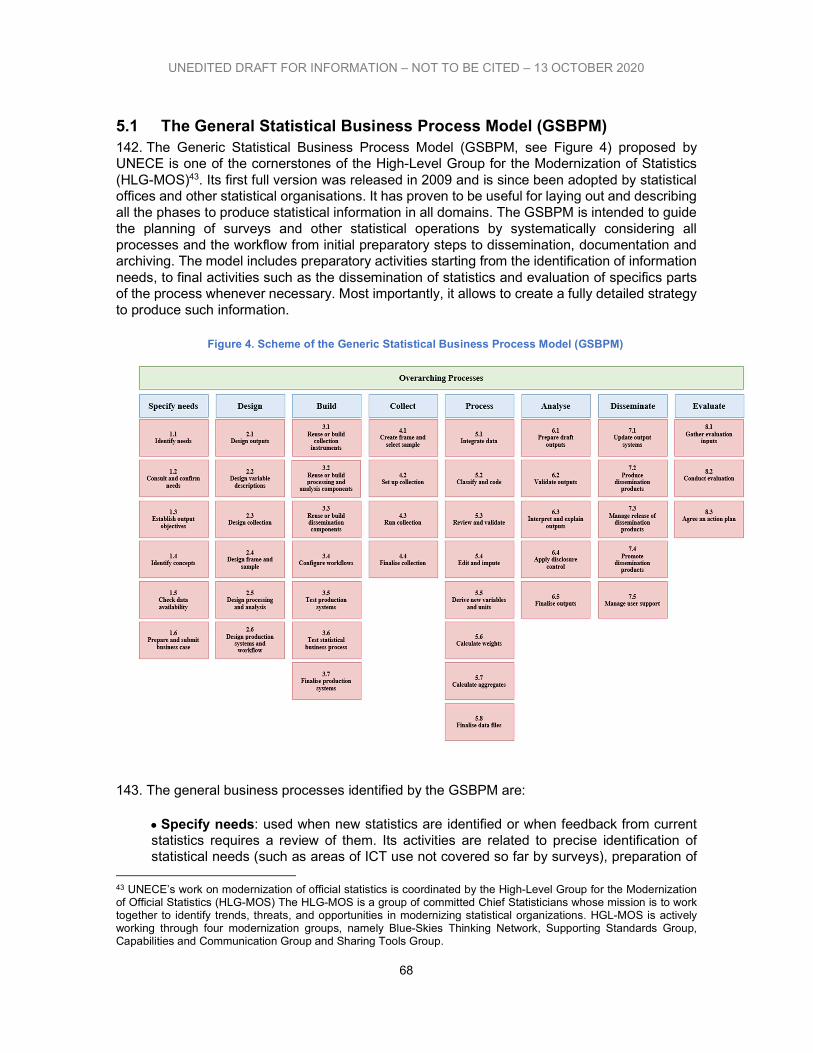
UNEDITED DRAFT FOR INFORMATION – NOT TO BE CITED – 13 OCTOBER 2020
68
5.1 The General Statistical Business Process Model (GSBPM) 142. The Generic Statistical Business Process Model (GSBPM, see Figure 4) proposed by UNECE is one of the cornerstones of the High-Level Group for the Modernization of Statistics (HLG-MOS)43. Its first full version was released in 2009 and is since been adopted by statistical offices and other statistical organisations. It has proven to be useful for laying out and describing all the phases to produce statistical information in all domains. The GSBPM is intended to guide the planning of surveys and other statistical operations by systematically considering all processes and the workflow from initial preparatory steps to dissemination, documentation and archiving. The model includes preparatory activities starting from the identification of information needs, to final activities such as the dissemination of statistics and evaluation of specifics parts of the process whenever necessary. Most importantly, it allows to create a fully detailed strategy to produce such information.
Figure 4. Scheme of the Generic Statistical Business Process Model (GSBPM)
143. The general business processes identified by the GSBPM are:
Specify needs: used when new statistics are identified or when feedback from current statistics requires a review of them. Its activities are related to precise identification of statistical needs (such as areas of ICT use not covered so far by surveys), preparation of
43 UNECE’s work on modernization of official statistics is coordinated by the High-Level Group for the Modernization of Official Statistics (HLG-MOS) The HLG-MOS is a group of committed Chief Statisticians whose mission is to work together to identify trends, threats, and opportunities in modernizing statistical organizations. HGL-MOS is actively working through four modernization groups, namely Blue-Skies Thinking Network, Supporting Standards Group, Capabilities and Communication Group and Sharing Tools Group.
UNEDITED DRAFT FOR INFORMATION – NOT TO BE CITED – 13 OCTOBER 2020
69
solutions for them and proposals of business cases to meet those needs;
Design: the statistical processes are related to development and design as well as research work to define outputs, methodologies and such. It includes all the design elements needed to define or redefine the metrics that the business case asks for. The metadata and procedures to be used in the following phases are specified at this point.
Build: the outputs from the “design” processes are assembled and configured in this case to create the complete operational environment to run the process. New services are also created in response to gaps in the existing catalogue of services sourced from within the organization and externally. These new services are constructed so that they can be reused when necessary or possible, for example, the dissemination of anonymized microdata from ICT surveys for further use by researchers.
Collect: gathering all the necessary information and load it to the proper environment for further processing. This may include validation of data set formats, but never the transformation of data, which is done in the process phase.
Process: processing of input data and preparation of it for analysis. The processing of the data enables not only the analysis, but also the dissemination of the data as statistical outputs. The activities can be parallel to those carried out in the analysis process and may commence before the collection phase.
Analyze: statistical outputs are produced and examined in detail. Statistical content for publications, reports, etc. is prepared, while ensuring that outputs are adequate before their dissemination. It includes sub-processes and activities that enable statistical analysts to understand the data and the statistics produced.
Disseminate: manages the release of statistical products to users. Activities are related with assembling and releasing the products via different channels. This can include presentation of the results of ICT surveys to forums of users.
Evaluate: in this last process, the purpose is to evaluate specific instances in the statistical process. It can be done at the end be ongoing during the statistical production process. Once the evaluation of the specific instance is done, a range of qualitative and quantitative inputs is drawn as well as the identification and prioritizing of potential improvements.
144. Applying this methodology to the statistical business processes in the field of ICT statistics (and other domains) has several benefits that cannot be overlooked. The first one is that the standardization of terminology creates efficiency savings as well as it makes comparisons internationally much easier. Secondly, its implementation allows the adherence to the standard framework for benchmarking in statistics and hence, it facilitates the use of common tools and methods that again, result in more efficiency savings. Also, the GSBPM includes tools to manage the quality of the process much better, making for better and more reliable data. Finally, it provides a clear and easy way to understand information for data producers and users.
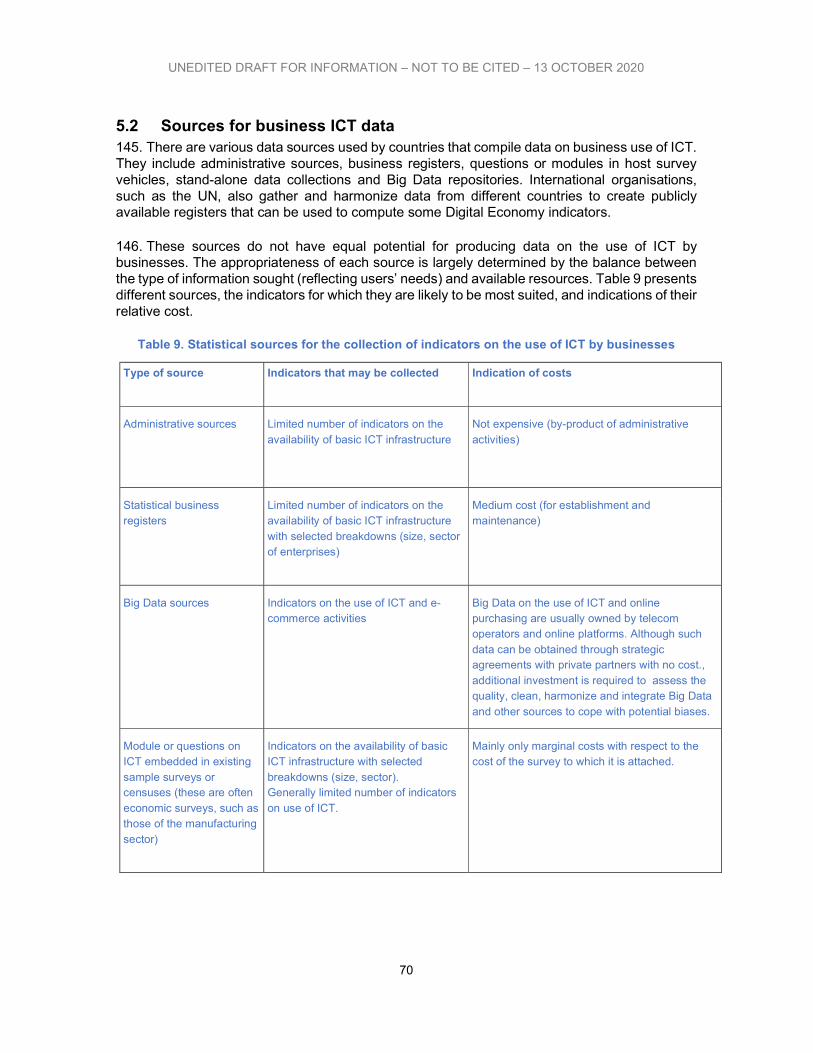
UNEDITED DRAFT FOR INFORMATION – NOT TO BE CITED – 13 OCTOBER 2020
70
5.2 Sources for business ICT data 145. There are various data sources used by countries that compile data on business use of ICT. They include administrative sources, business registers, questions or modules in host survey vehicles, stand-alone data collections and Big Data repositories. International organisations, such as the UN, also gather and harmonize data from different countries to create publicly available registers that can be used to compute some Digital Economy indicators.
146. These sources do not have equal potential for producing data on the use of ICT by businesses. The appropriateness of each source is largely determined by the balance between the type of information sought (reflecting users’ needs) and available resources. Table 9 presents different sources, the indicators for which they are likely to be most suited, and indications of their relative cost.
Table 9. Statistical sources for the collection of indicators on the use of ICT by businesses
Type of source
Indicators that may be collected
Indication of costs
Administrative sources
Limited number of indicators on the availability of basic ICT infrastructure
Not expensive (by-product of administrative activities)
Statistical business registers
Limited number of indicators on the availability of basic ICT infrastructure with selected breakdowns (size, sector of enterprises)
Medium cost (for establishment and maintenance)
Big Data sources Indicators on the use of ICT and e-commerce activities
Big Data on the use of ICT and online purchasing are usually owned by telecom operators and online platforms. Although such data can be obtained through strategic agreements with private partners with no cost., additional investment is required to assess the quality, clean, harmonize and integrate Big Data and other sources to cope with potential biases.
Module or questions on ICT embedded in existing sample surveys or censuses (these are often economic surveys, such as those of the manufacturing sector)
Indicators on the availability of basic ICT infrastructure with selected breakdowns (size, sector). Generally limited number of indicators on use of ICT.
Mainly only marginal costs with respect to the cost of the survey to which it is attached.
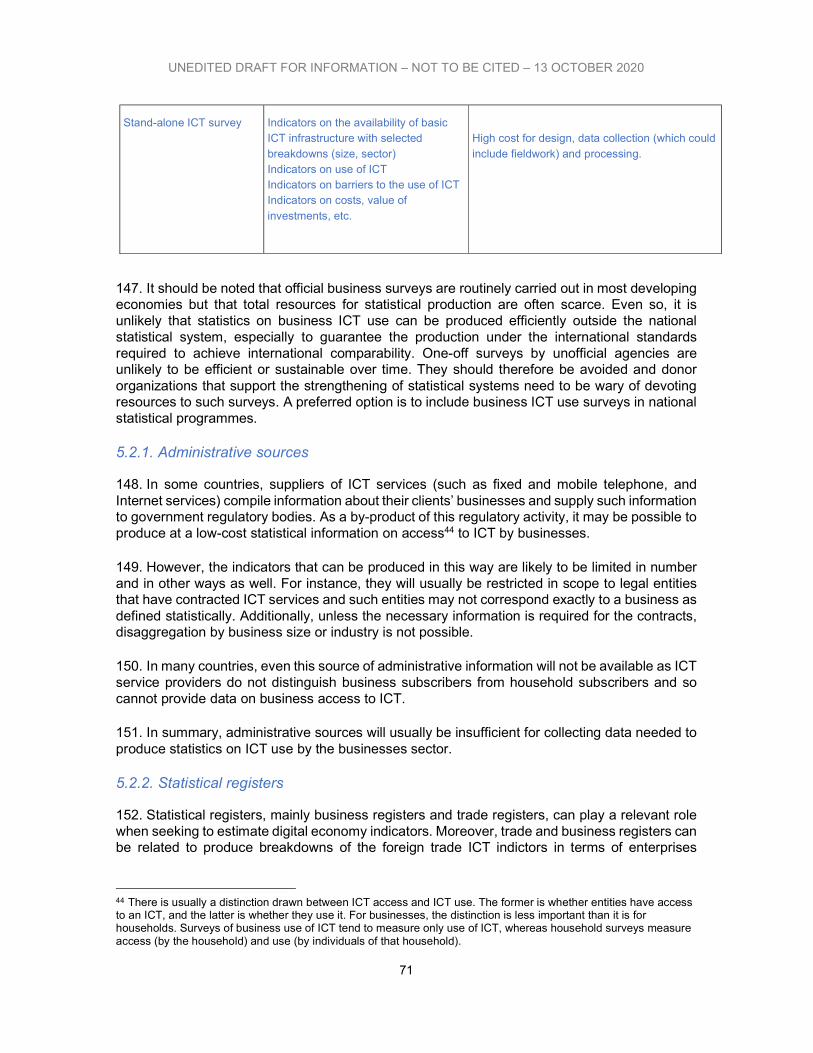
UNEDITED DRAFT FOR INFORMATION – NOT TO BE CITED – 13 OCTOBER 2020
71
Stand-alone ICT survey
Indicators on the availability of basic ICT infrastructure with selected breakdowns (size, sector) Indicators on use of ICT Indicators on barriers to the use of ICT Indicators on costs, value of investments, etc.
High cost for design, data collection (which could include fieldwork) and processing.
147. It should be noted that official business surveys are routinely carried out in most developing economies but that total resources for statistical production are often scarce. Even so, it is unlikely that statistics on business ICT use can be produced efficiently outside the national statistical system, especially to guarantee the production under the international standards required to achieve international comparability. One-off surveys by unofficial agencies are unlikely to be efficient or sustainable over time. They should therefore be avoided and donor organizations that support the strengthening of statistical systems need to be wary of devoting resources to such surveys. A preferred option is to include business ICT use surveys in national statistical programmes.
5.2.1. Administrative sources
148. In some countries, suppliers of ICT services (such as fixed and mobile telephone, and Internet services) compile information about their clients’ businesses and supply such information to government regulatory bodies. As a by-product of this regulatory activity, it may be possible to produce at a low-cost statistical information on access44 to ICT by businesses.
149. However, the indicators that can be produced in this way are likely to be limited in number and in other ways as well. For instance, they will usually be restricted in scope to legal entities that have contracted ICT services and such entities may not correspond exactly to a business as defined statistically. Additionally, unless the necessary information is required for the contracts, disaggregation by business size or industry is not possible.
150. In many countries, even this source of administrative information will not be available as ICT service providers do not distinguish business subscribers from household subscribers and so cannot provide data on business access to ICT.
151. In summary, administrative sources will usually be insufficient for collecting data needed to produce statistics on ICT use by the businesses sector.
5.2.2. Statistical registers
152. Statistical registers, mainly business registers and trade registers, can play a relevant role when seeking to estimate digital economy indicators. Moreover, trade and business registers can be related to produce breakdowns of the foreign trade ICT indictors in terms of enterprises
44 There is usually a distinction drawn between ICT access and ICT use. The former is whether entities have access to an ICT, and the latter is whether they use it. For businesses, the distinction is less important than it is for households. Surveys of business use of ICT tend to measure only use of ICT, whereas household surveys measure access (by the household) and use (by individuals of that household).
UNEDITED DRAFT FOR INFORMATION – NOT TO BE CITED – 13 OCTOBER 2020
72
features, such as size or activity sector.
153. Business registers or directories are a key element of the statistical infrastructure of most NSOs. Their role is to maintain an updated record of a country’s businesses (usually enterprises and their establishments), with information on the location, contact details and other characteristics such as industry and size. Business registers are used in the statistical process for the compilation of business demographic data and to generate population frames for business surveys. Most NSOs regularly update their business registers using administrative sources, such as tax or social security registers, and through their own statistical operations.
154. The main advantages of using a business register as a source to produce statistical indicators (besides its use as a population frame from which to draw samples) are that:
Indicators can be quickly aggregated (no fieldwork is required); and
The marginal cost of statistical production is very low.
155. The main disadvantage is that the number of indicators on the use of ICT that can be produced from statistical business registers is generally limited to basic indicators on the presence of certain technologies such as telephone (fixed and mobile), computers or the presence of email or a website (which may be present for contact purposes). Such indicators will only be feasible, of course, if the business register contains high-quality (complete and updated) information.
156. Administrative sources that are used to update an NSO’s business register are usually good for identifying new businesses but less effective at detecting businesses that disappear from the population. The problem of having a high rate of “dormant businesses” (or “dead units”) is generally more severe for small businesses.
157. In developing economies, the importance of the informal sector45 implies that a big share of economic activity occurs outside the administrative framework (for example, activities of retail trade without licensing or tax control). The economic agents involved will usually be excluded from business registers.
158. Coverage problems, such as those described above, can produce biases in statistical data. For example, there can be underestimation of the total number of businesses (if there is a large share of informal activity) or overestimation (if there is a large proportion of dormant businesses; see Example 7). Many developing economies are faced with both situations.
Example 7. Croatia: Activity ratios as a measure of quality of business registers
The ratio of active to registered firms provides a measure of the quality of administrative business registers and their suitability for use as population frames for statistical surveys. The activity of firms can be monitored by investigating administrative files that record compulsory activities, such as paying taxes, social security or pension contributions for employees. According to recent statistics, the ratio of active to registered firms has kept on dropping, and for example, in Croatia the number of active crafts has steadily decreased, yet their share in active trading companies has increased, which suggests
45 The coverage of the informal sector is not described in detail in this Manual and statisticians in countries where the informal sector has a relevant weight in the economy may refer to the OECD Manual “Measuring the Non-Observed Economy - A Handbook” (http://www.oecd.org/dataoecd/9/20/1963116.pdf). In some countries, informal sector is investigated through a combination of household surveys, surveys to small enterprises and to self-employed persons, which could serve as survey vehicles where questions on ICT access and use can be included.
UNEDITED DRAFT FOR INFORMATION – NOT TO BE CITED – 13 OCTOBER 2020
73
that active trading companies are disappearing more and more. This makes the use of the register as a survey frame inefficient as the response rate becomes low and the estimates are likely to suffer from non-response bias
Source: http://www.cepor.hr/wp-content/uploads/2015/04/EN-SME-Report-2018-za-web.pdf
159. Trade registers are the usual source to compute ICT goods trade indicators ICT3 and ICT4. Trade registers are elaborated from the aggregation of the information of the Customs Authority of the country. In general, trade registers include the total volume and economic value of import and export transactions in a given period (usually one year). Traded commodities are classified according to HS 2012 or 2016.
160. In addition to national trade registers, UN COMTRADE46 can be used to compute some of the ICT foreign trade indicators. UN COMTRADE is a repository containing over 3 billion data, covering over 170 countries/areas since 1962. Reporting countries provide the United Nations Statistics Division (UNSD) with their annual international trade statistics data detailed by commodities/service categories and partner countries. These data are subsequently transformed into the United Nations Statistics Division standard format with consistent coding and valuation using the processing systems. Finally, data are made publicly available on the internet and can be easily acquired using the data acquisition API47 provided by UN COMTRADE.
161. UN COMTRADE contains data on imports, exports, re-exports and re-imports, specifying annual data of each commodity by trading partner. The info includes the value of the transactions in US dollars, as well as net weight and secondary quantities. Commodities are reported in the current classification and revision (HS 2012 in most cases as of 2016) and are converted all the way down to the earliest classification SITC revision 1.
162. Services are intangible and leave little or no administrative trail when crossing the border and are not properly recorded in national trade registers or COMTRADE. Indicators on trade of ICT and ICT-enabled services (ICT5 to ICT8) require alternative data sources such as BOP data. Traded services can be classified according to the Extended Balance of Payments Services classification (EBOPS 2010).
163. The establishment of a link between the business register and trade register in a country48 makes it feasible to classify some ICT trade indicators in terms of enterprises characteristics with no additional costs in data collection. The critical issue to link both registers is the existence of a common identifier between a country trade and business register, making possible to relate the trade information coming from the customs data with the features of the enterprises collected in the business register.
164. Since the statistical units and the classification criteria may differ between the business and the trade registers, proper correspondences need to be established. First, trade registers are recorded based on transactions, which are assigned to a trade operator identified based on the declaring unit. However, the statistical unit of the business register is the enterprise, usually identified based on a legal unit. The linkage of both registers requires then the identification of the potentially multiple trade operators of each enterprise. Second, a correspondence between the HS classification of commodities (as generally used in trade registers) and the ISIC
46 Additional information on UN COMTRADE can be obtained in https://comtrade.un.org/ 47 The API and the instruction for data downloading are available at https://comtrade.un.org/data/dev/portal/ 48 Additional information on the linkage of business and trade registers can be found in UN (2018). This document includes a template of a questionnaire to check the feasibility of this linking for a country.
UNEDITED DRAFT FOR INFORMATION – NOT TO BE CITED – 13 OCTOBER 2020
74
classification (as generally used in business registers) is also required.
165. Countries may be interested in checking the feasibility of trade and business registers data linking. To this end, they are recommended to gather information on the existence and maintenance of a trade register, the correspondence between trade and business registers and the link between the customs declaration and the trade register through a questionnaire to be completed by the main stakeholders.
5.2.3. Big data sources
166. In an increasingly digitized world, digital behavioural footprints generate large amounts of information known as “big data”. Big data are provided by different types of sources, including telecom operators, payment providers, postal operators, satellite companies, online platforms, social networks and providers of Internet of Things (IoT). The volume, timeliness and heterogeneity of big data is very high compared to the kinds of datasets that have traditionally been used for ICT statistics, opening new opportunities for new measurement methodologies with better timeliness and granularity at a lower cost. However, gathering and analyzing big data is somewhat complex and requires specific methods, including web scraping or data science techniques.
167. Big data sources generated by telecom companies are of special interest for the estimation of the core ICT indicators and measurement of the digital economy in general. Telecom operators generate Call Detail Records (CDRs), documenting the features of telecommunications transactions. CDRs contain the relevant attributes of a call (source number and destination number, GPS localization or duration). Telecommunication companies also register the activity in the network, including for instance internet usage or mobile money transfers. A special mention should be made of the potentiality of non-Internet-related mobile network big data. Given the popularity of mobile phones, big data sets obtained from the mobile network seems to have the widest socioeconomic coverage among all data sources in developing countries. For example, mobile phone data can replace large mobility surveys and make feasible to follow commuting flows supporting labour and migration statistics or trace potential infections such as in the case of COVID-19 in the year 2020.
168. A challenge for the use of big data to measure (aspects of) the digital economy is that they are not in general exhaustive neither representative of the general population. For this reason, measurements obtained from this type of sources may exhibit relevant biases. The integration of big data with information obtained from registers or censuses or representative random-sampling surveys is required to analyze and correct these potential biases. Moreover, big data sets are usually owned by private companies and are a core element of their business model. Since data owners may be reluctant to share such strategic resource, the establishment of strong private-public partnerships is required to release the potential of big data, as well as a clear regulatory framework regarding the use of such data (see example 8).
Example 8. Russian Federation: Using online payment companies to measure digitally ordered trade transactions
Digitally ordered trade transactions are nearly always settled via specialized online payment companies. In Russia, both international companies such as PayPal, and national IT companies such as QIWI or Yandex operate in this market. Russian law requires such companies to have licenses to work as credit institutions and to notify the Bank of Russia when they begin transferring electronic funds. The online payment companies are required to report detailed information to the
UNEDITED DRAFT FOR INFORMATION – NOT TO BE CITED – 13 OCTOBER 2020
75
Bank of Russia on a regular basis, including on e.g. direction of payment, the counterparty country and the currency of transactions. Due to the large number of small transactions (the average transfer amount is $20), the individual transactions are not categorized by type of goods and services. However, considering the growing importance of digital ordering, a quarterly survey of specialized online payment companies was developed in order to obtain disaggregated information on transactions by major product categories.
Source: https://unctad.org/meetings/en/Contribution/tdb_ede_wg2019c04_RussianFederation2_en.pdf
5.3 Modules and stand-alone surveys on the use of ICT by businesses 169. Collecting data from businesses is usually a costly task that must be undertaken to the highest technical standards to ensure good quality of collected data (and resulting aggregates). The effectiveness and efficiency of a data collection system can be assessed from the viewpoints of different actors in the statistical system, namely data producers, data providers and data users:
Data producers are interested in obtaining high quality data at the lowest cost and in the shortest possible time. Data collection costs include outlays for preparation of collection instruments (usually, questionnaires), training interviewers and other staff, and the costs of collecting and capturing data; beyond the data collection phases, there are additional costs for data processing and dissemination;
Data providers (respondents) wish to minimize the burden of data collection in terms of their costs and time (for gathering requested data and completing questionnaires, see example 9), and
From the data users’ point of view, a data collection system will be satisfactory if it ultimately provides relevant and reliable information, in an accessible way and in a timely manner.
Example 9. Kazakhstan: Measurement of response burden
The 2017 survey on electronic commerce carried out in the Republic of Kazakhstan routinely recorded the time needed by respondents to fill in a self-administered questionnaire, via a question with closed answers in the form of time intervals: less than 1 hour, 1 to 4 hours, 4 to 8 hours, 8 to 40 hours and more than 40 hours. The same intervals are used in other Kazakhstan business surveys. This information allows comparison of the difficulty of completing the questionnaire on e-commerce with other business surveys. Source: Survey questionnaire, Agency for Statistics of the Republic of Kazakhstan Eurostat and UNECE (2017) “Global Assessment of the National Statistical System of Kazakhstan” https://www.unece.org/fileadmin/DAM/stats/documents/technical_coop/GA_Kazakhstan_Final_Report_EN.pdf
170. Respondents’ and users’ needs should always be considered when choosing a survey vehicle and data collection method. Mechanisms for consultation with respondents and users are described in Chapter 9.
171. There are several possible techniques for data collection: face-to-face interviews, mailed questionnaires, telephone-assisted interviews, computer-assisted interviews, or a combination of these. Country practice depends on the costs (of interviewers, transport and communication),
UNEDITED DRAFT FOR INFORMATION – NOT TO BE CITED – 13 OCTOBER 2020
76
and the existing infrastructure (call centres, regional or municipal offices, reliable business register, etc.). Advantages and drawbacks of each method from the developing country perspective, together with quality controls that can be applied to data collection, are reviewed later in this chapter.
172. The majority of OECD countries, as well as many developing countries, have collected data from businesses on the use of ICT through questions included in current business surveys (hereafter referred to as ‘modules on the use of ICT’) or through stand-alone surveys on the topic. The choice of one or another approach is related to several factors, including policy needs for information on use of ICT by businesses, and the resources and organization of the statistical system.
173. Developing economies may not be able to afford stand-alone surveys on ICT and instead may prefer to include questions in existing surveys that also include background information such as on employment and industry. This can be a useful way to estimate statistical parameters that may be needed later in the design of stand-alone surveys (as explained in detail in Chapter 7).
174. Stand-alone surveys on ICT use are generally necessary for countries that are interested in investigating more sophisticated ICT applications (such as e-business, e-commerce and IT security measures). The decision to carry out a stand-alone survey should take into consideration its inclusion in the current national statistical programme (the work programme of surveys, censuses and other statistical operations implemented by the public authorities in a country and usually established by a legal act). This aspect is examined in part C of this Manual (Institutional issues).
175. The next two sections discuss statistical issues relevant to modules and stand-alone ICT surveys. Chapter 6 provides further guidance on the design of a module to be embedded in an existing survey by providing model questions to collect the data needed to produce the core indicators. This is the option that commonly chosen by developing economies that are starting to collect ICT data in order to produce the core indicators.
5.3.1. Modules on the use of ICT
176. Many countries regularly carry out statistical surveys with the objective of investigating industry sectors of importance to their economy. Surveys on the manufacturing or trade sectors are two common examples in many developing economies. The maintenance of comparable statistical time-series is favored using the same or similar questions over several years. However, the introduction of new questions in the questionnaire enables an NSO to be responsive to new information needs, and to relate the newly introduced variables to the ones that are already investigated. Thus, the inclusion of specific modules in existing business surveys is a practice followed by many countries in order to study new interest areas, such as the use of ICT by businesses.
177. The decision to include a module on the use of ICT in an existing survey must consider:
The information needs that can be satisfied with such a module (variables that can be included and variables in the survey vehicle that can be used for analyzing ICT data). If the survey vehicle records classification variables such as industry and size, it will be possible to break down ICT indicators by these classificatory variables (see example 10) and
UNEDITED DRAFT FOR INFORMATION – NOT TO BE CITED – 13 OCTOBER 2020
77
The methodology of the candidate survey vehicle in terms of population scope and coverage, periodicity, sample design, sample size and distribution. Data collected via the module will reflect the statistical characteristics of the survey vehicle (population frame used, sampling method, factors to weight the observations, collection and processing methods, level of detail for economic activities, etc.). This may be a significant disadvantage if, for instance, the scope of the survey vehicle is narrower than that recommended for the ICT use core indicators, or the sample size is too small, leading to large sampling errors.
Example 10. Thailand: Inclusion of questions on ICT in the Manufacturing Survey
In Thailand, the inclusion of questions on the use of ICT in the questionnaire of the Manufacturing Survey, has enabled a research programme assessing the impact of ICT on productivity. Specifically, a total of 10 questions on the use of ICT were included in a section on general information about the establishment. Econometric models including these ICT variables (such as presence of computers and proportion of employees with access to computers) as explanatory variables for productivity measures can be estimated and interpreted in terms of gains in productivity due to the use of ICT (based on Cobb-Douglas-type models).
Source: Electronic Transactions Development Agency (ETDA), Thailand.
178. Some countries combine results from multiple surveys to publish ICT data (see example 11). Candidate survey vehicles that have been selected in different countries include:
Economy-wide business surveys: the coverage of all economic sectors allows investigation of the use of ICT in different industries. These surveys are generally carried out to monitor the productive sector and have secondary uses such as the preparation of input-output tables and national accounts. Some countries conduct exhaustive economy-wide surveys (censuses) but the frequency is generally low;
Surveys on the manufacturing or primary sectors: these are implemented in most countries. Some countries further investigate specific activities of relevance to the economy, such as key manufacturing industries or agriculture;
Surveys on the services sector: in many developing economies, the services sector is investigated via a series of service industry surveys. Important industries include: wholesale trade, transport and communications, tourism, and financial services; and
Innovation surveys and research and development (R&D) surveys: many countries have implemented stand-alone innovation or R&D or surveys to understand the technological behaviour of businesses. The OECD and Eurostat have developed methodologies (described in the Oslo and Frascati Manuals) and a Manual for developing economies (the Bogotá Manual) has been prepared and is applied principally in Latin American countries. These surveys can be well suited to the inclusion of a module on ICT use, since the adoption of technology is often associated with innovative processes, especially in developing economies.
Example 11. Japan: Usage of multiple surveys for ICT data collection
UNEDITED DRAFT FOR INFORMATION – NOT TO BE CITED – 13 OCTOBER 2020
78
In the field of ICT, the data collected in Japan is derived from many surveys and published under a single chapter in its statistical yearbook. The most important one is the “Basic Survey on the Information and Communications Industry” and “Communications Usage Trend Survey” complied by the Ministry of Internal Affairs and Communications. However, they also recover data from the “Economic Census for Business Activity” by the Statistical Survey Department, Statistics Bureau, Ministry of Internal Affairs and Communications and the Ministry of Economy, Trade and Industry, "Census of Manufactures" (see (where?) "9 Mining and Manufacturing"), "Survey of Selected Service Industries" by the Ministry of Economy, Trade and Industry, statistics posted on the website by the Bank of Japan and "Telecom Data Book" by Telecommunications Carriers Association.
Source: Statistics Bureau of Japan, http://www.stat.go.jp/english/data/nenkan/1431-12e.html
179. Once an existing business survey has been chosen to serve as a vehicle for an ICT module, the focus should be on the design of the module itself (wording of questions and definitions to be used). The sample design may boost the sample size in certain sectors and size classes in order to obtain more reliable estimates. It is important to recall that the methodological recommendations for the design of a stand-alone ICT use survey also apply to modules, in particular, those related to the requirement for a quality business register, definitions of statistical units and use of relevant industry classifications. However, control over the methodology of the survey vehicle may be limited.
180. Where modules on the use of ICT are implemented by developing economies, they generally include a small number of questions in order to limit the cost and response burden. In terms of size, they generally consist of 10 to 20 ICT-related variables.
181. The cost of collecting ICT data via modules is generally marginal to that of the survey vehicle, since the most important part of the survey cost is usually related to data collection (including fieldwork, where relevant). In addition, staff involved in data collection and processing are already trained and will require only complementary training on ICT questions. For countries with severe budgetary restrictions, the inclusion of a module should be more cost-efficient than the implementation of a stand-alone ICT survey of businesses (though this will depend on factors such as the size of the survey vehicle and the complexity of the ICT module).
182. The design of the module itself consists of choosing a limited number of relevant questions that can be easily interpreted by respondents. Suggested model questions to collect the necessary data to produce the core ICT indicators are provided in Chapter 6.
5.3.2. Economic censuses
183. Economic censuses are exhaustive surveys of the business sector (or parts of it), with the objective to collect statistical information from all in-scope businesses in a country. In some countries, they include also the economic activities carried out by households. They are often used to construct population frames for sample surveys.
184. Because of exhaustiveness, economic censuses are expensive to conduct, due to the cost of collection (which may require a detailed cartography of the country), and therefore, their periodicity is usually very low (5 or 10 years). This may make them inadequate for continuous monitoring of fast-growing phenomena such as Internet access.
185. Countries that have used censuses to investigate the use of ICT have included some questions on the availability of certain technologies in the business (e.g. telephone, fax,
UNEDITED DRAFT FOR INFORMATION – NOT TO BE CITED – 13 OCTOBER 2020
79
computer). However, the number of questions that can generally be included in a census questionnaire is necessarily limited.
186. Because of the limitation on the number of ICT questions that can be included and their low periodicity, economic censuses are not generally well suited to monitoring ICT use by businesses.
5.3.3. Stand-alone surveys
187. Stand-alone surveys on ICT allow for the collection of significantly more information than modules in other surveys. Stand-alone surveys are especially designed to collect information on different topics of interest in the measure of ICT use by businesses, such as access to ICT, purposes of use, e-commerce, security, skills, etc., that usually go beyond the possibilities of a module embedded in an existing business survey.
188. Several developing economies have implemented stand-alone ICT surveys of the business sector (see example 12). These countries have relatively widespread access to ICT in comparison with other countries of their region or have an economy increasingly based on ICT. In general, in countries that have carried out stand-alone ICT surveys, there is a high demand for business ICT indicators from policymakers, the market and society.
Example 12. Hong Kong, China: The Survey on Information Technology Usage and Penetration in the Business Sector
The Census and Statistics Department of Hong Kong, China (C&SD) conducts an annual Survey on Information Technology Usage and Penetration in the Business Sector. Apart from questions on computer and Internet usage, presence and use of a website and e-commerce, it includes items on the IT budget, IT security and use of wireless and mobile technologies, services and applications. C&SD also measures the ICT sector, with a stand-alone Manpower Survey of the IT Sector and compilation of ICT sector statistics from annual economic survey data. In its latest report in 2019, it also included more specific questions related to the reasons for not using the Internet (if applicable), about the mode of use, and on e-commerce.
Source: Census and Statistics Department, the Government of the Hong Kong Special Administrative Region, https://www.censtatd.gov.hk/hkstat/sub/sp120.jsp?productCode=B1110005
189. In some cases, surveys have been carried out by organizations outside the statistical system and linked with ICT policymaking institutions. There is a risk in carrying out stand-alone ICT surveys outside the national statistical system, due to the limitations on the use of key statistical infrastructure such as business registers, data collection systems (call centres, trained interviewers in regional or municipal offices, etc.), sampling methodology and the possibility that methodologies are not harmonized with those of the national statistical system (which are usually linked to international statistical standards).
190. The coordination of stand-alone surveys on ICT use by businesses with other ongoing or planned work of the national statistical system must be considered from at least two perspectives:
The first is related to the use of common methodologies. Methodological coordination with existing business surveys requires the use of coherent definitions of statistical units (enterprise, establishment, business, etc.), classifications (such as industry breakdowns) and common concepts (e.g. for income). Such harmonization will facilitate comparison of results on ICT use with those of other surveys (for example,
UNEDITED DRAFT FOR INFORMATION – NOT TO BE CITED – 13 OCTOBER 2020
80
those investigating production, financial results, labour costs, etc.).
The second is related to minimizing the response burden of businesses participating in many surveys. In some countries, the business sector is intensively surveyed by public and private organizations, and the response burden can be overwhelming. Large businesses are usually included exhaustively (i.e. without sampling) in surveys, thereby having to answer many questionnaires. In addition, some strata may contain a small number of businesses that are therefore surveyed particularly often (such as businesses in the telecommunications sector).
191. In relation to methodological coordination, a key issue is the use of comparable business registers from which samples are drawn. For instance, the implementation of stand-alone surveys based on a sample of businesses drawn from commercial directories (e.g. telephone directories such as ‘yellow pages’) and not statistical business registers can make it impossible to obtain breakdowns comparable to those that would be obtained by using a statistical business register that uses consistent unit concepts and classifies units to the national classification of economic activities.
192. Methodological coordination (between surveys and countries) requires the use of comparable definitions of concepts. In particular, for the calculation of the core indicators on the use of ICT by businesses, it is necessary that surveys adopt the same definition of a business (see Chapter 4) and of an employee (the definition proposed for the indicators proportion of employees using computers and the Internet includes all persons employed by the business (including working proprietors and employees)).49
193. Finally, coordination with existing business surveys is important if, for research purposes, it is required to link data at the micro-level (i.e. at the individual business level) in order to analyze the relationship between ICT and other variables, such as those related to performance (labour productivity, value added, etc.). It is of the utmost importance that the confidentiality of individual business information be guaranteed and, if the survey on ICT use is not carried out by the statistical office, that the necessary legal arrangements be made according to national statistical legislation.
194. Ideally, stand-alone ICT surveys would be based on representative samples of the business sector, requiring a sample size that allows for estimation with sufficient precision. Logically, stand-alone surveys usually incur higher costs than modules included in an existing survey, since they require a specific design, dedicated fieldwork with specialized training for the interviewers (if used), independent data processing and dissemination.
195. It is important to recall that, in order to effectively monitor the rapid changes in the information economy, surveys should be conducted reasonably frequently. This will allow the compilation of time series data. One-off ICT surveys may quickly lose their relevance and should be avoided due to their high costs relative to the validity of results over time. International donors should consider the national statistical programme before funding such ad-hoc surveys,
49 The ILO definition of an employed person is anyone who worked for remuneration or was self-employed or was a family worker for at least one hour in the one-week reference period. Also, persons formally having a job and not having performed that job only temporarily within the reference period are considered employed. In countries with a large informal sector, there is an interest in defining employees in the informal sector according to the recommendations of the International Conference of Labour Statisticians (www.ilo.org/public/english/bureau/stat/download/guidelines/defempl.pdf).
UNEDITED DRAFT FOR INFORMATION – NOT TO BE CITED – 13 OCTOBER 2020
81
particularly because their sustainability cannot be guaranteed.
5.3.4. Surveys of the ICT sector and ICT trade data
196. In Chapter 4, the ICT sector was defined in terms of the international classification, ISIC. It includes classes (4-digit codes) in the manufacturing sector, as well as ICT services. Accordingly, surveys of the manufacturing and services sectors will partially cover the ICT sector and may provide useful data if the level of detail is sufficient (noting that much of the ICT sector is defined in terms of 4-digit ISIC classes). Data that are collected in other industry surveys are also useful for the ICT sector. They may include the number of enterprises and establishments, turnover and production, value added, labour force information, wages and salaries, capital expenditure, expenditure on R&D and innovation.
197. The level of detail to which the ICT sector is defined (that is, 4-digit ISIC codes of economic activity) may present challenges in terms of sample size for economy-wide surveys, or even surveys covering the whole manufacturing or services sectors (economic censuses would not present this problem). NSOs with a high demand for indicators on the ICT sector may therefore consider the possibility of increasing the sample size in some classes, if the current coverage does not allow offering accurate estimates for these classes, or running a stand-alone survey of the ICT sector.
198. Some countries conduct sectoral trade surveys that may cover the wholesale trade of computers, peripheral equipment and software, as well as electronic and telecommunications parts and equipment (classes 4651 and 4652 of ISIC Rev. 4). Statistical offices may consider increasing the sample size for these classes in trade surveys if the current coverage does not allow offering accurate estimates for these classes. Note that an increase in sample size entails an increase in the associated costs for collection and data processing and may not be sustainable over time for NSOs with scarce resources.
199. One way to improve the coverage of the ICT sector is to collaborate with industry associations to identify ICT sector businesses. Further refinement of the classification of these businesses may be obtained by cross-checking with statistical directories and business registers. In some countries, there is a separate register for ICT businesses that helps to define the in-scope population.
200. In the questionnaire for the ICT sector survey, businesses may be asked a question on their activities or be invited to self-classify their activities with sufficient level of detail. This enables exclusion of businesses that are not part of the ICT sector as internationally defined and better classification of those that are. Questions on products offered by the business may also be of help in establishing the correct industry (using a correspondence between products and industries, such as the existing correspondence between the Central Product Classification, CPC, and ISIC50).
201. A good administrative source for ICT trade data are foreign trade registers, which are managed by customs authorities and are often used as a source to compile trade statistics – either by these institutions or by statistical offices. The regulations for declaring import and export transactions depend on national legislation, but there are international standards for compiling
50 Available at the United Nations Statistical Division website on international economic and social classifications (http://unstats.un.org/unsd/cr/registry/regso.asp?Ci=17&Lg=1) and http://unstats.un.org/unsd/cr/registry/regcst.asp?Cl=27.
UNEDITED DRAFT FOR INFORMATION – NOT TO BE CITED – 13 OCTOBER 2020
82
foreign trade statistics that are widely used, such as the classification of goods based on the HS. Data on exports and imports of ICT goods can be compiled using the OECD definition of ICT goods (see Annex 8) as it is based on the HS 2017.51
202. Surveys to measure exports of ICT and ICT-enabled services would benefit from the advantage that only a few enterprises sell these services abroad. In this case surveys can focus on those enterprises most likely to produce ICT-enabled services (or potentially ICT-enabled services providers) rather than covering the entire economy.
5.3.5. Surveys for e-commerce measurement
203. Adding questions to existing household and enterprise surveys and setting up stand-alone surveys are also potential strategies to collect data on e-commerce. The first option had the advantage that it was relatively easy and cheap to implement but faced limitations in terms of the number of questions that could be included, not to increase the burden on respondents and survey enumerators. The second option was more costly and time consuming to implement but could provide more detailed information. Depending on the country, both options could be relevant. The inclusion of e-commerce questions in European enterprise surveys is illustrated in example 6 above, and in the Eurostat model questionnaire in Annex 5.
204. However, such surveys would only measure part of the e-commerce landscape. For example, micro enterprises are often excluded from business surveys although they have a lot to gain from e-commerce and other opportunities in the digital economy, particularly in developing countries. Consumer-to-consumer (C2C) e-commerce is typically not being measured in official statistics, yet this has become an increasingly important component, especially in the use of social media platforms in developing countries.
205. For these reasons and given the decreasing response rates for household and enterprise surveys as well as the need to optimize resources in data collection, supplementary big data sources can be used to complete survey information for e-commerce measurement. The required information is usually owned by the digital platforms in the private sector. To cope with their reluctancy to share e-commerce data, the establishment of strong private-public partnerships based in a win-win cooperation would be required.
206. As an alternative approach to complete e-commerce data from surveys, some countries have started to identify e-commerce in their balance of payments reporting (e.g. the Netherlands and Oman), while others have set up ICT Satellite Accounts to estimate the contribution of e-commerce within the ICT sector (see example 4 above on Malaysia).
An alternative to surveys: observation of business behaviour in the digital economy
207. Modules and stand-alone surveys are based on self-assessments and self-reporting of each business on its activities on the digital economy. For this reason, the information provided by surveys may be affected by subjective factors, such as the understanding of the items and definitions in the questionnaire, the cognitive biases of the respondents or the motivations to complete the questionnaire properly. As alternatives to surveys, the increasing traceability of
51 Presented in the 10th UNCTAD Technical Note on ICT for Development, available at https://unctad.org/en/PublicationsLibrary/tn_unctad_ict4d10_en.pdf
UNEDITED DRAFT FOR INFORMATION – NOT TO BE CITED – 13 OCTOBER 2020
83
digital activities recorded in big data sets and the recent developments in behavioural-experimental analysis can help measure digital behaviour without relying on businesses self-reporting. Digital activities of the companies, from the existence of a corporate website to e-commerce transactions, are recorded in big data sets, which can even be publicly available (see example 13).
Example 13. Europe: Measuring purchases of digital goods and services using public data
In Europe, the International Public Procurement Initiative (IPPI) led by the European Commission’s Directorate-General for Trade, is a disruptive project aimed at measuring and characterizing public procurement market, including cross-border procurement flows and the economic assessment of barriers to public procurement. Using a combination of web crawling procedures and data downloading using APIs, IPPI acquired and harmonized publicly available data on 40 million contracts awarded by the central, subcentral government, as well as SOEs and other entities, from almost 1,000 big data sources (e-procurement and transparency portals) in Australia, Brazil, Canada, China, India, Indonesia, New Zealand, Thailand and the US. The harmonized dataset, after enrichment with data matching methods and integration with surveys and official information from National Accounts and Government Financial Statistics, made feasible a detailed analysis of public purchases in these countries, including ICT goods and services.
Source: Presentation to the 2019 IPPI event (Brussels, Belgium, 2019). https://trade.ec.europa.eu/doclib/press/index.cfm?id=2082
208. An example of publicly available big data are the contents of company websites which can be freely accessed online and describing the potential e-commerce activities offered by the company. Publicly available big data sources can be automatically downloaded using methods of web scraping or using the downloading functionalities provided by the source, such as Application Programming Interfaces (APIs) or direct downloading functionalities. Accessibility to publicly available big data may be compromised by technical challenges, since these sources are not in general structured, include textual information and do not apply classification systems. However, most of the big data that can be used to observe digital behaviour are owned by private companies, such as telecom operators or online platforms, which compromises data availability for policymakers or researchers. Cross-jurisdictional regulatory incompatibilities, as well as business models, privacy, confidentiality and security issues limit the use of big data for the measurement of the digital economy. New private-public business models and incentives are required to enhance big data.
209. Companies’ behaviour in the digital economy can also be observed in controlled environments using experiments. This approach is useful to quantify the impact of ICT policies on companies’ digital behaviour and to provide policymakers with empirical evidence to design effective policies. Roughly speaking, experiments compare how companies behave under alternative policy designs (experimental treatments). Experiments are also useful to quantify policy impacts that can be attributed to the policy itself, isolating the effects of the policy from those of the evolution of the environment. The core of the experimental method is the random allocation of companies to the different treatment groups. Then, and if randomization makes all the treatment groups perfectly comparable, the differences in the digital behaviour can be attributed to the exposition to the behavioural intervention in the treatment group.
210. The implementation of behavioural field experiments raises significant logistical and ethical concerns, which limit their application. Behavioural Economics Experiments (BEEs) provide a more feasible alternative to observe digital behaviour (see example 14). In a BEE, a person responsible of a company is invited to make their decisions in a gamified controlled environment.
UNEDITED DRAFT FOR INFORMATION – NOT TO BE CITED – 13 OCTOBER 2020
84
The central feature of a BEE is that the decisions made by the participants has an actual impact, for instance, by considering variable economic incentives depending in subjects’ decision and random changes in the gamified environment. Application of variable incentives only increase the attention paid during the participation in the experiment and induces in the respondent a mental state like that of real decision-making situation.
Example 14. Europe: Analyzing cybersecure behaviour of SMES
The EC research project Supporting Cybersinsurance from a Behavioural Choice Perspective (CYBECO) implemented a BEE to measure the impact of alternative behavioural interventions to promote cybersecure behaviour in European SMEs. In this experiment, 2,000 SMEs in four European countries were provided with an initial endowment to invest in protection measures and/or cyberinsurance policies. At the end of the experiment, SMEs could suffer or not a random cyberattack and receive a payment, with a probability depending on their protection level and an impact depending on the cyberinsurance coverage. The experiment allowed for establishing relevant empirical evidence for policy making, such as the lack of risk aversion between cyberprotection and cyberinsurance or the efficacy of behavioural interventions based in social norm to increase the cybersecurity level of SMEs.
Source: Rios Insua, D, Baylon, C and Vila, J. (editors): Security Risk Models for Cyber Insurance. (2020, forthcoming)
5.4 Data collection methods and quality control
5.4.1. Data collection methods
211. There are several methods of data collection according to the nature of the contact between the data provider (respondent) and the data producer (statistical office). They are personal (face-to-face) interviews, personal telephone interviews, questionnaires sent by ordinary mail, forms posted on web pages, acquisition of Big Data and economic experiments. Combinations of the different data collection methods are also used in some countries, in order to select the most suitable method of contact for different kinds of businesses.
212. Table 8 describes the relative advantages and disadvantages of each data collection method. In developing economies, the selection of data collection method should consider the transport and communications infrastructure of the country, including:
Density and quality of roads and railways (especially if interviewers must cover rural areas);
Efficiency of the postal service (including rural areas);
Easy identification and accuracy of postal addresses, and
Density of the telephone network.
213. Usually, the best approach is to have a mix of techniques, according to the location of businesses (urban/rural), their size and industry.
214. For surveys on ICT use by businesses (be they modules of business surveys or stand-alone surveys), the use of a combination of personal and telephone interviews may be the best option. The fast evolution of ICT technology and uses (and the corresponding definitions referred in the ICT surveys) often necessitates helping respondents to provide accurate answers, and this is
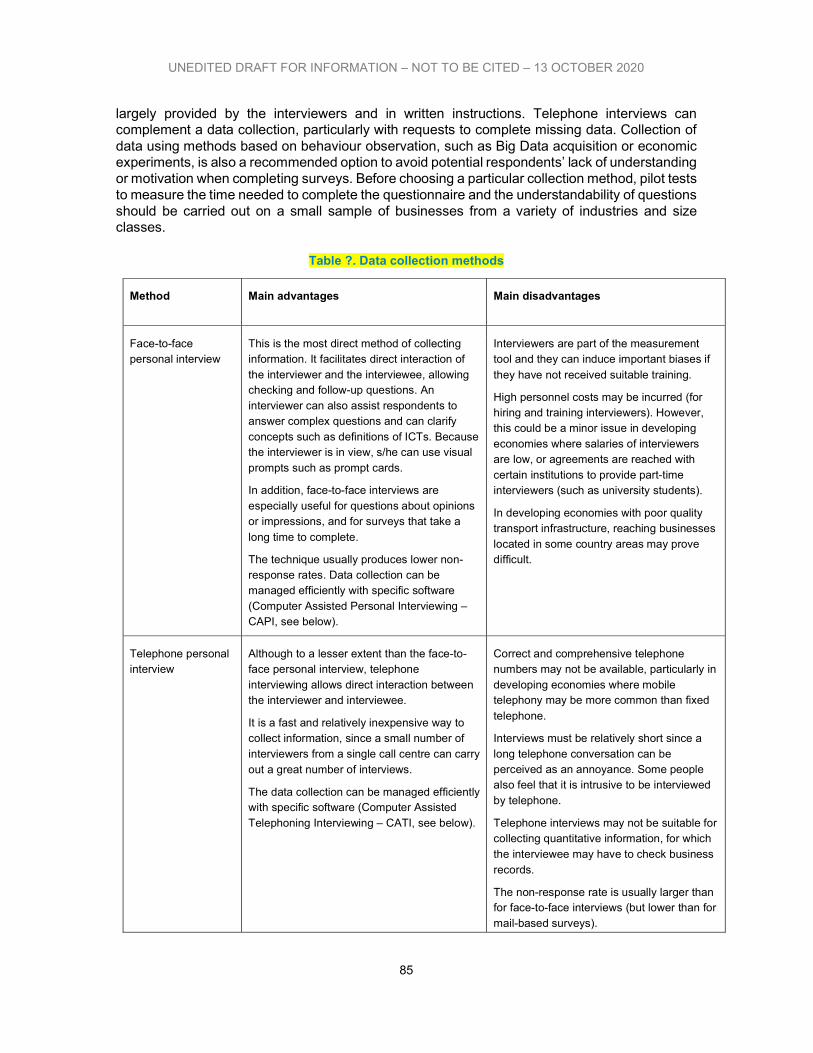
UNEDITED DRAFT FOR INFORMATION – NOT TO BE CITED – 13 OCTOBER 2020
85
largely provided by the interviewers and in written instructions. Telephone interviews can complement a data collection, particularly with requests to complete missing data. Collection of data using methods based on behaviour observation, such as Big Data acquisition or economic experiments, is also a recommended option to avoid potential respondents’ lack of understanding or motivation when completing surveys. Before choosing a particular collection method, pilot tests to measure the time needed to complete the questionnaire and the understandability of questions should be carried out on a small sample of businesses from a variety of industries and size classes.
Table ?. Data collection methods
Method
Main advantages
Main disadvantages
Face-to-face personal interview
This is the most direct method of collecting information. It facilitates direct interaction of the interviewer and the interviewee, allowing checking and follow-up questions. An interviewer can also assist respondents to answer complex questions and can clarify concepts such as definitions of ICTs. Because the interviewer is in view, s/he can use visual prompts such as prompt cards.
In addition, face-to-face interviews are especially useful for questions about opinions or impressions, and for surveys that take a
long time to complete.
The technique usually produces lower non-response rates. Data collection can be managed efficiently with specific software (Computer Assisted Personal Interviewing – CAPI, see below).
Interviewers are part of the measurement tool and they can induce important biases if
they have not received suitable training.
High personnel costs may be incurred (for hiring and training interviewers). However, this could be a minor issue in developing economies where salaries of interviewers are low, or agreements are reached with certain institutions to provide part-time interviewers (such as university students).
In developing economies with poor quality transport infrastructure, reaching businesses located in some country areas may prove difficult.
Telephone personal interview
Although to a lesser extent than the face-to-face personal interview, telephone interviewing allows direct interaction between the interviewer and interviewee.
It is a fast and relatively inexpensive way to collect information, since a small number of interviewers from a single call centre can carry out a great number of interviews.
The data collection can be managed efficiently with specific software (Computer Assisted Telephoning Interviewing – CATI, see below).
Correct and comprehensive telephone numbers may not be available, particularly in developing economies where mobile telephony may be more common than fixed
telephone.
Interviews must be relatively short since a long telephone conversation can be perceived as an annoyance. Some people also feel that it is intrusive to be interviewed by telephone.
Telephone interviews may not be suitable for collecting quantitative information, for which the interviewee may have to check business records.
The non-response rate is usually larger than for face-to-face interviews (but lower than for mail-based surveys).
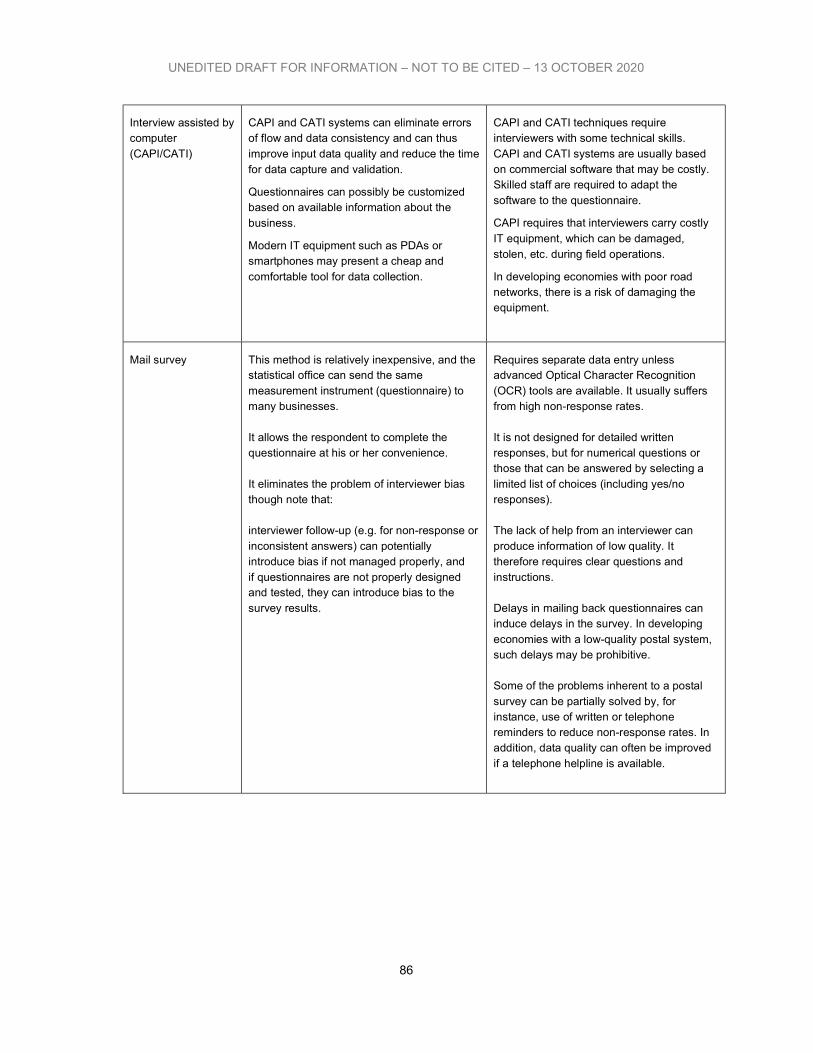
UNEDITED DRAFT FOR INFORMATION – NOT TO BE CITED – 13 OCTOBER 2020
86
Interview assisted by computer (CAPI/CATI)
CAPI and CATI systems can eliminate errors of flow and data consistency and can thus improve input data quality and reduce the time for data capture and validation.
Questionnaires can possibly be customized based on available information about the business.
Modern IT equipment such as PDAs or smartphones may present a cheap and comfortable tool for data collection.
CAPI and CATI techniques require interviewers with some technical skills. CAPI and CATI systems are usually based on commercial software that may be costly. Skilled staff are required to adapt the software to the questionnaire.
CAPI requires that interviewers carry costly IT equipment, which can be damaged, stolen, etc. during field operations.
In developing economies with poor road networks, there is a risk of damaging the equipment.
Mail survey
This method is relatively inexpensive, and the statistical office can send the same measurement instrument (questionnaire) to many businesses. It allows the respondent to complete the questionnaire at his or her convenience. It eliminates the problem of interviewer bias though note that: interviewer follow-up (e.g. for non-response or inconsistent answers) can potentially introduce bias if not managed properly, and if questionnaires are not properly designed and tested, they can introduce bias to the survey results.
Requires separate data entry unless advanced Optical Character Recognition (OCR) tools are available. It usually suffers from high non-response rates. It is not designed for detailed written responses, but for numerical questions or those that can be answered by selecting a limited list of choices (including yes/no responses). The lack of help from an interviewer can produce information of low quality. It therefore requires clear questions and instructions. Delays in mailing back questionnaires can induce delays in the survey. In developing economies with a low-quality postal system, such delays may be prohibitive. Some of the problems inherent to a postal survey can be partially solved by, for instance, use of written or telephone reminders to reduce non-response rates. In addition, data quality can often be improved if a telephone helpline is available.
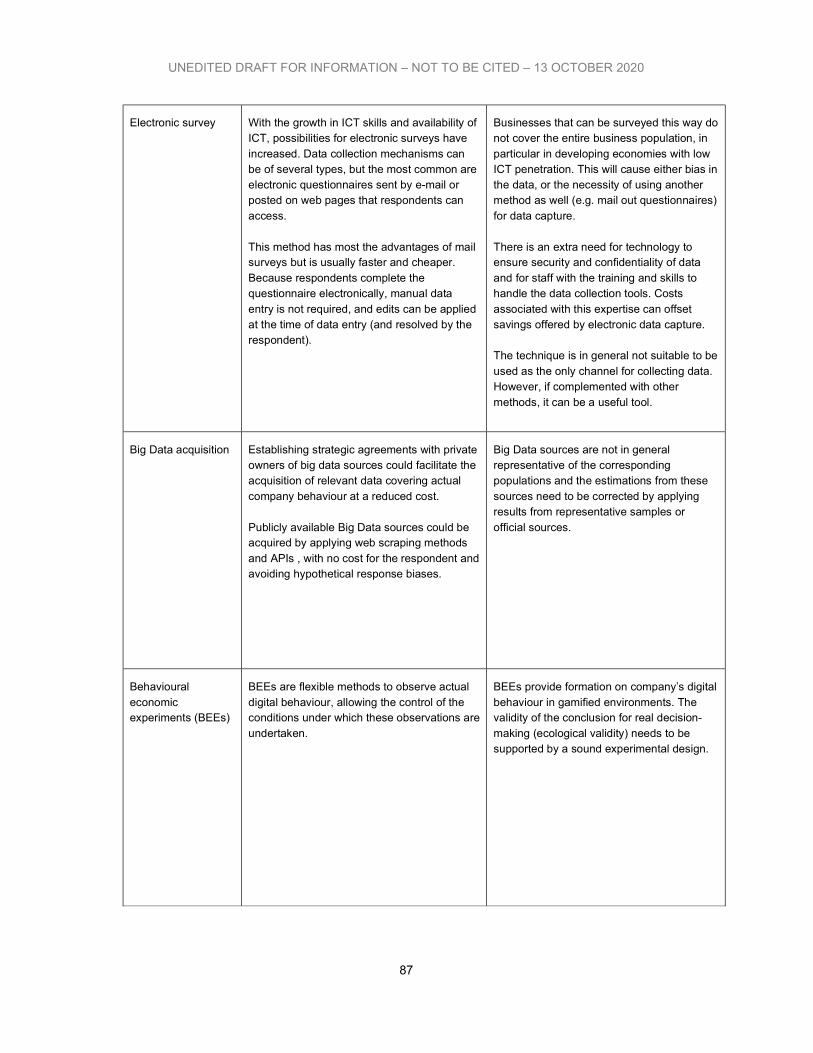
UNEDITED DRAFT FOR INFORMATION – NOT TO BE CITED – 13 OCTOBER 2020
87
Electronic survey
With the growth in ICT skills and availability of ICT, possibilities for electronic surveys have increased. Data collection mechanisms can be of several types, but the most common are electronic questionnaires sent by e-mail or posted on web pages that respondents can access. This method has most the advantages of mail surveys but is usually faster and cheaper. Because respondents complete the questionnaire electronically, manual data entry is not required, and edits can be applied at the time of data entry (and resolved by the respondent).
Businesses that can be surveyed this way do not cover the entire business population, in particular in developing economies with low ICT penetration. This will cause either bias in the data, or the necessity of using another method as well (e.g. mail out questionnaires) for data capture. There is an extra need for technology to ensure security and confidentiality of data and for staff with the training and skills to handle the data collection tools. Costs associated with this expertise can offset savings offered by electronic data capture. The technique is in general not suitable to be used as the only channel for collecting data. However, if complemented with other methods, it can be a useful tool.
Big Data acquisition Establishing strategic agreements with private owners of big data sources could facilitate the acquisition of relevant data covering actual company behaviour at a reduced cost. Publicly available Big Data sources could be acquired by applying web scraping methods and APIs , with no cost for the respondent and avoiding hypothetical response biases.
Big Data sources are not in general representative of the corresponding populations and the estimations from these sources need to be corrected by applying results from representative samples or official sources.
Behavioural economic experiments (BEEs)
BEEs are flexible methods to observe actual digital behaviour, allowing the control of the conditions under which these observations are undertaken.
BEEs provide formation on company’s digital behaviour in gamified environments. The validity of the conclusion for real decision-making (ecological validity) needs to be supported by a sound experimental design.
UNEDITED DRAFT FOR INFORMATION – NOT TO BE CITED – 13 OCTOBER 2020
88
Quality control of the data collection
215. The quality of the data collected will determine the quality of aggregate ICT indicators, whichever survey vehicle is used. Controls at data entry stage (whether by respondents or interviewers) are more effective than corrections at later stages. In this sense, computer-assisted personal interviewing (CAPI) or computer-assisted telephone interviewing (CATI) systems enable good quality control, since data collection and entry are simultaneous. Note that controlling for data quality after data capture requires actions that can be costly or introduce bias to the results, for example:
Re-contacting a business and asking it to respond to, or clarify, questions that were asked perhaps weeks or months before is not always feasible, annoys the respondent and gives a poor image of the statistical office; in addition, it can significantly increase the costs of the operation if the number of re-contacts is high;
Estimating responses to individual questions that have not been answered, or amending answers which are not valid, can be a complex technical exercise (though should result in unbiased responses if done correctly), and
Finally, ignoring an incorrect questionnaire, although sometimes the only solution, is an action with consequences, since the effective sample diminishes and bias may be introduced.
216. Although it is impossible to carry out a survey without errors in data collection, there are measures that can be put into practice by statistical offices, which will help to minimize the error rate. Examples of such measures are:
Establishing good frames that include in-scope businesses and are free of coverage errors such as inactive businesses or erroneous addresses;
Providing suitable training to interviewers on the questionnaire contents (especially required for complex technical concepts), and on dealing with respondents;
Preparing questionnaires so that questions are worded in a correct, clear and unambiguous manner, and respondents can perceive a logical flow in the order of questions (especially in self-administered questionnaires);
Filtering the collected data by a series of controls that are applied at the moment of data capture and in the data entry process;
Giving wide publicity before the start of the survey, highlighting the relevance of data collection for national policies and therefore the need for respondents’ collaboration. This may include a mention to the compulsory response required in countries where the statistical law grants this; and
Establishing a policy of incentives and sanctions that encourage the provision of good answers to interviews or questionnaires.
UNEDITED DRAFT FOR INFORMATION – NOT TO BE CITED – 13 OCTOBER 2020
89
Chapter 6 - Model questions and questionnaires for measuring ICT
use in businesses
217. This chapter presents model questions corresponding to the core ICT use indicators that were introduced in Chapter 4, including those added in this revision. It also discusses the structure of modules and questionnaires that could be adapted by countries planning on including an ICT use module in an existing business survey or undertaking a stand-alone survey. Two questionnaires are presented in this chapter: the model questionnaire on ICT use by businesses, and the model questionnaire for exports of ICT-enabled (or digitally delivered) services.
218. The model questions (for both questionnaires) presented in this chapter may need to be translated into local languages and adapted for other conditions, such as cultural norms. However, in order to respect international comparability, care must be taken that changes made do not alter the meaning of the questions nor any inherent logic (e.g. the populations to which they refer).
219. A complete model questionnaire for the core indicators on ICT use by businesses (B1 to B12) is shown in Annex 2. Countries wishing to go beyond those core indicators are referred to the model questionnaires of the OECD and Eurostat (shown in annexes 4 and 5).
220. A model questionnaire for collecting information about exports of ICT-enabled services (digitally delivered services) to compile indicators ICT7 and ICT8 is presented in Annex 10. As mentioned in section 4.5, the questionnaire comprises questions to identify the exports of services delivered remotely over ICT networks, by type of service, mode of delivery and partner economy.
221. It should be noted that indicators ICT1 to ICT6 are not collected through business surveys, but generally from trade data.
222. Model questions for the proposed indicators on the use of mobile phones (indicated as M1 to M4), which are not part of the list of core indicators, are also presented in table ?? in this chapter and Annex 2.
223. Apart from the technical recommendations for the preparation of questions to measure the ICT indicators, other important issues are to be taken into consideration such as the use of appropriate language (providing definitions and explanations to technical terms, prevention of bias due to the wording of questions, avoiding the use of acronyms without their definition, use of different official languages in a country, etc.), clear logical flow (filtering questions, order of questions, etc.), layout of the questionnaire (separate sections, visual display, etc.), and inclusion of instructions to the interviewers (also called “prompts”). Good practices in the design of questionnaires are usually known and applied by NSOs and should be valid also for ICT modules or stand-alone ICT surveys. They are therefore not discussed in this Manual.
6.1 Model questions for a module on use of ICT by businesses 224. The inclusion of a module on the use of ICT in existing business surveys (‘survey vehicles’) is an option that developing economies could consider as an alternative to carrying out stand-alone surveys. In any case, several developing countries have already implemented stand-alone
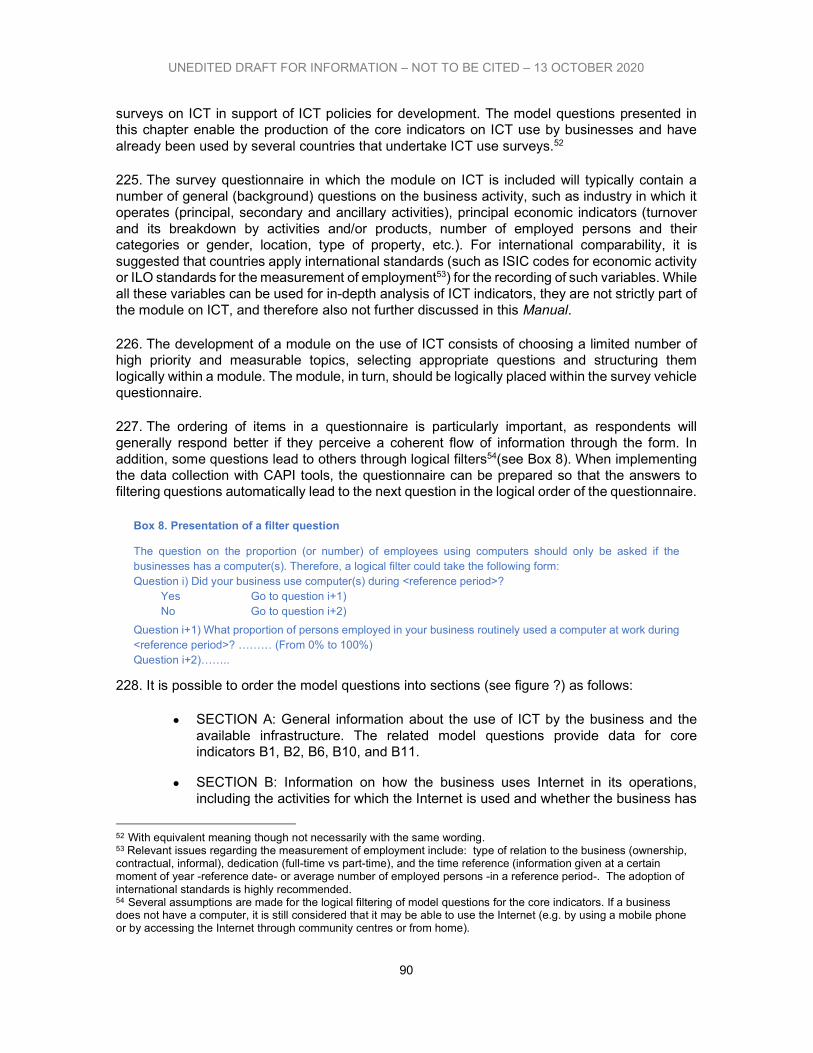
UNEDITED DRAFT FOR INFORMATION – NOT TO BE CITED – 13 OCTOBER 2020
90
surveys on ICT in support of ICT policies for development. The model questions presented in this chapter enable the production of the core indicators on ICT use by businesses and have already been used by several countries that undertake ICT use surveys.52
225. The survey questionnaire in which the module on ICT is included will typically contain a number of general (background) questions on the business activity, such as industry in which it operates (principal, secondary and ancillary activities), principal economic indicators (turnover and its breakdown by activities and/or products, number of employed persons and their categories or gender, location, type of property, etc.). For international comparability, it is suggested that countries apply international standards (such as ISIC codes for economic activity or ILO standards for the measurement of employment53) for the recording of such variables. While all these variables can be used for in-depth analysis of ICT indicators, they are not strictly part of the module on ICT, and therefore also not further discussed in this Manual.
226. The development of a module on the use of ICT consists of choosing a limited number of high priority and measurable topics, selecting appropriate questions and structuring them logically within a module. The module, in turn, should be logically placed within the survey vehicle questionnaire.
227. The ordering of items in a questionnaire is particularly important, as respondents will generally respond better if they perceive a coherent flow of information through the form. In addition, some questions lead to others through logical filters54(see Box 8). When implementing the data collection with CAPI tools, the questionnaire can be prepared so that the answers to filtering questions automatically lead to the next question in the logical order of the questionnaire.
Box 8. Presentation of a filter question
The question on the proportion (or number) of employees using computers should only be asked if the businesses has a computer(s). Therefore, a logical filter could take the following form: Question i) Did your business use computer(s) during <reference period>? Yes Go to question i+1) No Go to question i+2)
Question i+1) What proportion of persons employed in your business routinely used a computer at work during <reference period>? ……… (From 0% to 100%) Question i+2)……..
228. It is possible to order the model questions into sections (see figure ?) as follows:
SECTION A: General information about the use of ICT by the business and the available infrastructure. The related model questions provide data for core indicators B1, B2, B6, B10, and B11.
SECTION B: Information on how the business uses Internet in its operations, including the activities for which the Internet is used and whether the business has
52 With equivalent meaning though not necessarily with the same wording. 53 Relevant issues regarding the measurement of employment include: type of relation to the business (ownership, contractual, informal), dedication (full-time vs part-time), and the time reference (information given at a certain moment of year -reference date- or average number of employed persons -in a reference period-. The adoption of international standards is highly recommended. 54 Several assumptions are made for the logical filtering of model questions for the core indicators. If a business does not have a computer, it is still considered that it may be able to use the Internet (e.g. by using a mobile phone or by accessing the Internet through community centres or from home).
UNEDITED DRAFT FOR INFORMATION – NOT TO BE CITED – 13 OCTOBER 2020
91
a web presence. The related model questions provide data for core indicators B3, B4, B5, B7, B8, B9, and B12.
SECTION C: Any general (background) information about the business that is required but is not included in the survey vehicle.
Figure ?. Schematic structure of a module on the use of ICT by businesses
TO BE ADDED
229. Most of the core indicators require information in respect of a single reference period (indicators B1, B2, B3, B4, B7, B8, B9 and B12). In order to achieve international comparability, it is recommended that countries use a 12-month reference period55, and refer to it in the question. Countries wishing to collect information about other periods as well can do this by using period rows or columns to collect data for consecutive years (t-1, t, t+1 referring to the previous, current and next years). Reference dates are used for core indicators B5, B6, B10 and B11 and are usually the last day of the reference period or shortly after it. As with reference periods, the reference date should be referred to in the question and countries can collect information in respect of more than one reference date (see Box 9).
Box 9. Presentation of a question on ICT activities in multiple years
The question on web presence can be presented in the following way to allow recording of historical information and expectations for the future.
Question: Does your business have a web presence?
Yes, had a web presence as at <ref date, year t-1> (e.g. 31 December 2019)
Yes, established a web presence during <year t> (e.g. 2019)
No, but plan to establish a web presence in <year t+1> (e.g. 2020)
No, do not plan to establish a web presence in <year t+1> (e.g. 2020)
Note that even though the questions following the first one refer to periods (for ease of understanding), the information is in respect of a reference date, which is the last day of the year.
An alternative presentation for collecting this information is to have a yes/no filter question, where a ‘yes’ leads to a question with the first two options above and a ‘no’ leads to one with the third and fourth options.
230. For ease of reference, indicator fiches in section 4.1 propose model questions to collect the information for the core indicators (in the order of indicators rather than logical questionnaire order). For each indicator, the following information is provided: a suggested wording for the question (to be translated into the local language, respecting as far as possible its meaning), valid response items (Yes/No or a list of valid responses), and notes, including the applicable population for each question. Annex 2 shows the UNCTAD model questionnaire on use of ICT, which is suitable for use as a module in a survey vehicle or as a stand-alone questionnaire.
231. With respect to procedures for calculating the indicators (see Box 10), it should be noted
55 Note that for indicators on the use of ICT by individuals, the reference period is limited to the three previous months.
UNEDITED DRAFT FOR INFORMATION – NOT TO BE CITED – 13 OCTOBER 2020
92
that all core indicators are expressed as proportions of businesses satisfying certain conditions (as indicated by a particular answer or combination of answers to questions). The statistical estimation of a proportion depends on the survey design (complete enumeration of businesses, simple random sampling, stratified random sampling or a combination of designs). More information on survey design can be found in Chapter 7, while Annex 6 describes the statistical estimation of a proportion.
Box 10. Selection of responses for the calculation of an indicator
The calculation of the indicator Proportion of businesses with narrowband access to the Internet requires selecting the surveyed businesses that answered ‘yes’ to the question “Did your business use the Internet during the reference period?” and selected either/both the categories corresponding to narrowband (analogue modem, other narrowband) in the question “How did your business connect to the Internet during <the reference period>?” The estimation formula for the indicator will depend on the sample weights given to each selected business according to the sample design. Note that, as multiple responses to the connection question are possible, a business may report both narrowband and broadband access. The percentage of businesses with narrowband access plus the percentage with broadband access will therefore generally exceed 100 per cent.
232. Core indicators broken down by industry, size and location are compiled by cross-tabulating the information collected through the model questions with that of the background questions (generally present in the main questionnaire of the survey vehicle or as extra questions in a stand-alone survey). The proposed breakdowns (disaggregation) and the classifications that are recommended are included in the indicator fiches of Chapter 4.
233. The advantage of embedding a module on ICT in an existing business survey is that the number of possible crossing variables is potentially large. For example, ICT questions included in a survey on business innovation would allow studying the role of ICT in innovation patterns.
6.2 Model questionnaires for a stand-alone ICT use survey 234. Some developing economies are interested in measuring ICT topics that go beyond the core ICT indicators and would therefore, almost certainly, opt for a stand-alone survey (see example 15). As mentioned in Chapter 4, such topics could cover the following areas:
Business use of mobile phones;
ICT security measures in place and security problems experienced by the business;
Current and capital expenditure on ICT goods and services, including the mechanisms for financing them;
Uses of the Web, such as marketing research;
Availability of ICT skills in the business and provision of training;
More in-depth questions on e-commerce; and
Barriers to the adoption of ICT.
UNEDITED DRAFT FOR INFORMATION – NOT TO BE CITED – 13 OCTOBER 2020
93
Example 15. Brazil: ICT Enterprise Survey
Brazil conducts a comprehensive, stand-alone survey to measure the access to and use of ICT in Brazilian enterprises with 10 or more employed persons. The survey aims at measuring enterprises’ presence and activities on the web and social media, e-commerce and e-government activities as well as digital capabilities and skills conferring a wide view of the digital economy in Brazil. The ICT Enterprises Survey is conducted regularly since 2005 by the Brazilian Internet Steering Committee (CGI.br), through the Regional Centre for Studies on the Development of the Information Society (Cetic.br), a department of the Brazilian Network Information Centre (NIC.br). In its 13th edition the survey comprises the following modules:
Module A: General information on ICT systems; Module B: Internet use; Module C: Electronic government; Module D: Cybersecurity Module E: Electronic commerce; Module F: ICT skills; Module G: Software; Module H: New advanced technologies (robotics, 3D printing, big data analytics, cloud
computing). The survey’s results highlight the progress and, especially, describe the main challenges that arise in the competitive realm as a result of digital transformation, focusing on the digital environment of organizations and reveal the extent to which Brazilian enterprises are tapping into the potential unleashed by ICT. Data collected allow conducting an in-depth analysis of the current situation of enterprises within the context of the digital economy, including the following issues:
ICT access and use by small, medium and large enterprises and the availability of ICT infrastructure (broadband speed, type of broadband connections, networking facilities, usage of software and applications, etc.);
E-commerce readiness (means of selling online, payment methods, B2G, B2C and B2G transactions)
Online presence and their digital environment (websites and social networking websites, engagement in e-commerce and e-government activities);
Digital capabilities and skills, exploring the capabilities of enterprises to adopt software, cloud computing and other ICT-based applications in their processes;
Enterprises using technologies related with the digital economy like big data analytics, robotics and 3D printing.
The target population of the survey was defined by using the National Classification of Economic Activities (Classificação Nacional das Atividades Econômicas - CNAE 2.0), which is the basic framework used to classify registered Brazilian enterprises according to their economic activities and has been officially adopted by the National Statistical System and by the federal agencies that manage administrative registries. CNAE 2.0 is derived from the International Standard Industrial Classification of All Economic Activities (ISIC 4.0), and does not distinguish by type of ownership, legal nature, size of business, mode of operation or legality of activity. The survey methodology has the following aspects:
Unit of analysis: The enterprise, which IBGE defines as a legal entity characterized as a firm or company that includes a set of economic activities conducted in one or more local units (a physical space, usually a permanent location, where one or more economic activities are carried out, corresponding to one of the enterprise’s addresses);
Sampling Plan: The sampling plan was stratified, and the enterprises were randomly selected within each stratum;
UNEDITED DRAFT FOR INFORMATION – NOT TO BE CITED – 13 OCTOBER 2020
94
Survey Frame and Source of Information: The Central Register of Enterprises provided consolidation and updating of enterprises and other formal organization information recorded in the Company Registration Number from the Secretariat of Revenue and its local units that responded to the IBGE economic surveys and/or submitted the Annual List of Social Information (Relação Anual de Informações Sociais – RAIS);
Data Collection: Data of interest for the survey was gathered using a structured questionnaire, with open- and closed-ended questions (when applicable);
Data Collection Method: Enterprises were contacted for interview using a structured questionnaire by means of the computer-assisted telephone interview (CATI) technique.
Source: Regional Center for Studies on the Development of the Information Society of Brazil (Cetic.br). https://cetic.br/en/pesquisa/empresas/
235. If a country decides to collect more indicators on the use of ICT through a stand-alone business survey, it could be useful to refer to the experiences of OECD and Eurostat countries; the ICT statistics metadata of OECD countries could be of particular value. Most OECD/EU countries have used stand-alone ICT surveys that enable compilation of reasonably comparable ICT statistics.
236. The approach followed by the OECD’s WPIIS (now WPMADE) led to a model ICT use questionnaire, dealing with key aspects of readiness and intensity. In some situations, measures of the impact of the ICT use on business performance may be achieved by linking data from ICT use surveys with those collected by economic surveys (measuring turnover, labour, investment, etc.).
237. The OECD model questionnaire (Annex 5) has three sections. Section A includes questions on the use of computers, Internet and other networks, as well as IT security measures and experiences. Section B goes into more detail about how ICT is used by the business. It covers a range of e-business processes including e-commerce (via the Internet and other computer networks); barriers to, and benefits of, Internet selling; and features of the business’ web site. Section C collects the background information required to calculate values and to classify data. Not all surveys will need to include all background questions, as the information needed may be available from other sources, such as the business register. Questions in Section C should include: the main activity of the business (indicating its industry), its size (number of employees) and its turnover (indicating size but mainly used as a denominator to calculate the values associated with e-commerce selling). Other background variables may be included if required for further analysis or policy purposes (see Box 11 below).
Box 11. Background variables in the Eurostat questionnaires
The model questionnaires proposed by Eurostat for the Member States of the European Union to carry out the Community Survey on ICT Usage and E-Commerce in Enterprises include the following background variables: 1) Main economic activity of the enterprise, during the reference year 2) Average number of persons employed, during the reference year 3) Total purchases of goods and services (in value terms, excluding VAT) for the reference year 4) Total turnover (in value terms, excluding VAT) for the reference year 5) location (convergence/non-convergence region). The last variable is defined in terms of a classification of European regions by level of GDP per capita with respect to the EU average.
Source: Eurostat questionnaires
UNEDITED DRAFT FOR INFORMATION – NOT TO BE CITED – 13 OCTOBER 2020
95
238. Figure 4 schematically outlines the questionnaire’s contents, adding the topic of mobile phone use (see also Table 12). Inherent in its structure is a filtering logic based on certain assumptions (such as ‘businesses without a computer can still use the Internet’) and designed to move respondents efficiently through the questionnaire.
Figure 4. Schematic outline of a model questionnaire on ICT use by businesses
TO BE ADDED
239. Eurostat model questionnaires typically cover more topics than the OECD model and rotate topics between years. For instance, the 2020 Eurostat questionnaire had separate modules on 3D printing or robotics, while the 2019 included more detail in ICT security.
240. Model questions are provided in this Manual only for the core ICT indicators (including use of ICT and exports of digitally delivered services) and for mobile phone use by businesses. It is suggested that additional questions, if required, be adapted from the OECD and Eurostat model questionnaires presented in annexes 4 and 5.
241. Indicator fiches for M1 to M4 (see section 4.1) offer possible model questions on mobile phone use to include them in ICT surveys. Mobile phone use indicators and model questions will be further developed as users' needs and mobile services available become clearer. Countries interested in collecting mobile phone indicators may also want to include questions on the use of fixed telephone in businesses, which would allow comparison between the two technologies.
6.3 Model questions on exports of ICT-enabled services 242. In 2015 UNCTAD launched a project to measure international trade in ICT-enabled services. Between 2015 and 2016 a Task Group on ICT Services and ICT-enabled Services has been created to coordinate efforts and reduce the risk of duplicating work. In a second phase of the project (2016 to 2017) a model questionnaire for an enterprise survey was developed and pilot surveys were conducted in Costa Rica, India and, partly, in Thailand.56
243. The development of the questionnaire took carefully into account the feedback received from the private sector, in order to ensure that questions would be relevant and understandable for respondents. The piloting was carried out by face to face interviews, while the surveys could be collected using online questionnaires. It was necessary to provide some support to the respondents in the form of either a telephone platform, an email contact or a web forum. This helped to ensure a proper understanding of the questionnaire and high quality of the results. The provision of technical support to respondents is another way to improve the response rate.
244. The UNCTAD model questionnaire on exports of ICT-enabled services was revised based on the results of the three pilot surveys implemented. The revised questionnaire is attached in Annex 3.
245. The model questionnaire includes definitions of concepts and classifications of services and
56 The project was funded by the Government of Sweden and it came to an end in December 2017. More details on the three pilot countries is given in UNCTAD (2018). TECHNICAL NOTE NO.11 UNEDITED TN/UNCTAD/ICT4D/11- JUNE 2018.
UNEDITED DRAFT FOR INFORMATION – NOT TO BE CITED – 13 OCTOBER 2020
96
is structured as follows:
Section A collects general information about the enterprise, including control and overseas presence, employment, turnover, main activity, value of total exports of services, modes of delivery of services.
Section B includes filter questions on services exports to be included, related to the type of services.
Section C provides details of services exports delivered remotely over ICT networks (ICT-enabled services), including value and main partner economies (trading partners).
UNEDITED DRAFT FOR INFORMATION – NOT TO BE CITED – 13 OCTOBER 2020
97
Chapter 7 - Designing ICT business surveys and processing data
This chapter focuses on the survey design, the processing of collected data and the calculation of indicators for business surveys on the digital economy. The topics covered in this chapter are part of the Phases 2, 4, 5 and 6 (Design, Collect, Process and Analyze) of the GSBPM presented in Chapter 5. They include:
a) The design of business surveys on the digital economy:
Definition of target populations and statistical units;
Preparation of population frames; and
Sample design and selection.
b) The processing of collected business data on the digital economy:
Data editing, the treatment of missing data and misclassified units;
Weighting (grossing-up) procedures for sample data, to produce aggregates; and
Calculation of digital economy indicators from survey data.
246. While much of the general information presented in this chapter will apply generally to business surveys (and therefore to all business surveys on the digital economy), the emphasis is on ICT use surveys.
247. The information on survey design is relevant mainly for stand-alone ICT use surveys or for those on exports of ICT-enabled services. The design of modules to be embedded into an existing survey will be influenced by the statistical features of the survey vehicle. However, where possible, the recommendations given here should be considered when designing such modules. Recommendations on data processing will apply to both stand-alone surveys and modules, though in the latter case, survey vehicle practices may also determine some aspects of processing (for instance, treatment of misclassified units and weighting procedures).
7.1 Business surveys on the digital economy
7.1.1. Target population and scope
248. The target population for a statistical collection (whether a sample survey or a census) is the group of statistical units that are of interest. The target population is defined by the scope of the survey, which is based on attributes of the units. In the case of business surveys, the scope (and therefore target population) is usually defined in terms of economic activities performed (i.e. the industries in which the units operate), size of units (expressed in terms of the number of persons employed and/or turnover) and, in some cases, location.
249. Target populations for surveys of ICT use in the business sector vary between countries. They may also change within a country over time. For example, a country may decide to investigate the use of ICT in the manufacturing sector in a first phase, and then extend the target
UNEDITED DRAFT FOR INFORMATION – NOT TO BE CITED – 13 OCTOBER 2020
98
population in subsequent surveys to include the agriculture and services sectors. The target can also change with respect to size thresholds: several EU countries started by collecting information about ICT use by businesses with 10 or more employees and some have, more recently, undertaken surveys on micro-businesses (i.e. those with fewer than 10 employees).
250. The target population for the surveys of ICT sector and exports of ICT-enabled services are more restricted. In the former case, the coverage includes only the enterprises with the ISIC rev 4 code presented in Chapter 4 of this Manual. The latter survey covers only businesses exporting services that could be digitally delivered. A recommendation of the ISIC rev 4 codes that could be used to characterize such business are presented in section 4.5.
251. As with other business surveys, the scope and target population for statistical investigations on ICT use are usually defined in terms of:
Economic activity
Business size and, sometimes
Geographical location.
252. The use of international classifications, such as ISIC, to define industry of activity enhances comparability of statistical results across countries. Most national classifications57 have established correspondences with regional classifications (such as the European NACE or the North American NAICS) and with ISIC. At the most detailed level, ISIC codes consist of 4-digit identifiers of economic activities (for ISIC rev. 4, there are approximately 420 classes, 238 groups, 88 divisions and 21 sections).58 International working groups continuously revise the adequacy of international classifications and revisions are adopted at the highest level by the UNSC. This Manual will describe industries in terms of ISIC rev. 4 codes.
253. In developing economies, the scope of business surveys of ICT is recommended to be as large as possible to better suit country requirements. In particular, the agriculture and mining sectors are important in many developing economies and the use of ICT for specific purposes (such as getting price information via mobile phone where Internet and fixed telephone lines are unavailable) can increase economic returns in an important way. Hotels and restaurants (an important element of tourism activities) make up an industry, the ICT use of which developing economies may have a particular interest in measuring. Moreover, the facilities that e-tourism increasingly provides to foreign customers (e.g. information about destinations, reservations and payment online) has favored the economic development of new destinations in developing economies.
254. The Manual encourages a broader scope than the OECD recommendation for its member countries, suggesting that developing economies could extend the scope to cover all the activities in the 21 sections of the ISIC rev 4, including agriculture, forestry and fishing; mining and quarrying; and arts, entertainment and recreation activities. The inclusion of an ICT use module embedded in an economy-wide business survey may favor a broader scope.
255. However, this Manual recommends to consider separately for the target population of the ISIC rev. 4 sections corresponding to the public sector and households, The coverage of activities
57 National classifications are available at https://unstats.un.org/unsd/classifications/Econ . 58 ISIC rev. 4 are available at https://unstats.un.org/unsd/classifications/Econ/ISIC.cshtml
UNEDITED DRAFT FOR INFORMATION – NOT TO BE CITED – 13 OCTOBER 2020
99
related to education may need specific surveys to compile the core indicators on use of ICT in education59. Specifically, countries are suggested to consider separately the following ISIC rev 4 sections within the target population: section O (public administration and defense; compulsory social security), section P (education), section T (activities of households as employers; undifferentiated goods and services; producing activities of households for own use), and section U (activities of extraterritorial organizations and bodies).
256. A common scope criterion for ICT use surveys is business size based on the number of employees. There is no universal categorization of businesses based on this criterion, but in many countries, businesses are classified as micro-businesses (0 to 9 employees), small (10 to 49), medium (50 to 249) and large (250 or more). This size classification is consistent with OECD and Partnership recommendations (although the OECD suggests a minimum size scope of 10 or more employees for international comparability). Maintaining current size information in statistical business registers is generally more difficult for smaller businesses and, in many countries, businesses without employees do not follow the same registration procedures as employing businesses and so may be difficult to investigate.
257. For reasons of cost and respondent burden, most countries do not include all micro-businesses in the target population. However, the exclusion of micro-businesses from ICT use surveys in developing economies would bias the results and should be carefully considered for the following reasons:
Micro-businesses can account for a very high proportion of the total number of businesses (as high as 90 per cent or more);
They can account for a significant share of total employment, and
ICT enables businesses of any size, including micro-businesses (for example, in the ICT consultancy sector), to collaborate and generate economic growth.
258. It is therefore recommended that the establishment of a threshold for the size of businesses in the target population be based on the representativeness of the in-scope population in terms of total employment. Specific methods for investigating the micro-business segment may be needed for official statistics (see example 16).
Example 16. India: Investigating micro-business
In many developing countries, the Business Register may be outdated in relation to micro-businesses, which change more rapidly than larger firms. In India, where microenterprises make up the sampling frame used for the Annual Survey of Industries (ASI) is established in terms of establishments, is updated annually to gather potential changes in microenterprises by the National Sample Survey Organisation. The sampling scheme combines a census approach for larger establishments and random sampling for the rest, including specific strata for microenterprise. Source: National Sample Survey Organisation, Government of India. Note: Although this approach has not yet been used by India in a national survey to measure ICT access and use by microenterprises, a methodologically robust study on the same issue published
59 The UNESCO Institute of Statistics (UIS) has released a Guide to Measuring Information and Communication Technologies (ICT) in Education, which identifies sets of core and supplemental (extended) indicators utilized as part of its Regional Questionnaire on Statistics of Information and Education Technologies (ICT) in Education. See http://uis.unesco.org/en/topic/information-and-communication-technologies-ict.
UNEDITED DRAFT FOR INFORMATION – NOT TO BE CITED – 13 OCTOBER 2020
100
by LIRNEAsia in 2018, considered to be nationally representative, has been referred to by the Ministry of Communications of India as a source of baseline data to “develop policies” (see https://lirneasia.net/after-access/india/).
259. In some countries, the legal or administrative definition of business size is based not only on the number of employees, but also on a combination of the number of employees and the turnover (classified in intervals). Some harmonization of turnover intervals has been achieved at the regional level (for example in the EU, where the above classification of micro, small, medium and large businesses is used, in combination with common thresholds for turnover). However, given the variety of national situations and, within a country, the change over time of appropriate interval values for turnover, it is difficult to make recommendations on the definition of the target population in terms of turnover. Moreover, the ratio of turnover values to size (number of employees) varies considerably by industry.
260. In many developing countries, self-employed persons constitute an important part of the workforce, even if their contribution to the economic value is smaller than that of incorporated enterprises. Data on the use of ICT by self-employed can be collected through surveys to households, rather than through surveys to businesses, as the coverage in statistical registers of the self-employed may not be as updated as for enterprises. It is therefore recommended to analyze data on the use of ICT by individuals, selecting those with employment status described as self-employed, using surveys such as those recommended by the ITU Manual on Measuring Access and Use of ICT by Households and Individuals.
261. The third variable used to describe units of a survey on ICT use is the geographical location. The geographical scope of the business sector (and its parts) should in principle include the entire economic territory of the country. The geographical scope within a country should ideally include both urban and rural areas. This is likely to be particularly important in countries where there is an urban/rural digital divide. Rural areas of many developing economies, especially LDCs, suffer from a lack of the basic infrastructure, such as electricity and telephone lines, which are important to build a solid ICT base. Consequently, the use of ICT by rural businesses may present an important gap or even be almost non-existent. In some countries, the presence of businesses (including unorganized manufacturing businesses) in rural areas can be of great importance. As the use of ICT spreads throughout a country, it is recommended that rural areas be also included within the scope of ICT use surveys.60
262. The definition of rural and urban locations has not been harmonized at the international level, and therefore comparisons are often problematic. Where there is a statistical definition for urban and rural localities in a particular country, it is generally based on the number (or density) of inhabitants. The definition of urban agglomerations (which can include localities with a small number of inhabitants but geographically connected to larger cities) is also not unique. Therefore, in order to break down indicators by urban/rural location of the business, it is necessary to establish a definition at the country level (see example 17) and make it available in the metadata so that users can compare the data across countries. Recommendations about the classification of localities as urban or rural can be found in the UNSD Principles and Recommendations for Population and Housing Censuses, Revision 3 (2017)61.
60 Clearly, indicators resulting from a survey with such scope limitations will not be representative of the entire country (and would be upwardly biased if they purported to be). 61 https://unstats.un.org/unsd/demographic-social/Standards-and-Methods/files/Principles_and_Recommendations/Population-and-Housing-Censuses/Series_M67rev3-E.pdf
UNEDITED DRAFT FOR INFORMATION – NOT TO BE CITED – 13 OCTOBER 2020
101
Example 17. Europe: Definition of urban and rural areas Since 2013, Eurostat has adopted an urban-rural typology that has a three-step approach to classify the NUTS (Nomenclature of Units for Territorial Statistics) level 3 regions. The first step is to identify populations in rural areas: 'rural areas' are all areas outside urban clusters. 'Urban clusters' are clusters of contiguous grid cells of 1 km² with a density of at least 300 inhabitants per km² and a minimum population of 5 000. In the second step, NUTS 3 regions are classified based on the share of their population in rural areas as: 'Predominantly rural' if the share of the population living in rural areas is higher than 50 'Intermediate' if the share of the population living in rural areas is between 20 and 50 'Predominantly urban' if the share of the population living in rural areas is below 20
To resolve the distortion created by extremely small NUTS 3 regions, for classification purposes regions smaller than 500 km² are combined with one or more of their neighbors. In a third step, the size of the urban centres in the region is considered. A predominantly rural region which contains an urban centre of more than 200 000 inhabitants making up at least 25% of the regional population becomes intermediate. An intermediate region which contains an urban centre of more than 500 000 inhabitants making up at least 25% of the regional population becomes predominantly urban. Source: Eurostat, https://ec.europa.eu/eurostat/web/rural-development/methodology
7.1.2. Population frames and coverage
263. The population frame for a survey is the operational form of the target population and consists of a list of all relevant statistical units. The frame is generally used to extract samples of units (such as random samples of specific sub-populations).
264. In the case of business surveys, the frame population is usually extracted from the business register, which lists the economic agents operating in the economy. Business registers for statistical purposes (to be distinguished from registers for other administrative purposes) are generally established and maintained by NSOs and are based on both external sources (such as tax registers) and internal ones (such as the results of ongoing ‘unit surveys’ or other unit investigations). Business registers are key infrastructure for a statistical system and the quality of business statistics depends heavily on the quality of the underlying register.
265. The target population of the survey on exports of ICT-enabled service is limited to businesses exporting digitally deliverable services. The prevalence of this type of enterprises in general business register could be small, especially in developing countries. For this reason, the use of other sample frames focused on exporting is recommended for this survey. Specifically, the balance of payments (BOP) register of services exporting firms is the recommended option, if available. Usually the BOP register is managed by the national central bank and it includes details about the exporting or importing by resident enterprises. A BOP register includes not only the basic identification variables but also key economic information regarding the nature and type of exports and imports of each business.
266. Common quality problems of business registers in terms of coverage are: duplication of units, over coverage (i.e. inclusion of units that are not part of the target population) and under coverage (i.e. non-inclusion of units that should be part of the target population). Ideally, the frame population and the target population will be very close, though this is rare (in developed as well as developing economies). The quality of business statistics is usually sensitive to the quality of the business register, which should therefore be as high as possible. Maintenance of
UNEDITED DRAFT FOR INFORMATION – NOT TO BE CITED – 13 OCTOBER 2020
102
the business register can occur through feedback from periodic enterprise and establishment censuses, ad hoc or regular ‘unit surveys’ to investigate over and under coverage, checks of duplicates, and cross-verification against other registers – such as tax or administrative registers.
267. In many developing economies, the inadequacies of statistical business registers include:
The presence of a large informal sector which is not recorded in administrative systems (such as those dealing with licenses or taxes), leading to under coverage of the business register;
Micro-businesses (including self-employed persons) may be more difficult to identify and update, since they usually follow different administrative procedures for registration; this could lead to under coverage;
The existence of many ‘dormant’ businesses that were originally registered but have not been removed from the business register when they ceased to be active (or merged with other businesses). This is due to the administrative difficulties (or lack of administrative processes) that can be found in some countries in relation to ceasing a business; this leads to over coverage, and/or
The content of the business register is not adequate for correctly classifying businesses in terms of industry, size and/or location.
268. Obviously, the improvement of the statistical business register is not a task related to the collection of digital economy indicators, but a responsibility of the entire national statistical system. Usually, the best way of improving the adequacy of the business register is to coordinate general administrative registers (related to taxes, registrations, licenses, social security etc.), specific registers (such as licenses for operating telecommunications businesses) and statistical databases (updated from economic censuses). In countries with a well-developed tax or social security system, frames generated directly from associated registers could be an option if the law allows for use of registry information for this purpose.
269. In countries where there are no adequate statistical business registers, it is more difficult to conduct surveys on the digital economy. It will be necessary to consider the possibility of constructing a population frame from other sources such as lists of live units in economic censuses or external directories such as commercial telephone listings or industry association lists. Since it is unlikely that all businesses will be included in those lists, the frame may suffer from under coverage, thereby producing biased estimates. It is recommended in that case to compare the coverage of the frame with other sources and, if possible, to adjust estimates by a process of reweighting. In addition, the necessary documentation and metadata should be provided to inform users how the frame was constituted.
270. In order to improve the coverage of the business register for surveys on the digital economy, countries (particularly NSOs) may use the following sources:
Commercial directories of ICT sector associations;
Registers of companies carrying out foreign trade operations;
Registers of companies participating in public tenders;
UNEDITED DRAFT FOR INFORMATION – NOT TO BE CITED – 13 OCTOBER 2020
103
Web-scraping of business websites to obtain names, addresses and contact information for start-ups or established companies.
271. Countries using a population frame that lacks accurate information on industry should include a supplementary question in the survey to classify with sufficient detail the main activity of the respondent unit (using ISIC or the national classification) as well as its secondary and auxiliary activities. The same can be done to measure the size of the business. Clearly, samples based on incomplete frames will not be as efficient in this situation (as samples cannot be stratified by industry and/or size).
7.1.3. Statistical units
272. The statistical unit of a sample survey or census is defined as the basic unit of the target population about which data are compiled. Statistical operations such as estimation, imputation (for non-response) and tabulation are carried out on statistical units. The statistical unit may take the form of an observation unit (for which information is collected) or an analytical unit, information about which is created by statisticians.
273. Business surveys usually use enterprises or establishments (i.e. local units of enterprises) as the statistical unit but other choices are possible (enterprise groups, kind-of-activity units, etc.). The choice of the statistical unit is relevant for ICT indicators since it is probable that lower order units (such as establishments) will have a lower intensity of ICT use. Importantly, most of the denominators used to calculate the core ICT use indicators are related to the choice of statistical unit (proportion of enterprises or establishments) and should be well documented for international comparability purposes.
274. Since ICT use is not easy to attribute to the different establishments of an enterprise (the very nature of enterprise networks implies sharing some elements of ICT infrastructure, such as networks, between establishments), the enterprise is the statistical unit most commonly adopted by countries that have implemented ICT surveys. It is also the unit recommended by the Partnership and the OECD. Although there is no universally adopted definition of an enterprise (see Box 12), common criteria for defining an enterprise are autonomy of decision-making for allocation of resources, and engagement in one or more productive activities.
Box 12. SNA 08 and Eurostat definition of an enterprise
In the framework of ISIC, an enterprise ‘is an institutional unit in its capacity as a producer of goods and services. An enterprise is an economic transactor with autonomy in respect of financial and investment decision-making, as well as authority and responsibility for allocating resources to produce goods and services. It may be engaged in one or many productive activities. The enterprise is the level of statistical unit at which all information relating to its transactions, including financial and balance-sheet accounts, are maintained, and from which international transactions, an international investment position (when applicable), consolidated financial position and net worth can be derived.”
The definition of an enterprise according to the SNA08 methodology is “an institutional unit in its capacity as a producer of goods and services. An enterprise is “an institutional unit as a producer of goods and services. The term enterprise may refer to a corporation, a quasi-corporation, a non-profit institution or an unincorporated enterprise. An unincorporated enterprise represents the production activity of a government unit, NPISH or household that cannot be treated as the production activity of a quasi-corporation.”
The definition used by the European Commission of an enterprise is “an organizational unit producing goods or services which has a certain degree of autonomy in decision-making. An enterprise can carry out more than one economic activity and it can be situated at more than one location. An enterprise may consist out of one or more legal units.”
UNEDITED DRAFT FOR INFORMATION – NOT TO BE CITED – 13 OCTOBER 2020
104
Sources: ISIC (Rev. 4) (https://unstats.un.org/unsd/classifications/Econ/ISIC.cshtm), UNSTAT SNA08
(https://unstats.un.org/unsd/nationalaccount/docs/SNA2008.pdf) and Eurostat statistics explained
(https://ec.europa.eu/eurostat/statistics-explained/index.php?title=Glossary:Enterprise).
275. This Manual recommends that countries adopt the SNA08 concept of enterprise, in which an enterprise has some degree of autonomy in decision-making and consists of one or more legal units involved in one or more activities at one or more locations. The definition of an enterprise according to the SNA08 methodology is "an institutional unit as a producer of goods and services" which could be a corporation or an unincorporated enterprise. In some countries, the fact that (registered) legal units must submit certain financial reports to an administrative or fiscal authority is seen as an operational criterion for determining autonomy of decision-making. In addition, the sharing of production factors (buildings, capital goods, employees and management) is a strong indication for combining legal units into one enterprise unit. In developing countries, adopting the SNA08 definition may broaden the scope of ICT indicators to include the informal sector. The definition used should in all cases be clearly stated in the metadata.
276. The definition of the enterprise as the appropriate statistical unit poses some limitations in relation to geographical breakdown. Many enterprises, especially larger ones, will consist of several establishments. Because of this, a geographical breakdown of the results using the location of the main headquarters of the enterprise may be of limited use. An economic activity breakdown may also be problematic for enterprise units engaged in more than one type of industrial activity.
277. In practice, the preferred statistical unit may not be able to provide data for a survey. In such a case, a reporting unit could be defined as a unit that reports to the survey authority and provides data for the statistical unit (if possible) or otherwise the most practicable alternative unit. An example is where the objective of the survey is to collect data at the establishment level (which is therefore the statistical unit) but the parent enterprise (the ‘reporting unit’ in this case) provides data for each of its establishments. The alternative of establishments or enterprises as the statistical unit is relevant for firms with multiple locations, and for large firms. Usually, large firms constitute a stratum which is investigated exhaustively (that is, without sampling). In that case, the enterprise may provide information on all its establishments.
278. The choice of statistical units for ICT surveys will depend on organizational considerations such as the availability and detail of business registers (whether it consists of establishments or enterprises), the data collection method, and the business sector environment (business legislation, prevalence of small businesses and other considerations based on the country’s economic and administrative environment). In developing economies, where the share of micro and small enterprises is high, it may be convenient to collect data at the establishment level, as establishments and enterprises will generally be equivalent (large firms may be investigated exhaustively). Survey metadata need to specify information about the statistical unit chosen.
7.1.4. Sample design
279. Stand-alone surveys on ICT use by businesses are usually designed to collect information on many topics from businesses across a wide range of industries. For cost and respondent burden reasons, countries will usually wish to select a representative sample of the population of businesses. A complete enumeration of in-scope businesses would usually only be feasible if the number of businesses were small. This could occur, for instance, if the incidence of ICT use in
UNEDITED DRAFT FOR INFORMATION – NOT TO BE CITED – 13 OCTOBER 2020
105
the country were very low (and both ICT and non-ICT using businesses could be identified), or if a high size cut-off were used, thus limiting the scope to large businesses. From this point, we will assume that neither of these situations applies and that countries will be using samples of their population rather than selecting all units.
280. In order to guarantee the representativeness of a sample selection, it should be made using probabilistic techniques. Only probabilistic (random) sampling allows calculation of estimates of the sampling error (also known as ‘sample error’), which is defined as the deviation from the true value attributable to the fact that only a sample of the population was observed. The design of a random sample should be based on considerations of the structure of the population of businesses (its stratification), the cost of collecting data and the maximum acceptable statistical error associated with estimates.
281. In the case of modules on ICT use or exports of ICT-enabled services embedded in other survey vehicles, data may be collected from all selected units or only a portion of them. In either case, the design of the survey vehicle will influence the quality of digital economy statistics. Comments and recommendations in this Manual will have to be adapted to the survey vehicle design.
7.1.5. Stratification of the population
282. Stratification is the technique of dividing the business sector into relatively homogeneous groups (called strata) for the purposes of sample design and estimation. If done properly, stratification will minimize the sample variance of estimates for a given sample size. It allows the use of different sampling ratios (the number of selected businesses divided by the total number of businesses) across strata, reflecting characteristics such as their size, importance or homogeneity.
283. Optimal stratification strategies are based on variables closely related to the variables that are being measured. For the measurement of ICT use in the business sector, the experience of statistical offices of OECD countries shows that at least two criteria are useful for stratification: economic activity and size of business (in terms of number of employees). Use of these stratification variables will generally reduce the overall variance of estimates as well as disaggregation of ICT use statistics by industry and size.
284. A third stratification variable sometimes used is the geographical location of the business.62 This is especially important if it is anticipated that some areas of the country (such as the capital) have a different intensity of ICT use than other areas. In large countries or countries with a strong regional structure (such as federal states), strata that can also be defined according to the region or to the political-administrative organization; in practice, it is equivalent to designing independent samples in each region. Where location is used for stratification (or as an output classification), the way the location of businesses is determined is important. For example, if the statistical unit is the enterprise and it has several locations corresponding to geographically distributed establishments, the criteria for determining location of the enterprise need to be established. In OECD countries, the location will usually be the address of the head office, or equivalent.
285. It is recommended that the design of a sample to collect ICT use statistics consider at least
62 Countries with a strong regional structure (such as federal states) may establish region as a stratification variable. In practical means, it is equivalent to designing independent samples in each region.
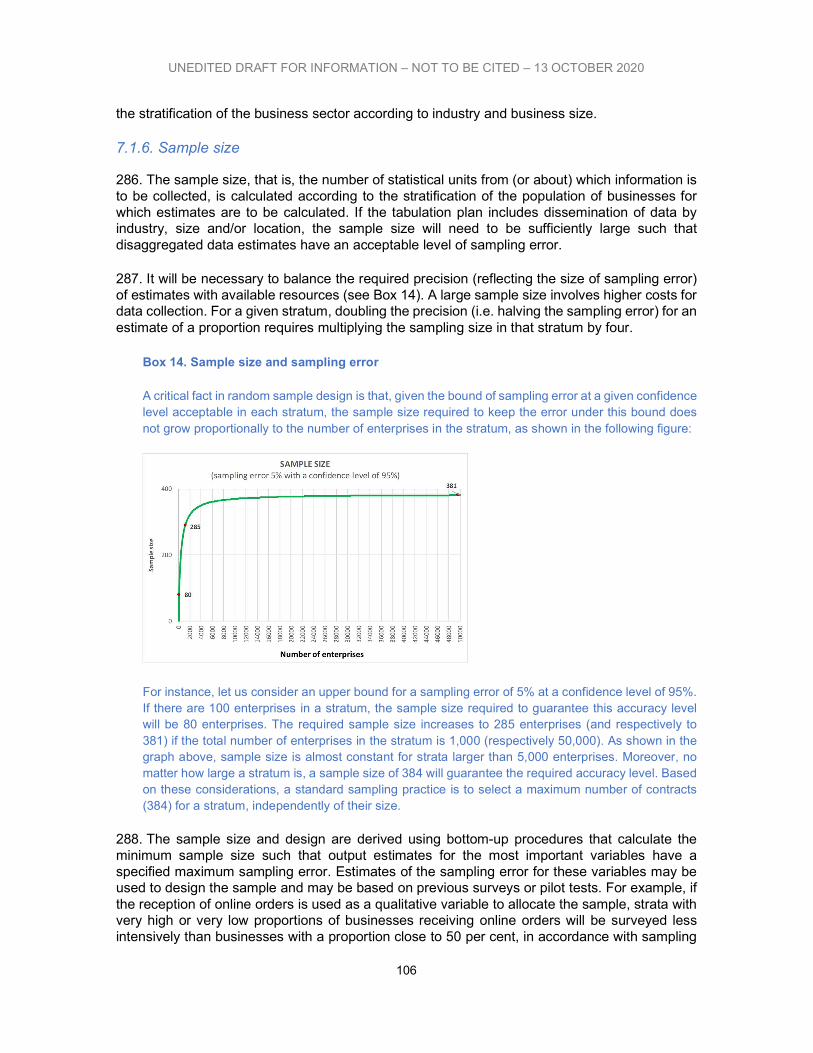
UNEDITED DRAFT FOR INFORMATION – NOT TO BE CITED – 13 OCTOBER 2020
106
the stratification of the business sector according to industry and business size.
7.1.6. Sample size
286. The sample size, that is, the number of statistical units from (or about) which information is to be collected, is calculated according to the stratification of the population of businesses for which estimates are to be calculated. If the tabulation plan includes dissemination of data by industry, size and/or location, the sample size will need to be sufficiently large such that disaggregated data estimates have an acceptable level of sampling error.
287. It will be necessary to balance the required precision (reflecting the size of sampling error) of estimates with available resources (see Box 14). A large sample size involves higher costs for data collection. For a given stratum, doubling the precision (i.e. halving the sampling error) for an estimate of a proportion requires multiplying the sampling size in that stratum by four.
Box 14. Sample size and sampling error
A critical fact in random sample design is that, given the bound of sampling error at a given confidence level acceptable in each stratum, the sample size required to keep the error under this bound does not grow proportionally to the number of enterprises in the stratum, as shown in the following figure:
For instance, let us consider an upper bound for a sampling error of 5% at a confidence level of 95%. If there are 100 enterprises in a stratum, the sample size required to guarantee this accuracy level will be 80 enterprises. The required sample size increases to 285 enterprises (and respectively to 381) if the total number of enterprises in the stratum is 1,000 (respectively 50,000). As shown in the graph above, sample size is almost constant for strata larger than 5,000 enterprises. Moreover, no matter how large a stratum is, a sample size of 384 will guarantee the required accuracy level. Based on these considerations, a standard sampling practice is to select a maximum number of contracts (384) for a stratum, independently of their size.
288. The sample size and design are derived using bottom-up procedures that calculate the minimum sample size such that output estimates for the most important variables have a specified maximum sampling error. Estimates of the sampling error for these variables may be used to design the sample and may be based on previous surveys or pilot tests. For example, if the reception of online orders is used as a qualitative variable to allocate the sample, strata with very high or very low proportions of businesses receiving online orders will be surveyed less intensively than businesses with a proportion close to 50 per cent, in accordance with sampling
UNEDITED DRAFT FOR INFORMATION – NOT TO BE CITED – 13 OCTOBER 2020
107
theory.
289. There are no international recommendations for the precision to be achieved for ICT indicators. The precision is usually expressed in terms of the coefficient of variation (i.e. the standard deviation divided by the value of the estimate, usually expressed as a percentage).
290. The final sample size will be the sum of individual strata samples. If the total size is too large, it may be necessary to reconsider the errors of some of the population groups, and to recalculate the total size. The usual approach to setting the precision required for estimates is to fix a maximum sample error for one-dimensional breakdowns of indicators and higher sampling errors for two-dimensional breakdowns. Eurostat recommendations for member States specify a maximum coefficient of variation for overall proportions of 2 per cent and 5 per cent for proportions relating to different sub-groups of the business population, where these sub-groups constitute at least 5 per cent of the total population in the scope of the survey.
291. A sample survey can be designed to provide a maximum statistical error of, say 5 per cent, for the total number of employees for sections of ISIC, while accepting statistical errors up to 10 per cent for the two-dimensional breakdown of ISIC section by business size interval. The sample will be smaller than that required for a maximum statistical error of 5 per cent for both one- and two- dimensional breakdowns.
292. A top-down procedure that is sometimes useful is to calculate the maximum sample size based on the available budget for the survey and the unit cost for collecting data from one business, and then allocate (distribute) the sample by strata according to some operational rule. The Neyman allocation (based on the cost and the variance of variables in each stratum), for example, guarantees that overall error is minimized.
293. These methods may be modified to adapt them to the survey requirements. Some of the most frequently applied modifications used are: 1) to fix minimum sizes to some strata, with the objective of calculating estimates with a minimum precision; 2) to completely enumerate some important strata (such as those containing large businesses); or 3) to select a larger sample than optimal, to anticipate the reduction of the effective sample caused by non-response.
294. It is important to note that, irrespective of sample size, a high non-response rate means that the calculated estimates are likely to be biased, and that bias will increase with the non-response rate if non-respondent businesses differ significantly from respondent ones (it is likely that businesses that have responded use ICT more intensively than those which have failed to respond). Therefore, one of the important goals of the survey is to minimize the non-response rate (note that the non-response rate does not give complete information about the bias of estimations).
Sample selection methods
295. Assuming that the population is stratified as described above, it is important to consider how to select samples within strata. Two of the simplest and most used methods are systematic sampling and simple random sampling. They are described in Box 15 below.
Box 15. Sample selection methods
Systematic sampling
The simplest method for random selection of businesses is systematic sampling. Units in the stratum must be
UNEDITED DRAFT FOR INFORMATION – NOT TO BE CITED – 13 OCTOBER 2020
108
arranged from 1 to N, where N is the number of units in the stratum. If n is the number of units to be selected, an interval K should be calculated, such that K=N/n (ignoring the remainder). Now, a random number (the starting point) between 1 and K is selected, call it t, and the sample will consist of the units t, t+K, t+2K, etc. This method can generate sample sizes of n or n+1 which means that the estimate will be biased, unless the weighting factor is adjusted to reflect the larger sample. The systematic sampling method allows distribution of the sample among the population of firms, by means of introducing some order in the frame. For example, if in each stratum companies are ordered by geographic code, the systematic sample will gather representative elements of all the localities.
Simple random sampling
Random sampling can be thought of as randomly drawing n numbers between 1 and N, where units in the stratum that correspond to those numbers will be included in the sample. Random numbers can be generated by means of randomization routines present in most statistical software. Another possibility is to use a fixed table of random numbers, but this procedure will be cumbersome. Usually selection will be without replacement, that is, there is no possibility of selecting the same unit more than once.
296. Systematic and random sampling can be combined to optimize the available sampling economic and human resources. For instance, an efficient sampling strategy could be to divide the whole sample frame into three tiers based on size intervals, an exhaustively sampled tier for the largest units, for which the sample ratio would hence be 100%; a sampling tier, with a sample ratio to be defined according to the number of units in this segment and the management capacities of the national institution in charge of implementing the survey; and an uncovered tier including small and very small businesses which could be left aside the regular implementation of the survey. This does not mean that small and very small business are not relevant, but that countries with limited resources may prioritize the statistical research on larger enterprises.
297. It is important to note that the method used for sample selection must correspond with the method of estimation. Thus, if it is considered appropriate to select businesses in a given stratum with unequal probabilities (e.g. proportional to their size), the estimates will have to weigh the units by a weight that is the reciprocal of those probabilities in their formula.
7.2 Data processing 298. The numerical processes that take place after data collection and before aggregate information is disseminated include data editing and data weighting. These processes are included in phase 5 (“process”) of the GSBPM. Data processing practices are country-specific, as data producers will usually have defined them for other business surveys. When ICT surveys are embedded into existing business surveys, data processing for ICT-related variables will tend to follow that of the vehicle survey, with the addition of edits that are specific to ICT questions.
7.2.1. Data editing
299. For many reasons, statistical information provided by businesses, whatever the instrument of data capture, can contain errors. These include erroneous or missing data, incorrect classifications, and inconsistent or illogical responses. In order to minimize such errors, it is important to apply techniques which optimize the effectiveness of data capture instruments and collection procedures. In addition, robust data editing techniques should be used to transform raw data provided by respondents into valid and coherent (‘clean’) data that can be used to produce aggregated statistics.
300. In this Manual, the term “editing” is used to cover all the phases of data processing, from the inspection of raw information provided by the respondent to the production of a clean data
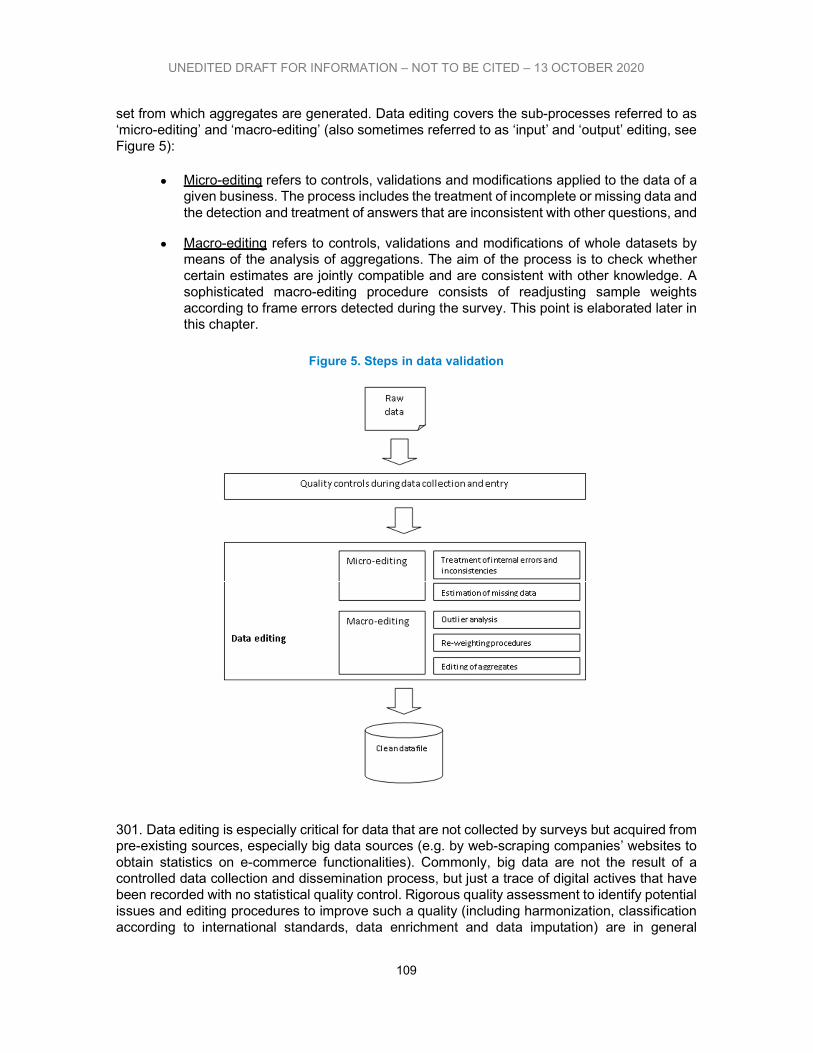
UNEDITED DRAFT FOR INFORMATION – NOT TO BE CITED – 13 OCTOBER 2020
109
set from which aggregates are generated. Data editing covers the sub-processes referred to as ‘micro-editing’ and ‘macro-editing’ (also sometimes referred to as ‘input’ and ‘output’ editing, see Figure 5):
Micro-editing refers to controls, validations and modifications applied to the data of a given business. The process includes the treatment of incomplete or missing data and the detection and treatment of answers that are inconsistent with other questions, and
Macro-editing refers to controls, validations and modifications of whole datasets by means of the analysis of aggregations. The aim of the process is to check whether certain estimates are jointly compatible and are consistent with other knowledge. A sophisticated macro-editing procedure consists of readjusting sample weights according to frame errors detected during the survey. This point is elaborated later in this chapter.
Figure 5. Steps in data validation
301. Data editing is especially critical for data that are not collected by surveys but acquired from pre-existing sources, especially big data sources (e.g. by web-scraping companies’ websites to obtain statistics on e-commerce functionalities). Commonly, big data are not the result of a controlled data collection and dissemination process, but just a trace of digital actives that have been recorded with no statistical quality control. Rigorous quality assessment to identify potential issues and editing procedures to improve such a quality (including harmonization, classification according to international standards, data enrichment and data imputation) are in general
UNEDITED DRAFT FOR INFORMATION – NOT TO BE CITED – 13 OCTOBER 2020
110
required for big data sources as a first step for its application in the measurement of the digital economy.
7.2.2. Treatment of internal inconsistencies and errors
302. Data editing involves checking and often manipulation of the original data. Such processes can introduce errors that affect aggregate data. Thus, although the process of data editing is essential, it is very important that practices be established that decrease the incidence of incomplete or inconsistent data, so that the impact of data editing is minimized. Quality controls already embedded in data collection instruments or at the data entry stage will directly improve the quality of raw data and reduce the task of data processing.
303. The choice of collection instrument has a direct impact on data quality. Both computer-assisted personal interviewing (CAPI) and computer-assisted telephone interviewing (CATI) can be expected to improve the quality of input data since they provide automatic controls for detecting response errors. Paper questionnaires require validation by statistical staff before and/or after data are entered into a computer for further processing.
304. Validity control of an individual data item consists of checking if the answer belongs to a predefined set (or range) of valid responses. In order to check questions for validity, it is necessary to check them against those defined valid responses. To check the internal consistency of a questionnaire, it is necessary to establish and apply rules that define the relationships between questions, so that certain answers restrict the valid values that other questions can accept (see Box 16). Arithmetic checks (for instance, that percentage distributions add to 100) may be applied during data entry or later run in batch mode across a set of records.
Box 16. Application of micro-editing rules
The question “How many employees use the Internet?” should only be answered if the business has declared in a previous question that it has used the Internet. In logical terms, the question on the business’ use of the Internet can only take two values (0=No or 1=Yes, for example). If the answer is No, then the second question on the number of employees using the Internet should not be answered by the respondent. If the answer to the business Internet use question is Yes, the question on employees’ use can only be answered with a numerical value that is more than zero but less than or equal to the number of employees of the business. (Please also recall the discussion earlier about the definition of ‘employees’ including employed persons such as owners.)
7.2.3. Treatment of missing data
305. Unit non-response refers to the failure to collect any information from some survey units. Item non-response refers to missing data in a returned questionnaire. Since both forms of non-response have the potential to introduce bias, data collection agencies should strive to reduce the extent of non-response, by means of advertising the survey to data providers through the best available media, improved questionnaires, high-quality fieldwork (if used) and good non-response follow up. However, even with such controls, a certain level of non-response is unavoidable. Analysis of patterns of non-response in relation to the type of unit (e.g. micro-businesses) or questions may enable improvement in data collection tools and procedures. Improvements include modification of question wording or instructions, and introduction of simplified questionnaires for some businesses (e.g. micro-businesses).
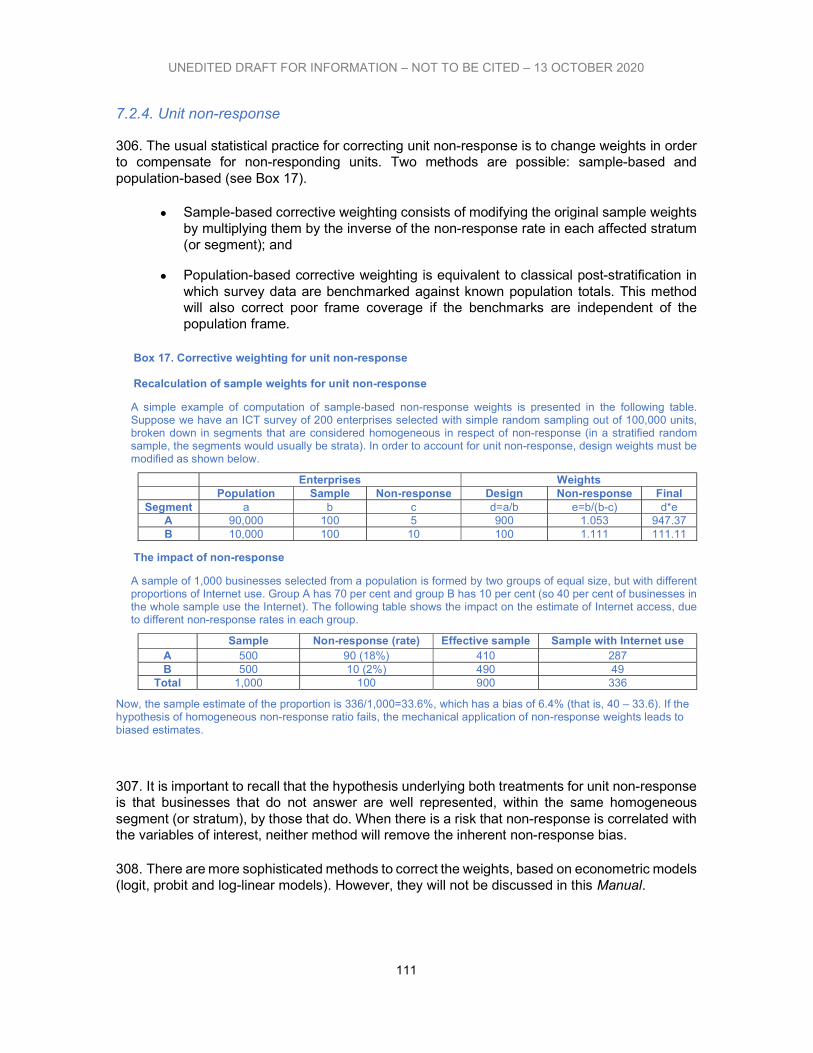
UNEDITED DRAFT FOR INFORMATION – NOT TO BE CITED – 13 OCTOBER 2020
111
7.2.4. Unit non-response
306. The usual statistical practice for correcting unit non-response is to change weights in order to compensate for non-responding units. Two methods are possible: sample-based and population-based (see Box 17).
Sample-based corrective weighting consists of modifying the original sample weights by multiplying them by the inverse of the non-response rate in each affected stratum (or segment); and
Population-based corrective weighting is equivalent to classical post-stratification in which survey data are benchmarked against known population totals. This method will also correct poor frame coverage if the benchmarks are independent of the population frame.
Box 17. Corrective weighting for unit non-response
Recalculation of sample weights for unit non-response
A simple example of computation of sample-based non-response weights is presented in the following table. Suppose we have an ICT survey of 200 enterprises selected with simple random sampling out of 100,000 units, broken down in segments that are considered homogeneous in respect of non-response (in a stratified random sample, the segments would usually be strata). In order to account for unit non-response, design weights must be modified as shown below.
Enterprises Weights Population Sample Non-response Design Non-response Final
Segment a b c d=a/b e=b/(b-c) d*e A 90,000 100 5 900 1.053 947.37 B 10,000 100 10 100 1.111 111.11
The impact of non-response
A sample of 1,000 businesses selected from a population is formed by two groups of equal size, but with different proportions of Internet use. Group A has 70 per cent and group B has 10 per cent (so 40 per cent of businesses in the whole sample use the Internet). The following table shows the impact on the estimate of Internet access, due to different non-response rates in each group.
Sample Non-response (rate) Effective sample Sample with Internet use A 500 90 (18%) 410 287 B 500 10 (2%) 490 49
Total 1,000 100 900 336
Now, the sample estimate of the proportion is 336/1,000=33.6%, which has a bias of 6.4% (that is, 40 – 33.6). If the hypothesis of homogeneous non-response ratio fails, the mechanical application of non-response weights leads to biased estimates.
307. It is important to recall that the hypothesis underlying both treatments for unit non-response is that businesses that do not answer are well represented, within the same homogeneous segment (or stratum), by those that do. When there is a risk that non-response is correlated with the variables of interest, neither method will remove the inherent non-response bias.
308. There are more sophisticated methods to correct the weights, based on econometric models (logit, probit and log-linear models). However, they will not be discussed in this Manual.
UNEDITED DRAFT FOR INFORMATION – NOT TO BE CITED – 13 OCTOBER 2020
112
7.2.5. Item non-response
309. The difference between item non-response and unit non-response is not always clear. In particular, if a business has failed to answer many questions, including some important items, it may be more effective from an operational viewpoint to treat that business as a unit non-response, instead of imputing estimates for a large number of item non-responses.
310. Item non-response is generally caused by one of the following:
The respondent refuses to answer a question (possibly because the information sought is sensitive);
The respondent does not know the answer (for instance, the information may not be available from business records);
The respondent misunderstands the question and so does not attempt to answer it; and/or
The respondent has unintentionally omitted an answer (possibly because the questionnaire has been poorly designed with confusing wording or unclear logic).
311. In the case of more technical ICT questions (such as type of Internet access), non-response may be decreased if it is specified that a person with ICT knowledge (e.g. the chief information officer) should respond for the business.
312. Ignoring missing answers can lead to statistically biased estimates, because the latter are calculated from an unrepresentative part of the sample. Following up item non-response is an obvious solution, especially in cases where the item non-response is extensive, the unit is significant or important questions have been omitted (e.g. those pertaining to the core ICT indicators). Obtaining responses may be easier where the collection is legally mandatory and, in any case, should be carried out as soon as possible after the incomplete response is received.
313. Where it is impractical to re-contact respondents, missing data could be estimated (imputed). Mathematical procedures for imputing missing data are described in Annex 5.
7.2.6. Treatment of misclassified units
314. A frequent problem affecting the quality of business statistics is that some responding businesses may be initially included in the wrong stratum in the population frame from which the sample is drawn. This is more likely when the frame (and the underlying business register) is of poor quality. Statistical business registers maintained by NSOs usually contain information on size (usually in terms of number of employees and/or turnover), industry and location (based on business address). Since ICT indicators are usually broken down by these classification variables, it is important to correct misclassified units.
315. Once the scope (target population) for a survey on ICT in business is defined, a list of ‘eligible’ (‘in-scope’) businesses for investigation must be put together in order to create a population frame. It is possible that misclassified units are erroneously included as eligible, and that eligible units are misclassified such that they do not appear on the frame or appear in the wrong stratum. In the first case, if a surveyed business is eliminated from the sample because of non-eligibility, this will reduce the effective sample size unless a reserve list is prepared.
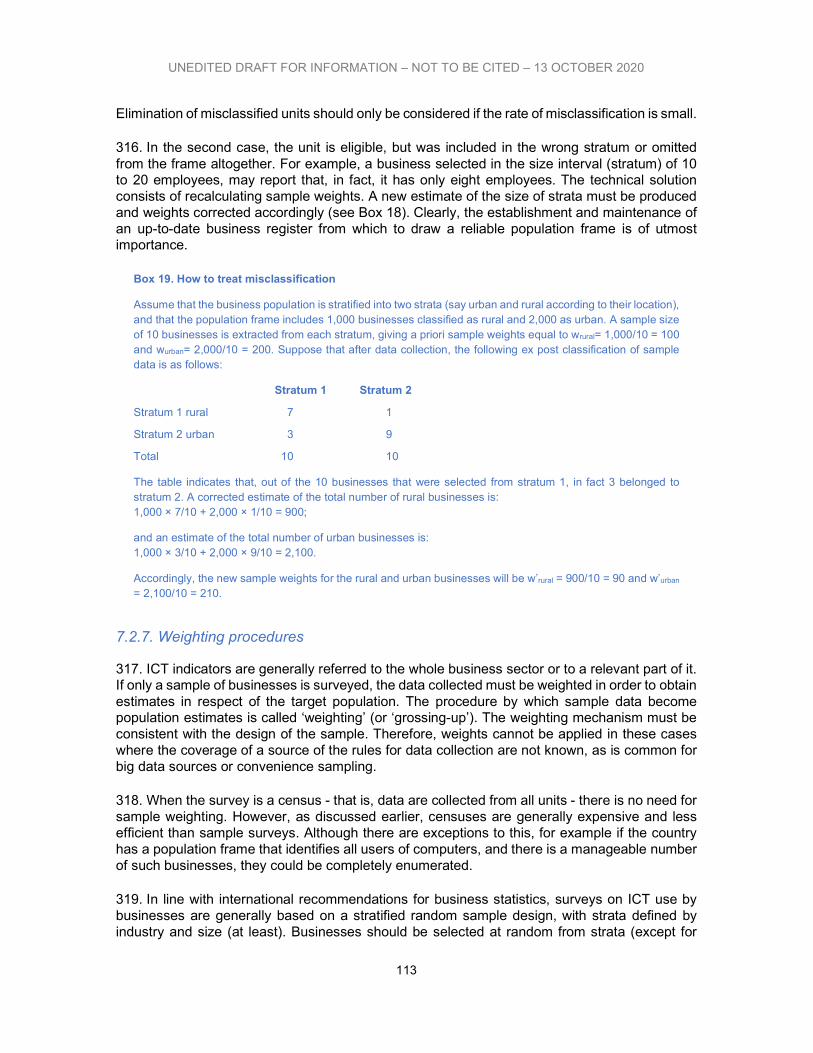
UNEDITED DRAFT FOR INFORMATION – NOT TO BE CITED – 13 OCTOBER 2020
113
Elimination of misclassified units should only be considered if the rate of misclassification is small.
316. In the second case, the unit is eligible, but was included in the wrong stratum or omitted from the frame altogether. For example, a business selected in the size interval (stratum) of 10 to 20 employees, may report that, in fact, it has only eight employees. The technical solution consists of recalculating sample weights. A new estimate of the size of strata must be produced and weights corrected accordingly (see Box 18). Clearly, the establishment and maintenance of an up-to-date business register from which to draw a reliable population frame is of utmost importance.
Box 19. How to treat misclassification
Assume that the business population is stratified into two strata (say urban and rural according to their location), and that the population frame includes 1,000 businesses classified as rural and 2,000 as urban. A sample size of 10 businesses is extracted from each stratum, giving a priori sample weights equal to wrural= 1,000/10 = 100 and wurban= 2,000/10 = 200. Suppose that after data collection, the following ex post classification of sample data is as follows:
Stratum 1 Stratum 2
Stratum 1 rural 7 1
Stratum 2 urban 3 9
Total 10 10
The table indicates that, out of the 10 businesses that were selected from stratum 1, in fact 3 belonged to stratum 2. A corrected estimate of the total number of rural businesses is: 1,000 × 7/10 + 2,000 × 1/10 = 900;
and an estimate of the total number of urban businesses is: 1,000 × 3/10 + 2,000 × 9/10 = 2,100.
Accordingly, the new sample weights for the rural and urban businesses will be w’rural = 900/10 = 90 and w’urban = 2,100/10 = 210.
7.2.7. Weighting procedures
317. ICT indicators are generally referred to the whole business sector or to a relevant part of it. If only a sample of businesses is surveyed, the data collected must be weighted in order to obtain estimates in respect of the target population. The procedure by which sample data become population estimates is called ‘weighting’ (or ‘grossing-up’). The weighting mechanism must be consistent with the design of the sample. Therefore, weights cannot be applied in these cases where the coverage of a source of the rules for data collection are not known, as is common for big data sources or convenience sampling.
318. When the survey is a census - that is, data are collected from all units - there is no need for sample weighting. However, as discussed earlier, censuses are generally expensive and less efficient than sample surveys. Although there are exceptions to this, for example if the country has a population frame that identifies all users of computers, and there is a manageable number of such businesses, they could be completely enumerated.
319. In line with international recommendations for business statistics, surveys on ICT use by businesses are generally based on a stratified random sample design, with strata defined by industry and size (at least). Businesses should be selected at random from strata (except for
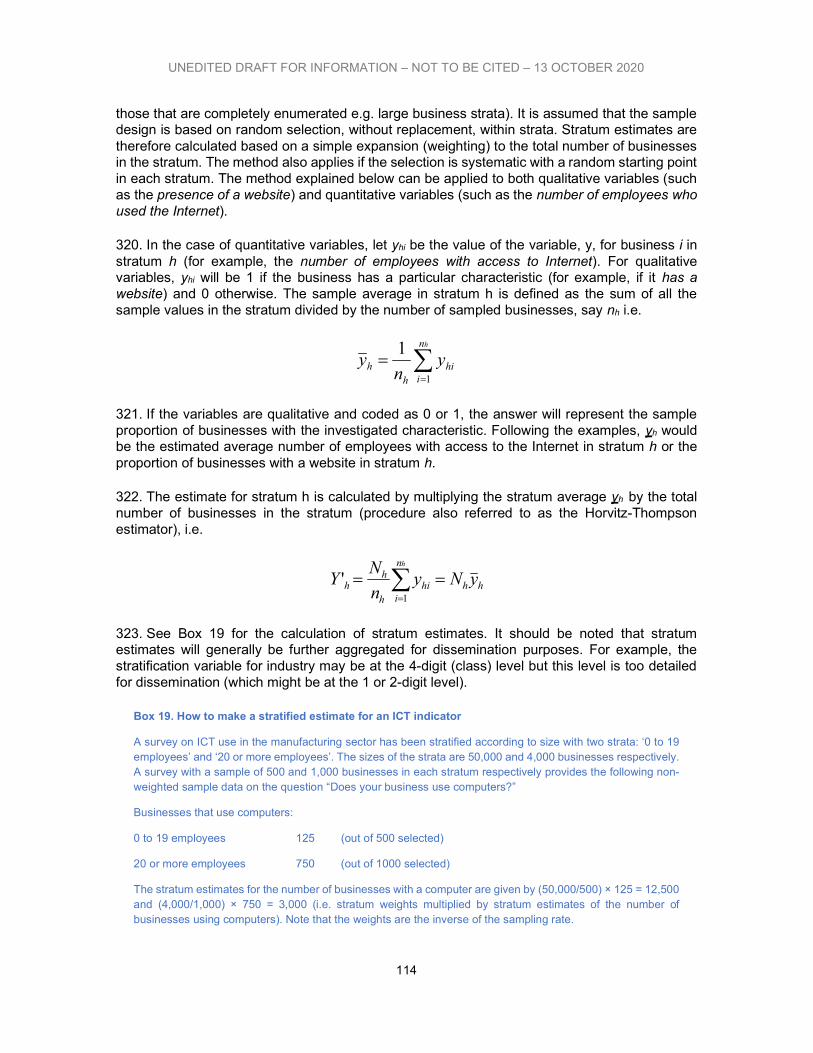
UNEDITED DRAFT FOR INFORMATION – NOT TO BE CITED – 13 OCTOBER 2020
114
those that are completely enumerated e.g. large business strata). It is assumed that the sample design is based on random selection, without replacement, within strata. Stratum estimates are therefore calculated based on a simple expansion (weighting) to the total number of businesses in the stratum. The method also applies if the selection is systematic with a random starting point in each stratum. The method explained below can be applied to both qualitative variables (such as the presence of a website) and quantitative variables (such as the number of employees who used the Internet).
320. In the case of quantitative variables, let yhi be the value of the variable, y, for business i in stratum h (for example, the number of employees with access to Internet). For qualitative variables, yhi will be 1 if the business has a particular characteristic (for example, if it has a website) and 0 otherwise. The sample average in stratum h is defined as the sum of all the sample values in the stratum divided by the number of sampled businesses, say nh i.e.
hn
ihi
hh y
ny
1
1
321. If the variables are qualitative and coded as 0 or 1, the answer will represent the sample proportion of businesses with the investigated characteristic. Following the examples, yh would be the estimated average number of employees with access to the Internet in stratum h or the proportion of businesses with a website in stratum h.
322. The estimate for stratum h is calculated by multiplying the stratum average yh by the total number of businesses in the stratum (procedure also referred to as the Horvitz-Thompson estimator), i.e.
hh
n
ihi
h
hh yNy
n
NY
h
1
'
323. See Box 19 for the calculation of stratum estimates. It should be noted that stratum estimates will generally be further aggregated for dissemination purposes. For example, the stratification variable for industry may be at the 4-digit (class) level but this level is too detailed for dissemination (which might be at the 1 or 2-digit level).
Box 19. How to make a stratified estimate for an ICT indicator
A survey on ICT use in the manufacturing sector has been stratified according to size with two strata: ‘0 to 19 employees’ and ‘20 or more employees’. The sizes of the strata are 50,000 and 4,000 businesses respectively. A survey with a sample of 500 and 1,000 businesses in each stratum respectively provides the following non-weighted sample data on the question “Does your business use computers?”
Businesses that use computers:
0 to 19 employees 125 (out of 500 selected)
20 or more employees 750 (out of 1000 selected)
The stratum estimates for the number of businesses with a computer are given by (50,000/500) × 125 = 12,500 and (4,000/1,000) × 750 = 3,000 (i.e. stratum weights multiplied by stratum estimates of the number of businesses using computers). Note that the weights are the inverse of the sampling rate.
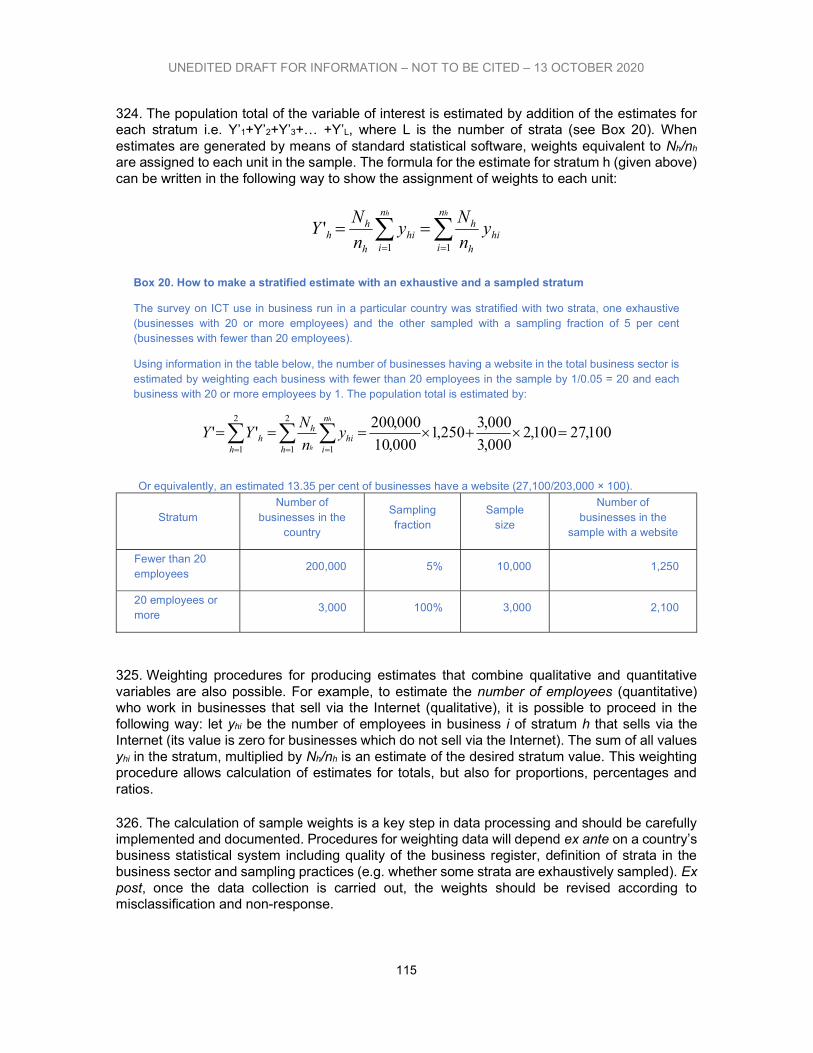
UNEDITED DRAFT FOR INFORMATION – NOT TO BE CITED – 13 OCTOBER 2020
115
324. The population total of the variable of interest is estimated by addition of the estimates for each stratum i.e. Y’1+Y’2+Y’3+… +Y’L, where L is the number of strata (see Box 20). When estimates are generated by means of standard statistical software, weights equivalent to Nh/nh are assigned to each unit in the sample. The formula for the estimate for stratum h (given above) can be written in the following way to show the assignment of weights to each unit:
hh n
ihi
h
hn
ihi
h
hh y
n
Ny
n
NY
11
'
Box 20. How to make a stratified estimate with an exhaustive and a sampled stratum
The survey on ICT use in business run in a particular country was stratified with two strata, one exhaustive (businesses with 20 or more employees) and the other sampled with a sampling fraction of 5 per cent (businesses with fewer than 20 employees).
Using information in the table below, the number of businesses having a website in the total business sector is estimated by weighting each business with fewer than 20 employees in the sample by 1/0.05 = 20 and each business with 20 or more employees by 1. The population total is estimated by:
100,27100,2000,3
000,3250,1
000,10
000,200''
2
1 1
2
1
h
n
ihi
h
hh
h
h
yn
NYY
Or equivalently, an estimated 13.35 per cent of businesses have a website (27,100/203,000 × 100).
Stratum Number of
businesses in the country
Sampling fraction
Sample size
Number of businesses in the
sample with a website
Fewer than 20 employees
200,000 5% 10,000 1,250
20 employees or more
3,000 100% 3,000 2,100
325. Weighting procedures for producing estimates that combine qualitative and quantitative variables are also possible. For example, to estimate the number of employees (quantitative) who work in businesses that sell via the Internet (qualitative), it is possible to proceed in the following way: let yhi be the number of employees in business i of stratum h that sells via the Internet (its value is zero for businesses which do not sell via the Internet). The sum of all values yhi in the stratum, multiplied by Nh/nh is an estimate of the desired stratum value. This weighting procedure allows calculation of estimates for totals, but also for proportions, percentages and ratios.
326. The calculation of sample weights is a key step in data processing and should be carefully implemented and documented. Procedures for weighting data will depend ex ante on a country’s business statistical system including quality of the business register, definition of strata in the business sector and sampling practices (e.g. whether some strata are exhaustively sampled). Ex post, once the data collection is carried out, the weights should be revised according to misclassification and non-response.
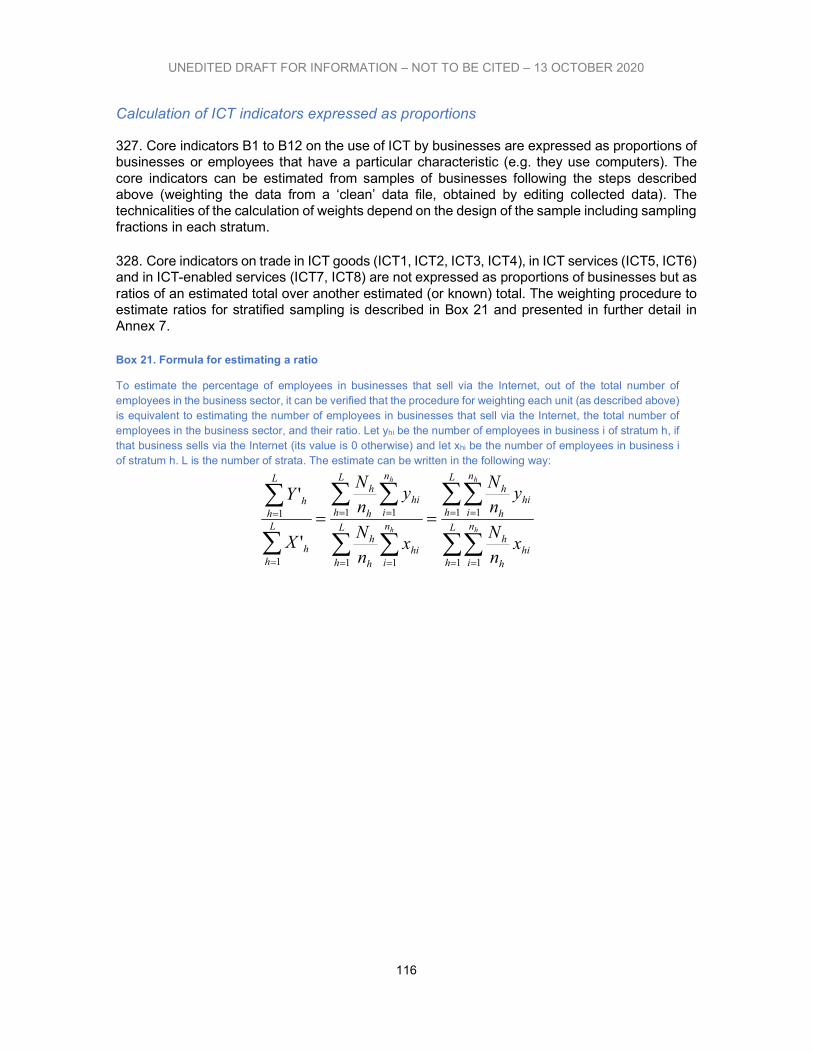
UNEDITED DRAFT FOR INFORMATION – NOT TO BE CITED – 13 OCTOBER 2020
116
Calculation of ICT indicators expressed as proportions
327. Core indicators B1 to B12 on the use of ICT by businesses are expressed as proportions of businesses or employees that have a particular characteristic (e.g. they use computers). The core indicators can be estimated from samples of businesses following the steps described above (weighting the data from a ‘clean’ data file, obtained by editing collected data). The technicalities of the calculation of weights depend on the design of the sample including sampling fractions in each stratum.
328. Core indicators on trade in ICT goods (ICT1, ICT2, ICT3, ICT4), in ICT services (ICT5, ICT6) and in ICT-enabled services (ICT7, ICT8) are not expressed as proportions of businesses but as ratios of an estimated total over another estimated (or known) total. The weighting procedure to estimate ratios for stratified sampling is described in Box 21 and presented in further detail in Annex 7.
Box 21. Formula for estimating a ratio
To estimate the percentage of employees in businesses that sell via the Internet, out of the total number of employees in the business sector, it can be verified that the procedure for weighting each unit (as described above) is equivalent to estimating the number of employees in businesses that sell via the Internet, the total number of employees in the business sector, and their ratio. Let yhi be the number of employees in business i of stratum h, if that business sells via the Internet (its value is 0 otherwise) and let xhi be the number of employees in business i of stratum h. L is the number of strata. The estimate can be written in the following way:
L
h
n
ihi
h
h
L
h
n
ihi
h
h
L
h
n
ihi
h
h
L
h
n
ihi
h
h
L
hh
L
hh
h
h
h
h
xn
N
ynN
xn
N
ynN
X
Y
1 1
1 1
1 1
1 1
1
1
'
'
UNEDITED DRAFT FOR INFORMATION – NOT TO BE CITED – 13 OCTOBER 2020
117
Chapter 8 - Dissemination
329. This chapter describes the statistical dissemination phase. As shown in the presentation of the GSBPM in section 5,1, this phase takes place once estimates for ICT indicators have been produced. Dissemination activities consist of preparation and distribution of ICT data and associated metadata (meaning ‘data about data’). While numerical information is commonly presented as a set of predefined or tailored tables or graphical elements, metadata usually takes the form of notes to tables and technical reports on data quality. This chapter describes tabulation plans for the presentation of survey results and discusses the related metadata, both at the indicator and survey level.
330. Statistical offices aim to produce statistics that are useful for decision-making and an important aspect of data usability is provision of associated metadata. This is especially important for ICT statistics, given the high level of interest in internationally comparable ICT indicators (for instance, from international conferences such as the WSIS). Agencies that produce and disseminate ICT indicators should therefore enhance their usability by routinely disclosing associated metadata. It is strongly recommended that production of these reports is integrated into the statistical production process and not undertaken as a separate activity. Related institutional issues are discussed in Chapter 9
331. Various NSOs and international bodies have defined quality frameworks and reports for statistical output. These constitute useful guidelines for determining the metadata that should be disseminated with ICT data. NSOs that have done work in this area include the US Bureau of the Census and the statistical offices of Australia,63 Canada and Sweden. International efforts include the IMF’s Data Quality Assessment Framework (DQAF)64 and Eurostat’s European Statistics Code of Practice.65 The latter is well documented and can be used to specify appropriate quality information about ICT use indicators according to six quality dimensions: relevance, accuracy, timeliness and punctuality, accessibility and clarity, comparability, and coherence. Between them, the six dimensions cover the range of metadata that result from statistical collection work.
332. Experience suggests that quality reports are best prepared by the same unit that produces the statistical indicators. Some NSOs may have a quality control system that includes standard documentation of all statistical products. Quality reports are needed to improve statistical operations and, for that reason, should be actively used by NSO staff (for instance, as part of an approval process for the release of statistics). At the same time, an adapted version of the report may be prepared for external users and made available along with statistical output.
63 The ABS Data Quality Framework, https://www.abs.gov.au/ausstats/[email protected]/mf/1520.0 quality, see: http://www.nss.gov.au/nss/. 64 The DQAF (https://dsbb.imf.org/dqrs/DQAF) has been applied to other statistical measurement systems such as National Accounts, Consumer Price index, Producer Price index, monetary statistics, etc. It has also been used by other international organizations such as UNESCO (on education statistics) and the World Bank (on poverty statistics). 65 See Eurostat’s European Statistics Code of Practice (2017) at https://ec.europa.eu/eurostat/documents/4031688/8971242/KS-02-18-142-EN-N.pdf/e7f85f07-91db-4312-8118-f729c75878c7.
UNEDITED DRAFT FOR INFORMATION – NOT TO BE CITED – 13 OCTOBER 2020
118
8.1. Tabulation plan
333. The presentation of survey results by NSOs most frequently takes the form of a pre-defined set of tables that are released as paper or electronic publications (‘static dissemination’). Users may also request tailored tabulations, which the NSO will prepare for them (often for a fee). Some NSOs have gone further and have adopted web-based technology that allows users to specify the tabulation to be displayed (‘dynamic dissemination’). This form of dissemination is beyond the scope of this Manual.66
334. Dissemination activities are usually complemented with other communication activities by NSOs, addressing the general population or specific groups of data users (such as decision-makers or the media). These activities target at providing information about the range of statistical products, increasing statistical literacy or trust in statistical institutions. They will not be discussed in this Manual, since their scope is larger than ICT statistics. Good practices in dissemination and communication have been identified for example, by the United Nations Statistics Division.67
335. Statistical information can also be presented using visual elements. Data visualization aims to aid users in exploring, understanding, and analyzing data through iterative visual exploration. With the development of user-friendly and powerful IT tools for data visualization, data visualization is spreading in a variety of applications. Although official statistics is not an exception to this trend, data visualization has not been leveraged to its full potential in this domain. Many developing-country NSOs still disseminate data only in the form of numerical tables, limiting the comprehension of the results to less “statistically literate” audiences. Good practices in official statistical visualization are available from some international organisations (see e.g. the UNECE suite on “Making Data Meaningful”).68
336. The set of statistical tables to be disseminated must consider the reliability of figures that will be released. Increasing the number and detail of table cells (for example, as a result of cross-tabulation by industry and business size, which can deliver small absolute figures due to a small sample size, or in the case of small economies with a reduced number of enterprises in specific strata) will decrease the precision of figures displayed, since the effective sample size on which cell estimates are based are lower. Confidentiality problems can also arise if the number of businesses contributing to a statistical aggregate displayed in one table cell is small (see Box 22).
Box 22. Statistical disclosure control rules
In order to decide which cells may be published, some NSOs use a minimum of three contributors as the threshold for the number of businesses that contribute to a cell total.
Other rules for protecting confidentiality are defined in terms of the value that is contributed by each unit in the
66 For an example of this kind of web-based application, several examples are available from developed and developing economies. For instance, the Eurostat database organized by subject matter (available at https://ec.europa.eu/eurostat/data/database/), or the on-line dissemination systems for population census data implemented by the Statistical Office of Colombia (http://200.21.49.233/Tot_censo05/inicio_col.htm). 67 See the Database of Good Practices at http://unstats.un.org/unsd/dnss/gp/searchgp.aspx . 68 UNECE (2009) Making Data Meaningful: A guide to presenting statistics (available at http://www.unece.org/fileadmin/DAM/stats/documents/writing/MDM_Part2_English.pdf)
UNEDITED DRAFT FOR INFORMATION – NOT TO BE CITED – 13 OCTOBER 2020
119
cell. For instance, a tabulation cell may be ‘sensitive’ and therefore not published if the contribution of one unit is greater than 80 per cent of the total value. This is especially important for developing economies where there are industries with a small number of competing businesses (for instance, in the telecommunications and energy sectors where very large businesses may be dominant in terms of value).
Possibilities for preventing the disclosure of confidential data include collapsing rows and/or columns, suppressing data (and indicating that data are not available for confidentiality reasons) and more technical approaches (such as microdata alteration) which will not be discussed here.
337. In each table cell, statistical estimates can be presented as absolute figures (number of businesses using computers, number of businesses using the Internet, etc.) or as proportions (proportion of businesses using computers, proportion of businesses using the Internet, etc.). In the latter case, it is important that the table title specifies the reference population (that is, whether the reference population is the total number of in-scope businesses or the total number of in-scope business that use the Internet) and that the value of denominators used is also made available.
338. A basic tabulation plan of ICT indicators in the business sector would consider the core indicators and the main breakdowns suggested by the Partnership, that is, business size and industry. This basic tabulation plan would consist of at least 24 tables (the 12 core indicators, each broken down by size and industry). Further cross-tabulation by industry and size can be of interest for many countries (should the sample size allow for sufficient accuracy of estimates). The breakdown by urban/rural location of the business is very much dependent on the availability of good classificatory data. As discussed earlier, such a breakdown is encouraged where feasible.
339. It is important that output data include some indication of the reliability of data in table cells. This is especially important for countries that base the production of ICT indicators on surveys whose sample size is small. It is recommended that figures with a low level of precision be highlighted (for instance, those that have a coefficient of variation higher than 20 per cent). Countries may set different reliability levels for different sectors or size categories (for example, allowing more sample error for the small enterprises than for larger enterprises).
340. For international dissemination purposes, UNCTAD recommends a breakdown for the size and industry classification variables (based on ISIC rev. 4) as shown in Box 23 below.69
Box 23. Breakdown by classification variables
For size of business TOTAL 0–9 employees (micro-businesses) 10–49 (small businesses) 50–249 (medium-sized businesses) 250 or more (large businesses)
For industry (ISIC Rev. 4) TOTAL ISIC A. Agriculture, forestry and fishing
69 A breakdown based on ISIC Rev. 4 is pending further consultation with countries that have implemented or are in the process of adopting that classification. ISIC rev. 4 was released in August 2008 and correspondence tables with ISIC rev 3.1 can be found in the UNSD website at http://unstats.un.org/unsd/cr/registry/isic-4.asp.
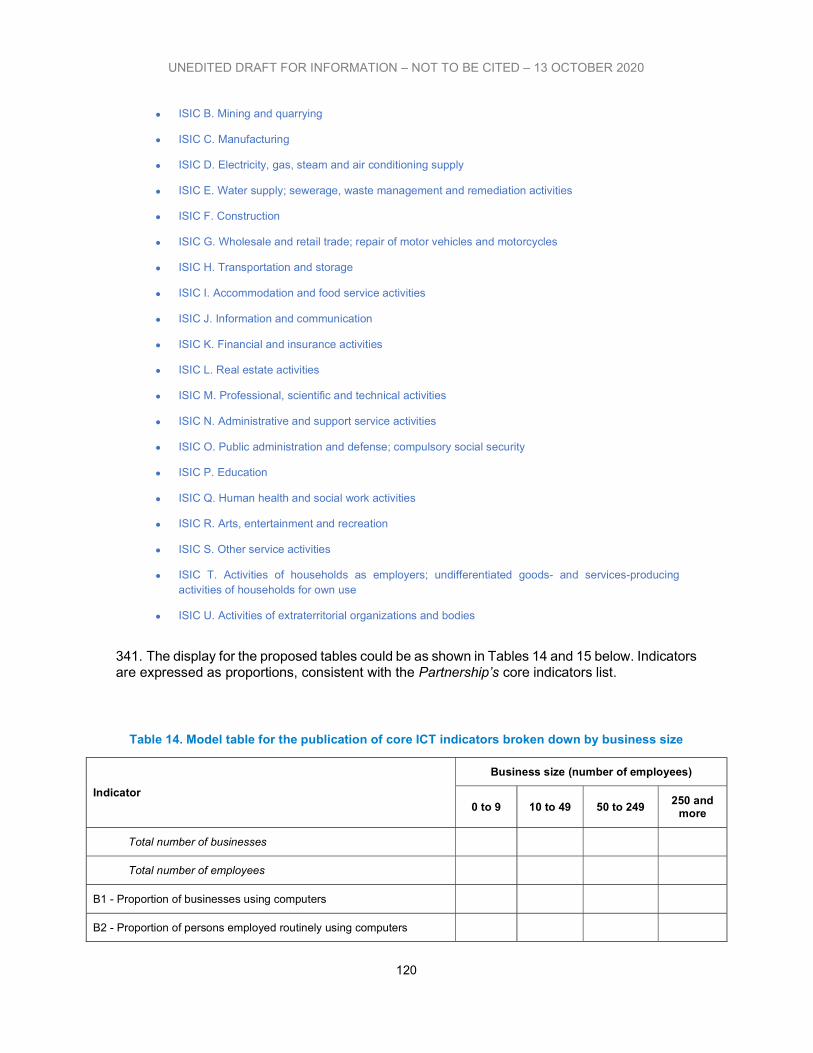
UNEDITED DRAFT FOR INFORMATION – NOT TO BE CITED – 13 OCTOBER 2020
120
ISIC B. Mining and quarrying
ISIC C. Manufacturing
ISIC D. Electricity, gas, steam and air conditioning supply
ISIC E. Water supply; sewerage, waste management and remediation activities
ISIC F. Construction
ISIC G. Wholesale and retail trade; repair of motor vehicles and motorcycles
ISIC H. Transportation and storage
ISIC I. Accommodation and food service activities
ISIC J. Information and communication
ISIC K. Financial and insurance activities
ISIC L. Real estate activities
ISIC M. Professional, scientific and technical activities
ISIC N. Administrative and support service activities
ISIC O. Public administration and defense; compulsory social security
ISIC P. Education
ISIC Q. Human health and social work activities
ISIC R. Arts, entertainment and recreation
ISIC S. Other service activities
ISIC T. Activities of households as employers; undifferentiated goods- and services-producing activities of households for own use
ISIC U. Activities of extraterritorial organizations and bodies
341. The display for the proposed tables could be as shown in Tables 14 and 15 below. Indicators are expressed as proportions, consistent with the Partnership’s core indicators list.
Table 14. Model table for the publication of core ICT indicators broken down by business size
Indicator
Business size (number of employees)
0 to 9 10 to 49 50 to 249 250 and
more
Total number of businesses
Total number of employees
B1 - Proportion of businesses using computers
B2 - Proportion of persons employed routinely using computers
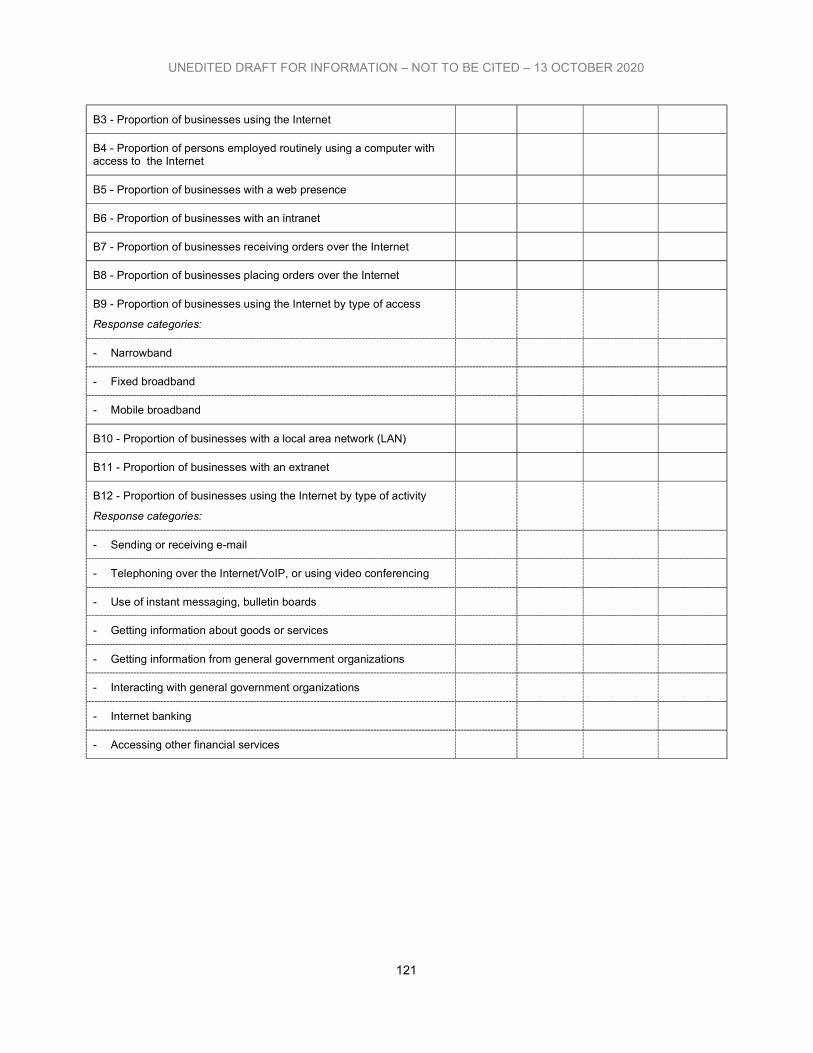
UNEDITED DRAFT FOR INFORMATION – NOT TO BE CITED – 13 OCTOBER 2020
121
B3 - Proportion of businesses using the Internet
B4 - Proportion of persons employed routinely using a computer with access to the Internet
B5 - Proportion of businesses with a web presence
B6 - Proportion of businesses with an intranet
B7 - Proportion of businesses receiving orders over the Internet
B8 - Proportion of businesses placing orders over the Internet
B9 - Proportion of businesses using the Internet by type of access
Response categories:
- Narrowband
- Fixed broadband
- Mobile broadband
B10 - Proportion of businesses with a local area network (LAN)
B11 - Proportion of businesses with an extranet
B12 - Proportion of businesses using the Internet by type of activity
Response categories:
- Sending or receiving e-mail
- Telephoning over the Internet/VoIP, or using video conferencing
- Use of instant messaging, bulletin boards
- Getting information about goods or services
- Getting information from general government organizations
- Interacting with general government organizations
- Internet banking
- Accessing other financial services
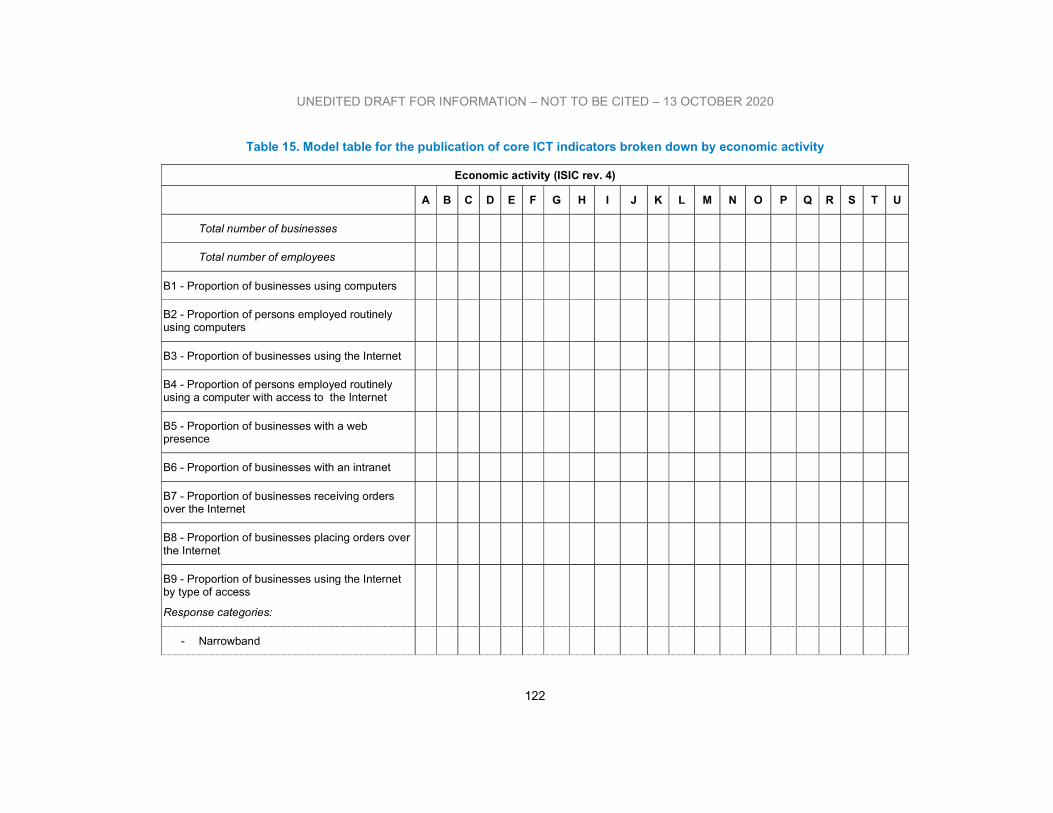
UNEDITED DRAFT FOR INFORMATION – NOT TO BE CITED – 13 OCTOBER 2020
122
Table 15. Model table for the publication of core ICT indicators broken down by economic activity
Economic activity (ISIC rev. 4)
A B C D E F G H I J K L M N O P Q R S T U
Total number of businesses
Total number of employees
B1 - Proportion of businesses using computers
B2 - Proportion of persons employed routinely using computers
B3 - Proportion of businesses using the Internet
B4 - Proportion of persons employed routinely using a computer with access to the Internet
B5 - Proportion of businesses with a web presence
B6 - Proportion of businesses with an intranet
B7 - Proportion of businesses receiving orders over the Internet
B8 - Proportion of businesses placing orders over the Internet
B9 - Proportion of businesses using the Internet by type of access
Response categories:
- Narrowband
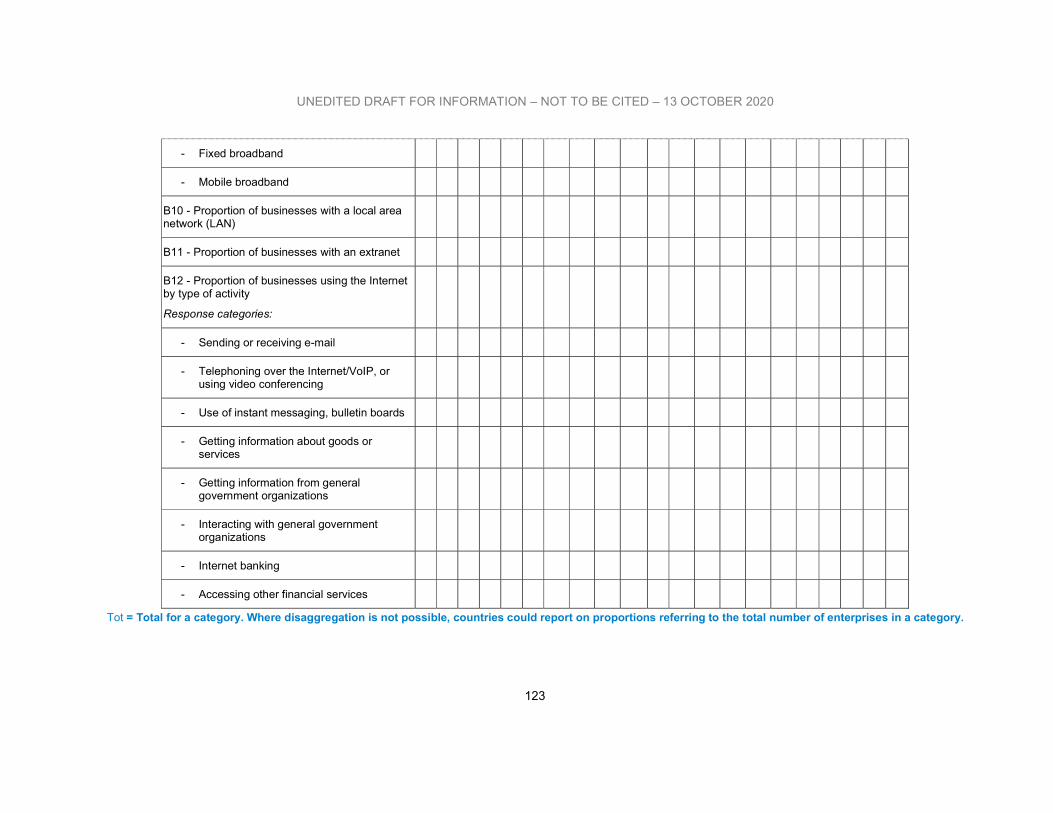
UNEDITED DRAFT FOR INFORMATION – NOT TO BE CITED – 13 OCTOBER 2020
123
- Fixed broadband
- Mobile broadband
B10 - Proportion of businesses with a local area network (LAN)
B11 - Proportion of businesses with an extranet
B12 - Proportion of businesses using the Internet by type of activity
Response categories:
- Sending or receiving e-mail
- Telephoning over the Internet/VoIP, or using video conferencing
- Use of instant messaging, bulletin boards
- Getting information about goods or services
- Getting information from general government organizations
- Interacting with general government organizations
- Internet banking
- Accessing other financial services
Tot = Total for a category. Where disaggregation is not possible, countries could report on proportions referring to the total number of enterprises in a category.
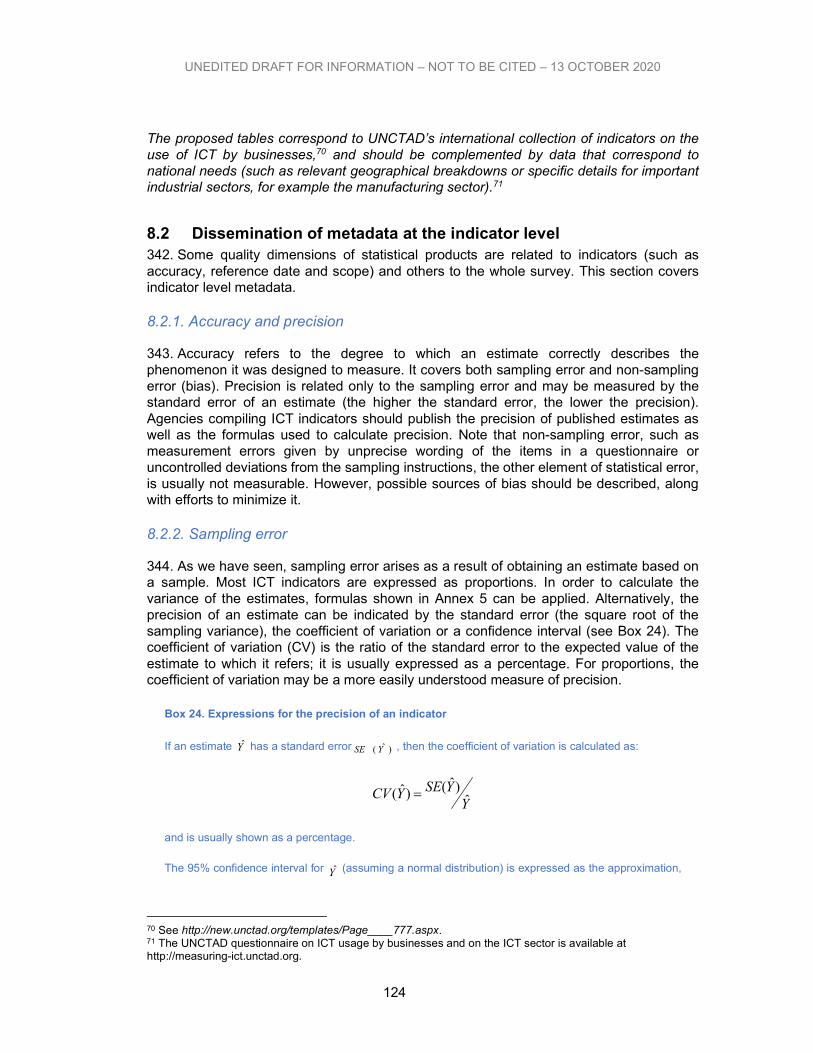
124
UNEDITED DRAFT FOR INFORMATION – NOT TO BE CITED – 13 OCTOBER 2020
The proposed tables correspond to UNCTAD’s international collection of indicators on the use of ICT by businesses,70 and should be complemented by data that correspond to national needs (such as relevant geographical breakdowns or specific details for important industrial sectors, for example the manufacturing sector).71
8.2 Dissemination of metadata at the indicator level 342. Some quality dimensions of statistical products are related to indicators (such as accuracy, reference date and scope) and others to the whole survey. This section covers indicator level metadata.
8.2.1. Accuracy and precision
343. Accuracy refers to the degree to which an estimate correctly describes the phenomenon it was designed to measure. It covers both sampling error and non-sampling error (bias). Precision is related only to the sampling error and may be measured by the standard error of an estimate (the higher the standard error, the lower the precision). Agencies compiling ICT indicators should publish the precision of published estimates as well as the formulas used to calculate precision. Note that non-sampling error, such as measurement errors given by unprecise wording of the items in a questionnaire or uncontrolled deviations from the sampling instructions, the other element of statistical error, is usually not measurable. However, possible sources of bias should be described, along with efforts to minimize it.
8.2.2. Sampling error
344. As we have seen, sampling error arises as a result of obtaining an estimate based on a sample. Most ICT indicators are expressed as proportions. In order to calculate the variance of the estimates, formulas shown in Annex 5 can be applied. Alternatively, the precision of an estimate can be indicated by the standard error (the square root of the sampling variance), the coefficient of variation or a confidence interval (see Box 24). The coefficient of variation (CV) is the ratio of the standard error to the expected value of the estimate to which it refers; it is usually expressed as a percentage. For proportions, the coefficient of variation may be a more easily understood measure of precision.
Box 24. Expressions for the precision of an indicator
If an estimate Y has a standard error )ˆ( YSE , then the coefficient of variation is calculated as:
YYSEYCV ˆ
)ˆ()ˆ(
and is usually shown as a percentage.
The 95% confidence interval for Y (assuming a normal distribution) is expressed as the approximation,
70 See http://new.unctad.org/templates/Page____777.aspx. 71 The UNCTAD questionnaire on ICT usage by businesses and on the ICT sector is available at http://measuring-ict.unctad.org.
125
UNEDITED DRAFT FOR INFORMATION – NOT TO BE CITED – 13 OCTOBER 2020
)ˆ(2ˆ YSEY to
)ˆ(2ˆ YSEY .
345. Sampling error usually increases as breakdowns become more detailed and the sample sizes smaller. Some statistical offices disseminate the precision measures for highly aggregated indicators (e.g. the proportion of businesses using the Internet and the same indicator by broad size interval). In addition, NSOs should indicate any cell estimates where the CV is over a particular level (e.g. 20%).
346. A business sample may be designed using information from previous or pilot surveys so that the maximum standard error for the indicator proportion of businesses using computers is 5 per cent for the total business population and less than 10 per cent for any ISIC section.
8.2.3. Bias
347. Bias (often referred to as non-sampling error) in statistical estimates is caused by various imperfections of the measurement system. As it is usually not possible to give a measure of bias, it is necessary to inform users about possible sources of bias and attempts made to minimize it. It is important to recognize that bias errors can be in opposite directions and can therefore cancel to some extent. Bias can arise from:
Non-response (where the characteristics of the responding population differ from those of the non-responding population);
Respondent errors (e.g. a tendency to underestimate income);
Errors in the population frame (e.g. coverage errors, misclassification errors);
Sub-optimal questionnaire design (e.g. unclear instructions or definitions, poor flow);
Systematic errors by interviewers (e.g. leading respondents to particular answers); and
Processing errors (e.g. in data entry, data editing, estimation and tabulation errors).
8.2.4. Reference date and period
348. The reference date and reference period are the date and period (respectively) to which the indicators refer. Characteristics such as use of the Internet or number of employees who use computers vary over time and therefore questions must refer to specific dates or periods to guarantee the coherence of the answer by different respondents.
349. For ICT indicators, the time references are of two types: reference period (generally last 12 last months, last calendar year or fiscal year) and reference date. Core indicators B1, B2, B3, B4, B7, B8, B9 and B12 (which relate to ICT use) have a 12-month reference period. If the question is asked in respect of the last 12 months, then problems can arise if the data collection phase spans several months. For this reason, it is suggested that a particular period (such as the last calendar year or the year ended 30 June 202X) is used as the reference period and that the survey date (date of interview or dispatch of questionnaires) is as close as possible to the last day of the reference period.
126
UNEDITED DRAFT FOR INFORMATION – NOT TO BE CITED – 13 OCTOBER 2020
350. Core indicators B5, B6, B10 and B11 (related to existing infrastructure) have as their time reference a specific day prior to the survey date. This is usually the last day of the reference period, for example 31 December 202X, or shortly after.
351. Metadata should refer to the reference date and period used, and explain any discrepancies arising from changes or from delays in data collection. Such information would typically be included in table headings, as notes to tables and/or in a survey execution report.
8.2.5. Scope of indicators
352. The scope of an indicator is defined by the population to which it refers. Most indicators on the use of ICT by businesses are proportions72, the denominator of which is determined by the scope specification of the survey in terms of size, economic activity, and so forth:
Indicators B1, B3, B5, B6, B7, B8, B9, B10, B11 and B12 are calculated as proportions with respect to all in-scope businesses, i.e. with respect to the target population of businesses;
Indicators B2 and B4 are calculated using as denominator the total number of employees of all in-scope businesses; and
For indicators B7, B8, B9 and B12, an alternative calculation is possible. These indicators can be calculated as a percentage of the subpopulation of businesses that use the Internet (i.e. the numerator of indicator B3).
353. It is especially important that the denominator of indicators B7, B8, B9 and B12 is made quite clear in each table (whether it is the total number of in-scope businesses or the total number of in-scope businesses that use the Internet, or the total number of the in-scope business in a particular industry or size categories). For international comparisons, it is desirable that these indicators are presented and published as proportions of the whole population of in-scope businesses, although international reporting might require that data be submitted in absolute numbers.73
8.3 Dissemination of metadata for surveys
354. At the survey level, there is a variety of metadata of interest to users. All indicators produced from the survey will share these metadata. They are related to the type of data source (be it a stand-alone survey or a module attached to an existing sample survey or census), the scope and coverage of the survey, classifications and definitions, and methodological issues including any technicalities of data collection. All these metadata are of relevance for assessing comparability with other national and international data. The metadata for a survey can be presented as a ‘survey execution report’ and is recommended to include the following items:
8.3.1. Rationale
355. Usually, a survey to collect ICT indicators derives from user demand and is expressed formally by a decision to include the necessary measurement work in the national statistical
72 For national purposes and for specific users (such as analysts), the publication of absolute figures may also be convenient. 73 For example, the UNCTAD questionnaire on ICT usage by businesses and on the ICT sector requests absolute numbers for analysis (calculation) purposes.
127
UNEDITED DRAFT FOR INFORMATION – NOT TO BE CITED – 13 OCTOBER 2020
programme. The survey execution report should describe any legislation that refers to the origin of the data collection exercise and details of decisions taken to implement the operation (such as a recommendation by a national statistical council).
8.3.2. Description of data sources
356. As we have seen, data sources for indicators on ICT use by businesses can be diverse and include administrative records, big data sources, stand-alone ICT surveys and modules in existing surveys. For that reason, metadata should refer to the nature of the data source(s) used for the calculation of ICT indicators. This is particularly important in the case of indicators expressed as a proportion since the numerator and denominator may be obtained from different data sources.
8.3.3. Timeliness and punctuality
357. Timeliness can be defined as the time interval between the availability of results and the date of reference of the information presented. Punctuality is the measurement of the delay between the anticipated date of release and the actual date of release. Both characteristics are easy to quantify and a quality report should include appropriate measures.
8.3.4. Data accessibility
358. Data accessibility is related to how easy it is for data users to obtain statistical results and associated metadata. It is related to the physical means available for data publication (paper, electronic, web-based), to the requirements for access (subscription, payment, free of charge, use of copyright, references to the producer institution, etc.) and how aware users are of available data and how it can be accessed (dissemination calendars, lists of distribution, etc.).
8.3.5. Statistical units, scope and coverage
359. Metadata should describe the statistical units used (establishments, enterprises, etc.), and how they have been defined. Any distinctions between reporting, observation and analytical units should be made clear. Impacts on the estimates from deviations from the recommended unit (enterprise) or changes over time should be described, even if it is not possible to quantify them.
360. Scope and coverage of a survey were discussed earlier in this Manual (Chapter 7). Metadata should specify the scope of the survey in terms of at least size and economic activity (and often geography). Any coverage limitations related to the scope should be specified e.g. whether there are some industries or geographical areas that have not been included in the survey or have been treated differently.
8.3.6. Response rate
361. An important item of metadata is the final response rate for the survey (overall and for major disaggregation). The response rate is calculated as the proportion of live (eligible) units responding to the survey. Disaggregation of response rate, by size for example, are useful in conveying an indication of non-response bias.
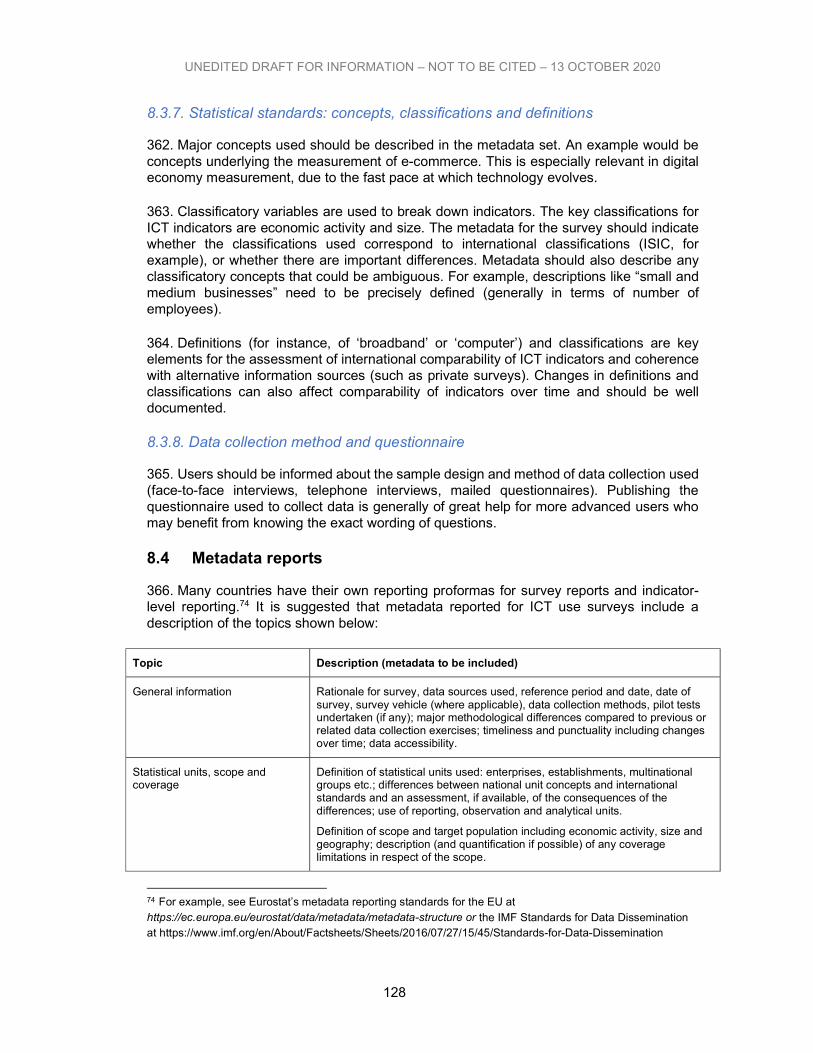
128
UNEDITED DRAFT FOR INFORMATION – NOT TO BE CITED – 13 OCTOBER 2020
8.3.7. Statistical standards: concepts, classifications and definitions
362. Major concepts used should be described in the metadata set. An example would be concepts underlying the measurement of e-commerce. This is especially relevant in digital economy measurement, due to the fast pace at which technology evolves.
363. Classificatory variables are used to break down indicators. The key classifications for ICT indicators are economic activity and size. The metadata for the survey should indicate whether the classifications used correspond to international classifications (ISIC, for example), or whether there are important differences. Metadata should also describe any classificatory concepts that could be ambiguous. For example, descriptions like “small and medium businesses” need to be precisely defined (generally in terms of number of employees).
364. Definitions (for instance, of ‘broadband’ or ‘computer’) and classifications are key elements for the assessment of international comparability of ICT indicators and coherence with alternative information sources (such as private surveys). Changes in definitions and classifications can also affect comparability of indicators over time and should be well documented.
8.3.8. Data collection method and questionnaire
365. Users should be informed about the sample design and method of data collection used (face-to-face interviews, telephone interviews, mailed questionnaires). Publishing the questionnaire used to collect data is generally of great help for more advanced users who may benefit from knowing the exact wording of questions.
8.4 Metadata reports
366. Many countries have their own reporting proformas for survey reports and indicator-level reporting.74 It is suggested that metadata reported for ICT use surveys include a description of the topics shown below:
Topic Description (metadata to be included)
General information Rationale for survey, data sources used, reference period and date, date of survey, survey vehicle (where applicable), data collection methods, pilot tests undertaken (if any); major methodological differences compared to previous or related data collection exercises; timeliness and punctuality including changes over time; data accessibility.
Statistical units, scope and coverage
Definition of statistical units used: enterprises, establishments, multinational groups etc.; differences between national unit concepts and international standards and an assessment, if available, of the consequences of the differences; use of reporting, observation and analytical units.
Definition of scope and target population including economic activity, size and geography; description (and quantification if possible) of any coverage limitations in respect of the scope.
74 For example, see Eurostat’s metadata reporting standards for the EU at https://ec.europa.eu/eurostat/data/metadata/metadata-structure or the IMF Standards for Data Dissemination at https://www.imf.org/en/About/Factsheets/Sheets/2016/07/27/15/45/Standards-for-Data-Dissemination
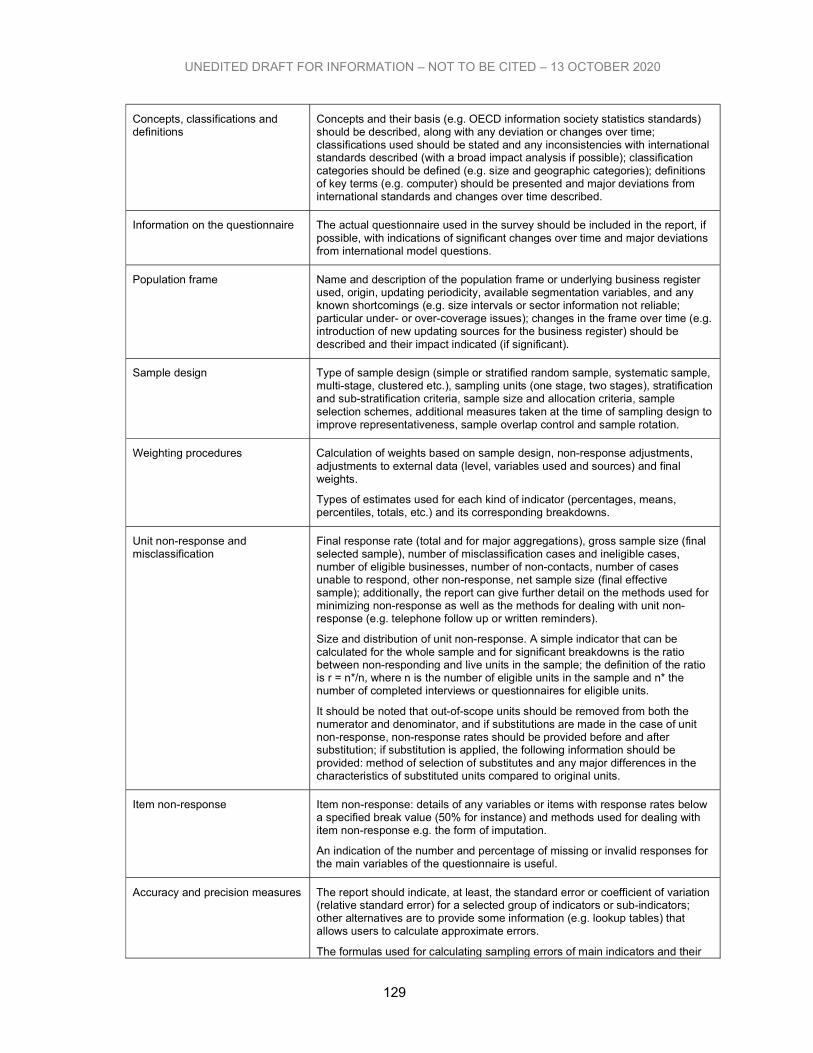
129
UNEDITED DRAFT FOR INFORMATION – NOT TO BE CITED – 13 OCTOBER 2020
Concepts, classifications and definitions
Concepts and their basis (e.g. OECD information society statistics standards) should be described, along with any deviation or changes over time; classifications used should be stated and any inconsistencies with international standards described (with a broad impact analysis if possible); classification categories should be defined (e.g. size and geographic categories); definitions of key terms (e.g. computer) should be presented and major deviations from international standards and changes over time described.
Information on the questionnaire The actual questionnaire used in the survey should be included in the report, if possible, with indications of significant changes over time and major deviations from international model questions.
Population frame Name and description of the population frame or underlying business register used, origin, updating periodicity, available segmentation variables, and any known shortcomings (e.g. size intervals or sector information not reliable; particular under- or over-coverage issues); changes in the frame over time (e.g. introduction of new updating sources for the business register) should be described and their impact indicated (if significant).
Sample design Type of sample design (simple or stratified random sample, systematic sample, multi-stage, clustered etc.), sampling units (one stage, two stages), stratification and sub-stratification criteria, sample size and allocation criteria, sample selection schemes, additional measures taken at the time of sampling design to improve representativeness, sample overlap control and sample rotation.
Weighting procedures Calculation of weights based on sample design, non-response adjustments, adjustments to external data (level, variables used and sources) and final weights.
Types of estimates used for each kind of indicator (percentages, means, percentiles, totals, etc.) and its corresponding breakdowns.
Unit non-response and misclassification
Final response rate (total and for major aggregations), gross sample size (final selected sample), number of misclassification cases and ineligible cases, number of eligible businesses, number of non-contacts, number of cases unable to respond, other non-response, net sample size (final effective sample); additionally, the report can give further detail on the methods used for minimizing non-response as well as the methods for dealing with unit non-response (e.g. telephone follow up or written reminders).
Size and distribution of unit non-response. A simple indicator that can be calculated for the whole sample and for significant breakdowns is the ratio between non-responding and live units in the sample; the definition of the ratio is r = n*/n, where n is the number of eligible units in the sample and n* the number of completed interviews or questionnaires for eligible units.
It should be noted that out-of-scope units should be removed from both the numerator and denominator, and if substitutions are made in the case of unit non-response, non-response rates should be provided before and after substitution; if substitution is applied, the following information should be provided: method of selection of substitutes and any major differences in the characteristics of substituted units compared to original units.
Item non-response Item non-response: details of any variables or items with response rates below a specified break value (50% for instance) and methods used for dealing with item non-response e.g. the form of imputation.
An indication of the number and percentage of missing or invalid responses for the main variables of the questionnaire is useful.
Accuracy and precision measures The report should indicate, at least, the standard error or coefficient of variation (relative standard error) for a selected group of indicators or sub-indicators; other alternatives are to provide some information (e.g. lookup tables) that allows users to calculate approximate errors.
The formulas used for calculating sampling errors of main indicators and their

130
UNEDITED DRAFT FOR INFORMATION – NOT TO BE CITED – 13 OCTOBER 2020
corresponding breakdowns should be presented; it is also helpful to provide the effective sample size.
In respect of indicator level metadata, it is useful to indicate any table cells that have a high CV (for instance, as notes to tables).
While bias is usually not measurable, the report should include likely sources of bias and attempts made to minimize it.
131
UNEDITED DRAFT FOR INFORMATION – NOT TO BE CITED – 13 OCTOBER 2020
Part C. INSTITUTIONAL ISSUES
Chapter 9 - Cooperation and coordination
367. Chapter 9 addresses relationships between actors in the statistical system, namely the cooperation and coordination between NSOs and other stakeholders – data providers, other data producers and data users. It also covers the inclusion of digital economy statistics in official statistical work programmes; international data collection and methodological work (already presented in Chapter 2 in what respects the work of the Partnership on Measuring ICT for Development); and capacity-building activities.
368. It is of the utmost importance that digital economy statistics be included in official statistical work programmes. Not only is this generally the most efficient way of using statistical infrastructure resources but it also provides strong support for indicators by giving an official “stamp” to the results.
369. The use of unofficial data on the digital economy is discussed in this Chapter, to provide orientations to NSOs on how to deal with these data sources, given the increasing collection of data from mobile operators, Internet providers, payment systems, etc. and the growing size of digital traces of the economic activities.
9.1 Cooperation among stakeholders of the national statistical system 370. Digital economy indicators can be produced from a variety of sources and be generated by different national institutions and private organizations. In order to optimize the use of existing resources, it is important to foster institutional coordination between data providers, producers and users. This includes collaboration with data providers (especially regarding response burden in the case of business surveys, and quality assurance in the case of private data sources), coordination among data producers (to increase the efficiency of technical and financial resources for data production) and cooperation with data users (to help them understand the statistics and to satisfy their data requirements).
371. It is strongly recommended that production of digital economy indicators be undertaken by an independent National Statistical Office (NSO). (Where a national statistical system is decentralized, there may be several official statistical agencies. For simplicity, this Manual refers to them as constituting a National Statistical Office.) This will provide advantages in managing relationships within the national statistical system. Additionally, statistical surveys carried out by NSOs often benefit from legislation ensuring compulsory response, which thus reduces non-response. The NSO is usually a central government institution specializing in statistics and able to optimize the efficient use of physical, human and technical resources (such as data collection networks, trained interviewers, statistical specialists, business registers and survey vehicles). Users will also benefit from using official statistics and associated metadata and will have confidence in the data released.
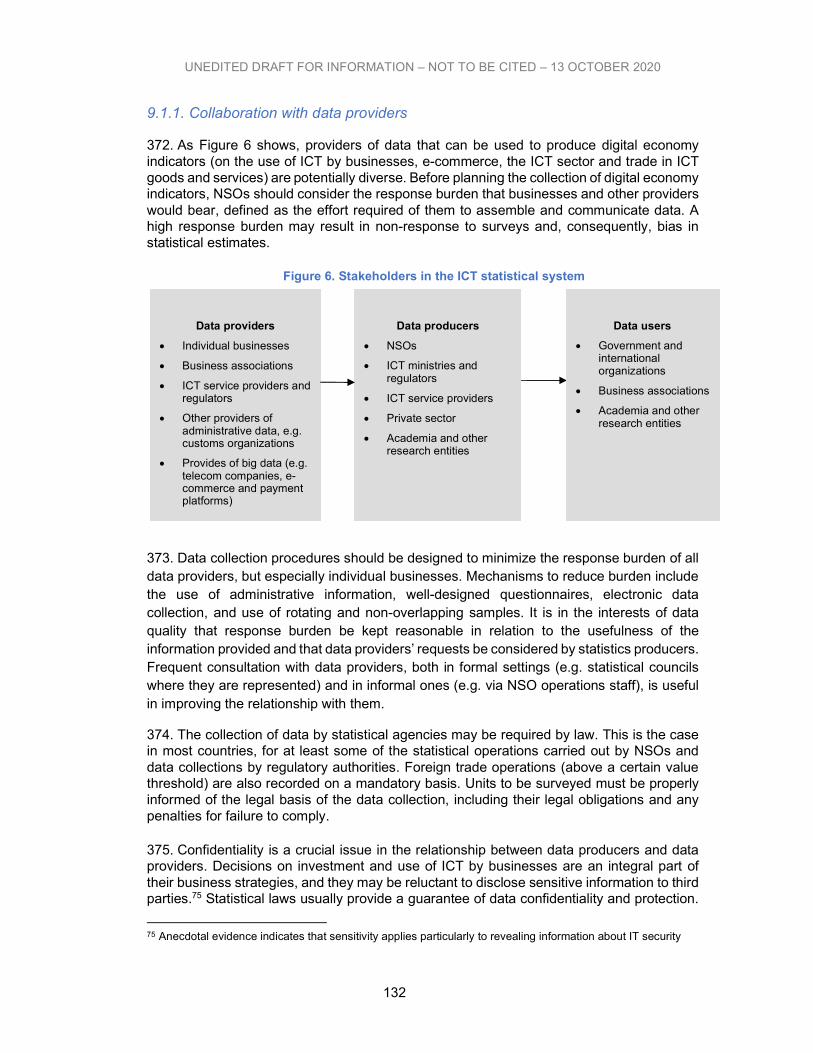
132
UNEDITED DRAFT FOR INFORMATION – NOT TO BE CITED – 13 OCTOBER 2020
9.1.1. Collaboration with data providers
372. As Figure 6 shows, providers of data that can be used to produce digital economy indicators (on the use of ICT by businesses, e-commerce, the ICT sector and trade in ICT goods and services) are potentially diverse. Before planning the collection of digital economy indicators, NSOs should consider the response burden that businesses and other providers would bear, defined as the effort required of them to assemble and communicate data. A high response burden may result in non-response to surveys and, consequently, bias in statistical estimates.
Figure 6. Stakeholders in the ICT statistical system
373. Data collection procedures should be designed to minimize the response burden of all data providers, but especially individual businesses. Mechanisms to reduce burden include the use of administrative information, well-designed questionnaires, electronic data collection, and use of rotating and non-overlapping samples. It is in the interests of data quality that response burden be kept reasonable in relation to the usefulness of the information provided and that data providers’ requests be considered by statistics producers. Frequent consultation with data providers, both in formal settings (e.g. statistical councils where they are represented) and in informal ones (e.g. via NSO operations staff), is useful in improving the relationship with them.
374. The collection of data by statistical agencies may be required by law. This is the case in most countries, for at least some of the statistical operations carried out by NSOs and data collections by regulatory authorities. Foreign trade operations (above a certain value threshold) are also recorded on a mandatory basis. Units to be surveyed must be properly informed of the legal basis of the data collection, including their legal obligations and any penalties for failure to comply.
375. Confidentiality is a crucial issue in the relationship between data producers and data providers. Decisions on investment and use of ICT by businesses are an integral part of their business strategies, and they may be reluctant to disclose sensitive information to third parties.75 Statistical laws usually provide a guarantee of data confidentiality and protection.
75 Anecdotal evidence indicates that sensitivity applies particularly to revealing information about IT security
Data providers
Individual businesses
Business associations
ICT service providers and regulators
Other providers of administrative data, e.g. customs organizations
Provides of big data (e.g. telecom companies, e-commerce and payment platforms)
Data producers
NSOs
ICT ministries and regulators
ICT service providers
Private sector
Academia and other research entities
Data users
Government and international organizations
Business associations
Academia and other research entities
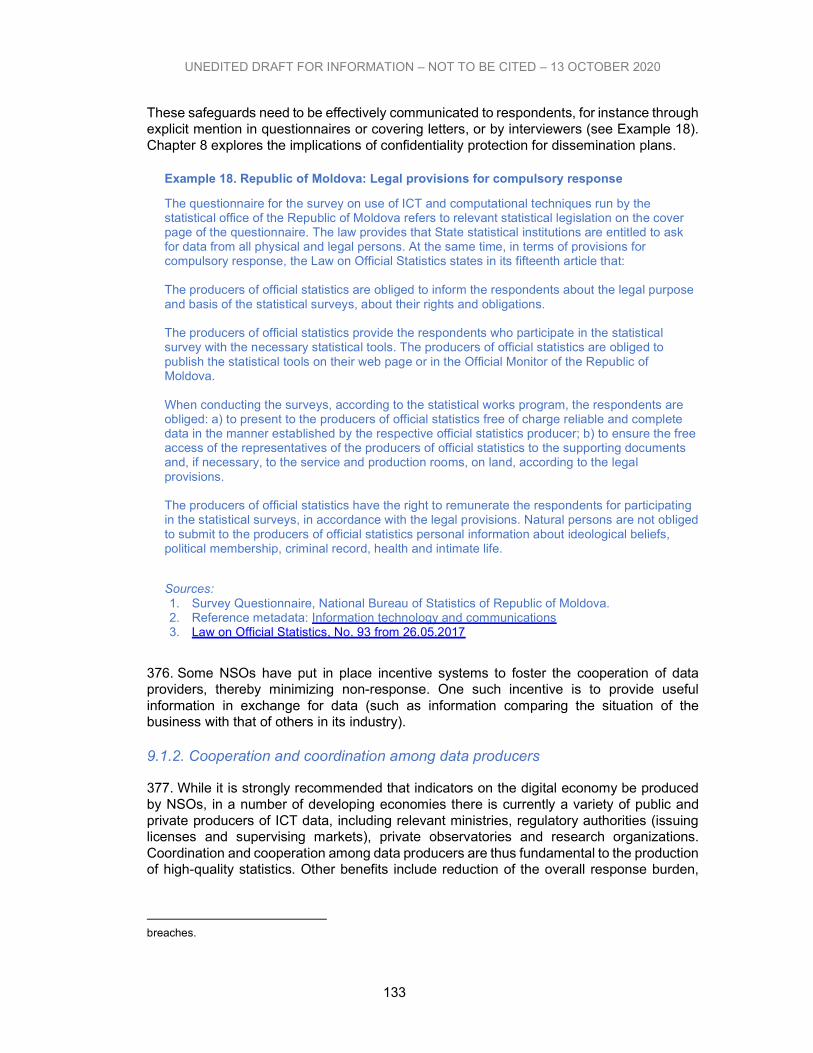
133
UNEDITED DRAFT FOR INFORMATION – NOT TO BE CITED – 13 OCTOBER 2020
These safeguards need to be effectively communicated to respondents, for instance through explicit mention in questionnaires or covering letters, or by interviewers (see Example 18). Chapter 8 explores the implications of confidentiality protection for dissemination plans.
Example 18. Republic of Moldova: Legal provisions for compulsory response
The questionnaire for the survey on use of ICT and computational techniques run by the statistical office of the Republic of Moldova refers to relevant statistical legislation on the cover page of the questionnaire. The law provides that State statistical institutions are entitled to ask for data from all physical and legal persons. At the same time, in terms of provisions for compulsory response, the Law on Official Statistics states in its fifteenth article that: The producers of official statistics are obliged to inform the respondents about the legal purpose and basis of the statistical surveys, about their rights and obligations. The producers of official statistics provide the respondents who participate in the statistical survey with the necessary statistical tools. The producers of official statistics are obliged to publish the statistical tools on their web page or in the Official Monitor of the Republic of Moldova. When conducting the surveys, according to the statistical works program, the respondents are obliged: a) to present to the producers of official statistics free of charge reliable and complete data in the manner established by the respective official statistics producer; b) to ensure the free access of the representatives of the producers of official statistics to the supporting documents and, if necessary, to the service and production rooms, on land, according to the legal provisions. The producers of official statistics have the right to remunerate the respondents for participating in the statistical surveys, in accordance with the legal provisions. Natural persons are not obliged to submit to the producers of official statistics personal information about ideological beliefs, political membership, criminal record, health and intimate life.
Sources: 1. Survey Questionnaire, National Bureau of Statistics of Republic of Moldova. 2. Reference metadata: Information technology and communications 3. Law on Official Statistics, No. 93 from 26.05.2017
376. Some NSOs have put in place incentive systems to foster the cooperation of data providers, thereby minimizing non-response. One such incentive is to provide useful information in exchange for data (such as information comparing the situation of the business with that of others in its industry).
9.1.2. Cooperation and coordination among data producers
377. While it is strongly recommended that indicators on the digital economy be produced by NSOs, in a number of developing economies there is currently a variety of public and private producers of ICT data, including relevant ministries, regulatory authorities (issuing licenses and supervising markets), private observatories and research organizations. Coordination and cooperation among data producers are thus fundamental to the production of high-quality statistics. Other benefits include reduction of the overall response burden,
breaches.
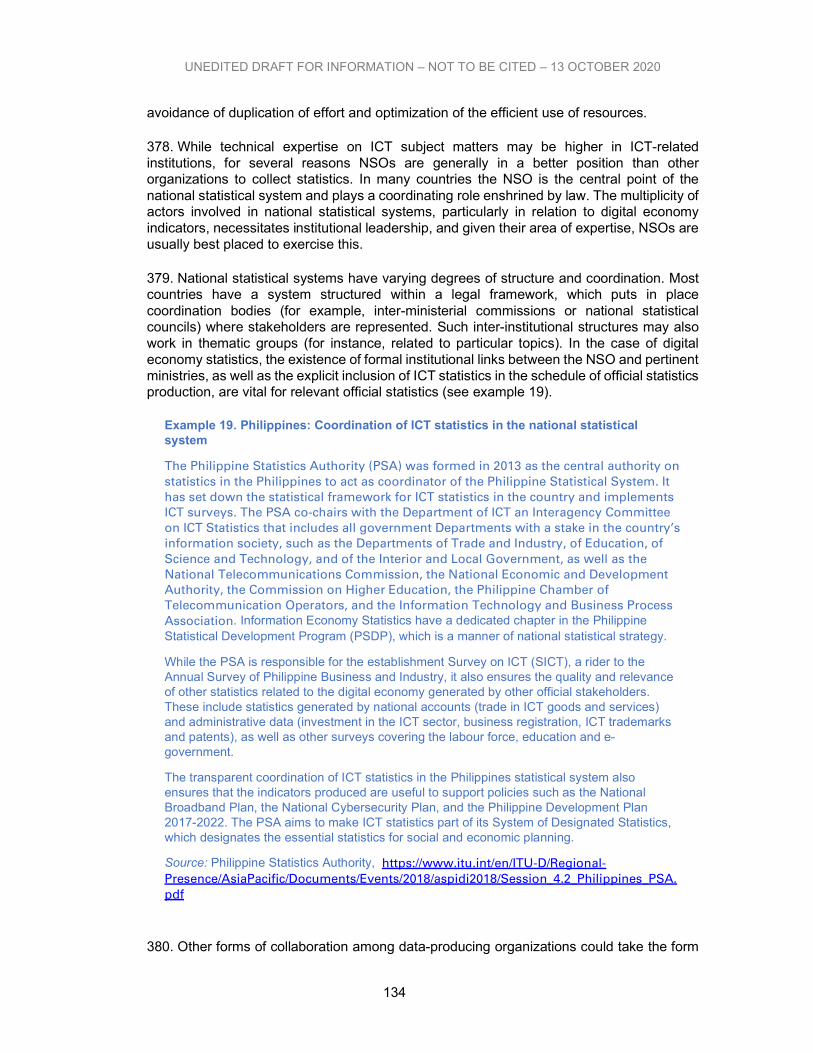
134
UNEDITED DRAFT FOR INFORMATION – NOT TO BE CITED – 13 OCTOBER 2020
avoidance of duplication of effort and optimization of the efficient use of resources.
378. While technical expertise on ICT subject matters may be higher in ICT-related institutions, for several reasons NSOs are generally in a better position than other organizations to collect statistics. In many countries the NSO is the central point of the national statistical system and plays a coordinating role enshrined by law. The multiplicity of actors involved in national statistical systems, particularly in relation to digital economy indicators, necessitates institutional leadership, and given their area of expertise, NSOs are usually best placed to exercise this.
379. National statistical systems have varying degrees of structure and coordination. Most countries have a system structured within a legal framework, which puts in place coordination bodies (for example, inter-ministerial commissions or national statistical councils) where stakeholders are represented. Such inter-institutional structures may also work in thematic groups (for instance, related to particular topics). In the case of digital economy statistics, the existence of formal institutional links between the NSO and pertinent ministries, as well as the explicit inclusion of ICT statistics in the schedule of official statistics production, are vital for relevant official statistics (see example 19).
Example 19. Philippines: Coordination of ICT statistics in the national statistical system
The Philippine Statistics Authority (PSA) was formed in 2013 as the central authority on statistics in the Philippines to act as coordinator of the Philippine Statistical System. It has set down the statistical framework for ICT statistics in the country and implements ICT surveys. The PSA co-chairs with the Department of ICT an Interagency Committee on ICT Statistics that includes all government Departments with a stake in the country’s information society, such as the Departments of Trade and Industry, of Education, of Science and Technology, and of the Interior and Local Government, as well as the National Telecommunications Commission, the National Economic and Development Authority, the Commission on Higher Education, the Philippine Chamber of Telecommunication Operators, and the Information Technology and Business Process Association. Information Economy Statistics have a dedicated chapter in the Philippine Statistical Development Program (PSDP), which is a manner of national statistical strategy.
While the PSA is responsible for the establishment Survey on ICT (SICT), a rider to the Annual Survey of Philippine Business and Industry, it also ensures the quality and relevance of other statistics related to the digital economy generated by other official stakeholders. These include statistics generated by national accounts (trade in ICT goods and services) and administrative data (investment in the ICT sector, business registration, ICT trademarks and patents), as well as other surveys covering the labour force, education and e-government.
The transparent coordination of ICT statistics in the Philippines statistical system also ensures that the indicators produced are useful to support policies such as the National Broadband Plan, the National Cybersecurity Plan, and the Philippine Development Plan 2017-2022. The PSA aims to make ICT statistics part of its System of Designated Statistics, which designates the essential statistics for social and economic planning.
Source: Philippine Statistics Authority, https://www.itu.int/en/ITU-D/Regional-Presence/AsiaPacific/Documents/Events/2018/aspidi2018/Session_4.2_Philippines_PSA.pdf
380. Other forms of collaboration among data-producing organizations could take the form
135
UNEDITED DRAFT FOR INFORMATION – NOT TO BE CITED – 13 OCTOBER 2020
of thematic cooperation agreements or inter-agency working groups with clearly defined responsibilities for establishing technical standards (e.g. for data collection and analysis, fieldwork and the verification and dissemination of findings). Before starting collection of data on the digital economy, the NSO should carefully assess the existence (see GSBPM phase “Specify needs” in Chapter 5), in other governmental organizations, of technical expertise and data infrastructure (such as business or administrative registers).
381. The powers of NSOs may be such that, inter alia, other organizations are obliged to consult them before altering administrative records that could be used for statistical purposes or before undertaking statistical work. Also, NSOs confer official status on the data they produce and may have responsibility for the preparation of national statistical plans. Legislation may endow NSOs with certain powers, for instance the power to establish technical procedures and standards, definitions, nomenclatures and survey frameworks.
382. Some governmental organizations may collect administrative data useful for producing digital economy (see Chapter 5). This include tax authorities (e.g. collecting e-invoices), customs or telecom operators. The access to and use of administrative data may require an adequate legal framework in addition to technical cooperation for the establishment of methodological standards (definition of concepts, metadata, etc.).
383. Coordination of statistical activities between NSOs and other agencies in the national statistical system to produce digital economy indicators should include technical, legal, and resource coordination.
Technical coordination
Establishment and coordinated use of definitions of digital economy concepts and relevant classifications. These definitions should be based on international standards, but adapted to country conditions;
Coordination of digital economy statistics within the broader domain of economic statistics, considering the established measurement frameworks (e.g. System of National Accounts, Balance of Payment statistics, classifications of economic activities);
Establishment of population frames for business surveys; and
Establishment of procedures for the preparation and dissemination of standardized metadata by agencies in the national statistical system.
Legal coordination
Establishment of an adequate institutional framework to represent the institutions that produce information, including (at least) the national authorities, in the areas of technological infrastructure, science, telecommunications and so forth;
Legal provisions that NSOs can use (following appropriate analysis and consensus) to establish technical standards that are obligatory for other data producers;
Legal provisions for the access by NSOs to administrative data held by other
136
UNEDITED DRAFT FOR INFORMATION – NOT TO BE CITED – 13 OCTOBER 2020
governmental institutions, as well as from private operators;
Legal provisions to confer official status on statistics from data collection exercises conducted by institutions that are members of the national statistical system (this is particularly important in the case of statistical operations financed by external agents without prior integration into national programmes of statistical activities); and
A legal framework to ensure sustainable funding from the national budget (or from donor cooperation, where relevant) for the operation of national statistical systems and for the implementation of programmes of statistical work.
Coordination in resource allocation
Development of synergies among the different institutions’ financial resources for the implementation of large-scale surveys (for example, collaboration with registration offices for the design of business population frames);
Making good use of the technical capacities of highly qualified staff in the national statistical system, for instance by having them participate in inter-agency task forces and training programmes as well-trained survey enumerators;
Efficient use of ICT resources available within different agencies in the national statistical system, and other cooperating organizations, for data collection, processing and dissemination; and
Coordination of financial resources (from external sources and between agencies involved in the project).
9.1.3. Using unofficial data on the digital economy
There is a wealth of unofficial statistics on the digital economy, compiled by private actors (think tanks, consultancies, sector associations, research centres, etc. as well as based on data collected for operational purposes by providers of ICT services, such as mobile network operators or Internet providers).
384. Unofficial sources may be used to give background or context to data from official sources, to assess official data on their plausibility, to cover information gaps by imputing missing values, etc. The Fundamental Principles of Official Statistics recognize that all sources are potentially usable for official statistics:
Principle 5. Data for statistical purposes may be drawn from all types of sources, be they statistical surveys or administrative records. Statistical agencies are to choose the source with regard to quality, timeliness, costs, sustainability in time and the burden on respondents.
385. Using unofficial statistics to compile official statistics has been suggested to fill the information gaps in several areas, such as the monitoring of the SDGs. This possibility of “accreditation” of unofficial sources has to be studied by NSOs and international organisations on the basis of quality assessments (using, for instance, the UN Statistical
137
UNEDITED DRAFT FOR INFORMATION – NOT TO BE CITED – 13 OCTOBER 2020
Quality Assessment Framework).76 The recommended practices77 for using unofficial sources by international organisations include:
The prior validation of their quality following professional standards in terms of accuracy, relevance, independence, availability, comparability, etc;
The documentation of the quality assessment, the methods used (for imputation or estimation); and
The dissemination with clear and accessible metadata, with adequate “flags” indicating the unofficial nature of data.
9.1.4. Cooperation with data users
386. Digital economy indicators are required by a variety of users: public policymakers to design technology policies, businesses to benchmark against competitors and make informed decisions, researchers to evaluate the impact of ICT use on productivity and working conditions, and the international community to compare the deployment of ICT across a range of countries. Because public resources are devoted to the production of ICT statistics, NSOs and other data producers wish to maximize their dissemination and facilitate their use (see example 20).
Example 20. Egypt: Cooperation with ICT data users
TO BE ADDED
387. Dissemination of digital economy data should be guided by the needs of users and follow best international practices. Data producers should constantly assess the demand for digital economy indicators. Contacts with – and feedback from – data users, in the framework of national statistical councils or technical working groups, can help the NSO and other data producers to better understand demand for digital economy statistics. In developing economies, civil society groups and NGOs have a major role to play in bridging the digital divide and assisting socially excluded groups. Civil society participation in the specification of data collection, via the participation of business associations, the media, universities and research centres, is more likely to ensure that data will be relevant to the digital economy data needs of such groups.
388. Dissemination formats and tools should increase the transparency of methodology. Digital economy statistics publications (in paper, in electronic format and/or on the Web) should provide not only numerical estimates, but also the metadata that are required in order to understand the data (see Chapter 8 for a discussion of metadata topics to be disseminated). An example is the quality reporting profiles prepared by Eurostat, which cover several areas of statistics.78
76 Committee of the Chief Statisticians of the United Nations System (2018). United Nations Statistics Quality Assurance Framework. Available at: https://unstats.un.org/unsd/unsystem/documents/UNSQAF-2018.pdf [last accessed April 25, 2018]. 77 Committee for the Coordination of Statistical Activities (2013). Recommended Practices on the Use of Non-Official Sources in International Statistics. Available at: https://unstats.un.org/unsd/accsub-public/practices.pdf [last accessed May31, 2018]. 78 Eurostat has applied quality profiles to various data sets such as those on employment, innovation and
138
UNEDITED DRAFT FOR INFORMATION – NOT TO BE CITED – 13 OCTOBER 2020
389. Other aspects of cooperation with users relate to the timeliness and accessibility of statistical information. ICT evolution is faster than the evolution of other economic and social processes, and data quickly become outdated. The earliest possible dissemination of data, preferably based on a pre-determined dissemination calendar, will be of great help to users.
390. Equity of access is an important principle that dictates that all users should have equal access to data, irrespective of their economic and social circumstances. Arranging such access is becoming easier with tools such as web-based statistical dissemination. The use of a variety of data dissemination formats (rapid notices, yearbooks, specific publications, electronic databases, etc.) should be considered in order to maximize the use of statistics.
9.2 Statistical work programmes
391. As we have seen, effective monitoring of the information economy requires high-quality and timely statistical information. One-off measuring exercises may provide a picture of the digital economy situation at a given point in time, but the rapid evolution of technologies, usage practices and policy interests quickly render one-off estimates outdated. A medium-term sustained programme of surveys and analysis is therefore necessary in order to monitor changes.
392. National statistical programmes are coordination and planning tools that are increasingly being adopted by countries. They comprise a set of statistical operations to be carried out and assign responsibilities to the various institutions that constitute the national statistical system. They would normally also include estimates of financial resources required in order to undertake the statistical programme. They can span annual or multi-annual periods and are periodically revised to reflect changes, including users’ new data requirements. Usually, statistical programmes are validated by a high-level multi-institutional group, where data producers and users are represented, before their approval and adoption by Governments.
393. Statistical operations related to the digital economy should be included in national statistical programmes (see example 21) in order to:
Increase the engagement of Governments for funding and other assistance, in a sustainable manner;
To communicate plans to users, including when data are expected to be available; and
To coordinate the technical and financial resources of the NSO and other data producers.
Example 21. Chile: Inclusion of ICT surveys in the statistical programme
The national statistical system of Chile is organized by means of a national statistical programme that is updated annually. The programme includes structured information about all the official statistical operations carried out not only by the NSO (INE) but also by ministries and other public institutions. It includes the description of statistical operations in terms of responsible institutions, general and specific objectives, targets for data
research, environment, social cohesion and others. The reports are available at http://epp.eurostat.ec.europa.eu/
139
UNEDITED DRAFT FOR INFORMATION – NOT TO BE CITED – 13 OCTOBER 2020
dissemination, periodicity, geographical coverage and sources of information. For example, in 2019 the programme clarified that statistical operations related to the digital economy included enterprise surveys and innovation surveys under the responsibility of the Subsecretariat of Economy and Small Enterprises, or e-banking services under the Bank Superintendency. It provides contact details for each statistical operation, helping users navigate the data producer ecosystem and find the information they are interested in, and is available as a publication (directory) and an online search engine.
Source: Instituto Nacional de Estadística (INE), https://www.ine.cl/docs/default-source/institucionalidad/sistema-estadistico-nacional/plan-nacional-de-recopilación-estadística/documentos/pnre-2019.pdf?sfvrsn=6eaa6f70_3
394. It is recommended that digital economy statistics collections are based on business surveys be coordinated with other business surveys in terms of timing and target populations, so that combined analysis of the e-business processes and other economic variables can be undertaken.
395. Several developing economies have prepared their national strategy for the development of statistics (NSDS) and statistical master plans, which are also being promoted by the international community of donors.79 NSDS are intended to encompass all statistical activities of public institutions in a country, not only those of the NSO. They therefore provide a tool for coordination and sustainability of statistical production. Countries that are in the process of preparing master plans and NSDSs should consider the inclusion of digital economy measurement work in medium- and long-term planning.
9.3 International data collection and methodological work
396. The need for international benchmarking, research and policy advice on digital economy issues has led to data collection initiatives by several international organizations. Many countries cooperate with international organizations to compile internationally comparable ICT data, whilst also satisfying national needs for indicators. Several regional and international initiatives on the collection of harmonized ICT data have been undertaken in the past few years by UNCTAD, the ITU, the UN Regional Commissions, OECD and Eurostat.
397. At the global level, the UNSC, at its 49th session in March 2018, reviewed the work of the Partnership, endorsed the updated core list of ICT indicators, including new ones on ICT trade in services and ICT-enabled services, and encouraged countries to adopt the indicators. The UNSC periodically reviews such list.
398. The Partnership on Measuring ICT for Development has a coordination and facilitation role in the area of international the measurement of the information society, the digital economy and related topics The Partnership periodically reports to the UNSC for an update of the international work on measuring information and communication technologies. See Chapter 2 for more detail on the work of the different member organizations of the Partnership.
79For instance, the STATCAP and the TFSCB funds managed by the World Bank support the preparation and implementation of statistical master plans.
140
UNEDITED DRAFT FOR INFORMATION – NOT TO BE CITED – 13 OCTOBER 2020
9.4 Capacity-building issues
399. The production of digital economy indicators in developing economies must be seen in the context of the general strengthening of national statistical systems. Countries that are willing to start producing such indicators should coordinate this activity with current or planned national capacity-building activities for statistical infrastructure (e.g. legal frameworks for statistics, business registers and data collection networks) and statistical practices (e.g. implementation of business surveys). Production of indicators on the digital economy should not be considered separately from those other issues since duplication of efforts and other inefficiencies can arise. Countries starting the collection of such indicators should consider the following capacity-building issues:
Statistics capacity assessment: before planning any intervention in capacity-building, a careful assessment of institutional and staff capacities must be undertaken. This includes identifying weak areas in terms of institutional setting (e.g. legislation, compliance with codes of practice, organizational chart, distribution of responsibilities across departments), implementation of statistical processes (for which the use of standards such as GSBPM and GAMSO can again help); IT infrastructure; as well as technical and “soft” skills of staff.
Improvement of the legal framework for statistical surveys: digital economy business surveys (whether dedicated to ICT or vehicles for ICT modules) should ideally be subject to statistical laws that establish obligations such as compulsory provision of data and protection of those data by the NSO and other official statistical agencies. The legislative framework may also establish legal mechanisms for implementation and funding of statistical operations. In some countries, revision of the legal framework for statistical surveys could increase the efficiency of the data collection system (see Box 25).
Box 25. The case for revision of statistical legislation to improve ICT statistics
The statistical legislation of developing economies may be the subject of revision, especially when countries have experienced important political or economic changes. In respect of ICT statistics, such changes might lead to the inclusion, on national statistical councils, of ministries responsible for science and technology or telecommunications, organizations representing the business and research community, and so forth.
In transition economies, the exhaustiveness of business surveys established by statistical laws for centrally planned economies may not be efficient compared with sample surveys if the business sector is developed (in particular, if the small and medium-sized enterprise (SME) sector is very large).
In some countries, respect for the confidentiality of individual data may not be fully reflected in current laws, a fact that should be carefully considered.
Establishment and improvement of business registers: The process of creating a business register for digital economy data collection should be coordinated with general plans to establish a business register or improve an existing one (see Chapter 7).
Improvement of data collection systems: Capacity-building projects for enhancing data collection should avoid duplication of structures that already exist, such as a network of data collection centres (which are generally spread over the country) that report to the central or regional statistical authorities.
141
UNEDITED DRAFT FOR INFORMATION – NOT TO BE CITED – 13 OCTOBER 2020
Coordination of the system of business statistics: current programmes of capacity-building for business statistics should be coordinated with other economic statistics. In many developing economies, there are international cooperation programmes devoted to implementing new business surveys or to adapting international standards within existing systems (see Box 26). These programmes should be considered by countries willing to carry out digital economy surveys.
Box 26. Reform of business statistics in former centrally planned economies
A number of Central and Eastern European, as well as Central Asian, countries have undergone a political and economic transition from centrally planned to market economies since the 1990s. Business surveys have been redesigned so that samples are used instead of complete enumeration of businesses. Samples for ICT surveys should be coordinated with those of other business surveys (such as manufacturing or service industry surveys) in order to reduce response burden and increase the coherence and usability of statistical results.
Training human resources for statistical production: Different types of staff are needed for the production and analysis of digital economy statistics: interviewers, data coders, statisticians and economists. Besides specific knowledge (for example, of ICT standards, concepts and definitions), staff will usually need to have statistical expertise (for example, in collecting data, units and classifications, business sampling methods, statistical estimation, data processing techniques and statistical dissemination practices). Capacity-building programmes in business statistics should include staff involved in the production of ICT indicators.
Enhancing the capacity for data dissemination: The implementation of statistical dissemination systems for digital economy indicators such as online databases or web dissemination can be coordinated with similar initiatives for other statistical projects within statistical organizations. Data visualization skills can improve the accessibility of digital economy statistics.
400. There are several international initiatives that support the improvement of ICT statistics in developing economies. The following capacity-building initiatives may be of interest to those economies:
Several members of the Partnership on Measuring ICT for Development can provide capacity-building services to member States. In the field of business ICT indicators, including indicators on the ICT sector and trade in ICT goods, ICT services and ICT-enabled services, UNCTAD provides technical assistance to countries interested in improving their ICT data production systems in the form of training and advisory missions. In order to improve the availability of comparable statistics on ICT for development, this technical assistance must be combined with a commitment by countries to collect the recommended core ICT indicators.
The consortium Partnership for Statistics in the 21st Century, PARIS21 (www.paris21.org), provides a reference library for the preparation of statistical development strategies and master plans. Guidelines for the preparation of NSDS are provided by the PARIS21 consortium. The approach for capacity building in national statistical systems is described in the Guidelines for

142
UNEDITED DRAFT FOR INFORMATION – NOT TO BE CITED – 13 OCTOBER 2020
Developing Statistical Capacity.80
80 PARIS 21(2020). Guidelines for developing statistical capacity. A roadmap for Capacity Development 4.0. https://paris21.org/sites/default/files/inline-files/UNV003_Guidelines%20for%20Capacity%20Development%20PRINT_0.pdf
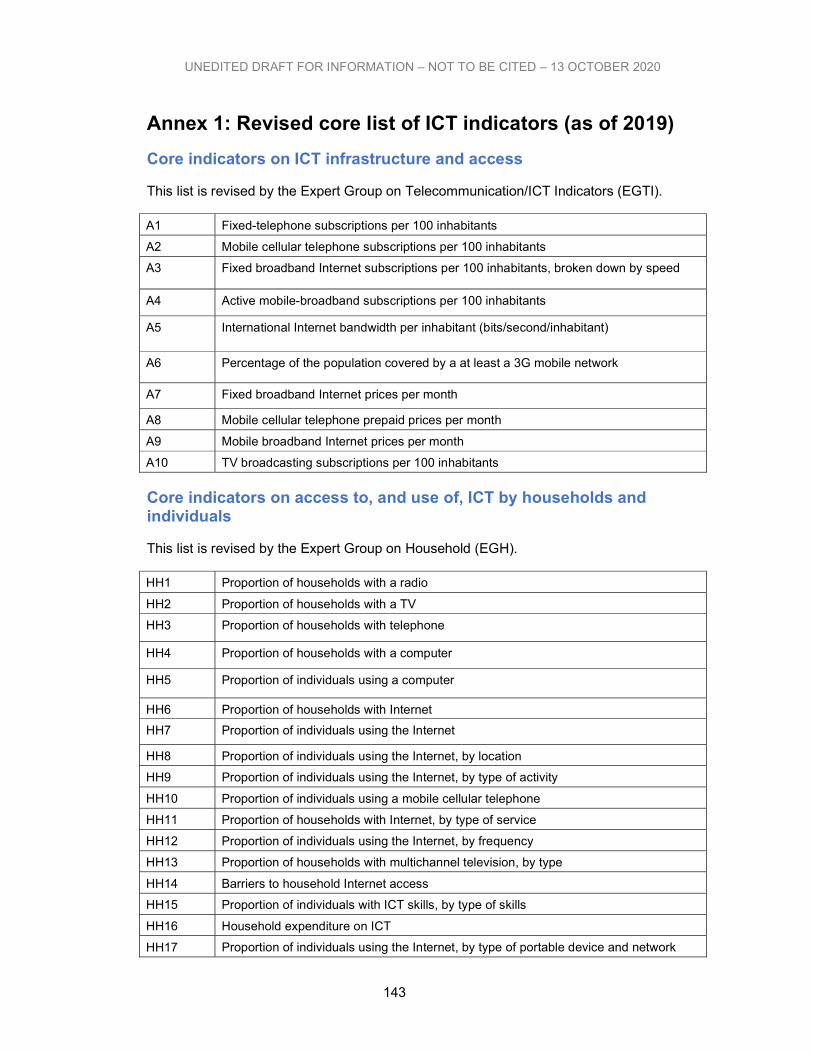
143
UNEDITED DRAFT FOR INFORMATION – NOT TO BE CITED – 13 OCTOBER 2020
Annex 1: Revised core list of ICT indicators (as of 2019)
Core indicators on ICT infrastructure and access
This list is revised by the Expert Group on Telecommunication/ICT Indicators (EGTI).
A1 Fixed-telephone subscriptions per 100 inhabitants
A2 Mobile cellular telephone subscriptions per 100 inhabitants
A3 Fixed broadband Internet subscriptions per 100 inhabitants, broken down by speed
A4 Active mobile-broadband subscriptions per 100 inhabitants
A5 International Internet bandwidth per inhabitant (bits/second/inhabitant)
A6 Percentage of the population covered by a at least a 3G mobile network
A7 Fixed broadband Internet prices per month
A8 Mobile cellular telephone prepaid prices per month
A9 Mobile broadband Internet prices per month
A10 TV broadcasting subscriptions per 100 inhabitants
Core indicators on access to, and use of, ICT by households and individuals
This list is revised by the Expert Group on Household (EGH).
HH1 Proportion of households with a radio
HH2 Proportion of households with a TV
HH3 Proportion of households with telephone
HH4 Proportion of households with a computer
HH5 Proportion of individuals using a computer
HH6 Proportion of households with Internet
HH7 Proportion of individuals using the Internet
HH8 Proportion of individuals using the Internet, by location
HH9 Proportion of individuals using the Internet, by type of activity
HH10 Proportion of individuals using a mobile cellular telephone
HH11 Proportion of households with Internet, by type of service
HH12 Proportion of individuals using the Internet, by frequency
HH13 Proportion of households with multichannel television, by type
HH14 Barriers to household Internet access
HH15 Proportion of individuals with ICT skills, by type of skills
HH16 Household expenditure on ICT
HH17 Proportion of individuals using the Internet, by type of portable device and network used to access the Internet
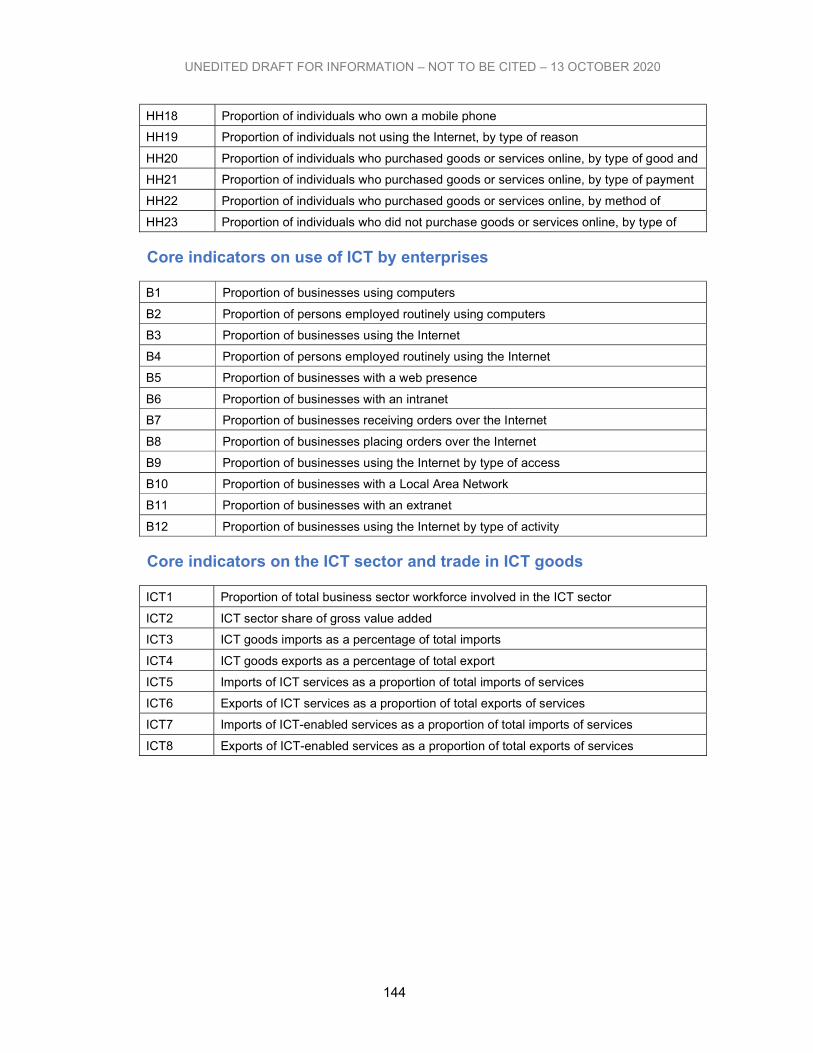
144
UNEDITED DRAFT FOR INFORMATION – NOT TO BE CITED – 13 OCTOBER 2020
HH18 Proportion of individuals who own a mobile phone
HH19 Proportion of individuals not using the Internet, by type of reason
HH20 Proportion of individuals who purchased goods or services online, by type of good and service purchased HH21 Proportion of individuals who purchased goods or services online, by type of payment channel HH22 Proportion of individuals who purchased goods or services online, by method of delivery HH23 Proportion of individuals who did not purchase goods or services online, by type of reason
Core indicators on use of ICT by enterprises
B1 Proportion of businesses using computers
B2 Proportion of persons employed routinely using computers
B3 Proportion of businesses using the Internet
B4 Proportion of persons employed routinely using the Internet
B5 Proportion of businesses with a web presence
B6 Proportion of businesses with an intranet
B7 Proportion of businesses receiving orders over the Internet
B8 Proportion of businesses placing orders over the Internet
B9 Proportion of businesses using the Internet by type of access
B10 Proportion of businesses with a Local Area Network
B11 Proportion of businesses with an extranet
B12 Proportion of businesses using the Internet by type of activity
Core indicators on the ICT sector and trade in ICT goods
ICT1 Proportion of total business sector workforce involved in the ICT sector
ICT2 ICT sector share of gross value added
ICT3 ICT goods imports as a percentage of total imports
ICT4 ICT goods exports as a percentage of total export
ICT5 Imports of ICT services as a proportion of total imports of services
ICT6 Exports of ICT services as a proportion of total exports of services
ICT7 Imports of ICT-enabled services as a proportion of total imports of services
ICT8 Exports of ICT-enabled services as a proportion of total exports of services
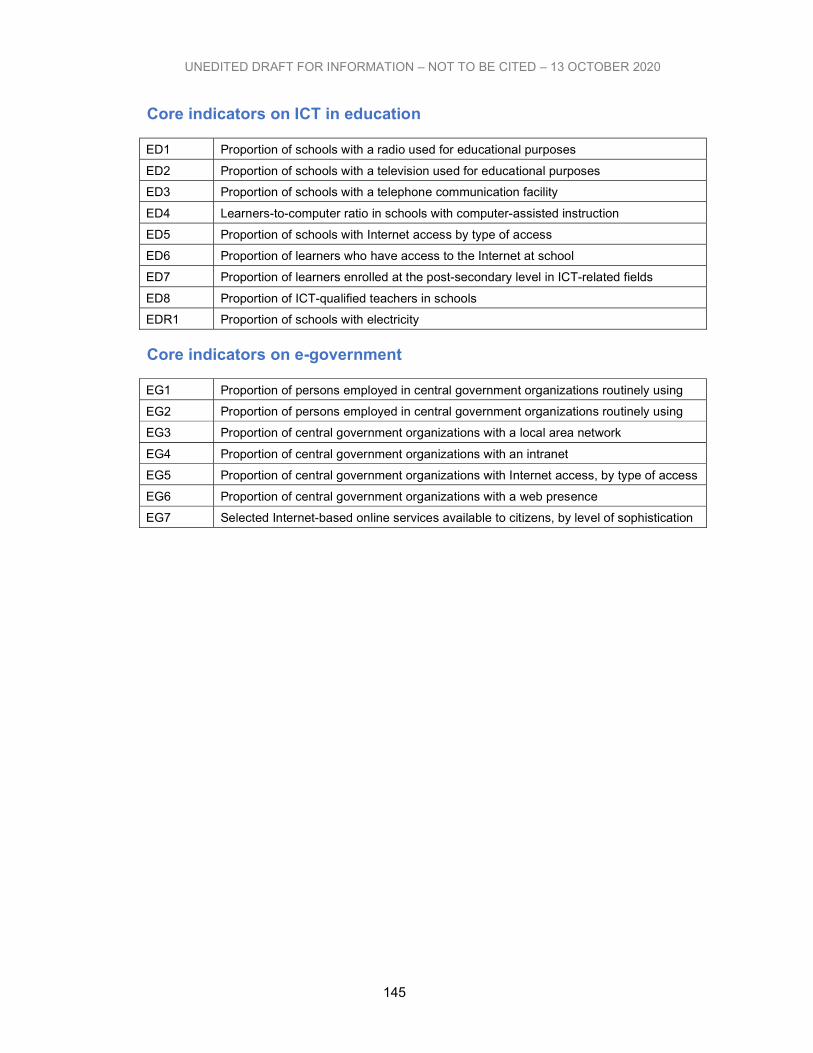
145
UNEDITED DRAFT FOR INFORMATION – NOT TO BE CITED – 13 OCTOBER 2020
Core indicators on ICT in education
ED1 Proportion of schools with a radio used for educational purposes
ED2 Proportion of schools with a television used for educational purposes
ED3 Proportion of schools with a telephone communication facility
ED4 Learners-to-computer ratio in schools with computer-assisted instruction
ED5 Proportion of schools with Internet access by type of access
ED6 Proportion of learners who have access to the Internet at school
ED7 Proportion of learners enrolled at the post-secondary level in ICT-related fields
ED8 Proportion of ICT-qualified teachers in schools
EDR1 Proportion of schools with electricity
Core indicators on e-government
EG1 Proportion of persons employed in central government organizations routinely using computers
EG2 Proportion of persons employed in central government organizations routinely using the Internet EG3 Proportion of central government organizations with a local area network
EG4 Proportion of central government organizations with an intranet
EG5 Proportion of central government organizations with Internet access, by type of access
EG6 Proportion of central government organizations with a web presence
EG7 Selected Internet-based online services available to citizens, by level of sophistication of service
146
UNEDITED DRAFT FOR INFORMATION – NOT TO BE CITED – 13 OCTOBER 2020
Annex 2. UNCTAD model questionnaire for business surveys
on the use of ICT TO BE ADDED
Annex 3. UNCTAD model questionnaire on exports of ICT-
enabled services TO BE ADDED
Annex 4. OECD model questionnaire for ICT use by
businesses TO BE ADDED
Annex 5. Eurostat model questionnaire on ICT usage and e-
commerce in enterprises TO BE ADDED
Annex 6. Estimation of a proportion under different
sampling schemes TO BE ADDED
Annex 7. Imputation of missing data in ICT surveys TO BE ADDED
Annex 8. UNCTAD list of ICT goods (based on HS 2017) TO BE ADDED
Annex 9. Definition of ICT sector (ISIC Rev. 4) TO BE ADDED
Annex 10. Potentially ICT-enabled services sub-groupings with the corresponding CPC Ver.2.1 products codes
TO BE ADDED
Annex 11. UNCTAD country data collection questionnaire TO BE ADDED
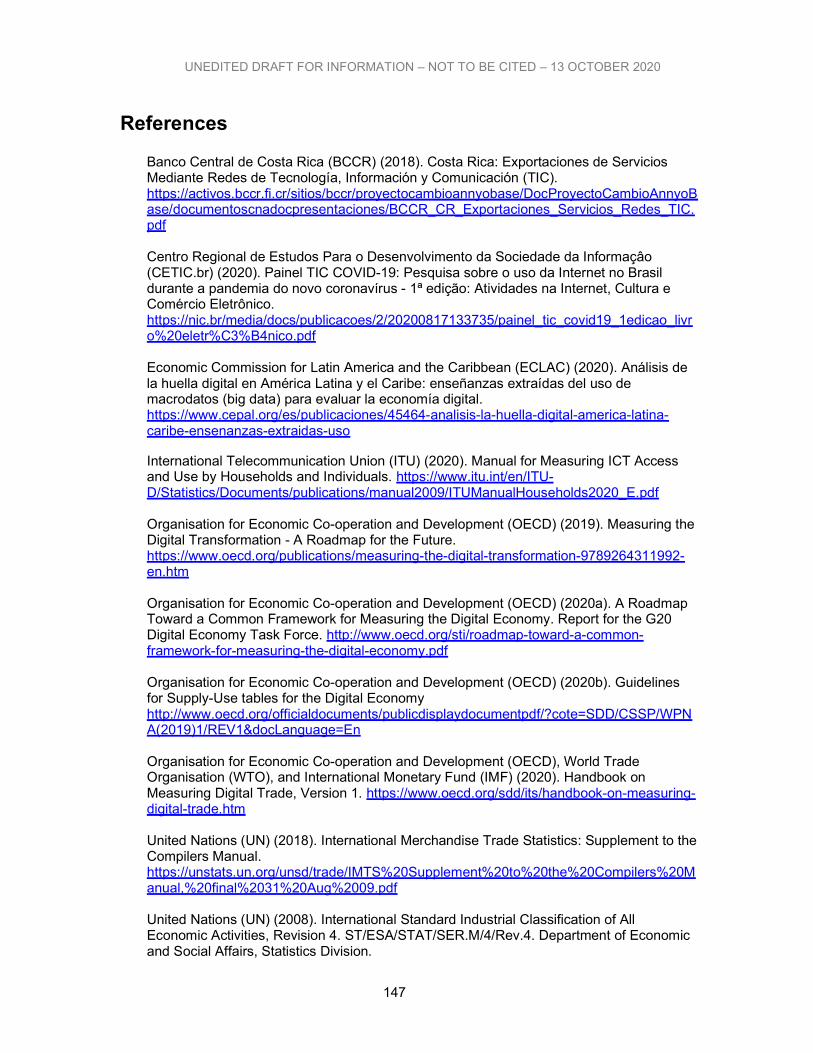
147
UNEDITED DRAFT FOR INFORMATION – NOT TO BE CITED – 13 OCTOBER 2020
References Banco Central de Costa Rica (BCCR) (2018). Costa Rica: Exportaciones de Servicios Mediante Redes de Tecnología, Información y Comunicación (TIC). https://activos.bccr.fi.cr/sitios/bccr/proyectocambioannyobase/DocProyectoCambioAnnyoBase/documentoscnadocpresentaciones/BCCR_CR_Exportaciones_Servicios_Redes_TIC.pdf Centro Regional de Estudos Para o Desenvolvimento da Sociedade da Informaçâo (CETIC.br) (2020). Painel TIC COVID-19: Pesquisa sobre o uso da Internet no Brasil durante a pandemia do novo coronavírus - 1ª edição: Atividades na Internet, Cultura e Comércio Eletrônico. https://nic.br/media/docs/publicacoes/2/20200817133735/painel_tic_covid19_1edicao_livro%20eletr%C3%B4nico.pdf Economic Commission for Latin America and the Caribbean (ECLAC) (2020). Análisis de la huella digital en América Latina y el Caribe: enseñanzas extraídas del uso de macrodatos (big data) para evaluar la economía digital. https://www.cepal.org/es/publicaciones/45464-analisis-la-huella-digital-america-latina-caribe-ensenanzas-extraidas-uso International Telecommunication Union (ITU) (2020). Manual for Measuring ICT Access and Use by Households and Individuals. https://www.itu.int/en/ITU-D/Statistics/Documents/publications/manual2009/ITUManualHouseholds2020_E.pdf Organisation for Economic Co-operation and Development (OECD) (2019). Measuring the Digital Transformation - A Roadmap for the Future. https://www.oecd.org/publications/measuring-the-digital-transformation-9789264311992-en.htm Organisation for Economic Co-operation and Development (OECD) (2020a). A Roadmap Toward a Common Framework for Measuring the Digital Economy. Report for the G20 Digital Economy Task Force. http://www.oecd.org/sti/roadmap-toward-a-common-framework-for-measuring-the-digital-economy.pdf Organisation for Economic Co-operation and Development (OECD) (2020b). Guidelines for Supply-Use tables for the Digital Economy http://www.oecd.org/officialdocuments/publicdisplaydocumentpdf/?cote=SDD/CSSP/WPNA(2019)1/REV1&docLanguage=En Organisation for Economic Co-operation and Development (OECD), World Trade Organisation (WTO), and International Monetary Fund (IMF) (2020). Handbook on Measuring Digital Trade, Version 1. https://www.oecd.org/sdd/its/handbook-on-measuring-digital-trade.htm United Nations (UN) (2018). International Merchandise Trade Statistics: Supplement to the Compilers Manual. https://unstats.un.org/unsd/trade/IMTS%20Supplement%20to%20the%20Compilers%20Manual,%20final%2031%20Aug%2009.pdf United Nations (UN) (2008). International Standard Industrial Classification of All Economic Activities, Revision 4. ST/ESA/STAT/SER.M/4/Rev.4. Department of Economic and Social Affairs, Statistics Division.
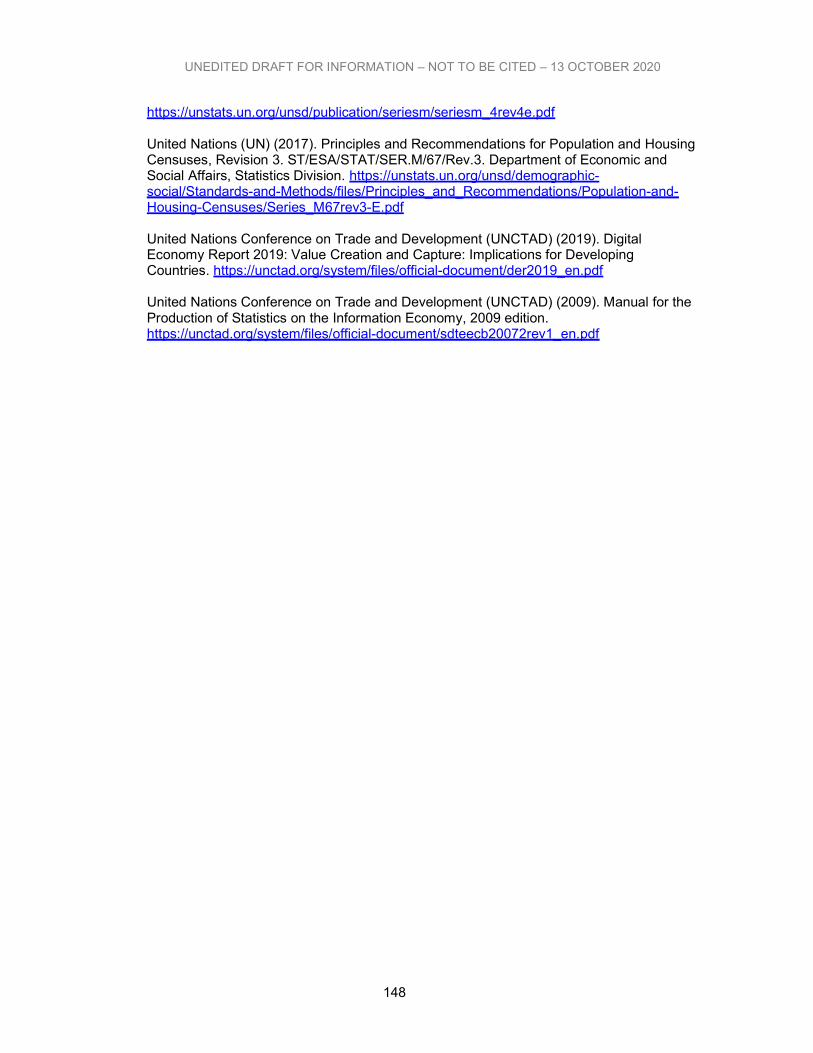
148
UNEDITED DRAFT FOR INFORMATION – NOT TO BE CITED – 13 OCTOBER 2020
https://unstats.un.org/unsd/publication/seriesm/seriesm_4rev4e.pdf United Nations (UN) (2017). Principles and Recommendations for Population and Housing Censuses, Revision 3. ST/ESA/STAT/SER.M/67/Rev.3. Department of Economic and Social Affairs, Statistics Division. https://unstats.un.org/unsd/demographic-social/Standards-and-Methods/files/Principles_and_Recommendations/Population-and-Housing-Censuses/Series_M67rev3-E.pdf United Nations Conference on Trade and Development (UNCTAD) (2019). Digital Economy Report 2019: Value Creation and Capture: Implications for Developing Countries. https://unctad.org/system/files/official-document/der2019_en.pdf United Nations Conference on Trade and Development (UNCTAD) (2009). Manual for the Production of Statistics on the Information Economy, 2009 edition. https://unctad.org/system/files/official-document/sdteecb20072rev1_en.pdf