uncertainty assessment for the buckling analysis of glass
TRANSCRIPT
© 2020 Mohammad Momeni and Chiara Bedon. This open access article is distributed der a Creative Commons Attribution
(CC-BY) 3.0 license.
International Journal of Structural Glass and Advanced Materials Research
Original Research Paper
Uncertainty Assessment for the Buckling Analysis of Glass
Columns with Random Parameters
1Mohammad Momeni and 2*Chiara Bedon
1Shiraz University of Technology, Shiraz, Iran 2University of Trieste, Trieste, Italy
Article history Received: 16-10-2020 Revised: 12-12-2020 Accepted: 21-12-2020
Corresponding Author: Chiara Bedon University of Trieste, Trieste, Italy E-mail: [email protected]
Abstract: Load-bearing elements composed of glass, as known, are often
susceptible to buckling collapse mechanisms. This intrinsic characteristic
(and thus potential limitation for design) typically derives from the use of
relatively small thicknesses to cover large spans and surfaces, thus resulting
in a multitude of columns, beams, or plates that are characterized by high slenderness. In the literature, accordingly, several and design propositions
support of the definition of efficient calculation models to capture the
typical buckling response of glass elements variably shaped, sized,
restrained and loaded. In this study, the attention is focused on the buckling
analysis of glass columns and on the assessment of uncertainties due to
input random parameters. With the support of finite element numerical
models, a total of 800 glass columns are investigated, by accounting for
stochastic variations in the geometry (size and thickness), modulus of
elasticity and density of glass, maximum amplitude of the imposed initial
imperfection, material type. Based on the Monte Carlo simulation method,
the final result takes the form of 2400 simulations, where the post-
processing analysis is spent on the derivation of empirical formulations for the correlation of the relevant buckling capacity indicators. From the
global out-of-plane bending analysis, the input random parameters are
observed to affect severely both long and short columns with different
flexural stiffness. Besides, a stable linear correlation is found for some
influencing indicators. The attention is thus focused on the sensitivity
analysis of critical buckling load, ultimate failure configuration,
deflection at collapse, buckling reduction coefficient.
Keyword: Glass Columns, Column Buckling, Parametric Analysis, Finite
Element (FE) Numerical Models, Monte Carlo Simulation (MCS) Method,
Stochastic Modelling
Introduction
Structural glass elements are notoriously associated
to severe susceptibility to possible buckling failure
mechanisms. As such, in the last few decades, a
multitude of studies have been dedicated to monolithic
or laminated glass members with a variable combination
of restraints and loading conditions. Various efforts can
be found in the literature in the form of experimental,
numerical and/or analytical analysis of glass beams in
lateral-torsional buckling (Belis et al., 2013; Bedon et al.,
2015; Valarinho et al., 2016; Santo et al., 2020), glass
members under flexural-torsional buckling (Amadio and
Bedon, 2013; Bedon and Amadio, 2014; Huang et al.,
2020), plates under in-plane compression and/or shear
(Luible and Crisinel, 2005; Bedon and Amadio, 2012), etc. Regarding the specific topic of column buckling for
glass members, (Luible and Crisinel, 2004) first
addressed this design issue and tried to develop a general
verification approach. In their parametric study, the
normalized stability curves for design were calculated
with the support of numerical models, for various
configurations of technical interest. Further studies and
design proposals for monolithic and laminated glass
columns have been presented in (Amadio et al., 2011;
Bedon and Amadio, 2015). Extensive buckling
experiments on various glass columns-both monolithic and
laminated-are discussed in (Foraboschi, 2009; Pešek et al.,
Mohammad Momeni and Chiara Bedon / International Journal of Structural Glass and Advanced Materials Research 2020, Volume 4: 254.275
DOI: 10.3844/sgamrsp.2020.254.275
255
2016; Liu et al., 2017). Glass columns with more
geometrical complexity are also investigated in the
literature, including also T- or X-shaped columns
(Aiello et al., 2011) hollow-box columns (Kalamar et al.,
2016), tubular columns (Kamarudin et al., 2018) or bundled columns (Oikonomopoulou et al., 2017). A
recent alternative formulation for the equivalent
thickness of laminated glass members in compression
has been presented in (D’Ambrosio and Galuppi, 2020).
In most of the cited studies, the buckling analysis of
glass members is carried out with the support of
experimental tests, non-linear analytical models and
additional Finite Element (FE) numerical models that
could facilitate a more detailed interpretation of test
results, as well as a wider extension of the examined
configurations. In most of the cases, however, these
calculations are carried out on the base of nominal input
parameters, such as material properties, dimensions, etc.
In this regard, a more detailed analysis has been carried
out with a focus on the actual thickness of glass, given
that even small variations can be responsible of severe
stiffness and slenderness modifications, thus susceptivity
to premature buckling collapse mechanism.
Luible and Crisinel (2004), for example,
considered for their parametric calculation a thickness
equal to the 97.61% part of the nominal glass
thickness (thus corresponding to the 5% percentile of
the normal distribution obtained from their previous
experimental thickness measurements). This is also in
line with (Kalamar et al., 2016), where several
thickness measurements are presented with the
support of a laser scanning system.
Besides, the actual role of uncertainties due to
random input parameters for the buckling
performance of glass members still lacks for general
applications and considerations. Literature studies
dedicated to the compression buckling of various
constructional elements and based on the stochastic
analysis, are mostly related to specific issues and
conventional materials for constructions, like the
buckling performance of cylindrical shells with
variable imperfections (Chryssanthopoulos and Poggi,
1995), or laminated composite plates with cutout
(Onkar et al., 2007) and others.
As known, the Monte Carlo Simulation (MCS)
approach represents an alternative and efficient
technique to the stochastic analysis method and has been
successfully taken into account for the compressive
buckling analysis of various constructional systems.
Literature examples can be found for lattice columns
with stochastic imperfections (Miller and Hedgepeth,
1979), steel columns (Strating and Vos, 1973;
Gonzalez Estrada et al., 2018), thin-walled steel I-
section beams/columns with random imperfections
(Schillinger et al., 2010), steel stiffened panels for oil
tankers (Gaspar et al., 2012) and even cross-laminated
timber panels (Oh et al., 2015). Le et al. (2019)
predicted the critical buckling load of steel columns,
based on hybrid Artificial Intelligence (AI)
approaches and AI-derived models, whose robustness
was verified with the MCS method.
Also (Ly et al., 2019), in this regard, quantified the
effect of random material properties on the critical
buckling load of circular columns made of steel. Their
parametric study, supported by FE models, included up
to 500 numerical simulations. In their paper, it is
correctly observed that several models are available in
the literature for the buckling analysis of columns under
axial compression. However, most of them are
deterministic and presume that material uncertainty has
no effect on the expected critical buckling load of a
given member in compression.
The above concepts can be extended also to glass
members in general, where the typically small
thickness of relatively flexible and slender elements is
a first influencing parameter that enforces their
typically high susceptibility to possible buckling
phenomena. Besides, many other input parameters
should be taken into account.
Existing Design Method for Glass Columns
Buckling failure and loss of stability represent, as
known, a frequent condition of premature collapse for
structural glass elements, due to the typical high slenderness
of these innovative load-carrying structural elements.
The number of studies and research activities
dedicated to stability and typical buckling behaviour of
glass columns, beams, panels under various boundary
and loading conditions confirms the large interest in this
topic and the current lack of knowledge on it. Although a
substantial amount of experimental research,
development of analytical models and sophisticated
numerical simulations has been carried out in the past
years, further studies are required.
The buckling behaviour of structural glass elements,
especially in the case of laminated glass cross-sections
composed of two (or more) glass sheets interacting
together by means of thermoplastic films able to
transfer shear loads between them-depending on the
connection stiffness-is in fact not easy predictable, due
to a series of mechanical and geometrical aspects to
assess and quantify, see (Blaauwendraad, 2007) and
many other analytical, numerical or experimental
studies, as also recalled above.
Mohammad Momeni and Chiara Bedon / International Journal of Structural Glass and Advanced Materials Research 2020, Volume 4: 254.275
DOI: 10.3844/sgamrsp.2020.254.275
256
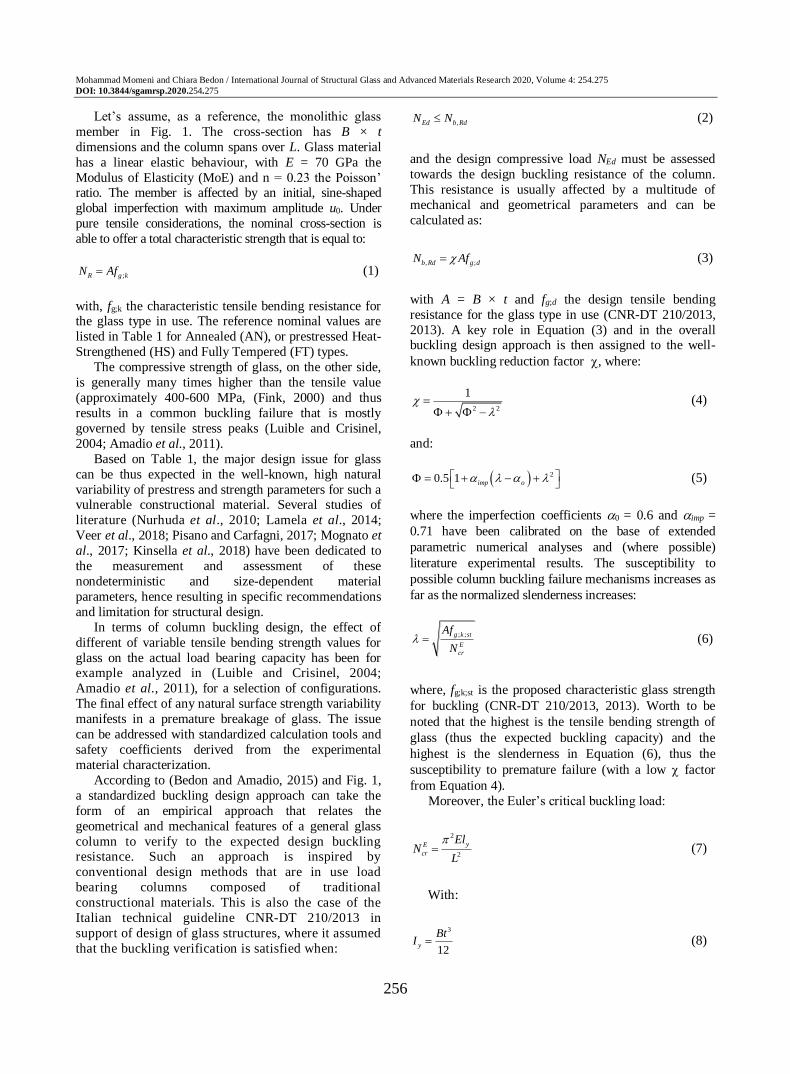
Let’s assume, as a reference, the monolithic glass
member in Fig. 1. The cross-section has B × t
dimensions and the column spans over L. Glass material
has a linear elastic behaviour, with E = 70 GPa the
Modulus of Elasticity (MoE) and n = 0.23 the Poisson’ ratio. The member is affected by an initial, sine-shaped
global imperfection with maximum amplitude u0. Under
pure tensile considerations, the nominal cross-section is
able to offer a total characteristic strength that is equal to:
;R g kN Af (1)
with, fg;k the characteristic tensile bending resistance for the glass type in use. The reference nominal values are
listed in Table 1 for Annealed (AN), or prestressed Heat-
Strengthened (HS) and Fully Tempered (FT) types.
The compressive strength of glass, on the other side,
is generally many times higher than the tensile value
(approximately 400-600 MPa, (Fink, 2000) and thus
results in a common buckling failure that is mostly
governed by tensile stress peaks (Luible and Crisinel,
2004; Amadio et al., 2011). Based on Table 1, the major design issue for glass
can be thus expected in the well-known, high natural
variability of prestress and strength parameters for such a vulnerable constructional material. Several studies of
literature (Nurhuda et al., 2010; Lamela et al., 2014;
Veer et al., 2018; Pisano and Carfagni, 2017; Mognato et
al., 2017; Kinsella et al., 2018) have been dedicated to
the measurement and assessment of these
nondeterministic and size-dependent material
parameters, hence resulting in specific recommendations
and limitation for structural design.
In terms of column buckling design, the effect of
different of variable tensile bending strength values for
glass on the actual load bearing capacity has been for example analyzed in (Luible and Crisinel, 2004;
Amadio et al., 2011), for a selection of configurations.
The final effect of any natural surface strength variability
manifests in a premature breakage of glass. The issue
can be addressed with standardized calculation tools and
safety coefficients derived from the experimental
material characterization.
According to (Bedon and Amadio, 2015) and Fig. 1,
a standardized buckling design approach can take the
form of an empirical approach that relates the
geometrical and mechanical features of a general glass
column to verify to the expected design buckling resistance. Such an approach is inspired by
conventional design methods that are in use load
bearing columns composed of traditional
constructional materials. This is also the case of the
Italian technical guideline CNR-DT 210/2013 in
support of design of glass structures, where it assumed
that the buckling verification is satisfied when:
,Ed b RdN N (2)
and the design compressive load NEd must be assessed
towards the design buckling resistance of the column.
This resistance is usually affected by a multitude of
mechanical and geometrical parameters and can be
calculated as:
, ;b Rd g dN Af (3)
with A = B × t and fg;d the design tensile bending
resistance for the glass type in use (CNR-DT 210/2013,
2013). A key role in Equation (3) and in the overall buckling design approach is then assigned to the well-
known buckling reduction factor , where:
2 2
1
(4)
and:
20.5 1 imp o
(5)
where the imperfection coefficients 0 = 0.6 and imp =
0.71 have been calibrated on the base of extended
parametric numerical analyses and (where possible)
literature experimental results. The susceptibility to
possible column buckling failure mechanisms increases as
far as the normalized slenderness increases:
; ;g k st
E
cr
Af
N (6)
where, fg;k;st is the proposed characteristic glass strength
for buckling (CNR-DT 210/2013, 2013). Worth to be
noted that the highest is the tensile bending strength of
glass (thus the expected buckling capacity) and the
highest is the slenderness in Equation (6), thus the
susceptibility to premature failure (with a low factor
from Equation 4).
Moreover, the Euler’s critical buckling load:
2
2
yE
cr
ElN
L
(7)
With:
3
12y
BtI (8)
Mohammad Momeni and Chiara Bedon / International Journal of Structural Glass and Advanced Materials Research 2020, Volume 4: 254.275
DOI: 10.3844/sgamrsp.2020.254.275
257
Fig. 1: Reference glass column with monolithic B × t resisting
section and span L (pinned ends) Table 1: Nominal characteristic values for the tensile bending
strength of glass (CNR-DT 210/2013, 2013)
Glass type
---------------------------------------------------- AN HS FT
fg;k (MPa) 45 70 120
Notoriously represents partial information only for
buckling design considerations. On the other side,
Equation (7) is one of the first design parameters that are
required in the overall calculation process.
The above design formulation represents an efficient
generalized approach for monolithic glass members that
have been adapted to laminated glass sections (Bedon and
Amadio, 2015) and later to glass members and plates
under variable loading/boundary conditions, with the
used o equivalent thickness formulations. In doing so,
the failure tensile resistance of glass for buckling, fg;k;st,
has been set to the characteristic tensile bending value
fg;k (Table 1), thus accounting for various glass types and
disregarding any kind of possible residual capacity after
the first tensile crack detection.
Within such a standardized approach, it is reasonably
expected that many influencing parameters (but especially the actual tensile strength of glass) could
affect the overall buckling performance and thus the
corresponding input parameters for safe design. On the
other side, the same approach allows to account for a
single formulation for various glass types and shapes and
it is hence efficient for design. The research study from
(Feldmann and Langosch, 2010), in this regard,
includes a set of buckling experiments on glass
elements under in-plane compression and the
derivation of a partial safety factor for buckling that
has been calculated by taking into account the 75% confidence probability and the 5% fractile for the
characteristic value (0.1% fractile for design value)
(EN, 1990:2002) (Annex D). Separate safety factor
coefficients have been then recommended for HS or
FT glass members in compression.
Disregarding the material type (and thus the possible
variability in the actual prestress and strength), many
other combinations of influencing parameters could lead
to premature buckling failure. In the experimental
analysis carried out by (Belis et al., 2011), both the
shape and size of the initial curvature has been measured
for various glass beam specimens (312 in total), proving that a sinusoidal shape can properly describe the initial
curvature of beam-like glass elements. The characteristic
value of initial imperfection, to account for design
calculations, has been thus recommended in mid-span
amplitude of L/400. The same imperfection amplitude is
taken into account for the design approach proposed in
the CNR-DT 210/2013 document.
Research Methods
This research study, compared to past literature
efforts, focuses on the analysis of the effects on the
buckling performance of glass members in compression
due to random input parameters. Based on Fig. 1 and the
above mathematical model for the standardized buckling
verification, major numerical efforts are spent on the side
of the member stiffness and susceptibility to possible
premature collapse mechanisms. Accordingly, the
parametric analysis is carried out on a set of glass
columns in agreement with Fig. 1, but inclusive of
variable geometry (thickness and span), MoE (E), glass
type (AN, HS, FT) and global imperfection for the initial
sine-shaped bow (u0). Material density is also included
in the set of random parameters, to assess the potential
effects on slender members.
In doing so, the Monte Carlo Simulation (MCS)
method is used as efficient technique for probabilistic
B
y
u
X
Z
L
N
X t
N
Mohammad Momeni and Chiara Bedon / International Journal of Structural Glass and Advanced Materials Research 2020, Volume 4: 254.275
DOI: 10.3844/sgamrsp.2020.254.275
258
analysis. MCS is a computational algorithm that relies
on repeated random sampling to address risk and
uncertainties associated with random input parameters
for quantitative analyses and decision making. Also,
MCS is one of the simplest and relatively most accurate methods which provides a feasible way to
determine the probability of failure, where the limit
state function is more complicated (i.e., FE
modelling), as also discussed in (Naess et al., 2009;
Hadianfard et al., 2018; Johari and Momeni, 2015;
Johari et al., 2015) and many other literature studies.
All the reference input properties are hence
summarized in Table 2, while Table 3 describes the basic
parameters for the MCS (based on truncated normal
Probability Density Function (PDF)). The basic material
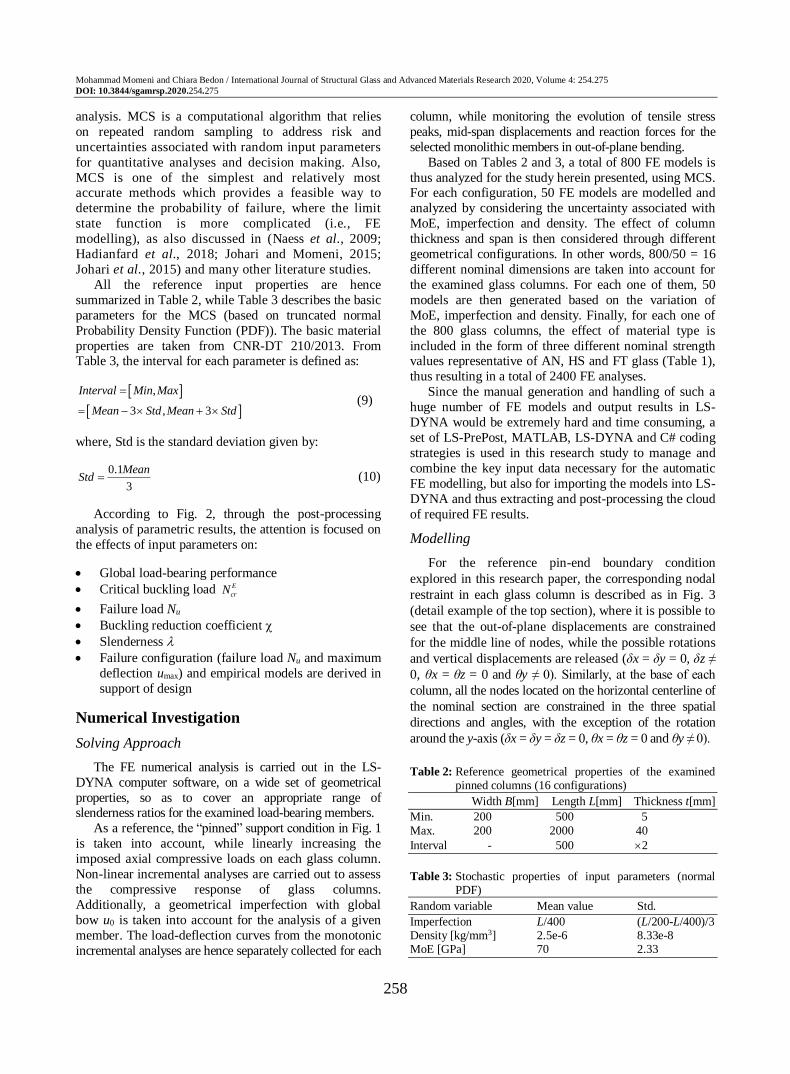
properties are taken from CNR-DT 210/2013. From Table 3, the interval for each parameter is defined as:
,
3 , 3
Interval Min Max
Mean Std Mean Std
(9)
where, Std is the standard deviation given by:
0.1
3
MeanStd (10)
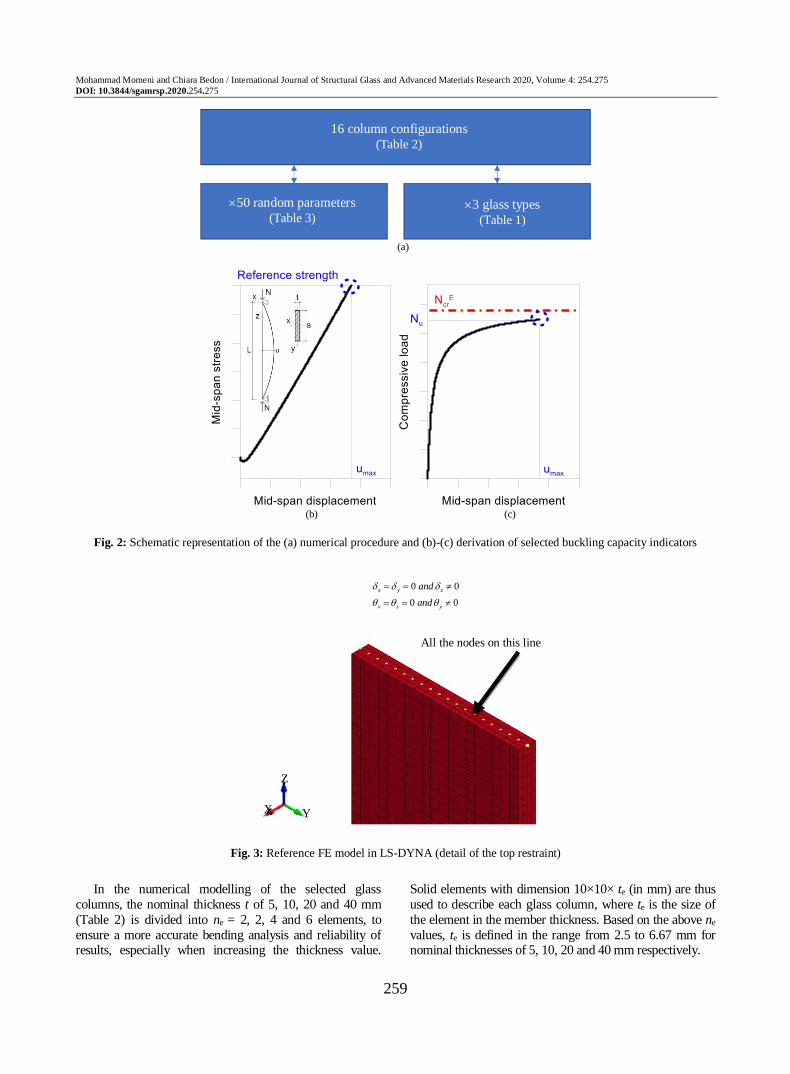
According to Fig. 2, through the post-processing
analysis of parametric results, the attention is focused on
the effects of input parameters on:
Global load-bearing performance
Critical buckling load E
crN
Failure load Nu
Buckling reduction coefficient
Slenderness
Failure configuration (failure load Nu and maximum
deflection umax) and empirical models are derived in
support of design
Numerical Investigation
Solving Approach
The FE numerical analysis is carried out in the LS-
DYNA computer software, on a wide set of geometrical
properties, so as to cover an appropriate range of slenderness ratios for the examined load-bearing members.
As a reference, the “pinned” support condition in Fig. 1
is taken into account, while linearly increasing the
imposed axial compressive loads on each glass column.
Non-linear incremental analyses are carried out to assess
the compressive response of glass columns.
Additionally, a geometrical imperfection with global
bow u0 is taken into account for the analysis of a given
member. The load-deflection curves from the monotonic
incremental analyses are hence separately collected for each
column, while monitoring the evolution of tensile stress
peaks, mid-span displacements and reaction forces for the
selected monolithic members in out-of-plane bending.
Based on Tables 2 and 3, a total of 800 FE models is
thus analyzed for the study herein presented, using MCS. For each configuration, 50 FE models are modelled and
analyzed by considering the uncertainty associated with
MoE, imperfection and density. The effect of column
thickness and span is then considered through different
geometrical configurations. In other words, 800/50 = 16
different nominal dimensions are taken into account for
the examined glass columns. For each one of them, 50
models are then generated based on the variation of
MoE, imperfection and density. Finally, for each one of
the 800 glass columns, the effect of material type is
included in the form of three different nominal strength values representative of AN, HS and FT glass (Table 1),
thus resulting in a total of 2400 FE analyses.
Since the manual generation and handling of such a
huge number of FE models and output results in LS-
DYNA would be extremely hard and time consuming, a
set of LS-PrePost, MATLAB, LS-DYNA and C# coding
strategies is used in this research study to manage and
combine the key input data necessary for the automatic
FE modelling, but also for importing the models into LS-
DYNA and thus extracting and post-processing the cloud
of required FE results.
Modelling
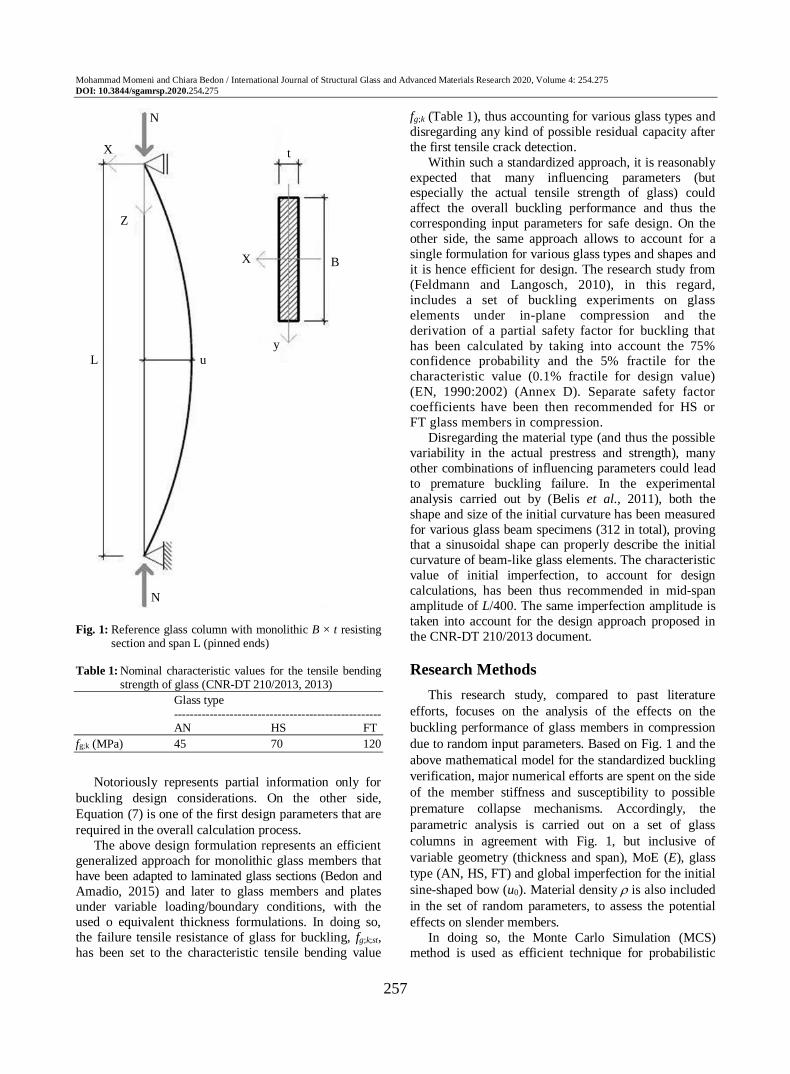
For the reference pin-end boundary condition
explored in this research paper, the corresponding nodal
restraint in each glass column is described as in Fig. 3
(detail example of the top section), where it is possible to
see that the out-of-plane displacements are constrained
for the middle line of nodes, while the possible rotations
and vertical displacements are released (δx = δy = 0, δz ≠
0, θx = θz = 0 and θy ≠ 0). Similarly, at the base of each
column, all the nodes located on the horizontal centerline of
the nominal section are constrained in the three spatial
directions and angles, with the exception of the rotation
around the y-axis (δx = δy = δz = 0, θx = θz = 0 and θy ≠ 0).
Table 2: Reference geometrical properties of the examined
pinned columns (16 configurations)
Width B[mm] Length L[mm] Thickness t[mm]
Min. 200 500 5
Max. 200 2000 40
Interval - 500 2
Table 3: Stochastic properties of input parameters (normal
PDF)
Random variable Mean value Std.
Imperfection L/400 (L/200-L/400)/3 Density [kg/mm3] 2.5e-6 8.33e-8 MoE [GPa] 70 2.33
Mohammad Momeni and Chiara Bedon / International Journal of Structural Glass and Advanced Materials Research 2020, Volume 4: 254.275
DOI: 10.3844/sgamrsp.2020.254.275
259
(a)
(b) (c)
Fig. 2: Schematic representation of the (a) numerical procedure and (b)-(c) derivation of selected buckling capacity indicators
Fig. 3: Reference FE model in LS-DYNA (detail of the top restraint)
In the numerical modelling of the selected glass
columns, the nominal thickness t of 5, 10, 20 and 40 mm
(Table 2) is divided into ne = 2, 2, 4 and 6 elements, to
ensure a more accurate bending analysis and reliability of results, especially when increasing the thickness value.
Solid elements with dimension 10×10× te (in mm) are thus
used to describe each glass column, where te is the size of
the element in the member thickness. Based on the above ne
values, te is defined in the range from 2.5 to 6.67 mm for nominal thicknesses of 5, 10, 20 and 40 mm respectively.
0 0
0 0
x y z
x z y
and
and
All the nodes on this line
Z
Y X
16 column configurations
(Table 2)
50 random parameters
(Table 3) 3 glass types
(Table 1)
Mohammad Momeni and Chiara Bedon / International Journal of Structural Glass and Advanced Materials Research 2020, Volume 4: 254.275
DOI: 10.3844/sgamrsp.2020.254.275
260
Regarding the characterization of glass, the
MAT_ELASTIC material model is used for all the FE
models, with input properties from Table 3, while the
nominal resistance values from Table 1 are indirectly
accounted in the post-processing stage.
Each FE model is preliminary subjected to an
initial sine-shaped geometrical imperfection as in
Table 3. Based on literature efforts, its shape is
basically detected in the first fundamental modal
shape of a pinned column and thus imported as a
reference geometrical configuration. Disregarding the
variability of real imperfection shapes (Belis et al.,
2011) and thus assuming the worst bending effects to
derive from a conventional imperfection shape, the
attention is focused on the analysis of bending and
buckling effects deriving from the imposed maximum
amplitude u0 of this imperfection that is progressively
modified as in Table 3.
Through the typical FE analysis of the so pre-
deformed glass columns, finally, the in-plane
compressive load N is imposed to the top section of
each model and modified with a ramp function in the
time of the simulation, so that it could be gradually
increased until any kind of buckling collapse
mechanism. To this aim, according to literature, the
propagation of tensile stress peaks is continuously
monitored as a function of the imposed compressive
load N. The reference analysis is then interrupted at
the first achievement of a maximum tensile bending
stress in glass at least equal to the assigned material
strength (Table 1). The possible occurrence of an
overall buckling deformation in the large
displacement field can represent an alternative
collapse configuration for slender members and it is
thus additionally taken into account for the analysis of
the collected parametric FE results. In this manner,
especially for long span members, it is ensured that
the derived resistance value at collapse can be
representative of their maximum capacity.
Discussion of Numerical Results
Boundaries
The random parameters from Tables 2 and 3 were
selected in a preliminary stage of the study, so as to
cover a wide range of potential scenarios of technical
interest, even in presence of a relatively small number
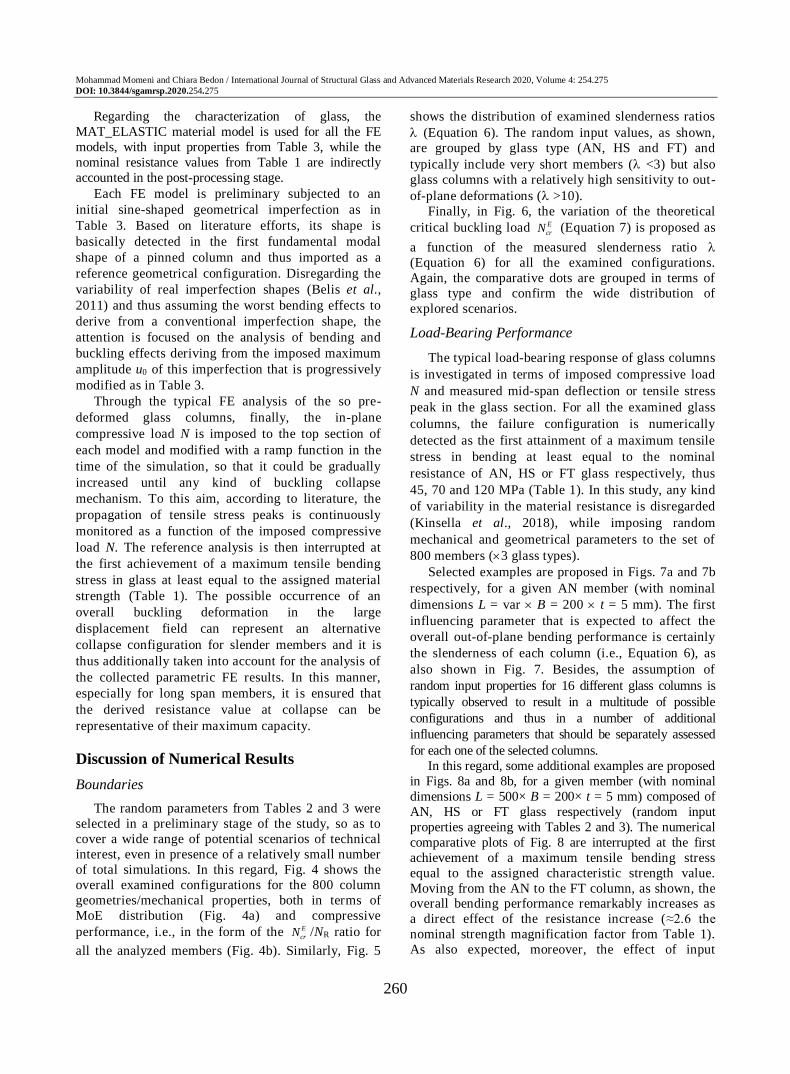
of total simulations. In this regard, Fig. 4 shows the
overall examined configurations for the 800 column
geometries/mechanical properties, both in terms of
MoE distribution (Fig. 4a) and compressive
performance, i.e., in the form of the E
crN /NR ratio for
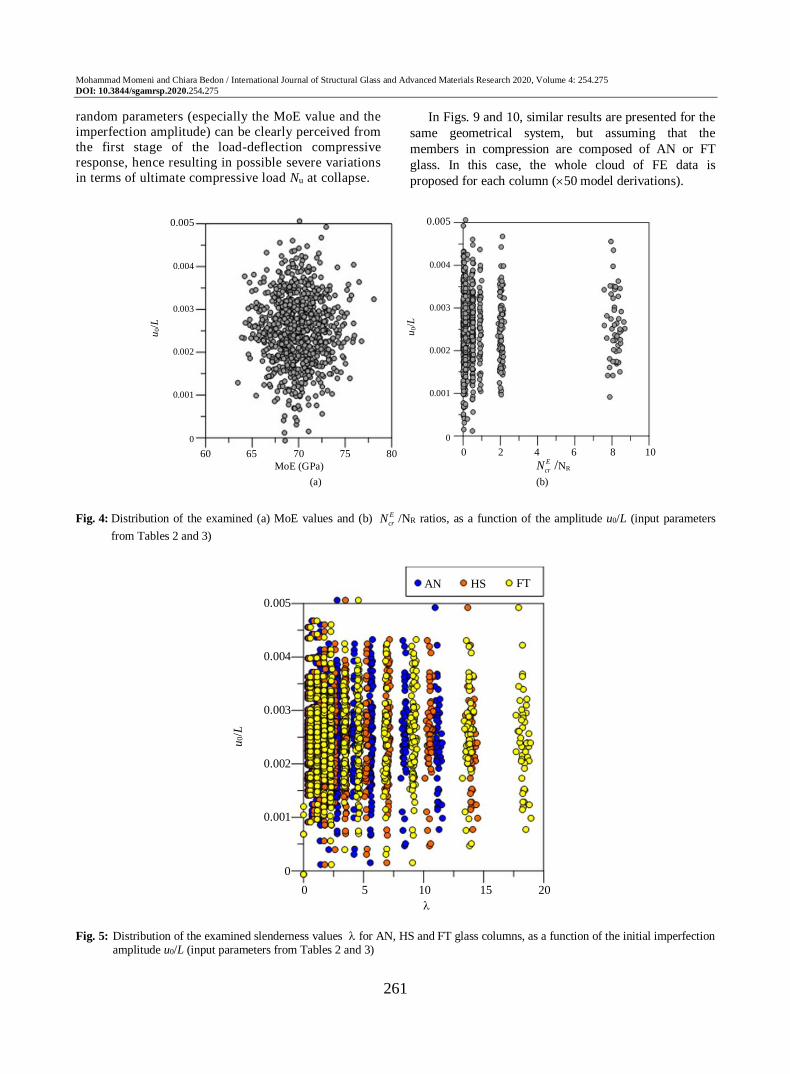
all the analyzed members (Fig. 4b). Similarly, Fig. 5
shows the distribution of examined slenderness ratios
(Equation 6). The random input values, as shown,
are grouped by glass type (AN, HS and FT) and
typically include very short members ( <3) but also
glass columns with a relatively high sensitivity to out-
of-plane deformations ( >10).
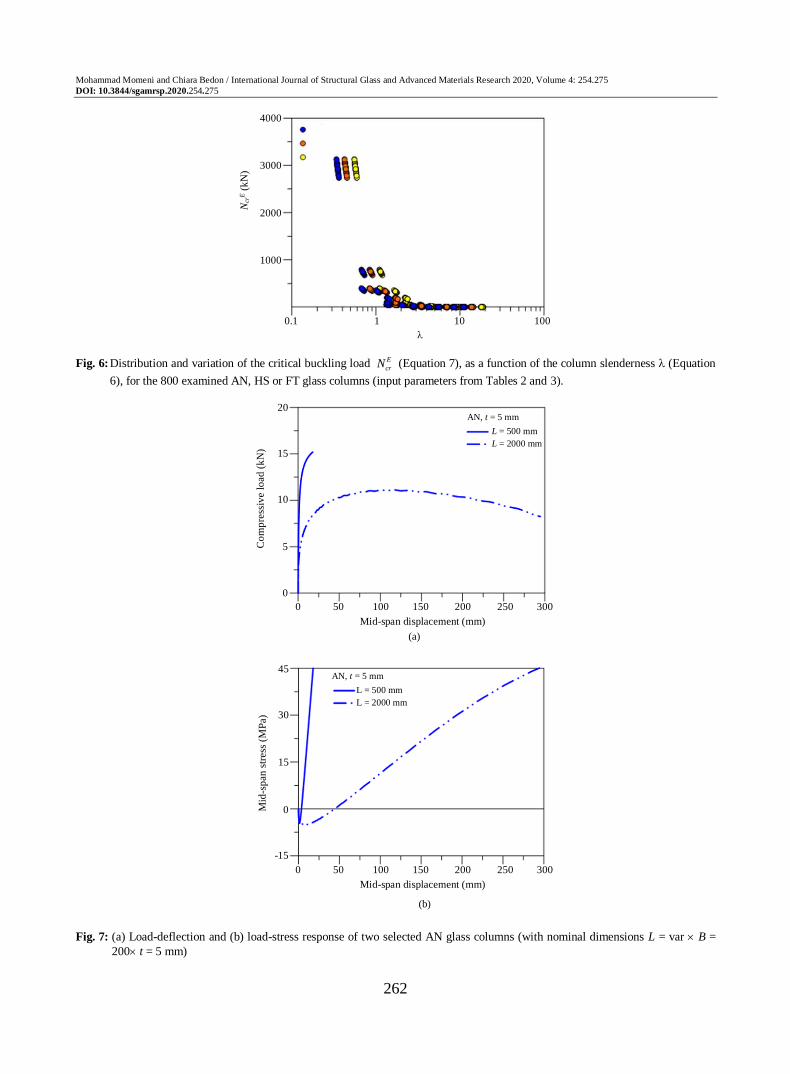
Finally, in Fig. 6, the variation of the theoretical
critical buckling load E
crN (Equation 7) is proposed as
a function of the measured slenderness ratio
(Equation 6) for all the examined configurations.
Again, the comparative dots are grouped in terms of
glass type and confirm the wide distribution of
explored scenarios.
Load-Bearing Performance
The typical load-bearing response of glass columns
is investigated in terms of imposed compressive load
N and measured mid-span deflection or tensile stress
peak in the glass section. For all the examined glass
columns, the failure configuration is numerically
detected as the first attainment of a maximum tensile
stress in bending at least equal to the nominal
resistance of AN, HS or FT glass respectively, thus
45, 70 and 120 MPa (Table 1). In this study, any kind
of variability in the material resistance is disregarded
(Kinsella et al., 2018), while imposing random
mechanical and geometrical parameters to the set of
800 members (3 glass types).
Selected examples are proposed in Figs. 7a and 7b
respectively, for a given AN member (with nominal
dimensions L = var B = 200 t = 5 mm). The first
influencing parameter that is expected to affect the
overall out-of-plane bending performance is certainly
the slenderness of each column (i.e., Equation 6), as
also shown in Fig. 7. Besides, the assumption of
random input properties for 16 different glass columns is
typically observed to result in a multitude of possible
configurations and thus in a number of additional
influencing parameters that should be separately assessed
for each one of the selected columns.
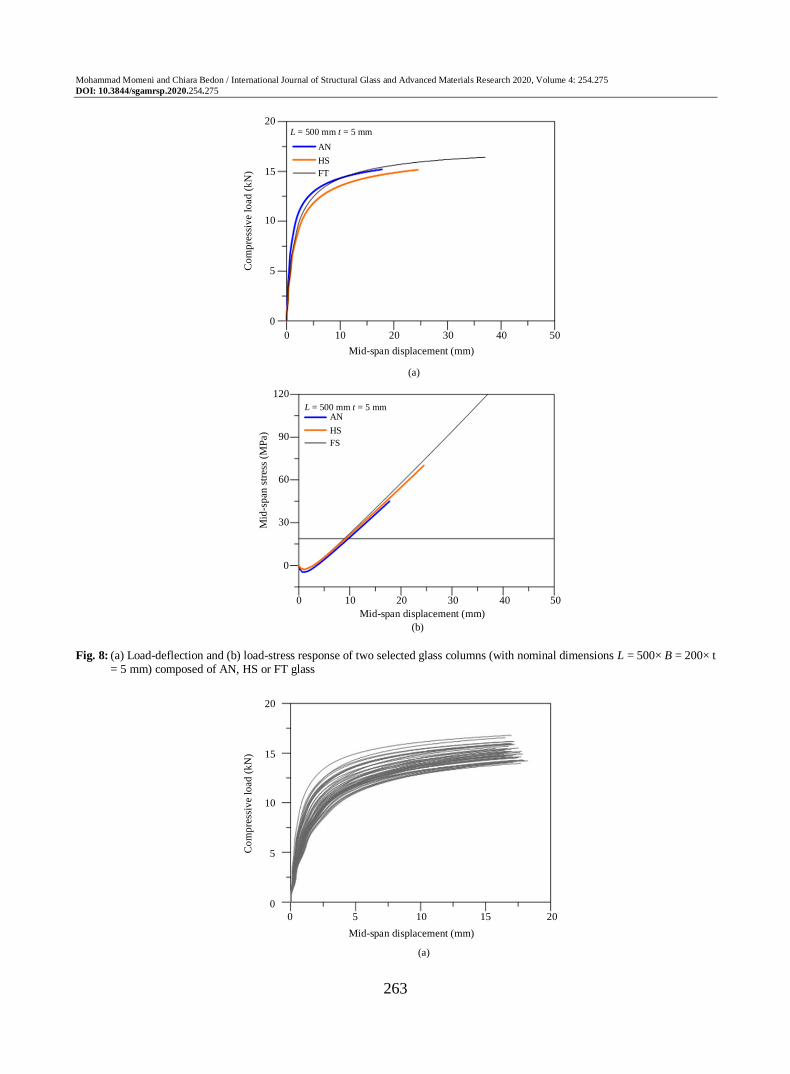
In this regard, some additional examples are proposed
in Figs. 8a and 8b, for a given member (with nominal
dimensions L = 500× B = 200× t = 5 mm) composed of
AN, HS or FT glass respectively (random input
properties agreeing with Tables 2 and 3). The numerical
comparative plots of Fig. 8 are interrupted at the first
achievement of a maximum tensile bending stress
equal to the assigned characteristic strength value.
Moving from the AN to the FT column, as shown, the overall bending performance remarkably increases as
a direct effect of the resistance increase (≈2.6 the
nominal strength magnification factor from Table 1).
As also expected, moreover, the effect of input
Mohammad Momeni and Chiara Bedon / International Journal of Structural Glass and Advanced Materials Research 2020, Volume 4: 254.275
DOI: 10.3844/sgamrsp.2020.254.275
261
random parameters (especially the MoE value and the
imperfection amplitude) can be clearly perceived from
the first stage of the load-deflection compressive
response, hence resulting in possible severe variations
in terms of ultimate compressive load Nu at collapse.
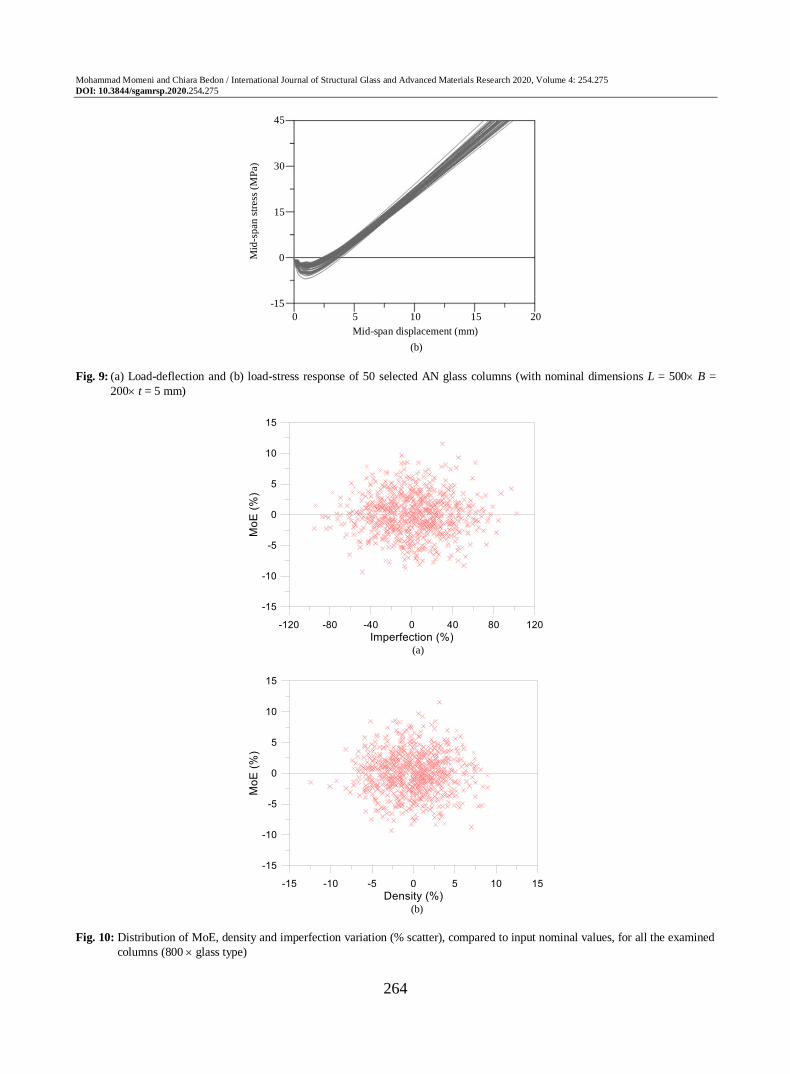
In Figs. 9 and 10, similar results are presented for the
same geometrical system, but assuming that the
members in compression are composed of AN or FT
glass. In this case, the whole cloud of FE data is
proposed for each column (50 model derivations).
(a) (b)
Fig. 4: Distribution of the examined (a) MoE values and (b) E
crN /NR ratios, as a function of the amplitude u0/L (input parameters
from Tables 2 and 3)
Fig. 5: Distribution of the examined slenderness values for AN, HS and FT glass columns, as a function of the initial imperfection
amplitude u0/L (input parameters from Tables 2 and 3)
0.005
0.004
0.003
0.002
0.001
0
60 65 70 75 80 0 2 4 6 8 10 E
crN /NR MoE (GPa)
u0/L
0.005
0.004
0.003
0.002
0.001
0
u0/L
0.005
0.004
0.003
0.002
0.001
0
AN HS FT
u0/L
0 5 10 15 20
Mohammad Momeni and Chiara Bedon / International Journal of Structural Glass and Advanced Materials Research 2020, Volume 4: 254.275
DOI: 10.3844/sgamrsp.2020.254.275
262
Fig. 6: Distribution and variation of the critical buckling load E
crN (Equation 7), as a function of the column slenderness (Equation
6), for the 800 examined AN, HS or FT glass columns (input parameters from Tables 2 and 3).
(a)
(b)
Fig. 7: (a) Load-deflection and (b) load-stress response of two selected AN glass columns (with nominal dimensions L = var B =
200 t = 5 mm)
4000
3000
2000
1000
Ncr
E (
kN
)
0.1 1 10 100
20
15
10
5
0
Co
mp
ress
ive
load
(k
N)
0 50 100 150 200 250 300
Mid-span displacement (mm)
AN, t = 5 mm
L = 500 mm
L = 2000 mm
AN, t = 5 mm
L = 500 mm
L = 2000 mm
0 50 100 150 200 250 300
Mid-span displacement (mm)
45
30
15
0
-15
Mid
-sp
an s
tres
s (M
Pa)
Mohammad Momeni and Chiara Bedon / International Journal of Structural Glass and Advanced Materials Research 2020, Volume 4: 254.275
DOI: 10.3844/sgamrsp.2020.254.275
263
(a)
(b)
Fig. 8: (a) Load-deflection and (b) load-stress response of two selected glass columns (with nominal dimensions L = 500× B = 200× t
= 5 mm) composed of AN, HS or FT glass
(a)
20
15
10
5
0
0 10 20 30 40 50
Mid-span displacement (mm)
Co
mp
ress
ive
load
(k
N)
L = 500 mm t = 5 mm
AN
HS
FT
120
90
60
30
0
Mid
-sp
an s
tres
s (M
Pa)
0 10 20 30 40 50
Mid-span displacement (mm)
L = 500 mm t = 5 mm AN
HS
FS
20
15
10
5
0
0 5 10 15 20
Mid-span displacement (mm)
Co
mp
ress
ive
load
(k
N)
Mohammad Momeni and Chiara Bedon / International Journal of Structural Glass and Advanced Materials Research 2020, Volume 4: 254.275
DOI: 10.3844/sgamrsp.2020.254.275
264
(b) Fig. 9: (a) Load-deflection and (b) load-stress response of 50 selected AN glass columns (with nominal dimensions L = 500 B =
200 t = 5 mm)
(a)
(b) Fig. 10: Distribution of MoE, density and imperfection variation (% scatter), compared to input nominal values, for all the examined
columns (800 glass type)
45
30
15
0
-15
Mid
-sp
an s
tres
s (M
Pa)
0 5 10 15 20
Mid-span displacement (mm)
Mohammad Momeni and Chiara Bedon / International Journal of Structural Glass and Advanced Materials Research 2020, Volume 4: 254.275
DOI: 10.3844/sgamrsp.2020.254.275
265
While each analysis is still separately interrupted at
the first achievement of a tensile stress peak at least
equal to the reference material strength in Table 1, it can
be perceived that the overall collected FE plots are rather
scattered in the initial flexural stiffness, maximum capacity and failure configuration, as a major effect of
the stochastic distribution of input data in Tables 2 and
3. More in detail, from the whole parametric study it is
also observed that:
MoE variations directly affect the bending stiffness of the glass members object of analysis and thus their
sensitivity to out-of-plane deformations. Due to MoE
variations only, the percentage scatter for the calculated
flexural stiffness values (and thus critical buckling load E
crN of the same member) is found in the range of
±15% compared to the nominal MoE (Fig. 10)
The amplitude of the initial global bow, u0, is a
further well-known, relevant influencing parameter,
given that it can manifest in a premature loss of
stability for the whole glass member object of study.
For the selected random parameters, a relatively
high variation is calculated in peak values of ±80%
the nominal ones (Fig. 10a)
The effects of both MoE and u0 parameters are
strictly connected to the slenderness of the
examined members. In this research study and
specifically for relatively short glass members
(expected to collapse for mainly compressive issues,
rather than buckling-related phenomena), very high
sensitivity can be observed to the assigned input
parameters (i.e., Fig. 9), in the same way of
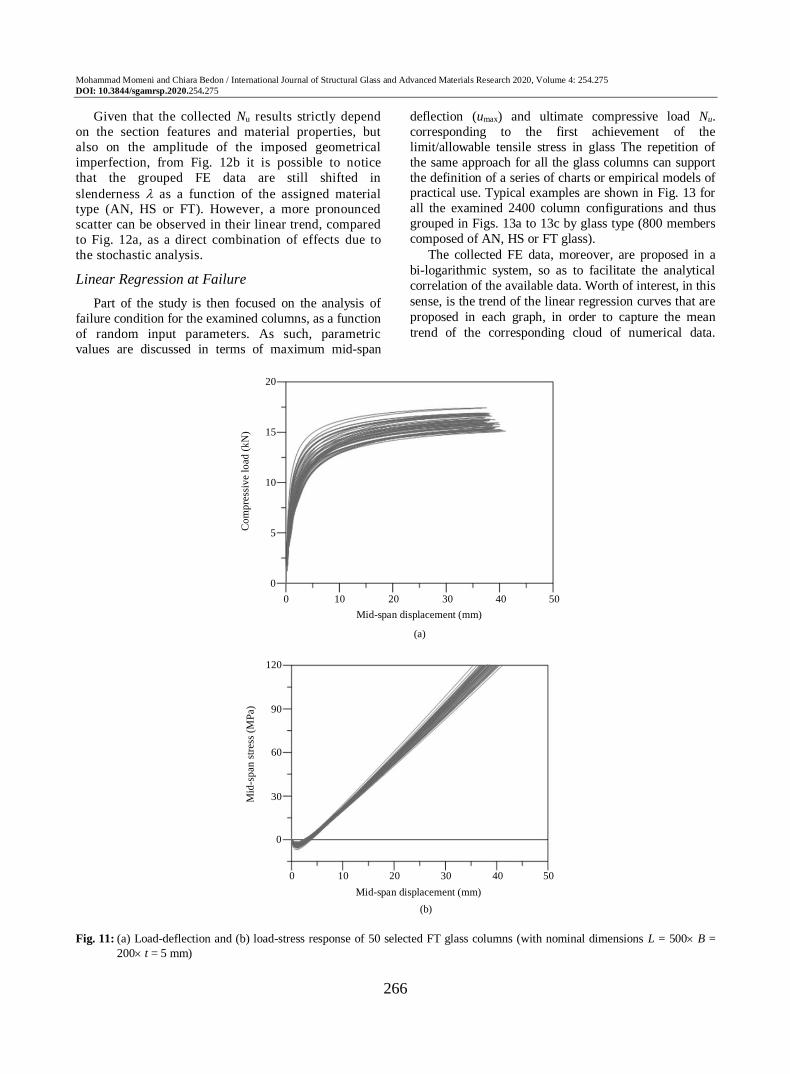
long/slender members (i.e., Fig. 11)
Finally, the possible variation in the material density
could represent a relevant parameter for
compressive buckling assessment purposes. Typical input values are shown in Fig. 10b. Compared to the
other random parameters, however, is observed to
have minimum effects, that can be slightly perceived
for glass columns with high slenderness
In this regard, the post-processing stage of the
collected FE results can be further maximized as far as
they are used for the definition of potential empirical
models that could capture any kind of correlation.
Critical and Failure Loads
The critical load E
crN for columns represents, as
known, a poor parameter only for the assessment of
the actual buckling capacity and response of a given
member. A multitude of parameters, including
geometrical and mechanical aspects, are responsible
of the final capacity and thus of the buckling failure,
Nu, for the examined members. Even more sensitivity
of their actual capacity can be expected under random
input parameters, as also previously observed from
Figs. 9 and 11.
To provide a more detailed interpretation of buckling measurements (especially in the case of background
experimental measurements), the Southwell plot
approach (Southwell, 1932) can be efficiently taken into
account. This method assumes that from the
experimental (or even numerical) measurements (plotted
in the form u/N versus u, with u the maximum out-of-
plane displacement due to the increasing applied
compressive load N), the slope of fitting curves can be
rationally determined for the examined load bearing
members. The advantage of the approach (as far as the
examined load bearing members behave elastically) is the possible minimization (or even avoidance) of cost-
consuming and destructive laboratory experiments.
Successful applications can be found (for glass/buckling-
related applications) in (Belis et al., 2013) and many
others. The first indication provided by Southwell plots
is in fact the critical load of a member, given by the
slope of the linear fitting curve which at best
approximates the u-(u/N) plot of available results. At the
same time, the interception between this linear fitting
curve and the y-axis gives an indication of the initial lack
of straightness of the tested specimens and in particular
the maximum amplitude u0 of possible geometrical imperfections or boundary and load eccentricities.
In this study, given the lack of experimental studies
and the final goal of the analysis, the attention is focused
on the quantification of uncertainties due to random
input parameters for the buckling performance
assessment of glass columns. The final results turns out
in fact in potential sensitivity of the traditional design
parameters and coefficients that are used to support safe
design calculations.
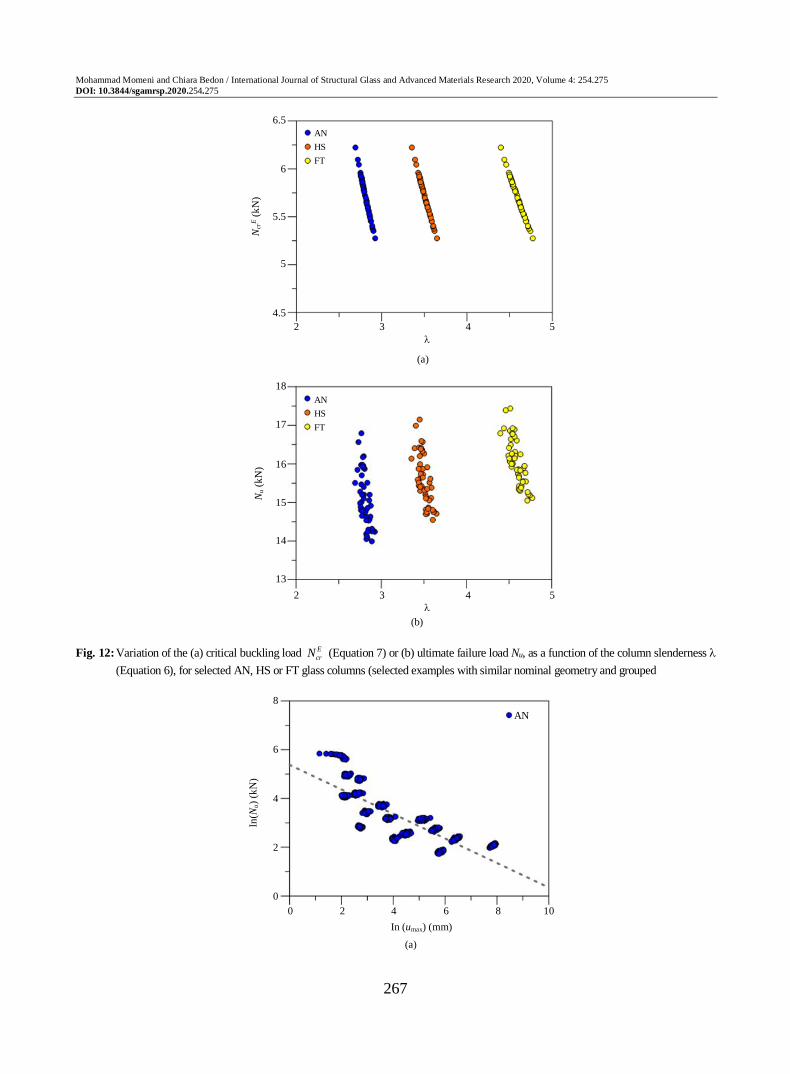
The collected results in Fig. 12, for example, are
selected to present an overview of random parameters effects on both the critical and failure load of grouped
column geometries (with 50 simulations for each
nominal geometry glass type, based on Tables 2 and
3). In Fig. 11a, more in detail, the attention is focused on
the variation of E
crN (Equation 7) with the slenderness
(Equation 6). The trend of collected values is generally
found to be perfectly linear, based on the selected
interval of random variables in Tables 2 and 3, as well as
on the theoretical basis of the calculated E
crN and
values. The same dots are then grouped by glass type
that basically affects the slenderness value only (due to
resistance variations in Equation 6).
In Fig. 12b, selected FE results are indeed proposed
in terms of ultimate load at failure, Nu, for groups of AN,
HS or FT glass columns with similar nominal geometry
and random input parameters from Tables 2 and 3.
Mohammad Momeni and Chiara Bedon / International Journal of Structural Glass and Advanced Materials Research 2020, Volume 4: 254.275
DOI: 10.3844/sgamrsp.2020.254.275
266
Given that the collected Nu results strictly depend
on the section features and material properties, but
also on the amplitude of the imposed geometrical
imperfection, from Fig. 12b it is possible to notice
that the grouped FE data are still shifted in
slenderness as a function of the assigned material type (AN, HS or FT). However, a more pronounced
scatter can be observed in their linear trend, compared
to Fig. 12a, as a direct combination of effects due to
the stochastic analysis.
Linear Regression at Failure
Part of the study is then focused on the analysis of
failure condition for the examined columns, as a function
of random input parameters. As such, parametric
values are discussed in terms of maximum mid-span
deflection (umax) and ultimate compressive load Nu.
corresponding to the first achievement of the
limit/allowable tensile stress in glass The repetition of
the same approach for all the glass columns can support
the definition of a series of charts or empirical models of practical use. Typical examples are shown in Fig. 13 for
all the examined 2400 column configurations and thus
grouped in Figs. 13a to 13c by glass type (800 members
composed of AN, HS or FT glass).
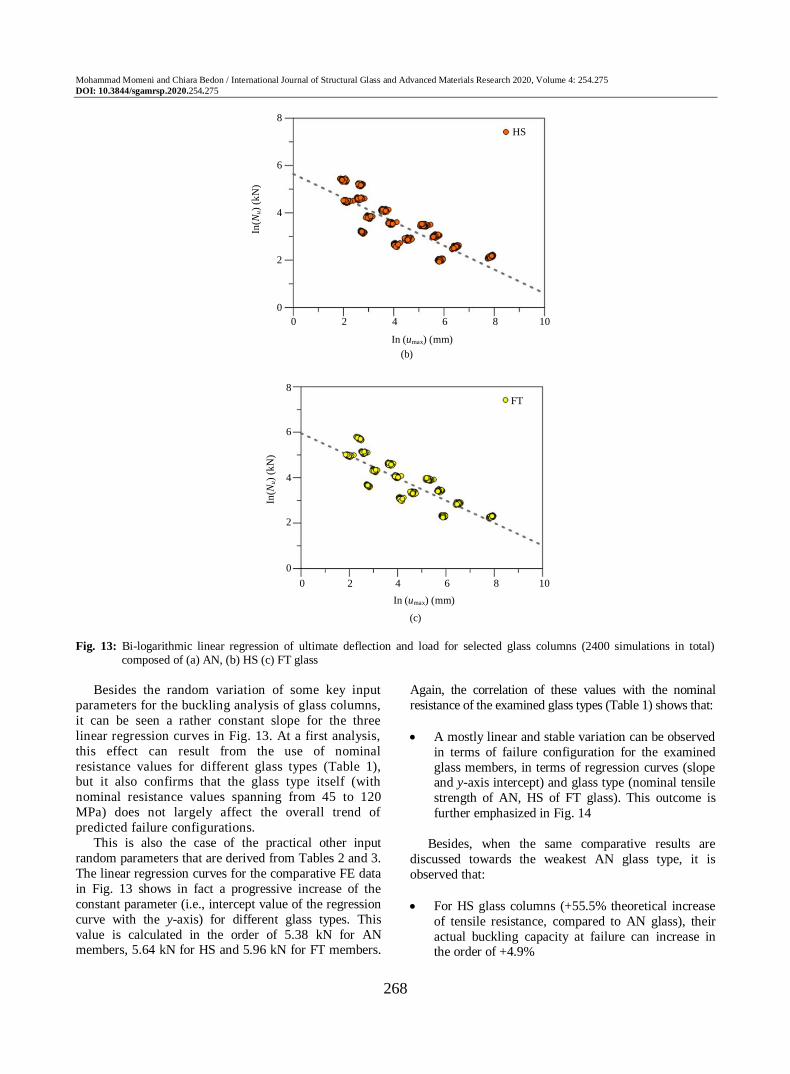
The collected FE data, moreover, are proposed in a
bi-logarithmic system, so as to facilitate the analytical
correlation of the available data. Worth of interest, in this
sense, is the trend of the linear regression curves that are
proposed in each graph, in order to capture the mean
trend of the corresponding cloud of numerical data.
(a)
(b) Fig. 11: (a) Load-deflection and (b) load-stress response of 50 selected FT glass columns (with nominal dimensions L = 500 B =
200 t = 5 mm)
20
15
10
5
0
0 10 20 30 40 50
Mid-span displacement (mm)
Co
mp
ress
ive
load
(k
N)
120
90
60
30
0
Mid
-sp
an s
tres
s (M
Pa)
0 10 20 30 40 50
Mid-span displacement (mm)
Mohammad Momeni and Chiara Bedon / International Journal of Structural Glass and Advanced Materials Research 2020, Volume 4: 254.275
DOI: 10.3844/sgamrsp.2020.254.275
267
(a)
(b)
Fig. 12: Variation of the (a) critical buckling load E
crN (Equation 7) or (b) ultimate failure load Nu, as a function of the column slenderness
(Equation 6), for selected AN, HS or FT glass columns (selected examples with similar nominal geometry and grouped
(a)
6.5
6
5.5
5
4.5
Ncr
E (
kN
)
AN
HS
FT
2 3 4 5
AN
HS
FT
2 3 4 5
18
17
16
15
14
13
Nu (
kN
)
8
6
4
2
0
In(N
u)
(kN
)
0 2 4 6 8 10
In (umax) (mm)
AN
Mohammad Momeni and Chiara Bedon / International Journal of Structural Glass and Advanced Materials Research 2020, Volume 4: 254.275
DOI: 10.3844/sgamrsp.2020.254.275
268
(b)
(c) Fig. 13: Bi-logarithmic linear regression of ultimate deflection and load for selected glass columns (2400 simulations in total)
composed of (a) AN, (b) HS (c) FT glass
Besides the random variation of some key input
parameters for the buckling analysis of glass columns,
it can be seen a rather constant slope for the three
linear regression curves in Fig. 13. At a first analysis,
this effect can result from the use of nominal
resistance values for different glass types (Table 1), but it also confirms that the glass type itself (with
nominal resistance values spanning from 45 to 120
MPa) does not largely affect the overall trend of
predicted failure configurations.
This is also the case of the practical other input
random parameters that are derived from Tables 2 and 3.
The linear regression curves for the comparative FE data
in Fig. 13 shows in fact a progressive increase of the
constant parameter (i.e., intercept value of the regression
curve with the y-axis) for different glass types. This
value is calculated in the order of 5.38 kN for AN members, 5.64 kN for HS and 5.96 kN for FT members.
Again, the correlation of these values with the nominal
resistance of the examined glass types (Table 1) shows that:
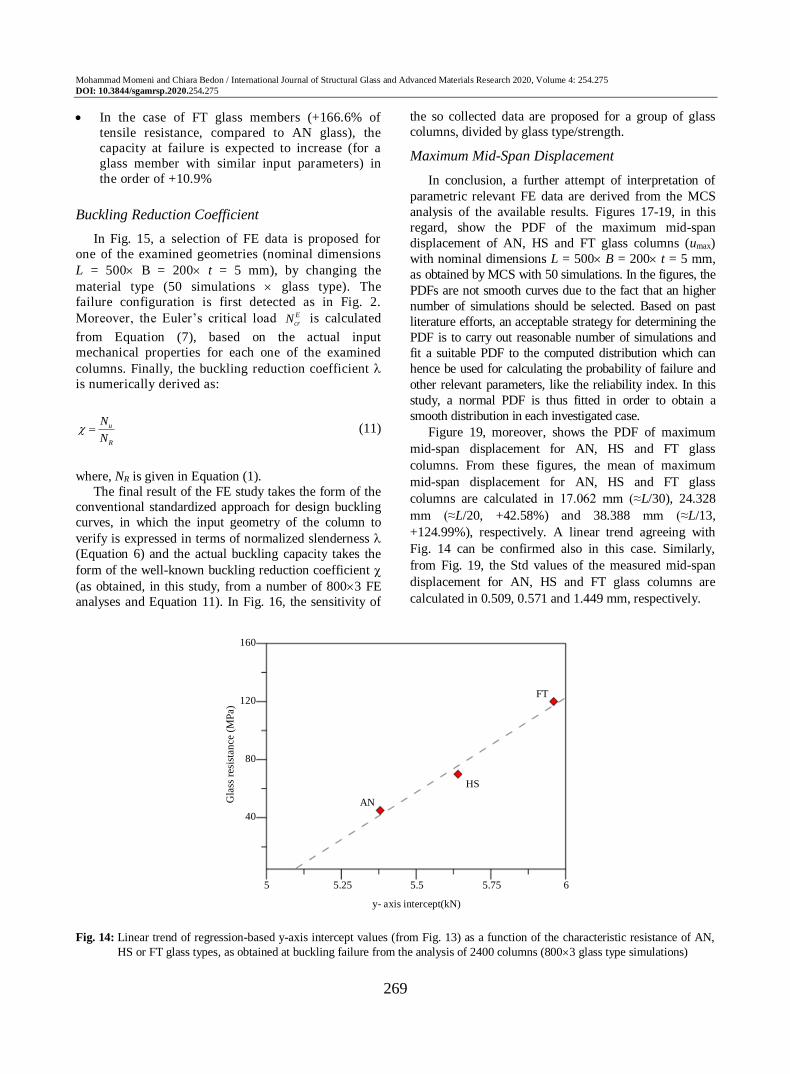
A mostly linear and stable variation can be observed
in terms of failure configuration for the examined
glass members, in terms of regression curves (slope and y-axis intercept) and glass type (nominal tensile
strength of AN, HS of FT glass). This outcome is
further emphasized in Fig. 14
Besides, when the same comparative results are
discussed towards the weakest AN glass type, it is
observed that:
For HS glass columns (+55.5% theoretical increase
of tensile resistance, compared to AN glass), their
actual buckling capacity at failure can increase in the order of +4.9%
8
6
4
2
0
In(N
u)
(kN
)
0 2 4 6 8 10
In (umax) (mm)
HS
8
6
4
2
0
In(N
u)
(kN
)
0 2 4 6 8 10
In (umax) (mm)
FT
Mohammad Momeni and Chiara Bedon / International Journal of Structural Glass and Advanced Materials Research 2020, Volume 4: 254.275
DOI: 10.3844/sgamrsp.2020.254.275
269
In the case of FT glass members (+166.6% of
tensile resistance, compared to AN glass), the
capacity at failure is expected to increase (for a
glass member with similar input parameters) in
the order of +10.9%
Buckling Reduction Coefficient
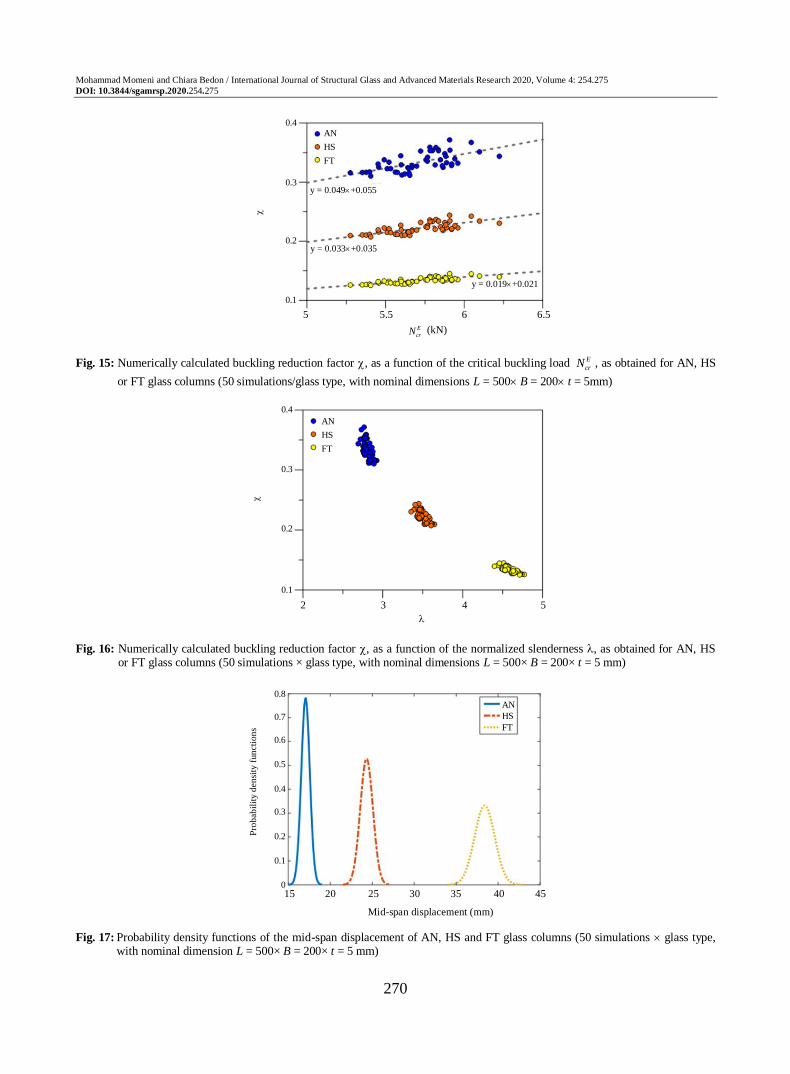
In Fig. 15, a selection of FE data is proposed for
one of the examined geometries (nominal dimensions
L = 500 B = 200 t = 5 mm), by changing the
material type (50 simulations glass type). The
failure configuration is first detected as in Fig. 2.
Moreover, the Euler’s critical load E
crN is calculated
from Equation (7), based on the actual input
mechanical properties for each one of the examined
columns. Finally, the buckling reduction coefficient
is numerically derived as:
u
R
N
N (11)
where, NR is given in Equation (1).
The final result of the FE study takes the form of the
conventional standardized approach for design buckling
curves, in which the input geometry of the column to
verify is expressed in terms of normalized slenderness
(Equation 6) and the actual buckling capacity takes the
form of the well-known buckling reduction coefficient
(as obtained, in this study, from a number of 8003 FE
analyses and Equation 11). In Fig. 16, the sensitivity of
the so collected data are proposed for a group of glass
columns, divided by glass type/strength.
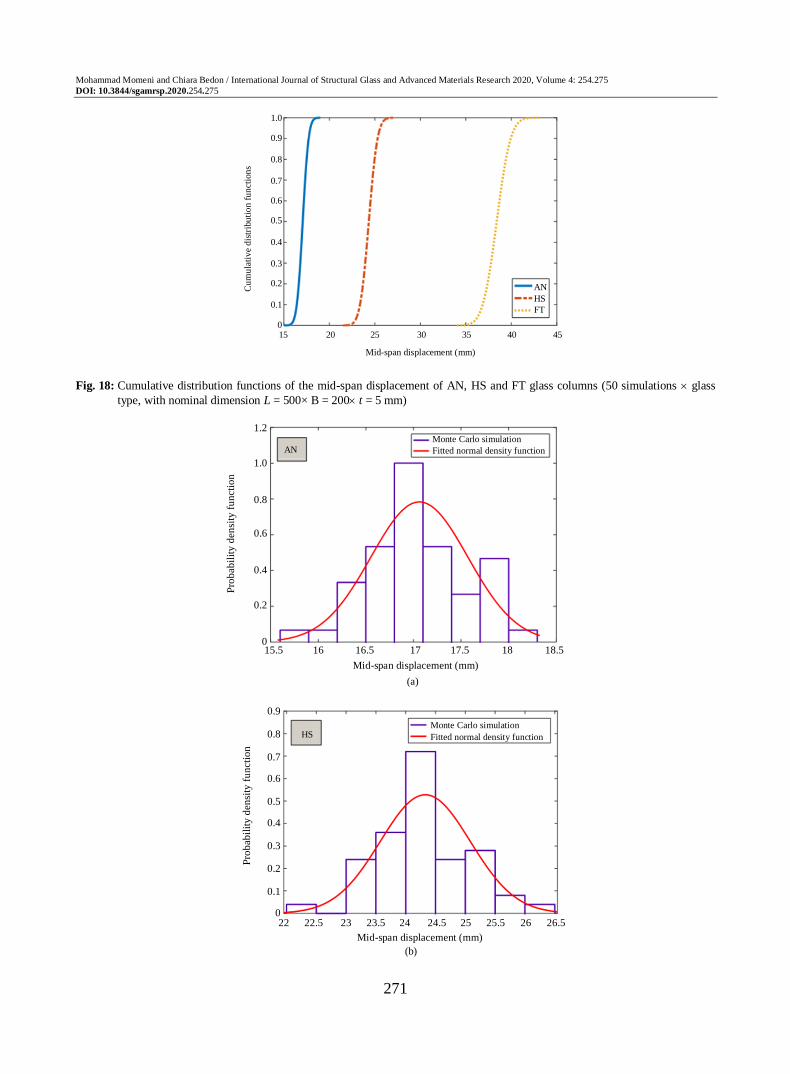
Maximum Mid-Span Displacement
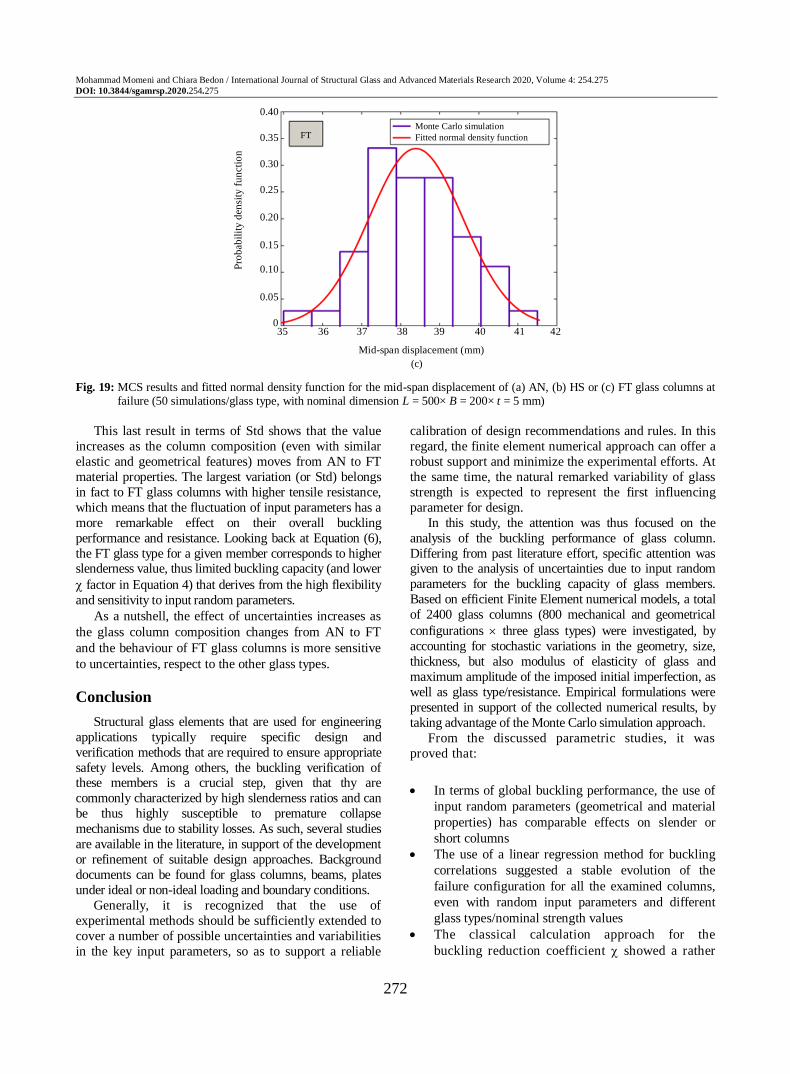
In conclusion, a further attempt of interpretation of
parametric relevant FE data are derived from the MCS
analysis of the available results. Figures 17-19, in this
regard, show the PDF of the maximum mid-span
displacement of AN, HS and FT glass columns (umax)
with nominal dimensions L = 500 B = 200 t = 5 mm,
as obtained by MCS with 50 simulations. In the figures, the
PDFs are not smooth curves due to the fact that an higher
number of simulations should be selected. Based on past
literature efforts, an acceptable strategy for determining the
PDF is to carry out reasonable number of simulations and
fit a suitable PDF to the computed distribution which can
hence be used for calculating the probability of failure and
other relevant parameters, like the reliability index. In this
study, a normal PDF is thus fitted in order to obtain a
smooth distribution in each investigated case.
Figure 19, moreover, shows the PDF of maximum
mid-span displacement for AN, HS and FT glass
columns. From these figures, the mean of maximum
mid-span displacement for AN, HS and FT glass
columns are calculated in 17.062 mm (≈L/30), 24.328
mm (≈L/20, +42.58%) and 38.388 mm (≈L/13,
+124.99%), respectively. A linear trend agreeing with
Fig. 14 can be confirmed also in this case. Similarly,
from Fig. 19, the Std values of the measured mid-span
displacement for AN, HS and FT glass columns are
calculated in 0.509, 0.571 and 1.449 mm, respectively.
Fig. 14: Linear trend of regression-based y-axis intercept values (from Fig. 13) as a function of the characteristic resistance of AN,
HS or FT glass types, as obtained at buckling failure from the analysis of 2400 columns (8003 glass type simulations)
160
120
80
40
Gla
ss r
esis
tan
ce (
MP
a)
5 5.25 5.5 5.75 6
y- axis intercept(kN)
FT
HS
AN
Mohammad Momeni and Chiara Bedon / International Journal of Structural Glass and Advanced Materials Research 2020, Volume 4: 254.275
DOI: 10.3844/sgamrsp.2020.254.275
270
Fig. 15: Numerically calculated buckling reduction factor , as a function of the critical buckling load E
crN , as obtained for AN, HS
or FT glass columns (50 simulations/glass type, with nominal dimensions L = 500 B = 200 t = 5mm)
Fig. 16: Numerically calculated buckling reduction factor , as a function of the normalized slenderness , as obtained for AN, HS
or FT glass columns (50 simulations × glass type, with nominal dimensions L = 500× B = 200× t = 5 mm)
Fig. 17: Probability density functions of the mid-span displacement of AN, HS and FT glass columns (50 simulations glass type,
with nominal dimension L = 500× B = 200× t = 5 mm)
5 5.5 6 6.5
AN
HS
FT
AN
HS
FT
0.4
0.3
0.2
0.1
y = 0.049+0.055
y = 0.033+0.035
y = 0.019+0.021
0.4
0.3
0.2
0.1
2 3 4 5
0.8
0.7
0.6
0.5
0.4
0.3
0.2
0.1
0
Pro
bab
ilit
y d
ensi
ty f
un
ctio
ns
15 20 25 30 35 40 45
Mid-span displacement (mm)
AN
HS
FT
E
crN (kN)
Mohammad Momeni and Chiara Bedon / International Journal of Structural Glass and Advanced Materials Research 2020, Volume 4: 254.275
DOI: 10.3844/sgamrsp.2020.254.275
271
Fig. 18: Cumulative distribution functions of the mid-span displacement of AN, HS and FT glass columns (50 simulations glass
type, with nominal dimension L = 500× B = 200 t = 5 mm)
(a)
(b)
1.0
0.9
0.8
0.7
0.6
0.5
0.4
0.3
0.2
0.1
0 15 20 25 30 35 40 45
AN
HS
FT
Cu
mu
lati
ve
dis
trib
uti
on
fu
nct
ion
s
Mid-span displacement (mm)
1.2
1.0
0.8
0.6
0.4
0.2
0
Pro
bab
ilit
y d
ensi
ty f
un
ctio
n
15.5 16 16.5 17 17.5 18 18.5
Mid-span displacement (mm)
AN
Monte Carlo simulation
Fitted normal density function
Monte Carlo simulation
Fitted normal density function HS
0.9
0.8
0.7
0.6
0.5
0.4
0.3
0.2
0.1
0
Pro
bab
ilit
y d
ensi
ty f
un
ctio
n
22 22.5 23 23.5 24 24.5 25 25.5 26 26.5
Mid-span displacement (mm)
Mohammad Momeni and Chiara Bedon / International Journal of Structural Glass and Advanced Materials Research 2020, Volume 4: 254.275
DOI: 10.3844/sgamrsp.2020.254.275
272
(c) Fig. 19: MCS results and fitted normal density function for the mid-span displacement of (a) AN, (b) HS or (c) FT glass columns at
failure (50 simulations/glass type, with nominal dimension L = 500× B = 200× t = 5 mm)
This last result in terms of Std shows that the value
increases as the column composition (even with similar
elastic and geometrical features) moves from AN to FT
material properties. The largest variation (or Std) belongs
in fact to FT glass columns with higher tensile resistance,
which means that the fluctuation of input parameters has a
more remarkable effect on their overall buckling
performance and resistance. Looking back at Equation (6),
the FT glass type for a given member corresponds to higher slenderness value, thus limited buckling capacity (and lower
factor in Equation 4) that derives from the high flexibility
and sensitivity to input random parameters.
As a nutshell, the effect of uncertainties increases as
the glass column composition changes from AN to FT
and the behaviour of FT glass columns is more sensitive
to uncertainties, respect to the other glass types.
Conclusion
Structural glass elements that are used for engineering
applications typically require specific design and
verification methods that are required to ensure appropriate
safety levels. Among others, the buckling verification of these members is a crucial step, given that thy are
commonly characterized by high slenderness ratios and can
be thus highly susceptible to premature collapse
mechanisms due to stability losses. As such, several studies
are available in the literature, in support of the development
or refinement of suitable design approaches. Background
documents can be found for glass columns, beams, plates
under ideal or non-ideal loading and boundary conditions.
Generally, it is recognized that the use of
experimental methods should be sufficiently extended to
cover a number of possible uncertainties and variabilities
in the key input parameters, so as to support a reliable
calibration of design recommendations and rules. In this
regard, the finite element numerical approach can offer a
robust support and minimize the experimental efforts. At
the same time, the natural remarked variability of glass
strength is expected to represent the first influencing
parameter for design.
In this study, the attention was thus focused on the
analysis of the buckling performance of glass column.
Differing from past literature effort, specific attention was given to the analysis of uncertainties due to input random
parameters for the buckling capacity of glass members.
Based on efficient Finite Element numerical models, a total
of 2400 glass columns (800 mechanical and geometrical
configurations three glass types) were investigated, by
accounting for stochastic variations in the geometry, size,
thickness, but also modulus of elasticity of glass and
maximum amplitude of the imposed initial imperfection, as
well as glass type/resistance. Empirical formulations were
presented in support of the collected numerical results, by
taking advantage of the Monte Carlo simulation approach.
From the discussed parametric studies, it was
proved that:
In terms of global buckling performance, the use of
input random parameters (geometrical and material
properties) has comparable effects on slender or
short columns
The use of a linear regression method for buckling
correlations suggested a stable evolution of the
failure configuration for all the examined columns,
even with random input parameters and different
glass types/nominal strength values
The classical calculation approach for the
buckling reduction coefficient showed a rather
0.40
0.35
0.30
0.25
0.20
0.15
0.10
0.05
0
Pro
bab
ilit
y d
ensi
ty f
un
ctio
n
35 36 37 38 39 40 41 42
Mid-span displacement (mm)
Monte Carlo simulation
Fitted normal density function FT
Mohammad Momeni and Chiara Bedon / International Journal of Structural Glass and Advanced Materials Research 2020, Volume 4: 254.275
DOI: 10.3844/sgamrsp.2020.254.275
273
stable linear trend with the theoretical critical
load E
crN . Major sensitivity to random parameters
was observed for AN glass, with a progressive
decrease for HS and FT glass columns
For the given set of glass columns, the use of AN
glass or prestressed HS (+55.5% strength) and FT
(+166.6% strength) glass types was quantified in
a theoretical increase of ≈5% (HS) and ≈10%
(FT) buckling capacity (based on stress peaks
control). Such a buckling capacity tendency
towards the glass type is expected to further
minimizes as far as the actual material resistance
has some variations from the nominal values
Similarly, the analysis of comparative FE results in
terms of ultimate mid-span deflection at failure
proved that the sensitivity of buckling capacity
estimates to random parameters increases as far as the
glass strength of glass increases (thus is minimum for
AN columns). The typical high flexibility of these
members is hence responsible of major sensitivity
effects that prevail on the improved resistance capacity
of prestressed glass types
It is finally worth to be noted that the whole
parametric study has been carried out under the
assumption of ideal restraints for the examined glass
columns. Additional sensitivity is thus expected in
presence of partial local flexibility due to soft
materials that are typical of glass applications
Author’s Contributions
Mohammad Momeni: Numerical modelling,
parametric analysis, discussion of results, paper drafting,
review.
Chiara Bedon: Supervision, discussion of results,
paper drafting, review.
Ethics
This article is original and contains unpublished
material. The corresponding author confirms that all of
the other authors have read and approved the manuscript
and no ethical issues involved.
References
Aiello, S., Campione, G., Minafò, G., & Scibilia, N. (2011).
Compressive behaviour of laminated structural glass
members. Engineering Structures, 33(12), 3402-3408.
Amadio, C. L. A. U. D. I. O., & Bedon, C. H. I. A. R. A.
(2011). Buckling of laminated glass elements in
compression. Journal of structural Engineering,
137(8), 803-810.
Amadio, C., & Bedon, C. (2013). A buckling verification
approach for monolithic and laminated glass
elements under combined in-plane compression and
bending. Engineering structures, 52, 220-229.
Bedon, C., & Amadio, C. (2012). Buckling of flat laminated glass panels under in-plane compression
or shear. Engineering Structures, 36, 185-197.
Bedon, C., & Amadio, C. (2014). Flexural–torsional
buckling: experimental analysis of laminated glass
elements. Engineering structures, 73, 85-99.
Bedon, C., & Amadio, C. (2015). Design buckling
curves for glass columns and beams. Proceedings of
the Institution of Civil Engineers-Structures and
Buildings, 168(7), 514-526.
Bedon, C., Belis, J., & Amadio, C. (2015). Structural
assessment and lateral–torsional buckling design of glass beams restrained by continuous sealant joints.
Engineering Structures, 102, 214-229.
Belis, J., Bedon, C., Louter, C., Amadio, C., & Van
Impe, R. (2013). Experimental and analytical
assessment of lateral torsional buckling of laminated
glass beams. Engineering Structures, 51, 295-305.
Belis, J., Mocibob, D., Luible, A., & Vandebroek, M.
(2011). On the size and shape of initial out-of-plane
curvatures in structural glass components. Construction
and Building Materials, 25(5), 2700-2712.
Blaauwendraad, J. (2007). Buckling of laminated glass
columns. Heron-English Edition-, 52(1/2), 147. Chryssanthopoulos, M. K., & Poggi, C. (1995).
Stochastic imperfection modelling in shell buckling
studies. Thin-walled structures, 23(1-4), 179-200.
CNR-DT 210/2013. (2013). Istruzioni per la progettazione,
l'esecuzione ed il controllo di costruzioni con elementi
strutturali di vetro, National Research Council, Rome,
Italy, Technical Document (in Italian)
D’Ambrosio, G., & Galuppi, L. (2020). Enhanced
effective thickness model for buckling of LG beams
with different boundary conditions. Glass Structures
& Engineering, 1-6. EN. (1990:2002) Eurocode - Basis of structural design.
CEN, Brussels, Belgium.
Feldmann, M., & Langosch, K. (2010). Buckling resistance
and buckling curves of pane-like glass columns with
monolithic sections of heat strengthened and tempered
glass. In Challenging Glass Conference Proceedings
(Vol. 2, pp. 319-330).
Fink, A. (2000). Ein Beitrag zum Einsatz von Floatglas
als dauerhaft tragender Konstruktionswerkstoff im
Bauwesen. Inst. für Statik.
Foraboschi, P. (2009). Buckling of a laminated glass
column under test. Struct Eng, 87(1), 2-8.
Gaspar, B., Naess, A., Leira, B. J., & Soares, C. G.
(2012). System reliability analysis of a stiffened
panel under combined uniaxial compression and
lateral pressure loads. Structural safety, 39, 30-43.

Mohammad Momeni and Chiara Bedon / International Journal of Structural Glass and Advanced Materials Research 2020, Volume 4: 254.275
DOI: 10.3844/sgamrsp.2020.254.275
274
Gonzalez Estrada, O. A., Martinez, J., & Casanova, E.
(2018). Sensitivity analysis of a member under
compression via Monte Carlo method. Revista
Uis Ingenierías.
Hadianfard, M. A., Malekpour, S., & Momeni, M. (2018). Reliability analysis of H-section steel columns under
blast loading. Structural Safety, 75, 45-56.
Huang, X., Cui, M., Liu, Q., & Nie, J. (2020). An
experimental study on the structural behaviour of
laminated glass members under combined axial
compression and in-plane bending. Materials and
Structures, 53, 1-14.
Johari, A., & Momeni, M. (2015). Stochastic analysis of
ground response using non-recursive algorithm. Soil
Dynamics and Earthquake Engineering, 69, 57-82.
Johari, A., Momeni, M., & Javadi, A. A. (2015). An analytical solution for reliability assessment of
pseudo-static stability of rock slopes using jointly
distributed random variables method.
Kalamar, R., Bedon, C., & Eliášová, M. (2016).
Experimental investigation for the structural
performance assessment of square hollow glass
columns. Engineering Structures, 113, 1-15.
Kamarudin, M. K., Yusoff, M. M., Disney, P., & Parke,
G. A. (2018, August). Experimental and numerical
investigation of the buckling performance of tubular
glass columns under compression. In Structures
(Vol. 15, pp. 355-369). Elsevier.
Kinsella, D., Lindström, J., & Persson, K. (2018).
Performance of standard statistical distributions
for modelling glass fracturee. International
journal of structural glass and advanced materials
research, 2, 178-190.
Lamela, M. J., Ramos, A., Fernández, P., Fernández-
Canteli, A., Przybilla, C., Huerta, C., & Pacios, A.
(2014). Probabilistic characterization of glass under
different type of testing. Procedia materials science,
3, 2111-2116.
Le, L. M., Ly, H. B., Pham, B. T., Le, V. M., Pham, T.
A., Nguyen, D. H., ... & Le, T. T. (2019). Hybrid
artificial intelligence approaches for predicting
buckling damage of steel columns under axial
compression. Materials, 12(10), 1670.
Liu, Q., Huang, X., Liu, G., Zhou, Z., & Li, G. (2017).
Investigation on flexural buckling of laminated glass
columns under axial compression. Engineering
Structures, 133, 14-23.
Luible, A., & Crisinel, M. (2004). Buckling strength of
glass elements in compression. Structural
engineering international, 14(2), 120-125.
Luible, A., & Crisinel, M. (2005). Plate buckling of glass
panels. In Proceedings of the International
Conference Glass Processing Days 2005 (No.
CONF, pp. 476-479).
Ly, H. B., Desceliers, C., Minh Le, L., Le, T. T., Thai
Pham, B., Nguyen-Ngoc, L., ... & Le, M. (2019).
Quantification of uncertainties on the critical buckling
load of columns under axial compression with
uncertain random materials. Materials, 12(11), 1828. Miller, R. K., & Hedgepeth, J. M. (1979). The
buckling of lattice columns with stochastic
imperfections. International Journal of Solids and
Structures, 15(1), 73-84.
Mognato, E., Brocca, S., Barbieri, A., & del Vetro, S. S.
(2017). Thermally processed glass: correlation
between surface compression, mechanical and
fragmentation test. Glass Performance Days, 8-11.
Naess, A., Leira, B. J., & Batsevych, O. (2009). System
reliability analysis by enhanced Monte Carlo
simulation. Structural safety, 31(5), 349-355. Nurhuda, I., Lam, N. T. K., Gad, E. F., & Calderone, I.
(2010). Estimation of strengths in large annealed
glass panels. International Journal of Solids and
Structures, 47(18-19), 2591-2599.
Oh, J. K., Lee, J. J., & Hong, J. P. (2015). Prediction of
compressive strength of cross-laminated timber
panel. Journal of wood science, 61(1), 28-34. Oikonomopoulou, F., van den Broek, E. A. M.,
Bristogianni, T., Veer, F. A., & Nijsse, R. (2017). Design and experimental testing of the bundled glass column. Glass Structures & Engineering, 2(2), 183-200.
Onkar, A. K., Upadhyay, C. S., & Yadav, D. (2007). Stochastic finite element buckling analysis of laminated plates with circular cutout under uniaxial compression.
Pešek, O., Horáček, M., & Melcher, J. (2016). Experimental verification of the buckling strength of structural glass columns. Procedia engineering, 161, 556-562.
Pisano, G., & Carfagni, G. R. (2017). Statistical interference of material strength and surface prestress in heat‐treated glass. Journal of the American Ceramic Society, 100(3), 954-967.
Santo, D., Mattei, S., & Bedon, C. (2020). Elastic Critical Moment for the Lateral–Torsional Buckling (LTB) Analysis of Structural Glass Beams with Discrete Mechanical Lateral Restraints. Materials, 13(11), 2492.
Schillinger, D., Papadopoulos, V., Bischoff, M., & Papadrakakis, M. (2010). Buckling analysis of imperfect I-section beam-columns with stochastic shell finite elements. Computational Mechanics, 46(3), 495-510.
Southwell, R. V. (1932). On the analysis of experimental observations in problems of elastic stability. Proceedings of the Royal Society of London. Series A, Containing Papers of a Mathematical and Physical Character, 135(828), 601-616.
Strating, J., & Vos, H. (1973). Computer simulation of
the ECCS buckling curve using a Monte-Carlo
method. HERON, 19 (2), 1973.
Mohammad Momeni and Chiara Bedon / International Journal of Structural Glass and Advanced Materials Research 2020, Volume 4: 254.275
DOI: 10.3844/sgamrsp.2020.254.275
275
Valarinho, L., Correia, J. R., Machado-e-Costa, M.,
Branco, F. A., & Silvestre, N. (2016). Lateral-
torsional buckling behaviour of long-span laminated
glass beams: Analytical, experimental and numerical
study. Materials & Design, 102, 264-275.
Veer, F. A., Bristogianni, T., & Baardolf, G. (2018). A
case study of apparently spontaneous fracture. Glass
Structures & Engineering, 3(1), 109-117.