ultrasound reference ranges of the intra-amniotic umbilical
TRANSCRIPT
Ultrasound Reference Ranges of the Intra-amniotic Umbilical
Cord Vein: Statistical Modelling and Implications for the
Detection of Intrauterine Growth Restriction
Doctor of Health Science
Exegesis
This exegesis is submitted to Charles Sturt University for the degree of
Doctor of Health Science
Faculty of Science
November 2017
Jacqueline Spurway
Associate Diploma in Medical Radiography Bachelor of Applied Science Graduate Diploma in Ultrasonography Master of Public Health and Tropical Medicine Master of Health Science

“The vessels join onto the uterus like the roots of plants and through them the
embryo receives its nourishment. This is why the embryo remains in the
uterus" (Aristotle)
(Needham, 1959, p. 51)

UMBILICAL CORD VEIN ULTRASOUND i
Table of Contents
Table of Contents i
Certificate of Authorship ix
Acknowledgments x
Ethics Approval xi
Professional Editorial Assistance xii
Professional Statistical Assistance xii
List of Figures xiii
List of Tables xvi
List of Publications and Posters xviii
List of Presentations xix
List of Abbreviations xx
Abstract ............................................................................................................................... 1
SECTION I EXECUTIVE SUMMARY
Chapter 1 Executive Summary
1.1. Aim ................................................................................................................... 3
1.2 Background ....................................................................................................... 3
1.3 Exegesis and Portfolio Structure ...................................................................... 4
1.4 Research Methods ........................................................................................... 5
1.5 Results .............................................................................................................. 6
1.6 Discussion and Implications for Clinical Practice ............................................. 8
1.7 Future Research ............................................................................................... 9
SECTION II BACKGROUND AND LITERATURE REVIEW
Chapter 2 Background and Literature Review
2.1 Introduction.................................................................................................... 10
2.2 Intrauterine Growth Restriction ..................................................................... 10
2.2.1 Definition .......................................................................................... 10
2.2.2 IUGR classifications .......................................................................... 13
2.2.3 Prevalence and incidence of IUGR ................................................... 17
2.2.4 Causes and risk factors for IUGR ...................................................... 18
2.2.5 Complications of IUGR ..................................................................... 23
2.2.6 Fetal growth ..................................................................................... 26
2.2.7 Current practices of predicting and managing IUGR ....................... 40
2.2.8 Conclusion ........................................................................................ 44
2.3 The Umbilical Cord ......................................................................................... 44
2.3.1 Introduction ..................................................................................... 44
2.3.2 Umbilical vein development. ........................................................... 45
2.3.3 Fetal venous circulation ................................................................... 46
2.3.4 Umbilical cord structure .................................................................. 48
2.3.5 Mechanisms of blood flow in the umbilical cord vein ..................... 51
UMBILICAL CORD VEIN ULTRASOUND ii
2.3.6 Conclusion ........................................................................................ 52
2.4 Ultrasound Assessment of the Umbilical Vein ............................................... 53
2.4.1 History of measurements of the umbilical vein…. ........................... 53
2.4.2 Umbilical vein measurement sites ................................................... 54
2.4.3 Umbilical vein diameter ................................................................... 55
2.4.4 Umbilical vein velocity ..................................................................... 62
2.4.5 Umbilical vein blood flow ................................................................ 75
2.5 Ultrasound Safety during Obstetric Examinations ......................................... 93
2.6 Gaps in Current Knowledge and Research Aims ............................................ 97
SECTION III MATERIALS AND METHODS
Chapter 3 Materials and Methods
3.1 Introduction ................................................................................................. 100
3.2 Study Design ................................................................................................. 100
3.3 Ethics and Research Approval ...................................................................... 101
3.4 Recruitment.................................................................................................. 101
3.5 Informed Consent ........................................................................................ 102
3.6 Study Sample ................................................................................................ 103
3.6.1 Research population ...................................................................... 103
3.6.2 Inclusion and exclusion criteria...................................................... 104
3.6.3 Sample size ..................................................................................... 105
3.7 Maternal Characteristics .............................................................................. 106
3.7.1 Ethnicity ......................................................................................... 106
3.7.2 Maternal age at conception ........................................................... 107
3.7.3 Conception ..................................................................................... 108
3.7.4 Parity .............................................................................................. 108
3.7.5 Maternal diseases .......................................................................... 108
3.7.6 Smoking during pregnancy ............................................................ 109
3.8 Birthweight Percentiles and Pregnancy Outcomes ..................................... 110
3.8.1 Birthweight percentiles and categories ......................................... 110
3.8.2 Pregnancy outcomes ...................................................................... 112
3.9 Construction of the “normal” AGA (nAGA) Group ....................................... 114
3.10 Stratification of the Small for Gestational Age (SGA) Category ................... 121
3.11 Ultrasound Equipment, Examination and Sonographers ............................ 124
3.11.1 The ultrasound machines ............................................................... 124
3.11.2 The ultrasound examination .......................................................... 124
3.11.3 Sonographers and reliability .......................................................... 125
3.12 Ultrasound Measurements and Calculations ............................................... 127
3.12.1 Gestational age and estimated delivery date ................................ 127
3.12.2 Fetal biometry, growth and estimated fetal weight ...................... 127
3.12.3 Amniotic fluid index ....................................................................... 128
3.12.4 Umbilical cord artery Doppler ....................................................... 128
3.12.5 Umbilical cord vein diameter ......................................................... 130

UMBILICAL CORD VEIN ULTRASOUND iii
3.12.6 Umbilical cord vein peak velocity .................................................. 134
3.12.7 Calculation of umbilical cord vein blood flow ................................ 136
3.12.8 Ratios and longitudinal trends ....................................................... 137
3.13 Data Analysis ................................................................................................ 138
3.13.1 Data management ......................................................................... 138
3.13.2 Statistical analysis .......................................................................... 139
3.13.3 Dissemination of results................................................................. 143
SECTION IV RESULTS AND DISCUSSION: THE SAMPLES
Whole Research Sample Results Chapter 4
4.1 Introduction.................................................................................................. 144
4.2 Whole Research Sample Size and Participation Rates ................................. 144
4.3 Birthweights and Birthweight Categories .................................................... 146
4.4 Whole Research Sample Maternal Characteristics in Relation to
Birthweight Categories ................................................................................. 147
4.4.1 Ethnicity ......................................................................................... 147
4.4.2 Maternal age at conception ........................................................... 148
4.4.3 Methods of conception. ................................................................. 149
4.4.4 Parity .............................................................................................. 150
4.4.5 Maternal diseases. ......................................................................... 151
4.4.6 Smoking status during pregnancy .................................................. 152
4.5 Whole Research Sample Pregnancy Outcomes in Relation to Birthweight
Categories ..................................................................................................... 153
4.5.1 Perinatal and infant deaths ............................................................ 153
4.5.2 Gestational age at delivery ............................................................ 153
4.5.3 Sex of the newborn ........................................................................ 154
4.5.4 Mode of delivery ............................................................................ 155
4.5.5 Apgar scores at one and five minutes after birth. ......................... 155
4.6 Whole Research Sample Ultrasound Indices in Relation to Birthweight
Categories ..................................................................................................... 157
4.6.1 Umbilical cord artery Dopplers ...................................................... 157
4.6.2 Amniotic fluid index ....................................................................... 158
4.7 Conclusion .................................................................................................... 159
Whole Research Sample Discussion Chapter 5
5.1 Introduction.................................................................................................. 160
5.2 Whole Research Sample ............................................................................... 160
5.2.1 Sample size ..................................................................................... 160
5.2.2 Participation rate ........................................................................... 160
5.2.3 Bias ................................................................................................. 161
5.3 Birthweight Categories ................................................................................. 162
5.4 Whole Research Sample Characteristics Summary ..................................... 163
5.5 Whole Research Sample Maternal Characteristics in Relation to
Birthweight Categories ................................................................................. 164
UMBILICAL CORD VEIN ULTRASOUND iv
5.6 Whole Research Sample Pregnancy Outcomes in Relation to
Birthweight Categories ................................................................................. 168
5.7 Whole Research Sample Ultrasound Indices in Relation to Birthweight
Categories..................................................................................................... 171
5.8 Conclusion .................................................................................................... 171
Chapter 6 “normal” Appropriate for Gestational Age (nAGA) Results
6.1 Introduction ................................................................................................. 173
6.2 nAGA Group Sample Size and Participation Rates ....................................... 173
6.3 nAGA Group Maternal Characteristics ......................................................... 175
6.4 nAGA Group Pregnancy Outcomes .............................................................. 176
6.5 Conclusion .................................................................................................... 178
Chapter 7 “normal” Appropriate for Gestational Age (nAGA) Discussion
7.1 Introduction ................................................................................................. 179
7.2 nAGA Group Sample..................................................................................... 179
7.2.1 Sample size ..................................................................................... 179
7.2.2 Bias ................................................................................................. 179
7.3 nAGA Group Maternal Characteristics ......................................................... 180
7.4 nAGA Group Pregnancy Outcomes .............................................................. 182
7.5 Conclusion .................................................................................................... 184
SECTION V RESULTS AND DISCUSSION: RELIABILITY
Chapter 8 Reliability Results
8.1. Introduction ................................................................................................. 186
8.2. Umbilical Cord Vein Diameter and Peak Velocity Reliability Results ........... 186
8.3. Conclusion .................................................................................................... 188
Chapter 9 Reliability Discussion 189
9.1 Introduction ................................................................................................. 189
9.2 Umbilical Cord Vein Diameter and Peak Velocity Reliability Discussion ..... 189
9.3 Conclusion .................................................................................................... 192
SECTION VI RESULTS AND DISCUSSION: UMBILICAL CORD VEIN
Chapter 10 Umbilical Cord Vein Diameter Results
10.1 Introduction ................................................................................................. 193
10.2 The Umbilical Cord Vein Diameter Data and Data Checking ....................... 193
10.3 Modelling the Three Birthweight Categories ............................................... 196
10.4 Developing a Reference Range (Nomogram) using Quantile Regression
and the nAGA Group .................................................................................... 202
10.5 Identification of IUGR/FGR Group using the Reference Range ................... 206
10.6 Conclusion .................................................................................................... 209
Chapter 11 Umbilical Cord Vein Diameter Discussion
11.1 Introduction ................................................................................................. 210
11.2 Comparison of Umbilical Cord Vein Diameter Values ................................. 210
11.3 Errors and Method Variations in Measuring the Umbilical Vein Diameter . 214
11.3.1 Averaging measurements .............................................................. 214

UMBILICAL CORD VEIN ULTRASOUND v
11.3.2 Measurement sites ........................................................................ 215
11.3.3 Measurement planes ..................................................................... 216
11.3.4 Vein shape ...................................................................................... 217
11.3.5 Structural variations ....................................................................... 217
11.3.6 Calliper placement ......................................................................... 217
11.3.7 Fetal behavioural states ................................................................. 218
11.3.8 Tissue harmonics ............................................................................ 218
11.4 Comparison of the Nomogram with Published Reference Ranges .............. 219
11.4.1 Linear relation with gestational age .............................................. 221
11.4.2 Curvilinear relation with gestational age ....................................... 221
11.5 Identifying IUGR/FGR Group using the Reference Range ............................ 224
11.6 Limitations and Advantages of the Umbilical Cord Vein Diameter Results . 227
11.7 Potential Application of the Umbilical Cord Vein Diameter Results ............ 230
11.8 Conclusion .................................................................................................... 231
Chapter 12 Umbilical Cord Vein Peak Velocity Results
12.1 Introduction.................................................................................................. 232
12.2 The Umbilical Cord Vein Peak Velocity Data and Data Checking ................. 232
12.3 Modelling the Three Birthweight Categories ............................................... 236
12.4 Developing a Reference Range (Nomogram) using Quantile Regression
and the nAGA Group .................................................................................... 241
12.5 Identification of IUGR/FGR Group using the Reference Range ................... 245
12.6 Conclusion .................................................................................................... 247
Chapter 13 Umbilical Cord Vein Peak Velocity Discussion
13.1 Introduction.................................................................................................. 248
13.2 Comparison of Umbilical Cord Vein Peak Velocity Values ........................... 248
13.3 Errors and Method Variations in Measuring the Umbilical Vein Velocity ... 251
13.3.1 Measurement sites ........................................................................ 251
13.3.2 Measurement methods ................................................................. 252
13.3.3 Doppler sampling ........................................................................... 252
13.3.4 Fluctuations in the spectral waveform .......................................... 253
13.4 Comparison of the Nomogram with Published Reference Ranges .............. 254
13.4.1 Constant velocity with gestational age .......................................... 255
13.4.2 Linear relation with gestational age .............................................. 256
13.4.3 Curvilinear relation with gestational age ....................................... 256
13.5 Identifying IUGR/FGR Group using the Reference Range ............................ 257
13.6 Limitations and Advantages of the Umbilical Cord Vein Velocity Results ... 261
13.7 Potential Application of the Umbilical Cord Vein Velocity Results .............. 263
13.8 Conclusion .................................................................................................... 263
Chapter 14 Umbilical Cord Vein Blood Flow Results
14.1 Introduction.................................................................................................. 264
14.2 The Umbilical Cord Vein Blood Flow Data and Data Checking .................... 264
14.3 Modelling the Three Birthweight Categories ............................................... 267

UMBILICAL CORD VEIN ULTRASOUND vi
14.4 Developing a Reference Range (Nomogram) using Quantile Regression
and the nAGA Group .................................................................................... 272
14.5 Identification of IUGR/FGR Group using the Reference Range ................... 276
14.6 Relationships between Umbilical Cord Vein Diameter and Peak Velocity .. 277
14.7 Conclusion .................................................................................................... 279
Chapter 15 Umbilical Cord Vein Blood Flow Discussion
15.1. Introduction ................................................................................................. 281
15.2 Comparison of Umbilical Cord Vein Blood Flow Values............................... 281
15.3 Errors and Method Variations in Measuring the Quv ................................... 284
15.3.1 Area of the umbilical vein .............................................................. 285
15.3.2 Impact of averaging diameter measurements on Quv ................... 286
15.3.3 Measurement sites ........................................................................ 287
15.3.4 Coiling of the umbilical cord .......................................................... 290
15.3.5 Fluctuations in blood flow ............................................................. 291
15.3.6 Mean velocity ................................................................................. 291
15.3.7 Spatial velocity profile coefficient ................................................. 292
15.4 Comparison of the Nomogram with Published Reference Ranges ............. 294
15.4.1 Linear relation with gestational age .............................................. 296
15.4.2 Curvilinear relation with gestational age ....................................... 296
15.5 Identifying IUGR/FGR Group using the Reference Range ............................ 299
15.6 Diameter and Velocity Effects on Blood Flow .............................................. 302
15.7 Limitation and Advantages of the Umbilical Cord Vein Blood Flow ............ 304
15.8 Potential Applications of the Umbilical Cord Vein Blood Flow Results ....... 306
15.9 Conclusion .................................................................................................... 307
Chapter 16 Ratios and Longitudinal Trends Results
16.1 Introduction ................................................................................................. 308
16.2 Developing Umbilical Cord Vein Ratios Reference Ranges and
Identification of the IUGR/FGR Group ......................................................... 308
16.3 Analysis of Longitudinal Data ....................................................................... 312
16.4 Conclusion .................................................................................................... 316
Chapter 17 Ratios and Longitudinal Trends Discussion
17.1 Introduction ................................................................................................. 317
17.2 Ratios and the Identification of the IUGR/FGR Group ................................. 317
17.3 Longitudinal Data and the Identification of the IUGR/FGR Group .............. 318
17.3.1 Umbilical cord vein diameter ......................................................... 318
17.3.2 Umbilical cord vein peak velocity .................................................. 318
17.3.3 Umbilical cord vein blood flow ...................................................... 319
17.4 Limitation and Advantages of the Umbilical Cord Vein Ratios and
Longitudinal Results ..................................................................................... 319
17.5 Potential Applications of the Umbilical Cord Vein Ratios and Slopes ......... 320
17.6 Conclusion .................................................................................................... 320
UMBILICAL CORD VEIN ULTRASOUND vii
SECTION VI CONCLUSION AND CLINICAL IMPLICATIONS
Chapter 18 Conclusions and Clinical Implications
18.1 Introduction.................................................................................................. 322
18.2 Research Outcomes ..................................................................................... 322
18.3 Advantages and Limitations of the Research Methods ............................... 324
18.4 Contributions to Knowledge ........................................................................ 326
18.5 Implications for Clinical Practice .................................................................. 328
18.6 Further Research .......................................................................................... 329
18.7 Conclusion .................................................................................................... 330
References ....................................................................................................................... 332
Appendices (CD) .............................................................................................................. 358
Appendix A Spurway, J. F., Logan, P., & Pak, S. (2012). The development,
structure and blood flow within the umbilical cord with particular
reference to the venous system. Australasian Journal of Ultrasound in
Medicine, 15(3), 97-102. doi:10.1002/j.2205-0140.2012.tb00013.x ........... 358
Appendix B Greater Western HREC approval letter.......................................... 358
Appendix C Greater Western HREC Site Specific approval letter ..................... 358
Appendix D CSU Board of Graduate Studies approval letter ............................ 358
Appendix E CSU HREC approval letter .............................................................. 358
Appendix F Participant Information Sheet ....................................................... 358
Appendix G Consent Form ................................................................................. 358
Appendix H Participant Characteristics Sheet ................................................... 358
Appendix I Quantitative Consulting Unit estimated minimum sample size .... 358
Appendix J Obstetric pre-sets ........................................................................... 358
Appendix K Raw data spreadsheets .................................................................. 358
Appendix K1 Whole research sample ......................................................... 358
Appendix K2 nAGA group ............................................................................ 358
Appendix K3 Sonographer reliability .......................................................... 358
Appendix K4 Ratios and SGA stratification ................................................. 358
Appendix K5 Longitudinal data .................................................................. 358
Appendix L Statistical analyses ......................................................................... 358
Appendix L1 Whole research sample .......................................................... 358
Appendix L2 nAGA group ........................................................................... 358
Appendix L3 Sonographer reliability .......................................................... 358
Appendix L4 Linear mixed modelling – 3 birthweight categories .............. 359
Appendix L5 Linear mixed modelling – 2 birthweight categories .............. 359
Appendix L6 Quantile regression nAGA group ........................................... 359
Appendix L7 Stratified SGA groups ............................................................. 359
Appendix L8 Ratios and longitudinal data analysis .................................... 359
Appendix L9 Longitudinal data analysis – all attendances ......................... 359
Appendix L10 Slope analysis ........................................................................ 359

UMBILICAL CORD VEIN ULTRASOUND viii
Appendix M Spurway, J., Logan, P., Pak, S. C., & Nielsen, S. (2016). A
comparison of a regional NSW obstetrics population to district, state and
national statistics. Australasian Journal of Ultrasound in Medicine, 19(3),
118-122. doi:10.1002/ajum.12017 .............................................................. 359
Appendix N Spurway, J., Logan, P., Pak, S. C., & Nielsen, S. (2017). Reference
ranges for the intra-amniotic umbilical cord vein diameter, peak velocity
and blood flow in a regional NSW population. Australasian Journal of
Ultrasound in Medicine, doi: 10.1002/ajum.12060. In Press ....................... 359

ix UMBILICAL CORD VEIN ULTRASOUND
Certificate of Authorship
I, Jacqueline Spurway, hereby declare that this submission is my own work and
to the best of my knowledge and belief, understand that it contains no material
previously published or written by another person, nor material which to a substantial
extent has been accepted for the award of any other degree or diploma at Charles
Sturt University or any other educational institution, except where due
acknowledgement is made in the exegesis and portfolio. Any contribution made to the
research by colleagues with whom I have worked at Charles Sturt University or
elsewhere during my candidature is fully acknowledged.
I agree that this thesis be accessible for the purpose of study and research in
accordance with normal conditions established by the Executive Director, Library
Services, Charles Sturt University or nominee, for the care, loan and reproduction of
thesis, subject to confidentiality provisions as approved by the University.
Name: Jacqueline Spurway
Date: 13 November 2017

UMBILICAL CORD VEIN ULTRASOUND x
Acknowledgments
First and foremost I would like to acknowledge the support, guidance and
multiple revisions undertaken by my principal supervisor Dr Patricia Logan and co-
supervisor Dr Sokcheon Pak.
The statistical analysis presented in this exegesis and portfolio was undertaken
in corroboration with Sharon Neilsen and I thank her for her support and extreme
patience. I would also like to acknowledge the support provided by other Charles Sturt
University staff members, most notably Gail Fuller from SPAN and Karen MacKney
from the library.
I am thankful to the mothers in my local area for their participation and
enthusiasm, and for allowing me the privilege of scanning their unborn children.
I would like to thank my colleagues for their assistance with data collection.
Sarah Glover, Peter Murfett and Katrina Stevens deserve special mention for critical
review of my writing.
I would like to thank my family and friends for their unconditional support and
their efforts to understand my research.
I am grateful to the NSW Department of Health (NSW Rural Allied Health
Postgraduate Scholarship), Charles Sturt University (Fee Waiver Scholarship) and the
Western NSW Local Health District (Research Capability Development Grant) for their
financial assistance during my higher research degree.

UMBILICAL CORD VEIN ULTRASOUND xi
Ethics Approval
The Greater Western Human Research Ethics Committee granted ethics
approval for this research project (HREC/10/GWAHS/34) on the 10 January 2011, for
the specific sites of Orange Health Service and Bathurst Health Service
(SSA/11GWAHS/6).
The Charles Sturt University Human Research Ethics Committee granted ethics
approval for this research project on the 15 February 2011 (2011/020).

UMBILICAL CORD VEIN ULTRASOUND xii
Professional Editorial Assistance
Dr Clare Wilding provided paid editorial assistance with the final version of this
exegesis. Editorial assistance comprised correction of punctuation and minor changes
to formatting to ensure that the presentation conformed to APA 6th guidelines.
Professional Statistical Assistance
Helen Nicol provided paid review of statistical aspects of the final version of this
exegesis.
UMBILICAL CORD VEIN ULTRASOUND xiii
List of Figures
Figure 2.1. Placenta transfers mechanisms ............................................................... 22
Figure 2.2. UA Doppler showing the sequence of increased downstream resistance
with placental insufficiency ..................................................................... 34
Figure 2.3. MCA Doppler showing the sequence of vasodilation with placental
insufficiency ............................................................................................. 35
Figure 2.4. DV Doppler sequence with placental insufficiency ................................. 36
Figure 2.5. Proposed temporal sequence of fetal compromise due to placental
insufficiency ............................................................................................. 39
Figure 2.6. Development of the human venous system ........................................... 45
Figure 2.7. Fetal circulation ....................................................................................... 46
Figure 2.8. Pathways for blood flow from the IVC and the DV ................................. 48
Figure 2.9. Cross-section of the umbilical cord following parturition....................... 49
Figure 2.10. Ultrasound images of the umbilical cord arteries ................................... 50
Figure 2.11. Parabolic and laminar blood flow profile ................................................ 65
Figure 2.12. Classification of placentae according to the number of maternal cell
layers present .......................................................................................... 81
Figure 3.1. UA spectral trace with indices formulae ............................................... 129
Figure 3.2. Schematic diagrams illustrating measurements of the widest UCV
diameter ................................................................................................ 131
Figure 3.3. Measurement technique for the UCV diameter based on nuchal
translucency protocol ............................................................................ 132
Figure 3.4. B-mode ultrasound images of the UCV showing measurement of the
lumen diameter. .................................................................................... 132
Figure 3.5. Ultrasound image measuring UCV PV ................................................... 135
Figure 4.1. Map of NSW Heath Districts showing the locality of the research
sample ................................................................................................... 145
Figure 4.2. Histogram of maternal age at conception ............................................ 149
Figure 6.1. Flowchart showing construction of research samples .......................... 174
Figure 8.1. Boxplots of repeated UCV diameter measurements recorded by four
sonographers on 10 random participants’ images ............................... 187
Figure 8.2. Boxplots of UCV PV measurements recorded by four sonographers
on 10 random participants’ images ....................................................... 187
Figure 10.1. Scatterplots of average UCV diameters with increasing GA. ................ 195
Figure 10.2. Boxplots of average UCV diameters during the second and third
trimesters .............................................................................................. 195
Figure 10.3. Scatterplots of ln(average UCV diameter) against advancing GA ......... 195
Figure 10.4. Colour coded scatterplot of the whole research sample
ln(average UCV diameter) at different GA ............................................ 196
Figure 10.5. Residual plots derived from the linear mixed model. ........................... 199

UMBILICAL CORD VEIN ULTRASOUND xiv
Figure 10.6. Predicted ln(average UCV diameter) for the three birthweight
categories .............................................................................................. 200
Figure 10.7. Predicted ln(average UCV diameter) for the SGA and combined AGA
and LGA birthweight groups .................................................................. 201
Figure 10.8. Nomogram of the predicted UCV diameter with advancing GA derived
from quadratic quantile regression ....................................................... 206
Figure 10.9. Nomogram of the UCV diameter with advancing GA with the
IUGR/FGR group data points plotted .................................................... 208
Figure 11.1. Precision improvement by increasing the number of UV diameter
repeated measurements ....................................................................... 215
Figure 11.2. Nomogram of UCV diameter with advancing GA derived from
quadratic quantile regression ............................................................... 220
Figure 11.3. Nomogram of UCV diameter with advancing GA derived from
quadratic quantile regression with the nAGA data points plotted ....... 220
Figure 11.4. Nomogram of UCV diameter with advancing GA with the IUGR/FGR
group data points plotted ..................................................................... 225
Figure 12.1. Scatterplot of average UCV PV against increasing GA with outlier ...... 234
Figure 12.2. Scatterplots of average UCV PV with advancing GA ............................. 234
Figure 12.3. Boxplots of UCV PV in the second and third trimesters ....................... 235
Figure 12.4. Scatterplot of ln(average UCV PV) with advancing GA ......................... 236
Figure 12.5. Colour coded scatterplot of ln(average UCV PV) with advancing GA ... 237
Figure 12.6. Residual plots from the linear mixed model. ........................................ 239
Figure 12.7. Predicted ln(average UCV PV) from the regression formulae of the
three birthweight categories ................................................................. 240
Figure 12.8. Predicted ln(average UCV PV) for the SGA, and combined AGA and LGA
birthweight categories .......................................................................... 241
Figure 12.9. Nomogram of UCV PV with advancing GA derived from linear quantile
regression with the nAGA data points plotted ..................................... 245
Figure 12.10. Nomogram of UCV PV with advancing GA derived from linear quantile
regression with the IUGR/FGR group average UCV PV data plotted .... 246
Figure 13.1. Nomogram of UCV PV with advancing GA derived from linear quantile
regression .............................................................................................. 254
Figure 13.2. Nomogram of UCV PV with advancing GA derived from linear quantile
regression with the nAGA data points plotted ..................................... 255
Figure 13.3. Nomogram of UCV PV with advancing GA derived from the linear
quantile regression formula with the IUGR/FGR group plotted ........... 258
Figure 14.1. Scatterplots of Qucv with advancing GA ................................................. 266
Figure 14.2. Boxplots of Qucv in the second and third trimesters ............................. 266
Figure 14.3. Scatterplot of ln(Qucv) with advancing GA ............................................. 266
Figure 14.4. Colour coded scatterplot of ln(Qucv) with advancing GA ...................... 267
Figure 14.5. Residual plots derived from the linear mixed model. ........................... 269
UMBILICAL CORD VEIN ULTRASOUND xv
Figure 14.6. Predicted ln(Qucv) from the birthweight categories quadratic
polynomial regression formulae ........................................................... 270
Figure 14.7. Predicted ln(Qucv) from the quadratic polynomial formulae for the SGA
birthweight category and the combined AGA and LGA category ......... 271
Figure 14.8. Nomogram of Qucv with advancing GA derived from cubic and linear
quantile regression with the nAGA data plotted .................................. 273
Figure 14.9. Nomogram of Qucv with advancing GA derived from cubic and linear
quantile regression with the IUGR/FGR group plotted ......................... 277
Figure 14.10. Colour coded scatterplot of average UCV PV against average UCV
diameter ................................................................................................ 278
Figure 14.11. UCV diameter and PV nomogram slopes .............................................. 279
Figure 15.1. Reduction in blood flow calculation errors with increasing number of
repeated intra-abdominal UV diameter measurements ...................... 287
Figure 15.2. Blood pathways in the umbilical, portal, and hepatic veins ................. 289
Figure 15.3. Blood flow profile in a circular vessel with the shape of the profile
corresponding to a spatial velocity profile coefficient .......................... 293
Figure 15.4. Nomogram of Qucv with advancing GA derived from cubic quantile
regression .............................................................................................. 295
Figure 15.5. Nomogram of Qucv with advancing GA derived from cubic quantile
regression with the nAGA data points plotted ...................................... 295
Figure 15.6. Nomogram of Qucv with advancing GA derived from the cubic quantile
regression formula with the IUGR/FGR group plotted ......................... 300
Figure 16.1. Nomogram of UCV diameter:PV ratio derived cubic quantile regression
with the nAGA data points plotted ....................................................... 309
Figure 16.2. Nomogram of UCV PV:diameter ratio derived cubic quantile regression
with the nAGA data points plotted ....................................................... 310
Figure 16.3. Nomogram of UCV diameter:PV ratio with IUGR/FGR group data ....... 311
Figure 16.4. Nomogram of UCV PV:diameter ratio with the IUGR/FGR group data 311
Figure 16.5. First and last average UCV diameters against GA ................................. 312
Figure 16.6. First and last average UCV PV against GA ............................................. 313
Figure 16.7. First and last Qucv against GA ................................................................. 313
Figure 16.8. Graph of the predicted means of the UCV diameter slope .................. 314
Figure 16.9. Graph of the predicted means of the Qucv slope. .................................. 315
UMBILICAL CORD VEIN ULTRASOUND xvi
List of Tables
Table 2.1 Characteristics of symmetrical and asymmetrical IUGR ......................... 14
Table 2.2 Early and late onset growth restriction comparison ............................... 16
Table 2.3 Factors associated with IUGR .................................................................. 20
Table 2.4 Prediction of EDD based on LMP and ultrasound measurements .......... 27
Table 2.5 Implications for diagnostic cut-offs of FGR ............................................. 30
Table 2.6 Thermal and mechanical indices guidelines ............................................ 95
Table 3.1 Maternal ethnicity categories based on nationality or geographical
origin ...................................................................................................... 107
Table 3.2 Maternal diseases categories ................................................................ 109
Table 3.3 Classification of fetal size based on ultrasound parameters ................ 110
Table 3.4 Exclusion and inclusion criteria for the nAGA group ............................ 115
Table 3.5 Parameters defining IUGR ..................................................................... 122
Table 4.1 Number of ultrasound examinations undertaken on participants ...... 146
Table 4.2 Number of participants/neonates in each birthweight category ........ 147
Table 4.3 Ethnicity of participants according to birthweight category ............... 147
Table 4.4 Maternal age group according to birthweight category and ethnicity . 148
Table 4.5 Conception methods according to birthweight category .................... 150
Table 4.6 Parity according to birthweight category .............................................. 151
Table 4.7 Mean birthweight by birthweight category and parity ......................... 151
Table 4.8 Number of participants experiencing various disorders according to
birthweight category ............................................................................. 152
Table 4.9 Smoking status of participants according to birthweight category ...... 153
Table 4.10 GA at delivery ....................................................................................... 154
Table 4.11 Number of neonates in three delivery categories according to
birthweight category ............................................................................. 154
Table 4.12 Neonate gender according to birthweight category ............................. 155
Table 4.13 Mode of delivery according to birthweight category .......................... 155
Table 4.14 Number of neonates in apgar score groups at one and five minutes
after birth .............................................................................................. 156
Table 4.15 Number of neonates in Apgar Score groups at one and five minutes
after birth according to birthweight category ...................................... 156
Table 4.16 Number of ultrasound examinations according to UA S/D ratio, PI
and birtweight category ....................................................................... 158
Table 4.17 Number of ultrasound examinations according to AFI and birthweight
category ................................................................................................. 158
Table 5.1 Mean birthweight for infants by sex in Australia between 1998
and 2012 ................................................................................................ 170
Table 6.1 Number of ultrasound examinations undertaken on nAGA group
participants ............................................................................................ 174
UMBILICAL CORD VEIN ULTRASOUND xvii
Table 6.2 Ethnicity of the nAGA group .................................................................. 175
Table 6.3 Number of nAGA participants per age group and Indigenous status .. 175
Table 6.4 Number of participants for each parity and mean maternal age at
conception in the nAGA group .............................................................. 176
Table 6.5 Number of deliveries between 37 and 42 weeks in the nAGA group ... 177
Table 6.6 Apgar scores at one and five minutes for the nAGA group .................. 178
Table 7.1 Percentage of women who gave birth by parity in the nAGA group,
NSW and Australia ................................................................................. 182
Table 7.2 Mean live birthweights of the nAGA group compared to 2021
Australian data ...................................................................................... 183
Table 7.3 Birth method and locality ...................................................................... 183
Table 7.4 Comparison of major maternal characteristic and pregnancy outcomes
between the whole research sample and the nAGA group .................. 185
Table 8.1 Intersonographer and intrasonographer ICC results ............................ 188
Table 9.1 Comparison of intersonographer and intrasonographer ICC
measurements ....................................................................................... 191
Table 10.1 ANOVA table .......................................................................................... 197
Table 10.2 UCV diameter coefficients ..................................................................... 204
Table 10.3 Predicted UCV diameter values ............................................................ 205
Table 10.4 Combinations of birthweight, EFW, AC, UA Doppler indices, AFI,
stillbirths for the SGA birthweight group and the percentage of data
points falling below specified percentiles ............................................ 207
Table 11.1 Research UCV diameter values ............................................................. 210
Table 11.2 Published and research UV diameters ................................................. 213
Table 12.1 ANOVA table .......................................................................................... 238
Table 12.2 UCV PV coefficients ............................................................................... 243
Table 12.3 Predicted UCV PV values ...................................................................... 244
Table 12.4 Birthweight < 10th and the IUGR/FGR group and the percentage of
data points falling below specified percentiles .................................... 246
Table 13.1 Research UCV PV values ....................................................................... 248
Table 13.2 Published and research UV PV ............................................................. 250
Table 14.1 ANOVA table .......................................................................................... 268
Table 14.2 Qucv coefficients .................................................................................... 274
Table 14.3 Predicted Qucv values ............................................................................ 275
Table 14.4 Birthweight < 10th and the IUGR/FGR group and the percentage of
data points falling below specified percentiles ..................................... 276
Table 15.1 Research Qucv values .............................................................................. 281
Table 15.2 Published and research Quv values ........................................................ 283
Table 16.1 Percentage of IUGR/FGR group data points falling below percentiles
for UCV ratios ........................................................................................ 310
UMBILICAL CORD VEIN ULTRASOUND xviii
List of Publications and Posters
i. A review publication:
Spurway, J., Logan, P., & Pak, S. (2012). The development, structure and blood
flow within the umbilical cord with particular reference to the venous system.
Australasian Journal of Ultrasound in Medicine, 15(3), 97-102.
doi:10.1002/j.2205-0140.2012.tb00013.x
ii. Original research publication:
Spurway, J., Logan, P., Pak, S. C., & Nielsen, S. (2016). A comparison of a
regional NSW obstetrics population to district, state and national statistics.
Australasian Journal of Ultrasound in Medicine, 19(3), 118-122.
doi:10.1002/ajum.12017
iii. Poster display:
Presentation Title: Normal reference ranges for the intra-amniotic umbilical
cord vein diameter, blood flow and peak velocity in a regional New South
Wales population
Venue: The Australasian Society for Ultrasound in Medicine 2016 Annual
Scientific Meeting held 28 to 30 October 2016, Brisbane.
Award: Best Poster Presentation at the Australasian Society for Ultrasound in
Medicine 46th Annual Scientific Meeting
iv. Original research publication:
Spurway, J., Logan, P., Pak, S. C., & Nielsen, S. (2017). Reference ranges for the
intra-amniotic umbilical cord vein diameter, peak velocity and blood flow in a
regional NSW population. Australasian Journal of Ultrasound in Medicine, doi:
10.1002/ajum.12060. In Press.

UMBILICAL CORD VEIN ULTRASOUND xix
List of Presentations
i. Presentation Title: Blood flow characteristics of the umbilical cord vein and
intrauterine growth restriction: the research proposal.
Audience: Charles Sturt University Science Symposium, 9 December 2010.
ii. Presentation Title: Characteristics of the umbilical cord vein (UCV) in the
prediction of intrauterine growth restriction (IUGR): preliminary results and
pitfalls.
Audience: Charles Sturt University Science Symposium, 6 July 2012.
iii. Presentation Title: Reference Ranges for the intra-amniotic umbilical cord
vein diameter, peak velocity and blood flow in a regional NSW population.
Audiences: Western NSW Local Health District Sonographers Group (23 March
2017), Orange Health Service Obstetrics and Gynaecology Education Session
(4 April 2017) and Charles Sturt University Faculty of Science (27 April 2017).

UMBILICAL CORD VEIN ULTRASOUND xx
List of Abbreviations
AC abdominal circumference
ADF™ advanced dynamic flow
AFI amniotic fluid index
AGA appropriate for gestational age
ALARA as-low-as-reasonably-achievable
ANOVA analysis of variance
ART assisted reproductive technology
ASUM Australasian Society for Ultrasound in Medicine
BHS Bathurst Health Service
BPD biparietal diameter
CI confidence interval
CNGOF French College of Gynaecologists and Obstetricians
CRL crown rump length
CTG cardiotocography
DHEA dehydroepiandrosterone
DV ductus venosus
EDD estimated date of delivery
EFW estimated fetal weight
FGR fetal growth restriction
FMF Fetal Medicine Foundation
GA gestational age
GIFT gamete intra-fallopian transfer
HC head circumference
HELLP haemolysis, elevated liver enzyme levels and low platelet levels
ICC intraclass correlation coefficient
ICSI intracytoplasmic sperm injection
IUGR intrauterine growth restriction
IUGR/FGR SGA subgroup defined by birthweight < 10th percentile, EFW ≤ 10th
percentile, AC ≤ 5th percentile and UA S/D > 95th percentile
IVC inferior vena cava

UMBILICAL CORD VEIN ULTRASOUND xxi
IVF in vitro fertilisation
LGA large for gestational age
LHD Local Health District
LMP last menstrual period
ln natural logarithm
MCA middle cerebral artery
MI mechanical index
MRI magnetic resonance imaging
nAGA “normal” appropriate for gestational age. Subgroup of the 10th to 90th
birthweight category with no confounders for abnormal fetal growth
NSW New South Wales
OECD Organisation for Economic Co-operation and Development
OHS Orange Health Service
PACS picture archive and communication system
PAPP-A pregnancy associated plasma protein-A
PI pulsatility index
POP study Pregnancy Outcome Prediction study
PRF pulse repetition frequency
PV peak velocity
Qucv intra-amniotic umbilical cord vein blood flow
Quv umbilical vein blood flow – generic term covering both intra-abdominal
and intra-amniotic portion unless specified
RANZCOG Royal Australian and New Zealand College of Obstetricians and
Gynaecologists
RCOG Royal College of Obstetricians and Gynaecologists
S/D ratio systolic/diastolic ratio
SOGC Society of Obstetricians and Gynaecologists of Canada
SGA small for gestational age
SVC superior vena cava
Tamaxv time-averaged maximum velocity
Tameanv time-averaged mean velocity
TI thermal index

UMBILICAL CORD VEIN ULTRASOUND xxii
TIB thermal index for bone
TIC thermal index for cranial bone
TIS thermal index for soft tissue
3D three dimensional
UA umbilical artery
UCV intra-amniotic umbilical cord vein
Vmax maximum velocity
UV umbilical vein describing both intra-abdominal and intra-amniotic
portions
Vmean mean velocity
WHO World Health Organisation
UMBILICAL CORD VEIN ULTRASOUND 1
Abstract
Background: The umbilical vein transports oxygen and nutrient rich blood from
the placenta to the fetus. Vein parameters related to blood flow can be reduced in
intrauterine growth restriction.
Aims: The principal research aims were to construct gestational age related
reference ranges of the umbilical cord vein diameter, peak velocity and blood flow
using a regional New South Wales population and to assess the ability of these ranges
to identify intrauterine growth restriction. Secondary aims were to document simple
measurement methods and investigate relationships between umbilical cord vein
measurements, birthweight categories and gestational age.
Method: This was a quasi-experimental study of low risk, singleton pregnancies
between 16 and 42 weeks of gestation. The umbilical cord vein diameter and peak
velocity were measured using B-mode and duplex Doppler, respectively, and blood
flow was calculated. Intraclass correlation coefficients assessed sonographer reliability.
Linear mixed modelling analysed the relationships between the vein parameters, three
birthweight categories and gestational age. Reference ranges for umbilical cord vein
parameters and ratios were established using quantile regression analysis of data
provided by a subgroup of “normal” pregnancies (nAGA group). A small group of
moderately growth restricted fetuses (IUGR/FGR group) was used to assess the
potential clinical utility of these reference ranges. Sequential plotting of data against
advancing gestational age enabled investigation of longitudinal trends and slopes.
Results: Maternal characteristics and pregnancy outcomes were typical of the
Australian population. Sonographer reliability showed almost perfect agreement.
Birthweight category modelling demonstrated a significant difference between the
UMBILICAL CORD VEIN ULTRASOUND 2
categories for all three vein parameters, but overlap of the 95% confidence interval
curves at some gestational ages. Reference ranges were developed and all three vein
parameters increased with advancing gestational age, with diameter and blood flow
exhibiting a decline in the late third trimester. In combination, the 10th percentile of
the reference ranges and birthweight categories cut-offs, identified 62.2% of
attendances of the IUGR/FRG group for the umbilical cord vein diameter and blood
flow, whereas the peak velocity and ratios had poorer rates. The diameter was the
only parameter to demonstrate a negative slope on longitudinal plotting.
Implications for clinical practice: These reference ranges provide normative
data from an Australian sample. The umbilical cord vein diameter is simple to measure,
had a negative slope on longitudinal plotting, and can be easily utilised in a broad
range of clinical situations. The umbilical cord vein peak velocity had a poor detection
rate of growth restricted data and the confidence intervals of the birthweight
categories overlapped during a crucial 15 week period of fetal growth. These findings
imply that peak velocity has a limited clinical application and may explain the historical
neglect of this Doppler measurement. The blood flow in the umbilical cord vein
identified more than half of the growth restricted data, but required two
measurements and a calculation that incorporated several assumptions. No clinical
benefit was identified by analysis of umbilical cord diameter and peak velocity ratios.
Conclusions: Reference ranges for the umbilical cord vein diameter, peak
velocity and blood flow were developed using quantile regression from a cohort of low
risk, singleton pregnancies in Central West New South Wales. The diameter reference
range has the most potential to assist in the diagnosis and monitoring of fetal growth
restriction in the second half of pregnancy.

UMBILICAL CORD VEIN ULTRASOUND 3
SECTION I EXECUTIVE SUMMARY
Chapter 1 Executive Summary
1.1. Aims
The umbilical vein is the solitary conduit supplying oxygen and nutrients to the
fetus. The ultrasound measurements of the intra-amniotic umbilical cord vein (UCV)
diameter, peak velocity (PV) and blood flow (Qucv) were the focus of this research
project. These three features have well documented relationships with advancing
gestational age (GA) and have been found to be altered in the presence of reduced
fetal growth.
The research reported in this doctoral dissertation addressed two key aims
related to the umbilical vein and fetal growth:
i. The construction of reference ranges of the UCV diameter, PV and Qucv
using data collected from a regional New South Wales (NSW) sample.
ii. The examination of these reference ranges in the identification of
intrauterine growth restriction (IUGR).
Secondary aims included; documentation of simple measurement methods, the
investigation of relationships between UCV parameters, birthweight categories and
advancing GA, and the exploration of alternative relationships involving UCV
measurements.
1.2 Background
Intrauterine growth restriction has multiple definitions, classifications and
causes but it essentially describes a fetus that fails to achieve its growth potential due
UMBILICAL CORD VEIN ULTRASOUND 4
to pathological reasons (Detti, Mari, Cheng, & Bahado-Singh, 2004; Royal College of
Obstetricians and Gynaecologists, 2014a). Growth restriction complicates
approximately 10% of all pregnancies (Lausman et al., 2013; von Beckerath et al.,
2013) and has major obstetrical implications, long-term health repercussions and
additional financial burdens to the health sector because of increased morbidity and
mortality of the fetus, the newborn and the adult. Reliable identification of IUGR could
detect fetuses requiring closer monitoring and may avoid neonatal and adult sequelae
of growth restriction by implementing preventative, risk reduction and monitoring
strategies (Conde-Agudelo, Papageorghiou, Kennedy, & Villar, 2013). The current gold
standard for ultrasound monitoring of fetal growth relies on a combination of fetal
biometry and Doppler assessment of fetal associated arteries (Kaponis et al., 2011; Ott,
2005; Vayssiere et al., 2015) with scant attention paid to the intra-amniotic umbilical
vein.
This research evolved from a desire to develop a deeper knowledge of the UCV
and to understand the ultrasound community’s inattention to this vital vessel. In order
to encourage examination of the UCV I hoped to document simple measurement
protocols, develop local reference ranges for ultrasound features of the umbilical cord
vein and ascertain the usefulness of these reference ranges in the identification of
IUGR.
1.3 Exegesis and Portfolio Structure
This doctoral dissertation presents two interrelated sections: a portfolio and an
exegesis. The portfolio documents my research journey demonstrating personal
growth as a researcher and catalogues the sequence of submissions on which the
UMBILICAL CORD VEIN ULTRASOUND 5
exegesis was constructed. The portfolio is divided into three sections covering early
literature reviews, the groundwork for the research and dissemination of results and
information.
The exegesis is divided into six sections containing 18 chapters. Chapter 1
provides an overview of the research and the interconnection of the portfolio and
exegesis. Chapter 2 reviews and scrutinises the literature on IUGR, the umbilical cord,
the UCV diameter, PV and Qucv and their associations with growth restriction. Chapter
3 details the methods and data analysis utilised in this research project. The remaining
chapters present the results with associated discussions. Chapters 4 to 7 present and
discuss samples sizes, maternal characteristics, pregnancy outcomes and ultrasound
indices in relation to two research samples. Chapters 8 and 9 present and discuss
sonographer reliability. Presentation and discussion of the UCV diameter, PV and Qucv
follow in Chapters 8 to 17. Chapter 18 summarises the research results, advantages
and limitations of the research methods, contributions to knowledge, implications for
clinical practice and areas of future research.
1.4 Research Methods
This was a quasi-experimental, quantitative research project using non-random
sample selection and both longitudinal and cross-sectional data collection. The
participants were recruited from regional NSW and ultrasound measurements of the
UCV diameter and PV were recorded, and the Qucv calculated.
Maternal characteristics were collected at recruitment and pregnancy
outcomes retrospectively obtained from medical records. Classifying fetuses by
Australian birthweight standards, the whole research sample was divided into three

UMBILICAL CORD VEIN ULTRASOUND 6
birthweight categories. Linear mixed modelling determined the relationships between
the birthweight categories, each of the ultrasound parameters and GA.
A subgroup of the 10th to 90th percentile birthweight fetuses (nAGA group)
was constructed by eliminating pregnancies affected by confounders for abnormal
fetal growth or fetal structural anomalies. Using the nAGA group data, reference
ranges were developed using polynomial quantile regression modelling of the
relationships between the UCV diameter, PV, Qucv and advancing GA.
A subgroup of fetuses (IUGR/FGR group) with a birthweight < 10th percentile,
estimated fetal weight (EFW) ≤ 10th percentile, an abdominal circumference (AC) ≤ 5th
percentile and an elevated umbilical artery (UA) ratio defined IUGR for this research
project and all reference ranges were assessed for their ability to identify this group.
Quantile regression was also used to model reference ranges for the ratios of
the UCV diameter and PV and identification of the IUGR/FRG group was assessed.
Lastly, longitudinal trends and slopes of data for multiple attendances were examined.
1.5 Results
The maternal and pregnancy outcome characteristics of the whole study
sample and the nAGA group were analysed and compared to local, state and national
populations. The whole research sample was typical of the Australian population,
except mothers were younger, more mothers smoked at some point in their
pregnancy, and neonates were lighter than comparable Australian data. The maternal
and pregnancy outcome characteristics of the nAGA group were reasonably typical of
the whole study sample. The nAGA group was similar to the broader 2012 Australian

UMBILICAL CORD VEIN ULTRASOUND 7
population, except the mothers were younger, parity was higher and fewer male
babies were born.
Linear mixed modelling showed a significant difference between the three
birthweight categories for each of the UCV features; however, there was overlap of the
95% confidence interval (CI) of the regression curves. The three birthweight curves for
the UCV diameter and Qucv had a similar shape and the CIs overlapped until the late
second trimester, whereas UCV PV had differently shaped curves for each birthweight
category and the CIs overlapped between 20 weeks and 4 days and 35 weeks and 1
day GA. The points where the CI boundaries ceased overlapping defined the
gestational ages when the reference ranges became clinical useful and this information
was incorporated into the assessment of the reference ranges’ ability to identify the
IUGR/FGR group.
Reference ranges developed from quantile regression demonstrated a
curvilinear increase in the UCV diameter with increasing GA up until 37 weeks,
followed by a plateau lasting 4 weeks and then a slight decline to 42 weeks GA. There
was a positive linear increase in UCV PV with increasing GA and an exponential
increase in Qucv up to a peak at 39 weeks and then a slight decline until 42 weeks GA.
Using the 10th percentile and the GA cut-offs established by the birthweight categories
curves, the reference ranges correctly identified 15% of IUGR/FGR group attendances
for UCV PV and 62.2% for both the UCV diameter and Qucv. Reference ranges for the
UCV diameter and PV ratios had curvilinear trends with advancing GA and identified
less than 20% of the IUGR/FGR group attendances. The UCV diameter was the only
parameter to demonstrate a negative slope on longitudinal plotting.

UMBILICAL CORD VEIN ULTRASOUND 8
1.6 Discussion and Implications for Clinical Practice
This research presents the first sonographic UCV reference ranges developed
from an Australian based “normal” obstetrics population using quantile regression.
The UCV diameter, PV and Qucv values that were measured or calculated were
comparable to previously published values. The reference ranges for all three UCV
measurements increased with advancing GA and the associations found in this
research have been described previously, some more frequently than others.
The UCV diameter and Qucv reference ranges had the best rates for the
identification of IUGR/FGR group data. In addition, the UCV diameter was the easiest
measurement to perform and demonstrated a negative slope with sequential plotting
of IUGR/FGR group data. These attributes make the measurement of the UCV diameter
and the application of this reference range practical across a wide range of ultrasound
machines and a broad range of clinicians. This exegesis demonstrated that UCV PV
birthweight category regression curves overlapped during a 15 week period of crucial
fetal growth and the reference range had a low identification rate of IUGR/FGR group
attendances; these findings may explain the failure of this measurement to be adopted
into clinical practice. The Qucv required an additional calculation and relied on several
assumptions making it susceptible to errors and more difficult to adopt into clinical
settings. Reference ranges for UCV diameter and PV ratios were developed; however,
their detection of IUGR/FGR group data was very low thereby limiting their clinical
usefulness.
Statistical analysis was limited in this research due to a sparsity of data
between 23 to 28 weeks and after 39 weeks GA, a small IUGR/FGR group sample

UMBILICAL CORD VEIN ULTRASOUND 9
comprised of moderately growth restricted fetuses, and the use of completed whole
weeks of pregnancy to allocate neonates into birthweight categories.
1.7 Future Research
The main limitation of this research could be overcome by the collection of a
larger “normal” sample to obtain an even distribution of data across all gestational
ages. The clinical utility of the reference ranges could be further explored by collecting
a larger sample of IUGR/FGR fetuses, by including more severely growth compromised
fetuses and by undertaking a multicentre, clinical trial involving the broader Australian
population. In addition, the possible effects of Qucv fluctuations over time, the effects
of coiling on PV and Qucv values and comparison of the research measurement
methods with automated techniques are areas of possible future research.

UMBILICAL CORD VEIN ULTRASOUND 10
SECTION II BACKGROUND AND LITERATURE REVIEW
Chapter 2 Background and Literature Review
2.1 Introduction
The umbilical vein is the solitary supply conduit of gases, molecules and ion rich
blood to the fetus. The consequence of poor supply through the umbilical vein is
compromised fetal growth. In this literature review I will focus on discussing IUGR, the
umbilical cord, ultrasound features of the umbilical vein including their association
with IUGR, and ultrasound safety. Lastly, gaps in current knowledge and the aims of
this research will be outlined.
The term IUGR will be used throughout this exegesis and portfolio to broadly
categorise intrauterine growth that falls below predetermined organisational
thresholds with or without abnormal UA Doppler indices or amniotic fluid volume. Use
of this term enabled inclusion of publications spanning many years, discussion on
placental causes of growth restriction, and a broader discussion of prediction,
surveillance and outcomes.
2.2 Intrauterine Growth Restriction
2.2.1 Definition.
IUGR is a descriptive term applied when fetal or neonate measurements do not
meet a predetermined threshold or the fetus fails to achieve its growth potential
(Mandruzzato et al., 2008; Suhag & Berghella, 2013). The word “growth” is a dynamic
feature and refers to size or weight and not the maturity or development of the fetus

UMBILICAL CORD VEIN ULTRASOUND 11
(Shinozuka & Taguchi, 2006). “Restriction” reflects the pathophysiology of adverse
intrauterine conditions and implies a reversible, transient condition (Wollmann, 1998).
Authors use a range of terms to describe poor intrauterine growth, including
fetal growth restriction (FGR), small for gestational age (SGA), small for dates, light for
dates, and low birthweight. There is no international agreement on the definition of
IUGR (Sehested & Pedersen, 2014; Unterscheider et al., 2014) and use of these labels
as interchangeable and synonymous terms is ambiguous and makes review of the
literature exceedingly difficult. Several definitions can be applied to either the
antenatal or postnatal period, for example, a birthweight below 2,500 g, EFW or
birthweight below the 10th, 5th or 3rd percentile for GA, an AC less than the 10th, 5th
or 3rd percentile for GA, reduced ultrasound biometry and abnormal UA and/or middle
cerebral artery (MCA) Dopplers, an infant with a low ponderal index, reduced growth
velocity on serial ultrasound examinations, or a fetus that fails to achieve its genetic
size potential (Bamfo & Odibo, 2011; Catalano et al., 2014; Sehested & Pedersen,
2014; Tate & Mari, 2013). Due to the numerous definitions for IUGR, footnotes have
been used throughout this exegesis to describe the IUGR criteria used by specific
researchers.
The Society of Obstetricians and Gynaecologists of Canada (SOGC) (Lausman et
al., 2013) defined IUGR as an EFW less than the 10th percentile due to a pathological
process. A prospective Irish study of 1,116 singleton pregnancies found that an EFW
below the 3rd percentile was consistently associated with adverse perinatal outcomes
(p = 0.0131) (Unterscheider et al., 2013a). Unterscheider et al.’s (2013a) finding
challenges the clinical usefulness of the 10th percentile EFW cut-off, and this shift in
characterisation is supported by the definition proposed by The Royal Australian and
UMBILICAL CORD VEIN ULTRASOUND 12
New Zealand College of Obstetricians and Gynaecologists (RANZCOG) (2015).
RANZCOG (2015) used the term SGA to describe fetuses with a birthweight less than
the 10th percentile, or an EFW or AC on ultrasound less than the 10th percentile;
severe fetal growth restriction was defined as SGA less than, or equal to, the 3rd or 5th
percentile. The Royal College of Obstetricians and Gynaecologists in the United
Kingdom (RCOG) (2014a) referred to SGA as an EFW or AC less than the 10th percentile
and severe SGA occurred when these features were less than the 3rd percentile. RCOG
(2014a, p. 6) stated that “fetal growth restriction is not synonymous with SGA” and
that “growth restriction implies a pathological restriction of the genetic growth
potential”. Worton, Sibley, and Heazell (2014, p. 95) stated the term IUGR “may refer
to constrained growth of either the fetus, placenta or both” and proposed that FGR
was a more specific description of reduced fetal growth. These authors also defined
SGA as a birthweight, EFW or AC less than the 10th percentile and reserved the
descriptor FGR for instances when there was “pathologically constrained fetal growth”
(Worton et al., 2014, p. 96). Recently, the French College of Gynaecologists and
Obstetricians (CNGOF) defined SGA as EFW or birthweight below the 10th percentile
and severe SGA when these two parameters were below the 3rd percentile (Vayssiere
et al., 2015). CNGOF defined FGR or IUGR, as SGA associated with evidence of
abnormal growth including abnormal uterine artery Doppler, abnormal UA Doppler or
poor longitudinal growth measured three weeks apart, but the EFW may be above the
10th percentile (Vayssiere et al., 2015). They also support the terminology of IUGR
when placental, fetal and amniotic fluid are involved and FGA when diagnosis is based
on growth restriction of only the fetus (Vayssiere et al., 2015). Albu, Anca, Horhoianu,
and Horhoianu (2014, p. 165) summarised the terminology for IUGR and concluded
UMBILICAL CORD VEIN ULTRASOUND 13
that “pathological SGA is known as intrauterine growth restriction (IUGR) or fetal
growth restriction (FGR)”.
The World Health Organisation (WHO) defined IUGR as a birthweight below the
10th percentile for gender specific GA related birthweight: if GA is not available, a
birthweight less than 2,500 g is considered growth restricted and if birthweight is
unobtainable a chest measurement less than 30 cm can be used as the indicator of
growth restriction (World Health Organization, 1995). In the research described in this
exegesis, the Australian birthweight percentiles compiled by Dobbins, Sullivan,
Roberts, and Simpson (2012) were used to classify neonates and these authors defined
SGA as a birthweight less than the 10th percentile by gender and GA.
A shortcoming of using an arbitrary cut-off to define IUGR is that fetuses that
are healthy, but constitutionally small, are mistakenly classified as IUGR. Conversely,
fetuses with parameters within the normal ranges, but with the potential to be larger,
are not classified as IUGR (Bamfo & Odibo, 2011; Collins, Arulkumaran, Hayes, Jackson,
& Impey, 2013; S. Lee & Walker, 2010; Worton et al., 2014).
2.2.2 IUGR classifications.
There are two phenotypical classifications of growth restriction. The original
classification describes IUGR on the basis of relative biometry as symmetrical or
asymmetrical; whereas, an evolving method based on the GA at onset classifies growth
restriction into early and late onset. There is considerable overlap of these two
classification systems with the newer system evolving as technology and research
provides more methods of diagnosing and monitoring IUGR.
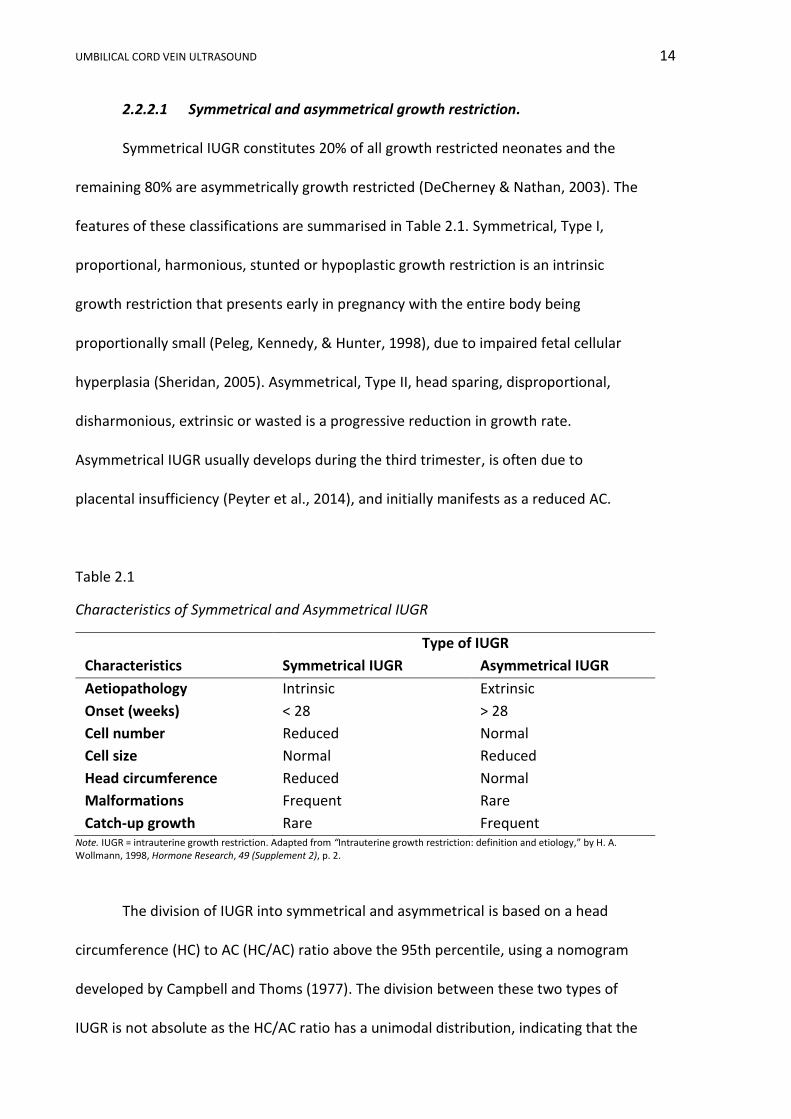
UMBILICAL CORD VEIN ULTRASOUND 14
2.2.2.1 Symmetrical and asymmetrical growth restriction.
Symmetrical IUGR constitutes 20% of all growth restricted neonates and the
remaining 80% are asymmetrically growth restricted (DeCherney & Nathan, 2003). The
features of these classifications are summarised in Table 2.1. Symmetrical, Type I,
proportional, harmonious, stunted or hypoplastic growth restriction is an intrinsic
growth restriction that presents early in pregnancy with the entire body being
proportionally small (Peleg, Kennedy, & Hunter, 1998), due to impaired fetal cellular
hyperplasia (Sheridan, 2005). Asymmetrical, Type II, head sparing, disproportional,
disharmonious, extrinsic or wasted is a progressive reduction in growth rate.
Asymmetrical IUGR usually develops during the third trimester, is often due to
placental insufficiency (Peyter et al., 2014), and initially manifests as a reduced AC.
Table 2.1
Characteristics of Symmetrical and Asymmetrical IUGR
Type of IUGR
Characteristics Symmetrical IUGR Asymmetrical IUGR
Aetiopathology Intrinsic Extrinsic
Onset (weeks) < 28 > 28
Cell number Reduced Normal
Cell size Normal Reduced
Head circumference Reduced Normal
Malformations Frequent Rare
Catch-up growth Rare Frequent Note. IUGR = intrauterine growth restriction. Adapted from “Intrauterine growth restriction: definition and etiology,” by H. A. Wollmann, 1998, Hormone Research, 49 (Supplement 2), p. 2.
The division of IUGR into symmetrical and asymmetrical is based on a head
circumference (HC) to AC (HC/AC) ratio above the 95th percentile, using a nomogram
developed by Campbell and Thoms (1977). The division between these two types of
IUGR is not absolute as the HC/AC ratio has a unimodal distribution, indicating that the
UMBILICAL CORD VEIN ULTRASOUND 15
two types of IUGR are extremes of a continuum of variable presentations of the ratio
(Callen, 2000). If the insult that initially induces asymmetrical IUGR is unrelenting, the
fetus may lose the ability to compensate and becomes symmetrically small, indicating
that the types of IUGR are not exclusive and may change over time (Vandenbosche &
Kirchner, 1998).
There is controversy about whether symmetrical or asymmetrical IUGR is more
detrimental to long term outcome. Some authors reported there were no differences
in clinical outcomes between the two types and advocated that classification using this
nomenclature should cease (Mongelli, 2007; Vayssiere et al., 2015). Others found that
symmetrical IUGR fetuses were at greater risk of aneuploidy and anatomical defects
(Pilu & Nicolaides, 1999). While fetuses with triploidy exhibit extreme asymmetrical
IUGR (Pilu & Nicolaides, 1999), and significantly increased adverse intrapartum and
neonatal outcomes have been reported among infants delivered with asymmetrical
IUGR (Dashe, McIntre, Lucas, & Leveno, 2000). The SOGC advocate that differentiation
between symmetrical or asymmetrical IUGR is clinically less important than
determining normality of fetal morphology, UA and uterine artery Dopplers (Lausman
et al., 2013).
2.2.2.2 Early and late onset growth restriction.
Early and late onset growth restriction describes two phenotypes of placental
insufficiency and has evolved as a description of timing of onset, association with pre-
eclampsia, course of development and the suitability of different Doppler
measurements for monitoring affected fetuses (Figueras & Gratacós, 2014; Muresan,
Rotar, & Stamatian, 2016; Seravalli & Baschat, 2015). These phenotypes are described
in Table 2.2.

UMBILICAL CORD VEIN ULTRASOUND 16
Table 2.2
Early and Late Onset Growth Restriction Comparison
Early onset growth restriction Late onset growth restriction
Proportion: 20% to 30% Proportion: 70% to 80%
Prevalence: ~ 1% Prevalence: 3 to 5%
Onset: before 32 to 34 weeks gestational
age
Onset: after 32 to 34 weeks gestational
age
Difficult management Difficult diagnosis
Placental disease: severe (UA Doppler
abnormal)
Placental disease: mild (UA Doppler
normal)
High association with preeclampsia Low association with preeclampsia
Severe hypoxia: systemic cardiovascular
changes
Mild hypoxia: central cardiovascular
adaption
Immature fetus: high tolerance to hypoxia Mature fetus: lower tolerance to hypoxia
High mortality and morbidity Lower mortality, (but common cause of
late stillbirth) and poor long term outcome Note. UA =
umbilical artery. Adapted from “An integrated approach to fetal growth restriction,” by F. Figueras and E.
Gratacós, 2017, Best Practice & Research Clinical Obstetrics and Gynaecology, 38, p. 51.
Early onset growth restriction describes an onset at less than 32 or 34 weeks
GA (Figueras & Gratacós, 2014), is attributed to suboptimal trophoblastic invasion of
the spiral arteries causing poor uteroplacental perfusion, and causes asymmetrical
IUGR (Mifsud & Sebire, 2014; Muresan et al., 2016). Early onset growth restriction
tends to follow the classic pathway of adaption to hypoxia with vascular deterioration
initially exhibited as elevated UA pulsatility index (PI), reduced MCA PI, absent or
reversed UA waveforms and then changes in the ductus venosus (DV) waveform;
however, this sequence may be altered and rapid (Muresan et al., 2016).
Late onset growth restriction describes an onset after 32 to 34 weeks GA
(Figueras & Gratacós, 2014), is often associated with reduced growth velocities, and
shows increased HC/AC ratio in a previously normal fetus. This IUGR phenotype is
frequently the result of subclinical placental insufficiency with few histological changes
UMBILICAL CORD VEIN ULTRASOUND 17
in the placenta and can present with normal UA Doppler indices (Mifsud & Sebire,
2014; Muresan et al., 2016). The Prospective Observational Trial to Optimize Pediatric
Health in Intrauterine Growth Restriction (PORTO) study (Unterscheider et al., 2013a,
2013b) found that fetuses with late onset growth restriction did not follow the classic
temporal sequence of deterioration and only 46% of cases showed deterioration in UA
Doppler first. In keeping with this finding, surveillance of late onset IUGR fetuses rely
on MCA PI and the cerebroplacental ratio (MCA PI:UA PI) measurements; however, the
predictive accuracy of this ratio is reduced after 34 weeks GA (Muresan et al., 2016;
Seravalli & Baschat, 2015).
2.2.3 Prevalence and incidence of IUGR.
The prevalence of IUGR is the number of existing cases of IUGR within the total
population at a given time (Hennekens & Burning, 1987). Given that the working
definition of IUGR is fetuses with an EFW below the 10th percentile for GA, then the
prevalence of IUGR is 10% of all pregnancies (Lausman et al., 2013). Amongst
published research, the prevalence of IUGR for developed countries has varied little in
the last decade. Bamfo and Odibo (2011) stated that IUGR affects 5% to 10% of
pregnancies, Saleem et al. (2011) and Gardosi (2011) proposed that 10% to 15% of all
pregnancies may be compromised by IUGR, von Beckerath et al. (2013) suggested that
7% to 9% of newborns were affected by growth restriction, and more recently Peyter
et al. (2014) proposed that approximately 8% of all fetuses may fail to achieve their full
growth potential, which is the same prevalence reported by Mandruzzato et al. (2008).
The WHO estimated that 20 to 30 million infants were born with IUGR each
year (Cailhol et al., 2009). Saleem et al. (2011) calculated that the rate of IUGR was six
times higher in developing countries compared to developed countries and estimated

UMBILICAL CORD VEIN ULTRASOUND 18
an international IUGR rate of 23.8%. The prevalence varied dramatically around the
world with the highest prevalence rates, as a percentage of live births, seen in India
(54.2%), Nepal (36.3%) and Sri Lanka (34%). Lower prevalence rates were found in
developed countries such as the United Kingdom (UK) (12.3%) and Argentina (9.7%)
(Bale, Stoll, & Lucas, 2003). In 2008, the Organisation for Economic Co-operation and
Development (OECD) countries reported the prevalence of low birthweight ranged
from 3.8% in Iceland to 11% in Turkey (Australian Institute of Health and Welfare,
2012). In 2009, 18,000 (6.2%) of live born, Australian infants had a birthweight below
2,500 g which was comparable to the 2008 OECD average of 6.7% (Australian Institute
of Health and Welfare, 2012). Caution is needed when reviewing international data as
weighting scales may not be available or accurately calibrated, babies may not be
weighed at birth and true gestational ages are often unknown in developing countries
(United Nations Children’s Fund and World Health Organization, 2004).
The incidence of IUGR is the number of newly diagnosed cases of IUGR that
develop in the population of pregnant women during a specific time (Hennekens &
Burning, 1987). The incidence of IUGR varies with the location, population and
definition of IUGR applied (Creasy, Resnik, & Iams, 2004).
2.2.4 Causes and risk factors for IUGR.
IUGR is the result of multiple, interlinked factors including maternal,
environmental, fetal and placental factors. The Australian Institute of Health and
Welfare (2012) identified first time mothers, Indigenous mothers, female infants,
extremes of maternal age, socio-economically disadvantaged mothers, and infants
born in remote and very remote areas of Australia as risk factors for Australian babies
born with a birthweight less than 2,500 g.
UMBILICAL CORD VEIN ULTRASOUND 19
A meta-analysis, undertaken by Kramer (1987), of 895 relevant English and
French medical texts published between 1970 and 1984, identified 43 potential causes
of low birthweight. In developing countries IUGR was more frequent in black and
Indian races and was associated with poor maternal nutrition, low pre-conception
weight, short stature and endemic malaria (Kramer, 1987). In developed countries,
cigarette smoking, poor maternal nutrition and low pre-conception weight were the
most influential factors for IUGR (Kramer, 1987). The maternal, fetal and placental
factors that may cause, or increase the risk of, IUGR during pregnancy are summarised
in Table 2.3.
Placental insufficiency or dysfunction is a generic term used to describe
reduced placental function. The extensive list of risk factors for IUGR that fall under
the umbrella classification of “placental insufficiency” make up 60% of the causes of
IUGR (Gagnon & Van den Hof, 2003). Placental development relies upon trophoblastic
invasion and remodelling of the spiral arterioles to create a low resistance
maternofetal vascular interface (Espinoza et al., 2006). Approximately 100 to 150 spiral
arteries are involved in this conversion, with roughly a third undergoing change by 18
weeks GA, but full conversion is not achieved until term (Nagtegaal, van Rijswijk,
McGavin, & Dekker, 2005). Failure to develop the low resistance, high capacity
circulatory interface and reduced surface area of the chorionic villi causes a poor
interface for maternofetal circulation and may lead to IUGR caused by nutrient and
oxygen deprivation of placental insufficiency (Biswas, Ghosh, & Chhabra, 2008; S. Lee
& Walker, 2010; Miller, Turan, & Baschat, 2008). Abnormal placentation may result in
reduced placental size, weight and volume (Worton et al., 2014).
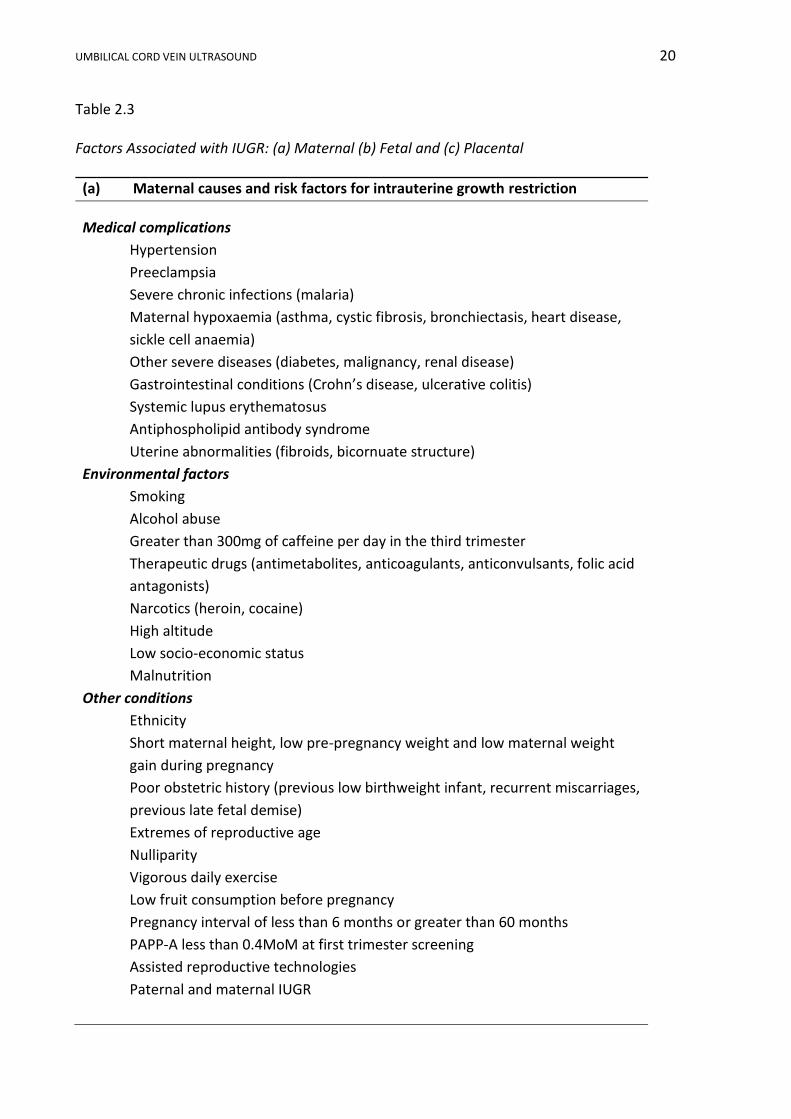
UMBILICAL CORD VEIN ULTRASOUND 20
Table 2.3
Factors Associated with IUGR: (a) Maternal (b) Fetal and (c) Placental
(a) Maternal causes and risk factors for intrauterine growth restriction
Medical complications
Hypertension
Preeclampsia
Severe chronic infections (malaria)
Maternal hypoxaemia (asthma, cystic fibrosis, bronchiectasis, heart disease,
sickle cell anaemia)
Other severe diseases (diabetes, malignancy, renal disease)
Gastrointestinal conditions (Crohn’s disease, ulcerative colitis)
Systemic lupus erythematosus
Antiphospholipid antibody syndrome
Uterine abnormalities (fibroids, bicornuate structure)
Environmental factors
Smoking
Alcohol abuse
Greater than 300mg of caffeine per day in the third trimester
Therapeutic drugs (antimetabolites, anticoagulants, anticonvulsants, folic acid
antagonists)
Narcotics (heroin, cocaine)
High altitude
Low socio-economic status
Malnutrition
Other conditions
Ethnicity
Short maternal height, low pre-pregnancy weight and low maternal weight
gain during pregnancy
Poor obstetric history (previous low birthweight infant, recurrent miscarriages,
previous late fetal demise)
Extremes of reproductive age
Nulliparity
Vigorous daily exercise
Low fruit consumption before pregnancy
Pregnancy interval of less than 6 months or greater than 60 months
PAPP-A less than 0.4MoM at first trimester screening
Assisted reproductive technologies
Paternal and maternal IUGR
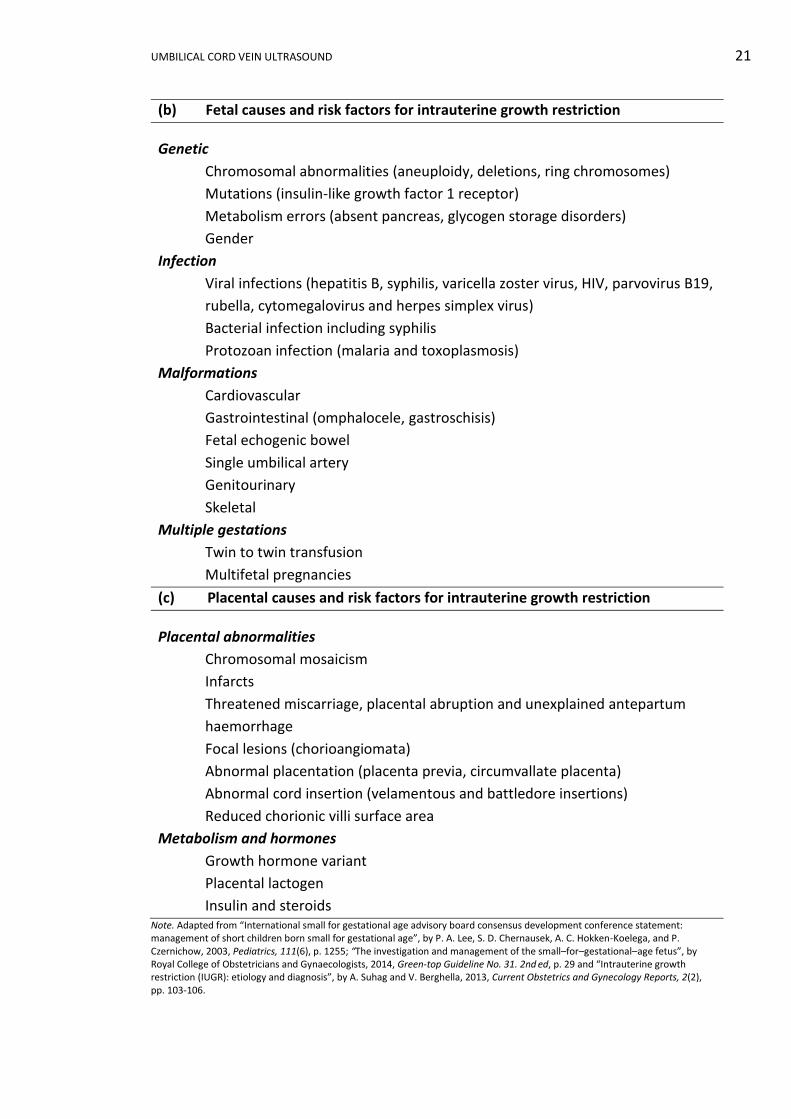
UMBILICAL CORD VEIN ULTRASOUND 21
(b) Fetal causes and risk factors for intrauterine growth restriction
Genetic
Chromosomal abnormalities (aneuploidy, deletions, ring chromosomes)
Mutations (insulin-like growth factor 1 receptor)
Metabolism errors (absent pancreas, glycogen storage disorders)
Gender
Infection
Viral infections (hepatitis B, syphilis, varicella zoster virus, HIV, parvovirus B19,
rubella, cytomegalovirus and herpes simplex virus)
Bacterial infection including syphilis
Protozoan infection (malaria and toxoplasmosis)
Malformations
Cardiovascular
Gastrointestinal (omphalocele, gastroschisis)
Fetal echogenic bowel
Single umbilical artery
Genitourinary
Skeletal
Multiple gestations
Twin to twin transfusion
Multifetal pregnancies
(c) Placental causes and risk factors for intrauterine growth restriction
Placental abnormalities
Chromosomal mosaicism
Infarcts
Threatened miscarriage, placental abruption and unexplained antepartum
haemorrhage
Focal lesions (chorioangiomata)
Abnormal placentation (placenta previa, circumvallate placenta)
Abnormal cord insertion (velamentous and battledore insertions)
Reduced chorionic villi surface area
Metabolism and hormones
Growth hormone variant
Placental lactogen
Insulin and steroids Note. Adapted from “International small for gestational age advisory board consensus development conference statement: management of short children born small for gestational age”, by P. A. Lee, S. D. Chernausek, A. C. Hokken-Koelega, and P. Czernichow, 2003, Pediatrics, 111(6), p. 1255; “The investigation and management of the small–for–gestational–age fetus”, by Royal College of Obstetricians and Gynaecologists, 2014, Green-top Guideline No. 31. 2nd ed, p. 29 and “Intrauterine growth restriction (IUGR): etiology and diagnosis”, by A. Suhag and V. Berghella, 2013, Current Obstetrics and Gynecology Reports, 2(2), pp. 103-106.
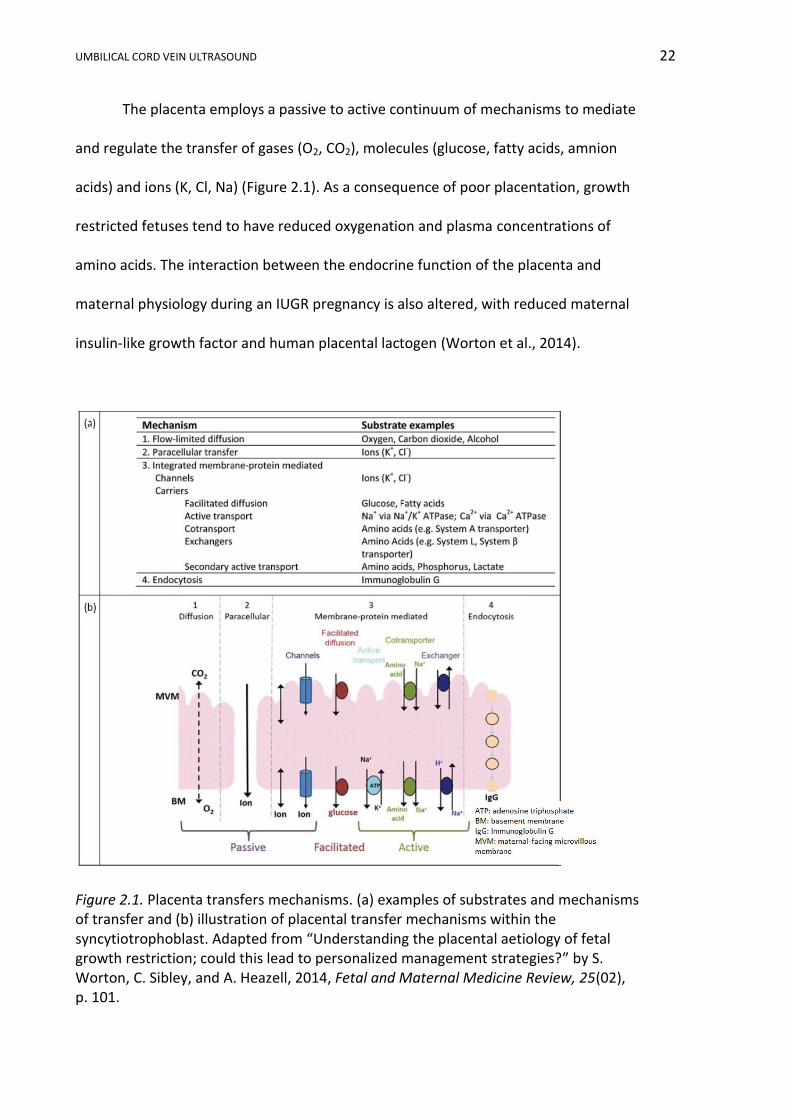
UMBILICAL CORD VEIN ULTRASOUND 22
The placenta employs a passive to active continuum of mechanisms to mediate
and regulate the transfer of gases (O2, CO2), molecules (glucose, fatty acids, amnion
acids) and ions (K, Cl, Na) (Figure 2.1). As a consequence of poor placentation, growth
restricted fetuses tend to have reduced oxygenation and plasma concentrations of
amino acids. The interaction between the endocrine function of the placenta and
maternal physiology during an IUGR pregnancy is also altered, with reduced maternal
insulin-like growth factor and human placental lactogen (Worton et al., 2014).
Figure 2.1. Placenta transfers mechanisms. (a) examples of substrates and mechanisms of transfer and (b) illustration of placental transfer mechanisms within the syncytiotrophoblast. Adapted from “Understanding the placental aetiology of fetal growth restriction; could this lead to personalized management strategies?” by S. Worton, C. Sibley, and A. Heazell, 2014, Fetal and Maternal Medicine Review, 25(02), p. 101.
UMBILICAL CORD VEIN ULTRASOUND 23
2.2.5 Complications of IUGR.
IUGR has major clinical implications, long-term health repercussions and
additional financial burdens to the health sector because of increased morbidity and
mortality of the fetus, the newborn and the adult.
2.2.5.1 Fetal complications.
A fetus suffering from IUGR is at risk of hypoxaemia, acidaemia and demise.
The expected death rate among IUGR fetuses has been reported to be 60 to 80 per
1,000 (Manning & Hohler, 1991) and the perinatal mortality rate to be 6 to 10 times
greater than normally grown fetuses (Collins et al., 2013). The literature reports that
between 30% and 52% of stillbirths are growth restricted (Collins et al., 2013; Figueras
& Gardosi, 2011). Fetuses compromised by IUGR have altered cardiac function (Cosmi,
Fanelli, Visentin, Trevisanuto, & Zanardo, 2011) and are more vulnerable to
intrapartum distress, including irregular heart rate patterns and cord compression due
to oligohydramnios (American College of Obstetricians and Gynecologists Practice
Bulletin, 2001). IUGR increases the risk of preterm delivery (Suhag & Berghella, 2013)
and IUGR affected fetuses are more likely to be delivered by caesarean section (Collins
et al., 2013; Sehested & Pedersen, 2014).
2.2.5.2 Neonate to adulthood complications.
GA at delivery and the magnitude of placental insufficiency are major
contributors to poor pregnancy outcomes with up to 10% of perinatal morbidity a
consequence of IUGR (Mandruzzato et al., 2008; Yagel et al., 2010). Growth restricted
newborns have a greater risk of death, or requiring resuscitation or prolonged
hospitalisation (Australian Institute of Health and Welfare, 2012). Neonates who
suffered from IUGR account for approximately 30% of all sudden infant death
UMBILICAL CORD VEIN ULTRASOUND 24
syndrome cases (DeCherney & Nathan, 2003). Neonate morbidity associated with
IUGR includes hypoglycaemia, dyslipidaemia, polycythaemia, cardiovascular disorders,
necrotising enterocolitis, intraventricular haemorrhage (Mandruzzato et al., 2008;
Paul, Sciscione, Leef, & Stefano, 2002; Sehested & Pedersen, 2014), periventricular
leukomalacia, convulsions (von Beckerath et al., 2013), impaired cognitive function,
cerebral palsy (Galan, Ferrazzi, & Hobbins, 2002), meconium aspiration syndrome,
hyaline membrane disease and early onset sepsis (Saleem et al., 2011).
IUGR infants have poor long term growth despite catch-up growth (Sayers,
Mackerras, & Singh, 2007) and this early rapid catch-up growth has been associated
with an increased potential of developing metabolic disorders in childhood (Sehested
& Pedersen, 2014). HC catch-up growth is most evident during the first six months of
life (Boers et al., 2007) and approximately 90% of height and weight catch-up growth is
achieved by 12 months of age (Sehested & Pedersen, 2014). A longitudinal study of
Northern Territory Aboriginal children demonstrated that catch-up growth is never
complete, as those born with IUGR were 2 cm shorter (p = 0.10), 4 kg lighter (p < 0.01)
and had a 1cm smaller HC (p < 0.01) at a mean age of 11.4 years (Sayers et al., 2007).
The researchers re-examined the cohort at a mean age of 18.3 years and those with
growth restriction at birth were 3 cm shorter (p = 0.0026), 9 kg lighter (p = 0.0001) and
had a 0.95 cm smaller HC (p = 0.0008) than those born without growth restriction
(Sayers, Mott, & Singh, 2011). These differences were still evident at 25 years of age
(Sayers, Mackerras, & Singh, 2017).
A survey of 4 to 13 year old children in Western Australia showed that IUGR
was associated with an increased risk of mental health problems (Zubrick et al., 2000).
Severely affected IUGR children were more likely to have poor academic competence,

UMBILICAL CORD VEIN ULTRASOUND 25
be withdrawn, suffer from aggression issues and exhibit socialising problems (Zubrick
et al., 2000). IUGR is recognised as a risk factor for poor cognitive outcomes in children
(Morsing & Marsal, 2014; von Beckerath et al., 2013) and a 2015 Finnish study
identified poor intrauterine growth as a risk factor for attention-deficit/hyperactivity
disorder (Sucksdorff et al., 2015). Japanese boys with IUGR were also found to have
more adverse neurological outcomes compared to normal birthweight boys (Tamaru
et al., 2011). Furthermore, an American study identified extremely low birthweight as
a risk factor for adolescent boys having behavioural problems, health issues, poor
social skills and being bullied more than normal birthweight boys (Yau et al., 2013).
The Barker hypothesis proposed that some adult diseases are a consequence of
fetal adaption to malnourishment and oxygen deprivation (Cosmi et al., 2011). This
hypothesis has been advanced by the recent proposal that epigenetic modification of
regulators of fetal glucose homeostasis, in response to in utero malnourishment, cause
maladaptation of multiple organs in adulthood (Devaskar & Chu, 2016). These
hypotheses are supported by epidemiological work showing that small babies at birth
have increased rates of cardiovascular disease, non-insulin dependent diabetes,
metabolic syndrome, obesity, hypertension and hypercholesterolaemia in adulthood
(Australian Institute of Health and Welfare, 2012; Barker et al., 1993; Conde-Agudelo
et al., 2013; Ross, 2015; Suhag & Berghella, 2013). A review of publications undertaken
by Cohen, Wong, Horne, and Yiallourou (2016) found that a large portion of available
literature supported an association between IUGR with cardiovascular alterations;
however, the progress of these alterations into adulthood required further longitudinal
studies.
UMBILICAL CORD VEIN ULTRASOUND 26
2.2.6 Fetal growth.
Intrauterine fetal and placental growth initially occurs by cell division followed
by an increase in the size of the cells; any disruption to fetal cell growth will result in
growth abnormalities (Suhag & Berghella, 2013). In order to detect growth
abnormalities, the duration of the pregnancy needs to be correctly established from
either the menstrual cycle or ultrasound parameters. Deviations in fetal size can be
determined by physical or ultrasound measurements.
2.2.6.1 Gestational age.
The identification of growth restriction begins with the establishment of an
accurate GA. German physician, Franz Naegele (1777-1851), calculated the due date by
subtracting three months from the first day of a woman's last menstrual period (LMP),
adding seven days and adjusting the year if necessary (Fraser & Copper, 2009).
Alternatively, the GA can be calculated by adding 280 days or 40 weeks from the last
known menses. These methods are notoriously incorrect as they rely on the correct
recollection of the date of the first day of the LMP, that a woman has a regular 28 day
long menstrual cycle and that conception occurred on day 14 of the cycle (Fraser &
Copper, 2009). Determining the GA by pregnancy milestones, such as the date of
quickening and auscultation of the fetal heartbeat, are clinically inadequate due to
variability in the accurate detection of the onset of these features (Manning & Hohler,
1991).
The ultrasound calculation of GA uses the recognised relationship between
fetal age and fetal size, with accuracy decreasing with increasing GA. The accuracy of
ultrasound dating at gestational ages 14 to 22 weeks is ± 1 week, from 22 to 28 weeks
± 2 weeks and 28 to 40 weeks ± 4 weeks (Quinton, 2006). Guidelines for assigning
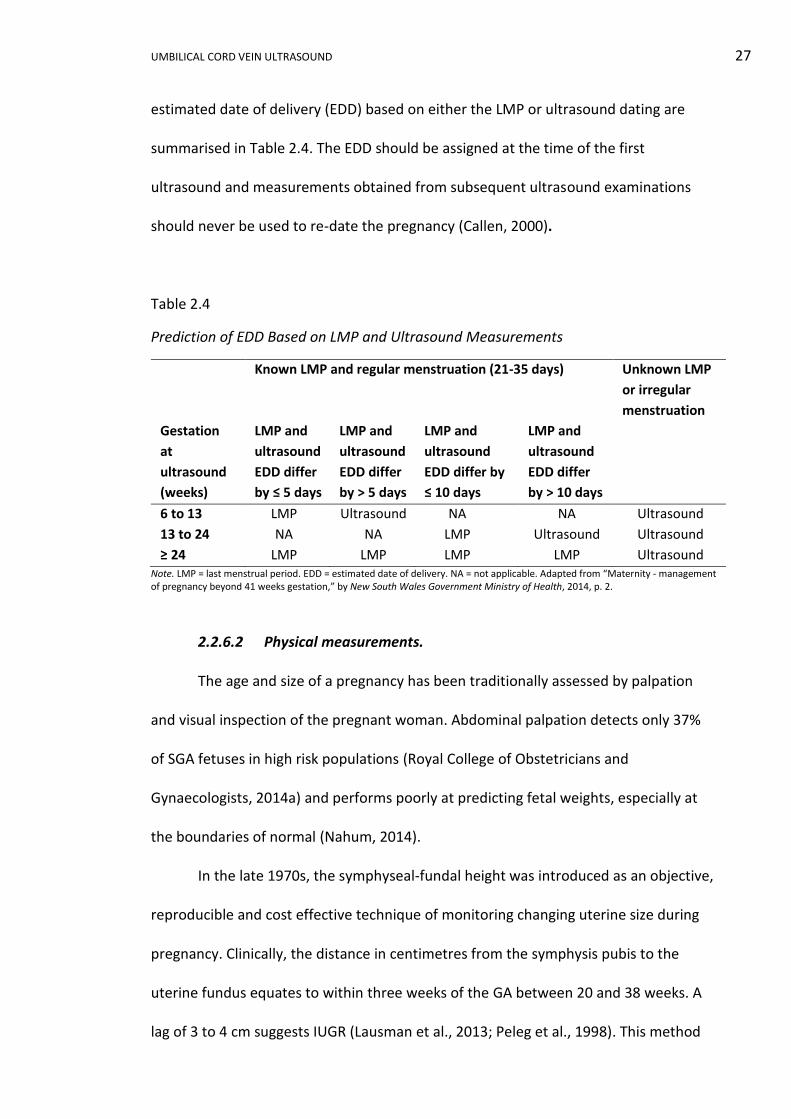
UMBILICAL CORD VEIN ULTRASOUND 27
estimated date of delivery (EDD) based on either the LMP or ultrasound dating are
summarised in Table 2.4. The EDD should be assigned at the time of the first
ultrasound and measurements obtained from subsequent ultrasound examinations
should never be used to re-date the pregnancy (Callen, 2000).
Table 2.4
Prediction of EDD Based on LMP and Ultrasound Measurements
Known LMP and regular menstruation (21-35 days) Unknown LMP
or irregular
menstruation
Gestation
at
ultrasound
(weeks)
LMP and
ultrasound
EDD differ
by ≤ 5 days
LMP and
ultrasound
EDD differ
by > 5 days
LMP and
ultrasound
EDD differ by
≤ 10 days
LMP and
ultrasound
EDD differ
by > 10 days
6 to 13 LMP Ultrasound NA NA Ultrasound
13 to 24 NA NA LMP Ultrasound Ultrasound
≥ 24 LMP LMP LMP LMP Ultrasound Note. LMP = last menstrual period. EDD = estimated date of delivery. NA = not applicable. Adapted from “Maternity - management of pregnancy beyond 41 weeks gestation,” by New South Wales Government Ministry of Health, 2014, p. 2.
2.2.6.2 Physical measurements.
The age and size of a pregnancy has been traditionally assessed by palpation
and visual inspection of the pregnant woman. Abdominal palpation detects only 37%
of SGA fetuses in high risk populations (Royal College of Obstetricians and
Gynaecologists, 2014a) and performs poorly at predicting fetal weights, especially at
the boundaries of normal (Nahum, 2014).
In the late 1970s, the symphyseal-fundal height was introduced as an objective,
reproducible and cost effective technique of monitoring changing uterine size during
pregnancy. Clinically, the distance in centimetres from the symphysis pubis to the
uterine fundus equates to within three weeks of the GA between 20 and 38 weeks. A
lag of 3 to 4 cm suggests IUGR (Lausman et al., 2013; Peleg et al., 1998). This method
UMBILICAL CORD VEIN ULTRASOUND 28
becomes increasingly inaccurate if the clinical examination is difficult due to uterine
pathology, multiparity, abnormal fetal lie, extremes of amniotic fluid, fetal head
engagement or maternal obesity (Manning & Hohler, 1991; Royal College of
Obstetricians and Gynaecologists, 2014a). The symphyseal-fundal height has a low
sensitivity of approximately 26% and specificity of 88% for predicating IUGR (Royal
College of Obstetricians and Gynaecologists, 2014a; Vandenbosche & Kirchner, 1998)
and a review by Neilson (2000) found inadequate evidence to evaluate the use of this
measurement in relation to pregnancy outcomes. However, when serial
measurements are performed, the symphyseal-fundal height has been reported as a
good surveillance tool (Figueras & Gardosi, 2011).
IUGR can be suspected if maternal weight gain is inadequate or decreasing
(Peleg et al., 1998) with the mean maternal weight gain during a normal pregnancy
being 14 kg for Australian women (Ash, Fisher, Truswell, Allen, & Irwig, 1989;
Goodman, Clarke, & Jehne, 1992). A maternal weight gain for women in the healthy
weight range of less than 10 kg (Vandenbosche & Kirchner, 1998), or the loss or gain of
less than 5 kg in overweight and obese women is associated with increased risk of
IUGR (Catalano et al., 2014).
2.2.6.3 Ultrasound measurements.
In order to isolate a pathologically small fetus from a heterogeneous group of
small fetuses, biometric and biophysical measurements need to be undertaken. These
measurements include fetal anthropometric measurements, EFW, Doppler
examination of various vessels, biophysical profile and amniotic fluid assessment.
Smaller than expected first trimester crown rump length (CRL) has been
associated with low birthweights (Bamfo & Odibo, 2011). However, CRL has limited
UMBILICAL CORD VEIN ULTRASOUND 29
clinical application as it cannot simultaneously be used to date a pregnancy and
determine if the pregnancy is growing normally, unless the exact date of conception is
known (Figueras & Gardosi, 2011). A retrospective Danish study involving 3,440
primiparous, spontaneous, singleton pregnancies found that greater than a seven day
discrepancy between self-reported and ultrasound GA at the nuchal translucency
ultrasound examination increased the risk of a birthweight less than 2,500 g (p < 0.05);
but, the seven day discrepancy was not an independent predictive factor for low
birthweight (p = 0.0967) (Bonnesen, Oddgeirsdottir, Naver, Jorgensen, & Nilas, 2016).
The preeminent method for identifying and monitoring IUGR is a combination
of Doppler analysis of fetal and umbilical cord vessels, and biometric analysis (Ott,
2005). Both the CNGOF (Vayssiere et al., 2015) and RCOG (2014a) recommended UA
Doppler as the principle method of monitoring growth restricted fetuses and the
CNGOF recommended the AC as the best screening indicator of growth restriction. This
last recommendation was supported by the large United Kingdom Pregnancy Outcome
Prediction (POP) study that found that fetuses with an EFW and AC less than the 10th
percentile had a relative risk of 17.6, 95% CI [9.2, 34.0], of delivering a SGA neonate
with neonatal morbidities of low Apgar score, metabolic acidosis or admission to a
neonatal unit (Sovio, White, Dacey, Pasupathy, & Smith, 2015). Seravalli and Baschat
(2015) summarised the advantages and disadvantages of different definitions of FGR
(Table 2.5).
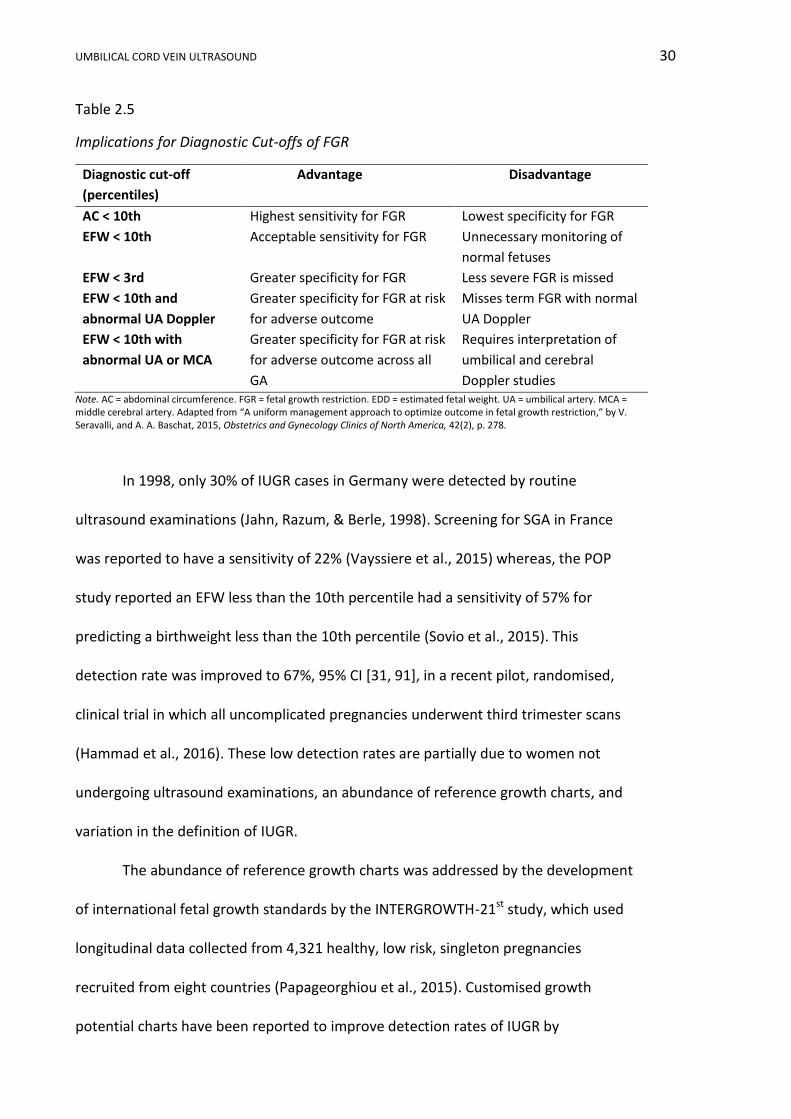
UMBILICAL CORD VEIN ULTRASOUND 30
Table 2.5
Implications for Diagnostic Cut-offs of FGR
Diagnostic cut-off
(percentiles)
Advantage Disadvantage
AC < 10th Highest sensitivity for FGR Lowest specificity for FGR
EFW < 10th Acceptable sensitivity for FGR Unnecessary monitoring of
normal fetuses
EFW < 3rd Greater specificity for FGR Less severe FGR is missed
EFW < 10th and
abnormal UA Doppler
Greater specificity for FGR at risk
for adverse outcome
Misses term FGR with normal
UA Doppler
EFW < 10th with
abnormal UA or MCA
Greater specificity for FGR at risk
for adverse outcome across all
GA
Requires interpretation of
umbilical and cerebral
Doppler studies Note. AC = abdominal circumference. FGR = fetal growth restriction. EDD = estimated fetal weight. UA = umbilical artery. MCA = middle cerebral artery. Adapted from “A uniform management approach to optimize outcome in fetal growth restriction,” by V. Seravalli, and A. A. Baschat, 2015, Obstetrics and Gynecology Clinics of North America, 42(2), p. 278.
In 1998, only 30% of IUGR cases in Germany were detected by routine
ultrasound examinations (Jahn, Razum, & Berle, 1998). Screening for SGA in France
was reported to have a sensitivity of 22% (Vayssiere et al., 2015) whereas, the POP
study reported an EFW less than the 10th percentile had a sensitivity of 57% for
predicting a birthweight less than the 10th percentile (Sovio et al., 2015). This
detection rate was improved to 67%, 95% CI [31, 91], in a recent pilot, randomised,
clinical trial in which all uncomplicated pregnancies underwent third trimester scans
(Hammad et al., 2016). These low detection rates are partially due to women not
undergoing ultrasound examinations, an abundance of reference growth charts, and
variation in the definition of IUGR.
The abundance of reference growth charts was addressed by the development
of international fetal growth standards by the INTERGROWTH-21st study, which used
longitudinal data collected from 4,321 healthy, low risk, singleton pregnancies
recruited from eight countries (Papageorghiou et al., 2015). Customised growth
potential charts have been reported to improve detection rates of IUGR by
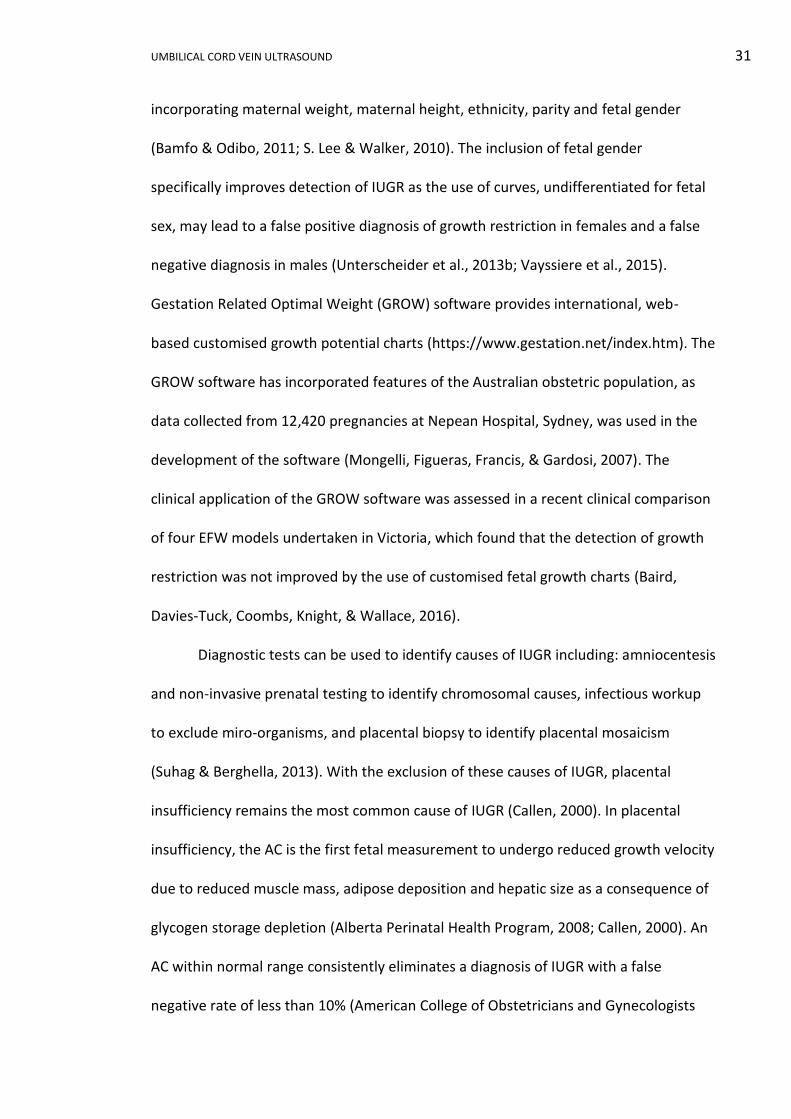
UMBILICAL CORD VEIN ULTRASOUND 31
incorporating maternal weight, maternal height, ethnicity, parity and fetal gender
(Bamfo & Odibo, 2011; S. Lee & Walker, 2010). The inclusion of fetal gender
specifically improves detection of IUGR as the use of curves, undifferentiated for fetal
sex, may lead to a false positive diagnosis of growth restriction in females and a false
negative diagnosis in males (Unterscheider et al., 2013b; Vayssiere et al., 2015).
Gestation Related Optimal Weight (GROW) software provides international, web-
based customised growth potential charts (https://www.gestation.net/index.htm). The
GROW software has incorporated features of the Australian obstetric population, as
data collected from 12,420 pregnancies at Nepean Hospital, Sydney, was used in the
development of the software (Mongelli, Figueras, Francis, & Gardosi, 2007). The
clinical application of the GROW software was assessed in a recent clinical comparison
of four EFW models undertaken in Victoria, which found that the detection of growth
restriction was not improved by the use of customised fetal growth charts (Baird,
Davies-Tuck, Coombs, Knight, & Wallace, 2016).
Diagnostic tests can be used to identify causes of IUGR including: amniocentesis
and non-invasive prenatal testing to identify chromosomal causes, infectious workup
to exclude miro-organisms, and placental biopsy to identify placental mosaicism
(Suhag & Berghella, 2013). With the exclusion of these causes of IUGR, placental
insufficiency remains the most common cause of IUGR (Callen, 2000). In placental
insufficiency, the AC is the first fetal measurement to undergo reduced growth velocity
due to reduced muscle mass, adipose deposition and hepatic size as a consequence of
glycogen storage depletion (Alberta Perinatal Health Program, 2008; Callen, 2000). An
AC within normal range consistently eliminates a diagnosis of IUGR with a false
negative rate of less than 10% (American College of Obstetricians and Gynecologists

UMBILICAL CORD VEIN ULTRASOUND 32
Practice Bulletin, 2001). Reduced growth rate of the AC is followed by reduced femur
growth rate, then HC and finally reduced growth of the transverse cerebellum
diameter, as the severity of IUGR progresses (Pilu & Nicolaides, 1999). In a study
involving 41 women, an HC/AC ratio greater than 1.067 was found to be the critical
indicator of fetuses born with a birthweight below the 10th percentile and has been
found to correctly identify 88% of these fetuses when scanned between 28 and 32
weeks GA (Quinton, Cook, & Peek, 2015).
An interval of two or three weeks between biometry was recommended
(Mongelli, Ek, & Tambyrajia, 1998), as the error in biometric measurements is likely to
surpass actual fetal growth in a shorter time span (Figueras & Gardosi, 2011).
Furthermore, a four or six week interval was shown to be superior in a Scottish study
of 274 low risk pregnancies (Owen, Maharaja, Khan, & Howie, 2001). More recent
guidelines from RCOG and CNGOF recommend a three week interval between
biometry in surveillance of growth restriction (Royal College of Obstetricians and
Gynaecologists, 2014a; Vayssiere et al., 2015).
UA Doppler assessment in a normal pregnancy shows that the impedance to
flow declines with advancing GA due to the expansion of the number of chorionic villi
vessels and intervillous circulation (Nicolaides, Sebrire, & Snijders, 1999). The
systolic/diastolic (S/D) ratio and the PI are angle independent indices used to quantify
placental impedance. The elimination of small muscular arteries of the chorionic stem
villi by vascular sclerosis causes increased placental vascular resistance and elevated
S/D ratio and PI (Fleischer, Romero, Manning, Jeanty, & James, 1991). The likelihood of
a poor pregnancy outcome increases with diminishing flow in diastole and the indices
assume clinical significance when the values exceed two standard deviations above the

UMBILICAL CORD VEIN ULTRASOUND 33
mean for GA. No or reversed flow in the UA during diastole is associated with an
approximate 45% increase in perinatal mortality rate (Hofer, 2001) and is a
consequence of more than half of the placental vessels being obliterated (Figueras &
Gardosi, 2011). The extent of UA flow abnormality is directly related to neonatal
hypoxia. The temporal sequence of change in the UA waveform in the presence of
worsening placental insufficiency is shown in Figure 2.2.
The MCA shows reduced resistance with worsening placental insufficiency,
which is reflected in a lower PI, due to vessel vasodilation to compensate for
worsening hypoxia (Figure 2.3). The DV waveform loses forward flow in atrial
contraction with fetal acidaemia and hypoxia (Figure 2.4). A fetus with absent DV
forward flow has a 60% to 100% risk of perinatal mortality with early onset IUGR
(Baschat, Gembruch, Weiner, & Harman, 2003). An abnormal DV PI value of less than
one has been shown to be the best predictor of poor pregnancy outcomes in severe
IUGR (AbdelMaboud & Elsaid, 2015; Baschat et al., 2007).
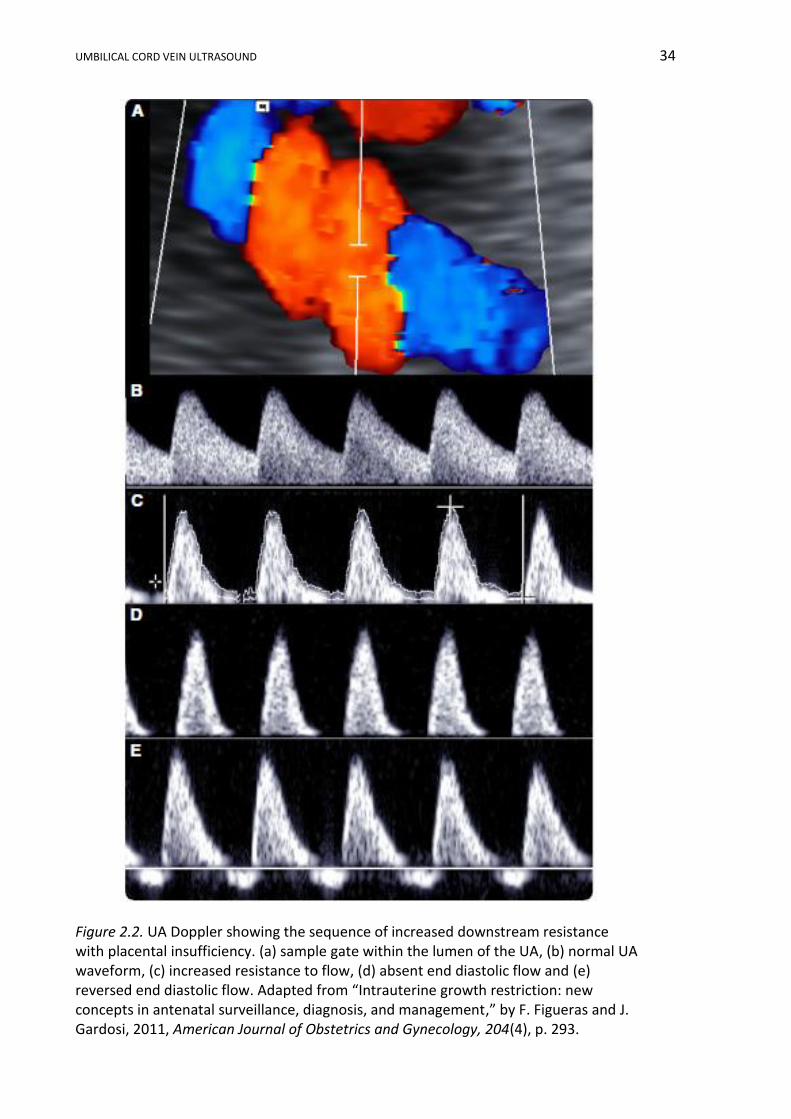
UMBILICAL CORD VEIN ULTRASOUND 34
Figure 2.2. UA Doppler showing the sequence of increased downstream resistance with placental insufficiency. (a) sample gate within the lumen of the UA, (b) normal UA waveform, (c) increased resistance to flow, (d) absent end diastolic flow and (e) reversed end diastolic flow. Adapted from “Intrauterine growth restriction: new concepts in antenatal surveillance, diagnosis, and management,” by F. Figueras and J. Gardosi, 2011, American Journal of Obstetrics and Gynecology, 204(4), p. 293.
UMBILICAL CORD VEIN ULTRASOUND 35
Figure 2.3. MCA Doppler showing the sequence of vasodilation with placental insufficiency. (a) sample gate placement in the MCA, (b) normal high resistance waveform and (c) low resistance waveform found in fetal hypoxia. Adapted from “Intrauterine growth restriction: new concepts in antenatal surveillance, diagnosis, and management,” by F. Figueras and J. Gardosi, 2011, American Journal of Obstetrics and Gynecology, 204(4), p. 295.
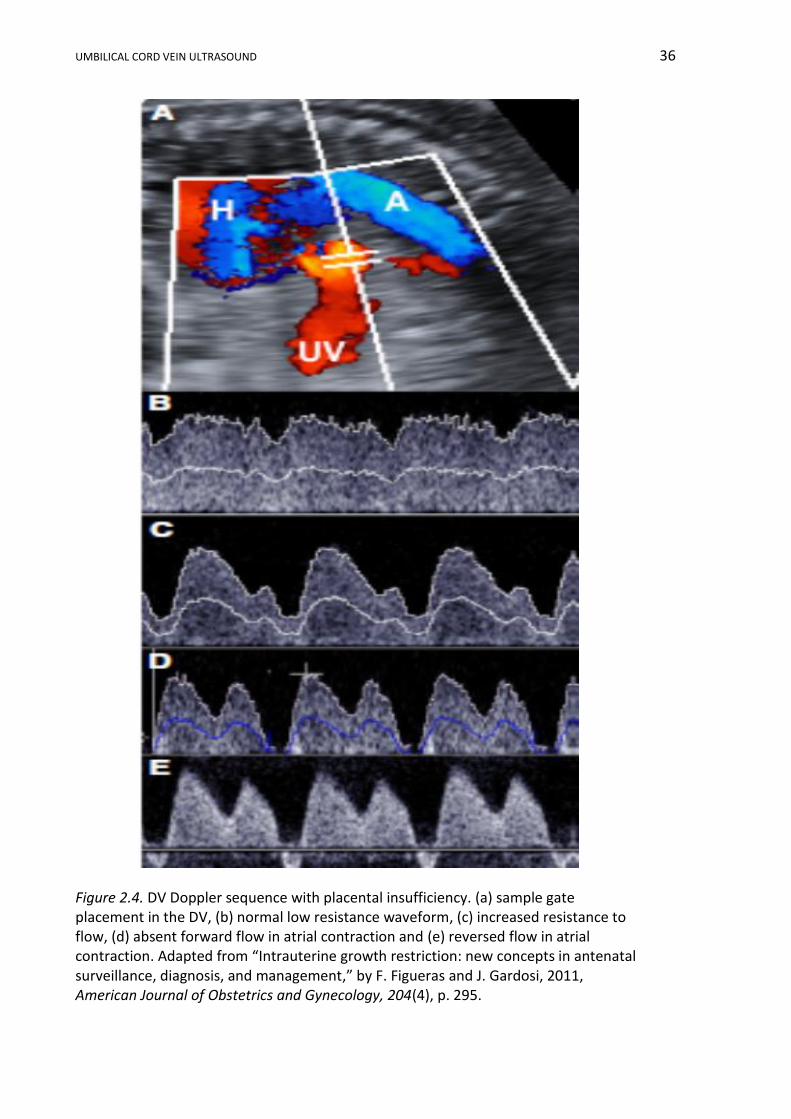
UMBILICAL CORD VEIN ULTRASOUND 36
Figure 2.4. DV Doppler sequence with placental insufficiency. (a) sample gate placement in the DV, (b) normal low resistance waveform, (c) increased resistance to flow, (d) absent forward flow in atrial contraction and (e) reversed flow in atrial contraction. Adapted from “Intrauterine growth restriction: new concepts in antenatal surveillance, diagnosis, and management,” by F. Figueras and J. Gardosi, 2011, American Journal of Obstetrics and Gynecology, 204(4), p. 295.
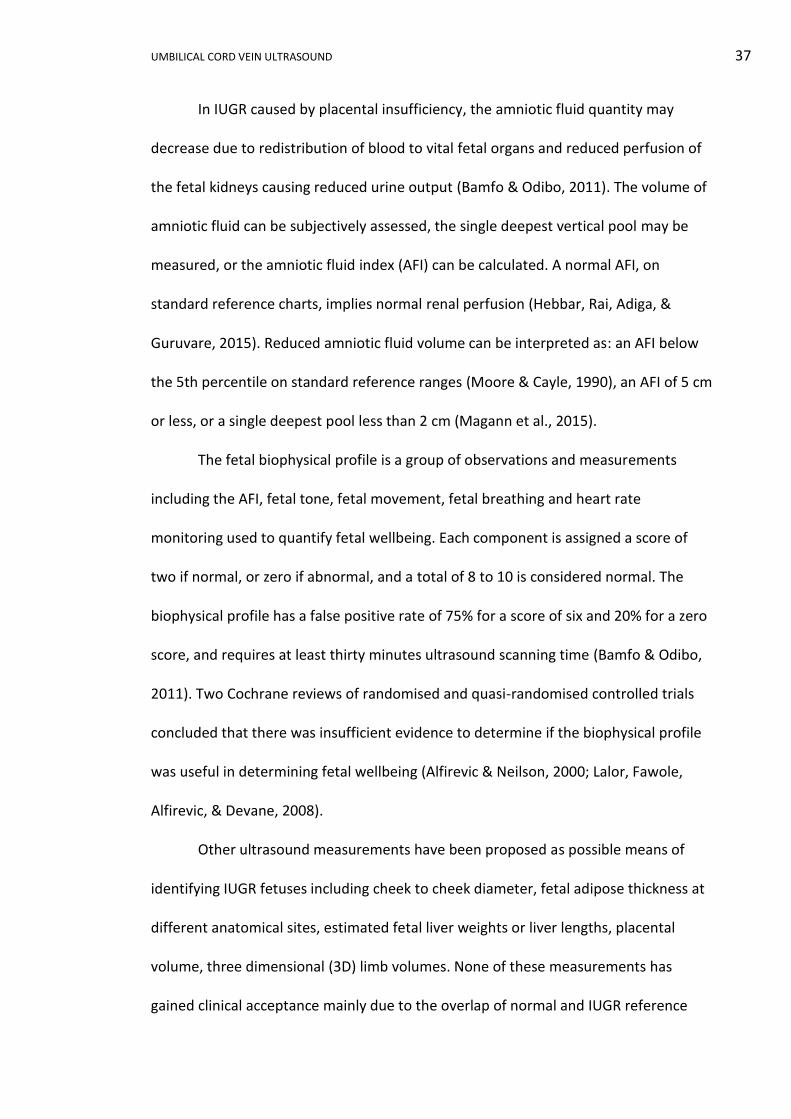
UMBILICAL CORD VEIN ULTRASOUND 37
In IUGR caused by placental insufficiency, the amniotic fluid quantity may
decrease due to redistribution of blood to vital fetal organs and reduced perfusion of
the fetal kidneys causing reduced urine output (Bamfo & Odibo, 2011). The volume of
amniotic fluid can be subjectively assessed, the single deepest vertical pool may be
measured, or the amniotic fluid index (AFI) can be calculated. A normal AFI, on
standard reference charts, implies normal renal perfusion (Hebbar, Rai, Adiga, &
Guruvare, 2015). Reduced amniotic fluid volume can be interpreted as: an AFI below
the 5th percentile on standard reference ranges (Moore & Cayle, 1990), an AFI of 5 cm
or less, or a single deepest pool less than 2 cm (Magann et al., 2015).
The fetal biophysical profile is a group of observations and measurements
including the AFI, fetal tone, fetal movement, fetal breathing and heart rate
monitoring used to quantify fetal wellbeing. Each component is assigned a score of
two if normal, or zero if abnormal, and a total of 8 to 10 is considered normal. The
biophysical profile has a false positive rate of 75% for a score of six and 20% for a zero
score, and requires at least thirty minutes ultrasound scanning time (Bamfo & Odibo,
2011). Two Cochrane reviews of randomised and quasi-randomised controlled trials
concluded that there was insufficient evidence to determine if the biophysical profile
was useful in determining fetal wellbeing (Alfirevic & Neilson, 2000; Lalor, Fawole,
Alfirevic, & Devane, 2008).
Other ultrasound measurements have been proposed as possible means of
identifying IUGR fetuses including cheek to cheek diameter, fetal adipose thickness at
different anatomical sites, estimated fetal liver weights or liver lengths, placental
volume, three dimensional (3D) limb volumes. None of these measurements has
gained clinical acceptance mainly due to the overlap of normal and IUGR reference
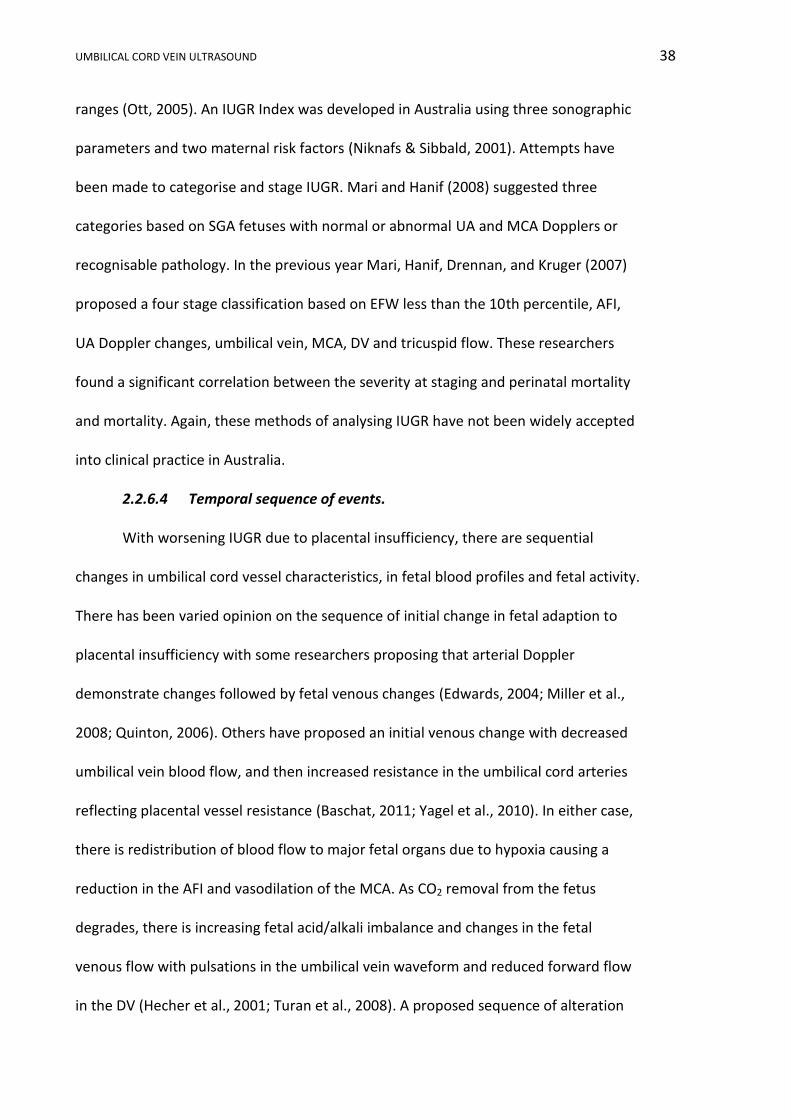
UMBILICAL CORD VEIN ULTRASOUND 38
ranges (Ott, 2005). An IUGR Index was developed in Australia using three sonographic
parameters and two maternal risk factors (Niknafs & Sibbald, 2001). Attempts have
been made to categorise and stage IUGR. Mari and Hanif (2008) suggested three
categories based on SGA fetuses with normal or abnormal UA and MCA Dopplers or
recognisable pathology. In the previous year Mari, Hanif, Drennan, and Kruger (2007)
proposed a four stage classification based on EFW less than the 10th percentile, AFI,
UA Doppler changes, umbilical vein, MCA, DV and tricuspid flow. These researchers
found a significant correlation between the severity at staging and perinatal mortality
and mortality. Again, these methods of analysing IUGR have not been widely accepted
into clinical practice in Australia.
2.2.6.4 Temporal sequence of events.
With worsening IUGR due to placental insufficiency, there are sequential
changes in umbilical cord vessel characteristics, in fetal blood profiles and fetal activity.
There has been varied opinion on the sequence of initial change in fetal adaption to
placental insufficiency with some researchers proposing that arterial Doppler
demonstrate changes followed by fetal venous changes (Edwards, 2004; Miller et al.,
2008; Quinton, 2006). Others have proposed an initial venous change with decreased
umbilical vein blood flow, and then increased resistance in the umbilical cord arteries
reflecting placental vessel resistance (Baschat, 2011; Yagel et al., 2010). In either case,
there is redistribution of blood flow to major fetal organs due to hypoxia causing a
reduction in the AFI and vasodilation of the MCA. As CO2 removal from the fetus
degrades, there is increasing fetal acid/alkali imbalance and changes in the fetal
venous flow with pulsations in the umbilical vein waveform and reduced forward flow
in the DV (Hecher et al., 2001; Turan et al., 2008). A proposed sequence of alteration
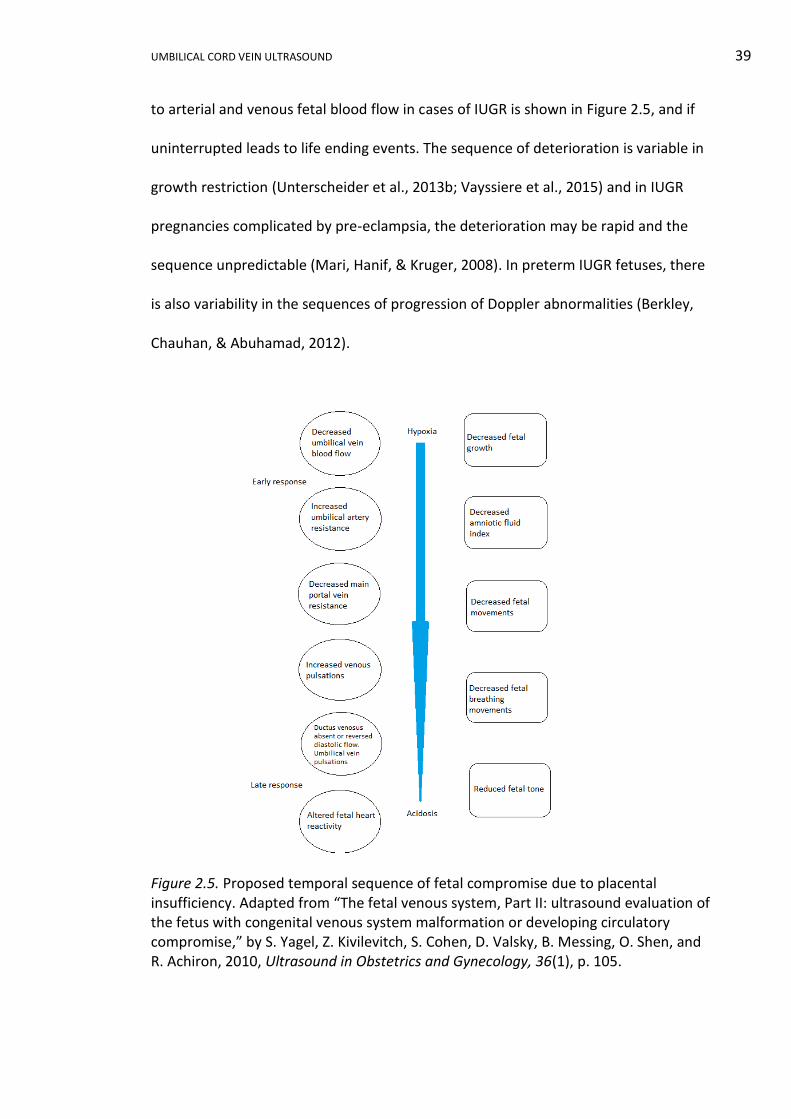
UMBILICAL CORD VEIN ULTRASOUND 39
to arterial and venous fetal blood flow in cases of IUGR is shown in Figure 2.5, and if
uninterrupted leads to life ending events. The sequence of deterioration is variable in
growth restriction (Unterscheider et al., 2013b; Vayssiere et al., 2015) and in IUGR
pregnancies complicated by pre-eclampsia, the deterioration may be rapid and the
sequence unpredictable (Mari, Hanif, & Kruger, 2008). In preterm IUGR fetuses, there
is also variability in the sequences of progression of Doppler abnormalities (Berkley,
Chauhan, & Abuhamad, 2012).
Figure 2.5. Proposed temporal sequence of fetal compromise due to placental insufficiency. Adapted from “The fetal venous system, Part II: ultrasound evaluation of the fetus with congenital venous system malformation or developing circulatory compromise,” by S. Yagel, Z. Kivilevitch, S. Cohen, D. Valsky, B. Messing, O. Shen, and R. Achiron, 2010, Ultrasound in Obstetrics and Gynecology, 36(1), p. 105.
UMBILICAL CORD VEIN ULTRASOUND 40
If changes in the umbilical vein are one of the first adaptive changes to
placental insufficiency, then developing easy to perform measurements and Australian
reference ranges of the vein characteristics may provide an IUGR detection method
that can be integrated into routine scanning protocols.
2.2.7 Current practices of predicting and managing IUGR.
Reliable prediction of IUGR would identify those fetuses requiring closer
monitoring, management in high level obstetric facilities and may avoid neonatal and
adult sequelae of IUGR by implementing preventative and risk reduction strategies
(Conde-Agudelo et al., 2013). Predicting pregnancies that have the potential to be
affected by IUGR begins with collecting a good clinical history identifying all risk
factors. Women with a previous history of growth restriction have a 50% increased risk
of IUGR in a subsequent pregnancy (Figueras & Gardosi, 2011). In the first trimester,
low pregnancy associated plasma protein-A (PAPP-A) or human chorionic
gonadotrophin can be associated with IUGR, as is a raised maternal serum alpha-
fetoprotein (Bamfo & Odibo, 2011; Lausman et al., 2013). Women with a low first
trimester PAPP-A, have an odds ratio of 2.8, 95% CI [2.0, 4.0], of delivering an IUGR
fetus compared to women with normal levels (Smith et al., 2006).
Trophoblastic invasion of the maternal spiral arteries causes a reduction in the
resistance to blood flow in the uterine arteries, which can be assessed by Doppler
ultrasound. Between 19 and 23 weeks GA, uterine artery Doppler with either a raised
PI on standard reference ranges or persistent early diastolic notch in one or both
arteries, is suggestive of the development of IUGR (Lausman et al., 2013; McLeod,
2008). In a review of 61 studies that assessed uterine artery prediction of IUGR,
Cnossen et al. (2008) found that in low risk populations, an elevated uterine artery PI
UMBILICAL CORD VEIN ULTRASOUND 41
with notching was the best predictor of GA corrected birthweight less than the 10th
percentile (positive likelihood ratio 9.1). Repeating uterine artery Doppler after 24
weeks GA provides no additional information as normalisation and subsequent loss of
the early diastolic notch is still associated with an increased risk of SGA (Royal College
of Obstetricians and Gynaecologists, 2014a). Velauthar et al. (2014) undertook a meta-
analysis of 18 studies and showed that the sensitivity and specificity of abnormal
uterine artery waveform during the first trimester in the prediction of early onset IUGR
were 39.2%, 95% CI [26.3, 53.8], and 93.1%, 95% CI [90.6, 95.0], respectively. The Fetal
Medicine Foundation (2008) First Trimester Screening Program includes software for
determining the risk of developing growth restriction based on maternal history, mean
maternal arterial pressure, uterine artery Doppler PI and maternal PAPP-A levels.
Recent research has proposed that 3D power Doppler measurement of the
placental vascular bed provides an early indication of severe pregnancy problems, one
of which was IUGR; however, the technique is heavily software and user dependent
and unlikely to be suitable as an independent test (Hafner, Metzenbauer, Stumpflen, &
Waldhor, 2013). During the second trimester elevated alpha-fetoprotein, human
chorionic gonadotrophin or inhibin A, or low oestriol can be associated with
development of IUGR. In a review of 37 novel biomarkers, none were identified as
clinically useful for predicting IUGR in women with a singleton gestation (Conde-
Agudelo et al., 2013).
There is currently no proficient treatment of IUGR; however, preventive
measures to reduce risk factors are possible (Marsál, 2009; Peyter et al., 2014).
Preventive methods include altering maternal behaviours, with smoking cessation
during pregnancy preventing 17% of low birthweight babies (Suhag & Berghella, 2013).

UMBILICAL CORD VEIN ULTRASOUND 42
Other measures include improving nutrition, elimination of illicit drug use, treatment
of infections, antimalarial precautions and medical management of maternal diseases.
In addition, low dose aspirin from early second trimester through to 36 weeks GA is
recommended for women with a previous history of IUGR or with two or more risk
factors (Lausman et al., 2013).
IUGR management is based on careful monitoring (Peyter et al., 2014).
Provided the fetus has reached a suitable GA, the aim of surveillance in IUGR is to
optimise the timing of delivery prior to fetal demise and the occurrence of permanent
damage (Kaponis et al., 2011; Marsál, 2009). Timing of delivery is one of the major
considerations in management of IUGR, as mortality and morbidity implications of a
preterm delivery need to be weighed against the mortality and morbidity of IUGR. At
less than 29 weeks, GA was the most important determinant of undamaged survival in
a prospective study of preterm, live born, IUGR neonates (Baschat et al., 2007). After
29 weeks, birthweight and DV Doppler were the best predictors of neonatal outcome
(Baschat et al., 2007). Several recent clinical trials have attempted to investigate the
optimum timing of delivery. The Growth Restriction Intervention Trial (GRIT)
encompassed 69 hospitals in 13 European countries between 1996 and 2002 and
recruited 548 women who were between 24 and 36 weeks pregnant with an IUGR
fetus. The GRIT study showed no difference in motor or intellectual morbidly up to
school age regardless of early or delayed delivery (Walker et al., 2011). The Trial of
Randomized Umbilical and Fetal Flow in Europe (TRUFFLE) was performed between
2005 and 2010 in 20 European centres. Of the surviving infants, more were free of
neurological impairment if they were delivered according to changes in the DV, as
opposed to cardiotocography (CTG) changes, but this was accompanied by a non-

UMBILICAL CORD VEIN ULTRASOUND 43
significant increase in perinatal and infant mortality (Vora & Chescheir, 2015). Tate and
Mari (2013) summarised the results of the Disproportionate Intrauterine Growth
Intervention Trial at Term (DIGITAT) from the Netherlands. This trial found maternal
and perinatal outcomes were similar for term IUGR fetuses irrespective of whether
they were induced or underwent expectant management (Tate & Mari, 2013). Doppler
investigation is an efficient method of surveillance in IUGR monitoring, but there
remains controversy over which Doppler provides the best predictors of poor
outcome. The DV was considered as the strongest Doppler predictor of perinatal
mortality in preterm IUGR fetuses (Giuliano et al., 2014; Yagel et al., 2010). If preterm
delivery is anticipated, administration of corticosteroids can accelerate fetal lung
development (Royal College of Obstetricians and Gynaecologists, 2014a).
When IUGR is diagnosed, serial ultrasound examinations, UA and other fetal
Dopplers can be used in fetal monitoring, as previously discussed. In addition, the
extent of fetal distress can be detected by the number of gross fetal movements (kick
chart) or by analysing CTG fetal heart traces. As the level of hypoxia increases, the
compromised fetus will attempt to conserve oxygen by reducing gross body
movements, ceasing breathing movements, reducing muscle tone, and can develop a
non-reactive CTG heart pattern (Rumack, Wilson, & Charboneau, 2005).
The optimum mode of delivery of IUGR fetuses is controversial, with IUGR
fetuses more likely to be delivered by an emergency caesarean section to avoid fetal
distress during labour (Marsál, 2009). However, the preferred method of delivery is
dependent on the obstetrician, fetal age and the site of delivery (Bamfo & Odibo,
2011; Collins et al., 2013).
UMBILICAL CORD VEIN ULTRASOUND 44
2.2.8 Conclusion.
IUGR is a complication of pregnancy with a prevalence of approximately 10%;
however, the definitions of IUGR are numerous and diagnostic criteria are
controversial. The early identification of IUGR has the potential to reduce
complications during pregnancy and adverse consequences throughout life. The
sequence of deterioration in a growth restricted fetus suggests that umbilical vein
ultrasound characteristics may provide a means of identifying and monitoring fetuses
at risk of IUGR.
2.3 The Umbilical Cord
2.3.1 Introduction.
The umbilical cord provides the conduit for unhindered blood transport from
the placenta to the fetus and vice versa. Aristotle (384 BC-322 BC) originally identified
the umbilical cord as the connection between the mother and unborn child (Gill,
Kossoff, Warren, & Garrett, 1984; Needham, 1959). The following description of the
development, structure and blood flow within the umbilical cord with specific
reference to the fetal venous system formed the basis of a review article published in
the Australasian Journal of Ultrasound in Medicine, August 2012 (Appendix A).
In the research described in this exegesis, the term umbilical vein (UV) is a used
as a generic term referring to the entire length of the vessel from placenta to within
the fetal liver. When the portion within the fetal abdomen is specifically discussed this
will be referred to as the intra-abdominal UV. The term umbilical cord vein (UCV)
specifically defines the intra-amniotic portion of the vein contained within the
umbilical cord.
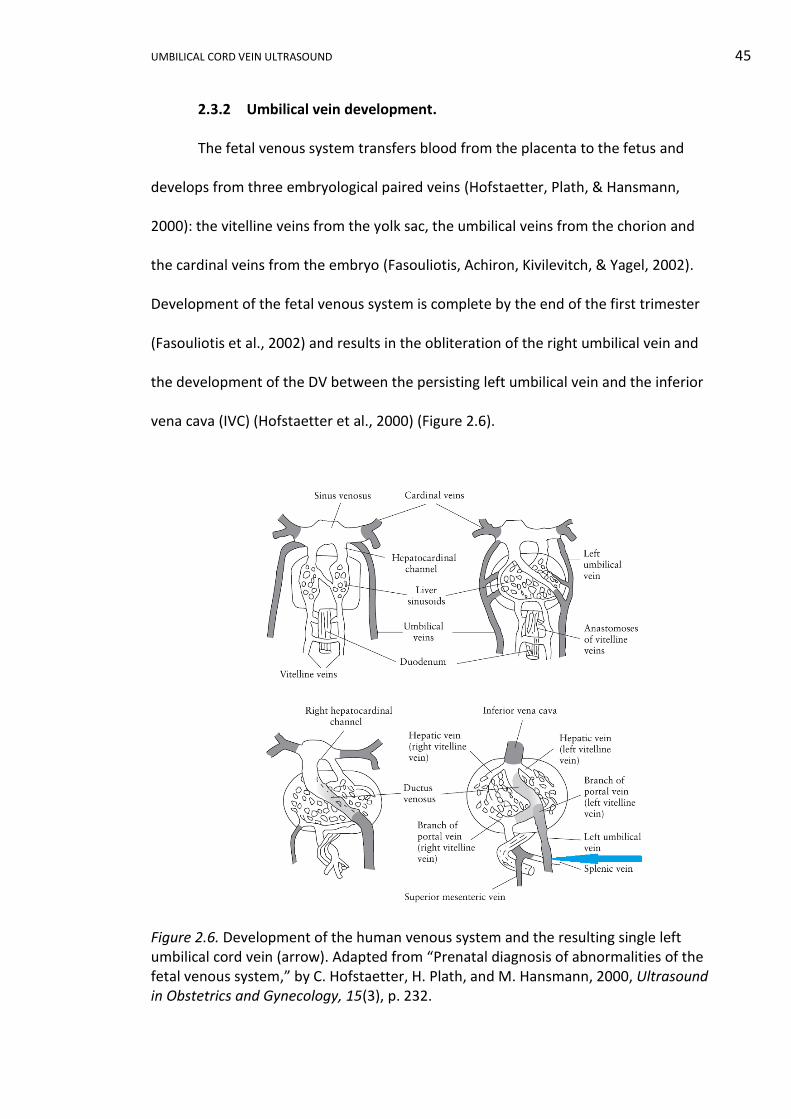
UMBILICAL CORD VEIN ULTRASOUND 45
2.3.2 Umbilical vein development.
The fetal venous system transfers blood from the placenta to the fetus and
develops from three embryological paired veins (Hofstaetter, Plath, & Hansmann,
2000): the vitelline veins from the yolk sac, the umbilical veins from the chorion and
the cardinal veins from the embryo (Fasouliotis, Achiron, Kivilevitch, & Yagel, 2002).
Development of the fetal venous system is complete by the end of the first trimester
(Fasouliotis et al., 2002) and results in the obliteration of the right umbilical vein and
the development of the DV between the persisting left umbilical vein and the inferior
vena cava (IVC) (Hofstaetter et al., 2000) (Figure 2.6).
Figure 2.6. Development of the human venous system and the resulting single left umbilical cord vein (arrow). Adapted from “Prenatal diagnosis of abnormalities of the fetal venous system,” by C. Hofstaetter, H. Plath, and M. Hansmann, 2000, Ultrasound in Obstetrics and Gynecology, 15(3), p. 232.
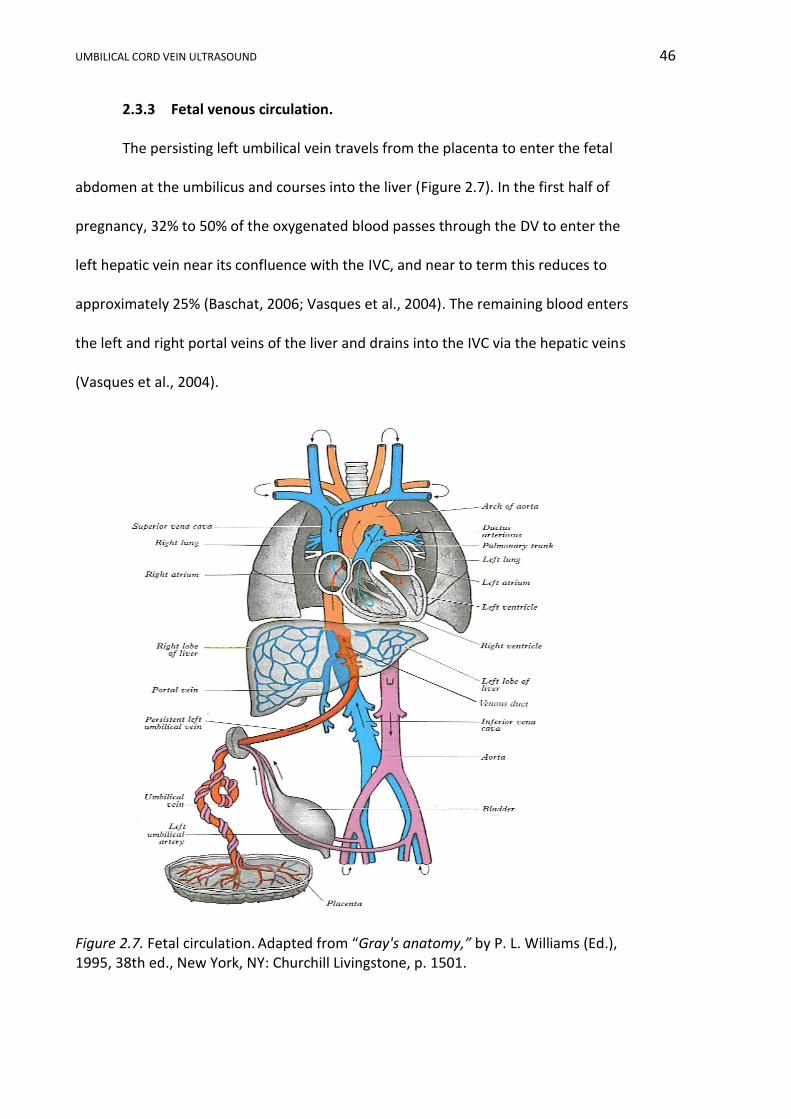
UMBILICAL CORD VEIN ULTRASOUND 46
2.3.3 Fetal venous circulation.
The persisting left umbilical vein travels from the placenta to enter the fetal
abdomen at the umbilicus and courses into the liver (Figure 2.7). In the first half of
pregnancy, 32% to 50% of the oxygenated blood passes through the DV to enter the
left hepatic vein near its confluence with the IVC, and near to term this reduces to
approximately 25% (Baschat, 2006; Vasques et al., 2004). The remaining blood enters
the left and right portal veins of the liver and drains into the IVC via the hepatic veins
(Vasques et al., 2004).
Figure 2.7. Fetal circulation. Adapted from “Gray's anatomy,” by P. L. Williams (Ed.), 1995, 38th ed., New York, NY: Churchill Livingstone, p. 1501.

UMBILICAL CORD VEIN ULTRASOUND 47
The blood from the DV enters the IVC along with blood returning from the
hepatic veins, lower limbs and abdominal wall and flows into the right atrium. From
the right atrium, there are two blood circulation pathways (Figure 2.8):
i. Blood from the IVC combines with blood from the superior vena cava (SVC)
and passes through the tricuspid valve into the right ventricle. From the
right ventricle, blood enters the pulmonary trunk and the ductus arteriosus
to flow into the descending aorta for distribution to the organs of the
abdomen, pelvis, lower limbs and return to the placenta by the paired
umbilical arteries.
ii. Blood diverted through the DV enters the left atrium via the foramen
ovale, and this bypass of the right ventricle occurs due to the higher
velocity of the DV blood and valve placement within the IVC. The blood in
the left atrium joins blood from the pulmonary veins to enter the
ascending aorta for distribution to the heart, head and upper limbs and
eventual return to the heart via the SVC (P. L. Williams, 1995).
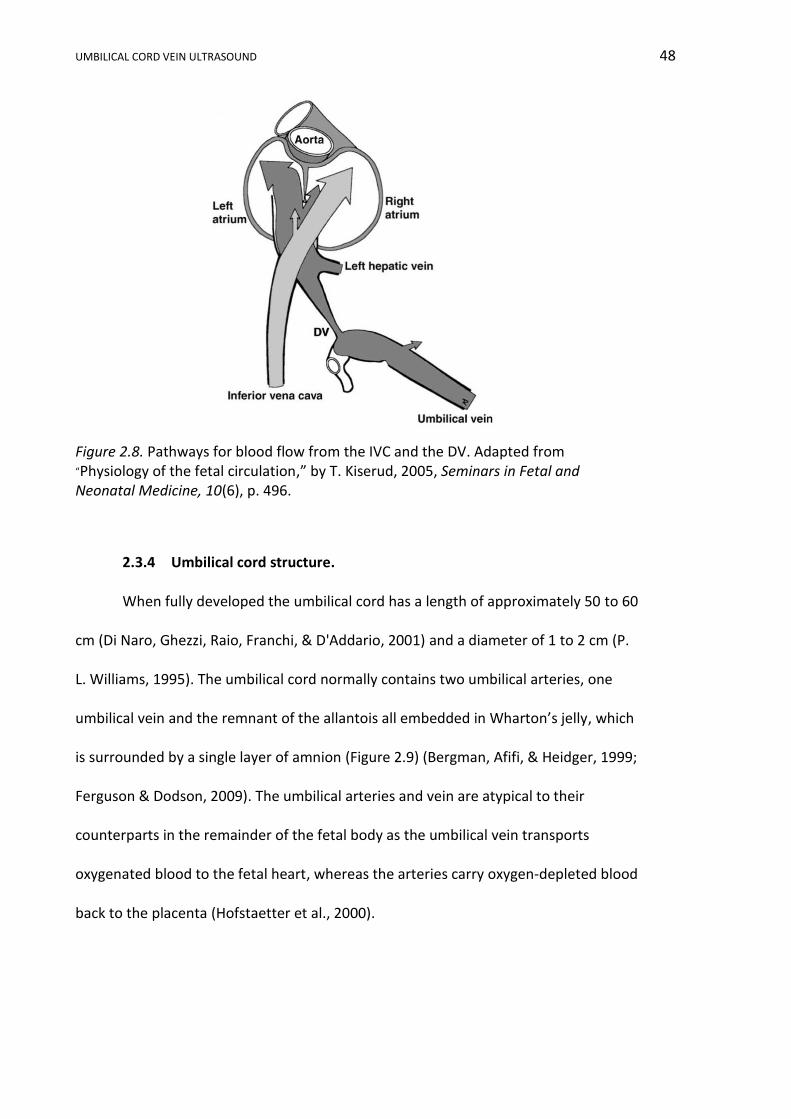
UMBILICAL CORD VEIN ULTRASOUND 48
Figure 2.8. Pathways for blood flow from the IVC and the DV. Adapted from
“Physiology of the fetal circulation,” by T. Kiserud, 2005, Seminars in Fetal and Neonatal Medicine, 10(6), p. 496.
2.3.4 Umbilical cord structure.
When fully developed the umbilical cord has a length of approximately 50 to 60
cm (Di Naro, Ghezzi, Raio, Franchi, & D'Addario, 2001) and a diameter of 1 to 2 cm (P.
L. Williams, 1995). The umbilical cord normally contains two umbilical arteries, one
umbilical vein and the remnant of the allantois all embedded in Wharton’s jelly, which
is surrounded by a single layer of amnion (Figure 2.9) (Bergman, Afifi, & Heidger, 1999;
Ferguson & Dodson, 2009). The umbilical arteries and vein are atypical to their
counterparts in the remainder of the fetal body as the umbilical vein transports
oxygenated blood to the fetal heart, whereas the arteries carry oxygen-depleted blood
back to the placenta (Hofstaetter et al., 2000).

UMBILICAL CORD VEIN ULTRASOUND 49
Figure 2.9. Cross-section of the umbilical cord following parturition. Adapted from
“UNSW Embryology,” by M. Hill, 2010, Placenta Histology. Retrieved from https://embryology.med.unsw.edu.au/embryology/index.php/File:Placental_cord_cross-section.jpg.
The walls of the UA lack an internal and external elastic lamina and the mucous
connective tissue replaces the adventitia found in other arteries. The umbilical vein has
a thickened muscularis layer with intermingling circular, longitudinal and oblique
smooth muscle fibres as well as internal elastic lamina (Bergman et al., 1999).
Obliteration of the allantoic duct occurs by the 15th week of gestation and the remains
are located between the two arteries. Minute vitelline ducts may also be seen in the
cord (Benirschile & Kaufmann, 2000). Wharton’s jelly was named after Thomas
Wharton (1614-1673), an English physician who first described the substance.
Wharton’s jelly is essentially a mucous connective tissue of interlacing collagen fibres
in which the umbilical vessels are embedded (Bergman et al., 1999; Di Naro, Ghezzi,
Raio, Franchi, D'Addario, et al., 2001). Wharton’s jelly facilitates the transfer of water
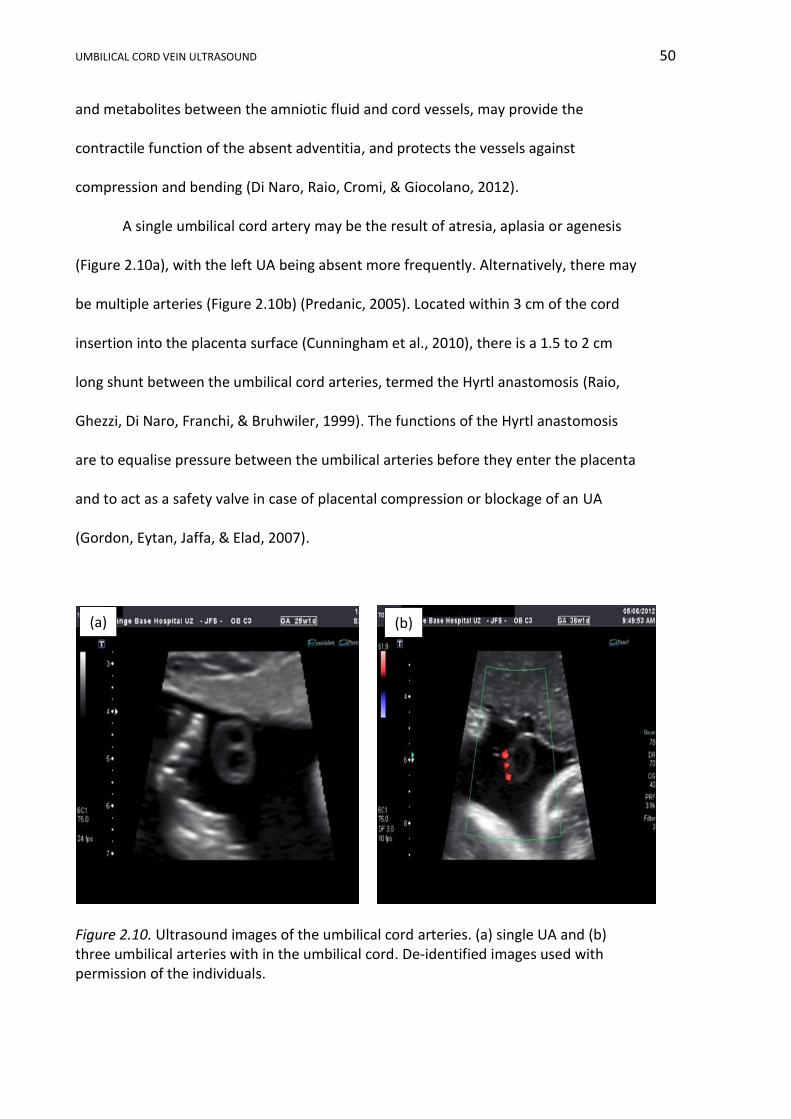
UMBILICAL CORD VEIN ULTRASOUND 50
and metabolites between the amniotic fluid and cord vessels, may provide the
contractile function of the absent adventitia, and protects the vessels against
compression and bending (Di Naro, Raio, Cromi, & Giocolano, 2012).
A single umbilical cord artery may be the result of atresia, aplasia or agenesis
(Figure 2.10a), with the left UA being absent more frequently. Alternatively, there may
be multiple arteries (Figure 2.10b) (Predanic, 2005). Located within 3 cm of the cord
insertion into the placenta surface (Cunningham et al., 2010), there is a 1.5 to 2 cm
long shunt between the umbilical cord arteries, termed the Hyrtl anastomosis (Raio,
Ghezzi, Di Naro, Franchi, & Bruhwiler, 1999). The functions of the Hyrtl anastomosis
are to equalise pressure between the umbilical arteries before they enter the placenta
and to act as a safety valve in case of placental compression or blockage of an UA
(Gordon, Eytan, Jaffa, & Elad, 2007).
Figure 2.10. Ultrasound images of the umbilical cord arteries. (a) single UA and (b) three umbilical arteries with in the umbilical cord. De-identified images used with permission of the individuals.
(a) (b)
UMBILICAL CORD VEIN ULTRASOUND 51
The umbilical arteries and umbilical vein are often arranged in a spiral
(Ferguson & Dodson, 2009), which may provide resistance against compression. The
umbilical cord spirals are dextral (clockwise) in approximately 90% and sinistral in the
remaining (Reynolds, 1978). The umbilical cord may develop up to 40 spirals, with an
average being 10 to 11 coils along its length (Di Naro et al., 2012). The spiralling has
been attributed to the helical muscle layers in the UA walls (Callen, 2000); however,
whether this mechanism is genetic or acquired is still under debate (Di Naro et al.,
2012).
In addition to its atypical transportation of oxygenated blood and prominent
muscularis layer, the umbilical cord vein has the following distinguishing
characteristics:
i. The umbilical cord vein pressure increases from 4.5 mmHg at 18 weeks
gestation to 6 mmHg at term (Kiserud, 2005).
ii. The area of the umbilical cord vein is approximately 30% larger than the
combined areas of the arteries and as such the velocity in the vein is
approximately half as slow as the velocity in either artery (Reynolds, 1978).
2.3.5 Mechanisms of blood flow in the umbilical cord vein.
The fetus can be considered a closed system as the quantity of blood flow from
the placenta to the fetus and vice versa are approximately equal (Reynolds, 1978). The
placenta delivers oxygenated blood to the umbilical vein, with a residual pressure from
the placenta (Kiserud, Eik-Nes, Blaas, Hellevik, & Simensen, 1994), and this blood is
transported through the UV to the fetus by the following methods:
i. Blood pressure gradient enables blood movement because blood pressure
is higher in the UV than in the fetal IVC (Reynolds, 1978). This gradient is
UMBILICAL CORD VEIN ULTRASOUND 52
due to at least two mechanisms. Firstly, normal fetal heart contractions
produce a pressure gradient between the atria and ventricles, which in
turn diminishes the preload in the venous circulation and allows the blood
in the UV to move towards the fetal heart (Fasouliotis et al., 2002).
Secondly, changes in fetal abdominal and thoracic cavity pressures occur
during fetal breathing movements and these cause a pressure gradient
between the UV and the DV (Fasouliotis et al., 2002) such that there is an
increase in the velocity of the blood in the UV during inspiration (Vasques
et al., 2004).
ii. Passive pressure changes in the UCV occur due to longitudinal distortion of
the arteries with each fetal heartbeat. This results in pressure peaks in the
UA and UV being out of phase by 180° (Reynolds, 1978) subsequently
causing multiple peaks in an additive fashion along the length of the UCV
(Di Naro, Ghezzi, Raio, Franchi, D'Addario, et al., 2001).
2.3.6 Conclusion.
The UV is the remnant of embryological venous development that results in the
obliteration of the right umbilical vein and the establishment of two pathways through
the liver and heart for oxygenated blood travelling from the placenta to the fetus via
the persisting left UV. The umbilical cord normally contains two umbilical arteries and
an umbilical vein, and it commonly exhibits dextral twisting along its length.
Oxygenated blood moves in the UV, from the placenta to the fetus, due to pressure
gradients established by fetal heart contractions, fetal breathing and distortions of the
umbilical cord arteries.
UMBILICAL CORD VEIN ULTRASOUND 53
2.4 Ultrasound Assessment of the Umbilical Vein
2.4.1 History of measurements of the umbilical vein.
In 1884, Cohnstein and Zuntz made the first attempt to examine the circulation
within the umbilical cord by placing a stromuhr in the UA of a fetal lamb (Gill et al.,
1984). Early investigations into umbilical cord blood flow were hampered by
inaccessibility and the risk of infection (Kurjak & Rajhvajn, 1982). In the 1960s and
1970s various in utero and postpartum methods were used to quantify umbilical vein
blood flow including xenon isotope injection, plethysmography, electromagnetic flow
meters and thermodilution (Eik-Nes, Marsal, Brubakk, Kristofferson, & Ulstein, 1982;
Lees, Albaiges, Deane, Parra, & Nicolaides, 1999). In the 1980s, the advancement of
ultrasound imaging sparked a cascade of research into the umbilical cord vessels, with
UA Doppler parameters dominating research and acceptance into clinical practice.
Early research into the umbilical vein was led by Australian researchers (Gill, 1979; Gill
et al., 1984) and in recent years several international researchers have published
reference ranges for ultrasound B-mode and Doppler measurements of the umbilical
vein (Acharya, Wilsgaard, Berntsen, Maltau, & Kiserud, 2005; Barbieri, Cecatti, Surita,
Marussi, & Costa, 2012; Flo, Wilsgaard, & Acharya, 2010; Rizzo, Rizzo, Aiello, Allegra, &
Arduini, 2016). Clinical practice has been slow to embrace measurements of umbilical
vein due to the perceived difficulty in acquiring measurements, relative inaccuracy of
results, low reproducibility (Ferrazzi et al., 2000; Kaponis et al., 2011), lack of reference
ranges and the absence of clinically proven relevance of such measurements. Recent
improvement in image quality, the development of population specific reference
ranges, a clinically proven relationship between UV measurements and IUGR, and the
suggestion that changes in umbilical venous flow may precede changes in other fetal

UMBILICAL CORD VEIN ULTRASOUND 54
measurements in the compromised fetus may overcome this resistance. The
development of Australian reference ranges will hopefully accelerate the integration of
UV measurements into everyday clinical practice.
2.4.2 Umbilical vein measurement sites.
There are two possible sampling sites for ultrasound measurements of the
umbilical vein: the UCV or the intra-abdominal UV. The main advantages of the intra-
abdominal UV are the absence of transmitted pulses from the UA (Vasques et al.,
2004), the sampling site can be anatomically fixed (Flo, Wilsgaard, & Acharya, 2009;
Tchirikov, Strohner, Förster, & Hüneke, 2009) and this portion has a known parabolic
flow profile (Flo et al., 2009). The main disadvantages of the intra-abdominal portion
include awkward orientation of the fetal abdomen presenting the UV in a plane that is
not ideal for accurate diameter or velocity measurements, acoustic shadowing from
ossified fetal bones and direct insonation of the fetus.
The main advantages of the UCV include ease of location, sonographer
familiarity with Doppler examination of the umbilical cord due to assessment of the
UA, easier optimisation of the Doppler angle and reduced insonation of the fetus. The
main disadvantages of the UCV are cord mobility, inability to reproduce the sampling
site in subsequent examinations (Flo et al., 2009), variability in the spatial velocity
profile coefficient along the length of the cord (Acharya et al., 2005) and the potential
impact of coiling (Di Naro, Ghezzi, Raio, Franchi, D'Addario, et al., 2001; El Behery,
Nouh, Alanwar, & Diab, 2011). In addition W. Li, Ruan, Zhang, and Zeng (2006)
reported that the UCV diameter significantly decreased in size (p < 0.01) in a segment
of cord nearer the fetal end of the cord, and the size reduced from the placental end
(3.067 mm) of this segment to the fetal end (2.3 mm) by less than a 1 mm. This trend

UMBILICAL CORD VEIN ULTRASOUND 55
has been incorrectly reported in the literature (Figueras, Fernández, Hernández-
Andrade, & Gratacós, 2008; Prior, Mullins, Bennett, & Kumar, 2014) due to the
confusing nomenclature used by Li and colleagues.
There are persuasive arguments for measurement of either portion of the UV,
but the method most easily assimilated into everyday practice is the one that requires
the least change in clinical practice, is the easiest to undertake, is always accessible,
and that minimises fetal exposure to ultrasound. For these reasons the UCV is
favoured in clinical practice as it is easier to locate and measure (Flo et al., 2010).
2.4.3 Umbilical vein diameter.
There are numerous techniques for measuring the dimensions of the UV and
these include measuring the diameter or the area, vessel wall inclusion or exclusion,
and automatic software measurement. In addition, there are variations in the UV
diameter depending on the location, fetal behavioural states and GA. The relationship
of the UV diameter with GA has been interpreted in several ways, as has the variation
of the diameter in the presence of IUGR. This section of the literature review discusses
the above aspects and includes information pertaining to both the diameter and area
of the umbilical vein, as the area can be derived from diameter measurements and
both can be used for calculation of the UV blood flow.
2.4.3.1 Measurement of the umbilical vein diameter.
There are several techniques for measuring the UV diameter. Link, Clark, and
Lang (2007) measured the outer to inner diameter in a plane parallel to the
longitudinal axis of the UCV three separate times. Acharya et al. (2005) used the
average of five measurements of the inner diameter of the intra-abdominal UV.
Ferrazzi et al. (2000) and Rigano et al. (2008) used the average of three inner to inner
UMBILICAL CORD VEIN ULTRASOUND 56
measurements in the longitudinal plane of the UCV. Sutton et al. (1990) and Barbera et
al. (1999) used the transverse plane to measure the UCV. Ghezzi et al. (2005), Togni et
al. (2007) and Gerada et al. (2006) calculated the cross-sectional area of the UCV by
tracing the circumference of the vein with the ellipse or spline function of the
ultrasound machine and more recent research has utilised automated nuchal
translucency functions for vein diameter measurements (Rizzo et al., 2016).
In several publications reviewed, researchers indicated that ultrasound data
was acquired during fetal quiescence to eliminate irregularities due to fetal breathing,
movement, hiccupping, etc. (Acharya et al., 2005; Flo et al., 2009; Rigano et al., 2001).
The practice of acquiring data during fetal quiescence was validated by Boito, Ursem,
Struijk, Stijnen, and Wladimiroff (2004), who found that in 17 normal pregnancies
there was a statistically significant increase of 5.6% in the cross-sectional area of the
UCV between a quietly asleep state and a state exhibiting gross fetal and eye
movements. Further support for measuring the UCV diameter during fetal quiescence
was presented by Nyberg, Johnsen, Rasmussen, and Kiserud (2010), whose research
found a 27% increase in UCV area between fetal resting and breathing states.
2.4.3.2. Normal ranges and relationship with gestational age.
Reference ranges have been established for both the diameter and cross-
sectional area of the UV. Both measurements are included in the following discussion
to allow a broader analysis of trends.
Moinian, Meyer, and Lind (1969) examined a transverse section of 255 cord
specimens collected after normal deliveries that had been double clamped to retain
cord blood and fixed in formalin. They determined that the mean UCV luminal
diameter was 6.6±0.2 mm five seconds after delivery. Although the GA at delivery was
UMBILICAL CORD VEIN ULTRASOUND 57
not documented, it is assumed that a normal delivery inferred a term delivery. The
validity of pathological studies has been questioned when formaldehyde solution
(formalin) was used as the fixing agent, as it causes the umbilical cord and vessels to
shrink (Raio et al., 2003).
An early study by Chen, Lu, Cheng, Hsieh, and Liu (1986) using the Octoson
ultrasound machine measured the diameter of the intra-abdominal UV on 163 normal
pregnancies between 25 and 41 weeks GA. These researchers found a curvilinear
relationship between diameter and GA: the UV diameter steadily increased from 4.7
mm at 25 weeks GA to a maximum of 7.8 mm at 38 to 40 weeks GA, followed by a
slight decline to 7.6 mm at 41 weeks GA.
The linear regression formula, based on UCV diameter, supplied by Sutton et al.
(1990) indicated the UCV diameter increased from 4.3 mm at 19 weeks to 8.7 mm at
40 weeks. Weissman, Jakobi, Bronshtein, and Goldstein (1994) measured the UCV near
the entrance to the abdominal wall in the longitudinal plane, using inner to inner
diameter, on 368 uncomplicated pregnancies. Their regression formula described a
curvilinear relation with GA, with a diameter of 2.6 mm at 16 weeks, 9.1 mm at 40
weeks and a maximum of 9.2 mm at 42 weeks.
Barbera et al. (1999) undertook a study of 70 pregnant women who delivered
normally grown fetuses at term. They measured the UCV inner width three times and
determined the diameter increased in a linear fashion from 4.1 mm at 20 weeks 8.3
mm at 38 weeks GA. Using 511 longitudinal observations on 130 low risk pregnant
women, Acharya et al. (2005) concluded the diameter of the intra-abdominal UV had a
curvilinear relation with advancing GA and increased steadily from a median of 2.6 mm
at 19 weeks to 6.1 mm at 35 weeks and then slowly increased to 6.8 mm at 41 weeks.
UMBILICAL CORD VEIN ULTRASOUND 58
The birthweights of 3% of neonates included in Acharaya et al.’s (2005) study were
below the 5th percentile for GA and given that these would be classified as IUGR and
assuming that there is a significant relation between UV diameter and IUGR, their
inclusion may have reduced the overall diameter measurements. A similar relationship
was described in 2012, using a prospective cross-sectional study on 2,310 low risk
singleton pregnancies. The UCV adjacent to abdominal wall insertion was measured in
the longitudinal plane and a curvilinear relation with GA was described, which showed
a rapidly increasing diameter from 12 to 27 weeks and then a slower increase to 9.1
mm at 40 weeks GA (Barbieri et al., 2012).
In a longitudinal prospective study of 53 low risk pregnancies, Flo et al. (2010)
established reference percentiles that indicated the UCV diameter had a curvilinear
relation with GA and steadily increased from 4.0 mm at 22 weeks to 7.6 mm at 39
weeks. This trend was reflected in a large, prospective, cross-sectional study of 852
low risk pregnancies that used quantile regression for modelling of their intra-
abdominal UV data (Rizzo et al., 2016). However, a private communication with Rizzo
revealed that the published coefficients for the UV diameter were incorrect; the
correct 50th percentile values indicated the intra-abdominal UV diameter increased in
a curvilinear trend and ranged from 2.3 mm at 16 weeks to 7.3 mm at 40 weeks.
Togni et al. (2007) published reference ranges of the UCV cross-sectional area
for gestational ages ranging from 24 to 39 weeks and showed a statistically significant
correlation between the cross-sectional area of the UCV at its insertion into the fetal
abdomen and GA. These Brazilian researchers observed that the UCV cross-sectional
area increased up to 34 weeks gestation; reached a plateau in the 38th week and then
decreased. Togni et al.’s (2007) results supported those published in 2001 that showed

UMBILICAL CORD VEIN ULTRASOUND 59
that both the umbilical cord area and diameter increased with GA up to the 34th week
of pregnancy and then decreased until delivery (Di Naro, Ghezzi, Raio, Franchi, &
D'Addario, 2001). Also using the UCV area, Rostamzadeh, Kalantari, Shahriari, and
Shakiba (2015) established reference ranges from a cross-sectional study of 278 low
risk pregnancies between 15 and 41 weeks GA. The cross-sectional area was computed
using ultrasound machine software and was found to have a curvilinear relationship
with advancing GA, as the area steadily increased up to 30 weeks GA and then
plateaued.
In summary, the articles reviewed indicate the UV diameter increases with GA,
with a diameter of approximately 2.5 mm at 16 weeks, 4 mm at 20 weeks and 8 mm at
term. In these articles both linear and curvilinear trends were identified with
researchers describing a continued linear increase with GA (Barbera et al., 1999;
Sutton et al., 1990), an increase in UV diameter followed by a slower increase towards
term (Acharya et al., 2005; Barbieri et al., 2012; Rizzo et al., 2016; Weissman et al.,
1994), or an increase in UV diameter followed by a decline towards term (Chen et al.,
1986; Di Naro, Ghezzi, Raio, Franchi, & D'Addario, 2001; Togni et al., 2007). The trend
of a more rapid increase of the UV diameter earlier in the pregnancy followed by
slower growth towards term was reflected in results by Najafzadeh, Jacoby, Mattes,
and Dickinson (2016). These Australian researchers, in a prospective longitudinal study
of 136 low risk pregnancies, found the UCV diameter had a 107% increase in size
between 18 and 26 weeks GA and only a 31% increase between 26 and 34 weeks.
2.4.3.3. Umbilical vein diameter in IUGR.
The diameter of the umbilical vein may be altered in fetuses that are
compromised by growth restriction; several theories have been proposed to explain
UMBILICAL CORD VEIN ULTRASOUND 60
this change. Ferrazzi and colleagues (2000) studied 37 IUGR1 fetuses and plotted their
UCV diameters against a linear nomogram established by their previous research team
(Barbera et al., 1999), and concluded that UCV diameter was not significantly reduced
in IUGR fetuses. However, other researchers have found that there was a change in the
diameter or area of the UV in growth restricted fetuses. Using computerised
morphometry on clamped and fixed umbilical cords, Bruch et al. (1997), found the UCV
area of 47 IUGR2 fetuses with normal UA Dopplers was reduced compared to 63
normal samples. Furthermore, they found that the UCV area tended to be decreased in
32 IUGR samples that had abnormal UA Dopplers compared to the IUGR sample with
normal UA Doppler indices (Bruch et al., 1997). Rigano et al. (2001) substantiated
Bruch et al.’s (1997) finding; Rigano et al. determined that in fetuses between 23 and
36 weeks of gestation, the UCV diameter (5.09 mm) in 21 IUGR3 fetuses was
significantly less than the 36 age matched control fetuses (6.42 mm). Boito, Struijk,
Ursem, Stijnen, and Wladimiroff (2002) also found that the cross-sectional area of the
UCV was reduced in 84% of IUGR4 fetuses.
Raio et al. (2003) found that in a case controlled study of 84 IUGR5 fetuses,
compared to 184 normally growing fetuses, that the prevalence of reduced cross-
sectional area of the entire umbilical cord was significantly higher in IUGR fetuses
compared to normally grown fetuses. These researchers also found that UCV area
decreased significantly with worsening UA Doppler parameters. Supporting evidence
by a collaborative, cross-sectional study between Italy and Switzerland involving 1,391
1 AC < 2 SD below mean and birthweight < 10th
%
2 Birthweight < 10th % for GA, normal and abnormal Doppler waveforms
3 AC < 2 SD below mean, UA PI > 2 SD above mean, abnormal uterine artery and birthweight < 10th %
4 AC and birthweight < 5th %
5 AC < 5th % and birthweight < 10th %
UMBILICAL CORD VEIN ULTRASOUND 61
women, found that the reduction in the UCV cross-sectional area was strongly
associated with poor intrauterine growth and neonatal outcomes (Ghezzi et al., 2005).
In a case control study involving 12 singleton IUGR6 fetuses who died in utero,
14 IUGR fetuses who survived and 22 normal controls, Rigano et al. (2008)
demonstrated that the UCV diameter was significantly lower in those fetuses who
died, than in viable IUGR and normally grown controls. These researchers proposed
that the UCV diameter was prognostically important in cases of early diagnosed IUGR.
Consistent with the previous research, Somprasit, Chanthasenanont, and Nuntakomon
(2010) found that the UCV diameter in 70 IUGR7 fetuses was smaller than the diameter
measured in age-matched appropriately grown fetuses. Contradictory to these
findings, a 2014 comparison study of 40 patients with pre-eclampsia and/or IUGR with
49 normal controls, found no significant difference (p = 0.064) between the two groups
for the UCV area measured at the fetal umbilicus; however, there was a correlation
between UCV area and birthweight (Arslan, Mendilcioglu, Sanhal, Ozekinci, & Simsek,
2014).
Several hypotheses have been proposed to explain the presence of a narrower
UV diameter in fetuses compromised by IUGR. Raio and colleagues (2003)
hypothesised that abnormal placentation may cause early reduction in UCV velocity
and remodelling of the vein, with subsequently reduced fetal growth and eventually
abnormal UA Doppler indices. Bruch and colleagues (1997) proposed two mechanisms
for reduction in the vein cross-sectional area: vasoconstriction and vascular
6 AC < 2 SD below mean, UA PI > 95th % and abnormal uterine artery Dopplers
7 EFW < 10th % for GA
UMBILICAL CORD VEIN ULTRASOUND 62
hypoplasia. Vasoconstriction decreases the luminal area by shortening the muscle
fibres, whereas vascular hypoplasia results from decreased muscle cell mass. It has
also been proposed that the UV is smaller in IUGR fetuses as the vessel size alters as a
response to chronic hypovolemia and venous overload (Di Naro et al., 2012).
In summary, the majority of researchers identified a reduction in the diameter
or cross-sectional area of the UV when fetuses are compromised by IUGR. This
reduction has been found to be more extreme in the presence of abnormal UA
Dopplers and poor pregnancy outcomes. Several theories have been proposed to
explain the difference in the size of the umbilical vein between normal and growth
comprised fetuses, including remodelling, vasoconstriction, vascular hypoplasia and
blood volume changes.
2.4.4 Umbilical vein velocity.
Velocity is a vector measurement of the rate and direction of blood movement
in the UV. Manual or automatic measurements of the velocity of blood within the UV
can be reported in several forms. Calculation of blood flow incorporates the mean
velocity which can be measured automatically or computed from the peak velocity.
Knowledge of the haemodynamic characteristics of the UV and Doppler angle of
insonation is required to correctly measure velocity with Doppler ultrasound. This
portion of the literature review discusses the above aspects and also describes the
various relationships that have been documented between UV velocity and advancing
GA during normal and IUGR pregnancies.

UMBILICAL CORD VEIN ULTRASOUND 63
2.4.4.1 Measurement of the umbilical vein velocity.
2.4.4.1.1 Measurement methods.
Umbilical vein velocities have been reported using various measurement forms.
The time-averaged maximum velocity (Tamaxv) is a software measurement equivalent to
the maximum (Vmax) or PV (peak velocity) averaged over several cardiac cycles. The PV
or Vmax are synonymous terms and will be simply referred to as PV (peak velocity). PV
can be measured manually or by automated trace. The time-averaged mean velocity
(Tameanv) is a software measurement equivalent to the mean velocity (Vmean) averaged
over several cardiac cycles. The Vmean can be a software measurement or calculated
from Tamaxv or PV and the spatial velocity profile coefficient. Some researchers have
reported time-averaged intensity weighted mean velocity, which reflects the spatial
mean blood velocity at any given time (Tchirikov, Rybakowski, Huneke, Schoder, &
Schroder, 2002), but is not available on all machines (Flo et al., 2009).
The PV is a plainly defined and robust measurement that is resistant to small
deviations from a 0° insonation angle (Pennati, Bellotti, De Gasperi, & Rognoni, 2004).
Automatic measurement of the PV is a software dependent function and will be
incorrect if spectral trace thresholds are erroneously set; whereas, manual
measurement of the PV is dependent on the subjective choice of the correct peak by
the sonographer. The PV can be recorded using a small sample volume compared to
the lumen of the vein, ensuring that the venous flow sample is not disturbed by
adjacent arterial flow (Boito et al., 2002). Shortcomings in measuring the PV include
noise distortion, failure to encompass the PV in the sample gate, and a tendency to
overestimate the PV by up to 30% due to geometric spectral broadening as insonation

UMBILICAL CORD VEIN ULTRASOUND 64
angles approach 90° (Boito et al., 2002; Hoskins, 2011; S. Li, Hoskins, Anderson, &
McDicken, 1993).
Colour Doppler cineloop analysis was used by researchers to measure PV in a
cross-sectional study of 18 uncomplicated, singleton pregnancies (Gerada et al., 2006).
Comparisons of PV recorded by both colour Doppler cineloop offline analysis and
spectral Doppler showed a significant difference between PV recorded by the two
different methods, with the cineloop analysis being approximately 10% higher (Gerada
et al., 2006). The cineloop technique is less angle dependent and requires fewer
assumptions about the spatial velocity profile than spectral Doppler, but has not been
embraced by mainstream ultrasound practice (Gerada et al., 2006). The importance of
Gerada et al.’s (2006) research was to emphasise that a strict adherence to protocol is
essential in any clinical practice and methods of acquiring numerical data are not
always interchangeable.
The mean velocity is required for computation of blood flow and can be
automatically measured by encompassing the entire lumen within the sample gate and
recording the Tameanv or Vmean. Overestimation of automatic measurements of the
mean velocity occur if the Doppler sample gate does not encompass the whole vessel
and if slower velocities are automatically removed by high pass filters (Fernández et
al., 2008; Ferrazzi et al., 2000). This filter is also known as low velocity reject or wall
motion filter (Bhide et al., 2013). The accuracy of the Tameanv is also diminished by noise
from vein wall movement and echoes from adjacent vessels (Acharya et al., 2005).
The mean velocity can also be calculated by 0.5 x Tamaxv or 0.5 x PV, where 0.5
is the commonly used spatial velocity profile coefficient (Acharya et al., 2005). The
mean velocity calculated in this way assumes a laminar (Sutton et al., 1990) and

UMBILICAL CORD VEIN ULTRASOUND 65
symmetrically parabolic flow profile (Kiserud et al., 1994) (Figure 2.11) through the
cord (Fernández et al., 2008; S. Li et al., 1993), throughout the cardiac cycle and a fully
developed axial flow, inferring that the velocity profile does not change along the
length or axes of the vessel (Hoskins, 2011). Some researchers have modelled the UV
blood movement on a helicoidal conduit and assumed an asymmetrical flow profile
(Boito et al., 2002). While others found that the flow profiles in the UCV were flat at
the placental insertion and developed a more parabolic profile further downstream
(Pennati et al., 2004). In Pennati et al.’s (2004) study, involving 10 singleton
pregnancies between 26 and 34 weeks gestation, spatial velocity profile coefficients of
0.85 and 0.61 were found to be more suitable for Vmean calculations at the cord
insertion site and for the UCV portion cord, respectively.
Figure 2.11. Parabolic and laminar blood flow profile within the internal jugular vein. De-identified image used with permission of the individual.

UMBILICAL CORD VEIN ULTRASOUND 66
Researchers (Acharya et al., 2005; Flo et al., 2010) have reported the time-
averaged intensity weighted mean velocity. However, this mean velocity measurement
is also stated to be highly unstable due to noise, effects of high pass filters (Flo et al.,
2009; Pennati et al., 2004), sample gate size, spectral broadening (Figueras et al.,
2008), non-uniform insonation, and misalignment of the Doppler beam (S. Li et al.,
1993).
2.4.4.1.2 Haemodynamic characteristics.
All UV velocity measurement techniques assume a steady flow; however,
pulsations or fluctuations can be present within the UV. Pulsatile flow in the UV is a
normal observation until the 12th week of gestation, due to a physiological decrease in
ventricular compliance (Hofer, 2001). Pulsatile UV flow can be observed in normal
second and third trimester fetuses during fetal breathing, hiccupping and movement
(Nicolaides et al., 1999; Zheng, Sampson, & Soper, 1998). Fetal breathing produces
changes in intra-abdominal and intra-thoracic pressure causing an increase in UV
velocity during inspiration and a decrease during expiration (Vasques et al., 2004).
Pulsatile UV flow is observed in fetuses with severe IUGR, congestive and
congenital heart disease, twin-to-twin transfusion syndrome (Hellevik et al., 2000),
cord compression, cord knots, or bradycardia (Loughna, 2002). The number and
location of the UV pulsations can vary. Pulsations associated with fetal compromise
typically occur at the end of diastole and may be single, double or triple (Callen, 2000);
whereas, pulsations occurring in systole are associated with cord compression, knots
and bradycardia (Loughna, 2002).
The mechanisms producing pulsations in compromised fetuses include
increased after-load on the fetal heart as a manifestation of congestive cardiac failure
UMBILICAL CORD VEIN ULTRASOUND 67
and abnormal cardiac filling due to increased placental resistance, sustained peripheral
vasoconstriction, and impaired myocardial performance (Callen, 2000; Murta, Moron,
& Ávila, 1999). In addition, the IVC and DV have normal cardiac pulsations produced by
atrial contractions that are not ordinarily transmitted to the UV due to the ductus
sphincter acting as a bulwark preventing back flow (Kiserud, 2000); however, the DV
can relax in severe fetal compromise, transmitting double pulsation along the UV
(Hofstaetter, Gudmundsson, & Hansmann, 2002).
UV pulsatility can also result from transmitted arterial pulses and external
compression from the neighbouring umbilical arteries (Todros et al., 2002; Yagel et al.,
2010). The direction of propagation of pulsations in compromised and breathing
fetuses is from the fetus to the placenta (Reed & Anderson, 2000), which is in the
opposite direction to the UV flow, thus causing a decrement in the velocity waveform
(Kiserud, 2003a). Whereas, external pulsation of severely abnormal umbilical arteries is
in the same direction as UCV flow and can cause a rise in the velocity (Todros et al.,
2002).
2.4.4.1.3 Doppler angle.
In addition to haemodynamic considerations, the Doppler insonation angle is
critical in velocity measurements. In measuring velocity, the smaller the angle of
insonation the more accurate the Doppler measurement of velocity (Detti et al., 2004).
Many researchers use a 0°angle of insonation or apply angle correction if a 0° angle
cannot be achieved. Recently researchers have used an insonation angle of less than
20° (Acharya et al., 2005; Flo et al., 2010; Rizzo et al., 2016), and in another study, 15°
was used (Najafzadeh et al., 2016). Irrespective of the chosen angle of insonation, the
visual error of aligning the Doppler angle to the UV introduces an additional user error
UMBILICAL CORD VEIN ULTRASOUND 68
(Yamamoto, Carrillo, Insunza, Mari, & Ville, 2006), but at insonation angles of less than
30° small errors have minimal effect on velocity measurement (Figueras et al., 2008).
2.4.4.2 Normal ranges and relationship with gestational age.
This section of the literature review presents research detailing the range and
relationships that researchers have found between UV velocities and advancing GA,
during normal pregnancies. To allow comparison between velocities in the following
discussions, Vmean values have been converted to PV values by multiplying by 0.5, the
commonly used spatial velocity profile coefficient (Acharya et al., 2005).
A pioneer researcher, Gill (1979), used the Octoson ultrasound machine to
record the intra-abdominal UV Vmean in 12 patients. The Vmean ranged from 6.1 to 17.0
cm/s, equivalent to a PV range from 12.2 to 34 cm/s, and no clear correlation with GA
was demonstrated (Gill, 1979). Using the same ultrasound equipment and method as
Gill (1979), Chen et al. (1986) recorded an intra-abdominal UV Vmean of 13.6±2.7 cm/s,
which is equivalent to a PV of 27.2 cm/s; Chen et al. (1986) found that the velocity
remained relatively stable after 25 weeks GA.
Sutton et al. (1990) described the UCV PV in 74 normal fetuses between 19 and
42 weeks GA as having a linear relation with GA and ranging from 7 to 23 cm/s. In a
cross-sectional study of 129 singleton, healthy pregnancies between 23 and 33 weeks
GA, Lees et al. (1999) found that UCV Tamaxv, increased in a linear fashion from
8.16±2.24 cm/s at 23 weeks to 10.79±2.25 cm/s at 33 weeks. Barbera and colleagues
(1999) reported a linear relation between velocity and GA in a cross-sectional study
and found that the UCV Vmean increased by only 20% from 8 cm/s at 20 weeks to 10
cm/s at 38 weeks GA.
UMBILICAL CORD VEIN ULTRASOUND 69
In a reference sonography manual, Hofer (2001) indicated that UV velocity was
10 to 15 cm/s without reference to GA or UV location. Di Naro, Ghezzi, Raio, Franchi,
D’Addarin, et al.’s (2001) study of 104 women who delivered at term (mean GA 39.5
weeks) with normal, entire umbilical cord cross-section areas found the Vmean to be
9.0±3.6 cm/s, giving a PV of 18 cm/s at term. Boito et al. (2002) showed a curvilinear
relation between Tamaxv and advancing GA in a cross-sectional study of 100 normal
singleton pregnancies and concluded that the UCV Tamaxv did not have a statistically
significant increase from 5.3 cm/s at 20 weeks to 7.1 cm/s at 36 weeks GA.
A larger longitudinal study completed in 2005, followed 130 low risk singleton
pregnancies between 19 and 41 weeks gestation, and gathered 511 observations that
were used for the construction of reference ranges (Acharya et al., 2005). The authors
found that the intra-abdominal UV PV had a curvilinear relation with GA and ranged
from 16.2 cm/s at 19 weeks to a maximum of 24.7 cm/s at 32 and 33 weeks GA, before
declining to 22.3 cm/s at 40 weeks GA (Acharya et al., 2005). Acharya et al.’s (2005)
study provided reference ranges developed from longitudinal study data, in contrast to
earlier cross-sectional research by Barbera et al. (1999). The perceived benefit of
longitudinal studies is that they better reflect the clinical practice of serial
measurements that are undertaken for fetal monitoring (Acharya et al., 2005; Flo et
al., 2010); however, recent changes in statistical modelling, such as linear mixed
modelling and quantile regression, can accommodate variance within and between
participants thus negating the need for exclusive longitudinal or cross-sectional data
collection for reference range modelling (Littell, Pendergast, & Natarajan, 2000).
Recently developed UV reference ranges have described a linear relationship
between UV Tamaxv and GA. A longitudinal study, with a sample of 53 low risk
UMBILICAL CORD VEIN ULTRASOUND 70
pregnancies, showed the UCV Tamaxv had a linear relation with GA and ranged from
13.6 cm/s at 22 weeks to 17.8 cm/s at 40 weeks GA (Flo et al., 2010). Women in Flo et
al.’s (2010) study were assumed to be normal as they had no prior poor obstetric
history and they did not develop any significant complications. Rizzo et al. (2016)
collected data from 852 low risk singleton pregnancies and used linear quantile
regression to describe the relation between intra-abdominal UV Tamaxv and GA, with
the calculated 50th percentile value increasing from 8.8 cm/s at 14 weeks to 18.5 cm/s
at 40 weeks GA. In contrast to the previous two research articles an Australian study of
136 low risk pregnancies measured the UCV Tamaxv at three specific gestational ages
(Najafzadeh et al., 2016); the study recorded a non-linear relationship, with the
average Tamaxv being 14.7 cm/s at 18 weeks, then a 14% increase to 16.7 cm/s at 26
weeks and a further 17% increase to 19.5 cm/s at 34 weeks’ gestation.
In summary, there appears to be three opinions regarding UV velocity
throughout normal pregnancies: some authors assumed a relatively constant velocity
for the duration (Jouppila & Kirkinen, 1984; Link et al., 2007; Sutton et al., 1990);
others demonstrated an increase in PV with advancing GA in either a linear (Barbera et
al., 1999; Flo et al., 2010; Lees et al., 1999; Rizzo et al., 2016) or curvilinear relationship
(Boito et al., 2002; Kiserud, Rasmussen, & Skulstad, 2000); and the third opinion was a
mid-third trimester peak followed by a decline towards term (Acharya et al., 2005). In
this review of articles spanning more than 30 years of research the UV velocity values
have consistently ranged from 8 to 20 cm/s between the second and third trimesters.
2.4.4.3 Umbilical vein velocity in IUGR.
Reduced velocity of the blood travelling in the UV has been found in fetuses
compromised by growth restriction and several authors have proposed plausible
UMBILICAL CORD VEIN ULTRASOUND 71
causes of this change in velocity. In 1984, Finnish researchers, Jouppila and Kirkinen
(1984) examined a small sample of 11 growth restricted8 pregnancies and found that in
eight patients the final measurement of the intra-abdominal Vmean was below the 10th
percentile, using reference ranges they established in 1981. In sampling the velocity, a
fixed Doppler angle of 50° was employed (Jouppila & Kirkinen, 1984), which is larger
than that used in more recent research. This factor may have contributed to
underestimation of the velocity readings; however, the same protocol was employed
for establishing the reference ranges and therefore the growth restricted results are
valid.
In a cross-sectional study of 37 IUGR9 fetuses, Ferrazzi et al. (2000) found that
the UCV Vmean was significantly (p < 0.001) reduced compared to normally growing
fetuses. This research group undertook a longitudinal study in 2001 to consolidate
their findings and targeted 21 IUGR10 fetuses with GA ranging from 23 to 36 weeks
(Rigano et al., 2001). Rigano et al. (2001) showed that the UCV Vmean was significantly
higher (p < 0.001) in the control group (0.90±0.16 cm/s) than in the IUGR group
(0.50±0.16 cm/s). The values quoted by Rigano and colleagues for the UCV Vmean were
a factor of ten less than those cited by other researchers. A possible explanation is that
Rigano et al. (2001) measured velocity over a 10 s time period, in which case their
denominator was a unit of 10 s instead of one second, converting control PV to 18
cm/s and IUGR to 10 cm/s.
Reduced UV velocity in growth restricted fetuses was also documented in two
other studies of singleton pregnancies and one study involving monochoronic twins.
8 Birthweight < 10th
%, reduced fetal growth, Apgar < 7 at 1 and 5 minutes, pathological CTG
9 AC < 2 SD below mean and birthweight < 10th
%
10 AC < 2 SD below mean, UA PI > 2 SD above mean, abnormal uterine artery and birthweight < 10th %
UMBILICAL CORD VEIN ULTRASOUND 72
Boito et al. (2002) found the UCV Tamaxv was reduced in 66% of IUGR11 fetuses when
compared to normal reference ranges. While, Spurway’s (2006)12 comparison of the
UCV PV between 108 normal singleton and 10 IUGR13 fetuses aged between 26 and 41
weeks showed a statistically significant association (p < 0.001) between IUGR and
reduced UCV PV. Liao, Nomura, Liao, Francisco, and Zugaib (2014) conducted a study
of 18 monochoronic twin pregnancies compromised by placental insufficiency and
measured the Tamaxv in the straight portion of the intra-abdominal UV. A low UV Tamaxv
was found to be a predictor of fetal demise and birth acidaemia. These researchers
used the reference range developed by Acharya et al. (2005) to plot serial UV Tamaxv for
a set of twins to visually demonstrate that the twin compromised by placental
insufficiency consistently plotted lower than the uncompromised twin.
Two studies involving younger fetuses demonstrated that reduced UCV PV was
present in the second trimester in IUGR affected fetuses: the first of these studies was
a small, retrospective study (Rigano et al., 2008). The researchers matched by GA 12
singleton IUGR14 fetuses who died in utero with a GA less than 26 weeks and a fetal
weight below 600 g with 14 singleton IUGR fetuses who were born alive after 26 weeks
gestation, and 22 normal fetuses who delivered at term. Both IUGR groups showed
lower UCV PV when compared to the controls, with a significant reduction in UCV
diameter seen in the IUGR fetuses that died in utero (Rigano et al., 2008). The
researchers proposed that a small UCV diameter multiplies the effect of low velocity
and that larger studies were needed to determine if UCV size was an important
prognostic tool for early onset IUGR (Rigano et al., 2008). The second study, published
11
AC and birthweight < 5th % 12
Unpublished Master of Health Science thesis 13
EFW < 10th % or AC < 5th %
14 AC < 2 SD below mean, UA PI > 95th % and abnormal uterine artery
UMBILICAL CORD VEIN ULTRASOUND 73
data on 181 pregnancies with GA ranging from 17 to 41 weeks (Tchirikov et al., 2009).
The researchers classified the pregnancies in relation to outcome: a poor outcome was
based on cord blood pH, Apgar score, birthweight percentile, GA, requirement of
respiratory support, and transfer of the newborn to a specialist ward. In the normal
group the intra-abdominal Vmean (15.95 cm/min) was significantly higher (p = 0.0033)
than in the group with poor outcomes (12.58 cm/min) (Tchirikov et al., 2009). It
appears that there was a typographical error in Tchirikov et al.’s (2009) report because
velocity were given in units of centimetres per minute instead of the more commonly
used measurement of centimetres per second, and conversion to centimetres per
second results in unusually small values. Tchirikov et al.’s (2009) study supports the
theory that UV velocity has a prognostic potential for predicting IUGR, as fetuses in the
early second trimester were included in the data collection and reduced UV velocities
were present in IUGR fetuses across a range of gestational ages.
Other researchers identified an association between lean umbilical cords,
reduced UV velocity, and IUGR. An examination of 116 consecutive pregnancies, within
24 hours of delivery at term, found that 10.3% had lean umbilical cords (Di Naro,
Ghezzi, Raio, Franchi, D'Addario, et al., 2001). Fetuses with lean umbilical cords had a
significantly reduced UCV Vmean (6.6 cm/s) compared to the group of fetuses with
normal sized cords (9.0 cm/s), and significantly more fetuses with lean cords had FGR15
(Di Naro, Ghezzi, Raio, Franchi, D'Addario, et al., 2001). Although Di Naro and
colleagues (2001) confirmed the reduction in UCV Vmean in pregnancies affected by
IUGR, the results have no prognostic value as the data collection occurred within 24
hours of delivery. Several years after Di Naro et al.’s (2001) study, an Egyptian research
15
Birthweight < 10th % for GA
UMBILICAL CORD VEIN ULTRASOUND 74
group examined the association between lean umbilical cords, IUGR and reduced
velocity (El Behery et al., 2011). These researchers examined 224 women carrying
fetuses of greater than 24 weeks gestation and found that 15.5% had a lean umbilical
cord. El Behery et al. (2011) reported that a lean umbilical cord was associated with
IUGR16 and fetal distress during labour. In addition, UCV Vmean was significantly lower in
the fetuses with lean cords (8.6 cm/s) compared to normal umbilical cords (12.1 cm/s)
(El Behery et al., 2011).
The cause of reduced UV velocity in IUGR pregnancies has been addressed by
two research groups. Ferrazzi and colleagues (2000) proposed that reduced velocity in
IUGR fetuses was a result of a decline in the pressure between the placental and fetal
ends of the umbilical cord. While Detti et al. (2004) proposed that changes in
resistance due to dilation, vasospasm, constriction or obliteration in downstream
vessels influence the velocity of blood flowing into the UV and as such it was the status
of both the fetus and placenta that influenced the UV velocity.
In the publications that I reviewed, the UV velocity was persistently lower in
IUGR fetuses. This conclusion was evident in both longitudinal and cross-sectional data
collection methods, in all sample sizes, in both intra-abdominal and intra-amniotic
sampling sites and across a range of gestational ages. Thus, there is evidence that UV
velocity has prognostic and surveillance roles in growth compromised pregnancies.
Changes in pressure and resistance were proposed as causes of reduced UV velocity in
growth restricted fetuses.
16
Birthweight < 10th %
UMBILICAL CORD VEIN ULTRASOUND 75
2.4.5 Umbilical vein blood flow.
Blood flow is the volume of blood moving in the umbilical vein and “determines
the amount of nutrients, energy and gas exchange available to the developing fetus”
(Rigano et al., 2008, p. 908). In the research described in this exegesis, the term
umbilical vein blood flow (Quv) is used as a generic term referring to blood flow within
the entire length of the vessel from placenta to within the fetal liver. When the portion
within the fetal abdomen is specifically discussed, it will be referred to as the intra-
abdominal Quv. The term umbilical cord vein blood flow (Qucv) specifically defines blood
flow within the intra-amniotic portion of the vein contained within the umbilical cord.
In this section of the literature review I will present the various methods
available for measuring and calculating Quv, identify the normal range of Quv and
describe the different relationships that have been documented between Quv and
increasing GA during normal and IUGR pregnancies. Included in these discussions are
the proposed influences of UV diameter and velocity on Quv. I will also outline the ways
in which researchers have analysed Quv to account for variations in fetal sizes.
2.4.5.1 Measurement or calculation of the umbilical vein blood flow.
Blood flow can be defined as the “volume of fluid that passes a given cross-
sectional area per unit time” (Figueras et al., 2008, p. 588). Blood flow is automatically
calculated by ultrasound machine software or it can be computed from UV
measurements.
Ultrasound software calculation of blood flow is accepted in some clinical
areas, such as when assessing haemodialysis arteriovenous fistulas (Tirinescu et al.,
2016; Zamboli, Fiorini, D’Amelio, Fatuzzo, & Granata, 2014), but it has not been
embraced in obstetrics ultrasound. The lack of acceptance of software calculated Quv in
UMBILICAL CORD VEIN ULTRASOUND 76
obstetric ultrasound may be due to the technical difficulty of performing the function,
slow velocities in the UV, and dependence on software programs thereby making the
calculation difficult to standardise and assimilate into routine obstetric practice.
The most commonly published formula for the calculation of UV blood flow
uses measurements of the UV diameter and velocity (Acharya et al., 2005; Flo et al.,
2010; Najafzadeh et al., 2016; Parra-Saavedra et al., 2014; Rigano et al., 2008; Rizzo et
al., 2016). The formula is:
𝑄𝑢𝑣(𝑚𝑙 𝑚𝑖𝑛⁄ ) = 𝜋(𝑈𝑉 𝑑𝑖𝑎𝑚𝑒𝑡𝑒𝑟 × 0.5)2 × 𝑈𝑉 𝑉𝑚𝑒𝑎𝑛 × 60
= 𝜋(𝑈𝑉 𝑑𝑖𝑎𝑚𝑒𝑡𝑒𝑟 × 0.5)2 × (𝑈𝑉 𝑃𝑉 × 0.5) × 60.
The formula assumes a circular vein and uses a UV spatial velocity profile coefficient of
0.5 to calculate the mean velocity from the peak velocity, and this coefficient value
assumes a parabolic flow profile. However, other authors have proposed the use of
higher coefficient values, for example 0.62 (Flo et al., 2010) and 0.61 (Pennati et al.,
2004), which suggest a blunted parabolic profile. Some researchers used the time-
average intensity weight mean velocity (Acharya et al., 2005; Flo et al., 2010), and Lees
et al. (1999) used the time averaged mean velocity (Tameanv), for the mean velocity
values.
Some researchers do not include the multiplication by 60 to convert seconds to
minutes, but still indicated their blood flow as millilitres per minute (Boito et al., 2002;
Rizzo et al., 2016). Other researchers measured the diameter in millimetres, without
conversion to centimetres, and expressed the formula as (Prior et al., 2014):
𝑈𝑉 𝑏𝑙𝑜𝑜𝑑 𝑓𝑙𝑜𝑤 (𝑚𝑙/𝑚𝑖𝑛) = 𝜋(𝑈𝑉 𝑟𝑎𝑑𝑖𝑢𝑠)2 × (𝑈𝑉 𝑚𝑎𝑥𝑖𝑚𝑢𝑚 𝑣𝑒𝑙𝑜𝑐𝑖𝑡𝑦) × 0.3.
Whereas, Link et al. (2007) expressed the formula as:
𝑈𝑉 𝑏𝑙𝑜𝑜𝑑 𝑓𝑙𝑜𝑤 (𝑚𝑙/𝑚𝑖𝑛) = 𝑈𝑉 𝑚𝑒𝑎𝑛 𝑣𝑒𝑙𝑜𝑐𝑖𝑡𝑦 × 𝑑𝑖𝑎𝑚𝑒𝑡𝑒𝑟2 × π × 0.15.
UMBILICAL CORD VEIN ULTRASOUND 77
Acharya et al. (2005) found little difference between the intra-abdominal Quv
calculated from 0.5 × 𝑃𝑉 and intensity weighted mean velocity. S. Li et al. (1993)
found little difference in calculations using either PV or Vmean. However, both Flo et al.
(2010) and Pennati et al. (2004) found that the blood flow calculated from Tamaxv was
just under 20% lower than that calculated using time average weighted mean velocity.
2.4.5.2 Normal ranges and relationship with gestational age.
This section of the literature review presents research detailing the range and
relationships that researchers have found between Quv and advancing GA, during
normal pregnancies. Fetal requirements for oxygen and nutrients increase in parallel
with fetal growth (Link et al., 2007) and researchers have recommended that Quv be
related to a tissue mass, otherwise a smaller mass will have a smaller flow without
carrying any implication of perfusion (Ferrazzi et al., 2000; Hebbar, Rubeena, Adiga, &
Rai, 2015; Rigano et al., 2008). Quv is related to the size and metabolic state of the
object supplied, with normal, younger fetuses having less flow compared to older
fetuses, but both have similar perfusion per weight unit (Hebbar, Rubeena, et al.,
2015; Rigano et al., 2008). Normalising for fetal weight takes into account perfusion of
the entire fetus (Hebbar, Rubeena, et al., 2015; Rigano et al., 2008), but introduces the
innate error of the EFW formula, the error involved in biometric measurements
incorporated into the formula (Ferrazzi et al., 2000), and introduces an inconsistency
from the use of different EFW formulae. For example, Sutton et al. (1990) used an EFW
algorithm that incorporated biparietal diameter (BPD) and AC for their normalisation
of Qucv to fetal weight; whereas, Hebbar, Rubeena, et al. (2015) used four
anthropometric measurements incorporated into the Hadlock formula. Other
researchers advocate normalising for AC as this is the first parameter reduced in IUGR

UMBILICAL CORD VEIN ULTRASOUND 78
(Rigano et al., 2001) or for HC (Di Naro et al., 2002; Ferrazzi et al., 2000). The scope of
this literature review, describing blood flow trends in normal and IUGR pregnancies,
has been broaden to include normalisation of Quv for EFW and biometric
measurements.
Two Australian studies using the obsolete Octoson multi-transducer, water-
coupled B scanner, forged research into the umbilical vein blood flow. Gill, Trudinger,
Garrett, Kossoff, and Warren (1981) found the intra-abdominal Quv increased from 100
ml/min at 22 weeks to 300 ml/min at 38 weeks. In a later study of normal pregnancies
conducted by Gill and colleagues, intra-abdominal Quv was reported to steadily
increase with GA up until 37 to 38 weeks, after which the blood flow reduced (Gill et
al., 1984). Gill et al. (1984, p. 353) also calculated the rate of flow per kilogram of fetal
weight “to account for variations in fetal size”. In doing so, the researchers introduced
a large unknown quantity, as fetal weights at this time were estimated from locally
derived birthweight charts incorporating preterm deliveries. The flow per kilogram was
relatively constant at 120 ml/min/kg until 35 weeks and then declined to 90 ml/min/kg
at 40 weeks (Gill et al., 1984). Gill and colleagues summarised the data collected by
their predecessors and favourably compared their data to that collected by various
means in the 1970s and 1980s, with the exception of 1965 postpartum data. Gill et
al.’s (1984) research was also comparable to an intra-abdominal Quv of 115 ml/min/kg
published by Eik-Nes et al. (1982) from Sweden and Norway.
Contrasting Gill and colleagues’ (1984) results, a 1986 Taiwanese publication
involving 163 normal pregnancies and using the equipment and methods described by
Gill et al., showed a linear increase in intra-abdominal Quv from 115.5±14.8 ml/min at
25 weeks GA to 450.0±77.0 ml/min a 41 weeks GA with no decrease approaching term
UMBILICAL CORD VEIN ULTRASOUND 79
(Chen et al., 1986). Chen et al. (1986) normalised the blood flow to the abdominal area
and found that the value remained relatively constant after 28 weeks GA.
Three subsequent Northern Hemisphere studies also described increasing Quv
with advancing GA. American researchers, Gerson et al. (1987), used a cross-sectional
study to analyse the intra-abdominal Quv results of 209 normal pregnant women
between 20 and 40 weeks GA. These results showed a linear increase in intra-
abdominal Quv with GA (Gerson et al., 1987). In addition, flow normalised per kilogram
steadily declined with advancing GA, which conflicts with the findings of Gill et al.
(1984). Supporting Gearson’s results was another American study (Sutton et al., 1990)
that used a sample of 74 uncomplicated pregnancies and found the Qucv increased
exponentially from 19 to 40 weeks. Blood flow normalised for EFW showed a slight
decline with increasing GA (Sutton et al., 1990). A British study (Lees et al., 1999)
involving 129 healthy pregnant women between 23 and 33 weeks gestation, calculated
the Qucv and found a linear relationship between GA and Qucv, with Qucv significantly
increasing from 95.04±64.8 ml/min at 23 weeks to 303.28±63.8 ml/min at 33 weeks
(Lees et al., 1999). Lees et al. (1999) identified that the high pass filter may have
elevated their Vmean; they demonstrated that the increase in flow with advancing GA
was more dependent on increasing vessel cross-sectional area than on the Vmean, and
they suggested that M-mode could be used to measure the diameter of the vessel.
Lees and colleagues (1999) also demonstrated that there was a close correlation
between the flow in the UA and UV during the 23 to 33 week gestational period, which
supports the theory that the fetus is a closed system.
A collaborative study by Barbera et al. (1999) confirmed fetal Quv data by
comparing their ultrasound values to those in obtained in ewes. Barbera et al. (1999)

UMBILICAL CORD VEIN ULTRASOUND 80
in a cross-sectional study of 74 fetuses found there was an exponential increase in
Qucv, rising from 97.3 ml/min at 20 weeks to 529.1 ml/min at 38 weeks. Barbera et al.
(1999) determined that the increase in Qucv was a result of growth in the area of the
UV and not the increase in Vmean, as the UV cross-sectional area had a fourfold increase,
whereas the velocity increased by only 20%. Barbera et al. (1999, p. 178) also reported
that flow per kilogram of EFW showed a non-significant linear reduction and that
“expression of blood flow per kilogram of estimated fetal weight introduces
unnecessary errors and may obscure underlying pathophysiologic characteristics”.
Barbera et al. (1999) validated their technique by repeating their ultrasound protocol
on seven ewes and comparing their outcomes to previous data obtained from steady-
state diffusion techniques in 34 ewes matched for weight and pregnancy stage; the
results between the two groups showed no difference. Barbera et al. (1999) suggested
that the results would be more binding if the same ewes were used for both blood
flow measurements.
Validation of Doppler techniques using pregnant ewes has been a common
practice; however, there should be some hesitation when comparing ovine results to
human fetal data. Problems with using ovine results as models for human outcomes
include:
i. Ovine and human placentae differ in their structure (Figure 2.12). Sheep
have a combined epitheliochorial placenta in which fetal chorion is in
contact with the uterine epithelium and a syndesmochorial placenta where
the chorion is in contact with the maternal connective tissue. Humans
develop haemochorial placentae in which free maternal blood bathes the
chorionic cells (Noden & De Lahunta, 1985).
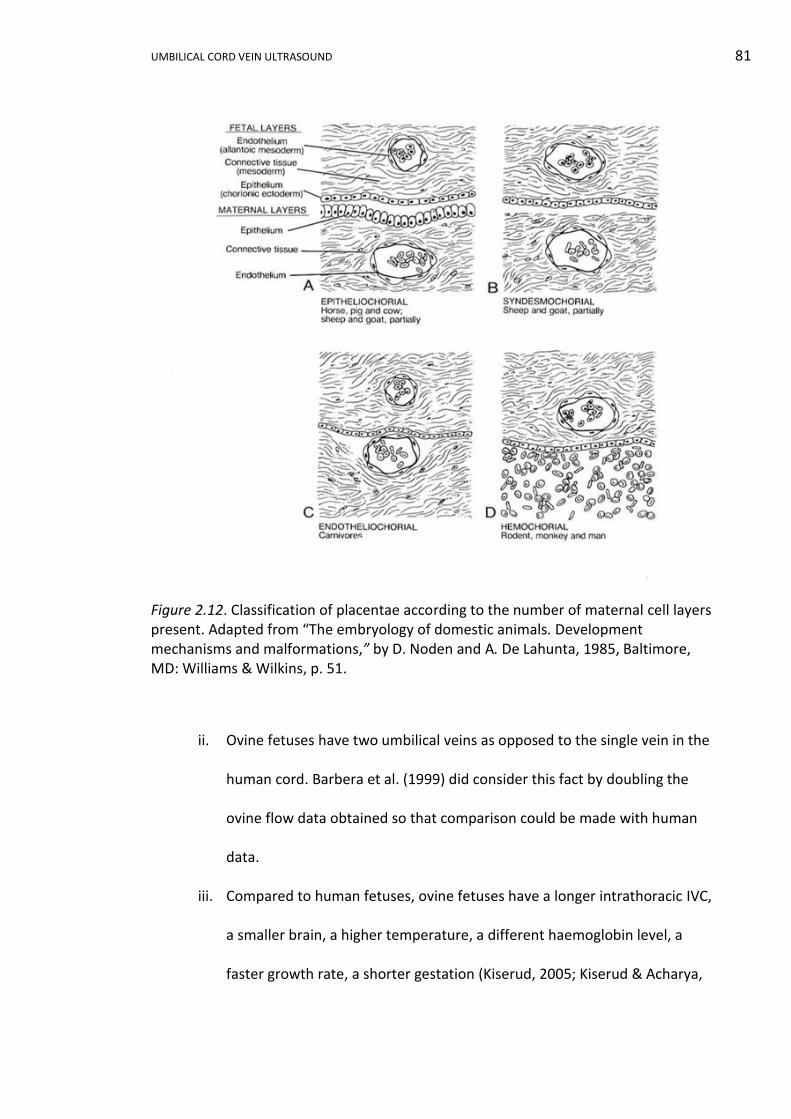
UMBILICAL CORD VEIN ULTRASOUND 81
Figure 2.12. Classification of placentae according to the number of maternal cell layers present. Adapted from “The embryology of domestic animals. Development mechanisms and malformations,” by D. Noden and A. De Lahunta, 1985, Baltimore, MD: Williams & Wilkins, p. 51.
ii. Ovine fetuses have two umbilical veins as opposed to the single vein in the
human cord. Barbera et al. (1999) did consider this fact by doubling the
ovine flow data obtained so that comparison could be made with human
data.
iii. Compared to human fetuses, ovine fetuses have a longer intrathoracic IVC,
a smaller brain, a higher temperature, a different haemoglobin level, a
faster growth rate, a shorter gestation (Kiserud, 2005; Kiserud & Acharya,
UMBILICAL CORD VEIN ULTRASOUND 82
2004), lower pulmonary flow, and higher foramen ovale flow (Kiserud et
al., 2000).
Barbera et al. (1999) noted that the length of time spent acquiring blood flow
data on each patient was 3±1 mins. Rigano et al. (2001) also reported that it is
common to spend only 2 to 4 mins per patient measuring Quv, which supports the
assertion that collecting Quv data is not time consuming.
Two further studies identified a linear relationship between Qucv and GA, and a
decline when Qucv was normalised for EFW. The first study, by Boito et al. (2002),
showed a seven fold increase in Qucv from 33.2 ml/min at 20 weeks GA to 221 ml/min
at 36 weeks GA according to their linear regression formula derived from a cross-
sectional study of 100 normal, singleton pregnancies. Boito et al. (2002) recorded
lower flow per kilogram of fetal weight than others, recording 117.5 ml/min/kg at 20
weeks and 78.3 ml/min/kg at 36 weeks gestation, but the discrepancy was attributed
to time-averaged velocity calculations. At the time of Boito et al.’s (2002) research,
images were stored and measured from videotape, and due to poor image
reproduction quality may have led to measurement inaccuracies. Current ultrasound
machines permit greater accuracy as measurements are performed on high resolution
ultrasound monitors with digital storage. The second study, by Flo et al. (2010), was a
longitudinal study of 53 singleton, low risk pregnancies measuring Tamaxv in a free-
floating portion of cord. Flo et al. (2010) recorded a linear increase in Qucv from 53
ml/min at 22 weeks to maximum of 250 ml/min during the 39th week of pregnancy,
compared to 66 ml/min and 313 ml/min using time-averaged intensity-weighted mean
velocity over the same GA range. When blood flow was normalised for EFW, using the
same parameters over the same GA range, there was a decrease from 110 ml/kg/min
UMBILICAL CORD VEIN ULTRASOUND 83
to 68 ml/kg/min and 134 ml/kg/min to 85 ml/kg/min, respectively. Flo et al. (2010)
provided an online supplement containing their reference values, which was a concise
and practical method for providing a large amount of data.
In contrast to the previous two studies, other research groups choose to
describe the relationship between the Qucv with GA as curvilinear or non-linear.
Acharya et al. (2005) demonstrated a steady curvilinear increase in the intra-
abdominal Quv throughout pregnancy from a minimum calculated from PV of 27.6
ml/min at 19 weeks to a maximum of 271.1 ml/min at 41 weeks. Acharya et al. (2005)
obtained similar values using time-averaged intensity-weighted mean velocity. Acharya
et al. (2005) reported that Quv normalised for EFW decreased after 25 weeks GA, but
when normalised for AC showed a continual increase from 19 to 41 weeks GA. Very
recently, in a cross-sectional study, Rizzo et al. (2016) found that the intra-abdominal
Quv had a curvilinear increase throughout pregnancy from 27.7 ml/min at 16 weeks to
424.8 ml/min at 40 weeks GA. These authors found both the diameter and velocity
contribute to increased blood flow. Rizzo et al. (2016) normalised the blood flow
against AC, as they concluded that AC growth rate best reflects intrauterine growth,
and showed a slight increase with GA from 0.2506 ml/min/mm at 16 weeks GA to
1.1458 ml/min/mm at 40 weeks GA. Supporting the non-linear relationship described
by Rizzo et al. (2016) and Acharya et al. (2005), Najafzadeh et al. (2016) found a
threefold increase from 18 weeks (28.7 ml/min) to 26 weeks (131.5 ml/min), followed
by doubling from 26 to 34 weeks (269 ml/min)17.
In recent years obstetric ultrasound has embraced 3D imaging, including 3D
fetal blood flow. Three dimensional Qucv was measured in seven singleton and one
17
Incorrect unit of cm/s quoted (Najafzadeh et al., 2016, p. 102)
UMBILICAL CORD VEIN ULTRASOUND 84
twin pregnancy between 17.9 and 36.3 weeks GA (Pinter et al., 2012). The Qucv results
compared favourably with those published by Tchirikov et al. (2002). Pinter et al.
(2012) overcame many of the problems faced in traditional Doppler measurements
including angle of insonation, flow profiles in the vessels, non-circular vessels and
coiling, by calculating Qucv from “power weighted surface integration of velocity
vectors” (Pinter et al., 2012, p. 1931). A major limitation of this technique was the
eight minute data acquisition time during which fetal acquiescence was necessary and
also the lack of appropriate nomograms (Pinter et al., 2012). Similarly, Scholbach,
Heien, and Eggebø (2016) calculated serial 3D Qucv for 43 low risk, singleton
pregnancies between 17 and 20 weeks GA. The readings were recorded every 30
seconds over a 5 min period. Scholbach et al. (2016) found the mean Qucv ranged from
1.01 to 2.60 ml/s, which were slightly higher than recorded from traditional blood flow
methods at comparable gestational ages. Interestingly, Scholbach et al. (2016) showed
a variation in Qucv over the 5 min period and vasomotion of the UCV. Scholbach et al.
(2016) proposed that these changes might reflect changes in metabolic requirements
of the fetus due to growth, movement and brain activity. Scholbach et al.’s (2016)
findings confirm the need to repeat readings and ensure fetal quiescence when
undertaking ultrasound assessment of the UCV.
In summary, during normal pregnancies Quv has a linear (Boito et al., 2002;
Chen et al., 1986; Flo et al., 2010; Gerson et al., 1987; Lees et al., 1999) or curvilinear
(Acharya et al., 2005; Barbera et al., 1999; Rizzo et al., 2016; Sutton et al., 1990)
increase with advancing GA and a decrease in flow as term approaches has been
described (Gill et al., 1984). When Quv was normalised for EFW, the commonest
relationship described by researchers was an overall decline with advancing GA. When
UMBILICAL CORD VEIN ULTRASOUND 85
blood flow was normalised for AC, a general increase in blood flow with advancing GA
was described. Given the variation in measurement sites and method of calculation
the volume, there is a general consensus that Quv increases from approximately 30
ml/min at 19 weeks, to 95 ml/min at 22 weeks and 300 ml/min near term. Both the
blood velocity and the size of the vein have been found to influence Quv.
2.4.5.3 Umbilical vein blood flow in IUGR.
In this section, research that details the relationships between Quv and
advancing GA in IUGR pregnancies, including research where Quv is normalised for fetal
weight and other parameters will be discussed. Explanations for Quv changes in IUGR
pregnancies will also be presented
In 1984, Australian research led to an eminent ultrasound publication whose
findings sparked ongoing research about Quv and IUGR. This research involved 124
complicated pregnancies18 and 118 normal pregnancies, with GA ranging from 22
weeks to term. Gill et al. (1984) reported that low Quv was detected up to three weeks
before reduced growth was detected by biometry. Gill et al. (1984) classified no
detectable flow in the intra-abdominal UV as “low flow” and this classification may
have erroneously elevated the number of low flow cases. Further research in 1984, by
Jouppila and Kirkinen, examined a sample of 11 growth restricted fetuses19 between
30 and 38 weeks GA. Jouppila and Kirkinen (1984) showed all fetuses had an intra-
abdominal Quv normalised for EFW, below the 10th percentile on Finnish reference
ranges, at the last ultrasound examination prior to delivery. They reported an
association between IUGR and reduced intra-abdominal UV diameter and proposed
18
Poor obstetric history or hospitalisation for preeclampsia, diabetes, suspected growth restriction, etc. 19
Birthweight < 10th %, reduced fetal growth, Apgar < 7 at 1 and 5 minutes, pathological CTG
UMBILICAL CORD VEIN ULTRASOUND 86
that reduced diameter was secondary to reduced flow rather than the cause of the
reduced flow.
Three sequential studies supported Gill et al.’s (1984) proposal that decreased
Quv was an early change in the IUGR temporal sequence of events. The first, was a
study by Kiserud et al. (1994) of 38 fetuses20 of which seven died in utero and four
postnatally. Kiserud et al. (1994) recorded the intra-abdominal Quv for 33 cases and
found that 25 of these had a reduced flow. Kiserud et al. (1994) also found that a
raised UA PI was more common (19 of the 25) in the group with reduced blood flow. In
addition, Kiserud et al. (1994) found that reduced intra-abdominal Quv was more
frequent before 31 weeks GA, and they proposed that at this may reflect a more
serious manifestation of IUGR, as it occurred during a more vulnerable phase of fetal
development when fetal blood pressure was lower. Kiserud et al. (1994) demonstrated
that there was an inter-relationship between the umbilical arteries and umbilical vein
by showing the association between increased placental impedance (increasing UA
Doppler) and reduced UV blood flow in severe IUGR. The second was a cross-sectional
study of 37 IUGR21 fetuses matched against normal controls by Ferrazzi et al. (2000).
Ferrazzi et al. (2000, p. 434) showed that Qucv “in IUGR pregnancy was significantly
lower (p < 0.001) at any given gestational age in comparison to normal pregnancies”.
Ferrazzi et al. (2000) showed that three IUGR fetuses with normal UA PI values had
reduced Qucv. This finding supported earlier research by Gill et al. (1984), who reported
that decreased UV flow pre-empted other characteristic changes of IUGR. The third
study was undertaken by another research team that included Ferrazzi (Rigano et al.,
2001). This study built upon Ferrazzi et al.’s (2000) research by conducting a
20
BPD, abdominal diameter and birthweight < 2.5th % 21
AC < 2 SD below mean and birthweight < 10th %
UMBILICAL CORD VEIN ULTRASOUND 87
longitudinal study of 21 IUGR22 fetuses with GA ranging from 23 to 36 weeks; Rigano et
al. (2001) found that the Qucv normalised for EFW or AC was reduced. In addition, this
reduction was not a “transient phenomenon” (Rigano et al., 2001, p. 838) but was
present throughout the gestation, thus suggesting that abnormally low Quv may be
useful as a predictor of IUGR. Rigano and colleagues (2001) showed that IUGR fetuses
had persistent reduced Qucv and that this reduction was mainly due to reduced velocity
and not diameter. Rigano et al. (2001) speculated that a reduction in blood flow was
not a late occurrence in the sequence of events in an IUGR pregnancy. Rigano and
colleagues (2001) concluded that in clinical practice a decrease in Qucv should allow
earlier differentiation of constitutionally small fetuses from IUGR affected fetuses.
Two publications from 2002 provide supporting evidence that IUGR was
associated with reduced Qucv. Boito et al. (2002) showed the mean Qucv was below the
5th percentile on their graphs for 32 of 33 (97%) IUGR23 fetuses and was mainly
determined by reduction in UCV cross-sectional area. While longitudinal research
involving 15 IUGR24 fetuses and 30 normally growing fetuses by Di Naro et al. (2002),
showed that Qucv was less in IUGR fetuses than in appropriately growing fetuses. Di
Naro et al. also showed that the Qucv normalised for AC and HC was lower in IUGR
fetuses. Di Naro et al.’s (2002) study showed that IUGR fetuses had a reduction of Qucv
over a two week period, even in the presence of normal UA Doppler indices. Di Naro et
al.’s (2002) research utilised reference ranges established by Barbera et al. (1999);
however, Kiserud (2003b) argued that Barbera et al.’s reference ranges were derived
from cross-sectional data, which were not ideal for Di Naro’s longitudinal data.
22
AC < 2 SD below mean, UA PI > 2 SD above mean, abnormal uterine artery and birthweight < 10th % 23
AC and birthweight < 5th %
24 AC < 5th % and birthweight < 10th
%

UMBILICAL CORD VEIN ULTRASOUND 88
Di Naro et al. (2002) proposed that blood flow was reduced in IUGR, partly due
to both blood viscosity and velocity; they cited Poiseuille’s law for their explanation of
reduced flow. Poiseuille’s law assumes Newtonian fluid characteristics and defines
blood flow as:
𝑄𝑢𝑣 = 𝜋(𝑝𝑟𝑒𝑠𝑠𝑢𝑟𝑒 𝑑𝑖𝑓𝑓𝑒𝑟𝑒𝑛𝑐𝑒)(𝑟4 ) ÷ 8(𝑣𝑖𝑠𝑐𝑜𝑠𝑖𝑡𝑦)(𝑙𝑒𝑛𝑔𝑡ℎ).
In citing Poiseuille’s law, Di Naro et al. failed to identify the conditions in which
Poiseuille’s law can apply to blood. Blood does not normally act as a Newtonian fluid
as its viscosity is velocity dependent (Hobbie & Roth, 2015). Blood is composed of cells
that change in shape and movement during velocity changes leading to variable
viscosity and non-Newtonian behaviour (Tu, Inthavong, & Wong, 2015). However,
there are situations in which non-Newtonian liquids can act in a Newtonian manner
with independent viscosities and velocities (Hobbie & Roth, 2015). Viscosity can be
assumed to be constant when velocity is constant as in vessels with venous flow
(Sochi, 2014). In vessels with diameters greater than 1 mm, when shear stresses are
negligible, blood can also be considered to have Newtonian properties (Sochi, 2014).
Therefore, during fetal quiescence, blood in the umbilical vein may behave in a
Newtonian manner and Poiseuille’s law may be applicable (Tu et al., 2015). Similarly,
Jouppila, Kirkinen, and Puukka (1986) found that UV blood viscosity and haematocrit
had a significant positive correlation and they proposed that an increase in
haematocrit may cause increased blood viscosity, which in turn reduces blood flow.
Blood viscosity is a result of the cohesive forces between molecules and the viscosity
of blood is dependent on the haematocrit which is the ratio of the volume of red blood
cells to the total blood volume (Hobbie & Roth, 2015).
UMBILICAL CORD VEIN ULTRASOUND 89
The association between IUGR and reduced Quv has been described in several
more recent publication; for example, Bellotti et al. (2004) reported that there was a
statistically significant reduction in Qucv and Qucv normalised for EFW in growth
restricted fetuses, in research involving 56 compromised fetuses25 compared to 137
normal fetuses. Rigano et al. (2008) reported the Qucv per kilogram was significantly
lower in the fetuses that died in utero in a small retrospective study involving 12
IUGR26 fetuses less than 26 weeks GA that died in utero matched against 14 IUGR
fetuses born alive after 26 weeks gestation. The differences between the IUGR groups
were more dramatic when Qucv was expressed per unit of AC (Rigano et al., 2008). The
association between IUGR and reduced Quv was also reported in a recent conference
presentation where Quv was reduced in 108 pregnancies complicated by IUGR27
compared to 31 controls (Di Martino et al., 2016). These researchers found that the
Quv was reduced irrespective of the severity of fetal compromise. Di Martino et al.’s
(2016) finding adds supporting evidence for the clinical application of blood flow, as
many previous studies have used extremely compromised fetuses.
The association between IUGR and low Quv was supported by a Spanish study of
placental specimens from singleton pregnancies greater than 34 weeks GA with
confirmed birthweights below the 10th percentile (Parra-Saavedra et al., 2014). There
were 44 normal placentae and 51 placentae that exhibited histological findings
consistent with placental under-perfusion (Parra-Saavedra et al., 2014). There was a
significant reduction in the Qucv (p = 0.003) and Qucv normalised for EFW (p < 0.001)
associated with the under-perfused placentae (Parra-Saavedra et al., 2014). The
25
AC and birthweight < 10th %, abnormal uterine and umbilical artery indices 26
AC < 2 SD below mean, UA PI > 95th % and abnormal uterine artery Dopplers 27
Fetal growth < 10th % for Italian standards

UMBILICAL CORD VEIN ULTRASOUND 90
researchers proposed that Qucv may be a proxy for placental under-perfusion providing
a marker for less efficient placenta function and thereby the quantity of oxygen and
nutrients available to the fetus, especially in cases of late onset IUGR (Parra-Saavedra
et al., 2014)
Poor pregnancy outcomes were found to be associated with low intra-
abdominal Quv normalised for fetal weight by Tchirikov et al. (2009) in a sample of 181
fetuses of which 33 had poor pregnancy outcomes28. Tchirikov et al. demonstrated
that normalised Quv had a sensitivity of 54.5%, a specificity of 95.6%, a positive
predictive value of 75%, and a negative predictive value of 90.4%, for predicting poor
fetal outcome. These values compare adequately with the UA PI, which is the current
gold standard for assessing a fetus compromised by placental insufficiency (Tchirikov
et al., 2009). The reference ranges developed by Tchirikov et al. were utilised in a 3D
study of blood flow which demonstrated that a fetus with IUGR and a pregnancy that
later developed pre-eclampsia, both had low intra-abdominal Quv (Pinter et al., 2012).
Another 3D blood flow study on fetuses aged between 23 and 40 weeks demonstrated
a reduced Qucv in IUGR29 (141 ml/kg/min) fetuses compared to small (253 ml/kg/min)
and normal (226 ml/kg/min) fetuses (Scholbach, Fersis, & Stolle, 2012). Scholbach et
al.’s (2012) data was used in a subsequent study that proposed IUGR might be the
consequence of low Qucv and restricted vasomotion of the UCV due to fetal signal
molecules causing “autonomous venous contractions” (Scholbach et al., 2016, p. 628).
Adverse pregnancy outcomes and low Quv have also been described in other
publications. For example, a study in London examined 589 women with
28
Poor outcome based on the cord blood pH, Apgar score, birthweight percentile, length of pregnancy, requirement of respiratory support and transfer of the newborn to a specialist ward 29
No definition documented

UMBILICAL CORD VEIN ULTRASOUND 91
uncomplicated pregnancies (Prior et al., 2014). Prior et al. (2014) demonstrated that
fetuses with the lowest Qucv, both uncorrected and corrected for birthweight, had the
highest rates of delivery by emergency caesarean section or instrumental delivery. The
researchers proposed that low Qucv was significantly associated with intrapartum
distress and that Qucv could contribute to pregnancy risk assessment prior to labour
(Prior et al., 2014). Also, in a study of 103 women within two weeks of delivery,
Hebbar, Rubeena, et al. (2015) found that a lower intra-abdominal Quv normalised for
EFW was associated with IUGR, reduced birthweight and complications, including
preterm delivery and higher admission rates to neonatal intensive care.
An association between lean umbilical cords, IUGR and low Quv was found in
116 women who underwent ultrasound examinations within 24 hours of delivery (Di
Naro, Ghezzi, Raio, Franchi, D'Addario, et al., 2001). Qucv normalised for EFW was lower
in cases of a lean cord (93.7 ml/kg per minute) versus a normal cord (126.7 ml/kg per
minute). Di Naro et al. (2001) also found a significant correlation between Qucv and
birthweight. In addition, El Behery et al. (2011) found Qucv normalised for EFW was
significantly reduced in fetuses with lean cords (83.4 ml/kg/min) compared to fetuses
with a normal cord (131 ml/kg/min). The association of lean umbilical cords and IUGR
was corroborated by Proctor et al. (2013) in a study of 497 post-delivery cords
collected from pregnancies with a GA range from 18 to 41 weeks. Proctor et al.
attributed thin cords to a significant reduction in Wharton’s jelly and found that thin
cords were associated with a birthweight less than the 10th percentile based on
Canadian standards for gender and GA.
Ovine studies have shown that the transportation of oxygen and nutrients to
the fetus is not affected until the Quv is reduced by roughly 50% (Battaglia, 2003). This
UMBILICAL CORD VEIN ULTRASOUND 92
haemodynamic cause of IUGR has been supported by a human magnetic resonance
imaging (MRI) study that found IUGR fetuses have reduced oxygen delivery and
consumption (Zhu et al., 2016). In this prospective case controlled study involving 14
IUGR30 and 26 normally grown fetuses between 32 and 42 weeks GA, MRI showed that
IUGR fetuses had lower intra-abdominal Quv (p = 0.04) and pulmonary (p = 0.01) blood
flow, high SVC flow (p < 0.0001), and smaller brains (p < 0.0001) (Zhu et al., 2016). MRI
assessment of fetal blood flow is compromised by fetal movement, small vessel size,
high cost and the limited number of machines (Zhu et al., 2016). Confirmation of
ultrasound findings by MRI endorses the need to pursue the development of robust
methods of ultrasound measurement of Quv.
In summary, Quv has been shown to be reduced in fetuses compromised by
IUGR and in some instances has been shown to be reduced prior to changes in UA
indices. Reduced Quv has been associated with poor pregnancy outcomes and lean
umbilical cords. Both EFW and AC normalised Quv were found reduced in IUGR fetuses
when compared to normal controls. The cause of reduced Quv in IUGR fetuses has been
attributed to both a smaller UV diameter and reduced velocity, with viscosity being
identified as a contributing factor to the latter. Quv analysis is complex to perform and
is dependent on the angle of insonation, determination of vein dimensions, and
application of mathematical formula. All these factors increase the likelihood of errors;
however, there is still potential to identify those fetuses that may develop IUGR.
Therefore the development of Australian based reference ranges which can be
incorporated into routine ultrasound examinations is supported.
30
A score of ≥ 2 of the 4 following parameters defined IUGR: birthweight ≤ 3rd % or ≥ 20% drop in the centile in EFW, cerebroplacental ratio after 30 weeks < 5th %, ponderal index < 2.2 and placental histology

UMBILICAL CORD VEIN ULTRASOUND 93
2.5 Ultrasound Safety during Obstetric Examinations
In this section of the literature review current standards and opinions on
ultrasound safety during obstetric ultrasound examinations will be explored. This
review formed the basis of a Local Operating Protocol which is contained in Portfolio
Appendix H.
Diagnostic ultrasound has been used for at least four decades with no
substantial evidence of serious adverse effects (Callen, 2000; Sande & Kiserud, 2013;
World Federation for Ultrasound in Medicine and Biology, 2013) and there has been
no causal link established between antenatal exposure to ultrasound and adverse
health outcomes (Australasian Society for Ultrasound in Medicine, 2008a; Safety
Group of the British Medical Ultrasound Society, 2010). However, several bioeffects
have been described with human and non-human exposure to ultrasound. The physical
effects of ultrasound exposure include streaming in fluids, stress at tissue interfaces,
heating of tissues by absorption, and cavitation due to the formation of gas bubbles.
The Output Display Standard is a screen display of the mechanical index (MI)
and the thermal index (TI), and both are estimates of bioeffects. The MI is an indicator
of the mechanical or non-thermal bioeffects and relates to peak rarefaction pressure
(Beirne, Westerway, & Ng, 2016). Current guidelines (Table 2.6) recommend an MI less
than 0.4 when gaseous bodies are present and up to 1.9 in the absence of gaseous
bodies (Moderiano, McEvoy, & Childs, 2015; T. R. Nelson, Fowlkes, Abramowicz, &
Church, 2009). A report prepared by the Safety Group of the British Medical
Ultrasound Society (2010) considered that there was no reason to restrict obstetric
scanning to an MI of less than 0.3 as no gaseous bodies are present, but indicated that
there was a theoretical risk of cavitation at an MI of greater than 0.7.
UMBILICAL CORD VEIN ULTRASOUND 94
The TI indicates the potential to increase tissue temperature with exposure to
ultrasound. A TI value of one indicates that the output settings are capable of raising
the temperature by 1°C (Sande & Kiserud, 2013). There are three thermal indices:
Thermal index for soft tissue (TIS) is used when there is no insonation of i.
bone and applies to obstetric ultrasounds less than 10 weeks GA.
Thermal index for bone (TIB) is used when there is insonation of structures ii.
containing bone and applies to obstetric ultrasounds of greater than 10
weeks GA.
Thermal index for cranial bone (TIC) is used when scanning very close to iii.
bone and does not apply to obstetric examinations.
During obstetric imaging a TI of less than 0.7 is recommended; higher values
are acceptable but only with time limits (Table 2.6), and a TI of greater than 3.0 is not
recommended for obstetric scanning (Moderiano et al., 2015; T. R. Nelson et al., 2009;
Royal Australian and New Zealand College of Radiologists, 2014; Safety Group of the
British Medical Ultrasound Society, 2010; World Federation for Ultrasound in Medicine
and Biology, 2013). International and American guidelines recommend that when
using Doppler in the first trimester, a TI of 1.0 is not exceeded and scanning time
limited (American Institute of Ultrasound in Medicine, 2016; Bhide et al., 2013). The
New Zealand and Maternal Fetal Medicine Network (2015) specified that by reducing
the acoustic output power, a TIB less than 1.0 should be maintained when using
Doppler in obstetric examinations.
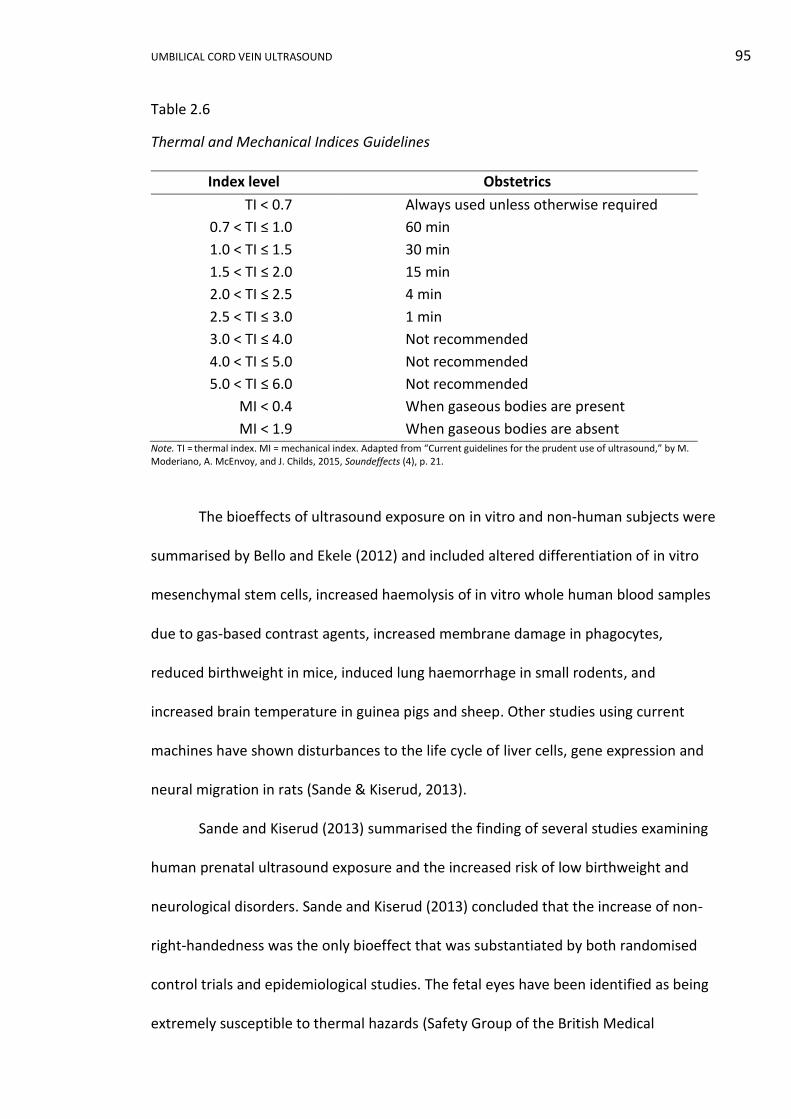
UMBILICAL CORD VEIN ULTRASOUND 95
Table 2.6
Thermal and Mechanical Indices Guidelines
Index level Obstetrics
TI < 0.7 Always used unless otherwise required
0.7 < TI ≤ 1.0 60 min
1.0 < TI ≤ 1.5 30 min
1.5 < TI ≤ 2.0 15 min
2.0 < TI ≤ 2.5 4 min
2.5 < TI ≤ 3.0 1 min
3.0 < TI ≤ 4.0 Not recommended
4.0 < TI ≤ 5.0 Not recommended
5.0 < TI ≤ 6.0 Not recommended
MI < 0.4 When gaseous bodies are present
MI < 1.9 When gaseous bodies are absent Note. TI = thermal index. MI = mechanical index. Adapted from “Current guidelines for the prudent use of ultrasound,” by M. Moderiano, A. McEnvoy, and J. Childs, 2015, Soundeffects (4), p. 21.
The bioeffects of ultrasound exposure on in vitro and non-human subjects were
summarised by Bello and Ekele (2012) and included altered differentiation of in vitro
mesenchymal stem cells, increased haemolysis of in vitro whole human blood samples
due to gas-based contrast agents, increased membrane damage in phagocytes,
reduced birthweight in mice, induced lung haemorrhage in small rodents, and
increased brain temperature in guinea pigs and sheep. Other studies using current
machines have shown disturbances to the life cycle of liver cells, gene expression and
neural migration in rats (Sande & Kiserud, 2013).
Sande and Kiserud (2013) summarised the finding of several studies examining
human prenatal ultrasound exposure and the increased risk of low birthweight and
neurological disorders. Sande and Kiserud (2013) concluded that the increase of non-
right-handedness was the only bioeffect that was substantiated by both randomised
control trials and epidemiological studies. The fetal eyes have been identified as being
extremely susceptible to thermal hazards (Safety Group of the British Medical

UMBILICAL CORD VEIN ULTRASOUND 96
Ultrasound Society, 2010). However, a prospective Western Australian study
investigating the impact of in utero ultrasound exposure on ocular biometry and visual
acuity found “no detrimental consequence of multiple ultrasound scans on ocular
health” at a 20 year follow-up (Forward et al., 2014, p. 169). Webb et al. (2016)
recently raised concerns that the diversity of autism spectrum disorder may be the
consequence of early pregnancy ultrasound exposure. However, the International
Society of Ultrasound in Obstetrics and Gynaecology (ISUOG) Bioeffects and Safety
Committee (Salvesen et al., 2016) found no scientifically substantiated evidence to
support the claim. A review by McLennan (2016) corroborated the Committee’s
findings and questioned the bias and statistical accuracy of Webb et al.’s study.
To minimise any possible detrimental effects of diagnostic ultrasound
examinations, both B-mode and Doppler imaging should apply the ALARA principle (as-
low-as-reasonably-achievable). In keeping with this principle, the acoustic power
should be as low as diagnostically possible, overall examination times should be
limited, and dwell times shortened (Australasian Society for Ultrasound in Medicine,
2008a, 2008b, 2008c). Even though the use of ultrasound appears to have no
detrimental effects, ultrasound should be judiciously used by competent, qualified
health professionals using well maintained units and should not be used without
medical value (McLennan, 2016; World Federation for Ultrasound in Medicine and
Biology, 2013).
There are three areas that warrant further investigation when assessing the
validity of low bioeffect risks from in utero ultrasound exposure: changes to maximal
power output, sensitivity of fetuses, and cumulative exposure. The maximum output of
ultrasound machines was increased from 94 mWcm-2 to 720 mWcm-2 in 1991, and a
UMBILICAL CORD VEIN ULTRASOUND 97
majority of studies that found no detrimental effects from in utero ultrasound
exposure where completed prior to this output change (Sande & Kiserud, 2013; Thoirs
& Lee, 2016). There has also been an assumption that all fetuses are equally vulnerable
to in utero ultrasound exposure (Bello & Ekele, 2012), whereas it is more likely that a
continuum exists from low to high tolerance. The third area of investigation relates to
cumulative exposure and dose. With the increase in machine maximal output and
frequent use of ultrasound during pregnancy, researchers need to fully investigate the
impact of cumulative dosage and associated exacerbation of bioeffects (Bello & Ekele,
2012). It is evident that further and ongoing investigation, using current technology, is
warranted.
2.6 Gaps in Current Knowledge and Research Aims
After an extensive review of the literature relating to ultrasound measurements
of the umbilical vein diameter, PV and blood flow, I have identified several gaps within
the current body of knowledge including:
i. A majority of investigations have been carried out in the Northern
Hemisphere. The three most recent reference ranges published have been
developed from data collected in Norway and Italy. However, there is no
contemporary Australian data on the diameter, peak velocity or blood flow
of the intra-amniotic portion of the umbilical cord vein.
ii. The incorporation of UCV measurements into the diagnosis and
surveillance regimes of fetal wellbeing has been poor. The main difficulties
have been dependence on software and use of advanced imaging
UMBILICAL CORD VEIN ULTRASOUND 98
techniques. There is a lack of simple protocols that can be embraced by all
sonographers, irrespective of their scanning expertise.
iii. The ability of UCV diameter, velocity and blood flow measurements to
identify growth compromised fetuses has been demonstrated by several
investigators; however, a majority of the research articles have
concentrated on preterm fetuses with grossly abnormal UA Doppler
indices, leaving the assessment of the moderately-compromised fetuses as
an under-investigated area.
iv. Research has indicated that the UCV diameter and velocity both contribute
by varying degrees to reduced blood flow in IUGR. Research investigating
other possible ways of examining the interconnection of UCV diameter and
velocity has not been published; such investigation may provide an easier
method of assessing the interplay of diameter and velocity, without using a
complicated Quv formula and its inherent errors.
v. Many researchers have used birthweight to confirm normality of their
control groups and to confirm IUGR, but no research has investigated the
interplay between birthweight percentiles, GA and ultrasound features of
the UV. Assessment of in utero UV measurements of fetuses born with
different birthweight percentiles may identify unknown relationships.
Arising from these gaps in current knowledge, the following research aims have
been determined:
i. Construct population specific reference ranges (nomograms) for the
ultrasound measurements of the UCV diameter, PV and Qucv.

UMBILICAL CORD VEIN ULTRASOUND 99
ii. Develop, document and publish a simple protocol for the measurement of
the UCV diameter and PV, and calculation of the Qucv.
iii. Ascertain if the nomograms developed for the UCV diameter, PV or Qucv
have a clinical application in identifying fetuses with mild to moderate
growth compromise.
iv. Determine if there is a significant difference between the UCV diameter, PV
and Qucv depending on birthweight percentiles and GA. Determine if this
information is useful in the clinical application of the reference ranges.
v. Investigate other relationships between UCV diameter and PV.
UMBILICAL CORD VEIN ULTRASOUND 100
SECTION III MATERIALS AND METHODS
Chapter 3 Materials and Methods
3.1 Introduction
The overarching aims of this research project were to develop Australian
specific, GA related reference ranges for the UCV diameter, PV and Qucv and to
determine if any of these measurements were useful in identification of growth
compromised fetuses. Secondary aims were to develop technically easy measurements
procedures, investigate interrelations between UCV measurements, birthweight and
advancing GA, and explore alternative relationships between UCV measurements.
The quasi-experimental design of this quantitative research project employed
both prospective and retrospective data collection. Participants, sonographers,
ultrasound machines and computer software were the materials utilised. Research
approval, the processes involved in recruitment, and the means of obtaining maternal
characteristics, pregnancy outcomes and all ultrasound data will be detailed in this
chapter. The methods of constructing birthweight categories and other subgroups,
plus the statistical methods employed in this research will also be described.
3.2 Study Design
This quantitative research project was quasi-experimental in design using non-
random sample selection from a naturally formed group of potential participants. The
study sample was non-random due to automatic exclusion of part of the population
based on maternal and gestational age. Furthermore, potential participants self-
selected. Of all hospitals and private practices within the study location, potential

UMBILICAL CORD VEIN ULTRASOUND 101
participants were only drawn from among the women who chose to attend either
Orange Health Service (OHS) or Bathurst Health Service (BHS) Medical Imaging
Departments.
Descriptive patient characteristics, as discrete or categorical quantitative data,
were collected using a prospective questionnaire. Pregnancy outcomes as continuous,
discrete and categorical quantitative data were collected postpartum. UCV continuous
quantitative data were collected prospectively, using both cross-sectional and
longitudinal sampling.
3.3 Ethics and Research Approval
The Greater Western Human Research Ethics Committee (HREC) granted ethics
approval for this research project (HREC/10/GWAHS/34, Appendix B) on 25 January
2011, for the specific sites of OHS and BHS (SSA/11GWAHS/6, Appendix C). The
National Ethics Application Form and the Site Specific Assessment Form submitted to
the Greater Western HREC are included in the portfolio along with my responses to
issues that were raised by the Committee (Portfolio Appendices B2, B4 and B6).
Charles Sturt University Board of Graduate Studies approved the research
proposal on 8 February 2011 (Appendix D), and a copy of the proposal is included in
the portfolio (Portfolio Appendix B13). The Charles Sturt University HREC granted
ethics approval for the research on 15 February 2011 (2011/020, Appendix E).
3.4 Recruitment
An invitation to participate in the research was extended to eligible clients who
had been referred to OHS and BHS for obstetric ultrasounds between 5 April 2011 and
22 March 2013. General Practitioners, obstetricians, staff medical officers and
UMBILICAL CORD VEIN ULTRASOUND 102
midwives referred clients to the Medical Imaging Departments. There was no intended
selection bias towards public or private health insurance status, ethnicity or complexity
of the pregnancy.
Participation was voluntary and no client was coerced into enrolling into the
research. A participant could withdraw from the research at any stage, as outlined in
the Participant Information Sheet (Appendix F), without influencing the professional
diligence with which their ultrasound examinations were performed.
Participant confidentiality was guaranteed, as the final data were summarised
in non-identifiable data blocks used for statistical analysis. No individual could be
identified by any characteristic in the results or any subsequent publications. Access to
the data was restricted and all data were stored in a secure cabinet in the Medical
Imaging Department at OHS.
3.5 Informed Consent
At the initial contact with the Medical Imaging Departments, eligible clients
were offered a Participant Information Sheet and Consent Form (Appendix G).
Providing information prior to their ultrasound examination allowed time for clients to
read the information and make an informed choice about participation without
coercion from sonographers. If the client had difficulty understanding the Participant
Information Sheet and Consent Form due to language or literacy issues, the
sonographer offered assistance or sourced help through the Aboriginal Liaison Officer
or The Department of Immigration and Citizenship Translating and Interpreting
Service.
UMBILICAL CORD VEIN ULTRASOUND 103
If the client agreed to participate in the research, the signed Consent Form was
collected and any questions raised by the client were answered by the sonographer
prior to the commencement of the ultrasound examination. The Information Sheet
remained in the participant’s possession and the signed Consent Form was stored in a
secure cabinet in the Medical Imaging Department at OHS.
3.6 Study Sample
3.6.1 Research population.
The research population consisted of women who were greater than 16 weeks
pregnant with a single fetus and aged between 16 years 0 days and 55 years and 0
days. This age range covered a large proportion of the female reproductive years. The
minimum age of 16 years adhered to the legal age for consensual sex in NSW
according to the Crimes Act 1900 Section 66C (Australian Institute of Family Studies,
2013; New South Wales Government, 2015) and with the NSW Ministry of Health
policy directive regarding the age at which an individual can consent to medical
treatment (New South Wales Government, 2005a).
A minimum GA of 16 weeks allowed the UCV to be reliably visualised on
transabdominal ultrasound imaging as the accurate measurement of the umbilical
vessels in early pregnancy is difficult unless a transvaginal examination is undertaken
(Barbieri et al., 2012). A lower limit of 16 weeks GA is in keeping with other published
UV works, although recently, some researchers opted for an earlier GA of 14 weeks
(Rizzo et al., 2016) whereas others utilised a latter GA of 19 to 22 weeks (Acharya et
al., 2005; Barbera et al., 1999; Flo et al., 2010).
UMBILICAL CORD VEIN ULTRASOUND 104
3.6.2 Inclusion and exclusion criteria.
In the initial sample, women were not excluded due to the presence of fetal or
cord abnormalities, parity, outcomes of previous pregnancies, ethnicity or maternal
medical conditions. Women were excluded if the EDD was not established and
confirmed by ultrasound prior to 14 weeks gestation. Women in labour were excluded
from participation to eliminate the effects of uterine contractions on umbilical cord
blood flow. Multifetal pregnancies were excluded so that data were not compromised
by potential vascular malformations between placentae. In the initial research design
participants were to be excluded if the EFW was above the 90th percentile or if
accelerated fetal growth velocities were observed. This exclusion was removed prior to
the start of data collection when actual birthweight, not ultrasound EFW, was chosen
as the parameter for pregnancy categorisation.
The inclusion and exclusion criteria were available to the sonographer on the
Participant Characteristics Sheet (Appendix H). Eligibility was assessed during routine
history taking prior to the ultrasound examination, or if there was insufficient data at
that time, eligibility was determined during the ultrasound examination as the GA and
fetal number were established. The inclusion and exclusion criteria were applied by
the sonographer completing the examination. Assessment of inclusion and exclusion
criteria occurred primarily in the ultrasound examination room, but it also occurred at
the time of booking if the client provided information that indicated her ineligibility to
participate in the research.
At the time of data entry into the re-identifiable, coded, aggregated data
spreadsheet, I reviewed all documents and images on the Picture Archive and
Communication System (PACS) ensuring strict adherence to the inclusion and exclusion
UMBILICAL CORD VEIN ULTRASOUND 105
criteria. Further revisions of the exclusion criteria occurred during the course of the
study:
i. Participants were removed from the study if the pregnancy outcomes were
unobtainable.
ii. Stillbirths were not excluded if the death occurred during labour. If the
fetus died prior to the onset of labour the participant was excluded. This
criterion was decided as the three fetuses that died during labour were
appropriately grown and their deaths were a consequence of antepartum
haemorrhages and not as a result of any undetermined adverse
intrauterine events prior to labour.
iii. Participants were excluded if the pregnancy was terminated.
iv. Attendances in which ultrasound measurements did not comply with
protocol were omitted.
3.6.3 Sample size.
Utilising research by Di Naro et al. (2002) and Lees et al. (1999), the
Quantitative Consulting Unit at Charles Sturt University estimated the minimum
sample size that was required for this research. Using a 95% confidence level and
power of 80%, the Quantitative Consulting Unit calculated that a sample size of at least
160 women was needed to detect differences between normally growing and IUGR
fetuses at the 5% significance level. A copy of the calculations is included in the
Appendix I. Allowing for a 10% dropout rate, a minimum of 176 women were needed
to be recruited to the research.
UMBILICAL CORD VEIN ULTRASOUND 106
The study sample was recruited from an estimated 4,810 eligible ultrasound
examinations undertaken at the Medical Imaging Departments of OHS and BHS during
the recruitment period. The rationales for the sample location were:
i. The principal researcher was a fulltime sonographer at OHS.
ii. OHS and BHS ultrasound equipment, PACS, medical records and staff were
accessible to the principal researcher.
iii. Both sites had comparable ultrasound machines that were serviced by the
same engineer, thereby limiting reproducibility errors due to machine and
calibration variation.
iv. Both sites were located in similar sized regional towns servicing a low to
moderate risk obstetric population.
There were 661 clients who volunteered to participate in this research project
and 36 were excluded, which left a sample size of 625.
3.7 Maternal Characteristics
After informed consent had been given, the sonographer completed the
Participant Characteristics Sheet (Appendix H) by questioning the participant, or
reviewing and confirming information provided on the referral form. The following
maternal characteristics were collected: ethnicity, maternal age at conception,
conception, parity, maternal diseases and smoking during pregnancy.
3.7.1 Ethnicity.
Maternal ethnicity categories were modified from The Fetal Medicine
Foundation (FMF) groups, who had devised categories to reflect differences in fetal
nasal bone and maternal serum biochemistry depending on maternal ethnicity

UMBILICAL CORD VEIN ULTRASOUND 107
(Spencer, Heath, El-Sheikhah, Ong, & Nicolaides, 2005). The FMF maternal ethnicity
categories were utilised in this research as all research sonographers were familiar
with the category definitions of the original groups. The FMF categories were modified
with the addition of Indigenous and Southeast Asian categories (Table 3.1) to tailor the
classifications to the Australian population.
Table 3.1
Maternal Ethnicity Categories Based on Nationality or Geographical Origin
Maternal ethnicity Nationality or geographical origin
Indigenous Australian Aboriginal and Torres Strait Islander
White Australian, European, Middle Eastern, North African,
Canadian, American, South American and Hispanic
Black African, Caribbean, and African American
East Asian Chinese, Japanese and Korean
South Asian Indian, Pakistani, Bangladeshi and Sri Lankan
Southeast Asian Philippines, Indonesia, Papua New Guinean, Bruneian
and Malaysian
Mixed Any combination of the above groups Note. Adapted from “Ethnicity and the need for correction of biochemical and ultrasound markers of chromosomal anomalies in the first trimester: a study of Oriental, Asian and Afro-Caribbean populations,” by K. Spencer, V. Heath, A. El-Sheikhah, C. Ong, and K. Nicolaides, 2005, Prenatal Diagnosis, 25(5), p. 366.
3.7.2 Maternal age at conception.
The maternal age at conception was defined as the age of the participant 38
weeks prior to her EDD or two weeks after her known or calculated first day of her
LMP. In the majority of cases the maternal age was established by questioning the
patient. Alternatively, the maternal age was deduced with the aid of the ultrasound
machine calculation packages.

UMBILICAL CORD VEIN ULTRASOUND 108
3.7.3 Conception.
Spontaneous conception was defined as a pregnancy that occurred naturally
without any medical assistance. Assisted conception was defined as a pregnancy that
occurred following medical assistance and was divided into two broad categories:
i. Assisted reproductive technologies (ART) including conceptions aided by
techniques such as in vitro fertilisation (IVF), gamete intra-fallopian
transfer (GIFT), intracytoplasmic sperm injection (ICSI) and artificial
insemination.
ii. Hormonal therapy to improve successful ovulation and implantation
included pharmaceuticals such as clomiphene citrate (Clomid®),
metformin, letrozole, dehydroepiandrosterone (DHEA), etc. In these cases
the pregnancy was assisted, but conception was spontaneous.
3.7.4 Parity.
Parity was defined as the number of births after 20 weeks GA, regardless of
pregnancy termination, or whether pregnancy resulted in a live or demised neonate
(Z. Li, Zeki, Hilder, & Sullivan, 2013).
3.7.5 Maternal diseases.
An overview of participants’ general wellbeing was documented by recording
the first disorder reported by participants when asked about their health. There was
no interrogation about the severity of the disorder or priority of multiple disorders as
this was a broad, non-specific question. The first stated disorder was documented and
categorised into the broad groups shown in Table 3.2. Hypertension and diabetes were
not combined into broader categories due to their known association with birthweight
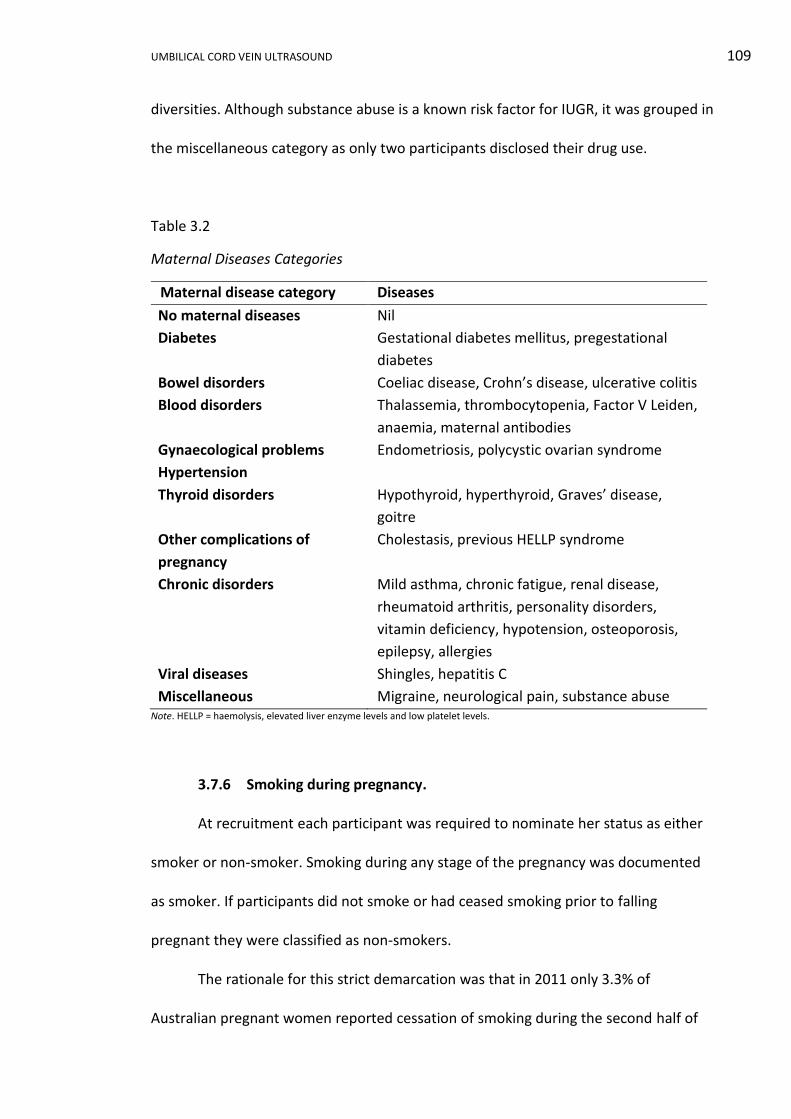
UMBILICAL CORD VEIN ULTRASOUND 109
diversities. Although substance abuse is a known risk factor for IUGR, it was grouped in
the miscellaneous category as only two participants disclosed their drug use.
Table 3.2
Maternal Diseases Categories
Maternal disease category Diseases
No maternal diseases Nil
Diabetes Gestational diabetes mellitus, pregestational
diabetes
Bowel disorders Coeliac disease, Crohn’s disease, ulcerative colitis
Blood disorders Thalassemia, thrombocytopenia, Factor V Leiden,
anaemia, maternal antibodies
Gynaecological problems Endometriosis, polycystic ovarian syndrome
Hypertension
Thyroid disorders Hypothyroid, hyperthyroid, Graves’ disease,
goitre
Other complications of
pregnancy
Cholestasis, previous HELLP syndrome
Chronic disorders Mild asthma, chronic fatigue, renal disease,
rheumatoid arthritis, personality disorders,
vitamin deficiency, hypotension, osteoporosis,
epilepsy, allergies
Viral diseases Shingles, hepatitis C
Miscellaneous Migraine, neurological pain, substance abuse Note. HELLP = haemolysis, elevated liver enzyme levels and low platelet levels.
3.7.6 Smoking during pregnancy.
At recruitment each participant was required to nominate her status as either
smoker or non-smoker. Smoking during any stage of the pregnancy was documented
as smoker. If participants did not smoke or had ceased smoking prior to falling
pregnant they were classified as non-smokers.
The rationale for this strict demarcation was that in 2011 only 3.3% of
Australian pregnant women reported cessation of smoking during the second half of
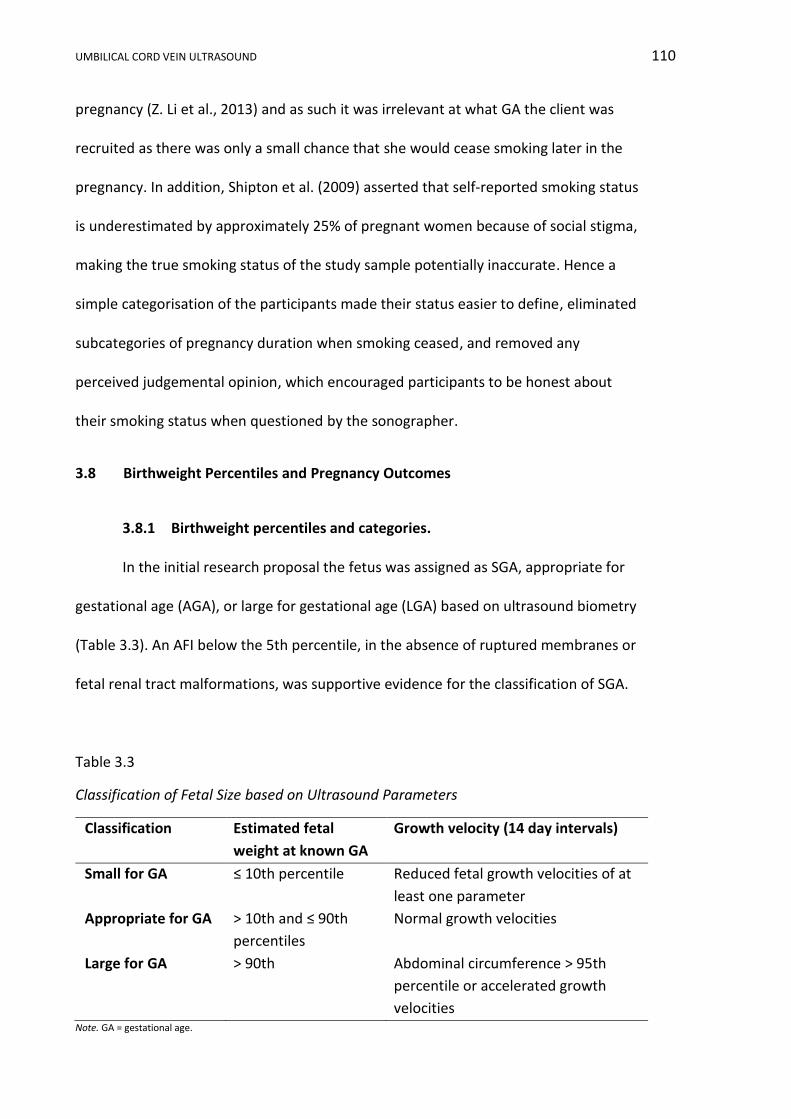
UMBILICAL CORD VEIN ULTRASOUND 110
pregnancy (Z. Li et al., 2013) and as such it was irrelevant at what GA the client was
recruited as there was only a small chance that she would cease smoking later in the
pregnancy. In addition, Shipton et al. (2009) asserted that self-reported smoking status
is underestimated by approximately 25% of pregnant women because of social stigma,
making the true smoking status of the study sample potentially inaccurate. Hence a
simple categorisation of the participants made their status easier to define, eliminated
subcategories of pregnancy duration when smoking ceased, and removed any
perceived judgemental opinion, which encouraged participants to be honest about
their smoking status when questioned by the sonographer.
3.8 Birthweight Percentiles and Pregnancy Outcomes
3.8.1 Birthweight percentiles and categories.
In the initial research proposal the fetus was assigned as SGA, appropriate for
gestational age (AGA), or large for gestational age (LGA) based on ultrasound biometry
(Table 3.3). An AFI below the 5th percentile, in the absence of ruptured membranes or
fetal renal tract malformations, was supportive evidence for the classification of SGA.
Table 3.3
Classification of Fetal Size based on Ultrasound Parameters
Classification Estimated fetal
weight at known GA
Growth velocity (14 day intervals)
Small for GA ≤ 10th percentile Reduced fetal growth velocities of at
least one parameter
Appropriate for GA
> 10th and ≤ 90th
percentiles
Normal growth velocities
Large for GA > 90th Abdominal circumference > 95th
percentile or accelerated growth
velocities Note. GA = gestational age.

UMBILICAL CORD VEIN ULTRASOUND 111
Pregnancy outcome data highlighted a discrepancy between the ultrasound
classification and actual birthweight classification of SGA, AGA or LGA. This
inconsistency was most obvious when a fetus had only one scan in the second
trimester and ultrasound information was then extrapolated to give a term
classification. This was not an unexpected outcome given that experienced
sonographers have an accepted error rate of between 15% and 20% (Quinton, 2006) in
ultrasonically estimating fetal weight. In addition, in a review article of ultrasonic fetal
weight estimation, Dudley (2013, p. 186) argued that “any trial where subjects are
selected on the basis of EFW will have serious limitations owing to the accuracy,
sensitivity and specificity of the technique”. Given these opinions and irregularities it
was appropriate to use actual birthweight to retrospectively classify fetal growth in
this research. This modification to research design allowed fetuses who only had an
early ultrasound to be classified using a known quantifiable endpoint, and not an
extrapolation based on an early ultrasound examination.
Birthweights were divided into categories using Australian national birthweight
percentiles for singleton infants, developed by Dobbins et al. (2012). These percentiles
covered gestational ages from 20 to 44 weeks with the GA at delivery rounded to
whole weeks and birthweight rounded to the nearest 5 g. The percentiles developed
by Dobbins et al. allowed the use of robust, current, Australian data collected from
2.53 million live births over a 10 year period from 1998. In addition, these percentiles
allowed classification to be gender specific, as the average Australian birthweight of
live born females is typically less than males (Z. Li et al., 2013).
When the birthweights, sex and GA at delivery of the fetuses was retrieved
from participants’ medical records, the information was used to assign the fetuses into
UMBILICAL CORD VEIN ULTRASOUND 112
percentile bands according to Dobbins et al. (2012). These percentiles were
summarised into three categories: SGA (< 10th percentile), AGA (10th to 90th
percentiles) and LGA (> 90th percentiles). These classifications formed the basis of
comparison and statistical analyses for the remainder of the research with participants
defined by the birthweight category of their offspring.
3.8.2 Pregnancy outcomes.
Pregnancy outcomes were retrieved from handwritten documents or through
password restricted, electronic medical records (InfoMedix – Clinical Patient Folder). If
these avenues were unfruitful, but the delivery hospital could be identified, a list of
required outcomes and the signed Consent Form giving permission for retrieval of this
information was faxed to the appropriate site. These sites included Nepean,
Westmead, Parkes, Forbes, and Cowra hospitals. The following six outcomes were
collected and entered into a re-identifiable spreadsheet:
i. Birthweight. The birthweight documented by the midwife at the time of
delivery was recorded as a continuous variable rounded to the nearest 5 g.
ii. Perinatal and infant deaths. Fetal deaths were defined as death before
birth after a GA of at least 20 weeks and a birthweight of more than 400 g,
neonatal deaths up to 27 completed days after birth, and infant death as
death occurring at less than one year of age (Hilder, Zhichao, Parker, Jahan,
& Chambers, 2014).
iii. Gestational age at delivery. The date of delivery was retrieved from the
participants’ medical records and the GA at delivery, expressed in weeks
and days, was calculated using the web-based Auckland District Health
Board newborn clinical guidelines package (Auckland District Health Board,
UMBILICAL CORD VEIN ULTRASOUND 113
2009). This package automatically adjusted for the 2012 leap year.
Allocation of birthweight categories was by completed whole weeks and
statistical analyses were undertaken using GA age in days. Statistical
analyses used three categories of GA at delivery: preterm (< 37 weeks 0
days), term (between 37 weeks 0 days and 41weeks and 6 days) and post
term (> 41 weeks and 6 days).
iv. Sex of the newborn. The sex of the neonate was classified into discrete
categories of male or female.
v. Mode of delivery. The mode of delivery was categorised as either normal
vaginal, instrumental including forceps or vacuum extraction, or caesarean
section.
vi. Apgar scores at one and five minutes after birth. The Apgar score was
recorded as a value between 0 and 10 reflecting the baby’s neurological
and cardiorespiratory rank at one and five minutes after birth (DeCherney,
Nathan, Goodwin, & Laufer, 2007). The midwife assigned a value between
0 and 2 for each of the following features: skin colour, pulse rate, reflex,
muscle tone and breathing. The sum of the five values gave a score out of
10; with a score of 7 to 10 considered normal, 4 to 7 required some
resuscitation, and 3 or less required immediate resuscitation.
Spreadsheet data was fully de-identified once all outcome data for each
pregnancy was included.
UMBILICAL CORD VEIN ULTRASOUND 114
3.9 Construction of the “normal” AGA (nAGA) Group
In an uncomplicated pregnancy women are usually referred for only one
ultrasound examination after the first trimester, which is the morphological
assessment at 18 to 20 weeks GA. At this examination women can be recruited, but
the difficulty lies in rescanning or recruiting these “normal” participants later in the
pregnancy as they have no medical reason to undergo another ultrasound examination
and are therefore not available for follow-up or recruitment. Recruiting non-referred
“normal” pregnant women would attract challenging ethical issues and financial
constraints beyond the capacity of this research. This limitation has been
acknowledged in previous hospital based research (Proctor et al., 2013).
The participants in the AGA birthweight category had already been identified as
delivering a neonate within the normal birthweight range (10th to 90th percentile)
based on Australian standards and were from a low risk population by virtue of
attending regional hospitals that did not offer high risk obstetric management. In order
to include only “normal” pregnancies in the data set used to develop the UCV
nomograms, the AGA birthweight category was further refined by the exclusion of
participants who were identified as having obstetric or ultrasound characteristics that
may cause, or indicate, abnormal fetal growth. These exclusion characteristics (Table
3.4) included non-term delivery, stillbirths, assisted conception, abnormal AFI or UA
Doppler measurements, fetal structural anomalies and significant maternal risk factors
for abnormal fetal growth. The refinement of the AGA birthweight category was based
on responses from participants at recruitment, the clinical history provided by the
referring medical officer, medical records and ultrasound results. The remaining
sample of “normal” AGA birthweight participants was identified as the nAGA group.
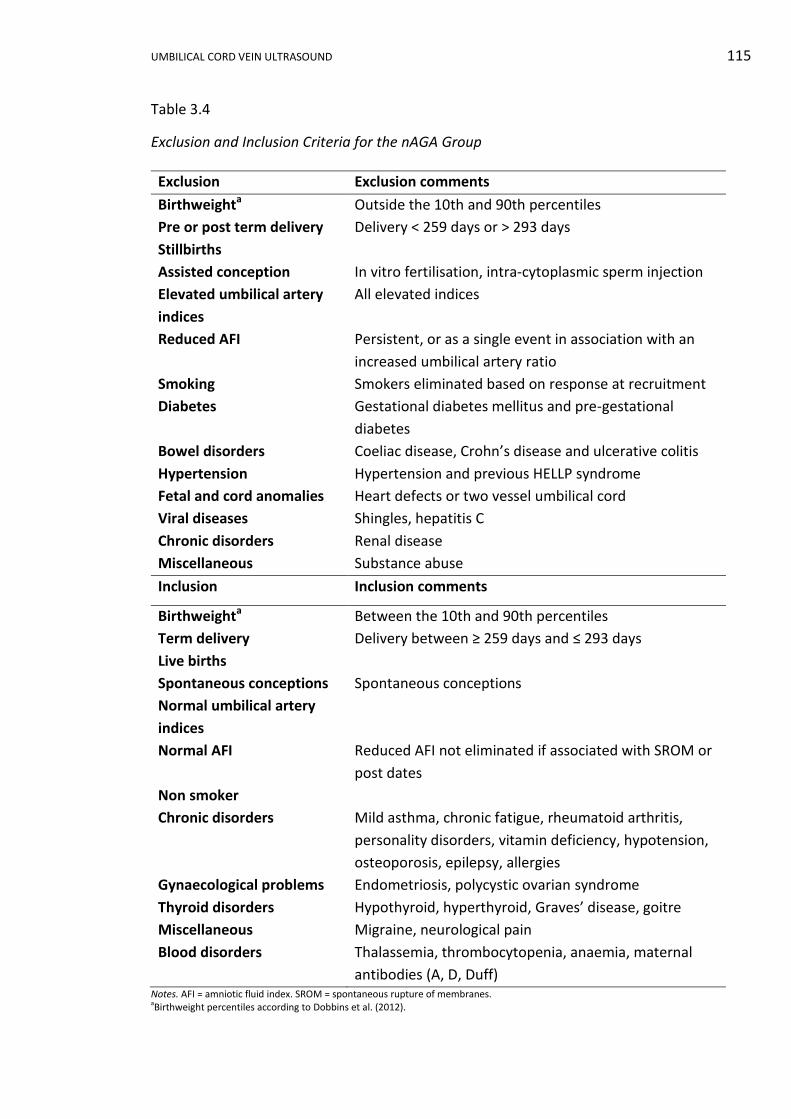
UMBILICAL CORD VEIN ULTRASOUND 115
Table 3.4
Exclusion and Inclusion Criteria for the nAGA Group
Exclusion Exclusion comments
Birthweighta Outside the 10th and 90th percentiles
Pre or post term delivery Delivery < 259 days or > 293 days
Stillbirths
Assisted conception In vitro fertilisation, intra-cytoplasmic sperm injection
Elevated umbilical artery
indices
All elevated indices
Reduced AFI Persistent, or as a single event in association with an
increased umbilical artery ratio
Smoking Smokers eliminated based on response at recruitment
Diabetes Gestational diabetes mellitus and pre-gestational
diabetes
Bowel disorders Coeliac disease, Crohn’s disease and ulcerative colitis
Hypertension Hypertension and previous HELLP syndrome
Fetal and cord anomalies Heart defects or two vessel umbilical cord
Viral diseases Shingles, hepatitis C
Chronic disorders Renal disease
Miscellaneous Substance abuse
Inclusion Inclusion comments
Birthweighta Between the 10th and 90th percentiles
Term delivery Delivery between ≥ 259 days and ≤ 293 days
Live births
Spontaneous conceptions Spontaneous conceptions
Normal umbilical artery
indices
Normal AFI Reduced AFI not eliminated if associated with SROM or
post dates
Non smoker
Chronic disorders Mild asthma, chronic fatigue, rheumatoid arthritis,
personality disorders, vitamin deficiency, hypotension,
osteoporosis, epilepsy, allergies
Gynaecological problems Endometriosis, polycystic ovarian syndrome
Thyroid disorders Hypothyroid, hyperthyroid, Graves’ disease, goitre
Miscellaneous Migraine, neurological pain
Blood disorders Thalassemia, thrombocytopenia, anaemia, maternal
antibodies (A, D, Duff) Notes. AFI = amniotic fluid index. SROM = spontaneous rupture of membranes. aBirthweight percentiles according to Dobbins et al. (2012).
UMBILICAL CORD VEIN ULTRASOUND 116
The nAGA participants were women who delivered a live, term neonate with
term defined as the GA range from 37 completed weeks (≥ 259 days) until less than 42
weeks (< 294 days) (Hilder et al., 2014). Stillbirths were excluded from the nAGA
subgroup as a fetal death may reflect placental disorders, IUGR, congenital
abnormality or maternal hypertension (Collins et al., 2013). Altman and Chitty (1994)
advocated the inclusion of fetal deaths in data used to develop nomograms; however,
they were excluded from this research as this was perceived as an abnormal outcome.
IVF singleton pregnancies are considered to be at higher risk of IUGR compared
to spontaneously conceived fetuses (McDonald et al., 2009; Suhag & Berghella, 2013).
However, there was evidence that when confounders such as maternal age, parity, and
fetal number are considered, the outcomes of IVF pregnancies are comparable to
unassisted conceptions (Kondapalli & Perales-Puchalt, 2013). Due to a lack of
consensus, ICSI and IVF conceptions were eliminated and only spontaneous
conceptions remained in the nAGA sample.
Participants were excluded if the umbilical cord artery S/D ratio or PI were
above the 95th percentile on standard nomograms. If the indices were elevated at a
single attendance the participants were excluded as they may have been subsequently
administered steroids, which can return the indices to normal (Nozaki, Francisco,
Fonseca, Miyadahira, & Zugaib, 2009). In the absence of ruptured membranes, post-
dates or renal anomalies, participants were excluded if the AFI persisted below the 5th
percentile on standard nomograms, as oligohydramnios can reflect reduced fetal
kidney perfusion as a consequence of fetal vascular redistribution caused by placental
insufficiency (Bamfo & Odibo, 2011).
UMBILICAL CORD VEIN ULTRASOUND 117
Participants who were identified as smoking anytime in the pregnancy or using
any illicit substances were excluded. Nicotine, heroin, cocaine and amphetamines are
linked to IUGR (Society of Obstetricians and Gynecologists of Canada, 2011; Soto &
Bahado-Singh, 2013). Women who smoke during pregnancy have approximately 3.5
the risk of IUGR compared to non-smokers and the increased risk is dose, duration and
GA dependent (Suhag & Berghella, 2013; M. Williams, Malik, Francis, & Gardosi, 2011).
Participants with pre-gestational or gestational diabetes mellitus were excluded
as the growth rate of fetuses of these mothers differs from that of the normal
population (Lepercq et al., 2001; Mohammadbeigi et al., 2013; Wong, Lee-Tannock,
Amaraddio, Chan, & McIntyre, 2006). Fetal complications associated with maternal
diabetes include macrosomia, and maternal complications include hypertension and
preeclampsia (Setji, Brown, & Feinglos, 2005).
There is a significant association between maternal coeliac disease and IUGR
(Suciu et al., 2014). Inflammatory bowel diseases including ulcerative colitis and
Crohn’s disease increase the risk of adverse birth outcomes such as stillbirth, growth
restriction and preterm birth, especially, if exacerbations occur during pregnancy
(Broms et al., 2014). As several participants who experienced bowel disorders were
admitted to hospital or investigated for abdominal pain, this group of participants
were excluded from the nAGA sample.
Preeclampsia is a risk factor for the development of IUGR and chronic
hypertension increases the likelihood of developing both IUGR and preeclampsia
(Srinivas et al., 2009). HELLP (haemolysis, elevated liver enzyme levels and low platelet
levels) syndrome is a variant of preeclampsia involving blood and liver complications in
pregnancy. In a subsequent pregnancy, women with a history of HELLP syndrome, at or
UMBILICAL CORD VEIN ULTRASOUND 118
before 28 weeks gestation, are at increased risk for preterm birth, pregnancy induced
hypertension and increased neonatal mortality (Haram, Svendsen, & Abildgaard,
2009). Hypertension or preeclampsia documented by the referring doctor or a history
of HELLP syndrome excluded participants from the nAGA group.
Fetal cardiac abnormities and a single UA are well documented structural
causes of IUGR (S. Lee & Walker, 2010). Participants who carried a fetus with these
anomalies were excluded from the nAGA group. Maternal infections such as
toxoplasmosis, rubella, cytomegalovirus, herpes simplex virus, varicella-zoster virus
(shingles) and syphilis are associated with approximately 5 to 15% of IUGR (Longo,
Borghesi, Tzialla, & Stronati, 2014). Participants were eliminated from the nAGA group
if any of these infections were documented by their referring doctor.
Prematurity, low birthweight, admission to neonatal intensive care, delivery by
caesarean and fetal death are more prevalent in women with chronic kidney disease
compared to women without renal disease (Kendrick et al., 2015). Recent data
suggested that for women with mild kidney disease, 65% of pregnancies experienced
no complications, such as preeclampsia, IUGR or preterm delivery (Bili, Tsolakidis,
Stangou, & Tarlatzis, 2013). However, the incidence of preterm delivery, SGA and
decline of maternal renal function increased with a reduction in the estimated
glomerular filtration rate (Feng, Minard, & Raghavan, 2015), and consequently
participants with chronic renal disease were excluded from the nAGA group.
Opinions vary about the outcomes of pregnancies complicated by hepatitis B or
C. Reddick, Jhaveri, Gandhi, James, and Swamy (2011) reported that there was no
association between hepatitis B and/or hepatitis C and IUGR or pre-eclampsia
However, when possible confounders had been controlled, Dunkelberg, Berkley, Thiel,
UMBILICAL CORD VEIN ULTRASOUND 119
and Leslie (2014) and Safir, Levy, Sikuler, and Sheiner (2010) found that there was a
significant association between a positive hepatitis B or C status and a birthweight less
than 2,500 g. During pregnancy, women with hepatitis C are not treated, whereas
women with chronic hepatitis B may undergo antiviral treatment (Dunkelberg et al.,
2014). Due to the possibility of treatment and the lack of consensus regarding the
association of hepatitis with IUGR, participants with hepatitis B or C were excluded
from the nAGA group.
Current guidelines (Government of South Australia, 2012; Royal College of
Obstetricians and Gynaecologists, 2014a; The American Congress of Obstetricians and
Gynecologists, 2008), national asthma handbook (National Asthma Council Australia,
2015) and several studies (Johnston & Said, 2012; Little, 2016; MacMullen, Shen, &
Tymkow, 2010) identified a low risk of IUGR in mothers with mild or well controlled
asthma. As asthma was not given as the clinical reason for any nAGA group participant
to undergo an ultrasound examination, and no participant was hospitalised during
their pregnancy for exacerbation of asthmatic symptoms, participants with mild
asthma were retained in the sample.
Women with seizure disorders are not at increased risk of IUGR (McPherson,
Harper, Odibo, Roehl, & Cahill, 2013). Intrahepatic cholestasis of pregnancy has been
associated with an increased incidence of spontaneous preterm delivery, respiratory
distress syndrome, meconium staining of the amniotic fluid and stillbirth, but not IUGR
(Williamson & Geenes, 2014). Participants with either of these conditions were
included in the nAGA group.
Hyperthyroidism and hypothyroidism can be associated with IUGR (Saki et al.,
2014). Graves’ disease is associated with hyperthyroid function. Goitre can be caused
UMBILICAL CORD VEIN ULTRASOUND 120
by either hyperthyroidism or hypothyroidism. Hyperthyroidism and hypothyroidism in
pregnancy are only risk factors for IUGR if the conditions are severe or uncontrolled
(Collins et al., 2013; Patil-Sisodia & Mestman, 2010). Participants with previous
abnormal thyroid function tests were medically managed by their referring medical
officer and presented with euthyroid function during pregnancy and therefore they
were included in the nAGA sample.
Women with thalassaemia are predisposed to severe maternal anaemia, which
is associated with IUGR (Royal College of Obstetricians and Gynaecologists, 2014b).
Higher rates of IUGR were found among patients with moderate to severe
thrombocytopenia and were attributed to preeclampsia and HELLP syndrome (Parnas
et al., 2006). As none of the participants identified with thalassaemia, anaemia or
thrombocytopenia suffered any complications of their disorders during their
pregnancies, they were not eliminated. Publication bias controlled meta-analyses
(Facco, You, & Grobman, 2009; Howley, Walker, & Rodger, 2005; Rodger et al., 2010)
and a recent clinical study (Coriu et al., 2014) indicate no significant association
between Factor V Leiden and IUGR. Participants with this thrombophilia would not be
excluded from the nAGA group. The most significant fetal complication of red cell
antibodies is fetal anaemia that may result in hydrops (Royal College of Obstetricians
and Gynaecologists, 2014c; Williamson & Geenes, 2014). As no fetus of a participant
with maternal antibodies exhibited hydrops or elevated Doppler indices associated
with fetal anaemia, these participants were included in the nAGA sample.
UMBILICAL CORD VEIN ULTRASOUND 121
3.10 Stratification of the Small for Gestational Age (SGA) Category
In this research the SGA category was defined as those fetuses born with a
birthweight below the 10th percentile based on Australian percentiles for GA and
gender. This broad category encompassed normally growing small fetuses as well as
fetuses that failed to reach their growth potential and were growth restricted (Parra-
Saavedra et al., 2014; Sovio et al., 2015). One of the research aims was to determine if
the GA related reference ranges, developed from the nAGA data, were able to identify
growth restricted fetuses. To achieve this aim, a practical, historically relevant and
clinically applicable stratification of the SGA birthweight category into normally
growing small fetuses and pathologically small fetuses was required.
In order to isolate IUGR fetuses from SGA fetuses and use criteria comparable
with previous research, a review of definitions used in nine relevant publications that
had analysed the diameter, velocity or blood flow in the UV of IUGR fetuses was
undertaken. The criteria used to define IUGR in these publications are shown in Table
3.5. The most common definition was birthweight or AC less than a predetermined
value and this was frequently supported by abnormal UA PI readings. Considering the
aim was to identify the in utero presence of growth restriction, it was anticipated that
EFW would be part of the definition, which was supported by the POP study (Sovio et
al., 2015). The POP study advocated that EFW and AC below the 10th percentile were
the best predictors of delivering a SGA neonate with a high morbidity risk (Sovio et al.,
2015). Including the EFW was consistent with results published by Ott (2002), who
found that either EFW or AC were good predictors of IUGR and that accuracy was
improved with Doppler evaluation of the UA. The inclusion of EFW was also supported
by Unterscheider et al. (2013a) who reported that an EFW less than the 3rd percentile
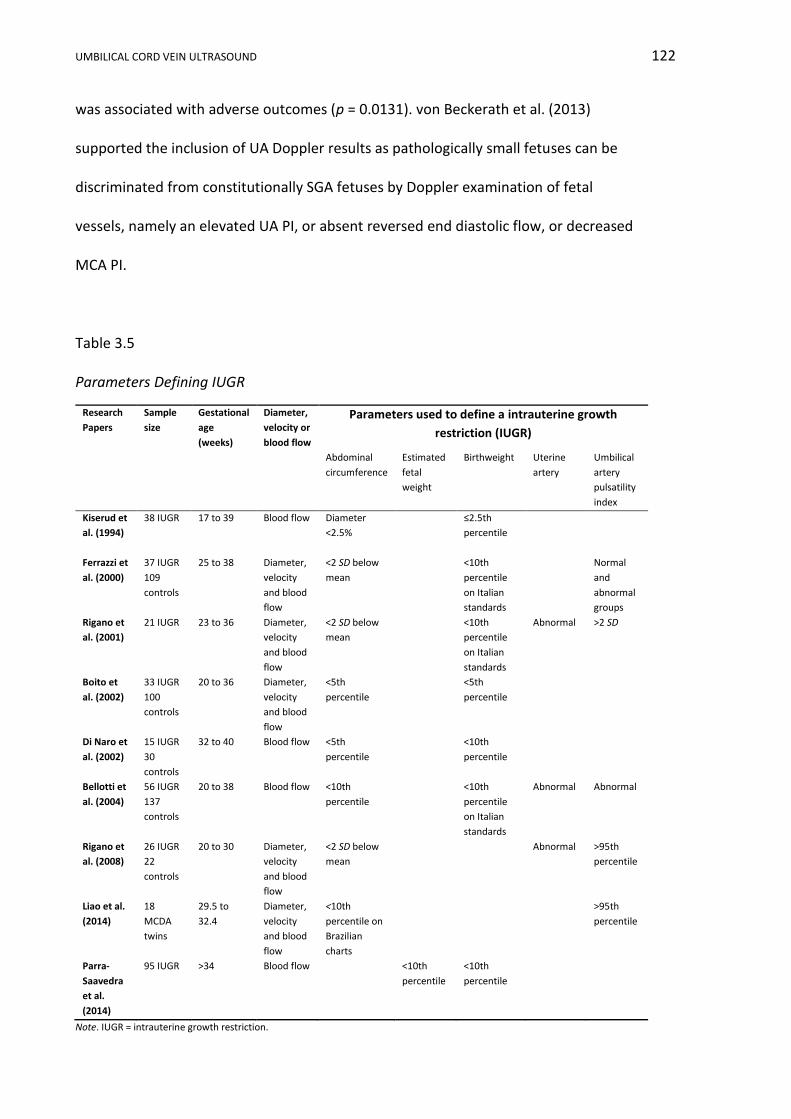
UMBILICAL CORD VEIN ULTRASOUND 122
was associated with adverse outcomes (p = 0.0131). von Beckerath et al. (2013)
supported the inclusion of UA Doppler results as pathologically small fetuses can be
discriminated from constitutionally SGA fetuses by Doppler examination of fetal
vessels, namely an elevated UA PI, or absent reversed end diastolic flow, or decreased
MCA PI.
Table 3.5
Parameters Defining IUGR
Research
Papers
Sample
size
Gestational
age
(weeks)
Diameter,
velocity or
blood flow
Parameters used to define a intrauterine growth
restriction (IUGR)
Abdominal
circumference
Estimated
fetal
weight
Birthweight Uterine
artery
Umbilical
artery
pulsatility
index
Kiserud et
al. (1994)
38 IUGR 17 to 39 Blood flow Diameter
<2.5%
≤2.5th
percentile
Ferrazzi et
al. (2000)
37 IUGR
109
controls
25 to 38 Diameter,
velocity
and blood
flow
<2 SD below
mean
<10th
percentile
on Italian
standards
Normal
and
abnormal
groups
Rigano et
al. (2001)
21 IUGR 23 to 36 Diameter,
velocity
and blood
flow
<2 SD below
mean
<10th
percentile
on Italian
standards
Abnormal >2 SD
Boito et
al. (2002)
33 IUGR
100
controls
20 to 36 Diameter,
velocity
and blood
flow
<5th
percentile
<5th
percentile
Di Naro et
al. (2002)
15 IUGR
30
controls
32 to 40 Blood flow <5th
percentile
<10th
percentile
Bellotti et
al. (2004)
56 IUGR
137
controls
20 to 38 Blood flow <10th
percentile
<10th
percentile
on Italian
standards
Abnormal Abnormal
Rigano et
al. (2008)
26 IUGR
22
controls
20 to 30 Diameter,
velocity
and blood
flow
<2 SD below
mean
Abnormal >95th
percentile
Liao et al.
(2014)
18
MCDA
twins
29.5 to
32.4
Diameter,
velocity
and blood
flow
<10th
percentile on
Brazilian
charts
>95th
percentile
Parra-
Saavedra
et al.
(2014)
95 IUGR >34 Blood flow <10th
percentile
<10th
percentile
Note. IUGR = intrauterine growth restriction.
UMBILICAL CORD VEIN ULTRASOUND 123
As there was no identifiable consistent definition of IUGR/FGR, several
combinations of ultrasound measurements and pregnancy outcomes were analysed.
Using the SGA birthweight category as a baseline, multiple combinations were
developed using:
i. Birthweight percentiles (< 10th, 5th and 3rd percentiles).
ii. EFW percentiles (≤ 10th, 5th and 3rd percentiles).
iii. AC ≤ 5th percentile.
iv. UA S/D ratio and /or UA PI > 95th percentile.
v. AFI < 5th percentile.
vi. MCA PI < 5th percentile.
vii. Apgar scores at 1 and 5 min.
viii. Stillbirths.
These combinations are shown in Table 10.4. The combination of birthweight
< 10th percentile, EFW ≤ 10th percentile, AC ≤ 5th percentile and UA S/D ratio > 95th
percentile was chosen to define IUGR for further analysis in this research and is
referred to as the IUGR/FGR group. This decision was based on the rationale:
i. AC is a widely accepted indicator of poor intrauterine growth and the
inclusion of this parameter makes the definition clinically robust.
ii. The 10th percentile is an established cut-off for both birthweight and EFW
classification of IUGR, whereas the 5th and 3rd percentiles isolate severely
growth restricted fetuses.
iii. This definition of IUGR is in keeping with findings in relevant publications
(Table 3.5), in which four out of nine research papers investigating UV
characteristics defined IUGR as reduced AC and elevated UA indices
UMBILICAL CORD VEIN ULTRASOUND 124
(Bellotti et al., 2004; Ferrazzi et al., 2000; Rigano et al., 2001; Rigano et al.,
2008).
iv. Most research has used an elevated UA PI as a diagnostic indicator of IUGR.
Review of research data found there were statistically inadequate numbers
of elevated UA PI values, as only Participant 66 presented with three
elevated UA PI readings, and therefore UA S/D ratio was used as an
indicator of placental function.
v. This definition defines a mild to moderate form of IUGR which is commonly
encountered and monitored in regional areas.
3.11 Ultrasound Equipment, Examination and Sonographers
3.11.1 The ultrasound machines.
Toshiba Aplio XG Version 3, model SSA-790A (Toshiba Medical Systems
Corporation, Otawara-shi, Tochigi-ken, Japan) ultrasound machines manufactured in
2008 and 2009 were used for all ultrasound examinations. All measurements were
recorded using either a transabdominal curved PVT-375BT transducer with a central
frequency of 3.5 MHz or a transabdominal curved PVT-674BT transducer with a central
frequency of 6 MHz depending on maternal body habitus. All examinations were
completed using obstetric presets (Appendix J) tailored for specific transducers with
optimised B-mode and Doppler imaging parameters. All ultrasound machines
underwent routine servicing and calibration to ensure their safety and accuracy
3.11.2 The ultrasound examination.
An ultrasound examination may take up to an hour depending on GA and
diagnostic intent of the examination. In this research, at each participant presentation,

UMBILICAL CORD VEIN ULTRASOUND 125
the sonographer took three additional optimised B-mode images of the UCV for
measurement of the diameter and three additional Doppler spectral traces for
measurement of the UCV PV.
The research actions extended the examination time by approximately 3 min
and there were no other changes to routine scanning practices. To minimise any
possible detrimental effects of the ultrasound examinations, all care was taken to
reduce overall scanning and dwell time, lower the acoustic power, and lower the frame
rate (Moderiano et al., 2015). Imaging the UCV reduced direct fetal exposure and all
forms of Doppler avoided the fetal eyes. The obstetric presets had an initial MI of 1.3
for the 3.5 MHz transducer and 1.0 for the 6 MHz transducer, which are both
compliant with previously discussed guidelines. The TI was also compliant with the
guidelines: the Toshiba Aplio XG only displayed the TI if the value exceeded 0.4.
In all obstetric ultrasound examinations the care of the mother and fetus is
paramount. Data collection was suspended if maternal or fetal well-being was
compromised, the participant’s referring doctor was notified and the participant was
escorted to the Maternity Ward. The measurements of the UCV diameter and PV were
not included in the formal imaging report nor did the measurements influence the
participant’s obstetric management. Neither the participants nor NSW Health and
Ageing incurred any additional costs for the completion of this research. All
sonographers respected the participants’ rights for dignity, comfort and privacy.
3.11.3 Sonographers and reliability.
Three sonographers at OHS and two sonographers at BHS received ethics
approval to participate in this research. Subsequently, in August 2011, one of the OHS

UMBILICAL CORD VEIN ULTRASOUND 126
sonographers resigned. The remaining four sonographers were senior staff members
with scanning experience ranging from 15 to 21 years.
The intersonographer and intrasonographer reproducibility was maximised by
using a strict protocol. This protocol required that the measurements be undertaken
using the Toshiba Aplio XG (Version 3) ultrasound machine, with standardised image
parameters at both sites, and by averaging three UCV measurements. I reviewed all
images to ensure adherence to the protocol.
The intersonographer and intrasonographer reliability was assessed by
retrospectively selecting B-mode images of the UCV diameter and Doppler spectral
images of the UCV PV from the stored images of ten randomly chosen participants
who had unmeasured images stored. These images were copied and downloaded to
the hard drive of a single ultrasound machine. Blinded to the results of their
colleagues, the four remaining research sonographers measured the diameter or the
PV on each of the 20 images and stored the images. Each sonographer repeated the
measurement three times for each image, with the images randomly selected from the
hard drive list of files so that the three measurements were not consecutively
repeated. All measurements were retrieved from the recorded images and entered
into a spreadsheet. The intersonographer and intrasonographer reliability was
assessed by a linear mixed model and the intraclass correlation coefficient (ICC)
calculated according to Gwet (2014) using R statistical software version 3.1.1 (R Core
Team, 2014). The ICC value ranges from 0 to 1: with poor agreement 0 to 0.2, fair
agreement 0.21 to 0.4, moderate agreement 0.41 to 0.61, good agreement 0.61 to
0.80, and 0.81 to 1.0 indicating almost perfect agreement (Costa-Santos, Bernardes,
Ayres-de-Campos, Costa, & Costa, 2011; Fernández et al., 2008).
UMBILICAL CORD VEIN ULTRASOUND 127
3.12 Ultrasound Measurements and Calculations
The ultrasound machines and images were used for making a range of
measurements and calculations.
3.12.1 Gestational age and estimated delivery date.
A reliable recollection of the first day of the LMP of a regular 28 day cycle, a
known embryo transfer date or ultrasound anthropometric parameters measured
before 14 weeks gestation determined the EDD of a fetus for the purpose of this
research. If none of these criteria were upheld the participant was excluded from the
research.
If there was a discrepancy of more than five days between the EDD estimated
by LMP and ultrasound EDD by CRL in the first trimester, the ultrasound EDD was
assigned (American College of Obstetricians and Gynecologists Opinion 611, 2014;
New South Wales Government, 2014) (Table 2.4). Ideally pregnancy dating was
undertaken at approximately eight weeks GA. Once the EDD was established, this date
was used for all calculations of GA, even if this date varied slightly from the EDD used
by the clinical team providing obstetric care to the participant.
The GA at the time of the ultrasound examination was calculated by the
ultrasound machine software upon the entry of the EDD. The ultrasound machines
automatically calculated the additional day added by the leap year in 2012.
3.12.2 Fetal biometry, growth and estimated fetal weight.
The anthropometric parameters of BPD, HC, AC and femur length were
measured according to Australasian Society for Ultrasound in Medicine (ASUM)
guidelines and plotted on ASUM 2000 graphs (Australasian Society for Ultrasound in
Medicine, 2001).
UMBILICAL CORD VEIN ULTRASOUND 128
The ASUM guidelines and graphs were standardised at both hospitals and
parameters were measured at intervals of no less than 14 days for the purpose of fetal
growth. The fetal weight was estimated by Hadlock C regression formula (Hadlock,
Harrist, Sharman, Deter, & Park, 1985):
𝐿𝑜𝑔10 = 1.335 − (0.0034 x 𝑎𝑏𝑑𝑜𝑚𝑖𝑛𝑎𝑙 𝑐𝑖𝑟𝑐𝑢𝑚𝑓𝑒𝑟𝑒𝑛𝑐𝑒 x 𝑓𝑒𝑚𝑢𝑟 𝑙𝑒𝑛𝑔ℎ𝑡)
+ (0.0316 x 𝑏𝑖𝑝𝑎𝑟𝑖𝑒𝑡𝑎𝑙 𝑑𝑖𝑎𝑚𝑒𝑡𝑒𝑟) + (0.1623 x 𝑓𝑒𝑚𝑢𝑟 𝑙𝑒𝑛𝑔𝑡ℎ)
+ (0.0457 x 𝑎𝑏𝑑𝑜𝑚𝑖𝑛𝑎𝑙 𝑐𝑖𝑟𝑐𝑢𝑚𝑓𝑒𝑟𝑒𝑛𝑐𝑒).
3.12.3 Amniotic fluid index.
The AFI was the sum of the deepest, unobstructed, vertical amniotic fluid pool
in each quadrant of the pregnant uterus. The sum was plotted on a nomogram (Moore
& Cayle, 1990) with < 5th percentile classified as oligohydramnios, a value between the
5th and 95th percentiles classified as normal, and an AFI > 95th percentile classified as
polyhydramnios. Prior to approximately 24 weeks GA, the quantity of amniotic fluid
was subjectively assessed by the sonographer and only quantified by the AFI if
suspected to be abnormal.
3.12.4 Umbilical cord artery Doppler.
Localisation of the umbilical cord was predominantly undertaken in B-mode.
Colour, power or advanced dynamic flow (ADF™) Doppler was used to enhance cord
localisation for participants with suboptimal body habitus or low amniotic fluid
volume. A mid portion of a free loop of umbilical cord was identified and the sweep
speed, velocity scale and gain were optimised for recording spectral traces of the UA.
Ideally the portion of umbilical cord was aligned parallel to the beam axis to minimise
the error in measuring the Doppler shift. A small gate size and locating the gate over
the central portion of the artery reduced spectral broadening. The pulse repetition

UMBILICAL CORD VEIN ULTRASOUND 129
frequency (PRF) was optimised to avoid aliasing. UA Doppler measurements were
taken during fetal quiescence (apnoea and absence of movement) from a frozen
spectral trace displaying at least three, consecutive, uniform arterial waveforms. The
traces of the umbilical cord artery were quantified by calculating the S/D ratio and PI
(Figure 3.1). The S/D ratio and PI are angle independent indices quantifying
downstream impedance. The lowest UA S/D and PI values were recorded and
documented as abnormal if the S/D or PI > 95th percentile for GA according to
nomograms (Arduini & Rizzo, 1990; Hecker, Campbell, Doyle, Harrington, &
Nicholaides, 1995), or when there was absent or reversed end diastolic flow. All indices
were calculated when the fetal heart rate was between 120 and 180 beats per minute
to eliminate errors in the indices induced by aberrant diastole velocities.
Figure 3.1. UA spectral trace with indices formulae. Adapted from “Doppler in obstetrics,” by K. Nicolaides, G. Rizzo, K. Hecker, and R. Ximenes, 2002, Diploma in Fetal Medicine and ISUOG Education Series, p. 23.
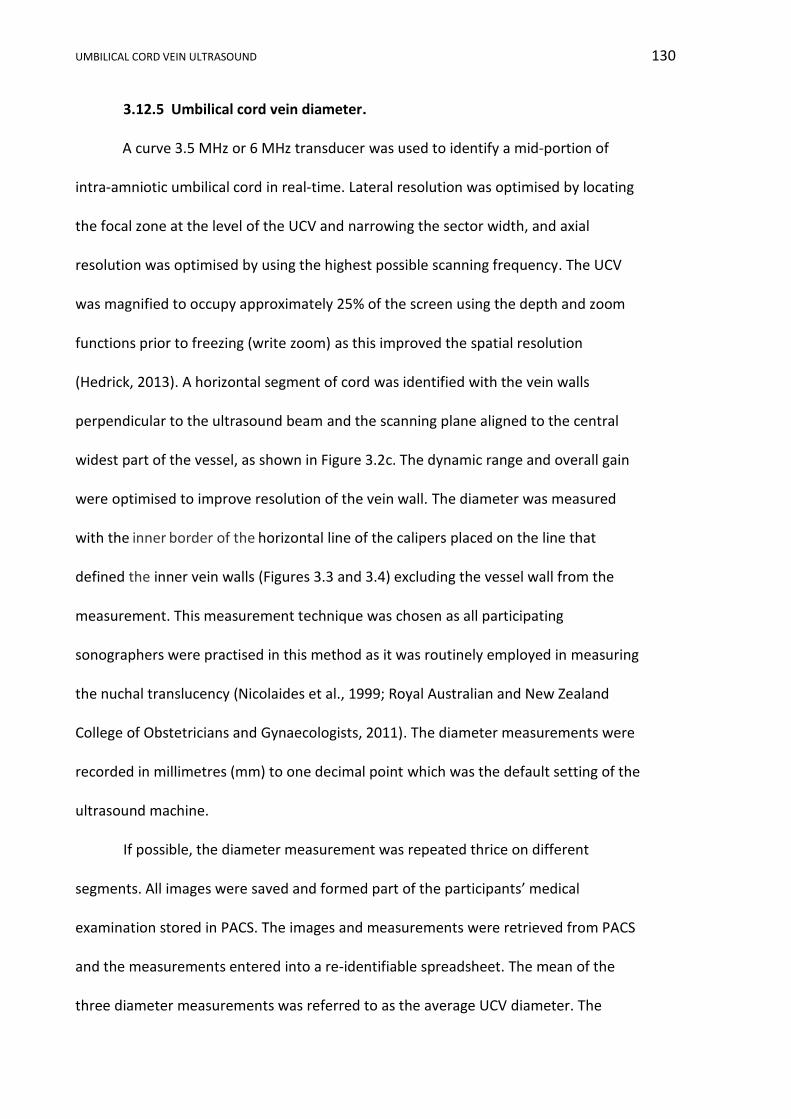
UMBILICAL CORD VEIN ULTRASOUND 130
3.12.5 Umbilical cord vein diameter.
A curve 3.5 MHz or 6 MHz transducer was used to identify a mid-portion of
intra-amniotic umbilical cord in real-time. Lateral resolution was optimised by locating
the focal zone at the level of the UCV and narrowing the sector width, and axial
resolution was optimised by using the highest possible scanning frequency. The UCV
was magnified to occupy approximately 25% of the screen using the depth and zoom
functions prior to freezing (write zoom) as this improved the spatial resolution
(Hedrick, 2013). A horizontal segment of cord was identified with the vein walls
perpendicular to the ultrasound beam and the scanning plane aligned to the central
widest part of the vessel, as shown in Figure 3.2c. The dynamic range and overall gain
were optimised to improve resolution of the vein wall. The diameter was measured
with the inner border of the horizontal line of the calipers placed on the line that
defined the inner vein walls (Figures 3.3 and 3.4) excluding the vessel wall from the
measurement. This measurement technique was chosen as all participating
sonographers were practised in this method as it was routinely employed in measuring
the nuchal translucency (Nicolaides et al., 1999; Royal Australian and New Zealand
College of Obstetricians and Gynaecologists, 2011). The diameter measurements were
recorded in millimetres (mm) to one decimal point which was the default setting of the
ultrasound machine.
If possible, the diameter measurement was repeated thrice on different
segments. All images were saved and formed part of the participants’ medical
examination stored in PACS. The images and measurements were retrieved from PACS
and the measurements entered into a re-identifiable spreadsheet. The mean of the
three diameter measurements was referred to as the average UCV diameter. The
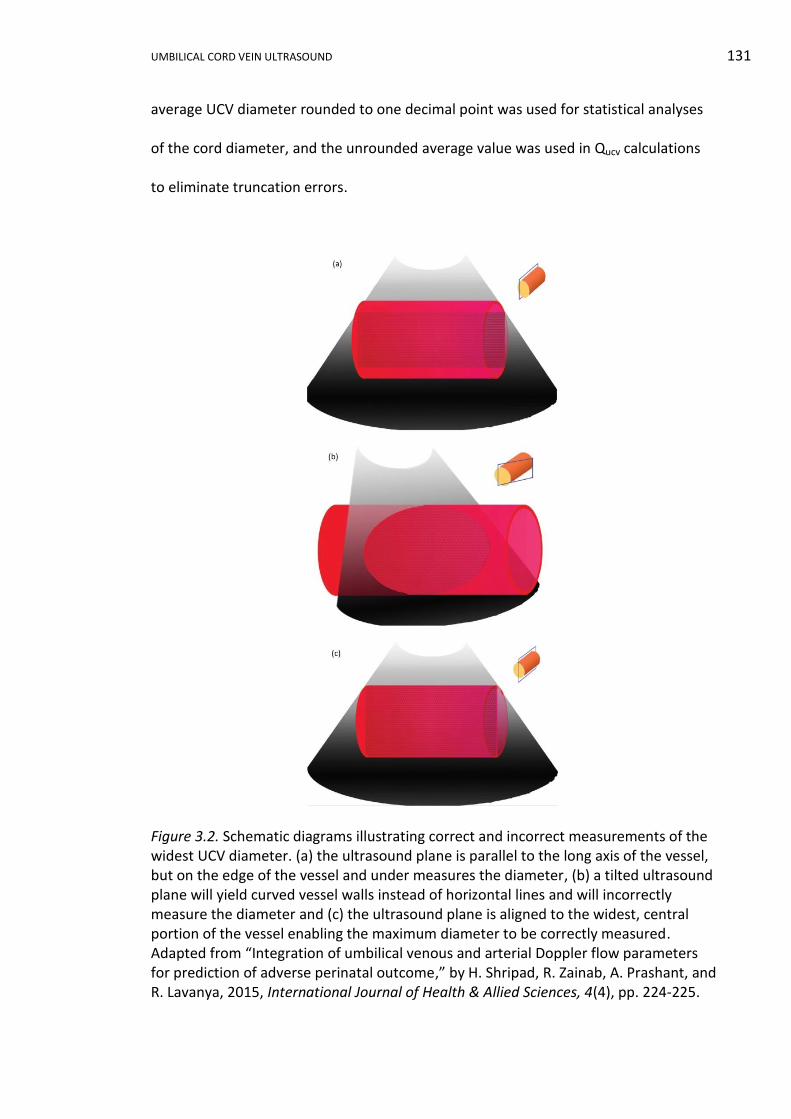
UMBILICAL CORD VEIN ULTRASOUND 131
average UCV diameter rounded to one decimal point was used for statistical analyses
of the cord diameter, and the unrounded average value was used in Qucv calculations
to eliminate truncation errors.
Figure 3.2. Schematic diagrams illustrating correct and incorrect measurements of the widest UCV diameter. (a) the ultrasound plane is parallel to the long axis of the vessel, but on the edge of the vessel and under measures the diameter, (b) a tilted ultrasound plane will yield curved vessel walls instead of horizontal lines and will incorrectly measure the diameter and (c) the ultrasound plane is aligned to the widest, central portion of the vessel enabling the maximum diameter to be correctly measured. Adapted from “Integration of umbilical venous and arterial Doppler flow parameters for prediction of adverse perinatal outcome,” by H. Shripad, R. Zainab, A. Prashant, and R. Lavanya, 2015, International Journal of Health & Allied Sciences, 4(4), pp. 224-225.
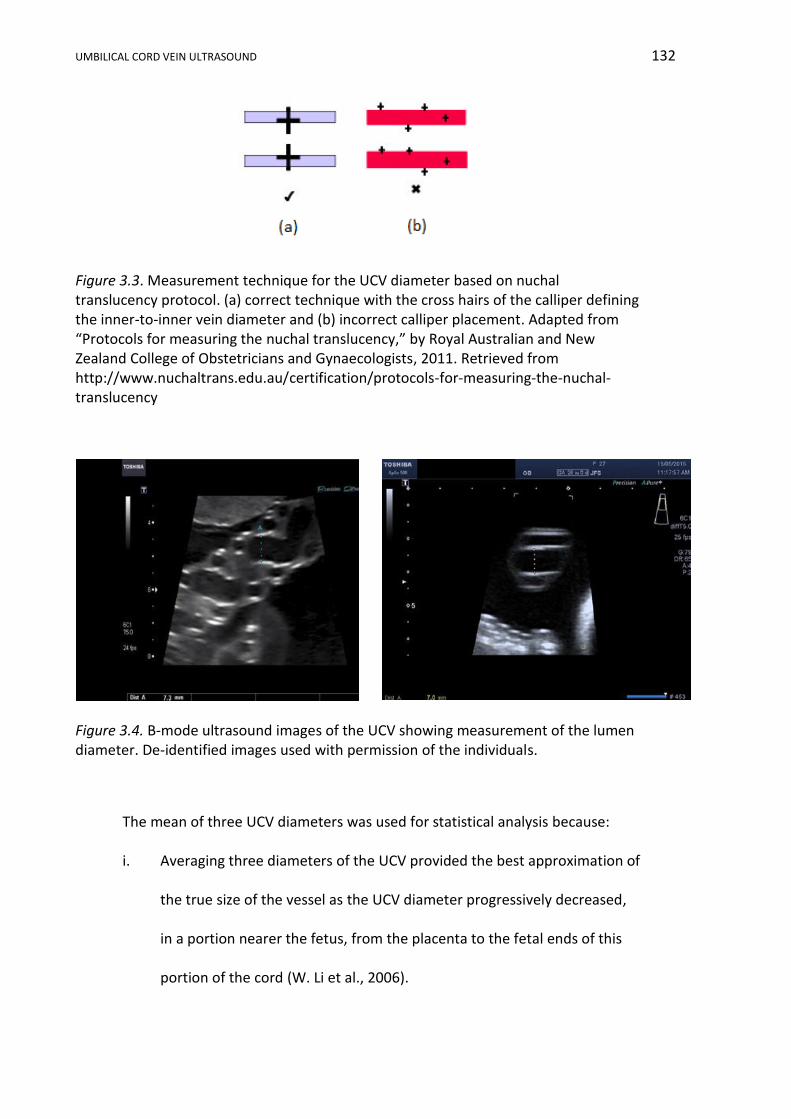
UMBILICAL CORD VEIN ULTRASOUND 132
Figure 3.3. Measurement technique for the UCV diameter based on nuchal translucency protocol. (a) correct technique with the cross hairs of the calliper defining the inner-to-inner vein diameter and (b) incorrect calliper placement. Adapted from “Protocols for measuring the nuchal translucency,” by Royal Australian and New Zealand College of Obstetricians and Gynaecologists, 2011. Retrieved from http://www.nuchaltrans.edu.au/certification/protocols-for-measuring-the-nuchal-translucency
Figure 3.4. B-mode ultrasound images of the UCV showing measurement of the lumen diameter. De-identified images used with permission of the individuals.
The mean of three UCV diameters was used for statistical analysis because:
i. Averaging three diameters of the UCV provided the best approximation of
the true size of the vessel as the UCV diameter progressively decreased,
in a portion nearer the fetus, from the placenta to the fetal ends of this
portion of the cord (W. Li et al., 2006).
UMBILICAL CORD VEIN ULTRASOUND 133
ii. Qucv calculations involving small vessels improves by increasing the
number of repeated diameter measurements (Kiserud & Rasmussen,
1998).
iii. International research supports the use of an average diameter value as
published by Acharya et al. (2005), who used the average of five
measurements, whereas Ferrazzi et al. (2000) and Rigano et al. (2008)
used the average of three diameter measurements.
In this research, the intra-amniotic UCV instead of the intra-abdominal portion
of the umbilical vein was examined because:
i. Intra-amniotic cord segments were easier to locate, especially later in a
pregnancy when the fetus was larger.
ii. Sonographers already had an established protocol and were familiar with
performing very similar Doppler measurements on the UA.
iii. The Doppler shift equation (𝑓𝐷 = 2𝑣𝑓 cos 2𝑣𝑓𝑐𝑜𝑠∅ 𝑐⁄ ) computes the
velocity of blood (𝑣) from the average speed of sound through tissue (𝑐),
the frequency shift (𝑓𝐷), the transmitted frequency (𝑓), and the angle of
insonation (∅) relative to the long axis of the vessel (Hofer, 2001). The best
estimation of blood velocity occurs when the beam alignment is 0°, or
parallel to the long axis of the vessel, and when the cosine of the
insonation angle approaches one. With an angle of insonation approaching
90°, the cosine of the angle approaches zero, the frequency shift
approaches zero, and there is an increasing relative error in calculating
blood velocity. Achieving an insonation angle that is 0°, or close to 0°, is
easier using the intra-amniotic portion, as some segment of the cord will
UMBILICAL CORD VEIN ULTRASOUND 134
be vertical, whereas, the orientation of the intra-abdominal UV is highly
dependent on fetal position.
iv. Direct insonation of the fetus was reduced in keeping with the ALARA
principle.
3.12.6 Umbilical cord vein peak velocity.
A vertical portion of free-floating UCV was identified in real-time B-mode.
Ideally the longest length of vertical cord was used as this allowed maximum
development of the parabolic flow profile (Najafzadeh et al., 2016). Colour, power or
ADF™ Doppler imaging was used to enhance cord localisation for participants with
suboptimal body habitus or low amniotic fluid volume and the image was optimised in
both modalities. The Doppler gate, with a default width of 3 mm, was placed in the
centre of the vessel, as the blood profile in the UCV was assumed to be symmetrically
parabolic (Kiserud et al., 1994) and laminar (Sutton et al., 1990) with the peak velocity
found in the centre of the vessel. Careful placement of the Doppler gate avoided
contamination of the waveform by adjacent umbilical arteries.
Ideally, the Doppler angle was 0° to improve the estimation of blood velocity; if
unachievable, an angle of less than 15° with angle correction was used in all cases
included in the data. The scale, PRF and baseline were set so that the venous
waveform occupied approximately three quarters of the available spectral window.
With B-mode and colour Doppler frozen, the spectral trace ran for at least four
seconds and the trace was optimised for sweep speed and gain. The umbilical vein
trace was visually inspected for the presence and extent of fluctuations in the flow
profile and it was only included in the research if there was a continuous, monophasic
flow pattern recorded during fetal quiescence.

UMBILICAL CORD VEIN ULTRASOUND 135
The PV was visually selected on the frozen image of the spectral trace and
manually measured in units of centimetre per second (cm/s) to one decimal point,
which was the default limit on the ultrasound machine (Figure 3.5). This procedure was
repeated thrice, on different segments of cord if possible. All images were saved and
formed part of the participant’s PACS ultrasound examination. The images and
measurements were retrieved from PACS and the measurements were entered into a
re-identifiable spreadsheet. The mean of the three PV measurements was referred to
as the average UCV PV. The average UCV PV rounded to one decimal point was used
for statistical analyses and construction of the GA related reference ranges. The
unrounded average PV value was used for Qucv calculations to eliminate truncation
errors.
Figure 3.5. Ultrasound image measuring UCV PV. De-identified image used with permission of the individual.
UMBILICAL CORD VEIN ULTRASOUND 136
The segment of cord used for Doppler velocity measurements was different to
the portion used to measure the diameter, as the ideal measurement in spectral
Doppler and B-mode necessitate vertical and horizontal orientation of the cord,
respectively.
The UCV PV measurements were repeated thrice because:
i. The average of three UCV peak velocities negated the different flow
patterns that exist along the length of the UCV.
ii. The current and established method in ultrasound research is the use of
the average of three PV measurements in calculating Quv (Barbera et al.,
1999; Di Naro et al., 2002; El Behery et al., 2011; Flo et al., 2009).
3.12.7 Calculation of umbilical cord vein blood flow.
To compute the Qucv, the UCV Vmean and area needed to be calculated from the
raw data. The UCV Vmean was calculated using the unrounded UCV PV value and the
following formula (Acharya et al., 2005; Flo et al., 2010; Najafzadeh & Dickinson, 2012;
Rizzo et al., 2016), in which 0.5 was the spatial velocity profile coefficient applicable to
a parabolic profile:
UCV Vmean (cm/s) = peak velocity (cm/s) x 0.5.
The calculation of the cross-sectional area assumed the UCV was circular in
shape, used the unrounded average UCV diameter measurements and the following
sequence of computations. Converting the average UCV diameter measurements
recorded in millimeters to centimetres:
𝐷𝑖𝑎𝑚𝑒𝑡𝑒𝑟(𝑐𝑚) = 𝐷𝑖𝑎𝑚𝑒𝑡𝑒𝑟(𝑚𝑚)/10,
where the radius (𝑟) was the diameter divided by two and expressed in centimetres:
𝑅𝑎𝑑𝑖𝑢𝑠(𝑐𝑚) = 𝐷𝑖𝑎𝑚𝑒𝑡𝑒𝑟(𝑐𝑚)/2.
UMBILICAL CORD VEIN ULTRASOUND 137
Calculating the UCV area used the formula for the area of a circle and a 15-digit
value of π automatically generated by Excel®:
𝑈𝐶𝑉 𝑎𝑟𝑒𝑎(𝑐𝑚2) = 𝜋 × 𝑟2.
The following formula was used to calculate Qucv (Acharya et al., 2005; Kiserud,
2003a; Rigano et al., 2008):
𝑄𝑈𝐶𝑉(ml/min) = 𝑈𝐶𝑉 𝑎𝑟𝑒𝑎 × 𝑈𝐶𝑉 𝑉𝑚𝑒𝑎𝑛 × 60
𝑄𝑢𝑐𝑣(ml/min) = (𝜋 × 𝑟2) × (𝑈𝐶𝑉 𝑃𝑉 × 0.5) × 60.
Multiplying by 60 converted Qucv to a value in minutes; as this value was an exact
count, it did not alter the number of significant figures. To avoid truncation errors the
intermediate results were unrounded. The final Qucv value, rounded to one decimal
point, was used for statistical analyses and construction of the GA related reference
ranges. The Qucv value was expressed in millilitres per minute (ml/min) where 1 cm3
equals 1 cc equals 1 ml.
3.12.8 Ratios and longitudinal trends.
The ratios of the UCV diameter:PV and the UCV PV:diameter were calculated
from the rounded average values for each nAGA group attendance and GA related
reference ranges were developed. Qucv, derived from the diameter and PV, was not
involved in this ratio assessment as the aim was to develop a simple parameter with
the least possibility for measurement or calculation errors.
In order to assess longitudinal trends all UCV diameter, PV and Qucv data points
for SGA participants with more than two scans, with more than three scans in the LGA
category and with more than five scans in the AGA birthweight category were selected
and plotted against GA. In order to simplify the trend assessment, all SGA category
participants with two or more scans were retained, giving 38 participants. Nineteen

UMBILICAL CORD VEIN ULTRASOUND 138
participants from both the nAGA and LGA categories, with two or more scans, were
randomly selected to give a combined data set of comparable size to the SGA group.
The first and last scan UCV variables values were selected for these 76 participants and
plotted against GA.
Using the previous data from the first and last attendances of the SGA, nAGA
and LGA participants and combining this with similar data from the IUGR/FGR group,
the slope of the longitudinal data from these subgroups was calculated:
𝑠𝑙𝑜𝑝𝑒 =𝑚𝑒𝑎𝑠𝑢𝑟𝑒𝑚𝑒𝑛𝑡𝑓𝑖𝑛𝑎𝑙 − 𝑚𝑒𝑎𝑠𝑢𝑟𝑒𝑚𝑒𝑛𝑡 𝑓𝑖𝑟𝑠𝑡
𝐺𝐴𝑓𝑖𝑛𝑎𝑙 − 𝐺𝐴𝑓𝑖𝑟𝑠𝑡.
3.13 Data Analysis
3.13.1 Data management.
All data were re-identifiable when entered into spreadsheets as each
participant was assigned a sequential number determined by the date and time that
the first image was recorded during the participant’s first ultrasound examination. The
first presentation was demarcated as “a”, the second “b”, and so on. The
characteristics of the participant were entered at the time of the first ultrasound
examination. Pregnancy outcomes were entered once available. When data collection
was completed, all information was stored in a non-identifiable format for statistical
analyses.
The electronic data were stored on a password-restricted computer. Consent
Forms and digital backups of data were stored in a locked filing cabinet. Both the
computer and filing cabinet were located in a lockable office within the Medical
Imaging Department of OHS. All care and diligence was taken in the transportation and
storage of information.

UMBILICAL CORD VEIN ULTRASOUND 139
All data collected in this research will be retained for 20 years after the project
is completed in accordance with the State Records Authority of New South Wales GDA
23 guidelines (New South Wales Government, 2005b). The ultrasound images acquired
for this research project will remain as part of the participants’ medical imaging record
in PACS and will be disposed of in accordance with the State Records Authority of New
South Wales GDA 17 guidelines (New South Wales Government, 2009b). These
guidelines consider the fetus as the patient, therefore the obstetric images must be
retained until the patient reaches the age of 25 years, or for a minimum of seven years
after the last attendance for a diagnostic procedure, whichever is longer. All paper
records relating to the participants’ obstetric ultrasounds were digitised, stored and
disposed of in accordance with the State Records Authority of New South Wales GA 36
guidelines relating to imaged records (New South Wales Government, 2009a).
At the end of the retention periods, electronically stored data will be deleted
and paperwork will be shredded. PACS images were stored in a centralised, offsite,
unlimited capacity, secure, long-term archive provided by NSW Health.
3.13.2 Statistical analysis.
All statistical analyses were undertaken using R statistical software version
3.1.1 (R Core Team, 2014) in collaboration with Sharon Nielsen, Director Quantitative
Consulting Unit, Charles Sturt University. Continuous variables were reported as means
and standard deviations. Categorical, ordinal and discrete variables were reported as
numbers and/or percentages. Where appropriate p values or confidence intervals
were provided. Descriptive data analyses used scatterplots, boxplots and histograms.
The Chi-squared Test for Independence was used to determine whether there
was a significant association between two categorical variables, such as sex of the
UMBILICAL CORD VEIN ULTRASOUND 140
neonate or smoking in relation to birthweight category. The requirements of the Chi-
squared Test were that the individual observations were independent of each other,
that the value of the cells in the contingency table was five or more in at least 80% of
the cells, and that no cell had a value less than one (Martin & Pierce, 1994). When
these requirements were not met, the Fisher’s Exact Test was applied.
Like the Chi-squared Test for Independence, the Fisher’s Exact Test was used to
determine whether there was a significant association between two categorical
variables. There was a requirement that the individual observations were independent
of each other, but as this test was an exact test, there are no requirements on the cell
sizes in the contingency table (Everitt, 1998). Fisher’s Exact Test was used to analyse
the association between birthweight category and mode of delivery, maternal
ethnicity, ART, gestational age at delivery, cord artery Doppler indices, and AFI.
Ordinal regression was used when the variable was ordinal (categorical variable
with an order implied) such as the Apgar scores or parity in relation to birthweight
category. When fitting an ordinal regression model to the data there was a
requirement that the Condition Hessian Value was less than 10,000. Numbers less than
10,000 indicate that the model was not ill defined.
Analysis of variance (ANOVA) was used to determine if there was a significant
association between the three dependent variables (UCV diameter, PV and Qucv), and
the two independent variables (birthweight category and GA). ANOVA methods were
also used in UCV longitudinal data analysis. Weighted least squares regression was
applied in UCV slope analysis to account for different variances across the four
subgroups.
UMBILICAL CORD VEIN ULTRASOUND 141
Linear mixed models were used to analyse maternal age at conception, GA at
delivery in relation to birthweight category, and to analyse UCV diameter, PV, Qucv in
relation to birthweight categories and GA. Statistical analysis methods have
assumptions or requirements to ensure that the results are reliable (Kuzma &
Bohnenblust, 2001). The model assumptions were that: the residuals were normally
distributed; they had a constant variance; they were independent; and, the factor level
variances were equal. The Shapiro-Wilk test of normality was used to determine if the
residuals were normally distributed and residual plots were used to visually determine
if model assumptions were met. A Brown-Forsythe Test was used to determine if the
factor level variances were equal. The coefficient of determination (R2) was used to
describe the goodness of fit of some linear mixed models to the data points; an R2
value approaching one indicated the regression line was a good fit to the data. The
greater the R2 value the more the variability in one variable (UCV parameter and GA) is
accounted for in terms of the variability in the other variable (birthweight category)
(Polgar & Thomas, 2008). Linear mixed regression models where graphed showing the
95% CIs. The 95% CI provided the range, between the upper and the lower limits of the
confidence interval, that 95% of the time will contain the true or population mean
(Polgar & Thomas, 2008).
Quantile regression using the Quantreg procedure in R software was used to
model the GA related reference ranges for UCV diameter, PV, Qucv and ratios.
Polynomial linear, quadratic and cubic quantile regression models were applied with
backward selection of power and the most parsimonious model was selected. For each
percentile, coefficients standard errors, t values and p values were produced and
tabulated.
UMBILICAL CORD VEIN ULTRASOUND 142
The polynomial regression equation expressing percentiles (𝑄𝑝) of the UCV
variables (𝑦) (diameter, PV, Qucv and ratio) as a function of GA was written:
𝑄𝑝(𝑦) = 𝑏0𝑝+ 𝑏1𝑝
𝐺𝐴 + 𝑏2𝑝 𝐺𝐴2 + 𝑏3𝑝
𝐺𝐴3 … … … … … …
Where 𝑏0𝑝 represents the intercept, 𝑏1𝑝 , 𝑏2𝑝 and 𝑏3𝑝 the regression coefficients, p
the 3rd, 5th, 10th, 25th, 50th, 75th, 90th, 95th, and 97th percentiles and GA the
gestational age in days.
Quantile regression has been used as an alternative to standard regression
models for statistical modelling of ultrasound data in recent years as it has been shown
“to offer a more flexible approach for the estimation of growth curves” (Rizzo et al.,
2016, p. 706). Quantile regression has several features that overcome assumptions of
standard regression analysis. Quantile regression is more robust to outliers, does not
assume a normal distribution of the data, or that the residuals have a mean of zero
and constant variance (homoscedasticity). Quantile regression considers the
distribution of data rather than the mean of data thereby allowing all portions of the
distribution to be assessed, such that for each percentile a different fitted function is
produced in response to advancing GA (Rizzo et al., 2016; Sandlin et al., 2014). A
percentile is a value below which certain percentage of observations will fall on the
reference ranges. Percentiles are easier to comprehend, are more intuitive to apply in
clinical practice, and indicate the expected prevalence. However, percentiles perform
poorly at quantifying outliers, as extreme values are combined in the highest or lowest
percentiles (Wang & Chen, 2012).
A significance level of less than 0.05 (p < 0.05) was used for all analyses. A p
value is a measure of the “strength of evidence” against the null hypothesis, where the
null hypothesis assumes no relationship or clinical difference between the variables

UMBILICAL CORD VEIN ULTRASOUND 143
(Dorey, 2010, p. 2297). This p value indicates a 5%, or “1 in 20 probability of observing
an association as large or larger than that found in the study by chance alone, given
that there is really no association” (Hennekens & Burning, 1987, p. 246). Conversely,
chance alone cannot be excluded as a possible explanation of the findings when the p
value is greater than 0.05 (p > 0.05) (Hennekens & Burning, 1987).
3.13.3 Dissemination of results.
Women participating in the study will receive a copy of the final publication if
this was requested on their Consent Forms. Referring medical officers will receive a
copy of the final publication. Journal publications, oral presentations and posters are
noted throughout the exegesis and portfolio.
UMBILICAL CORD VEIN ULTRASOUND 144
SECTION IV RESULTS AND DISCUSSION: THE SAMPLES
Whole Research Sample Results Chapter 4
4.1 Introduction
In this chapter, the sample size and participation rates for the whole research
sample will be detailed. Maternal characteristic, pregnancies outcomes, UA Dopplers,
and AFI variables of this sample will be described and analysed in relation to three
birthweight categories. The raw data are contained in Appendix K1 and statistical
analysis in Appendix L1. Continuous variables are reported as means ± SD. Categorical,
ordinal and discrete variables are reported as numbers or percentages. Where
appropriate p values are provided.
4.2 Whole Research Sample Size and Participation Rates
There were 661 clients who consented to participate in the research while
attending for obstetric ultrasound examinations at the Medical Imaging Departments
of Orange and Bathurst Health Services. The women attended these hospitals between
5 April 2011 and 22 March 2013 from the central west New South Wales towns of
Orange, Bathurst, Mudgee, Wellington, Parkes, Forbes, Condobolin, Cowra, and
surrounding localities (Figure 4.1).
Based upon inclusion criteria, 661 women were accepted into the research
project, 36 participants were later excluded due to:
i. Unavailable pregnancy outcomes (20).
ii. Early termination due to lethality (1).
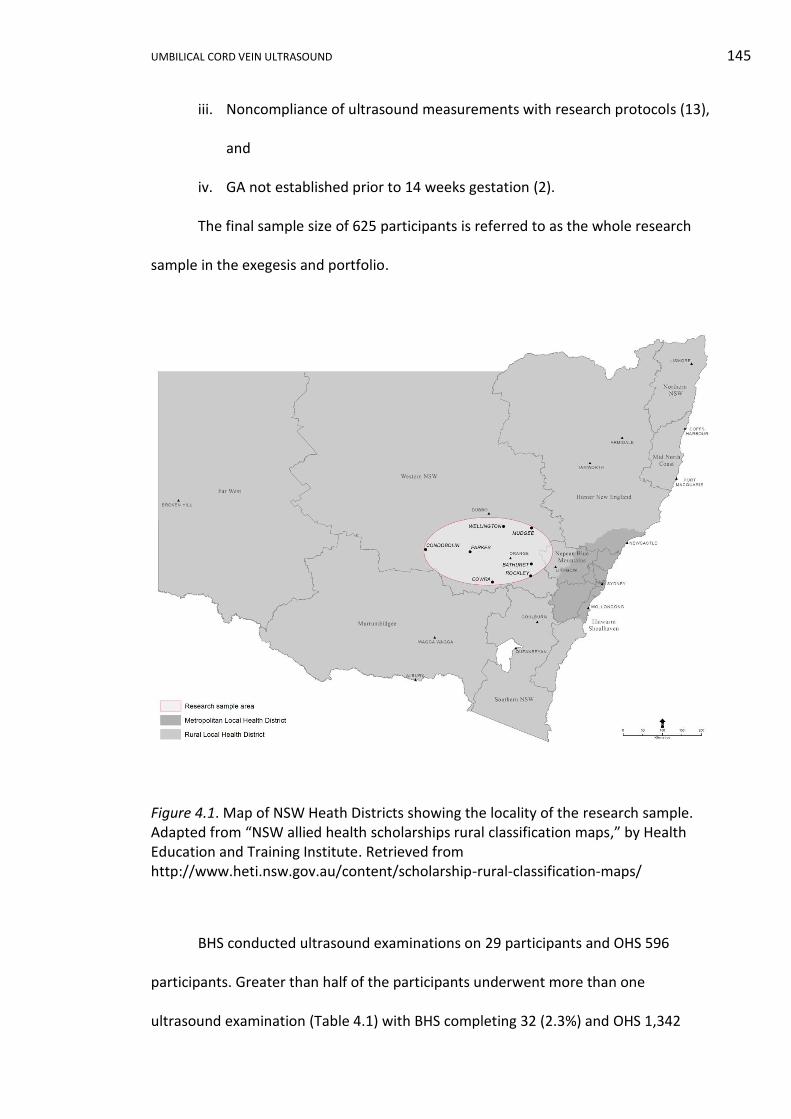
UMBILICAL CORD VEIN ULTRASOUND 145
iii. Noncompliance of ultrasound measurements with research protocols (13),
and
iv. GA not established prior to 14 weeks gestation (2).
The final sample size of 625 participants is referred to as the whole research
sample in the exegesis and portfolio.
Figure 4.1. Map of NSW Heath Districts showing the locality of the research sample. Adapted from “NSW allied health scholarships rural classification maps,” by Health Education and Training Institute. Retrieved from http://www.heti.nsw.gov.au/content/scholarship-rural-classification-maps/
BHS conducted ultrasound examinations on 29 participants and OHS 596
participants. Greater than half of the participants underwent more than one
ultrasound examination (Table 4.1) with BHS completing 32 (2.3%) and OHS 1,342
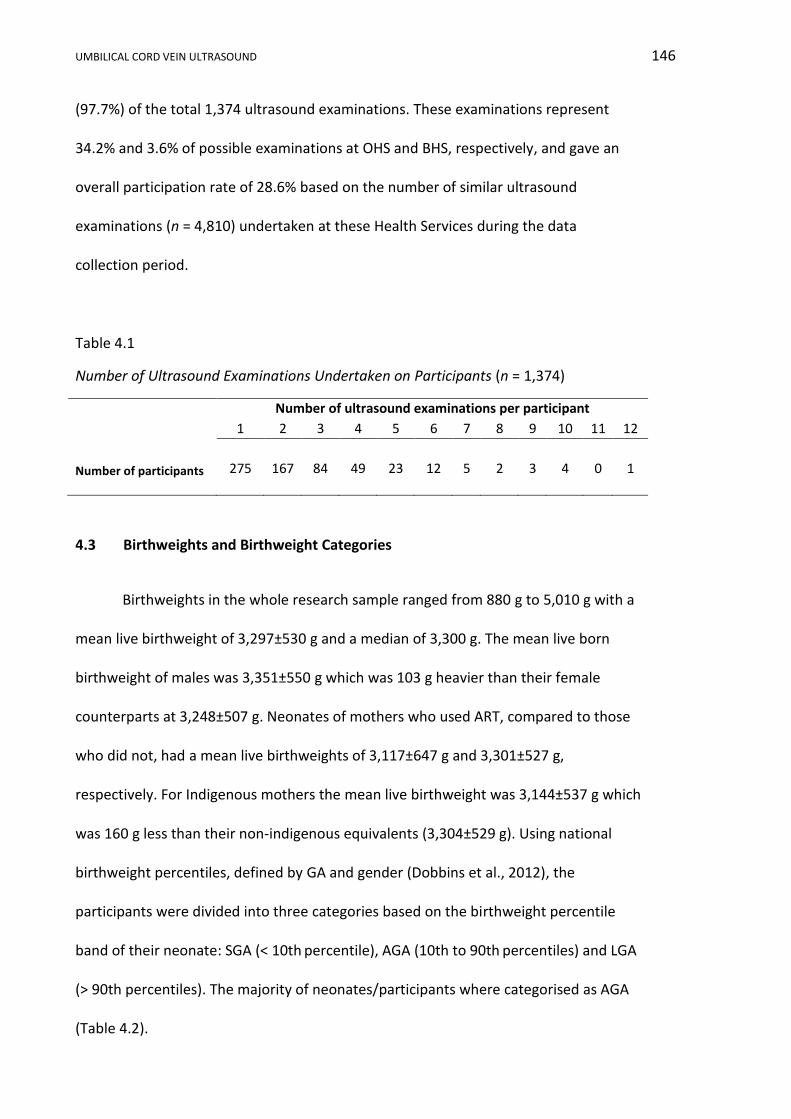
UMBILICAL CORD VEIN ULTRASOUND 146
(97.7%) of the total 1,374 ultrasound examinations. These examinations represent
34.2% and 3.6% of possible examinations at OHS and BHS, respectively, and gave an
overall participation rate of 28.6% based on the number of similar ultrasound
examinations (n = 4,810) undertaken at these Health Services during the data
collection period.
Table 4.1
Number of Ultrasound Examinations Undertaken on Participants (n = 1,374)
Number of ultrasound examinations per participant
1 2 3 4 5 6 7 8 9 10 11 12
Number of participants
275
167
84
49
23
12
5
2
3
4
0
1
4.3 Birthweights and Birthweight Categories
Birthweights in the whole research sample ranged from 880 g to 5,010 g with a
mean live birthweight of 3,297±530 g and a median of 3,300 g. The mean live born
birthweight of males was 3,351±550 g which was 103 g heavier than their female
counterparts at 3,248±507 g. Neonates of mothers who used ART, compared to those
who did not, had a mean live birthweights of 3,117±647 g and 3,301±527 g,
respectively. For Indigenous mothers the mean live birthweight was 3,144±537 g which
was 160 g less than their non-indigenous equivalents (3,304±529 g). Using national
birthweight percentiles, defined by GA and gender (Dobbins et al., 2012), the
participants were divided into three categories based on the birthweight percentile
band of their neonate: SGA (< 10th percentile), AGA (10th to 90th percentiles) and LGA
(> 90th percentiles). The majority of neonates/participants where categorised as AGA
(Table 4.2).

UMBILICAL CORD VEIN ULTRASOUND 147
Table 4.2
Number of Participants/Neonates in Each Birthweight Category (n = 625)
Number of
participants/neonates
Birthweight categories
Small for gestational
age
(SGA)
Appropriate for
gestational age
(AGA)
Large for
gestational age
(LGA)
62 (9.9%)
515 (82.4%)
48 (7.7%)
4.4 Whole Research Sample Maternal Characteristics in Relation to Birthweight
Categories
4.4.1 Ethnicity.
In the sample, 4% of mothers identified themselves as being Indigenous. The
remainder of the sample identified as white (90.6%), black (0.8%), East Asian (0.8%),
South Asian (1.6%), Southeast Asian (0.4%) and mixed race (1.8%) (Table 4.3). The
Fisher’s Exact Test (p = 0.569) showed birthweight category and maternal ethnicity
were not dependent.
Table 4.3
Ethnicity of Participants According to Birthweight Category (n = 625)
Birthweight categories
Ethnic Group Whole sample SGA AGA LGA
Indigenous 25 3 21 1
Black 5 0 5 0
East Asian 5 0 5 0
South Asian 10 0 10 0
Southeast Asian 3 1 1 1
White 566 56 464 46
Mixed 11 2 9 0
Total 625 62 515 48 Note. SGA = small for gestational age. AGA = appropriate for gestational age. LGA = large for gestational age.
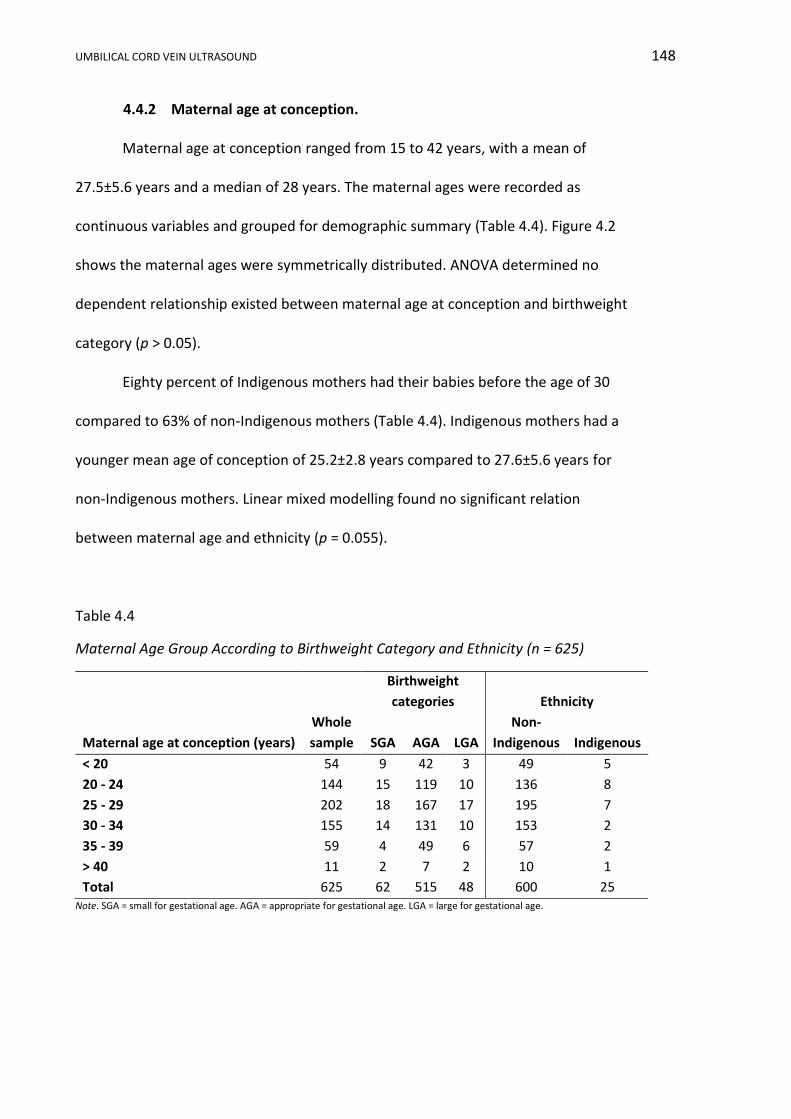
UMBILICAL CORD VEIN ULTRASOUND 148
4.4.2 Maternal age at conception.
Maternal age at conception ranged from 15 to 42 years, with a mean of
27.5±5.6 years and a median of 28 years. The maternal ages were recorded as
continuous variables and grouped for demographic summary (Table 4.4). Figure 4.2
shows the maternal ages were symmetrically distributed. ANOVA determined no
dependent relationship existed between maternal age at conception and birthweight
category (p > 0.05).
Eighty percent of Indigenous mothers had their babies before the age of 30
compared to 63% of non-Indigenous mothers (Table 4.4). Indigenous mothers had a
younger mean age of conception of 25.2±2.8 years compared to 27.6±5.6 years for
non-Indigenous mothers. Linear mixed modelling found no significant relation
between maternal age and ethnicity (p = 0.055).
Table 4.4
Maternal Age Group According to Birthweight Category and Ethnicity (n = 625)
Maternal age at conception (years)
Birthweight
categories
Ethnicity
Whole
sample SGA AGA LGA
Non-
Indigenous Indigenous
< 20 54 9 42 3 49 5
20 - 24 144 15 119 10 136 8
25 - 29 202 18 167 17 195 7
30 - 34 155 14 131 10 153 2
35 - 39 59 4 49 6 57 2
> 40 11 2 7 2 10 1
Total 625 62 515 48 600 25 Note. SGA = small for gestational age. AGA = appropriate for gestational age. LGA = large for gestational age.
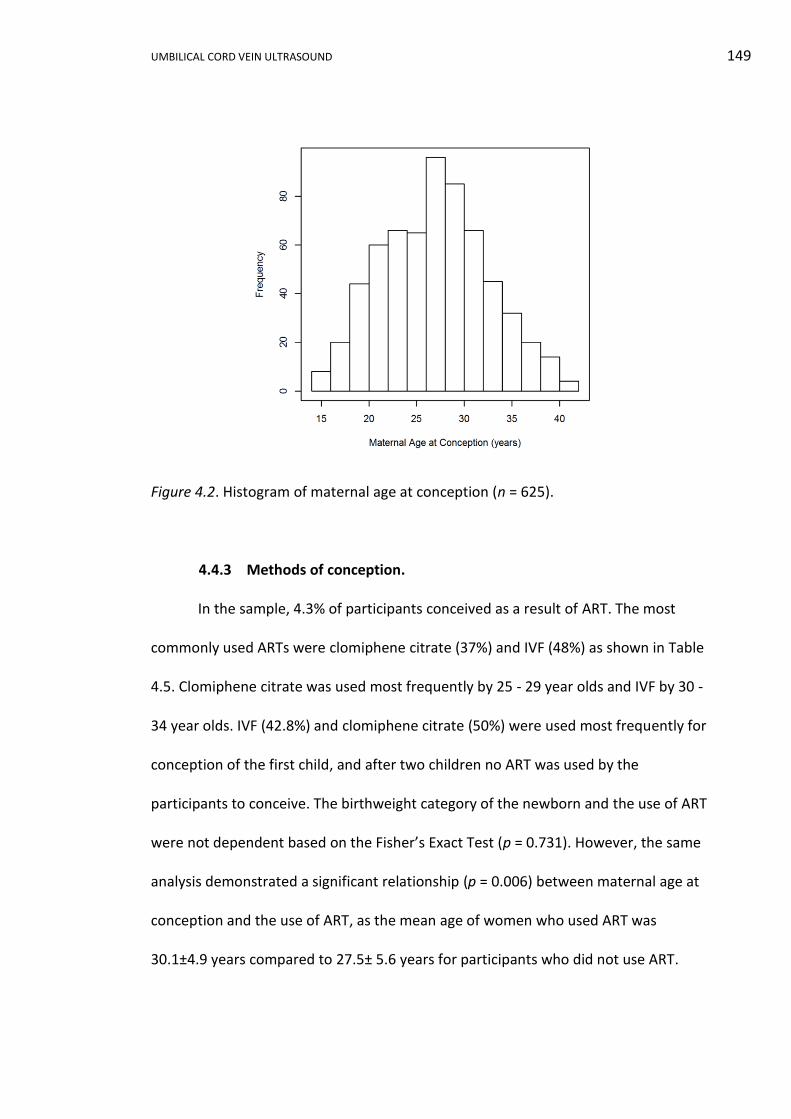
UMBILICAL CORD VEIN ULTRASOUND 149
Figure 4.2. Histogram of maternal age at conception (n = 625).
4.4.3 Methods of conception.
In the sample, 4.3% of participants conceived as a result of ART. The most
commonly used ARTs were clomiphene citrate (37%) and IVF (48%) as shown in Table
4.5. Clomiphene citrate was used most frequently by 25 - 29 year olds and IVF by 30 -
34 year olds. IVF (42.8%) and clomiphene citrate (50%) were used most frequently for
conception of the first child, and after two children no ART was used by the
participants to conceive. The birthweight category of the newborn and the use of ART
were not dependent based on the Fisher’s Exact Test (p = 0.731). However, the same
analysis demonstrated a significant relationship (p = 0.006) between maternal age at
conception and the use of ART, as the mean age of women who used ART was
30.1±4.9 years compared to 27.5± 5.6 years for participants who did not use ART.
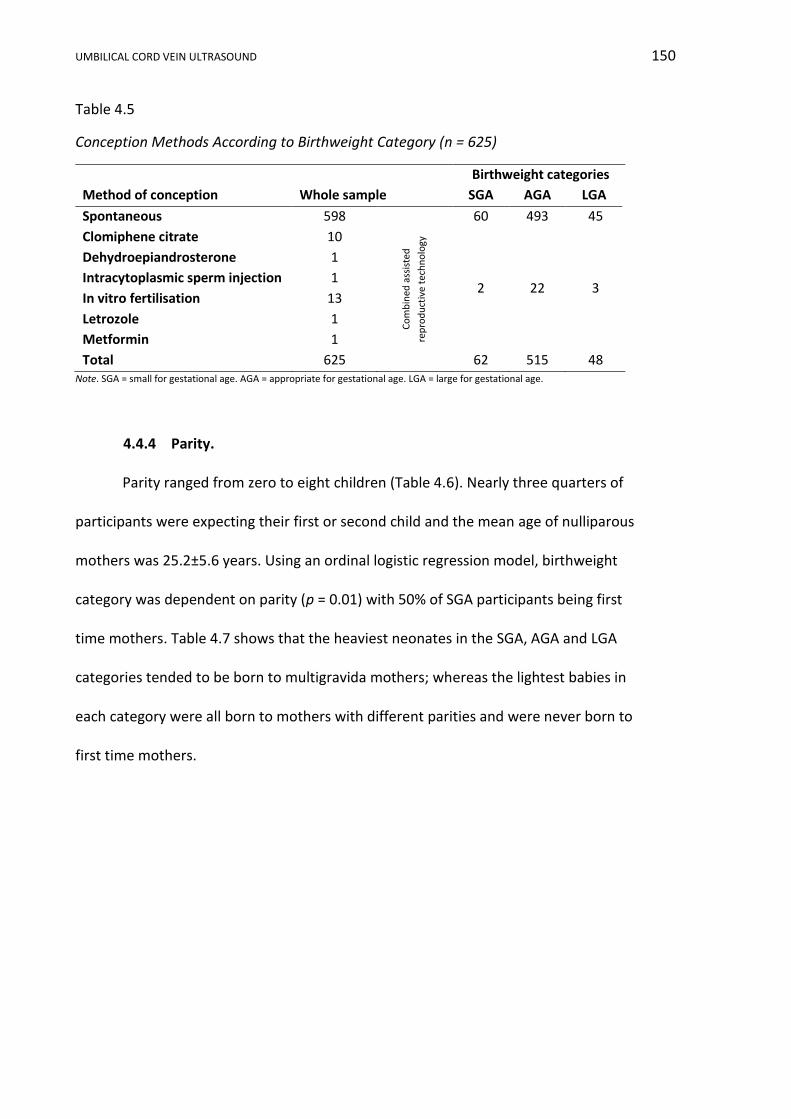
UMBILICAL CORD VEIN ULTRASOUND 150
Table 4.5
Conception Methods According to Birthweight Category (n = 625)
Birthweight categories
Method of conception Whole sample SGA AGA LGA
Spontaneous 598
60 493 45
Clomiphene citrate 10
Co
mb
ined
ass
iste
d
rep
rod
uct
ive
tech
no
logy
2 22 3
Dehydroepiandrosterone 1
Intracytoplasmic sperm injection 1
In vitro fertilisation 13
Letrozole 1
Metformin 1
Total 625
62 515 48 Note. SGA = small for gestational age. AGA = appropriate for gestational age. LGA = large for gestational age.
4.4.4 Parity.
Parity ranged from zero to eight children (Table 4.6). Nearly three quarters of
participants were expecting their first or second child and the mean age of nulliparous
mothers was 25.2±5.6 years. Using an ordinal logistic regression model, birthweight
category was dependent on parity (p = 0.01) with 50% of SGA participants being first
time mothers. Table 4.7 shows that the heaviest neonates in the SGA, AGA and LGA
categories tended to be born to multigravida mothers; whereas the lightest babies in
each category were all born to mothers with different parities and were never born to
first time mothers.
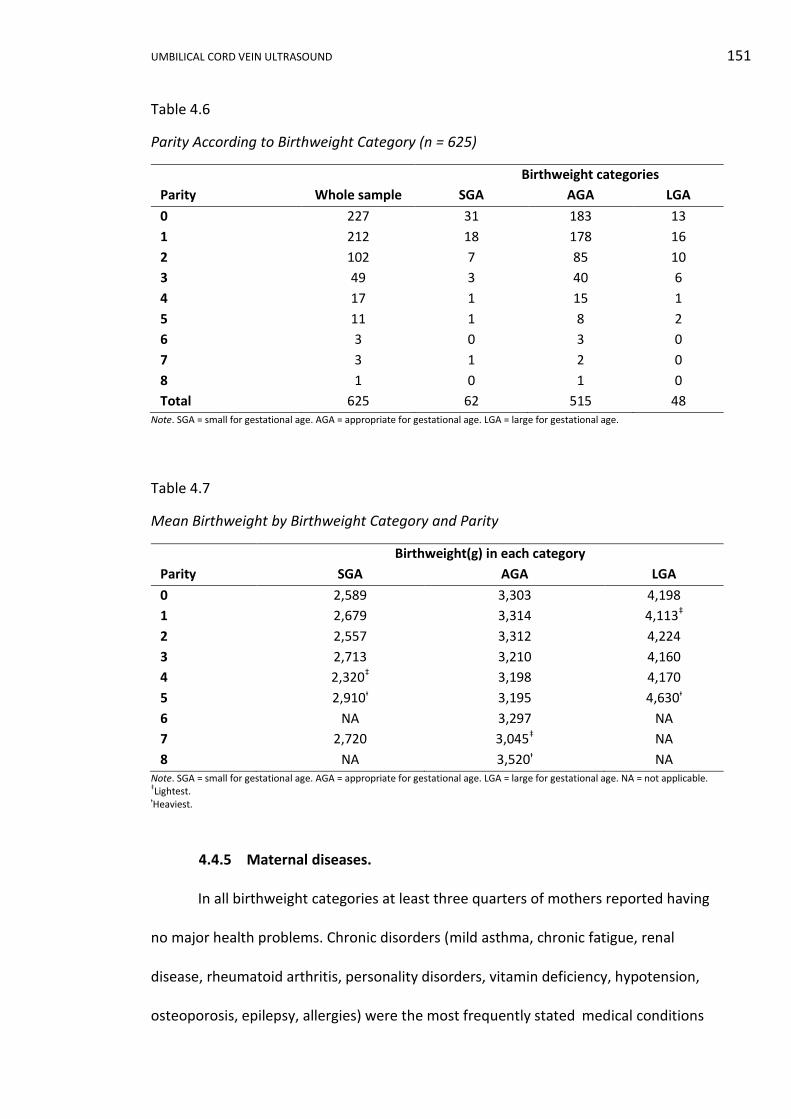
UMBILICAL CORD VEIN ULTRASOUND 151
Table 4.6
Parity According to Birthweight Category (n = 625)
Column1 Birthweight categories Column4
Parity Whole sample SGA AGA LGA
0 227 31 183 13
1 212 18 178 16
2 102 7 85 10
3 49 3 40 6
4 17 1 15 1
5 11 1 8 2
6 3 0 3 0
7 3 1 2 0
8 1 0 1 0
Total 625 62 515 48 Note. SGA = small for gestational age. AGA = appropriate for gestational age. LGA = large for gestational age.
Table 4.7
Mean Birthweight by Birthweight Category and Parity
Birthweight(g) in each category
Parity SGA AGA LGA
0 2,589 3,303 4,198
1 2,679 3,314 4,113‡
2 2,557 3,312 4,224
3 2,713 3,210 4,160
4 2,320‡ 3,198 4,170
5 2,910ᵻ 3,195 4,630ᵻ
6 NA 3,297 NA
7 2,720 3,045‡ NA
8 NA 3,520ᵻ NA Note. SGA = small for gestational age. AGA = appropriate for gestational age. LGA = large for gestational age. NA = not applicable. ‡Lightest. ᵻHeaviest.
4.4.5 Maternal diseases.
In all birthweight categories at least three quarters of mothers reported having
no major health problems. Chronic disorders (mild asthma, chronic fatigue, renal
disease, rheumatoid arthritis, personality disorders, vitamin deficiency, hypotension,
osteoporosis, epilepsy, allergies) were the most frequently stated medical conditions
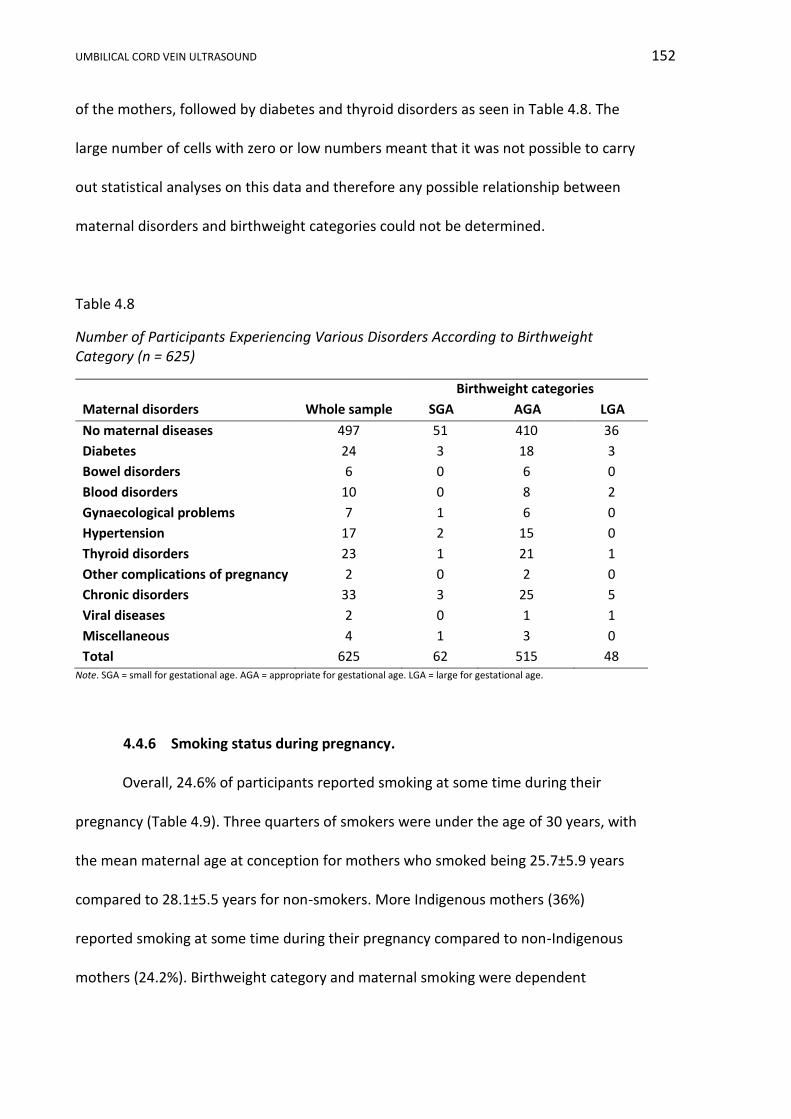
UMBILICAL CORD VEIN ULTRASOUND 152
of the mothers, followed by diabetes and thyroid disorders as seen in Table 4.8. The
large number of cells with zero or low numbers meant that it was not possible to carry
out statistical analyses on this data and therefore any possible relationship between
maternal disorders and birthweight categories could not be determined.
Table 4.8
Number of Participants Experiencing Various Disorders According to Birthweight Category (n = 625)
Birthweight categories
Maternal disorders Whole sample SGA AGA LGA
No maternal diseases 497 51 410 36
Diabetes 24 3 18 3
Bowel disorders 6 0 6 0
Blood disorders 10 0 8 2
Gynaecological problems 7 1 6 0
Hypertension 17 2 15 0
Thyroid disorders 23 1 21 1
Other complications of pregnancy 2 0 2 0
Chronic disorders 33 3 25 5
Viral diseases 2 0 1 1
Miscellaneous 4 1 3 0
Total 625 62 515 48 Note. SGA = small for gestational age. AGA = appropriate for gestational age. LGA = large for gestational age.
4.4.6 Smoking status during pregnancy.
Overall, 24.6% of participants reported smoking at some time during their
pregnancy (Table 4.9). Three quarters of smokers were under the age of 30 years, with
the mean maternal age at conception for mothers who smoked being 25.7±5.9 years
compared to 28.1±5.5 years for non-smokers. More Indigenous mothers (36%)
reported smoking at some time during their pregnancy compared to non-Indigenous
mothers (24.2%). Birthweight category and maternal smoking were dependent
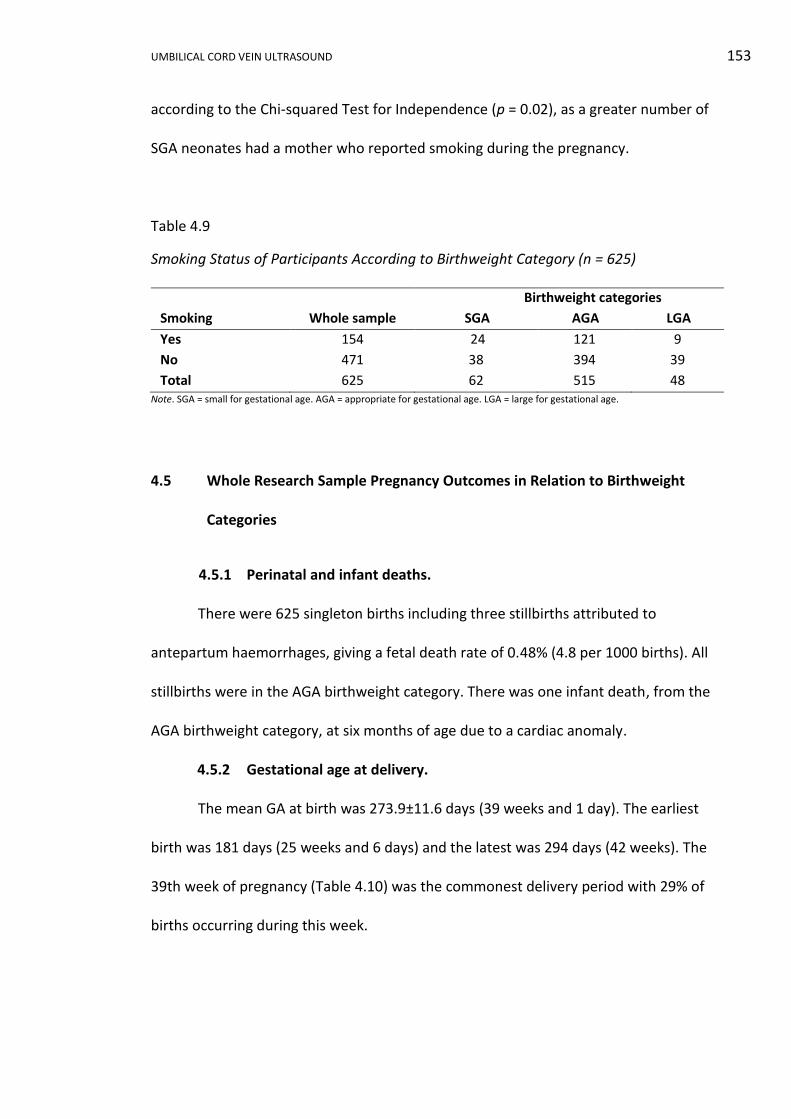
UMBILICAL CORD VEIN ULTRASOUND 153
according to the Chi-squared Test for Independence (p = 0.02), as a greater number of
SGA neonates had a mother who reported smoking during the pregnancy.
Table 4.9
Smoking Status of Participants According to Birthweight Category (n = 625)
Birthweight categories
Smoking Whole sample SGA AGA LGA
Yes 154 24 121 9
No 471 38 394 39
Total 625 62 515 48 Note. SGA = small for gestational age. AGA = appropriate for gestational age. LGA = large for gestational age.
4.5 Whole Research Sample Pregnancy Outcomes in Relation to Birthweight
Categories
4.5.1 Perinatal and infant deaths.
There were 625 singleton births including three stillbirths attributed to
antepartum haemorrhages, giving a fetal death rate of 0.48% (4.8 per 1000 births). All
stillbirths were in the AGA birthweight category. There was one infant death, from the
AGA birthweight category, at six months of age due to a cardiac anomaly.
4.5.2 Gestational age at delivery.
The mean GA at birth was 273.9±11.6 days (39 weeks and 1 day). The earliest
birth was 181 days (25 weeks and 6 days) and the latest was 294 days (42 weeks). The
39th week of pregnancy (Table 4.10) was the commonest delivery period with 29% of
births occurring during this week.
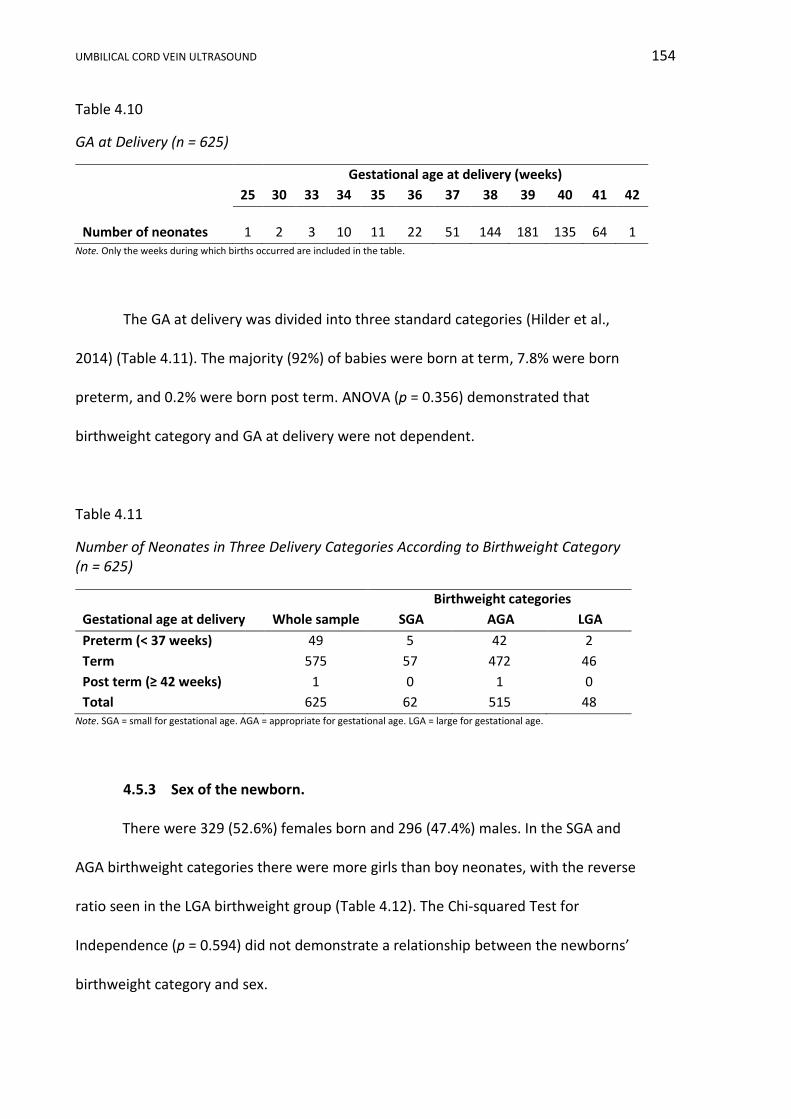
UMBILICAL CORD VEIN ULTRASOUND 154
Table 4.10
GA at Delivery (n = 625)
Gestational age at delivery (weeks)
25 30 33 34 35 36 37 38 39 40 41 42
Number of neonates 1 2 3 10 11 22 51 144 181 135 64 1 Note. Only the weeks during which births occurred are included in the table.
The GA at delivery was divided into three standard categories (Hilder et al.,
2014) (Table 4.11). The majority (92%) of babies were born at term, 7.8% were born
preterm, and 0.2% were born post term. ANOVA (p = 0.356) demonstrated that
birthweight category and GA at delivery were not dependent.
Table 4.11
Number of Neonates in Three Delivery Categories According to Birthweight Category (n = 625)
Birthweight categories
Gestational age at delivery Whole sample SGA AGA LGA
Preterm (< 37 weeks) 49 5 42 2
Term 575 57 472 46
Post term (≥ 42 weeks) 1 0 1 0
Total 625 62 515 48 Note. SGA = small for gestational age. AGA = appropriate for gestational age. LGA = large for gestational age.
4.5.3 Sex of the newborn.
There were 329 (52.6%) females born and 296 (47.4%) males. In the SGA and
AGA birthweight categories there were more girls than boy neonates, with the reverse
ratio seen in the LGA birthweight group (Table 4.12). The Chi-squared Test for
Independence (p = 0.594) did not demonstrate a relationship between the newborns’
birthweight category and sex.
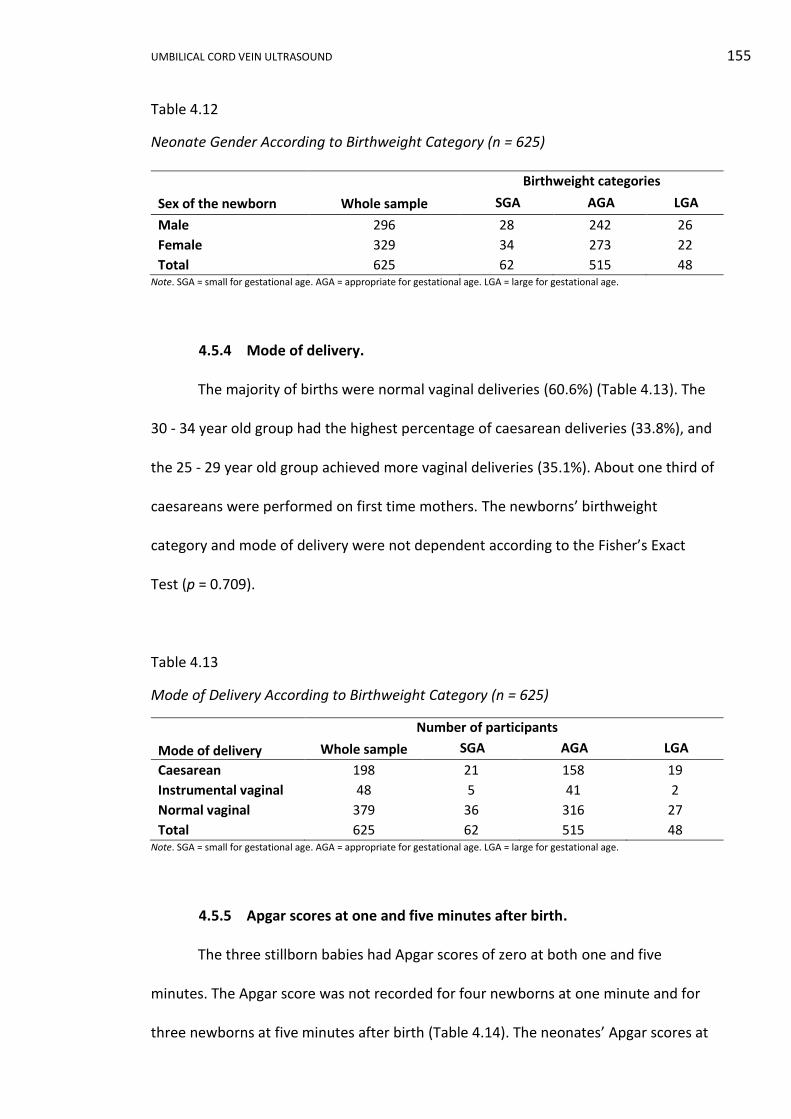
UMBILICAL CORD VEIN ULTRASOUND 155
Table 4.12
Neonate Gender According to Birthweight Category (n = 625)
Birthweight categories
Sex of the newborn Whole sample SGA AGA LGA
Male 296 28 242 26
Female 329 34 273 22
Total 625 62 515 48 Note. SGA = small for gestational age. AGA = appropriate for gestational age. LGA = large for gestational age.
4.5.4 Mode of delivery.
The majority of births were normal vaginal deliveries (60.6%) (Table 4.13). The
30 - 34 year old group had the highest percentage of caesarean deliveries (33.8%), and
the 25 - 29 year old group achieved more vaginal deliveries (35.1%). About one third of
caesareans were performed on first time mothers. The newborns’ birthweight
category and mode of delivery were not dependent according to the Fisher’s Exact
Test (p = 0.709).
Table 4.13
Mode of Delivery According to Birthweight Category (n = 625)
Column1 Number of participantsColumn4
Mode of delivery Whole sample SGA AGA LGA
Caesarean 198 21 158 19
Instrumental vaginal 48 5 41 2
Normal vaginal 379 36 316 27
Total 625 62 515 48 Note. SGA = small for gestational age. AGA = appropriate for gestational age. LGA = large for gestational age.
4.5.5 Apgar scores at one and five minutes after birth.
The three stillborn babies had Apgar scores of zero at both one and five
minutes. The Apgar score was not recorded for four newborns at one minute and for
three newborns at five minutes after birth (Table 4.14). The neonates’ Apgar scores at

UMBILICAL CORD VEIN ULTRASOUND 156
one and five minutes after birth, classified by birthweight category, are shown in Table
4.15. The Apgar score at one and five minutes was recorded as an ordinal variable, and
an ordinal logistic regression analysis model was used to assess the relationship
between birthweight category and Apgar scores. This type of analysis required that the
Condition Hessian Value was less than 10,000 which was true for both scores. The
neonates’ birthweight categories were not dependent at the one minute Apgar score
(p > 0.05) or the five minute Apgar score (p > 0.05).
Table 4.14
Number of Neonates in Apgar Score Groups at One and Five Minutes after Birth (n = 625)
Apgar scores at 1 min4
0 to 3 4 to 6 7 to 10 Not available
Number of neonates
12 39 570 4
Apgar scores at 5 min
4 10 608 3
Table 4.15
Number of Neonates in Apgar Score Groups at One and Five Minutes after Birth According to Birthweight Category (n = 625)
Birthweight categories
1 min Apgar scores Whole sample SGA AGA LGA
0 to 3 12 1 11 0
4 to 6 39 9 24 6
7 to 10 570 51 477 42
Not available 4 1 3 0
5 min Apgar scores 0 to 3 4 0 4 0
4 to 6 10 1 8 1
7 to 10 608 60 501 47
Not available 3 1 2 0 Note. SGA = small for gestational age. AGA = appropriate for gestational age. LGA = large for gestational age.
UMBILICAL CORD VEIN ULTRASOUND 157
4.6 Whole Research Sample Ultrasound Indices in Relation to Birthweight
Categories
4.6.1 Umbilical cord artery Dopplers.
A normal UA S/D ratio was recorded in 942 out of 1,374 ultrasound
examinations and 46 examinations recorded an S/D ratio above the 95th percentile
(Table 4.16). The ratio was not measured in 386 examinations as the GA was less than
the lower limit (28 weeks) on the relevant nomogram (Hecker et al., 1995) or the
measurement of ratio was inappropriate under the clinical context of the examination.
The birthweight category and the UA S/D ratio were dependent (p < 0.001) by the
Fisher’s Exact Test.
A normal PI was recorded during 1,053 out of 1,374 ultrasound examinations
(Table 4.16). The index was not measured in 318 examinations due to a GA less than
the lower limit (20 weeks) on the relevant nomogram (Arduini & Rizzo, 1990) or the
index measurement was inappropriate under the clinical context of the examination.
Only one SGA fetus (Participant 64/ Visits 66a - c) recorded an elevated UA PI on three
separate ultrasound examinations. The newborns’ birthweight category and UA PI
were dependent (p = 0.003) by the Fisher’s Exact Test.

UMBILICAL CORD VEIN ULTRASOUND 158
Table 4.16
Number of Ultrasound Examinations According to UA S/D ratio (n = 988), PI (n = 1,056) and Birthweight Category
Birthweight categories Whole sample SGA AGA LGA
Umbilical artery S/D ratio
Normal 942 119 742 81
> 95th percentile 46 24 22 0
Total 988 143 764 81
Umbilical artery PI
Normal 1,053 145 821 87
> 95th percentile 3 3 0 0
Total 1,056 148 821 87
Note. S/D = systolic/diastolic. PI = pulsatility index. SGA = small for gestational age. AGA = appropriate for gestational age.
LGA = large for gestational age.
4.6.2 Amniotic fluid index.
Greater than 95% of all examinations recorded a normal AFI and an AFI less
than the 5th percentile was commonest in the SGA birthweight category (Table 4.17).
The newborns’ birthweight category and AFI were dependent (p < 0.001) by the
Fisher’s Exact Test.
Table 4.17
Number of Ultrasound Examinations According to AFI and Birthweight Category (n = 1,374)
Birthweight categories
Amniotic fluid index Whole sample SGA AGA LGA
< 3rd percentile 18 9 9 0
< 5th percentile 35 13 22 0
> 95th percentile 15 0 12 3
Normal 1,306 147 1,043 115
Total 1,374 169 1,086 118 Note. SGA = small for gestational age. AGA = appropriate for gestational age. LGA = large for gestational age.

UMBILICAL CORD VEIN ULTRASOUND 159
4.7 Conclusion
Birthweight was used to divide the whole research sample into three categories
and statistical analysis was undertaken to define the relationships between these
categories, maternal characteristics and pregnancy outcomes. A dependent
relationship was identified between parity, smoking, UA Doppler indices, AFI and
birthweight categories. The remaining characteristics and outcomes did not have
dependent relationships with the birthweight categories.
UMBILICAL CORD VEIN ULTRASOUND 160
Whole Research Sample Discussion Chapter 5
5.1 Introduction
In this chapter the sample size, participation rates, bias and the use of
birthweight as a method of categorising the participants will be discussed. Participant
and neonate features of the whole sample will be compared to broader populations.
The relationships between maternal characteristics, pregnancy outcomes, ultrasound
indices and birthweight categories of the whole research sample will be discussed and
compared.
5.2 Whole Research Sample
5.2.1 Sample size.
To detect the difference between AGA and SGA fetuses for PV and Quv, at the
5% significance level and with a dropout rate of 10%, 176 participants were required.
The final sample size of 625 participants was approximately four times the
recommended sample size which halved the sample error to 0.04 and increased the
sample’s relevance.
5.2.2 Participation rate.
OHS was the major recruitment site and achieved a 34.2% participation rate,
which was lower than the mean participation rate of 55.6±19.7% reported in a review
of 141 academic papers (Baruch, 1999). The low participation rate of 3.6% at BHS was
a consequence of Bathurst being a satellite research site and I was not present to
encourage recruitment. An overall participation rate of 28.6% of all eligible ultrasound
examinations undertaken at Orange and Bathurst Health Services was comparable to
UMBILICAL CORD VEIN ULTRASOUND 161
an American study in which the participation response rates, in medical research,
varied with the type of recruitment procedure and was as low as 27% when written
advance permission was required (K. Nelson et al., 2002).
5.2.3 Bias.
There was no perceivable difference between participants and non-
participants, and no unintended bias was introduced by the non-participants. There
was no intentional selection bias as no client in the population was favoured in, or
excluded from, the selection process. However, selection bias cannot be wholly
excluded as there was systematic favouritism by clients who self-selected to attend the
public hospitals for their obstetric ultrasounds. As Medicare bulk billing was available
at the public health services, there was a higher attendance of lower socio-economic
clients as there were no out-of-pocket expenses for ultrasound examinations. OHS
operates antenatal clinics for diabetes and maternal obesity which may have skewed
the sample towards mothers with these disorders. Orange and Bathurst Health
Services both provide monitoring of fetuses with anomalies or growth discrepancies
and as such the whole research sample may not be wholly typical of a low risk
obstetric population. Neither hospital provided tertiary obstetric care and clients
requiring this level of care would not have been available as potential participants.
The lower and upper 10% of birthweights were defined as SGA and LGA,
respectively. Both the SGA (9.9%) and LGA (7.7%) categories contained approximately
10% of the participants indicating that the whole research sample was not biased
towards any particular birthweight category.
UMBILICAL CORD VEIN ULTRASOUND 162
5.3 Birthweight Categories
Participants and neonates were retrospectively classified as SGA, AGA or LGA
based on birthweight as there was an obvious disparity between EFW and birthweight.
The difference between these two weights stems from two broad areas:
i. The ultrasound measurements: The EFW formula is dependent on the
accuracy of the measurements which it incorporates (Nesbitt-Hawes,
Tetstall, Gee, & Welsh, 2014) and errors occur through poor calliper
placement and noncompliance with standardised measurement protocols.
These measurement errors may be intensified by sonographer
inexperience, awkward fetal position, reduced amniotic fluid, suboptimal
image quality and equipment faults (Edwards, 2001; Nahum, 2014).
ii. The EFW formula: In this research, EFW was calculated using the Hadlock C
formula (Hadlock et al., 1985). This formula was derived from a cross-
sectional study of 109, mainly white, middle-class, American women who
are not representative of the current Australian population.
In a study comparing ultrasound EFW to actual birthweight the Hadlock C
formula had an overall error of 14.7%, but this was as high as 37.8% for birthweights
less than 1,000 g and as low as 9.9% for birthweight between 2,000 - 2,999 g
(Anderson, Jolley, & Wells, 2007). A comparison of the six most commonly used
ultrasound EFW formulae against 1999 Australian birthweights demonstrated that
after 37 weeks gestation, ultrasound EFW significantly overestimated the birthweight
(Campbell Westerway, 2012). ASUM recognises this imprecision in EFW formulae and
does not recommend any specific formula for the calculation of fetal weight, since
UMBILICAL CORD VEIN ULTRASOUND 163
none have achieved sufficient accuracy to be endorsed (Australasian Society for
Ultrasound in Medicine, 2001).
Given these irregularities, it was appropriate to use Australian, sex stratified,
actual birthweights to classify fetal growth in this research. Other researchers have
also used local birthweights as a method of defining fetal growth (Boito et al., 2002;
Rigano et al., 2001). It was acknowledged that all fetuses classified below the 10th
percentile by birthweight were not growth restricted and some fetuses born within the
normal weight range may have failed to reach their potential weight and be growth
restricted. The aim of this study was to develop reference ranges for characteristics of
the UCV using the best classification system available, which arguably is not the
ultrasound derived EFW.
5.4 Whole Research Sample Characteristics Summary
A comparison of the maternal characteristics and pregnancy outcomes of the
whole research sample to Local Health District (LHD), state and national data was
published in the Australasian Journal of Ultrasound in Medicine, 19(3), pp. 118-122 in
2016 (Appendix M). In summary, the whole research sample was typical of the
Australian population with similar proportions of Indigenous mothers, ART usage,
parity, delivery by caesarean section, and the numbers of female and male neonates.
Mothers in the whole research sample were younger, especially non-Indigenous
mothers, more mothers smoked at some point in their pregnancy, and neonates were
lighter than comparable Australian populations.

UMBILICAL CORD VEIN ULTRASOUND 164
5.5 Whole Research Sample Maternal Characteristics in Relation to Birthweight
Categories
Using the whole research sample and birthweight categories, there was no
statistically dependent relation between birthweight categories and ethnicity,
maternal age at conception or ART usage. However, parity and smoking status during
pregnancy were shown to have a statistically dependent relationship with birthweight
categories.
Maternal ethnicity and birthweight category and were not dependent
(p = 0.569). National data from 2011, showed 12.6% of Indigenous mothers gave birth
to a live born weighing less than 2,500 g, compared to 6% of non-Indigenous mothers
(Z. Li et al., 2013). The research data did not reflect this trend, as 4% of Indigenous
neonates weighed less than 2,500 g, which was similar to 5.5% of non-Indigenous
neonates.
In the whole sample, 4% of mothers identified themselves as being Indigenous
which was similar to the NSW data (3.4%) and identical to national data (4.0%) (Hilder
et al., 2014). Western NSW LHD reported 13.8% of mothers as Indigenous in 2010
(Centre for Epidemiology and Evidence, 2012). The difference between the LHD and
the whole research sample may reflect the more easterly geographical location of the
research area compared to the whole LHD (Figure 4.1). The majority of the whole
research sample identified themselves as white (90.6%). Comparison to a broader
population was limited as maternal country of birth is the national reported maternal
feature. However, in the 2011 national census, ancestry data was collected based on
identification with cultural groups. Census data was difficult to interpret due to double
counting and the inclusion of whole Australian population, nevertheless,

UMBILICAL CORD VEIN ULTRASOUND 165
approximately 0.7% of respondents identified as being black, 4.6% as East Asian, 2.6%
as South Asian and 2.5% as Southeast Asian (Australian Government, 2011). An
ethnicity or ancestry defined as “white” was commonest in both the whole research
sample and the Australian census report.
No relationship between maternal age at conception and birthweight category
(p > 0.05) was identified, with the 25 - 29 year age range being the most frequent
range across all birthweight categories. This finding was at odds with a large 2006
meta-analysis that concluded a maternal age of 40 years or older was an independent
risk factor for IUGR with an odds ratio of 3.2 (Odibo, Nelson, Stamilio, Sehdev, &
Macones, 2006). SGA rates were also higher in 35 years or older women compared
with women aged 20 - 24 years, in a large Canadian study (Joseph et al., 2005). Kramer
(1987) proposed that age alone was not a risk factor in mothers older than 34 years,
but that age amplified the impact of other risk factors. This last statement was
reflected in the research sample as there were 70 participants aged 34 years and older
and only 6 (8.6%) had an SGA neonate.
National data from 2013 showed Indigenous women had their babies at
younger ages (median 24.9 years) compared with non-Indigenous women (median
30.8 years) (Australian Bureau of Statistics, 2014). In the whole research sample the
difference between the two groups was not as extreme as the national data (median
age at conception of 24 years versus 28 years, respectively). The overall trend of
Indigenous women being younger mothers was reflected in the research data, with
52% of Indigenous mothers having their babies before the age of 24 years compared to
30.8% in the non-Indigenous mothers, and 80% before 30 years compared to 63.3%
non-Indigenous.

UMBILICAL CORD VEIN ULTRASOUND 166
The birthweight category of the newborn and ART was not dependent (p =
0.731), as a low percentage of women used ART in all birthweight categories. In
Australia in 2011, the mean birthweight was 3,331 g for live born ART singletons which
was 67 g lower than the mean birthweight of all live born singletons (Macaldowie,
Wang, Chughtai, & Chambers, 2014). Using only IVF and ICSI data, the mean weight of
ART live born neonates was 3,117±647 g, which was 180 g lighter than the whole
research sample mean and consistent with the national trend. There was a significant
(p = 0.006) relation between maternal age at conception and ART usage, as a greater
proportion of older participants used ART. In 2011, the average age of Australian
women at the time of delivery was 30.0 years, which was five years younger than
women who used IVF, GIFT or ICSI (mean age 34.9 years) (Macaldowie et al., 2014). A
similar trend was seen in the whole research sample, as participants who conceived
using IVF and ICSI data had a mean age of 30.0±3.1 years compared to 27.4±5.6 years
for participants using all other methods of conception.
A dependent relationship between birthweight category and parity (p = 0.01)
was demonstrated and is consistent with a recent meta-analysis of 41 studies showing
nulliparity significantly increased the risk of low birthweight and SGA births (Shah,
2010). Shah’s (2010) finding was reflected in the whole research sample, as 50% of all
SGA neonates were born to nulliparous participants. Kramer (1987) showed that a
parity of five or greater was not associated with low birthweight and this was reflected
in the sample, as there were only 19 participants with a parity of five or greater, of
which only two had SGA neonates. Generally, the greater the parity, the heavier the
birthweight (Varvarigou, Asimakopoulou, & Beratis, 2008), which was reflected in the
research data, as the heaviest neonates in the AGA and LGA birthweight categories

UMBILICAL CORD VEIN ULTRASOUND 167
were born to mothers with the highest parity, whereas the heaviest SGA category
neonate was born to the mother with the second highest parity.
As could be expected from published research, birthweight category and
maternal smoking were dependent variables (p = 0.02). Overall, 24.6% of participants
reported smoking at some time during their pregnancy. A larger percentage (38.7%) of
mothers who gave birth to an SGA baby reported smoking during the pregnancy
compared to smoking mothers who gave birth to AGA babies (23.5%) or LGA babies
(18.8%). Cigarette smoking is the most significant maternal environmental factor for
IUGR and there is a linear correlation between the number of cigarettes smoked per
day and the degree of growth restriction (Wollmann, 1998). Recent research
confirmed that tobacco smoke inhibits fetal growth and proposed that tobacco smoke
causes vasoconstriction of the umbilical arteries (Milnerowicz-Nabzdyk & Bizoń, 2014).
Nationally in 2012, approximately 48% of Indigenous mothers and 11% of non-
Indigenous mothers reported smoking during pregnancy (Hilder et al., 2014) .
Compared to national data, a lower percentage of Indigenous mothers (36%) in the
whole research sample reported smoking at some time during their pregnancy, and a
greater proportion of non-Indigenous mothers (24.2%) reported smoking. Three
quarters of smokers were under the age of 30 years, and higher levels of smoking have
been associated with youth unemployment (Blank & Burau, 2013). This may explain
the higher rates of smoking identified in the sample, as there was 13.5% to 14.1%
youth unemployment within the local area, compared to 11.8% for NSW (Brotherhood
of St Laurence, 2014). Smoking during pregnancy is linked to socio-economic factors
including smoking behaviour by close family and peer groups, status as a single
mother, unemployment of the mother or a partner, low levels of education and
UMBILICAL CORD VEIN ULTRASOUND 168
occupational skills, poor living standards, and larger families (Gillies, Madeley, &
Power, 1989; Zolnierczuk-Kieliszek, Chemperek, & Koza, 2004).
5.6 Whole Research Sample Pregnancy Outcomes in Relation to Birthweight
Categories
In relation to birthweight categories there was no statistically established
dependent relation with GA at delivery, sex of the newborn, mode of delivery or Apgar
scores in the whole research sample. In the whole research sample, birthweight
category and GA at delivery were not dependent (p = 0.758), nor was the newborns’
birthweight category and sex (p = 0.594). This was the expected result as the
birthweight percentiles employed in this research (Dobbins et al., 2012) were stratified
according to GA and gender. The newborns’ birthweight category and method of
delivery were not dependent variables (p = 0.709), as the percentage of neonates
delivered by either caesarean, instrumental vaginal or normal vaginal delivery was
similar in all three birthweight categories for the research sample.
In the research sample, the neonates’ birthweight categories were not
dependent on the one (p > 0.05) or the five minute Apgar score (p > 0.05). In
developed countries, approximately 1% of newborns have an Apgar score less than
seven at five minutes, which if prolonged, is associated with an increased risk of death
and neurological incapacity (Ehrenstein, 2009). Excluding the three stillbirths and
unavailable results, 1.8% of all neonates had an Apgar score of less than seven at five
minutes consistent with Ehrenstein’s (2009) findings. By birthweight category 1.6% of
SGA, 1.8% of AGA and 2.1% of LGA category neonates had an Apgar score of less than
seven at five minutes, which is not consistent with a review of 17 articles, undertaken
UMBILICAL CORD VEIN ULTRASOUND 169
by Ehrenstein (2009), who concluded that extremes of neonatal size more frequently
received low Apgar scores. The association with low birthweight and low Apgar scores
was evident in earlier research undertaken in Taiwan from 1982 to 1987, which found
that infants with low and very low birthweights had low Apgar scores (Mori, Shiraishi,
Negishi, & Fujimura, 2008). Australian birth statistics also shows that 9% of low
birthweight babies (< 2,500 g) had an Apgar score of less than seven, whereas only 1%
of babies weighing 2,500 g or more had similar scores (Australian Institute of Health
and Welfare, 2015).
The three neonatal deaths within the sample had an AGA birthweight
classification and all deaths were attributed to antepartum haemorrhages. In a recent
Scottish study reviewing 784,576 term singleton births between 1992 and 2008, the
authors found that 33% of antepartum stillbirths and 17% of term delivery related
deaths occurred in neonates with a birthweight outside the 20th to 97th percentile
range (Moraitis, Wood, Fleming, & Smith, 2014). This association with extreme
birthweight was also acknowledged by Simchen et al. (2000) who found IUGR preterm
infants had a higher mortality compared to AGA preterm infants and proposed that the
long held belief that IUGR fetuses are more mature at delivery, due to prolonged
intrauterine stress, was incorrect.
In the whole research sample the mean male live birthweight was 103 g heavier
than the female equivalent. A Canadian study (van Vliet, Liu, & Kramer, 2009)
suggested that the difference between male and female birthweights had decreased
between 1981 and 2003 and proposed that environmental exposures to endocrine
disrupters may be responsible. Such a reduction in the difference between male and
female birthweights was not evident in a NSW study of term singleton deliveries
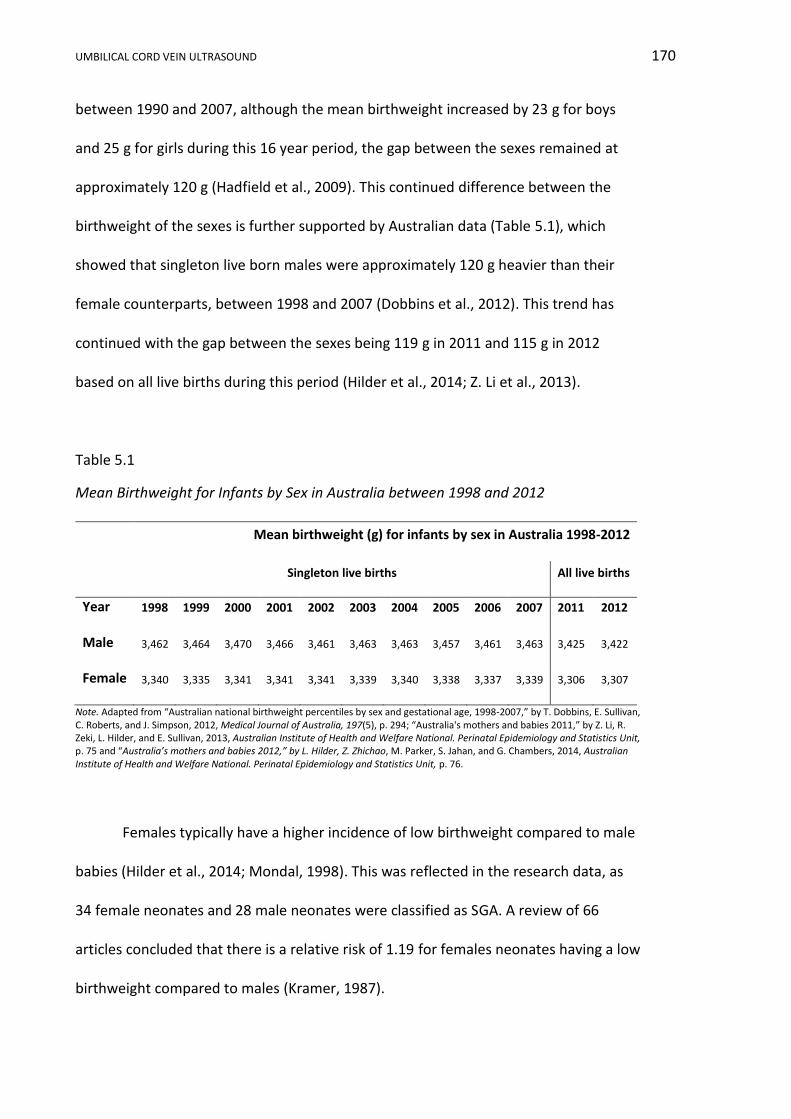
UMBILICAL CORD VEIN ULTRASOUND 170
between 1990 and 2007, although the mean birthweight increased by 23 g for boys
and 25 g for girls during this 16 year period, the gap between the sexes remained at
approximately 120 g (Hadfield et al., 2009). This continued difference between the
birthweight of the sexes is further supported by Australian data (Table 5.1), which
showed that singleton live born males were approximately 120 g heavier than their
female counterparts, between 1998 and 2007 (Dobbins et al., 2012). This trend has
continued with the gap between the sexes being 119 g in 2011 and 115 g in 2012
based on all live births during this period (Hilder et al., 2014; Z. Li et al., 2013).
Table 5.1
Mean Birthweight for Infants by Sex in Australia between 1998 and 2012
Mean birthweight (g) for infants by sex in Australia 1998-2012
Singleton live births All live births
Year 1998 1999 2000 2001 2002 2003 2004 2005 2006 2007 2011 2012
Male 3,462 3,464 3,470 3,466 3,461 3,463 3,463 3,457 3,461 3,463 3,425 3,422
Female 3,340 3,335 3,341 3,341 3,341 3,339 3,340 3,338 3,337 3,339 3,306 3,307
Note. Adapted from “Australian national birthweight percentiles by sex and gestational age, 1998-2007,” by T. Dobbins, E. Sullivan, C. Roberts, and J. Simpson, 2012, Medical Journal of Australia, 197(5), p. 294; “Australia's mothers and babies 2011,” by Z. Li, R. Zeki, L. Hilder, and E. Sullivan, 2013, Australian Institute of Health and Welfare National. Perinatal Epidemiology and Statistics Unit, p. 75 and “Australia’s mothers and babies 2012,” by L. Hilder, Z. Zhichao, M. Parker, S. Jahan, and G. Chambers, 2014, Australian Institute of Health and Welfare National. Perinatal Epidemiology and Statistics Unit, p. 76.
Females typically have a higher incidence of low birthweight compared to male
babies (Hilder et al., 2014; Mondal, 1998). This was reflected in the research data, as
34 female neonates and 28 male neonates were classified as SGA. A review of 66
articles concluded that there is a relative risk of 1.19 for females neonates having a low
birthweight compared to males (Kramer, 1987).
UMBILICAL CORD VEIN ULTRASOUND 171
5.7 Whole Research Sample Ultrasound Indices in Relation to Birthweight
Categories
In the whole research sample there was a significant relation between UA
indices, AFI and birthweight categories. Doppler assessment of the UA, in an
uncomplicated pregnancy, showed that the impedance to flow within the arteries
declines with advancing GA (Nicolaides et al., 1999). The newborns’ birthweight
category and the UA S/D ratio (p < 0.001) and PI (p = 0.003) were dependent. The
fetuses classified as SGA had a higher percentage (16.8%) of elevated UA S/D ratio
compared to other birthweight categories, and no LGA birthweight babies had an
elevated ratio. No AGA or LGA birthweight neonates had an elevated UA PI. One SGA
fetus had an elevated UA PI on three separate occasions.
The neonates’ birthweight category and AFI were found to be dependent
(p < 0.001) with a larger percentage of SGA (13%) neonates having an AFI below the
5th percentile compared to the AGA and LGA neonates. In uteroplacental insufficiency
IUGR there is redistribution of the cardiac output away from the fetal abdomen and
limbs to the vital organs, decreasing perfusion of the fetal kidneys and lungs and
consequently reducing amniotic fluid production (Manning, 2009), as reflected in the
research findings.
5.8 Conclusion
The whole sample of 625 participants was in excess of the size recommended
for research purposes and was recruited without intentional bias. The whole research
sample was relatively typical of the Australian population except that mothers were
younger, more mothers smoked, and neonates were lighter than comparable

UMBILICAL CORD VEIN ULTRASOUND 172
Australian populations. In relation to birthweight categories there was no statistically
established dependent relation with ethnicity, maternal age at conception, ART, GA at
delivery, sex of the neonate, mode of delivery or Apgar scores in the whole research
data. There was a statistically dependent relationship between birthweight categories
and parity, smoking status during pregnancy, umbilical cord indices and AFI.
UMBILICAL CORD VEIN ULTRASOUND 173
Chapter 6 “normal” Appropriate for Gestational Age (nAGA) Results
6.1 Introduction
The nAGA group was a subgroup of the AGA birthweight category participants
who had no significant risk factors for abnormal fetal growth. nAGA participants
delivered a live, term neonate, whose conception was unassisted, and normal AFI and
UA Doppler measurements were recorded throughout the pregnancy. This subgroup of
321 participants represented “normal” pregnancies and was used to construct the GA
related reference ranges. Sample features, maternal characteristics and pregnancy
outcomes of this subgroup will be detailed in this chapter. The raw data are contained
in Appendix K2 and statistical analysis in Appendix L2. Continuous variables are
reported as means ± SD. Categorical, ordinal and discrete variables are reported as
numbers and/or percentages.
6.2 nAGA Group Sample Size and Participation Rates
The elimination of confounders for abnormal intrauterine fetal growth from the
AGA birthweight category resulted in a nAGA group sample of 321 participants.
Fourteen (4.4%) participants in the nAGA group underwent their examinations at BHS
and the remaining 307 (95.6%) were scanned at OHS. Approximately half (50.5%) of
participants underwent more than one ultrasound examination as shown in Table 6.1,
producing a total of 603 ultrasound examinations, of which 15 examinations were
undertaken at BHS. The processes of establishing the birthweight categories and the
nAGA group are summarised in Figure 6.1.

UMBILICAL CORD VEIN ULTRASOUND 174
Table 6.1
Number of Ultrasound Examinations Undertaken on nAGA Group Participants (n = 603)
Number of ultrasound examinations per patient
1 2 3 4 5 6 7 8 9 10
Number of participants 159 93 35 25 6 1 0 0 1 1
Figure 6.1. Flowchart showing construction of research samples.
Potential participants attending Orange and Bathurst Health Services between 5/4/2011 and 22/03/2013
n = 4810
Consenting participants n = 661
Small for gestational age (SGA)
Birthweight < 10th % n = 62
Appropriate for
gestational age (AGA) Birthweight between
10th and 90th % n = 515
Large for gestational
age (LGA) Birthweight > 90th %
n = 48
nAGA group
n = 321
Whole research sample n = 625
EXCLUDED i. Unavailable outcomes ii. EDD not established iii. Poor ultrasound data iv. Termination
EXCLUDED i. Non-term delivery ii. Assisted conceptions and stillbirths iii. Fetal anomalies iv. Maternal confounders for abnormal growth v. Abnormal AFI or UA Dopplers

UMBILICAL CORD VEIN ULTRASOUND 175
6.3 nAGA Group Maternal Characteristics
In the nAGA cohort, the majority of participants were white with less than 3%
of participants in any of the other ethnicity categories (Table 6.2). Maternal age at
conception ranged from 15 to 42 years with a mean age of 27.8±5.4 years. The median
age of the group was 28.5 years and the maternal ages were normally distributed. All
Indigenous mothers had their babies before the age of 30 compared to 61.9% of non-
Indigenous mothers (Table 6.3). Indigenous mothers had a younger mean age of
conception of 23.3±2.8 years compared to 27.9±5.4 years for non-Indigenous mothers.
Table 6.2
Ethnicity of the nAGA Group (n = 321)
Ethnic Group Number of participants
Indigenous 9
Black 5
East Asian 4
South Asian 7
Southeast Asian 0
White 290
Mixed 7
Table 6.3
Number of nAGA Participants per Age Group and Indigenous Status (n = 321)
Number of participants
Maternal age at conception (years) nAGA Non-Indigenous Indigenous
< 20 17 16 1
20 - 24 76 71 5
25 - 29 109 106 3
30 - 34 80 80 0
35 - 39 35 35 0
> 40 4 4 0
Total 321 321 9 Note. nAGA = “normal” appropriate for gestational age.
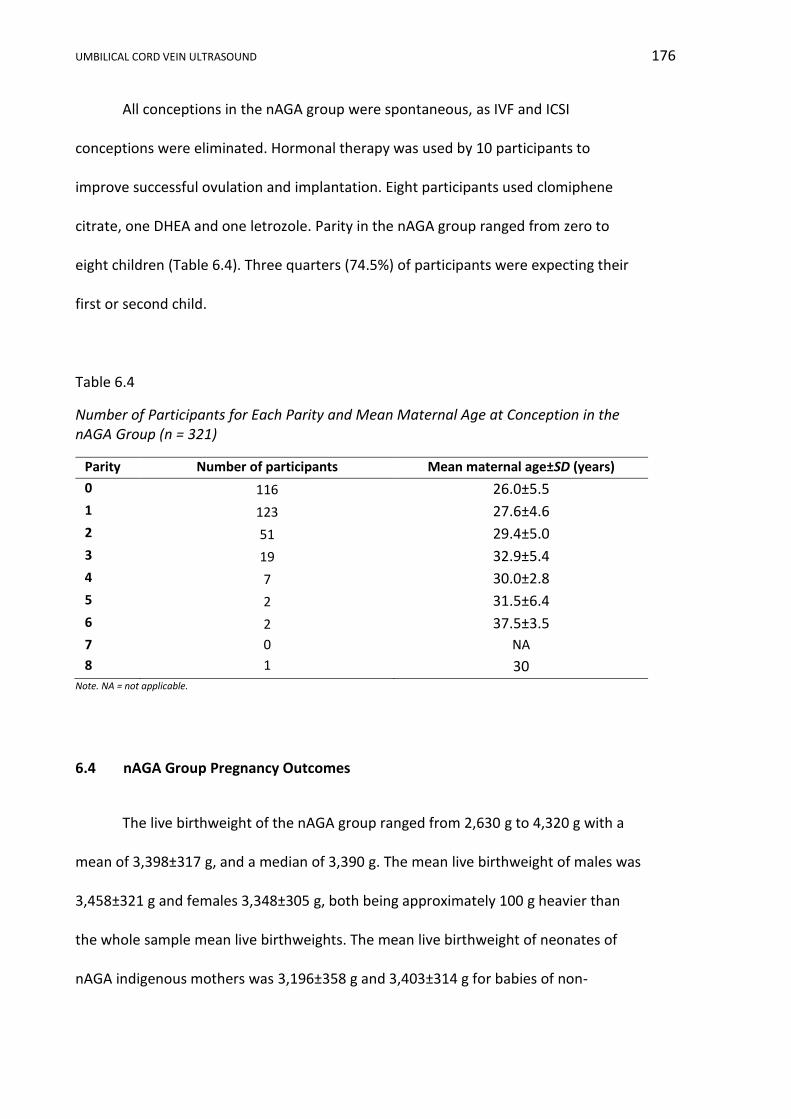
UMBILICAL CORD VEIN ULTRASOUND 176
All conceptions in the nAGA group were spontaneous, as IVF and ICSI
conceptions were eliminated. Hormonal therapy was used by 10 participants to
improve successful ovulation and implantation. Eight participants used clomiphene
citrate, one DHEA and one letrozole. Parity in the nAGA group ranged from zero to
eight children (Table 6.4). Three quarters (74.5%) of participants were expecting their
first or second child.
Table 6.4
Number of Participants for Each Parity and Mean Maternal Age at Conception in the nAGA Group (n = 321)
Parity Number of participants Mean maternal age±SD (years)
0 116 26.0±5.5
1 123 27.6±4.6
2 51 29.4±5.0
3 19 32.9±5.4
4 7 30.0±2.8
5 2 31.5±6.4
6 2 37.5±3.5
7 0 NA
8 1 30 Note. NA = not applicable.
6.4 nAGA Group Pregnancy Outcomes
The live birthweight of the nAGA group ranged from 2,630 g to 4,320 g with a
mean of 3,398±317 g, and a median of 3,390 g. The mean live birthweight of males was
3,458±321 g and females 3,348±305 g, both being approximately 100 g heavier than
the whole sample mean live birthweights. The mean live birthweight of neonates of
nAGA indigenous mothers was 3,196±358 g and 3,403±314 g for babies of non-
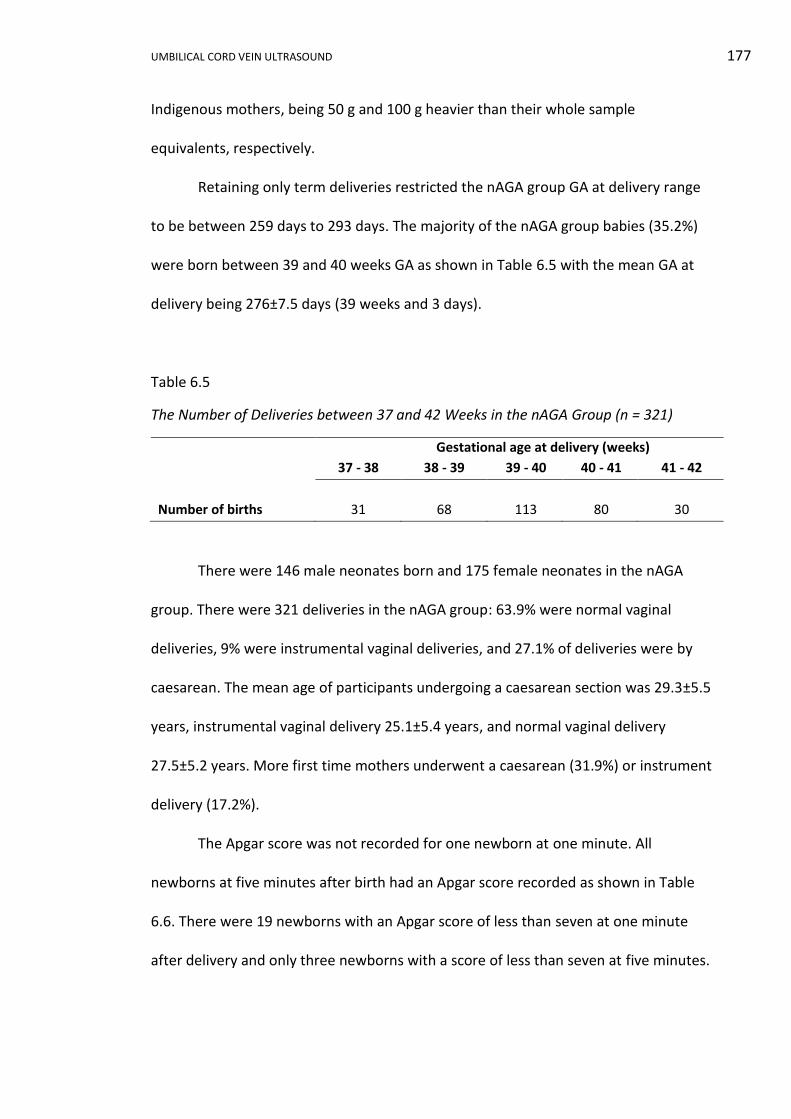
UMBILICAL CORD VEIN ULTRASOUND 177
Indigenous mothers, being 50 g and 100 g heavier than their whole sample
equivalents, respectively.
Retaining only term deliveries restricted the nAGA group GA at delivery range
to be between 259 days to 293 days. The majority of the nAGA group babies (35.2%)
were born between 39 and 40 weeks GA as shown in Table 6.5 with the mean GA at
delivery being 276±7.5 days (39 weeks and 3 days).
Table 6.5
The Number of Deliveries between 37 and 42 Weeks in the nAGA Group (n = 321)
Gestational age at delivery (weeks)
37 - 38 38 - 39 39 - 40 40 - 41 41 - 42
Number of births 31 68 113 80 30
There were 146 male neonates born and 175 female neonates in the nAGA
group. There were 321 deliveries in the nAGA group: 63.9% were normal vaginal
deliveries, 9% were instrumental vaginal deliveries, and 27.1% of deliveries were by
caesarean. The mean age of participants undergoing a caesarean section was 29.3±5.5
years, instrumental vaginal delivery 25.1±5.4 years, and normal vaginal delivery
27.5±5.2 years. More first time mothers underwent a caesarean (31.9%) or instrument
delivery (17.2%).
The Apgar score was not recorded for one newborn at one minute. All
newborns at five minutes after birth had an Apgar score recorded as shown in Table
6.6. There were 19 newborns with an Apgar score of less than seven at one minute
after delivery and only three newborns with a score of less than seven at five minutes.
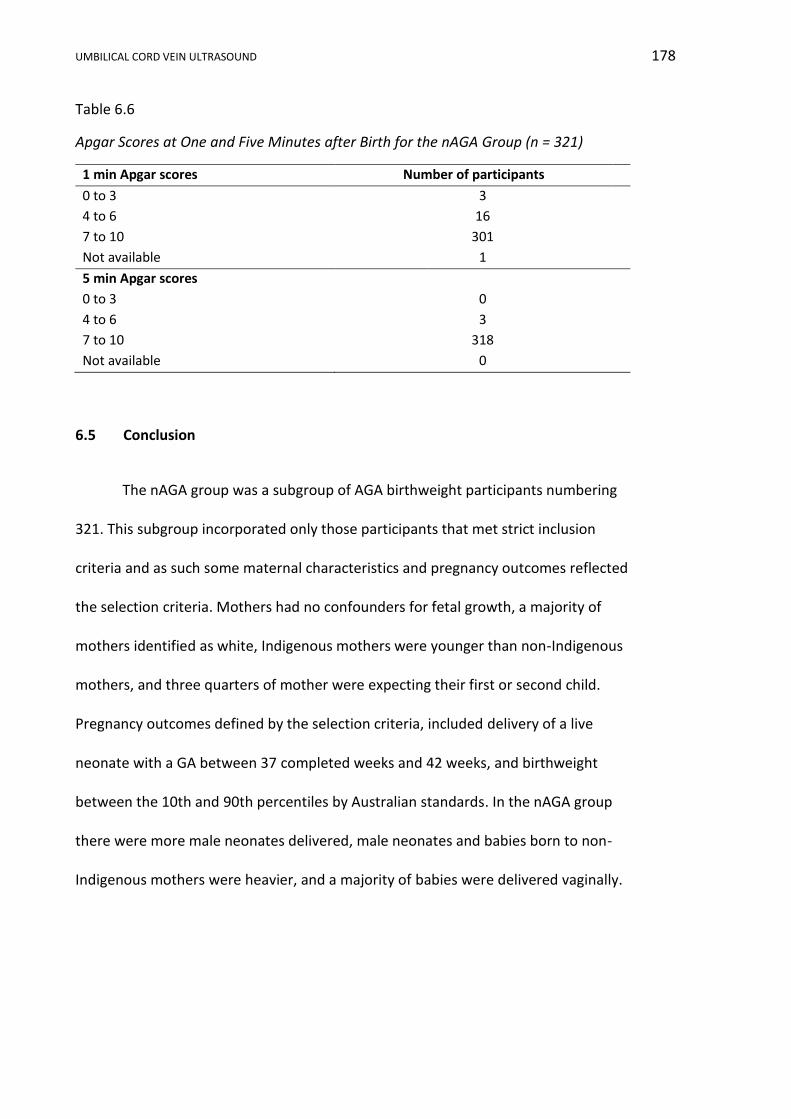
UMBILICAL CORD VEIN ULTRASOUND 178
Table 6.6
Apgar Scores at One and Five Minutes after Birth for the nAGA Group (n = 321)
1 min Apgar scores Number of participants
0 to 3 3
4 to 6 16
7 to 10 301
Not available 1
5 min Apgar scores
0 to 3 0
4 to 6 3
7 to 10 318
Not available 0
6.5 Conclusion
The nAGA group was a subgroup of AGA birthweight participants numbering
321. This subgroup incorporated only those participants that met strict inclusion
criteria and as such some maternal characteristics and pregnancy outcomes reflected
the selection criteria. Mothers had no confounders for fetal growth, a majority of
mothers identified as white, Indigenous mothers were younger than non-Indigenous
mothers, and three quarters of mother were expecting their first or second child.
Pregnancy outcomes defined by the selection criteria, included delivery of a live
neonate with a GA between 37 completed weeks and 42 weeks, and birthweight
between the 10th and 90th percentiles by Australian standards. In the nAGA group
there were more male neonates delivered, male neonates and babies born to non-
Indigenous mothers were heavier, and a majority of babies were delivered vaginally.
UMBILICAL CORD VEIN ULTRASOUND 179
Chapter 7 “normal” Appropriate for Gestational Age (nAGA) Discussion
7.1 Introduction
The sample, bias, maternal characteristics and pregnancy outcomes of the
nAGA group will be discussed in this chapter and compared to the Australian
population. The portion of analysis will determine if this subgroup, used for the
creation of the reference ranges, was typical of broader populations.
7.2 nAGA Group Sample
7.2.1 Sample size.
After removal of confounders for abnormal fetal growth (Table 3.4), the nAGA
group consisted of 321 participants, which is twice the recommended sample size.
7.2.2 Bias.
Data on which reference ranges are constructed should relate to “normal
fetuses”; individuals with maternal or fetal conditions known to affect fetal growth
should be excluded from any reference group (Altman & Chitty, 1994). Ideally, for a
normal sample, data should be collected on women not requiring ultrasound
examinations, as there is bias in using data collected from women referred for an
ultrasound due to the clinical reason for the investigation (Altman & Chitty, 1994). This
form of selection bias was minimised in this research design, as the participants in the
nAGA group were refined from the whole research sample after data collection was
completed and therefore no participant was recruited, or not recruited, based on their
potential to be part of the nAGA group. Additionally, many initial referrals were made
as a component of routine antenatal care, rather than due to pathological reasons.
UMBILICAL CORD VEIN ULTRASOUND 180
Altman and Chitty (1994) proposed that serial measurements be used for the
development of fetal growth reference percentiles, whereas cross-sectional data is
preferred for fetal size reference percentiles. Current statistical analyses are able to
accommodate for variances within, and between participants, negating the sole use of
either longitudinal or cross-sectional data collection (Littell et al., 2000). Altman and
Chitty (1994) also indicated that if only cross-sectional data was used, the number of
observations per fetus would vary and sampling bias would result since fetuses who
are delivered early will be underrepresented. This form of sampling bias was
minimalised in the research design by including only term deliveries.
7.3 nAGA Group Maternal Characteristics
The maternal characteristic of ART usage, diseases and smoking are not
discussed as these variables were eliminated by the exclusion criteria. Participants in
the nAGA group had similar ethnicity as the 2012 Australian population, but tended to
be younger and have a higher parity.
In the nAGA group, 2.8% of mothers identified themselves as Indigenous which
was not significantly different to the 2012 Australian (p = 0.341) or NSW (p = 0.663)
proportions (Hilder et al., 2014). The remaining nAGA participants identified as being
white (90.3%), black (1.6%), East Asian (1.2%), South Asian (2.2%), and mixed ethnicity
(1.9%); there were no Southeast Asian participants. Comparison of the nAGA ethnicity
diversity with a wider group was difficult due to the various methods of ethnical
classification and data collection. However, “white” ethnicity or ancestry was
commonest in both the nAGA group and the 2011 Australian census report (Australian
Government, 2011).
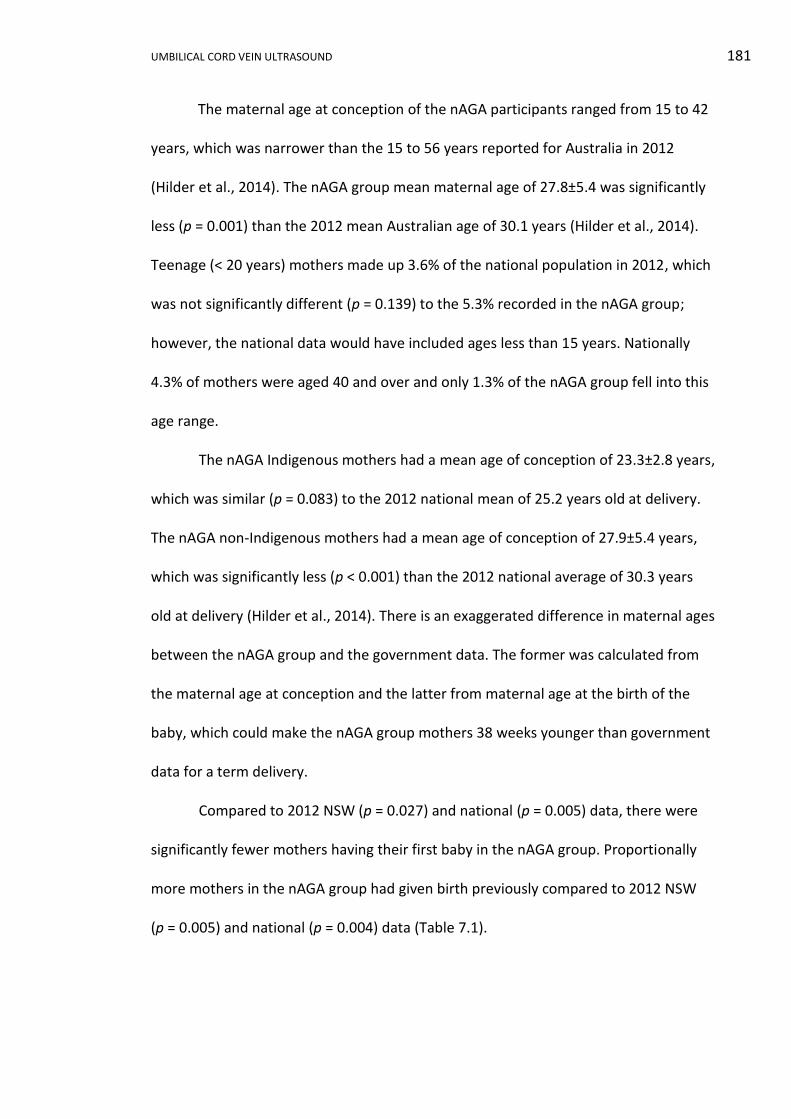
UMBILICAL CORD VEIN ULTRASOUND 181
The maternal age at conception of the nAGA participants ranged from 15 to 42
years, which was narrower than the 15 to 56 years reported for Australia in 2012
(Hilder et al., 2014). The nAGA group mean maternal age of 27.8±5.4 was significantly
less (p = 0.001) than the 2012 mean Australian age of 30.1 years (Hilder et al., 2014).
Teenage (< 20 years) mothers made up 3.6% of the national population in 2012, which
was not significantly different (p = 0.139) to the 5.3% recorded in the nAGA group;
however, the national data would have included ages less than 15 years. Nationally
4.3% of mothers were aged 40 and over and only 1.3% of the nAGA group fell into this
age range.
The nAGA Indigenous mothers had a mean age of conception of 23.3±2.8 years,
which was similar (p = 0.083) to the 2012 national mean of 25.2 years old at delivery.
The nAGA non-Indigenous mothers had a mean age of conception of 27.9±5.4 years,
which was significantly less (p < 0.001) than the 2012 national average of 30.3 years
old at delivery (Hilder et al., 2014). There is an exaggerated difference in maternal ages
between the nAGA group and the government data. The former was calculated from
the maternal age at conception and the latter from maternal age at the birth of the
baby, which could make the nAGA group mothers 38 weeks younger than government
data for a term delivery.
Compared to 2012 NSW (p = 0.027) and national (p = 0.005) data, there were
significantly fewer mothers having their first baby in the nAGA group. Proportionally
more mothers in the nAGA group had given birth previously compared to 2012 NSW
(p = 0.005) and national (p = 0.004) data (Table 7.1).
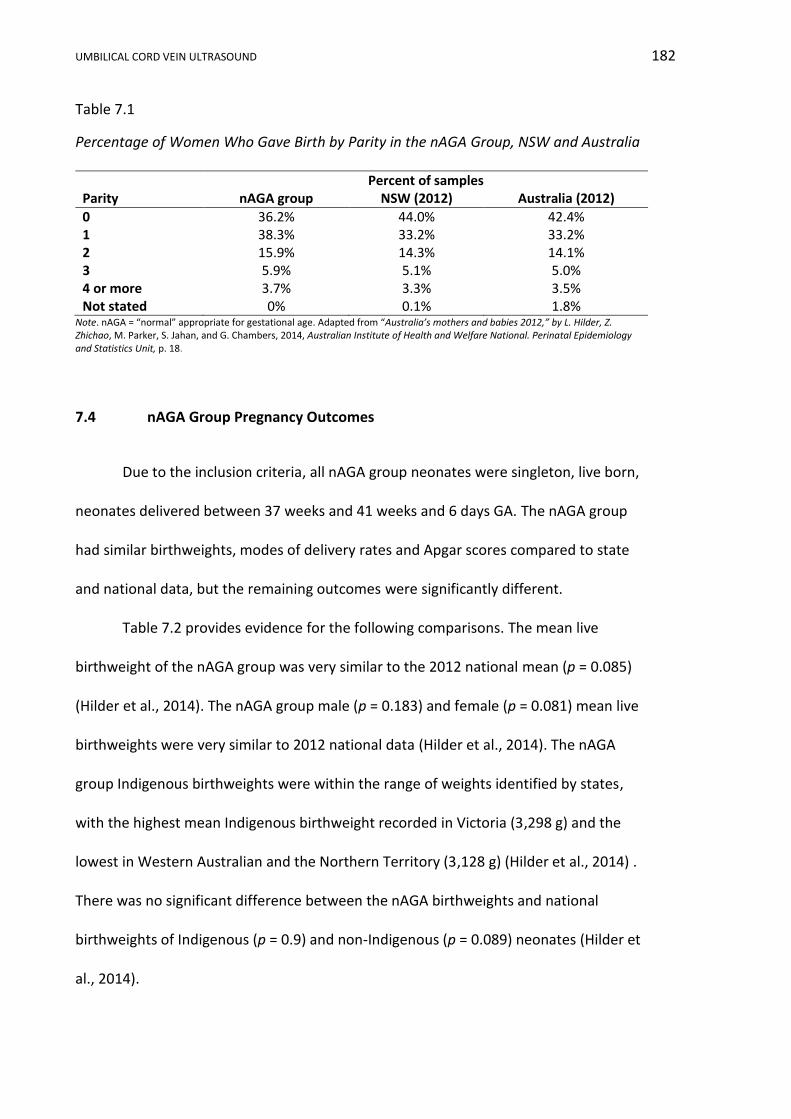
UMBILICAL CORD VEIN ULTRASOUND 182
Table 7.1
Percentage of Women Who Gave Birth by Parity in the nAGA Group, NSW and Australia
Percent of samples Parity nAGA group NSW (2012) Australia (2012)
0 36.2% 44.0% 42.4% 1 38.3% 33.2% 33.2% 2 15.9% 14.3% 14.1% 3 5.9% 5.1% 5.0% 4 or more 3.7% 3.3% 3.5% Not stated 0% 0.1% 1.8%
Note. nAGA = “normal” appropriate for gestational age. Adapted from “Australia’s mothers and babies 2012,” by L. Hilder, Z. Zhichao, M. Parker, S. Jahan, and G. Chambers, 2014, Australian Institute of Health and Welfare National. Perinatal Epidemiology and Statistics Unit, p. 18.
7.4 nAGA Group Pregnancy Outcomes
Due to the inclusion criteria, all nAGA group neonates were singleton, live born,
neonates delivered between 37 weeks and 41 weeks and 6 days GA. The nAGA group
had similar birthweights, modes of delivery rates and Apgar scores compared to state
and national data, but the remaining outcomes were significantly different.
Table 7.2 provides evidence for the following comparisons. The mean live
birthweight of the nAGA group was very similar to the 2012 national mean (p = 0.085)
(Hilder et al., 2014). The nAGA group male (p = 0.183) and female (p = 0.081) mean live
birthweights were very similar to 2012 national data (Hilder et al., 2014). The nAGA
group Indigenous birthweights were within the range of weights identified by states,
with the highest mean Indigenous birthweight recorded in Victoria (3,298 g) and the
lowest in Western Australian and the Northern Territory (3,128 g) (Hilder et al., 2014) .
There was no significant difference between the nAGA birthweights and national
birthweights of Indigenous (p = 0.9) and non-Indigenous (p = 0.089) neonates (Hilder et
al., 2014).

UMBILICAL CORD VEIN ULTRASOUND 183
Table 7.2
Mean Live Birthweights of the nAGA Group Compared to 2021 Australian Data
Mean live birthweight (g)
nAGA Australia 2012
(Hilder et al., 2014)
Whole sample 3,398±317 3,367
Male 3,458±321 3,422
Female 3,348±305 3,307
Indigenous mothers 3,196±358 3,211
Non-Indigenous mothers 3,403±314 3,373 Note. nAGA = “normal” appropriate for gestational age.
The nAGA group had a sex ratio of 83.4 male births per 100 female births.
Compared to 2012 national sex ratio of 106.4 males births per 100 female births (p =
0.033) and NSW sex ratio of 107.4 males births per 100 female births (p = 0.027), there
were significantly less males born in the nAGA group.
The mode of delivery of the nAGA group was compared to state and national
data in Table 7.3. The caesarean rate in the nAGA group was less than the Australian
rate (p = 0.049), but similar to the NSW caesarean rate (p = 0.137). The nAGA group
had a similar rate of all vaginal deliveries compared to 2012 state (p = 0.137) and
national data (p = 0.053) (Hilder et al., 2014).
Table 7.3
Birth Method and Locality
Percent of births Mode of delivery nAGA group NSW (2012) Australia (2012)
Caesarean 27.1% 31.1% 32.4% Instrumental vaginal 9% 11.4% 12.4% Normal vaginal 63.9% 57.5% 55.3%
Note. nAGA = “normal” appropriate for gestational age. Adapted from “Australia’s mothers and babies 2012,” by L. Hilder, Z. Zhichao, M. Parker, S. Jahan, and G. Chambers, 2014, Australian Institute of Health and Welfare National. Perinatal Epidemiology and Statistics Unit, p. 79.

UMBILICAL CORD VEIN ULTRASOUND 184
There were only three (0.9%) newborns with an Apgar score of less than seven
at five minutes in the nAGA group, which was not significantly different (p = 0.398) to
the 2012 national rate of 1.7%. In the same year, Apgar scores between 0 and 3 were
recorded at five minutes for 0.3% of live born babies nationally, compared to 0% in the
nAGA group and respective rates of 1.4% and 0.9% for scores 4 to 6 at five minutes
(Hilder et al., 2014).
7.5 Conclusion
Overall the nAGA group was similar to the Australian population in respect to
the proportion of Indigenous mothers, vaginal deliveries and low Apgar scores at five
minutes. There was no significant difference in the mean birthweight between the
nAGA group and 2012 Australian data. nAGA group mothers were significantly younger
than the 2012 average Australian mother, with non-Indigenous mothers dominating
this trend. Significantly fewer mothers were expecting their first child and less male
babies were born compared to 2012 national data. The major characteristics of the
whole research sample and the nAGA group are summarised in Table 7.4.
UMBILICAL CORD VEIN ULTRASOUND 185
Table 7.4
Comparison of Major Maternal Characteristic and Pregnancy Outcomes between the Whole Research Sample and the nAGA Group
Parameter Whole research sample
mean±SD or %
nAGA group
mean±SD or %
Participants numbers 625 321
Number of examinations 1,374 603
Maternal age (years) 27.5±5.6 27.8±5.4
Parity
0 36.3% 36.2%
> 1 63.7% 63.8%
Ethnicity
Indigenous 4% 2.8%
Non-Indigenous 96% 97.2% Smoking during pregnancy 24.6% 0.0% Fetal death rate 0.48% 0.0% Gestational age at delivery
(days)
273.9±11.6 276.2±7.5
Birthweight (g) 3,297±530 3,398±317
Mode of delivery Caesarean 31.7% 27.1%
Vaginal 68.3% 72.9% Sex
Males 47.4% 45.5% Females 52.6% 54.5%
Apgar score < 7 at 5 min 1.8% 0.9% Note. nAGA = “normal” appropriate for gestational age.
UMBILICAL CORD VEIN ULTRASOUND 186
SECTION V RESULTS AND DISCUSSION: RELIABILITY
Chapter 8 Reliability Results
8.1. Introduction
This chapter will report the intersonographer and intrasonographer reliability
for measurements of the UCV diameter and PV.
8.2. Umbilical Cord Vein Diameter and Peak Velocity Reliability Results
The data of three repeated UCV diameters and PV measurements made by four
sonographers on images from 10 randomly selected participants are contained in
Appendix K3 and related statistical analysis in Appendix L3. Boxplots displaying this
data are shown in Figures 8.1 and 8.2. The GA of the selected participants ranged from
23 weeks 6 days to 39 weeks 5 days.
The intersonographer and intrasonographer reliability for measurements of the
UCV diameter and PV were assessed by a linear mixed model including participants
and sonographers, and the ICC calculated according to Gwet (2014) using R statistical
package (R Core Team, 2014). All model assumptions were met, with the exception of
UCV PV residuals which were not derived from a normally distributed population as
indicated by the Shapiro-Wilk test (p = 0.011); however, ANOVA techniques are robust
against such departures and this was not considered to be important for this analysis.
The ICC for UCV diameter and PV measurements are shown in Table 8.1.
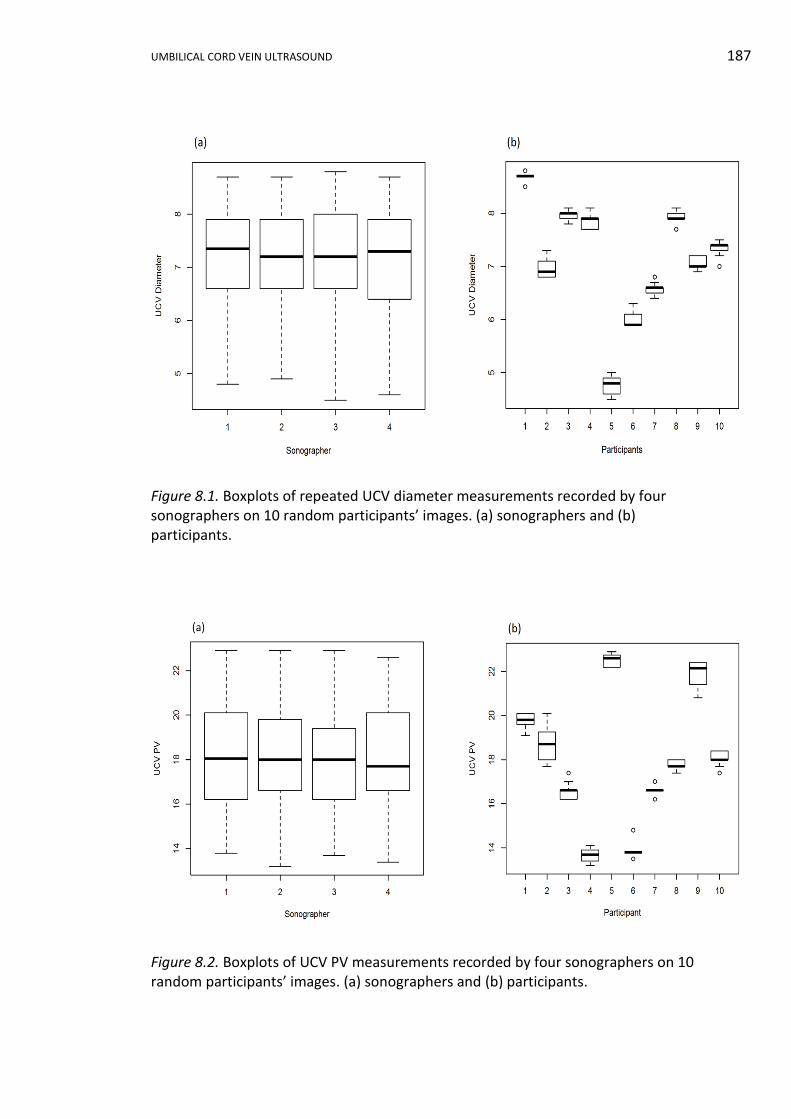
UMBILICAL CORD VEIN ULTRASOUND 187
Figure 8.1. Boxplots of repeated UCV diameter measurements recorded by four sonographers on 10 random participants’ images. (a) sonographers and (b) participants.
Figure 8.2. Boxplots of UCV PV measurements recorded by four sonographers on 10 random participants’ images. (a) sonographers and (b) participants.
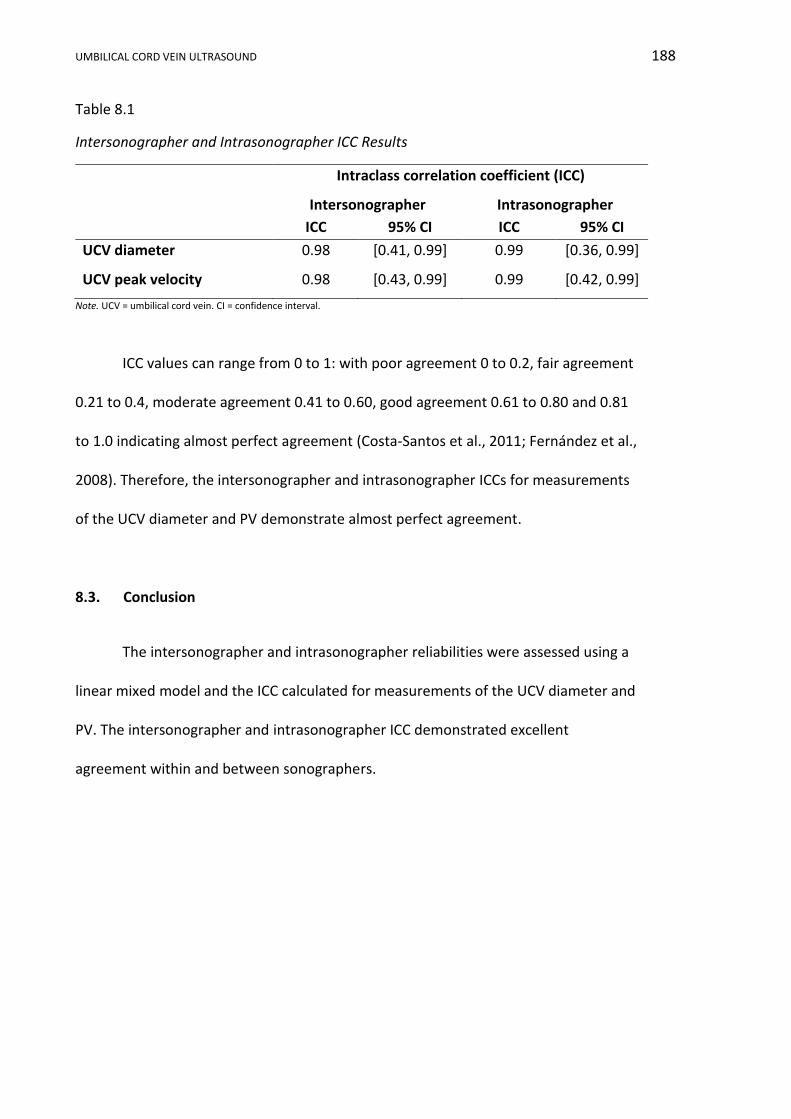
UMBILICAL CORD VEIN ULTRASOUND 188
Table 8.1
Intersonographer and Intrasonographer ICC Results
Intraclass correlation coefficient (ICC)
Intersonographer Intrasonographer
ICC 95% CI ICC 95% CI
UCV diameter 0.98 [0.41, 0.99] 0.99 [0.36, 0.99]
UCV peak velocity 0.98 [0.43, 0.99] 0.99 [0.42, 0.99]
Note. UCV = umbilical cord vein. CI = confidence interval.
ICC values can range from 0 to 1: with poor agreement 0 to 0.2, fair agreement
0.21 to 0.4, moderate agreement 0.41 to 0.60, good agreement 0.61 to 0.80 and 0.81
to 1.0 indicating almost perfect agreement (Costa-Santos et al., 2011; Fernández et al.,
2008). Therefore, the intersonographer and intrasonographer ICCs for measurements
of the UCV diameter and PV demonstrate almost perfect agreement.
8.3. Conclusion
The intersonographer and intrasonographer reliabilities were assessed using a
linear mixed model and the ICC calculated for measurements of the UCV diameter and
PV. The intersonographer and intrasonographer ICC demonstrated excellent
agreement within and between sonographers.

UMBILICAL CORD VEIN ULTRASOUND 189
Chapter 9 Reliability Discussion
9.1 Introduction
In this chapter, the intersonographer and intrasonographer ICC results will be
discussed and compared with previous publications. Reliability assessment is necessary
to determine if the raw data collected by the research sonographers had little
variability and provided the best possible data to construct the GA related reference
ranges. Reliability, reproducibility and precision are terms used to describe the
similarity of measurements repeated by the same sonographer and by different
sonographers at various sites, on different machines and at different times (Barbieri,
Cecatti, Souza, Marussi, & Costa, 2008).
9.2 Umbilical Cord Vein Diameter and Peak Velocity Reliability Discussion
Intersonographer reliability refers to the systematic variation between
sonographers undertaking a measurement. The greater the agreement between
sonographers means the reliability is higher. Intrasonographer reliability refers to the
deviation between repeated measurements by a sonographer measuring a particular
object and the more uniform the measurements, the higher the reliability.
The ICC is an assessment of the uniformity of measurements made by
individuals measuring the same item (Shrout & Fleiss, 1979). The ICC compares the
variance of different measurements with the total variance of all measurements. In
this analysis, variance was derived from ANOVA using a linear mixed model. ICC value
ranges from 0 to 1, with a value greater than 0.81 indicating almost perfect agreement
(Costa-Santos et al., 2011; Fernández et al., 2008). The ICC is considered superior to
UMBILICAL CORD VEIN ULTRASOUND 190
both Pearson and Spearman analyses, as the ICC takes into account the differences
between observers (Shrout & Fleiss, 1979) and the variance of all measurements
(Figueras et al., 2008).
The sonographer boxplots for measurement of the UCV diameter and PV in
Figures 8.1 and 8.2 showed no outliers; the data sets were relatively symmetrical for
each sonographer and the interquartile range length was similar, which indicated little
variation in the repeated measurements. As expected, the participant boxplots
showed that the UCV diameters and PV were different for each participant, as the
participants were randomly selected, independent and had different gestational ages.
In this research, the UCV diameter and PV intersonographer and
intrasonographer ICC values were greater than 0.81, which illustrates there was
consistency of measurements by each sonographer and between sonographers. These
results were compared with five published works in Table 9.1, and the diameter ICC
results were similar to three previously published papers and superior to those
reported by Fernandez et al. (2008) and Figueras et al. (2008). An excellent
intersonographer ICC result for UCV diameter measurements was reported by Barbieri
et al. (2008): the ICC was 0.91 for interobserver variability between two observers in a
cross-sectional study of 221 women. Nyberg and colleagues (2010) reported an
excellent interobserver ICC of 0.93 for one diameter measurement made by each of
two observers on 22 participants and an excellent interobserver ICC was reported by
Najafzadeh et al. (2016) for the variability between two observers repeating the
diameter measurement three times on 18 participants.

UMBILICAL CORD VEIN ULTRASOUND 191
Table 9.1
Comparison of Intersonographer and Intrasonographer ICC Measurements
Intraclass correlation coefficient (ICC)
UCV measurement Intersonographer
ICC 95% CI
Intrasonographer ICC
95% CI
Research diameter 0.98 [0.41, 0.99] 0.99 [0.36, 0.99]
Diameter (Fernández et al., 2008)
0.65 [0.48, 0.78] 0.70 [0.55, 0.81]
Diameter (Figueras et al., 2008)
0.65 [0.48, 0.78] 0.70 [0.55, 0.81]
Diameter (Barbieri et al., 2008)
0.91 - 0.94 -
Diameter (Nyberg et al., 2010)
0.93 [0.88, 0.96] 0.94 [0.90, 0.97]
Diameter (Najafzadeh et al., 2016)
0.94
[0.85, 0.98] 0.953 0.985
[0.90, 0.98] [0.97, 0.99]
Research PV 0.98 [0.43, 0.99] 0.99 [0.42, 0.99]
Tamaxv (Fernández et al., 2008)
0.46 [0.23, 0.64] 0.59 [0.4, 0.74]
Tamaxv (Figueras et al., 2008)
0.46 [0.23, 0.64] 0.59 [0.4, 0.74]
Note. CI = confidence interval. UCV = umbilical cord vein. PV = peak velocity. Tamaxv = time-averaged maximum velocity
In this research, the ICC results for the UCV diameter and PV were identical.
Other researchers recorded lower ICC values for velocity measurements: Fernández et
al. (2008) and Figueras et al. (2008) compared measurements of the Tamaxv between
two observers on 63 singleton pregnancies and reported the interobserver ICC as 0.46
and the intraobserver ICC as 0.59 . A possible cause of these lower velocity ICC values
is that the diameter is measured from a B-mode image with crisp borders, whereas the
velocity is a fluctuating spectral trace with either the sonographer or the automatic
software determining which fluctuation to measure, making the PV measurement

UMBILICAL CORD VEIN ULTRASOUND 192
more susceptible to variation and subjective choice. Scherjon, Kok, Oosting, and
Zondervan (1993) reported the UA PI interobserver ICC as 0.39 and Nakai and Oya
(2002) reported the UA resistive index interobserver ICC for as 0.49. These indices are
the accepted benchmarks in Doppler assessment of the UA and consequently, the
results calculated in this research demonstrate exceptional reliability and
reproducibility compared to current clinical benchmarks.
9.3 Conclusion
In this study, intersonographer and intrasonographer reliability were excellent,
with similar or superior values to other published results and higher than ultrasound
benchmark indices currently used in clinical practice. These high reliability results
demonstrate that by following a strict protocol, several sonographers can produce
similar measurements. The reliable measurement of the UCV diameter and PV ensured
that the data used to construct reference ranges in this research were reproducible at
Orange and Bathurst Health Services.
UMBILICAL CORD VEIN ULTRASOUND 193
SECTION VI RESULTS AND DISCUSSION: UMBILICAL CORD VEIN
Chapter 10 Umbilical Cord Vein Diameter Results
10.1 Introduction
In this chapter, the range and measures of central tendency of the average UCV
diameter will be reported and scatterplots constructed to display the relationship
between average UCV diameter and GA, for the whole research sample and the nAGA
group. Statistical modelling will determine if a significant difference exists between the
average UCV diameters of three different birthweight categories, plus construct a
reference range from the nAGA group data. Using stratified SGA category data,
analysis will be undertaken to assess the performance of the reference range in
identifying growth restricted fetuses. Continuous variables are reported as means ± SD
and discrete variables as numbers or percentages. Where appropriate p values are
provided.
10.2 The Umbilical Cord Vein Diameter Data and Data Checking
The diameter of the UCV was measured three times and the mean calculated to
produce a UCV diameter measurement for each participant at each attendance, which
is referred to as the average UCV diameter. In the whole research sample (n = 1,374)
(Appendix K1), the average UCV diameter was recorded during 1,359 (98.9%)
examinations. In the remaining 15 examinations, the diameter was not recorded by
the research sonographer. There were 168 average UCV diameter measurements in
the SGA birthweight category, 1,075 in the AGA category and 116 in the LGA category.
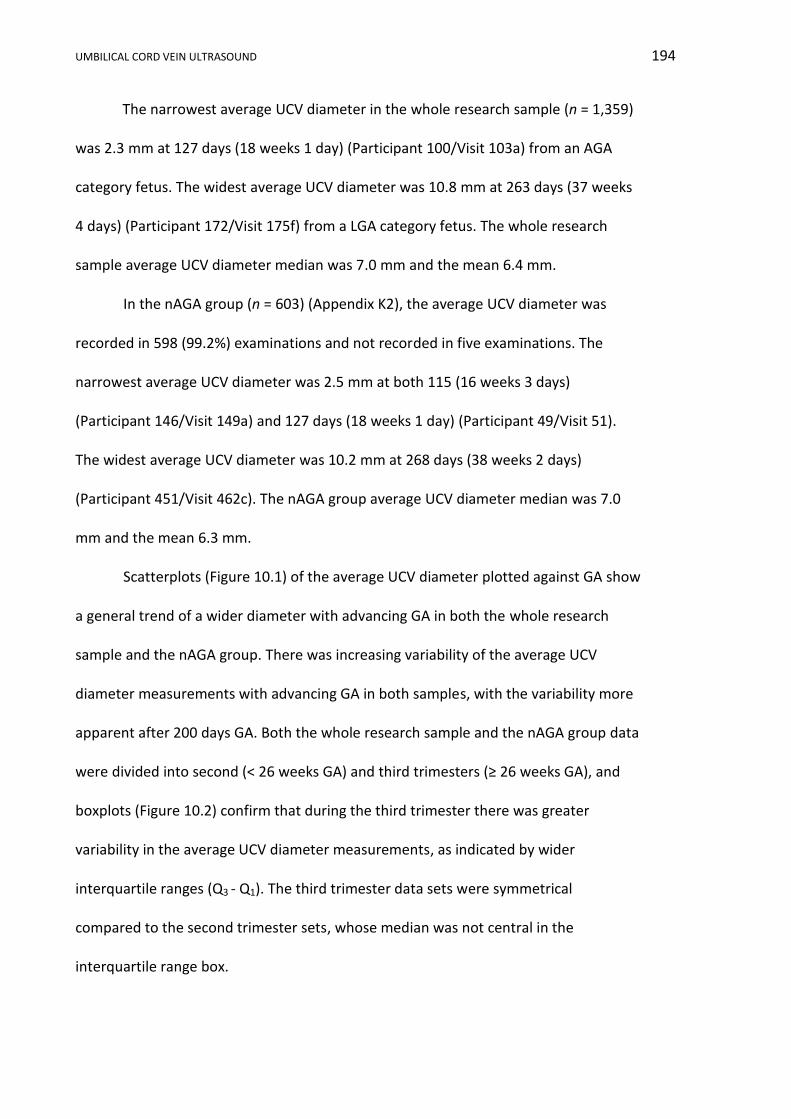
UMBILICAL CORD VEIN ULTRASOUND 194
The narrowest average UCV diameter in the whole research sample (n = 1,359)
was 2.3 mm at 127 days (18 weeks 1 day) (Participant 100/Visit 103a) from an AGA
category fetus. The widest average UCV diameter was 10.8 mm at 263 days (37 weeks
4 days) (Participant 172/Visit 175f) from a LGA category fetus. The whole research
sample average UCV diameter median was 7.0 mm and the mean 6.4 mm.
In the nAGA group (n = 603) (Appendix K2), the average UCV diameter was
recorded in 598 (99.2%) examinations and not recorded in five examinations. The
narrowest average UCV diameter was 2.5 mm at both 115 (16 weeks 3 days)
(Participant 146/Visit 149a) and 127 days (18 weeks 1 day) (Participant 49/Visit 51).
The widest average UCV diameter was 10.2 mm at 268 days (38 weeks 2 days)
(Participant 451/Visit 462c). The nAGA group average UCV diameter median was 7.0
mm and the mean 6.3 mm.
Scatterplots (Figure 10.1) of the average UCV diameter plotted against GA show
a general trend of a wider diameter with advancing GA in both the whole research
sample and the nAGA group. There was increasing variability of the average UCV
diameter measurements with advancing GA in both samples, with the variability more
apparent after 200 days GA. Both the whole research sample and the nAGA group data
were divided into second (< 26 weeks GA) and third trimesters (≥ 26 weeks GA), and
boxplots (Figure 10.2) confirm that during the third trimester there was greater
variability in the average UCV diameter measurements, as indicated by wider
interquartile ranges (Q3 - Q1). The third trimester data sets were symmetrical
compared to the second trimester sets, whose median was not central in the
interquartile range box.
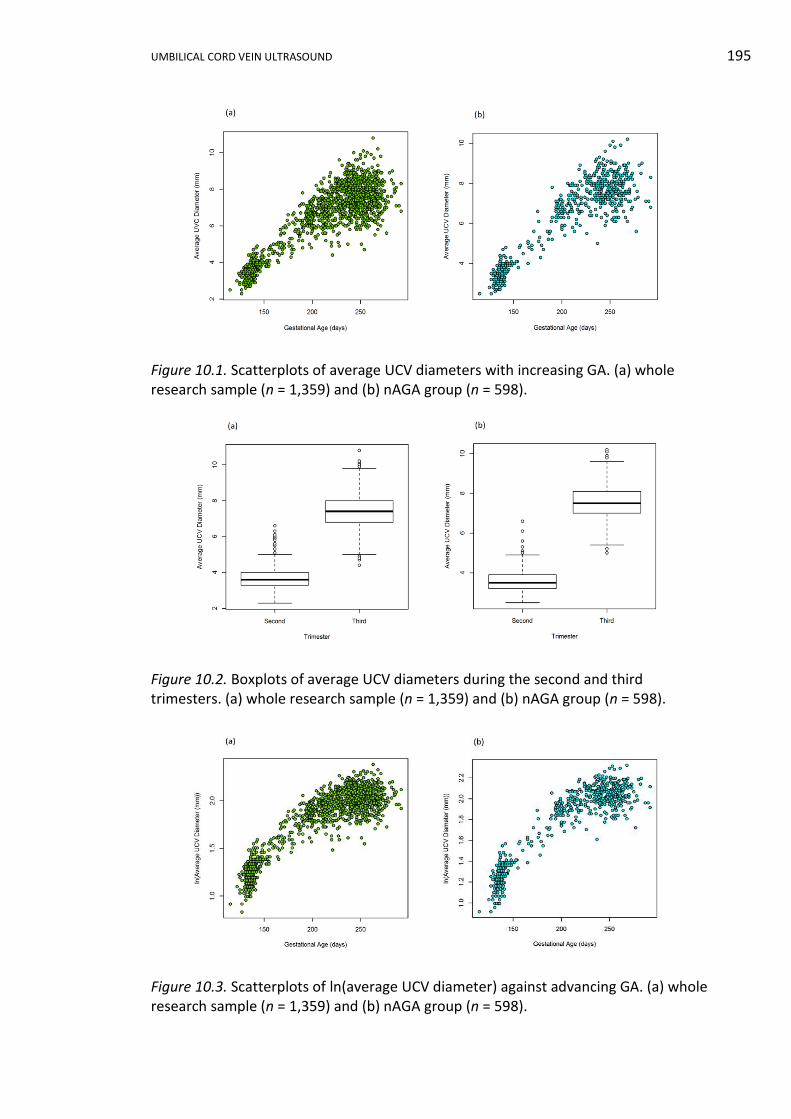
UMBILICAL CORD VEIN ULTRASOUND 195
Figure 10.1. Scatterplots of average UCV diameters with increasing GA. (a) whole research sample (n = 1,359) and (b) nAGA group (n = 598).
Figure 10.2. Boxplots of average UCV diameters during the second and third trimesters. (a) whole research sample (n = 1,359) and (b) nAGA group (n = 598).
Figure 10.3. Scatterplots of ln(average UCV diameter) against advancing GA. (a) whole research sample (n = 1,359) and (b) nAGA group (n = 598).
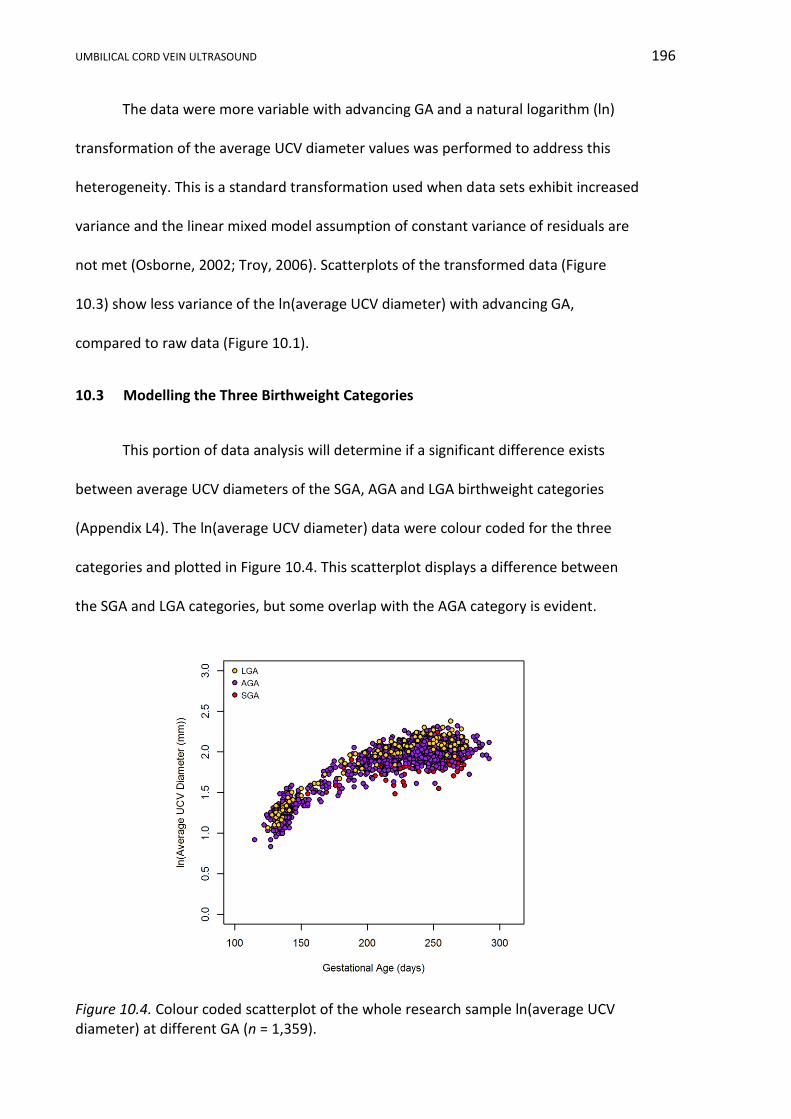
UMBILICAL CORD VEIN ULTRASOUND 196
The data were more variable with advancing GA and a natural logarithm (ln)
transformation of the average UCV diameter values was performed to address this
heterogeneity. This is a standard transformation used when data sets exhibit increased
variance and the linear mixed model assumption of constant variance of residuals are
not met (Osborne, 2002; Troy, 2006). Scatterplots of the transformed data (Figure
10.3) show less variance of the ln(average UCV diameter) with advancing GA,
compared to raw data (Figure 10.1).
10.3 Modelling the Three Birthweight Categories
This portion of data analysis will determine if a significant difference exists
between average UCV diameters of the SGA, AGA and LGA birthweight categories
(Appendix L4). The ln(average UCV diameter) data were colour coded for the three
categories and plotted in Figure 10.4. This scatterplot displays a difference between
the SGA and LGA categories, but some overlap with the AGA category is evident.
Figure 10.4. Colour coded scatterplot of the whole research sample ln(average UCV diameter) at different GA (n = 1,359).
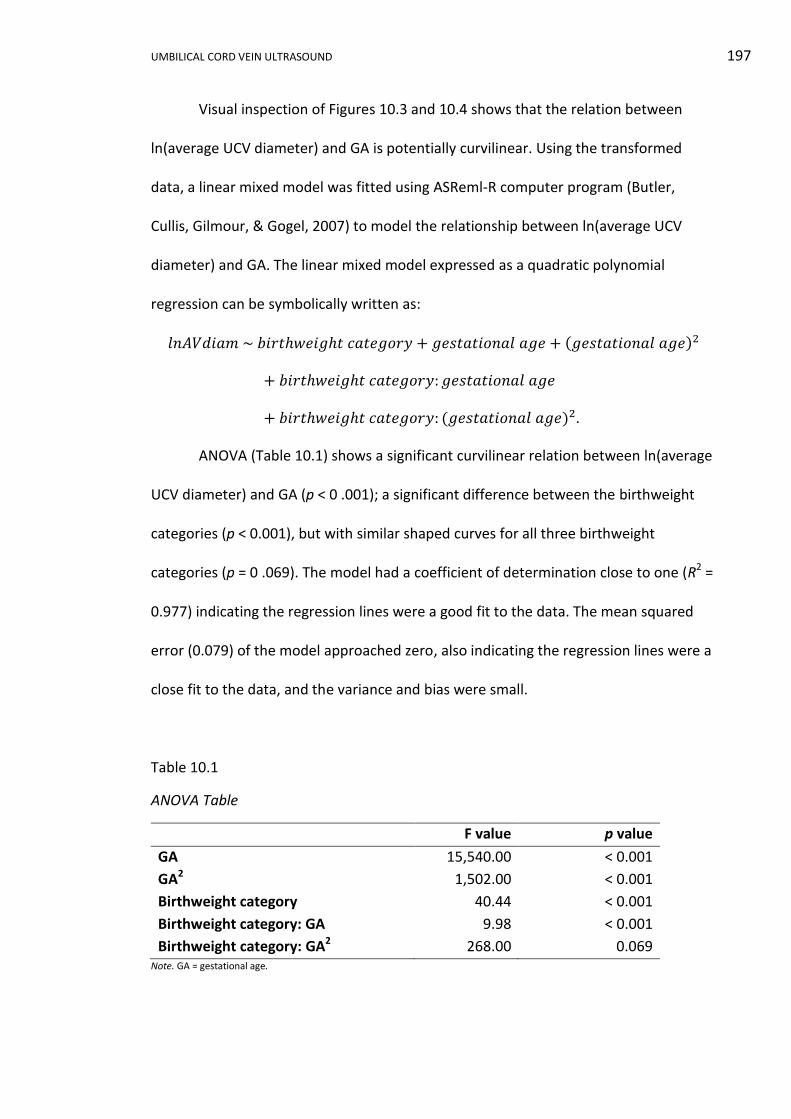
UMBILICAL CORD VEIN ULTRASOUND 197
Visual inspection of Figures 10.3 and 10.4 shows that the relation between
ln(average UCV diameter) and GA is potentially curvilinear. Using the transformed
data, a linear mixed model was fitted using ASReml-R computer program (Butler,
Cullis, Gilmour, & Gogel, 2007) to model the relationship between ln(average UCV
diameter) and GA. The linear mixed model expressed as a quadratic polynomial
regression can be symbolically written as:
𝑙𝑛𝐴𝑉𝑑𝑖𝑎𝑚 ~ 𝑏𝑖𝑟𝑡ℎ𝑤𝑒𝑖𝑔ℎ𝑡 𝑐𝑎𝑡𝑒𝑔𝑜𝑟𝑦 + 𝑔𝑒𝑠𝑡𝑎𝑡𝑖𝑜𝑛𝑎𝑙 𝑎𝑔𝑒 + (𝑔𝑒𝑠𝑡𝑎𝑡𝑖𝑜𝑛𝑎𝑙 𝑎𝑔𝑒)2
+ 𝑏𝑖𝑟𝑡ℎ𝑤𝑒𝑖𝑔ℎ𝑡 𝑐𝑎𝑡𝑒𝑔𝑜𝑟𝑦: 𝑔𝑒𝑠𝑡𝑎𝑡𝑖𝑜𝑛𝑎𝑙 𝑎𝑔𝑒
+ 𝑏𝑖𝑟𝑡ℎ𝑤𝑒𝑖𝑔ℎ𝑡 𝑐𝑎𝑡𝑒𝑔𝑜𝑟𝑦: (𝑔𝑒𝑠𝑡𝑎𝑡𝑖𝑜𝑛𝑎𝑙 𝑎𝑔𝑒)2.
ANOVA (Table 10.1) shows a significant curvilinear relation between ln(average
UCV diameter) and GA (p < 0 .001); a significant difference between the birthweight
categories (p < 0.001), but with similar shaped curves for all three birthweight
categories (p = 0 .069). The model had a coefficient of determination close to one (R2 =
0.977) indicating the regression lines were a good fit to the data. The mean squared
error (0.079) of the model approached zero, also indicating the regression lines were a
close fit to the data, and the variance and bias were small.
Table 10.1
ANOVA Table
F value p value
GA 15,540.00 < 0.001
GA2 1,502.00 < 0.001
Birthweight category 40.44 < 0.001
Birthweight category: GA 9.98 < 0.001
Birthweight category: GA2 268.00 0.069 Note. GA = gestational age.
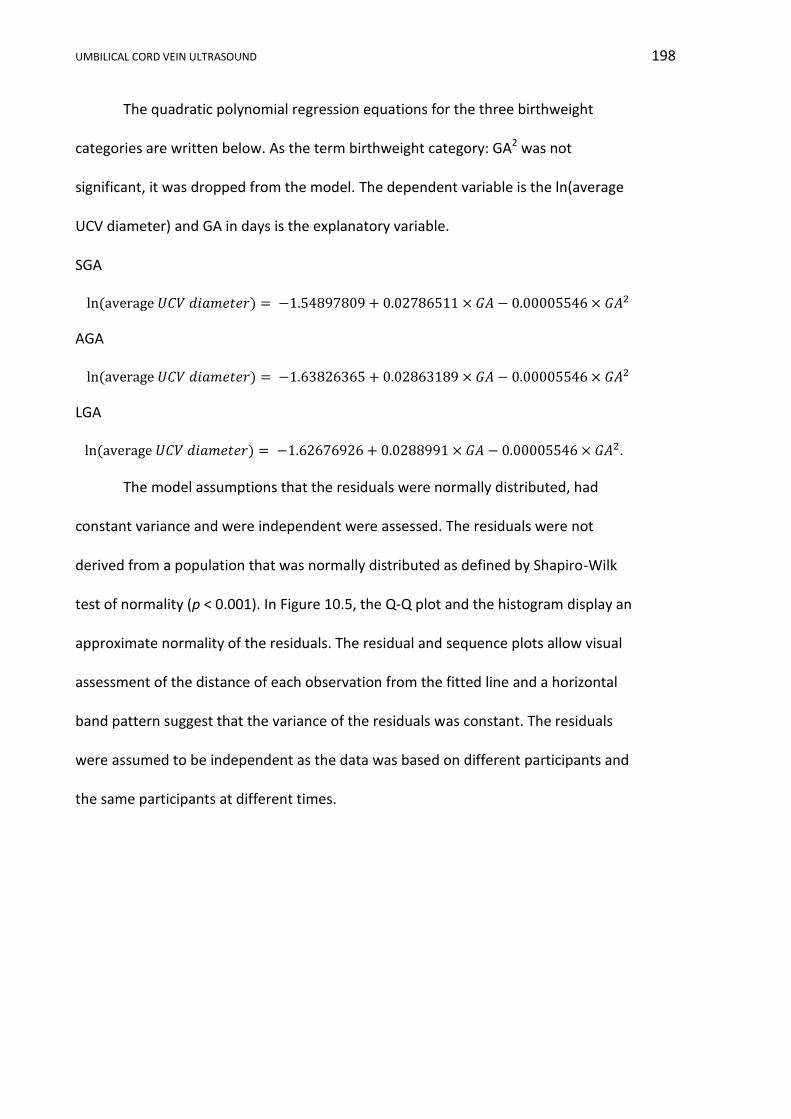
UMBILICAL CORD VEIN ULTRASOUND 198
The quadratic polynomial regression equations for the three birthweight
categories are written below. As the term birthweight category: GA2 was not
significant, it was dropped from the model. The dependent variable is the ln(average
UCV diameter) and GA in days is the explanatory variable.
SGA
ln (average 𝑈𝐶𝑉 𝑑𝑖𝑎𝑚𝑒𝑡𝑒𝑟) = −1.54897809 + 0.02786511 × 𝐺𝐴 − 0.00005546 × 𝐺𝐴2
AGA
ln (average 𝑈𝐶𝑉 𝑑𝑖𝑎𝑚𝑒𝑡𝑒𝑟) = −1.63826365 + 0.02863189 × 𝐺𝐴 − 0.00005546 × 𝐺𝐴2
LGA
ln(average 𝑈𝐶𝑉 𝑑𝑖𝑎𝑚𝑒𝑡𝑒𝑟) = −1.62676926 + 0.0288991 × 𝐺𝐴 − 0.00005546 × 𝐺𝐴2.
The model assumptions that the residuals were normally distributed, had
constant variance and were independent were assessed. The residuals were not
derived from a population that was normally distributed as defined by Shapiro-Wilk
test of normality (p < 0.001). In Figure 10.5, the Q-Q plot and the histogram display an
approximate normality of the residuals. The residual and sequence plots allow visual
assessment of the distance of each observation from the fitted line and a horizontal
band pattern suggest that the variance of the residuals was constant. The residuals
were assumed to be independent as the data was based on different participants and
the same participants at different times.
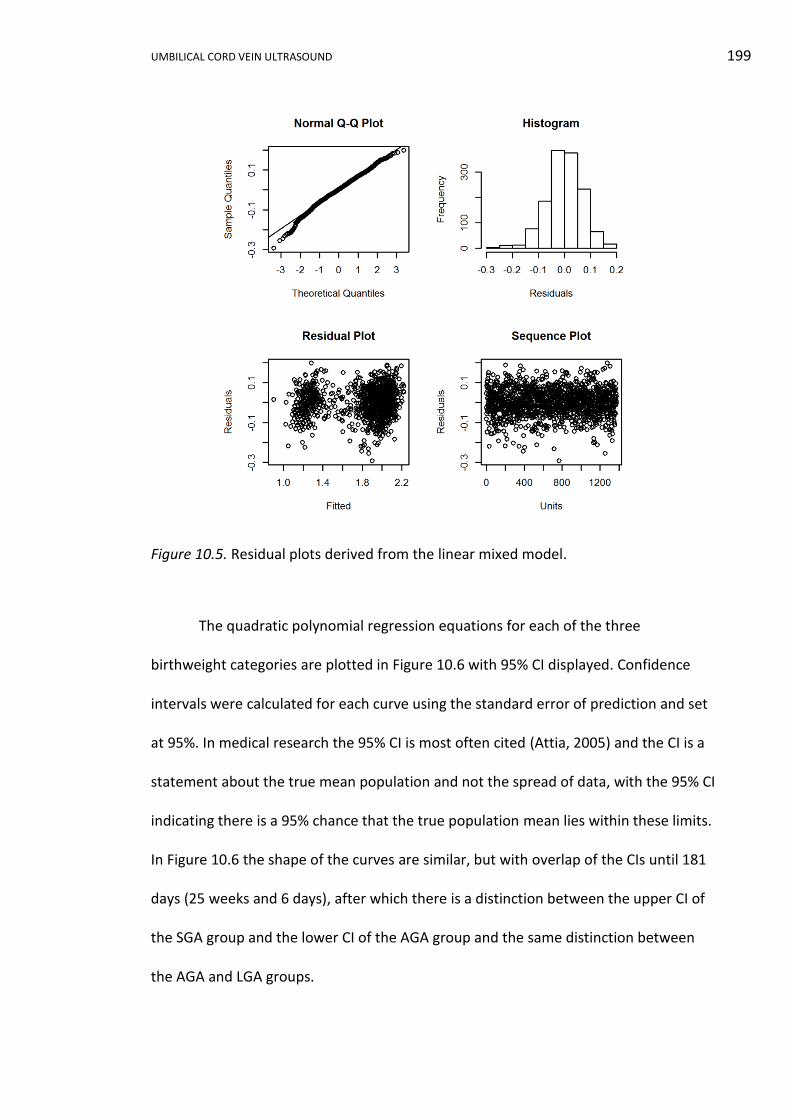
UMBILICAL CORD VEIN ULTRASOUND 199
Figure 10.5. Residual plots derived from the linear mixed model.
The quadratic polynomial regression equations for each of the three
birthweight categories are plotted in Figure 10.6 with 95% CI displayed. Confidence
intervals were calculated for each curve using the standard error of prediction and set
at 95%. In medical research the 95% CI is most often cited (Attia, 2005) and the CI is a
statement about the true mean population and not the spread of data, with the 95% CI
indicating there is a 95% chance that the true population mean lies within these limits.
In Figure 10.6 the shape of the curves are similar, but with overlap of the CIs until 181
days (25 weeks and 6 days), after which there is a distinction between the upper CI of
the SGA group and the lower CI of the AGA group and the same distinction between
the AGA and LGA groups.
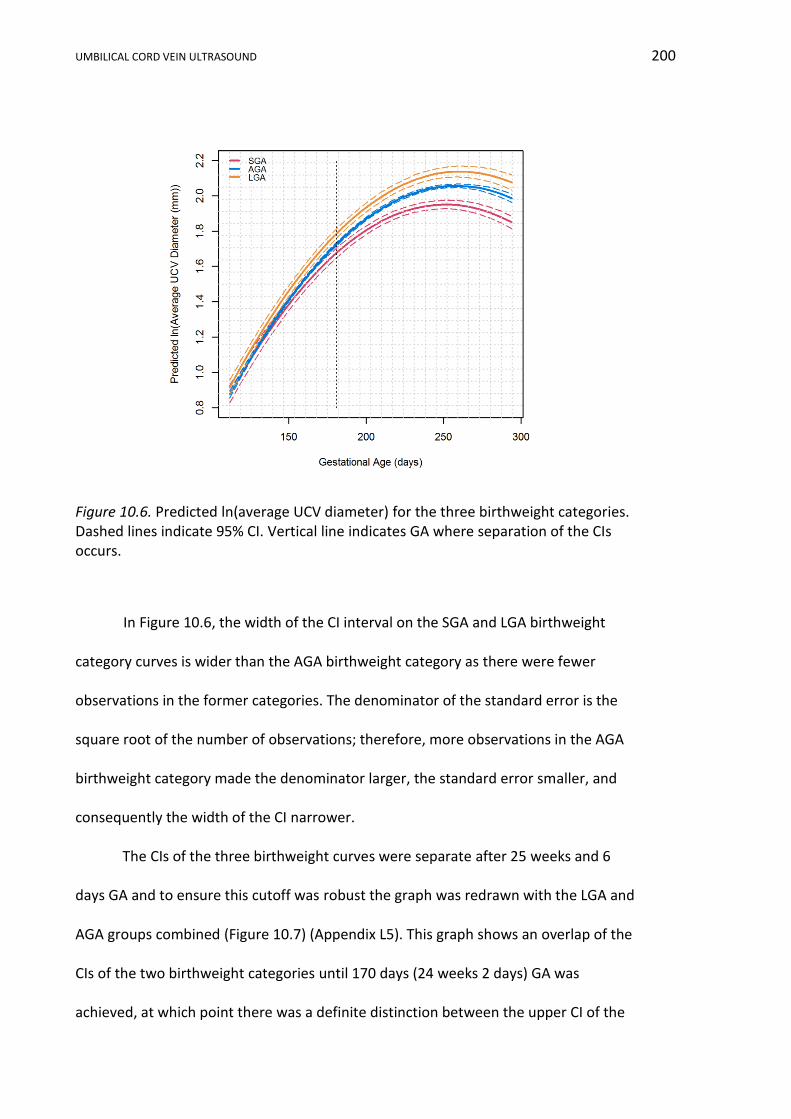
UMBILICAL CORD VEIN ULTRASOUND 200
Figure 10.6. Predicted ln(average UCV diameter) for the three birthweight categories. Dashed lines indicate 95% CI. Vertical line indicates GA where separation of the CIs occurs.
In Figure 10.6, the width of the CI interval on the SGA and LGA birthweight
category curves is wider than the AGA birthweight category as there were fewer
observations in the former categories. The denominator of the standard error is the
square root of the number of observations; therefore, more observations in the AGA
birthweight category made the denominator larger, the standard error smaller, and
consequently the width of the CI narrower.
The CIs of the three birthweight curves were separate after 25 weeks and 6
days GA and to ensure this cutoff was robust the graph was redrawn with the LGA and
AGA groups combined (Figure 10.7) (Appendix L5). This graph shows an overlap of the
CIs of the two birthweight categories until 170 days (24 weeks 2 days) GA was
achieved, at which point there was a definite distinction between the upper CI of the
UMBILICAL CORD VEIN ULTRASOUND 201
SGA and the lower CI of the combined group. The most advanced GA of 25 weeks and
6 days was chosen as the cut-off to define the separation between the birthweight
curves, as above this GA there was no overlap.
Figure 10.7. Predicted ln(average UCV diameter) for the SGA and combined AGA and LGA birthweight groups. Dashed lines indicate 95% CI. Vertical line indicates GA where separation of the CIs occurs.
In summary, linear mixed modelling of the birthweight categories showed a
curvilinear relationship between average UCV diameter and advancing GA. The
quadratic polynomial regression equations demonstrated a significant difference
among the three birthweight categories (p < 0.001). The regression curves had a
similar shape and a separation of the curves was not evident until after 25 weeks and 6
days GA.
UMBILICAL CORD VEIN ULTRASOUND 202
10.4 Developing a Reference Range (Nomogram) using Quantile Regression and
the nAGA Group
The development of a GA related reference range, from the nAGA group data,
will be reported in this portion of analysis. Visual inspection of Figures 10.1b and 10.3b
and previous analysis of the whole research sample indicated the relation between
UCV diameter and GA was potentially curvilinear.
Initially, the nAGA average UCV diameters were transformed using natural
logarithms and linear mixed modelling was used to model the correlation within
participants using the ASReml-R computer program (Butler et al., 2007). The model
assumptions that the residuals were normally distributed, had constant variance, were
independent, and that the factor level variances were equal, were assessed. The
residuals were not derived from a normally distributed population as assessed by the
Shapiro-Wilk test of normality (p = 0.006). The Q-Q plot and the histogram also showed
the assumptions of normality were not met. The residual plot showed the variance of
the residuals was constant. The residuals were assumed independent. The ln(average
UCV diameters) were back-transformed and the 95% CI described the data, but did not
encapsulate the variability of the data (Appendix L4).
The linear mixed model provided a reliable estimate of the data, but hypothesis
testing was unreliable as the data were not derived from a normally distributed
population, thereby failing to comply with one of the linear mixed model assumptions.
Most importantly, back-transformation of this model failed to accommodate the
variability in the data and therefore the CI was not estimated correctly. Linear
regression modelling was applied to the UCV PV and Qucv nAGA data and back-
transformation showed that the poor estimation of the 95% CI was even more
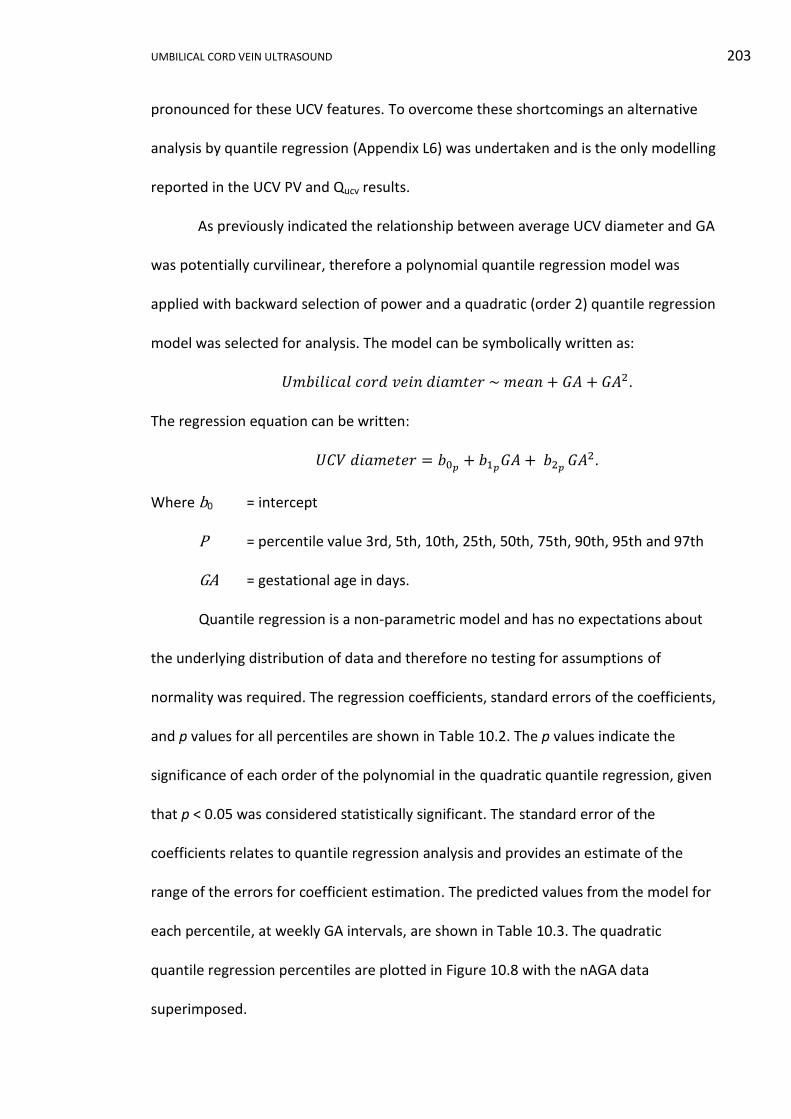
UMBILICAL CORD VEIN ULTRASOUND 203
pronounced for these UCV features. To overcome these shortcomings an alternative
analysis by quantile regression (Appendix L6) was undertaken and is the only modelling
reported in the UCV PV and Qucv results.
As previously indicated the relationship between average UCV diameter and GA
was potentially curvilinear, therefore a polynomial quantile regression model was
applied with backward selection of power and a quadratic (order 2) quantile regression
model was selected for analysis. The model can be symbolically written as:
𝑈𝑚𝑏𝑖𝑙𝑖𝑐𝑎𝑙 𝑐𝑜𝑟𝑑 𝑣𝑒𝑖𝑛 𝑑𝑖𝑎𝑚𝑡𝑒𝑟 ~ 𝑚𝑒𝑎𝑛 + 𝐺𝐴 + 𝐺𝐴2.
The regression equation can be written:
𝑈𝐶𝑉 𝑑𝑖𝑎𝑚𝑒𝑡𝑒𝑟 = 𝑏0𝑝+ 𝑏1𝑝
𝐺𝐴 + 𝑏2𝑝 𝐺𝐴2.
Where b0 = intercept
P = percentile value 3rd, 5th, 10th, 25th, 50th, 75th, 90th, 95th and 97th
GA = gestational age in days.
Quantile regression is a non-parametric model and has no expectations about
the underlying distribution of data and therefore no testing for assumptions of
normality was required. The regression coefficients, standard errors of the coefficients,
and p values for all percentiles are shown in Table 10.2. The p values indicate the
significance of each order of the polynomial in the quadratic quantile regression, given
that p < 0.05 was considered statistically significant. The standard error of the
coefficients relates to quantile regression analysis and provides an estimate of the
range of the errors for coefficient estimation. The predicted values from the model for
each percentile, at weekly GA intervals, are shown in Table 10.3. The quadratic
quantile regression percentiles are plotted in Figure 10.8 with the nAGA data
superimposed.
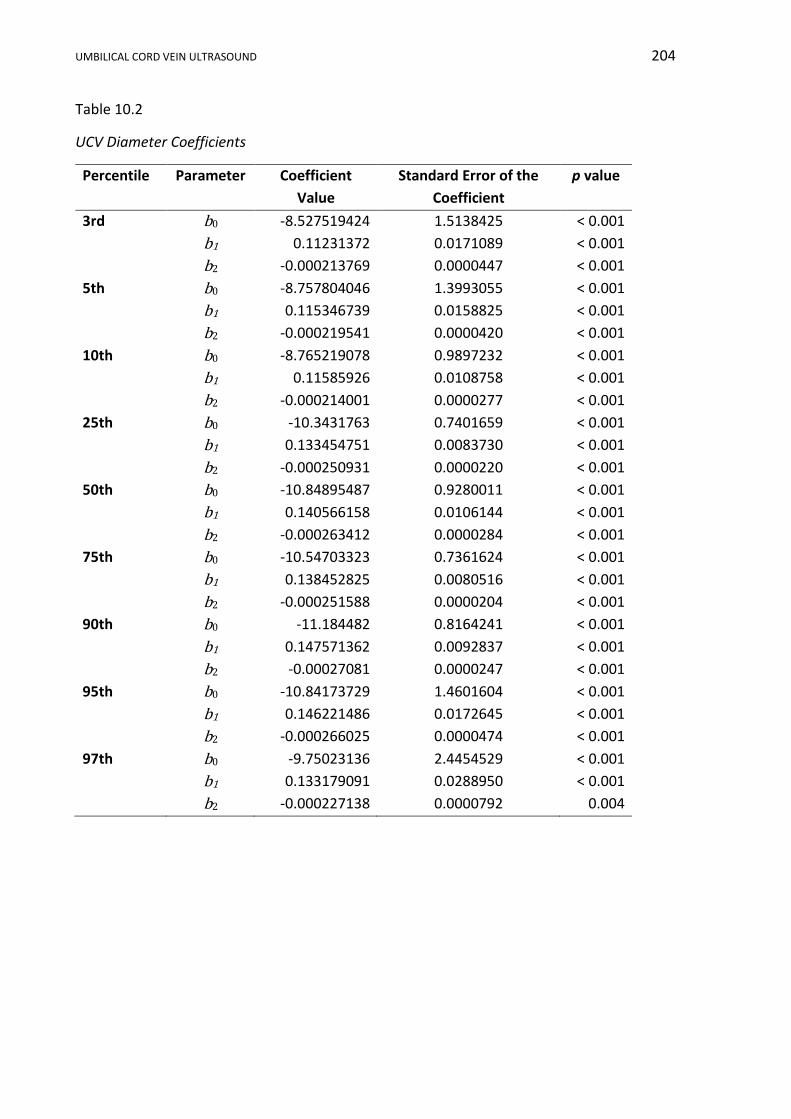
UMBILICAL CORD VEIN ULTRASOUND 204
Table 10.2
UCV Diameter Coefficients
Percentile Parameter Coefficient
Value
Standard Error of the
Coefficient
p value
3rd b0 -8.527519424 1.5138425 < 0.001
b1 0.11231372 0.0171089 < 0.001
b2 -0.000213769 0.0000447 < 0.001
5th b0 -8.757804046 1.3993055 < 0.001
b1 0.115346739 0.0158825 < 0.001
b2 -0.000219541 0.0000420 < 0.001
10th b0 -8.765219078 0.9897232 < 0.001
b1 0.11585926 0.0108758 < 0.001
b2 -0.000214001 0.0000277 < 0.001
25th b0 -10.3431763 0.7401659 < 0.001
b1 0.133454751 0.0083730 < 0.001
b2 -0.000250931 0.0000220 < 0.001
50th b0 -10.84895487 0.9280011 < 0.001
b1 0.140566158 0.0106144 < 0.001
b2 -0.000263412 0.0000284 < 0.001
75th b0 -10.54703323 0.7361624 < 0.001
b1 0.138452825 0.0080516 < 0.001
b2 -0.000251588 0.0000204 < 0.001
90th b0 -11.184482 0.8164241 < 0.001
b1 0.147571362 0.0092837 < 0.001
b2 -0.00027081 0.0000247 < 0.001
95th b0 -10.84173729 1.4601604 < 0.001
b1 0.146221486 0.0172645 < 0.001
b2 -0.000266025 0.0000474 < 0.001
97th b0 -9.75023136 2.4454529 < 0.001
b1 0.133179091 0.0288950 < 0.001
b2 -0.000227138 0.0000792 0.004
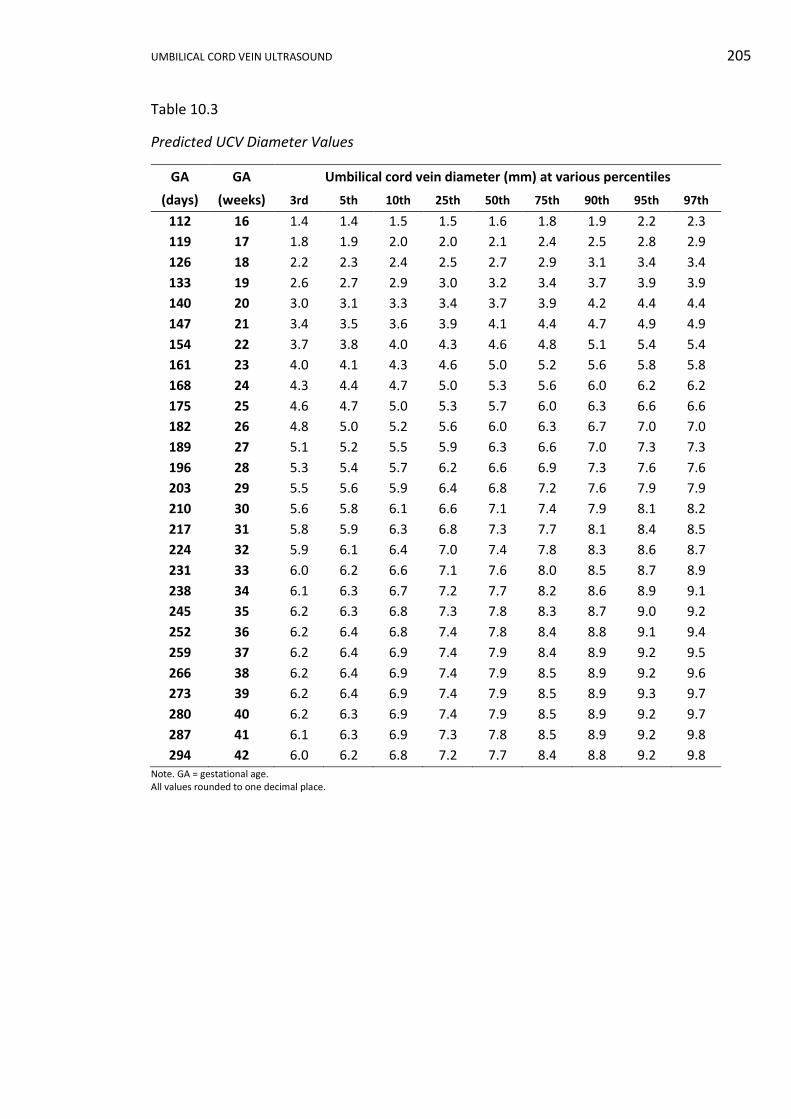
UMBILICAL CORD VEIN ULTRASOUND 205
Table 10.3
Predicted UCV Diameter Values
GA GA Umbilical cord vein diameter (mm) at various percentiles
(days) (weeks) 3rd 5th 10th 25th 50th 75th 90th 95th 97th
112 16 1.4 1.4 1.5 1.5 1.6 1.8 1.9 2.2 2.3
119 17 1.8 1.9 2.0 2.0 2.1 2.4 2.5 2.8 2.9
126 18 2.2 2.3 2.4 2.5 2.7 2.9 3.1 3.4 3.4
133 19 2.6 2.7 2.9 3.0 3.2 3.4 3.7 3.9 3.9
140 20 3.0 3.1 3.3 3.4 3.7 3.9 4.2 4.4 4.4
147 21 3.4 3.5 3.6 3.9 4.1 4.4 4.7 4.9 4.9
154 22 3.7 3.8 4.0 4.3 4.6 4.8 5.1 5.4 5.4
161 23 4.0 4.1 4.3 4.6 5.0 5.2 5.6 5.8 5.8
168 24 4.3 4.4 4.7 5.0 5.3 5.6 6.0 6.2 6.2
175 25 4.6 4.7 5.0 5.3 5.7 6.0 6.3 6.6 6.6
182 26 4.8 5.0 5.2 5.6 6.0 6.3 6.7 7.0 7.0
189 27 5.1 5.2 5.5 5.9 6.3 6.6 7.0 7.3 7.3
196 28 5.3 5.4 5.7 6.2 6.6 6.9 7.3 7.6 7.6
203 29 5.5 5.6 5.9 6.4 6.8 7.2 7.6 7.9 7.9
210 30 5.6 5.8 6.1 6.6 7.1 7.4 7.9 8.1 8.2
217 31 5.8 5.9 6.3 6.8 7.3 7.7 8.1 8.4 8.5
224 32 5.9 6.1 6.4 7.0 7.4 7.8 8.3 8.6 8.7
231 33 6.0 6.2 6.6 7.1 7.6 8.0 8.5 8.7 8.9
238 34 6.1 6.3 6.7 7.2 7.7 8.2 8.6 8.9 9.1
245 35 6.2 6.3 6.8 7.3 7.8 8.3 8.7 9.0 9.2
252 36 6.2 6.4 6.8 7.4 7.8 8.4 8.8 9.1 9.4
259 37 6.2 6.4 6.9 7.4 7.9 8.4 8.9 9.2 9.5
266 38 6.2 6.4 6.9 7.4 7.9 8.5 8.9 9.2 9.6
273 39 6.2 6.4 6.9 7.4 7.9 8.5 8.9 9.3 9.7
280 40 6.2 6.3 6.9 7.4 7.9 8.5 8.9 9.2 9.7
287 41 6.1 6.3 6.9 7.3 7.8 8.5 8.9 9.2 9.8
294 42 6.0 6.2 6.8 7.2 7.7 8.4 8.8 9.2 9.8 Note. GA = gestational age. All values rounded to one decimal place.
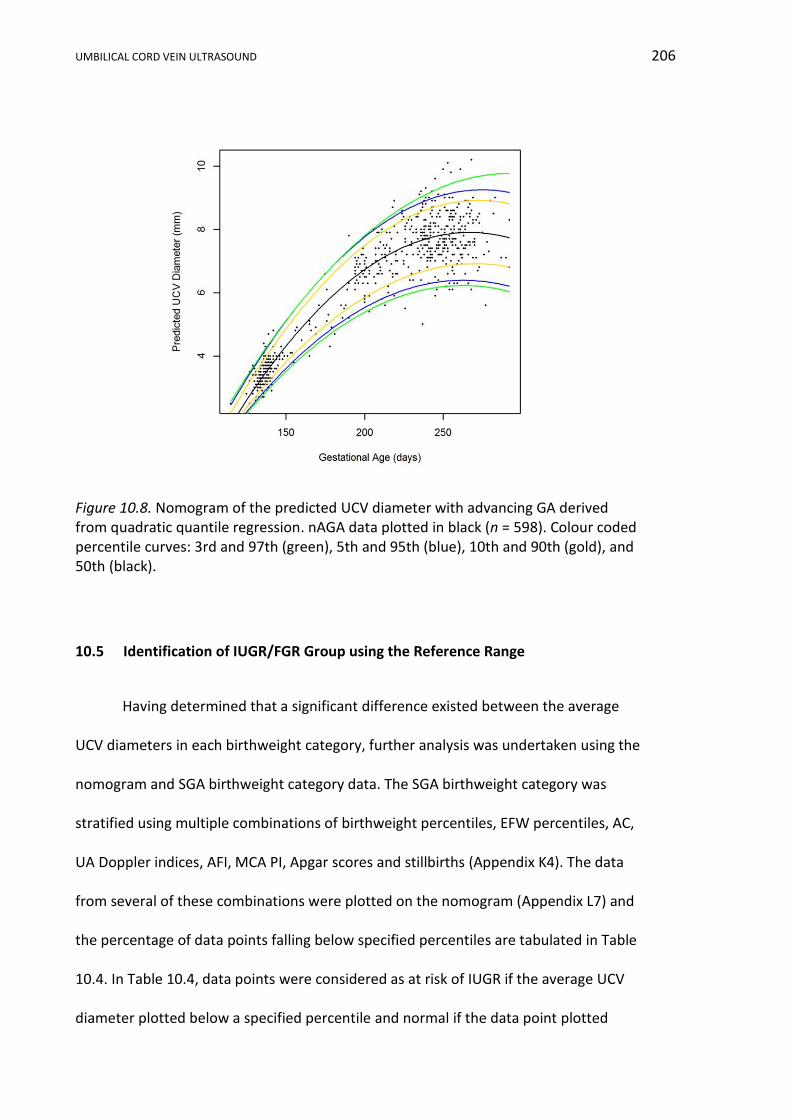
UMBILICAL CORD VEIN ULTRASOUND 206
Figure 10.8. Nomogram of the predicted UCV diameter with advancing GA derived from quadratic quantile regression. nAGA data plotted in black (n = 598). Colour coded percentile curves: 3rd and 97th (green), 5th and 95th (blue), 10th and 90th (gold), and 50th (black).
10.5 Identification of IUGR/FGR Group using the Reference Range
Having determined that a significant difference existed between the average
UCV diameters in each birthweight category, further analysis was undertaken using the
nomogram and SGA birthweight category data. The SGA birthweight category was
stratified using multiple combinations of birthweight percentiles, EFW percentiles, AC,
UA Doppler indices, AFI, MCA PI, Apgar scores and stillbirths (Appendix K4). The data
from several of these combinations were plotted on the nomogram (Appendix L7) and
the percentage of data points falling below specified percentiles are tabulated in Table
10.4. In Table 10.4, data points were considered as at risk of IUGR if the average UCV
diameter plotted below a specified percentile and normal if the data point plotted
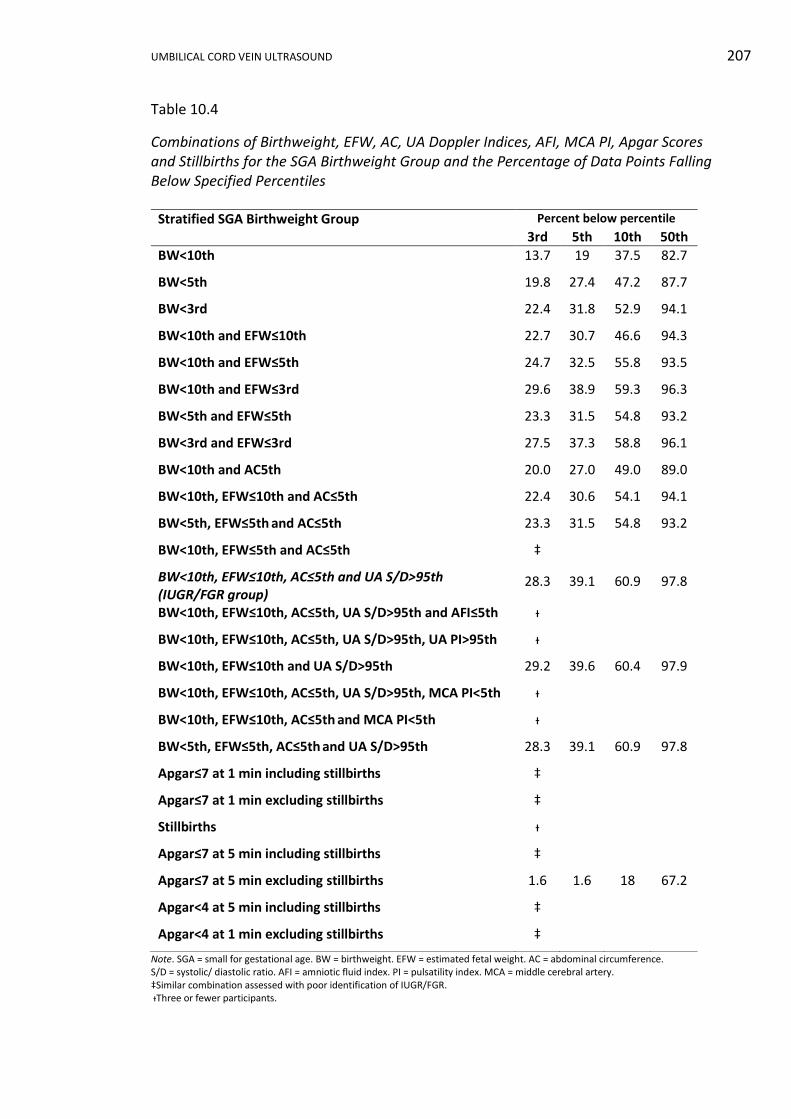
UMBILICAL CORD VEIN ULTRASOUND 207
Table 10.4
Combinations of Birthweight, EFW, AC, UA Doppler Indices, AFI, MCA PI, Apgar Scores and Stillbirths for the SGA Birthweight Group and the Percentage of Data Points Falling Below Specified Percentiles
Note. SGA = small for gestational age. BW = birthweight. EFW = estimated fetal weight. AC = abdominal circumference. S/D = systolic/ diastolic ratio. AFI = amniotic fluid index. PI = pulsatility index. MCA = middle cerebral artery. ‡Similar combination assessed with poor identification of IUGR/FGR. ᵻThree or fewer participants.
Stratified SGA Birthweight Group Percent below percentile
3rd 5th 10th 50th
BW<10th 13.7 19 37.5 82.7
BW<5th 19.8 27.4 47.2 87.7
BW<3rd 22.4 31.8 52.9 94.1
BW<10th and EFW≤10th 22.7 30.7 46.6 94.3
BW<10th and EFW≤5th 24.7 32.5 55.8 93.5
BW<10th and EFW≤3rd 29.6 38.9 59.3 96.3
BW<5th and EFW≤5th 23.3 31.5 54.8 93.2
BW<3rd and EFW≤3rd 27.5 37.3 58.8 96.1
BW<10th and AC5th 20.0 27.0 49.0 89.0
BW<10th, EFW≤10th and AC≤5th 22.4 30.6 54.1 94.1
BW<5th, EFW≤5th and AC≤5th 23.3 31.5 54.8 93.2
BW<10th, EFW≤5th and AC≤5th ‡
BW<10th, EFW≤10th, AC≤5th and UA S/D>95th
(IUGR/FGR group) 28.3 39.1 60.9 97.8
BW<10th, EFW≤10th, AC≤5th, UA S/D>95th and AFI≤5th ᵻ
BW<10th, EFW≤10th, AC≤5th, UA S/D>95th, UA PI>95th ᵻ
BW<10th, EFW≤10th and UA S/D>95th 29.2 39.6 60.4 97.9
BW<10th, EFW≤10th, AC≤5th, UA S/D>95th, MCA PI<5th ᵻ
BW<10th, EFW≤10th, AC≤5th and MCA PI<5th ᵻ
BW<5th, EFW≤5th, AC≤5th and UA S/D>95th 28.3 39.1 60.9 97.8
Apgar≤7 at 1 min including stillbirths ‡
Apgar≤7 at 1 min excluding stillbirths ‡
Stillbirths ᵻ
Apgar≤7 at 5 min including stillbirths ‡
Apgar≤7 at 5 min excluding stillbirths 1.6 1.6 18 67.2
Apgar<4 at 5 min including stillbirths ‡
Apgar<4 at 1 min excluding stillbirths ‡

UMBILICAL CORD VEIN ULTRASOUND 208
above the same specified percentile. Not all combinations were analysed as there
were three or fewer participants in some categories, thus providing an insufficient
number of data points for statistical analysis. In other cases, more severe IUGR
combinations had been analysed and the results were inconclusive, inferring that less
severe combinations would not provide any more useful information and therefore
analysis was not undertaken.
Three combinations had similar detection rates and two combinations had
equal highest rates of 60.9% of attendances using the 10th percentile as a cutoff. The
two combinations with the highest detection rate at the 10th percentile contained the
same seven participants providing 46 data points, and one of these two combinations
was the previously defined the IUGR/FGR group (Subsection 3.10). The IUGR/FGR
group average UCV diameters are plotted on the nomogram in Figure 10.9.
Figure 10.9. Nomogram of the UCV diameter with advancing GA with the IUGR/FGR group data points plotted in red (n = 46). Colour coded percentile curves: 3rd and 97th (green), 5th and 95th (blue), 10th and 90th (gold), and 50th (black).
UMBILICAL CORD VEIN ULTRASOUND 209
10.6 Conclusion
The narrowest UCV diameter recorded in the whole research sample was 2.3
mm and the widest was 10.8 mm. The narrowest UCV diameter recorded in the nAGA
group was 2.5 mm and the widest was 10.2 mm. The narrowest UCV 50th percentile
predicted diameter was 1.6 mm and the widest was 7.9 mm during the 37th to 40th
weeks. A curvilinear relation between average UCV diameter and GA was established.
Linear mixed regression was used to model the three birthweight categories. A
significant difference between the ln(average UCV diameters) in each birthweight
categories was identified. The regression curves had a similar shape and a separation
of the CI curves was not evident until after 25 weeks and 6 days GA.
Initially a linear mixed regression was used to model the nAGA group data, but
all model assumptions were not upheld. Consequently, quadratic quantile regression
was used to model the nAGA data and develop a reference range of the UCV diameter
with advancing GA. The coefficients for the regression formula and the calculated
values for each percentile were presented. Multiple combinations of birthweight
percentiles, EFW percentiles, AC, UA Doppler indices, AFI, MCA PI, Apgar scores and
stillbirths were established from the SGA birthweight category and analyses against
the nomogram. Using the reference range, 60.9% of the IUGR/FGR group data plotted
below 10th percentile.
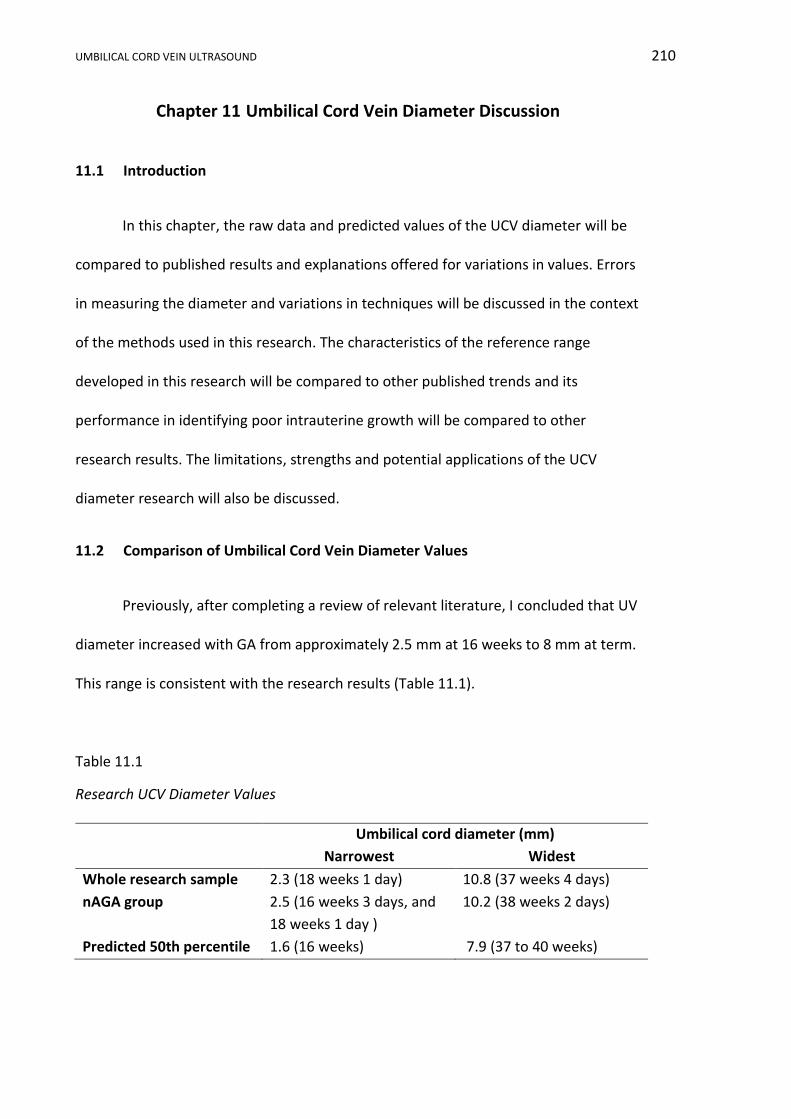
UMBILICAL CORD VEIN ULTRASOUND 210
Chapter 11 Umbilical Cord Vein Diameter Discussion
11.1 Introduction
In this chapter, the raw data and predicted values of the UCV diameter will be
compared to published results and explanations offered for variations in values. Errors
in measuring the diameter and variations in techniques will be discussed in the context
of the methods used in this research. The characteristics of the reference range
developed in this research will be compared to other published trends and its
performance in identifying poor intrauterine growth will be compared to other
research results. The limitations, strengths and potential applications of the UCV
diameter research will also be discussed.
11.2 Comparison of Umbilical Cord Vein Diameter Values
Previously, after completing a review of relevant literature, I concluded that UV
diameter increased with GA from approximately 2.5 mm at 16 weeks to 8 mm at term.
This range is consistent with the research results (Table 11.1).
Table 11.1
Research UCV Diameter Values
Umbilical cord diameter (mm)
Narrowest Widest
Whole research sample 2.3 (18 weeks 1 day) 10.8 (37 weeks 4 days)
nAGA group 2.5 (16 weeks 3 days, and
18 weeks 1 day )
10.2 (38 weeks 2 days)
Predicted 50th percentile 1.6 (16 weeks) 7.9 (37 to 40 weeks)
UMBILICAL CORD VEIN ULTRASOUND 211
The UV diameter measurements and methods published in research spanning
26 years are summarised in Table 11.2. In the following discussion, I explore the
similarities and differences of these publications with the research results and propose
possible reasons for variations. In Table 11.2, UV diameters acquired from either
longitudinal or transverse planes were relatively similar. Weissman et al. (1994)
determined that longitudinal and transverse measurement of the umbilical cord and
vessels were very similar and they preferred the longitudinal plane, as it was easier to
obtain measurements.
In Table 11.2, the intra-abdominal measurements were narrower than intra-
amniotic ones and both were narrower than measurements at the abdominal wall. The
intra-abdominal UV diameter was expected to be the smallest, as it is within the
confines of the fetal abdominal cavity and liver. It was unexpected that the
measurement at the abdominal wall was wider than the UCV measurement, as there is
a significant reduction in the UCV diameter as it approaches the fetus (W. Li et al.,
2006) and it has been shown that the UV diameter at the abdominal wall was smaller
than in the cord, but similar to the intra-abdominal measurement (Skulstad, Kiserud, &
Rasmussen, 2004). Barbieri et al. (2012) were the only authors to include the vein wall
in the UV diameter and as expected their diameters were larger than all inner to inner
measurements after 20 weeks GA.
Table 11.2 shows greater variability of UV diameter values with advancing GA.
At 22 weeks GA, when data from all eight publications were available, the range was
3.5 mm to 5.4 mm with a difference of 1.9 mm. At 39 weeks, the oldest GA when all
results are available, the range was 6.6 mm to 9.0 mm a difference of 2.4 mm. This
UMBILICAL CORD VEIN ULTRASOUND 212
increase in the range of diameters at comparable GA reflects the increased variance
displayed in raw data from this research.
Predicted maximum and term diameter measurements reflect the model
chosen to describe the data. Linear modelling resulted in a continual rise and a
maximum diameter at the oldest GA, whereas curvilinear modelling may predict a
higher or lower end value depending on the regression formula. The 50th percentile
UCV diameter calculated in this research recorded a maximum diameter between 37
and 40 weeks GA followed by a decline. Only the research values followed this trend in
Table 11.2, however, this trend has been reported in other researchers (Chen et al.,
1986; Togni et al., 2007) and will be discussed in more detail later in this chapter
In summary, there was a similarity in the diameter values in Table 11.2, as they
ranged from approximately 4 mm at 20 weeks to less than 10 mm at term. The
diameter values were similar despite different methods of acquiring the diameter
measurements, sample sizes, the year of the research, and whether the values were
obtained from raw data or from regression formulae. In conclusion, the UCV diameter
values from this research are in accordance with previously published diameter values.
The major differences in results arise from measurement techniques, location of
diameter measurement and the choice of models used to describe the data.

UMBILICAL CORD VEIN ULTRASOUND 213
Table 11.2
Published and Research UV Diameters
Published research articles Authors Sutton et
al.
(1990)
Weissman
et al. (1994)
Barbera
et al.
(1999)
Acharya
et al.
(2005)
Flo et al.
(2010)
Barbieri
et al. (2012)
Rizzo et al.
(2016)
Spurway’s
research
Participants n= 74 n = 368 n = 70 n = 133 n = 53 n = 2,310 n = 852 n = 321
Data points n = 74 n = 368 n = 70 n = 511 n = 232 n = 2,310 n = 852 n = 598
Measurement site
intra-amniotic
abdominal wall
intra-amniotic
intra- abdominal
intra-amniotic
intra-amniotic
adjacent to insertion
intra-abdominal
intra-amniotic
Measurement method
not specified
inner to inner
inner to inner
inner to inner
inner to inner
outer to outer
inner to inner
inner to inner
Scan plan for measurement
transverse longitudinal transverse ? longitudinal
longitudinal longitudinal longitudinal longitudinal
Model linear linear linear curvilinear curvilinear curvilinear curvilinear curvilinear
Acquisition of measurement
formula formula formula 50th percentile
from published
charts
50th percentile
from published
charts
50th percentile
from published
charts
50th percentile
from formula
50th percentile
from formula
Gestational
age (weeks) Umbilical vein diameter (mm)
16 3.6 2.6 - - - 2.6 2.3 1.6
17 3.8 3.0 - - - 3.1 2.6 2.1
18 4.1 3.5 - - - 3.5 2.9 2.7
19 4.3 3.9 - 2.6 - 4.0 3.2 3.2
20 4.5 4.3 4.1 2.9 - 4.5 3.5 3.7
21 4.7 4.7 4.3 3.2 - 4.9 3.8 4.1
22 4.9 5.1 4.5 3.5 4.0 5.4 4.0 4.6
23 5.1 5.4 4.8 3.8 4.5 5.9 4.3 5.0
24 5.3 5.8 5.0 4.1 4.9 6.3 4.5 5.3
25 5.5 6.1 5.2 4.3 5.2 6.7 4.8 5.7
26 5.7 6.4 5.5 4.6 5.5 7.1 5.0 6.0
27 5.9 6.7 5.7 4.8 5.8 7.4 5.2 6.3
28 6.2 7.0 5.9 5.0 6.0 7.7 5.4 6.6
29 6.4 7.3 6.2 5.2 6.3 7.9 5.6 6.8
30 6.6 7.5 6.4 5.4 6.5 8.1 5.8 7.1
31 6.8 7.7 6.6 5.5 6.6 8.3 6.0 7.3
32 7.0 7.9 6.9 5.7 6.8 7.5 6.2 7.4
33 7.2 8.1 7.1 5.9 7.0 8.6 6.3 7.6
34 7.4 8.3 7.3 6.0 7.1 8.7 6.5 7.7
35 7.6 8.5 7.6 6.1 7.2 8.8 6.7 7.8
36 7.8 8.7 7.8 6.2 7.3 8.8 6.8 7.8
37 8.0 8.8 8.0 6.4 7.4 8.9 6.9 7.9
38 8.3 8.9 8.3 6.5 7.5 9.0 7.1 7.9
39 8.5 9.0 8.5 6.6 7.6 9.0 7.2 7.9
40 8.7 9.1 8.7 6.7 - 9.1 7.3 7.9
41 8.9 9.2 8.9 6.8 - - - 7.8
42 9.1 9.2 9.2 - - - - 7.7 Note. All measurements rounded to one decimal place for comparison
UMBILICAL CORD VEIN ULTRASOUND 214
11.3 Errors and Method Variations in Measuring the Umbilical Vein Diameter
There are several possible errors and variations in UV diameter measurement
techniques including averaging diameter measurements, UV measurement sites,
measurement planes and fetal behavioural states. Measurement accuracy has
improved with enhanced computer measurement tools and new technologies such as
tissue harmonics.
11.3.1 Averaging measurements.
The research protocol used the mean of three UCV diameter measurements to
improve accuracy of the diameter value used in subsequent calculations, as a small
error in the diameter measurement results in a large error in the area calculation and
Quv (Link et al., 2007; Rizzo et al., 2016). Kiserud and Rasmussen (1998) repeated
measurements of the intra-abdominal UV between two and 20 times on 163
participants and found that by increasing the repeated measurements from one to
five, the error in the measurement was halved (Figure 11.1). Kiserud, Saito, Ozaki,
Rasmussen, and Hanson (1999) used silicone rods implanted into sheep to validate
their hypothesis that UV diameters were highly reproducible when averaging repeated
measurements; these researchers concluded that variations in measurements was
halved when three to five measurements were averaged, but further improvement
was difficult to achieve. Using Kiserud et al.’s (1999) research, Figueras et al. (2008)
concluded that repeating the UV diameter between three and five times greatly
improved clinical accuracy. Both Figureras et al.’s (2008) and Kiserud et al.’s (1999)
findings support the research method of using the mean of three UCV diameter
measurements and they highlight the trade-off between precision requirements and
the need to conduct a clinical examination within a limited time frame.
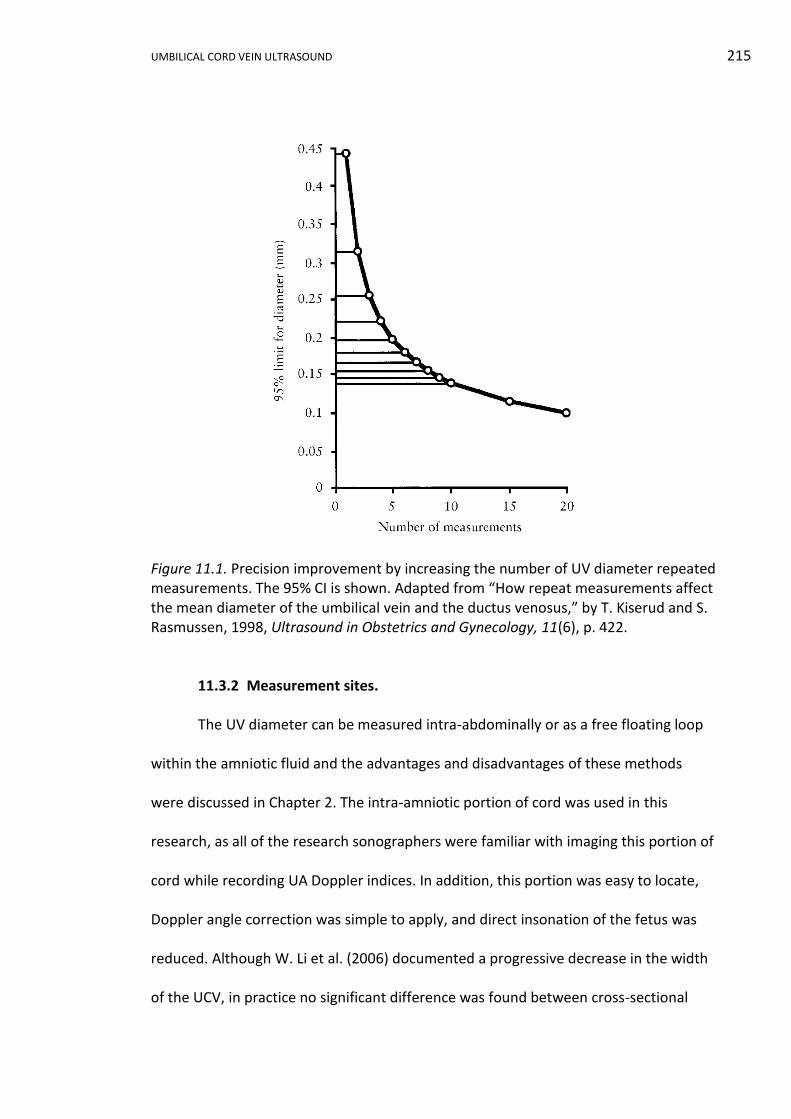
UMBILICAL CORD VEIN ULTRASOUND 215
Figure 11.1. Precision improvement by increasing the number of UV diameter repeated measurements. The 95% CI is shown. Adapted from “How repeat measurements affect the mean diameter of the umbilical vein and the ductus venosus,” by T. Kiserud and S. Rasmussen, 1998, Ultrasound in Obstetrics and Gynecology, 11(6), p. 422.
11.3.2 Measurement sites.
The UV diameter can be measured intra-abdominally or as a free floating loop
within the amniotic fluid and the advantages and disadvantages of these methods
were discussed in Chapter 2. The intra-amniotic portion of cord was used in this
research, as all of the research sonographers were familiar with imaging this portion of
cord while recording UA Doppler indices. In addition, this portion was easy to locate,
Doppler angle correction was simple to apply, and direct insonation of the fetus was
reduced. Although W. Li et al. (2006) documented a progressive decrease in the width
of the UCV, in practice no significant difference was found between cross-sectional

UMBILICAL CORD VEIN ULTRASOUND 216
areas measured at three points along the UCV (Boito et al., 2002), thus supporting the
research method of averaging three diameter measurements from different portions
of the UCV.
Figueras et al. (2008) compared the cross-sectional areas of the UV recorded by
other researchers at 30 weeks gestation. The mean intra-abdominal area was 22.6
mm2; the mean intra-amniotic area was 32.2 mm2 using the diameter and assuming a
circular vein for calculations, and was 40 mm2 using direct area measurements.
Figueras et al. (2008) proposed that standard measurement techniques ought to be
adopted because techniques were not interchangeable. Thus, Figueras et al.’s (2008)
work provides a rationale for the need to use a standardised measurement method, as
employed in this research.
11.3.3 Measurement planes.
Both the longitudinal and transverse measurement planes have limitations with
incorrect orientations causing erroneous diameter measurements. In the transverse
plane the orientation of ultrasound beam and the UV may be oblique, causing a false
cross-section and incorrect measurement of the diameter (Lees et al., 1999). Also, the
accuracy of the UV diameter in the transverse plane may be reduced if a horizontal, as
opposed to a vertical measurement, is recorded, as lateral resolution is poorer than
axial resolution in ultrasound imaging. Measurement in the longitudinal plane also
encounters errors in orientation. The ultrasound beam must be perpendicular to the
mid portion of the vessel in order to measure the most accurate central diameter as
illustrated in Figure 3.2.

UMBILICAL CORD VEIN ULTRASOUND 217
11.3.4 Vein shape.
Irrespective of the measurement plane there is an assumption that the
diameter is measured in a circular shaped vessel (Flo et al., 2010; Hoskins, 2011; Raio
et al., 1999a). This assumption may be invalid as the UCV can be distorted by extrinsic
pressure (Najafzadeh & Dickinson, 2012) and the UCV is not circular as it enters the
abdomen (Skulstad et al., 2004).The availability of trace, spline and autotrace tools
allows the circumference of odd shaped vessels to be outlined, but incurs errors of
poor calliper placement. Tracing the area of the UCV has been reported in UV research
undertaken by Boito et al. (2002), Lees et al. (1999) and Togni et al. (2007).
11.3.5 Structural variations.
Excluding the slight reduction in diameter as the cord enters the fetal
abdomen; there is an assumption that the UV has a relatively uniform diameter.
However, areas of segmental thinning of the cord have been reported (Raio et al.,
1999a) and hypercoiling may compress the UCV causing folding and narrowing (Louis,
2011). Portions of the umbilical cord may be enlarged due to structural anomalies such
as tumours, urachal cysts, omphalomesenteric cysts, knots (Bosselmann & Mielke,
2015; Di Naro, Ghezzi, Raio, Franchi, & D'Addario, 2001) and intra- and extra-
abdominal UV varices (Yagel et al., 2010). A large umbilical cord has been reported in
cases of gestational diabetes (Weissman & Jakobi, 1997); however, more recent
research has not confirmed that finding (Saha, Farhat, & Karmaker, 2014). The
inclusion of grossly abnormal diameters will distort normative assessment.
11.3.6 Calliper placement.
Incorrect calliper placement introduces measurement errors (Lees et al., 1999).
The use of a strict protocol and a familiar technique, as was employed in this research,
UMBILICAL CORD VEIN ULTRASOUND 218
helps reduce calliper placement errors. An automated measurement function designed
for nuchal translucency measurement was used for UV diameter measurements by
Rizzo et al. (2016) with the intention of reducing human error in calliper placement.
The use of the nuchal translucency measurement guidelines by Rizzo and colleagues
(2016) corroborates the choice of this technique in this research.
11.3.7 Fetal behavioural states.
Boito et al. (2004) showed that the traced UCV cross-sectional area significantly
increased (p = 0.02) in size between fetal quiescence and a behavioural state when the
fetus exhibited gross body and eye movements. These researchers proposed that fetal
activity raised cardiac inflow increasing the mean venous pressure in the UCV, which in
turn increased the vessel size due to an extremely compliant wall (Boito et al., 2004).
Thus, Boito et al.’s (2004) research reinforces the study protocol of undertaking
ultrasound UCV measurements during fetal quiescence.
11.3.8 Tissue harmonics.
Tissue harmonics imaging utilises the reflected harmonic echoes produced by
the non-linear propagation of ultrasound through soft tissues and are produced at
multiples of the fundamental frequency. The advantages of harmonic imaging are
decreased side lobe artefacts, reduced reverberation and near-field artefacts,
increased axial and lateral resolution, increased signal to nose ratio and increased
penetration without loss of detail providing improved imaging in obese patients
(Paladini, 2009; Shapiro et al., 1998; van Neera et al., 2011).
Tissue harmonics imaging has not been investigated in umbilical vein imaging
(Najafzadeh & Dickinson, 2012). Extensive research into harmonics imaging versus
conventional imaging technology was undertaken in the measurement of the nuchal
UMBILICAL CORD VEIN ULTRASOUND 219
translucency in which the use of harmonic underestimated the width of translucency
(Pasquini et al., 2010). However, RANZCOG (2011) guidelines recommend that the use
of harmonic be reviewed in respect to the nuchal image quality. The use of harmonics,
as in this research, should be reported in the methods of research papers to allow
reproduction of imaging parameters (Appendix J).
11.4 Comparison of the Nomogram with Published Reference Ranges
The predicted UCV diameters in the research project showed an increase with
advancing GA until 37 weeks, then a four week plateau, followed by a slight decrease
after 40 weeks GA; this progression was described by the quadratic quantile regression
equation: 𝑈𝐶𝑉 𝑑𝑖𝑎𝑚𝑒𝑡𝑒𝑟 = 𝑏0𝑝+ 𝑏1𝑝
𝐺𝐴 + 𝑏2𝑝 𝐺𝐴2. Using the coefficients provided
in Table 10.2, the reference ranges are plotted in Figures 11.2 and 11.3, with the latter
showing the nAGA data points. The final reference ranges graphs omitted the 3rd and
97th percentile lines because:
i. Both linear and cubic regression equations were used to describe the Qucv
producing reference ranges with percentile lines that were overlapping and
visually confusing. Omission of the 3rd and 97th percentile linear lines on
the Qucv reference ranges improved the graph’s clarity. In the interest of
continuity, all graphs were made similar.
ii. No other recent publication had included nomograms with the 3rd and
97th percentiles (Barbieri et al., 2012; Flo et al., 2010; Rizzo et al., 2016).
iii. The percentage of data points plotting below the 3rd percentile in Table
10.4 were always less than a third of all the data points and therefore was
not clinically useful.

UMBILICAL CORD VEIN ULTRASOUND 220
Figure 11.2. Nomogram of UCV diameter with advancing GA derived from quadratic quantile regression. Colour coded percentile curves: 5th and 95th (blue), 10th and 90th (gold), and 50th (black).
Figure 11.3. Nomogram of UCV diameter with advancing GA derived from quadratic quantile regression with the nAGA data points plotted in black (n = 598). Colour coded percentile curves: 5th and 95th (blue), 10th and 90th (gold), and 50th (black).
UMBILICAL CORD VEIN ULTRASOUND 221
In the following section I will discuss the varied opinions about the relationship
between UV diameter and GA, with researchers describing a linear increase of UV
diameter with advancing GA, or a curvilinear trend with an early peak followed by
either a plateau or a decline in diameter towards term.
11.4.1 Linear relation with gestational age.
A positive linear trend has been used to describe the relationship between UCV
diameter and advancing GA including early work by Sutton et al. (1990), who described
a linear relationship between the UCV diameter and advancing GA from 19 to 40
weeks, with the equation: 𝑈𝐶𝑉 𝑑𝑖𝑎𝑚𝑒𝑡𝑒𝑟 = 0.027 + 0.021𝐺𝐴. Barbera et al. (1999)
described a linear relationship between the UCV diameter and GA with the formula:
𝑈𝐶𝑉 𝑑𝑖𝑎𝑚𝑒𝑡𝑒𝑟 = 0.231585𝐺𝐴 − 0.550006. Lees et al. (1999), in a cross-sectional
study of 129 singleton pregnancies between 23 and 33 weeks GA, used an ellipse trace
measurement of the internal cross-sectional area of the UCV and demonstrated a
linear relation between area and GA. A cross-sectional study from Thailand also
described a linear relation between UCV diameter and advancing GA (Somprasit et al.,
2010).
11.4.2 Curvilinear relation with gestational age.
Other researchers found UV diameter increased rapidly until the mid-third
trimester and then the rate of increase slowed or declined. Early research by Chen et
al. (1986) showed a curvilinear relationship with intra-abdominal UV diameter and
advancing GA until 38 weeks GA, then a three week plateau and then a decline.
Weissman et al. (1994) constructed reference ranges from 14 to 42 weeks GA and
described the trend by the formula: 𝑈𝐶𝑉 𝑑𝑖𝑎𝑚𝑒𝑡𝑒𝑟 = −6.9 + 0.72𝐺𝐴 − 8.8 ×
UMBILICAL CORD VEIN ULTRASOUND 222
10−3𝐺𝐴2. This trend had bimodal peaks, but has been interpreted as a steady increase
up to 32 weeks GA and then stabilising (Togni et al., 2007).
Acharya et al. (2005) showed a curvilinear relation between GA and intra-
abdominal UV diameter, with a steady linear increase of 0.2 to 0.3 mm per week in
diameter up until the 34th week. From this point to term, the weekly increase in
diameter was 0.1 mm until a maximum at 41 weeks. Togni et al. (2007) studied 312
healthy Brazilian women with EFW between the 10th and 90th percentile based on the
Hadlock formula, with normal UA Dopplers and AFI. Togni et al. (2007) showed that
the cross-sectional area of the UCV increased up to the 34th week, then remained
relatively stable until the 38th week and then decreased after the 39th week. Although
Togni and colleagues traced the vein and automatically calculated the area, their study
showed a similar trend to the research findings. Flo et al. (2010) found a curvilinear
relationship between UCV diameter and increasing GA. While Barbieri et al. (2012)
showed a rapid increase in UCV diameter from 12 to 27 weeks, followed by a slowed
increase in diameter to a maximum at 40 weeks GA as described by the formula:
log10(UCV)= -1.717 + 0.21GA - 0.0056GA2 + 0.00005GA3.
The whole umbilical cord diameter close to the placental insertion site,
collected from 973 placenta specimens, was shown to have a non-linear relation with
GA which peaked during the 37th week and then declined until 41 weeks (Pinar &
Iyigun, 2012). The pathological specimens were 30 to 40% smaller than ultrasound
measurements, which may be explained by post-delivery cord exsanguination. The
nomograms developed from postpartum, entire umbilical cord specimens support the
general curvilinear relation between diameter and GA and a decline close to term.

UMBILICAL CORD VEIN ULTRASOUND 223
A large recent study (Rizzo et al., 2016) using quantile regression modelled a
curvilinear trend between increasing UV diameter with increasing GA, unfortunately,
the published coefficients were incorrect and therefore the formula cannot be
included. Rizzo et al.’s (2016) research showed a 0.2 to 0.3 mm increase per week up
until approximately 32 weeks GA and then only 0.1 mm per week until term. This trend
of rapid increase of the UV diameter earlier in the pregnancy with a slowing of the
growth towards term was reflected in an Australian study that found a 107% increase
in UCV diameter between results 18 and 26 weeks GA and only a 31% increase
between 26 and 34 weeks (Najafzadeh et al., 2016).
In my opinion, the consensus of published data is that the widest UV diameter
occurs during the third trimester, somewhere between 32 and 42 weeks GA. The
majority of researchers found that the rate of UV diameter increase slowed in the third
trimester and a few found a decline after a peak. In this research, the diameter
reached a peak value at 37 weeks GA and remained stable until 40 weeks GA, before
declining. A decline after a third trimester peak was also described by Chen et al.
(1986), who measured the intra-abdominal UV, Togni et al. (2007), who used the cross-
sectional area of the UCV, and Raio et al. (1999a), who described the whole umbilical
cord. A third trimester peak and then decline was also supported by assessment of
clinical specimens by Pinar and Iyigun (2012). The decline after 40 weeks GA
documented in this research may be the result of a small number of observations, as
only six average UCV diameters were recorded during the 40 to 42 week period.
Variations in the diameter of the UV in published reference ranges may be a
reflection of improvement of imaging machinery, variations in where and how the
measurements were taken, and perhaps most significantly, the interpretation of the
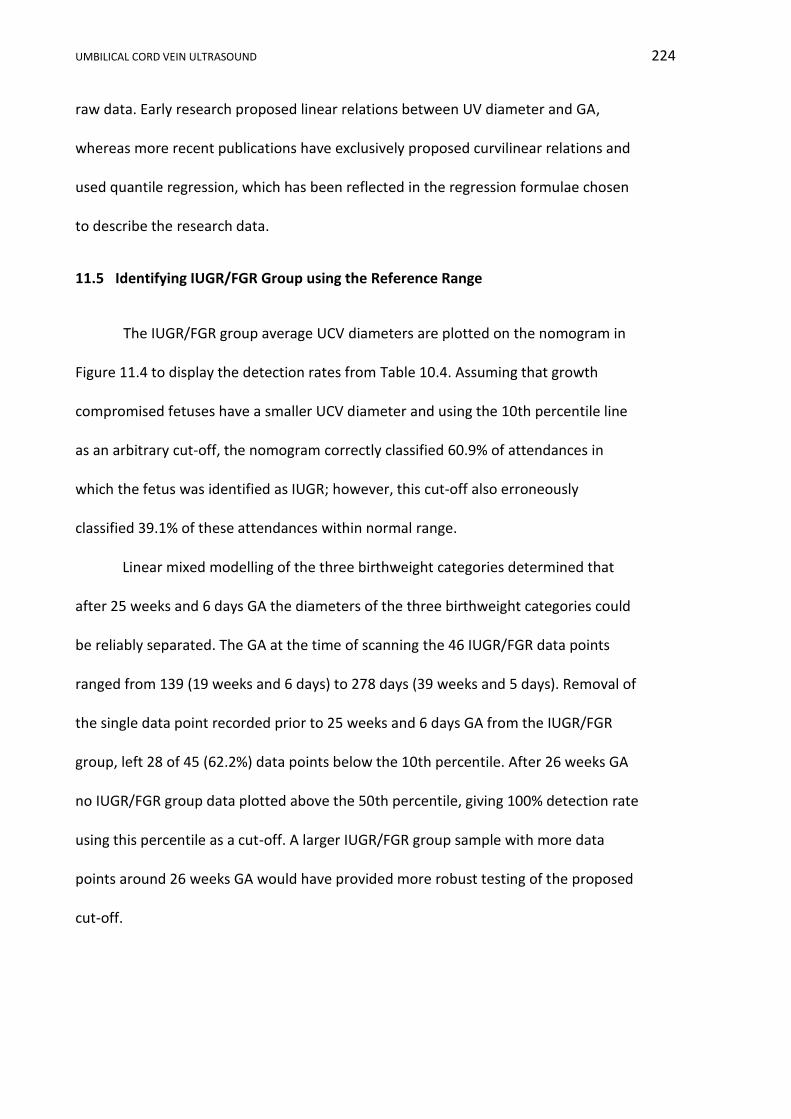
UMBILICAL CORD VEIN ULTRASOUND 224
raw data. Early research proposed linear relations between UV diameter and GA,
whereas more recent publications have exclusively proposed curvilinear relations and
used quantile regression, which has been reflected in the regression formulae chosen
to describe the research data.
11.5 Identifying IUGR/FGR Group using the Reference Range
The IUGR/FGR group average UCV diameters are plotted on the nomogram in
Figure 11.4 to display the detection rates from Table 10.4. Assuming that growth
compromised fetuses have a smaller UCV diameter and using the 10th percentile line
as an arbitrary cut-off, the nomogram correctly classified 60.9% of attendances in
which the fetus was identified as IUGR; however, this cut-off also erroneously
classified 39.1% of these attendances within normal range.
Linear mixed modelling of the three birthweight categories determined that
after 25 weeks and 6 days GA the diameters of the three birthweight categories could
be reliably separated. The GA at the time of scanning the 46 IUGR/FGR data points
ranged from 139 (19 weeks and 6 days) to 278 days (39 weeks and 5 days). Removal of
the single data point recorded prior to 25 weeks and 6 days GA from the IUGR/FGR
group, left 28 of 45 (62.2%) data points below the 10th percentile. After 26 weeks GA
no IUGR/FGR group data plotted above the 50th percentile, giving 100% detection rate
using this percentile as a cut-off. A larger IUGR/FGR group sample with more data
points around 26 weeks GA would have provided more robust testing of the proposed
cut-off.
UMBILICAL CORD VEIN ULTRASOUND 225
Figure 11.4. Nomogram of UCV diameter with advancing GA with the IUGR/FGR group data points plotted in red (n = 46). Colour coded percentile curves: 5th and 95th (blue), 10th and 90th (gold), and 50th (black).
Other published results have showed a wide range of percentages for the
detected IUGR fetuses on reference ranges. Ferrazzi et al. (2000) plotted the UCV
diameters of 37 IUGR31 fetuses against a linear nomogram provided by Barbera et al.
(1999) and concluded that UCV diameter was reduced in IUGR fetuses, but not
significantly. Ferrazzi et al.’s (2000) graph was difficult to interpret due to the large
symbol size, but at least 15 of the 37 (40.5%) IUGR fetuses plotted below the 10th
percentile. Using the UCV cross-sectional area Boito et al. (2002) found that 28 of 33
(84%) IUGR32 fetuses plotted below the 5th percentile on their reference range.
31
AC < 2 SD below mean and birthweight < 10th %
32 AC and birthweight < 5th
%
UMBILICAL CORD VEIN ULTRASOUND 226
The mean UCV diameter of the nAGA group was 6.3 mm (mean GA = 207 days)
and the mean IUGR/FGR group diameter was also 6.3 mm (mean GA = 235 days), but
at an older mean GA. Given that the diameter increases with advancing GA, the trend
of reduced diameter in the IUGR/FGR group is in keeping with previous research by
Rigano et al. (2001), who reported the UCV diameter in 21 IUGR33 fetuses was 5.09
mm and 6.42 mm in 36 age matched control fetuses. A later research group led by
Rigano et al. (2008) found that the mean UCV diameter in 22 control fetuses was 5.1
mm, compared to 4.4 mm in 14 IUGR34 live births and 3.2 mm in 12 IUGR stillbirths. In
addition, a Thailand study of 70 IUGR and 70 AGA age matched fetuses found the IUGR
UCV diameter was less than comparable AGA diameters (Somprasit et al., 2010).
Although used in several studies, direct comparison of the mean of the UV diameter
between normal and IUGR fetuses fails to consider the natural increase in diameter
with advancing GA, which is accentuated if the groups are not age matched.
In summary, the IUGR detection rate in this research was comparable to earlier
research based on the UV diameter. The research project detection rate of 62.2% also
compared favourably with other methods of IUGR identification with similar rates of
IUGR detection quoted for third trimester ultrasound biometry (67 %) (Hammad et al.,
2016) fetal weight (65.8%), AC (62.2%) and UA S/D (66.7%) (Ott, 2005).
33
AC < 2 SD below mean, UA PI > 2 SD above mean, abnormal uterine artery and birthweight < 10th % 34
AC < 2 SD below mean, UA PI > 95th % and abnormal uterine artery
UMBILICAL CORD VEIN ULTRASOUND 227
11.6 Limitations and Advantages of the Umbilical Cord Vein Diameter Results
The weaknesses of the UCV diameter measurement, development of the
reference ranges, and identification of IUGR/FGR in this research can be summarised
as follows:
i. There was sparsity of data between 23 to 28 weeks and after 39 weeks GA.
The reference range would have been more robust if the modelling did not
rely on interpolation between available data. This sparsity of data is a
reflection of referral patterns for obstetric ultrasounds in regional
hospitals. Morphological assessments are undertaken between 18 and 22
weeks gestation and most growth scans are not requested until the third
trimester, leaving a gap in late second trimester, when participants were
not referred. The sparsity of data after 39 weeks GA again reflects referral
patterns, as uncomplicated pregnancies seldom require further imaging at
this GA.
ii. In the IUGR/FGR group there were seven participants, providing 46 data
points. Again the sparsity of data between 23 and 28 weeks gestation
prohibited extensive testing of the 25 week 6 day GA defined cut-off for
separation of the three birthweight groups.
iii. The characteristics defining the IUGR/SGA group were in keeping with
other IUGR definitions; however, UA S/D was used instead of the more
specific UA PI. The use of an elevated UA PI would have isolated severe
IUGR, whereas my definition was of moderate IUGR. The differences
between the severities of IUGR definitions may explain the comparative
lower identification rates in this research.

UMBILICAL CORD VEIN ULTRASOUND 228
iv. Participants were classified on the basis of the birthweight, gender and GA
at delivery into SGA, AGA or LGA using reference ranges developed by
Dobbins et al. (2012). These charts used completed whole weeks of
pregnancy to define the newborn, which introduced errors as a fetus born
at 36 weeks and 1 day was classified as the same age at birth as a fetus
born at 36 weeks and 6 days.
Overcoming the first two limitations could involve extending data collection in
order to recruit more participants and hopefully even the spread of data across all
gestational ages. Alternatively, and as suggested by Silverwood and Cole (2007),
healthy women could be recruited specifically for developing reference ranges and
thereby not rely on data collected from women referred for medical reasons; however,
this alternative method has ethical, safety and funding issues.
The strengths of the UCV diameter measurement, development of the
reference ranges and identification of IUGR in this research can be summarised as
follows:
i. The nAGA group contained 321 participants resulting in 598 data points,
which was comparable to sample sizes to other publications and exceeded
the recommended sample size.
ii. The inclusion criteria for the nAGA group were extremely strict. This rigid
selection process ensured the data used for the development of the
reference ranges was as “normal” as possible, given the participants were
referred for obstetric ultrasounds.
iii. A high ICC calculated in this research demonstrated that measurement of
the UCV diameter was very reliable and this reproducibility should be

UMBILICAL CORD VEIN ULTRASOUND 229
exportable to everyday clinical practice, as the documented measurement
method was easy to follow.
iv. The UCV diameter measurement requires only B-mode imaging, which is
readily available in vast range of health facilities including regional and
remote centres.
v. The UCV diameter reference range is the only range developed from
Australian data.
vi. The UCV diameters from both the raw data and the 50th percentile
predicted from the quantile regression formula were in keeping with
previous published data spanning 26 years.
vii. The reference range was expressed in percentiles, which are easy to
understand, and described the percentage of observations that fell below a
predetermined value, e.g. 10th percentile.
viii. The UCV diameter reference range was developed using quantile
regression, which is robust against outlines and variance within the data.
ix. The curvilinear reference range is similar to recently published results with
clinical specimens supporting the slight decrease in diameter around term.
x. The modelling of the three birthweight categories identified a significant
difference between the birthweight groups after 26 weeks GA, which
supports opinion that the UCV diameter is reduced in cases of SGA.
xi. The reference range was able to identify 60.9% of IUGR/FGR group
attendances using only the 10th percentile and this rate increased to 62.2%
when the cut-off of 25 weeks and 6 days GA was applied. This detection
UMBILICAL CORD VEIN ULTRASOUND 230
rate compared favourably with other current ultrasound methods used for
the identification of IUGR.
11.7 Potential Application of the Umbilical Cord Vein Diameter Results
The potential of UCV diameter measurements and application of the
nomogram lies in its easy acquisition and application. The UCV diameter measurement
requires only B-mode imaging which is available on all ultrasound machines
throughout metropolitan, regional and remote Australia. The diameter is a simple,
straight forward, easily reproducible measurement that can be undertaken by
individuals of all skill levels. It is the combination of these two features that promote
the UCV diameter as a very useful diagnostic tool to individuals isolated from major
referral centres.
The detection rate was too low to permit the UCV diameter to be used as a
stand-alone parameter for the diagnosis of IUGR; however, application of the
nomogram may provide supporting evidence that could be a useful addition to the
assemblage of ultrasound parameters currently employed for the diagnosis and
monitoring of fetal growth restriction.
The UCV diameter may assist in separating normally growing small fetuses from
pathological small fetuses after 26 weeks GA. Normally growing small fetuses are
expected to have a UCV diameter which falls between the 10th and 90th percentiles.
Whereas, it would be expected that pathologically small fetuses will have UCV
diameters below the 10th percentile and never above the 50th percentile; however, a
larger sample size or a clinical trial would be needed to substantiate this expectation.
UMBILICAL CORD VEIN ULTRASOUND 231
11.8 Conclusion
This research presents the first UCV diameter reference range developed from
an Australian based “normal” obstetrics population using quantile regression. This
research demonstrated a curvilinear increase in the UCV diameter with increasing GA
up until 37 weeks, followed by a plateau lasting 4 weeks, and then a slight decline to
42 weeks GA; this trend is in keeping with other published works. Using linear mixed
modelling, a significant difference was demonstrated between the UCV diameters
recorded by the SGA, AGA and LGA birthweight categories and the CIs of these
categories did not overlap after 25 weeks and 6 days GA. The reference range correctly
identified 62.2% of IUGR/FGR group attendances after 25 weeks 6 days GA using the
10th percentile as a cut-off, suggesting the UCV diameter is reduced in fetal growth
restriction and that this easy to measure feature may have a role to play in the
diagnosis and monitoring of poor fetal growth.

UMBILICAL CORD VEIN ULTRASOUND 232
Chapter 12 Umbilical Cord Vein Peak Velocity Results
12.1 Introduction
In this chapter, the range and measures of central tendency of the average UCV
PV will be reported and scatterplots constructed to display the relationship between
average UCV PV and GA, for the whole research sample and for the nAGA group.
Statistical modelling will determine if a significant difference exists between the
average UCV PV recorded for fetuses in the three birthweight categories. Further
modelling will develop a reference range from the nAGA group data. Analysis will
determine the nomogram’s ability to identify growth restricted fetuses. Continuous
variables are reported as means ± SD and discrete variables are reported as numbers
or percentages. Where appropriate p values are provided.
12.2 The Umbilical Cord Vein Peak Velocity Data and Data Checking
The PV of the blood coursing in the UCV was measured three times for each
participant and these values were averaged to produce a UCV PV measurement for
each participant at each attendance, which is referred to as the average UCV PV. In the
whole research sample (n = 1,374) (Appendix K1) average PV measurements were
acquired in 1,360 or 98.9% of examinations undertaken. There was no omitted data in
either the SGA or LGA birthweight categories, giving 169 and 118 average UCV PV
measurements, respectively. In the AGA birthweight category, three average PV
measurements were eliminated due to phasic flow, one was eliminated due to a
Doppler angle greater than 15°, and no measurements were recorded during 10

UMBILICAL CORD VEIN ULTRASOUND 233
attendances, giving 1,073 average UCV PV measurements available for analysis in this
category.
The slowest average UCV PV recorded in the whole research sample was 8.1
cm/s at both 138 days (19 weeks and 5 days) (Participant 608/Visit 13) and 161 days
(23 weeks) (Participant 57/Visit 59b). The whole research sample average UCV PV
measurements were plotted against GA (Figure 12.1) to visually determine the
strength and type of relation between the two variables. There was an outlier with a
velocity of 52.1 cm/s (Participant 58/Visit 60d). Review of the ultrasound images for
Visit 60d showed that the Doppler technique met protocol requirements and the raw
data values were all similar; however, this participant had six ultrasound examinations
as part of this research, with average UCV PV measurements recorded as 14.0, 13.2,
17.1, 52.1, 19.6 and 23.0 cm/s. This indicated that the value of 52.1 cm/s was an
outlier even within the data set collected on Participant 58, and it was therefore
eliminated from further analysis. A revised scatterplot without the outlier and with
appropriate scale changes was constructed (Figure 12.2a). The fastest velocity
recorded during the research was revised down to 29.2 cm/s (Participant 41/Visit 43)
at 247 days (35 weeks 2 days). The whole research sample average UCV PV median
was 16.5 cm/s and the mean 16.9 cm/s.
In the nAGA group (n = 603) (Appendix K2) the average UCV PV was recorded in
593 (98.3%) examinations and a scatterplot of these measurements against GA
constructed (Figure 12.2b). The average UCV PV was not recorded in seven
examinations; two were eliminated due to phasic flow and one due to a Doppler angle
greater than 15°. The slowest average UCV PV was 8.1 cm/s at 138 days (19 weeks 5
days) (Participant 608/Visit 13) and the fastest was 29.2 cm/s at 247 days (35 weeks 2

UMBILICAL CORD VEIN ULTRASOUND 234
days) (Participant 41/Visit 43), these values were identical to the whole research
sample. The nAGA group UCV PV median was 16.0 cm/s and the mean 16.6 cm/s.
Figure 12.1. Scatterplot of average UCV PV against increasing GA with outlier (n = 1,360).
Figure 12.2. Scatterplots of average UCV PV with advancing GA. (a) whole research sample with the outlier removed (n = 1,359) and (b) nAGA group (n = 593).
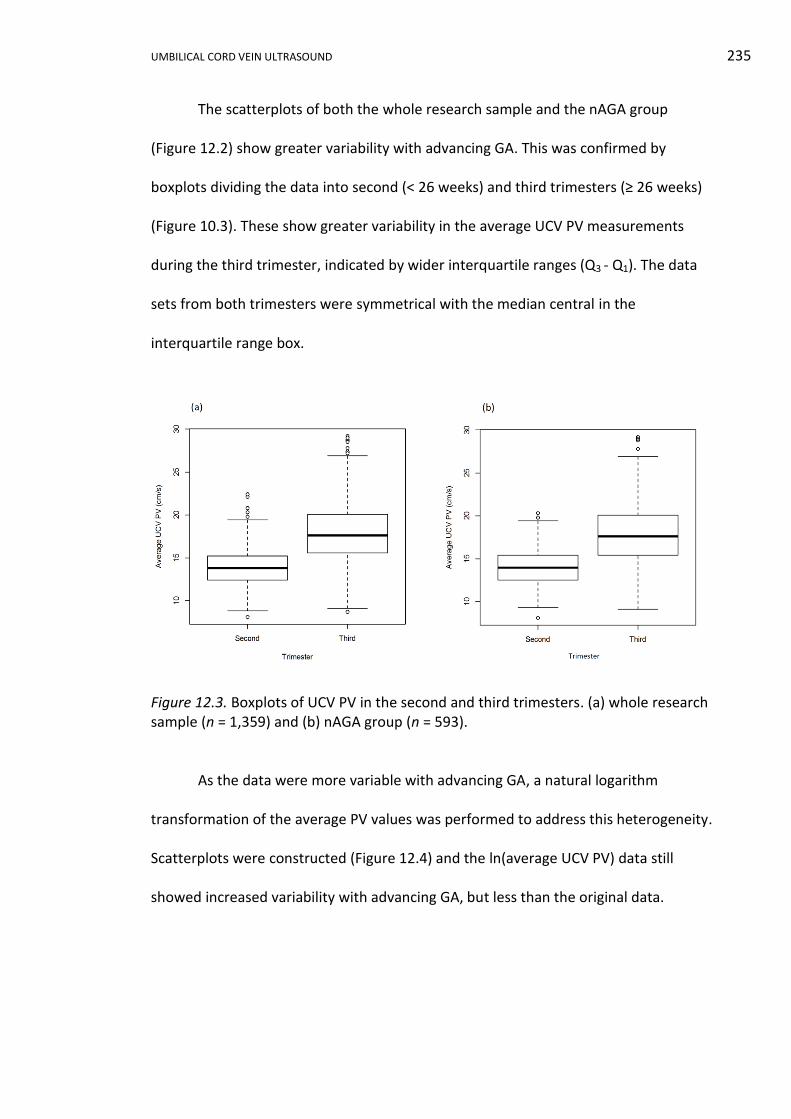
UMBILICAL CORD VEIN ULTRASOUND 235
The scatterplots of both the whole research sample and the nAGA group
(Figure 12.2) show greater variability with advancing GA. This was confirmed by
boxplots dividing the data into second (< 26 weeks) and third trimesters (≥ 26 weeks)
(Figure 10.3). These show greater variability in the average UCV PV measurements
during the third trimester, indicated by wider interquartile ranges (Q3 - Q1). The data
sets from both trimesters were symmetrical with the median central in the
interquartile range box.
Figure 12.3. Boxplots of UCV PV in the second and third trimesters. (a) whole research sample (n = 1,359) and (b) nAGA group (n = 593).
As the data were more variable with advancing GA, a natural logarithm
transformation of the average PV values was performed to address this heterogeneity.
Scatterplots were constructed (Figure 12.4) and the ln(average UCV PV) data still
showed increased variability with advancing GA, but less than the original data.
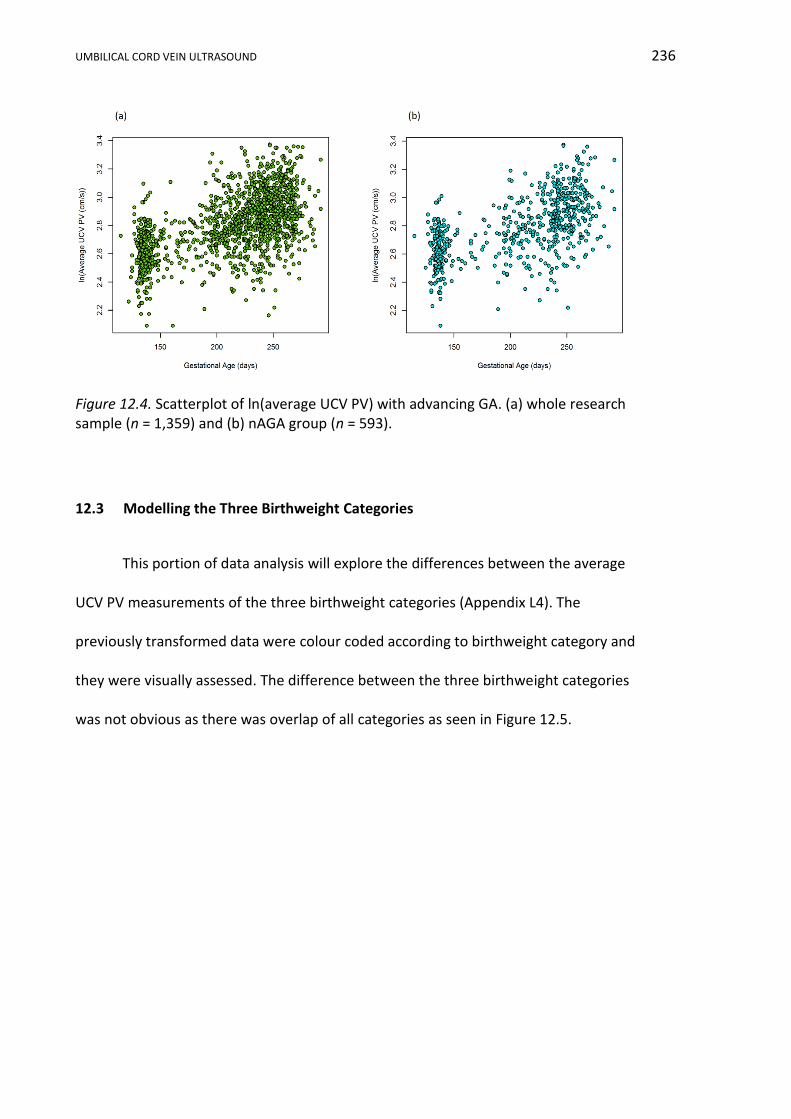
UMBILICAL CORD VEIN ULTRASOUND 236
Figure 12.4. Scatterplot of ln(average UCV PV) with advancing GA. (a) whole research sample (n = 1,359) and (b) nAGA group (n = 593).
12.3 Modelling the Three Birthweight Categories
This portion of data analysis will explore the differences between the average
UCV PV measurements of the three birthweight categories (Appendix L4). The
previously transformed data were colour coded according to birthweight category and
they were visually assessed. The difference between the three birthweight categories
was not obvious as there was overlap of all categories as seen in Figure 12.5.
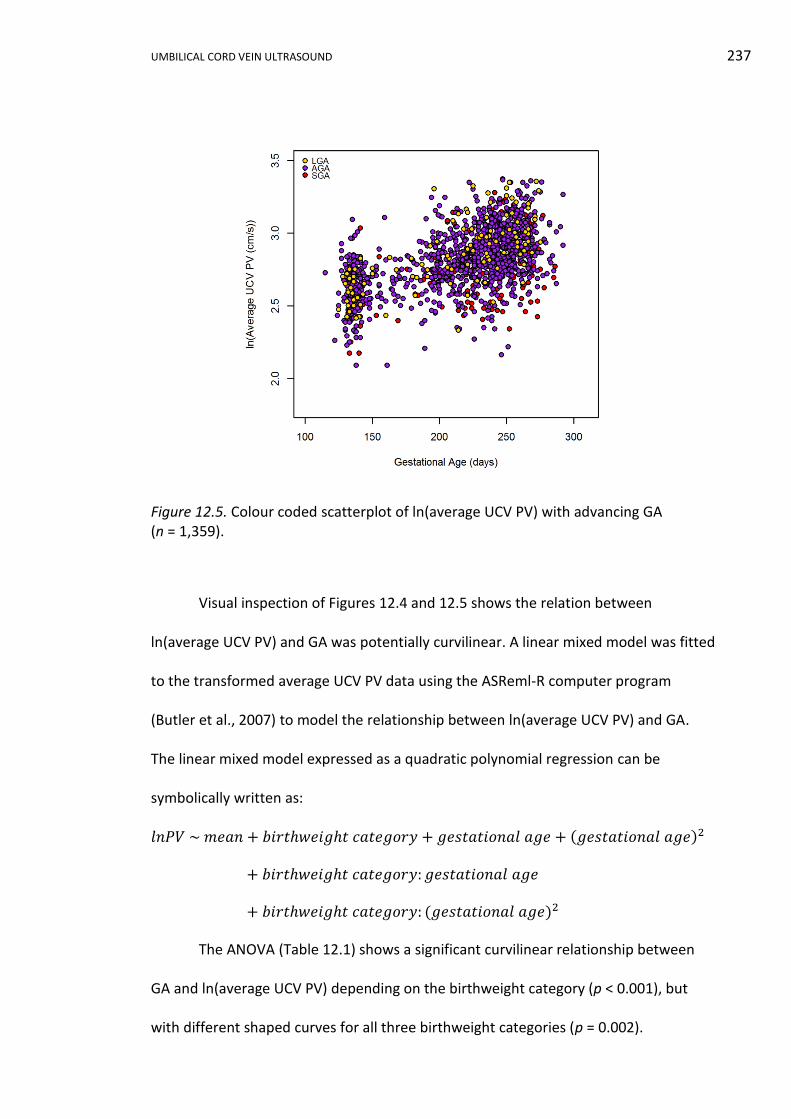
UMBILICAL CORD VEIN ULTRASOUND 237
Figure 12.5. Colour coded scatterplot of ln(average UCV PV) with advancing GA (n = 1,359).
Visual inspection of Figures 12.4 and 12.5 shows the relation between
ln(average UCV PV) and GA was potentially curvilinear. A linear mixed model was fitted
to the transformed average UCV PV data using the ASReml-R computer program
(Butler et al., 2007) to model the relationship between ln(average UCV PV) and GA.
The linear mixed model expressed as a quadratic polynomial regression can be
symbolically written as:
𝑙𝑛𝑃𝑉 ~ 𝑚𝑒𝑎𝑛 + 𝑏𝑖𝑟𝑡ℎ𝑤𝑒𝑖𝑔ℎ𝑡 𝑐𝑎𝑡𝑒𝑔𝑜𝑟𝑦 + 𝑔𝑒𝑠𝑡𝑎𝑡𝑖𝑜𝑛𝑎𝑙 𝑎𝑔𝑒 + (𝑔𝑒𝑠𝑡𝑎𝑡𝑖𝑜𝑛𝑎𝑙 𝑎𝑔𝑒)2
+ 𝑏𝑖𝑟𝑡ℎ𝑤𝑒𝑖𝑔ℎ𝑡 𝑐𝑎𝑡𝑒𝑔𝑜𝑟𝑦: 𝑔𝑒𝑠𝑡𝑎𝑡𝑖𝑜𝑛𝑎𝑙 𝑎𝑔𝑒
+ 𝑏𝑖𝑟𝑡ℎ𝑤𝑒𝑖𝑔ℎ𝑡 𝑐𝑎𝑡𝑒𝑔𝑜𝑟𝑦: (𝑔𝑒𝑠𝑡𝑎𝑡𝑖𝑜𝑛𝑎𝑙 𝑎𝑔𝑒)2
The ANOVA (Table 12.1) shows a significant curvilinear relationship between
GA and ln(average UCV PV) depending on the birthweight category (p < 0.001), but
with different shaped curves for all three birthweight categories (p = 0.002).
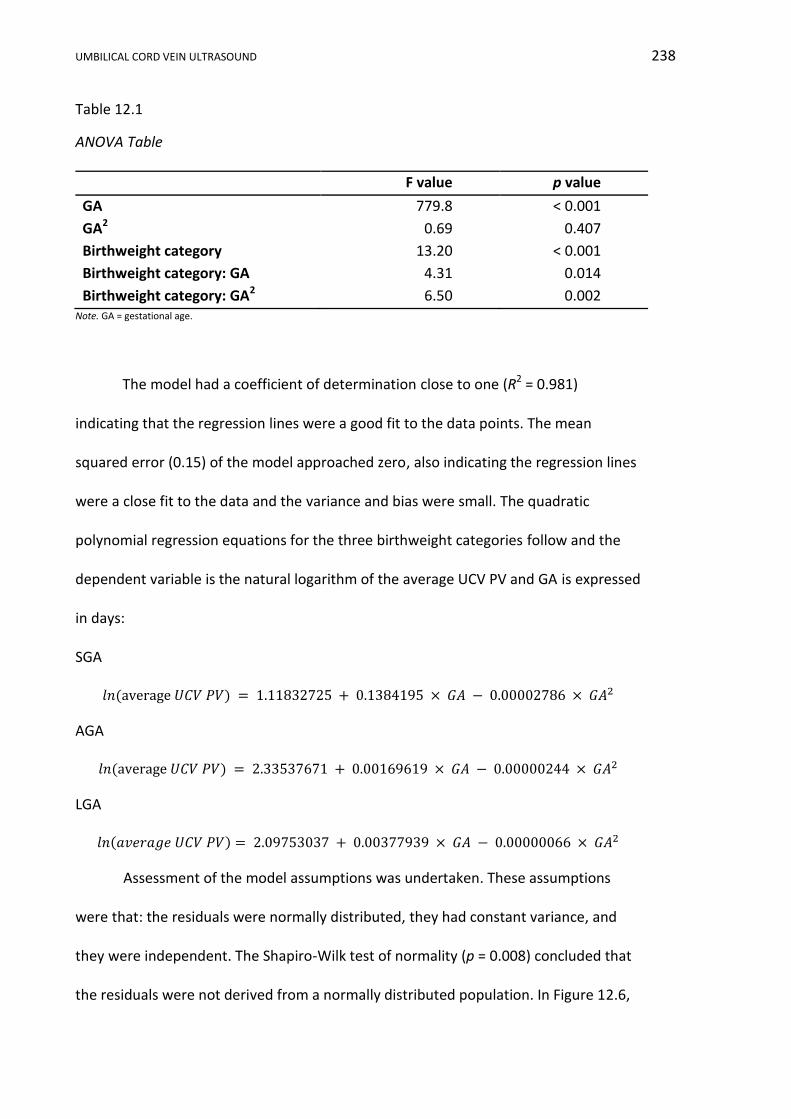
UMBILICAL CORD VEIN ULTRASOUND 238
Table 12.1
ANOVA Table
F value p value
GA 779.8 < 0.001
GA2 0.69 0.407
Birthweight category 13.20 < 0.001
Birthweight category: GA 4.31 0.014
Birthweight category: GA2 6.50 0.002 Note. GA = gestational age.
The model had a coefficient of determination close to one (R2 = 0.981)
indicating that the regression lines were a good fit to the data points. The mean
squared error (0.15) of the model approached zero, also indicating the regression lines
were a close fit to the data and the variance and bias were small. The quadratic
polynomial regression equations for the three birthweight categories follow and the
dependent variable is the natural logarithm of the average UCV PV and GA is expressed
in days:
SGA
𝑙𝑛(average 𝑈𝐶𝑉 𝑃𝑉) = 1.11832725 + 0.1384195 × 𝐺𝐴 − 0.00002786 × 𝐺𝐴2
AGA
𝑙𝑛(average 𝑈𝐶𝑉 𝑃𝑉) = 2.33537671 + 0.00169619 × 𝐺𝐴 − 0.00000244 × 𝐺𝐴2
LGA
𝑙𝑛(𝑎𝑣𝑒𝑟𝑎𝑔𝑒 𝑈𝐶𝑉 𝑃𝑉) = 2.09753037 + 0.00377939 × 𝐺𝐴 − 0.00000066 × 𝐺𝐴2
Assessment of the model assumptions was undertaken. These assumptions
were that: the residuals were normally distributed, they had constant variance, and
they were independent. The Shapiro-Wilk test of normality (p = 0.008) concluded that
the residuals were not derived from a normally distributed population. In Figure 12.6,
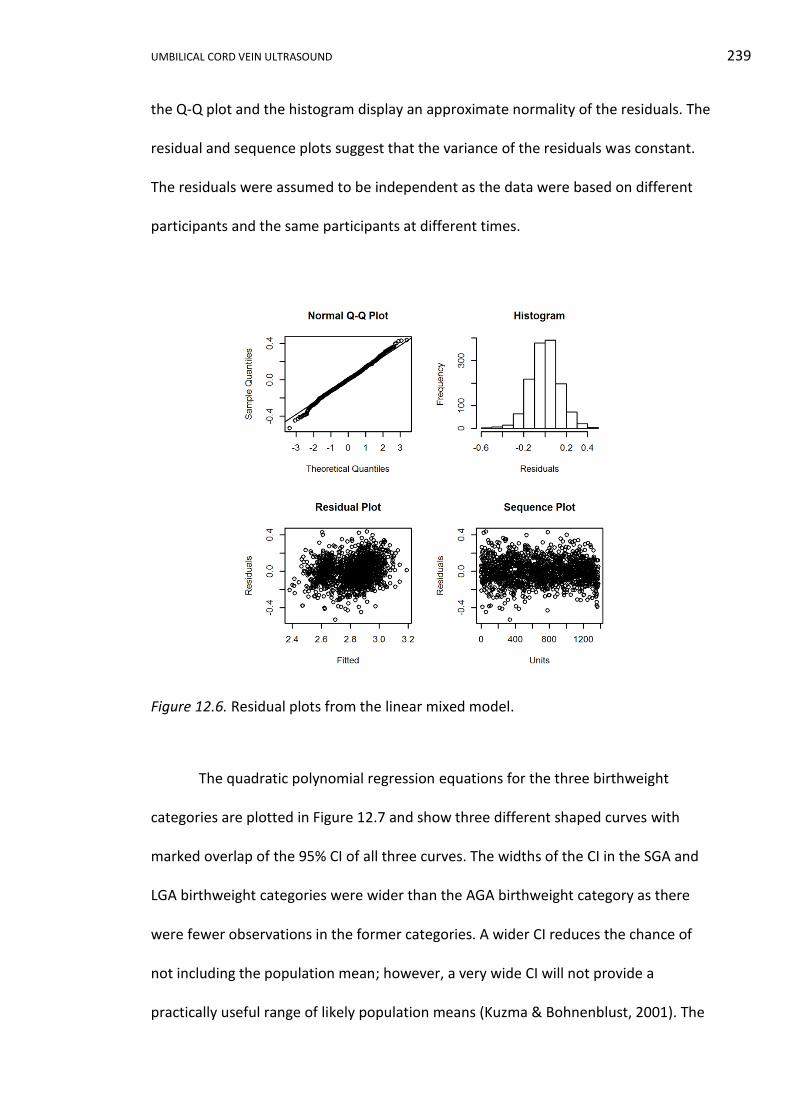
UMBILICAL CORD VEIN ULTRASOUND 239
the Q-Q plot and the histogram display an approximate normality of the residuals. The
residual and sequence plots suggest that the variance of the residuals was constant.
The residuals were assumed to be independent as the data were based on different
participants and the same participants at different times.
Figure 12.6. Residual plots from the linear mixed model.
The quadratic polynomial regression equations for the three birthweight
categories are plotted in Figure 12.7 and show three different shaped curves with
marked overlap of the 95% CI of all three curves. The widths of the CI in the SGA and
LGA birthweight categories were wider than the AGA birthweight category as there
were fewer observations in the former categories. A wider CI reduces the chance of
not including the population mean; however, a very wide CI will not provide a
practically useful range of likely population means (Kuzma & Bohnenblust, 2001). The
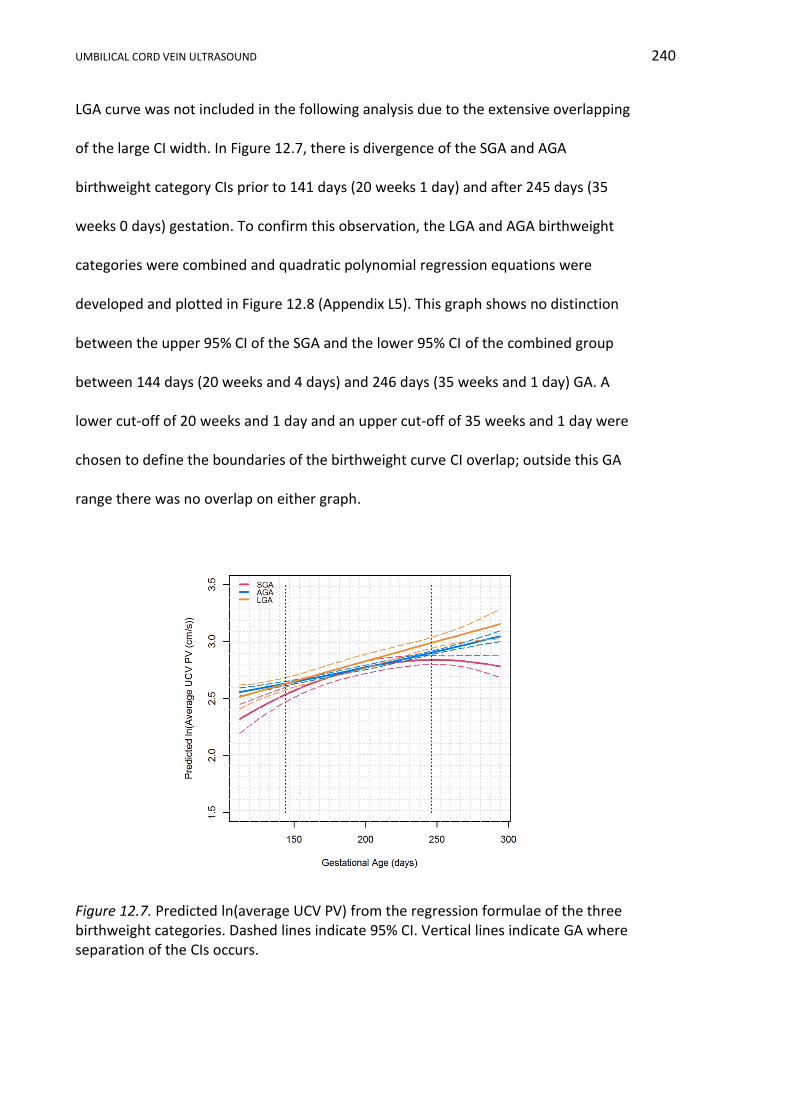
UMBILICAL CORD VEIN ULTRASOUND 240
LGA curve was not included in the following analysis due to the extensive overlapping
of the large CI width. In Figure 12.7, there is divergence of the SGA and AGA
birthweight category CIs prior to 141 days (20 weeks 1 day) and after 245 days (35
weeks 0 days) gestation. To confirm this observation, the LGA and AGA birthweight
categories were combined and quadratic polynomial regression equations were
developed and plotted in Figure 12.8 (Appendix L5). This graph shows no distinction
between the upper 95% CI of the SGA and the lower 95% CI of the combined group
between 144 days (20 weeks and 4 days) and 246 days (35 weeks and 1 day) GA. A
lower cut-off of 20 weeks and 1 day and an upper cut-off of 35 weeks and 1 day were
chosen to define the boundaries of the birthweight curve CI overlap; outside this GA
range there was no overlap on either graph.
Figure 12.7. Predicted ln(average UCV PV) from the regression formulae of the three birthweight categories. Dashed lines indicate 95% CI. Vertical lines indicate GA where separation of the CIs occurs.

UMBILICAL CORD VEIN ULTRASOUND 241
Figure 12.8. Predicted ln(average UCV PV) for the SGA, and combined AGA and LGA birthweight categories. Dashed lines indicate 95% CI. Vertical lines indicate the GA when the CIs cease overlapping.
In summary, linear mixed modelling of the three birthweight categories showed
a curvilinear relationship between ln(average UCV PV) and advancing GA. The
quadratic polynomial regression equations demonstrated a significant difference
between the three birthweight categories (p < 0.001). The regression curves had
different shapes and CI separation was only evident prior to 20 weeks and 4 days and
after 35 weeks and 1 day GA.
12.4 Developing a Reference Range (Nomogram) using Quantile Regression and
the nAGA Group
In this portion of PV data analysis the development of a GA related reference
range from nAGA data will be reported (Appendix L6). Visual inspection of Figures
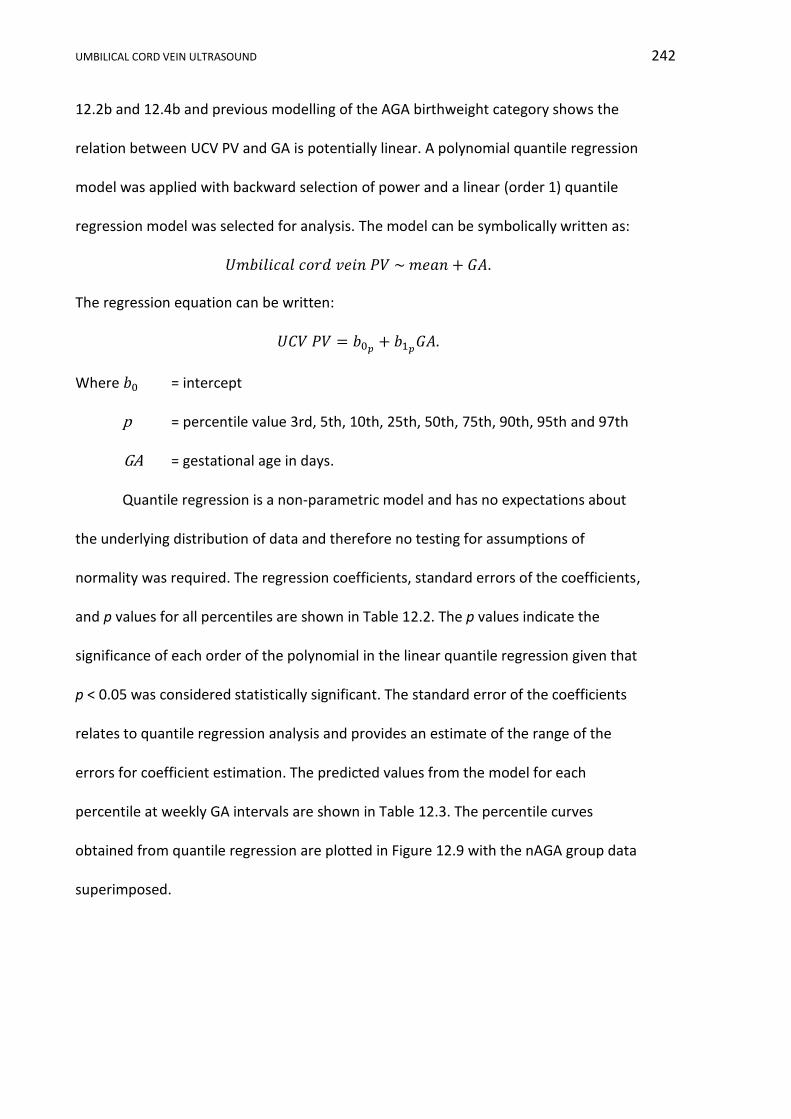
UMBILICAL CORD VEIN ULTRASOUND 242
12.2b and 12.4b and previous modelling of the AGA birthweight category shows the
relation between UCV PV and GA is potentially linear. A polynomial quantile regression
model was applied with backward selection of power and a linear (order 1) quantile
regression model was selected for analysis. The model can be symbolically written as:
𝑈𝑚𝑏𝑖𝑙𝑖𝑐𝑎𝑙 𝑐𝑜𝑟𝑑 𝑣𝑒𝑖𝑛 𝑃𝑉 ~ 𝑚𝑒𝑎𝑛 + 𝐺𝐴.
The regression equation can be written:
𝑈𝐶𝑉 𝑃𝑉 = 𝑏0𝑝+ 𝑏1𝑝
𝐺𝐴.
Where 𝑏0 = intercept
p = percentile value 3rd, 5th, 10th, 25th, 50th, 75th, 90th, 95th and 97th
GA = gestational age in days.
Quantile regression is a non-parametric model and has no expectations about
the underlying distribution of data and therefore no testing for assumptions of
normality was required. The regression coefficients, standard errors of the coefficients,
and p values for all percentiles are shown in Table 12.2. The p values indicate the
significance of each order of the polynomial in the linear quantile regression given that
p < 0.05 was considered statistically significant. The standard error of the coefficients
relates to quantile regression analysis and provides an estimate of the range of the
errors for coefficient estimation. The predicted values from the model for each
percentile at weekly GA intervals are shown in Table 12.3. The percentile curves
obtained from quantile regression are plotted in Figure 12.9 with the nAGA group data
superimposed.
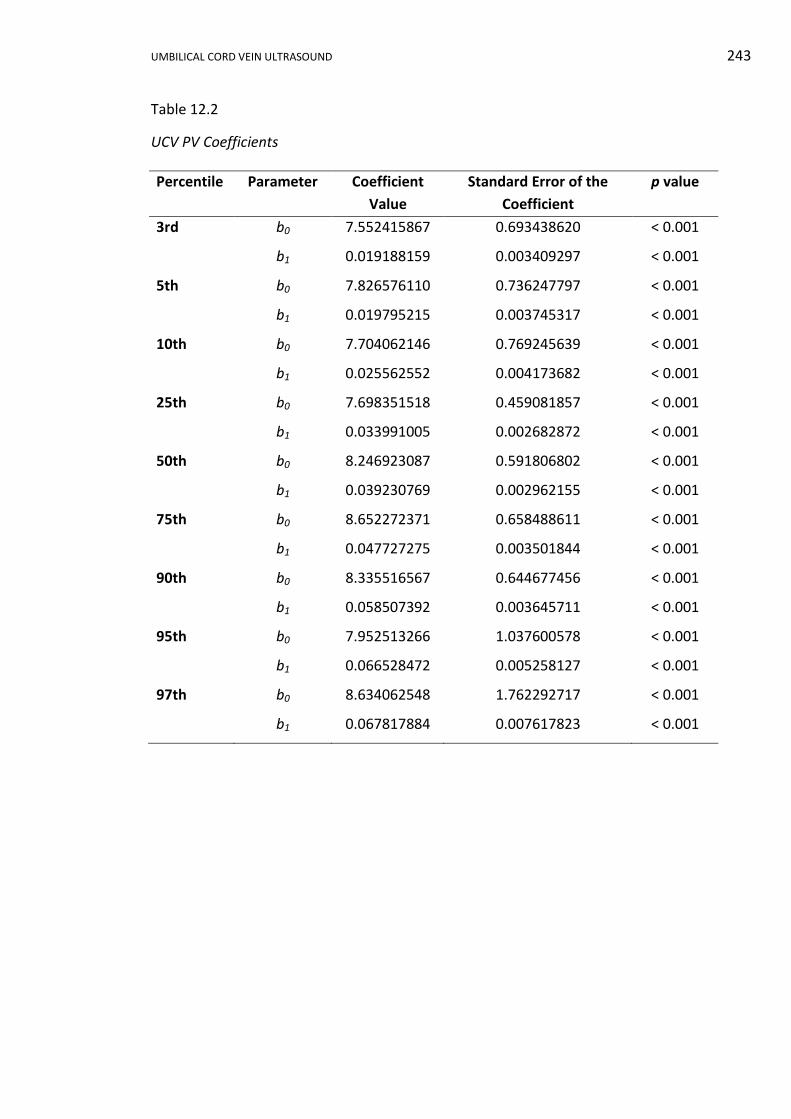
UMBILICAL CORD VEIN ULTRASOUND 243
Table 12.2
UCV PV Coefficients
Percentile Parameter Coefficient
Value
Standard Error of the
Coefficient
p value
3rd b0 7.552415867 0.693438620 < 0.001
b1 0.019188159 0.003409297 < 0.001
5th b0 7.826576110 0.736247797 < 0.001
b1 0.019795215 0.003745317 < 0.001
10th b0 7.704062146 0.769245639 < 0.001
b1 0.025562552 0.004173682 < 0.001
25th b0 7.698351518 0.459081857 < 0.001
b1 0.033991005 0.002682872 < 0.001
50th b0 8.246923087 0.591806802 < 0.001
b1 0.039230769 0.002962155 < 0.001
75th b0 8.652272371 0.658488611 < 0.001
b1 0.047727275 0.003501844 < 0.001
90th b0 8.335516567 0.644677456 < 0.001
b1 0.058507392 0.003645711 < 0.001
95th b0 7.952513266 1.037600578 < 0.001
b1 0.066528472 0.005258127 < 0.001
97th b0 8.634062548 1.762292717 < 0.001
b1 0.067817884 0.007617823 < 0.001

UMBILICAL CORD VEIN ULTRASOUND 244
Table 12.3
Predicted UCV PV Values
GA GA Umbilical cord vein peak velocity (cm/s) at various percentiles
(days) (weeks) 3rd 5th 10th 25th 50th 75th 90th 95th 97th
112 16 9.7 10.0 10.6 11.5 12.6 14.0 14.9 15.4 16.2
119 17 9.8 10.2 10.7 11.7 12.9 14.3 15.3 15.9 16.7
126 18 10.0 10.3 10.9 12.0 13.2 14.7 15.7 16.3 17.2
133 19 10.1 10.5 11.1 12.2 13.5 15.0 16.1 16.8 17.7
140 20 10.2 10.6 11.3 12.5 13.7 15.3 16.5 17.3 18.1
147 21 10.4 10.7 11.5 12.7 14.0 15.7 16.9 17.7 18.6
154 22 10.5 10.9 11.6 12.9 14.3 16.0 17.3 18.2 19.1
161 23 10.6 11.0 11.8 13.2 14.6 16.3 17.8 18.7 19.6
168 24 10.8 11.2 12.0 13.4 14.8 16.7 18.2 19.1 20.0
175 25 10.9 11.3 12.2 13.6 15.1 17.0 18.6 19.6 20.5
182 26 11.0 11.4 12.4 13.9 15.4 17.3 19.0 20.1 21.0
189 27 11.2 11.6 12.5 14.1 15.7 17.7 19.4 20.5 21.5
196 28 11.3 11.7 12.7 14.4 15.9 18.0 19.8 21.0 21.9
203 29 11.4 11.8 12.9 14.6 16.2 18.3 20.2 21.5 22.4
210 30 11.6 12.0 13.1 14.8 16.5 18.7 20.6 21.9 22.9
217 31 11.7 12.1 13.3 15.1 16.8 19.0 21.0 22.4 23.4
224 32 11.9 12.3 13.4 15.3 17.0 19.3 21.4 22.9 23.8
231 33 12.0 12.4 13.6 15.6 17.3 19.7 21.9 23.3 24.3
238 34 12.1 12.5 13.8 15.8 17.6 20.0 22.3 23.8 24.8
245 35 12.3 12.7 14.0 16.0 17.9 20.3 22.7 24.3 25.2
252 36 12.4 12.8 14.1 16.3 18.1 20.7 23.1 24.7 25.7
259 37 12.5 13.0 14.3 16.5 18.4 21.0 23.5 25.2 26.2
266 38 12.7 13.1 14.5 16.7 18.7 21.3 23.9 25.6 26.7
273 39 12.8 13.2 14.7 17.0 19.0 21.7 24.3 26.1 27.1
280 40 12.9 13.4 14.9 17.2 19.2 22.0 24.7 26.6 27.6
287 41 13.1 13.5 15.0 17.5 19.5 22.4 25.1 27.0 28.1
294 42 13.2 13.6 15.2 17.7 19.8 22.7 25.5 27.5 28.6 Note. GA = gestational age. All values rounded to one decimal place.

UMBILICAL CORD VEIN ULTRASOUND 245
Figure 12.9. Nomogram of UCV PV with advancing GA derived from linear quantile regression with the nAGA data points plotted in black (n = 593). Colour coded percentile curves: 3rd and 97th (green), 5th and 95th (blue), 10th and 90th (gold), and 50th (black).
12.5 Identification of IUGR/FGR Group using the Reference Range
Having determined a significant difference existed between the average UCV
PV birthweight categories, further analysis was undertaken using the nomogram and
stratified SGA birthweight category data. The data from 15 of these combinations was
plotted on the nomogram (Appendix L7) and visual inspection of these graphs found
the data points were spread across all percentile lines and in five combinations the
data points plotted above the 95th percentile. Table 12.4 shows the percentage of
data points falling below specified percentiles, for birthweights less than the 10th
percentile and the IUGR/FGR group. In this table, data points were described as normal

UMBILICAL CORD VEIN ULTRASOUND 246
if the average UCV PV plotted above a specified percentile and at risk of IUGR if the
data point plotted below the same specified percentile.
Table 12.4
Birthweight < 10th and the IUGR/FGR Group and the Percentage of Data Points Falling Below Specified Percentiles
Note. SGA = small for gestational age.
The IUGR/FGR group average UCV PV, consisting of seven participants
providing 47 data points, are plotted on the nomogram in Figure 12.10.
Figure 12.10. Nomogram of UCV PV with advancing GA derived from linear quantile regression with the IUGR/FGR group average UCV PV data plotted in red (n = 47). Colour coded percentile curves: 3rd and 97th (green), 5th and 95th (blue), 10th and 90th (gold), and 50th (black).
Stratified SGA Birthweight Group Percent below percentile
3rd 5th 10th 50th
Birthweight < 10th 8.3 13 21.3 65.7
IUGR/FGR group 4.3 14.9 27.7 74.5
UMBILICAL CORD VEIN ULTRASOUND 247
12.6 Conclusion
The slowest average UCV PV recorded in the whole research sample and the
nAGA group was 8.1 cm/s and the fastest was 29.2 cm/s, after the elimination of an
outlier. The slowest UCV 50th percentile predicted PV was 12.6 cm/s and the fastest
was 19.8 cm/s.
There was increased variability in the UCV PV measurements with advancing
GA and a natural logarithm transformation was undertaken to accommodate this data
heterogeneity. Linear mixed modelling developed regression formulae for the three
birthweight categories. A significant difference between the birthweight categories
was identified and modelling showed that the curves were different in shape, with
considerable overlap of the CIs between 20 weeks and 4 days and 35 weeks and 1 day
GA.
Linear quantile regression was used to model the nAGA data and develop a
reference range of the UCV PV with advancing GA. The coefficients for the regression
formula and the calculated values for each percentile were presented. Using the
IUGR/FGR group, the percentage of average UCV PV measurements plotting below the
3rd, 5th, 10th and 50th percentiles on the reference range were determined. With
27.7% of the IUGR/FGR group attendances plotting below 10th percentile on the
reference range.
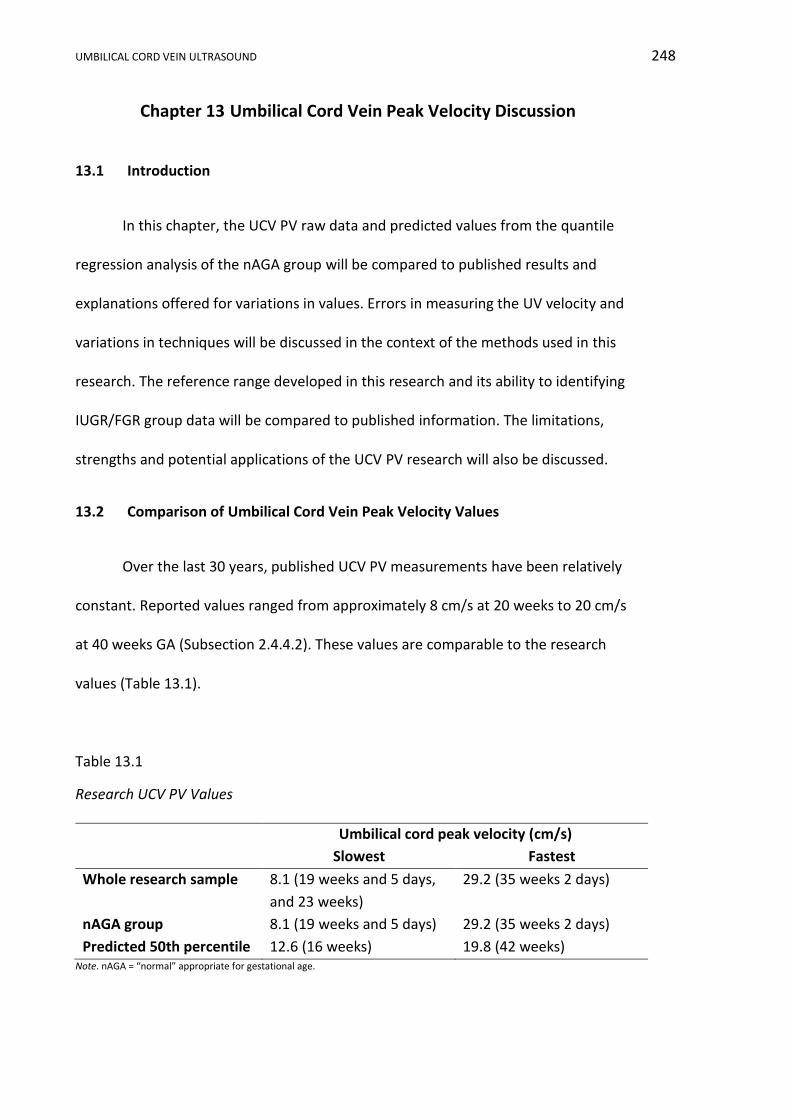
UMBILICAL CORD VEIN ULTRASOUND 248
Chapter 13 Umbilical Cord Vein Peak Velocity Discussion
13.1 Introduction
In this chapter, the UCV PV raw data and predicted values from the quantile
regression analysis of the nAGA group will be compared to published results and
explanations offered for variations in values. Errors in measuring the UV velocity and
variations in techniques will be discussed in the context of the methods used in this
research. The reference range developed in this research and its ability to identifying
IUGR/FGR group data will be compared to published information. The limitations,
strengths and potential applications of the UCV PV research will also be discussed.
13.2 Comparison of Umbilical Cord Vein Peak Velocity Values
Over the last 30 years, published UCV PV measurements have been relatively
constant. Reported values ranged from approximately 8 cm/s at 20 weeks to 20 cm/s
at 40 weeks GA (Subsection 2.4.4.2). These values are comparable to the research
values (Table 13.1).
Table 13.1
Research UCV PV Values
Umbilical cord peak velocity (cm/s)
Slowest Fastest
Whole research sample 8.1 (19 weeks and 5 days,
and 23 weeks)
29.2 (35 weeks 2 days)
nAGA group 8.1 (19 weeks and 5 days) 29.2 (35 weeks 2 days)
Predicted 50th percentile 12.6 (16 weeks) 19.8 (42 weeks) Note. nAGA = “normal” appropriate for gestational age.
UMBILICAL CORD VEIN ULTRASOUND 249
The velocity values from four publications are compared to the predicted 50th
percentile PV values in Table 13.2, and comparing data across gestational ages there
are striking similarities. Boito et al. (2002) published a regression formula: 𝑇𝑎𝑚𝑎𝑥𝑣 =
0.000216 × 𝐺𝐴3 + 0.011526 × 𝐺𝐴2 + 46.271224, which unfortunately did not
compute realistic velocities and therefore was omitted from the comparison.
In Table 13.2, the slowest velocities were recorded at the earliest gestational
ages. At 22 weeks GA, when data for all studies was available, the PV varied from
11.7 cm/s to 19.4 cm/s. In four out of five cases, the fastest velocities were recorded at
the oldest GA. At 39 weeks GA, when all data was available, the velocity ranged from
17.8 cm/s to 22.9 cm/s, excluding the work by Acharya et al. (2005), who recorded a
peak value of 24.7 cm/s during the 32nd and 33rd weeks of gestation. These different
trends were due to modelling: the four studies with the fastest peak velocities at the
oldest GA used linear modelling, whereas Acharya et al. (2005) chose a curvilinear
model which declined towards term. Velocities published by Acharya et al. (2005)
using the intra-abdominal UV were faster than all intra-amniotic velocities until 41
weeks GA and were faster than recent intra-abdominal velocities provided by Rizzo et
al. (2016).
In Table 13.2, research undertaken in 2010 had the least number of participants
and the slowest velocities across all gestational ages. The oldest study undertaken in
1999 documented the fastest velocities. Rizzo et al. (2016) and the current research
were the most recent, had the largest number of participants and had velocities
towards the lower end of the comparative range; perhaps indicating that sample size
was not an influencing factor, but advancing technology and statistical analysis may
account for some of the variation in published UV velocities.

UMBILICAL CORD VEIN ULTRASOUND 250
Table 13.2
Published and Research UV PV
Published Research Papers Author Barbera et al.
(1999) Archraya et al. (2005) Flo et al. (2010) Rizzo et al. (2016) Spurway’s
research Participants n = 70 n = 130 n = 53 n = 852 n = 321
Data points n = 70 n = 511 n = 232 n = 852 n = 593
Velocity Tamaxv PV Tamaxv Tamaxv PV
Sample gate Covered lumen 10-12mm gate Not specified Not specified 3mm gate
Doppler angle <20 0 <15 0 <15 0 00 and always < 200 00 and always < 150
UV site Intra-amniotic Intra-abdominal Intra-amniotic Intra-abdominal Intra-amniotic
Model Linear Curvilinear Linear Linear Linear
Acquisition Mean from formula
50th percentile from published charts
50th percentile from published
charts
50th percentile from formula
50th percentile from formula
Gestational age (weeks)
Umbilical vein PV (cm/s)
16 14.5 - - 9.4 12.6
17 14.8 - - 9.8 12.9
18 15.1 - - 10.2 13.2
19 15.4 16.2 - 10.6 13.5
20 15.7 17.4 - 11.0 13.7
21 16.0 18.4 - 11.3 10.0
22 16.3 19.4 13.6 11.7 14.3
23 16.6 20.4 13.8 12.1 14.6
24 16.9 21.2 14.0 12.5 14.8
25 17.2 22.0 14.3 12.8 15.1
26 17.5 22.7 14.5 13.2 15.4
27 17.8 23.3 14.7 13.6 15.7
28 18.1 23.8 15.0 14.0 15.9
29 18.4 24.1 15.2 14.4 16.2
30 18.7 24.4 15.4 14.7 16.5
31 19.0 24.6 15.7 15.1 16.8
32 19.3 24.7 16.0 15.5 17.0
33 19.6 24.7 16.2 15.9 17.3
34 19.9 24.6 16.4 16.2 17.6
35 20.2 24.4 16.7 16.6 17.9
36 20.5 24.2 17.0 17.0 18.1
37 20.8 23.8 17.2 17.4 18.4
38 21.1 23.4 17.5 17.8 18.7
39 21.4 22.9 17.8 18.1 19.0
40 21.7 22.3 - 18.5 19.2
41 22.0 21.7 - 18.9 19.5
42 22.3 - - 19.3 19.8 Note. Tamaxv = time averaged maximum velocity peak velocity. PV = peak velocity. Mean velocities converted to peak velocities for ease of comparison. All measurements rounded to one decimal place for ease of comparison.
UMBILICAL CORD VEIN ULTRASOUND 251
All research in Table 13.2 used Doppler angles less than 20° and aimed at
having a 0° angle of insonation, thereby eliminating angle of insonation as a cause of
variation. The studies recording the Tamaxv had marginally lower velocity values
compared to the two studies recording PV. Tamaxv is a software dependent automatic
function that averages PV over time and the sample gate must cover the lumen;
whereas, PV records the subjective chosen highest velocity from a centrally located
sample gate and these different techniques may account for the variation in the tabled
values.
In summary, there were no glaring differences based on the year the research
was undertaken, the sample size, the method of recording the velocity or the angle of
insonation between the range of velocities in the raw data or the predicted velocities
in this research project and four previously published works.
13.3 Errors and Method Variations in Measuring the Umbilical Vein Velocity
There are several errors and variations in methods that are associated with
measuring the UV velocity and some of these may account for the disparity between
values documented by researchers. These broadly include measurement site and
methods, variations in Doppler sampling and fluctuations in the spectral waveform.
13.3.1 Measurement sites.
Several researchers promote the intra-abdominal over the intra-amniotic UV
for Doppler sampling, as the vein is separated from its accompanying arteries thereby
eliminating any transmitted pulsations (Raio et al., 2003; Vasques et al., 2004);
however, a good Doppler angle is sometimes difficult to achieve. Researchers have
avoided the cord insertion sites as the UCV velocity near the placental cord insertion
UMBILICAL CORD VEIN ULTRASOUND 252
has a flat flow profile (Pennati et al., 2004), may be obscured by fetal parts or is not
identifiable due to oligohydramnios. The cord insertion into the fetal abdomen has
also been avoided as the UCV velocity at this point is elevated due to umbilical ring
narrowing (Skulstad et al., 2004). Choosing the free-floating portion of the UCV in this
research avoided these insertion site issues.
13.3.2 Measurement methods.
The peak or maximum velocity can be measured manually as in this research or
by an automated trace (Tamaxv). Both methods have advantages and limitations, as
discussed previously in Chapter 2. Both methods require conscientious and diligent
appraisal by the sonographer so that the most accurate peak velocity is recorded, so
that the angle of insonation is close to 0°, and so the sample gate contains the
maximum velocity. The manual measurement of the PV is simple to perform and it is
less technique and software dependent. It has been applied in this research as it is a
method that is easily employed by all levels of users and machines models.
The research protocol averaged three UCV PV measurements to improve
accuracy of the value used in subsequent calculations. This method of improving
accuracy is recommended (Najafzadeh & Dickinson, 2012) and utilised in other similar
ultrasound research (Barbera et al., 1999; Di Naro et al., 2002; El Behery et al., 2011;
Flo et al., 2009; Flo et al., 2010).
13.3.3 Doppler sampling.
The UV velocity may be measured with a small sample gate placed entirely
within the vein or by a large gate covering the entire vein. In this research, a 3 mm
Doppler gate was placed in the middle of a vertical portion of UCV (Figure 3.5) with the
lateral dimension of the sample gate limited by the Doppler beam dimensions
UMBILICAL CORD VEIN ULTRASOUND 253
(Figueras et al., 2008). The research protocol assumed that by identifying a vertical
portion of umbilical cord, the parabolic flow profile would be developed and the
maximum velocity would occur in the centre of the UV, as laminar flow is fastest in the
centre and slowest close to the vein wall. The protocol also assumed that by using a
small sample gate that only venous velocities would be sampled; however, arterial
velocities may have been included at early gestational ages as the width of the sample
gate may have exceeded the UCV width. If UCV Vmean is measured then the width of
the gate needs to cover the vessel so that mean velocity is not overestimated by
exclusion of slower flow along the wall (Ferrazzi et al., 2000), but it also needs to
exclude the neighbouring umbilical arteries’ flow, which may distort the Doppler
waveform.
The peak velocity is overestimated by an amount that is relative to the
insonation angle, with an overestimation of up to 30% as insonation angles approach
90° (Figueras et al., 2008; Hoskins, 2011; S. Li et al., 1993). There is also an inherent
error in the visual alignment of the Doppler angle with the UCV (Figueras et al., 2008;
Yamamoto et al., 2006). Both these errors were minimised by using a 0° insonation
angle and a vertical portion of cord in this research.
13.3.4 Fluctuations in the spectral waveform.
The normal spectral trace of the UCV vein during the second and third
trimesters is continuous with no variations (Najafzadeh & Dickinson, 2012). Spectral
traces that demonstrate a repetitious single or double pulsatile waveform due to
altered fetal heart or DV states should not be used for UV PV readings. The research
protocol of measuring the PV during fetal quiescence was essential to eliminate
fluctuations caused by fetal movement, breathing (Vasques et al., 2004), and
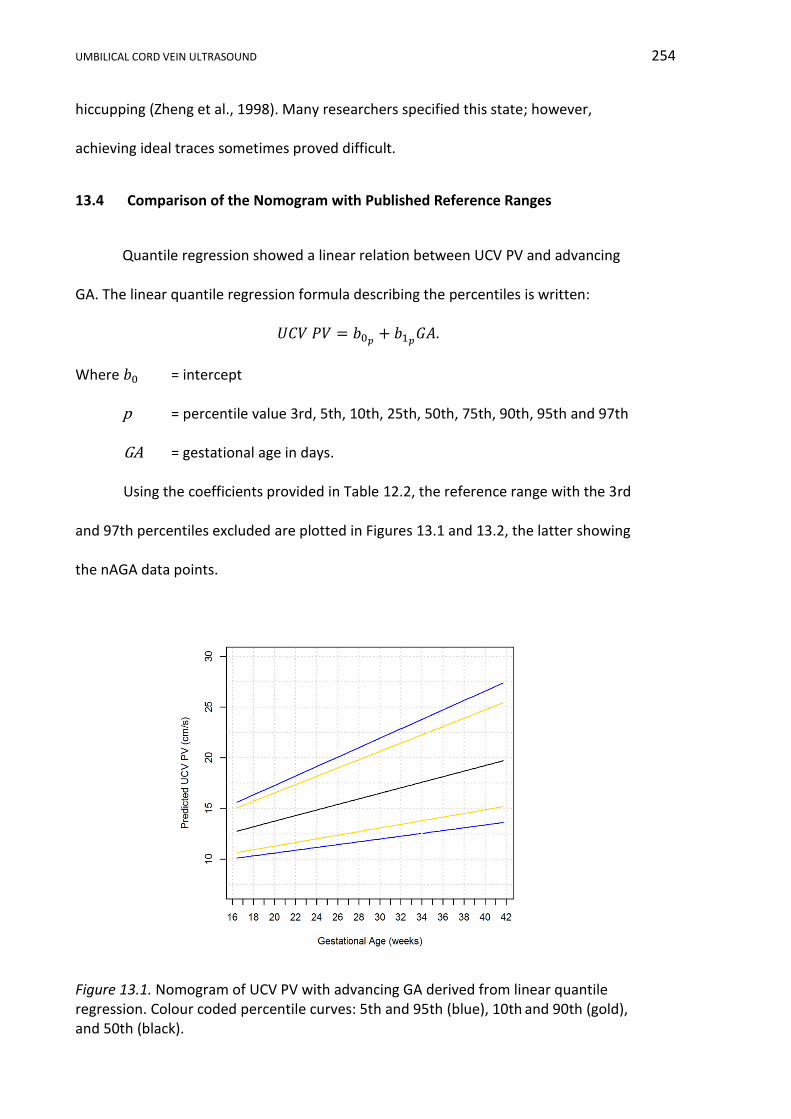
UMBILICAL CORD VEIN ULTRASOUND 254
hiccupping (Zheng et al., 1998). Many researchers specified this state; however,
achieving ideal traces sometimes proved difficult.
13.4 Comparison of the Nomogram with Published Reference Ranges
Quantile regression showed a linear relation between UCV PV and advancing
GA. The linear quantile regression formula describing the percentiles is written:
𝑈𝐶𝑉 𝑃𝑉 = 𝑏0𝑝+ 𝑏1𝑝
𝐺𝐴.
Where 𝑏0 = intercept
p = percentile value 3rd, 5th, 10th, 25th, 50th, 75th, 90th, 95th and 97th
GA = gestational age in days.
Using the coefficients provided in Table 12.2, the reference range with the 3rd
and 97th percentiles excluded are plotted in Figures 13.1 and 13.2, the latter showing
the nAGA data points.
Figure 13.1. Nomogram of UCV PV with advancing GA derived from linear quantile regression. Colour coded percentile curves: 5th and 95th (blue), 10th and 90th (gold), and 50th (black).
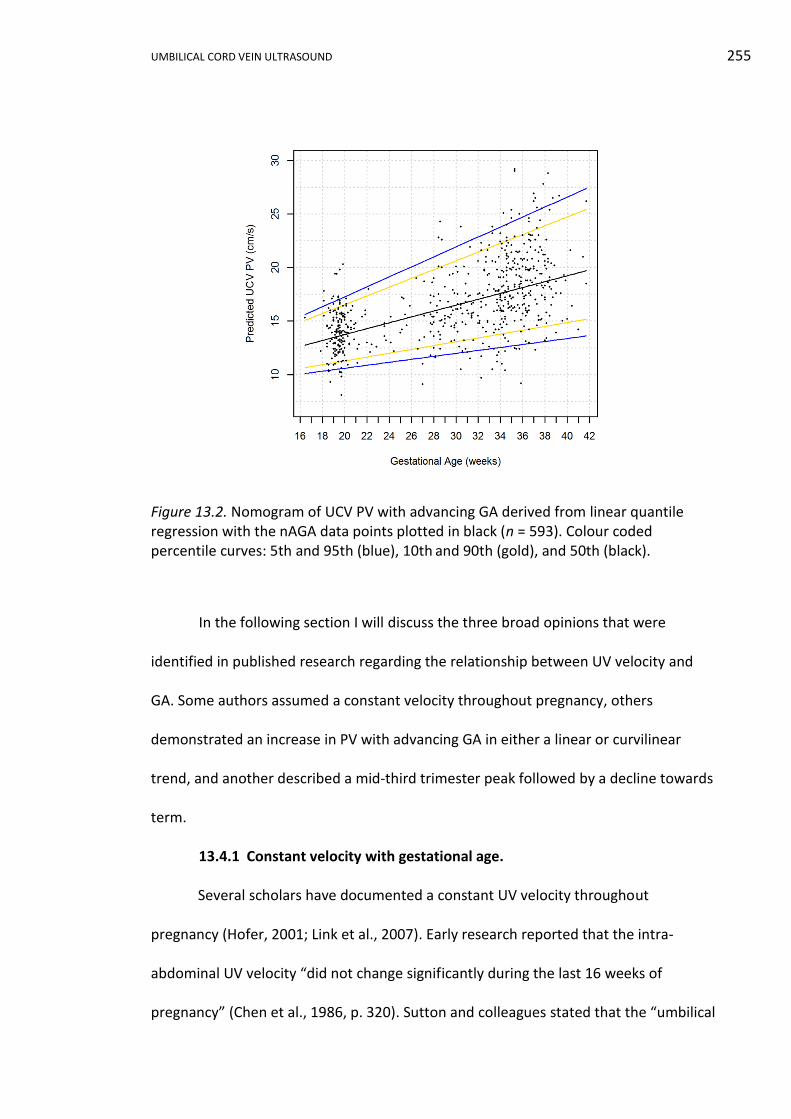
UMBILICAL CORD VEIN ULTRASOUND 255
Figure 13.2. Nomogram of UCV PV with advancing GA derived from linear quantile regression with the nAGA data points plotted in black (n = 593). Colour coded percentile curves: 5th and 95th (blue), 10th and 90th (gold), and 50th (black).
In the following section I will discuss the three broad opinions that were
identified in published research regarding the relationship between UV velocity and
GA. Some authors assumed a constant velocity throughout pregnancy, others
demonstrated an increase in PV with advancing GA in either a linear or curvilinear
trend, and another described a mid-third trimester peak followed by a decline towards
term.
13.4.1 Constant velocity with gestational age.
Several scholars have documented a constant UV velocity throughout
pregnancy (Hofer, 2001; Link et al., 2007). Early research reported that the intra-
abdominal UV velocity “did not change significantly during the last 16 weeks of
pregnancy” (Chen et al., 1986, p. 320). Sutton and colleagues stated that the “umbilical
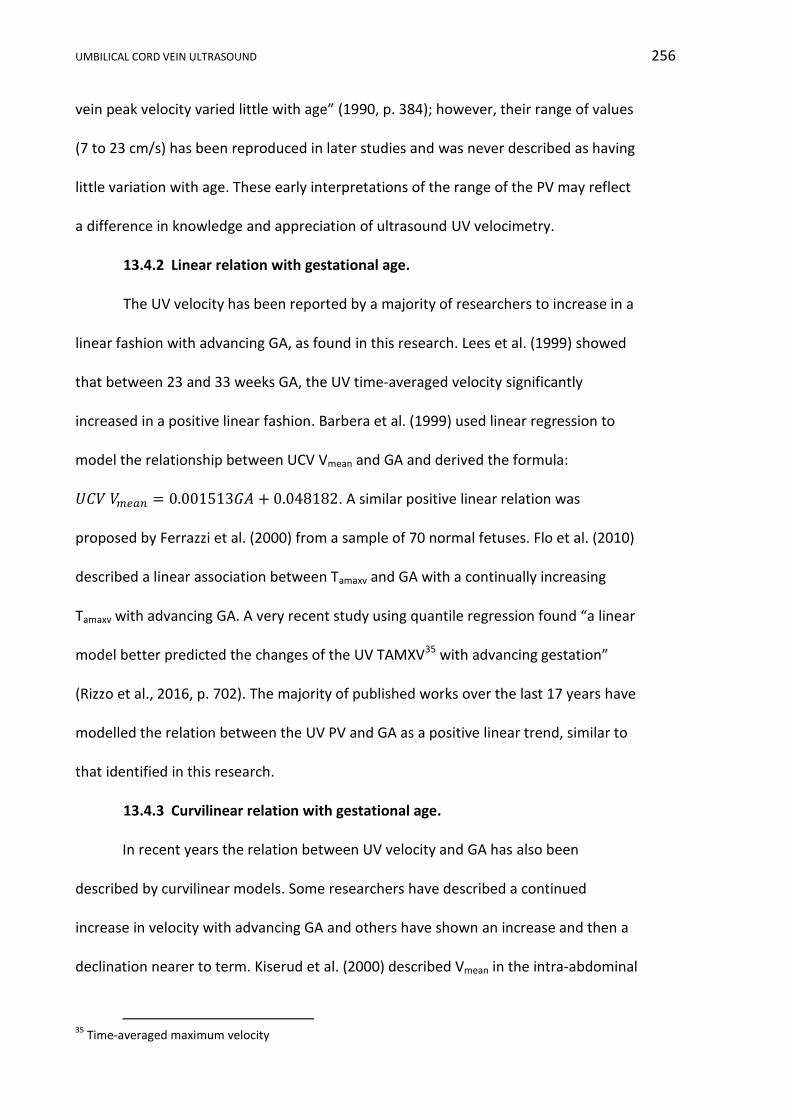
UMBILICAL CORD VEIN ULTRASOUND 256
vein peak velocity varied little with age” (1990, p. 384); however, their range of values
(7 to 23 cm/s) has been reproduced in later studies and was never described as having
little variation with age. These early interpretations of the range of the PV may reflect
a difference in knowledge and appreciation of ultrasound UV velocimetry.
13.4.2 Linear relation with gestational age.
The UV velocity has been reported by a majority of researchers to increase in a
linear fashion with advancing GA, as found in this research. Lees et al. (1999) showed
that between 23 and 33 weeks GA, the UV time-averaged velocity significantly
increased in a positive linear fashion. Barbera et al. (1999) used linear regression to
model the relationship between UCV Vmean and GA and derived the formula:
𝑈𝐶𝑉 𝑉𝑚𝑒𝑎𝑛 = 0.001513𝐺𝐴 + 0.048182. A similar positive linear relation was
proposed by Ferrazzi et al. (2000) from a sample of 70 normal fetuses. Flo et al. (2010)
described a linear association between Tamaxv and GA with a continually increasing
Tamaxv with advancing GA. A very recent study using quantile regression found “a linear
model better predicted the changes of the UV TAMXV35 with advancing gestation”
(Rizzo et al., 2016, p. 702). The majority of published works over the last 17 years have
modelled the relation between the UV PV and GA as a positive linear trend, similar to
that identified in this research.
13.4.3 Curvilinear relation with gestational age.
In recent years the relation between UV velocity and GA has also been
described by curvilinear models. Some researchers have described a continued
increase in velocity with advancing GA and others have shown an increase and then a
declination nearer to term. Kiserud et al. (2000) described Vmean in the intra-abdominal
35
Time-averaged maximum velocity
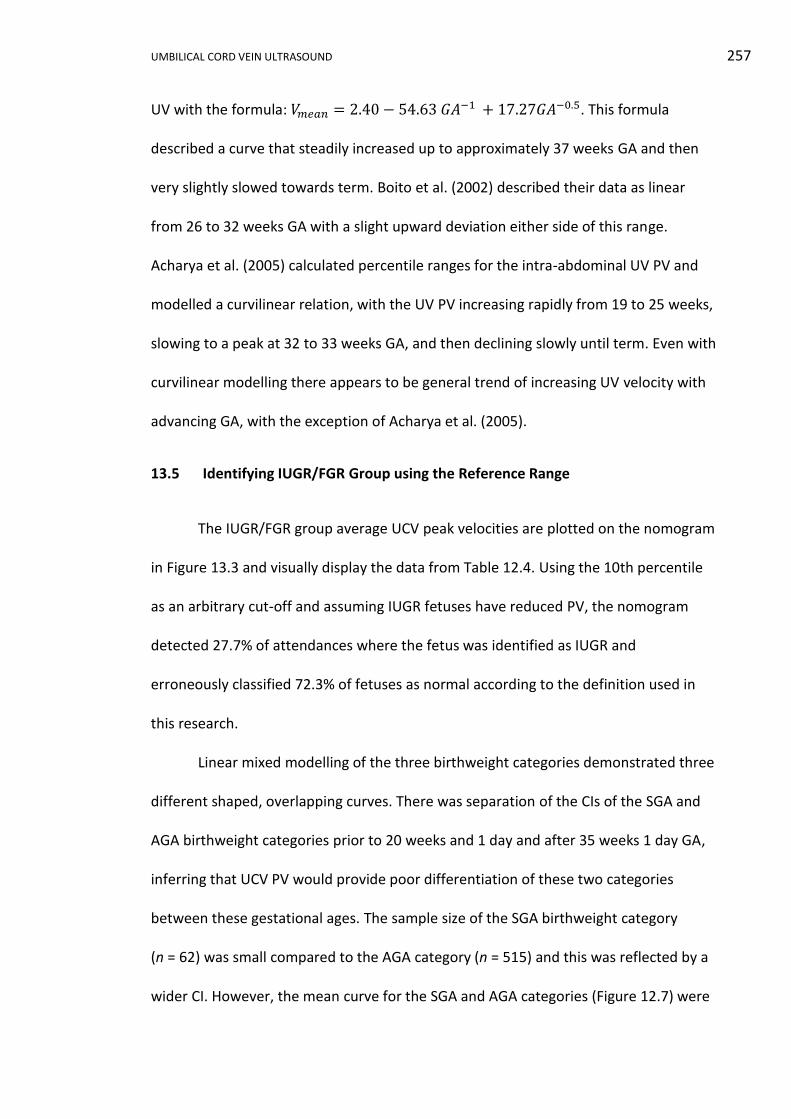
UMBILICAL CORD VEIN ULTRASOUND 257
UV with the formula: 𝑉𝑚𝑒𝑎𝑛 = 2.40 − 54.63 𝐺𝐴−1 + 17.27𝐺𝐴−0.5. This formula
described a curve that steadily increased up to approximately 37 weeks GA and then
very slightly slowed towards term. Boito et al. (2002) described their data as linear
from 26 to 32 weeks GA with a slight upward deviation either side of this range.
Acharya et al. (2005) calculated percentile ranges for the intra-abdominal UV PV and
modelled a curvilinear relation, with the UV PV increasing rapidly from 19 to 25 weeks,
slowing to a peak at 32 to 33 weeks GA, and then declining slowly until term. Even with
curvilinear modelling there appears to be general trend of increasing UV velocity with
advancing GA, with the exception of Acharya et al. (2005).
13.5 Identifying IUGR/FGR Group using the Reference Range
The IUGR/FGR group average UCV peak velocities are plotted on the nomogram
in Figure 13.3 and visually display the data from Table 12.4. Using the 10th percentile
as an arbitrary cut-off and assuming IUGR fetuses have reduced PV, the nomogram
detected 27.7% of attendances where the fetus was identified as IUGR and
erroneously classified 72.3% of fetuses as normal according to the definition used in
this research.
Linear mixed modelling of the three birthweight categories demonstrated three
different shaped, overlapping curves. There was separation of the CIs of the SGA and
AGA birthweight categories prior to 20 weeks and 1 day and after 35 weeks 1 day GA,
inferring that UCV PV would provide poor differentiation of these two categories
between these gestational ages. The sample size of the SGA birthweight category
(n = 62) was small compared to the AGA category (n = 515) and this was reflected by a
wider CI. However, the mean curve for the SGA and AGA categories (Figure 12.7) were
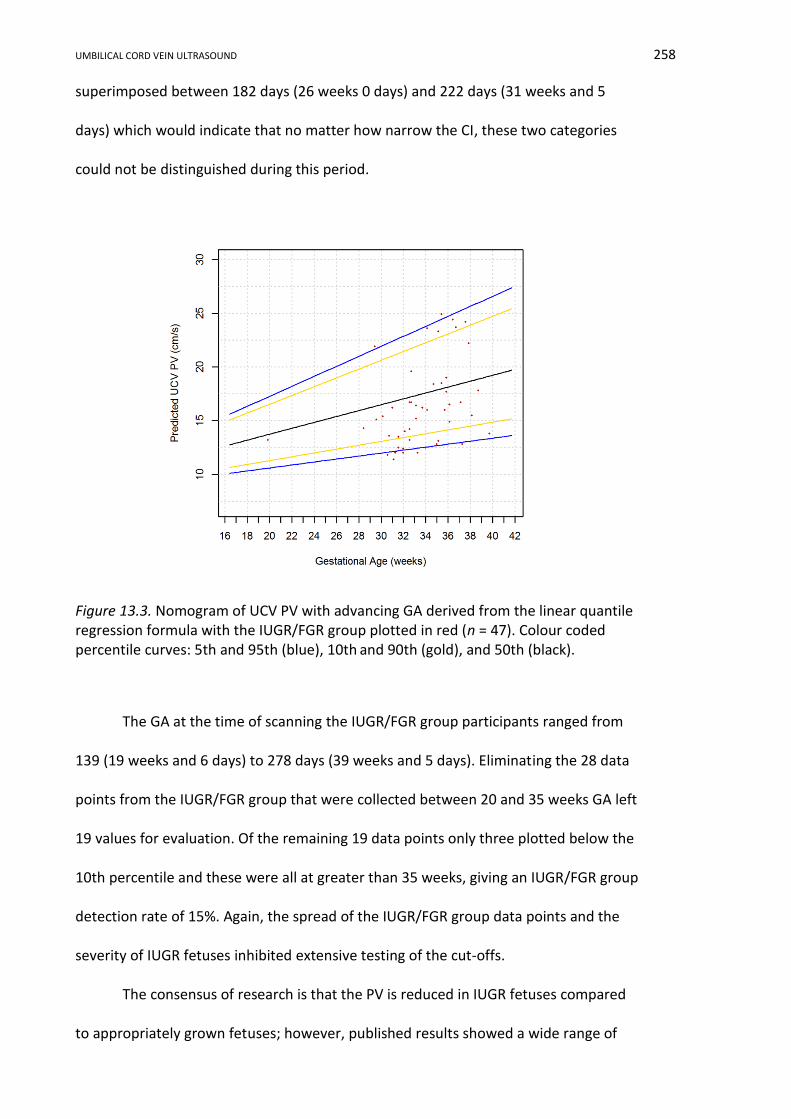
UMBILICAL CORD VEIN ULTRASOUND 258
superimposed between 182 days (26 weeks 0 days) and 222 days (31 weeks and 5
days) which would indicate that no matter how narrow the CI, these two categories
could not be distinguished during this period.
Figure 13.3. Nomogram of UCV PV with advancing GA derived from the linear quantile regression formula with the IUGR/FGR group plotted in red (n = 47). Colour coded percentile curves: 5th and 95th (blue), 10th and 90th (gold), and 50th (black).
The GA at the time of scanning the IUGR/FGR group participants ranged from
139 (19 weeks and 6 days) to 278 days (39 weeks and 5 days). Eliminating the 28 data
points from the IUGR/FGR group that were collected between 20 and 35 weeks GA left
19 values for evaluation. Of the remaining 19 data points only three plotted below the
10th percentile and these were all at greater than 35 weeks, giving an IUGR/FGR group
detection rate of 15%. Again, the spread of the IUGR/FGR group data points and the
severity of IUGR fetuses inhibited extensive testing of the cut-offs.
The consensus of research is that the PV is reduced in IUGR fetuses compared
to appropriately grown fetuses; however, published results showed a wide range of
UMBILICAL CORD VEIN ULTRASOUND 259
detection rates. Jouppila and Kirkinen (1984) found that 8 of 11 (73%) IUGR36 fetuses
had a last attendance UV Vmean below the 10th percentile on their normal reference
ranges, but four of these fetuses had an undetectable velocity at their last attendance,
which they presumed to be low. If the IUGR detection rate is calculated on an
attendance basis and the four attendances with no flow are eliminated, then 6 of 12
attendances were below the 10th percentile therefore correctly identifying 50% of
IUGR fetuses. Ferrazzi et al. (2000) indicated the UCV Vmean was significantly (p < 0.001)
reduced in a sample of 37 IUGR37 fetuses compared to normally growing fetuses. In
addition, 34 of the 37 IUGR fetuses plotted wholly below the 10th percentile, thereby
correctly identifying 92% of IUGR fetuses; however, the physical size of the data points
on the nomogram made interpretation difficult. Boito et al. (2002) found the Tamaxv was
below the 5th percentile in 66% of IUGR38 fetuses when compared to their nomogram.
All the above cited studies quote a higher rate of IUGR identification compared
to this research. Reduced biometry and birthweight defined IUGR in these publications
and both methods of measuring velocity (PV and Vmean) were used, thereby eliminating
these possible reasons for variations in the results. The research ICCs were noticeably
higher than those recorded by other researchers (Fernández et al., 2008; Figueras et
al., 2008) and hence the nomograms developed in this research were based on more
reliable data, which may explain the poor detection rate, as the values were not as
variable.
The average UCV PV of the nAGA group was 16.6 cm/s (mean GA = 207 days)
and the average of the IUGR/FGR group was 16.3 cm/s (mean GA = 235 days). The non-
age matched mean values are relatively similar, which is in conflict with other
36
Birthweight < 10th %, reduced fetal growth, Apgar < 7 at 1 and 5 minutes, pathological CTG 37
AC < 2 SD below mean and birthweight < 10th %
38 AC and birthweight < 5th %
UMBILICAL CORD VEIN ULTRASOUND 260
research. Rigano et al. (2001) concluded from a longitudinal study of 21 IUGR39 fetuses,
between 23 and 36 weeks GA, that the UCV Vmean was significantly (p < 0.001) higher
(0.9 cm/s) in the age matched control group than in the IUGR group (0.5 cm/s). In
unpublished research, a comparison of the average UCV PV between an IUGR40 group
(17.2±3.9 cm/s) and a non-age matched AGA group (13.1±3.0 cm/s), identified a
statistically significant (p < 0.001) association between IUGR and reduced UCV PV
(Spurway, 2006)41. Tchirikov et al. (2009) found the Vmean in a control group (15.95
cm/min) of fetuses with a good pregnancy outcomes was significantly higher (p =
0.0033) than in non-age matched, compromised fetuses42 (12.58 cm/min). Although
used in several studies, direct comparison of the mean UV PV between control and
IUGR fetuses fails to consider the natural increase in PV with advancing GA. If the
control groups were constructed from fetuses that were older than the IUGR group
fetuses, this alone would produce a difference in the means of the two groups and
misrepresent the data.
In summary, modelling of the three birthweight categories has shown that the
three categories overlapped between approximately 20 and 35 weeks GA, even though
each birthweight category quadratic equation was significantly different. The overlap
demonstrated by modelling the birthweight categories is perhaps one of the most
significant outcomes of this research. Figures 12.7 and 12.8 show the gestational ages
of separation of the categories, were too early and too late in pregnancy, to be
clinically helpful in the diagnosis and monitoring of IUGR. Previously, Yagel et al. (2010,
p. 106) stated “the considerable overlap with normal ranges precludes the usefulness
39
AC < 2 SD below mean, UA PI > 2 SD above mean and abnormal uterine artery S/D ratio 40
EFW < 10th % or AC < 5th
%
41 Master of Health Science thesis
42 Poor outcome based on the cord blood pH, Apgar score, birthweight percentile, length of pregnancy,
requirement of respiratory support and transfer of the newborn to a specialist ward
UMBILICAL CORD VEIN ULTRASOUND 261
of the UV flow velocity as a measure of IUGR”, which supports the research findings.
This finding may explain why UCV PV has never become firmly established within the
obstetric ultrasound community and it also provides a possible explanation for the low
detection rate found in analysis of the IUGR/FGR group.
13.6 Limitations and Advantages of the Umbilical Cord Vein Velocity Results
In this research there were several weaknesses in the UCV PV measurement
and identification of IUGR. These weaknesses are in addition to the sparsity of data in
the late second and third trimesters, the IUGR/FGR sample size defining moderate
growth restriction, and whole weeks used to define birthweight categories as
previously discussed. These weaknesses can be summarised as follows:
i. A high ICC result demonstrated that measurement of the UCV PV was very
reliable in this research; however, this reproducibility may not be
exportable to everyday clinical practice, as the measurement of the UCV PV
was extremely user dependent. Incorrect placement of the sample gate,
poor angle of insonation and incorrect selection of the maximum velocity
can make the reproducibility of the measurement difficult.
ii. The recording of a non-fluctuating UCV PV spectral trace was difficult to
capture as it was dependent on the absence of fetal movement, breathing
action, hiccupping, and a myriad of intrauterine conditions.
iii. The Doppler sample gate width may have exceeded the UCV width in early
pregnancy thereby distorting the spectral trace by including adjacent UA
velocities.
iv. When the 10th percentile was used as a cut-off, the reference range only
correctly identified 27.7% of IUGR/FGR group attendances. Excluding the
UMBILICAL CORD VEIN ULTRASOUND 262
attendances between 20 and 35 weeks GA, only 15% of IUGR/FGR group
attendances plotted blow the 10th percentile.
In addition to the common strengths of the nomogram being developed from a
strictly selected Australian based population, analysis using quantile regression and the
expression of the results in percentiles, the strengths of the UCV PV measurement,
development of the reference ranges, and identification of IUGR/FGR can be
summarised as follows:
i. The nomogram was developed using a manual measurement of the PV in a
vertical portion of intra-amniotic UCV. This measurement technique is a
robust and easy to perform measurement that is available on a wide
spectrum of ultrasound machines; inferring this measurement can be
undertaken in many clinical settings.
ii. The UCV peak velocities from both the raw data and the 50th percentile
predicted from the quantile regression formula were in keeping with
previous published data.
iii. The quantile regression linear modelling used in the development on the
reference range was a similar trend to the majority of previously published
results.
iv. The modelling of the three birthweight categories identified a significant
difference between the birthweight groups with different shaped curves,
but with overlapping CI curves between 20 and 35 weeks GA. This
overlapping of the CI curves may explain the poor adoption of UCV PV
reference ranges into clinical practice. If the separation between SGA and
AGA fetuses is not obvious, then UCV PV will not allow distinction between
normally growing and compromised fetuses.
UMBILICAL CORD VEIN ULTRASOUND 263
13.7 Potential Application of the Umbilical Cord Vein Velocity Results
Even though the ICC results for measurement of the UCV PV were excellent in
this research, the PV is technically difficult to accurately measure, with both
sonographer and fetal aspects contributing to erroneous values. This coupled with the
poor detection rate identified in this research and the lack of distinct separation
between the birthweight groups, infers that the UCV PV has relatively limited clinical
application.
13.8 Conclusion
This research presents the first UCV PV reference range developed from an
Australian derived “normal” obstetrics population using quantile regression. The
research demonstrated a linear increase in UCV PV with increasing GA and this trend is
in keeping with other published works. Using linear mixed modelling, different shaped,
overlapping curves were used to describe the UCV peak velocities of the SGA, AGA and
LGA birthweight categories and it is this lack of distinction between the groups that
may explain the poor detection rate of IUGR/FGR fetuses and the failure of UCV PV to
be widely accepted into clinical practice. The reference range correctly identified
27.7% of IUGR/FGR group data points using the 10th percentile as a cut-off and 15%
when employing the GA cut-offs suggested by the birthweight category regression
curves. In combination, all these factors suggest that UCV PV would be of little use in
the diagnosis and monitoring of abnormal fetal growth.
UMBILICAL CORD VEIN ULTRASOUND 264
Chapter 14 Umbilical Cord Vein Blood Flow Results
14.1 Introduction
In this chapter, the range and measures of central tendency of Qucv will be
outlined and scatterplots constructed to display the relationship between Qucv and GA,
for the whole research sample and the nAGA group. Statistical modelling will assess
the differences between the Qucv for the three birthweight categories. Further
modelling will develop a reference range from the nAGA data. Analysis will determine
the nomogram’s ability to identify growth restricted fetuses and specifically the
IUGR/FGR group. Lastly, the relationships between UCV diameter and PV will be
explored. Continuous variables are reported as means ± SD and discrete variables are
reported as numbers or percentages. Where appropriate p values are provided.
14.2 The Umbilical Cord Vein Blood Flow Data and Data Checking
The Qucv was calculated from the untruncated average UCV diameter and PV
measurements for each participant at each attendance. In the whole research sample
the Qucv was calculated in 1,345 (97.9%) examinations and was not calculated in 29
examinations as 15 average UCV diameters and 14 average UCV PV measurements
were not available (Appendix K1). The exclusion of the UCV PV outlier (Participant
58/Visit 60d) left 1,344 Qucv data points available for analyses which were plotted
against GA to visually determine the strength and type of relation between the two
variables (Figure 14.1a). In the whole research sample the lowest Qucv was 16.5 ml/min
at 138 days (19 weeks and 5 days) and was calculated for a fetus (Participant 608/Visit
13) classified as AGA by birthweight. The highest Qucv was 516.4 ml/min at 236 days
(33 weeks and 5 days) and was calculated for a fetus (Participant 4/Visit 4b) classified
UMBILICAL CORD VEIN ULTRASOUND 265
as LGA by birthweight. The whole research sample Qucv median was 195.6 ml/min and
the mean 187.1 ml/min.
In the nAGA group the Qucv was calculated in 588 (97.5%) examinations
(Appendix K2). The Qucv was not calculated in 15 examinations due to five missing
average UCV diameters and 10 missing average UCV PV values. A scatterplot of these
measurements against GA was constructed (Figure 14.1b). The lowest Qucv was 16.5
ml/min at 138 days (19 weeks 5 days) (Participant 608/Visit 13) and the highest was
499.3 ml/min at 268 days (38 weeks 2 days) (Participant 451/Visit 462c). The lowest
Qucv in both the whole research sample and the nAGA group were recorded by the
same participant at the same visit. The nAGA group Qucv median was 185 ml/min and
the mean 177.4 ml/min.
The Figure 14.1 scatterplots, of both the whole research sample and the nAGA
group, show greater variability after 200 days GA. This was confirmed by boxplots of
both samples divided into second (< 26 weeks GA) and third trimesters (≥ 26 weeks
GA) (Figure 14.2). These boxplots show greater variability in the Qucv measurements, as
indicated by wider interquartile ranges (Q3 - Q1) during the third trimester, and data
sets from both trimesters were symmetrical with the median central in the
interquartile range boxes.
The scatterplots in Figure 14.1 suggest a curvilinear relation between Qucv and
GA. A natural logarithm transformation of the Qucv values was performed to address
the greater variability in the Qucv data with advancing GA and scatterplots produced for
both the whole research sample and the nAGA group (Figure 14.3). Figure 14.3 still
shows increased variability with advancing GA, but was less than Figure 14.1. This
increased variability with advancing GA was also evident in the scatterplots of the UCV
diameter and PV, which are two components of the Qucv calculation.
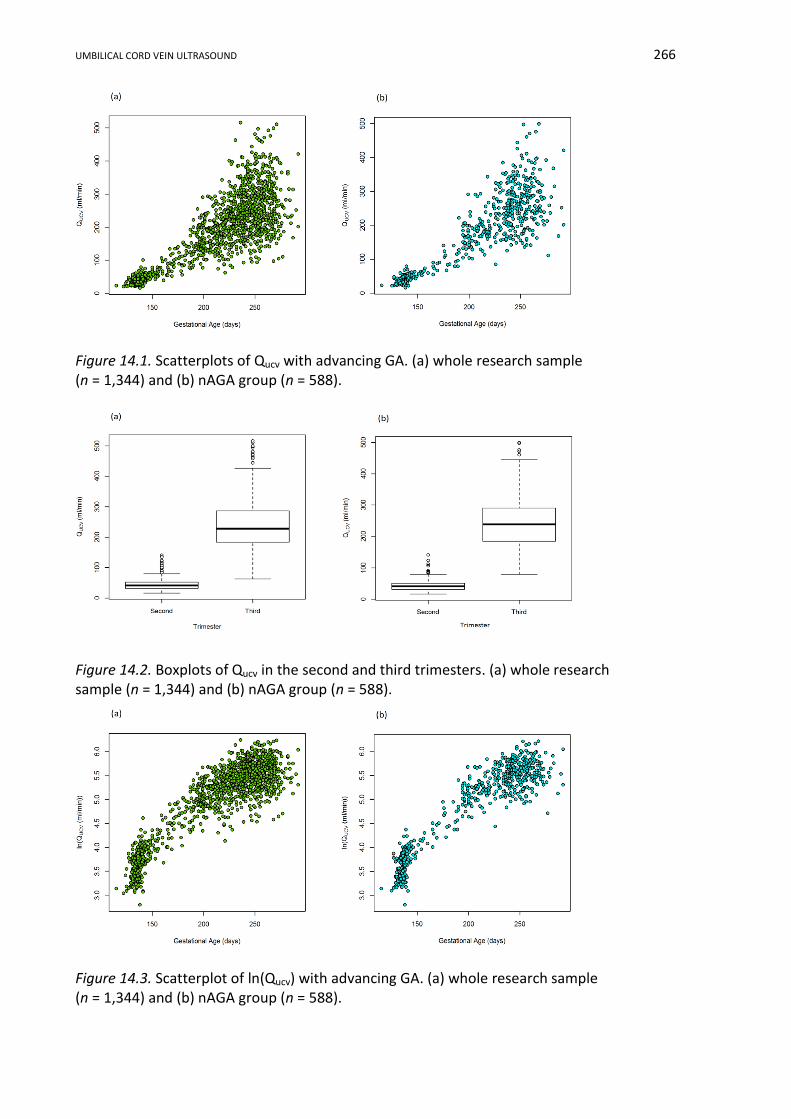
UMBILICAL CORD VEIN ULTRASOUND 266
Figure 14.1. Scatterplots of Qucv with advancing GA. (a) whole research sample (n = 1,344) and (b) nAGA group (n = 588).
Figure 14.2. Boxplots of Qucv in the second and third trimesters. (a) whole research sample (n = 1,344) and (b) nAGA group (n = 588).
Figure 14.3. Scatterplot of ln(Qucv) with advancing GA. (a) whole research sample (n = 1,344) and (b) nAGA group (n = 588).

UMBILICAL CORD VEIN ULTRASOUND 267
14.3 Modelling the Three Birthweight Categories
The differences between Qucv of the SGA, AGA and LGA birthweight categories
will be explored in this section of data analysis (Appendix L4). The previously
transformed whole research sample data was colour coded according to birthweight
category and visually assessed for differences between the birthweight categories
(Figure 14.4). This figure shows that after 200 days GA the SGA birthweight category
fetuses tended to have lower Qucv than the LGA classified fetuses, but there was some
overlap with the AGA fetuses across all GA.
Figure 14.4. Colour coded scatterplot of ln(Qucv) with advancing GA (n = 1,344).
Figures 14.3 and 14.4 show a curvilinear relationship between ln(Qucv) and GA.
A linear mixed model was fitted to the transformed Qucv data using ASReml-R
computer program (Butler et al., 2007) to model the relationship between ln(Qucv) and
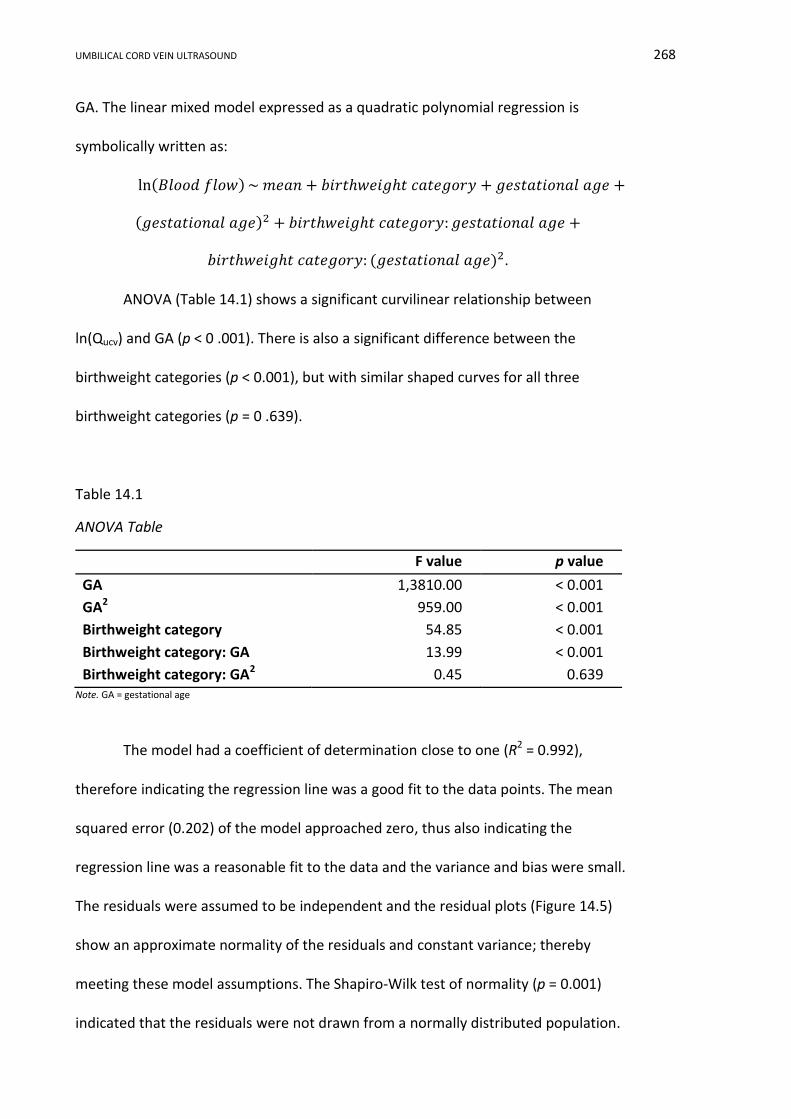
UMBILICAL CORD VEIN ULTRASOUND 268
GA. The linear mixed model expressed as a quadratic polynomial regression is
symbolically written as:
ln(𝐵𝑙𝑜𝑜𝑑 𝑓𝑙𝑜𝑤) ~ 𝑚𝑒𝑎𝑛 + 𝑏𝑖𝑟𝑡ℎ𝑤𝑒𝑖𝑔ℎ𝑡 𝑐𝑎𝑡𝑒𝑔𝑜𝑟𝑦 + 𝑔𝑒𝑠𝑡𝑎𝑡𝑖𝑜𝑛𝑎𝑙 𝑎𝑔𝑒 +
(𝑔𝑒𝑠𝑡𝑎𝑡𝑖𝑜𝑛𝑎𝑙 𝑎𝑔𝑒)2 + 𝑏𝑖𝑟𝑡ℎ𝑤𝑒𝑖𝑔ℎ𝑡 𝑐𝑎𝑡𝑒𝑔𝑜𝑟𝑦: 𝑔𝑒𝑠𝑡𝑎𝑡𝑖𝑜𝑛𝑎𝑙 𝑎𝑔𝑒 +
𝑏𝑖𝑟𝑡ℎ𝑤𝑒𝑖𝑔ℎ𝑡 𝑐𝑎𝑡𝑒𝑔𝑜𝑟𝑦: (𝑔𝑒𝑠𝑡𝑎𝑡𝑖𝑜𝑛𝑎𝑙 𝑎𝑔𝑒)2.
ANOVA (Table 14.1) shows a significant curvilinear relationship between
ln(Qucv) and GA (p < 0 .001). There is also a significant difference between the
birthweight categories (p < 0.001), but with similar shaped curves for all three
birthweight categories (p = 0 .639).
Table 14.1
ANOVA Table
F value p value
GA 1,3810.00 < 0.001
GA2 959.00 < 0.001
Birthweight category 54.85 < 0.001
Birthweight category: GA 13.99 < 0.001
Birthweight category: GA2 0.45 0.639 Note. GA = gestational age
The model had a coefficient of determination close to one (R2 = 0.992),
therefore indicating the regression line was a good fit to the data points. The mean
squared error (0.202) of the model approached zero, thus also indicating the
regression line was a reasonable fit to the data and the variance and bias were small.
The residuals were assumed to be independent and the residual plots (Figure 14.5)
show an approximate normality of the residuals and constant variance; thereby
meeting these model assumptions. The Shapiro-Wilk test of normality (p = 0.001)
indicated that the residuals were not drawn from a normally distributed population.

UMBILICAL CORD VEIN ULTRASOUND 269
Figure 14.5. Residual plots derived from the linear mixed model.
The quadratic polynomial regression equations for the three birthweight
categories are written below. The dependent variable is ln(Qucv) and GA in days is the
explanatory variable. The birthweight category: GA2 term was not significant and was
dropped from the model.
SGA
ln(𝑈𝐶𝑉 𝑄𝑢𝑐𝑣 ) = −2.34583669 + 0.05856228 × 𝐺𝐴 − 0.00011227 × 𝐺𝐴2
AGA
ln(𝑈𝐶𝑉 𝑄𝑢𝑐𝑣 ) = −2.52446344 + 0.06045165 × 𝐺𝐴 − 0.00011227 × 𝐺𝐴2
LGA
ln(𝑈𝐶𝑉 𝑄𝑢𝑐𝑣 ) = −2.62659149 + 0.06184323 × 𝐺𝐴 − 0.00011227 × 𝐺𝐴2
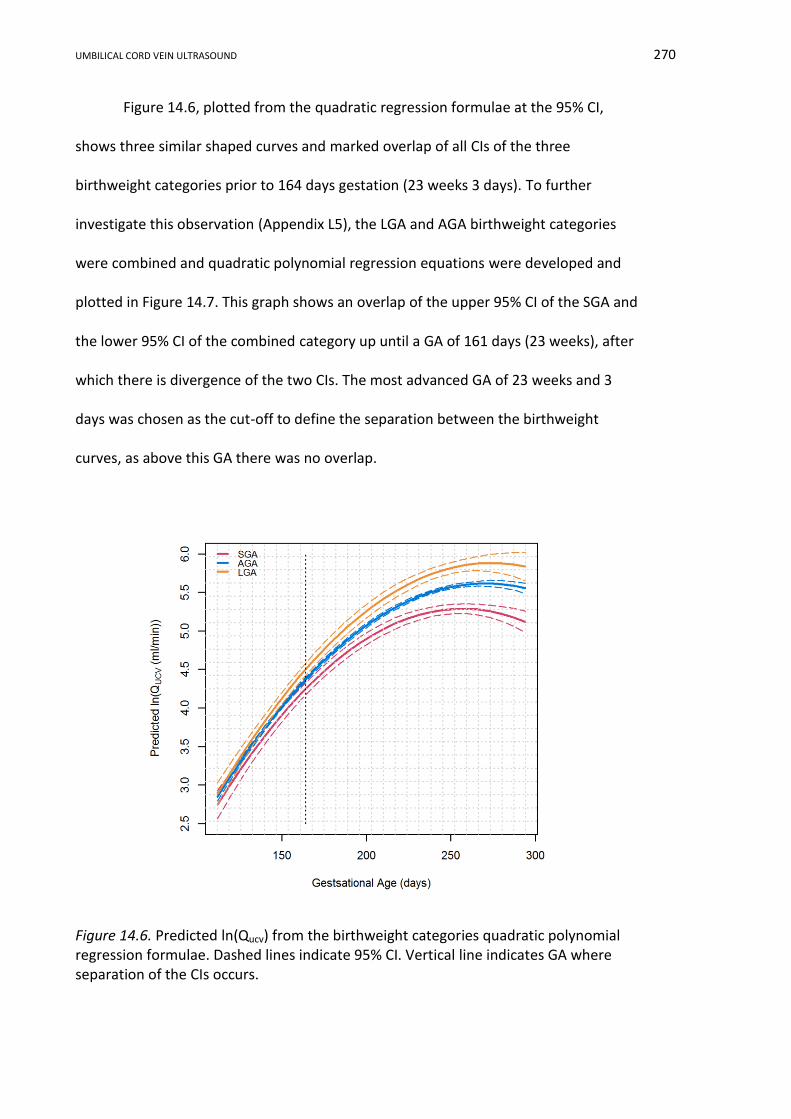
UMBILICAL CORD VEIN ULTRASOUND 270
Figure 14.6, plotted from the quadratic regression formulae at the 95% CI,
shows three similar shaped curves and marked overlap of all CIs of the three
birthweight categories prior to 164 days gestation (23 weeks 3 days). To further
investigate this observation (Appendix L5), the LGA and AGA birthweight categories
were combined and quadratic polynomial regression equations were developed and
plotted in Figure 14.7. This graph shows an overlap of the upper 95% CI of the SGA and
the lower 95% CI of the combined category up until a GA of 161 days (23 weeks), after
which there is divergence of the two CIs. The most advanced GA of 23 weeks and 3
days was chosen as the cut-off to define the separation between the birthweight
curves, as above this GA there was no overlap.
Figure 14.6. Predicted ln(Qucv) from the birthweight categories quadratic polynomial regression formulae. Dashed lines indicate 95% CI. Vertical line indicates GA where separation of the CIs occurs.
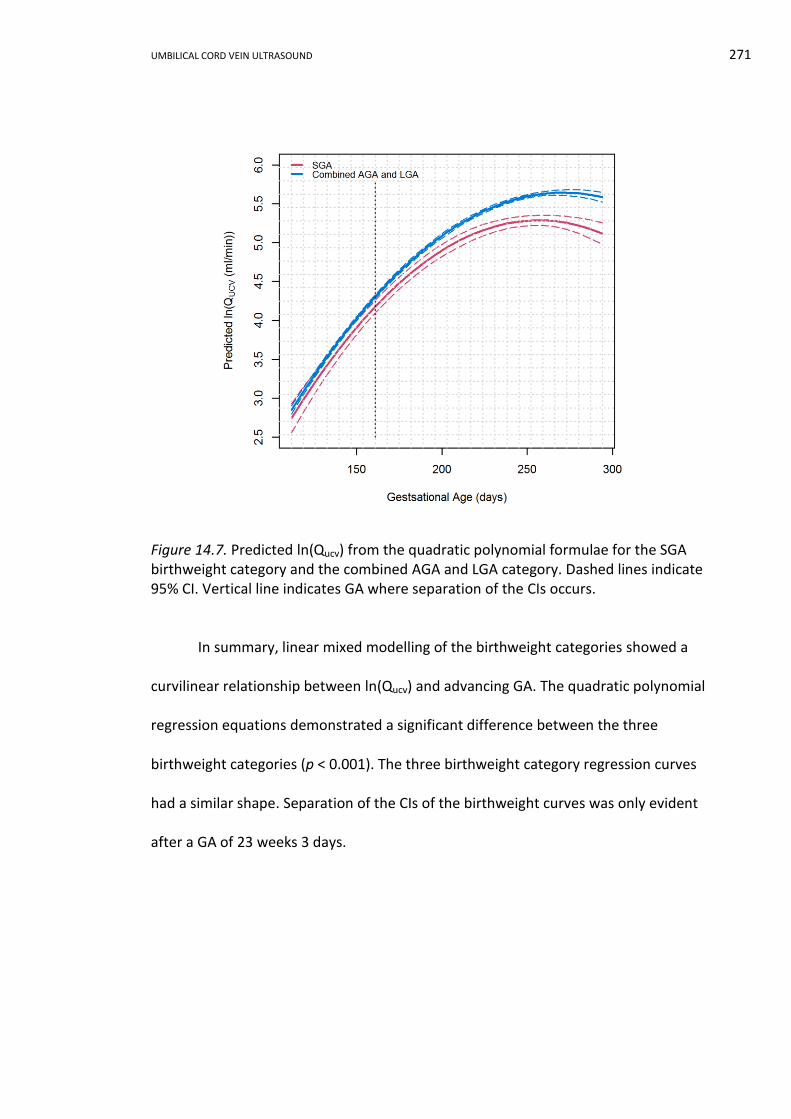
UMBILICAL CORD VEIN ULTRASOUND 271
Figure 14.7. Predicted ln(Qucv) from the quadratic polynomial formulae for the SGA birthweight category and the combined AGA and LGA category. Dashed lines indicate 95% CI. Vertical line indicates GA where separation of the CIs occurs.
In summary, linear mixed modelling of the birthweight categories showed a
curvilinear relationship between ln(Qucv) and advancing GA. The quadratic polynomial
regression equations demonstrated a significant difference between the three
birthweight categories (p < 0.001). The three birthweight category regression curves
had a similar shape. Separation of the CIs of the birthweight curves was only evident
after a GA of 23 weeks 3 days.

UMBILICAL CORD VEIN ULTRASOUND 272
14.4 Developing a Reference Range (Nomogram) using Quantile Regression and
the nAGA Group
This portion of data analysis will report on the development a Qucv reference
range from the nAGA data. Visual inspection of Figures 14.1b and 14.3b and previous
modelling of the AGA birthweight category suggests a curvilinear relation between Qucv
and GA. A polynomial quantile regression model was applied with backward selection
of power and initially a cubic (order 3) model was selected for analysis. The model can
be symbolically written as:
𝑈𝑚𝑏𝑖𝑙𝑖𝑐𝑎𝑙 𝑐𝑜𝑟𝑑 𝑣𝑒𝑖𝑛 𝑏𝑙𝑜𝑜𝑑 𝑓𝑙𝑜𝑤 ~ 𝑚𝑒𝑎𝑛 + 𝐺𝐴 + 𝐺𝐴2 + 𝐺𝐴3.
The regression equation can be written:
𝑄𝑢𝑐𝑣 = 𝑏0𝑝+ 𝑏1𝑝
𝐺𝐴 + 𝑏2𝑝 𝐺𝐴2 + 𝑏3𝑝
𝐺𝐴3.
Where b0 = intercept
p = percentile value 3rd, 5th, 10th, 25th, 50th, 75th, 90th, 95th and 97th
GA = gestational age in days
However, the 3rd and 97th percentiles were not significant at both cubic (order 3) and
quadratic (order 2) powers. Using backward selection it was found that a linear (order
1) quantile regression was required for these two percentiles. The model can be
written as:
𝑈𝑚𝑏𝑖𝑙𝑖𝑐𝑎𝑙 𝑐𝑜𝑟𝑑 𝑣𝑒𝑖𝑛 𝑏𝑙𝑜𝑜𝑑 𝑓𝑙𝑜𝑤 ~ 𝑚𝑒𝑎𝑛 + 𝐺𝐴.
The regression equation can be written:
𝑄𝑢𝑐𝑣 = 𝑏0𝑝+ 𝑏1𝑝
𝐺𝐴.
Where b0 = intercept
p = percentile value 3rd and 97th
GA = gestational age in days

UMBILICAL CORD VEIN ULTRASOUND 273
Quantile regression is a non-parametric model and has no assumptions about
the underlying distribution of data. Therefore, no tests for assumptions of normality
were required in this form of modelling. The regression coefficients, standard errors of
the coefficients, and p values for all percentiles are shown in Table 14.2. The p values
indicate the significance of each order of the polynomial in the quantile regression
given that p < 0.05 was considered statistically significant. The standard error of the
coefficients relates to quantile regression analysis and provides an estimate of the
range of the errors for coefficient estimation. The predicted values from the model for
each percentile at weekly GA intervals are shown in Table 14.3. The percentile curves
obtained from quantile regression are plotted in Figure 14.8 with the nAGA group data
superimposed.
Figure 14.8. Nomogram of Qucv with advancing GA derived from cubic and linear quantile regression with the nAGA data plotted in black (n = 588). Colour coded percentile curves: 3rd and 97th (green), 5th and 95th (blue), 10th and 90th (gold), and 50th (black).
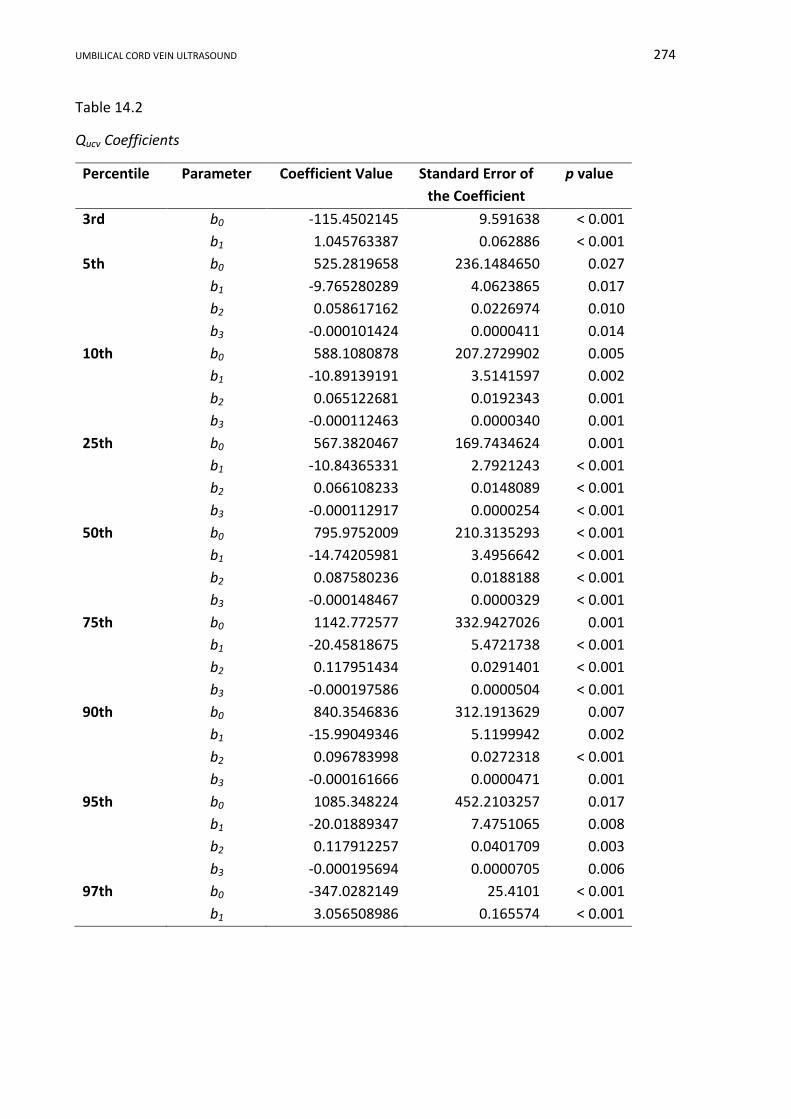
UMBILICAL CORD VEIN ULTRASOUND 274
Table 14.2
Qucv Coefficients
Percentile
Parameter Coefficient Value Standard Error of
the Coefficient
p value
3rd b0 -115.4502145 9.591638 < 0.001
b1 1.045763387 0.062886 < 0.001
5th b0 525.2819658 236.1484650 0.027
b1 -9.765280289 4.0623865 0.017
b2 0.058617162 0.0226974 0.010
b3 -0.000101424 0.0000411 0.014
10th b0 588.1080878 207.2729902 0.005
b1 -10.89139191 3.5141597 0.002
b2 0.065122681 0.0192343 0.001
b3 -0.000112463 0.0000340 0.001
25th b0 567.3820467 169.7434624 0.001
b1 -10.84365331 2.7921243 < 0.001
b2 0.066108233 0.0148089 < 0.001
b3 -0.000112917 0.0000254 < 0.001
50th b0 795.9752009 210.3135293 < 0.001
b1 -14.74205981 3.4956642 < 0.001
b2 0.087580236 0.0188188 < 0.001
b3 -0.000148467 0.0000329 < 0.001
75th b0 1142.772577 332.9427026 0.001
b1 -20.45818675 5.4721738 < 0.001
b2 0.117951434 0.0291401 < 0.001
b3 -0.000197586 0.0000504 < 0.001
90th b0 840.3546836 312.1913629 0.007
b1 -15.99049346 5.1199942 0.002
b2 0.096783998 0.0272318 < 0.001
b3 -0.000161666 0.0000471 0.001
95th b0 1085.348224 452.2103257 0.017
b1 -20.01889347 7.4751065 0.008
b2 0.117912257 0.0401709 0.003
b3 -0.000195694 0.0000705 0.006
97th b0 -347.0282149 25.4101 < 0.001
b1 3.056508986 0.165574 < 0.001
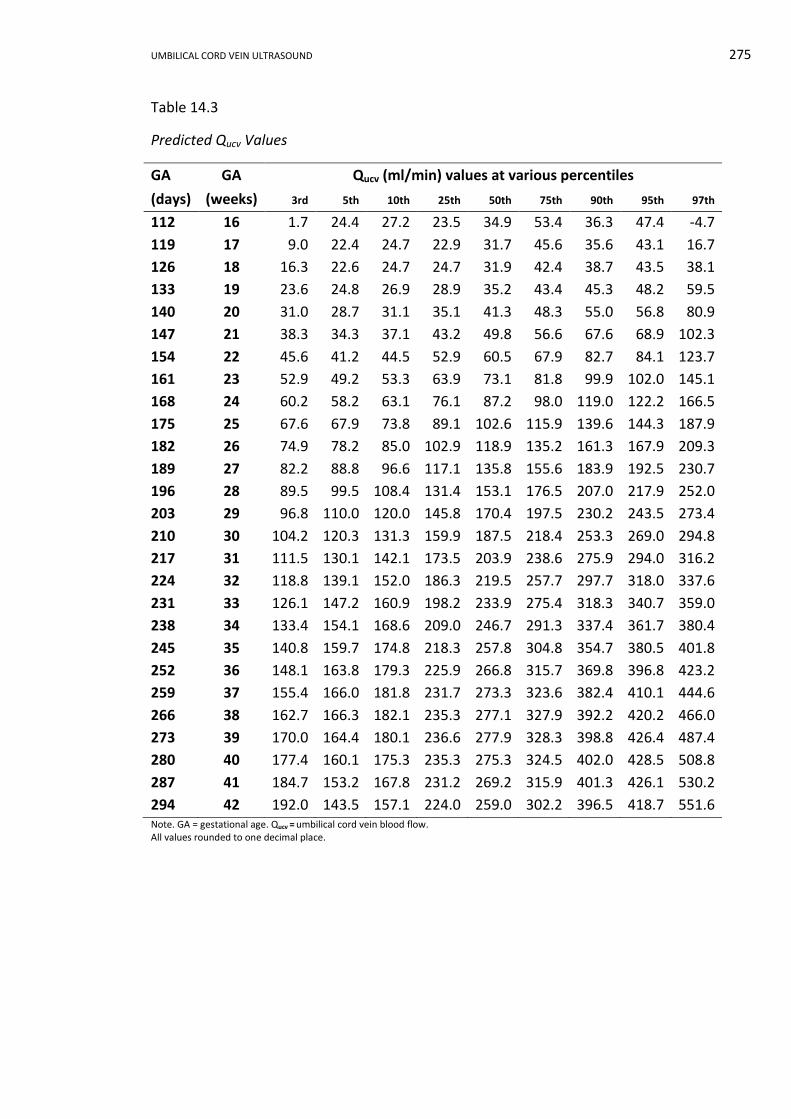
UMBILICAL CORD VEIN ULTRASOUND 275
Table 14.3
Predicted Qucv Values
GA GA Qucv (ml/min) values at various percentiles
(days) (weeks) 3rd 5th 10th 25th 50th 75th 90th 95th 97th
112 16 1.7 24.4 27.2 23.5 34.9 53.4 36.3 47.4 -4.7
119 17 9.0 22.4 24.7 22.9 31.7 45.6 35.6 43.1 16.7
126 18 16.3 22.6 24.7 24.7 31.9 42.4 38.7 43.5 38.1
133 19 23.6 24.8 26.9 28.9 35.2 43.4 45.3 48.2 59.5
140 20 31.0 28.7 31.1 35.1 41.3 48.3 55.0 56.8 80.9
147 21 38.3 34.3 37.1 43.2 49.8 56.6 67.6 68.9 102.3
154 22 45.6 41.2 44.5 52.9 60.5 67.9 82.7 84.1 123.7
161 23 52.9 49.2 53.3 63.9 73.1 81.8 99.9 102.0 145.1
168 24 60.2 58.2 63.1 76.1 87.2 98.0 119.0 122.2 166.5
175 25 67.6 67.9 73.8 89.1 102.6 115.9 139.6 144.3 187.9
182 26 74.9 78.2 85.0 102.9 118.9 135.2 161.3 167.9 209.3
189 27 82.2 88.8 96.6 117.1 135.8 155.6 183.9 192.5 230.7
196 28 89.5 99.5 108.4 131.4 153.1 176.5 207.0 217.9 252.0
203 29 96.8 110.0 120.0 145.8 170.4 197.5 230.2 243.5 273.4
210 30 104.2 120.3 131.3 159.9 187.5 218.4 253.3 269.0 294.8
217 31 111.5 130.1 142.1 173.5 203.9 238.6 275.9 294.0 316.2
224 32 118.8 139.1 152.0 186.3 219.5 257.7 297.7 318.0 337.6
231 33 126.1 147.2 160.9 198.2 233.9 275.4 318.3 340.7 359.0
238 34 133.4 154.1 168.6 209.0 246.7 291.3 337.4 361.7 380.4
245 35 140.8 159.7 174.8 218.3 257.8 304.8 354.7 380.5 401.8
252 36 148.1 163.8 179.3 225.9 266.8 315.7 369.8 396.8 423.2
259 37 155.4 166.0 181.8 231.7 273.3 323.6 382.4 410.1 444.6
266 38 162.7 166.3 182.1 235.3 277.1 327.9 392.2 420.2 466.0
273 39 170.0 164.4 180.1 236.6 277.9 328.3 398.8 426.4 487.4
280 40 177.4 160.1 175.3 235.3 275.3 324.5 402.0 428.5 508.8
287 41 184.7 153.2 167.8 231.2 269.2 315.9 401.3 426.1 530.2
294 42 192.0 143.5 157.1 224.0 259.0 302.2 396.5 418.7 551.6 Note. GA = gestational age. Qucv = umbilical cord vein blood flow. All values rounded to one decimal place.
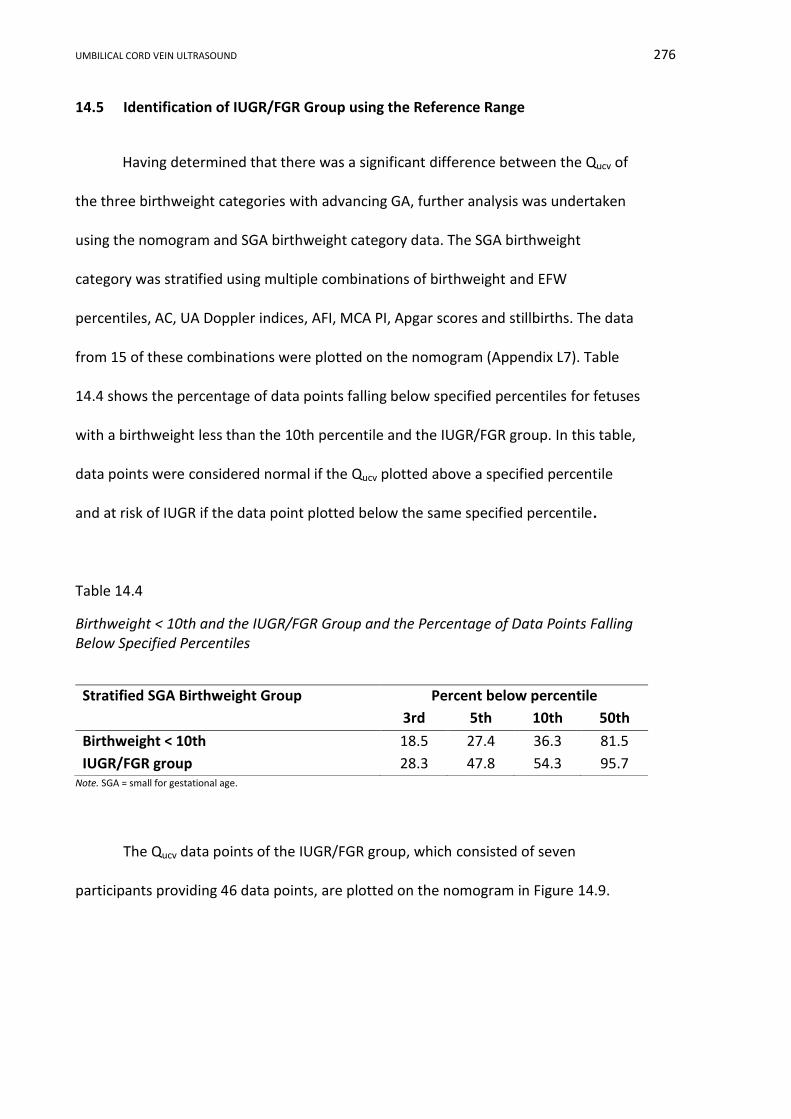
UMBILICAL CORD VEIN ULTRASOUND 276
14.5 Identification of IUGR/FGR Group using the Reference Range
Having determined that there was a significant difference between the Qucv of
the three birthweight categories with advancing GA, further analysis was undertaken
using the nomogram and SGA birthweight category data. The SGA birthweight
category was stratified using multiple combinations of birthweight and EFW
percentiles, AC, UA Doppler indices, AFI, MCA PI, Apgar scores and stillbirths. The data
from 15 of these combinations were plotted on the nomogram (Appendix L7). Table
14.4 shows the percentage of data points falling below specified percentiles for fetuses
with a birthweight less than the 10th percentile and the IUGR/FGR group. In this table,
data points were considered normal if the Qucv plotted above a specified percentile
and at risk of IUGR if the data point plotted below the same specified percentile.
Table 14.4
Birthweight < 10th and the IUGR/FGR Group and the Percentage of Data Points Falling Below Specified Percentiles
Note. SGA = small for gestational age.
The Qucv data points of the IUGR/FGR group, which consisted of seven
participants providing 46 data points, are plotted on the nomogram in Figure 14.9.
Stratified SGA Birthweight Group Percent below percentile
3rd 5th 10th 50th
Birthweight < 10th 18.5 27.4 36.3 81.5
IUGR/FGR group 28.3 47.8 54.3 95.7
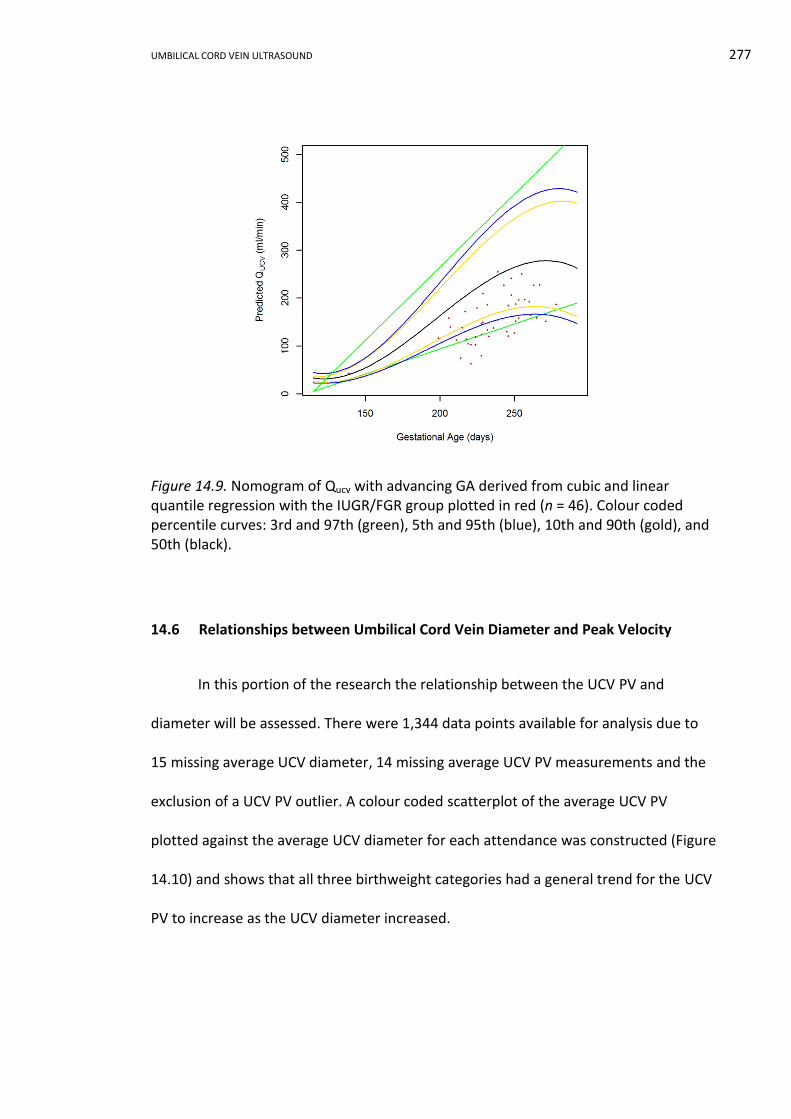
UMBILICAL CORD VEIN ULTRASOUND 277
Figure 14.9. Nomogram of Qucv with advancing GA derived from cubic and linear quantile regression with the IUGR/FGR group plotted in red (n = 46). Colour coded percentile curves: 3rd and 97th (green), 5th and 95th (blue), 10th and 90th (gold), and 50th (black).
14.6 Relationships between Umbilical Cord Vein Diameter and Peak Velocity
In this portion of the research the relationship between the UCV PV and
diameter will be assessed. There were 1,344 data points available for analysis due to
15 missing average UCV diameter, 14 missing average UCV PV measurements and the
exclusion of a UCV PV outlier. A colour coded scatterplot of the average UCV PV
plotted against the average UCV diameter for each attendance was constructed (Figure
14.10) and shows that all three birthweight categories had a general trend for the UCV
PV to increase as the UCV diameter increased.
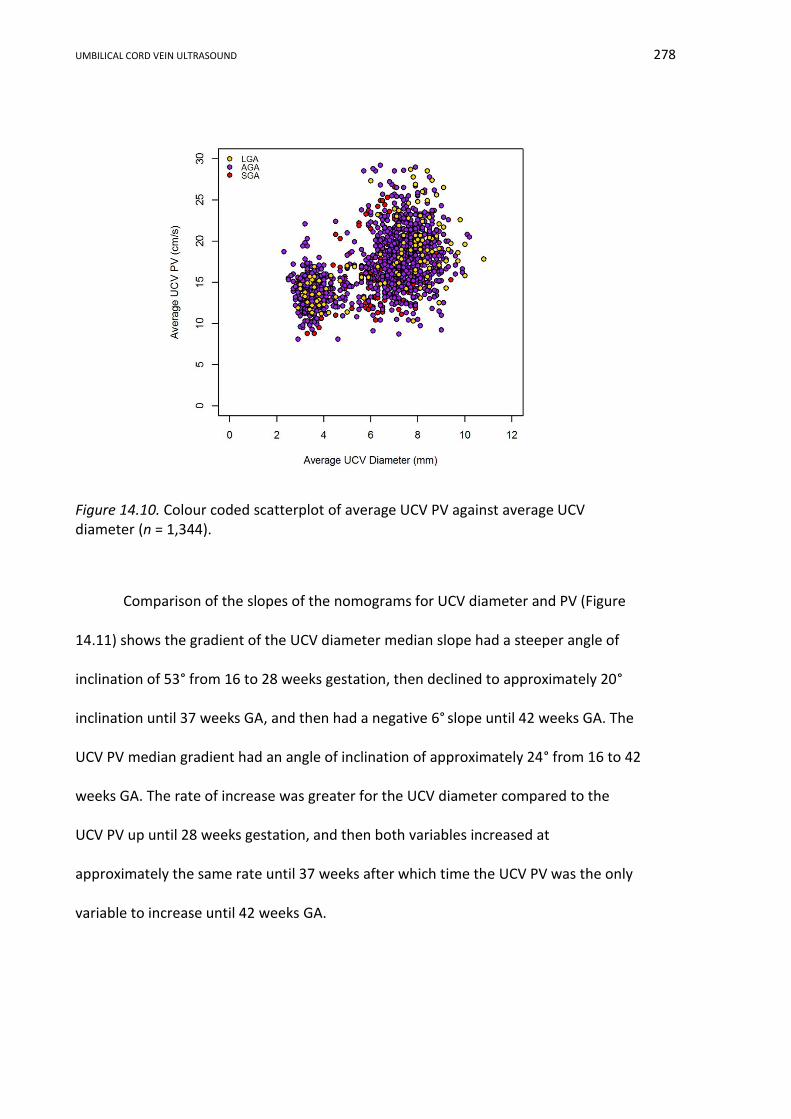
UMBILICAL CORD VEIN ULTRASOUND 278
Figure 14.10. Colour coded scatterplot of average UCV PV against average UCV diameter (n = 1,344).
Comparison of the slopes of the nomograms for UCV diameter and PV (Figure
14.11) shows the gradient of the UCV diameter median slope had a steeper angle of
inclination of 53° from 16 to 28 weeks gestation, then declined to approximately 20°
inclination until 37 weeks GA, and then had a negative 6° slope until 42 weeks GA. The
UCV PV median gradient had an angle of inclination of approximately 24° from 16 to 42
weeks GA. The rate of increase was greater for the UCV diameter compared to the
UCV PV up until 28 weeks gestation, and then both variables increased at
approximately the same rate until 37 weeks after which time the UCV PV was the only
variable to increase until 42 weeks GA.
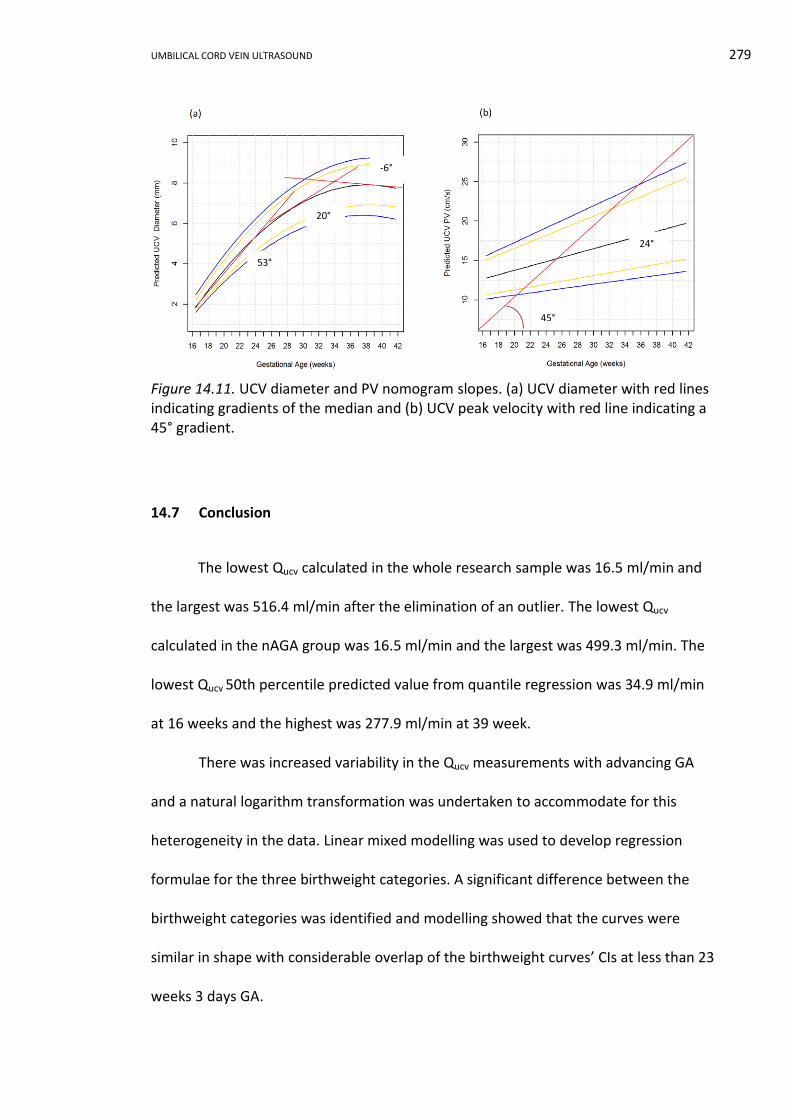
UMBILICAL CORD VEIN ULTRASOUND 279
Figure 14.11. UCV diameter and PV nomogram slopes. (a) UCV diameter with red lines indicating gradients of the median and (b) UCV peak velocity with red line indicating a 45° gradient.
14.7 Conclusion
The lowest Qucv calculated in the whole research sample was 16.5 ml/min and
the largest was 516.4 ml/min after the elimination of an outlier. The lowest Qucv
calculated in the nAGA group was 16.5 ml/min and the largest was 499.3 ml/min. The
lowest Qucv 50th percentile predicted value from quantile regression was 34.9 ml/min
at 16 weeks and the highest was 277.9 ml/min at 39 week.
There was increased variability in the Qucv measurements with advancing GA
and a natural logarithm transformation was undertaken to accommodate for this
heterogeneity in the data. Linear mixed modelling was used to develop regression
formulae for the three birthweight categories. A significant difference between the
birthweight categories was identified and modelling showed that the curves were
similar in shape with considerable overlap of the birthweight curves’ CIs at less than 23
weeks 3 days GA.
45°
53°
20°
-6°
24°
UMBILICAL CORD VEIN ULTRASOUND 280
Both linear and cubic quantile regression was used to model the nAGA data and
develop a reference range of the Qucv with advancing GA. The coefficients for the
regression formula and the calculated values for each percentile were presented.
Using the stratified SGA data, the percentage of Qucv measurements plotting below the
3rd, 5th, 10th and 50th percentiles on the reference range were determined and
54.3% of the IUGR/FGR group attendances plotted below the 10th percentile. The UCV
PV increased with enlarging UCV diameter; however, the rate of change was constant
for the UCV PV and was greatest in the UCV diameter prior to 28 weeks GA.
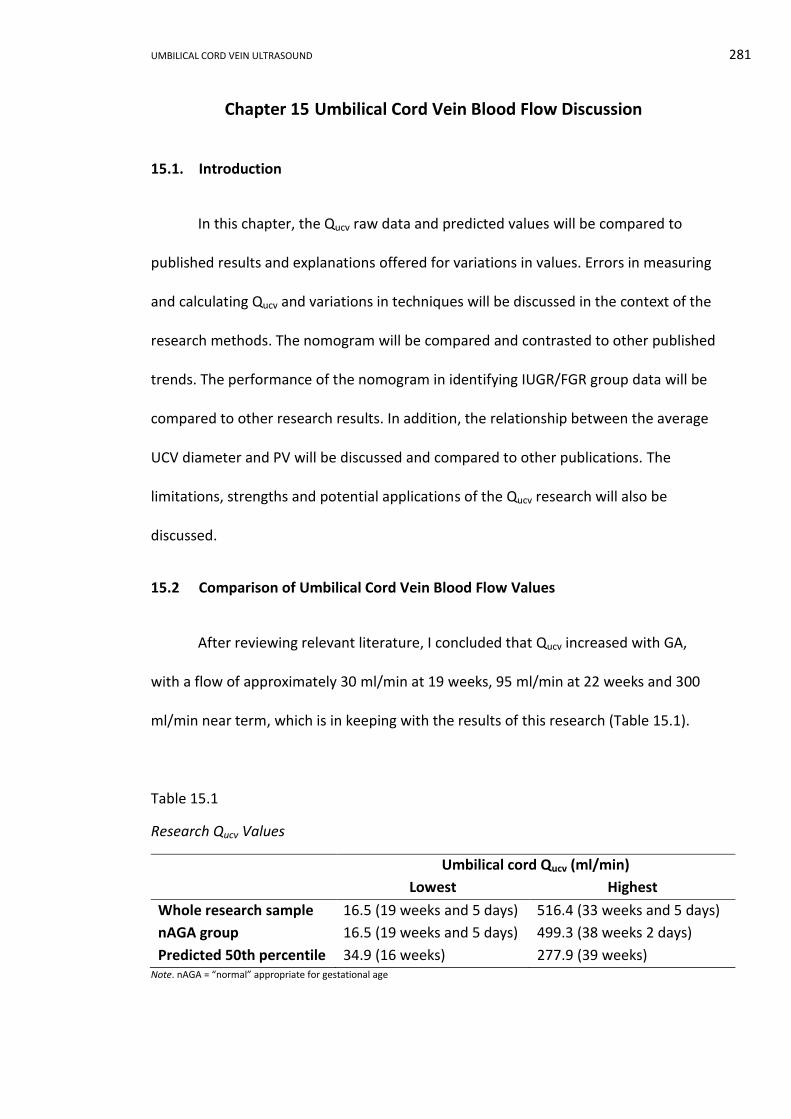
UMBILICAL CORD VEIN ULTRASOUND 281
Chapter 15 Umbilical Cord Vein Blood Flow Discussion
15.1. Introduction
In this chapter, the Qucv raw data and predicted values will be compared to
published results and explanations offered for variations in values. Errors in measuring
and calculating Qucv and variations in techniques will be discussed in the context of the
research methods. The nomogram will be compared and contrasted to other published
trends. The performance of the nomogram in identifying IUGR/FGR group data will be
compared to other research results. In addition, the relationship between the average
UCV diameter and PV will be discussed and compared to other publications. The
limitations, strengths and potential applications of the Qucv research will also be
discussed.
15.2 Comparison of Umbilical Cord Vein Blood Flow Values
After reviewing relevant literature, I concluded that Qucv increased with GA,
with a flow of approximately 30 ml/min at 19 weeks, 95 ml/min at 22 weeks and 300
ml/min near term, which is in keeping with the results of this research (Table 15.1).
Table 15.1
Research Qucv Values
Umbilical cord Qucv (ml/min)
Lowest Highest
Whole research sample 16.5 (19 weeks and 5 days) 516.4 (33 weeks and 5 days)
nAGA group 16.5 (19 weeks and 5 days) 499.3 (38 weeks 2 days)
Predicted 50th percentile 34.9 (16 weeks) 277.9 (39 weeks) Note. nAGA = “normal” appropriate for gestational age
UMBILICAL CORD VEIN ULTRASOUND 282
The range of the 50th percentile predicted Qucv values in this research were
comparable to early research. The predicted range was very similar to work by Gill et
al. (1981), who found that intra-abdominal Quv increased from 100 ml/min at 22 weeks
to a peak of 300 ml/min at 38 weeks. Gerson et al. (1987) reported a similar range of
92.4 ml/min at 22 weeks to 295.6 ml/min at 38 weeks for intra-abdominal Quv, as did
Lees et al. (1999) who reported a Qucv range from 95.0 ml/min at 23 weeks to 303.3
ml/min at 33 weeks. Two other 20th century research papers identified higher term
values than the 50th percentile predicted values, although they were similar to raw
data: Chen et al. (1986) reported an intra-abdominal Quv of 450 ml/min at 41weeks GA
and Barbera et al. (1999) reported a Qucv of 529.1 ml/min at 38 weeks.
The Quv values of four recent studies are compared to research values in Table
15.2. These four studies, spanning 17 years of research, were chosen as comparisons
as they applied the same formula and spatial velocity profile coefficient as used in this
research. There was a consistent trend across all studies for an increasing Quv with
advancing GA and this is in keeping with the concept that Quv is higher in the term
fetus compared to the preterm fetus (Link et al., 2007). At 22 weeks GA, the earliest
GA when data was available for all studies in Table 15.2, the predicted research Qucv
values were very similar to the three earliest works, and that were noticeably less than
the large recent study by Rizzo et al. (2016). This observation was repeated when the
data were compared at 39 weeks GA. Also at 39 weeks GA there was a wider range of
the Quv values, which has been reported previously by Prior et al. (2014, p. 61.e5), who
found “considerable variation” in Quv values in term fetuses.
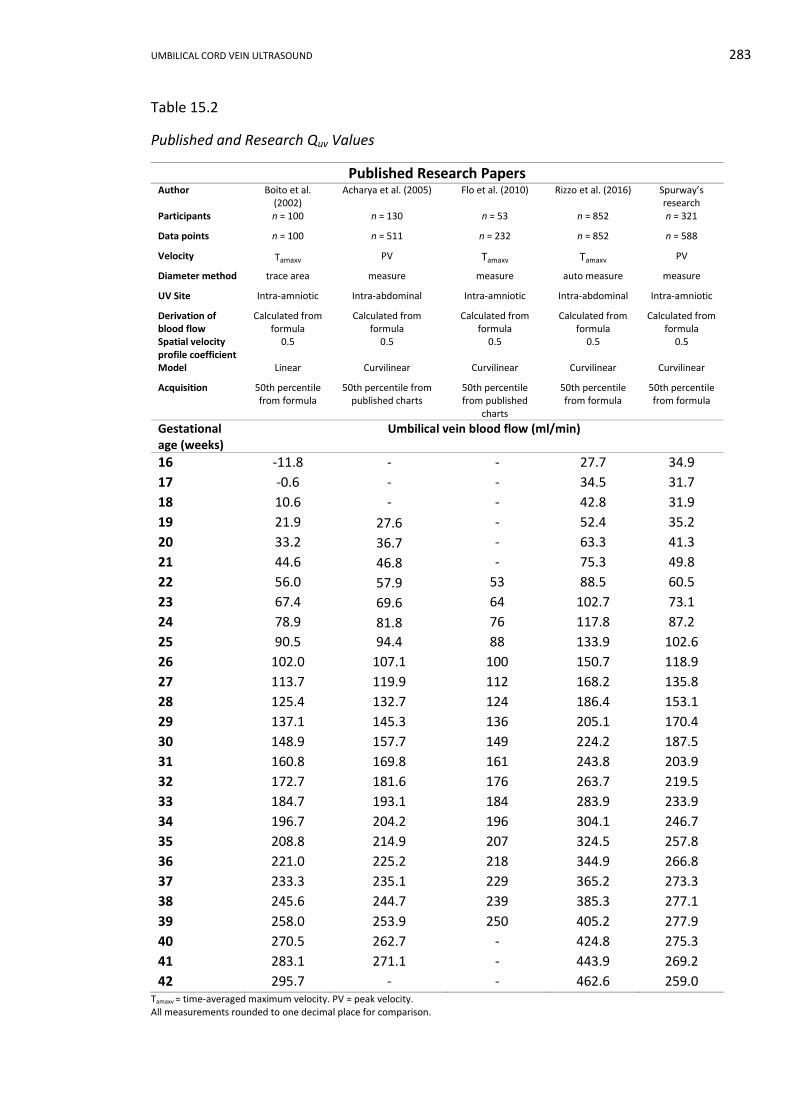
UMBILICAL CORD VEIN ULTRASOUND 283
Table 15.2
Published and Research Quv Values
Published Research Papers Author Boito et al.
(2002) Acharya et al. (2005) Flo et al. (2010) Rizzo et al. (2016) Spurway’s
research Participants n = 100 n = 130 n = 53 n = 852 n = 321
Data points n = 100 n = 511 n = 232 n = 852 n = 588
Velocity Tamaxv PV Tamaxv Tamaxv PV
Diameter method trace area measure measure auto measure measure
UV Site Intra-amniotic Intra-abdominal Intra-amniotic Intra-abdominal Intra-amniotic
Derivation of blood flow
Calculated from formula
Calculated from formula
Calculated from formula
Calculated from formula
Calculated from formula
Spatial velocity profile coefficient
0.5 0.5 0.5 0.5 0.5
Model Linear Curvilinear Curvilinear Curvilinear Curvilinear
Acquisition 50th percentile from formula
50th percentile from published charts
50th percentile from published
charts
50th percentile from formula
50th percentile from formula
Gestational age (weeks)
Umbilical vein blood flow (ml/min)
16 -11.8 - - 27.7 34.9
17 -0.6 - - 34.5 31.7
18 10.6 - - 42.8 31.9
19 21.9 27.6 - 52.4 35.2
20 33.2 36.7 - 63.3 41.3
21 44.6 46.8 - 75.3 49.8
22 56.0 57.9 53 88.5 60.5
23 67.4 69.6 64 102.7 73.1
24 78.9 81.8 76 117.8 87.2
25 90.5 94.4 88 133.9 102.6
26 102.0 107.1 100 150.7 118.9
27 113.7 119.9 112 168.2 135.8
28 125.4 132.7 124 186.4 153.1
29 137.1 145.3 136 205.1 170.4
30 148.9 157.7 149 224.2 187.5
31 160.8 169.8 161 243.8 203.9
32 172.7 181.6 176 263.7 219.5
33 184.7 193.1 184 283.9 233.9
34 196.7 204.2 196 304.1 246.7
35 208.8 214.9 207 324.5 257.8
36 221.0 225.2 218 344.9 266.8
37 233.3 235.1 229 365.2 273.3
38 245.6 244.7 239 385.3 277.1
39 258.0 253.9 250 405.2 277.9
40 270.5 262.7 - 424.8 275.3
41 283.1 271.1 - 443.9 269.2
42 295.7 - - 462.6 259.0 Tamaxv = time-averaged maximum velocity. PV = peak velocity. All measurements rounded to one decimal place for comparison.
UMBILICAL CORD VEIN ULTRASOUND 284
The predicted Qucv in this research was very similar to earlier works in Table
15.2, when comparison was made across sample sizes, measurement sites, and model
type. Rizzo et al.’s (2016) study, with the largest sample size, predicted larger Quv than
earlier, smaller studies, and their Quv values were larger than comparable intra-
abdominal results from Acharya et al. (2005). This finding may reflect the
advancements in the quality of ultrasound equipment, refinement of research and
statistical analysis techniques, and more robust data from larger sample sizes. The only
striking difference in Table 15.2, was that the research values were the only values in
this comparison to show a peak prior to the oldest GA; however, this trend has been
described by other researchers (Gill et al., 1984; Gill et al., 1981) and will be discussed
in more detail later in this chapter.
15.3 Errors and Method Variations in Measuring the Quv
In a review of the accuracy of Quv measurements, Figueras et al. (2008)
compared the Quv measured in ovine subjects by triplex ultrasound to radionuclide
microspheres coupled with electromagnetic flow transducers and steady state
diffusion techniques. Figueras et al. concluded that Doppler measurements of Quv were
accurate when compared to in vivo gold standards. This supported previous work
comparing Doppler ultrasound and steady state diffusion techniques in ovine fetuses
undertaken by Galan and colleagues (1999).
Irrespective of comparability with gold standards, blood flow studies are
complex to perform and require careful attention to measurements, as small errors in
any component will result in a substantial error in the calculated Quv value. There are
several points that deserve interrogation when errors and variations in measurement
techniques involved in blood flow calculations are discussed, including: the area of the
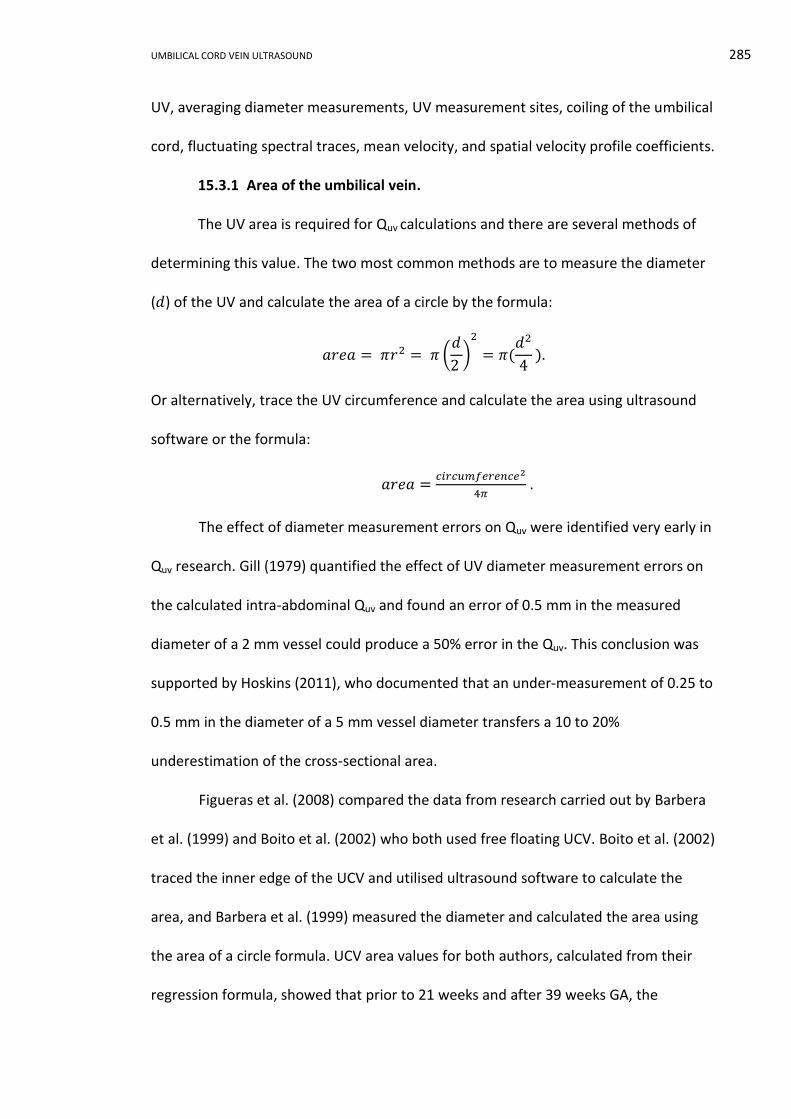
UMBILICAL CORD VEIN ULTRASOUND 285
UV, averaging diameter measurements, UV measurement sites, coiling of the umbilical
cord, fluctuating spectral traces, mean velocity, and spatial velocity profile coefficients.
15.3.1 Area of the umbilical vein.
The UV area is required for Quv calculations and there are several methods of
determining this value. The two most common methods are to measure the diameter
(𝑑) of the UV and calculate the area of a circle by the formula:
𝑎𝑟𝑒𝑎 = 𝜋𝑟2 = 𝜋 (𝑑
2 )
2
= 𝜋(𝑑2
4
).
Or alternatively, trace the UV circumference and calculate the area using ultrasound
software or the formula:
𝑎𝑟𝑒𝑎 =𝑐𝑖𝑟𝑐𝑢𝑚𝑓𝑒𝑟𝑒𝑛𝑐𝑒2
4𝜋 .
The effect of diameter measurement errors on Quv were identified very early in
Quv research. Gill (1979) quantified the effect of UV diameter measurement errors on
the calculated intra-abdominal Quv and found an error of 0.5 mm in the measured
diameter of a 2 mm vessel could produce a 50% error in the Quv. This conclusion was
supported by Hoskins (2011), who documented that an under-measurement of 0.25 to
0.5 mm in the diameter of a 5 mm vessel diameter transfers a 10 to 20%
underestimation of the cross-sectional area.
Figueras et al. (2008) compared the data from research carried out by Barbera
et al. (1999) and Boito et al. (2002) who both used free floating UCV. Boito et al. (2002)
traced the inner edge of the UCV and utilised ultrasound software to calculate the
area, and Barbera et al. (1999) measured the diameter and calculated the area using
the area of a circle formula. UCV area values for both authors, calculated from their
regression formula, showed that prior to 21 weeks and after 39 weeks GA, the
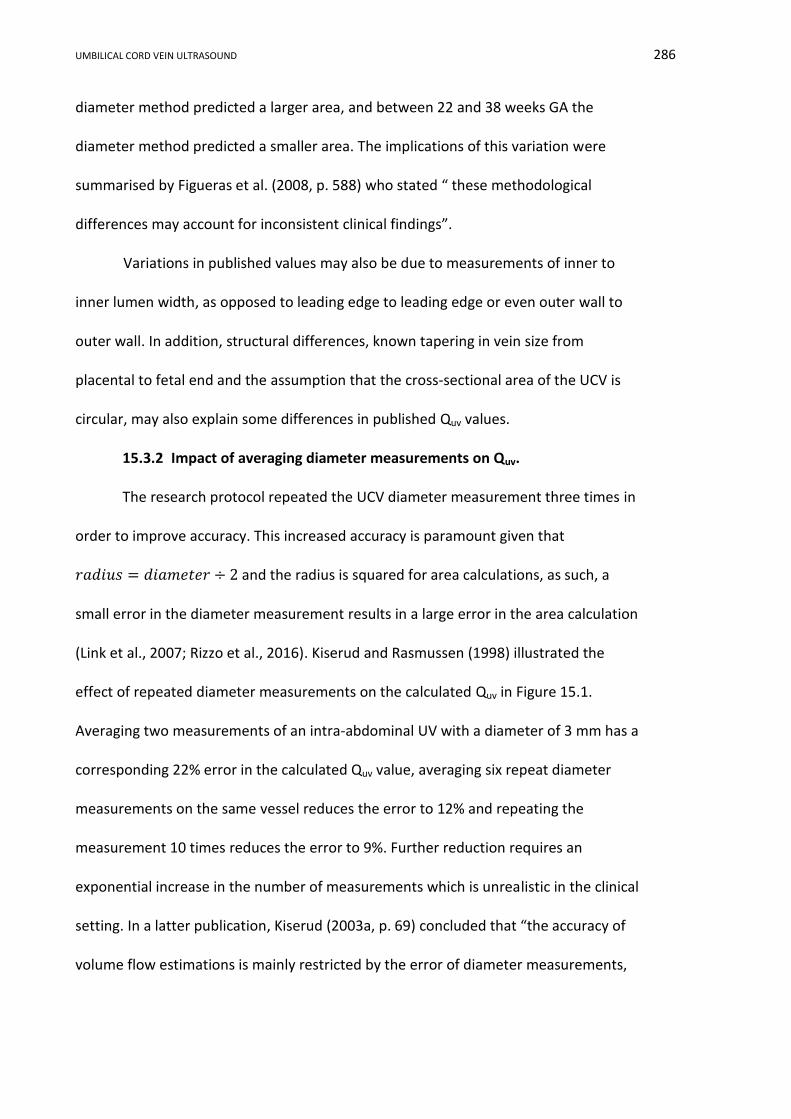
UMBILICAL CORD VEIN ULTRASOUND 286
diameter method predicted a larger area, and between 22 and 38 weeks GA the
diameter method predicted a smaller area. The implications of this variation were
summarised by Figueras et al. (2008, p. 588) who stated “ these methodological
differences may account for inconsistent clinical findings”.
Variations in published values may also be due to measurements of inner to
inner lumen width, as opposed to leading edge to leading edge or even outer wall to
outer wall. In addition, structural differences, known tapering in vein size from
placental to fetal end and the assumption that the cross-sectional area of the UCV is
circular, may also explain some differences in published Quv values.
15.3.2 Impact of averaging diameter measurements on Quv.
The research protocol repeated the UCV diameter measurement three times in
order to improve accuracy. This increased accuracy is paramount given that
𝑟𝑎𝑑𝑖𝑢𝑠 = 𝑑𝑖𝑎𝑚𝑒𝑡𝑒𝑟 ÷ 2 and the radius is squared for area calculations, as such, a
small error in the diameter measurement results in a large error in the area calculation
(Link et al., 2007; Rizzo et al., 2016). Kiserud and Rasmussen (1998) illustrated the
effect of repeated diameter measurements on the calculated Quv in Figure 15.1.
Averaging two measurements of an intra-abdominal UV with a diameter of 3 mm has a
corresponding 22% error in the calculated Quv value, averaging six repeat diameter
measurements on the same vessel reduces the error to 12% and repeating the
measurement 10 times reduces the error to 9%. Further reduction requires an
exponential increase in the number of measurements which is unrealistic in the clinical
setting. In a latter publication, Kiserud (2003a, p. 69) concluded that “the accuracy of
volume flow estimations is mainly restricted by the error of diameter measurements,
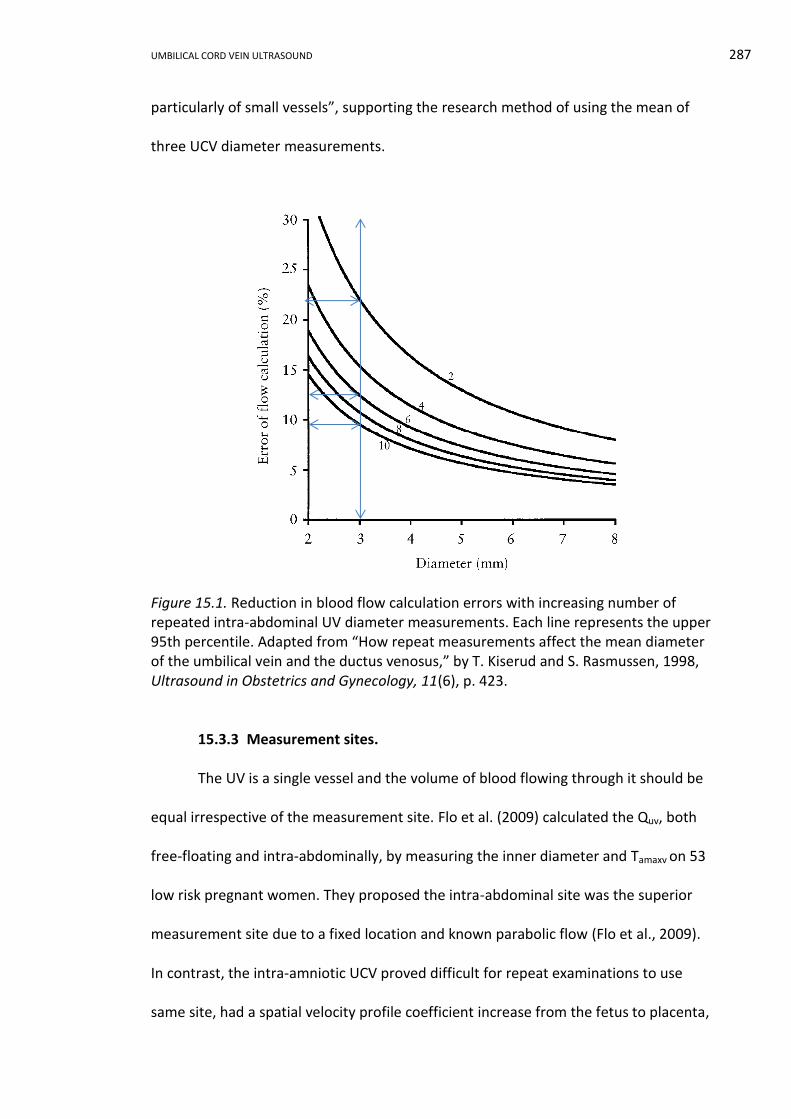
UMBILICAL CORD VEIN ULTRASOUND 287
particularly of small vessels”, supporting the research method of using the mean of
three UCV diameter measurements.
Figure 15.1. Reduction in blood flow calculation errors with increasing number of repeated intra-abdominal UV diameter measurements. Each line represents the upper 95th percentile. Adapted from “How repeat measurements affect the mean diameter of the umbilical vein and the ductus venosus,” by T. Kiserud and S. Rasmussen, 1998, Ultrasound in Obstetrics and Gynecology, 11(6), p. 423.
15.3.3 Measurement sites.
The UV is a single vessel and the volume of blood flowing through it should be
equal irrespective of the measurement site. Flo et al. (2009) calculated the Quv, both
free-floating and intra-abdominally, by measuring the inner diameter and Tamaxv on 53
low risk pregnant women. They proposed the intra-abdominal site was the superior
measurement site due to a fixed location and known parabolic flow (Flo et al., 2009).
In contrast, the intra-amniotic UCV proved difficult for repeat examinations to use
same site, had a spatial velocity profile coefficient increase from the fetus to placenta,

UMBILICAL CORD VEIN ULTRASOUND 288
and a diameter reduction along the length of the cord. Flo et al. (2009) concluded that
free floating and intra-abdominal Quv were similar, but were not interchangeable, and
adherence to method was crucial in the clinical application of nomograms.
In early studies of intra-abdominal Quv it was seldom documented that the
measurement was undertaken before the origin of the portal vein (Ferrazzi, 2001). The
research groups lead by Tchirikov (Tchirikov et al., 2002; Tchirikov et al., 2009) were
the only ones who stated that the intra-abdominal Quv was measured prior of any
intra-hepatic branches. Whereas, other researchers simply stated the straight intra-
abdominal segment (Acharya et al., 2005; Hebbar, Rubeena, et al., 2015; Kiserud et al.,
1994; Liao et al., 2014; Rizzo et al., 2016).
When the UV is measured intra-abdominally there is an assumption that the
straight portion between the umbilicus and the liver is the portion under investigation.
If this assumption is incorrect, there are multiple factors that can cause erroneous Quv
values. Within the liver the UV joins a confluence of vessels termed the portal sinus
which connects the left and right intrahepatic portal veins and from which the DV
arises (Mavrides, Moscoso, Carvalho, Campbell, & Thilaganathan, 2001) (Figure 15.2).
The intra-abdominal UV must be measured prior to portal vein branches, prior to
shunting through the DV to the fetal right atrium, exclude blood contributed by
possible reversed flow in the portal vein, and not be measured in the periphery of the
liver (Baschat, 2006; Battaglia, 2003; Bellotti et al., 2004; Kiserud, 2005; Kiserud et al.,
2000). Skulstad et al. (2004) found that UV velocities were higher at the umbilicus due
to constriction of the vessels by the umbilical ring. The velocity rapidly reduces in the
intra-abdominal portion, but Quv based on measuring PV close to the umbilicus results
in mistakenly increased values. Conversely, Acharya et al. (2005) found minimal effect
UMBILICAL CORD VEIN ULTRASOUND 289
of the umbilical ring in their study comparing intra-abdominal to free loop blood flow.
The presence of branches, the potential redistribution of blood flow and the possibility
of measuring vessels in the periphery of the liver diminishes the reproducibility of
blood flow calculations involving the intra-abdominal portion of the UV and supports
the choice of imaging the intra-amniotic portion in this research.
RA right atrium PS portal sinus DV ductus venosus LPV left portal vein UV umbilical vein RPV right portal vein HV hepatic veins EPV extrahepatic portal vein IVC inferior vena cava GB Gallbladder
Figure 15.2. Blood pathways in the umbilical, portal, and hepatic veins. Arrows indicate the direction of blood movement and the colour, the degree of oxygen content: red high, purple medium and blue low. Adapted from “The anatomy of the umbilical, portal and hepatic venous systems in the human fetus at 14–19 weeks of gestation,” by E. Mavrides, G. Moscoso, J. Carvalho, S. Campbell, and B. Thilaganathan, 2001, Ultrasound in Obstetrics and Gynecology, 18(6), p. 602.

UMBILICAL CORD VEIN ULTRASOUND 290
15.3.4 Coiling of the umbilical cord.
In a study of 45 singleton term pregnancies who were examined within 24
hours of delivery, Degani, Lewinsky, Berger, and Spiegel (1995) found a significant
(p < 0.001) linear trend between the umbilical cord coiling index (reciprocal of the
distance (cm) between two adjacent coils in the UA) and both Tameanv and Qucv per
kilogram of EFW. Degani et al. concluded that decreased coiling was associated with
reduced Qucv and this was supported by Di Naro, Ghezzi, Raio, Franchi, D'Addario, et al.
(2001). A subsequent study of 244 singleton pregnancies after 24 weeks gestation
found that increased cord coiling correlated with increased Qucv (El Behery et al.,
2011). Both El Behery et al. (2011) and Di Naro, Ghezzi, Raio, Franchi, D'Addario, et al.
(2001) proposed that less UA coils reduced Qucv due to the reduction in small variations
in pressure produced by the pumping arteries, which has been referred to as arterial
massaging (Todros et al., 2002). Arterial massaging is based on an original hypothesis
by Reynolds (1978), who proposed that the umbilical cord was a pistonless pulsometer
pumping system. However, using physical models, Waters and Guoit (2002) showed
that under physiological conditions the venous flow was unlikely to be enhanced by
the umbilical arteries pulse as suggested by Reynolds (1978). Dado, Dobrin, and
Mrkvicka (1997) found a similar outcome using ten postpartum segments of cord; they
found no difference in the Qucv in the veins of coiled and noncoiled umbilical cords
when exposed to physical stresses. This raises the question as to whether coiling index
should be a consideration in the development of velocity and Quv nomograms, as there
are persuasive arguments from both sides.
UMBILICAL CORD VEIN ULTRASOUND 291
15.3.5 Fluctuations in blood flow.
Blood flow has been shown to increase slightly during active phases when the
fetus exhibits gross body and eye movements (Boito et al., 2004). In 330 observations
of the placental end of the UCV, Nyberg et al. (2010) noted the UCV cross-sectional
area increased by 27% and the velocity by 9%, which resulted in a 42% increase in Qucv
between fetal quiescence and fetal breathing states. Boito et al. (2004) and Nyberg et
al.’s (2010) research findings reinforce the study protocol that measurements should
only be performed during fetal quiescence.
In addition to changes during fetal activity, a recent 3D perfusion study found
that healthy second trimester fetuses demonstrated an undulating, cyclical variation in
Qucv resulting from changes in size of the UCV and velocity (Scholbach et al., 2016).
These undulations were present in both resting and active states. Scholbach et al.’s
(2016) finding has implication for the application of the nomogram, but also reinforces
the study protocol of averaging measurements.
15.3.6 Mean velocity.
The advantages and disadvantages of calculating the mean from either the
Tamaxv or PV, or measuring the mean velocity by Tameanv, Vmean or intensity-weighted
mean frequency have been previously discussed in Chapter 2. Multiplying the
automatic Tamaxv or the manual PV measurement by the spatial velocity profile co-
efficient 0.5, is an easy method of determining the Vmean, assuming parabolic flow
throughout the length of the cord, the axes of the cord and the cardiac cycle (Hoskins,
2011). Pennati et al. (2004) thought that the Vmean calculated from PV was more robust
to small deviations from 0o in the insonation angle. Figueras et al. (2008) considered
that Vmean calculated from PV resulted in less distortion by adjacent arteries and was
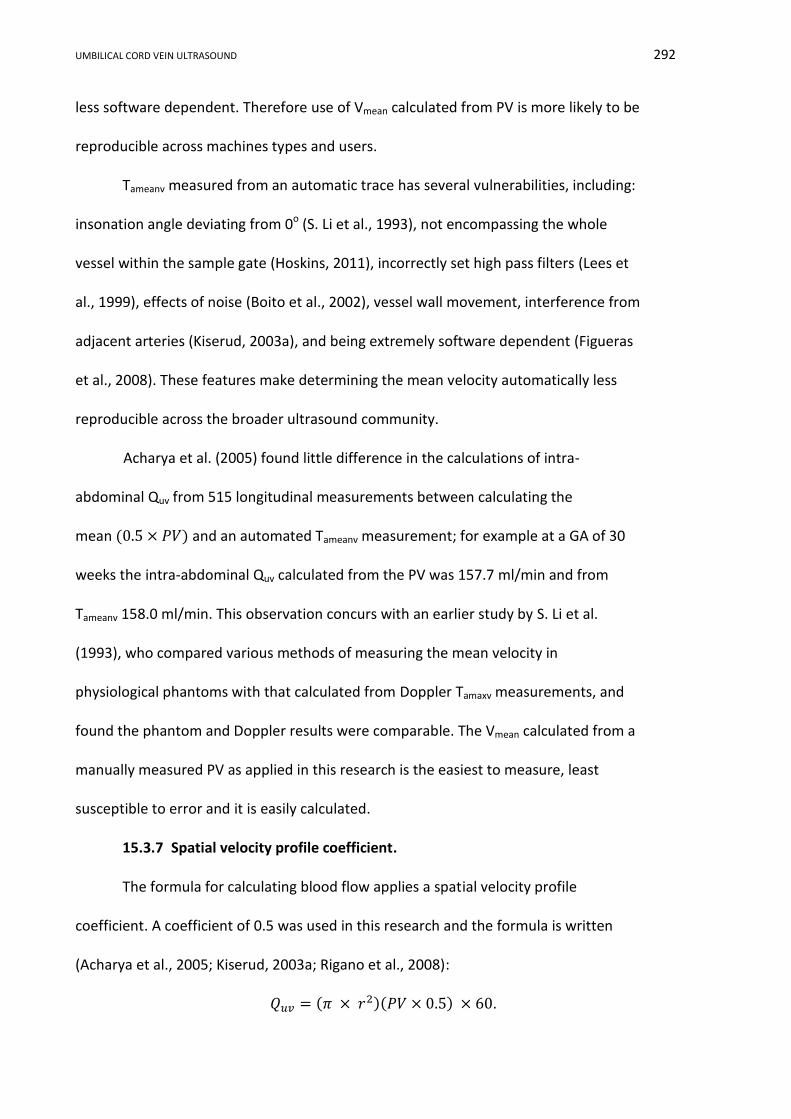
UMBILICAL CORD VEIN ULTRASOUND 292
less software dependent. Therefore use of Vmean calculated from PV is more likely to be
reproducible across machines types and users.
Tameanv measured from an automatic trace has several vulnerabilities, including:
insonation angle deviating from 0o (S. Li et al., 1993), not encompassing the whole
vessel within the sample gate (Hoskins, 2011), incorrectly set high pass filters (Lees et
al., 1999), effects of noise (Boito et al., 2002), vessel wall movement, interference from
adjacent arteries (Kiserud, 2003a), and being extremely software dependent (Figueras
et al., 2008). These features make determining the mean velocity automatically less
reproducible across the broader ultrasound community.
Acharya et al. (2005) found little difference in the calculations of intra-
abdominal Quv from 515 longitudinal measurements between calculating the
mean (0.5 × 𝑃𝑉) and an automated Tameanv measurement; for example at a GA of 30
weeks the intra-abdominal Quv calculated from the PV was 157.7 ml/min and from
Tameanv 158.0 ml/min. This observation concurs with an earlier study by S. Li et al.
(1993), who compared various methods of measuring the mean velocity in
physiological phantoms with that calculated from Doppler Tamaxv measurements, and
found the phantom and Doppler results were comparable. The Vmean calculated from a
manually measured PV as applied in this research is the easiest to measure, least
susceptible to error and it is easily calculated.
15.3.7 Spatial velocity profile coefficient.
The formula for calculating blood flow applies a spatial velocity profile
coefficient. A coefficient of 0.5 was used in this research and the formula is written
(Acharya et al., 2005; Kiserud, 2003a; Rigano et al., 2008):
𝑄𝑢𝑣 = (𝜋 × 𝑟2)(𝑃𝑉 × 0.5) × 60.

UMBILICAL CORD VEIN ULTRASOUND 293
The spatial velocity profile coefficient is calculated as the ratio between Vmean
and PV (Flo et al., 2010; Pennati et al., 2004). A value of 1 corresponds to a flat profile,
0.5 to parabolic flow and values closer to zero relate to a high velocity central flow
(Figure 15.3) (Pennati et al., 2004). Several researchers have used a spatial velocity
profile coefficient of 0.5 (Acharya et al., 2005; Barbera et al., 1999; Boito et al., 2002;
Prior et al., 2014; Rizzo et al., 2016); however, others have disputed use of this value.
Pennati et al. (2004) suggested the use of 0.61, as the coefficient in free floating cord
as the flow profile changes with vessel curvature and with distance from the placental
insertion site. Flo et al. (2009) found that using a spatial velocity profile coefficient of
0.5 instead of 0.61 underestimates the Vmean in free floating cord. In fact, in their own
study, Flo et al. (2010) calculated the coefficient as 0.62 with a partially blunted profile.
Figure 15.3. Blood flow profile in a circular vessel with the shape of the profile corresponding to a spatial velocity profile coefficient of 0.5, 0.7 and 0.97. Adapted from “Fetal venous circulation,” by T. Kiserud, 2003, Fetal and Maternal Medicine Review, 14(01), p. 68.
Other potential sources of errors related to flow profiles included the third
dimension of blood flow and coiling. Current 2D Doppler systems are used to quantify

UMBILICAL CORD VEIN ULTRASOUND 294
three dimensional blood flow based on an assumption of axial symmetry of the flow
distribution in the third plane (Pennati et al., 2004), which is not imaged in standard
Doppler. Guiot, Roatta, Piccoli, Saccomandi, and Todros (1999) found an asymmetrical
parabolic velocity profile related to vessel coiling and avoiding Doppler sampling near
vessel curvatures has been recommended (S. Li et al., 1993). Selection of a vertical
segment of cord in this research optimised the flow profile within the vein; however,
reliability of this technique can be diminished if a hypercoiled segment of cord is
sampled or if the blood flow profile is not symmetrically parabolic in all dimensions.
15.4 Comparison of the Nomogram with Published Reference Ranges
Quantile regression showed a linear relation between Qucv and advancing GA
for the 3rd and 97th percentiles, whereas a curvilinear relation described the
remaining percentiles. The linear and cubic quantile regression formulae can be
written:
𝑄𝑢𝑐𝑣 = 𝑏0𝑝+ 𝑏1𝑝
𝐺𝐴
𝑄𝑢𝑐𝑣 = 𝑏0𝑝+ 𝑏1𝑝
𝐺𝐴 + 𝑏2𝑝 𝐺𝐴2 + 𝑏3𝑝
𝐺𝐴3.
Where p = percentile value 3rd, 5th, 10th, 25th, 50th, 75th, 90th 95th and 97th
𝑏0 = intercept
GA = gestational age in days
Using the coefficients provided in Table 14.2, the normal reference ranges are
plotted in Figures 15.4 and 15.5, with the latter showing the nAGA data points.
Omission of the 3rd and 97th percentile eliminated the visually confusing
superimposed linear and curvilinear percentile lines, and was consistent with other
published reference ranges.
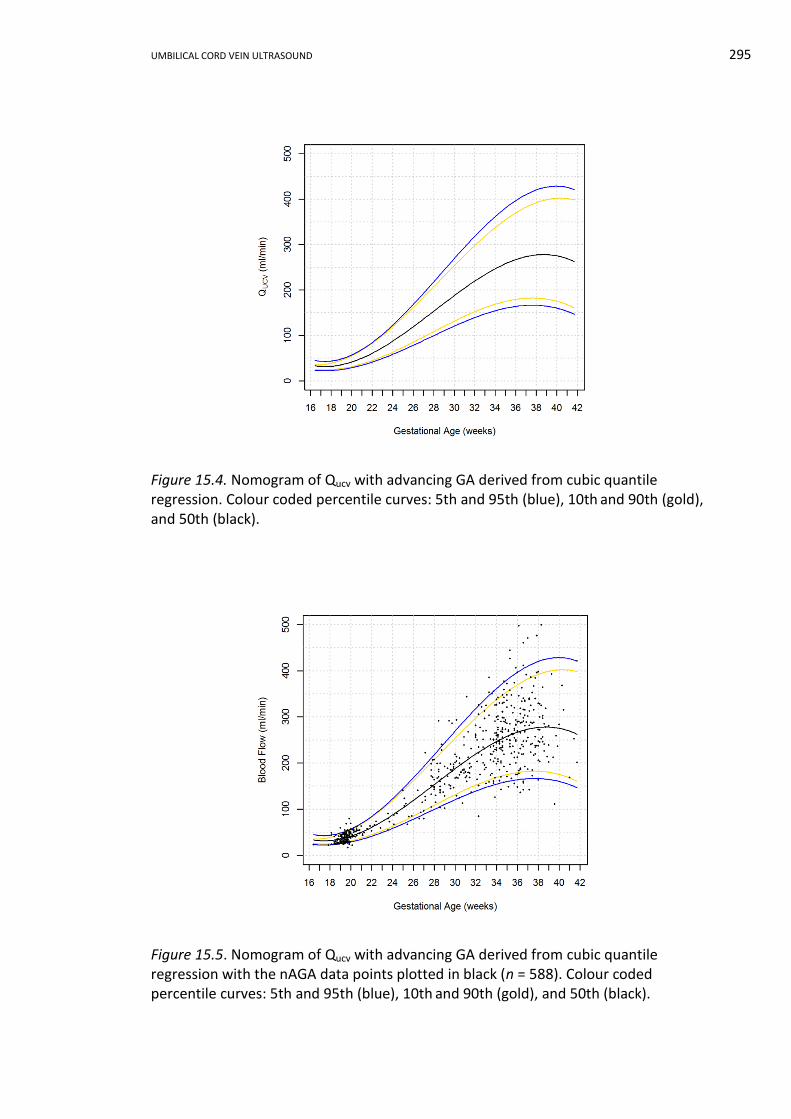
UMBILICAL CORD VEIN ULTRASOUND 295
Figure 15.4. Nomogram of Qucv with advancing GA derived from cubic quantile regression. Colour coded percentile curves: 5th and 95th (blue), 10th and 90th (gold), and 50th (black).
Figure 15.5. Nomogram of Qucv with advancing GA derived from cubic quantile regression with the nAGA data points plotted in black (n = 588). Colour coded percentile curves: 5th and 95th (blue), 10th and 90th (gold), and 50th (black).

UMBILICAL CORD VEIN ULTRASOUND 296
Three relationships between Quv and GA were identified in published research
papers. Some authors demonstrated a linear increase in Quv with advancing GA, others
describe a curvilinear relationship with either Quv continuing to increase until term, or
declining after a mid-third trimester peak. As linear and curvilinear trends were
modelled in this research, the following discussion includes comparison with both
trends.
15.4.1 Linear relation with gestational age.
A positive linear trend has been used to describe the relationship between Quv
and advancing GA by several researchers including Chen et al. (1986). Chen et al.
(1986) found a steadily increasing linear relationship with the intra-abdominal Quv and
GA. Gerson et al. (1987) described a linear relation between intra-abdominal Quv and
GA with the formula: 𝑄𝑢𝑣 = −187.02 + 12.7(𝐺𝐴). In a cross-sectional study, Lees et
al. (1999) identified a significant increase in Qucv (p < 0.001) between 23 to 33 weeks
GA and described the increase as linear. Boito et al. (2002) also modelled a linear
response to their data with the formula: 𝑄𝑢𝑐𝑣(𝑚𝑙/𝑚𝑖𝑛) = 0.000328 × 𝐺𝐴3 +
10.9443931 × 𝐺𝐴 − 188.288068. Linear modelling confirms a positive trend of
increasing UV blood flow with advancing GA, similar to that modelled in this research
for the 3rd and 97th percentiles.
15.4.2 Curvilinear relation with gestational age.
The relationship between Quv and GA has also been described by curvilinear
models. Some researchers have described a continued increase in Quv with advancing
GA and others have shown an increase and then a declined near term, similar to this
research. Pioneering researchers, Gill et al. (1981, 1984) observed that the intra-
abdominal Quv increased steadily with GA until 36 weeks, reached a peak at 37 to 38

UMBILICAL CORD VEIN ULTRASOUND 297
weeks, and then declined towards 40 weeks, in 47 normal fetuses. This work
supported Gill and colleagues’ earlier research from 1979, in which the intra-
abdominal Quv recorded in 12 patients was described as having a curvilinear relation
with GA.
Sutton et al. (1990) were some of the first researchers to visualise the cord and
align the Doppler angle. Sutton et al. (1990) found that Qucv increased exponentially
with GA with no tendency to decrease near term as described by the formula:
𝑙𝑜𝑔10𝑄𝑢𝑐𝑣 = 1.09 + 0.04 × 𝐺𝐴. Barbera et al. (1999) proposed that Qucv increased
exponentially throughout pregnancy and they described the curvilinear relation
between Qucv and GA with the equation: 𝑄𝑢𝑐𝑣 = 14.811𝑒0.0941 × 𝐺𝐴. In addition,
Kiserud et al. (2000) found intra-abdominal Quv increased throughout pregnancy and
described the curve with the formula: 𝑄𝑢𝑣 = −10.85 + 4.97 ln(𝐺𝐴) − 0.00125𝐺𝐴2.
Kiserud et al. also found that the variability of blood flow values increased with GA,
which was also one of the features of the research data.
Acharya et al. (2005) found that the intra-abdominal Quv had a curvilinear
increased throughout pregnancy with no reduction nearer term. Flo et al. (2010)
published reference ranges in 2010 that showed a similar curvature as that described
by Acharya et al. (2005), but it was at a lesser gradient and with lower maximum
values at term. The latest research by Rizzo and colleagues (2016) showed a steady,
continual increase of the intra-abdominal Quv with advancing GA, and these
researchers described their data by the cubic regression formula for the 50th
percentile as 𝑄𝑢𝑣 = 176.7367 − 28.1074𝐺𝐴 + 1.3857𝐺𝐴2 − 0.0132𝐺𝐴3.
The majority of previous studies describe an exponential increase in UV blood
flow throughout pregnancy; there is some variation in opinion as to whether this
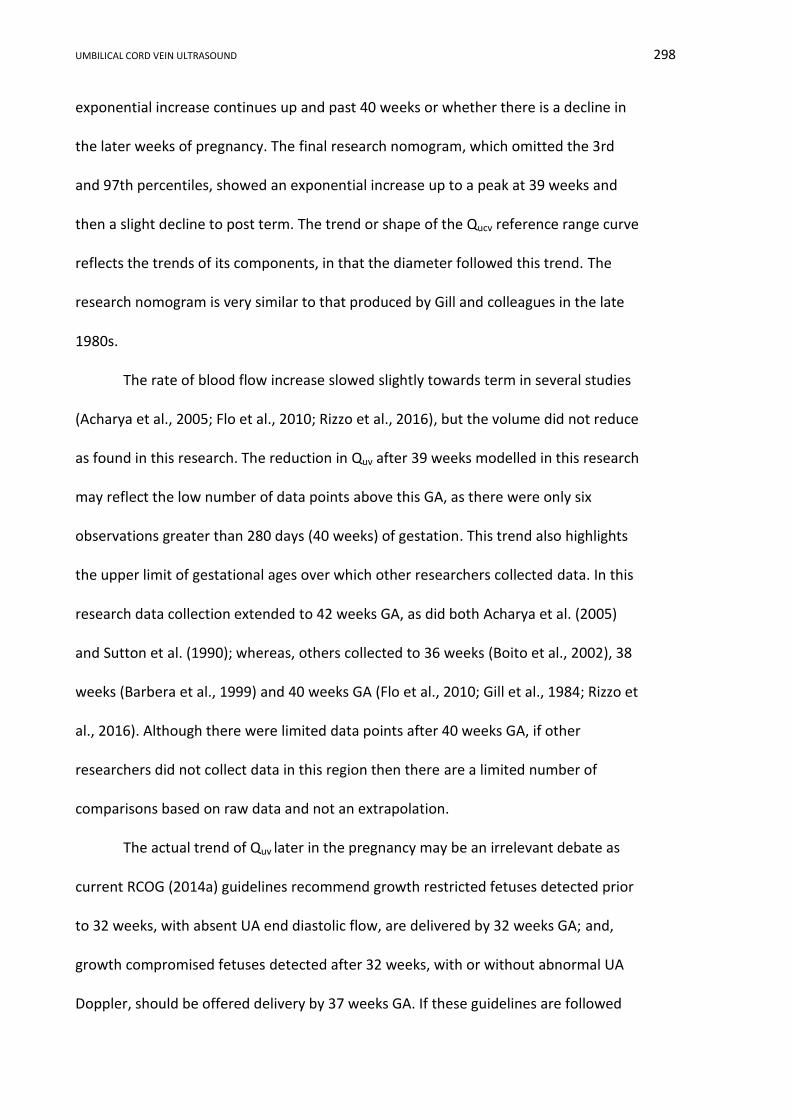
UMBILICAL CORD VEIN ULTRASOUND 298
exponential increase continues up and past 40 weeks or whether there is a decline in
the later weeks of pregnancy. The final research nomogram, which omitted the 3rd
and 97th percentiles, showed an exponential increase up to a peak at 39 weeks and
then a slight decline to post term. The trend or shape of the Qucv reference range curve
reflects the trends of its components, in that the diameter followed this trend. The
research nomogram is very similar to that produced by Gill and colleagues in the late
1980s.
The rate of blood flow increase slowed slightly towards term in several studies
(Acharya et al., 2005; Flo et al., 2010; Rizzo et al., 2016), but the volume did not reduce
as found in this research. The reduction in Quv after 39 weeks modelled in this research
may reflect the low number of data points above this GA, as there were only six
observations greater than 280 days (40 weeks) of gestation. This trend also highlights
the upper limit of gestational ages over which other researchers collected data. In this
research data collection extended to 42 weeks GA, as did both Acharya et al. (2005)
and Sutton et al. (1990); whereas, others collected to 36 weeks (Boito et al., 2002), 38
weeks (Barbera et al., 1999) and 40 weeks GA (Flo et al., 2010; Gill et al., 1984; Rizzo et
al., 2016). Although there were limited data points after 40 weeks GA, if other
researchers did not collect data in this region then there are a limited number of
comparisons based on raw data and not an extrapolation.
The actual trend of Quv later in the pregnancy may be an irrelevant debate as
current RCOG (2014a) guidelines recommend growth restricted fetuses detected prior
to 32 weeks, with absent UA end diastolic flow, are delivered by 32 weeks GA; and,
growth compromised fetuses detected after 32 weeks, with or without abnormal UA
Doppler, should be offered delivery by 37 weeks GA. If these guidelines are followed

UMBILICAL CORD VEIN ULTRASOUND 299
the reference range is only useful prior to 37 weeks GA, then whether the Qucv
decreases after this time has no clinical relevance.
15.5 Identifying IUGR/FGR Group using the Reference Range
Figure 15.6 displays the calculations from Table 14.4, in that 47.8% of data
points fell below the 5th percentile, 54.3% below the 10th percentile and 95.7% below
the median. Using the 10th percentile line as an arbitrary cut-off and assuming IUGR
fetuses have reduced Qucv, the nomogram correctly detected 54.3% of the IUGR/FGR
group attendances and erroneously classified 45.7% of these attendances as normal.
The CIs of the birthweight curves in Figures 14.6 and 14.7 showed marked overlap of
all three birthweight categories prior to 164 days gestation (23 weeks 3 days) and this
defined the earliest GA when Qucv could be reliably differentiated between the
categories. The GA at the time of scanning the IUGR/FGR group ranged from 139 (19
weeks and 6 days) to 278 days (39 weeks and 5 days). Elimination of the single
IUGR/FGR group data point collected prior to 23 weeks and 3 days GA left 45 Qucv data
points for evaluation. Of the remaining 45 data points, 28 plotted below the 10th
percentile giving a detection rate of 62.2%. This is a useful GA at which monitoring for
growth restriction could be initiated and at which other ultrasound parameters are
also available to identify and monitor poor intrauterine growth.
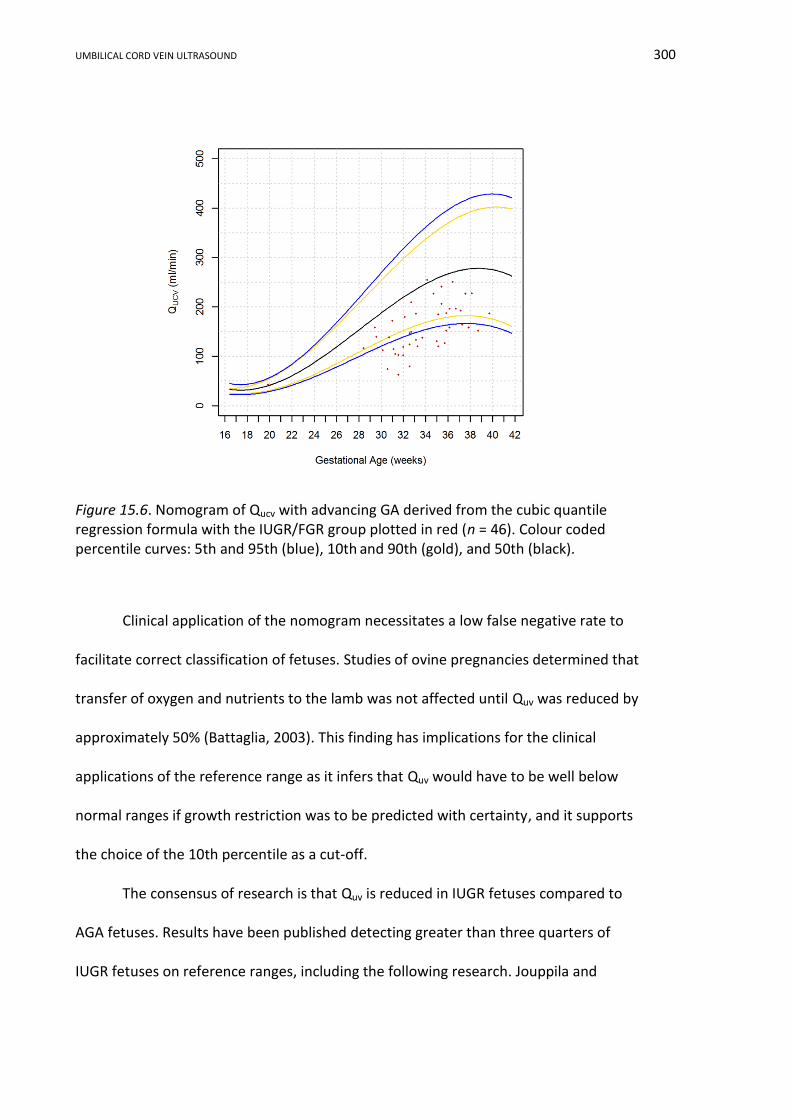
UMBILICAL CORD VEIN ULTRASOUND 300
Figure 15.6. Nomogram of Qucv with advancing GA derived from the cubic quantile regression formula with the IUGR/FGR group plotted in red (n = 46). Colour coded percentile curves: 5th and 95th (blue), 10th and 90th (gold), and 50th (black).
Clinical application of the nomogram necessitates a low false negative rate to
facilitate correct classification of fetuses. Studies of ovine pregnancies determined that
transfer of oxygen and nutrients to the lamb was not affected until Quv was reduced by
approximately 50% (Battaglia, 2003). This finding has implications for the clinical
applications of the reference range as it infers that Quv would have to be well below
normal ranges if growth restriction was to be predicted with certainty, and it supports
the choice of the 10th percentile as a cut-off.
The consensus of research is that Quv is reduced in IUGR fetuses compared to
AGA fetuses. Results have been published detecting greater than three quarters of
IUGR fetuses on reference ranges, including the following research. Jouppila and

UMBILICAL CORD VEIN ULTRASOUND 301
Kirkinen (1984) found that 100% of IUGR43 fetuses had a last attendance intra-
abdominal Quv corrected for EFW, below the 10th percentile on their reference ranges,
but four of these fetuses had an undetectable velocity at their last attendance which
was presumed to be low. If the IUGR detection rate is calculated on an attendance
basis and the four attendances with no flow were eliminated, then 92% of IUGR
fetuses were correctly identified. In a study of 38 IUGR44 fetuses involving 11 fetal or
neonatal deaths, Kiserud et al. (1994) reported 76% of these fetuses had a reduced
value Qucv and the reduction was more frequent before 31 weeks GA. Ferrazzi et al.
(2000) found that 28 of 37 IUGR45 fetuses plotted wholly below the 10th percentile,
thereby correctly identifying 92% of IUGR fetuses; however, the physical size of the
data points on the nomogram made interpretation difficult. Boito et al. (2002) also
showed a high level of detection with 94% of IUGR46 fetuses plotting below their
normal Qucv range. In summary, these studies quote a higher rate of IUGR identification
compared to the research. They also used the 5th or 10th percentile as the cut-off, and
reduced biometry and birthweight defined IUGR, thereby eliminating these possible
reasons for variations in the results. The research detection rate of 62.2% compared
favourably with other methods of IUGR identification, with similar rates of IUGR
detection quoted for third trimester ultrasound biometry (67 %) (Hammad et al., 2016)
fetal weight (65.8%), AC (62.2%) and UA S/D (66.7%) (Ott, 2005).
In this research, the mean Qucv of the nAGA group was 177.4 ml/min (mean GA
= 207 days) and was greater than the mean of the IUGR/FGR group at 154.5 ml/min
(mean GA = 235 days). Rigano et al. (2001) reported a similar observation with the
43
Birthweight < 10th %, reduced fetal growth, Apgar < 7 at 1 and 5 minutes, pathological CTG
44 BPD, abdominal diameter and birthweight < 2.5th %
45 AC < 2 SD below mean and birthweight < 10th
%
46 AC and birthweight < 5th %

UMBILICAL CORD VEIN ULTRASOUND 302
mean Qucv per kilogram significantly (p < 0.001) higher in the age matched control
group (121 ml/min/kg) than in the IUGR47 group (66 ml/min/kg). Tchirikov et al. (2009)
found the mean intra-abdominal Qucv in a control group (253.3 ml/min) of fetuses with
a good pregnancy outcomes was significantly higher (p = 0.0054) than in non-age
matched, compromised fetuses48 (160.2 ml/min). Direct comparison of the mean Quv
between normal control fetuses and IUGR fetuses does show a difference between the
groups, but fails to consider the natural increase in Quv with advancing GA, which is
accentuated if the groups are not age matched.
15.6 Diameter and Velocity Effects on Blood Flow
The scatterplot of average UCV PV plotted against average UCV diameter
(Figure 14.10) showed that all three birthweight categories had a general trend of
increasing UCV PV with increasing UCV diameter. The nomograms in Figure 14.11
showed the gradient of the UCV diameter median slope had an angle of inclination of
53° from 16 to 28 weeks gestation, then 20° inclination until 37 weeks GA and a
declining 6° slope until 42 weeks GA. The UCV PV nomogram median gradient had a
constant 24° positive angle of inclination from 16 to 42 weeks GA. These changes in
the gradients of the nomograms infers that at different GA, the magnitude of the
contribution to increasing Qucv switches between widening diameter and PV increase,
with diameter contributing mostly to increasing blood flow up until 28 weeks GA. Both
UCV PV and diameter contribute equally between 28 and 33 weeks, and increased PV
is the major component after 37 weeks GA. Although Acharya et al. (2005) imaged the
intra-abdominal UV and demonstrated that PV declined towards term, their research
47
AC < 2 SD below mean, UA PI > 2 SD above mean, abnormal uterine artery and birthweight < 10th % 48
Poor outcome based on the cord blood pH, Apgar score, birthweight percentile, length of pregnancy, requirement of respiratory support and transfer of the newborn to a specialist ward
UMBILICAL CORD VEIN ULTRASOUND 303
also showed the gradient of the UV diameter graph was steeper than the rise in PV
nomogram.
In normal pregnancies, the size of the umbilical vein has been found to be the
major contributor to the increase in Quv, in four publications. Lees et al. (1999)
proposed a positive linear relation between UV area, Tamaxv and advancing GA, and
concluded that increasing blood flow throughout pregnancy had a greater dependency
on increasing UV area than on velocity. Barbera et al. (1999) proposed a positive linear
relation between UV diameter and velocity with increasing GA, and concluded the
slope was greater for the UCV diameter and that growth of the vein accounted for
most of the increase in Quv. Boito et al. (2002) found that the five-fold increase in the
UV area far outstripped the increase in the Tamaxv. In a study of preterm and term
fetuses, Link et al. (2007) found that the growth of the UV was responsible for
increasing Quv with advancing GA. Rizzo et al. (2016) found that the increase in intra-
abdominal Quv was due to an increase in both the UV diameter and Tamaxv, which is
similar to the conclusion formed in this research; however, different degrees of
contribution were attributed at different stages of the pregnancy.
Early research by Jouppila and Kirkinen (1984) attributed reduced umbilical
blood flow in compromised fetuses entirely to constriction of the vein. In some cases
of growth restriction, a reduction in UV velocity has been cited as the major cause of
reduced blood flow: Rigano et al. (2001) found that the UV diameter normalised to
body size was unaffected by IUGR and that reduced UV velocity was the major cause of
reduced Quv in IUGR fetuses. However, Skulstad et al. (2004) proposed that to maintain
Quv, the UV velocity increased to compensate for a reduction in diameter; however,
several researchers found that blood flow is not maintained in cases of IUGR (Bellotti

UMBILICAL CORD VEIN ULTRASOUND 304
et al., 2004; Di Naro et al., 2002; Ferrazzi et al., 2000; Gill et al., 1984; Kiserud et al.,
1994).
Rigano et al. (2008) found that both diameter and velocity were the cause of
reduced blood flow. Raio et al. (2003) also found that both velocity and diameter
contributed to a reduced Qucv in IUGR and speculated that “abnormal placentation
might cause an early reduction of both the umbilical vein blood flow and velocity. A
persistent reduction of umbilical vein velocity with increasing fetoplacental impedance
might induce remodeling (sic) of the umbilical vessels and, in particular, the umbilical
vein” (p. 1345).
Numerous researchers have proposed that either, or both, UCV diameter and
PV contribute to increasing blood flow in the normal fetus and that either, or both,
may contribute to reduced flow in growth compromised fetuses. Differing
contributions of UCV diameter and PV to increasing Quv with advancing GA, found in
this research concurs with previous studies.
15.7 Limitation and Advantages of the Umbilical Cord Vein Blood Flow
In this research there were several weaknesses in the calculated Qucv value.
These weaknesses are in addition to; the sparsity of data in the late second and third
trimesters, the IUGR/FGR sample of moderately compromised fetuses, and whole
weeks used to define birthweight categories as previously discussed. These
weaknesses can be summarised as follows:
i. The Qucv is extremely dependent on the accuracy of both the diameter and
PV measurements.
ii. A Qucv value requires a calculation or additional software techniques that
are dependent on the sonographer for correct application.
UMBILICAL CORD VEIN ULTRASOUND 305
iii. The formula for the blood flow assumes a parabolic flow in three
dimensions and uses a spatial velocity profile coefficient of 0.5. Although
this is accepted within the research community, some researchers have
found different coefficient values better describe the blood flow along the
length of the cord and consideration should be given to this factor if the
UCV is measured at different points.
iv. Fluctuations in Quv have been demonstrated over a five minute time frame.
Further investigation of the effects of these fluctuations on Quv provide an
area for future research and consideration in the application of this
nomogram; provided implications of prolonging fetal exposure to
ultrasound are considered.
In addition to the common strengths of the nomogram being developed from a
strictly selected Australian based “normal “population, analysis using quantile
regression and the expression of the results in percentiles, the strengths of the Qucv
measurement, development of the reference ranges and identification of IUGR can be
summarised as follows:
i. The nomogram was developed using the simplest possible measurement
techniques for the PV and diameter and a commonly used blood flow
calculation. Using this combination means that Qucv can be calculated and
the nomogram utilized by all clinicians irrespective of their location or the
complexity of their ultrasound machine.
ii. The Qucv from both the raw data and the 50th percentile predicted from
the quantile regression formula were in keeping with previous published
data.
UMBILICAL CORD VEIN ULTRASOUND 306
iii. The modelling of the three birthweight categories identified a significant
difference between the groups with overlapping CI curves prior to 23
weeks 3 days GA. This adds further support to the hypothesis that blood
flow is reduced in IUGR fetuses and indicates that measurements
undertaken before this cut-off will have little diagnostic value.
iv. Quantile regression with backward selection of powers modelled both
linear and curvilinear lines to describe the nAGA data. Both trends have
been described previously in the literature. Modelling both trends
highlights recent advances in statistical analysis which allow the true
relation between the variables to be explored, as this may be different at
various percentiles.
v. The reference range correctly identified 54.3% of IUGR/FGR group
attendances and detection rate increased to 62.2% when the cut-off of 23
weeks and 3 days GA was applied which compared favourably with other
current ultrasound methods used for the identification of IUGR.
15.8 Potential Applications of the Umbilical Cord Vein Blood Flow Results
Qucv is technically difficult to accurately measure or calculate due to the errors
associated with components of the formula. Given this, Quv is well established in other
facets of ultrasound and its use in obstetrics should be encouraged. Further research
could be undertaken to compare software calculation versus manual calculation, and
determine if the reference ranges developed in this research are compatible with
different methods of acquiring Qucv values.
The detection rate of 54.3%, or 62.2% when the cut-off of 23 weeks and 3 days
GA was applied, is not sufficient to support the use of Qucv as a stand-alone diagnostic
UMBILICAL CORD VEIN ULTRASOUND 307
tool for IUGR. However, in combination with other established ultrasound parameters,
Qucv may prove to be another useful tool in the arsenal of ultrasound measurements
that can be used to monitor and diagnose IUGR.
Recent research has found that in a low risk obstetric population a Qucv below
the 20th percentile increased the risk of intrapartum fetal distress, necessitating
emergency delivery (Prior et al., 2014). This finding may have beneficial repercussions
for obstetric management of patients in regional and rural area where timely transfer
to larger facilities may be appropriate.
15.9 Conclusion
This research presents the first Qucv reference range developed from an
Australian based “normal” obstetrics population using quantile regression. Both linear
and curvilinear relationships between Qucv with increasing GA have been demonstrated
and these trends are in keeping with other published works. Linear mixed modelling
found a significance difference between the birthweight categories, with similar
shaped curves and overlapping of the CIs of the three categories prior to 23 weeks 3
days GA.
The reference range correctly identified 62.2% of IUGR/FGR group attendances
using the 10th percentile and 23 weeks and 3 days as cut-offs, suggesting that Qucv has
a role in the identification of growth restricted fetuses. Analysis of the relationship
between the average UCV PV and diameter showed that there was a simultaneous
increase in both, but their contribution to increasing blood flow varied with GA.
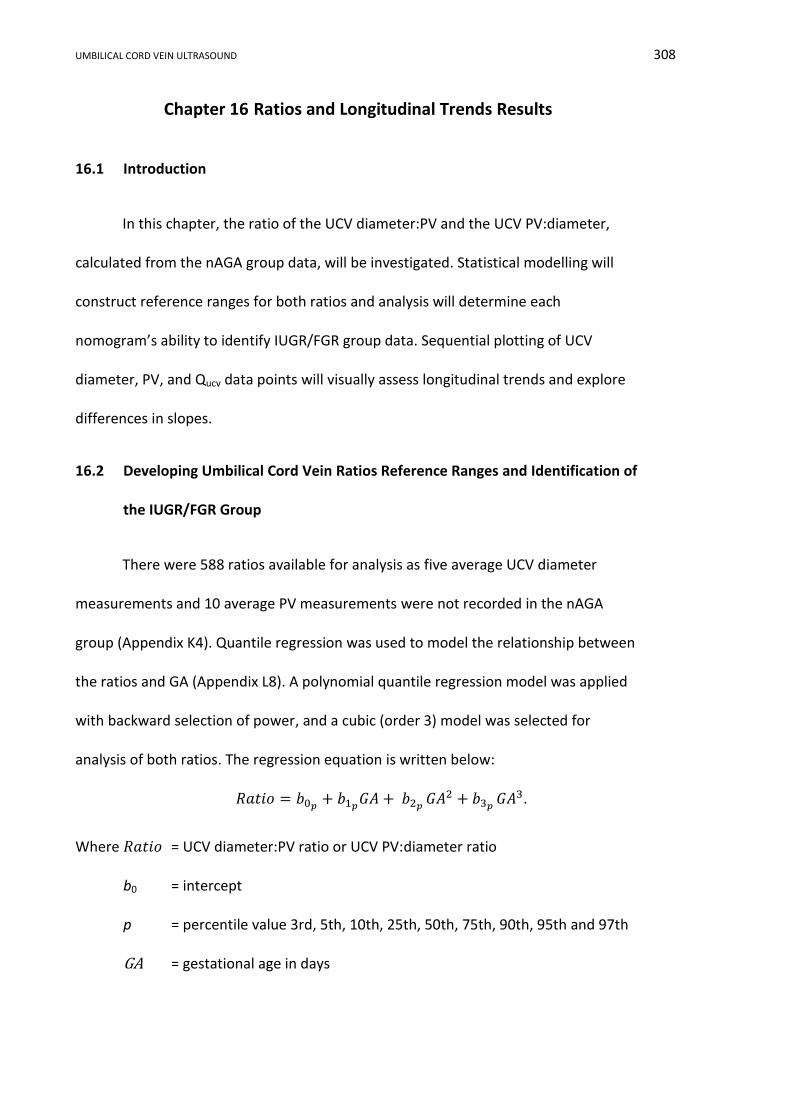
UMBILICAL CORD VEIN ULTRASOUND 308
Chapter 16 Ratios and Longitudinal Trends Results
16.1 Introduction
In this chapter, the ratio of the UCV diameter:PV and the UCV PV:diameter,
calculated from the nAGA group data, will be investigated. Statistical modelling will
construct reference ranges for both ratios and analysis will determine each
nomogram’s ability to identify IUGR/FGR group data. Sequential plotting of UCV
diameter, PV, and Qucv data points will visually assess longitudinal trends and explore
differences in slopes.
16.2 Developing Umbilical Cord Vein Ratios Reference Ranges and Identification of
the IUGR/FGR Group
There were 588 ratios available for analysis as five average UCV diameter
measurements and 10 average PV measurements were not recorded in the nAGA
group (Appendix K4). Quantile regression was used to model the relationship between
the ratios and GA (Appendix L8). A polynomial quantile regression model was applied
with backward selection of power, and a cubic (order 3) model was selected for
analysis of both ratios. The regression equation is written below:
𝑅𝑎𝑡𝑖𝑜 = 𝑏0𝑝+ 𝑏1𝑝
𝐺𝐴 + 𝑏2𝑝 𝐺𝐴2 + 𝑏3𝑝
𝐺𝐴3.
Where 𝑅𝑎𝑡𝑖𝑜 = UCV diameter:PV ratio or UCV PV:diameter ratio
b0 = intercept
p = percentile value 3rd, 5th, 10th, 25th, 50th, 75th, 90th, 95th and 97th
GA = gestational age in days
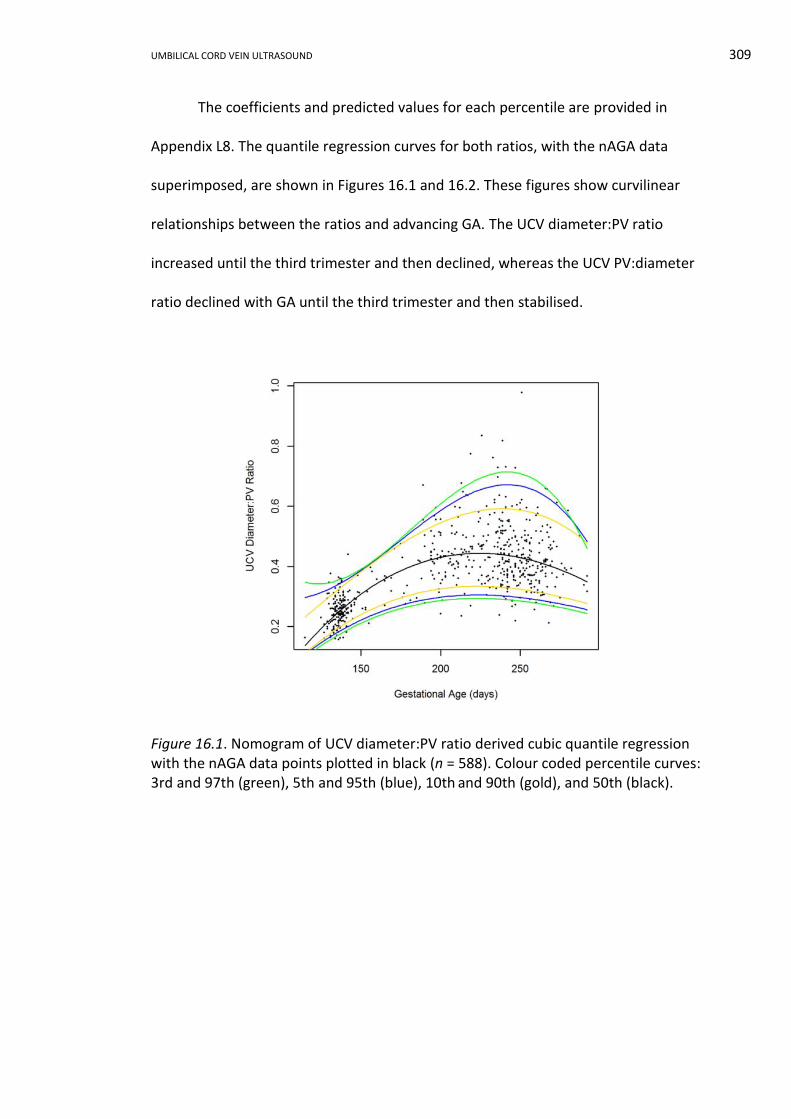
UMBILICAL CORD VEIN ULTRASOUND 309
The coefficients and predicted values for each percentile are provided in
Appendix L8. The quantile regression curves for both ratios, with the nAGA data
superimposed, are shown in Figures 16.1 and 16.2. These figures show curvilinear
relationships between the ratios and advancing GA. The UCV diameter:PV ratio
increased until the third trimester and then declined, whereas the UCV PV:diameter
ratio declined with GA until the third trimester and then stabilised.
Figure 16.1. Nomogram of UCV diameter:PV ratio derived cubic quantile regression with the nAGA data points plotted in black (n = 588). Colour coded percentile curves: 3rd and 97th (green), 5th and 95th (blue), 10th and 90th (gold), and 50th (black).
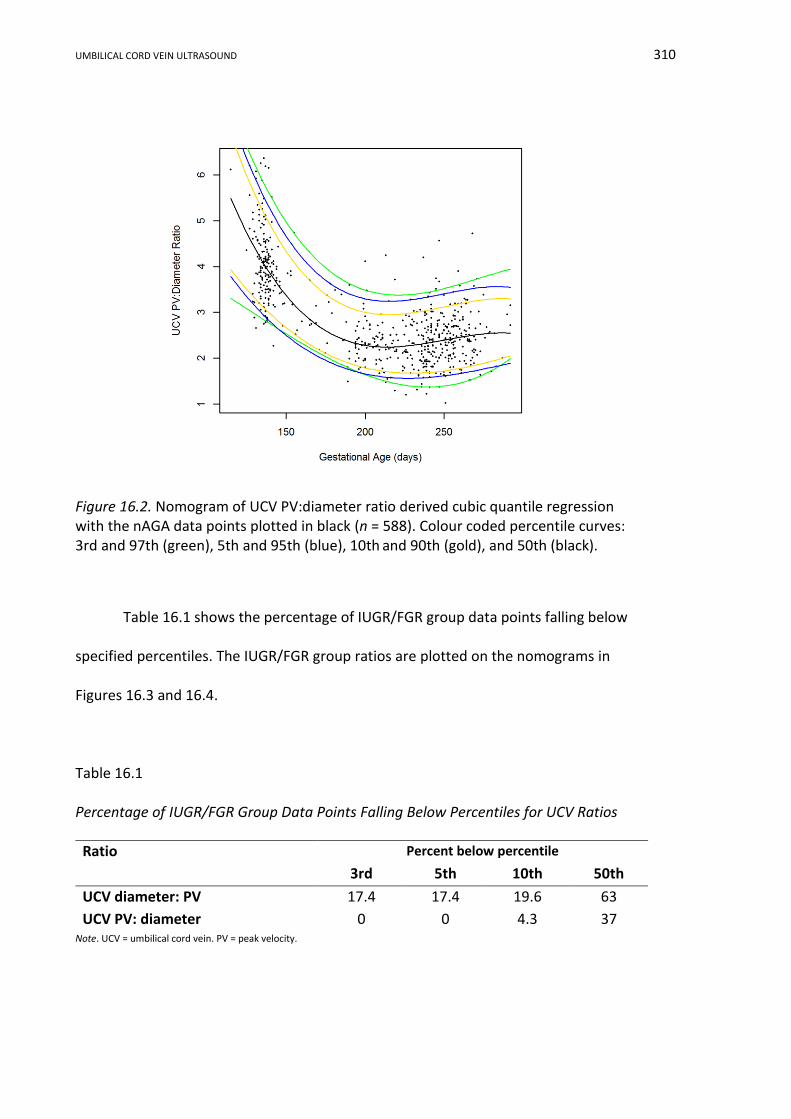
UMBILICAL CORD VEIN ULTRASOUND 310
Figure 16.2. Nomogram of UCV PV:diameter ratio derived cubic quantile regression with the nAGA data points plotted in black (n = 588). Colour coded percentile curves: 3rd and 97th (green), 5th and 95th (blue), 10th and 90th (gold), and 50th (black).
Table 16.1 shows the percentage of IUGR/FGR group data points falling below
specified percentiles. The IUGR/FGR group ratios are plotted on the nomograms in
Figures 16.3 and 16.4.
Table 16.1
Percentage of IUGR/FGR Group Data Points Falling Below Percentiles for UCV Ratios
Note. UCV = umbilical cord vein. PV = peak velocity.
Ratio Percent below percentile
3rd 5th 10th 50th
UCV diameter: PV 17.4 17.4 19.6 63
UCV PV: diameter 0 0 4.3 37

UMBILICAL CORD VEIN ULTRASOUND 311
Figure 16.3. Nomogram of UCV diameter:PV ratio with IUGR/FGR group data in red (n = 46). Colour coded percentile curves: 3rd and 97th (green), 5th and 95th (blue), 10th and 90th (gold), and 50th (black).
Figure 16.4. Nomogram of UCV PV:diameter ratio with the IUGR/FGR group data in red (n = 46). Colour coded percentile curves: 3rd and 97th (green), 5th and 95th (blue), 10th and 90th (gold), and 50th (black).
UMBILICAL CORD VEIN ULTRASOUND 312
16.3 Analysis of Longitudinal Data
All average UCV diameter, average UCV PV, and Qucv data points for SGA
participants with more than two scans (n = 38), with more than three scans in the LGA
category (n = 11), and with more than five scans in the AGA birthweight category
(n = 11) were plotted against GA (Appendix L9). Visual assessment of these longitudinal
plots demonstrated an increasing trend of the UCV variables with advancing GA;
however, the graphs were chaotic and no clear distinction between the birthweight
categories was identifiable. In order to declutter these graphs the first and last UCV
variables values from subgroups of the SGA (n = 38), nAGA (n = 19), and LGA categories
(n = 19) were constructed (Appendix K5) and plotted against GA (Appendix L8). The
decluttered graphs, plotting only the first and last scan UCV variables values, are
shown in Figures 16.5, 16.6 and 16.7.
Figure 16.5. First and last average UCV diameters against GA (n = 76).
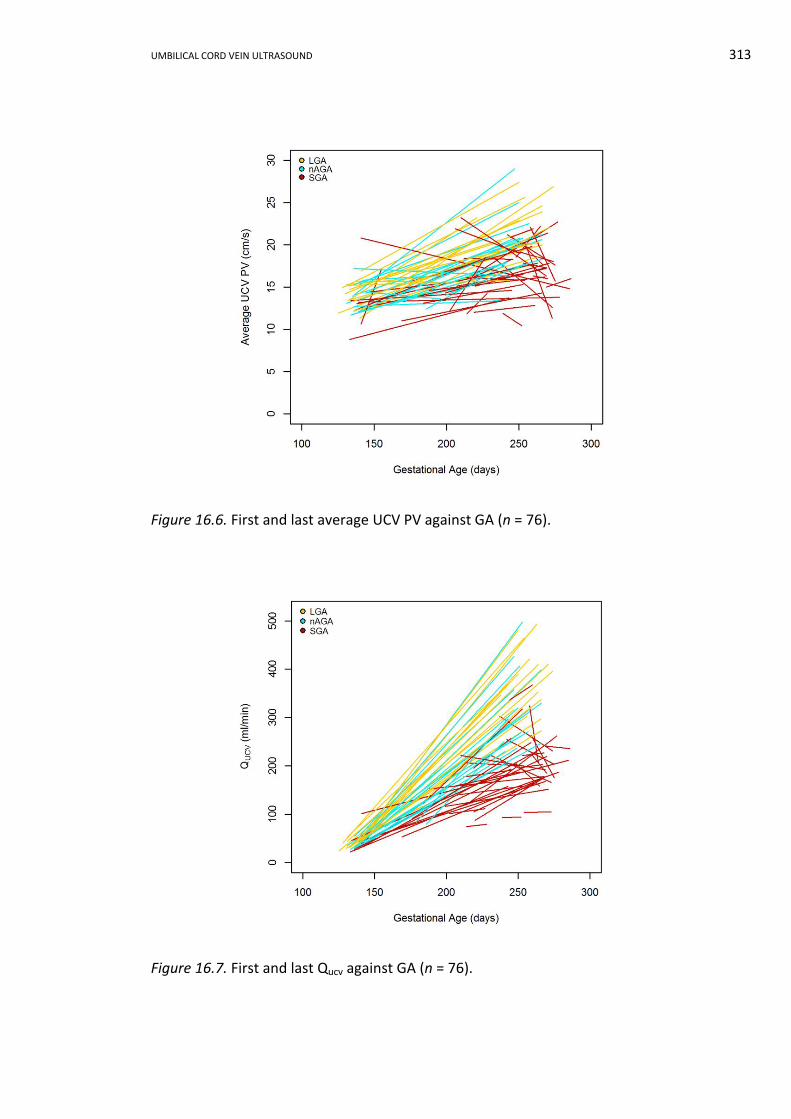
UMBILICAL CORD VEIN ULTRASOUND 313
Figure 16.6. First and last average UCV PV against GA (n = 76).
Figure 16.7. First and last Qucv against GA (n = 76).
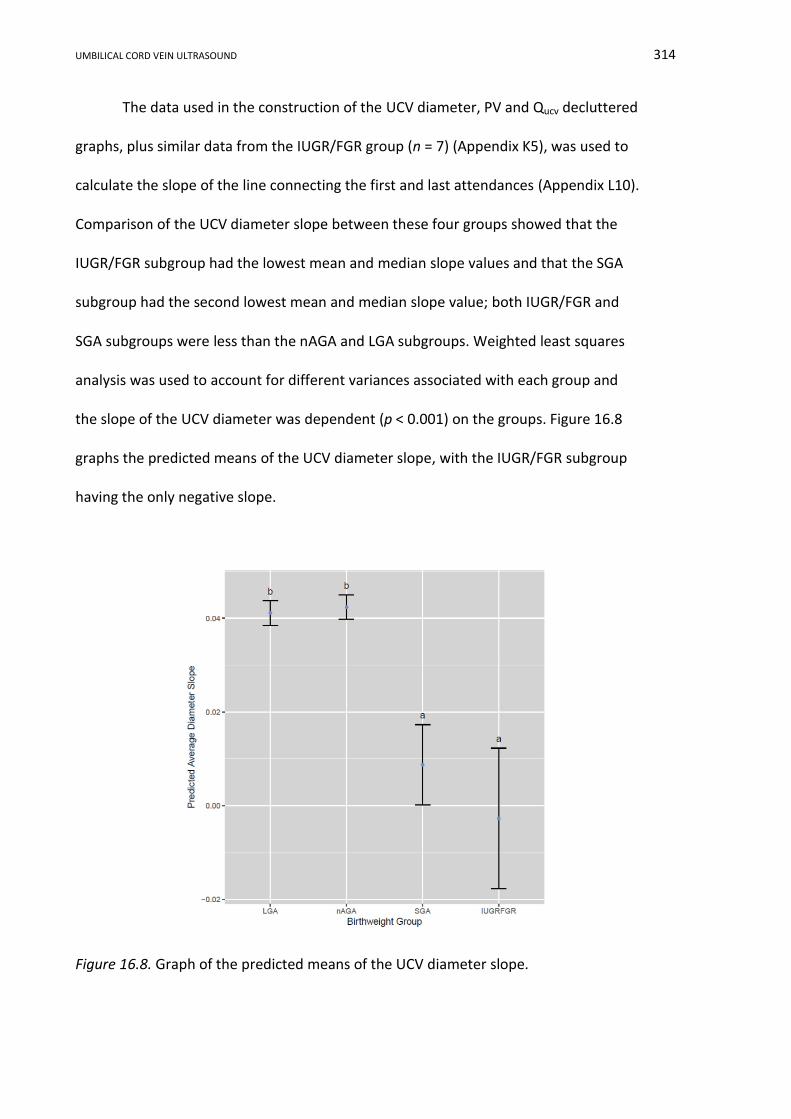
UMBILICAL CORD VEIN ULTRASOUND 314
The data used in the construction of the UCV diameter, PV and Qucv decluttered
graphs, plus similar data from the IUGR/FGR group (n = 7) (Appendix K5), was used to
calculate the slope of the line connecting the first and last attendances (Appendix L10).
Comparison of the UCV diameter slope between these four groups showed that the
IUGR/FGR subgroup had the lowest mean and median slope values and that the SGA
subgroup had the second lowest mean and median slope value; both IUGR/FGR and
SGA subgroups were less than the nAGA and LGA subgroups. Weighted least squares
analysis was used to account for different variances associated with each group and
the slope of the UCV diameter was dependent (p < 0.001) on the groups. Figure 16.8
graphs the predicted means of the UCV diameter slope, with the IUGR/FGR subgroup
having the only negative slope.
Figure 16.8. Graph of the predicted means of the UCV diameter slope.
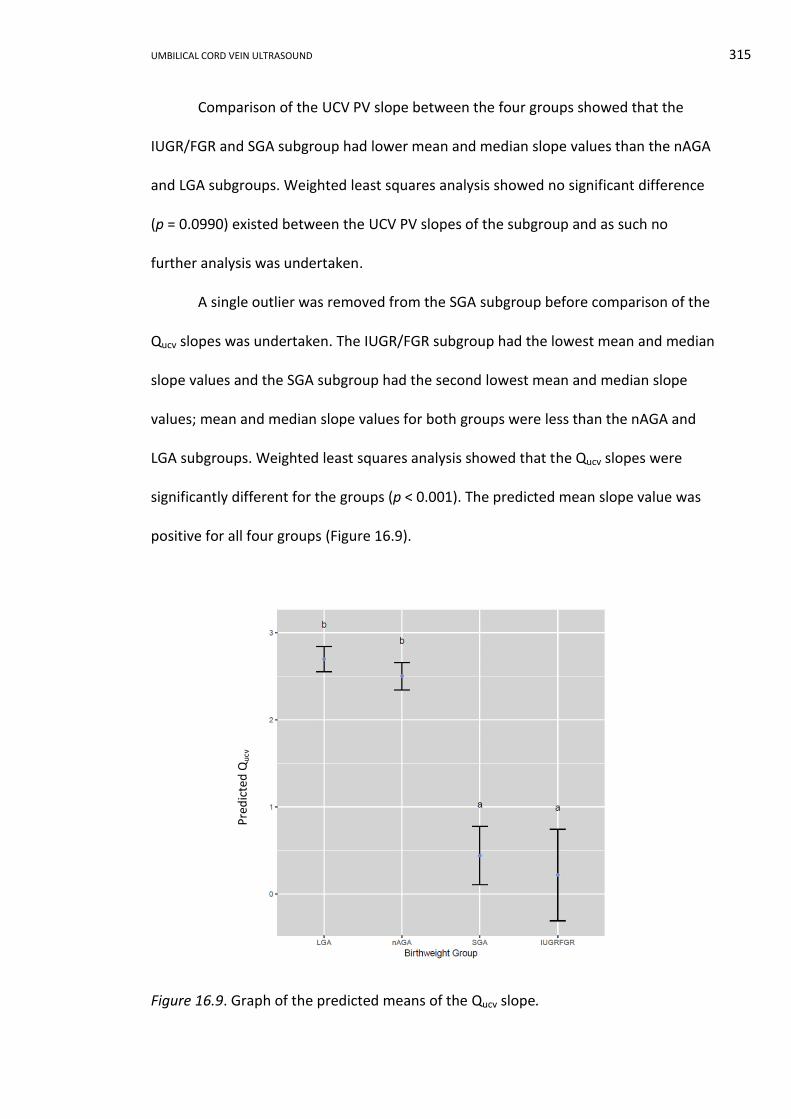
UMBILICAL CORD VEIN ULTRASOUND 315
Comparison of the UCV PV slope between the four groups showed that the
IUGR/FGR and SGA subgroup had lower mean and median slope values than the nAGA
and LGA subgroups. Weighted least squares analysis showed no significant difference
(p = 0.0990) existed between the UCV PV slopes of the subgroup and as such no
further analysis was undertaken.
A single outlier was removed from the SGA subgroup before comparison of the
Qucv slopes was undertaken. The IUGR/FGR subgroup had the lowest mean and median
slope values and the SGA subgroup had the second lowest mean and median slope
values; mean and median slope values for both groups were less than the nAGA and
LGA subgroups. Weighted least squares analysis showed that the Qucv slopes were
significantly different for the groups (p < 0.001). The predicted mean slope value was
positive for all four groups (Figure 16.9).
Figure 16.9. Graph of the predicted means of the Qucv slope.
Pre
dic
ted
Qu
cv
UMBILICAL CORD VEIN ULTRASOUND 316
16.4 Conclusion
The ratios of UCV diameter:PV and PV:diameter were calculated and quantile
regression modelled cubic curvilinear curves. Using the 10th percentile as a cut-off, the
UCV diameter:PV ratio correctly identified 4.3% and the UCV PV:diameter ratio 19.6%
of the IUGR/FGR group data. The IUGR/FGR subgroup had the lowest mean and
median slope values for all three UCV parameters. There was a significant difference
between the UCV diameter and Qucv slope depending on the four subgroups. The only
negatively predicted slope was the IUGR/FGR subgroup UCV diameter.
UMBILICAL CORD VEIN ULTRASOUND 317
Chapter 17 Ratios and Longitudinal Trends Discussion
17.1 Introduction
In this chapter, the reference ranges developed from quantile regression
analysis of the UCV ratios and their performance in identifying IUGR fetuses will be
discussed. Longitudinal data will be reviewed in the context of identifying trends
associated with poor intrauterine growth and compared to other published results.
17.2 Ratios and the Identification of the IUGR/FGR Group
Reference ranges for UCV diameter and PV ratios against advancing GA have
not been presented previously. The regression curves of both ratios were curvilinear
and highlight one of the benefits of using percentiles, which is that a majority of the
percentile curves have a unique shape tailored to the response of each variable at
various gestational ages.
The UCV diameter:PV ratio reference range had a non-normal distribution and
exhibited increased variability with advancing GA, but did perform better at correctly
classifying IUGR/FGR group data. This ratio correctly identified 63% of IUGR/FGR group
attendances using the median as a cut-off and 19.6% using the 10th percentile. The
denominator in the ratio UCV PV:diameter was the most stable variable and therefore
ideally the reference range developed from this ratio would be the most robust.
However, the reference range only correctly identified 37% of IUGR/FGR group
attendances using the median as a cut-off and 4.3% using the 10th percentile. These
detection rates were less than the 62.2% rate achieved by both the UCV diameter and
Qucv.
UMBILICAL CORD VEIN ULTRASOUND 318
17.3 Longitudinal Data and the Identification of the IUGR/FGR Group
17.3.1 Umbilical cord vein diameter.
Figure 16.5 shows a predominantly positive UCV diameter slope with advancing
GA for the nAGA and LGA subgroups and the slope appeared less in the SGA subgroup.
Only the IUGR/FGR subgroup had a negatively predicted slope (Figure 16.8) inferring
that this group did not experience a significant increase in UCV diameter throughout
the pregnancy. The SGA subgroup had a small positive predicted mean value inferring
that the slope of the UCV diameter was positive, but at a lesser gradient than the
nAGA and LGA subgroups.
The UCV diameter of the IUGR/FGR and SGA subgroups showed an overall
tendency to not increase, or not increase rapidly, with advancing GA, compared to the
nAGA and LGA subgroups. This finding is similar to data published by Di Naro et al.
(2002), who compared the UCV cross-sectional area of 15 IUGR49 to 30 AGA fetuses at
ultrasound scans completed two weeks apart. The mean UCV cross-sectional area
reduced between the first examination and second examination for IUGR fetuses (35.5
to 34.2 mm2) compared to an increase in the AGA mean value (43.1 to 45.3 mm2).
17.3.2 Umbilical cord vein peak velocity.
The decluttered PV longitudinal graph (Figure 16.6) shows a predominant trend
of increasing UCV PV with advancing GA for the nAGA and LGA subgroups and the
slope appeared less in the SGA subgroup; however, statistically there was no
association between the groups and the UCV PV slope. This finding was at odds with a
49
AC < 5th % and birthweight < 10th %
UMBILICAL CORD VEIN ULTRASOUND 319
study of 11 compromised pregnancies50 in which the UV Vmean declined in three of the
four women undergoing serial scans (Jouppila & Kirkinen, 1984).
17.3.3 Umbilical cord vein blood flow.
The decluttered Qucv longitudinal graph shown in Figure 16.7 displayed a
predominant trend of increasing Qucv with advancing GA, between the first and last
scan measurements. There was a significant difference between the slopes of the four
subgroups; however, all predicted Qucv slopes were positive, making it visually difficult
to distinguish between the groups on the basis of trend alone.
The predicted mean of the slope for the SGA and IUGR/FGR subgroups were
positive, but were less than the nAGA and LGA subgroups. This is in keeping with a
longitudinal study of Qucv corrected for AC and EFW undertaken by Rigano et al. (2001),
who reported that Qucv was reduced in IUGR51 fetuses at first diagnosis of IUGR and
that the reduction persisted throughout the pregnancy. Both Rigano et al.’s and the
research findings differ from the trend described by Di Naro et al. (2002), in which a
progressive reduction in Qucv for IUGR52 fetuses was identified between fortnightly
scans, even in the presence of normal UA Dopplers.
17.4 Limitation and Advantages of the Umbilical Cord Vein Ratios and Longitudinal
Results
The limitations for making a robust analysis of the detection of fetal growth
restriction was the sparsity of data between 23 to 28 weeks and after 39 weeks GA,
and the absence of severely growth restricted data. The collection of larger data sets
would overcome these limitations and is an avenue for further research.
50
Birthweight < 10th %, reduced fetal growth, Apgar < 7 at 1 and 5 minutes, pathological CTG
51 AC < 2 SD below mean, UA PI > 2 SD above mean, abnormal uterine artery and birthweight < 10th %
52 AC < 5th % and birthweight < 10th
%
UMBILICAL CORD VEIN ULTRASOUND 320
This portion of the research presents the first analysis undertaken on ratios
between the UCV diameter and PV. The ratio reference ranges did not correctly
classify the IUGR/FGR group attendances to a clinically useful level; however, further
data collection including fetuses with severe IUGR could be undertaken to thoroughly
assess these reference ranges. This analysis provides supporting evidence for the use
of the UCV diameter in the diagnosis of IUGR fetuses as the SGA and IUGR/FGR
subgroup had little or no increase in the diameters on serial plotting compared to
increasing UCV diameters seen in the nAGA and LGA subgroups.
17.5 Potential Applications of the Umbilical Cord Vein Ratios and Slopes
The reference ranges developed from the ratios of the UCV diameter and PV
have limited clinical applications as they involved an additional calculation and proved
to have a low detection rate of IUGR/FGR group data. The diameter of the IUGR/FGR
group was the only UCV feature to exhibit a negative slope when longitudinal data was
examined over several weeks of gestation. Therefore in clinical practice when
sequential plotting of the UCV diameter is undertaken over several weeks of the
pregnancy, the presence of a negative slope provides supporting evidence of
compromised growth.
17.6 Conclusion
The reference ranges developed from the ratios of the UCV diameter and PV
performed poorly in the correct identification of IUGR/FGR fetuses using the 10th
percentile as a cut-off, inferring that their clinical application may be limited. Analysis
of the slope of the UCV diameter, PV and Qucv against advancing GA showed that the
UCV diameter for IUGR/FGR subgroup fetuses had the only negative slope. Given that

UMBILICAL CORD VEIN ULTRASOUND 321
the UCV diameter is a simple measurement to undertake, serial plotting of this
measurement may provide supporting evidence for the diagnosis of IUGR.
UMBILICAL CORD VEIN ULTRASOUND 322
SECTION VI CONCLUSION AND CLINICAL IMPLICATIONS
Chapter 18 Conclusions and Clinical Implications
18.1 Introduction
This exegesis presents umbilical cord vein diameter, PV and Qucv reference
ranges that were developed using a Central West NSW “normal” obstetrics population
and quantile regression. In addition, this research assessed the proficiency of these
reference ranges in the identification of moderately growth restricted fetuses,
documented measurement and calculation methods, investigated other relations
between the UCV parameters and analysed maternal and pregnancy outcome
characteristics of the samples. The research had several advantageous design features;
however, data analysis was restricted by referral patterns to regional hospitals and
categorical boundaries. All research aims were achieved and the outcomes have
contributed to the expansion of knowledge, potentially influenced clinical practice and
identified several areas for further research.
18.2 Research Outcomes
The maternal and pregnancy outcome characteristics of the whole research
sample and the nAGA group were analysed and compared to local, state and national
populations. The whole research sample was typical of the Australian population;
except mothers were younger, more mothers smoked at some point in their
pregnancy, and neonates were lighter than comparable Australian data. The
characteristics of the nAGA group were reasonably typical of the whole research

UMBILICAL CORD VEIN ULTRASOUND 323
sample and the nAGA group was similar to the 2012 Australian population, except that
mothers were younger, parity was higher, and fewer male babies were born.
Linear mixed modelling showed a significant difference between the SGA, AGA
and LGA birthweight categories for each of the UCV features; however, there was
overlap of the CIs of the three birthweight regression curves at certain gestational
ages. The three birthweight curves for the UCV diameter and Qucv had similar shapes
and their CIs overlapped until 25 weeks and 6 days GA and 23 weeks and 3 days,
respectively. The UCV PV had different shaped curves for each birthweight category
and the CIs overlapped between 20 weeks and 4 days and 35 weeks and 1 day GA.
The reference ranges developed from quantile regression demonstrated a
curvilinear increase in the UCV diameter with advancing GA up until 37 weeks,
followed by a plateau lasting 4 weeks, and then a slight decline to 42 weeks GA. There
was a positive linear increase in UCV PV with increasing GA and an exponential
increase in Qucv up to a peak at 39 weeks followed by a slight decline until 42 weeks
GA. The UCV diameter, PV and Qucv values that were measured, calculated or predicted
from modelling were comparable to previously published values. The reference ranges
for all three UCV measurements increased with advancing GA and the trends described
in this research are in keeping with previously published outcomes. A peer reviewed
article detailing these reference ranges is contained in Appendix N.
Using the 10th percentile and the GA cut-offs defined by the CIs of the
birthweight categories, the reference ranges correctly identified 15% of IUGR/FGR
group attendances for UCV PV, and 62.2% for both the UCV diameter and Qucv.
Reference ranges for ratios of the UCV diameter and PV had curvilinear trends with
advancing GA and identified less than 20% of the IUGR/FGR group attendances.
UMBILICAL CORD VEIN ULTRASOUND 324
Analysis of the slope of the UCV diameter, PV and Qucv showed that the UCV diameter
for IUGR/FGR subgroup fetuses had the only negative slope.
18.3 Advantages and Limitations of the Research Methods
The research methods employed population appropriate data, strict selection
criteria, familiar measurement protocols, and preeminent statistical analyses. Data
collection and analyses were restricted by referral patterns to regional hospitals, the
absence of severely growth compromised fetuses, rounding the GA at delivery to
whole weeks, and a Doppler sample gate that was wider than the UCV at early
gestational ages.
The advantages of the research methods included:
i. Australian, gender and GA specific birthweights percentiles, instead of
ultrasound criteria, were used to retrospectively classify intrauterine
growth. This was a superior method based on a tangible outcome as
opposed to ultrasound biometry and EFW that incur errors in
measurement and formulae.
ii. The exclusion criteria used to sequester the nAGA group was strict,
resulting in data collected from “normal” pregnancies without recruiting
clients with no medical or clinical need for an obstetric ultrasound, which
would have had financial, ethical and safety issues beyond the scope of this
research.
iii. Comparison of the maternal characteristic and pregnancy outcomes of the
whole research sample and the nAGA group indicated: the nAGA group was
typical of the whole research sample and that both research samples were
reasonable typical of NSW and Australian populations. Inferring that the
UMBILICAL CORD VEIN ULTRASOUND 325
data was representative and the reference ranges developed from the data
were applicable to the broader population.
iv. Measuring the intra-amniotic UCV and utilising the nuchal translucency
measurement protocol meant that the research sonographers were
familiar with the required technical aspects of data collection and the
measurement protocol should be readily transportable to the wider
sonography profession.
v. The excellent ICC results demonstrated that the measurement methods for
the UCV diameter and PV where simple, reproducible and provided high
quality data for the construction of the reference ranges.
vi. Quantile regression was used in the development of the reference ranges
and has several features that overcome assumptions of parametric
analysis. Quantile regression is more robust to outliers, does not assume a
normal distribution of the data, or that the residuals have a mean of zero
and constant variance.
vii. The use of percentiles to describe the data trends when developing the
reference ranges permitted a different fitted function for each percentile.
The interpretation and assessment of the results were subject to several
limitations including:
i. A sparsity of data between 23 to 28 weeks and after 39 weeks GA
reflecting the referral patterns to the research hospitals. The reference
ranges may have been more robust if the modelling did not rely on
interpolation between available data.

UMBILICAL CORD VEIN ULTRASOUND 326
ii. The IUGR/FGR group definition identified moderately compromised
fetuses, as severely growth restricted fetuses were not available within the
sample population. The IUGR/FGR group contained seven participants who
provided less than 50 data points for evaluation.
iii. Birthweight categories were assigned using the GA at delivery rounded to
whole weeks, which may have inadvertently skewed the classification of
the birthweights; however, this was the most relevant, population
appropriate data available.
iv. The Doppler sample gate covered the entire umbilical cord in early
pregnancy. However, modelling of the three birthweight categories
demonstrated that the PV reference range had limited clinical usefulness
and the Qucv reference range which incorporated the PV value, was not
appropriate until late second trimester, when this limitation is no longer be
relevant.
18.4 Contributions to Knowledge
The exegesis and portfolio have made the following contributions to
knowledge:
i. UCV diameter, PV and Qucv reference ranges derived from a cohort of low
risk, singleton pregnancies in Central West NSW were developed and
disseminated (Appendix N).
ii. Simple measurement and calculation protocols for the UCV diameter, PV
and Qucv were documented and disseminated (Appendix N).
iii. Mixed linear modelling of the SGA, AGA and LGA birthweight categories
indicated there was a significant difference between the birthweight
UMBILICAL CORD VEIN ULTRASOUND 327
groups for all three UCV parameters. The differences between the
birthweight categories were not identifiable during the gestational ages
when the CI curves overlapped. The CI curves for the UCV diameter and
Qucv overlapped until the late second trimester, but the overlapping was
the most significant for the UCV PV as this occurred during the crucial
period of fetal growth from 20 to 35 weeks GA.
iv. UCV diameter and Qucv reference ranges were used to correctly identify
more than half of IUGR/FGR group attendance using a 10th percentile cut-
off. This detection rate increased to 62.2% when the GA cut-offs identified
in the linear mixed modelling of the birthweight categories was applied.
The UCV PV reference range detected only 27.7% of IUGR/FGR group
attendances using a 10th percentile cut-off. This detection rate reduced to
15% when the GA cut-offs identified in the linear mixed modelling of the
birthweight categories was applied.
v. Reference ranges for ratios of the UCV diameter and PV were developed
using quantile regression and found to have a detection rate of less than
20% for IUGR/FGR group data using a 10th percentile cut-off.
vi. Analysis of the slope of the UCV diameter, PV and Qucv against advancing
GA showed that the UCV diameter for IUGR/FGR subgroup fetuses had the
only negative slope.
vii. Analysis of the slopes of the UCV and PV nomograms showed that UCV PV
increased with enlarging UCV diameter; however, the rate of increase was
constant for the UCV PV and was greatest in the UCV diameter prior to 28
weeks GA. This finding was in keeping with previous research and implied
UMBILICAL CORD VEIN ULTRASOUND 328
that both UCV diameter and PV contribute to increasing Qucv, but increasing
UCV diameter contributes most to rising Qucv before 28 weeks GA.
viii. The literature review highlighted an absence of a comprehensive review of
the anatomy and development of the umbilical vein and a review article
was published to address this gap in knowledge (Appendix A).
ix. An article comparing maternal and pregnancy outcome of the whole
research sample to local, state and national data was published and
provided a detailed review of the local obstetric population (Appendix M).
18.5 Implications for Clinical Practice
The exegesis and portfolio provided six significant implications for clinical
practice:
i. The UCV diameter, PV and Qucv reference ranges provide a useful addition
to the assemblage of ultrasound parameters currently employed for the
diagnosis and monitoring of fetal growth restriction.
ii. The UCV diameter was easy to measure and required only B-mode imaging.
It was used to identify 62.2% of attendances of the IUGR/FGR fetuses after
25 weeks and 6 days and demonstrated a negative slope with sequential
plotting for fetuses classified as growth restricted. These features make the
UCV diameter measurement and reference range useful across a wide
array of ultrasound machine designs and to a diverse range of user
expertise.
iii. Analysis of the three birthweight categories showed overlap of the
confidence intervals, most significantly for the UCV PV during an important
15 week period of fetal growth. The inability of the UCV PV to distinguish
UMBILICAL CORD VEIN ULTRASOUND 329
between fetuses in different birthweight categories during the gestational
ages of 20 and 35 weeks may explain the historical neglect of this
measurement in clinical practice and indicates that UCV PV would be of
little use in the diagnosis and monitoring of abnormal fetal growth.
iv. The Qucv reference range identified 62.2% of IUGR/FGR data, but the errors
in measuring the components, the additional calculation, and the
assumptions in the formula inhibit clinical application.
v. Reference ranges of the ratios between UCV diameter and PV were
developed and had a low detection rate of the IUGR/FGR data implying
that these ranges would have restricted clinical use in the identification of
growth restriction.
vi. The ultrasound safety portion of the literature review formed the basis of a
Local Health District Operating Protocol to inform sonographers of the
current bioeffect indices and their limits, a means of complying with the
guideline limits, and current opinions regarding the bioeffects of fetal
ultrasound exposure (Portfolio Appendix H).
18.6 Further Research
On the basis of the literature review and research results, suggestions for
future studies include:
i. Continue data collection to provide a larger sample and data covering the
gestational ages that currently have limited information and reanalyse.
ii. Assess the reference ranges with a larger IUGR/FGR sample including
severely growth compromised fetuses.
UMBILICAL CORD VEIN ULTRASOUND 330
iii. Undertake a multicentre study to assess the utility of the reference ranges
to the broader Australian population.
iv. Compare the UCV diameter, PV and Qucv data collection techniques to
automated methods to determine if these reference ranges remain
relevant with different acquisition methods.
v. Examine the possible effects of umbilical vein fluctuations on the
calculation or measurement of Qucv.
vi. Examine the possible effects of coiling on PV and Qucv values.
vii. Investigate possible interrelations between the UCV diameter and UA
indices given that the fetus is considered a closed system and that UCV
diameter decreases in the presence of IUGR and UA indices increase.
viii. Determine if there is a significant difference between the UCV diameter, PV
and Qucv of males and females fetuses.
18.7 Conclusion
In this exegesis and portfolio, I have presented reference ranges for the UCV
diameter, PV and Qucv that were developed from a Central West NSW population.
Simple methods of measuring or calculating these values have been documented. In
conjunction with cut-offs identified from modelling three birthweight categories, these
reference ranges have been assessed for their ability to identify IUGR. Due to the
simplicity of measurement, availability of B-mode imaging across a wide range of
machines and localities, and a negative slope with longitudinal plotting, the UCV
diameter was found to be the superior parameter. The UCV PV was less successful in
identifying IUGR attendances and I proposed that the overlap of the birthweight

UMBILICAL CORD VEIN ULTRASOUND 331
categorises between 20 and 35 weeks GA may explain the poor acceptance of the UCV
PV in clinical practice.

UMBILICAL CORD VEIN ULTRASOUND 332
References
AbdelMaboud, N. M., & Elsaid, H. H. (2015). Role of venous Doppler evaluation of intrauterine growth retardation. The Egyptian Journal of Radiology and Nuclear Medicine, 46(1), 167-174. doi:10.1016/j.ejrnm.2014.11.013
Acharya, G., Wilsgaard, T., Berntsen, G. K. R., Maltau, J. M., & Kiserud, T. (2005). Reference ranges for umbilical vein blood flow in the second half of pregnancy based on longitudinal data. Prenatal Diagnosis, 25(2), 99-111. doi:10.1002/pd.1091
Alberta Perinatal Health Program. (2008). Intrauterine growth restriction. Diagnosis and management. Retrieved from http://aphp.dapasoft.com/PublicHtml/doc/IUGR%20Practice%20Resource%2005%2009.pdf
Albu, A. R., Anca, A. F., Horhoianu, V. V., & Horhoianu, I. A. (2014). Predictive factors for intrauterine growth restriction. Journal of Medicine and Life, 7(2), 165-171. Retrieved from http://www.ncbi.nlm.nih.gov/pmc/articles/PMC4197512/
Alfirevic, Z., & Neilson, J. P. (2000). Biophysical profile for fetal assessment in high risk pregnancies. The Cochrane Database of Systematic Reviews(2). doi:10.1002/14651858.cd000038
Altman, D. G., & Chitty, L. S. (1994). Charts of fetal size. 1. Methodology. British Journal of Obstetrics and Gynaecology, 101(1), 29-34. doi:10.1111/j.1471-0528.1994.tb13006.x
American College of Obstetricians and Gynecologists Opinion 611. (2014). Method for estimating due date. Obstetrics & Gynecology, 124(4), 863-866.
American College of Obstetricians and Gynecologists Practice Bulletin. (2001). Intrauterine growth restriction. Clinical management guidelines for obstetrician-gynecologists. International Journal of Gynecology & Obstretrics, 75, 85-96.
American Institute of Ultrasound in Medicine. (2016, 21 March). Statement on the safe use of doppler ultrasound during 11–14 week scans (or earlier in pregnancy). Retrieved from http://www.aium.org/officialStatements/42
Anderson, N. G., Jolley, I. J., & Wells, J. E. (2007). Sonographic estimation of fetal weight: comparison of bias, precision and consistency using 12 different formulae. Ultrasound in Obstetrics and Gynecology, 30(2), 173-9. doi:10.1002/uog.4037
Arduini, G., & Rizzo, G. (1990). Normal values of pulsatility index from fetal vessels: A cross-sectional study on 1556 healthy fetuses. Journal of Perinatal Medicine, 18(3), 165-172.
Arslan, O., Mendilcioglu, I., Sanhal, C. Y., Ozekinci, M., & Simsek, M. (2014). Sonographic umbilical cord morphology in patients with pre‐eclampsia and intrauterine growth restriction in the second and third trimester. Ultrasound in Obstetrics and Gynecology, 44(Supplement 1), 119. doi:10.1002/uog.13812
Ash, S., Fisher, C. C., Truswell, A. S., Allen, J. R., & Irwig, L. (1989). Maternal weight gain, smoking and other factors in pregnancy as predictors of infant birth-weight in Sydney women. Australian and New Zealand Journal of Obstetrics and Gynaecology, 29(3), 212-219. doi:10.1111/j.1479-828X.1989.tb01722.x

UMBILICAL CORD VEIN ULTRASOUND 333
Attia, A. (2005). Why should researchers report the confidence interval in modern research? Middle East Fertility Society Journal, 10(1), 78-81. Retrieved from http://www.bioline.org.br/pdf?mf05015
Auckland District Health Board. (2009). Gestation calculator. Retrieved from http://www.adhb.govt.nz/newborn/Guidelines/Admission/GACalc.htm
Australasian Society for Ultrasound in Medicine. (2001). Policies and Statements. D7. Statement on normal ultrasonic fetal measurements. Retrieved from http://www.asum.com.au/site/files/P&S/D7_policy.pdf
Australasian Society for Ultrasound in Medicine. (2008a). Policies and Statements. A1. Statement on the safety of ultrasound in grey scale imaging in obstetrics. Retrieved from http://www.asum.com.au/site/files/P&S/A1_policy.pdf
Australasian Society for Ultrasound in Medicine. (2008b). Policies and Statements. A2. Statement on Doppler ultrasound. Retrieved from http://www.asum.com.au/site/files/P&S/A2_policy.pdf
Australasian Society for Ultrasound in Medicine. (2008c). Policies and Statements. A4. Safety statement on thermal biological effects. Retrieved from http://www.asum.com.au/newsite/files/documents/policies/PS/A4_policy.pdf
Australian Bureau of Statistics. (2014, 3 November). Births, Australia, 2013. Retrieved from http://www.abs.gov.au/AUSSTATS/[email protected]/mf/3301.0
Australian Government. (2011). The people of Australia statistics from the 2011 census. Canberra. Retrieved from https://www.border.gov.au/ReportsandPublications/Documents/research/people-australia-2013-statistics.pdf.
Australian Institute of Family Studies. (2013). Age of Consent Laws. Retrieved from www3.aifs.gov.au/cfca/publications/age-consent-laws.
Australian Institute of Health and Welfare. (2012). A picture of Australia's children 2012, Cat. no. PHE 167. Retrieved from http://www.aihw.gov.au/WorkArea/DownloadAsset.aspx?id=10737423340
Australian Institute of Health and Welfare. (2015). Australia’s mothers and babies 2013 - in brief. Perinatal statistics series no. 31. Cat no. PER 72. Canberra.
Baird, S. M., Davies-Tuck, M., Coombs, P., Knight, M., & Wallace, E. M. (2016). Detection of the growth-restricted fetus: which centile charts? Sonography, 3(3), 81-86. doi:10.1002/sono.12065
Bale, J. R., Stoll, B. J., & Lucas, A. O. (2003). Improving birth outcomes: meeting the challenge in the developing world. Washington, DC: The National Academies Press.
Bamfo, J., & Odibo, A. (2011). Diagnosis and management of fetal growth restriction. Journal of Pregnancy, 1-15. doi:10.1155/2011/640715
Barbera, A., Galan, H. L., Ferrazzi, E., Rigano, S., Józwik, M., Battaglia, F. C., & Pardi, G. (1999). Relationship of umbilical vein blood flow to growth parameters in the human fetus. American Journal of Obstetrics and Gynecology, 181(1), 174-179. doi:10.1016/S0002-9378(99)70456-4
Barbieri, C., Cecatti, J., Souza, C., Marussi, E., & Costa, J. (2008). Inter- and intra-observer variability in sonographic measurements of the cross-sectional diameters and area of the umbilical cord and its vessels during pregnancy. Reproductive Health, 5(5), 1-10. doi:10.1186/1742-4755-5-5
Barbieri, C., Cecatti, J., Surita, F., Marussi, E., & Costa, J. (2012). Sonographic measurement of the umbilical cord area and the diameters of its vessels during
UMBILICAL CORD VEIN ULTRASOUND 334
pregnancy. Journal of Obstetrics & Gynaecology, 32(3), 230-236. doi:10.3109/01443615.2011.647129
Barker, D., Gluckman, P., Godfrey, K., Harding, J., Owens, J., & Robinson, J. (1993). Fetal nutrition and cardiovascular disease in adult life. The Lancet, 341(8850), 938-941.
Baruch, Y. (1999). Response rate in academic studies - a comparative analysis. Human Relations, 52(4), 421-438. doi:10.1177/001872679905200401
Baschat, A. A. (2006). The fetal circulation and essential organs—a new twist to an old tale. Ultrasound in Obstetrics and Gynecology, 27(4), 349-354. doi:10.1002/uog.2762
Baschat, A. A. (2011). Venous Doppler evaluation of the growth-restricted fetus. Clinics in Perinatology, 38(1), 103-112. doi:10.1016/j.clp.2010.12.001
Baschat, A. A., Cosmi, E., Bilardo, C. M., Wolf, H., Berg, C., Rigano, S., . . . Harman, C. R. (2007). Predictors of neonatal outcome in early-onset placental dysfunction. Obstetrics & Gynecology, 109(2 Part 1), 253-261. doi:10.1097/01.aog.0000253215.79121.75
Baschat, A. A., Gembruch, U., Weiner, C. P., & Harman, C. R. (2003). Qualitative venous Doppler waveform analysis improves prediction of critical outcomes in premature growth restricted fetuses. Ultrasound in Obstetrics and Gynecology, 22(3), 240-245.
Battaglia, F. C. (2003). Clinical studies linking fetal velocimetry, blood flow and placental transport in pregnancies complicated by intrauterine growth retardation (IUGR). Transactions of the American Clinical and Climatological Association, 114, 305-313.
Beirne, G. C., Westerway, S. C., & Ng, C. K. C. (2016). National survey of Australian sonographer knowledge and behaviour surrounding the ALARA principles when conducting the 11–14-week obstetric screening ultrasound. Australasian Journal of Ultrasound in Medicine, 19(2), 47-55. doi:10.1002/ajum.12008
Bello, S., & Ekele, B. (2012). On the safety of diagnostic ultrasound in pregnancy: have we handled the available data correctly? Annals of African Medicine, 11(1), 1-4. doi:10.4103/1596-3519.91006
Bellotti, M., Pennati, G., De Gasperi, C., Bozzo, M., Battaglia Frederick, C., & Ferrazzi, E. (2004). Simultaneous measurements of umbilical venous, fetal hepatic, and ductus venosus blood flow in growth-restricted human fetuses. American Journal of Obstetrics and Gynecology, 190(5), 1347-1358. doi:10.1016/j.ajog.2003.11.018
Benirschile, K., & Kaufmann, P. (2000). Pathology of the human placenta. (4th ed.). New York, NY: Springer-Verlag.
Bergman, R. A., Afifi, A. K., & Heidger, P. M. (1999). Altas of microscopic anatomy - a functional approach. Retrieved from http://www.anatomyatlases.org/MicroscopicAnatomy/Section13/Plate13261.shtml
Berkley, E., Chauhan, S. P., & Abuhamad, A. (2012). Doppler assessment of the fetus with intrauterine growth restriction. American Journal of Obstetrics and Gynecology, 206(4), 300-308. doi:10.1016/j.ajog.2012.01.022
Bhide, A., Acharya, G., Bilardo, C. M., Brezinka, C., Cafici, D., Hernandez-Andrade, E., . . . Trudinger, B. (2013). ISUOG practice guidelines: use of Doppler

UMBILICAL CORD VEIN ULTRASOUND 335
ultrasonography in obstetrics. Ultrasound in Obstetrics and Gynecology, 41(2), 233-239. doi:10.1002/uog.12371
Bili, E., Tsolakidis, D., Stangou, S., & Tarlatzis, B. (2013). Pregnancy management and outcome in women with chronic kidney disease. Hippokratia, 17(2), 163-168. Retrieved from http://www.ncbi.nlm.nih.gov/pmc/articles/PMC3743623/
Biswas, S., Ghosh, S. K., & Chhabra, S. (2008). Surface area of chorionic villi of placentas: An index of intrauterine growth restriction of fetuses. Journal of Obstetrics and Gynaecology Research, 34(4), 487-493. doi:10.1111/j.1447-0756.2008.00719.x
Blank, R. H., & Burau, V. (2013). Comparative Health Policy (4th ed.). Basingstoke, United Kingdom: Palgrave Macmillan.
Boers, K., Bijlenga, D., Mol, B., LeCessie, S., Birnie, E., van Pampus, M., . . . Scherjon, S. (2007). Disproportionate intrauterine growth intervention trial at term: DIGITAT. BMC Pregnancy and Childbirth, 7(1), 1-12. doi:10.1186/1471-2393-7-12
Boito, S., Struijk, P. C., Ursem, N. T. C., Stijnen, T., & Wladimiroff, J. W. (2002). Umbilical venous volume flow in the normally developing and growth-restricted human fetus. Ultrasound in Obstetrics and Gynecology, 19(4), 344-349. doi:10.1046/j.1469-0705.2002.00671.x
Boito, S., Ursem, N. T. C., Struijk, P. C., Stijnen, T., & Wladimiroff, J. W. (2004). Umbilical venous volume and fetal behavioral states in the normally developing fetus. Ultrasound in Obstetrics and Gynecology, 23(2), 138-142.
Bonnesen, B., Oddgeirsdottir, H. L., Naver, K. V., Jorgensen, F. S., & Nilas, L. (2016). Women with minor menstrual irregularities have increased risk of preeclampsia and low birthweight in spontaneous pregnancies. Acta Obstetricia Et Gynecologica Scandinavica, 95(1), 88-92. doi:10.1111/aogs.12792
Bosselmann, S., & Mielke, G. (2015). Sonographic assessment of the umbilical cord. Geburtshilfe und Frauenheilkunde, 75(8), 808-818. doi:10.1055/s-0035-1557819
Broms, G., Granath, F., Linder, M., Stephansson, O., Elmberg, M., & Kieler, H. (2014). Birth outcomes in women with inflammatory bowel disease: effects of disease activity and drug exposure. Inflammatory Bowel Diseases, 20(6), 1091-1098. doi:10.1097/mib.0000000000000060
Brotherhood of St Laurence. (2014). Youth unemployment maps. Retrieved from http://library.bsl.org.au/jspui/bitstream/1/6985/1/MyChanceOurFuture-ALLMaps-March.pdf
Bruch, J. F., Sibony, O., Benali, K., Challier, J. C., Blot, P., & Nessmann, C. (1997). Computerized microscope morphometry of umbilical vessels from pregnancies with intrauterine growth retardation and abnormal umbilical artery Doppler. Human Pathology, 28(10), 1139-1145.
Butler, D., Cullis, B., Gilmour, C., & Gogel, B. (2007). ASReml-R reference manual. Brisbane: Queensland Department of Primary Industries and Fisheries and NSW Department of Primary Industries. Retrieved from http://www.vsni.co.uk/downloads/asreml/release2/doc/asreml-R.pdf
Cailhol, J., Jourdain, G., Coeur, S. L., Traisathit, P., Boonrod, K., Prommas, S., . . . Perinatal HIV Prevention Trial Group. (2009). Association of low CD4 cell count and intrauterine growth retardation in Thailand. Journal of Acquired Immune Deficiency Syndromes, 50(4), 409-413 doi:10.1097/QAI.0b013e3181958560

UMBILICAL CORD VEIN ULTRASOUND 336
Callen, P. W. (2000). Ultrasonography in obstetrics and gynecology. (4th ed.). Philadelphia, PA: W.B Saunders Company.
Campbell, S., & Thoms, A. (1977). Ultrasound measurement of the fetal head to abdomen circumference ratio in the assessment of growth retardation. British Journal of Obstretrics and Gynaecology, 84(3), 165-74. doi:10.1111/j.1471-0528.1977.tb12550.x
Campbell Westerway, S. (2012). Estimating fetal weight for best clinical outcome. Australasian Journal of Ultrasound in Medicine, 15(1), 13-17.
Catalano, P. M., Mele, L., Landon, M. B., Ramin, S. M., Reddy, U. M., Casey, B., . . . Tolosa, J. E. (2014). Inadequate weight gain in overweight and obese pregnant women: what is the effect on fetal growth? American Journal of Obstetrics and Gynecology, 211(2), 137.e1-7. doi:10.1016/j.ajog.2014.02.004
Centre for Epidemiology and Evidence. (2012). New South Wales Mothers and Babies 2010. Sydney: New South Wales Ministry of Health. Retrieved from http://www.health.nsw.gov.au/hsnsw/Publications/mothers-and-babies-2010.pdf.
Chen, H. Y., Lu, C. C., Cheng, Y. T., Hsieh, F. J., & Liu, J. Y. (1986). Antenatal measurement of fetal umbilical venous flow by pulsed Doppler and B-mode ultrasonography. Journal of Ultrasound in Medicine, 5(6), 319-21. doi:10.7863/jum.1986.5.6.319
Cnossen, J. S., Morris, R. K., ter Riet, G., Mol, B. W. J., van der Post, J. A. M., Coomarasamy, A., . . . Khan, K. S. (2008). Use of uterine artery Doppler ultrasonography to predict pre-eclampsia and intrauterine growth restriction: a systematic review and bivariable meta-analysis. Canadian Medical Association Journal, 178(6), 701-711. doi:10.1503/cmaj.070430
Cohen, E., Wong, F. Y., Horne, R. S., & Yiallourou, S. R. (2016). Intrauterine growth restriction: impact on cardiovascular development and function throughout infancy. Pediatric Research, 79(6), 821-830. doi:10.1038/pr.2016.24
Collins, S., Arulkumaran, S., Hayes, K., Jackson, S., & Impey, L. (Eds.). (2013). Oxford handbook of obstetrics and gynaecology (3rd ed.). Oxford, England: Oxford University Press.
Conde-Agudelo, A., Papageorghiou, A. T., Kennedy, S. H., & Villar, J. (2013). Novel biomarkers for predicting intrauterine growth restriction: a systematic review and meta-analysis. British Journal of Obstetrics and Gynaecology, 120(6), 681-694. doi:10.1111/1471-0528.12172
Coriu, L., Copaciu, E., Tulbure, D., Talmaci, R., Secara, D., Coriu, D., & Cirstoiu, M. (2014). Inherited Thrombophilia in Pregnant Women with Intrauterine Growth Restriction. Mædica, 9(4), 351-355. Retrieved from http://www.ncbi.nlm.nih.gov/pmc/articles/PMC4316879/
Cosmi, E., Fanelli, T., Visentin, S., Trevisanuto, D., & Zanardo, V. (2011). Consequences in infants that were intrauterine growth restricted. Journal of Pregnancy, 2011. doi:10.1155/2011/364381
Costa-Santos, C., Bernardes, J., Ayres-de-Campos, D., Costa, A., & Costa, C. (2011). The limits of agreement and the intraclass correlation coefficient may be inconsistent in the interpretation of agreement. Journal of Clinical Epidemiology, 64(3), 264-269. doi:10.1016/j.jclinepi.2009.11.010
Creasy, R. K., Resnik, R., & Iams, J. D. (Eds.). (2004). Maternal-fetal medicine (5th ed.). Philadelphia,PA: Saunders.
UMBILICAL CORD VEIN ULTRASOUND 337
Cunningham, F. G., Leveno, K. J., Bloom, S. L., Hauth, J. C., Rouse, D. J., & Spong, C. Y. (2010). Williams obstetrics (23rd ed.). New York, NY: McGraw Hill Medical.
Dado, G. M., Dobrin, P. B., & Mrkvicka, R. S. (1997). Venous flow through coiled and noncoiled umbilical cords. Effects of external compression, twisting and longitudinal stretching. Journal of Reproductive Medicine, 42(9), 576-580.
Dashe, J. S., McIntre, D. D., Lucas, M. J., & Leveno, K. (2000). Effects of symmetric and asymmetric fetal growth on pregnancy outcomes. Obstetrics & Gynecology, 96(3), 321-327. Retrieved from http://journals.lww.com/greenjournal/Fulltext/2000/09000/Effects_of_Symmetric_and_Asymmetric_Fetal_Growth.1.aspx
DeCherney, A. H., & Nathan, L. (2003). Current obstetric and gynecology diagnosis and treatment. (9th ed.). New York, NY: McGraw-Hill.
DeCherney, A. H., Nathan, L., Goodwin, T. M., & Laufer, N. (2007). Current diagnosis and treatment obstetrics and gynecology (10th ed.). New York, NY: McGraw-Hill.
Degani, S., Lewinsky, R. M., Berger, H., & Spiegel, D. (1995). Sonographic estimation of umbilical coiling index and correlation with Doppler flow characteristics. Obstetrics & Gynecology, 86(6), 990-993.
Detti, L., Mari, G., Cheng, C., & Bahado-Singh, R. (2004). Fetal Doppler velocimetry. Obstetrics and Gynecology Clinics of North America, 31(1), 201-214. doi:10.1016/j.ogc.2003.12.002
Devaskar, S. U., & Chu, A. (2016). Intrauterine growth restriction: hungry for an answer. Physiology, 31(2), 131-146. doi:10.1152/physiol.00033.2015
Di Martino, D., Rosti, E., Rigano, S., Mantegazza, V., Casati, D., Zullino, S., . . . Ferrazzi, E. (2016). OP03.04: Added value of umbilical vein blood flow in identifying different type of intrauterine growth restriction and placental dysfunction. Ultrasound in Obstetrics and Gynecology, 48(S1), 58. doi:10.1002/uog.16179
Di Naro, E., Ghezzi, F., Raio, L., Franchi, M., & D'Addario, V. (2001). Umbilical cord morphology and pregnancy outcome. European Journal of Obstetrics & Gynecology and Reproductive Biology, 96(2), 150-157. doi:10.1016/S0301-2115(00)00470-X
Di Naro, E., Ghezzi, F., Raio, L., Franchi, M., D'Addario, V., Lanzillotti, G., & Schneider, H. (2001). Umbilical vein blood flow in fetuses with normal and lean umbilical cord. Ultrasound in Obstetrics and Gynecology, 17(3), 224-228. doi:10.1046/j.1469-0705.2001.00309.x
Di Naro, E., Raio, L., Cromi, A., & Giocolano, A. (2012). Sonographic assessment of the umbilical cord. Donald School Journal of Ultrasound in Obstetrics & Gynecology, 6(1), 66-75. doi:10.5005/jp-journals-10009-1227
Di Naro, E., Raio, L., Ghezzi, F., Franchi, M., Romano, F., & D'Addario, V. (2002). Longitudinal umbilical vein blood flow changes in normal and growth-retarded fetuses. Acta Obstetricia Et Gynecologica Scandinavica, 81(6), 527-533. doi:10.1034/j.1600-0412.2002.810609.x
Dobbins, T. A., Sullivan, E. A., Roberts, C. L., & Simpson, J. M. (2012). Australian national birthweight percentiles by sex and gestational age, 1998-2007. Medical Journal of Australia, 197(5), 291-294. doi:10.5694/mja11.11331
Dorey, F. (2010). In brief: the P value: what is it and what does it tell you? Clinical Orthopaedics and Related Research, 468(8), 2297-2298. doi:10.1007/s11999-010-1402-9

UMBILICAL CORD VEIN ULTRASOUND 338
Dudley, N. J. (2013). A review of ultrasound fetal weight estimation in the early prediction of low birthweight. Ultrasound, 21(4), 181-186. doi:10.1177/1742271x13505259
Dunkelberg, J., Berkley, E., Thiel, K., & Leslie, K. (2014). Hepatitis B and C in pregnancy: a review and recommendations for care. Journal of Perinatology, 34(12), 882-891. doi:10.1038/jp.2014.167
Edwards, A. (2001). In the balance: the accuracy of sonographic estimation of fetal weight. Ultrasound Bulletin, 4(1), 3-6.
Edwards, A. (2004). The third trimester: assessment of the fetus at risk. Paper presented at the 11th National Conference of the Australian Sonographers Association, Melbourne Convention Centre.
Ehrenstein, V. (2009). Association of Apgar scores with death and neurologic disability. Clinical Epidemiology, 1, 45-53. Retrieved from http://www.ncbi.nlm.nih.gov/pmc/articles/PMC2943160/
Eik-Nes, S., Marsal, K., Brubakk, A., Kristofferson, K., & Ulstein, M. (1982). Ultrasonic measurement of human fetal blood flow. Journal of Biomedical Engineering, 4(1), 28-36.
El Behery, M., Nouh, A., Alanwar, A., & Diab, A. (2011). Effect of umbilical vein blood flow on perinatal outcome of fetuses with lean and/or hypo-coiled umbilical cord. Archives of Gynecology and Obstetrics, 283(1), 53-58. doi:10.1007/s00404-009-1272-0
Espinoza, J., Romero, R., Kim, Y. M., Kusanovic, J. P., Hassan, S., Erez, O., . . . Kim, C. J. (2006). Normal and abnormal transformation of the spiral arteries during pregnancy. Journal of Perinatal Medicine, 34, 447-458. doi:10.1515/JPM.2006.089
Everitt, B. (1998). The Cambridge dictionary of statistics. Cambridge, England: Cambridge University Press.
Facco, F., You, W., & Grobman, W. (2009). Genetic thrombophilias and intrauterine growth restriction: a meta-analysis. Obstetrics & Gynecology, 113(6), 1206-1216. doi:10.1097/AOG.0b013e3181a6e96a
Fasouliotis, S. J., Achiron, R., Kivilevitch, Z., & Yagel, S. (2002). The human fetal venous system: normal embryologic, anatomic, and physiologic characteristics and developmental abnormalities. Journal of Ultrasound in Medicine, 21(10), 1145-1158. doi:10.7863/jum.2002.21.10.1145
Feng, Z., Minard, C., & Raghavan, R. (2015). Pregnancy outcomes in advanced kidney disease. Clinical Nephrology, 83(5), 272-278.
Ferguson, V. L., & Dodson, R. B. (2009). Bioengineering aspects of the umbilical cord. European Journal of Obstetrics & Gynecology and Reproductive Biology, 144 (Supplement 1), S108-S113. doi:10.1016/j.ejogrb.2009.02.024
Fernández, S., Figueras, F., Gomez, O., Martinez, J. M., Eixarch, E., Comas, M., . . . Gratacos, E. (2008). Intra- and interobserver reliability of umbilical vein blood flow. Prenatal Diagnosis, 28(11), 999-1003. doi:10.1002/pd.2092
Ferrazzi, E. (2001). Measurement of venous blood flow in the human fetus: a dream comes true, but now for some standardization. Ultrasound in Obstetrics and Gynecology, 18(1), 1-4. doi:10.1046/j.1469-0705.2001.00491.x
Ferrazzi, E., Rigano, S., Bozzo, M., Bellotti, M., Giovannini, N., Galan, H. L., & Battaglia, F. C. (2000). Umbilical vein blood flow in growth-restricted fetuses. Ultrasound

UMBILICAL CORD VEIN ULTRASOUND 339
in Obstetrics and Gynecology, 16(5), 432-438. doi:10.1046/j.1469-0705.2000.00208.x
Figueras, F., Fernández, S., Hernández-Andrade, E., & Gratacós, E. (2008). Umbilical venous blood flow measurement: accuracy and reproducibility. Ultrasound in Obstetrics and Gynecology, 32(4), 587-591. doi:10.1002/uog.5306
Figueras, F., & Gardosi, J. (2011). Intrauterine growth restriction: new concepts in antenatal surveillance, diagnosis, and management. American Journal of Obstetrics and Gynecology, 204(4), 288-300. doi:10.1016/j.ajog.2010.08.055
Figueras, F., & Gratacós, E. (2014). Update on the diagnosis and classification of fetal growth restriction and proposal of a stage-based management protocol. Fetal Diagnosis and Therapy, 36(2), 86-98. doi:10.1159/000357592
Figueras, F., & Gratacós, E. (2017). An integrated approach to fetal growth restriction. Best Practice & Research Clinical Obstetrics & Gynaecology, 38, 48-58. doi:10.1016/j.bpobgyn.2016.10.006
Fleischer, A., Romero, R., Manning, F., Jeanty, P., & James, A. (1991). The principles and practice of ultrasound in obstetrics and gynecology (4th ed.). Norwalk, CT: Appleton and Lange.
Flo, K., Wilsgaard, T., & Acharya, G. (2009). Agreement between umbilical vein volume blood flow measurements obtained at the intra-abdominal portion and free loop of the umbilical cord. Ultrasound in Obstetrics and Gynecology, 34(2), 171-176. doi:10.1002/uog.6441
Flo, K., Wilsgaard, T., & Acharya, G. (2010). Longitudinal reference ranges for umbilical vein blood flow at a free loop of the umbilical cord. Ultrasound in Obstetrics and Gynecology, 36(5), 567-572. doi:10.1002/uog.7730
Forward, H., Yazar, S., Hewitt, A. W., Khan, J., Mountain, J. A., Pesudovs, K., . . . Newnham, J. P. (2014). Multiple prenatal ultrasound scans and ocular development: 20-year follow-up of a randomized controlled trial. Ultrasound in Obstetrics and Gynecology, 44(2), 166-70. doi:10.1002/uog.13399
Fraser, D., & Copper, M., (Eds). (2009). Myles textbook for midwives. (15th ed.). Edinburgh, Scotland: Churchill Livingstone Elsevier.
Gagnon, R., & Van den Hof, M. (2003). Society of Obstetricians and Gynaecologists of Canada: Clinical practice guidelines: The use of fetal Doppler in obstetrics. Journal of Obstetrics and Gynaecology Canada., 25(7), 601-607.
Galan, H. L., Ferrazzi, E., & Hobbins, J. C. (2002). Intrauterine growth restriction (IUGR): biometric and Doppler assessment. Prenatal Diagnosis, 22(4), 331-337. doi:10.1002/pd.311
Galan, H. L., Jozwik, M., Rigano, S., Regnault, T. R. H., Hobbins, J. C., Battaglia, F. C., & Ferrazzi, E. (1999). Umbilical vein blood flow determination in the ovine fetus: Comparison of Doppler ultrasonographic and steady-state diffusion techniques. American Journal of Obstetrics and Gynecology, 181(5), 1149-1153. doi:10.1016/S0002-9378(99)70098-0
Gardosi, J. (2011). Clinical strategies for improving the detection of fetal growth restriction. Clinics in Perinatology, 38(1), 21-31. doi:10.1016/j.clp.2010.12.012
Gerada, M., Struijk, P., Stewart, P. A., Guerriero, S., Melis, G. B., & Wladimiroff, J. W. (2006). Comparison between color Doppler cineloop and conventional spectral Doppler derived maximum velocity and flow in the umbilical vein. Ultrasound in Obstetrics and Gynecology, 28(2), 156-161.

UMBILICAL CORD VEIN ULTRASOUND 340
Gerson, A., Wallace, D., Stiller, R., Paul, D., Weiner, S., & Bolognese, R. (1987). Doppler evaluation of umbilical venous and arterial blood flow in the second and third trimesters of normal pregnancy. Obstetrics & Gynecology, 70(4), 622-626.
Ghezzi, F., Raio, L., Duwe, D. G., Cromi, A., Karousou, E., & Dürig, P. (2005). Sonographic umbilical vessel morphometry and perinatal outcome of fetuses with a lean umbilical cord. Journal of Clinical Ultrasound, 33(1), 18-23. doi:10.1002/jcu.20076
Gill, R. W. (1979). Pulsed Doppler with B-mode imaging for quantitative blood flow measurement. Ultrasound in Medicine & Biology, 5(3), 223-225. doi:10.1016/0301-5629(79)90014-0
Gill, R. W., Kossoff, G., Warren, P. S., & Garrett, W. J. (1984). Umbilical venous flow in normal and complicated pregnancy. Ultrasound in Medicine & Biology, 10(3), 349-363.
Gill, R. W., Trudinger, B. J., Garrett, W. J., Kossoff, G., & Warren, P. S. (1981). Fetal umbilical venous flow measured in utero by pulsed Doppler and B-mode ultrasound. 1. Normal pregnancies. American Journal of Obstetrics and Gynecology, 139(6), 720-725.
Gillies, P. A., Madeley, R. J., & Power, F. L. (1989). Why do pregnant women smoke? Public Health, 103(5), 337-343.
Giuliano, N., Annunziata, M. L., Tagliaferri, S., Esposito, F. G., Imperato, O. C. M., Campanile, M., . . . Di Lieto, A. (2014). IUGR management: new perspectives. Journal of Pregnancy, 2014, 1-8. doi:10.1155/2014/620976
Goodman, M. M., Clarke, J. A., & Jehne, C. (1992). A case for revising the 'weight gain during pregnancy' guidelines for Australian women. Australian and New Zealand Journal of Obstetrics and Gynaecology, 32(2), 129-132. doi:10.1111/j.1479-828X.1992.tb01924.x
Gordon, Z., Eytan, O., Jaffa, A. J., & Elad, D. (2007). Hemodynamic analysis of Hyrtl anastomosis in human placenta. American Journal of Physiology - Regulatory, Integrative and Comparative Physiology, 292(2), R977-R982. doi:10.1152/ajpregu.00410.2006
Government of South Australia. (2012). Asthma in Pregnancy. Retrieved from http://www.sahealth.sa.gov.au/wps/wcm/connect/ea28ed004ee1da8eacbeadd150ce4f37/Asthma-pregnancy-WCHN-PPG-20052012.pdf?MOD=AJPERES&CACHEID=ea28ed004ee1da8eacbeadd150ce4f37.
Guiot, C., Roatta, S., Piccoli, E., Saccomandi, F., & Todros, T. (1999). Quantitative Doppler measures in coiled vessels: investigation on excised umbilical veins. Ultrasound in Medicine & Biology, 25(9), 1465-1473. doi:http://dx.doi.org/10.1016/S0301-5629(99)00108-8
Gwet, K. L. (2014). Handbook of inter-rater reliability: the definitive guide to measuring the extent and agreement among raters (4th ed.). Gaithersburg, MD: Advanced Analytics, LLC.
Hadfield, R., Lain, S., Simpson, J., Ford, J., Raynes-Greenow, C., Morris, J., & Roberts, C. (2009). Are babies getting bigger? An analysis of birthweight trends in New South Wales, 1990–2005. Medical Journal of Australia, 190(6), 312-315. Retrieved from https://www.mja.com.au/journal/2009/190/6/are-babies-getting-bigger-analysis-birthweight-trends-new-south-wales-1990-2005

UMBILICAL CORD VEIN ULTRASOUND 341
Hadlock, F. P., Harrist, R. B., Sharman, R. S., Deter, R. L., & Park, S. K. (1985). Estimation of fetal weight with the use of head, body, and femur measurements; a prospective study. American Journal of Obstetrics and Gynecology, 151(3), 333-337. doi:10.5555/uri:pii:0002937885902984
Hafner, E., Metzenbauer, M., Stumpflen, I., & Waldhor, T. (2013). Measurement of placental bed vascularization in the first trimester, using 3D-power-Doppler, for the detection of pregnancies at-risk for fetal and maternal complications. Placenta, 34(10), 892-898. doi:10.1016/j.placenta.2013.06.303
Hammad, I. A., Chauhan, S. P., Mlynarczyk, M., Rabie, N., Goodie, C., Chang, E., . . . Abuhamad, A. Z. (2016). Uncomplicated pregnancies and ultrasounds for fetal growth restriction: a pilot randomized clinical trial. American Journal of Perinatology Reports, 6(1), e83-e90. doi:10.1055/s-0035-1567857
Haram, K., Svendsen, E., & Abildgaard, U. (2009). The HELLP syndrome: Clinical issues and management. A Review. BMC Pregnancy and Childbirth, 9(1), 1-15. doi:10.1186/1471-2393-9-8
Hebbar, S., Rai, L., Adiga, P., & Guruvare, S. (2015). Reference ranges of amniotic fluid index in late third trimester of pregnancy: what should the optimal interval between two ultrasound examinations be? Journal of Pregnancy, 2015, 319-204. doi:10.1155/2015/319204
Hebbar, S., Rubeena, Z., Adiga, P., & Rai, L. (2015). Integration of umbilical venous and arterial Doppler flow parameters for prediction of adverse perinatal outcome. International Journal of Health & Allied Sciences, 4(4), 222-229. doi:10.4103/2278-344X.167656
Hecher, K., Bilardo, C. M., Stigter, R. H., Ville, Y., Hackeloer, B. J., Kok, H. J., . . . Visser, G. H. (2001). Monitoring of fetuses with intrauterine growth restriction: a longitudinal study. Ultrasound in Obstetrics and Gynecology, 18(6), 564-570. doi:10.1046/j.0960-7692.2001.00590.x
Hecker, K., Campbell, S., Doyle, P., Harrington, K., & Nicholaides, K. (1995). Assessment of fetal compromise by Doppler ultrasound investigation of the fetal circulation. Circulation, 91, 129-138.
Hedrick, W. R. (2013). Technology for diagnostic sonography. St Louis, MO: Elsevier Mosby.
Hellevik, L. R., Stergiopulos, N., Kiserud, T., Rabben, S. I., Eik-Nes, S. H., & Irgens, F. (2000). A mathematical model of umbilical venous pulsations. Journal of Biomechanics, 33(9), 1123-1130.
Hennekens, C. H., & Burning, J. E. (1987). Epidemiology in medicine. Boston, MA: Little, Brown and Company.
Hilder, L., Zhichao, Z., Parker, M., Jahan, S., & Chambers, G. (2014). Australia’s mothers and babies 2012. Perinatal statistics series no. 30. Cat. no. Per 69. Australian Institute of Health and Welfare. Perinatal Epidemiology and Statistics Unit, Canberra.
Hill, M. (2010, 26 May). UNSW Embryology. Placenta Histology. Retrieved from https://embryology.med.unsw.edu.au/embryology/index.php/Main_Page
Hobbie, R. K., & Roth, B. J. (2015). Intermediate Physics for Medicine and Biology. (5th ed.). Heidelberg, Germany: Springer International Publishing.
Hofer, M. (Ed.) (2001). Teaching manual of colour duplex sonography. Stuttgart, Germany: Georg Thieme Verlag.
UMBILICAL CORD VEIN ULTRASOUND 342
Hofstaetter, C., Gudmundsson, S., & Hansmann, M. (2002). Venous Doppler velocimetry in the surveillance of severely compromised fetuses. Ultrasound in Obstetrics and Gynecology, 20(3), 233-239. doi:10.1046/j.1469-0705.2002.00791.x
Hofstaetter, C., Plath, H., & Hansmann, M. (2000). Prenatal diagnosis of abnormalities of the fetal venous system. Ultrasound in Obstetrics and Gynecology, 15(3), 231-241. doi:10.1046/j.1469-0705.2000.00066.x
Hoskins, P. (2011). Estimation of blood velocity, volumetric flow and wall shear rates using Doppler ultrasound. Ultrasound, 19(9), 120-129. doi:10.1258/ult.2011.011015
Howley, H. E., Walker, M., & Rodger, M. A. (2005). A systematic review of the association between factor V Leiden or prothrombin gene variant and intrauterine growth restriction. American Journal of Obstetrics and Gynecology, 192(3), 694-708. doi:10.1016/j.ajog.2004.09.011
Jahn, A., Razum, O., & Berle, P. (1998). Routine screening for intrauterine growth retardation in Germany: low sensitivity and questionable benefit for diagnosed cases. Acta Obstetricia Et Gynecologica Scandinavica, 77(6), 643-648.
Johnston, S., & Said, J. (2012). Perinatal complications associated with maternal asthma during pregnancy. Obstetric Medicine, 5(1), 14-18. doi:10.1258/om.2011.110062
Joseph, K. S., Allen, A. C., Dodds, L., Turner, L. A., Scott, H., & Liston, R. (2005). The perinatal effects of delayed childbearing. Obstetrics & Gynecology, 105(6), 1410-1418. doi:10.1097/01.aog.0000163256.83313.36
Jouppila, P., & Kirkinen, P. (1984). Umbilical vein blood flow as an indicator of fetal hypoxia. British Journal of Obstetrics and Gynaecology, 91(2), 107-110.
Jouppila, P., Kirkinen, P., & Puukka, R. (1986). Correlation between umbilical vein blood flow and umbilical blood viscosity in normal and complicated pregnancies. Archives of Gynecology, 237(4), 191-197.
Kaponis, A., Harada, T., Makrydimas, G., Kiyama, T., Arata, K., Adonakis, G., . . . Harada, T. (2011). The importance of venous Doppler velocimetry for evaluation of intrauterine growth restriction. Journal of Ultrasound in Medicine, 30(4), 529-545.
Kendrick, J., Sharma, S., Holmen, J., Palit, S., Nuccio, E., & Chonchol, M. (2015). Kidney disease and maternal and fetal outcomes in pregnancy. American Journal of Kidney Diseases, 66(1), 55-59. doi:10.1053/j.ajkd.2014.11.019
Kiserud, T. (2000). Fetal venous circulation - an update on hemodynamics. Journal of Perinatal Medicine, 28(2), 90-96. doi:10.1515/jpm.2000.011
Kiserud, T. (2003a). Fetal venous circulation. Fetal and Maternal Medicine Review, 14(01), 57-95. doi:10.1017/S0965539503001037
Kiserud, T. (2003b). Umbilical venous blood flow and reference ranges. [Letter to the editor]. Acta Obstetricia Et Gynecologica Scandinavica, 82(11), 1061.
Kiserud, T. (2005). Physiology of the fetal circulation. Seminars in Fetal and Neonatal Medicine, 10(6), 493-503. doi:10.1016/j.siny.2005.08.007
Kiserud, T., & Acharya, G. (2004). The fetal circulation. Prenatal Diagnosis., 24, 1049-1059.
Kiserud, T., Eik-Nes, S., Blaas, H., Hellevik, L., & Simensen, B. (1994). Ductus venosus blood velocity and the umbilical circulation in the seriously growth-retarded

UMBILICAL CORD VEIN ULTRASOUND 343
fetus. Ultrasound in Obstetrics and Gynecology, 4(2), 109-114. doi:10.1046/j.1469-0705.1994.04020109.x
Kiserud, T., & Rasmussen, S. (1998). How repeat measurements affect the mean diameter of the umbilical vein and the ductus venosus. Ultrasound in Obstetrics and Gynecology, 11(6), 419-425. doi:10.1046/j.1469-0705.1998.11060419.x
Kiserud, T., Rasmussen, S., & Skulstad, S. (2000). Blood flow and the degree of shunting through the ductus venosus in the human fetus. American Journal of Obstetrics and Gynecology, 182(1), 147-153. doi:10.1016/S0002-9378(00)70504-7
Kiserud, T., Saito, T., Ozaki, T., Rasmussen, S., & Hanson, M. (1999). Validation of diameter measurements by ultrasound: intraobserver and interobserver variation assessed in vitro and in fetal sheep. Ultrasound in Obstetetrics and Gynecology, 13(1), 52-57.
Kondapalli, L. A., & Perales-Puchalt, A. (2013). Low birth weight: is it related to assisted reproductive technology or underlying infertility? Fertility and Sterility., 99(2), 303-310. doi:10.1016/j.fertnstert.2012.12.035
Kramer, M. S. (1987). Determinants of low birth weight: methodological assessment and meta-analysis. Bulletin of the World Health Organization, 65(5), 663-737. Retrieved from http://www.ncbi.nlm.nih.gov/pmc/articles/PMC2491072/
Kurjak, A., & Rajhvajn, B. (1982). Ultrasonic measurement of the umbilical blood flow in normal and complicated pregnancies. Journal of Perinatal Medicine, 10(3), 3-16.
Kuzma, J., & Bohnenblust, S. (2001). Basic statistics for health sciences (4th ed.). Mountain View, CA: Myfield Publishing Company.
Lalor, J. G., Fawole, B., Alfirevic, Z., & Devane, D. (2008). Biophysical profile for fetal assessment in high risk pregnancies. The Cochrane Database of Systematic Reviews(1). doi:10.1002/14651858.CD000038.pub2
Lausman, A., Kingdom, J., Gagnon, R., Basso, M., Bos, H., Crane, J., . . . Sanderson, F. (2013). Intrauterine growth restriction: screening, diagnosis, and management. Journal of Obstetrics and Gynaecology Canada, 35(8), 741-748. doi:10.1016/S1701-2163(15)30865-3
Lee, P. A., Chernausek, S. D., Hokken-Koelega, A. C., & Czernichow, P. (2003). International small for gestational age advisory board consensus development conference statement: management of short children born small for gestational age, April 24-October 1, 2001. Pediatrics, 111(6), 1253-1261. Retrieved from http://search.ebscohost.com/login.aspx?direct=true&db=hxh&AN=9942296&site=ehost-live
Lee, S., & Walker, S. (2010). The role of ultrasound in the diagnosis and management of the growth restricted fetus. Australasian Journal of Ultrasound in Medicine, 13(3), 31-36. doi:10.1002/j.2205-0140.2010.tb00161.x
Lees, C., Albaiges, G., Deane, C., Parra, M., & Nicolaides, K. (1999). Assessment of umbilical arterial and venous flow using color Doppler. Ultrasound in Obstetrics and Gynecology, 14(4), 250-255. doi:10.1046/j.1469-0705.1999.14040250.x
Lepercq, J., Taupin, P., Dubois-Laforgue, D., Duranteau, L., Lahlou, N., Boitard, C., . . . Timsit, J. (2001). Heterogeneity of fetal growth in Type 1 diabetic pregnancy. Diabetes & Metabolism, 27(3), 339-344. Retrieved from http://journals.indexcopernicus.com/abstract.php?icid=522826
UMBILICAL CORD VEIN ULTRASOUND 344
Li, S., Hoskins, P. R., Anderson, T., & McDicken, W. N. (1993). Measurement of mean velocity during pulsatile flow using time-averaged maximum frequency of Doppler ultrasound waveforms. Ultrasound in Medicine & Biology, 19(2), 105-113. doi:10.1016/0301-5629(93)90002-6
Li, W., Ruan, X., Zhang, H., & Zeng, Y. (2006). Biomechanical properties of different segments of human umbilical cord vein and its value for clinical application. Journal of Biomedical Materials Research Part B: Applied Biomaterials, 76B(1), 93-97. doi:10.1002/jbm.b.30339
Li, Z., Zeki, R., Hilder, L., & Sullivan, E. (2013). Australia's mothers and babies 2011. Perinatal statistics series no. 28. Cat. no. Per 29. Australian Institute of Health and Welfare National. Perinatal Epidemiology and Statistics Unit. Canberra.
Liao, T. B., Nomura, R. M. Y., Liao, A. W., Francisco, R. P. V., & Zugaib, M. (2014). Fetal venous circulation in monochorionic twin pregnancies with placental insufficiency: prediction of acidemia at birth or intrauterine fetal death. Ultrasound in Obstetrics and Gynecology, 43(4), 426-431. doi:10.1002/uog.12549
Link, G., Clark, K. E., & Lang, U. (2007). Umbilical blood flow during pregnancy: evidence for decreasing placental perfusion. American Journal of Obstetrics and Gynecology, 196(5), 489. e1-e7. doi:10.106/j.ajog.2006.11.017
Littell, R. C., Pendergast, J., & Natarajan, R. (2000). Modelling covariance structure in the analysis of repeated measures data. Statistics in Medicine, 19, 1793-1819.
Little, M. (2016, 06 June). Asthma in pregnancy. Retrieved from http://emedicine.medscape.com/article/796274-overview
Longo, S., Borghesi, A., Tzialla, C., & Stronati, M. (2014). IUGR and infections. Early Human Development, 90 Supplement 1, S42-44. doi:10.1016/s0378-3782(14)70014-3
Loughna, P. (2002). Doppler of fetal venous circulation. British Medical Ultrasound Society Bulletin, 10(4), 6-8.
Louis, G. (2011). Umbilical cord coiling - a case study and review. Soundeffects (4), 28-30.
Macaldowie, A., Wang, Y. A., Chughtai, A. A., & Chambers, G. M. (2014). Assisted reproductive technology in Australia and New Zealand 2012. Sydney: National Perinatal Epidemiology and Statistics Unit, University of New South Wales.
MacMullen, N. J., Shen, J. J., & Tymkow, C. (2010). Adverse maternal outcomes in women with asthma versus women without asthma. Applied Nursing Research, 23(1), e9-e13. doi:10.1016/j.apnr.2009.03.004
Magann, E. F., Ounpraseuth, S., Chauhan, S. P., Ranganathan, A. S., Dajani, N. K., Bergstrom, J., & Morrison, J. C. (2015). Correlation of ultrasound estimated with dye-determined or directly measured amniotic fluid volume revisited. Gynecologic and Obstetric Investigation, 79(1), 46-49. doi:10.1159/000365088
Mandruzzato, G., Antsaklis, A., Botet, F., Chervenak, F. A., Figueras, F., Grunebaum, A., . . . Stanojevic, M. (2008). Intrauterine restriction (IUGR). Journal of Perinatal Medicine, 36(4), 277-281. doi:10.1515/jpm.2008.050
Manning, F. A. (2009). Antepartum fetal testing: a critical appraisal. Current Opinion in Obstetrics and Gynecology, 21(4), 348-352. doi:10.1097/GCO.0b013e32832ae0b3
Manning, F. A., & Hohler, C. (1991). Intrauterine growth retardation: diagnosis, prognostication and management based on ultrasound methods. In A.
UMBILICAL CORD VEIN ULTRASOUND 345
Fleischer, R. Romero, F. Manning, P. Jeanty, & A. James (Eds.), The principles and practice of ultrasonography in obstetrics and gynecology (4th ed.). Norwalk, CT: Appleton & Lange.
Mari, G., & Hanif, F. (2008). Fetal Doppler: umbilical artery, middle cerebral artery, and venous system. Seminars in Perinatology, 32(4), 253-257. doi:10.1053/j.semperi.2008.04.007
Mari, G., Hanif, F., Drennan, K., & Kruger, M. (2007). Staging of intrauterine growth-restricted fetuses. Journal of Ultrasound in Medicine, 26(11), 1469-1477. doi:10.7863/jum.2007.26.11.1469
Mari, G., Hanif, F., & Kruger, M. (2008). Sequence of cardiovascular changes in IUGR in pregnancies with and without preeclampsia. Prenatal Diagnosis, 28(5), 377-383. doi:10.1002/pd.1990
Marsál, K. (2009). Obstetric management of intrauterine growth restriction. Best Practice & Research Clinical Obstetrics & Gynaecology, 23(6), 857-870. doi:10.1016/j.bpobgyn.2009.08.011
Martin, P., & Pierce, R. (1994). Practical statistics for the health sciences. Melbourne, Australia: Thomas Nelson Australia.
Mavrides, E., Moscoso, G., Carvalho, J. S., Campbell, S., & Thilaganathan, B. (2001). The anatomy of the umbilical, portal and hepatic venous systems in the human fetus at 14-19 weeks of gestation. Ultrasound in Obstetrics and Gynecology, 18(6), 598-604. doi:10.1046/j.0960-7692.2001.00581.x
McDonald, S. D., Han, Z., Mulla, S., Murphy, K. E., Beyene, J., & Ohlsson, A. (2009). Preterm birth and low birth weight among in vitro fertilization singletons: A systematic review and meta-analyses. European Journal of Obstetrics & Gynecology and Reproductive Biology, 146(2), 138-148. doi:10.1016/j.ejogrb.2009.05.035
McLennan, A. (2016). Ultrasound and Autism Spectrum Disorder. Australasian Journal of Ultrasound in Medicine, 19(4), 131-132. doi:10.1002/ajum.12033
McLeod, L. (2008). How useful is uterine artery Doppler ultrasonography in predicting pre-eclampsia and intrauterine growth restriction? Canadian Medical Association Journal, 178(6), 727-729. doi:10.1503/cmaj.080242
McPherson, J. A., Harper, L. M., Odibo, A. O., Roehl, K. A., & Cahill, A. G. (2013). Maternal seizure disorder and risk of adverse pregnancy outcomes. American Journal of Obstetrics and Gynecology, 208(5), 378. e1-5. doi:10.1016/j.ajog.2013.01.048
Mifsud, W., & Sebire, N. J. (2014). Placental pathology in early-onset and late-onset fetal growth restriction. Fetal Diagnosis and Therapy, 36(2), 117-128. doi:10.1159/000359969
Miller, J., Turan, S., & Baschat, A. A. (2008). Fetal growth restriction. Seminars in Perinatology, 32(4), 274-280. doi:10.1053/j.emperi.2008.04.010
Milnerowicz-Nabzdyk, E., & Bizoń, A. (2014). Effect of cigarette smoking on vascular flows in pregnancies complicated by intrauterine growth restriction. Reproductive Toxicology, 50, 27-35. doi:10.1016/j.reprotox.2014.10.002
Moderiano, M., McEvoy, A., & Childs, J. (2015). Current guidelines for the prudent use of ultrasound. Soundeffects, (4), 18-21.
Mohammadbeigi, A., Farhadifar, F., Soufi zadeh, N., Mohammadsalehi, N., Rezaiee, M., & Aghaei, M. (2013). Fetal macrosomia: risk factors, maternal, and perinatal

UMBILICAL CORD VEIN ULTRASOUND 346
outcome. Annals of Medical and Health Sciences Research, 3(4), 546-550. doi:10.4103/2141-9248.122098
Moinian, M., Meyer, W. W., & Lind, J. (1969). Diameters of umbilical cord vessels and the weight of the cord in relation to clamping time. American Journal of Obstetrics and Gynecology, 105(4), 604-611.
Mondal, B. (1998). Low birth weight in relation to sex of baby, maternal age and parity: a hospital based study on Tangsa tribe from Arunachal Pradesh. Journal of Indian Medical Association, 96(12), 362-364.
Mongelli, M. (2007). Detecting fetal growth restriction: can we improve on ultrasound techniques. Ultrasound Bulletin, 10(3), 16-18.
Mongelli, M., Ek, S., & Tambyrajia, R. (1998). Screening for fetal growth restriction: a mathematical model of the effect of time interval and ultrasound error. Obstetrics & Gynecology, 92(6), 908-912. Retrieved from http://journals.lww.com/greenjournal/Fulltext/1998/12000/Screening_for_Fetal_Growth_Restriction__A.3.aspx
Mongelli, M., Figueras, F., Francis, A., & Gardosi, J. (2007). A customised birthweight centile calculator developed for an Australian population. Australian and New Zealand Journal of Obstetrics and Gynaecology, 47(2), 128-131. doi:10.1111/j.1479-828X.2007.00698.x
Moore, T. R., & Cayle, J. E. (1990). The amniotic fluid index in normal human pregnancy. American Journal of Obstetrics and Gynecology, 162 (5), 1168-73.
Moraitis, A. A., Wood, A. M., Fleming, M., & Smith, G. C. S. (2014). Birth weight percentile and the risk of term perinatal death. Obstetrics & Gynecology, 124(2, Part 1), 274-283. doi:10.1097/aog.0000000000000388
Mori, R., Shiraishi, J., Negishi, H., & Fujimura, M. (2008). Predictive value of Apgar score in infants with very low birth weight. Acta Paediatrica, 97(6), 720-723. doi:10.1111/j.1651-2227.2008.00759.x
Morsing, E., & Marsal, K. (2014). Pre-eclampsia - an additional risk factor for cognitive impairment at school age after intrauterine growth restriction and very preterm birth. Early Human Development, 90(2), 99-101. doi:10.1016/j.earlhumdev.2013.12.002
Muresan, D., Rotar, I. C., & Stamatian, F. (2016). The usefulness of fetal Doppler evaluation in early versus late onset intrauterine growth restriction. Review of the literature. Medical Ultrasonography., 18(1), 103-109. doi:10.11152/mu.2013.2066.181.dop
Murta, C., Moron, A., & Ávila, M. (1999). Detection of functional changes of the fetal heart in the first trimester of gestation. Arquivos Brasileiros de Cardiologia, 72, 745-750. doi:10.1590/S0066-782X1999000600009
Nagtegaal, M., van Rijswijk, S., McGavin, S., & Dekker, G. (2005). Use of uterine Doppler in an Australian Level II maternity hospital. Australian and New Zealand Journal of Obstetrics and Gynaecology, 45, 424-429. doi:10.1111/j.1479-828X.2005.00469.x
Nahum, G. (2014, 14 September). Estimation of fetal weight. Retrieved from http://emedicine.medscape.com/article/262865-overview#a5
Najafzadeh, A., & Dickinson, J. E. (2012). Umbilical venous blood flow and its measurement in the human fetus. Journal of Clinical Ultrasound, 40(8), 502-511. doi:10.1002/jcu.21970

UMBILICAL CORD VEIN ULTRASOUND 347
Najafzadeh, A., Jacoby, P., Mattes, E., & Dickinson, J. E. (2016). The umbilical vein in the human fetus has a non-linear growth pattern across gestation. Australasian Journal of Ultrasound in Medicine, 19(3), 99-104. doi:10.1002/ajum.12018
Nakai, A., & Oya, A. (2002). Accuracy and reproducibility of ultrasound measurements in obstetric management. Gynecologic and Obstetric Investigation, 54(1), 31-36. doi:64694
National Asthma Council Australia. (2015). Australia Asthma Handbook, Version 1.1. Retrieved from http://www.asthmahandbook.org.au/populations/pregnant-women
Needham, J. (1959). A history of embryology. Cambridge, England: Cambridge University Press.
Neilson, J. P. (2000). Symphysis-fundal height measurement in pregnancy. Cochrane Database of Systematic Reviews(2). doi:10.1002/14651858.cd000944
Nelson, K., Garcia, R. E., Brown, J., Mangione, C. M., Louis, T. A., Keeler, E., & Cretin, S. (2002). Do patient consent procedures affect participation rates in health services research? Medical Care, 40(4), 283-288. doi:10.2307/3767832
Nelson, T. R., Fowlkes, J. B., Abramowicz, J. S., & Church, C. C. (2009). Ultrasound biosafety considerations for the practicing sonographer and sonologist. Journal of Ultrasound in Medicine, 28(2), 139-150. doi:10.7863/jum.2009.28.2.139
Nesbitt-Hawes, E. M., Tetstall, E., Gee, K., & Welsh, A. W. (2014). Ultrasound (in)accuracy: it's in the formulae not in the technique - assessment of accuracy of abdominal circumference measurement in term pregnancies. Australasian Journal of Ultrasound in Medicine, 17(1), 38-44. doi:10.1002/j.2205-0140.2014.tb00083.x
New South Wales Government. (2005a). Consent to Medical Treatment - Patient Information. Sydney: Ministry of Health, NSW. Retrieved from http://www1.health.nsw.gov.au/pds/ActivePDSDocuments/PD2005_406.pdf.
New South Wales Government. (2005b). General Retention and Disposal Authority: University Records GDA 23. Sydney: State Records Authority of New South Wales. Retrieved from http://arp.nsw.gov.au/node/318.
New South Wales Government. (2009a). General Retention and Disposal Authority - Imaged Records (G36). Sydney: State Records Authority of New South Wales. Retrieved from http://arp.nsw.gov.au/ga-36-general-retention-and-disposal-authority-imaged-records.
New South Wales Government. (2009b). General Retention and Disposal Authority Public Health Services: Patient/Client Records GDA 17. Sydney: State Records Authority of New South Wales. Retrieved from http://www.records.nsw.gov.au.
New South Wales Government. (2014). Maternity - management of pregnancy beyond 41 weeks gestation. Sydney: Ministry of Health, NSW. Retrieved from http://www0.health.nsw.gov.au/policies/gl/2014/GL2014_015.html.
New South Wales Government. (2015). Crimes Act 1900 No 40 66C Sexual intercourse - child between 10 and 16. Retrieved from www.legislation.nsw.gov.au.
New Zealand and Maternal Fetal Medicine Network. (2015). New Zealand obstretric Doppler guideline. Retrieved from www.asum.com.au/wp.../NZMFMN-Obstetric-Doppler-Guideline-09-11-2014.pdf

UMBILICAL CORD VEIN ULTRASOUND 348
Nicolaides, K., Rizzo, G., Hecker, K., & Ximenes, R. (2002). Doppler in obstetrics. Diploma in Fetal Medicine and ISUOG Education Series. Retrieved from https://fetalmedicine.org/var/uploads/Doppler-in-Obstetrics.pdf
Nicolaides, K., Sebrire, N. J., & Snijders, J. M. (1999). The 11-14 week scan: the diagnosis of fetal abnormalities. New York, NY: The Parthenon Publishing Group.
Niknafs, P., & Sibbald, J. (2001). Intrauterine growth retardation index. Ultrasound Quarterly., 17(4), 255-260.
Noden, D. M., & De Lahunta, A. (1985). The embryology of domestic animals. Development mechanisms and malformations. Baltimore, MD: Williams & Wilkins.
Nozaki, A. M., Francisco, R. P., Fonseca, E. S., Miyadahira, S., & Zugaib, M. (2009). Fetal hemodynamic changes following maternal betamethasone administration in pregnancies with fetal growth restriction and absent end-diastolic flow in the umbilical artery. Acta Obstetricia Et Gynecologica Scandinavica, 88(3), 350-354. doi:10.1080/00016340902730334
Nyberg, M. K., Johnsen, S. L., Rasmussen, S., & Kiserud, T. (2010). Fetal breathing is associated with increased umbilical blood flow. Ultrasound in Obstetrics and Gynecology, 36(6), 718-723. doi:10.1002/uog.7701
Odibo, A. O., Nelson, D., Stamilio, D. M., Sehdev, H. M., & Macones, G. A. (2006). Advanced maternal age is an independent risk factor for intrauterine growth restriction. American Journal of Perinatology, 23(05), 325-328. doi:10.1055/s-2006-947164
Osborne, J. (2002). Notes on the use of data transformations. Practical Assessment, Research & Evaluation, 8(6), 1-7. Retrieved from http://pareonline.net/getvn.asp?v=8&n=6
Ott, W. J. (2002). Diagnosis of intrauterine growth restriction: comparison of ultrasound parameters. American Journal of Perinatology, 19(3), 133-137.
Ott, W. J. (2005). An update in the ultrasonic diagnosis and evaluation of intrauterine growth restriction. The Ultrasound Review of Obstetrics & Gynecology, 5(2), 111-124. doi:10.1080/14722240500190426
Owen, P., Maharaja, S., Khan, K. S., & Howie, P. W. (2001). Interval between fetal measurements in predicting growth restriction. Obstetrics & Gynecology, 97(4), 499-504. doi:10.1016/S0029-7844(00)1155-8
Paladini, D. (2009). Sonography in obese and overweight pregnant women: clinical, medicolegal and technical issues. Ultrasound in Obstetrics and Gynecology, 33(6), 720-729. doi:10.1002/uog.6393
Papageorghiou, A. T., Ohuma, E. O., Altman, D. G., Todros, T., Ismail, L. C., Lambert, A., . . . Villar, J. (2015). International standards for fetal growth based on serial ultrasound measurements: the Fetal Growth Longitudinal Study of the INTERGROWTH-21st Project. The Lancet, 384(9946), 869-879. doi:10.1016/S0140-6736(14)61490-2
Parnas, M., Sheiner, E., Shoham-Vardi, I., Burstein, E., Yermiahu, T., Levi, I., . . . Yerushalmi, R. (2006). Moderate to severe thrombocytopenia during pregnancy. European Journal of Obstetrics & Gynecology and Reproductive Biology, 128(1-2), 163-168. doi:10.1016/j.ejogrb.2005.12.031
Parra-Saavedra, M., Crovetto, F., Triunfo, S., Savchev, S., Peguero, A., Nadal, A., . . . Figueras, F. (2014). Association of Doppler parameters with placental signs of
UMBILICAL CORD VEIN ULTRASOUND 349
underperfusion in late-onset small-for-gestational-age pregnancies. Ultrasound in Obstetrics and Gynecology, 44(3), 330-337. doi:10.1002/uog.13358
Pasquini, L., Tondi, F., Rizzello, F., Pontello, V., Paoletti, E., & Fontanarosa, M. (2010). Impact of tissue harmonic imaging on measurement of nuchal translucency thickness. Ultrasound in Obstetrics and Gynecology, 36(4), 423-426. doi:10.1002/uog.7615
Patil-Sisodia, K., & Mestman, J. H. (2010). Graves hyperthyroidism and pregnancy: A clinical update. Endocrine Practice, 16(1), 118-129. doi:10.4158/EP09233.RA
Paul, D. A., Sciscione, A., Leef, K. H., & Stefano, J. L. (2002). Caesarean delivery and outcome in very low birthweight infants. Australian and New Zealand Journal of Obstetrics and Gynaecology, 42(1), 47-51. doi:10.1111/j.0004-8666.2002.00047.x
Peleg, D., Kennedy, C., & Hunter, S. (1998). Intrauterine growth restriction: identification and management. American Family Physician, 58(2), 453-460, 466-467.
Pennati, G., Bellotti, M., De Gasperi, C., & Rognoni, G. (2004). Spatial velocity profile changes along the cord in normal human fetuses: can these affect Doppler measurements of venous umbilical blood flow? Ultrasound in Obstetrics and Gynecology, 23(2), 131-137. doi:10.1002/uog.938
Peyter, A. C., Delhaes, F., Baud, D., Vial, Y., Diaceri, G., Menétrey, S., . . . Tolsa, J. F. (2014). Intrauterine growth restriction is associated with structural alterations in human umbilical cord and decreased nitric oxide-induced relaxation of umbilical vein. Placenta, 35(11), 891-899. doi:10.1016/j.placenta.2014.08.090
Pilu, G., & Nicolaides, K. (1999). Diagnosis of fetal abnormalities. The 18-23 week scan. New York, NY: The Parthenon Publishing Group.
Pinar, H., & Iyigun, M. (2012). Reference values for umbilical cord diameters in placental specimens. Retrieved from http://www.colorado.edu/economics/courses/iyigun/umbilicalrefvalues.pdf
Pinter, S. Z., Rubin, J. M., Kripfgans, O. D., Treadwell, M. C., Romero, V. C., Richards, M. S., . . . Fowlkes, J. B. (2012). Three-dimensional sonographic measurement of blood volume flow in the umbilical cord. Journal of Ultrasound in Medicine, 31(12), 1927-1934.
Polgar, S., & Thomas, S. (2008). Introduction to research in health sciences. Edinburgh, Scotland: Churchill Livingstone Elsevier.
Predanic, M. (2005). Sonographic assessment of the umbilical cord. The Ultrasound Review of Obstetrics & Gynecology, 5(2), 105-110.
Prior, T., Mullins, E., Bennett, P., & Kumar, S. (2014). Umbilical venous flow rate in term fetuses: can variations in flow predict intrapartum compromise? American Journal of Obstetrics and Gynecology, 210(1), 61.e1-e8. doi:10.1016/j.ajog.2013.08.042
Proctor, L. K., Fitzgerald, B., Whittle, W. L., Mokhtari, N., Lee, E., Machin, G., . . . Keating, S. J. (2013). Umbilical cord diameter percentile curves and their correlation to birth weight and placental pathology. Placenta, 34(1), 62-66. doi:10.1016/j.placenta.2012.10.015
Quinton, A. (2006). The third trimester ultrasound. Soundeffects(3), 26-30. Quinton, A., Cook, C., & Peek, M. (2015). The prediction of the small for gestational age
fetus with the head circumference to abdominal circumference (HC/AC) ratio: a
UMBILICAL CORD VEIN ULTRASOUND 350
new look at an old measurement. Sonography, 2(2), 27-31. doi:10.1002/sono.12022
R Core Team. (2014). R: A language and environment for statistical computing [Computer software manual]. Retrieved from http://www.R-project.org/
Raio, L., Ghezzi, F., Di Naro, E., Franchi, M., & Bruhwiler, H. (1999). Prenatal assessment of the Hyrtl anastomosis and evaluation of its function. Human Reproduction, 14(7), 1890-1893.
Raio, L., Ghezzi, F., Di Naro, E., Gomez, R., Franchi, M., Mazor, M., & Brühwiler, H. (1999a). Sonographic measurement of the umbilical cord and fetal anthropometric parameters. European Journal of Obstetrics & Gynecology and Reproductive Biology, 83(2), 131-135. doi:10.1016/S0301-2115(98)00314-5
Raio, L., Ghezzi, F., Di Naro, E., Gunter Duwe, D., Cromi, A., & Schneider, H. (2003). Umbilical cord morphologic characteristics and umbilical artery Doppler parameters in intrauterine growth-restricted fetuses. Journal of Ultrasound in Medicine, 22, 1341-1347.
Reddick, K. L. B., Jhaveri, R., Gandhi, M., James, A. H., & Swamy, G. K. (2011). Pregnancy outcomes associated with viral hepatitis. Journal of Viral Hepatitis, 18(7), e394-e398. doi:10.1111/j.1365-2893.2011.01436.x
Reed, K. L., & Anderson, C. F. (2000). Changes in umbilical venous velocities with physiologic perturbations. American Journal of Obstetrics and Gynecology, 182(4), 835-840. doi:10.1067/mob.2000.104921
Reynolds, S. R. M. (1978). Mechanisms of placentofetal blood flow. Obstetrics & Gynecology, 51(2), 245-249. Retrieved from http://journals.lww.com/greenjournal/Fulltext/1978/02000/Mechanisms_of_Placentofetal_Blood_Flow.29.aspx
Rigano, S., Bozzo, M., Ferrazzi, E., Bellotti, M., Battaglia, F., & Galan, H. L. (2001). Early and persistent reduction in umbilical vein blood flow in the growth-restricted fetus: A longitudinal study. American Journal of Obstetrics and Gynecology, 185(4), 834-838. doi:10.1067/mob.2001.117356
Rigano, S., Bozzo, M., Padoan, A., Mustoni, P., Bellotti, M., Galan, H. L., & Ferrazzi, E. (2008). Small size-specific umbilical vein diameter in severe growth restricted fetuses that die in utero. Prenatal Diagnosis, 28(10), 908-913. doi:10.1002/pd.2054
Rizzo, G., Rizzo, L., Aiello, E., Allegra, E., & Arduini, D. (2016). Modelling umbilical vein blood flow normograms at 14-40 weeks of gestation by quantile regression analysis. The Journal of Maternal-Fetal & Neonatal Medicine, 29(5), 701-706. doi:10.3109/14767058.2015.1019855
Rodger, M. A., Betancourt, M. T., Clark, P., Lindqvist, P. G., Dizon-Townson, D., Said, J., . . . Greer, I. A. (2010). The association of factor V leiden and prothrombin gene mutation and placenta-mediated pregnancy complications: a systematic review and meta-analysis of prospective cohort studies. PLoS Med, 7(6), e1000292. doi:10.1371/journal.pmed.1000292
Ross, M. (2015, 10 November). Fetal growth restriction. Retrieved from http://emedicine.medscape.com/article/261226-overview
Rostamzadeh, S., Kalantari, M., Shahriari, M., & Shakiba, M. (2015). Sonographic measurement of the umbilical cord and its vessels and their relation with fetal anthropometric measurements. Iranian Journal of Radiology, 12(3), 1-17. doi:10.5812/iranjradiol.12230v2
UMBILICAL CORD VEIN ULTRASOUND 351
Royal Australian and New Zealand College of Obstetricians and Gynaecologists. (2011). Protocols for measuring the nuchal translucency. Retrieved from http://www.nuchaltrans.edu.au/certification/protocols-for-measuring-the-nuchal-translucency
Royal Australian and New Zealand College of Obstetricians and Gynaecologists. (2015). Screening in early pregnancy for adverse perinatal outcomes. Retrieved from http://www.ranzcog.edu.au/college-statements-guidelines.html
Royal Australian and New Zealand College of Radiologists. (2014). Standards of practice for diagnostic and interventional radiology. Version 10. Retrieved from http://www.ranzcr.edu.au/quality-a-safety/radiology/standards-of-practice
Royal College of Obstetricians and Gynaecologists. (2014a, January). The investigation and management of the small–for–gestational–age fetus. Green-top Guideline No. 31. 2nd ed. Retrieved from https://www.rcog.org.uk/globalassets/documents/guidelines/gtg_31.pdf
Royal College of Obstetricians and Gynaecologists. (2014b, March ). Management of beta thalassaemia in pregnancy. Green-top Guideline No. 66. Retrieved from https://www.rcog.org.uk/globalassets/.../gtg_66_thalassaemia.pdf
Royal College of Obstetricians and Gynaecologists. (2014c, May). The management of women with red cell antibodies during pregnancy. Green-top Guideline No.65. Retrieved from https://www.rcog.org.uk/en/guidelines-research-services/guidelines/gtg65/
Rumack, C. M., Wilson, S. R., & Charboneau, J. W. (2005). Diagnostic ultrasound. (3rd ed. Vol. 2). St. Louis, MO: Elsevier Mosby.
Safety Group of the British Medical Ultrasound Society. (2010). Guidelines for the safe use of diagnostic ultrasound equipment. Ultrasound, 18(2), 52-59. doi:10.1258/ult.2010.100003
Safir, A., Levy, A., Sikuler, E., & Sheiner, E. (2010). Maternal hepatitis B virus or hepatitis C virus carrier status as an independent risk factor for adverse perinatal outcome. Liver International, 30(5), 765-770. doi:10.1111/j.1478-3231.2010.02218.x
Saha, R., Farhat, N., & Karmaker, M. (2014). Study of umbilical cord in pregnancy induced hypertension with and without diabetes mellitus. Bangladesh Journal of Anatomy, 12(1), 3-6. doi:10.3329/bja.v12i1.22609
Saki, F., Dabbaghmanesh, M. H., Ghaemi, S. Z., Forouhari, S., Ranjbar Omrani, G., & Bakhshayeshkaram, M. (2014). Thyroid function in pregnancy and its influences on maternal and fetal outcomes. International Journal of Endocrinology and Metabolism, 12(4), e19378. doi:10.5812/ijem.19378
Saleem, T., Sajjad, N., Fatima, S., Habib, N., Ali, S. R., & Qadir, M. (2011). Intrauterine growth retardation - small events, big consequences. Italian Journal of Pediatrics, 37, 41-41. doi:10.1186/1824-7288-37-41
Salvesen, K., Lees, C., Abramowicz, J., Brezinka, C., Ter Haar, G., & Marsal, K. (2016). ISUOG statement on ultrasound exposure in the first trimester and autism spectrum disorders. Retrieved from http://www.isuog.org/NR/rdonlyres/57A3E1B7-5022-4D7F-BE0E-93E1D239F29D/0/ISUOG_statement_on_ultrasound_exposure_in_the_first_trimester_and_autism_spectrum_disorders.pdf

UMBILICAL CORD VEIN ULTRASOUND 352
Sande, R. K., & Kiserud, T. (2013). Ultrasound safety, power and image quality: what do we know? Fetal and Maternal Medicine Review, 24(04), 260-276. doi:10.1017/S0965539514000035
Sandlin, A. T., Ounpraseuth, S. T., Spencer, H. J., Sick, C. L., Lang, P. M., & Magann, E. F. (2014). Amniotic fluid volume in normal singleton pregnancies: modeling with quantile regression. Archives of Gynecology and Obstetrics, 289(5), 967-972. doi:10.1007/s00404-013-3087-2
Sayers, S., Mackerras, D., & Singh, G. (2007). Growth outcomes for Australian Aboriginal children aged 11 years with intrauterine growth retardation at term gestation. Paediatric and Perinatal Epidemiology, 21, 411-417.
Sayers, S., Mackerras, D., & Singh, G. (2017). Cohort Profile: The Australian Aboriginal Birth Cohort (ABC) study. International Journal of Epidemiology, 46(1). doi:10.1093/ije/dyw291
Sayers, S., Mott, S., & Singh, G. (2011). Fetal growth restriction and 18-year growth and nutritional status: Aboriginal birth cohort 1987–2007. American Journal of Human Biology, 23(3), 417-419. doi:10.1002/ajhb.21133
Scherjon, S. A., Kok, J. H., Oosting, H., & Zondervan, H. A. (1993). Intra-observer and inter-observer reliability of the pulsatility index calculated from pulsed Doppler flow velocity waveforms in three fetal vessels. British Journal of Obstetrics and Gynaecology, 100(2), 134-138. doi:10.1111/j.1471-0528.1993.tb15208.x
Scholbach, T. M., Fersis, N., & Stolle, J. (2012). Significant differences of fetal blood supply in fetuses of different weight classes demonstrated by the novel method of three-dimensional pixelwise fetal volume flow measurements (PixelFlux-method). Ultrasound in Obstetrics and Gynecology, 40(S1), 118. doi:10.1002/uog.11592
Scholbach, T. M., Heien, C., & Eggebø, T. M. (2016). Umbilical vein vasomotion detected in vivo by serial three-dimensional pixelwise spatially angle-corrected volume flow measurements. Ultrasound in Obstetrics and Gynecology, 47(5), 623-628. doi:10.1002/uog.14890
Sehested, L. T., & Pedersen, P. (2014). Prognosis and risk factors for intrauterine growth retardation. Danish Medical Journal, 61(4). Retrieved from http://www.danmedj.dk/portal/page/portal/danmedj.dk/dmj_forside/PAST_ISSUE/2014/DMJ_2014_04/A4826
Seravalli, V., & Baschat, A. A. (2015). A uniform management approach to optimize outcome in fetal growth restriction. Obstetrics and Gynecology Clinics of North America, 42(2), 275-288. doi:10.1016/j.ogc.2015.01.005
Setji, T. L., Brown, A. J., & Feinglos, M. N. (2005). Gestational diabetes mellitus. Clinical Diabetes, 23(1), 17-24. doi:10.2337/diaclin.23.1.17
Shah, P. S. (2010). Parity and low birth weight and preterm birth: a systematic review and meta-analyses. Acta Obstetricia Et Gynecologica Scandinavica, 89(7), 862-875. doi:10.3109/00016349.2010.486827
Shapiro, R. S., Wagreich, J., Parsons, R. B., Stancato-Pasik, A., Yeh, H. C., & Lao, R. (1998). Tissue harmonic imaging sonography: evaluation of image quality compared with conventional sonography. American Journal of Roentgenology, 171(5), 1203-1206. doi:10.2214/ajr.171.5.9798848
Sheridan, C. (2005). Intrauterine growth restriction: diagnosis and management. Australian Family Physician, 34(9), 717-723.
UMBILICAL CORD VEIN ULTRASOUND 353
Shinozuka, N., & Taguchi, A. (2006). Ultrasound diagnosis and management of intra-uterine growth restriction. The Ultrasound Review of Obstetrics & Gynecology, 6(3/4), 157-162. doi:10.1080/14722240600785901
Shipton, D., Tappin, D. M., Vadiveloo, T., Crossley, J. A., Aitken, D. A., & Chalmers, J. (2009). Reliability of self reported smoking status by pregnant women for estimating smoking prevalence: a retrospective, cross sectional study. British Medical Journal, 339; b4347, 1-8. doi:10.1136/bmj.b4347
Shrout, P. E., & Fleiss, J. L. (1979). Intraclass correlations: uses in assessing rater reliability. Psychological Bulletin, 86(2), 420-428. doi:10.1037/0033-2909.86.2.420
Silverwood, R. J., & Cole, T. J. (2007). Statistical methods for constructing gestational age-related reference intervals and centile charts for fetal size. Ultrasound in Obstetrics and Gynecology, 29(1), 6-13. doi:10.1002/uog.3911
Simchen, M. J., Beiner, M. E., Strauss-Liviathan, N., Dulitzky, M., Kuint, J., Mashiach, S., & Schiff, E. (2000). Neonatal outcome in growth-restricted versus appropriately grown preterm infants. American Journal of Perinatology, 17(04), 187-192. doi:10.1055/s-2000-9423
Skulstad, S. M., Kiserud, T., & Rasmussen, S. (2004). The effect of vascular constriction on umbilical venous pulsation. Ultrasound in Obstetrics and Gynecology, 23(2), 126-130.
Smith, G. C., Shah, I., Crossley, J. A., Aitken, D. A., Pell, J. P., Nelson, S. M., . . . Dobbie, R. (2006). Pregnancy-associated plasma protein A and alpha-fetoprotein and prediction of adverse perinatal outcome. Obstetrics & Gynecology, 107(1), 161-166. doi:10.1097/01.AOG.0000191302.79560.d8
Sochi, T. (2014, 9 June). Non-Newtonian Rheology in Blood Circulation. Retrieved from http://arxiv.org/pdf/1306.2067.pdf
Society of Obstetricians and Gynecologists of Canada. (2011). Substance use in pregnancy: No. 256, April 2011. International Journal of Gynecology & Obstetrics, 114(2), 190-202. doi:10.1016/j.ijgo.2011.06.001
Somprasit, C., Chanthasenanont, A., & Nuntakomon, T. (2010). The change of umbilical cord components in intrauterine growth restriction comparative with normal growth fetuses by using sonographic measurement. Journal of the Medical Association of Thailand, 93 (Supplement 7), S15-20.
Soto, E., & Bahado-Singh, R. (2013). Fetal abnormal growth associated with substance abuse. Current Opinion in Obstetrics and Gynecology, 56(1), 142-53. doi:10.1097/GRF.0b013e31827e6b60
Sovio, U., White, I. R., Dacey, A., Pasupathy, D., & Smith, G. C. S. (2015). Screening for fetal growth restriction with universal third trimester ultrasonography in nulliparous women in the Pregnancy Outcome Prediction (POP) study: a prospective cohort study. The Lancet, 386(10008), 2089-2097. doi:10.1016/S0140-6736(15)00131-2
Spencer, K., Heath, V., El-Sheikhah, A., Ong, C. Y. T., & Nicolaides, K. (2005). Ethnicity and the need for correction of biochemical and ultrasound markers of chromosomal anomalies in the first trimester: a study of Oriental, Asian and Afro-Caribbean populations. Prenatal Diagnosis, 25(5), 365-369. doi:10.1002/pd.1153

UMBILICAL CORD VEIN ULTRASOUND 354
Spurway, J. F. (2006). Pulsations and velocity of the umbilical cord vein in the assessment of intrauterine growth restriction. (Unpublished Masters dissertation). The University of Sydney, Sydney, NSW.
Srinivas, S. K., Edlow, A. G., Neff, P. M., Sammel, M. D., Andrela, C. M., & Elovitz, M. A. (2009). Rethinking IUGR in preeclampsia: dependent or independent of maternal hypertension? Journal of Perinatology, 29(10), 680-684. doi:10.1038/jp.2009.83
Suciu, N., Pop, L., Panaitescu, E., Suciu, I. D., Popp, A., & Anca, I. (2014). Fetal and neonatal outcome in celiac disease. The Journal of Maternal-Fetal & Neonatal Medicine, 27(8), 851-855. doi:10.3109/14767058.2013.839650
Sucksdorff, M., Lehtonen, L., Chudal, R., Suominen, A., Joelsson, P., Gissler, M., & Sourander, A. (2015). Preterm birth and poor fetal growth as risk factors of attention-deficit/hyperactivity disorder. Pediatrics, 136(3), e600-e608. doi:10.1542/peds.2015-1043
Suhag, A., & Berghella, V. (2013). Intrauterine growth restriction (IUGR): etiology and diagnosis. Current Obstetrics and Gynecology Reports, 2(2), 102-111. doi:10.1007/s13669-013-0041-z
Sutton, M. S. J., Theard, M. A., Bhatia, S. J. S., Plappert, T., Saltzman, D. H., & Doubilet, P. (1990). Changes in placental blood flow in the normal human fetus with gestational age. Pediatric Research, 28(4), 383-387. doi:10.1203/00006450-199010000-00016
Tamaru, S., Kikuchi, A., Takagi, K., Wakamatsu, M., Ono, K., Horikoshi, T., . . . Nakamura, T. (2011). Neurodevelopmental outcomes of very low birth weight and extremely low birth weight infants at 18 months of corrected age associated with prenatal risk factors. Early Human Development, 87(1), 55-59. doi:10.1016/j.earlhumdev.2010.10.004
Tate, D., & Mari, G. (2013). Detection and surveillance of IUGR. Contemporary OB/GYN. Retrieved from http://contemporaryobgyn.modernmedicine.com/contemporary-obgyn/content/tags/intrauterine-growth-restriction/detection-and-surveillance-iugr
Tchirikov, M., Rybakowski, C., Huneke, B., Schoder, V., & Schroder, H. J. (2002). Umbilical vein blood volume flow rate and umbilical artery pulsatility as 'venous-arterial index' in the prediction of neonatal compromise. Ultrasound in Obstetrics and Gynecology, 20(6), 580-585. doi:10.1046/j.1469-0705.2002.00832.x
Tchirikov, M., Strohner, M., Förster, D., & Hüneke, B. (2009). A combination of umbilical artery PI and normalized blood flow volume in the umbilical vein: Venous-arterial index for the prediction of fetal outcome. European Journal of Obstetrics & Gynecology and Reproductive Biology, 142(2), 129-133. doi:10.1016/j.ejogrb.2008.10.015
The American Congress of Obstetricians and Gynecologists. (2008). ACOG Practice Bulletin No. 90: Asthma in Pregnancy. Obstetrics & Gynecology, 111(2), 457-464. doi:10.1097/AOG.0b013e3181665ff4
The Fetal Medicine Foundation. (2008). The first trimester screening program. Risk calculation program. (Version 2.2.0). London, England. Retrieved from www.fetalmedicine.com

UMBILICAL CORD VEIN ULTRASOUND 355
Thoirs, K., & Lee, L. (2016). Multiple prenatal ultrasound scans and ocular development: 20-year follow-up of a randomised, controlled trial. Ultrasound in Obstetrics & Gynaecology 2014; 44:166–170. Forward H, Yazar S, Hewitt AW, Khan J, Mountain JM, Pesudovs K et al. Sonography, 3(1), 36. doi:10.1002/sono.12046
Tirinescu, D., Bondor, C. I., Vladutiu, D. S., Patiu, I. M., Moldovan, D., Orasan, R., & Kacsó, I. M. (2016). Ultrasonographic diagnosis of stenosis of native arteriovenous fistulas in haemodialysis patients. Medical Ultrasonography., 18(3), 332-338. doi:10.11152/mu.2013.2066.183.fis
Todros, T., Adamson, S. L., Guiot, C., Bankowski, E., Raio, L., di Naro, E., & Schneider, H. (2002). Umbilical cord and fetal growth. A workshop report. Placenta, 23 (Supplement A, Trophoblast Research), S130-S132. doi:10.1053/plac.2002.0797
Togni, F. A., Araujo Júnior, E., Vasques, F. A. P., Moron, A. F., Torloni, M. R., & Nardozza, L. M. M. (2007). The cross-sectional area of umbilical cord components in normal pregnancy. International Journal of Gynecology & Obstetrics, 96(3), 156-161. doi:10.1016/j.ijgo.2006.10.003
Troy, D. B. (Ed.) (2006). Remington: The Science and Practice of Pharmacy (21st ed.). Baltimore, MD: Lippincott Williams & Wilkins.
Tu, J., Inthavong, K., & Wong, K. K. L. (2015). Computational hemodynamics - theory, modelling and applications. Dordrecht, Netherlands: Springer.
Turan, O. M., Turan, S., Gungor, S., Berg, C., Moyano, D., Gembruch, U., . . . Baschat, A. A. (2008). Progression of Doppler abnormalities in intrauterine growth restriction. Ultrasound in Obstetrics and Gynecology, 32(2), 160-167. doi:10.1002/uog.5386
United Nations Children’s Fund and World Health Organization. (2004). Low Birthweight: Country, regional and global estimates. Retrieved from http://apps.who.int/iris/bitstream/10665/43184/1/9280638327.pdf
Unterscheider, J., Daly, S., Geary, M. P., Kennelly, M. M., McAuliffe, F. M., O'Donoghue, K., . . . Malone, F. D. (2013a). Optimizing the definition of intrauterine growth restriction: the multicenter prospective PORTO Study. American Journal of Obstetrics and Gynecology, 208(4), 290.e1-6. doi:10.1016/j.ajog.2013.02.007
Unterscheider, J., Daly, S., Geary, M. P., Kennelly, M. M., McAuliffe, F. M., O'Donoghue, K., . . . Malone, F. D. (2013b). Predictable progressive Doppler deterioration in IUGR: does it really exist? American Journal of Obstetrics and Gynecology, 209(6), 539.e1-539.e7. doi:https://doi.org/10.1016/j.ajog.2013.08.039
Unterscheider, J., Daly, S., Geary, M. P., Kennelly, M. M., McAuliffe, F. M., O'Donoghue, K., . . . Malone, F. D. (2014). Definition and management of fetal growth restriction: a survey of contemporary attitudes. European Journal of Obstetrics & Gynecology and Reproductive Biology, 174, 41-45. doi:10.1016/j.ejogrb.2013.11.022
van Neera, P., Danilouchkine, M., Verweij, M. D., Demi, L., Voormolen, M. M., van der Steen, A. F. W., & de Jong, N. (2011). Comparison of fundamental, second harmonic, and superharmonic imaging: a simulation study. Journal of the Acoustical Society of America, 130(5), 3148-3157. doi:10.1121/1.3643815
van Vliet, G., Liu, S., & Kramer, M. (2009). Decreasing sex difference in birth weight. [Letter to the editor]. Epidemiology, 20(4), 622. doi:10.1097/EDE.0b013e3181a82806
UMBILICAL CORD VEIN ULTRASOUND 356
Vandenbosche, R. C., & Kirchner, J. T. (1998). Intrauterine growth retardation. American Family Physician, 58(6), 1384-1390.
Varvarigou, A. A., Asimakopoulou, A., & Beratis, N. G. (2008). Impact of maternal smoking on birth size: effect of parity and sex dimorphism. Neonatology, 95(1), 61-67. doi:10.1159/000151756
Vasques, F. A. P., Moron, A. F., Murta, C. G. V., Carvalho, F. H. C., Barbosa, M. M., & Marcolino, L. A. (2004). The assessment of fetal well-being by venous Doppler velocimetry. The Ultrasound Review of Obstetrics & Gynecology, 4(2), 121-125. doi:10.1080/14722240410001667292
Vayssiere, C., Sentilhes, L., Ego, A., Bernard, C., Cambourieu, D., Flamant, C., . . . Carbonne, B. (2015). Fetal growth restriction and intra-uterine growth restriction: guidelines for clinical practice from the French College of Gynaecologists and Obstetricians. European Journal of Obstetrics & Gynecology and Reproductive Biology, 193, 10-18. doi:10.1016/j.ejogrb.2015.06.021
Velauthar, L., Plana, M. N., Kalidindi, M., Zamora, J., Thilaganathan, B., Illanes, S. E., . . . Thangaratinam, S. (2014). First-trimester uterine artery Doppler and adverse pregnancy outcome: a meta-analysis involving 55,974 women. Ultrasound in Obstetrics and Gynecology, 43(5), 500-507. doi:10.1002/uog.13275
von Beckerath, A. K., Kollmann, M., Rotky-Fast, C., Karpf, E., Lang, U., & Klaritsch, P. (2013). Perinatal complications and long-term neurodevelopmental outcome of infants with intrauterine growth restriction. American Journal of Obstetrics and Gynecology, 208(2), 130. e1-6. doi:10.1016/j.ajog.2012.11.014
Vora, N. L., & Chescheir, N. (2015). Delivery of the growth restricted preterm fetus. The Lancet, 385(9983), 2126-2128. doi:10.1016/S0140-6736(14)62455-7
Walker, D. M., Marlow, N., Upstone, L., Gross, H., Hornbuckle, J., Vail, A., . . . Thornton, J. G. (2011). The Growth Restriction Intervention Trial: long-term outcomes in a randomized trial of timing of delivery in fetal growth restriction. American Journal of Obstetrics and Gynecology, 204(1), 34.e1-9. doi:10.1016/j.ajog.2010.09.019
Wang, Y., & Chen, H.-J. (2012). Use of percentiles and Z scores in anthropometry. In V. R. Preedy (Ed.), Handbook of anthropometry. New York, NY: Springer-Verlag
Waters, S., & Guoit, C. (2002). Flow in an elastic tube subject to prescribed forcing: a model of umbilical venous flow. Journal of Theoretical Medicine, 3, 287-298.
Webb, S. J., Garrison, M. M., Bernier, R., McClintic, A. M., King, B. H., & Mourad, P. D. (2016). Severity of ASD symptoms and their correlation with the presence of copy number variations and exposure to first trimester ultrasound. Autism Research, 10(3), 472-484. doi:10.1002/aur.1690
Weissman, A., & Jakobi, P. (1997). Sonographic measurements of the umbilical cord in pregnancies complicated by gestational diabetes. Journal of Ultrasound in Medicine, 16(10), 691-694. doi:10.7863/jum.1997.16.10.691
Weissman, A., Jakobi, P., Bronshtein, M., & Goldstein, I. (1994). Sonographic measurements of the umbilical cord and vessels during normal pregnancies. Journal of Ultrasound in Medicine, 13(1), 11-14. doi:10.7863/jum.1994.13.1.11
Williams, M., Malik, A., Francis, A., & Gardosi, J. (2011). The effect of smoking during pregnancy on incidence of hypertensive diseases, prematurity and intrauterine growth restriction. Archives of Disease in Childhood - Fetal and Neonatal Edition, 96(Supplement 1), Fa103. doi:10.1136/adc.2011.300163.21
UMBILICAL CORD VEIN ULTRASOUND 357
Williams, P. L. (Ed.) (1995). Gray's anatomy (38th ed.). New York, NY: Churchill Livingstone.
Williamson, C., & Geenes, V. (2014). Intrahepatic cholestasis of pregnancy. Obstetrics & Gynecology, 124(1), 120-133. doi:10.1097/AOG.0000000000000346
Wollmann, H. A. (1998). Intrauterine growth restriction: definition and etiology. Hormone Research, 49 (Supplement 2), 1-6. doi:10.1159/000053079
Wong, S. F., Lee-Tannock, A., Amaraddio, D., Chan, F. Y., & McIntyre, H. D. (2006). Fetal growth patterns in fetuses of women with pregestational diabetes mellitus. Ultrasound in Obstetrics and Gynecology, 28(7), 934-938. doi:10.1002/uog.3831
World Federation for Ultrasound in Medicine and Biology. (2013). WFUMB policy and statements on safety of ultrasound. Ultrasound in Medicine & Biology, 39(5), 926-929. doi:10.1016/j.ultrasmedbio.2013.02.007
World Health Organization. (1995). Expert Committee Report: Physical status: the use and interpretation of anthropometry. Retrieved from http://apps.who.int/iris/bitstream/10665/37003/1/WHO_TRS_854.pdf
Worton, S. A., Sibley, C. P., & Heazell, A. E. P. (2014). Understanding the placental aetiology of fetal growth restriction; could this lead to personalized management strategies? Fetal and Maternal Medicine Review, 25(02), 95-116. doi:10.1017/S0965539514000114
Yagel, S., Kivilevitch, Z., Cohen, S. M., Valsky, D. V., Messing, B., Shen, O., & Achiron, R. (2010). The fetal venous system, Part II: ultrasound evaluation of the fetus with congenital venous system malformation or developing circulatory compromise. Ultrasound in Obstetrics and Gynecology, 36(1), 93-111. doi:10.1002/uog.7622
Yamamoto, M., Carrillo, J., Insunza, A., Mari, G., & Ville, Y. (2006). Error introduced into velocity measurements by inappropriate Doppler angle assignment. Ultrasound in Obstetrics and Gynecology, 28(6), 853-854. doi:10.1002/uog.3847
Yau, G., Schluchter, M., Taylor, H. G., Margevicius, S., Forrest, C. B., Andreias, L., . . . Hack, M. (2013). Bullying of extremely low birth weight children: associated risk factors during adolescence. Early Human Development, 89(5), 333-338. doi:10.1016/j.earlhumdev.2012.11.004
Zamboli, P., Fiorini, F., D’Amelio, A., Fatuzzo, P., & Granata, A. (2014). Color Doppler ultrasound and arteriovenous fistulas for hemodialysis. Journal of Ultrasound, 17(4), 253-263. doi:10.1007/s40477-014-0113-6
Zheng, Y. T., Sampson, M. B., & Soper, R. (1998). The significance of umbilical vein Doppler changes during fetal hiccups. Journal of Fetal Investigation, 8(8), 89-91.
Zhu, M. Y., Milligan, N., Keating, S., Windrim, R., Keunen, J., Thakur, V., . . . Seed, M. (2016). The hemodynamics of late-onset intrauterine growth restriction by MRI. American Journal of Obstetrics and Gynecology, 214(3), 367.e1-367.e17 doi:10.1016/j.ajog.2015.10.004
Zolnierczuk-Kieliszek, D., Chemperek, E., & Koza, M. (2004). Circumstances of tobacco smoking by pregnant women. Annales Universitatis Mariae Curie-Skłodowska 59(1), 163-168.
Zubrick, S. R., Kurinczuk, J. J., McDermott, B. M., McKelvey, R. S., Silburn, S. R., & Davies, L. C. (2000). Fetal growth and subsequent mental health problems in children aged 4 to 13 years. Developmental Medicine & Child Neurology, 42(1), 14-20.
UMBILICAL CORD VEIN ULTRASOUND 358
Appendices (CD)
Appendix A Spurway, J. F., Logan, P., & Pak, S. (2012). The development, structure
and blood flow within the umbilical cord with particular reference to the
venous system. Australasian Journal of Ultrasound in Medicine, 15(3),
97-102. doi:10.1002/j.2205-0140.2012.tb00013.x
Appendix B Greater Western HREC approval letter
Appendix C Greater Western HREC Site Specific approval letter
Appendix D CSU Board of Graduate Studies approval letter
Appendix E CSU HREC approval letter
Appendix F Participant Information Sheet
Appendix G Consent Form
Appendix H Participant Characteristics Sheet
Appendix I Quantitative Consulting Unit estimated minimum sample size
Appendix J Obstetric pre-sets
Appendix K Raw data spreadsheets
Appendix K1 Whole research sample
Appendix K2 nAGA group
Appendix K3 Sonographer reliability
Appendix K4 Ratios and SGA stratification
Appendix K5 Longitudinal data
Appendix L Statistical analyses
Appendix L1 Whole research sample
Appendix L2 nAGA group
Appendix L3 Sonographer reliability
UMBILICAL CORD VEIN ULTRASOUND 359
Appendix L4 Linear mixed modelling – 3 birthweight categories
Appendix L5 Linear mixed modelling – 2 birthweight categories
Appendix L6 Quantile regression nAGA group
Appendix L7 Stratified SGA groups
Appendix L8 Ratios and longitudinal data analysis
Appendix L9 Longitudinal data analysis – all attendances
Appendix L10 Slope analysis
Appendix M Spurway, J., Logan, P., Pak, S. C., & Nielsen, S. (2016). A comparison of a
regional NSW obstetrics population to district, state and national statistics.
Australasian Journal of Ultrasound in Medicine, 19(3), 118-122.
doi:10.1002/ajum.12017
Appendix N Spurway, J., Logan, P., Pak, S. C., & Nielsen, S. (2017). Reference ranges
for the intra-amniotic umbilical cord vein diameter, peak velocity and blood
flow in a regional NSW population. Australasian Journal of Ultrasound in
Medicine, doi: 10.1002/ajum.12060. In Press

UMBILICAL CORD VEIN ULTRASOUND 360
CD in sleeve