\u003ctitle\u003eoptical enhanced luminescent measurements and sequential reagent mixing on a...
TRANSCRIPT
Optical enhanced luminescent measurements and sequential reagent mixing on a centrifugal microfluidic device
for multi-analyte point-of-care applications
Daniel A. Bartholomeusz*a, Rupert H. Daviesb, Joseph D. Andradea aDept. of Bioengineering, University of Utah, 50 S. Central Campus Drive, 2480 MEB,
Salt Lake City, UT USA 84112-9202 bDept. of Bioengineering, University of Washington, 411 Bagley Hall, Box 351721,
Seattle, WA USA 98195-1721
ABSTRACT
A centrifugal-based microfluidic device1 was built with lyophilized bioluminescent reagents for measuring multiple metabolites from a sample of less than 15 µL. Microfluidic channels, reaction wells, and valves were cut in adhesive vinyl film using a knife plotter with features down to 30 µm and transferred to metalized polycarbonate compact disks (CDs). The fabrication method was simple enough to test over 100 prototypes within a few months. It also allowed enzymes to be packaged in microchannels without exposure to heat or chemicals. The valves were rendered hydrophobic using liquid phase deposition. Microchannels were patterned using soft lithography to make them hydrophilic. Reagents and calibration standards were deposited and lyophilized in different wells before being covered with another adhesive film. Sample delivery was controlled by a modified CD ROM. The CD was capable of distributing 200 nL sample aliquots to 36 channels, each with a different set of reagents that mixed with the sample before initiating the luminescent reactions. Reflection of light from the metalized layer and lens configuration allowed for 20% of the available light to be collected from each channel. ATP was detected down to 0.1 µM. Creatinine, glucose, and galactose were also measured in micro and milliMolar ranges. Other optical-based analytical assays can easily be incorporated into the device design. The minimal sample size needed and expandability of the device make it easier to simultaneously measure a variety of clinically relevant analytes in point-of-care settings.
Keywords: Bioluminescence, centrifugal devices, microfluidics, point-of-care, rapid-prototyping
1. INTRODUCTION
1.1. Point-of-Care During the past 10 years, some in vitro diagnostic (IVD) testing has moved from centralized labs to point of care testing. The point-of-care (POC) is where treatment decisions are made and includes emergency rooms, battlefields, outpatient clinics, nursing homes, patients’ homes, or hospital bedside. POC testing is mostly used in applications that require frequent testing, such as diabetes, or for tests that need to be done quickly, such as in emergency rooms. POC sensors are being developed around the need to measure common analytes, which include blood gases, coagulation, and general chemistry, and immunoassays for drugs and proteins to provide physicians and caregivers with quantitative information to diagnose, triage, and treat patients2.
Effective management of some pathologies require regular, routine clinical chemistry measurements of low molecular weight biochemicals important to metabolism. A well-known example is glucose measurements necessary for the management of diabetes. Other diseases such as the inborn metabolic diseases phenylketonuria (PKU)3 and galactosemia4 also need regular monitoring of relevant analytes. POC sensors for measuring multiple low molecular weight metabolites would help determine multi-parametric profiles of different pathologies in clinical diagnostics and research.
1.2. Bioluminescence-based analysis Luminescence-based detection is a highly sensitive and specific analytical method that is starting to be used more frequently in IVD laboratory analyzers, but has not been readily implemented in POC devices2. Luminescence-based assays can have a detection range of five or more orders of magnitude without dilution or concentration of the sample fluid5. Luminescent reactions have inherently low background noise that can be 100 to 1,000 time less than that which can come from emission sources in fluorescence based measurements5 and can have up to 90% quantum efficiencies6. In the last 20 years, the detection limit of luminescence-based methods has improved from 10-14 moles (10 femtomoles) to 10-18 moles (1 attomole) using reasonably priced reagents and luminometers.
Bioluminescent reactions, which are luminescent reactions catalyzed by enzymes, have the potential to measure a wide range of low molecular weight metabolites. The firefly luciferase (FFL) reaction below is a common bioluminescent reaction involving Adenosine Triphosphate (ATP:
Luciferin + ATP ⎯⎯⎯⎯⎯ →⎯ LuciferaseFirefly Oxyluciferin + AMP + CO2 + PP + Light (560nm). (1)
Metabolites can be measured by coupling the appropriate enzyme reaction(s) to an ATP bioluminescent reaction and measuring the light output. The specificity of the luminescence-based analysis is determined by the selectivity of a coupling reaction. Analytes of interest are measured by coupling them to enzymatic reactions that produce or consume ATP as follows:
Production: Analyte + ADP + Reagents ⎯⎯ →⎯Enzyme Products + ATP (2)
Competition: Analyte + ATP + Reagents ⎯⎯ →⎯Enzyme Products + ADP. (3)
Numerous metabolites can be measured using the ATP platform luminescent reaction (Equation 1) since many metabolites in the body are within one or two enzymatic reactions from ATP7. Even more metabolites can be measured by using reactions that produce or consume nicotinamide adenine dinucleotide (NADH) or H2O2. These reactions can be coupled to a bioluminescent platform consuming NADH through an oxidoreductase and bacterial luciferase reaction, or a chemiluminescent platform consuming H2O2 though a peroxidase reaction. Details of these platform reactions are discussed by Andrade et al.7, 8. These platforms have already been used to measure metabolites in solution, human blood (serum & plasma), and urine.
The changes in light intensity reflect stoichiometrically proportional changes in concentration of the platform molecule (ATP). The light intensity changes are proportional to the metabolite of interest. Equation 2 represents a production reaction, which feeds into one of the platform reactions (Equations 1). Higher concentrations of analyte produce more ATP and thus more photons (or photons per unit time) in production reactions. Competition reactions (Equation 3) consume more ATP, thus producing less intense signals as the concentration of the analyte increase.
Although bioluminescence-based analysis is well known and has been used regularly in research for sensitive reactions, it has not been widely applied to POC or routine clinical analysis due to issues associated with the enzymes. Luciferases have a reputation for being somewhat labile, unstable, and difficult to utilize, with precise and somewhat sophisticated protocols. However, there have been recent advances in enzyme stabilization techniques and highly active, thermally stable mutant luciferases that have become more available6, allowing bioluminescent detection assays to be prepared and stabilized with relatively straightforward protocols. Luciferases tend to be expensive, however the sensitivity of bioluminescence assays does not require large volumes for measuring microMolar analyte concentrations. Microfabrication and ink-jet dispensing make it possible to dispense small amount of enzymes, reducing the cost per test.
Through microfabrication and ink-jet dispensing, a bioluminescence based sensor capable of measuring multiple low molecular weight metabolites can be built. Different assay reagents can be deposited and lyophilized in separate reaction wells. Microfluidic structures can deliver sample aliquots to each well, whereupon the reagents rehydrate and the luminescent reactions begin. In addition to the ATP platform reaction, creatinine, galactose, and glucose assays were tested on a centrifugal based sample delivery system, or “ChemCD,” as described below.
1.2.1. Assays tested Serum creatinine measurements are used to assess kidney function and glomerular filtration rate6. Normal adult serum creatinine levels range from 50 to 100 µM. Since creatine concentration is relatively constant, the measurement of creatine in urine is used to allow for correction of urine dilution when measuring other analytes in urine. Creatine can be measured by coupling a two stage reaction, involving creatinine deaminase and N-methylhydantoinase, which competes for ATP in reaction (1):
Creatinine + H2O ⎯⎯⎯⎯⎯⎯ →← Deaminase Creatinine N-methylhydantoin + NH3
N-methylhydantoin + ATP ⎯⎯⎯⎯⎯⎯ →← ntoinaseMethylhyda-N N-carbamoylsarcosine + ADP + Pi. (5)
Galactose measurements are used in the management of galactosemia. Normal serum galactose concentration in newborns is 0-44 µM, while galactosemics can have galactose concentrations in the millimolar range6, 9. Galactose can be measured by competing for ATP in reaction (1) through the galactokinase reaction
Galactose + ATP ⎯⎯⎯⎯⎯⎯ →←++MgaseGalactokin ,
Galactose-1-Phosphate + ADP. (6)
Glucose is a frequently measured analyte and is commonly measured to help diabetics monitor and manage their blood glucose levels through diet and insulin injections. Glucose concentrations in blood can range from 3 to 6 mM in normal patients and 5 to 20 mM in diabetics. Glucokinase competes for ATP in reaction (1) as seen here:
Glucose + ATP ⎯⎯⎯⎯ →← eGlucokinas ADP + Glucose-6-Phosphate. (7)
1.3. Centrifugal devices Simultaneous and quantitative measurements of multiple analytes through bioluminescence-based assays requires separation of sample aliquots. Since luminescent reactions involve cofactors that cannot be immobilized, reaction wells must be isolated, even if the enzymes are immobilized. If there was more than one reaction well in a channel, unbound reagents would flow from one well to another, causing crosstalk. Variations in sample volume could change the amount of analyte available to react as well as final enzyme concentrations after rehydration, thus affecting the luminescence.
Centrifugal pumping is an ideal sample delivery method for a bioluminescence-based POC device. It uses centrifugal force to move fluids radially outward from the center of a disk with fluidic channels. Centrifugal pumping is also capable of valving, decanting, calibration, mixing, metering, sample splitting, separation, and capillarity without sensitivity to bubbles, ions, or type of fluid1, 10. Microfabricated centrifugal devices have been used in a variety of commercial and research applications11. An extensive review of the principles of centrifugal pumping, fluid control, and applications was done by Zoval and Madou1. Only a few details are presented here.
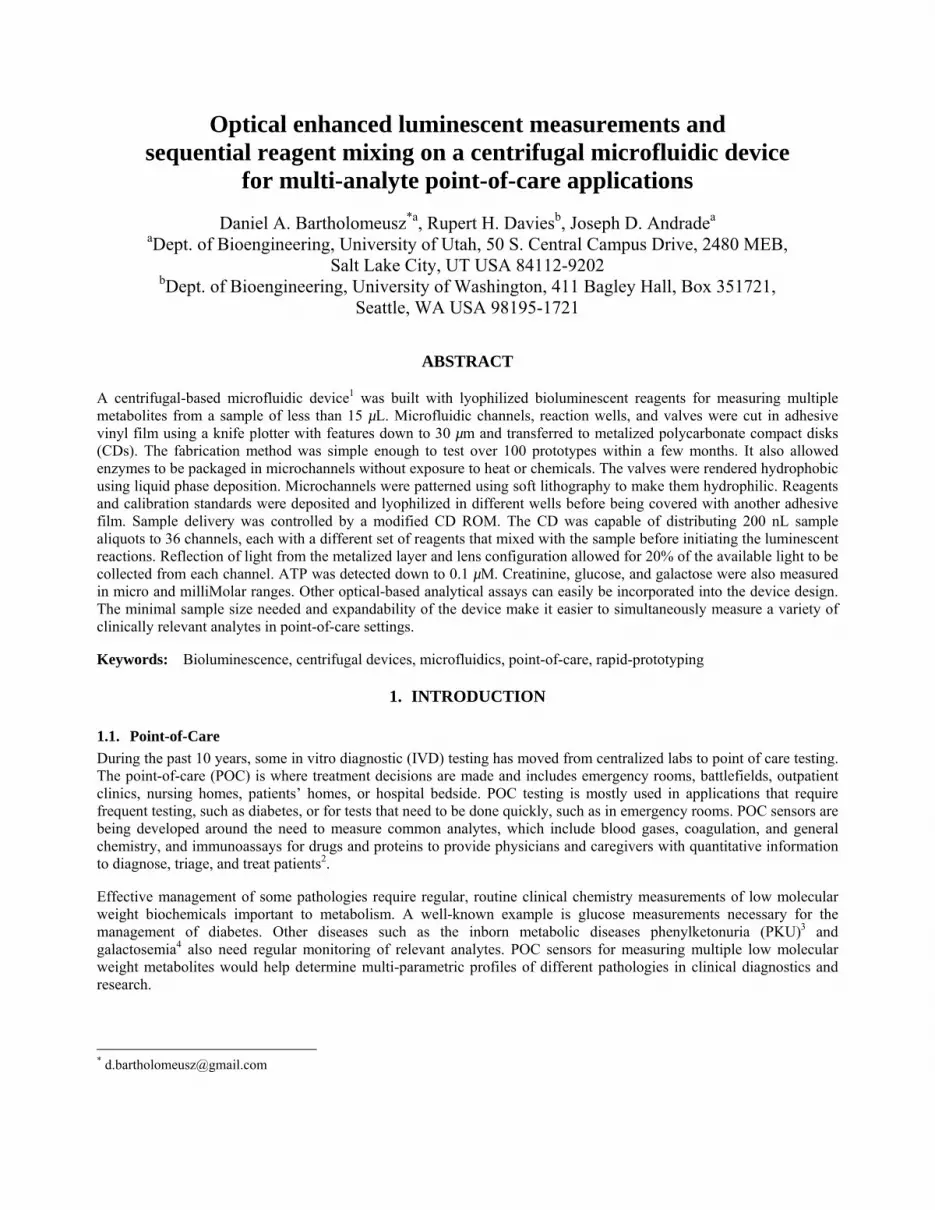
Passive valves, including hydrophobic and capillary valves, are commonly used in centrifugal devices1, 10 to meter, or aliquot, specific sample volumes for downstream reactions or other sensing functions1. This is done by filling liquid metering reservoirs through common distribution channels at a low rotation rate (Fig. 1a). The fluid stops at the passive valve barrier and the excess fluid leaves the distribution chamber as the device continues to spin, leaving a metered volume (Fig. 1b). This sample volume then passes the barrier by increasing the spin speed ω until the centrifugal pressure PC exceeds the valve’s burst pressure PV (Fig. 1c).
The effectiveness of hydrophobic and capillary valves, i.e. the magnitude of PV, depends on the surface tension and contact angle of the fluid involved. Low surface tension fluids, including biological fluids, tend to have low contact angles, decreasing the maximum burst valve pressure for a given channel. Plasma’s surface tension ranges from 25 – 55 dynes/cm (σwater ~ 73 dynes/cm)12 because proteins are present in high concentrations (> 1 mg/mL)13 and act as a surfactant.
2. METHODOLOGY
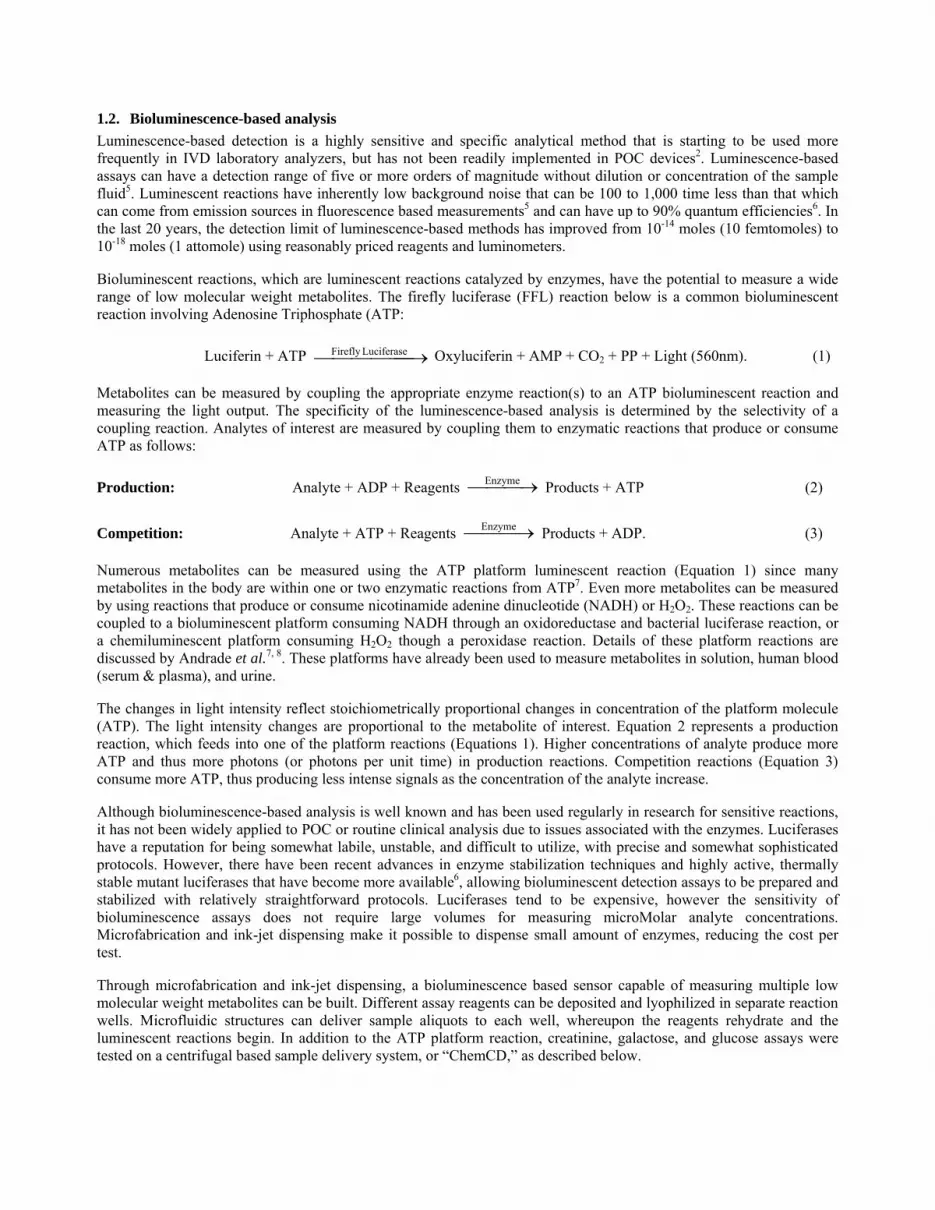
Zigzag shaped hydrophobic burst valves were built and tested on a compact disk (CD) shaped device to meter multiple aliquots of 200 nL samples into separate reaction channels (Fig. 2 & 3). The sample is delivered from a reservoir and pumped through a distribution channel to fill multiple metering chambers. Each channel had two wells, wherein reagents were deposited and lyophilized. After distributing the sample aliquots to each channel, the spin speed was increased to rehydrate and mix with the reagents. The bioluminescent reactions started as the sample, mixed with the reagents in the first well, entered into the 2nd reagent well/reaction well. The luminescent signal from each well was recorded as the CD rotated over a photomultiplier tube (PMT).
2.1. Fabrication Prototypes were built using xurography, which is a rapid prototyping method that uses a knife plotter to cut microfluidic structures in adhesive films14. This prototyping method was fast and inexpensive enough to allow the device to go through over 100 design iterations within a few months, until the final design in Fig. 3 was achieved. To summarize, a Graphtec FC5100A-75 knife plotter (Graphtec, Irvine, CA) was used to cut channel and cover layers in adhesive backed films, which were then transferred to a CD substrate (Fig. 3). First, channels, valves, and wells were cut in 100 µm thick QuantumTM 2000 calendared vinyl film (Gerber Scientific, South Windsor, CT). The channels and wells were removed, or weeded, and transferred to metalized polycarbonate CDs using an alignment jig described below. The channel layer was then modified to create hydrophobic valves and hydrophilic channels and wells (also described below). The reagents were deposited in the wells and then lyophilized. Finally, the channels were covered with a 75 µm thick Scotchcal 220 clear adhesive vinyl (3M, St. Paul, MN) with air holes cut in it using the knife plotter.
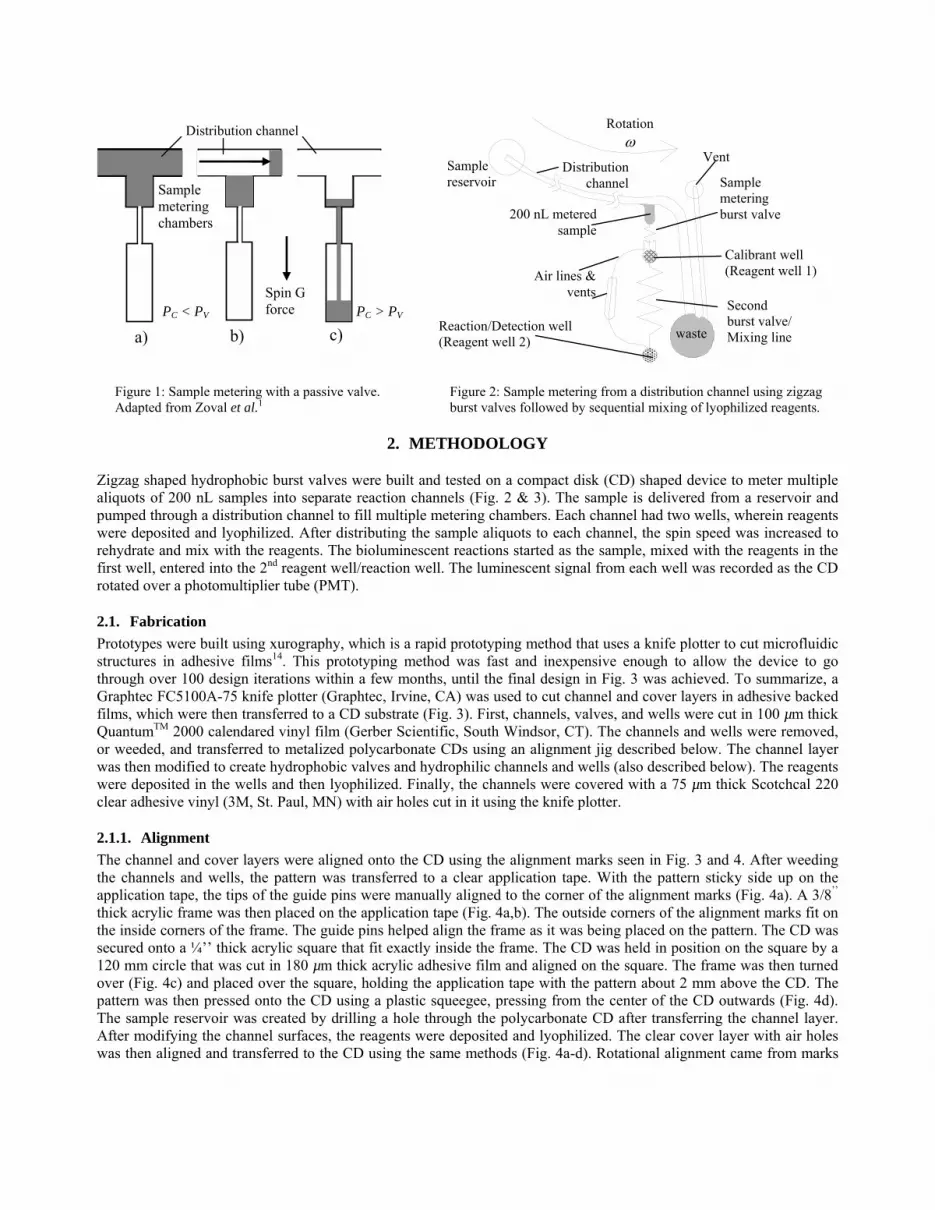
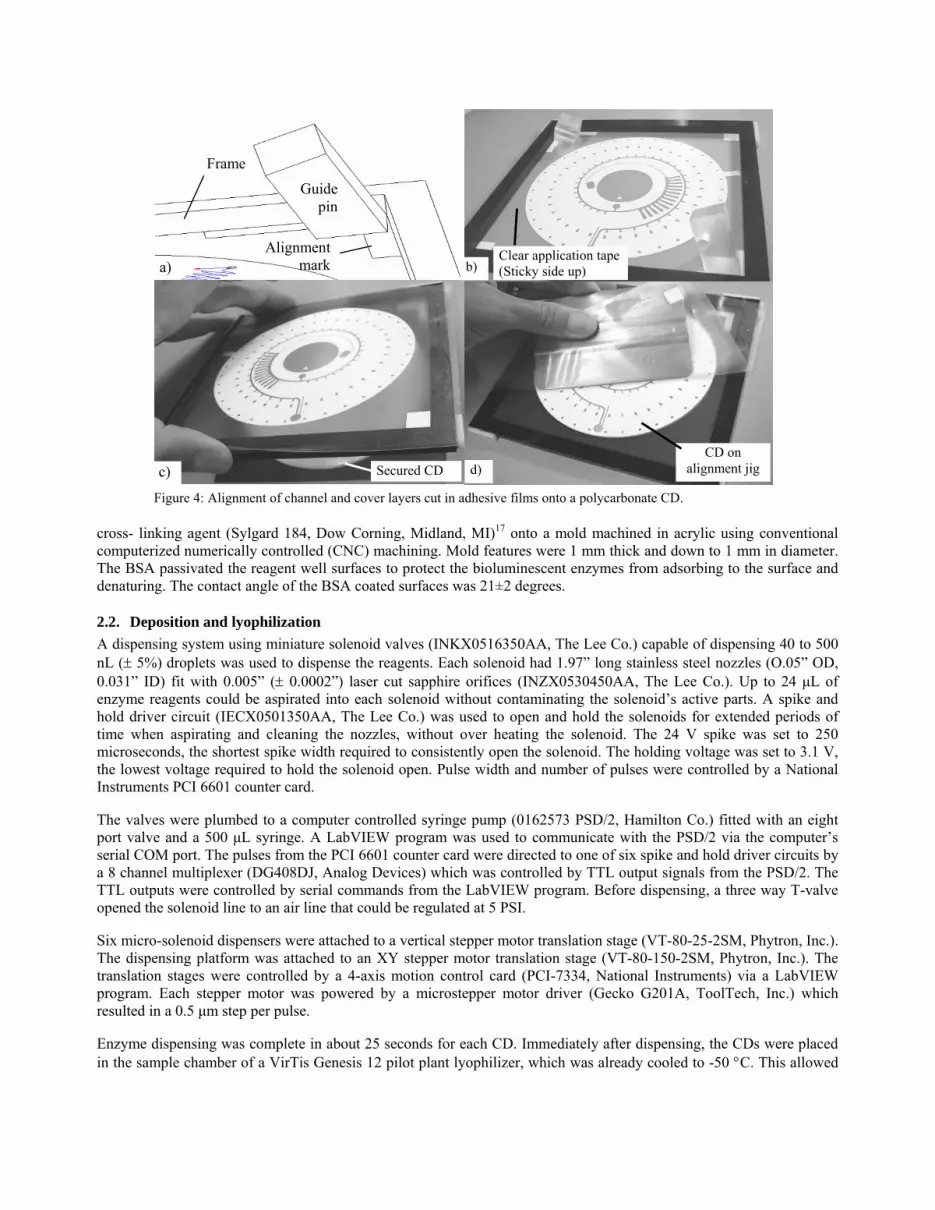
2.1.1. Alignment The channel and cover layers were aligned onto the CD using the alignment marks seen in Fig. 3 and 4. After weeding the channels and wells, the pattern was transferred to a clear application tape. With the pattern sticky side up on the application tape, the tips of the guide pins were manually aligned to the corner of the alignment marks (Fig. 4a). A 3/8’’
thick acrylic frame was then placed on the application tape (Fig. 4a,b). The outside corners of the alignment marks fit on the inside corners of the frame. The guide pins helped align the frame as it was being placed on the pattern. The CD was secured onto a ¼’’ thick acrylic square that fit exactly inside the frame. The CD was held in position on the square by a 120 mm circle that was cut in 180 µm thick acrylic adhesive film and aligned on the square. The frame was then turned over (Fig. 4c) and placed over the square, holding the application tape with the pattern about 2 mm above the CD. The pattern was then pressed onto the CD using a plastic squeegee, pressing from the center of the CD outwards (Fig. 4d). The sample reservoir was created by drilling a hole through the polycarbonate CD after transferring the channel layer. After modifying the channel surfaces, the reagents were deposited and lyophilized. The clear cover layer with air holes was then aligned and transferred to the CD using the same methods (Fig. 4a-d). Rotational alignment came from marks
a) b) c)
Sample metering chambers
PC < PV PC > PV Spin G force
Air lines & vents
Sample reservoir
Rotation ω
waste
Sample metering burst valve200 nL metered
sample
Calibrant well (Reagent well 1)
Reaction/Detection well (Reagent well 2)
Second burst valve/ Mixing line
Distribution channel
Vent
Distribution channel
Figure 1: Sample metering with a passive valve. Adapted from Zoval et al.1
Figure 2: Sample metering from a distribution channel using zigzag burst valves followed by sequential mixing of lyophilized reagents.
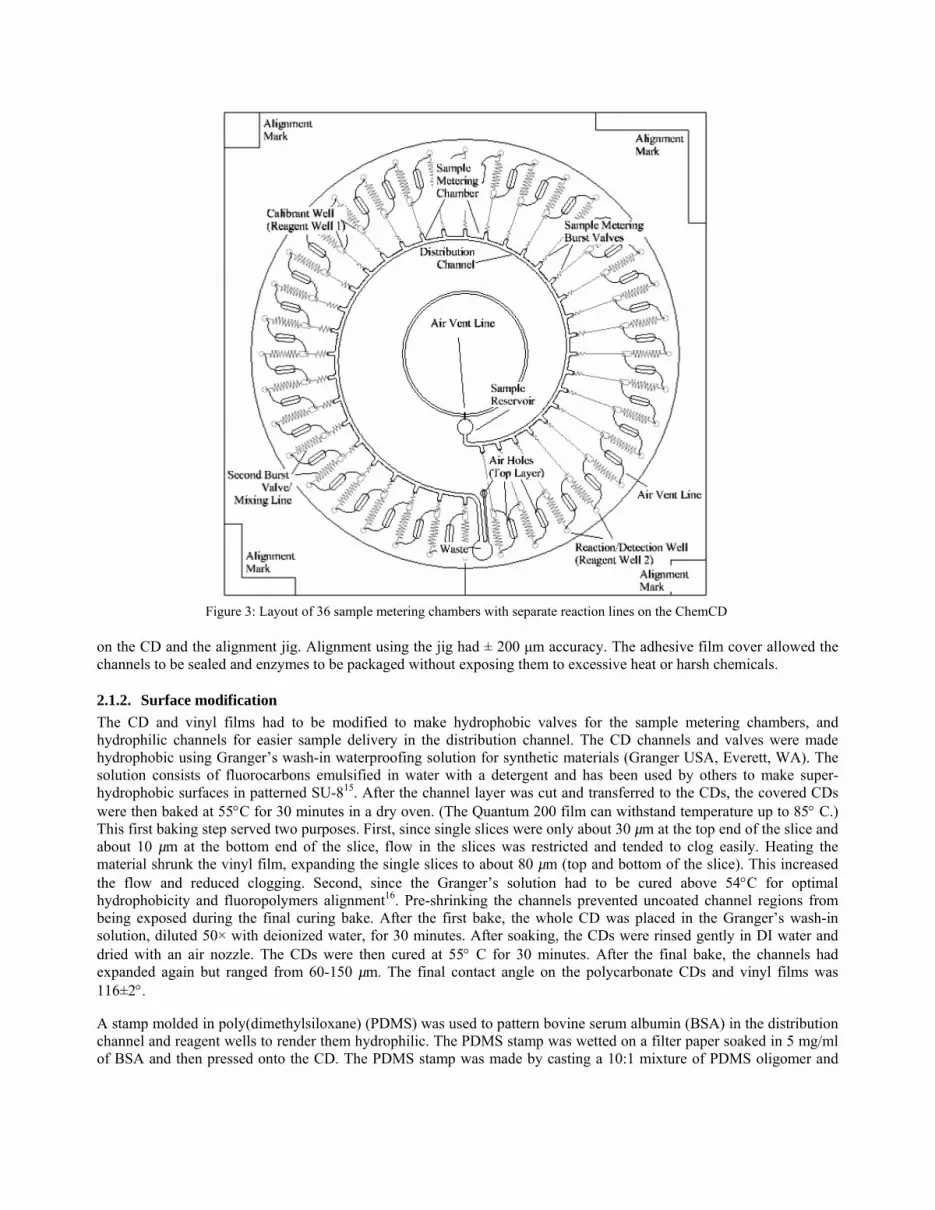
on the CD and the alignment jig. Alignment using the jig had ± 200 µm accuracy. The adhesive film cover allowed the channels to be sealed and enzymes to be packaged without exposing them to excessive heat or harsh chemicals.
2.1.2. Surface modification The CD and vinyl films had to be modified to make hydrophobic valves for the sample metering chambers, and hydrophilic channels for easier sample delivery in the distribution channel. The CD channels and valves were made hydrophobic using Granger’s wash-in waterproofing solution for synthetic materials (Granger USA, Everett, WA). The solution consists of fluorocarbons emulsified in water with a detergent and has been used by others to make super-hydrophobic surfaces in patterned SU-815. After the channel layer was cut and transferred to the CDs, the covered CDs were then baked at 55°C for 30 minutes in a dry oven. (The Quantum 200 film can withstand temperature up to 85° C.) This first baking step served two purposes. First, since single slices were only about 30 µm at the top end of the slice and about 10 µm at the bottom end of the slice, flow in the slices was restricted and tended to clog easily. Heating the material shrunk the vinyl film, expanding the single slices to about 80 µm (top and bottom of the slice). This increased the flow and reduced clogging. Second, since the Granger’s solution had to be cured above 54°C for optimal hydrophobicity and fluoropolymers alignment16. Pre-shrinking the channels prevented uncoated channel regions from being exposed during the final curing bake. After the first bake, the whole CD was placed in the Granger’s wash-in solution, diluted 50× with deionized water, for 30 minutes. After soaking, the CDs were rinsed gently in DI water and dried with an air nozzle. The CDs were then cured at 55° C for 30 minutes. After the final bake, the channels had expanded again but ranged from 60-150 µm. The final contact angle on the polycarbonate CDs and vinyl films was 116±2°.
A stamp molded in poly(dimethylsiloxane) (PDMS) was used to pattern bovine serum albumin (BSA) in the distribution channel and reagent wells to render them hydrophilic. The PDMS stamp was wetted on a filter paper soaked in 5 mg/ml of BSA and then pressed onto the CD. The PDMS stamp was made by casting a 10:1 mixture of PDMS oligomer and
Figure 3: Layout of 36 sample metering chambers with separate reaction lines on the ChemCD
cross- linking agent (Sylgard 184, Dow Corning, Midland, MI)17 onto a mold machined in acrylic using conventional computerized numerically controlled (CNC) machining. Mold features were 1 mm thick and down to 1 mm in diameter. The BSA passivated the reagent well surfaces to protect the bioluminescent enzymes from adsorbing to the surface and denaturing. The contact angle of the BSA coated surfaces was 21±2 degrees.
2.2. Deposition and lyophilization A dispensing system using miniature solenoid valves (INKX0516350AA, The Lee Co.) capable of dispensing 40 to 500 nL (± 5%) droplets was used to dispense the reagents. Each solenoid had 1.97” long stainless steel nozzles (O.05” OD, 0.031” ID) fit with 0.005” (± 0.0002”) laser cut sapphire orifices (INZX0530450AA, The Lee Co.). Up to 24 µL of enzyme reagents could be aspirated into each solenoid without contaminating the solenoid’s active parts. A spike and hold driver circuit (IECX0501350AA, The Lee Co.) was used to open and hold the solenoids for extended periods of time when aspirating and cleaning the nozzles, without over heating the solenoid. The 24 V spike was set to 250 microseconds, the shortest spike width required to consistently open the solenoid. The holding voltage was set to 3.1 V, the lowest voltage required to hold the solenoid open. Pulse width and number of pulses were controlled by a National Instruments PCI 6601 counter card.
The valves were plumbed to a computer controlled syringe pump (0162573 PSD/2, Hamilton Co.) fitted with an eight port valve and a 500 µL syringe. A LabVIEW program was used to communicate with the PSD/2 via the computer’s serial COM port. The pulses from the PCI 6601 counter card were directed to one of six spike and hold driver circuits by a 8 channel multiplexer (DG408DJ, Analog Devices) which was controlled by TTL output signals from the PSD/2. The TTL outputs were controlled by serial commands from the LabVIEW program. Before dispensing, a three way T-valve opened the solenoid line to an air line that could be regulated at 5 PSI.
Six micro-solenoid dispensers were attached to a vertical stepper motor translation stage (VT-80-25-2SM, Phytron, Inc.). The dispensing platform was attached to an XY stepper motor translation stage (VT-80-150-2SM, Phytron, Inc.). The translation stages were controlled by a 4-axis motion control card (PCI-7334, National Instruments) via a LabVIEW program. Each stepper motor was powered by a microstepper motor driver (Gecko G201A, ToolTech, Inc.) which resulted in a 0.5 µm step per pulse.
Enzyme dispensing was complete in about 25 seconds for each CD. Immediately after dispensing, the CDs were placed in the sample chamber of a VirTis Genesis 12 pilot plant lyophilizer, which was already cooled to -50 °C. This allowed
Figure 4: Alignment of channel and cover layers cut in adhesive films onto a polycarbonate CD.
Alignment mark
Guide pin
Frame
c) d) Secured CD
Clear application tape (Sticky side up) b) a)
CD on alignment jig
the reagents to freeze before evaporating, which would have denatured the enzymes. Primary lyophilization was performed at less than 100 mTorr with the condenser chamber cooled to –70˚C for 48-72 hr. Secondary lyophilization was then performed for 12-24 hours after changing the sample chamber to 25 ˚C at an average ramp rate of ~3 ˚C/hr. After lyophilization, the CDs were sealed with the cover layer as described above and stored in vacuum sealed aluminium coated nylon pouches.
2.3. Assays tested The basic ATP bioluminescence assay was tested in the ChemCD to determine detection limits and the potential of onboard calibration. ATP was dispensed into the calibration wells (reagent well 1) in seven channels in different amounts and then allowed to air dry. During sample delivery, the ATP in each channel mixed with the 200 nL of metered sample of deionized (DI) water to act as a standard. Final concentrations of the sample mixed with the standards ranged from 0.001 µM to 100 µm in logarithmic increments, plus one blank. The standards then moved downstream to mix with the FFL reagents in the 2nd reagent wells. These 7 channels were repeated 5 times on the CD, leaving the 36th channel empty as a blank. The enzyme concentrations (200 µL each) dispensed in the reaction wells (reagent well 2) are listed in Table 1. The ATP test CDs also compared enzyme concentrations. 14 channels used 1 µM of firefly luciferase (FFL), another 14 used 2 µM, and another 7 used 5 µM FFL. The enzyme reagents were then dispensed into the reagent wells.
ChemCDs with assays for measuring creatinine, galactose, and glucose were also tested. The reagents and enzymes used are listed in Table 2. The ATP for the competition with the FFL reaction was placed in the first reagent well. The remaining reagents were dispensed and lyophilized in the 2nd reagent wells. Samples with varying concentrations of creatinine, galactose, and glucose were dispensed onto different CDs and the results were compared.
2.4. Sample delivery
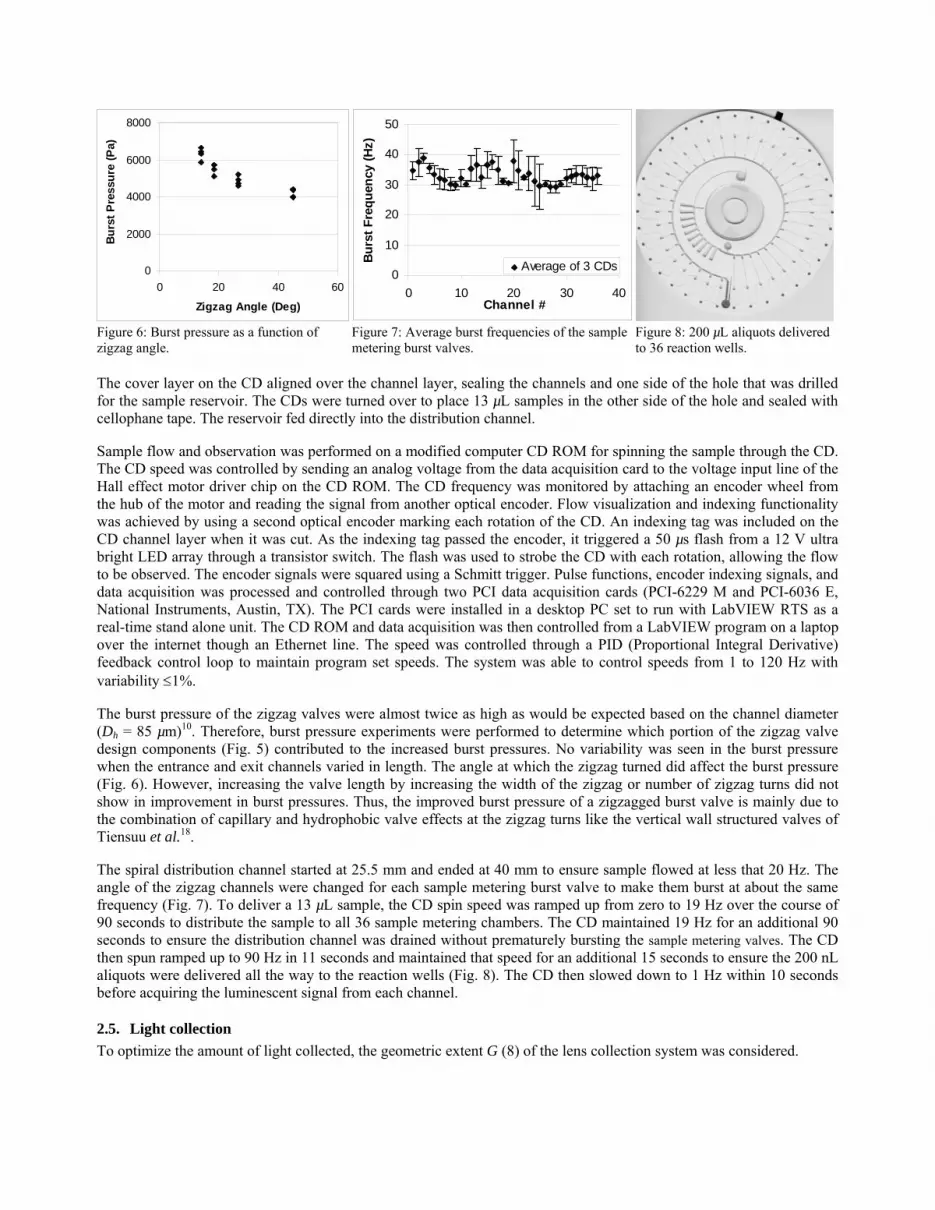
Figure 5: Example zigzag valve.
2nd Reagent
Well (200 µL)
Assay Recipe (in µM)
Wells 1-14
Wells15-28
Wells 29-35 Supplier
Firefly Lucif-erase
1 2 5 Promega
Plat
form
A
ssay
Lucif-erin
100 100 100 Biosynth
Tricine pH 7.8
100,000 Sigma
BSA 2 mg/mL Sigma PEG (8kD)
2mg/mL Sigma
CoA 100 Fluka Mannitol
200,000 Pfanstiehl
Buf
fer/
exci
pien
ts
DTT 10,000 Fluka
Table 1: Assay concentrations for ATP tests.
Assay Recipe
(in µM) Creatinine Galactose Glucose SupplierATP stock 200 200 1,000 Sigma Mg2+ (as SO4) 5,000 5,000 50,000 Sigma Volume of ATP stock (nL)
200 40 200
1st R
eage
nt W
ell
Initi
atin
g re
agen
ts fo
r co
mpe
titio
n as
say
Rehydrated ATP concentration
200 40 1,000
Creatine Deaminase
10 ICN
N-methylhy-dantoinase
4 Roche
NH4+ 60 Sigma
Galactokinase pH 8.5
1 U/mL Sigma
Ana
lyte
spec
ific
enzy
me
Glucokinase 10 Sigma Firefly Luciferase
1 Promega
Plat
form
as
say
Luciferin 100 Biosynth
Tricine pH 7.8 100,000 Sigma BSA 2 mg/mL Sigma PEG (8kD) 2mg/mL Sigma CoA 100 Fluka Mannitol 200,000 Pfanstiehl
2nd
Rea
gent
Wel
l (20
0 nL
dis
pens
ed)
Buf
fer/
exci
pien
ts
DTT 10,000 Fluka
Table 2: Assay concentrations for creatinine, galactose, and glucose tests.
Zigzag angle
Zigzag width
Entrance length
Exit length
The cover layer on the CD aligned over the channel layer, sealing the channels and one side of the hole that was drilled for the sample reservoir. The CDs were turned over to place 13 µL samples in the other side of the hole and sealed with cellophane tape. The reservoir fed directly into the distribution channel.
Sample flow and observation was performed on a modified computer CD ROM for spinning the sample through the CD. The CD speed was controlled by sending an analog voltage from the data acquisition card to the voltage input line of the Hall effect motor driver chip on the CD ROM. The CD frequency was monitored by attaching an encoder wheel from the hub of the motor and reading the signal from another optical encoder. Flow visualization and indexing functionality was achieved by using a second optical encoder marking each rotation of the CD. An indexing tag was included on the CD channel layer when it was cut. As the indexing tag passed the encoder, it triggered a 50 µs flash from a 12 V ultra bright LED array through a transistor switch. The flash was used to strobe the CD with each rotation, allowing the flow to be observed. The encoder signals were squared using a Schmitt trigger. Pulse functions, encoder indexing signals, and data acquisition was processed and controlled through two PCI data acquisition cards (PCI-6229 M and PCI-6036 E, National Instruments, Austin, TX). The PCI cards were installed in a desktop PC set to run with LabVIEW RTS as a real-time stand alone unit. The CD ROM and data acquisition was then controlled from a LabVIEW program on a laptop over the internet though an Ethernet line. The speed was controlled through a PID (Proportional Integral Derivative) feedback control loop to maintain program set speeds. The system was able to control speeds from 1 to 120 Hz with variability ≤1%.
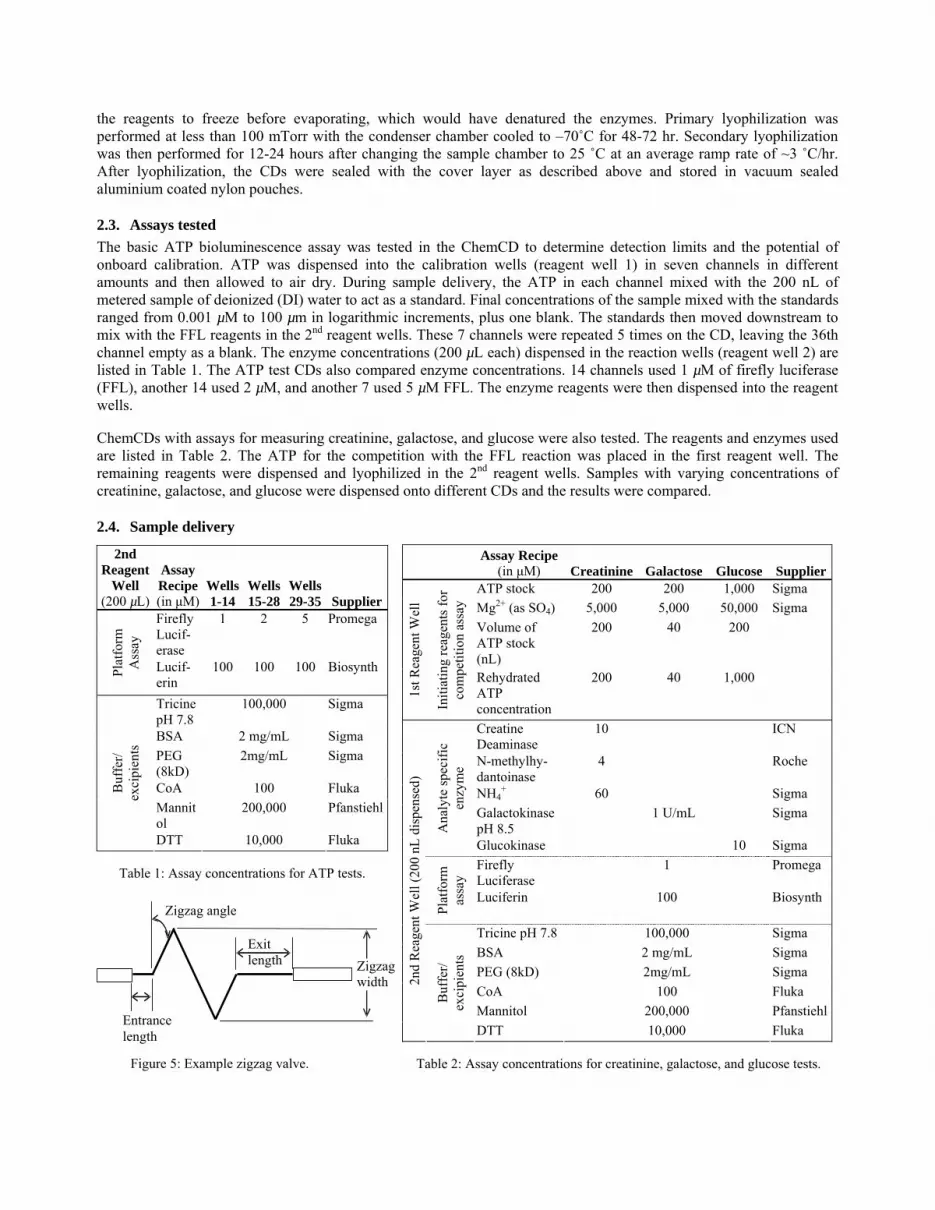
The burst pressure of the zigzag valves were almost twice as high as would be expected based on the channel diameter (Dh = 85 µm)10. Therefore, burst pressure experiments were performed to determine which portion of the zigzag valve design components (Fig. 5) contributed to the increased burst pressures. No variability was seen in the burst pressure when the entrance and exit channels varied in length. The angle at which the zigzag turned did affect the burst pressure (Fig. 6). However, increasing the valve length by increasing the width of the zigzag or number of zigzag turns did not show in improvement in burst pressures. Thus, the improved burst pressure of a zigzagged burst valve is mainly due to the combination of capillary and hydrophobic valve effects at the zigzag turns like the vertical wall structured valves of Tiensuu et al.18.
The spiral distribution channel started at 25.5 mm and ended at 40 mm to ensure sample flowed at less that 20 Hz. The angle of the zigzag channels were changed for each sample metering burst valve to make them burst at about the same frequency (Fig. 7). To deliver a 13 µL sample, the CD spin speed was ramped up from zero to 19 Hz over the course of 90 seconds to distribute the sample to all 36 sample metering chambers. The CD maintained 19 Hz for an additional 90 seconds to ensure the distribution channel was drained without prematurely bursting the sample metering valves. The CD then spun ramped up to 90 Hz in 11 seconds and maintained that speed for an additional 15 seconds to ensure the 200 nL aliquots were delivered all the way to the reaction wells (Fig. 8). The CD then slowed down to 1 Hz within 10 seconds before acquiring the luminescent signal from each channel.
2.5. Light collection To optimize the amount of light collected, the geometric extent G (8) of the lens collection system was considered.
Figure 7: Average burst frequencies of the sample metering burst valves.
Figure 6: Burst pressure as a function of zigzag angle.
0
2000
4000
6000
8000
0 20 40 60
Zigzag Angle (Deg)
Burs
t Pre
ssur
e (P
a)
0
10
20
30
40
50
0 10 20 30 40Channel #
Burs
t Fre
quen
cy (H
z)
Average of 3 CDs
b)
Figure 8: 200 µL aliquots delivered to 36 reaction wells.
⎥⎦⎤
⎢⎣⎡
⎟⎠⎞
⎜⎝⎛
⎟⎠⎞⎜
⎝⎛−≈Ω= f
DaTanAAG LSS 2cos12π (8)
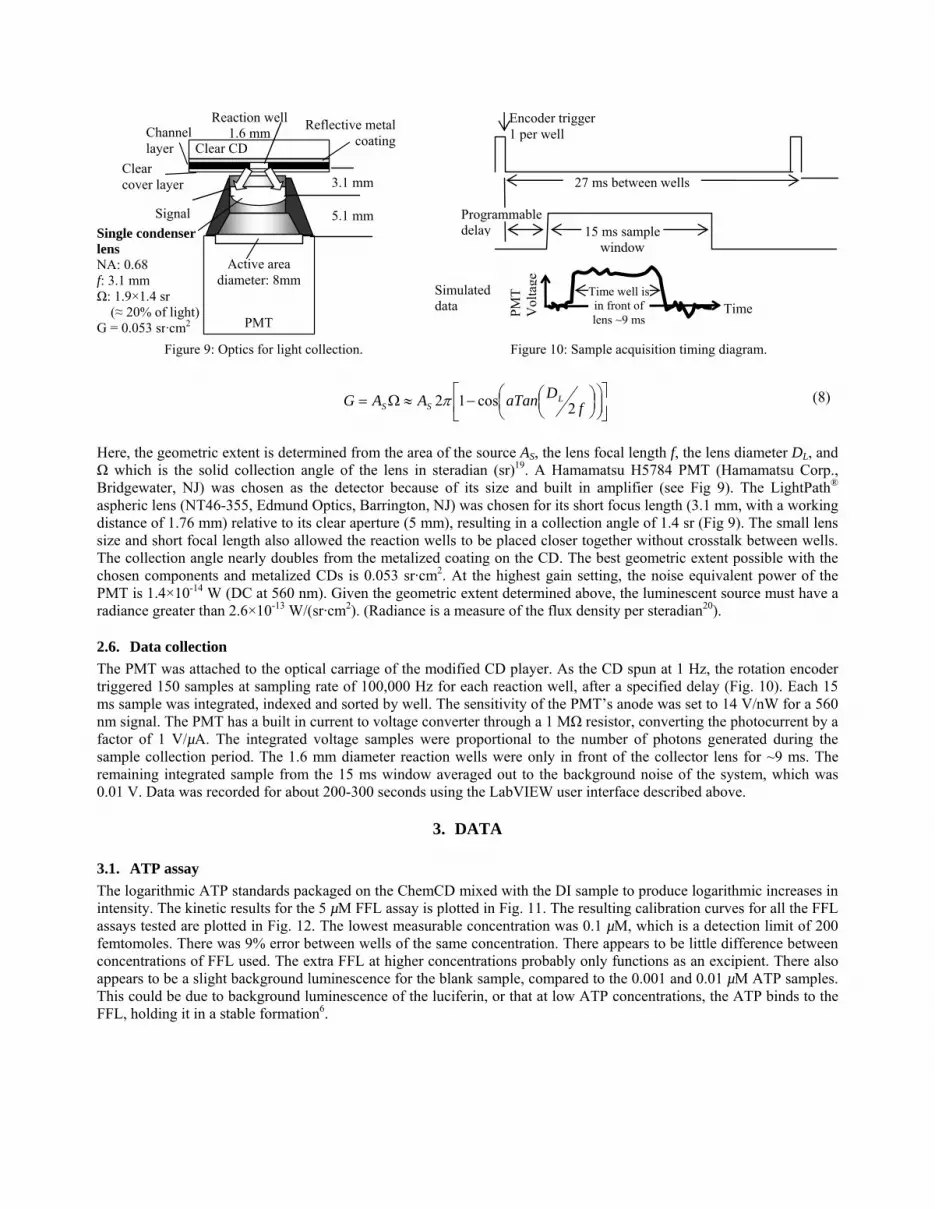
Here, the geometric extent is determined from the area of the source AS, the lens focal length f, the lens diameter DL, and Ω which is the solid collection angle of the lens in steradian (sr)19. A Hamamatsu H5784 PMT (Hamamatsu Corp., Bridgewater, NJ) was chosen as the detector because of its size and built in amplifier (see Fig 9). The LightPath® aspheric lens (NT46-355, Edmund Optics, Barrington, NJ) was chosen for its short focus length (3.1 mm, with a working distance of 1.76 mm) relative to its clear aperture (5 mm), resulting in a collection angle of 1.4 sr (Fig 9). The small lens size and short focal length also allowed the reaction wells to be placed closer together without crosstalk between wells. The collection angle nearly doubles from the metalized coating on the CD. The best geometric extent possible with the chosen components and metalized CDs is 0.053 sr·cm2. At the highest gain setting, the noise equivalent power of the PMT is 1.4×10⁻¹⁴ W (DC at 560 nm). Given the geometric extent determined above, the luminescent source must have a radiance greater than 2.6×10⁻¹³ W/(sr·cm2). (Radiance is a measure of the flux density per steradian20).
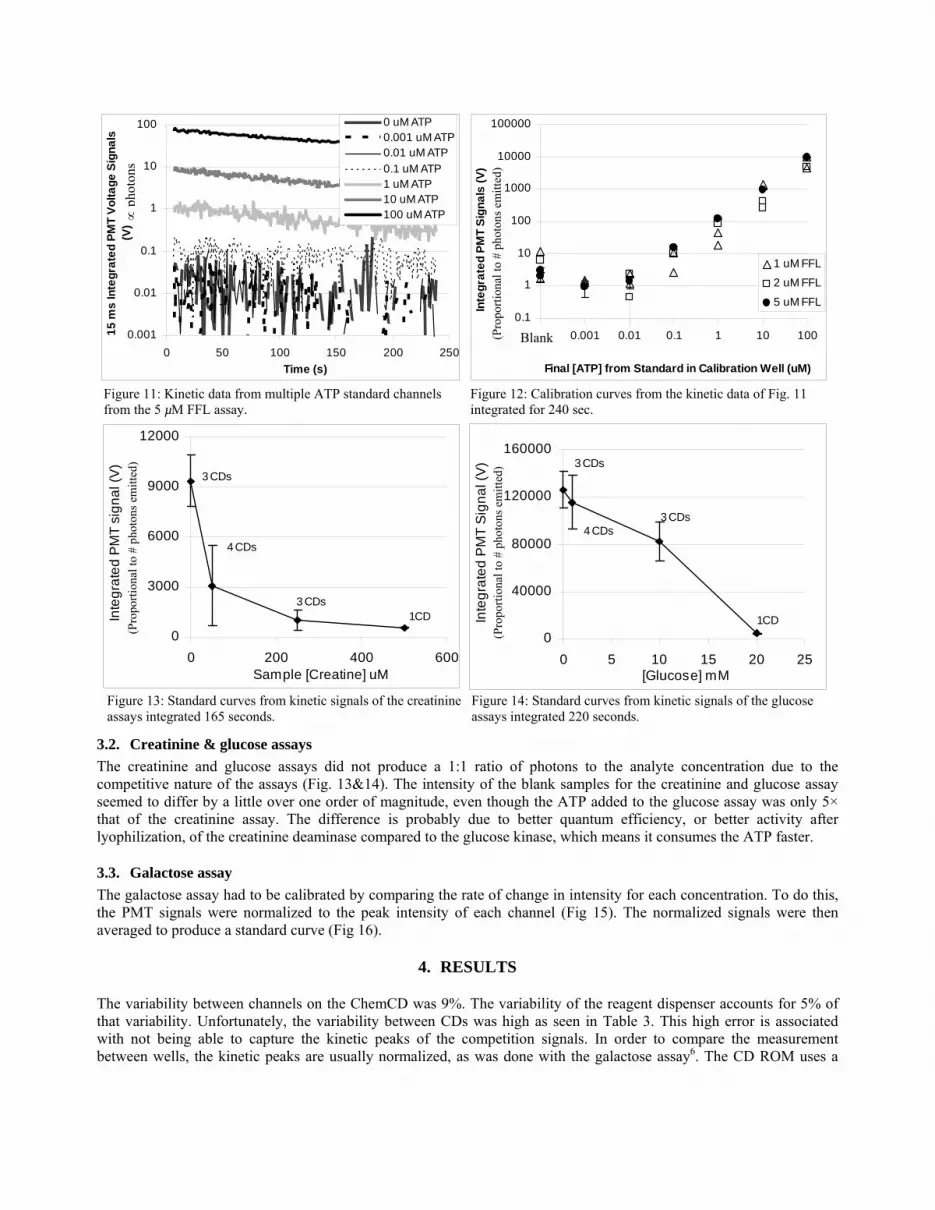
2.6. Data collection The PMT was attached to the optical carriage of the modified CD player. As the CD spun at 1 Hz, the rotation encoder triggered 150 samples at sampling rate of 100,000 Hz for each reaction well, after a specified delay (Fig. 10). Each 15 ms sample was integrated, indexed and sorted by well. The sensitivity of the PMT’s anode was set to 14 V/nW for a 560 nm signal. The PMT has a built in current to voltage converter through a 1 MΩ resistor, converting the photocurrent by a factor of 1 V/µA. The integrated voltage samples were proportional to the number of photons generated during the sample collection period. The 1.6 mm diameter reaction wells were only in front of the collector lens for ~9 ms. The remaining integrated sample from the 15 ms window averaged out to the background noise of the system, which was 0.01 V. Data was recorded for about 200-300 seconds using the LabVIEW user interface described above.
3. DATA
3.1. ATP assay The logarithmic ATP standards packaged on the ChemCD mixed with the DI sample to produce logarithmic increases in intensity. The kinetic results for the 5 µM FFL assay is plotted in Fig. 11. The resulting calibration curves for all the FFL assays tested are plotted in Fig. 12. The lowest measurable concentration was 0.1 µM, which is a detection limit of 200 femtomoles. There was 9% error between wells of the same concentration. There appears to be little difference between concentrations of FFL used. The extra FFL at higher concentrations probably only functions as an excipient. There also appears to be a slight background luminescence for the blank sample, compared to the 0.001 and 0.01 µM ATP samples. This could be due to background luminescence of the luciferin, or that at low ATP concentrations, the ATP binds to the FFL, holding it in a stable formation6.
Figure 10: Sample acquisition timing diagram. Figure 9: Optics for light collection.
Clear CD
Reflective metalcoatingChannel
layer Clear cover layer
PMT
Active area diameter: 8mm
Signal
Reaction well 1.6 mm
3.1 mm
5.1 mm Single condenser lens NA: 0.68 f: 3.1 mm Ω: 1.9×1.4 sr (≈ 20% of light) G = 0.053 sr·cm2
Simulated data TimePM
T V
olta
ge
Time well is in front of lens ~9 ms
15 ms sample window
27 ms between wells
Programmable delay
Encoder trigger 1 per well
3.2. Creatinine & glucose assays The creatinine and glucose assays did not produce a 1:1 ratio of photons to the analyte concentration due to the competitive nature of the assays (Fig. 13&14). The intensity of the blank samples for the creatinine and glucose assay seemed to differ by a little over one order of magnitude, even though the ATP added to the glucose assay was only 5× that of the creatinine assay. The difference is probably due to better quantum efficiency, or better activity after lyophilization, of the creatinine deaminase compared to the glucose kinase, which means it consumes the ATP faster.
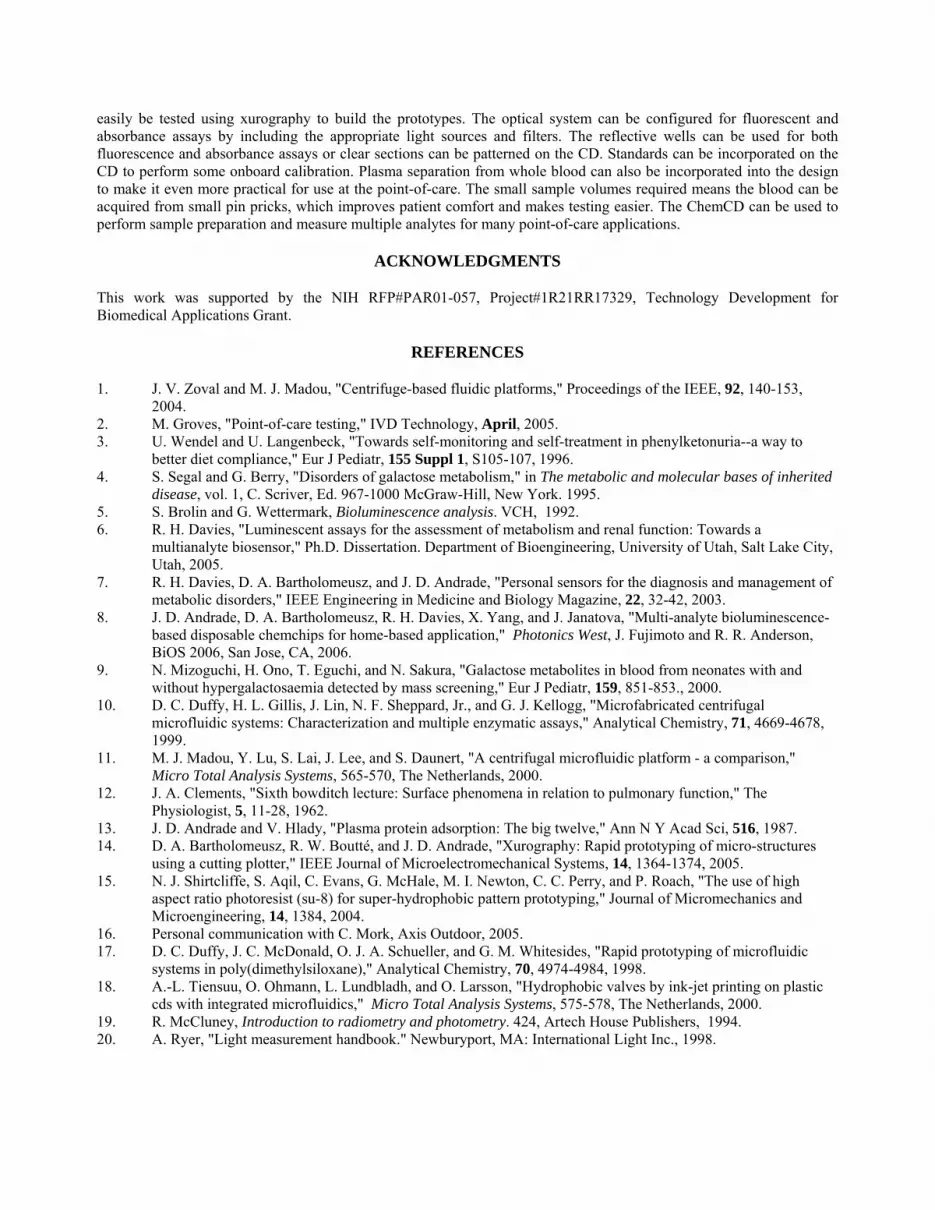
3.3. Galactose assay The galactose assay had to be calibrated by comparing the rate of change in intensity for each concentration. To do this, the PMT signals were normalized to the peak intensity of each channel (Fig 15). The normalized signals were then averaged to produce a standard curve (Fig 16).
4. RESULTS
The variability between channels on the ChemCD was 9%. The variability of the reagent dispenser accounts for 5% of that variability. Unfortunately, the variability between CDs was high as seen in Table 3. This high error is associated with not being able to capture the kinetic peaks of the competition signals. In order to compare the measurement between wells, the kinetic peaks are usually normalized, as was done with the galactose assay6. The CD ROM uses a
0.1
1
10
100
1000
10000
100000
0.0001 0.001 0.01 0.1 1 10 100
Final [ATP] from Standard in Calibration Well (uM)
Inte
grat
ed P
MT
Sign
als
(V)
1 uM FFL
2 uM FFL
5 uM FFL
Blank0.001
0.01
0.1
1
10
100
0 50 100 150 200 250Time (s)
15 m
s In
tegr
ated
PM
T Vo
ltage
Sig
nals
(V
)0 uM ATP0.001 uM ATP0.01 uM ATP0.1 uM ATP1 uM ATP10 uM ATP100 uM ATP
6
Figure 11: Kinetic data from multiple ATP standard channels from the 5 µM FFL assay.
Figure 12: Calibration curves from the kinetic data of Fig. 11 integrated for 240 sec.
∝ p
hoto
ns
(Pro
porti
onal
to #
pho
tons
em
itted
)
0
3000
6000
9000
12000
0 200 400 600Sample [Creatine] uM
Inte
grat
ed P
MT
sign
al (V
)
3 CDs
4 CDs
3 CDs1 CD
Figure 13: Standard curves from kinetic signals of the creatinine assays integrated 165 seconds.
(Pro
porti
onal
to #
pho
tons
em
itted
)
Figure 14: Standard curves from kinetic signals of the glucose assays integrated 220 seconds.
0
40000
80000
120000
160000
0 5 10 15 20 25[Glucose] mM
Inte
grat
ed P
MT
Sig
nal (
V)
1 CD
3 CDs4 CDs
3 CDs
(Pro
porti
onal
to #
pho
tons
em
itted
)
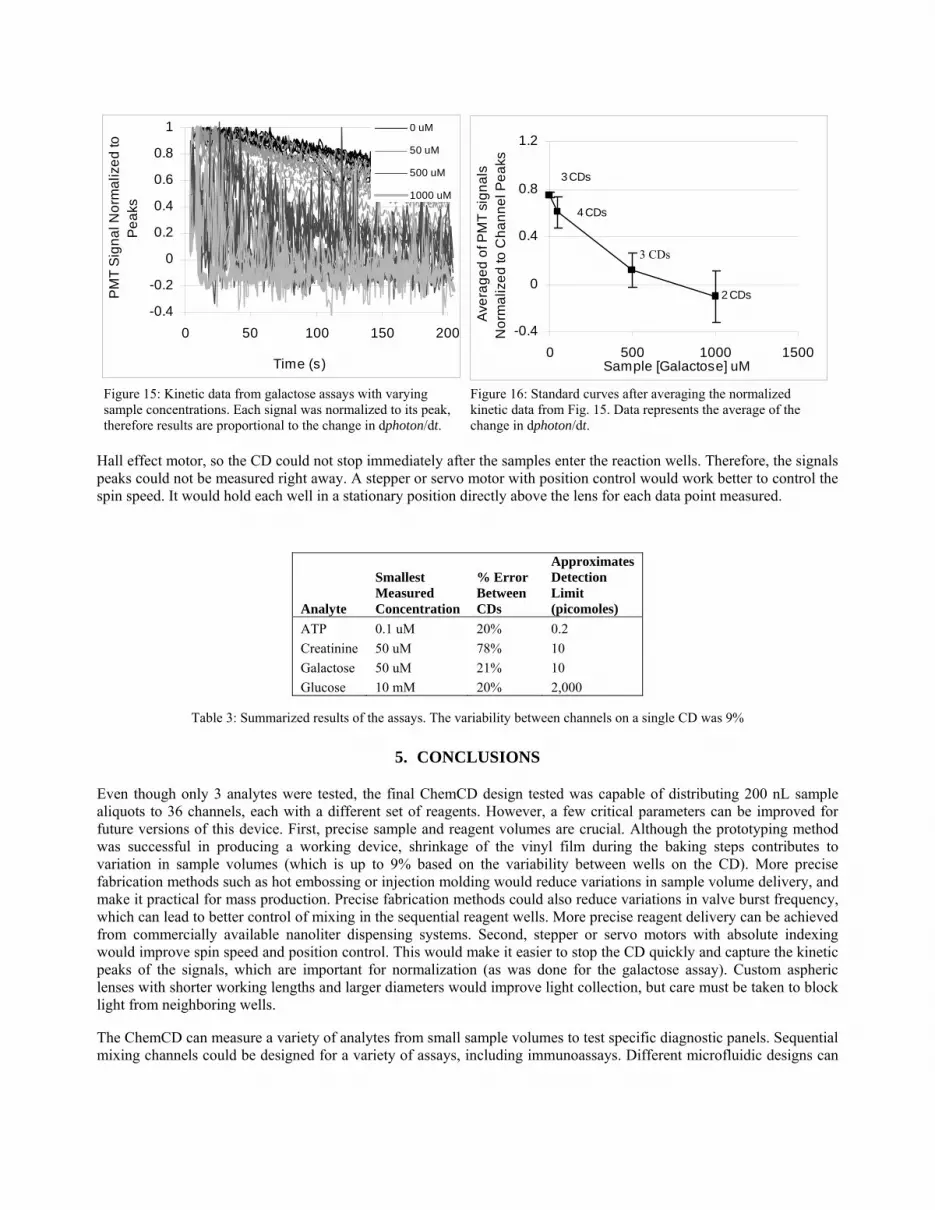
Hall effect motor, so the CD could not stop immediately after the samples enter the reaction wells. Therefore, the signals peaks could not be measured right away. A stepper or servo motor with position control would work better to control the spin speed. It would hold each well in a stationary position directly above the lens for each data point measured.
Analyte
Smallest Measured Concentration
% Error Between CDs
Approximates Detection Limit (picomoles)
ATP 0.1 uM 20% 0.2 Creatinine 50 uM 78% 10 Galactose 50 uM 21% 10 Glucose 10 mM 20% 2,000
Table 3: Summarized results of the assays. The variability between channels on a single CD was 9%
5. CONCLUSIONS
Even though only 3 analytes were tested, the final ChemCD design tested was capable of distributing 200 nL sample aliquots to 36 channels, each with a different set of reagents. However, a few critical parameters can be improved for future versions of this device. First, precise sample and reagent volumes are crucial. Although the prototyping method was successful in producing a working device, shrinkage of the vinyl film during the baking steps contributes to variation in sample volumes (which is up to 9% based on the variability between wells on the CD). More precise fabrication methods such as hot embossing or injection molding would reduce variations in sample volume delivery, and make it practical for mass production. Precise fabrication methods could also reduce variations in valve burst frequency, which can lead to better control of mixing in the sequential reagent wells. More precise reagent delivery can be achieved from commercially available nanoliter dispensing systems. Second, stepper or servo motors with absolute indexing would improve spin speed and position control. This would make it easier to stop the CD quickly and capture the kinetic peaks of the signals, which are important for normalization (as was done for the galactose assay). Custom aspheric lenses with shorter working lengths and larger diameters would improve light collection, but care must be taken to block light from neighboring wells.
The ChemCD can measure a variety of analytes from small sample volumes to test specific diagnostic panels. Sequential mixing channels could be designed for a variety of assays, including immunoassays. Different microfluidic designs can
-0.4
0
0.4
0.8
1.2
0 500 1000 1500Sample [Galactose] uM
Aver
aged
of P
MT
sign
als
Nor
mal
ized
to C
hann
el P
eaks
4 CDs
3 CDs
3 CDs
2 CDs
Figure 15: Kinetic data from galactose assays with varying sample concentrations. Each signal was normalized to its peak, therefore results are proportional to the change in dphoton/dt.
Figure 16: Standard curves after averaging the normalized kinetic data from Fig. 15. Data represents the average of the change in dphoton/dt.
-0.4
-0.2
0
0.2
0.4
0.6
0.8
1
0 50 100 150 200
Time (s)
PM
T S
igna
l Nor
mal
ized
to
Pea
ks0 uM
50 uM
500 uM
1000 uM
3 CDs
easily be tested using xurography to build the prototypes. The optical system can be configured for fluorescent and absorbance assays by including the appropriate light sources and filters. The reflective wells can be used for both fluorescence and absorbance assays or clear sections can be patterned on the CD. Standards can be incorporated on the CD to perform some onboard calibration. Plasma separation from whole blood can also be incorporated into the design to make it even more practical for use at the point-of-care. The small sample volumes required means the blood can be acquired from small pin pricks, which improves patient comfort and makes testing easier. The ChemCD can be used to perform sample preparation and measure multiple analytes for many point-of-care applications.
ACKNOWLEDGMENTS
This work was supported by the NIH RFP#PAR01-057, Project#1R21RR17329, Technology Development for Biomedical Applications Grant.
REFERENCES
1. J. V. Zoval and M. J. Madou, "Centrifuge-based fluidic platforms," Proceedings of the IEEE, 92, 140-153, 2004.
2. M. Groves, "Point-of-care testing," IVD Technology, April, 2005. 3. U. Wendel and U. Langenbeck, "Towards self-monitoring and self-treatment in phenylketonuria--a way to
better diet compliance," Eur J Pediatr, 155 Suppl 1, S105-107, 1996. 4. S. Segal and G. Berry, "Disorders of galactose metabolism," in The metabolic and molecular bases of inherited
disease, vol. 1, C. Scriver, Ed. 967-1000 McGraw-Hill, New York. 1995. 5. S. Brolin and G. Wettermark, Bioluminescence analysis. VCH, 1992. 6. R. H. Davies, "Luminescent assays for the assessment of metabolism and renal function: Towards a
multianalyte biosensor," Ph.D. Dissertation. Department of Bioengineering, University of Utah, Salt Lake City, Utah, 2005.
7. R. H. Davies, D. A. Bartholomeusz, and J. D. Andrade, "Personal sensors for the diagnosis and management of metabolic disorders," IEEE Engineering in Medicine and Biology Magazine, 22, 32-42, 2003.
8. J. D. Andrade, D. A. Bartholomeusz, R. H. Davies, X. Yang, and J. Janatova, "Multi-analyte bioluminescence-based disposable chemchips for home-based application," Photonics West, J. Fujimoto and R. R. Anderson, BiOS 2006, San Jose, CA, 2006.
9. N. Mizoguchi, H. Ono, T. Eguchi, and N. Sakura, "Galactose metabolites in blood from neonates with and without hypergalactosaemia detected by mass screening," Eur J Pediatr, 159, 851-853., 2000.
10. D. C. Duffy, H. L. Gillis, J. Lin, N. F. Sheppard, Jr., and G. J. Kellogg, "Microfabricated centrifugal microfluidic systems: Characterization and multiple enzymatic assays," Analytical Chemistry, 71, 4669-4678, 1999.
11. M. J. Madou, Y. Lu, S. Lai, J. Lee, and S. Daunert, "A centrifugal microfluidic platform - a comparison," Micro Total Analysis Systems, 565-570, The Netherlands, 2000.
12. J. A. Clements, "Sixth bowditch lecture: Surface phenomena in relation to pulmonary function," The Physiologist, 5, 11-28, 1962.
13. J. D. Andrade and V. Hlady, "Plasma protein adsorption: The big twelve," Ann N Y Acad Sci, 516, 1987. 14. D. A. Bartholomeusz, R. W. Boutté, and J. D. Andrade, "Xurography: Rapid prototyping of micro-structures
using a cutting plotter," IEEE Journal of Microelectromechanical Systems, 14, 1364-1374, 2005. 15. N. J. Shirtcliffe, S. Aqil, C. Evans, G. McHale, M. I. Newton, C. C. Perry, and P. Roach, "The use of high
aspect ratio photoresist (su-8) for super-hydrophobic pattern prototyping," Journal of Micromechanics and Microengineering, 14, 1384, 2004.
16. Personal communication with C. Mork, Axis Outdoor, 2005. 17. D. C. Duffy, J. C. McDonald, O. J. A. Schueller, and G. M. Whitesides, "Rapid prototyping of microfluidic
systems in poly(dimethylsiloxane)," Analytical Chemistry, 70, 4974-4984, 1998. 18. A.-L. Tiensuu, O. Ohmann, L. Lundbladh, and O. Larsson, "Hydrophobic valves by ink-jet printing on plastic
cds with integrated microfluidics," Micro Total Analysis Systems, 575-578, The Netherlands, 2000. 19. R. McCluney, Introduction to radiometry and photometry. 424, Artech House Publishers, 1994. 20. A. Ryer, "Light measurement handbook." Newburyport, MA: International Light Inc., 1998.