twisted sister species of pygmy angelfishes: discordance between taxonomy, coloration, and...
TRANSCRIPT

Seediscussions,stats,andauthorprofilesforthispublicationat:https://www.researchgate.net/publication/230692866
Twistedsisterspeciesofpygmyangelfishes:Discordancebetweentaxonomy,coloration,andphylogenetics
ARTICLEinCORALREEFS·SEPTEMBER2012
ImpactFactor:3.32·DOI:10.1007/s00338-012-0907-y
CITATIONS
24
READS
97
7AUTHORS,INCLUDING:
BrianWBowen
UniversityofHawaiʻiatMānoa192PUBLICATIONS9,552CITATIONS
SEEPROFILE
MichelleRGaither
DurhamUniversity
50PUBLICATIONS671CITATIONS
SEEPROFILE
RichardLawrencePyle
BernicePauahiBishopMuseum
59PUBLICATIONS737CITATIONS
SEEPROFILE
LuizARocha
CaliforniaAcademyofSciences
93PUBLICATIONS2,514CITATIONS
SEEPROFILE
Allin-textreferencesunderlinedinbluearelinkedtopublicationsonResearchGate,
lettingyouaccessandreadthemimmediately.
Availablefrom:MichelleRGaither
Retrievedon:05February2016
REPORT
Twisted sister species of pygmy angelfishes: discordancebetween taxonomy, coloration, and phylogenetics
Joseph D. DiBattista • Ellen Waldrop • Brian W. Bowen •
Jennifer K. Schultz • Michelle R. Gaither • Richard L. Pyle •
Luiz A. Rocha
Received: 19 November 2011 / Accepted: 9 April 2012 / Published online: 5 May 2012
� Springer-Verlag 2012
Abstract The delineation of reef fish species by colora-
tion is problematic, particularly for the pygmy angelfishes
(genus Centropyge), whose vivid colors are sometimes the
only characters available for taxonomic classification. The
Lemonpeel Angelfish (Centropyge flavissima) has Pacific
and Indian Ocean forms separated by approximately
3,000 km and slight differences in coloration. These
disjunct populations hybridize with Eibl’s Angelfish
(Centropyge eibli) in the eastern Indian Ocean and the
Pearl-Scaled Angelfish (Centropyge vrolikii) in the western
Pacific. To resolve the evolutionary history of these species
and color morphs, we employed mitochondrial DNA
(mtDNA) cytochrome b and three nuclear introns (TMO,
RAG2, and S7). Phylogenetic analyses reveal three deep
mtDNA lineages (d = 7.0–8.3 %) that conform not to
species designation or color morph but to geographic
region: (1) most Pacific C. flavissima plus C. vrolikii, (2) C.
flavissima from the Society Islands in French Polynesia,
and (3) Indian Ocean C. flavissima plus C. eibli. In con-
trast, the nuclear introns each show a cluster of closely
related alleles, with frequency differences between the
three geographic groups. Hence, the mtDNA phylogeny
reveals a period of isolation (ca. 3.5–4.2 million years) typical
of congeneric species, whereas the within-lineage mtDNA
UST values and the nuclear DNA data reveal recent or ongoing
gene flow between species. We conclude that an ancient
divergence of C. flavissima, recorded in the non-recombining
mtDNA, was subsequently swamped by introgression and
hybridization in two of the three regions, with only the Society
Islands retaining the original C. flavissima haplotypes among
our sample locations. Alternatively, the yellow color pattern
of C. flavissima may have appeared independently in the
central Pacific Ocean and eastern Indian Ocean. Regardless of
how the pattern arose, C. flavissima seems to be retaining
species identity where it interbreeds with C. vrolikii and
C. eibli, and sexual or natural selection may help to maintain
color differences despite apparent gene flow.
Keywords Centropyge � Color variation � Coral reef fish �Hybridization � Incomplete lineage sorting �Mitochondrial DNA � Nuclear introns
Introduction
The delineation of species is important for preserving bio-
diversity, and yet, this process is fraught with difficulties
(Coyne and Orr 2004). The problem is particularly acute in
reef fishes, whose conspicuous colors are often the sole
character available to distinguish taxa. Coloration in fishes
serves various functions, including social communication,
camouflage, and mimicry, but it can also indicate repro-
ductive isolation if it serves as a cue in mate recognition
(Randall 1998; McMillan et al. 1999). If sexual selection is
strong (Puebla et al. 2007) or ecological differentiation is
rapid (Ramon et al. 2003; Choat 2006; Rocha and Bowen
2008), color polymorphisms in incipient reef fish species
Communicated by Biology Editor Prof. Philip Munday
J. D. DiBattista (&) � E. Waldrop � B. W. Bowen � J. K. Schultz
Hawai’i Institute of Marine Biology, P.O. Box 1346, Kane’ohe,
HI 96744, USA
e-mail: [email protected]
M. R. Gaither � L. A. Rocha
Section of Ichthyology, California Academy of Sciences,
55 Music Concourse Dr, San Francisco, CA 94118, USA
R. L. Pyle
Bernice P. Bishop Museum, 1525 Bernice St., Honolulu,
HI 96817, USA
123
Coral Reefs (2012) 31:839–851
DOI 10.1007/s00338-012-0907-y

may accumulate faster than genetic differences at neutral
markers, including mitochondrial DNA (mtDNA) genes
(Bowen et al. 2006). Therefore, as a taxonomic tool, color is
much more reliable when coupled with biogeographic,
genetic, or additional morphological data (Rocha 2004).
To explore the relationship between coloration, taxonomy,
and phylogeographic patterns, we surveyed the Lemonpeel
Angelfish (Centropyge flavissima [Cuvier 1831]) throughout
its Indo-Pacific range using mtDNA cytochrome b (cyt b) and
three nuclear introns (TMO, RAG2, and S7). C. flavissima
inhabits shallow lagoons or seaward reefs (Allen et al. 1998)
and has a long pelagic larval duration (PLD) relative to
other genera of angelfish (PLD = 28–32 days; Thresher and
Brothers 1985). C. flavissima is found at Christmas (S10�300,E105�400) and Cocos-Keeling (S12�100, E96�520) Islands in
the Indian Ocean and in the Western and Central Pacific
Ocean (east to the Marquesas Islands and north to the Line
Islands but not Hawaii; see Fig. 1), but despite its high dis-
persal potential, it is not found in most of the species rich
Coral Triangle region between the extremes of its range. This
disjunct distribution is coupled with subtle differences in
coloration; the blue ring around the eye characteristic of
Pacific C. flavissima is notably absent from Indian Ocean
populations, and a distinct black bar on the posterior margin of
the operculum is only present in the Pacific fish (Fig. 2; Allen
et al. 1998). A blue-rimmed black ocellate spot on the side of
the body during the juvenile stage of this species also appears
to persist in larger juveniles of the Indian Ocean form, com-
pared with the Pacific Ocean form (see photo on p. 131 of
Allen and Steene 1987). Our first aim is therefore to determine
whether these color differences represent separate popula-
tions or deeper evolutionary lineages.
Evidence from a molecular phylogeny of angelfishes
(Bellwood et al. 2004) indicates that the genus Centropyge is
not monophyletic. However, apart from coloration, C. fla-
vissima is indistinguishable from two other species within
this genus, Eibl’s Angelfish (Centropyge eibli Klausewitz
1963) and the Pearl-Scaled Angelfish (Centropyge vrolikii
[Bleeker 1853]). Although previous research focused on the
number of lateral-line or vertical scales as diagnostic char-
acters, these often vary with size of the specimen and are
therefore unreliable (Pyle 2003). C. eibli is found exclu-
sively in the eastern Indian Ocean (including parts of Indo-
nesia) and Northwestern Australia, whereas C. vrolikii is
distributed throughout the tropical western Pacific, from the
Coral Triangle east to the Marshall Islands and south to
Vanuatu and the Great Barrier Reef (Fig. 1). C. flavissima
regularly hybridizes with these two species in regions of
overlap (Pyle and Randall 1994; Hobbs et al. 2009).
The propensity of species in this genus to hybridize in
areas of sympatry, along with their outlined distributions and
morphological similarity, led Pyle (1992) to suggest that
they may form a single monophyletic group of recently
diverged species. In addition, a molecular phylogeny of the
Centropyge genus (M.R. Gaither et al. pers. comm.) unam-
biguously supports sister relationships (monophyly) among
these three species. Therefore, our second goal is to test
whether these three Indo-Pacific angelfish species represent
old lineages that have secondary contact or whether they
form a cluster of species that diverged recently.
Materials and methods
Sample collection
A total of 271 C. flavissima were collected at nine sites
while scuba diving or snorkeling between 2005 and 2010
(Fig. 1). Specimens of C. eibli (N = 7) and C. vrolikii
(N = 14) were also collected from several locations
(Fig. 1). Tissue samples were preserved in saturated salt-
DMSO (Seutin et al. 1991). Total genomic DNA was
extracted using the ‘‘HotSHOT’’ protocol (Meeker et al.
2007) and subsequently stored at -20 �C.
Mitochondrial DNA analysis
A 594-base pair (bp) segment of the mtDNA cyt b
gene was amplified using modified primers, which were
KIR
MORNUK
PAL
TOK
FIJ
= C. flavissima= C. vrolikii
= C. eibli
XMACOC
Species distribution
INDI
PAUPHO
GBR
OKI
CAR
Fig. 1 Scaled map indicating collection sites (site abbreviations are
provided in Table 1) for Centropyge flavissima (open circles) in the
Indo-Pacific. Additional specimens from two related angelfish
species, Centropyge eibli (filled black circles) and Centropygevrolikii (filled gray circles), which have been shown to hybridize in
areas of overlap with C. flavissima, were collected opportunistically
(additional site abbreviations include the Caroline Islands [CAR], the
Great Barrier Reef, Australia [GBR], Indonesia [IND], Okinawa,
Japan [OKI], and the Republic of Palau [PAU])
840 Coral Reefs (2012) 31:839–851
123

designed for these species (CFLM_FOR: 50-TCCCTCC
AACATTTCAGCAT-30; CFLM_REV: 50-TCTGGATCTC
CAAGCAGGTT-30). Polymerase chain reaction (PCR)
mixes contained 7.6 ll of BioMix solution (BioMix Red;
Bioline Ltd., London, UK), 0.26 lM of each primer, and
5–50 ng template DNA in 15 ll total volume. PCRs also
used an initial denaturing step at 95 �C for 3 min, then 35
cycles of amplification (30 s of denaturing at 94 �C, 45 s of
annealing at 62 �C, and 45 s of extension at 72 �C), fol-
lowed by a final extension at 72 �C for 10 min.
PCR products were visualized through 1.5 % agarose gel
electrophoresis and purified by incubating with exonuclease
I and shrimp alkaline phosphatase (ExoSAP; USB, Cleve-
land, OH, USA) at 37 �C for 60 min, followed by 85 �C for
15 min. All samples were sequenced in the forward direction
(and reverse direction for questionable cyt b haplotypes
[N = 6]) with fluorescently labeled dye terminators (Big-
Dye version 3.1, Applied Biosystems Inc., Foster City, CA,
USA) and analyzed using an ABI 3130XL Genetic Analyzer
(Applied Biosystems). The sequences were aligned, edited,
and trimmed to a uniform length using Geneious Pro vers.
4.8.4 (Drummond et al. 2009); unique mtDNA cyt b haplo-
types were deposited in GenBank (accession numbers:
JQ914310–JQ914394). jModelTest vers. 1.0.1 (Posada 2008;
but also see Guindon and Gascuel 2003) was used with an
Akaike information criterion (AIC) test to determine the
best nucleotide substitution model for our dataset; the
TIM1 ? G (Posada 2003) model with a gamma parameter
of 0.12 was here selected.
To evaluate phylogenetic relationships among cyt b
haplotypes, we constructed neighbor-joining (NJ) and
maximum-likelihood (ML) trees using PAUP* vers. 4.0
(Swofford 2000). For comparison, we constructed a Bayes-
ian tree using MRBAYES (Ronquist and Huelsenbeck 2003)
implemented in Geneious Pro. Bootstrap support values for
NJ and ML trees were calculated using default settings with
10,000 replicates; only nodes with bootstrap values[50 %
were considered. The Bayesian MCMC search strategy con-
sisted of four heated, 1 million step chains with an initial
burn-in of 100,000 steps. A single Centropyge bicolor sample
(Genbank accession number: JQ914309) was used to root the
tree. We calculated divergence between mitochondrial lin-
eages (here denoted d) as the uncorrected pairwise sequence
distance between lineages minus the pairwise sequence dis-
tance within a lineage using ARLEQUIN vers. 3.1 (Excoffier
et al. 2005). The evolutionary relationship among all angelfish
haplotypes was further explored with an unrooted network
constructed with NETWORK vers. 4.5.1.0 (www.fluxus-
engineering.com/network_terms.htm) using a median-join-
ing algorithm and default settings (as per Bandelt et al. 1999).
ARLEQUIN was used to calculate haplotype (h) and
nucleotide diversity (p), as well as to test for range-wide
patterns of population structure for C. flavissima. Initially,
global UST, which incorporates sequence divergence in
Fig. 2 ‘‘Pure’’ Centropyge flavissima (a Pacific Ocean morph, Mar-
shall Islands; d Indian Ocean morph, Christmas Island, Australia),
Centropyge vrolikii (c Indonesia), and Centropyge eibli (f Indonesia),
in addition to some hybrids between these species (b C. flavissima 9 C.
vrolikii, Guam; e C. vrolikii 9 C. eibli, Indonesia). Note the charac-
teristic blue ring around the orbit of the Pacific Ocean C. flavissimaspecimen (a), which is absent from the Indian Ocean C. flavissimaspecimen (d). Photo credit: Luiz Rocha
Coral Reefs (2012) 31:839–851 841
123

addition to allele frequency differentiation, was estimated
using analysis of molecular variance (AMOVA; Excoffier
et al. 1992); deviations from null distributions were tested
with nonparametric permutation procedures (N = 99,999).
Subsequently, pairwise UST statistics were generated to
identify particular sites associated with genetic partition-
ing. We controlled for false discovery rate using the
method of Narum (2006).
Deviations from neutral sequence evolution were asses-
sed with Fu’s FS (Fu 1997) for each population using
ARLEQUIN; significance was tested with 99,999 permuta-
tions. Each site (and lineage) was also fitted with the popu-
lation parameter s in order to estimate the time since the most
recent population (or lineage) expansion (as per Rogers and
Harpending 1992). Time since expansion was estimated
using the equation s = 2lt, where t is the age of the popu-
lation (or lineage) in generations, and l is the mutation
rate per generation for the sequence (l = number of
bp 9 divergence rate within a lineage 9 generation time in
years). We used a range of cyt b mutation rates, available
from previous fish studies: 1 % per million years (MY)
within lineages (Bowen et al. 2001; Reece et al. 2010) or
1.55 % per MY within lineages (Lessios 2008). While
generation time is unknown for our study species, we con-
ditionally used the equation T = (a ? x)/2, where a is the
age at first reproduction, and x is the age at last reproduction
(or longevity; Pianka 1978). We therefore obtained a gen-
eration time of 4 years for C. flavissima based on the study
of larval stages in captivity for this species (20 months to
reproductive maturity and 7-year longevity; Frank Baensch,
Reef Culture Technologies, LLC, Oahu, HI). Although
absolute expansion times should be interpreted with caution
owing to mutation rate and generation time estimates, rela-
tive comparisons are robust to such approximations.
Nuclear gene analysis
To provide independent estimates of phylogenetic rela-
tionships and ensure genealogical concordance across
multiple loci, we sequenced a subset of the specimens at
three nuclear genes. Individuals sequenced included
specimens from all species and across the three observed
mtDNA lineages (Lineage 1, N = 50; Lineage 2, N = 24;
Lineage 3, N = 34). Approximately 254 bp of the TMO
4C4 gene was amplified using the modified primers TMO
F1 (50-ACCTCTCATTAAGAAAMGAGTGTTTG-30) and
TMO R2 (50-TGCTTCTCAAATTCTTTMACCTS-30),122 bp of the recombination-activating gene 2 (RAG2) was
amplified using the modified primers RAG2 2F (50-SAC-
CTTGTGCTGCAAAGAGA-30) and RAG2 2R (50-GG
ATCCCCTTBTCATCCAGA-30), and 120 bp of the first
intron of the S7 ribosomal protein (S7) gene was amplified
using the primers S7RPEX1F (50-TGGCCTCTTCCT
TGGCCGTC-30) and S7RPEX2R (50-AACTCGTCTGGCT
TTTCGCC-30; Chow and Hazama 1998).
Sequences for each nuclear locus were aligned and edited
using Geneious Pro. In all cases, the alignment was unam-
biguous with no frameshift mutations or indels; unique geno-
types were deposited in GenBank (accession numbers:
JQ914560–JQ914585 [TMO], JQ914395–JQ914456 [RAG2],
JQ914457–JQ914559 [S7]). Allelic states of nuclear sequen-
ces trimmed to a uniform length, with more than one hetero-
zygous site, were estimated using the Bayesian program
PHASE vers. 2.1 (Stephens and Donnelly 2003) as imple-
mented in the software DnaSP vers. 5.0 (Librado and Rozas
2009). We conducted 3 runs in PHASE for each dataset with
a burn-in of 10,000, and 100,000 or 200,000 iterations. All
runs returned consistent allele identities, and PHASE was
able to differentiate most alleles with [85 % probability
except at single nucleotide positions in 3 individuals at
the TMO locus, 19 individuals at the RAG2 locus, and 28
individuals at the S7 locus (or 3, 17, and 26 % of the samples,
respectively), which were excluded from further analysis.
Unrooted median-joining networks were produced for
each nuclear dataset as outlined above. Although the S7
network was further simplified by removing all singleton
alleles (N = 4) to minimize circularity between closely
related alleles, this did not influence our overall interpre-
tation. ARLEQUIN was used to test for genetic structure
between lineages, color morphs, and previously recognized
species. Because jModelTest did not converge on a model
of sequence evolution for any nuclear locus, we calculated
global and pairwise FST values based on conventional
allele frequencies only.
Results
Mitochondrial DNA analysis
Phylogenetic analysis revealed that samples partitioned into
three reciprocally monophyletic lineages, based on cyt
b sequence data: (1) C. flavissima and C. vrolikii sampled
at most Pacific Ocean sites, which shared six haplotypes
between the species, (2) C. flavissima sampled at Moorea, and
(3) C. flavissima and C. eibli sampled at Indian Ocean sites,
which shared the most common haplotype (Fig. 3). Lineage 1
was 7.2 and 7.0 % divergent from Lineage 2 and Lineage 3,
respectively (which represents ca. 3.6 or 3.5 MY of separa-
tion, based on 2 % per MY between lineages), whereas
Lineage 2 was 8.3 % divergent from Lineage 3 (ca. 4.2 MY of
separation). Sequence divergence within each lineage, on the
other hand, was low (Lineage 1, d = 0.17–0.26 %; Lineage 2,
d = 0.20–0.31 %; Lineage 3, d = 0.15–0.22 %). The out-
group, C. bicolor, was 12.0–14.0 % divergent from the
C. flavissima complex.
842 Coral Reefs (2012) 31:839–851
123

Median-joining haplotype networks were consistent
with a scenario of minimal genetic differentiation within
each lineage and no shared haplotypes between geographic
groupings (Fig. 4). The only exception was Nuku Hiva in
the Marquesas Archipelago (within Lineage 1), which did
not share a haplotype with any other Pacific location and
was distinguished by two diagnostic mutations (at bp 300
and bp 567).
C. flavissima cyt b sequence data revealed 43, 19, and 17
haplotypes for Lineages 1, 2, and 3, respectively, with
h = 0.22 to 0.94 and p = 0.0004 to 0.0043 for individual
sample locations (Table 1). Nucleotide diversity was
almost twice as high in Lineage 2 (Moorea) versus Lineage
3 (Indian Ocean), which cannot be explained by a greater
sampling effort in the former (N = 45 vs. N = 66).
Tests of neutrality revealed negative and significant Fu’s
FS values at all sample sites (Fu’s FS = -18.28 to -2.58;
Table 1). Our estimates of s yielded time of expansion
approximations for each lineage, with Lineage 3
(63,000–97,600 years) expanding more recently than
either Lineage 1 (100,400–155,600 years) or Lineage 2
(131,700–204,200 years), although there was variability
among individual sites within lineages (Table 1).
AMOVA confirmed the geographic grouping based
on mtDNA lineages (overall UST = 0.98, P \ 0.001;
Table 2), with 97 % of the variation in haplotype diversity
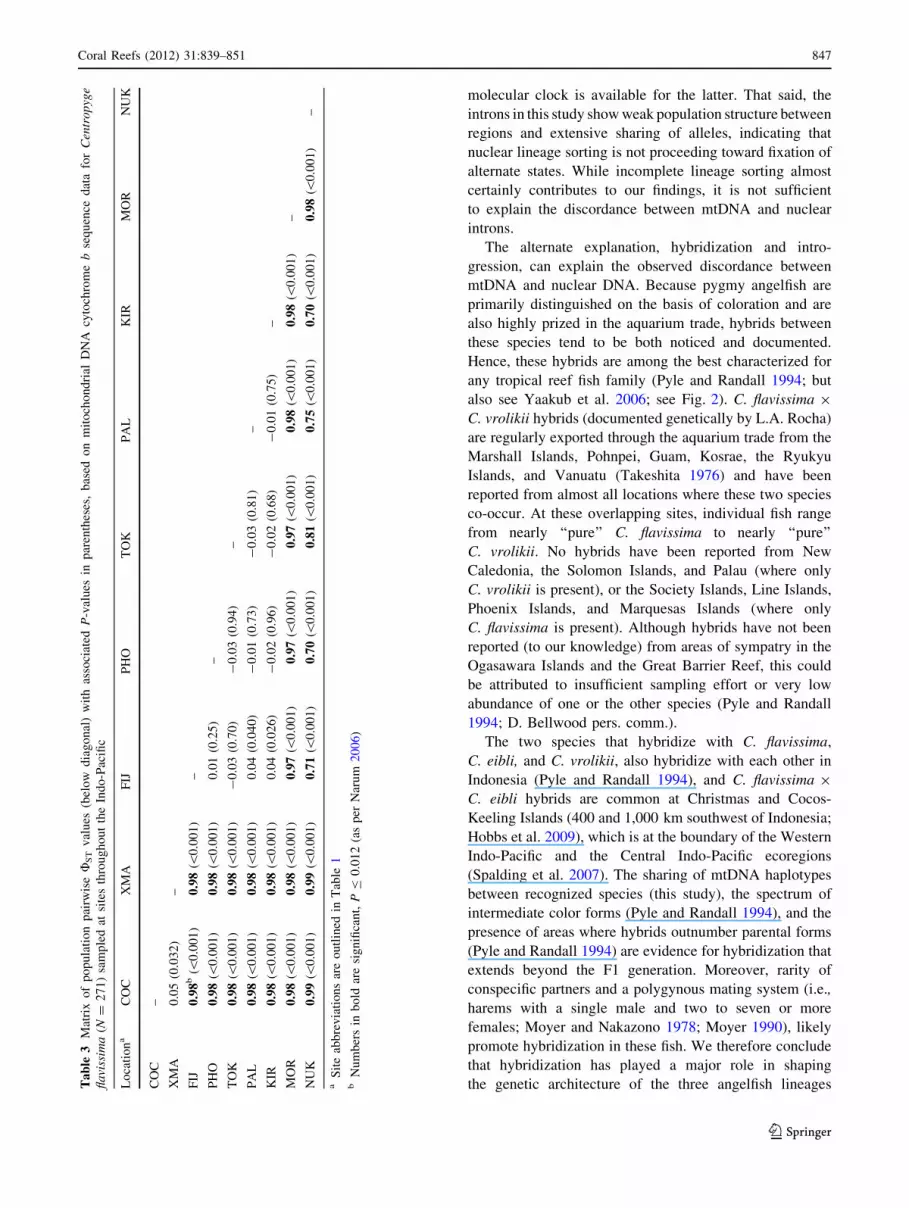
explained by these three groups. Population pairwise tests
also revealed that mtDNA haplotypes were significantly
different in 25 of 36 comparisons (all P \ 0.001; Table 3),
with estimates of UST ranging from -0.01 to 0.99. All UST
values were significant between geographic regions, but
Nuku Hiva (Marquesas Islands) was the only site that was
significantly different from other sites within regions
(UST = 0.70 to 0.81, all P \ 0.001; Table 3).
Nuclear gene analysis
Based on nuclear sequences from 108 angelfish specimens,
15 variable sites yielded 18 alleles at the TMO locus, 8
variable sites yielded 13 alleles at the RAG2 locus, and 7
variable sites yielded 12 alleles at the S7 locus. Median-
joining networks for all three nuclear genes revealed
common alleles at each locus that were shared among
every sampling site or putative species (Fig. 5). We did,
however, detect significant shifts in allele frequencies
among samples from Indian Ocean sites, Moorea, and
all other Pacific Ocean sites (TMO, FST = 0.062,
P \ 0.001; RAG2, FST = 0.024, P = 0.028; S7, FST =
0.062, P = 0.0013). We found few allele frequency dif-
ferences, however, among recognized species (TMO,
FST = 0.26, P \ 0.001; RAG2, FST = 0.040, P = 0.084;
S7, FST = 0.025, P = 0.12), and none between C. fla-
vissima color morphs (TMO, FST = 0.029, P = 0.33;
RAG2, FST = 0.028, P = 0.29; S7, FST = 0.041,
P = 0.22), indicating that these markers may be in the
process of segregating by location, albeit much more
slowly than the mtDNA.
Discussion
Our genetic survey of C. flavissima color morphs and two
closely related species (C. vrolikii and C. eibli) indicates
that previous taxonomic divisions are not compatible with
a molecular phylogenetic hypothesis. The mtDNA analyses
identified three monophyletic lineages that grouped by
sampling location rather than coloration or species desig-
nation. C. flavissima and C. vrolikii sampled at Pacific
Ocean sites grouped together in Lineage 1, C. flavissima
sampled at Moorea grouped in Lineage 2, and C. flavissima
and C. eibli sampled at Indian Ocean sites grouped in
Lineage 3. Our mtDNA results confirm that the two
C. flavissima color morphs, separated by approximately
3,000 km in adjacent ocean basins, are following inde-
pendent evolutionary trajectories with an approximate
divergence time of 3.5 MY. Genetic differentiation at the
three nuclear genes indicates concordant separation
between these three regional groups, although at the level
of allele frequency differences only. This is consistent with
recent work in other reef fish systems (e.g., Cleaner
Wrasse, Labroides dimidiatus, Drew et al. 2008; Brown-
cheek Blenny, Acanthemblemaria crockery, Lin et al.
2009), where location but not phenotype dictates the
genetic affinity of color morphs.
Discordance between genetic divergence and coloration
is well documented in butterflyfishes (family Chaetodonti-
dae: McMillan and Palumbi 1995), the sister family to
marine angelfishes, and in hamlets (Ramon et al. 2003;
Garcia-Machado et al. 2004); both groups having bright
coloration. Counter examples exist as well, wherein similar
coloration masks evolutionary divergence in damselfishes
(Pomacentridae: Planes and Doherty 1997a, b; Bernardi
et al. 2002; McCafferty et al. 2002; Rocha 2004; Drew et al.
2010; Leray et al. 2010), groupers (Serranidae: McCartney
et al. 2003; Craig et al. 2009), and wrasses (Labridae: Rocha
et al. 2005). In most cases, however, color morphs do cor-
respond to genetic partitions (Randall and Rocha 2009).
Centropyge angelfishes stand out as an evolutionary
enigma, even against this backdrop of discordant taxon-
omy, coloration, and genetics in reef fishes. All phy-
logeographic studies published on Centropyge to date
(including this one) show discordance between color
morphs (or coloration-based taxonomy) and genetic parti-
tions. In the Atlantic, color differences separate three
described species inhabiting the Caribbean, Brazil, and
mid-Atlantic ridge, but these species share mtDNA
Coral Reefs (2012) 31:839–851 843
123

haplotypes, and the Brazilian and Caribbean species are not
distinguishable even at the population level (Bowen et al.
2006). The Flame Angelfish (Centropyge loricula) in the
central Pacific maintains distinct color morphs in different
parts of its range yet shows high gene flow between these
regions (Schultz et al. 2007). These observations may be
0.4 substitutions/site
Centropyge bicolor
100/100/1.00
73/67/0.91
100/100/1.00
100/100/1.00
cflm1105 (1)cflm1123 (5)
cflm1 (1)cflm1104 (17)
cflm1110 (1)cflm1111 (3)
cflm1112 (1)cflm1113 (1)
cflm1116 (2)cflm1117 (1)cflm1121 (1)
cflm1124 (2)cflm1131 (2)
cflm1133 (1)cflm1135 (1)
cflm1138 (1)cflm13 (2)cflm26 (1)cflm31 (1)
cflm1225 (10)
cflm1226 (1)
cflm1237 (1)cflm1239 (19)
cflm1248 (1)cflm1179 (1)
cflm1230 (3)cflm12 (1)
cflm1224 (19) + cei1 (IND/XMA; 2)
cflm1234 (2)cflm1227 (1)
cflm1236 (1)cflm1240 (1)cflm1188 (1)cflm1194 (2)
cflm1200 (1)cei1001 (XMA; 1)
cei1003 (XMA; 1)
cei3 (IND; 1)
cflm9 (1)cei1002 (XMA; 1)
cei2 (IND; 1)
Lineage 1(Pacific Ocean & C. vrolikii)
Lineage 2(Moorea, French Polynesia)
Lineage 3(Indian Ocean and C. eibli)
cflm1139 (31)
cvr1005 (CAR; 1) + cflm1207 (5)
cflm1151 (1)cflm1154 (1)cflm1157 (1)cflm1171 (1)
cflm15 (1)cflm1093 (1)cflm1251 (1)
cflm1203 (4)cflm1216 (1)
cflm1040 (2)cflm1221 (1)
cflm1050 (2)cflm1257 (1)
cvr4 (CAR/GBR/OKI; 8) + cflm1206 (54)cvr3 (GBR; 1) + cflm1047 (1)
cvr1002 (CAR; 1) + cflm1103 (4)
cvr1006 (CAR; 1) + cflm1058 (1)cvr7 (OKI; 1)
cvr1001 (PAU; 1) + cflm1205 (6)
cflm1211 (6)
cflm1212 (1)
cflm1214 (3)
cflm1215 (1)cflm1217 (3)
cflm17 (2)cflm1095 (1)cflm1097 (1)cflm1100 (4)cflm1101 (2)cflm1102 (1)
cflm1045 (1)
cflm1053 (3)cflm1063 (1)
cflm1065 (1)
cflm1066 (1)cflm1220 (1)cflm21 (2)
cflm1090 (1)cflm1076 (1)
cflm1254 (1)cflm1258 (1)
cflm1272 (1)
844 Coral Reefs (2012) 31:839–851
123

the key to understanding the triad of putative species
examined here, as apparently members of this genus tend
to preserve color differences despite gene flow.
What conditions can explain the maintenance of color
differences in the face of gene flow? The most likely
explanation is that natural or sexual selection is acting to
conserve these color differences. For many reef fishes,
coloration is a key character involved in mate recognition
and therefore subject to strong sexual selection (Seehausen
et al. 1997, 1999). As one example, strong preference for
mating with their own morphotype (assortative mating)
appears to have played a role in maintaining evolutionarily
stable color polymorphisms in Caribbean hamlets (Hypo-
plectrus complex; Puebla et al. 2008; Holt et al. 2011).
Selective pressures that are not directly related to mate
choice (i.e., predation, habitat preference, or territoriality)
can also reinforce differences in color patterns among
butterflyfishes in the face of ongoing gene flow (McMillan
et al. 1999). Indeed, predation against novel color types is
an important factor in reducing hybrid success in other
vertebrate systems (Langham 2007) and may factor into the
maintenance of regional color morphs here. Although our
three study species inhabit similar depths and habitats
(Hobbs et al. 2010), C. flavissima is found almost
X-mas Island, Indian Ocean
Cocos-Keeling
Moorea
Phoenix Islands
Palmyra
X-mas Island, Pacific Ocean
Nuku Hiva
Fiji
Tokelau Islands
Centropyge eibli (cei)
Centropyge vrolikii (cvr)
c
Cyt b - Lineage 1(Pacific Ocean & C. vrolikii)
a
Cyt b - Lineage 2(Moorea, French Polynesia)
b
Cyt b - Lineage 3(Indian Ocean & C. eibli )
Fig. 4 Median-joining
networks showing relationships
among mitochondrial DNA,
non-singleton cytochrome
b haplotypes for Centropygeflavissima specimens (N = 271)
collected in the Indo-Pacific.
Additional sequences from two
closely related angelfishes,
Centropyge eibli (cei: Christmas
Island, Australia [XMA],
N = 4; Indonesia [IND],
N = 3) and Centropyge vrolikii(cvr: Caroline Islands [CAR],
N = 6; Great Barrier Reef,
Australia [GBR], N = 4;
Okinawa, Japan [OKI], N = 3;
Republic of Palau [PAU],
N = 1), were also included.
Each circle represents a
haplotype and its size is
proportional to its total
frequency. Branches or blackcrossbars represent a single
nucleotide change, open circlesrepresent unsampled
haplotypes, and colors denote
collection location as indicated
by the embedded key. The
network was separated into the
three distinct lineages
(a Lineage 1; b Lineage 2;
c Lineage 3)
Fig. 3 Phylogenetic relationship among mitochondrial DNA cyto-
chrome b haplotypes (594 base pairs) for Centropyge flavissimaspecimens (cflm; N = 271) collected in the Indo-Pacific based on
neighbor-joining (NJ), maximum-likelihood (ML), and Bayesian
(BA) inference. Additional sequences from two closely related
angelfish, Centropyge eibli (cei: Christmas Island, Australia
[XMA], N = 4; Indonesia [IND], N = 3) and Centropyge vrolikii(cvr: Caroline Islands [CAR], N = 6; Great Barrier Reef, Australia
[GBR], N = 4; Okinawa, Japan [OKI], N = 3; Republic of Palau
[PAU], N = 1) were also included. Branch support values ([50 %,
based on 10,000 replicates) for NJ and ML analysis, and posterior
probabilities for BA analysis are shown above the nodes (NJ/ML/
BA). All analyses resulted in identical lineages, and so the BA
topology is presented here. Branch lengths are according to indicated
scale but the branch leading to the outgroup species, Centropygebicolor, was here reduced by 50 %. Values in parentheses represent
the number of samples for each haplotype, and colors denote
collection location as indicated by the embedded key. Each haplotype
in the tree was therefore assigned a corresponding rectangle to the
right of the figure, and each color denoting a location within that
rectangle was proportional to its total frequency for that haplotype
b
Coral Reefs (2012) 31:839–851 845
123

exclusively on reefs around low oceanic islands, whereas
C. vrolikii and C. eibli predominate at high islands or
continental shelves, indicating that there may be some
niche partitioning in areas of overlap.
Our findings include deep (reciprocally monophyletic)
differentiation in mtDNA, coupled with weak population-
level differentiation at nuclear loci, which can certainly be
explained by the non-recombining nature of mtDNA
inheritance and the slower mutation rate at introns relative
to mtDNA. Two additional (not mutually exclusive) factors
require consideration here: (1) incomplete lineage sorting
and (2) hybridization and introgression. These two expla-
nations are difficult to tease apart but we discuss each
possibility. It should be noted that natural selection for
particular mtDNA types can also produce such a pattern,
although such selective sweeps are thought to be rare (Karl
et al. 2012).
Incomplete lineage sorting occurs during the transitional
stage when evolutionary lineages begin to diverge (Avise
2004). The haploid inheritance of mtDNA yields a fourfold
lower effective population size (Ne) relative to nuclear DNA,
such that isolated mtDNA lineages are expected to drift to
reciprocal monophyly in Ne generations on average, whereas
diploid nuclear loci will attain this evolutionary divergence
in 4Ne generations on average (Tavare 1984). A divergence
time of 4 MY (based on our mtDNA cyt b molecular clock)
seems sufficient for these lineages to completely sort at both
mtDNA and nuclear genes, although no comparable
Table 1 Molecular diversity indices for Centropyge flavissima based on mitochondrial DNA (cytochrome b) sequence data for all sampling
locations, including the three identified Indo-Pacific lineages (also see Fig. 3)
Collection locality N HN HU Time since
expansion (Years)
Haplotype diversity
(h ± SD)
Nucleotide diversity
(p ± SD)
Fu’s FS
Pacific Ocean
Christmas Island, Line Islands (KIR) 43 19 8 69,700–108,000 0.78 ± 0.066 0.0026 ± 0.0018 218.28a
Fiji (FIJ) 19 12 4 106,500–165,100 0.94 ± 0.035 0.0043 ± 0.0027 26.97
Nuku Hiva, Marquesas Islands (NUK) 35 5 5 126,300–195,700 0.22 ± 0.092 0.0004 ± 0.0005 24.74
Palmyra Atoll, Line Islands (PAL) 30 11 5 73,700–114,200 0.67 ± 0.093 0.0023 ± 0.0016 26.96
Phoenix Islands (PHO) 24 15 6 89,400–138,600 0.87 ± 0.067 0.0035 ± 0.0023 212.26
Tokelau Islands (TOK) 9 6 1 82,900–128,400 0.83 ± 0.130 0.0030 ± 0.0022 22.58
All samples—Lineage 1 160 43 43 100,400–155,600 0.85 ± 0.023 0.0035 ± 0.0022 227.30
Moorea, French Polynesia (MOR)
All samples—Lineage 2 45 19 19 131,700–204,200 0.85 ± 0.049 0.0043 ± 0.0026 211.93
Indian Ocean
Christmas Island, Aus. (XMA) 27 11 6 70,100–108,600 0.85 ± 0.042 0.0027 ± 0.0018 26.32
Cocos-Keeling Islands, Aus. (COC) 39 11 6 56,600–87,700 0.78 ± 0.047 0.0027 ± 0.0018 -5.01
All samples—Lineage 3 66 17 17 63,000–97,600 0.82 ± 0.029 0.0026 ± 0.0017 211.13
Time since the most recent population expansion was calculated using a range of mutation rates (1–1.55 % per million years within lineages;
Bowen et al. 2001; Lessios 2008; Reece et al. 2010) and a generation time of four years (see ‘‘Methods’’)
N sample size, HN number of haplotypes, HU number of unique haplotypesa Numbers in bold are significant, P \ 0.02 (see Fu 1997)
Table 2 Results of the analysis of molecular variance (AMOVA) based on mitochondrial DNA cytochrome b sequence data for Centropygeflavissima (N = 271)
Source df SS Variance
components
% Variation UCT
USC
P-value UST P-value
Among groups 2 7147.24 46.51 97.43 0.97 0.004 0.98 \0.001
0.32 \0.001
Among populations (within groups) 6 68.79 0.40 0.83
Within populations 262 217.36 0.83 1.74
Groups were based on the three Indo-Pacific lineages identified by phylogenetic reconstruction (see Fig. 3). UCT is the group variance component
relative to total variance, USC is the between sample within group variance component divided by the sum of itself and within sample variance,
and UST is the sum of the variance due to group and sample within group divided by the total variance
df degrees of freedom, SS sum of squares
846 Coral Reefs (2012) 31:839–851
123
molecular clock is available for the latter. That said, the
introns in this study show weak population structure between
regions and extensive sharing of alleles, indicating that
nuclear lineage sorting is not proceeding toward fixation of
alternate states. While incomplete lineage sorting almost
certainly contributes to our findings, it is not sufficient
to explain the discordance between mtDNA and nuclear
introns.
The alternate explanation, hybridization and intro-
gression, can explain the observed discordance between
mtDNA and nuclear DNA. Because pygmy angelfish are
primarily distinguished on the basis of coloration and are
also highly prized in the aquarium trade, hybrids between
these species tend to be both noticed and documented.
Hence, these hybrids are among the best characterized for
any tropical reef fish family (Pyle and Randall 1994; but
also see Yaakub et al. 2006; see Fig. 2). C. flavissima 9
C. vrolikii hybrids (documented genetically by L.A. Rocha)
are regularly exported through the aquarium trade from the
Marshall Islands, Pohnpei, Guam, Kosrae, the Ryukyu
Islands, and Vanuatu (Takeshita 1976) and have been
reported from almost all locations where these two species
co-occur. At these overlapping sites, individual fish range
from nearly ‘‘pure’’ C. flavissima to nearly ‘‘pure’’
C. vrolikii. No hybrids have been reported from New
Caledonia, the Solomon Islands, and Palau (where only
C. vrolikii is present), or the Society Islands, Line Islands,
Phoenix Islands, and Marquesas Islands (where only
C. flavissima is present). Although hybrids have not been
reported (to our knowledge) from areas of sympatry in the
Ogasawara Islands and the Great Barrier Reef, this could
be attributed to insufficient sampling effort or very low
abundance of one or the other species (Pyle and Randall
1994; D. Bellwood pers. comm.).
The two species that hybridize with C. flavissima,
C. eibli, and C. vrolikii, also hybridize with each other in
Indonesia (Pyle and Randall 1994), and C. flavissima 9
C. eibli hybrids are common at Christmas and Cocos-
Keeling Islands (400 and 1,000 km southwest of Indonesia;
Hobbs et al. 2009), which is at the boundary of the Western
Indo-Pacific and the Central Indo-Pacific ecoregions
(Spalding et al. 2007). The sharing of mtDNA haplotypes
between recognized species (this study), the spectrum of
intermediate color forms (Pyle and Randall 1994), and the
presence of areas where hybrids outnumber parental forms
(Pyle and Randall 1994) are evidence for hybridization that
extends beyond the F1 generation. Moreover, rarity of
conspecific partners and a polygynous mating system (i.e.,
harems with a single male and two to seven or more
females; Moyer and Nakazono 1978; Moyer 1990), likely
promote hybridization in these fish. We therefore conclude
that hybridization has played a major role in shaping
the genetic architecture of the three angelfish lineagesTa
ble
3M
atri
xo
fp
op
ula
tio
np
airw
ise
US
Tv
alu
es(b
elo
wd
iag
on
al)
wit
has
soci
ated
P-v
alu
esin
par
enth
eses
,b
ased
on
mit
och
on
dri
alD
NA
cyto
chro
me
bse
qu
ence
dat
afo
rC
entr
op
yge
fla
viss
ima
(N=
27
1)
sam
ple
dat
site
sth
rou
gh
ou
tth
eIn
do
-Pac
ific
Lo
cati
on
aC
OC
XM
AF
IJP
HO
TO
KP
AL
KIR
MO
RN
UK
CO
C–
XM
A0
.05
(0.0
32
)–
FIJ
0.9
8b
(\0
.00
1)
0.9
8(\
0.0
01
)–
PH
O0
.98
(\0
.00
1)
0.9
8(\
0.0
01
)0
.01
(0.2
5)
–
TO
K0
.98
(\0
.00
1)
0.9
8(\
0.0
01
)-
0.0
3(0
.70
)-
0.0
3(0
.94
)–
PA
L0
.98
(\0
.00
1)
0.9
8(\
0.0
01
)0
.04
(0.0
40
)-
0.0
1(0
.73
)-
0.0
3(0
.81
)–
KIR
0.9
8(\
0.0
01
)0
.98
(\0
.00
1)
0.0
4(0
.02
6)
-0
.02
(0.9
6)
-0
.02
(0.6
8)
-0
.01
(0.7
5)
–
MO
R0
.98
(\0
.00
1)
0.9
8(\
0.0
01
)0
.97
(\0
.00
1)
0.9
7(\
0.0
01
)0
.97
(\0
.00
1)
0.9
8(\
0.0
01
)0
.98
(\0
.00
1)
–
NU
K0
.99
(\0
.00
1)
0.9
9(\
0.0
01
)0
.71
(\0
.00
1)
0.7
0( \
0.0
01
)0
.81
(\0
.00
1)
0.7
5(\
0.0
01
)0
.70
(\0
.00
1)
0.9
8(\
0.0
01
)–
aS
ite
abb
rev
iati
on
sar
eo
utl
ined
inT
able
1b
Nu
mb
ers
inb
old
are
sig
nifi
can
t,P
B0
.01
2(a
sp
erN
aru
m2
00
6)
Coral Reefs (2012) 31:839–851 847
123

observed in this study, although further research on the
fertility and viability of hybrids is needed to confirm this
conclusion.
We here suggest a scenario where the species complex
was divided three to four MY ago into ancestral C. eibli in
the Indian Ocean, C. vrolikii in the western Pacific, and
C. flavissima in the central South Pacific. C. flavissima
subsequently extended its range to the western Pacific,
where it hybridized with C. vrolikii, and the eastern Indian
Ocean where it hybridized with C. eibli. The end result is
three lineages: C. eibli found in the Indian Ocean (whose
haplotypes are mixed with Indian Ocean C. flavissima due
to introgression), C. vrolikii found everywhere in the
western Pacific (whose haplotypes are mixed with western
Pacific C. flavissima, also due to introgression), and
C. flavissima found in the Society Islands, which may be
the last refugium of pure individuals in this lineage. The
fact that C. flavissima currently inhabits the Phoenix
Islands without C. vrolikii, yet still has C. vrolikii mtDNA,
supports a scenario of introgression. Even though precise
reasons for this ancient isolation could not be identified,
similarly deep mtDNA divergences have been observed in
other reef fish: two lineages coalescing between 2.9 and 5.5
MY ago were identified for Naso vlamingii (Klanten et al.
2007), and three lineages coalescing between 2.0 and 5.0
MY ago were observed in Naso brevirostris (Horne et al.
2008). In both cases, the authors invoke ancient periods of
isolation likely caused by sea level fluctuations to explain
the observed genetic divergences. Indeed, the intensifica-
tion of glaciation 2.7 MY ago is one of several factors that
altered and accelerated surface currents in the Indo-Pacific
(Ivanova 2009). We suggest that these processes started the
ancient differentiation in our study group, with one key
distinction: the Naso lineages show no color or morpho-
logical difference and are completely mixed in all locali-
ties, whereas in our case, the lineages are still segregated
geographically, but they do not match the color (and spe-
cies) boundaries.
A second and perhaps equally plausible (although hard
to test) scenario is the possibility that the yellow coloration
of C. flavissima originated independently in the Indian and
Pacific oceans (Pyle 2003). In this scenario, the ancestral
a
X-mas Island, Indian Ocean
Cocos-Keeling
Moorea
Phoenix Islands
Palmyra
X-mas Island, Pacific Ocean
Nuku Hiva
Fiji
Tokelau Islands
Centropyge eibli (cei)
Centropyge vrolikii (cvr)
TMO
c S7
b RAG2
Fig. 5 Median-joining
networks showing relationships
among nuclear DNA alleles
(a TMO, 254 base pairs,
N = 145; b RAG2, 122 base
pairs, N = 160; c S7, 120 base
pairs, N = 138) based on a
subset of all angelfish samples
collected in this study. Each
circle represents an allele and its
size is proportional to its total
frequency. Branches or blackcrossbars represent a single
nucleotide change, open circlesrepresent unsampled alleles, and
colors denote collection
location as indicated by the
embedded key. All singleton
alleles (N = 4) were removed
from the S7 analysis in order to
minimize circularity between
closely related alleles
848 Coral Reefs (2012) 31:839–851
123

C. eibli in the Indian Ocean and the ancestral C. vrolikii in
the Pacific Ocean each gave rise to a xanthic form. Indeed,
the aquarium trade has documented a long list of xanthic
fish variants that are cultivated for their beauty and novelty,
including a wild-caught xanthic strain of the Dusky
Angelfish, Centropyge multispinis (http://www.reefs.org/
forums/topic120708.html). Slight color differences between
the Indian and Pacific Ocean ‘‘C. flavissima’’ lend further
support to this hypothesis, however, the presence of three
genetic lineages instead of two (one C. eibli ? Indian Ocean
xanthics and one C. vrolikii ? Pacific Ocean xanthics), and
the lack of xanthic C. vrolikii and C. eibli inside their
respective ranges, weaken it.
All but one of our sampling sites is located in the vast
Indo-Polynesian biogeographic province, which stretches
from Polynesia to the central Indian Ocean (Briggs and
Bowen 2012). Our sample from Nuku Hiva in the Marquesas
Archipelago (east of the Society Islands; Fig. 1) represents a
distinct biogeographic province with a depauperate fish
fauna and high rates of endemism (11.6 % in fishes; Randall
1998). Recent phylogeographic surveys have found genetic
differentiation between Society Island and Marquesan
populations in several groups of fishes, including snappers
(genus Lutjanus; Gaither et al. 2010), surgeonfishes (genus
Acanthurus; Planes and Fauvelot 2002), and wrasses (genus
Halichoeres; W.B. Ludt et al. pers. comm.). The distinc-
tiveness of Marquesan reef fishes is attributed to a combi-
nation of geographic isolation owing to the westerly South
Equatorial Current, limited coral reef development, and
variable water temperatures due to major upwelling events
(Randall 1998; Gaither et al. 2010).
Our results reinforce the genetic uniqueness of fishes in
the Marquesas Islands, with C. flavissima sampled at
Nuku Hiva not sharing haplotypes with any other location
(Table 1, Fig. 4). In phylogenetic analyses, however, the
Marquesas individuals grouped with the widespread Pacific
lineage and not the nearby Society Islands lineage (Fig. 3).
A relatively recent colonization event is consistent with the
low genetic variation detected at Nuka Hiva despite good
sampling effort (N = 35); haplotype or nucleotide diversity
was at least three or six times lower here than at any other
location. Further sampling is needed at other reef systems
in the Society Islands, Tuamotu Islands, and surrounding
islands chains (such as Samoa or Tonga) to test our
hypotheses of a recent colonization event of the Marquesas
Islands by introgressed western Pacific C. flavissima, in
addition to the rest of French Polynesia acting as a refu-
gium for the ‘‘pure’’ C. flavissima. Indeed, we identified
a single C. flavissima specimen from Tonga (2,000 km
west of the Society Islands; GenBank Accession Number:
FJ582964.1) that groups with our Moorea samples based on
the mtDNA barcoding gene (COI; data not shown), indi-
cating that there are other places in the Central Pacific
where C. flavissima and C. vrolikii have not yet fully
introgressed.
Taxonomic implications
Since our phylogeny seems to contradict recognized spe-
cies boundaries, are these angelfishes valid species? While
the recognized angelfish species in the complex studied
here might not represent reciprocally monophyletic
mtDNA or nuclear intron lineages, they represent stable
color forms and the presence of deeply separated mtDNA
lineages indicate that those forms have existed for millions
of years.
The solution proposed by de Queiroz (2007) for
dilemmas like the one presented here is simple; use the
common element to define the species, and one or more
secondary properties as qualifiers to support this designa-
tion. In our case, despite the apparent gene flow, these
species maintain unique color characteristics and are par-
titioned into cohesive geographic regions. We therefore
suggest that these angelfish remain recognized as taxo-
nomically diagnosable species.
In conclusion, the emerging picture of evolution in the
pygmy angelfishes (genus Centropyge) includes a number
of factors known from other organisms, but which combine
here into a unique synthesis of dispersal, hybridization,
natural (or sexual) selection, and speciation. First, this
group contains members that are good dispersers, with low
or no population structure recorded across entire ocean
basins (Bowen et al. 2006; Schultz et al. 2007; present
study). This is almost certainly due to a pelagic larval stage
that readily traverses oceans; Centropyge larvae have been
detected in mid-oceanic trawls (MCZ 73476, 73518,
73521, 73531–73532, 73546, 735554–735556, 81683,
82468, 158311, 163525; http://www.mcz.harvard.edu/
Departments/Fish/), notably to the exclusion of many
other common and abundant reef fishes (D. Smith and
K. Hartel, pers. comm.). Second, this group is known for
extensive natural hybridization (Pyle and Randall 1994), a
phenomenon that is rare in other groups of reef organisms
(Hubbs 1955; Gardner 1997; but see Hobbs et al. 2009).
Third, all seven species examined with molecular data
retain regional color morphs in the face of gene flow, a
signature of natural or sexual selection. At least some
species are also sexually dimorphic for color patterns
(Allen et al. 1998), adding greater weight to the interpre-
tation that coloration influences mate choice. Fourth, the
three species (C. flavissima, C. eibli, and C. vrolikii) would
probably be regarded as a single species if coloration
was omitted from taxonomic consideration (Pyle 2003).
In these circumstances, it is tempting (and defensible) to
conclude that these are emerging species, but this is con-
tradicted by the ancient history inscribed in mtDNA, which
Coral Reefs (2012) 31:839–851 849
123

is also concordant with biogeographic partitions observed
in other reef fish species (Rocha et al. 2007). The evidence
therefore indicates that at one time three species existed but
that extensive dispersal and hybridization has rearranged
formerly isolated species into semi-isolated color morphs.
Like the cichlids of Africa’s rift lakes, the novel aspects of
pygmy angelfish evolution will continue to provide insights
about the ragged edge of speciation in the oceans.
Acknowledgments This research was supported by the National
Science Foundation grants OCE-0453167 and OCE-0929031 to
BWB, NOAA National Marine Sanctuaries Program MOA No.
2005-008/66882 to R.J. Toonen, and by a Natural Sciences and
Engineering Research Council of Canada (NSERC) postgraduate
fellowship to JDD. For specimen collections, we thank Kim Ander-
sen, Paul Barber, Larry Basch, David Bellwood, J. Howard Choat,
Matthew Craig, Joshua Drew, John Earle, Jeff Eble, Brian Greene,
Matthew Iacchei, Stephen Karl, Randall Kosaki, David Pence, and
Ross Robertson. We thank Sue Taei at Conservation International,
Graham Wragg of the RV Bounty Bay, the Government of Kiribati,
including Tukabu Teroroko and the Phoenix Island Protected Area
who assisted with Kiribati collections. We also thank Robert Toonen,
Serge Planes, Stephen Karl, John Randall, Joann Leong, Patrick
Colin, Laura Colin, the Coral Reef Research Foundation, and mem-
bers of the ToBo lab for their logistic support; we thank the Center
for Genomics, Proteomics, and Bioinformatics at the University of
Hawaii for their assistance with DNA sequencing. This is contribution
no. 1492 from the Hawai’i Institute of Marine Biology and no. 8605
from the School of Ocean and Earth Science and Technology.
References
Allen GR, Steene R (1987) Reef fishes of the Indian Ocean. T.F.H.
Publications Inc., Neptune City
Allen GR, Steene R, Allen M (1998) A guide to angelfishes and
butterflyfishes. Odyssey Publishing/Tropical Reef Research,
Perth, Australia
Avise JC (2004) Molecular markers, natural history, and evolution,
2nd edn. Sinauer Associates, Sunderland, MA
Bandelt HJ, Forster P, Rohl A (1999) Median-joining networks for
inferring intraspecific phylogenies. Mol Biol Evol 16:37–48
Bellwood DR, Van Hewerden L, Konow N (2004) Evolution and
biogeography of marine angelfishes (Pisces: Pomacanthidae).
Mol Phylogenet Evol 33:150–155
Bernardi G, Holbrook SJ, Schmitt RJ, Crane NL, DeMartini E (2002)
Species boundaries, populations and colour morphs in the coral
reef three-spot damselfish (Dascyllus trimaculatus) species
complex. Proc R Soc Lond B Biol Sci 269:599–605
Bowen BW, Bass AL, Rocha LA, Grant WS, Robertson DR (2001)
Phylogeography of the trumpetfishes (Aulostomus): Ring species
complex on a global scale. Evolution 55:1029–1039
Bowen BW, Muss A, Rocha LA, Grant WS (2006) Shallow mtDNA
coalescence in Atlantic pygmy angelfishes (genus Centropyge)
indicates a recent invasion from the Indian Ocean. J Hered
97:1–12
Briggs JC, Bowen BW (2012) A realignment of marine biogeographic
provinces with particular reference to fish distributions. J Bioge-
ogr 39:12–30
Choat JH (2006) Phylogeography and reef fishes: bringing ecology
back into the argument. J Biogeogr 33:967–968
Chow S, Hazama K (1998) Universal PCR primers for S7 ribosomal
protein gene introns in fish. Mol Ecol 7:1255–1256
Coyne JA, Orr HA (2004) Speciation. Sinauer Associates, Sunder-
land, MA
Craig MT, Graham RT, Torres RA, Hyde JR, Freitas MO, Ferreira
BP, Hostim M, Gerhardinger LC, Andrade AB, Robertson DR
(2009) How many species of goliath grouper are there?
Cryptic genetic divergence in a threatened marine fish and the
resurrection of a geopolitical species. Endanger Species Res
7:167–174
de Queiroz K (2007) Species concepts and species delimitation. Syst
Biol 56:879–886
Drew JA, Allen GR, Kaufman L, Barber PH (2008) Endemism and
regional color and genetic differences in five putatively cosmo-
politan reef fishes. Conserv Biol 22:965–975
Drew JA, Allen GR, Erdmann MV (2010) Congruence between
mitochondrial genes and color morphs in a coral reef fish:
population variability in the Indo-Pacific damselfish Chrysipterarex (Snyder, 1909). Coral Reefs 29:439–444
Drummond AJ, Ashton B, Cheung M, Heled J, Kearse M, Moir R,
Stones-Havas S, Thierer T, Wilson A (2009) Geneious v4.8,
Available from http://www.geneious.com
Excoffier R, Smouse P, Quattro J (1992) Analysis of molecular
variance inferred from metric distances among DNA haplotypes:
Application to human mitochondrial DNA restriction data.
Genetics 131:479–491
Excoffier R, Laval LG, Schneider S (2005) Arlequin ver. 3.0: An
integrated software package for population genetics data anal-
ysis. Evol Bioinform Online 1:47–50
Fu YX (1997) Statistical tests of neutrality of mutations against
population growth, hitchhiking and background selection.
Genetics 147:915–925
Gaither MR, Toonen RJ, Robertson DR, Planes S, Bowen BW (2010)
Genetic evaluation of marine biogeographic barriers: perspec-
tives from two widespread Indo-Pacific snappers (Lutjanus spp.).
J Biogeogr 37:133–147
Garcia-Machado E, Chevalier Monteagudo PP, Solignac M (2004)
Lack of mtDNA differentiation among hamlets (Hypoplectrus,
Serranidae). Mar Biol 144:147–152
Gardner JPA (1997) Hybridization in the sea. Adv Mar Biol 31:1–78
Guindon S, Gascuel O (2003) A simple, fast, and accurate algorithm
to estimate large phylogenies by maximum likelihood. Syst Biol
52:696–704
Hobbs JPA, Frisch AJ, Allen GR, Van Herwerden L (2009) Marine
hybrid hotspot at Indo-Pacific biogeographic border. Biol Lett
5:258–261
Hobbs JPA, Jones GP, Munday PL (2010) Rarity and extinction risk
in coral reef angelfishes on isolated islands: interrelationships
among abundance, geographic range size and specialization.
Coral Reefs 29:1–11
Holt BG, Cote IM, Emerson BC (2011) Searching for speciation
genes: Molecular evidence for selection associated with colour
morphotypes in the Caribbean reef fish genus Hypoplectrus. PloS
ONE [doi:10.1371/journal.pone.0020394.g001]
Horne JB, van Herwerden L, Choat JH, Robertson DR (2008) High
population connectivity across the Indo-Pacific: Congruent lack
of phylogeographic structure in three reef fish congeners. Mol
Phylogenet Evol 49:629–638
Hubbs CL (1955) Hybridization between fish species in nature. Syst
Zool 4:1–20
Ivanova EV (2009) The global thermohaline circulation. Springer,
New York
Karl SA, Toonen RJ, Grant WS, Bowen BW (2012) Common
misconceptions in molecular ecology: Echos of the modern
synthesis. Mol Ecol (in press)
Klanten OS, Choat JH, van Hewerden L (2007) Extreme genetic
diversity and temporal rather than spatial partitioning in a widely
distributed coral reef fish. Mar Biol 150:659–670
850 Coral Reefs (2012) 31:839–851
123

Langham GM (2007) Specialized avian predators repeatedly attack
novel color morphs of Heliconius butterflies. Evolution 58:
2783–2787
Leray M, Beldade R, Holbrook SJ, Schmitt RJ, Planes S, Bernardi G
(2010) Allopatric divergence and speciation in coral reef fish:
The Three-Spot Dascyllus, Dascyllus trimaculatus, species
complex. Evolution 64:1218–1230
Lessios HA (2008) The great American schism: Divergence of marine
organisms after the rise of the Central American isthmus. Annual
Reviews of Ecology Evolution and Systematics 39:63–91
Librado P, Rozas J (2009) DnaSP v5: A software for comprehensive
analysis of DNA polymorphism data. Bioinformatics 25:1451–1452
Lin H-C, Sanchez-Ortiz C, Hastings PA (2009) Colour variation is
incongruent with mitochondrial lineages: cryptic speciation and
subsequent diversification in a Gulf of California reef fish
(Teleostei: Blennioidei). Mol Ecol 18:2476–2488
McCafferty S, Bermingham E, Quenouille B, Planes S, Hoelzer G,
Asoh K (2002) Historical biogeography and molecular system-
atics of the Indo-Pacific genus Dascyllus (Teleostei: Pomacen-
tridae). Mol Ecol 11:1377–1392
McCartney MA, Acevedo J, Heredia C, Rico C, Quenouille B,
Bermingham E, McMillan WO (2003) Genetic mosaic in a
marine species flock. Mol Ecol 12:2963–2973
McMillan WO, Palumbi SR (1995) Concordant evolutionary patterns
among Indo-West Pacific butterflyfishes. Proc R Soc Lond B
Biol Sci 260:229–236
McMillan WO, Weigt LA, Palumbi SR (1999) Color pattern evolution,
assortative mating, and genetic differentiation in brightly colored
butterflyfishes (Chaetodontidae). Evolution 53:247–260
Meeker ND, Hutchinson SA, Ho L, Trede NS (2007) Method for
isolation of PCR-ready genomic DNA from zebrafish tissues.
Biotechniques 43:610–614
Moyer JT (1990) Social and reproductive behavior of Chaetodonto-plus mesoleucus (Pomacanthidae) at Bantayan Island, Philip-
pines, with notes on pomacanthid relationships. Japan J Ichthyol
36:459–467
Moyer JT, Nakazono A (1978) Population structure, reproductive
behavior, and protogynous hermaphroditism in the angelfish
Centropyge interruptus at Miyake-jima, Japan. Japan J Ichthyol
25:25–39
Narum SR (2006) Beyond Bonferroni: Less conservative analyses for
conservation genetics. Conserv Genet 7:783–787
Pianka ER (1978) Evolutionary ecology. Harper and Row, New York,
USA
Planes S, Doherty PJ (1997a) Genetic relationships of the colour
morphs of Acanthochromis polyacanthus (Pomacentridae) on the
northern Great Barrier Reef. Mar Biol 130:109–117
Planes S, Doherty PJ (1997b) Genetic and color interactions at a
contact zone of Acanthochromis polyacanthus: A marine fish
lacking pelagic larvae. Evolution 51:1232–1243
Planes S, Fauvelot C (2002) Isolation by distance and vicariance drive
genetic structure of a coral reef fish in the Pacific Ocean.
Evolution 56:378–399
Posada D (2003) Using Modeltest and PAUP* to select a model of
nucleotide substitution. pp. 6.5.1–6.5.14. In: Baxevanis AD,
Davison DB, Page RDM, Petsko GA, Stein LD, Stormo GD (eds)
Current protocols in bioinformatics. John Wiley & Sons, Inc
Posada D (2008) jModelTest: Phylogenetic model averaging. Mol
Biol Evol 25:253–1256
Puebla O, Bermingham E, Guichard F, Whiteman E (2007) Colour
pattern as a single trait driving speciation in Hypoplectrus coral
reef fishes? Proc R Soc Lond B Biol Sci 274:1265–1271
Puebla O, Bermingham E, Guichard F (2008) Population genetic
analyses of Hypoplectrus coral reef fishes provide evidence that
local processes are operating during the early stages of marine
adaptive radiations. Mol Ecol 17:1405–1415
Pyle RL (1992) Rare and unusual marines: A hybrid angelfish
Centropyge flavissimus x eibli. Freshw Mar Aquar 15(98–110):212
Pyle RL (2003) A systematic treatment of the reef-fish family
Pomacanthidae (Pisces: Perciformes). Ph.D. Dissertation,
University of Hawai’i, Honolulu, p 422
Pyle RL, Randall JE (1994) A review of hybridization in marine
angelfishes (perciformes: Pomacanthidae). Environ Biol Fish
41:127–145
Ramon ML, Lobel PS, Sorenson MD (2003) Lack of mitochondrial
genetic structure in hamlets (Hypoplectrus spp.): recent speci-
ation or ongoing hybridization? Mol Ecol 12:2975–2980
Randall JE (1998) Zoogeography of shore fishes of the Indo-Pacific
region. Zool Stud 37:227–268
Randall JE, Rocha LA (2009) Chaetodontoplus poliourus, a new
angelfish (Percirformes: Pomacanthidae) from the tropical
western Pacific. Raffles Bull Zool 57:511–520
Reece JS, Bowen BW, Joshi K, Goz V, Larson L (2010) Phyloge-
ography of two moray eels indicates high dispersal throughout
the Indo-Pacific. J Hered 101:391–402
Rocha LA (2004) Mitochondrial DNA and color pattern variation in
three western Atlantic Halichoeres (Labridae), with the reval-
idation of two species. Copeia 2004:770–782
Rocha LA, Bowen BW (2008) Speciation in coral reef fishes. J Fish
Biol 72:1101–1121
Rocha LA, Robertson DR, Roman J, Bowen BW (2005) Ecological
speciation in tropical reef fishes. Proc R Soc Lond B Biol Sci
272:573–579
Rocha LA, Craig MT, Bowen BW (2007) Phylogeography and the
conservation genetics of coral reef fishes. Coral Reefs 26:
501–512
Rogers AR, Harpending H (1992) Population growth makes waves in
the distribution of pairwise genetic differences. Mol Biol Evol
9:552–569
Ronquist F, Huelsenbeck JP (2003) MrBayes 3: Bayesian phylogenetic
inference under mixed models. Bioinformatics 19:1572–1574
Schultz JK, Pyle RL, DeMartini E, Bowen BW (2007) Genetic
connectivity among color morphs and Pacific archipelagos for the
flame angelfish, Centropyge loriculus. Mar Biol 151:167–175
Seehausen O, Van Alphen JJM, Witte F (1997) Cichlid fish diversity
threatened by eutrophication that curbs sexual selection. Science
277:1808–1811
Seehausen O, Mayhew PJ, Van Alphen JJM (1999) Evolution of
colour patterns in East African cichlid fish. J Evol Biol 12:
514–534
Seutin G, White BN, Boag PT (1991) Preservation of avian and blood
tissue samples for DNA analyses. Can J Zool 69:82–92
Spalding MD, Fox HE, Allen GR, Davidson N, Ferdana ZA,
Finlayson M, Halpern BS, Jorge MA, Lombana A, Lourie SA,
Martin KD, McManus E, Molnar J, Recchia CA, Robertson J
(2007) Marine ecoregions of the world: A bioregionalization of
coastal and shelf areas. Bioscience 57:573–583
Stephens M, Donnelly P (2003) A comparison of Bayesian methods
for haplotype reconstruction from population genotype data. Am
J Hum Genet 73:1162–1169
Swofford DL (2000) PAUP*: Phylogenetic analysis by parsimony,
version 4.0. Sinauer Associates. Sunderland, MA
Takeshita GY (1976) An angel hybrid. Mar Aquarist 7:27–35
Tavare S (1984) Line-of-descent and genealogical processes, and
their applications in population genetics models. Theor Popul
Biol 26:119–164
Thresher RE, Brothers EB (1985) Reproductive ecology and bioge-
ography of Indo-West Pacific angelfishes (Pisces: Pomacanthi-
dae). Evolution 39:878–887
Yaakub SM, Bellwood DR, Van Herwerden L (2006) A rare
hybridization event in two common Caribbean wrasses (genus
Halichoeres; family Labridae). Coral Reefs 26:597–602
Coral Reefs (2012) 31:839–851 851
123