tubulin and microtubules as drug targets for potential
TRANSCRIPT
SAPIENZA
University of Rome
Department of Drug Chemistry and Technologies
Istituto Pasteur Italia – Fondazione Cenci Bolognetti
Tubulin and Microtubules as Drug Targets for
Potential Cancer Chemotherapy and CNS-Directed Therapies
Ludovica Monti XXX Cycle
PhD Programme in Life Sciences
Supervisors: Coordinator:
Prof. Romano Silvestri, Sapienza University Prof. Marco Tripodi
Prof. Carlo Ballatore, University of California
ii
Director of PhD program:
Prof. Marco Tripodi
Department of Cellular Biotechnolgy and Hemathology, “Sapienza” University of Rome
Scientific Supervisors:
Prof. Romano Silvestri
Department of Drug Chemistry and Technologies, “Sapienza” University of Rome
Prof. Carlo Ballatore
Skaggs School of Pharmacy and Pharmaceutical Sciences, University of California, San Diego

iii
“Look up at the stars and not down at your feet. Try to make sense of what you see, and wonder about
what makes the universe exist. Be curious”.
Stephen Hawking
To my beloved parents
iv
Table of Contents Abstract ................................................................................................................ vi List of Abbreviations ......................................................................................... viii Chapter 1: Tubulin and Microtubules ............................................................... 1
1.1 Composition and Organization ..................................................................................................... 1 1.2 The Tubulin Superfamily .............................................................................................................. 3 1.3 Microtubule Dynamics: Dynamic Instability and Treadmilling ................................................... 4 1.4 GTP Hydrolysis ............................................................................................................................ 6 1.5 Endogenous Microtubule Modulators .......................................................................................... 7 1.6 Post-Translational Modifications of Tubulin ............................................................................... 9 1.7 The Importance of Microtubule Dynamics in Mitosis ............................................................... 14 1.8 Tubulin-Binding Agents ............................................................................................................. 16 1.9 Resistance to Tubulin-Binding Agents ....................................................................................... 25 1.10 References ................................................................................................................................. 27
Chapter 2: New Indole Derivatives as Potent Inhibitors of Tubulin Polymerization .................................................................................................... 45
2.1 Introduction ................................................................................................................................ 45 2.2 Arylthioindoles as New Potent Anticancer Agents .................................................................... 45 2.3 Objective of the Study ................................................................................................................ 46 2.4 Chemistry .................................................................................................................................... 49 2.5 Results and Discussion ............................................................................................................... 52 2.6 Conclusions ................................................................................................................................ 71 2.7 Experimental Section .................................................................................................................. 73
2.7.1 Chemistry ............................................................................................................................ 73 2.7.2 Molecular Modeling ............................................................................................................ 88 2.7.3 Biological Assay ................................................................................................................. 89
2.8 References ................................................................................................................................... 94
Chapter 3: Multitargeted Imidazoles: A Potential Tactic for Alzheimer’s and Other Neurodegenerative Diseases ................................................................. 101
3.1 Introduction .............................................................................................................................. 101 3.1.1 Alzheimer’s Disease .......................................................................................................... 101 3.1.2 Current Drug Treatment .................................................................................................... 102 3.1.3 Alzheimer’s Disease Pathogenesis .................................................................................... 103
3.2 Objective of the Study .............................................................................................................. 111 3.3 Chemistry .................................................................................................................................. 114 3.4 Results and Discussion ............................................................................................................. 117 3.5 Conclusions .............................................................................................................................. 130 3.6 Experimental Section ................................................................................................................ 131
3.6.1 Chemistry .......................................................................................................................... 131 3.6.2 Biological Assay ............................................................................................................... 147
3.7 References ................................................................................................................................. 149
Chapter 4: CNS-Active Microtubule-Stabilizing Agents as Potential Leads for Human African Trypanosomiasis and Other Neuroparasitic Infections .... 160
4.1 Introduction .............................................................................................................................. 160 4.1.1 Human African Trypanosomiasis ...................................................................................... 160 4.1.2 Current Drug Treatment .................................................................................................... 161 4.1.3 The Life Cycle of African Trypanosomes ......................................................................... 163 4.1.4 Microtubules in Trypanosomes ......................................................................................... 164 4.1.5 Tubulin in Trypanosomes .................................................................................................. 167
4.2 Objective of the Study .............................................................................................................. 167
v
4.3 Results and Discussion ............................................................................................................. 169 4.4 Chemistry .................................................................................................................................. 179 4.5 Conclusions .............................................................................................................................. 181 4.6 Experimental Section ................................................................................................................ 182
4.6.1 Chemistry .......................................................................................................................... 182 4.6.2 Biological Assay ............................................................................................................... 189
4.7 References ................................................................................................................................. 191
Other Collaborations .......................................................................................... 196
Chapter 5: 1,1′-Biphenyl-4-sulfonamides as Potent Inhibitors of Carbonic Anhydrases ........................................................................................................ 197
5.1 Introduction .............................................................................................................................. 197 5.2 Objective of the Study .............................................................................................................. 197 5.3 Chemistry .................................................................................................................................. 197 5.4 Results and Discussion ............................................................................................................. 200 5.5 Conclusions .............................................................................................................................. 205 5.6 Experimental Section ................................................................................................................ 206
5.6.1 Chemistry .......................................................................................................................... 206 5.6.2 Biological Assay ............................................................................................................... 213 5.6.3 X-ray Crystallography ....................................................................................................... 214 5.6.4 Molecular Modeling .......................................................................................................... 214
5.7 References ................................................................................................................................. 216
Chapter 6: Arylboronic Acids as Dual FAAH and TRPV1 Ligands ........... 220 6.1 Introduction .............................................................................................................................. 220 6.2 Objective of the Study .............................................................................................................. 221 6.3 Chemistry .................................................................................................................................. 221 6.4 Results and Discussion ............................................................................................................. 223 6.5 Conclusions .............................................................................................................................. 227 6.6 Experimental Section ................................................................................................................ 228
6.6.1 Chemistry .......................................................................................................................... 228 6.6.2 Biological Assay ............................................................................................................... 246
6.7 References ................................................................................................................................. 248
Chapter 7: Structure-Property Relationships of Carboxylic Acid Isosters..251 7.1 Introduction .............................................................................................................................. 251 7.2 Objective of the Study .............................................................................................................. 252 7.3 Chemistry .................................................................................................................................. 252 7.4 Results and Discussion ............................................................................................................. 254 7.5 Conclusions .............................................................................................................................. 258 7.6 Experimental section ................................................................................................................ 259
7.6.1 Chemistry .......................................................................................................................... 259 7.6.2 Biological Assay ............................................................................................................... 259
7.7 References ................................................................................................................................. 260
General Conclusions ......................................................................................... 262
Acknowledgements ........................................................................................... 265
vi
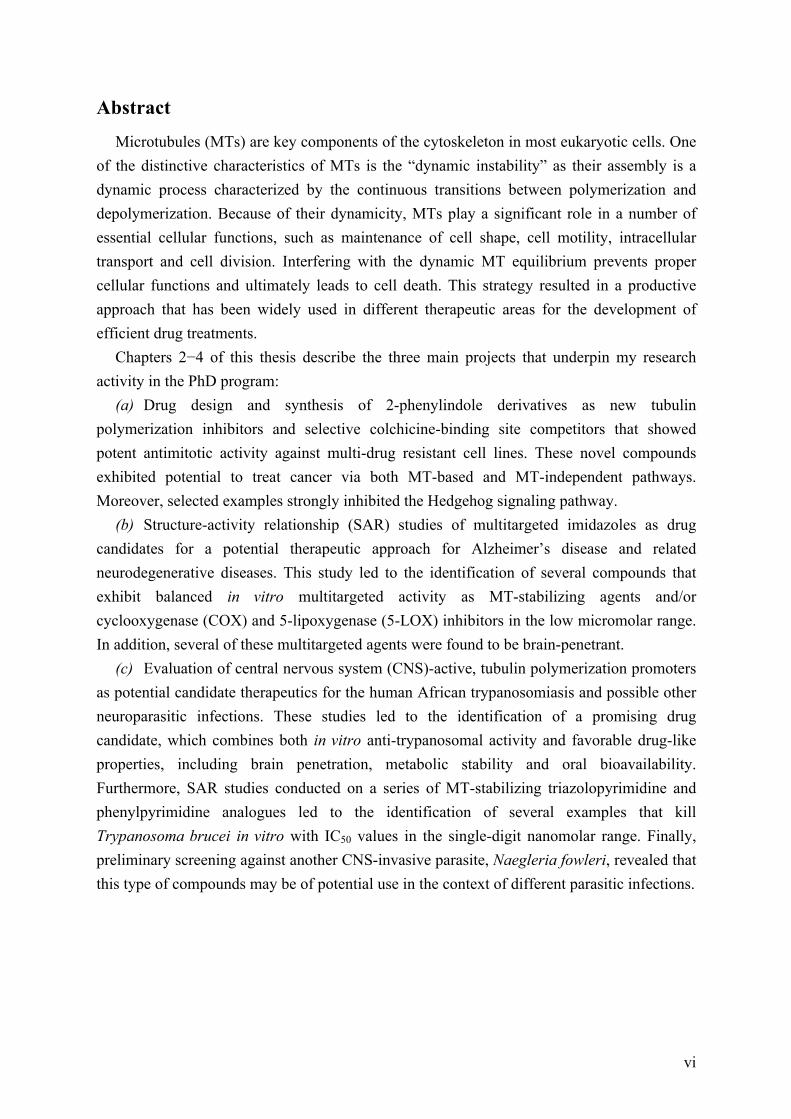
Abstract
Microtubules (MTs) are key components of the cytoskeleton in most eukaryotic cells. One of the distinctive characteristics of MTs is the “dynamic instability” as their assembly is a dynamic process characterized by the continuous transitions between polymerization and depolymerization. Because of their dynamicity, MTs play a significant role in a number of essential cellular functions, such as maintenance of cell shape, cell motility, intracellular transport and cell division. Interfering with the dynamic MT equilibrium prevents proper cellular functions and ultimately leads to cell death. This strategy resulted in a productive approach that has been widely used in different therapeutic areas for the development of efficient drug treatments.
Chapters 2−4 of this thesis describe the three main projects that underpin my research activity in the PhD program:
(a) Drug design and synthesis of 2-phenylindole derivatives as new tubulin polymerization inhibitors and selective colchicine-binding site competitors that showed potent antimitotic activity against multi-drug resistant cell lines. These novel compounds exhibited potential to treat cancer via both MT-based and MT-independent pathways. Moreover, selected examples strongly inhibited the Hedgehog signaling pathway.
(b) Structure-activity relationship (SAR) studies of multitargeted imidazoles as drug candidates for a potential therapeutic approach for Alzheimer’s disease and related neurodegenerative diseases. This study led to the identification of several compounds that exhibit balanced in vitro multitargeted activity as MT-stabilizing agents and/or cyclooxygenase (COX) and 5-lipoxygenase (5-LOX) inhibitors in the low micromolar range. In addition, several of these multitargeted agents were found to be brain-penetrant.
(c) Evaluation of central nervous system (CNS)-active, tubulin polymerization promoters as potential candidate therapeutics for the human African trypanosomiasis and possible other neuroparasitic infections. These studies led to the identification of a promising drug candidate, which combines both in vitro anti-trypanosomal activity and favorable drug-like properties, including brain penetration, metabolic stability and oral bioavailability. Furthermore, SAR studies conducted on a series of MT-stabilizing triazolopyrimidine and phenylpyrimidine analogues led to the identification of several examples that kill Trypanosoma brucei in vitro with IC50 values in the single-digit nanomolar range. Finally, preliminary screening against another CNS-invasive parasite, Naegleria fowleri, revealed that this type of compounds may be of potential use in the context of different parasitic infections.

vii
Chapters 5–7 briefly present other research collaborations, in which I have been involved: (d) Discovery of 1,1′-biphenyl-4-sulfonamides as potent inhibitors of the human
carbonic anhydrase ezymes. (e) SAR studies of arylboronic acids as dual ligands of fatty acid amide hydrolase
(FAAH) enzyme and transient receptor potential vanilloid 1 (TRPV1) channel. (f) Evaluation of oxetan-3-ol, thietan-3-ol, and derivatives thereof as bioisosteres of the
carboxylic acid functional group and dual COX/5-LOX inhibitors.
viii
List of Abbreviations
°C degree Celsius [Ca2+]i intracellular Ca2+ concentration
Å angstrom AAZ acetazolamide Aβ amyloid-β Ac acetil group ACN or CH3CN acetonitrile AcOH acetic acid AcOK potassium acetate AcTub acetylated α-tubulin AD Alzheimer’s disease AEA anandamide APC allophycocyanin APOE apolipoprotein E APP amyloid precursor protein ARAP 3-aroyl-1-arylpyrrole ATCC American type culture collection ATI arylthioindole ATP adenosine triphosphate BBB blood−brain barrier
BOP (benzotriazol-1-yloxy)tris(dimethylamino)phosphonium hexafluorophosphate
B/P brain-to-plasma BSA bovine serum albumin (h)CA (human) carbonic anhydrase Cc critical concentration CDCl3 deuterated chloroform CDI 1,1′-carbonyldiimidazole CD3OD deuterated methanol CDT cell doubling time CHCl3 chloroform cm centimeter
CNS central nervous system COX cyclooxygenase
m-CPBA m-chloroperbenzoic acid CSA4 combretastatin A-4
ix
CTR control CTT C-terminal tail δ chemical shift in parts per million Da dalton DAMA-colchicine N-deacetyl-N-(2mercaptoacetyl)colchicine DCE 1,2-dichloroethane DCM or CH2Cl2 dichloromethane DIPEA N,N-diisopropylethylamine DME 1,2-dimethoxyethane DMEM Dulbecco’s modified Eagle’s medium DMF N,N-dimethylformamide DMSO dimethyl sulfoxide DMSO-d6 deuterated dimethyl sulfoxide DNA deoxyribonucleic acid D2O deuterium oxide DPPF 1,1'-bis(diphenylphosphino)ferrocene EC50 half maximal effective concentration
EDC N-ethyl-N'-(3-dimethylaminopropyl)carbodiimide hydrochloride
EDTA ethylenediaminetetraacetic acid EM electron micrograph Emax maximum efficacy equiv equivalent(s) Et ethyl Et2O diethyl ether EtOAc ethyl acetate EtOH ethanol EtONa sodium ethoxide FAAH fatty acid amide hydrolase FAZ flagellar attachment zone FBS fetal bovine serum g gram(s) GAM mouse IgG GDP guanosine diphosphate gHAT gambiense human African trypanosomiasis GTP guanosine triphosphate γ-TuRCs γ-tubulin ring complexes
x
h hour(s) HAT human African trypanosomiasis HB hydrogen bond HEK 293 human embryonic kidney 293 cells Hh Hedgehog HOBt 1-hydroxybenzotriazole HPLC high-performance liquid chromatography HRMS high-resolution mass spectra Hz herz IC50 half maximal inhibitory concentration I.c.v. intracerebroventricular IF immunofluorescence i.p. intraperitoneal IR infrared J coupling constant in hertz Ka acid dissociation constant Keq equilibrium constants Ki inhibitory constant λ wavelength LC–MS/MS liquid chromatography–mass spectrometry
LDA lithium diisopropylamide 5-LOX 5-lipoxygenase LT leukotriene M molarity MAP(s) microtubule-associated protein(s)
MCF-7 cells human breast adenocarcinoma cancer cells (Michigan Cancer Foundation-7)
MDR multi-drug resistance Me methyl MEM minimum essential medium MeOH methanol µg microgram(s)
mg milligram(s) MHz megahertz MIC minimum inhibitory concentration min minute
mL millilitre(s)
µM micromolar
xi
mm millimetre(s) mmol millimol(s) MOE Molecular Operating Environment M.p. melting points mRNA messenger ribonucleic acid MT microtubule MTOC microtubule-organizing center
MTT 3-(4,5-dimethylthiazol-2-yl)-2,5-diphenyltetrazolium bromide
ν frequency N normality NaBH4 sodium borohydride NaH sodium hydroxide NaOAc sodium acetate NCS N-chlorosuccinimide ND not determined NFT(s) neurofibrillary tangle(s) NK natural killer nm nanometer nM nanomolar NMP 1-methyl-2-pyrrolidinone NMR nuclear magnetic resonance NS not significant NSAID nonsteroidal anti-inflammatory drug PAM primary amebic meningoencephalitis
PAMPA parallel artificial membrane permeability assay
PBS phosphate-buffered saline PCC pyridinium chlorochromate PCR polymerase chain reaction PFR paraflagellar rod PG prostaglandin
Pgp P-glycoprotein ph phenyl PhNTf2 N-phenyl-bis(trifluoromethanesulfonimide)
Pi inorganic phosphate
PI propidium iodide PK pharmacokinetic

xii
Pmax maximum pressure PPA polyphosphoric acid PPD phenylpyrimidine psi pound-force per square inch PTM(s) post-translational modification(s) RBL-1 rat basophilic leukemia rHAT rhodesiense human African trypanosomiasis rt room temperature SAG smoothened (Smo) agonist SAR structure-activity relationship Satd. aq. saturated aqueous SD standard deviation SEM standard error of mean SI selectivity index SP senile plaque TBA tubulin-binding agent t-BuLi tert-butyllithium t-BuOH tert-butanol t-BuOK potassium tert-butoxide t-Bu-4-PhNCO 4-tert-butyl-phenylisocyanate TEA or Et3N triethylamine TES triethylsilane TFA trifluoroacetic acid Tg transgenic THF tetrahydrofuran +TIPs microtubule plus end tracking proteins TLC thin-layer chromatography TosMIC toluenesulfonylmethyl isocyanide TP thromboxane-prostanoid TPD triazolopyrimidine TPI tubulin polymerization inhibition TRPV1 transient receptor potential vanilloid 1 TTL(L) tubulin tyrosine ligase (like) TXA thromboxane A2 UV ultraviolet VSG variant surface glycoprotein W watt

1
Chapter 1: Tubulin and Microtubules
1.1 Composition and Organization
Microtubules (MTs) are cytoplasmic filamentous constituents that play essential structural and regulatory functions in most eukaryotic cells. They are involved in a wide range of processes, such as transport of vesicles and organelles into and out of the cell, cell signaling, development and maintenance of cell shape and organization of the endoplasmic reticulum and the Golgi apparatus. Furthermore, MTs are the major structural components of the axonemes responsible for ciliary and flagellar motility. However, their most crucial function is in cell division and mitosis.1,2
MTs are strictly organized to form hollow tubes that are composed of two polypeptides, denoted as α- and β-tubulin, which consist of about 450 amino acid residues with a molecular mass of ~55 kDa. The two polypeptodes interact non covalently to form a stable heterodimer of dimentions 4 nm × 5 nm × 8 nm and 100,000 daltons in mass, and the association of tubulin heterodimers in a head-to-tail fashion create protofilaments, which in turn associate in a parallel manner to form sheets of tubulin.3 This arrangement of protofilaments imparts polarity to the final structure of the MT. The β-tubulin subunits are exposed at the “plus end” of the polymer, which is the more dynamic end of the MT that can actively explore the cell and attaches to the kinetochore during mitosis, while the “minus end” is capped by α-tubulin subunits and it is generally attached to the centrosome. Thus, the supramolecular structure of MT in most eukaryotic cells results in a cylindrical tube of about ~24 nm in diameter and of highly variable length ranging 1–100 µm in vivo (Figure 1.1).4 Whereas the arrangement of 13 protofilaments is the most common organization in vivo,5 it is possible for purified tubulin to assemble with a fairly wide range of diameters and to contain 9–18 protofilaments.6 This variation reveals that there is some flexibility in the bonds between adjacent protofilaments, at least in the direction involved in curvature of the MT wall.

2
Figure 1.1. Schematic representation of the MT organization. Head-to-tail polymerization of α- and β-tubulin heterodimers results in protofilaments. Lateral interactions allow protofilaments to assemble into sheets of tubulin, which fold on themselves to form polarized hollow MT structures of approximately 24 nm in diameter, typically composed of 13 protofilaments. During the polymerization process, guanosine 5′-triphosphate (GTP)-bound α,β-tubulin dimers are added at the plus end of the MT. Concomitantly or soon after incorporation into the MT, GTP-bound to β-tubulin is hydrolyzed to the corresponding diphosphate (GDP-MT).
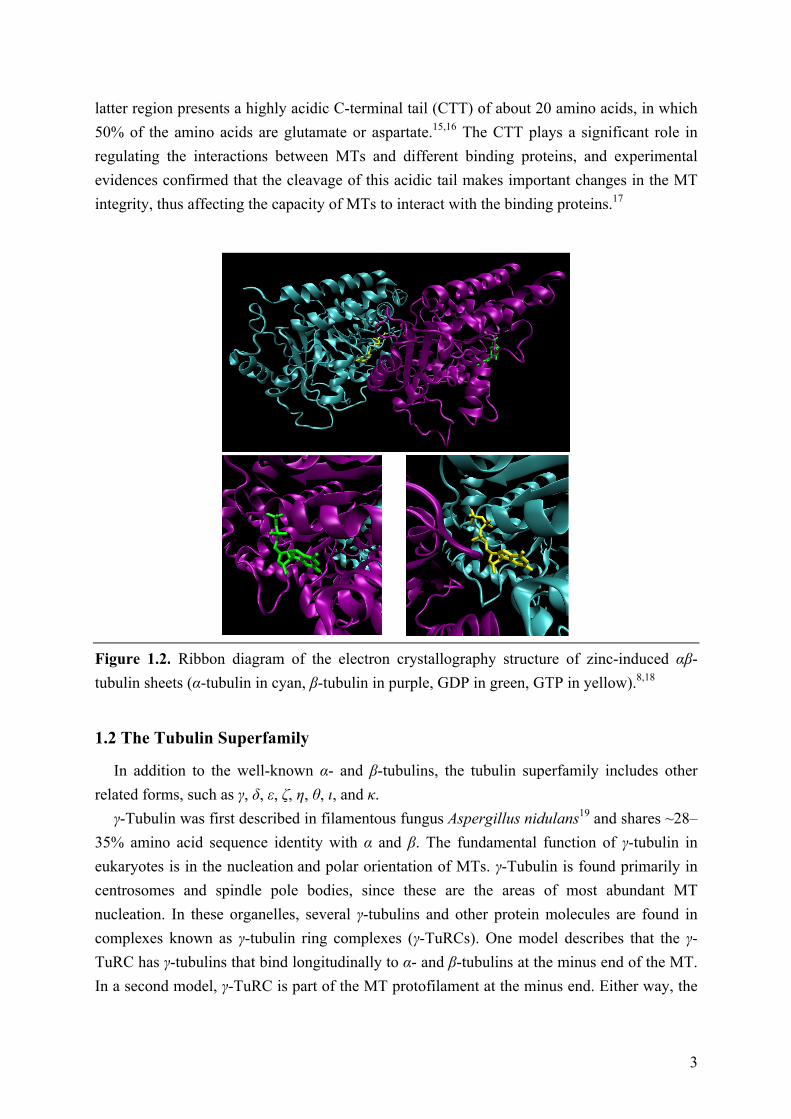
The atomic structure of tubulin in one assembled conformation is known from a 3.5 Å resolution map obtained by electron crystallography of zinc-induced polymers (Figure 1.2).7,8 Tubulin structure can be divided into three functional domains: the amino-terminal (N-terminal) region, an intermediate/central domain, and the carboxyl-terminal (C-terminal) region. The N-terminal domain corresponds to amino acid residues 1–205 and includes a binding site for guanosine triphosphate (GTP), which is required for mediating MT dynamics (see Section 1.3).9 The central domain encompasses residues 206–381 and includes a protease sensitive site10,11 and a binding site for the MT-stabilizing agent taxol on β-tubulin isotypes.7 The C-terminal domain of each tubulin polypeptide forms two long helices (H11 and H12) connected by a U-turn and projects outward from the MT surface, making it preferentially accessible for several enzymes involved in post-translational modifications (PTMs) of tubulin and facilitating the interaction of MTs with MT-binding proteins, such as motor proteins or MT-associated proteins (MAPs), which modulate MT function and dynamics (see section 1.5).12,13 The α- and β-tubulin isotypes, which consist in peptides with different amino acid sequences, show 40% homology in the N-terminal domain, whereas the last 50 amino acids of the C-terminal domain impart much of the heterogeneity between tubulin isotypes.7,14 The
3
latter region presents a highly acidic C-terminal tail (CTT) of about 20 amino acids, in which 50% of the amino acids are glutamate or aspartate.15,16 The CTT plays a significant role in regulating the interactions between MTs and different binding proteins, and experimental evidences confirmed that the cleavage of this acidic tail makes important changes in the MT integrity, thus affecting the capacity of MTs to interact with the binding proteins.17
Figure 1.2. Ribbon diagram of the electron crystallography structure of zinc-induced αβ-tubulin sheets (α-tubulin in cyan, β-tubulin in purple, GDP in green, GTP in yellow).8,18
1.2 The Tubulin Superfamily
In addition to the well-known α- and β-tubulins, the tubulin superfamily includes other related forms, such as γ, δ, ε, ζ, η, θ, ι, and κ. γ-Tubulin was first described in filamentous fungus Aspergillus nidulans19 and shares ~28–
35% amino acid sequence identity with α and β. The fundamental function of γ-tubulin in eukaryotes is in the nucleation and polar orientation of MTs. γ-Tubulin is found primarily in centrosomes and spindle pole bodies, since these are the areas of most abundant MT nucleation. In these organelles, several γ-tubulins and other protein molecules are found in complexes known as γ-tubulin ring complexes (γ-TuRCs). One model describes that the γ-TuRC has γ-tubulins that bind longitudinally to α- and β-tubulins at the minus end of the MT. In a second model, γ-TuRC is part of the MT protofilament at the minus end. Either way, the
4
γ-TuRC acts as a cap at the minus end of the MT thus preventing further addition of tubulin subunits there.20 δ-Tubulin was first discovered in Chlamydomonas and it is primarily located in basal
bodies and centrosomes,21 where often colocalizes with γ-tubulin.22 The function of δ-tubulin is not completely clear. Its location in centrosomes suggests that it may play a structural role in organizing these organelles. It is also likely to be involved in the function of basal bodies. The fact that in some cells δ-tubulin only becomes concentrated in centrosomes during mitosis, suggests that it may have a particular mitotic function, perhaps in centrosome separation. ε-Tubulin was discovered by searching the human genome23 and, as δ, it is located in both
basal bodies and centrosomes. During the early stages of the cell cycle, ε-tubulin associates predominantly with old centrosomes, while only later in the cell cycle it becomes associated with both old and new centrosomes. It appears likely that ε-tubulin is required for the formation of basal bodies and centrioles. η-Tubulin has not been observed in humans, but in the protists Chlamydomonas and
Paramecium and the animals Ciona and Xenopus. η-Tubulin is located in basal bodies21 and studies in Paramecium have suggested that it is required for basal body duplication. η-Tubulin also appears to interact with γ-tubulin24 and with β-tubulin, acting as a minus end capping protein.25 ζ-tubulin has been found in basal bodies of the related protists Trypanosoma and
Leishmania, as well as in the Xenopus genome. Its role remains unclear. Finally, θ-, ι-, and κ-tubulins have been identified in the genome of Paramecium. θ-Tubulin occurs in basal bodies, while the subcellular localization of ι and κ, as well as their functional roles, remain unknown.26
1.3 Microtubule Dynamics: Dynamic Instability and Treadmilling
MTs are highly dynamic structures with many of them in a state of permanent turnover. They show two kinds of non-equilibrium dynamics that are both crucial to mitosis and cell division: ‘dynamic instability’ and ‘treamilling’.
‘Dynamic instability’ is a process in which MT ends switch stochastically between phases of slow growing and rapid shortening (Figure 1.3).27,28 In cells, the two ends of a MT are not equivalent: the more dynamic plus end grows and shortens more rapidly and more extensively than the minus end. MTs can continue to grow as long as the free tubulin concentration is above a critical level (Cc, at which α- and β-tubulins polymerize into MTs, whereas at concentrations below the Cc, MTs depolymerize). However, even when the tubulin concentration is above this level, it is observed that MT ends may suddenly stop growing and begin to shrink rapidly. The change from growth to shrinkage has been termed as ‘catastrophe’. After a while, a shrinking MT end may ‘pause’ and/or begin to grow again; the

5
latter process is known as ‘rescue’. MTs tend to disassemble when cells are cooled below their normal temperature and reassemble when they are rewarmed, but they show dynamic instability even under constant warm conditions.6
Figure 1.3. Dynamic instability of MTs. Changes in length of a single MT over time.29
The second dynamic behaviour is called ‘treadmilling’ that is the net addition of tubulin at one MT end and the balanced net loss at the other end. It involves the intrinsic flow of tubulin subunits from the plus end of the MT to the minus end and it is created by differences in the critical subunit concentrations at the opposite MT ends (Figure 1.4).30–34 The length of the MT remains unchanged. This dynamic behaviour occurs in cells as well as in vitro, and it has been demonstrated that it is particularly important in mitosis.35
Treadmilling and dynamic instability are compatible behaviours. A specific MT population can show primarily treadmilling behaviour, dynamic instability behaviour or some mixture of both. The mechanisms that control the degree to which MT population shows one or the other behaviour are poorly understood, but probably involve the tubulin isotype composition of the MT population, the degree of PTM of tubulin and, especially, the actions of regulatory proteins.36
Figure 1.4. Treadmilling MT. Tubulin heterodimers are added at the plus end of the MT at time 0, treadmill through the MT, and are lost from the minus end at time 3.29
6
1.4 GTP Hydrolysis
During MT assembly, α- and β-tubulin heterodimers polymerize in a head-to-tail fashion resulting in a polarized structure with a β-tubulin cap at the plus end and a α-tubulin cap at the minus end.37,38 The assembly requires that α- and β-tubulins bind one molecule of GTP each monomer. The GTP bound to α-tubulin is trapped between the two monomers thus resulting nonexchangeable. It is apparently never hydrolysed and permanently present at the N-site.39,40 When tubulin subunits associate to create protofilaments, as a consequence of the interaction with α-tubulin in the next dimer, the β-tubulin subunit acts as a GTPase and hydrolyzes GTP to GDP at the exchangeable E-site. GDP is nonexchangeable, as long as tubulin is present in MTs41 and can only be replaced by GTP when tubulin is in the heterodimeric form. The hydrolysis rate of GTP by unpolymerized tubulin dimer is very low (0.054 min−1 at most42,43), but it dramatically increases during the polymerization process (21 min−1).44
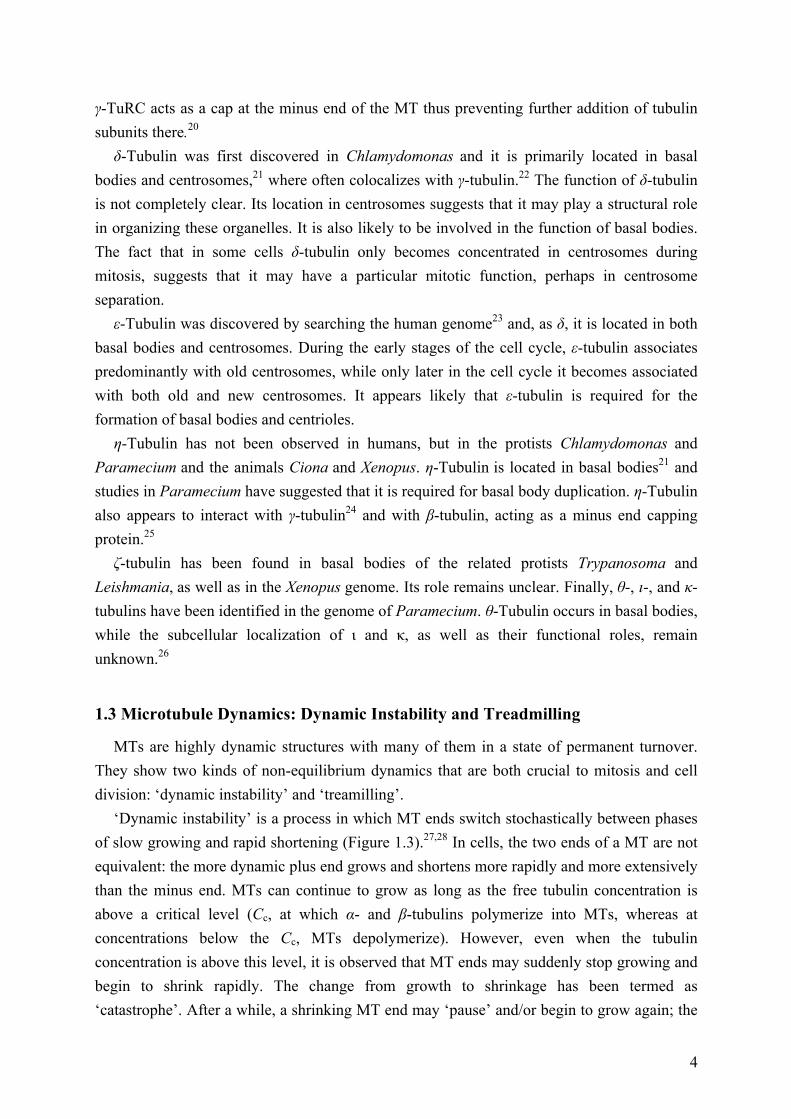
The GTP to GDP hydrolysis is not strictly required for MT polymerization; however, this conversion plays an important role in determining the MTs dynamic behaviour and instability, as GTP-tubulin forms more stable inter-subunit interactions, while GDP-tubulin establishes comparatively weaker interactions and is therefore prone to depolymerization. The presence of a GTP-bound tubulin at the growing end of the MT (called “GTP cap” or “stabilizing cap”) protects the MT from depolymerization, thus stabilizing the MT structure and maintaining the association between protofilaments.45 As a consequence, removal of the GTP cap can trigger rapid depolymerization events. Upon depolymerization, released tubulin heterodimers can exchange GDP with GTP and re-enter the polymerization cycle. These characteristics result in the dynamic instability of MTs (Figure 1.5).
Figure 1.5. Dynamic instability and the GTP cap. GTP bound to β-tubulin is hydrolyzed to GDP and inorganic phosphate (Pi) at the time that tubulin adds to the MT plus ends, or shortly thereafter. A MT end containing tubulin-GTP or tubulin-GDP-Pi is stable or “capped,” against depolymerization. Hydrolysis of GTP-bound tubulin and the subsequent release of Pi induce conformational changes that destabilizes the MT polymer.29
7
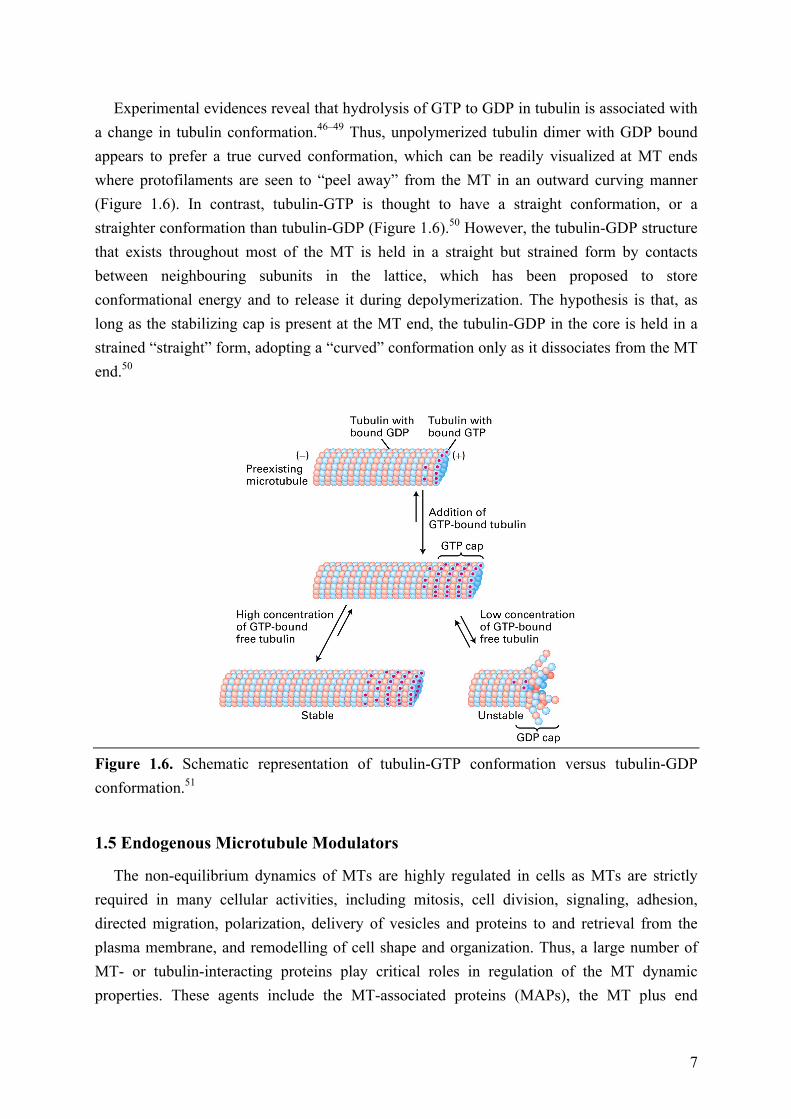
Experimental evidences reveal that hydrolysis of GTP to GDP in tubulin is associated with a change in tubulin conformation.46–49 Thus, unpolymerized tubulin dimer with GDP bound appears to prefer a true curved conformation, which can be readily visualized at MT ends where protofilaments are seen to “peel away” from the MT in an outward curving manner (Figure 1.6). In contrast, tubulin-GTP is thought to have a straight conformation, or a straighter conformation than tubulin-GDP (Figure 1.6).50 However, the tubulin-GDP structure that exists throughout most of the MT is held in a straight but strained form by contacts between neighbouring subunits in the lattice, which has been proposed to store conformational energy and to release it during depolymerization. The hypothesis is that, as long as the stabilizing cap is present at the MT end, the tubulin-GDP in the core is held in a strained “straight” form, adopting a “curved” conformation only as it dissociates from the MT end.50
Figure 1.6. Schematic representation of tubulin-GTP conformation versus tubulin-GDP conformation.51
1.5 Endogenous Microtubule Modulators
The non-equilibrium dynamics of MTs are highly regulated in cells as MTs are strictly required in many cellular activities, including mitosis, cell division, signaling, adhesion, directed migration, polarization, delivery of vesicles and proteins to and retrieval from the plasma membrane, and remodelling of cell shape and organization. Thus, a large number of MT- or tubulin-interacting proteins play critical roles in regulation of the MT dynamic properties. These agents include the MT-associated proteins (MAPs), the MT plus end
8
tracking proteins (+TIPs), the minus end binding proteins and proteins that bind along the lengths of MTs, GTPases and guanine nucleotide exchange factors (Figure 1.7). Among these agents, MAPs are primarily involved in modulating MT stability and dynamics. They were initially identified by their activity to copurify with tubulin through repetitive cycles of depolymerization and reassembly. A variety of structural MAPs can interact on the surface of MTs and reduce their dynamic behavior by stimulating tubulin polymerization and stabilization. The brain is a particularly rich source of MAPs and several structural MAPs such as tau, MAP1A, MAP1B, and MAP2 may play a central role in regulation of neuronal MT structure and function during development. As an example, MAP1A is abundant in the adult brain, whereas MAP1B is a neuritogenesis-associated MAP predominantly expressed during the early stages of cell maturation, and tau and MAP2 are expressed in both immature and mature neurons.52 Several MAPs also exhibit a pronounced compartment-specific distribution such as MAP2A and MAP2B, which preferentially locate in the cell bodies and dendrites in mature neurons,53 whereas tau is mostly present in the axons,54 although it can be found also in dendrites.55 However, under physiological conditions, the vast majority of tau molecules are bound to MT with the primary function to promote MT stabilization.56 The most abundant and ubiquitous MAP in non-neuronal cells is MAP4 that can localize both to interphase and mitotic MTs, which suggests that it may contribute to the role of MTs in proliferation and differentiation of cells.57
In general, the activity of MAPs is regulated by phosphorylation that causes the dissociation of MAPs from MTs, promoting depolymerization and increased dynamic instability. Furthermore, the stabilizing activity of MAPs is counteracted by proteins that bind to tubulin dimers and promote MT depolymerization. This class of proteins included, for example, the stathmin (also referred to as oncoprotein 18, OP18; metablastin; p19), which was first identified as a highly overexpressed protein in leukemia58,59 and as a protein that underwent phosphorylation in response to extracellular stimuli.60 Stathmin is a well-conserved, ubiquitous, cytosolic phosphoprotein that forms a specific complex with two tubulin dimers thereby preventing MT polymerization.61,62 SCG10 belongs to the same gene family as stathmin and also promotes MT destabilization. However, while stathmin is expressed in a variety of cell types and shows a cytosolic distribution, SCG10 is neuron-specific and membrane-associated. Both stathmin and SCG10 are regulated by phosphorylation and have high expression in the developing nervous system, but persists in regions of synaptic plasticity of the adult brain.63−65
While MAPs such as tau and MAP2 localize to the entire MT surface, proteins like +TIPs, such as the cytoplasmic linker protein CLIP-170, the EB1, and others, bind to MT plus ends (Figure 1.7). +TIPs are involved in intracellular transport and crosstalk of MTs with the actin cytoskeleton.66 Furthermore, they participate in the establishment of neuron polarity, axon navigation, and spine growth and maintenance.67 EB1 is a potent inducer of MT

9
polymerization and plays an important role in anchoring the minus end of MTs to the centriole.
Minus end binding proteins include the γ-TuRCs,68 stathmin,69 and possibly ninein.70 The GTPase Ran,71 and the chromatin-bound guanine nucleotide exchange factor RCC1 are additional recently discovered important MT regulatory proteins.
Other important families of proteins involved in regulation of MT dynamics and functions are the motor proteins, such as kinesins72 and dyneins73 (Figure 1.7). Kinesins and dyneins are protein complexes that move along MTs (towards the plus and minus ends, respectively) by hydrolysing ATP. They generate forces that are used for various intracellular functions, especially for intracellular transport. For example, in neurons, these proteins allow the transport of cargoes over long distances from the cell body to the synapses.74 Moreover, motor proteins generate forces for ciliary beating75 and self-organization of the mitotic spindle, whereas specific kinesins catalyse the depolymerization of MTs,76 thus participating in the complex network of interacting proteins that regulate MT dynamics.
Figure 1.7. Schematic representation of MT dynamics and their regulation.77
1.6 Post-Translational Modifications of Tubulin
Tubulin and MTs are subject to a large number of evolutionarily conserved and particularly regulated post-translational modifications (PTMs) (Figure 1.8). These modifications may be involved in modulating stability and dynamics of MTs and interactions with MAPs, but they also may have as yet undiscovered functions. Modifications such as phosphorylation, acetylation, palmitoylation, or polyglutamylation occur also on other
10
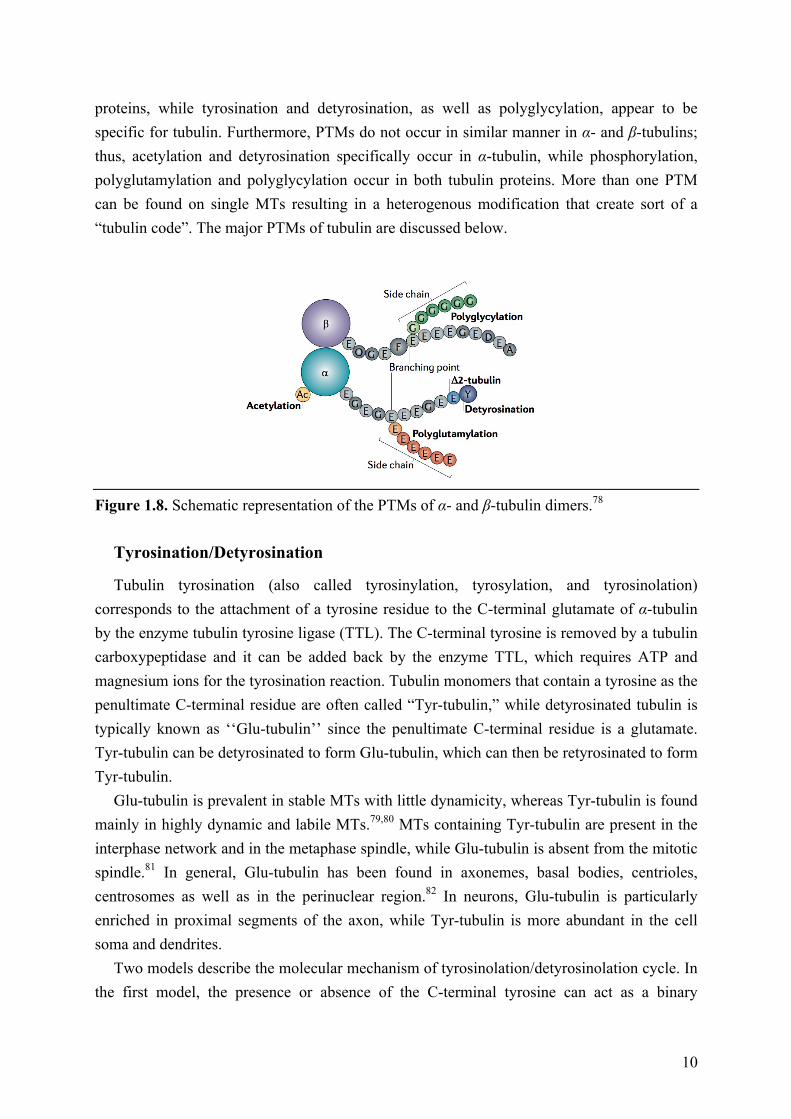
proteins, while tyrosination and detyrosination, as well as polyglycylation, appear to be specific for tubulin. Furthermore, PTMs do not occur in similar manner in α- and β-tubulins; thus, acetylation and detyrosination specifically occur in α-tubulin, while phosphorylation, polyglutamylation and polyglycylation occur in both tubulin proteins. More than one PTM can be found on single MTs resulting in a heterogenous modification that create sort of a “tubulin code”. The major PTMs of tubulin are discussed below.
Figure 1.8. Schematic representation of the PTMs of α- and β-tubulin dimers.78
Tyrosination/Detyrosination
Tubulin tyrosination (also called tyrosinylation, tyrosylation, and tyrosinolation) corresponds to the attachment of a tyrosine residue to the C-terminal glutamate of α-tubulin by the enzyme tubulin tyrosine ligase (TTL). The C-terminal tyrosine is removed by a tubulin carboxypeptidase and it can be added back by the enzyme TTL, which requires ATP and magnesium ions for the tyrosination reaction. Tubulin monomers that contain a tyrosine as the penultimate C-terminal residue are often called “Tyr-tubulin,” while detyrosinated tubulin is typically known as ‘‘Glu-tubulin’’ since the penultimate C-terminal residue is a glutamate. Tyr-tubulin can be detyrosinated to form Glu-tubulin, which can then be retyrosinated to form Tyr-tubulin.
Glu-tubulin is prevalent in stable MTs with little dynamicity, whereas Tyr-tubulin is found mainly in highly dynamic and labile MTs.79,80 MTs containing Tyr-tubulin are present in the interphase network and in the metaphase spindle, while Glu-tubulin is absent from the mitotic spindle.81 In general, Glu-tubulin has been found in axonemes, basal bodies, centrioles, centrosomes as well as in the perinuclear region.82 In neurons, Glu-tubulin is particularly enriched in proximal segments of the axon, while Tyr-tubulin is more abundant in the cell soma and dendrites.
Two models describe the molecular mechanism of tyrosinolation/detyrosinolation cycle. In the first model, the presence or absence of the C-terminal tyrosine can act as a binary
11
ON/OFF switch for the recruitment of MT dynamics regulators, rather than directly influence the intrinsic properties of the protein itself. For example, Glu-tubulin interacts with a complex at the growing end of the MT, thereby promoting its stability, but the Glu-tubulin by itself does not stabilize the MT.83−85 In the second model, alteration of the C-terminal tyrosine can affect the overall conformation of the tubulin molecule and change its intrinsic properties. Indeed, the presence of a terminal tyrosine may alter the property of the C-terminus to project out from the tubulin molecule rather than lie down along the tubulin surface resulting in change of the tubulin conformation.86 One additional possibility is that the TTL can incorporate nitrotyrosine, which is generated by the interaction between nitric oxide and a tyrosine residue.87 Incorporation of nitrotyrosine into tubulin is irreversible and can cause disorganization of the cell, perhaps by altering the relative proportions of stable and unstable MTs and/or by affecting the binding of other proteins to the C-terminal region.88
Deglutamylation
Under physiological conditions, the Glu-tubulin, which resulted from detyrosination of Tyr-tubulin, can be further converted to Δ2-tubulin by the removal of the C-terminal glutamyl-tyrosine group, potentially by 6-cytoplasmic carboxypeptidases (CCP1-6).89 This reaction is irreversible, thus Δ2-Tubulin cannot be tyrosinated or polyglutamylated any longer. ∆2-tubulin accumulates in stable MTs and represents about 35% of mammalian brain α-tubulin.
Acetylation
Acetylation of α-tubulin is one of the earliest tubulin PTMs discovered90,91 and consists in the addition of an acetyl group to a lysine residue on position 40 (Lys40) of α-tubulin by the enzyme acetyltransferase (TAT). Interestingly, acetylation is the only known PTM that occurs in the lumenal surface of the MTs, whereas other tubulin PTMs take place on the C-terminal domains on the outside of the MT.
Acetylated α-tubulin (AcTub) is often seen in long-lived and low dynamic MTs, such as in the neuronal growth cones, in the leading edges of fibroblasts,92,93 in centrioles, centrosomes, primary cilia, and the perinuclear region.94
AcTub, which can be detected by specific antibodies, can be use as a marker for a stable MTs. However, studies conducted by Borisy and coworkers in 1989 revealed that the acetylation is most likely a consequence of MT stabilization and not a cause.95 Deacetylation of tubulin is mediated by histone deacetylase (HDAC) 5 and 6 and SIRT2 enzyme.96,97 It has been demonstrated that HDAC6 is able to deacetylate tubulin in vivo98 and its overexpression promotes tubulin deacetylation and induces chemotactic cell movement,96 thus indirectly suggesting that acetylation of α-tubulin may play important roles in regulation of cell signaling and homeostasis.

12
Polyglutamylation
Polyglutamylation can occur in both α- and β-tubulins and involves the attachment of oligoglutamyl-side chains of variable lengths to the γ-carboxyl group of specific glutamate residues in the C-terminal region of tubulin by an isopeptide (α/γ) linkage. To this added glutamate are then added several others through α/α linkages, resulting in side chains that can vary in length between 1 and 17 glutamyl units.99 Tubulin tyrosine ligase like (TTLL) proteins catalyze the polyglutamylation on tubulin dimers. TTLL1 preferentially polyglutamylates α-tubulin, while TTLL7 targets β-tubulin.100,101
Polyglutamylation of tubulin is one of the major PTMs, which occurs in axonal MTs and is also enriched in long-lived MTs,102,103 such as those of centrioles, basal bodies, axonemes, and axostyles,104,105 whereas less stable MTs are sometimes monoglutamylated.103,106 However, glutamylation can also occur on less stable MTs, such as in neuronal MTs.107,108
The mechanism by which this modification occurs is probably quite complex. One TTLL enzyme must find an appropriate glutamate residue at the C-terminal end of tubulin to catalyze the addition of another glutamate residue through an α/γ linkage (these enzymes are called ‘‘initiases’’). After that, TTLL enzymes are also specialized to elongate the amino acid chain adding a series of glutamates to the first one through α/α linkages (thus are called ‘‘elongases’’).109 The fact that polyglutamylation was found in brain Tyr-tubulin and Glu-tubulin, but not in ∆2-tubulin, suggests that the penultimate glutamate residue may be essential for the tubulin polyglutamylase.110
Polyglutamylation seems to influence binding of MAPs and kinesin to tubulin thus playing an important regulatory role in MTs. Indeed, polyglutamylation adds a number of negative charges to a region of the molecule that is already strongly negatively charged. Thus, polyglutamylated C-terminus will project from the MT surface promoting the interaction of tubulin with MAPs and kinesins.111−113
Polyglycylation
In addition to polyglutamylation, both α- and β-tubulins can undergo polyglycylation that consists in the addition of multiple glycine residues to the γ-carboxyl groups of specific glutamic acid residues at the C-terminal region.114,115 As in the case of polyglutamylation, in polyglycylation the first glycine is connected to the glutamate residue by a α/γ linkage, while the remaining glycines are added to the first one through α/α linkages. Unlike polyglutamylation, where one chain of glutamates is added to a single specific residue, in polyglycylation the glycines are added to more than one glutamate residue in the C-terminal region. Thus polyglycylation results as a large-scale modification. For example, in Paramecium, up to 34 glycines can be added to a single tubulin molecule.114,116
Polyglycylation is particularly common in MTs forming stable organelles, such as axonemes and basal bodies. Interestingly, it has not been observed in centrioles.105
13
Polyglycylation is also observed in less stable MTs, such as those of the cochlea and neurons.117 In these cases, however, polyglycylation appears to be much less, with up to 3 attached glycines that have been observed as the most extent form of polyglycylation in neuronal tubulin.110,118
The mechanism by which polyglycylation occurs is not completely clear. First, there would be the addition of a single glycine to a glutamate through a α/γ linkage. Then, follows the addition of more glycines through α/α linkages. The third step would be the removal of some or all the glycine residue by a deglycylase that suggests the presence of a polyglycylation cycle.
Phosphorylation
Phosphorylation of mammalian brain β-tubulin was discovered in the early 1970s.119 Whereas most tubulin PTMs act on α- and β-tubulin subunits already incorporated into MTs, phosphorylation can occur on both tubulin dimers and polymers. In addition, although several serine as well as tyrosine residues can undergo phosphorylation,120−126 when phosphorylation occurs on serine172, it can only take place on β-tubulin.127
The precise mechanism of phosphorylation of tubulin is not yet clear. Tubulin is phosphorylated by a variety of kinases, including the non-receptor tyrosine kinases, such as Fes, Jak2, and Syk that specifically targets a tyrosine residue at the C-terminal region of α-tubulin in vivo and in vitro.122,128 The physiological relevance of tubulin phosphorylation remains an active area of research with several studies129−132 suggesting an important role for phosphorylation in regulating polymerization, both positively and negatively. Several of the MAPs are subject to PTMs and can be phosphorylated at many sites. Some of these events may influence the interaction of MAPs with MTs thereby affecting MT dynamicity.10 Phosphorylation may also induce conformational changes that could, for example, affect MT spacing in the axon or dendrites, or influence the availability of the MT surface towards several enzymes.133
Palmitoylation
Tubulin can undergo palmitoylation that constists in the addition of the fatty acid palmitate to the sulfhydryl group of a cysteine residue (cys376 of α-tubulin). The presence of a covalently linked palmitate could facilitate the connection of a protein to a membrane. Mutation of the palmitoylated residue in Saccharomyces cerevisiae showed a striking effect during mitosis and changes the position of the nucleus.134 Thus, it is possible that palmitoylation may play a role in proper orientation of the mitotic spindle.

14
Changes in tubulin PTMs have been linked to several human disease states ranging from cancers and neurodegenerative disorders to stroke.135 For example, low TTL levels have been associated with aggressive tumors that are resistant to chemotherapy136−138 and with the formation of tentacles rich in detyrosinated tubulin that facilitate penetration into the endothelial layer of circulating tumor cells, thus contributing to metastasis.139 Similarly, increased levels of TTLL12 and consequently glutamylated tubulin has been associated with metastatic progression in prostate cancer.140 In a mouse model of Charcot-Marie-Tooth disease, a descrease in acetylated tubulin levels and the axonal transport defects observed in these mice were corrected by the administration of HDAC6 inhibitors that also partially recovered the acetylated tubulin levels.141 In neurodegenerative disorders, such as Huntington’s and Alzheimer’s, were found similar connections between hyperphosphorylated stabilizing tau protein and axonal transport deficits.142,143 The cellular mechanisms behind these changes in tubulin PTMs are largely unclear. However, a better understanding of these mechanisms will likely lead to a better understanding of the disease states as well as aid in the identification of novel drug targets.
1.7 The Importance of Microtubule Dynamics in Mitosis
Highly dynamic MTs in the spindle are required for all stages of mitosis. Mitosis is a process of different stages in which duplicated chromosomes of a cell are separated into two identical sets before cleavage of the cell into two daughter cells.144 With the development of sophisticated methods for observing MT dynamics in living cells, it become possible to visualize the dynamics of mitotic-spindle MTs. It is now clear that the prime requirement for appropriate cell division is the correct functioning of mitotic spindle throughout mitosis.145−147
During interphase, the turn over of MTs, in which they exchange tubulin with the soluble tubulin pool, is a relatively slow process (half-times range from several minutes to several hours)146−148 In interphase, MTs are nucleated at the centrosome or at the MT-organizing center (MTOC) located near the cell nucleus,68,149 and they extend toward the cell periphery. Following nucleation, the plus ends grow toward the cell periphery, whereas the minus ends generally remain at the centrosome. The interphase MT network disassembles at the onset of mitosis and is replaced by a new population of spindle MTs that are 4–100 times more dynamic than the MTs in the interphase cytoskeleton.147,148,150 During prometaphase, dynamic MTs are importantly required for the correct attachment of chromosomes at their kinetochores to the spindle. During metaphase, they promote the complex movements of the chromosomes that bring them to their properly aligned positions at the metaphase plate. In anaphase and telophase, MTs are needed for the synchronous separation of the chromosomes.
Remarkably, during prometaphase, MTs emanating from each of the two spindle poles make vast growing and shortening excursions, essentially probing the cytoplasm until they ‘find’ and become attached to chromosomes at their kinetochores.151 Such MTs must be able
15
to grow for long distances (typically 5–10 µm), then shorten almost completely, then re-grow again until they successfully become attached. The presence of a single chromosome that is unable to achieve a bipolar attachment to the spindle is sufficient to prevent a cell from transitioning to anaphase; the cell then remains blocked in a metaphase/anaphase-like state and eventually undergoes cell death.152
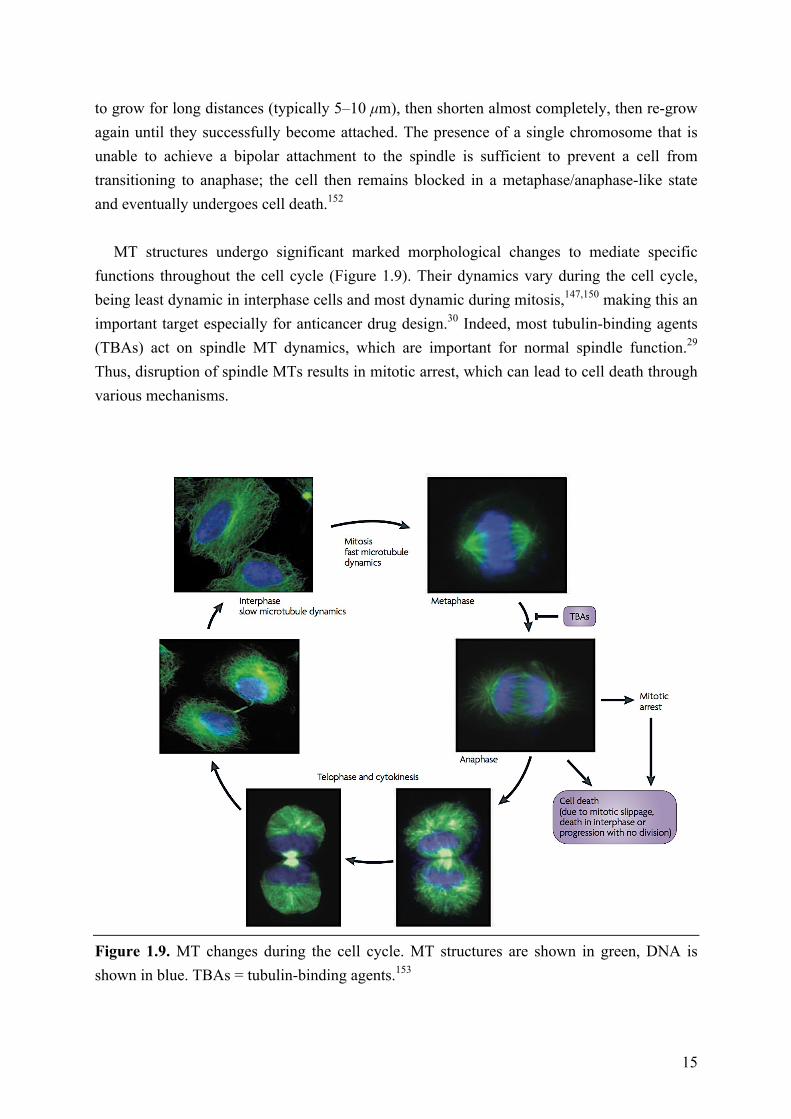
MT structures undergo significant marked morphological changes to mediate specific
functions throughout the cell cycle (Figure 1.9). Their dynamics vary during the cell cycle, being least dynamic in interphase cells and most dynamic during mitosis,147,150 making this an important target especially for anticancer drug design.30 Indeed, most tubulin-binding agents (TBAs) act on spindle MT dynamics, which are important for normal spindle function.29 Thus, disruption of spindle MTs results in mitotic arrest, which can lead to cell death through various mechanisms.
Figure 1.9. MT changes during the cell cycle. MT structures are shown in green, DNA is shown in blue. TBAs = tubulin-binding agents.153
16
1.8 Tubulin-Binding Agents
A large number of structurally different substances, generally originating from natural sources, bind to tubulin and/or MTs, thus altering MT dynamics in different ways.154 These agents can be divided into two major classes: the MT-destabilizing agents and the MT-stabilizing agents, according to their effects on MT polymer mass at high concentration. The MT-destabilizing agents bind preferentially to depolymerized MTs and inhibit MT assembly at high concentration, while the MT-stabilizing drugs bind to polymerized MTs and inhibit MT disassembly. The result of these interactions is inevitably the failure of the cell to undergo a normal mitosis.
The first group includes compounds like the Vinca alkaloids (vinblastine, vincristine, vinorelbine, vindesine and vinflunine), cryptophycins, eribulin, halichondrins, estramustine, colchicine and combretastatins, which are mostly used for treatment of cancer.29,155,156 In addition, this group includes a large number of compounds that have not undergone clinical development for cancer therapy, including the anti-tussive noscapine,157 maytansine, rhizoxin, spongistatins, podophyllotoxin, steganacins and curacins,156 several herbicides,158 antifungal and antihelmintic agents,159 and some psychoactive drugs.160−162 The second group includes paclitaxel (Taxol), docetaxel (Taxotere; Sanofi-Aventis), the epothilones, discodermolide, the eleutherobins, sarcodictyins, dictyostatin, laulimalide, rhazinalam, peloruside A and certain steroids and polyisoprenyl benzophenones.155,163
The vast majority of the MT-binding agents act as antimitotic drugs and interfere with the normal dynamic equilibrium of MTs, thereby disrupting the function of the mitotic apparatus. The suppression of MT dynamics, which are essential to proper spindle function, result in the slowing or blocking of mitosis at the metaphase/anaphase transition and induction of apoptotic cell death. Furthermore, these compounds can affect MTs in interphase cells and have the potential to inhibit cell motility and normal subcellular organization. Interestingly, the effects of the drugs on dynamics are often more powerful than their effects on polymer mass. Thus, they can modulate MT dynamics at 10- to 100-fold lower concentrations than those required to affect (increase or decrease) the MT polymer mass.
The effects of the major tubulin-binding drugs on MT dynamics and functions are described next.
Vinca alkaloids
The naturally occurring members of this family, vinblastine (1.1, Figure 1.10) and vincristine (1.2, Figure 1.10), were originally isolated from the leaves of the periwinkle plant Catharanthus rosea (Vinca rosea). In the late 1950s, the Eli Lilly Research Laboratories and the University of Western Ontario164,165 both discovered the antimitotic and, therefore, anticancer potential of these drugs that came into widespread use for the treatment of leukemias, lymphomas, and solid malignancies.166−168 Since that time, the clinical efficacy of
17
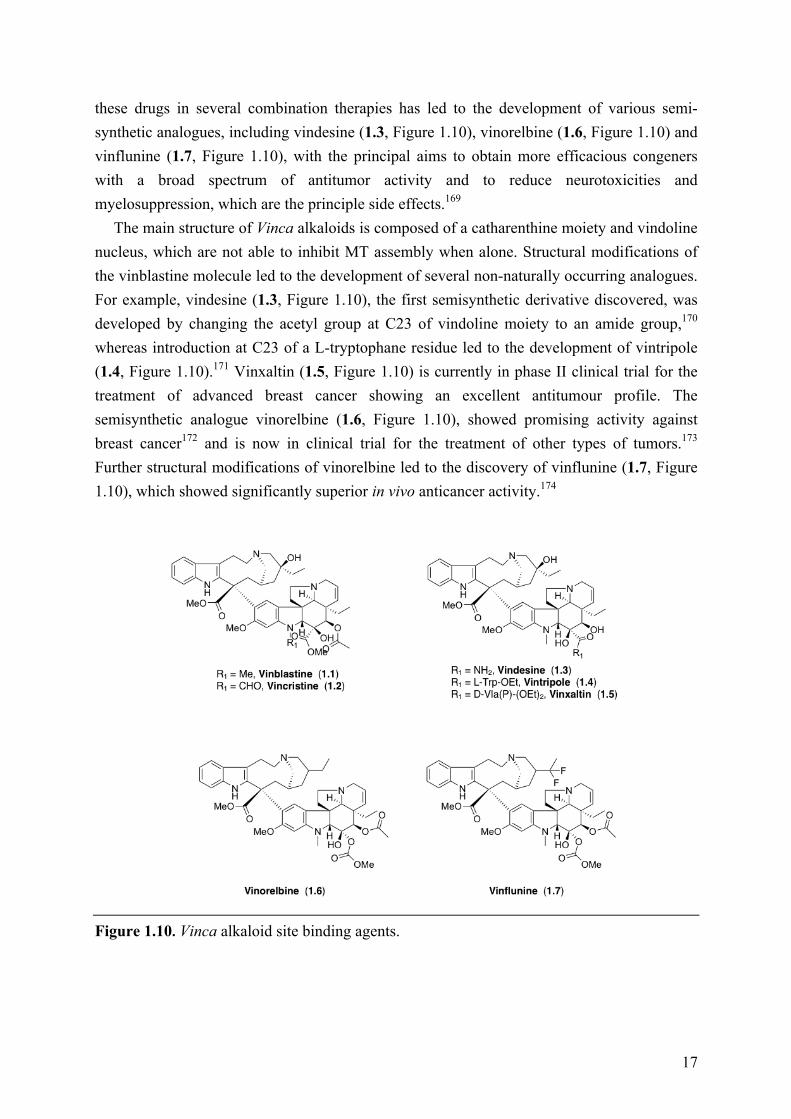
these drugs in several combination therapies has led to the development of various semi-synthetic analogues, including vindesine (1.3, Figure 1.10), vinorelbine (1.6, Figure 1.10) and vinflunine (1.7, Figure 1.10), with the principal aims to obtain more efficacious congeners with a broad spectrum of antitumor activity and to reduce neurotoxicities and myelosuppression, which are the principle side effects.169
The main structure of Vinca alkaloids is composed of a catharenthine moiety and vindoline nucleus, which are not able to inhibit MT assembly when alone. Structural modifications of the vinblastine molecule led to the development of several non-naturally occurring analogues. For example, vindesine (1.3, Figure 1.10), the first semisynthetic derivative discovered, was developed by changing the acetyl group at C23 of vindoline moiety to an amide group,170 whereas introduction at C23 of a L-tryptophane residue led to the development of vintripole (1.4, Figure 1.10).171 Vinxaltin (1.5, Figure 1.10) is currently in phase II clinical trial for the treatment of advanced breast cancer showing an excellent antitumour profile. The semisynthetic analogue vinorelbine (1.6, Figure 1.10), showed promising activity against breast cancer172 and is now in clinical trial for the treatment of other types of tumors.173 Further structural modifications of vinorelbine led to the discovery of vinflunine (1.7, Figure 1.10), which showed significantly superior in vivo anticancer activity.174
Figure 1.10. Vinca alkaloid site binding agents.
18
The interactions of Vinca alkaloids, especially vinblastine, with tubulin and MTs have been extensively studied.155,175−177 Vinblastine binds to the β-tubulin subunit at a distinct region, usually referred to as the “Vinca-binding domain”,178,179 which is located very close to the GTP site at the interface between β1-tubulin subunit and the adjacent α2-tubulin subunit. The binding of vinblastine to soluble tubulin is rapid and reversible, but relatively weak (Ka ~2 × 10⁴ M), and is not influenced by temperature.177,180,181 Remarkably, binding of vinblastine induces a conformational change in tubulin, which not only promotes tubulin self-association, but it also results in an increased affinity of vinblastine for the tubulin.175,177,182
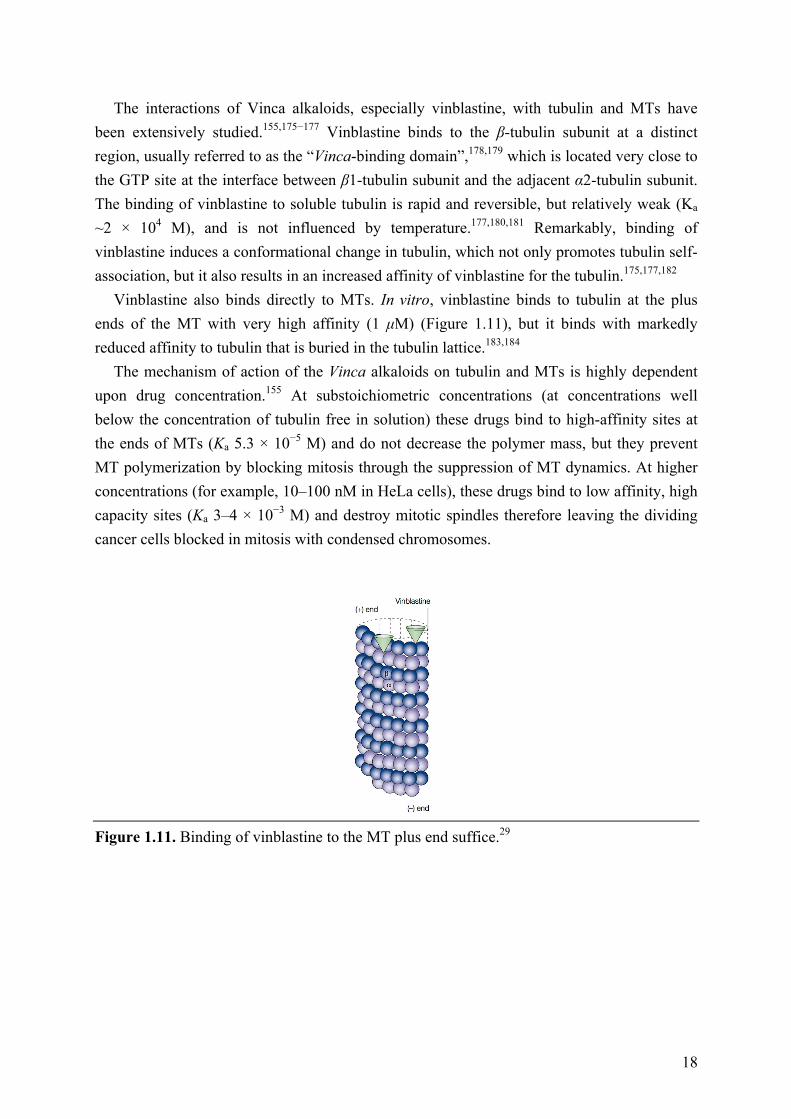
Vinblastine also binds directly to MTs. In vitro, vinblastine binds to tubulin at the plus ends of the MT with very high affinity (1 µM) (Figure 1.11), but it binds with markedly reduced affinity to tubulin that is buried in the tubulin lattice.183,184
The mechanism of action of the Vinca alkaloids on tubulin and MTs is highly dependent upon drug concentration.155 At substoichiometric concentrations (at concentrations well below the concentration of tubulin free in solution) these drugs bind to high-affinity sites at the ends of MTs (Ka 5.3 × 10⁻⁵ M) and do not decrease the polymer mass, but they prevent MT polymerization by blocking mitosis through the suppression of MT dynamics. At higher concentrations (for example, 10–100 nM in HeLa cells), these drugs bind to low affinity, high capacity sites (Ka 3–4 × 10⁻³ M) and destroy mitotic spindles therefore leaving the dividing cancer cells blocked in mitosis with condensed chromosomes.
Figure 1.11. Binding of vinblastine to the MT plus end suffice.29
19
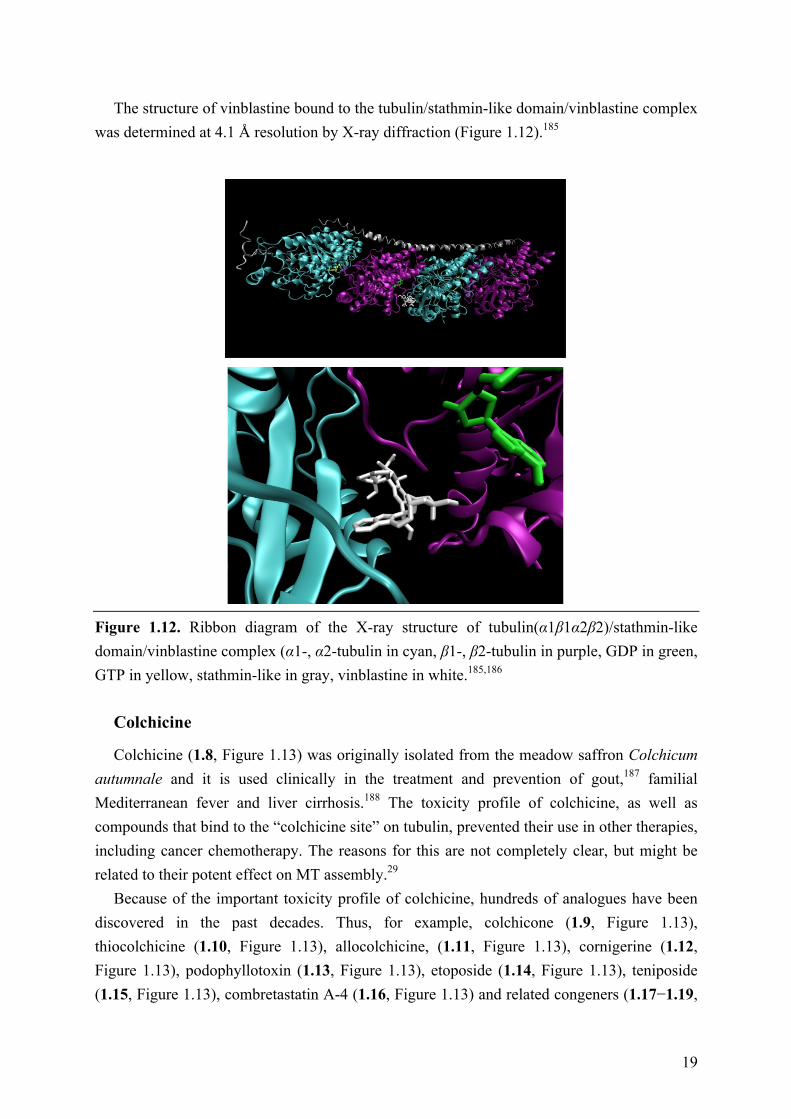
The structure of vinblastine bound to the tubulin/stathmin-like domain/vinblastine complex was determined at 4.1 Å resolution by X-ray diffraction (Figure 1.12).185
Figure 1.12. Ribbon diagram of the X-ray structure of tubulin(α1β1α2β2)/stathmin-like domain/vinblastine complex (α1-, α2-tubulin in cyan, β1-, β2-tubulin in purple, GDP in green, GTP in yellow, stathmin-like in gray, vinblastine in white.185,186
Colchicine
Colchicine (1.8, Figure 1.13) was originally isolated from the meadow saffron Colchicum autumnale and it is used clinically in the treatment and prevention of gout,187 familial Mediterranean fever and liver cirrhosis.188 The toxicity profile of colchicine, as well as compounds that bind to the “colchicine site” on tubulin, prevented their use in other therapies, including cancer chemotherapy. The reasons for this are not completely clear, but might be related to their potent effect on MT assembly.29
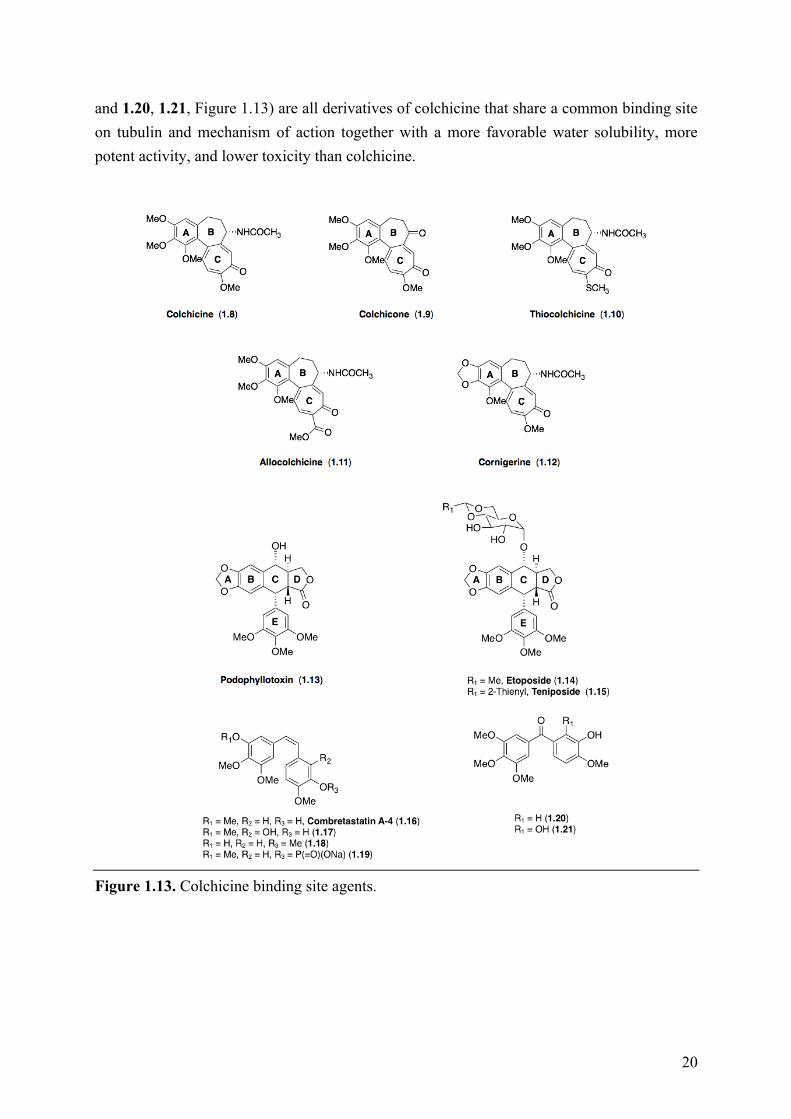
Because of the important toxicity profile of colchicine, hundreds of analogues have been discovered in the past decades. Thus, for example, colchicone (1.9, Figure 1.13), thiocolchicine (1.10, Figure 1.13), allocolchicine, (1.11, Figure 1.13), cornigerine (1.12, Figure 1.13), podophyllotoxin (1.13, Figure 1.13), etoposide (1.14, Figure 1.13), teniposide (1.15, Figure 1.13), combretastatin A-4 (1.16, Figure 1.13) and related congeners (1.17−1.19,
20
and 1.20, 1.21, Figure 1.13) are all derivatives of colchicine that share a common binding site on tubulin and mechanism of action together with a more favorable water solubility, more potent activity, and lower toxicity than colchicine.
Figure 1.13. Colchicine binding site agents.
21
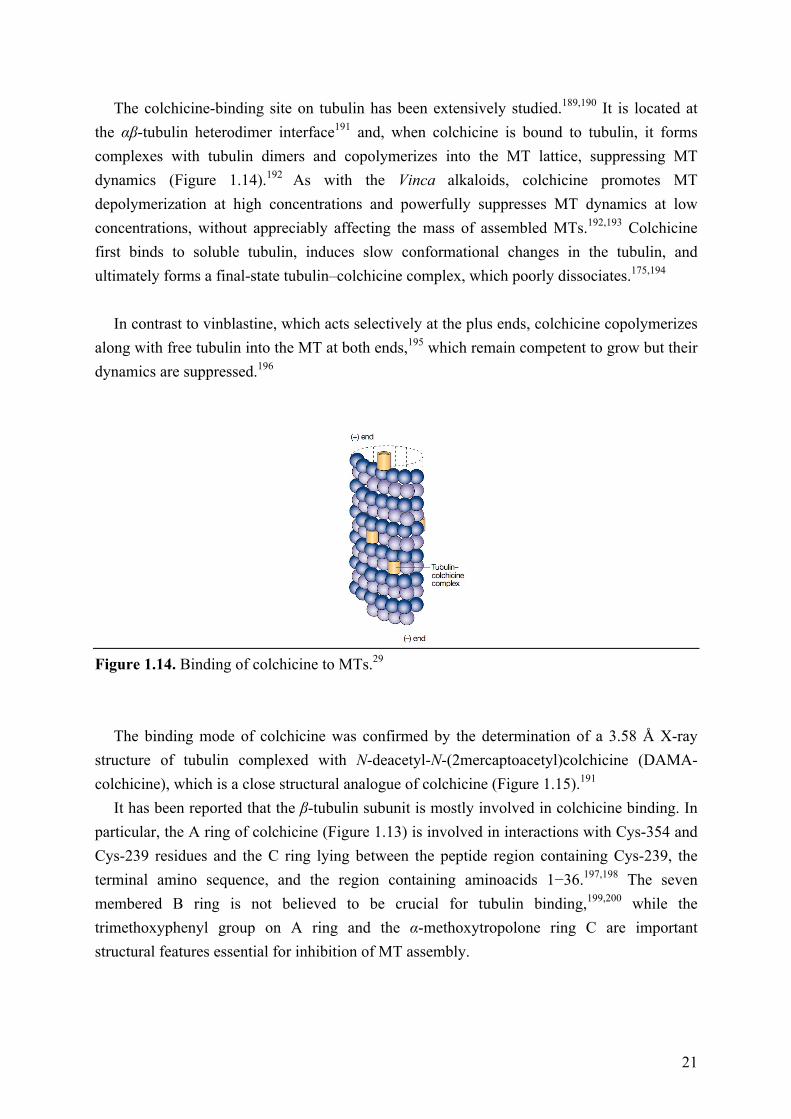
The colchicine-binding site on tubulin has been extensively studied.189,190 It is located at the αβ-tubulin heterodimer interface191 and, when colchicine is bound to tubulin, it forms complexes with tubulin dimers and copolymerizes into the MT lattice, suppressing MT dynamics (Figure 1.14).192 As with the Vinca alkaloids, colchicine promotes MT depolymerization at high concentrations and powerfully suppresses MT dynamics at low concentrations, without appreciably affecting the mass of assembled MTs.192,193 Colchicine first binds to soluble tubulin, induces slow conformational changes in the tubulin, and ultimately forms a final-state tubulin–colchicine complex, which poorly dissociates.175,194
In contrast to vinblastine, which acts selectively at the plus ends, colchicine copolymerizes
along with free tubulin into the MT at both ends,195 which remain competent to grow but their dynamics are suppressed.196
Figure 1.14. Binding of colchicine to MTs.29
The binding mode of colchicine was confirmed by the determination of a 3.58 Å X-ray
structure of tubulin complexed with N-deacetyl-N-(2mercaptoacetyl)colchicine (DAMA-colchicine), which is a close structural analogue of colchicine (Figure 1.15).191
It has been reported that the β-tubulin subunit is mostly involved in colchicine binding. In particular, the A ring of colchicine (Figure 1.13) is involved in interactions with Cys-354 and Cys-239 residues and the C ring lying between the peptide region containing Cys-239, the terminal amino sequence, and the region containing aminoacids 1−36.197,198 The seven membered B ring is not believed to be crucial for tubulin binding,199,200 while the trimethoxyphenyl group on A ring and the α-methoxytropolone ring C are important structural features essential for inhibition of MT assembly.
22
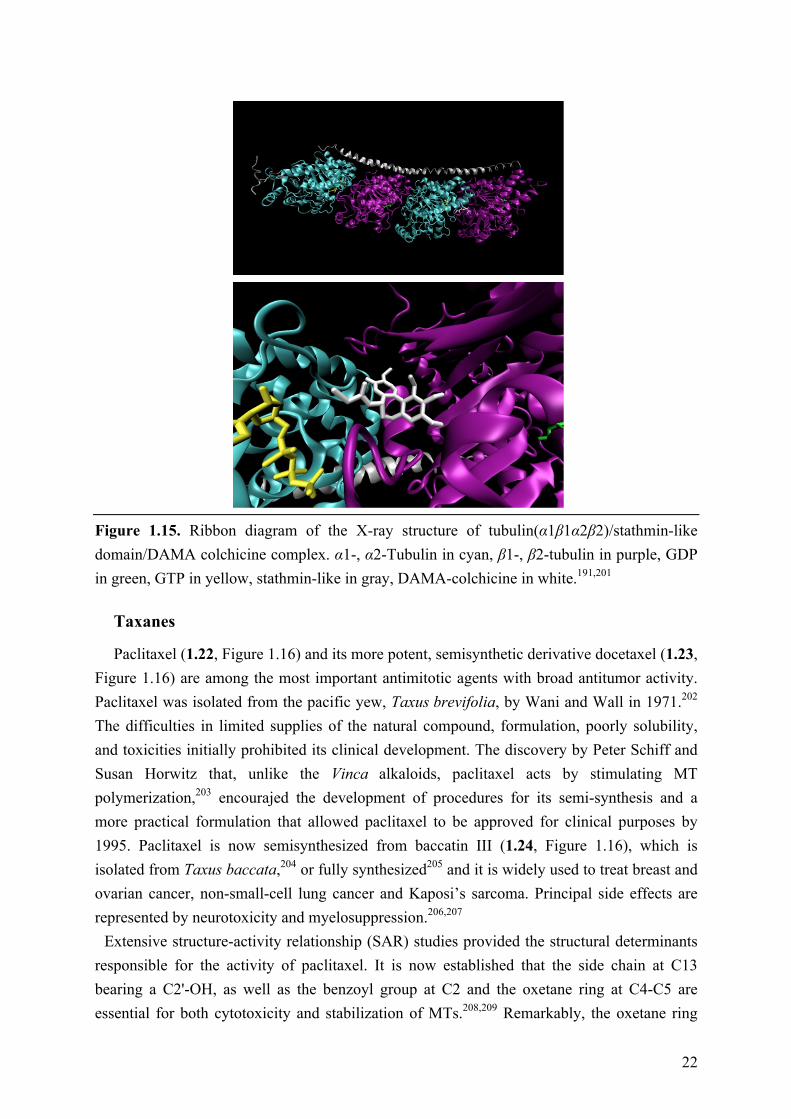
Figure 1.15. Ribbon diagram of the X-ray structure of tubulin(α1β1α2β2)/stathmin-like domain/DAMA colchicine complex. α1-, α2-Tubulin in cyan, β1-, β2-tubulin in purple, GDP in green, GTP in yellow, stathmin-like in gray, DAMA-colchicine in white.191,201
Taxanes
Paclitaxel (1.22, Figure 1.16) and its more potent, semisynthetic derivative docetaxel (1.23, Figure 1.16) are among the most important antimitotic agents with broad antitumor activity. Paclitaxel was isolated from the pacific yew, Taxus brevifolia, by Wani and Wall in 1971.202 The difficulties in limited supplies of the natural compound, formulation, poorly solubility, and toxicities initially prohibited its clinical development. The discovery by Peter Schiff and Susan Horwitz that, unlike the Vinca alkaloids, paclitaxel acts by stimulating MT polymerization,203 encourajed the development of procedures for its semi-synthesis and a more practical formulation that allowed paclitaxel to be approved for clinical purposes by 1995. Paclitaxel is now semisynthesized from baccatin III (1.24, Figure 1.16), which is isolated from Taxus baccata,204 or fully synthesized205 and it is widely used to treat breast and ovarian cancer, non-small-cell lung cancer and Kaposi’s sarcoma. Principal side effects are represented by neurotoxicity and myelosuppression.206,207
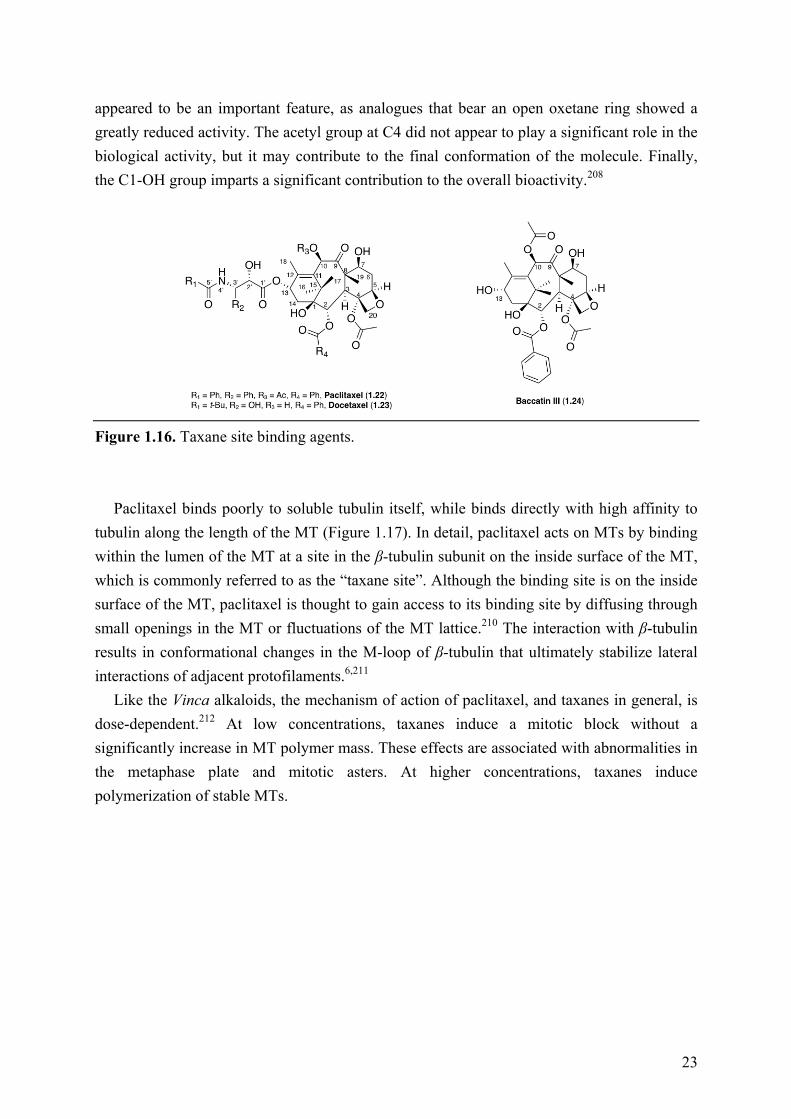
Extensive structure-activity relationship (SAR) studies provided the structural determinants responsible for the activity of paclitaxel. It is now established that the side chain at C13 bearing a C2'-OH, as well as the benzoyl group at C2 and the oxetane ring at C4-C5 are essential for both cytotoxicity and stabilization of MTs.208,209 Remarkably, the oxetane ring
23
appeared to be an important feature, as analogues that bear an open oxetane ring showed a greatly reduced activity. The acetyl group at C4 did not appear to play a significant role in the biological activity, but it may contribute to the final conformation of the molecule. Finally, the C1-OH group imparts a significant contribution to the overall bioactivity.208
Figure 1.16. Taxane site binding agents.
Paclitaxel binds poorly to soluble tubulin itself, while binds directly with high affinity to
tubulin along the length of the MT (Figure 1.17). In detail, paclitaxel acts on MTs by binding within the lumen of the MT at a site in the β-tubulin subunit on the inside surface of the MT, which is commonly referred to as the “taxane site”. Although the binding site is on the inside surface of the MT, paclitaxel is thought to gain access to its binding site by diffusing through small openings in the MT or fluctuations of the MT lattice.210 The interaction with β-tubulin results in conformational changes in the M-loop of β-tubulin that ultimately stabilize lateral interactions of adjacent protofilaments.6,211
Like the Vinca alkaloids, the mechanism of action of paclitaxel, and taxanes in general, is dose-dependent.212 At low concentrations, taxanes induce a mitotic block without a significantly increase in MT polymer mass. These effects are associated with abnormalities in the metaphase plate and mitotic asters. At higher concentrations, taxanes induce polymerization of stable MTs.
24
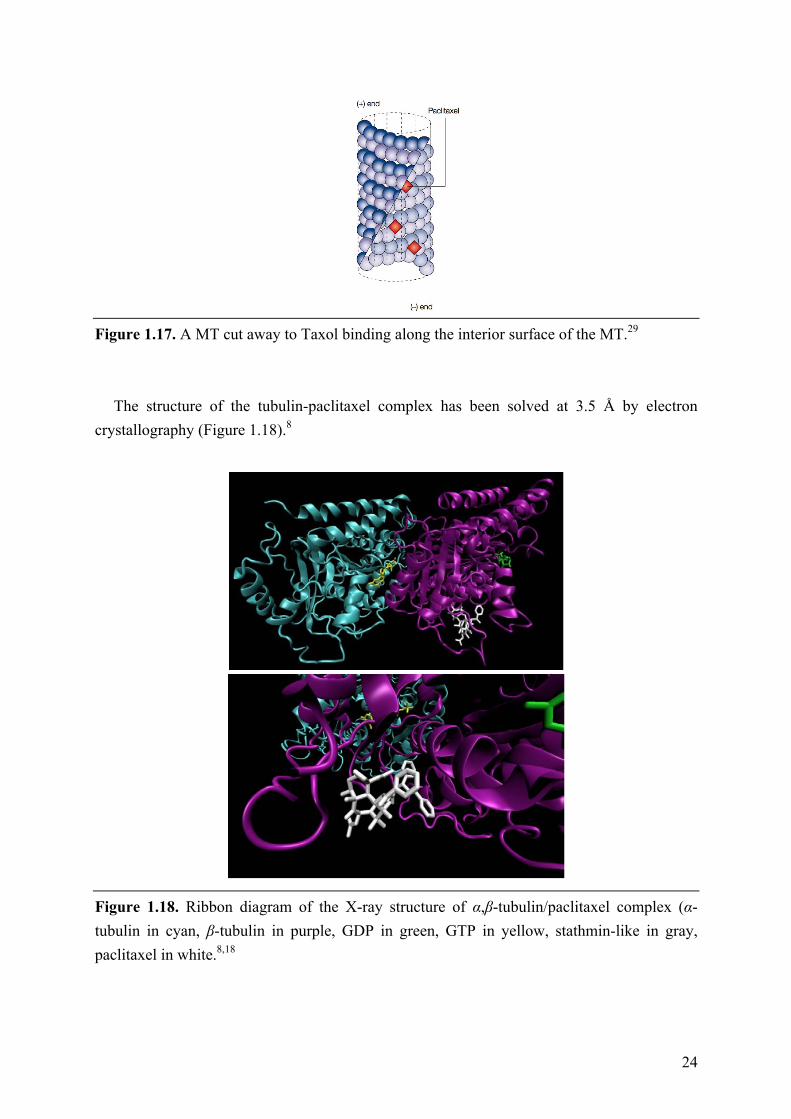
Figure 1.17. A MT cut away to Taxol binding along the interior surface of the MT.29
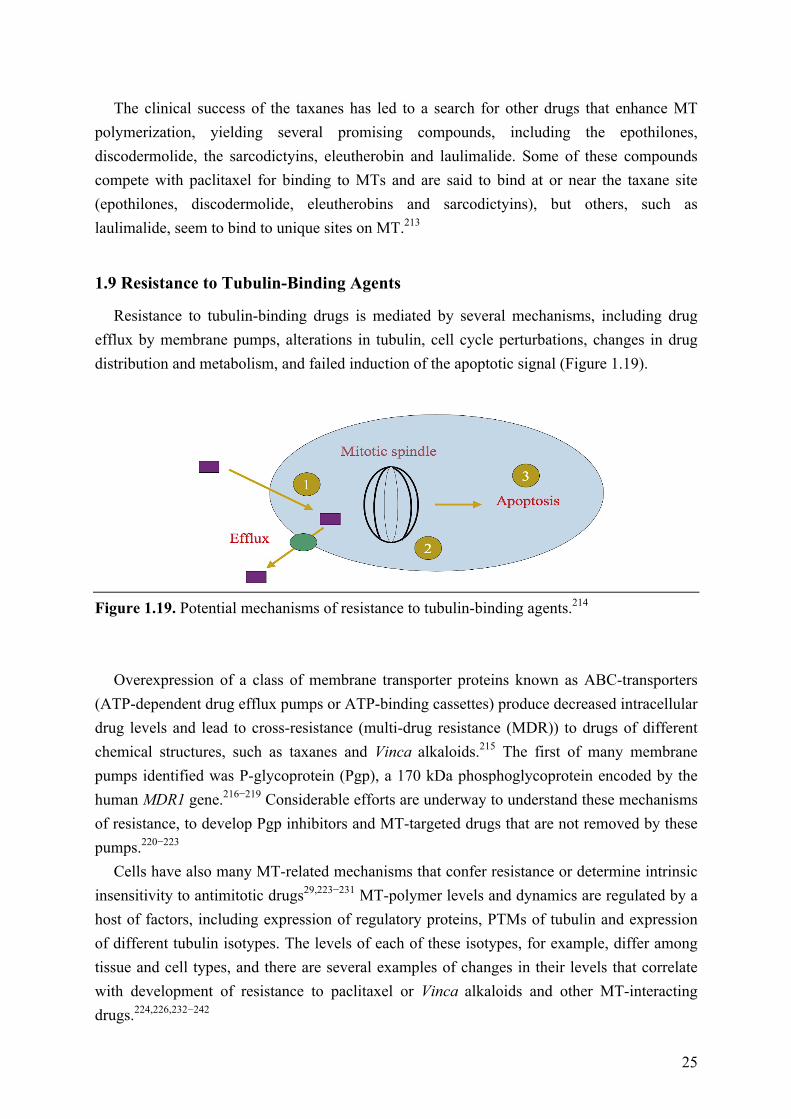
The structure of the tubulin-paclitaxel complex has been solved at 3.5 Å by electron
crystallography (Figure 1.18).8
Figure 1.18. Ribbon diagram of the X-ray structure of α,β-tubulin/paclitaxel complex (α-tubulin in cyan, β-tubulin in purple, GDP in green, GTP in yellow, stathmin-like in gray, paclitaxel in white.8,18
25
The clinical success of the taxanes has led to a search for other drugs that enhance MT polymerization, yielding several promising compounds, including the epothilones, discodermolide, the sarcodictyins, eleutherobin and laulimalide. Some of these compounds compete with paclitaxel for binding to MTs and are said to bind at or near the taxane site (epothilones, discodermolide, eleutherobins and sarcodictyins), but others, such as laulimalide, seem to bind to unique sites on MT.213
1.9 Resistance to Tubulin-Binding Agents
Resistance to tubulin-binding drugs is mediated by several mechanisms, including drug efflux by membrane pumps, alterations in tubulin, cell cycle perturbations, changes in drug distribution and metabolism, and failed induction of the apoptotic signal (Figure 1.19).
Figure 1.19. Potential mechanisms of resistance to tubulin-binding agents.214
Overexpression of a class of membrane transporter proteins known as ABC-transporters
(ATP-dependent drug efflux pumps or ATP-binding cassettes) produce decreased intracellular drug levels and lead to cross-resistance (multi-drug resistance (MDR)) to drugs of different chemical structures, such as taxanes and Vinca alkaloids.215 The first of many membrane pumps identified was P-glycoprotein (Pgp), a 170 kDa phosphoglycoprotein encoded by the human MDR1 gene.216−219 Considerable efforts are underway to understand these mechanisms of resistance, to develop Pgp inhibitors and MT-targeted drugs that are not removed by these pumps.220−223
Cells have also many MT-related mechanisms that confer resistance or determine intrinsic insensitivity to antimitotic drugs29,223−231 MT-polymer levels and dynamics are regulated by a host of factors, including expression of regulatory proteins, PTMs of tubulin and expression of different tubulin isotypes. The levels of each of these isotypes, for example, differ among tissue and cell types, and there are several examples of changes in their levels that correlate with development of resistance to paclitaxel or Vinca alkaloids and other MT-interacting drugs.224,226,232−242
26
The ability of tubulin-binding agents to kill cells appears to require the cell to enter mitosis. Therefore, alterations that prevent entry into mitosis and determine cell cycle perturbations might be expected to result in drug resistance. Accordingly, Fojo and coworkers243 demonstrated that tumor cells that lose the G2 check point (p53, p21 incompetent) do not delay proliferation following exposure to a DNA damaging drug (doxorubicin) and are readily killed by Vinca alkaloids and taxanes. In contrast, cells that maintain normal G2/M checkpoint control (p53/p21 competent) are resistant to killing by anti-MT drugs because they delay at G2/M following DNA damage. These data suggest that normal cells exposed to low doses of anthracyclines will become transiently resistant to anti-MT agents whereas certain tumor cells will not, thereby improving the therapeutic index of tubulin-binding agents. However, this same strategy could potentially protect malignant cells with intact checkpoints. For example, Alli and coworkers244 found that breast cancer cell lines with mutant p53 overexpress stathmin and are less sensitive to Vinca alkaloids and taxanes; this decrease in sensitivity was associated with G2 arrest.
Scientific evidence demonstrated that changes in drug metabolism, such as overexpression of CYP3A4, produce resistance to Vinca alkaloids and that treatment of several malignant cell lines with vincristine or vinblastine select for surviving cells that express the cytochrome p450 phenotype.245
Finally, prolonged cell-cycle arrest, caused by the interaction of antimitotic drugs with tubulin, may induce death signals. Indeed, abrogation of the G2/M checkpoint by mutations in tubulin, as well as several antiapoptotic molecules including bcl-2, bcl-xL, bim, and p53 have been demonstrated to be involved in resistance to these drugs.246,247 For example, bcl-2 was first discovered as the gene on chromosome 18q21 at the breakpoint of the t(14;18) chromosomal translocation found in B-cell follicular lymphomas.248 This translocation places the bcl-2 gene next to the immunoglobulin heavy chain enhancer, leading to overexpression of the bcl-2 protein that gives B cells the ability to survive in the absence of a requisite growth factor, interleukin-3. Thus, bcl-2 promotes malignant transformation by prolonging cell survival independent of usual control factors rather than by increasing the rate of cell division.249
27
1.10 References 1. Avila, J. Microtubule functions. Life Sci. 1992, 50, 327–334. 2. Brady, S. T.; Lasek, R. J.; Allen, R. D. Fast axonal transport in extruded axoplasm from
squid giant axon. Science 1982, 218, 1129–1131. 3. Bryan, J.; Wilson, L. Are cytoplasmic microtubules heteropolymers? Proc. Natl. Acad.
Sci. U. S. A. 1971, 68, 1762–1766. 4. Odde, D. Diffusion inside microtubules. Eur. Biophys. J. 1998, 27, 514–520. 5. Tilney, L. G., Bryan, J., Bush, D. J., Fujiwara, K., Mooseker, M. S., Murphy, D. B.,
Snyder, D. H., Microtubules: evidence for 13 protofilaments. J. Cell Biol. 1973, 59, 267–275.
6. Amos, L. A. Microtubule structure and its stabilisation. Org. Biomol. Chem. 2004, 2, 2153–2160.
7. Nogales, E.; Wolf, S.; Downing, K. H. Structure of the tubulin dimer by electron crystallography. Nature 1998, 391, 199–203.
8. Löwe, J.; Li, H.; Downing K. H.; Nogales, E. Refined structure of tubulin at 3.5Å resolution. J. Mol. Biol. 2001, 313, 1045–1057.
9. Sullivan, K.F. Structure and utilization of tubulin isotypes. Annu. Rev. Cell Biol. 1988, 4, 687–716.
10. Littauer, U. Z.; Giveon, D.; Thierauf, M.; Ginzburg, I.; Ponstingl, H. Common and distinct tubulin binding sites for microtubule-associated proteins. Proc. Natl. Acad. Sci. U. S. A. 1986, 83, 7162–7166.
11. Mandelkow, E. M.; Herrmann, M.; Rühl, U., Tubulin domains probed by limited proteolysis and subunit-specific antibodies. J. Mol. Biol. 1985, 185, 311–327.
12. Maccioni, R. B.; Serrano, L.; Avila, J.; Cann, J. R. Characterization and structural aspects of the enhanced assembly of tubulin after removal of its carboxyl-terminal domain. Eur. J. Biochem. 1986, 156, 375–381.
13. Serrano, L.; de la Torre, J.; Maccioni, R. B.; Avila, J. Involvement of the carboxyl- terminal domain of tubulin in the regulation of its assembly. Proc. Natl. Acad. Sci. U. S. A. 1984, 81, 5989–5993.
14. Little, M.; Seehaus, T. Comparative analysis of tubulin sequences. Comp. Biochem. Physiol. B Comp. Biochem. 1988, 90, 655–670.
15. Aiken, J.; Sept, D.; Costanzo, M.; Boone, C.; Cooper, J. A.; Moore, J. K. Genome-wide analysis reveals novel and discrete functions for tubulin carboxy-terminal tails. Curr. Biol. 2014, 24, 1295–1303.
16. Lefèvre, J.; Chernov, K. G.; Joshi, V.; Delga, S.; Toma, F., Pastré, D.; Curmi, P. A.; Savarin, P. The C terminus of tubulin, a versatile partner for cationic molecules: binding of tau, polyamines, and calcium. J. Biol. Chem. 2011, 286, 3065–3078.
17. Sackett, D. L.; Bhattacharyya, B.; Wolff, J. Tubulin subunit carboxyl termini determine
28
polymerization efficiency. J. Biol. Chem. 1985, 260, 43–45. 18. Protein Data Bank, http://www.rcsb.org/, PDB code: 1JFF. 19. Oakley, C. E.; Oakley, B. R. Identification of γ-tubulin, a new member of the tubulin
superfamily encoded by mipA gene of Aspergillus nidulans. Nature, 1989, 338, 662–664.
20. Moritz, M.; Agard, D. A. γ-Tubulin complexes and microtubule nucleation. Curr. Op. Struct. Biol. 2001, 11, 174–181.
21. Dutcher, S. K. Long-lost relatives reappear: identification of new members of the tubulin superfamily. Curr. Op. Microbiol. 2003, 6, 634–640.
22. Smrzka, O. W.; Delgehyr, N.; Bornens, M. Tissue-specific expression and subcellular localisation of mammalian δ-tubulin. Curr. Biol. 2000, 10, 413–416.
23. Chang, P.; Stearns, T. [delta]-Tubulin and [varepsilon]-tubulin: two new human centrosomal tubulins reveal new aspects of centrosome structure and function. Nature Cell Biol. 2000, 2, 30–35.
24. Ruiz, F.; Krzywicka, A.; Klotz, C; Keller, A.-M.; Cohen, J.; Koll, F.; Balavoine, G.; Beisson, J. The SM19 gene, required for duplication of basal bodies in Paramecium, encodes a novel tubulin, η-tubulin. Curr. Biol. 2000, 10, 1451–1454.
25. Ruiz, F.; Dupuis-Williams, P.; Klotz, C.; Forquignon, F.; Bergdoll, M.; Beisson, J.; Koll, F. Genetic evidence for interaction between η-and β-tubulins. Eukaryotic Cell 2004, 3, 212–220.
26. Ludueña, R. F.; Banerjee, A. The tubulin superfamily. In The Role of Microtubules in Cell Biology, Neurobiology, and Oncology; Humana Press, NJ, 2008; pp 177–191.
27. Mitchison, T.; Kirschner, M. Dynamic instability of microtubule growth. Nature 1984, 312, 237–242.
28. Desai, A.; Mitchison, T. Microtubule polymerization dynamics. Annu. Rev. Cell Dev. Biol. 1997, 13, 83–117.
29. Jordan, M. A.; Wilson, L. Microtubules as a target for anticancer drugs. Nature Rev. Cancer 2004, 4, 253–265.
30. Margolis, R. L.; Wilson, L. Opposite end assembly and disassembly of microtubules at steady state in vitro. Cell 1978, 13, 1–8.
31. Margolis, R. L.; Wilson, L. Microtubule treadmilling: what goes around comes around. Bioessays 1998, 20, 830–836.
32. Rodionov, V. I.; Borisy, G. G. Microtubule treadmilling in vivo. Science 1997, 275, 215–218.
33. Shaw, S. L.; Kamyar, R.; Ehrhardt, D. W. Sustained microtubule treadmilling in Arabidopsis cortical arrays. Science 2003, 300, 1715–1718.
29
34. Panda, D.; Miller, H. P.; Wilson, L. Rapid treadmilling of MAP-free brain microtubules in vitro and its suppression by tau. Proc. Natl. Acad. Sci. U. S. A. 1999, 96, 12459–12464.
35. Chen, W.; Zhang, D. Kinetochore fibre dynamics outside the context of the spindle during anaphase. Nature Cell Biol. 2004, 6, 227–231.
36. Wilson, L.; Panda, D; Jordan, M. A. Modulation of microtubule dynamics by drugs: a paradigm for the actions of cellular regulators. Cell Struct. Funct. 1999, 24, 329–335.
37. Hirose, K.; Fan, J.; Amos, L. A. Re-examination of the polarity of microtubules and sheets decorated with kinesin motor domain. J. Mol. Biol. 1995, 251, 329–333.
38. Mitchison, T.J. Localization of an exchangeable GTP binding site at the plus end of microtubules. Science 1993, 261, 1044–1047.
39. Burns, R.; Farrell, K. Getting to the heart of B-tubulin. Trends Cell Biol. 1996, 6, 297–303.
40. Mejillano, M. R.; Barton, J. S.; Nath, J. P.; Himes, R. H. GTP analogues interact with the tubulin exchangeable site during assembly and upon binding. Biochemistry 1990, 29, 1208–1216.
41. David-Pfeuty, T.; Erickson, H. P.; Pantaloni, D. Guanosinetriphosphatase activity of tubulin associated with microtubule assembly. Proc. Natl. Acad. Sci. U. S. A. 1977, 74, 5372–5376.
42. David-Pfeuty, T.; Simon C.; Pantaloni, D. Effect of antimitotic drugs on tubulin GTPase activity and self-assembly. J. Biol. Chem. 1979, 254, 11696–11702.
43. Erickson, H. P. FtsZ, a prokaryotic homolog of tubulin? Cell 1995, 80, 367–370. 44. Melki, R.; Fievez, S.; Carlier, M.-F. Continuous monitoring of Pi release following
nucleotide hydrolysis in actin or tubulin assembly using 2-amino-6-mercapto-7-methylpurine ribonucleoside and purine-nucleoside phosphorylase as an enzyme-linked assay. Biochemistry 1996, 35, 12038–12045.
45. Heald, R.; Nogales, E. Microtubule dynamics. J. Cell Sci. 2002, 115, 3–4. 46. Simon, J. R.; Salmon, E. D. The structure of microtubule ends during the elongation and
shortening phases of dynamic instability examined by negative-stain electron microscopy. J. Cell Sci. 1990, 96, 571–582.
47. Mandelkow, E. M.; Mandelkow, E.; Milligan, R. A. Microtubule dynamics and microtubule caps: a time-resolved cryo-electron microscopy study. J. Cell Biol. 1991, 114, 977–991.
48. Hyman, A.; Chrétien, D.; Arnal, I.; Wade, R. Structural changes accompanying GTP hydrolysis in microtubules: information from a slowly hydrolyzable analogue guanylyl-(alpha,beta)-methylene-diphosphonate. J. Cell Biol. 1995, 128, 117–125.
49. Müller-Reichert, T.; Chrétien, D.; Hyman A. A. Structural changes at microtubule ends accompanying GTP hydrolysis: information from a slowly hydrolysable analogue of
30
GTP, guanylyl (α,β) methylenediphosphonate. Proc. Natl. Acad. Sci. U. S. A. 1998, 95, 3661–3666.
50. Jánosi, I. M.; Chrétien, D.; Flyvbjerg, H. Structural microtubule cap: Stability, catastrophe, rescue, and third state. Biophys. J. 2002, 83, 1317–1330.
51. https://www.google.it 52. Tucker, R. P. The roles of microtubule-associated proteins in brain morphogenesis: a
review. Brain Res. Brain Res. Rev. 1990, 15, 101–120. 53. Sanchez, C.; Diaz-Nido, J.; Avila, J. Phosphorylation of microtubule-associated protein
2 (MAP2) and its relevance for the regulation of the neuronal cytoskeleton function. Prog. Neurobiol. 2000, 61, 133–168.
54. Dehmelt, L.; Halpain, S. The MAP2/Tau family of microtubule-associated proteins. Genome Biol. 2005, 6, 204.
55. Chen, Q.; Zhou, Z.; Zhang, L.; Wang, Y.; Zhang, Y. W.; Zhong, M.; Xu, S. C.; Chen, C. H.; Li, L.; Yu, Z. P. Tau protein is involved in morphological plasticity in hippocampal neurons in response to BDNF. Neurochem. Int. 2012, 60, 233–242.
56. Drechsel, D. N.; Hyman, A. A.; Cobb, M. H.; Kirschner, M. W. Modulation of the dynamic instability of tubulin assembly by the microtubule-associated protein tau. Mol. Biol. Cell 1992, 3, 1141−1154.
57. Chapin, S. J.; Bulinski, J. C. Cellular microtubules heterogeneous in their content of microtubule‐associated protein 4 (MAP4). Cytoskeleton 1994, 27, 133–149.
58. Hanash, S. M.; Baier, L. J.; McCurry, L.; Schwartz, S. A. Lineage-related polypeptide markers in acute lymphoblastic leukemia detected by two-dimensional gel electrophoresis. Proc. Natl. Acad. Sci. U. S. A. 1986, 83, 807–811.
59. Melhem, R. F.; Zhu, X. X.; Hailat, N.; Strahler, J. R.; Hanash, S. M. Characterization of the gene for a proliferation-related phosphoprotein (oncoprotein 18) expressed in high amounts in acute leukemia. J. Biol. Chem. 1991, 266, 17747–17753.
60. Sobel, A.; Tashjian, A. H. Jr. Distinct patterns of cytoplasmic protein phosphorylation related to regulation of synthesis and release of prolactin by GH cells. J. Biol. Chem. 1983, 258, 10312–10324.
61. Sobel, A. Stathmin: a relay phosphoprotein for multiple signal transduction? Trends Biochem. Sci. 1991, 16, 301–305.
62. Belmont, L.; Mitchison, T. Identification of a protein that interacts with tubulin dimers and increases the catastrophe rate of microtubules. Cell 1996, 84, 623–631.
63. Grenningloh, G.; Soehrman, S.; Bondallaz, P.; Ruchti, E.; Cadas, H. Role of the microtubule destabilizing proteins SCG10 and stathmin in neuronal growth. J. Neurobiol. 2004, 58, 60–69.
64. Koppel, J.; Boutterin, M. C.; Doye, V.; Peyro-Saint-Paul, H.; Sobel, A. Developmental tissue expression and phylogenetic conservation of stathmin, a phosphoprotein
31
associated with cell regulations. J. Biol. Chem. 1990, 265, 3703–3707. 65. Sobel, A.; Boutterin, M. C.; Beretta, L.; Chneiweiss, H.; Doye, V.; Peyro-Saint-Paul, H.
Intracellular substrates for extracellular signaling. Characterization of a ubiquitous, neuron-enriched phosphoprotein (stathmin). J. Biol. Chem. 1989, 264, 3765–3772.
66. Lansbergen, G.; Akhmanova, A. Microtubule plus end: a hub of cellular activities. Traffic 2006, 7, 499–507.
67. Akhmanova, A.; Hoogenraad, C.C. Microtubule plus-end-tracking proteins: mechan- isms and functions. Curr. Opin. Cell Biol. 2005, 17, 47–54.
68. Job, D.; Valiron, O.; Oakley, B. Microtubule nucleation. Curr. Opin. Cell Biol. 2003, 15, 111–117.
69. Manna, T.; Thrower, D.; Miller, H. P.; Curmi, P.; Wilson, L. Stathmin strongly increases the minus end catastrophe frequency and induces rapid treadmilling of bovine brain microtubules at steady state in vitro. J. Biol. Chem. 2006, 281, 2071–2078.
70. Wittmann, T.; Bokoch, G. M.; Waterman-Storer C. M. Regulation of microtubule destabilizing activity of Op18/stathmin downstream of Rac1. J. Biol. Chem. 2004, 279, 6196–6203.
71. Wilde, A.; Lizarraga, S. B.; Zhang, L.; Wiese, C.; Gliksman, N. R.; Walczak, C. E.; Zheng, Y. Ran stimulates spindle assembly by altering microtubule dynamics and the balance of motor activities. Nat. Cell Biol. 2001, 3, 221–227.
72. Verhey, K. J.; Hammond, J. W. Traffic control: regulation of kinesin motors. Nature Rev. Mol. Cell Biol. 2009, 10, 765–777.
73. Vallee, R. B.; Williams, J. C.; Varma, D.; Barnhart, L. E. Dynein: an ancient motor protein involved in multiple modes of transport. J. Neurobiol. 2004, 58, 189–200.
74. Sheetz, M. P.; Steuer, E. R.; Schroer, T. A. The mechanism and regulation of fast axonal transport. Trends Neurosci. 1989, 12, 474–478.
75. Lindemann, C. B.; Lesich, K. A. Flagellar and ciliary beating: the proven and the possible. J. Cell Sci. 2010, 123, 519–528.
76. Howard, J.; Hyman, A. A. Microtubule polymerases and depolymerases. Curr. Opin. Cell Biol. 2007, 19, 31–35.
77. Penazzi, L.; Bakota, L.; Brandt, R. Chapter Three-Microtubule Dynamics in Neuronal Development, Plasticity, and Neurodegeneration. Int. Rev. Cell Mol. Biol. 2016, 321, 89–169.
78. Janke, C.; Bulinski, J. C. Post-translational regulation of the microtubule cytoskeleton: mechanisms and functions. Nature reviews. Mol.Cell Biol. 2011, 12, 773–786.
79. Kreis, T. E. Microtubules containing detyrosinated tubulin are less dynamic. EMBO J. 1987, 6, 2597–2606.
32
80. Khawaja, S.; Gundersen, G. G.; Bulinski, J. C. Enhanced stability of microtubules enriched in detyrosinated tubulin is not a direct function of detyrosination level. J. Cell Biol. 1988, 106, 141–149.
81. Gundersen, G. G.; Kalnoski, M. H.; Bulinski, J. C. Distinct populations of microtubules: tyrosinated and nontyrosinated α-tubulin are distributed differently in vivo. Cell 1984, 38, 779–789.
82. Geimer, S.; Teltenkötter A.; Plessmann, U.; Weber K.; Lechtreck K. F. Purification and characterization of basal apparatuses from a flagellate green alga. Cell Motil. Cytoskeleton 1997, 37, 72–85.
83. Idriss, H. T. Man to Trypanosome: the tubulin tyrosination/detyrosination cycle revisited. Cell Motil. Cytoskeleton 2000, 45, 173–184.
84. Infante, A. S.; Stein, M. S.; Zhai, Y.; Borisy, G. G.; Gundersen, G. G. Detyrosinated (Glu) microtubules are stabilized by an ATP-sensitive plus-end cap. J. Cell Sci. 2000, 113, 3907–3919.
85. Webster, D. R.; Wehland, J.; Weber, K.; Borisy, G. G. Detyrosination of α-tubulin does not stabilize microtubules in vivo. J. Cell Biol. 1990, 141, 175–185.
86. Ponstingl, H.; Little, M.; Krauhs, E.; Kempf, T. Carboxy-terminal aminoacid sequence of α-tubulin from porcine brain. Nature 1979, 282, 423–424.
87. Kalisz, H. M.; Erck, C.; Plessmann, U.; Wehland, J. Incorporation of nitrotyrosinein to α-tubulin by recombinant mammalian tubulin-tyrosine ligase. Biochim. Biophys. Acta 2000, 148, 131–138.
88. Eiserich, J. P.; Estévez, A. G.; Bamberg, T. V.; Zu Ye, Y.; Chumley, P. H.; Beckman, J. S.; Freeman, B. A. Microtubule dysfunction by posttranslational nitrotyrosination of α-tubulin: a nitric oxide-dependent mechanism of cellular injury. Proc. Nat. Acad. Sci. U. S. A. 1999, 96, 6365–6370.
89. Paturle-Lafanechere, L.; Edde, B.; Denoulet, P.; Van Dorsselaer, A.; Mazarguil, H.; Le Caer, J. P.; Wehland, J.; Job, D. Characterization of a major brain tubulin variant which cannot be tyrosinated. Biochem. 1991, 30, 10523–10528.
90. L'Hernault, S. W.; Rosenbaum, J. L. Chlamydomonas alpha-tubulin is posttranslationally modified in the flagella during flagellar assembly. J. Cell Biol. 1983, 97, 258–263.
91. L'Hernault, S. W.; Rosenbaum, J. L. Reversal of the posttranslational modification on Chlamydomonas flagellar alpha-tubulin occurs during flagellar resorption. J. Cell Biol. 1985, 100, 457–462.
92. Piperno, G.; Le Dizet, M.; Chang, X. J. Microtubules containing acetylated α-tubulin in mammalian cells in culture. J. Cell Biol. 1987, 104, 289–302.
33
93. Robson, S. J.; Burgoyne, R. D. Differential localisation of tyrosinated, detyrosinated, and acetylated α-tubulins in neurites and growth cones of dorsal root ganglion neurons. Cell Motil. Cytoskeleton 1989, 12, 273–282.
94. Poole, C. A.; Zhang, Z. J.; Ross, J. M. The differential distribution of acetylated and detyrosinated alpha-tubulin in the microtubular cytoskeleton and primary cilia of hyaline cartilage chondrocytes. J. Anat. 2001, 199, 393–405.
95. Webster, D. R.; Borisy, G. G. Microtubules are acetylated in domains that turn over slowly. J. Cell Sci. 1989, 92, 57–65.
96. Hubbert, C.; Guardiola, A.; Shao, R.; Kawaguchi, Y.; Ito, A.; Nixon, A.; Yoshida, M.; Wang, X.-F.; Yao, T.-P. HDAC6 is a microtubule-associated deacetylase. Nature 2002, 417, 455–458.
97. North, B. J.; Marshall, B. L.; Borra, M. T.; Denu, J. M.; Verdin, E. The human Sir2 ortholog, SIRT2, is an NAD+-dependent tubulin deacetylase. Mol. Cell 2003, 11, 437–444.
98. Zhang, Y.; Caron, C.; Matthias, G.; Hess, D.; Khochbin, S.; Matthias, P. HDAC-6 interacts with and deacetylates tubulin and microtubules in vivo. EMBO J. 2003, 22, 1168–1179.
99. Eddé, B.; Rossier, J.; Le Caer, J. P.; Promé, J. C.; Desbruyères, E.; Gros, F.; Denoulet, P. Polyglutamylated alpha-tubulin can enter the tyrosination/detyrosination cycle. Biochemistry 1992, 31, 403–410.
100. Ikegami, K.; Mukai, M.; Tsuchida, J. I.; Heier, R. L.; MacGrego, G. R.; Setou, M.; TTLL7 is a mammalian beta-tubulin polyglutamylase required for growth of MAP2- positive neurites. J. Biol. Chem. 2006, 281, 30707–30716.
101. Janke, C.; Rogowski, K.; Wloga, D.; Regnard, C.; Kajava, A. V.; Strub, J.-M.; Temurak, N.; van Dijk, J.; Boucher, D.; van Dorsselaer, A.; Suryavanshi, S.; Gaertig, J.; Eddé, B. Tubulin polyglutamylase enzymes are members of the TTL domain protein family. Science 2005, 308, 1758–1762.
102. Eddé, B.; Rossier, J.; Le Caer, J. P.; Desbruyères, E.; Gros, F.; Denoulet, P. Posttranslational glutamylation of alpha-tubulin. Science 1990, 247, 83–85.
103. Wolff, A.; de Néchaud, B.; Chillet, D.; Mazarguil, H.; Desbruyères, E.; Audebert, S.; Eddé, B.; Gros, F.; Denoulet, P. Distribution of glutamylated alpha and beta-tubulin in mouse tissues using a specific monoclonal antibody, GT335. Eur. J. Cell Biol. 1992, 59, 425–432.
104. Mencarelli, C.; Caroti, D.; Bré, M. H.; Levilliers, N.; Mercati, D.; Robbins, L. G.; Dallai, R. Glutamylated and glycylated tubulin isoforms in the aberrant sperm axoneme of the gall-midge fly, Asphondylia ruebsaameni. Cell Motil. Cytoskeleton 2004, 58, 160–174.

34
105. Million, K.; Larcher, J. C.; Laoukili, J.; Bourguignon, D.; Marano, F.; Tournier, F. Polyglutamylation and polyglycylation of α- and β-tubulins during in vitro ciliated cell differentiation of human respiratory epithelial cells. J. Cell Sci. 1999, 112, 4357–4366.
106. Kann, M. L.; Soues, S.; Levilliers, N.; Fouquet, J. P. Glutamylated tubulin: diversity of expression and distribution of isoforms. Cell Motil. Cytoskeleton 2003, 55, 14–25.
107. Bobinnec, Y.; Marcaillou, C.; Debec, A. Microtubule polyglutamylation in Drosophila melanogaster brain and testis. Eur. J. Cell Biol. 1999, 78, 671–674.
108. Bonnet, C.; Denarier, E.; Bosc, C.; Lazereg, S.; Denoulet, P.; Larcher, J. C. Interaction of STOP with neuronal tubulin is independent of polyglutamylation. Biochem. Biophys. Res. Commun. 2002, 297, 787–793.
109. Westermann, S.; Plessmann, U.; Weber K. Synthetic peptides identify the minimal substrate requirements of tubulin polyglutamylase in side chain elongation. FEBS Lett. 1999, 459, 90–94.
110. Banerjee, A. Coordination of posttranslational modifications of bovine brain α-tubulin. Polyglycylation of ∆2-tubulin. J. Biol. Chem. 2002, 277, 46140–46144.
111. Boucher, D.; Larcher, J. C.; Gros, F.; Denoulet, P. Polyglutamylation of tubulin as a progressive regulator of in vitro interactions between the microtubule-associated protein tau and tubulin. Biochemistry 1994, 33, 12471–12477.
112. Larcher, J. C.; Boucher, D.; Lazereg, S.; Gros, F.; Denoulet, P. Interaction of kinesin motor domains with α- and β-tubulin subunits at a tau-independent binding site. Regulation of polyglutamylation. J. Biol. Chem. 1996, 271, 22117–22124.
113. Bonnet, C.; Boucher, D.; Lazereg, S.; Pedrotti, B.; Islam, K.; Denoulet, P.; Larcher, J. C. Differential binding regulation of microtubule-associated proteins MAP1A, MAP1B, and MAP2 by tubulin polyglutamylation. J. Biol. Chem. 2001, 276, 12839–12848.
114. Redeker, V.; Levilliers, N.; Schmitter, J. M.; Le Caer, J. P.; Rossier, J.; Adoutte, A.; Bré, M. H. Polyglycylation of tubulin: A posttranslational modification in axonemal microtubules. Science 1992, 266, 1688–1691.
115. Weber, K.; Schneider, A.; Müller, N.; Plessman, U. Polyglycylation of tubulin in the diplomonad Giardia lamblia, one of the oldest eukaryotes. FEBS Lett. 1996, 393, 27–30.
116. Vinh, J.; Langridge, J. I.; Bré, M. H; Levilliers, N.; Redeker, V.; Loyaux, D.; Rossier, J. Structural characterization by tandem mass spectrometry of the posttranslational polyglycylation of tubulin. Biochemistry 1999, 38, 3133–3139.
117. Bane, B. C.; MacRae, T. H.; Xiang, H.; Bateman, J.; Slepecky, N. B. Microtubule cold stability in supporting cells of the gerbil auditory sensory epithelium: correlation with tubulin post-translational modifications. Cell Tissue Res. 2002, 307, 57–67.
35
118. Bré, M. H.; Redeker, V.; Vinh, J.; Rossier, J.; Levilliers, N. Tubulin polyglycylation: differential posttranslational modification of dynamic cytoplasmic and stable axonemal microtubules in Paramecium. Mol. Biol. Cell 1998, 9, 2655–2665.
119. Eipper BA. Rat brain microtubule protein. Purification and determination of covalently bound phosphate and carbohydrate. Proc. Nat. Acad. Sci. U. S. A. 1972, 69, 2283–2287.
120. Wandosell, F.; Serrano, L.; Avila, J. Phosphorylation of alpha-tubulin carboxyl-terminal tyrosine prevents its incorporation into microtubules. J. Biol. Chem. 1987, 262, 8268–8273.
121. Matten, W. T.; Aubry, M.; West, J.; Maness, P. F. Tubulin is phosphorylated at tyrosine by pp60c-src in nerve growth cone membranes. J. Cell Biol. 1990, 111, 1959–1970.
122. Faruki, S.; Geahlen, R. L.; Asai D. J. Syk-dependent phosphorylation of microtubules in activated B-lymphocytes. J. Cell Sci. 2000, 113, 2557–2565.
123. Vogel, J.; Drapkin, B.; Oomen, J.; Beach, D.; Bloom, K.; Snyder, M. Phosphorylation of γ-tubulin regulates microtubule organization in budding yeast. Dev. Cell. 2001, 1, 621–631.
124. Mitsopoulos, C.; Zihni, C.; Garg, R.; Ridley, A. J.; Morris J. D. H. The prostate-derived sterile 20-like kinase (PSK) regulates microtubule organization and stability. J. Biol. Chem. 2003, 278, 18085–18091.
125. Laurent, C. E.; Delfino, F. J.; Chen, H. Y.; Smithgall, T. E. The human c-Fes tyrosine kinase binds tubulin and microtubules through separate domains and promotes microtubule assembly. Mol. Cell. Biol. 2004, 24, 9351–9358.
126. Ma, X.; Sayeski, P. P. Identification of tubulin as a substrate of Jak2 tyrosine kinase and its role in Jak2-dependent signaling. Biochemistry 2007, 46, 7153–7162.
127. Fourest-Lieuvin, A.; Peris, L.; Gache, V.; Garcia-Saez, I.; Juillan-Binard, C., Juillan-Binard, C.; Lantez, V.; Job, D. Microtubule regulation in mitosis: tubulin phosphorylation by the cyclin-dependent kinase Cdk1. Mol. Biol. Cell. 2006, 17, 1041–1050.
128. Peters, J. D.; Furlong, M. T.; Asai, D. J.; Harrison, M. L.; Geahlen R. L. Syk, activated by cross-linking the B-cell antigen receptor, localizes to the cytosol where it interacts with and phosphorylates-tubulin on tyrosine. J. Biol. Chem. 1996, 271, 4755–4762.
129. Di Paolo, G.; Antonsson, B.; Kassel, D.; Riederer, B. M.; Grenningloh, G. Phosphorylation regulates the microtubule‐destabilizing activity of stathmin and its interaction with tubulin. FEBS Lett. 1997, 416, 149–152.
130. Kim, Y.; Sung, J. Y.; Ceglia, I.; Lee, K. W.; Ahn, J. H.; Halford, J. M.; Kim, A. M.; Kwak, S. P.; Park, J. B.; Ryu, S. H.; Schenck, A.; Bardoni, B.; Scott, J. D.; Nairn, A. C. Greengard, P. Phosphorylation of WAVE1 regulates actin polymerization and dendritic spine morphology. Nature 2006, 442, 814–817.

36
131. Piotrowicz, R. S.; Hickey, E.; Levin, E. G. Heat shock protein 27 kDa expression and phosphorylation regulates endothelial cell migration. FASEB J. 1998, 12, 1481–1490.
132. Goeckeler, Z. M.; Wysolmerski, R. B. Myosin light chain kinase-regulated endothelial cell contraction: the relationship between isometric tension, actin polymerization, and myosin phosphorylation. J. Cell Biol. 1995, 130, 613–627.
133. Qiang, L.; Yu, W.; Andreadis, A.; Luo, M.; Baas, P.W. Tau protects microtubules in the axon from severing by katanin. J. Neurosci. 2006, 26, 3120–3129.
134. Caron, J. M.; Vega, L. R.; Fleming, J.; Bishop, R.; Solomon, F. Single site α-tubulin mutation affects astral microtubules and nuclear positioning during anaphase in Saccharomyces cerevisiae: possible role of palmitoylation of α-tubulin. Mol. Biol. Cell 2001, 12, 2672–2687.
135. Garnham, C. P.; Roll‐Mecak, A. The chemical complexity of cellular microtubules: tubulin post‐translational modification enzymes and their roles in tuning microtubule functions. Cytoskeleton 2012, 69, 442–463.
136. Mialhe, A.; Lafanechere, L.; Treilleux, I.; Peloux, N.; Dumontet, C.; Bremond, A.; Panh, M. H.; Payan, R.; Wehland, J.; Margolis, R. L.; Job, D. Tubulin detyrosination is a frequent occurrence in breast cancers of poor prognosis. Cancer Res. 2001, 61, 5024–5027.
137. Kato, C.; Miyazaki, K.; Nakagawa, A.; Ohira, M.; Nakamura, Y.; Ozaki, T.; Imai, T.; Nakagawara, A. Low expression of human tubulin tyrosine ligase and suppressed tubulin tyrosination/detyrosination cycle are associated with impaired neuronal differentiation in neuroblastomas with poor prognosis. Int. J. Cancer 2004, 112, 365–375.
138. Soucek, K.; Kamaid, A.; Phung, A. D.; Kubala, L.; Bulinski, J. C.; Harper, R. W.; Eiserich, J. P. Normal and prostate cancer cells display distinct molecular profiles of alpha-tubulin posttranslational modifications. Prostate 2006, 66, 954–965.
139. Whipple, R. A.; Matrone, M. A.; Cho, E. H.; Balzer, E. M.; Vitolo, M. I.; Yoon, J. R.;, Ioffe O. B.; Tuttle, K. C.; Yang, J.; Martin, S. S. Epithelial-to-mesenchymal transition promotes tubulin detyrosination and microtentacles that enhance endothelial engagement. Cancer Res. 2010, 70, 8127–8137.
140. Wasylyk, C.; Zambrano, A.; Zhao, C.; Brants, J.; Abecassis, J.; Schalken, J. A.; Rogatsch, H.; Schaefer, G.; Pycha, A.; Klocker, H.; Wasylyk, B. Tubulin tyrosine ligase like 12 links to prostate cancer through tubulin posttranslational modification and chromosome ploidy. Int. J. Cancer 2010, 127, 2542–2553.
141. d’Ydewalle, C.; Krishnan, J.; Chiheb, D. M.; Van Damme, P.; Irobi, J.; Kozikowski, A. P.; Vanden Berghe, P.; Timmerman, V.; Robberecht, W.; Van Den Bosch, L. HDAC6 inhibitors reverse axonal loss in a mouse model of mutant HSPB1-induced Charcot-Marie-Tooth disease. Nat. Med. 2011, 17, 968–974.
37
142. Dompierre, J. P.; Godin, J. D.; Charrin, B. C.; Cordelieres, F. P.; King, S. J.; Humbert, S.; Saudou, F. Histone deacetylase 6 inhibition compensates for the transport deficit in Huntington’s disease by increasing tubulin acetylation. J. Neurosci. 2007, 27, 3571–3583.
143. Kazantsev, A. G.; Thompson, L. M. Therapeutic application of histone deacetylase inhibitors for central nervous system disorders. Nat. Rev. Drug Discov. 2008, 7, 854–868.
144. Kaur, R.; Kaur, G.; Gill, K. R.; Soni, R.; Bariwal, J. Recent developments in tubulin polymerization inhibitors: an overview. Eur. J. Med. Chem. 2014, 87, 89–124.
145. Mitchison, T. J. Microtubule dynamics and kinetochore function in mitosis. Annu. Rev. Cell Biol. 1988, 4, 527–549.
146. Saxton, W. M.; Stemple, D. L.; Leslie, R. J.; Salmon, E. D.; Zavortink, M.; McIntosh, J. R. Tubulin dynamics in cultured mammalian cells. J. Cell Biol. 1984, 99, 2175–2186.
147. Rusan, N. M.; Fagerstrom, C. J.; Yvon, A.-M. C.; Wadsworth, P. Cell cycle-dependent changes in microtubule dynamics in living cells expressing green fluorescent protein–α tubulin. Mol. Biol. Cell 2001, 12, 971–980.
148. Pepperkok, R.; Bre, M. H.; Davoust, J.; Kreis, T. E. Microtubules are stabilized in confluent epithelial cells but not in fibroblasts. J. Cell Biol. 1990, 111, 3003–3012.
149. Abal, M.; Piel, M.; Bouckson-Castaing, V.; Mogensen, M.; Sibarita, J. B.; Bornens, M. Microtubule release from the centrosome in migrating cells. J. Cell Biol. 2002, 159, 731–737.
150. Zhai, Y.; Kronebusch, P. J.; Simon, P. M.; Borisy, G. G. Microtubule dynamics at the G2/M transition: abrupt breakdown of cytoplasmic microtubules at nuclear envelope breakdown and implications for spindle morphogenesis. J. Cell Biol. 1996, 135, 201–214.
151. Hayden, J. J.; Bowser, S. S.; Rieder, C. Kinetochores capture astral microtubules during chromosome attachment to the mitotic spindle: direct visualization in live newt cells. J. Cell Biol. 1990, 111, 1039–1045.
152. Jordan, M. A.; Wendell, K.; Gardiner, S.; Derry, W. B.; Copp, H.; Wilson, L. Mitotic block induced in HeLa cells by low concentrations of paclitaxel (Taxol) results in abnormal mitotic exit and apoptotic cell death. Cancer Res. 1996, 56, 816–825
153. Kavallaris, M. Microtubules and resistance to tubulin-binding agents. Nature Rev. Cancer 2010, 10, 194–204.
154. Dumontet, C.; Jordan, M. A. Microtubule-binding agents: a dynamic field of cancer therapeutics. Nature 2010, 9, 790–803.
155. Jordan, M. A. Mechanism of action of antitumor drugs that interact with microtubules and tubulin. Curr. Med. Chem. Anticancer Agents 2002, 2, 1–17.
38
156. Hamel, E.; Covell, D. G. Antimitotic peptides and depsipeptides. Curr. Med. Chem. Anticancer Agents 2002, 2, 19–53.
157. Zhou, J.; Gupta, K.; Aggarwal, S.; Aneja, R.; Chandra, R.; Panda, D.; Joshi, H. C. Brominated derivatives of noscapine are potent microtubule-interfering agents that perturb mitosis and inhibit cell proliferation. Mol. Pharmacol. 2003, 63, 799–807.
158. Hoffman, J. C.; Vaughn, K. C. Mitotic disrupter herbicides act by a single mechanism but vary in efficacy. Protoplasma 1994, 179, 16–25.
159. Lacey, E.; Gill, J. H. Biochemistry of benzimidazole resistance. Acta Trop. 1994, 56, 245–262.
160. Cann, J. R.; Hinman, N. D. Interaction of chlorpromazine with brain microtubule subunit protein. Mol. Pharmacol. 1975, 11, 256–267.
161. Boder, G. B.; Paul, D. C.; Williams, D. C. Chlorpromazine inhibits mitosis of mammalian cells. Eur. J. Cell Biol. 1983, 31, 349–353.
162. Lobert, S.; Ingram, J.; Correia, J. Additivity of dilantin and vinblastine inhibitory effects on microtubule assembly. Cancer Res. 1999, 59, 4816–4822.
163. Jimenez-Barbero, J.; Amat-Guerri, F.; Snyder, J. P. The solid state, solution and tubulin-bound conformations of agents that promote microtubule stabilization. Curr. Med. Chem. Anticancer Agents 2002, 2, 91–122.
164. Johnson, I. S.; Wright, H. F.; Svoboda, G. H. Experimental basis for clinical evaluation of anti-tumor principles derived from Vinca rosea Linn. J. Lab. Clin. Med. 1959, 54, 830–837.
165. Noble, R. L.; Beer, C. T.; Cutts, J. H. Further biological activities of vincaleukoblastine: an alkaloid isolated from Vinca rosea (L.). Biochem. Pharmacol. 1958, 1, 347–348.
166. Mukherjee, A. K.; Basu, S.; Sarkar, N.; Ghosh, A. C. Advances in cancer therapy with plant based natural products. Curr. Med. Chem. 2001, 8, 1467–1486.
167. Svoboda, G. H. Alkaloids of Vinca rosea. IX. Extraction and characterization of leurosidine and leurocristine. Lloydia 1961, 24, 173–178.
168. Neuss, N.; Gorman, M.; Svoboda, G. H.; Maciak, G.; Beer, C. T. Vinca alkaloids. III. Characterization of leurosine and vincaleukoblastine, new alkaloids from Vinca rosea. J. Am. Chem. Soc. 1959, 81, 4754–4755.
169. Gidding, C. E.; Kellie, S. J.; Kamps, W. A.; de Graaf, S. S. Vincristine revisited. Crit. Rev. Oncol. Hematol. 1999, 29, 267–287.
170. Barnett, C. J.; Cullinan, G. J.; Gerzon, K.; Hoying, R. C.; Jones, W. E.; Newlon, W. M.; Poore, G. A.; Robison, R. L.; Sweeney, M. J. Structure activity relationships of dimeric Catharanthus alkaloids. 1. Deacetyl vinblastine amide (vindesine) sulfate. J. Med. Chem. 1978, 21, 88–96.
171. Budman, D. R. New vinca alkaloids and related compounds. Sem. Oncol. 1992, 19, 639–645.

39
172. Canobbio, L.; Boccardo, F; Pastorino, G.; Brema, F.; Martini, C.; Resasco, M.; Santi, L. Phase-II study of Navelbine in advanced breast cancer. Sem. Oncol. 1989, 16, 33–36.
173. Martins, R. G.; Dienstmann, R.; de Biasi, P. Dantas, K.; Santos, V.; Toscano, E.; Roriz, W.; Zamboni, M.; Sousa, A.; Small, I. A.; Moreira, D.; Ferreira, C. G.; Zukinb, M. Phase II trial of neoadjuvant chemotherapy using alternating doublets in non-small-cell lung cancer. Clin. Lung Cancer 2007, 8, 257–263.
174. Kruczynski, A.; Etievant, C.; Perrin, D.; Chansard, N.; Duflos, A.; Hill, B. T. Characterization of cell death induced by vinflunine, the most recent Vinca alkaloid in clinical development. Br. J. Cancer 2002, 86, 143–150.
175. Wilson, L.; Jordan, M. A. Pharmacological probes of microtubule function. Microtubules. Modern Cell Biol. 1994, 13, 59–83.
176. Jordan, M. A.; Wilson, L. [22] Use of drugs to study the role of microtubule assembly dynamics in living cells. Meth. Enzymol. 1998, 298, 252–276.
177. Lobert, S.; Correia, J. Energetics of Vinca alkaloid interactions with tubulin. Meth. Enzymol. 2000, 323, 77–103.
178. Bai, R. B.; Pettit, G. R.; Hamel E. Dolastatin 10. A powerful cytostatic peptide derived from a marine animal. Inhibition of tubulin polymerization mediated through the vinca alkaloid binding domain. Biochem. Pharmacol. 1990, 39, 1941–1949.
179. Bai, R. B.; Pettit, G. R.; Hamel E. Binding of dolastatin 10 to tubulin at a distinct site for peptide antimitotic agents near the exchangeable nucleotide and vinca alkaloid sites. J. Biol. Chem. 1990, 265, 17141–17149.
180. Wilson, L.; Jordan, M. A.; Morse, A.; Margolis, R. L. Interaction of vinblastine with steady-state microtubules in vitro. J. Mol. Biol. 1982, 159, 129–149.
181. Correia, J. J.; Lobert, S. Physiochemical aspects of tubulin-interacting antimitotic drugs. Curr. Pharm. Des. 2001, 7, 1213–1228.
182. Na, G. C.; Timasheff, S. N. Thermodynamic linkage between tubulin self-association and the binding of vinblastine. Biochemistry 1980, 19, 1347–1354.
183. Jordan, M. A.; Margolis, R. L.; Himes, R. H.; Wilson, L. Identification of a distinct class of vinblastine binding sites on microtubules. J. Mol. Biol. 1986, 187, 61–73.
184. Singer, W. D.; Jordan, M. A.; Wilson, L.; Himes, R. H. Binding of vinblastine to stabilized microtubules. Mol. Pharmacol. 1989, 36, 366–370.
185. Gigant, B.; Wang, C.; Ravelli, R. B. G.; Roussi, F.; Steinmetz, M. O.; Sobel, A.; Knossow, M. Structural Basis for the Regulation of Tubulin by Vinblastine. Nature 2005, 435, 519–522.
186. Protein Data Bank, http://www.rcsb.org/, PDB code: 1Z2B. 187. Jordan, A.; Hadfield, J. A.; Lawrence, N. J, McGown, A. T. Tubulin as a target for
anticancer drugs: agents which interact with the mitotic spindle. Med. Res. Rev. 1998, 18, 259–296.

40
188. Niel, E.; Scherrmann, J. M. Colchicine today. Joint Bone Spine 2006, 73, 672–678. 189. Hamel, E. Interactions of tubulin with small ligands. In Microtubule Proteins. (J. Avila,
ed.); CRC Press: Boca Raton, FL, 1990; pp 89–192. 190. Uppuluri, S.; Knipling, L.; Sackett, D. L.; Wolff, J. Localization of the colchicine-
binding site of tubulin. Proc. Natl. Acad. Sci. U. S. A. 1993, 90, 11598–11602. 191. Ravelli, R. B.; Gigant B.; Curmi, P. A.; Jourdain, I.; Lachkar, S.; Sobel, A.; Knossow,
M. Insight into tubulin regulation from a complex with colchicine and a stathmin-like domain. Nature 2004, 428, 198–202.
192. Skoufias, D. A.; Wilson L. Mechanism of inhibition of microtubule polymerization by colchicine: inhibitory potencies of unliganded colchicine and tubulin colchicine complexes. Biochemistry 1992, 31, 738–746.
193. Wilson, L.; Farrell, K. W. Kinetics and steady-state dynamics of tubulin addition and loss at opposite microtubule ends: the mechanism of action of colchicine. Ann. NY Acad. Sci. 1986, 466, 690–708.
194. Hastie, S. B. Interactions of colchicine with tubulin. Pharmacol. Ther. 1991, 512, 377–401.
195. Margolis, R. L.; Rauch, C. T.; Wilson, L. Mechanism of colchicine dimer addition to microtubule ends: Implications for the microtubule polymerization mechanism. Biochemistry 1980, 19, 5550–5557.
196. Farrell, K. W.; Wilson, L. The differential kinetic stabilization of opposite microtubule ends by tubulin-colchicine complexes. Biochemistry 1984, 23, 3741–3748.
197. Bai, R.; Pei, X. F.; Boye, O., Getahun, Z.; Grover, S.; Bekisz, J.; Nguyen, N. Y.; Brossi, A.; Hamel, E. Identification of cysteine 354 of β-tubulin as part of the binding site for the A ring of colchicine. J. Biol. Chem. 1996, 271, 12639–12645.
198. Dumortier, C.; Gorbunoff, M. J.; Andreu, J. M.; Engelborghs, Y. Different kinetic pathways of the binding of two biphenyl analogs of colchicine to tubulin. Biochemistry 1996, 35, 4387–4395.
199. Andreu, J. M.; Perez-Ramirez, B.; Gorbunoff, M. J.; Ayala, D.; Timasheff, S. N. Role of the colchicine ring A and its methoxy groups in the binding to tubulin and microtubule inhibition. Biochemistry 1998, 37, 8356–8368.
200. Andreu, J. M.; Timasheff, S. N. Conformational states of tubulin liganded to colchicine, tropolone methyl ether, and podophyllotoxin. Biochemistry 1982, 21, 6465–6476.
201. Protein Data Bank, http://www.rcsb.org/, PDB code: 1SA0. 202. Wall, M. E.; Wani, M. C. Camptothecin and taxol: discovery to clinic—thirteenth Bruce
F. Cain Memorial Award Lecture. Cancer Res. 1995, 55, 753–760. 203. Schiff, P. B.; Fant, J.; Band Horwitz, S. Promotion of microtubule assembly in vitro by
taxol. Nature 1979, 277, 665–667. 204. He, L.; Jagtap, P. G.; Kingston, D. G. I.; Shen, H.-J.; Orr G. A.; Band Horwitz, S. A
41
common pharmacophore for taxol and the epothilones based on the biological activity of a taxane molecule lacking a C-13 side chain. Biochemistry 2000, 39, 3972–3978.
205. Nicolaou, K. C.; Yang, Z.; Liu, J. J.; Ueno, H.; Nantermet, P. G.; Guy, R. K.; Claiborne, C. F.; Renaud, J.; Couladouros, E. A.; Paulvannan, K.; Sorensen, E. J. Total synthesis of taxol. Nature 1994, 367, 630–634.
206. Von Hoff, D. D. The taxoids: same roots, different drugs. Semin. Oncol. 1997, 24, S13.3–S13.10.
207. Markman, M. Managing taxane toxicities. Support Care Cancer 2003, 11, 144–147. 208. Gueritte-Voegelein, F.; Guenard, D.; Lavelle, F.; Le Goff, M. T.; Mangatal, L.; Potier,
P. Relationships between the structure of taxol analogs and their antimitotic activity. J. Med. Chem. 1991, 34, 992–998.
209. Saicic, R. N.; Matovic, R. An efficient semisynthesis of 7-deoxypaclitaxel from taxine. J. Chem. Soc. Perkin Trans. 2000, 1, 59–65.
210. Nogales, E. Structural insights into microtubule function. Annu. Rev. Biophys. Biomol. Struct. 2001, 30, 397–420.
211. Amos, L. A.; Löwe, J. How Taxol® stabilises microtubule structure. Chem. Biol. 1999, 6, R65–R69.
212. Huizing, M. T.; Giaccone, G.; van Warmerdam, L. J.; Rosing, H.; Bakker, P. J.; Vermorken, J. P.; Postmus, P. E.; van Zandwijk, N.; Koolen, M. G.; ten Bokkel Huinink, W. W.; van der Vijgh, W. J.; Bierhorst, F. J.; Lai, A.; Dalesio, O.; Pinedo, H. M.; Veenhof, C. H.; Beijnen, J. H. Pharmacokinetics of paclitaxel and carboplatin in a dose-escalating and dose-sequencing study in patients with non-small-cell lung cancer. The European Cancer Centre. J. Clin, Oncol. 1997, 15, 317–329.
213. Pryor, D. E.; O'Brate, A.; Bilcer, G.; Díaz, J. F.; Wang, Y.; Wang, Y.; Kabaki, M.; Jung, M. K.; Andreu, J. M.; Ghosh, A. K.; Giannakakou, P.; Hamel, E. The microtubule stabilizing agent laulimalide does not bind in the taxoid site, kills cells resistant to paclitaxel and epothilones, and may not require its epoxide moiety for activity. Biochemistry 2002, 41, 9109–9115.
214. Dumontet, C. Mechanisms of action and resistance to tubulin-binding agents. Exp. Op. Invest. Drugs 2000, 9, 779–788.
215. Moscow, J. A.; Cowan, K. H. Multidrug resistance. J. Natl. Cancer Inst. 1988, 80, 14–20.
216. Ling, V. Charles F. Kettering Prize. P-glycoprotein and resistance to anticancer drugs. Cancer 1992, 69, 2603–2609.
217. Ueda, K.; Cornwell, M. M.; Gottesman, M. M.; Pastan, I.; Roninson, I. B.; Ling, V.; Riordan, J. R. The mdr1 gene, responsible for multidrug-resistance, codes for P-glycoprotein. Biochem. Biophys. Res. Commun. 1986, 141, 956–62.
218. Biedler, J. L.; Riehm, H.; Peterson, R. H.; Spengler, B. A. Membrane-mediated drug
42
resistance and phenotypic reversion to normal growth behavior of Chinese hamster cells. J. Natl. Cancer Inst. 1975, 55, 671–80.
219. Ling, V.; Thompson, L. H. Reduced permeability in CHO cells as a mechanism of resistance to colchicine. J. Cell Physiol. 1974, 83, 103–16.
220. Ambudkar, S. V.; Kimchi-Sarfaty, C.; Sauna, Z. E.; Gottesman, M. M. P-glycoprotein: from genomics to mechanism. Oncogene 2003, 22, 7468–7485.
221. Safa, A. R. Identification and characterization of the binding sites of P-glycoprotein for multidrug resistance-related drugs and modulators. Curr. Med. Chem. Anti-Canc. Agents 2004, 4, 1–17.
222. Thomas, H.; Coley, H. M. Overcoming multidrug resistance in cancer: an update on the clinical strategy of inhibiting P-glycoprotein. Cancer Control 2003, 10, 159–165.
223. Geney, R.; Ungureanu, M.; Li, D.; Ojima, I. Overcoming multidrug resistance in taxane chemotherapy. Clin. Chem. Lab. Med. 2002, 40, 918–925.
224. Dumontet, C.; Sikic, B. Mechanisms of action of and resistance to antitubulin agents: microtubule dynamics, drug transport, and cell death. J. Clin. Oncol. 1999, 17, 1061–1070.
225. Orr, G. A.; Verdier-Pinard, P.; McDaid, H.; Band Horwitz, S. Mechanisms of taxol resistance related to microtubules. Oncogene 2003, 22, 7280–7295.
226. Kavallaris, M.; Tait, A. S.; Walsh, B. J.; He, L.; Horwitz, S. B.; Norris, M. D.; Haber, M. Multiple microtubule alterations are associated with Vinca alkaloid resistance in human leukemia cells. Cancer Res. 2001, 61, 5803–5809.
227. Minotti, A. M.; Barlow, S. B.; Cabral, F. Resistance to antimitotic drugs in Chinese hamster ovary cells correlated with changes in the level of polymerized tubulin. J. Biol. Chem. 1991, 266, 3987–3994.
228. James, S. W.; Silflow, C. D.; Stroom, P.; Lefebvre, P. A. A mutation in the α1-tubulin gene of Chlamydomonas reinhardtii confers resistance to anti-microtubule herbicides. J. Cell Sci. 1993, 106, 209–218.
229. Lee, W.-P. Purification and characterization of tubulin from parental and vincristine-resistant HOB1 lymphoma cells. Arch. Biochem. Biophys. 1995, 319, 498–503.
230. Ohta, S.; Nishio, K.; Kubota, N.; Ohmori, T.; Funayama, Y.; Ohira, T.; Nakajima, H.; Adachi, M.; Saijo, N. Characterization of a taxol-resistant human small-cell lung cancer cell line. Jpn. J. Cancer Res. 1994, 85, 290–297.
231. Laing, N. M.; Belinsky, M. G.; Kruh, G. D.; Bell, D. W.; Boyd, J. T.; Barone, L.; Testa, J. R.; Tew, K. D. Amplification of the ATP-binding cassette 2 transporter gene is functionally linked with enhanced efflux of estramustine in ovarian carcinoma cells. Cancer Res. 1998, 58, 1332–1337.
232. Galmarini, C. M.; Kamath, K.; Vanier-Viornery, A.; Hervieu, V.; Peiller, E.; Falette, N.; Puisieux, A.; Jordan, M. A.; Dumontet, C. Drug resistance associated with loss of
43
p53 involves extensive alterations in microtubule composition and dynamics. Br. J. Cancer 2003, 88, 1793–1799.
233. Burkhart, C. A.; Kavallaris, M.; Band Horwitz, S. The role of β-tubulin isotypes in resistance to antimitotic drugs. Biochim. Biophys. Acta. 2001, 2, O1–O9.
234. Dumontet, C.; Jaffrezou, J. P.; Tsuchiya, E.; Duran, G. E.; Chen, G.; Derry, W. B.; Wilson, L.; Jordan, M. A.; Sikic, B. I. Resistance to microtubule–targeted cytotoxins in a K562 leukemia cell variant is associated with altered tubulin expression Elec. J. Oncol. 1999, 2, 33–44.
235. Giannakakou, P.; Gussio, R.; Nogales, E.; Downing, K. H.; Zaharevitz, D.; Bollbuck, B.; Poy, G.; Sackett, D.; Nicolaou, K. C.; Fojo, T. A common pharmacophore for epothilone and taxanes: molecular basis for drug resistance conferred by tubulin mutations in human cancer cells. Proc. Natl Acad. Sci. U. S. A. 2000, 97, 2904–2909.
236. Goncalves, A.; Braguer, D.; Kamath, K.; Martello, L.; Briand, C.; Horwitz, S.; Wilson, L.; Jordan, M. A. Resistance to taxol in lung cancer cells associated with increased microtubule dynamics. Proc. Natl Acad. Sci. U. S. A. 2001, 98, 11737–11741.
237. Haber, M.; Burkhart, C. A.; Regl, D. L.; Madafiglio, J.; Norris, M. D.; Horwitz, S. B. Altered expression of Mβ2, the class II β-tubulin isotype, in a murine J774. 2 cell line with a high level of taxol resistance. J. Biol. Chem. 1995, 270, 31269–31275.
238. Jaffrezou, J.-P.; Dumontet, C.; Derry, W. B.; Duran, G.; Chen, G.; Tsuchiya, E.; Wilson. L.; Jordan, M. A.; Sikic, B. I. Novel mechanism of resistance to paclitaxel in human K562 leukemia cells by combined selection with PSC833. Oncology Res. 1995, 7, 517–527.
239. Kavallaris, M.; Kuo, D. Y. S.; Burkhart, C. A.; Regl, D. L.; Norris, M. D.; Haber, M.; Horwitz, S. B. Taxol-resistant epithelial ovarian tumors are associated with altered expression of specific β-tubulin isotypes. J. Clin. Invest. 1997, 100, 1–12.
240. Poruchynsky, M. S.; Giannakakou, P.; Ward, Y.; Bulinski, J. C.; Telford, W. G.; Robey, R. W.; Fojo, T. Accompanying protein alterations in malignant cells with a microtubule-polymerizing drug-resistance phenotype and a primary resistance mechanism. Biochem. Pharmacol. 2001, 62, 1469–1480.
241. Ranganathan, S.; Dexter, D. W.; Benetatos, C. A.; Chapman, A. E.; Tew, K. D.; Hudes, G. R. Increase of βIII- and βIVa-tubulin isotypes in human prostate carcinoma cells as a result of estramustine resistance. Cancer Res. 1996, 56, 2584–2589.
242. Verdier-Pinard, P.; Wang, F.; Martello, L.; Burd, B.; Orr, G. A.; Horwitz, S. B. Analysis of tubulin isotypes and mutations from taxol-resistant cells by combined isoelectrofocusing and mass spectrometry. Biochemistry 2003, 42, 5349–5357.
243. Blagosklonny, M. V.; Robey, R.; Bates, S.; Fojo, T. Pretreatment with DNA-damaging agents permits selective killing of checkpoint-deficient cells by microtubule-active drugs. J. Clin. Invest. 2000, 105, 533–539.
44
244. Alli, E.; Bash-Babula, J.; Yang, J. M.; Hait, W. N. Effect of stathmin on the sensitivity to antimicrotubule drugs in human breast cancer. Cancer Res. 2002, 62, 6864–6869.
245. Yao, D.; Ding, S.; Burchell, B.; Wolf, C. R.; Friedberg, T. Detoxication of vinca alkaloids by human P450 CYP3A4-mediated metabolism: implications for the development of drug resistance. J. Pharmacol. Exp. Ther. 2000, 294, 387–395.
246. Sumantran, V. N.; Ealovega, M. W.; Nunez, G.; Clarke, M. F.; Wicha, M. S. Overexpression of Bcl-XS sensitizes MCF-7 cells to chemotherapy-induced apoptosis. Cancer Res. 1995, 55, 2507–2510.
247. Tang, C.; Willingham, M. C.; Reed, J. C.; Miyashita, T.; Ray, S.; Ponnathpur, V.; Huang, Y.; Mahoney, M. E.; Bullock, G.; Bhalla, K. High levels of p26BCL-2 oncoprotein retard taxol-induced apoptosis in human pre-B leukemia cells. Leukemia 1994, 8, 1960–1969.
248. Tsujimoto, Y.; Croce, C. M. Analysis of the structure, transcripts, and protein products of bcl-2, the gene involved in human follicular lymphoma. Proc. Natl. Acad. Sci. U. S. A. 1986, 83, 5214–5218.
249. Hockenbery, D.; Nuñez, G.; Milliman, C.; Schreiber, R. D.; Korsmeyer, S. J. Bcl-2 is an inner mitochondrial membrane protein that blocks programmed cell death. Nature 1990, 348, 334–336.
45
Chapter 2: New Indole Derivatives as Potent Inhibitors of Tubulin Polymerization
2.1 Introduction
The cytoskeleton of MTs is both an effective and a validated target in the therapy of cancer.1−4 Because of their crucial role in the formation of the mitotic spindle during cell division, drugs that bind to either unpolymerized tubulin or tubulin polymer interfere both with cell division and interphase functions, which require a normal MT cytoskeleton, and invariably lead to cell death. As discussed in chapter 1, a wide-range of natural products are known to interact with the tubulin/MT system displaying antimitotic and anticancer properties. In this respect, colchicine,5,6 combretastatin A-4 (CSA4)7 and the Catharanthus alkaloids vincristine, vinblastine and vinorelbine are tubulin assembly inhibitors that interact with α,β-tubulin dimers at distinct interfaces between the two subunits. This effect results in MT destabilization, arrest of mitotic progression, and subsequent apoptosis.8,9 In contrast, MT-stabilizing drugs, such as the toxoids paclitaxel and docetaxel, as well as epothilones, block MT disassembly by targeting a lumenal site on the β-subunit10,11 and entering the lumen through a binding site located at a pore on the MT surface formed by different tubulin dimers.12 Overall, these drugs (especially Vinca alkaloids and taxanes) have been broadly used in cancer therapy for the treatment of a variety of tumor types. However, although their notably efficacy in some patients, their clinical use is limited by resistance that occurs with high frequency either at the onset or during the course of therapy. Furthermore, toxicity and unwanted side effects still remain unsolved problems. Therefore, despite the progress achieved in the development of MT-targeting drugs with different mechanisms of action and improved afficacy the quest for new and potent anticancer agents remains mandatory.13
2.2 Arylthioindoles as New Potent Anticancer Agents
Over the years, a great number of indoles were found to be effective as inhibitors of tubulin assembly.14−17 In this context, Silvestri and coworkers recently discovered arylthioindoles (ATIs, Figure 2.1) as a new class of potent inhibitors of tubulin polymerization and the growth of MCF-7 human breast carcinoma cells.18−23 ATIs inhibit [3H]colchicine binding on β-tubulin close to its interface with α-tubulin within the α,β-dimer.18 A number of ATIs proved to be more potent than other chemotypes so far presented, thus encouraging their development as new potential therapeutics in cancer therapy.22,23
Structure-activity relationship (SAR) and molecular modeling studies on ATI derivatives highlighted three essential structural requirements: (a) aromatic ring at position 2 of the indole, which is important for activity and improves metabolic stability (b) 3,4,5-trimethoxyphenyl moiety; (c) sulfur, ketone, or methylene bridging group at position 3 of the indole (Figure 2.1).
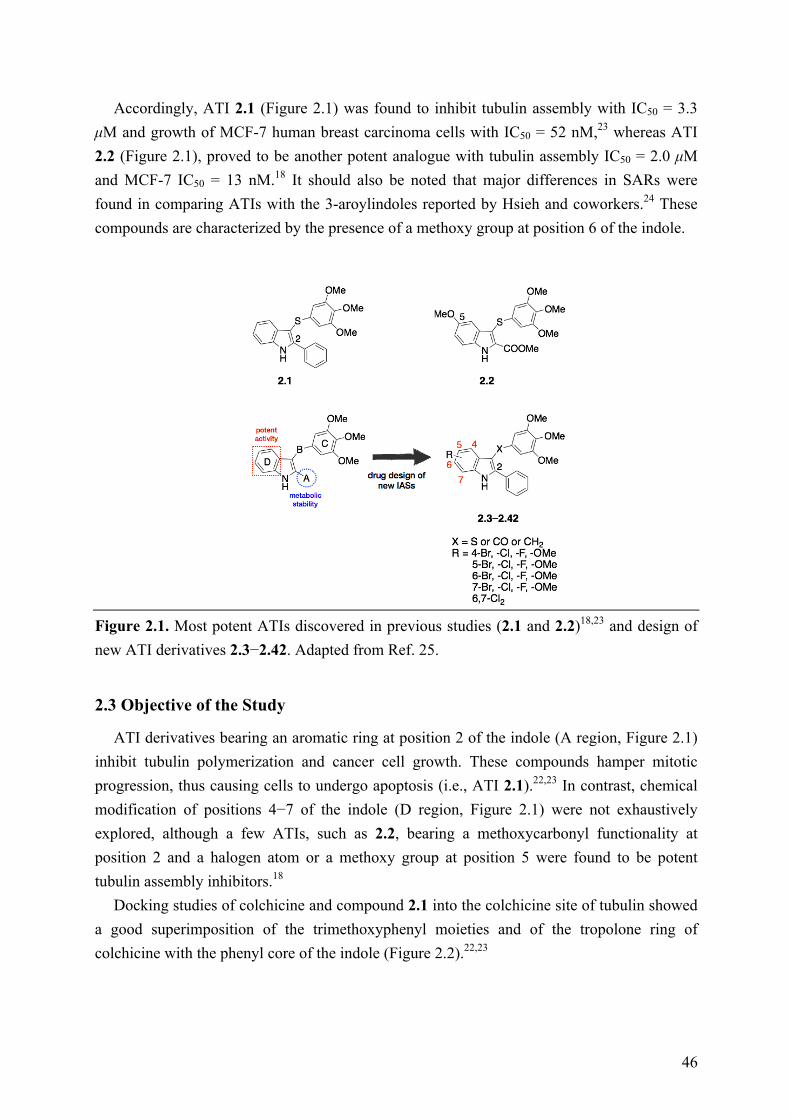
46
Accordingly, ATI 2.1 (Figure 2.1) was found to inhibit tubulin assembly with IC50 = 3.3 µM and growth of MCF-7 human breast carcinoma cells with IC50 = 52 nM,23 whereas ATI 2.2 (Figure 2.1), proved to be another potent analogue with tubulin assembly IC50 = 2.0 µM and MCF-7 IC50 = 13 nM.18 It should also be noted that major differences in SARs were found in comparing ATIs with the 3-aroylindoles reported by Hsieh and coworkers.24 These compounds are characterized by the presence of a methoxy group at position 6 of the indole.
Figure 2.1. Most potent ATIs discovered in previous studies (2.1 and 2.2)18,23 and design of new ATI derivatives 2.3−2.42. Adapted from Ref. 25.
2.3 Objective of the Study
ATI derivatives bearing an aromatic ring at position 2 of the indole (A region, Figure 2.1) inhibit tubulin polymerization and cancer cell growth. These compounds hamper mitotic progression, thus causing cells to undergo apoptosis (i.e., ATI 2.1).22,23 In contrast, chemical modification of positions 4−7 of the indole (D region, Figure 2.1) were not exhaustively explored, although a few ATIs, such as 2.2, bearing a methoxycarbonyl functionality at position 2 and a halogen atom or a methoxy group at position 5 were found to be potent tubulin assembly inhibitors.18
Docking studies of colchicine and compound 2.1 into the colchicine site of tubulin showed a good superimposition of the trimethoxyphenyl moieties and of the tropolone ring of colchicine with the phenyl core of the indole (Figure 2.2).22,23
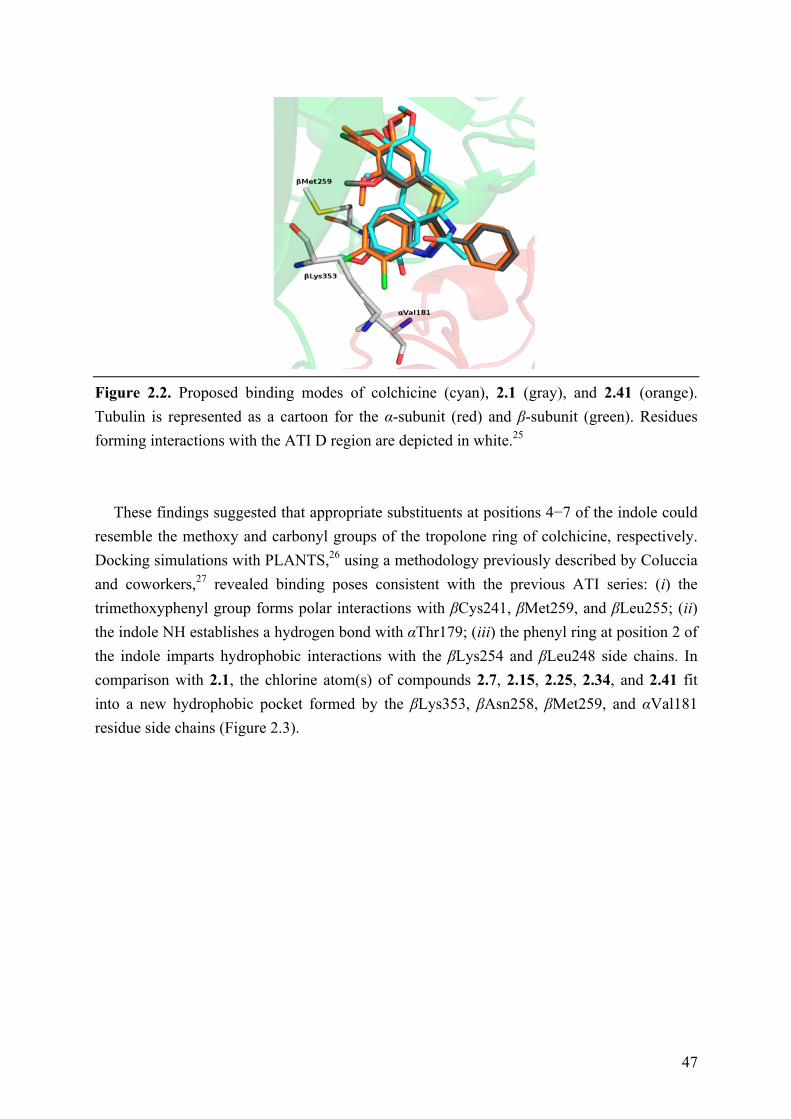
47
Figure 2.2. Proposed binding modes of colchicine (cyan), 2.1 (gray), and 2.41 (orange). Tubulin is represented as a cartoon for the α-subunit (red) and β-subunit (green). Residues forming interactions with the ATI D region are depicted in white.25
These findings suggested that appropriate substituents at positions 4−7 of the indole could
resemble the methoxy and carbonyl groups of the tropolone ring of colchicine, respectively. Docking simulations with PLANTS,26 using a methodology previously described by Coluccia and coworkers,27 revealed binding poses consistent with the previous ATI series: (i) the trimethoxyphenyl group forms polar interactions with βCys241, βMet259, and βLeu255; (ii) the indole NH establishes a hydrogen bond with αThr179; (iii) the phenyl ring at position 2 of the indole imparts hydrophobic interactions with the βLys254 and βLeu248 side chains. In comparison with 2.1, the chlorine atom(s) of compounds 2.7, 2.15, 2.25, 2.34, and 2.41 fit into a new hydrophobic pocket formed by the βLys353, βAsn258, βMet259, and αVal181 residue side chains (Figure 2.3).

48
Figure 2.3. Proposed binding mode of 2.7 (pink), 2.15 (magenta), 2.25 (violet), and 2.41 (orange); colchicine is shown in cyan. Tubulin is represented as a cartoon for the α- (red) and β- (green) subunits. Residues forming interactions with the D region of the ATIs are depicted in white. HBs are indicated by yellow dashed lines.25
The 7-fluoro atom of 2.37 behaves as a hydrogen bond acceptor with αVal181, while the methoxy group of 2.30 mimics the corresponding group at position 10 of colchicine, resembling its interaction with the εN of βLys353 (Figure2.4).
Figure 2.4. Proposed binding modes of 2.30 (grey) and 2.37 (orange); colchicine is shown in cyan. Tubulin is represented as a cartoon for the α- (red) and β- (green) subunits. Residues forming interactions with the D region of the ATIs are depicted in white. HBs are indicated by yellow dashed lines.25
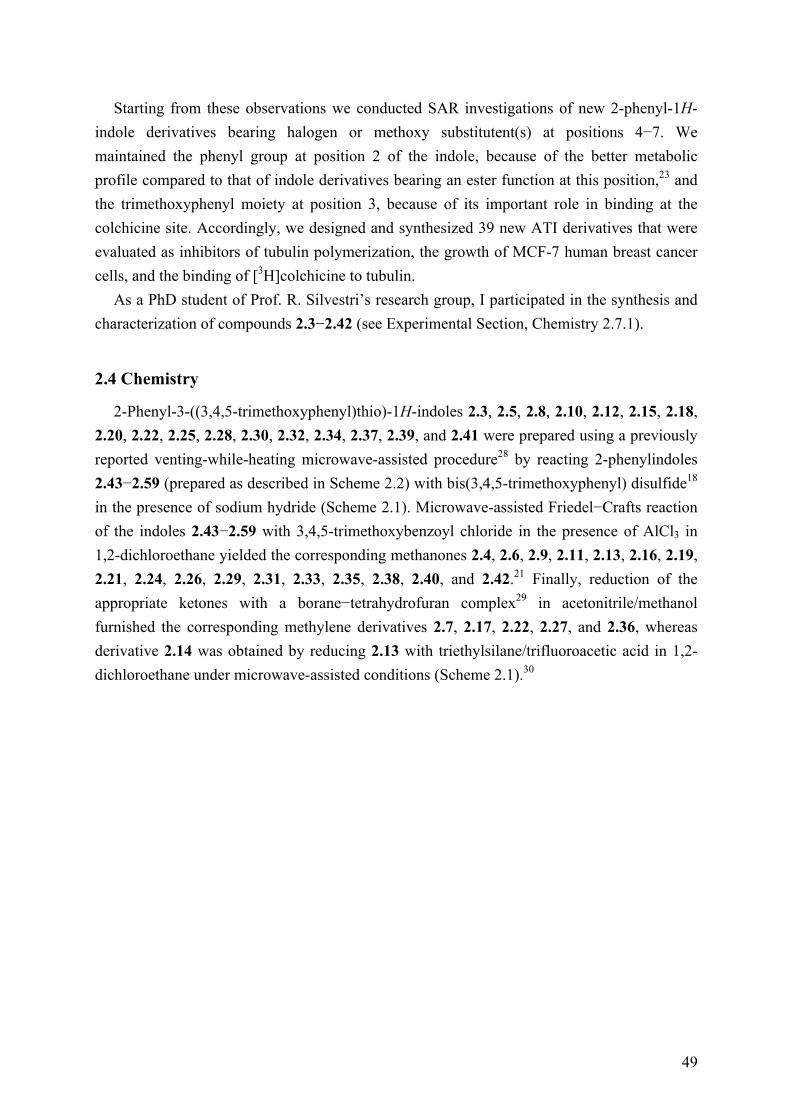
49
Starting from these observations we conducted SAR investigations of new 2-phenyl-1H-indole derivatives bearing halogen or methoxy substitutent(s) at positions 4−7. We maintained the phenyl group at position 2 of the indole, because of the better metabolic profile compared to that of indole derivatives bearing an ester function at this position,23 and the trimethoxyphenyl moiety at position 3, because of its important role in binding at the colchicine site. Accordingly, we designed and synthesized 39 new ATI derivatives that were evaluated as inhibitors of tubulin polymerization, the growth of MCF-7 human breast cancer cells, and the binding of [3H]colchicine to tubulin.
As a PhD student of Prof. R. Silvestri’s research group, I participated in the synthesis and characterization of compounds 2.3−2.42 (see Experimental Section, Chemistry 2.7.1).
2.4 Chemistry
2-Phenyl-3-((3,4,5-trimethoxyphenyl)thio)-1H-indoles 2.3, 2.5, 2.8, 2.10, 2.12, 2.15, 2.18, 2.20, 2.22, 2.25, 2.28, 2.30, 2.32, 2.34, 2.37, 2.39, and 2.41 were prepared using a previously reported venting-while-heating microwave-assisted procedure28 by reacting 2-phenylindoles 2.43−2.59 (prepared as described in Scheme 2.2) with bis(3,4,5-trimethoxyphenyl) disulfide18 in the presence of sodium hydride (Scheme 2.1). Microwave-assisted Friedel−Crafts reaction of the indoles 2.43−2.59 with 3,4,5-trimethoxybenzoyl chloride in the presence of AlCl3 in 1,2-dichloroethane yielded the corresponding methanones 2.4, 2.6, 2.9, 2.11, 2.13, 2.16, 2.19, 2.21, 2.24, 2.26, 2.29, 2.31, 2.33, 2.35, 2.38, 2.40, and 2.42.21 Finally, reduction of the appropriate ketones with a borane−tetrahydrofuran complex29 in acetonitrile/methanol furnished the corresponding methylene derivatives 2.7, 2.17, 2.22, 2.27, and 2.36, whereas derivative 2.14 was obtained by reducing 2.13 with triethylsilane/trifluoroacetic acid in 1,2-dichloroethane under microwave-assisted conditions (Scheme 2.1).30
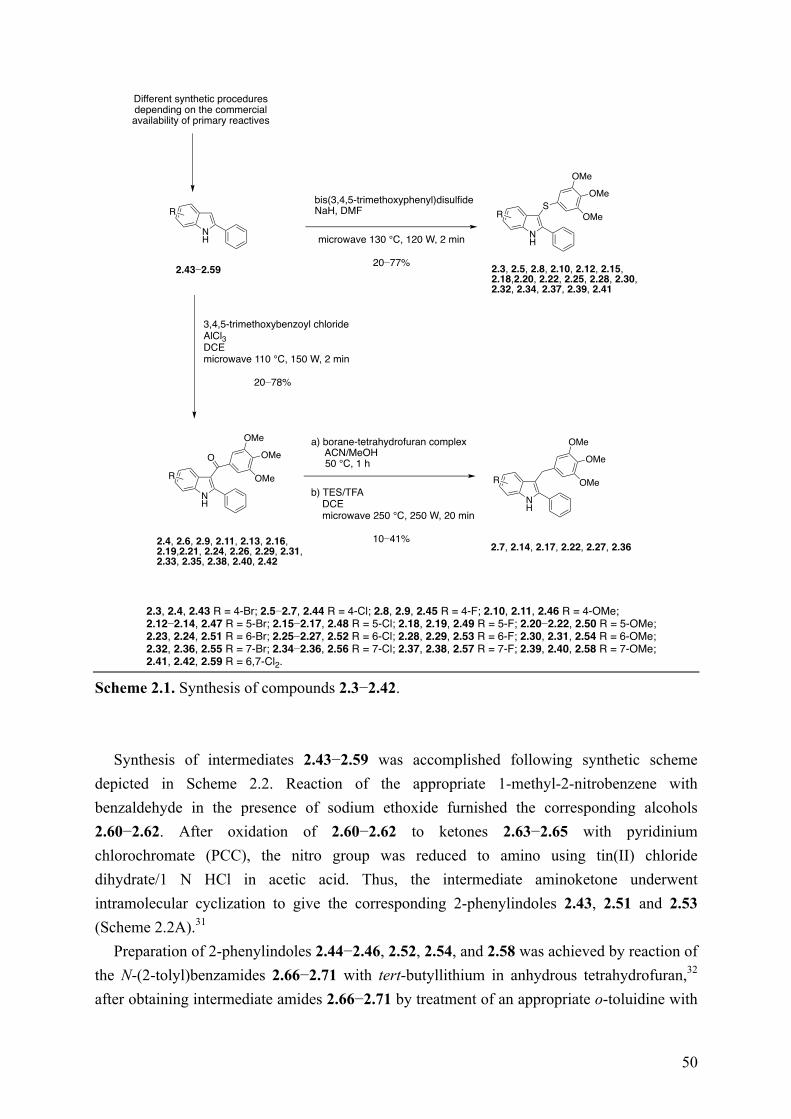
50
Scheme 2.1. Synthesis of compounds 2.3−2.42.
Synthesis of intermediates 2.43−2.59 was accomplished following synthetic scheme
depicted in Scheme 2.2. Reaction of the appropriate 1-methyl-2-nitrobenzene with benzaldehyde in the presence of sodium ethoxide furnished the corresponding alcohols 2.60−2.62. After oxidation of 2.60−2.62 to ketones 2.63−2.65 with pyridinium chlorochromate (PCC), the nitro group was reduced to amino using tin(II) chloride dihydrate/1 N HCl in acetic acid. Thus, the intermediate aminoketone underwent intramolecular cyclization to give the corresponding 2-phenylindoles 2.43, 2.51 and 2.53 (Scheme 2.2A).31
Preparation of 2-phenylindoles 2.44−2.46, 2.52, 2.54, and 2.58 was achieved by reaction of the N-(2-tolyl)benzamides 2.66−2.71 with tert-butyllithium in anhydrous tetrahydrofuran,32 after obtaining intermediate amides 2.66−2.71 by treatment of an appropriate o-toluidine with
NH
Rbis(3,4,5-trimethoxyphenyl)disulfideNaH, DMF
microwave 130 °C, 120 W, 2 min
20−77%
3,4,5-trimethoxybenzoyl chlorideAlCl3DCEmicrowave 110 °C, 150 W, 2 min
20−78%
a) borane-tetrahydrofuran complex ACN/MeOH 50 °C, 1 h
b) TES/TFA DCE microwave 250 °C, 250 W, 20 min
10−41%
Different synthetic proceduresdepending on the commercialavailability of primary reactives
NH
RS
OMe
OMe
OMe
NH
R
OMe
OMe
OMe
O
NH
R
OMe
OMe
OMe
2.43−2.59 2.3, 2.5, 2.8, 2.10, 2.12, 2.15,2.18,2.20, 2.22, 2.25, 2.28, 2.30,2.32, 2.34, 2.37, 2.39, 2.41
2.4, 2.6, 2.9, 2.11, 2.13, 2.16,2.19,2.21, 2.24, 2.26, 2.29, 2.31,2.33, 2.35, 2.38, 2.40, 2.42
2.7, 2.14, 2.17, 2.22, 2.27, 2.36
2.3, 2.4, 2.43 R = 4-Br; 2.5−2.7, 2.44 R = 4-Cl; 2.8, 2.9, 2.45 R = 4-F; 2.10, 2.11, 2.46 R = 4-OMe;2.12−2.14, 2.47 R = 5-Br; 2.15−2.17, 2.48 R = 5-Cl; 2.18, 2.19, 2.49 R = 5-F; 2.20−2.22, 2.50 R = 5-OMe;2.23, 2.24, 2.51 R = 6-Br; 2.25−2.27, 2.52 R = 6-Cl; 2.28, 2.29, 2.53 R = 6-F; 2.30, 2.31, 2.54 R = 6-OMe;2.32, 2.36, 2.55 R = 7-Br; 2.34−2.36, 2.56 R = 7-Cl; 2.37, 2.38, 2.57 R = 7-F; 2.39, 2.40, 2.58 R = 7-OMe; 2.41, 2.42, 2.59 R = 6,7-Cl2.
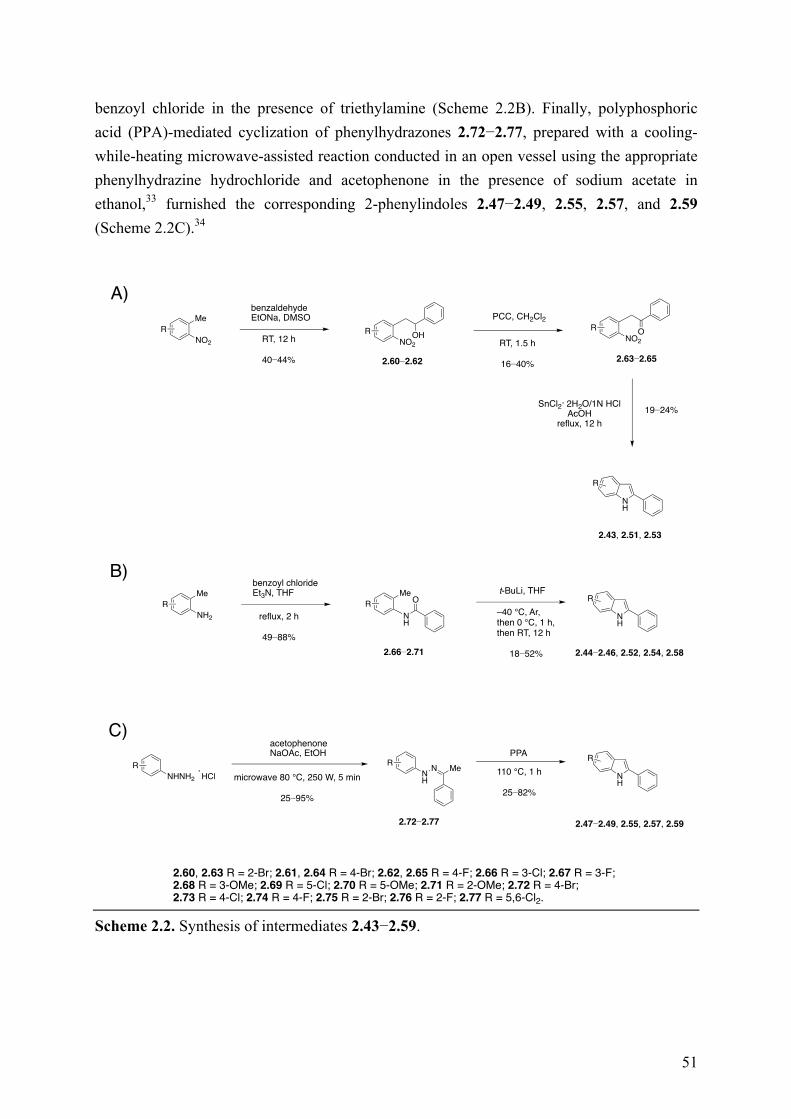
51
benzoyl chloride in the presence of triethylamine (Scheme 2.2B). Finally, polyphosphoric acid (PPA)-mediated cyclization of phenylhydrazones 2.72−2.77, prepared with a cooling-while-heating microwave-assisted reaction conducted in an open vessel using the appropriate phenylhydrazine hydrochloride and acetophenone in the presence of sodium acetate in ethanol,33 furnished the corresponding 2-phenylindoles 2.47−2.49, 2.55, 2.57, and 2.59 (Scheme 2.2C).34
Scheme 2.2. Synthesis of intermediates 2.43−2.59.
Me
NO2
RNO2
R OH NO2
R O
NH
R
2.43, 2.51, 2.53
benzaldehydeEtONa, DMSO
RT, 12 h
40−44% 2.60−2.62 2.63−2.65
PCC, CH2Cl2
RT, 1.5 h
16−40%
SnCl2 2H2O/1N HClAcOH
reflux, 12 h19−24%
Me
NH2
RNH
R
benzoyl chlorideEt3N, THF
reflux, 2 h
49−88%2.66−2.71
OMe
NH
R
2.44−2.46, 2.52, 2.54, 2.58
t-BuLi, THF
–40 °C, Ar,then 0 °C, 1 h,then RT, 12 h
18−52%
NHNH2 HClR R
acetophenoneNaOAc, EtOH
microwave 80 °C, 250 W, 5 min
25−95%
2.72−2.77
NH
R
2.47−2.49, 2.55, 2.57, 2.59
PPA
110 °C, 1 h
25−82%
NH
N Me
A)
B)
C)
2.60, 2.63 R = 2-Br; 2.61, 2.64 R = 4-Br; 2.62, 2.65 R = 4-F; 2.66 R = 3-Cl; 2.67 R = 3-F;2.68 R = 3-OMe; 2.69 R = 5-Cl; 2.70 R = 5-OMe; 2.71 R = 2-OMe; 2.72 R = 4-Br;2.73 R = 4-Cl; 2.74 R = 4-F; 2.75 R = 2-Br; 2.76 R = 2-F; 2.77 R = 5,6-Cl2.
52
2.5 Results and Discussion
SAR Analysis. Activities of compounds 2.3−2.42, colchicine, CSA4, and ATIs 2.1 and 2.2 are shown in Table 2.1. The majority of the new derivatives (23 compounds: 2.5, 2.8, 2.9, 2.12, 2.15, 2.18, 2.23−2.27, 2.30−2.35, and 2.37−2.42) inhibited tubulin polymerization with IC50 values in the 1.0−2.0 µM range, being comparable to the references colchicine and CSA4.
Evaluation of the effect of different substitutions at position 4 of the indole (compounds 2.3−2.11) reveals that the 4-chloro derivative 2.5 exhibits good tubulin assembly inhibitiory activity with an half maximal inhibitory concentration (IC50) value of 1.6 µM, being 2.2-fold more active compared to the corresponding ketone 2.6 (IC50 = 3.6 µM). The thio/keto 4-fluoro derivatives 2.8 and 2.9 are almost equipotent as tubulin assembly inhibitors and showed the greatest inhibition of MCF-7 cell growth in the nanomolar range. Neither the bromine atom nor the methoxy group was found among the most active 4-substituted indole derivatives in both the thio and ketone series. In terms of effects on MCF-7 cell growth, there is no evident major difference between the thio and ketone series, although the data are limited.
Among ATI derivatives 2.12−2.22, bearing a substituent at position 5 of the indole, four compounds (2.12, 2.15, 2.18, and 2.20) were found to be significantly more potent than the corresponding ketones (2.13, 2.16, 2.19, and 2.21, respectively) and slightly more active than the methylene analogues (2.14, 2.17, and 2.22, respectively). In general, the tubulin inhibitory activity of 5-substituted analogues seems to be weakly affected by the nature of the substituent. In contrast to the corresponding ester derivatives, all these compounds were found to be weak inhibitors of MCF-7 cell growth with IC50 ≥ 100 nM (cf., 2.2 with 2.20). Furthermore, within the limitations of the data, there are no major differences in the effects on MCF-7 cell growth dependent on the bridging group (thio, ketone, or methylene).
All the derivatives bearing the substituent at position 6 of the indole (compounds 2.23−2.31) inhibited tubulin polymerization with IC50 < 2.5 µM, with the possible exception of the 6-fluoro derivative 2.29, which showed an IC50 value of 10 µM. As inhibitors of MCF-7 cell growth, ketones showed to be generally less potent than the corresponding thio derivatives (cf., 2.23 with 2.24, 2.30 with 2.31). Furthermore, among the thio-derivatives, the 6-bromo derivative 2.23 and 6-methoxy derivative 2.30 showed the most potent cell growth inhibitory activity.
With respect to the substitution at position 7 of the indole, all the derivatives (compounds 2.32−2.40) showed to be essentially potent inhibitors of tubulin assembly with IC50 < 2.5 µM. With the exception of 2.36 and 2.40, these compounds potently inhibited the growth of the MCF-7 cells, with 2.33 and 2.35 being the most active analogues of the series (IC50 = 4 and 9 nM, respectively). However, in contrast to what was observed for the 6-substituted indoles, the 7-substituted derivatives, particularly the bromo and chloro ketones appeared to be generally more potent than the corresponding thio-counterparts as inhibitors of MCF-7 cell

53
growth (cf., 2.23 and 2.24 with 2.32 and 2.33, 2.25 and 2.26 with 2.34 and 2.35). Finally, we tried to join the features of 2.25 and 2.26 with those of 2.34 and 2.35 to further enhance activity. This effort yielded the 6,7-dichlorinated derivatives 2.41 and 2.42, which showed to be highly potent inhibitors of tubulin polymerization and MCF-7 cell growth.
Cmpd R X Tubulin assembly
IC50 ± SDa (µM)
MCF-7
IC50 ± SDb (nM)
Colchicine binding
inhibitionb,c (% ± SD)
2.3 4-Br S 2.4 ± 0.1 400 ± 70 33 ± 2
2.4 4-Br C=O >20 (partial activity)d 430 ± 100 ND
2.5 4-Cl S 1.6 ± 0.07 290 ± 50 48 ± 5
2.6 4-Cl C=O 3.6 ± 0.2 260 ± 50 38 ± 3
2.7 4-Cl CH2 17 ± 0.2 >5000 ND
2.8 4-F S 1.7 ± 0.07 80 ± 30 80 ± 0.4
2.9 4-F C=O 1.6 ± 0.08 65 ± 7 63 ± 1
2.10 4-OMe S >20 (partial activity)d 1400 ± 300 ND
2.11 4-OMe C=O >20 (no activity)e >5000 ND
2.12 5-Br S 1.3 ± 0.1 320 ± 100 39 ± 3
2.13 5-Br C=O >40 530 ± 100 ND
2.14 5-Br CH2 4.0 ± 0.5 700 ± 300 31 ± 2
2.15 5-Cl S 1.5 ± 0.2 280 ± 70 49 ± 5
2.16 5-Cl C=O >20 330 ± 100 ND
2.17 5-Cl CH2 4.4 ± 0.8 310 ± 10 38 ± 3
2.18 5-F S 1.5 ± 0.1 300 ± 0 61 ± 4
2.19 5-F C=O 13 ± 0.4 240 ± 90 ND
2.20 5-OMe S 2.1 ± 0.01 200 ± 80 58 ± 0.5
2.21 5-OMe C=O 8.3 ± 1 170 ± 60 ND
2.22 5-OMe CH2 3.5 ± 0.4 100 ± 0 41 ± 0.9
NH
R X
OMe
OMe
OMe
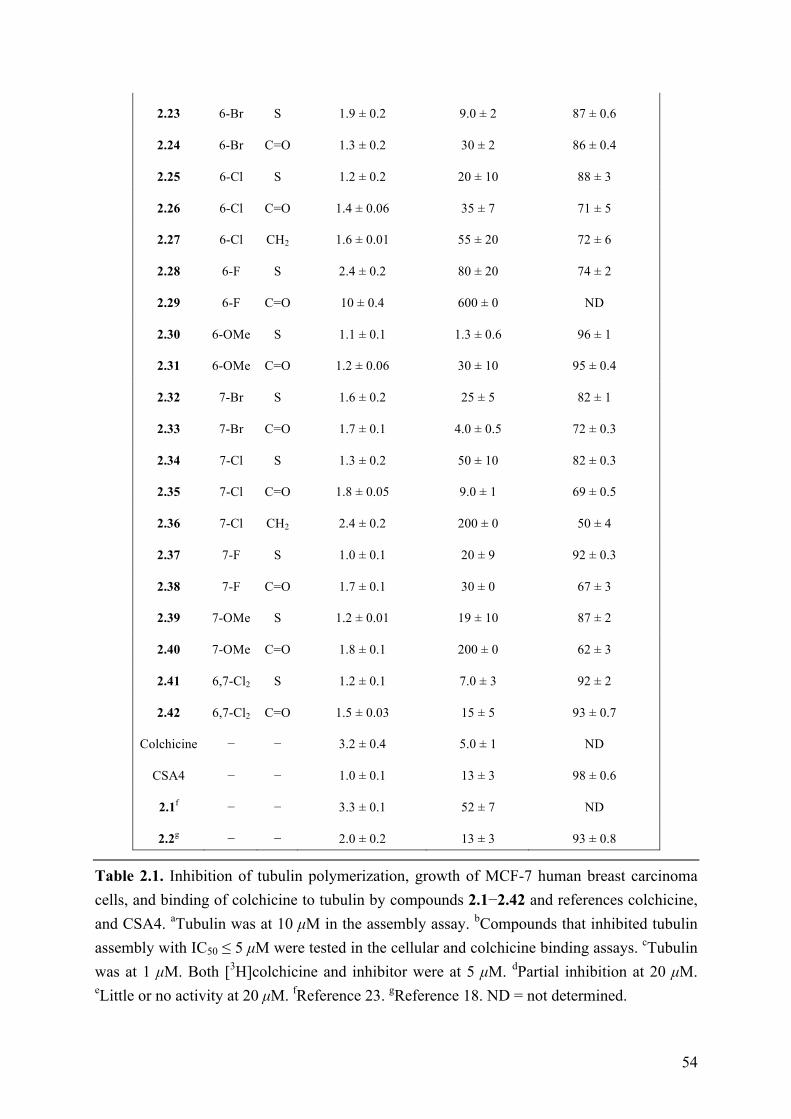
54
2.23 6-Br S 1.9 ± 0.2 9.0 ± 2 87 ± 0.6
2.24 6-Br C=O 1.3 ± 0.2 30 ± 2 86 ± 0.4
2.25 6-Cl S 1.2 ± 0.2 20 ± 10 88 ± 3
2.26 6-Cl C=O 1.4 ± 0.06 35 ± 7 71 ± 5
2.27 6-Cl CH2 1.6 ± 0.01 55 ± 20 72 ± 6
2.28 6-F S 2.4 ± 0.2 80 ± 20 74 ± 2
2.29 6-F C=O 10 ± 0.4 600 ± 0 ND
2.30 6-OMe S 1.1 ± 0.1 1.3 ± 0.6 96 ± 1
2.31 6-OMe C=O 1.2 ± 0.06 30 ± 10 95 ± 0.4
2.32 7-Br S 1.6 ± 0.2 25 ± 5 82 ± 1
2.33 7-Br C=O 1.7 ± 0.1 4.0 ± 0.5 72 ± 0.3
2.34 7-Cl S 1.3 ± 0.2 50 ± 10 82 ± 0.3
2.35 7-Cl C=O 1.8 ± 0.05 9.0 ± 1 69 ± 0.5
2.36 7-Cl CH2 2.4 ± 0.2 200 ± 0 50 ± 4
2.37 7-F S 1.0 ± 0.1 20 ± 9 92 ± 0.3
2.38 7-F C=O 1.7 ± 0.1 30 ± 0 67 ± 3
2.39 7-OMe S 1.2 ± 0.01 19 ± 10 87 ± 2
2.40 7-OMe C=O 1.8 ± 0.1 200 ± 0 62 ± 3
2.41 6,7-Cl2 S 1.2 ± 0.1 7.0 ± 3 92 ± 2
2.42 6,7-Cl2 C=O 1.5 ± 0.03 15 ± 5 93 ± 0.7
Colchicine − − 3.2 ± 0.4 5.0 ± 1 ND
CSA4 − − 1.0 ± 0.1 13 ± 3 98 ± 0.6
2.1f − − 3.3 ± 0.1 52 ± 7 ND
2.2g − − 2.0 ± 0.2 13 ± 3 93 ± 0.8 Table 2.1. Inhibition of tubulin polymerization, growth of MCF-7 human breast carcinoma cells, and binding of colchicine to tubulin by compounds 2.1−2.42 and references colchicine, and CSA4. aTubulin was at 10 µM in the assembly assay. bCompounds that inhibited tubulin assembly with IC50 ≤ 5 µM were tested in the cellular and colchicine binding assays. cTubulin was at 1 µM. Both [3H]colchicine and inhibitor were at 5 µM. dPartial inhibition at 20 µM. eLittle or no activity at 20 µM. fReference 23. gReference 18. ND = not determined.
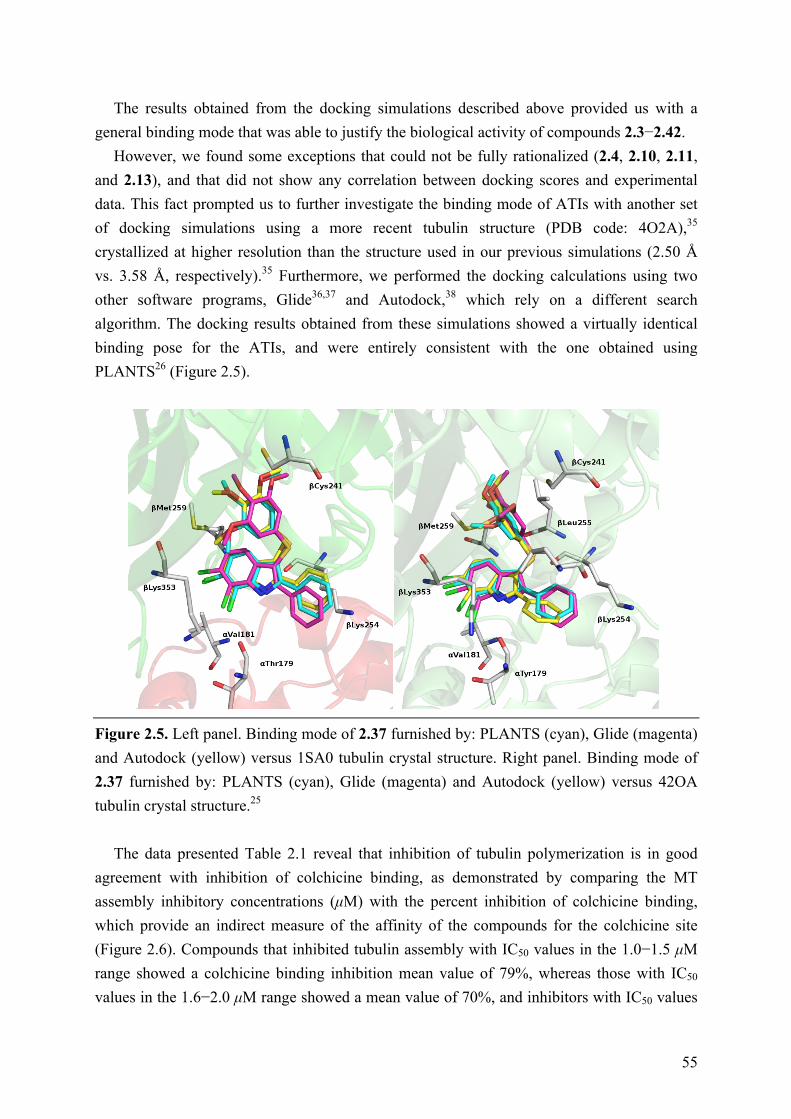
55
The results obtained from the docking simulations described above provided us with a general binding mode that was able to justify the biological activity of compounds 2.3−2.42.
However, we found some exceptions that could not be fully rationalized (2.4, 2.10, 2.11, and 2.13), and that did not show any correlation between docking scores and experimental data. This fact prompted us to further investigate the binding mode of ATIs with another set of docking simulations using a more recent tubulin structure (PDB code: 4O2A),35 crystallized at higher resolution than the structure used in our previous simulations (2.50 Å vs. 3.58 Å, respectively).35 Furthermore, we performed the docking calculations using two other software programs, Glide36,37 and Autodock,38 which rely on a different search algorithm. The docking results obtained from these simulations showed a virtually identical binding pose for the ATIs, and were entirely consistent with the one obtained using PLANTS26 (Figure 2.5).
Figure 2.5. Left panel. Binding mode of 2.37 furnished by: PLANTS (cyan), Glide (magenta) and Autodock (yellow) versus 1SA0 tubulin crystal structure. Right panel. Binding mode of 2.37 furnished by: PLANTS (cyan), Glide (magenta) and Autodock (yellow) versus 42OA tubulin crystal structure.25
The data presented Table 2.1 reveal that inhibition of tubulin polymerization is in good agreement with inhibition of colchicine binding, as demonstrated by comparing the MT assembly inhibitory concentrations (µM) with the percent inhibition of colchicine binding, which provide an indirect measure of the affinity of the compounds for the colchicine site (Figure 2.6). Compounds that inhibited tubulin assembly with IC50 values in the 1.0−1.5 µM range showed a colchicine binding inhibition mean value of 79%, whereas those with IC50 values in the 1.6−2.0 µM range showed a mean value of 70%, and inhibitors with IC50 values

56
in the 2.1−3.0 µM range inhibited colchicine binding with a mean value of 53%. CSA4 has been used as reference compound (tubulin assembly inhibition, IC50 = 1.0 µM; colchicine binding inhibition, 98%).
Figure 2.6. Correlation between inhibition of tubulin assembly (IC50 values, µM) and inhibition of colchicine binding (%). Data of ATI derivatives 2.3−2.42 are shown as open circles. The black circle represents the reference CSA4.25
Same good correlation was observed beetween the MCF-7 cell growth inhibition (nM) of
ATIs 2.3−2.42 and the percent inhibition on the binding of [3H]colchicine to tubulin (Figure 2.7B).
Figure 2.7. Correlation between the MCF-7 cytotoxicity data and inhibition of tubulin assembly (A) or inhibition of colchicine binding (B). Data of ATI derivatives 2.3−2.42 are shown as open circles. Black circle represents the reference CSA4.25
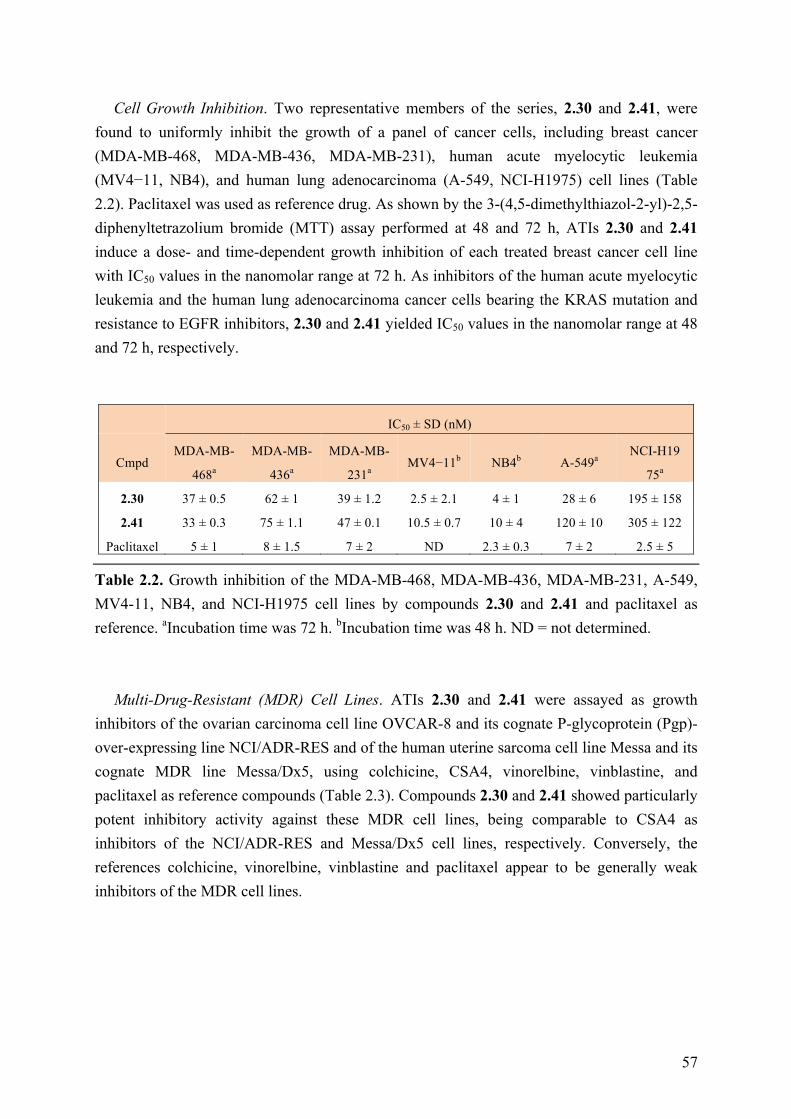
57
Cell Growth Inhibition. Two representative members of the series, 2.30 and 2.41, were found to uniformly inhibit the growth of a panel of cancer cells, including breast cancer (MDA-MB-468, MDA-MB-436, MDA-MB-231), human acute myelocytic leukemia (MV4−11, NB4), and human lung adenocarcinoma (A-549, NCI-H1975) cell lines (Table 2.2). Paclitaxel was used as reference drug. As shown by the 3-(4,5-dimethylthiazol-2-yl)-2,5-diphenyltetrazolium bromide (MTT) assay performed at 48 and 72 h, ATIs 2.30 and 2.41 induce a dose- and time-dependent growth inhibition of each treated breast cancer cell line with IC50 values in the nanomolar range at 72 h. As inhibitors of the human acute myelocytic leukemia and the human lung adenocarcinoma cancer cells bearing the KRAS mutation and resistance to EGFR inhibitors, 2.30 and 2.41 yielded IC50 values in the nanomolar range at 48 and 72 h, respectively.
IC50 ± SD (nM)
Cmpd MDA-MB-
468a
MDA-MB-
436a
MDA-MB-
231a MV4−11b NB4b A-549a
NCI-H19
75a
2.30 37 ± 0.5 62 ± 1 39 ± 1.2 2.5 ± 2.1 4 ± 1 28 ± 6 195 ± 158
2.41 33 ± 0.3 75 ± 1.1 47 ± 0.1 10.5 ± 0.7 10 ± 4 120 ± 10 305 ± 122
Paclitaxel 5 ± 1 8 ± 1.5 7 ± 2 ND 2.3 ± 0.3 7 ± 2 2.5 ± 5 Table 2.2. Growth inhibition of the MDA-MB-468, MDA-MB-436, MDA-MB-231, A-549, MV4-11, NB4, and NCI-H1975 cell lines by compounds 2.30 and 2.41 and paclitaxel as reference. aIncubation time was 72 h. bIncubation time was 48 h. ND = not determined.
Multi-Drug-Resistant (MDR) Cell Lines. ATIs 2.30 and 2.41 were assayed as growth inhibitors of the ovarian carcinoma cell line OVCAR-8 and its cognate P-glycoprotein (Pgp)-over-expressing line NCI/ADR-RES and of the human uterine sarcoma cell line Messa and its cognate MDR line Messa/Dx5, using colchicine, CSA4, vinorelbine, vinblastine, and paclitaxel as reference compounds (Table 2.3). Compounds 2.30 and 2.41 showed particularly potent inhibitory activity against these MDR cell lines, being comparable to CSA4 as inhibitors of the NCI/ADR-RES and Messa/Dx5 cell lines, respectively. Conversely, the references colchicine, vinorelbine, vinblastine and paclitaxel appear to be generally weak inhibitors of the MDR cell lines.
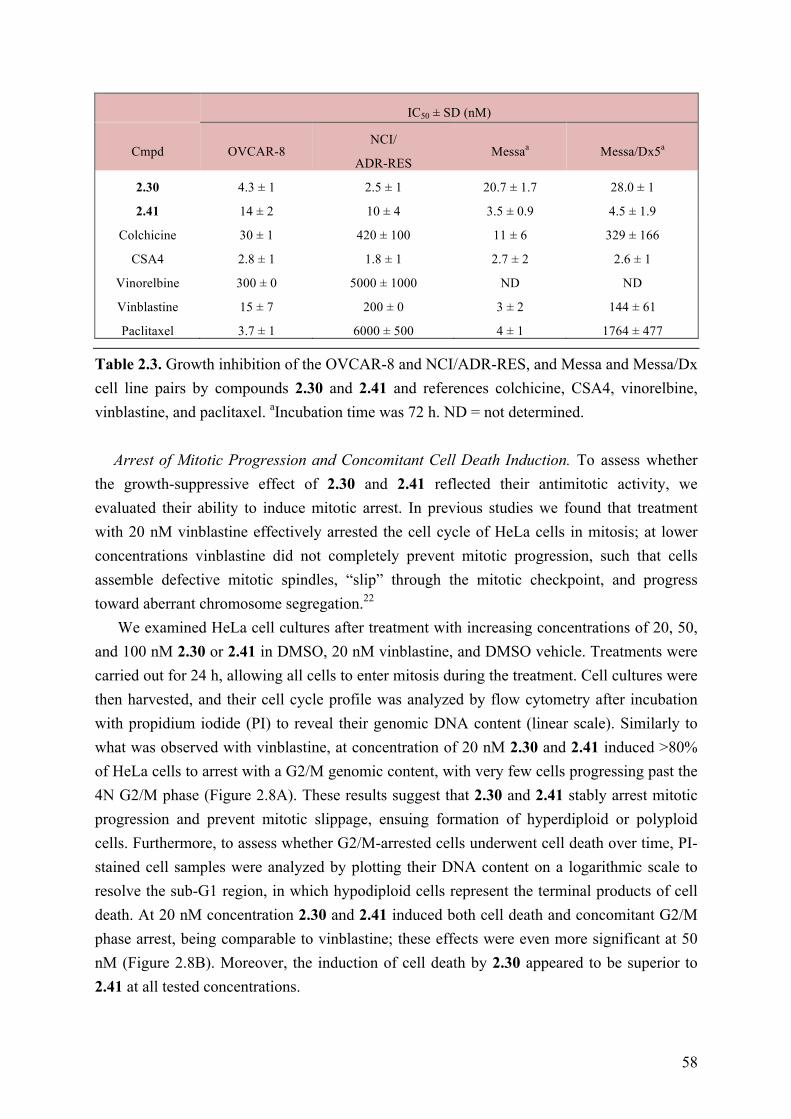
58
IC50 ± SD (nM)
Cmpd OVCAR-8 NCI/
ADR-RES Messaa Messa/Dx5a
2.30 4.3 ± 1 2.5 ± 1 20.7 ± 1.7 28.0 ± 1
2.41 14 ± 2 10 ± 4 3.5 ± 0.9 4.5 ± 1.9
Colchicine 30 ± 1 420 ± 100 11 ± 6 329 ± 166
CSA4 2.8 ± 1 1.8 ± 1 2.7 ± 2 2.6 ± 1
Vinorelbine 300 ± 0 5000 ± 1000 ND ND
Vinblastine 15 ± 7 200 ± 0 3 ± 2 144 ± 61
Paclitaxel 3.7 ± 1 6000 ± 500 4 ± 1 1764 ± 477 Table 2.3. Growth inhibition of the OVCAR-8 and NCI/ADR-RES, and Messa and Messa/Dx cell line pairs by compounds 2.30 and 2.41 and references colchicine, CSA4, vinorelbine, vinblastine, and paclitaxel. aIncubation time was 72 h. ND = not determined.
Arrest of Mitotic Progression and Concomitant Cell Death Induction. To assess whether the growth-suppressive effect of 2.30 and 2.41 reflected their antimitotic activity, we evaluated their ability to induce mitotic arrest. In previous studies we found that treatment with 20 nM vinblastine effectively arrested the cell cycle of HeLa cells in mitosis; at lower concentrations vinblastine did not completely prevent mitotic progression, such that cells assemble defective mitotic spindles, “slip” through the mitotic checkpoint, and progress toward aberrant chromosome segregation.22
We examined HeLa cell cultures after treatment with increasing concentrations of 20, 50, and 100 nM 2.30 or 2.41 in DMSO, 20 nM vinblastine, and DMSO vehicle. Treatments were carried out for 24 h, allowing all cells to enter mitosis during the treatment. Cell cultures were then harvested, and their cell cycle profile was analyzed by flow cytometry after incubation with propidium iodide (PI) to reveal their genomic DNA content (linear scale). Similarly to what was observed with vinblastine, at concentration of 20 nM 2.30 and 2.41 induced >80% of HeLa cells to arrest with a G2/M genomic content, with very few cells progressing past the 4N G2/M phase (Figure 2.8A). These results suggest that 2.30 and 2.41 stably arrest mitotic progression and prevent mitotic slippage, ensuing formation of hyperdiploid or polyploid cells. Furthermore, to assess whether G2/M-arrested cells underwent cell death over time, PI-stained cell samples were analyzed by plotting their DNA content on a logarithmic scale to resolve the sub-G1 region, in which hypodiploid cells represent the terminal products of cell death. At 20 nM concentration 2.30 and 2.41 induced both cell death and concomitant G2/M phase arrest, being comparable to vinblastine; these effects were even more significant at 50 nM (Figure 2.8B). Moreover, the induction of cell death by 2.30 appeared to be superior to 2.41 at all tested concentrations.
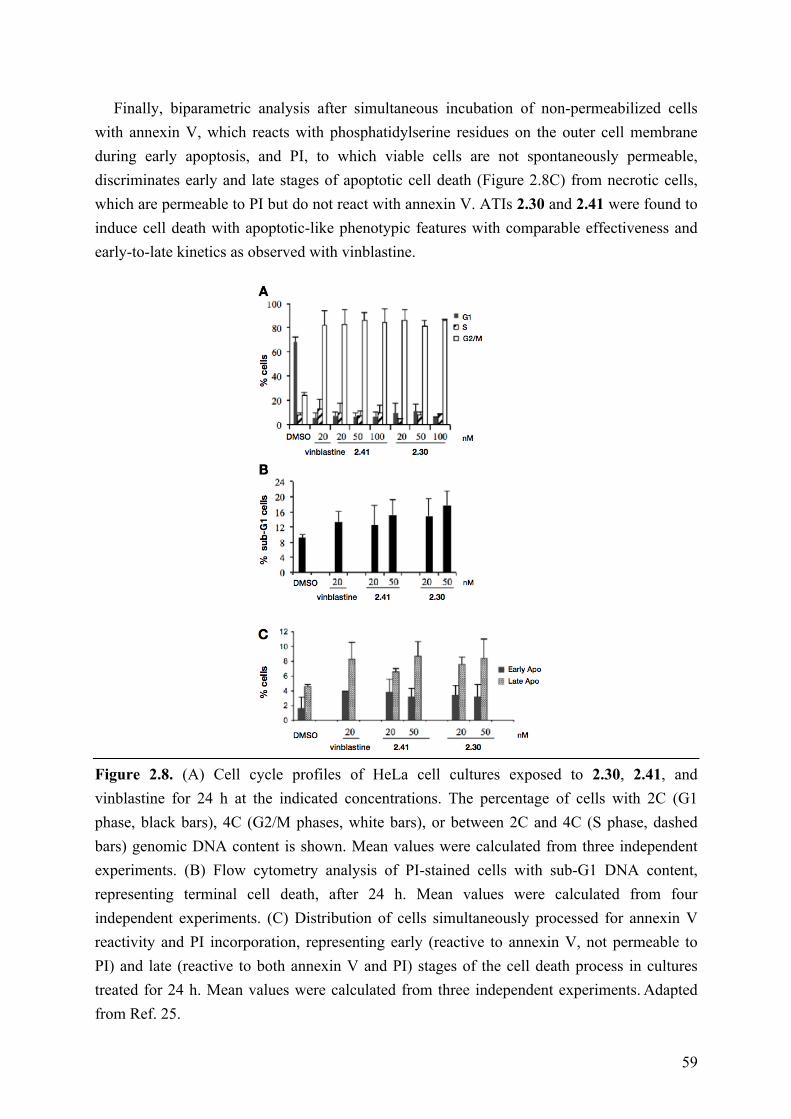
59
Finally, biparametric analysis after simultaneous incubation of non-permeabilized cells with annexin V, which reacts with phosphatidylserine residues on the outer cell membrane during early apoptosis, and PI, to which viable cells are not spontaneously permeable, discriminates early and late stages of apoptotic cell death (Figure 2.8C) from necrotic cells, which are permeable to PI but do not react with annexin V. ATIs 2.30 and 2.41 were found to induce cell death with apoptotic-like phenotypic features with comparable effectiveness and early-to-late kinetics as observed with vinblastine.
Figure 2.8. (A) Cell cycle profiles of HeLa cell cultures exposed to 2.30, 2.41, and vinblastine for 24 h at the indicated concentrations. The percentage of cells with 2C (G1 phase, black bars), 4C (G2/M phases, white bars), or between 2C and 4C (S phase, dashed bars) genomic DNA content is shown. Mean values were calculated from three independent experiments. (B) Flow cytometry analysis of PI-stained cells with sub-G1 DNA content, representing terminal cell death, after 24 h. Mean values were calculated from four independent experiments. (C) Distribution of cells simultaneously processed for annexin V reactivity and PI incorporation, representing early (reactive to annexin V, not permeable to PI) and late (reactive to both annexin V and PI) stages of the cell death process in cultures treated for 24 h. Mean values were calculated from three independent experiments. Adapted from Ref. 25.
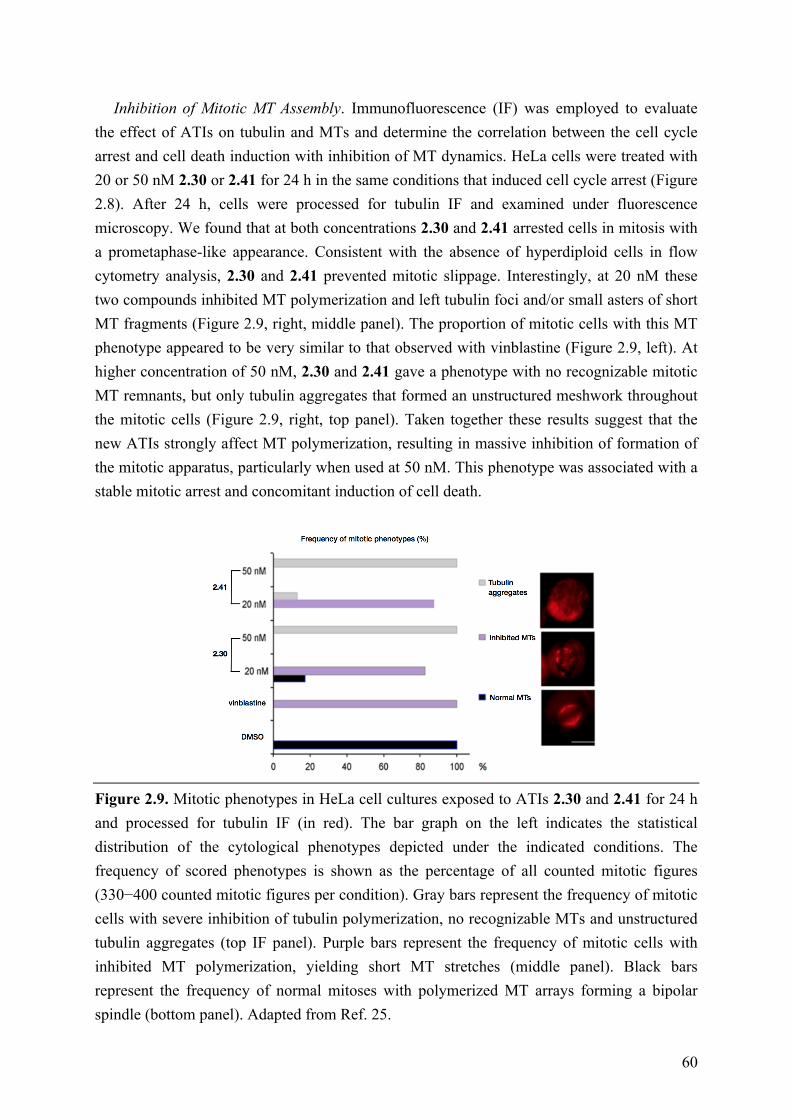
60
Inhibition of Mitotic MT Assembly. Immunofluorescence (IF) was employed to evaluate the effect of ATIs on tubulin and MTs and determine the correlation between the cell cycle arrest and cell death induction with inhibition of MT dynamics. HeLa cells were treated with 20 or 50 nM 2.30 or 2.41 for 24 h in the same conditions that induced cell cycle arrest (Figure 2.8). After 24 h, cells were processed for tubulin IF and examined under fluorescence microscopy. We found that at both concentrations 2.30 and 2.41 arrested cells in mitosis with a prometaphase-like appearance. Consistent with the absence of hyperdiploid cells in flow cytometry analysis, 2.30 and 2.41 prevented mitotic slippage. Interestingly, at 20 nM these two compounds inhibited MT polymerization and left tubulin foci and/or small asters of short MT fragments (Figure 2.9, right, middle panel). The proportion of mitotic cells with this MT phenotype appeared to be very similar to that observed with vinblastine (Figure 2.9, left). At higher concentration of 50 nM, 2.30 and 2.41 gave a phenotype with no recognizable mitotic MT remnants, but only tubulin aggregates that formed an unstructured meshwork throughout the mitotic cells (Figure 2.9, right, top panel). Taken together these results suggest that the new ATIs strongly affect MT polymerization, resulting in massive inhibition of formation of the mitotic apparatus, particularly when used at 50 nM. This phenotype was associated with a stable mitotic arrest and concomitant induction of cell death.
Figure 2.9. Mitotic phenotypes in HeLa cell cultures exposed to ATIs 2.30 and 2.41 for 24 h and processed for tubulin IF (in red). The bar graph on the left indicates the statistical distribution of the cytological phenotypes depicted under the indicated conditions. The frequency of scored phenotypes is shown as the percentage of all counted mitotic figures (330−400 counted mitotic figures per condition). Gray bars represent the frequency of mitotic cells with severe inhibition of tubulin polymerization, no recognizable MTs and unstructured tubulin aggregates (top IF panel). Purple bars represent the frequency of mitotic cells with inhibited MT polymerization, yielding short MT stretches (middle panel). Black bars represent the frequency of normal mitoses with polymerized MT arrays forming a bipolar spindle (bottom panel). Adapted from Ref. 25.

61
Inhibition of PC-3, RD, and HepG2 Cancer Cell Growth. ATIs 2.30 and 2.41 were evaluated as growth inhibitors of prostate cancer PC-3, rhabdomyosarcoma RD, and human liver hepatocellular carcinoma HepG2 cell lines. After 48 h incubation in the presence of test compounds, 2.30 and 2.41 strongly inhibited the growth of these cell lines showing IC50 values in the nanomolar range, being superior to the references vinblastine and paclitaxel. Furthermore, compound 2.30 showed to be particularly more potent than 2.41.
IC50 ± SD (nM)
Cmpd PC3 RD HepG2
2.30 0.3 ± 0.06 0.2 ± 0.04 0.1 ± 0.02
2.41 19 ± 1 16 ± 1.3 62 ± 2
Vinblastine 766 ± 1000 53 ± 2.5 81 ± 2.4
Paclitaxel 4900 ± 1.3 >10000 2600 ± 1.5 Table 2.4. Growth inhibition of PC-3, RD, and HepG2 cell lines by compounds 2.30 and 2.41 and references vinblastine and paclitaxel. Incubation time was 48 h.
To evaluate the ability of the new ATIs to induce mitotic arrest of this type of cells, PC-3, RD, and HEPG2 cell cultures were treated with 500, 1000, and 2000 nM 2.30, 2.41, and paclitaxel. After a 48 h exposure, cells and vehicle controls (0.1% DMSO) were incubated with PI to analyze their DNA content in flow cytometry assays. Interestingly, both ATIs arrested cell cycle progression in all cell lines at low concentrations. Similarly to what was observed with paclitaxel, 2.30 and 2.41 induced an accumulation in the G2/M phase in PC-3 and RD cells, whereas in HepG2 cells the effect of these compounds on cell cyle progression appeared to be even stronger than the drug refence (Figure 2.10).
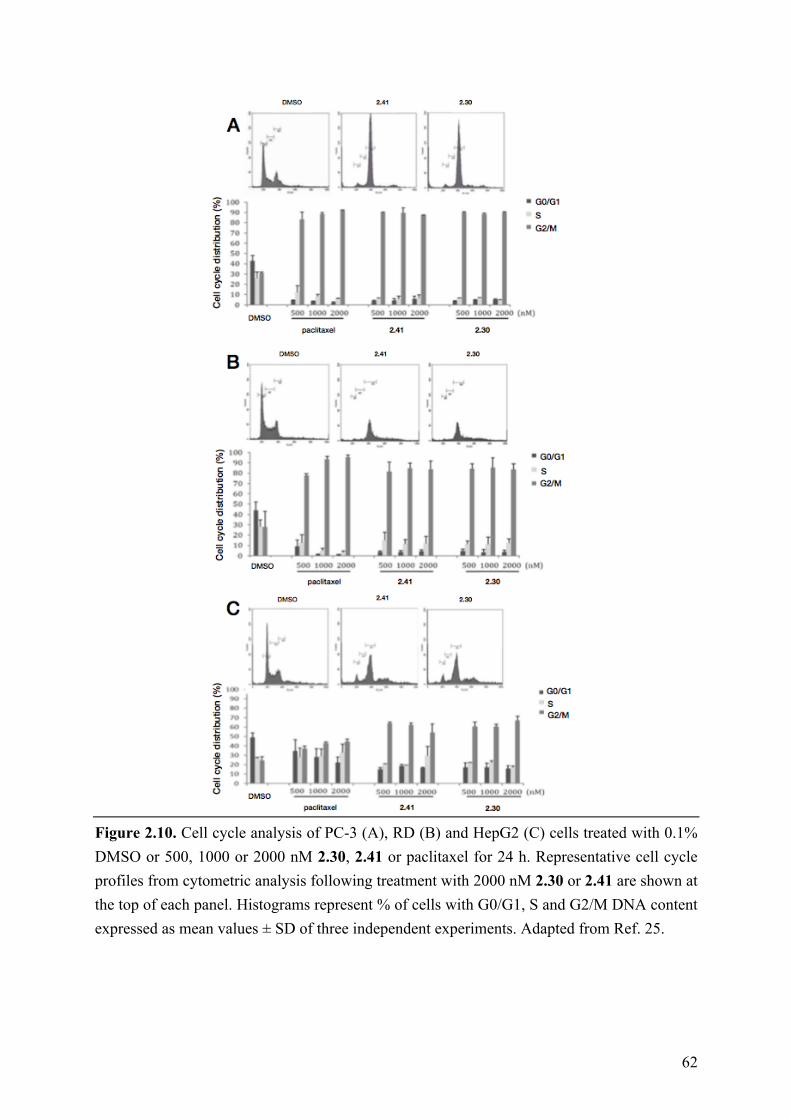
62
Figure 2.10. Cell cycle analysis of PC-3 (A), RD (B) and HepG2 (C) cells treated with 0.1% DMSO or 500, 1000 or 2000 nM 2.30, 2.41 or paclitaxel for 24 h. Representative cell cycle profiles from cytometric analysis following treatment with 2000 nM 2.30 or 2.41 are shown at the top of each panel. Histograms represent % of cells with G0/G1, S and G2/M DNA content expressed as mean values ± SD of three independent experiments. Adapted from Ref. 25.
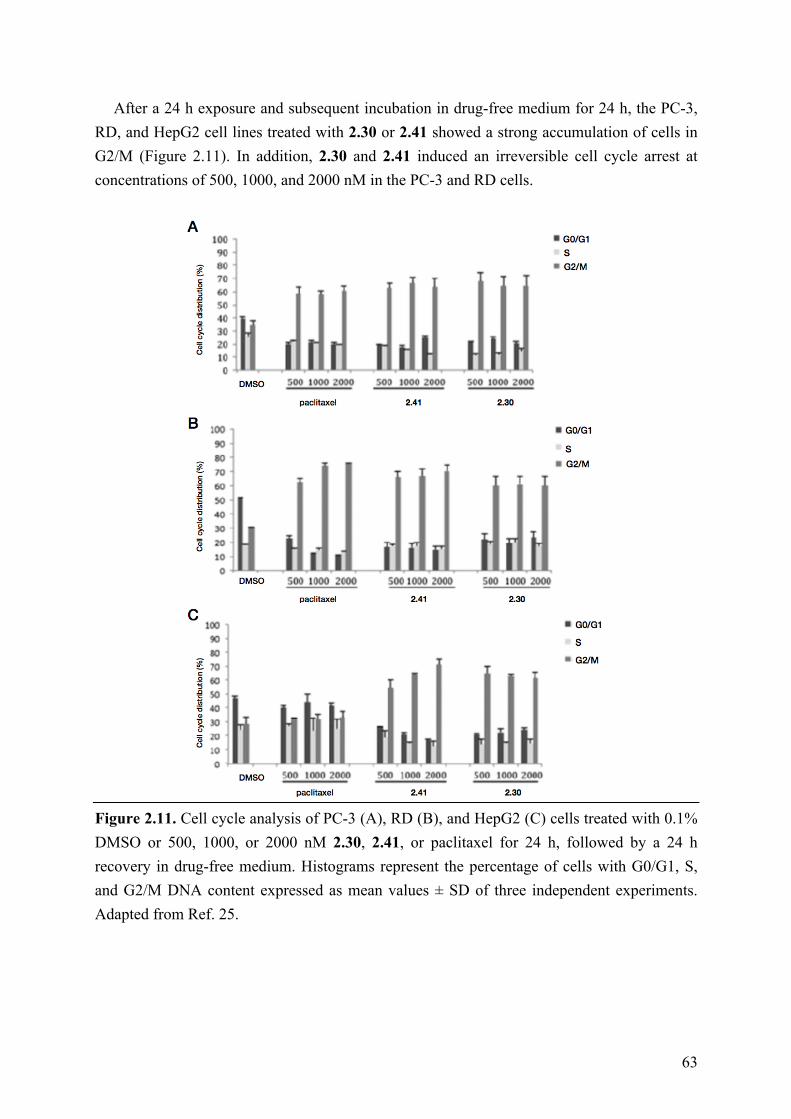
63
After a 24 h exposure and subsequent incubation in drug-free medium for 24 h, the PC-3, RD, and HepG2 cell lines treated with 2.30 or 2.41 showed a strong accumulation of cells in G2/M (Figure 2.11). In addition, 2.30 and 2.41 induced an irreversible cell cycle arrest at concentrations of 500, 1000, and 2000 nM in the PC-3 and RD cells.
Figure 2.11. Cell cycle analysis of PC-3 (A), RD (B), and HepG2 (C) cells treated with 0.1% DMSO or 500, 1000, or 2000 nM 2.30, 2.41, or paclitaxel for 24 h, followed by a 24 h recovery in drug-free medium. Histograms represent the percentage of cells with G0/G1, S, and G2/M DNA content expressed as mean values ± SD of three independent experiments. Adapted from Ref. 25.
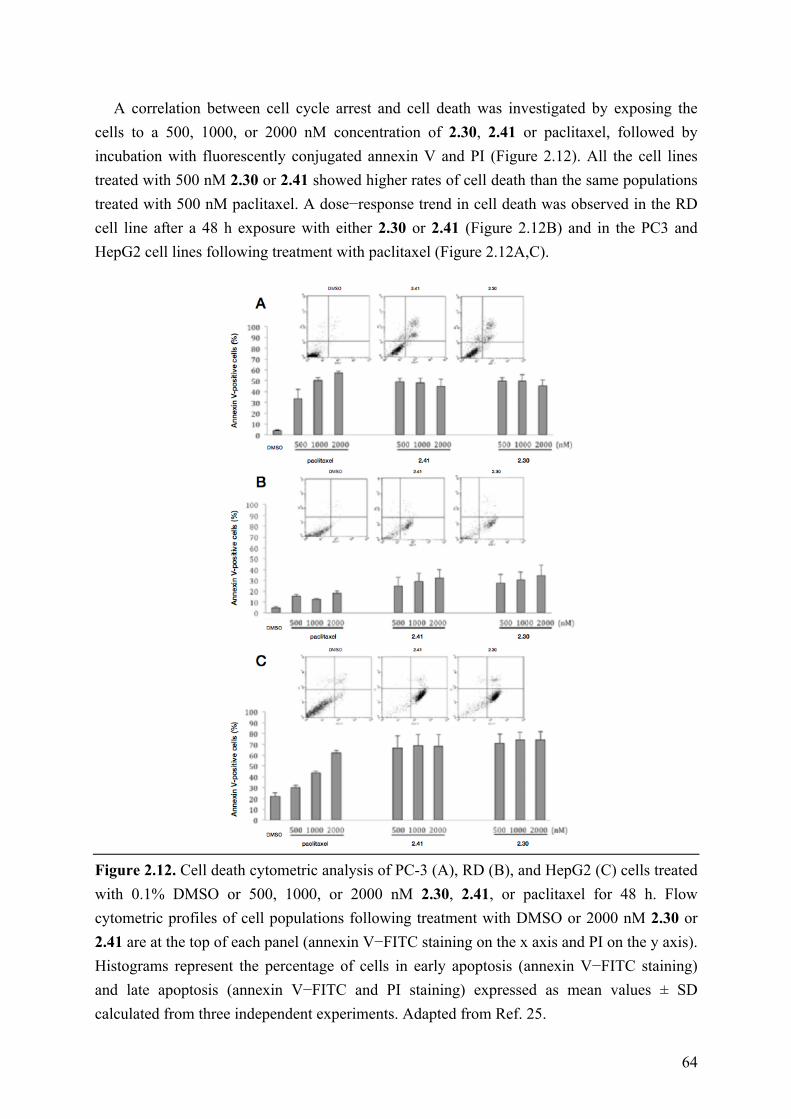
64
A correlation between cell cycle arrest and cell death was investigated by exposing the cells to a 500, 1000, or 2000 nM concentration of 2.30, 2.41 or paclitaxel, followed by incubation with fluorescently conjugated annexin V and PI (Figure 2.12). All the cell lines treated with 500 nM 2.30 or 2.41 showed higher rates of cell death than the same populations treated with 500 nM paclitaxel. A dose−response trend in cell death was observed in the RD cell line after a 48 h exposure with either 2.30 or 2.41 (Figure 2.12B) and in the PC3 and HepG2 cell lines following treatment with paclitaxel (Figure 2.12A,C).
Figure 2.12. Cell death cytometric analysis of PC-3 (A), RD (B), and HepG2 (C) cells treated with 0.1% DMSO or 500, 1000, or 2000 nM 2.30, 2.41, or paclitaxel for 48 h. Flow cytometric profiles of cell populations following treatment with DMSO or 2000 nM 2.30 or 2.41 are at the top of each panel (annexin V−FITC staining on the x axis and PI on the y axis). Histograms represent the percentage of cells in early apoptosis (annexin V−FITC staining) and late apoptosis (annexin V−FITC and PI staining) expressed as mean values ± SD calculated from three independent experiments. Adapted from Ref. 25.
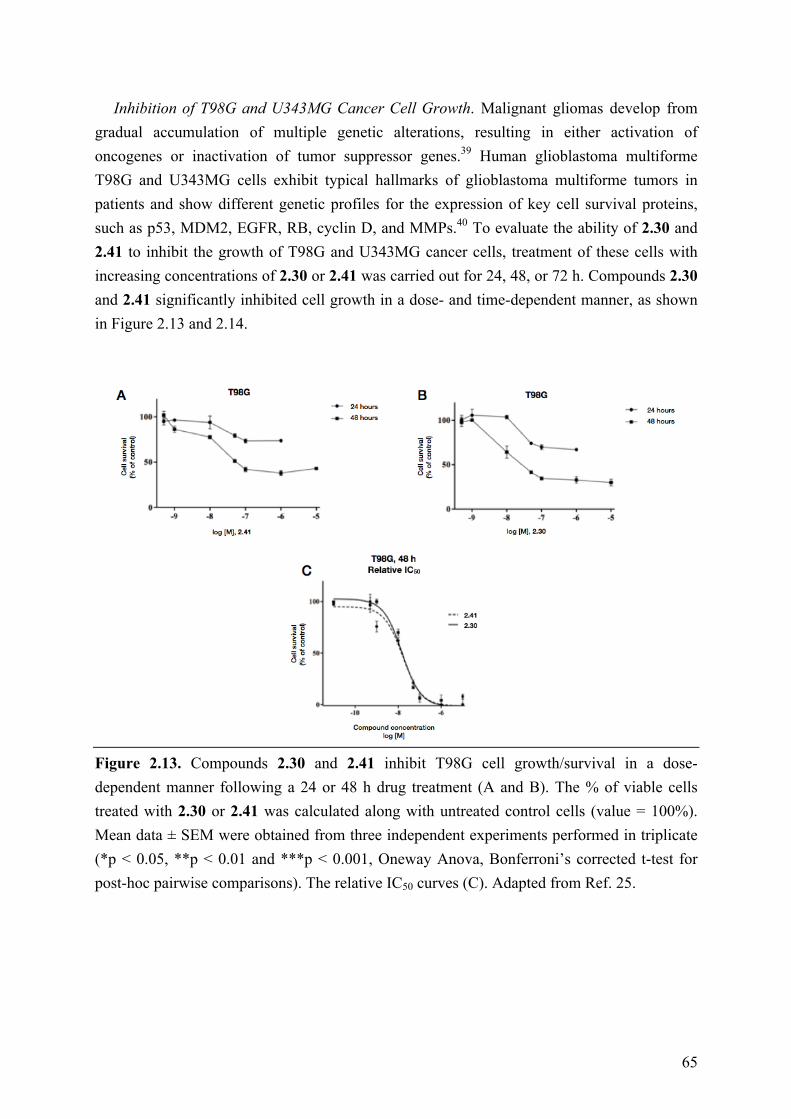
65
Inhibition of T98G and U343MG Cancer Cell Growth. Malignant gliomas develop from gradual accumulation of multiple genetic alterations, resulting in either activation of oncogenes or inactivation of tumor suppressor genes.39 Human glioblastoma multiforme T98G and U343MG cells exhibit typical hallmarks of glioblastoma multiforme tumors in patients and show different genetic profiles for the expression of key cell survival proteins, such as p53, MDM2, EGFR, RB, cyclin D, and MMPs.40 To evaluate the ability of 2.30 and 2.41 to inhibit the growth of T98G and U343MG cancer cells, treatment of these cells with increasing concentrations of 2.30 or 2.41 was carried out for 24, 48, or 72 h. Compounds 2.30 and 2.41 significantly inhibited cell growth in a dose- and time-dependent manner, as shown in Figure 2.13 and 2.14.
Figure 2.13. Compounds 2.30 and 2.41 inhibit T98G cell growth/survival in a dose-dependent manner following a 24 or 48 h drug treatment (A and B). The % of viable cells treated with 2.30 or 2.41 was calculated along with untreated control cells (value = 100%). Mean data ± SEM were obtained from three independent experiments performed in triplicate (*p < 0.05, **p < 0.01 and ***p < 0.001, Oneway Anova, Bonferroni’s corrected t-test for post-hoc pairwise comparisons). The relative IC50 curves (C). Adapted from Ref. 25.
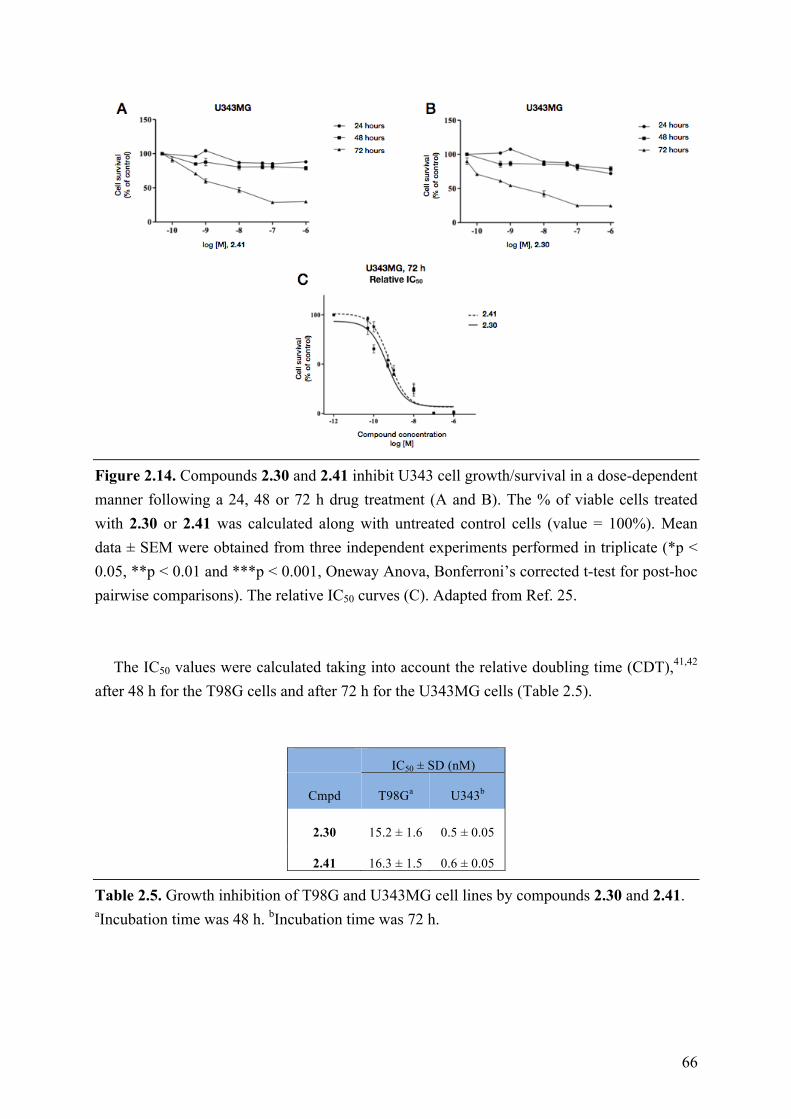
66
Figure 2.14. Compounds 2.30 and 2.41 inhibit U343 cell growth/survival in a dose-dependent manner following a 24, 48 or 72 h drug treatment (A and B). The % of viable cells treated with 2.30 or 2.41 was calculated along with untreated control cells (value = 100%). Mean data ± SEM were obtained from three independent experiments performed in triplicate (*p < 0.05, **p < 0.01 and ***p < 0.001, Oneway Anova, Bonferroni’s corrected t-test for post-hoc pairwise comparisons). The relative IC50 curves (C). Adapted from Ref. 25.
The IC50 values were calculated taking into account the relative doubling time (CDT),41,42 after 48 h for the T98G cells and after 72 h for the U343MG cells (Table 2.5).
IC50 ± SD (nM)
Cmpd T98Ga U343b
2.30 15.2 ± 1.6 0.5 ± 0.05
2.41 16.3 ± 1.5 0.6 ± 0.05 Table 2.5. Growth inhibition of T98G and U343MG cell lines by compounds 2.30 and 2.41. aIncubation time was 48 h. bIncubation time was 72 h.
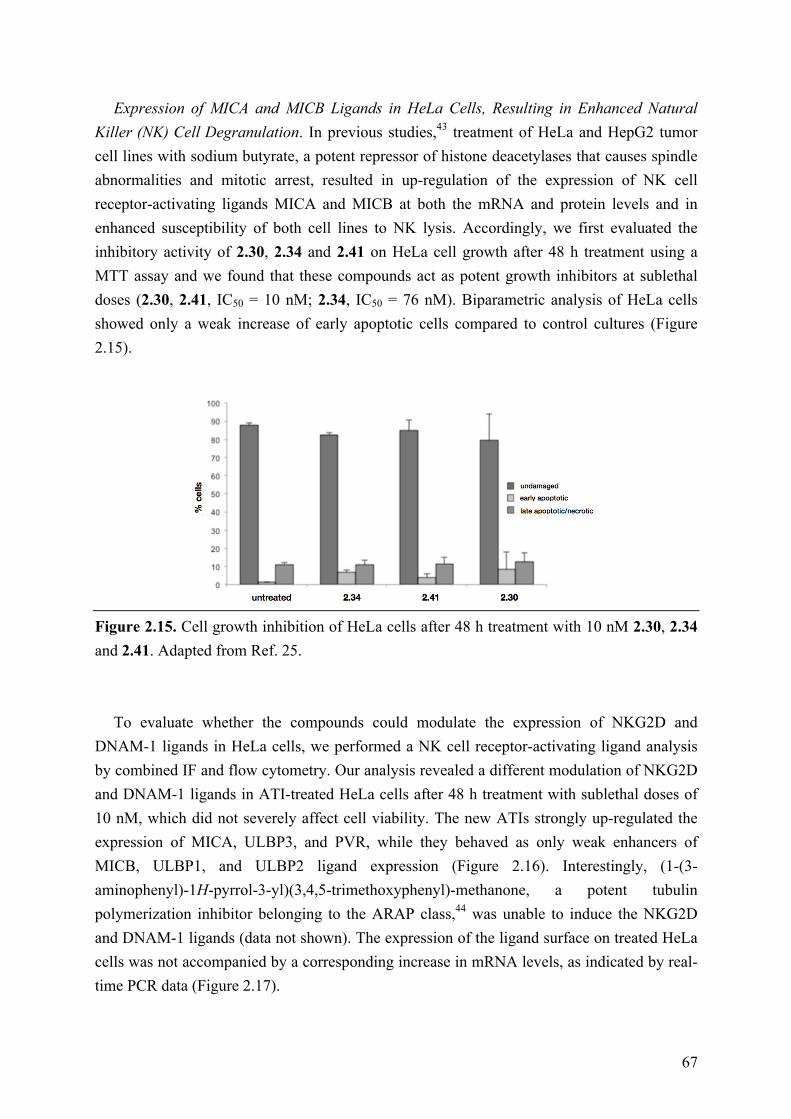
67
Expression of MICA and MICB Ligands in HeLa Cells, Resulting in Enhanced Natural Killer (NK) Cell Degranulation. In previous studies,43 treatment of HeLa and HepG2 tumor cell lines with sodium butyrate, a potent repressor of histone deacetylases that causes spindle abnormalities and mitotic arrest, resulted in up-regulation of the expression of NK cell receptor-activating ligands MICA and MICB at both the mRNA and protein levels and in enhanced susceptibility of both cell lines to NK lysis. Accordingly, we first evaluated the inhibitory activity of 2.30, 2.34 and 2.41 on HeLa cell growth after 48 h treatment using a MTT assay and we found that these compounds act as potent growth inhibitors at sublethal doses (2.30, 2.41, IC50 = 10 nM; 2.34, IC50 = 76 nM). Biparametric analysis of HeLa cells showed only a weak increase of early apoptotic cells compared to control cultures (Figure 2.15).
Figure 2.15. Cell growth inhibition of HeLa cells after 48 h treatment with 10 nM 2.30, 2.34 and 2.41. Adapted from Ref. 25.
To evaluate whether the compounds could modulate the expression of NKG2D and
DNAM-1 ligands in HeLa cells, we performed a NK cell receptor-activating ligand analysis by combined IF and flow cytometry. Our analysis revealed a different modulation of NKG2D and DNAM-1 ligands in ATI-treated HeLa cells after 48 h treatment with sublethal doses of 10 nM, which did not severely affect cell viability. The new ATIs strongly up-regulated the expression of MICA, ULBP3, and PVR, while they behaved as only weak enhancers of MICB, ULBP1, and ULBP2 ligand expression (Figure 2.16). Interestingly, (1-(3-aminophenyl)-1H-pyrrol-3-yl)(3,4,5-trimethoxyphenyl)-methanone, a potent tubulin polymerization inhibitor belonging to the ARAP class,44 was unable to induce the NKG2D and DNAM-1 ligands (data not shown). The expression of the ligand surface on treated HeLa cells was not accompanied by a corresponding increase in mRNA levels, as indicated by real-time PCR data (Figure 2.17).

68
Figure 2.16. ATIs 2.30, 2.34 and 2.41 up-regulate DNAM-1 and NKG2D ligands in HeLa cells. NKG2D and DNAM-1 ligand surface expression was analyzed by flow cytometry after a 48 h treatment with the indicated ATI compound. Data are representative of one out of three independent experiments. Adapted from Ref. 25.
Figure 2.17.mRNA abundance by real-time PCR after a 24 h treatment with the indicated ATI at 10 nM. Adapted from Ref. 25.
These findings prompted us to evaluate whether ATIs 2.30 and 2.41 would increase NK cell degranulation toward HeLa cells. The expression of the lysosomal marker CD107a, which correlates with NK cell cytotoxicity,45 was evaluated by IF and flow cytometry analysis by gating on NK cells upon their interaction with treated or untreated HeLa cells, used as targets. The expression of CD107a on NK cells contacting treated HeLa target cells indicated that those cells were more susceptible to NK cell lysis (Figure 2.18).
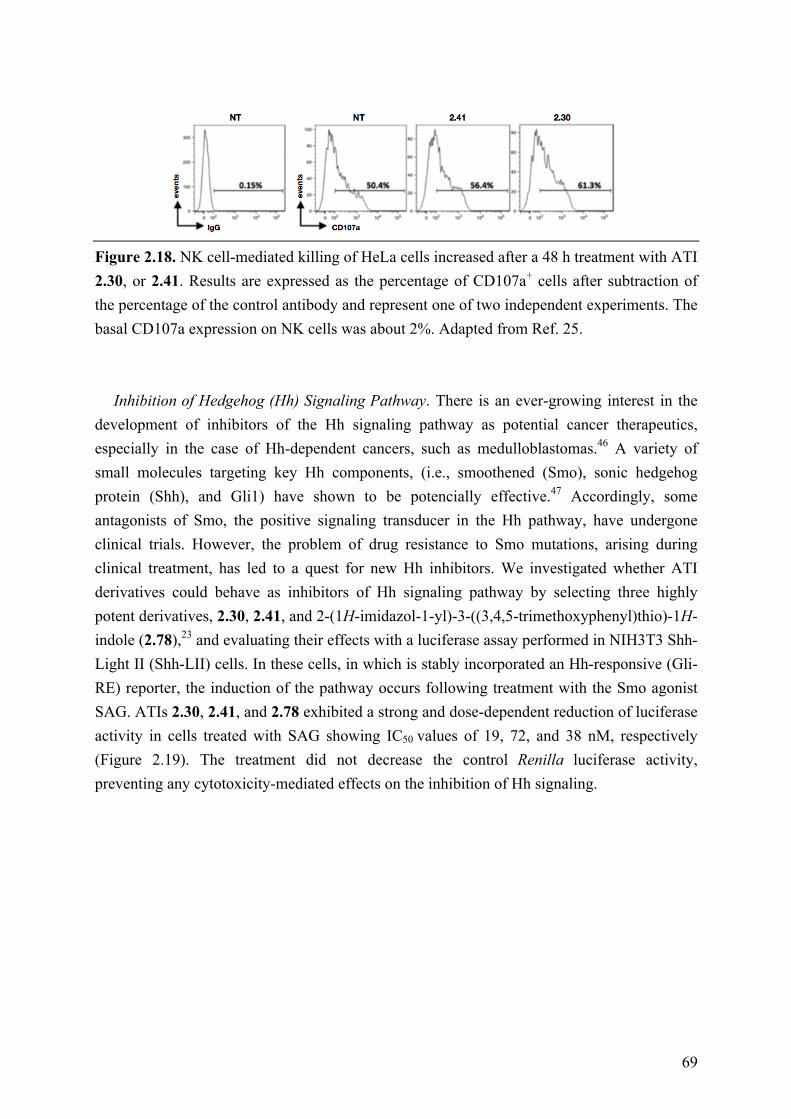
69
Figure 2.18. NK cell-mediated killing of HeLa cells increased after a 48 h treatment with ATI 2.30, or 2.41. Results are expressed as the percentage of CD107a+ cells after subtraction of the percentage of the control antibody and represent one of two independent experiments. The basal CD107a expression on NK cells was about 2%. Adapted from Ref. 25.
Inhibition of Hedgehog (Hh) Signaling Pathway. There is an ever-growing interest in the
development of inhibitors of the Hh signaling pathway as potential cancer therapeutics, especially in the case of Hh-dependent cancers, such as medulloblastomas.46 A variety of small molecules targeting key Hh components, (i.e., smoothened (Smo), sonic hedgehog protein (Shh), and Gli1) have shown to be potencially effective.47 Accordingly, some antagonists of Smo, the positive signaling transducer in the Hh pathway, have undergone clinical trials. However, the problem of drug resistance to Smo mutations, arising during clinical treatment, has led to a quest for new Hh inhibitors. We investigated whether ATI derivatives could behave as inhibitors of Hh signaling pathway by selecting three highly potent derivatives, 2.30, 2.41, and 2-(1H-imidazol-1-yl)-3-((3,4,5-trimethoxyphenyl)thio)-1H-indole (2.78),23 and evaluating their effects with a luciferase assay performed in NIH3T3 Shh-Light II (Shh-LII) cells. In these cells, in which is stably incorporated an Hh-responsive (Gli-RE) reporter, the induction of the pathway occurs following treatment with the Smo agonist SAG. ATIs 2.30, 2.41, and 2.78 exhibited a strong and dose-dependent reduction of luciferase activity in cells treated with SAG showing IC50 values of 19, 72, and 38 nM, respectively (Figure 2.19). The treatment did not decrease the control Renilla luciferase activity, preventing any cytotoxicity-mediated effects on the inhibition of Hh signaling.
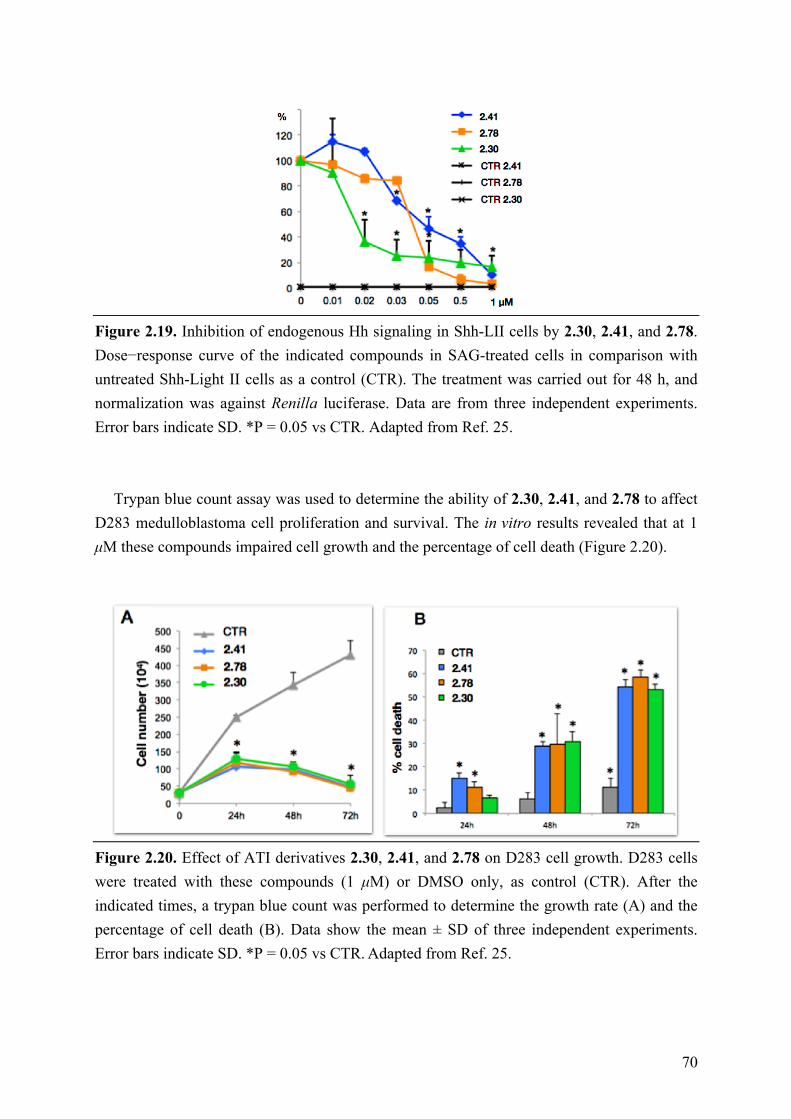
70
Figure 2.19. Inhibition of endogenous Hh signaling in Shh-LII cells by 2.30, 2.41, and 2.78. Dose−response curve of the indicated compounds in SAG-treated cells in comparison with untreated Shh-Light II cells as a control (CTR). The treatment was carried out for 48 h, and normalization was against Renilla luciferase. Data are from three independent experiments. Error bars indicate SD. *P = 0.05 vs CTR. Adapted from Ref. 25.
Trypan blue count assay was used to determine the ability of 2.30, 2.41, and 2.78 to affect D283 medulloblastoma cell proliferation and survival. The in vitro results revealed that at 1 µM these compounds impaired cell growth and the percentage of cell death (Figure 2.20).
Figure 2.20. Effect of ATI derivatives 2.30, 2.41, and 2.78 on D283 cell growth. D283 cells were treated with these compounds (1 µM) or DMSO only, as control (CTR). After the indicated times, a trypan blue count was performed to determine the growth rate (A) and the percentage of cell death (B). Data show the mean ± SD of three independent experiments. Error bars indicate SD. *P = 0.05 vs CTR. Adapted from Ref. 25.

71
Metabolic Stability and Aqueous Solubility. Compounds 2.30 and 2.41 were examined in a microsomal stability assay, using both human and mouse liver microsomes, to estimate compound stability to phase I oxidative metabolism. 7-Ethoxy-coumarin and propranolol were used as controls (Table 2.6). Compound 2.41 showed metabolic stability of 25.6 and <3 µL/min/mg of protein in mouse and human liver microsomes, respectively. Compound 2.30 showed medium metabolic stability with human liver microsomes and low to medium metabolic stability with mouse liver microsomes (Table 2.6). Solubility of compounds 2.30 and 2.41 was about 1 µM and 3.2 µM respectively, when measured in aqueous pH 7.4 buffer using a high-throughput screening solubility assay. In general, 2.41 showed higher metabolic stability in human and mouse liver microsomes and greater water solubility than 2.30 (Table 2.6).
Clearancea,b
(µL/min/mg of protein)
Compd Human liver microsomes Mouse liver
microsomes
Solubilityc at
pH 7.4 (µM)
2.30 15.2 ± 8.0 43.1 ± 7.9 0.99 ± 0.13
2.41 <3 25.6 ± 1.7 3.18 ± 0.50
7-ethoxy cumarin 209 ± 10.2 710.8 ± 1.2 −
propanolol 19.1 ± 2.2 235.1 ± 24.1 − Table 2.6. Metabolic stability with human and mouse liver microsomes and aqueous solubility of compounds 2.30 and 2.41. Metabolic stability: <3, good; 3−60, medium; >60, low. aResults are expressed as the mean ± SD, n = 2. bThe standard compounds 7-ethoxycoumarin and propranolol showed metabolic stability in agreement with the literature and internal validation data REF. cHigh-throughput screening solubility assay.
2.6 Conclusions
Our synthetic effort led to the preparation and SAR description of 39 new 2-phenylindole derivatives bearing a 3,4,5-trimethoxyphenyl moiety with a sulfur, ketone, or methylene bridging group at position 3 of the indole and a methoxy or halogen substituent at positions 4−7 (SAR summary depicted in Figure 2.21). As inhibitors of tubulin polymerization, 23 compounds showed IC50 values in the 1.0−2.0 µM range. They inhibited colchicine binding with a value >70% and the growth of MCF-7 human breast cancer cells with IC50 in the nanomolar range. Two representative examples, 2.30 and 2.41, uniformly inhibited a panel of cancer cells at nanomolar concentration, being comparable or superior to the drug references. Compounds 2.30 and 2.41 strongly inhibited the growth of the MDR cell lines NCI/ADR-RES and Messa/Dx5.
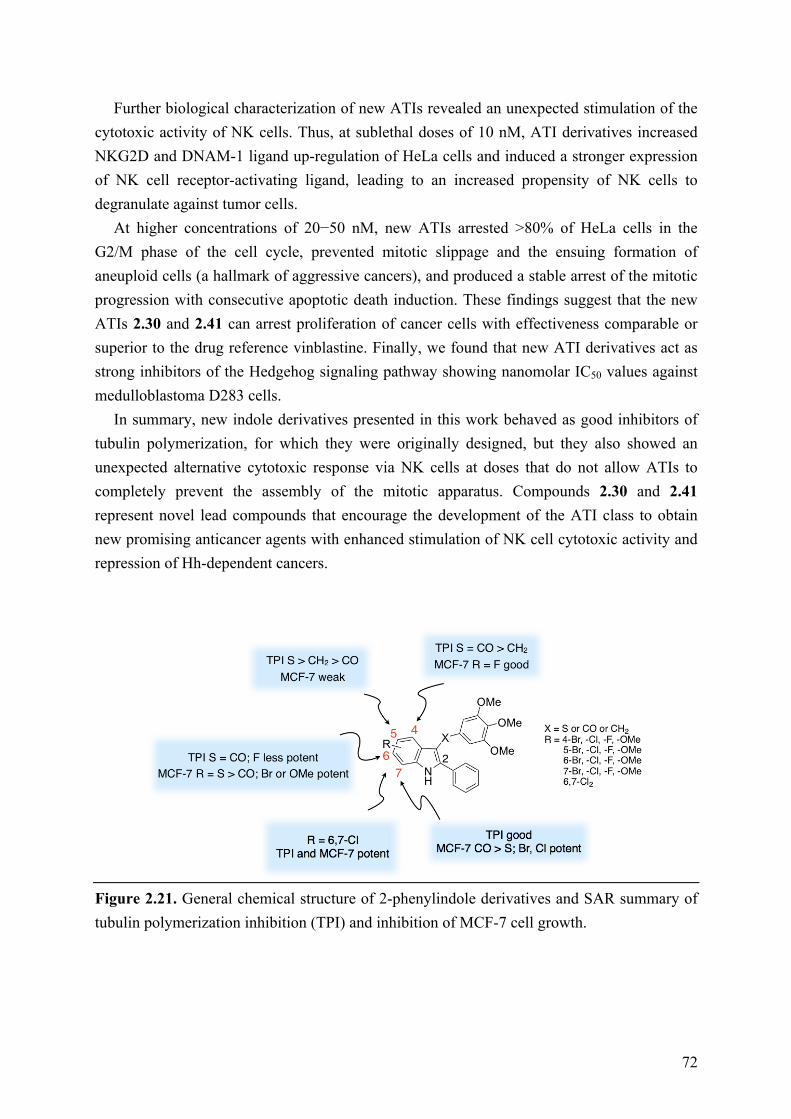
72
Further biological characterization of new ATIs revealed an unexpected stimulation of the cytotoxic activity of NK cells. Thus, at sublethal doses of 10 nM, ATI derivatives increased NKG2D and DNAM-1 ligand up-regulation of HeLa cells and induced a stronger expression of NK cell receptor-activating ligand, leading to an increased propensity of NK cells to degranulate against tumor cells.
At higher concentrations of 20−50 nM, new ATIs arrested >80% of HeLa cells in the G2/M phase of the cell cycle, prevented mitotic slippage and the ensuing formation of aneuploid cells (a hallmark of aggressive cancers), and produced a stable arrest of the mitotic progression with consecutive apoptotic death induction. These findings suggest that the new ATIs 2.30 and 2.41 can arrest proliferation of cancer cells with effectiveness comparable or superior to the drug reference vinblastine. Finally, we found that new ATI derivatives act as strong inhibitors of the Hedgehog signaling pathway showing nanomolar IC50 values against medulloblastoma D283 cells.
In summary, new indole derivatives presented in this work behaved as good inhibitors of tubulin polymerization, for which they were originally designed, but they also showed an unexpected alternative cytotoxic response via NK cells at doses that do not allow ATIs to completely prevent the assembly of the mitotic apparatus. Compounds 2.30 and 2.41 represent novel lead compounds that encourage the development of the ATI class to obtain new promising anticancer agents with enhanced stimulation of NK cell cytotoxic activity and repression of Hh-dependent cancers.
Figure 2.21. General chemical structure of 2-phenylindole derivatives and SAR summary of tubulin polymerization inhibition (TPI) and inhibition of MCF-7 cell growth.
73
2.7 Experimental Section
2.7.1 Chemistry
Microwave-assisted reactions were performed on a CEM Discover SP single-mode reactor. The instrument settings were controlled with PC-running CEM Synergy 1.49 software. Closed vessel experiments were carried out in capped microwave-dedicated vials (10 mL) with a cylindrical stirring bar (length 8 mm, diameter 3 mm). Open vessel experiments were carried out in 100 mL round-bottom flasks equipped with a Dimroth reflux condenser and a cylindrical stirring bar (length 20 mm, diameter 6 mm). Stirring, temperature, irradiation power, maximum pressure (Pmax), PowerMAX (simultaneous cooling-while-heating), ActiVent (simultaneous venting-while-heating), and ramp and hold times were set as indicated. The temperature of the reaction was monitored by an external fiber optic temperature sensor. After completion of the reaction, the mixture was cooled to 25 °C via air-jet cooling. Melting points (m.p.) were determined on a Stuart Scientific SMP1 apparatus and are uncorrected. IR spectra were run on a PerkinElmer SpectrumOne FT-ATR spectrophotometer. Band position and absorption ranges are given in inverse centimeters. Proton (1H) NMR spectra were acquired on a Bruker 400 MHz FT spectrometer in the indicated solvent by TopSpin 2.1 software and the files processed by MestreLab Research S.L. MestreReNova 6.2.1−769 software. Flash chromatography was carried out on an Interchim Spot II Flash system, using Merck SuperVarioFlash D26 cartridges packed with Merck Geduran 60 (0.040−0.063 mm) silica gel. Column chromatography was performed on columns packed with alumina from Merck (70−230 mesh) or silica gel from Macherey-Nagel (70−230 mesh). Aluminum oxide thin layer chromatography (TLC) cards from Fluka (aluminum oxide-precoated aluminum cards with fluorescent indicator visualizable at 254 nm) and silica gel TLC cards from Macherey-Nagel (silica gel-precoated aluminum cards with fluorescent indicator visualizable at 254 nm) were used for TLC. Developed plates were visualized by a Spectroline ENF 260C/FE UV apparatus. Evaporation of solvents was carried out on a Büchi Rotavapor R-210 equipped with a Büchi V-850 vacuum controller and a Büchi V-700 or V-710 vacuum pump. All commercially available reagents were used without further purification. Elemental analyses of the compounds were found within ± 0.4% of the theoretical values. The purity of the tested compounds was determined by high-performance liquid chromatography (HPLC) and was >95%. The HPLC system (Dionex UltiMate 3000, Thermo Fisher Scientific Inc.) was equipped with an SR-3000 solvent rack, an LPG-3400SD quaternary analytical pump, a TCC-3000SD column compartment, a DAD-3000 diode array detectorn and an analytical manual injection valve with a 20 µL loop. Compounds were dissolved in acetonitrile (10 mg/mL). HPLC analysis was performed by using an Acclaim 120 C18 reversed-phase column (5 µm, 4.6 × 250 mm, Thermo Fisher Scientific Inc.) at a temperature of 30 ± 1 °C, an isocratic gradient (acetonitrile/water 90:10), a flow rate of 1.0

74
mL/min, and detector signals 254 and 365 nm. Chromatographic data were acquired and processed by Chromeleon 6.80 software (Thermo Fisher Scientific Inc.).
General Procedure A for the Synthesis of 2.3, 2.5, 2.8, 2.10, 2.12, 2.15, 2.18, 2.20, 2.23, 2.25, 2.28, 2.30, 2.32, 2.34, 2.37, 2.39, and 2.41. A mixture of the appropriate substituted 2-phenyl-1H-indole (1 equiv), bis(3,4,5-trimethoxyphenyl) disulfide (1.1 equiv), and sodium hydride (2.2 equiv; 60% in mineral oil) in anhydrous DMF (0.3 M) was placed into the microwave cavity (closed vessel mode, Pmax = 250 psi). Starting microwave irradiation of 120 W was used, the temperature being ramped from 25 to 130 °C, with rapid stirring and venting (pressure set point 100 psi, times at set point 100, delta pressure 20 psi). Once 130 °C was reached, taking about 1 min, the reaction mixture was held at this temperature for 2 min. The mixture was diluted with water and extracted with EtOAc. The organic layer was washed with brine, dried over Na2SO4, filtered and concentrated in vacuo. The resulting material was putified by silica gel column chromatography to obtain the desired thio-indole derivative.
General Procedure B for the Synthesis of 2.4, 2.6, 2.9, 2.11, 2.13, 2.16, 2.19, 2.21, 2.24, 2.26, 2.29, 2.31, 2.33, 2.35, 2.38, 2.40, and 2.42. A mixture of the appropriate substituted 2-phenyl-1H-indole (1 equiv), 3,4,5-trimethoxybenzoyl chloride (1 equiv), and anhydrous aluminum chloride (1 equiv) in anhydrous DCE (0.5 M) was placed into the microwave cavity (closed vessel mode, Pmax = 250 psi). A starting microwave irradiation of 150 W was used, the temperature being ramped from 25 to 110 °C, with stirring. Once 110 °C was reached, taking about 1 min, the reaction mixture was held at this temperature for 2 min. The reaction mixture was quenched on 1 M HCl/crushed ice and extracted with chloroform. The organic layer was washed with brine, dried over Na2SO4, filtered, and concentrated in vacuo. Removal of the solvent gave a residue that was purified by silica gel column chromatography to obtain the desired methanone derivative.
General Procedure C for the Preparation of 2.7, 2.17, 2.22, 2.27, 2.36. A borane−tetrahydrofuran complex (0.24 M, 1.0 M in THF) was slowly added to a cold solution of the appropriate methanone (1 equiv) in anhydrous acetonitrile (0.17 M) containing anhydrous MeOH (12 M) under an Ar stream. The reaction was stirred for 1 h at 50 °C. After cooling, the mixture was carefully diluted with water and extracted with EtOAc. The organic layer was washed with brine, dried over Na2SO4, filtered and concentrated in vacuo. The resulting material was purified by silica gel column chromatography to obtain the corresponding methylene derivative.
General Procedure D for the Synthesis of 2.43, 2.51, 2.53. A mixture of the appropriate ketone derivative (1 equiv), tin(II) chloride dihydrate (1.5 equiv), and 1 N HCl (0.43 M) in glacial acetic acid (0.08 M) was heated at reflux temperature for 12 h. After cooling, the reaction mixture was diluted with a saturated aqueous solution of potassium carbonate and extracted with EtOAc. The organic layer was washed with brine, dried over Na2SO4, and
75
filtered. Removal of the solvent gave a residue that was purified by silica gel column chromatography to furnish the corresponding 2-phenylindole derivative.
General Procedure E for the Synthesis of 2.44−2.46, 2.52, 2.54, and 2.58. A solution of the appropriate N-(2-tolyl)benzamide (1 equiv) in anhydrous THF (0.07 M) was cooled at −40 °C, and then a solution of tert-butyllithium (7.7 M in pentane, 0.5 M) was added dropwise under an Ar stream. The reaction mixture was stirred at 0 °C for 1 h and at 25 °C for 12 h, diluted with water, and extracted with EtOAc. The organic layer was washed with brine, dried over Na2SO4, filtered and concentrated in vacuo. Purification via silica gel column chromatography yielded the desired 2-phenylindole derivative.
General Procedure F for the Synthesis of 2.47−2.49, 2.55, 2.57, and 2.59. The appropriate phenylhydrazone (1 equiv) was added by portions to polyphosphoric acid (29 equiv) preheated at 110 °C. The reaction mixture was stirred at the same temperature for 1 h and then quenched on crushed ice. The solid was filtered and crystallized to obtain the desired 2-phenylindole derivative.
General Procedure G for the Synthesis of 2.60−2.62. To a solution of benzaldehyde (1 equiv) and appropriate 1-methyl-2-nitrobenzene (1.09 equiv) in anhydrous DMSO (0.22 M) was added a solution of sodium ethoxide in anhydrous EtOH (3.4 M). The reaction mixture was stirred at 25 °C for 12 h, carefully diluted with water, and extracted with EtOAc. The organic layer was washed with brine, dried over Na2SO4, and filtered. Removal of the solvent gave a residue that was purified by silica gel column chromatography to obtain the alcohol derivative.
General Procedure H for the Synthesis of 2.63−2.65. A solution of appropriate alcohol derivative (1 equiv) in anhydrous CH2Cl2 (0.3 M) was added to a suspension of pyridinium chlorochromate (1.6 equiv) in CH2Cl2 (0.2 M). The reaction mixture was stirred at 25 °C for 1.5 h and diluted with water. The layers were separated, and the organic phase was washed with brine, dried over Na2SO4, filtered and concentrated in vacuo. Purification via silica gel column chromatography furnished the ketone derivative.
General Procedure I for the Synthesis of 2.66−2.71. A solution of benzoyl chloride (1.19 equiv) in THF (2.8 M) was added dropwise to a solution of appropriate o-toluidine (1 equiv) and Et3N (1.19 equiv) at 0 °C in the same solvent (0.35 M). The reaction was heated at reflux for 2 h. After cooling, the mixture was diluted with water and extracted with ethyl acetate. The organic layer was washed with brine, dried, and filtered. Removal of the solvent gave a residue that was triturated with diethyl ether to furnish the desired amide derivative.
General Procedure J for the Synthesis of 2.72−2.77. A mixture of appropriate phenylhydrazine hydrochloride (1.5 equiv), acetophenone (1 equiv), and sodium acetate (1.5 equic) in EtOH (0.7 M) was placed into the microwave cavity (open vessel mode). Microwave irradiation of 250 W was used, the temperature being ramped from 25 to 80 °C. Once 80 °C was reached, taking about 1 min, the reaction mixture was held at this

76
temperature for 5 min, with stirring and cooling. The reaction mixture was cooled to 0 °C, filtered, washed with petroleum ether, and dried to obtain the desire phenylhydrazone.
4-Bromo-2-phenyl-3-((3,4,5-trimethoxyphenyl)thio)-1H-indole (2.3). Following synthetic procedure A using 4-bromo-2-phenyl-1H-indole (0.035 g, 0.128 mmol), purification by silica gel column chromatography (hexanes/EtOAc 67:33) afforded the title compound as a yellow solid (0.017 g, 0.036 mmol, 28% yield). M.p. 202−205 °C (EtOH). 1H NMR (CDCl3) δ 3.66 (s, 6H), 3.79 (s, 3H), 6.37 (s, 2H), 7.10 (t, J = 7.8 Hz, 1H), 7.38− 7.41 (m, 5H), 7.71 (d, J = 6.7 Hz, 2H), 8.72 (br s, disappeared on treatment with D2O, 1H) ppm. IR ν 3344 cm−1. Anal. (C23H20BrNO3S (470.38)) C, H, Br, N, S.
(4-Bromo-2-phenyl-1H-indol-3-yl)(3,4,5-trimethoxyphenyl)methanone (2.4). Following synthetic procedure B using 4-bromo-2-phenyl-1H-indole (0.030 g, 0.110 mmol), purification by silica gel column chromatography (hexanes/EtOAc 50:50) afforded the title compound as a yellow solid (0.004 g, 0.193 mmol, 8% yield). M.p. 228−230 °C (EtOH). 1H NMR (CDCl3) δ 3.74 (s, 6H), 3.88 (s, 3H), 7.13−7.16 (m, 3H), 7.31−7.37 (m, 4H), 7.42−7.46 (m, 3H), 8.58 (br s, disappeared on treatment with D2O, 1H) ppm. IR ν 1618, 3344 cm−1. Anal. (C24H20BrNO4 (466.32)) C, H, Br, N.
4-Chloro-2-phenyl-3-((3,4,5-trimethoxyphenyl)thio)-1H-indole (2.5). Following synthetic procedure A using 4-chloro-2-phenyl-1H-indole (0.250 g, 1.10 mmol), purification by silica gel column chromatography (hexanes/EtOAc 67:33) afforded the title compound as a white solid (0.290 g, 0.681 mmol, 62% yield). M.p. 178−180 °C (EtOH). 1H NMR (DMSO-d6) δ 3.54 (s, 6H), 3.57 (s, 3H), 6.26 s, 2H), 7.10−7.11 (m, 1H), 7.18−7.20 (m, 1H), 7.44−7.54 (m, 4H), 7.77−7.80 (m, 2H), 12.51 (br s, disappeared on treatment with D2O, 1H) ppm. IR ν 3345 cm−1. Anal. (C23H20ClNO3S (425.93)) C, H, Cl, N, S.
(4-Chloro-2-phenyl-1H-indol-3-yl)(3,4,5-trimethoxyphenyl)-methanone (2.6). Following synthetic procedure B using 4-chloro-2-phenyl-1H-indole (0.250 g, 1.10 mmol), purification by silica gel column chromatography (hexanes/EtOAc 50:50) afforded the title compound as a yellow solid (0.300 g, 0.711 mmol, 65% yield). M.p. 232−235 °C (EtOH). 1H NMR (CDCl3) δ 3.72 (s, 6H), 3.94 (s, 3H), 7.17 (s, 2H), 7.19−7.23 (m, 2H), 7.30−7.33 (m, 3H), 7.38 (dd, J = 2.0 and 7.0 Hz, 1H), 7.45−7.48 (m, 2H), 8.73 (br s, disappeared on treatment with D2O, 1H) ppm. IR ν 1618, 3169 cm−1. Anal. (C24H20ClNO4 (421.87)) C, H, Cl, N.
4-Chloro-2-phenyl-3-(3,4,5-trimethoxybenzyl)-1H-indole (2.7). Following synthetic procedure C using (4-chloro-2-phenyl-1H-indol-3-yl)(3,4,5-trimethoxyphenyl)-methanone (0.100 g, 0.240 mmol), purification by silica gel column chromatography (hexanes/EtOAc 67:33) afforded the title compound as a yellow solid (0.010 g, 0.024 mmol, 10% yield). M.p. 178−180 °C (EtOH). 1H NMR (CDCl3) δ 3.74 (s, 6H), 3.84 (s, 3H), 4.45 (s, 2H), 6.44 (s, 2H), 7.10−7.15 (m, 2H), 7.33 (dd, J = 2.2 and 6.8 Hz, 1H), 7.41−7−47 (m, 3H), 7.51−7.53 (m, 2H), 8.29 (br s, disappeared on treatment with D2O, 1H) ppm. IR ν 3358 cm−1. Anal. (C24H22ClNO3 (407.89)) C, H, Cl, N.
77
4-Fluoro-2-phenyl-3-((3,4,5-trimethoxyphenyl)thio)-1H-indole (2.8). Following synthetic procedure A using 4-fluoro-2-phenyl-1H-indole (0.250 g, 1.18 mmol), purification by silica gel column chromatography (hexanes/EtOAc 80:20) afforded the title compound as a yellow solid (0.150 g, 0.366 mmol, 31% yield). M.p. 168−170 °C (EtOH). 1H NMR (DMSO-d6) δ 3.53 (s, 6H), 3.56 (s, 3H), 6.28 (s, 2H), 6.80−6.85 (m, 1H), 7.14−7.19 (m, 1H), 7.32 (d, J = 8.0 Hz, 1H), 7.44 (t, J = 7.1 Hz, 1H), 7.51 (t, J = 7.1 Hz, 2H), 7.80−7.82 (m, 2H), 12.30 (br s, disappeared on treatment with D2O, 1H) ppm. IR ν 3307 cm−1. Anal. (C23H20FNO3S (409.47)) C, H, F, N, S.
(4-Fluoro-2-phenyl-1H-indol-3-yl)(3,4,5-trimethoxyphenyl)-methanone (2.9). Following synthetic procedure B using 4-fluoro-2-phenyl-1H-indole (0.250 g, 1.18 mmol), purification by silica gel column chromatography (hexanes/EtOAc 80:20) afforded the title compound as a yellow solid (0.120 g, 0.295 mmol, 25% yield). M.p. 212−215 °C (toluene). 1H NMR (DMSO-d6) δ 3.62 (s, 6H), 3.64 (s, 3H), 6.84−6.89 (m, 1H), 6.99 (s, 2H), 7.18−7.22 (m, 1H), 7.30− 7.35 (m, 4H), 7.42−7.44 (m, 2H), 12.34 (br s, disappeared on treatment with D2O, 1H) ppm. IR ν 1618, 3205 cm−1. Anal. (C24H20FNO4 (405.42)) C, H, F, N.
4-Methoxy-2-phenyl-3-((3,4,5-trimethoxyphenyl)thio)-1H-indole (2.10). Following synthetic procedure A using 4-methoxy-2-phenyl-1H-indole (0.140 g, 0.627 mmol), purification by silica gel column chromatography (CH2Cl2/EtOAc 99:1) afforded the title compound as a white solid (0.110 g, 0.261 mmol, 42% yield). M.p. 133−136 °C (toluene). 1H NMR (CDCl3) δ 3.66 (s, 6H), 3.78 (s, 6H), 6.44 (s, 2H), 6.57−6.59 (m, 1H), 7.05 (d, J = 8.2 Hz, 1H), 7.18 (t, J = 7.7 Hz, 1H), 7.38−7.48 (m, 3H), 7.73 (d, J = 7.2 Hz, 2H), 8.52 (br s, disappeared on treatment with D2O, 1H) ppm. IR ν 3261 cm−1. Anal. (C24H23NO4S (421.51)) C, H, N, S.
(4-Methoxy-2-phenyl-1H-indol-3-yl)(3,4,5-trimethoxyphenyl)-methanone (2.11). Following synthetic procedure B using 4-methoxy-2-phenyl-1H-indole (0.250 g, 1.12 mmol), purification by silica gel column chromatography (hexanes/EtOAc 67:33) afforded the title compound as a yellow solid (0.230 g, 0.551 mmol, 49% yield). M.p. 144−146 °C (toluene). 1H NMR (DMSO-d6) δ 3.53 (s, 3H), 3.64 (s, 6H), 3.69 (s, 3H), 6.55−6.57 (m, 1H), 7.02 (s, 2H), 7.09−7.16 (m, 2H), 7.29−7.39 (m, 3H), 7.49−7.51 (m, 2H), 11.95 (br s, disappeared on treatment with D2O, 1H) ppm. IR ν 1622, 3220 cm−1. Anal. (C25H23NO5 (417.45)) C, H, N.
5-Bromo-2-phenyl-3-((3,4,5-trimethoxyphenyl)thio)-1H-indole (2.12). Following synthetic procedure A using 5-bromo-2-phenyl-1H-indole (0.250 g, 0.919 mmol), purification by silica gel column chromatography (hexanes/EtOAc 75:25) afforded the title compound as a yellow solid (0.080 g, 0.170 mmol, 18% yield). M.p. 152−155 °C (EtOH). 1H NMR (DMSO-d6) δ 3.53 (s, 6H), 3.56 (s, 3H), 6.27 (s, 2H), 7.32−7.35 (m, 1H), 7.44−7.58 (m, 5H), 7.86−7.88 (m, 2H), 12.29 (br s, disappeared on treatment with D2O, 1H) ppm. IR ν 3316 cm−1. Anal. (C23H20BrNO3S (470.38)) C, H, Br, N, S.
78
(5-Bromo-2-phenyl-1H-indol-3-yl)(3,4,5-trimethoxyphenyl)-methanone (2.13). Following synthetic procedure B using 5-bromo-2-phenyl-1H-indole (0.250 g, 0.919 mmol), purification by silica gel column chromatography (hexanes/EtOAc 40:60) afforded the title compound as a brown solid (0.260 g, mmol, 61% yield). M.p. 200−203 °C (EtOH). 1H NMR (DMSO-d6) δ 3.57 (s, 3H), 3.58 (s, 6H), 6.78 (s, 2H), 7.23−7.27 (m, 3H), 7.35−7.41 (m, 3H), 7.48 (d, J = 8.3 Hz, 1H), 8.09 (s, 1H), 12.40 (br s, disappeared on treatment with D2O, 1H) ppm. IR ν 1610, 3305 cm−1. Anal. (C24H20BrNO4 (466.32)) C, H, Br, N.
5-Bromo-2-phenyl-3-(3,4,5-trimethoxybenzyl)-1H-indole (2.14). A mixture of (5-bromo-2-phenyl-1H-indol-3-yl)(3,4,5-trimethoxyphenyl)-methanone (0.250 g, 0.540 mmol), triethylsilane (0.140 g, 1.20 mmol), and trifluoroacetic acid (0.630 g, 5.50 mmol) in 1,2-dichloroethane (2.0 mL) was placed into the microwave cavity (closed vessel mode, Pmax =250 psi). A starting microwave irradiation of 250 W was used, the temperature being ramped from 25 to 250 °C, with rapid stirring and cooling. Once 250 °C was reached, taking about 2 min, the reaction mixture was held at this temperature for 20 min. The reaction mixture was diluted with satd. aq. NaHCO3 and extracted with EtOAc. The organic layer was washed with brine, dried, and filtered. Removal of the solvent gave a residue that was purified by silica gel column chromatography (hexanes/EtOAc 75:25) to furnish the title compound as a colorless oil (0.040 g, 0.088 mmol, 15% yield) 1H NMR (CDCl3) δ 3.73 (s, 6H), 3.83 (s, 3H), 4.17 (s, 2H), 6.42 (s, 2H), 7.28 (s, 2H), 7.37−7.47 (m, 3H), 7.53−7.55 (m, 2H), 7.62 (s, 1H), 8.25 (br s, disappeared on treatment with D2O, 1H) ppm. IR ν 3338 cm−1. Anal. (C24H22BrNO3 (452.34)) C, H, Br, N.
5-Chloro-2-phenyl-3-((3,4,5-trimethoxyphenyl)thio)-1H-indole (2.15). Following synthetic procedure A using 5-chloro-2-phenyl-1H-indole (0.250 g, 1.10 mmol), purification by silica gel column chromatography (hexanes/EtOAc 70:30) afforded the title compound as a pink solid (0.030 g, 0.070 mmol, 6% yield). M.p. 158−160 °C (EtOH). 1H NMR (CDCl3) δ 3.65 (s, 6H), 3.78 (s, 3H), 6.33 (s, 2H), 7.21−7.24 (m, 1H), 7.36−7.49 (m, 4H), 7.66−7.67 (m, 1H), 7.77−7.80 (m, 2H), 8.69 (br s, disappeared on treatment with D2O, 1H) ppm. IR ν 3319 cm−1. Anal. (C23H20ClNO3S (425.93)) C, H, Cl, N, S.
(5-Chloro-2-phenyl-1H-indol-3-yl)(3,4,5-trimethoxyphenyl)-methanone (2.16). Following synthetic procedure B using 5-chloro-2-phenyl-1H-indole (0.250 g, 1.10 mmol), purification by silica gel column chromatography (hexanes/EtOAc 60:40) afforded the title compound as a white solid (0.230 g, 0.545 mmol, 50% yield). M.p. 222−225 °C (EtOH). 1H NMR (CDCl3) δ 3.69 (s, 6H), 3.81 (s, 3H), 6.94 (s, 2H), 7.24−7.30 (m, 4H), 7.33−7.40 (m, 3H), 8.07−8.08 (m, 1H), 8.81 (br s, disappeared on treatment with D2O, 1H) ppm. IR ν 1610, 3340 cm−1. Anal. (C24H20ClNO4 (421.87)) C, H, Cl, N.
5-Chloro-2-phenyl-3-(3,4,5-trimethoxybenzyl)-1H-indole (2.17). Following synthetic procedure C using (5-chloro-2-phenyl-1H-indol-3-yl)(3,4,5-trimethoxyphenyl)-methanone (0.100 g, 0.237 mmol), purification by silica gel column chromatography (hexanes/EtOAc
79
50:50) afforded the title compound as a yellow solid (0.040 g, 0.098 mmol, 41% yield). M.p. 172−175 °C (EtOH). 1H NMR (CDCl3) δ 3.76 (s, 6H), 3.82 (s, 3H), 4.16 (s, 2H), 6.41 (s, 2H), 7.15 (dd, J = 2.0 and 8.6 Hz, 1H), 7.31 (d, J = 8.6 Hz, 1H), 7.37−7.39 (m, 1H), 7.42−7.46 (m, 3H), 7.51−7.54 (m, 2H), 8.23 (br s, disappeared on treatment with D2O, 1H) ppm. IR ν 3340 cm−1. Anal. (C24H22ClNO3 (407.89)) C, H, Cl, N.
5-Fluoro-2-phenyl-3-((3,4,5-trimethoxyphenyl)thio)-1H-indole (2.18). Following synthetic procedure A using 5-fluoro-2-phenyl-1H-indole (0.250 g, 1.18 mmol), purification by silica gel column chromatography (CH2Cl2/EtOAc 99:1) afforded the title compound as a yellow solid (0.130 g, 0.317 mmol, 27% yield). M.p. 158−160 °C (toluene). 1H NMR (DMSO-d6) δ 3.54 (s, 6H), 3.57 (s, 3H), 6.30 (s, 2H), 7.1 (t, J = 8.0 Hz, 1H), 7.16 (d, J = 9.2 Hz, 1H), 5.45 (t, J = 7.2 Hz, 1H), 7.50−7.55 (m, 3H), 7.88 (d, J = 7.4 Hz, 2H), 12.21 (br s, disappeared on treatment with D2O, 1H) ppm. IR ν 3231 cm−1. Anal. (C23H20FNO3S (409.47)) C, H, F, N, S.
(5-Fluoro-2-phenyl-1H-indol-3-yl)(3,4,5-trimethoxyphenyl)-methanone (2.19). Following synthetic procedure B using 5-fluoro-2-phenyl-1H-indole (0.250 g, 1.18 mmol), purification by silica gel column chromatography (hexanes/EtOAc 67:33) afforded the title compound as a white solid (0.320 g, 0.789 mmol, 67% yield). M.p. 198−200 °C (toluene). 1H NMR (DMSO-d6) δ 3.58 (s, 3H), 3.59 (s, 6H), 6.78 (s, 2H), 7.10−7.15 (m, 1H), 7.24−7.27 (m, 3H), 7.34− 7.37 (m, 2H), 7.51 (q, J = 4.6 Hz, 1H), 7.66 (dd, J = 2.5 and 10.1, 1H), 12.30 (br s, disappeared on treatment with D2O, 1H) ppm. IR ν 1620, 3225 cm−1. Anal. (C24H20FNO4
(405.42)) C, H, F, N. 5-Methoxy-2-phenyl-3-((3,4,5-trimethoxyphenyl)thio)-1H-indole (2.20). Following
synthetic procedure A using 5-methoxy-2-phenyl-1H-indole (0.250 g, 1.12 mmol), purification by silica gel column chromatography (hexanes/EtOAc 70:30) afforded the title compound as a yellow oil (0.050 g, 0.119 mmol, 11% yield). 1H NMR (CDCl3) δ 3.63 (s, 6H), 3.77 (s, 3H), 3.83 (s, 3H), 6.35 (s, 2H), 6.90−6.93 (m, 1H), 7.10−7.11 (m, 1H), 7.32−7.46 (m, 4H), 7.76−7.77 (m, 2H), 8.58 (br s, disappeared on treatment with D2O, 1H) ppm. IR ν 3337 cm−1. Anal. (C24H23NO4S (421.51)) C, H, N, S.
(5-Methoxy-2-phenyl-1H-indol-3-yl)(3,4,5-trimethoxyphenyl)-methanone (2.21). Following synthetic procedure B using 5-methoxy-2-phenyl-1H-indole (0.250 g, 1.12 mmol), purification by silica gel column chromatography (hexanes/EtOAc 50:50) afforded the title compound as a green solid (0.360 g, 0.862 mmol, 77% yield). M.p. 202−205 °C (EtOH). 1H NMR (DMSO-d6) δ 3.58 (s, 3H), 3.59 (s, 6H), 3.78 (s, 3H), 6.78 (s, 2H), 6.90 (dd, J = 2.6 and 8.8 Hz, 1H), 7.24−7.25 (m, 3H), 7.32−7.34 (m, 2H), 7.41 (d, J = 8.8 Hz, 1H), 7.48 (d, J = 2.4 Hz, 1H), 12.11 (br s, disappeared on treatment with D2O, 1H) ppm. IR ν 1652, 3195 cm−1. Anal. (C25H23NO5 (417.45)) C, H, N.
5-Methoxy-2-phenyl-3-(3,4,5-trimethoxybenzyl)-1H-indole (2.22). Following synthetic procedure C using (5-methoxy-2-phenyl-1H-indol-3-yl)(3,4,5-trimethoxyphenyl)-methanone (0.200 g, 0.479 mmol), purification by silica gel column chromatography (hexanes/EtOAc
80
75:25) afforded the title compound as a white solid (0.050 g, 0.124 mmol, 26% yield). M.p. 137−139 °C (EtOH). 1H NMR (DMSO-d6) δ 3.59 (s, 3H), 3.60 (s, 6H), 3.72 (s, 3H), 4.14 (s, 2H), 6.48 (s, 2H), 6.76 (dd, J = 2.4 and 8.9 Hz, 1H), 6.97 (d, J = 2.4 Hz, 1H), 7.27 (d, J = 8.9 Hz, 1H), 7.35−7.39 (m, 1H), 7.50 (t, J = 7.4 Hz, 2H), 7.61−7.64 (m, 2H), 11.12 (br s, disappeared on treatment with D2O, 1H) ppm. IR ν 3361 cm−1. Anal. (C25H25NO4 (403.47)) C, H, N.
6-Bromo-2-phenyl-3-((3,4,5-trimethoxyphenyl)thio)-1H-indole (2.23). Following synthetic procedure A using 6-bromo-2-phenyl-1H-indole (0.060 g, 0.220 mmol), purification by silica gel column chromatography (hexanes/EtOAc 67:33) afforded the title compound as a yellow solid (0.023 g, 0.049 mmol, 22% yield). M.p. 200−203 °C (EtOH). 1H NMR (DMSO-d6) δ 3.57 (s, 3H), 3.58 (s, 6H), 6.78 (s, 2H), 7.23−7.27 (m, 3H), 7.35−7.41 (m, 3H), 7.48 (d, J = 8.3 Hz, 1H), 8.09 (s, 1H), 12.40 (br s, disappeared on treatment with D2O, 1H) ppm. IR ν 3320 cm−1. Anal. (C23H20BrNO3S (470.38)) C, H, Br, N, S.
(6-Bromo-2-phenyl-1H-indol-3-yl)(3,4,5-trimethoxyphenyl)-methanone (2.24). Following synthetic procedure B using 6-bromo-2-phenyl-1H-indole (0.033 g, 0.121 mmol), purification by silica gel column chromatography (hexanes/EtOAc 50:50) afforded the title compound as a yellow oil (0.022 g, 0.047 mmol, 39% yield). 1H NMR (CDCl3) δ 3.68 (s, 6H), 3.81 (s, 3H), 6.94 (s, 2H), 7.23− 7.27 (m, 3H), 7.33−7.36 (m, 3H), 7.59 (s, 1H), 7.87 (d, J = 8.6 Hz, 1H), 8.84 (br s, disappeared on treatment with D2O, 1H) ppm. IR ν 1610, 3304 cm−1. Anal. (C24H20BrNO4 (466.32)) C, H, Br, N.
6-Chloro-2-phenyl-3-((3,4,5-trimethoxyphenyl)thio)-1H-indole (2.25). Following synthetic procedure A using 6-chloro-2-phenyl-1H-indole (0.140 g, 0.615 mmol), purification by silica gel column chromatography (hexanes/EtOAc 67:33) afforded the title compound as a white solid (0.130 g, 0.305 mmol, 50% yield). M.p. 207−210 °C (EtOH). 1H NMR (DMSO-d6) δ 3.54 (s, 6H), 3.57 (s, 3H), 6.29 (s, 2H), 7.14 (dd, J = 1.1 and 7.7 Hz, 1H), 7.43−7.55 (m, 5H), 7.87 (d, J = 7.9 Hz, 2H), 12.23 (br s, disappeared on treatment with D2O, 1H) ppm. IR ν 3319 cm−1. Anal. (C23H20ClNO3S (425.93)) C, H, Cl, N, S.
(6-Chloro-2-phenyl-1H-indol-3-yl)(3,4,5-trimethoxyphenyl)-methanone (2.26). Following synthetic procedure B using 6-chloro-2-phenyl-1H-indole (0.250 g, 1.10 mmol), purification by silica gel column chromatography (hexanes/EtOAc 67:33) afforded the title compound as a yellow solid (0.280 g, 0.657 mmol, 60% yield). M.p. 188−190 °C (EtOH). 1H NMR (CDCl3) δ 3.63 (s, 6H), 3.79 (s, 3H), 6.93 (s, 2H), 7.20−7.24 (m, 4H), 7.31−7.33 (m, 2H), 7.41−7.43 (m, 1H), 7.91 (d, J = 8.6 Hz, 1H), 8.84 (br s, disappeared on treatment with D2O, 1H) ppm. IR ν 3319, 1618 cm−1. Anal. (C24H20ClNO4 (421.87)) C, H, Cl, N.
6-Chloro-2-phenyl-3-(3,4,5-trimethoxybenzyl)-1H-indole (2.27). Following synthetic procedure C using (6-chloro-2-phenyl-1H-indol-3-yl)(3,4,5-trimethoxyphenyl)-methanone (0.100 g, 0.237 mmol), purification by silica gel column chromatography (hexanes/EtOAc 67:33) afforded the title compound as a yellow solid (0.040 g, 0.098 mmol, 41% yield). M.p.
81
187−185 °C (EtOH). 1H NMR (CDCl3) δ 3.73 (s, 6H), 3.84 (s, 3H), 4.21 (s, 2H), 6.44 (s, 2H), 7.07 (dd, J = 2.0 and 8.4 Hz, 1H), 7.38−7.42 (m, 3H), 7.45−7.49 (m, 2H), 7.53−7.56 (m, 2H), 8.25 (br s, disappeared on treatment with D2O, 1H) ppm. IR ν 3332 cm−1. Anal. (C24H22ClNO3 (407.89)) C, H, Cl, N.
6-Fluoro-2-phenyl-3-((3,4,5-trimethoxyphenyl)thio)-1H-indole (2.28). Following synthetic procedure A using 6-fluoro-2-phenyl-1H-indole (0.040 g, 0.189 mmol), purification by silica gel column chromatography (hexanes/EtOAc 67:33) afforded the title compound as a yellow oil (0.030 g, 0.073 mmol, 39% yield). 1H NMR (CDCl3) δ 3.64 (s, 6H), 3.78 (s, 3H), 6.35 (s, 2H), 6.96 (t, J = 8.8 Hz, 1H), 7.14 (d, J = 9.0 Hz, 1H), 7.41−7.50 (m, 3H), 7.58−7.59 (m, 1H), 7.78 (d, J = 8.0 Hz, 2H), 8.56 (br s, disappeared on treatment with D2O, 1H) ppm. IR ν 3320 cm−1. Anal. (C23H20FNO3S (409.47)) C, H, F, N, S.
(6-Fluoro-2-phenyl-1H-indol-3-yl)(3,4,5-trimethoxyphenyl)-methanone (2.29). Following synthetic procedure B using 6-fluoro-2-phenyl-1H-indole (0.040 g, 0.189 mmol), purification by silica gel column chromatography (hexanes/EtOAc 67:33) afforded the title compound as a yellow oil (0.020 g, 0.049 mmol, 26% yield). 1H NMR (CDCl3) δ 3.68 (s, 6H), 3.80 (s, 3H), 6.94 (s, 2H), 7.05 (t, J = 8.9 Hz, 1H), 7.14 (d, J = 9.0 Hz, 1H), 7.26−7.33 (m, 5H), 7.99− 8.02 (m, 1H), 8.58 (br s, disappeared on treatment with D2O, 1H) ppm. IR ν 1621, 3265 cm−1. Anal. (C24H20FNO4 (405.42)) C, H, F, N.
6-Methoxy-2-phenyl-3-((3,4,5-trimethoxyphenyl)thio)-1H-indole (2.30). Following synthetic procedure A using 6-methoxy-2-phenyl-1H-indole (0.250 g, 1.12 mmol), purification by silica gel column chromatography (CHCl3/EtOAc 95:5) afforded the title compound as a yellow solid (0.110 g, 0.261 mmol, 23% yield). M.p. 121−124 °C (toluene). 1H NMR (DMSO-d6) δ 3.54 (s, 6H), 3.60 (s, 3H), 3.81 (s, 3H), 6.31 (s, 2H), 6.77 (dd, J = 2.2 and 8.6 Hz, 1H), 6.97 (d, J = 2.0 Hz, 1H), 7.34−7.42 (m, 2H), 7.50 (t, J = 7.4 Hz, 2H), 7.85 (d, J = 7.2 Hz, 2H), 11.88 (br s, disappeared on treatment with D2O, 1H) ppm. IR ν 3322 cm−1. Anal. (C24H23NO4S (421.51)) C, H, N, S.
(6-Methoxy-2-phenyl-1H-indol-3-yl)(3,4,5-trimethoxyphenyl)-methanone (2.31). Following synthetic procedure B using 6-methoxy-2-phenyl-1H-indole (0.250 g, 1.12 mmol), purification by silica gel column chromatography (hexanes/EtOAc 67:33) afforded the title compound as a yellow solid (0.290 g, 0.695 mmol, 62% yield). M.p. 186−188 °C (toluene). 1H NMR (DMSO-d6) δ 3.59 (s, 9H), 3.83 (s, 3H), 6.80 (s, 2H), 6.85 (dd, J = 2.3 and 8.8 Hz, 1H), 6.97 (d, J = 2.2 Hz, 1H), 7.24−7.26 (m, 3H), 7.32−7.34 (m, 2H), 7.79 (d, J = 8.8 Hz, 1H), 12.01 (br s, disappeared on treatment with D2O, 1H) ppm. IR ν 1610, 3302 cm−1. Anal. (C25H23NO5 (417.45)) C, H, N.
7-Bromo-2-phenyl-3-((3,4,5-trimethoxyphenyl)thio)-1H-indole (2.32). Following synthetic procedure A using 7-bromo-2-phenyl-1H-indole (0.150 g, 0.551 mmol), purification by silica gel column chromatography (hexanes/EtOAc 75:25) afforded the title compound as a white solid (0.100 g, 0.213 mmol, 39% yield). M.p. 142−145 °C (toluene). 1H NMR (DMSO-d6) δ
82
3.54 (s, 6H), 3.57 (s, 3H), 6.29 (s, 2H), 7.08 (t, J = 7.7 Hz, 1H), 6.97 (d, J = 7.7 Hz, 1H), 7.43−7.54 (m, 5H), 7.82 (d, J = 7.1 Hz, 1H), 12.11 (br s, disappeared on treatment with D2O, 1H) ppm. IR ν 3335 cm−1. Anal. (C23H20BrNO3S (470.38)) C, H, Br, N, S.
(7-Bromo-2-phenyl-1H-indol-3-yl)(3,4,5-trimethoxyphenyl)-methanone (2.33). Following synthetic procedure B using 7-bromo-2-phenyl-1H-indole (0.150 g, 0.551 mmol), purification by silica gel column chromatography (hexanes/EtOAc 67:33) afforded the title compound as a yellow solid (0.150 g, 0.322 mmol, 58% yield). M.p. 188−190 °C (EtOH). 1H NMR (CDCl3) δ 3.71 (s, 6H), 3.82 (s, 3H), 6.97 (s, 2H), 7.18 (t, J = 7.8 Hz, 1H), 7.28−7.32 (m, 3H), 7.42− 7.44 (m, 2H), 7.48 (d, J = 7.6 Hz, 1H), 7.99 (d, J = 8.0 Hz, 1H), 8.67 (br s, disappeared on treatment with D2O, 1H) ppm. IR ν 1618, 3258 cm−1. Anal. (C24H20BrNO4 (466.32)) C, H, Br, N.
7-Chloro-2-phenyl-3-((3,4,5-trimethoxyphenyl)thio)-1H-indole (2.34). Following synthetic procedure A using 7-chloro-2-phenyl-1H-indole (0.140 g, 0.615 mmol), purification by silica gel column chromatography (hexanes/EtOAc 67:33) afforded the title compound as a white solid (0.200 g, 0.470 mmol, 76% yield). M.p. 62−65 °C (EtOH). 1H NMR (CDCl3) δ 3.66 (s, 6H), 3.78 (s, 3H), 6.36 (s, 2H), 7.12−7.17 (m, 1H), 7.43−7.57 (m, 4H), 7.58−7.60 (m, 1H), 7.83−7.85 (m, 2H), 8.72 (br s, disappeared on treatment with D2O, 1H) ppm. IR ν 3259 cm−1. Anal. (C23H20ClNO3S (425.93)) C, H, Cl, N, S.
(7-Chloro-2-phenyl-1H-indol-3-yl)(3,4,5-trimethoxyphenyl)-methanone (2.35). Following synthetic procedure B using 7-chloro-2-phenyl-1H-indole (0.250 g, 1.10 mmol), purification by silica gel column chromatography (hexanes/EtOAc 67:33) afforded the title compound as a brown solid (0.270 g, 0.640 mmol, 58% yield). M.p. 148−150 °C (EtOH). 1H NMR (DMSO-d6) δ 3.59 (s, 3H), 3.61 (s, 6H), 6.80 (s, 2H), 7.20−7.29 (m, 4H), 7.34 (dd, J = 1.0 and 7.6 Hz, 1H), 7.38−7.41 (m, 2H), 7.88 (dd, J = 1.0 and 8.0 Hz, 1H), 12.41 (br s, disappeared on treatment with D2O, 1H) ppm. IR ν 1607, 3215 cm−1. Anal. (C24H20ClNO4 (421.87)) C, H, Cl, N.
7-Chloro-2-phenyl-3-(3,4,5-trimethoxybenzyl)-1H-indole (2.36). Following synthetic procedure C using (7-chloro-2-phenyl-1H-indol-3-yl)(3,4,5-trimethoxyphenyl)-methanone (0.100 g, 0.237 mmol), purification by silica gel column chromatography (hexanes/EtOAc 67:33) afforded the title compound as a yellow solid (0.040 g, 0.098 mmol, 41% yield). M.p. 156−158 °C (EtOH). 1H NMR (CDCl3) δ 3.74 (s, 6H), 3.83 (s, 3H), 4.22 (s, 2H), 6.44 (s, 2H), 7.05 (t, J = 7.8 Hz, 1H), 7.22−7−24 (m, 1H), 7.39− 7.45 (m, 2H), 7.48−7.51 (m, 2H), 7.59−7.61 (m, 2H), 8.34 (br s, disappeared on treatment with D2O, 1H) ppm. IR ν 3347 cm−1. Anal. (C24H22ClNO3 (407.89)) C, H, Cl, N.
7-Fluoro-2-phenyl-3-((3,4,5-trimethoxyphenyl)thio)-1H-indole (2.37). Following synthetic procedure A using 7-fluoro-2-phenyl-1H-indole (0.080 g, 0.379 mmol), purification by silica gel column chromatography (hexanes/EtOAc 67:33) afforded the title compound as a yellow solid (0.050 g, 0.122 mmol, 32% yield). M.p. 98−100 °C (toluene). 1H NMR (DMSO-d6) δ
83
3.54 (s, 6H), 3.57 (s, 3H), 6.30 (s, 2H), 7.05−7.10 (m, 2H), 7.31 (d, J = 7.1 Hz, 1H), 7.46 (t, J = 7.2 Hz, 1H), 7.53 (t, J = 7.1 Hz, 2H), 7.88 (d, J = 7.2 Hz, 2H), 12.46 (br s, disappeared on treatment with D2O, 1H) ppm. IR ν 3247 cm−1. Anal. (C23H20FNO3S (409.47)) C, H, F, N, S.
(7-Fluoro-2-phenyl-1H-indol-3-yl)(3,4,5-trimethoxyphenyl)-methanone (2.38). Following synthetic procedure B using 7-fluoro-2-phenyl-1H-indole (0.080 g, 0.379 mmol), purification by silica gel column chromatography (hexanes/EtOAc 67:33) afforded the title compound as a yellow solid (0.100 g, 0.247 mmol, 65% yield). M.p. 172−175 °C (toluene). 1H NMR (DMSO-d6) δ 3.59 (s, 3H), 3.61 (s, 6H), 6.81 (s, 2H), 7.07−7.18 (m, 2H), 7.26−7.27 (m, 3H), 7.38− 7.40 (m, 2H), 7.72 (d, J = 7.8 Hz, 1H), 12.60 (br s, disappeared on treatment with D2O, 1H) ppm. IR ν 1615, 3254 cm−1. Anal. (C24H20FNO4 (405.42)) C, H, F, N.
7-Methoxy-2-phenyl-3-((3,4,5-trimethoxyphenyl)thio)-1H-indole (2.39). Following synthetic procedure A using 7-methoxy-2-phenyl-1H-indole (0.250 g, 1.12 mmol), purification by silica gel column chromatography (CH2Cl2/EtOAc 99:1) afforded the title compound as a white solid (0.270 g, 0.647 mmol, 58% yield). M.p. 158−160 °C (EtOH). 1H NMR (DMSO-d6) δ 3.53 (s, 6H), 3.57 (s, 3H), 3.97 (s, 3H), 6.29 (s, 2H), 6.79−6.81 (m, 1H), 7.04−7.08 (m, 2H), 7.40−7.49 (m, 3H), 7.83−7.86 (m, 2H), 12.09 (br s, disappeared on treatment with D2O, 1H) ppm. IR ν 3300 cm−1. Anal. (C24H23NO4S (417.45)) C, H, N, S.
(7-Methoxy-2-phenyl-1H-indol-3-yl)(3,4,5-trimethoxyphenyl)-methanone (2.40). Following synthetic procedure B using 7-methoxy-2-phenyl-1H-indole (0.250 g, 1.12 mmol), purification by silica gel column chromatography (hexanes/Et2O 30:70) afforded the title compound as a yellow solid (0.030 g, 0.072 mmol, 6% yield). M.p. 185−188 °C (EtOH). 1H NMR (DMSO-d6) δ 3.59 (s, 3H), 3.60 (s, 6H), 3.98 (s, 3H), 6.79 (s, 2H), 6.83 (d, J = 7.4 Hz, 1H), 7.11 (t, J = 7.9 Hz, 1H), 7.20−7.23 (m, 3H), 7.35−7.38 (m, 2H), 7.47−7.49 (m,1H), 12.24 (br s, disappeared on treatment with D2O, 1H) ppm. IR ν 1606, 3270 cm−1. Anal. (C25H23NO5 (417.45)) C, H, N.
6,7-Dichloro-2-phenyl-3-((3,4,5-trimethoxyphenyl)thio)-1H-indole (2.41). Following synthetic procedure A using 6,7-dichloro-2-phenyl-1H-indole (0.050 g, 0.191 mmol), purification by silica gel column chromatography (hexanes/EtOAc 67:33) afforded the title compound as a yellow solid (0.050 g, 0.109 mmol, 57% yield). M.p. 158−160 °C (EtOH). 1H NMR (DMSO-d6) δ 3.55 (s, 6H), 3.57 (s, 3H), 6.29 (s, 2H), 7.32 (d, J = 8.5 Hz, 1H), 7.44−7.55 (m, 4H), 7.83−7.85 (m, 2H), 12.44 (br s, disappeared on treatment with D2O, 1H) ppm. IR ν 1610, 3268 cm−1. Anal. (C23H19Cl2NO3S (460.37)) C, H, Cl, N, S.
(6,7-Dichloro-2-phenyl-1H-indol-3-yl)(3,4,5-trimethoxyphenyl)-methanone (2.42). Following synthetic procedure B using 6,7-dichloro-2-phenyl-1H-indole (0.050 g, 0.191 mmol), purification by silica gel column chromatography (hexanes/EtOAc 75:25) afforded the title compound as a green solid (0.020 g, 0.044 mmol, 23% yield). M.p. 218−220 °C (EtOH). 1H NMR (DMSO-d6) δ 3.59 (s, 3H), 3.61 (s, 6H), 6.81 (s, 2H), 7.25−7.32 (m, 3H),
84
7.39−7.42 (m, 3H), 7.86 (d, J = 8.5 Hz, 1H), 12.58 (br s, disappeared on treatment with D2O, 1H) ppm. IR ν 1607, 3271 cm−1. Anal. (C24H19Cl2NO4S (456.32)) C, H, Cl, N, S.
4-Bromo-2-phenyl-1H-indole (2.43). Following synthetic procedure D using 2-(2-bromo-6-nitrophenyl)-1-phenylethanone (0.100 g, 0.400 mmol), purification by silica gel column chromatography (CHCl3) afforded the title compound as a solid (0.020 g, 0.073 mmol, 19% yield). M.p. 98−100 °C. Lit.48 100−102 °C.
4-Chloro-2-phenyl-1H-indole (2.44). Following synthetic procedure E using N-(3-chloro-2-methylphenyl)benzamide (2.00 g, 8.00 mmol), purification by silica gel column chromatography (CH2Cl2) afforded the title compound as a solid (0.56 g, mmol, 31% yield). M.p. 73−76 °C (EtOH). Lit.48 73−75 °C.
4-Fluoro-2-phenyl-1H-indole (2.45). Following synthetic procedure E using N-(3-fluoro-2-methylphenyl)benzamide (1.75 g, 7.63 mmol), purification by silica gel column chromatography (hexanes/EtOAc 80:20) afforded the title compound as a yellow solid (0.840 g, 3.98 mmol, 52% yield). M.p. 60−62 °C (EtOH). Lit.48 62−64 °C.
4-Methoxy-2-phenyl-1H-indole (2.46). Following synthetic procedure E using N-(3-methoxy-2-methylphenyl)benzamide (2.4 g, 9.95 mmol), purification by silica gel column chromatography (hexanes/EtOAc 80:20) afforded the title compound as a yellow solid (0.750 g, 3.36 mmol, 34% yield). M.p. 100−103 °C (EtOH). Lit.49 103−105 °C.
5-Bromo-2-phenyl-1H-indole (2.47). Following synthetic procedure F using 1-(4-bromophenyl)-2-(1-phenylethylidene)hydrazine (0.800 g, 2.77 mmol), crystallization from EtOH afforded the title compound as a brown solid (0.65 g, 2.39 mmol, 82% yield). M.p. 190−192 °C. Lit.50 193−196 °C.
5-Chloro-2-phenyl-1H-indole (2.48). Following synthetic procedure F using 1-(4-chlorophenyl)-2-(1-phenylethylidene)hydrazine (0.500 g, 2.04 mmol), crystallization from EtOH afforded the title compound as a yellow solid (0.170 g, 0.747 mmol, 37% yield). M.p. 198−200 °C. Lit.51 203−204 °C.
5-Fluoro-2-phenyl-1H-indole (2.49). Following synthetic procedure F using 1-(4-fluorophenyl)-2-(1-phenylethylidene)hydrazine (4.77 g, 21.0 mmol), purification by silica gel column chromatography afforded the title compound as a yellow solid (1.57 g, 7.43 mmol, 35% yield). M.p. 180−185 °C. Lit.52 181−183 °C.
5-Methoxy-2-phenyl-1H-indole (2.50) was synthesized according to a literature procedure.53
6-Bromo-2-phenyl-1H-indole (2.51). Following synthetic procedure D using 2-(4-bromo-2-nitrophenyl)-1-phenylethanone (0.250 g, 0.781 mmol), purification by silica gel column chromatography (hexanes/EtOAc 75:25) afforded the title compound as a yellow solid (0.100 g, 0.367 mmol, 47% yield). M.p. 188−190 °C (EtOH). Lit.54 187 °C.
6-Chloro-2-phenyl-1H-indole (2.52). Following synthetic procedure E using N-(5-chloro-2-methylphenyl)benzamide (2.00 g, 8.14 mmol), purification by silica gel column
85
chromatography (hexanes/EtOAc 80:20) afforded the title compound as a white solid (0.315 g, 1.38 mmol, 18% yield). M.p. 176−177 °C (EtOH). Lit.49 180−181 °C.
6-Fluoro-2-phenyl-1H-indole (2.53). Following synthetic procedure D using 2-(4-fluoro-2-nitrophenyl)-1-phenylethanone (0.050 g, 0.193 mmol), purification by silica gel column chromatography (hexanes/EtOAc 75:25) afforded the title compound as a solid (0.010 g, 0.047 mmol, 25% yield). M.p. 170−171 °C (EtOH). Lit.55 171−172 °C.
6-Methoxy-2-phenyl-1H-indole (2.54). Following synthetic procedure E using N-(5-methoxy-2-methylphenyl)benzamide (2.00 g, 8.29 mmol), purification by silica gel column chromatography (CHCl3) afforded the title compound as a green solid (0.620 g, 2.78 mmol, 33% yield). M.p. 170−173 °C (EtOH). Lit.56 173−176 °C.
7-Bromo-2-phenyl-1H-indole (2.55). Following synthetic procedure F using 1-(2-bromophenyl)-2-(1-phenylethylidene)hydrazine (2.49 g, 8.61 mmol), crystallization from EtOH afforded the title compound as a yellow solid (0.320 g, 1.18 mmol, 14% yield). M.p. 115−117 °C. Lit.57 117−118 °C. 1H NMR (DMSO-d6) δ 6.97 (t, J = 7.7, 1H), 7.02 (s, 1H), 7.31−7.38 (m, 2H), 7.47 (t, J = 7.5 Hz, 2H), 7.56 (d, J = 7.8 Hz, 1H), 7.98−8.00 (m, 2H), 11.36 (br s, disappeared on treatment with D2O, 1H) ppm. IR ν 3436 cm−1.
7-Chloro-2-phenyl-1H-indole (2.56) was synthesized according to a literature procedure.58 7-Fluoro-2-phenyl-1H-indole (2.57). Following synthetic procedure F using 1-(2-
fluorophenyl)-2-(1-phenylethylidene)hydrazine (2.99 g, 13.0 mmol), purification by silica gel column chromatography (hexanes/acetone 80:20) afforded the title compound as a yellow solid (0.180 g, 0.852 mmol, 7% yield). M.p. 122−125 °C. 1H NMR (DMSO-d6) δ 6.91−7.00 (m, 3H), 7.33−7.38 (m, 2H), 7.47 (t, J = 7.5 Hz, 2H), 7.95 (d, J = 7.4 Hz, 2H), 11.85 (br s, disappeared on treatment with D2O, 1H) ppm. IR ν 3436 cm−1.
7-Methoxy-2-phenyl-1H-indole (2.58). Following synthetic procedure E using N-(2-methoxy-6-methylphenyl)benzamide (2.88 g, 0.012 mmol), purification by silica gel column chromatography (hexanes/EtOAc 5:1) afforded the title compound as a yellow solid (0.760 g, 3.40 mmol, 28% yield). M.p. 83−87 °C (EtOH). Lit.59,60 85−86 °C.
6,7-Dichloro-2-phenyl-1H-indole (2.59). Following synthetic procedure F using 1-(2,3-dichlorophenyl)-2-(1-phenylethylidene)hydrazine (1.11 g, 3.98 mmol), purification by silica gel column chromatography (hexanes/acetone 80:20) afforded the title compound as a yellow solid (0.120 g, 0.458 mmol, 12% yield). M.p. 105−108 °C. 1H NMR (DMSO-d6) δ 7.03 (s, 1H), 7.21 (t, J = 8.4 Hz, 1H), 7.37 (t, J = 7.4 Hz, 1H), 7.46−7.55 (m, 3H), 7.99 (d, J = 8.0 Hz, 2H), 11.71 (br s, disappeared on treatment with D2O, 1H) ppm. IR ν 3248 cm−1.
2-(2-Bromo-6-nitrophenyl)-1-phenylethanol (2.60). Following synthetic procedure G using 2-bromo-6-nitrotoluene (0.250 g, 1.16 mmol), purification by silica gel column chromatography (hexanes/EtOAc 75:25) afforded the title compound as a yellow oil (0.150 g, 0.466 mmol, 40% yield). 1H NMR (DMSO-d6) δ 3.21−3.24 (m, 2H), 4.64 (d, J = 7.4 Hz, 1H), 5.48 (br s, disappeared on treatment with D2O, 1H), 7.25−7.33 (m, 5H), 7.42 (t, J = 8.0 Hz,
86
1H), 7.84 (d, J = 2 8.0 Hz, 1H), 7.97 (d, J = 8.2 Hz, 1H) ppm. IR ν 2961, 3030, 3063, 3325, 3560 cm−1.
2-(4-Bromo-2-nitrophenyl)-1-phenylethanol (2.61). Following synthetic procedure G using 4-bromo-1-methyl-2-nitrobenzene (0.250 g, 1.16 mmol), purification by silica gel column chromatography (hexanes/EtOAc 75:25) afforded the title compound as an oil (0.164 g, 0.509 mmol, 44% yield). 1H NMR (DMSO-d6) δ 3.07−3.12 (m, 2H), 4.69−4.73 (m, 1H), 5.43 (d, J = 4.5 Hz, disappeared on treatment with D2O, 1H), 7.21−7.25 (m, 1H), 7.28−7.33 (m, 4H), 7.39 (d, J = 8.3 Hz, 1H), 7.80 (dd, J = 1.7 and 8.2 Hz, 1H), 8.08−8.10 (m, 1H) ppm. IR ν 2934, 3030, 3065, 3418 cm−1.
2-(4-Fluoro-2-nitrophenyl)-1-phenylethanol (2.62). Following synthetic procedure G using 4-fluoro-1-methyl-2-nitrobenzene (0.180 g, 1.16 mmol), purification by silica gel column chromatography (hexanes/EtOAc 75:25) afforded the title compound as an oil (0.100 g, 0.383 mmol, 33% yield). 1H NMR (DMSO-d6) δ 3.12−3.14 (m, 2H), 4.68−4.73 (m, 1H), 5.40 (d, J = 4.4 Hz, disappeared on treatment with D2O, 1H), 7.22−7.33 (m, 5H), 7.46−7.51 (m, 2H), 7.81 (dd, J = 2.3 and 9.0 Hz, 1H) ppm. IR ν 2932, 3032, 3087, 3404 cm−1.
2-(2-Bromo-6-nitrophenyl)-1-phenylethanone (2.63). Following synthetic procedure H using 2-(2-bromo-6-nitrophenyl)-1-phenylethanol (0.100 g, 0.310 mmol), purification by silica gel column chromatography (CHCl3/petroleum ether 50:50) afforded the title compound as a solid (0.040 g, 0.125 mmol, 40% yield). M.p. 113−115 °C (EtOH). 1H NMR (DMSO-d6) δ 4.89 (s, 2H), 7.52−7.62 (m, 3H), 7.70 (t, J = 7.8 Hz, 1H), 8.05−8.10 (m, 4H) ppm. IR ν 1680 cm−1.
2-(4-Bromo-2-nitrophenyl)-1-phenylethanone (2.64). Following synthetic procedure H using 2-(4-bromo-2-nitrophenyl)-1-phenylethanol (0.100 g, 0.310 mmol), purification by silica gel column chromatography (CHCl3/petroleum ether 50:50) afforded the title compound as a solid (0.040 g, 0.125 mmol, 40% yield). M.p. 114−116 °C (EtOH). 1H NMR (DMSO-d6) δ 4.87 (s, 2H), 7.53−7.60 (m, 3H), 7.70 (t, J = 7.1 Hz, 1H), 7.96−7.98 (m, 1H), 8.05 (d, J = 7.4 Hz, 2H), 8.28−8.30 (m, 1H) ppm. IR ν 1686 cm−1.
2-(4-Fluoro-2-nitrophenyl)-1-phenylethanone (2.65). Following synthetic procedure H using 2-(4-fluoro-2-nitrophenyl)-1-phenylethanol (0.100 g, 0.383 mmol), purification by silica gel column chromatography (CHCl3/petroleum ether 50:50) afforded the title compound as a white solid (0.020 g, 0.077 mmol, 20% yield). M.p. 95−98 °C (EtOH). 1H NMR (DMSO-d6) δ 4.88 (s, 2H), 7.56−7.72 (m, 5H), 8.03−8.06 (m, 3H) ppm. IR ν 1680 cm−1.
N-(3-Chloro-2-methylphenyl)benzamide (2.66). Following synthetic procedure I using 3-chloro-2-methylaniline (6.68 g, 47.2 mmol), treatment with diethyl ether furnished the title compound (5.66 g, 23.0 mmol, 49% yield). M.p. 168−170 °C. Lit.61 170 °C. 1H NMR (CDCl3) δ 2.40 (s, 3H), 7.21 (t, J = 8.0 Hz, 1H), 7.26−7.29 (m, 1H), 7.51−7.55 (m, 2H), 7.58−7.62 (m, 1H), 7.75−7.80 (m, 2H; one proton disappeared after treatment with D2O), 7.90−7.92 (m, 2H) ppm. IR ν 1647, 3244 cm−1.
87
N-(3-Fluoro-2-methylphenyl)benzamide (2.67). Following synthetic procedure I using 3-fluoro-2-methylaniline (3.00 g, 24.0 mmol), purification by silica gel column chromatography (hexanes/EtOAc 67:33) afforded the title compound as a white solid (3.67 g, 16.0 mmol, 67% yield). M.p. 150−152 °C (EtOH). Lit.62 157−158 °C. 1H NMR (CDCl3) δ 2.25 (s, 3H), 6.93 (t, J = 9.0 Hz, 1H), 7.20−7.27 (m, 1H), 7.52 (t, J = 7.7 Hz, 2H), 7.59 (t, J = 7.3 Hz, 1H), 7.71−7.75 (m, 2H; one proton disappeared after treatment with D2O), 7.88−7.91 (m, 2H) ppm. IR ν 1670, 3230 cm−1.
N-(3-Methoxy-2-methylphenyl)benzamide (2.68). Following synthetic procedure I using 3-methoxy-2-methylaniline (2.00 g, 14.6 mmol), purification by silica gel column chromatography (hexanes/EtOAc 75:25) afforded the title compound as a yellow solid (2.73 g, 11.3 mmol, 77% yield). Mp: 173−175 °C (EtOH). Lit.63 177 °C. 1H NMR (DMSO-d6) δ 2.06 (s, 3H), 3.82 (s, 3H), 6.89 (d, J = 8.2 Hz, 1H), 6.94 (d, J = 7.8 Hz, 1H), 7.19 (t, J = 8.1 Hz, 1H), 7.53 (t, J = 7.6 Hz, 2H), 7.59 (t, J = 7.4 Hz, 1H), 7.98 (d, J = 7.2 Hz, 2H), 9.89 (br s, disappeared on treatment with D2O, 1H) ppm. IR ν 1649, 3229 cm−1.
N-(5-Chloro-2-methylphenyl)benzamide (2.69). Following synthetic procedure I using 5-chloro-2-methylaniline (7.16 g, 50.6 mmol), treatment with diethyl ether furnished the title compound as a white solid (7.25 g, 29.5 mmol, 58% yield). M.p. 125−127 °C (EtOH). Lit.64 121−123 °C.
N-(5-Methoxy-2-methylphenyl)benzamide (2.70). Following synthetic procedure I using 5-methoxy-2-methylaniline (1.38 g, 10.0 mmol), purification by silica gel column chromatography (CHCl3/EtOAc 95:5) afforded the title compound as a pink solid (2.00 g, 8.29 mmol, 83% yield). M.p. 113−115 °C (EtOH). 1H NMR (DMSO-d6) δ 2.17 (s, 3H), 3.74 (s, 3H), 6.77 (dd, J = 2.6 and 8.4 Hz, 1H), 6.98 (d, J = 2.6 Hz, 1H), 7.17 (d, J = 8.4 Hz, 1H), 7.53 (t, J = 7.6 Hz, 2H), 7.59 (t, J = 7.3 Hz, 1H), 7.98 (d, J = 7.1 Hz, 2H), 9.83 (br s, disappeared on treatment with D2O, 1H) ppm. IR ν 1650, 3299 cm−1.
N-(2-Methoxy-6-methylphenyl)benzamide (2.71). Following synthetic procedure I using 2-methoxy-6-methylaniline (2.00 g, 0.015 mmol), purification by silica gel column chromatography (hexanes/EtOAc 75:25) afforded the title compound as awhite solid (2.88 g, 11.9 mmol, 80% yield). M.p. 127−130 °C (EtOH). 1H NMR (DMSO-d6) δ 2.50 (s, 3H), 3.74 (s, 3H), 6.87−6.93 (m, 2H), 7.20 (t, J = 8.0 Hz, 1H), 7.49−7.60 (m, 3H), 8.00 (d, J = 7.3 Hz, 2H), 9.57 (br s, disappeared on treatment with D2O, 1H) ppm. IR ν 1647, 3360 cm−1.
1-(4-Bromophenyl)-2-(1-phenylethylidene)hydrazine (2.72). Following synthetic procedure J using (4-bromophenyl)hydrazine hydrochloride (3.71 g, 16.6 mmol), the title compound was obtained as a yellow solid (0.90 g, 0.311 mmol, 30% yield). M.p. 118−120 °C (EtOH). 1H NMR (CDCl3) δ 2.25 (s, 3H), 7.08 (d, J = 8.9 Hz, 2H), 7.35−7.41 (m, 6H; one proton disappeared after treatment with D2O), 7.83 (d, J = 8.5 Hz, 2H) ppm. IR ν 3353 cm−1.
1-(4-Chlorophenyl)-2-(1-phenylethylidene)hydrazine (2.73). Following synthetic procedure J using (4-chlorophenyl)hydrazine hydrochloride (2.23 g, 15.6 mmol), the title
88
compound was obtained as a brown solid (0.500 g, 2.04 mmol, 25% yield). M.p. 105−107 °C (EtOH). Lit.65 100−102 °C. 1H NMR (CDCl3) δ 2.25 (s, 3H), 7.12 (d, J = 8.8 Hz, 2H), 7.24 (d, J = 8.8 Hz, 2H), 7.31−7.35 (m, 2H; one proton disappeared after treatment with D2O), 7.40 (t, J = 7.0 Hz, 2H), 7.79 (d, J = 7.1 Hz, 2H) ppm. IR ν 3352 cm−1.
1-(4-Fluorophenyl)-2-(1-phenylethylidene)hydrazine (2.74). Following synthetic procedure J using (4-fluorophenyl)hydrazine hydrochloride (2.44 g, 15.0 mmol), the title compound was obtained as a yellow solid (2.44 g, 10.7 mmol, 95% yield). M.p. 110−112 °C (EtOH). Lit.66
107 °C. 1H NMR (DMSO-d6) δ 2.25 (s, 3H), 7.00−7.10 (m, 2H), 7.22−7.29 (m, 3H), 7.38 (t, J = 7.3 Hz, 2H), 7.78 (d, J = 7.2 Hz, 2H), 9.31 (br s, disappeared on treatment with D2O, 1H) ppm. IR ν 3380 cm−1.
1-(2-Bromophenyl)-2-(1-phenylethylidene)hydrazine (2.75). Following synthetic procedure J using (2-bromophenyl)hydrazine hydrochloride (3.35 g, 15.0 mmol), the title compound was obtained as a yellow solid (2.49 g, 8.61 mmol, 86% yield). M.p. >300 °C (EtOH). Spectral data were consistent with those reported in the literature.67
1-(2-Fluorophenyl)-2-(1-phenylethylidene)hydrazine (2.76). Following synthetic procedure J using (2-fluorophenyl)hydrazine hydrochloride (2.44 g, 15.0 mmol), the title compound was obtained as a yellow solid (1.55 g, 6.79 mmol, 68% yield). M.p. >300 °C (EtOH). 1H NMR (DMSO-d6) δ 2.32 (s, 3H), 6.79−6.84 (m, 1H), 7.13−7.17 (m, 2H), 7.34−7.43 (m, 3H), 7.56−7.59 (m, 1H), 7.80−7.83 (m, 2H), 8.64 (br s, disappeared on treatment with D2O, 1H) ppm. IR ν 3380 cm−1.
1-(2,3-Dichlorophenyl)-2-(1-phenylethylidene)hydrazine (2.77). Following synthetic procedure J using (2,3-dichlorophenyl)hydrazine hydrochloride (1.60 g, 7.49 mmol), the title compound was obtained as a white solid (1.11 g, 0.398 mmol, 79% yield). M.p. 112−115 °C. 1H NMR (DMSO-d6) δ 2.36 (s, 3H), 7.09 (dd, J = 1.4 and 7.9 Hz, 1H), 7.31 (t, J = 8.4, 1H), 7.37−7.45 (m, 3H), 7.60 (dd, J = 1.3 and 8.4 Hz, 1H), 7.84−7.87 (m, 2H), 8.40 (br s, disappeared on treatment with D2O, 1H) ppm. IR ν 3270 cm−1.
2.7.2 Molecular Modeling
All molecular modeling studies were performed on a MacPro dual 2.66 GHz Xeon running Ubuntu 14. The tubulin structure was downloaded from the Protein Data Bank (http://www.rcsb.org/, PDB codes: 1SA06 and 4O2A29).6 Ligand structures were built with MOE68 and minimized using the MMFF94x force field until an RMSD gradient of 0.05 kcal mol−1 Å−1 was reached. The docking simulations were performed using PLANTS26 on the 1SA0 crystal structure.
89
2.7.3 Biological Assay
Tubulin Assembly. The reaction mixtures contained 0.8 M monosodium glutamate (pH 6.6 with HCl in a 2 M stock solution), 10 µM tubulin, 4% (v/v) DMSO, and varying concentrations of drug. Following a 15 min preincubation at 30 °C, samples were chilled on ice, GTP to 0.4 mM was added, and turbidity development was followed at 350 nm in a temperature-controlled recording spectrophotometer for 20 min at 30 °C. The extent of reaction was measured. Full experimental details were previously reported.69
[3H]Colchicine Binding Assay. The reaction mixtures contained 1.0 µM tubulin, 5.0 µM [3H]colchicine, and 5.0 µM inhibitor and were incubated for 10 min at 37 °C. Complete details were described previously.70
Cell Cultures. Cell lines were obtained from the American Type Culture Collection (ATCC), unless otherwise specified. MCF-7 breast carcinoma, OVCAR-8, and NCI/ADR-RES cells were obtained from the National Cancer Institute drug screening laboratory, and NB4 cells and MV4−11 cells from the Deutsche Sammlung von Mikroorganismen and Zellkulturen. All cell lines, except as indicated, were grown in Dulbecco’s modified Eagle’s medium (DMEM) supplemented with 10% fetal bovine serum (FBS), 20 mM HEPES, 100 U/mL penicillin, 100 mg/mL streptomycin, and 1% L-glutamine; specific requirements include the addition of sodium pyruvate (1−2% for RD rhabdomyosarcoma, HepG2 hepatoma, and the three MDA breast carcinoma cell lines) and glucose (1 g/L for RD and HepG2, 4.5 g/L for PC3 prostate carcinoma). Cell lines were cultured at 37 °C in 5% CO2/95% air in a humidified incubator. Treatments were initiated 24 h after cell seeding using ATI compound diluted in 0.1% DMSO, the indicated reference compound, or 0.1% DMSO vehicle, for 24−72 h as indicated.
Cell Viability Assays. For MCF-7 breast carcinoma and OVCAR-8 and NCI/ADR-RES ovary carcinoma cells, the methodology for evaluation of growth was previously described, except that cells were grown for 96 h for IC50 determinations.71
MV4−11, NB4, A-549, NCI-H1975, Messa, and Messa/Dx5 cells were seeded into 96-well plates (Corning Inc., Costar) at a density of 2 × 10³ cells/well in 50 µL of the appropriate medium. For the MDA-MB-468, MDA-MB-436, and MDA-MB-231 breast carcinoma cell lines, the cells were plated in 100 µL of medium in 96-well plates at a density of 3.5 × 10³ cells/well for MDA-MB-468, 3 × 10³ cells/well for MDA-MB-436, and 2 × 10³ cells/well for MDA-MB-436. After 24 h, the cells were treated with the inhibitor (0.39−100 nM) and then evaluated in MTT assays as described.72 Statistical analysis was performed by analysis of variance (ANOVA) with Neumann−Keul’s multiple comparison test or the Kolmogorov−Smirnov test where appropriate.
For the PC-3, HepG2, and RD cell lines, the cells were seeded in 24-well plates at a density of 95 × 103 cells/100 µL well (PC-3 and RD) or 120 × 103 cells/100 µL well (HepG2). After 24 h, the test compound was added (0.01−25 µM) for 48 h. After removal of the

90
medium, MTT was added (500 µM final concentration in 500 µL/well of phosphate-buffered saline (PBS)) and incubation continued at 37 °C for 2 h in the dark. The formazan crystals were dissolved in 2-propanol containing 0.04 N HCl (200 µL). A550 in the wells was determined using a Multiskan Spectrum Thermo Electron Corp. reader. IC50 values were calculated by nonlinear regression analysis (GraphPad Prism statistics software). Experiments were performed in triplicate. For HeLa cells, 7 × 10³ cell aliquots were seeded in a flat-bottom 96-well tissue culture plate and, after 24 h, were exposed to the inhibitor (10−100 nM) for 24 or 48 h. MTT (10 µL, 5 mg/mL) (Sigma-Aldrich) was added to each well, and the cells were further incubated for 3 h at 37 °C. After solubilization of the crystals with 2-propanol/0.04 N HCl, A570 measurements were made with an ELISA reader, and IC50 values were derived from dose−response curves.
For the MV4−11, NB4 (AML), A-549, and NCI-H1975 (lung adenocarcinoma) cell lines, cell growth was measured using CellTiter-Flor (Promega), a nonlytic, single-reagent-addition fluorescence assay that detects the relative number of living cells in samples after experimental manipulation. The CellTiter-Fluor cell viability assay measures the conserved and constitutive protease activity within live cells and, therefore, acts as a marker for cell viability. NB4 and MV4−11 cells in exponential growth were incubated for 48 h with different concentrations of the inhibitors. After 48 h, CellTiter-Fluor reagent was added to the cell culture medium (1:1, v/v) and incubated for at least 90 min at 37 °C. A549 and NCI-H1975 cells were treated with the inhibitor for 72 h, and then CellTiter-Fluor reagent was added to one-fifth of the culture medium volume. Fluorescence was recorded (excitation wavelength, 360 nm; emission wavelength, 535 nm), and the IC50 was calculated using GraphPad software.
For the Messa and Messa/Dx5 (resistant) sarcoma cell lines, the CellTiter-Glo luminescent cell viability assay was used (Promega, Madison, WI). Cells in exponential growth were incubated for 72 h with different concentrations of the inhibitor, and then the same volume of CellTiter-Glo reagent was added. The solution was stirred for 2 min to induce cell lysis. Luminescence was recorded after an additional 10 min. IC50 values were calculated using nonlinear regression analysis (GraphPad Prism statistics software).
For T98G and U343MG cells, growth was measured by a colorimetric MTS conversion assay, as previously reported.23
For D283 medulloblastoma cells, 3 × 10⁵ D283 cells/well were plated in a 24-multiwell dish. After 24 h, ATI derivative 2.41 or 2.78 (1 µM) was added to the cells for the indicated time. Viability was evaluated with a trypan blue assay.
Antibodies and Immunostaining. The following unconjugated monoclonal antibodies (mAb’s) were used for immunostaining: anti-MICA (MAB159227), anti-MICB (MAB236511), anti-ULBP1 (MAB170818), anti-ULBP2 (MAB165903), and anti-ULBP3 (MAB166510) from R&D Systems (Minneapolis, MN), anti-PVR (SKII.4) kindly provided
91
by Prof M. Colonna (Washington University, St Louis, MO), anti-Nec-2 (R2.525) from BD Pharmingen (San Diego, CA), and allophycocyanin (APC)-conjugated goat affinity purified F(ab′)2 fragment to mouse IgG (GAM) from Jackson ImmunoResearch Laboratories (West Grove, PA).
Flow Cytometry Analysis. A total of 3 × 10⁵ HeLa cells were seeded in tissue culture dishes. After ATI treatment, cell numbers were counted using a Z1 Coulter particle counter (Beckman Coulter). Cell cycle phase distribution was analyzed in permeabilized cells incubated with PI (Sigma-Aldrich P4170, 0.04 mg/mL). SS and FL-3 parameters were acquired on a linear amplification scale, and FS and Fl2 on a log scale. Cell aggregates were gated out on the biparametric graph FL-3lin/ratio. Apoptosis was determined as the proportion of cells exhibiting a DNA content lower than 2 N after gating out cell debris on the biparametric graph FS/SS using the WinMDI software. Cell death was analyzed in 200 000 cell aliquots in binding buffer (10 mM HEPES/NaOH, pH 7.4, 140 mM NaCl, 2.5 mM CaCl2) incubated with annexin V−FITC (Immunological Sciences, IK-11120) alone or annexin V−FITC in combination with PI in the absence of permeabilizing agents. Cell samples were analyzed in a Coulter Epics XL cytofluorometer (Beckman Coulter) equipped with EXPO 32 ADC software. At least 10 000 cells per sample were acquired.
IF and Image Analysis. Cells were seeded on sterile polylysine-coated coverslips placed in tissue culture plates. After treatment with ATI or vinblastine, as indicated, the cells were fixed with 3.7% para-formaldehyde in PBS for 10 min at room temperature and then permeabilized in 0.1% Triton-X100 in PBS for 5 min. Blocking and antibody reactions were carried out in PBS/0.05% Tween 20 containing 3% BSA at room temperature using mouse anti-α-tubulin (1:2000, B-5-1-2, Sigma-Aldrich) followed by FITC-conjugated goat antimouse IgG (Jackson ImmunoResearch Laboratories). Chromosomal DNA was stained with 4,6-diamidino-2-phenylindole (DAPI; 0.1 µg/mL) and mounted in Vectashield (Vector Laboratories). Images were analyzed using a Nikon Eclipse 90i microscope equipped with a Qicam Fast 1394 CCD camera (Qimaging). To resolve MT remnants or unstructured tubulin foci, some of the acquired images were deconvoluted and analyzed using the extended depth of focus on Z-serial optical sections using a Nis-Elements AR 4.2 (Nikon).
IF and Flow Cytometry Ligand Analysis. NKG2D and DNAM-1 ligand surface expression on HeLa cells was analyzed by IF staining using anti-MICA, anti-MICB, anti-ULBP1/2/3, anti-PVR, or anti-Nec2 unconjugated mAb’s, followed by secondary GAM/APC. Samples were analyzed using a FACSCanto II (BD Biosciences, San Jose, CA). Flow cytometric analysis was performed using the FlowJo software, version 8.8.7 (TreeStar, Ashland, OR).
Degranulation Assay. NK cell-mediated cytotoxicity was evaluated using the degranulation lysosomal marker CD107a as previously described.73 As a source of effector cells, we used human peripheral blood mononuclear cells (PBMCs) isolated from healthy donors by Lymphoprep (Nycomed, Oslo, Norway) gradient centrifugation and then
92
cocultured for 10 days with an irradiated (30 Gy) Epstein−Barr virus (EBV)-transformed B-cell line. Cells were grown in RPMI 8866 at 37 °C in a humidified 5% CO2 atmosphere. On day 10, the cell population was routinely more than 90% CD56+CD16+CD3−, as assessed by IF and flow cytometric analysis. After a 48 h treatment with 2.30 or 2.41, HeLa cells were incubated with activated NK cells at effector:target (E:T) ratios of 1:1 in a flat-bottom 96-well tissue culture plate in complete medium (DMEM (Life Technologies, Gaithersburg, MD) supplemented with 10% FCS). The plates were incubated at 37 °C in a 5% CO2 atmosphere for 2 h. Thereafter, the cells were washed with PBS and incubated with anti-CD107a/APC (or cIgG/APC) for 45 min at 4 °C. The cells were also stained with anti-CD3/FITC and anti-CD56/PE to gate the CD3−CD56+ NK cell population.
Real-Time PCR. MICA, MICB, ULBP1, ULBP2, ULBP3, and PVR mRNA expression was analyzed by real-time PCR. Total RNA from HeLa cells was extracted using Trizol (Invitrogen) after a maximum of 24 h of drug treatment. Total RNA (1 µg) was used for cDNA first-strand synthesis using oligo-dT (Promega, Madison, WI) in a 25 µL reaction volume. To analyze ligand mRNA expression, the cDNA was amplified in triplicate with the following primers: Hs00792952_m1 for MICA, Hs00792952_m1 for MICB, Hs00197846_m1 for PVR, Hs00607609_m1 for ULBP2, Hs00225909_m1 for ULBP3, and Hs99999903_m1 for β-actin, all conjugated with fluorochrome FAM (Applied Biosystems). The level of ligand expression was measured using the threshold cycle value (Ct). The ΔCt was obtained by subtracting the Ct value of the gene of interest (MICA, MICB, or PVR) from the housekeeping gene (β-actin) Ct value. We used ΔCt of the NT sample as the calibrator. The fold change was calculated according to the formula 2−ΔΔCt, where ΔΔCt was the difference between ΔCt of the sample and that of the calibrator (according to the formula, the value of the calibrator in each run is 1).
Hh-Dependent Luciferase Reporter Assay. The luciferase assay was performed in Shh-Light II (Shh-LII) cells, stably incorporating a Gli-responsive luciferase reporter and the pRL-TK Renilla (normalization control), treated for 48 h with SAG (200 nM) and the studied com- pounds. Luciferase and Renilla activity were assayed with a dual-luciferase assay system according to the manufacturer’s instructions (Promega, Madison, WI). The results are expressed as luciferase/Renilla ratios and represent the mean ± SD of three experiments, each performed in triplicate.
LC−MS/MS Analytical Method. Samples were analyzed under the following conditions: UFLC (Shimadzu) AC20 coupled with an API 3200 triple-quadrupole (ABSciex); eluents, (phase A) 95% water, 5% acetonitrile + 0.1% formic acid, (phase B) 5% water, 95% acetonitrile + 0.1% formic acid; flow rate, 0.3 mL/min; column, Gemini-Nx 5 µm C18 110A (50 × 2.00 mm) at 35 °C; injection volume, 5 µL. LC−MS/MS analyses were carried out using an ESI(+) interface in multiple reaction monitoring mode.
93
Metabolic Stability. Compounds 2.30 and 2.41 were dissolved in DMSO in duplicate at a final concentration of 1 µM and preincubated for 10 min at 37 °C in potassium phosphate buffer (pH 7.4), 3 mM MgCl2, with human or mouse liver microsomes (Xenotech) at a final concentration of 0.5 mg/mL. After the preincubation period, the reactions were started by adding the cofactor mixture (NADP, Glc6P, G6P-DH). Samples were taken at times 0, 10, 20, 30, and 60 min. Acetonitrile was added to stop the reaction and centrifuged. Supernatants were analyzed and quantified by LC−MS/MS. A control sample without cofactors was always added to check the stability of the test compounds in the reaction mixtures. The reference standards were 7-ethoxycoumarin and propranolol. A fixed concentration of verapamil was added in every sample as an internal standard for LC−MS/MS. The percentage of the area of the test compound remaining at the various incubation times was calculated with respect to the area of the compound at time 0 min. The rate constant, k (min-1), derived for the exponential decay equation (peak area/IS vs time) was used to calculate the rate of intrinsic clearance (CL) of the compound using the following equation:
CL (µL/min /mg of protein) = (k/microsomal concn) × 103 Aqueous Solubility. The solubilities of compounds 2.30 and 2.41 were measured using a
high-throughput screening assay format. Samples prepared at the target concentration of 200 µM were placed in a 96-well filter plate and incubated at room temperature for 90 min. The plate was then filtered, and solutions were analyzed by LC−MS/MS. Final concentrations were evaluated by comparing the area under the curve of the MeOH stock solution with those of the test compound solutions.
94
2.8 References
1. Bhalla, K. N. Microtubule-targeted anticancer agents and apoptosis. Oncogene 2003, 22, 9075−9086.
2. Jordan, M. A.; Wilson, L. Microtubules as a target for anticancer drugs. Nat. Rev. Cancer 2004, 4, 253−265.
3. Teicher, B. A. Newer cytotoxic agents: attacking cancer broadly. Clin. Cancer Res. 2008, 14, 1610−1617.
4. Honore, S.; Pasquier, E.; Braguer, D. Understanding microtubule dynamics for improved cancer therapy. Cell. Mol. Life Sci. 2005, 62, 3039−3056.
5. Bhattacharyya, B.; Panda, D.; Gupta, S.; Banerjee, M. Anti-mitotic activity of colchicine and the structural basis for its interaction with tubulin. Med. Res. Rev. 2008, 28, 155−183.
6. Ravelli, R. B.; Gigant, B.; Curmi, P. A.; Jourdain, I.; Lachkar, S.; Sobel, A.; Knossow, M. Insight into tubulin regulation from a complex with colchicine and a stathmin-like domain. Nature 2004, 428, 198−202.
7. Lin, M. C.; Ho, H. H.; Pettit, G. R.; Hamel, E. Antimitotic natural products combretastatin A-4 and combretastatin A-2: studies on the mechanism of their inhibition of the binding to colchicine to tubulin. Biochemistry 1989, 28, 6984−6991.
8. Pellegrini, F.; Budman D. R. Review: tubulin function, action of antitubulin drugs, and new drug development. Cancer InVest. 2005, 23, 264−273.
9. Iyer, S.; Chaplin, D. J.; Rosenthal, D. S.; Boulares, A. H.; Li, L.-Y.; Smulson, M. E. Induction of apoptosis in proliferating human endothelial cells by the tumor-specific antiangiogenesis agent combretastatin A-4. Cancer Res. 1998, 58, 4510−4514.
10. Nogales, E.; Whittaker, M.; Milligan, R. A.; Downing, K. H. High-resolution model of the microtubule. Cell 1999, 96, 79−88.
11. Nettles, J. H.; Li, H.; Cornett, B.; Krahn, J. M.; Snyder, J. P.; Downing, K. H. The binding mode of epothilone A on alpha, beta-tubulin by electron crystallography. Science 2004, 305, 866−869.
12. Buey, R. M.; Calvo, E.; Barasoain, I.; Pineda, O.; Edler, M. C.; Matesanz, R.; Cerezo, G.; Vanderwal, C. D.; Day, B. W.; Sorensen, E. J.; Lopez, J. A.; Andreu, J. M.; Hamel, E.; Diaz, J. F. Cyclostreptin binds covalently to microtubule pores and lumenal taxoid binding sites. Nat. Chem. Biol. 2007, 3, 117−125.
13. Schmidt, M.; Bastians, H. Mitotic drug targets and the development of novel anti-mitotic anticancer drugs. Drug Resist. Updates 2007, 10, 162−181.
14. http://www.baxter-oncology.com/english/projects/index.html. 15. Gastpar, R.; Goldbrunner, M.; Marko, D.; von Angerer, E. Methoxy-substituted 3-
formyl-2-phenylindoles inhibit tubulin polymerization. J. Med. Chem. 1998, 41, 4965−4972.
95
16. Medarde, M.; Ramos, A.; Caballero, E.; Peláz-Lamamié de Clairac, R.; López, J. L.; García Grávalos, D.; San Feliciano, A. Synthesis and antineoplastic activity of combretastatin analogues: heterocom- bretastatins. Eur. J. Med. Chem. 1998, 33, 71−77.
17. Flynn, B. L., Hamel, E.; Jung, M. K. One-pot synthesis of benzo-[b]furan and indole inhibitors of tubulin polymerization. J. Med. Chem. 2002, 45, 2670−2673.
18. De Martino, G.; La Regina, G.; Coluccia, A.; Edler, M. C.; Barbera, M. C.; Brancale, A.; Wilcox, E.; Hamel, E.; Artico, M.; Silvestri, R. Arylthioindoles, potent inhibitors of tubulin polymerization. J. Med. Chem. 2004, 47, 6120−6123.
19. De Martino, G.; Edler, M. C.; La Regina, G.; Coluccia, A.; Barbera, M. C.; Barrow, D.; Nicholson, R. I.; Chiosis, G.; Brancale, A.; Hamel, E.; Artico, M.; Silvestri, R. New arylthioindoles: potent inhibitors of tubulin polymerization. 2. Structure−activity relationships and molecular modeling studies. J. Med. Chem. 2006, 49, 947−954.
20. La Regina, G.; Edler, M. C.; Brancale, A.; Kandil, S.; Coluccia, A.; Piscitelli, F.; Hamel, E.; De Martino, G.; Matesanz, R.; Díaz, J. F.; Scovassi, A. I.; Prosepri, E.; Lavecchia, A.; Novellino, E.; Artico, M.; Silvestri, R. Arylthioindole inhibitors of tubulin polymerization. 3. Biological evaluation, structure−activity relationships and molecular modeling studies. J. Med. Chem. 2007, 50, 2865−2874.
21. La Regina, G.; Sarkar, T.; Bai, R.; Edler, M. C.; Saletti, R.; Coluccia, A.; Piscitelli, F.; Minelli, L.; Gatti, V.; Mazzoccoli, C.; Palermo, V.; Mazzoni, C.; Falcone, C.; Scovassi, A. I.; Giansanti, V.; Campiglia, P.; Porta, A.; Maresca, B.; Hamel, E.; Brancale, A.; Novellino, E.; Silvestri, R. New arylthioindoles and related bioisosteres at the sulfur bridging group. 4. Synthesis, tubulin polymerization, cell growth inhibition, and molecular modeling studies. J. Med. Chem. 2009, 52, 7512−7527.
22. La Regina, G.; Bai, R.; Rensen, W.; Coluccia, A.; Piscitelli, F.; Gatti, V.; Bolognesi, A.; Lavecchia, A.; Granata, I.; Porta, A.; Maresca, B.; Soriani, A.; Iannitto, M. L.; Mariani, M.; Santoni, A.; Brancale, A.; Ferlini, C.; Dondio, G.; Varasi, M.; Mercurio, C.; Hamel, E.; Lavia, P.; Novellino, E.; Silvestri, R. Design and synthesis of 2-heterocyclyl-3-arylthio-1H-indoles as potent tubulin polymerization and cell growth inhibitors with improved metabolic stability. J. Med. Chem. 2011, 54, 8394−8406.
23. La Regina, G.; Bai, R.; Rensen, W. M.; Di Cesare, E.; Coluccia, A.; Piscitelli, F.; Famiglini, V.; Reggio, A.; Nalli, M.; Pelliccia, S.; Da Pozzo, E.; Costa, B.; Granata, I.; Porta, A.; Maresca, B.; Soriani, A.; Iannitto, M. L.; Santoni, A.; Li, J.; Cona, M. M.; Chen, F.; Ni, Y.; Brancale, A.; Dondio, G.; Vultaggio, S.; Varasi, M.; Mercurio, C.; Martini, C.; Hamel, E.; Lavia, P.; Novellino, E.; Silvestri, R. Towards highly potent cancer agents by modulating the C-2 group of the arylthioindole class of tubulin polymerization inhibitors. J. Med. Chem. 2013, 56, 123−149.
24. Liou, J.-P.; Chang, Y.-L.; Kuo, F.-M.; Chang, C.-W.; Tseng, H.-Y.; Wang, C.-C.; Yang, Y.-N.; Chang, J.-Y.; Lee, S.-J.; Hsieh, H.-P. Concise synthesis and structure-activity
96
relationships of combretastatin A-4 analogues, 1-aroylindoles, and 3-aroylindoles as novel classes of potent antitubulin agents. J. Med. Chem. 2004, 47, 4247−4257.
25. La Regina, G.; Bai, R.; Coluccia, A.; Famiglini, V.; Pelliccia, S.; Passacantilli, S.; Mazzoccoli, C.; Ruggieri, V.; Verrico, A.; Miele, A.; Monti, L.; Nalli, M.; Alfonsi, R.; Di Marcotullio, L.; Gulino, A.; Ricci, B.; Soriani, A.; Santoni, A.; Caraglia, M.; Porto, S.; Da Pozzo, E.; Martini, C.; Brancale, A.; Marinelli, L.; Novellino, E.; Vultaggio, S.; Varasi, M.; Mercurio, C.; Bigogno, C.; Dondio, G.; Hamel, E.; Lavia, P.; Silvestri, R. New indole tubulin assembly inhibitors cause stable arrest of mitotic progression, enhanced stimulation of natural killer cell cytotoxic activity, and repression of Hedgehog-dependent cancer. J. Med. Chem. 2015, 58, 5789−5807.
26. Korb, O.; Stutzle, T.; Exner, T. E. PLANTS: Application of ant colony optimization to structure-based drug design. In Ant Colony Optimization and Swarm Intelligence, Proceedings of the 5th International Workshop, ANTS; Dorigo, M.; Gambardella, L. M.; Birattari, M.; Martinoli, A.; Poli, R.; Stutzle, T.; Eds. Lecture Notes in Computer Science, Series 4150; Springer: Berlin, 2006; pp 247−258.
27. Coluccia, A.; Sabbadin, D.; Brancale, A. Molecular modeling studies on arylthioindoles, as potent inhibitors of tubulin polymerization. Eur. J. Med. Chem. 2011, 46, 3519−3525.
28. La Regina, G.; Gatti, V.; Famiglini, V.; Piscitelli, F.; Silvestri, R. Venting-while-heating microwave-assisted synthesis of 3-arylthioindoles. ACS Comb. Sci. 2012, 14, 258−262.
29. Chapleo, C. B.; Butler, R. C. M.; England, D. C.; Myers, P. L.; Roach, A. G.; Smith, C. F. C.; Stillings, M. R.; Tulloch, I. F. Heteroaromatic analogs of the α2-adrenoreceptor partial agonist clonidine. J. Med. Chem. 1989, 32, 1627−1630.
30. Erker, T. Chemistry of thieno-annelated O,N- and S,N-containing heterocyclic compounds. Part 14. Syntheses of thieno[2,3-b][1,4]-thiazepine derivatives with calcium antagonistic activity. Sci. Pharm. 1996, 64, 345−352.
31. Kermack, W. O.; Perkin, W. H., Jr.; Robinson, R. Harmine and harmaline. V. Synthesis of norharman. J. Chem. Soc., Trans. 1921, 119, 1602−1642.
32. Houlihan, W. J.; Parrino, V. A.; Uike, Y. Lithiation of N-(2-alkylphenyl)alkanamides and related compounds. A modified Madelung indole synthesis. J. Org. Chem. 1981, 46, 4511−4515.
33. La Regina, G.; Gatti, V.; Piscitelli, F.; Silvestri, R. Open vessel and cooling while heating microwave-assisted synthesis of pyridinyl N-aryl hydrazones. ACS Comb. Sci. 2011, 13, 2−6.
34. Robinson, B. The Fischer Indole Synthesis; J. Wiley and Sons: Chichester, U.K., 1982. 35. Prota, A. E.; Danel, F.; Bachmann, F.; Bargsten, K.; Buey, R. M.; Pohlmann, J.; Reinelt,
S.; Lane, H.; Steinmetz, M. O. The novel microtubule-destabilizing drug BAL27862 binds to the colchicine site of tubulin with distinct effects on microtubule organization. J. Mol. Biol. 2014, 426, 1848−18609.
97
36. Friesner, R. A.; Murphy, R. B.; Repasky, M. P.; Frye, L. L.; Greenwood, J. R.; Halgren, T. A.; Sanschagrin, P. C.; Mainz, D. T. Extra Precision Glide: Docking and Scoring Incorporating a Model of Hydrophobic Enclosure for Protein-Ligand Complexes. J. Med. Chem. 2006, 49, 6177−6196.
37. Small-Molecule Drug Discovery Suite 2015−2: Glide, version 6.7; Schrödinger, LLC: New York, 2015.
38. Morris, G. M.; Huey, R.; Lindstrom, W.; Sanner, M. F.; Belew, R. K.; Goodsell, D. S.; Olson, A. J. Autodock4 and AutoDockTools4: automated docking with selective receptor flexiblity. J. Comput. Chem. 2009, 30, 2785−2791.
39. Cavenee, W. K. Accumulation of genetic defects during astrocytoma progression. Cancer 1992, 70, 1788−1793.
40. Ishii, N.; Maier, D.; Merlo, A.; Tada, M.; Sawamura, Y.; Diserens, A. C.; Van Meir, E. G. Frequent co-alterations of TP53, p16/CDKN2A, p14ARF, PTEN tumor suppressor genes in human glioma cell lines. Brain Pathol. 1999, 9, 469−479.
41. Simonart, T.; Andrei, G.; Parent, D.; Van Vooren, J. P.; De Clercq, E.; Snoeck, R. In vitro sensitivity of Kaposi’s sarcoma cells to various chemotherapeutic agents including acyclic nucleoside phosphonates. Antiviral Chem. Chemother. 1999, 10, 129−134.
42. Ryu, H. H.; Jung, S.; Jung, T. Y.; Moon, K. S.; Kim, I. Y.; Jeong, Y. I.; Jin, S. G.; Pei, J.; Wen, M.; Jang, W. Y. Role of metallothionein 1E in the migration and invasion of human glioma cell lines. Int. J. Oncol. 2012, 41, 1305−1313.
43. Zhang, C.; Wang, Y.; Zhou, Z.; Zhang, J.; Tian, Z. Sodium butyrate upregulates expression of NKG2D ligand MICA/B in HeLa and HepG2 cell lines and increases their susceptibility to NK lysis. Cancer Immunol. Immunother. 2009, 58, 1275−1285.
44. La Regina, G.; Bai, R.; Coluccia, A.; Famiglini, V.; Pelliccia, S.; Passacantilli, S.; Mazzoccoli, C.; Ruggieri, V.; Sisinni, L.; Bolognesi, A.; Rensen, W. M.; Miele, A.; Nalli, M.; Alfonsi, R.; Di Marcotullio, L.; Gulino, A.; Brancale, A.; Novellino, E.; Dondio, G.; Vultaggio, S.; Varasi, M.; Mercurio, C.; Hamel, E.; Lavia, P.; Silvestri, R. New pyrrole derivatives with potent tubulin polymerization inhibiting activity as anticancer agents including Hedgehog-dependent cancer. J. Med. Chem. 2014, 57, 6531−6552.
45. Bryceson, Y. T.; March, M. E.; Barber, D. F.; Ljunggren, H. G.; Long, E. O. Cytolytic granule polarization and degranulation controlled by different receptors in resting NK cells. J. Exp. Med. 2005, 202, 1001−1012.
46. MacDonald, T. J.; Aguilera, D.; Castellino, R. C. The rationale for targeted therapies in medulloblastoma. Neuro Oncol. 2014, 16, 9−20.
47. Amakye, D.; Jagani, Z.; Dorsch, M. Unraveling the therapeutic potential of the Hedgehog pathway in cancer. Nat. Med. 2013, 19, 1410−1422.
98
48. Guilarte, V.; Castroviejo, M. P.; Garcia-Garcia, P.; Fernandez- Rodriguez, M. A.; Sanz, R. Approaches to the synthesis of 2,3-dihaloanilines. Useful precursors of 4-functionalized-1H-indoles. J. Org. Chem. 2011, 76, 3416−3437.
49. Suzuki, N.; Yasaki, S.; Yasuhara, A.; Sakamoto, T. Convenient indole synthesis from 2-iodoanilines and terminal alkynes by the sequential Sonogashira reaction and the cyclization reaction promoted by tetrabutylammonium fluoride (TBAF). Chem. Pharm. Bull. 2003, 51, 1170−1173.
50. Deprez, N. R.; Kalyani, D.; Krause, A.; Sanford, M. S. Room temperature palladium-catalyzed 2-arylation of indoles. J. Am. Chem. Soc. 2006, 128, 4972−4973.
51. Davies, I. W.; Smitrovich, J. H.; Sidler, R.; Qu, C.; Gresham, V.; Bazaral, C. A highly active catalyst for the reductive cyclization of ortho-nitrostyrenes under mild conditions. Tetrahedron 2005, 61, 6425−6437.
52. Maizuru, N.; Inami, T.; Kurahashi, T.; Matsubara, S. Nickel-catalyzed cycloaddition of anthranilic acid derivatives to alkynes. Org. Lett. 2011, 13, 1206−1209.
53. Kaczor, A. A.; Kronbach, C.; Unverferth, K.; Pihlaja, K.; Wiinamaki, K.; Sinkkonen, J.; Kijkowska-Murak, U.; Wrobel, T.; Stachal, T.; Matosiuk, D. Novel non-competitive antagonists of kainate GluK1/GluK2 receptors. Lett. Drug Des. Discovery 2012, 9, 891−898.
54. Valois-Escamilla, I.; Alvarez-Hernandez, A.; Rangel-Ramos, L. F.; Suarez-Castillo, O. R.; Ayala-Mata, F.; Zepeda-Vallejo, G. Synthesis of 6-bromo-2-arylindoles using 2-iodobenzoic acid as precursor. Tetrahedron Lett. 2011, 52, 3726−3728.
55. Wang, H.; Li, Y.; Jiang, L.; Zhang, R.; Jin, K.; Zhao, D.; Duan, C. Ready synthesis of free N-H 2-arylindoles via the copper-catalyzed amination of 2-bromo-arylacetylenes with aqueous ammonia and sequential intramolecular cyclization. Org. Biomol. Chem. 2011, 9, 4983−4986.
56. Shen, M.; Leslie, B. E.; Driver, T. G. Dirhodium(II)-catalyzed intramolecular C-H amination of aryl azides. Angew. Chem., Int. Ed. 2008, 47, 5056−5059.
57. Carlin, R. B.; Larson, G. W. The Fischer indole synthesis. IV. Halogen interchange during zinc halide induced Fischer reactions of acetophenone 2,6-dihalophenylhydrazones. J. Am. Chem. Soc. 1957, 79, 934−941.
58. Da Settimo, F.; Simorini, F.; Taliani, S.; La Motta, C.; Marini, A. M.; Salerno, S.; Bellandi, M.; Novellino, E.; Greco, G.; Cosimelli, B.; Da Pozzo, E.; Costa, B.; Simola, N.; Morelli, M.; Martini, C. Anxiolytic-like effects of N,N-dialkyl-2-phenylindol-3-ylglyoxylamides by modulation of translocator protein promoting neurosteroid biosynthesis. J. Med. Chem. 2008, 51, 5798−5806.
59. Sridharan, V.; Perumal, S.; Avendano, C.; Menendez, J. C. Microwave-assisted, solvent-free Bischler indole synthesis. Synlett 2006, 1, 91−95.
99
60. Candito, D. A.; Lautens, M. Exploiting the chemistry of strained rings: synthesis of indoles via domino reaction of aryl iodides with 2H-azirines. Org. Lett. 2010, 12, 3312−3315.
61. Wibaut, J. P. Quantitative researches on the nitration of chlorotoluenes. Recl. Trav. Chim. Pays-Bas Belg. 1913, 32, 244−320.
62. Barben, I. K.; Suschitzky, H. Heterocyclic fluorine compounds. IV. Monofluoroindazoles. J. Chem. Soc. 1960, 672−676.
63. Ruggli, P.; Leonhardt, W.; Isatogens, V. Hydroxyhydroquinol derivatives of the isatogen series. Helv. Chim. Acta 1924, 7, 689−702.
64. Katritzky, A. R.; Hayden, A. E.; Kirichenko, K.; Pelphrey, P.; Ji, Y. A Novel route to imidoylbenzotriazoles and their application for the synthesis of enaminones. J. Org. Chem. 2004, 69, 5108−5111.
65. Ghiglieri-Bertez, C.; Coquelet, C.; Alazet, A.; Bonne, C. Dual inhibitors of the cyclooxygenase and lipoxygenase pathways: synthesis and activity of hydrazone derivatives. Eur. J. Med. Chem. 1987, 22, 147−152.
66. Suschitzky, H. Fluorine-substituted phenylhydrazines. J. Chem. Soc. 1953, 3326−3327. 67. Woelfle, H.; Kopacka, H.; Wurst, K.; Preishuber-Pfluegl, P.; Bildstein, B. On the way to
biodegradable poly(hydroxyl butyrate) from propylene oxide and carbon monoxide via β-butyrolactone: Multisite catalysis with newly designed chiral indole-imino chromium(III) complexes. J. Organomet. Chem. 2009, 694, 2493−2512.
68. Molecular Operating Environment (MOE 2007.09); Chemical Computing Group, Inc.: Montreal, Quebec, Canada.
69. Hamel, E. Evaluation of antimitotic agents by quantitative comparisons of their effects on the polymerization of purified tubulin. Cell Biochem. Biophys. 2003, 38, 1−21.
70. Verdier-Pinard, P.; Lai, J.-Y.; Yoo, H.-D.; Yu, J.; Marquez, B.; Nagle, D. G.; Nambu, M.; White, J. D.; Falck, J. R.; Gerwick, W. H.; Day, B. W.; Hamel, E. Structure−activity analysis of the interaction of curacin A, the potent colchicine site antimitotic agent, with tubulin and effects of analogs on the growth of MCF-7 breast cancer cells. Mol. Pharmacol. 1998, 35, 62−76.
71. Monks, A.; Scudiero, D.; Skehan, P.; Shoemaker, R.; Paull, K.; Vistica, D.; Hose, C.; Langley, J.; Cronise, P.; Vaigro-Wolff, A.; Gray-Goodrich, M.; Campbell, H.; Mayo, J.; Boyd, M. Feasibility of a high-flux anticancer drug screen using a diverse panel of cultured human tumor-cell lines. J. Natl. Cancer Inst. 1991, 83, 757−766.
72. Caraglia, M.; Marra, M.; Leonetti, C.; Meo, G.; D'Alessandro, A. M.; Baldi, A.; Santini, D.; Tonini, G.; Bertieri, R.; Zupi, G.; Budillon, A.; Abbruzzese, A. R115777 (Zarnestra)/Zoledronic acid (Zometa) cooperation on inhibition of prostate cancer proliferation is paralleled by Erk/Akt inactivation and reduced Bcl-2 and Bad phosphorylation. J. Cell. Physiol. 2007, 211, 533−543.
100
73. Soriani, A.; Iannitto, M. L.; Ricci, B.; Fionda, C.; Malgarini, G.; Morrone, S.; Peruzzi, G.; Ricciardi, M. R.; Petrucci, M. T.; Cippitelli, M.; Santoni, A. Reactive oxygen species- and DNA damage response-dependent NK cell activating ligand upregulation occurs at transcriptional levels and requires the transcriptional factor E2F1. J. Immunol. 2014, 193, 950−960.
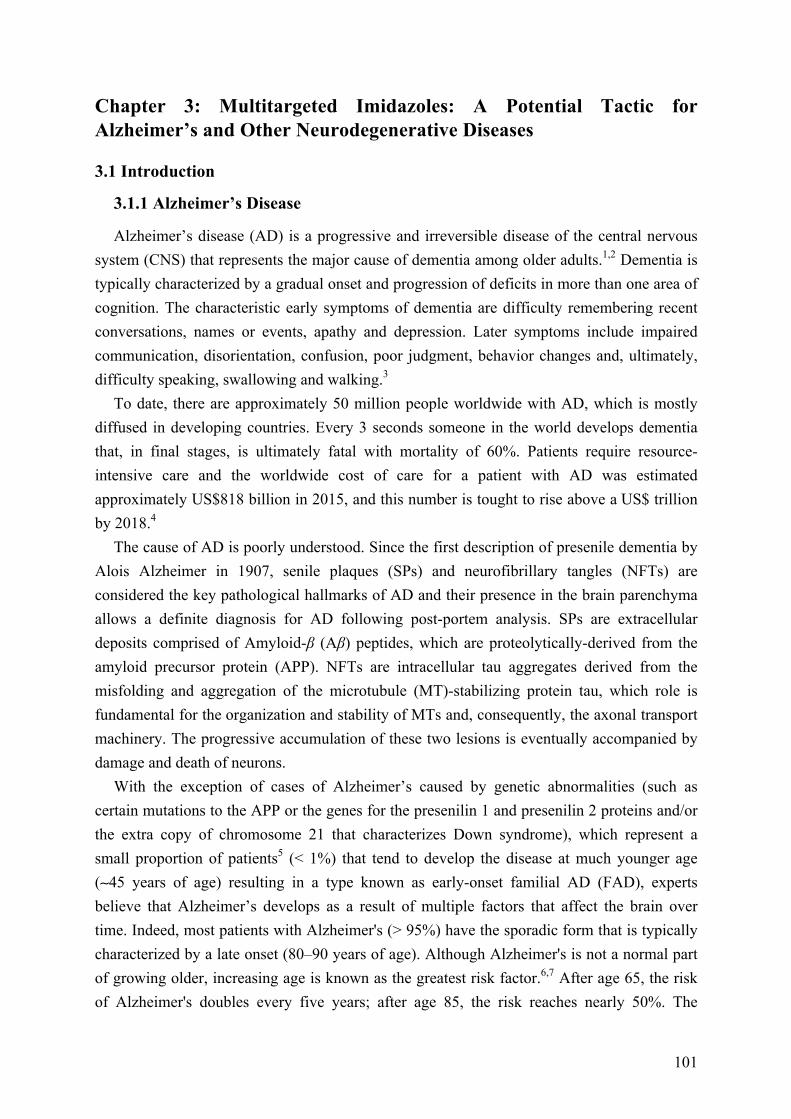
101
Chapter 3: Multitargeted Imidazoles: A Potential Tactic for Alzheimer’s and Other Neurodegenerative Diseases
3.1 Introduction
3.1.1 Alzheimer’s Disease
Alzheimer’s disease (AD) is a progressive and irreversible disease of the central nervous system (CNS) that represents the major cause of dementia among older adults.1,2 Dementia is typically characterized by a gradual onset and progression of deficits in more than one area of cognition. The characteristic early symptoms of dementia are difficulty remembering recent conversations, names or events, apathy and depression. Later symptoms include impaired communication, disorientation, confusion, poor judgment, behavior changes and, ultimately, difficulty speaking, swallowing and walking.3
To date, there are approximately 50 million people worldwide with AD, which is mostly diffused in developing countries. Every 3 seconds someone in the world develops dementia that, in final stages, is ultimately fatal with mortality of 60%. Patients require resource-intensive care and the worldwide cost of care for a patient with AD was estimated approximately US$818 billion in 2015, and this number is tought to rise above a US$ trillion by 2018.4
The cause of AD is poorly understood. Since the first description of presenile dementia by Alois Alzheimer in 1907, senile plaques (SPs) and neurofibrillary tangles (NFTs) are considered the key pathological hallmarks of AD and their presence in the brain parenchyma allows a definite diagnosis for AD following post-portem analysis. SPs are extracellular deposits comprised of Amyloid-β (Aβ) peptides, which are proteolytically-derived from the amyloid precursor protein (APP). NFTs are intracellular tau aggregates derived from the misfolding and aggregation of the microtubule (MT)-stabilizing protein tau, which role is fundamental for the organization and stability of MTs and, consequently, the axonal transport machinery. The progressive accumulation of these two lesions is eventually accompanied by damage and death of neurons.
With the exception of cases of Alzheimer’s caused by genetic abnormalities (such as certain mutations to the APP or the genes for the presenilin 1 and presenilin 2 proteins and/or the extra copy of chromosome 21 that characterizes Down syndrome), which represent a small proportion of patients5 (< 1%) that tend to develop the disease at much younger age (∼45 years of age) resulting in a type known as early-onset familial AD (FAD), experts believe that Alzheimer’s develops as a result of multiple factors that affect the brain over time. Indeed, most patients with Alzheimer's (> 95%) have the sporadic form that is typically characterized by a late onset (80–90 years of age). Although Alzheimer's is not a normal part of growing older, increasing age is known as the greatest risk factor.6,7 After age 65, the risk of Alzheimer's doubles every five years; after age 85, the risk reaches nearly 50%. The

102
disease has an estimated prevalence of 10–30% in the population >65 years of age with an incidence of 1–3%. Other risk factors for late-onset AD are having a family history of Alzheimer’s and/or carrying the APOE-e4 gene. Accordingly, research has shown that those who have a parent, brother, or sister with Alzheimer's are more likely to develop the disease. The risk increases if more than one family member has the illness.8−12
The apolipoprotein E (APOE) is a 34-kDa secreted protein that is synthesized predominantly in the liver but is also produced by glial cells in the brain. It acts as a lipoprotein-binding protein and mediates lipid metabolism by binding to the low-density lipoprotein superfamily of receptors. This gene has several forms (e.g., ε2, ε3 or ε4). One of them, APOE ε4, increases a person’s risk of developing AD and is also associated with an earlier age of disease onset.13−15 However, carrying the APOE ε4 form of the gene does not mean that a person will definitely develop AD, and some people with no APOE ε4 may also develop the disease.
Beyond genetics, a number of different factors may also play a role in the development and course of AD. Although risk factors such as age, family history and genetic mutations cannot be changed, others, including cardiovascular conditions16,17 such as heart disease, stroke and high blood pressure,18−20 as well as metabolic conditions such as diabetes21−24 and obesity,25,26 represent factors that can be modulated to reduce risk of cognitive decline and dementia.27
3.1.2 Current Drug Treatment
None of the pharmacologic treatments available today for AD can slow, stop or reverse the progressive damage and destruction of neurons that cause Alzheimer’s symptoms and make the disease fatal. Current drug treatments that are used to temporarily alleviate symptoms include the acetylcholinesterase inhibitors donepezil (Aricept; Eisai/Pfizer, 3.1, Figure 3.1), galantamine (Razadyne; Johnson & Johnson, 3.2, Figure 3.1) and rivastigmine (Exelon; Novartis, 3.3, Figure 3.1), and the low-affinity NMDA (N-methyl-d-aspartate) receptor antagonist memantine (3.4, Figure 3.1) used for moderate to severe AD. The acetylcholinesterase inhibitors mediate their effects by increasing the amount of the neurotransmitter acetylcholinesterase in the brain, thus remediating, in part, the cholinergic deficit. The precise mechanism of action of memantine remains to be elucidated.
Overall, the success of the therapy varies from person to person, although the effects of these drugs are limited as they do not treat the disease but modestly improve/delay symptoms and help people to maintain mental function and manage behavioral symptoms. Current strategies aim to develop therapies directed toward specific genetic, molecular and cellular mechanisms so that the actual underlying cause of the disease can be stopped or prevented.
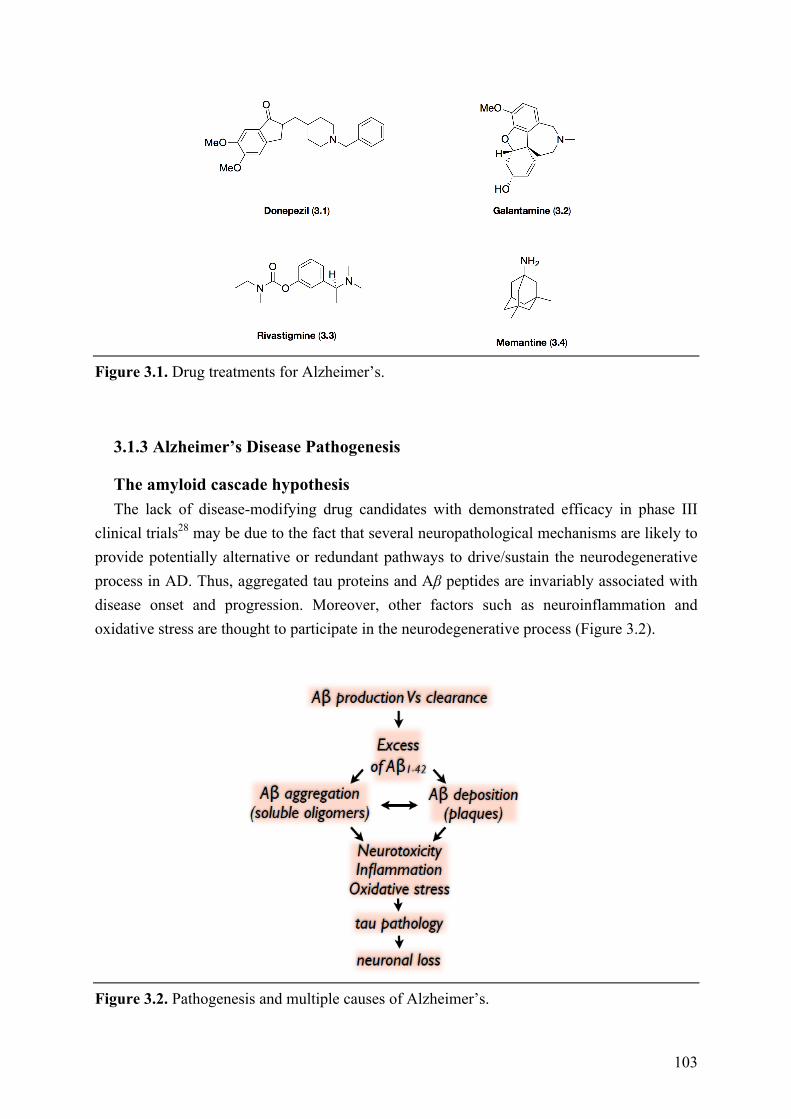
103
Figure 3.1. Drug treatments for Alzheimer’s.
3.1.3 Alzheimer’s Disease Pathogenesis
The amyloid cascade hypothesis The lack of disease-modifying drug candidates with demonstrated efficacy in phase III
clinical trials28 may be due to the fact that several neuropathological mechanisms are likely to provide potentially alternative or redundant pathways to drive/sustain the neurodegenerative process in AD. Thus, aggregated tau proteins and Aβ peptides are invariably associated with disease onset and progression. Moreover, other factors such as neuroinflammation and oxidative stress are thought to participate in the neurodegenerative process (Figure 3.2).
Figure 3.2. Pathogenesis and multiple causes of Alzheimer’s.

104
A key pathological feature of the AD brain is the presence of SPs comprised of Aβ peptides, which proteolytically-derived from sequential cleavage of the APP by the β-cleaving amyloid precursor protein enzyme (BACE) and γ-secretase.29 These peptides vary in length, with Aβ40 (the 40-amino acid form of the peptide) being predominant. Amyloid plaques are deposits of insoluble Aβ in the parenchyma of the brain that can be diffuse or compact. If they are associated with dystrophic and degenerating neurons, they are often referred to as ‘neuritic plaques’. The amyloid cascade hypothesis posits that accumulation and aggregation of Aβ is the initial pathological trigger in AD, which subsequently results in the formation and deposition of SPs, neuronal cell death and dementia.30 Thus far, Aβ amyloidosis has been the target of choice in AD drug discovery, as most drug candidates have been designed to modulate Aβ homeostasis. There are currently three main therapeutic intervention strategies aimed at Aβ: reducing Aβ production, facilitating Aβ clearance, and preventing Aβ aggregation. However, in spite of generally strong preclinical data with such therapeutic candidates, the outcomes of late-stage AD clinical trials have thus far failed to demonstrate clinical efficacy. These disappointing results raise the possibility that AD treatments may have to interfere concurrently with more than one neuropathological mechanism to exert disease modifying benefits.
Neuroinflammation Inflammatory eicosanoids have also been reported as key contributing factors to Aβ plaque
deposition in AD.31 Indeed, the increased microglial activation in the vicinity of SPs32,33 stimulates the activation of the arachidonic acid cascade (Figure 3.3) and the release of inflammatory molecules, including eicosanoids, cytokines and chemokines, as well as oxidizing molecules, contributing to exacerbate AD neuropathology.31,34 For example, it has been demonstrated that elevated levels of a lipid oxidation product, isoprostane F2αIII (iPF2αIII), in AD brain35,36 can activate the thromboxane A2 (TXA2)-prostanoid (TP) receptor in neurons with a resulting increase of APP mRNA stability that leads to enhanced APP expression and Aβ production.37,38 Similarly, activated microglia induces the production of TXA2, resulting in increased levels of this eicosanoid in AD brain.39
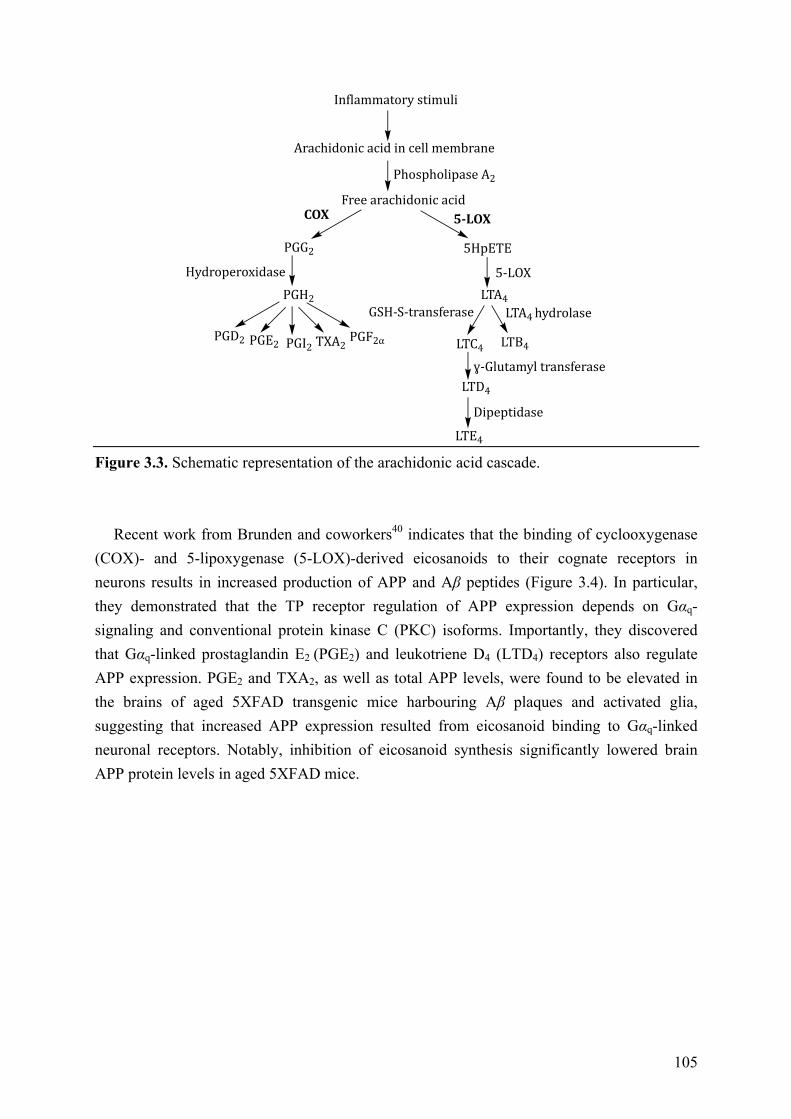
105
Figure 3.3. Schematic representation of the arachidonic acid cascade.
Recent work from Brunden and coworkers40 indicates that the binding of cyclooxygenase
(COX)- and 5-lipoxygenase (5-LOX)-derived eicosanoids to their cognate receptors in neurons results in increased production of APP and Aβ peptides (Figure 3.4). In particular, they demonstrated that the TP receptor regulation of APP expression depends on Gαq-signaling and conventional protein kinase C (PKC) isoforms. Importantly, they discovered that Gαq-linked prostaglandin E2 (PGE2) and leukotriene D4 (LTD4) receptors also regulate APP expression. PGE2 and TXA2, as well as total APP levels, were found to be elevated in the brains of aged 5XFAD transgenic mice harbouring Aβ plaques and activated glia, suggesting that increased APP expression resulted from eicosanoid binding to Gαq-linked neuronal receptors. Notably, inhibition of eicosanoid synthesis significantly lowered brain APP protein levels in aged 5XFAD mice.
Arachidonicacidincellmembrane
Inflammatorystimuli
FreearachidonicacidCOX 5-LOX
PGG2 5HpETE
PGH2
HydroperoxidaseLTA4
LTA4hydrolaseGSH-S-transferase
LTC4 LTB4PGD2 PGE2 PGI2 TXA2PGF2⍺
5-LOX
LTD4
LTE4
PhospholipaseA2
ɣ-Glutamyltransferase
Dipeptidase
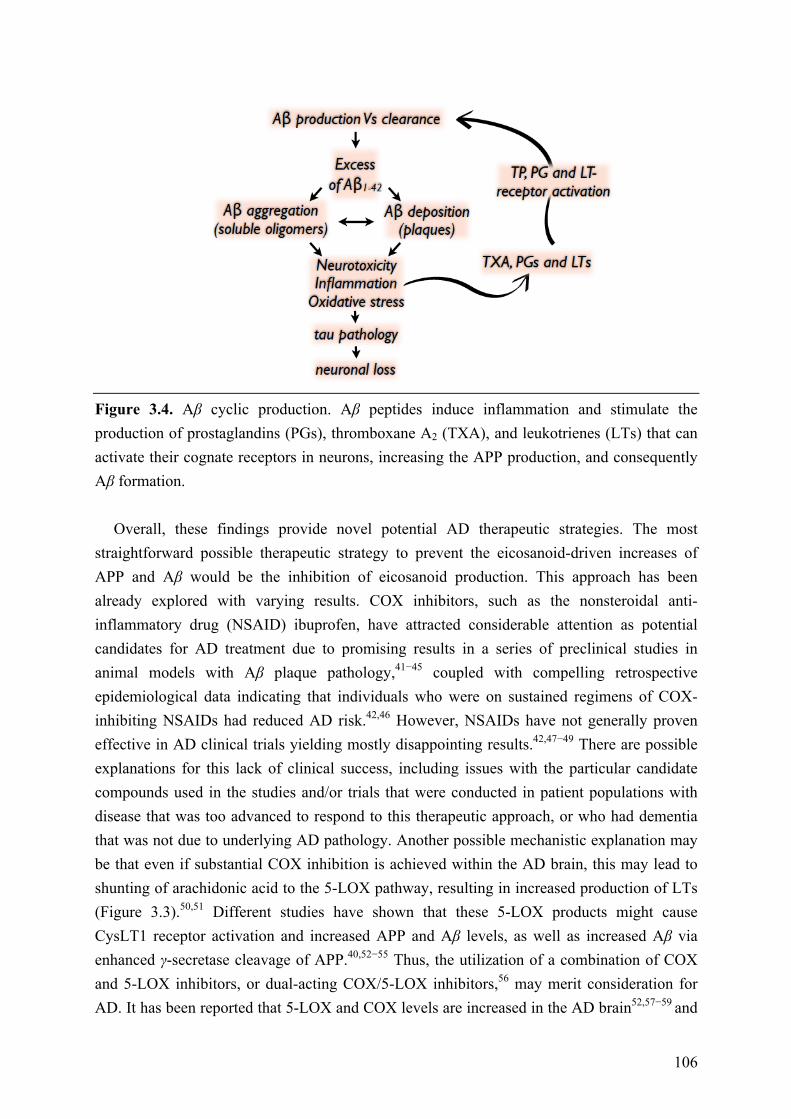
106
Figure 3.4. Aβ cyclic production. Aβ peptides induce inflammation and stimulate the production of prostaglandins (PGs), thromboxane A2 (TXA), and leukotrienes (LTs) that can activate their cognate receptors in neurons, increasing the APP production, and consequently Aβ formation.
Overall, these findings provide novel potential AD therapeutic strategies. The most straightforward possible therapeutic strategy to prevent the eicosanoid-driven increases of APP and Aβ would be the inhibition of eicosanoid production. This approach has been already explored with varying results. COX inhibitors, such as the nonsteroidal anti-inflammatory drug (NSAID) ibuprofen, have attracted considerable attention as potential candidates for AD treatment due to promising results in a series of preclinical studies in animal models with Aβ plaque pathology,41−45 coupled with compelling retrospective epidemiological data indicating that individuals who were on sustained regimens of COX-inhibiting NSAIDs had reduced AD risk.42,46 However, NSAIDs have not generally proven effective in AD clinical trials yielding mostly disappointing results.42,47−49 There are possible explanations for this lack of clinical success, including issues with the particular candidate compounds used in the studies and/or trials that were conducted in patient populations with disease that was too advanced to respond to this therapeutic approach, or who had dementia that was not due to underlying AD pathology. Another possible mechanistic explanation may be that even if substantial COX inhibition is achieved within the AD brain, this may lead to shunting of arachidonic acid to the 5-LOX pathway, resulting in increased production of LTs (Figure 3.3).50,51 Different studies have shown that these 5-LOX products might cause CysLT1 receptor activation and increased APP and Aβ levels, as well as increased Aβ via enhanced γ-secretase cleavage of APP.40,52−55 Thus, the utilization of a combination of COX and 5-LOX inhibitors, or dual-acting COX/5-LOX inhibitors,56 may merit consideration for AD. It has been reported that 5-LOX and COX levels are increased in the AD brain52,57−59 and

107
combined COX/5-LOX inhibitors should reduce the production of PGs, TXs and LTs. Furthermore, whereas NSAIDs can cause gastrointestinal or cardiovascular complications, and were poorly tolerated by a percentage of AD patients,60 dual COX/5-LOX inhibitors, such as licofelone, appear to have decreased side-effects when compared to typical NSAIDs.61,62 However, such an approach would result in a systemic reduction of PGs, TXs and LTs, some of which clearly play a beneficial role within the body, so as with all drugs, a benefit-to-risk assessment would be important if such a strategy were pursued.
Microtubule organization in neurons and the tau hypothesis In neuronal axons, MTs are more stable than in other cell types. They are assembled to
form polarized linear arrays with the plus ends directed toward the synapses and the minus ends directed toward the cell body, thus providing both structural support and directionality for the intracellular transport of proteins and vesicles to and from the cell body and the synapses (Figure 3.5).63 This cytoskeletal structure, together with molecular motors such as kinesins and dyneins, form a sophisticated machinery that is essential to provide an efficient axonal transport, which is critical to the viability of neurons.64
Neurodegenerative tauopathies, of which AD is the most prominent and common example, are characterized by axonal transport deficits that are thought to arise, at least in part, from the misfolding and aggregation of the MT associated protein tau.65,66 The protein tau is expressed particularly in the axons of neurons with the primary function to promote MT stabilization.67 Under physiological conditions, the vast majority of tau molecules are bound to MTs. Although the presence of tau on MTs presents a physical obstacle for vesicles and other cargoes that are moving along the axon, MT-bound tau is essential to maintain the MT integrity. Thus, relatively frequent cycles of tau–MT binding (promoted by dephosphorylation of tau) and detachment of tau from the MT (promoted by phosphorylation of tau) are needed for an effective axonal transport. However, when neurons are affected by tauopathies, the hyperphosphorylation of tau is thought to induce its progressive disengagment from the axons, thus reducing the binding affinity of this protein for the MTs (Figure 3.5).68−70 An abnormal disengagment of tau from the MTs is believed to alter the dynamics and organization of the axonal MTs, which in turn can trigger or exacerbate axonal transport defects, leading to neuronal dysfunction, neuron loss and cognitive decline.63,64 Furthermore, hyperphosphorylated tau becomes considerably more prone to misfolding and aggregation,71,72 facilitating the formation of insoluble tau aggregates known as NFTs and neuropil threads within the neuronal soma and dendritic processes, respectively.65,73 This event contributes further to the destabilization of axonal MTs.66 Thus, these evidences suggest that a possible therapeutic strategy for the treatment of AD and related tauopathies is to employ exogenous MT-stabilizing agents that might attenuate these deficits and compensate for loss of tau functions.74,75
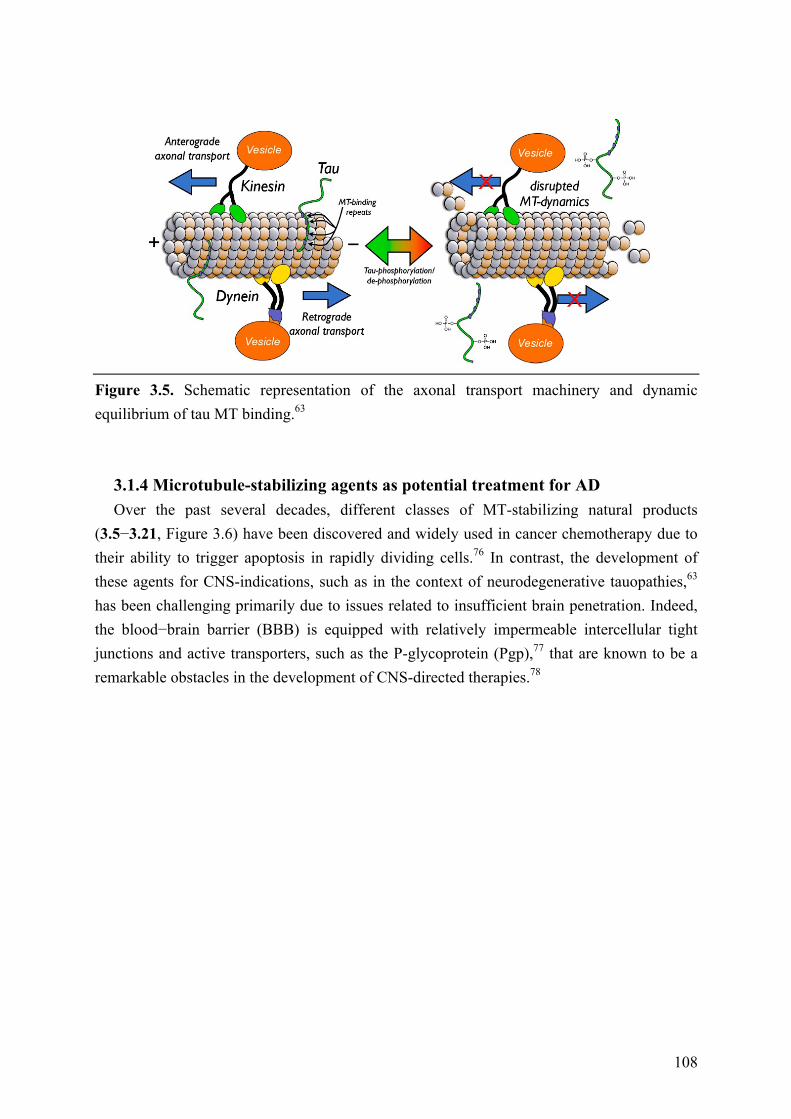
108
Figure 3.5. Schematic representation of the axonal transport machinery and dynamic equilibrium of tau MT binding.63
3.1.4 Microtubule-stabilizing agents as potential treatment for AD Over the past several decades, different classes of MT-stabilizing natural products
(3.5−3.21, Figure 3.6) have been discovered and widely used in cancer chemotherapy due to their ability to trigger apoptosis in rapidly dividing cells.76 In contrast, the development of these agents for CNS-indications, such as in the context of neurodegenerative tauopathies,63 has been challenging primarily due to issues related to insufficient brain penetration. Indeed, the blood−brain barrier (BBB) is equipped with relatively impermeable intercellular tight junctions and active transporters, such as the P-glycoprotein (Pgp),77 that are known to be a remarkable obstacles in the development of CNS-directed therapies.78
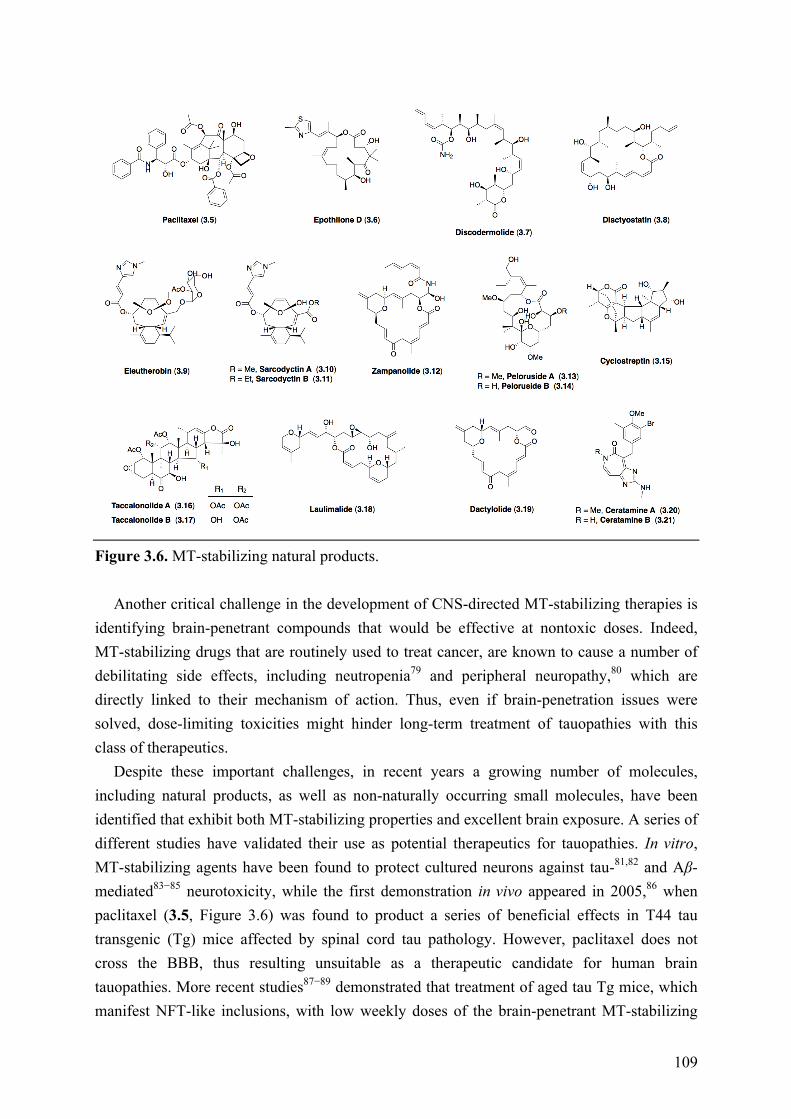
109
Figure 3.6. MT-stabilizing natural products.
Another critical challenge in the development of CNS-directed MT-stabilizing therapies is identifying brain-penetrant compounds that would be effective at nontoxic doses. Indeed, MT-stabilizing drugs that are routinely used to treat cancer, are known to cause a number of debilitating side effects, including neutropenia79 and peripheral neuropathy,80 which are directly linked to their mechanism of action. Thus, even if brain-penetration issues were solved, dose-limiting toxicities might hinder long-term treatment of tauopathies with this class of therapeutics.
Despite these important challenges, in recent years a growing number of molecules, including natural products, as well as non-naturally occurring small molecules, have been identified that exhibit both MT-stabilizing properties and excellent brain exposure. A series of different studies have validated their use as potential therapeutics for tauopathies. In vitro, MT-stabilizing agents have been found to protect cultured neurons against tau-81,82 and Aβ-mediated83−85 neurotoxicity, while the first demonstration in vivo appeared in 2005,86 when paclitaxel (3.5, Figure 3.6) was found to product a series of beneficial effects in T44 tau transgenic (Tg) mice affected by spinal cord tau pathology. However, paclitaxel does not cross the BBB, thus resulting unsuitable as a therapeutic candidate for human brain tauopathies. More recent studies87−89 demonstrated that treatment of aged tau Tg mice, which manifest NFT-like inclusions, with low weekly doses of the brain-penetrant MT-stabilizing
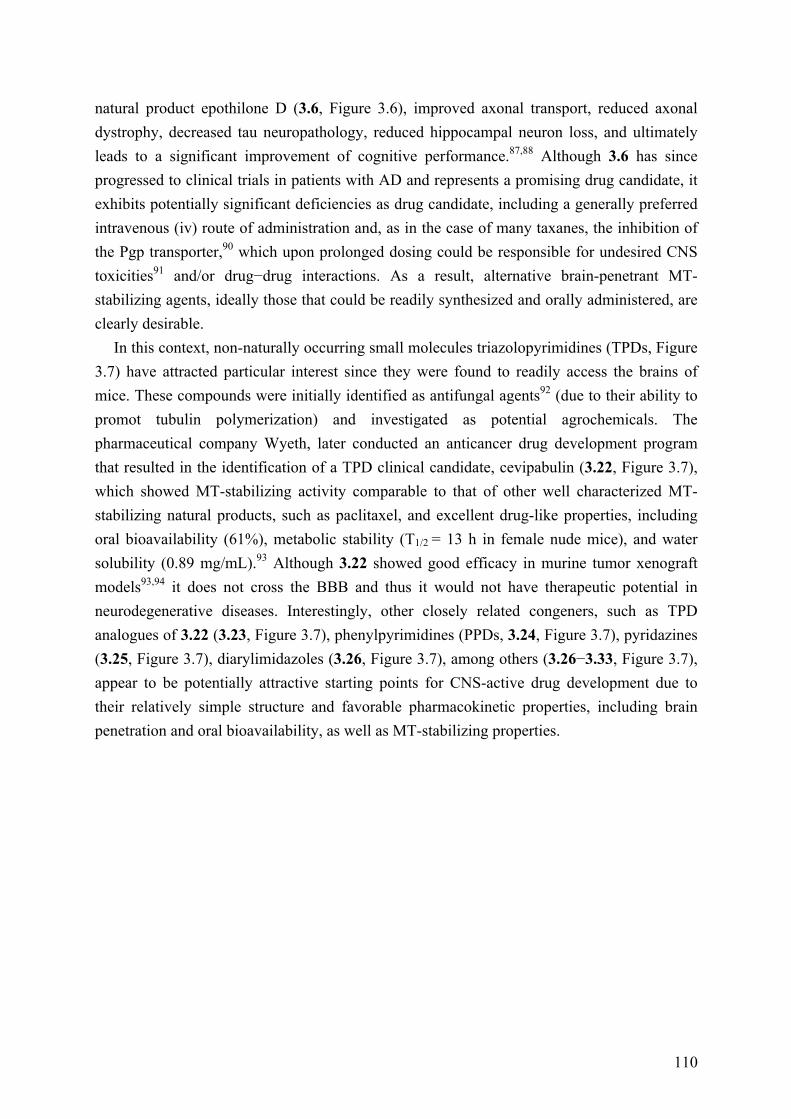
110
natural product epothilone D (3.6, Figure 3.6), improved axonal transport, reduced axonal dystrophy, decreased tau neuropathology, reduced hippocampal neuron loss, and ultimately leads to a significant improvement of cognitive performance.87,88 Although 3.6 has since progressed to clinical trials in patients with AD and represents a promising drug candidate, it exhibits potentially significant deficiencies as drug candidate, including a generally preferred intravenous (iv) route of administration and, as in the case of many taxanes, the inhibition of the Pgp transporter,90 which upon prolonged dosing could be responsible for undesired CNS toxicities91 and/or drug−drug interactions. As a result, alternative brain-penetrant MT-stabilizing agents, ideally those that could be readily synthesized and orally administered, are clearly desirable.
In this context, non-naturally occurring small molecules triazolopyrimidines (TPDs, Figure 3.7) have attracted particular interest since they were found to readily access the brains of mice. These compounds were initially identified as antifungal agents92 (due to their ability to promot tubulin polymerization) and investigated as potential agrochemicals. The pharmaceutical company Wyeth, later conducted an anticancer drug development program that resulted in the identification of a TPD clinical candidate, cevipabulin (3.22, Figure 3.7), which showed MT-stabilizing activity comparable to that of other well characterized MT-stabilizing natural products, such as paclitaxel, and excellent drug-like properties, including oral bioavailability (61%), metabolic stability (T1/2 = 13 h in female nude mice), and water solubility (0.89 mg/mL).93 Although 3.22 showed good efficacy in murine tumor xenograft models93,94 it does not cross the BBB and thus it would not have therapeutic potential in neurodegenerative diseases. Interestingly, other closely related congeners, such as TPD analogues of 3.22 (3.23, Figure 3.7), phenylpyrimidines (PPDs, 3.24, Figure 3.7), pyridazines (3.25, Figure 3.7), diarylimidazoles (3.26, Figure 3.7), among others (3.26−3.33, Figure 3.7), appear to be potentially attractive starting points for CNS-active drug development due to their relatively simple structure and favorable pharmacokinetic properties, including brain penetration and oral bioavailability, as well as MT-stabilizing properties.
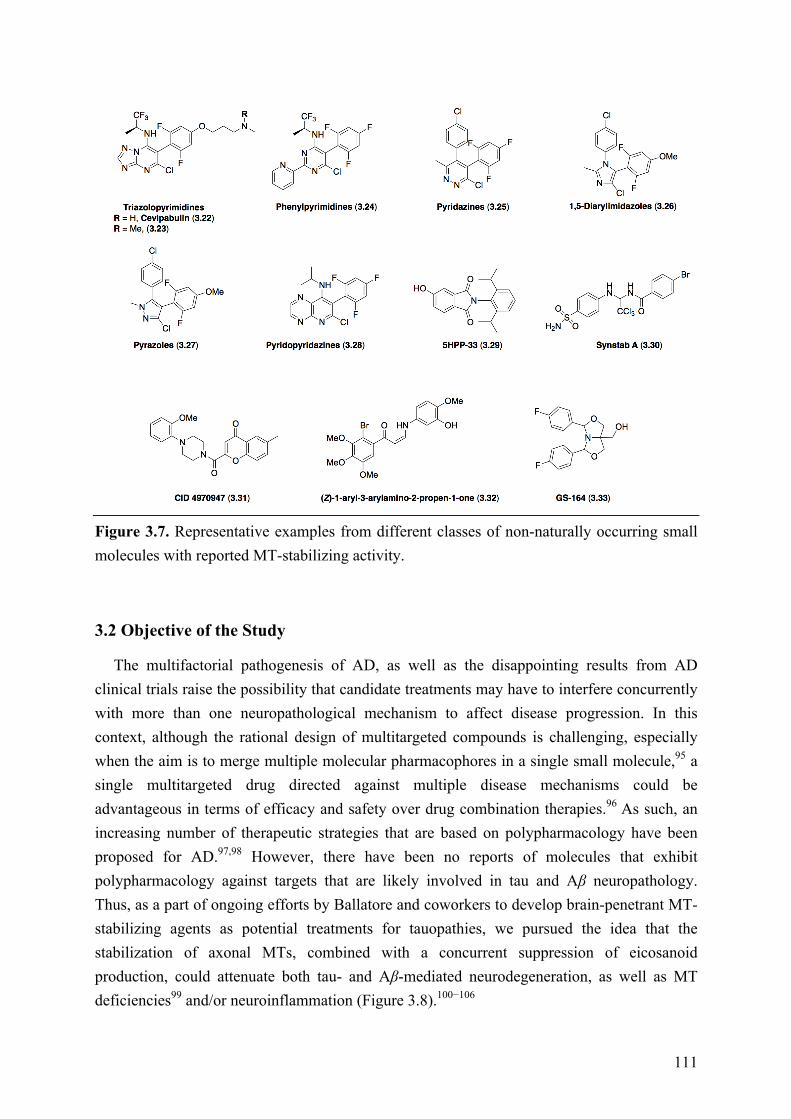
111
Figure 3.7. Representative examples from different classes of non-naturally occurring small molecules with reported MT-stabilizing activity.
3.2 Objective of the Study
The multifactorial pathogenesis of AD, as well as the disappointing results from AD clinical trials raise the possibility that candidate treatments may have to interfere concurrently with more than one neuropathological mechanism to affect disease progression. In this context, although the rational design of multitargeted compounds is challenging, especially when the aim is to merge multiple molecular pharmacophores in a single small molecule,95 a single multitargeted drug directed against multiple disease mechanisms could be advantageous in terms of efficacy and safety over drug combination therapies.96 As such, an increasing number of therapeutic strategies that are based on polypharmacology have been proposed for AD.97,98 However, there have been no reports of molecules that exhibit polypharmacology against targets that are likely involved in tau and Aβ neuropathology. Thus, as a part of ongoing efforts by Ballatore and coworkers to develop brain-penetrant MT-stabilizing agents as potential treatments for tauopathies, we pursued the idea that the stabilization of axonal MTs, combined with a concurrent suppression of eicosanoid production, could attenuate both tau- and Aβ-mediated neurodegeneration, as well as MT deficiencies99 and/or neuroinflammation (Figure 3.8).100−106
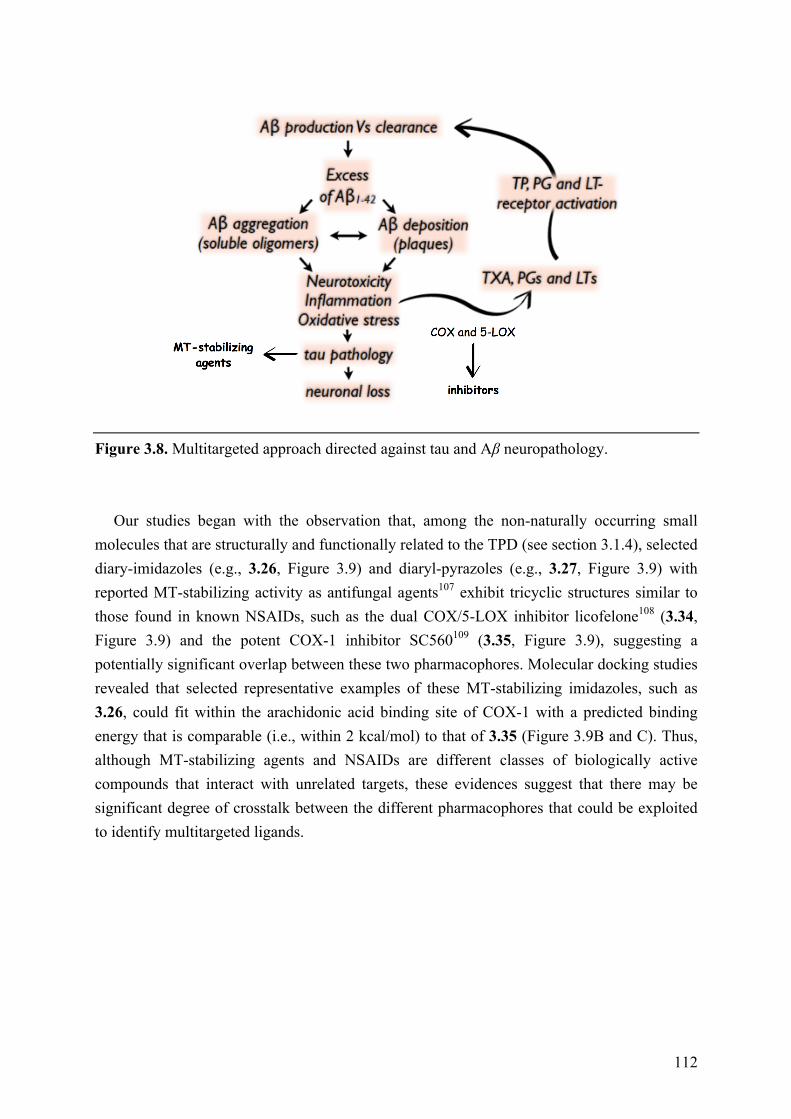
112
Figure 3.8. Multitargeted approach directed against tau and Aβ neuropathology.
Our studies began with the observation that, among the non-naturally occurring small
molecules that are structurally and functionally related to the TPD (see section 3.1.4), selected diary-imidazoles (e.g., 3.26, Figure 3.9) and diaryl-pyrazoles (e.g., 3.27, Figure 3.9) with reported MT-stabilizing activity as antifungal agents107 exhibit tricyclic structures similar to those found in known NSAIDs, such as the dual COX/5-LOX inhibitor licofelone108 (3.34, Figure 3.9) and the potent COX-1 inhibitor SC560109 (3.35, Figure 3.9), suggesting a potentially significant overlap between these two pharmacophores. Molecular docking studies revealed that selected representative examples of these MT-stabilizing imidazoles, such as 3.26, could fit within the arachidonic acid binding site of COX-1 with a predicted binding energy that is comparable (i.e., within 2 kcal/mol) to that of 3.35 (Figure 3.9B and C). Thus, although MT-stabilizing agents and NSAIDs are different classes of biologically active compounds that interact with unrelated targets, these evidences suggest that there may be significant degree of crosstalk between the different pharmacophores that could be exploited to identify multitargeted ligands.
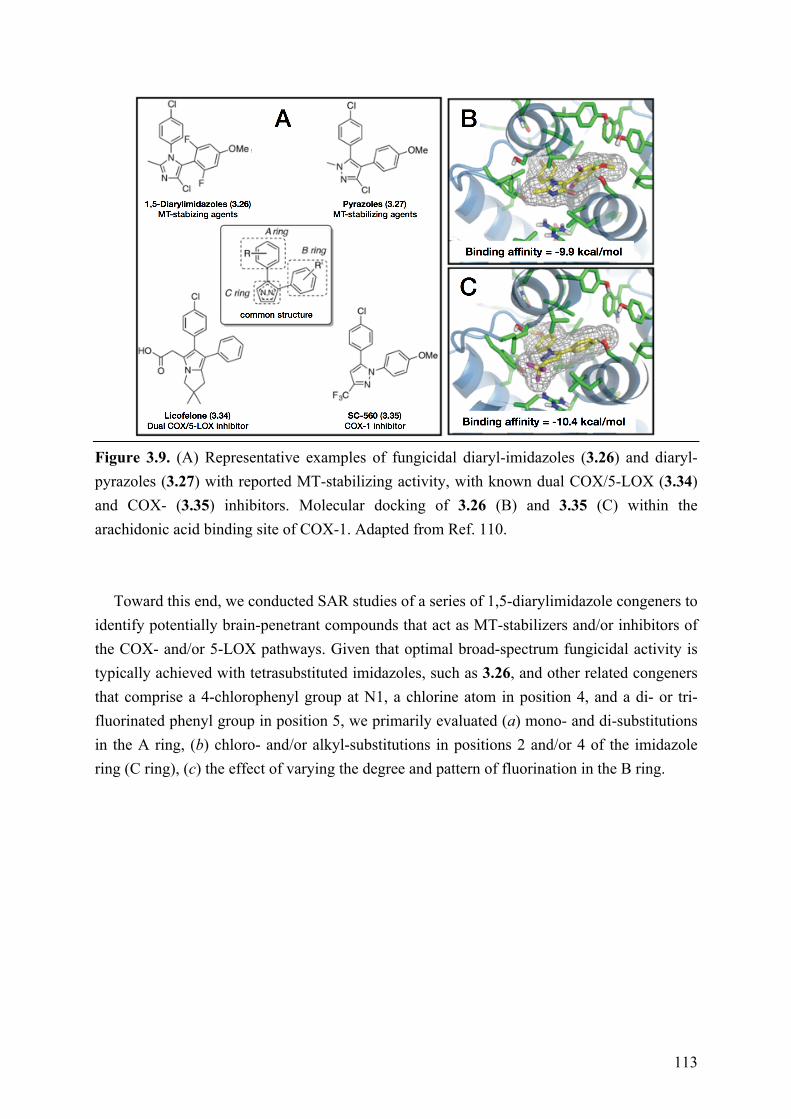
113
Figure 3.9. (A) Representative examples of fungicidal diaryl-imidazoles (3.26) and diaryl-pyrazoles (3.27) with reported MT-stabilizing activity, with known dual COX/5-LOX (3.34) and COX- (3.35) inhibitors. Molecular docking of 3.26 (B) and 3.35 (C) within the arachidonic acid binding site of COX-1. Adapted from Ref. 110.
Toward this end, we conducted SAR studies of a series of 1,5-diarylimidazole congeners to
identify potentially brain-penetrant compounds that act as MT-stabilizers and/or inhibitors of the COX- and/or 5-LOX pathways. Given that optimal broad-spectrum fungicidal activity is typically achieved with tetrasubstituted imidazoles, such as 3.26, and other related congeners that comprise a 4-chlorophenyl group at N1, a chlorine atom in position 4, and a di- or tri-fluorinated phenyl group in position 5, we primarily evaluated (a) mono- and di-substitutions in the A ring, (b) chloro- and/or alkyl-substitutions in positions 2 and/or 4 of the imidazole ring (C ring), (c) the effect of varying the degree and pattern of fluorination in the B ring.
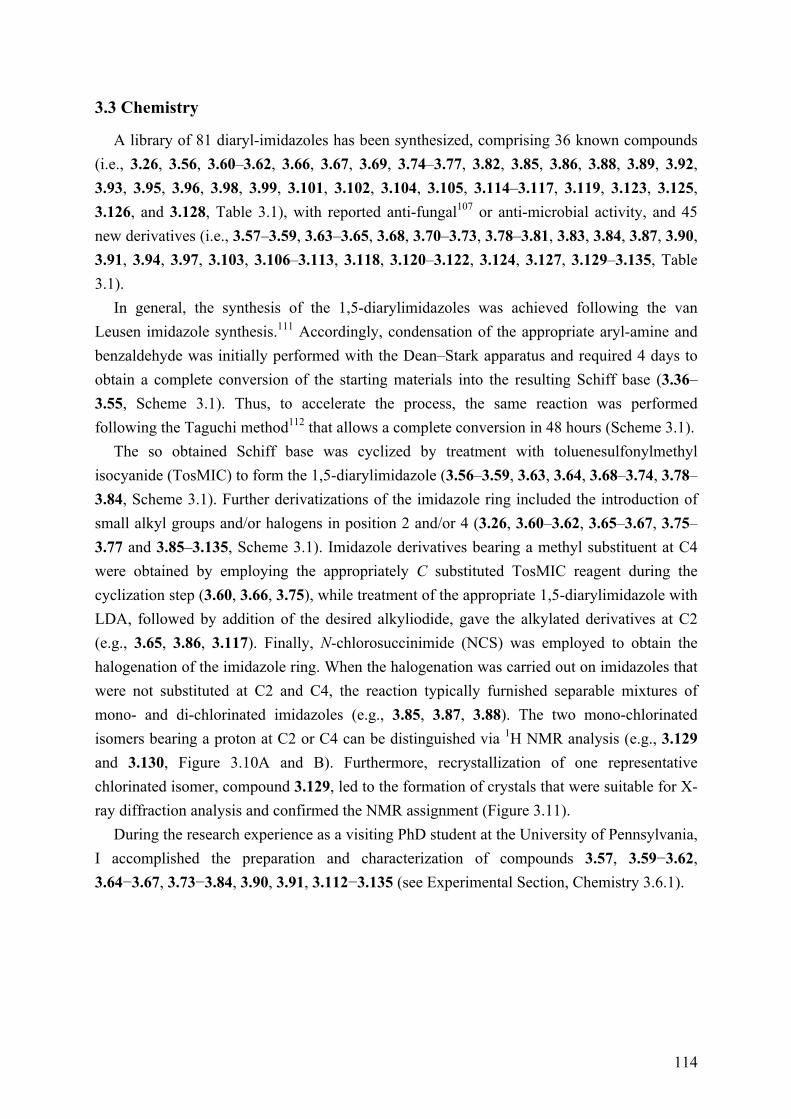
114
3.3 Chemistry
A library of 81 diaryl-imidazoles has been synthesized, comprising 36 known compounds (i.e., 3.26, 3.56, 3.60–3.62, 3.66, 3.67, 3.69, 3.74–3.77, 3.82, 3.85, 3.86, 3.88, 3.89, 3.92, 3.93, 3.95, 3.96, 3.98, 3.99, 3.101, 3.102, 3.104, 3.105, 3.114–3.117, 3.119, 3.123, 3.125, 3.126, and 3.128, Table 3.1), with reported anti-fungal107 or anti-microbial activity, and 45 new derivatives (i.e., 3.57–3.59, 3.63–3.65, 3.68, 3.70–3.73, 3.78–3.81, 3.83, 3.84, 3.87, 3.90, 3.91, 3.94, 3.97, 3.103, 3.106–3.113, 3.118, 3.120–3.122, 3.124, 3.127, 3.129–3.135, Table 3.1).
In general, the synthesis of the 1,5-diarylimidazoles was achieved following the van Leusen imidazole synthesis.111 Accordingly, condensation of the appropriate aryl-amine and benzaldehyde was initially performed with the Dean–Stark apparatus and required 4 days to obtain a complete conversion of the starting materials into the resulting Schiff base (3.36–3.55, Scheme 3.1). Thus, to accelerate the process, the same reaction was performed following the Taguchi method112 that allows a complete conversion in 48 hours (Scheme 3.1).
The so obtained Schiff base was cyclized by treatment with toluenesulfonylmethyl isocyanide (TosMIC) to form the 1,5-diarylimidazole (3.56–3.59, 3.63, 3.64, 3.68–3.74, 3.78–3.84, Scheme 3.1). Further derivatizations of the imidazole ring included the introduction of small alkyl groups and/or halogens in position 2 and/or 4 (3.26, 3.60–3.62, 3.65–3.67, 3.75–3.77 and 3.85–3.135, Scheme 3.1). Imidazole derivatives bearing a methyl substituent at C4 were obtained by employing the appropriately C substituted TosMIC reagent during the cyclization step (3.60, 3.66, 3.75), while treatment of the appropriate 1,5-diarylimidazole with LDA, followed by addition of the desired alkyliodide, gave the alkylated derivatives at C2 (e.g., 3.65, 3.86, 3.117). Finally, N-chlorosuccinimide (NCS) was employed to obtain the halogenation of the imidazole ring. When the halogenation was carried out on imidazoles that were not substituted at C2 and C4, the reaction typically furnished separable mixtures of mono- and di-chlorinated imidazoles (e.g., 3.85, 3.87, 3.88). The two mono-chlorinated isomers bearing a proton at C2 or C4 can be distinguished via 1H NMR analysis (e.g., 3.129 and 3.130, Figure 3.10A and B). Furthermore, recrystallization of one representative chlorinated isomer, compound 3.129, led to the formation of crystals that were suitable for X-ray diffraction analysis and confirmed the NMR assignment (Figure 3.11).
During the research experience as a visiting PhD student at the University of Pennsylvania, I accomplished the preparation and characterization of compounds 3.57, 3.59−3.62, 3.64−3.67, 3.73−3.84, 3.90, 3.91, 3.112−3.135 (see Experimental Section, Chemistry 3.6.1).
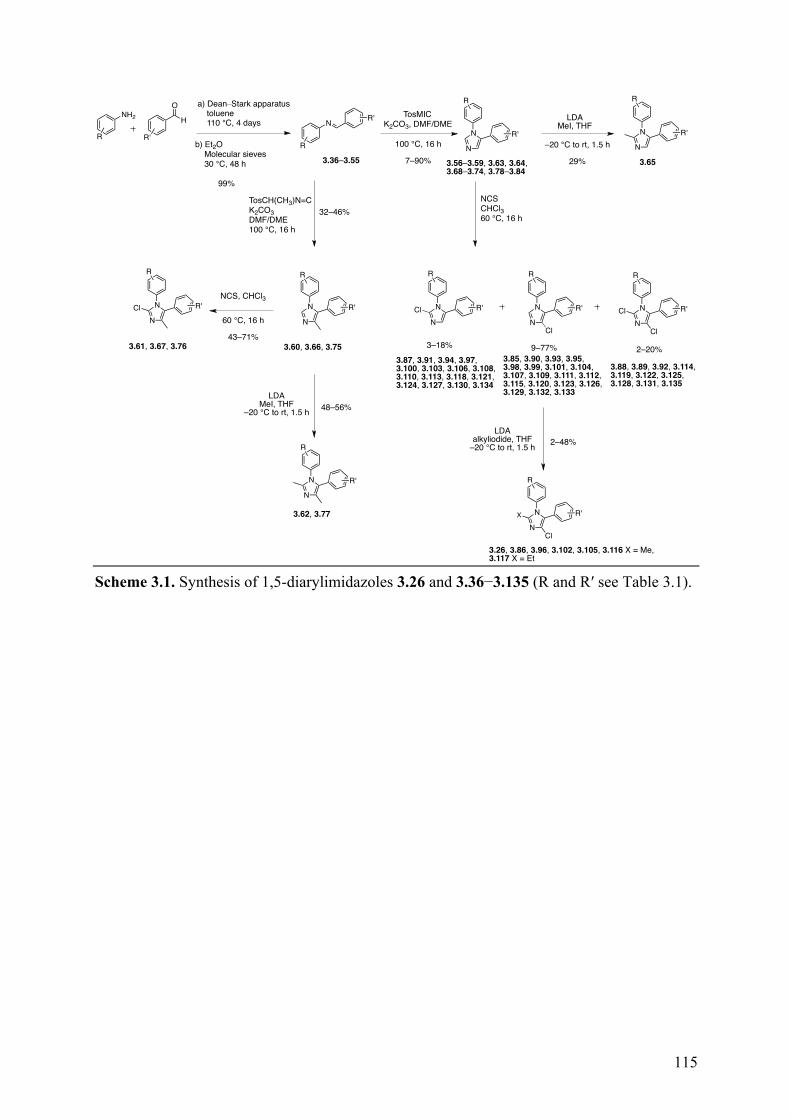
115
Scheme 3.1. Synthesis of 1,5-diarylimidazoles 3.26 and 3.36−3.135 (R and R′ see Table 3.1).
NH2 H
O
N
100 °C, 16 h
7–90%
N
NR'
R'
R'
N
N
R'
N
N
R'
LDAMeI, THF
NCSCHCl360 °C, 16 h
–20 °C to rt, 1.5 h
29%
N
N
R'
TosMICK2CO3, DMF/DME
TosCH(CH3)N=CK2CO3DMF/DME100 °C, 16 h
NCS, CHCl3
60 °C, 16 h
43–71%
N
N
R'Cl N
N
R' N
N
R'
Cl
Cl
3–18% 9–77% 2–20%
32–46%
N
NCl
R'X
2–48%
LDAMeI, THF
–20 °C to rt, 1.5 h 48–56%
N
N
R'
R R
R R R R
R
R
R
RR
a) Dean–Stark apparatus toluene 110 °C, 4 days
b) Et2O Molecular sieves 30 °C, 48 h
99%
Cl
Cl
LDAalkyliodide, THF
–20 °C to rt, 1.5 h
3.36–3.55 3.56–3.59, 3.63, 3.64,3.68–3.74, 3.78–3.84
3.60, 3.66, 3.753.61, 3.67, 3.76
3.62, 3.77
3.65
3.87, 3.91, 3.94, 3.97,3.100, 3.103, 3.106, 3.108,3.110, 3.113, 3.118, 3.121,3.124, 3.127, 3.130, 3.134
3.85, 3.90, 3.93, 3.95,3.98, 3.99, 3.101, 3.104,3.107, 3.109, 3.111, 3.112,3.115, 3.120, 3.123, 3.126,3.129, 3.132, 3.133
3.88, 3.89, 3.92, 3.114,3.119, 3.122, 3.125,3.128, 3.131, 3.135
3.26, 3.86, 3.96, 3.102, 3.105, 3.116 X = Me,3.117 X = Et
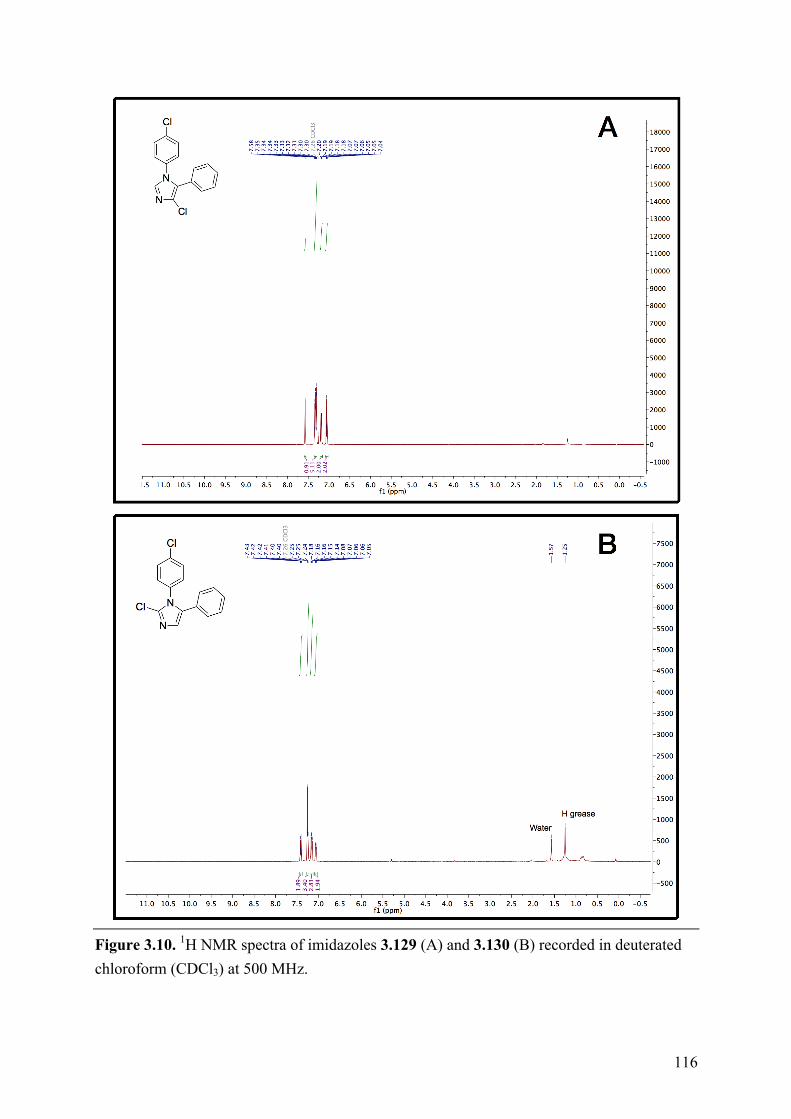
116
Figure 3.10. 1H NMR spectra of imidazoles 3.129 (A) and 3.130 (B) recorded in deuterated chloroform (CDCl3) at 500 MHz.
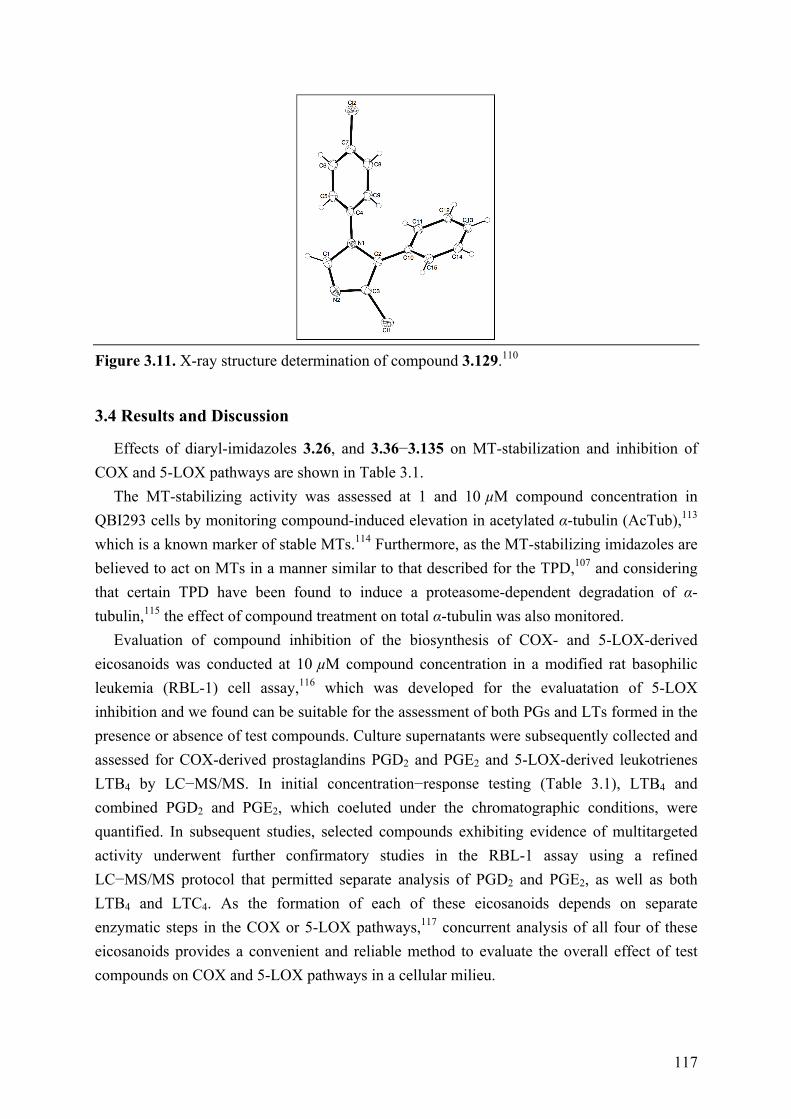
117
Figure 3.11. X-ray structure determination of compound 3.129.110
3.4 Results and Discussion
Effects of diaryl-imidazoles 3.26, and 3.36−3.135 on MT-stabilization and inhibition of COX and 5-LOX pathways are shown in Table 3.1.
The MT-stabilizing activity was assessed at 1 and 10 µM compound concentration in QBI293 cells by monitoring compound-induced elevation in acetylated α-tubulin (AcTub),113 which is a known marker of stable MTs.114 Furthermore, as the MT-stabilizing imidazoles are believed to act on MTs in a manner similar to that described for the TPD,107 and considering that certain TPD have been found to induce a proteasome-dependent degradation of α-tubulin,115 the effect of compound treatment on total α-tubulin was also monitored.
Evaluation of compound inhibition of the biosynthesis of COX- and 5-LOX-derived eicosanoids was conducted at 10 µM compound concentration in a modified rat basophilic leukemia (RBL-1) cell assay,116 which was developed for the evaluatation of 5-LOX inhibition and we found can be suitable for the assessment of both PGs and LTs formed in the presence or absence of test compounds. Culture supernatants were subsequently collected and assessed for COX-derived prostaglandins PGD2 and PGE2 and 5-LOX-derived leukotrienes LTB4 by LC−MS/MS. In initial concentration−response testing (Table 3.1), LTB4 and combined PGD2 and PGE2, which coeluted under the chromatographic conditions, were quantified. In subsequent studies, selected compounds exhibiting evidence of multitargeted activity underwent further confirmatory studies in the RBL-1 assay using a refined LC−MS/MS protocol that permitted separate analysis of PGD2 and PGE2, as well as both LTB4 and LTC4. As the formation of each of these eicosanoids depends on separate enzymatic steps in the COX or 5-LOX pathways,117 concurrent analysis of all four of these eicosanoids provides a convenient and reliable method to evaluate the overall effect of test compounds on COX and 5-LOX pathways in a cellular milieu.

118
Finally, we evaluated the brain penetration of several diaryl-imidazoles monitoring the levels of compounds in mouse brain and plasma 1 h after intraperitoneal (i.p.) administration of 5 mg/kg test compound (Table 3.2). In general, the vast majority of CNS-active drugs typically exhibit brain-to-plasma (B/P) exposure ratios of ≥0.3, although there are exceptions.118
MT-stabilizing activity: Evaluation of compounds activity revealed that 48 examples of 71
overall tested compounds induced statistically significant changes in AcTub levels. Among them, seven examples (i.e., 3.26, 3.89, 3.96, 3.102, 3.116, 3.117, and 3.128) showed activity at 1 µM compound concentration, whereas the remaining 41 were active only at 10 µM. Consistent with the notion that the MT-stabilizing 1,5-diarylimidazoles may be acting on MTs in a similar manner as the TPDs,107 the data presented in Table 3.1 reveal that like the latter molecules, these imidazoles can be broadly divided into two subsets: one group of 15 entries, which cause a significant reduction in total α-tubulin levels at doses that induce an elevation in AcTub (i.e., 3.26, 3.61, 3.65, 3.89, 3.93, 3.94, 3.96, 3.97, 3.102, 3.104, 3.116, 3.125–3.128); and a second group of 33 compounds that produce an elevation in AcTub at 1 or 10 µM without decreasing α-tubulin level (3.60, 3.62, 3.66, 3.67, 3.75–3.77, 3.85, 3.86–3.88, 3.90, 3.91, 3.95, 3.98–3.101, 3.103, 3.105, 3.109, 3.113–3.115, 3.117–3.119, 3.121–3.124, 3.133, 3.135). Interestingly, we previously found that TPDs bearing an alkoxy side chain in the fluorinated phenyl ring (e.g., 3.23, Table 3.1) typically produce an unusual cellular phenotype that is characterized by a bell-shaped concentration-response relationship in the AcTub assay and proteasome-dependent degradation of α-tubulin.115 A similar effect is observed with the MT-active 1,5-diarylimidazoles bearing an alkoxy side chain in ring B (i.e., 3.26, 3.89, 3.126–3.128, Table 3.1), which cause a reduction in α-tubulin levels at compound concentrations that are required to increase AcTub. However, our results with the 1,5-diarylimidazoles clearly suggest that the substitution pattern of ring B may not be the only determining factor in whether α-tubulin is affected, as other substitutions in the A and C ring appear to play a role (cf., 3.60 with 3.61, and 3.85 with 3.104, Table 1). As was noted for the TPDs,115 MT-stabilizing imidazoles that cause a reduction in total α-tubulin may not be desirable for neurodegenerative diseases as this effect would be expected to ultimately compromise rather than restore axonal MT function. Conversely, certain multitargeted congeners (see Table 3.2) that do not appear to reduce total α-tubulin levels at concentrations that increase AcTub, may be more promising candidates for tauopathy treatment.
Irrespective of whether or not test compounds cause a reduction in total α-tubulin, the AcTub SAR emerging from the data shown in Table 3.1 appears to be in general agreement with the anti-fungal activity SAR of 1,5-diarylimidazoles that was reported in prior studies.107 Thus, our results indicate that ring A is preferably a 4-chloro-phenyl, although examples bearing other substituents in the para-position, such as a trifluoromethoxy (3.114), are also
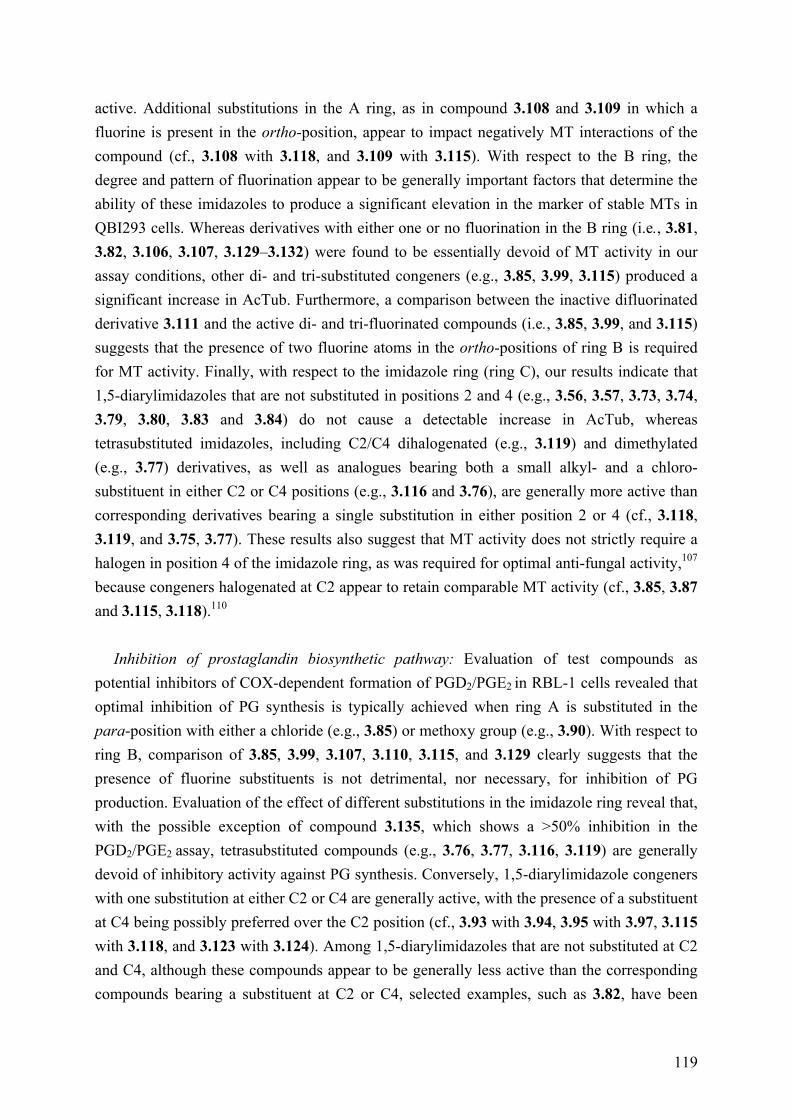
119
active. Additional substitutions in the A ring, as in compound 3.108 and 3.109 in which a fluorine is present in the ortho-position, appear to impact negatively MT interactions of the compound (cf., 3.108 with 3.118, and 3.109 with 3.115). With respect to the B ring, the degree and pattern of fluorination appear to be generally important factors that determine the ability of these imidazoles to produce a significant elevation in the marker of stable MTs in QBI293 cells. Whereas derivatives with either one or no fluorination in the B ring (i.e., 3.81, 3.82, 3.106, 3.107, 3.129–3.132) were found to be essentially devoid of MT activity in our assay conditions, other di- and tri-substituted congeners (e.g., 3.85, 3.99, 3.115) produced a significant increase in AcTub. Furthermore, a comparison between the inactive difluorinated derivative 3.111 and the active di- and tri-fluorinated compounds (i.e., 3.85, 3.99, and 3.115) suggests that the presence of two fluorine atoms in the ortho-positions of ring B is required for MT activity. Finally, with respect to the imidazole ring (ring C), our results indicate that 1,5-diarylimidazoles that are not substituted in positions 2 and 4 (e.g., 3.56, 3.57, 3.73, 3.74, 3.79, 3.80, 3.83 and 3.84) do not cause a detectable increase in AcTub, whereas tetrasubstituted imidazoles, including C2/C4 dihalogenated (e.g., 3.119) and dimethylated (e.g., 3.77) derivatives, as well as analogues bearing both a small alkyl- and a chloro-substituent in either C2 or C4 positions (e.g., 3.116 and 3.76), are generally more active than corresponding derivatives bearing a single substitution in either position 2 or 4 (cf., 3.118, 3.119, and 3.75, 3.77). These results also suggest that MT activity does not strictly require a halogen in position 4 of the imidazole ring, as was required for optimal anti-fungal activity,107 because congeners halogenated at C2 appear to retain comparable MT activity (cf., 3.85, 3.87 and 3.115, 3.118).110
Inhibition of prostaglandin biosynthetic pathway: Evaluation of test compounds as potential inhibitors of COX-dependent formation of PGD2/PGE2 in RBL-1 cells revealed that optimal inhibition of PG synthesis is typically achieved when ring A is substituted in the para-position with either a chloride (e.g., 3.85) or methoxy group (e.g., 3.90). With respect to ring B, comparison of 3.85, 3.99, 3.107, 3.110, 3.115, and 3.129 clearly suggests that the presence of fluorine substituents is not detrimental, nor necessary, for inhibition of PG
production. Evaluation of the effect of different substitutions in the imidazole ring reveal that, with the possible exception of compound 3.135, which shows a >50% inhibition in the PGD2/PGE2 assay, tetrasubstituted compounds (e.g., 3.76, 3.77, 3.116, 3.119) are generally devoid of inhibitory activity against PG synthesis. Conversely, 1,5-diarylimidazole congeners with one substitution at either C2 or C4 are generally active, with the presence of a substituent at C4 being possibly preferred over the C2 position (cf., 3.93 with 3.94, 3.95 with 3.97, 3.115 with 3.118, and 3.123 with 3.124). Among 1,5-diarylimidazoles that are not substituted at C2 and C4, although these compounds appear to be generally less active than the corresponding compounds bearing a substituent at C2 or C4, selected examples, such as 3.82, have been
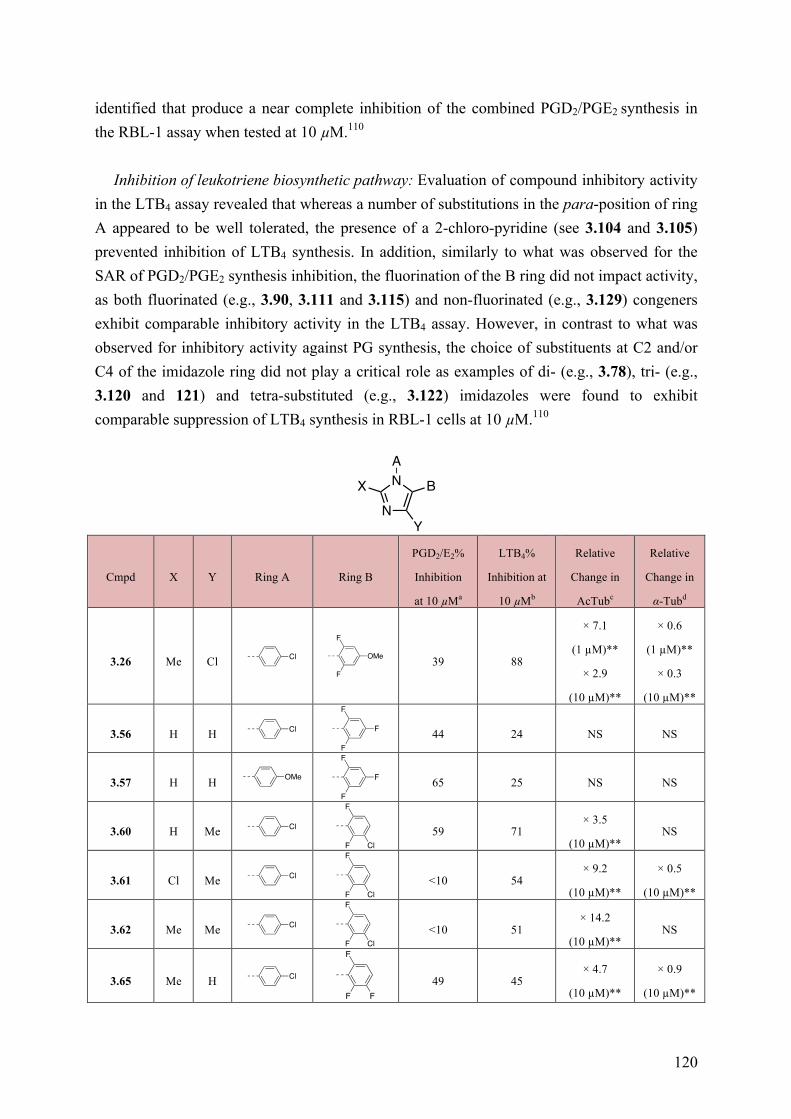
120
identified that produce a near complete inhibition of the combined PGD2/PGE2 synthesis in the RBL-1 assay when tested at 10 µM.110
Inhibition of leukotriene biosynthetic pathway: Evaluation of compound inhibitory activity in the LTB4 assay revealed that whereas a number of substitutions in the para-position of ring A appeared to be well tolerated, the presence of a 2-chloro-pyridine (see 3.104 and 3.105) prevented inhibition of LTB4 synthesis. In addition, similarly to what was observed for the SAR of PGD2/PGE2 synthesis inhibition, the fluorination of the B ring did not impact activity, as both fluorinated (e.g., 3.90, 3.111 and 3.115) and non-fluorinated (e.g., 3.129) congeners exhibit comparable inhibitory activity in the LTB4 assay. However, in contrast to what was observed for inhibitory activity against PG synthesis, the choice of substituents at C2 and/or C4 of the imidazole ring did not play a critical role as examples of di- (e.g., 3.78), tri- (e.g., 3.120 and 121) and tetra-substituted (e.g., 3.122) imidazoles were found to exhibit comparable suppression of LTB4 synthesis in RBL-1 cells at 10 µM.110
Cmpd X Y Ring A Ring B
PGD2/E2%
Inhibition
at 10 µMa
LTB4%
Inhibition at
10 µMb
Relative
Change in
AcTubc
Relative
Change in
α-Tubd
3.26 Me Cl
39 88
× 7.1
(1 µM)**
× 2.9
(10 µM)**
× 0.6
(1 µM)**
× 0.3
(10 µM)**
3.56 H H
44 24 NS NS
3.57 H H
65 25 NS NS
3.60 H Me
59 71 × 3.5
(10 µM)** NS
3.61 Cl Me
<10 54 × 9.2
(10 µM)**
× 0.5
(10 µM)**
3.62 Me Me
<10 51 × 14.2
(10 µM)** NS
3.65 Me H
49 45 × 4.7
(10 µM)**
× 0.9
(10 µM)**
N
N
X
Y
B
A
Cl OMe
F
F
Cl F
F
F
OMe F
F
F
Cl
F
F
Cl
Cl
F
F
Cl
Cl
F
F
Cl
Cl
F
F
F
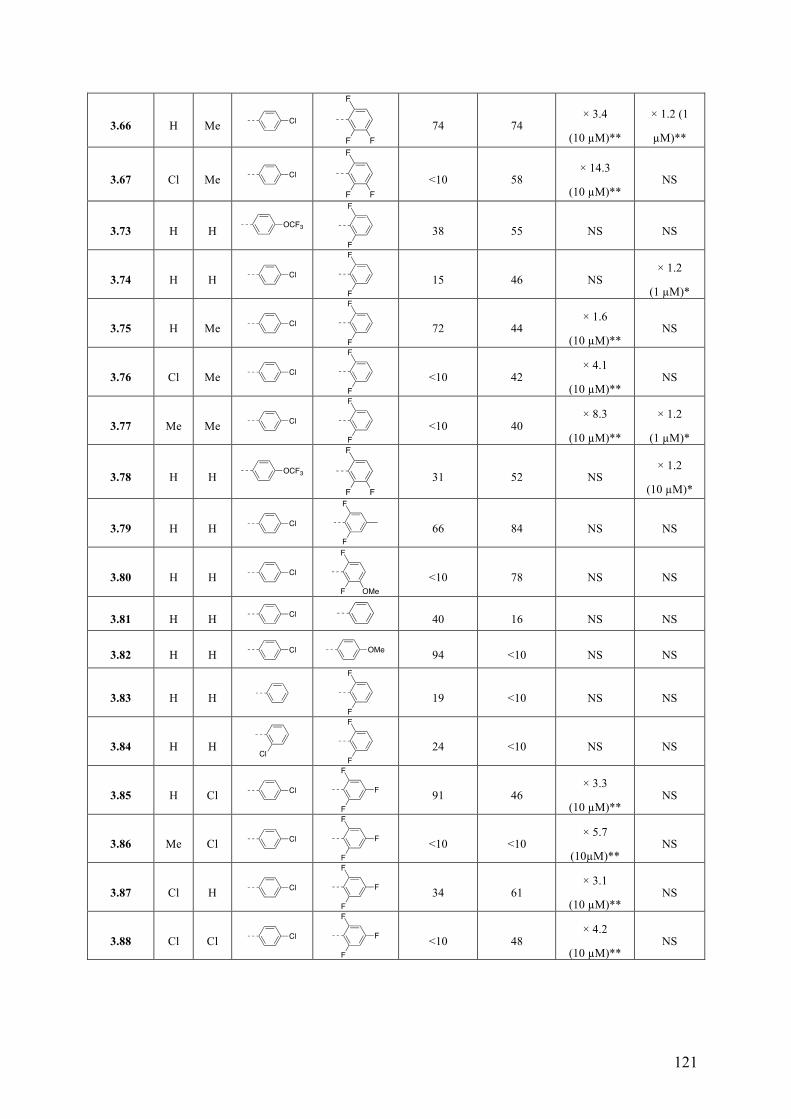
121
3.66 H Me
74 74 × 3.4
(10 µM)**
× 1.2 (1
µM)**
3.67 Cl Me
<10 58 × 14.3
(10 µM)** NS
3.73 H H
38 55 NS NS
3.74 H H
15 46 NS × 1.2
(1 µM)*
3.75 H Me
72 44 × 1.6
(10 µM)** NS
3.76 Cl Me
<10 42 × 4.1
(10 µM)** NS
3.77 Me Me
<10 40 × 8.3
(10 µM)**
× 1.2
(1 µM)*
3.78 H H
31 52 NS × 1.2
(10 µM)*
3.79 H H
66 84 NS NS
3.80 H H
<10 78 NS NS
3.81 H H 40 16 NS NS
3.82 H H 94 <10 NS NS
3.83 H H
19 <10 NS NS
3.84 H H
24 <10 NS NS
3.85 H Cl
91 46 × 3.3
(10 µM)** NS
3.86 Me Cl
<10 <10 × 5.7
(10µM)** NS
3.87 Cl H
34 61 × 3.1
(10 µM)** NS
3.88 Cl Cl
<10 48 × 4.2
(10 µM)** NS
Cl
F
F
F
Cl
F
F
F
OCF3
F
F
Cl
F
F
Cl
F
F
Cl
F
F
Cl
F
F
OCF3
F
F
F
Cl
F
F
Cl
F
F
OMe
Cl
Cl OMe
F
F
ClF
F
Cl F
F
F
Cl F
F
F
Cl F
F
F
Cl F
F
F
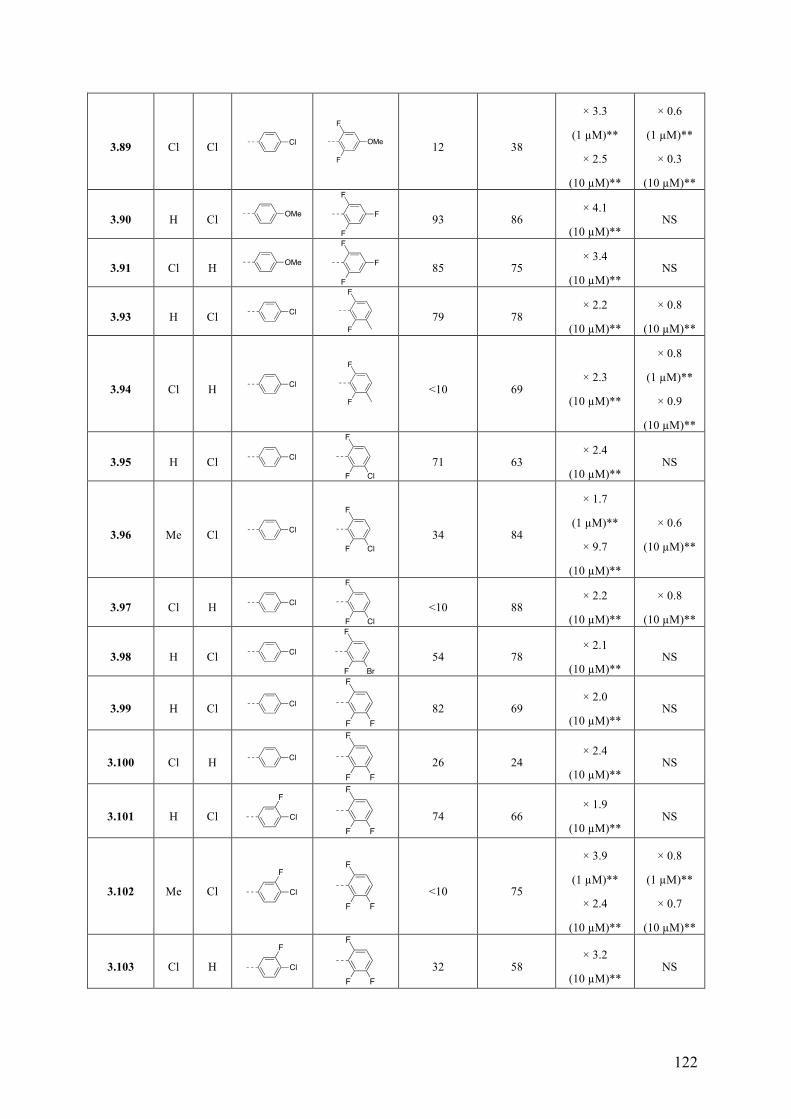
122
3.89 Cl Cl
12 38
× 3.3
(1 µM)**
× 2.5
(10 µM)**
× 0.6
(1 µM)**
× 0.3
(10 µM)**
3.90 H Cl
93 86 × 4.1
(10 µM)** NS
3.91 Cl H
85 75 × 3.4
(10 µM)** NS
3.93 H Cl
79 78 × 2.2
(10 µM)**
× 0.8
(10 µM)**
3.94 Cl H
<10 69 × 2.3
(10 µM)**
× 0.8
(1 µM)**
× 0.9
(10 µM)**
3.95 H Cl
71 63 × 2.4
(10 µM)** NS
3.96 Me Cl
34 84
× 1.7
(1 µM)**
× 9.7
(10 µM)**
× 0.6
(10 µM)**
3.97 Cl H
<10 88 × 2.2
(10 µM)**
× 0.8
(10 µM)**
3.98 H Cl
54 78 × 2.1
(10 µM)** NS
3.99 H Cl
82 69 × 2.0
(10 µM)** NS
3.100 Cl H
26 24 × 2.4
(10 µM)** NS
3.101 H Cl
74 66
× 1.9
(10 µM)** NS
3.102 Me Cl
<10 75
× 3.9
(1 µM)**
× 2.4
(10 µM)**
× 0.8
(1 µM)**
× 0.7
(10 µM)**
3.103 Cl H
32 58
× 3.2
(10 µM)** NS
Cl OMe
F
F
OMe F
F
F
OMe F
F
F
Cl
F
F
Cl
F
F
Cl
F
F
Cl
Cl
F
F
Cl
Cl
F
F
Cl
Cl
F
F
Br
Cl
F
F
F
Cl
F
F
F
Cl
F
F
F
F
Cl
F
F
F
F
Cl
F
F
F
F
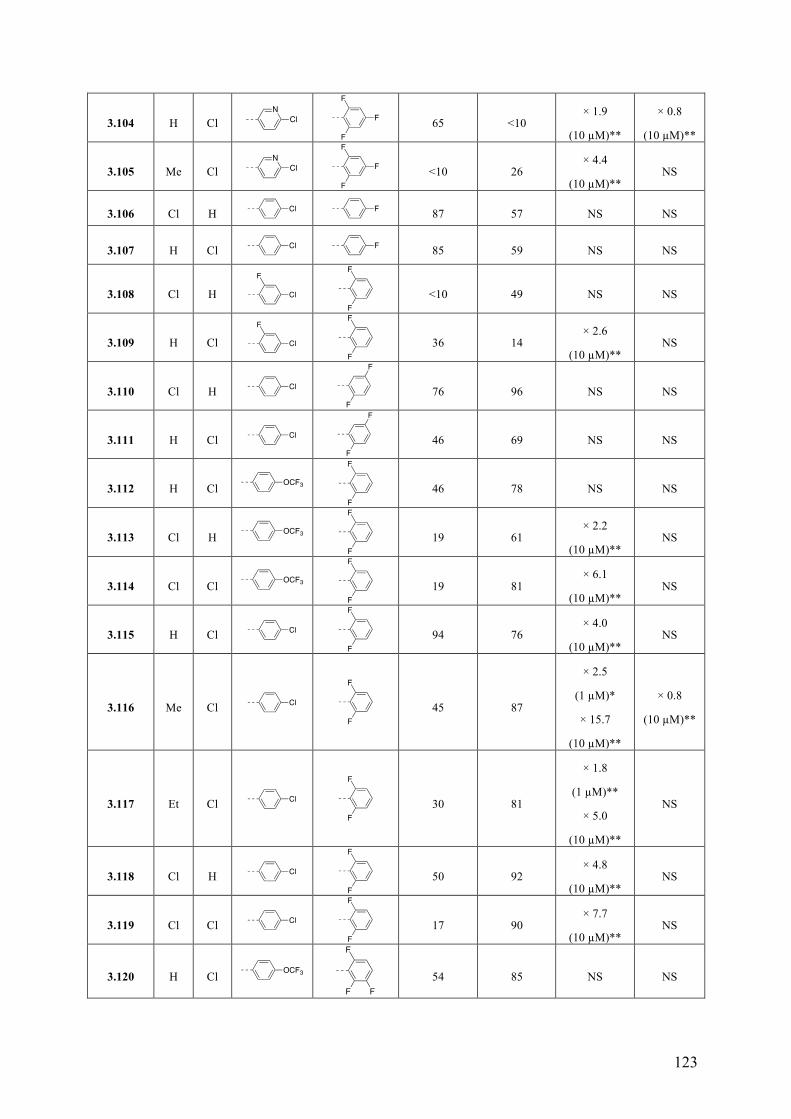
123
3.104 H Cl
65 <10 × 1.9
(10 µM)**
× 0.8
(10 µM)**
3.105 Me Cl
<10 26 × 4.4
(10 µM)** NS
3.106 Cl H 87 57 NS NS
3.107 H Cl 85 59 NS NS
3.108 Cl H
<10 49 NS NS
3.109 H Cl
36 14 × 2.6
(10 µM)** NS
3.110 Cl H
76 96 NS NS
3.111 H Cl
46 69 NS NS
3.112 H Cl
46 78 NS NS
3.113 Cl H
19 61 × 2.2
(10 µM)** NS
3.114 Cl Cl
19 81 × 6.1
(10 µM)** NS
3.115 H Cl
94 76 × 4.0
(10 µM)** NS
3.116 Me Cl
45 87
× 2.5
(1 µM)*
× 15.7
(10 µM)**
× 0.8
(10 µM)**
3.117 Et Cl
30 81
× 1.8
(1 µM)**
× 5.0
(10 µM)**
NS
3.118 Cl H
50 92 × 4.8
(10 µM)** NS
3.119 Cl Cl
17 90 × 7.7
(10 µM)** NS
3.120 H Cl
54 85 NS NS
NCl F
F
F
NCl F
F
F
Cl F
Cl F
Cl
F
F
F
Cl
F
F
F
Cl
F
F
Cl
F
F
OCF3
F
F
OCF3
F
F
OCF3
F
F
Cl
F
F
Cl
F
F
Cl
F
F
Cl
F
F
Cl
F
F
OCF3
F
F
F
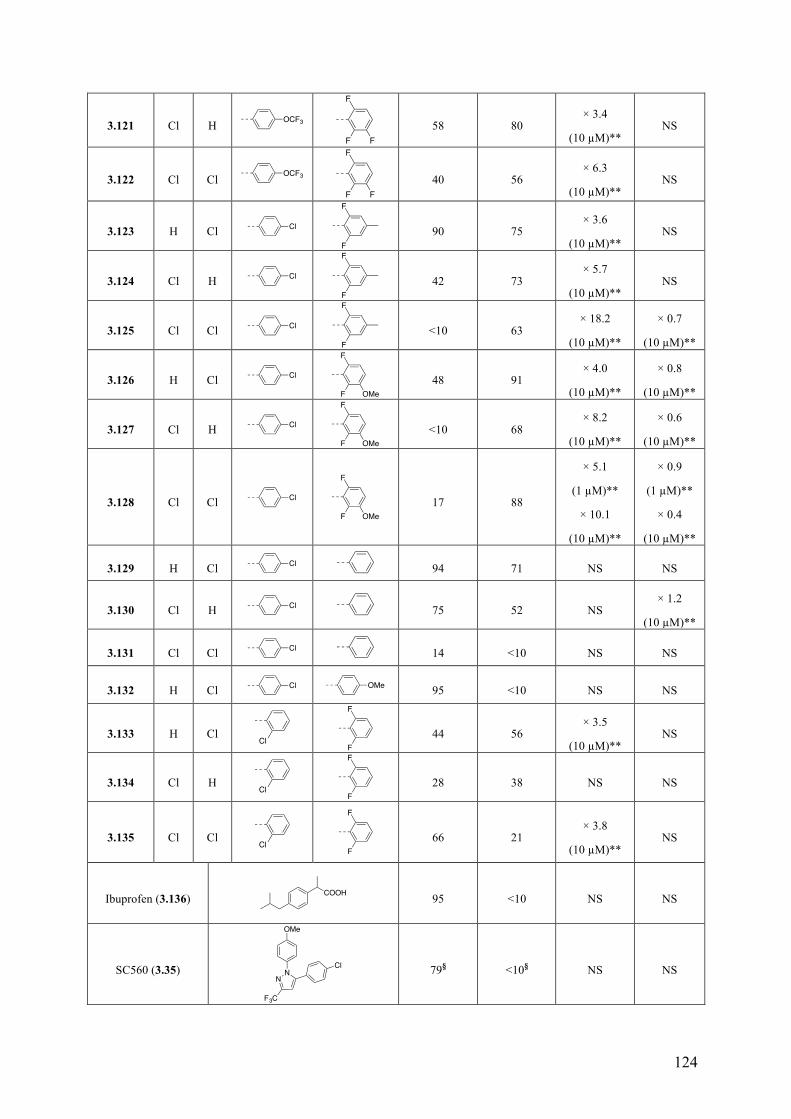
124
3.121 Cl H
58 80 × 3.4
(10 µM)** NS
3.122 Cl Cl
40 56 × 6.3
(10 µM)** NS
3.123 H Cl
90 75 × 3.6
(10 µM)** NS
3.124 Cl H
42 73 × 5.7
(10 µM)** NS
3.125 Cl Cl
<10 63 × 18.2
(10 µM)**
× 0.7
(10 µM)**
3.126 H Cl
48 91 × 4.0
(10 µM)**
× 0.8
(10 µM)**
3.127 Cl H
<10 68 × 8.2
(10 µM)**
× 0.6
(10 µM)**
3.128 Cl Cl
17 88
× 5.1
(1 µM)**
× 10.1
(10 µM)**
× 0.9
(1 µM)**
× 0.4
(10 µM)**
3.129 H Cl 94 71 NS NS
3.130 Cl H 75 52 NS × 1.2
(10 µM)**
3.131 Cl Cl 14 <10 NS NS
3.132 H Cl 95 <10 NS NS
3.133 H Cl
44 56 × 3.5
(10 µM)** NS
3.134 Cl H
28 38 NS NS
3.135 Cl Cl
66 21 × 3.8
(10 µM)** NS
Ibuprofen (3.136)
95 <10 NS NS
SC560 (3.35)
79§ <10§ NS NS
OCF3
F
F
F
OCF3
F
F
F
Cl
F
F
Cl
F
F
Cl
F
F
Cl
F
F
OMe
Cl
F
F
OMe
Cl
F
F
OMe
Cl
Cl
Cl
Cl OMe
ClF
F
ClF
F
ClF
F
COOH
NN
F3C
OMe
Cl
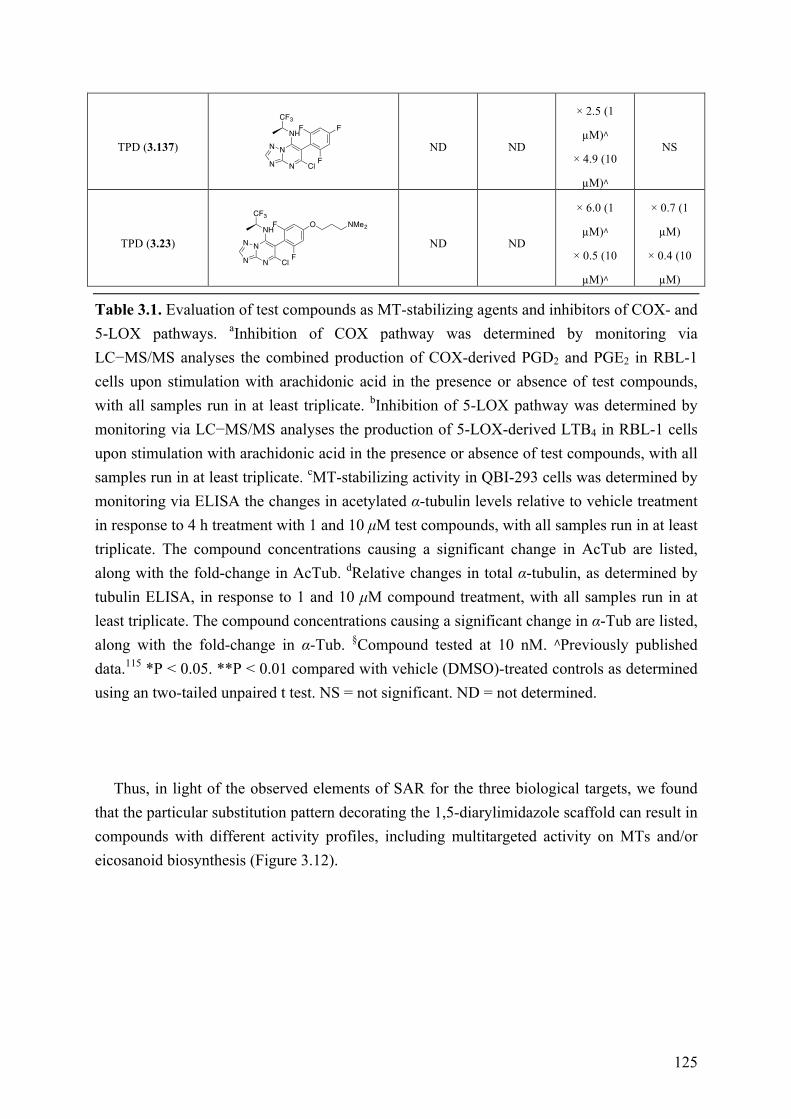
125
TPD (3.137)
ND ND
× 2.5 (1
µM)∧
× 4.9 (10
µM)∧
NS
TPD (3.23)
ND ND
× 6.0 (1
µM)∧
× 0.5 (10
µM)∧
× 0.7 (1
µM)
× 0.4 (10
µM) Table 3.1. Evaluation of test compounds as MT-stabilizing agents and inhibitors of COX- and 5-LOX pathways. aInhibition of COX pathway was determined by monitoring via LC−MS/MS analyses the combined production of COX-derived PGD2 and PGE2 in RBL-1 cells upon stimulation with arachidonic acid in the presence or absence of test compounds, with all samples run in at least triplicate. bInhibition of 5-LOX pathway was determined by monitoring via LC−MS/MS analyses the production of 5-LOX-derived LTB4 in RBL-1 cells upon stimulation with arachidonic acid in the presence or absence of test compounds, with all samples run in at least triplicate. cMT-stabilizing activity in QBI-293 cells was determined by monitoring via ELISA the changes in acetylated α-tubulin levels relative to vehicle treatment in response to 4 h treatment with 1 and 10 µM test compounds, with all samples run in at least triplicate. The compound concentrations causing a significant change in AcTub are listed, along with the fold-change in AcTub. dRelative changes in total α-tubulin, as determined by tubulin ELISA, in response to 1 and 10 µM compound treatment, with all samples run in at least triplicate. The compound concentrations causing a significant change in α-Tub are listed, along with the fold-change in α-Tub. §Compound tested at 10 nM. ∧Previously published data.115 *P < 0.05. **P < 0.01 compared with vehicle (DMSO)-treated controls as determined using an two-tailed unpaired t test. NS = not significant. ND = not determined.
Thus, in light of the observed elements of SAR for the three biological targets, we found
that the particular substitution pattern decorating the 1,5-diarylimidazole scaffold can result in compounds with different activity profiles, including multitargeted activity on MTs and/or eicosanoid biosynthesis (Figure 3.12).
N
N
N
N
NH
Cl
F
F
FCF3
N
N
N
N
NH
Cl
F
F
OCF3
NMe2
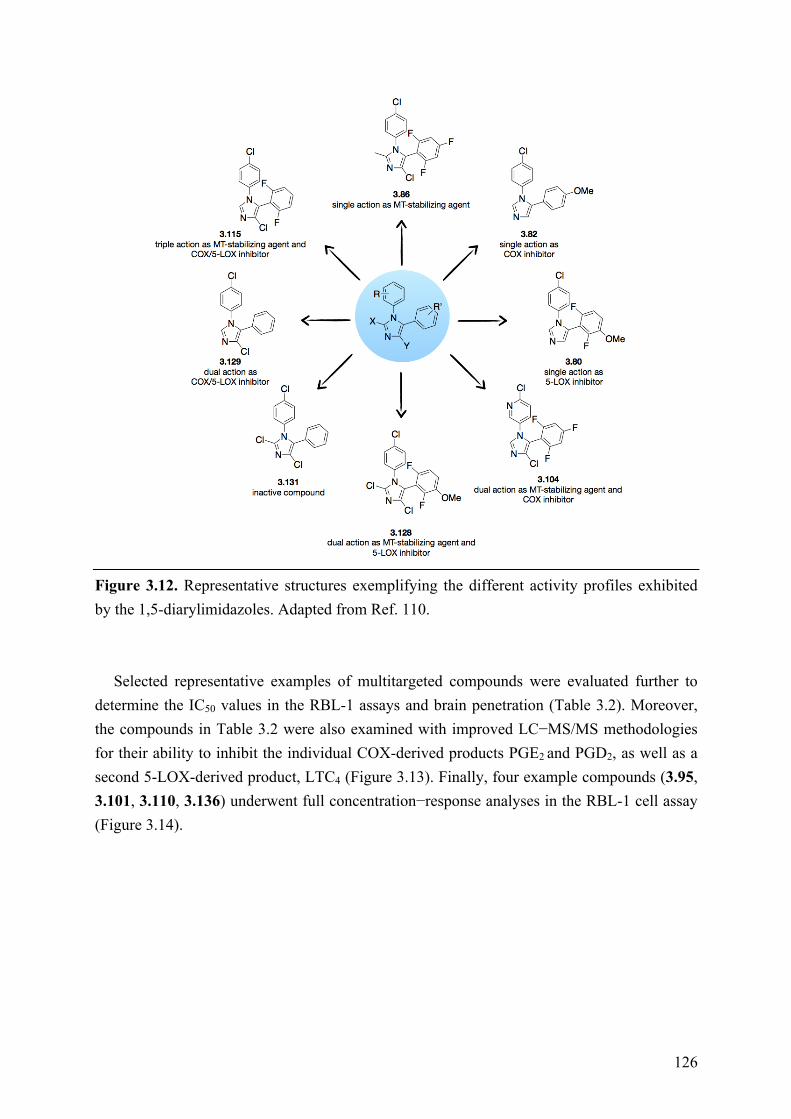
126
Figure 3.12. Representative structures exemplifying the different activity profiles exhibited by the 1,5-diarylimidazoles. Adapted from Ref. 110.
Selected representative examples of multitargeted compounds were evaluated further to determine the IC50 values in the RBL-1 assays and brain penetration (Table 3.2). Moreover, the compounds in Table 3.2 were also examined with improved LC−MS/MS methodologies for their ability to inhibit the individual COX-derived products PGE2 and PGD2, as well as a second 5-LOX-derived product, LTC4 (Figure 3.13). Finally, four example compounds (3.95, 3.101, 3.110, 3.136) underwent full concentration−response analyses in the RBL-1 cell assay (Figure 3.14).
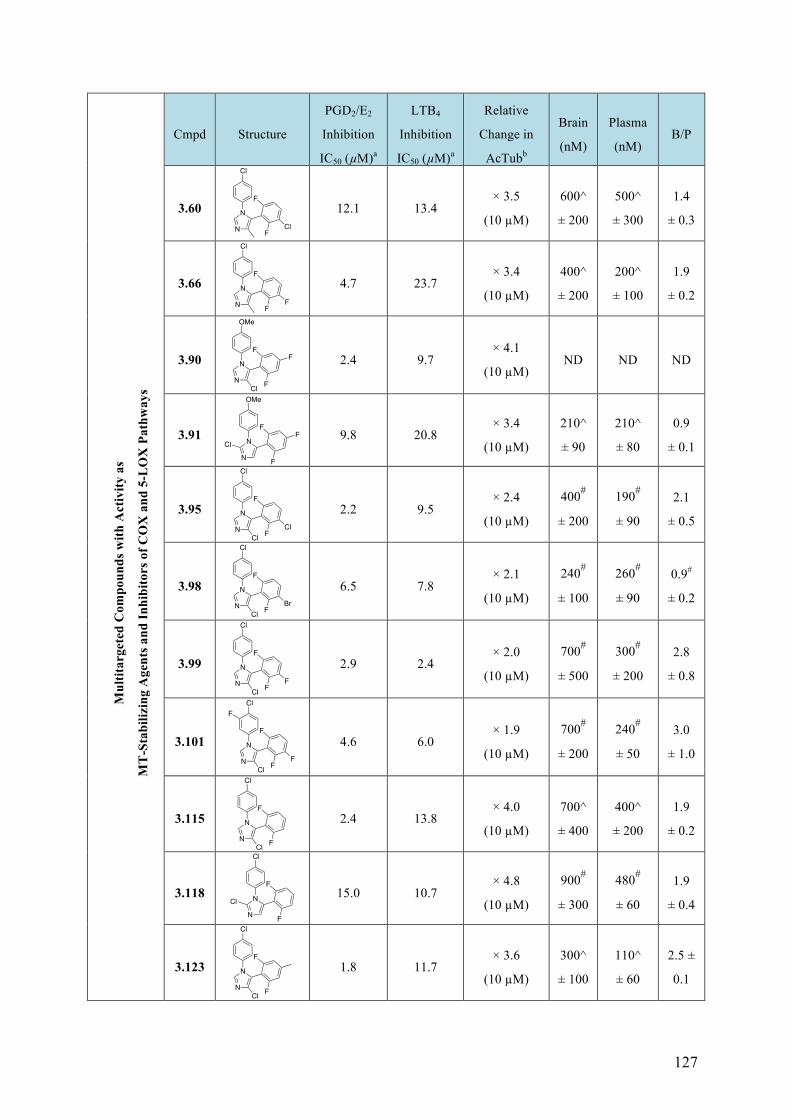
127
Cmpd Structure
PGD2/E2
Inhibition
IC50 (µM)a
LTB4
Inhibition
IC50 (µM)a
Relative
Change in
AcTubb
Brain
(nM)
Plasma
(nM) B/P
Mul
titar
gete
d C
ompo
unds
with
Act
ivity
as
MT
-Sta
biliz
ing
Age
nts a
nd In
hibi
tors
of C
OX
and
5-L
OX
Pat
hway
s
3.60
12.1 13.4 × 3.5
(10 µM)
600^
± 200
500^
± 300
1.4
± 0.3
3.66
4.7 23.7 × 3.4
(10 µM)
400^
± 200
200^
± 100
1.9
± 0.2
3.90
2.4 9.7 × 4.1
(10 µM) ND ND ND
3.91
9.8 20.8 × 3.4
(10 µM)
210^
± 90
210^
± 80
0.9
± 0.1
3.95
2.2 9.5 × 2.4
(10 µM)
400#
± 200
190#
± 90
2.1
± 0.5
3.98
6.5 7.8 × 2.1
(10 µM)
240#
± 100
260#
± 90
0.9#
± 0.2
3.99
2.9 2.4 × 2.0
(10 µM)
700#
± 500
300#
± 200
2.8
± 0.8
3.101
4.6 6.0 × 1.9
(10 µM)
700#
± 200
240#
± 50
3.0
± 1.0
3.115
2.4 13.8 × 4.0
(10 µM)
700^
± 400
400^
± 200
1.9
± 0.2
3.118
15.0 10.7 × 4.8
(10 µM)
900#
± 300
480#
± 60
1.9
± 0.4
3.123
1.8 11.7 × 3.6
(10 µM)
300^
± 100
110^
± 60
2.5 ±
0.1
Cl
N
N F
F
Cl
Cl
N
N F
F
F
OMe
N
N F
FF
ClOMe
N
N
Cl
F
FF
Cl
N
N F
F
ClCl
Cl
N
N F
F
ClBr
Cl
N
N F
F
ClF
Cl
N
N F
F
F
F
ClCl
N
N F
F
ClCl
N
N F
F
Cl
Cl
N
N F
F
Cl
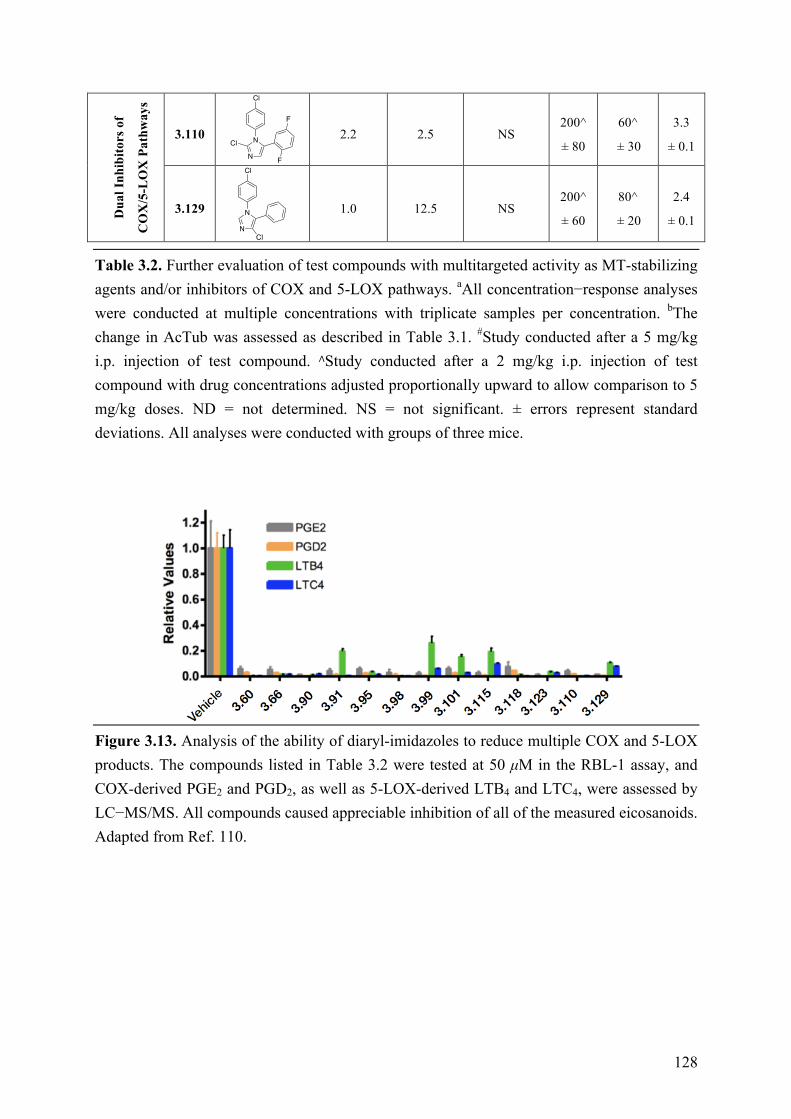
128
Dua
l Inh
ibito
rs o
f
CO
X/5
-LO
X P
athw
ays
3.110
2.2 2.5 NS 200^
± 80
60^ ± 30
3.3
± 0.1
3.129
1.0 12.5 NS 200^
± 60
80^ ± 20
2.4
± 0.1 Table 3.2. Further evaluation of test compounds with multitargeted activity as MT-stabilizing agents and/or inhibitors of COX and 5-LOX pathways. aAll concentration−response analyses were conducted at multiple concentrations with triplicate samples per concentration. bThe change in AcTub was assessed as described in Table 3.1. #Study conducted after a 5 mg/kg i.p. injection of test compound. ∧Study conducted after a 2 mg/kg i.p. injection of test compound with drug concentrations adjusted proportionally upward to allow comparison to 5 mg/kg doses. ND = not determined. NS = not significant. ± errors represent standard deviations. All analyses were conducted with groups of three mice.
Figure 3.13. Analysis of the ability of diaryl-imidazoles to reduce multiple COX and 5-LOX products. The compounds listed in Table 3.2 were tested at 50 µM in the RBL-1 assay, and COX-derived PGE2 and PGD2, as well as 5-LOX-derived LTB4 and LTC4, were assessed by LC−MS/MS. All compounds caused appreciable inhibition of all of the measured eicosanoids. Adapted from Ref. 110.
Cl
N
N
Cl
F
F
Cl
N
NCl

129
Figure 3.14. Representative dose−response curves in the RBL-1 cell assays. Adapted from Ref. 110.
Collectively, these studies confirmed that all Table 3.2 compounds effectively inhibited both COX and 5-LOX biosynthetic pathways with multiple compounds exhibiting balanced multitargeted activity in the low µM range. It has to be noted that, with respect to the ability of these compounds to act as inhibitors of the COX and/or 5-LOX pathways, although the IC50 values in the COX biosynthetic pathway assay are much higher than the IC50 of COX inhibitor 3.35 (i.e., ~1 nM), the activity level displayed by these molecules is closely comparable to that of the over-the-counter drug, ibuprofen (3.136, Table 3.1). Unlike 3.136 or 3.35, however, these multitargeted 1,5-diarylimidazoles (e.g., 3.110, Table 3.2) exhibit inhibition activity against the leukotriene biosynthetic pathway, while other derivatives are also capable of affecting MT stability in vitro, with several examples (e.g., 3.99, 3.101, 3.118) exhibiting relatively balanced multitargeted activity and brain penetration (Table 3.2). Indeed, the evaluation of the brain penetration of these molecules revealed that, consistent with the relatively small size of these molecules, they are generally capable of reaching significant brain concentrations after peripheral administration, suggesting that compounds of this type may be appropriate for further evaluation in the context of CNS diseases.
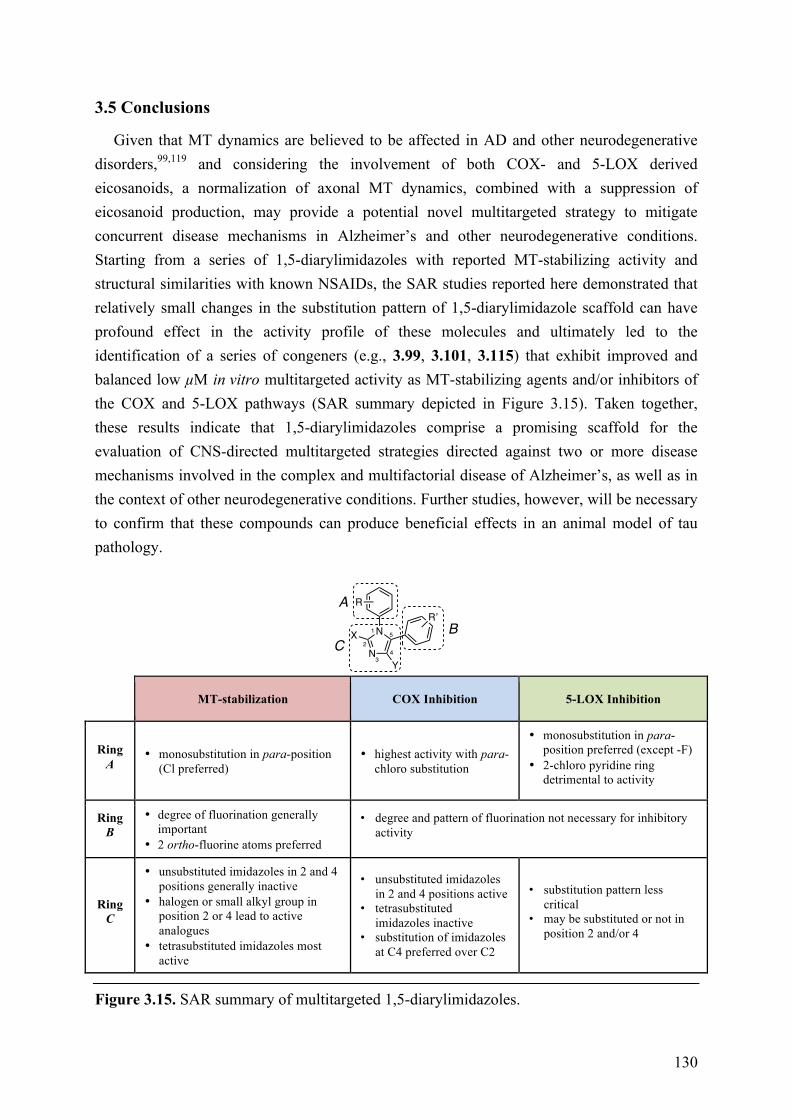
130
3.5 Conclusions
Given that MT dynamics are believed to be affected in AD and other neurodegenerative disorders,99,119 and considering the involvement of both COX- and 5-LOX derived eicosanoids, a normalization of axonal MT dynamics, combined with a suppression of eicosanoid production, may provide a potential novel multitargeted strategy to mitigate concurrent disease mechanisms in Alzheimer’s and other neurodegenerative conditions. Starting from a series of 1,5-diarylimidazoles with reported MT-stabilizing activity and structural similarities with known NSAIDs, the SAR studies reported here demonstrated that relatively small changes in the substitution pattern of 1,5-diarylimidazole scaffold can have profound effect in the activity profile of these molecules and ultimately led to the identification of a series of congeners (e.g., 3.99, 3.101, 3.115) that exhibit improved and balanced low µM in vitro multitargeted activity as MT-stabilizing agents and/or inhibitors of the COX and 5-LOX pathways (SAR summary depicted in Figure 3.15). Taken together, these results indicate that 1,5-diarylimidazoles comprise a promising scaffold for the evaluation of CNS-directed multitargeted strategies directed against two or more disease mechanisms involved in the complex and multifactorial disease of Alzheimer’s, as well as in the context of other neurodegenerative conditions. Further studies, however, will be necessary to confirm that these compounds can produce beneficial effects in an animal model of tau pathology.
MT-stabilization COX Inhibition 5-LOX Inhibition
Ring A
• monosubstitution in para-position (Cl preferred)
• highest activity with para-chloro substitution
• monosubstitution in para-position preferred (except -F)
• 2-chloro pyridine ring detrimental to activity
Ring B
• degree of fluorination generally important
• 2 ortho-fluorine atoms preferred
• degree and pattern of fluorination not necessary for inhibitory activity
Ring C
• unsubstituted imidazoles in 2 and 4 positions generally inactive
• halogen or small alkyl group in position 2 or 4 lead to active analogues
• tetrasubstituted imidazoles most active
• unsubstituted imidazoles in 2 and 4 positions active
• tetrasubstituted imidazoles inactive
• substitution of imidazoles at C4 preferred over C2
• substitution pattern less critical
• may be substituted or not in position 2 and/or 4
Figure 3.15. SAR summary of multitargeted 1,5-diarylimidazoles.
N
R
N
X
Y
R’1
2
34
5
A
BC
131
3.6 Experimental Section
3.6.1 Chemistry
All solvents were reagent grade. All reagents were purchased from Aldrich or Acros and used as received. Thin layer chromatography (TLC) was performed with 0.25 mm E. Merck precoated silica gel plates. Silica gel column chromatography was performed with silica gel 60 (particle size 0.040−0.062 mm) supplied by Silicycle and Sorbent Technologies. TLC spots were detected by viewing under a UV light. Melting points (m.p.) were acquired on a Thomas−Hoover apparatus and are uncorrected. Infrared (IR) spectra were recorded on a Jasco model FT/IR-480 Plus spectrometer. Proton (1H) and carbon (13C) NMR spectra were recorded on a Bruker AMX-500 spectrometer. Chemical shifts were reported relative to solvents. High-resolution mass spectra were measured at the University of Pennsylvania Mass Spectrometry Center on either a VG Micromass 70/70H or VG ZAB-E spectrometer. Single-crystal X-ray structure determinations were performed at the University of Pennsylvania with an Enraf Nonius CAD-4 diffractometer. Analytical reverse-phase (Sunfire C18; 4.6 mm × 50 mm, 5 mL) HPLC was performed with a Waters binary gradient module 2525 equipped with Waters 2996 PDA and Waters micromass ZQ. All samples were analyzed employing a linear gradient from 10% to 90% of CH3CN in water over 8 min and flow rate of 1 mL/min, and unless otherwise stated, the purity level was >95%. Preparative reverse-phase HPLC purifications were performed on a Gilson instrument (i.e., Gilson 333 pumps, a 215 liquid handler, 845Z injection module, and PDA detector) employing Waters SunFire preparative C18 OBD columns (5 µm 19 mm × 50 mm or 19 mm × 100 mm). Purifications were carried out employing a linear gradient from 10% to 90% of CH3CN in water for 15 min with a flow rate of 20 mL/min. Unless otherwise stated, all final compounds were found to be >95% pure as determined by HPLC/MS and NMR.
General procedure A for the synthesis of imines 3.37, 3.39, 3.41, 3.47, 3.48−3.52. A solution of aniline (1 equiv) and benzaldehyde (1 equiv) in toluene (0.2 M) was heated at 110 ˚C in a Dean−Stark apparatus for 4 days. The reaction mixture was then cooled and evaporated in vacuo to obtain the title compound, which was used in the next step without further purification.
General procedure B for the synthesis of imines 3.53−3.55. To a solution of a primary amine (1 equiv) in anhydrous Et2O (0.3 M) in the presence of molecular sieves (4 Å, 1.6 mm pellets, 7 g/mmol) was added an aldehyde (1 equiv) according to the Taguchi’s method. The mixture was heated and stirred at 30 °C for 48 h. Molecular sieves were then removed by filtration and the solvent was evaporated in vacuo to afford the desired imine in quantitative yields.
General procedure C for the synthesis of imidazoles 3.57, 3.59, 3.64, 3.73, 3.74, 3.78−3.84. To a solution of imine (1 equiv) in a mixture of DMF (0.26 M) and 1,2-dimethoxyethane (0.32 M) were added toluenesulfonylmethyl isocyanide (1.5 equiv) and

132
anhydrous K2CO3 (2.08 equiv). The reaction mixture was heated for 16 h at 100 °C, then cooled to room temperature, filtered, and evaporated in vacuo. The resulting material was adsorbed on Celite® 545 AW and purified by silica gel column chromatography to obtain the desired compound. General procedure D for the synthesis of 4-alkylated imidazoles 3.60, 3.66, 3.75. To a solution of imine (1 equiv) in a mixture of DMF (0.14 M) and 1,2-dimethoxyethane (0.17 M) were added 1-((1-isocyanoethyl)sulfonyl)-4-methylbenzene (1.5 equiv) and anhydrous K2CO3 (2.08 equiv). The reaction mixture was heated for 16 h at 100 °C, then cooled to room temperature, filtered through a pad of Celite® 545 AW, and evaporated in vacuo. The resulting material was purified by silica gel column chromatography to obtain the desired compound.
General procedure E for the mono and di-chlorination of 1,5-diarylimidazoles 3.61, 3.67, 3.76, 3.90, 3.91, 3.112−3.115, 3.118−3.135. To a solution of imidazole (1 equiv) in CHCl3 (0.16 M) was added N-chlorosuccinimide (1.06 equiv). The reaction mixture was heated at 60 °C for 16 h, then cooled to room temperature and diluted with EtOAc. The organic layer was washed with brine (×3), dried over MgSO4, filtered, and evaporated in vacuo. Purification via silica gel column chromatography furnished the mono- and di-chlorinated imidazoles.
General procedure F for alkylation of 1,5-diarylimidazoles 3.62, 3.77, 3.116, 3.117. To a solution of diisopropylamine (1.5 equiv) in THF (0.3 M) at –20 °C was added n-BuLi (2.5 M in hexanes, 1.5 equiv), and the mixture was stirred for 10 min. A solution of imidazole (1 equiv) in THF (0.15 M) was added, and after stirring for 30 min, methyliodide or ethyliodide (3 equiv) was added. The mixture was stirred for 30 min at –20 °C and for 30 min at room temperature. Water was then added to the reaction mixture. The aqueous phase was extracted with EtOAc, and the combined organic layers were washed with brine (×3), dried over MgSO4, filtered, and concentrated in vacuo. Purification via silica gel column chromatography furnished the desired alkylated imidazoles.
(E)-N-(4-methoxyphenyl)-1-(2,4,6-trifluorophenyl)methanimine (3.37). Following synthetic procedure A using 4-methoxyaniline (0.370 g, 3.00 mmol) and 2,4,6-trifluorobenzaldehyde (0.480 g, 3.00 mmol), the title compound was obtained as a brown solid (0.814 g, 3.07 mmol, 99% yield). 1H NMR (500 MHz, CDCl3) δ 8.59 (s, 1H), 7.25–7.22 (m, 2H), 6.97–6.90 (m, 2H), 6.81–6.72 (m, 2H), 3.84 (s, 3H) ppm.
(E)-1-(3-chloro-2,6-difluorophenyl)-N-(4-chlorophenyl)methanimine (3.39). Following synthetic procedure A using 4-chloro-aniline (0.383 g, 3.00 mmol) and 3-chloro-2,6-difluorobenzaldehyde (0.530 g, 3.00 mmol), the title compound was obtained as a brown solid (0.850 g, 2.97 mmol, 99% yield). 1H NMR (500 MHz, CDCl3) δ 8.60 (s, 1H), 7.47 (td, J = 8.4, 5.5 Hz, 1H), 7.37 (app d, J = 8.5 Hz, 2H), 7.17 (app d, J = 8.5 Hz, 2H), 7.00–6.96 (m, 1H) ppm; 13C NMR (126 MHz, CDCl3) δ 159.87 (dd, J = 390.8, 5.6 Hz), 157.80 (dd, J =
133
393.2, 5.6 Hz), 150.87, 150.42, 132.72 (d, J = 10.3 Hz), 132.65, 129.47, 122.29, 117.77 (dd, J = 18.0, 3.9 Hz), 115.03 (t, J = 12.9 Hz), 112.80 (dd, J = 23.0, 4.4 Hz) ppm.
(E)-N-(4-chlorophenyl)-1-(2,3,6-trifluorophenyl)methanimine (3.41). Following synthetic procedure A using 4-chloro-aniline (0.383 g, 3.00 mmol) and 2,3,6-trifluorobenzaldehyde (0.337 mL, 3.00 mmol), the title compound was obtained as a brown solid (0.778 g, 2.88 mmol, 96% yield). 1H NMR (500 MHz, CDCl3) δ 8.58 (s, 1H), 7.34 (app d, J = 8.3 Hz, 2H), 7.26–7.20 (m, 1H), 7.16 (app d, J = 8.2 Hz, 2H), 6.92 (app t, J = 9.0 Hz, 1H) ppm; 13C NMR (126 MHz, CDCl3) δ 158.28, 156.26, 150.76, 150.19, 148.36–148.23 (m), 146.34 (dd, J = 12.5, 3.6 Hz), 132.51, 129.30, 122.18, 119.33 (dd, J = 19.4, 10.4 Hz), 115.07 (dd, J = 14.2, 9.0 Hz), 111.42 (dt, J = 24.4, 5.3 Hz) ppm.
(E)-1-(2,6-difluorophenyl)-N-(4-(trifluoromethoxy)phenyl)methanimine (3.47). Following synthetic procedure A using 4-(trifluoromethoxy)aniline (0.531 g, 3.00 mmol) and 2,6-difluorobenzaldehyde (0.426 g, 3.00 mmol), the title compound was obtained as a brown liquid (1.03 g, 3.43 mmol, 99% yield). 1H NMR (500 MHz, CDCl3) δ 8.65 (s, 1H), 7.46–7.39 (m, 1H), 7.26–7.22 (m, 4H), 7.01 (t, J = 8.6 Hz, 2H) ppm. (E)-N-(4-chlorophenyl)-1-(2,6-difluorophenyl)methanimine (3.48). Following synthetic procedure A using 4-chloroaniline (0.829 g, 6.50 mmol) and 2,6-difluorobenzaldehyde (0.924 g, 6.50 mmol) the title compound was obtained as a brown liquid (1.62 g, 6.45 mmol, 99% yield). 1H NMR (500 MHz, CDCl3) δ 8.64 (s, 1H), 7.46–7.40 (m, 1H), 7.40–7.34 (m, 2H), 7.20–7.14 (m, 2H), 7.04–6.96 (m, 2H) ppm.
(E)-N-(4-(trifluoromethoxy)phenyl)-1-(2,3,6-trifluorophenyl)methanimine (3.49). Following synthetic procedure A using 4-(trifluoromethoxy)aniline (0.531 g, 3.00 mmol) and 2,3,6-trifluorobenzaldehyde (0.480 g, 3.00 mmol), the title compound was obtained as a brown solid (1.08 g, 3.47 mmol, 99% yield). 1H NMR (500 MHz, CDCl3) δ 8.62 (s, 1H), 7.45–7.25 (m, 2H), 7.27–7.22 (m, 2H), 7.20–7.11 (m, 1H), 7.02–6.93 (m, 1H) ppm.
(E)-N-(4-chlorophenyl)-1-(2,6-difluoro-4-methylphenyl)methanimine (3.50). Following synthetic procedure A using 4-chloroaniline (0.157 g, 1.23 mmol) and 2,6-difluoro-4-methylbenzaldehyde (0.192 g, 3.00 mmol), the title compound was obtained as a brown solid (0.183 g, 0.689 mmol, 56% yield). 1H NMR (500 MHz, CDCl3) δ 8.59 (s, 1H), 7.36 (d, J = 8.2 Hz, 2H), 7.15 (d, J = 8.2 Hz, 2H), 6.82 (d, J = 10.1 Hz, 2H), 2.40 (s, 3H) ppm.
(E)-N-(4-chlorophenyl)-1-(2,6-difluoro-3-methoxyphenyl)methanimine (3.51). Following synthetic procedure A using 4-chloroaniline (0.383 g, 3.00 mmol) and 2,6-difluoro-3-methoxybenzaldehyde (0.468 g, 3.00 mmol), the title compound was obtained as a brown solid (0.745 g, 2.64 mmol, 88% yield). 1H NMR (500 MHz, CDCl3) δ 8.63 (s, 1H), 7.39–7.32 (m, 2H), 7.20–7.11 (m, 2H), 7.07–6.98 (m, 1H), 6.96–6.87 (m, 1H), 3.90 (s, 3H) ppm.
(E)-N-(4-chlorophenyl)-1-phenylmethanimine (3.52). Following synthetic procedure A using 4-chloroaniline (0.383 g, 3.00 mmol) and benzaldehyde (0.318 g, 3.00 mmol), the title compound was obtained as a brown solid (0.702 g, 3.25 mmol, 99% yield). 1H NMR
134
(500 MHz, CDCl3) δ 8.44 (s, 1H), 7.96–7.87 (m, 2H), 7.57–7.45 (m, 3H), 7.36 (d, J = 8.3 Hz, 2H), 7.16 (d, J = 8.3 Hz, 2H) ppm.
(E)-N-(4-chlorophenyl)-1-(4-methoxyphenyl)methanimine (3.53). Following synthetic procedure B using 4-chloroaniline (0.765 g, 6.00 mmol) and 4-methoxybenzaldehyde (0.817 g, 6.00 mmol), the title compound was obtained as a yellow solid (1.37 g, 5.58 mmol, 93% yield). 1H NMR (500 MHz, CDCl3) δ 8.35 (s, 1H), 7.84 (d, J = 8.4 Hz, 2H), 7.37–7.31 (m, 2H), 7.13 (d, J = 8.5 Hz, 2H), 6.98 (d, J = 8.4 Hz, 2H), 3.87 (s, 3H) ppm.
(E)-1-(2,6-difluorophenyl)-N-phenylmethanimine (3.54). Following synthetic procedure B using aniline (0.559 g, 6.00 mmol) and 2,6-difluorobenzaldehyde (0.853 g, 6.00 mmol), the title compound was obtained as a yellow liquid (0.637 g, 2.93 mmol, 49% yield). 1H NMR (500 MHz, CDCl3) δ 8.65 (s, 1H), 7.44–7.34 (m, 3H), 7.26–7.19 (m, 3H), 7.02–6.95 (m, 2H) ppm.
(E)-N-(2-chlorophenyl)-1-(2,6-difluorophenyl)methanimine (3.55). Following synthetic procedure B using 2-chloroaniline (0.765 g, 6.00 mmol) and 2,6-difluorobenzaldehyde (0.853 g, 6.00 mmol), the title compound was obtained as a yellow liquid (1.41 g, 5.58 mmol, 93% yield). 1H NMR (500 MHz, CDCl3) δ 8.62 (s, 1H), 7.49–7.39 (m, 2H), 7.32–7.27 (m, 1H), 7.20–7.14 (m, 1H), 7.06–6.98 (m, 3H) ppm.
1-(4-Methoxyphenyl)-5-(2,4,6-trifluorophenyl)-1H-imidazole (3.57). Following synthetic procedure C using (E)-N-(4-methoxyphenyl)-1-(2,4,6-trifluorophenyl)methanimine (0.814 g, 3.07 mmol), purification by silica gel column chromatography (hexanes/EtOAc 60:40) afforded the title compound as an orange solid (0.065 g, 0.214 mmol, 7% yield). 1H NMR (500 MHz, CDCl3) δ 7.76 (s, 1H), 7.25 (s, 1H), 7.09–7.04 (m, 2H), 6.88–6.83 (m, 2H), 6.66–6.59 (m, 2H), 3.79 (s, 3H) ppm. 13C NMR (126 MHz, CDCl3) δ 163.05 (dt, J = 251.4, 15.1 Hz), 160.93 (ddd, J = 251.1, 14.8, 8.6 Hz), 159.50, 139.30, 131.76, 129.27, 126.21, 119.50, 114.58, 104.15 (td, J = 20.4, 4.9 Hz), 101.30–99.76 (m), 55.61 ppm. IR (KBr) ν 3102, 3008, 2935, 2840, 1689, 1644, 1599, 1564, 1515, 1489, 1465, 1439, 1301, 1250, 1172, 1123, 1033 cm-1. HRMS (ES+) calculated for C16H12F3N2O [M + H]+ 309.0902, found 309.0908.
5-(3-Chloro-2,6-difluorophenyl)-1-(4-chlorophenyl)-1H-imidazole (3.59). Following synthetic procedure C using (E)-1-(3-chloro-2,6-difluorophenyl)-N-(4-chlorophenyl)methanimine (0.429 g, 1.50 mmol), purification by silica gel column chromatography (hexanes/EtOAc 100:0 to 60:40) afforded the title compound as a white solid (0.298 g, 0.916 mmol, 61% yield). 1H NMR (500 MHz, CDCl3) δ 7.77 (d, J = 0.5 Hz, 1H), 7.32–7.27 (m, 4H), 7.06–7.04 (m, 2H), 6.78 (td, J = 8.7, 1.4 Hz, 1H) ppm. 13C NMR (126 MHz, CDCl3) δ 158.27 (dd, J = 251.2, 4.4 Hz), 155.38 (dd, J = 252.0, 6.3 Hz), 138.97, 134.65, 134.11, 132.45, 130.90, 130.83, 129.57, 125.53, 119.00, 116.96 (dd, J = 18.6, 4.2 Hz), 112.05 (dd, J = 23.5, 4.1 Hz), 108.51 (t, J = 20.1 Hz) ppm. MS (ES+) calculated for C15H9Cl2F2N2 [M + H]+ 325.01, found 324.93.

135
5-(3-Chloro-2,6-difluorophenyl)-1-(4-chlorophenyl)-4-methyl-1H-imidazole (3.60). Following synthetic procedure D using (E)-1-(3-chloro-2,6-difluorophenyl)-N-(4-chlorophenyl)methanimine (0.800 g, 2.80 mmol), purification by silica gel column chromatography (hexanes/EtOAc 65:35) afforded the title compound as an orange solid (0.433 g, 1.28 mmol, 46% yield). 1H NMR (500 MHz, CDCl3) δ 7.72 (s, 1H), 7.37 (ddd, J = 9.0, 8.0, 5.6 Hz, 1H), 7.34–7.27 (m, 2H), 7.08–7.01 (m, 2H), 6.84 (ddd, J = 9.0, 8.2, 1.8 Hz, 1H), 2.20 (s, 3H) ppm. 13C NMR (126 MHz, CDCl3) δ 158.82 (dd, J = 250.6, 4.6 Hz), 155.87 (dd, J = 251.8, 6.6 Hz), 140.71, 138.02, 135.11, 134.20, 131.25 (d, J = 9.6 Hz), 129.79, 125.77, 117.22 (dd, J = 18.7, 4.2 Hz), 115.41, 112.29 (dd, J = 23.6, 4.3 Hz), 109.12 (t, J = 20.3 Hz), 13.48 ppm. IR (KBr) ν 3077, 3036, 2960, 2925, 1625, 1568, 1498, 1477, 1453, 1352, 1282, 1269, 1218, 1091, 1003 cm-1. HRMS (ES+) calculated for C16H11Cl2F2N2 [M + H]+ 339.0267, found 339.0273.
2-Chloro-5-(3-chloro-2,6-difluorophenyl)-1-(4-chlorophenyl)-4-methyl-1H-imidazole (3.61). Following synthetic procedure E using 5-(3-chloro-2,6-difluorophenyl)-1-(4-chlorophenyl)-4-methyl-1H-imidazole (0.150 g, 0.442 mmol), purification by silica gel column chromatography (hexanes/EtOAc 80:20) afforded the title compound as a white solid (0.071 g, 0.190 mmol, 43% yield). 1H NMR (500 MHz, CDCl3) δ 7.39–7.31 (m, 3H), 7.14–7.06 (m, 2H), 6.86–6.75 (m, 1H), 2.17 (s, 3H) ppm. 13C NMR (126 MHz, CDCl3) δ 158.94 (dd, J = 250.9, 4.3 Hz), 156.02 (dd, J = 252.1, 6.2 Hz), 139.23, 135.37, 133.53 (d, J = 11.2 Hz), 131.74 (d, J = 9.8 Hz), 129.85, 129.61, 128.57, 117.71, 117.16 (dd, J = 18.3, 3.5 Hz), 112.23 (dd, J = 23.6, 4.3 Hz), 108.57 (t, J = 20.1 Hz), 13.43 ppm. IR (KBr) ν 3074, 2924, 2848, 1627, 1572, 1494, 1474, 1455, 1388, 1283, 1218, 1092, 1007 cm-1. HRMS (ES+) calculated for C16H10Cl3F2N2 [M + H]+ 372.9878, found 372.9874.
5-(3-Chloro-2,6-difluorophenyl)-1-(4-chlorophenyl)-2,4-dimethyl-1H-imidazole (3.62). Following synthetic procedure F using 5-(3-chloro-2,6-difluorophenyl)-1-(4-chlorophenyl)-4-methyl-1H-imidazole (0.050 g, 0.147 mmol), purification by silica gel column chromatography (hexanes/EtOAc 60:40) afforded the title compound as a orange solid (0.029 g, 0.082 mmol, 56% yield). 1H NMR (500 MHz, CDCl3) δ 7.34–7.29 (m, 2H), 7.31–7.26 (m, 1H), 7.03 (d, J = 8.4 Hz, 2H), 6.82–6.74 (m, 1H), 2.29 (s, 3H), 2.14 (s, 3H) ppm. 13C NMR (126 MHz, CDCl3) δ 158.99 (dd, J = 249.9, 4.9 Hz), 156.01 (dd, J = 251.2, 6.6 Hz), 146.28, 138.04, 135.07, 134.66, 130.99 (d, J = 9.7 Hz), 129.62, 128.34, 116.96 (dd, J = 19.0, 3.9 Hz), 115.69, 112.05 (dd, J = 23.9, 4.3 Hz), 109.60 (t, J = 20.7 Hz), 14.04, 13.13 ppm. IR (KBr) ν 3052, 2962, 2922, 2849, 1693, 1629, 1593, 1571, 1495, 1474, 1402, 1266, 1218, 1092, 1004 cm-1. HRMS (ES+) calculated for C17H13Cl2F2N2 [M + H]+ 353.0424, found 353.0413.
1-(4-Chlorophenyl)-5-(2,3,6-trifluorophenyl)-1H-imidazole (3.64). Following synthetic procedure C using (E)-N-(4-chlorophenyl)-1-(2,3,6-trifluorophenyl)methanimine (0.405 g, 1.50 mmol), purification by silica gel column chromatography (hexanes/EtOAc 100:0 to
136
60:40) afforded the title compound as a brown solid (0.350 g, 1.13 mmol, 76% yield). 1H NMR (500 MHz, CDCl3) δ 7.80 (s, 1H), 7.34–7.31 (m, 3H), 7.15–7.11 (m, J = 9.0, 5.0 Hz, 1H), 7.09 (d, J = 8.6 Hz, 2H), 6.82–6.78 (m, 1H) ppm. MS (ES+) calculated for C15H8ClF3N2 [M + H]+ 309.04, found 309.18.
1-(4-Chlorophenyl)-2-methyl-5-(2,3,6-trifluorophenyl)-1H-imidazole (3.65). To a solution of diisopropylamine (0.020 mL, 0.146 mmol, 1.50 equiv) in THF (0.5 mL) at –20 °C was added n-BuLi (2.5 M in hexanes, 0.060 mL, 0.146 mmol, 1.50 equiv), and the mixture was stirred for 10 min. A solution of 1-(4-chlorophenyl)-5-(2,3,6-trifluorophenyl)-1H-imidazole (0.030 g, 0.097 mmol, 1.00 equiv) in THF (1 mL) was added, and after stirring for 30 min, methyliodide (0.009 mL, 0.146 mmol, 1.50 equiv) was added. The mixture was stirred for 30 min at –20 °C and for 30 min at room temperature. H2O was added to the reaction mixture, the aqueous phase was extracted with EtOAc, and the combined organic layers were washed with brine (×3), dried over MgSO4, filtered, and concentrated. The mixture was purified by silica gel column chromatography (hexanes/EtOAc 65:35) afforded the title compound as a yellow solid (0.009 g, 0.028 mmol, 29% yield). 1H NMR (500 MHz, CDCl3) δ 7.38–7.33 (m, 2H), 7.19 (s, 1H), 7.11–7.04 (m, 3H), 6.78–6.73 (m, 1H), 2.34 (s, 3H) ppm. 13C NMR (126 MHz, CDCl3) δ 155.73 (dt, J = 246.7, 3.2 Hz), 148.24 (ddd, J = 251.2, 14.2, 6.5 Hz), 147.45, 147.13 (ddd, J = 245.9, 13.2, 3.6 Hz), 134.95, 134.80, 130.14, 129.73, 128.32, 125.88, 119.63, 117.77–117.37 (m), 110.88 (ddd, J = 24.7, 6.9, 4.3 Hz), 109.67 (dd, J = 21.8, 16.1 Hz), 14.24 ppm. IR (KBr) ν 3098, 3061, 2961, 2924, 2850, 1641, 1494, 1402, 1237, 1093 cm-1. HRMS (ES+) calculated for C16H11ClF3N2 [M + H]+ 323.0563, found 323.0568.
1-(4-Chlorophenyl)-4-methyl-5-(2,3,6-trifluorophenyl)-1H-imidazole (3.66). Following synthetic procedure D using (E)-N-(4-chlorophenyl)-1-(2,3,6-trifluorophenyl)methanimine (0.500 g, 1.85 mmol), purification by silica gel column chromatography (hexanes/EtOAc 60:40) afforded the title compound as an orange solid (0.190 g, 0.589 mmol, 32% yield). 1H NMR (500 MHz, CDCl3) δ 7.72 (s, 1H), 7.33–7.29 (m, 2H), 7.15 (qd, J = 9.1, 5.0 Hz, 1H), 7.07–7.02 (m, 2H), 6.85–6.79 (m, 1H), 2.22 (s, 3H) ppm. 13C NMR (126 MHz, CDCl3) δ 155.69 (dt, J = 247.2, 3.4 Hz), 148.15 (ddd, J = 252.2, 14.3, 6.4 Hz), 147.28 (ddd, J = 246.6, 12.8, 4.1 Hz), 140.74, 138.07, 135.11, 134.20, 129.79, 125.77, 117.83 (dd, J = 19.4, 9.7 Hz), 115.33 (d, J = 2.3 Hz), 111.14 (ddd, J = 24.4, 6.9, 4.2 Hz), 109.45 (dd, J = 22.0, 16.2 Hz), 13.48 ppm. IR (KBr) ν 3094, 2925, 1642, 1595, 1500, 1472, 1353, 1269, 1250, 1231, 1092, 1002, 973 cm-1. HRMS (ES+) calculated for C16H11ClF3N2 [M + H]+ 323.0563, found 323.0557.
2-Chloro-1-(4-chlorophenyl)-4-methyl-5-(2,3,6-trifluorophenyl)-1H-imidazole (3.67). Following synthetic procedure E using 1-(4-chlorophenyl)-4-methyl-5-(2,3,6-trifluorophenyl)-1H-imidazole (0.100 g, 0.310 mmol), purification by silica gel column chromatography (hexanes/EtOAc 80:20) afforded the title compound as a white solid (0.079 g, 0.221 mmol, 71% yield). 1H NMR (500 MHz, CDCl3) δ 7.36–7.31 (m, 2H), 7.17–
137
7.07 (m, 3H), 6.82–6.76 (m, 1H), 2.17 (s, 3H) ppm. 13C NMR (126 MHz, CDCl3) δ 155.82 (dt, J = 247.3, 2.9 Hz), 148.29 (ddd, J = 251.9, 14.1, 7.0 Hz), 147.12 (ddd, J = 246.7, 13.0, 3.9 Hz), 139.27, 135.37, 133.55 (d, J = 5.2 Hz), 129.85, 129.60, 128.57, 118.34 (dd, J = 19.3, 9.9 Hz), 117.60 (d, J = 2.3 Hz), 111.11 (ddd, J = 24.7, 6.9, 4.4 Hz), 108.90 (dd, J = 22.0, 16.2 Hz), 13.44 ppm. IR (KBr) ν 3052, 2983, 2918, 2849, 1494, 1448, 1265, 1236, 1092, 1001 cm-
1. HRMS (ES+) calculated for C16H10Cl2F3N2 [M + H]+ 357.0173, found 357.0170. 5-(2,6-Difluorophenyl)-1-(4-(trifluoromethoxy)phenyl)-1H-imidazole (3.73). Following
synthetic procedure C using (E)-1-(2,6-difluorophenyl)-N-(4-(trifluoromethoxy)phenyl)methanimine (1.03 g, 3.43 mmol), purification by silica gel column chromatography (hexanes/EtOAc 60:40) afforded the title compound as a white solid (0.644 g, 1.89 mmol, 55% yield). 1H NMR (500 MHz, DMSO-d6) δ 8.20 (s, 1H), 7.54–7.47 (m, 1H), 7.45 (d, J = 8.5 Hz, 2H), 7.35 (d, J = 8.5 Hz, 2H), 7.32 (s, 1H), 7.15 (t, J = 8.2 Hz, 2H) ppm. 13C NMR (126 MHz, DMSO-d6) δ 159.54 (dd, J = 248.4, 6.0 Hz), 147.54–147.48 (m), 139.64, 135.08, 131.88, 131.76 (t, J = 5.2 Hz), 126.09, 122.12, 119.91 (q, J = 256.9 Hz), 118.93, 111.98 (dd, J = 20.4, 5.1 Hz), 106.56 (t, J = 19.7 Hz) ppm. IR (KBr) ν 3059, 2917, 2849, 1632, 1580, 1562, 1514, 1472, 1448, 1262, 1212, 1169 cm-1. HRMS (ES+) calculated for C16H10F5N2O [M + H]+ 341.0713, found 341.0714.
1-(4-Chlorophenyl)-5-(2,6-difluorophenyl)-1H-imidazole (3.74). Following synthetic procedure C using (E)-N-(4-chlorophenyl)-1-(2,6-difluorophenyl)methanimine (1.62 g, 6.45 mmol), purification by silica gel column chromatography (hexanes/EtOAc 65:35) afforded the title compound as a yellow solid (1.18 g, 4.04 mmol, 63% yield). 1H NMR (500 MHz, CDCl3) δ 8.86 (s, 1H), 7.60 (s, 1H), 7.49–7.44 (m, 1H), 7.44–7.40 (m, 2H), 7.21–7.17 (m, 2H), 6.99–6.93 (m, 2H) ppm. 13C NMR (126 MHz, CDCl3) δ 160.46 (dd, J = 253.1, 5.2 Hz), 136.99, 136.90, 133.44 (t, J = 10.2 Hz), 132.54, 130.41, 126.30, 123.71, 122.62, 112.21 (dd, J = 20.4, 4.2 Hz), 103.71 (t, J = 19.4 Hz) ppm. IR (KBr) ν 3104, 2919, 2851, 2612, 1987, 1680, 1590, 1536, 1491, 1469, 1414, 1348, 1148 cm-1. HRMS (ES+) calculated for C15H10ClF2N2 [M + H]+ 291.0501, found 291.0503.
1-(4-Chlorophenyl)-5-(2,6-difluorophenyl)-4-methyl-1H-imidazole (3.75). Following synthetic procedure D using (E)-N-(4-chlorophenyl)-1-(2,6-difluorophenyl)methanimine (0.618 g, 2.46 mmol), purification by silica gel column chromatography (hexanes/EtOAc 65:35) afforded the title compound as an orange solid (0.292 g, 0.958 mmol, 39% yield). 1H NMR (500 MHz, CDCl3) δ 7.72 (s, 1H), 7.36–7.28 (m, 1H), 7.32–7.25 (m, 2H), 7.08–7.01 (m, 2H), 6.93–6.83 (m, 2H), 2.21 (s, 3H) ppm. 13C NMR (126 MHz, CDCl3) δ 160.61 (dd, J = 250.3, 6.3 Hz), 140.19, 137.61, 135.40, 133.91, 131.00 (t, J = 10.2 Hz), 129.63, 125.7, 116.13, 111.74 (dd, J = 20.1, 5.3 Hz), 107.53 (t, J = 20.0 Hz), 13.44 ppm. IR (KBr) ν 3105, 2921, 2851, 1692, 1630, 1590, 1569, 1498, 1479, 1461, 1274, 1235, 1091, 997 cm-1. HRMS (ES+) calculated for C16H12ClF2N2 [M + H]+ 305.0657, found 305.0661.
138
2-Chloro-1-(4-chlorophenyl)-5-(2,6-difluorophenyl)-4-methyl-1H-imidazole (3.76). Following synthetic procedure E using 1-(4-chlorophenyl)-5-(2,6-difluorophenyl)-4-methyl-1H-imidazole (0.150 g, 0.492 mmol), purification by silica gel column chromatography (hexanes/EtOAc 80:20) afforded the title compound as a yellow oil (0.079 g, 0.232 mmol, 47% yield). 1H NMR (500 MHz, CDCl3) δ 7.31 (d, J = 8.6 Hz, 2H), 7.30–7.26 (m, 1H), 7.12–7.07 (m, 2H), 6.88–6.81 (m, 2H), 2.16 (s, 3H) ppm. 13C NMR (126 MHz, CDCl3) δ 160.70 (dd, J = 250.6, 6.0 Hz), 138.71, 135.08, 133.82, 132.88, 131.46 (t, J = 10.2 Hz), 129.41, 128.60, 118.49, 111.65 (dd, J = 20.6, 5.1 Hz), 107.02 (t, J = 19.8 Hz), 13.37 ppm. IR (KBr) ν 3056, 2959, 2923, 2850, 1633, 1590, 1571, 1495, 1467, 1448, 1387, 1280, 1236, 1092, 998 cm-1. HRMS (ES+) calculated for C16H11Cl2F2N2 [M + H]+ 339.0267, found 339.0277.
1-(4-Chlorophenyl)-5-(2,6-difluorophenyl)-2,4-dimethyl-1H-imidazole (3.77). Following synthetic procedure F using 1-(4-chlorophenyl)-5-(2,6-difluorophenyl)-4-methyl-1H-imidazole (0.050 g, 0.164 mmol), purification by silica gel column chromatography (hexanes/EtOAc 65:35) afforded the title compound as a colorless liquid (0.025 g, 0.078 mmol, 48% yield). 1H NMR (500 MHz, CDCl3) δ 7.31–7.27 (m, 2H), 7.25–7.18 (m, 1H), 7.06–7.01 (m, 2H), 6.81 (t, J = 7.6 Hz, 2H), 2.29 (s, 3H), 2.14 (s, 3H) ppm. 13C NMR (126 MHz, CDCl3) δ 160.79 (dd, J = 249.7, 6.3 Hz), 145.79, 137.59, 135.43, 134.38, 130.69 (t, J = 10.2 Hz), 129.44, 128.40, 116.41, 111.49 (dd, J = 20.3, 5.3 Hz), 108.12 (t, J = 20.1 Hz), 14.09, 13.12 ppm. IR (KBr) ν 2958, 2923, 2851, 1633, 1594, 1572, 1495, 1464, 1403, 1274, 1235, 1092 cm-1. HRMS (ES+) calculated for C17H14ClF2N2 [M + H]+ 319.0814, found 319.0807.
1-(4-(Trifluoromethoxy)phenyl)-5-(2,3,6-trifluorophenyl)-1H-imidazole (3.78). Following synthetic procedure C using (E)-N-(4-(trifluoromethoxy)phenyl)-1-(2,3,6-trifluorophenyl)methanimine (1.08 g, 3.37 mmol), purification by silica gel column chromatography (hexanes/EtOAc 65:35) afforded the title compound as a brown solid (0.587 g, 1.64 mmol, 49% yield). 1H NMR (500 MHz, CDCl3) δ 7.83 (s, 1H), 7.36 (s, 1H), 7.26–7.17 (m, 4H), 7.14 (qd, J = 9.1, 4.9 Hz, 1H), 6.86–6.77 (m, 1H) ppm. 13C NMR (126 MHz, CDCl3) δ 155.51 (dt, J = 247.8, 3.2 Hz), 149.06–148.90 (m), 148.12 (ddd, J = 261.9, 15.9, 9.2 Hz), 147.33 (ddd, J = 246.6, 12.7, 4.1 Hz), 139.36, 134.80, 132.76, 126.15, 122.02, 120.40 (q, J = 258.6 Hz), 119.39, 117.84 (dd, J = 19.1, 9.6 Hz), 111.17 (ddd, J = 24.6, 6.7, 4.2 Hz), 109.03 (dd, J = 21.9, 15.9 Hz) ppm. IR (KBr) ν 3097, 2917, 2850, 1734, 1642, 1599, 1563, 1514, 1494, 1448, 1383, 1260, 1211, 1167, 1103, 1027, 1016, 994 cm-1. HRMS (ES+) calculated for C16H9F6N2O [M + H]+ 359.0619, found 359.0621.
1-(4-Chlorophenyl)-5-(2,6-difluoro-4-methylphenyl)-1H-imidazole (3.79). Following synthetic procedure C using (E)-N-(4-chlorophenyl)-1-(2,6-difluoro-4-methylphenyl)methanimine (0.183 g, 0.689 mmol), purification by silica gel column chromatography (hexanes/EtOAc 60:40) afforded the title compound as a yellow solid (0.127 g, 0.417 mmol, 61% yield). 1H NMR (500 MHz, CDCl3) δ 7.76 (s, 1H), 7.31 (d, J =

139
8.2 Hz, 2H), 7.26 (s, 1H), 7.08 (d, J = 8.3 Hz, 2H), 6.67 (d, J = 8.2 Hz, 2H), 2.32 (s, 3H) ppm. 13C NMR (126 MHz, CDCl3) δ 160.10 (dd, J = 249.8, 7.0 Hz), 142.34 (t, J = 9.8 Hz), 138.65, 135.27, 134.11, 132.11, 129.68, 125.88, 120.32, 112.32 (dd, J = 19.8, 5.3 Hz), 104.03 (t, J = 19.8 Hz), 21.58 ppm. IR (KBr) ν 3113, 3073, 3037, 2923, 2854, 1642, 1572, 1499, 1464, 1323, 1277, 1249, 1215, 1205, 1091 cm-1. HRMS (ES+) calculated for C16H12ClF2N2 [M + H]+ 305.0657, found 305.0658.
1-(4-Chlorophenyl)-5-(2,6-difluoro-3-methoxyphenyl)-1H-imidazole (3.80). Following synthetic procedure C using (E)-N-(4-chlorophenyl)-1-(2,6-difluoro-3-methoxyphenyl)methanimine (0.745 g, 2.64 mmol), purification by silica gel column chromatography (hexanes/EtOAc 60:40) afforded the title compound as a yellow solid (0.278 g, 0.867 mmol, 33% yield). 1H NMR (500 MHz, CDCl3) δ 7.79 (s, 1H), 7.35–7.29 (m, 3H), 7.10 (d, J = 8.1 Hz, 2H), 6.94–6.85 (m, 1H), 6.79 (t, J = 8.8 Hz, 1H), 3.83 (s, 3H) ppm. 13C NMR (126 MHz, CDCl3) δ 153.72 (dd, J = 243.6, 4.1 Hz), 149.74 (dd, J = 250.3, 5.9 Hz), 144.52 (dd, J = 11.1, 3.0 Hz), 138.92, 135.18, 134.20, 132.42, 129.73, 125.86, 120.12, 113.94 (dd, J = 9.4, 2.9 Hz), 110.40 (dd, J = 23.1, 4.3 Hz), 108.08 (dd, J = 21.4, 16.8 Hz), 56.86 ppm. IR (KBr) ν 3098, 2941, 2842, 1592, 1500, 1441, 1318, 1281, 1247, 1172, 1110, 1049 cm-1. HRMS (ES+) calculated for C16H12ClF2N2O [M + H]+ 321.0606, found 321.0606.
1-(4-Chlorophenyl)-5-phenyl-1H-imidazole (3.81). Following synthetic procedure C using (E)-N-(4-chlorophenyl)-1-phenylmethanimine (0.702 g, 3.25 mmol), purification by silica gel column chromatography (hexanes/EtOAc 60:40) afforded the title compound as a orange solid (0.088 g, 0.345 mmol, 11% yield). 1H NMR (500 MHz, CDCl3) δ 7.67 (s, 1H), 7.36 (d, J = 8.0 Hz, 2H), 7.30–7.26 (m, 4H), 7.16–7.09 (m, 4H) ppm. 13C NMR (126 MHz, CDCl3) δ 138.80, 135.25, 134.08, 133.08, 129.77, 129.19, 129.15, 128.66, 128.28, 127.80, 126.84 ppm. IR (KBr) ν 3115, 3062, 2957, 2921, 2851, 1604, 1495, 1468, 1269, 1117, 1093 cm-1. HRMS (ES+) calculated for C15H12ClN2 [M + H]+ 255.0689, found 255.0690.
1-(4-Chlorophenyl)-5-(4-methoxyphenyl)-1H-imidazole (3.82). Following synthetic procedure C using (E)-N-(4-chlorophenyl)-1-(4-methoxyphenyl)methanimine (0.100 g, 0.407 mmol), purification by silica gel column chromatography (hexanes/EtOAc 65:35) afforded the title compound as a orange solid (0.065 g, 0.228 mmol, 56% yield). 1H NMR (500 MHz, CDCl3) δ 7.64 (s, 1H), 7.38–7.30 (m, 2H), 7.18 (s, 1H), 7.14–7.07 (m, 2H), 7.08–6.99 (m, 2H), 6.85–6.75 (m, 2H), 3.78 (s, 3H) ppm. 13C NMR (126 MHz, CDCl3) δ 159.35, 138.30, 135.38, 134.01, 132.95, 129.74, 128.50, 126.88, 121.62, 114.17, 55.35 ppm. IR (KBr) ν 3118, 3046, 2960, 2916, 2836, 1614, 1557, 1497, 1466, 1297, 1271, 1250, 1178, 1113, 1093, 1063, 1030 cm-1. HRMS (ES+) calculated for C16H14ClN2O [M + H]+ 285.0795, found 285.0798.
5-(2,6-Difluorophenyl)-1-phenyl-1H-imidazole (3.83). Following synthetic procedure C using (E)-1-(2,6-difluorophenyl)-N-phenylmethanimine (0.600 g, 2.76 mmol), purification by silica gel column chromatography (hexanes/EtOAc 65:35) afforded the title compound as an
140
orange solid (0.193 g, 0.753 mmol, 27% yield). 1H NMR (500 MHz, CDCl3) δ 7.84 (s, 1H), 7.41–7.34 (m, 3H), 7.34 (s, 1H), 7.34–7.25 (m, 1H), 7.21–7.15 (m, 2H), 6.91–6.83 (m, 2H) ppm. 13C NMR (126 MHz, CDCl3) δ 160.55 (dd, J = 250.5, 6.2 Hz), 138.99, 136.71, 132.15, 130.67 (t, J = 10.2 Hz), 129.46, 128.25, 124.59, 120.06, 111.61 (dd, J = 20.4, 5.0 Hz), 107.65 (t, J = 19.7 Hz) ppm. IR (KBr) ν 3103, 3070, 3045, 2916, 2848, 1631, 1597, 1563, 1498, 1470, 1447, 1278, 1255, 1236, 1216, 1116, 1077, 998 cm-1. HRMS (ES+) calculated for C15H11F2N2 [M + H]+ 257.0890, found 257.0881.
1-(2-Chlorophenyl)-5-(2,6-difluorophenyl)-1H-imidazole (3.84). Following synthetic procedure C using (E)-N-(2-chlorophenyl)-1-(2,6-difluorophenyl)methanimine (0.600 g, 2.38 mmol), purification by silica gel column chromatography (hexanes/EtOAc 65:35) afforded the title compound as a yellow solid (0.478 g, 1.64 mmol, 69% yield). 1H NMR (500 MHz, CDCl3) δ 7.72 (s, 1H), 7.41–7.37 (m, 1H), 7.32–7.24 (m, 2H), 7.25–7.14 (m, 3H), 6.82–6.74 (m, 2H) ppm. 13C NMR (126 MHz, CDCl3) δ 160.49 (dd, J = 250.9, 6.1 Hz), 139.5, 134.11, 131.55, 131.53, 130.68 (t, J = 10.2 Hz), 130.54, 130.13, 129.00, 127.44, 121.01, 111.52 (dd, J = 20.3, 5.0 Hz), 107.32 (t, J = 19.4 Hz) ppm. IR (KBr) ν 3104, 3062, 1632, 1587, 1566, 1491, 1467, 1444, 1275, 1235, 1213, 1110, 1089, 1045, 999 cm-1. HRMS (ES+) calculated for C15H10ClF2N2 [M + H]+ 291.0501, found 291.0494.
4-Chloro-1-(4-methoxyphenyl)-5-(2,4,6-trifluorophenyl)-1H-imidazole (3.90). Following synthetic procedure E using 1-(4-methoxyphenyl)-5-(2,4,6-trifluorophenyl)-1H-imidazole (0.086 g, 0.283 mmol), purification by silica gel column chromatography (hexanes/EtOAc 80:20) afforded the title compound as a yellow solid (0.043 g, 0.127 mmol, 45% yield). 1H NMR (500 MHz, CDCl3) δ 77.64 (s, 1H), 7.06 (d, J = 8.6 Hz, 2H), 6.88–6.82 (m, 2H), 6.71–6.61 (m, 2H), 3.79 (s, 3H) ppm. 13C NMR (126 MHz, CDCl3) δ 163.80 (dt, J = 252.7, 15.1 Hz), 161.21 (ddd, J = 252.7, 15.3, 8.6 Hz), 159.90, 137.20, 131.91, 128.82, 126.27, 115.50, 114.71, 102.27 (td, J = 20.4, 4.7 Hz), 101.15–100.40 (m), 55.62 ppm. IR (KBr) ν 3149, 3047, 2983, 2941, 2916, 2838, 1644, 1595, 1564, 1517, 1468, 1439, 1249, 1179, 1128, 1028 cm-1. HRMS (ES+) calculated for C16H11ClF3N2O [M + H]+ 339.0512, found 339.0481.
2-Chloro-1-(4-methoxyphenyl)-5-(2,4,6-trifluorophenyl)-1H-imidazole (3.91). Following synthetic procedure E using 1-(4-methoxyphenyl)-5-(2,4,6-trifluorophenyl)-1H-imidazole (0.086 g, 0.283 mmol), purification by silica gel column chromatography (hexanes/EtOAc 80:20) afforded the title compound as a yellow solid (0.015 g, 0.044 mmol, 16% yield). 1H NMR (500 MHz, CDCl3) δ 7.14 (s, 1H), 7.11–7.06 (m, 2H), 6.89–6.84 (m, 2H), 6.64–6.56 (m, 2H), 3.81 (s, 3H) ppm. 13C NMR (126 MHz, CDCl3) δ 163.34 (dt, J = 252.7, 15.4 Hz), 161.13 (ddd, J = 251.5, 15.0, 8.5 Hz), 160.07, 134.94, 130.16, 128.51, 127.52, 121.78, 114.42, 103.86 (td, J = 20.3, 4.7 Hz), 101.08–100.00 (m), 55.59 ppm. IR (KBr) ν 3053, 2962, 2917, 2847, 1645, 1596, 1570, 1514, 1485, 1448, 1253, 1171, 1124, 1035 cm-1. HRMS (ES+) calculated for C16H11ClF3N2O [M + H]+ 339.0512, found 339.0499.
141
4-Chloro-5-(2,6-difluorophenyl)-1-(4-(trifluoromethoxy)phenyl)-1H-imidazole (3.112). Following synthetic procedure E using 5-(2,6-difluorophenyl)-1-(4-(trifluoromethoxy)phenyl)-1H-imidazole (0.400 g, 1.17 mmol), purification by silica gel column chromatography (hexanes/EtOAc 85:15) afforded the title compound as a white solid (0.192 g, 0.512 mmol, 44% yield). 1H NMR (500 MHz, CDCl3) δ 7.70 (s, 1H), 7.43–7.33 (m, 1H), 7.24–7.16 (m, 4H), 6.91 (t, J = 7.8 Hz, 2H) ppm. 13C NMR (126 MHz, CDCl3) δ 160.71 (dd, J = 252.1, 6.0 Hz), 149.23–149.16 (m), 136.84, 134.52, 132.53, 132.20 (t, J = 10.2 Hz), 126.25, 122.01, 120.39 (q, J = 238.7 Hz), 116.18, 111.88 (dd, J = 20.5, 5.1 Hz), 105.32 (t, J = 19.7 Hz) ppm. IR (KBr) ν 3121, 3088, 1632, 1588, 1565, 1513, 1473, 1330, 1259, 1212, 1169, 1099 cm-1. HRMS (ES+) calculated for C16H9ClF5N2O [M + H]+ 375.0324, found 375.0334.
2-Chloro-5-(2,6-difluorophenyl)-1-(4-(trifluoromethoxy)phenyl)-1H-imidazole (3.113). Following synthetic procedure E using 5-(2,6-difluorophenyl)-1-(4-(trifluoromethoxy)phenyl)-1H-imidazole (0.400 g, 1.17 mmol), purification by silica gel column chromatography (hexanes/EtOAc 85:15) afforded the title compound as a white solid (0.033 g, 0.088 mmol, 8% yield). 1H NMR (500 MHz, CDCl3) δ 7.34–7.25 (m, 1H), 7.27–7.20 (m, 4H), 7.20 (s, 1H), 6.88–6.82 (m, 2H) ppm. 13C NMR (126 MHz, CDCl3) δ 160.59 (dd, J = 251.3, 5.8 Hz), 149.51–149.44 (m), 134.36, 133.35, 131.57 (t, J = 10.2 Hz), 130.53, 128.96, 122.52, 121.41, 120.39 (q, J = 259.6 Hz), 111.67 (dd, J = 21.2, 4.6 Hz), 106.84 (t, J = 19.5 Hz) ppm. IR (KBr) ν 3077, 2920, 2852, 1632, 1586, 1511, 1469, 1436, 1388, 1261, 1211, 1172, 1001 cm-1. HRMS (ES+) calculated for C16H8ClF5N2NaO [M + Na]+ 397.0143, found 397.0149.
2,4-Dichloro-5-(2,6-difluorophenyl)-1-(4-(trifluoromethoxy)phenyl)-1H-imidazole (3.114). Following synthetic procedure E using 5-(2,6-difluorophenyl)-1-(4-(trifluoromethoxy)phenyl)-1H-imidazole (0.400 g, 1.17 mmol), purification by silica gel column chromatography (hexanes/EtOAc 85:15) afforded the title compound as a white solid (0.028 g, 0.068 mmol, 6% yield). 1H NMR (500 MHz, CDCl3) δ 7.40–7.30 (m, 1H), 7.27–7.19 (m, 4H), 6.91–6.84 (m, 2H) ppm. 13C NMR (126 MHz, CDCl3) δ 160.74 (dd, J = 252.3, 5.6 Hz), 149.85–149.77 (m), 132.76, 132.65, 132.61 (t, J = 10.3 Hz), 130.50, 128.96, 121.54, 120.34 (q, J = 258.7 Hz), 118.60, 111.81 (dd, J = 21.0, 4.3 Hz), 104.93 (t, J = 19.4 Hz) ppm. IR (KBr) ν 3079, 2921, 2851, 1633, 1590, 1570, 1511, 1468, 1439, 1388, 1263, 1213, 1174 cm-1. HRMS (ES+) calculated for C16H8Cl2F5N2O [M + H]+ 408.9934, found 408.9940.
4-Chloro-1-(4-chlorophenyl)-5-(2,6-difluorophenyl)-1H-imidazole (3.115). Following synthetic procedure E using 1-(4-chlorophenyl)-5-(2,6-difluorophenyl)-1H-imidazole (0.400 g, 1.38 mmol), purification by silica gel column chromatography (hexanes/EtOAc 85:15) afforded the title compound as a white solid (0.265 g, 0.815 mmol, 59% yield). 1H NMR (500 MHz, CDCl3) δ 7.69 (s, 1H), 7.41–7.35 (m, 1H), 7.33 (d, J = 8.0 Hz, 2H), 7.12–7.05 (m, 2H), 6.91 (t, J = 7.9 Hz, 2H) ppm. 13C NMR (126 MHz, CDCl3) δ 160.67 (dd, J =
142
252.0, 5.9 Hz), 136.75, 134.89, 134.65, 132.40, 132.12 (t, J = 10.1 Hz), 129.91, 125.93, 116.10, 111.88 (dd, J = 21.1, 4.3 Hz), 105.36 (t, J = 19.5 Hz) ppm. IR (KBr) ν 3128, 2917, 2849, 1631, 1587, 1564, 1497, 1470, 1453, 1383, 1265, 1236, 1091, 998 cm-1. HRMS (ES+) calculated for C15H9Cl2F2N2 [M + H]+ 325.0111, found 325.0122.
4-Chloro-1-(4-chlorophenyl)-5-(2,6-difluorophenyl)-2-methyl-1H-imidazole (3.116). Following synthetic procedure F using 4-chloro-1-(4-chlorophenyl)-5-(2,6-difluorophenyl)-1H-imidazole (0.050 g, 0.154 mmol), purification by silica gel column chromatography (hexanes/EtOAc 80:20) afforded the title compound as a white solid (0.020 g, 0.059 mmol, 38% yield). 1H NMR (500 MHz, CDCl3) δ 7.37–7.31 (m, 2H), 7.31–7.27 (m, 1H), 7.08 (d, J = 8.6 Hz, 2H), 6.89–6.82 (m, 2H), 2.31 (s, 3H) ppm. 13C NMR (126 MHz, CDCl3) δ 160.83 (dd, J = 250.5, 6.9 Hz), 145.60, 135.23, 134.48, 131.79 (t, J = 10.1 Hz), 130.20, 129.75, 128.37, 116.02, 111.63 (dd, J = 20.4, 4.8 Hz), 105.96 (t, J = 17.7 Hz), 14.13 ppm. IR (KBr) ν 3064, 2960, 2921, 2850, 1634, 1576, 1494, 1467, 1402, 1278, 1238, 1093, 999 cm-1. HRMS (ES+) calculated for C16H11Cl2F2N2 [M + H]+ 339.0267, found 339.0265.
4-Chloro-1-(4-chlorophenyl)-5-(2,6-difluorophenyl)-2-ethyl-1H-imidazole (3.117). Following synthetic procedure F using 4-chloro-1-(4-chlorophenyl)-5-(2,6-difluorophenyl)-1H-imidazole (0.040 g, 0.123 mmol), purification by silica gel column chromatography (hexanes/EtOAc 85:15) afforded the title compound as a white solid (0.015 g, 0.042 mmol, 35% yield). 1H NMR (500 MHz, CDCl3) δ 7.36–7.30 (m, 2H), 7.30–7.27 (m, 1H), 7.09 (d, J = 8.5 Hz, 2H), 6.87–6.81 (m, 2H), 2.58 (q, J = 7.5 Hz, 2H), 1.26 (t, J = 7.4 Hz, 3H) ppm. 13C NMR (126 MHz, CDCl3) δ 160.87 (dd, J = 251.5, 5.8 Hz), 150.43, 135.27, 134.34, 131.77 (t, J = 10.3 Hz), 130.33, 129.71, 128.59, 115.90, 111.61 (dd, J = 20.7, 5.4 Hz), 105.96 (t, J = 20.3 Hz), 21.16, 12.21 ppm. IR (KBr) ν 3070, 2973, 2923, 2852, 1633, 1586, 1494, 1468, 1411, 1276, 1238, 1092, 1001 cm-1. HRMS (ES+) calculated for C17H13Cl2F2N2 [M + H]+ 353.0424, found 353.0429.
2-Chloro-1-(4-chlorophenyl)-5-(2,6-difluorophenyl)-1H-imidazole (3.118). Following synthetic procedure E using 1-(4-chlorophenyl)-5-(2,6-difluorophenyl)-1H-imidazole (0.400 g, 1.38 mmol), purification by silica gel column chromatography (hexanes/EtOAc 85:15) afforded the title compound as a white solid (0.056 g, 0.172 mmol, 12% yield). 1H NMR (500 MHz, CDCl3) δ 7.36–7.31 (m, 2H), 7.31–7.23 (m, 1H), 7.18 (s, 1H), 7.12 (d, J = 8.2 Hz, 2H), 6.84 (t, J = 7.9 Hz, 2H) ppm. 13C NMR (126 MHz, CDCl3) δ 160.33 (dd, J = 251.1, 5.8 Hz), 135.10, 134.03, 133.32, 131.24 (t, J = 10.3 Hz), 130.21, 129.27, 128.36, 122.21, 111.39 (dd, J = 20.4, 4.8 Hz), 106.64 (t, J = 19.5 Hz) ppm. IR (KBr) ν 3098, 3063, 2919, 2847, 1632, 1585, 1564, 1495, 1468, 1434, 1384, 1315, 1276, 1235, 1092, 1001 cm-1. HRMS (ES+) calculated for C15H8Cl2F2N2Na [M + Na]+ 346.9930, found 346.9933.
2,4-Dichloro-1-(4-chlorophenyl)-5-(2,6-difluorophenyl)-1H-imidazole (3.119). Following synthetic procedure E using 1-(4-chlorophenyl)-5-(2,6-difluorophenyl)-1H-imidazole (0.400 g, 1.38 mmol), purification by silica gel column chromatography (hexanes/EtOAc
143
85:15) afforded the title compound as a white solid (0.026 g, 0.072 mmol, 5% yield). 1H NMR (500 MHz, CDCl3) δ 7.39–7.30 (m, 3H), 7.13 (d, J = 8.1 Hz, 2H), 6.88 (t, J = 8.0 Hz, 2H) ppm. 13C NMR (126 MHz, CDCl3) δ 160.75 (dd, J = 252.3, 5.6 Hz), 135.94, 133.03, 132.59, 132.54 (t, J = 10.2 Hz), 130.43, 129.75, 128.57, 118.55, 111.81 (dd, J = 21.2, 4.2 Hz), 105.00 (t, J = 19.7 Hz) ppm. IR (KBr) ν 2961, 2918, 2850, 1632, 1589, 1568, 1495, 1468, 1434, 1384, 1262, 1236, 1092, 1003 cm-1. HRMS (ES+) calculated for C15H8Cl3F2N2 [M + H]+ 358.9721, found 358.9725.
4-Chloro-1-(4-(trifluoromethoxy)phenyl)-5-(2,3,6-trifluorophenyl)-1H-imidazole (3.120). Following synthetic procedure E using 1-(4-(trifluoromethoxy)phenyl)-5-(2,3,6-trifluorophenyl)-1H-imidazole (0.500 g, 1.40 mmol), purification by silica gel column chromatography (hexanes/EtOAc 85:15) afforded the title compound as a yellow oil (0.198 g, 0.504 mmol, 36% yield). 1H NMR (500 MHz, CDCl3) δ 7.72 (s, 1H), 7.25–7.17 (m, 5H), 6.88–6.82 (m, 1H) ppm. 13C NMR (126 MHz, CDCl3) δ 155.78 (dt, J = 248.9, 3.1 Hz), 149.38 – 149.32 (m), 148.35 (ddd, J = 253.2, 14.1, 6.8 Hz), 147.23 (ddd, J = 247.2, 12.8, 3.7 Hz), 137.27, 134.21, 132.94, 126.29, 122.13, 120.36 (q, J = 258.7 Hz), 119.05 (dd, J = 19.2, 9.6 Hz), 115.30, 111.35 (ddd, J = 24.2, 6.8, 4.2 Hz), 107.15 (dd, J = 21.7, 15.8 Hz) ppm. IR (KBr) ν 3095, 2918, 2850, 1568, 1513, 1493, 1467, 1383, 1162, 1110, 999 cm-1. HRMS (ES+) calculated for C16H7ClF6N2NaO [M + Na]+ 415.0049, found 415.0059.
2-Chloro-1-(4-(trifluoromethoxy)phenyl)-5-(2,3,6-trifluorophenyl)-1H-imidazole (3.121). Following synthetic procedure E using 1-(4-(trifluoromethoxy)phenyl)-5-(2,3,6-trifluorophenyl)-1H-imidazole (0.500 g, 1.40 mmol), purification by silica gel column chromatography (hexanes/EtOAc 85:15) afforded the title compound as a yellow solid (0.047 g, 0.120 mmol, 9% yield). 1H NMR (500 MHz, CDCl3) δ 7.29–7.24 (m, 5H), 7.16 (qd, J = 9.1, 5.0 Hz, 1H), 6.86–6.78 (m, 1H) ppm. 13C NMR (126 MHz, CDCl3) δ 155.69 (dt, J = 248.0, 3.1 Hz), 149.67–149.59 (m), 148.28 (ddd, J = 252.4, 14.7, 5.9 Hz), 147.13 (ddd, J = 246.5, 12.4, 3.6 Hz), 134.96, 133.11, 130.95, 128.93, 121.59, 121.52, 120.37 (q, J = 258.7 Hz), 118.40 (dd, J = 19.2, 9.7 Hz), 111.10 (ddd, J = 24.3, 6.7, 4.1 Hz), 108.67 (dd, J = 21.8, 15.9 Hz) ppm. IR (KBr) ν 3081, 2920, 1511, 1493, 1460, 1433, 1387, 1260, 1211, 1172, 1113, 1018, 998 cm-1. HRMS (ES+) calculated for C16H8ClF6N2O [M + H]+ 393.0229, found 393.0232.
2,4-Dichloro-1-(4-(trifluoromethoxy)phenyl)-5-(2,3,6-trifluorophenyl)-1H-imidazole (3.122). Following synthetic procedure E using 1-(4-(trifluoromethoxy)phenyl)-5-(2,3,6-trifluorophenyl)-1H-imidazole (0.500 g, 1.40 mmol), purification by silica gel column chromatography (hexanes/EtOAc 85:15) afforded the title compound as a yellow solid (0.010 g, 0.023 mmol, 2% yield). 1H NMR (600 MHz, DMSO-d6) δ 7.72 – 7.63 (m, 1H), 7.57 (d, J = 8.8 Hz, 2H), 7.53 – 7.48 (m, 2H), 7.27 – 7.21 (m, 1H). ppm. 13C NMR (151 MHz, DMSO-d6) δ 155.16 (dt, J = 248.0, 3.1 Hz), 148.96 (q, J = 2.0 Hz), 147.29 (ddd, J = 252.1, 14.5, 6.2 Hz), 146.31 (ddd, J = 244.4, 12.4, 4.1 Hz), 133.01, 132.51, 129.62, 129.15, 122.11,
144
120.66 (dd, J = 19.3, 9.7 Hz), 119.87 (q, J = 258.7 Hz), 119.55, 112.27 (ddd, J = 24.2, 7.6, 4.4 Hz), 105.61 (dd, J = 22.5, 16.2 Hz) ppm. IR (KBr) ν 2919, 2850, 1642, 1383, 1247, 1179 cm-1. HRMS (ES+) calculated for C16H7Cl2F6N2O [M + H]+ 426.9840, found 426.9850.
4-Chloro-1-(4-chlorophenyl)-5-(2,6-difluoro-4-methylphenyl)-1H-imidazole (3.123). Following synthetic procedure E using 1-(4-chlorophenyl)-5-(2,6-difluoro-4-methylphenyl)-1H-imidazole (0.100 g, 0.328 mmol), purification by silica gel column chromatography (hexanes/EtOAc 85:15) afforded the title compound as a yellow solid (0.070 g, 0.206 mmol, 63% yield). 1H NMR (500 MHz, CDCl3) δ 7.67 (s, 1H), 7.35–7.29 (m, 2H), 7.11–7.05 (m, 2H), 6.71 (d, J = 8.4 Hz, 2H), 2.35 (s, 3H) ppm. 13C NMR (126 MHz, CDCl3) δ 160.37 (dd, J = 251.2, 6.9 Hz), 143.68 (t, J = 9.9 Hz), 136.56, 134.77, 134.75, 132.25, 129.86, 125.96, 116.31, 112.46 (dd, J = 20.3, 4.9 Hz), 102.16 (t, J = 19.8 Hz), 21.74 ppm. IR (KBr) ν 3064, 2922, 1644, 1568, 1496, 1412, 1321, 1265, 1205, 1086, 1037 cm-1. HRMS (ES+) calculated for C16H11Cl2F2N2 [M + H]+ 339.0267, found 339.0259.
2-Chloro-1-(4-chlorophenyl)-5-(2,6-difluoro-4-methylphenyl)-1H-imidazole (3.124). Following synthetic procedure E using 1-(4-chlorophenyl)-5-(2,6-difluoro-4-methylphenyl)-1H-imidazole (0.100 g, 0.328 mmol), purification by silica gel column chromatography (hexanes/EtOAc 85:15) afforded the title compound as a yellow solid (0.009 g, 0.026 mmol, 8% yield). 1H NMR (500 MHz, CDCl3) δ 7.38–7.31 (m, 2H), 7.18–7.10 (m, 3H), 6.65 (d, J = 8.5 Hz, 2H), 2.31 (s, 3H) ppm. 13C NMR (126 MHz, CDCl3) δ 160.30 (dd, J = 250.0, 6.7 Hz), 143.00 (t, J = 9.9 Hz), 135.27, 134.04, 133.66, 130.31, 129.52, 128.68, 122.73, 112.24 (dd, J = 21.0, 4.4 Hz), 103.73 (t, J = 19.4 Hz), 21.68 ppm. IR (KBr) ν 2918, 2850, 1644, 1494, 1440, 1383, 1315, 1205, 1094, 1039 cm-1. HRMS (ES+) calculated for C16H11Cl2F2N2 [M + H]+ 339.0267, found 339.0263.
2,4-Dichloro-1-(4-chlorophenyl)-5-(2,6-difluoro-4-methylphenyl)-1H-imidazole (3.125). Following synthetic procedure E using 1-(4-chlorophenyl)-5-(2,6-difluoro-4-methylphenyl)-1H-imidazole (0.100 g, 0.328 mmol), purification by silica gel column chromatography (hexanes/EtOAc 85:15) afforded the title compound as a yellow solid (0.024 g, 0.064 mmol, 20% yield). 1H NMR (500 MHz, CDCl3) δ 7.35 (d, J = 8.3 Hz, 2H), 7.12 (d, J = 8.3 Hz, 2H), 6.68 (d, J = 8.5 Hz, 2H), 2.33 (s, 3H) ppm. 13C NMR (126 MHz, CDCl3) δ 160.45 (dd, J = 251.3, 6.7 Hz), 144.17 (t, J = 9.9 Hz), 135.85, 133.15, 132.32, 130.31, 129.72, 128.61, 118.80, 112.40 (dd, J = 20.2, 4.1 Hz), 101.84 (t, J = 20.0 Hz), 21.79 ppm. IR (KBr) ν 3065, 2924, 2853, 1645, 1573, 1493, 1436, 1385, 1324, 1263, 1237, 1206, 1093, 1040 cm-1. HRMS (ES+) calculated for C16H10Cl3F2N2 [M + H]+ 372.9878, found 372.9869.
4-Chloro-1-(4-chlorophenyl)-5-(2,6-difluoro-3-methoxyphenyl)-1H-imidazole (3.126). Following synthetic procedure E using 1-(4-chlorophenyl)-5-(2,6-difluoro-3-methoxyphenyl)-1H-imidazole (0.132 g, 0.412 mmol), purification by silica gel column chromatography (hexanes/EtOAc 80:20) afforded the title compound as white foam (0.065 g, 0.183 mmol, 45% yield). 1H NMR (500 MHz, CDCl3) δ 7.67 (s, 1H), 7.32 (d, J = 8.7 Hz, 2H), 7.09 (d, J =
145
8.3 Hz, 2H), 6.96 (td, J = 9.2, 5.0 Hz, 1H), 6.85–6.77 (m, 1H), 3.83 (s, 3H) ppm. 13C NMR (126 MHz, CDCl3) δ 153.82 (dd, J = 244.9, 3.7 Hz), 149.93 (dd, J = 251.9, 5.9 Hz), 144.49 (dd, J = 10.6, 2.7 Hz), 136.77, 134.84, 134.59, 132.37, 129.88, 125.92, 116.10, 114.96 (dd, J = 9.5, 2.1 Hz), 110.52 (dd, J = 22.6, 4.3 Hz), 106.13 (dd, J = 21.1, 16.7 Hz), 56.81 ppm. IR (KBr) ν 3097, 2925, 2843, 1591, 1563, 1495, 1463, 1440, 1328, 1257, 1203, 1094, 1070 cm-1. HRMS (ES+) calculated for C16H11Cl2F2N2O [M + H]+ 355.0217, found 355.0203.
2-Chloro-1-(4-chlorophenyl)-5-(2,6-difluoro-3-methoxyphenyl)-1H-imidazole (3.127). Following synthetic procedure E using 1-(4-chlorophenyl)-5-(2,6-difluoro-3-methoxyphenyl)-1H-imidazole (0.132 g, 0.412 mmol), purification by silica gel column chromatography (hexanes/EtOAc 80:20) afforded the title compound as a yellow solid (0.015 g, 0.042 mmol, 10% yield). 1H NMR (500 MHz, CDCl3) δ 7.38–7.31 (m, 2H), 7.18 (s, 1H), 7.16–7.11 (m, 2H), 6.88 (td, J = 9.1, 5.0 Hz, 1H), 6.80–6.72 (m, 1H), 3.82 (s, 3H) ppm. 13C NMR (126 MHz, CDCl3) δ 153.85 (dd, J = 243.6, 4.2 Hz), 149.92 (dd, J = 250.9, 5.9 Hz), 144.38 (dd, J = 11.0, 3.4 Hz), 135.36, 134.38, 133.55, 130.48, 129.57, 128.66, 122.51, 114.40 (dd, J = 9.5, 3.2 Hz), 110.34 (dd, J = 23.3, 4.4 Hz), 107.70 (dd, J = 21.2, 16.9 Hz), 56.84 ppm. IR (KBr) ν 3096, 2923, 2849, 1590, 1493, 1459, 1438, 1383, 1318, 1244, 1175, 1123, 1093, 1058 cm-1. HRMS (ES+) calculated for C16H11Cl2F2N2O [M + H]+ 355.0217, found 355.0219.
2,4-Dichloro-1-(4-chlorophenyl)-5-(2,6-difluoro-3-methoxyphenyl)-1H-imidazole (3.128). Following synthetic procedure E using 1-(4-chlorophenyl)-5-(2,6-difluoro-3-methoxyphenyl)-1H-imidazole (0.132 g, 0.412 mmol), purification by silica gel column chromatography (hexanes/EtOAc 80:20) afforded the title compound as a yellow solid (0.009 g, 0.023 mmol, 6% yield). 1H NMR (500 MHz, CDCl3) δ 7.37 – 7.34 (m, 2H), 7.15 – 7.12 (m, 2H), 6.94 (td, J = 9.2, 5.0 Hz, 1H), 6.81– 6.77 (m, 1H), 3.83 (s, 3H) ppm. 13C NMR (126 MHz, CDCl3) δ 153.94 (dd, J = 244.9, 4.0 Hz), 150.12 (dd, J = 252.5, 5.6 Hz), 144.45 (dd, J = 10.6, 3.4 Hz), 135.95, 133.06, 132.65, 130.49, 129.78, 128.61, 118.59, 115.43 (dd, J = 9.8, 3.0 Hz), 110.51 (dd, J = 22.8, 4.3 Hz), 105.84 (dd, J = 21.4, 16.8 Hz), 56.88 ppm. IR (KBr) ν 2921, 2850, 1639, 1494, 1440, 1384, 1331, 1251, 1090 cm-1. HRMS (ES+) calculated for C16H10Cl3F2N2O [M + H]+ 388.9827, found 388.9832.
4-Chloro-1-(4-chlorophenyl)-5-phenyl-1H-imidazole (3.129). Following synthetic procedure E using 1-(4-chlorophenyl)-5-phenyl-1H-imidazole (0.070 g, 0.275 mmol), purification by silica gel column chromatography (hexanes/EtOAc 80:20) afforded the title compound as a yellow solid (0.061 g, 0.211 mmol, 77% yield). X-ray quality crystals were obtained by slow evaporation from a CH2Cl2/hexanes solution (see Supporting Information): mp (CH2Cl2/hexanes) 126–128˚C. 1H NMR (500 MHz, CDCl3) δ 7.58 (s, 1H), 7.36–7.29 (m, 5H), 7.22–7.16 (m, 2H), 7.09–7.02 (m, 2H) ppm. 13C NMR (126 MHz, CDCl3) δ 135.72, 134.91, 134.49, 129.89, 129.75, 129.24, 128.62, 128.44, 127.28, 127.09, 126.61 ppm. IR (KBr) ν 3121, 3096, 3034, 2917, 2849, 1607, 1558, 1497, 1483, 1467, 1413, 1329, 1259,
146
1199, 1090 cm-1. HRMS (ES+) calculated for C15H11Cl2N2 [M + H]+ 289.0299, found 289.0300.
2-Chloro-1-(4-chlorophenyl)-5-phenyl-1H-imidazole (3.130). Following synthetic procedure E using 1-(4-chlorophenyl)-5-phenyl-1H-imidazole (0.070 g, 0.275 mmol), purification by silica gel column chromatography (hexanes/EtOAc 80:20) afforded the title compound as a yellow solid (0.007 g, 0.025 mmol, 9% yield). 1H NMR (500 MHz, CDCl3) δ 7.45–7.38 (m, 2H), 7.27–7.22 (m, 3H), 7.20–7.12 (m, 3H), 7.10–7.03 (m, 2H) ppm. 13C NMR (126 MHz, CDCl3) δ 135.32, 134.09, 133.77, 129.85, 129.37, 128.95, 128.76, 128.12, 127.94, 127.21, 125.13 ppm. IR (KBr) ν 2956, 2918, 2850, 1487, 1457, 1432, 1383, 1307, 1256, 1146, 1146, 1093 cm-1. HRMS (ES+) calculated for C15H11Cl2N2 [M + H]+ 289.0299, found 289.0324.
2,4-Dichloro-1-(4-chlorophenyl)-5-phenyl-1H-imidazole (3.131). Following synthetic procedure E using 1-(4-chlorophenyl)-5-phenyl-1H-imidazole (0.070 g, 0.275 mmol), purification by silica gel column chromatography (hexanes/EtOAc 80:20) afforded the title compound as a yellow solid (0.008 g, 0.024 mmol, 9% yield). 1H NMR (500 MHz, CDCl3) δ 7.40–7.36 (m, 2H), 7.30–7.27 (m, 3H), 7.16–7.12 (m, 2H), 7.12–7.08 (m, 2H) ppm. 13C NMR (126 MHz, CDCl3) δ 135.64, 133.57, 131.34, 129.89, 129.59, 129.21, 128.71, 128.65, 127.20, 127.05 ppm. IR (KBr) ν 2956, 2917, 2849, 1493, 1452, 1381, 1230, 1091 cm-1. HRMS (ES+) calculated for C15H10Cl3N2 [M + H]+ 322.9910, found 322.9906.
4-Chloro-1-(4-chlorophenyl)-5-(4-methoxyphenyl)-1H-imidazole (3.132). Following synthetic procedure E using 1-(4-chlorophenyl)-5-(4-methoxyphenyl)-1H-imidazole (0.220 g, 0.773 mmol), purification by silica gel column chromatography (hexanes/EtOAc 80:20) afforded the title compound as a yellow solid (0.159 g, 0.498 mmol, 65% yield). 1H NMR (500 MHz, CDCl3) δ 7.55 (s, 1H), 7.36–7.31 (m, 2H), 7.11 (d, J = 8.1 Hz, 2H), 7.06 (d, J = 7.9 Hz, 2H), 6.84 (d, J = 8.3 Hz, 2H), 3.79 (s, 3H) ppm. 13C NMR (126 MHz, CDCl3) δ 159.66, 135.29, 135.02, 134.43, 131.15, 129.87, 128.71, 127.05, 126.64, 119.49, 114.17, 55.36 ppm. IR (KBr) ν 3116, 3004, 2960, 2836, 1713, 1614, 1556, 1497, 1467, 1290, 1253, 1179, 1087 cm-1. HRMS (ES+) calculated for C16H12Cl2N2NaO [M + Na]+ 341.0224, found 341.0229.
4-Chloro-1-(2-chlorophenyl)-5-(2,6-difluorophenyl)-1H-imidazole (3.133). Following synthetic procedure E using 1-(2-chlorophenyl)-5-(2,6-difluorophenyl)-1H-imidazole (0.260 g, 0.894 mmol), purification by silica gel column chromatography (hexanes/EtOAc 75:25) afforded the title compound as a white solid (0.187 g, 0.575 mmol, 64% yield). 1H NMR (500 MHz, CDCl3) δ 7.63 (s, 1H), 7.42 (d, J = 7.9 Hz, 1H), 7.36–7.29 (m, 2H), 7.29–7.26 (m, 2H), 6.85 (t, J = 8.6 Hz, 2H) ppm. 13C NMR (126 MHz, CDCl3) δ 160.77 (dd, J = 252.5, 5.9 Hz), 137.58, 133.55, 131.88 (t, J = 10.2 Hz), 131.70, 131.67, 130.73, 130.61, 129.10, 127.60, 117.02, 111.64 (dd, J = 21.8, 3.6 Hz), 105.35 (t, J = 19.5 Hz) ppm. IR (KBr)
147
ν 3129, 3052, 2988, 2922, 2846, 1633, 1589, 1568, 1492, 1471, 1455, 1266, 1238, 1003 cm-1. HRMS (ES+) calculated for C15H9Cl2F2N2 [M + H]+ 325.0111, found 325.0111.
2-Chloro-1-(2-chlorophenyl)-5-(2,6-difluorophenyl)-1H-imidazole (3.134). Following synthetic procedure E using 1-(2-chlorophenyl)-5-(2,6-difluorophenyl)-1H-imidazole (0.260 g, 0.894 mmol), purification by silica gel column chromatography (hexanes/EtOAc 75:25) afforded the title compound as a white solid (0.026 g, 0.080 mmol, 9% yield). 1H NMR (500 MHz, CDCl3) δ 7.40 (d, J = 8.0 Hz, 1H), 7.36–7.27 (m, 3H), 7.25–7.16 (m, 2H), 6.79 (t, J = 7.7 Hz, 2H) ppm. 13C NMR (126 MHz, CDCl3) δ 160.72 (dd, J = 251.5, 5.8 Hz), 134.75, 133.21, 132.81, 131.34 (t, J = 10.2 Hz), 131.06, 130.51, 130.44, 130.32, 127.44, 122.84, 111.53 (dd, J = 20.6, 5.1 Hz), 106.87 (t, J = 19.5 Hz) ppm. IR (KBr) ν 2916, 2852, 1633, 1587, 1487, 1468, 1435, 1383, 1313, 1277, 1235, 1000 cm-1. HRMS (ES+) calculated for C15H9Cl2F2N2 [M + H]+ 325.0111, found 325.0119.
2,4-Dichloro-1-(2-chlorophenyl)-5-(2,6-difluorophenyl)-1H-imidazole (3.135). Following synthetic procedure E using 4-chloro-1-(2-chlorophenyl)-5-(2,6-difluorophenyl)-1H-imidazole (0.060 g, 0.184 mmol), purification by silica gel column chromatography (hexanes/EtOAc 80:20) afforded the title compound as a white solid (0.047 g, 0.131 mmol, 71% yield). 1H NMR (500 MHz, CDCl3) δ 7.44 (d, J = 7.9 Hz, 1H), 7.40–7.27 (m, 4H), 6.88 (t, J = 8.5 Hz, 1H), 6.82 (t, J = 8.6 Hz, 1H) ppm. 13C NMR (126 MHz, CDCl3) δ 161.07 (dd, J = 254.4, 5.9 Hz), 133.11, 133.08, 132.37 (t, J = 11.2 Hz), 131.53, 130.56, 130.39, 130.24, 130.22, 127.62, 118.89, 111.95 (dd, J = 21.7, 3.5 Hz), 111.41 (dd, J = 21.8, 3.7 Hz), 104.92 (t, J = 19.8 Hz) ppm. IR (KBr) ν 3073, 2918, 2853, 1633, 1588, 1487, 1466, 1439, 1384, 1278, 1237, 1002 cm-1. HRMS (ES+) calculated for C15H8Cl3F2N2 [M + H]+ 358.9721, found 358.9717.
3.6.2 Biological Assay
Acetyl-Tubulin Assay. QBI-293 cells (ATCC, Manassas, VA, USA) were maintained in Dulbecco’s Modified Eagle’s Medium (DMEM, Mediatech Inc., Manassas, VA, USA) containing 10% fetal bovine serum (FBS) (Atlanta Biologicals, Lawrenceville, GA, USA), 2 mM L-glutamine (Mediatech), 50 units/mL penicillin, and 50 µg/mL streptomycin (1% penicillin/streptomycin; Thermo Fisher Scientific, Waltham, MA, USA). Cells were maintained at 37 °C in a humidified atmosphere (5% CO2) for all experiments. For compound testing, cells were dissociated with trypsin/EDTA (Thermo Fisher Scientific) and plated at 6 × 10⁵ cells/well in 6-well plates. The medium was aspirated after overnight incubation and fresh medium containing vehicle or test compound was added. After incubating for 4 h, cells were washed once with 1× phosphate-buffered saline (PBS), pH 7.4 and then lysed in 200 µL RIPA buffer containing protease inhibitor cocktail, 1 mM PMSF, and 1 µM TSA. Lysed cells were scraped into 1.5 mL Beckman ultracentrifuge tubes (Beckman, Brea, CA, USA) and centrifuged at 100000g for 30 min at 4 °C. Following centrifugation, the supernatant from
148
each sample was collected and analyzed for protein content by BCA assay. The samples subsequently underwent analysis for acetyl-tubulin and α-tubulin levels by ELISA, as previously described.115
RBL-1 Cell PG and LT Assay. Inhibition of PG and LT synthesis by test compounds was determined through the utilization of an established RBL-1 cell assay.116 Briefly, RBL-1 cells (ATCC) were maintained in RPMI 1640 medium (Mediatech Inc., Manassas, VA) containing 10% FBS (Atlanta Biologicals, Lawrenceville, GA), 1 mM L-glutamine (Mediatech), 50 U/mL penicillin, and 0.05 mg/mL streptomycin (Thermo Fisher Scientific). For analysis of PG and LT production, RBL-1 cells were plated at a density of 9 × 10⁵ cells/well in 24-well plates. After 2 h incubation at 37 °C, cells were added with indicated concentrations of test compounds. Following 2 h incubation with test compounds, cells were incubated with 12 µM calcium ionophore, A23187, for 15 min to induce arachidonic acid production. Cell culture supernatants (200 µL/well) were then collected and treated with 600 µL of MeOH containing 0.01% BHT (butylated hydroxytoluene) to extract eicosanoids. After centrifugation, the supernatant was dried with a vacuum centrifugation and redissolved in 200 µL of 50% acetonitrile. Enzyme products were quantified with an Acquity UPLC-TQ MS system (Waters Corporation, Milford, MA). Injections (10 µL) were separated on an Acquity BEH C18, 1.7 µm, 2.1 mm × 50 mm column at 37 °C using a gradient from 5 to 95% acetonitrile with 10 mM ammonium formate over 2 min at 0.6 mL/min. Combined PGD2+PGE2, as well as LTB4, were detected in negative ion mode using compound specific collision induced mass transitions (PGD2 and PGE2, 351 > 315; LTB4, 335 > 195). To separate the isomeric PGD2 and PGE2, a higher resolution gradient from 5 to 60% acetonitrile over 3 min at 0.6 mL/min was used. The cysteinyl leukotriene LTC4 was separated using a gradient from 5 to 95% acetonitrile with 0.1% formic acid over 2 min at 0.6 mL/min. LTC4 was detected using electrospray ionization in positive mode while monitoring for a compound specific mass transition (626 > 189). Chromatograms are integrated and peak areas used to quantitate unknowns against a curve of standards (Cayman Chemical, Ann Arbor, MI) from 1 to 50 ng/mL in 50% acetonitrile. The IC50 values and 95% confidence intervals of compound concentration-response curves were determined in GraphPad Prism from triplicate samples at each concentration using a sigmoidal fit allowing for variable slope.
Brain and Plasma Compound Determinations. All animal protocols were approved by the University of Pennsylvania Institutional Animal Care and Use Committee (IACUC). Test compounds were administered to groups of three 2−5 month old CD-1 or B6SJL mice, with both female and male mice used but not mixed within experimental groups. For standard single time-point brain and plasma determinations, mice were injected i.p. with a single dose of 5 mg/kg compound dissolved in DMSO, or a dose of 2 mg/kg if two or three compounds were dosed concurrently (cassette dosing). Compounds were quantified in plasma and brain homogenates as previously described.115
149
3.7 References
1. Wilson, R. S.; Segawa, E.; Boyle, P. A.; Anagnos, S. E.; Hizel, L. P.; Bennett, D. A. The natural history of cognitive decline in Alzheimer’s disease. Psychol. Aging 2012, 27, 1008−1017.
2. Barker, W. W.; Luis, C. A.; Kashuba, A.; Luis, M, Harwood, D. G.; Loewenstein, D.; Waters, C.; Jimison, P.; Shepherd, E.; Sevush, S.; Graff-Radford, N.; Newland, D.; Todd, M.; Miller, B.; Gold, M.; Heilman, K.; Doty, L.; Goodman, I.; Robinson, B.; Pearl, G.; Dickson, D.; Duara, R. Relative frequencies of Alzheimer’s disease, Lewy body, vascular and frontotemporal dementia, and hippocampal sclerosis in the State of Florida Brain Bank. Alzheimer Dis. Assoc. Disord. 2002, 16, 203−212.
3. Alzheimer’s Association. 2017 Alzheimer’s Disease Facts and Figures. Alzheimers Dement. 2017, 13, 325−373.
4. Alzheimer’s Disease International https://www.alz.co.uk/ 5. Bekris, L. M.; Yu, C. E.; Bird, T. D.; Tsuang, D. W. Genetics of Alzheimer disease. J.
Geriatr. Psychiatry Neurol. 2010, 23, 213−227. 6. Hebert, L. E.; Bienias, J. L.; Aggarwal, N. T.; Wilson, R. S.; Bennett, D. A.; Shah, R.
C.; Evans, D. A. Change in risk of Alzheimer disease over time. Neurology 2010, 75, 786−791.
7. Hebert, L. E.; Weuve, J.; Scherr, P. A.; Evans, D. A. Alzheimer disease in the United States (2010−2050) estimated using the 2010 Census. Neurology 2013, 80, 1778−1783.
8. Green, R. C; Cupples, L. A.; Go, R.; Benke, K. S.; Edeki, T.; Griffith, P. A.; Williams, M.;Hipps, Y.; Graff-Radford, N.; Bachman, D.; Farrer, L. A. Risk of dementia among white and African American relatives of patients with Alzheimer disease. Jama 2002, 287, 329−336.
9. Fratiglioni, L.; Ahlbom, A.; Viitanen, M.; Winblad, B. Risk factors for late-onset Alzheimer’s disease: A population-based, case-control study. Ann. Neurol. 1993, 33, 258−266.
10. Mayeux, R.; Sano, M.; Chen, J.; Tatemichi, T.; Stern, Y. Risk of dementia in first-degree relatives of patients with Alzheimer’s disease and related disorders. Arch. Neurol. 1991, 48, 269−273.
11. Lautenschlager, N. T.; Cupples, L. A.; Rao, V. S.; Auerbach, S. A.; Becker, R.; Burke, J.; Chui, H; Duara, R.; Foley, E. J.; Glatt, S. L.; Green, R. C.; Jones, R.; Karlinsky, H.; Kukull, W. A.; Kurz, A.; Larson, E. B.; Martelli, K.; Sadovnick, A. D.; Volicer, L.; Waring, S. C.; Growdon, J. H.; Farrer, L. A. Risk of dementia among relatives of Alzheimer’s disease patients in the MIRAGE Study: What is in store for the oldest old? Neurology 1996, 46, 641−650.
12. Loy, C. T.; Schofield, P. R.; Turner, A. M.; Kwok, J. B. J. Genetics of dementia. Lancet 2014, 383, 828−840.
150
13. Saunders, A. M.; Strittmatter, W. J.; Schmechel, D.; George-Hyslop, P. H.; Pericak-Vance, M. A.; Joo, S. H.; Rosi, B. L.; Gusella, J. F.; Crapper-MacLachlan, D. R.; Alberts, M. J.; Hulette, C.; Crain, B.; Goldgaber, D.; Roses, A. D. Association of apolipoprotein E allele epsilon 4 with late-onset familial and sporadic Alzheimer’s disease. Neurology 1993, 43, 1467−1472.
14. Raber, J.; Huang, Y.; Ashford, J. W. ApoE genotype accounts for the vast majority of AD risk and AD pathology. Neurobiol. Aging 2004, 25, 641−650.
15. Holtzman, D. M.; Herz, J.; Bu, G. Apolipoprotein E and apolipoprotein E receptors: Normal biology and roles in Alzheimer disease. Cold Spring Harb. Perspect. Med. 2012, 2, a006312.
16. Viswanathan, A.; Rocca, W. A.; Tzourio, C. Vascular risk factors and dementia: How to move forward? Neurology 2009, 72, 368−374.
17. Rönnemaa, E.; Zethelius, B.; Lannfelt, L.; Kilander, L. Vascular risk factors and dementia: 40-year follow-up of a population-based cohort. Dement. Geriatr. Cogn. Disord. 2011, 31, 460−466.
18. Launer, L. J.; Ross, G. W.; Petrovitch, H.; Masaki, K.; Foley, D.; White, L. R.; Havlik, R. J. Midlife blood pressure and dementia: The Honolulu-Asia Aging Study. Neurobiol. Aging 2000, 21, 49−55.
19. Ninomiya, T.; Ohara, T.; Hirakawa, Y.; Yoshida, D.; Doi, Y.; Hata, J.; Kanba, S.; Iwaki, T.; Kiyohara, Y. Midlife and late-life blood pressure and dementia in Japanese elderly: The Hisayama Study. Hypertension 2011, 58, 22−28.
20. Debette, S.; Seshadri, S.; Beiser, A.; Au, R.; Himali, J. J.; Palumbo, C.; Wolf, P. A.; DeCarli, C. Midlife vascular risk factor exposure accelerates structural brain aging and cognitive decline. Neurology 2011, 77, 461−468.
21. Wu, W.; Brickman, A. M.; Luchsinger, J.; Ferrazzano, P.; Pichiule, P.; Yoshita, M.; Brown, T.; DeCarli, C.; Barnes, C. A.; Mayeux, R.; Vannucci, S. J.; Small, S. A. The brain in the age of old: The hippocampal formation is targeted differentially by diseases of late life. Ann. Neurol. 2008, 64, 698−706.
22. Gudala, K.; Bansal, D.; Schifano, F.; Bhansali, A. Diabetes mellitus and risk of dementia: A meta-analysis of prospective observational studies. J. Diabetes Investig. 2013, 4, 640−650.
23. Vagelatos, N. T.; Eslick, G. D. Type 2 diabetes as a risk factor for Alzheimer’s disease: The confounders, interactions, and neuropathology associated with this relationship. Epidemiol. Rev. 2013, 35, 152−160.
24. Reitz, C.; Brayne, C.; Mayeux, R. Epidemiology of Alzheimer disease. Nat. Rev. Neurol. 2011, 7, 137−152.
151
25. Loef, M.; Walach, H. Midlife obesity and dementia: Meta-analysis and adjusted forecast of dementia prevalence in the United States and China. Obesity 2013, 21, E51−55.
26. Anstey, K. J.; Cherbuin, N; Budge. M; Young, J. Body mass index in midlife and late-life as a risk factor for dementia: A meta-analysis of prospective studies. Obes. Rev. 2011, 12, e426−437.
27. Baumgart, M.; Snyder, H. M.; Carrillo, M. C.; Fazio, S; Kim, H.; Johns, H. Summary of the evidence on modifiable risk factors for cognitive decline and dementia: A population-based perspective. Alzheimers Dement. 2015, 11, 718−726.
28. Schneider, L. S.; Mangialasche, F.; Andreasen, N.; Feldman, H.; Giacobini, E.; Jones, R.; Mantua, V.; Mecocci, P.; Pani, L.; Winblad, B.; Kivipelto, M. Clinical trials and late-stage drug development for Alzheimer’s disease: an appraisal from 1984 to 2014. J. Intern. Med. 2014, 275, 251−283.
29. Selkoe, D. J.; Schenk, D. Alzheimer’s disease: Molecular understanding predicts amyloid-based therapeutics. Ann. Rev. Pharmacol. 2003, 43, 545–584.
30. Karran, E.; Mercken, M.; De Strooper, B. The amyloid cascade hypothesis for Alzheimer’s disease: an appraisal for the development of therapeutics. Nat. Rev. Drug Discov. 2011, 10, 698–712.
31. Wyss-Coray, T.; Rogers, J. Inflammation in Alzheimer disease-a brief review of the basic science and clinical literature. CSH Perspec. Med. 2012, 2, a006346.
32. Haga, S.; Akai, K.; Ishii, T. Demonstration of microglial cells in and around senile (neuritic) plaques in the Alzheimer brain. An immunohistochemical study using a novel monoclonal antibody. Acta Neuropathol. 1989, 77, 569–575.
33. Rogers, J., Luber-Narod, J., Styren, S. D. & Civin, W. H. Expression of immune system-associated antigens by cells of the human central nervous system: relationship to the pathology of Alzheimer’s disease. Neurobiol. Aging 1988, 9, 339–349.
34. Dumont, M.; Beal, M. F. Neuroprotective strategies involving ROS in Alzheimer disease. Free Radical Bio. Med. 2011, 51, 1014–1026.
35. Montine, T. J.; Markesbery, W. R.; Morrow, J. D.; Roberts, L. J. II. Cerebrospinal fluid F2-isoprostane levels are increased in Alzheimer’s disease. Ann. Neurol. 1998, 44, 410–413.
36. Pratico, D.; Lee, V.; Trojanowski, J. Q.; Rokach, J.; Fitzgerald, G. A. Increased F2-isoprostanes in Alzheimer’s disease: evidence for enhanced lipid peroxidation in vivo. FASEB J. 1998, 12, 1777–1783.
37. Shineman, D. W.; Zhang, B.; Leight, S. N.; Pratico, D.; Lee, V. M. Y. Tromboxane receptor activation mediates isoprostane-induced increases in amyloid pathology in Tg2576 mice. J. Neurosci. 2008, 28, 4785–4794.
152
38. Soper, J. H.; Sugiyama, S.; Herbst-Robinson, K.; James, M. J.; Wang, X.; Trojanowsky, J. Q.; Smith, A. B. III; Lee, V. M.-Y.; Ballatore, C.; Brunden, K. R. Brain-penetrant tetrahydronaphthalene thromboxane A2-prostanoid (TP) receptor antagonists as prototype therapeutics for Alzheimer’s disease. ACS Chem. Neurosci. 2012, 3, 928–940.
39. Giulian, D.; Corpuz, M.; Richmond, B.; Wendt, E.; Hall, E. R. Activated microglia are the principal glial source of thromboxane in the central nervous system. Neurochem. Int. 1996, 29, 65–76.
40. Herbst-Robinson, K. J.; Liu, L.; James, M.; Yao, Y.; Xie, S. X.; Brunden, K. R. Inflammatory eicosanoids increase amyloid precursor protein expression via activation of multiple neuronal receptors. Sci. Rep. 2016, 5, 18286.
41. Choi, S. H.; Aid, S.; Caracciolo, L.; Minami, S. S.; Niikura, T.; Matsuoka, Y.; Turner, R. S.; Mattson, M. P.; Bosetti, F. Cyclo-oxygenase-1 inhibition reduces amyloid pathology and improves memory deficits in a mouse model of Alzheimer’s disease. J. Neurochem. 2013, 124, 59−68.
42. McGeer, P. L.; McGeer, E. G. NSAIDs and Alzheimer disease: epidemiological, animal model and clinical studies. Neurobiol. Aging 2007, 28, 639−647.
43. Yan, Q.; Zhang, J.; Liu, H.; Babu-Khan, S.; Vassar, R.; Biere, A. L.; Citron, M.; Landreth, G. Anti-inflammatory drug therapy alters beta-amyloid processing and deposition in an animal model of Alzheimer’s disease. J. Neurosci. 2003, 23, 7504−7509.
44. Lim, G. P.; Yang, F.; Chu, T.; Chen, P.; Beech, W.; Teter, B.; Tran, T.; Ubeda, O.; Ashe, K. H.; Frautschy, S. A.; Cole, G. M. Ibuprofen suppresses plaque pathology and inflammation in a mouse model for Alzheimer’s disease. J. Neurosci. 2000, 20, 5709−5714.
45. Lim, G. P.; Yang, F.; Chu, T.; Gahtan, E.; Ubeda, O.; Beech, W.; Overmier, J. B.; Hsiao-Ashec, K.; Frautschy, S. A.; Cole, G. M. Ibuprofen effects on Alzheimer pathology and open field activity in APPsw transgenic mice. Neurobiol. Aging 2001, 22, 983−991.
46. Szekely, C. A.; Thorne, J. E.; Zandi, P. P.; Ek, M.; Messias, E.; Breitner, J. C.; Goodman, S. N. Nonsteroidal anti-inflammatory drugs for the prevention of Alzheimer’s disease: a systematic review. Neuroepidemiology 2004, 23, 159−169.
47. Martin, B. K.; Szekely, C.; Brandt, J.; Piantadosi, S.; Breitner, J. C.; Craft, S.; Evans, D.; Green, R.; Mullan, M. Cognitive function over time in the Alzheimer’s Disease Anti-inflammatory Prevention Trial (ADAPT): results of a randomized, controlled trial of naproxen and celecoxib. Arch. Neurol. 2008, 65, 896−905.
48. Breitner, J. C.; Baker, L. D.; Montine, T. J.; Meinert, C. L.; Lyketsos, C. G.; Ashe, K. H.; Brandt, J.; Craft, S.; Evans, D. E.; Green, R. C.; Ismail, M. S.; Martin, B. K.;

153
Mullan, M. J.; Sabbagh, M.; Tariot, P. N. Extended results of the Alzheimer’s disease anti-inflammatory prevention trial. Alzheimer's Dementia 2011, 7, 402−411.
49. Leoutsakos, J. M.; Muthen, B. O.; Breitner, J. C.; Lyketsos, C. G. Effects of non-steroidal anti-inflammatory drug treatments on cognitive decline vary by phase of pre-clinical Alzheimer disease: findings from the randomized controlled Alzheimer’s Disease Anti- inflammatory Prevention Trial. Int. J. Geriatr. Psychiatry 2012, 27, 364−374.
50. Maxis, K.; Delalandre, A.; Martel-Pelletier, J.; Pelletier, J. P.; Duval, N.; Lajeunesse, D. The shunt from the cyclooxygenase to lipoxygenase pathway in human osteoarthritic subchondral osteoblasts is linked with a variable expression of the 5-lipoxygenase-activating protein. Arthritis Res. Ther. 2006, 8, R181.
51. Duffield-Lillico, A. J.; Boyle, J. O.; Zhou, X. K.; Ghosh, A.; Butala, G. S.; Subbaramaiah, K.; Newman, R. A.; Morrow, J. D.; Milne, G. L.; Dannenberg, A. J. Levels of prostaglandin E metabolite and leukotriene E(4) are increased in the urine of smokers: evidence that celecoxib shunts arachidonic acid into the 5-lipoxygenase pathway. Cancer Prev. Res. 2009, 2, 322−329.
52. Firuzi, O.; Zhuo, J.; Chinnici, C. M.; Wisniewski, T.; Pratico, D. 5-Lipoxygenase gene disruption reduces amyloid-beta pathology in a mouse model of Alzheimer’s disease. FASEB J. 2007, 22, 1169−1178.
53. Chu, J.; Giannopoulos, P. F.; Ceballos-Diaz, C.; Golde, T. E.; Pratico, D. 5-Lipoxygenase gene transfer worsens memory, amyloid, and tau brain pathologies in a mouse model of Alzheimer disease. Ann. Neurol. 2012, 72, 442−454.
54. Chu, J.; Pratico, D. Pharmacologic blockade of 5-lipoxygenase improves the amyloidotic phenotype of an Alzheimer’s disease transgenic mouse model involvement of gamma-secretase. Am. J. Pathol. 2011, 178, 1762−1769.
55. Tang, S. S.; Wang, X. Y.; Hong, H.; Long, Y.; Li, Y. Q.; Xiang, G. Q.; Jiang, L. Y.; Zhang, H. T.; Liu, L. P.; Miao, M. X.; Hu, M.; Zhang, T. T.; Hu, W.; Ji, H.; Ye, F. Y. Leukotriene D4 induces cognitive impairment through enhancement of CysLT(1) R-mediated amyloid-beta generation in mice. Neuropharmacology 2013, 65, 182−192.
56. Hwang, S. H. W.; Wecksler A. T.; Wagner, K.; Hammock, B. D. Rationally designed mutlitarget agents against inflammation and pain. Curr. Med. Chem. 2013, 20, 1783–1799.
57. Manev, H.; Chen, H.; Dzitoyeva, S.; Manev, R. Cyclooxygenases and 5-lipoxygenase in Alzheimer’s disease. Prog. Neuro-Psychopharmacol. Biol. Psychiatry 2011, 35, 315−319.
58. Kitamura, Y.; Shimohama, S.; Koike, H.; Kakimura, J.; Matsuoka, Y.; Nomura, Y.; Gebicke-Haerter, P. J.; Taniguchi, T. Increased expression of cyclooxygenases and peroxisome proliferator-activated receptor-gamma in Alzheimer’s disease brains.

154
Biochem. Biophys. Res. Commun. 1999, 254, 582−586. 59. Fujimi, K.; Noda, K.; Sasaki, K.; Wakisaka, Y.; Tanizaki, Y.; Iida, M.; Kiyohara, Y.;
Kanba, S.; Iwaki, T. Altered expression of COX-2 in subdivisions of the hippocampus during aging and in Alzheimer’s disease: the Hisayama Study. Dementia Geriatr. Cognit. Disord. 2007, 23, 423−431.
60. Montine, T. J.; Sonnen, J. A.; Milne, G.; Baker, L. D.; Breitner, J. C. Elevated ratio of urinary metabolites of thromboxane and prostacyclin is associated with adverse cardiovascular events in ADAPT. PloS one 2010, 5, e9340.
61. Kulkarni, S. K.; Singh, V. P. Licofelone: the answer to unmet needs in osteoarthritis therapy? Curr. Rheumatol. Rep. 2008, 10, 43–48.
62. Brune, K. Safety of anti-inflammatory treatment−new ways of thinking. Rheumatology 2004, 43, i16–i20.
63. Ballatore, C.; Brunden, K. R.; Huryn, D. M.; Trojanowski, J. Q.; Lee, V. M.-Y.; Smith, A. B. III Microtubule stabilizing agents as potential treatment for Alzheimer’s disease and related neurodegenerative tauopathies. J. Med. Chem. 2012, 55, 8979–8996.
64. Roy, S.; Zhang, B.; Lee, V. M.-Y.; Trojanowski, J. Q. Axonal transport defects: a common theme in neurodegenerative diseases. Acta Neuropathol. 2005, 109, 5−13.
65. Lee V. M.; Goedert, M.; Trojanowski, J. Q. Neurodegenerative tauopathies. Ann. Rev. Neurosci. 2001, 24, 1121–1159.
66. Ballatore, C.; Lee, V. M.-Y.; Trojanowski, J. Q. Tau-mediated neurodegeneration in Alzheimer’s disease and related disorders. Nat. Rev. Neurosci. 2007, 8, 663−672.
67. Drechsel, D. N.; Hyman, A. A.; Cobb, M. H.; Kirschner, M. W. Modulation of the dynamic instability of tubulin assembly by the microtubule-associated protein tau. Mol. Biol. Cell 1992, 3, 1141−1154.
68. Biernat, J.; Gustke, N.; Drewes, G.; Mandelkow, E. M.; Mandelkow, E. Phosphorylation of Ser262 strongly reduces binding of tau to microtubules: distinction between PHF-like immunoreactivity and microtubule binding. Neuron 1993, 11, 153−163.
69. Buee, L.; Bussiere, T.; Buee-Scherrer, V.; Delacourte, A.; Hof, P. R. Tau protein isoforms, phosphorylation and role in neurodegenerative disorders. Brain Res. Rev. 2000, 33, 95−130.
70. Alonso, A. D.; Grundke-Iqbal, I.; Barra, H. S.; Iqbal, K. Abnormal phosphorylation of tau and the mechanism of Alzheimer neurofibrillary degeneration: sequestration of microtubule-associated proteins 1 and 2 and the disassembly of microtubules by the abnormal tau. Proc. Natl. Acad. Sci. U. S. A. 1997, 94, 298–303.
71. Kuret, J.; Congdon, E. E.; Li, G.; Yin, H.; Yu, X.; Zhong, Q. Evaluating triggers and enhancers of tau fibrillization. Microsc. Res. Tech. 2005, 67, 141−155.

155
72. Kuret, J.; Chirita, C. N.; Congdon, E. E.; Kannanayakal, T.; Li, G.; Necula, M.; Yin, H.; Zhong, Q. Pathways of tau fibrillization. Biochim. Biophys. Acta, Mol. Basis Dis. 2005, 1739, 167−178.
73. Wood, J. G.; Mirra, S. S.; Pollock, N. J.; Binder, L. I. Neurofibrillary tangles of Alzheimer disease share antigenic determinants with the axonal microtubule-associated protein tau (tau). Proc. Natl. Acad. Sci. U. S. A. 1986, 83, 4040–4043.
74. Lee, V. M.-Y.; Daughenbaugh, R.; Trojanowski, J. Q. Microtubule stabilizing drugs for the treatment of Alzheimer’s disease. Neurobiol. Aging 1994, 15, S87−S89.
75. Trojanowski, J. Q.; Smith, A. B.; Huryn, D.; Lee, V. M.-Y. Microtubule-stabilizing drugs for therapy of Alzheimer’s disease and other neurodegenerative disorders with axonal transport impairments. Expert Opin. Pharmacother. 2005, 6, 683−686.
76. Jordan, M. A.; Wilson, L. Microtubules as a target for anticancer drugs. Nature Rev. Cancer 2004, 4, 253−265.
77. Tsuji, A.; Tamai, I. Blood−brain barrier function of P-glycoprotein. Adv. Drug Delivery Rev. 1997, 25, 287−298.
78. Pardridge, W. M. The blood−brain barrier: bottleneck in brain drug development. NeuroRx 2005, 2, 3−14.
79. Bedard, P. L.; Di Leo, A.; Piccart-Gebhart, M. J. Taxanes: optimizing adjuvant chemotherapy for early-stage breast cancer. Nat. Rev. Clin. Oncol. 2010, 7, 22−36.
80. Lee, J.; Swain, S. M. Peripheral neuropathy induced by microtubule-stabilizing agents. J. Clin. Oncol. 2006, 24, 1633−164.
81. Shemesh, O. A.; Spira, M. E. Rescue of neurons from undergoing hallmark tau-induced Alzheimer’s disease cell pathologies by the antimitotic drug paclitaxel. Neurobiol. Dis. 2011, 43, 163−175.
82. Das, V.; Miller, J. H. Microtubule stabilization by peloruside A and paclitaxel rescues degenerating neurons from okadaic acid-induced tau phosphorylation. Eur. J. Neurosci. 2012, 35, 1705−1717.
83. Michaelis, M. L.; Ranciat, N.; Chen, Y.; Bechtel, M.; Ragan, R.; Hepperle, M.; Liu, Y.; Georg, G. Protection against beta-amyloid toxicity in primary neurons by paclitaxel (Taxol). J. Neurochem. 1998, 70, 1623−1627.
84. Michaelis, M. L.; Chen, Y.; Hill, S.; Reiff, E.; Georg, G.; Rice, A.; Audus, K. Amyloid peptide toxicity and microtubule-stabilizing drugs. J. Mol. Neurosci. 2002, 19, 101−105.
85. Michaelis, M. L.; Ansar, S.; Chen, Y.; Reiff, E. R.; Seyb, K. I.; Himes, R. H.; Audus, K. L.; Georg, G. I. {beta}-Amyloid-induced neurodegeneration and protection by structurally diverse microtubule- stabilizing agents. J. Pharmacol. Exp. Ther. 2005, 312, 659−68.

156
86. Zhang, B.; Maiti, A.; Shively, S.; Lakhani, F.; McDonald-Jones, G.; Bruce, J.; Lee, E. B.; Xie, S. X.; Joyce, S.; Li, C.; Toleikis, P. M.; Lee, V. M.-Y.; Trojanowski, J. Q. Microtubule-binding drugs offset tau sequestration by stabilizing microtubules and reversing fast axonal transport deficits in a tauopathy model. Proc. Natl. Acad. Sci. U. S. A. 2005, 102, 227−231.
87. Brunden, K. R.; Zhang, B.; Carroll, J.; Yao, Y.; Potuzak, J. S.; Hogan, A. M.; Iba, M.; James, M. J.; Xie, S. X.; Ballatore, C.; Smith, A. B. III; Lee, V. M.; Trojanowski, J. Q. Epothilone D improves microtubule density, axonal integrity, and cognition in a transgenic mouse model of tauopathy. J. Neurosci. 2010, 30, 13861−13866.
88. Zhang, B.; Carroll, J.; Trojanowski, J. Q.; Yao, Y.; Iba, M.; Potuzak, J. S.; Hogan, A. M.; Xie, S. X.; Ballatore, C.; Smith, A. B. III; Lee, V. M.; Brunden, K. R. The microtubule-stabilizing agent, epothilone D, reduces axonal dysfunction, neurotoxicity, cognitive deficits, and Alzheimer-like pathology in an interventional study with aged tau transgenic mice. J. Neurosci. 2012, 32, 3601−3611.
89. Barten, D. M.; Fanara, P.; Andorfer, C.; Hoque, N.; Wong, P. Y. A.; Husted, K. H.; Cadelina, G. W.; DeCarr, L. B.; Yang, L.; Liu, L.; Fessler, C.; Protassio, J.; Riff, T.; Turner, H.; Janus, C. G.; Sankaranarayanan, S.; Polson, C.; Meredith, J. E.; Gray, G.; Hanna, A.; Olson, R. E.; Kim, S.-H.; Vite, G. D.; Lee, F. Y.; Albright, C. F. Hyperdynamic microtubules, cognitive deficits, and pathology are improved in tau transgenic mice with low doses of the microtubule-stabilizing agent BMS-241027. J. Neurosci. 2012, 32, 7137−7145.
90. Brunden, K. R.; Yao, Y.; Potuzak, J. S.; Ferrer, N. I.; Ballatore, C.; James, M. J.; Hogan, A. M.; Trojanowski, J. Q.; Smith, A. B.; Lee, V. M.- Y. The characterization of microtubule-stabilizing drugs as possible therapeutic agents for Alzheimer’s disease and related tauopathies. Pharmacol. Res. 2011, 63, 341−351.
91. Cirrito, J. R.; Deane, R.; Fagan, A. M.; Spinner, M. L.; Parsadanian, M.; Finn, M. B.; Jiang, H.; Prior, J. L.; Sagare, A.; Bales, K. R.; Paul, S. M.; Zlokovic, B. V.; Piwnica-Worms, D.; Holtzman, D. M. P-glycoprotein deficiency at the blood−brain barrier increases amyloid-{beta} deposition in an Alzheimer disease mouse model. J. Clin. Invest. 2005, 115, 3285−3290.
92. Pees, K.-J.; Albert, G. Triazolopyrimidine derivatives with fungicidal activity. European Patent EP0550113, 1993.
93. Zhang, N.; Ayral-Kaloustian, S.; Nguyen, T.; Afragola, J.; Hernandez, R.; Lucas, J.; Gibbons, J.; Beyer, C. Synthesis and SAR of [1,2,4]triazolo[1,5-a]pyrimidines, a class of anticancer agents with a unique mechanism of tubulin inhibition. J. Med. Chem. 2007, 50, 319−327.
157
94. Beyer, C. F.; Zhang, N.; Hernandez, R.; Vitale, D.; Lucas, J.; Nguyen, T.; Discafani, C.; Ayral- Kaloustian, S.; Gibbons, J. J. TTI-237: a novel microtubule-active compound with in vivo antitumor activity. Cancer Res. 2008, 68, 2292–2300.
95. Morphy, R.; Rankovic, Z.; Abraham, D. J. Medicinal chemistry approaches for multitarget drugs. In Burger’s Medicinal Chemistry and Drug Discovery; John Wiley & Sons, Inc.: Hoboken, NJ, 2003; pp 249−274.
96. Anighoro, A.; Bajorath, J.; Rastelli, G. Polypharmacology: challenges and opportunities in drug discovery. J. Med. Chem. 2014, 57, 7874−7887.
97. Geldenhuys, W. J.; Van der Schyf, C. J. Rationally designed multi- targeted agents against neurodegenerative diseases. Curr. Med. Chem. 2013, 20, 1662−1672.
98. Cavalli, A.; Bolognesi, M. L.; Minarini, A.; Rosini, M.; Tumiatti, V.; Recanatini, M.; Melchiorre, C. Multi-target-directed ligands to combat neurodegenerative diseases. J. Med. Chem. 2008, 51, 347−372.
99. Brunden, K. R.; Lee, V. M.; Smith, A. B.; Trojanowski, J. Q.; Ballatore, C. Altered microtubule dynamics in neurodegenerative disease: therapeutic potential of microtubule-stabilizing drugs. Neurobiol. Dis. 2017, 2016, 21.
100. Phillis, J. W.; Horrocks, L. A.; Farooqui, A. A. Cyclooxygenases, lipoxygenases, and epoxygenases in CNS: their role and involvement in neurological disorders. Brain Res. Rev. 2006, 52, 201−243.
101. Kang, K. H.; Liou, H. H.; Hour, M. J.; Liou, H. C.; Fu, W. M. Protection of dopaminergic neurons by 5-lipoxygenase inhibitor. Neuropharmacology 2013, 73, 380−387.
102. Chou, V. P.; Holman, T. R.; Manning-Bog, A. B. Differential contribution of lipoxygenase isozymes to nigrostriatal vulnerability. Neuroscience 2013, 228, 73−82.
103. Thakur, P.; Nehru, B. Anti-inflammatory properties rather than anti-oxidant capability is the major mechanism of neuroprotection by sodium salicylate in a chronic rotenone model of Parkinson’s disease. Neuroscience 2013, 231, 420−431.
104. Teismann, P. COX-2 in the neurodegenerative process of Parkinson’s disease. Biofactors 2012, 38, 395−397.
105. Yokota, O.; Terada, S.; Ishizu, H.; Ishihara, T.; Nakashima, H.; Kugo, A.; Tsuchiya, K.; Ikeda, K.; Hayabara, T.; Saito, Y.; Murayama, S.; Ueda, K.; Checler, F.; Kuroda, S. Increased expression of neuronal cyclooxygenase-2 in the hippocampus in amyotrophic lateral sclerosis both with and without dementia. Acta Neuropathol. 2004, 107, 399− 405.
106. Kong, W.; Hooper, K. M.; Ganea, D. The natural dual cyclooxygenase and 5-lipoxygenase inhibitor flavocoxid is protective in EAE through effects on Th1/Th17 differentiation and macrophage/ microglia activation. Brain, Behav., Immun. 2016, 53, 59−71.
158
107. Lamberth, C.; Dumeunier, R.; Trah, S.; Wendeborn, S.; Godwin, J.; Schneiter, P.; Corran, A. Synthesis and fungicidal activity of tubulin polymerisation promoters. Part 3: imidazoles. Bioorg. Med. Chem. 2013, 21, 127−134.
108. Laufer, S. A.; Augustin, J.; Dannhardt, G.; Kiefer, W. 6,7-Diaryldihydropyrrolizin-5-yl)acetic acids, a novel class of potent dual inhibitors of both cyclooxygenase and 5-lipoxygenase. J. Med. Chem. 1994, 37, 1894−1897.
109. Smith, C. J.; Zhang, Y.; Koboldt, C. M.; Muhammad, J.; Zweifel, B. S.; Shaffer, A.; Talley, J. J.; Masferrer, J. L.; Seibert, K.; Isakson, P. C. Pharmacological analysis of cyclooxygenase-1 in inflammation. Proc. Natl. Acad. Sci. U. S. A. 1998, 95, 13313−13318.
110. Cornec, A.-S.; Monti, L.; Kovalevich, J.; Makani, V.; James, M. J.; Vijayendran, K. G.; Oukoloff, K.; Yao, Y.; Lee, V. M.-Y.; Trojanowski, J. Q.; Smith, A. B. III; Brunden, K. R.; Ballatore, C. Multitargeted imidazoles: potential therapeutic leads for Alzheimer’s and other neurodegenerative diseases. J. Med. Chem. 2017, 60, 5120–5145.
111. Van Leusen, A. M.; Wildeman, J.; Oldenziel, O. H. Chemistry of sulfonylmethyl isocyanides. 12. Base-induced cycloaddition of sulfonylmethyl isocyanides to carbon, nitrogen double bonds. Synthesis of 1,5-disubstituted and 1,4,5-trisubstituted imidazoles from aldimines and imidoyl chlorides. J. Org. Chem. 1977, 42, 1153−1159.
112. Westheimer, F. H.; Taguchi, K. J. Org. Chem. 1971, 36, 1570−1572. 113. Lou, K.; Yao, Y.; Hoye, A. T.; James, M. J.; Cornec, A. S.; Hyde, E.; Gay, B.; Lee, V.
M.; Trojanowski, J. Q.; Smith, A. B., III; Brunden, K. R.; Ballatore, C. Brain-penetrant, orally bioavailable microtubule- stabilizing small molecules are potential candidate therapeutics for Alzheimer’s disease and related tauopathies. J. Med. Chem. 2014, 57, 6116−6127.
114. Fukushima, N.; Furuta, D.; Hidaka, Y.; Moriyama, R.; Tsujiuchi, T. Post-translational modifications of tubulin in the nervous system. J. Neurochem. 2009, 109, 683−693.
115. Kovalevich, J.; Cornec, A. S.; Yao, Y.; James, M.; Crowe, A.; Lee, V. M.; Trojanowski, J. Q.; Smith, A. B., III; Ballatore, C.; Brunden, K. R. Characterization of brain-penetrant pyrimidine-containing mole- cules with differential microtubule-stabilizing activities developed as potential therapeutic agents for Alzheimer’s disease and related tauopathies. J. Pharmacol. Exp. Ther. 2016, 357, 432−450.
116. Tries, S.; Neupert, W.; Laufer, S. The mechanism of action of the new antiinflammatory compound ML3000: inhibition of 5-LOX and COX-1/2. Inflammation Res. 2002, 51, 135−143.
117. Meirer, K.; Steinhilber, D.; Proschak, E. Inhibitors of the arachidonic acid cascade: interfering with multiple pathways. Basic Clin. Pharmacol. Toxicol. 2014, 114, 83−91.
118. Reichel, A. The role of blood−brain barrier studies in the pharmaceutical industry. Curr. Drug Metab. 2006, 7, 183−203.

159
119. Mariano, M.; Schmitt, C.; Miralinaghi, P.; Catto, M.; Hartmann, R. W.; Carotti, A.; Engel, M. First selective dual inhibitors of tau phosphorylation and Beta-amyloid aggregation, two major pathogenic mechanisms in Alzheimer’s disease. ACS Chem. Neurosci. 2014, 5, 1198−202.
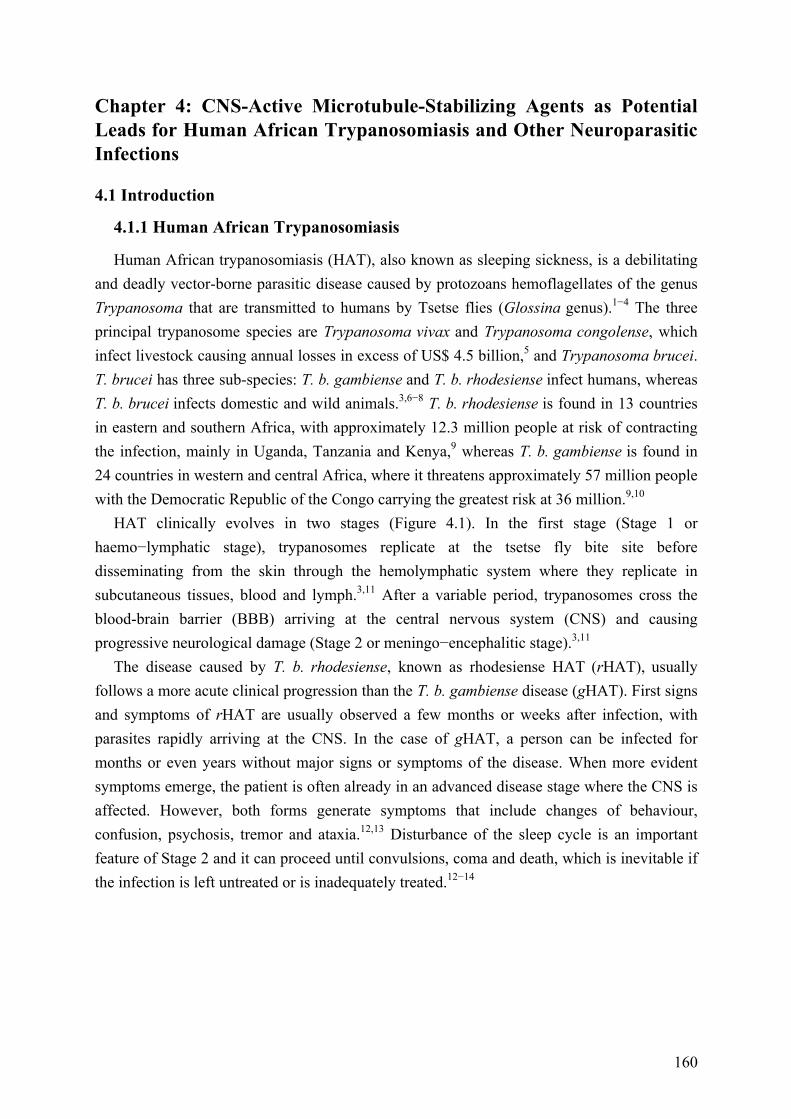
160
Chapter 4: CNS-Active Microtubule-Stabilizing Agents as Potential Leads for Human African Trypanosomiasis and Other Neuroparasitic Infections
4.1 Introduction
4.1.1 Human African Trypanosomiasis
Human African trypanosomiasis (HAT), also known as sleeping sickness, is a debilitating and deadly vector-borne parasitic disease caused by protozoans hemoflagellates of the genus Trypanosoma that are transmitted to humans by Tsetse flies (Glossina genus).1−4 The three principal trypanosome species are Trypanosoma vivax and Trypanosoma congolense, which infect livestock causing annual losses in excess of US$ 4.5 billion,5 and Trypanosoma brucei. T. brucei has three sub-species: T. b. gambiense and T. b. rhodesiense infect humans, whereas T. b. brucei infects domestic and wild animals.3,6−8 T. b. rhodesiense is found in 13 countries in eastern and southern Africa, with approximately 12.3 million people at risk of contracting the infection, mainly in Uganda, Tanzania and Kenya,9 whereas T. b. gambiense is found in 24 countries in western and central Africa, where it threatens approximately 57 million people with the Democratic Republic of the Congo carrying the greatest risk at 36 million.9,10
HAT clinically evolves in two stages (Figure 4.1). In the first stage (Stage 1 or haemo−lymphatic stage), trypanosomes replicate at the tsetse fly bite site before disseminating from the skin through the hemolymphatic system where they replicate in subcutaneous tissues, blood and lymph.3,11 After a variable period, trypanosomes cross the blood-brain barrier (BBB) arriving at the central nervous system (CNS) and causing progressive neurological damage (Stage 2 or meningo−encephalitic stage).3,11
The disease caused by T. b. rhodesiense, known as rhodesiense HAT (rHAT), usually follows a more acute clinical progression than the T. b. gambiense disease (gHAT). First signs and symptoms of rHAT are usually observed a few months or weeks after infection, with parasites rapidly arriving at the CNS. In the case of gHAT, a person can be infected for months or even years without major signs or symptoms of the disease. When more evident symptoms emerge, the patient is often already in an advanced disease stage where the CNS is affected. However, both forms generate symptoms that include changes of behaviour, confusion, psychosis, tremor and ataxia.12,13 Disturbance of the sleep cycle is an important feature of Stage 2 and it can proceed until convulsions, coma and death, which is inevitable if the infection is left untreated or is inadequately treated.12−14
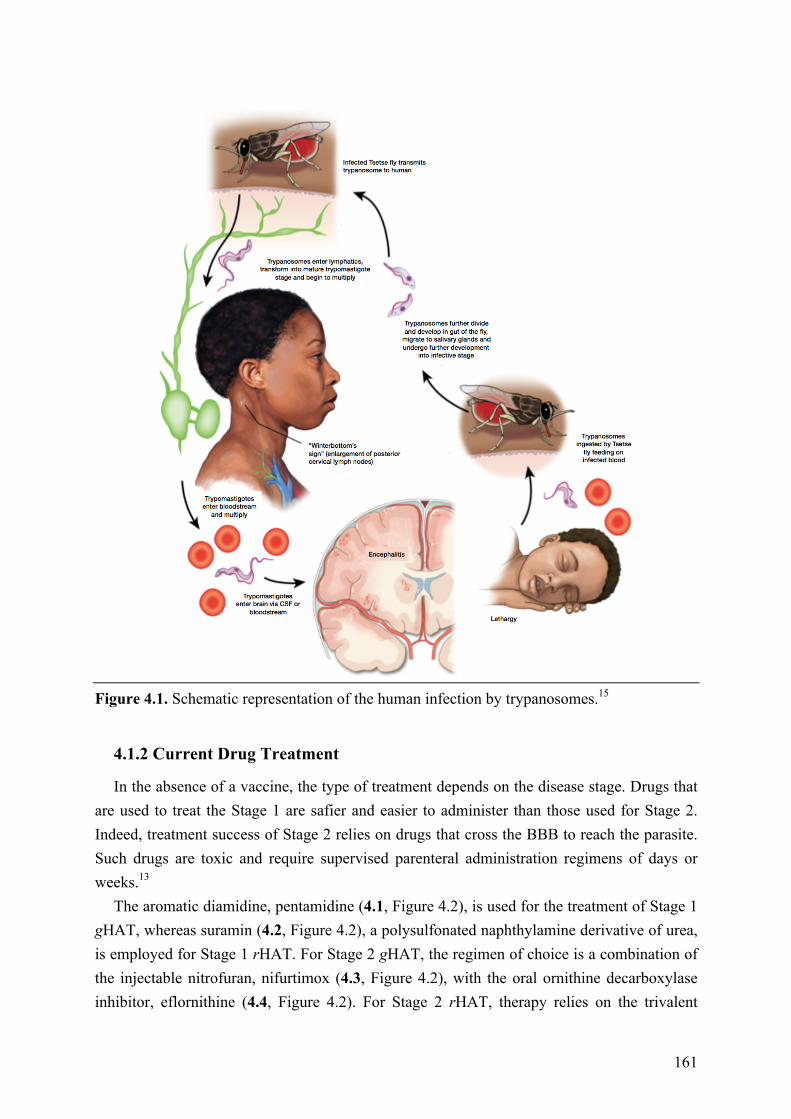
161
Figure 4.1. Schematic representation of the human infection by trypanosomes.15
4.1.2 Current Drug Treatment
In the absence of a vaccine, the type of treatment depends on the disease stage. Drugs that are used to treat the Stage 1 are safier and easier to administer than those used for Stage 2. Indeed, treatment success of Stage 2 relies on drugs that cross the BBB to reach the parasite. Such drugs are toxic and require supervised parenteral administration regimens of days or weeks.13
The aromatic diamidine, pentamidine (4.1, Figure 4.2), is used for the treatment of Stage 1 gHAT, whereas suramin (4.2, Figure 4.2), a polysulfonated naphthylamine derivative of urea, is employed for Stage 1 rHAT. For Stage 2 gHAT, the regimen of choice is a combination of the injectable nitrofuran, nifurtimox (4.3, Figure 4.2), with the oral ornithine decarboxylase inhibitor, eflornithine (4.4, Figure 4.2). For Stage 2 rHAT, therapy relies on the trivalent
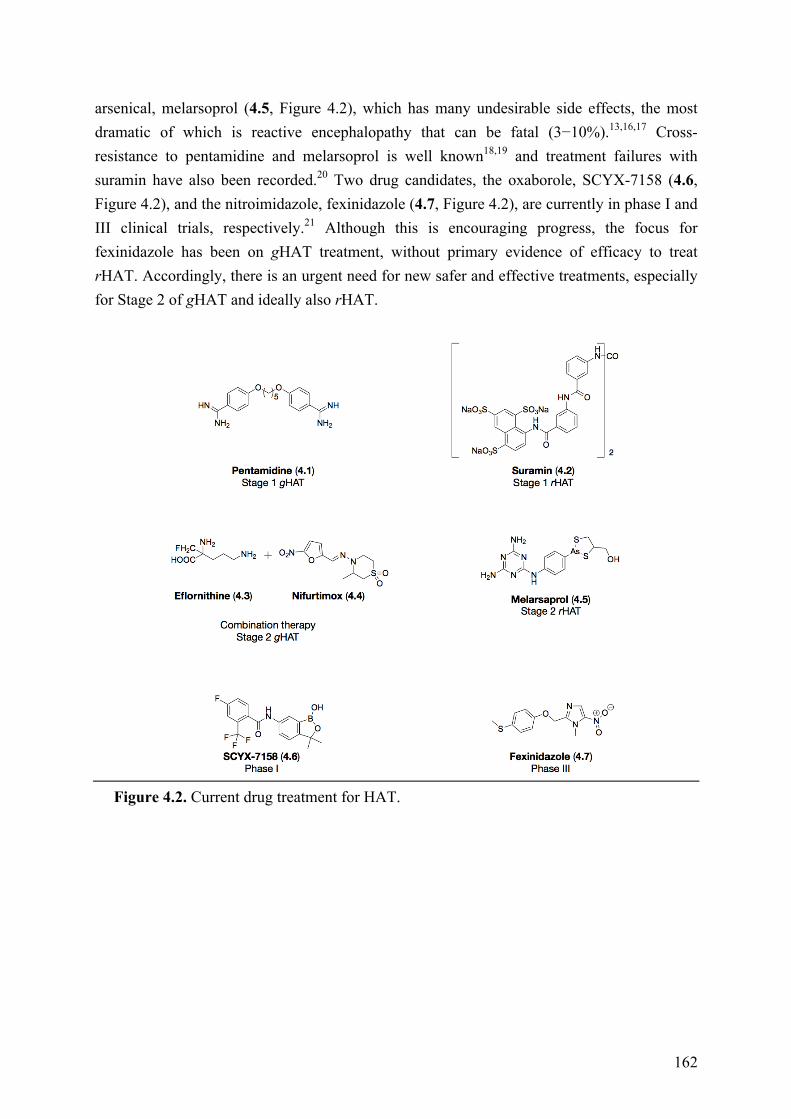
162
arsenical, melarsoprol (4.5, Figure 4.2), which has many undesirable side effects, the most dramatic of which is reactive encephalopathy that can be fatal (3−10%).13,16,17 Cross-resistance to pentamidine and melarsoprol is well known18,19 and treatment failures with suramin have also been recorded.20 Two drug candidates, the oxaborole, SCYX-7158 (4.6, Figure 4.2), and the nitroimidazole, fexinidazole (4.7, Figure 4.2), are currently in phase I and III clinical trials, respectively.21 Although this is encouraging progress, the focus for fexinidazole has been on gHAT treatment, without primary evidence of efficacy to treat rHAT. Accordingly, there is an urgent need for new safer and effective treatments, especially for Stage 2 of gHAT and ideally also rHAT.
Figure 4.2. Current drug treatment for HAT.
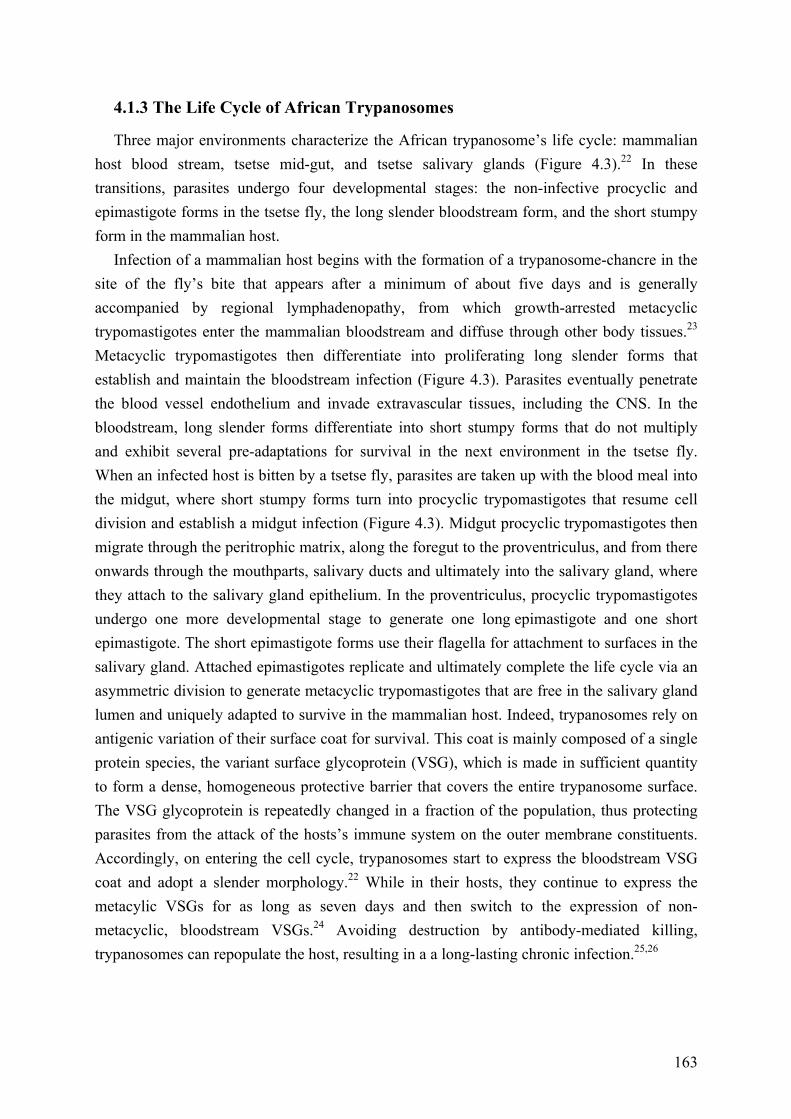
163
4.1.3 The Life Cycle of African Trypanosomes
Three major environments characterize the African trypanosome’s life cycle: mammalian host blood stream, tsetse mid-gut, and tsetse salivary glands (Figure 4.3).22 In these transitions, parasites undergo four developmental stages: the non-infective procyclic and epimastigote forms in the tsetse fly, the long slender bloodstream form, and the short stumpy form in the mammalian host.
Infection of a mammalian host begins with the formation of a trypanosome-chancre in the site of the fly’s bite that appears after a minimum of about five days and is generally accompanied by regional lymphadenopathy, from which growth-arrested metacyclic trypomastigotes enter the mammalian bloodstream and diffuse through other body tissues.23 Metacyclic trypomastigotes then differentiate into proliferating long slender forms that establish and maintain the bloodstream infection (Figure 4.3). Parasites eventually penetrate the blood vessel endothelium and invade extravascular tissues, including the CNS. In the bloodstream, long slender forms differentiate into short stumpy forms that do not multiply and exhibit several pre-adaptations for survival in the next environment in the tsetse fly. When an infected host is bitten by a tsetse fly, parasites are taken up with the blood meal into the midgut, where short stumpy forms turn into procyclic trypomastigotes that resume cell division and establish a midgut infection (Figure 4.3). Midgut procyclic trypomastigotes then migrate through the peritrophic matrix, along the foregut to the proventriculus, and from there onwards through the mouthparts, salivary ducts and ultimately into the salivary gland, where they attach to the salivary gland epithelium. In the proventriculus, procyclic trypomastigotes undergo one more developmental stage to generate one long epimastigote and one short epimastigote. The short epimastigote forms use their flagella for attachment to surfaces in the salivary gland. Attached epimastigotes replicate and ultimately complete the life cycle via an asymmetric division to generate metacyclic trypomastigotes that are free in the salivary gland lumen and uniquely adapted to survive in the mammalian host. Indeed, trypanosomes rely on antigenic variation of their surface coat for survival. This coat is mainly composed of a single protein species, the variant surface glycoprotein (VSG), which is made in sufficient quantity to form a dense, homogeneous protective barrier that covers the entire trypanosome surface. The VSG glycoprotein is repeatedly changed in a fraction of the population, thus protecting parasites from the attack of the hosts’s immune system on the outer membrane constituents. Accordingly, on entering the cell cycle, trypanosomes start to express the bloodstream VSG coat and adopt a slender morphology.22 While in their hosts, they continue to express the metacylic VSGs for as long as seven days and then switch to the expression of non-metacyclic, bloodstream VSGs.24 Avoiding destruction by antibody-mediated killing, trypanosomes can repopulate the host, resulting in a a long-lasting chronic infection.25,26

164
Figure 4.3. Stages of life cycle of trypanosomes.27
4.1.4 Microtubules in Trypanosomes
The cytoskeleton of trypanosomes plays essential roles in the parasites’s life cycle, as the parasites must migrate between different tissues in the mammalian host. Thus, the cytoskeleton is particularly important for development and maintenance of cell shape, motility, cell division, and attachment to host cell surfaces.
Microtubules (MTs) are major structural components of the cytoskeleton of trypanosomes, together with the axoneme, the basal body, the paraflagellar rod (PFR), and the attached flagellum. MTs in trypanosomes are generally distinguished in four structurally different classes: subpellicular, flagellar, cytoplasmic, and mitotic.22
Subsurface MTs are important to support and maintain cell form and shape, whereas the subpellicular MTs form a unique corset-like structure lying right underneath the plasma membrane. This structure is not found in mammalian cells and, in trypanosomes, it has been attributed to the subpellicular MT-associated proteins (MAPs) that cross-link tubulin polymers and connect the MT network to the plasma membrane (Figure 4.4).28 Subpellicular MTs have a defined polarity with the fast-growing plus ends orientated towards the posterior of the cell.22
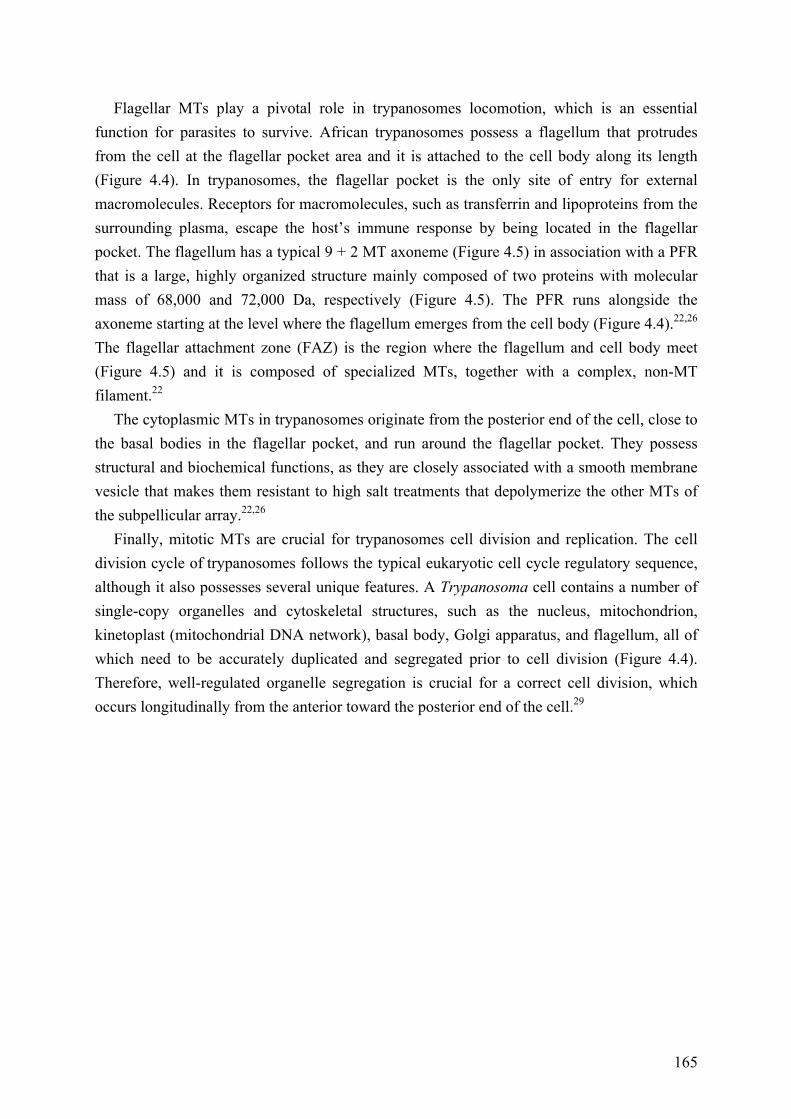
165
Flagellar MTs play a pivotal role in trypanosomes locomotion, which is an essential function for parasites to survive. African trypanosomes possess a flagellum that protrudes from the cell at the flagellar pocket area and it is attached to the cell body along its length (Figure 4.4). In trypanosomes, the flagellar pocket is the only site of entry for external macromolecules. Receptors for macromolecules, such as transferrin and lipoproteins from the surrounding plasma, escape the host’s immune response by being located in the flagellar pocket. The flagellum has a typical 9 + 2 MT axoneme (Figure 4.5) in association with a PFR that is a large, highly organized structure mainly composed of two proteins with molecular mass of 68,000 and 72,000 Da, respectively (Figure 4.5). The PFR runs alongside the axoneme starting at the level where the flagellum emerges from the cell body (Figure 4.4).22,26 The flagellar attachment zone (FAZ) is the region where the flagellum and cell body meet (Figure 4.5) and it is composed of specialized MTs, together with a complex, non-MT filament.22
The cytoplasmic MTs in trypanosomes originate from the posterior end of the cell, close to the basal bodies in the flagellar pocket, and run around the flagellar pocket. They possess structural and biochemical functions, as they are closely associated with a smooth membrane vesicle that makes them resistant to high salt treatments that depolymerize the other MTs of the subpellicular array.22,26
Finally, mitotic MTs are crucial for trypanosomes cell division and replication. The cell division cycle of trypanosomes follows the typical eukaryotic cell cycle regulatory sequence, although it also possesses several unique features. A Trypanosoma cell contains a number of single-copy organelles and cytoskeletal structures, such as the nucleus, mitochondrion, kinetoplast (mitochondrial DNA network), basal body, Golgi apparatus, and flagellum, all of which need to be accurately duplicated and segregated prior to cell division (Figure 4.4). Therefore, well-regulated organelle segregation is crucial for a correct cell division, which occurs longitudinally from the anterior toward the posterior end of the cell.29
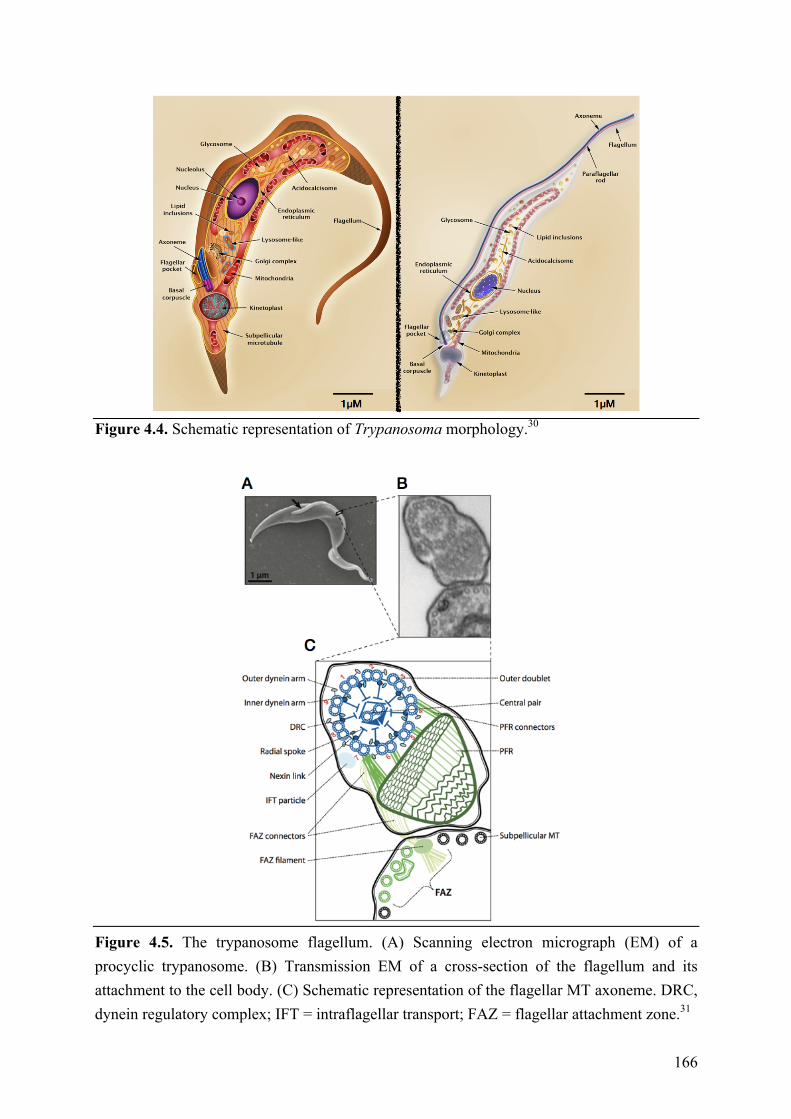
166
Figure 4.4. Schematic representation of Trypanosoma morphology.30
Figure 4.5. The trypanosome flagellum. (A) Scanning electron micrograph (EM) of a procyclic trypanosome. (B) Transmission EM of a cross-section of the flagellum and its attachment to the cell body. (C) Schematic representation of the flagellar MT axoneme. DRC, dynein regulatory complex; IFT = intraflagellar transport; FAZ = flagellar attachment zone.31
167
4.1.5 Tubulin in Trypanosomes
The α- and β-tubulins of flagellar and cytoskeletal MTs in unicellular parasites share ~85−95% amino-acid sequence identity with their mammalian counterparts. As with most tubulins, the α-tubulin gene of trypanosomes codes for a C-terminal tyrosine residue, but surprisingly, the β-tubulin gene also codes for a C-terminal tyrosine. This has not been found in any other cell or tissue.26,32
The assembly and stability of MTs are favorited by a number of molecules that bind to tubulins, such as guanine nucleotides, Mg2+, Ca2+ and MAPs. In contrast, tubulin-binding anti-mitotic agents, such as colchicine and benzimidazoles, destabilize and prevent MT assembly.33
In trypanosomes, both α- and β-tubulins undergo post-translational modifications (PTMs). Acetylation occurs at lysine 40 of α-tubulin, which in this acetylated form is found in both the subpellicular and the axonemal MTs. Acetylation occurs with assembly of axonemal MTs, and the modification can be reversed upon MT disassembly.22 Detyrosination of α-tubulin occurs after MT assembly, and tyrosinated α-tubulin acts as a molecular marker for new MTs.26 β-Tubulin can also be detyrosinated, and both tyrosinated and detyrosinated α- and β-tubulins are extensively glutamylated. Polyglutamylation adds a number of negative charges to the already very acidic carboxyl termini of the tubulins.22,26
In addition to the α- and β-tubulins there are several isoforms that are expressed at much reduced levels and that show special localizations.26 γ-Tubulin is generally associated with basal bodies and spindle poles and its assembly with a group of other proteins forms the γ-TuRCs, which constitute key components of the MT-organizing center (MTOC) and promote MT assembly. Trypanosomes also contain three other tubulin forms: δ, ε and ζ, but their functions remain to be elucidated.22
4.2 Objective of the Study
The cytoskeleton of trypanosomes, and tubulin in particular, has long been considered a drug target.32,34 Over the past several years, inhibitors of tubulin polymerization have been evaluated as novel anti-parasitics,34−37 and, interestingly, trypanosome and mammalian tubulins were found to exhibit different reactivities in the colchicine binding site to these type of compounds.35 However, in spite of generally promising in vitro activity with such therapeutic candidates, they were not pursued due to a rapid metabolism/elimination.38 Furthermore, there are no data about brain penetration and metabolic stability, and there is only one demonstration of in vivo efficacy against T. brucei Lister 427 in a mouse model of Stage 1 infection.37 In contrast, tubulin polymerization promoters, such as MT-stabilizing agents, have not been investigated. Thus, we reason that promoters of tubulin polymerization should also be explored as potential candidates.
168
As previously described in section 3.1.4, the evaluation and development of MT-stabilizing agents for CNS-indications such as brain tumor39 and neurodegenerative diseases40 have been challenging due to issues of insufficient brain penetration. This situation changed with the discovery that selected MT-stabilizing natural products, such as epothilone D,41 as well as synthetic heterocyclic molecules,42,43 including several triazolopyrimidines (TPDs), phenylpyrimidines (PPDs) and related congeners, can readily access the brain of mice. Interestingly, competitive binding studies using radioactive [3H]-labeled vinblastine, colchicine and paclitaxel showed that these TPDs and related congeners do not effectively inhibit the binding of colchicine or paclitaxel. Instead, somewhat surprisingly, these agents were found to inhibit the binding of the tubulin polymerization inhibitor, vinblastine.44 Until recently, it was not clear, however, whether the observed competition with [3H]-vinblastine results from overlapping binding sites or a distinct allosteric site. Either way, these findings suggested that the mechanism of action of these molecules is completely distinct from other known MT-stabilizing compounds. Recent studies from Díaz and coworkers45 revealed the innovative molecular mode of action of this class of compounds: instead of stabilizing lateral contacts between tubulin subunits in MTs, as tubulin polymerization promoters typically do, these compounds stabilize longitudinal contacts by binding to the vinca-site that is normally targeted by classical MT-destabilizing agents, such as vinblastine and eribulin.
Over the years, as part of ongoing studies in the context of Alzheimer’s disease an related neurodegenerative tauopathies, Dr. Ballatore and coworkers worked on the development and evaluation of structurally related non-naturally occurring small molecules as CNS-active MT-stabilizing agents.42,43,46 Using a library of more than two-hundred synthetic molecules, their studies noted that MT-stabilizing agents can be divided into two general classes. One group, that is usually referred to as “phenotype I compounds”, increase markers of stable MTs in a concentration-dependent manner in dividing cells and neurons without affecting total tubulin levels or disrupting MT architecture. The second group, the so called “phenotype II compounds”, produce a bell-shaped concentration-response effect on markers of MT stabilization in cellular assays. Moreover, these compounds induced proteasome-dependent degradation of α- and β-tubulin and cause altered MT morphology in both dividing cells and neuron cultures.43 As a result, phenotype II compounds, which were found to cause a reduction in total tubulin, may not be desirable for neurodegenerative diseases as this effect would be expected to ultimately compromise rather than restore axonal MT function. However, regardless of whether these compounds elicit a phenotype I or II, both groups of MT-stabilizing agents may be of potential use in the context of neuroparasitic infection, such as the HAT. Accordingly, we propose the evaluation of CNS-active MT-stabilizing agents against T. brucei that could lead to the identification of viable candidates for in vivo proof-of-concept studies.
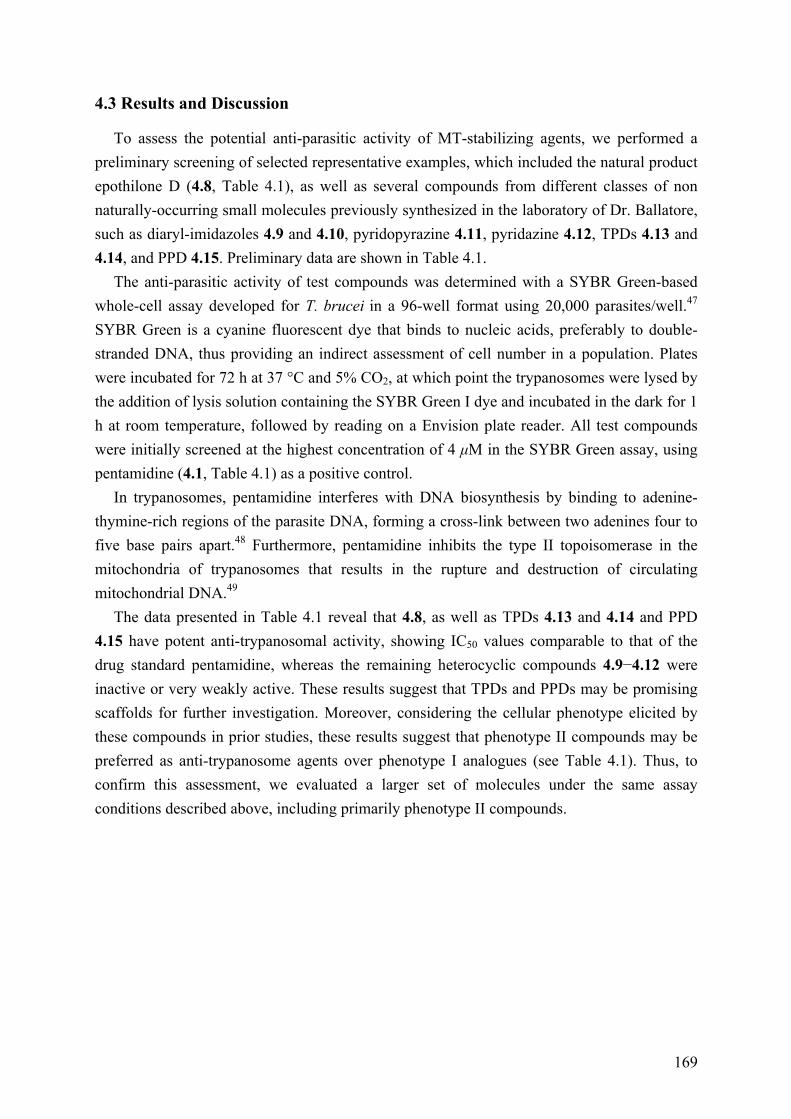
169
4.3 Results and Discussion
To assess the potential anti-parasitic activity of MT-stabilizing agents, we performed a preliminary screening of selected representative examples, which included the natural product epothilone D (4.8, Table 4.1), as well as several compounds from different classes of non naturally-occurring small molecules previously synthesized in the laboratory of Dr. Ballatore, such as diaryl-imidazoles 4.9 and 4.10, pyridopyrazine 4.11, pyridazine 4.12, TPDs 4.13 and 4.14, and PPD 4.15. Preliminary data are shown in Table 4.1.
The anti-parasitic activity of test compounds was determined with a SYBR Green-based whole-cell assay developed for T. brucei in a 96-well format using 20,000 parasites/well.47 SYBR Green is a cyanine fluorescent dye that binds to nucleic acids, preferably to double-stranded DNA, thus providing an indirect assessment of cell number in a population. Plates were incubated for 72 h at 37 °C and 5% CO2, at which point the trypanosomes were lysed by the addition of lysis solution containing the SYBR Green I dye and incubated in the dark for 1 h at room temperature, followed by reading on a Envision plate reader. All test compounds were initially screened at the highest concentration of 4 µM in the SYBR Green assay, using pentamidine (4.1, Table 4.1) as a positive control.
In trypanosomes, pentamidine interferes with DNA biosynthesis by binding to adenine-thymine-rich regions of the parasite DNA, forming a cross-link between two adenines four to five base pairs apart.48 Furthermore, pentamidine inhibits the type II topoisomerase in the mitochondria of trypanosomes that results in the rupture and destruction of circulating mitochondrial DNA.49
The data presented in Table 4.1 reveal that 4.8, as well as TPDs 4.13 and 4.14 and PPD 4.15 have potent anti-trypanosomal activity, showing IC50 values comparable to that of the drug standard pentamidine, whereas the remaining heterocyclic compounds 4.9−4.12 were inactive or very weakly active. These results suggest that TPDs and PPDs may be promising scaffolds for further investigation. Moreover, considering the cellular phenotype elicited by these compounds in prior studies, these results suggest that phenotype II compounds may be preferred as anti-trypanosome agents over phenotype I analogues (see Table 4.1). Thus, to confirm this assessment, we evaluated a larger set of molecules under the same assay conditions described above, including primarily phenotype II compounds.
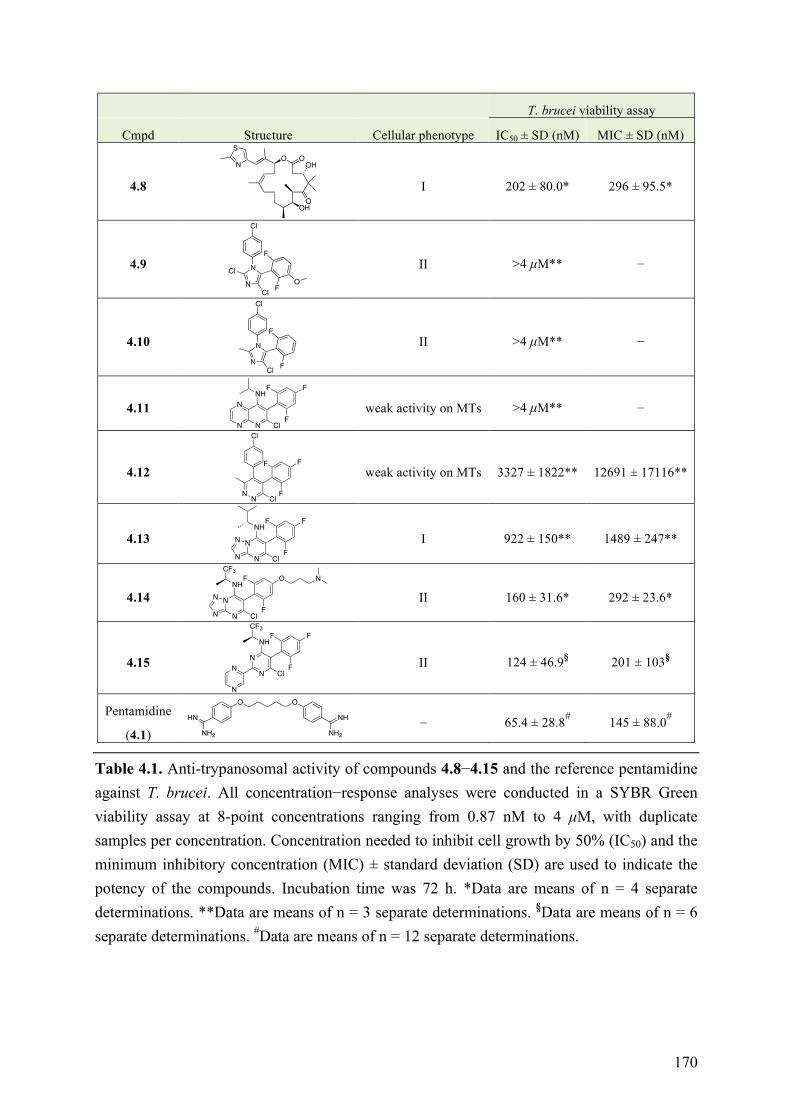
170
T. brucei viability assay
Cmpd Structure Cellular phenotype IC50 ± SD (nM) MIC ± SD (nM)
4.8
I 202 ± 80.0* 296 ± 95.5*
4.9
II >4 µM** −
4.10
II >4 µM** −
4.11
weak activity on MTs >4 µM** −
4.12
weak activity on MTs 3327 ± 1822** 12691 ± 17116**
4.13
I 922 ± 150** 1489 ± 247**
4.14
II 160 ± 31.6* 292 ± 23.6*
4.15
II 124 ± 46.9§ 201 ± 103§
Pentamidine
(4.1) − 65.4 ± 28.8# 145 ± 88.0#
Table 4.1. Anti-trypanosomal activity of compounds 4.8−4.15 and the reference pentamidine against T. brucei. All concentration−response analyses were conducted in a SYBR Green viability assay at 8-point concentrations ranging from 0.87 nM to 4 µM, with duplicate samples per concentration. Concentration needed to inhibit cell growth by 50% (IC50) and the minimum inhibitory concentration (MIC) ± standard deviation (SD) are used to indicate the potency of the compounds. Incubation time was 72 h. *Data are means of n = 4 separate determinations. **Data are means of n = 3 separate determinations. §Data are means of n = 6 separate determinations. #Data are means of n = 12 separate determinations.
S
NOO
OH
OH
O
N
N
F
F
Cl
Cl
ClO
N
N
F
F
Cl
Cl
N
NH
Cl
F
F
F
N
N
NN
Cl
ClF
FF
N
N
NH
Cl
F
F
F
N
N
N
N
NH
Cl
F
F
CF3O
N
N
N
N
N
NH
Cl
F
FN
N
CF3F
NH2
HN
O O
NH
NH2
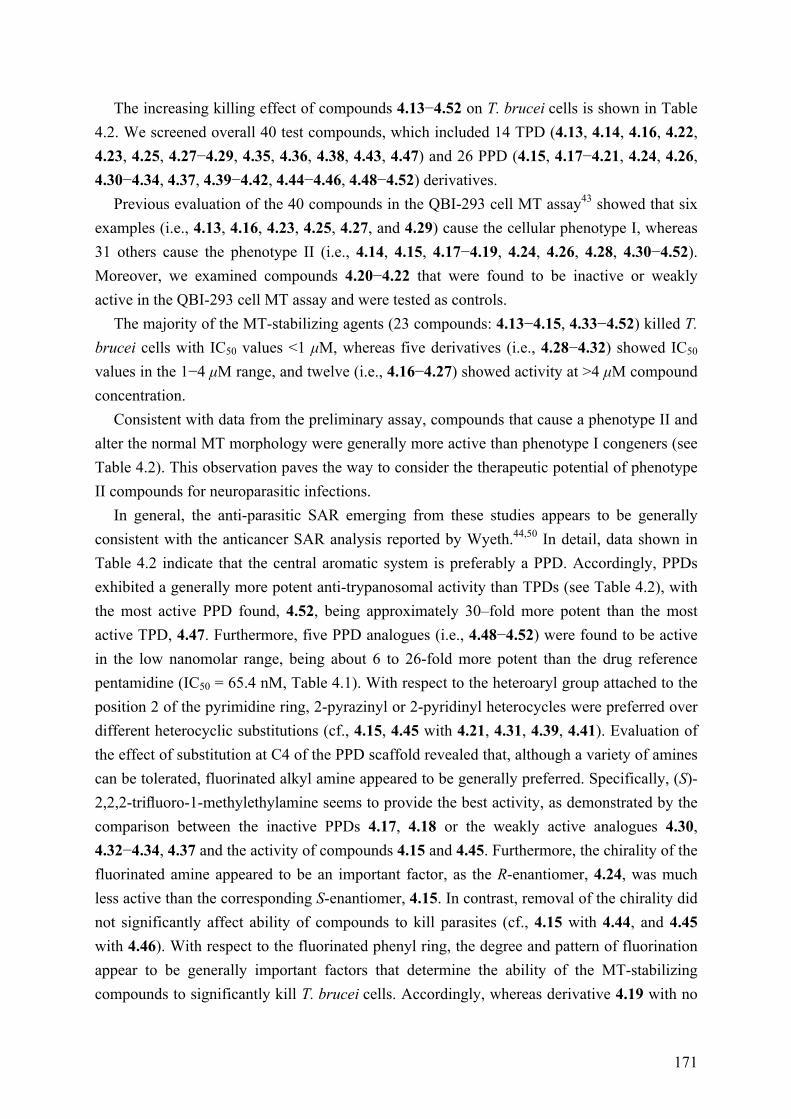
171
The increasing killing effect of compounds 4.13−4.52 on T. brucei cells is shown in Table 4.2. We screened overall 40 test compounds, which included 14 TPD (4.13, 4.14, 4.16, 4.22, 4.23, 4.25, 4.27−4.29, 4.35, 4.36, 4.38, 4.43, 4.47) and 26 PPD (4.15, 4.17−4.21, 4.24, 4.26, 4.30−4.34, 4.37, 4.39−4.42, 4.44−4.46, 4.48−4.52) derivatives.
Previous evaluation of the 40 compounds in the QBI-293 cell MT assay43 showed that six examples (i.e., 4.13, 4.16, 4.23, 4.25, 4.27, and 4.29) cause the cellular phenotype I, whereas 31 others cause the phenotype II (i.e., 4.14, 4.15, 4.17−4.19, 4.24, 4.26, 4.28, 4.30−4.52). Moreover, we examined compounds 4.20−4.22 that were found to be inactive or weakly active in the QBI-293 cell MT assay and were tested as controls.
The majority of the MT-stabilizing agents (23 compounds: 4.13−4.15, 4.33−4.52) killed T. brucei cells with IC50 values <1 µM, whereas five derivatives (i.e., 4.28−4.32) showed IC50 values in the 1−4 µM range, and twelve (i.e., 4.16−4.27) showed activity at >4 µM compound concentration.
Consistent with data from the preliminary assay, compounds that cause a phenotype II and alter the normal MT morphology were generally more active than phenotype I congeners (see Table 4.2). This observation paves the way to consider the therapeutic potential of phenotype II compounds for neuroparasitic infections.
In general, the anti-parasitic SAR emerging from these studies appears to be generally consistent with the anticancer SAR analysis reported by Wyeth.44,50 In detail, data shown in Table 4.2 indicate that the central aromatic system is preferably a PPD. Accordingly, PPDs exhibited a generally more potent anti-trypanosomal activity than TPDs (see Table 4.2), with the most active PPD found, 4.52, being approximately 30–fold more potent than the most active TPD, 4.47. Furthermore, five PPD analogues (i.e., 4.48−4.52) were found to be active in the low nanomolar range, being about 6 to 26-fold more potent than the drug reference pentamidine (IC50 = 65.4 nM, Table 4.1). With respect to the heteroaryl group attached to the position 2 of the pyrimidine ring, 2-pyrazinyl or 2-pyridinyl heterocycles were preferred over different heterocyclic substitutions (cf., 4.15, 4.45 with 4.21, 4.31, 4.39, 4.41). Evaluation of the effect of substitution at C4 of the PPD scaffold revealed that, although a variety of amines can be tolerated, fluorinated alkyl amine appeared to be generally preferred. Specifically, (S)-2,2,2-trifluoro-1-methylethylamine seems to provide the best activity, as demonstrated by the comparison between the inactive PPDs 4.17, 4.18 or the weakly active analogues 4.30, 4.32−4.34, 4.37 and the activity of compounds 4.15 and 4.45. Furthermore, the chirality of the fluorinated amine appeared to be an important factor, as the R-enantiomer, 4.24, was much less active than the corresponding S-enantiomer, 4.15. In contrast, removal of the chirality did not significantly affect ability of compounds to kill parasites (cf., 4.15 with 4.44, and 4.45 with 4.46). With respect to the fluorinated phenyl ring, the degree and pattern of fluorination appear to be generally important factors that determine the ability of the MT-stabilizing compounds to significantly kill T. brucei cells. Accordingly, whereas derivative 4.19 with no

172
fluorination on the phenyl ring was found to be essentially devoid of killing activity in our assay conditions, other di- and tri-fluorinated analogues (i.e., 4.15, 4.40, 4.42) were more potently parasiticidal. Furthermore, a comparison between the di-fluorinated analogues, 4.26, 4.40, 4.42, suggest that the presence of either one or two fluorine atoms in the ortho-positions of the phenyl ring is required for anti-trypanosomal activity. However, the highest activity was observed with tri-fluorinated derivative 4.15 that killed T. brucei with potency comparable to that of pentamidine. Finally, replacement of the fluorine atom in the para-position of the phenyl ring with an alkoxy side chain led to a boost in activity, regardless of whether the general scaffold is a TPD or a PPD (cf., 4.25 with 4.14, 4.47, and 4.15 with 4.48, 4.50). High potency was achieved when the alkoxy side chain bears an oxygen linkage, a three-carbon spacer and a terminal secondary or tertiary amine (e.g., 4.47, 4.52). Accordingly, compounds with a two-, four- or no methylene unit tether instead of a three-methylene unit tether (i.e., 4.28, 4.35, 4.38), as well as derivatives with terminal hydroxyl or heterocyclic amino groups (i.e., 4.36, 4.43) showed much lower activity. Finally, replacement of the chlorine atom on the pyrimidine ring with an azetidine led to a loss in activity regardless of the nature of the scaffold (cf., 4.14 with 4.22, and 4.15 with 4.20).
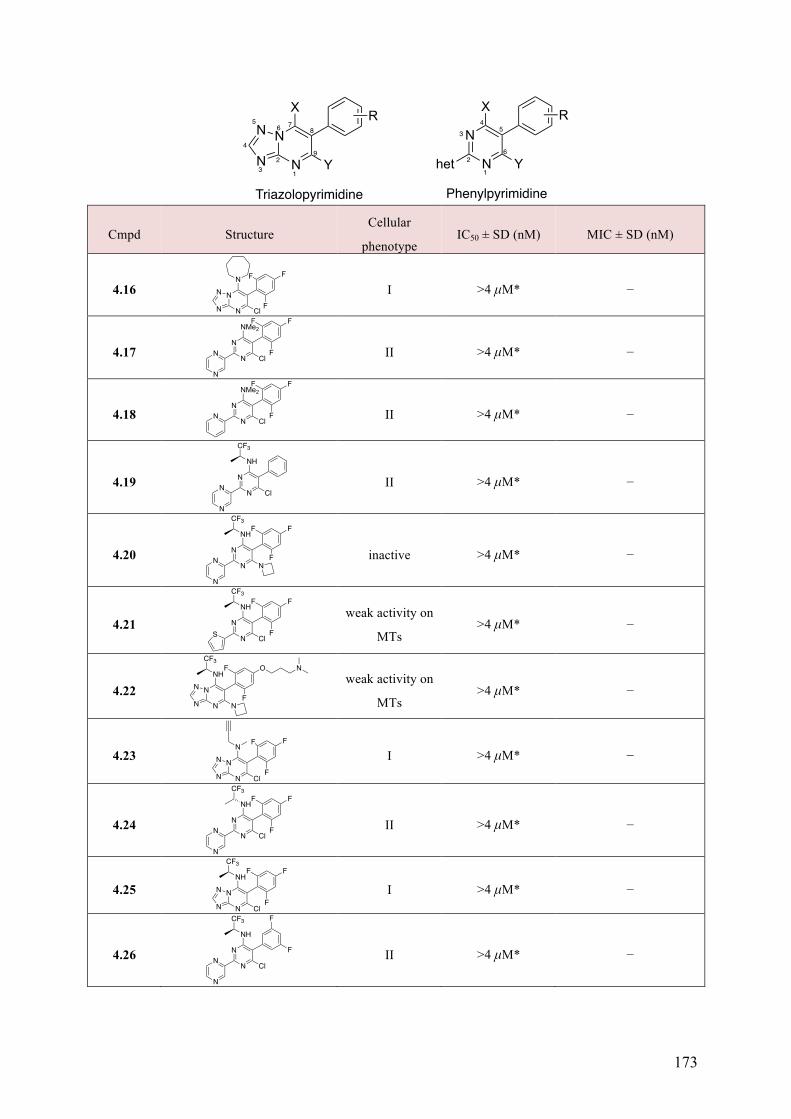
173
Cmpd Structure Cellular
phenotype IC50 ± SD (nM) MIC ± SD (nM)
4.16
I >4 µM* −
4.17
II >4 µM* −
4.18
II >4 µM* −
4.19
II >4 µM* −
4.20
inactive >4 µM* −
4.21
weak activity on
MTs >4 µM* −
4.22
weak activity on
MTs >4 µM* −
4.23
I >4 µM* −
4.24
II >4 µM* −
4.25
I >4 µM* −
4.26
II >4 µM* −
N
N
X
Y
R
Triazolopyrimidine
N
N1
23
4
56 7
8
9
N
Nhet
X
Y
R
Phenylpyrimidine
2
1
34
5
6
N
N
N
ClF
F
N
N
F
N
N
NMe2
ClN
N
F
FF
N
N
NMe2
ClN F
FF
N
N
NH
Cl
CF3
N
N
N
N
NH
N
CF3F
N
N
F
F
N
N
NH
Cl
CF3FF
FS
N
N
NHF
CF3O
N
N
N
NF
N
N
N
ClF
F
N
N
F
N
N
NH
Cl
CF3F
N
N
F
F
N
N
NH
Cl
F
F
CF3F
N
N
N
N
NH
Cl
CF3
N
N
F
F

174
4.27
I >4 µM* −
4.28
II 3403 ± 1263* 6382 ± 5856*
4.29
I 2142 ± 2050* 35456 ± 75213*
4.30
II 1435 ± 1198* 69736 ± 119232*
4.31
II 1223 ± 225* 1500 ± 98.2*
4.32
II 1121 ± 70.3* 1958 ± 1227*
4.13
I 922 ± 150* 1489 ± 247*
4.33
II 853 ± 310* 646 ± 601*
4.34
II 697 ± 277* 1108 ± 105*
4.35
II 627 ± 282* 513 ± 9.2*
4.36
II 506 ± 173* 743 ± 311*
4.37
II 489 ± 104* 659 ± 367*
4.38
II 449 ± 22.2* 788 ± 218*
4.39
II 403 ± 9.2* 530 ± 120*
N
N
N
ClF
CF3F
N
N
F
N
N
NH
Cl
F
F
CF3O
N
N
N
N
N
N
ClF
F
N
N
F
N
NF
Cl
N
N
N
FF
N
N
NH
Cl
CF3
O
F
F
F
N
N
NH
Cl
F
F
F
N
N
N
N
NH
Cl
F
F
F
N
N
N
N
NH
Cl
F
F
F
N
N
N
NH
Cl
F
F
F
N
N
N
N
NH
Cl
F
F
CF3O
N
N
N
N
NH
Cl
F
F
CF3O OH
N
N
N
N
NH
Cl
F
F
F
N
N
N
N
NH
Cl
F
F
CF3O
N
N
N
N
N
NH
Cl
F
F
F
N
CF3
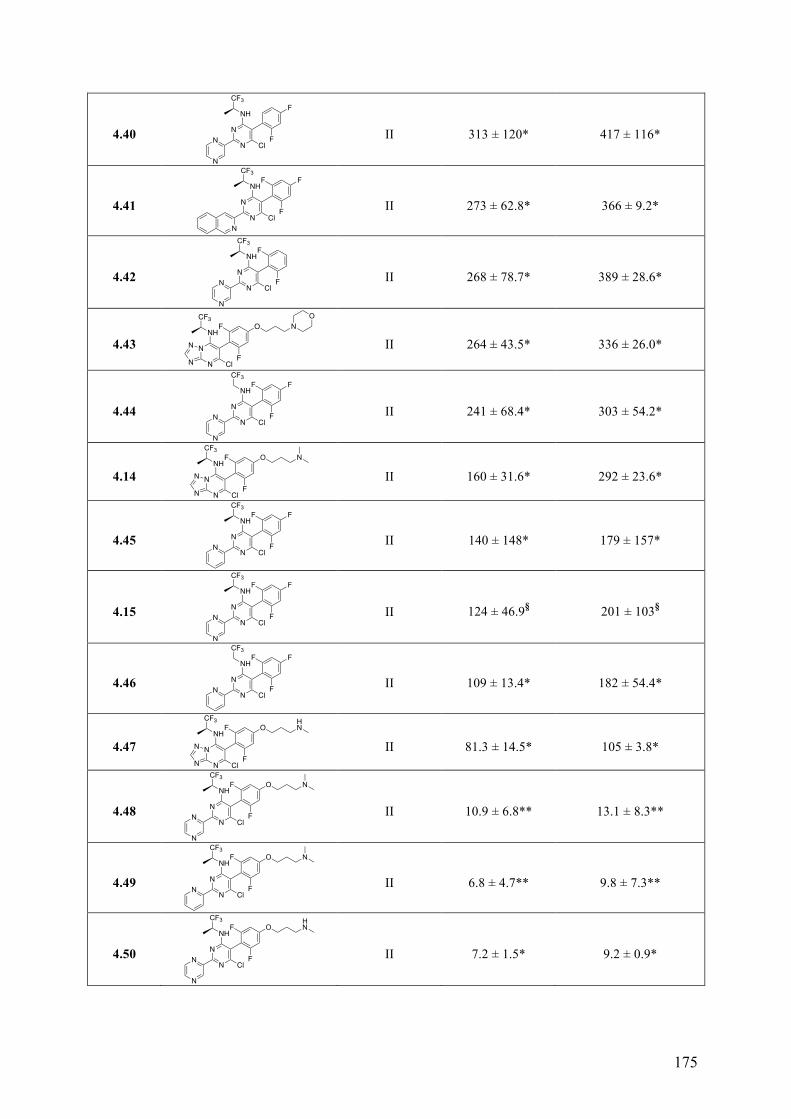
175
4.40
II 313 ± 120* 417 ± 116*
4.41
II 273 ± 62.8* 366 ± 9.2*
4.42
II 268 ± 78.7* 389 ± 28.6*
4.43
II 264 ± 43.5* 336 ± 26.0*
4.44
II 241 ± 68.4* 303 ± 54.2*
4.14
II 160 ± 31.6* 292 ± 23.6*
4.45
II 140 ± 148* 179 ± 157*
4.15
II 124 ± 46.9§ 201 ± 103§
4.46
II 109 ± 13.4* 182 ± 54.4*
4.47
II 81.3 ± 14.5* 105 ± 3.8*
4.48
II 10.9 ± 6.8** 13.1 ± 8.3**
4.49
II 6.8 ± 4.7** 9.8 ± 7.3**
4.50
II 7.2 ± 1.5* 9.2 ± 0.9*
N
N
NH
ClF
F
N
N
CF3
N
N
NH
Cl
F
F
F
N
CF3
N
N
NH
Cl
F
FN
N
CF3
N
N
NH
Cl
F
F
CF3O N
N
N
O
N
N
NH
Cl
F
FN
N
CF3F
N
N
NH
Cl
F
F
CF3O
N
N
N
N
N
NH
Cl
F
FN
CF3F
N
N
NH
Cl
F
FN
N
CF3F
N
N
NH
Cl
F
FN
CF3F
N
N
NH
Cl
F
F
CF3O
HN
N
N
N
N
NH
Cl
F
FN
N
CF3O N
N
N
NH
Cl
F
FN
CF3O N
N
N
NH
Cl
F
FN
N
CF3O
HN
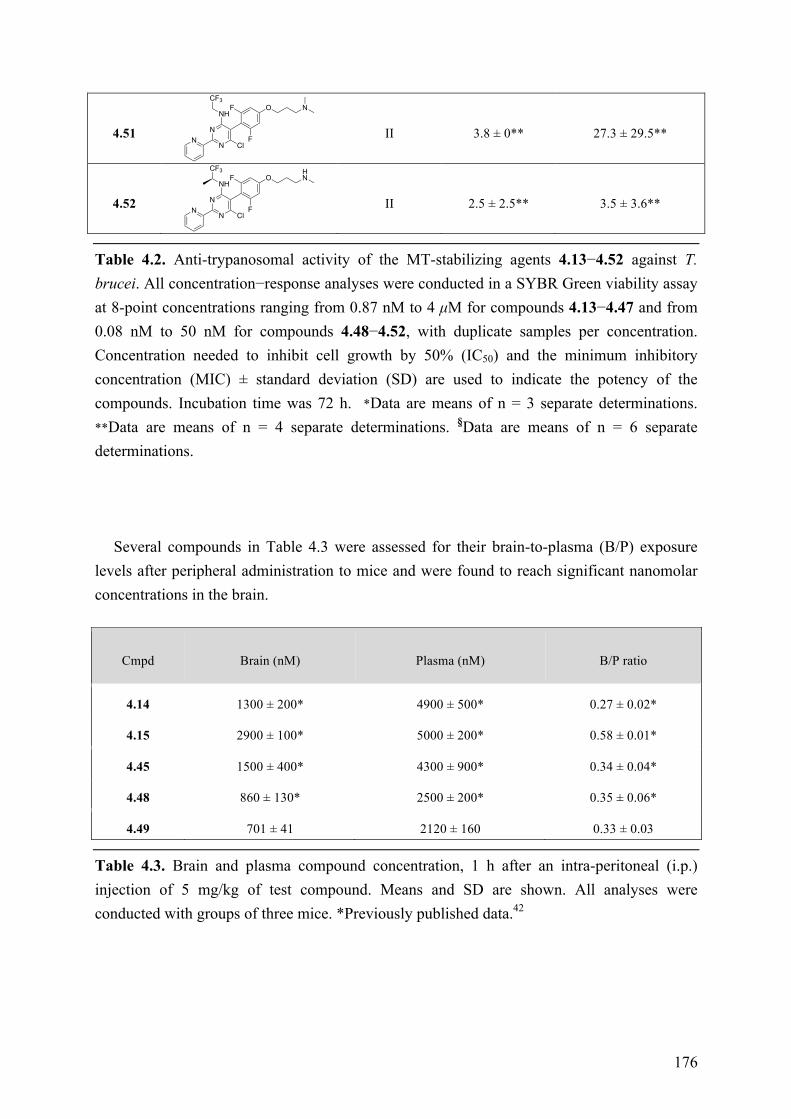
176
4.51
II 3.8 ± 0** 27.3 ± 29.5**
4.52
II 2.5 ± 2.5** 3.5 ± 3.6**
Table 4.2. Anti-trypanosomal activity of the MT-stabilizing agents 4.13−4.52 against T. brucei. All concentration−response analyses were conducted in a SYBR Green viability assay at 8-point concentrations ranging from 0.87 nM to 4 µM for compounds 4.13−4.47 and from 0.08 nM to 50 nM for compounds 4.48−4.52, with duplicate samples per concentration. Concentration needed to inhibit cell growth by 50% (IC50) and the minimum inhibitory concentration (MIC) ± standard deviation (SD) are used to indicate the potency of the compounds. Incubation time was 72 h. *Data are means of n = 3 separate determinations. **Data are means of n = 4 separate determinations. §Data are means of n = 6 separate determinations.
Several compounds in Table 4.3 were assessed for their brain-to-plasma (B/P) exposure levels after peripheral administration to mice and were found to reach significant nanomolar concentrations in the brain.
Cmpd Brain (nM) Plasma (nM) B/P ratio
4.14 1300 ± 200* 4900 ± 500* 0.27 ± 0.02*
4.15 2900 ± 100* 5000 ± 200* 0.58 ± 0.01*
4.45 1500 ± 400* 4300 ± 900* 0.34 ± 0.04*
4.48 860 ± 130* 2500 ± 200* 0.35 ± 0.06*
4.49 701 ± 41 2120 ± 160 0.33 ± 0.03 Table 4.3. Brain and plasma compound concentration, 1 h after an intra-peritoneal (i.p.) injection of 5 mg/kg of test compound. Means and SD are shown. All analyses were conducted with groups of three mice. *Previously published data.42
N
N
NH
Cl
F
FN
CF3O N
N
N
NH
Cl
F
FN
CF3O
HN
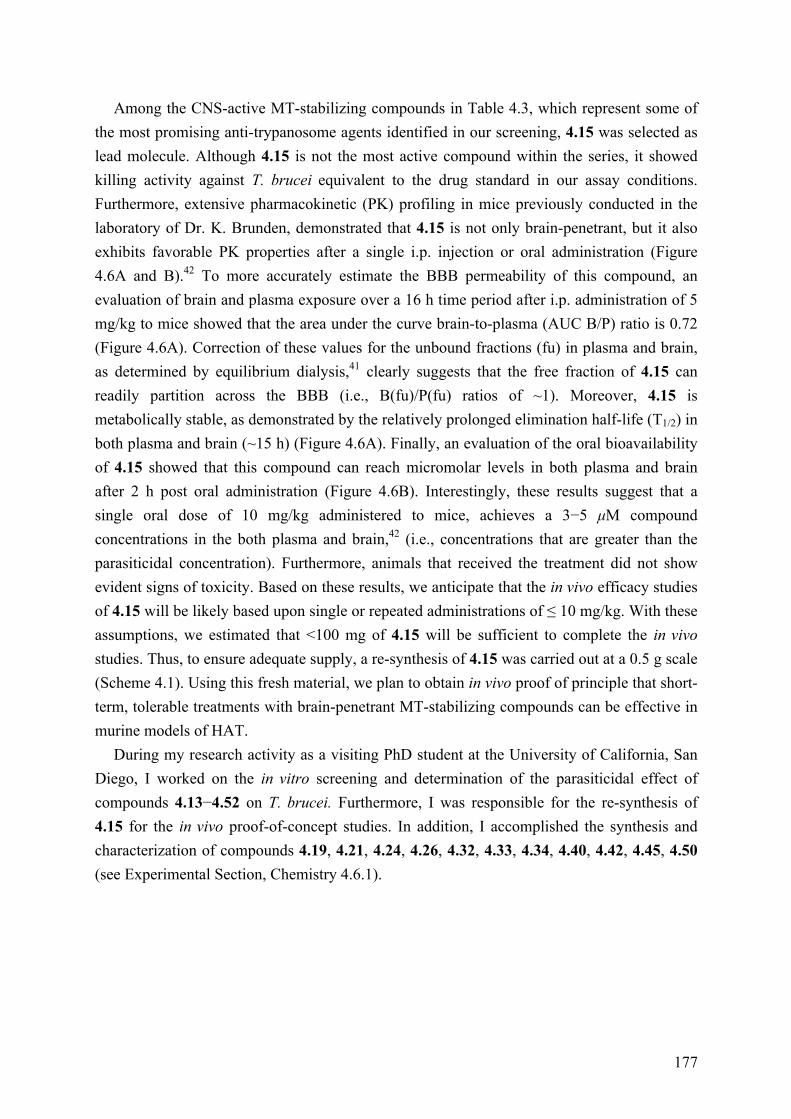
177
Among the CNS-active MT-stabilizing compounds in Table 4.3, which represent some of the most promising anti-trypanosome agents identified in our screening, 4.15 was selected as lead molecule. Although 4.15 is not the most active compound within the series, it showed killing activity against T. brucei equivalent to the drug standard in our assay conditions. Furthermore, extensive pharmacokinetic (PK) profiling in mice previously conducted in the laboratory of Dr. K. Brunden, demonstrated that 4.15 is not only brain-penetrant, but it also exhibits favorable PK properties after a single i.p. injection or oral administration (Figure 4.6A and B).42 To more accurately estimate the BBB permeability of this compound, an evaluation of brain and plasma exposure over a 16 h time period after i.p. administration of 5 mg/kg to mice showed that the area under the curve brain-to-plasma (AUC B/P) ratio is 0.72 (Figure 4.6A). Correction of these values for the unbound fractions (fu) in plasma and brain, as determined by equilibrium dialysis,41 clearly suggests that the free fraction of 4.15 can readily partition across the BBB (i.e., B(fu)/P(fu) ratios of ~1). Moreover, 4.15 is metabolically stable, as demonstrated by the relatively prolonged elimination half-life (T1/2) in both plasma and brain (~15 h) (Figure 4.6A). Finally, an evaluation of the oral bioavailability of 4.15 showed that this compound can reach micromolar levels in both plasma and brain after 2 h post oral administration (Figure 4.6B). Interestingly, these results suggest that a single oral dose of 10 mg/kg administered to mice, achieves a 3−5 µM compound concentrations in the both plasma and brain,42 (i.e., concentrations that are greater than the parasiticidal concentration). Furthermore, animals that received the treatment did not show evident signs of toxicity. Based on these results, we anticipate that the in vivo efficacy studies of 4.15 will be likely based upon single or repeated administrations of ≤ 10 mg/kg. With these assumptions, we estimated that <100 mg of 4.15 will be sufficient to complete the in vivo studies. Thus, to ensure adequate supply, a re-synthesis of 4.15 was carried out at a 0.5 g scale (Scheme 4.1). Using this fresh material, we plan to obtain in vivo proof of principle that short-term, tolerable treatments with brain-penetrant MT-stabilizing compounds can be effective in murine models of HAT.
During my research activity as a visiting PhD student at the University of California, San Diego, I worked on the in vitro screening and determination of the parasiticidal effect of compounds 4.13−4.52 on T. brucei. Furthermore, I was responsible for the re-synthesis of 4.15 for the in vivo proof-of-concept studies. In addition, I accomplished the synthesis and characterization of compounds 4.19, 4.21, 4.24, 4.26, 4.32, 4.33, 4.34, 4.40, 4.42, 4.45, 4.50 (see Experimental Section, Chemistry 4.6.1).
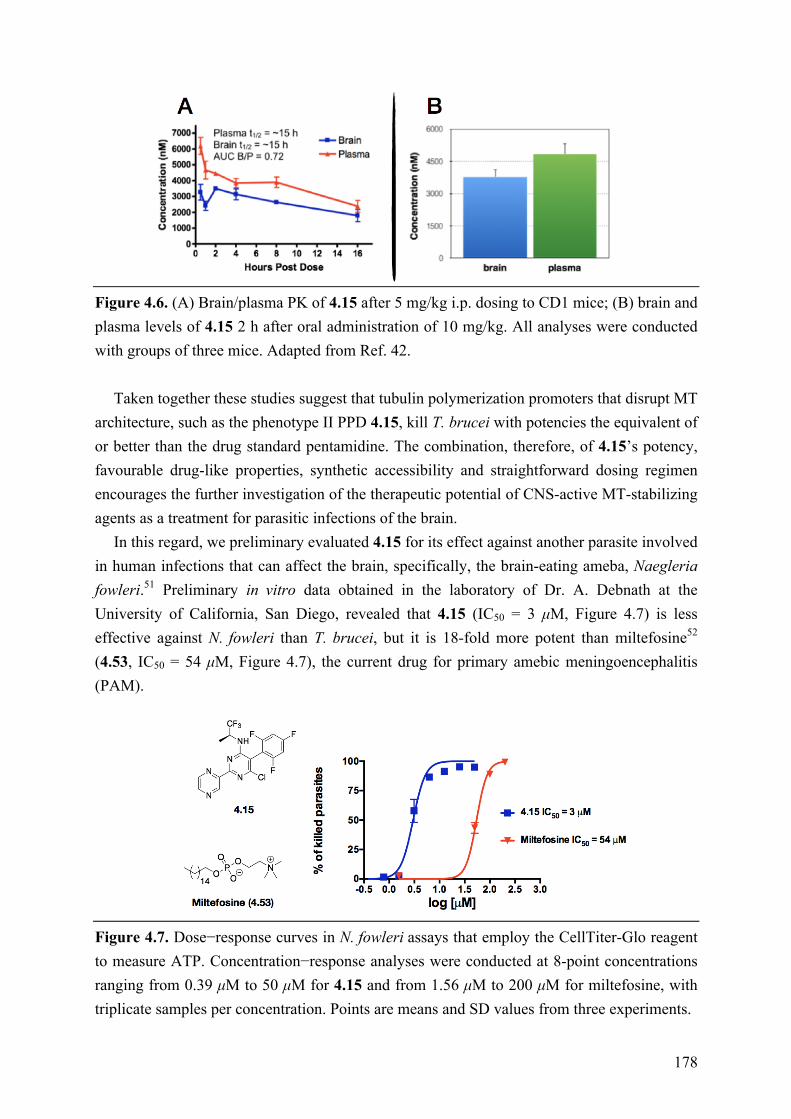
178
Figure 4.6. (A) Brain/plasma PK of 4.15 after 5 mg/kg i.p. dosing to CD1 mice; (B) brain and plasma levels of 4.15 2 h after oral administration of 10 mg/kg. All analyses were conducted with groups of three mice. Adapted from Ref. 42.
Taken together these studies suggest that tubulin polymerization promoters that disrupt MT architecture, such as the phenotype II PPD 4.15, kill T. brucei with potencies the equivalent of or better than the drug standard pentamidine. The combination, therefore, of 4.15’s potency, favourable drug-like properties, synthetic accessibility and straightforward dosing regimen encourages the further investigation of the therapeutic potential of CNS-active MT-stabilizing agents as a treatment for parasitic infections of the brain.
In this regard, we preliminary evaluated 4.15 for its effect against another parasite involved in human infections that can affect the brain, specifically, the brain-eating ameba, Naegleria fowleri.51 Preliminary in vitro data obtained in the laboratory of Dr. A. Debnath at the University of California, San Diego, revealed that 4.15 (IC50 = 3 µM, Figure 4.7) is less effective against N. fowleri than T. brucei, but it is 18-fold more potent than miltefosine52 (4.53, IC50 = 54 µM, Figure 4.7), the current drug for primary amebic meningoencephalitis (PAM).
Figure 4.7. Dose−response curves in N. fowleri assays that employ the CellTiter-Glo reagent to measure ATP. Concentration−response analyses were conducted at 8-point concentrations ranging from 0.39 µM to 50 µM for 4.15 and from 1.56 µM to 200 µM for miltefosine, with triplicate samples per concentration. Points are means and SD values from three experiments.
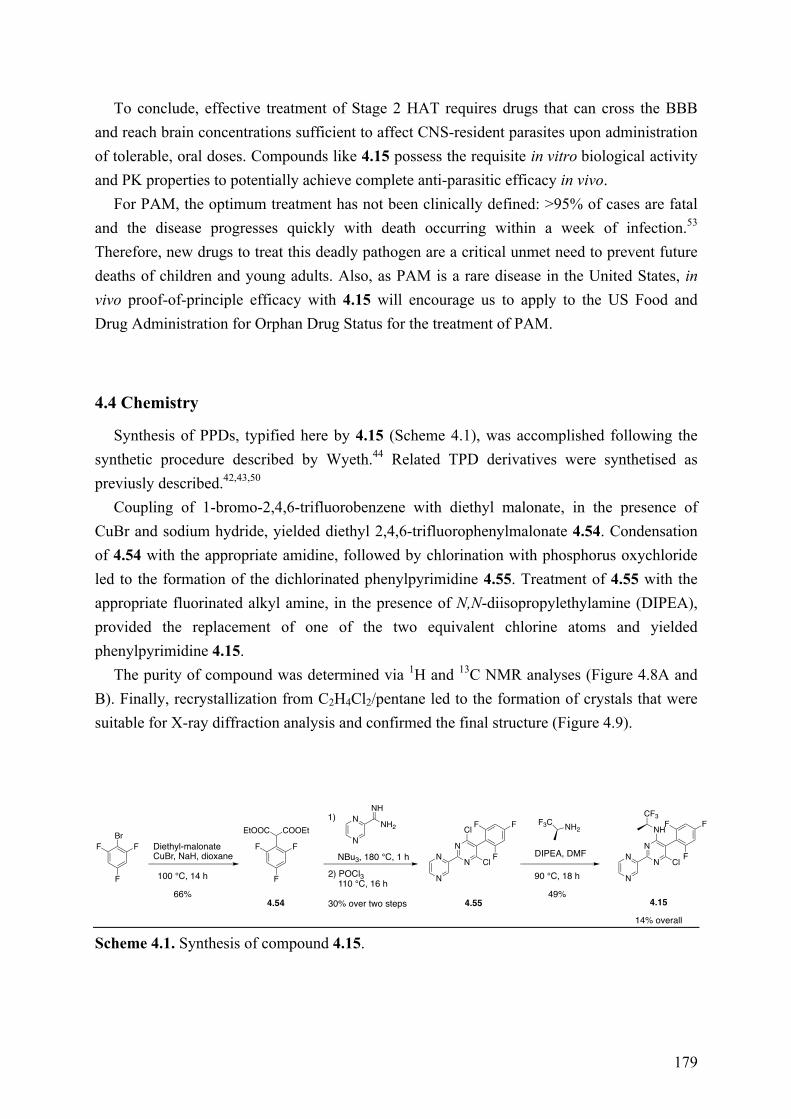
179
To conclude, effective treatment of Stage 2 HAT requires drugs that can cross the BBB and reach brain concentrations sufficient to affect CNS-resident parasites upon administration of tolerable, oral doses. Compounds like 4.15 possess the requisite in vitro biological activity and PK properties to potentially achieve complete anti-parasitic efficacy in vivo.
For PAM, the optimum treatment has not been clinically defined: >95% of cases are fatal and the disease progresses quickly with death occurring within a week of infection.53 Therefore, new drugs to treat this deadly pathogen are a critical unmet need to prevent future deaths of children and young adults. Also, as PAM is a rare disease in the United States, in vivo proof-of-principle efficacy with 4.15 will encourage us to apply to the US Food and Drug Administration for Orphan Drug Status for the treatment of PAM.
4.4 Chemistry
Synthesis of PPDs, typified here by 4.15 (Scheme 4.1), was accomplished following the synthetic procedure described by Wyeth.44 Related TPD derivatives were synthetised as previusly described.42,43,50
Coupling of 1-bromo-2,4,6-trifluorobenzene with diethyl malonate, in the presence of CuBr and sodium hydride, yielded diethyl 2,4,6-trifluorophenylmalonate 4.54. Condensation of 4.54 with the appropriate amidine, followed by chlorination with phosphorus oxychloride led to the formation of the dichlorinated phenylpyrimidine 4.55. Treatment of 4.55 with the appropriate fluorinated alkyl amine, in the presence of N,N-diisopropylethylamine (DIPEA), provided the replacement of one of the two equivalent chlorine atoms and yielded phenylpyrimidine 4.15.
The purity of compound was determined via 1H and 13C NMR analyses (Figure 4.8A and B). Finally, recrystallization from C2H4Cl2/pentane led to the formation of crystals that were suitable for X-ray diffraction analysis and confirmed the final structure (Figure 4.9).
Scheme 4.1. Synthesis of compound 4.15.
1)
NBu3, 180 °C, 1 h
NH2
NH
2) POCl3 110 °C, 16 h
30% over two steps
N
N
Cl
Cl
F
F
F
DIPEA, DMF
90 °C, 18 h
49%
N
N
NH
Cl
BrF F
F
Diethyl-malonateCuBr, NaH, dioxane
100 °C, 14 h
66%
F F
F
EtOOC COOEtN
N
N
N
CF3F
N
N
4.15
14% overall
F3C NH2F
F
4.54 4.55
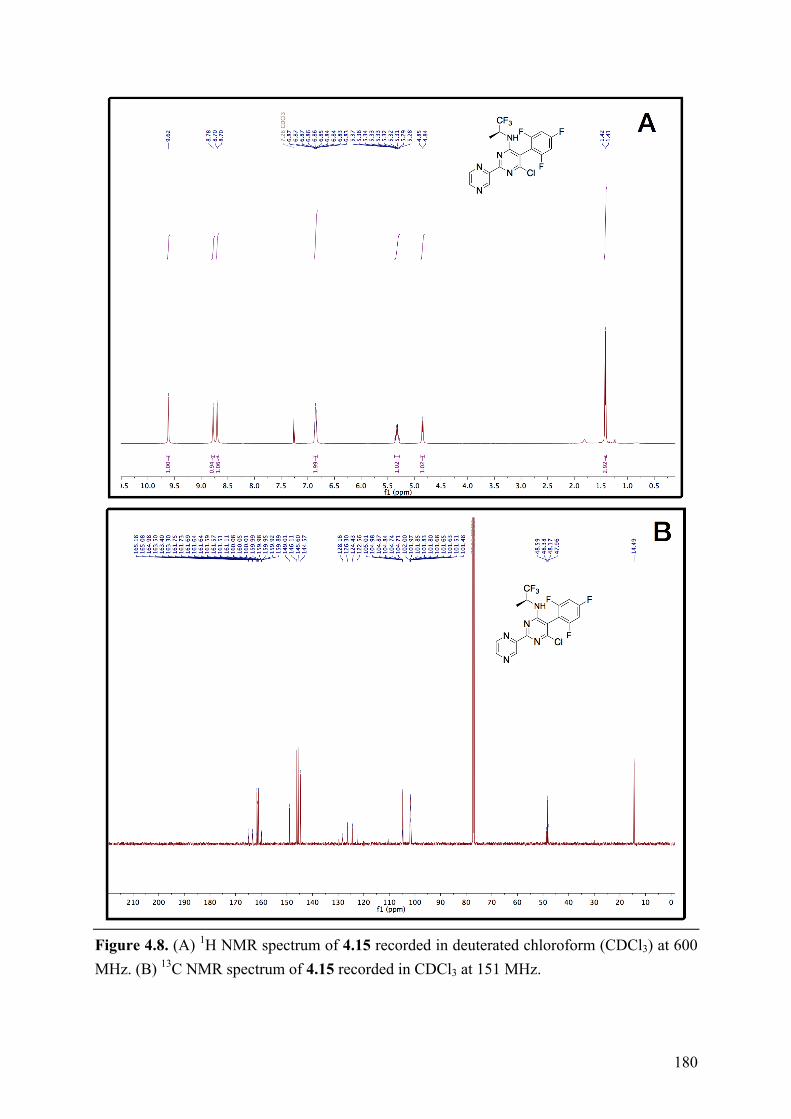
180
Figure 4.8. (A) 1H NMR spectrum of 4.15 recorded in deuterated chloroform (CDCl3) at 600 MHz. (B) 13C NMR spectrum of 4.15 recorded in CDCl3 at 151 MHz.
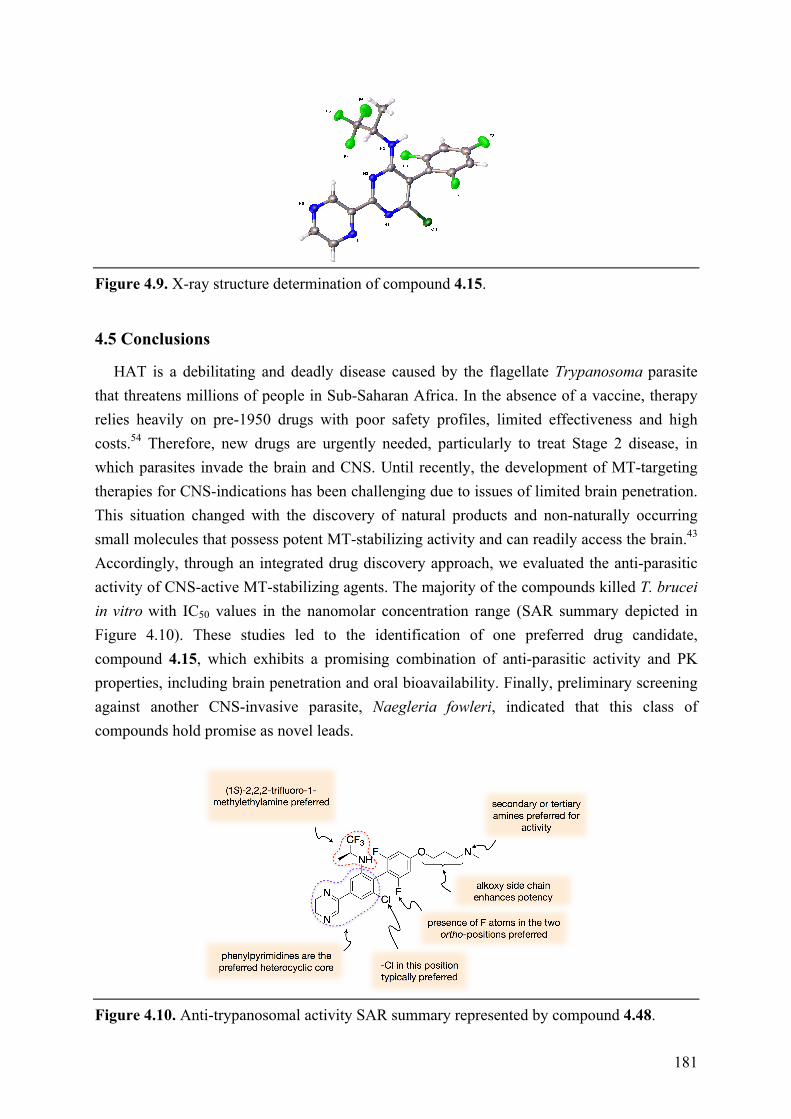
181
Figure 4.9. X-ray structure determination of compound 4.15.
4.5 Conclusions
HAT is a debilitating and deadly disease caused by the flagellate Trypanosoma parasite that threatens millions of people in Sub-Saharan Africa. In the absence of a vaccine, therapy relies heavily on pre-1950 drugs with poor safety profiles, limited effectiveness and high costs.54 Therefore, new drugs are urgently needed, particularly to treat Stage 2 disease, in which parasites invade the brain and CNS. Until recently, the development of MT-targeting therapies for CNS-indications has been challenging due to issues of limited brain penetration. This situation changed with the discovery of natural products and non-naturally occurring small molecules that possess potent MT-stabilizing activity and can readily access the brain.43 Accordingly, through an integrated drug discovery approach, we evaluated the anti-parasitic activity of CNS-active MT-stabilizing agents. The majority of the compounds killed T. brucei in vitro with IC50 values in the nanomolar concentration range (SAR summary depicted in Figure 4.10). These studies led to the identification of one preferred drug candidate, compound 4.15, which exhibits a promising combination of anti-parasitic activity and PK properties, including brain penetration and oral bioavailability. Finally, preliminary screening against another CNS-invasive parasite, Naegleria fowleri, indicated that this class of compounds hold promise as novel leads.
Figure 4.10. Anti-trypanosomal activity SAR summary represented by compound 4.48.
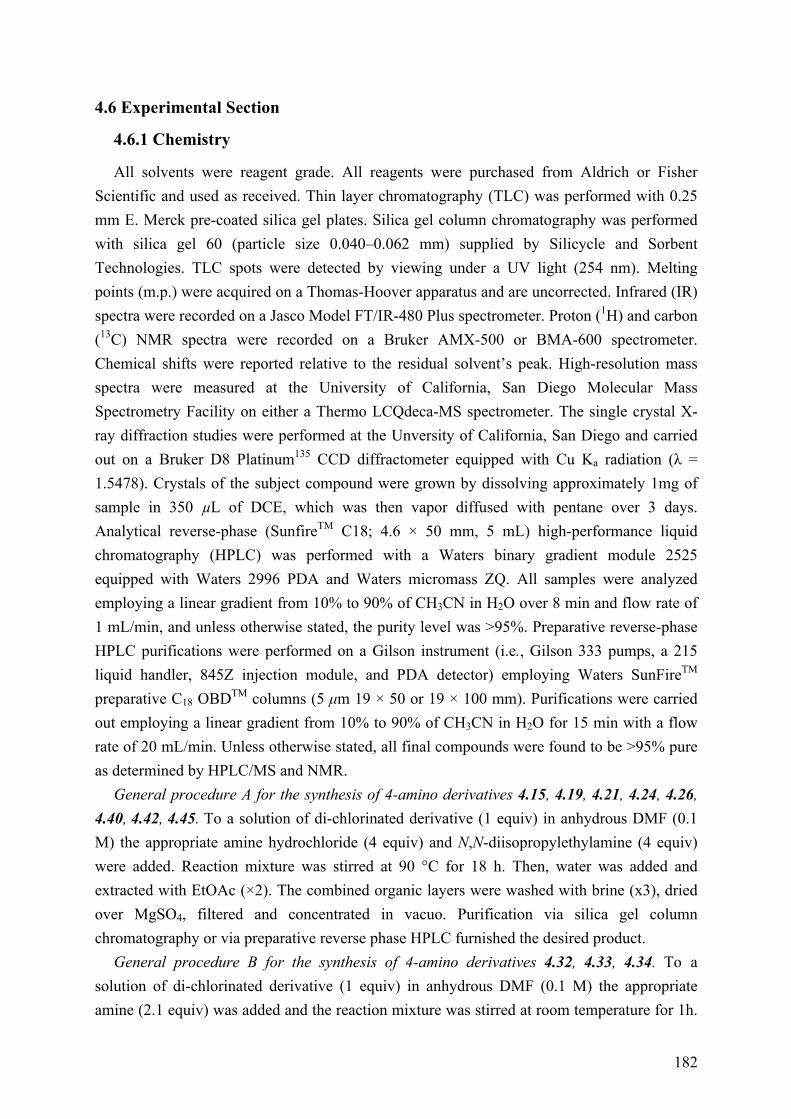
182
4.6 Experimental Section
4.6.1 Chemistry
All solvents were reagent grade. All reagents were purchased from Aldrich or Fisher Scientific and used as received. Thin layer chromatography (TLC) was performed with 0.25 mm E. Merck pre-coated silica gel plates. Silica gel column chromatography was performed with silica gel 60 (particle size 0.040–0.062 mm) supplied by Silicycle and Sorbent Technologies. TLC spots were detected by viewing under a UV light (254 nm). Melting points (m.p.) were acquired on a Thomas-Hoover apparatus and are uncorrected. Infrared (IR) spectra were recorded on a Jasco Model FT/IR-480 Plus spectrometer. Proton (1H) and carbon (13C) NMR spectra were recorded on a Bruker AMX-500 or BMA-600 spectrometer. Chemical shifts were reported relative to the residual solvent’s peak. High-resolution mass spectra were measured at the University of California, San Diego Molecular Mass Spectrometry Facility on either a Thermo LCQdeca-MS spectrometer. The single crystal X-ray diffraction studies were performed at the Unversity of California, San Diego and carried out on a Bruker D8 Platinum135 CCD diffractometer equipped with Cu Ka radiation (λ = 1.5478). Crystals of the subject compound were grown by dissolving approximately 1mg of sample in 350 µL of DCE, which was then vapor diffused with pentane over 3 days. Analytical reverse-phase (SunfireTM C18; 4.6 × 50 mm, 5 mL) high-performance liquid chromatography (HPLC) was performed with a Waters binary gradient module 2525 equipped with Waters 2996 PDA and Waters micromass ZQ. All samples were analyzed employing a linear gradient from 10% to 90% of CH3CN in H2O over 8 min and flow rate of 1 mL/min, and unless otherwise stated, the purity level was >95%. Preparative reverse-phase HPLC purifications were performed on a Gilson instrument (i.e., Gilson 333 pumps, a 215 liquid handler, 845Z injection module, and PDA detector) employing Waters SunFireTM preparative C18 OBDTM columns (5 µm 19 × 50 or 19 × 100 mm). Purifications were carried out employing a linear gradient from 10% to 90% of CH3CN in H2O for 15 min with a flow rate of 20 mL/min. Unless otherwise stated, all final compounds were found to be >95% pure as determined by HPLC/MS and NMR.
General procedure A for the synthesis of 4-amino derivatives 4.15, 4.19, 4.21, 4.24, 4.26, 4.40, 4.42, 4.45. To a solution of di-chlorinated derivative (1 equiv) in anhydrous DMF (0.1 M) the appropriate amine hydrochloride (4 equiv) and N,N-diisopropylethylamine (4 equiv) were added. Reaction mixture was stirred at 90 °C for 18 h. Then, water was added and extracted with EtOAc (×2). The combined organic layers were washed with brine (x3), dried over MgSO4, filtered and concentrated in vacuo. Purification via silica gel column chromatography or via preparative reverse phase HPLC furnished the desired product.
General procedure B for the synthesis of 4-amino derivatives 4.32, 4.33, 4.34. To a solution of di-chlorinated derivative (1 equiv) in anhydrous DMF (0.1 M) the appropriate amine (2.1 equiv) was added and the reaction mixture was stirred at room temperature for 1h.
183
Then water was added and extracted with EtOAc (×2). The combined organic layers were washed with brine (x3), dried over MgSO4, filtered and concentrated in vacuo. Then, water was added and extracted with EtOAc (×2). The combined organic layers were washed with brine (x3), dried over MgSO4, filtered and concentrated in vacuo. Purification via silica gel column chromatography furnished the desired product.
General procedure C for the installment of side chain (e.g., 4.50). To a solution of the 7-amino derivative (1 equiv) and the appropriate aminoalcohol (5.17 eq) in DMSO (0.2 M) was added sodium hydride (60% mineral oil, 5.17 equiv) at room temperature. Reaction mixture was stirred at 60 °C for 2 h, cooled to room temperature, dissolved in additional DMSO, filtered and purified by preparative reverse phase HPLC to obtain the desired product.
General procedure D for the synthesis of diethylmalonate derivatives (e.g., 4.54). To a suspension of NaH (60 % in mineral oil, 1.00 equiv) in anhydrous 1,4-dioxane (previously degassed with N2) (1.75 mol/L from aryl bromide derivate) at 60 °C under N2 was slowly added diethyl malonate (3.00 equiv). After addition, the reaction was stirred at 60 °C for 10 minutes. Then, CuBr (1.20 equiv) and appropriate aryl bromide derivate (3 equiv) were added and the reaction was heated at reflux overnight. Then, at room temperature the reaction was quenched with HCl 12N (1.40 equiv). The mixture was filtrated and washed with water. The filtrate was extracted with EtOAc (x3). The combined organic extracts were washed with brine, then dried over MgSO4, filtered and concentrated in vacuo. Purification via silica gel column chromatography furnished the desired product.
General procedure E for the synthesis of di-chlorinated derivative 4.55−4.61. A mixture of the diethylmalonate derivate (1.00 equiv), appropriate amidine (1.05 equiv) and tributylamine (1.08 equiv) was stirred in a sealed tube at 180 °C for 1 h. After cooling at 110 °C, phosphorus oxychloride (3 equiv) was added dropwise and the mixture was stirred at 100 °C for 16 h. Then, the reaction was cooled to room temperature and slowly diluted with a mixture of CH2Cl2 and water (1:1). The aqueous phase was extracted with CH2Cl2 (x1), the combined organic layers were washed with brine (x3), dried over MgSO4, filtered and concentrated in vacuo. Purification via silica gel column chromatography furnished the desired di-chlorinated product.
(S)-6-chloro-2-(pyrazin-2-yl)-5-(2,4,6-trifluorophenyl)-N-(1,1,1-trifluoropropan-2-yl)pyrimidin-4-amine (4.15). Following synthetic procedure A using 4,6-dichloro-2-(pyrazin-2-yl)-5-(2,4,6-trifluorophenyl)pyrimidine (0.500 g, 1.40 mmol) and (S)-1,1,1-trifluoropropan-2-amine hydrochloride (0.837 g, 5.60 mmol), purification by silica gel column chromatography (hexanes/EtOAc 100:0 to 80:20) afforded the title compound as a beige solid (0.296 g, 0.682 mmol, 49% yield). X-ray quality crystals were obtained by slow evaporation from a C2H4Cl2/pentane solution: m.p. 190–192 °C (C2H4Cl2/pentane). 1H NMR (600 MHz, CDCl3) δ 9.62 (s, 1H), 8.78 (s, 1H), 8.70 (s, 1H), 6.89–6.81 (m, 2H), 5.38–5.27 (m, 1H), 4.85 (d, J = 9.3 Hz, 1H), 1.42 (d, J = 7.0 Hz, 3H) ppm. 13C NMR (151 MHz, CDCl3) δ 164.24 (dt,

184
J = 254.1, 15.1 Hz), 161.64, 161.51, 161.11, 160.87 (ddd, J = 252.2, 9.1, 4.0 Hz), 160.77 (ddd, J = 253.3, 9.4, 4.0 Hz), 149.01, 146.11, 145.60, 144.57, 125.36 (q, J = 281.9 Hz), 104.85 (td, J = 21.1, 20.6, 5.1 Hz), 104.74, 101.74 (tdd, J = 26.1, 22.7, 4.0 Hz), 48.27 (q, J = 31.7 Hz), 14.49 ppm. IR (KBr) ν 3279, 2923, 1638, 1579, 1556 cm-1. HRMS (ES+) calculated for C17H11ClF6N5 [M + H]+ 434.0602, found 434.0601.
(S)-6-chloro-5-phenyl-2-(pyrazin-2-yl)-N-(1,1,1-trifluoropropan-2-yl)pyrimidin-4-amine (4.19). Following synthetic procedure A using 4,6-dichloro-5-phenyl-2-(pyrazin-2-yl)pyrimidine (0.100 g, 0.330 mmol) and (S)-1,1,1-trifluoropropan-2-amine hydrochloride (0.163 g, 1.09 mmol, 3.30 equiv), purification by silica gel column chromatography (hexanes/EtOAc 60:40) afforded the title compound as an brown solid (0.012 g, 0.033 mmol, 10% yield). 1H NMR (600 MHz, CDCl3) δ 9.63 (s, 1H), 8.79 (s, 1H), 8.70 (s, 1H), 7.61–7.54 (m, 1H), 7.55–7.49 (m, 1H), 7.38–7.32 (m, 2H), 7.27–7.11 (m, 1H), 5.32–5.20 (m, 1H), 4.80 (d, J = 9.3 Hz, 1H), 1.35 (d, J = 7.0 Hz, 3H) ppm. 13C NMR (151 MHz, CDCl3) δ 160.95, 160.22, 159.17, 149.38, 145.83, 145.50, 144.56, 131.39, 130.07, 129.96, 129.83, 129.72, 129.49, 125.49 (q, J = 282.1 Hz), 117.14, 48.06 (q, J = 31.5 Hz), 14.56 ppm. IR (KBr) ν 3420, 2920. 1722, 1578, 1552 cm-1. HRMS (ES+) calculated for C17H14ClF3N5 [M + H]+ 380.0884, found 380.0883.
(S)-6-chloro-2-(thiophen-2-yl)-5-(2,4,6-trifluorophenyl)-N-(1,1,1-trifluoropropan-2-yl)pyrimidin-4-amine (4.21). Following synthetic procedure A using 4,6-dichloro-2-(thiophen-2-yl)-5-(2,4,6-trifluorophenyl)pyrimidine (0.140 g, 0.387 mmol) and (S)-1,1,1-trifluoropropan-2-amine (0.232 g, 1.55 mmol), purification by silica gel column chromatography (hexanes/EtOAc 99:1) afforded the title compound as an white solid (0.022 g, 0.050 mmol, 13% yield). 1H NMR (600 MHz, CDCl3) δ 8.02 (d, J = 3.7 Hz, 1H), 7.51 (d, J = 5.0 Hz, 1H), 7.14 (t, J = 4.4 Hz, 1H), 6.92–6.84 (m, 2H), 5.31–5.19 (m, 1H), 4.44 (d, J = 9.4 Hz, 1H), 1.39 (d, J = 7.0 Hz, 3H) ppm. 13C NMR (151 MHz, CDCl3) δ 164.07 (dt, J = 253.4, 15.2 Hz), 160.99 (ddd, J = 252.8, 9.7, 5.5 Hz), 160.88 (ddd, J = 246.8, 8.3, 5.9 Hz), 160.87, 160.46, 160.30, 142.02, 131.04, 130.39, 128.37, 125.44 (q, J = 281.6 Hz), 105.28 (td, J = 21.1, 4.2 Hz), 101.66 (qd, J = 25.8, 25.0, 4.2 Hz), 48.02 (q, J = 31.7 Hz), 14.61 ppm. IR (KBr) ν 3353, 2923, 1637, 1556, 1527 cm-1. HRMS (ES+) calculated for C17H11ClF6N3S [M + H]+ 438.0261, found 438.0262.
(R)-6-chloro-2-(pyrazin-2-yl)-5-(2,4,6-trifluorophenyl)-N-(1,1,1-trifluoropropan-2-yl)pyrimidin-4-amine (4.24). Following synthetic procedure A using 4,6-dichloro-2-(pyrazin-2-yl)-5-(2,4,6-trifluorophenyl)pyrimidine (0.065 g, 0.182 mmol) and (S)-1,1,1-trifluoropropan-2-amine hydrochloride (0.109 g, 0.728 mmol), purification by reverse phase afforded the title compound as a white solid (0.011 g, 0.682 mmol, 14% yield). 1H NMR (600 MHz, CDCl3) δ 9.63 (s, 1H), 8.79 (s, 1H), 8.71 (s, 1H), 6.95–6.83 (m, 2H), 5.38–5.26 (m, 1H), 4.70 (d, J = 9.3 Hz, 1H), 1.42 (d, J = 7.0 Hz, 3H) ppm. 13C NMR (151 MHz, CDCl3) δ 164.31 (dt, J = 253.6, 15.0 Hz), 161.74, 161.55, 161.09, 160.81 (ddd, J = 245.6, 15.5, 9.0 Hz),
185
149.05, 146.15, 145.65, 144.61, 125.35 (q, J = 281.7 Hz), 104.82 (td, J = 20.7, 4.7 Hz), 104.75, 101.83 (tdd, J = 26.1, 22.7, 4.0 Hz), 48.28 (q, J = 31.7 Hz), 14.57 ppm. IR (KBr) ν 3280, 2917, 1637, 1579, 1554 cm-1. HRMS (ES+) calculated for C17H11ClF6N5 [M + H]+ 434.0602, found 434.0604.
(S)-6-chloro-5-(3,5-difluorophenyl)-2-(pyrazin-2-yl)-N-(1,1,1-trifluoropropan-2-yl)pyrimidin-4-amine (4.26). Following synthetic procedure A using 4,6-dichloro-5-(3,5-difluorophenyl)-2-(pyrazin-2-yl)pyrimidine (0.075 g, 0.221 mmol) and (S)-1,1,1-trifluoropropan-2-amine hydrochloride (0.132 g, 0.885 mmol), purification by reverse phase HPLC afforded the title compound as a beige solid (0.020 g, 0.048 mmol, 22% yield). 1H NMR (600 MHz, CDCl3) δ 9.60 (s, 1H), 8.79 (s, 1H), 8.70 (d, J = 2.4 Hz, 1H), 7.00–6.93 (m, 1H), 6.90 (d, J = 7.6 Hz, 2H), 5.35–5.23 (m, 1H), 4.79 (d, J = 9.3 Hz, 1H), 1.39 (d, J = 7.0 Hz, 3H) ppm. 13C NMR (151 MHz, CDCl3) δ 163.98 (dd, J = 249.8, 10.5 Hz), 163.91 (dd, J = 251.3, 13.1 Hz), 160.81, 160.49, 159.26, 149.00, 146.07, 145.53, 144.59, 134.49 (t, J = 9.8 Hz), 125.40 (q, J = 281.9 Hz), 114.94, 113.24 (dd, J = 22.0, 3.6 Hz), 112.96 (dd, J = 22.3, 3.7 Hz), 105.58 (t, J = 24.9 Hz), 48.18 (q, J = 31.6 Hz), 14.53 ppm. IR (KBr) ν 3289, 2921, 1621, 1579, 1554 cm-1. HRMS (ES+) calculated for C17H12ClF5N5 [M + H]+ 416.0696, found 416.0699.
6-chloro-N-isopropyl-2-(pyrazin-2-yl)-5-(2,4,6-trifluorophenyl)pyrimidin-4-amine (4.32). Following synthetic procedure B using 4,6-dichloro-2-(pyrazin-2-yl)-5-(2,4,6-trifluorophenyl)pyrimidine (0.030 g, 0.084 mmol) and isopropylamine (0.010 g, 0.176 mmol), the title compound was used with no further purification, beige solid (0.134 g, 0.328 mmol, 96%), purification by silica gel column chromatography (hexanes/EtOAc 70:30) afforded the title compound as a beige solid (0.025 g, 0.066 mmol, 78% yield). 1H NMR (600 MHz, CDCl3) δ 9.65 (s, 1H), 8.77 (s, 1H), 8.67 (s, 1H), 6.88–6.81 (m, 2H), 4.59–4.55 (m, 1H), 4.55–4.47 (m, 1H), 1.24 (d, J = 6.5 Hz, 6H) ppm. 13C NMR (151 MHz, CDCl3) δ 163.94 (dt, J = 253.2, 15.2 Hz), 161.74, 160.98, 160.87 (ddd, J = 252.3, 15.0, 8.9 Hz), 160.39, 149.61, 145.76, 145.60, 144.46, 105.68 (td, J = 20.9, 4.2 Hz), 103.75, 101.57 (td, J = 25.6, 3.6 Hz), 43.85, 22.61 ppm. IR (KBr) ν 3310, 2922, 1639, 1579, 1556 cm-1. HRMS (ES+) calculated for C17H14ClF3N5 [M + H]+ 380.0884, found 380.0885.
6-chloro-N-isopropyl-2-(pyridin-2-yl)-5-(2,4,6-trifluorophenyl)pyrimidin-4-amine (4.33). Following synthetic procedure B using 4,6-dichloro-2-(pyridin-2-yl)-5-(2,4,6-trifluorophenyl)pyrimidine (0.060 g, 0.168 mmol) and isopropylamine (0.040 g, 0.674 mmol), purification by silica gel column chromatography (hexanes/EtOAc 60:40) afforded the title compound as a white solid (0.051 g, 0.135 mmol, 80% yield). 1H NMR (600 MHz, CDCl3) δ 8.81 (d, J = 4.6 Hz, 1H), 8.43 (d, J = 7.9 Hz, 1H), 7.82 (td, J = 7.7, 1.7 Hz, 1H), 7.41–7.35 (m, 1H), 6.85–6.78 (m, 2H), 4.59–4.49 (m, 2H), 1.23 (d, J = 6.2 Hz, 6H) ppm. 13C NMR (151 MHz, CDCl3) δ 163.77 (dt, J = 252.8, 15.1 Hz), 163.32, 161.02, 160.88 (ddd, J = 252.4, 15.1, 9.2 Hz), 160.31, 154.23, 149.98, 136.84, 125.11, 123.89, 106.02 (td, J = 21.1, 4.6 Hz),
186
102.97, 101.43 (td, J = 25.7, 4.1 Hz), 43.62, 22.67 ppm. IR (KBr) ν 3272, 2917, 1639, 1575, 1556 cm-1. HRMS (ES+) calculated for C18H15ClF3N4 [M + H]+ 379.0932, found 379.0931.
(R)-6-chloro-N-(3-methylbutan-2-yl)-2-(pyridin-2-yl)-5-(2,4,6-trifluorophenyl)pyrimidin-4-amine (4.34). Following synthetic procedure B using 4,6-dichloro-2-(pyrazin-2-yl)-5-(2,4,6-trifluorophenyl)pyrimidine (0.122 g, 0.342 mmol) and (R)-3-methylbutan-2-amine (0.063 g, 0.717 mmol), the title compound was used with no further purification, orange wax (0.134 g, 0.328 mmol, 96% yield). 1H NMR (600 MHz, CDCl3) δ 9.64 (s, 1H), 8.79 (s, 1H), 8.68 (s, 1H), 6.92–6.85 (m, 2H), 4.50 (s, 1H), 4.38–4.28 (m, 1H), 1.87–1.78 (m, 1H), 1.15 (d, J = 6.6 Hz, 3H), 0.89 (d, J = 6.8 Hz, 6H) ppm. 13C NMR (151 MHz, CDCl3) δ 163.99 (dt, J = 253.6, 15.3 Hz), 161.70, 161.34, 161.00 (ddd, J = 252.8, 15.2, 9.7 Hz), 160.79 (ddd, J = 251.7, 14.6, 9.1 Hz), 160.44, 149.69, 145.63, 145.46, 144.55, 105.65 (td, J = 21.5, 5.2 Hz), 103.65, 101.64 (qd, J = 25.8, 4.2 Hz), 52.35, 33.01, 18.61, 18.43, 17.41 ppm. IR (KBr) ν 3305, 2962, 1637, 1580, 1557 cm-1. HRMS (ES+) calculated for C19H18ClF3N5 [M + H]+ 408.1197, found 408.1199.
6-chloro-5-(2,4-difluorophenyl)-2-(pyrazin-2-yl)-N-((S)-1,1,1-trifluoropropan-2-yl)pyrimidin-4-amine (4.40). Following synthetic procedure A using 4,6-dichloro-5-(2,4-difluorophenyl)-2-(pyrazin-2-yl)pyrimidine (0.100 g, 0.295 mmol) and (S)-1,1,1-trifluoropropan-2-amine hydrochloride (0.176 g, 1.18 mmol), purification by reverse phase HPLC afforded the title compound as a mixture of atropisomers, uncolorless oil (0.015 g, 0.036 mmol, 12% yield). 1H NMR (600 MHz, CDCl3) mixture of atropisomers δ 9.62 (s, 1H), 8.78 (s, 1H), 8.70 (d, J = 2.4 Hz, 1H), 7.36–7.28 (m, 1H), 7.13–7.05 (m, 1H), 7.08–7.00 (m, 1H), 5.35–5.23 (m, 1H), 4.71 (d, J = 9.4 Hz, 1H), 1.39 (dd, J = 7.0, 4.6 Hz, 3H) ppm. 13C NMR (151 MHz, CDCl3) mixture of atropisomers δ 165.05, 165.02, 164.97, 164.94, 163.37, 163.34, 163.29, 163.26, 161.27, 161.24, 161.19, 161.16, 161.07, 161.02, 161.00, 160.62, 160.54, 159.60, 159.57, 159.52, 159.49, 149.14, 146.02, 145.56, 144.58, 132.86, 132.84, 132.80, 132.77, 132.68, 132.65, 132.61, 132.59, 128.26, 128.14, 126.40, 126.27, 124.53, 124.40, 122.66, 122.53, 115.06, 115.03, 115.01, 114.99, 114.95, 114.92, 114.90, 114.88, 113.40, 113.37, 113.25, 113.23, 113.21, 113.09, 113.06, 110.46, 105.92, 105.86, 105.76, 105.69, 105.59, 105.53, 48.53, 48.46, 48.32, 48.25, 48.11, 48.04, 47.90, 47.83, 14.55 ppm. IR (KBr) ν 3280, 2997, 1732, 1619, 1557 cm-1. HRMS (ES+) calculated for C17H12ClF5N5 [M + H]+ 416.0696, found 416.0698.
(S)-6-chloro-5-(2,6-difluorophenyl)-2-(pyrazin-2-yl)-N-(1,1,1-trifluoropropan-2-yl)pyrimidin-4-amine (4.42). Following synthetic procedure A using 4,6-dichloro-5-(2,6-difluorophenyl)-2-(pyrazin-2-yl)pyrimidine (0.100 g, 0.295 mmol) and (S)-1,1,1-trifluoropropan-2-amine (0.133 g, 1.08 mmol), purification by silica gel column chromatography (hexanes/EtOAc 65:35) afforded the title compound as an orange solid (0.034 g, 0.082 mmol, 28% yield). 1H NMR (600 MHz, CDCl3) δ 9.60 (d, J = 1.5 Hz, 1H), 8.78–8.74 (m, 1H), 8.68 (d, J = 2.5 Hz, 1H), 7.49–7.41 (m, 1H), 7.06–7.01 (m, 2H), 5.37–
187
5.28 (m, 1H), 4.99 (d, J = 9.3 Hz, 1H), 1.40 (d, J = 7.0 Hz, 3H) ppm. 13C NMR (151 MHz, CDCl3) δ 161.38, 161.19, 161.05, 160.41 (dd, J = 251.3, 4.3 Hz), 160.37 (dd, J = 252.0, 4.9 Hz), 149.10, 145.95, 145.52, 144.47, 132.46 (t, J = 10.0 Hz), 125.42 (q, J = 282.0 Hz), 112.57 (dd, J = 21.4, 3.5 Hz), 112.37 (dd, J = 21.4, 3.5 Hz), 108.46 (t, J = 20.3 Hz), 105.63, 48.22 (q, J = 31.7 Hz), 14.41 ppm. IR (KBr) ν 3281, 2922, 1626, 1582, 1556 cm-1. HRMS (ES+) calculated for C17H12ClF5N5 [M + H]+ 416.0696, found 416.0698.
(S)-6-chloro-2-(pyridin-2-yl)-5-(2,4,6-trifluorophenyl)-N-(1,1,1-trifluoropropan-2-yl)pyrimidin-4-amine (4.45). Following synthetic procedure A using 4,6-dichloro-2-(pyridin-2-yl)-5-(2,4,6-trifluorophenyl)pyrimidine (0.500 g, 1.40 mmol) and (S)-1,1,1-trifluoropropan-2-amine hydrochloride (0.840 g, 5.62 mmol), purification by silica gel column chromatography (hexanes/EtOAc 80:20 to 70:30) afforded the title compound as a white solid (0.106 g, 0.245 mmol, 17% yield). 1H NMR (600 MHz, CDCl3) δ 8.83 (s, 1H), 8.42 (d, J = 7.6 Hz, 1H), 7.87 (t, J = 7.5 Hz, 1H), 7.43 (dd, J = 7.6, 3.8 Hz, 1H), 6.86–6.78 (m, 2H), 5.42–5.32 (m, 1H), 4.83 (d, J = 9.2 Hz, 1H), 1.41 (d, J = 6.9 Hz, 3H) ppm. 13C NMR (151 MHz, CDCl3) δ 164.07 (dt, J = 253.8, 15.4, 14.9 Hz), 163.14, 161.38, 161.09, 160.90 (ddd, J = 251.7, 8.8, 4.6 Hz), 160.80 (ddd, J = 253.8, 9.3, 4.2 Hz), 153.56, 150.09, 137.12, 125.52, 125.50 (q, J = 282.1 Hz), 124.11, 105.19 (td, J = 21.8, 21.0, 4.4 Hz), 104.00, 101.60 (tdd, J = 26.0, 22.0, 3.9 Hz), 48.14 (q, J = 31.5 Hz), 14.51 ppm. IR (KBr) ν 3259, 2919, 1635, 1575, 1548 cm-1.
(S)-6-chloro-5-(2,6-difluoro-4-(3-(methylamino)propoxy)phenyl)-2-(pyrazin-2-yl)-N-(1,1,1-trifluoropropan-2-yl)pyrimidin-4-amine (4.50). Following synthetic procedure C using (S)-6-chloro-2-(pyrazin-2-yl)-5-(2,4,6-trifluorophenyl)-N-(1,1,1-trifluoropropan-2-yl)pyrimidin-4-amine (0.050 g, 0.115 mmol) and 3-(methylamino)propan-1-ol (0.053 g, 0.596 mmol), purification by reverse phase HPLC afforded the title compound as a yellow solid (0.008 g, 0.016 mmol, 14% yield). 1H NMR (600 MHz, CDCl3) δ 9.63 (d, J = 1.5 Hz, 1H), 8.83–8.79 (m, 1H), 8.71 (d, J = 2.4 Hz, 1H), 8.19 (s, 2H), 6.59 (d, J = 9.5 Hz, 2H), 5.83 (d, J = 9.2 Hz, 1H), 5.40–5.28 (m, 1H), 4.18–4.09 (m, 2H), 3.28–3.17 (m, 2H), 2.73 (s, 3H), 2.32–2.24 (m, 2H), 1.41 (d, J = 7.0 Hz, 4H) ppm. 13C NMR (151 MHz, CDCl3) δ 166.49, 162.00 (d, J = 9.7 Hz), 161.72, 161.38, 161.24 (t, J = 14.5, 13.5 Hz), 161.14, 160.34 (d, J = 9.3 Hz), 149.16, 146.01, 145.57, 144.45, 125.63 (q, J = 282.2 Hz), 105.58, 101.19 (t, J = 21.3 Hz), 99.54 (ddd, J = 29.0, 25.7, 2.5 Hz), 65.30, 48.14 (q, J = 31.5 Hz), 46.65, 33.46, 25.67, 14.18 ppm. IR (KBr) ν 3411, 2919, 1639, 1580, 1556 cm-1. HRMS (ES+) calculated for C21H21ClF5N6O [M + H]+ 503.1380, found 503.1377.
Diethyl 2-(2,4,6-trifluorophenyl)malonate (4.54). Following synthetic procedure D using diethyl malonate (9.13 g, 57.0 mmol) and 2-bromo-1,3,5-trifluorobenzene (4.00 g, 19.0 mmol), purification by silica gel column chromatography (hexanes/EtOAc 70:30) afforded the title compound as a colourless oil (3.67 g, 12.6 mmol, 66% yield). 1H NMR (500 MHz,
188
CDCl3) δ 6.71 (t, J = 8.8 Hz, 2H), 4.90 (s, 1H), 4.26 (q, J = 7.1 Hz, 4H), 1.28 (t, J = 7.2 Hz, 6H) ppm.
4,6-dichloro-2-(pyrazin-2-yl)-5-(2,4,6-trifluorophenyl)pyrimidine (4.55). Following synthetic procedure E using diethyl 2-(2,4,6-trifluorophenyl)malonate (0.679 g, 2.34 mmol) and pyrazine-2-carboximidamide hydrochloride (0.390 g, 2.46 mmol), purification by silica gel column chromatography (hexanes/EtOAc 100:0 to 77:23) afforded the title compound as a brown solid (0.252 g, 0.706 mmol, 30% yield). 1H NMR (600 MHz, CDCl3) δ 9.74 (d, J = 1.3 Hz, 1H), 8.84 (dd, J = 2.5, 1.5 Hz, 1H), 8.77 (d, J = 2.4 Hz, 1H), 6.91–6.83 (m, 2H) ppm. 13C NMR (151 MHz, CDCl3) δ 164.31 (dt, J = 254.0, 15.1 Hz), 163.71, 162.40, 160.24 (ddd, J = 252.7, 15.2, 8.9 Hz), 147.44, 146.98, 146.05, 144.95, 122.30, 106.76 (td, J = 20.6, 4.9 Hz), 101.47–100.97 (m) ppm.
4,6-dichloro-5-phenyl-2-(pyrazin-2-yl)pyrimidine (4.56). Following synthetic procedure E using diethyl 2-phenylmalonate (0.500 g, 2.12 mmol) and pyrazine-2-carboximidamide hydrochloride (0.352 g, 2.22 mmol), purification by silica gel column chromatography (hexanes/EtOAc 70:30) afforded the title compound as a brown solid (0.117 g, 0.386 mmol, 18% yield). 1H NMR (600 MHz, CDCl3) δ 9.73 (s, 1H), 8.83 (s, 1H), 8.76 (s, 1H), 7.57–7.49 (m, 3H), 7.38–7.34 (m, 2H) ppm. 13C NMR (151 MHz, CDCl3) δ 162.37, 160.76, 147.73, 146.67, 145.82, 144.87, 133.49, 132.68, 129.65, 129.31, 128.92 ppm.
4,6-dichloro-2-(thiophen-2-yl)-5-(2,4,6-trifluorophenyl)pyrimidine (4.57). Following synthetic procedure E using diethyl 2-(2,6-difluorophenyl)malonate (0.850 g, 2.93 mmol) and thiophene-2-carboximidamide hydrochloride (0.500 g, 3.07 mmol), purification by silica gel column chromatography (hexanes/EtOAc 98:2) afforded the title compound as a white solid (0.430 g, 1.19 mmol, 41% yield). 1H NMR (600 MHz, CDCl3) δ 8.13 (d, J = 2.6 Hz, 1H), 7.61 (d, J = 4.4 Hz, 1H), 7.18 (t, J = 4.4 Hz, 1H), 6.87–6.81 (m, 2H) ppm. 13C NMR (151 MHz, CDCl3) δ 164.04 (dt, J = 252.9, 15.1 Hz), 162.48, 161.64, 160.41 (ddd, J = 252.0, 15.1, 8.9 Hz), 140.12, 132.90, 132.16, 128.87, 118.45, 107.29 (td, J = 20.6, 4.9 Hz), 101.26–100.79 (m) ppm.
4,6-dichloro-5-(3,5-difluorophenyl)-2-(pyrazin-2-yl)pyrimidine (4.58). Following synthetic procedure E using diethyl 2-(3,5-difluorophenyl)malonate (0.500 g, 1.84 mmol) and pyrazine-2-carboximidamide hydrochloride (0.306 g, 1.93 mmol), purification by silica gel column chromatography (hexanes/EtOAc 70:30 to 65:35) afforded the title compound as a brown solid (0.082 g, 0.242 mmol, 13% yield). 1H NMR (600 MHz, CDCl3) δ 9.72 (s, 1H), 8.84 (s, 1H), 8.77 (d, J = 2.5 Hz, 1H), 7.01–6.94 (m, 1H), 6.93–6.88 (m, 2H) ppm. 13C NMR (151 MHz, CDCl3) δ 164.03 (d, J = 12.8 Hz), 162.37 (d, J = 12.8 Hz), 162.07, 161.50, 147.42, 146.93, 145.95, 144.95, 135.35 (t, J = 10.3 Hz), 131.34 (t, J = 2.3 Hz), 112.85 (dd, J = 21.0, 5.9 Hz), 105.44 (t, J = 25.0 Hz) ppm; 13C NMR (151 MHz, Chloroform-d) δ 163.20 (dd, J = 250.9, 12.8 Hz), 162.07, 161.50, 147.42, 146.93, 145.95, 144.95, 135.35 (t, J = 10.3 Hz),

189
131.34 (t, J = 2.3 Hz), 112.85 (dd, J = 21.0, 5.9 Hz), 105.44 (t, J = 25.0 Hz) ppm. HRMS (ES+) calculated for C14H7Cl2F2N4 [M + H]+ 339.0010, found 339.0010.
4,6-dichloro-2-(pyridin-2-yl)-5-(2,4,6-trifluorophenyl)pyrimidine (4.59). Following synthetic procedure E using diethyl 2-(2,4,6-trifluorophenyl)malonate (0.871 g, 3.00 mmol) and pyridine-2-carboximidamide hydrochloride (0.496 g, 3.15 mmol), purification by silica gel column chromatography (hexanes/EtOAc 100:0 to 75:25) afforded the title compound as a yellow solid (0.350 g, 0.983 mmol, 33% yield). 1H NMR (600 MHz, CDCl3) δ 8.92–8.87 (m, 1H), 8.55 (dt, J = 7.9, 1.1 Hz, 1H), 7.90 (td, J = 7.7, 1.8 Hz, 1H), 7.48 (ddd, J = 7.6, 4.7, 1.2 Hz, 1H), 6.89–6.81 (m, 2H) ppm. 13C NMR (151 MHz, Chloroform-d) δ 164.18 (dt, J = 254.0, 15.1 Hz), 163.98, 163.44, 160.27 (ddd, J = 252.4, 15.1, 8.8 Hz), 151.93, 150.65, 137.37, 126.33, 124.80, 121.35, 107.06 (td, J = 20.4, 4.8 Hz), 101.43–100.82 (m) ppm.
4,6-dichloro-5-(2,4-difluorophenyl)-2-(pyrazin-2-yl)pyrimidine (4.60). Following synthetic procedure E using diethyl 2-(2,4-difluorophenyl)malonate (0.500 g, 1.84 mmol) and pyrazine-2-carboximidamide hydrochloride (0.306 g, 1.93 mmol), purification by silica gel column chromatography (hexanes/EtOAc 70:30 to 63:35) afforded the title compound as a brown solid (0.133 g, 0.392 mmol, 21%). 1H NMR (600 MHz, CDCl3) δ 9.73 (s, 1H), 8.84 (s, 1H), 8.77 (d, J = 2.4 Hz, 1H), 7.37–7.29 (m, 1H), 7.07 (td, J = 8.3, 2.5 Hz, 1H), 7.01 (td, J = 9.1, 2.5 Hz, 1H) ppm. 13C NMR (151 MHz, CDCl3) δ 164.17 (dd, J = 253.2, 11.6 Hz), 163.12, 161.69, 159.87 (dd, J = 252.1, 12.4 Hz), 147.53, 146.87, 145.96, 144.91, 132.12 (dd, J = 10.0, 3.7 Hz), 127.46, 116.71 (dd, J = 16.1, 4.0 Hz), 112.33 (dd, J = 21.8, 3.6 Hz), 104.98 (t, J = 25.3 Hz) ppm. 4,6-dichloro-5-(2,6-difluorophenyl)-2-(pyrazin-2-yl)pyrimidine (4.61). Following synthetic procedure E using diethyl 2-(2,6-difluorophenyl)malonate (0.330 g, 1.21 mmol) and pyrazine-2-carboximidamide hydrochloride (0.201 g, 1.27 mmol), purification by silica gel column chromatography (hexanes/EtOAc 70:30) afforded the title compound as an orange solid (0.114 g, 0.336 mmol, 28% yield). 1H NMR (600 MHz, CDCl3) δ 9.75 (s, 1H), 8.85 (s, 1H), 8.78 (d, J = 2.4 Hz, 1H), 7.57–7.48 (m, 1H), 7.09 (t, J = 7.9 Hz, 2H) ppm. 13C NMR (151 MHz, CDCl3) δ 163.58, 162.24, 159.86 (dd, J = 251.8, 6.1 Hz), 147.56, 146.93, 146.04, 144.94, 132.57 (t, J = 10.1 Hz), 123.16, 112.03 (dd, J = 20.8, 4.0 Hz), 110.26 (t, J = 19.9 Hz) ppm.
4.6.2 Biological Assay
Cell culture. T. b. brucei Lister 427 were cultured in HMI-9 medium55 with 10% heat-inactivated fetal bovine serum (FBS; Gibco, Carlsbad, CA) and 10% serum plus medium supplement (Sigma-Aldrich), in vented flasks in a humidified atmosphere of 5% CO2 at 37 °C. Parasites were maintained in log-phase growth (between 1×10⁵ and 1×10⁶ parasites/mL) and subcultured every 48 h. Trophozoites of N. fowleri strain KUL were axenically cultured in Nelson's medium supplemented with 10% FBS at 37 °C.56
190
In vitro activity against T. brucei (SYBR Green assay). SYBR Green assay was used to determine the killing effect of tubulin polymerization promoters on T. b. brucei cell viability.47 For the in vitro screening, compounds were serially diluted in duplicate to test at 8-point concentrations ranging from 4 µM to 0.8 nM. Trypanosomes in log-phase growth were suspended at 2×10⁵ trypanosomes/mL in complete HMI-9 medium under continuous agitation. Then, they were dispensed into 96-well plates (100 µL/well) containing 1 µL of test compound in 0.5% DMSO and 100 µL/well of fresh HMI-9 medium. Plates were incubated for 72 h at 37 °C and 5% CO2, at which point the trypanosomes were lysed by the addition of 50 µL/well of lysis solution [30 mM Tris pH 7.5, 7.5 mM EDTA, 0.012% saponin, and 0.12% Triton X-100, modified from Co et al.;57 saponin was obtained from Sigma-Aldrich (Cat. No. S9430)] containing 0.3 µL/mL SYBR Green I (10,000× in DMSO; Invitrogen, Carlsbad, CA). The plates were agitated at 1700 rpm for 45 s using the MixMate plate mixer (Eppendorf, Hamburg-Eppendorf, Germany) and incubated in the dark for 1 h at room temperature, followed by reading on the 2104 EnVision® multilabel plate reader (PerkinElmer, Waltham, MA), with excitation at 485 nm/emission at 535 nm during 1 min per plate. The activity of test compounds was normalized against controls from the same plate according to the following formula: Activity (%) = [1 − (FCpd − blank) / (FNeg − blank)] × 100, where FCpd corresponds to the emitted fluorescent signal expressed in arbitrary fluorescence units for the test compound; and FNeg and blank correspond to the mean fluorescent signal of the negative control wells and the background signal, respectively. Data are means of three separate determinations. In each experiment, the whole library of test compounds was screened in a single day for each duplicate. Dose–response curves and IC50 values were calculated using the function asymmetrical sigmoidal, 5PL, X from the GraphPad Prism software, version 6.00 for Apple Macintosh.
In vitro activity against N. fowleri. For primary screening, 0.5 µL of each 10 µM stock compound was transferred in duplicate to a 96-well microtiter plate to achieve a final concentration of 50 µM. Screening was carried out with 10,000 trophozoites/well. Plates were incubated at 37 °C for 48 h in an oxygenated environment and in the absence of the GasPak EZ anaerobe gas-generating pouch system (VWR).58 0.5% DMSO was used as a vehicle control and 200 µM miltefosine as a positive control. After 48 h incubation, the activity of the compounds was measured using a luminometer (EnVision multilabel plate reader, PerkinElmer) using an ATP bioluminescence-based CellTiter-Glo luminescent cell viability assay (Promega) technology.59,60 Compound 4.15, which showed more than 50% inhibition in primary screening at 50 µM, underwent secondary screening to confirm the activity and to determine IC50. For the secondary screening 4.15 was serially diluted in triplicate to test at 8-point concentrations ranging from 0.39 µM to 50 µM. Dose–response curves and IC50 of 4.15 were determined using GraphPad Prism software, version 6.00 for Apple Macintosh.
Brain and Plasma Compound Determinations. Test compounds were quantified in plasma

191
and brain homogenates as previously described.42
4.7 References
1. Bruce, D. The Croonian lectures on trypanosomes causing disease in man and domestic animals in Central Africa. Brit. Med. J. 1915, 1, 1073–1078.
2. Caffrey, C. R.; Steverding, D. Recent initiatives and strategies to developing new drugs for tropical parasitic diseases. Exp. Op. Drug Discov. 2008, 3, 173–186.
3. Brun, R.; Blum, J.; Chappuis, F.; Burri, C. Human African trypanosomiasis. Lancet 2010, 375, 148–159.
4. Wamwiri, F. N.; Changasi, R. E. Tsetse Flies (Glossina) as vectors of Human African Trypanosomiasis: a review. BioMed. Res. Int. 2016, 2016, 6201350.
5. Yaro, M.; Munyard, K. A.; Stear, M. J.; Groth, D. M. Combatting African animal trypanosomiasis (AAT) in livestock: the potential role of trypanotolerance. Vet. Parasitol. 2016, 225, 43–52.
6. Welburn, S. C.; Fevre, E. M.; Coleman, P. G.; Odiit, M.; Maudlin, I. Sleeping sickness: a tale of two diseases. Trends Parasitol. 2001, 17, 19–24.
7. Steverding, D. The history of African trypanosomiasis. Parasit. Vectors 2008, 1, 3. 8. Morrison, L. J.; Vezza, L.; Rowan, T.; Hope, J. C. Animal African trypanosomiasis: time
to increase focus on clinically relevant parasite and host species. Trends Parasitol. 2016, 32, 599–607.
9. Simarro, P. P.; Cecchi, G.; Franco, J. R.; Paone, M.; Diarra, A.; Ruiz-Postigo, J. A.; Fevre, E. M.; Mattioli, R. C.; Jannin, J. G. Estimating and mapping the population at risk of sleeping sickness. PLoS Negl. Trop. Dis. 2012, 6, e1859.
10. Simarro, P. P.; Cecchi, G.; Franco, J. R.; Paone, M.; Diarra, A.; Priotto, G.; Mattioli, R. C.; Jannin, J. G. Monitoring the progress towards the elimination of gambiense human African trypanosomiasis. PLoS Negl. Trop. Dis. 2015, 9, e0003785.
11. World Health Organization. Control and Surveillance of Human African Trypanosomiasis Report of a WHO Expert Committee WHO Technical Report Series 984. Geneva, Switzerland: World Health Organization; 2013.
12. Barrett, M. P.; Burchmore, R. J.; Stich, A.; Lazzari, J. O.; Frasch, A. C.; Cazzulo, J. J.; Krishna, S. The trypanosomiases. Lancet 2003, 362, 1469–1480.
13. Sanjeev, K. S.; Stich, A. Clinical manifestations, diagnosis, and treatment of African trypanosomiasis. UpToDate 2016.
14. Kennedy, P. G. Human African trypanosomiasis of the CNS: current issues and challenges. J. Clin. Invest. 2004, 113, 496–504.
15. Jones Jr, H. R.; Srinivasan, J.; Allam, G. J.; Baker, R. A. In Netter's Neurology E-Book 2E; Elsevier Health Sciences, PA, 2011, ID 63489.
192
16. Braakman, H. M.; van de Molengraft, F. J.; Hubert, W. W.; Boerman, D. H. Lethal African trypanosomiasis in a traveler: MRI and neuropathology. Neurology 2006, 66, 1094–1096.
17. Balasegaram, M.; Harris, S.; Checchi, F.; Ghorashian, S.; Hamel, C.; Karunakara, U. Melarsoprol versus eflornithine for treating late-stage Gambian trypanosomiasis in the Republic of the Congo. Bull. World Health Organ. 2006, 84, 783–791.
18. Legros, D.; Evans, S.; Maiso, F.; Enyaru, J. C.; Mbulamberi, D. Risk factors for treatment failure after melarsoprol for Trypanosoma brucei gambiense trypanosomiasis in Uganda. Trans. R. Soc. Trop. Med. Hyg. 1999, 93, 439–442.
19. de Koning, H. P. Ever-increasing complexities of diamidine and arsenical crossresistance in African trypanosomes. Trends Parasitol. 2008, 24, 345–349.
20. Pepin, J.; Milord, F. The treatment of human African trypanosomiasis. Adv. Parasitol. 1994, 33, 1–47.
21. Matthews, K. R. 25 years of African trypanosome research: From description to molecular dissection and new drug discovery. Mol. Biochem. Parasitol. 2015, 200, 30–40.
22. Gull, K. The cell biology of parasitism in Trypanosoma brucei: insights and drug targets from genomic approaches? Curr. Pharmaceutical design. 2002, 8, 241–256.
23. Stich, A.; Abel, M. P.; Krishna S. Human African trypansomiasis. BMJ 2002, 325, 203–206.
24. Donelson, E., J. Antigenic variation in the African trypansome genome. Acta Trop. 2003, 85, 391–404.
25. Pays, E.; Vanhamme, L.; Morga-Perez, D. Antigenic variation in T. brucei; facts, challenges and mysteries. Curr. Opinion Microbiol. 2004, 7, 369–374.
26. Kateete, D. An evaluation of in vitro trypanocidal activity of antibodies to recombinant tubulin from Trypanosoma B. Brucei. 2009.
27. Chonkar, S. Life cycle of trypanosoma gambiense. (www.biologydiscussion.com). 28. Rasooly, R.; Balaban, N. Trypanosome microtubule-associated protein p15 as a vaccine
for the prevention of African sleeping sickness. Vaccine 2004, 22, 1007–1015. 29. Li, Z. Regulation of the cell division cycle in Trypanosoma brucei. Eukaryotic Cell 2012,
11, 1180–1190. 30. Teixeira, D. E.; Benchimol, M.; Crepaldi, P. H.; de Souza, W. Interactive multimedia to
teach the life cycle of Trypanosoma cruzi, the causative agent of Chagas disease. PLoS Negl. Trop. Dis. 2012, 6, e1749.
31. Ralston, K. S.; Kabututu, Z. P.; Melehani, J. H.; Oberholzer, M.; Hill, K. L. The Trypanosoma brucei flagellum: moving parasites in new directions. Ann. Rev. Microbiol. 2009, 63, 335–362.
193
32. Gallo, J. M.; Precigout, E. Tubulin expression in trypanosomes. Biol. Cell 1988, 64, 137–143.
33. Wu, J.; Yarbrough, L. R. Expression of the alpha and beta tubulin genes of the African trypansome in Escherichia coli. Gene 1987, 61, 51–62.
34. Ochola, D. O.; Prichard, R. K.; Lubega, G. W. Classical ligands bind tubulin of trypanosomes and inhibit their growth in vitro. J. Parasitol. 2002, 88, 600–604.
35. Werbovetz, K. A.; Sackett, D. L.; Delfin, D.; Bhattacharya, G.; Salem, M.; Obrzut, T.; Rattendi, D.; Bacchi, C. Selective antimicrotubule activity of N1-phenyl-3,5-dinitro-N4,N4-di-n-propylsulfanilamide (GB-II-5) against kinetoplastid parasites. Mol. Pharmacol. 2003, 64, 1325–1333.
36. Lama, R.; Sandhu, R.; Zhong, B.; Li, B.; Su, B. Identification of selective tubulin inhibitors as potential anti-trypanosomal agents. Bioorg. Med. Chem. Lett. 2012, 22, 5508–5516.
37. Nanavaty, V., Lama, R., Sandhu, R., Zhong, B., Kulman, D., Bobba, V., Zhao, A.; Li, B.; Su, B. Orally active and selective tubulin inhibitors as anti-trypanosome agents. PloS one 2016, 11, e0146289.
38. Wu, D.; George, T. G.; Hurh, E.; Werbovetz, K. A.; Dalton, J. T. Pre-systemic metabolism prevents in vivo antikinetoplastid activity of N1,N4-substituted 3,5-dinitro sulfanilamide, GB-II-150. Life Sciences 2006, 79, 1081–1093.
39. Katsetos, C. D.; Reginato, M. J.; Baas, P. W.; D'Agostino, L.; Legido, A.; Tuszyn Ski, J. A.; Draberova, E.; Draber, P. Emerging microtubule targets in glioma therapy. In Seminars in Pediatric Neurology 2015, 22, 49–72.
40. Ballatore, C.; Brunden, K. R.; Huryn, D. M.; Trojanowski, J. Q.; Lee, V. M.-Y.; Smith, A. B. III Microtubule stabilizing agents as potential treatment for Alzheimer's disease and related neurodegenerative tauopathies. J. Med. Chem. 2012, 55, 8979–8996.
41. Brunden, K. R.; Yao, Y.; Potuzak, J. S.; Ferrer, N. I.; Ballatore, C.; James, M. J.; Hogan, A. M.; Trojanowski, J. Q.; Smith, A. B.; Lee, V. M.-Y. The characterization of microtubule-stabilizing drugs as possible therapeutic agents for Alzheimer’s disease and related tauopathies. Pharmacol. Res. 2011, 63, 341−351.
42. Lou, K.; Yao, Y.; Hoye, A. T.; James, M. J.; Cornec, A. S.; Hyde, E.; Gay, B.; Lee, V. M.; Trojanowski, J. Q.; Smith, A. B., III; Brunden, K. R.; Ballatore, C. Brain-penetrant, orally bioavailable microtubule-stabilizing small molecules are potential candidate therapeutics for Alzheimer’s disease and related tauopathies. J. Med. Chem. 2014, 57, 6116−6127.
43. Kovalevich, J.; Cornec, A. S.; Yao, Y.; James, M.; Crowe, A.; Lee, V. M.; Trojanowski, J. Q.; Smith, A. B., III; Ballatore, C.; Brunden, K. R. Characterization of brain-penetrant pyrimidine-containing molecules with differential microtubule-stabilizing activities developed as potential therapeutic agents for Alzheimer’s disease and related tauopathies.
194
J. Pharmacol. Exp. Ther. 2016, 357, 432−450. 44. Zhang, N.; Ayral-Kaloustian, S.; Nguyen, T.; Hernandez, R.; Lucas, J.; Discafani, C.;
Beyer, C. Synthesis and SAR of 6-chloro-4-fluoroalkylamino-2-heteroaryl-5-(substituted) phenylpyrimidines as anti-cancer agents. Bioorg. Med. Chem. 2009, 17, 111−118.
45. Sáez-Calvo, G.; Sharma, A.; de Asís Balaguer, F.; Barasoain, I.; Rodríguez-Salarichs, J.; Olieric, N.; Muñoz-Hernández, H.; Berbís, M. Á.; Wendeborn, S.; Peñalva, M. A.; Matesanz, R.; Canales, A.; Prota, A. E.; Jímenez-Barbero, J.; Andreu, J. M.; Lamberth, C.; Steinmetz, M. O.; Díaz, J. F. Triazolopyrimidines are microtubule-stabilizing agents that bind the Vinca inhibitor site of tubulin. Cell Chem. Biol. 2017, 24, 737−750.
46. Ballatore, C.; Brunden, K. R.; Trojanowski, J. Q.; Lee, V. M.-Y.; Smith , A. B. III Non-naturally occurring small molecule microtubule-stabilizing agents: a potential tactic for CNS-directed therapies. ACS Chem. Neurosci. 2017, 8, 5−7.
47. Faria, J.; Moraes, C. B.; Song, R.; Pascoalino, B. S.; Lee, N.; Siqueira-Neto, J. L.; Cruz, D. J. M.; Parkinson, T.; Ioset, J.-R.; Cordeiro-da-Silva, A.; Freitas-Junior, L. H. Drug discovery for human African trypanosomiasis: identification of novel scaffolds by the newly developed HTS SYBR Green assay for Trypanosoma brucei. J. Biomol. Screen. 2015, 20, 70–81.
48. Sands, M.; Kron, M. A.; Brown, R. B. Pentamidine: a review. Rev. Infect. Dis. 1985, 7, 625–6344.
49. Lemke, Thomas L.; Williams, David A. Foye's Principles of Medicinal Chemistry (Seventh ed.); Lippincott Williams & Wilkins, PA, 2013.
50. Zhang, N.; Ayral-Kaloustian, S.; Nguyen, T.; Afragola, J.; Hernandez, R.; Lucas, J.; Gibbons, J.; Beyer, C. Synthesis and SAR of [1,2,4]triazolo[1,5-a]pyrimidines, a class of anticancer agents with a unique mechanism of tubulin inhibition. J. Med. Chem. 2007, 50, 319−327.
51. Grace, E.; Asbill, S.; Virga, K. Naegleria fowleri: pathogenesis, diagnosis, and treatment options. Antimicrob. Agents Chemother. 2015, 59, 6677−6681.
52. Centers for Disease Control and Prevention (CDC). Investigational drug available directly from CDC for the treatment of infections with free-living amebae. MMWR. Morb. Mortal. Wkly Rep. 2013, 62, 666.
53. Cope, J. R.; Ali, I. K. Primary amebic meningoencephalitis: What have we learned in the last 5 years? Curr. Infect. Dis. Rep. 2016, 18, 31−38.
54. Mackey, T. K.; Liang, B. A.; Cuomo, R.; Hafen, R.; Brouwer, K. C.; Lee, D. E. Emerging and reemerging neglected tropical diseases: a review of key characteristics, risk factors, and the policy and innovation environment. Clin. Microbiol. Rev. 2014, 27, 949–979.
195
55. Hirumi, H.; Hirumi, K. Continuous Cultivation of Trypanosoma brucei Blood Stream Forms in a Medium Containing a Low Concentration of Serum Protein Without Feeder Cell Layers. J. Parasitol. 1989, 75, 985–989.
56. Lee, J.; Kim, J. H.; Sohn, H. J; Yang, H. J.; Na, B. K.; Chwae, Y. J.; Park, S.; Kim, K.; Shin, H. Novel cathepsin B and cathepsin B-like cysteine protease of Naegleria fowleri excretory–secretory proteins and their biochemical properties. J. Parasitol. Res. 2014, 113, 2765–2776.
57. Co, E.-M. A.; Dennull, R. A.; Reinbold, D. D.; Waters, N. C.; Johnson, J. D. Assessment of malaria in vitro drug combination screening and mixed-strain infections using the malaria Sybr green I-based fluorescence assay. Antimicrob. Agents Chemother. 2009, 53, 2557–2563.
58. Singh, A.; Nisha, N.; Bains, T.; Hahn, H. J.; Liu, N., Tam, C.; Cheng, L. W.; Kim, J.; Debnath, A.; Land, K. M.; Kumar, V. Design, synthesis and preliminary antimicrobial evaluation of N-alkyl chain tethered C-5 functionalized bis-isatins. Med. Chem. Comm. 2017, 8, 1982–1992.
59. Debnath, A.; Shahinas, D.; Bryant, C.; Hirata, K.; Miyamoto, Y.; Hwang, G.; Gut, J.; Renslo, A. R.; Pillai, D. R.; Eckmann, L.; Reed, S. L.; McKerrow, J. H. Hsp90 inhibitors as new leads to target parasitic diarrheal diseases. Antimicrob. Agents Chemother. 2014, 58, 4138–4144.
60. Debnath, A.; Parsonage, D.; Andrade, R. M.; He, C.; Cobo, E. R.; Hirata, K.; Gunatilleke, S. S.; Barrios, A. M.; Arkin, M. R.; Poole, L. B.; McKerrow, J. H.; Reed, S. L. A high-throughput drug screen for Entamoeba histolytica identifies a new lead and target. Nature Med. 2012, 18, 956–960.

196
Other Collaborations
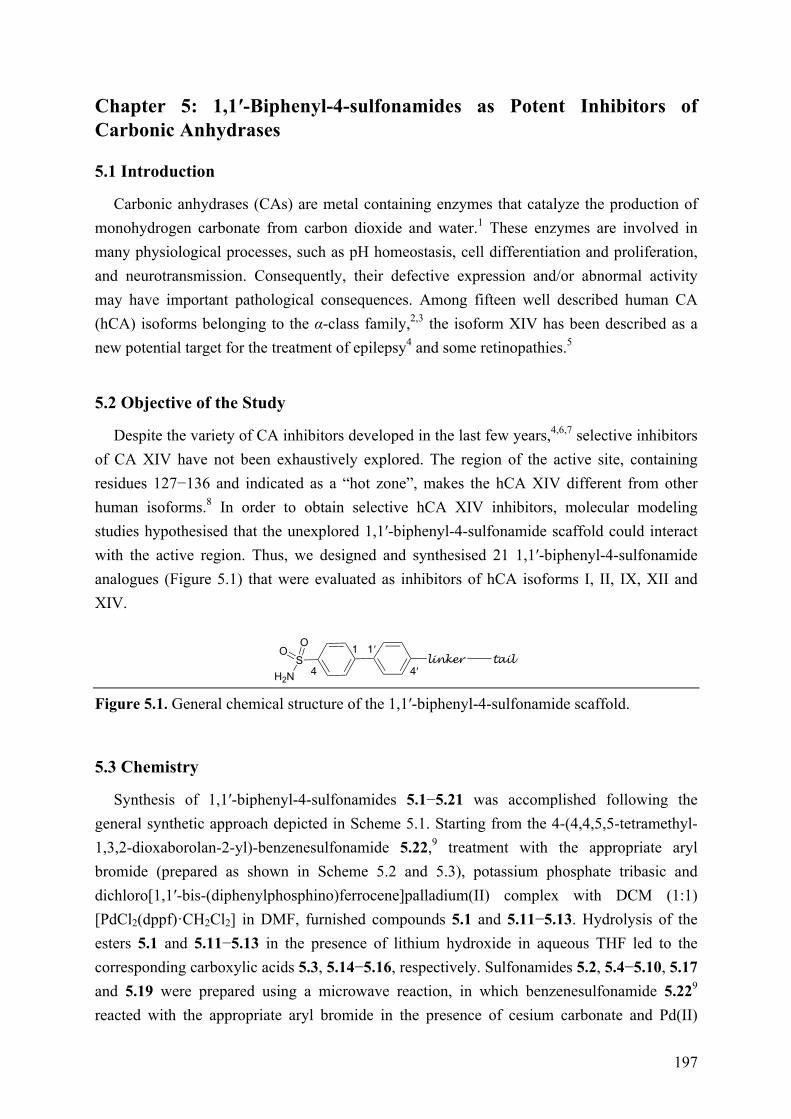
197
Chapter 5: 1,1′-Biphenyl-4-sulfonamides as Potent Inhibitors of Carbonic Anhydrases
5.1 Introduction
Carbonic anhydrases (CAs) are metal containing enzymes that catalyze the production of monohydrogen carbonate from carbon dioxide and water.1 These enzymes are involved in many physiological processes, such as pH homeostasis, cell differentiation and proliferation, and neurotransmission. Consequently, their defective expression and/or abnormal activity may have important pathological consequences. Among fifteen well described human CA (hCA) isoforms belonging to the α-class family,2,3 the isoform XIV has been described as a new potential target for the treatment of epilepsy4 and some retinopathies.5
5.2 Objective of the Study
Despite the variety of CA inhibitors developed in the last few years,4,6,7 selective inhibitors of CA XIV have not been exhaustively explored. The region of the active site, containing residues 127−136 and indicated as a “hot zone”, makes the hCA XIV different from other human isoforms.8 In order to obtain selective hCA XIV inhibitors, molecular modeling studies hypothesised that the unexplored 1,1′-biphenyl-4-sulfonamide scaffold could interact with the active region. Thus, we designed and synthesised 21 1,1′-biphenyl-4-sulfonamide analogues (Figure 5.1) that were evaluated as inhibitors of hCA isoforms I, II, IX, XII and XIV.
Figure 5.1. General chemical structure of the 1,1′-biphenyl-4-sulfonamide scaffold.
5.3 Chemistry
Synthesis of 1,1′-biphenyl-4-sulfonamides 5.1−5.21 was accomplished following the general synthetic approach depicted in Scheme 5.1. Starting from the 4-(4,4,5,5-tetramethyl-1,3,2-dioxaborolan-2-yl)-benzenesulfonamide 5.22,9 treatment with the appropriate aryl bromide (prepared as shown in Scheme 5.2 and 5.3), potassium phosphate tribasic and dichloro[1,1′-bis-(diphenylphosphino)ferrocene]palladium(II) complex with DCM (1:1) [PdCl2(dppf)·CH2Cl2] in DMF, furnished compounds 5.1 and 5.11−5.13. Hydrolysis of the esters 5.1 and 5.11−5.13 in the presence of lithium hydroxide in aqueous THF led to the corresponding carboxylic acids 5.3, 5.14−5.16, respectively. Sulfonamides 5.2, 5.4−5.10, 5.17 and 5.19 were prepared using a microwave reaction, in which benzenesulfonamide 5.229 reacted with the appropriate aryl bromide in the presence of cesium carbonate and Pd(II)
SH2N
linkerO
O 1
4
1′
4′tail
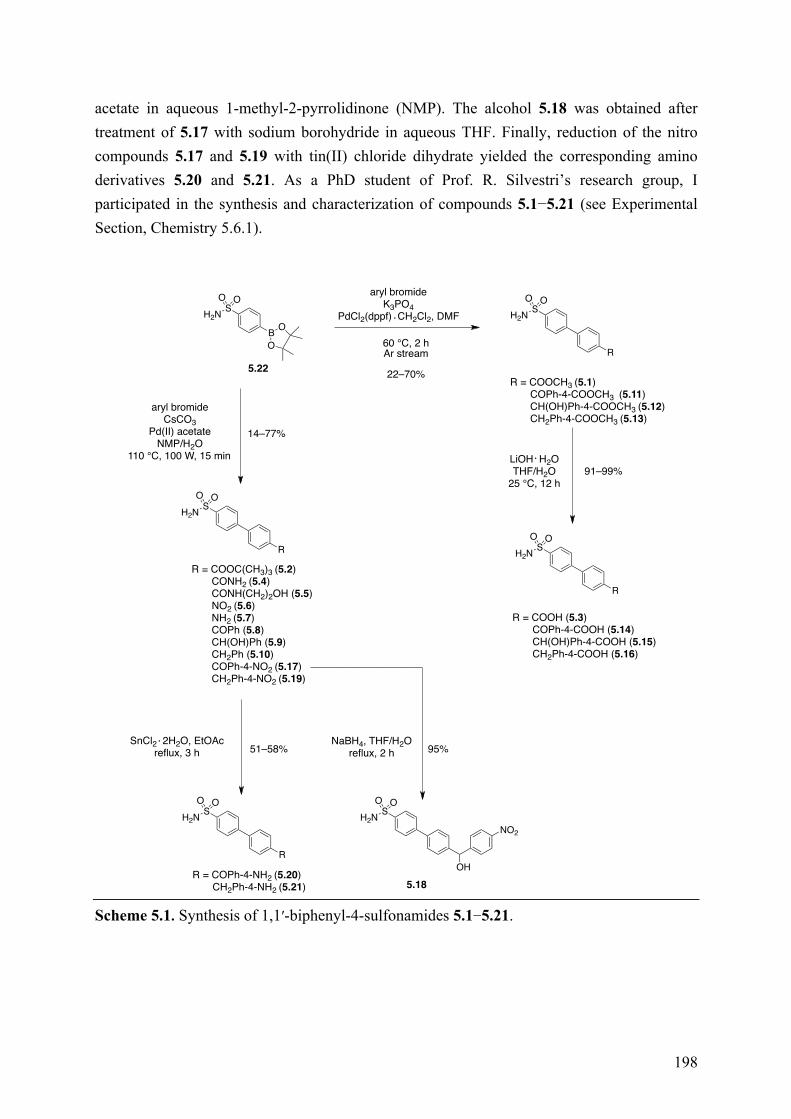
198
acetate in aqueous 1-methyl-2-pyrrolidinone (NMP). The alcohol 5.18 was obtained after treatment of 5.17 with sodium borohydride in aqueous THF. Finally, reduction of the nitro compounds 5.17 and 5.19 with tin(II) chloride dihydrate yielded the corresponding amino derivatives 5.20 and 5.21. As a PhD student of Prof. R. Silvestri’s research group, I participated in the synthesis and characterization of compounds 5.1−5.21 (see Experimental Section, Chemistry 5.6.1).
Scheme 5.1. Synthesis of 1,1′-biphenyl-4-sulfonamides 5.1−5.21.
S
B O
O
H2NOO
SH2NOO
R
R = COOCH3 (5.1) COPh-4-COOCH3 (5.11) CH(OH)Ph-4-COOCH3 (5.12) CH2Ph-4-COOCH3 (5.13)
SH2NOO
R
R = COOH (5.3) COPh-4-COOH (5.14) CH(OH)Ph-4-COOH (5.15) CH2Ph-4-COOH (5.16)
SH2NOO
R
R = COOC(CH3)3 (5.2) CONH2 (5.4) CONH(CH2)2OH (5.5) NO2 (5.6) NH2 (5.7) COPh (5.8) CH(OH)Ph (5.9) CH2Ph (5.10) COPh-4-NO2 (5.17) CH2Ph-4-NO2 (5.19)
SH2NOO
R
R = COPh-4-NH2 (5.20) CH2Ph-4-NH2 (5.21)
aryl bromideK3PO4
PdCl2(dppf) CH2Cl2, DMF
60 °C, 2 hAr stream
22–70%
LiOH H2OTHF/H2O
25 °C, 12 h91–99%
aryl bromideCsCO3
Pd(II) acetateNMP/H2O
110 °C, 100 W, 15 min
14–77%
SnCl2 2H2O, EtOAcreflux, 3 h 51–58%
5.22
SH2NOO
5.18
OH
NO2
95%NaBH4, THF/H2O
reflux, 2 h

199
1-Bromo-4-nitrobenzene (5.24) was obtained by oxidation of 4-bromoaniline (5.23) with m-chloroperbenzoic acid (m-CPBA) in toluene (Scheme 5.2). Activation of 4-bromobenzoic acid (5.25) with 1,1′-carbonyldiimidazole (CDI) in anhydrous THF and subsequent treatment with potassium tert-butoxide or ammonium hydroxide solution furnished compounds 5.26 and 5.27, respectively. Intermediates 5.28 and 5.29 were prepared by treating 5.25 with 2-aminoethanol or N,O-dimethylhydroxylamine hydrochloride (CH3NHOCH3·HCl) in the presence of (benzotriazol-1-yloxy)tris(dimethylamino)phosphonium hexafluorophosphate (BOP reagent) and triethylamine in anhydrous DMF (Scheme 5.2).
Scheme 5.2. Synthesis of intermediates 5.24−5.29.
Treatment of 5.29 with phenyllithium in anhydrous Et2O furnished compound 5.30,
whereas ketones 5.31 and 5.32 were obtained by reacting bromobenzene with nitrobenzene or toluene in the presence of AlCl3 (Scheme 5.3). Oxidation of 5.32 with potassium permanganate in aqueous tert-butanol furnished the carboxylic acid 5.33, which, after treatment with methanol in the presence of sulfuric acid gave the corresponding methyl ester 5.34. Finally, alcohols 5.35−5.37 that were prepared as above reported by sodium borohydride reduction of ketones 5.30, 5.31 and 5.34, were converted into the corresponding methylene derivatives 5.38−5.40 by reaction with triethylsilane (TES) and trifluoromethanesulfonic acid in chloroform (Scheme 5.3).
Br
NH2
Br
NO25.23 5.24
Br
COOH
5.25
Br
5.26
Br
5.27
Br
5.28
Br
5.29
O
O
NH2
O
HN
N
O
O
OH
OMe
m-CPBA, toluenereflux, 3 h
95%
1) CDI, THF 25 °C, 2 h2) t-BuOK 25 °C, 2 h
89%
1) CDI, THF 25 °C, 2 h2) NH4OH 25 °C, 2 h
93%2-aminoethanolBOP reagentEt3N, DMF25 °C, 2 h
66%
CH3NHOCH3 HClBOP reagentEt3N, DMF25 °C, 2 h
71%
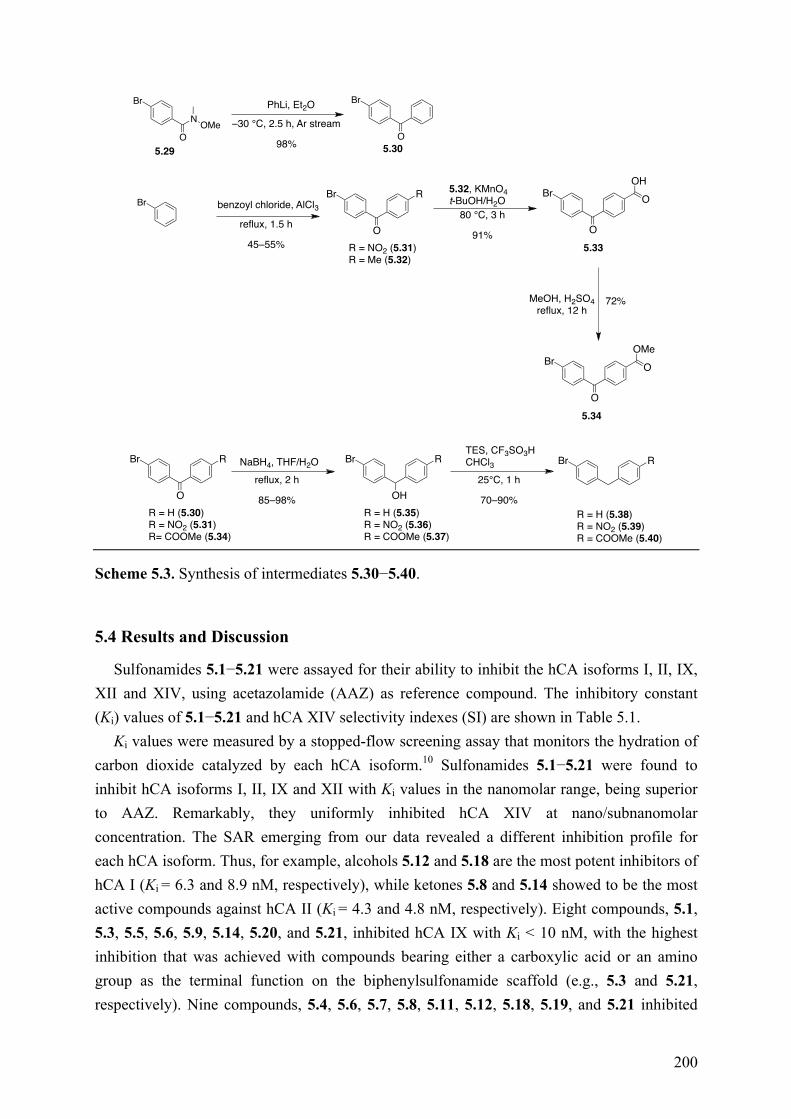
200
Scheme 5.3. Synthesis of intermediates 5.30−5.40.
5.4 Results and Discussion
Sulfonamides 5.1−5.21 were assayed for their ability to inhibit the hCA isoforms I, II, IX, XII and XIV, using acetazolamide (AAZ) as reference compound. The inhibitory constant (Ki) values of 5.1−5.21 and hCA XIV selectivity indexes (SI) are shown in Table 5.1.
Ki values were measured by a stopped-flow screening assay that monitors the hydration of carbon dioxide catalyzed by each hCA isoform.10 Sulfonamides 5.1−5.21 were found to inhibit hCA isoforms I, II, IX and XII with Ki values in the nanomolar range, being superior to AAZ. Remarkably, they uniformly inhibited hCA XIV at nano/subnanomolar concentration. The SAR emerging from our data revealed a different inhibition profile for each hCA isoform. Thus, for example, alcohols 5.12 and 5.18 are the most potent inhibitors of hCA I (Ki = 6.3 and 8.9 nM, respectively), while ketones 5.8 and 5.14 showed to be the most active compounds against hCA II (Ki = 4.3 and 4.8 nM, respectively). Eight compounds, 5.1, 5.3, 5.5, 5.6, 5.9, 5.14, 5.20, and 5.21, inhibited hCA IX with Ki < 10 nM, with the highest inhibition that was achieved with compounds bearing either a carboxylic acid or an amino group as the terminal function on the biphenylsulfonamide scaffold (e.g., 5.3 and 5.21, respectively). Nine compounds, 5.4, 5.6, 5.7, 5.8, 5.11, 5.12, 5.18, 5.19, and 5.21 inhibited
Br
5.29
N OMeO
Br
5.30O
Br
R = NO2 (5.31)R = Me (5.32)
O
BrR Br
5.33
O
OHO
5.32, KMnO4t-BuOH/H2O
Br
5.34
O
OMeO
R = H (5.30)R = NO2 (5.31)R= COOMe (5.34)
Br
O
R
R = H (5.35)R = NO2 (5.36)R = COOMe (5.37)
Br
OH
R
R = H (5.38)R = NO2 (5.39)R = COOMe (5.40)
Br R
PhLi, Et2O
–30 °C, 2.5 h, Ar stream
98%
benzoyl chloride, AlCl3reflux, 1.5 h
45–55%
80 °C, 3 h
91%
MeOH, H2SO4reflux, 12 h
72%
NaBH4, THF/H2Oreflux, 2 h
85–98%
TES, CF3SO3HCHCl3
25°C, 1 h
70–90%
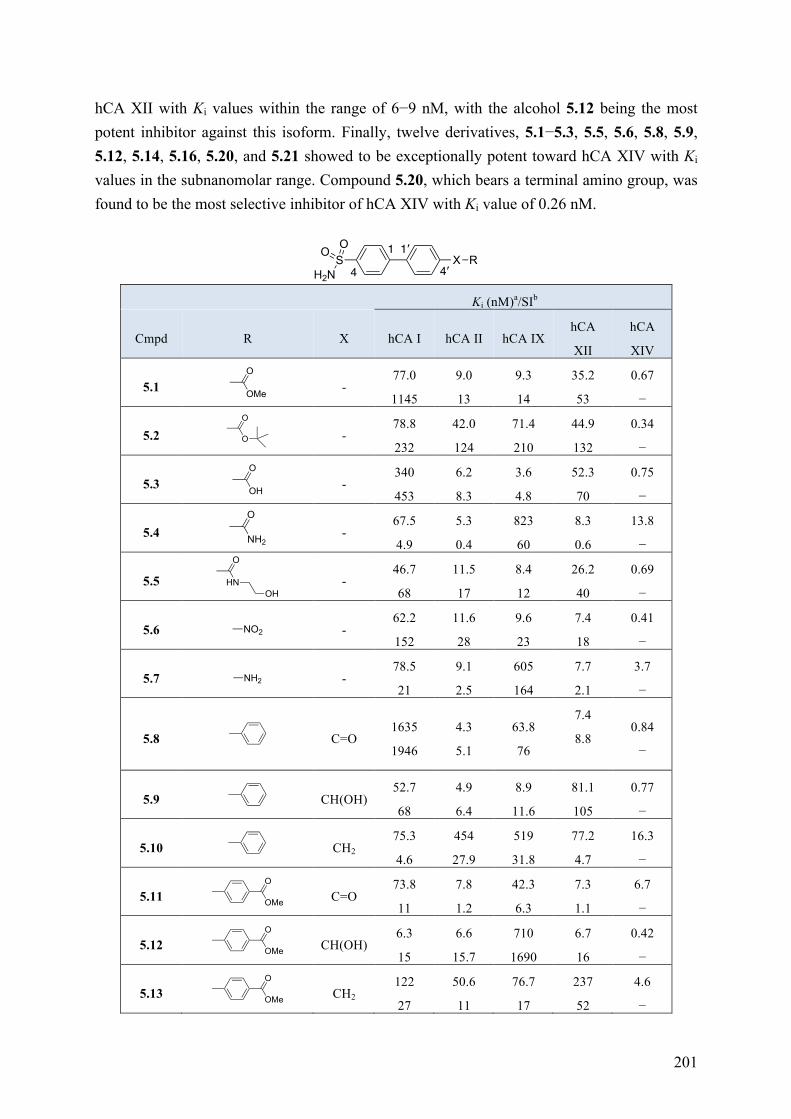
201
hCA XII with Ki values within the range of 6−9 nM, with the alcohol 5.12 being the most potent inhibitor against this isoform. Finally, twelve derivatives, 5.1−5.3, 5.5, 5.6, 5.8, 5.9, 5.12, 5.14, 5.16, 5.20, and 5.21 showed to be exceptionally potent toward hCA XIV with Ki values in the subnanomolar range. Compound 5.20, which bears a terminal amino group, was found to be the most selective inhibitor of hCA XIV with Ki value of 0.26 nM.
Ki (nM)a/SIb
Cmpd R X hCA I hCA II hCA IX hCA
XII
hCA
XIV
5.1 - 77.0
1145
9.0
13
9.3
14
35.2
53
0.67
−
5.2
- 78.8
232
42.0
124
71.4
210
44.9
132
0.34
−
5.3 - 340
453
6.2
8.3
3.6
4.8
52.3
70
0.75
−
5.4
- 67.5
4.9
5.3
0.4
823
60
8.3
0.6
13.8
−
5.5
- 46.7
68
11.5
17
8.4
12
26.2
40
0.69
−
5.6 - 62.2
152
11.6
28
9.6
23
7.4
18
0.41
−
5.7 - 78.5
21
9.1
2.5
605
164
7.7
2.1
3.7
−
5.8 C=O 1635
1946
4.3
5.1
63.8
76
7.4
8.8
0.84
−
5.9 CH(OH) 52.7
68
4.9
6.4
8.9
11.6
81.1
105
0.77
−
5.10 CH2 75.3
4.6
454
27.9
519
31.8
77.2
4.7
16.3
−
5.11 C=O 73.8
11
7.8
1.2
42.3
6.3
7.3
1.1
6.7
−
5.12 CH(OH) 6.3
15
6.6
15.7
710
1690
6.7
16
0.42
−
5.13 CH2 122
27
50.6
11
76.7
17
237
52
4.6
−
XSH2N
RO
O
4 4′
1 1′
OMe
O
O
O
OH
O
NH2
O
HN
O
OH
NO2
NH2
OMe
O
OMe
O
OMe
O

202
5.14 C=O 263
283
4.8
5.2
8.5
9.1
45.5
48.9
0.93
−
5.15 CH(OH) 72.5
18
814
204
450
113
93.9
23
4.0
−
5.16
CH2 236
284
6.9
8.3
31.4
38
90.8
109
0.83
−
5.17 C=O 80.1
23
63.3
18
85.6
24
70.6
20
3.6
−
5.18 CH(OH) 8.9
1.0
5.9
0.7
678
80
8.1
0.9
8.5
−
5.19 CH2 70.5
19
39.7
11
705
191
9.3
2.5
3.7
−
5.20 C=O 62.0
238
86.2
332
9.2
35
25.4
98
0.26
−
5.21 CH2 589
879
5.2
7.8
6.0
9
8.1
13
0.67
−
AAZ
250
6
12
0.3
25
0.7
5.7
0.1
41
− Table 5.1. Inhibition of hCA I, II, IX, XII and XIV by 1,1′-biphenyl-4-sulfonamides 5.1−5.21 and reference compound acetazolamide (AAZ). CO2 hydrase, stopped-flow method, mean from three different assays. aStandard deviations (SD) went from ±5% to ±10% of the indicated inhibitory constant (Ki) values. bhCA XIV selectivity indexes (SI) were obtained as ratio between the Kis of the indicated hCA and the corresponding hCA XIV Kis.
X-ray crystallography and molecular modeling studies furnished the molecular basis
responsible for the high selectivity of the most potent hCA XIV inhibitor within the series (compound 5.20) toward the target enzyme. Crystals of the hCA XIV/5.20 adduct were obtained by cocrystallization experiments as previously reported for other sulfonamide CA inhibitors.8 Data collected from crystallography studies revealed that the sulfonamide group of 5.20 coordinates the catalytic zinc ion and forms two hydrogen bonds with residue Thr199, as tipically observed in all CA/sulfonamide complexes (Figure 5.2).11 The biphenyl scaffold is located in the hydrophobic part of the active site8 and established several van der Waals interactions (<4.0 Å) with enzyme residues (Figures 5.3A and 5.3B). In one of the two conformations observed for the carbonyl group, it forms a hydrogen bond with the Ser132OG atom located in the “hot zone”, whereas in its second conformation, the side chain of Ser132 is hydrogen bonded with the Ser130OG atom. Finally, the 4-aminophenyl moiety forms only weak binding interaction with the enzyme, thus resulting rather disordered.
OH
O
OH
O
OH
O
NO2
NO2
NO2
NH2
NH2
H2NS
N N
SNH
O
O O
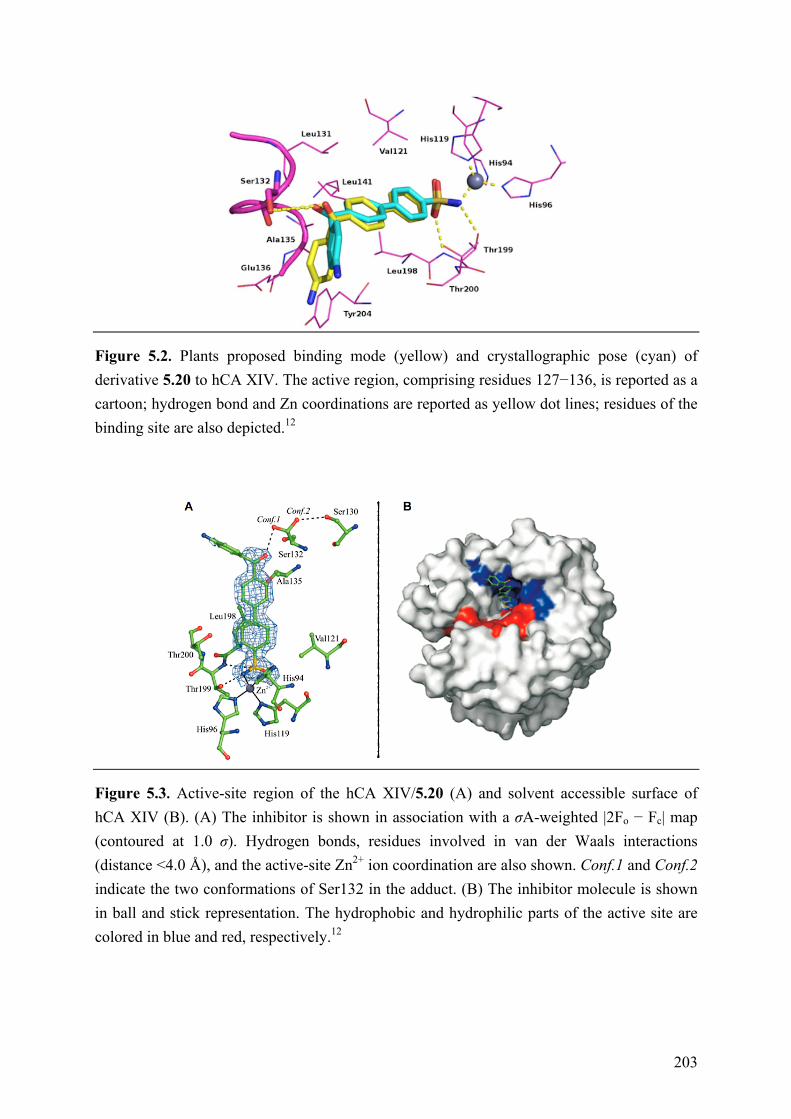
203
Figure 5.2. Plants proposed binding mode (yellow) and crystallographic pose (cyan) of derivative 5.20 to hCA XIV. The active region, comprising residues 127−136, is reported as a cartoon; hydrogen bond and Zn coordinations are reported as yellow dot lines; residues of the binding site are also depicted.12
Figure 5.3. Active-site region of the hCA XIV/5.20 (A) and solvent accessible surface of hCA XIV (B). (A) The inhibitor is shown in association with a σA-weighted |2Fo − Fc| map (contoured at 1.0 σ). Hydrogen bonds, residues involved in van der Waals interactions (distance <4.0 Å), and the active-site Zn2+ ion coordination are also shown. Conf.1 and Conf.2 indicate the two conformations of Ser132 in the adduct. (B) The inhibitor molecule is shown in ball and stick representation. The hydrophobic and hydrophilic parts of the active site are colored in blue and red, respectively.12
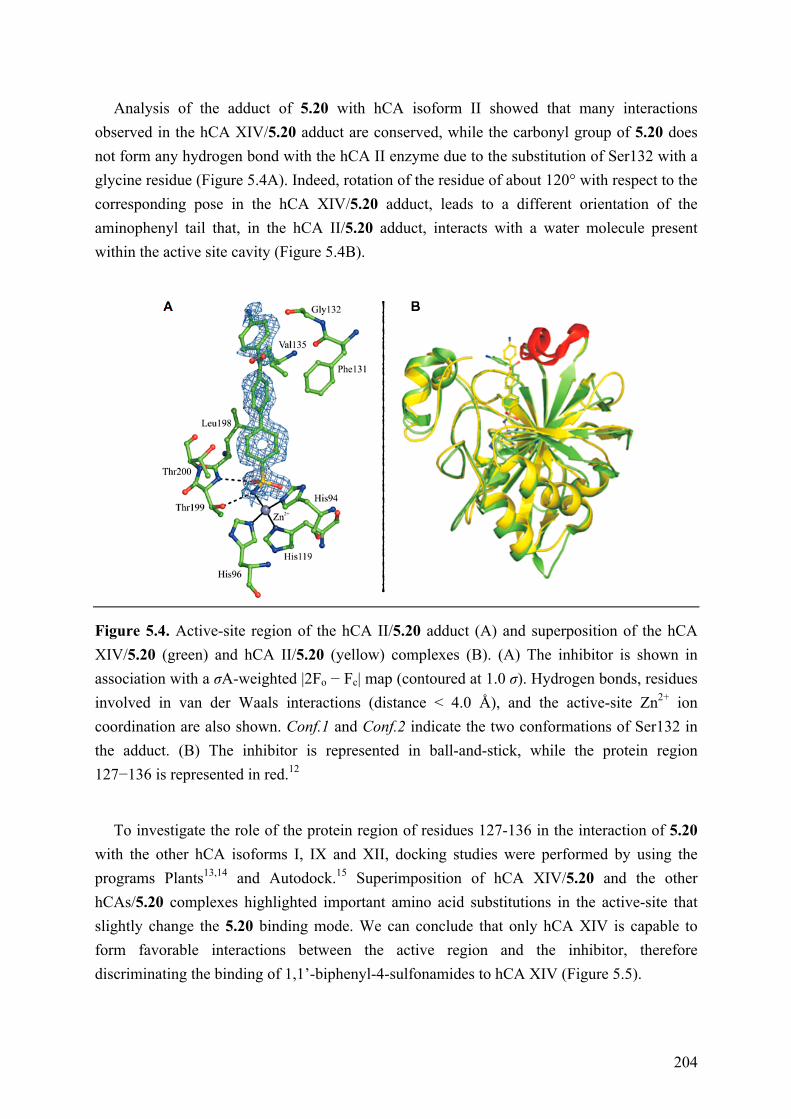
204
Analysis of the adduct of 5.20 with hCA isoform II showed that many interactions observed in the hCA XIV/5.20 adduct are conserved, while the carbonyl group of 5.20 does not form any hydrogen bond with the hCA II enzyme due to the substitution of Ser132 with a glycine residue (Figure 5.4A). Indeed, rotation of the residue of about 120° with respect to the corresponding pose in the hCA XIV/5.20 adduct, leads to a different orientation of the aminophenyl tail that, in the hCA II/5.20 adduct, interacts with a water molecule present within the active site cavity (Figure 5.4B).
Figure 5.4. Active-site region of the hCA II/5.20 adduct (A) and superposition of the hCA XIV/5.20 (green) and hCA II/5.20 (yellow) complexes (B). (A) The inhibitor is shown in association with a σA-weighted |2Fo − Fc| map (contoured at 1.0 σ). Hydrogen bonds, residues involved in van der Waals interactions (distance < 4.0 Å), and the active-site Zn2+ ion coordination are also shown. Conf.1 and Conf.2 indicate the two conformations of Ser132 in the adduct. (B) The inhibitor is represented in ball-and-stick, while the protein region 127−136 is represented in red.12
To investigate the role of the protein region of residues 127-136 in the interaction of 5.20
with the other hCA isoforms I, IX and XII, docking studies were performed by using the programs Plants13,14 and Autodock.15 Superimposition of hCA XIV/5.20 and the other hCAs/5.20 complexes highlighted important amino acid substitutions in the active-site that slightly change the 5.20 binding mode. We can conclude that only hCA XIV is capable to form favorable interactions between the active region and the inhibitor, therefore discriminating the binding of 1,1’-biphenyl-4-sulfonamides to hCA XIV (Figure 5.5).
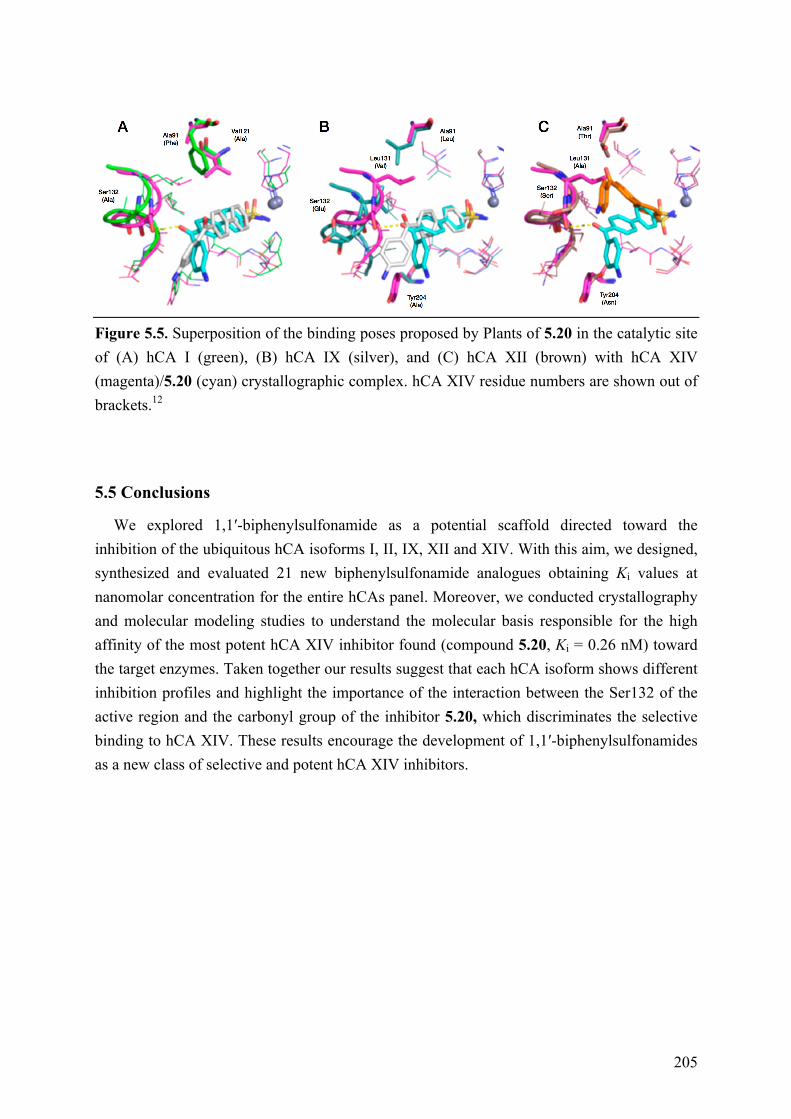
205
Figure 5.5. Superposition of the binding poses proposed by Plants of 5.20 in the catalytic site of (A) hCA I (green), (B) hCA IX (silver), and (C) hCA XII (brown) with hCA XIV (magenta)/5.20 (cyan) crystallographic complex. hCA XIV residue numbers are shown out of brackets.12
5.5 Conclusions
We explored 1,1′-biphenylsulfonamide as a potential scaffold directed toward the inhibition of the ubiquitous hCA isoforms I, II, IX, XII and XIV. With this aim, we designed, synthesized and evaluated 21 new biphenylsulfonamide analogues obtaining Ki values at nanomolar concentration for the entire hCAs panel. Moreover, we conducted crystallography and molecular modeling studies to understand the molecular basis responsible for the high affinity of the most potent hCA XIV inhibitor found (compound 5.20, Ki = 0.26 nM) toward the target enzymes. Taken together our results suggest that each hCA isoform shows different inhibition profiles and highlight the importance of the interaction between the Ser132 of the active region and the carbonyl group of the inhibitor 5.20, which discriminates the selective binding to hCA XIV. These results encourage the development of 1,1′-biphenylsulfonamides as a new class of selective and potent hCA XIV inhibitors.
206
5.6 Experimental Section
5.6.1 Chemistry
General description of common materials and instrumentation has been previously discussed in section 2.7.1.
General Procedure A for the Synthesis of Compounds 5.1 and 5.11−5.13. A mixture of 4-(4,4,5,5-tetramethyl-1,3,2-dioxaborolan-2-yl)-benzenesulfonamide (1.3 equiv), appropriate aryl bromide (1 equiv), and potassium phosphate tribasic (3 equiv) in DMF (0.2 M) was degassed for 30 min. PdCl2(dppf)·CH2Cl2 (0.03 equiv) was added under Ar stream, and the reaction mixture was heated at 60 °C for 2 h. After cooling, water and EtOAc were added and the resulting mixture was filtered through a pad of silica gel. The organic layer was washed with brine, dried over Na2SO4, filtered anc concentrated in vacuo. The resulting material was purified by silica gel column chromatography to obtain the desired compound.
General Procedure B for the Synthesis of Compounds 5.2, 5.4−5.10, 5.17, and 5.19. A mixture of 4-(4,4,5,5-tetramethyl-1,3,2-dioxaborolan-2-yl)-benzenesulfonamide (1.3 equiv), appropriate arylbromide (1 equiv), cesium carbonate (1.3 equiv), and Pd(II) acetate (0.13 equiv) in 1-methyl-2-pyrrolidinone (2.3 mL) and water (5 M) was placed into the microwave cavity (closed vessel mode, Pmax = 250 PSI). Starting MW irradiation of 100 W was used, the temperature being ramped from 25 to 110 °C. Once 110 °C was reached, taking about 2 min, the reaction mixture was held at the same temperature for 15 min while highly stirring and cooling. The mixture was diluted with water and extracted with EtOAc. The organic layer was washed with brine, dried over Na2SO4, filtered and concentrated in vacuo. Purification via silica gel column chromatography yielded the desired product.
General Procedure C for the Synthesis of Compounds 5.3, 5.14−5.16. A mixture of the appropriate 1,1′-biphenylsulfonamide (1 equiv) and lithium hydroxide hydrate (3 equiv) in THF (0.1 M) and water (0.1 M) was stirred at 25 °C overnight. The reaction mixture was made acidic (pH = 2) with 1 N HCl and extracted with EtOAc. The organic layer was washed with brine, dried over Na2SO4, and filtered. Removal of the solvent furnished the desired product.
General Procedure D for the Synthesis of Compounds 5.18 and 5.35−5.37. A mixture of the appropriate 1,1′-biphenylsulfonamide (1 equiv) and sodium borohydride (1 equiv) in THF (0.2 M) and water (4 M) was heated at reflux for 2 h. After cooling, cold water and EtOAc were added and layers were separated. The organic layer was washed with brine, dried over Na2SO4, filtered and concentrated in vacuo. The resulting material was purified by silica gel column chromatography to obtain the desired compound.
General Procedure E for the Synthesis of Compounds 5.20 and 5.21. A mixture of the appropriate 1,1′-biphenylsulfonamide (1 equiv) and tin(II) chloride dihydrate (5 equiv) in EtOAc (0.1 M) was refluxed for 3 h. After cooling, the reaction mixture was made basic (pH = 10) with satd. aq. NaHCO3 and extracted with EtOAc. The organic layer was dried over
207
Na2SO4 and filtered. Removal of the solvent furnished the desired product. General Procedure F for the Synthesis of Compounds 5.38−5.40.
Trifluoromethanesulfonic acid (11 equiv) was added dropwise to a cold solution of the appropriate 4-bromoderivative (1 equiv) and triethylsilane (4 equiv) in CHCl3 (0.2 mL). The reaction mixture was stirred for 1 h at 25 °C, then diluted with water and extracted with CHCl3. The organic layer was washed with satd. aq. NaHCO3 and brine, dried over Na2SO4 and filtered. Removal of the solvent gave a residue that was purified by silica gel column chromatography to obtain the desired compound.
Methyl 4-sulfamoyl-1,1'-biphenyl-4'-carboxylate (5.1). Following synthetic procedure A using methyl ester of the 4-bromobenzoic acid (0.210 g, 1.00 mmol), purification by silica gel column chromatography (hexanes/EtOAc 50:50) afforded the title compound as a brown solid (0.170 g, 0.583 mmol, 58% yield). M.p. 240−243 °C (EtOH). 1H NMR (400 MHz, DMSO-d6) δ 3.89 (s, 3H), 7.44 (broad s, 2H, disappeared on treatment with D2O), 7.88−7.96 (m, 6H), 8.07 (d, J = 8.2 Hz, 2H) ppm. IR ν 1701, 3231, 3232 cm−1. Anal. (C14H13NO4S (291.32)) C, H, N, S.
tert-Butyl 4-sulfamoyl-1,1'-biphenyl-4'-carboxylate (5.2). Following synthetic procedure B using tert-butyl 4-bromobenzoate (0.070 g, 0.272 mmol), purification by silica gel column chromatography (CH2Cl2/EtOH 95:5) afforded the title compound as a green solid (0.025 g, 0.075 mmol, 28% yield). M.p. 178−181 °C (EtOH). 1H NMR (400 MHz, DMSO-d6) δ 1.57 (s, 9H), 7.45 (broad s, 2H, disappeared on treatment with D2O), 7.87 (d, J = 7.9 Hz, 2H), 7.90−7.93 (m, 4H), 8.01 (d, J = 7.9 Hz, 2H) ppm. IR ν 1683, 3232, 3281 cm−1. Anal. (C17H19NO4S (333.40)) C, H, N, S.
4-Sulfamoyl-1,1'-biphenyl-4'-carboxylic acid (5.3). Following synthetic procedure C using methyl 4-sulfamoyl-1,1′-biphenyl-4′-carboxylate (0.100 g, 0.340 mmol), the title compound was obtained as a brown solid (0.090 g, 0.324 mmol, 95% yield). M.p. >280 °C (EtOH). 1H NMR (400 MHz, DMSO-d6) δ 7.43 (broad s, 2H, disappeared on treatment with D2O), 7.86 (d, J = 8.2 Hz, 2H), 7.93 (m, 4H), 8.05 (d, J = 8.3 Hz, 2H), 12.75 (broad s, 1H, disappeared on treatment with D2O) ppm. IR ν 1670, 3258, 3374 cm−1. Anal. (C13H11NO4S (277.30)) C, H, N, S.
4-sulfamoyl-1,1'-biphenyl-4'-carboxamide (5.4). Following synthetic procedure B using 4-bromobenzamide (0.054 g, 0.270 mmol), purification by silica gel column chromatography (EtOAc) afforded the title compound as a white solid (0.070 g, 0.253 mmol, 94% yield). M.p. >280 °C (EtOH). 1H NMR (400 MHz, DMSO-d6) δ 7.43 (broad s, 2H, disappeared on treatment with D2O), 7.83 (d, J = 8.3 Hz, 2H), 7.90−7.95 (m, 4H), 8.00 (d, J = 8.1 Hz, 2H), 8.07 (broad s, 2H, disappeared on treatment with D2O) ppm. IR ν 1643, 3163, 3367 cm−1. Anal. (C13H12N2O3S (276.31)) C, H, N, S.
N-(2-Hydroxyethyl)-4-sulfamoyl-1,1'-biphenyl-4'-carboxamide (5.5). Following synthetic procedure B using 4-bromo-N-(2-hydroxyethyl)-benzamide (0.066 g, 0.270 mmol),
208
purification by silica gel column chromatography (CH2Cl2/EtOH 80:20) afforded the title compound as a white solid (0.060 g, 0.187 mmol, 69% yield). M.p. 187−190 °C (EtOH). 1H NMR (400 MHz, DMSO-d6) δ 3.31−3.38 (m, 2H), 3.51−3.54 (m, 2H), 4.75 (t, J = 5.5 Hz, 1H), 7.43 (broad s, 2H, disappeared on treatment with D2O), 7.84 (d, J = 8.6 Hz, 2H), 7.90−7.95 (m, 4H), 7.99 (d, J = 8.2 Hz, 2H), 8.53 (broad s, 1H, disappeared on treatment with D2O) ppm. IR ν 1637, 2922, 3068, 3316, 3389 cm−1. Anal. (C15H16N2O4S (320.36)) C, H, N, S.
4'-Nitro-1,1'-biphenyl-4-sulfonamide (5.6). Following synthetic procedure B using 1-bromo-4-nitrobenzene (0.054 g, 0.267 mmol), purification by silica gel column chromatography (hexanes/EtOAc 50:50) afforded the title compound as a yellow solid (0.030 g, 0.108 mmol, 40% yield). M.p. 143−145 °C (EtOH). Lit.16 m.p. 145 °C.
4'-Amino-1,1'-biphenyl-4-sulfonamide (5.7). Following synthetic procedure B using 4-bromoaniline (0.172 g, 1.00 mmol), purification by silica gel column chromatography (hexanes/EtOAc 50:50) afforded the title compound as a yellow solid (0.110 g, 0.443 mmol, 45% yield). M.p. 271−274 °C (EtOH). Lit.17 266−267 °C. 1H NMR (400 MHz, DMSO-d6) δ 5.38 (broad s, 2H, disappeared on treatment with D2O), 6.65 (d, J = 8.6 Hz, 2H), 7.29 (broad s, 2H, disappeared on treatment with D2O), 7.44 (d, J = 8.5 Hz, 2H), 7.71 (d, J = 8.7 Hz, 2H), 7.78 (d, J = 8.4 Hz, 2H) ppm. IR ν 1588, 3276, 3434 cm−1. Anal. (C12H12N2O2S (248.30)) C, H, N, S.
4'-Benzoyl-1,1'-biphenyl-4-sulfonamide (5.8). Following synthetic procedure B using (4-bromophenyl)(phenyl)methanone (0.070 g, 0.268 mmol), purification by silica gel column chromatography (hexanes/EtOAc 50:50) afforded the title compound as a white solid (0.070 g, 0.207 mmol, 77% yield). M.p. 262−265 °C (EtOH). 1H NMR (400 MHz, DMSO-d6) δ 7.44 (broad s, 2H, disappeared on treatment with D2O), 7.57−7.61 (m, 2H), 7.68−7.98 (m, 11H) ppm. IR ν 1649, 3234, 3299 cm−1. Anal. (C19H15NO3S (337.39)) C, H, N, S.
4'-(Hydroxy(phenyl)methyl)-1,1'-biphenyl-4-sulfonamide (5.9). Following synthetic procedure B using (4-bromophenyl)(phenyl)methanol (0.071 g, 0.270 mmol), purification by silica gel column chromatography (hexanes/EtOAc 50:50) afforded the title compound as a white solid (0.055 g, 0.162 mmol, 60 % yield). M.p. 195−197 °C (from EtOH). 1H NMR (400 MHz, DMSO-d6) δ 5.76 (d, J = 3.82 Hz, 1H), 5.96 (d, J = 4 Hz, 1H), 7.19−7.23 (m, 1H), 7.29−7.33 (m, 2H), 7.36 (broad s, 2H, disappeared on treatment with D2O), 7.40−7.42 (m, 2H), 7.50 (d, J = 8.1 Hz, 2H), 7.67 (d, J = 8.2 Hz, 2H), 7.81−7.88 (m, 4H) ppm. IR ν 1595, 2923, 3337 cm−1. Anal. (C19H17NO3S (339.41)) C, H, N, S.
4'-Benzyl-1,1'-biphenyl-4-sulfonamide (5.10). Following synthetic procedure B using 1-benzyl-4-bromobenzene (0.067 g, 0.271 mmol), purification by silica gel column chromatography (hexanes/EtOAc 50:50) afforded the title compound as a white solid (0.050 g, 0.154 mmol, 57% yield). M.p. 165−168 °C (EtOH). 1H NMR (400 MHz, DMSO-d6) δ 4.00 (s, 2H), 7.19−7.32 (m, 5H; m, 3H after treatment with D2O), 7.35−7.37 (m, 4H), 7.65 (d, J =
209
8.1 Hz, 2H), 7.81−7.88 (m, 4H) ppm. IR ν 3271, 3375 cm−1. Anal. (C19H17NO2S (323.41)) C, H, N, S.
Methyl 4-(4-Sulfamoyl-1,1′-biphenyl-4′-carbonyl)benzoate (5.11). Following synthetic procedure A using methyl 4-(4-bromobenzoyl)benzoate (0.319 g, 1.00 mmol), purification by silica gel column chromatography (hexanes/EtOAc 50:50) afforded the title compound as a white solid (0.277 g, 0.700 mmol, 70% yield). M.p. 283−286 °C (EtOH). 1H NMR (400 MHz, DMSO-d6) δ 3.92 (s, 3H), 7.45 (broad s, 2H, disappeared on treatment with D2O), 7.87−7.90 (m, 4H), 7.94−7.99 (m, 6H), 8.13−8.15 (m, 2H) ppm. IR ν 1644, 1720, 3277, 3375 cm−1. Anal. (C21H17NO5S (395.43)) C, H, N, S.
Methyl 4-(4-Sulfamoyl-1,1′-biphenyl-4′-hydroxymethyl)benzoate (5.12). Following synthetic procedure A using methyl 4-(hydroxy(4-bromophenyl)methyl)benzoate (1.17 g, 3.64 mmol), purification by silica gel column chromatography (CHCl3/EtOAc 50:50) afforded the title compound as a white solid (0.350 g, 0.881 mmol, 24% yield). M.p. 163−165 °C (EtOH). 1H NMR (400 MHz, DMSO-d6) δ 3.83 (s, 3H), 5.85 (d, J = 3.7 Hz, 1H), 6,16 (d, J = 3.9 Hz, 1H), 7.38 (broad s, 2H, disappeared on treatment with D2O) 7.51 (d, J = 8.2 Hz, 2H), 7.57 (d, J = 8.1 Hz, 2H), 7.68 (d, J = 8.3 Hz, 2H), 7.81−7.88 (m, 4H), 7.92 (d, J = 8.4 Hz, 2H) ppm. IR ν 1721, 3277, 3379, 3506 cm−1. Anal. (C21H19NO5S (397.44)) C, H, N, S.
Methyl 4-(4-Sulfamoyl-1,1′-biphenyl-4′-methyl)benzoate (5.13). Following synthetic procedure A using methyl 4-(4-bromobenzyl)benzoate (0.880 g, 2.88 mmol), purification by silica gel column chromatography (CHCl3/EtOAc 50:50) afforded the title compound as a white solid (0.240 g, 0.629 mmol, 22% yield). M.p. 150−153 °C (EtOH). 1H NMR (400 MHz, DMSO-d6) δ 3.82 (s, 3H), 4.08 (s, 2H), 7.36−7.38 (m, 4H), 7.40−7.42 (m, 2H) 7.66 (d, J = 7.9 Hz, 2H), 7.81−7.91 (m, 6H) ppm. IR ν 1704, 3258, 3353 cm−1. Anal. (C21H19NO4S (381.44)) C, H, N, S.
4-(4-Sulfamoyl-1,1′-biphenyl-4′-carbonyl)benzoic Acid (5.14). Following synthetic procedure C using methyl 4-(4-sulfamoyl-1,1′-biphenyl-4′-carbonyl)benzoate (0.050 g, 0.126 mmol), the title compound was obtained as a white solid (0.030 g, 0.079 mmol, 62% yield). M.p. >280 °C (EtOH). Lit.18 351−352 °C. 1H NMR (400 MHz, DMSO-d6) δ 7.45 (broad s, 2H, disappeared on treatment with D2O), 7.86−7.90 (m, 4H), 7.93−7.99 (m, 6H) 8.11−8.13 (m, 2H), 12.85 (broad s, 1H, disappeared on treatment with D2O) ppm. IR ν 1687, 2845, 3273, 3370 cm−1. Anal. (C20H15NO5S (381.40)) C, H, N, S.
4-(4-Sulfamoyl-1,1′-biphenyl-4′-hydroxymethyl)benzoic Acid (5.15). Following synthetic procedure C using methyl 4-(4-sulfamoyl-1,1′-biphenyl-4′-hydroxymethyl)benzoate (0.050 g, 0.126 mmol), purification by silica gel column chromatography (EtOAc/EtOH 90:10) the title compound was obtained as a white solid (0.043 g, 0.112 mmol, 89% yield). M.p. >280 °C (EtOH). 1H NMR (400 MHz, DMSO-d6) δ 5.79 (d, J = Hz, 1H), 6.03 (d, J = Hz, 1H), 7.39−7.42 (m, 4H; m, 2H after treatment with D2O), 7.50 (d, J = 8.2 Hz, 2H), 7.67 (d, J = 8.0 Hz, 2H), 7.81−7.89 ppm (m, 6H), 12.83 (broad s, 1H, disappeared on treatment with D2O)

210
ppm. IR ν 1685, 2845, 3360, 3365, 3568 cm−1. Anal. (C20H17NO5S (383.42)) C, H, N, S. 4-(4-Sulfamoyl-1,1′-biphenyl-4′-methyl)benzoic Acid (5.16). Following synthetic procedure
C using methyl 4-(4-sulfamoyl-1,1′-biphenyl-4′-methyl)benzoate (0.050 g, 0.131 mmol), the title compound was obtained as a white solid (0.047 g, 0.127 mmol, 98% yield). M.p. >280 °C (EtOH). 1H NMR (400 MHz, DMSO-d6) δ 4.08 (s, 2H), 7.31−7.43 (m, 6H; m, 4H after treatment with D2O), 7.67 (d, J = 8.2 Hz, 2H), 7.82−7.89 (m, 6H), 12.79 (broad s, 1H, disappeared on treatment with D2O) ppm. IR ν 3346, 3258, 1681 cm−1. Anal. (C20H17NO4S (367.42)) C, H, N, S.
4-Sulfamoyl-4′-(4-nitrobenzoyl)-1,1′-biphenyl (5.17). Following synthetic procedure B using (4-bromophenyl)(4-nitrophenyl)methanone (0.083 g, 0.271 mmol), purification by silica gel column chromatography (hexanes/EtOAc 50:50) afforded the title compound as a white solid (0.031 g, 0.081 mmol, 30% yield). M.p. 222−225 °C (EtOH). 1H NMR (400 MHz, DMSO-d6) δ 7.46 (broad s, 2H, disappeared on treatment with D2O), 7.89−7.94 (m, 3H), 7.95−8.02 (m, 7H), 8.38−8.41 (m, 2H) ppm. IR ν 1641, 3103, 3211, 3380 cm−1. Anal. (C19H14N2O5S (382.39)) C, H, N, S.
4-Sulfamoyl-4′- hydroxymethyl(4-nitrophenyl)-1,1′-biphenyl (5.18). Following synthetic procedure D using 4-sulfamoyl-4′-(4-nitrobenzoyl)-1,1′-biphenyl (0.190 g, 0.497 mmol), purification by silica gel column chromatography (hexanes/EtOAc 50:50) afforded the title compound as a white solid (0.070 g, 0.182 mmol, 37% yield). M.p. 169−172 °C (EtOH). 1H NMR (400 MHz, DMSO-d6) δ 5.94 (d, J = 2.5 Hz, 1H), 6.31 (d, J = 3.5 Hz, 1H), 7.37 (broad s, 2H, disappeared on treatment with D2O), 7.53 (d, J = 8.2 Hz, 2H), 7.68−7.72 (m, 4H), 7.82−7.89 (m, 4H), 8.19−8.21 (m, 2H) ppm. IR ν 3258, 3362, 3571 cm−1. Anal. (C19H16N2O5S (384.41)) C, H, N, S.
4-Sulfamoyl-4′-methyl(4-nitrophenyl)-1,1′-biphenyl (5.19). Following synthetic procedure B using 1-bromo-4-(4-nitrobenzyl)benzene (0.079 g, 0.270 mmol), purification by silica gel column chromatography (CHCl3/EtOAc 50:50) afforded the title compound as a yellow solid (0.060 g, 0.163 mmol, 60% yield). M.p. 165−168 °C (EtOH). 1H NMR (400 MHz, DMSO-d6) δ 4.16 (s, 2H), 7.39−7.41 (m, 4H; m, 2H after treatment with D2O), 7.56 (d, J = 8.7 Hz, 2H), 7.68 (d, J = 8.2 Hz, 2H), 7.82−7.89 (m, 4H), 8.18 (d, J = 8.8 Hz, 2H) ppm. IR ν 3270, 3367 cm−1. Anal. (C19H16N2O4S (368.41)) C, H, N, S.
4-Sulfamoyl-4′-(4-aminobenzoyl)-1,1′-biphenyl (5.20). Following synthetic procedure D using 4-sulfamoyl-4′-(4-nitrobenzoyl)-1,1′-biphenyl (0.150 g, 0.390 mmol), the title compound was obtained as a yellow solid (0.080 g, 0.226 mmol, 58% yield). M.p. 140−145 °C (EtOH). 1H NMR (400 MHz, DMSO-d6) δ 6.20 (broad s, 2H, disappeared on treatment with D2O), 6.62 (d, J = 8.7 Hz, 2H), 7.44 (broad s, 2H, disappeared on treatment with D2O), 7.57 (d, J = 8.7 Hz, 2H), 7.72 (d, J = 7.9 Hz, 2H), 7.87 (d, J = 7.9 Hz, 2H), 7.86−7.96 (m, 4H) ppm. IR ν 1638, 3264, 3340 cm−1. Anal. (C19H16N2O3S (352.41)) C, H, N, S.
4-Sulfamoyl-4′-methyl(4-aminophenyl)-1,1′-biphenyl (5.21). Following synthetic procedure
211
D using 4-sulfamoyl-4′-methyl(4-nitrophenyl)-1,1′-biphenyl (0.084 g, 0.228 mmol), the title compound was obtained as a yellow solid (0.040 g, 0.118 mmol, 52% yield). M.p. 235 °C with decomposition (EtOH). 1H NMR (400 MHz, DMSO-d6) δ 3.80 (s, 2H), 4.87 (broad s, 2H, disappeared on treatment with D2O), 6.50 (d, J = 8.2 Hz, 2H), 6.90 (d, J = 8.2 Hz, 2H), 7.30 (d, J = 8.1 Hz, 2H), 7.36 (broad s, 2H, disappeared on treatment with D2O), 7.63 (d, J = 8.1 Hz, 2H), 7.81−7.88 (m, 4H) ppm. IR ν 3310, 3410 cm−1. Anal. (C19H18N2O2S (338.42)) C, H, N, S.
1-Bromo-4-nitrobenzene (5.24). 3-Chloroperbenzoic acid (10.3 g, 60.0 mmol) was added to a mixture of 4-bromoaniline (2.00 g, 12.0 mmol) in toluene (50 mL). The reaction was refluxed for 3 h, and after cooling was diluted with water and extracted with EtOAc. The organic layer was washed with 1 N NaOH and with brine, dried over Na2SO4 and filtered. Removal of the solvent furnished the desired product as a solid (2.30 g, 11.4 mmol, 95% yield). M.p. 123−125 °C (EtOH). Lit.19 m.p. 126−128 °C.
tert-Butyl 4-bromobenzoate (5.26). 1,1'-Carbonyldiimidazole (2.43 g, 15.0 mmol) was added to a solution of 4-bromobenzoic acid (2.00 g, 10.0 mmol) in THF (20 mL). The reaction mixture was stirred for 2 h at 25 °C. A solution of potassium tert-butoxide (3.37 g, 30.0 mmol) in THF (30 mL) was added dropwise and the reaction mixture was stirred for 2 h at 25 °C. Water was added and the resulting solution was extracted with EtOAc. The organic layer was washed with brine, dried over Na2SO4 and filtered. Removal of the solvent gave a residue that was purified by silica gel column chromatography (CH2Cl2) to furnish the title compound as a yellow oil (2.29 g, 8.91 mmol, 89% yield).20
4-Bromobenzamide (5.27). Following synthetic procedure described for 5.26 using an NH4OH solution (≥25% in water), purification by silica gel column chromatography (EtOAc) afforded the title compound as a white solid (1.86 g, 9.30 mmol, 93% yield). M.p. 198−200 °C (EtOH). Lit.21 m.p. 199−200 °C.
4-Bromo-N-(2-hydroxyethyl)benzamide (5.28). To a solution of 4-bromobenzoic acid (2.00 g, 10.0 mmol), 2-aminoethanol (1.83 g, 30.0 mmol) and Et3N (3.0 g, 30.0 mmol) in DMF (20 mL) wad added (benzotriazol-1-yloxy)tris(dimethylamino) phosphonium hexafluorophosphate (4.42 g, 10.0 mmol). The reaction mixture was stirred for 2 h at 25 °C, diluted with water and extracted with EtOAc. The organic layer was washed with brine, dried over Na2SO4 and filtered. Removal of the solvent gave a residue that was triturated with n-hexane to obtain the desired product as a white solid (1.60 g, 6.55 mmol, 66% yield). M.p. 131−134 °C (EtOH). 1H NMR (400 MHz, DMSO-d6) δ 3.27-3.31 (m, 2H), 3.46- 3.50 (m, 2H), 4.70 (t, J = 5.6 Hz, 1H), 7.64 (d, J = 8.5 Hz, 2H), 7.77 (d, J = 8.6 Hz, 2H), 8.49 (broad s, 1H, disappeared on treatment with D2O) ppm. IR ν 1629, 3082, 3279 cm-1. Anal. (C9H10BrNO2 (244.09)) C, H, Br, N.
4-Bromo-N-methoxy-N-methylbenzamide (5.29). Following synthetic procedure described for 5.28 using N,O-dimethylhydroxylamine hydrochloride (0.975 g, 10.0 mmol), the title
212
compound was obtained as a colourless oil (1.73 g, 7.10 mmol, 71% yield).22 (4-Bromophenyl)(phenyl)methanone (5.30). Phenyllithium (0.294 g, 3.50 mmol, 1.9 M in
butyl ether) was added to a suspension of 4-bromo-N-methoxy-N-methylbenzamide 29 (1.00 g, 3.50 mmol) in anhydrous Et2O (20 mL) at −30 °C under Ar stream. The reaction mixture was stirred in the same conditions for 2.5 h, diluted with a saturated aqueous solution of NH4Cl and extracted with EtOAc. The organic layer was washed with brine, dried over Na2SO4, filtered and concentrated in vacuo. The resulting material was putified by silica gel column chromatography (CH2Cl2) to obtain the title compound (0.900 g, 0.345 mmol, 98% yield). M.p. 65−67 °C (EtOH). Lit.23 m.p. 75−76 °C.
(4-Bromophenyl)(4-nitrophenyl)methanone (5.31). To a suspension of AlCl3 (0.720 g, 5.40 mmol) in bromobenzene (4.24 g, 27.0 mmol) was added dropwise a solution of 4-nitrobenzoyl chloride (1.00 g, 5.40 mmol) in bromobenzene (10 mL). The reaction mixture was refluxed for 1.5 h. After cooling the mixture was quenced on crushed ice containing 6 N HCl and extracted with EtOAc. The organic layer was washed with brine, dried over Na2SO4, filtered and concentrated in vacuo. Purification via silica gel column chromatography (hexanes/EtOAc 80:20) afforded the title compound as a solid (0.910 g, 0.297 mmol, 55% yield). M.p. 115−117 °C (EtOH). Lit.24 m.p. 125 °C.
(4-Bromophenyl)(p-tolyl)methanone (5.32). Following synthetic procedure described for 5.31 using 4-toluoyl chloride (0.835 g, 5.40 mmol), purification by silica gel column chromatography (hexanes/EtOAc 80:20) afforded the title compound as a solid (0.669 g, 2.43 mmol, 45% yield). M.p. 135−138 °C (EtOH). Lit.25 m.p. 139−140 °C.
4-(4-Bromobenzoyl)benzoic acid (5.33). Potassium permanganate (2.84 g, 180 mmol) was added portionwise to a mixture of (4-bromophenyl)(p-tolyl)methanone (1.00 g, 3.60 mmol) in tert-buyl alcohol (5 mL) and water (7.5 mL) at 50 °C. The reaction mixture was heated and stirred for 3 h at 80 °C, then cooled to 0 °C, made acidic with 6 N HCl and extracted with EtOAc. The organic layer was washed with brine, dried over Na2SO4 and filtered. Removal of the solvent furnished the desired product (1.00 g, 3.28 mmol, 91% yield). M.p. 270−274 °C (EtOH). Lit.26 m.p. 274 °C.
Methyl 4-(4-Bromobenzoyl)benzoate (5.34). Synthesized following synthetic procedure described by Campagnola, P. J. et al.27 M.p. 175−177 °C (EtOH). Lit.28 m.p. 177−178 °C.
(4-Bromophenyl)(phenyl)methanol (5.35). Following synthetic procedure D using (4-bromophenyl)(phenyl)methanone (0.128 g, 0.490 mmol), purification by silica gel column chromatography (hexanes/EtOAc 50:50) afforded the title compound as an oil (0.113 g, 0.431 mmol, 88% yield). Lit.29 (4-Bromophenyl)(4-nitrophenyl)methanol (5.36). Following synthetic procedure D using (4-bromophenyl)(4-nitrophenyl)methanone (0.150 g, 0.490 mmol), purification by silica gel column chromatography (hexanes/EtOAc 50:50) afforded the title compound as a solid (0.128 g, 0.416 mmol, 85% yield). M.p. 159−162 °C (EtOH). Lit.30 m.p. 158−159 °C.
213
Methyl 4-((4-Bromophenyl)(hydroxy)methyl)benzoate (5.37). Following synthetic procedure D using methyl 4-(4-bromobenzoyl)benzoate (2.95 g, 9.24 mmol), purification by silica gel column chromatography (hexanes/EtOAc 50:50) afforded the title compound as a white solid (2.90 g, 9.03 mmol, 98% yield). M.p. 50−53 °C (EtOH). 1H NMR (400 MHz, CDCl3) δ 2.39 (d, J = 3.4 Hz, 1H), 3.90 (s, 3H), 5.84 (d, J = 3.1 Hz, 1H), 7.22-7.25 (m, 2H), 7.42-7.48 (m, 4H), 7.99-8.01 (m, 2H) ppm. IR ν 1719, 3438 cm-1. Anal. (C15H13BrO3 (321.17)) C, H, Br.
1-Benzyl-4-bromobenzene (5.38). Following synthetic procedure F using (4-bromophenyl)(phenyl)methanol (1.00 g, 3.80 mmol), purification by silica gel column chromatography (hexanes/EtOAc 67:33) furnished the title compound as an oil (0.800 g, 0.324 mmol, 85% yield).31
1-Bromo-4-(4-nitrobenzyl)benzene (5.39). Following synthetic procedure F using (4-bromophenyl)(4-nitrophenyl)methanol (1.00 g, 3.24 mmol), trituration with hexanes furnished the title compound as a brown solid (0.850 g, 2.91 mmol, 90%yield). M.p. 118−121 °C (EtOH). 1H NMR (400 MHz, CDCl3) δ 4.05 (s, 2H), 7.06 (d, J = 8.1 Hz, 2H), 7.33 (d, J = 8.3 Hz, 2H), 7.46 (d, J = 8.3 Hz, 2H), 8.17 (d, J = 8.6 Hz, 2H) ppm. Anal. (C13H10BrNO2 (292.13)) C, H, Br, N.
Methyl 4-(4-bromobenzyl)benzoate (5.40). Following synthetic procedure F using methyl 4-((4-Bromophenyl)(hydroxy)methyl)benzoate (1.50 g, 4.67 mmol), purification by silica gel column chromatography (hexanes/EtOAc 80:20) furnished the title compound as a white solid (1.00 g, 3.28 mmol, 70% yield). M.p. 58−60 °C (EtOH). Lit.32 m.p. 60−61 °C.
5.6.2 Biological Assay
CA Inhibition Screening Assay. An Applied Photophysics stopped-flow instrument has been used for assaying the CA-catalyzed CO2 hydration activity.10 Phenol red (at a concentration of 0.2 mM) has been used as an indicator, working at the maximum absorbance of 557 nm, with 20 mM Hepes (pH 7.5) as buffer, and 20 mM Na2SO4 (for maintaining constant the ionic strength). The initial rates of the CA-catalyzed CO2 hydration reaction were followed for a period of 10−100 s. The CO2 concentrations ranged from 1.7 to 17 mM for the determination of the kinetic parameters and inhibition constants. For each inhibitor, at least six traces of the initial 5−10% of the reaction have been used for determining the initial velocity. The uncatalyzed rates were determined in the same manner and subtracted from the total observed rates. Stock solutions of inhibitor (0.1 mM) were prepared in distilled−deionized water, and dilutions up to 0.01 nM were done thereafter with distilled−deionized water. Inhibitor and enzyme solutions were preincubated together for 15 min at room temperature prior to assay to allow for the formation of the E−I complex. The inhibition constants were obtained by nonlinear least-squares methods using the Cheng−Prusoff equation and represent the mean from at least three different determinations.
214
Errors were in the range of ± 5−10% of the reported Ki values. CA isoforms were recombinant enzymes obtained in house as reported earlier.33−35 The enzyme concentrations in the assay system were: hCA I, 13.2 nM; hCA II, 8.4 nM; hCA IX, 7.9 nM; hCA XII, 15.2 nM; hCA XIV, 10.7 nM.
5.6.3 X-ray Crystallography
Co-crystallization. hCA XIV enzyme was prepared and purified as previously described.11 The hCA XIV/20 adduct was prepared by adding a 50-fold excess of the inhibitor to a 0.1 mg/mL enzyme solution in 20 mM Tris-HCl pH 7.5. After incubation overnight at 4 °C, the complex was concentrated to 10 mg/mL. Crystals were obtained at 20 °C using the hanging drop vapor diffusion technique by equilibrating drops containing 1 µL of complex solution and an equal volume of precipitant solution consisting of 1.9 M ammonium sulfate, 0.1 M Tris-HCl, pH 8.5, over a reservoirs containing 1 mL of precipitant solution. Crystals appeared after 3 days. Crystals of the hCA II/5.20 adduct were obtained as previously described.36
Diffraction Data and Collection. X-ray diffraction data for both hCA XIV/5.20 and hCA II/5.20 adducts were collected at 100 K, using a copper rotating anode generator developed by Rigaku and equipped with Rigaku Saturn CCD detector. Prior to cryogenic freezing, the crystals were transferred to the respective precipitant solution with the addition of 20% (v/v) glycerol. Data were integrated, merged, and scaled using HKL2000.37 Crystal parameters and data collection for both adducts are reported in Table 1S of Supporting Information from Lit. 12.
Structure Determination. Phasing of the complexes was carried out with CNS38 using as starting model the structures of previously solved hCA XIV (PDB ID: 4LU3)8 and hCA II (PDB ID: 1CA2).39 The graphic program O40 was used to view the electron density maps, and the structure was adjusted based on the calculated electron density. Composite simulated-annealing omit maps were used regularly during the building process to verify and correct the models.38 Topology files of the inhibitor was generated using the PRODRG2 server.41 The geometric restraints of the final models were analyzed using PROCHECK.42 The refinement statistics of the final models are summarized in Table 1S, Supporting Information from Lit. 12. Coordinates and structure factors were deposited in the Protein Data Bank (accession code 5CJF and 5E2R).
5.6.4 Molecular Modeling
All molecular modeling studies were performed on a MacPro dual 2.66 GHz Xeon running Ubuntu 14.04 LTS. The CA structures were downloaded from the PDB (http://www.rcsb.org/). Hydrogen atoms were added to the protein, using Molecular Operating Environment (MOE) 2010 (Molecular Operating Environment (MOE 2010.10),
215
Chemical Computing Group, Inc., Montreal, Quebec, Canada, http://www.chemcomp. com) and minimized, keeping all the heavy atoms fixed until a rmsd gradient of 0.05 kcal mol−1 Å−1 was reached. Ligand structures were built with MOE and minimized using the MM-FF94x force field until a rmsd gradient of 0.05 kcal mol−1 Å−1 was reached. The docking simulations were performed using PLANTS13,14 and Autodock 4.0.15 The images presented here were created with PyMOL.43
216
5.7 References
1. Supuran, C. T. Carbonic anhydrases. Bioorg. Med. Chem. 2013, 21, 1377−1378. 2. Alterio, V.; Di Fiore, A.; D’Ambrosio, K.; Supuran, C. T.; De Simone, G. Multiple
binding modes of inhibitors to carbonic anhydrases: how to design specific drugs targeting 15 different isoforms? Chem. Rev. 2012, 112, 4421−4468.
3. De Simone, G.; Di Fiore, A.; Capasso, C.; Supuran, C. T. The zinc coordination pattern in the η-carbonic anhydrase from Plasmodium falciparum is different from all other carbonic anhydrase genetic families. Bioorg. Med. Chem. Lett. 2015, 25, 1385−1389.
4. Neri, D.; Supuran, C. T. Interfering with pH regulation in tumours as a therapeutic strategy. Nat. Rev. Drug Discovery 2011, 10, 767−777.
5. Ogilvie, J. M.; Ohlemiller, K. K.; Shah, G. N.; Ulmasov, B.; Becker, T. A.; Waheed, A.; Hennig, A. K.; Lukasiewicz, P. D.; Sly, W. S. Carbonic anhydrase XIV deficiency produces a functional defect in the retinal light response. Proc. Natl. Acad. Sci. U. S. A. 2007, 104, 8514−8519.
6. Supuran, C. T.; Scozzafava, A. Carbonic anhydrases as targets for medicinal chemistry. Bioorg. Med. Chem. 2007, 15, 4336−4350.
7. Supuran, C. T. Carbonic anhydrases: novel therapeutic applications for inhibitors and activators. Nat. Rev. Drug Discovery 2008, 7, 168−181.
8. Alterio, V.; Pan, P.; Parkkila, S.; Buonanno, M.; Supuran, C. T.; Monti, S. M.; De Simone, G. The structural comparison between membrane-associated human carbonic anhydrases provides insights into drug design of selective inhibitors. Biopolymers 2014, 101, 769−778.
9. Bollbuck, B.; Denholm, A.; Eder, J.; Hersperger, R.; Janser, P.; Revesz, L.; Schlapbach, A.; Waelchli, R. Preparation of amino-pyrimidines as IKK inhibitors for treating autoimmune diseases and inflammations. PCT Int. Appl. WO 2004089913 A1, October 21, 2004.
10. Khalifah, R. G. The carbon dioxide hydration activity of carbonic anhydrase. I. Stop-flow kinetic studies on the native human isoenzymes B and C. J. Biol. Chem. 1971, 246, 2561−2573.
11. Supuran, C. T. Carbonic anhydrases: from biomedical applications of the inhibitors and activators to biotechnologic use for CO2 capture. J. Enzyme Inhib. Med. Chem. 2013, 28, 229−230.
12. La Regina, G.; Coluccia, A.; Famiglini, V.; Pelliccia, S.; Monti, L.; Vullo, D.; Nuti, E.; Alterio, V.; De Simone, G.; Monti, S. M.; Pan, P.; Parkkila, S.; Supuran, C. T.; Rossello, A.; Silvestri, R. Discovery of 1,1′-biphenyl-4-sulfonamides as a new class of potent and selective carbonic anhydrase XIV inhibitors. J. Med. Chem. 2015, 58, 8564–8572.

217
13. Korb, O.; Stutzle, T.; Exner, T. E. PLANTS: Application of ant colony optimization to structure-based drug design. In Ant Colony Optimization and Swarm Intelligence, Lecture Notes in Computer Science; Springer: Berlin, Heidelberg, 2006, 4150, 247, 24710.1007/11839088_22.
14. Dorigo, M.; Gambardella, L. M.; Birattari, M.; Martinoli, A.; Poli, R.; Stutzle, T. Eds. Lecture Notes in Computer Science; Series 4150; Springer: Berlin, 2006, 247−258.
15. Morris, G. M.; Huey, R.; Lindstrom, W.; Sanner, M. F.; Belew, R. K.; Goodsell, D. S.; Olson, A. J. Autodock4 and AutoDockTools4: automated docking with selective receptor flexiblity. J. Comput. Chem. 2009, 30, 2785−279.
16. Rubino, M. T.; Agamennone, M.; Campestre, C.; Campiglia, P.; Cremasco, V.; Faccio, R.; Laghezza, A.; Loiodice, F.; Maggi, D.; Panza, E.; Rossello, A.; Tortorella, P. Biphenyl sulfonylamino methyl bisphosphonic acids as inhibitors of matrix metalloproteinases and bone resorption. Chem. Med. Chem. 2011, 6, 1258−1268.
17. Halverstadt, I. F.; Kumler, W. D. p-(p-Aminophenyl)- benzenesulfonamide and derivatives. J. Am. Chem. Soc. 1941, 63, 624−625.
18. Moskvichev, Y. A.; Timoshenko, G. N.; Mironov, G. S.; Gracheva, S. G.; Kryukova, G. G.; Kozlova, O. S. Synthesis of bifunctional aromatic trinuclear bridging compounds. Zh. Org. Khim. 1982, 18, 1006−1010.
19. Yin, W.-P.; Shi, M. Indium triflate as a recyclable catalyst for the nitration of aromatic compounds without a halogenated solvent. J. Chem. Res. 2006, 9, 549−551.
20. Taylor, E. C.; Ray, P. S. Pteridines. 53. A convenient synthetic approach to 10- deazaaminopterin and 10-deazafolic acid. J. Org. Chem. 1988, 53, 35−38.
21. Zhang, L.; Wang, S.; Zhou, S.; Yang, G.; Sheng, E. Cannizzaro-type disproportionation of aromatic aldehydes to amides and alcohols by using either a stoichiometric amount or a catalytic amount of lanthanide compounds. J. Org. Chem. 2006, 71, 3149−3153.
22. Kishore Kumar, G. D.; Chavarria, G. E.; Charlton-Sevcik, A. K.; Arispe, W. M.; MacDonough, M. T.; Strecker, T. E.; Chen, S.-E.; Siim, B. G.; Chaplin, D. J.; Trawick, M. L.; Pinney, K. G. Design, synthesis, and biological evaluation of potent thiosemicarbazone based cathepsin L inhibitors. Bioorg. Med. Chem. Lett. 2010, 4, 1415−1419.
23. Zhao, B.; Lu, X. Cationic palladium(II)-catalyzed addition of arylboronic acids to nitriles. One-step synthesis of benzofurans from phenoxyacetonitriles. Org. Lett. 2006, 8, 5987−5990.
24. Jin, T.-S.; Yang, M.-N.; Feng, G.-L.; Li, T.-S. Synthesis of diaryl ketones catalyzed by Al2O3-ZrO2/S2O2-8 solid superacid. Synthetic Commun. 2004, 34, 479−485.
25. Mingzhong, C.; Guomin, Z.; Lingfang, Z.; Jian, P. Carbonylative Suzuki-Miyaura coupling of arylboronic acids with aryl iodides catalyzed by the MCM-41-supported bidentate phosphane palladium(II) complex. Eur. J. Org. Chem. 2009, 10, 1585−1591.
218
26. Shah, B. K.; Neckers, D. C. Synthesis, crystal structures, and laser flash photolysis of tert-butyl aroylperbenzoates. J. Org. Chem. 2003, 68, 8368−8372.
27. Campagnola, P. J.; Howell, A. R.; Wang, J.; Goodman, S. L. Preparation of benzophenone derivative crosslinking photoactivators. U. S. Pat. US2004259023 A1, December 23, 2004.
28. Salem, O. I. A.; Frotscher, M.; Scherer, C.; Neugebauer, A.; Biemel, K.; Streiber, M.; Maas, R.; Hartmann, R. W. Novel 5α-reductase inhibitors: synthesis, structure-activity studies, and pharmacokinetic profile of phenoxybenzoylphenyl acetic acids. J. Med. Chem. 2006, 49, 748−759.
29. Barros, T. G.; Williamson, J. S.; Antunes, O. A. C.; Muri, E. M. F. Hydroxamic acids designed as inhibitors of urease. Lett. Drug Des. Discov. 2009, 3, 186−192.
30. Ogawa, Y.; Saiga, A.; Mori, M.; Shibata, T.; Takagi, K. Nucleophilic additions of arylzinc compounds to aldehydes mediated by CrCl3: efficient and facile synthesis of functionalized benzhydrols, 1(3H)-isobenzofuranones, benzyl alcohols, or diaryl ketones. J. Org. Chem. 2000, 4, 1031−1036.
31. Hardouin, C.; Kelso, M. J.; Romero, F. A.; Rayl, T. J.; Leung, D.; Hwang, I.; Cravatt, B. F.; Boger. D. L. Structure-activity relationships of α-ketooxazole inhibitors of fatty acid amide hydrolase. J. Med. Chem. 2007, 50, 3359−3368.
32. Dohle, W.; Lindsay, D. M.; Knochel, P. Copper-mediated cross-coupling of functionalized arylmagnesium reagents with functionalized alkyl and benzylic halides. Org. Lett. 2001, 3, 2871−2873.
33. Vitale, R. M.; Alterio, V.; Innocenti, A.; Winum, J. Y.; Monti, S. M.; De Simone, G.; Supuran, C. T. Carbonic anhydrase inhibitors. Comparison of aliphatic sulfamate/bis-sulfamate adducts with isozymes II and IX as a platform for designing tight-binding, more isoform-selective inhibitors. J. Med. Chem. 2009, 52, 5990−5998.
34. D'Ambrosio, K.; Smaine, F. Z.; Carta, F.; De Simone, G.; Winum, J.-Y.; Supuran, C. T. Development of potent carbonic anhydrase inhibitors incorporating both sulfonamide and sulfamide groups. J. Med. Chem. 2012, 55, 6776−6783.
35. Pacchiano, F.; Carta, F.; McDonald, P. C.; Lou, Y.; Vullo, D.; Scozzafava, A.; Dedhar, S.; Supuran, C. T. Ureido-substituted benzenesulfonamides potently inhibit carbonic anhydrase IX and show antimetastatic activity in a model of breast cancer metastasis. J. Med. Chem. 2011, 54, 1896−1902.
36. De Simone, G.; Pizika, G.; Monti, S. M.; Di Fiore, A.; Ivanova, J.; Vozny, I.; Trapencieris, P.; Zalubovskis, R.; Supuran, C. T.; Alterio, V. Hydrophobic substituents of the phenylmethylsulfamide moiety can be used for the development of new selective carbonic anhydrase inhibitors. BioMed Res. Int. 2014, 2014, 1−11.
37. Otwinowski, Z.; Minor, W. Processing of X-ray diffraction data collected in oscillation mode. Methods in Enzymology 1997, 276, 307−326.
219
38. Brünger, A. T.; Adams, P. D.; Clore, G. M.; DeLano, W. L.; Gros, P.; Grosse-Kunstleve, R. W.; Jiang, J.-S.; Kuszewski, J.; Nilges, M.; Pannu, N. S.; Read, R. J.; Rice, L. M.; Simonson, T.; Warren, G. L. Crystallography & NMR system: A new software suite for macromolecular structure determination. Acta Crystallogr., Sect. D: Biol. Crystallogr. 1998, 54, 905−921.
39. Eriksson, A. E.; Jones, T. A.; Liljas, A. Refined structure of human carbonic anhydrase II at 2.0 Å resolution. Proteins: Struct., Funct., Genet. 1988, 4, 274−282.
40. Jones, T. A.; Zou, J.-Y.; Cowan, S. W.; Kjeldgaard, M. Improved methods for building protein models in electron density maps and the location of errors in these models. Acta Crystallogr., Sect. A: Found. Crystallogr. 1991, 47, 110−119.
41. Schüttelkopf, A. W.; van Aalten, D. M. F. PRODRG: a tool for high-throughput crystallography of protein-ligand complexes. Acta Crystallogr., Sect. D: Biol. Crystallogr. 2004, 60, 1355−1363.
42. Laskowski, R. A.; MacArthur, M. W.; Moss, D. S.; Thornton, J. M. PROCHECK: a program to check the stereochemical quality of protein structures. J. Appl. Crystallogr. 1993, 26, 283−291.
43. The PyMol Molecular Graphics System; www.pymol.org.
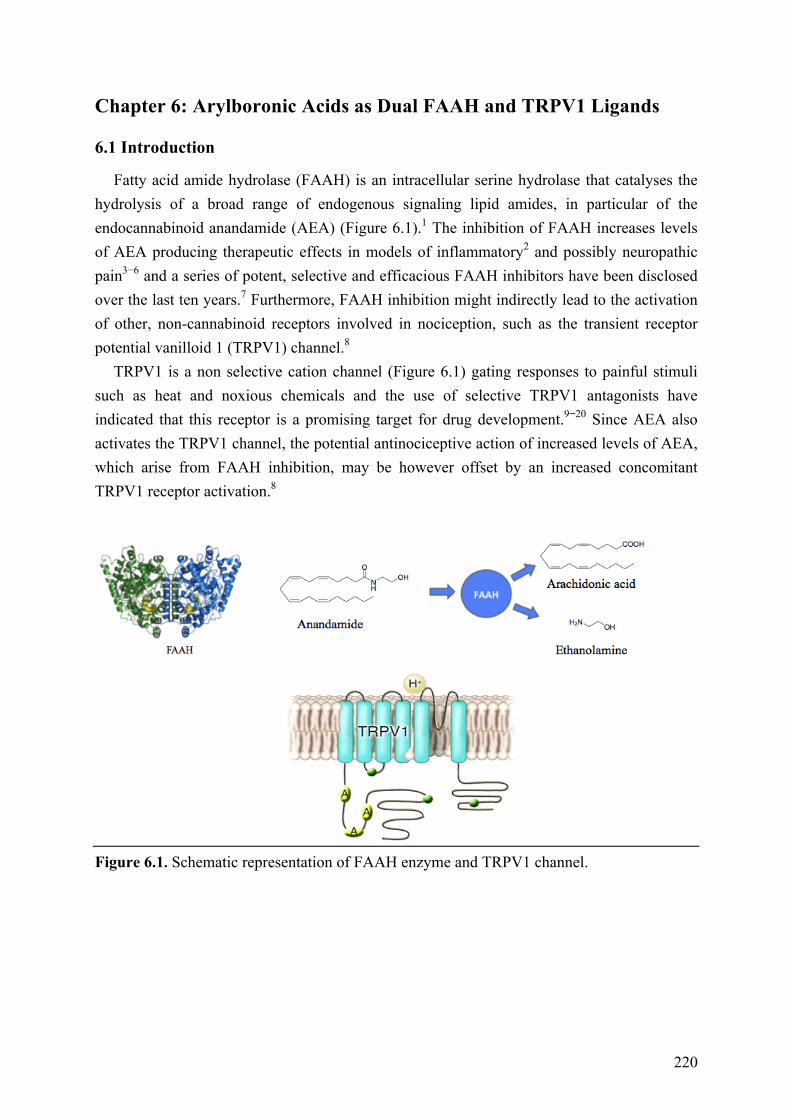
220
Chapter 6: Arylboronic Acids as Dual FAAH and TRPV1 Ligands
6.1 Introduction
Fatty acid amide hydrolase (FAAH) is an intracellular serine hydrolase that catalyses the hydrolysis of a broad range of endogenous signaling lipid amides, in particular of the endocannabinoid anandamide (AEA) (Figure 6.1).1 The inhibition of FAAH increases levels of AEA producing therapeutic effects in models of inflammatory2 and possibly neuropathic pain3−6 and a series of potent, selective and efficacious FAAH inhibitors have been disclosed over the last ten years.7 Furthermore, FAAH inhibition might indirectly lead to the activation of other, non-cannabinoid receptors involved in nociception, such as the transient receptor potential vanilloid 1 (TRPV1) channel.8
TRPV1 is a non selective cation channel (Figure 6.1) gating responses to painful stimuli such as heat and noxious chemicals and the use of selective TRPV1 antagonists have indicated that this receptor is a promising target for drug development.9−20 Since AEA also activates the TRPV1 channel, the potential antinociceptive action of increased levels of AEA, which arise from FAAH inhibition, may be however offset by an increased concomitant TRPV1 receptor activation.8
Figure 6.1. Schematic representation of FAAH enzyme and TRPV1 channel.
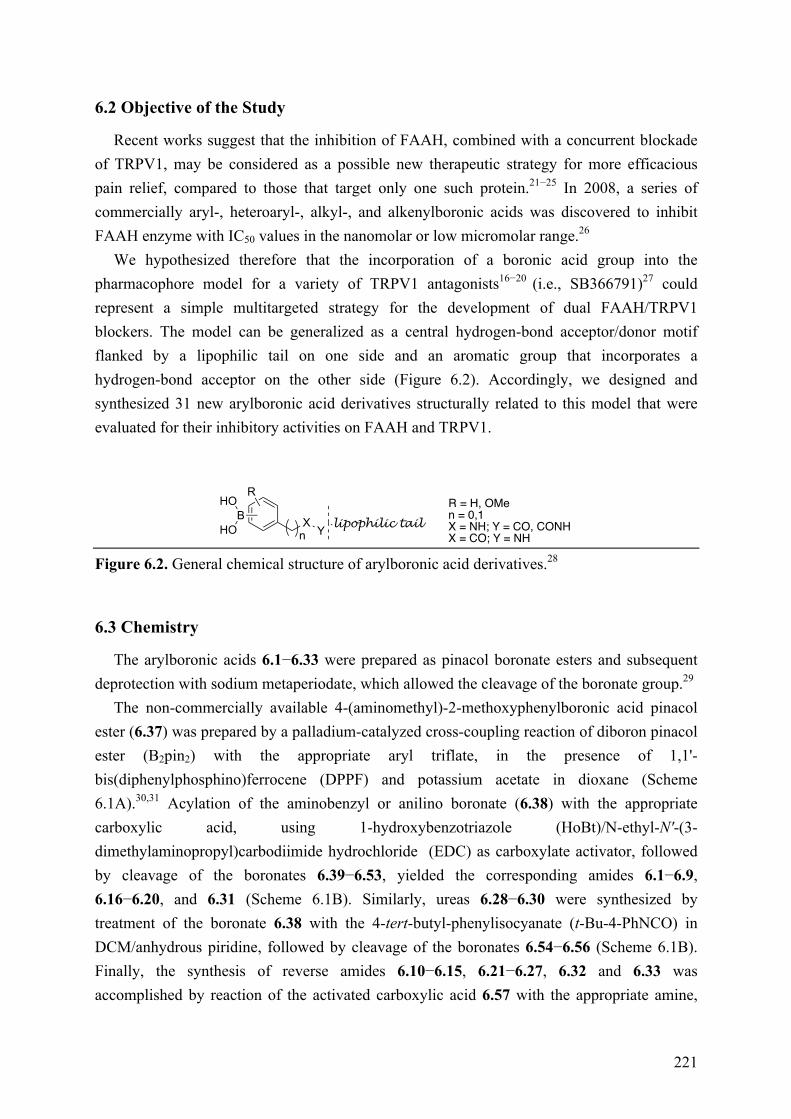
221
6.2 Objective of the Study
Recent works suggest that the inhibition of FAAH, combined with a concurrent blockade of TRPV1, may be considered as a possible new therapeutic strategy for more efficacious pain relief, compared to those that target only one such protein.21−25 In 2008, a series of commercially aryl-, heteroaryl-, alkyl-, and alkenylboronic acids was discovered to inhibit FAAH enzyme with IC50 values in the nanomolar or low micromolar range.26
We hypothesized therefore that the incorporation of a boronic acid group into the pharmacophore model for a variety of TRPV1 antagonists16−20 (i.e., SB366791)27 could represent a simple multitargeted strategy for the development of dual FAAH/TRPV1 blockers. The model can be generalized as a central hydrogen-bond acceptor/donor motif flanked by a lipophilic tail on one side and an aromatic group that incorporates a hydrogen-bond acceptor on the other side (Figure 6.2). Accordingly, we designed and synthesized 31 new arylboronic acid derivatives structurally related to this model that were evaluated for their inhibitory activities on FAAH and TRPV1.
Figure 6.2. General chemical structure of arylboronic acid derivatives.28
6.3 Chemistry
The arylboronic acids 6.1−6.33 were prepared as pinacol boronate esters and subsequent deprotection with sodium metaperiodate, which allowed the cleavage of the boronate group.29
The non-commercially available 4-(aminomethyl)-2-methoxyphenylboronic acid pinacol ester (6.37) was prepared by a palladium-catalyzed cross-coupling reaction of diboron pinacol ester (B2pin2) with the appropriate aryl triflate, in the presence of 1,1'-bis(diphenylphosphino)ferrocene (DPPF) and potassium acetate in dioxane (Scheme 6.1A).30,31 Acylation of the aminobenzyl or anilino boronate (6.38) with the appropriate carboxylic acid, using 1-hydroxybenzotriazole (HoBt)/N-ethyl-N'-(3-dimethylaminopropyl)carbodiimide hydrochloride (EDC) as carboxylate activator, followed by cleavage of the boronates 6.39−6.53, yielded the corresponding amides 6.1−6.9, 6.16−6.20, and 6.31 (Scheme 6.1B). Similarly, ureas 6.28−6.30 were synthesized by treatment of the boronate 6.38 with the 4-tert-butyl-phenylisocyanate (t-Bu-4-PhNCO) in DCM/anhydrous piridine, followed by cleavage of the boronates 6.54−6.56 (Scheme 6.1B). Finally, the synthesis of reverse amides 6.10−6.15, 6.21−6.27, 6.32 and 6.33 was accomplished by reaction of the activated carboxylic acid 6.57 with the appropriate amine,
BHO
HOR
XY lipophilic tail
R = H, OMen = 0,1X = NH; Y = CO, CONHX = CO; Y = NHn
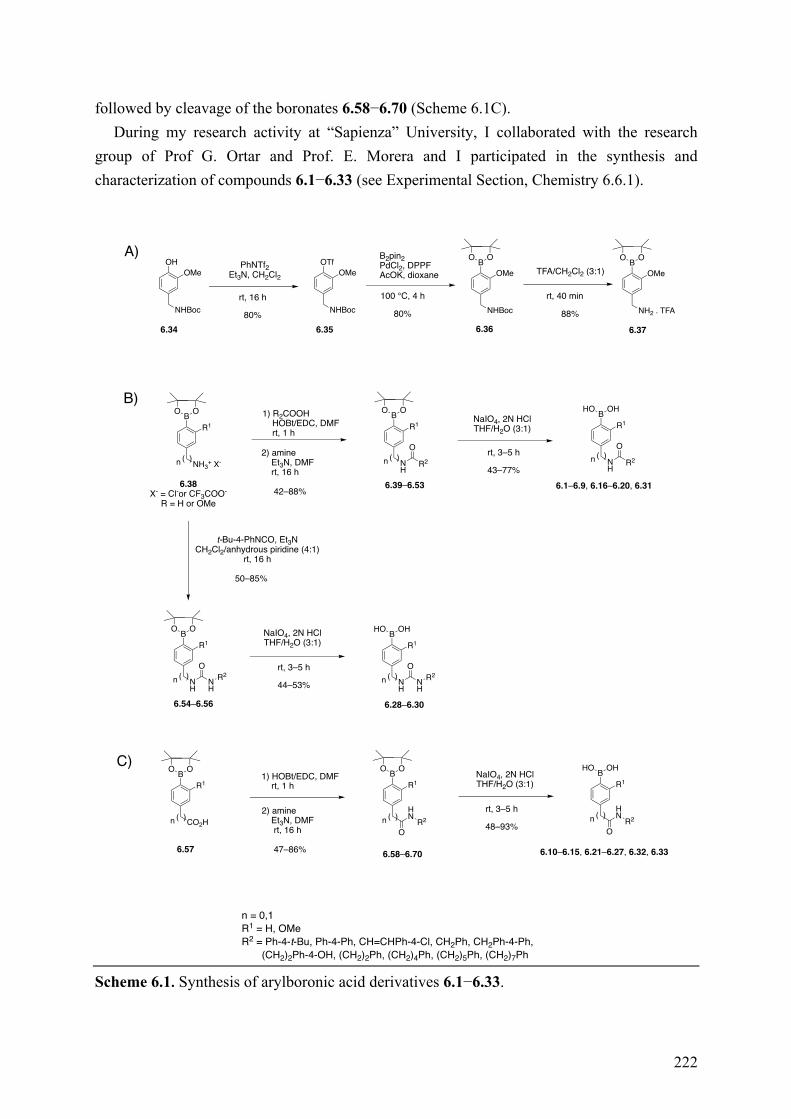
222
followed by cleavage of the boronates 6.58−6.70 (Scheme 6.1C). During my research activity at “Sapienza” University, I collaborated with the research
group of Prof G. Ortar and Prof. E. Morera and I participated in the synthesis and characterization of compounds 6.1−6.33 (see Experimental Section, Chemistry 6.6.1).
Scheme 6.1. Synthesis of arylboronic acid derivatives 6.1−6.33.
OH
NHBoc
OMePhNTf2
Et3N, CH2Cl2
rt, 16 h
80%
OTf
NHBoc
OMe
B2pin2PdCl2, DPPFAcOK, dioxane
100 °C, 4 h
80%
B
NHBoc
OMe TFA/CH2Cl2 (3:1)
88%
O O
B
NH3+ X-
R1
O O
( )n
B
NH
R1
O O
( )n
B
NH
R1
O O
( )nO
NH
R2
B
NH
R1
HO OH
( )nO
NH
R2
t-Bu-4-PhNCO, Et3NCH2Cl2/anhydrous piridine (4:1)
rt, 16 h
NaIO4, 2N HClTHF/H2O (3:1)
rt, 3–5 h
44–53%
50–85%
O
R2
B
NH
R1
HO OH
O
R2
NaIO4, 2N HClTHF/H2O (3:1)
2) amine Et3N, DMF rt, 16 h
42–88%
rt, 3–5 h
43–77%
B
CO2H
R1
O O
( )n
1) HOBt/EDC, DMF rt, 1 h
2) amine Et3N, DMF
rt, 16 h
47–86%
BR1
O O
( )nHN
OR2
BR1
HO OH
HN
R2
NaIO4, 2N HClTHF/H2O (3:1)
rt, 3–5 h
48–93%
A)
B)
O
( )n
( )n
6.28–6.30
6.1–6.9, 6.16–6.20, 6.31
6.10–6.15, 6.21–6.27, 6.32, 6.33
6.34 6.35 6.36 6.37
6.54–6.56
6.39–6.53
6.57 6.58–6.70
B
NH2 . TFA
OMe
O O
6.38X- = Cl-or CF3COO-
R = H or OMe
rt, 40 min
C)
n = 0,1R1 = H, OMeR2 = Ph-4-t-Bu, Ph-4-Ph, CH=CHPh-4-Cl, CH2Ph, CH2Ph-4-Ph, (CH2)2Ph-4-OH, (CH2)2Ph, (CH2)4Ph, (CH2)5Ph, (CH2)7Ph
1) R2COOH HOBt/EDC, DMF rt, 1 h
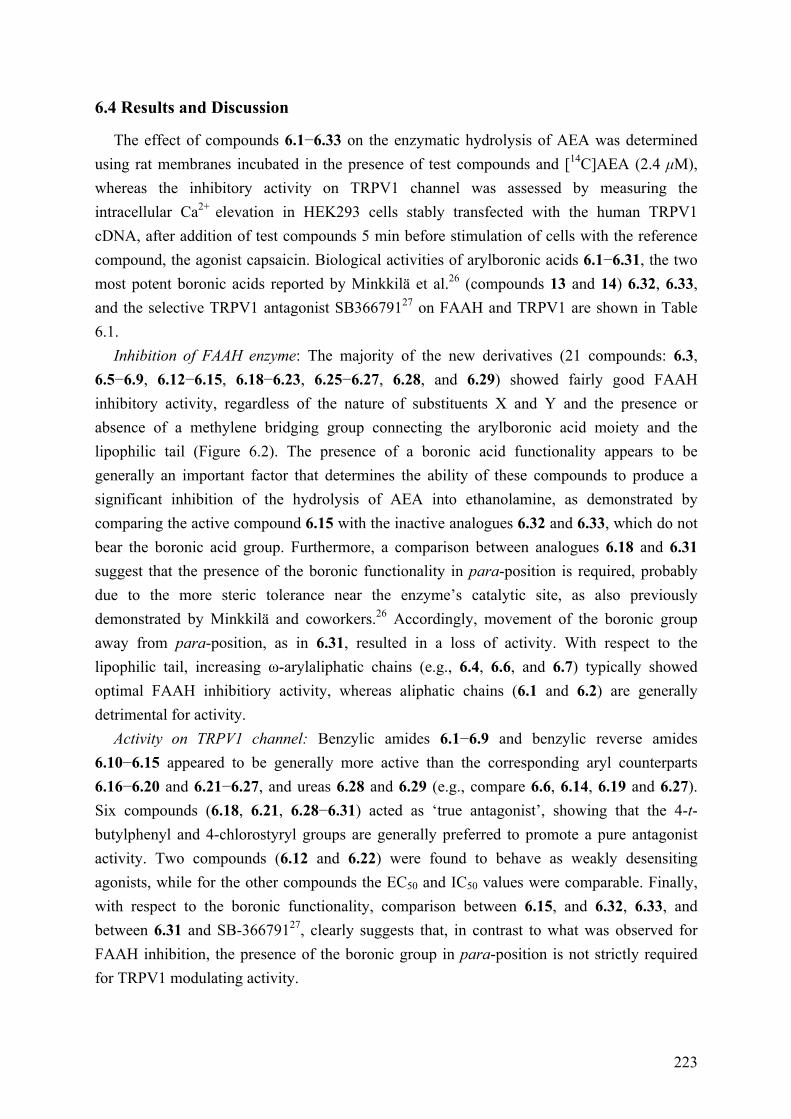
223
6.4 Results and Discussion
The effect of compounds 6.1−6.33 on the enzymatic hydrolysis of AEA was determined using rat membranes incubated in the presence of test compounds and [14C]AEA (2.4 µM), whereas the inhibitory activity on TRPV1 channel was assessed by measuring the intracellular Ca2+ elevation in HEK293 cells stably transfected with the human TRPV1 cDNA, after addition of test compounds 5 min before stimulation of cells with the reference compound, the agonist capsaicin. Biological activities of arylboronic acids 6.1−6.31, the two most potent boronic acids reported by Minkkilä et al.26 (compounds 13 and 14) 6.32, 6.33, and the selective TRPV1 antagonist SB36679127 on FAAH and TRPV1 are shown in Table 6.1.
Inhibition of FAAH enzyme: The majority of the new derivatives (21 compounds: 6.3, 6.5−6.9, 6.12−6.15, 6.18−6.23, 6.25−6.27, 6.28, and 6.29) showed fairly good FAAH inhibitory activity, regardless of the nature of substituents X and Y and the presence or absence of a methylene bridging group connecting the arylboronic acid moiety and the lipophilic tail (Figure 6.2). The presence of a boronic acid functionality appears to be generally an important factor that determines the ability of these compounds to produce a significant inhibition of the hydrolysis of AEA into ethanolamine, as demonstrated by comparing the active compound 6.15 with the inactive analogues 6.32 and 6.33, which do not bear the boronic acid group. Furthermore, a comparison between analogues 6.18 and 6.31 suggest that the presence of the boronic functionality in para-position is required, probably due to the more steric tolerance near the enzyme’s catalytic site, as also previously demonstrated by Minkkilä and coworkers.26 Accordingly, movement of the boronic group away from para-position, as in 6.31, resulted in a loss of activity. With respect to the lipophilic tail, increasing ω-arylaliphatic chains (e.g., 6.4, 6.6, and 6.7) typically showed optimal FAAH inhibitiory activity, whereas aliphatic chains (6.1 and 6.2) are generally detrimental for activity.
Activity on TRPV1 channel: Benzylic amides 6.1−6.9 and benzylic reverse amides 6.10−6.15 appeared to be generally more active than the corresponding aryl counterparts 6.16−6.20 and 6.21−6.27, and ureas 6.28 and 6.29 (e.g., compare 6.6, 6.14, 6.19 and 6.27). Six compounds (6.18, 6.21, 6.28−6.31) acted as ‘true antagonist’, showing that the 4-t-butylphenyl and 4-chlorostyryl groups are generally preferred to promote a pure antagonist activity. Two compounds (6.12 and 6.22) were found to behave as weakly desensiting agonists, while for the other compounds the EC50 and IC50 values were comparable. Finally, with respect to the boronic functionality, comparison between 6.15, and 6.32, 6.33, and between 6.31 and SB-36679127, clearly suggests that, in contrast to what was observed for FAAH inhibition, the presence of the boronic group in para-position is not strictly required for TRPV1 modulating activity.
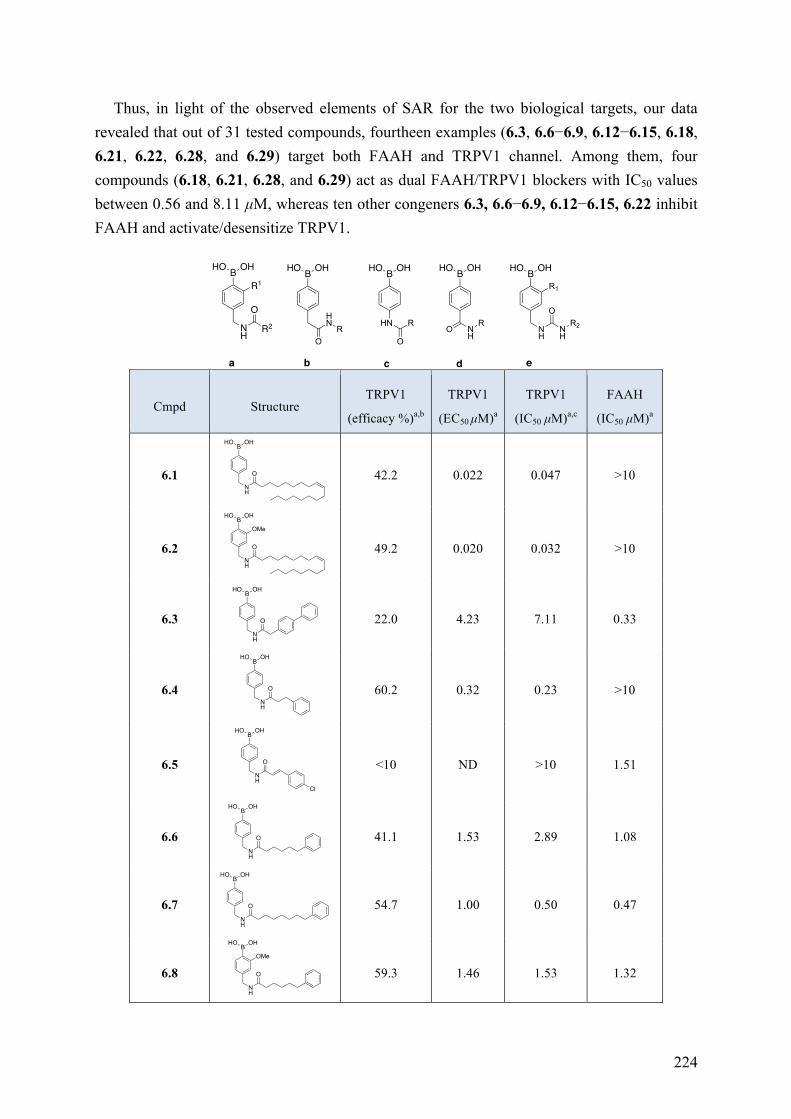
224
Thus, in light of the observed elements of SAR for the two biological targets, our data revealed that out of 31 tested compounds, fourtheen examples (6.3, 6.6−6.9, 6.12−6.15, 6.18, 6.21, 6.22, 6.28, and 6.29) target both FAAH and TRPV1 channel. Among them, four compounds (6.18, 6.21, 6.28, and 6.29) act as dual FAAH/TRPV1 blockers with IC50 values between 0.56 and 8.11 µM, whereas ten other congeners 6.3, 6.6−6.9, 6.12−6.15, 6.22 inhibit FAAH and activate/desensitize TRPV1.
Cmpd Structure TRPV1
(efficacy %)a,b
TRPV1
(EC50 µM)a
TRPV1
(IC50 µM)a,c
FAAH
(IC50 µM)a
6.1
42.2 0.022 0.047 >10
6.2
49.2 0.020 0.032 >10
6.3
22.0 4.23 7.11 0.33
6.4
60.2 0.32 0.23 >10
6.5
<10 ND >10 1.51
6.6
41.1 1.53 2.89 1.08
6.7
54.7 1.00 0.50 0.47
6.8
59.3 1.46 1.53 1.32
B
NH
R1HO OH
O
R2
BHO OH
HNR
B
HN
HO OH
R
B
NH
HO OH
R
O OO
B
NH
HO OH
a b c d e
NH
OR2
R1
BHO OH
NH
O
BHO OH
NH
O
OMe
B
NH
HO OH
O
BHO OH
NH
O
BHO OH
NH
O
Cl
BHO OH
NH
O
BHO OH
NH
O
BHO OH
NH
O
OMe
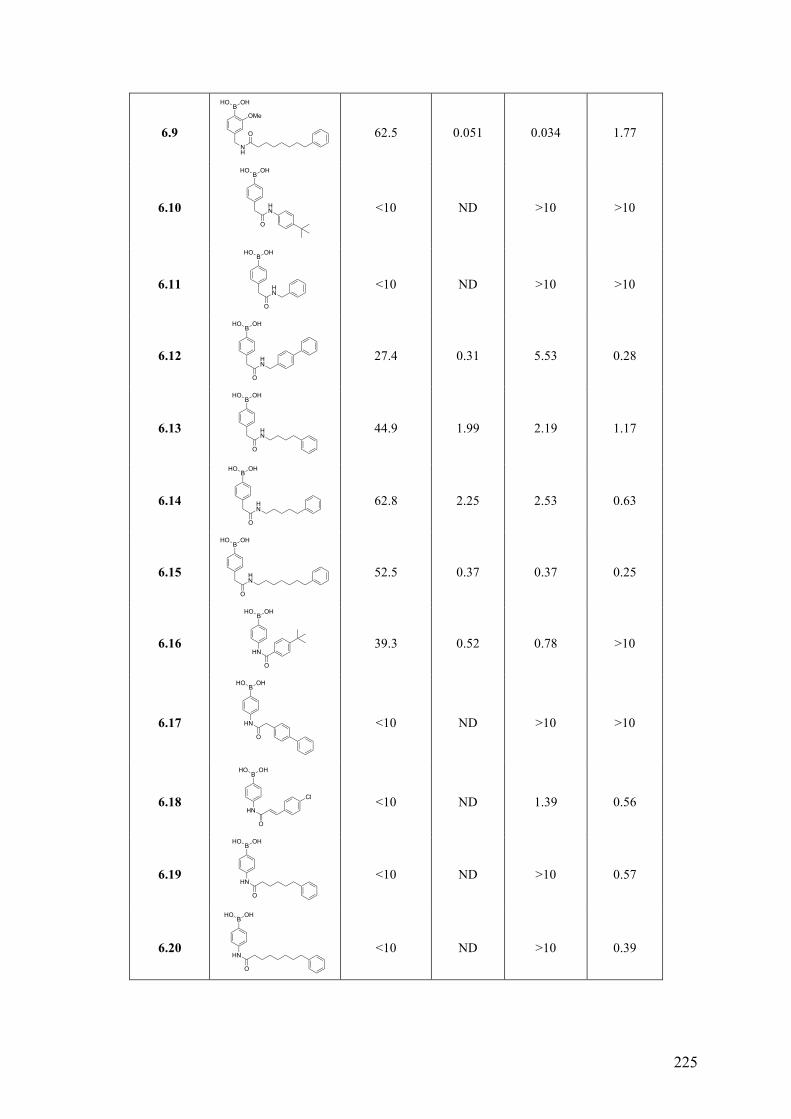
225
6.9
62.5 0.051 0.034 1.77
6.10
<10 ND >10 >10
6.11
<10 ND >10 >10
6.12
27.4 0.31 5.53 0.28
6.13
44.9 1.99 2.19 1.17
6.14
62.8 2.25 2.53 0.63
6.15
52.5 0.37 0.37 0.25
6.16
39.3 0.52 0.78 >10
6.17
<10 ND >10 >10
6.18
<10 ND 1.39 0.56
6.19
<10 ND >10 0.57
6.20
<10 ND >10 0.39
BHO OH
NH
O
OMe
BHO OH
HN
O
BHO OH
HN
O
BHO OH
HN
O
BHO OH
HN
O
BHO OH
HN
O
BHO OH
HN
O
BHO OH
HN
O
BHO OH
HN
O
BHO OH
HN
O
Cl
BHO OH
HN
O
BHO OH
HN
O
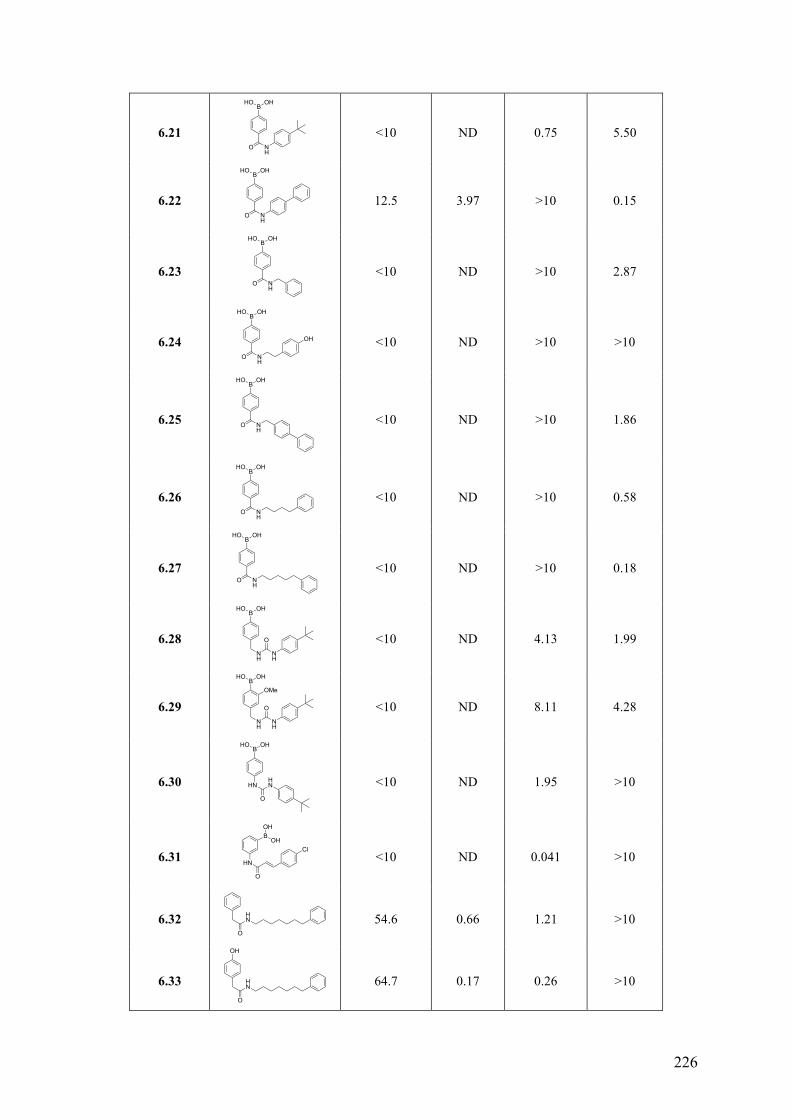
226
6.21
<10 ND 0.75 5.50
6.22
12.5 3.97 >10 0.15
6.23
<10 ND >10 2.87
6.24
<10 ND >10 >10
6.25
<10 ND >10 1.86
6.26
<10 ND >10 0.58
6.27
<10 ND >10 0.18
6.28
<10 ND 4.13 1.99
6.29
<10 ND 8.11 4.28
6.30
<10 ND 1.95 >10
6.31
<10 ND 0.041 >10
6.32
54.6 0.66 1.21 >10
6.33
64.7 0.17 0.26 >10
BHO OH
NH
O
BHO OH
NH
O
BHO OH
NH
O
BHO OH
NH
O
OH
BHO OH
NH
O
BHO OH
NH
O
BHO OH
NH
O
BHO OH
NH
NH
O
BHO OH
NH
NH
O
OMe
BHO OH
HNHN
O
HN
O
BOH
OH
Cl
HN
O
HN
O
OH
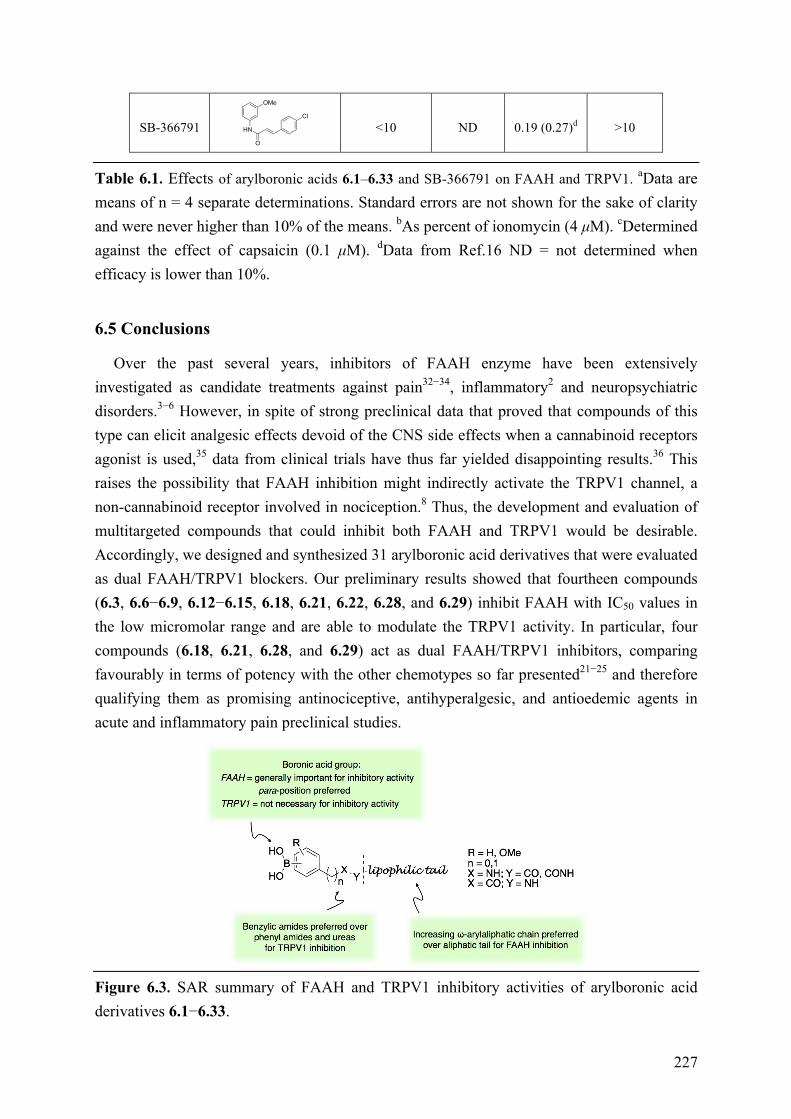
227
SB-366791
<10 ND 0.19 (0.27)d >10
Table 6.1. Effects of arylboronic acids 6.1–6.33 and SB-366791 on FAAH and TRPV1. aData are means of n = 4 separate determinations. Standard errors are not shown for the sake of clarity and were never higher than 10% of the means. bAs percent of ionomycin (4 µM). cDetermined against the effect of capsaicin (0.1 µM). dData from Ref.16 ND = not determined when efficacy is lower than 10%.
6.5 Conclusions
Over the past several years, inhibitors of FAAH enzyme have been extensively investigated as candidate treatments against pain32−34, inflammatory2 and neuropsychiatric disorders.3−6 However, in spite of strong preclinical data that proved that compounds of this type can elicit analgesic effects devoid of the CNS side effects when a cannabinoid receptors agonist is used,35 data from clinical trials have thus far yielded disappointing results.36 This raises the possibility that FAAH inhibition might indirectly activate the TRPV1 channel, a non-cannabinoid receptor involved in nociception.8 Thus, the development and evaluation of multitargeted compounds that could inhibit both FAAH and TRPV1 would be desirable. Accordingly, we designed and synthesized 31 arylboronic acid derivatives that were evaluated as dual FAAH/TRPV1 blockers. Our preliminary results showed that fourtheen compounds (6.3, 6.6−6.9, 6.12−6.15, 6.18, 6.21, 6.22, 6.28, and 6.29) inhibit FAAH with IC50 values in the low micromolar range and are able to modulate the TRPV1 activity. In particular, four compounds (6.18, 6.21, 6.28, and 6.29) act as dual FAAH/TRPV1 inhibitors, comparing favourably in terms of potency with the other chemotypes so far presented21−25 and therefore qualifying them as promising antinociceptive, antihyperalgesic, and antioedemic agents in acute and inflammatory pain preclinical studies.
Figure 6.3. SAR summary of FAAH and TRPV1 inhibitory activities of arylboronic acid derivatives 6.1−6.33.
HN
O
OMe
Cl
228
6.6 Experimental Section 6.6.1 Chemistry
All solvents were reagent grade. All chemical reagents were commercially available unless otherwise indicated and were used as received. Thin layer chromatography (TLC) was performed by using Merck F254 silica gel plates (Kenilworth, NJ) and TLC spots were detected by using UV light and an iodine chamber. Silica gel column chromatography was performed using Merck silica gel 60 (230–400 mesh). Preparative liquid chromatography (PLC) was performed with 0.5 mm Merck pre-coated silica gel plates. Melting points (m.p.) were acquired on a Buchi apparatus and are uncorrected. Infrared (IR) spectra were recorded on a Spectrum-One FT-ATR spectrometer (Perkin-Elmer, Waltham, MA). Proton (1H) and carbon (13C) NMR spectra were recorded on a Bruker Avance 400 MHz spectrometer (Pittsburgh, PA) or on a Varian Mercury 300 MHz spectrometer. Chemical shifts are expressed in δ units (ppm) from tetramethylsilane. The purity of tested compounds was >95%.
General Procedure A for the Synthesis of Amides 6.1−6.27, and 6.31−6.33 and Ureas 6.28−6.30. To a solution of the pinacol boronate ester (1 equiv) in THF/H2O (3:1 mL) sodium periodate (3 equiv) was added at room temperature and then followed by addition of 2 N HCl (2.5 M). The mixture was stirred at room temperature for 3-5 h, then concentrated in vacuo, diluted with water, and extracted with EtOAc. The organic layer was washed with water (×2), dried over Na2SO4, filtered, and concentrated in vacuo. The resulting material was purified by PLC or crystallized from THF/H2O to obtain the desired product.
General Procedure B for the Synthesis of Pinacol Boronate Amides 6.42−6.53. To a stirred solution of the appropriate carboxylic acid (1 equiv) in DMF (1.0 M) at 0 °C were added HOBt (1 equiv) and EDC (1 equiv). The mixture was stirred for 15 min at 0 °C and for 1 h at room temperature. The pinacol boronate ester amine hydrochloride or trifluoroacetate (1 equiv) and Et3N (1 equiv) were added and the mixture was stirred overnight at room temperature. Water was then added to the reaction mixture and the aqueous phase was extracted with EtOAc. The combined organic layers were washed with 2 N HCl solution, satd. aq. NaHCO3, and brine (×2), dried over Na2SO4, filtered, and concentrated in vacuo. The resulting material was purified by silica gel column chromatography to obtain the desired product.
General procedure C for the Synthesis of Pinacol Boronate Ureas 6.54−6.56. To a solution of 4-(tert-butyl)aniline (1 equiv) and Et3N (2 equiv) in CH2Cl2 (0.2 M) bis-(trichloromethyl) carbonate (1 equiv) was added at 0 °C under N2. The reaction mixture was stirred for 16 h at reflux, then cooled to room temperature and filtered. The material was concentrated in vacuo to obtain the intermediate 4-tert-butylphenyl isocyanate, which was monitored by IR analysis (ν 2260 cm-1). To a solution of the isocyanate (1 equiv) in CH2Cl2 (0.25 M) was added a solution of the appropriate boronate ester amine (0.5 equiv) and Et3N

229
(1.5 equiv) in anhydrous piridine (0.5 M). The reaction mixture was stirred for 16 h at room temperature, then diluited with water and extracted with EtOAc. The organic layer was washed with water, dried over Na2SO4, filtered and concentrated in vacuo. The resulting material was purified by silica gel column chromatography or crystallized from THF/H2O to obtain the desired product.
General Procedure D for the Synthesis of the Pinacol Boronate Reverse Amides 6.58−6.70. To a stirred solution of pinacol boronate ester carboxylic acid (1 equiv) in DMF (1 M) at 0 °C were added HOBt (1 equiv) and EDC (1 equiv). The mixture was stirred for 15 min at 0 °C and for 1 h at room temperature. The appropriate amine (1 equiv) was added and the mixture was stirred overnight at room temperature. Water was then added to the reaction mixture and the aqueous phase was extracted with EtOAc. The combined organic layers were washed with 2 N HCl solution, satd. aq. NaHCO3, and brine, dried over Na2SO4, filtered, and concentrated in vacuo. The resulting material was purified by silica gel column chromatography to obtain the desired product.
(4-(Oleamidomethyl)phenyl)boronic Acid (6.1). Following synthetic procedure A using N-(4-(4,4,5,5-tetramethyl-1,3,2-dioxaborolan-2-yl)benzyl)oleamide (0.112 g, 0.225 mmol), purification by PLC (hexanes/EtOAc/MeOH 60:40:5) afforded the title compound as a white solid (0.042 g, 0.101 mmol, 45% yield). M.p. 132−133 °C. 1H NMR (400 MHz, CD3OD) δ 0.88 (t, J = 6.4 Hz, 3H), 1.30 (m, 20H), 1.63 (m, 2H), 2.02 (m, 4H), 2.23 (t, J = 7.0 Hz, 2H), 4.35 (s, 2H), 5.34 (m, 2H), 7.25 (m, 2H), 7.59 (d, J = 6.8 Hz, 1H), 7.69 (d, J = 6.8 Hz, 1H) ppm. 13C NMR (100 MHz, CD3OD) δ 14.47, 23.75, 27.09, 28.16, 30.27, 30.34, 30.46, 30.62, 30.81, 30.86, 33.07, 37.10, 127.65, 127.80, 130.82, 130.90, 134.84, 135.19, 176.26 ppm. IR ν 3382, 3296, 3002, 2918, 2850, 1634, 1611, 1551, 1465, 1405, 1345, 1327, 1227, 1111, 1022 cm-1.
(2-Methoxy-4-(oleamidomethyl)phenyl)boronic Acid (6.2). Following synthetic procedure A using N-(3-methoxy-4-(4,4,5,5-tetramethyl-1,3,2-dioxaborolan-2-yl)benzyl)oleamide (0.104 g, 0.197 mmol), purification by PLC (hexanes/EtOAc 50:50) afforded the title compound as a white solid (0.029 g, 0.065 mmol, 33% yield). M.p. 97−100 °C. 1H NMR (400 MHz, CDCl3) δ 0.88 (t, J = 6.8 Hz, 3H), 1.28 (m, 20H), 1.65 (m, 2H), 2.00 (m, 4H), 2.22 (t, J = 7.4 Hz, 2H), 3.89 (s, 3H), 4.44 (d, J = 6.0 Hz, 2H), 5.34 (m, 2H), 5.91 (br s, 1H), 6.28 (s, 2H), 6.83 (s, 1H), 6.90 (d, J = 7.2 Hz, 1H), 7.79 (d, J = 7.2 Hz, 1H) ppm. 13C NMR (100 MHz, CDCl3) δ 14.12, 22.70, 25.81, 27.19, 27.25, 29.16, 29.33, 29.54, 29.73, 29.79, 31.92, 36.82, 43.67, 55.56, 109.57, 120.38, 129.73, 130.06, 137.27, 143.74, 164.90, 173.16 ppm. IR ν 3377, 3299, 3003, 2919, 2850, 1640, 1613, 1535, 1414, 1355, 1247, 1169, 1040 cm-1.
(4-((2-([1,1'-Biphenyl]-4-yl)acetamido)methyl)phenyl)boronic Acid (6.3). Following synthetic procedure A using 2-([1,1'-biphenyl]-4-yl)-N-(4-(4,4,5,5-tetramethyl-1,3,2-dioxaborolan-2-yl)benzyl)acetamide (0.075 g, 0.175 mmol), treatment with Et2O (5 mL) afforded the title compound (0.022 g, 0.064 mmol, 36% yield). M.p. 253−255 °C (Et2O). 1H
230
NMR (400 MHz, CD3OD) δ 3.61 (s, 2H), 4.40 (d, J = 4.8 Hz, 2H), 7.22−7.72 (m, 13H), 8.04 (br s, 1H) ppm. 13C NMR (100 MHz, CD3OD) δ 43.26, 44.06, 127.20, 127.80, 129.25, 130.06, 134.16, 134.52, 134.96, 140.63, 141.32, 173.14 ppm. IR ν 3408, 3292, 1629, 1408, 1339, 1007, 816, 750 cm-1.
(4-((3-Phenylpropanamido)methyl)phenyl)boronic Acid (6.4). Following synthetic procedure A using 3-phenyl-N-(4-(4,4,5,5-tetramethyl-1,3,2-dioxaborolan-2-yl)benzyl)propanamide (0.057 g, 0.156 mmol), purification by PLC (EtOAc/hexanes 70:30) afforded the title compound as a white solid (0.017 g, 0.06 mmol, 38% yield). M.p. >250 °C. 1H NMR (400 MHz, CDCl3/CD3OD) δ 2.52 (t, J = 7.6 Hz, 2H), 2.95 (t, J = 7.6 Hz, 2H), 4.33 (br s, 2H), 7.10−7.67 (m, 9H) ppm. 13C NMR (100 MHz, CDCl3/CD3OD) δ 31.95, 38.30, 43.49, 126.41, 126.96, 128.53, 128.68, 134.14, 140.40, 140.90, 173.38 ppm. IR ν 3323, 3027, 2928, 1626, 1610, 1408, 1338, 1018, 731, 699 cm-1.
(E)-(4-((3-(4-Chlorophenyl)acrylamido)methyl)phenyl)boronic Acid (6.5). Following synthetic procedure A using (E)-3-(4-chlorophenyl)-N-(4-(4,4,5,5-tetramethyl-1,3,2-dioxaborolan-2-yl)benzyl)acrylamide (0.077 g, 0.194 mmol), crystallization from THF afforded the title compound (0.060 g, 0.190 mmol, 98% yield). M.p. >230 °C. 1H NMR (400 MHz, DMSO-d6) δ 4.41 (d, J = 5.6 Hz, 2H), 6.71 (d, J = 15.6 Hz, 1H), 7.26 (d, J = 7.7 Hz, 2H), 7.45−7.49 (m, 3H), 7.60 (d, J = 8.4 Hz, 2H), 7.76 (d, J = 7.6 Hz, 2H), 8.00 (s, 2H), 8.63 (br s, 1H) ppm. 13C NMR (100 MHz, DMSO-d6) δ 42.34, 122.83, 126.32, 128.93, 129.20, 133.84, 134.18, 135.46, 137.57, 141.08, 164.71 ppm. IR ν 3297, 2927, 1654, 1622, 1404, 1330, 1222, 1901, 820 cm-1.
(4-((6-Phenylhexanamido)methyl)phenyl)boronic Acid (6.6). Following synthetic procedure A using 6-phenyl-N-(4-(4,4,5,5-tetramethyl-1,3,2-dioxaborolan-2-yl)benzyl)hexanamide (0.055 g, 0.135 mmol), crystallization from Et2O afforded the title compound (0.028 g, 0.086 mmol, 64% yield). M.p. 197−200 °C. 1H NMR (400 MHz, CD3OD) δ 1.34 (m, 2H), 1.64 (m, 4H), 2.22 (t, J = 7.6 Hz, 2H), 2.58 (t, J = 7.6 Hz, 2H), 4.34 (s, 2H), 7.14 (m, 3H), 7.22 (m, 4H), 7.56 (d, J = 6.0 Hz, 1H), 7.71 (d, J = 6,4 Hz, 1H) ppm. 13C NMR (100 MHz, CD3OD) δ 24.38, 27.31, 29.85, 34.25, 34.50, 41.55, 124.16, 125.27, 126.76, 126.91, 132.33, 132.68, 141.25, 173.59 ppm. IR ν 3380, 3292, 2929, 1623, 1553, 1404, 1339, 1231, 996, 693 cm-1.
(4-((8-Phenyloctanamido)methyl)phenyl)boronic Acid (6.7). Following synthetic procedure A using 8-phenyl-N-(4-(4,4,5,5-tetramethyl-1,3,2-dioxaborolan-2-yl)benzyl)octanamide (0.081 g, 0.186 mmol), purification by PLC (EtOAc) afforded the title compound as a white solid (0.029 g, 0.082 mmol, 43% yield). M.p. 227−230 °C. 1H NMR (400 MHz, DMSO-d6) δ 1.28 (m, 6H), 1,53 (m, 4H), 2.14 (t, J = 7.2 Hz, 2H), 2.55 (t, J = 7.6 Hz, 2H), 4.26 (d, J = 5.6 Hz, 2H), 7.18 (m, 7H), 7.76 (d J = 7.6 Hz, 2H), 8.05 (s, 2H), 8.30 (m, 1H) ppm. 13C NMR (100 MHz, DMSO-d6) δ 25.86, 26.53, 29.80, 29.85, 32.21, 36.37, 36.56, 43.23, 126.76, 127.36, 129.40, 129.44, 135.36, 142.81, 143.51, 173.36 ppm. IR ν 3293, 2925, 1639, 1543,
231
1409, 1346, 1020 cm-1. (2-Methoxy-4-((6-phenylhexanamido)methyl)phenyl)boronic Acid (6.8). Following
synthetic procedure A using N-(3-methoxy-4-(4,4,5,5-tetramethyl-1,3,2-dioxaborolan-2-yl)benzyl)-6-phenylhexanamide (0.046 g, 0.105 mmol), purification by PLC (EtOAc/hexanes 70:30) afforded the title compound as a white solid (0.022 g, 0.062 mmol, 61% yield). M.p. 102−105 °C. 1H NMR (400 MHz, CDCl3) δ 1.33 (m, 2H), 1,65 (m, 4H), 2.20 (t, J = 7.6 Hz, 2H), 2.58 (t, J = 7.6 Hz, 2H), 3.82 (s, 3H), 4.39 (d, J = 6.0 Hz, 2H), 6.13 (m, 1H), 6.63 (br s, 2H), 6.78 (s, 1H), 6.86 (d, J = 7.2 Hz, 1H), 7.15 (m, 3H), 7.25 (m, 2H), 7.77 (d J = 7.2 Hz, 1H) ppm. 13C NMR (100 MHz, CDCl3) δ 25.57, 28.85, 31.06, 35.67, 36.54, 43.54, 55.46, 109.44, 120.23. 125.66, 128.24, 128.33, 137.15, 142.42, 143.61, 164.78, 173.24 ppm. IR ν 3493, 3303, 2932, 1643, 1610, 1566, 1416, 1328, 1243, 1164, 1039, 909, 729 cm-1.
(2-Methoxy-4-((8-phenyloctanamido)methyl)phenyl)boronic Acid (6.9). Following synthetic procedure A using N-(3-methoxy-4-(4,4,5,5-tetramethyl-1,3,2-dioxaborolan-2-yl)benzyl)-8-phenyloctanamide (0.046 g, 0.099 mmol), purification by PLC (EtOAc/hexanes 70:30) afforded the title compound as a white solid (0.040 g, 0.104 mmol, 74% yield). M.p. 105−107 °C. 1H NMR (400 MHz, DMSO-d6) δ 1.27 (m, 6H), 1.52 (m, 4H), 2.14 (t, J = 7.2 Hz, 2H), 2.55 (t, J = 7.4 Hz, 2H), 3.78 (s, 3H), 4.26 (d, J = 5.6 Hz, 2H), 6.81 (d, J = 7.4 Hz, 1H), 6.85 (s, 1H), 7.17 (m, 3H), 7.27 (m, 2H), 7.52 (d J = 7.4 Hz, 1H), 7.62 (s, 2H), 8.3 (m, 1H) ppm. 13C NMR (100 MHz, DMSO-d6) δ 25.25, 28.47, 28.53, 30.33, 30.89, 35.05, 35.26, 41.98, 55.04, 108.98, 118.88, 125.47, 128.10, 128.14, 135.44, 142.20, 143.83, 163.67, 172.06 ppm. IR ν 3410, 3296, 2931, 2851, 1640, 1610, 1546, 1411, 1353, 1243, 1045, 827 cm-1.
(4-(2-((4-(tert-Butyl)phenyl)amino)-2-oxoethyl)phenyl)boronic Acid (6.10). Following synthetic procedure A using N-(4-(tert-butyl)phenyl)-2-(4-(4,4,5,5-tetramethyl-1,3,2-dioxaborolan-2-yl)phenyl)acetamide (0.053 g, 0.135 mmol), crystallization from THF/H2O afforded the title compound (0.034 g, 0.109 mmol, 93% yield). M.p. >230 °C. 1H NMR (400 MHz, DMSO-d6) δ 1.26 (s, 9H), 3.63 (s, 2H), 7.30 (m, 4H), 7.52 (d, J = 8.4 Hz, 2H), 7.75 (d, J = 7.6 Hz, 2H), 8.00 (s, 2H), 10.10 (s, 1H) ppm. 13C NMR (100 MHz, DMSO-d6) δ 31.15, 33.93, 43.40, 118.91, 125.24, 128.08, 134.12, 136.58, 137.93, 145.52, 168.46 ppm. IR ν 3321, 2924, 1673, 1600, 1533, 1358, 1179, 1094, 1034, 820 cm-1.
(4-(2-(Benzylamino)-2-oxoethyl)phenyl)boronic Acid (6.11). Following synthetic procedure A using N-benzyl-2-(4-(4,4,5,5-tetramethyl-1,3,2-dioxaborolan-2-yl)phenyl)acetamide (0.100 g, 0.285 mmol), crystallization from THF/H2O afforded the title compound (0.062 g, 0.230 mmol, 80% yield). M.p. >230°C. 1H NMR (400 MHz, DMSO-d6) δ 3.52 (s, 2H), 4.28 (d, J = 6.0 Hz, 2H), 7.27 (m, 8H), 7.73 (d, J = 8.0 Hz, 2H), 7.99 (s, 2H) ppm. 13C NMR (100 MHz, DMSO-d6) δ 42.21, 42.49, 126.74, 127.19, 128.06, 128.24, 134.08, 138.24, 139.42, 170.02 ppm. IR ν 3392, 3286, 3030, 2925, 1641, 1543, 1410, 1341, 1182, 1022, 818, 695 cm-1.
(4-(2-(([1,1'-Biphenyl]-4-ylmethyl)amino)-2-oxoethyl)phenyl)boronic Acid (6.12).
232
Following synthetic procedure A using N-([1,1'-biphenyl]-4-ylmethyl)-2-(4-(4,4,5,5-tetramethyl-1,3,2-dioxaborolan-2-yl)phenyl)acetamide (0.102 g, 0.239 mmol), crystallization from THF/H2O afforded the title compound (0.039 g, 0.113 mmol, 47% yield). M.p. >230 °C. 1H NMR (400 MHz, DMSO-d6) δ 3.45 (s, 2H), 4.26 (d, J = 5.8 Hz, 2H), 7.20 (d, J = 8.0 Hz, 2H), 7.29 (m, 3H), 7.41 (m, 2H), 7.58 (m, 4H), 7.67 (d, J = 7.6 Hz, 2H), 7.94 (s, 2H), 8.54 (t, J = 5.8 Hz, 1H) ppm. 13C NMR (100 MHz, DMSO-d6) δ 41.82, 42.40, 126.48, 126.52, 127.22, 127.74, 127.98, 128.80, 133.99, 138.13, 138.61, 139.82, 149.62, 169.92 ppm. IR ν 3292, 3281, 3061, 2924, 1632, 1548, 1333, 1255, 1079, 808 cm-1.
(4-(2-Oxo-2-((4-phenylbutyl)amino)ethyl)phenyl)boronic Acid (6.13). Following synthetic procedure A using N-(4-phenylbutyl)-2-(4-(4,4,5,5-tetramethyl-1,3,2-dioxaborolan-2-yl)phenyl)acetamide (0.072 g, 0.183 mmol), crystallization from THF/H2O afforded the title compound (0.039 g, 0.125 mmol, 68% yield). M.p. 219−230 °C. 1H NMR (400 MHz, DMSO-d6) δ 1.41 (m, 2H), 1.53 (m, 2H), 2.54 (t, J = 7.6 Hz, 2H), 3.08 (m, 2H), 3.38 (s, 2H), 7.15 (m, 3H), 7.25 (m, 4H), 7.72 (d, J = 8.0 Hz, 2H), 7.99 (s, 2H), 8.03 (m, 1H) ppm. 13C NMR (100 MHz, DMSO-d6) δ 28.31, 28.72, 34.73, 38.27, 42.61, 125.58, 127.94, 128.17, 128.22, 134.05, 138.44, 142.07, 169.81. IR ν 3268, 2965, 1652, 1604, 1535, 1359, 1142, 1089, 962, 858 cm-1.
(4-(2-Oxo-2-((5-phenylpentyl)amino)ethyl)phenyl)boronic Acid (6.14). Following synthetic procedure A using N-(5-phenylpentyl)-2-(4-(4,4,5,5-tetramethyl-1,3,2-dioxaborolan-2-yl)phenyl)acetamide (0.111 g, 0.272 mmol), crystallization from THF/H2O afforded the title compound (0.063 g, 0.194 mmol, 72% yield). M.p. >230 °C. 1H NMR (400 MHz, DMSO-d6) δ 1.23 (m, 2H), 1.42 (quintet, J = 7.2 Hz, 2H), 1.54 (quintet, J = 7.6 Hz, 2H), 2.50 (m, 2H), 3.02 (q, J = 7.2 Hz, 2H), 3.37 (s, 2H), 7.16 (m, 3H), 7.20 (d, J = 8.0 Hz, 2H), 7.26 (m, 2H), 7.70 (d, J = 8.0 Hz, 2H), 7.96 (s, 2H), 7.98 (t, J = 5.6 Hz, 1H) ppm. 13C NMR (100 MHz, DMSO-d6) δ 25.98, 28.84, 30.63, 35.07, 38.46, 42.57, 125.56, 127.94, 128.17, 128.21, 134.02, 138.42, 142.17, 169.72 ppm. IR ν 3696, 3387, 3291, 2923, 1633, 1604, 1556, 1332, 1055, 733 cm-1.
(4-(2-Oxo-2-((7-phenylheptyl)amino)ethyl)phenyl)boronic Acid (6.15). Following synthetic procedure A using N-(7-phenylheptyl)-2-(4-(4,4,5,5-tetramethyl-1,3,2-dioxaborolan-2-yl)phenyl)acetamide (0.180 g, 0.413 mmol), crystallization from THF/H2O afforded the title compound (0.092 g, 0.260 mmol, 63% yield). M.p. >230 °C. 1H NMR (400 MHz, DMSO-d6) δ 1.20 (m, 6H), 1.37 (quintet, J = 6.8 Hz, 2H), 1.54 (quintet, J = 7.2 Hz, 2H), 2.50 (t, J = 7.6 Hz, 2H), 3.02 (q, J = 6.8 Hz, 2H), 3.37 (s, 2H), 7.17 (m, 7H), 7.70 (d, J = 8.0 Hz, 2H), 7.93 (s, 2H), 7.98 (m, 1H) ppm. 13C NMR (100 MHz, DMSO-d6) δ 24.57, 26.26, 28.48, 28.54, 28.98, 30.88, 35.08, 42.55, 125.47, 127.89, 128.10, 128.16, 133.99, 138.39, 142.21, 169.72 ppm. IR ν 3388, 3292, 2923, 1633, 1604, 1560, 1342, 1109, 716 cm-1.
(4-(4-(tert-Butyl)benzamido)phenyl)boronic Acid (6.16). Following synthetic procedure A using 4-(tert-butyl)-N-(4-(4,4,5,5-tetramethyl-1,3,2-dioxaborolan-2-yl)phenyl)benzamide
233
(0.110 g , 0.290 mmol), crystallization from THF/H2O afforded the title compound (0.091 g, 0.306 mmol, 103 % yield). M.p. 172−174 °C. 1H NMR (400 MHz, DMSO-d6) δ 1.32 (s, 9H), 7.55 (d, J = 11.0 Hz, 2H), 7.76 (m, 4H), 7.89 (d, J = 11.0 Hz, 2H), 7.93 (s, 2H), 10.19 (s, 1H) ppm. 13C NMR (100 MHz, DMSO-d6) δ 30.84, 34.58, 118.83, 125.04, 127.44, 132.19, 134.59, 140.83, 154.30, 165.44 ppm. IR ν 3380, 3295, 2955, 1644, 1589, 1526, 1402, 1326, 1154, 1039, 1013, 829 cm-1.
(4-(2-([1,1'-Biphenyl]-4-yl)acetamido)phenyl)boronic Acid (6.17). Following synthetic procedure A using 2-([1,1'-biphenyl]-4-yl)-N-(4-(4,4,5,5-tetramethyl-1,3,2-dioxaborolan-2-yl)phenyl)acetamide (0.106 g, 0.256 mmol), crystallization from THF/H2O afforded the title compound (0.049 g, 0.148 mmol, 56% yield). M.p. >210 °C. 1H NMR (300 MHz, DMSO-d6) δ 3.70 (s, 2H), 7.43 (m, 5H), 7.64 (m, 6H), 7.74 (d, J = 8.1 Hz, 2H), 7.91 (s, 2H), 10.23 (s, 1H) ppm. 13C NMR (75 MHz, DMSO-d6) δ 42.90, 117.76, 126.45, 126.52, 127.19, 128.79, 129.59, 134.76, 135.10, 138.39, 139.86, 140.73, 169.02 ppm. IR ν 3440, 3296, 1657, 1591, 1525, 1367, 1346, 1110, 1005, 801 cm-1.
(E)-(4-(3-(4-Chlorophenyl)acrylamido)phenyl)boronic Acid (6.18). Following synthetic procedure A using (E)-3-(4-chlorophenyl)-N-(4-(4,4,5,5-tetramethyl-1,3,2-dioxaborolan-2-yl)phenyl)acrylamide (0.128 g, 0.334 mmol), crystallization from THF/H2O afforded the title compound (0.071 g, 0.235 mmol, 71% yield). M.p. >230 °C. 1H NMR (400 MHz, DMSO-d6) δ 6.86 (d, J = 16.0 Hz, 1H), 7.52 (d, J = 8.4 Hz, 2H), 7.59 (d, J = 16.0 Hz, 1H), 7.66 (m, 4H), 7.77 (d, J = 8.4 Hz, 2H), 7.94 (s, 2H), 10.25 (s, 1H) ppm. 13C NMR (100 MHz, DMSO-d6) δ 117.95, 123.03, 128.98, 129.33, 133.60, 134.13, 134.84, 138.77, 140.71, 163.29 ppm. IR ν 3302, 1661, 1626, 1589, 1524, 1340, 1242, 1124, 1013, 972, 817 cm-1.
(4-(6-Phenylhexanamido)phenyl)boronic Acid (6.19). Following synthetic procedure A using 6-phenyl-N-(4-(4,4,5,5-tetramethyl-1,3,2-dioxaborolan-2-yl)phenyl)hexanamide (0.156 g, 0.397 mmol), crystallization from THF/H2O afforded the title compound (0.096 g, 0.308 mmol, 77% yield). M.p. 191−193 °C. 1H NMR (300 MHz, DMSO-d6) δ 1.33 (m, 3H), 1.60 (m, 3H), 2.30 (t, J = 7.2 Hz, 2H), 2.57 (t, J = 7.5 Hz, 2H), 7.20 (m, 5H), 7.55 (t, J = 8.0 Hz, 2H), 7.71 (t, J = 8.0 Hz, 2H), 7.89 (s, 2H), 9.87 (s, 1H) ppm. 13C NMR (75 MHz, DMSO-d6) δ 24.84, 28.19, 30.68, 34.92, 36.31, 117.66, 125.48, 128.09, 128.15, 134.70, 140.87, 142.11, 171.21 ppm. IR ν 3400, 3306, 2926, 2854, 1662, 1587, 1509, 1346, 1315, 1249, 1107, 1009, 808 cm-1.
(4-(8-Phenyloctanamido)phenyl)boronic Acid (6.20). Following synthetic procedure A using 8-phenyl-N-(4-(4,4,5,5-tetramethyl-1,3,2-dioxaborolan-2-yl)phenyl)octanamide (0.121 g, 0.287 mmol), crystallization from THF/H2O afforded the title compound (0.068 g, 0.200 mmol, 69% yield). M.p. 166−169 °C. 1H NMR (400 MHz, DMSO-d6) δ 1.55 (m, 6H), 1.56 (m, 4H), 2.29 (t, J = 9.6 Hz, 2H), 2.55 (m, 2H), 7.16−7.28 (m, 5H), 7.55 (d, J = 10.8 Hz, 2H), 7.70 (d, J = 10.8 Hz, 2H), 7.89 (s, 2H), 9.87 (s, 1H) ppm. 13C NMR (100 MHz, DMSO-d6) δ 24.97, 25.61, 28.43, 28.50, 30.87, 30.31, 36.33, 117.64, 125.45, 128.08, 128.12, 134.69,
234
140.88, 142.18, 171.23 ppm. IR ν 3437, 3309, 2925, 2853, 1663, 1587, 1509, 1345, 1105, 1008, 807 cm-1.
(4-((4-(tert-Butyl)phenyl)carbamoyl)phenyl)boronic Acid (6.21). Following syntetic procedure A using N-(4-(tert-butyl)phenyl)-4-(4,4,5,5-tetramethyl-1,3,2-dioxaborolan-2-yl)benzamide (0.076 g, 0.200 mmol), crystallization from THF/H2O afforded the title compound (0.030 g, 0.101 mmol, 50% yield). M.p. >230 °C. 1H NMR (400 MHz, DMSO-d6) δ 1.28 (s, 9H), 7.36 (d, J = 8.8 Hz, 2H), 7.70 (d, J = 8.8 Hz, 2H), 7.93 (s, 4H), 8.26 (s, 2H), 10.19 (s, 1H) ppm. 13C NMR (100 MHz, DMSO-d6) δ 31.18, 34.00, 120.15, 125.15, 126.44, 133.95, 136.19, 136.52, 145.99, 165.43 ppm. IR ν 3349, 2959, 1656, 1638, 1517, 1407, 1320, 1251, 1100, 1008, 835, 729 cm-1.
(4-([1,1'-Biphenyl]-4-ylcarbamoyl)phenyl)boronic Acid (6.22). Following synthetic procedure A using N-([1,1'-biphenyl]-4-yl)-4-(4,4,5,5-tetramethyl-1,3,2-dioxaborolan-2-yl)benzamide (0.078 g, 0.195 mmol), crystallization from THF/H2O afforded the title compound (0.030 g, 0.095 mmol, 48% yield). M.p. >230 °C. 1H NMR (400 MHz, DMSO-d6) δ 7.36 (t, J = 7.6 Hz, 1H), 7.46 (t, J = 7.6 Hz, 2H), 7.69 (d, J = 8.0 Hz, 4H), 7.97 (m, 6H), 8.32 (s, 2H), 10.45 (s, 1H) ppm. 13C NMR (100 MHz, DMSO-d6) δ 120.68, 126.26, 126.58, 126.73, 127.02, 128.87, 134.02, 135.23, 136.09, 138.71, 139.69, 165.69 ppm. IR ν 3323, 2923, 1646, 1530, 1403, 1251, 1125, 1033, 834, 760 cm-1.
(4-(Benzylcarbamoyl)phenyl)boronic Acid (6.23). Following synthetic procedure A using N-benzyl-4-(4,4,5,5-tetramethyl-1,3,2-dioxaborolan-2-yl)benzamide (0.105 g, 0.310 mmol), crystallization from THF/H2O afforded the title compound (0.053 g, 0.208 mmol, 66% yield). M.p. >230 °C. 1H NMR (400 MHz, DMSO-d6) δ 4.49 (br s, 2H), 7.25 (br s, 1H), 7.33 (br s, 2H), 7.86 (br s, 4H), 8.19 (s, 2H), 8.19 (s, 2H), 9.03 (br s, 1H) ppm. 13C NMR (100 MHz, DMSO-d6) δ 42.60, 126.12, 126.69, 127.19, 128.24, 133.96, 135.59, 139.64, 166.38 ppm. IR ν 3402, 3301, 3030, 2925, 1636, 1539, 1352, 1314, 1120, 1025, 805, 695 cm-1.
(4-((4-Hydroxyphenethyl)carbamoyl)phenyl)boronic Acid (6.24). Following synthetic procedure A using N-(4-hydroxyphenethyl)-4-(4,4,5,5-tetramethyl-1,3,2-dioxaborolan-2-yl)benzamide (0.062 g, 0.170 mmol), crystallization from THF/H2O afforded the title compound (0.016 g, 0.056 mmol, 33% yield). M.p. 195−202 °C. 1H NMR (400 MHz, DMSO-d6) δ 2.73 (t, J = 7.2 Hz, 2H), 3.44 (m, 2H), 6.70 (d, J = 7.6 Hz, 2H), 7.03 (d, J = 7.6 Hz, 2H), 7.78 (d, J = 7.6 Hz, 2H), 7.86 (d, J = 7.6 Hz, 2H), 8.20 (s, 2H), 8.52 (t, J = 5.2 Hz, 1H), 9.19 (s, 1H) ppm. 13C NMR (100 MHz, DMSO-d6) δ 34.28, 41.20, 115.09, 125.97, 129.47, 129.54, 133.87, 135.89, 155.58, 166.24 ppm. IR ν 3315, 1633, 1542, 1513, 1342, 1249, 1106, 1005, 823 cm-1.
(4-(([1,1'-Biphenyl]-4-ylmethyl)carbamoyl)phenyl)boronic Acid (6.25). Following synthetic procedure A using N-([1,1'-biphenyl]-4-ylmethyl)-4-(4,4,5,5-tetramethyl-1,3,2-dioxaborolan-2-yl)benzamide (0.150 g, 0.363 mmol), crystallization from THF/H2O afforded the title compound (0.069 g, 0.208 mmol, 59% yield). M.p. >230 °C. 1H NMR (400 MHz,

235
DMSO-d6) δ 4.58 (br s, 2H), 7.35 (br s, 1H), 7.45 (br s, 4H), 7.64 (br s, 4H), 7.95 (br s, 2H), 8.29 (s, 2H), 8.19 (br s, 2H), 9.15 (br s, 1H) ppm. 13C NMR (100 MHz, DMSO-d6) δ 42.38, 126.18, 126.54, 126.59, 127.27, 127.87, 128.88, 134.02, 135.60, 138.69, 138.92, 139.96, 166.42 ppm. IR ν 3294, 1636, 1539, 1352, 1315, 1121, 807 cm-1.
(4-((4-Phenylbutyl)carbamoyl)phenyl)boronic Acid (6.26). Following synthetic procedure A using N-(4-phenylbutyl)-4-(4,4,5,5-tetramethyl-1,3,2-dioxaborolan-2-yl)benzamide (0.114 g, 0.300 mmol), crystallization from THF/H2O afforded the title compound (0.057 g, 0.192 mmol, 63% yield). M.p. 173−180 °C. 1H NMR (400 MHz, DMSO-d6) δ 1.56 (m, 4H), 2.59 (t, J = 7.2 Hz, 2H), 3.29 (m, 2H), 7.19 (m, 3H), 7.26 (m, 2H), 7.78 (d, J = 8.0 Hz, 2H), 7.84 (d, J = 8.0 Hz, 2H), 8.19 (s, 2H), 8.44 (m, 1H) ppm. 13C NMR (100 MHz, DMSO-d6) δ 28.39, 28.70, 34.73, 38.79, 125.52, 125.89, 128.11, 128.18, 133.77, 135.85, 142.05, 166.11 ppm. IR ν 3464, 3308, 3026, 2917, 1627, 1533, 1470, 1319, 1118, 804, 742, 694 cm-1.
(4-((5-Phenylpentyl)carbamoyl)phenyl)boronic Acid (6.27). Following synthetic procedure A using N-(5-phenylpentyl)-4-(4,4,5,5-tetramethyl-1,3,2-dioxaborolan-2-yl)benzamide (0.099 g, 0.252 mmol), crystallization from THF/H2O afforded the title compound (0.068 g, 0.218 mmol, 94% yield). M.p. 210−211 °C. 1H NMR (400 MHz, DMSO-d6) δ 1.29 (m, 2H), 1.54 (m, 4H), 2.54 (m, 2H), 3.21 (m, 2H), 7.15 (m, 3H), 7.21 (m, 2H), 7.75 (m, 2H), 7.81 (m, 2H), 8.17 (s, 2H), 8.41 (br s, 1H) ppm. 13C NMR (100 MHz, DMSO-d6) δ 24.56, 26.06, 28.87, 30.69, 35.02, 125.55, 125.97, 128.17, 128.23, 133.84, 135.95, 142.19, 166.15 ppm. IR ν 3438, 3311, 2930, 2854, 1633, 1555, 1352, 1118, 1007, 805, 743, 696 cm-1.
(4-((3-(4-(tert-Butyl)phenyl)ureido)methyl)phenyl)boronic Acid (6.28). Following synthetic procedure A using 1-(4-(tert-butyl)phenyl)-3-(4-(4,4,5,5-tetramethyl-1,3,2-dioxaborolan-2-yl)benzyl)urea (0.142 g, 0.348 mmol), purification by PLC (hexanes/EtOAc 30:70) followed by treatment with a mixture of Et2O/hexanes (2:1 mL) gave a residue that was cristallized from THF/H2O to obtain the title compound (0.060 g, 0.183 mmol, 53% yield). M.p. >230 °C. 1H NMR (400 MHz, DMSO-d6) δ 1.24 (s, 9H), 4.30 (d, J = 6.0 Hz, 2H), 6.54 (t, J = 6.0 Hz, 1H), 722−7.33 (m, 6H), 7.52 (d, J = 7.8 Hz, 2H), 8.00 (s, 2H), 8.46 (s, 1H) ppm. 13C NMR (100 MHz, DMSO-d6) δ 31.17, 33.69, 42.66, 117.45, 125.10, 125.95, 134.07, 137.70, 142.14, 143.24, 155.19 ppm. IR ν 3319, 2959, 1639, 1598, 1550, 1408, 1359, 1231, 1114, 1016, 816 cm-1.
(4-((3-(4-(tert-Butyl)phenyl)ureido)methyl)-2-methoxyphenyl)boronic Acid (6.29). Following synthetic procedure A using 1-(4-(tert-butyl)phenyl)-3-(3-methoxy-4-(4,4,5,5-tetramethyl-1,3,2-dioxaborolan-2-yl)benzyl)urea (0.092 g, 0.21 mmol), purification by silica gel column chromatography (EtOAc/hexanes 60:40) afforded the title compound as an oil (0.033 g, 0.093 mmol, 44% yield). 1H NMR (400 MHz, DMSO-d6) δ 1.24 (s, 9H), 3.81 (s, 3H), 4.30 (d, J = 6.0 Hz, 2H), 6.55 (m, 1H), 6.90 (m, 2H), 7.23 (d, J = 8.0 Hz, 2H), 7.32 (d, J = 8.0 Hz, 2H), 7.55 (d, J = 7.2 Hz, 1H), 7.63 (s, 2H), 8.47 (s, 1H) ppm. 13C NMR (100 MHz, DMSO-d6) δ 31.18, 33.70, 39.42, 42.84, 109.00, 117.52, 118.81, 125.13, 135.51, 137.71,
236
143.30, 144.47, 155.21, 163.70 ppm. IR ν 3470, 3330, 2959, 1644, 1597, 1548, 1416, 1361, 1316, 1243, 1165, 1043, 823, 755 cm-1.
(4-(3-(4-(tert-Butyl)phenyl)ureido)phenyl)boronic Acid (6.30). Following synthetic procedure A using 1-(4-(tert-butyl)phenyl)-3-(4-(4,4,5,5-tetramethyl-1,3,2-dioxaborolan-2-yl)phenyl)urea (0.098 g, 0.25 mmol), crystallization from THF/H2O afforded the title compound (0.082 g, 0.263 mmol, 105% yield). M.p. 213−214 °C. 1H NMR (400 MHz, DMSO-d6) δ 1.26 (s, 9H), 7.29 (d, J = 8.8 Hz, 2H), 7.37 (d, J = 8.4 Hz, 2H), 7.41 (d, J = 8.4 Hz, 2H), 7.71 (d, J = 8.0 Hz, 2H), 7.84 (s, 2H), 8.59 (s, 1H), 8.64 (s, 1H) ppm. 13C NMR (100 MHz, DMSO-d6) δ 31.21, 33.84, 116.72, 118.03, 125.34, 134.98, 136.94, 141.49, 144.14, 152.39 ppm. IR ν 3316, 2958, 1673, 1647, 1589, 1518, 1401, 1360, 1316, 1216, 1111, 830 cm-1.
(E)-(3-(3-(4-Chlorophenyl)acrylamido)phenyl)boronic Acid (6.31). Following synthetic procedure A using (E)-3-(4-chlorophenyl)-N-(3-(4,4,5,5-tetramethyl-1,3,2-dioxaborolan-2-yl)phenyl)acrylamide (0.152 g, 0.396 mmol), crystallization from THF/H2O afforded the title compound (0.095 g, 0.315 mmol, 79% yield). M.p. >230 °C. 1H NMR (400 MHz, DMSO-d6) δ 6.87 (d, J = 15.6 Hz, 1H), 7.31 (m, 1H), 7.52 (m, 3H), 7.58 (d, J = 15.6 Hz, 1H) 7.65 (d, J = 8.4 Hz, 2H), 7.89 (m, 2H), 8.05 (s, 2H), 10.17 (s, 1H) ppm. 13C NMR (100 MHz, DMSO-d6) δ 121.143, 123.197, 125.153, 127.70, 128.97, 129.17, 129.29, 133.66, 134.04, 138.27, 138.43, 163.14 ppm. IR ν 3303, 1659, 1627, 1547, 1489, 1350, 1091, 1003, 818 cm-1.
2-Phenyl-N-(7-phenylheptyl)acetamide (6.32). Following synthetic procedure D using 2-phenylacetic acid (0.082 g, 0.602 mmol) and 7-phenylheptan-1-amine (0.113 g, 0.591 mmol), crystallization from hexanes/CH2Cl2 afforded the title compound (0.110 g, 0.355 mmol, 60% yield). M.p. 79−80 °C. 1H NMR (400 MHz, CDCl3) δ 1.35 (m, 6H), 1.37 (m, 2H), 1.39 (m, 2H), 2.57 (t, J = 7.8 Hz, 2H), 3.18 (m, 2H), 3.55 (s, 2H), 5.38 (br s, 1H), 7.15−7.35 (m, 10H) ppm. 13C NMR (100 MHz, CDCl3) δ 26.67, 29.04, 29.11, 29.41, 31.34, 35.90, 39.63, 43.90, 125.59, 127.31, 128.23, 128.38, 129.01, 129.44, 135.06, 142.75, 170.87 ppm. IR ν 3293, 2921, 2848, 1633, 1557, 1452, 1350, 1186, 1027, 708 cm-1.
2-(4-Hydroxyphenyl)-N-(7-phenylheptyl)acetamide (6.33). Following synthetic procedure D using 2-(4-hydroxyphenyl)acetic acid (0.102 g, 0.670 mmol) and 7-phenylheptan-1-amine (0.128 g, 0.669 mmol), crystallization from hexanes/CH2Cl2 afforded the title compound (0.126 g, 0.387 mmol, 58% yield). M.p. 93−94 °C. 1H NMR (400 MHz, DMSO-d6) δ 1.21 (m, 6H), 1.35 (m, 2H), 1.54 (m, 2H), 2.55 (t, J = 7.6 Hz, 2H), 3.00 (m, 2H), 3.24 (s, 2H), 6.66 (d, J = 8.4 Hz, 2H), 7.02 (d, J = 8.4 Hz, 2H), 7.16 (m, 3H), 7.26 (m, 2H), 7.85 (m, 1H), 9.22 (s, 1H) ppm. 13C NMR (100 MHz, DMSO-d6) δ 26.22, 28.44, 28.50, 28.98, 30.85, 35.04, 38.41, 41.54, 114.82, 125.47, 126.61, 128.10, 128.15, 129.68, 142.21, 155.73, 170.30 ppm. IR ν 3420, 3290, 2922, 2849, 1633, 1558, 1513, 1451, 1251, 755 cm-1.
N-[(1,1-Dimethylethoxy)carbonyl]-4-hydroxy-3-methoxybenzylamine (6.34). To a solution of 4-(aminomethyl)-2-methoxyphenol hydrochloride (1.138 g, 6.00 mmol) in a mixture of
237
THF/H20 (25:10 mL) was added Et3N (0.607 g, 6.00 mmol) at 0 °C and followed by addition of di-tert-butyl dicarbonate (1.309 g, 6.00 mmol). The reaction mixture was stirred at 0 °C for 30 min, then at room temperature for 18 h. The mixture was concentrated in vacuo and the residue was diluited with water and EtOAc. The organic layer was washed with brine (×3), dried over Na2SO4, filtered and concentated in vacuo. The resulting material was purified by silica gel column chromatography (CH2Cl2/EtOAc 95:5) to obtain the desired product (1.26 g, 4.99 mmol, 83% yield). 1H NMR (400 MHz, CDCl3) δ 1.46 (s, 9H), 3.87 (s, 3H), 4.22 (d, J = 5.2 Hz, 2H), 4.80 (br s, 1H), 5.63 (s, 1H), 6.76 (d, J = 8.0 Hz, 1H), 6.81 (s, 1H), 6.66 (d, J = 8.0 Hz, 1H) ppm.
N-[(1,1-Dimethylethoxy)carbonyl]-4-[(trifluoromethyl)sulfonyl]oxy-3-methoxybenzylamine (6.35). To a solution of N-[(1,1-dimethylethoxy)carbonyl]-4-hydroxy-3-methoxybenzylamine (0.785 g, 3.10 mmol) and N-phenyl-bis(trifluoromethanesulfonimide) (1.107 g, 3.10 mmol) in CH2Cl2 (8 mL) was added dropwise Et3N (0.314 g, 3.10 mmol) at 0 °C. The mixture was stirred at room temperature for 16 h and then diluited with brine. The aqueous phase was extracted with CH2Cl2 (×3). The organic layer was washed with brine, dried over Na2SO4, filtered and concentrated in vacuo. The resulting material was purified by silica gel column chromatography (hexanes/EtOAc 80:20) to obtain the desired product (0.950 g, 4.46 mmol, 80% yield). M.p. 99−101 °C (hexanes/CH2Cl2). 1H NMR (400 MHz, CDCl3) δ 1.47 (s, 9H), 3.90 (s, 3H), 4.31 (d, J = 5.6 Hz, 2H), 4.94 (br s, 1H), 6,87 (d, J = 8,4 Hz, 1H), 6.97 (s, 1H), 7.16 (d, J = 8,4 Hz, 1H) ppm. 13C NMR (100 MHz, CDCl3) δ 28.37, 44.30, 56.17, 80.00, 112.21, 119.46, 122.44, 137.84, 140.85, 151.48, 155.97, 166.80 ppm. IR ν 3374, 2984, 2943, 1685, 1609, 1528, 1507, 1422, 1284, 1199, 1141, 1033, 883 cm-1.
N-[(1,1-Dimethylethoxy)carbonyl]-4-(4,4,5,5-tetramethyl-1,3,2-dioxaborolan-2-yl)-3-methoxybenzylamine (6.36). A mixture of palladium(II) chloride (0.012 g, 0.07 mmol), 1,1'-bis(diphenylphosphino)ferrocene (0.078 g, 0.140 mmol), potassium acetate (0.687 g, 7.0 mmol), N-[(1,1-dimethylethoxy)carbonyl]-4-[(trifluoromethyl)sulfonyl]oxy-3-methoxybenzylamine (0.902 g, 2.34 mmol), and bis(pinacolato)diboron (0.653 g, 2.57 mmol) was stirred min at room temperature for 10 under N2. Dioxane was added (16 mL) and the reaction mixture was stirred at 100 °C for 4 h. The reaction mixture was cooled to room temperature and diluited with water and EtOAc. The organic layer was washed with brine, dried over Na2SO4, filtered and concentrated in vacuo. The resulting material was purified by silica gel column chromatography (hexanes/EtOAc 65:35) to obtain the desired product (0.680 g, 1.80 mmol, 80% yield). M.p. 85−86 °C (hexanes/Et2O). 1H NMR (400 MHz, CDCl3) δ 1.34 (s, 12H), 1.45 (s, 9H), 3.87 (s, 3H), 4.28 (d, J = 4.8 Hz, 2H), 4.97 (br s, 1H), 6.77 (s, 1H), 6.83 (d, J = 7.2 Hz, 1H), 7.62 (d, J = 7.2 Hz, 1H) ppm. 13C NMR (100 MHz, CDCl3) δ 24.81, 28.41, 44.88, 55.81, 79.48, 83.43, 109.66, 119.12, 137.09, 143.89, 155.97, 164.61 ppm. IR ν 3371, 2977, 2934, 1709, 1612, 1567, 1525, 1463, 1418, 2358, 1252, 1166, 1067, 862 cm-1.
238
4-(4,4,5,5-Tetramethyl-1,3,2-dioxaborolan-2-yl)-3-methoxybenzylamime trifluoroacetate (6.37). A solution of N-[(1,1-dimethylethoxy)carbonyl]-4-(4,4,5,5-tetramethyl-1,3,2-dioxaborolan-2-yl)-3-methoxybenzylamine (0.541 g, 1.43 mmol) in a mixture of TFA/ CH2Cl2 (4 mL, 3:1) was stirred for 40 min at room temperature. Then, the reaction mixture was concentrated in vacuo, diluited with CHCl3 and concentrated in vacuo (×4). The resulting material was washed crystallized from hexanes/Et2O to obtain a white solid (0.474 g, 1.26 mmol, 88% yield). M.p. 145−147 °C. 1H NMR (400 MHz, CDCl3) δ 1.30 (s, 12H), 3.74 (s, 3H), 4.00 (br s, 2H), 6.85 (m, 2H), 7.58 (d, J = 7.2 Hz, 1H), 7.84 (br s, 3H) ppm. 13C NMR (100 MHz, CDCl3) δ 24.59, 44.23, 55.69, 84.32, 111.13, 115.80 (q, J = 320 Hz), 120.78, 136.41, 137.55, 160.97 (q, J = 38.7 Hz), 164.48 ppm. IR ν 2981, 1669, 1614, 1420, 1347, 1140, 1067, 798 cm-1.
N-(4-(4,4,5,5-tetramethyl-1,3,2-dioxaborolan-2-yl)benzyl)oleamide (6.39). A solution of oleic acid (0.071 g, 0.251 mmol) and 1,1'-carbonyldiimidazole (0.081 g, 0.5 mmol) in CH2Cl2 (2 mL) was stirred at room temperature for 1 h and added to a solution of 4-(4,4,5,5-tetramethyl-1,3,2-dioxaborolan-2-yl)-benzylamine trifluoroacetate (0.094 g, 0.250 mmol) in CH2Cl2 (1 mL). Et3N (0.026 g, 0.260 mmol) was added at 0 °C. Reaction mixture was stirred at room temperature for 16 h, then diluited with EtOAc. The organic layer was washed with satd. aq. NaHCO3 and brine (×2), dried over Na2SO4, filtered and concentrated in vacuo. The resulting material was used in the next step without further purification (0.119 g, 0.239 mmol, 96% yield). 1H NMR (400 MHz, CDCl3) δ 0.88 (t, J = 6.4 Hz, 3H), 1.29 (m, 32H), 1.63 (m, 2H), 2.00 (m, 4H), 2.19 (t, J = 7.6 Hz, 2H), 4.41 (d, J = 5.6 Hz, 2H), 5.34 (m, 2H), 6.16 (m, 1H), 7.24 (d, J = 8.0 Hz, 2H), 7.75 (d, J = 8.0 Hz, 2H) ppm. 13C NMR (100 MHz, CDCl3) δ 14.10, 22.68, 24.86, 25.02, 25.79, 27.20, 27.23, 29.15, 29.32, 29.53, 29.72, 29.78, 31.91, 34.38, 36.71, 43.58, 83.82, 127.02, 129.76, 129.99, 135.19, 141.58, 173.28 ppm. IR ν 3447, 3029, 2920, 2856, 1665, 1613, 1513, 1466, 1398, 1357, 1322, 1273, 1143, 1088, 1021, 962, 857 cm-1.
N-[4-(4,4,5,5-Tetrametil-1,3,2-diossiborolan-2-il)-3-metossibenzil]oleamide (6.40). Following synthetic procedure described for 6.39 using oleic acid (0.076 g, 0.269 mmol) and 3-methoxy-4-(4,4,5,5-tetramethyl-1,3,2-dioxaborolan-2-yl)-benzylamine trifluoroacetate (0.100 g, 0.265 mmol), the resulting material was used in the next step without further purification (0.146 g, 0.277 mmol, 104% yield). 1H NMR (400 MHz, CDCl3) δ 0.88 (t, J = 7.2 Hz, 3H), 1.29 (m, 32H), 1.64 (m, 2H), 2.00 (m, 4H), 2.21 (t, J = 7.4 Hz, 2H), 3.75 (s, 3H), 4.39 (d, J = 5.6 Hz, 2H), 5.34 (m, 2H), 6.41 (br s, 1H), 6.73 (s, 1H), 6.82 (d, J = 7.6 Hz, 1H), 7.62 (d, J = 7.6 Hz, 1H) ppm. 13C NMR (100 MHz, CDCl3) δ 14.10, 22.67, 24.81, 25.85, 27.18, 27.23, 29.15, 29.32, 29.52, 29.72, 29.77, 31.90, 36.73, 43.63, 55.74, 83.48, 109.94, 119.40, 129.73, 130.00, 137.18, 143.38, 164.56, 173.30 ppm. IR ν 3285, 2924, 2853, 1646, 1610, 1567, 1412, 1355, 1255, 1146, 1066, 860 cm-1.
2-([1,1'-Biphenyl]-4-yl)-N-(4-(4,4,5,5-tetramethyl-1,3,2-dioxaborolan-2-
239
yl)benzyl)acetamide (6.41). Following synthetic procedure described for 6.39 using 4-biphenylacetic acid (0.042 g, 0.198 mmol) and 4-(4,4,5,5-tetramethyl-1,3,2-dioxaborolan-2-yl)-benzylamine trifluoroacetate (0.069 g, 0.199 mmol), the resulting material was used in the next step without further purification (0.075 g, 0.175 mmol, 88% yield). 1H NMR (400 MHz, CDCl3) δ 1.31 (m, 12H), 3.60 (s, 2H), 4.39 (d, J = 5.2 Hz, 2H), 6.15 (m, 1H), 7.18 (d, J = 7.2 Hz, 2H), 7.31 (m, 3H), 7.41 (m, 2H), 7.54 (m, 4H), 7.74 (d, J = 7.2 Hz, 2H) ppm. 13C NMR (100 MHz, CDCl3) δ 24.83, 43.23, 43.65, 83.80, 126.83, 127.00, 127.36, 127.64, 128.78, 129.81, 133.76, 135.15, 140.24, 140.51, 141.24 ppm. IR ν 3427, 3009, 2983, 1664, 1613, 1517, 1361, 1322, 1197, 1143, 1089, 857 cm-1.
3-Phenyl-N-(4-(4,4,5,5-tetramethyl-1,3,2-dioxaborolan-2-yl)benzyl)propanamide (6.42). Following synthetic procedure described for 6.39 using 3-phenylpropanoic acid (0.030 g, 0.2 mmol) and 4-(4,4,5,5-tetramethyl-1,3,2-dioxaborolan-2-yl)-benzylamine trifluoroacetate (0.069 g, 0.199 mmol) the resulting material was used in the next step without further purification (0.057 g, 0.156 mmol, 78% yield). 1H NMR (400 MHz, CDCl3) δ 1.33 (m, 12H), 2.48 (t, J = 7.6 Hz, 2H), 2.95 (t, J = 7.6 Hz, 2H), 4.35 (d, J = 5.6 Hz, 2H), 5.99 (br s, 1H), 7.11 (d, J = 7.6 Hz, 2H), 7.15−7.25 (m, 5H), 7.72 (d, J = 7.6 Hz, 2H) ppm. 13C NMR (100 MHz, CDCl3) δ 24.85, 31.69, 38.36, 43.55, 83.81, 126.25, 126.95, 128.36, 128.54, 135.12, 140.76, 141.33, 172.03 ppm. IR ν 3344, 3005, 2981, 1667, 1612, 1516, 1360, 1235, 1143, 1088, 1021, 857 cm-1.
(E)-3-(4-chlorophenyl)-N-(4-(4,4,5,5-tetramethyl-1,3,2-dioxaborolan-2-yl)benzyl)acrylamide (6.43). Following synthetic procedure B using (E)-3-(4-chlorophenyl)acrylic acid (0.091 g, 0.500 mmol) and 4-(4,4,5,5-tetramethyl-1,3,2-dioxaborolan-2-yl)-benzylamine trifluoroacetate (0.174 g, 0.500 mmol), purification by silica gel column chromatography (CH2Cl2/EtOAc 95:5) afforded the title compound (0.077 g, 0.194 mmol, 39% yield). 1H NMR (400 MHz, CDCl3) δ 1.32 (m, 12H), 4.53 (s, 2H), 6.43 (d, J = 15.6 Hz, 1H), 6.52 (s, 1H), 7.27−7.34 (m, 6H), 7.55 (d, J = 15.6 Hz, 1H), 7.74−7.76 (m, 2H) ppm. 13C NMR (100 MHz, CDCl3) δ 24.84, 43.80, 83.83, 121.12, 127.08, 128.95, 129.01, 133.27, 135.21, 135.46, 139.91, 141.28, 165.68 ppm. IR ν 3264, 2980, 1655, 1616, 1405, 1359, 1142, 1089, 818 cm-1.
6-Phenyl-N-(4-(4,4,5,5-tetramethyl-1,3,2-dioxaborolan-2-yl)benzyl)hexanamide (6.44). Following synthetic procedure B using 6-phenylhexanoic acid (0.076 g, 0.395 mmol) and 4-(4,4,5,5-tetramethyl-1,3,2-dioxborolan-2-yl)-benzylamine trifluoroacetate (0.138 g, 0.415 mmol), purification by silica gel column chromatography (hexanes/EtOAc 70:30) afforded the title compound as an oil (0.055 g, 0.135 mmol, 34% yield). 1H NMR (400 MHz, CDCl3) δ 1.33 (m, 14H), 1.63 (m, 4H), 2.17 (t, J = 7.4 Hz, 2H), 2.58 (t, J = 7.6 Hz, 2H), 4.39 (d, J = 6.0, 2H), 6.01 (br s, 1H), 7.13−7.27 (m, 7H), 7.76 (d, J = 7.6 Hz, 2H) ppm. 13C NMR (100 MHz, CDCl3) δ 24.83, 25.55, 28.83, 31.09, 35.70, 36.53, 43.50, 83.79, 125.63, 127.02, 128.24, 128.36, 135.15, 141.54, 142.47, 173.02 ppm. IR ν 3287, 2930, 1644, 1612, 1358,
240
1142, 1087, 858 cm-1. 8-Phenyl-N-(4-(4,4,5,5-tetramethyl-1,3,2-dioxaborolan-2-yl)benzyl)octanamide (6.45).
Following synthetic procedure B using 8-phenyloctanoic acid (0.077 g, 0.349 mmol) and 4-(4,4,5,5-tetramethyl-1,3,2-dioxaborolan-2-yl)-benzylamine trifluoroacetate (0.121 g, 0.349 mmol), purification by silica gel column chromatography (hexanes/EtOAc 70:30) afforded the title compound as an oil (0.081 g, 0.186 mmol, 54% yield). 1H NMR (400 MHz, CDCl3) δ 1.32 (m, 18H), 1.61 (m, 4H), 2.16 (t, J = 7.2 Hz, 2H), 2.58 (t, J = 7.6 Hz, 2H), 4.40 (d, J = 5.6 Hz, 2H), 6.01 (m, 1H), 7.17 (m, 3H), 7.25 (m, 4H), 7.77 (d, J = 8.0 Hz, 2H) ppm. 13C NMR (100 MHz, CDCl3) δ 24.83, 25.70, 29.08, 29.18, 31.39, 35.90, 36.65, 43.49, 83.79, 125.55, 127.03, 128.20, 128.37, 135.15, 141.59, 142.76, 173.06 ppm. IR ν 3284, 2927, 1644, 1612, 1359, 1142, 1087, 858 cm-1.
N-(3-Methoxy-4-(4,4,5,5-tetramethyl-1,3,2-dioxaborolan-2-yl)benzyl)-6-phenylhexanamide (6.46). Following synthetic procedure B using 6-phenylhexanoic acid (0.048 g, 0.250 mmol) and 3-methoxy-4-(4,4,5,5-tetramethyl-1,3,2-dioxaborolan-2-yl)-benzylamine trifluoroacetate (0.087 g, 0.251 mmol), purification by silica gel column chromatography (hexanes/EtOAc 50:50) afforded the title compound as an oil (0.046 g, 0.105 mmol, 42% yield). 1H NMR (400 MHz, CDCl3) δ 1.34 (m, 14H), 1.65 (m, 4H), 2.20 (t, J = 7.8 Hz, 2H), 2.60 (t, J = 7.8 Hz, 2H), 3.81 (s, 3H), 4.41 (d, J = 5.6 Hz, 2H), 5.74 (m, 1H), 6.75 (s, 1H), 6.82 (d, J = 7.2 Hz, 1H), 7.17 (m, 3H), 7.27 (m, 2H), 7.64 (d J = 7.2 Hz, 1H) ppm. 13C NMR (100 MHz, CDCl3) δ 24.80 , 25.61, 28.88, 31.13, 35.72, 36.69, 43.74, 55.84, 83.49, 109.99, 119.44, 125.68, 128.28, 128.38, 137.22, 142.49, 143.14, 164.60, 172.88 ppm. IR ν 3286, 2931, 1646, 1567, 1412, 1355, 1256, 1144, 1066, 859 cm-1.
N-(3-Methoxy-4-(4,4,5,5-tetramethyl-1,3,2-dioxaborolan-2-yl)benzyl)-8-phenyloctanamide (6.47). Following synthetic procedure B using 8-phenyloctanoic acid (0.081 g, 0.368 mmol) and (3-methoxy-4-(4,4,5,5-tetramethyl-1,3,2-dioxaborolan-2-yl)-benzylamine trifluoroacetate (0.140 g, 0.371 mmol) purification by silica gel column chromatography (hexanes/EtOAc 70:30) afforded the title compound as an oil (0.070 g, 0.150 mmol, 41% yield). 1H NMR (400 MHz, CDCl3) δ 1.32 (m, 18H) 1.60 (m, 4H) 2.18 (t, J = 7.6 Hz, 2H), 2.58 (t, J = 7.6 Hz, 2H), 3.79 (s, 3H), 4.40 (d, J = 6.0 Hz, 2H), 5.84 (m, 1H), 6.74 (s, 1H), 6.82 (d, J = 7.4 Hz, 1H), 7.16 (m, 3H), 7.26 (m. 2H), 7.62 (d, J = 7.4 Hz, 1H) ppm. 13C NMR (100 MHz, CDCl3) δ 24.83, 25.55, 28.83, 31.09, 35.70, 36.53, 43.50, 83.79, 125.63, 127.02, 128.24, 128.36, 135.15, 141.54, 142.47, 173.02 ppm. IR ν 3285, 2928, 1644, 1609, 1411, 1354, 1255, 1144, 1066, 859 cm-1.
4-(tert-Butyl)-N-(4-(4,4,5,5-tetramethyl-1,3,2-dioxaborolan-2-yl)phenyl)benzamide (6.48). Following synthetic procedure B using 4-(tert-butyl)benzoic acid (0.089 g, 0.500 mmol) and 4-(4,4,5,5-tetramethyl-1,3,2-dioxaborolan-2-yl)aniline (0.109 g, 0.497 mmol), purification by silica gel column chromatography (hexanes/EtOAc 70:30) afforded the title compound (0.161 g, 0.424 mmol, 81% yield). M.p. 172−175 °C (hexanes/CH2Cl2). 1H NMR (400 MHz, CDCl3)

241
δ 1.35 (s, 21H), 7.48 (d, J = 11.2 Hz, 2H), 7.67 (d, J = 11.2 Hz, 2H), 7.82 (m, 4H), 7.92 (s, 1H) ppm. 13C NMR (100 MHz, CDCl3) δ 24.87, 31.15, 34.99, 83.74, 118.83, 125.74, 126.88, 131.99, 135.87, 140.76, 155.52, 165.57 ppm. IR ν 3335, 2970, 1652, 1606, 1586, 1397, 1356, 1317, 1144, 1084, 831 cm-1.
2-([1,1'-Biphenyl]-4-yl)-N-(4-(4,4,5,5-tetramethyl-1,3,2-dioxaborolan-2-yl)phenyl)acetamide (6.49). Following synthetic procedure B using 2-([1,1'-biphenyl]-4-yl)acetic acid (0.106 g, 0.499 mmol) and 4-(4,4,5,5-tetramethyl-1,3,2-dioxaborolan-2-yl)aniline (0.109 g, 0.497 mmol), purification by silica gel column chromatography (hexanes/EtOAc 60:40) afforded the title compound (0.133 g, 0.322 mmol, 62% yield). 1H NMR (400 MHz, CDCl3) δ 1.32 (s, 12H), 3.76 (s, 2H), 7.28 (br s, 1H), 7.42 (m, 7H), 7.60 (m, 4H), 7.74 (d, J = 11.2 Hz, 2H) ppm. 13C NMR (100 MHz, CDCl3) δ 24.85, 44.55, 83.74, 118.58, 127.05, 127.50, 127.90, 128.84, 129.97, 133.20, 135.76, 140.29, 140.43, 140.62, 169.00 ppm. IR ν 3299, 2978, 1662, 1594, 1528, 1398, 1356, 1142, 1089, 859 cm-1.
(E)-3-(4-chlorophenyl)-N-(4-(4,4,5,5-tetramethyl-1,3,2-dioxaborolan-2-yl)phenyl)acrylamide (6.50). Following synthetic procedure B using (E)-3-(4-chlorophenyl)acrylic acid (0.183 g, 1.00 mmol) and 4-(4,4,5,5-tetramethyl-1,3,2-dioxaborolan-2-yl)aniline (0.219 g, 1.00 mmol), purification by silica gel column chromatography (CHCl3/MeOH 97.2:2.5) afforded the title compound (0.301 g, 0.784 mmol, 79% yield). 1H NMR (400 MHz, DMSO-d6) δ 1.30 (s, 12H), 6.87 (d, J = 16.0 Hz, 1H), 7.52 (d, J = 8.4 Hz, 2H), 7.61 (d, J = 16.0 Hz, 1H), 7.67 (m, 4H), 7.75 (d, J = 8.4 Hz, 2H), 10.39 (s, 1H) ppm. 13C NMR (100 MHz, DMSO-d6) δ 24.60, 83.39, 118.25, 122.85, 128.98, 129.38, 133.53, 134.22, 135.30, 139.05, 141.92, 163.45 ppm. IR ν 3282, 2979, 2929, 1662, 1630, 1587, 1532, 1398, 1358, 1147, 1087, 978, 819 cm-1.
6-Phenyl-N-(4-(4,4,5,5-tetramethyl-1,3,2-dioxaborolan-2-yl)phenyl)hexanamide (6.51). Following synthetic procedure B using 6-phenylhexanoic acid (0.110 g, 0.572 mmol) and 4-(4,4,5,5-tetramethyl-1,3,2-dioxaborolan-2-yl)aniline (0.131 g, 0.598 mmol), purification by silica gel column chromatography (CH2Cl2/EtOAc 95:5) afforded the title compound (0.156 g, 0.397 mmol, 66% yield). 1H NMR (300 MHz, CDCl3) δ 1.40 (s, 12H), 1.63 (m, 2H), 1.71 (m, 4H), 2.33 (d, J = 7.5 Hz, 2H), 2.61 (d, J = 7.5 Hz, 2H), 7.17 (m, 3H), 7.26 (m, 3H), 7.51 (d, J = 8.0 Hz, 2H), 7.76 (d, J = 8.0, 2H) ppm. 13C NMR (75 MHz, CDCl3) δ 24.86, 25.32, 28.82, 31.16, 35.71, 37.74, 83.72, 118.49, 125.68, 128.27, 128.34, 135.80, 140.59, 142.46, 171.27 ppm. IR ν 3301, 2930, 2857, 1663, 1592, 1527, 1397, 1356, 1319, 1142, 859 cm-1.
8-Phenyl-N-(4-(4,4,5,5-tetramethyl-1,3,2-dioxaborolan-2-yl)phenyl)octanamide (6.52). Following synthetic procedure B using 8-phenyloctanoic acid (0.110 g, 0.500 mmol) and 4-(4,4,5,5-tetramethyl-1,3,2-dioxaborolan-2-yl)aniline (0.109 g, 0.497 mmol), purification by silica gel column chromatography (hexanes/EtOAc 80:20) afforded the title compound (0.142 g, 0.337 mmol, 67% yield). 1H NMR (400 MHz, CDCl3) δ 1.33 (m, 18H), 1.62 (m, 4H), 1.69 (m, 4H), 2.32 (t, J = 10.4 Hz, 2H), 2.58 (t, J = 10.4 Hz, 2H), 7.14−7.77 (m, 9H) ppm. 13C
242
NMR (100 MHz, CDCl3) δ 24.85, 25.49, 29.08, 29.16, 29.21, 31.40, 35.91, 37.81, 83.70, 118.53, 125.56, 128.21, 128.38, 135.77, 140.69, 142.76, 171.52 ppm. IR ν 3291, 2976, 2922, 1662, 1593, 1529, 1359, 1144, 1092, 838 cm-1.
(E)-3-(4-chlorophenyl)-N-(3-(4,4,5,5-tetramethyl-1,3,2-dioxaborolan-2-yl)phenyl)acrylamide (6.53). Following synthetic procedure B using (E)-3-(4-chlorophenyl)acrylic acid (0.183 g, 1.00 mmol) and 3-(4,4,5,5-tetramethyl-1,3,2-dioxaborolan-2-yl)aniline (0.219 g, 1.00 mmol), purification by silica gel column chromatography (CHCl3/MeOH 97.5:2.5) afforded the title compound (0.292 g, 0.761 mmol, 76% yield). M.p. 165−166 °C. 1H NMR (400 MHz, DMSO-d6) δ 1.31 (s, 12H), 6.83 (d, J = 15.6 Hz, 1H), 7.37 (m, 2H), 7.52 (d, J = 8.4 Hz, 2H), 7.59 (d, J = 15.6 Hz, 1H) 7.66 (d, J = 8.4 Hz, 2H), 7.90 (m, 1H), 8.01 (s, 1H), 10.28 (s, 1H) ppm. 13C NMR (100 MHz, DMSO-d6) δ 24.61, 83.63, 99.45, 122.08, 122.94, 125.12, 128.38, 128.98, 129.28, 129.34, 133.54, 134.14, 138.72, 163.24 ppm. IR ν 3269, 2980, 1661, 1624, 1550, 1427, 1357, 1141, 1093, 964, 817, 704 cm-1.
1-(4-(tert-Butyl)phenyl)-3-(4-(4,4,5,5-tetramethyl-1,3,2-dioxaborolan-2-yl)benzyl)urea (6.54). Following synthetic procedure C using 4-tert-butylphenyl isocyanate (0.140 g, 0.800 mmol) and 4-(4,4,5,5-tetramethyl-1,3,2-dioxaborolan-2-yl)-benzylamine trifluoroacetate (0.170 g, 0.490 mmol), purification by silica gel column chromatography (hexanes/EtOAc 60:40) afforded the title compound (0.178 g, 0.435 mmol, 88% yield). M.p. 87−89 °C. 1H NMR (400 MHz, CDCl3) δ 1.20 (s, 9H), 1.32 (s, 12H), 4.16 (t, J = 5.6 Hz, 2H), 6.32 (m, 1H), 7.05 (t, J = 8.8 Hz, 2H), 7.08 (t, J = 8.8 Hz, 2H), 7.13 (t, J = 7.6 Hz, 2H), 7.69 (t, J = 7.6 Hz, 2H), 7.82 (s, 1H) ppm. 13C NMR (100 MHz, CDCl3) δ 24.78, 31.34, 34.08, 43.66, 83.62, 120.00, 125.67, 126.25, 135.02, 136.14, 142.46, 146.85, 156.85 ppm. IR ν 3324, 2965, 1645, 1598, 1551, 1515, 1358, 1316, 1235, 1142, 1086, 1020, 858 cm-1.
1-(4-(tert-Butyl)phenyl)-3-(3-methoxy-4-(4,4,5,5-tetramethyl-1,3,2-dioxaborolan-2-yl)benzyl)urea (6.55). Following synthetic procedure C using 4-tert-butylphenyl isocyanate (0.065 g, 0.371 mmol) and 3-methoxy-4-(4,4,5,5-tetramethyl-1,3,2-dioxaborolan-2-yl)-benzylamine trifluoroacetate (0.070 g, 0.186 mmol), purification by silica gel column chromatography (hexanes/EtOAc 60:40) afforded the title compound (0.062 g, 0.141 mmol, 85% yield). 1H NMR (400 MHz, CDCl3/CD3OD) δ 1.29 (s, 9H), 1.35 (s, 12H), 3.83 (s, 3H), 4.40 (s, 2H), 6.89 (m, 3H), 7.28 (s, 4H), 7.63 (t, J = 7,6 Hz, 2H) ppm. 13C NMR (100 MHz, CDCl3/CD3OD) δ 24.92, 31.66, 34.62, 44.30, 55.73, 84.28, 109.94, 119.55, 119.78, 126.19, 137.32, 137.70, 145.56, 146.11, 157.68, 165.34 ppm. IR ν 3334, 2962, 1646, 1599, 1547, 1409, 1315, 1239, 1142, 1062, 830 cm-1.
1-(4-(tert-Butyl)phenyl)-3-(4-(4,4,5,5-tetramethyl-1,3,2-dioxaborolan-2-yl)phenyl)urea (6.56). Following synthetic procedure C using 4-tert-butylphenyl isocyanate (0.220 g, 1.25 mmol) and 4-(4,4,5,5-tetramethyl-1,3,2-dioxaborolan-2-yl)aniline (0.198 g, 0.500 mmol), purification by column chromatography (CH2Cl2/EtOAc 95:5) afforded the title compound

243
(0.098 g, 0.248 mmol, 50% yield). M.p. >220 °C. 1H NMR (400 MHz, CDCl3) δ 1.19 (s, 9H), 1.30 (s, 12H), 7.10 (d, J = 8.4 Hz, 2H), 7.16 (d, J = 8.8 Hz, 2H), 7.19 (d, J = 8.0 Hz, 2H), 7.63 (d, J = 8.4 Hz, 2H), 7.75 (s, 1H), 7.82 (s, 1H), ppm. 13C NMR (100 MHz, CDCl3) δ 24.85, 31.31, 34.20, 85.54, 118.99, 120.97, 125.87, 135.13, 135.83, 141.25, 146.82, 154.23 ppm. IR ν 3319, 2965, 1652, 1592, 1543, 1360, 1315, 1142, 1091, 828 cm-1.
N-(4-(tert-butyl)phenyl)-2-(4-(4,4,5,5-tetramethyl-1,3,2-dioxaborolan-2-yl)phenyl)acetamide (6.58). Following synthetic procedure D using 2-(4-(4,4,5,5-tetramethyl-1,3,2-dioxaborolan-2-yl)phenyl)acetic acid (0.100 g, 0.381 mmol) and 4-(tert-butyl)aniline (0.057 g, 0.381 mmol), purification by silica gel column chromatography (CH2Cl2) afforded the title compound as an oil (0.064 g, 0.163 mmol, 43% yield). 1H NMR (400 MHz, CDCl3) δ 1.27 (s, 9H), 1.35 (s, 12H), 3.71 (s, 2H), 7.30 (m, 7H), 7.82 (d, J = 8.0 Hz, 2H) ppm. 13C NMR (100 MHz, CDCl3) δ 24.86, 31.31, 34.31, 83.89, 119.77, 125.68, 128.84, 135.00, 135.57, 137.69, 147.41, 168.85 ppm. IR ν 3259, 2966, 1650, 1604, 1536, 1516, 1360, 1270, 1142, 1090, 1023, 962, 859 cm-1.
N-benzyl-2-(4-(4,4,5,5-tetramethyl-1,3,2-dioxaborolan-2-yl)phenyl)acetamide (6.59). Following synthetic procedure D using 2-(4-(4,4,5,5-tetramethyl-1,3,2-dioxaborolan-2-yl)phenyl)acetic acid (0.131 g, 0.500 mmol) and phenylmethanamine (0.054 g, 0.500 mmol), purification by silica gel column chromatography (hexanes/EtOAc 70:30) afforded the title compound (0.132 g, 0.376 mmol, 75% yield). M.p. 132−134 °C (hexanes/CH2Cl2). 1H NMR (400 MHz, CDCl3) δ 1.33 (s, 12H), 3.55 (s, 2H), 4.33 (t, J = 5.6 Hz, 2H), 6.16 (br s, 1H), 7.14 (d, J = 7.4 Hz, 2H), 7.25 (m, 5H), 7.76 (d, J = 7.4 Hz, 2H) ppm. 13C NMR (100 MHz, CDCl3) δ 24.83, 43.47, 43.77, 83.81, 127.30, 127.45, 128.56, 128.74, 135.37, 138.01, 138.13, 170.66 ppm. IR ν 3260, 2983, 1644, 1552, 1359, 1140, 1089, 858 cm-1.
N-([1,1'-biphenyl]-4-ylmethyl)-2-(4-(4,4,5,5-tetramethyl-1,3,2-dioxaborolan-2-yl)phenyl)acetamide (6.60). Following synthetic procedure D using 2-(4-(4,4,5,5-tetramethyl-1,3,2-dioxaborolan-2-yl)phenyl)acetic acid (0.131 g, 0.500 mmol) and (1,1'-biphenyl)-4-ylmethanamine (0.092 g, 0.500 mmol), purification by silica gel column chromatography (hexanes/EtOAc 60:40) afforded the title compound (0.181 g, 0.423 mmol, 85% yield). M.p. 110−111 °C (hexanes/CH2Cl2). 1H NMR (400 MHz, DMSO-d6) δ 1.28 (s, 12H), 3.56 (s, 2H), 4.34 (br s, 2H), 7.34 (m, 5H), 7.43 (m, 2H), 7.65 (m, 6H), 8.68 (br s, 1H) ppm. 13C NMR (100 MHz, DMSO-d6) δ 24.60, 41.96, 42.56, 83.48, 126.54, 126.58, 127.27, 127.83, 128.59, 128.86, 134.45, 138.62, 138.73, 139.87, 139.91, 169.83 ppm. IR ν 3291, 2978, 1641, 1612, 1542, 1358, 1143, 1088, 858 cm-1.
N-(4-phenylbutyl)-2-(4-(4,4,5,5-tetramethyl-1,3,2-dioxaborolan-2-yl)phenyl)acetamide (6.61). Following synthetic procedure D using 2-(4-(4,4,5,5-tetramethyl-1,3,2-dioxaborolan-2-yl)phenyl)acetic acid (0.100 g, 0.381 mmol) and 4-phenylbutan-1-amine (0.057 g, 0.381 mmol), purification by silica gel column chromatography (hexanes/EtOAc 60:40) afforded the title compound as an oil (0.102 g, 0.259 mmol, 68% yield). 1H NMR (400 MHz, CDCl3) δ
244
1.34 (s, 12H), 1.41 (m, 2H), 1.53 (m, 2H), 2.54 (t, J = 7.2 Hz, 2H), 3.44 (m, 2H), 3.53 (s, 2H), 5.67 (br s, 1H), 7.09 (d, J = 7.4 Hz, 2H), 7.13 (m, 1H), 7.23 (m, 4H), 7.78 (d, J = 7.4 Hz, 2H) ppm. 13C NMR (100 MHz, CDCl3) δ 24.64, 28.27, 28.74, 35.13, 39.19, 43.73, 83.62, 125.52, 128.08, 128.10, 128.54, 135.19, 137.98, 141.78, 170.48 ppm. IR ν 3288, 2977, 2933, 1643, 1551, 1358, 1143, 1089, 858 cm-1.
N-(5-phenylpentyl)-2-(4-(4,4,5,5-tetramethyl-1,3,2-dioxaborolan-2-yl)phenyl)acetamide (6.62). Following synthetic procedure D using 2-(4-(4,4,5,5-tetramethyl-1,3,2-dioxaborolan-2-yl)phenyl)acetic acid (0.126 g, 0.481 mmol) and 5-phenylpentan-1-amine (0.078 g, 0.481 mmol), purification by silica gel column chromatography (hexanes/EtOAc 70:30) afforded the title compound (0.142 g, 0.349 mmol, 73% yield). M.p. 101−102 °C (hexanes/Et2O). 1H NMR (400 MHz, DMSO-d6) δ 1.28 (m, 14H), 1.42 (m, 2H), 1.53 (m, 2H), 2.52 (m, 2H), 3.04 (m, 2H), 3.50 (s, 2H), 5.67 (br s, 1H), 7.16 (m, 3H), 7.25 (m, 2H), 7.30 (m, 2H), 7.64 (d, J = 6.4 Hz, 2H), 8.08 (br s, 1H) ppm. 13C NMR (100 MHz, DMSO-d6) δ 24.58, 24.90, 25.99, 28.85, 30.70, 35.12, 42.67, 73.43, 125.53, 128.14, 128.17, 128.44, 134.38, 140.05, 142.12, 169.58 ppm. IR ν 3263, 2982, 2920, 1643, 1549, 1357, 1140, 1087, 858 cm-1.
N-(7-phenylheptyl)-2-(4-(4,4,5,5-tetramethyl-1,3,2-dioxaborolan-2-yl)phenyl)acetamide (6.63). Following synthetic procedure D using 2-(4-(4,4,5,5-tetramethyl-1,3,2-dioxaborolan-2-yl)phenyl)acetic acid (0.120 g, 0.458 mmol) and 7-phenylheptan-1-amine (0.088 g, 0.458 mmol), purification by silica gel column chromatography (hexanes/EtOAc 70:30) afforded the title compound as an oil (0.135 g, 0.310 mmol, 67% yield). 1H NMR (400 MHz, CDCl3) δ 1.26 (m, 6H), 1.34 (s, 12H), 1.36 (m, 2H), 1.57 (m, 2H), 2.57 (t, J = 7.6 Hz, 2H), 3.15 (q, J = 7.2 Hz, 2H), 3.56 (s, 2H), 5.46 (m, 1H), 7.15 (m, 3H), 7.25 (m, 4H), 7.79 (d, J = 8.0 Hz, 2H), 8.08 (s, 1H) ppm. 13C NMR (100 MHz, CDCl3) δ 24.88, 26.70, 29.05, 29.10, 29.42, 31.36, 35.90, 39.69, 44.06, 83.89, 125.59, 128.24, 128.39, 128.84, 135.46, 138.19, 142.75, 170.62 ppm. IR ν 3298, 2981, 2930, 1644, 1547, 1359, 1143, 1088, 908, 858, 727 cm-1.
N-(4-(tert-Butyl)phenyl)-4-(4,4,5,5-tetramethyl-1,3,2-dioxaborolan-2-yl)benzamide (6.64). Following synthetic procedure B using 4-(4,4,5,5-tetramethyl-1,3,2-dioxaborolan-2-yl)benzoic acid (0.124 g, 0.500 mmol) and 4-(tert-butyl)aniline (0.075 g, 0.500 mmol), purification by silica gel column chromatography (hexanes/EtOAc 80:20) afforded the title compound (0.146 g, 0.385 mmol, 77% yield). M.p. 160−162 °C (hexanes/CH2Cl2). 1H NMR (400 MHz, CDCl3) δ 1.29 (s, 9H), 1.37 (s, 12H), 7.31 (d, J = 8.4 Hz, 2H), 7.56 (d, J = 8.4 Hz, 2H), 7.83 (m, 4H), 8.32 (s, 1H) ppm. 13C NMR (100 MHz, CDCl3) δ 24.86, 31.36, 34.35, 84.11, 120.35, 125.73, 126.26, 134.97, 135.35, 137.26, 147.45, 165.91 ppm. IR ν 3347, 2961, 1640, 1532, 1354, 1324, 1142, 1102, 834 cm-1.
N-([1,1'-biphenyl]-4-yl)-4-(4,4,5,5-tetramethyl-1,3,2-dioxaborolan-2-yl)benzamide (6.65). Following synthetic procedure D using 4-(4,4,5,5-tetramethyl-1,3,2-dioxaborolan-2-yl)benzoic acid (0.248 g, 1.00 mmol) and (1,1'-biphenyl)-4-amine (0.169 g, 1.00 mmol), purification by silica gel column chromatography (EtOAc) afforded the title compound (0.187

245
g, 0.468 mmol, 47% yield). 1H NMR (400 MHz, CDCl3 + 10% CD3OD) δ 1.37 (s, 12H), 7.33 (m, 1H), 7.43 (m, 2H), 7.59 (m, 4H), 7.76 (m, 2H), 7.91 (m, 4H) ppm. 13C NMR (100 MHz, CDCl3 + 10% CD3OD) δ 24.88, 84.43, 121.05, 121.15, 126.60, 126.90, 127.21, 127.57, 128.88, 135.01, 137.42, 140.62, 166.78 ppm. IR ν 3394, 2979, 1643, 1523, 1354, 1322, 1140, 1085, 832, cm-1.
N-benzyl-4-(4,4,5,5-tetramethyl-1,3,2-dioxaborolan-2-yl)benzamide (6.66). Following synthetic procedure D using 4-(4,4,5,5-tetramethyl-1,3,2-dioxaborolan-2-yl)benzoic acid (0.124 g, 0.500 mmol) and phenylmethanamine (0.054 g, 0.500 mmol), purification by silica gel column chromatography (hexanes/EtOAc 70:30) afforded the title compound as an oil (0.105 g, 0.311 mmol, 63% yield). 1H NMR (400 MHz, CDCl3) δ 1.34 (s, 12H), 4.60 (t, J = 5.6 Hz, 2H), 6.72 (br s, 1H), 7.30 (m, 5H), 7.76 (t, J = 8.0 Hz, 2H), 7.84 (d J = 8.0 Hz, 2H) ppm. 13C NMR (100 MHz, CDCl3) δ 24.86, 44.10, 84.11, 126.13, 127.55, 127.90, 128.73, 134.93, 136.58, 138.18, 167.35 ppm. IR ν 3312, 2978, 1638, 1537, 1353, 1140, 1088, 856, cm-1.
N-(4-hydroxyphenethyl)-4-(4,4,5,5-tetramethyl-1,3,2-dioxaborolan-2-yl)benzamide (6.67). Following synthetic procedure D using 4-(4,4,5,5-tetramethyl-1,3,2-dioxaborolan-2-yl)benzoic acid (0.124 g, 0.500 mmol) and 4-(2-aminoethyl)phenol (0.069 g, 0.500 mmol), purification by silica gel column chromatography (hexanes/EtOAc 50:50) afforded the title compound (0.070 g, 0.191 mmol, 38% yield). M.p. 189−193 °C (hexanes/CH2Cl2). 1H NMR (400 MHz, CDCl3 + 10% CD3OD) δ 1.36 (s, 12H), 2.55 (m, 2H), 3.60 (m, 2H), 6.78 (d, J = 6.2 Hz, 2H), 7.06 (d, J = 6.2 Hz, 2H), 7.38 (br s, 1H), 7.71 (d, J = 7.2 Hz, 2H), 7.84 (d J = 7.2 Hz, 2H) ppm. 13C NMR (100 MHz, CDCl3 + 10% CD3OD) δ 24.87, 34.77, 41.90, 84.46, 115.58, 126.28, 129.92, 130.04, 135.00, 136.97, 155.53, 168.66 ppm.
N-([1,1'-biphenyl]-4-ylmethyl)-4-(4,4,5,5-tetramethyl-1,3,2-dioxaborolan-2-yl)benzamide (6.68). Following synthetic procedure D using 4-(4,4,5,5-tetramethyl-1,3,2-dioxaborolan-2-yl)benzoic acid (0.124 g, 0.500 mmol) and (1,1'-biphenyl)-4-ylmethanamine (0.092 g, 0.500 mmol), purification by silica gel column chromatography (hexanes/EtOAc 70:30) afforded the title compound as an oil (0.150 g, 0.363 mmol, 72% yield). 1H NMR (400 MHz, CDCl3) δ 1.32 (s, 12H), 4.59 (d, J = 5.6 Hz, 2H), 7.13 (m, 1H), 7.32 (m, 3H), 7.39 (m, 2H), 7.50 (m, 4H), 7.80 (d, J = 7.6 Hz, 2H), 7.84 (d J = 7.6 Hz, 2H) ppm. 13C NMR (100 MHz, CDCl3) δ 24.82, 43.64, 84.06, 126.22, 126.98, 127.25, 127.31, 128.23, 128.72, 134.88, 136.49, 137.26, 140.29, 140.62, 167.49 ppm. IR ν 3325, 2977, 1637, 1541, 1358, 1141, 1089, 856 cm-1.
N-(4-phenylbutyl)-4-(4,4,5,5-tetramethyl-1,3,2-dioxaborolan-2-yl)benzamide (6.69). Following synthetic procedure D using 4-(4,4,5,5-tetramethyl-1,3,2-dioxaborolan-2-yl)benzoic acid (0.124 g, 0.500 mmol) and 4-phenylbutan-1-amine (0.089 g, 0.600 mmol), purification by silica gel column chromatography (hexanes/EtOAc 70:30) afforded the title compound (0.114 g, 0.300 mmol, 60% yield). M.p. 145−148 °C (MeOH). 1H NMR (400 MHz, CDCl3) δ 1.35 (s, 12H), 1.66 (m, 4H), 2.65 (t, J = 7.0 Hz, 2H), 3.44 (m, 2H), 6.28 (br s,
246
1H), 7.17 (m, 3H), 7.27 (m, 2H), 7.72 (d, J = 8.0 Hz, 2H), 7.84 (d J = 8.0 Hz, 2H) ppm. 13C NMR (100 MHz, CDCl3) δ 24.88, 28.70, 29.21, 35.48, 39.92, 84.10, 125.83, 125.99, 128.35, 128.41, 134.92, 136.98, 142.06, 167.44 ppm. IR ν 3310, 2979, 2935, 1633, 1543, 1356, 1137, 1089, 853 cm-1.
N-(5-phenylpentyl)-4-(4,4,5,5-tetramethyl-1,3,2-dioxaborolan-2-yl)benzamide (6.70). Following synthetic procedure D using 4-(4,4,5,5-tetramethyl-1,3,2-dioxaborolan-2-yl)benzoic acid (0.124 g, 0.500 mmol) and 5-phenylpentan-1-amine (0.082 g, 0.500 mmol), purification by silica gel column chromatography (hexanes/EtOAc 70:30) afforded the title compound (0.169 g, 0.430 mmol, 86% yield). M.p. 104−106 °C (MeOH). 1H NMR (400 MHz, CDCl3) δ 1.30 (m, 14H), 1.56 (m, 4H), 2.53 (m, 2H), 3.26 (m, 2H), 7.16 (m, 3H), 7.23 (m, 2H), 7.76 (t, J = 7.4 Hz, 2H), 7.87 (d J = 7.4 Hz, 2H) 8.26 (br s, 1H) ppm. 13C NMR (100 MHz, CDCl3) δ 24.61, 26.09, 28.87, 30.74, 35.06, 39.14, 83.81, 125.52, 126.47, 128.13, 128.19, 134.22, 137.13, 142.15, 165.77 ppm. IR ν 3306, 2978, 2931, 1637, 1542, 1357, 1141, 1089, 856 cm-1.
6.6.2 Biological Assay
Fatty acid amide hydrolase (FAAH) assay. The effect of compounds on the enzymatic hydrolysis of anandamide was obtained using membranes prepared from rat brain, incubated with the test compounds and [14C]AEA (2.4 µM) in 50 mM Tris-HCl, pH 9, for 30 min at 37 °C. [14C]Ethanolamine produced from [14C]AEA hydrolysis was measured by scintillation counting of the aqueous phase after extraction of the incubation mixture with 2 volumes of CHCl3/MeOH 2:1 (by volume). Data are expressed as the concentration exerting 50% inhibition of AEA hydrolysis (IC50), calculated by GraphPad.
Transient receptor potential vanilloid 1 (TRPV1) channel assay. HEK293 (human embryonic kidney) cells stably over-expressing recombinant human TRPV1 were grown on 100 mm diameter Petri dishes as mono-layers in minimum essential medium (MEM) supplemented with non-essential amino acids, 10% fetal bovine serum, and 2 mM glutamine, and maintained at 5% CO2 at 37 °C. The effect of the substances on intracellular Ca2+ concentration ([Ca2+]i) was determined by using the selective intracellular fluorescent probe Fluo-4. On the day of the experiment, cells were loaded for 1 h at room temperature with the methyl ester Fluo-4-AM (4 µM in dimethyl sulfoxide containing 0.02% Pluronic F-127, Invitrogen) in MEM without fetal bovine serum, then were washed twice in Tyrode’s buffer (145 mM NaCl, 2.5 mM KCl, 1.5 mM CaCl2, 1.2 mM MgCl2, 10 mM D-glucose, and 10 mM HEPES, pH 7.4), resuspended in the same buffer, and transferred (about 100,000 cells) to the quartz cuvette of the spectrofluorimeter (Perkin-Elmer LS50B equipped with PTP-1 Fluorescence Peltier System; PerkinElmer Life and Analytical Sciences, Waltham, MA, USA) under continuous stirring. The changes in [Ca2+]i were determined before and after addition of various concentrations of test compounds by measuring cell fluorescence (λEX =
247
488 nm, λEM = 516 nm) at 25 °C. Curve fitting (sigmoidal dose–response variable slope) and parameter estimation were performed with GraphPad Prism® (GraphPad Software Inc., San Diego, CA). Potency was expressed as the concentration of test substances exerting a half-maximal agonist effect (i.e., half-maximal increases in [Ca2+]i) (EC50). The efficacy of the agonists was determined by normalizing their effect to the maximum Ca2+ influx effect on [Ca2+]i observed with application of 4 µM ionomycin (Cayman). When significant, the values of the effect on [Ca2+]i in wild-type (i.e., not transfected with any construct) HEK293 cells were taken as baseline and subtracted from the values obtained from transfected cells. Antagonist/desensitizing behaviour was evaluated against capsaicin (0.1 µM), by adding the test compounds in the quartz cuvette 5 min before stimulation of cells with agonists. Data are expressed as the concentration exerting a half-maximal inhibition of agonist-induced [Ca2+]i elevation (IC50), which was calculated again using GraphPad Prism® software. The effect on [Ca2+]i exerted by agonist alone was taken as 100%. Dose response curves were fitted by a sigmoidal regression with variable slope. All determinations were performed at least in triplicate. Statistical analysis of the data was performed by analysis of variance at each point using ANOVA followed by the Bonferroni’s test.

248
6.7 References
1. Devane, W. A.; Hanus, L.; Breuer, A.; Pertwee, R. G.; Stevenson, L. A.; Griffin, G.; Gibson, D.; Mandelbaum, A.; Etinger, A.; Mechoulam, R. Isolation and structure of a brain constituent that binds to the cannabinoid receptor. Science 1992, 258, 1946−1949.
2. Karsak, M.; Gaffal, E.; Date, R.; Wang-Eckhardt, L.; Rehnelt, J.; Petrosino, S.; Starowicz, K.; Steuder, R.; Schlicker, E.; Cravatt, B. F.; Mechoulam, R.; Buettner, R.; Werner, S.; Di Marzo, V.; Tueting, T.; Zimmer, A. Attenuation of allergic contact dermatitis through the endocannabinoid system. Science 2007, 316, 1494−1497.
3. Naidu, P. S.; Varvel, S. A.; Ahn, K.; Cravatt, B. F.; Martin, B. R.; Lichtman, A. H. Evaluation of fatty acid amide hydrolase inhibition in murine models of emotionality. Psychopharmacology 2007, 192, 61−70.
4. Huitrón Reséndiz, S.; Sanchez-Alavez, M.; Wills, D. N.; Cravatt, B. F.; Henriksen, S. J. Characterization of the sleep-wake patterns in mice lacking fatty acid amide hydrolase. Sleep 2004, 27, 857−865.
5. Kathuria, S.; Gaetani, S.; Fegley, D.; Valino, F.; Duranti, A.; Tontini, A.; Mor, M.; Tarzia, G.; La Rana, G.; Calignano, A.; Giustino, A.; Tattoli, M.; Palmery, M.; Cuomo, V.; Piomelli, D. Modulation of anxiety through blockade of anandamide hydrolysis. Nat. Med. 2003, 9, 76−81.
6. Huitrón-Reséndiz, S.; Gombart, L.; Cravatt, B. F.; Henriksen, S. J. Effect of oleamide on sleep and its relationship to blood pressure, body temperature, and locomotor activity in rats. Exp. Neurol. 2001, 172, 235−243.
7. Otrubova, K.; Ezzili, C.; Boger, D. L. The discovery and development of inhibitors of fatty acid amide hydrolase (FAAH). Bioorg. Med. Chem. Lett. 2011, 21, 4674−4685.
8. Di Marzo, V. Inhibitors of endocannabinoid breakdown for pain: not so FA(AH)cile, after all. Pain 2012, 153, 1785−1786.
9. Kaneko, Y.; Szallasi, A. Transient receptor potential (TRP) channels: a clinical perspective. Br. J. Pharmacol. 2014, 171, 2474−2507.
10. Julius, D. TRP channels and pain. Annu. Rev. Cell Dev. Biol. 2013, 29, 355−384. 11. Trevisani, M.; Gatti, R. TRPV1 antagonists as analgesic agents. Open Pain J. 2013, 6,
108−118. 12. Bishnoi, M.; Premkumar, L. S. Changes in TRP channel expression in painful
conditions. Open Pain J. 2013, 6, 10−22. 13. Szallasi, A.; Sheta, M. Targeting TRPV1 for pain relief: limits, losers and laurels. Expert
Opin. Invest. Drugs 2012, 21, 1351−1369. 14. Trevisani, M.; Szallasi, A. Targeting TRPV1: challenges and issues in pain management.
Open Drug Discovery J. 2010, 2, 37−49. 15. Cortright, D. N.; Szallasi, A. TRP channels and pain. Curr. Pharm. Des. 2009, 15,
1736−1749.

249
16. Broad, L. M.; Keding, S. J.; Blanco, M. Recent progress in the development of selective TRPV1 antagonists for pain. Curr. Top. Med. Chem. 2008, 8, 1431−1441.
17. Gunthorpe, M. J.; Szallasi, A. Peripheral TRPV1 receptors as targets for drug development: new molecules and mechanisms. Curr. Pharm. Des. 2008, 14, 32−41.
18. Westaway, S. M. The potential of transient receptor potential vanilloid type 1 channel modulators for the treatment of pain. J. Med. Chem. 2007, 50, 2589−2596.
19. Gharat, L.; Szallasi, A. Medicinal chemistry of the vanilloid (Capsaicin) TRPV1 receptor: Current knowledge and future perspectives. Drug Develop. Res. 2007, 68, 477−497.
20. Szallasi, A.; Cortright, D. N.; Blum, C. A.; Eid, S. R. The vanilloid receptor TRPV1: 10 years from channel cloning to antagonist proof-of-concept. Nat. Rev. Drug Disc. 2007, 6, 357−372.
21. Maione, S.; Costa, B.; Piscitelli, F.; Morera, E.; De Chiaro, M.; Comelli, F.; Boccella, S.; Guida, F.; Verde, R.; Ortar, G.; Di Marzo, V. Piperazinyl carbamate fatty acid amide hydrolase inhibitors and transient receptor potential channel modulators as “dual-target” analgesics. Pharmacol. Res. 2013, 76, 98−105.
22. Morera, E.; De Petrocellis, L.; Morera, L.; Schiano Moriello, A.; Ligresti, A.; Nalli, M.; Woodward, D. F.; Di Marzo, V.; Ortar, G. Synthesis and biological evaluation of piperazinyl carbamates and ureas as fatty acid amide hydrolase (FAAH) and transient receptor potential (TRP) channel dual ligands. Bioorg. Med. Chem. Lett. 2009, 19, 6806−6809.
23. Maione, S.; De Petrocellis, L.; de Novellis, V.; Schiano Moriello, A.; Petrosino, S.; Palazzo, E.; Rossi, F.; Woodward, D. F.; Di Marzo, V. Analgesic actions of N‐arachidonoyl‐serotonin, a fatty acid amide hydrolase inhibitor with antagonistic activity at vanilloid TRPV1 receptors. Br. J. Pharmacol. 2007, 150, 766−781.
24. Fowler, C. J.; Naidu, P. S.; Lichtman, A.; Onnis, V. The case for the development of novel analgesic agents targeting both fatty acid amide hydrolase and either cyclooxygenase or TRPV1. Br. J. Pharmacol. 2009, 156, 412−419.
25. Rose, T. M.; Reilly, C. A.; Deering-Rice, C. E.; Brewster, C. Inhibition of FAAH, TRPV1, and COX2 by NSAID–serotonin conjugates. Bioorg. Med. Chem. Lett. 2014, 24, 5695−5698.
26. Minkkilä, A.; Saario, S. M.; Käsnänen, H.; Leppänen, J.; Poso, A.; Nevalainen, T. Discovery of boronic acids as novel and potent inhibitors of fatty acid amide hydrolase. J. Med. Chem. 2008, 51, 7057−7060.
27. Gunthorpe, M. J.; Rami, H. K.; Jerman, J. C.; Smart, D.; Gill, C. H.; Soffin, E. M.; Hannan, S. L.; Lappin, S. C.; Egerton, J.; Smith, G. D.; Worby, A.; Howett, L.; Owen, D.; Nasir, S.; Davies, C. H.; Thompson, M.; Wyman, P. A.; Randall, A. D.; Davis, J. B.
250
Identification and characterisation of SB-366791, a potent and selective vanilloid receptor (VR1/TRPV1) antagonist. Neuropharmacology 2004, 46, 133−149.
28. Morera, E.; Di Marzo, V.; Monti, L.; Allarà, M.; Schiano Moriello, A.; Nalli, M.; Ortar, G.; De Petrocellis, L. Arylboronic acids as dual-action FAAH and TRPV1 ligands. Bioorg. Med. Chem Lett. 2016, 26, 1401–1405.
29. Coutts, S. J.; Adams, J.; Krolikowski, D.; Snow, R. J. Two efficient methods for the cleavage of pinanediol boronate esters yielding the free boronic acids. Tetrahedron Lett. 1994, 35, 5109−5112.
30. Ishiyama, T.; Murata, M.; Miyaura, N. Palladium (0)-catalyzed cross-coupling reaction of alkoxydiboron with haloarenes: a direct procedure for arylboronic esters. J. Org. Chem. 1995, 60, 7508−7510.
31. Ishiyama, T.; Kitano, T.; Miyaura, N. Synthesis of arylboronates via the palladium (0)-catalyzed cross-coupling reaction of tetra (alkoxo) diborons with aryl triflates. Tetrahedron Lett. 1997, 38, 3447−3450.
32. Cravatt, B. F.; Saghatelian, A.; Hawkins, E. G.; Clement, A. B.; Bracey, M. H.; Lichtman, A. H. Functional disassociation of the central and peripheral fatty acid amide signaling systems. Proc. Natl. Acad. Sci. U. S. A. 2004, 101, 10821−10826.
33. Lichtman, A. H.; Shelton, C. C.; Advani, T.; Cravatt, B. F. Mice lacking fatty acid amide hydrolase exhibit a cannabinoid receptor-mediated phenotypic hypoalgesia. Pain 2004, 109, 319−327.
34. Cravatt, B. F.; Demarest, K.; Patricelli, M. P.; Bracey, M. H.; Giang, D. K.; Martin, B. R.; Lichtman, A. H. Supersensitivity to anandamide and enhanced endogenous cannabinoid signaling in mice lacking fatty acid amide hydrolase. Proc. Natl. Acad. Sci. U. S. A. 2001, 98, 9371−9376.
35. Blankman, J. L.; Cravatt, B. F.; Barker, E. L. Chemical probes of endocannabinoid metabolism. Pharmacol. Rev. 2013, 65, 849−871.
36. Huggins, J. P.; Smart, T. S.; Langman, S.; Taylor, L.; Young, T. An efficient randomised, placebo-controlled clinical trial with the irreversible fatty acid amide hydrolase-1 inhibitor PF-04457845, which modulates endocannabinoids but fails to induce effective analgesia in patients with pain due to osteoarthritis of the knee. Pain 2012, 153, 1837−1846.
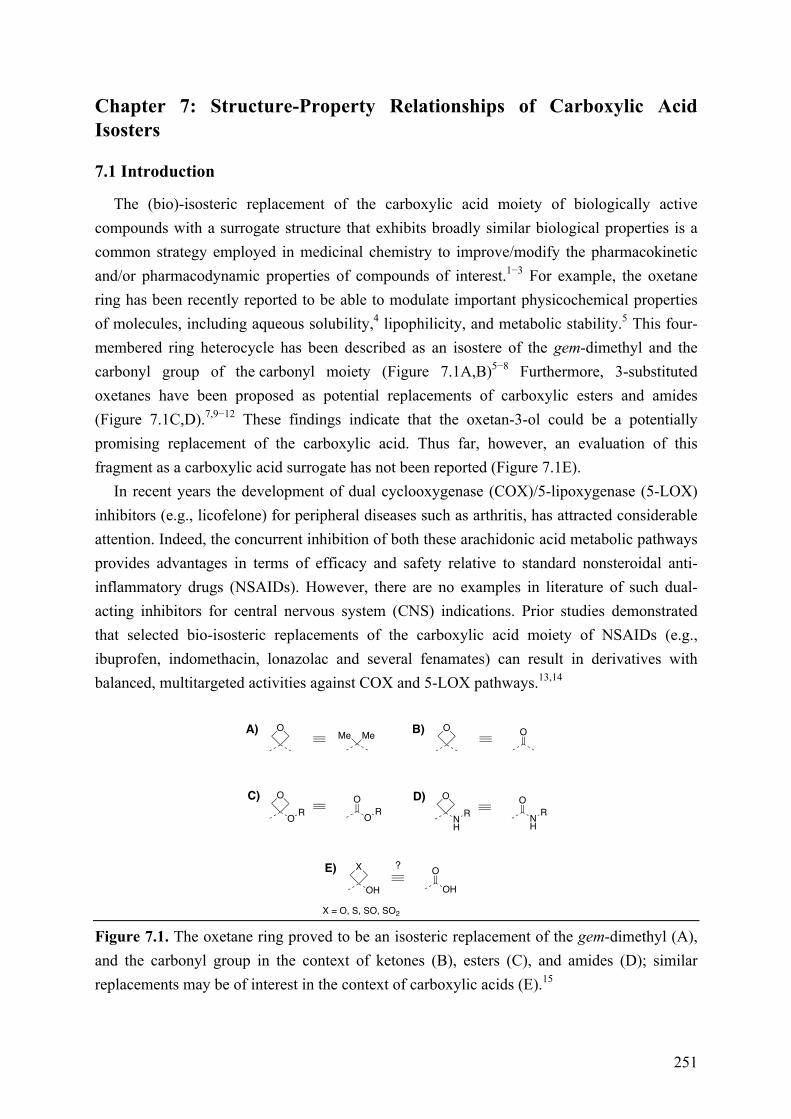
251
Chapter 7: Structure-Property Relationships of Carboxylic Acid Isosters
7.1 Introduction
The (bio)-isosteric replacement of the carboxylic acid moiety of biologically active compounds with a surrogate structure that exhibits broadly similar biological properties is a common strategy employed in medicinal chemistry to improve/modify the pharmacokinetic and/or pharmacodynamic properties of compounds of interest.1−3 For example, the oxetane ring has been recently reported to be able to modulate important physicochemical properties of molecules, including aqueous solubility,4 lipophilicity, and metabolic stability.5 This four-membered ring heterocycle has been described as an isostere of the gem-dimethyl and the carbonyl group of the carbonyl moiety (Figure 7.1A,B)5−8 Furthermore, 3-substituted oxetanes have been proposed as potential replacements of carboxylic esters and amides (Figure 7.1C,D).7,9−12 These findings indicate that the oxetan-3-ol could be a potentially promising replacement of the carboxylic acid. Thus far, however, an evaluation of this fragment as a carboxylic acid surrogate has not been reported (Figure 7.1E).
In recent years the development of dual cyclooxygenase (COX)/5-lipoxygenase (5-LOX) inhibitors (e.g., licofelone) for peripheral diseases such as arthritis, has attracted considerable attention. Indeed, the concurrent inhibition of both these arachidonic acid metabolic pathways provides advantages in terms of efficacy and safety relative to standard nonsteroidal anti-inflammatory drugs (NSAIDs). However, there are no examples in literature of such dual-acting inhibitors for central nervous system (CNS) indications. Prior studies demonstrated that selected bio-isosteric replacements of the carboxylic acid moiety of NSAIDs (e.g., ibuprofen, indomethacin, lonazolac and several fenamates) can result in derivatives with balanced, multitargeted activities against COX and 5-LOX pathways.13,14
Figure 7.1. The oxetane ring proved to be an isosteric replacement of the gem-dimethyl (A), and the carbonyl group in the context of ketones (B), esters (C), and amides (D); similar replacements may be of interest in the context of carboxylic acids (E).15
OMeMe
O
O OR RO
A)
C)
OB) O
O
NH
NH
R ROD)
X
OH OH
E) O
X = O, S, SO, SO2
?

252
7.2 Objective of the Study
To investigate the structural unit of the oxetan-3-ol, as well as the thietan-3-ol and the corresponding sulfoxide and sulphone derivatives, as potential carboxylic acid bioisosteres, a set of model compounds was designed, synthesized, and evaluated for physicochemical properties, including acidity (pKa), lipophilicity (logD7.4), and permeability in the parallel artificial membrane permeability assay (PAMPA). Hydrogen-bonding studies were also conducted to evaluate these fragments as hydrogen bond (HB) donors. We explored a focused set of derivatives of the phenylpropionic acid (7.1, Table 7.1), as this compound was already employed as a template structure for the evaluation of analogues comprising a wide selection of known carboxylic acid surrogates.16 In addition, we investigated novel potential isosteric replacements of the carboxylic acid moiety of the COX inhibitor, ibuprofen (7.2, Table 7.2). Accordingly, we constructed a small set of derivatives of ibuprofen that were evaluated as inhibitors of eicosanoid formation in rat basophilic leukemia (RBL-1) cells.
7.3 Chemistry
Oxetane and thietane derivatives 7.3–7.6 and 7.7–7.10 have been prepared as described in Scheme 7.1 and 7.2.
Reaction of phenethyl-magnesium chloride (7.11) with the appropriate oxetan-3-one (7.12) or thietan-3-one (7.13) in anhydrous tetrahydrofuran furnished the alcohols 7.3 and 7.4, respectively (Scheme 7.1). Treatment of 7.4 with urea-hydrogen peroxide complex (UHP) in acetic acid led to the formation of the corresponding sulfoxide as a mixture (6:4) of cis- and trans-isomers, as determined by 1H NMR. When m-chloroperbenzoic acid (m-CPBA) was used for the oxidation step, the cis/trans ratio was >98:2. Recrystallization of this mixture afforded crystals of the cis-isomer 7.5 that were suitable for X-ray diffraction analysis (Figure 7.2). Oxidation of 7.4 with oxone led to the formation of the fully oxidized sulfone derivative 7.6 (Scheme 7.1).
As a visiting PhD student of Prof. C. Ballatore’s research group, I accomplished the re-synthesis of compound 7.3 in 0.2 g scale (see Experimental Section, Chemistry 7.6.1).
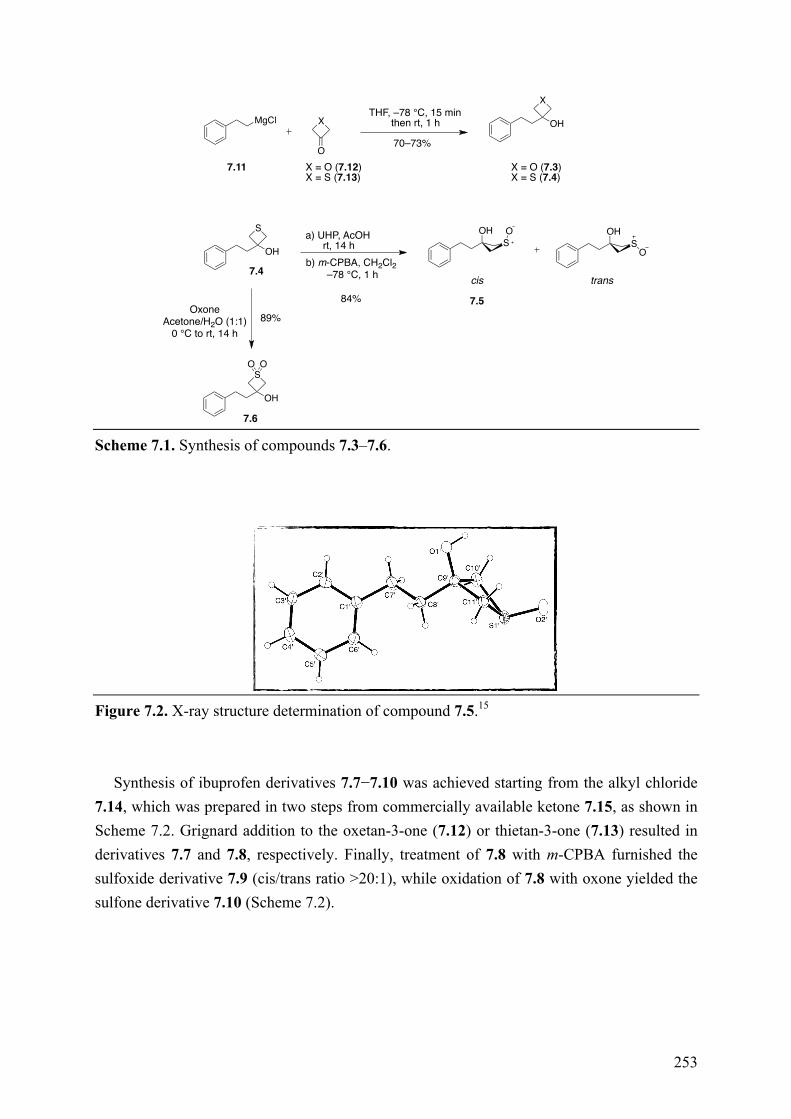
253
Scheme 7.1. Synthesis of compounds 7.3–7.6.
Figure 7.2. X-ray structure determination of compound 7.5.15
Synthesis of ibuprofen derivatives 7.7−7.10 was achieved starting from the alkyl chloride
7.14, which was prepared in two steps from commercially available ketone 7.15, as shown in Scheme 7.2. Grignard addition to the oxetan-3-one (7.12) or thietan-3-one (7.13) resulted in derivatives 7.7 and 7.8, respectively. Finally, treatment of 7.8 with m-CPBA furnished the sulfoxide derivative 7.9 (cis/trans ratio >20:1), while oxidation of 7.8 with oxone yielded the sulfone derivative 7.10 (Scheme 7.2).
MgCl X
OX = O (7.12)X = S (7.13)
THF, –78 °C, 15 minthen rt, 1 h OH
X
70–73%
X = O (7.3)X = S (7.4)
7.11
OH
S a) UHP, AcOHrt, 14 h
b) m-CPBA, CH2Cl2 –78 °C, 1 h
84%
OHSO
cis
7.5
OHS
O
trans
OxoneAcetone/H2O (1:1)
0 °C to rt, 14 h89%
OH
S
7.6
O O
7.4

254
Scheme 7.2. Synthesis of compounds 7.7–7.10.
7.4 Results and Discussion
Evaluation of physicochemical properties of the phenylpropionic acid derivatives 7.3–7.6 showed that oxetan-3-ol, thietan-3-ol and related structures are comparatively less acidic than the carboxylic acid functionality of compound 7.1 (cf., pKa value of 7.1, 7.6 and the other derivatives, Table 7.1). A previously reported colorimetric assay17 was employed to assess the HB acidity of compounds 7.3–7.6. Data revealed that the replacement of the carboxylic acid of 7.1 with a four-member ring heterocycle generally causes a far less dramatic reduction in the HB acidity scale. This is evident from the fact that compound 7.3 was at least eight orders of magnitude less acidic than 7.1, but it exhibited less than two orders of magnitude weaker binding via hydrogen bonding to the fluorescent HB acceptor used in the assay (Keq shown in Table 7.1). Interestingly, derivatives 7.3–7.6 showed significantly higher Keq values than that of alcohol 7.16, confirming that the replacements play an important role in determining the HB-donating ability of the hydroxyl moiety. Thus, the drastic reduction in acid character combined with the significant HB capacity exhibited by our derivatives, may be a desirable feature of these structural units with possible applications in drug design, especially when the presence of a negatively ionizable acid in a drug candidate may be responsible for an insufficient passive diffusion across biological membranes. Indeed, consistent with the
ONaBH4, MeOH
0 °C to rt, 30 min
98 %
OH SOCl2, CH2Cl20 °C to rt, 18 h
98 %
Cl
OH
X
1) Mg, LiCl, ZnCl2, THF rt, 6 h2) 7.12 or 7.13, THF rt, 17 h
15–16%
X = O (7.7)X = S (7.8)
m-CPBA, CH2Cl2 –78 °C, 1 h
87%
Oxone Acetone/H2O (1:1)
0 °C to rt, 20 h82%
OH
S
OH
S
OH
S
7.8 7.9
O O7.10
7.147.15 7.16
O
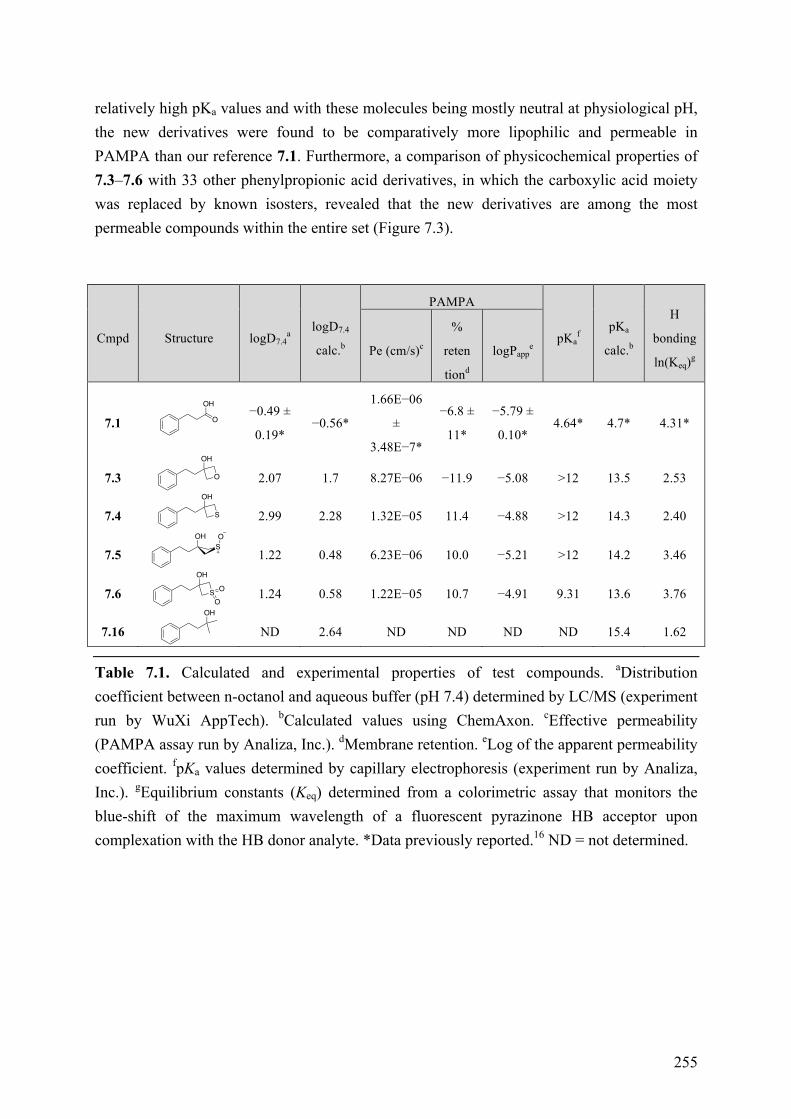
255
relatively high pKa values and with these molecules being mostly neutral at physiological pH, the new derivatives were found to be comparatively more lipophilic and permeable in PAMPA than our reference 7.1. Furthermore, a comparison of physicochemical properties of 7.3–7.6 with 33 other phenylpropionic acid derivatives, in which the carboxylic acid moiety was replaced by known isosters, revealed that the new derivatives are among the most permeable compounds within the entire set (Figure 7.3).
Cmpd Structure logD7.4a
logD7.4
calc.b
PAMPA
pKaf
pKa
calc.b
H
bonding
ln(Keq)g Pe (cm/s)c
%
reten
tiond
logPappe
7.1
−0.49 ±
0.19* −0.56*
1.66E−06
±
3.48E−7*
−6.8 ±
11*
−5.79 ±
0.10* 4.64* 4.7* 4.31*
7.3
2.07 1.7 8.27E−06 −11.9 −5.08 >12 13.5 2.53
7.4
2.99 2.28 1.32E−05 11.4 −4.88 >12 14.3 2.40
7.5
1.22 0.48 6.23E−06 10.0 −5.21 >12 14.2 3.46
7.6
1.24 0.58 1.22E−05 10.7 −4.91 9.31 13.6 3.76
7.16
ND 2.64 ND ND ND ND 15.4 1.62 Table 7.1. Calculated and experimental properties of test compounds. aDistribution coefficient between n-octanol and aqueous buffer (pH 7.4) determined by LC/MS (experiment run by WuXi AppTech). bCalculated values using ChemAxon. cEffective permeability (PAMPA assay run by Analiza, Inc.). dMembrane retention. eLog of the apparent permeability coefficient. fpKa values determined by capillary electrophoresis (experiment run by Analiza, Inc.). gEquilibrium constants (Keq) determined from a colorimetric assay that monitors the blue-shift of the maximum wavelength of a fluorescent pyrazinone HB acceptor upon complexation with the HB donor analyte. *Data previously reported.16 ND = not determined.
O
OH
OH
O
OH
S
OHSO
OH
SOO
OH
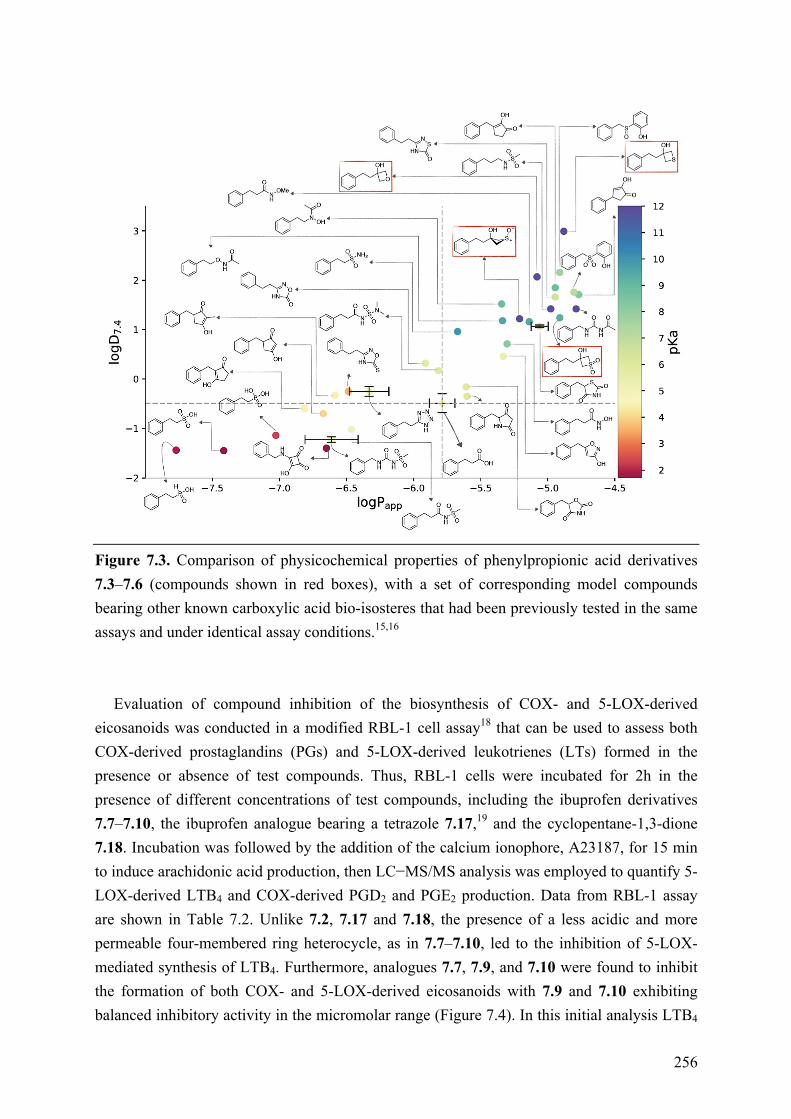
256
Figure 7.3. Comparison of physicochemical properties of phenylpropionic acid derivatives 7.3–7.6 (compounds shown in red boxes), with a set of corresponding model compounds bearing other known carboxylic acid bio-isosteres that had been previously tested in the same assays and under identical assay conditions.15,16
Evaluation of compound inhibition of the biosynthesis of COX- and 5-LOX-derived eicosanoids was conducted in a modified RBL-1 cell assay18 that can be used to assess both COX-derived prostaglandins (PGs) and 5-LOX-derived leukotrienes (LTs) formed in the presence or absence of test compounds. Thus, RBL-1 cells were incubated for 2h in the presence of different concentrations of test compounds, including the ibuprofen derivatives 7.7–7.10, the ibuprofen analogue bearing a tetrazole 7.17,19 and the cyclopentane-1,3-dione 7.18. Incubation was followed by the addition of the calcium ionophore, A23187, for 15 min to induce arachidonic acid production, then LC−MS/MS analysis was employed to quantify 5-LOX-derived LTB4 and COX-derived PGD2 and PGE2 production. Data from RBL-1 assay are shown in Table 7.2. Unlike 7.2, 7.17 and 7.18, the presence of a less acidic and more permeable four-membered ring heterocycle, as in 7.7–7.10, led to the inhibition of 5-LOX-mediated synthesis of LTB4. Furthermore, analogues 7.7, 7.9, and 7.10 were found to inhibit the formation of both COX- and 5-LOX-derived eicosanoids with 7.9 and 7.10 exhibiting balanced inhibitory activity in the micromolar range (Figure 7.4). In this initial analysis LTB4
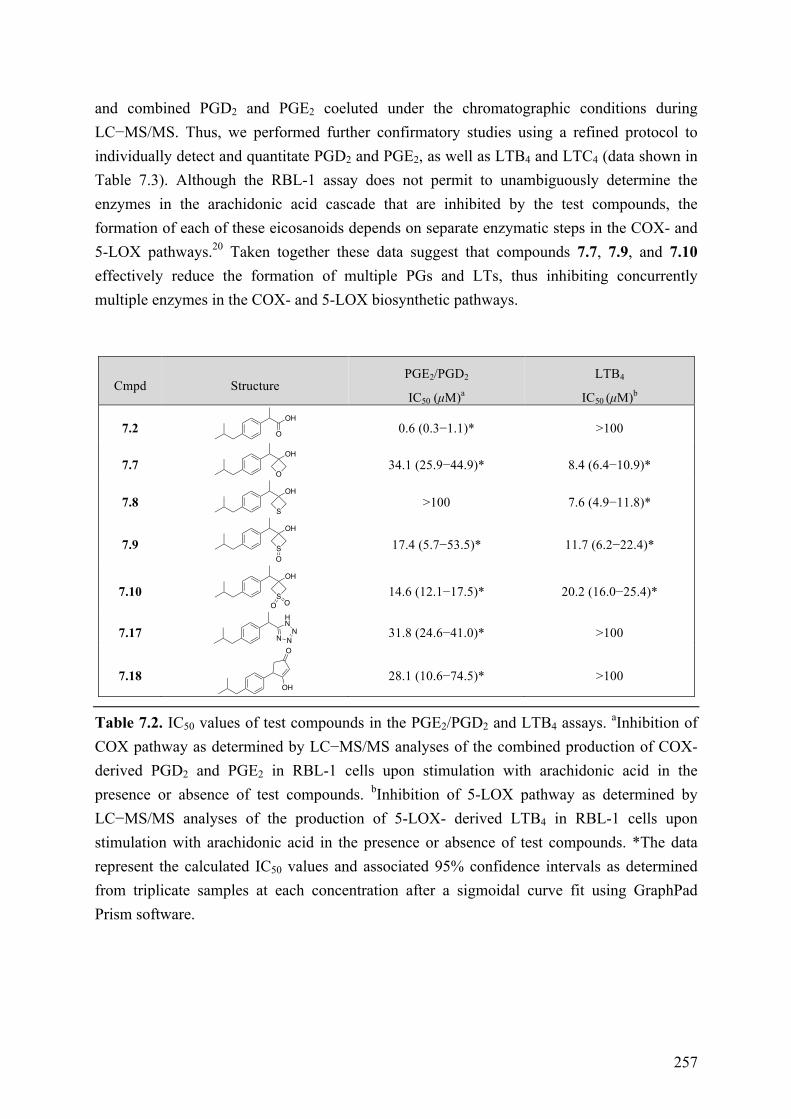
257
and combined PGD2 and PGE2 coeluted under the chromatographic conditions during LC−MS/MS. Thus, we performed further confirmatory studies using a refined protocol to individually detect and quantitate PGD2 and PGE2, as well as LTB4 and LTC4 (data shown in Table 7.3). Although the RBL-1 assay does not permit to unambiguously determine the enzymes in the arachidonic acid cascade that are inhibited by the test compounds, the formation of each of these eicosanoids depends on separate enzymatic steps in the COX- and 5-LOX pathways.20 Taken together these data suggest that compounds 7.7, 7.9, and 7.10 effectively reduce the formation of multiple PGs and LTs, thus inhibiting concurrently multiple enzymes in the COX- and 5-LOX biosynthetic pathways.
Cmpd Structure PGE2/PGD2
IC50 (µM)a
LTB4
IC50 (µM)b
7.2
0.6 (0.3−1.1)* >100
7.7
34.1 (25.9−44.9)* 8.4 (6.4−10.9)*
7.8
>100 7.6 (4.9−11.8)*
7.9
17.4 (5.7−53.5)* 11.7 (6.2−22.4)*
7.10
14.6 (12.1−17.5)* 20.2 (16.0−25.4)*
7.17
31.8 (24.6−41.0)* >100
7.18
28.1 (10.6−74.5)* >100
Table 7.2. IC50 values of test compounds in the PGE2/PGD2 and LTB4 assays. aInhibition of COX pathway as determined by LC−MS/MS analyses of the combined production of COX-derived PGD2 and PGE2 in RBL-1 cells upon stimulation with arachidonic acid in the presence or absence of test compounds. bInhibition of 5-LOX pathway as determined by LC−MS/MS analyses of the production of 5-LOX- derived LTB4 in RBL-1 cells upon stimulation with arachidonic acid in the presence or absence of test compounds. *The data represent the calculated IC50 values and associated 95% confidence intervals as determined from triplicate samples at each concentration after a sigmoidal curve fit using GraphPad Prism software.
OH
O
OH
O
OH
S
OH
SO
OH
SO O
N NN
HN
OH
O
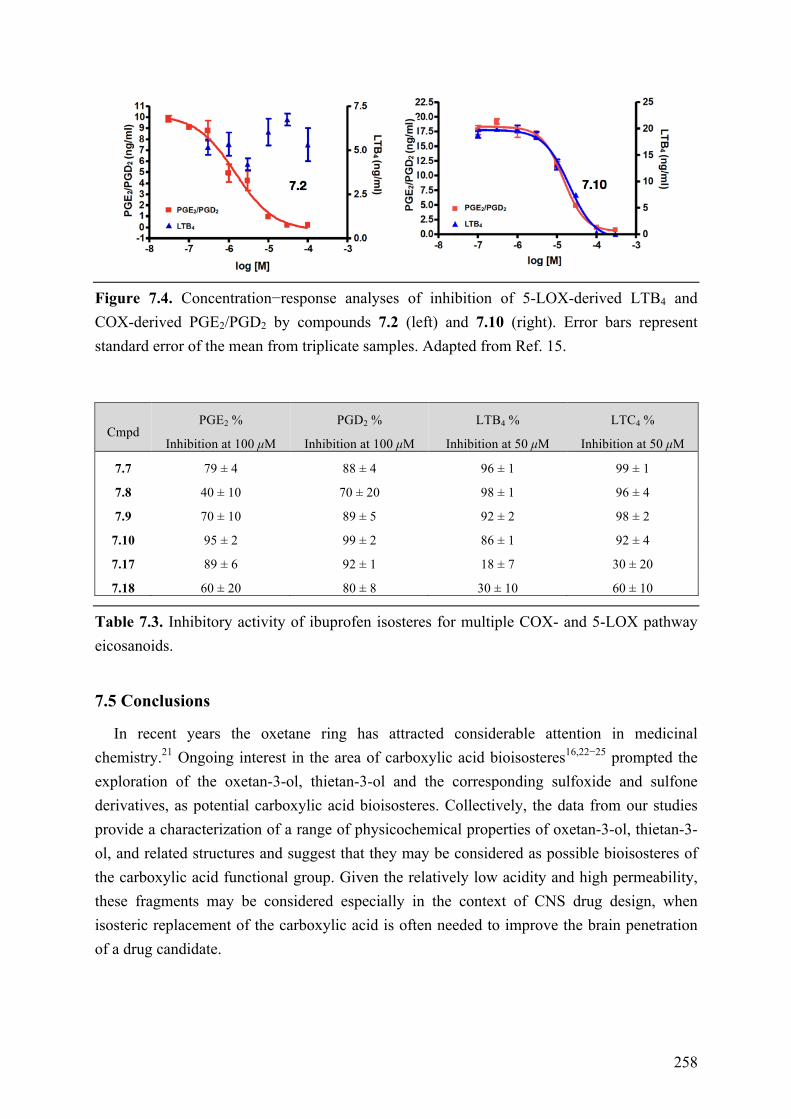
258
Figure 7.4. Concentration−response analyses of inhibition of 5-LOX-derived LTB4 and COX-derived PGE2/PGD2 by compounds 7.2 (left) and 7.10 (right). Error bars represent standard error of the mean from triplicate samples. Adapted from Ref. 15.
Cmpd PGE2 %
Inhibition at 100 µM
PGD2 %
Inhibition at 100 µM
LTB4 %
Inhibition at 50 µM
LTC4 %
Inhibition at 50 µM
7.7 79 ± 4 88 ± 4 96 ± 1 99 ± 1
7.8 40 ± 10 70 ± 20 98 ± 1 96 ± 4
7.9 70 ± 10 89 ± 5 92 ± 2 98 ± 2
7.10 95 ± 2 99 ± 2 86 ± 1 92 ± 4
7.17 89 ± 6 92 ± 1 18 ± 7 30 ± 20
7.18 60 ± 20 80 ± 8 30 ± 10 60 ± 10 Table 7.3. Inhibitory activity of ibuprofen isosteres for multiple COX- and 5-LOX pathway eicosanoids.
7.5 Conclusions
In recent years the oxetane ring has attracted considerable attention in medicinal chemistry.21 Ongoing interest in the area of carboxylic acid bioisosteres16,22−25 prompted the exploration of the oxetan-3-ol, thietan-3-ol and the corresponding sulfoxide and sulfone derivatives, as potential carboxylic acid bioisosteres. Collectively, the data from our studies provide a characterization of a range of physicochemical properties of oxetan-3-ol, thietan-3-ol, and related structures and suggest that they may be considered as possible bioisosteres of the carboxylic acid functional group. Given the relatively low acidity and high permeability, these fragments may be considered especially in the context of CNS drug design, when isosteric replacement of the carboxylic acid is often needed to improve the brain penetration of a drug candidate.
259
7.6 Experimental section
7.6.1 Chemistry
General description of common materials and instrumentation has been previously discussed in section 3.6.1.
3-Phenethyloxetan-3-ol (7.3). To a stirred solution of oxetan-3-one (100 µL, 1.56 mmol, 1 equiv) in THF (4 mL) at –78 °C under N2 was added dropwise phenethylmagnesium chloride (1.88 mL of a 1 M solution in THF, 1.2 equiv). The reaction was stirred at this temperature for 10 min, then at room temperature for 1 h. The reaction was quenched with satd. aq. NH4Cl, then extracted with Et2O (×3). The combined organic extracts were washed with brine, dried over MgSO4, filtered, and concentrated in vacuo. Purification by silica gel column chromatography (hexanes/EtOAc 60:40) afforded the title compound as a colorless low-melting solid (0.190 g, 1.07 mmol, 68% yield). 1H NMR (500 MHz, CDCl3) δ 7.34–7.27 (m, 2H), 7.25–7.18 (m, 3H), 4.56 (d, J = 6.8 Hz, 2H), 4.49 (d, J = 7.2 Hz, 2H), 2.89 (s, 1H), 2.78–2.71 (m, 2H), 2.21–2.14 (m, 2H) ppm. 13C NMR (126 MHz, CDCl3) δ 141.4, 128.7, 128.5, 126.3, 84.1, 74.6, 39.6, 29.9 ppm. IR (KBr) ν 3389, 3026, 2950, 2872, 2359, 2344, 1603, 1495 cm–1. HRMS (Cl+) calculated for C10H12O [M–CH2O]+ 148.0888, found 148.0892.
7.6.2 Biological Assay
RBL-1 Cell PG and LT Assay. Inhibition of PG and LT synthesis by test compounds was determined through an established RBL-1 cell assay18 previously discussed in section 3.6.2.
260
7.7 References
1. Ballatore, C.; Huryn, D. M.; Smith, A. B., III Carboxylic acid (bio)isosteres in drug design. ChemMedChem 2013, 8, 385−395.
2. Meanwell, N. A. Synopsis of some recent tactical application of bioisosteres in drug design. J. Med. Chem. 2011, 54, 2529−2591.
3. Herr, R. J. 5-Substituted-1H-tetrazoles as carboxylic acid isosteres: medicinal chemistry and synthetic methods. Bioorg. Med. Chem. 2002, 10, 3379−3393.
4. Skoda, E. M.; Sacher, J. R.; Kazancioglu, M. Z.; Saha, J.; Wipf, P. An uncharged oxetanyl sulfoxide as a covalent modifier for improving aqueous solubility. ACS Med. Chem. Lett. 2014, 5, 900−904.
5. Wuitschik, G.; Rogers-Evans, M.; Müller, K.; Fischer, H.; Wagner, B.; Schuler, F.; Polonchuk, L.; Carreira, E. M. Oxetanes as promising modules in drug discovery. Angew. Chem., Int. Ed. 2006, 45, 7736−7739.
6. Wuitschik, G.; Carreira, E. M.; Wagner, B. R.; Fischer, H.; Parrilla, I.; Schuler, F.; Rogers-Evans, M.; Müller, K. Oxetanes in drug discovery: structural and synthetic insights. J. Med. Chem. 2010, 53, 3227−3246.
7. Burkhard, J. A.; Wuitschik, G.; Rogers-Evans, M.; Müller, K.; Carreira, E. M. Oxetanes as versatile elements in drug discovery and synthesis. Angew. Chem., Int. Ed. 2010, 49, 9052−9067.
8. Croft, R. A.; Mousseau, J. J.; Choi, C.; Bull, J. A. Structurally Divergent Lithium Catalyzed Friedel−Crafts Reactions on oxetan-3-ols: Synthesis of 3,3-diaryloxetanes and 2,3-dihydrobenzofurans. Chem. - Eur. J. 2016, 22, 16271−16276.
9. McLaughlin, M.; Yazaki, R.; Fessard, T. C.; Carreira, E. M. Oxetanyl peptides: novel peptidomimetic modules for medicinal chemistry. Org. Lett. 2014, 16, 4070−4073.
10. Möller, G. P.; Müller, S.; Wolfstad̈ter, B. T.; Wolfrum, S.; Schepmann, D.; Wünsch, B.; Carreira, E. M. Oxetanyl amino acids for peptidomimetics. Org. Lett. 2017, 19, 2510−2513.
11. Beadle, J. D.; Knuhtsen, A.; Hoose, A.; Raubo, P.; Jamieson, A. G.; Shipman, M. Solid-phase synthesis of oxetane modified peptides. Org. Lett. 2017, 19, 3303−3306.
12. Powell, N. H.; Clarkson, G. J.; Notman, R.; Raubo, P.; Martin, N. G.; Shipman, M. Synthesis and structure of oxetane containing tripeptide motifs. Chem. Commun. 2014, 50, 8797−8800.
13. Elkady, M.; Niess, R.; Schaible, A. M.; Bauer, J.; Luderer, S.; Ambrosi, G.; Werz, O.; Laufer, S. A. Modified acidic nonsteroidal anti-inflammatory drugs as dual inhibitors of mPGES-1 and 5-LOX. J. Med. Chem. 2012, 55, 8958−8962.
14. Boschelli, D. H.; Connor, D. T.; Hoefle, M.; Bornemeier, D. A.; Dyer, R. D. Conversion of NSAIDS into balanced dual inhibitors of cyclooxygenase and 5-lipoxygenase. Bioorg. Med. Chem. Lett. 1992, 2, 69−72.

261
15. Lassalas, P.; Oukoloff, K.; Makani, V.; James, M.; Tran, V.; Yao, M.; Huang, L.; Vijayendran, K.; Monti, L.; Trojanowski, J. Q.; Lee, V. M.-Y.; Kozlowski, M.; Smith, A. B. III; Brunden, K. R.; Ballatore, C. Evaluation of oxetan-3-ol, thietan-3-ol, and derivatives thereof as bioisosteres of the carboxylic acid functional group. ACS Med. Chem. Lett. 2017, 8, 864–868.
16. Lassalas, P.; Gay, B.; Lasfargeas, C.; James, M. J.; Tran, V.; Vijayendran, K. G.; Brunden, K. R.; Kozlowski, M. C.; Thomas, C. J.; Smith, A. B., III; Huryn, D. M.; Ballatore, C. Structure property relationships of carboxylic acid isosteres. J. Med. Chem. 2016, 59, 3183−3203.
17. Huynh, P. N. H.; Walvoord, R. R.; Kozlowski, M. C. Rapid Quantification of the activating effects of hydrogen-bonding catalysts with a colorimetric sensor. J. Am. Chem. Soc. 2012, 134, 15621−15623.
18. Tries, S.; Neupert, W.; Laufer, S. The mechanism of action of the new antiinflammatory compound ML3000: inhibition of 5-LOX and COX-1/2. Inflammation Res. 2002, 51, 135−143.
19. Valenti, P.; Rampa, A.; Fabbri, G.; Giusti, P.; Cima, L. Tetrazole analogs of ibuprofen and flurbiprofen. Arch. Pharm. (Weinheim, Ger.) 1983, 316, 752−755.
20. Meirer, K.; Steinhilber, D.; Proschak, E. Inhibitors of the arachidonic acid cascade: interfering with multiple pathways. Basic Clin. Pharmacol. Toxicol. 2014, 114, 83−91.
21. Bull, J. A.; Croft, R. A.; Davis, O. A.; Doran, R.; Morgan, K. F. Oxetanes: recent advances in synthesis, reactivity, and medicinal chemistry. Chem. Rev. 2016, 116, 12150−12233.
22. Ballatore, C.; Soper, J. H.; Piscitelli, F.; James, M.; Huang, L.; Atasoylu, O.; Huryn, D. M.; Trojanowski, J. Q.; Lee, V. M.; Brunden, K. R.; Smith, A. B., III Cyclopentane-1,3-dione: a novel isostere for the carboxylic acid functional group. application to the design of potent thromboxane (A2) receptor antagonists. J. Med. Chem. 2011, 54, 6969−6983.
23. Ballatore, C.; Gay, B.; Huang, L.; Robinson, K. H.; James, M. J.; Trojanowski, J. Q.; Lee, V. M. Y.; Brunden, K. R.; Smith, A. B., III Evaluation of the cyclopentane-1,2-dione as a potential bio-isostere of the carboxylic acid functional group. Bioorg. Med. Chem. Lett. 2014, 24, 4171−4175.
24. Wang, X.; Liu, L.; Huang, L.; Herbst-Robinson, K.; Cornec, A.-S.; James, M. J.; Sugiyama, S.; Bassetto, M.; Brancale, A.; Trojanowski, J. Q.; Lee, V. M. Y.; Smith, A. B., III; Brunden, K. R.; Ballatore, C. Potent, long-acting cyclopentane-1,3-dione thromboxane (A2)-receptor antagonists. ACS Med. Chem. Lett. 2014, 5, 1015−1020.
25. Soper, J. H.; Sugiyama, S.; Herbst-Robinson, K.; James, M. J.; Wang, X.; Trojanowski, J. Q.; Smith, A. B., III; Lee, V. M.; Ballatore, C.; Brunden, K. R. Brain-penetrant tetrahydronaphthalene thrombox- ane A2-prostanoid (TP) receptor antagonists as prototype therapeutics for Alzheimer’s disease. ACS Chem. Neurosci. 2012, 3, 928−940.
262
General Conclusions
During the PhD program, my research interest aimed at the discovery of molecules of therapeutic relevance, through modern methods of organic synthesis, for the treatment of diseases that affect health.
In this context, I have been primarily involved in the development of agents that target tubulin and microtubules. Thus, during the first year in the PhD program I conducted my research activity at the Department of Drug Chemistry and Technologies of “Sapienza” University in Rome, where I worked on the design and synthesis of new tubulin polymerization inhibitors as anticancer agents. I also had the opportunity to collaborate with the research group of Prof. Giorgio Ortar and Prof. Enrico Morera, gaining practical experience in the rational design and synthesis of multitargeted agents.
The passion for research combined with my interest in the study of tubulin-targeting agents, prompted me to move abroad and work for six months at the Department of Chemistry of University of Pennsylvania in the laboratory of Prof. Carlo Ballatore and Prof. Amos B. Smith III. There, I was involved in the development of multitargeted microtubule-stabilizing agents, as drug candidates for Alzheimer’s disease, working in collaboration with the Center for Neurodegenerative Disease Research (CNDR) of Philadelphia. Furthermore, I had the opportunity to be part of Prof. A. B. Smith’s group meetings and present my research goals and results. Finally, my research achievements in the Alzheimer’s disease field were awarded the Alzheimer’s Drug Discovery Foundation’s (ADDF) scholarship, which allowed me to participate to the ADDF International Conference in New Jersey with a poster communication.
To continue my experience as a visiting PhD student in the research group of Prof. C. Ballatore, I moved to San Diego, where I spent a year at the Skaggs School of Pharmacy and Pharmaceutical Sciences and I continued to work on microtubule-stabilizing agents for neurodegenerative disease. I also had the great opportunity to be trained in the biological laboratory of Prof. Conor R. Caffrey, where I gained practical experience in maintaining cell cultures of Trypanosoma brucei and Caenorhabditis elegans, and performing in vitro screening of libraries of compounds.
The research activities conducted during my PhD work resulted in the publication of six
peer reviewed research articles (with additional manuscripts that are in preparation):
1- La Regina, G.; Bai, R.; Coluccia, A.; Famiglini, V.; Pelliccia, S.; Passacantilli, S.; Mazzoccoli, C.; Ruggieri, V.; Verrico, A.; Miele, A.; Monti, L.; Nalli, M.; Alfonsi, R.; Di Marcotullio, L.; Gulino, A.; Ricci, B.; Soriani, A.; Santoni, A.; Caraglia, M.; Porto, S.; Da Pozzo, E.; Martini, C.; Brancale, A.; Marinelli, L.; Novellino, E.; Vultaggio, S.; Varasi, M.; Mercurio, C.; Bigogno, C.; Dondio, G.; Hamel, E.; Lavia, P.; Silvestri, R. New indole tubulin assembly inhibitors cause stable arrest of mitotic progression,
263
enhanced stimulation of natural killer cell cytotoxic activity, and repression of Hedgehog-dependent cancer. J. Med. Chem. 2015, 58, 5789−5807.
2- La Regina, G.; Coluccia, A.; Famiglini, V.; Pelliccia, S.; Monti, L.; Vullo, D.; Nuti, E.; Alterio, V.; De Simone, G.; Monti, S. M.; Pan, P.; Parkkila, S.; Supuran, C. T.; Rossello, A.; Silvestri, R. Discovery of 1,1′-biphenyl-4-sulfonamides as a new class of potent and selective carbonic anhydrase XIV inhibitors. J. Med. Chem. 2015, 58, 8564–8572.
3- Morera, E.; Di Marzo, V.; Monti, L.; Allarà, M.; Schiano Moriello, A.; Nalli, M.; Ortar, G.; De Petrocellis, L. Arylboronic acids as dual-action FAAH and TRPV1 ligands. Bioorg. Med. Chem Lett. 2016, 26, 1401–1405.
4- Monti, L.; Stefanucci, A.; Pieretti, S.; Marzoli, F.; Fidanza, L.; Mollica, A.; Mirzaie, S.; Carradori, S.; De Petrocellis, L.; Sciano Moriello, A; Benyhe, S.; Zádor, F.; Szűcs, E.; Ötvös, F.; Erdei, A. I.; Samavati, R.; Dvorácskó, S.; Tömböly, C.; Novellino, E. Evaluation of the analgesic effect of 4-anilidopiperidine scaffold containing ureas and carbamates. J. Enzyme Inhib. Med. Chem. 2016, 31, 1638–1647.
5- Cornec, A.-S.; Monti, L.; Kovalevich, J.; Makani, V.; James, M. J.; Vijayendran, K. G.; Oukoloff, K.; Yao, Y.; Lee, V. M.-Y.; Trojanowski, J. Q.; Smith, A. B. III; Brunden, K. R.; Ballatore, C. Multitargeted imidazoles: potential therapeutic leads for Alzheimer’s and other neurodegenerative diseases. J. Med. Chem. 2017, 60, 5120–5145.
6- Lassalas, P.; Oukoloff, K.; Makani, V.; James, M.; Tran, V.; Yao, M.; Huang, L.; Vijayendran, K.; Monti, L.; Trojanowski, J. Q.; Lee, V. M.-Y.; Kozlowski, M.; Smith, A. B. III; Brunden, K. R.; Ballatore, C. Evaluation of oxetan-3-ol, thietan-3-ol, and derivatives thereof as bioisosteres of the carboxylic acid functional group. ACS Med. Chem. Lett. 2017, 8, 864–868.
As well as five poster or oral presentations:
1. Monti, L.; Ortar, G.; Silvestri, G.; De Petrocellis, L.; Di Marzo, V.; Morera, E. “Synthesis and Biological Evaluation of Arylboronic Acid Derivatives as FAAH and TRPV1 Dual Ligands”. XXIII National Meeting on Medicinal Chemistry (NMMC) and 9th Young Medicinal Chemists Symposium “Nuove Prospettive in Chimica Farmaceutica” (NPCF9). Poster presentation. September 6–9, 2015, Fisciano (Salerno, Italy).
2. Monti, L.; Cornec, A.-S.; Kovalevich, J.; James, M.; Vijayendran, K.; Lee, V. M.-Y.; Trojanowski, J. Q.; Smith, A. B. III; Brunden, K. R.; Ballatore, C. “Multitargeted Heterocyclic Compounds as Therapeutic Leads for Alzheimer’s Disease”. 17th International Conference on Alzheimer’s Drug Discovery. Poster presentation. September 12–13, 2016, Jersey City (New Jersey, USA).

264
3. Monti, L.; Cornec, A.-S.; Kovalevich, J.; Makani, V.; James, M. J.; Vijayendran, K. G.; Oukoloff, K.; Yao, Y.; Lee, V. M.-Y.; Trojanowski, J. Q.; Smith, A. B. III; Brunden, K. R.; Ballatore C. “Multitargeted Imidazoles as Therapeutic Leads for Alzheimer’s Disease”. UC-Wide Drug Discovery Symposium. Poster presentation. February 21–22, 2017, University of California, Los Angeles, Los Angeles (CA, USA).
4. “CNS-Active Microtubule-Stabilizing Agents as Potential Leads for Neuroparasitic Infections”. Skaggs School of Pharmacy and Pharmaceutical Sciences Seminar Series. Oral presentation. June 30, 2017, University of California, San Diego, La Jolla (CA, USA).
5. Monti, L.; Oukoloff, K.; Wang, S.; Brunden, K. R.; Debnath, A.; Caffrey, C. R.; Ballatore C. “CNS-Active Microtubule-Stabilizing Agents as Potential Leads for Human African Trypanosomiasis and Other Neuroparasitic Infections”. Biology and Molecular Medicine Symposium. Poster presentation. November 20, 2017, “Sapienza” University of Rome, Rome (Italy).
Finally, in December 2017 I was awarded the “Premio Minerva alla ricerca scientifica”,
recognition of merit founded by “Sapienza” University for the innovation, internationalization and high quality level of the research conducted in the PhD program.
In conclusion, I believe that the PhD experience has given me the opportunity to improve my scientific competence and knowledge as a student of “Sapienza” University, also training undergraduate students, working in different research groups and participating to scientific meetings, seminaries and conferences.
265
Acknowledgements
My PhD work was funded by the Istituto Pasteur Italia − Fondazione Cenci Bolognetti. I am grateful to the PhD program coordinator, Prof. Marco Tripodi, who, during these three years, has excellently guided us. I remember Prof. Anna Tramontano, who always encouraged and guided us in a very constructive way.
I am very thankful to my supervisor Prof. Romano Silvestri for the invaluable advice and suggestions during the entire PhD experience. I am profoundly grateful to Prof. Carlo Ballatore who gave me the opportunity to work under his guidance for 18 months in the United States. The work we conducted and the experience abroad represent important achievements that significantly enriched not only my career but my life in general. I would like to express my graditude to Prof. Amos B. Smith III for training me in his laboratory at the University of Pennsylvania (UPenn) where I conducted my research activity from January 2016 to July 2016.
From September 2016 to August 2017 I had the opportunity to be trained and work side by side with Prof. Conor R. Caffrey at the University of California, San Diego (UCSD), and I thank him for introducing me to the biochemistry and cell biology world and for teaching me so much about living parasites.
A special thanks to Prof. Giorgio Ortar, who introduced me to the medicinal chemistry world since I was an undergraduate student in his laboratory and for his long-tem support even from long distance. I also thank Prof. Enrico Morera, Prof. Marianna Nalli and Prof. Giuseppe La Regina for supporting me and helping me, especially during my first year in the PhD program.
My graditude goes to all the research collaborators for the invaluable cooperation exhibited towards these studies, to the CNDR of Philadelphia (particularly to Virginia M.-Y. Lee, Jhon Q. Trojanowski and Kurt R. Brunden) and the other collaborators at UPenn, to Dr. James McKerrow and the center for discovery and innovation in parasitic disease’s team (CDIPD) (particularly to Dr. Anjan Debnath and Dr. Jair L. Siqueira-Neto) and all the scientists at UCSD, to the research collaborators of Prof. R. Silvestri’s research group, to Prof. Ettore Novellino of University of Naples “Federico II” and the research group of Prof. Vincenzo Di Marzo of the National Research Council of Naples. I also thank my colleagues from the PhD program, the colleagues from Sapienza, UPenn and UCSD.
Finally, a special feeling of gratitudeto Alessandro and Natalia for their invaluable support in a foreign country and for being present in every circumstance, to all my friends and family who have always believed in me, encouraging and supporting my professional carreer.