trends in small lake water chemistry near sudbury, canada, 1983?1991
TRANSCRIPT
T R E N D S IN S M A L L L A K E WATER C H E M I S T R Y N E A R S U D B U R Y ,
CANADA, 1983-1991
DONALD K. McNICOL 1 and MARK L. MALLORY
Canadian Wildlife Service, Ontario Region 49 Camelot Drive, Nepean, Onta~qo, Canada, K1A OH3
(Received 5 November, 1992; accepted 9 November, 1992)
Abstract. While many studies have documented improvements in chemical conditions of large lakes near Sudbury, Canada in response to reduced smelter emissions, few have examined changes in water chemistry of small lakes. We studied trends in water chemistry of 97 small (< 10 ha), shallow (< 15 m) lakes northeast of Sudbury that are important habitat for breeding waterfowl. Currently, many small lakes near Sudbury are acidified, with little acid-neutralizing capacity and with relatively high con- centrations of A1, Mn, and Ni. We also present evidence of short-term improvements in pH and SO4 levels, but demonstrate that, over a nine year period, there has been no consistent, long-term trend of chemical recovery. Chemical conditions in these lakes varied considerably between 1983 and 1991, and responded quickly to changes in precipitation levels. However, the present condition of most lakes suggests that further reductions in emissions will be required to improve these habitats for breeding waterfowl.
1. Introduction
Acid precipitation has caused widespread chemical and biological damage to aquatic
ecosystems in parts of North America, Scandinavia and Europe (e.g. Almer et aL,
1974; Haines, 1981; Jeffries, 1984; Schindler et al., 1985). However, recent studies
indicate that lakes and streams previously affected by acidic precipitation can exhibit
improved water quality following reductions in the emission and deposition of
airborne pollutants (e.g. Forsberg et al., 1985; Wright et al., 1986; Kelso and Jeffries, 1988). One location where these effects have been examined intensively is the
geographical area surrounding Sudbury in northeastern Ontario, Canada. The
deleterious effects of acid deposition on local aquatic systems have been known in this region for many years (e.g. Gorham and Gordon, 1960; Beamish and Harvey,
1972; Neary and Dillon, 1988), but recent improvements have been documented
in many of these lakes. Most authors agree that significant declines in trace metal
and SO4 concentrations and significant increases in lake p H are attributable primarily
to emission reductions at the local smelting operations (LaZerte and Dillon, 1984; Dillon et al., 1986; Hutchinson and Havas, 1986; Keller and Pitblado, 1986; Keller
et al., 1986, 1992). More importantly, research now indicates that certain aquatic biota in the Sudbury area (Gunn and Keller, 1990; Keller and Yan, 1991) and elsewhere in Ontario (Kelso and Jeffries, 1988) are recovering in response to these improvements.
These studies have focused on relatively large lakes (i.e. surface area > 10 ha;
1 Author to whom correspondence should be addressed.
Water, Air, and Soil Pollution 73: 105-120, 1994. �9 1994KluwerAcademicPublishers. PrintedintheNetherlands.
106 D . K . McNICOL AND M. L. MALLORY
Hutchinson and Havas, 1986; Dillon et al., 1986; Kelso and Jeffries, 1988; Gunn and Keller, 1990; Keller et al., 1992). However, the most abundant lakes in acid- stressed regions of Ontario are smaller than 10 ha (McNicol et al., 1990; RMCC, 1990). Often these small lakes have short water retention times and inherently poor acid-neutralizing capacities (McNicol et al., 1987), and are therefore particularly sensitive to acidic deposition (Schindler, 1988). Aquatic biota of these lakes are typically at high risk to acidification (McNicol et al., 1990).
As part of an ongoing study on the effects of acidic precipitation on waterfowl, we recognized that the majority of prime breeding habitat for many boreal ducks is represented by small lakes (McNicol et al., 1987, 1990; McNicol and Wayland, 1992), and thus information for these habitats was lacking. Therefore, we defined two goals in this study: (1) to assess the current chemical status of small, pre- dominantly headwater lake systems in the Sudbury area, and (2) to determine whether the chemical recovery documented for nearby large lakes was also occurring in the small lakes upon which breeding waterfowl rely.
2. Site Description
The study area is located 40-70 km northeast of Sudbury, Ontario at 46 ~ 45' N, 80 ~ 45' W, and covers approximately 460 km 2. The area has been heavily affected by local smelting emissions in Sudbury and from long-range transport of airborne pol- lutants (Jeffries, 1984). Many lakes are situated on highly sensitive, metamorphic bedrock which provides poor acid-neutralizing capacity, but others are underlain by carbonate-rich, sedimentary bedrock with high acid-neutralizing capacity. The result is a broad range of pHs in a relatively small geographic area (McNicol et al., 1987). A comprehensive description of the study area is given in McNicol et al. (1987).
Approximately 378 lakes and wetlands (size 1-20 ha) lie within the study area boundaries. However, we restricted our study to small (1-10 ha), shallow (0.6- 15 m) lakes because: (1) information on the general chemistry, as well as the rate and extent of recovery of these systems was lacking, (2) these size and depth criteria excluded data from peatlands (i.e. bogs and fens) which often contain high amounts of natural acidity and are affected differently by acidic deposition (see Blancher and McNicol 1987), and (3) these lakes represent critical waterfowl breeding habitat at risk from acidification (McNico et al., 1987, 1990). The majority of these lakes are headwaters receiving no inflows from other surface waters (wetlands, lakes, streams, etc.).
3. Methods
3.1. PHYSICAL AND ENVIRONMENTAL DATA
For each lake, three physical parameters were recorded. Surface area (i.e. open water area) was determined from 1:15 840 aerial photographs, and mid-lake depth was determined by sonar transects (Lowrance Bluewater Model LFG-225). The

TRENDS IN SMALL LAKE WATER CHEMISTRY 107
TABLE I
Comparison of the media chemistry of study lakes (N = 97) and secondary lakes (N = 55) in the study area in autumn 1991 (*P < 0.01, **P < 0.05, Wilcoxon tests). Values below detection limits
are noted by '<DL'.
Study lakes Secondary lakes
Parameter Median Range Median Range
Area (ha) 3.8 1.0-9.3 **15.4 0.5-13584 Depth (m) 3.6 0.6-14.6 **9.8 0.6-31.4 Flushing Index a (yr) 0 . 1 6 0.003-2.40 **0.32 0.01-7.36 pH 5.23 4.01-7.30 **5.84 4.16-7.69 Conductivity (~tS cm -l) 34.7 21.2-91.9 * 3 5 . 9 14.7-160.0 ANC (~eq L -I) 3.2 -90.6-689.5 *'19.0 -56.6-1409.6 Ca (rag L -l) 2 . 6 8 0.97-10.78 *'3.71 0.60-29.25 Mg (mg L -l) 0.69 0.31--4.72 *'0.81 0.22-3.67 Na (mg L -1) 0.80 0,56-3.56 0.84 0.28-7.30 K (rag L -1) 0.28 0.02-1.12 *0.32 0.09-0.96 SO4 (mg L -I) 9 . 5 8 3,63-15.74 *'10.03 2.82-14.33 CI (rag L -l) 0 . 2 2 <DL-0.52 0 . 2 4 <DL-11,08 SiO2 (rag L -1) 1 . 2 8 0.24-10.10 "1.85 0.20-8.76 DOC (rag L -1) 4 . 2 9 0.53-13.40 3.56 0.53-8.23 TP (~tg L -1) 6 .11 <DL-169.00 *4.94 1.55-22.10 NO2 + NO3 0~g L -1) 8.0 <DL-170.0 8.0 1.0-210.0 NH 3 (~tg L -l) 1 5 . 4 0 5.80-767.60 11 .90 5.27-405.90 AI (Isg L -1) 127.60 <DI.,-978.30 **43.80 8.00-409.80 Fe ()~g L-I) 7 7 . 8 0 4.34-942.80 *51.50 5.92-447.00 Mn (~tg L -~) 39.20 <DL-218.30 *26.86 3.17-180.10 Ni 0~g L-)) 6 . 2 8 <DL-33.82 **3.97 1.90-33.54
a sample sizes are 48 and 21 respectively
l inear d is tance to the C o p p e r Cliff smel ter was de t e rmined f rom 1:50 000 t o p o g r a p h i c
maps , and was l og - t r ans fo rmed for analyses , F o r lakes for which we knew the
wa te r shed a rea (N = 69), a f lushing index was ca lcu la ted which represen ted the
relat ive ra te o f wate r r ep lacemen t in each lake. The f lushing index (yr) was the
p r o d u c t o f surface a rea (ha) and mid- lake dep th (m), d iv ided by the p r o d u c t o f
wa te rshed a rea (ha) and mean annua l p rec ip i t a t ion (m yr-1). Es t imates for bo th
s tudy lakes and s econda ry lakes (Table I) are b iased t o w a r d lower values, because
indices were no t ca lcu la ted for m a n y of the larger , s econda ry lakes tha t would
re ta in water for much longer per iods .
M o n t h l y wea the r records were o b t a i n e d f rom the A t m o s p h e r i c E n v i r o n m e n t
Service at the S u d b u r y a i rpo r t l oca ted near the s tudy area. D a t a on S u d b u r y a rea
SO2 emiss ions were o b t a i n e d f rom the On ta r io Min is t ry o f Env i ronment .
3.2. SAMPLE COLLECTION AND ANALYSES
In 1991, wa te r chemis t ry da t a were col lected for 152 o f the 378 lakes in the s tudy
area, i r respect ive o f lake size. Of these, 97 lakes met the cr i ter ia defined above
for a rea and dep th , and are hereaf te r t e rmed ' s tudy lakes ' . The 55 lakes tha t exceeded
108 D. K. McNICOL AND M. L. MALLORY
the physical criteria to qualify as small (study) lakes are hereafter termed 'secon- dary lakes'. Because annual water collections were conducted in conjunction with ongoing waterfowl studies (McNicol et al., 1987), the number of study lakes sampled each year varied. Hence, the subset (N = 25) of the 97 study lakes that were sampled in each of the six study years are hereafter termed 'core lakes'. Secondary lakes were sampled in 1991 and occasionally in other years. The locations of core, study and secondary lakes and the years sampled can be obtained from the authors (Appendix I).
Water samples were collected as mid-lake surface grabs from a helicopter after autumn lake turnover (i.e. late October/early November) in each of four years: 1984, 1986, 1987, and 1991. In addition, shoreline surface grab collections were conducted in 1983 (late June) and 1990 (late August). Because of differences in the timing (several weeks after spring snowmelt) of collections, we excluded 1983 data from all trend analyses. These data had been previously analysed (McNicol et al., 1987), and thus we comment on them where appropriate. However, we included the 1990 data in the trend analyses because water chemistry parameters of interest are usually similar in August and October in this area (e.g. Keller et al., 1986).
Twenty-three chemical parameters were determined for each lake. All chemical analyses were performed at the Great Lakes Forestry Centre (GLFC), Sault Ste. Marie, and followed procedures outlined by Environment Canada (1979). pH was measured with a Radiometer DTS 893 Water Analysis System using a GK240L B/C Electrode. Acid neutralizing capacity (ANC) was measured as total alkalinity by electrometric titration on a Metrohm E636 Titroprocessor (equivalent to the Gran titration technique). For samples collected prior to 1988, negative ANCs were not calculated but were given values of 0; however, negative ANC was calculated for 1990 and 1991 water samples. Specific conductance was measured using a Radiometer Type CDM83 Conductivity meter. A Varian 1275 Spectrophotometer was used to measure calcium (Ca 2 +), magnesium (Mg 2+), sodium (Na+), and potassium (K§ Sulphate (SO42-) and chloride (C1-) determinations were made using ion chromatography (Dionex I.C.) on colored samples; otherwise the automated methyl thymol blue method was used (Technicon Autoanalyzer IIC plus). Ammonia (NH3), nitrite (NO2) plus nitrate (NO3), total phosphorus (TP) and silica (SiO2) were analysed colorimetrically on a Technicon Auto-Analyzer IIC plus system. Dissolved organic carbon (DOC) was determined by the Automated Auto-analyzer method. Trace metals, including aluminum (A1), iron (Fe), manganese (Mn), and zinc (Zn) were measured by the Inductively Coupled Plasma Method using a Thermo Jarrel Ash ICAP 1100, while nickel (Ni), copper (Cu), lead (Pb), and cadmium (Cd) were measured by atomic absorption on a Perkin-Elmer 4000 Spectrophotometer equipped with a Varian 975 graphite furnace. For most lakes, values for Cu, Pb, Cd and Zn were below detection limits and thus are not presented in Table I.
3.3. S T A T I S T I C A L ANALYSES
Comparisons of individual water chemistry variables between study lakes and
TRENDS IN SMALL LAKE WATER CHEMISTRY 109
secondary lakes were based on non-parametric Wilcoxon tests, owing to the non- normal distributions of many of the variables. Values below detection limits were assigned a value 0.1 units below the detection limit (either 1.90 v,g L -1 for TP, NO2+NO3, Mn and Ni or 4,90 ~g L -1 for C1 or A1). Paired t-tests were used as an exploratory tool to examine the relationship between 1984 and 1991 values for several parameters. A two-way ANOVA with a 1 df contrast (lake and year set as classes) was used to assess the trends in water chemistry over specific time periods (PROC GLM; SAS Institute Inc., 1988). This approach enabled us to use a more complete set of data than a pairwise approach and incorporated the in- fluence of lake chemistries in years between 1984 and 1991. All means are pre- sented + SE.
4. Results
4.1. G E N E R A L PHYSICAL AND C H E M I C A L CHARACTERISTICS
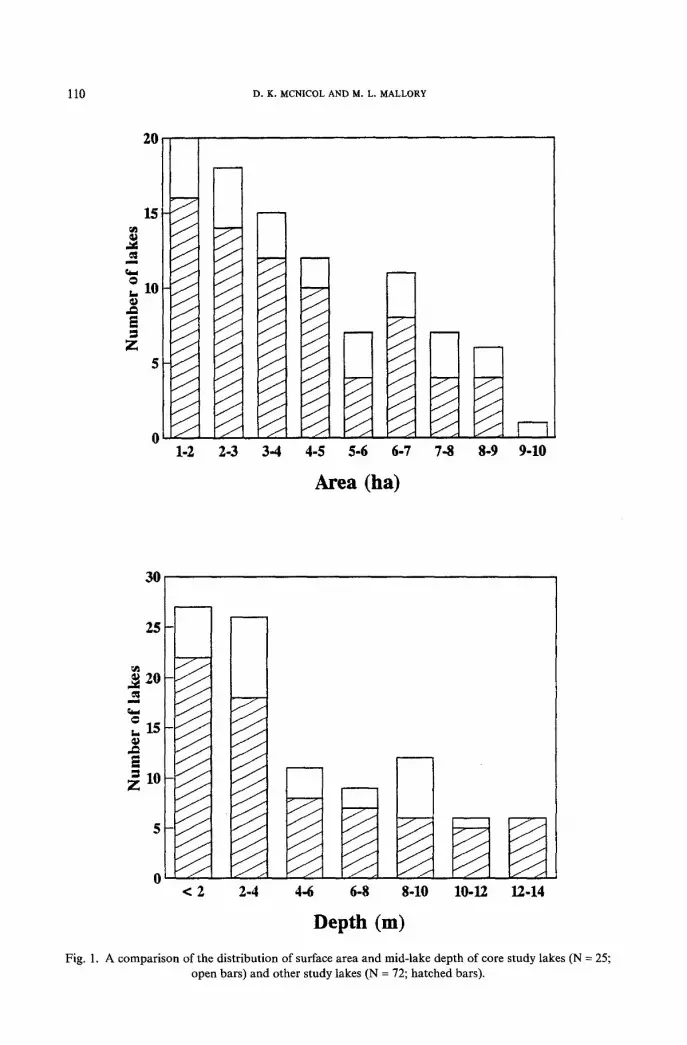
Ninety-seven study lakes were studied between 1983 and 1991. As previously defined, these study lakes were small and shallow (Figure 1), with 67% less than 5 ha in surface area (range 1.0 to 9.3 ha), and 66% less than 6 m deep (range 0.6 to 14.6 m). Small study lakes differed from larger, secondary lakes sampled in 1991 in most parameters (Table I). Most notably, study lakes replaced lake water twice as often, were more acidic, had lower ANCs and concentrations of base cations and SO4 and had higher concentrations of trace metals. Concentrations of DOC were only slightly higher in study lakes than in secondary lakes, and were repre- sentative of levels in dilute lakes. Within the set of study lakes, 61% were head- waters, although lake chemistries were very similar between headwater and non- headwater situations.
Concentrations of TP suggest that the majority of the study lakes are presently oligotrophic (TP ~< 10 ~g L-I), with the remainder primarily mesotrophic (TP = 10-35 vtg L -1) (Vollenweider and Kerekes, 1982). These lakes currently have very low ANC (only 8% had ANCs ~> 200 ~teq L-~), which is attributable to the inherently low buffering capacity of local soils and bedrock and the long-term depletion of ANC from SO2 inputs (McNicol et aL, 1987). Consequently, many of the lakes are acidic (e.g. 58% with pH < 5.5, although 5% have pH > 7.0 and are underlain by carbonate-rich bedrock) (Table I). The lakes also have relatively high concen- trations of trace metals, particularly A1, Mn and Ni. Concentrations of A1 and Mn were strongly correlated with lake pH (Spearman rank correlations, r s A1 ----
-0.82, P < 0.001; r s Mn ---- - - 0 . 7 8 , P < 0.001). Nickel concentrations were weakly correlated with the distance from the Copper Cliff smelter (r s Ni = - - 0 . 2 5 , P = 0.01), but concentrations of other trace metals were uncorrelated with distance to the smelter (all Ps > 0.05). Moreover, concentrations of Zn, Cd, Pb, and Cu were below detection limits for most of the study lakes, suggesting that generally the lakes were beyond the area that receives high trace metal deposition from the smelters.
] 10 D . K . MCNICOL A N D M. L. MALLORY
20
15
m
O ~. 10
5
0
/ /
1-2
/ z /
2-3 3-4 4-5 5-6 6-7
Area (ha)
7-8 8-9 9-10
30
25
20 w l
k, 15
= 10 Z
/ /
/ /
j " /
/ /
/ /
/ /
/ /
/ /
. . / /
/ /
/ / - "
/ /
< 2
L,
f " / '
f / / J
f - / ~ j ~ j
2-4 4-6 6-8 8-10 10-12 12-14
Depth (m)
Fig. 1. A comparison of the distribution of surface area and mid-lake depth of core study lakes (N = 25; open bars) and other study lakes (N = 72; hatched bars).
TRENDS IN SMALL LAKE WATE CHEMISTRY 111
7.5
6.5
5.5
o /
./--.
�9 0 0 / ? 00
." :.
4 �9 ' : 4 4.5 5 5.5 6 6.5 7 7.5
4.5
1984 pH
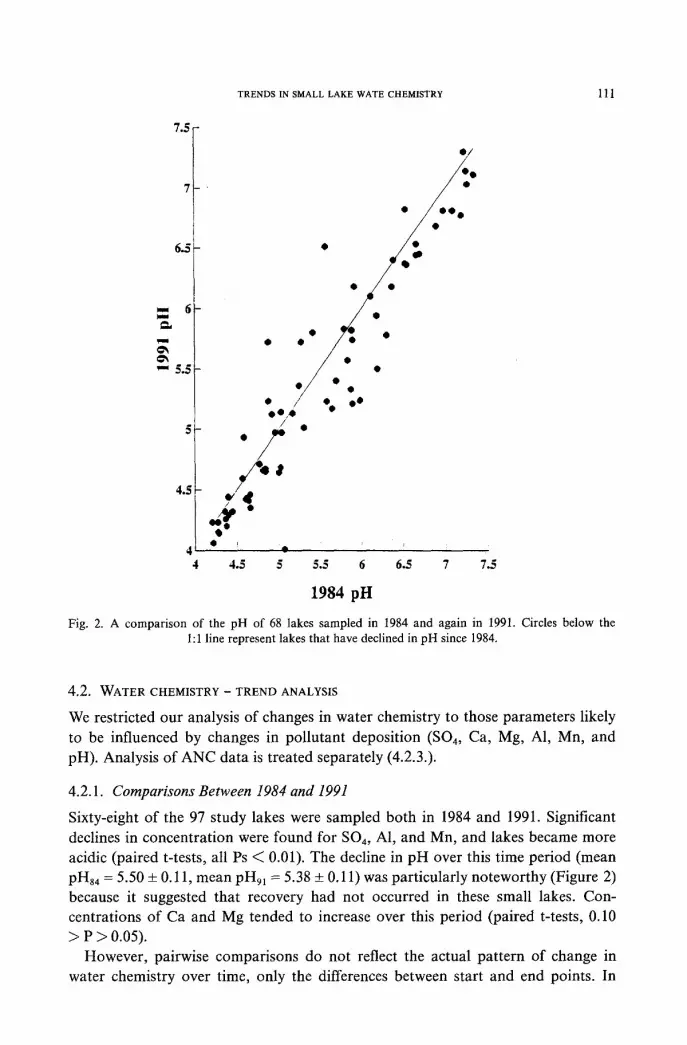
Fig. 2. A comparison of the pH of 68 lakes sampled in 1984 and again in 1991. Circles below the 1:1 line represent lakes that have declined in pH since 1984,
4.2. WATER CHEMISTRY - TREND ANALYSIS
We restricted our analysis of changes in water chemistry to those parameters likely to be influenced by changes in pollutant deposition (SO4, Ca, Mg, A1, Mn, and pH). Analysis of ANC data is treated separately (4.2.3.).
4.2.1. Comparisons Between 1984 and 1991
Sixty-eight of the 97 study lakes were sampled both in 1984 and 1991. Significant declines in concentration were found for SO4, A1, and Mn, and lakes became more acidic (paired t-tests, all Ps ~ 0.01). The decline in pH over this time period (mean pH84 = 5.50 -+ 0.11, mean pH91 = 5.38 + 0.11) was particularly noteworthy (Figure 2) because it suggested that recovery had not occurred in these small lakes. Con- centrations of Ca and Mg tended to increase over this period (paired t-tests, 0.10 > P > 0.05).
However, pairwise comparisons do not reflect the actual pattern of change in water chemistry over time, only the differences between start and end points. In
112 D. K. M c N I C O L A N D M. L. MALLORY
TABLE II
Changes in key water chemistry parameters of study lakes between years.
1984-1987(N=85) 1987-1991(N=97) 1984-1991 (N=97)
Parameter Trend F Trend F Trend F
pH increase 11.23'** decrease 33.81"** decrease 6.61"* Ca increase 3.45* decrease 12.39"** none 0.68 Mg increase 12.70"** decrease 26.03*** none 0.04 SO4 none 2.03 decrease 9.64** decrease 27.70*** AI decrease 6.09** none 0.59 decrease 6.07** Mn none 1.48 none 0.01 decrease 4.70**
i Probabilities based on two-way ANOVA (classes lake and year, 1 df contrast among years); NS - P > 0.1, * - P < 0.10, ** - P < 0.05, *** - P < 0.001.
25 core lakes sampled in each study year, the yearly means of pH, SO4, Ca, and A1
varied considerably (Figure 3). For this reason, a more detailed examination of
changes in these variables over this time period was performed for all 97 study
lakes.
4.2.2. Patterns of Change in Water Chemistry
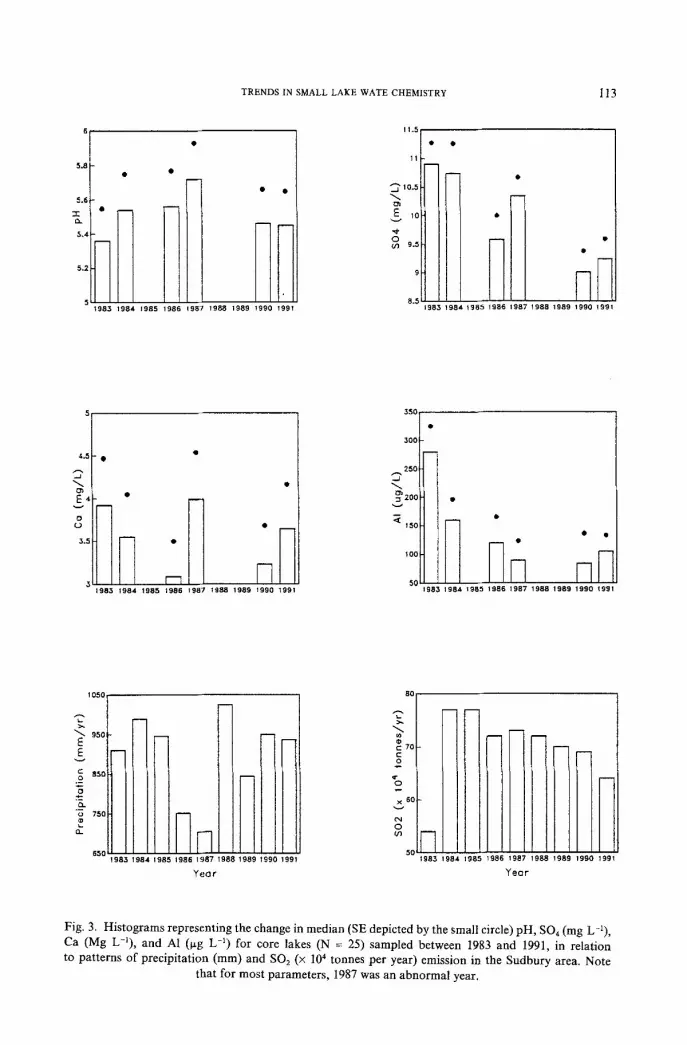
We examined the yearly changes in pH, SO 4, Ca, Mg, A1 and Mn to assess short- term and long-term trends in the water chemistry of the study lakes. The data indicated that 1987 was a pivotal year for local lake chemistries (Figure 3, depicting
this pattern for the core lakes); conditions appeared to improve between 1983 and
1987, but deteriorate between 1987 and 1991. Emission of SOz over the study period
declined gradually (Figure 3), except for the very low values recorded in 1983 which
resulted f rom economic factors in the local mining industry. Over this same time period, however, annual precipitation varied markedly (Figure 3). The mean annual
precipitation for the Sudbury area is 861 mm, but a two-decade low was recorded in 1987 (704 ram), and relatively high values were recorded for the years following
1987 (Figure 3). For all study lakes, concentrations of the major cations (Ca and Mg) and pH
increased between 1984 and 1987, while concentrations of A1 decreased (Table II). This pattern was reversed between 1987 and 1991; large declines in p H and in concentrations of Ca, Mg and SO4 were observed (Table II). The net result over the entire study period was significant declines in pH and in concentrations of
SO4, A1 and Mn (Table II).
4.2.3. Changes in ANC
Differences in the procedures of ANC analyses for samples collected before and after 1987 precluded a trend analysis on ANC similar to that used for pH. Instead, trends in lake alkalinity were assessed using two different approaches. For lakes that had positive ANC in 1984, we examined whether lake ANC had increased
T R E N D S IN SMALL LAKE WATE CHEMISTRY 1 ] 3
8
5.8
5 .6
"l- Q-
5,4
5.2
5~ 198,5 1984 1985 1986 1987 1988 1989 1990 1991
I 1.5
~ " 10.5
~ ,0
9
8.5
i 0
il 198,5 1988 1985 1986 1987 1988 1989 1990 1991
5
4.8 �9 �9
"L" ) ~
E 4 �9
1983 1984 1988 1988 1987 1988 1989 1991
350,
30C
25C
4. 3~' 200
~E 180
I OO
50
0
1983 1984 1985 1986 1987 1988 1989 1990 1991
1050
950
8,50
o 750 m
{1.
650 198,5 1984 1985 1988 1987 1988 1989 1990 1991
Yeor
8C
c 7C
%
x 8(
I/I
50 1983 1984 1985 1986 1987 1988 1989 1990 1991
Year
Fig. 3. Histograms representing the change in median (SE depicted by the small circle) pH, SO4 (mg L-z), Ca (Mg L-l), and A1 (r~g L-l) for core lakes (N = 25) sampled between 1983 and 1991, in relation to patterns of precipitation (mm) and SO2 (• 104 tonnes per year) emission in the Sudbury area. Note
that for most parameters, 1987 was an abnormal year.
114 D. K. McNICOL AND M . L . MALLORY
or declined by 1991. For these 34 lakes, there was a significant decline in average ANC of 13.9 _+ 6.8 ~eq L -1 (paired t-test, P = 0.048).
We also tested whether the number of lakes having positive or negative ANC changed between these two years. Of the 68 lakes sampled both in 1984 and 1991, 34 lakes had positive ANC and 34 had negative ANC in 1984, while 36 were positive and 32 were negative in 1991. This difference between years is not significant (X z= 0.12, df=l, NS). Seven lakes that had ANC ~< 0 in 1984 were positive in 1991, and five lakes with ANC >~ 0 in 1984 were negative in 1991. Note that 10 of the 12 lakes that changed ANC signs between 1984 and 1991 had 1991 ANCs between -25 ~teq L -1 and 25 tteq L -1.
Collectively, these analyses suggest that there has been no improvement in ANC over the study period.
5. Discussion
Presently, many small lakes near Sudbury remain threatened by acidic precipitation. In our study area, the typical small lake ~< 10 ha is currently acidified (pH < 5.5), with virtually no ANC and with relatively high concentrations of trace metals (particularly A1 and Mn). These conditions are more extreme than water quality reported for other small headwater lake systems elsewhere in the boreal region of Ontario (Kelso and Jeffries, 1988) and Quebec (Papineau and Haemmerli, 1992). Moreover, the water quality of small lakes near Sudbury is similar to or poorer than the quality of nearby larger lakes (Neary and Dillon, 1988; Keller et aL, 1992; this study), indicating that the documented effects of acid precipitation on large lake systems may also be found in these small systems. While this result has not been identified previously, it is not unexpected. In fact, because small lakes near Sudbury generally have poor buffering capacity and flush relatively quickly, they are likely more sensitive to ambient rainfall conditions than larger lakes. This suggests that the water quality in small lakes will not show consistent improvements until significant reductions occur in concentrations of pollutants in precipitation.
The trends in water chemistry observed in large lakes near Sudbury were also found for small lakes in this area. However, small lake water chemistry was variable and fluctuated considerably between 1983 and 1991, a result similar to findings on relatively small, headwater lakes elsewhere in Ontario (Kelso and Jeffries, 1988; Schindler, 1988). Short-term improvements in water chemistry were detected between the years 1983 and 1987. For example, average pH values in core lakes increased by 0.4 units during this time period. This finding is consistent with the work on much larger lakes near Sudbury, where improvements in pH and declines in SO4 concentrations in lake water have been documented through the 1970s and mid- 1980s (Dillon et aL, 1986; Hutchinson and Havas, 1986; Keller and Pitblado, 1986; Keller et aL, 1986; Gunn and Keller, 1990). Given that long-term recovery from conditions in the early 1970s has occurred for many larger lakes in close proximity to our study area (e.g. Keller et al., 1986, 1992), it is probable that our measure
T R E N D S IN SMALL LAKE W A T E R CHEMISTRY 115
of short-term recovery prior to 1987 represents the end of a similar period of long- term recovery in these lakes.
Despite these general improvements in water chemistry, conditions deteriorated significantly after 1987 and resulted in no net improvement (in fact, a net deterioration) in pH for the duration of the study. Although concentrations of A1 and Mn declined over the study period, there was no evidence of an improvement in ANC for most study lakes, in agreement with the pattern of slightly declining pH. We speculate that annual precipitation (or the lack thereof) was largely responsible for the observed patterns in small lake water chemistry. Dry conditions in 1987 resulted in a mean incrase of 0.15 pH units for 25 lakes in a one year period (1986-1987), yet a decline of nearly 0.3 pH units occurred in the following four wet years (Figure 3). Keller et al. (1992) observed similar large, rapid changes in pH and other chemical variables in Swan Lake, a small lake near Sudbury with similar physical characteristics as most of our study lakes (area = 5.8 ha, depth = 8.8 m). Keller et al. (1992) also reported general declines in pH in the larger lakes near Sudbury between 1987 and 1989, and proposed that storage (due to dry deposition) and oxidation of sulphur in watersheds during the dry years of 1986 and 1987 resulted in a large export of acid during the ensuing wet years, accounting in part for this decline. Although we lacked data from 1988 and 1989, continued deposition of wet and dry sulphur during periods of relatively high rainfall (1988-1991) combined with the release of accumulated sulphur in the watershed (Dillon, 1984; Jeffries 1984) is a plausible explanation for our results. The decrease in concentrations of SO4 and base cations observed in 1990 and 1991 may represent a dilution effect in response to the relatively high precipitation levels in the latter years. This finding is noteworthy because it confirms our suspicion that much of the most valuable breeding habitat for boreal waterfowl considered at risk from acidification (McNicol et alo, 1990) can be severely altered by local and long-range transport of airborne pollutants.
While there has been considerable variation in the water chemistry of these small lakes over a nine year period, it is important to note that the majority of these lakes remain acidified or severely acid-stressed (Table I). Approximately 77% of the lakes presently have ANCs ~< 40 ~eq L -1, and hence remain very sensitive to further acidification (Brousseau et al., 1985). Moreover, 58% have pHs ~< 5.5, where biological damage to aquatic organisms and ecosystems occurs (e.g. Pough and Wilson, 1977; Magnuson et al., 1984; Campbell and Stokes, 1985; and many others). Thus, waterfowl and loons that continue to breed in this area clearly remain at high risk from acidification through habitat deterioration (McNicol et al., 1990). Increases in lake pH should benefit all waterfowl species, but certain 'target pH levels' are particularly important. A return of highly acidic waters to pH 5.0 may allow the re-coloniztion of some lakes by acid-tolerant fish species (Bendell and McNicol, 1987; McNicol et al., 1990). If lakes can be restored to pH 5.5, many of the more acid-sensitive invertebrates which are important waterfowl foods should return (Bendell, 1986, 1988; Bendell and McNicol, 1991). Finally, improvements
116 D . K . McNICOL AND M. L. MALLORY
in lake pH to 6.3 should restore aquatic ecosystems to conditions acceptable for successful breeding by all boreal waterfowl species (McNicol et al., 1990; Blancher et aL, 1992; McNicol and Wayland, 1992). In Ontario, emission controls are proposed for the mid-1990s that will further reduce acid deposition from local and long- range sources, and should greatly benefit these lakes and the waterfowl breeding on them. Therefore, continued long-term monitoring of water quality and the aquatic resources of small lakes in the Sudbury area should serve as a useful model to test whether future emission reductions yield the anticipated environmental im- provements.
Small lakes near Sudbury have exhibited short-term recovery of chemical con- ditions, presumably in response to reduced local smelter emissions. However, the chemistry of these lakes changes quickly in response to the levels of pollutants in precipitation, and thus they show considerable annual variation in water chemistry. Chemical conditions of these lakes fluctuated during the 1980s, but did not demon- strate consistent improvement. Nonetheless, our evidence suggests that recovery of many of these lakes should be expected with further reductions in deposition of atmospheric pollutants.
Acknowledgements
We thank Don Kurylo and the staff at GLFC for chemical analyses, Lise Brisebois for computer assistance, Ken Ross for field assistance, Brian Collins for statistical advice, Dave Yap for SO2 data and the Atmospheric Environment Service (Sudbury Airport) for precipitation data. John Gunn, Bill Keller and two anonymous reviewers provided useful comments on this paper, and BK kindly provided an unpublished manuscript. This study was funded by the Long-Range Transport of Airborne Pollutants (LRTAP) program of Environment Canada.
References
Almer, B., Dickson, W., Ekstrom, C., and Hornstrom, E.: 1974, Ambio 3, 30-36. Beamish, R. J. and Harvey, H. H.: 1972, J. Fish. Res. Board Can. 29, 1131-1143. BendeU, B. E.: 1986, Can. Z Zool. 64, 2696-2699. Bendell, B. E.: 1988, Can. J. Zool. 66, 2209-2211. Bendell, B. E. and McNicol, D. K.: 1987, Hydrobiologia 150, 193-202. Bendell, B. E. and McNicol, D. K.: 1991, Can. J. Zool. 69, 130-133. Blancher, P. J. and McNicol, D. K.: 1987, Water, lAir and Soil Pollut. 35, 217-232. Blancher, P. J., McNicol, D. K., Ross, R. K., Wedeles, C. H. R., and Morrison, P.: 1992, Environ.
Pollut. 78, 57-63. Brousseau, C. S., Baccante, D. and Maki, L. W.: 1985: J. Great Lakes Res. 11, 501-507. Campbell, P. G. C. and Stokes, P. M.: 1985, Can. J. Fish. Aquat. Sci. 42, 2034-2049. Dillon, P. J.: 1984, 'The Use of Mass Balances and Mass Balance Models for Quantification of the
Effects of Anthropogenic Activities on Lakes near Sudbury, Ontario', in J. Nriagu (ed.), Environmental Impacts of Smelters, John Wiley and Sons Inc., New York, pp. 284-347.
Dillon, P. J., Reid, R. A. and Girard, R.: 1986, Water, Air. and Soil Pollut. 31, 59-65. Environment Canada.: 1979, Analytical Methods Manual, 2nd Edition, Inland Waters Directorate, Water
Quality Branch, Ottawa.

TRENDS IN SMALL LAKE WATER CHEMISTRY 117
Forsberg, C., Morling, G. and Wetzel, R. G.: 1985, Ambio 14, 164-166. Gorham, E. and Gordon, A. G.: 1960, Can. J. Bot. 30, 477-487. Gunn, J. M. and Keller, W.: 1990, Nature 345, 431-433. Haines, T. A.: 1981, Trans. Am. Fish. Soc. 110, 669-707. Hutchinson, T. C. and Havas, M.: 1986,
Water, Air and Soil Pollut. 28, 319-333. Jeffries, D. S.: 1984, 'Atmospheric Deposition of Pollutants in the Sudbury Area', in J. Nriagu (ed.),
Environmentallmpacts of Smelters, John Wiley and Sons Inc., New York, pp. 195-241. Keller, W. and Pitblado, J. R.: 1986, Water, Air, and SoilPollut. 29, 285-296. Keller, W. and Yan, N. D.: 1991, Can. J. Fish. Aquat. Sci. 48, 1635-1644. Keller, W., Pitblado, J. R. and Conroy, N. I.: 1986, Water, Air, and Soil Pollut. 31,765-774. Keller, W., Pitblado, J. R. and Carbone, J.: 1992, Can. J. Fish. Aquat. Sci. 49 (Suppl. 1): 25-32. Kelso, J. R. M. and Jeffries, D. S.: 1988, Can. J. Fish, Aquat. ScL 45, 1905-1911. LaZerte, B. D. and Dillon, P. J.: 1984, Can. J. Fish. Aquat. Sci. 41, 1664-1677. Magnuson, J. J., Baker, J. P. and Rahel, E. J.: 1984, Phil. Trans. R. Soc. London 305, 501-516. McNicol, D. K., Bendell, B. and Ross, R. K.: 1987, Studies of the effects of acidification on aquatic
wildlife in Canada: waterfowl and trophic relationships in small lakes in northeastern Ontario, Can. Wildl. Serv. Occasional. Paper Ser. No. 62.
McNicol, D. K., Ross, R. K., and Blancher, P. J.: 1990, Trans. 19th IUGB Congress, Trondheim. pp. 251-258.
McNicol, D. K., and Wayland, M.: 1992, Can. J. Fish. Aquat. Sci. 49 (Suppl. 1): 122-133. Neary, B. P. and Dillon, P. J.: 1988, Nature 333, 340-343. Papineau, M. and Haemmerli, J.: 1992, Water, Air, and Soil Pollut. 61, 95-105. Pough, F. H. and Wilson, R. E.: 1977, Water, Air, andSoilPollut. 7, 307-316. RMCC (Federal/Provincial Research and Monitoring Coordinating Committee): 1990, The 1990 Canadian
Long-Range Transport of Air Pollutants and Acid Deposition Assessment Report. Part 4 - Aquatic Effects, 151 pp.
SAS Institute Inc.: 1988, SAS User's Guide, 1988 Edition, SAS Institute Inc., Cary, NC, U.S.A. Schindler, D. W., Mills, K. H., Malley, D. F., Findlay, D. L., Shearer, J. A., Davies, I. J., Turner,
M. A., Linsey, G. A., and Cruikshank, D. R.: 1985, Science 228, 1395-1401. Schindler, D. W.: 1988, Science 239, 149-157. Vollenweider, R. and Kerekes, J.: 1982, Eutrophication of waters. Monitoring, Assessment and Control,
Organization for Economic Co-operation and Development. Paris, 154 pp. Wright, R. F., Cosby, B. J., Gjessing, G. E., Christophersen, N., Lotze, E., Seip, H. M., Semb, A.,
Sletaune, B., Storhaug, R., and Wedung, K.: 1986, Water, Air, and Soil Pollut. 30, 47-64.
Appendix I
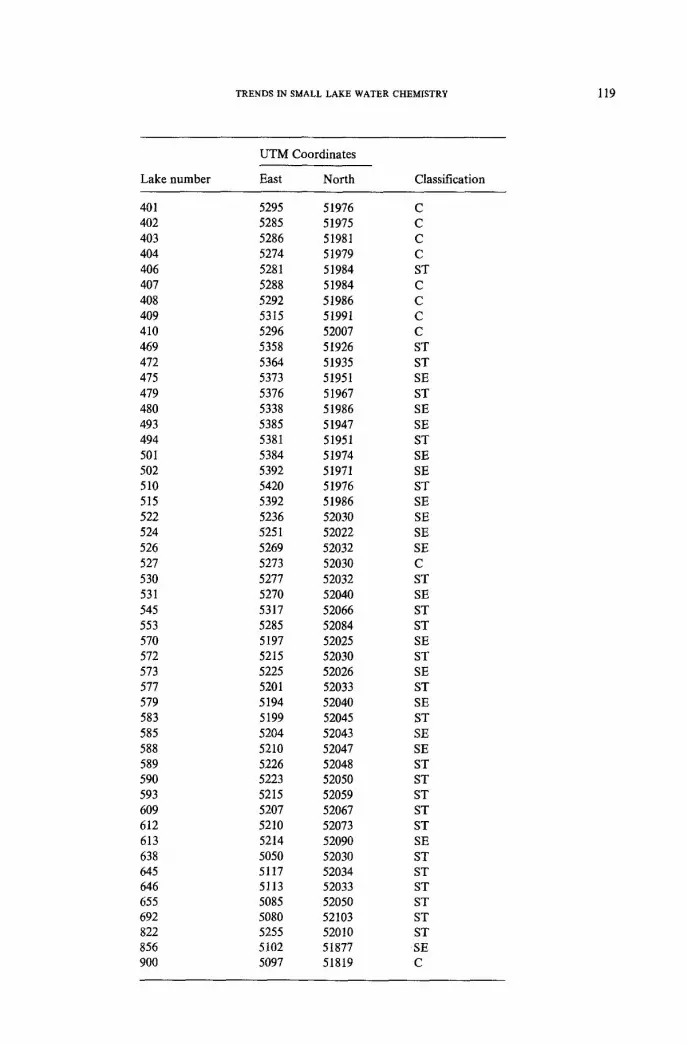
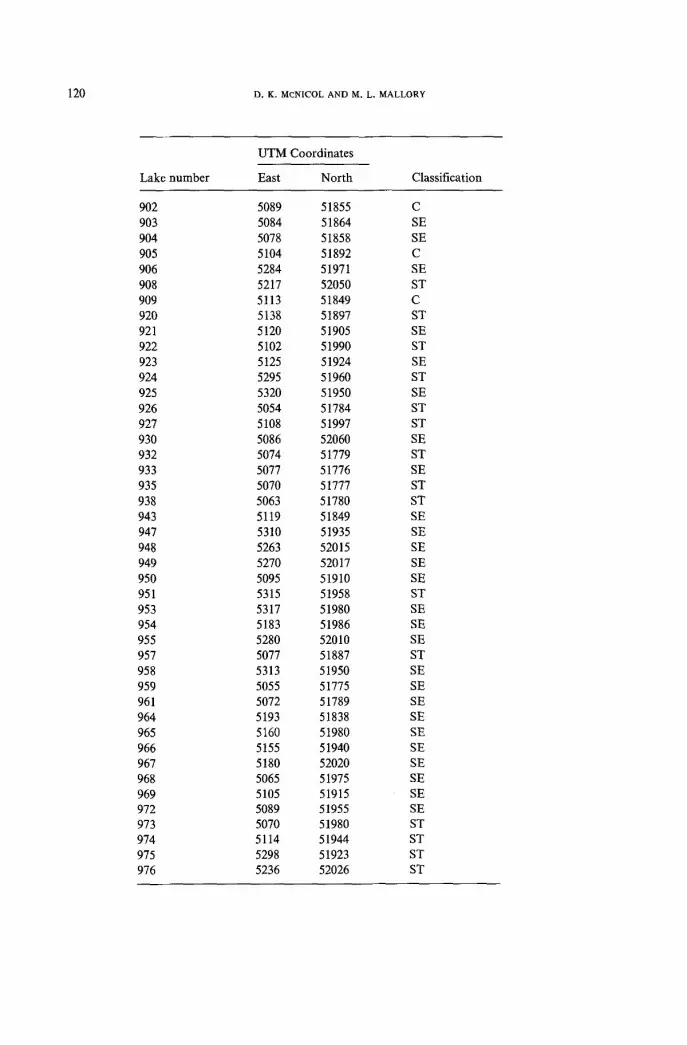
Locations of the lakes used in this project. Universal Transverse Mercator (UTM) coordinates are provided for core (C), study (ST) and secondary (SE) lakes. Lakes have been numbered arbitrarily by
Canadian Wildlife Service identification numbers.
UTM Coordinates
Lake number East North Classification
001 5097 51835 SE 002 5095 51852 C 003 5121 51917 ST 005 5113 51842 C 006 5103 51858 SE 010 5058 51898 ST 013 5117 51915 C 016 5133 51922 C
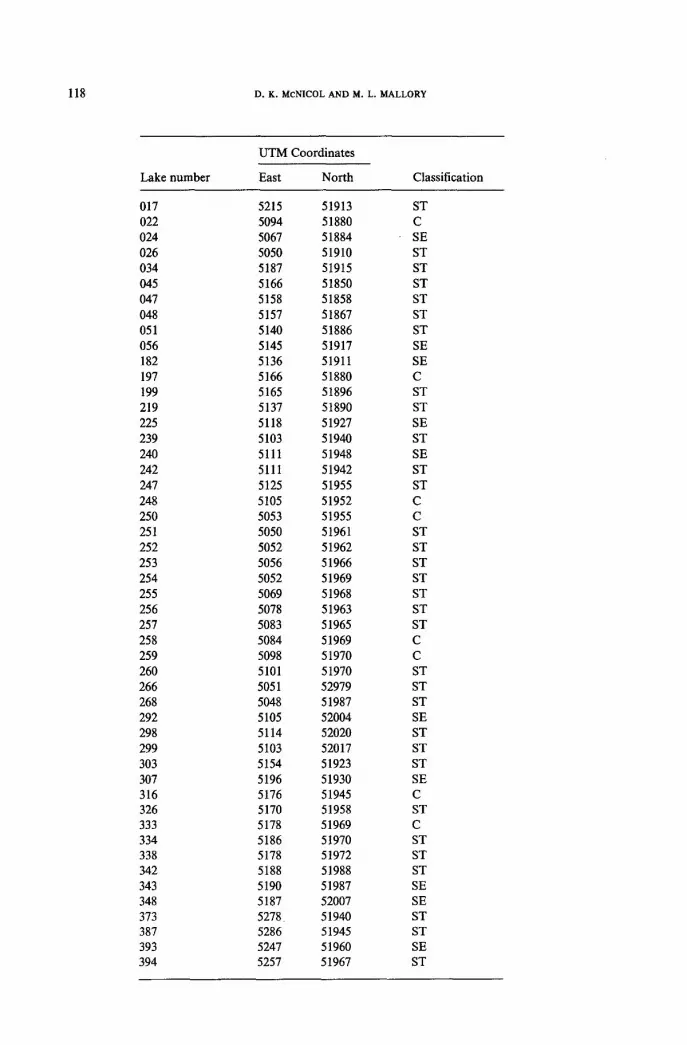
118 o.K. McNICOL AND M. L. MALLORY
UTM Coordinates
Lake number East North Classification
017 022 024 026 034 045 047 048 051 056 182 197 199 219 225 239 240 242 247 248 250 251 252 253 254 255 256 257 258 259 260 266 268 292 298 299 303 307 316 326 333 334 338 342 343 348 373 387 393 394
5215 51913 5094 51880 5067 51884 5050 51910 5187 51915 5166 51850 5158 51858 5157 51867 5140 51886 5145 51917 5136 51911 5166 51880 5165 51896 5137 51890 5118 51927 5103 51940 5111 51948 5111 51942 5125 51955 5105 51952 5053 51955 5050 51961 5052 51962 5056 51966 5052 51969 5069 51968 5078 51963 5083 51965 5084 51969 5098 51970 5101 51970 5051 52979 5048 51987 5105 52004 5114 52020 5103 52017 5154 51923 5196 51930 5176 51945 5170 51958 5178 51969 5186 51970 5178 51972 5188 51988 5190 51987 5187 52007 5278 51940 5286 51945 5247 51960 5257 51967
ST C SE ST ST ST ST ST ST SE SE C ST ST SE ST SE ST ST C C ST ST ST ST ST ST ST C C ST ST ST SE ST ST ST SE C ST C ST ST ST SE SE ST ST SE ST
TRENDS IN SMALL LAKE WATER CHEMISTRY 119
UTM Coordinates
Lake number East North Classification
401 402 403 404 406 407 408 409 410 469 472 475 479 480 493 494 501 502 510 515 522 524 526 527 530 531 545 553 570 572 573 577 579 583 585 588 589 590 593 609 612 613 638 645 646 655 692 822 856 900
5295 51976 C 5285 51975 C 5286 51981 C 5274 51979 C 5281 51984 ST 5288 51984 C 5292 51986 C 5315 51991 C 5296 52007 C 5358 51926 ST 5364 51935 ST 5373 51951 SE 5376 51967 ST 5338 51986 SE 5385 51947 SE 5381 51951 ST 5384 51974 SE 5392 51971 SE 5420 51976 ST 5392 51986 SE 5236 52030 SE 5251 52022 SE 5269 52032 SE 5273 52030 C 5277 52032 ST 5270 52040 SE 5317 52066 ST 5285 52084 ST 5197 52025 SE 5215 52030 ST 5225 52026 SE 5201 52033 ST 5194 52040 SE 5199 52045 ST 5204 52043 SE 5210 52047 SE 5226 52048 ST 5223 52050 ST 5215 52059 ST 5207 52067 ST 5210 52073 ST 5214 52090 SE 5050 52030 ST 5117 52034 ST 5113 52033 ST 5085 52050 ST 5080 52103 ST 5255 52010 ST 5102 51877 SE 5097 51819 C
120 D. K. MCNICOL AND M. L. MALLORY
UTM Coordinates
Lake number East North Classification
902 903 904 905 906 908 909 920 921 922 923 924 925 926 927 930 932 933 935 938 943 947 948 949 950 951 953 954 955 957 958 959 961 964 965 966 967 968 969 972 973 974 975 976
5089 51855 5084 51864 5078 51858 5104 51892 5284 51971 5217 52050 5113 51849 5138 51897 5120 51905 5102 51990 5125 51924 5295 51960 5320 51950 5054 51784 5108 51997 5086 52060 5074 51779 5077 51776 5070 51777 5063 51780 5119 51849 5310 51935 5263 52015 5270 52017 5095 51910 5315 51958 5317 51980 5183 51986 5280 52010 5077 51887 5313 51950 5055 51775 5072 51789 5193 51838 5160 51980 5155 51940 5180 52020 5065 51975 5105 51915 5089 51955 5070 51980 5114 51944 5298 51923 5236 52026
C SE SE C SE ST C ST SE ST SE ST SE ST ST SE ST SE ST ST SE SE SE SE SE ST SE SE SE ST SE SE SE SE SE SE SE SE SE SE ST ST ST ST