trends in attitudes towards foreigners in south africa 1997-2011
TRANSCRIPT

Copyright © Afrobarometer 2015 1
Dispatch No. 44 | 4 September 2015
Trends in attitudes toward foreigners in South
Africa, 1997-2011
Afrobarometer Dispatch No. 44 | Matthias Krönke
Summary
In public debate about the resurgence of xenophobic violence in South Africa’s KwaZulu-
Natal and Gauteng provinces in March-April 2015, which killed at least seven people and
displaced more than 5,000 (Smith, 2015), a considerable amount of ink has been spilled on
trying to map out why the attacks took place. Broadly speaking, one can group the various
explanations into three categories. The first is King Goodwill Zwelithini’s inflammatory speech
during a “moral regeneration event.” The second is a structural argument pointing to the
country’s widespread poverty, inequality, and concomitant frustration at the non-delivery of
basic services exacerbated by economic competition posed by foreigners. A third
explanation invokes South Africa’s supposed inherent violence and the opportunistic and
sporadic actions of criminal elements.
Collectively these explanations fail to broaden the analytical scope beyond the areas and
time period in which the violence occurred. By looking at longitudinal trends in South
Africans’ attitudes toward foreigners, we might be able to place xenophobic attacks that
erupted dramatically in 2008 and 2015 – but have also occurred sporadically at other times –
into a broader context of cross-cultural interactions, identity, and citizenship and move
beyond simplistic explanations that equate poverty with xenophobia.
This dispatch presents an initial multidimensional analysis of citizens’ attitudes toward
foreigners in South Africa from 1997 to 2011, based on data from the 1997 Institute for
Democracy in Africa (IDASA) Political Culture survey and Afrobarometer surveys in 2008 and
2011. Building on previous Afrobarometer analyses (Carter, 2010; Mataure, 2013), this
dispatch disaggregates the data according to respondents’ poverty levels, education levels,
and racial groups. It also provides insight into over-time trends in tolerance toward foreigners
according to geographic areas (provinces as well as urban/rural residence), revealing
several drastic temporal shifts as well as continuities. This analysis focuses on South Africans’
attitudes (rather than action taken against foreigners) as a useful point of departure to
further disentangle the complexities of xenophobia.
Data sources
Afrobarometer survey
Afrobarometer is a pan-African, non-partisan research network that conducts public attitude
surveys on democracy, governance, economic conditions, and related issues across more
than 30 countries in Africa. Five rounds of surveys were conducted between 1999 and 2013,
and Round 6 surveys are currently under way (2014-2015). Afrobarometer conducts face-to-
face interviews in the language of the respondent’s choice with nationally representative
samples of between 1,200 and 2,400 respondents.
The Afrobarometer team in South Africa, led by IDASA, interviewed 2,400 adult South Africans
in 2008 and 2011. A sample of this size yields country-level results with a margin of error of +/-
2% at a 95% confidence level. Analysis of smaller subsamples results in wider margins of
uncertainty surrounding numerical results.

Copyright © Afrobarometer 2015 2
Previous Afrobarometer surveys were conducted in South Africa in 2000, 2002, 2004, and
2006.
IDASA survey
Prior to cooperating with Afrobarometer, IDASA conducted the Political Culture survey in
June-July 1997. The survey consisted of face-to-face interviews in the language of the
respondent’s choice with a nationally representative sample of 3,500 adult South Africans,
which provides national results with a margin of error of +/-2% at a 95% confidence level, with
larger margins around sub-national estimates.
Key findings
More than one in five South Africans would like the government to deport all
foreigners, irrespective of their legal status. Socioeconomic factors such as levels of
education and poverty are only weakly associated with the most xenophobic
attitudes.
Between 1997 and 2011, more than one in 10 individuals indicated that they would
be “very likely” to take action against foreigners who attempted to move into their
neighbourhood or operate a business in their area, although there are noticeable
changes over time when disaggregating the data according to education and
poverty levels.
In 2008 and 2011, one-third of South Africans thought that the government was
handling immigration-related issues “very badly.” Urban residents were more
dissatisfied with the government’s performance than rural respondents.
Trust in foreigners
To better understand variation in levels of tolerance for immigrants, this section contextualises
attitudes toward foreigners by comparing them to South Africans’ attitudes toward relatives
and other people they know before disaggregating their views toward foreigners along
several sub-dimensions.
Not surprisingly, South Africans’ trust in their relatives is fairly stable and far higher than their
trust in other people (Table 1). The difference in trust between “other people you know” and
“foreigners in South Africa” is striking. In 2011, 23% of respondents indicated that they don’t
trust “at all” other people they know, an increase of 6 percentage points from 2008. There is
a similar increase in distrust vis-à-vis foreigners, but the absolute numbers are twice as high
(67% in 2011). Men and women are about equally likely to express distrust.
Table 1: South Africans’ level of trust | 2008-2011
Not at all Just a little Somewhat A lot
2008 2011 2008 2011 2008 2011 2008 2011
Relatives 6 6 13 15 28 28 53 50
Other people you know 13 23 34 38 38 30 13 8
Foreigners in South Africa 60 67 23 21 11 9 3 2
Respondents were asked: How much do you trust each of the following types of people? (%)
Disaggregating responses according to apartheid race categories shows small differences
between groups and over time. In 2008, Coloureds were the most distrusting group (88%

Copyright © Afrobarometer 2015 3
trusted foreigners “just a little” or “not at all”), while whites were the least distrusting group
(80%). Three years later, Afrobarometer found an across-the-board increase in distrust, with
Indians/Asians now the most distrusting group (92%), followed by Coloured (90%), black
(89%), and white South Africans (82%).
These high levels of distrust also prevail across different levels of education. Respondents with
no formal education consistently trusted foreigners living in South Africa the least (88% in 2008
and 89% in 2011 who said “not at all” or “just a little”). Somewhat surprisingly, respondents
whose highest level of education was primary school were the least distrustful group (79%) in
2008. This value rose to 88% in 2011, putting them on par with citizens who had attained
higher levels of formal education (Figure 1).
Figure 1: South Africans' trust in foreigners | by level of education | 2008-2011
(% who said “not at all” or “just a little”)
While available data do not allow us to test the popular theory that poverty caused the
xenophobic attacks, it may be of interest to disaggregate respondents’ level of trust
according to their level of poverty. The Afrobarometer surveys asked respondents how often
they had gone without food, water, medical care, cooking fuel, and a cash income over the
previous year. Using these responses and creating a common factor (the Lived Poverty
Index), this analysis subdivides the factor into four groups (from Top 25% = Never experiencing
shortages to Bottom 25% = frequently suffering from shortages).
Contrary to popular discourse, those who most frequently suffer from a shortage of basic
necessities distrust foreigners less than the rest of society, though differences are small (Figure
2).
85 85
83
89
85
92
82
85
76
78
80
82
84
86
88
90
92
94
2008 2011
Top 25% Upper 25% Lower 25% Bottom 25%

Copyright © Afrobarometer 2015 4
Figure 2: South Africans' level of trust in foreigners | by respondents’ poverty level
| 2008-2011
(% who said “not at all” or “just a little”)
Overall, this first part of the analysis shows that South Africans’ distrust of foreigners is not a
fringe phenomenon but rather is prevalent across racial, educational, and poverty lines.
Tolerance of foreigners
Policy preferences
In the surveys in 1997 and 2008 (but not 2011), respondents were asked which of the
foreigners living in South Africa should be sent back to their own countries. Figure 3 indicates
only minor changes over time, the most significant being a 4-percentage-point increase in
support for a skills-based approach, i.e. deporting foreigners who are not contributing to
South Africa’s economy. More than one in five South Africans preferred the deportation of all
foreigners, irrespective of their potential to contribute to the economy or their legal status in
the country.
Dividing respondents according to their racial groups uncovers some interesting changes. In
1997, 25% of black South Africans wanted the government to follow the most restrictive
approach (i.e. to deport all foreigners), while white (17%), Indian (12%), and Coloured (9%)
respondents were more tolerant. Eleven years later, however, the proportion of Coloureds in
favour of this approach had tripled (to 27%), followed by white (25%), black (20%), and
Indian (14%) South Africans.
In 1997, respondents who had received post-secondary education were almost four times as
likely as respondents with no formal education to favour the skills-based approach (Figure 4).
This gap decreased from 21 to 4 percentage points in 2008. By contrast, respondents with the
least formal education consistently supported the most restrictive policy option in 1997 and
2008. The difference between respondents with no formal education and the other three
groups increased slightly in 2008 (Figure 5).
85
83
89
92
82
85
50
60
70
80
90
100
2008 2011
Top 25% Upper 25% Lower 25% Bottom 25%

Copyright © Afrobarometer 2015 5
Figure 3: South Africans' policy preferences regarding foreigners living in the country
| 1997-2008
Respondents were asked: How about people from other countries who are presently living in South
Africa? Who do you think the government should send back to their own countries? (Note: In 2008, the
question was phrased as: “Who, if anyone, do you think. …?”) (%)
Figure 4: Support for deporting only foreigners who are not contributing to the
economy | by respondents’ education level | 1997-2008
(% who said “Only those who are not contributing to the economy”)
2221
18
22
3234
16 15
46
0
10
20
30
40
1997 2008
All of these people
Only those who are not contributing to the economy
Only those who are here without the permission of the South African government
Only those who have committed crimes
Government should not send back any people to their own countries
8
20
12
2119
22
29
24
0
10
20
30
40
1997 2008
No formal education Primary Secondary Post-secondary

Copyright © Afrobarometer 2015 6
Figure 5: Support for deporting all foreigners | by respondents’ education level
| 1997-2008
(% who said “All of these people”)
Analysing respondents’ policy preferences according to the province they live in reveals
further differences. Focusing on the most restrictive option, it is possible to categorise the nine
provinces into three clusters. The first group (Eastern Cape, Limpopo, Mpumalanga, and
North West) shows a decrease of roughly 10 percentage points in support for this policy
option between 1997 and 2008, while the second cluster (Free State, Gauteng, and KwaZulu-
Natal) shows only minor changes and the third group (Northern Cape and Western Cape)
shows substantial increases (Figure 6). While the Northern Cape also has the highest
preference for this option in absolute terms, Gauteng and KwaZulu-Natal are the only other
provinces that score 25% or higher for this option in 2008.
Figure 6: Support for deporting all foreigners | by respondents’ province | 1997-2008
(% who said “All of these people”)
26 29
25
17
222119
22
0
10
20
30
40
1997 2008
No formal education Primary
Secondary Post-secondary
30
26 25
18
9
27
22
108
20
15
118
10
2825
34
21
0
10
20
30
40
1997 2008

Copyright © Afrobarometer 2015 7
In comparison, the skills-based policy preference (deporting those not contributing to the
economy) shows a more stable pattern. Two provinces from the first cluster (Mpumalanga
and North West) show changes of roughly 20 percentage points, whereas the other
provinces display smaller changes (Figure 7). It is not possible to compare the data over time
using the Lived Poverty Index, as this data was not collected in 1997.
Figure 7: Support for deporting only foreigners who are not contributing to the
economy | by respondents’ province | 1997-2008
(% who said “Only those who are not contributing to the economy”)
Likelihood of taking action against foreigners
To gain a fuller picture of the tolerance dimension, the above statistics can be
complemented with data pertaining to attitudes toward immigrants who want to move into
respondents’ neighbourhoods or operate businesses in their areas.
About one-third of respondents said they would be “likely” or “very likely” to take action
against foreigners who attempted to move into (Figure 8) or operate a business in (Figure 9)
the respondents’ neighbourhood. Particularly worrying is that in each of the three surveys
and on both questions, more than one in 10 individuals indicated that they would be “very
likely” to take action. Since the surveys did not have follow-up questions asking respondents
to specify their actions, it is unclear where on the spectrum of possible actions they might
locate themselves. For example, do people primarily think of rallying their neighbours to try to
influence the local councillor, or would they be willing to personally attack foreigners?
1614
12
16
2219 20
16
24
19
23
3134
28
2119
1619
0
10
20
30
40
1997 2008

Copyright © Afrobarometer 2015 8
Figure 8: Likelihood of taking action to prevent immigrants from moving into
respondents’ neighbourhood | 1997-2011
Respondents were asked: How likely is it that you would take part in action to prevent people who
have come to South Africa from other countries in southern Africa [in 2008 and 2011: who have come
here from other countries in Africa] from moving into your neighbourhood? (%)
Figure 9: Likelihood of taking action to prevent immigrants from operating a business
in respondents' area | 1997-2011
Respondents were asked: How likely is it that you would take part in action to prevent people who have
come to South Africa from other countries in southern Africa [in 2008 and 2001: who have come here
from other countries in Africa] from other countries in Africa from operating a business in your area? (%)
Assuming that the respondents who said they are “very likely” to take action are also those
who are most likely to partake in xenophobic attacks, the analysis focuses primarily on this
group. (Additional analysis combining “very likely” and “likely” categories can be found in
the Appendix.) As can be seen in the overall distribution of answers in Figure 8 and Figure 9,
the response patterns for the two questions were similar. Examining responses by racial group,
in 1997 Coloureds were the least likely group to take action, while other groups scored
between 6 and 10 percentage points higher (Figure 10). In 2008, the distribution diverged
3535
32
58
59 66
77
20
10
20
30
40
50
60
70
1997 2008 2011
Likely/Very likely Not very likely/Not likely at all Don't know
34
3636
59 5863
76
20
10
20
30
40
50
60
70
1997 2008 2011
Likely/Very likely Not very likely/Not likely at all Don't know

Copyright © Afrobarometer 2015 9
slightly, with white South Africans becoming the most likely to take action while Indian/Asians
individuals scored lowest (11 to 14 percentage points difference). In 2011, the ranking order
changed again. Although white and black South Africans remained fairly stable in second
and third place, Indians scored much higher than any other group, while Coloureds
recorded the smallest proportion in this category.
Figure 10: ‘Very likely’ to take action against immigrants | by respondents’ racial
groups | 1997-2011
A) Prevent moving into the neighbourhood B) Prevent operating business in the area
(%)
This raises the question whether people answer questions differently depending on whether
the issue is fairly abstract (a policy preference) or “close to home” (immigrants moving into
their own neighbourhood). To investigate this aspect further, it is worth interrogating
additional sub-dimensions.
As shown above, data from 1997 suggested a reasonably clear association between
respondents’ level of formal education and their likelihood of choosing the most restrictive
policy option – the more educated, the less likely respondents are to favour deporting all
foreigners. This relationship is also partly borne out by the data on action against immigrants.
In 1997, all four levels of educational attainment were within a 4-percentage-point range.
This pattern remains fairly stable for those with primary, secondary, or post-secondary
education, but respondents with no formal education scored higher than the other groups in
2008 and 2011 (Figure 11).
1212
1313
17
12
6
12
8
13
3
27
0
10
20
30
1997 2008 2011
Black
White
Coloured-Mixed Race
Indian/Asian
12 16
1612
16
15
3
11 911
5
27
0
10
20
30
1997 2008 2011
Black
White
Coloured-Mixed Race
Indian/Asian

Copyright © Afrobarometer 2015 10
Figure 11: ‘Very likely’ to take action against immigrants | by respondents’
education level | 1997-2011
A) Prevent moving into the neighbourhood B) Prevent operating business in the area
(%)
Regarding differences by province, we saw earlier that Gauteng was the only province that
consistently scored above the national average in support for the most restrictive policy
option (“all these people should go”) in 1997 and 2008. On the question about immigrants
moving into the respondents’ neighbourhood, residents in the Free State, Gauteng, and
North West Province consistently gave an above-national-average hostile answer (“very
likely” to take action). On the question about immigrants operating a business, only Gauteng
residents gave the most hostile answer consistently above the national average for all three
survey rounds. Although it is beyond the scope of this study to investigate the particular
results for Gauteng, it is important to explore these findings further; they cannot be explained
by the province’s comparatively large proportion of urban residents, since the surveys
revealed only minor differences when data are disaggregated along the urban/rural
dimension.
A longitudinal comparison along the lived poverty sub-dimension is hampered by the lack of
data from the 1997 survey, allowing for a comparison of the 2008 and 2011 data only.
Recalling the results regarding trust in foreigners, we found that the levels of distrust were
lowest among the poorest 25% of South Africans, while the next 25% were the most distrustful.
Similarly, there does not seem to be a clear trend when it comes to South Africans’ hostility
toward foreigners moving into their neighbourhoods. However, poorer citizens tended to feel
more threatened by foreigners operating businesses in their area (Figure 12). Yet, once we
include respondents who said they would be “likely” to take action against foreign business
owners in their neighbourhood, this trend also becomes less clear (see Appendix).
14
1721
11 12
1412
13
12
15
11 10
0
10
20
30
1997 2008 2011
No formal education
Primary
Secondary
Post-secondary
10
23
18
10
13
16
12
15
1514 14
0
10
20
30
1997 2008 2011
No formal education
Primary
Secondary
Post-secondary

Copyright © Afrobarometer 2015 11
Figure 12: ‘Very likely’ to take action against immigrants | by respondents’ poverty
level | 2008-2011
A) Prevent moving into the neighbourhood B) Prevent operating business in the area
(%) Note: In slide at right, results for “Bottom 25%” and “Lower 25%” are identical (18% in 2008 and 2011).
Government performance on immigration
In October/November 2008, six months after an outbreak of xenophobic violence that killed
dozens and displaced thousands, Afrobarometer asked South Africans how satisfied they
were with the government’s handling of immigration-related issues. About one-third of
respondents said the government was performing “very badly,” while an additional 27% said
the government was managing the situation “fairly badly.” Three years later, citizens’
evaluation of the government’s performance on this issue was virtually the same.
While the difference between male and female respondents was again negligible, urban
residents were more dissatisfied with the government’s performance than rural respondents.
The 13-percentage-point difference in 2011 is by far the biggest urban/rural split in the data
across all the questions discussed in this paper.
A second difference is black South Africans’ less unfavourable evaluation of the government
compared to other racial groups. In 2011, 60% of black South Africans said the government
was performing fairly/very badly, compared to between 71% and 80% of white, Coloured,
and Indian/Asian South Africans (Figure 13). This difference was not reflected in preferences
regarding government policy on foreigners.
1112
13
11
15
12
15
0
2
4
6
8
10
12
14
16
Top 25% Upper 25%
Lower 25% Bottom 25%
1113
14 14
1818 18
0
10
20
30
2008 2011
Top 25% Upper 25%
Lower 25% Bottom 25%

Copyright © Afrobarometer 2015 12
Figure 13: Government performance on immigration-related issues | by
respondents’ racial groups | 2008-2011
Respondents were asked: How well or badly would you say the current government is handling the
following matters, or haven’t you heard enough to say: Managing immigration? (% who said “very
badly” or “fairly badly”)
In 2008, citizens with post-secondary education were most dissatisfied with how government
handled immigration (71% “fairly” or “very” badly), while those with only primary education
held a less unfavourable view (52%). While this gap narrowed from 19 to 7 percentage points
in 2011, the response pattern was similar to the one on questions about policy preferences.
This seems to confirm that on these more abstract questions, education may be a slightly
better discriminator than on questions about foreigners’ potential impact in people’s
immediate physical surroundings.
As for poverty levels, 2008 data suggest that the top 25% were less satisfied with the way the
government managed this issue than the rest of society (Figure 14). By 2011, however, the
poorer half of society was the more critical of government performance. (This development
is even more pronounced if one considers only the “very badly” response category, shown in
the Appendix).
5860
80
73
7179
80
0
10
20
30
40
50
60
70
80
90
2008 2011
Black White Coloured-Mixed Race Indian/Asian

Copyright © Afrobarometer 2015 13
Figure 14: Government performance on immigration-related issues | by
respondents’ level of lived poverty | 2008-2011
(% who said “very badly” or fairly badly”)
Conclusion
This preliminary examination of attitudes toward foreigners confirms that most South Africans
do not trust people from outside the country. The fact that more than one in five citizens
would like the government to deport all foreigners, irrespective of their legal status, underlines
the consistently high level of anti-foreigner sentiment in the country. What is more,
socioeconomic factors such as levels of education and poverty are only weakly associated
with the most xenophobic attitudes. While education may have some effect on abstract
policy preferences, the picture becomes murkier when people are asked about foreigners
being their neighbours or operating a business in their area. Except for the particularly high
levels of anti-foreigner sentiment in Gauteng, which require further investigation, these
attitudes are also only weakly related to geographic features (e.g. province, urban/rural
residence).
More in-depth analyses would do well to study interaction effects of these structural aspects
and complement findings with examinations of cross-cultural networks and government
attempts to reduce the country’s high levels of anti-foreigner attitudes.
72
6260
57
60
64
59
69
0
10
20
30
40
50
60
70
80
90
2008 2011
Top 25% Upper 25% Lower 25% Bottom 25%
To further explore this data, please visit Afrobarometer's online data analysis facility at www.afrobarometer.org/online-data-analysis.

Copyright © Afrobarometer 2015 14
References
Aryeetey, E. & Oduro, A. (1996). Regional integration efforts in Africa: An overview, in Teunissen, J. J. (ed), Regionalism and the Global Economy: The Case of Africa. The Hague: FONDAD.
CPS International. (2012). Ranking of universities in Africa. Retrieved from http://www.cps-research.com/index.php?option=com_zoo&task=item&item_id=10&Itemid=197.
McCaskie, Tom C. (2008). The United States, Ghana and oil: Global and local perspectives. African Affairs, 107, 313–332.
Copyright © Afrobarometer 2015 15
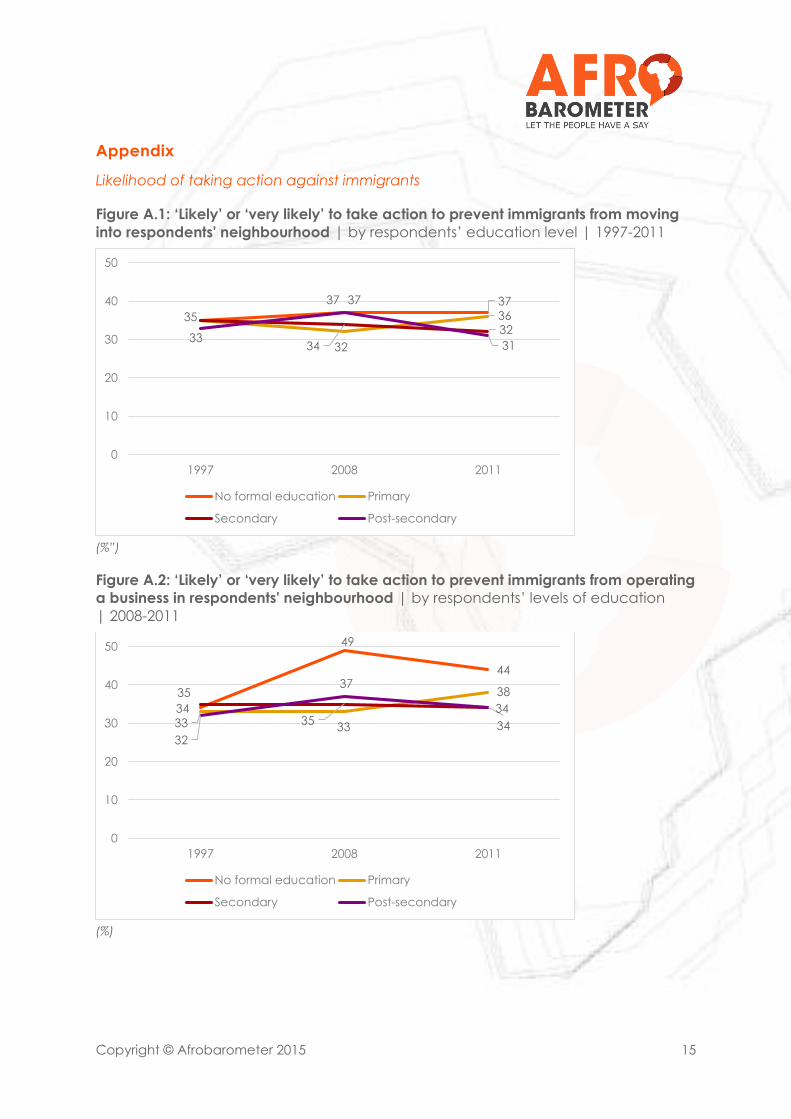
Appendix
Likelihood of taking action against immigrants
Figure A.1: ‘Likely’ or ‘very likely’ to take action to prevent immigrants from moving
into respondents' neighbourhood | by respondents’ education level | 1997-2011
(%”)
Figure A.2: ‘Likely’ or ‘very likely’ to take action to prevent immigrants from operating
a business in respondents' neighbourhood | by respondents’ levels of education
| 2008-2011
(%)
37 37
32
3635
34
3233
37
31
0
10
20
30
40
50
1997 2008 2011
No formal education Primary
Secondary Post-secondary
34
49
44
33 33
3835
35 3432
37
34
0
10
20
30
40
50
1997 2008 2011
No formal education Primary
Secondary Post-secondary

Copyright © Afrobarometer 2015 16
Figure A.3: ‘Likely’ or ‘very likely’ to take action to prevent immigrants from moving
into respondents' neighbourhood | by respondents’ levels of poverty | 2008-2011
(%)
Figure A.4: ‘Likely’ or ‘very likely’ to take action to prevent immigrants from operating
a business in respondents' neighbourhood | by respondents’ levels of poverty
| 2008-2011
(%)
3332
36
28
3434
3637
0
10
20
30
40
50
2008 2011
Top 25% Upper 25% Lower 25% Bottom 25%
30
34
39
32
3537
41 39
0
10
20
30
40
50
2008 2011
Top 25% Upper 25% Lower 25% Bottom 25%

Copyright © Afrobarometer 2015 17
Government performance on immigration
Figure A.5: Government performing ‘very badly’ on immigration-related issues
| by respondents’ level of poverty | 2008-2011
(%)
44
323231
36 37
29
43
0
10
20
30
40
50
2008 2011
Top 25% Upper 25% Lower 25% Bottom 25%

Copyright © Afrobarometer 2015 18
Matthias Krönke is a research assistant for the Democracy in Africa Research Unit at the
University of Cape Town. Email: [email protected]
Afrobarometer is produced collaboratively by social scientists from more than 30 African
countries. Coordination is provided by the Center for Democratic Development (CDD) in
Ghana, the Institute for Justice and Reconciliation (IJR) in South Africa, the Institute for
Development Studies (IDS) at the University of Nairobi in Kenya, and the Institute for Empirical
Research in Political Economy (IREEP) in Benin. Michigan State University (MSU) and the
University of Cape Town (UCT) provide technical support to the network.
Core support for Afrobarometer Rounds 5 and 6 has been provided by the UK’s Department
for International Development (DFID), the Mo Ibrahim Foundation, the Swedish International
Development Cooperation Agency (SIDA), the United States Agency for International
Development (USAID), and the World Bank.
For more information, please visit www.afrobarometer.org.
Afrobarometer Dispatch No. 44 | 4 September 2015