tree planters' notes - reforestation, nurseries and genetics
TRANSCRIPT
United States Department of AgricultureForest Service
Fall 2018Volume 61, Number 2

In accordance with Federal civil rights law and U.S. Department of Agriculture (USDA) civil rights regulations and policies, the USDA, its Agencies, offices, and employees, and institutions participating in or administering USDA programs are prohibited from discriminating based on race, color, national origin, religion, sex, gender identity (including gender expression), sexual orientation, disability, age, mari-tal status, family/parental status, income derived from a public assistance program, political beliefs, or reprisal or retaliation for prior civil rights activity, in any program or activity conducted or funded by USDA (not all bases apply to all programs). Remedies and complaint filing deadlines vary by program or incident.
Persons with disabilities who require alternative means of communication for program information (e.g., Braille, large print, audiotape, American Sign Language, etc.) should contact the responsible Agency or USDA’s TARGET Center at (202) 720-2600 (voice and TTY) or contact USDA through the Federal Relay Service at (800) 877-8339. Additionally, program information may be made available in languages other than English.
To file a program discrimination complaint, complete the USDA Program Discrimination Complaint Form, AD-3027, found online at http://www.ascr.usda.gov/complaint_filing_cust.html and at any USDA office or write a letter addressed to USDA and provide in the letter all of the information requested in the form. To request a copy of the complaint form, call (866) 632-9992. Submit your completed form or letter to USDA by: (1) mail: U.S. Department of Agriculture, Office of the Assistant Secretary for Civil Rights, 1400 Independence Avenue, SW, Washington, D.C. 20250-9410; (2) fax: (202) 690-7442; or (3) email: [email protected].
USDA is an equal opportunity provider, employer, and lender.

Volume 61, Number 2 (Fall 2018) 1
Dear TPN ReaderTree Planters’ Notes (TPN) is dedicated to technology transfer and publication of information relating to nursery production and outplanting of trees and shrubs for reforestation, restoration, and conservation.
TPN is sponsored by the Cooperative Forestry Staff of the U.S. Department of Agriculture (USDA), Forest Service, State and Private Forestry Deputy Area, in Washington, DC. The Secretary of Agriculture has determined that the publication of this periodical is necessary in the transaction of public business required by law of this Department.
Editor: Diane L. Haase
TPN accepts both technical and research articles; each is reviewed by the editor and/or anonymous referees. Please see the Guidelines for Authors at the end of the journal for details about editorial policy, formatting, style, and submission. Guidelines can also be accessed on line at http://www.rngr.net/publications/tpn/author_guidelines.
Individual authors are responsible for the accu-racy of the material in their respective articles. The mention of commercial products in this publication is solely for the information of the reader, and endorsement is not intended by the Forest Service or USDA.
On occasion, this publication reports informa-tion involving pesticides. It does not contain recommendations for their use, nor does it imply that the uses discussed here have been registered. All uses of pesticides must be registered by appropriate State and/or Federal agencies before they can be recommended. Caution: pesticides can injure humans, do-mestic animals, desirable plants, and fish and other wildlife if they are not handled or applied properly. Be sure to read and understand all label instructions. Use all pesticides selectively and carefully. Follow recommended practices for the disposal of surplus pesticides and pesticide containers.
The use of trade or firm names in this publi-cation is for reader information and does not imply endorsement by the U.S. Department of Agriculture of any product or service.
Web site: http://www.rngr.net/publications/tpn
E-mail: [email protected]
Printed on recycled paper.
Fall 2018
First, I must apologize to all of you who received a letter with your Spring TPN issue stating that it would be your last unless you contacted me. That letter was intended only for USDA Forest Service addresses that were automatically receiving TPN. Over the years, some of those recipients requested to no longer receive the hardcopy of TPN, and some of the addresses were not valid but I did not have control of those mailing lists. Thus, I decided to send a letter to those lists in February and again with the Spring issue to let them know they would need to get on the regular subscriber list if they wanted to continue receiving TPN. Unfor-tunately, however, the second letter mistakenly went to all TPN subscrib-ers as well as the Forest Service lists. As a result, I was inundated with emails! The silver lining was that I heard from so many of you who love reading TPN, and several of you sent corrections to your subscription information. Furthermore, the original goal was accomplished—many Forest Service people subscribed to TPN’s regular electronic or hardcopy lists, and the future need for printing and postage has been reduced.
This Fall 2018 issue is the longest yet in TPN history and includes pro-ceedings papers from the 2017 annual nursery meetings:
• Joint Annual Meeting of the Northeast Forest and Conservation Association, the Southern Forest Nursery Association, and the In-tertribal Nursery Council (Walker, MN, July 31 to August 3, 2017).
• Joint Annual Meeting of the Western Forestry and Conservation Nursery Association and the Pacific Northwest Reforestation Council (Corvallis, OR, October 11–12, 2017)
Since 2014, proceedings papers from the annual nursery meetings are published in TPN. All proceedings papers from the annual nursery meetings (1949 to now) are available online at: http://www.rngr.net/publications/proceedings/.
This issue contains ten articles from the above-mentioned nursery meet-ings, six other technical articles, and the annual report on forest seedling production in the United States. I have no doubt that each subscriber will find new, interesting, and useful information inside this issue!
May you all have an enjoyable fall and winter ~
Diane L. Haase
From a small seed a mighty trunk may grow.
~ Aeschylus
2 Tree Planters’ Notes
Contents
SEE PAGE 25
SEE PAGE 56
SEE PAGE 11
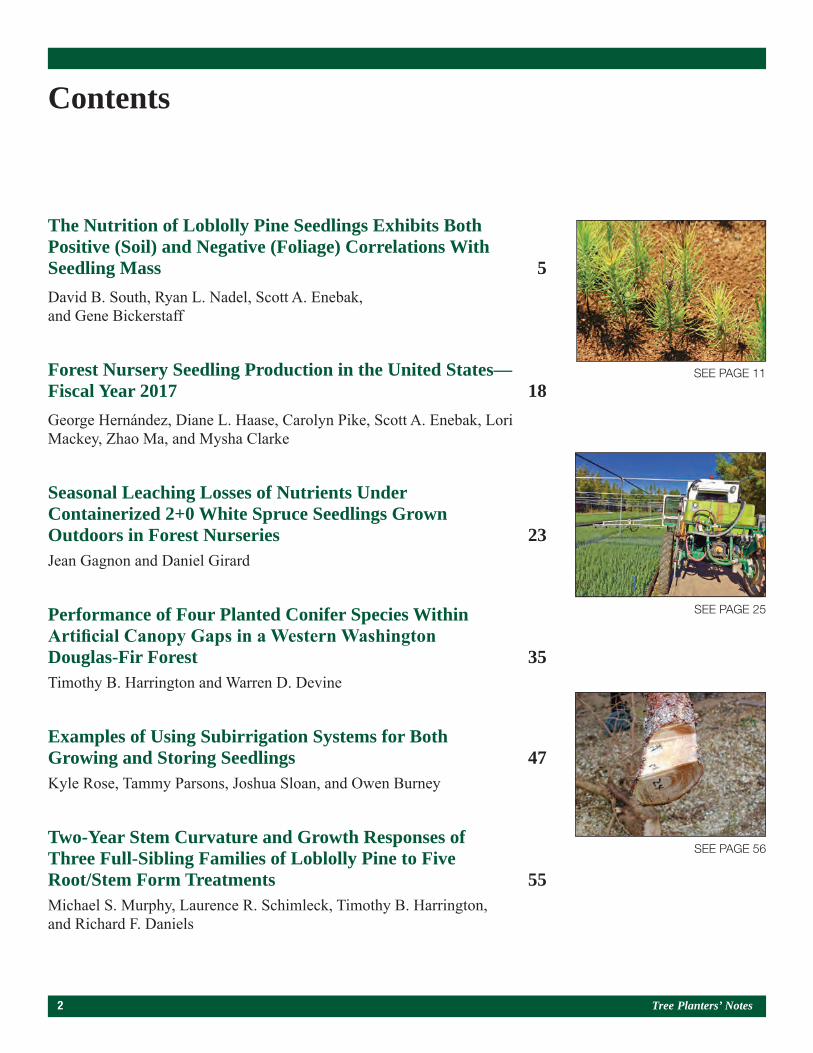
The Nutrition of Loblolly Pine Seedlings Exhibits Both Positive (Soil) and Negative (Foliage) Correlations With Seedling Mass 5David B. South, Ryan L. Nadel, Scott A. Enebak, and Gene Bickerstaff
Forest Nursery Seedling Production in the United States—Fiscal Year 2017 18George Hernández, Diane L. Haase, Carolyn Pike, Scott A. Enebak, Lori Mackey, Zhao Ma, and Mysha Clarke
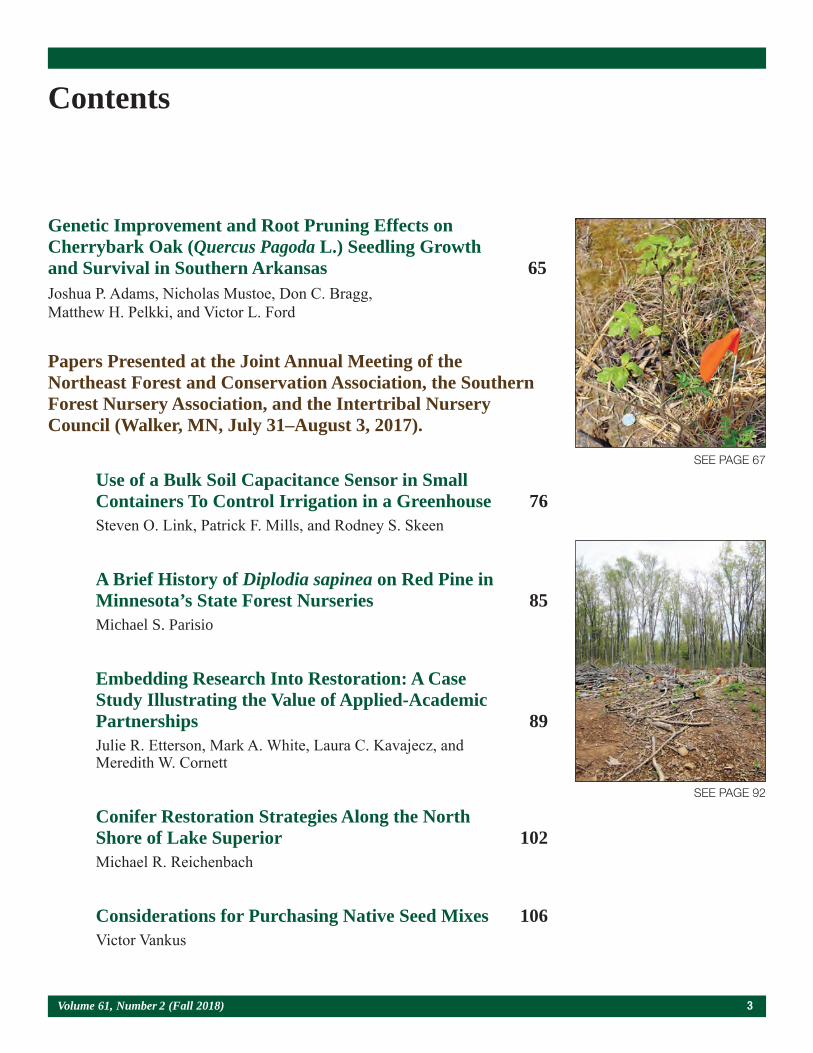
Seasonal Leaching Losses of Nutrients Under Containerized 2+0 White Spruce Seedlings Grown Outdoors in Forest Nurseries 23Jean Gagnon and Daniel Girard
Performance of Four Planted Conifer Species Within Artificial Canopy Gaps in a Western Washington Douglas-Fir Forest 35Timothy B. Harrington and Warren D. Devine
Examples of Using Subirrigation Systems for Both Growing and Storing Seedlings 47Kyle Rose, Tammy Parsons, Joshua Sloan, and Owen Burney
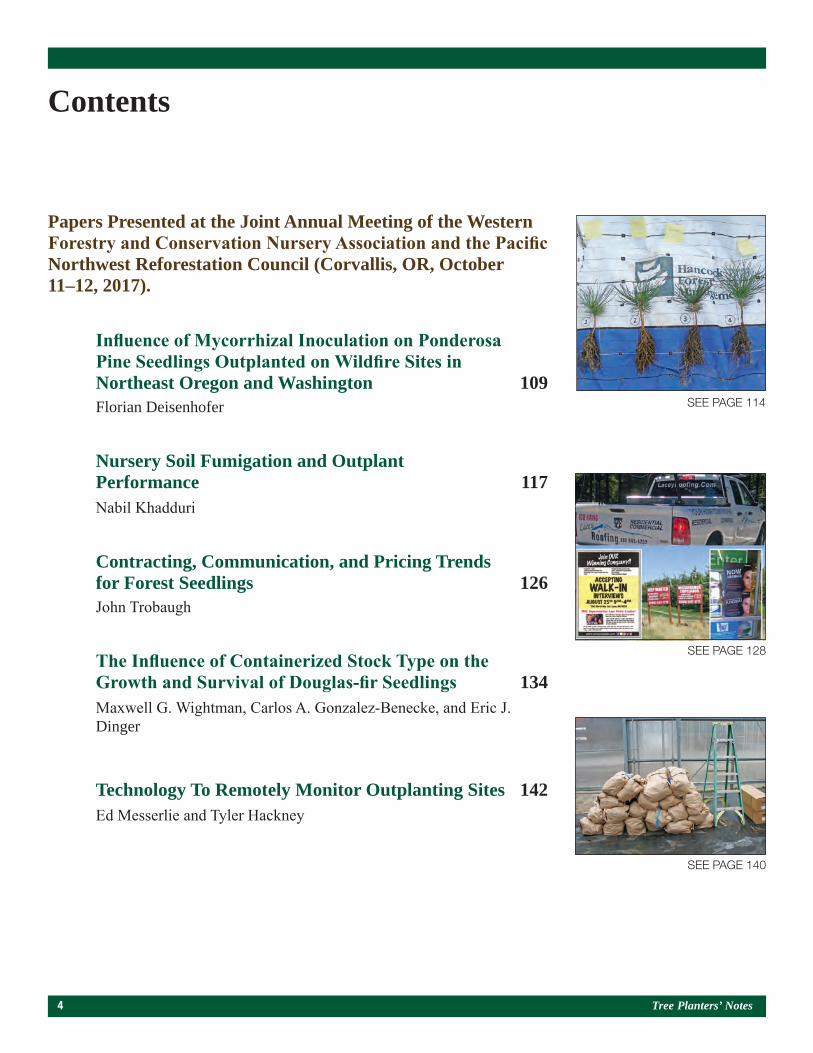
Two-Year Stem Curvature and Growth Responses of Three Full-Sibling Families of Loblolly Pine to Five Root/Stem Form Treatments 55Michael S. Murphy, Laurence R. Schimleck, Timothy B. Harrington, and Richard F. Daniels
Volume 61, Number 2 (Fall 2018) 3
Contents
SEE PAGE 92
SEE PAGE 67
Genetic Improvement and Root Pruning Effects on Cherrybark Oak (Quercus Pagoda L.) Seedling Growth and Survival in Southern Arkansas 65Joshua P. Adams, Nicholas Mustoe, Don C. Bragg, Matthew H. Pelkki, and Victor L. Ford
Papers Presented at the Joint Annual Meeting of the Northeast Forest and Conservation Association, the Southern Forest Nursery Association, and the Intertribal Nursery Council (Walker, MN, July 31–August 3, 2017).
Use of a Bulk Soil Capacitance Sensor in Small Containers To Control Irrigation in a Greenhouse 76Steven O. Link, Patrick F. Mills, and Rodney S. Skeen
A Brief History of Diplodia sapinea on Red Pine in Minnesota’s State Forest Nurseries 85Michael S. Parisio
Embedding Research Into Restoration: A Case Study Illustrating the Value of Applied-Academic Partnerships 89Julie R. Etterson, Mark A. White, Laura C. Kavajecz, and Meredith W. Cornett
Conifer Restoration Strategies Along the North Shore of Lake Superior 102Michael R. Reichenbach
Considerations for Purchasing Native Seed Mixes 106Victor Vankus
4 Tree Planters’ Notes
Contents
SEE PAGE 128
SEE PAGE 140
SEE PAGE 114
Papers Presented at the Joint Annual Meeting of the Western Forestry and Conservation Nursery Association and the Pacific Northwest Reforestation Council (Corvallis, OR, October 11–12, 2017).
Influence of Mycorrhizal Inoculation on Ponderosa Pine Seedlings Outplanted on Wildfire Sites in Northeast Oregon and Washington 109Florian Deisenhofer
Nursery Soil Fumigation and Outplant Performance 117Nabil Khadduri
Contracting, Communication, and Pricing Trends for Forest Seedlings 126John Trobaugh
The Influence of Containerized Stock Type on the Growth and Survival of Douglas-fir Seedlings 134Maxwell G. Wightman, Carlos A. Gonzalez-Benecke, and Eric J. Dinger
Technology To Remotely Monitor Outplanting Sites 142Ed Messerlie and Tyler Hackney
Volume 61, Number 2 (Fall 2018) 5
The Nutrition of Loblolly Pine Seedlings Exhibits Both Positive (Soil) and Negative (Foliage)
Correlations with Seedling MassDavid B. South, Ryan L. Nadel, Scott A. Enebak, and Gene Bickerstaff
Emeritus Professor, School of Forestry and Wildlife Sciences, Auburn University, AL; Assistant Research Professor, School of Forestry and Wildlife Sciences, Auburn University, AL;
Director, Southern Forest Nursery Management Cooperative and Professor, School of Forestry and Wildlife Sciences, Auburn University, AL; Nursery Manager, Arborgen, Bullard, TX.
Abstract
Sulfur and lime experiments at a sandy nursery in Texas detected no significant rate effect on height, root-collar diameter, or seedling mass of 1-0 loblolly pine (Pinus taeda L.) seedlings. Location of replica-tions, however, had a large effect (P < 0.001) on seed-ling growth, which was related to nutrient levels in the soil. Positive correlations occurred between seedling height and the level of four macronutrients and three micronutrients in the soil. In contrast, due to carbohy-drate dilution, negative correlations occurred between seedling mass and concentrations of nutrients (e.g., nitrogen and phosphorus) in needles. Height of seed-lings at time of lifting was negatively related to foliar levels of aluminum and five other nutrients. In this study, low levels of organic matter (0.5 to 0.8 percent) and low levels of cation exchange capacity (0.9 to 1.9 meq 100 g–1) were not correlated with seedling mor-phology. It appears that applied fertilizers and inherent levels of soil nutrients affect seedling growth more than soil pH (3.6 to 6.3) or small changes in organic matter.
Introduction
Bareroot loblolly pine (Pinus taeda L.) seedlings are produced in nurseries with soils that vary in texture (South and Davey 1983). Coarse-textured soils with high sand content have advantages when it comes to sowing seed and lifting seedlings (South et al. 2016). As a result, most loblolly pine nurseries established after 1990 were established on soils with more than 85 percent sand. These soils typically retain fewer nutrients than fine-textured soils typical of nurseries established before 1960. Because coarse-textured soils typically have low cation exchange capacity (CEC), they require more fertilizer to achieve target seedling growth. Even so, Wakeley (1935: p. 37) said, “Fairly
sandy soils frequently meet all forest nursery require-ments if they are underlain by less pervious soils. The cost of enriching such soils with various fertilizers is offset by greater ease of working, and most pine species develop better root systems in light than heavy soils.” Although we have gained knowledge about seedling fertilization during the past century, much remains to be learned about nutrition of pine seedlings on sandy soils.
Trials at a nursery in Texas revealed that applying sul-fur or dolomitic lime had no significant effect on shoot or root growth of fertilized loblolly pine seedlings (South et al. 2017). Soil properties, however, varied greatly due to location of plots in the seedbed result-ing in large seedling growth differences. We asked the question, if adding calcium, magnesium, or sulfur does not increase seedling mass, might differences in other nutrients account for observed differences in seedling size? The objectives of this investigation were to doc-ument the degree of soil nutrient variability in bareroot seedbeds and to compare seedling morphology with soil and foliar nutrition at time of lifting.
Materials and Methods
Two studies were established at the Richard O. Barham SuperTree Nursery (Bullard, TX). In March 2016, the soil was fumigated with a combination of chloropicrin and 1,3-dichloropropene. The trials were established on separate beds in the same field on a loamy sand soil (83:1:16 sand:silt:clay) with a CEC < 2.0 meq 100g–1. Stratified loblolly pine seed (half-sib family) were machine sown on April 16. The sulfur (S) trial was established on bed 7 and the lime trial was established on bed 3 (figure 1). On April 9, elemental S treatments (0, 813, 1,626 and 2,439 kg/ha) and pelletized dolomit-ic lime (90 percent passing 100 mesh sieve) treatments
6 Tree Planters’ Notes
The experiment was terminated after 10 months (February 7, 2017), at which point soil samples were collected (top 15 cm; one pooled sample per treat-ment plot). In addition, a sample of 15 seedlings was lifted from the center of each plot using shovels and transported to Auburn University, where they were placed in a cooler at 3 ºC. Seedling root-collar diameter (RCD) and height were measured and recorded. The seedlings were then dried for 72 hours at 70 °C, and dry weights of roots and shoots were recorded. The root weight ratio (RWR) was determined by dividing the root mass by the total seedling mass. Waypoint Analytical (Memphis, TN) analyzed foliar nutrients, and the Mehlich 3 ex-traction procedure was used to analyze soil samples. Organic matter (OM) was determined by loss on ignition. Temperature and precipitation data were recorded at the nursery.
For each trial, the original study design was a ran-domized complete block design with 4 treatments and 4 replications (i.e., 16 experimental units). Results of those trials are presented in South et al. (2017) and showed no effect of S or lime treat-ments on seedling morphology. Because differences among replications in both the S and lime trials were notable, however, further data examination was warranted. For this secondary investigation, the 2 trials were combined for a total of 8 replications, 4 dummy treatments, and 32 sampling units. The zero, low, medium, and high lime (or elemental S) rates were assigned dummy variables of A, B, C, and D, respectively. Plot means were analyzed using PROC GLM and PROC CORR of the Statistical Analysis System software package (SAS 1988). Replicates were treated as random effects, and correlations be-tween variables were declared significant at the alpha = 0.05 level. Statistics were not conducted for soil B, because all data were the same (i.e., 0.1 ppm).
Results and Discussion
Because the S and lime treatments had no effect on seedling morphology (South et al. 2017), the meaning-less dummy variables also had no effect on seedling morphology. In contrast, plot location (i.e., replication) impacted seedling growth. For example, seedlings from the control plot in L3 were 13 percent taller, 25 percent larger in RCD, 123 percent heavier in root mass, and
(0, 813, 1,626 and 3,252 kg/ha) were applied. Material was mechanically incorporated into the soil to a depth of 15 cm. For each study, the size of each treatment plot was 183 cm by 610 cm and each replication (four plots) covered 44.6 m2. Rainfall in April was above average and totaled 254 mm (South et al. 2017).
Herbicide applications began on June 7 when oxyfluo-rfen (122 g a.i./ha) was applied as a broadcast applica-tion. Similar amounts of oxyfluorfen were applied on June 15, 23, 30, July 8, 18, and August 8. Insecticide applications (esfenvalerate) began on June 14 and were applied periodically through October 2 to con-trol Lygus linenarious (Palisot de Beauvois). Fungicide (tridimefon at 140 g a.i./ha) was applied three times to control Cronartium quorum f. sp. fusiforme (Hedg. & Hunt ex Cumm.). Other fungicides were also applied to lower the incidence of foliar diseases. Seedlings were wrenched in mid-July, top-pruned on August 2 and September 18 (to a height of 27 cm), and undercut on October 28. Prior to sowing, calcium (Ca), potassium (K), magnesium (Mg), and S (448 kg/ha of gypsum and 280 kg/ha of sulfate of potash-magnesium) fertiliz-ers were applied and tilled into the soil. Small amounts of chelated micronutrients (< 90 g/ha/element: boron [B], copper [Cu], iron [Fe], manganese [Mn], molyb-denum [Mo], and zinc [Zn]) were applied in April. Top dressings of fertilizer were applied from June through September (a total of 179 kg/ha of nitrogen [N] and 58 kg/ha of K). In July, seedlings received a foliar appli-cation containing 1.17 kg/ha Ca, 0.23 kg/ha B and 0.46 kg/ha Zn. The average seedling density was estimated at about 215 seedlings/m2.
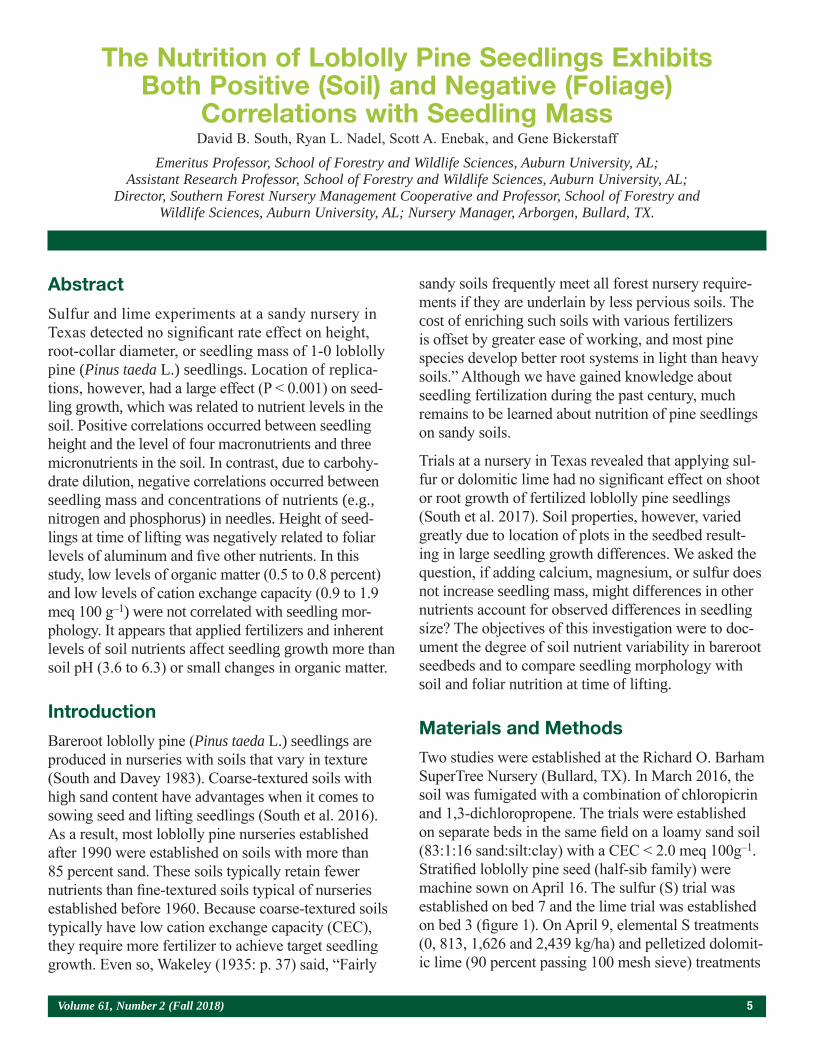
Figure 1. The dolomitic lime study was established on bed 3 (far left), and the sulfur study was established on bed 7 (foreground). The distance between flags within a bed is 6.1 m. (Photo by Gene Bickerstaff, July 2017)
Volume 61, Number 2 (Fall 2018) 7
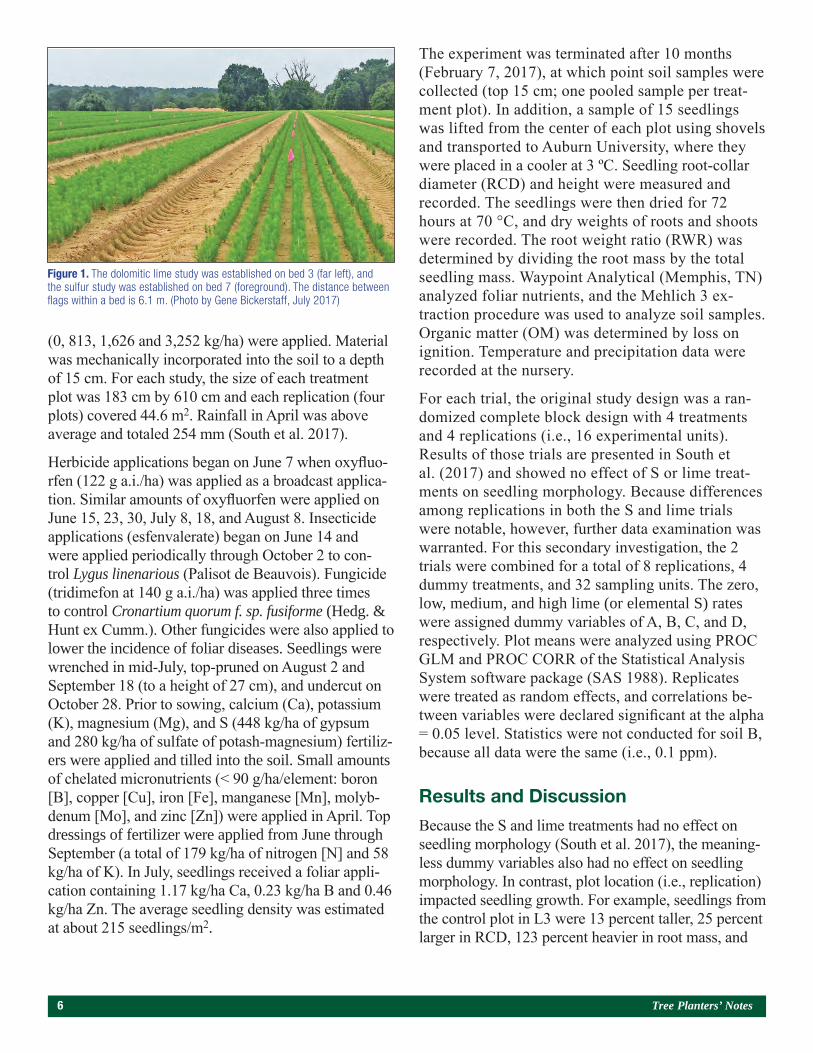
95 percent heavier in total mass than seedlings from the control plot in S1 (data not shown). As it turned out, replication L3 produced the greatest seedling mass and the highest levels of phosphorus (P), Cu, and Zn, while the smallest seedlings (replication S1) were growing in soil with low levels of K, Cu, and Zn (table 1). Several factors like soil moisture, soil compaction, and soil
oxygen content can affect seedling growth, but these factors were not measured. Soil pH, OM, and CEC were not correlated with shoot mass or root mass (table 2). Exploratory examinations indicate that inherent variations in soil fertility likely explain why seedling size varied among replications.
Rep RCD(mm)
HT(cm)
Root(g)
Shoot(g)
Total(g)
P(ppm)
K(ppm)
Cu(ppm)
Fe(ppm)
Zn(ppm)
Mn(ppm)
pH(water)
Na(ppm)
OM(%)
S1 6.9d 30d 1.8c 7.5c 9.4c 48bc 22c 0.20c 133c 0.45b 8cd 4.6c 7 0.60
S2 7.5bc 30d 2.2bc 9.6bc 11.8bc 46cd 24c 0.20c 116c 0.60ab 12abc 4.9bc 7 0.60
S3 7.9b 31d 2.2bc 9.2bc 10.0bc 50bc 27bc 0.35a 235a 0.72a 9bcd 4.4c 11 0.67
S4 7.7b 31cd 2.0c 8.0bc 11.4bc 50bc 28bc 0.22c 186b 0.57ab 6d 4.2c 9 0.65
L1 7.5bc 33b 2.5bc 8.1bc 10.6bc 47bc 32ab 0.25bc 126c 0.92ab 19a 5.5ab 7 0.62
L2 7.1cd 33bc 2.0c 7.6c 9.6c 42c 27bc 0.20c 110c 0.80b 14ab 5.5ab 7 0.57
L3 8.7a 36a 3.8a 13.5a 17.3a 59a 35a 0.35a 215ab 1.17a 13abc 5.7a 11 0.62
L4 8.5a 35a 2.8b 10.4b 13.2b 52b 36a 0.3ab 196b 1.07ab 15ab 5.7a 9 0.70
P > F 0.001 0.001 0.001 0.001 0.001 0.001 0.001 0.001 0.001 0.001 0.003 0.004 0.119 0.330
LSD 0.6 1.5 0.65 2.4 3.0 4.9 5.3 0.06 30.4 0.025 5.8 0.7 3.3 0.11
Table 1. Replication (Rep) means for seedling morphology, soil nutrients, soil pH, and soil organic matter (OM) (n = 4). The replication effect (P > F) was significant at α = 0.01 for all listed variables except OM and sodium (Na). The least significant difference (LSD) values are provided at the 0.05 level of probability. Means in a column with the same small letter are not statistically different at α = 0.05 according to Duncan’s Multiple Range test.
Cu = copper. Fe = iron. HT = height. K = potassium. L = lime trial. Mn = manganese. P = phosphorus. RCD = root-collar diameter. Root = root mass. S = sulfur trial. Shoot = shoot mass. Total = total seedling mass. Zn = zinc.
Soil factor Total Root Shoot Height RCD H/D RWR
Phosphorus 0.63 0.61 0.65 0.53 0.66 – 0.27 – 0.20
Zinc 0.52 0.49 0.56 0.84 0.55 0.21 – 0.27
Copper 0.50 0.50 0.47 0.50 0.63 – 0.27 – 0.04
Potassium 0.49 0.46 0.56 0.77 0.63 0.04 – 0.34
Iron 0.44 0.44 0.41 0.33 0.66 – 0.48 – 0.01
Sodium 0.34 0.35 0.28 0.21 0.43 0.33 0.08
Magnesium 0.26 0.23 0.33 0.73 0.27 0.44 – 0.30
Calcium 0.16 0.12 0.28 0.69 0.19 0.50 – 0.41
pH 0.23 0.21 0.30 0.63 0.15 0.49 – 0.25
Organic matter 0.20 0.19 0.22 0.24 0.45 – 0.30 – 0.12
Manganese 0.09 0.06 0.17 0.42 0.04 0.39 – 0.28
Cation exchange capacity – 0.05 – 0.05 – 0.02 0.06 0.15 – 0.13 – 0.08
Sulfur – 0.12 – 0.14 – 0.03 – 0.26 – 0.06 – 0.20 – 0.23
Table 2. Pearson correlation coefficients (r) among soil properties and loblolly pine seedling attributes for all plots (n = 32). Significant r values are show in bold; absolute values above 0.54 are statistically significant at α = 0.001, and absolute values above 0.34 are significant at α = 0.05. Rows are ordered according to correlations with total seedling mass (Total).
Root = root mass. Shoot = shoot mass. Height = shoot height. RCD = root-collar diameter. H/D = height/RCD. RWR = root mass/total seedling mass.
8 Tree Planters’ Notes
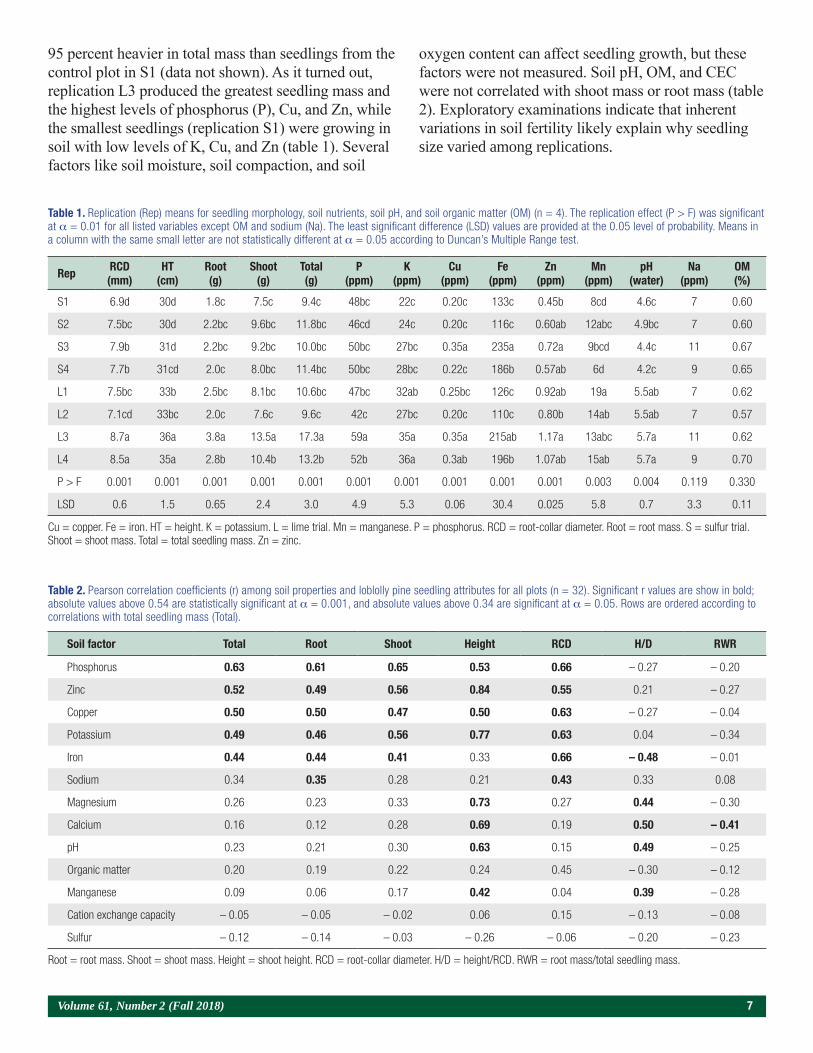
Replicate location affected various soil nutrients (P, K, Mn, Fe, Cu, Zn; table 1) and foliar nutrients (N, S, P, B, Mg, Cu; table 3). Not surprisingly, Ca (P = 0.001) and Mg (P = 0.003) were highest in lime-treated replications (152 ppm Ca; 26 ppm Mg; 12 ppm S), and sulfate (S) was highest in S-treated replications (77 ppm Ca; 14 ppm Mg; 19 ppm S).
All 32 soil samples contained 0.1 ppm B, and foliar B levels were all above 14 ppm. In contrast, much variability occurred in soil S levels (coefficient of variation [CV] = 93.5) and soil sodium (Na; CV = 25.8). As a result, replication location had no effect on B, S (P = 0.49), or Na (P = 0.12).
Rep Nitrogen(%)
Sulfur(%)
Phosphorus(%)
Boron(ppm)
Manganese(ppm)
Copper(ppm)
Aluminum(ppm)
Potassium(%)
S1 1.39a 0.13a 0.17a 18cd 950ab 12b 626a 0.75
S2 1.38a 0.11b 0.16ab 19cd 1058a 12b 599ab 0.76
S3 1.21bc 0.11b 0.14cd 22ab 784cd 11b 524bc 0.75
S4 1.38a 0.11b 0.15bc 23a 829bc 16a 573ab 0.82
L1 1.31ab 0.09c 0.14cd 18cd 772cd 11b 422de 0.71
L2 1.26bc 0.08c 0.13cd 17d 675d 10b 461cd 0.67
L3 1.08d 0.08c 0.14cd 18cd 705cd 9b 354e 0.73
L4 1.20c 0.09c 0.13d 18bc 706cd 10b 368de 0.74
P > F 0.001 0.001 0.001 0.001 0.001 0.031 0.001 0.275
LSD 0.09 1.8 1.6 2.3 126 3.4 91 0.11
Table 3. Replication (Rep) means for foliar levels of selected elements (n = 4). The replication effect (P > F) was significant at α = 0.001 for all listed variables except copper and potassium. The least significant difference (LSD) values are provided at α = 0.05. Means in a column with the same small letter are not statisti-cally different at α = 0.05 according to Duncan’s Multiple Range test.
L = lime trial. S = sulfur trial.
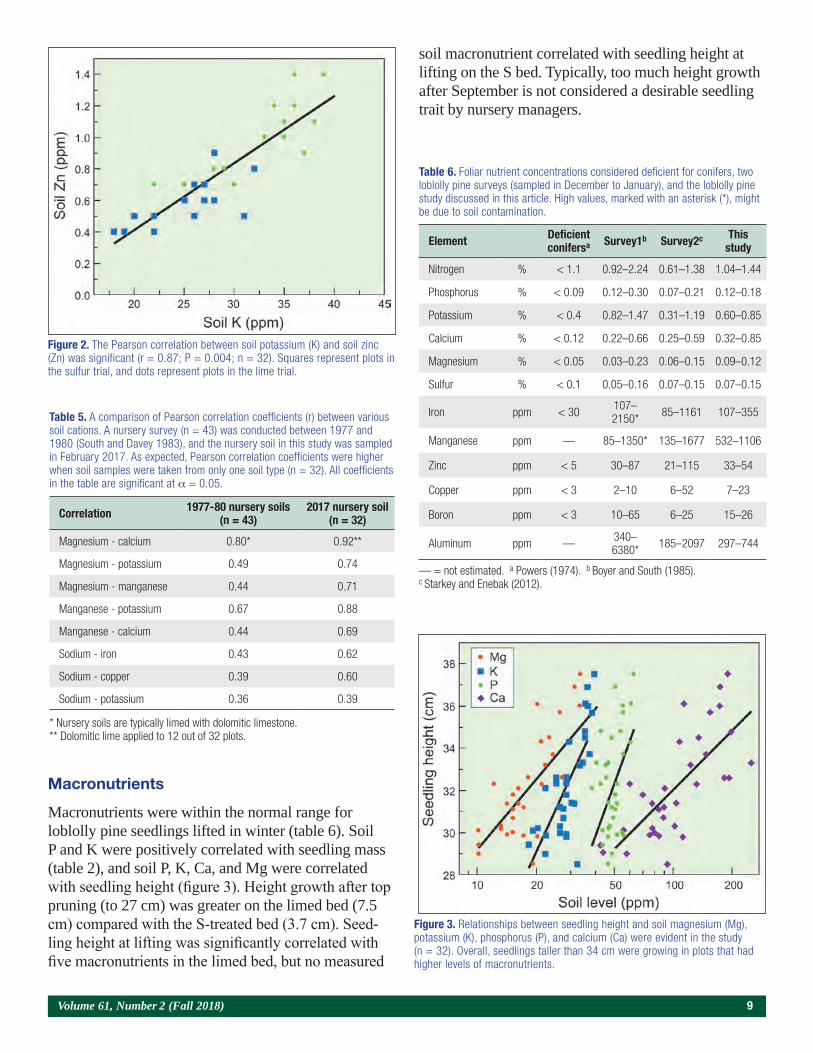
Because soil nutrients are often correlated with other nutrients (table 4), it was not possible to be certain which elements produced better growth at this nurs-ery. For example, the correlation between Zn and K was high (figure 2), and several cations were positive-ly correlated with Mg, Mn, and Na. Similar positive correlations were observed when comparing nutrients
from several nurseries that ranged in soil texture from 95 percent sand to a silt loam with only 15 percent sand (table 5). As a result, inherent difficulties exist when assumptions are based on correlations between pine growth and foliar or soil nutrients (MacCarthy and Davey 1976). A significant correlation does not prove that an underlying relationship exists.
Soil factor Soil phosphorus
Soil potassium
Soil copper
Soil iron
Soil zinc
Soil manganese
Foliar nitrogen
Potassium 0.55 — — — — 0.55 – 0.44
Copper 0.56 0.56 — — — 0.19 – 0.62
Iron 0.67 0.39 0.78 — — – 0.30 – 0.59
Zinc 0.43 0.87 0.64 0.34 — 0.55 – 0.59
Sodium 0.43 0.39 0.60 0.63 0.39 – 0.11 – 0.23
Organic matter 0.30 0.40 0.43 0.61 0.26 – 0.16 – 0.22
pH 0.14 0.65 0.26 – 0.12 0.76 0.73 – 0.37
Cation exchange capacity 0.13 0.03 0.20 0.39 – 0.06 – 0.29 – 0.02
Table 4. Pearson correlation coefficients (r) among soil properties and loblolly pine seedling attributes for all plots (n = 32). Significant r values are show in bold; absolute values above 0.54 are statistically significant at α = 0.001, and absolute values above 0.34 are significant at α = 0.05. Rows are ordered according to correlations with total seedling mass (Total).
Volume 61, Number 2 (Fall 2018) 9
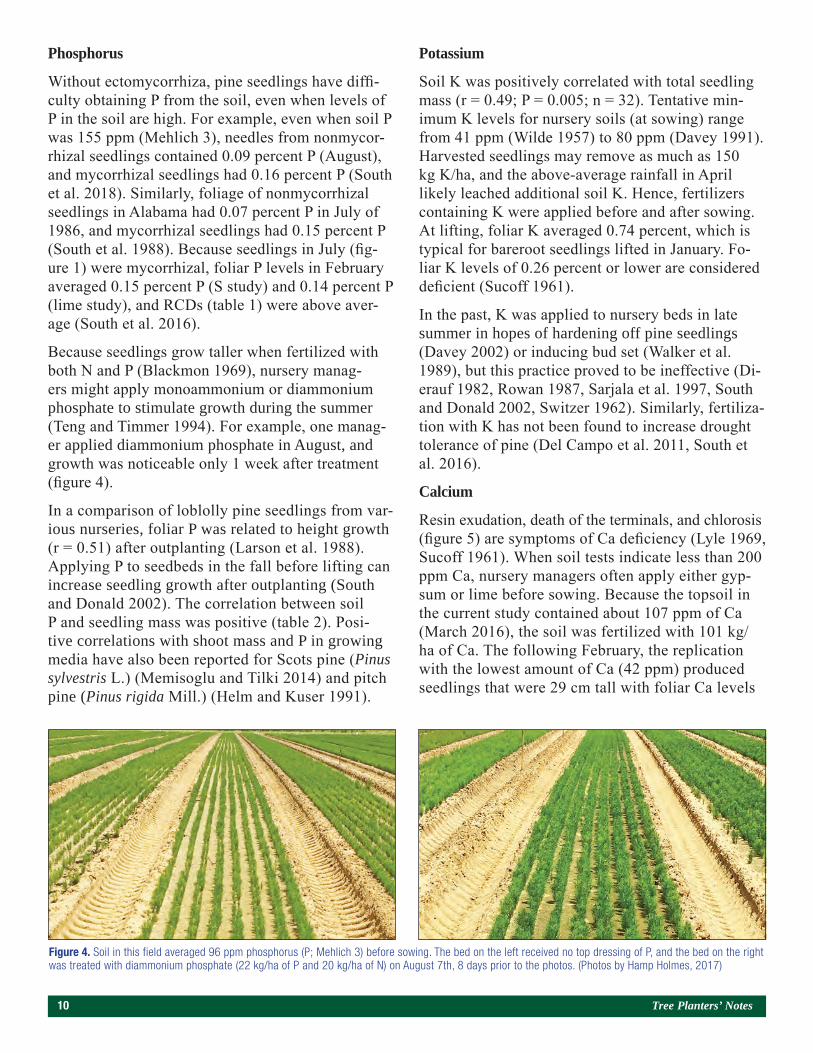
Macronutrients
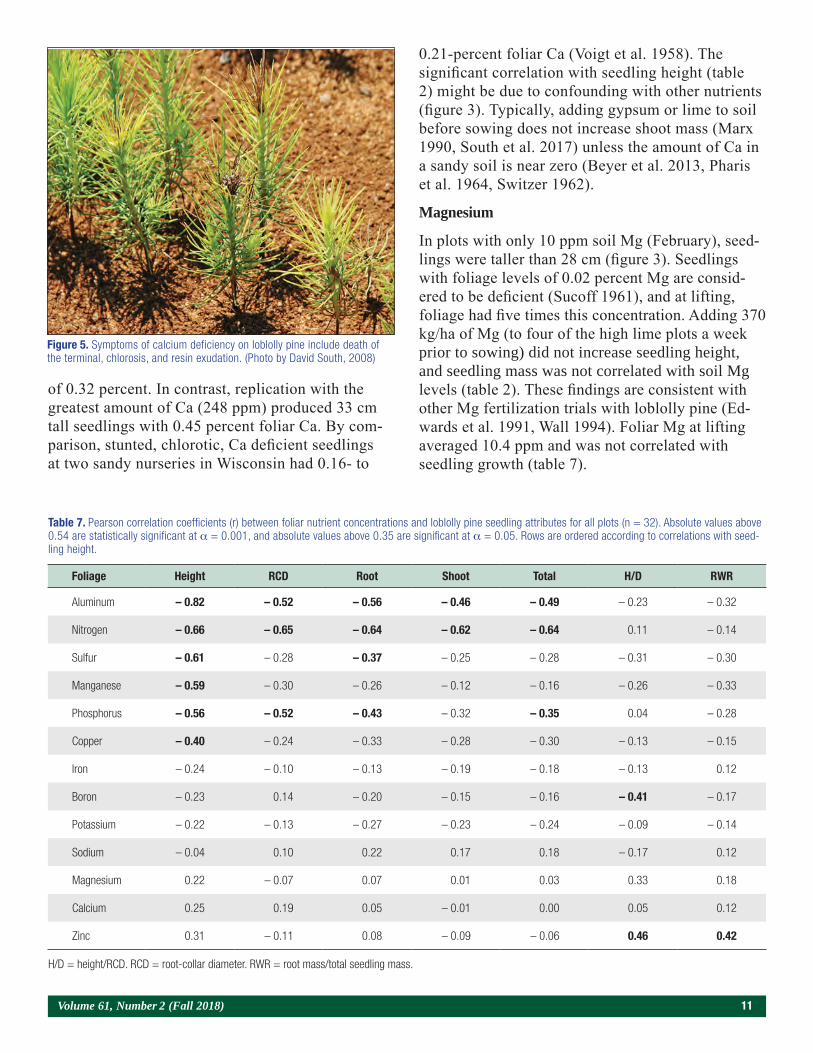
Macronutrients were within the normal range for loblolly pine seedlings lifted in winter (table 6). Soil P and K were positively correlated with seedling mass (table 2), and soil P, K, Ca, and Mg were correlated with seedling height (figure 3). Height growth after top pruning (to 27 cm) was greater on the limed bed (7.5 cm) compared with the S-treated bed (3.7 cm). Seed-ling height at lifting was significantly correlated with five macronutrients in the limed bed, but no measured
soil macronutrient correlated with seedling height at lifting on the S bed. Typically, too much height growth after September is not considered a desirable seedling trait by nursery managers.
Figure 2. The Pearson correlation between soil potassium (K) and soil zinc (Zn) was significant (r = 0.87; P = 0.004; n = 32). Squares represent plots in the sulfur trial, and dots represent plots in the lime trial.
Figure 3. Relationships between seedling height and soil magnesium (Mg), potassium (K), phosphorus (P), and calcium (Ca) were evident in the study (n = 32). Overall, seedlings taller than 34 cm were growing in plots that had higher levels of macronutrients.
Correlation 1977-80 nursery soils (n = 43)
2017 nursery soil (n = 32)
Magnesium - calcium 0.80* 0.92**
Magnesium - potassium 0.49 0.74
Magnesium - manganese 0.44 0.71
Manganese - potassium 0.67 0.88
Manganese - calcium 0.44 0.69
Sodium - iron 0.43 0.62
Sodium - copper 0.39 0.60
Sodium - potassium 0.36 0.39
Table 5. A comparison of Pearson correlation coefficients (r) between various soil cations. A nursery survey (n = 43) was conducted between 1977 and 1980 (South and Davey 1983), and the nursery soil in this study was sampled in February 2017. As expected, Pearson correlation coefficients were higher when soil samples were taken from only one soil type (n = 32). All coefficients in the table are significant at α = 0.05.
* Nursery soils are typically limed with dolomitic limestone.** Dolomitic lime applied to 12 out of 32 plots.
Element Deficient conifersa Survey1b Survey2c This
study
Nitrogen % < 1.1 0.92–2.24 0.61–1.38 1.04–1.44
Phosphorus % < 0.09 0.12–0.30 0.07–0.21 0.12–0.18
Potassium % < 0.4 0.82–1.47 0.31–1.19 0.60–0.85
Calcium % < 0.12 0.22–0.66 0.25–0.59 0.32–0.85
Magnesium % < 0.05 0.03–0.23 0.06–0.15 0.09–0.12
Sulfur % < 0.1 0.05–0.16 0.07–0.15 0.07–0.15
Iron ppm < 30 107–2150* 85–1161 107–355
Manganese ppm — 85–1350* 135–1677 532–1106
Zinc ppm < 5 30–87 21–115 33–54
Copper ppm < 3 2–10 6–52 7–23
Boron ppm < 3 10–65 6–25 15–26
Aluminum ppm — 340–6380* 185–2097 297–744
Table 6. Foliar nutrient concentrations considered deficient for conifers, two loblolly pine surveys (sampled in December to January), and the loblolly pine study discussed in this article. High values, marked with an asterisk (*), might be due to soil contamination.
— = not estimated. a Powers (1974). b Boyer and South (1985).c Starkey and Enebak (2012).
10 Tree Planters’ Notes
Phosphorus
Without ectomycorrhiza, pine seedlings have diffi-culty obtaining P from the soil, even when levels of P in the soil are high. For example, even when soil P was 155 ppm (Mehlich 3), needles from nonmycor-rhizal seedlings contained 0.09 percent P (August), and mycorrhizal seedlings had 0.16 percent P (South et al. 2018). Similarly, foliage of nonmycorrhizal seedlings in Alabama had 0.07 percent P in July of 1986, and mycorrhizal seedlings had 0.15 percent P (South et al. 1988). Because seedlings in July (fig-ure 1) were mycorrhizal, foliar P levels in February averaged 0.15 percent P (S study) and 0.14 percent P (lime study), and RCDs (table 1) were above aver-age (South et al. 2016).
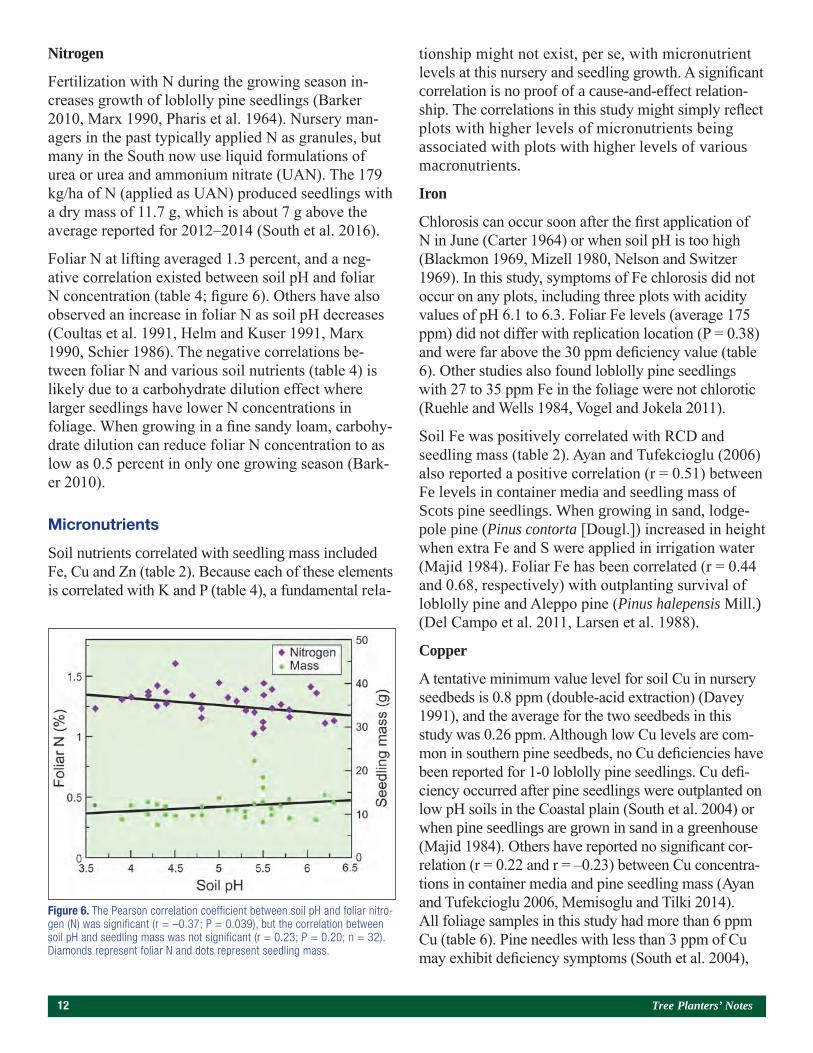
Because seedlings grow taller when fertilized with both N and P (Blackmon 1969), nursery manag-ers might apply monoammonium or diammonium phosphate to stimulate growth during the summer (Teng and Timmer 1994). For example, one manag-er applied diammonium phosphate in August, and growth was noticeable only 1 week after treatment (figure 4).
In a comparison of loblolly pine seedlings from var-ious nurseries, foliar P was related to height growth (r = 0.51) after outplanting (Larson et al. 1988). Applying P to seedbeds in the fall before lifting can increase seedling growth after outplanting (South and Donald 2002). The correlation between soil P and seedling mass was positive (table 2). Posi-tive correlations with shoot mass and P in growing media have also been reported for Scots pine (Pinus sylvestris L.) (Memisoglu and Tilki 2014) and pitch pine (Pinus rigida Mill.) (Helm and Kuser 1991).
Potassium
Soil K was positively correlated with total seedling mass (r = 0.49; P = 0.005; n = 32). Tentative min-imum K levels for nursery soils (at sowing) range from 41 ppm (Wilde 1957) to 80 ppm (Davey 1991). Harvested seedlings may remove as much as 150 kg K/ha, and the above-average rainfall in April likely leached additional soil K. Hence, fertilizers containing K were applied before and after sowing. At lifting, foliar K averaged 0.74 percent, which is typical for bareroot seedlings lifted in January. Fo-liar K levels of 0.26 percent or lower are considered deficient (Sucoff 1961).
In the past, K was applied to nursery beds in late summer in hopes of hardening off pine seedlings (Davey 2002) or inducing bud set (Walker et al. 1989), but this practice proved to be ineffective (Di-erauf 1982, Rowan 1987, Sarjala et al. 1997, South and Donald 2002, Switzer 1962). Similarly, fertiliza-tion with K has not been found to increase drought tolerance of pine (Del Campo et al. 2011, South et al. 2016).
Calcium
Resin exudation, death of the terminals, and chlorosis (figure 5) are symptoms of Ca deficiency (Lyle 1969, Sucoff 1961). When soil tests indicate less than 200 ppm Ca, nursery managers often apply either gyp-sum or lime before sowing. Because the topsoil in the current study contained about 107 ppm of Ca (March 2016), the soil was fertilized with 101 kg/ha of Ca. The following February, the replication with the lowest amount of Ca (42 ppm) produced seedlings that were 29 cm tall with foliar Ca levels
Figure 4. Soil in this field averaged 96 ppm phosphorus (P; Mehlich 3) before sowing. The bed on the left received no top dressing of P, and the bed on the right was treated with diammonium phosphate (22 kg/ha of P and 20 kg/ha of N) on August 7th, 8 days prior to the photos. (Photos by Hamp Holmes, 2017)
Volume 61, Number 2 (Fall 2018) 11
of 0.32 percent. In contrast, replication with the greatest amount of Ca (248 ppm) produced 33 cm tall seedlings with 0.45 percent foliar Ca. By com-parison, stunted, chlorotic, Ca deficient seedlings at two sandy nurseries in Wisconsin had 0.16- to
0.21-percent foliar Ca (Voigt et al. 1958). The significant correlation with seedling height (table 2) might be due to confounding with other nutrients (figure 3). Typically, adding gypsum or lime to soil before sowing does not increase shoot mass (Marx 1990, South et al. 2017) unless the amount of Ca in a sandy soil is near zero (Beyer et al. 2013, Pharis et al. 1964, Switzer 1962).
Magnesium
In plots with only 10 ppm soil Mg (February), seed-lings were taller than 28 cm (figure 3). Seedlings with foliage levels of 0.02 percent Mg are consid-ered to be deficient (Sucoff 1961), and at lifting, foliage had five times this concentration. Adding 370 kg/ha of Mg (to four of the high lime plots a week prior to sowing) did not increase seedling height, and seedling mass was not correlated with soil Mg levels (table 2). These findings are consistent with other Mg fertilization trials with loblolly pine (Ed-wards et al. 1991, Wall 1994). Foliar Mg at lifting averaged 10.4 ppm and was not correlated with seedling growth (table 7).
Figure 5. Symptoms of calcium deficiency on loblolly pine include death of the terminal, chlorosis, and resin exudation. (Photo by David South, 2008)
Foliage Height RCD Root Shoot Total H/D RWR
Aluminum – 0.82 – 0.52 – 0.56 – 0.46 – 0.49 – 0.23 – 0.32
Nitrogen – 0.66 – 0.65 – 0.64 – 0.62 – 0.64 0.11 – 0.14
Sulfur – 0.61 – 0.28 – 0.37 – 0.25 – 0.28 – 0.31 – 0.30
Manganese – 0.59 – 0.30 – 0.26 – 0.12 – 0.16 – 0.26 – 0.33
Phosphorus – 0.56 – 0.52 – 0.43 – 0.32 – 0.35 0.04 – 0.28
Copper – 0.40 – 0.24 – 0.33 – 0.28 – 0.30 – 0.13 – 0.15
Iron – 0.24 – 0.10 – 0.13 – 0.19 – 0.18 – 0.13 0.12
Boron – 0.23 0.14 – 0.20 – 0.15 – 0.16 – 0.41 – 0.17
Potassium – 0.22 – 0.13 – 0.27 – 0.23 – 0.24 – 0.09 – 0.14
Sodium – 0.04 0.10 0.22 0.17 0.18 – 0.17 0.12
Magnesium 0.22 – 0.07 0.07 0.01 0.03 0.33 0.18
Calcium 0.25 0.19 0.05 – 0.01 0.00 0.05 0.12
Zinc 0.31 – 0.11 0.08 – 0.09 – 0.06 0.46 0.42
Table 7. Pearson correlation coefficients (r) between foliar nutrient concentrations and loblolly pine seedling attributes for all plots (n = 32). Absolute values above 0.54 are statistically significant at α = 0.001, and absolute values above 0.35 are significant at α = 0.05. Rows are ordered according to correlations with seed-ling height.
H/D = height/RCD. RCD = root-collar diameter. RWR = root mass/total seedling mass.
12 Tree Planters’ Notes
Nitrogen
Fertilization with N during the growing season in-creases growth of loblolly pine seedlings (Barker 2010, Marx 1990, Pharis et al. 1964). Nursery man-agers in the past typically applied N as granules, but many in the South now use liquid formulations of urea or urea and ammonium nitrate (UAN). The 179 kg/ha of N (applied as UAN) produced seedlings with a dry mass of 11.7 g, which is about 7 g above the average reported for 2012–2014 (South et al. 2016).
Foliar N at lifting averaged 1.3 percent, and a neg-ative correlation existed between soil pH and foliar N concentration (table 4; figure 6). Others have also observed an increase in foliar N as soil pH decreases (Coultas et al. 1991, Helm and Kuser 1991, Marx 1990, Schier 1986). The negative correlations be-tween foliar N and various soil nutrients (table 4) is likely due to a carbohydrate dilution effect where larger seedlings have lower N concentrations in foliage. When growing in a fine sandy loam, carbohy-drate dilution can reduce foliar N concentration to as low as 0.5 percent in only one growing season (Bark-er 2010).
Micronutrients
Soil nutrients correlated with seedling mass included Fe, Cu and Zn (table 2). Because each of these elements is correlated with K and P (table 4), a fundamental rela-
tionship might not exist, per se, with micronutrient levels at this nursery and seedling growth. A significant correlation is no proof of a cause-and-effect relation-ship. The correlations in this study might simply reflect plots with higher levels of micronutrients being associated with plots with higher levels of various macronutrients.
Iron
Chlorosis can occur soon after the first application of N in June (Carter 1964) or when soil pH is too high (Blackmon 1969, Mizell 1980, Nelson and Switzer 1969). In this study, symptoms of Fe chlorosis did not occur on any plots, including three plots with acidity values of pH 6.1 to 6.3. Foliar Fe levels (average 175 ppm) did not differ with replication location (P = 0.38) and were far above the 30 ppm deficiency value (table 6). Other studies also found loblolly pine seedlings with 27 to 35 ppm Fe in the foliage were not chlorotic (Ruehle and Wells 1984, Vogel and Jokela 2011).
Soil Fe was positively correlated with RCD and seedling mass (table 2). Ayan and Tufekcioglu (2006) also reported a positive correlation (r = 0.51) between Fe levels in container media and seedling mass of Scots pine seedlings. When growing in sand, lodge-pole pine (Pinus contorta [Dougl.]) increased in height when extra Fe and S were applied in irrigation water (Majid 1984). Foliar Fe has been correlated (r = 0.44 and 0.68, respectively) with outplanting survival of loblolly pine and Aleppo pine (Pinus halepensis Mill.) (Del Campo et al. 2011, Larsen et al. 1988).
Copper
A tentative minimum value level for soil Cu in nursery seedbeds is 0.8 ppm (double-acid extraction) (Davey 1991), and the average for the two seedbeds in this study was 0.26 ppm. Although low Cu levels are com-mon in southern pine seedbeds, no Cu deficiencies have been reported for 1-0 loblolly pine seedlings. Cu defi-ciency occurred after pine seedlings were outplanted on low pH soils in the Coastal plain (South et al. 2004) or when pine seedlings are grown in sand in a greenhouse (Majid 1984). Others have reported no significant cor-relation (r = 0.22 and r = –0.23) between Cu concentra-tions in container media and pine seedling mass (Ayan and Tufekcioglu 2006, Memisoglu and Tilki 2014). All foliage samples in this study had more than 6 ppm Cu (table 6). Pine needles with less than 3 ppm of Cu may exhibit deficiency symptoms (South et al. 2004),
Figure 6. The Pearson correlation coefficient between soil pH and foliar nitro-gen (N) was significant (r = –0.37; P = 0.039), but the correlation between soil pH and seedling mass was not significant (r = 0.23; P = 0.20; n = 32). Diamonds represent foliar N and dots represent seedling mass.
Volume 61, Number 2 (Fall 2018) 13
and those with 4.4 ppm Cu might not show deficiency symptoms (Helm and Kuser 1991).
Zinc
A tentative minimum level for Zn in nursery soils may be 1 ppm (Davey 1991), and an average value for the nursery in this study is 1.8 ppm. The area selected for the S study, however, had low Zn (0.7 ppm) but still produced seedlings with more than 11 g of mass (table 1). In another study, omitting zinc chloride from nu-trients resulted in larger Scots pine seedlings (Goslin 1959). Although sandy, easily leached soils with very high P levels are likely candidates for Zn deficiency, no Zn deficiencies have been reported for loblolly pine seedbeds. All seedlings in this study received a foliar application of Zn in July, and all foliar Zn levels were within surveyed ranges (table 6) and averaged 42 ppm.
Boron
Boron deficiencies are rare in loblolly pine seedbeds, perhaps because B is usually applied before sowing,
and soil acidity is typically maintained below pH 6. A tentative minimum level for B in nursery soils is 0.3 ppm (Davey 1991). Prior to sowing, the soil in this study had 0.2 ppm B, and a year later (February 2017), the soil was at 0.1 ppm with no deficiency symptoms present on seedlings. The application of 0.16 kg/ha of elemental B (applied in July) helped to maintain foliar B levels above 14 ppm (table 3).
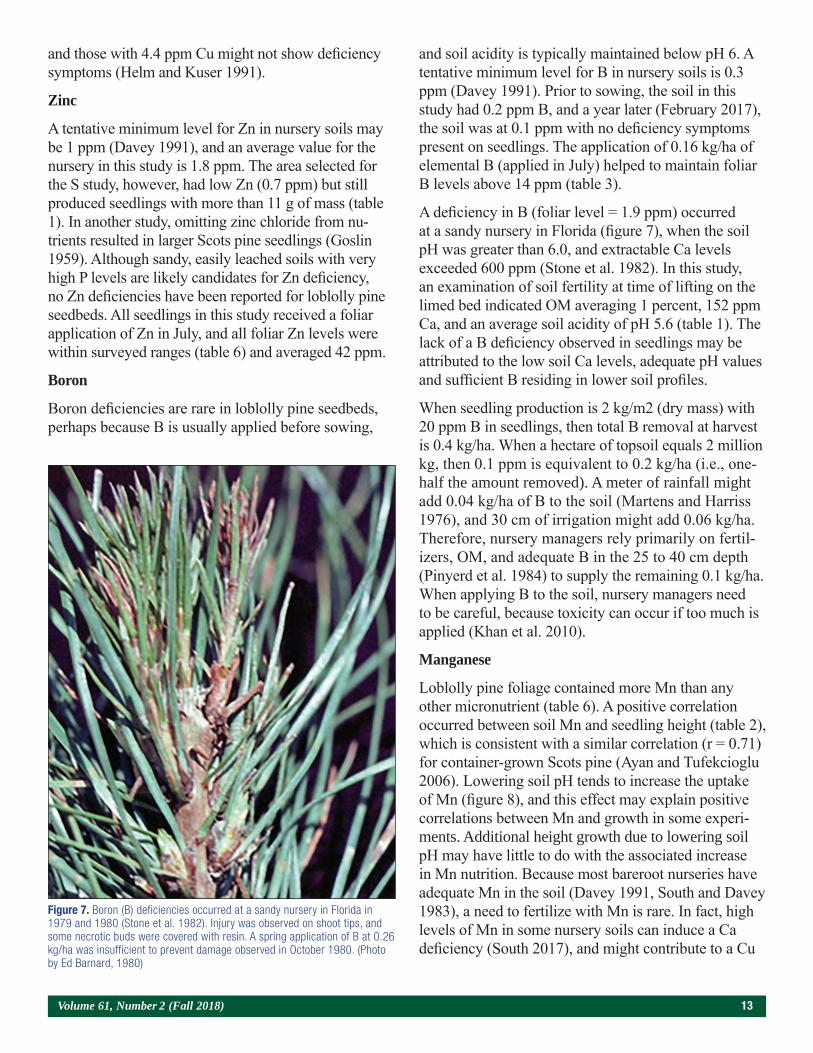
A deficiency in B (foliar level = 1.9 ppm) occurred at a sandy nursery in Florida (figure 7), when the soil pH was greater than 6.0, and extractable Ca levels exceeded 600 ppm (Stone et al. 1982). In this study, an examination of soil fertility at time of lifting on the limed bed indicated OM averaging 1 percent, 152 ppm Ca, and an average soil acidity of pH 5.6 (table 1). The lack of a B deficiency observed in seedlings may be attributed to the low soil Ca levels, adequate pH values and sufficient B residing in lower soil profiles.
When seedling production is 2 kg/m2 (dry mass) with 20 ppm B in seedlings, then total B removal at harvest is 0.4 kg/ha. When a hectare of topsoil equals 2 million kg, then 0.1 ppm is equivalent to 0.2 kg/ha (i.e., one-half the amount removed). A meter of rainfall might add 0.04 kg/ha of B to the soil (Martens and Harriss 1976), and 30 cm of irrigation might add 0.06 kg/ha. Therefore, nursery managers rely primarily on fertil-izers, OM, and adequate B in the 25 to 40 cm depth (Pinyerd et al. 1984) to supply the remaining 0.1 kg/ha. When applying B to the soil, nursery managers need to be careful, because toxicity can occur if too much is applied (Khan et al. 2010).
Manganese
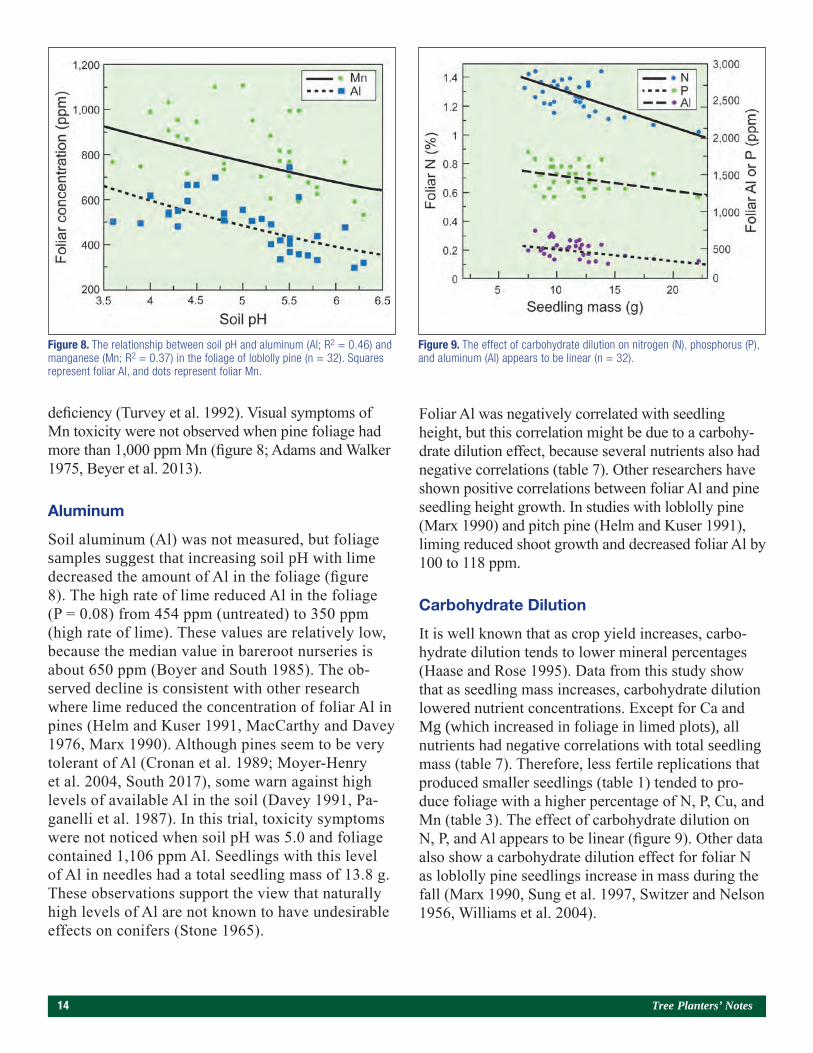
Loblolly pine foliage contained more Mn than any other micronutrient (table 6). A positive correlation occurred between soil Mn and seedling height (table 2), which is consistent with a similar correlation (r = 0.71) for container-grown Scots pine (Ayan and Tufekcioglu 2006). Lowering soil pH tends to increase the uptake of Mn (figure 8), and this effect may explain positive correlations between Mn and growth in some experi-ments. Additional height growth due to lowering soil pH may have little to do with the associated increase in Mn nutrition. Because most bareroot nurseries have adequate Mn in the soil (Davey 1991, South and Davey 1983), a need to fertilize with Mn is rare. In fact, high levels of Mn in some nursery soils can induce a Ca deficiency (South 2017), and might contribute to a Cu
Figure 7. Boron (B) deficiencies occurred at a sandy nursery in Florida in 1979 and 1980 (Stone et al. 1982). Injury was observed on shoot tips, and some necrotic buds were covered with resin. A spring application of B at 0.26 kg/ha was insufficient to prevent damage observed in October 1980. (Photo by Ed Barnard, 1980)
14 Tree Planters’ Notes
deficiency (Turvey et al. 1992). Visual symptoms of Mn toxicity were not observed when pine foliage had more than 1,000 ppm Mn (figure 8; Adams and Walker 1975, Beyer et al. 2013).
Aluminum
Soil aluminum (Al) was not measured, but foliage samples suggest that increasing soil pH with lime decreased the amount of Al in the foliage (figure 8). The high rate of lime reduced Al in the foliage (P = 0.08) from 454 ppm (untreated) to 350 ppm (high rate of lime). These values are relatively low, because the median value in bareroot nurseries is about 650 ppm (Boyer and South 1985). The ob-served decline is consistent with other research where lime reduced the concentration of foliar Al in pines (Helm and Kuser 1991, MacCarthy and Davey 1976, Marx 1990). Although pines seem to be very tolerant of Al (Cronan et al. 1989; Moyer-Henry et al. 2004, South 2017), some warn against high levels of available Al in the soil (Davey 1991, Pa-ganelli et al. 1987). In this trial, toxicity symptoms were not noticed when soil pH was 5.0 and foliage contained 1,106 ppm Al. Seedlings with this level of Al in needles had a total seedling mass of 13.8 g. These observations support the view that naturally high levels of Al are not known to have undesirable effects on conifers (Stone 1965).
Foliar Al was negatively correlated with seedling height, but this correlation might be due to a carbohy-drate dilution effect, because several nutrients also had negative correlations (table 7). Other researchers have shown positive correlations between foliar Al and pine seedling height growth. In studies with loblolly pine (Marx 1990) and pitch pine (Helm and Kuser 1991), liming reduced shoot growth and decreased foliar Al by 100 to 118 ppm.
Carbohydrate Dilution
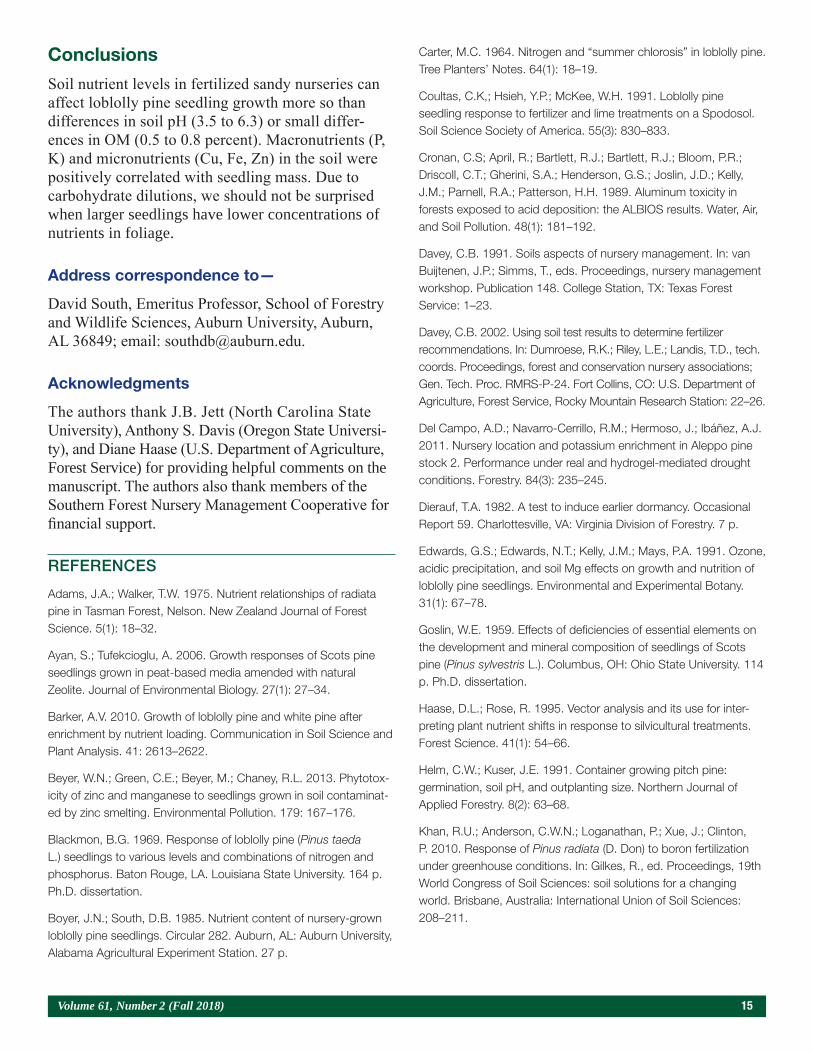
It is well known that as crop yield increases, carbo-hydrate dilution tends to lower mineral percentages (Haase and Rose 1995). Data from this study show that as seedling mass increases, carbohydrate dilution lowered nutrient concentrations. Except for Ca and Mg (which increased in foliage in limed plots), all nutrients had negative correlations with total seedling mass (table 7). Therefore, less fertile replications that produced smaller seedlings (table 1) tended to pro-duce foliage with a higher percentage of N, P, Cu, and Mn (table 3). The effect of carbohydrate dilution on N, P, and Al appears to be linear (figure 9). Other data also show a carbohydrate dilution effect for foliar N as loblolly pine seedlings increase in mass during the fall (Marx 1990, Sung et al. 1997, Switzer and Nelson 1956, Williams et al. 2004).
Figure 8. The relationship between soil pH and aluminum (Al; R2 = 0.46) and manganese (Mn; R2 = 0.37) in the foliage of loblolly pine (n = 32). Squares represent foliar Al, and dots represent foliar Mn.
Figure 9. The effect of carbohydrate dilution on nitrogen (N), phosphorus (P), and aluminum (Al) appears to be linear (n = 32).
Volume 61, Number 2 (Fall 2018) 15
Conclusions
Soil nutrient levels in fertilized sandy nurseries can affect loblolly pine seedling growth more so than differences in soil pH (3.5 to 6.3) or small differ-ences in OM (0.5 to 0.8 percent). Macronutrients (P, K) and micronutrients (Cu, Fe, Zn) in the soil were positively correlated with seedling mass. Due to carbohydrate dilutions, we should not be surprised when larger seedlings have lower concentrations of nutrients in foliage.
Address correspondence to—
David South, Emeritus Professor, School of Forestry and Wildlife Sciences, Auburn University, Auburn, AL 36849; email: [email protected].
Acknowledgments
The authors thank J.B. Jett (North Carolina State University), Anthony S. Davis (Oregon State Universi-ty), and Diane Haase (U.S. Department of Agriculture, Forest Service) for providing helpful comments on the manuscript. The authors also thank members of the Southern Forest Nursery Management Cooperative for financial support.
REFERENCES
Adams, J.A.; Walker, T.W. 1975. Nutrient relationships of radiata pine in Tasman Forest, Nelson. New Zealand Journal of Forest Science. 5(1): 18–32.
Ayan, S.; Tufekcioglu, A. 2006. Growth responses of Scots pine seedlings grown in peat-based media amended with natural Zeolite. Journal of Environmental Biology. 27(1): 27–34.
Barker, A.V. 2010. Growth of loblolly pine and white pine after enrichment by nutrient loading. Communication in Soil Science and Plant Analysis. 41: 2613–2622.
Beyer, W.N.; Green, C.E.; Beyer, M.; Chaney, R.L. 2013. Phytotox-icity of zinc and manganese to seedlings grown in soil contaminat-ed by zinc smelting. Environmental Pollution. 179: 167–176.
Blackmon, B.G. 1969. Response of loblolly pine (Pinus taeda L.) seedlings to various levels and combinations of nitrogen and phosphorus. Baton Rouge, LA. Louisiana State University. 164 p. Ph.D. dissertation.
Boyer, J.N.; South, D.B. 1985. Nutrient content of nursery-grown loblolly pine seedlings. Circular 282. Auburn, AL: Auburn University, Alabama Agricultural Experiment Station. 27 p.
Carter, M.C. 1964. Nitrogen and “summer chlorosis” in loblolly pine. Tree Planters’ Notes. 64(1): 18–19.
Coultas, C.K,; Hsieh, Y.P.; McKee, W.H. 1991. Loblolly pine seedling response to fertilizer and lime treatments on a Spodosol. Soil Science Society of America. 55(3): 830–833.
Cronan, C.S; April, R.; Bartlett, R.J.; Bartlett, R.J.; Bloom, P.R.; Driscoll, C.T.; Gherini, S.A.; Henderson, G.S.; Joslin, J.D.; Kelly, J.M.; Parnell, R.A.; Patterson, H.H. 1989. Aluminum toxicity in forests exposed to acid deposition: the ALBIOS results. Water, Air, and Soil Pollution. 48(1): 181–192.
Davey, C.B. 1991. Soils aspects of nursery management. In: van Buijtenen, J.P.; Simms, T., eds. Proceedings, nursery management workshop. Publication 148. College Station, TX: Texas Forest Service: 1–23.
Davey, C.B. 2002. Using soil test results to determine fertilizer recommendations. In: Dumroese, R.K.; Riley, L.E.; Landis, T.D., tech. coords. Proceedings, forest and conservation nursery associations; Gen. Tech. Proc. RMRS-P-24. Fort Collins, CO: U.S. Department of Agriculture, Forest Service, Rocky Mountain Research Station: 22–26.
Del Campo, A.D.; Navarro-Cerrillo, R.M.; Hermoso, J.; Ibáñez, A.J. 2011. Nursery location and potassium enrichment in Aleppo pine stock 2. Performance under real and hydrogel-mediated drought conditions. Forestry. 84(3): 235–245.
Dierauf, T.A. 1982. A test to induce earlier dormancy. Occasional Report 59. Charlottesville, VA: Virginia Division of Forestry. 7 p.
Edwards, G.S.; Edwards, N.T.; Kelly, J.M.; Mays, P.A. 1991. Ozone, acidic precipitation, and soil Mg effects on growth and nutrition of loblolly pine seedlings. Environmental and Experimental Botany. 31(1): 67–78.
Goslin, W.E. 1959. Effects of deficiencies of essential elements on the development and mineral composition of seedlings of Scots pine (Pinus sylvestris L.). Columbus, OH: Ohio State University. 114 p. Ph.D. dissertation.
Haase, D.L.; Rose, R. 1995. Vector analysis and its use for inter-preting plant nutrient shifts in response to silvicultural treatments. Forest Science. 41(1): 54–66.
Helm, C.W.; Kuser, J.E. 1991. Container growing pitch pine: germination, soil pH, and outplanting size. Northern Journal of Applied Forestry. 8(2): 63–68.
Khan, R.U.; Anderson, C.W.N.; Loganathan, P.; Xue, J.; Clinton, P. 2010. Response of Pinus radiata (D. Don) to boron fertilization under greenhouse conditions. In: Gilkes, R., ed. Proceedings, 19th World Congress of Soil Sciences: soil solutions for a changing world. Brisbane, Australia: International Union of Soil Sciences: 208–211.

16 Tree Planters’ Notes
Larsen, H.S.; South, D.B.; Boyer, J.N. 1988. Foliar nitrogen content at lifting correlates with early growth of loblolly pine seedlings from 20 nurseries. Southern Journal of Applied Forestry. 12(3): 181–185.
Lyle, E.S. 1969. Mineral deficiency symptoms in loblolly pine seedlings. Agronomy Journal. 61(3): 395–398.
MacCarthy, R.; Davey, C.B. 1976. Nutritional problems of Pinus taeda L. (loblolly pine) growing on Pocosin soil. Soil Science Society America. 40(4): 582–585.
Majid, N.M. 1984. Some aspects of boron, copper and iron nutrition of lodgepole pine and Douglas-fir. Vancouver, Canada: University of British Columbia. 149 p. Ph.D. dissertation.
Martens, C.S.; Harriss, R.C. 1976. Boron in coastal North Florida rainfall. Journal of Geophysical Research. 81(36): 6371–6375.
Marx, D.H. 1990. Soil pH and nitrogen influence Pisolithus ectomy-corrhizal development and growth of loblolly pine seedlings. Forest Science. 36(2): 224–245.
Memisoglu, T.; Tilki, F. 2014. Growth of Scots pine and silver birch seedlings on different nursery container media. Notulae Botanicae Horti Agrobotanici. 42(2): 565–572.
Mizell, L. 1980. Maintaining optimum soil pH in sandy forest tree nurseries. In: Abrahamson, L.P.; Bickelhaupt, D.H., eds. Proceed-ings, North American forest tree nursery soils workshop. Syracuse, NY: State University of New York: 285–298.
Moyer-Henry, K.; Silva, I.; MacFall, J.; Johannes, E.; Allen, N.; Goldfarb, B.; Rufty, T. 2004. Accumulation and localization of aluminum in root tips of loblolly pine seedlings and the associated ectomycorrhiza Pisolithus tinctorius. Plant, Cell & Environment. 28(2): 113–120.
Nelson, L.E.; Switzer, G.L. 1969. Chlorosis of loblolly pine seedlings. In: Jones, L. ed. Proceedings, southeastern area forest nurserymen conferences—1968. Atlanta, GA: U.S. Department of Agriculture, Forest Service, State and Private Forestry: 116–118.
Paganelli, D.J.; Seiler, J.R.; Feret, P.P. 1987. Root regeneration as an indicator of aluminum toxicity in loblolly pine. Plant and Soil. 102(1): 115–118.
Pharis, R.P.; Barnes, R.L.; Naylor, A.W. 1964. Effects of nitrogen level, calcium level and nitrogen source upon the growth and composition of Pinus taeda L. Physiologia Plantarium. 17(3): 560–572.
Pinyerd, C.A.; Odom, J.W.; Long, F.L.; Dane, J.H. 1984. Boron movement in a Norfolk loamy sand. Soil Science. 137(6): 428–433.
Powers, R.F. 1974. Evaluating fertilizer programs using soil analysis, foliar analysis, and bioassay methods. In: Proceedings, Service Wide Silviculture Work Conference. Washington, DC: U.S. Department of Agriculture, Forest Service, Division of Timber Management: 124–162.
Rowan, S.J. 1987. Effects of potassium fertilization in the nursery on survival and growth of pine seedlings in the plantation. Dry Branch, GA: Georgia Forestry Research Paper. 68 p.
Ruehle, J.L.; Wells, C.G. 1984. Development of Pisolithus tinctorius ectomycorrhizae on container-grown pine seedlings as affected by fertility. Forest Science. 30(4): 1010–1015.
Sarjala, T.; Taulavuori, K.; Savonen, E.-M.; Edfast, A.-B. 1997. Does availability of potassium affect cold hardening of Scots pine through polyamine metabolism? Physiologia Plantarum. 99(1): 56–62.
Schier, G.A. 1986. Seedling growth and nutrient relationships in a New Jersey Pine Barrens soil treated with “acid rain.” Canadian Journal of Forest Research. 16(1): 136–142.
South, D.B. 2017. Optimum pH for growing pine seedlings. Tree Planters Notes. 60(2): 47–60.
South, D.B.; Carey, W.A.; Johnson, D.A. 2004. Copper deficiency in pine plantations in the Georgia Coastal Plain. In: Connor, K.F., ed. Proceedings, 12th biennial southern silvicultural research confer-ence. Gen. Tech. Pap. SRS-71. Asheville, NC: U.S. Department of Agriculture, Forest Service, Southern Research Station: 387–390.
South, D.B.; Davey, C.B. 1983. The southern forest nursery soil testing program. Circular 265. Auburn, AL: Auburn University, Alabama Agricultural Experiment Station. 38 p.
South, D.B.; Donald, D.G.M. 2002. Effect of nursery conditioning treatments and fall fertilization on survival and early growth of Pinus taeda seedlings in Alabama, U.S.A. Canadian Journal of Forest Research. 32(7): 1171–1179.
South, D.B.; Funk, J.; Davis, C.M. 2018. Spring fumigation using totally impermeable film may cause ectomycorrhizal deficiencies at sandy loblolly pine nurseries. Tree Planters’ Notes. 61(1): 45–56.
South, D.B.; Mitchell, R.J.; Dixon R.K. 1988. New-ground syn-drome: an ectomycorrhizal deficiency in pine nurseries. Southern Journal of Applied Forestry. 12(4): 234–239.
South, D.B.; Nadel, R.L.; Enebak, S.A.; Bickerstaff, G. 2017. Effect of sulfur and lime on soil pH and nutrients in a sandy Pinus taeda nursery. Reforesta. 4: 12–20.
South, D.B.; Starkey, T.E.; Enebak, S.A. 2016. Forest nursery practices in the Southern United States. Reforesta. 1(1): 106–146.
Starkey, T.; Enebak, S. 2012. Foliar nutrient survey of loblolly and longleaf pine seedlings. Research Report 12-02. Auburn, AL: Auburn University, Southern Forest Nursery Management Cooper-ative. 11 p.
Stone, E.L. 1965. Nursery soil fertility. In: Leaf, A.L. Proceedings, nursery soil improvement sessions. Syracuse, NY: State University of New York, College of Forestry: 16–27.

Volume 61, Number 2 (Fall 2018) 17
Stone, E.L.; Hollis, C.A.; Barnard, E.L. 1982. Boron deficiency in a southern pine nursery. Southern Journal of Applied Forestry. 6(2): 108–112.
Sucoff, E.I. 1961. Potassium, magnesium and calcium deficiency of loblolly and Virginia pine seedlings. Station Paper 164. Upper Darby, PA: U.S. Department of Agriculture, Forest Service, North-eastern Forest Experiment Station. 18 p.
Sung, S.S.; Black, C.C.; Kormanik, T.L.; Zarnoch, S.J.; Kormanik, P.P.; Counce, P.A. 1997. Fall nitrogen fertilization and the biology of Pinus taeda seedling development. Canadian Journal of Forest Research. 27(9): 1406–1412.
Switzer, G.L. 1962. Some effects of nursery soil fertility on loblolly pine (Pinus taeda L.) planting stock. Syracuse, NY. Syracuse University. 181 p. Ph.D. dissertation.
Switzer, G.L.; Nelson, L.E. 1956. The effect of fertilization on seedling weight and utilization of N, P, and K by loblolly pine (Pinus taeda L.) grown in the nursery. Soil Science Society America. 20(3): 404–408.
Teng, Y.; Timmer, V.R. 1994. Nitrogen and phosphorus interactions in an intensively managed nursery soil-plant system. Soil Science Society of America. 58(1): 232–238.
Turvey, N.D.; Carlyle, C.; Downes, G.M. 1992. Effects of micronu-trients on the growth form of two families of Pinus radiata (D. Don) seedlings. Plant and Soil. 139(1): 59–65.
Vogel, J.G.; Jokela, E.J. 2011. Micronutrient limitations in two managed southern pine stands planted on Florida Spodosols. Soil Science Society of America. 75(3): 1117–1124.
Voigt, G.K.; Stoeckeler, J.H.; Wilde, S.A. 1958. Response of coniferous seedlings to soil applications of calcium and magnesium fertilizers. Soil Science Society of America. 22(4): 343–345.
Wakeley, P.C. 1935. Artificial reforestation in the southern pine region. Technical Bulletin 492. Washington, DC: U.S. Department of Agriculture: 115 p.
Walker, R.F.; West, D.C.; McLaughlin, S.B.; Amundsen, C.C. 1989. Growth, xylem pressure potential, and nutrient absorption of loblolly pine on a reclaimed surface mine as affected by an induced Pisolithus tinctorius infection. Forest Science. 35(2): 569–581.
Wall, M.M. 1994. Influence of fertilization on nutrient status of bare-root Pinus taeda L. seedlings. College Station, TX: Texas A&M University. 98 p. M.S. thesis.
Wilde, S.A. 1957. Forest Soils. New York, NY: Ronald Press. 537 p.
Williams, H.; Woodard, K.; Stewart, T. 2004. The response of bare-root loblolly pine seedlings to the amount and timing of nitrogen fertilization in the nursery. In: Connor, K.F., ed. Proceedings, 12th biennial southern silvicultural research conference. Gen. Tech. Rep. SRS-71. Asheville, NC: U.S. Department of Agriculture, Forest Service, Southern Research Station: 425–428.
18 Tree Planters’ Notes
Abstract
Forest nursery production for the 2017 planting season was nearly 1.3 billion forest tree seedlings with nearly 2.5 million ac (1 million ha) of trees planted. Similar to previous years, most production and planting occurred in the Southern States, and approximately 75 percent of outplanted trees are bareroot stock.
Background
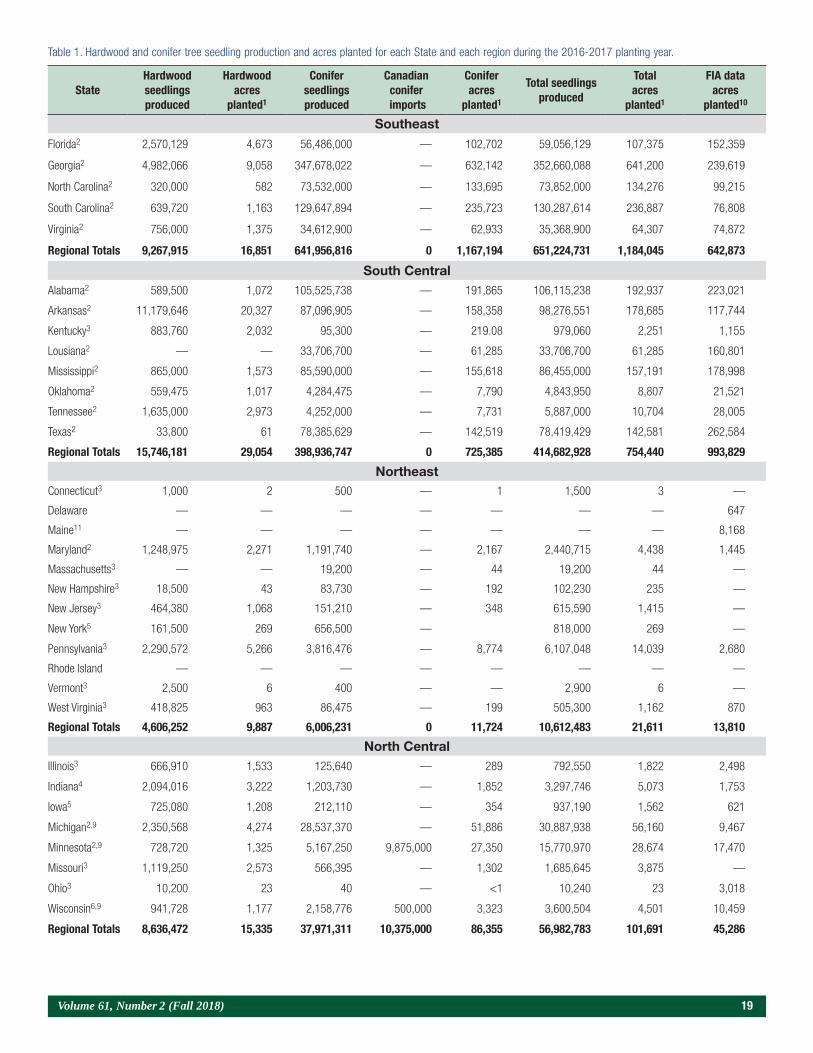
This annual report summarizes forest nursery seed-ling production in the United States. The number of seedlings reported is used to estimate the number of acres of forest planting per year. Prepared by the USDA Forest Service, Forest Inventory and Analysis (FIA) and State and Private Forestry, this report includes State-by-State breakdowns, regional totals, and an analysis of data trends. Universities in the Southern, Northeastern, and Western regions of the United States made an effort to collect data from all the major producers of forest and conservation seedlings in the 50 States. Forest and conservation nursery managers provided the information present-ed in this report. As far as we know, it is the most complete compilation of such data in the country. Because all data are provided voluntarily by outside sources and some data are estimated, caution must be used in drawing inferences.
Methodology
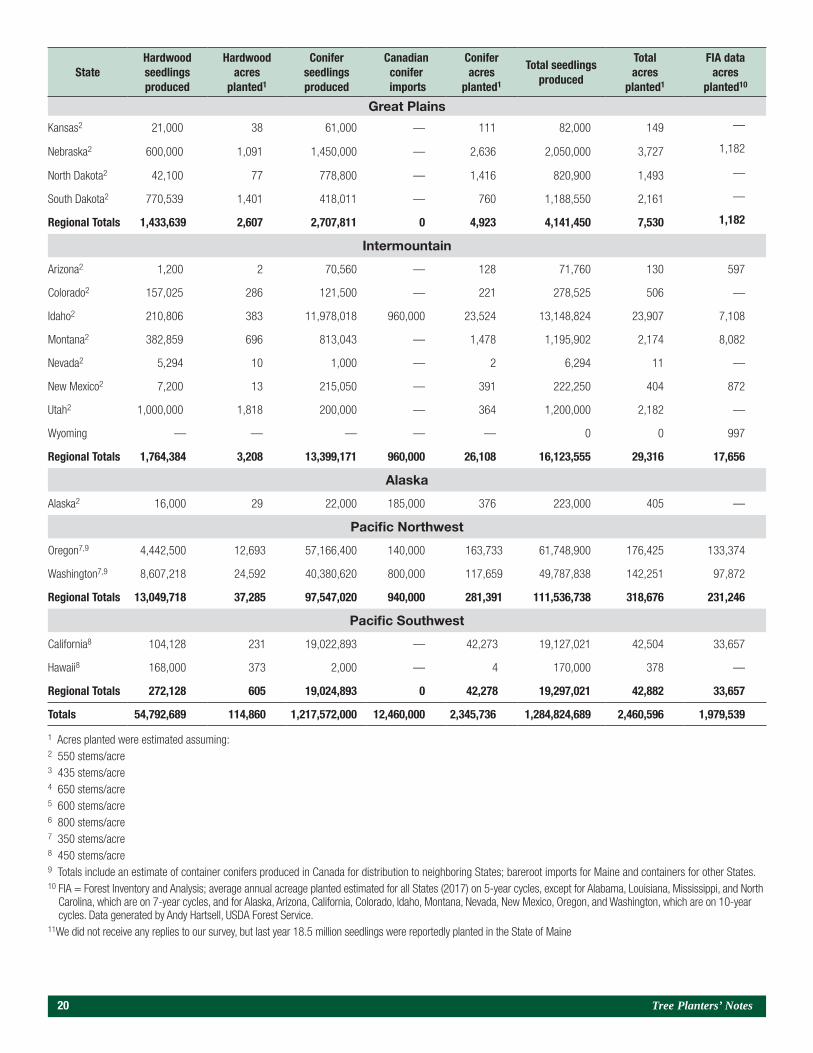
State and Private Forestry, in collaboration with Auburn University, the University of Idaho, and Purdue University, produced the data for this report. These universities collected forest tree seedling production data directly from the forest and conservation nurseries that grow forest tree seedlings in their region of the United States (Au-burn University collected from 13 States in the Southeast, the University of Idaho collected from 17 States in the West, and Purdue University col-lected from 21 States in the Northeast and Mid-west). The approximation of planted acres for each State is derived from FIA estimates of tree planting area based on ground–plot data that States collect-ed during 5-, 7-, or 10-year periods and compiled as an average annual estimate for the associated period. FIA estimates of acres of trees planted by State may not correlate with nursery production surveys because nurseries do not report shipments across State lines. Total acres by region, however, provide a reasonable comparison between the two methods. Data collected are reported by hardwood and conifer seedlings produced and acreage plant-ed of each (table 1) and by bareroot and container seedlings produced (table 2). A complete list of the assumptions used in compiling this report appears in the Forest Nursery Seedling Production in the United States—Fiscal Year 2013 (Harper et al. 2014).
Forest Nursery Seedling Production in the United States—Fiscal Year 2017
George Hernández, Diane L. Haase, Carolyn Pike, Scott Enebak, Lori Mackey, Zhao Ma, and Mysha Clarke
Southern Region Regeneration Specialist, U.S. Department of Agriculture (USDA), Forest Service, Atlanta, GA; Western Nursery Specialist, USDA Forest Service, Portland, OR; Northeastern Area Regeneration Specialist, USDA
Forest Service, West Lafayette, IN; Director, Southern Forest Nursery Management Cooperative, School of Forestry and Wildlife Sciences, Auburn University, Auburn, AL; Special Projects Coordinator, Center for Forest Nursery and Seedling
Research, Department of Forest, Rangeland, and Fire Sciences, University of Idaho, Moscow, ID; Professor, Purdue University, Department of Forestry and Natural Resources, West Lafayette, IN; Graduate Student,
Department of Forestry and Natural Resources, Purdue University, West Lafayette, IN
Volume 61, Number 2 (Fall 2018) 19
Table 1. Hardwood and conifer tree seedling production and acres planted for each State and each region during the 2016-2017 planting year.
StateHardwood seedlings produced
Hardwood acres
planted1
Conifer seedlings produced
Canadian conifer
imports
Conifer acres
planted1
Total seedlings produced
Total acres
planted1
FIA data acres
planted10
SoutheastFlorida2 2,570,129 4,673 56,486,000 — 102,702 59,056,129 107,375 152,359
Georgia2 4,982,066 9,058 347,678,022 — 632,142 352,660,088 641,200 239,619
North Carolina2 320,000 582 73,532,000 — 133,695 73,852,000 134,276 99,215
South Carolina2 639,720 1,163 129,647,894 — 235,723 130,287,614 236,887 76,808
Virginia2 756,000 1,375 34,612,900 — 62,933 35,368,900 64,307 74,872
Regional Totals 9,267,915 16,851 641,956,816 0 1,167,194 651,224,731 1,184,045 642,873
South CentralAlabama2 589,500 1,072 105,525,738 — 191,865 106,115,238 192,937 223,021
Arkansas2 11,179,646 20,327 87,096,905 — 158,358 98,276,551 178,685 117,744
Kentucky3 883,760 2,032 95,300 — 219.08 979,060 2,251 1,155
Lousiana2 — — 33,706,700 — 61,285 33,706,700 61,285 160,801
Mississippi2 865,000 1,573 85,590,000 — 155,618 86,455,000 157,191 178,998
Oklahoma2 559,475 1,017 4,284,475 — 7,790 4,843,950 8,807 21,521
Tennessee2 1,635,000 2,973 4,252,000 — 7,731 5,887,000 10,704 28,005
Texas2 33,800 61 78,385,629 — 142,519 78,419,429 142,581 262,584
Regional Totals 15,746,181 29,054 398,936,747 0 725,385 414,682,928 754,440 993,829
NortheastConnecticut3 1,000 2 500 — 1 1,500 3 —
Delaware — — — — — — — 647
Maine11 — — — — — — — 8,168
Maryland2 1,248,975 2,271 1,191,740 — 2,167 2,440,715 4,438 1,445
Massachusetts3 — — 19,200 — 44 19,200 44 —
New Hampshire3 18,500 43 83,730 — 192 102,230 235 —
New Jersey3 464,380 1,068 151,210 — 348 615,590 1,415 —
New York5 161,500 269 656,500 — 818,000 269 —
Pennsylvania3 2,290,572 5,266 3,816,476 — 8,774 6,107,048 14,039 2,680
Rhode Island — — — — — — — —
Vermont3 2,500 6 400 — — 2,900 6 —
West Virginia3 418,825 963 86,475 — 199 505,300 1,162 870
Regional Totals 4,606,252 9,887 6,006,231 0 11,724 10,612,483 21,611 13,810
North CentralIllinois3 666,910 1,533 125,640 — 289 792,550 1,822 2,498
Indiana4 2,094,016 3,222 1,203,730 — 1,852 3,297,746 5,073 1,753
Iowa5 725,080 1,208 212,110 — 354 937,190 1,562 621
Michigan2,9 2,350,568 4,274 28,537,370 — 51,886 30,887,938 56,160 9,467
Minnesota2,9 728,720 1,325 5,167,250 9,875,000 27,350 15,770,970 28,674 17,470
Missouri3 1,119,250 2,573 566,395 — 1,302 1,685,645 3,875 —
Ohio3 10,200 23 40 — <1 10,240 23 3,018
Wisconsin6,9 941,728 1,177 2,158,776 500,000 3,323 3,600,504 4,501 10,459
Regional Totals 8,636,472 15,335 37,971,311 10,375,000 86,355 56,982,783 101,691 45,286
20 Tree Planters’ Notes
StateHardwood seedlings produced
Hardwood acres
planted1
Conifer seedlings produced
Canadian conifer
imports
Conifer acres
planted1
Total seedlings produced
Total acres
planted1
FIA data acres
planted10
Great Plains
Kansas2 21,000 38 61,000 — 111 82,000 149 —
Nebraska2 600,000 1,091 1,450,000 — 2,636 2,050,000 3,727 1,182
North Dakota2 42,100 77 778,800 — 1,416 820,900 1,493 —
South Dakota2 770,539 1,401 418,011 — 760 1,188,550 2,161 —
Regional Totals 1,433,639 2,607 2,707,811 0 4,923 4,141,450 7,530 1,182
Intermountain
Arizona2 1,200 2 70,560 — 128 71,760 130 597
Colorado2 157,025 286 121,500 — 221 278,525 506 —
Idaho2 210,806 383 11,978,018 960,000 23,524 13,148,824 23,907 7,108
Montana2 382,859 696 813,043 — 1,478 1,195,902 2,174 8,082
Nevada2 5,294 10 1,000 — 2 6,294 11 —
New Mexico2 7,200 13 215,050 — 391 222,250 404 872
Utah2 1,000,000 1,818 200,000 — 364 1,200,000 2,182 —
Wyoming — — — — — 0 0 997
Regional Totals 1,764,384 3,208 13,399,171 960,000 26,108 16,123,555 29,316 17,656
Alaska
Alaska2 16,000 29 22,000 185,000 376 223,000 405 —
Pacific Northwest
Oregon7,9 4,442,500 12,693 57,166,400 140,000 163,733 61,748,900 176,425 133,374
Washington7,9 8,607,218 24,592 40,380,620 800,000 117,659 49,787,838 142,251 97,872
Regional Totals 13,049,718 37,285 97,547,020 940,000 281,391 111,536,738 318,676 231,246
Pacific Southwest
California8 104,128 231 19,022,893 — 42,273 19,127,021 42,504 33,657
Hawaii8 168,000 373 2,000 — 4 170,000 378 —
Regional Totals 272,128 605 19,024,893 0 42,278 19,297,021 42,882 33,657
Totals 54,792,689 114,860 1,217,572,000 12,460,000 2,345,736 1,284,824,689 2,460,596 1,979,539
1 Acres planted were estimated assuming:2 550 stems/acre3 435 stems/acre4 650 stems/acre5 600 stems/acre6 800 stems/acre7 350 stems/acre8 450 stems/acre9 Totals include an estimate of container conifers produced in Canada for distribution to neighboring States; bareroot imports for Maine and containers for other States.10 FIA = Forest Inventory and Analysis; average annual acreage planted estimated for all States (2017) on 5-year cycles, except for Alabama, Louisiana, Mississippi, and North
Carolina, which are on 7-year cycles, and for Alaska, Arizona, California, Colorado, Idaho, Montana, Nevada, New Mexico, Oregon, and Washington, which are on 10-year cycles. Data generated by Andy Hartsell, USDA Forest Service.
11We did not receive any replies to our survey, but last year 18.5 million seedlings were reportedly planted in the State of Maine

Volume 61, Number 2 (Fall 2018) 21
Data Trends
Nearly 1.3 billion forest tree seedlings were shipped from forest and conservation nurseries in the United States in fiscal year (FY) 2017. This production level is an increase of nearly 45 million seedlings compared with seedling production reported for
FY 2016 (Hernández et al. 2017). Based on the total number of seedlings shipped and the average number of seedlings planted per acre in each State, 2,460,543 ac (995,746 ha) of trees were planted during the fall 2016 through spring 2017 planting season. Table 3 shows overall production and regional trends.
State Bareroot Container1 Total Seedlings Produced
SoutheastFlorida 54,515,263 4,540,866 59,056,129
Georgia 211,114,488 141,545,600 352,660,088
North Carolina 59,712,000 14,140,000 73,852,000
South Carolina 129,417,840 869,774 130,287,614
Virginia 35,360,900 8,000 35,368,900
Regional Totals 490,120,491 161,104,240 651,224,731
South CentralAlabama 98,529,066 7,586,172 106,115,238
Arkansas 98,215,051 61,500 98,276,551
Kentucky 978,060 1,000 979,060
Louisiana — 33,706,700 33,706,700
Mississippi 76,955,000 9,500,000 86,455,000
Oklahoma 4,497,425 346,525 4,843,950
Tennessee 5,887,000 — 5,887,000
Texas 78,419,429 — 78,419,429
Regional Totals 363,481,031 51,201,897 414,682,928
NortheastConnecticut — 1,500 1,500
Delaware — — —
Maine5,9 — — —
Maryland 2,199,715 241,000 2,440,715
Massachusetts 6,000 13,200 19,200
New Hampshire 102,230 — 102,230
New Jersey 256,600 358,990 615,590
New York 818,000 — 818,000
Pennsylvania 6,090,686 16,362 6,107,048
Rhode Island — — —
Vermont 1,500 1,400 2,900
West Virginia 505,300 — 505,300
Regional Totals 9,980,031 632,452 10,612,483
North CentralIllinois 755,250 37,300 792,550
Indiana 3,120,396 177,350 3,297,746
State Bareroot Container1 Total Seedlings Produced
Iowa 926,190 11,000 937,190
Michigan 28,442,114 2,445,824 30,887,938
Minnesota 3,051,570 12,719,400 15,770,970
Missouri 1,679,645 6,000 1,685,645
Ohio — 10,240 10,240
Wisconsin 3,089,704 510,800 3,600,504
Regional Totals 41,064,869 15,917,914 56,982,783
Great PlainsKansas — 82,000 82,000
North Dakota 1,200,000 850,000 2,050,000
Nebraska 740,500 80,400 820,900
South Dakota 1,159,202 29,348 1,188,550
Regional Totals 3,099,702 1,041,748 4,141,450
IntermountainArizona — 71,760 71,760
Colarado 153,775 124,750 278,525
Idaho 1,044,055 12,104,769 13,148,824
Montana 454,920 740,982 1,195,902
New Mexico — 222,250 222,250
Nevada — 6,294 6,294
Utah — 1,200,000 1,200,000
Wyoming — — —
Regional Totals 1,652,750 14,470,805 16,123,555
AlaskaAlaska — 223,000 223,000
Pacific NorthwestOregon 37,560,000 24,188,900 61,748,900
Washington 38,431,300 11,356,538 49,787,838
Regional Totals 75,991,300 35,545,438 111,536,738
Pacific SouthwestCalifornia 750 19,126,271 19,127,021
Hawaii — 170,000 170,000
Regional Totals 750 19,296,271 19,297,021
Totals 985,390,924 299,433,765 1,284,824,689
1 Alaska, Idaho, Michigan, Minnesota, Oregon, Washington, and Wisconsin received container seedlings produced in Canada.
Table 2. Bareroot and container tree seedling production for each State and each region during the 2016-2017 planting year.

22 Tree Planters’ Notes
Address correspondence to—
George Hernández, Regional Regeneration Specialist, U.S. Department of Agriculture, Forest Service, State and Private Forestry, 1720 Peachtree Road NW, Atlan-ta, GA 30309; e-mail: [email protected]; phone: 404–347–3554.
Acknowledgments
The authors thank the U.S. Department of Agriculture, Forest Service, Washington Offices of the Forest Inventory and Analysis program and the State and Private Forestry Deputy Area for their support.
REFERENCES
Harper, R.A.; Hernández, G.; Arsenault, J.; Bryntesen, M.; Enebak, S.; Overton, R.P. 2013. Forest nursery seedling production in the United States—fiscal year 2012. Tree Planters’ Notes. 56(2): 72–75.
Harper, R.A.; Hernández, G.; Arsenault, J.; Woodruff, K.J.; Enebak, S.; Overton, R.P.; Haase, D.L. 2014. Forest nursery seedling production in the United States—fiscal year 2013. Tree Planters’ Notes. 57(2): 62–66.
Hernández, G.; Harper, R.A.; Woodruff, K.J.; Enebak, S.; Overton, R.P.; Lesko, J.; Haase, D.L. 2015. Forest nursery seedling produc-tion in the United States—fiscal year 2014. Tree Planters’ Notes. 58(2): 28–32.
Hernández, G.; Haase, D.L.; Pike, C.; Enebak, S.; Mackey, L.; Ma, Z.; Clarke, M. 2017. Forest nursery seedling production in the United States—fiscal year 2016. Tree Planters’ Notes. 60(2): 24–28.
Hernández, G.; Pike, C.; Haase, D.L.; Enebak, S.; Ma, Z.; Clarke, L.; Mackey, L. 2016. Forest nursery seedling production in the United States—fiscal year 2015. Tree Planters’ Notes. 59(2): 20–24.
Table 3. Total forest nursery seedling production, including region, by year, from FY 2012 through FY 2017.
Year Total seedling production West East South
FY 2017 1,284,824,689 151,321,764 67,595,266 1,065,907,659
FY 2016 1,260,216,076 152,785,327 72,314,630 1,035,094,369
FY 2015 1,302,237,795 175,464,446 95,417,986 1,031,355,363
FY 2014 1,217,607,888 115,620,820 85,684,417 1,015,564,370
FY 2013 1,181,554,535 96,344,063 102,066,671 983,143,801
FY 2012 1,190,552,819 170,975,830 81,672,547 936,918,542
FY = fiscal year.Sources: This report, Harper et al. (2013, 2014), and Hernández et al. (2015, 2016).
Volume 61, Number 2 (Fall 2018) 23
Abstract
In forest nurseries of Québec, containerized 2+0 seedlings are produced outdoors where they can receive rainfall in addition to irrigation. These water inputs can lead to nutrient leaching losses. Two experiments with 2+0 white spruce (Picea glauca [Moench.] Voss) grown outdoors in containers were conducted to quantify seasonal leaching losses of nutrients (experiment 1 with no treatment [natural conditions] and experiment 2 with three irriga-tion and nitrogen [N] fertilization treatments). For both experiments, nitrogen was the most leached nutrient (roughly two-thirds nitrate and one-third ammonium) followed by phosphorus, potassium, calcium, and magnesium. In experiment 2, seedlings receiving the lowest irrigation, and N fertilization treatment had the greatest nitrogen use efficiency (89 percent) compared with the two other treatments (55 and 68 percent, respectively), while also having the lowest nutrient leaching losses without affect-ing morphology or nutrient concentrations. These results suggest that decreasing irrigation treatments can reduce water use and fertilizer leaching without compromising seedling quality.
Introduction
Pollution of groundwater and surface waters by ni-trate (NO3-) has been reported throughout the world due to agricultural and horticultural practices (Bro-schat 1995, Colangelo and Brand 2001, Follett and Hatfield 2001, Goulding 2000, Pepper et al. 1996, Stevenson 1982). Although the areas and the amount of nitrogen (N) fertilizer applied in forest nurseries are small compared with those in agriculture and horticulture, NO3- leaching is a significant environ-
mental issue in forest nurseries (Dumroese et al. 1992, 1995, 2005, Gagnon and Girard 2001, Juntunen 2003, Juntunen et al. 2002, 2003, Lamhamedi et al. 2002, Landis et al. 1991, Park et al. 2012). Indeed, leaching of NO3- can lead to groundwater contamination and to NO3- concentration in drinking water that could exceed the standard for NO3- of 45 parts per million (ppm) (10 ppm of NO3--N) for North America (Health Canada 2008, EPA 2009) and of 50 ppm (11.3 ppm of NO3--N) for Europe (European Community 1998).
In the 19 forest nurseries (13 privately owned and 6 government owned) of Québec (Canada), 96 percent of the 128 million seedlings produced in 2017 were grown in containers (Arseneault 2017). These seed-lings receive weekly N, phosphorus (P), and potas-sium (K), fertilizations to meet morphological (e.g., height, diameter, height/diameter) and physiological (minimal foliar N concentrations of 1.6 percent for seedlings grown in cavities with volumes < 200 cm3 [12 in3] and 1.8 percent for cavities ≥ 200 cm3) quali-ty criteria before outplanting (Veilleux et al. 2014). In Québec nurseries, containerized seedlings are grown for 2 years; 1+0 seedlings are produced in white, un-heated polyethylene tunnels during their first season, whereas during their second year, 2+0 seedlings are cultivated outdoors. Although all these seedlings are fertilized to satisfy their weekly NPK growth needs (Langlois and Gagnon 1993) determined by Plantec software (Girard et al. 2001), losses of nutrients by leaching can occur along their two growing sea-sons if water inputs (rainfall, irrigation) exceed the water-holding capacity of their low-density, peat moss-based substrates, which range between 0.08 and 0.12 g/cm3 (0.0018 and 0.0026 oz/in3).
Several irrigation experiments conducted in forest nurseries of Québec with containerized 1+0 black
Seasonal Leaching Losses of Nutrients Under Containerized 2+0 White Spruce Seedlings Grown
Outdoors in Forest NurseriesJean Gagnon and Daniel Girard
Forest Nursery Researcher (retired), Ministère des Forêts, de la Faune et des Parcs (MFFP), Direction de la recherche forestière (DRF), Québec City, Québec, Canada;
Forest Nursery Specialist Technician, MFFP, DRF, Québec City, Québec, Canada
24 Tree Planters’ Notes
spruce (Picea mariana [Mill.] B.S.P.) (Bergeron et al. 2004, Lamhamedi et al. 2003) and white spruce (Picea glauca [Moench.] Voss) (Lamhamedi et al. 2001) seedlings grown in tunnels showed that vol-umetric water content (VWC; percent, volume per volume [v/v]) of 60 percent had the greatest leach-ing losses of nutrients compared with 15, 30, or 45 percent VWC. Because containerized 2+0 seedlings are grown outdoors in these nurseries, they receive rainfall, which makes them more prone to important seasonal nutrient leaching losses than 1+0 seedlings due to generally high VWC (> 50 percent, v/v). In a leaching study with containerized 2+0 white spruce seedlings growing outdoors (Gagnon and Girard 2001), continuous monitoring of substrate VWC showed that it varied between 50 and 70 percent throughout the growing season and that 30 percent of the applied N was lost by leaching as NO3- (Gagnon and Girard 2001). Similar N loss (32 percent) was observed with containerized ponderosa pine seed-lings (Dumroese et al. 1995). Other leaching exper-iments carried out in Québec forest nurseries with containerized 2+0 white spruce seedlings grown outdoors (Gagnon and Girard 2003, 2011, Lamha-medi et al. 2006) and also in tunnels to control ir-rigation treatments (Stowe et al. 2010) showed that nutrient losses by leaching were important when these 2+0 seedlings were irrigated in excess.
This paper presents the results of two leaching experiments carried out with containerized large 2+0 white spruce grown outdoors in Québec for-est nurseries. In the first experiment, no irrigation or fertilization treatments were applied to enable measurement of the magnitude of nutrient leach-ing losses under natural conditions. In the second experiment, three irrigation and fertilization treat-ments were applied to compare their effects on nutrient leaching losses and seedling growth. The purpose of these studies was (1) to develop accurate and efficient measurement tools to quantify seasonal leaching losses of mineral nutrients (N, P, K, calci-um [Ca], and magnesium [Mg]) for containerized 2+0 seedlings grown outdoors and (2) to test and implement irrigation and fertilization practices and software to increase the N use efficiency of seed-lings and thereby decrease leaching losses of N and other nutrients in forest nurseries.
Materials and Methods
In Quebec forest nurseries, containerized seedlings produced in cavity volumes greater than 300 cm3 (18 in3) are deemed large seedlings. More details about cultural conditions of these 1+0 and 2+0 seedlings are summarized in Gagnon and DeBlois (2014). Two leaching experiments were carried out with large 2+0 white spruce seedlings grown outdoors in two govern-mental forest nurseries of Québec (Direction générale de la production de semences et de plants forestiers of the Ministère des Forêts, de la Faune et des Parcs [MFFP]). All seedlings were produced in peat-ver-miculite substrates (3:1, v/v) with a mean bulk density of 0.1 g/cm3 and were fertilized biweekly with NPK according to the rates calculated by Plantec software (Girard et al. 2001). They also received small amounts of Ca and Mg, as well as micronutrients present in commercial soluble fertilizers. After each fertilization, a light irrigation was conducted to rinse their foliage.
Experiment 1—Evaluation of Leaching Under Natural Conditions
Large 2+0 white spruce seedlings were grown outdoors in 25-350A containers (25 cavities with a volume of 350 cm3 [21 in3] each, IPL, Inc., Saint-Damien, Québec, Canada) at Normandin nursery in the Saguenay-Lac St. Jean region of Québec (48°48’48” N, 72°45’00” W), Canada. A completely randomized design totaling 1,820 containers divid-ed into 4 replicates was installed May, 10–12, 2000 (figure 1a).
Leachate collectors (LC) were installed under con-tainers to quantify nutrient leaching losses during the growing season. LCs made in 1999 (Gagnon and Girard 2001) were used in this experiment (figure 1b). Each LC had the same area as the container (1314 cm2 [210 ft2]: 37.0 cm [14.8 in] by 35.5 cm [14.2 in]) and was made from a vinyl cloth stretched over a plastic frame connected to a 4-L (1.1-gal) bottle to collect the leachate. Between May 12 and October 18, 20 LC (5 LC/replicate x 4 replicates) were used to measure the substrate solution leached under 20 containers (500 seedlings).
Between May 12 and September 5, 2+0 seedlings received 30 fertilizations totaling 221 mg (0.0074 oz) N (33 percent urea, 29 percent ammonium [NH4+], and 38 percent NO3-), 45 mg (0.0015 oz) P, and 109 mg
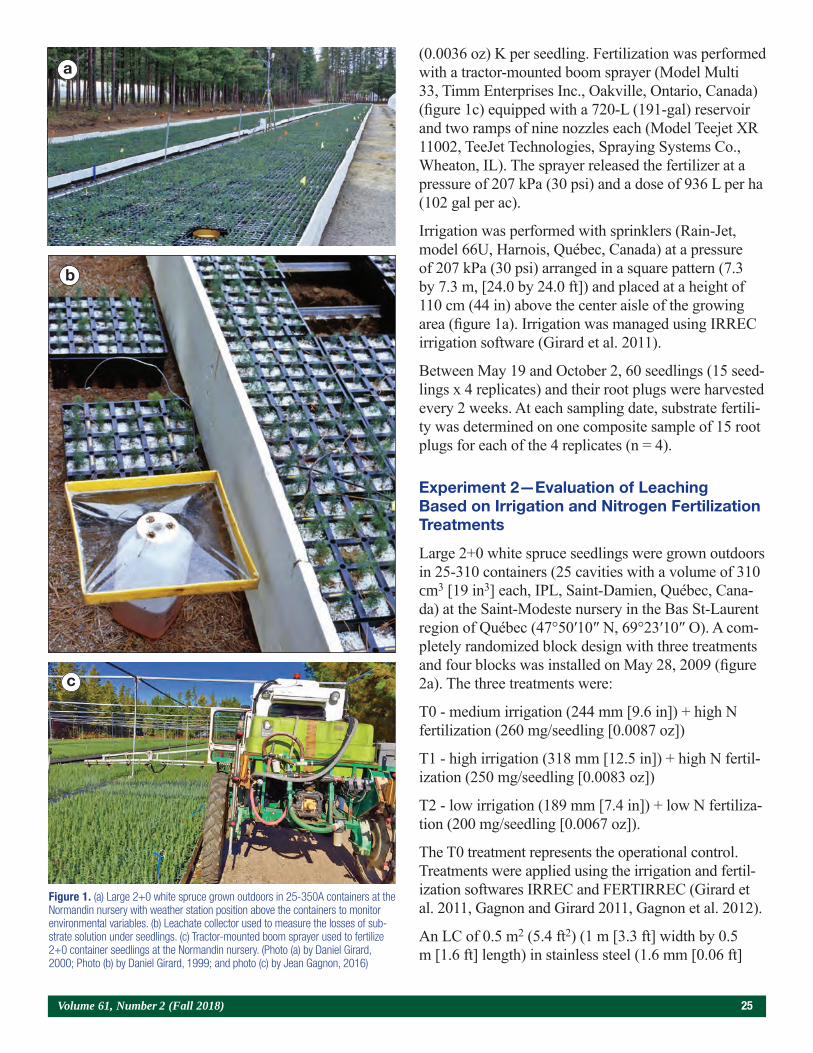
Volume 61, Number 2 (Fall 2018) 25
(0.0036 oz) K per seedling. Fertilization was performed with a tractor-mounted boom sprayer (Model Multi 33, Timm Enterprises Inc., Oakville, Ontario, Canada) (figure 1c) equipped with a 720-L (191-gal) reservoir and two ramps of nine nozzles each (Model Teejet XR 11002, TeeJet Technologies, Spraying Systems Co., Wheaton, IL). The sprayer released the fertilizer at a pressure of 207 kPa (30 psi) and a dose of 936 L per ha (102 gal per ac).
Irrigation was performed with sprinklers (Rain-Jet, model 66U, Harnois, Québec, Canada) at a pressure of 207 kPa (30 psi) arranged in a square pattern (7.3 by 7.3 m, [24.0 by 24.0 ft]) and placed at a height of 110 cm (44 in) above the center aisle of the growing area (figure 1a). Irrigation was managed using IRREC irrigation software (Girard et al. 2011).
Between May 19 and October 2, 60 seedlings (15 seed-lings x 4 replicates) and their root plugs were harvested every 2 weeks. At each sampling date, substrate fertili-ty was determined on one composite sample of 15 root plugs for each of the 4 replicates (n = 4).
Experiment 2—Evaluation of Leaching Based on Irrigation and Nitrogen Fertilization Treatments
Large 2+0 white spruce seedlings were grown outdoors in 25-310 containers (25 cavities with a volume of 310 cm3 [19 in3] each, IPL, Saint-Damien, Québec, Cana-da) at the Saint-Modeste nursery in the Bas St-Laurent region of Québec (47°50′10″ N, 69°23′10″ O). A com-pletely randomized block design with three treatments and four blocks was installed on May 28, 2009 (figure 2a). The three treatments were:
T0 - medium irrigation (244 mm [9.6 in]) + high N fertilization (260 mg/seedling [0.0087 oz])
T1 - high irrigation (318 mm [12.5 in]) + high N fertil-ization (250 mg/seedling [0.0083 oz])
T2 - low irrigation (189 mm [7.4 in]) + low N fertiliza-tion (200 mg/seedling [0.0067 oz]).
The T0 treatment represents the operational control. Treatments were applied using the irrigation and fertil-ization softwares IRREC and FERTIRREC (Girard et al. 2011, Gagnon and Girard 2011, Gagnon et al. 2012).
An LC of 0.5 m2 (5.4 ft2) (1 m [3.3 ft] width by 0.5 m [1.6 ft] length) in stainless steel (1.6 mm [0.06 ft]
Figure 1. (a) Large 2+0 white spruce grown outdoors in 25-350A containers at the Normandin nursery with weather station position above the containers to monitor environmental variables. (b) Leachate collector used to measure the losses of sub-strate solution under seedlings. (c) Tractor-mounted boom sprayer used to fertilize 2+0 container seedlings at the Normandin nursery. (Photo (a) by Daniel Girard, 2000; Photo (b) by Daniel Girard, 1999; and photo (c) by Jean Gagnon, 2016)
a
b
c
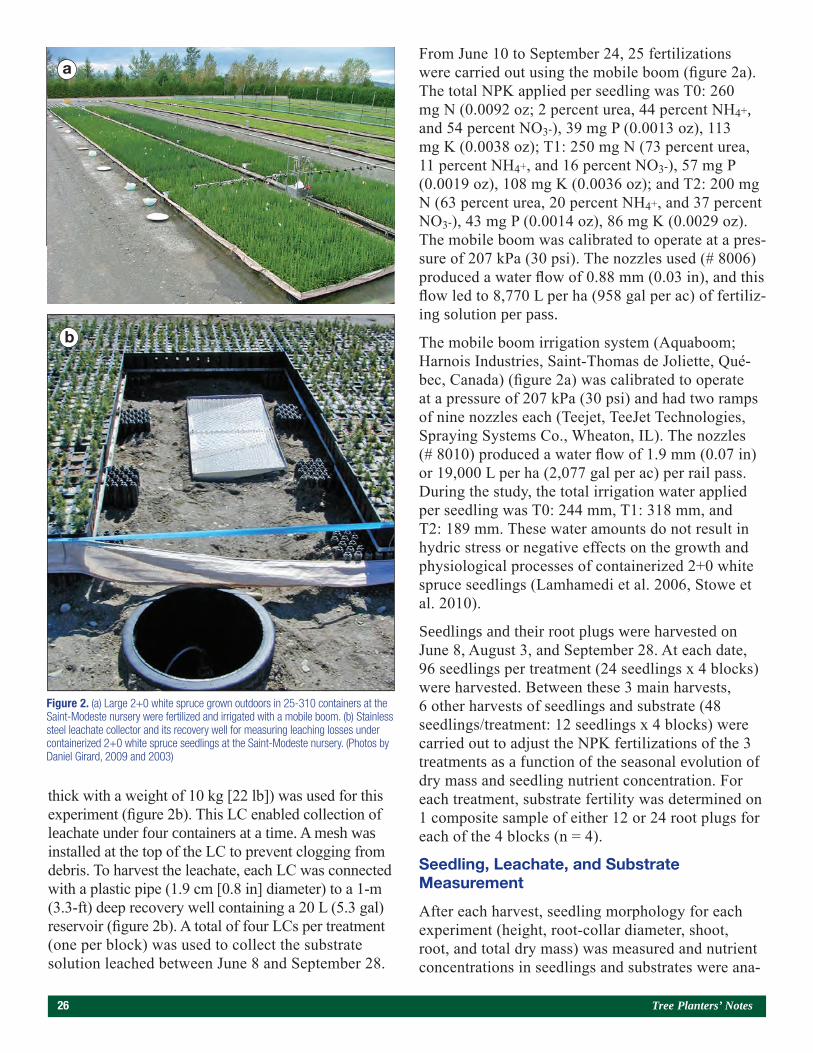
26 Tree Planters’ Notes
thick with a weight of 10 kg [22 lb]) was used for this experiment (figure 2b). This LC enabled collection of leachate under four containers at a time. A mesh was installed at the top of the LC to prevent clogging from debris. To harvest the leachate, each LC was connected with a plastic pipe (1.9 cm [0.8 in] diameter) to a 1-m (3.3-ft) deep recovery well containing a 20 L (5.3 gal) reservoir (figure 2b). A total of four LCs per treatment (one per block) was used to collect the substrate solution leached between June 8 and September 28.
From June 10 to September 24, 25 fertilizations were carried out using the mobile boom (figure 2a). The total NPK applied per seedling was T0: 260 mg N (0.0092 oz; 2 percent urea, 44 percent NH4+, and 54 percent NO3-), 39 mg P (0.0013 oz), 113 mg K (0.0038 oz); T1: 250 mg N (73 percent urea, 11 percent NH4+, and 16 percent NO3-), 57 mg P (0.0019 oz), 108 mg K (0.0036 oz); and T2: 200 mg N (63 percent urea, 20 percent NH4+, and 37 percent NO3-), 43 mg P (0.0014 oz), 86 mg K (0.0029 oz). The mobile boom was calibrated to operate at a pres-sure of 207 kPa (30 psi). The nozzles used (# 8006) produced a water flow of 0.88 mm (0.03 in), and this flow led to 8,770 L per ha (958 gal per ac) of fertiliz-ing solution per pass.
The mobile boom irrigation system (Aquaboom; Harnois Industries, Saint-Thomas de Joliette, Qué-bec, Canada) (figure 2a) was calibrated to operate at a pressure of 207 kPa (30 psi) and had two ramps of nine nozzles each (Teejet, TeeJet Technologies, Spraying Systems Co., Wheaton, IL). The nozzles (# 8010) produced a water flow of 1.9 mm (0.07 in) or 19,000 L per ha (2,077 gal per ac) per rail pass. During the study, the total irrigation water applied per seedling was T0: 244 mm, T1: 318 mm, and T2: 189 mm. These water amounts do not result in hydric stress or negative effects on the growth and physiological processes of containerized 2+0 white spruce seedlings (Lamhamedi et al. 2006, Stowe et al. 2010).
Seedlings and their root plugs were harvested on June 8, August 3, and September 28. At each date, 96 seedlings per treatment (24 seedlings x 4 blocks) were harvested. Between these 3 main harvests, 6 other harvests of seedlings and substrate (48 seedlings/treatment: 12 seedlings x 4 blocks) were carried out to adjust the NPK fertilizations of the 3 treatments as a function of the seasonal evolution of dry mass and seedling nutrient concentration. For each treatment, substrate fertility was determined on 1 composite sample of either 12 or 24 root plugs for each of the 4 blocks (n = 4).
Seedling, Leachate, and Substrate Measurement
After each harvest, seedling morphology for each experiment (height, root-collar diameter, shoot, root, and total dry mass) was measured and nutrient concentrations in seedlings and substrates were ana-
a
b
Figure 2. (a) Large 2+0 white spruce grown outdoors in 25-310 containers at the Saint-Modeste nursery were fertilized and irrigated with a mobile boom. (b) Stainless steel leachate collector and its recovery well for measuring leaching losses under containerized 2+0 white spruce seedlings at the Saint-Modeste nursery. (Photos by Daniel Girard, 2009 and 2003)

Volume 61, Number 2 (Fall 2018) 27
lyzed. Each seedling was separated into shoot (nee-dle and stem) and root, and these two components were oven dried at 60 °C (140 °F) for 48 hours in order to get dry mass for each of these components (weighing by groups of five and six seedlings for experiments 1 and 2, respectively).
After water inputs (rainfall, irrigation, fertilization) in both experiments, leachate was collected, and its volume (ml) was measured. For experiment 1, leachate samples were composited into one sample for each of the four replicates. For experiment 2, there were four samples per treatment (1 per block). Leachate samples were kept frozen until laboratory analysis of their nutrient concentration (urea, NH4, NO3, P, K, Ca, Mg), pH, and electrical conductiv-ity (EC). Prior to analysis, samples were passed through a filter of 0.45 μm. For each leachate sam-ple analyzed, the quantity of each nutrient leached was obtained by multiplying the volume (ml) by its concentration (ppm or mg/l), and thereafter the loss per seedling (mg/seedling) of each nutrient was calculated.
For leachate, urea was determined by liquid chroma-tography (HPLC Agilent-1200 chromatograph with diode array detector) using a Sugar-Pak I column from Waters. Inorganic N was determined by col-orimetry with a continuous flow spectrophotome-ter (model QuickChem 8000, Lachat Instruments, Milwaukee, WI, USA), whereas P, K, Ca, and Mg were determined by using inductively coupled argon plasma analysis (model ICAP 9000 or 61E, Ther-mo Instruments, Franklin, MA, USA). For seed-ling analysis, after grinding and acid digestion of seedling tissues, composite samples were analyzed for N (Kjeldahl method) and for P, K, Ca, and Mg (inductively coupled argon plasma analysis). Nutri-ent content of each seedling part (shoot, roots, and total) was calculated (concentration by dry mass) to accurately reflect nutrient uptake and accumulation. Substrate nutrients were extracted by vacuum filtra-tion (Whatman filters # 4) after saturating in water for 90 minutes. Urea, mineral N, and other nutrients (P, K, Ca, and Mg) were determined by using the same analysis methods described previously for the leachate. The laboratoire de chimie organique et inorganique (ISO/CEI 17025) de la Direction de la recherche forestière, MFFP du Québec, performed all nutrient analyses (leachate, tissue, and substrate).
Environmental Variables and Substrate Water Content
For both experiments, a weather station was in-stalled in May at 3.5 m (11.5 ft) above the ground to continuously monitor environmental variables (air temperature, relative humidity, wind speed, and rain-fall) (figures 1a and 3a). Water inputs were monitored with rain gauges (model TE525M, Texas Instruments, Dallas, TX, USA) installed at the ground level among containers (one for experiment 1 [figure 1a] and one per treatment for experiment 2). These data were monitored every 15 min (May 12 to October 18) for experiment 1 and every 2 h (May 28 to October 6) for experiment 2 by using a CR10X data logger (Campbell Scientific, Logan, UT, USA) (figure 3b).
Substrate VWC was measured continuously by time domain reflectometry (Topp and Davis 1985) using a portable moisture monitoring system MP-917 (ESI Environmental Sensors Inc., Victoria, BC, Canada) equipped with double-diode humidity probes (figure 3b). To convert the time domain reflectometry signal to VWC (cm3 H2O/cm3 substrate) in peat-vermiculite substrate (3:1, v/v), calibration of the MP-917 param-eters was determined by Lambany et al. (1996, 1997) and then was successfully tested with this substrate (Gagnon and Girard 2001, 2003, Lamhamedi et al. 2001, 2003, 2006, Stowe et al. 2010). Each of the 8 probes of the MP-917, which consisted of 2 parallel stainless steel waveguides (407 mm long, 3.17 mm diameter, spaced 10 mm apart), was inserted through the middle of the root plugs in the 5 central cavities of a container to measure substrate of a total of 40 seed-lings for experiment 1 and 40 seedlings per treatment for experiment 2. These probes were connected per-manently to the MP-917 via a coaxial multiplexer (ESI Environmental Sensors Inc., Victoria, BC, Canada) to juxtapose the substrate VWC with the environmental variables (figure 3b).
Statistical Analyses
For experiment 1, simple averages and standard errors were calculated for the collected data. For experiment 2, statistical analyses to determine differences among treatments were performed using the MIXED proce-dure of SAS (version 9.4, SAS Institute, Cary, NC, United States). When required, a simulation-based approach taking account of multiplicity was used to assess differences. Normality of the residuals was

28 Tree Planters’ Notes
confirmed using the Shapiro-Wilk’s statistic, and homogeneity of variance was validated using stan-dard graphical methods. Differences were deemed significant when p < 0.05. A cubic model was used to simulate total of water inputs (rainfall, irrigation, fertilization) for three inputs. For substrate N fertility, a logarithmic transformation of the data was done to validate the hypotheses of normality and homogeneity, and untransformed data are presented.
Results—Experiment 1
Water Input, Leachate, and Volumetric Water Content
Between May 18 and October 18, large 2+0 white spruce seedlings grown outdoors in 25-350A con-tainers at Normandin nursery received 871 mm (34.8 in) of water inputs (43 percent in rainfall and 57 percent in irrigation) corresponding to a water input of 114.7 L (30.4 gal) per container. Leachate amounted to 47 L (12.5 gal) per container, which is a 41-percent loss of the water inputs. Leachate vol-ume varied between 25 and 164 ml per seedling (1 and 7 oz/seedling) over 25 leachate collections for a total of 1.9 L/seedling (64 oz/seedling). During the same period, substrate VWC varied between 37 and 69 percent with an overall average of 53 percent.
Nutrient Leaching Losses
Nitrogen was the most leached nutrient, averaging 96 mg per seedling cavity (0.0032 oz) with two-thirds as NO3- and one-third as NH4+. Other nutrient losses in decreasing order were K (63 mg [0.0021 oz]), P (27 mg [0.0009 oz]), Mg (23 mg [0.008 oz]), and Ca (8 mg [0.0003 oz]) per seedling cavity. Compared with the amount of NPK applied between May 18 through October 18, the percentage of N, P, and K lost by leaching was 43, 60, and 58 percent, respectively.
Seedling Morphology and Nitrogen Status in Seedlings and Substrate
At the end of the growing season (October 2), seedling morphological variables (± standard error [SE]) were height of 17.0 ± 0.5 cm (6.8 in), diameter of 4.56 ± 0.15 mm (0.2 in), shoot dry mass of 2,501 ± 174 mg (0.08 oz), root dry mass of 1,163 ± 98 mg (0.04 oz), and total dry mass of 3,664 ± 261 mg (0.12 oz). Between May 19 and October 2, N concentration increased from 1.58 to 2.43 percent, and total N content increased from 8 to 89 mg, representing an N uptake of 81 mg per seedling. Seedling P concentration increased from 0.18 to 0.42 percent, and P uptake averaged 14.5 mg per seedling. Seedling K concentration increased from 0.38 to 0.57 percent, and K uptake averaged 19.1 mg per seedling. Also during this period, the average substrate N con-
a
b
Figure 3. (a) Weather station above the 25-310 containers to monitor environmen-tal variables of 2+0 white spruce seedlings grown at the Saint-Modeste nursery. (b) Waterproof case containing a MP-917 soil moisture system (blue device), a CR10X data logger, and an ESI coaxial multiplexer. (Photos by Daniel Girard, 2009)
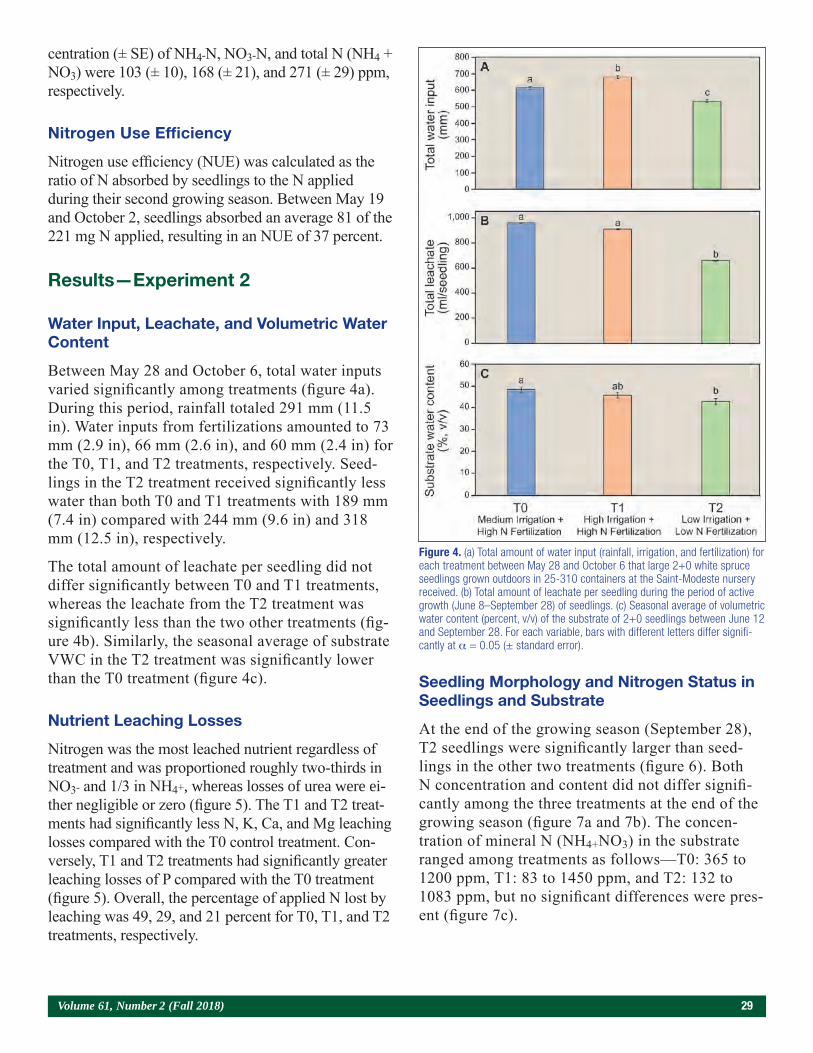
Volume 61, Number 2 (Fall 2018) 29
centration (± SE) of NH4-N, NO3-N, and total N (NH4 + NO3) were 103 (± 10), 168 (± 21), and 271 (± 29) ppm, respectively.
Nitrogen Use Efficiency
Nitrogen use efficiency (NUE) was calculated as the ratio of N absorbed by seedlings to the N applied during their second growing season. Between May 19 and October 2, seedlings absorbed an average 81 of the 221 mg N applied, resulting in an NUE of 37 percent.
Results—Experiment 2
Water Input, Leachate, and Volumetric Water Content
Between May 28 and October 6, total water inputs varied significantly among treatments (figure 4a). During this period, rainfall totaled 291 mm (11.5 in). Water inputs from fertilizations amounted to 73 mm (2.9 in), 66 mm (2.6 in), and 60 mm (2.4 in) for the T0, T1, and T2 treatments, respectively. Seed-lings in the T2 treatment received significantly less water than both T0 and T1 treatments with 189 mm (7.4 in) compared with 244 mm (9.6 in) and 318 mm (12.5 in), respectively.
The total amount of leachate per seedling did not differ significantly between T0 and T1 treatments, whereas the leachate from the T2 treatment was significantly less than the two other treatments (fig-ure 4b). Similarly, the seasonal average of substrate VWC in the T2 treatment was significantly lower than the T0 treatment (figure 4c).
Nutrient Leaching Losses
Nitrogen was the most leached nutrient regardless of treatment and was proportioned roughly two-thirds in NO3- and 1/3 in NH4+, whereas losses of urea were ei-ther negligible or zero (figure 5). The T1 and T2 treat-ments had significantly less N, K, Ca, and Mg leaching losses compared with the T0 control treatment. Con-versely, T1 and T2 treatments had significantly greater leaching losses of P compared with the T0 treatment (figure 5). Overall, the percentage of applied N lost by leaching was 49, 29, and 21 percent for T0, T1, and T2 treatments, respectively.
Seedling Morphology and Nitrogen Status in Seedlings and Substrate
At the end of the growing season (September 28), T2 seedlings were significantly larger than seed-lings in the other two treatments (figure 6). Both N concentration and content did not differ signifi-cantly among the three treatments at the end of the growing season (figure 7a and 7b). The concen-tration of mineral N (NH4+NO3) in the substrate ranged among treatments as follows—T0: 365 to 1200 ppm, T1: 83 to 1450 ppm, and T2: 132 to 1083 ppm, but no significant differences were pres-ent (figure 7c).
Figure 4. (a) Total amount of water input (rainfall, irrigation, and fertilization) for each treatment between May 28 and October 6 that large 2+0 white spruce seedlings grown outdoors in 25-310 containers at the Saint-Modeste nursery received. (b) Total amount of leachate per seedling during the period of active growth (June 8–September 28) of seedlings. (c) Seasonal average of volumetric water content (percent, v/v) of the substrate of 2+0 seedlings between June 12 and September 28. For each variable, bars with different letters differ signifi-cantly at α = 0.05 (± standard error).
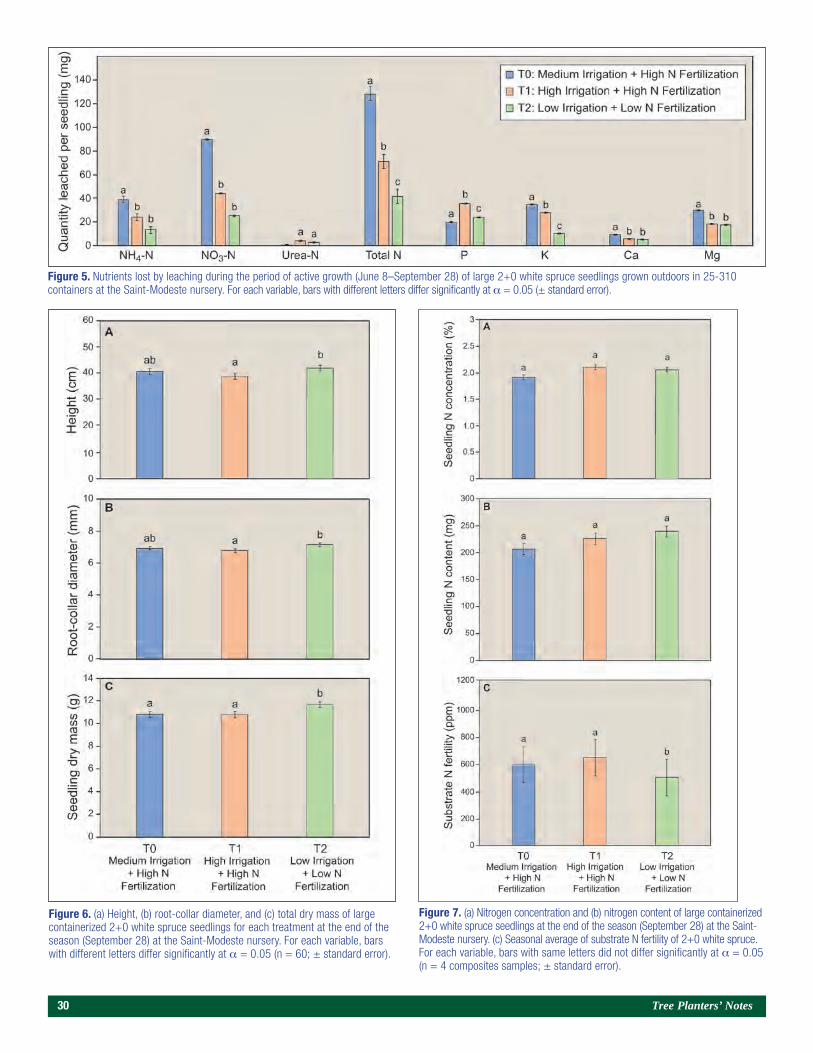
30 Tree Planters’ Notes
Figure 6. (a) Height, (b) root-collar diameter, and (c) total dry mass of large containerized 2+0 white spruce seedlings for each treatment at the end of the season (September 28) at the Saint-Modeste nursery. For each variable, bars with different letters differ significantly at α = 0.05 (n = 60; ± standard error).
Figure 7. (a) Nitrogen concentration and (b) nitrogen content of large containerized 2+0 white spruce seedlings at the end of the season (September 28) at the Saint-Modeste nursery. (c) Seasonal average of substrate N fertility of 2+0 white spruce. For each variable, bars with same letters did not differ significantly at α = 0.05 (n = 4 composites samples; ± standard error).
Figure 5. Nutrients lost by leaching during the period of active growth (June 8–September 28) of large 2+0 white spruce seedlings grown outdoors in 25-310 containers at the Saint-Modeste nursery. For each variable, bars with different letters differ significantly at α = 0.05 (± standard error).
Volume 61, Number 2 (Fall 2018) 31
Nitrogen Use Efficiency
The NUE was 55 percent for T0 ([144 mg N absorbed /260 mg N applied] x 100), 68 percent for T1 ([169 mg N absorbed/250 mg N applied] x 100), and 89 percent for T2 ([179 mg N absorbed/200 mg N applied] x 100).
Discussion
The leachate loss observed in experiment 1 (47 L per container) was of the same order of magnitude as a previous study in similar natural conditions where 51 L per 25-350A container were lost with a substrate VWC varying between 50 and 70 percent during the season (Gagnon and Girard 2001). In experiment 2, however, irrigation treatments sig-nificantly influenced leachate volume. These results demonstrate that managing irrigation to maintain a lower substrate VWC lowers water use, leachate, and nutrient losses without compromising seedling morphology. In a similar study, Stowe et al. (2010) evaluated three irrigation regimes (30, 40, and 55 percent, v/v) on large containerized 2+0 white spruce seedlings grown in a tunnel and found that reduction of VWC from 55 to 30 percent reduced the total leachate volume 65 percent and the quanti-ty of N leached 52 percent.
Among all nutrients, N was the most leached nu-trient (roughly 2/3 NO3- and 1/3 NH4+) in both experiments. Gagnon and Girard (2001) also found 30 percent of applied N was lost by leaching. The greater loss of NO3- compared with NH4+ can be explained by the fact that, unlike the cation NH4+, the anion NO3- is not retained by the negative charges of the peaty substrate. By varying irrigation and fertilization in experiment 2, seasonal quantities of leached nutrients (N, P, K, Ca, and Mg) also var-ied. Although seedlings in all treatments were fer-tilized with three N sources (NH4+, NO3-, and urea), urea losses were either negligible or zero. These zero or very low losses of urea can be explained by the fact that ureaze enzyme, which is ubiquitous in soils (Stevenson 1982), rapidly hydrolyzes into NH4+ so that the applied urea that is not rapidly absorbed by seedlings will be quickly converted into NH4+. In a forest nursery soil (loamy sand), 64 percent of urea was converted into NH4+ after only 1 day of incubation in a growth chamber, and after 4 days, all the applied urea was hydrolyzed into NH4+
(Gagnon and Camiré 2001). In a peat-vermiculite substrate incubated in a growth chamber, 25 and 95 percent of urea were converted into NH4+ after 1 and 7 days, respectively (Gagnon 2009).
The T2 seedlings in experiment 2 received the lowest amount of irrigation and N fertilization but were not significantly smaller than the two other treatments, nor did they have lower N concentration or contents at the end of the season. As a result, T2 seedlings had the greatest NUE of all three treat-ments, with 89 percent compared with 55 and 68 percent for T0 (control) and T1, respectively. The lower irrigation volume led to significantly smaller leachate amounts and corresponding N losses by leaching compared with the two other treatments and, therefore, more N was available in the sub-strate to be absorbed by T2 seedlings. Park et al. (2012) showed that among three nutrient fertiliza-tion methods (constant, three-stage rate, and expo-nential fertilization) applied to containerized yellow poplar (Ŀiriodendron tulipifera L.) and Japanese larch (Larix leptolepsis [Siebold et Zucc.] Endl.), exponential fertilization increased NUE of both yellow poplar (63, 61, and 85 percent, respectively) and Japanese larch (35, 30, and 53 percent, respec-tively) and also reduced nutrient leaching losses. Similarly, Dumroese et al. (2005) showed that NUE of containerized western white pine (P. monticola Dougl. ex D. Don) was 50 percent with constant fertilization, whereas it increased to 75 percent with exponential fertilization, which also resulted in de-creased nutrient leaching losses.
Concerning the fertilization of containerized seedlings grown outdoors, it is important to avoid applications when it is windy, because it will lead to drift losses of nutrients. The equipment used to fertilize is also important. In previous studies of Gagnon and Girard (2001, 2003, and 2011), the use of leachate collec-tors placed between containers showed that fertilizer losses by drift averaged to 20 percent when fertil-ization was performed with a tractor-mounted boom sprayer and 5 percent when a mobile boom irrigation system was used under similar wind-speed conditions. These greater nutrient losses by drift obtained with a tractor are due to the smaller sized fertilizer droplets caused by higher pressure applications. To minimize drift losses of fertilizer, it is more appropriate to use a mobile boom irrigation system for fertilization and to fertilize when wind conditions are minimal.
32 Tree Planters’ Notes
Conclusions
These two experiments quantify leaching losses of N (NO3-, NH4+) and other nutrients (P, K, Ca, and Mg) from large containerized 2+0 seedlings grown outdoors when water inputs exceed the water-hold-ing capacity of their peaty substrate. To minimize these nutrient losses, growers must take into account short-term rainfall forecasts before irrigation and fertilization of outdoor-grown container seedlings. Also, they must manage irrigation and fertilization schedules to optimize NUE and minimize N loss-es by leaching. Monitoring container weights is an important tool. To improve the substrate monitoring, wireless networks of electronic scales, which permit real-time measurements of substrate VWC of several containers at the same time, can be particularly use-ful (Girard and Gagnon 2016) for managing irriga-tion of containerized seedlings.
Address correspondence to—
Jean Gagnon (retired), e-mail: [email protected].
Acknowledgments
The authors thank the staff of Normandin and Saint-Modeste nurseries for their collaboration in these ex-periments. The authors acknowledge the staff of the laboratoire de chimie organique et inorganique (ISO/CEI 17025) de la Direction de la recherche forestière (DRF) of the Ministère des Forêts, de la Faune et des Parcs (MFFP) who performed analyses of water, tissue, and substrate. They also thank Josianne De-Blois, statistician at the DRF, for performing statisti-cal analysis and also for the pertinent revision of this article. They acknowledge Mohammed S. Lamhame-di (DRF) for advice and suggestions of corrections of this paper. The authors thank Diane Haase (editor of Tree Planters’ Notes) for her pertinent corrections and editorial comments. Financial support for this research project was provided to Jean Gagnon by the MFFP (project: 142332084).
REFERENCES
Arseneault, J. 2017. Personal communication regarding the num-ber and species of containerized and bareroot seedlings produced in 2017 in forest tree nurseries of Québec. Québec City, Canada: Forest Technician, Ministère des Forêts, de la Faune et des Parcs (MFFP), Direction générale de la production de semences et de plants forestiers (DGPSPF).
Bergeron, O.; Lamhamedi, M.S.; Margolis, H.A.; Bernier, P.Y.; Stowe, D.C. 2004. Irrigation control and physiological responses of nursery-grown black spruce seedlings (1+0) cultivated in air-slit containers. HortScience. 39: 599–605.
Broschat, T.K. 1995. Nitrate, phosphate, and potassium leaching from container-grown plants fertilized by several methods. Hort-Science. 30: 74–77.
Colangelo, D.J.; Brand, M.H. 2001. Nitrate leaching beneath a containerized nursery crop receiving trickle or overhead irrigation. Journal of Environmental Quality. 30: 1564–1574.
Dumroese, R.K.; Page-Dumroese, D.S.; Wenny, D.L. 1992. Managing pesticide and fertilizer leaching and runoff in a container nursery. In: Landis, T.D., ed. National proceedings, intermountain forest nursery associations––1991. Proceedings RM-211. Fort Collins, CO: U.S. Department of Agriculture, Forest Service, Rocky Mountain Research Station: 27–33.
Dumroese, R.K.; Page-Dumroese, D.S.; Salifu, K.F.; Jacobs, D.F. 2005. Exponential fertilization of Pinus monticola seedlings: nutrient uptake efficiency, leaching fractions, and early outplanting perfor-mance. Canadian Journal of Forest Research. 35: 2961–2967.
Dumroese, R.K.; Wenny, D.L.; Page-Dumroese, D.S. 1995. Nursery wastewater: the problem and possible remedies. In: Landis, T.D.; Cregg, B., tech. coords. National proceedings, forest and conser-vation nursery associations–1994. Proceedings PNW-GTR-365. Portland, OR: U.S. Department of Agriculture, Forest Service, Pacific Northwest Research Station: 89–97.
European Community. 1998. Official Journal JO L330 (05.12.98) Council Directive 98/83/EC on the quality of water intented for human consumption. Adopted by the Council on 3 November 1998. http://www.lenntech.com/EU’s-drinking-water-standards.htm. (May 2018).
Follett, R.F.; Hatfield, J.L. 2001. Nitrogen in the environment: sources, problems, and management. Amsterdam: Elsevier. 520 p.
Gagnon, J., 2009. Impact des différentes formes d’azote (Urée, NH4+, NO3-) sur la croissance des plants et sur le lessivage des engrais. In: Lamhamedi, M.S.; Gingras, B.-M., eds. Session de formation sur la nutrition minérale des plants forestiers dédiée aux pépinières forestières du Québec: conference proceedings [CD-ROM]. Québec City, Canada: Ministère des Ressources naturelles et de la Faune du Québec. 72 p.

Volume 61, Number 2 (Fall 2018) 33
Gagnon, J.; Camiré, C. 2001. In vitro urea transformations in a soil of forest tree nursery. In: Lefèvre, J.; Dazin, V., eds. INRA Centre de Lille, Laon. Recueil des résumés du 11th nitrogen workshop. Reims, France: 447–448.
Gagnon, J.; DeBlois, J. 2014. Effects of foliar urea fertilization on nitrogen status of containerized 2+0 black spruce seedlings produced in forest nurseries. Tree Planters’ Notes. 57(2): 53–61.
Gagnon, J.; Girard, D. 2001. Bilan des pertes saisonnières de nitrates (NO3-) et d’eau sous une culture d’épinette blanche 2+0 produite dans le récipient 25-350A. Rapp. Int. no 466. Québec, Canada: Ministère des Ressources naturelles, Direction de la recherche forestière. 36 p.
Gagnon, J.; Girard, D. 2003. Le lessivage des éléments minéraux sous les cultures produites en récipients dans les pépinières forestières. In: Colas, F.; Gagnon, J.; Gingras, B.-M.; Labbé, L.; Lamhamedi, M.S.; Thiffault, N.; Tousignant, D.; Tremblay, F.; Bettez, M.; Tourigny, M. La filière de production de plants au Québec : de la semence à la plantation. Naturaliste Canadien. 127(2): 77-84.
Gagnon, J.; Girard, D. 2011. Mesures novatrices pour protéger la qualité des eaux souterraines en pépinière. Avis de recherche forestière no 36. Québec, Canada: Ministère des Ressources naturelles, Direction de la recherche forestière. 2 p.
Gagnon, J.; Girard, D.; Lamhamedi, M.S. 2012. IRREC: un outil informatique de gestion de l’irrigation des plants produits en pépinière forestière. Avis de recherche forestière no 38. Québec, Canada: Ministère des Ressources naturelles, Direction de la recherche forestière. 2 p.
Girard, D.; Gagnon, J. 2016. Wireless network of electronic scales to monitor the substrate volumetric water content for managing irrigation of containerized seedlings produced in forest nurseries. Tree Planters’ Notes. 59(2): 9–19.
Girard, D.; Gagnon, J.; Lamhamedi, M.S. 2011. IRREC: un système informatisé de calcul des besoins en irrigation pour les plants en récipients produits dans les pépinières forestières du Québec. Mémoire de recherche forestière no 162. Québec, Canada: Ministère des Ressources naturelles, Direction de la recherche forestière. 54 p.
Girard, D.; Gagnon, J.; Langlois, C.G. 2001. PLANTEC: un logiciel pour gérer la fertilisation des plants dans les pépinières forestières. Note de recherche forestière no 111. Québec, Canada: Ministère des Ressources naturelles, Direction de la recherche forestière. 8 p.
Goulding, K. 2000. Nitrate leaching from arable and horticultural land. Soil Use and Management. 16: 145–151.
Health Canada. 2008. Guidelines for Canadian drinking water quality summary table. http://www.hc-sc.gc.ca/ewh-semt/alt_formats/hecs-sesc/pdf/pubs/water-eau/sum_guide-res_recom/summary-sommaireeng.pdf. (May 2018).
Juntunen, M.L., 2003. Environmental impacts of nurseries. In: Riley, L.E.; Dumroese, R.K.; Landis, T.D., tech. coords. National proceedings, forest and conservation nursery associations–2002. Proceedings RMRS-P-28. Ogden, UT: U.S. Department of Agricul-ture, Forest Service, Rocky Mountain Research Station: 64–73.
Juntunen, M.L.; Hammar, T.; Rikala, R. 2002. Leaching of nitrogen and phosphorus during production of forest seedlings in contain-ers. Journal of Environmental Quality. 31: 1868–1874.
Juntunen, M.L.; Hammar, T.; Rikala, R. 2003. Nitrogen and phosphorus leaching and uptake by container birch seedlings (Betula pendula Roth) grown in three different fertilizations. New Forests. 25: 133–147.
Lambany, G.; Renaud, M.; Beauchesne, M. 1997. Control of growing medium water content and its effect on small seedlings grown in large containers. Tree Planters’ Notes. 48(3/4): 48–54.
Lambany, G.; Robidas, L.; Ballester, P. 1996. Measurement of soil water content in a peat-vermiculite medium using time domain reflectometry (TDR): a laboratory and field evaluation. Tree Planters’ Notes. 47(3): 88–93.
Lamhamedi, M.S.; Labbé, L.; Margolis, H.A.; Stowe, D.C.; Blais, L.; Renaud, M. 2006. Spatial variability of substrate water content and growth of white spruce seedlings. Soil Science Society American Journal. 70: 108–120.
Lamhamedi, M.S.; Lambany, G.; Margolis, H.; Renaud, M.; Veilleux, L.; Bernier, P-Y. 2001. Growth, physiology and leachate losses in Picea glauca seedlings (1 + 0) grown in air-slit containers under different irrigation regimes. Canadian Journal of Forest Research. 31(11): 1968–1980.
Lamhamedi, M.S.; Margolis, H.; Renaud, M.; Veilleux, L.; Auger, I. 2003. Effets de différentes régies d’irrigation sur la croissance, la nutrition minérale et le lessivage des éléments nutritifs des semis d’épinette noire (1 + 0) produits en récipients à parois ajourées en pépinière forestière. Canadian Journal of Forest Research. 33: 1–14.
Lamhamedi, M.S.; Renaud, M.; Margolis, H.A. 2002. La réflec-tométrie dans le domaine temporel: une technique d’optimisation de l’irrigation et de réduction du lessivage en pépinières forestières au Québec. Cahiers Agricultures. 11: 275–283.
Landis, T.D.; Campbell, S.; Zensen, F. 1991. Agricultural pollution of surface water and groundwater in forest nurseries. In: Landis, T.D., tech. coord. Proceedings, intermountain forest nursery associations—1991. Gen. Tech. Rep. RM-211. Fort Collins, CO: U.S. Department of Agriculture, Forest Service, Rocky Mountain Forest and Range Experimental Station: 1–15.
Langlois, C.G.; Gagnon, J. 1993. A global approach to mineral nutrition based on the growth needs of seedlings produced in forest tree nurseries. In: Barrow, N.J., ed. Plant nutrition: from genetic engineering to field practice. Dordrecht, The Netherlands: Kluwer Academic Publishers: 303–306.

34 Tree Planters’ Notes
Park, B.B.; Cho, M.S.; Lee, S.W.; Yanai, R.D.; Lee, D.K. 2012. Minimizing nutrient leaching and improving nutrient use efficiency of Liriodentron tulipifera and Larix leptolepis in a container nursery system. New Forests. 43(1): 57–68.
Pepper, I.L.; Gerba, C.P.; Brusseau, M.L.; Brendecke, J.W. 1996. Pollution science. San Diego: Academic Press. 397 p.
Stevenson, F.J. 1982. Nitrogen in agricultural soils. Agronomy Monograph 22. Madison, WI: American Society of Agronomy. 940 p.
Stowe, D.C.; Lamhamedi, M.S.; Carles, S.; Fecteau, B.; Margolis, H.A.; Renaud, M.; Bernier, P.Y. 2010. Managing irrigation to reduce nutrient leaching in containerized white spruce seedling production. New Forests. 40: 185–204.
Topp, G.C.; Davis, J.L. 1985. Measurement of soil water content using time-domain reflectrometry (TDR): a field evaluation. Soil Science Society of America Journal. 49(1): 19–24.
U.S. Environmental Protection Agency (EPA). 2009. Drinking water contaminants – Standards and Regulations. http://www.epa.gov/safewater/contaminants/index.html - listmcl. (May 2018).
Veilleux, P.; Allard, J.Y.; Bart, F.; Gingras, B.M.; Boyer Groulx, D.; Labrecque, D.; Murray, A. 2014. Inventaire de qualification des plants résineux cultivés en récipients. Guide terrain. Québec City, Canada: Ministère des Ressources naturelles du Québec, Direction générale de la production de semences et de plants forestiers. 141 p.
Volume 61, Number 2 (Fall 2018) 35
Performance of Four Planted Conifer Species Within Artificial Canopy Gaps in a
Western Washington Douglas-Fir ForestTimothy B. Harrington and Warren D. Devine
Research Forester, U.S. Department of Agriculture, Forest Service, Pacific Northwest Research Station, Olympia Forestry Sciences Laboratory, Olympia, WA; Data Management Specialist, Washington State Department of Natural
Resources, Forest Resources Division, Olympia, WA
Abstract
Regeneration performance of planted grand fir (Abies grandis [Dougl. ex D. Don] Lindl.), coast Douglas-fir (Pseudotsuga menziesii [Mirb.] Franco var. menziesii), western redcedar (Thuja plicata Donn ex D. Don), and western hemlock (Tsuga heterophylla [Raf.] Sarg.) seedlings was studied for 3 years within artificial can-opy gaps in a mature Douglas-fir forest near Tacoma, WA. Third-year survival of Douglas-fir and western redcedar did not vary with gap size, but peak surviv-al of grand fir and western hemlock occurred at gap sizes of 0.13 and 0.14 ha (0.32 and 0.35 ac), respec-tively. Peak values of stem diameter occurred within a narrow range of gap sizes for all species. Because of their larger initial size and superior performance across a range of gap sizes, Douglas-fir and west-ern redcedar were concluded to be the most suitable species for group selection on droughty, glacial-origin soils of western Washington.
Introduction
Coast Douglas-fir (Pseudotsuga menziesii [Mirb.] Fran-co var. menziesii) began to colonize the prairies of Joint Base Lewis-McChord (JBLM), a U.S. military instal-lation near Tacoma, WA, in the mid-1800s after sus-pension of burning by Native Americans. From about 1878 to 1938, Douglas-fir density at JBLM increased in waves associated with low-intensity fires having return intervals of 10 to 91 years (Peter and Harrington 2014). Today, many of the 12,000 ha (29,640 ac) of prairie-colonization forests at JBLM have developed secondary forest characteristics, including a diverse understory of herbaceous, shrub, and hardwood species and a forest floor of decomposing tree litter and coarse
woody debris (Foster and Schaff 2003). Because these prairie-colonization forests developed on droughty, glacial-origin soils, natural regeneration of conifers is often variable in distribution and development.
The diverse array of management objectives associ-ated with the mission of JBLM (e.g., diverse cover types needed for military training, wildlife habitat, and timber management) has prompted land managers to preferentially select uneven-aged regeneration methods over even-aged methods. Light availability, however, can be an important factor limiting growth of coni-fer seedlings in uneven-aged methods because of the inherent juxtaposition of mature trees and seedlings (Brodie and DeBell 2013, Harrington 2006). Cre-ation of artificial canopy gaps using the uneven-aged, group-selection method of regeneration avoids some of the light limitations, because much of the regener-ation will occur near the center of the openings where shading from overstory trees is less (Tappeiner et al. 2015). Hence, species exhibiting a wide range of shade tolerances can be regenerated with group selection. Isaac (1943) recommended openings of 0.4 ha (1 ac) or larger for natural regeneration of Douglas-fir.
From a silvicultural perspective, shade tolerances of common Northwestern conifers can be ranked as follows: Douglas-fir ≤ grand fir (Abies grandis [Dougl. ex D. Don] Lindl.) << western redcedar (Thuja plicata Donn ex D. Don) < western hemlock (Tsuga hetero-phylla [Raf.] Sarg.) (Burns and Honkala 1990, Daniel et al. 1979, Minore 1979). Douglas-fir seedlings need greater than 20 percent of full sunlight to survive, at least 40 percent for continued morphological devel-opment (Mailly and Kimmins 1997), and full sunlight for maximum growth rates (Drever and Lertzman 2001). In contrast, western redcedar seedlings require
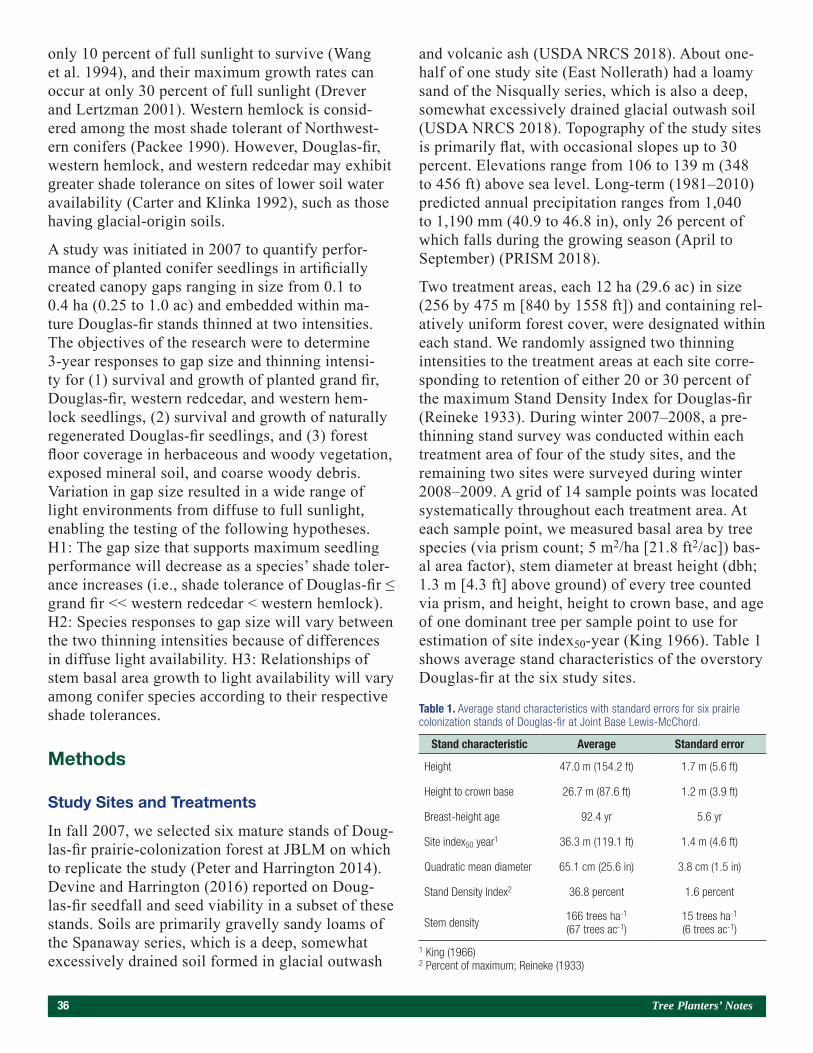
36 Tree Planters’ Notes
only 10 percent of full sunlight to survive (Wang et al. 1994), and their maximum growth rates can occur at only 30 percent of full sunlight (Drever and Lertzman 2001). Western hemlock is consid-ered among the most shade tolerant of Northwest-ern conifers (Packee 1990). However, Douglas-fir, western hemlock, and western redcedar may exhibit greater shade tolerance on sites of lower soil water availability (Carter and Klinka 1992), such as those having glacial-origin soils.
A study was initiated in 2007 to quantify perfor-mance of planted conifer seedlings in artificially created canopy gaps ranging in size from 0.1 to 0.4 ha (0.25 to 1.0 ac) and embedded within ma-ture Douglas-fir stands thinned at two intensities. The objectives of the research were to determine 3-year responses to gap size and thinning intensi-ty for (1) survival and growth of planted grand fir, Douglas-fir, western redcedar, and western hem-lock seedlings, (2) survival and growth of naturally regenerated Douglas-fir seedlings, and (3) forest floor coverage in herbaceous and woody vegetation, exposed mineral soil, and coarse woody debris. Variation in gap size resulted in a wide range of light environments from diffuse to full sunlight, enabling the testing of the following hypotheses. H1: The gap size that supports maximum seedling performance will decrease as a species’ shade toler-ance increases (i.e., shade tolerance of Douglas-fir ≤ grand fir << western redcedar < western hemlock). H2: Species responses to gap size will vary between the two thinning intensities because of differences in diffuse light availability. H3: Relationships of stem basal area growth to light availability will vary among conifer species according to their respective shade tolerances.
Methods
Study Sites and Treatments
In fall 2007, we selected six mature stands of Doug-las-fir prairie-colonization forest at JBLM on which to replicate the study (Peter and Harrington 2014). Devine and Harrington (2016) reported on Doug-las-fir seedfall and seed viability in a subset of these stands. Soils are primarily gravelly sandy loams of the Spanaway series, which is a deep, somewhat excessively drained soil formed in glacial outwash
and volcanic ash (USDA NRCS 2018). About one-half of one study site (East Nollerath) had a loamy sand of the Nisqually series, which is also a deep, somewhat excessively drained glacial outwash soil (USDA NRCS 2018). Topography of the study sites is primarily flat, with occasional slopes up to 30 percent. Elevations range from 106 to 139 m (348 to 456 ft) above sea level. Long-term (1981–2010) predicted annual precipitation ranges from 1,040 to 1,190 mm (40.9 to 46.8 in), only 26 percent of which falls during the growing season (April to September) (PRISM 2018).
Two treatment areas, each 12 ha (29.6 ac) in size (256 by 475 m [840 by 1558 ft]) and containing rel-atively uniform forest cover, were designated within each stand. We randomly assigned two thinning intensities to the treatment areas at each site corre-sponding to retention of either 20 or 30 percent of the maximum Stand Density Index for Douglas-fir (Reineke 1933). During winter 2007–2008, a pre-thinning stand survey was conducted within each treatment area of four of the study sites, and the remaining two sites were surveyed during winter 2008–2009. A grid of 14 sample points was located systematically throughout each treatment area. At each sample point, we measured basal area by tree species (via prism count; 5 m2/ha [21.8 ft2/ac]) bas-al area factor), stem diameter at breast height (dbh; 1.3 m [4.3 ft] above ground) of every tree counted via prism, and height, height to crown base, and age of one dominant tree per sample point to use for estimation of site index50-year (King 1966). Table 1 shows average stand characteristics of the overstory Douglas-fir at the six study sites.
Stand characteristic Average Standard error
Height 47.0 m (154.2 ft) 1.7 m (5.6 ft)
Height to crown base 26.7 m (87.6 ft) 1.2 m (3.9 ft)
Breast-height age 92.4 yr 5.6 yr
Site index50 year1 36.3 m (119.1 ft) 1.4 m (4.6 ft)
Quadratic mean diameter 65.1 cm (25.6 in) 3.8 cm (1.5 in)
Stand Density Index2 36.8 percent 1.6 percent
Stem density 166 trees ha-1 (67 trees ac-1)
15 trees ha-1 (6 trees ac-1)
Table 1. Average stand characteristics with standard errors for six prairie colonization stands of Douglas-fir at Joint Base Lewis-McChord.
1 King (1966)2 Percent of maximum; Reineke (1933)
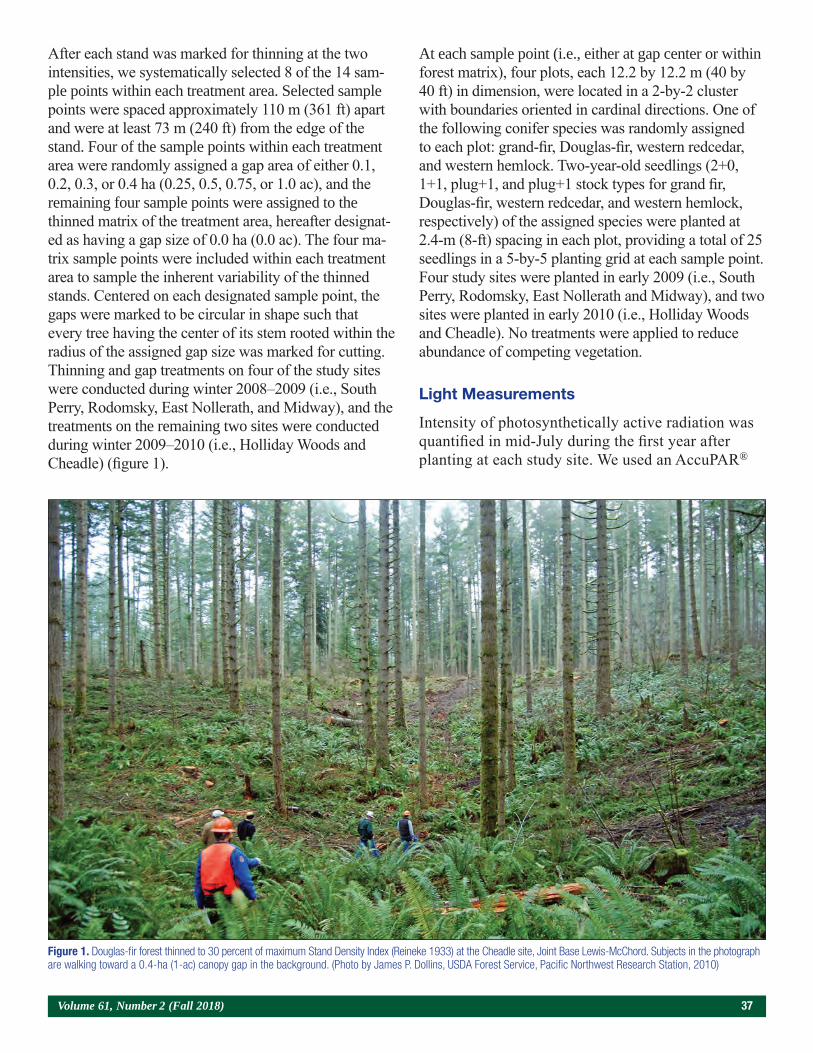
Volume 61, Number 2 (Fall 2018) 37
After each stand was marked for thinning at the two intensities, we systematically selected 8 of the 14 sam-ple points within each treatment area. Selected sample points were spaced approximately 110 m (361 ft) apart and were at least 73 m (240 ft) from the edge of the stand. Four of the sample points within each treatment area were randomly assigned a gap area of either 0.1, 0.2, 0.3, or 0.4 ha (0.25, 0.5, 0.75, or 1.0 ac), and the remaining four sample points were assigned to the thinned matrix of the treatment area, hereafter designat-ed as having a gap size of 0.0 ha (0.0 ac). The four ma-trix sample points were included within each treatment area to sample the inherent variability of the thinned stands. Centered on each designated sample point, the gaps were marked to be circular in shape such that every tree having the center of its stem rooted within the radius of the assigned gap size was marked for cutting. Thinning and gap treatments on four of the study sites were conducted during winter 2008–2009 (i.e., South Perry, Rodomsky, East Nollerath, and Midway), and the treatments on the remaining two sites were conducted during winter 2009–2010 (i.e., Holliday Woods and Cheadle) (figure 1).
At each sample point (i.e., either at gap center or within forest matrix), four plots, each 12.2 by 12.2 m (40 by 40 ft) in dimension, were located in a 2-by-2 cluster with boundaries oriented in cardinal directions. One of the following conifer species was randomly assigned to each plot: grand-fir, Douglas-fir, western redcedar, and western hemlock. Two-year-old seedlings (2+0, 1+1, plug+1, and plug+1 stock types for grand fir, Douglas-fir, western redcedar, and western hemlock, respectively) of the assigned species were planted at 2.4-m (8-ft) spacing in each plot, providing a total of 25 seedlings in a 5-by-5 planting grid at each sample point. Four study sites were planted in early 2009 (i.e., South Perry, Rodomsky, East Nollerath and Midway), and two sites were planted in early 2010 (i.e., Holliday Woods and Cheadle). No treatments were applied to reduce abundance of competing vegetation.
Light Measurements
Intensity of photosynthetically active radiation was quantified in mid-July during the first year after planting at each study site. We used an AccuPAR®
Figure 1. Douglas-fir forest thinned to 30 percent of maximum Stand Density Index (Reineke 1933) at the Cheadle site, Joint Base Lewis-McChord. Subjects in the photograph are walking toward a 0.4-ha (1-ac) canopy gap in the background. (Photo by James P. Dollins, USDA Forest Service, Pacific Northwest Research Station, 2010)
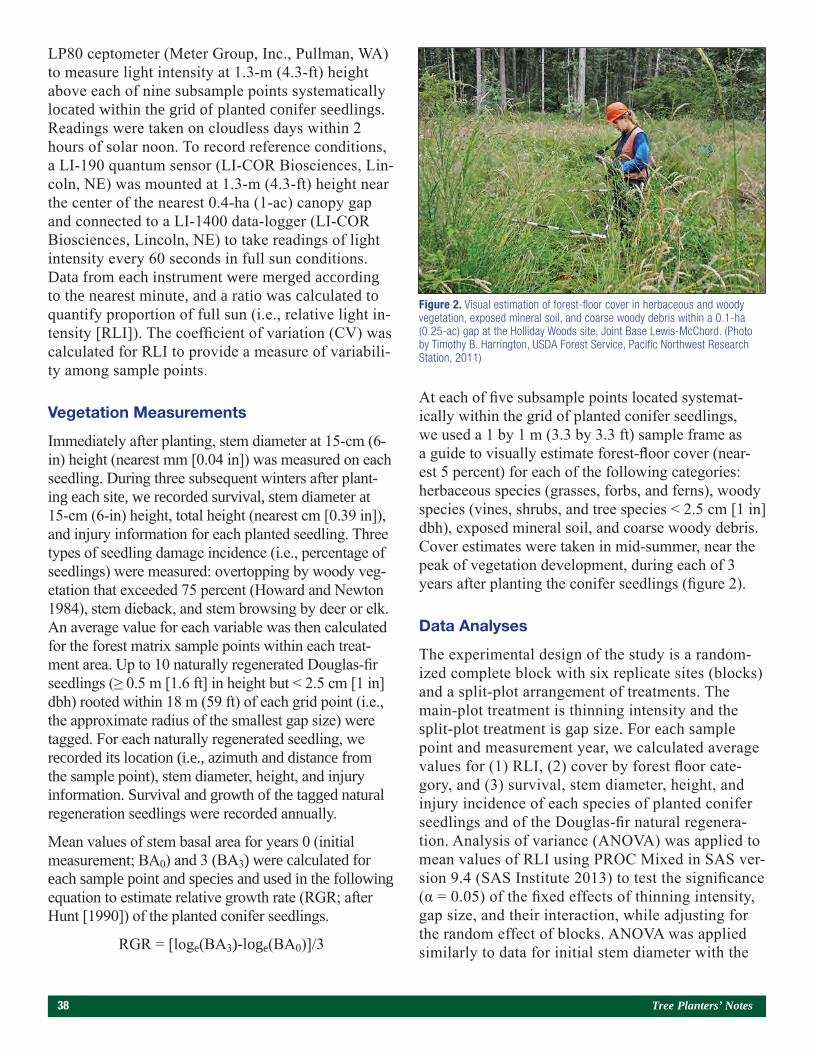
38 Tree Planters’ Notes
LP80 ceptometer (Meter Group, Inc., Pullman, WA) to measure light intensity at 1.3-m (4.3-ft) height above each of nine subsample points systematically located within the grid of planted conifer seedlings. Readings were taken on cloudless days within 2 hours of solar noon. To record reference conditions, a LI-190 quantum sensor (LI-COR Biosciences, Lin-coln, NE) was mounted at 1.3-m (4.3-ft) height near the center of the nearest 0.4-ha (1-ac) canopy gap and connected to a LI-1400 data-logger (LI-COR Biosciences, Lincoln, NE) to take readings of light intensity every 60 seconds in full sun conditions. Data from each instrument were merged according to the nearest minute, and a ratio was calculated to quantify proportion of full sun (i.e., relative light in-tensity [RLI]). The coefficient of variation (CV) was calculated for RLI to provide a measure of variabili-ty among sample points.
Vegetation Measurements
Immediately after planting, stem diameter at 15-cm (6-in) height (nearest mm [0.04 in]) was measured on each seedling. During three subsequent winters after plant-ing each site, we recorded survival, stem diameter at 15-cm (6-in) height, total height (nearest cm [0.39 in]), and injury information for each planted seedling. Three types of seedling damage incidence (i.e., percentage of seedlings) were measured: overtopping by woody veg-etation that exceeded 75 percent (Howard and Newton 1984), stem dieback, and stem browsing by deer or elk. An average value for each variable was then calculated for the forest matrix sample points within each treat-ment area. Up to 10 naturally regenerated Douglas-fir seedlings (≥ 0.5 m [1.6 ft] in height but < 2.5 cm [1 in] dbh) rooted within 18 m (59 ft) of each grid point (i.e., the approximate radius of the smallest gap size) were tagged. For each naturally regenerated seedling, we recorded its location (i.e., azimuth and distance from the sample point), stem diameter, height, and injury information. Survival and growth of the tagged natural regeneration seedlings were recorded annually.
Mean values of stem basal area for years 0 (initial measurement; BA0) and 3 (BA3) were calculated for each sample point and species and used in the following equation to estimate relative growth rate (RGR; after Hunt [1990]) of the planted conifer seedlings.
RGR = [loge(BA3)-loge(BA0)]/3
At each of five subsample points located systemat-ically within the grid of planted conifer seedlings, we used a 1 by 1 m (3.3 by 3.3 ft) sample frame as a guide to visually estimate forest-floor cover (near-est 5 percent) for each of the following categories: herbaceous species (grasses, forbs, and ferns), woody species (vines, shrubs, and tree species < 2.5 cm [1 in] dbh), exposed mineral soil, and coarse woody debris. Cover estimates were taken in mid-summer, near the peak of vegetation development, during each of 3 years after planting the conifer seedlings (figure 2).
Data Analyses
The experimental design of the study is a random-ized complete block with six replicate sites (blocks) and a split-plot arrangement of treatments. The main-plot treatment is thinning intensity and the split-plot treatment is gap size. For each sample point and measurement year, we calculated average values for (1) RLI, (2) cover by forest floor cate-gory, and (3) survival, stem diameter, height, and injury incidence of each species of planted conifer seedlings and of the Douglas-fir natural regenera-tion. Analysis of variance (ANOVA) was applied to mean values of RLI using PROC Mixed in SAS ver-sion 9.4 (SAS Institute 2013) to test the significance (α = 0.05) of the fixed effects of thinning intensity, gap size, and their interaction, while adjusting for the random effect of blocks. ANOVA was applied similarly to data for initial stem diameter with the
Figure 2. Visual estimation of forest-floor cover in herbaceous and woody vegetation, exposed mineral soil, and coarse woody debris within a 0.1-ha (0.25-ac) gap at the Holliday Woods site, Joint Base Lewis-McChord. (Photo by Timothy B. Harrington, USDA Forest Service, Pacific Northwest Research Station, 2011)
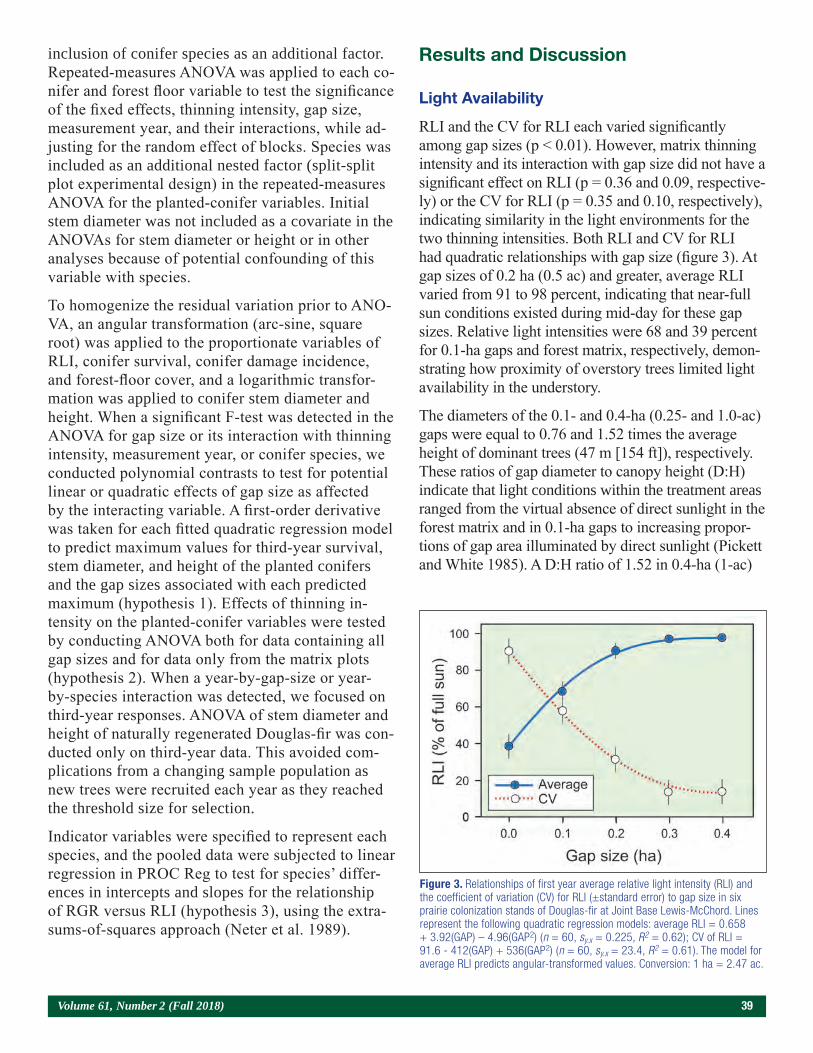
Volume 61, Number 2 (Fall 2018) 39
inclusion of conifer species as an additional factor. Repeated-measures ANOVA was applied to each co-nifer and forest floor variable to test the significance of the fixed effects, thinning intensity, gap size, measurement year, and their interactions, while ad-justing for the random effect of blocks. Species was included as an additional nested factor (split-split plot experimental design) in the repeated-measures ANOVA for the planted-conifer variables. Initial stem diameter was not included as a covariate in the ANOVAs for stem diameter or height or in other analyses because of potential confounding of this variable with species.
To homogenize the residual variation prior to ANO-VA, an angular transformation (arc-sine, square root) was applied to the proportionate variables of RLI, conifer survival, conifer damage incidence, and forest-floor cover, and a logarithmic transfor-mation was applied to conifer stem diameter and height. When a significant F-test was detected in the ANOVA for gap size or its interaction with thinning intensity, measurement year, or conifer species, we conducted polynomial contrasts to test for potential linear or quadratic effects of gap size as affected by the interacting variable. A first-order derivative was taken for each fitted quadratic regression model to predict maximum values for third-year survival, stem diameter, and height of the planted conifers and the gap sizes associated with each predicted maximum (hypothesis 1). Effects of thinning in-tensity on the planted-conifer variables were tested by conducting ANOVA both for data containing all gap sizes and for data only from the matrix plots (hypothesis 2). When a year-by-gap-size or year-by-species interaction was detected, we focused on third-year responses. ANOVA of stem diameter and height of naturally regenerated Douglas-fir was con-ducted only on third-year data. This avoided com-plications from a changing sample population as new trees were recruited each year as they reached the threshold size for selection.
Indicator variables were specified to represent each species, and the pooled data were subjected to linear regression in PROC Reg to test for species’ differ-ences in intercepts and slopes for the relationship of RGR versus RLI (hypothesis 3), using the extra-sums-of-squares approach (Neter et al. 1989).
Results and Discussion
Light Availability
RLI and the CV for RLI each varied significantly among gap sizes (p < 0.01). However, matrix thinning intensity and its interaction with gap size did not have a significant effect on RLI (p = 0.36 and 0.09, respective-ly) or the CV for RLI (p = 0.35 and 0.10, respectively), indicating similarity in the light environments for the two thinning intensities. Both RLI and CV for RLI had quadratic relationships with gap size (figure 3). At gap sizes of 0.2 ha (0.5 ac) and greater, average RLI varied from 91 to 98 percent, indicating that near-full sun conditions existed during mid-day for these gap sizes. Relative light intensities were 68 and 39 percent for 0.1-ha gaps and forest matrix, respectively, demon-strating how proximity of overstory trees limited light availability in the understory.
The diameters of the 0.1- and 0.4-ha (0.25- and 1.0-ac) gaps were equal to 0.76 and 1.52 times the average height of dominant trees (47 m [154 ft]), respectively. These ratios of gap diameter to canopy height (D:H) indicate that light conditions within the treatment areas ranged from the virtual absence of direct sunlight in the forest matrix and in 0.1-ha gaps to increasing propor-tions of gap area illuminated by direct sunlight (Pickett and White 1985). A D:H ratio of 1.52 in 0.4-ha (1-ac)
Figure 3. Relationships of first year average relative light intensity (RLI) and the coefficient of variation (CV) for RLI (±standard error) to gap size in six prairie colonization stands of Douglas-fir at Joint Base Lewis-McChord. Lines represent the following quadratic regression models: average RLI = 0.658 + 3.92(GAP) – 4.96(GAP2) (n = 60, sy.x = 0.225, R2 = 0.62); CV of RLI = 91.6 - 412(GAP) + 536(GAP2) (n = 60, sy.x = 23.4, R2 = 0.61). The model for average RLI predicts angular-transformed values. Conversion: 1 ha = 2.47 ac.
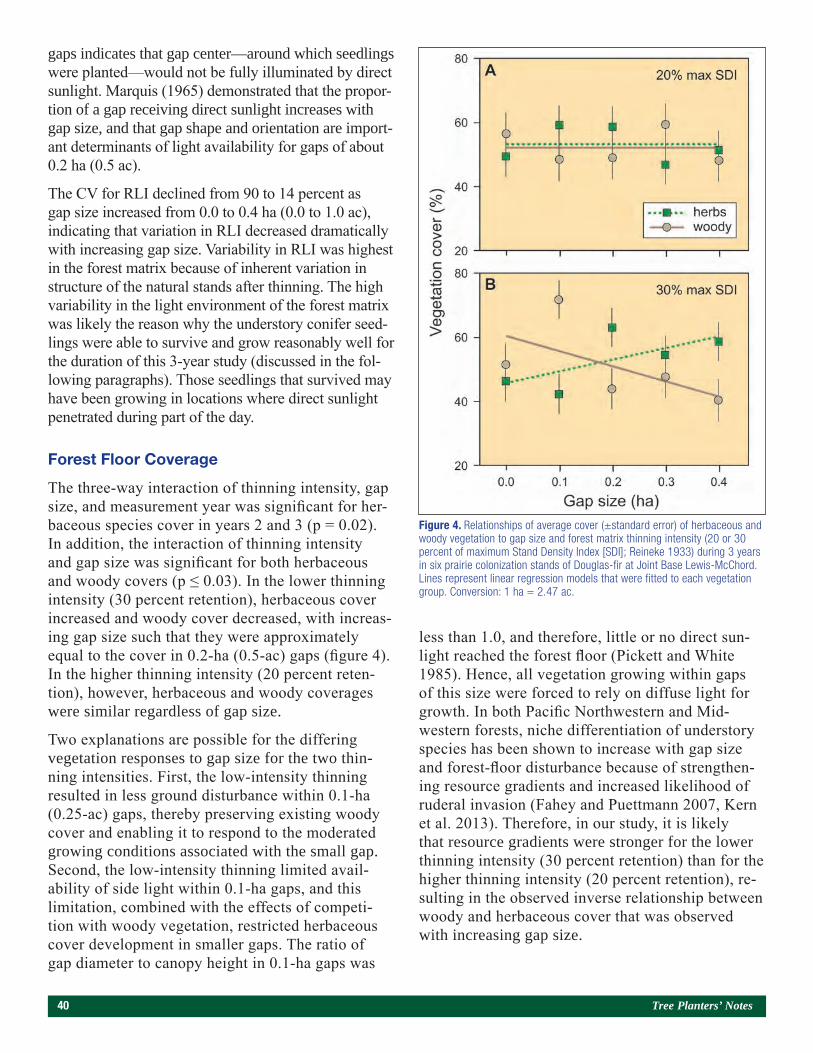
40 Tree Planters’ Notes
gaps indicates that gap center—around which seedlings were planted—would not be fully illuminated by direct sunlight. Marquis (1965) demonstrated that the propor-tion of a gap receiving direct sunlight increases with gap size, and that gap shape and orientation are import-ant determinants of light availability for gaps of about 0.2 ha (0.5 ac).
The CV for RLI declined from 90 to 14 percent as gap size increased from 0.0 to 0.4 ha (0.0 to 1.0 ac), indicating that variation in RLI decreased dramatically with increasing gap size. Variability in RLI was highest in the forest matrix because of inherent variation in structure of the natural stands after thinning. The high variability in the light environment of the forest matrix was likely the reason why the understory conifer seed-lings were able to survive and grow reasonably well for the duration of this 3-year study (discussed in the fol-lowing paragraphs). Those seedlings that survived may have been growing in locations where direct sunlight penetrated during part of the day.
Forest Floor Coverage
The three-way interaction of thinning intensity, gap size, and measurement year was significant for her-baceous species cover in years 2 and 3 (p = 0.02). In addition, the interaction of thinning intensity and gap size was significant for both herbaceous and woody covers (p ≤ 0.03). In the lower thinning intensity (30 percent retention), herbaceous cover increased and woody cover decreased, with increas-ing gap size such that they were approximately equal to the cover in 0.2-ha (0.5-ac) gaps (figure 4). In the higher thinning intensity (20 percent reten-tion), however, herbaceous and woody coverages were similar regardless of gap size.
Two explanations are possible for the differing vegetation responses to gap size for the two thin-ning intensities. First, the low-intensity thinning resulted in less ground disturbance within 0.1-ha (0.25-ac) gaps, thereby preserving existing woody cover and enabling it to respond to the moderated growing conditions associated with the small gap. Second, the low-intensity thinning limited avail-ability of side light within 0.1-ha gaps, and this limitation, combined with the effects of competi-tion with woody vegetation, restricted herbaceous cover development in smaller gaps. The ratio of gap diameter to canopy height in 0.1-ha gaps was
less than 1.0, and therefore, little or no direct sun-light reached the forest floor (Pickett and White 1985). Hence, all vegetation growing within gaps of this size were forced to rely on diffuse light for growth. In both Pacific Northwestern and Mid-western forests, niche differentiation of understory species has been shown to increase with gap size and forest-floor disturbance because of strengthen-ing resource gradients and increased likelihood of ruderal invasion (Fahey and Puettmann 2007, Kern et al. 2013). Therefore, in our study, it is likely that resource gradients were stronger for the lower thinning intensity (30 percent retention) than for the higher thinning intensity (20 percent retention), re-sulting in the observed inverse relationship between woody and herbaceous cover that was observed with increasing gap size.
Figure 4. Relationships of average cover (±standard error) of herbaceous and woody vegetation to gap size and forest matrix thinning intensity (20 or 30 percent of maximum Stand Density Index [SDI]; Reineke 1933) during 3 years in six prairie colonization stands of Douglas-fir at Joint Base Lewis-McChord. Lines represent linear regression models that were fitted to each vegetation group. Conversion: 1 ha = 2.47 ac.
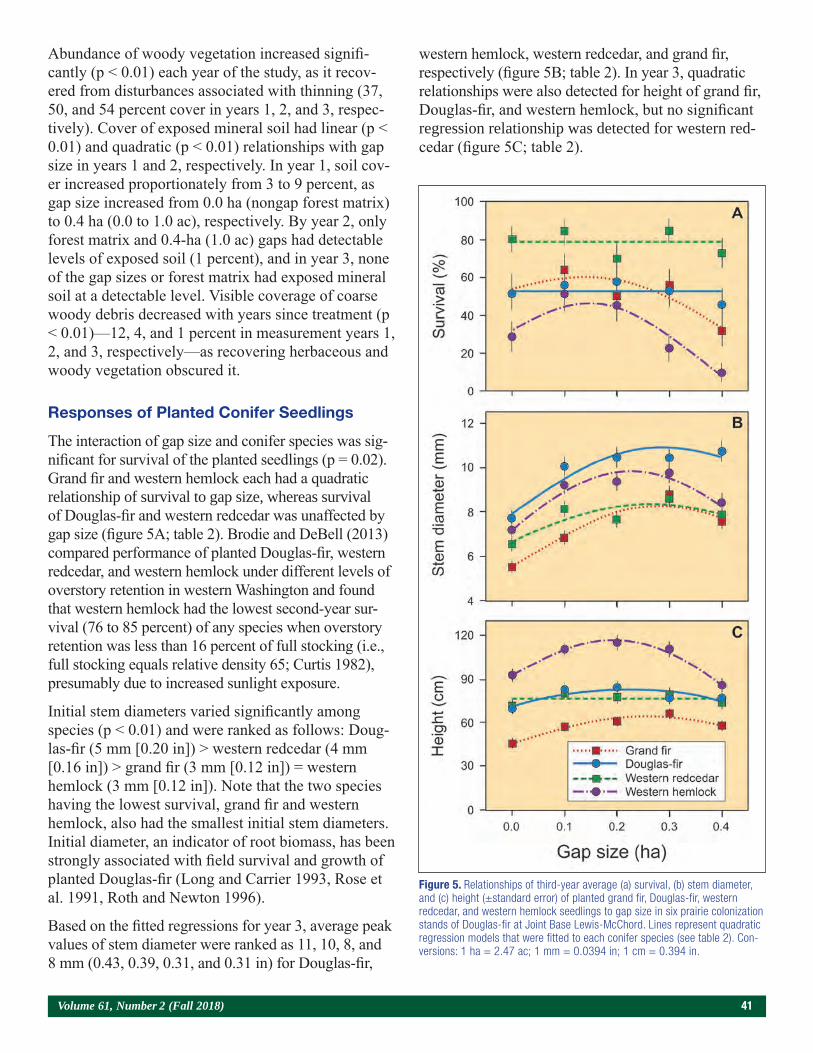
Volume 61, Number 2 (Fall 2018) 41
Abundance of woody vegetation increased signifi-cantly (p < 0.01) each year of the study, as it recov-ered from disturbances associated with thinning (37, 50, and 54 percent cover in years 1, 2, and 3, respec-tively). Cover of exposed mineral soil had linear (p < 0.01) and quadratic (p < 0.01) relationships with gap size in years 1 and 2, respectively. In year 1, soil cov-er increased proportionately from 3 to 9 percent, as gap size increased from 0.0 ha (nongap forest matrix) to 0.4 ha (0.0 to 1.0 ac), respectively. By year 2, only forest matrix and 0.4-ha (1.0 ac) gaps had detectable levels of exposed soil (1 percent), and in year 3, none of the gap sizes or forest matrix had exposed mineral soil at a detectable level. Visible coverage of coarse woody debris decreased with years since treatment (p < 0.01)—12, 4, and 1 percent in measurement years 1, 2, and 3, respectively—as recovering herbaceous and woody vegetation obscured it.
Responses of Planted Conifer Seedlings
The interaction of gap size and conifer species was sig-nificant for survival of the planted seedlings (p = 0.02). Grand fir and western hemlock each had a quadratic relationship of survival to gap size, whereas survival of Douglas-fir and western redcedar was unaffected by gap size (figure 5A; table 2). Brodie and DeBell (2013) compared performance of planted Douglas-fir, western redcedar, and western hemlock under different levels of overstory retention in western Washington and found that western hemlock had the lowest second-year sur-vival (76 to 85 percent) of any species when overstory retention was less than 16 percent of full stocking (i.e., full stocking equals relative density 65; Curtis 1982), presumably due to increased sunlight exposure.
Initial stem diameters varied significantly among species (p < 0.01) and were ranked as follows: Doug-las-fir (5 mm [0.20 in]) > western redcedar (4 mm [0.16 in]) > grand fir (3 mm [0.12 in]) = western hemlock (3 mm [0.12 in]). Note that the two species having the lowest survival, grand fir and western hemlock, also had the smallest initial stem diameters. Initial diameter, an indicator of root biomass, has been strongly associated with field survival and growth of planted Douglas-fir (Long and Carrier 1993, Rose et al. 1991, Roth and Newton 1996).
Based on the fitted regressions for year 3, average peak values of stem diameter were ranked as 11, 10, 8, and 8 mm (0.43, 0.39, 0.31, and 0.31 in) for Douglas-fir,
western hemlock, western redcedar, and grand fir, respectively (figure 5B; table 2). In year 3, quadratic relationships were also detected for height of grand fir, Douglas-fir, and western hemlock, but no significant regression relationship was detected for western red-cedar (figure 5C; table 2).
Figure 5. Relationships of third-year average (a) survival, (b) stem diameter, and (c) height (±standard error) of planted grand fir, Douglas-fir, western redcedar, and western hemlock seedlings to gap size in six prairie colonization stands of Douglas-fir at Joint Base Lewis-McChord. Lines represent quadratic regression models that were fitted to each conifer species (see table 2). Con-versions: 1 ha = 2.47 ac; 1 mm = 0.0394 in; 1 cm = 0.394 in.
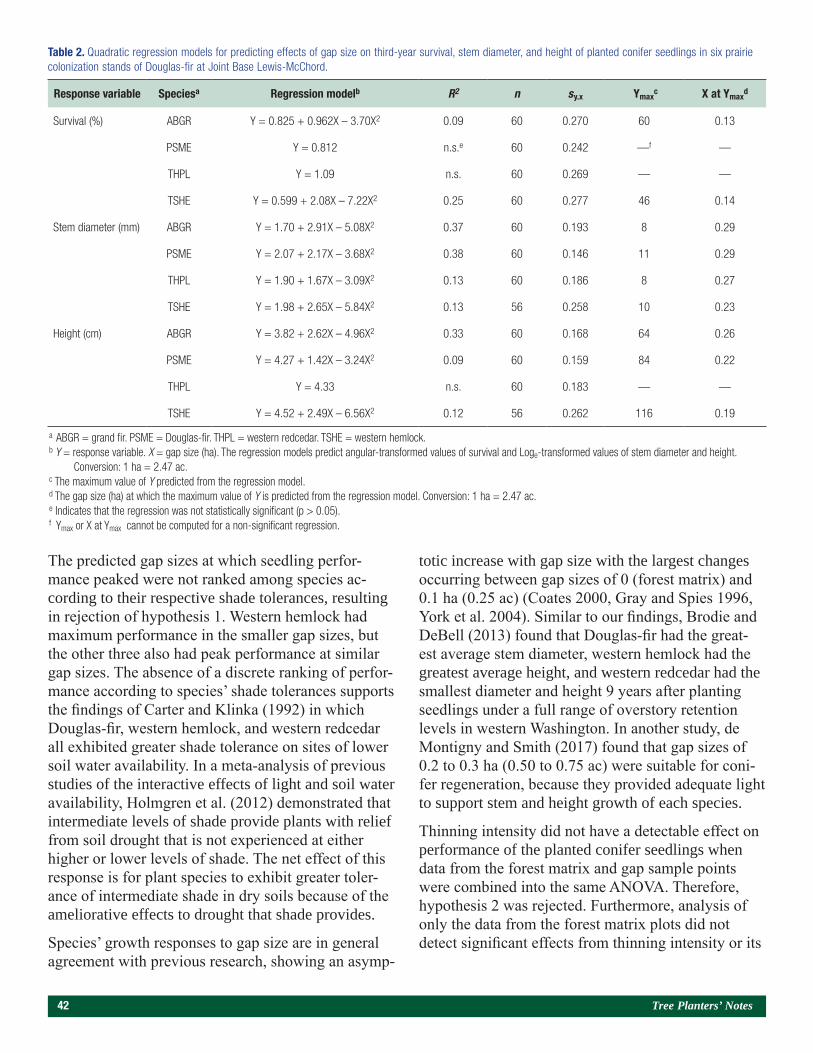
42 Tree Planters’ Notes
The predicted gap sizes at which seedling perfor-mance peaked were not ranked among species ac-cording to their respective shade tolerances, resulting in rejection of hypothesis 1. Western hemlock had maximum performance in the smaller gap sizes, but the other three also had peak performance at similar gap sizes. The absence of a discrete ranking of perfor-mance according to species’ shade tolerances supports the findings of Carter and Klinka (1992) in which Douglas-fir, western hemlock, and western redcedar all exhibited greater shade tolerance on sites of lower soil water availability. In a meta-analysis of previous studies of the interactive effects of light and soil water availability, Holmgren et al. (2012) demonstrated that intermediate levels of shade provide plants with relief from soil drought that is not experienced at either higher or lower levels of shade. The net effect of this response is for plant species to exhibit greater toler-ance of intermediate shade in dry soils because of the ameliorative effects to drought that shade provides.
Species’ growth responses to gap size are in general agreement with previous research, showing an asymp-
totic increase with gap size with the largest changes occurring between gap sizes of 0 (forest matrix) and 0.1 ha (0.25 ac) (Coates 2000, Gray and Spies 1996, York et al. 2004). Similar to our findings, Brodie and DeBell (2013) found that Douglas-fir had the great-est average stem diameter, western hemlock had the greatest average height, and western redcedar had the smallest diameter and height 9 years after planting seedlings under a full range of overstory retention levels in western Washington. In another study, de Montigny and Smith (2017) found that gap sizes of 0.2 to 0.3 ha (0.50 to 0.75 ac) were suitable for coni-fer regeneration, because they provided adequate light to support stem and height growth of each species.
Thinning intensity did not have a detectable effect on performance of the planted conifer seedlings when data from the forest matrix and gap sample points were combined into the same ANOVA. Therefore, hypothesis 2 was rejected. Furthermore, analysis of only the data from the forest matrix plots did not detect significant effects from thinning intensity or its
Table 2. Quadratic regression models for predicting effects of gap size on third-year survival, stem diameter, and height of planted conifer seedlings in six prairie colonization stands of Douglas-fir at Joint Base Lewis-McChord.
Response variable Speciesa Regression modelb R2 n sy.x Ymaxc X at Ymax
d
Survival (%) ABGR Y = 0.825 + 0.962X – 3.70X2 0.09 60 0.270 60 0.13
PSME Y = 0.812 n.s.e 60 0.242 —f —
THPL Y = 1.09 n.s. 60 0.269 — —
TSHE Y = 0.599 + 2.08X – 7.22X2 0.25 60 0.277 46 0.14
Stem diameter (mm) ABGR Y = 1.70 + 2.91X – 5.08X2 0.37 60 0.193 8 0.29
PSME Y = 2.07 + 2.17X – 3.68X2 0.38 60 0.146 11 0.29
THPL Y = 1.90 + 1.67X – 3.09X2 0.13 60 0.186 8 0.27
TSHE Y = 1.98 + 2.65X – 5.84X2 0.13 56 0.258 10 0.23
Height (cm) ABGR Y = 3.82 + 2.62X – 4.96X2 0.33 60 0.168 64 0.26
PSME Y = 4.27 + 1.42X – 3.24X2 0.09 60 0.159 84 0.22
THPL Y = 4.33 n.s. 60 0.183 — —
TSHE Y = 4.52 + 2.49X – 6.56X2 0.12 56 0.262 116 0.19
a ABGR = grand fir. PSME = Douglas-fir. THPL = western redcedar. TSHE = western hemlock.b Y = response variable. X = gap size (ha). The regression models predict angular-transformed values of survival and Loge-transformed values of stem diameter and height. Conversion: 1 ha = 2.47 ac.c The maximum value of Y predicted from the regression model.d The gap size (ha) at which the maximum value of Y is predicted from the regression model. Conversion: 1 ha = 2.47 ac. e Indicates that the regression was not statistically significant (p > 0.05).f Ymax or X at Ymax cannot be computed for a non-significant regression.
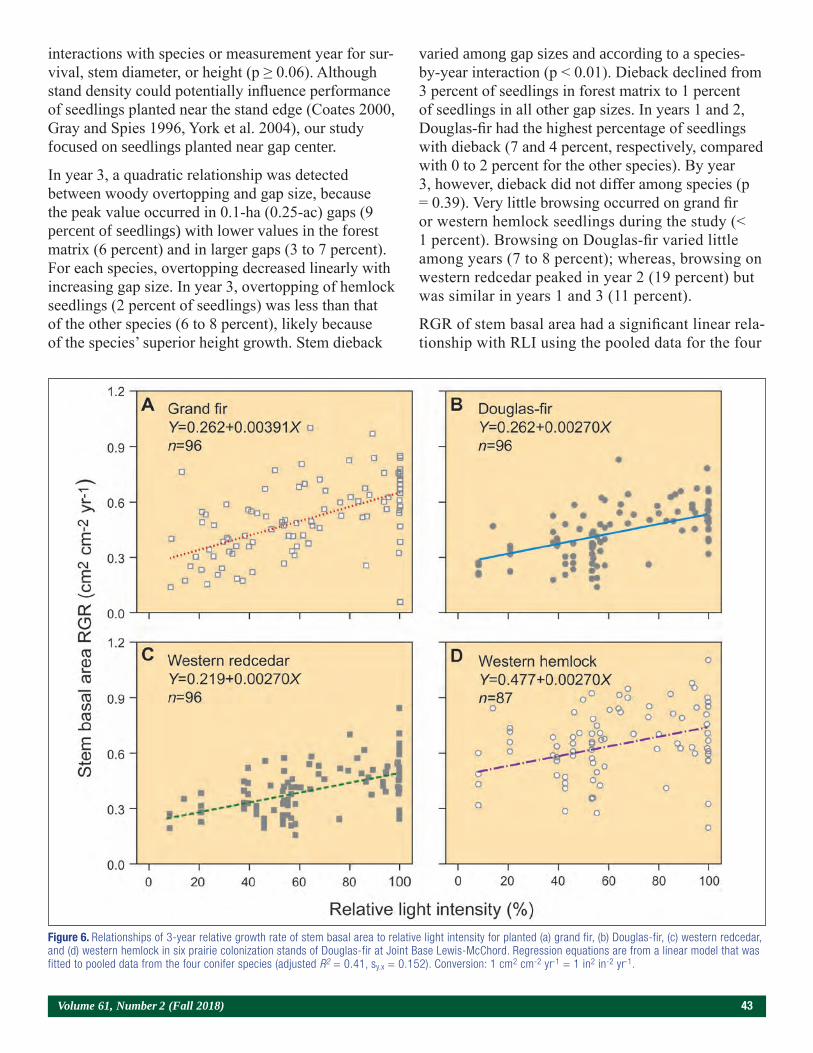
Volume 61, Number 2 (Fall 2018) 43
interactions with species or measurement year for sur-vival, stem diameter, or height (p ≥ 0.06). Although stand density could potentially influence performance of seedlings planted near the stand edge (Coates 2000, Gray and Spies 1996, York et al. 2004), our study focused on seedlings planted near gap center.
In year 3, a quadratic relationship was detected between woody overtopping and gap size, because the peak value occurred in 0.1-ha (0.25-ac) gaps (9 percent of seedlings) with lower values in the forest matrix (6 percent) and in larger gaps (3 to 7 percent). For each species, overtopping decreased linearly with increasing gap size. In year 3, overtopping of hemlock seedlings (2 percent of seedlings) was less than that of the other species (6 to 8 percent), likely because of the species’ superior height growth. Stem dieback
varied among gap sizes and according to a species-by-year interaction (p < 0.01). Dieback declined from 3 percent of seedlings in forest matrix to 1 percent of seedlings in all other gap sizes. In years 1 and 2, Douglas-fir had the highest percentage of seedlings with dieback (7 and 4 percent, respectively, compared with 0 to 2 percent for the other species). By year 3, however, dieback did not differ among species (p = 0.39). Very little browsing occurred on grand fir or western hemlock seedlings during the study (< 1 percent). Browsing on Douglas-fir varied little among years (7 to 8 percent); whereas, browsing on western redcedar peaked in year 2 (19 percent) but was similar in years 1 and 3 (11 percent).
RGR of stem basal area had a significant linear rela-tionship with RLI using the pooled data for the four
Figure 6. Relationships of 3-year relative growth rate of stem basal area to relative light intensity for planted (a) grand fir, (b) Douglas-fir, (c) western redcedar, and (d) western hemlock in six prairie colonization stands of Douglas-fir at Joint Base Lewis-McChord. Regression equations are from a linear model that was fitted to pooled data from the four conifer species (adjusted R2 = 0.41, sy.x = 0.152). Conversion: 1 cm2 cm-2 yr-1 = 1 in2 in-2 yr-1.
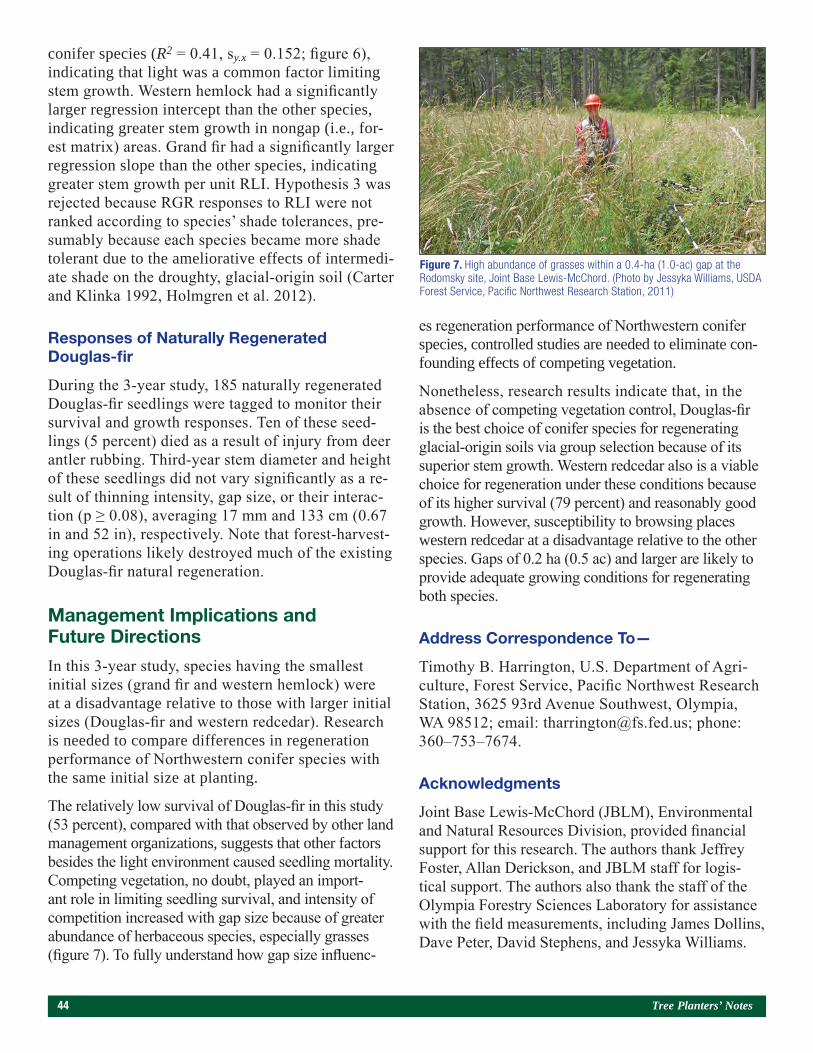
44 Tree Planters’ Notes
conifer species (R2 = 0.41, sy.x = 0.152; figure 6), indicating that light was a common factor limiting stem growth. Western hemlock had a significantly larger regression intercept than the other species, indicating greater stem growth in nongap (i.e., for-est matrix) areas. Grand fir had a significantly larger regression slope than the other species, indicating greater stem growth per unit RLI. Hypothesis 3 was rejected because RGR responses to RLI were not ranked according to species’ shade tolerances, pre-sumably because each species became more shade tolerant due to the ameliorative effects of intermedi-ate shade on the droughty, glacial-origin soil (Carter and Klinka 1992, Holmgren et al. 2012).
Responses of Naturally Regenerated Douglas-fir
During the 3-year study, 185 naturally regenerated Douglas-fir seedlings were tagged to monitor their survival and growth responses. Ten of these seed-lings (5 percent) died as a result of injury from deer antler rubbing. Third-year stem diameter and height of these seedlings did not vary significantly as a re-sult of thinning intensity, gap size, or their interac-tion (p ≥ 0.08), averaging 17 mm and 133 cm (0.67 in and 52 in), respectively. Note that forest-harvest-ing operations likely destroyed much of the existing Douglas-fir natural regeneration.
Management Implications and Future Directions
In this 3-year study, species having the smallest initial sizes (grand fir and western hemlock) were at a disadvantage relative to those with larger initial sizes (Douglas-fir and western redcedar). Research is needed to compare differences in regeneration performance of Northwestern conifer species with the same initial size at planting.
The relatively low survival of Douglas-fir in this study (53 percent), compared with that observed by other land management organizations, suggests that other factors besides the light environment caused seedling mortality. Competing vegetation, no doubt, played an import-ant role in limiting seedling survival, and intensity of competition increased with gap size because of greater abundance of herbaceous species, especially grasses (figure 7). To fully understand how gap size influenc-
es regeneration performance of Northwestern conifer species, controlled studies are needed to eliminate con-founding effects of competing vegetation.
Nonetheless, research results indicate that, in the absence of competing vegetation control, Douglas-fir is the best choice of conifer species for regenerating glacial-origin soils via group selection because of its superior stem growth. Western redcedar also is a viable choice for regeneration under these conditions because of its higher survival (79 percent) and reasonably good growth. However, susceptibility to browsing places western redcedar at a disadvantage relative to the other species. Gaps of 0.2 ha (0.5 ac) and larger are likely to provide adequate growing conditions for regenerating both species.
Address Correspondence To—
Timothy B. Harrington, U.S. Department of Agri-culture, Forest Service, Pacific Northwest Research Station, 3625 93rd Avenue Southwest, Olympia, WA 98512; email: [email protected]; phone: 360–753–7674.
Acknowledgments
Joint Base Lewis-McChord (JBLM), Environmental and Natural Resources Division, provided financial support for this research. The authors thank Jeffrey Foster, Allan Derickson, and JBLM staff for logis-tical support. The authors also thank the staff of the Olympia Forestry Sciences Laboratory for assistance with the field measurements, including James Dollins, Dave Peter, David Stephens, and Jessyka Williams.
Figure 7. High abundance of grasses within a 0.4-ha (1.0-ac) gap at the Rodomsky site, Joint Base Lewis-McChord. (Photo by Jessyka Williams, USDA Forest Service, Pacific Northwest Research Station, 2011)

Volume 61, Number 2 (Fall 2018) 45
REFERENCES
Brodie, L.C.; DeBell, D.S. 2013. Residual densities affect growth of overstory trees and planted Douglas-fir, western hemlock, and western redcedar: results from the first decade. Western Journal of Applied Forestry. 28(3): 121–127.
Burns, R.M.; Honkala, B.H., tech. coords. 1990. Silvics of North America. 1: Conifers. Agric. Handb. 654. Washington, DC: U.S. Department of Agriculture, Forest Service. 877 p.
Carter, R.E.; Klinka, K. 1992. Variation in shade tolerance of Doug-las-fir, western hemlock, and western red cedar in coastal British Columbia. Forest Ecology and Management. 55(1–4): 87–105.
Coates, K.D. 2000. Conifer seedling response to northern tem-perate forest gaps. Forest Ecology and Management. 127(1–3): 249–269.
Curtis, R.O. 1982. A simple index of stand density for Douglas-fir. Forest Science. 28(1): 92–94.
Daniel, T.W.; Helms, J.A.; Baker, F.S. 1979. Principles of silviculture. Second ed. New York: McGraw-Hill: 292–298.
de Montigny, L.E.; Smith, N.J. 2017. The effects of gap size in a group selection silvicultural system on the growth response of young, planted Douglas-fir: a sector plot analysis. Forestry. 90(3): 426–435.
Devine, W.D.; Harrington, T.B. 2016. Seedfall and seed viability within artificial canopy gaps in a western Washington Douglas-fir forest. Tree Planters’ Notes. 59(1): 23–32.
Drever, C.R.; Lertzman, K.P. 2001. Light-growth responses of coastal Douglas-fir and western redcedar saplings under different regimes of soil moisture and nutrients. Canadian Journal of Forest Research. 31(12): 2124–2133.
Fahey, R.T.; Puettmann, K.J. 2007. Ground-layer disturbance and initial conditions influence gap partitioning of understorey vegeta-tion. Journal of Ecology. 95(5): 1098–1109.
Foster, J. R.; Shaff, S.E. 2003. Forest colonization of Puget Lowland grasslands at Fort Lewis, Washington. Northwest Science. 77(4): 283–296.
Gray, A.N.; Spies, T.A. 1996. Gap size, within-gap position and canopy structure effects on conifer seedling establishment. Journal of Ecology. 84(5): 635–645.
Harrington, T.B. 2006. Five-year growth responses of Douglas-fir, western hemlock, and western redcedar seedlings to manipulated levels of overstory and understory competition. Canadian Journal of Forest Research. 36(10): 2439–2453.
Holmgren, M.; Gómez-Aparicio, L.; Quero, J.L.; Valladares, F. 2012. Non-linear effects of drought under shade: reconciling physiological and ecological models in plant communities. Oecologia. 169(2): 293–305.
Howard, K.M.; Newton, M. 1984. Overtopping by successional Coast-Range vegetation slows Douglas-fir seedlings. Journal of Forestry. 82(3): 178–180.
Hunt, R. 1990. Basic growth analysis. London: Unwin Hyman: 25–27.
Isaac, L. 1943. Reproductive habits of Douglas-fir. Washington, DC: Charles Lathrop Pack Forestry Foundation. 107 p.
Kern, C.C.; Montgomery, R.A.; Reich, P.B.; Strong, T.F. 2013. Canopy gap size influences niche partitioning of the ground-layer plant community in a northern temperate forest. Journal of Plant Ecology. 6(1): 101–112.
King, J.E. 1966. Site index curves for Douglas-fir in the Pacific Northwest. Weyerhaeuser Forestry Paper No. 8. Centralia, WA: Weyerhaeuser Company. 49 p.
Long, A.J.; Carrier, B.D. 1993. Effects of Douglas-fir 2+0 seedling morphology on field performance. New Forests. 7(1): 19–32.
Mailly, D.; Kimmins, J.P. 1997. Growth of Pseudotsuga menziesii and Tsuga heterophylla seedlings along a light gradient: resource allocation and morphological acclimation. Canadian Journal of Botany. 75(9): 1424–1435.
Marquis, D.A. 1965. Controlling light in small clearcuttings. Research Paper NE-39.U.S. Upper Darby, PA: U.S. Department of Agriculture, Forest Service, Northeastern Forest Experiment Station. 16 p.
Minore, D. 1979. Comparative autecological characteristics of northwestern tree species: a literature review. Gen. Tech. Rep. PNW-87. Portland, OR: U.S. Department of Agriculture, Forest Service, Pacific Northwest Forest and Range Experiment Station. 72 p.
Neter, J.; Wasserman, W.; Kutner, M.H. 1989. Applied linear regres-sion models. 2nd ed. Homewood, IL: Richard D. Irwin: 271–284.
Packee, E.C. 1990. Tsuga heterophylla (Raf.) Sarg., Western hemlock. In: Burns, R.M.; Honkala, B.H., tech coords. Silvics of North America. 1: Conifers. Agric. Handb. 654. Washington, DC: U.S. Department of Agriculture, Forest Service: 613–622.
Peter, D.H.; Harrington, T.B. 2014. Historic colonization of South Puget Sound Prairies by Douglas-fir at Joint Base Lewis McChord, Washington. Northwest Science. 88(3): 186–205.
Pickett, S.T.A.; White, P.S. 1985. The ecology of natural distur-bance and patch dynamics. New York: Academic Press: 19, 220–221.
PRISM Climate Group (PRISM). 2018. Prism climate data. Corvallis, OR: Oregon State University. http://prism.oregonstate.edu. (March 2018).
Reineke, L.H. 1933. Perfecting a stand-density index for even-aged forests. Journal of Agricultural Research. 46(7): 627–638.

46 Tree Planters’ Notes
Rose, R.; Atkinson, M.; Gleason, J.; Sabin, T. 1991. Root volume as a grading criterion to improve field performance of Douglas-fir seedlings. New Forests. 5(3): 195–209.
Roth, B.E.; Newton, M. 1996. Survival and growth of Douglas-fir relating to weeding, fertilization, and seed source. Western Journal of Applied Forestry. 11(2): 62–69.
SAS Institute. 2013. Base SAS 9.4 procedures guide: statistical procedures. 2nd ed. Cary, NC: SAS Institute, Inc. 550 p.
Tappeiner, J.C., II; Maguire, D.A.; Harrington, T.B.; Bailey, J.D. 2015. Silviculture and ecology of western U.S. forests. 2nd ed. Corvallis, OR: Oregon State University Press: 225–227, 362–363.
U.S. Department of Agriculture, Natural Resources Conservation Service (USDA NRCS). 2018. Official soil series descriptions.
http://www.nrcs.usda.gov/wps/portal/nrcs/detail/soils/survey/class/?cid=nrcs142p2_053587. (March 2018).
Wang, G.G.; Qian, H.; Klinka, K. 1994. Growth of Thuja plicata seedlings along a light gradient. Canadian Journal of Botany. 72(12): 1749–1757.
York, R.A.; Heald, R.C.; Battles, J.J.; York, J.D. 2004. Group selec-tion management in conifer forests: relationships between opening size and tree growth. Canadian Journal of Forest Research. 34(3): 630–641.
Volume 61, Number 2 (Fall 2018) 47
Abstract
Subirrigation systems offer a water-efficient alternative to the industry standard of overhead irrigation. These systems can be used in growing environments, as well as during storage of overwintered seedlings. This article offers examples for using subirrigation in both the growing and storage environments. Additionally, detailed instructions are provided for creating a subirri-gation tank to fit any nursery need.
Introduction
Efficient water resource management is of increasing importance to industrial systems. Thus, it is critical to continually develop industrial systems that are more efficient in water usage (Ridoutt and Pfister 2010, Smakhtin 2008). Forest nurseries represent one of these industry systems, producing seedlings for both com-mercial and restoration purposes. With containerized nurseries producing more than 500 million seedlings in the United States alone (Hernández et al. 2017), an op-portunity exists to make significant reductions of water usage in this industry.
Nearly all containerized nurseries use overhead irriga-tion systems for both irrigation and fertilization (Landis et al. 1989, Leskovar 1998). The efficiency of this system is poor, with a range of only 57 to 70 percent of irrigation water actually reaching the substrate sur-face (Beeson and Knox 1991). Additionally, overhead systems do not uniformly irrigate individual cells as a result of differences in spray patterns and interception from plant foliage, especially with broad-leaved plants (Dumroese et al. 2007). Moreover, water that is inter-cepted by foliage is prone to spreading foliar diseases
(Oh and Kim 1998). These negative outcomes of over-head irrigation systems have created a need to explore alternative irrigation methods.
Subirrigation is one such system that offers opportu-nities to increase water use efficiency. The first docu-mented subirrigation system was through an 1895 Ohio Experimental Station bulletin (Green and Green 1895). Since the description of this first system, a variety of subirrigation systems have been developed, such as ebb-and-flow benches, flood-floor, trough-tray, wick system, mobile or Dutch trays, and capillary mat (Fer-rarezi et al. 2015, Landis and Wilkinson 2004). How-ever, all use the same basic principle of watering plants from below using a combination of atmospheric air pressure on the water source and capillary action inside the container medium to saturate the medium.
Water use is significantly reduced in a subirrigation system compared with overhead irrigation systems. For example, Dumroese et al. (2006) found that subirriga-tion systems used only 44 percent of the water that con-ventional overhead irrigation systems use. Additionally, they found that subirrigation systems reduced moss growth 33 percent and eliminated nitrogen leaching from the media (based on controlled-released fertilizer incorporated into the medium). With respect to plant performance, subirrigated plants have been shown to be morphologically similar or superior to those receiv-ing overhead irrigation (Davis et al. 2008, Dumroese et al. 2006, 2007, Landis et al. 2006, Schmal et al. 2011).
This article describes examples of subirrigation systems used in a growing and a storage environment. The ex-amples are based on a medium-sized nursery at the John T. Harrington Forestry Research Center (JTH FRC) with New Mexico State University in Mora, NM.
Examples of Using Subirrigation Systems for Both Growing and Storing Seedlings
Kyle Rose, Tammy Parsons, Joshua Sloan, and Owen Burney
Assistant Professor, Department of Natural Resources Management, New Mexico Highlands University (NMHU), Las Vegas, NM; Nursery Manager, John T. Harrington Forestry Research Center at Mora, Department of
Plant and Environmental Sciences, New Mexico State University (NMSU), Mora, NM; Assistant Professor and Department Chair, Department of Natural Resources Management, NMHU, Las Vegas, NM;
Associate Professor and Superintendent, John T. Harrington Forestry Research Center at Mora, Department of Plant and Environmental Sciences, NMSU, Mora, NM
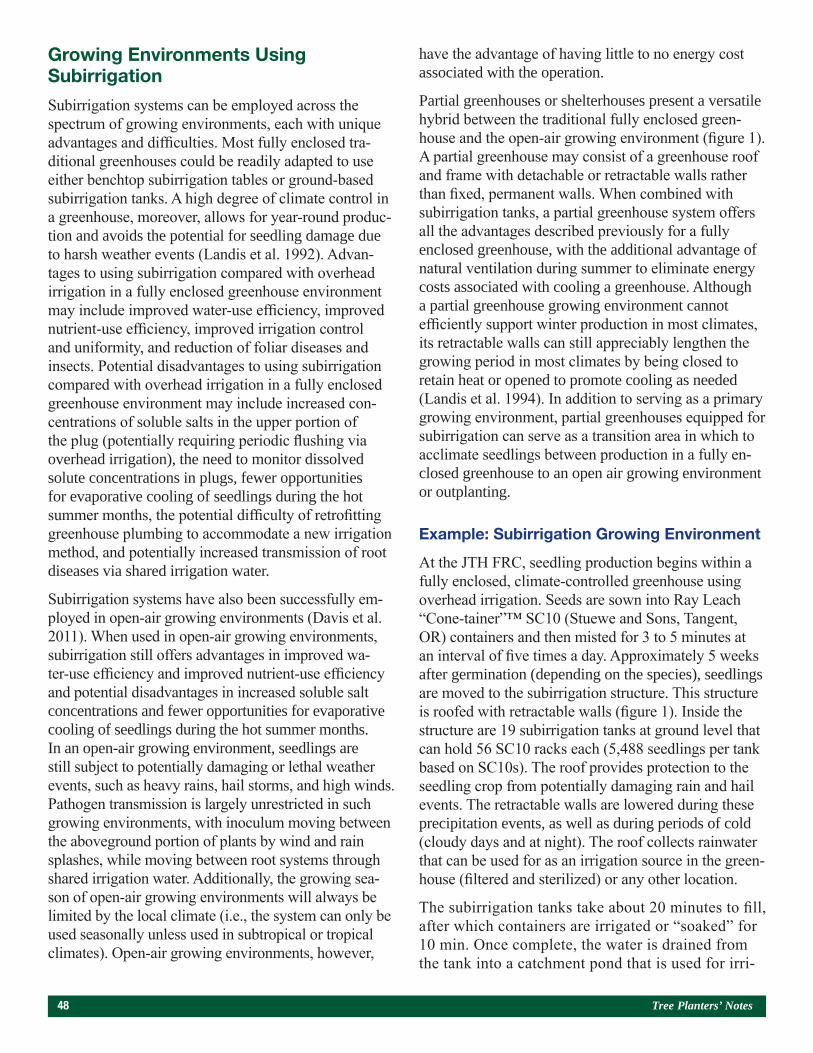
48 Tree Planters’ Notes
Growing Environments Using Subirrigation
Subirrigation systems can be employed across the spectrum of growing environments, each with unique advantages and difficulties. Most fully enclosed tra-ditional greenhouses could be readily adapted to use either benchtop subirrigation tables or ground-based subirrigation tanks. A high degree of climate control in a greenhouse, moreover, allows for year-round produc-tion and avoids the potential for seedling damage due to harsh weather events (Landis et al. 1992). Advan-tages to using subirrigation compared with overhead irrigation in a fully enclosed greenhouse environment may include improved water-use efficiency, improved nutrient-use efficiency, improved irrigation control and uniformity, and reduction of foliar diseases and insects. Potential disadvantages to using subirrigation compared with overhead irrigation in a fully enclosed greenhouse environment may include increased con-centrations of soluble salts in the upper portion of the plug (potentially requiring periodic flushing via overhead irrigation), the need to monitor dissolved solute concentrations in plugs, fewer opportunities for evaporative cooling of seedlings during the hot summer months, the potential difficulty of retrofitting greenhouse plumbing to accommodate a new irrigation method, and potentially increased transmission of root diseases via shared irrigation water.
Subirrigation systems have also been successfully em-ployed in open-air growing environments (Davis et al. 2011). When used in open-air growing environments, subirrigation still offers advantages in improved wa-ter-use efficiency and improved nutrient-use efficiency and potential disadvantages in increased soluble salt concentrations and fewer opportunities for evaporative cooling of seedlings during the hot summer months. In an open-air growing environment, seedlings are still subject to potentially damaging or lethal weather events, such as heavy rains, hail storms, and high winds. Pathogen transmission is largely unrestricted in such growing environments, with inoculum moving between the aboveground portion of plants by wind and rain splashes, while moving between root systems through shared irrigation water. Additionally, the growing sea-son of open-air growing environments will always be limited by the local climate (i.e., the system can only be used seasonally unless used in subtropical or tropical climates). Open-air growing environments, however,
have the advantage of having little to no energy cost associated with the operation.
Partial greenhouses or shelterhouses present a versatile hybrid between the traditional fully enclosed green-house and the open-air growing environment (figure 1). A partial greenhouse may consist of a greenhouse roof and frame with detachable or retractable walls rather than fixed, permanent walls. When combined with subirrigation tanks, a partial greenhouse system offers all the advantages described previously for a fully enclosed greenhouse, with the additional advantage of natural ventilation during summer to eliminate energy costs associated with cooling a greenhouse. Although a partial greenhouse growing environment cannot efficiently support winter production in most climates, its retractable walls can still appreciably lengthen the growing period in most climates by being closed to retain heat or opened to promote cooling as needed (Landis et al. 1994). In addition to serving as a primary growing environment, partial greenhouses equipped for subirrigation can serve as a transition area in which to acclimate seedlings between production in a fully en-closed greenhouse to an open air growing environment or outplanting.
Example: Subirrigation Growing Environment
At the JTH FRC, seedling production begins within a fully enclosed, climate-controlled greenhouse using overhead irrigation. Seeds are sown into Ray Leach “Cone-tainer”™ SC10 (Stuewe and Sons, Tangent, OR) containers and then misted for 3 to 5 minutes at an interval of five times a day. Approximately 5 weeks after germination (depending on the species), seedlings are moved to the subirrigation structure. This structure is roofed with retractable walls (figure 1). Inside the structure are 19 subirrigation tanks at ground level that can hold 56 SC10 racks each (5,488 seedlings per tank based on SC10s). The roof provides protection to the seedling crop from potentially damaging rain and hail events. The retractable walls are lowered during these precipitation events, as well as during periods of cold (cloudy days and at night). The roof collects rainwater that can be used for as an irrigation source in the green-house (filtered and sterilized) or any other location.
The subirrigation tanks take about 20 minutes to fill, after which containers are irrigated or “soaked” for 10 min. Once complete, the water is drained from the tank into a catchment pond that is used for irri-
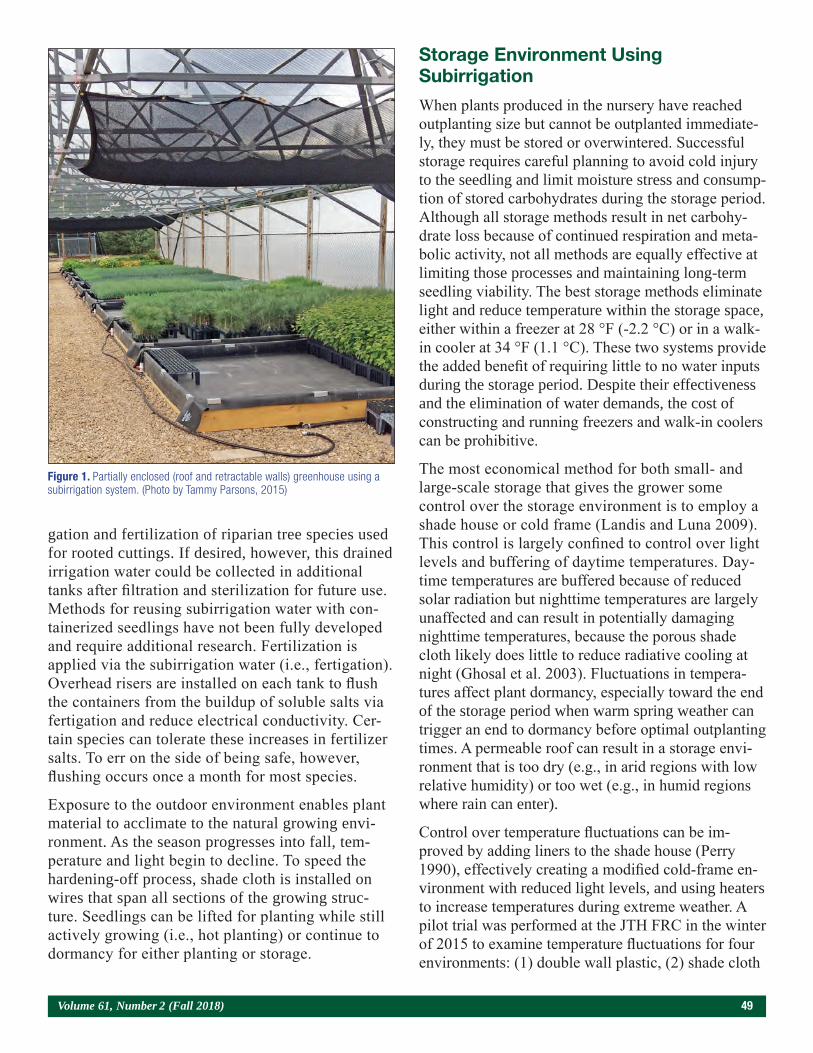
Volume 61, Number 2 (Fall 2018) 49
Figure 1. Partially enclosed (roof and retractable walls) greenhouse using a subirrigation system. (Photo by Tammy Parsons, 2015)
gation and fertilization of riparian tree species used for rooted cuttings. If desired, however, this drained irrigation water could be collected in additional tanks after filtration and sterilization for future use. Methods for reusing subirrigation water with con-tainerized seedlings have not been fully developed and require additional research. Fertilization is applied via the subirrigation water (i.e., fertigation). Overhead risers are installed on each tank to flush the containers from the buildup of soluble salts via fertigation and reduce electrical conductivity. Cer-tain species can tolerate these increases in fertilizer salts. To err on the side of being safe, however, flushing occurs once a month for most species.
Exposure to the outdoor environment enables plant material to acclimate to the natural growing envi-ronment. As the season progresses into fall, tem-perature and light begin to decline. To speed the hardening-off process, shade cloth is installed on wires that span all sections of the growing struc-ture. Seedlings can be lifted for planting while still actively growing (i.e., hot planting) or continue to dormancy for either planting or storage.
Storage Environment Using Subirrigation
When plants produced in the nursery have reached outplanting size but cannot be outplanted immediate-ly, they must be stored or overwintered. Successful storage requires careful planning to avoid cold injury to the seedling and limit moisture stress and consump-tion of stored carbohydrates during the storage period. Although all storage methods result in net carbohy-drate loss because of continued respiration and meta-bolic activity, not all methods are equally effective at limiting those processes and maintaining long-term seedling viability. The best storage methods eliminate light and reduce temperature within the storage space, either within a freezer at 28 °F (-2.2 °C) or in a walk-in cooler at 34 °F (1.1 °C). These two systems provide the added benefit of requiring little to no water inputs during the storage period. Despite their effectiveness and the elimination of water demands, the cost of constructing and running freezers and walk-in coolers can be prohibitive.
The most economical method for both small- and large-scale storage that gives the grower some control over the storage environment is to employ a shade house or cold frame (Landis and Luna 2009). This control is largely confined to control over light levels and buffering of daytime temperatures. Day-time temperatures are buffered because of reduced solar radiation but nighttime temperatures are largely unaffected and can result in potentially damaging nighttime temperatures, because the porous shade cloth likely does little to reduce radiative cooling at night (Ghosal et al. 2003). Fluctuations in tempera-tures affect plant dormancy, especially toward the end of the storage period when warm spring weather can trigger an end to dormancy before optimal outplanting times. A permeable roof can result in a storage envi-ronment that is too dry (e.g., in arid regions with low relative humidity) or too wet (e.g., in humid regions where rain can enter).
Control over temperature fluctuations can be im-proved by adding liners to the shade house (Perry 1990), effectively creating a modified cold-frame en-vironment with reduced light levels, and using heaters to increase temperatures during extreme weather. A pilot trial was performed at the JTH FRC in the winter of 2015 to examine temperature fluctuations for four environments: (1) double wall plastic, (2) shade cloth
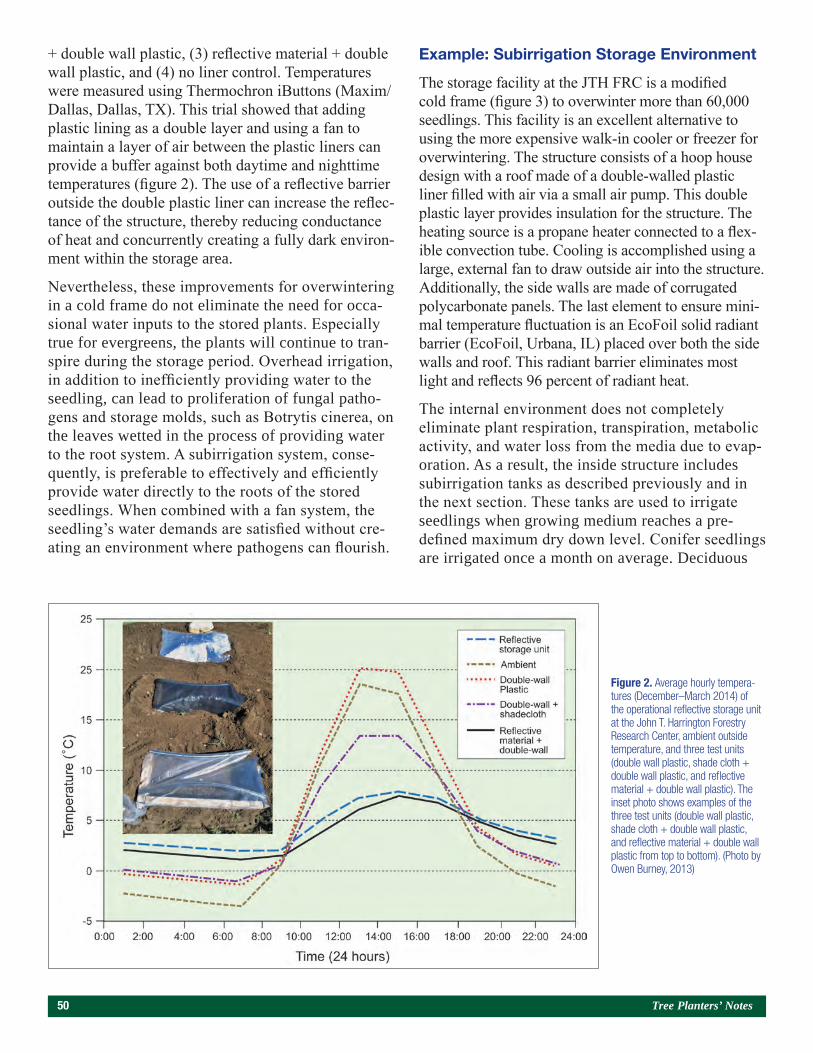
50 Tree Planters’ Notes
+ double wall plastic, (3) reflective material + double wall plastic, and (4) no liner control. Temperatures were measured using Thermochron iButtons (Maxim/Dallas, Dallas, TX). This trial showed that adding plastic lining as a double layer and using a fan to maintain a layer of air between the plastic liners can provide a buffer against both daytime and nighttime temperatures (figure 2). The use of a reflective barrier outside the double plastic liner can increase the reflec-tance of the structure, thereby reducing conductance of heat and concurrently creating a fully dark environ-ment within the storage area.
Nevertheless, these improvements for overwintering in a cold frame do not eliminate the need for occa-sional water inputs to the stored plants. Especially true for evergreens, the plants will continue to tran-spire during the storage period. Overhead irrigation, in addition to inefficiently providing water to the seedling, can lead to proliferation of fungal patho-gens and storage molds, such as Botrytis cinerea, on the leaves wetted in the process of providing water to the root system. A subirrigation system, conse-quently, is preferable to effectively and efficiently provide water directly to the roots of the stored seedlings. When combined with a fan system, the seedling’s water demands are satisfied without cre-ating an environment where pathogens can flourish.
Example: Subirrigation Storage Environment
The storage facility at the JTH FRC is a modified cold frame (figure 3) to overwinter more than 60,000 seedlings. This facility is an excellent alternative to using the more expensive walk-in cooler or freezer for overwintering. The structure consists of a hoop house design with a roof made of a double-walled plastic liner filled with air via a small air pump. This double plastic layer provides insulation for the structure. The heating source is a propane heater connected to a flex-ible convection tube. Cooling is accomplished using a large, external fan to draw outside air into the structure. Additionally, the side walls are made of corrugated polycarbonate panels. The last element to ensure mini-mal temperature fluctuation is an EcoFoil solid radiant barrier (EcoFoil, Urbana, IL) placed over both the side walls and roof. This radiant barrier eliminates most light and reflects 96 percent of radiant heat.
The internal environment does not completely eliminate plant respiration, transpiration, metabolic activity, and water loss from the media due to evap-oration. As a result, the inside structure includes subirrigation tanks as described previously and in the next section. These tanks are used to irrigate seedlings when growing medium reaches a pre-defined maximum dry down level. Conifer seedlings are irrigated once a month on average. Deciduous
Figure 2. Average hourly tempera-tures (December–March 2014) of the operational reflective storage unit at the John T. Harrington Forestry Research Center, ambient outside temperature, and three test units (double wall plastic, shade cloth + double wall plastic, and reflective material + double wall plastic). The inset photo shows examples of the three test units (double wall plastic, shade cloth + double wall plastic, and reflective material + double wall plastic from top to bottom). (Photo by Owen Burney, 2013)

Volume 61, Number 2 (Fall 2018) 51
seedlings require less water and are irrigated every other month while in storage.
Constructing a Commercial Subirrigation System
This section describes the process for building a wood-en tank structure with a pond liner designed to hold container racks or styroblock containers for the purpose of subirrigation (figure 4).
The 16-ft by 8-ft (5-m by 2.5-m) tank described here is designed to accommodate the Ray Leach Cone-tain-er™ SC10 racks with 56 racks per tank. This config-uration allows for air space every few rows so air can travel between racks to prevent moisture from collect-ing on the bottom of the tank. Tank size can be adjusted to meet requirements of containers, space available, or both. The tanks must be sloped so they can drain after each irrigation.
[Conversions: 1 in = 2.54 cm; 1 ft = 30.48 cm]
1. Framework assembly—
a. The frame of the subirrigation tank is built like the subfloor of a house (figure 5).
b. To assemble the frame, cut two 2-in by 12-in by 8-ft treated boards to exactly 8 ft in length, these boards will be the two side rims. Use two 2-in by 12-in by 16-ft treated boards for the length.
c. Assemble the four rims into a box shape by secur-ing the corners with four 3-in decking screws in
each corner. Make sure the 8-ft boards are inside of the longer boards. Square the box up.
1. Joist assembly—
a. Joists are secured to a rim board, and a 0.75-in oriented strand board (OSB) decking is attached to the joists for the floor.
b. Because the floor must have a slope for drainage, the joists need to be cut to create an angle in the floor.
c. Take a 2-in by 8-in by 8-ft treated board and rip from 3.25-in to 2.25-in wide to obtain a minimum ⅛ in per 1-ft slope for drainage (figures 4 and 5).
d. Using a 2-in by 8-in board will enable you to get two joists from each board. Attach the joists to the long rim boards.
e. Start by attaching one joist to the 8-ft side rim and at 16-in on center across the length. Make sure the ripped sides of the joists are facing up and that all the joists are angled the same direction.
f. Attach joists to the rim with 2-in to 3-in decking screws in each end. The high side of the joists should be about 8 in down from the top edge of the rim, and the low side should be about 9 in down.
g. A joist should be attached to each side rim, as well as to support the floor decking.
2. Flooring and predrainage assembly—
a. Set the bench in its permanent location and make sure all four sides are level so the slope will drain properly. Setting the box on level concrete blocks for support is a good method. You will need to have access to where the drain will exit from underneath.
b. Install a block to support the drain assembly be-tween two joists on the low side.
c. Three drains are installed on the 16-ft tank (figures 4 and 6). A 1-in by 6-in board planed down to approx-imately 0.5-in thick is used as the block attached up against the long rim and even with the top edge of the joists. Attach blocks using decking screws going through the joists into the ends of the blocks.
d. Install 4-ft by 8-ft by 0.75-in OSB sheets on top of the joists and attach with 1½-in decking screws every 12 in. Make sure the screws are set and not sticking above the surface.
e. At the location of each drain block and approxi-mately 2 in from the rim joist, use a 3-in hole saw to drill only through the OSB layer—do not drill through the support block (figure 6).
Figure 3. Modified cold frame using EcoFoil radiant barrier during winter at the John T. Harrington Forestry Research Center in Mora, NM. (Photo by Owen Burney, 2013)

52 Tree Planters’ Notes
f. Change to a 2.25-in hole saw and drill through the support block.
1.Tank liner assembly—
a. Install the rubber pond liner—45-mil, 10-ft wide EPDM Pondgard (ethylene propylene diene mono-mer rubber). Make sure the inside of the box is clean so nothing will damage the liner.
b. Cut the length of the liner approximately 2 ft lon-ger than the length of the tank (i.e.,10-ft wide by 18-ft length).
c. Roll the liner out and smooth into the bottom and up the sides of the tank. There should be 1 ft of liner to go up and over the edges on all sides.
d. Tuck the liner into the bottom and corners as tightly as possible. Fold up and over the top edge of the rim
boards and secure with 2- by 6-in fence brackets by clipping onto the top edges of the rim boards.
2. Final drainage assembly—
a. Install the drain assembly using a 1-in heavy duty polypropylene tank fitting, 2.25-in hole size (figures 4 and 6).
b. Find the center of the drain hole in the OSB and carefully cut a small hole (approximately 1.25 in diameter) through the rubber liner.
c. Carefully push the drain assembly through the liner and hole in block with the rubber washer between the drain top flange and the liner. Make sure the liner does not tear. It should stretch around drain. Push down until the top flange is set into the recessed hole (the top of the drain should be flush with the tank floor).
Figure 4. Schematic used at John T. Harrington Forestry Research Center to construct a 16 ft by 8 ft subirrigation tank designed to hold 56 racks of Ray Leach “Cone-tainer”™ SC10s
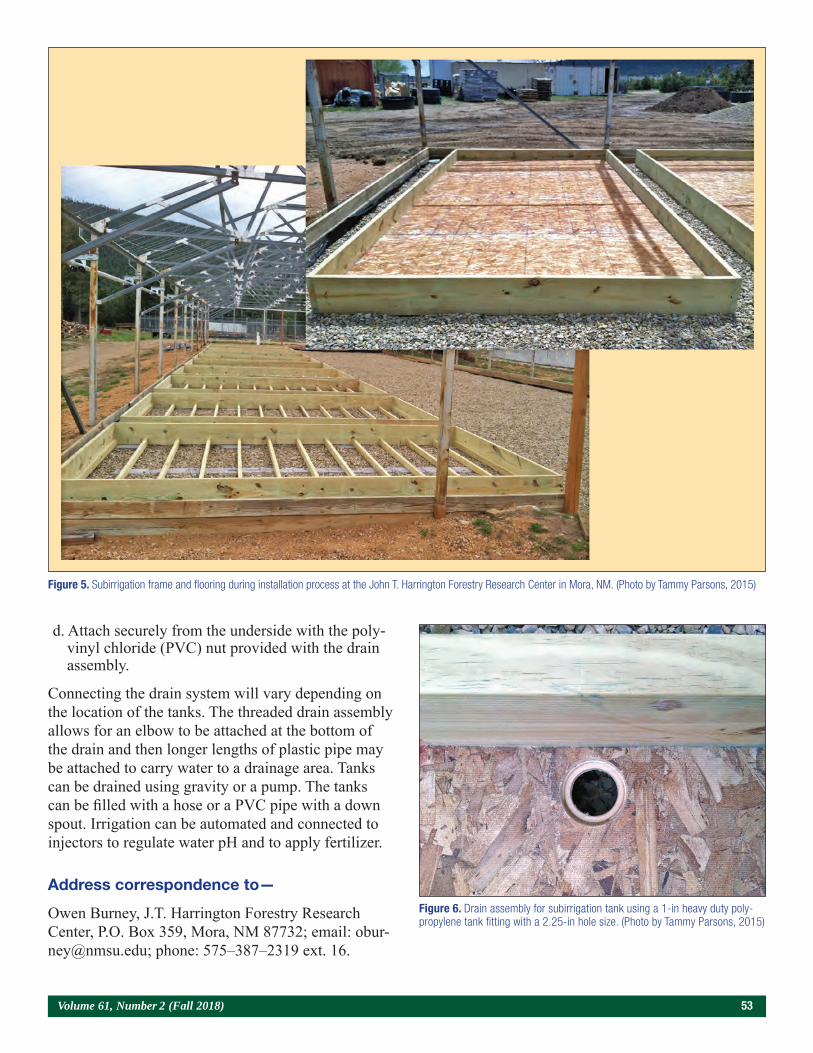
Volume 61, Number 2 (Fall 2018) 53
Figure 5. Subirrigation frame and flooring during installation process at the John T. Harrington Forestry Research Center in Mora, NM. (Photo by Tammy Parsons, 2015)
d. Attach securely from the underside with the poly-vinyl chloride (PVC) nut provided with the drain assembly.
Connecting the drain system will vary depending on the location of the tanks. The threaded drain assembly allows for an elbow to be attached at the bottom of the drain and then longer lengths of plastic pipe may be attached to carry water to a drainage area. Tanks can be drained using gravity or a pump. The tanks can be filled with a hose or a PVC pipe with a down spout. Irrigation can be automated and connected to injectors to regulate water pH and to apply fertilizer.
Address correspondence to—
Owen Burney, J.T. Harrington Forestry Research Center, P.O. Box 359, Mora, NM 87732; email: [email protected]; phone: 575–387–2319 ext. 16.
Figure 6. Drain assembly for subirrigation tank using a 1-in heavy duty poly-propylene tank fitting with a 2.25-in hole size. (Photo by Tammy Parsons, 2015)

54 Tree Planters’ Notes
REFERENCES
Beeson, R.C., Jr.; Knox, G.W. 1991. Analysis of efficiency of overhead irrigation in container production. HortScience. 26: 848–850.
Davis, A.S.; Jacobs, D.F.; Overton, R.P.; Dumroese, R.K. 2008. Influence of irrigation method and container type on northern red oak seedling growth and media electrical conductivity. Native Plants Journal. 9: 5–12.
Davis, A.S.; Pinto, J.R.; Jacobs, D.F. 2011. Early field perfor-mance of Acacia koa seedlings grown under subirrigation and overhead irrigation. Native Plants Journal. 12(2): 95–99.
Dumroese, R.K.; Jacobs, D.F.; Davis, A.S.; Pinto, J.R.; Landis, T.D. 2007. An introduction to subirrigation in forest and conser-vation nurseries and some preliminary results of demonstrations. In: Riley, L.E.; Dumroese, R.K.; Landis, T.D., tech. coords. National proceedings, forest and conservation nursery associa-tions. RMRS-P50: 20–26. Fort Collins, CO: U.S. Department of Agriculture, Forest Service, Rocky Mountain Research Station.
Dumroese, R.K; Pinto, J.R.; Jacobs, D.F.; Davis, A.S.; Horiuchi, B. 2006. Subirrigation reduces water use, nitrogen loss, and moss growth in a container nursery. Native Plants Journal. 7(3): 253–261.
Ferrarezi, R.S.; Weaver, G.M.; van Iersel, M.W.; Testezlaf, R. 2015. Subirrigation: historical overview, challenges, and future prospects. HortTechnology. 25: 262–276.
Ghosal, M.K.; Tiwari, G.N.; Srivastava, N.S.L. 2003. Modeling and experimental validation of a greenhouse with evaporative cooling by moving water film over external shade cloth. Energy and Buildings. 35(8): 843–850.
Green, W.J.; Green, E. 1895. Sub-irrigation in the greenhouse. Bulletin 61. Wooster, OH: Ohio Agricultural Experiment Station: 57–76.
Hernández, G.; Haase, D.L.; Pike, C.; Enebak, S.; Mackey, L.; Ma, Z.; Clarke, M. 2017. Forest nursery seedling production in the United States—Fiscal Year 2016. Tree Planters’ Notes. 60(2): 24–28.
Landis, T.D.; Dumroese, R.K.; Chandler, R. 2006. Subirrigation trials with native plants. In: Dumroese, R.K.; Landis, T.D., eds. Forest nursery notes, winter 2006. R6-CP-TP-08-05. Portland, OR: U.S. Department of Agriculture, Forest Service, Pacific Northwest Region, State and Private Forestry, Cooperative Programs: 14–15.
Landis, T.D.; Luna, T. 2009. Harvesting, storing, and shipping. In: Dumroese, R.K.; Luna, T.; Landis, T.D., eds. Nursery manual
for native plants: a guide for tribal nurseries - volume 1: nursery management. Agric. Handb. 730. Washington, DC: U.S. Depart-ment of Agriculture, Forest Service: 229–245. Chapter 13.
Landis, T.D.; Tinus, R.W.; McDonald, S.E.; Barnett, J.P. 1989. Seedling nutrition and irrigation. 4: The container tree nursery manual. Agric. Handb. 674. Washington, DC: U.S. Department of Agriculture, Forest Service. 119 p.
Landis, T.D.; Tinus, R.W.; McDonald, S.E.; Barnett, J.P. 1992. Atmospheric environment. 3: The container tree nursery manual. Agric. Handb. 674. Washington, DC: U.S. Department of Agriculture, Forest Service. 145 p.
Landis, T.D.; Tinus, R.W.; McDonald, S.E.; Barnett, J.P. 1994. Nursery planning, development and management. 1: The container tree nursery manual. Agric. Handb. 674. Washington, DC: U.S. Department of Agriculture, Forest Service. 188 p.
Landis, T.D.; Wilkinson, K. 2004. Subirrigation: a better option for broad-leaved container nursery crops? In: Dumroese, R.K.; Landis, T.D., eds. Forest nursery notes, summer 2004. R6-CP-TP-07-04. Portland, OR: U.S. Department of Agriculture, Forest Service, Pacific Northwest Region, State and Private Forestry, Cooperative Programs: 14–17.
Leskovar, D.I. 1998. Root and shoot modification by leaching. HortTechnology. 8: 510–514.
Oh, W.; Kim, K. 1998. Effects of irrigation method and frequency, and nutrient solution on rooting, growth, and nutrient uptake of chrysanthemum cuttings. Journal of the Korean Society for Horticultural Science. 39: 464–468.
Perry, L.P. 1990. Overwintering container-grown herbaceous perennials in northern regions. Journal of Environmental Horticul-ture. 8: 135–138.
Ridoutt, B.G.; Pfister S. 2010. A revised approach to water footprinting to make transparent the impacts of consumption and production on global freshwater scarcity. Global Environmental Change. 20: 113–120.
Schmal, J.L.; Dumroese, R.K.; Davis, A.S.; Pinto, J.R.; Jacobs, D.F. 2011. Subirrigation for production of native plants in nurseries - concepts, current knowledge, and implementation. Native Plants Journal. 12(2): 81–93.
Smakhtin, V. 2008. Basin closure and environmental flow requirements. Water Resources Development. 24(2): 227–233.
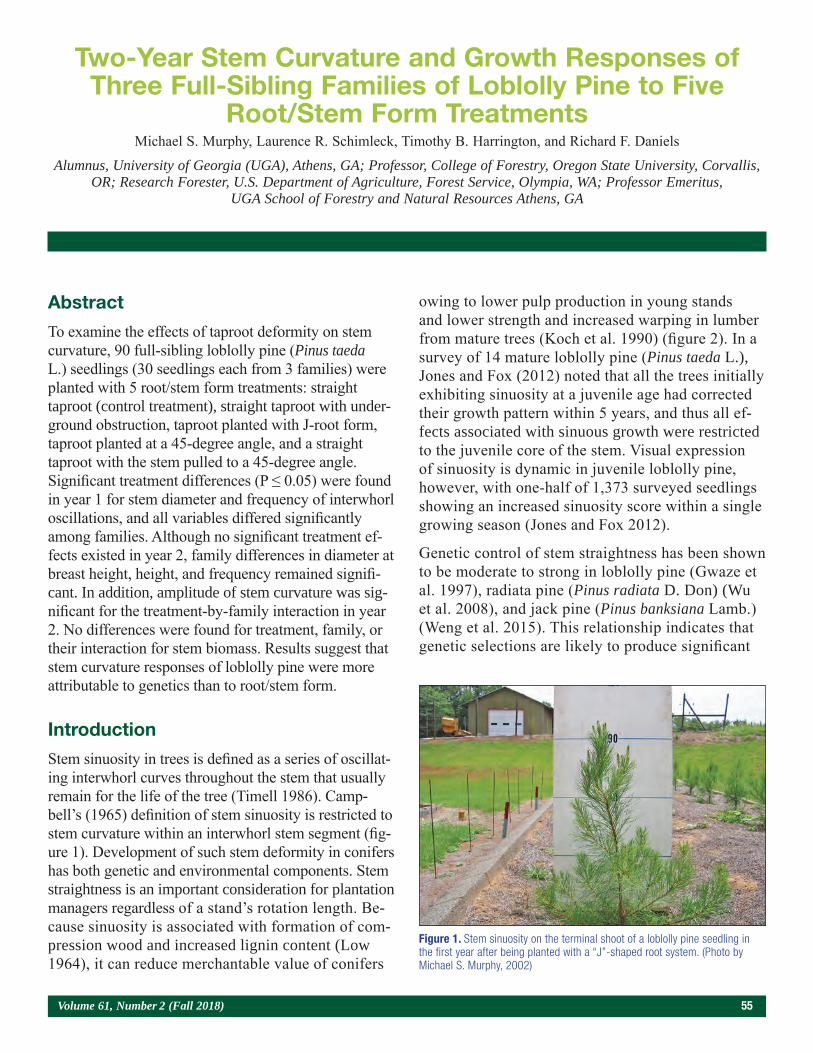
Volume 61, Number 2 (Fall 2018) 55
Abstract
To examine the effects of taproot deformity on stem curvature, 90 full-sibling loblolly pine (Pinus taeda L.) seedlings (30 seedlings each from 3 families) were planted with 5 root/stem form treatments: straight taproot (control treatment), straight taproot with under-ground obstruction, taproot planted with J-root form, taproot planted at a 45-degree angle, and a straight taproot with the stem pulled to a 45-degree angle. Significant treatment differences (P ≤ 0.05) were found in year 1 for stem diameter and frequency of interwhorl oscillations, and all variables differed significantly among families. Although no significant treatment ef-fects existed in year 2, family differences in diameter at breast height, height, and frequency remained signifi-cant. In addition, amplitude of stem curvature was sig-nificant for the treatment-by-family interaction in year 2. No differences were found for treatment, family, or their interaction for stem biomass. Results suggest that stem curvature responses of loblolly pine were more attributable to genetics than to root/stem form.
Introduction
Stem sinuosity in trees is defined as a series of oscillat-ing interwhorl curves throughout the stem that usually remain for the life of the tree (Timell 1986). Camp-bell’s (1965) definition of stem sinuosity is restricted to stem curvature within an interwhorl stem segment (fig-ure 1). Development of such stem deformity in conifers has both genetic and environmental components. Stem straightness is an important consideration for plantation managers regardless of a stand’s rotation length. Be-cause sinuosity is associated with formation of com-pression wood and increased lignin content (Low 1964), it can reduce merchantable value of conifers
owing to lower pulp production in young stands and lower strength and increased warping in lumber from mature trees (Koch et al. 1990) (figure 2). In a survey of 14 mature loblolly pine (Pinus taeda L.), Jones and Fox (2012) noted that all the trees initially exhibiting sinuosity at a juvenile age had corrected their growth pattern within 5 years, and thus all ef-fects associated with sinuous growth were restricted to the juvenile core of the stem. Visual expression of sinuosity is dynamic in juvenile loblolly pine, however, with one-half of 1,373 surveyed seedlings showing an increased sinuosity score within a single growing season (Jones and Fox 2012).
Genetic control of stem straightness has been shown to be moderate to strong in loblolly pine (Gwaze et al. 1997), radiata pine (Pinus radiata D. Don) (Wu et al. 2008), and jack pine (Pinus banksiana Lamb.) (Weng et al. 2015). This relationship indicates that genetic selections are likely to produce significant
Two-Year Stem Curvature and Growth Responses of Three Full-Sibling Families of Loblolly Pine to Five
Root/Stem Form TreatmentsMichael S. Murphy, Laurence R. Schimleck, Timothy B. Harrington, and Richard F. Daniels
Alumnus, University of Georgia (UGA), Athens, GA; Professor, College of Forestry, Oregon State University, Corvallis, OR; Research Forester, U.S. Department of Agriculture, Forest Service, Olympia, WA; Professor Emeritus,
UGA School of Forestry and Natural Resources Athens, GA
Figure 1. Stem sinuosity on the terminal shoot of a loblolly pine seedling in the first year after being planted with a “J”-shaped root system. (Photo by Michael S. Murphy, 2002)
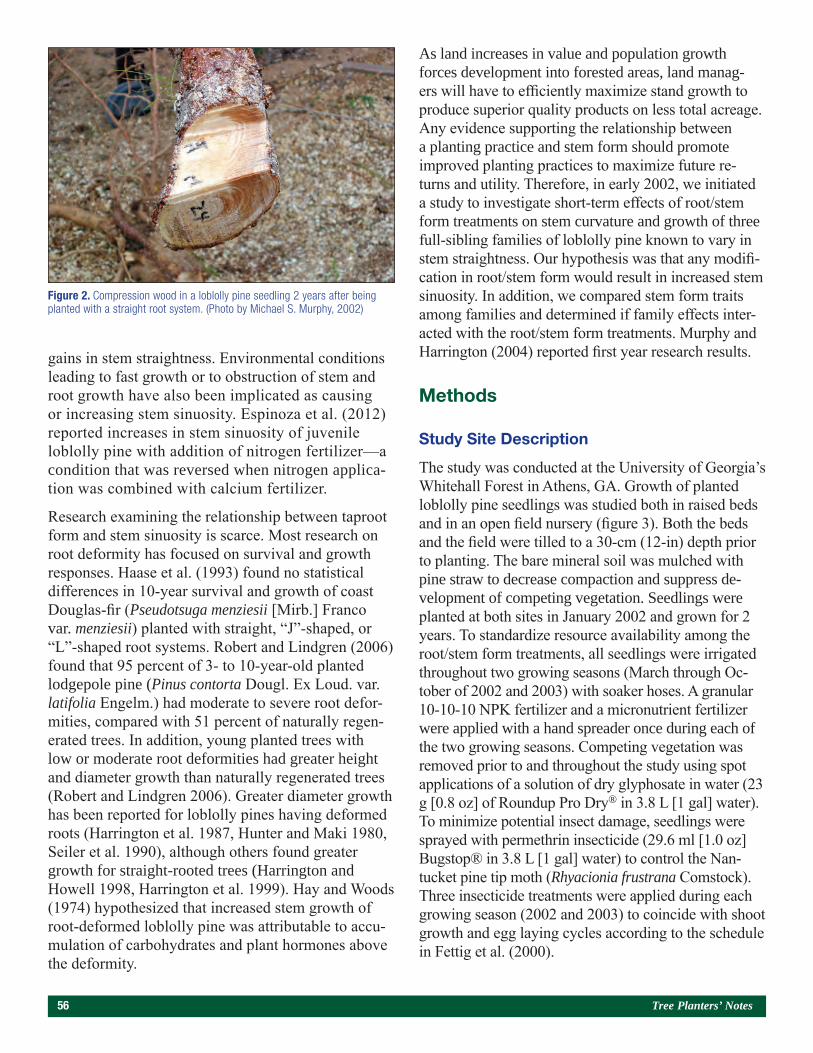
56 Tree Planters’ Notes
gains in stem straightness. Environmental conditions leading to fast growth or to obstruction of stem and root growth have also been implicated as causing or increasing stem sinuosity. Espinoza et al. (2012) reported increases in stem sinuosity of juvenile loblolly pine with addition of nitrogen fertilizer—a condition that was reversed when nitrogen applica-tion was combined with calcium fertilizer.
Research examining the relationship between taproot form and stem sinuosity is scarce. Most research on root deformity has focused on survival and growth responses. Haase et al. (1993) found no statistical differences in 10-year survival and growth of coast Douglas-fir (Pseudotsuga menziesii [Mirb.] Franco var. menziesii) planted with straight, “J”-shaped, or “L”-shaped root systems. Robert and Lindgren (2006) found that 95 percent of 3- to 10-year-old planted lodgepole pine (Pinus contorta Dougl. Ex Loud. var. latifolia Engelm.) had moderate to severe root defor-mities, compared with 51 percent of naturally regen-erated trees. In addition, young planted trees with low or moderate root deformities had greater height and diameter growth than naturally regenerated trees (Robert and Lindgren 2006). Greater diameter growth has been reported for loblolly pines having deformed roots (Harrington et al. 1987, Hunter and Maki 1980, Seiler et al. 1990), although others found greater growth for straight-rooted trees (Harrington and Howell 1998, Harrington et al. 1999). Hay and Woods (1974) hypothesized that increased stem growth of root-deformed loblolly pine was attributable to accu-mulation of carbohydrates and plant hormones above the deformity.
As land increases in value and population growth forces development into forested areas, land manag-ers will have to efficiently maximize stand growth to produce superior quality products on less total acreage. Any evidence supporting the relationship between a planting practice and stem form should promote improved planting practices to maximize future re-turns and utility. Therefore, in early 2002, we initiated a study to investigate short-term effects of root/stem form treatments on stem curvature and growth of three full-sibling families of loblolly pine known to vary in stem straightness. Our hypothesis was that any modifi-cation in root/stem form would result in increased stem sinuosity. In addition, we compared stem form traits among families and determined if family effects inter-acted with the root/stem form treatments. Murphy and Harrington (2004) reported first year research results.
Methods
Study Site Description
The study was conducted at the University of Georgia’s Whitehall Forest in Athens, GA. Growth of planted loblolly pine seedlings was studied both in raised beds and in an open field nursery (figure 3). Both the beds and the field were tilled to a 30-cm (12-in) depth prior to planting. The bare mineral soil was mulched with pine straw to decrease compaction and suppress de-velopment of competing vegetation. Seedlings were planted at both sites in January 2002 and grown for 2 years. To standardize resource availability among the root/stem form treatments, all seedlings were irrigated throughout two growing seasons (March through Oc-tober of 2002 and 2003) with soaker hoses. A granular 10-10-10 NPK fertilizer and a micronutrient fertilizer were applied with a hand spreader once during each of the two growing seasons. Competing vegetation was removed prior to and throughout the study using spot applications of a solution of dry glyphosate in water (23 g [0.8 oz] of Roundup Pro Dry® in 3.8 L [1 gal] water). To minimize potential insect damage, seedlings were sprayed with permethrin insecticide (29.6 ml [1.0 oz] Bugstop® in 3.8 L [1 gal] water) to control the Nan-tucket pine tip moth (Rhyacionia frustrana Comstock). Three insecticide treatments were applied during each growing season (2002 and 2003) to coincide with shoot growth and egg laying cycles according to the schedule in Fettig et al. (2000).
Figure 2. Compression wood in a loblolly pine seedling 2 years after being planted with a straight root system. (Photo by Michael S. Murphy, 2002)
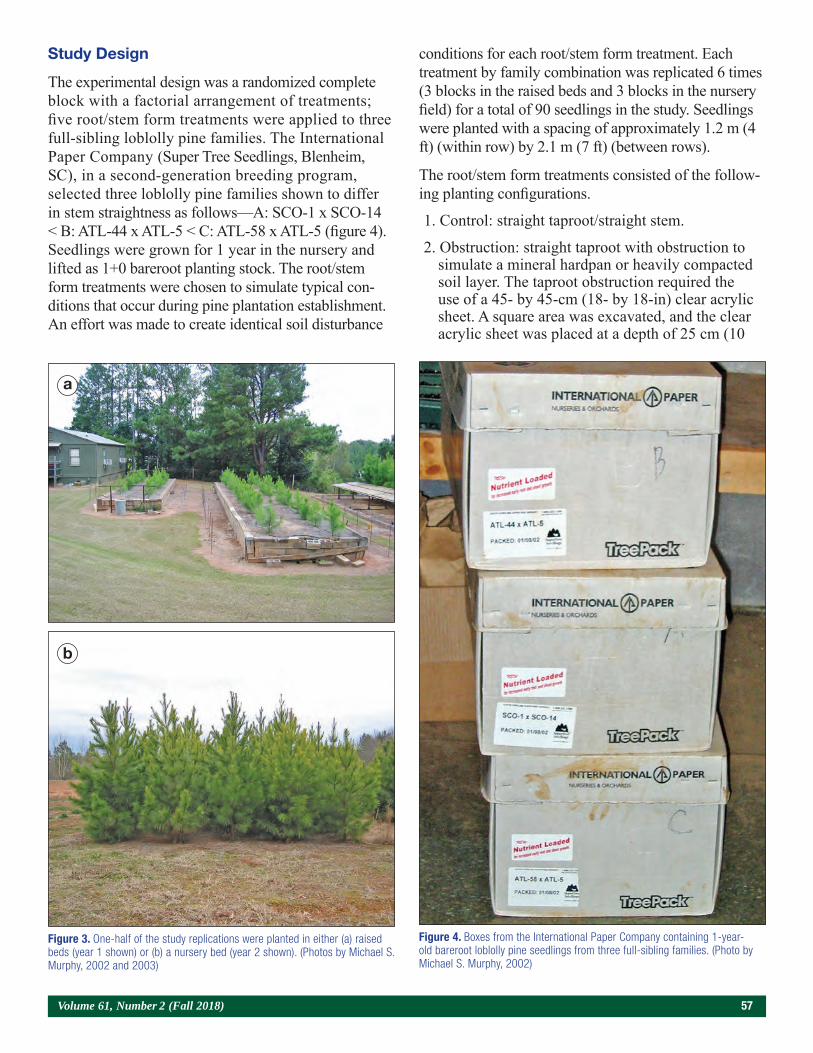
Volume 61, Number 2 (Fall 2018) 57
Study Design
The experimental design was a randomized complete block with a factorial arrangement of treatments; five root/stem form treatments were applied to three full-sibling loblolly pine families. The International Paper Company (Super Tree Seedlings, Blenheim, SC), in a second-generation breeding program, selected three loblolly pine families shown to differ in stem straightness as follows—A: SCO-1 x SCO-14 < B: ATL-44 x ATL-5 < C: ATL-58 x ATL-5 (figure 4). Seedlings were grown for 1 year in the nursery and lifted as 1+0 bareroot planting stock. The root/stem form treatments were chosen to simulate typical con-ditions that occur during pine plantation establishment. An effort was made to create identical soil disturbance
conditions for each root/stem form treatment. Each treatment by family combination was replicated 6 times (3 blocks in the raised beds and 3 blocks in the nursery field) for a total of 90 seedlings in the study. Seedlings were planted with a spacing of approximately 1.2 m (4 ft) (within row) by 2.1 m (7 ft) (between rows).
The root/stem form treatments consisted of the follow-ing planting configurations.
1. Control: straight taproot/straight stem.
2. Obstruction: straight taproot with obstruction to simulate a mineral hardpan or heavily compacted soil layer. The taproot obstruction required the use of a 45- by 45-cm (18- by 18-in) clear acrylic sheet. A square area was excavated, and the clear acrylic sheet was placed at a depth of 25 cm (10
Figure 3. One-half of the study replications were planted in either (a) raised beds (year 1 shown) or (b) a nursery bed (year 2 shown). (Photos by Michael S. Murphy, 2002 and 2003)
Figure 4. Boxes from the International Paper Company containing 1-year-old bareroot loblolly pine seedlings from three full-sibling families. (Photo by Michael S. Murphy, 2002)
a
b
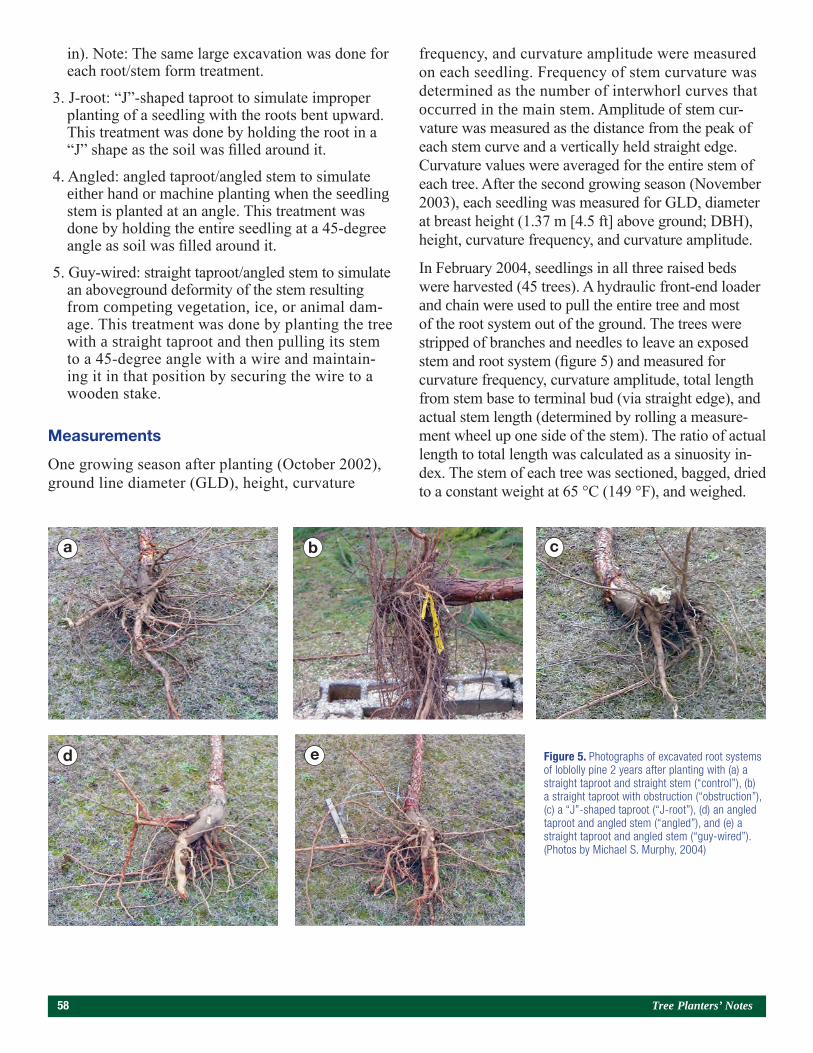
58 Tree Planters’ Notes
in). Note: The same large excavation was done for each root/stem form treatment.
3. J-root: “J”-shaped taproot to simulate improper planting of a seedling with the roots bent upward. This treatment was done by holding the root in a “J” shape as the soil was filled around it.
4. Angled: angled taproot/angled stem to simulate either hand or machine planting when the seedling stem is planted at an angle. This treatment was done by holding the entire seedling at a 45-degree angle as soil was filled around it.
5. Guy-wired: straight taproot/angled stem to simulate an aboveground deformity of the stem resulting from competing vegetation, ice, or animal dam-age. This treatment was done by planting the tree with a straight taproot and then pulling its stem to a 45-degree angle with a wire and maintain-ing it in that position by securing the wire to a wooden stake.
Measurements
One growing season after planting (October 2002), ground line diameter (GLD), height, curvature
frequency, and curvature amplitude were measured on each seedling. Frequency of stem curvature was determined as the number of interwhorl curves that occurred in the main stem. Amplitude of stem cur-vature was measured as the distance from the peak of each stem curve and a vertically held straight edge. Curvature values were averaged for the entire stem of each tree. After the second growing season (November 2003), each seedling was measured for GLD, diameter at breast height (1.37 m [4.5 ft] above ground; DBH), height, curvature frequency, and curvature amplitude.
In February 2004, seedlings in all three raised beds were harvested (45 trees). A hydraulic front-end loader and chain were used to pull the entire tree and most of the root system out of the ground. The trees were stripped of branches and needles to leave an exposed stem and root system (figure 5) and measured for curvature frequency, curvature amplitude, total length from stem base to terminal bud (via straight edge), and actual stem length (determined by rolling a measure-ment wheel up one side of the stem). The ratio of actual length to total length was calculated as a sinuosity in-dex. The stem of each tree was sectioned, bagged, dried to a constant weight at 65 °C (149 °F), and weighed.
Figure 5. Photographs of excavated root systems of loblolly pine 2 years after planting with (a) a straight taproot and straight stem (“control”), (b) a straight taproot with obstruction (“obstruction”), (c) a “J”-shaped taproot (“J-root”), (d) an angled taproot and angled stem (“angled”), and (e) a straight taproot and angled stem (“guy-wired”). (Photos by Michael S. Murphy, 2004)
a b c
d e
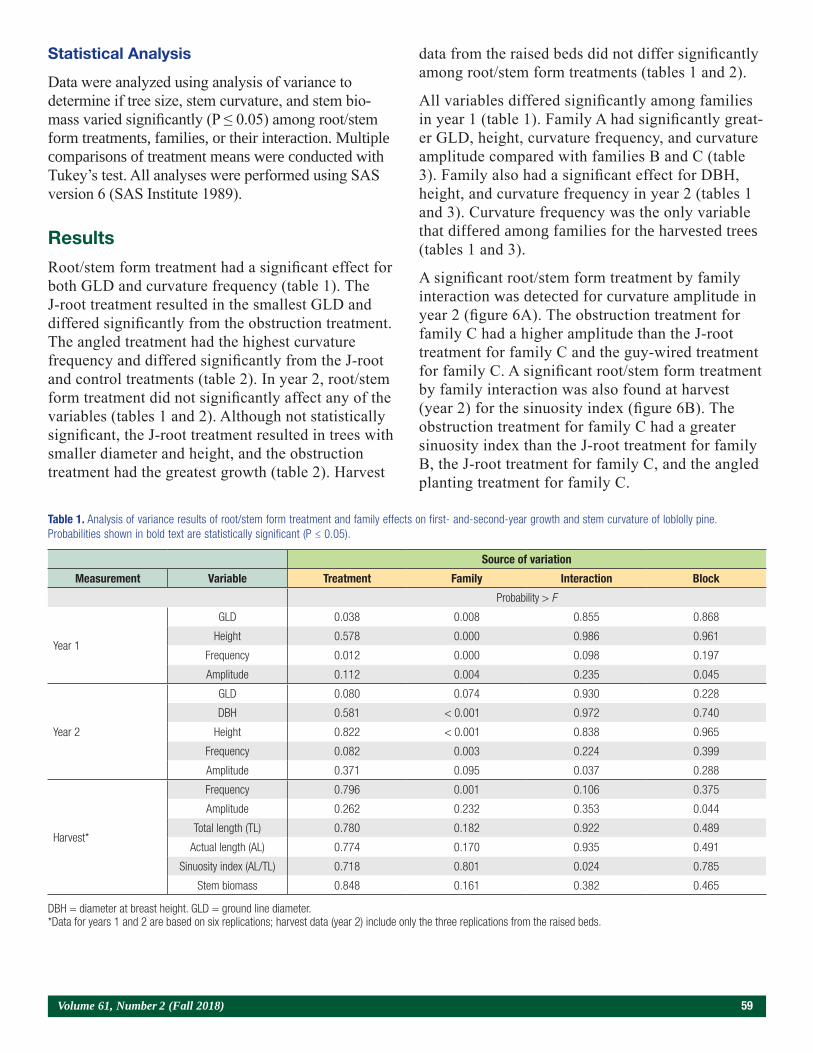
Volume 61, Number 2 (Fall 2018) 59
Statistical Analysis
Data were analyzed using analysis of variance to determine if tree size, stem curvature, and stem bio-mass varied significantly (P ≤ 0.05) among root/stem form treatments, families, or their interaction. Multiple comparisons of treatment means were conducted with Tukey’s test. All analyses were performed using SAS version 6 (SAS Institute 1989).
Results
Root/stem form treatment had a significant effect for both GLD and curvature frequency (table 1). The J-root treatment resulted in the smallest GLD and differed significantly from the obstruction treatment. The angled treatment had the highest curvature frequency and differed significantly from the J-root and control treatments (table 2). In year 2, root/stem form treatment did not significantly affect any of the variables (tables 1 and 2). Although not statistically significant, the J-root treatment resulted in trees with smaller diameter and height, and the obstruction treatment had the greatest growth (table 2). Harvest
data from the raised beds did not differ significantly among root/stem form treatments (tables 1 and 2).
All variables differed significantly among families in year 1 (table 1). Family A had significantly great-er GLD, height, curvature frequency, and curvature amplitude compared with families B and C (table 3). Family also had a significant effect for DBH, height, and curvature frequency in year 2 (tables 1 and 3). Curvature frequency was the only variable that differed among families for the harvested trees (tables 1 and 3).
A significant root/stem form treatment by family interaction was detected for curvature amplitude in year 2 (figure 6A). The obstruction treatment for family C had a higher amplitude than the J-root treatment for family C and the guy-wired treatment for family C. A significant root/stem form treatment by family interaction was also found at harvest (year 2) for the sinuosity index (figure 6B). The obstruction treatment for family C had a greater sinuosity index than the J-root treatment for family B, the J-root treatment for family C, and the angled planting treatment for family C.
Source of variation
Measurement Variable Treatment Family Interaction Block
Probability > F
Year 1
GLD 0.038 0.008 0.855 0.868
Height 0.578 0.000 0.986 0.961
Frequency 0.012 0.000 0.098 0.197
Amplitude 0.112 0.004 0.235 0.045
Year 2
GLD 0.080 0.074 0.930 0.228
DBH 0.581 < 0.001 0.972 0.740
Height 0.822 < 0.001 0.838 0.965
Frequency 0.082 0.003 0.224 0.399
Amplitude 0.371 0.095 0.037 0.288
Harvest*
Frequency 0.796 0.001 0.106 0.375
Amplitude 0.262 0.232 0.353 0.044
Total length (TL) 0.780 0.182 0.922 0.489
Actual length (AL) 0.774 0.170 0.935 0.491
Sinuosity index (AL/TL) 0.718 0.801 0.024 0.785
Stem biomass 0.848 0.161 0.382 0.465
DBH = diameter at breast height. GLD = ground line diameter. *Data for years 1 and 2 are based on six replications; harvest data (year 2) include only the three replications from the raised beds.
Table 1. Analysis of variance results of root/stem form treatment and family effects on first- and-second-year growth and stem curvature of loblolly pine. Probabilities shown in bold text are statistically significant (P ≤ 0.05).
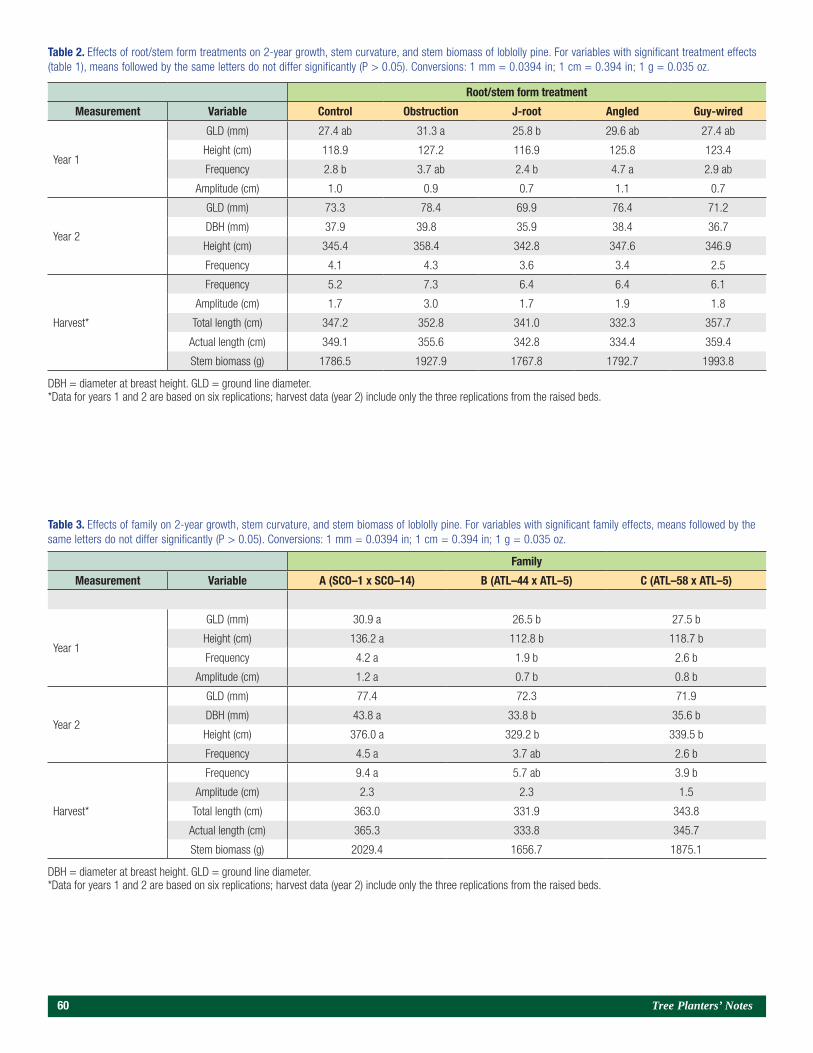
60 Tree Planters’ Notes
Root/stem form treatment
Measurement Variable Control Obstruction J-root Angled Guy-wired
Year 1
GLD (mm) 27.4 ab 31.3 a 25.8 b 29.6 ab 27.4 ab
Height (cm) 118.9 127.2 116.9 125.8 123.4
Frequency 2.8 b 3.7 ab 2.4 b 4.7 a 2.9 ab
Amplitude (cm) 1.0 0.9 0.7 1.1 0.7
Year 2
GLD (mm) 73.3 78.4 69.9 76.4 71.2
DBH (mm) 37.9 39.8 35.9 38.4 36.7
Height (cm) 345.4 358.4 342.8 347.6 346.9
Frequency 4.1 4.3 3.6 3.4 2.5
Harvest*
Frequency 5.2 7.3 6.4 6.4 6.1
Amplitude (cm) 1.7 3.0 1.7 1.9 1.8
Total length (cm) 347.2 352.8 341.0 332.3 357.7
Actual length (cm) 349.1 355.6 342.8 334.4 359.4
Stem biomass (g) 1786.5 1927.9 1767.8 1792.7 1993.8
DBH = diameter at breast height. GLD = ground line diameter.*Data for years 1 and 2 are based on six replications; harvest data (year 2) include only the three replications from the raised beds.
Table 2. Effects of root/stem form treatments on 2-year growth, stem curvature, and stem biomass of loblolly pine. For variables with significant treatment effects (table 1), means followed by the same letters do not differ significantly (P > 0.05). Conversions: 1 mm = 0.0394 in; 1 cm = 0.394 in; 1 g = 0.035 oz.
Family
Measurement Variable A (SCO–1 x SCO–14) B (ATL–44 x ATL–5) C (ATL–58 x ATL–5)
Year 1
GLD (mm) 30.9 a 26.5 b 27.5 b
Height (cm) 136.2 a 112.8 b 118.7 b
Frequency 4.2 a 1.9 b 2.6 b
Amplitude (cm) 1.2 a 0.7 b 0.8 b
Year 2
GLD (mm) 77.4 72.3 71.9
DBH (mm) 43.8 a 33.8 b 35.6 b
Height (cm) 376.0 a 329.2 b 339.5 b
Frequency 4.5 a 3.7 ab 2.6 b
Harvest*
Frequency 9.4 a 5.7 ab 3.9 b
Amplitude (cm) 2.3 2.3 1.5
Total length (cm) 363.0 331.9 343.8
Actual length (cm) 365.3 333.8 345.7
Stem biomass (g) 2029.4 1656.7 1875.1
Table 3. Effects of family on 2-year growth, stem curvature, and stem biomass of loblolly pine. For variables with significant family effects, means followed by the same letters do not differ significantly (P > 0.05). Conversions: 1 mm = 0.0394 in; 1 cm = 0.394 in; 1 g = 0.035 oz.
DBH = diameter at breast height. GLD = ground line diameter.*Data for years 1 and 2 are based on six replications; harvest data (year 2) include only the three replications from the raised beds.
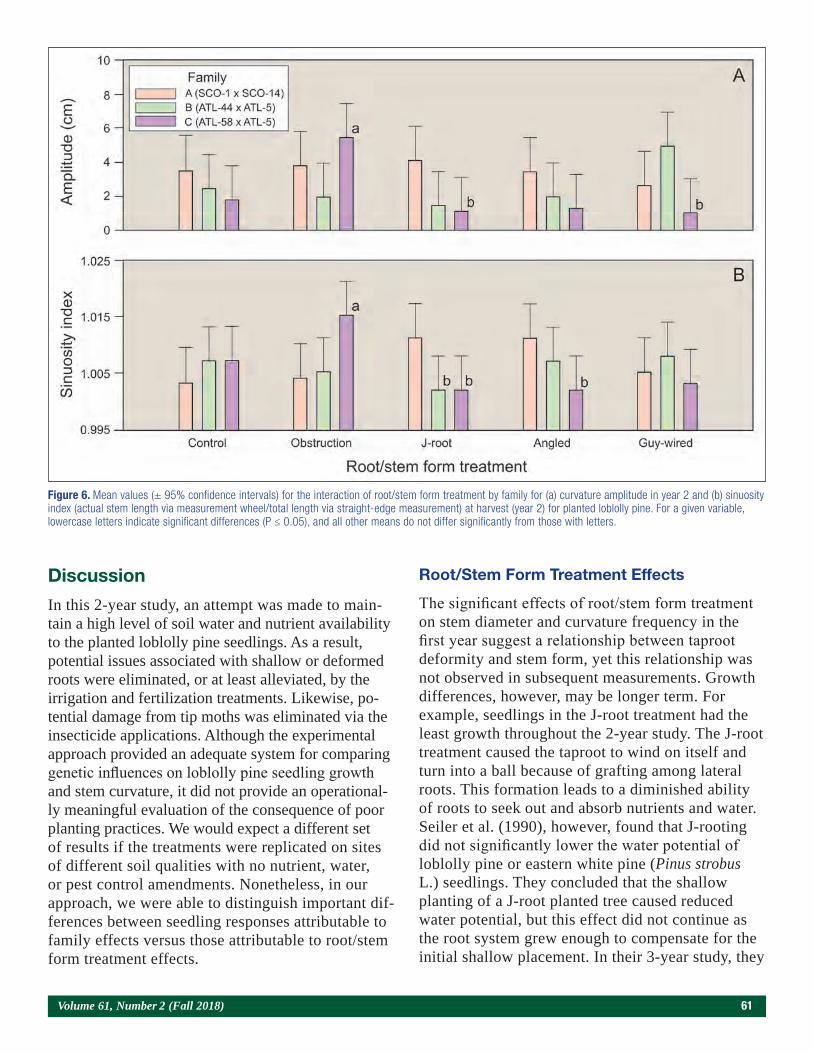
Volume 61, Number 2 (Fall 2018) 61
Discussion
In this 2-year study, an attempt was made to main-tain a high level of soil water and nutrient availability to the planted loblolly pine seedlings. As a result, potential issues associated with shallow or deformed roots were eliminated, or at least alleviated, by the irrigation and fertilization treatments. Likewise, po-tential damage from tip moths was eliminated via the insecticide applications. Although the experimental approach provided an adequate system for comparing genetic influences on loblolly pine seedling growth and stem curvature, it did not provide an operational-ly meaningful evaluation of the consequence of poor planting practices. We would expect a different set of results if the treatments were replicated on sites of different soil qualities with no nutrient, water, or pest control amendments. Nonetheless, in our approach, we were able to distinguish important dif-ferences between seedling responses attributable to family effects versus those attributable to root/stem form treatment effects.
Root/Stem Form Treatment Effects
The significant effects of root/stem form treatment on stem diameter and curvature frequency in the first year suggest a relationship between taproot deformity and stem form, yet this relationship was not observed in subsequent measurements. Growth differences, however, may be longer term. For example, seedlings in the J-root treatment had the least growth throughout the 2-year study. The J-root treatment caused the taproot to wind on itself and turn into a ball because of grafting among lateral roots. This formation leads to a diminished ability of roots to seek out and absorb nutrients and water. Seiler et al. (1990), however, found that J-rooting did not significantly lower the water potential of loblolly pine or eastern white pine (Pinus strobus L.) seedlings. They concluded that the shallow planting of a J-root planted tree caused reduced water potential, but this effect did not continue as the root system grew enough to compensate for the initial shallow placement. In their 3-year study, they
Figure 6. Mean values (± 95% confidence intervals) for the interaction of root/stem form treatment by family for (a) curvature amplitude in year 2 and (b) sinuosity index (actual stem length via measurement wheel/total length via straight-edge measurement) at harvest (year 2) for planted loblolly pine. For a given variable, lowercase letters indicate significant differences (P ≤ 0.05), and all other means do not differ significantly from those with letters.
62 Tree Planters’ Notes
also found greater height growth for J-root planted seedlings when compared with straight-root planted seedlings. Harrington et al. (1999) excavated 3- to 10-year-old planted loblolly pine to determine if taproots were bent or straight and if taproot form was related to stem form. They found that trees with bent taproots had medium to high levels of stem sinuosity, and those with straight taproots had low levels. Har-rington and Howell (1998) found that loblolly pine seedlings planted with deformed (“balled”) roots with the slit method had less growth than those planted with straight roots using the dug-hole method. Trees planted with a “J”-shaped root system may also have decreased wind resistance (Hunter and Maki 1980, Lindström and Rune 1999).
Seedlings in the obstruction treatment had vigorous taproot and lateral root development in the upper soil layer, generally resulting in a broad, flattened root system (figure 5B). From visual observation, these root systems had a large number of far reach-ing laterals near the surface. This lateral expansion likely increased the surface area available for water and nutrient uptake, hence the greater growth that was observed. Although the clear acrylic sheet used for the obstruction was installed at an angle to minimize water pooling, some water and nutrients may have collected on its impermeable surface, giving trees in this treatment an advantage. Analogously, in the sandhill region of the South, site quality for southern pines decreases gradually with depth to a fine-tex-tured horizon, because the clay layer traps soil water and increases its availability to plants (Duryea and Dougherty 1991). Balneaves and De La Mare (1989) did not find growth differences for radiata pine grown in an area with a mineral hardpan that limited root penetration to a maximum depth of 48 cm (18.9 in). In their study, growth was compared between a con-trol and a series of ripping depths where the soil was mechanically penetrated. Because the Whitehall study trees were irrigated, the broad root expansion near the surface was advantageous for water capture. In the field, an obstruction may be a disadvantage as it limits root exploration for deeper water sources.
The angled plantings had greater diameter growth than any other treatment except the control at all three measurement dates. Manual bending increases xylem and bark production at the point of bending leading to a possible effect on stem form (Valinger et al. 1995).
Likewise, preventing stem bending by staking results in decreased diameter growth (Dean 1991). Decreased height growth has been observed for Fraser fir (Abies fraseri [Pursh] Poir.) trees that were subjected to wind stress or mechanical perturbation (Telewski and Jaffe 1986).
Family Effects
Genetic variation among families was evident in growth and stem curvature for years 1 and 2. At harvest (year 2), only curvature frequency differed significantly among families. One family (family A) significantly outgrew the others in height and stem diameter during both seasons. Vargas-Hernandez et al. (2003) evaluated family heritability of growth traits for coast Douglas-fir seedlings and consistent-ly found height to be under stronger genetic control than stem diameter, top weight, or stem curvature. Bail and Pederick (1989) found no correlation be-tween mean height and stem deformity characteris-tics among 44 full-sibling families of radiata pine.
Family C, which had the least stem curvature and growth of all families, showed an interaction with the obstruction treatment resulting in the largest values for curvature amplitude (year 2) and sinu-osity index (harvest). Although we are unable to explain the mechanism for this response, we can infer that this family was particularly sensitive to taproot obstruction, and hence, it responded dis-proportionately to the treatment compared with the other families.
Conclusions
Our study suggests that genetic variation is a great-er factor than root/stem form treatment in affecting stem straightness. We cannot conclude that variations in root and stem form during planting practices are a cause of stem curvature. It is likely that stem cur-vature responses are the result of genetics and site conditions. Trees that are more genetically prone to irregular growth may show an intensified response owing to poor planting practices, reinforcing the im-portance of selecting high quality genotypes, proper site preparation, and careful planting practices.
Research results also suggest a potential exists to select genotypes that are best adapted to site con-ditions restricting root growth, such as soils with

Volume 61, Number 2 (Fall 2018) 63
a compacted layer. In our study, family C was noted to show a significant increase in stem curvature in response to the obstruction treatment. The study also emphasizes the resilience of loblolly pine, and likely many other tree species, to environmental stress. De-spite our attempts to create planting conditions likely to stimulate increases in stem curvature, the seedlings differed little in their development among the root/stem form treatments. However, in no way should the results of our research be taken as a justification for limiting planting quality. Instead, our work highlights the importance of seed source and genetic selection, breeding, or both; adequate planting depth; and proper vertical alignment of the seedling within the planting hole
Address correspondence to—
Michael S. Murphy, 3311 Woodside Court NE, Olym-pia, WA 98506; email: [email protected]; phone: 706–338–0775.
Acknowledgments
We are grateful to the International Paper Company for providing full-sibling seedlings of loblolly pine for the study. We would like to thank Terry Price (Georgia Forestry Commission) for help with initi-ating the study, fellow University of Georgia (UGA) students Gopal Ahuja, Nikhil Narahari, Doug Mar-shall, and Michael Huffman for their time and labor, and Dale Porterfield and Mike Hunter (UGA School of Forestry and Natural Resources) for providing the facilities and assisting with study maintenance.
REFERENCES
Bail, I.R.; Pederick, L.A. 1989. Stem deformity in Pinus radiata on highly fertile sites: expression and genetic variation. Australian Forestry. 52(4): 309–320.
Balneaves, J.M.; De La Mare, P.J. 1989. Root patterns of Pinus radiata on five ripping treatments in a Canterbury forest. New Zealand Journal of Forest Science. 19(1): 29–40.
Campbell, R.K. 1965. Phenotypic variation and repeatability of variation in stem sinuosity of Douglas-fir. Northwest Science. 39(2): 47–59.
Dean, T.J. 1991. Effect of growth rate and wind sway on the relation between mechanical and water-flow properties in slash pine seedlings. Canadian Journal of Forestry Research. 21: 1501–1506.
Duryea, M.L.; Dougherty, P.M., eds. 1991. Forest regeneration manual. Dordrecht, The Netherlands: Kluwer Academic Publish-ers: 194–195.
Espinoza, J.A.; Allen, H.L.; McKeand, S.E.; Dougherty, P.M. 2012. Stem sinuosity in loblolly pine with nitrogen and calcium additions. Forest Ecology and Management. 265: 55–61.
Fettig, C.J.; Dalusky, M.J.; Berisford, C.W. 2000. Nantucket pine tip moth phenology and timing of insecticide spray applications in seven southeastern states. Research Paper SRS-18. Asheville, NC: U.S. Department of Agriculture, Forest Service, Southern Research Station. 23 p.
Gwaze, D.P.; Woolliams, J.A.; Kanowski, P.J. 1997. Genetic parameters for height and stem straightness in Pinus taeda L. in Zimbabwe. Forest Genetics. 4: 159–169.
Haase, D.L.; Batdorff, J.H.; Rose, R. 1993. Effect of root form on 10-year survival and growth of planted Douglas-fir trees. Tree Planters’ Notes. 44(2): 53–57.
Harrington, C.A.; Carlson, W.C.; Brissette, J.C. 1987. Rela-tionships between height growth and root system orientation in planted and seeded loblolly and shortleaf pines. In: Phillips, D.R., comp. Proceedings of the Fourth Biennial Southern Silvicul-tural Research Conference. General Technical Report SE-42. Asheville, NC: U.S. Department of Agriculture, Forest Service, Southeastern Forest Experiment Station: 53–60.
Harrington, T.B.; Howell, K.D. 1998. Planting cost, survival, and growth one to three years after establishing loblolly pine seed-lings with straight, deformed, and pruned taproots. New Forests. 15:193–204.
Harrington, T.B.; Gatch, J.A.; Price, T.S. 1999. Stem sinuosity, tree size, and pest injury of machine-planted loblolly pine with bent versus straight taproots. Southern Journal of Applied Forestry. 23(4): 197–202.
Hay, R.L.; Woods, F.W. 1974. Root deformation correlated with sapling size for loblolly pine Journal of Forestry. 72(3): 143–145.
Hunter, S.C.; Maki, T.E. 1980. The effects of root-curling on loblolly pine. Southern Journal of Applied Forestry. 4(1): 45–48.
Jones, D.P.; Fox, T.R. 2012. Stem sinuosity changes in young and merchantable stands of Pinus taeda. Forest Products Journal. 62(5): 354–358.
Koch, P.W.; Cote, W.A., Jr., Schlieter, J.; Day, A.C. 1990. Inci-dence of compression wood and stem eccentricity in lodgepole pine of North America. Research Paper INT-420. Ogden, UT: U.S. Department of Agriculture, Forest Service, Intermountain Research Station. 42 p.
Lindström, A.; Rune, G. 1999. Root deformation in plantations of container-grown Scots pine trees: effects on root growth, tree stability and stem straightness. Plant and Soil. 217: 29–37.

64 Tree Planters’ Notes
Low, A.J. 1964. A study of compression wood in Scots pine (Pinus sylvestris L.). Forestry. 37: 179–201.
Murphy, M.S.; Harrington, T.B. 2004. Stem sinuosity of loblolly pine seedlings as influenced by taproot shape. In: Connor, K.F., ed. Proceedings of the 12th Biennial Southern Silvicultural Research Conference. Gen. Tech. Rep. SRS–71. Asheville, NC: U.S. Department of Agriculture, Forest Service, Southern Research Station: 465–468.
Robert, J.A.; Lindgren, B.S. 2006. Relationships between root form and growth, stability, and mortality in planted versus natural-ly regenerated lodgepole pine in north-central British Columbia. Canadian Journal of Forest Research. 36: 2642–2653.
SAS Institute. 1989 SAS/STAT User’s Guide, Version 6. 4th ed. 2 vol. Cary, NC: SAS Institute, Inc. 846 p.
Seiler, J.R.; Paganelli, D.J.; Cazell, B.H. 1990. Growth and water potential of j-rooted loblolly and eastern white pine seedlings over three growing seasons. New Forests. 4: 147–153.
Timell, T.E. 1986. Compression wood in gymnosperms. 2 vol. Berlin, Germany: Springer-Verlag: 707–1338.
Telewski, F.W.; Jaffe, M.J. 1986. Thigmomorphogenesis: field and laboratory studies of Abies fraseri in response to wind or mechanical perturbation. Physiologia Plantarum. 66(2): 211–218.
Valinger, E.; Lundqvist, L.; Sundberg, B. 1995. Mechanical bending stress applied during dormancy and (or) growth stimu-lates stem diameter growth of Scots pine seedlings. Canadian Journal of Forestry Research. 25(6): 886–890.
Vargas-Hernandez, J.J.; Adams, W.T.; Joyce, D.G. 2003. Quantitative genetic structure of stem form and branching traits in Douglas-fir seedlings and implications for early selection. Silvae Genetica. 52(1): 36–44.
Weng, Y.H.; Lu, P.; Adams, G.W.; Fullarton, M.S.; Tosh, K.J. 2015. Genetic parameters of growth and stem quality traits for jack pine second-generation progeny tested in New Brunswick. Canadian Journal of Forestry Research. 45(1): 36–43.
Wu, H.X.; Ivkovich, M.; Gapare, W.J.; Matheson, A.C.; Baltunis, B.S.; Powell, M.B.; McRae, T.A. 2008. Breeding for wood quality and profit in radiata pine: a review of genetic parameters and implication for breeding and deployment. New Zealand Journal of Forestry Science. 38: 56–87.
Volume 61, Number 2 (Fall 2018) 65
Abstract
Cherrybark oak is a highly desirable hardwood species across the Southeastern United States. Sil-vicultural techniques for establishment have been carefully studied, but advances in tree improvement have yet to be realized. Cherrybark oak seedlings of genetically improved and unimproved stock were tested in field plantings in southern Arkansas and in a controlled pot study for root pruning effects. After 2 years, initial growth advantages of improved stock were no longer present; however, improved stock averaged 19 percent higher survival compared with unimproved seedlings. The improved stock also had greater resprouting after top dieback, indicating more resiliency. In the root pruning study, seedlings with pruned roots were easier to plant, had better survival, and exhibited less transpiration and stomatal conduc-tance. Also, larger roots of the improved stock were more apt to be uncovered by erosion, potentially killing the tree. Larger roots systems are considered more desirable, but caution must be taken when plant-ing. The larger root systems of genetically improved cherrybark oak seedlings make proper planting more challenging. However, pruning may offer a remedy making the seedlings easier to plant and more drought hardy initially.
Introduction
Bottomland hardwood forests are important con-tributors of ecological richness, mast for wildlife, and wood products in the Southern United States
(Wharton et al. 1982). Among hardwoods, red oaks (Quercus subgroup Erythrobalanus) are ecologically and economically valuable. Despite the high desir-ability of red oaks, natural regeneration failures in stands historically dominated by these oaks has been well documented (Clatterbuck and Meadows 1992, Hodges and Janzen 1987, Lorimer 1989, Oliver et al. 2005). The lack of natural oak regeneration on many sites has resulted in some landowners planting oaks to ensure this taxa remains viable for future genera-tions, provides wildlife habitat, conserves the natu-ral environment, and produces high-value products (Michler et al. 2005). For example, oak afforestation by planting is an increasingly common, if sometimes risky, practice to restore mid-successional forests. In recent years, numerous silvicultural techniques have been developed to improve the survivorship and growth rates of planted red oaks, including the use of tree shelters, competition control, and a range of site preparation techniques (Burgess et al. 1990, Hansen and Tolsted 1981). In spite of these efforts, oak seed-ling production in the Southern United States is only a fraction of overall seedling production but has in-creased over the years from 17.8 million oak bareroot seedlings and 154,000 containerized seedlings in the 2008 and 2009 seasons (Enebak 2011) to more than 23 million seedlings overall in 2016 (Hernández et al. 2017). As oak seedling planting will likely continue at a high level into the foreseeable future, managers should adopt field planting practices using the best quality nursery stock available while balancing costs and risks with gain potential.
Genetic Improvement and Root Pruning Effects on Cherrybark Oak (Quercus Pagoda L.) Seedling Growth
and Survival in Southern ArkansasJoshua P. Adams, Nicholas Mustoe, Don C. Bragg, Matthew H. Pelkki, and Victor L. Ford
Associate Professor, School of Agricultural Sciences and Forestry, Louisiana Tech University, Ruston, LA; Forester, U.S. Department of Agriculture (USDA) Forest Service, Fishlake National Forest, Richfield, UT; Research Forester and Project Leader, USDA Forest Service, Southern Research Station, Monticello, AR;
Professor and Associate Director, Arkansas Forest Resources Center, University of Arkansas at Monticello, Monticello, AR; Director and Professor, Southwest Research and Extension Center,
University of Arkansas Research and Extension, Little Rock, AR
66 Tree Planters’ Notes
Although most of the research effort related to arti-ficial regeneration of oaks has been on mechanical site practices or competition treatments (Collins and Battaglia 2008, Holladay et al. 2006, Leonardsson et al. 2015), more attention recently has been directed to the biological component of planting, including nursery practices (e.g., lifting depth and seedling sizes), which can improve the growth and survival performance of most hardwoods (Collins and Batta-glia 2008, Farmer and Pezeshki 2004). Perhaps more importantly, using genetically improved hardwood seedlings has the potential to be as important as for stock quality as silvicultural practices such as irriga-tion, fertilization, weed control, and root culturing practices in plantation and nursery settings (Jacobs 2003). The potential for gains in survival and growth through hardwood tree improvement has yet to be greatly explored. Although desirable, these gains are elusive because of many challenges, including long generation and reproductive cycles, intermittent seed crops, difficulty in controlling pollination, overall higher production costs, and greater monetary risk in the case of planting failure (Dickmann et al. 1980, Lantz 2008). Limitations to using improved hardwood seedlings are gradually changing. Starting in 2012, the Arkansas Forestry Commission began offering im-proved (second generation) cherrybark oak (Quercus pagoda Raf.) seedlings to the public. Cherrybark oak is one of the most widely distributed and prized of the red oaks in the Eastern United States, desired for its fast-growing, high-quality wood and abundant hard mast for wildlife (Ezell and Hodges 1994, Putnam 1951). In addition, research has shown that cherrybark oak may be particularly amenable to tree improvement programs. Adams et al. (2007) found cherrybark oak had high family heritability for height (0.5 to 0.7) and diameter (0.55 to 0.7), which opens the door for improvement. These results are in line with previous studies on heritability for other oak species such as Nuttall oak (Quercus texana Buckley) and are high-er than the 0.36 heritability estimated for white oak (Quercus alba L.) height growth (Gwaze et al. 2003, Rink 1984).
Although improved cherrybark oak seedlings may offer significantly better volume growth over unim-proved seedlings, this improvement comes at pre-mium—improved seedlings sell for $400 per 1,000 seedlings, or twice the cost of unimproved seedlings (Adams et al. 2015). More study is needed to deter-
mine if the added expense of improved cherrybark oak seedlings can be realized by increased returns. Some questions regarding nursery practices and genetic improvement (and their interactions) can be addressed even at an early stage. The objective of our research was to evaluate the growth and survival characteristics of a genetically improved variety of cherrybark oak compared with unimproved seedlings 2 years after planting at two field sites. Because the large root size in the improved stock was a hindrance during planting, three distinct root pruning treatments were examined for both improved and unimproved cherrybark oaks in a parallel study. These two studies were intended to provide one of the first field assess-ments of genetic improvement in cherrybark oak.
Methods
Field Planting Study
During the winter of 2011–2012, two sites were pre-pared for this study in South Arkansas. Sites were on the University of Arkansas at Monticello’s Teaching and Research School Forest in Drew County (Monti-cello site) and at the University of Arkansas’s Southeast Research and Extension Center in Hempstead County (Hope site). The Monticello plantings were installed on two formerly pine-dominated stands slightly east of the city of Monticello (N 33° 37’ 12.31”, W 91° 44’ 0.38”). The previously pine-dominated stands had been salvaged and cleared following a tornado in 2010. The Hope location (N 33° 43’ 9.76”, W 93° 31’ 49.92”) was formerly an abandoned pasture that was cleared and brush-hogged prior to planting. The Monticello site was on Grenada and Henry silt loams (cherrybark oak SI50 = 24 - 26 m), and the Hope site was on a Una silty clay loam (SI50 = 27 m) (USDA NRCS 2017).
In March 2012, 1-year-old, bareroot, open-pollinat-ed (half-sib) second-generation improved cherrybark oak seedlings and 1-year-old unimproved woods-run cherrybark oak seedlings grown at Arkansas Forestry Commission’s Baucum Nursery (North Little Rock, AR) were planted by hand with a hardwood dibble on a 2.43 by 3.04 m spacing at both sites (figure 1a). The overall study design was a randomized complete block at two sites: Monticello and Hope. Each site had two blocks within which improved or unimproved seedlings were randomly assigned to plots. Following planting, a pre-emergent sulfometuron methyl herbicide (Oust XP,
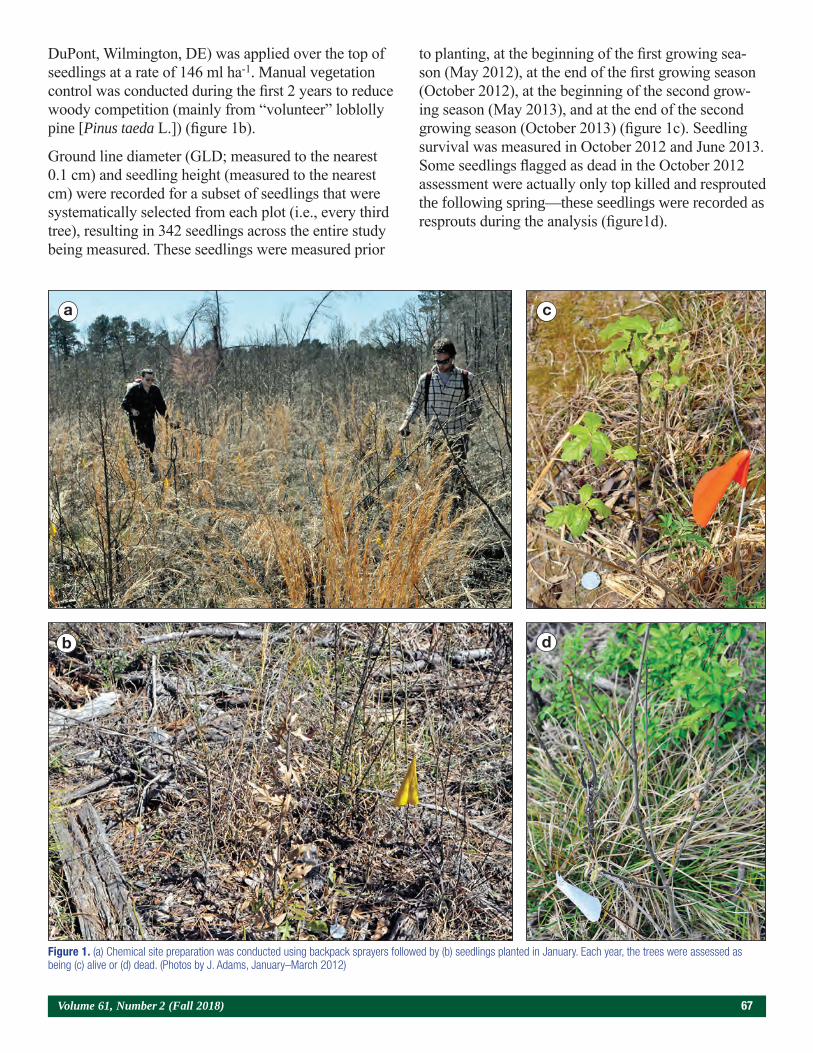
Volume 61, Number 2 (Fall 2018) 67
DuPont, Wilmington, DE) was applied over the top of seedlings at a rate of 146 ml ha-1. Manual vegetation control was conducted during the first 2 years to reduce woody competition (mainly from “volunteer” loblolly pine [Pinus taeda L.]) (figure 1b).
Ground line diameter (GLD; measured to the nearest 0.1 cm) and seedling height (measured to the nearest cm) were recorded for a subset of seedlings that were systematically selected from each plot (i.e., every third tree), resulting in 342 seedlings across the entire study being measured. These seedlings were measured prior
to planting, at the beginning of the first growing sea-son (May 2012), at the end of the first growing season (October 2012), at the beginning of the second grow-ing season (May 2013), and at the end of the second growing season (October 2013) (figure 1c). Seedling survival was measured in October 2012 and June 2013. Some seedlings flagged as dead in the October 2012 assessment were actually only top killed and resprouted the following spring—these seedlings were recorded as resprouts during the analysis (figure1d).
Figure 1. (a) Chemical site preparation was conducted using backpack sprayers followed by (b) seedlings planted in January. Each year, the trees were assessed as being (c) alive or (d) dead. (Photos by J. Adams, January–March 2012)
a
b
c
d
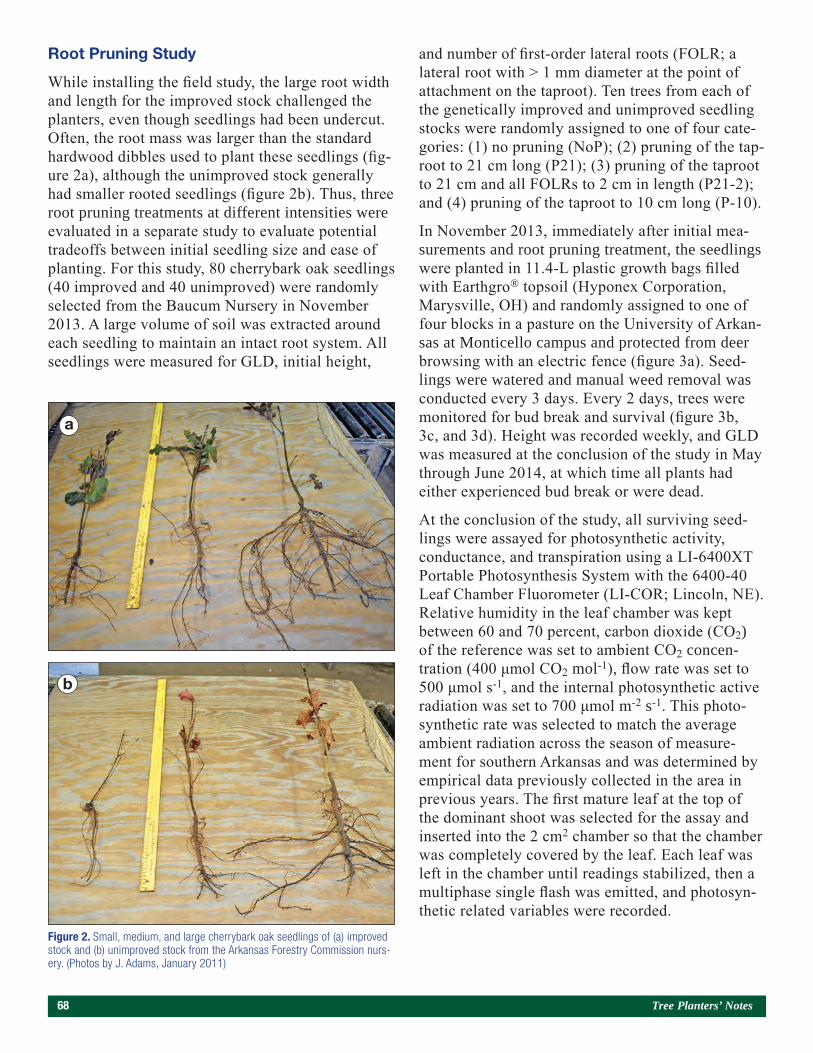
68 Tree Planters’ Notes
Root Pruning Study
While installing the field study, the large root width and length for the improved stock challenged the planters, even though seedlings had been undercut. Often, the root mass was larger than the standard hardwood dibbles used to plant these seedlings (fig-ure 2a), although the unimproved stock generally had smaller rooted seedlings (figure 2b). Thus, three root pruning treatments at different intensities were evaluated in a separate study to evaluate potential tradeoffs between initial seedling size and ease of planting. For this study, 80 cherrybark oak seedlings (40 improved and 40 unimproved) were randomly selected from the Baucum Nursery in November 2013. A large volume of soil was extracted around each seedling to maintain an intact root system. All seedlings were measured for GLD, initial height,
and number of first-order lateral roots (FOLR; a lateral root with > 1 mm diameter at the point of attachment on the taproot). Ten trees from each of the genetically improved and unimproved seedling stocks were randomly assigned to one of four cate-gories: (1) no pruning (NoP); (2) pruning of the tap-root to 21 cm long (P21); (3) pruning of the taproot to 21 cm and all FOLRs to 2 cm in length (P21-2); and (4) pruning of the taproot to 10 cm long (P-10).
In November 2013, immediately after initial mea-surements and root pruning treatment, the seedlings were planted in 11.4-L plastic growth bags filled with Earthgro® topsoil (Hyponex Corporation, Marysville, OH) and randomly assigned to one of four blocks in a pasture on the University of Arkan-sas at Monticello campus and protected from deer browsing with an electric fence (figure 3a). Seed-lings were watered and manual weed removal was conducted every 3 days. Every 2 days, trees were monitored for bud break and survival (figure 3b, 3c, and 3d). Height was recorded weekly, and GLD was measured at the conclusion of the study in May through June 2014, at which time all plants had either experienced bud break or were dead.
At the conclusion of the study, all surviving seed-lings were assayed for photosynthetic activity, conductance, and transpiration using a LI-6400XT Portable Photosynthesis System with the 6400-40 Leaf Chamber Fluorometer (LI-COR; Lincoln, NE). Relative humidity in the leaf chamber was kept between 60 and 70 percent, carbon dioxide (CO2) of the reference was set to ambient CO2 concen-tration (400 μmol CO2 mol-1), flow rate was set to 500 μmol s-1, and the internal photosynthetic active radiation was set to 700 μmol m-2 s-1. This photo-synthetic rate was selected to match the average ambient radiation across the season of measure-ment for southern Arkansas and was determined by empirical data previously collected in the area in previous years. The first mature leaf at the top of the dominant shoot was selected for the assay and inserted into the 2 cm2 chamber so that the chamber was completely covered by the leaf. Each leaf was left in the chamber until readings stabilized, then a multiphase single flash was emitted, and photosyn-thetic related variables were recorded.
Figure 2. Small, medium, and large cherrybark oak seedlings of (a) improved stock and (b) unimproved stock from the Arkansas Forestry Commission nurs-ery. (Photos by J. Adams, January 2011)
a
b
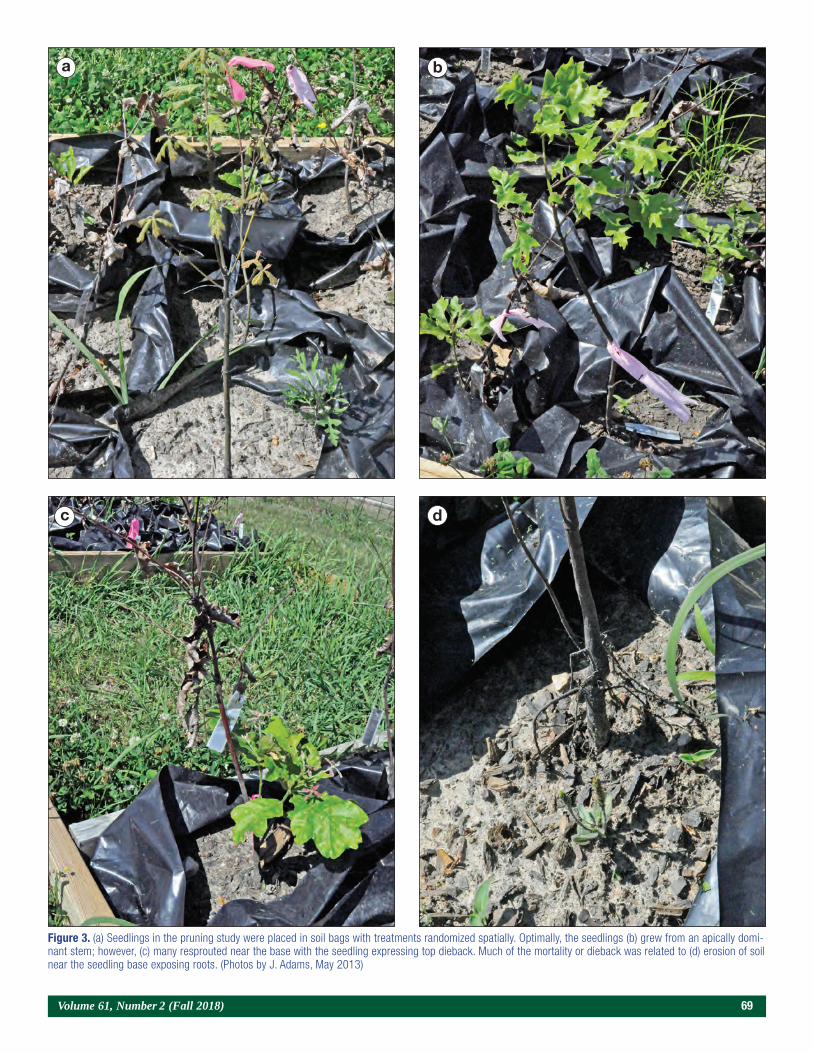
Volume 61, Number 2 (Fall 2018) 69
Figure 3. (a) Seedlings in the pruning study were placed in soil bags with treatments randomized spatially. Optimally, the seedlings (b) grew from an apically domi-nant stem; however, (c) many resprouted near the base with the seedling expressing top dieback. Much of the mortality or dieback was related to (d) erosion of soil near the seedling base exposing roots. (Photos by J. Adams, May 2013)
a
c
b
d
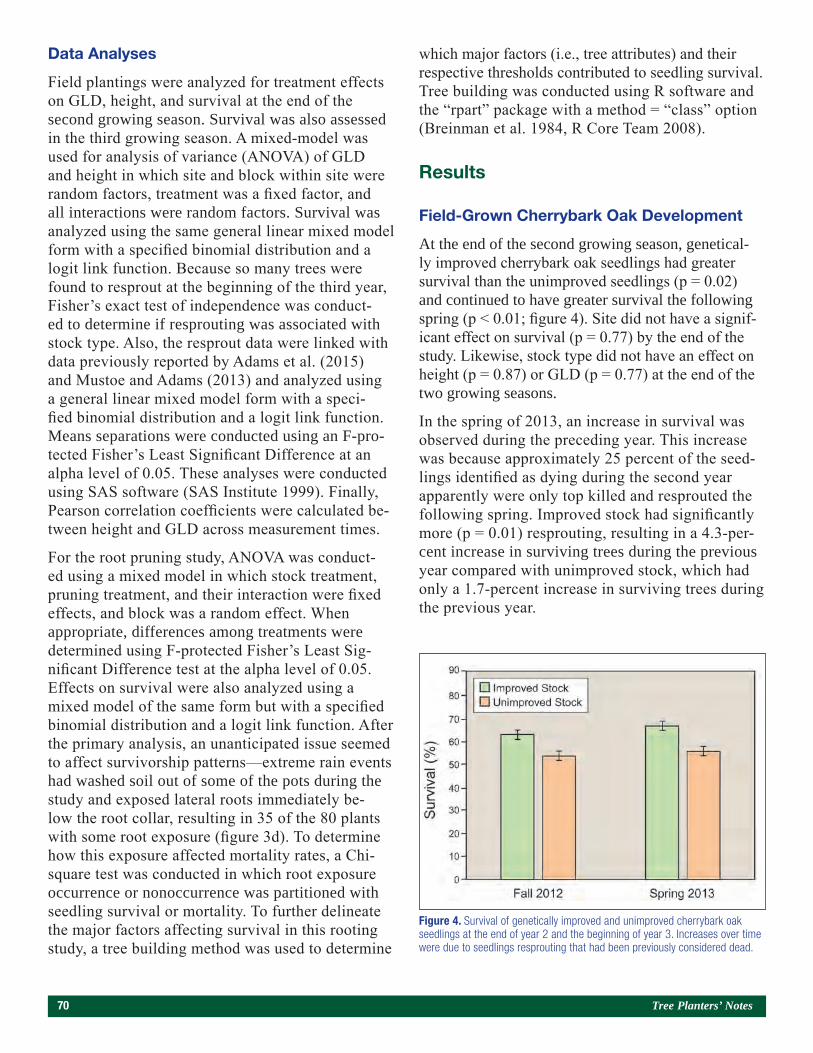
70 Tree Planters’ Notes
Data Analyses
Field plantings were analyzed for treatment effects on GLD, height, and survival at the end of the second growing season. Survival was also assessed in the third growing season. A mixed-model was used for analysis of variance (ANOVA) of GLD and height in which site and block within site were random factors, treatment was a fixed factor, and all interactions were random factors. Survival was analyzed using the same general linear mixed model form with a specified binomial distribution and a logit link function. Because so many trees were found to resprout at the beginning of the third year, Fisher’s exact test of independence was conduct-ed to determine if resprouting was associated with stock type. Also, the resprout data were linked with data previously reported by Adams et al. (2015) and Mustoe and Adams (2013) and analyzed using a general linear mixed model form with a speci-fied binomial distribution and a logit link function. Means separations were conducted using an F-pro-tected Fisher’s Least Significant Difference at an alpha level of 0.05. These analyses were conducted using SAS software (SAS Institute 1999). Finally, Pearson correlation coefficients were calculated be-tween height and GLD across measurement times.
For the root pruning study, ANOVA was conduct-ed using a mixed model in which stock treatment, pruning treatment, and their interaction were fixed effects, and block was a random effect. When appropriate, differences among treatments were determined using F-protected Fisher’s Least Sig-nificant Difference test at the alpha level of 0.05. Effects on survival were also analyzed using a mixed model of the same form but with a specified binomial distribution and a logit link function. After the primary analysis, an unanticipated issue seemed to affect survivorship patterns—extreme rain events had washed soil out of some of the pots during the study and exposed lateral roots immediately be-low the root collar, resulting in 35 of the 80 plants with some root exposure (figure 3d). To determine how this exposure affected mortality rates, a Chi-square test was conducted in which root exposure occurrence or nonoccurrence was partitioned with seedling survival or mortality. To further delineate the major factors affecting survival in this rooting study, a tree building method was used to determine
which major factors (i.e., tree attributes) and their respective thresholds contributed to seedling survival. Tree building was conducted using R software and the “rpart” package with a method = “class” option (Breinman et al. 1984, R Core Team 2008).
Results
Field-Grown Cherrybark Oak Development
At the end of the second growing season, genetical-ly improved cherrybark oak seedlings had greater survival than the unimproved seedlings (p = 0.02) and continued to have greater survival the following spring (p < 0.01; figure 4). Site did not have a signif-icant effect on survival (p = 0.77) by the end of the study. Likewise, stock type did not have an effect on height (p = 0.87) or GLD (p = 0.77) at the end of the two growing seasons.
In the spring of 2013, an increase in survival was observed during the preceding year. This increase was because approximately 25 percent of the seed-lings identified as dying during the second year apparently were only top killed and resprouted the following spring. Improved stock had significantly more (p = 0.01) resprouting, resulting in a 4.3-per-cent increase in surviving trees during the previous year compared with unimproved stock, which had only a 1.7-percent increase in surviving trees during the previous year.
Figure 4. Survival of genetically improved and unimproved cherrybark oak seedlings at the end of year 2 and the beginning of year 3. Increases over time were due to seedlings resprouting that had been previously considered dead.
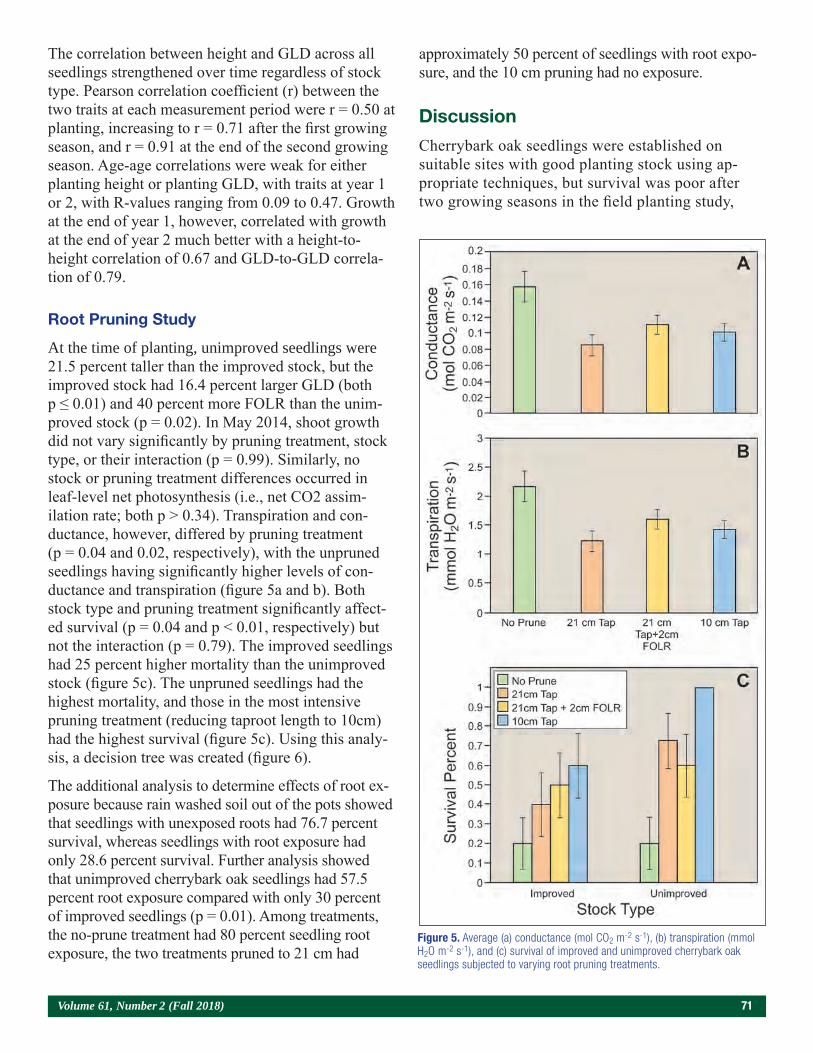
Volume 61, Number 2 (Fall 2018) 71
The correlation between height and GLD across all seedlings strengthened over time regardless of stock type. Pearson correlation coefficient (r) between the two traits at each measurement period were r = 0.50 at planting, increasing to r = 0.71 after the first growing season, and r = 0.91 at the end of the second growing season. Age-age correlations were weak for either planting height or planting GLD, with traits at year 1 or 2, with R-values ranging from 0.09 to 0.47. Growth at the end of year 1, however, correlated with growth at the end of year 2 much better with a height-to-height correlation of 0.67 and GLD-to-GLD correla-tion of 0.79.
Root Pruning Study
At the time of planting, unimproved seedlings were 21.5 percent taller than the improved stock, but the improved stock had 16.4 percent larger GLD (both p ≤ 0.01) and 40 percent more FOLR than the unim-proved stock (p = 0.02). In May 2014, shoot growth did not vary significantly by pruning treatment, stock type, or their interaction (p = 0.99). Similarly, no stock or pruning treatment differences occurred in leaf-level net photosynthesis (i.e., net CO2 assim-ilation rate; both p > 0.34). Transpiration and con-ductance, however, differed by pruning treatment (p = 0.04 and 0.02, respectively), with the unpruned seedlings having significantly higher levels of con-ductance and transpiration (figure 5a and b). Both stock type and pruning treatment significantly affect-ed survival (p = 0.04 and p < 0.01, respectively) but not the interaction (p = 0.79). The improved seedlings had 25 percent higher mortality than the unimproved stock (figure 5c). The unpruned seedlings had the highest mortality, and those in the most intensive pruning treatment (reducing taproot length to 10cm) had the highest survival (figure 5c). Using this analy-sis, a decision tree was created (figure 6).
The additional analysis to determine effects of root ex-posure because rain washed soil out of the pots showed that seedlings with unexposed roots had 76.7 percent survival, whereas seedlings with root exposure had only 28.6 percent survival. Further analysis showed that unimproved cherrybark oak seedlings had 57.5 percent root exposure compared with only 30 percent of improved seedlings (p = 0.01). Among treatments, the no-prune treatment had 80 percent seedling root exposure, the two treatments pruned to 21 cm had
approximately 50 percent of seedlings with root expo-sure, and the 10 cm pruning had no exposure.
Discussion
Cherrybark oak seedlings were established on suitable sites with good planting stock using ap-propriate techniques, but survival was poor after two growing seasons in the field planting study,
Figure 5. Average (a) conductance (mol CO2 m-2 s-1), (b) transpiration (mmol H2O m-2 s-1), and (c) survival of improved and unimproved cherrybark oak seedlings subjected to varying root pruning treatments.
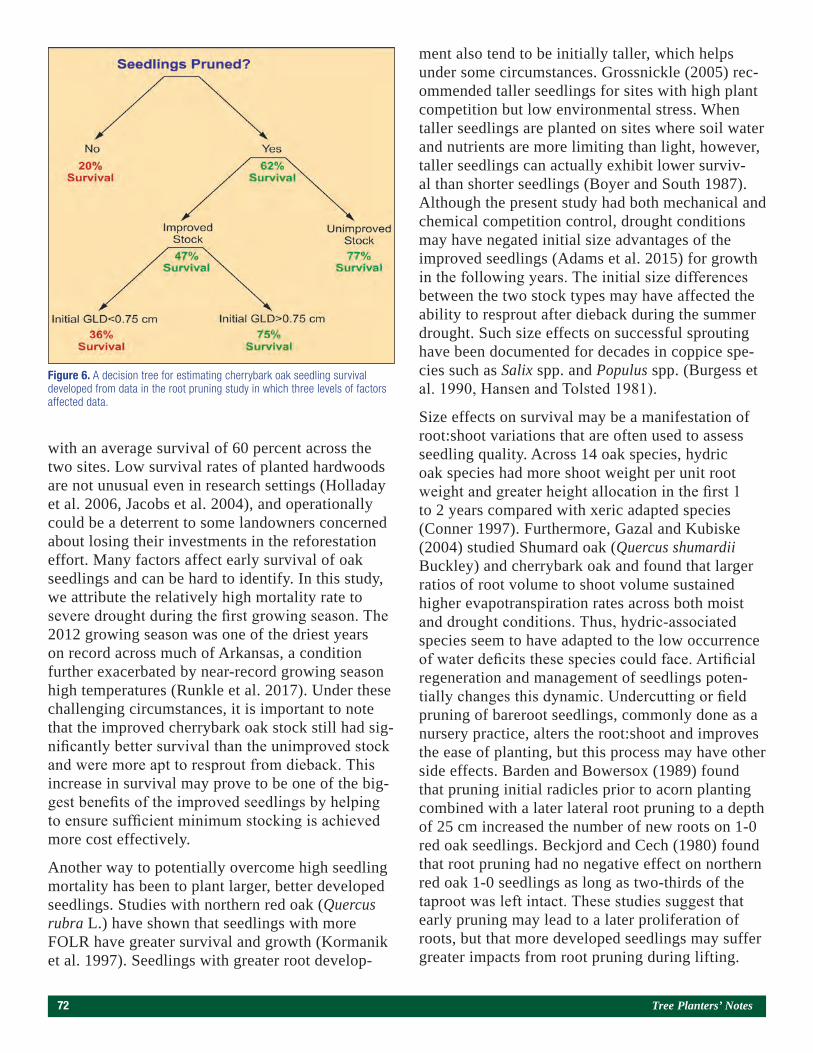
72 Tree Planters’ Notes
with an average survival of 60 percent across the two sites. Low survival rates of planted hardwoods are not unusual even in research settings (Holladay et al. 2006, Jacobs et al. 2004), and operationally could be a deterrent to some landowners concerned about losing their investments in the reforestation effort. Many factors affect early survival of oak seedlings and can be hard to identify. In this study, we attribute the relatively high mortality rate to severe drought during the first growing season. The 2012 growing season was one of the driest years on record across much of Arkansas, a condition further exacerbated by near-record growing season high temperatures (Runkle et al. 2017). Under these challenging circumstances, it is important to note that the improved cherrybark oak stock still had sig-nificantly better survival than the unimproved stock and were more apt to resprout from dieback. This increase in survival may prove to be one of the big-gest benefits of the improved seedlings by helping to ensure sufficient minimum stocking is achieved more cost effectively.
Another way to potentially overcome high seedling mortality has been to plant larger, better developed seedlings. Studies with northern red oak (Quercus rubra L.) have shown that seedlings with more FOLR have greater survival and growth (Kormanik et al. 1997). Seedlings with greater root develop-
ment also tend to be initially taller, which helps under some circumstances. Grossnickle (2005) rec-ommended taller seedlings for sites with high plant competition but low environmental stress. When taller seedlings are planted on sites where soil water and nutrients are more limiting than light, however, taller seedlings can actually exhibit lower surviv-al than shorter seedlings (Boyer and South 1987). Although the present study had both mechanical and chemical competition control, drought conditions may have negated initial size advantages of the improved seedlings (Adams et al. 2015) for growth in the following years. The initial size differences between the two stock types may have affected the ability to resprout after dieback during the summer drought. Such size effects on successful sprouting have been documented for decades in coppice spe-cies such as Salix spp. and Populus spp. (Burgess et al. 1990, Hansen and Tolsted 1981).
Size effects on survival may be a manifestation of root:shoot variations that are often used to assess seedling quality. Across 14 oak species, hydric oak species had more shoot weight per unit root weight and greater height allocation in the first 1 to 2 years compared with xeric adapted species (Conner 1997). Furthermore, Gazal and Kubiske (2004) studied Shumard oak (Quercus shumardii Buckley) and cherrybark oak and found that larger ratios of root volume to shoot volume sustained higher evapotranspiration rates across both moist and drought conditions. Thus, hydric-associated species seem to have adapted to the low occurrence of water deficits these species could face. Artificial regeneration and management of seedlings poten-tially changes this dynamic. Undercutting or field pruning of bareroot seedlings, commonly done as a nursery practice, alters the root:shoot and improves the ease of planting, but this process may have other side effects. Barden and Bowersox (1989) found that pruning initial radicles prior to acorn planting combined with a later lateral root pruning to a depth of 25 cm increased the number of new roots on 1-0 red oak seedlings. Beckjord and Cech (1980) found that root pruning had no negative effect on northern red oak 1-0 seedlings as long as two-thirds of the taproot was left intact. These studies suggest that early pruning may lead to a later proliferation of roots, but that more developed seedlings may suffer greater impacts from root pruning during lifting.
Figure 6. A decision tree for estimating cherrybark oak seedling survival developed from data in the root pruning study in which three levels of factors affected data.
Volume 61, Number 2 (Fall 2018) 73
Other studies have shown that root pruning can negatively impact seedlings and result in decreased height growth. For example, light root pruning of 25 percent of individual root length was found to have a negative effect on initial height growth in Nuttall oak (Farmer and Pezeshki 2004). Harrington and Howell (1998) determined that even lightly pruning taproots (i.e., pruning the portion of the taproot with a diameter < 1 mm) was enough to reduce height growth in loblolly pine.
Potentially, the decrease in height growth and sub-sequent decrease in net photosynthesis feeds back to root production, as the photosynthates are not present to support further root growth (Grossnickle 2005). Although a net reduction in photosynthesis has been shown to occur in Monterey pine (Pinus radiata D. Don) for at least the first 30 days following initial planting of root-pruned seedlings (Stupendick and Shepherd 1980), the current study did not detect dif-ferences among leaf-level photosynthesis rates across pruning treatments, although stomatal conductance and transpiration rates decreased after pruning. This phenomenon inversely mirrored the survival rates, which were better in the pruned seedlings and sup-ports the supposition put forth that floodplain oaks with large root systems may have poor morphology to adapt to a dry growing season as they experience excess water loss (Gazal and Kubiske 2004). Thus, pruning may alter the physiology of the seedlings, causing seedlings with larger shoots to decrease their stomatal transpiration. Although we did not prune the roots for the field planting component, small root systems may also have an advantage as they are sim-ply easier to plant and pose less risk for eventual root exposure and subsequent mortality.
Conclusions
Our examination of genetically improved cher-rybark oak seedlings showed that having a larger seedling and root system may increase survival and resprout in the field, although mechanically limiting the size of the roots may aid in proper planting. Thus, seedlings with a larger GLD but with a trimmed root mass may be the optimum for a successful seedling. Still, further study is needed to assess the long-term effects of pruning the seedlings for field use over multiple summer droughts.
Address correspondence to—
Joshua P. Adams, Assistant Professor of Silviculture and Genetics, School of Agricultural Sciences and Forestry, Louisiana Tech University, 1501 Reese Drive, Ruston, LA 71272; email: [email protected]; phone: 318–257–4457..
Acknowledgments
The authors extend their appreciation to the Arkansas Forestry Commission for the donation of seedlings and time, notably David Bowling and Allan Murray. Michael Blazier also provided comments in the devel-opment of this paper. The authors also acknowledge Tom Byram with the Western Gulf Tree Improvement Cooperative for advice on the study, as the Coopera-tive directed the tree improvement that led to produc-tion of the improved seedlings.
REFERENCES
Adams, J.P.; Graves, D.; Pelkki, M.H.; Stuhlinger, C.; Barry, J. 2015. Survival and initial growth attributes of improved and unimproved cherrybark oak in South Arkansas. In: Holley, A.; Conner, K.; Haywood, J., eds. Proceeding of the 17th biennial southern silvicutlural research conference. Gen. Tech. Rep. SRS-203. Ashville, NC: U.S. Department of Agriculture, Forest Service, Southern Research Station: 1–4.
Adams, J.P.; Rousseau, R.J.; Adams, J.C. 2007. Genetic performance and maximizing genetic gain through direct and indirect selection in cherrybark oak. Silvae Genetica. 56: 80–87.
Barden, C.J.; Bowersox, T.W. 1989. The effect of root pruning treatments on red oak seedling root growth capacity. In: Rink, G.; Budelsky, C.A., eds. Proceeding of the 7th central hardwood forest conference. Carbondale, IL: U.S. Department of Agricul-ture, Forest Service: 115–119.
Beckjord, P.R.; Cech, F.C. 1980. Effects of various methods of root pruning on the establishment of transplanted red oak seedlings. Tree Planters’ Notes. 31(4): 10–11.
Boyer, J.N.; South, D.B. 1987. Excessive seedling height, high shoot-to-root ratio, and benomyl root dip reduce survival of stored loblolly pine seedlings. Tree Planters’ Notes. 38(4): 19–22.
Breinman, L.; Friedman, J.H.; Olshen, R.A.; Stone, C.J. 1984. Classification and regression trees. Belmont, CA: Wadsworth International Group.

74 Tree Planters’ Notes
Burgess, D.; Hendrickson, O.; Roy, L. 1990. The importance of initial cutting size for improving the growth performance of Salix alba L. Scandinavian Journal of Forest Research. 5(1–4): 215–224.
Clatterbuck, W.; Meadows, J. 1992. Regenerating oaks in the bottomlands. In: Loftis, D.; McGee, C.E., eds. Oak regeneration: serious problems, practical recommendations. Gen. Tech. Rep. SE-84. Asheville, NC: U.S. Department of Agriculture, Forest Service, Southeastern Forest Experiment Station: 184–195.
Collins, B.; Battaglia, L.L. 2008. Oak regeneration in southeast-ern bottomland hardwood forest. Forest Ecology and Manage-ment. 255(7): 3026–3034.
Conner, W.H. 1997. Pocotaligo swamp forest planting demon-stration project. In: Waldrop, N.A., ed. Proceedings of the 9th biennial southern silvicultural research conference. Gen. Tech. Rep. SRS-20. Asheville, NC: U.S. Department of Agriculture, Southern Research Station: 281–283.
Dickmann, D.; Phipps, H.; Netzer, D. 1980. Cutting diameter influences early survival and growth of several Populus clones. Research Note NC-261. St. Paul, MN: U.S. Department of Agriculture, Forest Service, Southern Research Station. 4 p.
Enebak, S.A. 2011. Historical forest seedling production in the southern United States: 2008 to 2009 planting season. In: Riley, L.E.; Haase, D.L.; Pinto, J.R., tech coords. National proceedings: forest and conservation nursery associations—2010. Proc. RMRS-P-65. Fort Collins: CO: U.S. Department of Agriculture, Forest Service, Rocky Mountain Research Station: 19–34.
Ezell, A.W.; Hodges, J. 1994. Bottomland hardwoods: Match the species to the site. Forest Farmer. 53(21):18-20.
Farmer, J.; Pezeshki, S. 2004. Effects of periodic flooding and root pruning on Quercus nuttallii seedlings. Wetlands Ecology and Management. 12(3): 205–214.
Gazal, R.M.; Kubiske, M.E. 2004. Influence of initial root length on physiological responses of cherrybark oak and Shumard oak seedlings to field drought conditions. Forest Ecology and Management. 189(1–3): 295–305.
Grossnickle, S.C. 2005 Importance of root growth in overcoming planting stress. New Forests. 30(2–3): 273–294.
Gwaze, D.P.; Byram, T.D.; Raley, E.M. 2003. Performance of Nuttal oak (Quercus texana Buckl.) provenances in the western gulf region. In: 27th Southern Forest Tree Improvement Confer-ence. Stillwater, OK: Oklahoma State University: 126–137.
Hansen, E.A.; Tolsted, D.N. 1981. Effect of cutting diameter and stem or branch position on establishment of a difficult-to-root clone of a Populus alba hybrid. Canadian Journal of Forest Research. 11(3): 723–727.
Harrington, T.B.; Howell, K.D. 1998. Planting cost, survival, and growth one to three years after establishing loblolly pine seed-lings with straight, deformed, or pruned taproots. New Forests. 15(2): 193–204.
Hernández, G.; Haase, D.L.; Pike, C.; Enebak, S.; Mackey, L.; Ma, Z.; Clarke, M. 2017. Forest nursery seedling production in the United States—fiscal year 2016. Tree Planters’ Notes. 60(2): 24–28.
Hodges, J.D.; Janzen, G. 1987. Studies on the biology of cherrybark oak: recommendations for regeneration. In: Phillips, D.R., ed. Proceedings of the 4th biennial southern silvicultural research conference. Gen. Tech. Rep. SE-42. Atlanta, GA: U.S. Department of Agriculture, Forest Service, Southeastern Forest Experiment Station: 133–139.
Holladay, C.-A.; Kwit, C.; Collins, B. 2006. Woody regeneration in and around aging southern bottomland hardwood forest gaps: effects of herbivory and gap size. Forest Ecology and Manage-ment. 223(1–3): 218–225.
Jacobs, D.F. 2003. Nursery production of hardwood seedlings. FNR-212. St. Paul, MN: U.S. Department of Agriculture, Forest Service, North Central Research Station. 8 p.
Jacobs, D.F.; Ross-Davis, A.L.; Davis, A.S. 2004. Establishment success of conservation tree plantations in relation to silvicultural practices in Indiana, USA. New Forests. 28(1): 23–36.
Kormanik, P.P.; Sung, S.; Kass, D.J.; Schlarbaum, S. 1997. Effect of seedling size and first-order-lateral roots on early development of northern red oak on mesic sites. In: Waldrop, T.A., ed. Proceedings of the 9th biennial southern silvicultural research conference. Gen. Tech. Rep. SRS-20. Asheville, NC: U.S. Department of Agriculture, Southern Research Station: 247–252.
Lantz, C.W. 2008. Genetic improvement of forest trees. The woody plant seed manual. Agric. Handb. 727. Washington, DC: U.S. Department of Agriculture, Forest Service: 39–56.
Leonardsson, J.; Löf, M.; Götmark, F. 2015. Exclosures can favour natural regeneration of oak after conservation-oriented thinning in mixed forests in Sweden: a 10-year study. Forest Ecology and Management. 354: 1–9.
Lorimer, C.G. 1989. The oak regeneration problem: new evidence on causes and possible solutions. For. Res. Bull. 8. Madison, WI: University of Wisconsin, Department of Forestry. 31 p.
Michler, C.; Meilan, R.; Woeste, K.; Pijut, P.; Jacobs, D.; Aldrich, P.; Glaubitz, P. 2005. Hardwood genetics and tree improve-ment – a Midwest USA perspective. In: Colombo, S.J., comp. Proceedings, the thin green line: a symposium on the state-of-the-art in reforestation. Forest Resources Information Paper 160. Sault Saint Marie, Canada: Ministry of Natural Resources, Ontario Forest Research Institute: 69–74.

Volume 61, Number 2 (Fall 2018) 75
Mustoe, N.A.; Adams, J.P. 2013. Effects of genetic improvement on growth and survival of cherrybark oaks (Quercus pagoda Raf.) in southern Arkansas: first year results. In: Cunningham, M.W., ed. Proceedings, 32nd southern forest tree improvement conference. Clemson, SC: Clemson Universtiy, College of Agriculture: 67–72.
Oliver, C.D.; Burkhardt, E.; Skojac, D.A. 2005. The increasing scarcity of red oaks in Mississippi River floodplain forests: influ-ence of the residual overstory. Forest Ecology and Management. 210(1–3): 393–414.
Putnam, J.D. 1951. Management of bottomland hardwoods. U.S. Department of Agriculture, Forest Service. Southern Forest Experiment Station, Occasional Papers. No. 116. 60 p.
R Core Team. 2008. R: a language and environment for statistical computing. Vienna, Austria: The R Foundataion for Statistical Computing. http://www.R-project.org/.
Rink, G. 1984. Notes: trends in genetic control of juvenile black walnut height growth. Forest Science. 30(3): 821–827.
Runkle, J.; Kunkel, K.; Champion, S.; Stewart, B.; Easterling, D. 2017. Arkansas State Climate Summary. National Oceanic Atmospheric Association (NOAA) Tech. Rep. National Environmental Satellite, Data, and Information Service (NESDIS) 149-AR. p. 4.
SAS Institute. 1999. SAS user’s guide: statistics. Carey, NC: SAS Institute, Inc.
Stupendick, J.; Shepherd, K. 1980. Root regeneration of root-pruned Pinus radiata seedlings. II. Effects of root pruning on photosynthesis and translocation. New Zealand Journal of Forest Science. 10(1): 148–158.
U.S. Department of Agriculture (USDA) Natural Resrouces Conservation Service (NRCS). 2017. Web soil survey. https://websoilsurvey.sc.egov.usda.gov/. (21 August).
Wharton, C.H.; Kitchens, W.M.; Pendleton, E.C.; Sipe, T.W. 1982. Ecology of bottomland hardwood swamps of the south-east: a community profile. Lafayette, LA: U.S. Department of the Interior, Fish and Wildlife Service.
76 Tree Planters’ Notes
Abstract
Automating greenhouse irrigation based on grow-ing medium water content measured by sensors, instead of a tactile, timing, or weighing method, has been done with large containers. Using sensors with small containers (e.g., 10 in3 [164 cm3]) commonly used in forest and native plant nurseries, however, has not been done. We tested the EC-5 sensor (ME-TER Group, Pullman, WA) by examining calibration relationships for small containers as they dried from container capacity. These relationships were highly significant down to 63 percent saturation. Three sen-sors were then used to control irrigation for 90 days. One sensor drifted approximately 10 percent, and the other two were stable. Repositioning two sensors resulted in no change for one and an increase of 10 percent for the other. These sensors have potential for automating irrigation in small containers provided they are calibrated, tracked for sensor drift, and recali-brated after repositioning. This paper was presented at the Joint Annual Meeting of the Northeast Forest and Conservation Association, the Southern Forest Nurs-ery Association, and the Intertribal Nursery Council (Walker, MN, July 31 to August 3, 2017).
Introduction
Irrigation control is a crucial part of greenhouse opera-tions (Dumroese and Haase 2018, Landis and Wilkin-son 2009). If too little water is available, the plants may grow slowly or even die if the irrigation system is turned off or fails (Landis and Wilkinson 2009). If too much water is present, the plants are susceptible to root disease or can become hypoxic, each of which con-tributes to growth problems or mortality (Klaring and Zude 2009, Landis and Wilkinson 2009).
Implementing a quality irrigation method to satisfy plant needs can be done several ways. Monitoring to determine when to irrigate can be done manually by inspecting plant condition, lifting containers to feel if they are lighter, or by weighing containers (Dumroese et al. 2015, Landis and Wilkinson 2009). Automated weighing methods are another option and can be more efficient than manually weighing containers (Walters 1977). Recently, automation using load cells to weigh containers has been demonstrated (Girard and Gag-non 2016). This approach has drawbacks, however, because plants gain mass as they grow, thereby neces-sitating container capacity recalibration, and load cells can have significant thermal drift needing correction (Girard and Gagnon 2016). Using soil moisture sensors is another automated monitoring method that avoids some of those drawbacks (Nemali and van Iersel 2006).
In recent work, irrigation control has been imple-mented using a variety of sensors to determine media moisture content (Lea-Cox 2012), which are then used to activate irrigation systems when reaching a target water content. The sensor discussed in this article is the ECH20 EC-5 (METER Group, Inc., Pullman, WA). This sensor and similar sensors work well in soilless substrates commonly used in greenhouse and nursery settings (Hoskins et al. 2012, Lea-Cox 2012, Nemali and van Iersel 2006). These sensors were designed for bulk soil applications in field settings and are also used to control irrigation in agricultural fields (Kim et al. 2008). As such, they also work well in relatively large (> 4 gal [17.5 L]) containers (Girard and Gag-non 2016). Functionality in large containers has been recognized for many nursery and greenhouse applica-tions, but less work has been performed using smaller containers (e.g., 10 in3 [164 cm3]). Girard and Gagnon (2016) indicated that the EC-5 sensor, which has a measurement volume of 14.6 in3 (240 cm3) (Cobos
Use of a Bulk Soil Capacitance Sensor in Small Containers To Control Irrigation in a Greenhouse
Steven O. Link, Patrick F. Mills, and Rodney S. Skeen
Scientist 3, Energy and Environmental Science Program (EESP), Department of Natural Resources (DNR), Confederated Tribes of the Umatilla Indian Reservation (CTUIR), Pendleton, OR; Scientist 1, EESP, DNR, CTUIR, Pendleton, OR;
Hazardous Waste Analyst, EESP, DNR, CTUIR, Pendleton, OR
Volume 61, Number 2 (Fall 2018) 77
2015), would not be adequate for small containers (3 to 21.4 in3 [50 to 350 cm3]) commonly used in forest (Girard and Gagnon 2016) and native plant nurseries (Stuewe 2018). With a measurement volume larger than some small containers, the concern is that the sensor would be measuring more than media moisture (e.g., air or materials surrounding the small container). We argue the sensor may be adequate, however, be-cause the measurement volume is strongly weighted toward the sensor surface (Cobos 2015).
In this study, we tested the hypothesis that the EC-5 sensor could accurately determine medium moisture content in small (10 in3 [164 cm3]) containers and be useful as a signal for computer-controlled greenhouse irrigation systems. This method enables irrigation to be controlled based on mass loss from 100 percent saturation (i.e., container capacity) to differing tar-get desiccation levels used at various growth stages (Landis 1989). The technique will allow for automat-ed irrigation without weighing racks of containers by hand other than for calibration.
Materials and Methods
We conducted this study at the greenhouse facility of the Confederated Tribes of the Umatilla Indian Reser-vation (CTUIR) Science and Engineering Laboratory (Pendleton, OR). The greenhouse was designed to use 10 independent irrigation-controlled sectors. Each sector holds 32 1- by 2-ft (30.5- by 61-cm) trays, each of which holds 98 10-in3 (164-cm3) containers (Ray Leach Cone-tainers, Stuewe & Sons, Inc., Tangent, OR) that have a 1.5-in (3.8-cm) diameter and 8.3-in (21.0-cm) depth. All plants were kept on benches that are about 3.5 ft (1.1 m) high.
Irrigation and Sensor Control System
The irrigation system (figure 1) is similar to that described in Nemali and van Iersel (2006). The EC-5 sensors were connected to a multiplexer (AM16/32B, Campbell Scientific, Logan, UT), which was con-nected to a datalogger (CR10X, Campbell Scientific, Logan, UT) to measure the sensor response. The datalogger was programmed to measure the EC-5 response once every minute. Medium temperature was measured in the same container as the EC-5 sen-sor and used to describe drying patterns during hot and cool periods. Temperature was measured with
Type-T copper-constantan thermocouples that were connected to the multiplexer. The EC-5 sensor has a minor response to temperature, and such effects were ignored (Nemali and van Iersel 2006).
Irrigation was controlled using 10 solenoid valves (one for each sector) (264-06-03, The Toro Com-pany, Riverside, CA) connected to a 16-port relay driver (SDM-CD16 AC/DC controller, Campbell Sci.) (figure 1). The solenoids were supplied with pressure-controlled water (40 to 60 psi), which was routed to each sector with flexible 0.5-in (1.3-cm) black plastic tubing. Irrigation water was emitted at a rate of 1.3 gal per min (5 L per min) from each mister located about every 24 in (61 cm) along the tubing. Each mister was about 12 in (30 cm) below the tubing at the end of 0.25-in (0.64-cm) diameter black plastic tubing. Two irrigation lines are along and above each table. The misters are suspended approximately 27 in (69 cm) above the top of the containers.
The containers were periodically watered manually by turning solenoid switches on and off. In addition, manual watering was done to fertilize, water newly transplanted seedlings, or test the system. Each liquid fertilization event was done for 36 minutes using the irrigation system.
Sensor Placement and Calibration
Each sensor, along with a thermocouple, was placed near the center of a container in a full rack (figure 2a). To facilitate sensor placement, a screwdriver was used to create an opening in the medium (figure 2b). The sensor was then carefully pushed into the con-tainer until the top of the sensor was below the media surface (figure 2c). The medium was then pushed down around the sensor to eliminate air spaces at the sensor surface. Medium was added to the surface to ensure that the sensor body was covered (figure 2d). The medium used was Sun Gro SS LA4 RSI Potting Soil (Sun Gro Horticulture Distribution Inc., Aga-wam, MA), which is composed of 65 percent peat and 35 percent pumice and perlite.
Six sensors were used to examine regression relation-ships for a variety of species and plant sizes between sensor signal (mV) and percent saturation of racks as they dried between 31 May and 8 June 2017. Three racks next to the rack with a sensor were used for mass determination. The six sets of racks and sensors were
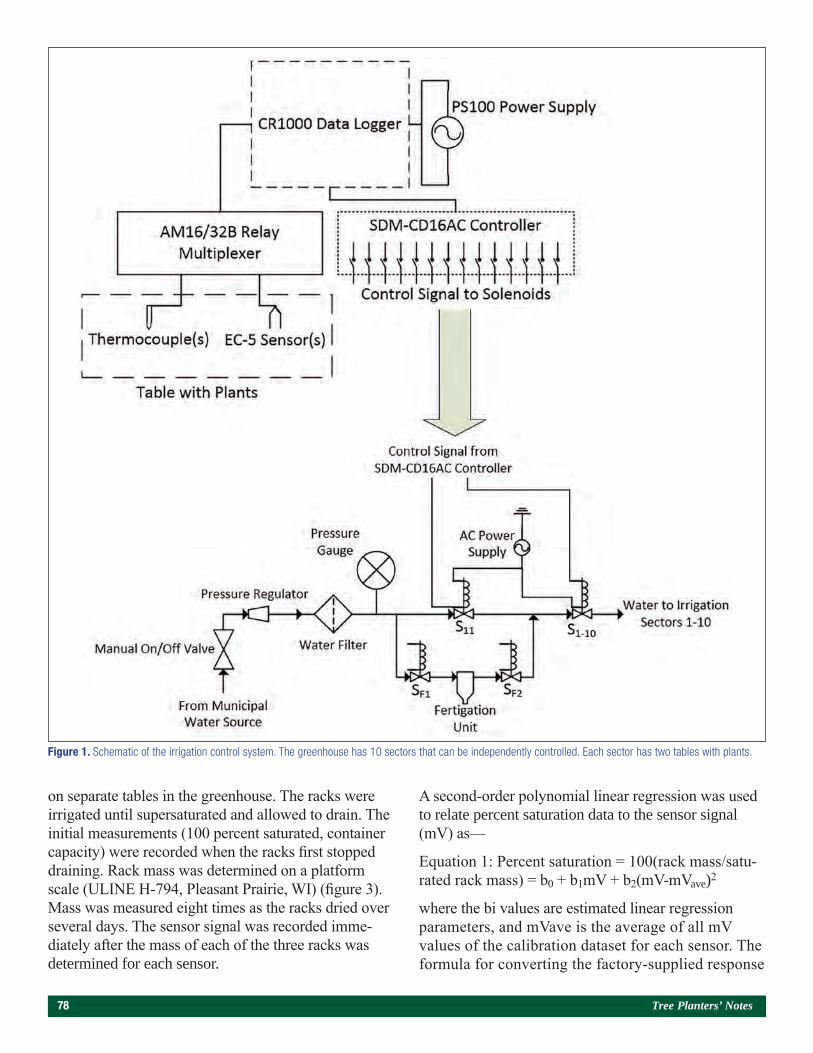
78 Tree Planters’ Notes
on separate tables in the greenhouse. The racks were irrigated until supersaturated and allowed to drain. The initial measurements (100 percent saturated, container capacity) were recorded when the racks first stopped draining. Rack mass was determined on a platform scale (ULINE H-794, Pleasant Prairie, WI) (figure 3). Mass was measured eight times as the racks dried over several days. The sensor signal was recorded imme-diately after the mass of each of the three racks was determined for each sensor.
A second-order polynomial linear regression was used to relate percent saturation data to the sensor signal (mV) as—
Equation 1: Percent saturation = 100(rack mass/satu-rated rack mass) = b0 + b1mV + b2(mV-mVave)2
where the bi values are estimated linear regression parameters, and mVave is the average of all mV values of the calibration dataset for each sensor. The formula for converting the factory-supplied response
Figure 1. Schematic of the irrigation control system. The greenhouse has 10 sectors that can be independently controlled. Each sector has two tables with plants.
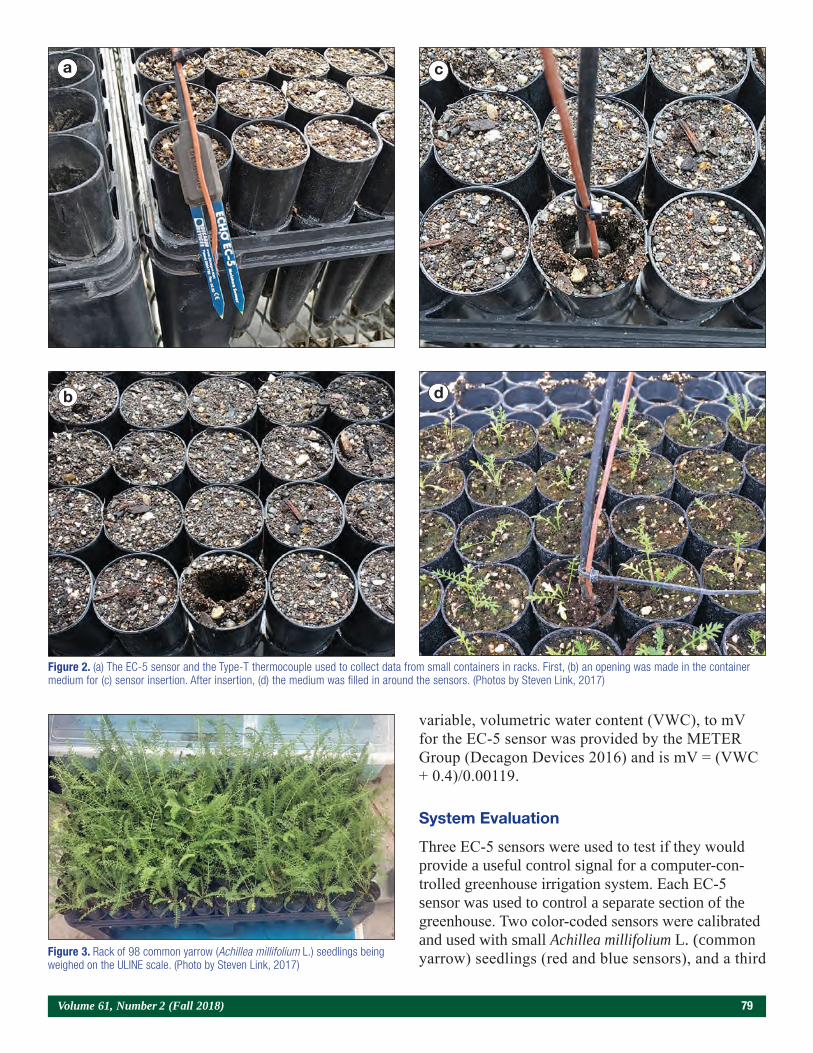
Volume 61, Number 2 (Fall 2018) 79
variable, volumetric water content (VWC), to mV for the EC-5 sensor was provided by the METER Group (Decagon Devices 2016) and is mV = (VWC + 0.4)/0.00119.
System Evaluation
Three EC-5 sensors were used to test if they would provide a useful control signal for a computer-con-trolled greenhouse irrigation system. Each EC-5 sensor was used to control a separate section of the greenhouse. Two color-coded sensors were calibrated and used with small Achillea millifolium L. (common yarrow) seedlings (red and blue sensors), and a third
Figure 2. (a) The EC-5 sensor and the Type-T thermocouple used to collect data from small containers in racks. First, (b) an opening was made in the container medium for (c) sensor insertion. After insertion, (d) the medium was filled in around the sensors. (Photos by Steven Link, 2017)
a
b
c
d
Figure 3. Rack of 98 common yarrow (Achillea millifolium L.) seedlings being weighed on the ULINE scale. (Photo by Steven Link, 2017)
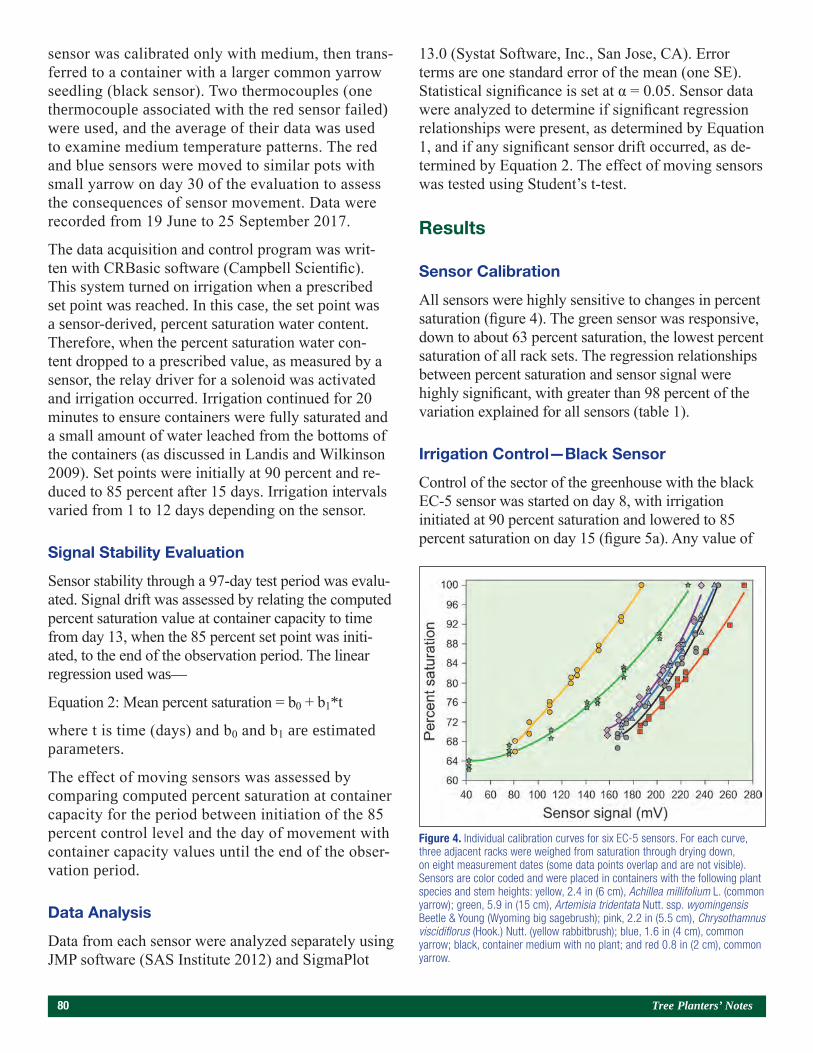
80 Tree Planters’ Notes
sensor was calibrated only with medium, then trans-ferred to a container with a larger common yarrow seedling (black sensor). Two thermocouples (one thermocouple associated with the red sensor failed) were used, and the average of their data was used to examine medium temperature patterns. The red and blue sensors were moved to similar pots with small yarrow on day 30 of the evaluation to assess the consequences of sensor movement. Data were recorded from 19 June to 25 September 2017.
The data acquisition and control program was writ-ten with CRBasic software (Campbell Scientific). This system turned on irrigation when a prescribed set point was reached. In this case, the set point was a sensor-derived, percent saturation water content. Therefore, when the percent saturation water con-tent dropped to a prescribed value, as measured by a sensor, the relay driver for a solenoid was activated and irrigation occurred. Irrigation continued for 20 minutes to ensure containers were fully saturated and a small amount of water leached from the bottoms of the containers (as discussed in Landis and Wilkinson 2009). Set points were initially at 90 percent and re-duced to 85 percent after 15 days. Irrigation intervals varied from 1 to 12 days depending on the sensor.
Signal Stability Evaluation
Sensor stability through a 97-day test period was evalu-ated. Signal drift was assessed by relating the computed percent saturation value at container capacity to time from day 13, when the 85 percent set point was initi-ated, to the end of the observation period. The linear regression used was—
Equation 2: Mean percent saturation = b0 + b1*t
where t is time (days) and b0 and b1 are estimated parameters.
The effect of moving sensors was assessed by comparing computed percent saturation at container capacity for the period between initiation of the 85 percent control level and the day of movement with container capacity values until the end of the obser-vation period.
Data Analysis
Data from each sensor were analyzed separately using JMP software (SAS Institute 2012) and SigmaPlot
13.0 (Systat Software, Inc., San Jose, CA). Error terms are one standard error of the mean (one SE). Statistical significance is set at α = 0.05. Sensor data were analyzed to determine if significant regression relationships were present, as determined by Equation 1, and if any significant sensor drift occurred, as de-termined by Equation 2. The effect of moving sensors was tested using Student’s t-test.
Results
Sensor Calibration
All sensors were highly sensitive to changes in percent saturation (figure 4). The green sensor was responsive, down to about 63 percent saturation, the lowest percent saturation of all rack sets. The regression relationships between percent saturation and sensor signal were highly significant, with greater than 98 percent of the variation explained for all sensors (table 1).
Irrigation Control—Black Sensor
Control of the sector of the greenhouse with the black EC-5 sensor was started on day 8, with irrigation initiated at 90 percent saturation and lowered to 85 percent saturation on day 15 (figure 5a). Any value of
Figure 4. Individual calibration curves for six EC-5 sensors. For each curve, three adjacent racks were weighed from saturation through drying down, on eight measurement dates (some data points overlap and are not visible). Sensors are color coded and were placed in containers with the following plant species and stem heights: yellow, 2.4 in (6 cm), Achillea millifolium L. (common yarrow); green, 5.9 in (15 cm), Artemisia tridentata Nutt. ssp. wyomingensis Beetle & Young (Wyoming big sagebrush); pink, 2.2 in (5.5 cm), Chrysothamnus viscidiflorus (Hook.) Nutt. (yellow rabbitbrush); blue, 1.6 in (4 cm), common yarrow; black, container medium with no plant; and red 0.8 in (2 cm), common yarrow.
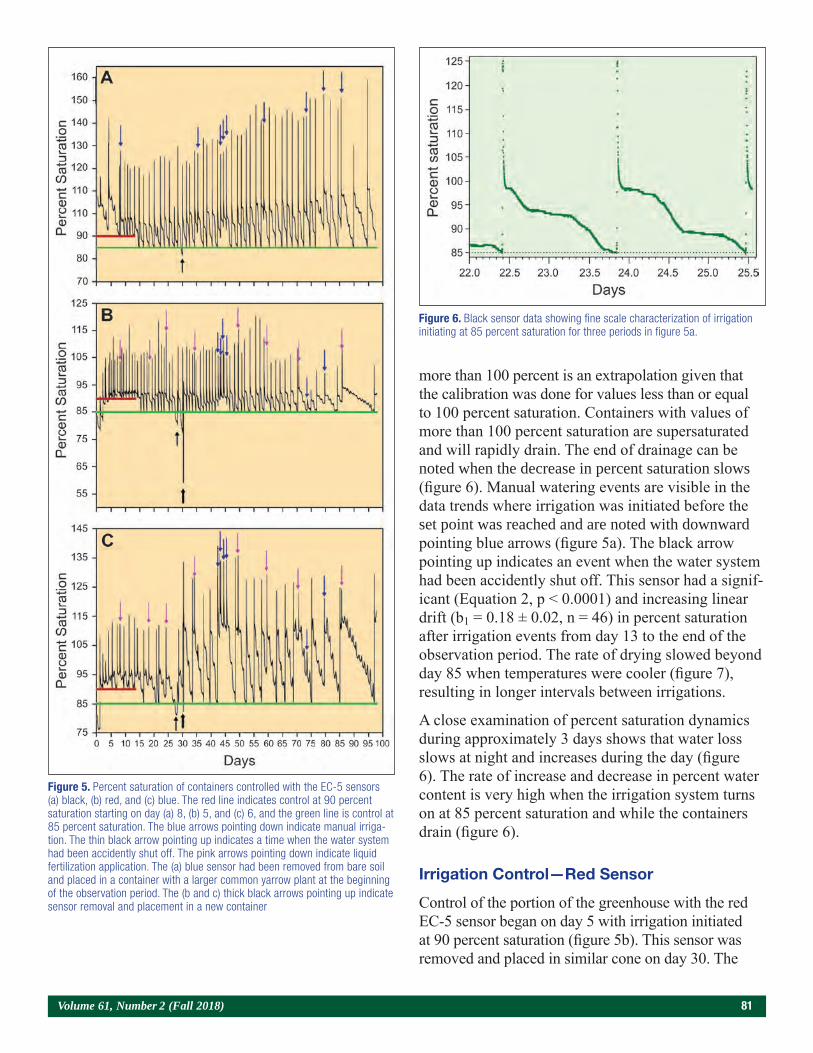
Volume 61, Number 2 (Fall 2018) 81
Figure 5. Percent saturation of containers controlled with the EC-5 sensors (a) black, (b) red, and (c) blue. The red line indicates control at 90 percent saturation starting on day (a) 8, (b) 5, and (c) 6, and the green line is control at 85 percent saturation. The blue arrows pointing down indicate manual irriga-tion. The thin black arrow pointing up indicates a time when the water system had been accidently shut off. The pink arrows pointing down indicate liquid fertilization application. The (a) blue sensor had been removed from bare soil and placed in a container with a larger common yarrow plant at the beginning of the observation period. The (b and c) thick black arrows pointing up indicate sensor removal and placement in a new container
more than 100 percent is an extrapolation given that the calibration was done for values less than or equal to 100 percent saturation. Containers with values of more than 100 percent saturation are supersaturated and will rapidly drain. The end of drainage can be noted when the decrease in percent saturation slows (figure 6). Manual watering events are visible in the data trends where irrigation was initiated before the set point was reached and are noted with downward pointing blue arrows (figure 5a). The black arrow pointing up indicates an event when the water system had been accidently shut off. This sensor had a signif-icant (Equation 2, p < 0.0001) and increasing linear drift (b1 = 0.18 ± 0.02, n = 46) in percent saturation after irrigation events from day 13 to the end of the observation period. The rate of drying slowed beyond day 85 when temperatures were cooler (figure 7), resulting in longer intervals between irrigations.
A close examination of percent saturation dynamics during approximately 3 days shows that water loss slows at night and increases during the day (figure 6). The rate of increase and decrease in percent water content is very high when the irrigation system turns on at 85 percent saturation and while the containers drain (figure 6).
Irrigation Control—Red Sensor
Control of the portion of the greenhouse with the red EC-5 sensor began on day 5 with irrigation initiated at 90 percent saturation (figure 5b). This sensor was removed and placed in similar cone on day 30. The
Figure 6. Black sensor data showing fine scale characterization of irrigation initiating at 85 percent saturation for three periods in figure 5a.
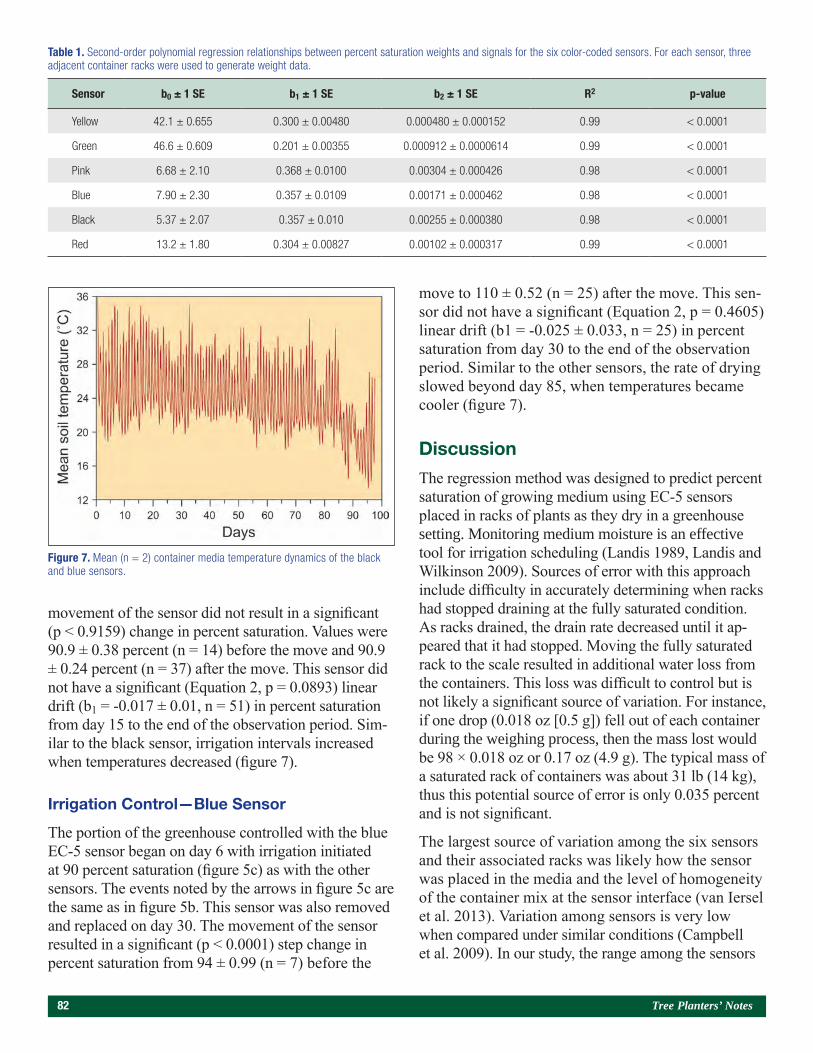
82 Tree Planters’ Notes
movement of the sensor did not result in a significant (p < 0.9159) change in percent saturation. Values were 90.9 ± 0.38 percent (n = 14) before the move and 90.9 ± 0.24 percent (n = 37) after the move. This sensor did not have a significant (Equation 2, p = 0.0893) linear drift (b1 = -0.017 ± 0.01, n = 51) in percent saturation from day 15 to the end of the observation period. Sim-ilar to the black sensor, irrigation intervals increased when temperatures decreased (figure 7).
Irrigation Control—Blue Sensor
The portion of the greenhouse controlled with the blue EC-5 sensor began on day 6 with irrigation initiated at 90 percent saturation (figure 5c) as with the other sensors. The events noted by the arrows in figure 5c are the same as in figure 5b. This sensor was also removed and replaced on day 30. The movement of the sensor resulted in a significant (p < 0.0001) step change in percent saturation from 94 ± 0.99 (n = 7) before the
move to 110 ± 0.52 (n = 25) after the move. This sen-sor did not have a significant (Equation 2, p = 0.4605) linear drift (b1 = -0.025 ± 0.033, n = 25) in percent saturation from day 30 to the end of the observation period. Similar to the other sensors, the rate of drying slowed beyond day 85, when temperatures became cooler (figure 7).
Discussion
The regression method was designed to predict percent saturation of growing medium using EC-5 sensors placed in racks of plants as they dry in a greenhouse setting. Monitoring medium moisture is an effective tool for irrigation scheduling (Landis 1989, Landis and Wilkinson 2009). Sources of error with this approach include difficulty in accurately determining when racks had stopped draining at the fully saturated condition. As racks drained, the drain rate decreased until it ap-peared that it had stopped. Moving the fully saturated rack to the scale resulted in additional water loss from the containers. This loss was difficult to control but is not likely a significant source of variation. For instance, if one drop (0.018 oz [0.5 g]) fell out of each container during the weighing process, then the mass lost would be 98 × 0.018 oz or 0.17 oz (4.9 g). The typical mass of a saturated rack of containers was about 31 lb (14 kg), thus this potential source of error is only 0.035 percent and is not significant.
The largest source of variation among the six sensors and their associated racks was likely how the sensor was placed in the media and the level of homogeneity of the container mix at the sensor interface (van Iersel et al. 2013). Variation among sensors is very low when compared under similar conditions (Campbell et al. 2009). In our study, the range among the sensors
Figure 7. Mean (n = 2) container media temperature dynamics of the black and blue sensors.
Table 1. Second-order polynomial regression relationships between percent saturation weights and signals for the six color-coded sensors. For each sensor, three adjacent container racks were used to generate weight data.
Sensor b0 ± 1 SE b1 ± 1 SE b2 ± 1 SE R2 p-value
Yellow 42.1 ± 0.655 0.300 ± 0.00480 0.000480 ± 0.000152 0.99 < 0.0001
Green 46.6 ± 0.609 0.201 ± 0.00355 0.000912 ± 0.0000614 0.99 < 0.0001
Pink 6.68 ± 2.10 0.368 ± 0.0100 0.00304 ± 0.000426 0.98 < 0.0001
Blue 7.90 ± 2.30 0.357 ± 0.0109 0.00171 ± 0.000462 0.98 < 0.0001
Black 5.37 ± 2.07 0.357 ± 0.010 0.00255 ± 0.000380 0.98 < 0.0001
Red 13.2 ± 1.80 0.304 ± 0.00827 0.00102 ± 0.000317 0.99 < 0.0001
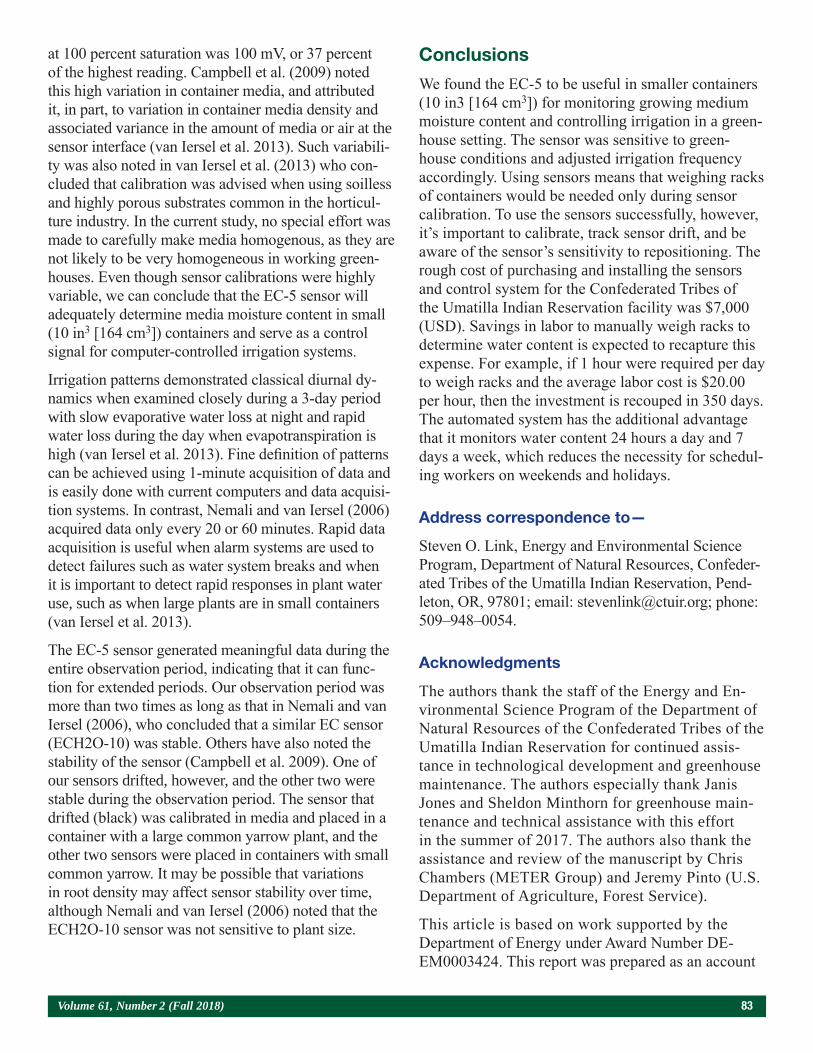
Volume 61, Number 2 (Fall 2018) 83
at 100 percent saturation was 100 mV, or 37 percent of the highest reading. Campbell et al. (2009) noted this high variation in container media, and attributed it, in part, to variation in container media density and associated variance in the amount of media or air at the sensor interface (van Iersel et al. 2013). Such variabili-ty was also noted in van Iersel et al. (2013) who con-cluded that calibration was advised when using soilless and highly porous substrates common in the horticul-ture industry. In the current study, no special effort was made to carefully make media homogenous, as they are not likely to be very homogeneous in working green-houses. Even though sensor calibrations were highly variable, we can conclude that the EC-5 sensor will adequately determine media moisture content in small (10 in3 [164 cm3]) containers and serve as a control signal for computer-controlled irrigation systems.
Irrigation patterns demonstrated classical diurnal dy-namics when examined closely during a 3-day period with slow evaporative water loss at night and rapid water loss during the day when evapotranspiration is high (van Iersel et al. 2013). Fine definition of patterns can be achieved using 1-minute acquisition of data and is easily done with current computers and data acquisi-tion systems. In contrast, Nemali and van Iersel (2006) acquired data only every 20 or 60 minutes. Rapid data acquisition is useful when alarm systems are used to detect failures such as water system breaks and when it is important to detect rapid responses in plant water use, such as when large plants are in small containers (van Iersel et al. 2013).
The EC-5 sensor generated meaningful data during the entire observation period, indicating that it can func-tion for extended periods. Our observation period was more than two times as long as that in Nemali and van Iersel (2006), who concluded that a similar EC sensor (ECH2O-10) was stable. Others have also noted the stability of the sensor (Campbell et al. 2009). One of our sensors drifted, however, and the other two were stable during the observation period. The sensor that drifted (black) was calibrated in media and placed in a container with a large common yarrow plant, and the other two sensors were placed in containers with small common yarrow. It may be possible that variations in root density may affect sensor stability over time, although Nemali and van Iersel (2006) noted that the ECH2O-10 sensor was not sensitive to plant size.
Conclusions
We found the EC-5 to be useful in smaller containers (10 in3 [164 cm3]) for monitoring growing medium moisture content and controlling irrigation in a green-house setting. The sensor was sensitive to green-house conditions and adjusted irrigation frequency accordingly. Using sensors means that weighing racks of containers would be needed only during sensor calibration. To use the sensors successfully, however, it’s important to calibrate, track sensor drift, and be aware of the sensor’s sensitivity to repositioning. The rough cost of purchasing and installing the sensors and control system for the Confederated Tribes of the Umatilla Indian Reservation facility was $7,000 (USD). Savings in labor to manually weigh racks to determine water content is expected to recapture this expense. For example, if 1 hour were required per day to weigh racks and the average labor cost is $20.00 per hour, then the investment is recouped in 350 days. The automated system has the additional advantage that it monitors water content 24 hours a day and 7 days a week, which reduces the necessity for schedul-ing workers on weekends and holidays.
Address correspondence to—
Steven O. Link, Energy and Environmental Science Program, Department of Natural Resources, Confeder-ated Tribes of the Umatilla Indian Reservation, Pend-leton, OR, 97801; email: [email protected]; phone: 509–948–0054.
Acknowledgments
The authors thank the staff of the Energy and En-vironmental Science Program of the Department of Natural Resources of the Confederated Tribes of the Umatilla Indian Reservation for continued assis-tance in technological development and greenhouse maintenance. The authors especially thank Janis Jones and Sheldon Minthorn for greenhouse main-tenance and technical assistance with this effort in the summer of 2017. The authors also thank the assistance and review of the manuscript by Chris Chambers (METER Group) and Jeremy Pinto (U.S. Department of Agriculture, Forest Service).
This article is based on work supported by the Department of Energy under Award Number DE-EM0003424. This report was prepared as an account

84 Tree Planters’ Notes
of work sponsored by an agency of the U.S. Govern-ment. Neither the U.S. Government nor any agency thereof, nor any of their employees, makes any war-ranty, express or implied, or assumes any legal liability or responsibility for the accuracy, completeness, or usefulness of any information, apparatus, product, or process disclosed, or represents that its use would not infringe privately owned rights. Reference herein to any specific commercial product, process, or service by trade name, trademark, manufacturer, or otherwise does not necessarily constitute or imply its endorse-ment, recommendation, or favoring by the U.S. Government or any agency thereof. The views and opinions of authors expressed herein do not neces-sarily state or reflect those of the U.S. Government or any agency thereof. The opinions expressed by the authors are their own and are not necessarily those of the Confederated Tribes of the Umatilla Indian Reservation.
REFERENCES
Campbell, C.S.; Campbell, G.S.; Cobos, D.R.; Bissey, L.L. 2009. Calibration and evaluation of an improved low-cost soil moisture sensor. Application Note 13492-01. Pullman, WA: Decagon Devices. 13 p.
Cobos, D. 2015. Measurement volume of Decagon volumetric water content sensors. Application Note 14955. Pullman, WA: Decagon Devices. 4 p.
Decagon Devices. 2016. EC-5 soil moisture sensor operator’s manual. Pullman, WA. 22 p.
Dumroese, R.K.; Haase, D.L. 2018. Water management in container nurseries to minimize pests. Tree Planters’ Notes. 61(1): 4–11.
Dumroese, R.K.; Montville, M.E.; Pinto, J.R. 2015. Using contain-er weights to determine irrigation needs: a simple method. Native Plants Journal. 16(1): 67–71.
Girard, D.; Gagnon, J. 2016. Wireless network of electronic scales to monitor the substrate volumetric water content for managing irrigation of containerized seedlings produced in forest nurseries. Tree Planters’ Notes. 59(2): 9–19.
Hoskins, T.; Owen, J.; Stoven, H. 2012. Monitoring from a distance: using a remote moisture monitoring system to manage irrigation. Digger. 56(7): 41–44.
Kim, Y.; Evans, R.G.; Iverson, W.M. 2008. Remote sensing and control of an irrigation systemusing a distributed wireless sensor network. Institue of Electrical and Electronics Engineers Transac-tions on Instrumentation and Measurement. 57(7): 1379–1387.
Klaring, H-P.; Zude, M. 2009. Sensing of tomato plant response to hypoxia in the root environment. Scientia Horticulturae. 122(1): 17–25.
Landis, T.D. 1989. Irrigation and water management. In: Landis, T.D.; Tinus, R.W.; McDondald, S.E.; Barnett, J.P. The container tree nursery manual. 4: Seedling nutrition and irrigation. Agric. Handb. 674. Washington, DC: U.S. Department of Agriculture, Forest Service: 69–118.
Landis, T.D.; Wilkinson, K.M. 2009. Water quality and irrigation. In: Dumroese, R.K.; Luna, T.; Landis, T.D., eds. Nursery manual for native plants: a guide for tribal nurseries. 1: Nursery manage-ment. Agric. Handb. 730. Washington, DC: U.S. Department of Agriculture, Forest Service: 177–199.
Lea-Cox, J.D. 2012. Using wireless sensor networks for precision irrigation scheduling. In: Kumar, M., ed. Problems, perspectives and challenges of agricultural water management. Rijeka, Croatia: InTech Europe: 233–258.
Nemali, K.S.; van Iersel, M.W. 2006. An automated system for controlling drought stress and irrigation in potted plants. Scientia Horticulturae. 110(3): 292–297.
SAS Institute. 2012. Using JMP 10. Cary, NC. 462 p.
Stuewe, E. 2018. Personal communication. Owner, Stuewe & Sons, Inc., 31933 Rolland Drive, Tangent, OR 97389.
van Iersel, M.W.; Chappell, M.; Lea-Cox, J.D. 2013. Sensors for improved efficiency of irrigation in greenhouse and nursery production. HortTechnology. 23(6): 735–746.
Walters, G.A. 1977. Moist-scale—a way to irrigate according to a plant’s needs. Tree Planters’ Notes. 28(3): 27–28.
Volume 61, Number 2 (Fall 2018) 85
Abstract
Diplodia sapinea is a common fungal pathogen that has caused sporadic issues on red pine seedlings in Minnesota nurseries since the mid-1970s. Despite significant improvements in cultural controls made during the early 2000s, the Badoura State Forest Nursery in Akeley, MN, still experienced an un-expected resurgence of Diplodia problems in 2016 that resulted in the destruction of an entire field of 3–0 seedlings due to unacceptably high disease incidence. To address concerns about the possibility of addi-tional Diplodia infections elsewhere in the nursery, Minnesota Department of Natural Resources forest health program and nursery staff have reinitiated annual testing and outplanted an experimental plot to monitor long-term mortality of potentially infected red pine seedlings. This paper was presented at the Joint Annual Meeting of the Northeast Forest and Conservation Association, the Southern Forest Nursery Association, and the Intertribal Nursery Council (Walker, MN, July 31–August 3, 2017).
Background
Diplodia sapinea (syn. Diplodia pinea, syn. Sphaeropsis sapinea), hereafter referred to simply as Diplodia, is a fungal pathogen most commonly asso-ciated with shoot blight on red pine (Pinus resinosa A.). Although shoot blight is the most recognizable form of Diplodia infection, Diplodia also causes collar rot, which can lead to extensive seedling mortality in both nurseries and forest plantations (Stanosz and Carlson 1996). In Minnesota, elevated levels of shoot blight and seedling mortality first became apparent in State forest nurseries around the mid-1970s. Once Diplodia was determined to be the cause, State nurseries adopted a fungicide treatment regimen that resulted in a noticeable decrease in
the prevalence of shoot blight on red pine seed-lings. Considerable mortality continued, however, throughout the 1980s and 1990s of outplanted red pine seedlings sourced from State nurseries. In the absence of conspicuous shoot blight symptoms, mortality was unknowingly attributed to excess stress from drought or handling. It was not until the late 1990s that research revealed Diplodia can also exist as a latent infection within seedling stems, meaning it is nonactive and asymptomatic at times (Stanosz et al. 1997, 2001).
Diplodia Infection Levels 2002 to 2010
The potential for prolific latent infections led to renewed interest in Diplodia and inspired indepth investigations at Minnesota’s State-operated nurser-ies to better understand disease levels. In 2002, an estimated 65 percent of out-planted red pine seed-lings died in the field statewide, with latent Diplodia infection as the prime suspect. Subsequent testing revealed that as much as 88 percent of the 2002 nursery stock had harbored latent infections. In 2003, formal surveys revealed latent infection rates ranging from 40 to 71 percent in fields of red pine seedlings at both the Badoura State Forest Nursery in Akeley, MN and the now-decommissioned Gen-eral Andrews State Forest Nursery in Willow River, MN. As a control measure, all windbreaks contain-ing mature red pines on the nursery grounds were promptly removed to prevent spreading of Diplodia spores from mature trees onto the seedlings below (figure 1). Latent Diplodia infections decreased to only 2.5 percent in 2004 following removal of these mature trees (figure 2). Annual laboratory testing continued through 2010 (except 2009), followed by visual monitoring by nursery inspectors once the problem finally appeared to be largely resolved.
A Brief History of Diplodia sapinea on Red Pine in Minnesota’s State Forest Nurseries
Michael S. Parisio
Regional Forest Health Specialist, Minnesota Department of Natural Resources, Bemidji, MN
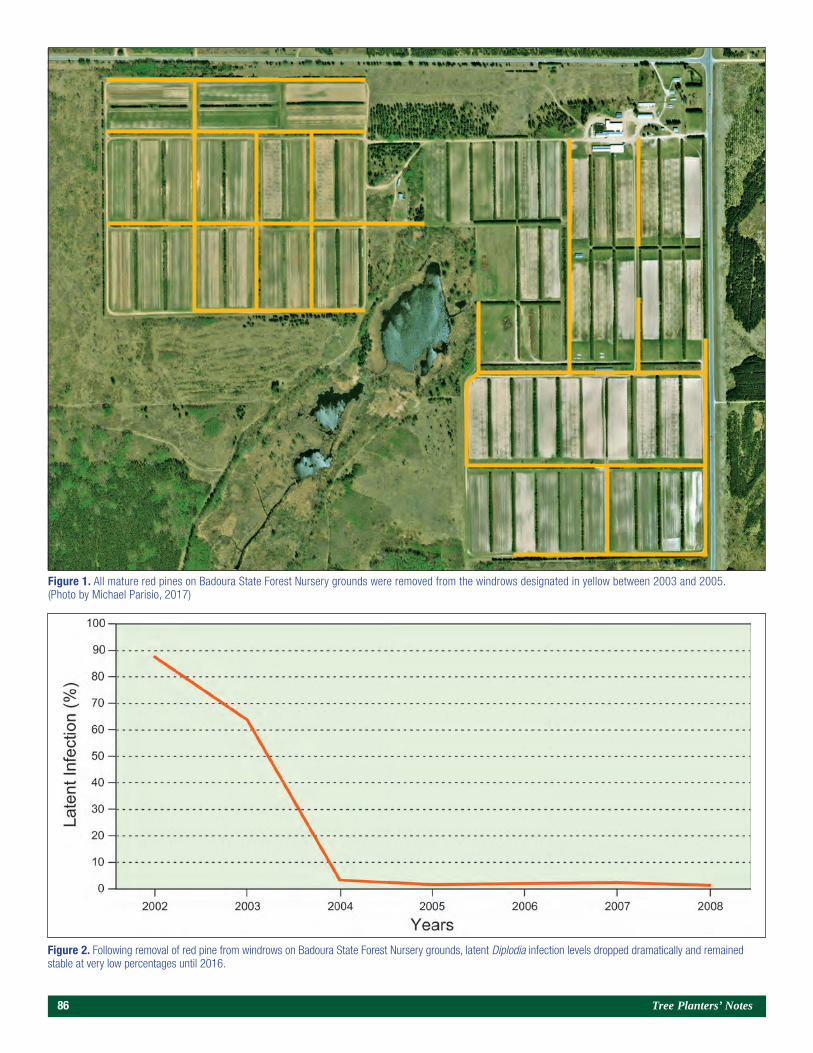
86 Tree Planters’ Notes
Figure 1. All mature red pines on Badoura State Forest Nursery grounds were removed from the windrows designated in yellow between 2003 and 2005. (Photo by Michael Parisio, 2017)
Figure 2. Following removal of red pine from windrows on Badoura State Forest Nursery grounds, latent Diplodia infection levels dropped dramatically and remained stable at very low percentages until 2016.
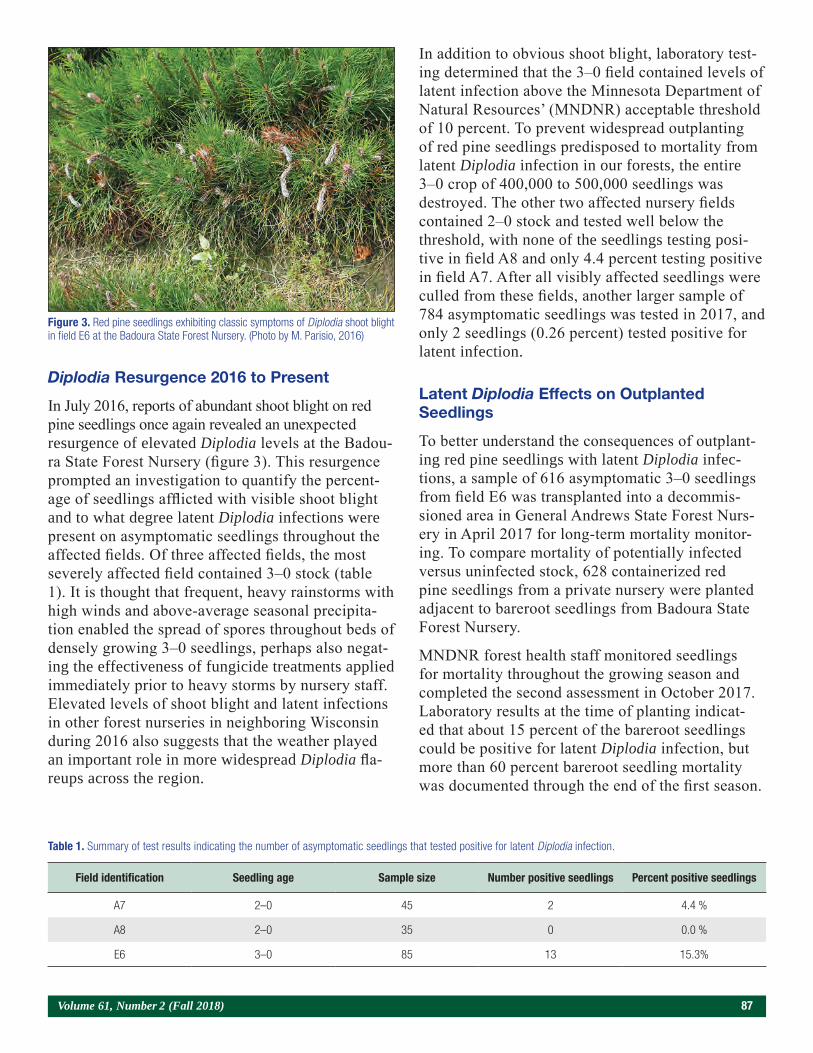
Volume 61, Number 2 (Fall 2018) 87
Diplodia Resurgence 2016 to Present
In July 2016, reports of abundant shoot blight on red pine seedlings once again revealed an unexpected resurgence of elevated Diplodia levels at the Badou-ra State Forest Nursery (figure 3). This resurgence prompted an investigation to quantify the percent-age of seedlings afflicted with visible shoot blight and to what degree latent Diplodia infections were present on asymptomatic seedlings throughout the affected fields. Of three affected fields, the most severely affected field contained 3–0 stock (table 1). It is thought that frequent, heavy rainstorms with high winds and above-average seasonal precipita-tion enabled the spread of spores throughout beds of densely growing 3–0 seedlings, perhaps also negat-ing the effectiveness of fungicide treatments applied immediately prior to heavy storms by nursery staff. Elevated levels of shoot blight and latent infections in other forest nurseries in neighboring Wisconsin during 2016 also suggests that the weather played an important role in more widespread Diplodia fla-reups across the region.
In addition to obvious shoot blight, laboratory test-ing determined that the 3–0 field contained levels of latent infection above the Minnesota Department of Natural Resources’ (MNDNR) acceptable threshold of 10 percent. To prevent widespread outplanting of red pine seedlings predisposed to mortality from latent Diplodia infection in our forests, the entire 3–0 crop of 400,000 to 500,000 seedlings was destroyed. The other two affected nursery fields contained 2–0 stock and tested well below the threshold, with none of the seedlings testing posi-tive in field A8 and only 4.4 percent testing positive in field A7. After all visibly affected seedlings were culled from these fields, another larger sample of 784 asymptomatic seedlings was tested in 2017, and only 2 seedlings (0.26 percent) tested positive for latent infection.
Latent Diplodia Effects on Outplanted Seedlings
To better understand the consequences of outplant-ing red pine seedlings with latent Diplodia infec-tions, a sample of 616 asymptomatic 3–0 seedlings from field E6 was transplanted into a decommis-sioned area in General Andrews State Forest Nurs-ery in April 2017 for long-term mortality monitor-ing. To compare mortality of potentially infected versus uninfected stock, 628 containerized red pine seedlings from a private nursery were planted adjacent to bareroot seedlings from Badoura State Forest Nursery.
MNDNR forest health staff monitored seedlings for mortality throughout the growing season and completed the second assessment in October 2017. Laboratory results at the time of planting indicat-ed that about 15 percent of the bareroot seedlings could be positive for latent Diplodia infection, but more than 60 percent bareroot seedling mortality was documented through the end of the first season.
Figure 3. Red pine seedlings exhibiting classic symptoms of Diplodia shoot blight in field E6 at the Badoura State Forest Nursery. (Photo by M. Parisio, 2016)
Table 1. Summary of test results indicating the number of asymptomatic seedlings that tested positive for latent Diplodia infection.
Field identification Seedling age Sample size Number positive seedlings Percent positive seedlings
A7 2–0 45 2 4.4 %
A8 2–0 35 0 0.0 %
E6 3–0 85 13 15.3%
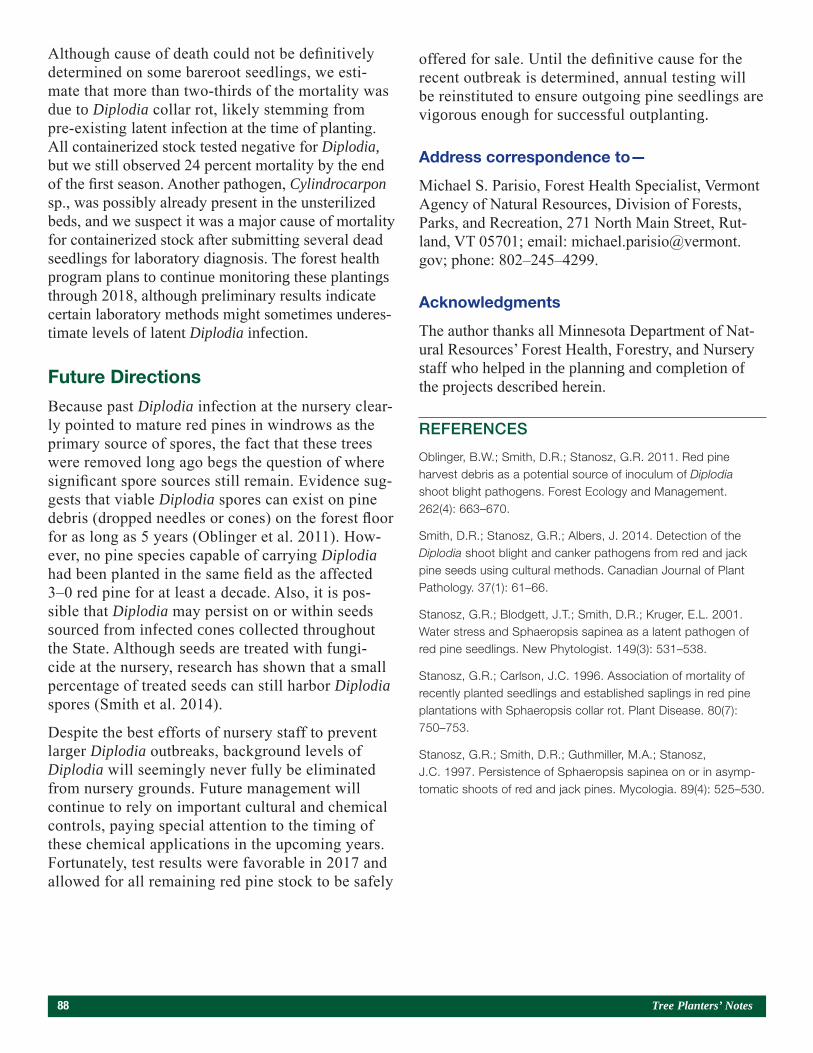
88 Tree Planters’ Notes
Although cause of death could not be definitively determined on some bareroot seedlings, we esti-mate that more than two-thirds of the mortality was due to Diplodia collar rot, likely stemming from pre-existing latent infection at the time of planting. All containerized stock tested negative for Diplodia, but we still observed 24 percent mortality by the end of the first season. Another pathogen, Cylindrocarpon sp., was possibly already present in the unsterilized beds, and we suspect it was a major cause of mortality for containerized stock after submitting several dead seedlings for laboratory diagnosis. The forest health program plans to continue monitoring these plantings through 2018, although preliminary results indicate certain laboratory methods might sometimes underes-timate levels of latent Diplodia infection.
Future Directions
Because past Diplodia infection at the nursery clear-ly pointed to mature red pines in windrows as the primary source of spores, the fact that these trees were removed long ago begs the question of where significant spore sources still remain. Evidence sug-gests that viable Diplodia spores can exist on pine debris (dropped needles or cones) on the forest floor for as long as 5 years (Oblinger et al. 2011). How-ever, no pine species capable of carrying Diplodia had been planted in the same field as the affected 3–0 red pine for at least a decade. Also, it is pos-sible that Diplodia may persist on or within seeds sourced from infected cones collected throughout the State. Although seeds are treated with fungi-cide at the nursery, research has shown that a small percentage of treated seeds can still harbor Diplodia spores (Smith et al. 2014).
Despite the best efforts of nursery staff to prevent larger Diplodia outbreaks, background levels of Diplodia will seemingly never fully be eliminated from nursery grounds. Future management will continue to rely on important cultural and chemical controls, paying special attention to the timing of these chemical applications in the upcoming years. Fortunately, test results were favorable in 2017 and allowed for all remaining red pine stock to be safely
offered for sale. Until the definitive cause for the recent outbreak is determined, annual testing will be reinstituted to ensure outgoing pine seedlings are vigorous enough for successful outplanting.
Address correspondence to—
Michael S. Parisio, Forest Health Specialist, Vermont Agency of Natural Resources, Division of Forests, Parks, and Recreation, 271 North Main Street, Rut-land, VT 05701; email: [email protected]; phone: 802–245–4299.
Acknowledgments
The author thanks all Minnesota Department of Nat-ural Resources’ Forest Health, Forestry, and Nursery staff who helped in the planning and completion of the projects described herein.
REFERENCES
Oblinger, B.W.; Smith, D.R.; Stanosz, G.R. 2011. Red pine harvest debris as a potential source of inoculum of Diplodia shoot blight pathogens. Forest Ecology and Management. 262(4): 663–670.
Smith, D.R.; Stanosz, G.R.; Albers, J. 2014. Detection of the Diplodia shoot blight and canker pathogens from red and jack pine seeds using cultural methods. Canadian Journal of Plant Pathology. 37(1): 61–66.
Stanosz, G.R.; Blodgett, J.T.; Smith, D.R.; Kruger, E.L. 2001. Water stress and Sphaeropsis sapinea as a latent pathogen of red pine seedlings. New Phytologist. 149(3): 531–538.
Stanosz, G.R.; Carlson, J.C. 1996. Association of mortality of recently planted seedlings and established saplings in red pine plantations with Sphaeropsis collar rot. Plant Disease. 80(7): 750–753.
Stanosz, G.R.; Smith, D.R.; Guthmiller, M.A.; Stanosz, J.C. 1997. Persistence of Sphaeropsis sapinea on or in asymp-tomatic shoots of red and jack pines. Mycologia. 89(4): 525–530.
Volume 61, Number 2 (Fall 2018) 89
Abstract
Conservationists are increasingly dependent on res-toration as a means of expanding natural areas as the availability of natural habitats for preservation declines. The uptick in number and scale of restoration projects provides an opportunity to learn about how to restore habitats most effectively. This information is especially valuable in an era of climate change where restoration ecologists and foresters are already implementing mitigation strategies, such as assisted migration. Here, we advocate for the establishment of applied-academic partnerships that can be used to glean the most infor-mation possible from revegetation projects. Our work was conducted in the context of assisted migration into a boreal forest that is already under decline with climate change and is a model for achieving both applied and academic goals. We outline the value of collaborative initiatives that create translational research with real-world impact. We also underscore key steps that can lead to productive partnerships that achieve both restoration and research goals. This paper was presented at the Joint Annual Meeting of the Northeast Forest and Conservation Association, the Southern Forest Nurs-ery Association, and the Intertribal Nursery Council (Walker, MN, July 31–August 3, 2017).
Introduction
As the availability of intact, native habitats de-clines, conservationists are increasingly dependent on restoration as a means of expanding the number and size of natural areas (Maunder 1992, Miller and Hobbs 2007). Habitat restoration typically starts with reestablishing the vegetation by either planting new populations or augmenting existing populations (Temperton 2004). Although plant establishment is an essential first step, the success rate of these efforts
is rarely known (Deredec and Courchamp 2007), except for some cases of endangered plant species reintroductions (e.g., Bottin et al. 2007). This reality is underscored in a survey of the plant restoration litera-ture showing that only 14 percent of studies reported restoration success after seeding or planting (Ruiz-Jaen and Mitchell Aide 2005). Moreover, it is possible that this scant information is biased toward positive results (Fanelli 2010). Based on the published studies, the success rate of plant species introductions is 78 per-cent, which contrasts sharply with a success rate of 33 percent based on a survey of restoration practitioners (Godefroid et al. 2011). Although additional infor-mation on success rates may be available in the gray literature, this body of work is not widely accessible. Overall, the collection, analysis, and publication of les-sons learned from successful and unsuccessful revege-tation approaches is the exception rather than the rule. To address this gap in our understanding, we suggest the establishment of translational ecology partnerships (Enquist et al. 2017) to maximize the learning potential from habitat restoration and management.
The coupling of methodological and outcome infor-mation is critical both to advancing the science of restoration ecology and identifying ways to improve restoration success in the establishment of function-al communities. Although previous papers (Menges 2008) and publications from restoration organiza-tions (McDonald et al. 2016) have outlined best practices for evaluating restoration success, these methods are rarely implemented, and, when they are, assessments are typically based on few metrics (Ruiz-Jaen and Mitchell Aide 2005; see also Guerrant and Kaye 2007). Valid reasons exist for this lack of follow-through. For example, restoration projects are rarely active for more than 5 years (Ruiz-Jaen and Mitchell Aide 2005), which may be a shorter time-
Embedding Research Into Restoration: A Case Study Illustrating the Value of Applied-Academic Partnerships
Julie R. Etterson, Mark A. White, Laura C. Kavajecz, and Meredith W. Cornett
Professor, Department of Biology, University of Minnesota Duluth, Duluth, MN; Forest Ecologist, The Nature Conservancy, Duluth, MN; Integrated Bioscience Graduate Student, University of Minnesota Duluth, Duluth, MN; Director of Conservation Science for The Nature Conservancy in Minnesota, North and South Dakota, Duluth, MN
90 Tree Planters’ Notes
frame than is necessary to collect relevant data, espe-cially for long-lived species. Financial resources may also be a very real and severe limitation. Moreover, restoration practitioners may not have the time or incentive to collect, analyze, and publish this informa-tion. The situation, although understandable, amounts to a lost opportunity for learning and improving the practice of restoration.
It is especially important to track the success of res-toration efforts in an era of climate change. Globally, mean land surface air temperatures have increased by a rate of 0.092 °C (0.17 °F) per decade from 1880 to 2012. These rates have increased dramatically during the past 30 years (0.26 °C [0.47 °F] per decade, 1979 to 2012; Field et al. 2014). Climate change is impos-ing a natural experiment on the world’s biota that will require wild and restored populations of organisms to adapt to the changing environment or face extinc-tion (Davis et al. 2005). Although plants and animals faced such environmental challenges during previous time points in Earth’s history (Zachos et al. 2001), human-induced climate change is expected to occur faster than in the past (Pachauri et al. 2014). More-over, rapid climate change is superimposed on other anthropogenic factors that already imperil native organisms and have made restoration efforts neces-sary. Namely, wild and restored populations are often isolated in a matrix of altered habitat that may reduce the opportunity for range shifts. Populations may be cut off from input of novel genetic variation through pollen flow and seed dispersal that might promote adaptive responses (Kremer et al. 2012, Swindell and Bouzat 2006). For many species, contemporary populations are smaller than in the past, which may cause genetic diversity to be lost by drift and inbreed-ing and may increase susceptibility to extinction by stochastic environmental events (Heschel and Paige 1995). Habitat degradation may also facilitate inva-sion of exotic species that compete for resources and compound stress (Strauss et al. 2006). Furthermore, positive interactions between organisms (for example, between plants and pollinators) may be decoupled as species respond to climate change in different ways (McCarty 2001), which also threatens the long-term persistence of these populations. Thus, whether wild or restored, the long-term fate of populations will depend on a multiplicity of interacting factors that are rapidly changing in the Anthropocene (Smith and Zeder 2013).
If species cannot adapt to climate change rapidly enough, it may be necessary to manage populations as climate changes. One widely discussed approach is to move organisms with the band of climate to which they are adapted. This movement is often referred to as “assisted migration” (AM) (Mc-Lachlan et al. 2007). In concept, AM has been the subject of controversy and confusion in the pub-lished literature, sometimes meaning translocation outside of the current range and sometimes within the current range. In the context of our case study, we use the term “forestry-AM” (Pedlar et al. 2012) that generally involves common, widespread spe-cies and strives to sustain ecosystem productivity through the within-range movement of populations. Although academics have debated the relative risks and benefits of this climate mitigation approach (Hoegh-Guldberg et al. 2008, McLachlan et al. 2007, Pedlar et al. 2012, Richardson et al. 2009, Williams and Dumroese 2013), some restoration ecologists and forest managers are forging ahead and implementing AM because the impacts of cli-mate change, such as the decline and loss of cano-py tree species, is already evident. Given that AM is a bold and largely untested restoration concept, it is critical that its success or failure is monitored over time.
For all these reasons, the field of restoration ecol-ogy would benefit from monitoring projects and other formal scientific studies that help improve our understanding of methods that underpin restoration success in general and provide opportunities for scientifically rigorous tests of alternative strategies, like AM. Here, we report on a unique partnership between a conservation organization (The Nature Conservancy [TNC]) and a regional university (Uni-versity of Minnesota Duluth [UMD]) that achieved dual objectives through collaboration. From a conservation perspective, the goal was to conduct AM in the declining boreal forests of northeastern Minnesota. From a research perspective, the goal was to formally study the efficacy of AM. Here, we discuss our project, “Adaptation in the Great North Woods.” We emphasize the value added by joining resources and expertise in this collaborative project. We also provide suggestions on how to establish similar fruitful relationships between restoration practitioners, academics, and their students.
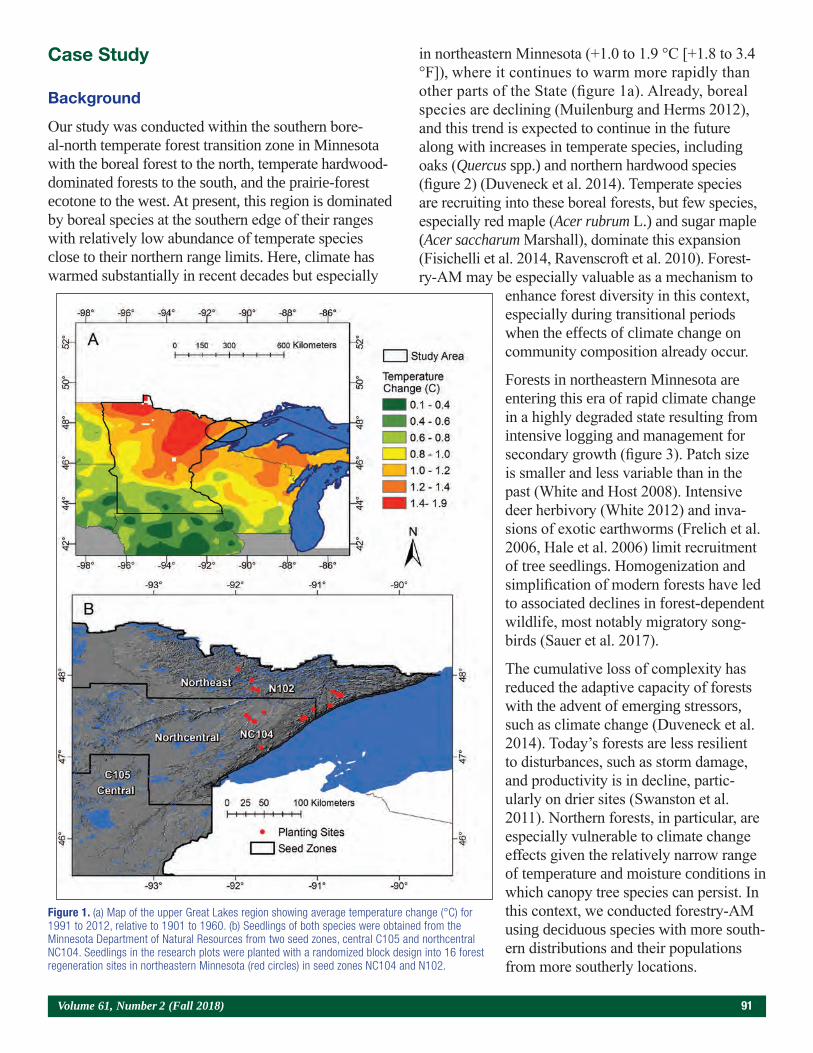
Volume 61, Number 2 (Fall 2018) 91
Case Study
Background
Our study was conducted within the southern bore-al-north temperate forest transition zone in Minnesota with the boreal forest to the north, temperate hardwood- dominated forests to the south, and the prairie-forest ecotone to the west. At present, this region is dominated by boreal species at the southern edge of their ranges with relatively low abundance of temperate species close to their northern range limits. Here, climate has warmed substantially in recent decades but especially
in northeastern Minnesota (+1.0 to 1.9 °C [+1.8 to 3.4 °F]), where it continues to warm more rapidly than other parts of the State (figure 1a). Already, boreal species are declining (Muilenburg and Herms 2012), and this trend is expected to continue in the future along with increases in temperate species, including oaks (Quercus spp.) and northern hardwood species (figure 2) (Duveneck et al. 2014). Temperate species are recruiting into these boreal forests, but few species, especially red maple (Acer rubrum L.) and sugar maple (Acer saccharum Marshall), dominate this expansion (Fisichelli et al. 2014, Ravenscroft et al. 2010). Forest-ry-AM may be especially valuable as a mechanism to
enhance forest diversity in this context, especially during transitional periods when the effects of climate change on community composition already occur.
Forests in northeastern Minnesota are entering this era of rapid climate change in a highly degraded state resulting from intensive logging and management for secondary growth (figure 3). Patch size is smaller and less variable than in the past (White and Host 2008). Intensive deer herbivory (White 2012) and inva-sions of exotic earthworms (Frelich et al. 2006, Hale et al. 2006) limit recruitment of tree seedlings. Homogenization and simplification of modern forests have led to associated declines in forest-dependent wildlife, most notably migratory song-birds (Sauer et al. 2017).
The cumulative loss of complexity has reduced the adaptive capacity of forests with the advent of emerging stressors, such as climate change (Duveneck et al. 2014). Today’s forests are less resilient to disturbances, such as storm damage, and productivity is in decline, partic-ularly on drier sites (Swanston et al. 2011). Northern forests, in particular, are especially vulnerable to climate change effects given the relatively narrow range of temperature and moisture conditions in which canopy tree species can persist. In this context, we conducted forestry-AM using deciduous species with more south-ern distributions and their populations from more southerly locations.
Figure 1. (a) Map of the upper Great Lakes region showing average temperature change (°C) for 1991 to 2012, relative to 1901 to 1960. (b) Seedlings of both species were obtained from the Minnesota Department of Natural Resources from two seed zones, central C105 and northcentral NC104. Seedlings in the research plots were planted with a randomized block design into 16 forest regeneration sites in northeastern Minnesota (red circles) in seed zones NC104 and N102.
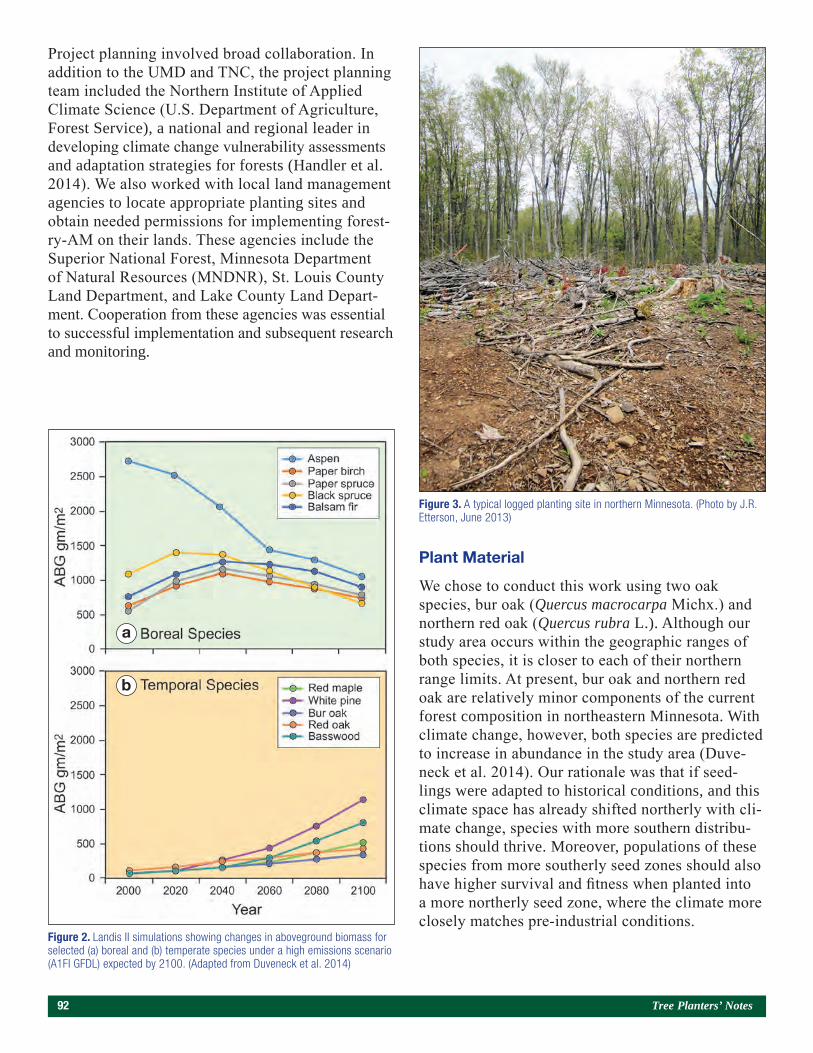
92 Tree Planters’ Notes
Project planning involved broad collaboration. In addition to the UMD and TNC, the project planning team included the Northern Institute of Applied Climate Science (U.S. Department of Agriculture, Forest Service), a national and regional leader in developing climate change vulnerability assessments and adaptation strategies for forests (Handler et al. 2014). We also worked with local land management agencies to locate appropriate planting sites and obtain needed permissions for implementing forest-ry-AM on their lands. These agencies include the Superior National Forest, Minnesota Department of Natural Resources (MNDNR), St. Louis County Land Department, and Lake County Land Depart-ment. Cooperation from these agencies was essential to successful implementation and subsequent research and monitoring.
Plant Material
We chose to conduct this work using two oak species, bur oak (Quercus macrocarpa Michx.) and northern red oak (Quercus rubra L.). Although our study area occurs within the geographic ranges of both species, it is closer to each of their northern range limits. At present, bur oak and northern red oak are relatively minor components of the current forest composition in northeastern Minnesota. With climate change, however, both species are predicted to increase in abundance in the study area (Duve-neck et al. 2014). Our rationale was that if seed-lings were adapted to historical conditions, and this climate space has already shifted northerly with cli-mate change, species with more southern distribu-tions should thrive. Moreover, populations of these species from more southerly seed zones should also have higher survival and fitness when planted into a more northerly seed zone, where the climate more closely matches pre-industrial conditions.
Figure 2. Landis II simulations showing changes in aboveground biomass for selected (a) boreal and (b) temperate species under a high emissions scenario (A1FI GFDL) expected by 2100. (Adapted from Duveneck et al. 2014)
a
b
Figure 3. A typical logged planting site in northern Minnesota. (Photo by J.R. Etterson, June 2013)
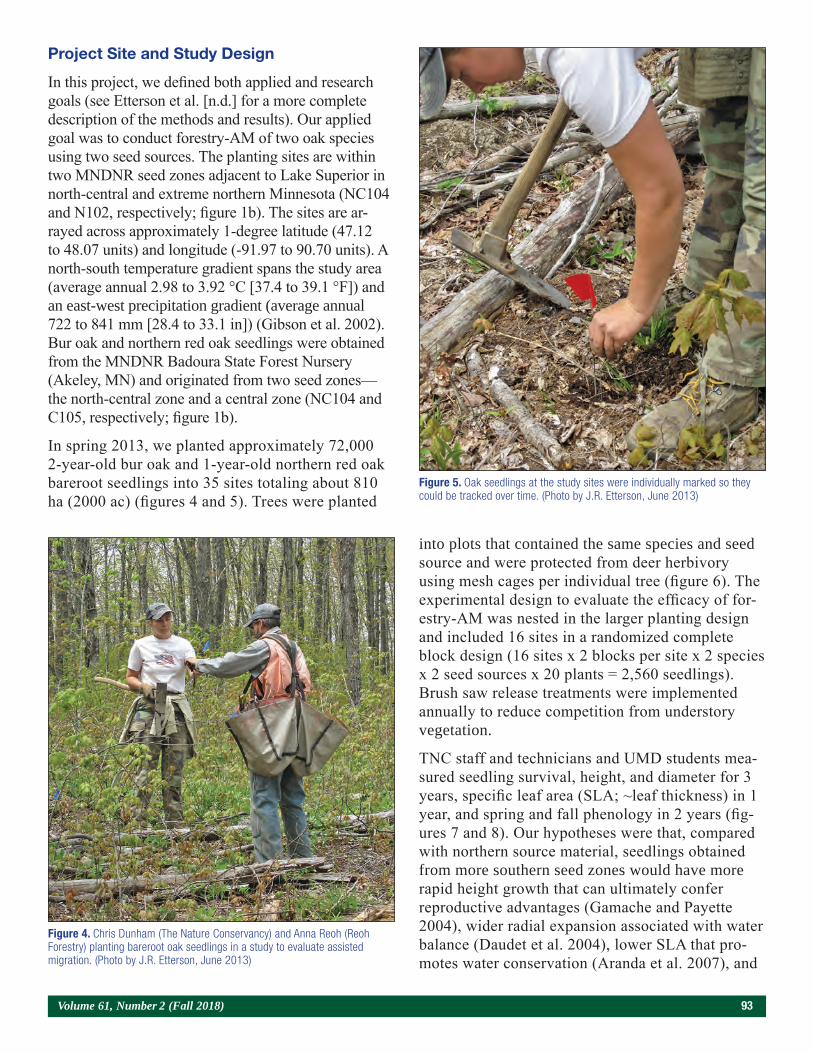
Volume 61, Number 2 (Fall 2018) 93
Project Site and Study Design
In this project, we defined both applied and research goals (see Etterson et al. [n.d.] for a more complete description of the methods and results). Our applied goal was to conduct forestry-AM of two oak species using two seed sources. The planting sites are within two MNDNR seed zones adjacent to Lake Superior in north-central and extreme northern Minnesota (NC104 and N102, respectively; figure 1b). The sites are ar-rayed across approximately 1-degree latitude (47.12 to 48.07 units) and longitude (-91.97 to 90.70 units). A north-south temperature gradient spans the study area (average annual 2.98 to 3.92 °C [37.4 to 39.1 °F]) and an east-west precipitation gradient (average annual 722 to 841 mm [28.4 to 33.1 in]) (Gibson et al. 2002). Bur oak and northern red oak seedlings were obtained from the MNDNR Badoura State Forest Nursery (Akeley, MN) and originated from two seed zones—the north-central zone and a central zone (NC104 and C105, respectively; figure 1b).
In spring 2013, we planted approximately 72,000 2-year-old bur oak and 1-year-old northern red oak bareroot seedlings into 35 sites totaling about 810 ha (2000 ac) (figures 4 and 5). Trees were planted
into plots that contained the same species and seed source and were protected from deer herbivory using mesh cages per individual tree (figure 6). The experimental design to evaluate the efficacy of for-estry-AM was nested in the larger planting design and included 16 sites in a randomized complete block design (16 sites x 2 blocks per site x 2 species x 2 seed sources x 20 plants = 2,560 seedlings). Brush saw release treatments were implemented annually to reduce competition from understory vegetation.
TNC staff and technicians and UMD students mea-sured seedling survival, height, and diameter for 3 years, specific leaf area (SLA; ~leaf thickness) in 1 year, and spring and fall phenology in 2 years (fig-ures 7 and 8). Our hypotheses were that, compared with northern source material, seedlings obtained from more southern seed zones would have more rapid height growth that can ultimately confer reproductive advantages (Gamache and Payette 2004), wider radial expansion associated with water balance (Daudet et al. 2004), lower SLA that pro-motes water conservation (Aranda et al. 2007), and
Figure 4. Chris Dunham (The Nature Conservancy) and Anna Reoh (Reoh Forestry) planting bareroot oak seedlings in a study to evaluate assisted migration. (Photo by J.R. Etterson, June 2013)
Figure 5. Oak seedlings at the study sites were individually marked so they could be tracked over time. (Photo by J.R. Etterson, June 2013)
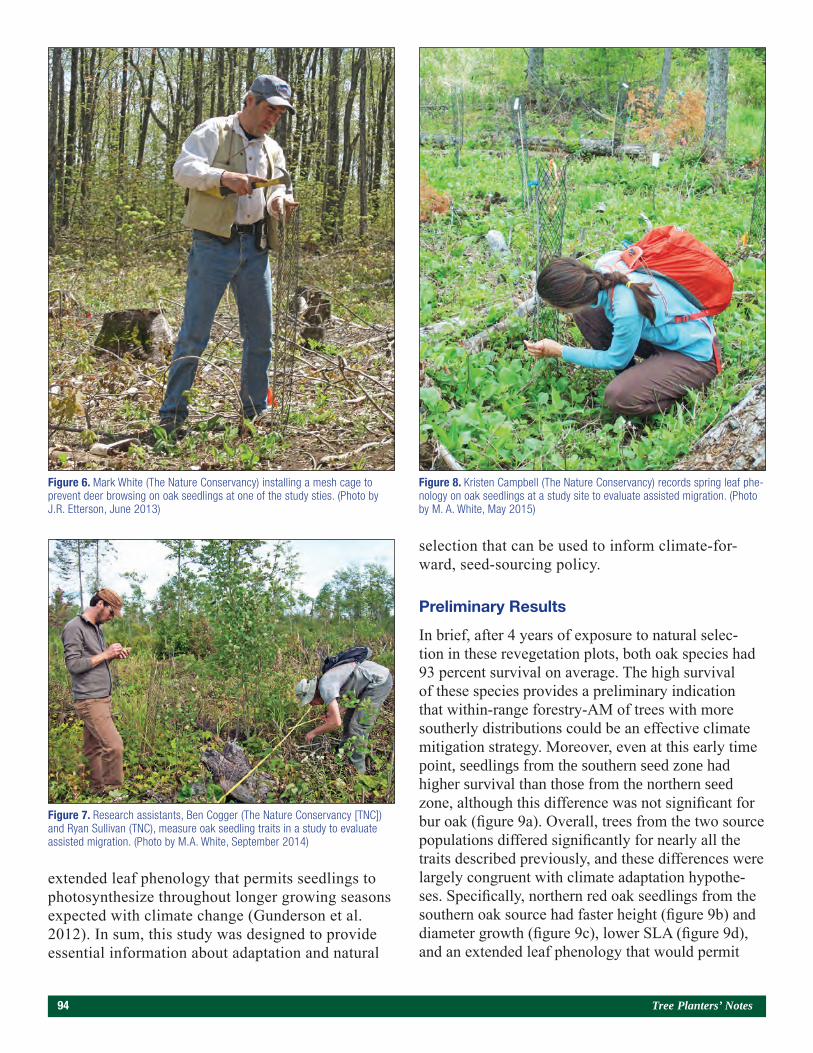
94 Tree Planters’ Notes
Figure 6. Mark White (The Nature Conservancy) installing a mesh cage to prevent deer browsing on oak seedlings at one of the study sties. (Photo by J.R. Etterson, June 2013)
Figure 8. Kristen Campbell (The Nature Conservancy) records spring leaf phe-nology on oak seedlings at a study site to evaluate assisted migration. (Photo by M. A. White, May 2015)
Figure 7. Research assistants, Ben Cogger (The Nature Conservancy [TNC]) and Ryan Sullivan (TNC), measure oak seedling traits in a study to evaluate assisted migration. (Photo by M.A. White, September 2014)
extended leaf phenology that permits seedlings to photosynthesize throughout longer growing seasons expected with climate change (Gunderson et al. 2012). In sum, this study was designed to provide essential information about adaptation and natural
selection that can be used to inform climate-for-ward, seed-sourcing policy.
Preliminary Results
In brief, after 4 years of exposure to natural selec-tion in these revegetation plots, both oak species had 93 percent survival on average. The high survival of these species provides a preliminary indication that within-range forestry-AM of trees with more southerly distributions could be an effective climate mitigation strategy. Moreover, even at this early time point, seedlings from the southern seed zone had higher survival than those from the northern seed zone, although this difference was not significant for bur oak (figure 9a). Overall, trees from the two source populations differed significantly for nearly all the traits described previously, and these differences were largely congruent with climate adaptation hypothe-ses. Specifically, northern red oak seedlings from the southern oak source had faster height (figure 9b) and diameter growth (figure 9c), lower SLA (figure 9d), and an extended leaf phenology that would permit
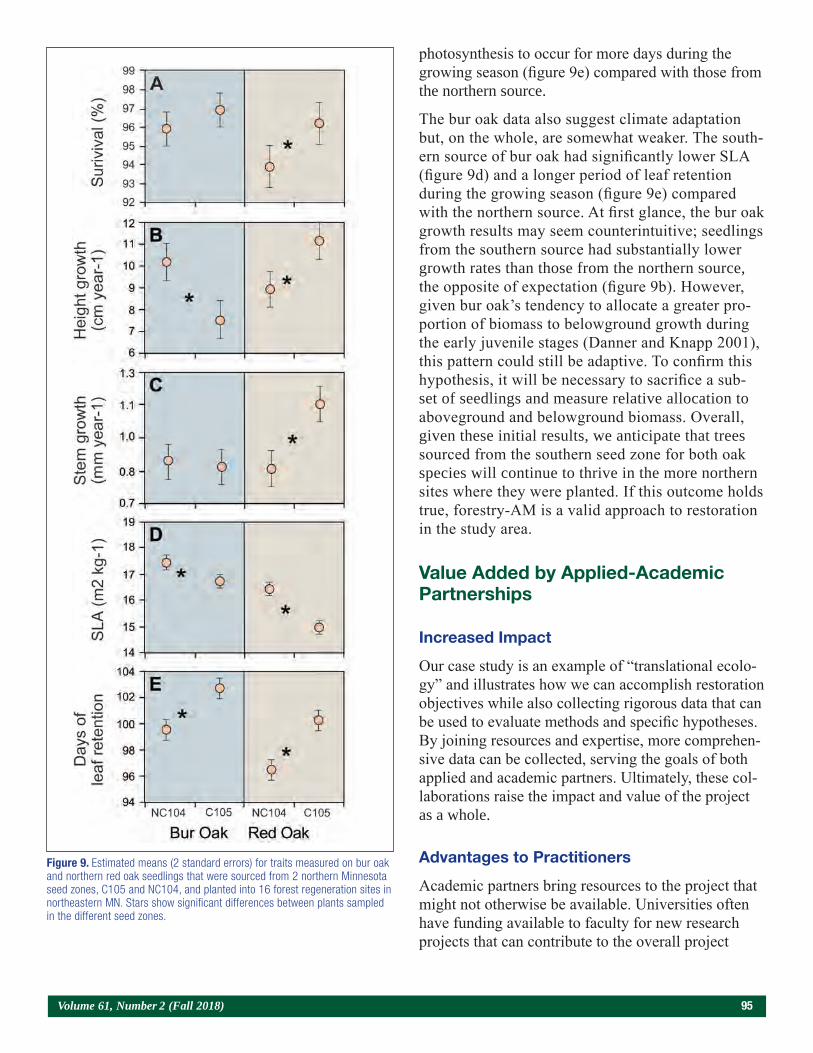
Volume 61, Number 2 (Fall 2018) 95
photosynthesis to occur for more days during the growing season (figure 9e) compared with those from the northern source.
The bur oak data also suggest climate adaptation but, on the whole, are somewhat weaker. The south-ern source of bur oak had significantly lower SLA (figure 9d) and a longer period of leaf retention during the growing season (figure 9e) compared with the northern source. At first glance, the bur oak growth results may seem counterintuitive; seedlings from the southern source had substantially lower growth rates than those from the northern source, the opposite of expectation (figure 9b). However, given bur oak’s tendency to allocate a greater pro-portion of biomass to belowground growth during the early juvenile stages (Danner and Knapp 2001), this pattern could still be adaptive. To confirm this hypothesis, it will be necessary to sacrifice a sub-set of seedlings and measure relative allocation to aboveground and belowground biomass. Overall, given these initial results, we anticipate that trees sourced from the southern seed zone for both oak species will continue to thrive in the more northern sites where they were planted. If this outcome holds true, forestry-AM is a valid approach to restoration in the study area.
Value Added by Applied-Academic Partnerships
Increased Impact
Our case study is an example of “translational ecolo-gy” and illustrates how we can accomplish restoration objectives while also collecting rigorous data that can be used to evaluate methods and specific hypotheses. By joining resources and expertise, more comprehen-sive data can be collected, serving the goals of both applied and academic partners. Ultimately, these col-laborations raise the impact and value of the project as a whole.
Advantages to Practitioners
Academic partners bring resources to the project that might not otherwise be available. Universities often have funding available to faculty for new research projects that can contribute to the overall project
Figure 9. Estimated means (2 standard errors) for traits measured on bur oak and northern red oak seedlings that were sourced from 2 northern Minnesota seed zones, C105 and NC104, and planted into 16 forest regeneration sites in northeastern MN. Stars show significant differences between plants sampled in the different seed zones.
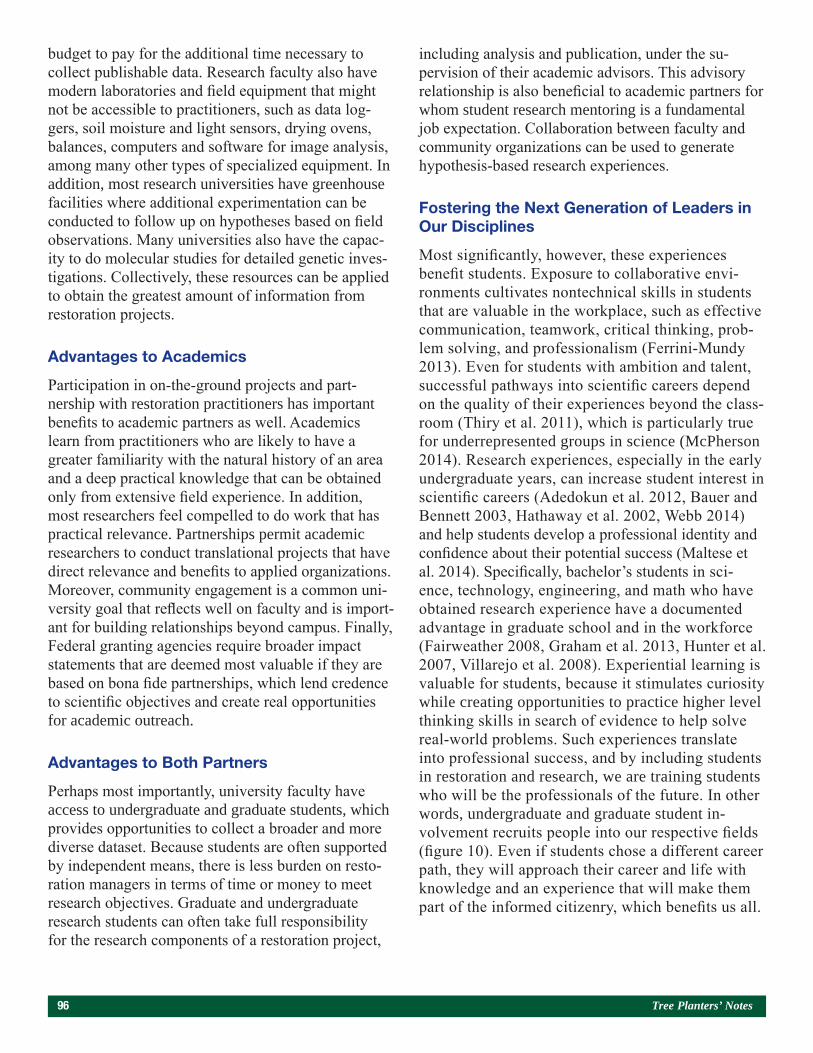
96 Tree Planters’ Notes
budget to pay for the additional time necessary to collect publishable data. Research faculty also have modern laboratories and field equipment that might not be accessible to practitioners, such as data log-gers, soil moisture and light sensors, drying ovens, balances, computers and software for image analysis, among many other types of specialized equipment. In addition, most research universities have greenhouse facilities where additional experimentation can be conducted to follow up on hypotheses based on field observations. Many universities also have the capac-ity to do molecular studies for detailed genetic inves-tigations. Collectively, these resources can be applied to obtain the greatest amount of information from restoration projects.
Advantages to Academics
Participation in on-the-ground projects and part-nership with restoration practitioners has important benefits to academic partners as well. Academics learn from practitioners who are likely to have a greater familiarity with the natural history of an area and a deep practical knowledge that can be obtained only from extensive field experience. In addition, most researchers feel compelled to do work that has practical relevance. Partnerships permit academic researchers to conduct translational projects that have direct relevance and benefits to applied organizations. Moreover, community engagement is a common uni-versity goal that reflects well on faculty and is import-ant for building relationships beyond campus. Finally, Federal granting agencies require broader impact statements that are deemed most valuable if they are based on bona fide partnerships, which lend credence to scientific objectives and create real opportunities for academic outreach.
Advantages to Both Partners
Perhaps most importantly, university faculty have access to undergraduate and graduate students, which provides opportunities to collect a broader and more diverse dataset. Because students are often supported by independent means, there is less burden on resto-ration managers in terms of time or money to meet research objectives. Graduate and undergraduate research students can often take full responsibility for the research components of a restoration project,
including analysis and publication, under the su-pervision of their academic advisors. This advisory relationship is also beneficial to academic partners for whom student research mentoring is a fundamental job expectation. Collaboration between faculty and community organizations can be used to generate hypothesis-based research experiences.
Fostering the Next Generation of Leaders in Our Disciplines
Most significantly, however, these experiences benefit students. Exposure to collaborative envi-ronments cultivates nontechnical skills in students that are valuable in the workplace, such as effective communication, teamwork, critical thinking, prob-lem solving, and professionalism (Ferrini-Mundy 2013). Even for students with ambition and talent, successful pathways into scientific careers depend on the quality of their experiences beyond the class-room (Thiry et al. 2011), which is particularly true for underrepresented groups in science (McPherson 2014). Research experiences, especially in the early undergraduate years, can increase student interest in scientific careers (Adedokun et al. 2012, Bauer and Bennett 2003, Hathaway et al. 2002, Webb 2014) and help students develop a professional identity and confidence about their potential success (Maltese et al. 2014). Specifically, bachelor’s students in sci-ence, technology, engineering, and math who have obtained research experience have a documented advantage in graduate school and in the workforce (Fairweather 2008, Graham et al. 2013, Hunter et al. 2007, Villarejo et al. 2008). Experiential learning is valuable for students, because it stimulates curiosity while creating opportunities to practice higher level thinking skills in search of evidence to help solve real-world problems. Such experiences translate into professional success, and by including students in restoration and research, we are training students who will be the professionals of the future. In other words, undergraduate and graduate student in-volvement recruits people into our respective fields (figure 10). Even if students chose a different career path, they will approach their career and life with knowledge and an experience that will make them part of the informed citizenry, which benefits us all.
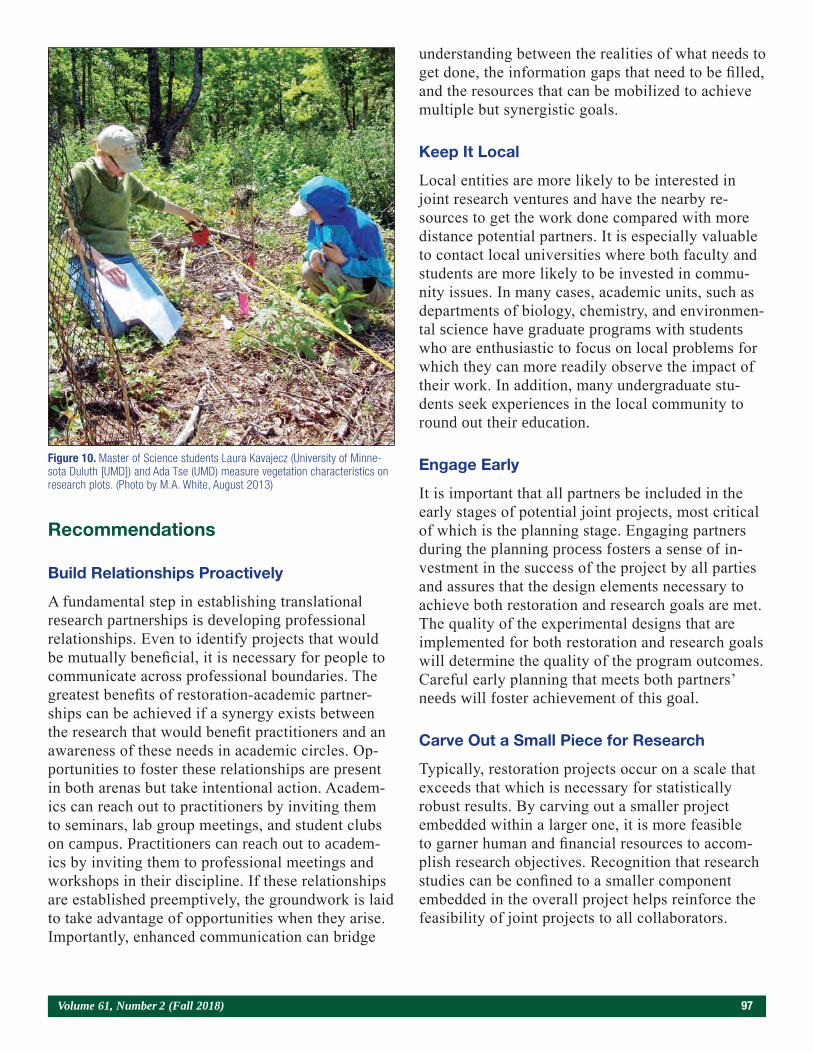
Volume 61, Number 2 (Fall 2018) 97
Recommendations
Build Relationships Proactively
A fundamental step in establishing translational research partnerships is developing professional relationships. Even to identify projects that would be mutually beneficial, it is necessary for people to communicate across professional boundaries. The greatest benefits of restoration-academic partner-ships can be achieved if a synergy exists between the research that would benefit practitioners and an awareness of these needs in academic circles. Op-portunities to foster these relationships are present in both arenas but take intentional action. Academ-ics can reach out to practitioners by inviting them to seminars, lab group meetings, and student clubs on campus. Practitioners can reach out to academ-ics by inviting them to professional meetings and workshops in their discipline. If these relationships are established preemptively, the groundwork is laid to take advantage of opportunities when they arise. Importantly, enhanced communication can bridge
understanding between the realities of what needs to get done, the information gaps that need to be filled, and the resources that can be mobilized to achieve multiple but synergistic goals.
Keep It Local
Local entities are more likely to be interested in joint research ventures and have the nearby re-sources to get the work done compared with more distance potential partners. It is especially valuable to contact local universities where both faculty and students are more likely to be invested in commu-nity issues. In many cases, academic units, such as departments of biology, chemistry, and environmen-tal science have graduate programs with students who are enthusiastic to focus on local problems for which they can more readily observe the impact of their work. In addition, many undergraduate stu-dents seek experiences in the local community to round out their education.
Engage Early
It is important that all partners be included in the early stages of potential joint projects, most critical of which is the planning stage. Engaging partners during the planning process fosters a sense of in-vestment in the success of the project by all parties and assures that the design elements necessary to achieve both restoration and research goals are met. The quality of the experimental designs that are implemented for both restoration and research goals will determine the quality of the program outcomes. Careful early planning that meets both partners’ needs will foster achievement of this goal.
Carve Out a Small Piece for Research
Typically, restoration projects occur on a scale that exceeds that which is necessary for statistically robust results. By carving out a smaller project embedded within a larger one, it is more feasible to garner human and financial resources to accom-plish research objectives. Recognition that research studies can be confined to a smaller component embedded in the overall project helps reinforce the feasibility of joint projects to all collaborators.
Figure 10. Master of Science students Laura Kavajecz (University of Minne-sota Duluth [UMD]) and Ada Tse (UMD) measure vegetation characteristics on research plots. (Photo by M.A. White, August 2013)
98 Tree Planters’ Notes
Aim for the Long Term
Some of the most valuable information obtained from forest regeneration (and many other aspects of science) has resulted from long-term studies. In forestry, provenance trials have yielded some of the best examples of long-term studies of stand productiv-ity across species’ ranges (Callaham 1963). These extraordinarily valuable long-term datasets have been reinterpreted in more recent years to help understand the impacts of climate change and guide appropriate management responses (Alberto et al. 2013, Matyas 1996, O’Neill et al. 2008, Rehfeldt et al. 1999, Schmidtling 1994, Thomson and Parker 2008). Beyond forestry, long-term monitoring of diverse ecosystems has yielded insights into biotic response to climate change that could not otherwise have been obtained (e.g., Bertrand et al. 2011, Fitter and Fitter 2002, Gordo and Sanz 2005, Kelly and Goulden 2008, Lenoir et al. 2008). Similar long-term studies of restoration outcomes are not widely available. Long-term studies are important because they could provide critical information to guide habitat restoration in an age where, out of necessity, reconstruction efforts are increasingly common.
Future Work
Here, we described one set of information derived from this collaborative project. In addition to the results described in this article, another UMD graduate student collaborated with TNC to conduct similar work on eastern white pine (Pinus strobus L.). Teams of people characterized the soils on these plots and processed samples in the laboratory at UMD. In 2 successive years, students participating in the Biology Undergrad-uate Research Program in Science and Technology conducted invasive earthworm surveys in our revegeta-tion plots. Other faculty and students have been en-gaged in processing field samples to better understand bud and leaf attributes in laboratories at both UMD and North Dakota State University. Crews of young profes-sionals, which TNC hires seasonally, collected baseline data on herbaceous forest species within our plots. A more recent UMD graduate student is following up on that work and has begun to study genetic differentia-tion and the value of forestry-AM in this understudied component of forest ecosystems. Finally, TNC joined forces with aquatic ecologists to compare the degree of freshwater and terrestrial resilience in some of the
Lake Superior coastal watersheds where our plots were located. Forthcoming publications on these rich and di-verse initiatives will enhance our ability to mitigate the negative effects of climate change and other stressors in these forests that are already transitioning.
Summary
As practitioners struggle with how to restore and manage populations that are threatened with climate change, applied-academic partnerships can achieve both restoration and research goals. Through transla-tional collaboration, we can increase the impact of our work by combining our resources to get projects done while also studying their efficacy. Student engage-ment is an important component in this effort because it increases opportunities to collect more extensive and longer term data using different cohorts of stu-dents over time. However, the greatest benefit may be to stimulate interest in a diverse cadre of students to encourage them to continue on to professional careers in our disciplines and become a component of an informed citizenry.
Address correspondence to—
Julie Etterson, University of Minnesota Duluth, De-partment of Biology, 207 Swenson Science Building, 1035 Kirby Drive, Duluth, MN 55812-3004; email: [email protected]; phone: 218–726–8110.
Acknowledgments
The Nature Conservancy (TNC) generously provided financial support for this work through the Cox Fam-ily Fund for Science and Research. The authors thank the Integrated Biosciences Program at the Universi-ty of Minnesota Duluth for support to L. Kavajecz. Experimental plantings were funded by a grant from the Wildlife Conservation Society Climate Adaptation Fund to M. Cornett, M. White, and J. Etterson, orig-inating from the Doris Duke Charitable Foundation. The Carolyn M. Crosby Foundation also provided generous funding in the first year of the project. We thank C. Dunham (TNC) for planting coordination and field operations. J. Mead, A. Tse, D. Thiel (Uni-versity of Minnesota Duluth) and D. Myhre, B. Cog-ger, R. Sullivan, and K. Campbell (TNC) provided field assistance. R. Sagar (TNC) assisted with spatial data preparation and field measurements.

Volume 61, Number 2 (Fall 2018) 99
REFERENCES
Adedokun, O.A.; Zhang, D.; Parker, L.C.; Bessenbacher, A.; Childress, A.; Burgess, W.D.; Adedokun, B. 2012. Understanding how undergraduate research experiences influence student aspirations for research careers and graduate education. Journal of College Science Teaching. 42(1): 82–90.
Alberto, F.J.; Aitken, S.N.; Alía, R.; González-Martínez, S.C.; Hänninen, H.; Kremer, A.; Lefèvre, F.; Lenormand, T.; Yeaman, S.; Whetten, R. 2013. Potential for evolutionary responses to climate change–evidence from tree populations. Global Change Biology. 19(6): 1645–1661.
Aranda, I.; Pardos, M.; Puértolas, J.; Jiménez, M.D.; Pardos, J.A. 2007. Water-use efficiency in cork oak (Quercus suber) is modified by the interaction of water and light availabilities. Tree Physiology. 27(5): 671–677.
Bauer, K.W.; Bennett, J.S. 2003. Alumni perceptions used to assess undergraduate research experience. The Journal of Higher Education. 74(2): 210–230.
Bertrand, R.; Lenoir, J.; Piedallu, C.; Riofrío-Dillon, G.; De Ruffray, P.; Vidal, C.; Pierrat, J.-C.; Gégout, J.-C. 2011. Changes in plant community composition lag behind climate warming in lowland forests. Nature. 479(7374): 517–520.
Bottin, L.; Le Cadre, S.; Quilichini, A.; Bardin, P.; Moret, J.; Machon, N. 2007. Re-establishment trials in endangered plants: a review and the example of Arenaria grandiflora, a species on the brink of extinction in the Parisian region (France). Ecoscience. 14(4): 410–419.
Callaham, R.Z. 1963. Provenance research: investigation of genetic diversity associated with geography. Unasylva. 18(2–3): 2–12.
Danner, B.T.; Knapp, A.K. 2001. Growth dynamics of oak seedlings (Quercus macrocarpa Michx. and Quercus muhlenbergii Engelm.) from gallery forests: implications for forest expansion into grass-lands. Trees. 15(5): 271–277.
Daudet, F.-A.; Améglio, T.; Cochard, H.; Archilla, O.; Lacointe. A. 2004. Experimental analysis of the role of water and carbon in tree stem diameter variations. Journal of Experimental Botany. 56(409): 135–144.
Davis, M.B.; Shaw, R.G.; Etterson, J.R. 2005. Evolutionary responses to changing climate. Ecology. 86(7): 1704–1714.
Deredec, A.; Courchamp, F. 2007. Importance of the Allee effect for reintroductions. Ecoscience. 14(4): 440–451.
Duveneck, M.J.; Scheller, R.M.; White, M.A. 2014. Effects of alternative forest management on biomass and species diversity in the face of climate change in the northern Great Lakes region (USA). Canadian Journal of Forest Research. 44(999): 700–710.
Enquist, C.A.; Jackson, S.T.; Garfin, G.M.; Davis, F.W.; Gerber, L.R.; Littell, J.A.; Tank, J.L.; Terando, A.J.; Wall, T.U.; Halpern, B. 2017. Foundations of translational ecology. Frontiers in Ecology and the Environment. 15(10): 541–550.
Etterson, J.R.; White, M.A.; Cornett, M.W.; Kavajecz, L.C. [N.d.] Assisted migration in a boreal forest that is already transitioning under climate change. Manuscript in preparation.
Fairweather, J. 2008. Linking evidence and promising practices in science, technology, engineering, and mathematics (STEM) undergraduate education. Washington, DC: Board of Science Education; National Research Council; The National Academies of Sciences, Engineering, and Medicine. 31 p.
Fanelli, D. 2010. Do pressures to publish increase scientists’ bias? An empirical support from US States Data. PLOS One. 5:e10271.
Ferrini-Mundy, J. 2013. Driven by diversity. Science. 340(6130): 278–278.
Field, C.B.; Barros, V.R.; Mach, K.; Mastrandrea, M. 2014. Climate change 2014: impacts, adaptation, and vulnerability. New York: Cambridge University Press. 1101 p.
Fisichelli, N.A.; Frelich, L.E.; Reich, P.B. 2014. Temperate tree expansion into adjacent boreal forest patches facilitated by warmer temperatures. Ecography. 37(2): 152–161.
Fitter, A.; Fitter, R. 2002. Rapid changes in flowering time in British plants. Science. 296 (5573): 1689–1691.
Frelich, L.E.; Hale, C.M.; Reich, P.B.; Holdsworth, A.R.; Scheu, S.; Heneghan, L.; Bohlen, P.J. 2006. Earthworm invasion into previously earthworm-free temperate and boreal forests. In: Hendrix, P.F, ed. Biological invasions belowground: earthworms as invasive species: 35–45. Chapter 4.
Gamache, I.; Payette, S. 2004. Height growth response of tree line black spruce to recent climate warming across the forest-tundra of eastern Canada. Journal of Ecology. 92(5): 835–845.
Gibson, W.; Daly, C.; Kittel, T.; Nychka, D.; Johns, C.; Rosen-bloom, N.; McNab, A.; Taylor, G. 2002. Development of a 103-year high-resolution climate data set for the conterminous United States. Proceedings of the 13th AMS Conference on Applied Climatology. Portland, OR: American Meteorological Society: 13–16.
Godefroid, S.; Piazza, C.; Rossi, G.; Buord, S.; Stevens, A.-D.; Aguraiuja, R.; Cowell, C.; Weekley, C.W.; Vogg, G.; Iriondo, J.M. 2011. How successful are plant species reintroductions? Biological Conservation. 144(2): 672–682.
Gordo, O.; Sanz, J.J. 2005. Phenology and climate change: a long-term study in a Mediterranean locality. Oecologia. 146(3): 484–495.

100 Tree Planters’ Notes
Graham, M.J.; Frederick, J.; Byars-Winston, A.; Hunter, A.-B.; Handelsman, J. 2013. Increasing persistence of college students in STEM. Science. 341(6153): 1455–1456.
Guerrant, E.O., Jr.; Kaye, T.N. 2007. Reintroduction of rare and endangered plants: common factors, questions and approaches. Australian Journal of Botany. 55(3): 362–370.
Gunderson, C.A.; Edwards, N.T.; Walker, A.V.; O’hara, K.H.; Campion, C.M.; Hanson, P.J. 2012. Forest phenology and a warmer climate–growing season extension in relation to climatic provenance. Global Change Biology. 18(6): 2008–2025.
Hale, C.M.; Frelich, L.E.; Reich, P.B. 2006. Changes in hardwood forest understory plant communities in response to European earthworm invasions. Ecology. 87(7): 1637–1649.
Handler, S.; Duveneck, M.J.; Iverson, L; Peters, E.; Scheller, R.M.; Wythers, K.R.; Brandt, L.; Butler, P.; Janowiak, M.; Shannon, P.D.; Swanston, C.; Barrett, K.; Kolka, R.; McQuiston, C.; Palik, B.; Reich, P.B.; Turner, C.; White, M.; Adams, C.; D’Amato, A.; Hagell, S.; Johnson, P.; Johnson, R.; Larson, M.; Matthews, S.; Montgomery, R.; Olson, S.; Peters, M.; Prasad, A.; Rajala, J.; Daley, J.; Davenport, M.; Emery, M.R.; Fehringer, D.; Hoving, C.L.; Johnson, G.; Johnson, L.; Neitzel, D.; Rissman, A.; Rittenhouse, C.; Ziel, R. 2014. Minnesota forest ecosystem vulnerability assessment and synthesis: a report from the Northwoods Climate Change Response Framework project. Gen. Tech. Rep. NRS-133. Newtown Square, PA; U.S. Department of Agriculture, Forest Service, Northern Research Station. 228 p.
Hathaway, R.S.; Nagda, B.A.; Gregerman, S.R. 2002. The relationship of undergraduate research participation to graduate and professional education pursuit: an empirical study. Journal of College Student Development. 43(5): 614–631.
Heschel, M.S.; Paige, K.N. 1995. Inbreeding depression, environmental stress, and population size variation in scarlet gilia (Ipomopsis aggregata). Conservation Biology. 9(1): 126–133.
Hoegh-Guldberg, O.; Hughes, L.; McIntyre, S.; Lindenmayer, D.; Parmesan, C.; Possingham, H.P.; Thomas, C. 2008. Assisted coloni-zation and rapid climate change. Science. 321(4679): 345–346.
Hunter, A.B.; Laursen, S.L.; Seymour, E. 2007. Becoming a sci-entist: the role of undergraduate research in students’ cognitive, personal, and professional development. Science Education. 91(1): 36–74.
Kelly, A.E.; Goulden, M.L. 2008. Rapid shifts in plant distribution with recent climate change. Proceedings of the National Acade-my of Sciences. 105(33): 11823–11826.
Kremer, A.; Ronce, O.; Robledo-Arnuncio, J.J.; Guillaume, F.; Bohrer, G.; Nathan, R.; Bridle, J.R.; Gomulkiewicz, R.; Klein, E.K.; Ritland, K. 2012. Long-distance gene flow and adaptation of forest trees to rapid climate change. Ecology Letters. 15(4): 378–392.
Lenoir, J.; Gégout, J.-C.; Marquet, P.; De Ruffray, P.; Brisse, H. 2008. A significant upward shift in plant species optimum eleva-tion during the 20th century. Science. 320(5884): 1768–1771.
Maltese, A.V.; Melki, C.S.; Wiebke, H.L. 2014. The nature of experiences responsible for the generation and maintenance of interest in STEM. Science Education. 98(6): 937–962.
Matyas, C. 1996. Climatic adaptation of trees: rediscovering provenance tests. Euphytica. 92(1–2): 45–54.
Maunder, M. 1992. Plant reintroduction: an overview. Biodiversity and Conservation. 1(1): 51–61.
McCarty, J.P. 2001. Ecological consequences of recent climate change. Conservation Biology. 15(2): 320–331.
McDonald, T.; Gann, G.; Jonson, J.; Dixon, K. 2016. International standards for the practice of ecological restoration–including principles and key concepts. Washington, DC: Society for Ecological Restoration. 47 p.
McLachlan, J.S.; Hellmann, J.J.; Schwartz, M.W. 2007. A framework for debate of assisted migration in an era of climate change. Conservation Biology. 21(2): 297–302.
McPherson, E. 2014. High-impact practices that retain underrep-resented STEM students. Rochester, MI: Oakland University 2nd Annual Retention Conference. 22 p. http://www.oakland.edu/upload/docs/UGEducation/Retention_Conference/Retention_Pre-seations/2014_Ret_Conf_Presentations/52_HIP_That_Retain.pdf. (January 2015).
Menges, E.S. 2008. Restoration demography and genetics of plants: when is a translocation successful? Australian Journal of Botany. 56(3): 187–196.
Miller, J.R.; Hobbs, R.J. 2007. Habitat restoration—Do we know what we’re doing? Restoration Ecology. 15(3): 382–390.
Muilenburg, V.L.; Herms, D.A. 2012. A review of bronze birch borer (Coleoptera: Buprestidae) life history, ecology, and man-agement. Environmental Entomology. 41(6): 1372–1385.
O’Neill, G.A.; Hamann, A.; Wang, T. 2008. Accounting for population variation improves estimates of the impact of climate change on species’ growth and distribution. Journal of Applied Ecology. 45(4): 1040–1049.
Pachauri, R.K.; Allen, M.R.; Barros, V.R.; Broome, J.; Cramer, W.; Christ, R.; Church, J.A.; Clarke, L.; Dahe, Q.; Dasgupta, P. 2014. Climate change 2014 synthesis report: fifth assessment report. Geneva, Switzerland: Intergovernmental Panel on Climate Change. 151 p.
Pedlar, J.H.; McKenney, D.W.; Aubin, I.; Beardmore, T.; Beaulieu, J.; Iverson, L.; O’Neill, G.A.; Winder, R.S.; Ste-Marie, C. 2012. Placing forestry in the assisted migration debate. Bioscience. 62(9): 835–842.

Volume 61, Number 2 (Fall 2018) 101
Ravenscroft, C.; Scheller, R.M.; Mladenoff, D.J.; White, M.A. 2010. Forest restoration in a mixed-ownership landscape under climate change. Ecological Applications. 20(2): 327–346.
Rehfeldt, G.E.; Ying, C.C.; Spittlehouse, D.L.; Hamilton, D.A., Jr. 1999. Genetic responses to climate in Pinus contorta: niche breadth, climate change, and reforestation. Ecological Mono-graphs. 69(3): 375–407.
Richardson, D.M.; Hellmann, J.J.; McLachlan, J.S.; Sax, D.F.; Schwartz, M.W.; Gonzalez, P.; Brennan, E.J.; Camacho, A.; Root, T.L.; Sala, O.E. 2009. Multidimensional evaluation of managed relocation. Proceedings of the National Academy of Sciences. 106(24): 9721–9724.
Ruiz-Jaen, M.C.; Mitchell Aide, T. 2005. Restoration success: how is it being measured? Restoration Ecology. 13(3): 569–577.
Sauer, J.R.; Pardieck, K.L.; Ziolkowski, D.J., Jr.; Smith, A.C.; Hudson, M.-A. R.; Rodriguez, V.; Berlanga, H.; Niven, D.K.; Link, W.A. 2017. The first 50 years of the North American breeding bird survey. The Condor. 119(3): 576–593.
Schmidtling, R. 1994. Use of provenance tests to predict response to climate change: loblolly pine and Norway spruce. Tree Physiology. 14(7–9): 805–817.
Smith, B.D.; Zeder, M.A. 2013. The onset of the anthropocene. Anthropocene. 4: 8–13.
Strauss, S.Y.; Lau, J.A.; Carroll, S.P. 2006. Evolutionary respons-es of natives to introduced species: what do introductions tell us about natural communities? Ecology Letters. 9(3): 357–374.
Swanston, C.; Janowiak, M.; Iverson, L.; Parker, L.; Mladenoff, D.; Brandt, L.; Butler, P.; Pierre, M.S.; Prasad, A.; Matthews, S. 2011. Ecosystem vulnerability assessment and synthesis: a report from the climate change response framework project in northern Wisconsin. Gen. Tech. Rep. NRS-136. Newtown Square, PA: U.S. Department of Agriculture, Forest Service, Northern Research Station. 247 p.
Swindell, W.R.; Bouzat, J.L. 2006. Gene flow and adaptive potential in Drosophila melanogaster. Conservation Genetics. 7(1): 79–89.
Temperton, V.M. 2004. Assembly rules and restoration ecology: bridging the gap between theory and practice. Washington, DC: Island Press. 465 p.
Thiry, H.; Laursen, S.L.; Hunter, A.-B. 2011. What experiences help students become scientists? A comparative study of research and other sources of personal and professional gains for STEM undergraduates. The Journal of Higher Education. 82(4): 357–388.
Thomson, A.M.; Parker; W.H. 2008. Boreal forest provenance tests used to predict optimal growth and response to climate change. 1. Jack pine. Canadian Journal of Forest Research. 38(1): 157–170.
Villarejo, M.; Barlow, A.E.; Kogan, D.; Veazey, B.D.; Sweeney, J.K. 2008. Encouraging minority undergraduates to choose science careers: career paths survey results. CBE—Life Sciences Education. 7(4): 394–409.
Webb, M. 2014. Early college expansion: propelling students to postsecondary success, at a school near you. Alameda, CA: Alameda Science and Technology Institute. 22 p. https://files.eric.ed.gov/fulltext/ED559689.pdf. (January 2015).
White, M.; Host, G. 2008. Forest disturbance frequency and patch structure from pre-European settlement to present in the Mixed Forest Province of Minnesota, USA. Canadian Journal of Forest Research. 38(8): 2212–2226.
White, M.A. 2012. Long-term effects of deer browsing: com-position, structure and productivity in a northeastern Minnesota old-growth forest. Forest Ecology and Management. 269: 222–228.
Williams, M.I.; Dumroese, R.K. 2013. Preparing for climate change: forestry and assisted migration. Journal of Forestry. 111(4): 287–297.
Zachos, J.; Pagani, M.; Sloan, L.; Thomas, E.; Billups, K. 2001. Trends, rhythms, and aberrations in global climate 65 Ma to present. Science. 292(5517): 686–693.
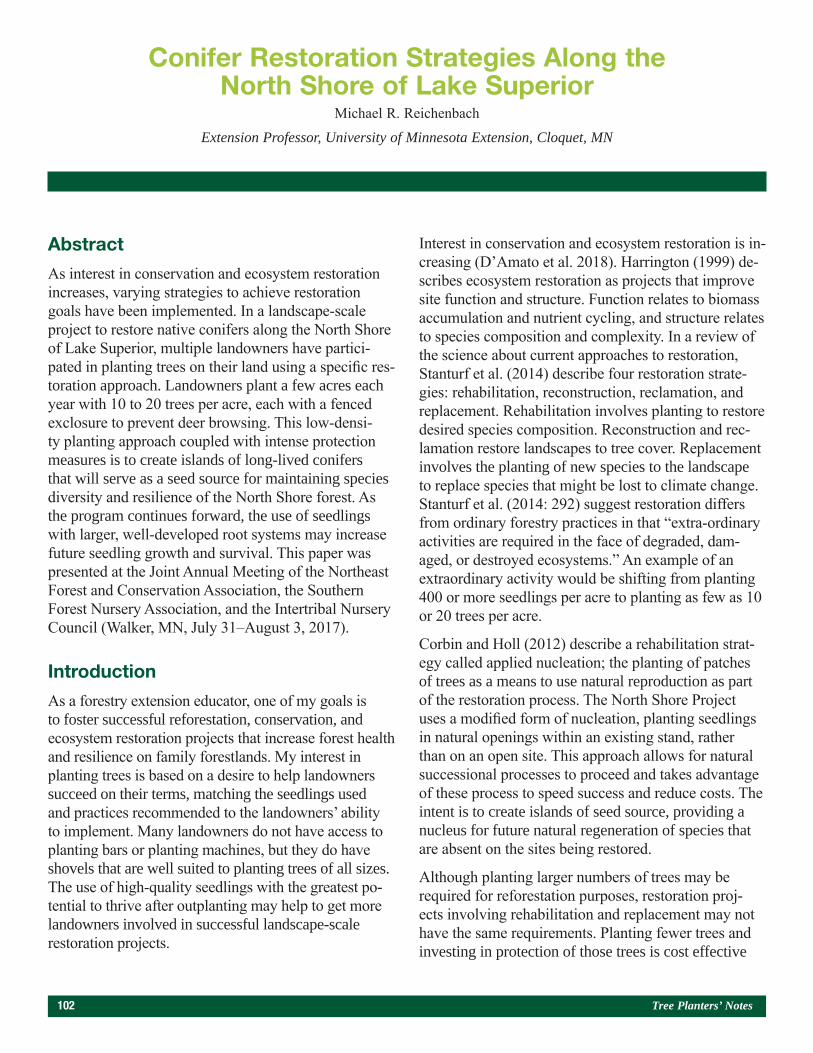
102 Tree Planters’ Notes
Abstract
As interest in conservation and ecosystem restoration increases, varying strategies to achieve restoration goals have been implemented. In a landscape-scale project to restore native conifers along the North Shore of Lake Superior, multiple landowners have partici-pated in planting trees on their land using a specific res-toration approach. Landowners plant a few acres each year with 10 to 20 trees per acre, each with a fenced exclosure to prevent deer browsing. This low-densi-ty planting approach coupled with intense protection measures is to create islands of long-lived conifers that will serve as a seed source for maintaining species diversity and resilience of the North Shore forest. As the program continues forward, the use of seedlings with larger, well-developed root systems may increase future seedling growth and survival. This paper was presented at the Joint Annual Meeting of the Northeast Forest and Conservation Association, the Southern Forest Nursery Association, and the Intertribal Nursery Council (Walker, MN, July 31–August 3, 2017).
Introduction
As a forestry extension educator, one of my goals is to foster successful reforestation, conservation, and ecosystem restoration projects that increase forest health and resilience on family forestlands. My interest in planting trees is based on a desire to help landowners succeed on their terms, matching the seedlings used and practices recommended to the landowners’ ability to implement. Many landowners do not have access to planting bars or planting machines, but they do have shovels that are well suited to planting trees of all sizes. The use of high-quality seedlings with the greatest po-tential to thrive after outplanting may help to get more landowners involved in successful landscape-scale restoration projects.
Interest in conservation and ecosystem restoration is in-creasing (D’Amato et al. 2018). Harrington (1999) de-scribes ecosystem restoration as projects that improve site function and structure. Function relates to biomass accumulation and nutrient cycling, and structure relates to species composition and complexity. In a review of the science about current approaches to restoration, Stanturf et al. (2014) describe four restoration strate-gies: rehabilitation, reconstruction, reclamation, and replacement. Rehabilitation involves planting to restore desired species composition. Reconstruction and rec-lamation restore landscapes to tree cover. Replacement involves the planting of new species to the landscape to replace species that might be lost to climate change. Stanturf et al. (2014: 292) suggest restoration differs from ordinary forestry practices in that “extra-ordinary activities are required in the face of degraded, dam-aged, or destroyed ecosystems.” An example of an extraordinary activity would be shifting from planting 400 or more seedlings per acre to planting as few as 10 or 20 trees per acre.
Corbin and Holl (2012) describe a rehabilitation strat-egy called applied nucleation; the planting of patches of trees as a means to use natural reproduction as part of the restoration process. The North Shore Project uses a modified form of nucleation, planting seedlings in natural openings within an existing stand, rather than on an open site. This approach allows for natural successional processes to proceed and takes advantage of these process to speed success and reduce costs. The intent is to create islands of seed source, providing a nucleus for future natural regeneration of species that are absent on the sites being restored.
Although planting larger numbers of trees may be required for reforestation purposes, restoration proj-ects involving rehabilitation and replacement may not have the same requirements. Planting fewer trees and investing in protection of those trees is cost effective
Conifer Restoration Strategies Along the North Shore of Lake Superior
Michael R. Reichenbach
Extension Professor, University of Minnesota Extension, Cloquet, MN
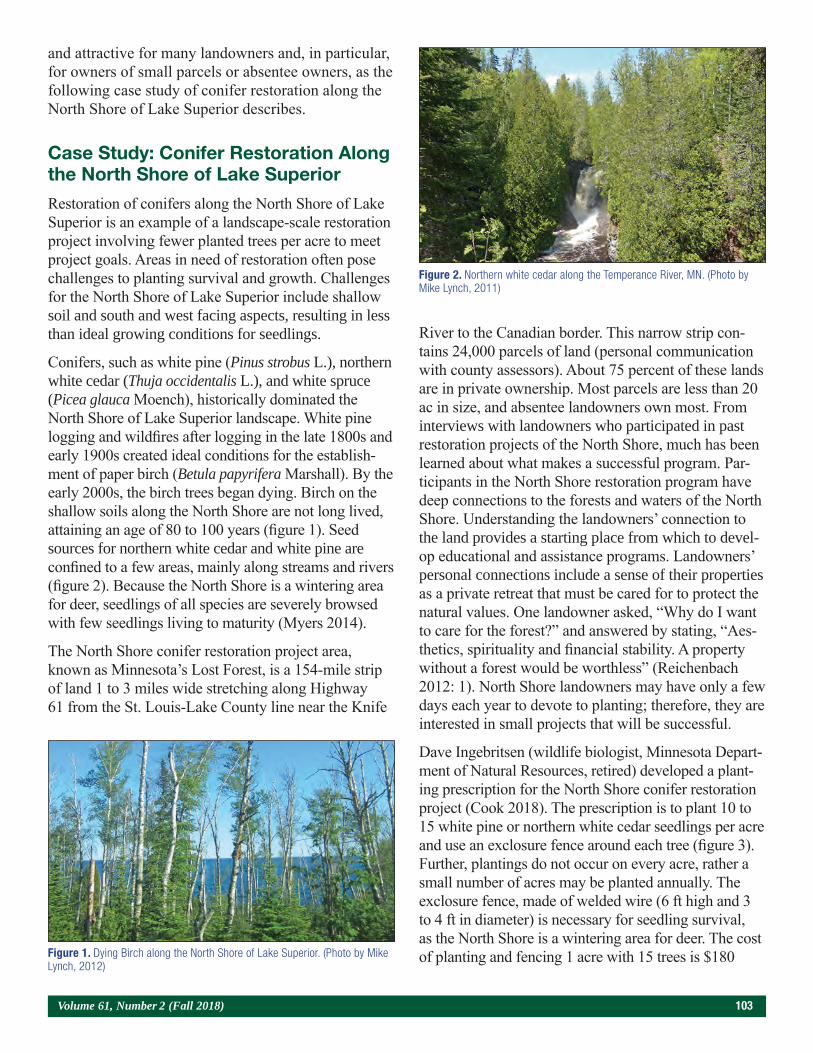
Volume 61, Number 2 (Fall 2018) 103
and attractive for many landowners and, in particular, for owners of small parcels or absentee owners, as the following case study of conifer restoration along the North Shore of Lake Superior describes.
Case Study: Conifer Restoration Along the North Shore of Lake Superior
Restoration of conifers along the North Shore of Lake Superior is an example of a landscape-scale restoration project involving fewer planted trees per acre to meet project goals. Areas in need of restoration often pose challenges to planting survival and growth. Challenges for the North Shore of Lake Superior include shallow soil and south and west facing aspects, resulting in less than ideal growing conditions for seedlings.
Conifers, such as white pine (Pinus strobus L.), northern white cedar (Thuja occidentalis L.), and white spruce (Picea glauca Moench), historically dominated the North Shore of Lake Superior landscape. White pine logging and wildfires after logging in the late 1800s and early 1900s created ideal conditions for the establish-ment of paper birch (Betula papyrifera Marshall). By the early 2000s, the birch trees began dying. Birch on the shallow soils along the North Shore are not long lived, attaining an age of 80 to 100 years (figure 1). Seed sources for northern white cedar and white pine are confined to a few areas, mainly along streams and rivers (figure 2). Because the North Shore is a wintering area for deer, seedlings of all species are severely browsed with few seedlings living to maturity (Myers 2014).
The North Shore conifer restoration project area, known as Minnesota’s Lost Forest, is a 154-mile strip of land 1 to 3 miles wide stretching along Highway 61 from the St. Louis-Lake County line near the Knife
River to the Canadian border. This narrow strip con-tains 24,000 parcels of land (personal communication with county assessors). About 75 percent of these lands are in private ownership. Most parcels are less than 20 ac in size, and absentee landowners own most. From interviews with landowners who participated in past restoration projects of the North Shore, much has been learned about what makes a successful program. Par-ticipants in the North Shore restoration program have deep connections to the forests and waters of the North Shore. Understanding the landowners’ connection to the land provides a starting place from which to devel-op educational and assistance programs. Landowners’ personal connections include a sense of their properties as a private retreat that must be cared for to protect the natural values. One landowner asked, “Why do I want to care for the forest?” and answered by stating, “Aes-thetics, spirituality and financial stability. A property without a forest would be worthless” (Reichenbach 2012: 1). North Shore landowners may have only a few days each year to devote to planting; therefore, they are interested in small projects that will be successful.
Dave Ingebritsen (wildlife biologist, Minnesota Depart-ment of Natural Resources, retired) developed a plant-ing prescription for the North Shore conifer restoration project (Cook 2018). The prescription is to plant 10 to 15 white pine or northern white cedar seedlings per acre and use an exclosure fence around each tree (figure 3). Further, plantings do not occur on every acre, rather a small number of acres may be planted annually. The exclosure fence, made of welded wire (6 ft high and 3 to 4 ft in diameter) is necessary for seedling survival, as the North Shore is a wintering area for deer. The cost of planting and fencing 1 acre with 15 trees is $180 Figure 1. Dying Birch along the North Shore of Lake Superior. (Photo by Mike
Lynch, 2012)
Figure 2. Northern white cedar along the Temperance River, MN. (Photo by Mike Lynch, 2011)
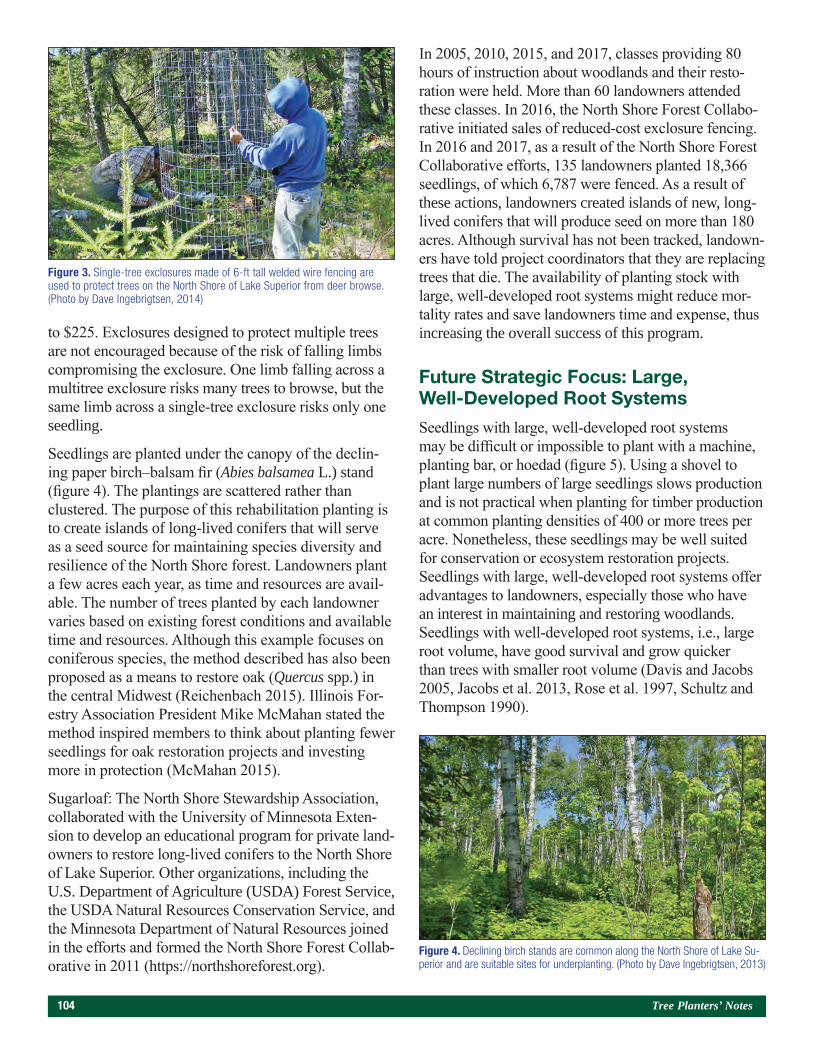
104 Tree Planters’ Notes
to $225. Exclosures designed to protect multiple trees are not encouraged because of the risk of falling limbs compromising the exclosure. One limb falling across a multitree exclosure risks many trees to browse, but the same limb across a single-tree exclosure risks only one seedling.
Seedlings are planted under the canopy of the declin-ing paper birch–balsam fir (Abies balsamea L.) stand (figure 4). The plantings are scattered rather than clustered. The purpose of this rehabilitation planting is to create islands of long-lived conifers that will serve as a seed source for maintaining species diversity and resilience of the North Shore forest. Landowners plant a few acres each year, as time and resources are avail-able. The number of trees planted by each landowner varies based on existing forest conditions and available time and resources. Although this example focuses on coniferous species, the method described has also been proposed as a means to restore oak (Quercus spp.) in the central Midwest (Reichenbach 2015). Illinois For-estry Association President Mike McMahan stated the method inspired members to think about planting fewer seedlings for oak restoration projects and investing more in protection (McMahan 2015).
Sugarloaf: The North Shore Stewardship Association, collaborated with the University of Minnesota Exten-sion to develop an educational program for private land-owners to restore long-lived conifers to the North Shore of Lake Superior. Other organizations, including the U.S. Department of Agriculture (USDA) Forest Service, the USDA Natural Resources Conservation Service, and the Minnesota Department of Natural Resources joined in the efforts and formed the North Shore Forest Collab-orative in 2011 (https://northshoreforest.org).
In 2005, 2010, 2015, and 2017, classes providing 80 hours of instruction about woodlands and their resto-ration were held. More than 60 landowners attended these classes. In 2016, the North Shore Forest Collabo-rative initiated sales of reduced-cost exclosure fencing. In 2016 and 2017, as a result of the North Shore Forest Collaborative efforts, 135 landowners planted 18,366 seedlings, of which 6,787 were fenced. As a result of these actions, landowners created islands of new, long-lived conifers that will produce seed on more than 180 acres. Although survival has not been tracked, landown-ers have told project coordinators that they are replacing trees that die. The availability of planting stock with large, well-developed root systems might reduce mor-tality rates and save landowners time and expense, thus increasing the overall success of this program.
Future Strategic Focus: Large, Well-Developed Root Systems
Seedlings with large, well-developed root systems may be difficult or impossible to plant with a machine, planting bar, or hoedad (figure 5). Using a shovel to plant large numbers of large seedlings slows production and is not practical when planting for timber production at common planting densities of 400 or more trees per acre. Nonetheless, these seedlings may be well suited for conservation or ecosystem restoration projects. Seedlings with large, well-developed root systems offer advantages to landowners, especially those who have an interest in maintaining and restoring woodlands. Seedlings with well-developed root systems, i.e., large root volume, have good survival and grow quicker than trees with smaller root volume (Davis and Jacobs 2005, Jacobs et al. 2013, Rose et al. 1997, Schultz and Thompson 1990).
Figure 3. Single-tree exclosures made of 6-ft tall welded wire fencing are used to protect trees on the North Shore of Lake Superior from deer browse. (Photo by Dave Ingebrigtsen, 2014)
Figure 4. Declining birch stands are common along the North Shore of Lake Su-perior and are suitable sites for underplanting. (Photo by Dave Ingebrigtsen, 2013)
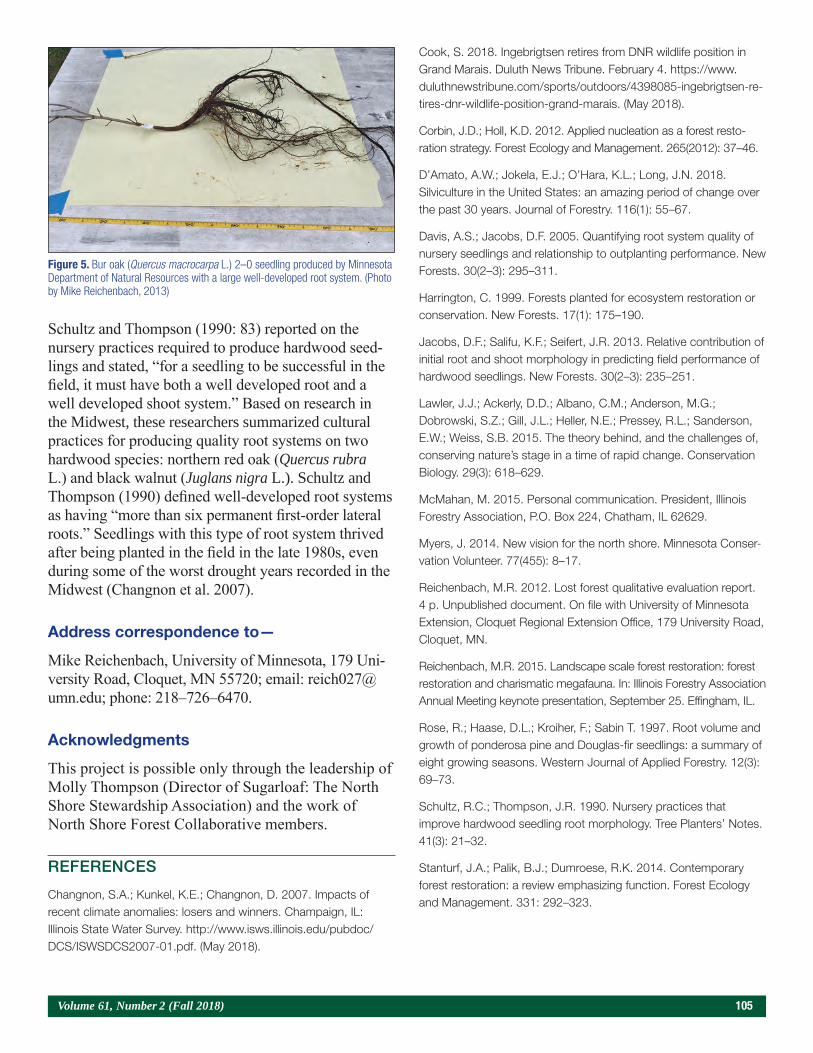
Volume 61, Number 2 (Fall 2018) 105
Schultz and Thompson (1990: 83) reported on the nursery practices required to produce hardwood seed-lings and stated, “for a seedling to be successful in the field, it must have both a well developed root and a well developed shoot system.” Based on research in the Midwest, these researchers summarized cultural practices for producing quality root systems on two hardwood species: northern red oak (Quercus rubra L.) and black walnut (Juglans nigra L.). Schultz and Thompson (1990) defined well-developed root systems as having “more than six permanent first-order lateral roots.” Seedlings with this type of root system thrived after being planted in the field in the late 1980s, even during some of the worst drought years recorded in the Midwest (Changnon et al. 2007).
Address correspondence to—
Mike Reichenbach, University of Minnesota, 179 Uni-versity Road, Cloquet, MN 55720; email: [email protected]; phone: 218–726–6470.
Acknowledgments
This project is possible only through the leadership of Molly Thompson (Director of Sugarloaf: The North Shore Stewardship Association) and the work of North Shore Forest Collaborative members.
REFERENCES
Changnon, S.A.; Kunkel, K.E.; Changnon, D. 2007. Impacts of recent climate anomalies: losers and winners. Champaign, IL: Illinois State Water Survey. http://www.isws.illinois.edu/pubdoc/DCS/ISWSDCS2007-01.pdf. (May 2018).
Cook, S. 2018. Ingebrigtsen retires from DNR wildlife position in Grand Marais. Duluth News Tribune. February 4. https://www.duluthnewstribune.com/sports/outdoors/4398085-ingebrigtsen-re-tires-dnr-wildlife-position-grand-marais. (May 2018).
Corbin, J.D.; Holl, K.D. 2012. Applied nucleation as a forest resto-ration strategy. Forest Ecology and Management. 265(2012): 37–46.
D’Amato, A.W.; Jokela, E.J.; O’Hara, K.L.; Long, J.N. 2018. Silviculture in the United States: an amazing period of change over the past 30 years. Journal of Forestry. 116(1): 55–67.
Davis, A.S.; Jacobs, D.F. 2005. Quantifying root system quality of nursery seedlings and relationship to outplanting performance. New Forests. 30(2–3): 295–311.
Harrington, C. 1999. Forests planted for ecosystem restoration or conservation. New Forests. 17(1): 175–190.
Jacobs, D.F.; Salifu, K.F.; Seifert, J.R. 2013. Relative contribution of initial root and shoot morphology in predicting field performance of hardwood seedlings. New Forests. 30(2–3): 235–251.
Lawler, J.J.; Ackerly, D.D.; Albano, C.M.; Anderson, M.G.; Dobrowski, S.Z.; Gill, J.L.; Heller, N.E.; Pressey, R.L.; Sanderson, E.W.; Weiss, S.B. 2015. The theory behind, and the challenges of, conserving nature’s stage in a time of rapid change. Conservation Biology. 29(3): 618–629.
McMahan, M. 2015. Personal communication. President, Illinois Forestry Association, P.O. Box 224, Chatham, IL 62629.
Myers, J. 2014. New vision for the north shore. Minnesota Conser-vation Volunteer. 77(455): 8–17.
Reichenbach, M.R. 2012. Lost forest qualitative evaluation report. 4 p. Unpublished document. On file with University of Minnesota Extension, Cloquet Regional Extension Office, 179 University Road, Cloquet, MN.
Reichenbach, M.R. 2015. Landscape scale forest restoration: forest restoration and charismatic megafauna. In: Illinois Forestry Association Annual Meeting keynote presentation, September 25. Effingham, IL.
Rose, R.; Haase, D.L.; Kroiher, F.; Sabin T. 1997. Root volume and growth of ponderosa pine and Douglas-fir seedlings: a summary of eight growing seasons. Western Journal of Applied Forestry. 12(3): 69–73.
Schultz, R.C.; Thompson, J.R. 1990. Nursery practices that improve hardwood seedling root morphology. Tree Planters’ Notes. 41(3): 21–32.
Stanturf, J.A.; Palik, B.J.; Dumroese, R.K. 2014. Contemporary forest restoration: a review emphasizing function. Forest Ecology and Management. 331: 292–323.
Figure 5. Bur oak (Quercus macrocarpa L.) 2–0 seedling produced by Minnesota Department of Natural Resources with a large well-developed root system. (Photo by Mike Reichenbach, 2013)
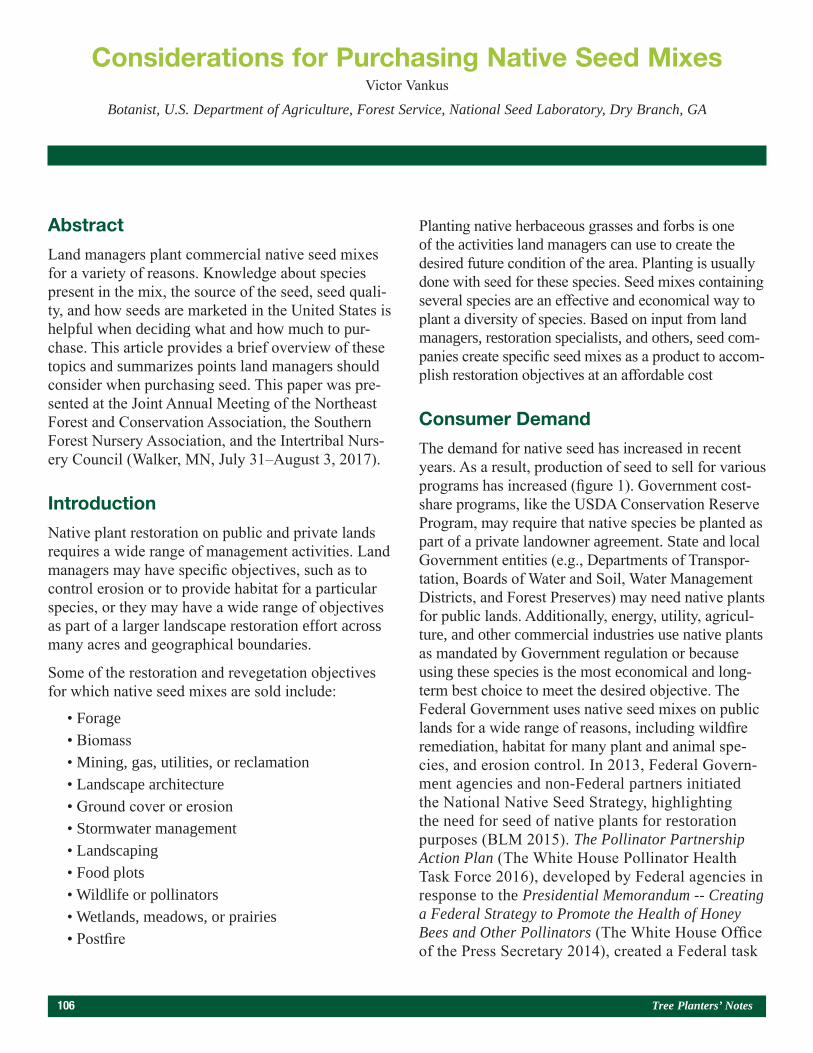
106 Tree Planters’ Notes
Abstract
Land managers plant commercial native seed mixes for a variety of reasons. Knowledge about species present in the mix, the source of the seed, seed quali-ty, and how seeds are marketed in the United States is helpful when deciding what and how much to pur-chase. This article provides a brief overview of these topics and summarizes points land managers should consider when purchasing seed. This paper was pre-sented at the Joint Annual Meeting of the Northeast Forest and Conservation Association, the Southern Forest Nursery Association, and the Intertribal Nurs-ery Council (Walker, MN, July 31–August 3, 2017).
Introduction
Native plant restoration on public and private lands requires a wide range of management activities. Land managers may have specific objectives, such as to control erosion or to provide habitat for a particular species, or they may have a wide range of objectives as part of a larger landscape restoration effort across many acres and geographical boundaries.
Some of the restoration and revegetation objectives for which native seed mixes are sold include:
• Forage• Biomass• Mining, gas, utilities, or reclamation• Landscape architecture• Ground cover or erosion• Stormwater management• Landscaping• Food plots• Wildlife or pollinators• Wetlands, meadows, or prairies• Postfire
Planting native herbaceous grasses and forbs is one of the activities land managers can use to create the desired future condition of the area. Planting is usually done with seed for these species. Seed mixes containing several species are an effective and economical way to plant a diversity of species. Based on input from land managers, restoration specialists, and others, seed com-panies create specific seed mixes as a product to accom-plish restoration objectives at an affordable cost
Consumer Demand
The demand for native seed has increased in recent years. As a result, production of seed to sell for various programs has increased (figure 1). Government cost-share programs, like the USDA Conservation Reserve Program, may require that native species be planted as part of a private landowner agreement. State and local Government entities (e.g., Departments of Transpor-tation, Boards of Water and Soil, Water Management Districts, and Forest Preserves) may need native plants for public lands. Additionally, energy, utility, agricul-ture, and other commercial industries use native plants as mandated by Government regulation or because using these species is the most economical and long-term best choice to meet the desired objective. The Federal Government uses native seed mixes on public lands for a wide range of reasons, including wildfire remediation, habitat for many plant and animal spe-cies, and erosion control. In 2013, Federal Govern-ment agencies and non-Federal partners initiated the National Native Seed Strategy, highlighting the need for seed of native plants for restoration purposes (BLM 2015). The Pollinator Partnership Action Plan (The White House Pollinator Health Task Force 2016), developed by Federal agencies in response to the Presidential Memorandum -- Creating a Federal Strategy to Promote the Health of Honey Bees and Other Pollinators (The White House Office of the Press Secretary 2014), created a Federal task
Considerations for Purchasing Native Seed MixesVictor Vankus
Botanist, U.S. Department of Agriculture, Forest Service, National Seed Laboratory, Dry Branch, GA
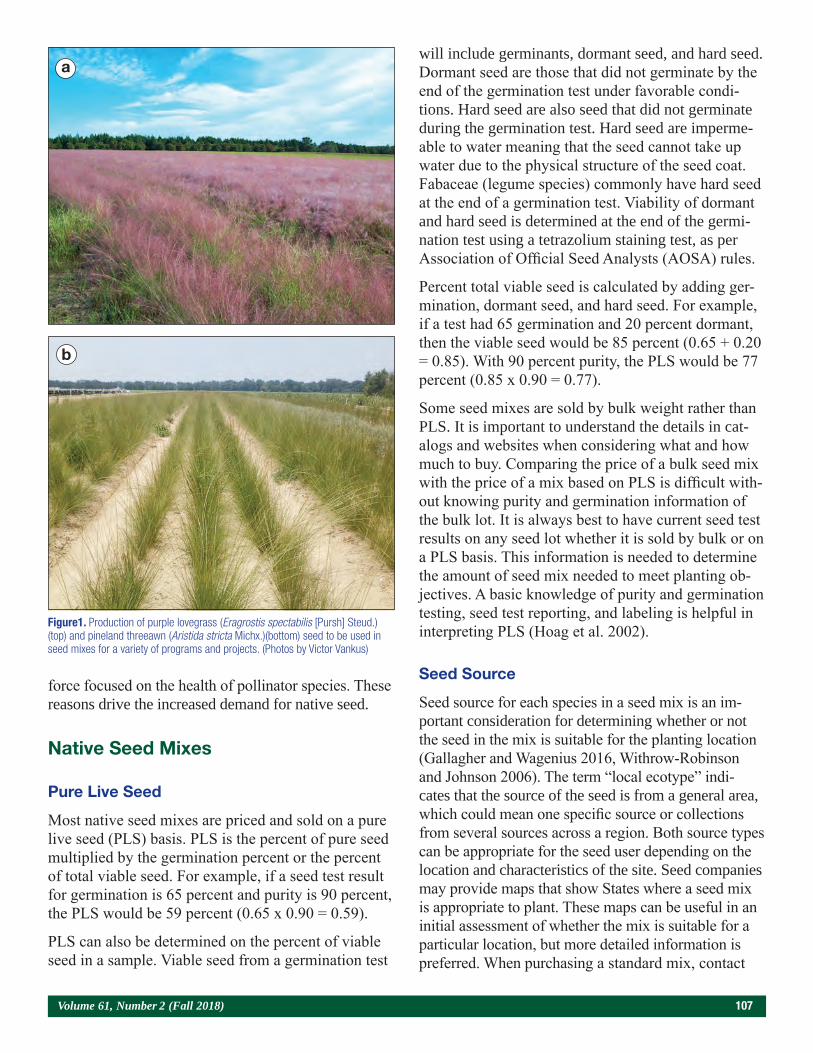
Volume 61, Number 2 (Fall 2018) 107
force focused on the health of pollinator species. These reasons drive the increased demand for native seed.
Native Seed Mixes
Pure Live Seed
Most native seed mixes are priced and sold on a pure live seed (PLS) basis. PLS is the percent of pure seed multiplied by the germination percent or the percent of total viable seed. For example, if a seed test result for germination is 65 percent and purity is 90 percent, the PLS would be 59 percent (0.65 x 0.90 = 0.59).
PLS can also be determined on the percent of viable seed in a sample. Viable seed from a germination test
will include germinants, dormant seed, and hard seed. Dormant seed are those that did not germinate by the end of the germination test under favorable condi-tions. Hard seed are also seed that did not germinate during the germination test. Hard seed are imperme-able to water meaning that the seed cannot take up water due to the physical structure of the seed coat. Fabaceae (legume species) commonly have hard seed at the end of a germination test. Viability of dormant and hard seed is determined at the end of the germi-nation test using a tetrazolium staining test, as per Association of Official Seed Analysts (AOSA) rules.
Percent total viable seed is calculated by adding ger-mination, dormant seed, and hard seed. For example, if a test had 65 germination and 20 percent dormant, then the viable seed would be 85 percent (0.65 + 0.20 = 0.85). With 90 percent purity, the PLS would be 77 percent (0.85 x 0.90 = 0.77).
Some seed mixes are sold by bulk weight rather than PLS. It is important to understand the details in cat-alogs and websites when considering what and how much to buy. Comparing the price of a bulk seed mix with the price of a mix based on PLS is difficult with-out knowing purity and germination information of the bulk lot. It is always best to have current seed test results on any seed lot whether it is sold by bulk or on a PLS basis. This information is needed to determine the amount of seed mix needed to meet planting ob-jectives. A basic knowledge of purity and germination testing, seed test reporting, and labeling is helpful in interpreting PLS (Hoag et al. 2002).
Seed Source
Seed source for each species in a seed mix is an im-portant consideration for determining whether or not the seed in the mix is suitable for the planting location (Gallagher and Wagenius 2016, Withrow-Robinson and Johnson 2006). The term “local ecotype” indi-cates that the source of the seed is from a general area, which could mean one specific source or collections from several sources across a region. Both source types can be appropriate for the seed user depending on the location and characteristics of the site. Seed companies may provide maps that show States where a seed mix is appropriate to plant. These maps can be useful in an initial assessment of whether the mix is suitable for a particular location, but more detailed information is preferred. When purchasing a standard mix, contact
Figure1. Production of purple lovegrass (Eragrostis spectabilis [Pursh] Steud.)(top) and pineland threeawn (Aristida stricta Michx.)(bottom) seed to be used in seed mixes for a variety of programs and projects. (Photos by Victor Vankus)
a
b
108 Tree Planters’ Notes
the seller to find out the source of each component species in as much detail as possible. When ordering a custom mix, ask the seed company about available seed sources for species you want to plant to deter-mine which seed lots are best for the mix.
Certification and Labeling
State seed laws require seed mixes that are sold in the open market to be labeled with species, purity, and viability. If seed is sold as source-identified, selected, pre-varietal, etc., the seller should be able to provide documentation from the certifying State crop im-provement agency to prove that the product meets the standard’s for that class under the State’s certifying scheme. Several websites and articles provide infor-mation to help consumers understand seed tags and labels (e.g., USDA 2014). The Association of Official Seed Certifying Agencies has a standard for certifying native seed and works with member crop improve-ment associations to ensure standards for native seed certification are available (AOSCA 2017).
Species in Seed Mixes
Native seed mixes can be made up of just a few species or can contain a couple dozen. Species composition in standard pollinator or restoration mixes commonly change from year to year based on the available seed crop for that year and cost. Some standard seed mixes may not contain all of the species advertised as part of the mix. It is important to determine which species are actually present in a seed mix to be able to determine amounts and proportions of required, undesirable, or less desirable species in the mix. If purchasing a stan-dard stock mix, check with the seed company for a complete list of species present in the mix.
Summary
Summary of points to consider when purchasing native seed mixes—
• Understand PLS and how it is determined for the seed lot under consideration.• Determine the source of the seed in the mix.• Ensure the seed being purchased is labeled accurately and contains all pertinent information.• Determine the species present in the seed mix.
Address correspondence to—
Victor Vankus, Botanist, U.S. Department of Agri-culture Forest Service, National Seed Laboratory, 5675 Riggins Mill Road, Dry Branch, GA 31020; email: [email protected]; phone: 478–751–6656.
REFERENCES
Association of Official Seed Certifying Agencies (AOSCA). 2017. Native plant restoration. https://www.aosca.org/programs-and-ser-vices/native-plant-restoration/. (June 2017).
Bureau of Land Management. 2015. National seed strategy for rehabilitation and restoration: 2015–2020. Washington, DC: U.S. Department of the Interior.
Gallagher, M.K.; Wagenius, S. 2016. Seed source impacts germination and early establishment of dominant grasses in prairie restorations. Journal of Applied Ecology. 53(1): 251–263.
Hoag, J.C.; St. John, L; Ogle, D.G. 2002. Reading seed packaging labels and calculating seed mixtures. Technical Note Plant Materials No 4. Boise, ID: U.S. Department of Agriculture, Natural Resources Conservation Service. 15 p.
U.S. Department of Agriculture (USDA). 2014. A guide to understand-ing seed tags. https://www.nrcs.usda.gov/Internet/FSE_PLANTMA-TERIALS/publications/ndpmctn12317.pdf. (June 2018).
The White House Office of the Press Secretary. 2014. Presidential memorandum—creating a federal strategy to promote the health of honey bees and other pollinators. https://obamawhitehouse.archives.gov/the-press-office/2014/06/20/presidential-memorandum-creat-ing-federal-strategy-promote-health-honey-b. (June 2017).
The White House Pollinator Health Task Force. 2016. Pollinator part-nership action plan. https://www.whitehouse.gov/sites/whitehouse.gov/files/images/Blog/PPAP_2016.pdf. (June 2017).
Withrow-Robinson, B.; Johnson, R. 2006. Selecting native plant ma-terials for restoration projects: ensuring local adaptation and maintain-ing genetic diversity. Corvallis, OR: Oregon State University Extension Service. https://www.fs.fed.us/wildflowers/Native_Plant_Materials/documents/SelectingNativePlantMaterial.pdf. (June 2018).
Volume 61, Number 2 (Fall 2018) 109
Abstract
Hot-planted, 4-month-old container ponderosa pine (Pinus ponderosa Lawson & C. Lawson) seedlings were planted on five sites affected by wildfire in northeast Oregon and Washington. Seedlings were planted with or without mycorrhizal treatments. Survival exceeded 90 percent regardless of site or treatment after two growing seasons. Mycorrhizal inoculation at the nursery or in the field before out-planting did not improve seedling survival or growth. Only one test site, likely the most severely burned site, averaged better seedling growth with mycor-rhizal inoculation compared with the noninoculated control treatment. Height and stem diameter growth differed among sites, likely due to differences in vegetation management strategies and subsequent competing vegetation levels. This paper was present-ed at the Joint annual meeting of the Western Forestry and Conservation Nursery Association and the Pacif-ic Northwest Reforestation Council (Corvallis, OR, October 11–12, 2017).
Introduction
In the hot and dry summer of 2015, numerous wildfires burned across the Pacific Northwest, affecting several thousand acres of forest land in eastern Washington and Oregon. On land managed by Hancock Forest Management, salvage logging activities started imme-diately after the wildfires, raising questions of how to best reforest thousands of acres of interior forest land dominated by ponderosa pine (Pinus ponderosa Lawson & C. Lawson), western larch (Larix occidentalis Nutt.), and interior Douglas-fir (Pseudotsuga menziesii [Mirb.] Franco var. glauca [Beissn.] Franco). The scale of re-forestation called for innovative ideas and approaches,
offering an opportunity to test both old and new meth-ods during the multiyear effort.
Webster and Fredrickson (2005) provided valuable insights into wildfire reforestation and prioritizing planting units. The need to reforest burned areas quickly to take advantage of the brief period of reduced competing vegetation became one of the guiding principles. Inspired by a nursery visit that indicated that outplanting success can be obtained with small container ponderosa pine seedlings, we approached several nurseries with the idea to grow a 4-month-old seedling started in January for hot-planting in the spring of 2016—less than 10 months after the fires started. In discussions with these nurseries, it became obvious that doing so might be possible but would involve some risk, as no operational experience with the approach was available. In the end, one nursery was confident that they could produce a viable seedling, and two Han-cock Forest Management regions ordered approxi-mately 340,000 seedlings for spring 2016 planting.
A second question that we wanted to address was whether we should inoculate these seedlings with mycorrhizae. Reforestation sites typically have an adequate complement of mycorrhizal fungi that quickly colonize outplanted seedlings. Severe forest fires, however, may eliminate soil microorganisms, including mycorrhizal fungi (Landis and Dumroese 2006). Although we were unable to directly test for fire severity, wildfire reforestation sites were gen-erally in areas of lower site productivity, especially in eastern Oregon. Landis and Dumroese (2006) recommend that plants destined for sites potentially lacking mycorrhizal inoculum should receive an appropriate fungal symbiont before outplanting.
Influence of Mycorrhizal Inoculation on Ponderosa Pine Seedlings Outplanted on Wildfire Sites in Northeast
Oregon and WashingtonFlorian Deisenhofer
Silviculture Manager, Hancock Forest Management, Vancouver, WA
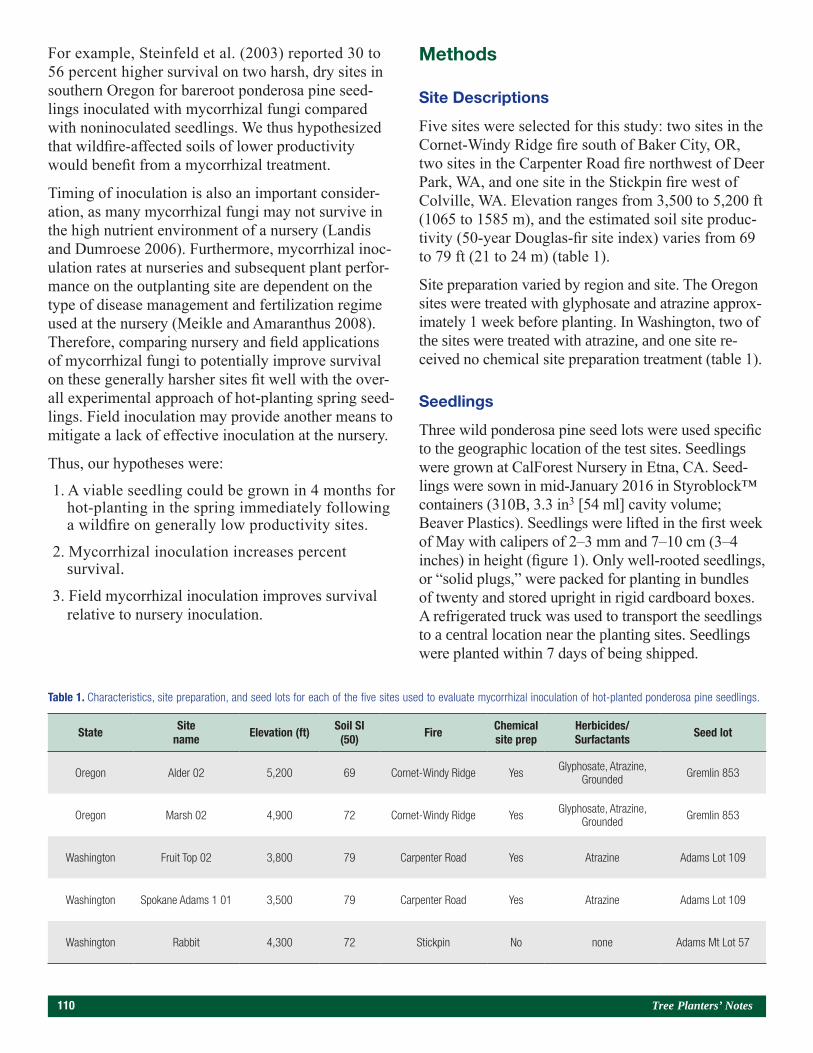
110 Tree Planters’ Notes
For example, Steinfeld et al. (2003) reported 30 to 56 percent higher survival on two harsh, dry sites in southern Oregon for bareroot ponderosa pine seed-lings inoculated with mycorrhizal fungi compared with noninoculated seedlings. We thus hypothesized that wildfire-affected soils of lower productivity would benefit from a mycorrhizal treatment.
Timing of inoculation is also an important consider-ation, as many mycorrhizal fungi may not survive in the high nutrient environment of a nursery (Landis and Dumroese 2006). Furthermore, mycorrhizal inoc-ulation rates at nurseries and subsequent plant perfor-mance on the outplanting site are dependent on the type of disease management and fertilization regime used at the nursery (Meikle and Amaranthus 2008). Therefore, comparing nursery and field applications of mycorrhizal fungi to potentially improve survival on these generally harsher sites fit well with the over-all experimental approach of hot-planting spring seed-lings. Field inoculation may provide another means to mitigate a lack of effective inoculation at the nursery.
Thus, our hypotheses were:
1. A viable seedling could be grown in 4 months for hot-planting in the spring immediately following a wildfire on generally low productivity sites.
2. Mycorrhizal inoculation increases percent survival.
3. Field mycorrhizal inoculation improves survival relative to nursery inoculation.
Methods
Site Descriptions
Five sites were selected for this study: two sites in the Cornet-Windy Ridge fire south of Baker City, OR, two sites in the Carpenter Road fire northwest of Deer Park, WA, and one site in the Stickpin fire west of Colville, WA. Elevation ranges from 3,500 to 5,200 ft (1065 to 1585 m), and the estimated soil site produc-tivity (50-year Douglas-fir site index) varies from 69 to 79 ft (21 to 24 m) (table 1).
Site preparation varied by region and site. The Oregon sites were treated with glyphosate and atrazine approx-imately 1 week before planting. In Washington, two of the sites were treated with atrazine, and one site re-ceived no chemical site preparation treatment (table 1).
Seedlings
Three wild ponderosa pine seed lots were used specific to the geographic location of the test sites. Seedlings were grown at CalForest Nursery in Etna, CA. Seed-lings were sown in mid-January 2016 in Styroblock™ containers (310B, 3.3 in3 [54 ml] cavity volume; Beaver Plastics). Seedlings were lifted in the first week of May with calipers of 2–3 mm and 7–10 cm (3–4 inches) in height (figure 1). Only well-rooted seedlings, or “solid plugs,” were packed for planting in bundles of twenty and stored upright in rigid cardboard boxes. A refrigerated truck was used to transport the seedlings to a central location near the planting sites. Seedlings were planted within 7 days of being shipped.
Table 1. Characteristics, site preparation, and seed lots for each of the five sites used to evaluate mycorrhizal inoculation of hot-planted ponderosa pine seedlings.
State Site name Elevation (ft) Soil SI
(50) Fire Chemical site prep
Herbicides/ Surfactants Seed lot
Oregon Alder 02 5,200 69 Cornet-Windy Ridge Yes Glyphosate, Atrazine, Grounded Gremlin 853
Oregon Marsh 02 4,900 72 Cornet-Windy Ridge Yes Glyphosate, Atrazine, Grounded Gremlin 853
Washington Fruit Top 02 3,800 79 Carpenter Road Yes Atrazine Adams Lot 109
Washington Spokane Adams 1 01 3,500 79 Carpenter Road Yes Atrazine Adams Lot 109
Washington Rabbit 4,300 72 Stickpin No none Adams Mt Lot 57
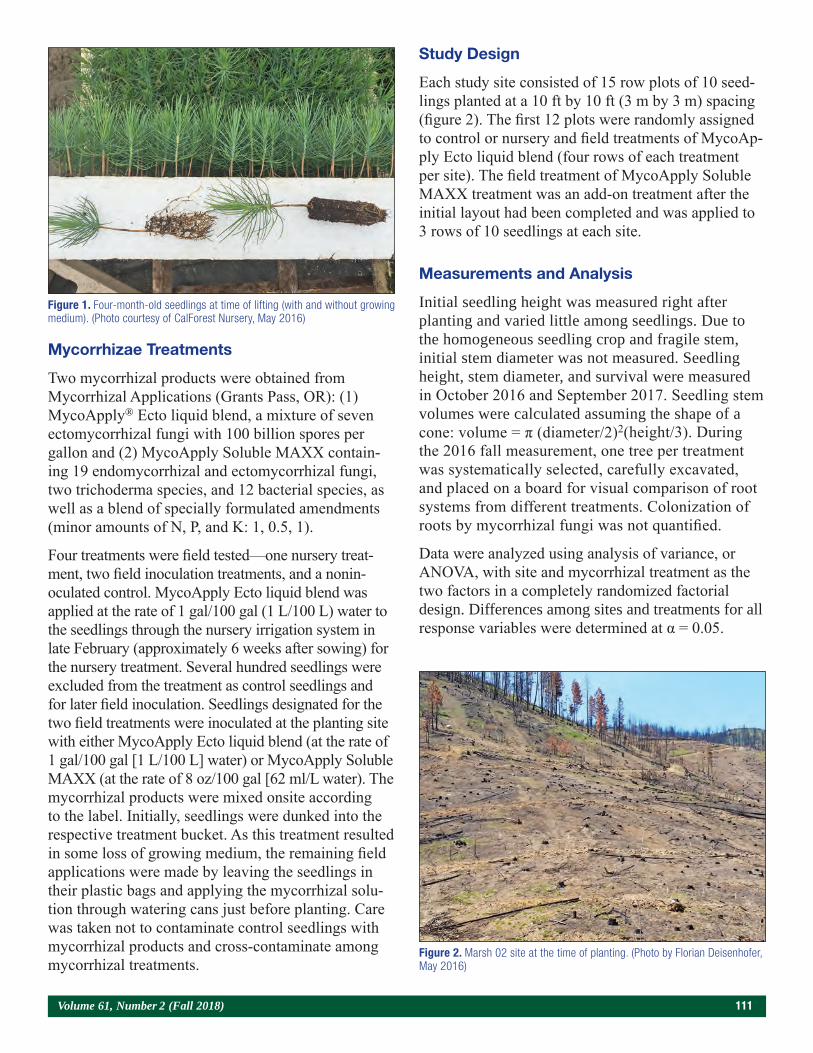
Volume 61, Number 2 (Fall 2018) 111
Figure 1. Four-month-old seedlings at time of lifting (with and without growing medium). (Photo courtesy of CalForest Nursery, May 2016)
Figure 2. Marsh 02 site at the time of planting. (Photo by Florian Deisenhofer, May 2016)
Mycorrhizae Treatments
Two mycorrhizal products were obtained from Mycorrhizal Applications (Grants Pass, OR): (1) MycoApply® Ecto liquid blend, a mixture of seven ectomycorrhizal fungi with 100 billion spores per gallon and (2) MycoApply Soluble MAXX contain-ing 19 endomycorrhizal and ectomycorrhizal fungi, two trichoderma species, and 12 bacterial species, as well as a blend of specially formulated amendments (minor amounts of N, P, and K: 1, 0.5, 1).
Four treatments were field tested—one nursery treat-ment, two field inoculation treatments, and a nonin-oculated control. MycoApply Ecto liquid blend was applied at the rate of 1 gal/100 gal (1 L/100 L) water to the seedlings through the nursery irrigation system in late February (approximately 6 weeks after sowing) for the nursery treatment. Several hundred seedlings were excluded from the treatment as control seedlings and for later field inoculation. Seedlings designated for the two field treatments were inoculated at the planting site with either MycoApply Ecto liquid blend (at the rate of 1 gal/100 gal [1 L/100 L] water) or MycoApply Soluble MAXX (at the rate of 8 oz/100 gal [62 ml/L water). The mycorrhizal products were mixed onsite according to the label. Initially, seedlings were dunked into the respective treatment bucket. As this treatment resulted in some loss of growing medium, the remaining field applications were made by leaving the seedlings in their plastic bags and applying the mycorrhizal solu-tion through watering cans just before planting. Care was taken not to contaminate control seedlings with mycorrhizal products and cross-contaminate among mycorrhizal treatments.
Study Design
Each study site consisted of 15 row plots of 10 seed-lings planted at a 10 ft by 10 ft (3 m by 3 m) spacing (figure 2). The first 12 plots were randomly assigned to control or nursery and field treatments of MycoAp-ply Ecto liquid blend (four rows of each treatment per site). The field treatment of MycoApply Soluble MAXX treatment was an add-on treatment after the initial layout had been completed and was applied to 3 rows of 10 seedlings at each site.
Measurements and Analysis
Initial seedling height was measured right after planting and varied little among seedlings. Due to the homogeneous seedling crop and fragile stem, initial stem diameter was not measured. Seedling height, stem diameter, and survival were measured in October 2016 and September 2017. Seedling stem volumes were calculated assuming the shape of a cone: volume = π (diameter/2)2(height/3). During the 2016 fall measurement, one tree per treatment was systematically selected, carefully excavated, and placed on a board for visual comparison of root systems from different treatments. Colonization of roots by mycorrhizal fungi was not quantified.
Data were analyzed using analysis of variance, or ANOVA, with site and mycorrhizal treatment as the two factors in a completely randomized factorial design. Differences among sites and treatments for all response variables were determined at α = 0.05.
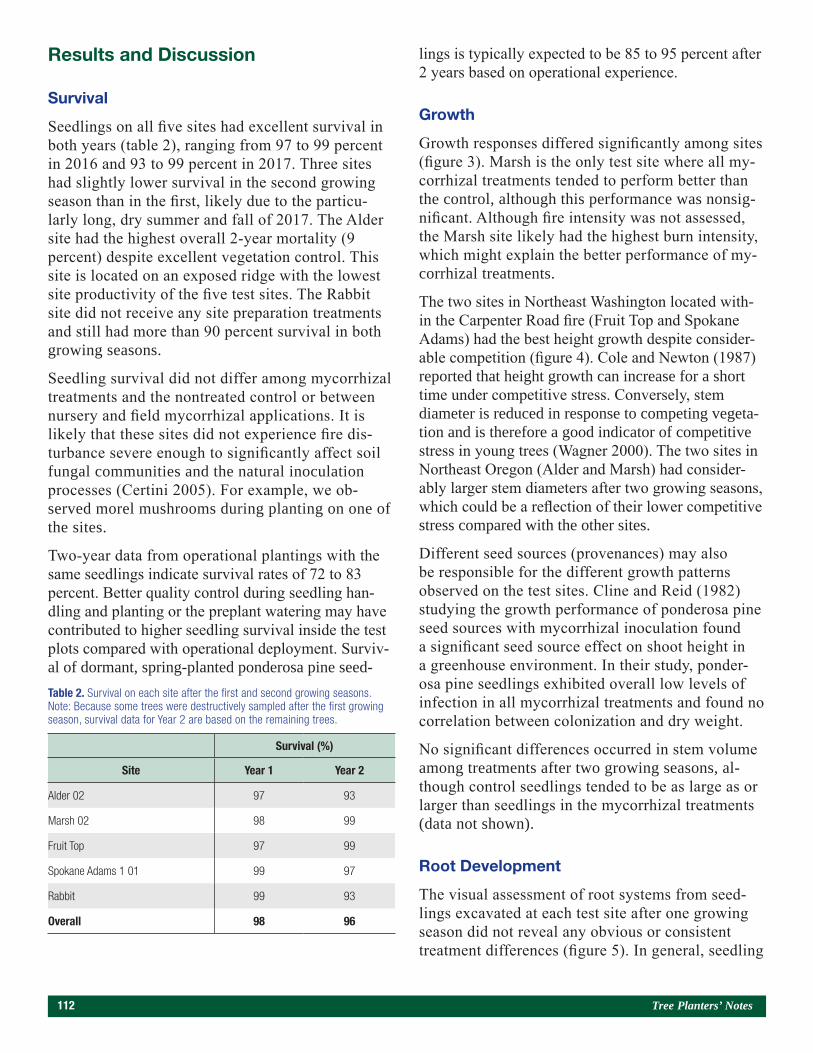
112 Tree Planters’ Notes
Results and Discussion
Survival
Seedlings on all five sites had excellent survival in both years (table 2), ranging from 97 to 99 percent in 2016 and 93 to 99 percent in 2017. Three sites had slightly lower survival in the second growing season than in the first, likely due to the particu-larly long, dry summer and fall of 2017. The Alder site had the highest overall 2-year mortality (9 percent) despite excellent vegetation control. This site is located on an exposed ridge with the lowest site productivity of the five test sites. The Rabbit site did not receive any site preparation treatments and still had more than 90 percent survival in both growing seasons.
Seedling survival did not differ among mycorrhizal treatments and the nontreated control or between nursery and field mycorrhizal applications. It is likely that these sites did not experience fire dis-turbance severe enough to significantly affect soil fungal communities and the natural inoculation processes (Certini 2005). For example, we ob-served morel mushrooms during planting on one of the sites.
Two-year data from operational plantings with the same seedlings indicate survival rates of 72 to 83 percent. Better quality control during seedling han-dling and planting or the preplant watering may have contributed to higher seedling survival inside the test plots compared with operational deployment. Surviv-al of dormant, spring-planted ponderosa pine seed-
lings is typically expected to be 85 to 95 percent after 2 years based on operational experience.
Growth
Growth responses differed significantly among sites (figure 3). Marsh is the only test site where all my-corrhizal treatments tended to perform better than the control, although this performance was nonsig-nificant. Although fire intensity was not assessed, the Marsh site likely had the highest burn intensity, which might explain the better performance of my-corrhizal treatments.
The two sites in Northeast Washington located with-in the Carpenter Road fire (Fruit Top and Spokane Adams) had the best height growth despite consider-able competition (figure 4). Cole and Newton (1987) reported that height growth can increase for a short time under competitive stress. Conversely, stem diameter is reduced in response to competing vegeta-tion and is therefore a good indicator of competitive stress in young trees (Wagner 2000). The two sites in Northeast Oregon (Alder and Marsh) had consider-ably larger stem diameters after two growing seasons, which could be a reflection of their lower competitive stress compared with the other sites.
Different seed sources (provenances) may also be responsible for the different growth patterns observed on the test sites. Cline and Reid (1982) studying the growth performance of ponderosa pine seed sources with mycorrhizal inoculation found a significant seed source effect on shoot height in a greenhouse environment. In their study, ponder-osa pine seedlings exhibited overall low levels of infection in all mycorrhizal treatments and found no correlation between colonization and dry weight.
No significant differences occurred in stem volume among treatments after two growing seasons, al-though control seedlings tended to be as large as or larger than seedlings in the mycorrhizal treatments (data not shown).
Root Development
The visual assessment of root systems from seed-lings excavated at each test site after one growing season did not reveal any obvious or consistent treatment differences (figure 5). In general, seedling
Survival (%)
Site Year 1 Year 2
Alder 02 97 93
Marsh 02 98 99
Fruit Top 97 99
Spokane Adams 1 01 99 97
Rabbit 99 93
Overall 98 96
Table 2. Survival on each site after the first and second growing seasons. Note: Because some trees were destructively sampled after the first growing season, survival data for Year 2 are based on the remaining trees.
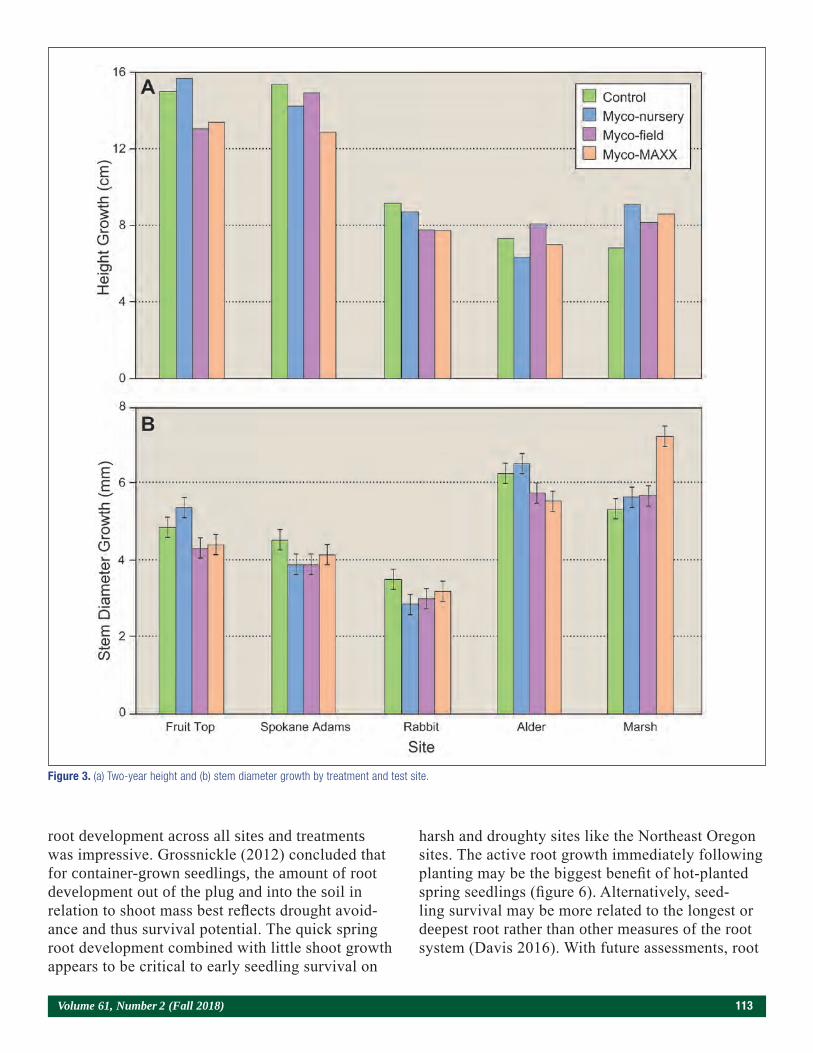
Volume 61, Number 2 (Fall 2018) 113
root development across all sites and treatments was impressive. Grossnickle (2012) concluded that for container-grown seedlings, the amount of root development out of the plug and into the soil in relation to shoot mass best reflects drought avoid-ance and thus survival potential. The quick spring root development combined with little shoot growth appears to be critical to early seedling survival on
harsh and droughty sites like the Northeast Oregon sites. The active root growth immediately following planting may be the biggest benefit of hot-planted spring seedlings (figure 6). Alternatively, seed-ling survival may be more related to the longest or deepest root rather than other measures of the root system (Davis 2016). With future assessments, root
Figure 3. (a) Two-year height and (b) stem diameter growth by treatment and test site.
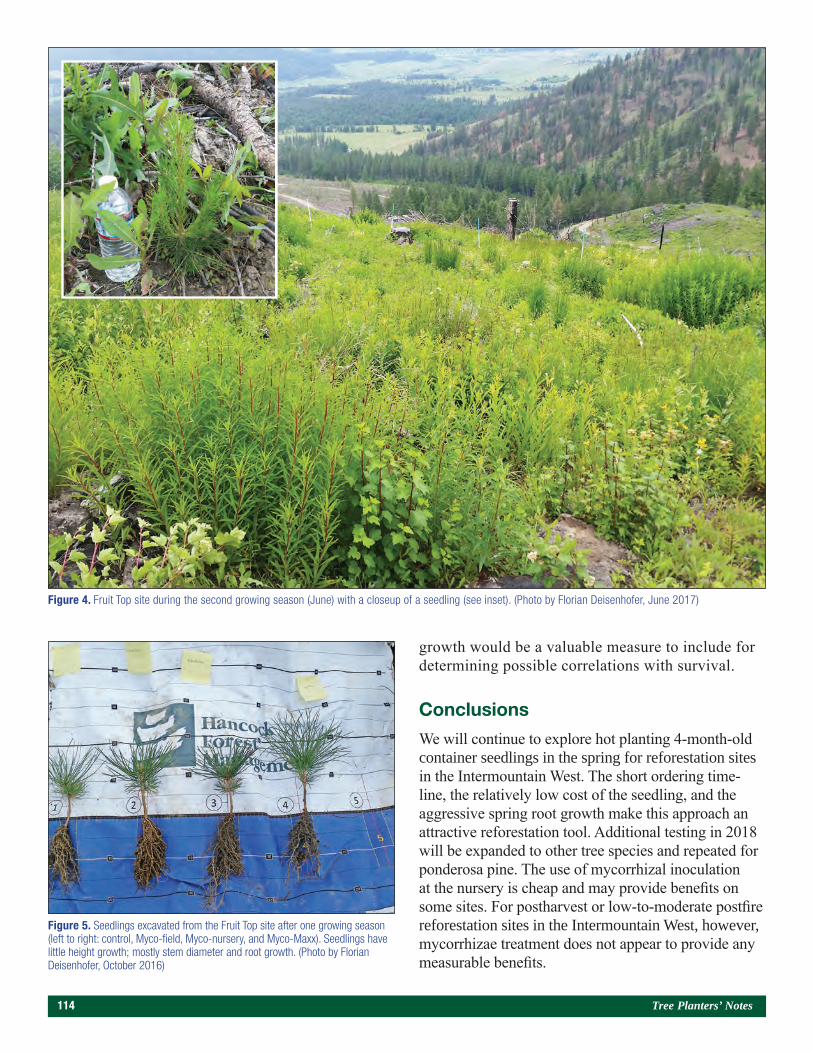
114 Tree Planters’ Notes
growth would be a valuable measure to include for determining possible correlations with survival.
Conclusions
We will continue to explore hot planting 4-month-old container seedlings in the spring for reforestation sites in the Intermountain West. The short ordering time-line, the relatively low cost of the seedling, and the aggressive spring root growth make this approach an attractive reforestation tool. Additional testing in 2018 will be expanded to other tree species and repeated for ponderosa pine. The use of mycorrhizal inoculation at the nursery is cheap and may provide benefits on some sites. For postharvest or low-to-moderate postfire reforestation sites in the Intermountain West, however, mycorrhizae treatment does not appear to provide any measurable benefits.
Figure 4. Fruit Top site during the second growing season (June) with a closeup of a seedling (see inset). (Photo by Florian Deisenhofer, June 2017)
Figure 5. Seedlings excavated from the Fruit Top site after one growing season (left to right: control, Myco-field, Myco-nursery, and Myco-Maxx). Seedlings have little height growth; mostly stem diameter and root growth. (Photo by Florian Deisenhofer, October 2016)
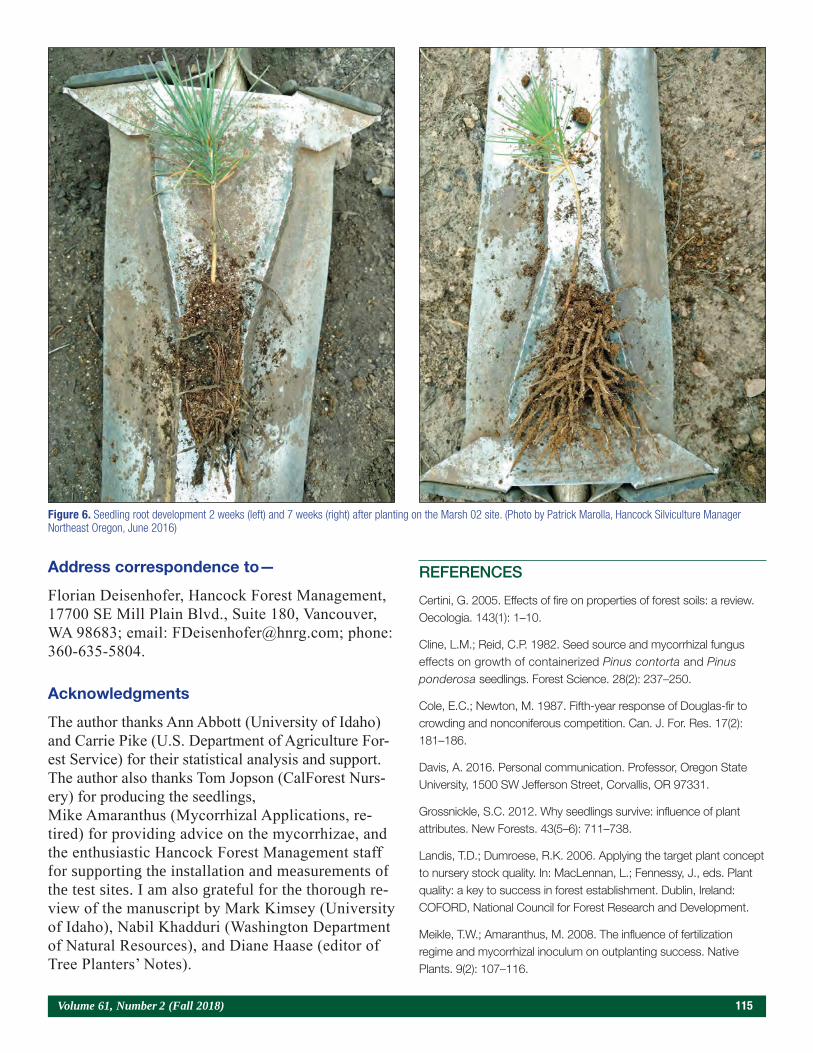
Volume 61, Number 2 (Fall 2018) 115
Address correspondence to—
Florian Deisenhofer, Hancock Forest Management, 17700 SE Mill Plain Blvd., Suite 180, Vancouver, WA 98683; email: [email protected]; phone: 360-635-5804.
Acknowledgments
The author thanks Ann Abbott (University of Idaho) and Carrie Pike (U.S. Department of Agriculture For-est Service) for their statistical analysis and support. The author also thanks Tom Jopson (CalForest Nurs-ery) for producing the seedlings, Mike Amaranthus (Mycorrhizal Applications, re-tired) for providing advice on the mycorrhizae, and the enthusiastic Hancock Forest Management staff for supporting the installation and measurements of the test sites. I am also grateful for the thorough re-view of the manuscript by Mark Kimsey (University of Idaho), Nabil Khadduri (Washington Department of Natural Resources), and Diane Haase (editor of Tree Planters’ Notes).
REFERENCES
Certini, G. 2005. Effects of fire on properties of forest soils: a review. Oecologia. 143(1): 1–10.
Cline, L.M.; Reid, C.P. 1982. Seed source and mycorrhizal fungus effects on growth of containerized Pinus contorta and Pinus ponderosa seedlings. Forest Science. 28(2): 237–250.
Cole, E.C.; Newton, M. 1987. Fifth-year response of Douglas-fir to crowding and nonconiferous competition. Can. J. For. Res. 17(2): 181–186.
Davis, A. 2016. Personal communication. Professor, Oregon State University, 1500 SW Jefferson Street, Corvallis, OR 97331.
Grossnickle, S.C. 2012. Why seedlings survive: influence of plant attributes. New Forests. 43(5–6): 711–738.
Landis, T.D.; Dumroese, R.K. 2006. Applying the target plant concept to nursery stock quality. In: MacLennan, L.; Fennessy, J., eds. Plant quality: a key to success in forest establishment. Dublin, Ireland: COFORD, National Council for Forest Research and Development.
Meikle, T.W.; Amaranthus, M. 2008. The influence of fertilization regime and mycorrhizal inoculum on outplanting success. Native Plants. 9(2): 107–116.
Figure 6. Seedling root development 2 weeks (left) and 7 weeks (right) after planting on the Marsh 02 site. (Photo by Patrick Marolla, Hancock Silviculture Manager Northeast Oregon, June 2016)

116 Tree Planters’ Notes
Steinfeld, D.; Amaranthus, M.P.; Cazares, E. 2003. Survival of ponderosa pine seedlings outplanted with rhizopogon mycorrhizae inoculated with spores at the nursery. Journal of Arboriculture. 29(4): 197–207.
Wagner, R.G. 2000. Competition and critical-period thresholds for vegetation management decisions in young conifer stands. The Forestry Chronicle. 76(6): 961–968.
Webster, J.; Fredrickson, E. 2005. Lessons learned on 50,000 acres of plantation in northern California. In: Ritchie, M.W.; Maguire, D.A.; Youngblood, A., tech. coordinators. Proceedings of the Symposium on ponderosa pine: issues, trends, and management. Gen. Tech. Rep PSW-GTR-198. Albany, CA: Pacific Southwest Research Station, Forest Service, U.S. Department of Agriculture: 267-281.
Volume 60, Number 2 (Fall 2017) 116
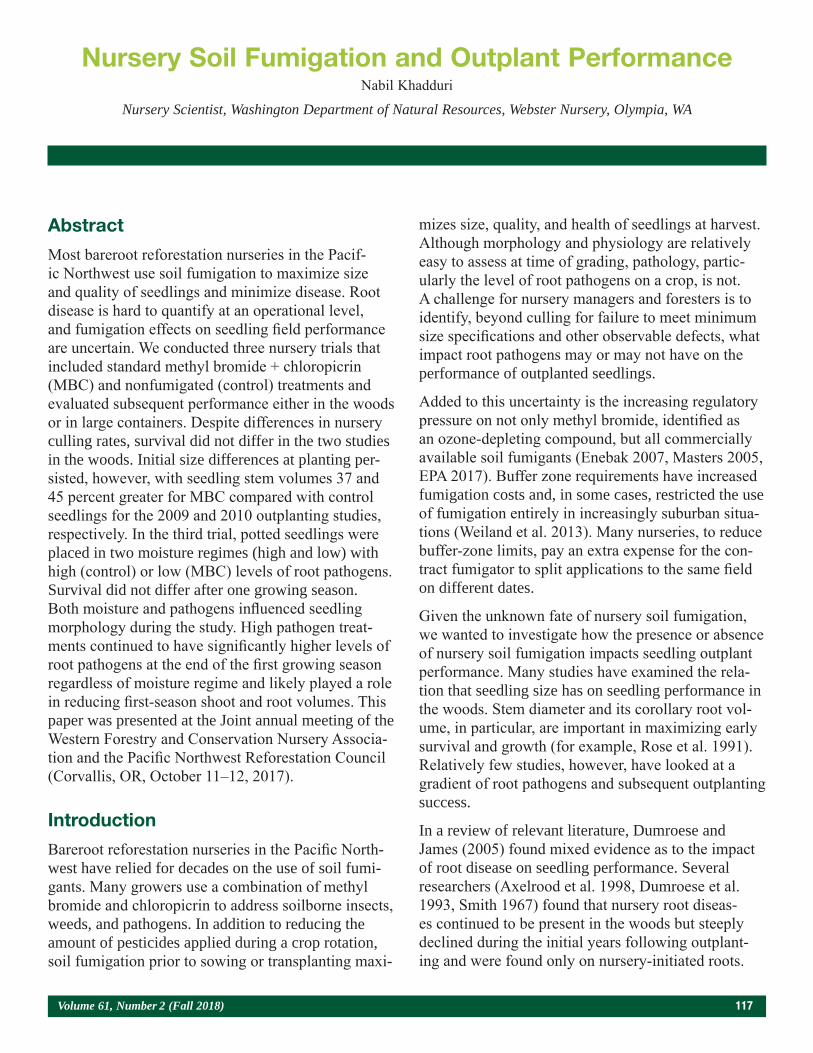
Volume 61, Number 2 (Fall 2018) 117
Abstract
Most bareroot reforestation nurseries in the Pacif-ic Northwest use soil fumigation to maximize size and quality of seedlings and minimize disease. Root disease is hard to quantify at an operational level, and fumigation effects on seedling field performance are uncertain. We conducted three nursery trials that included standard methyl bromide + chloropicrin (MBC) and nonfumigated (control) treatments and evaluated subsequent performance either in the woods or in large containers. Despite differences in nursery culling rates, survival did not differ in the two studies in the woods. Initial size differences at planting per-sisted, however, with seedling stem volumes 37 and 45 percent greater for MBC compared with control seedlings for the 2009 and 2010 outplanting studies, respectively. In the third trial, potted seedlings were placed in two moisture regimes (high and low) with high (control) or low (MBC) levels of root pathogens. Survival did not differ after one growing season. Both moisture and pathogens influenced seedling morphology during the study. High pathogen treat-ments continued to have significantly higher levels of root pathogens at the end of the first growing season regardless of moisture regime and likely played a role in reducing first-season shoot and root volumes. This paper was presented at the Joint annual meeting of the Western Forestry and Conservation Nursery Associa-tion and the Pacific Northwest Reforestation Council (Corvallis, OR, October 11–12, 2017).
Introduction
Bareroot reforestation nurseries in the Pacific North-west have relied for decades on the use of soil fumi-gants. Many growers use a combination of methyl bromide and chloropicrin to address soilborne insects, weeds, and pathogens. In addition to reducing the amount of pesticides applied during a crop rotation, soil fumigation prior to sowing or transplanting maxi-
mizes size, quality, and health of seedlings at harvest. Although morphology and physiology are relatively easy to assess at time of grading, pathology, partic-ularly the level of root pathogens on a crop, is not. A challenge for nursery managers and foresters is to identify, beyond culling for failure to meet minimum size specifications and other observable defects, what impact root pathogens may or may not have on the performance of outplanted seedlings.
Added to this uncertainty is the increasing regulatory pressure on not only methyl bromide, identified as an ozone-depleting compound, but all commercially available soil fumigants (Enebak 2007, Masters 2005, EPA 2017). Buffer zone requirements have increased fumigation costs and, in some cases, restricted the use of fumigation entirely in increasingly suburban situa-tions (Weiland et al. 2013). Many nurseries, to reduce buffer-zone limits, pay an extra expense for the con-tract fumigator to split applications to the same field on different dates.
Given the unknown fate of nursery soil fumigation, we wanted to investigate how the presence or absence of nursery soil fumigation impacts seedling outplant performance. Many studies have examined the rela-tion that seedling size has on seedling performance in the woods. Stem diameter and its corollary root vol-ume, in particular, are important in maximizing early survival and growth (for example, Rose et al. 1991). Relatively few studies, however, have looked at a gradient of root pathogens and subsequent outplanting success.
In a review of relevant literature, Dumroese and James (2005) found mixed evidence as to the impact of root disease on seedling performance. Several researchers (Axelrood et al. 1998, Dumroese et al. 1993, Smith 1967) found that nursery root diseas-es continued to be present in the woods but steeply declined during the initial years following outplant-ing and were found only on nursery-initiated roots.
Nursery Soil Fumigation and Outplant PerformanceNabil Khadduri
Nursery Scientist, Washington Department of Natural Resources, Webster Nursery, Olympia, WA
118 Tree Planters’ Notes
treatments. For more information regarding the nurs-ery fumigation trials, see Khadduri (2010), Khadduri et al. (2017), and Weiland et al. (2011).
Study 1: 2009 Nursery to Woods Evaluation
In late January 2009, we lifted bareroot 1+1 Doug-las-fir seedlings grown with or without nursery fumigation (methyl bromide:chloropicrin 67:33 350 lb/ac [392 kg/ha] tarped with high-density polyeth-ylene [HDPE] plastic), culled out those that did not meet minimum specifications, and stored the rest at 34 °F (1.5 °C) for 5 weeks prior to planting. The day before planting, we randomly sampled 20 seedlings per treatment for pathology analysis conducted by Robert James (U.S. Department of Agriculture, Forest Service, retired, Vancouver, WA). For pathology methods, see Khadduri (2010). Table 1 details cull, morphology, and pathology parameters.
On March 6, 2009, we planted 60 seedlings from each treatment on 2 sites (table 2, figure 1), in a random-ized complete block design with 4 rows of 15 trees per treatment at each site. We interplanted an addi-tional 20 trees per treatment (5 within each row) for destructive pathology sampling in the first season. We incorporated replications from the nursery trial plots in the field design. We spaced seedlings 8 ft (2.4 m) within rows and 10 ft (3 m) apart between rows (figure 2).
On June 6 and October 10 of the first growing season, we destructively sampled five interplanted trees per replicate and sent to Robert James’ laboratory for analy-
Specifically, Fusarium oxysporum, a major nursery pathogen on many conifers, seemed to compete poorly with, and even be antagonized by, forest soil microorganisms.
Hansen et al. (1980) found that Douglas-fir (Pseudotsuga menziesii Mirb. Franco) seedlings with severe root-disease symptoms had the highest mor-tality and poorest growth 18 months after planting, but seedlings with “inconspicuous symptoms” fared as well as healthy, control seedlings. Similarly, Dum-roese et al. (2000) compared Cylindrocarpon-infected and noninfected western white pine (Pinus monticola ex D. Don), where both groups met packable speci-fications of firm root plug and minimum height and root collar diameter and found no differences in out-planting survival and growth.
Dumroese and James (2005) suggest that, unless obvi-ous deficiencies are noted, seedlings meeting nursery standards for quality (morphological and physiological) should perform well on most outplanting sites even if root disease symptoms are present. Although root pathogens from the nursery may persist after outplant-ing, they compete poorly in the rhizosphere when new roots penetrate into forest soil. Nonetheless, seedlings with root disease symptoms should be given critical attention at grading and may need to be subjected to additional testing, such as a root growth potential assay (Dennis and Trotter 1998). Ideally, nurseries will use effective integrated pest management techniques to mitigate root pathogens and avoid potential patho-gen-induced losses after outplanting. The series of studies described in this article examined the integrated pest management tool of nursery soil fumigation and its influence on seedling quality, root disease symp-toms, and subsequent outplanting performance.
Materials and Methods
In two studies, initiated in 2009 and 2010, we evalu-ated seedling outplant performance from the nursery to the woods. In a third study initiated in 2017, we examined seedling performance after transplanting into large containers. For all three studies, we used 1+1 Douglas-fir seedlings grown in replicated nursery fumigation trials at Webster Nursery (Latitude 46.949, Longitude -122.952, slightly south of Olympia, WA). For all three trials, we compared seedlings from methyl bromide + chloropicrin (MBC; operational standard) versus no-fumigation (control) nursery
Seedling parameter
Methyl bromide fumigation
No fumigation
Cull rate at nursery harvest (%) 4.5 14.7
Average height at outplant (cm) 49.4 42.6
Average stem diameter at outplant (mm) 7.7 7.1
Fusarium root infection end of storage (%) 0 16
Pythium root infection (%) 4 19
Cylindrocarpon root infection (%) 0 32
Trichoderma (beneficial) colonization (%) 83 41
Table 1. Douglas-fir seedling parameters for those grown with and without fumigation used in the 2009 nursery to woods evaluation. Morphology and pathology data are only for packable seedlings, i.e., seedlings that were not culled at time of harvest.
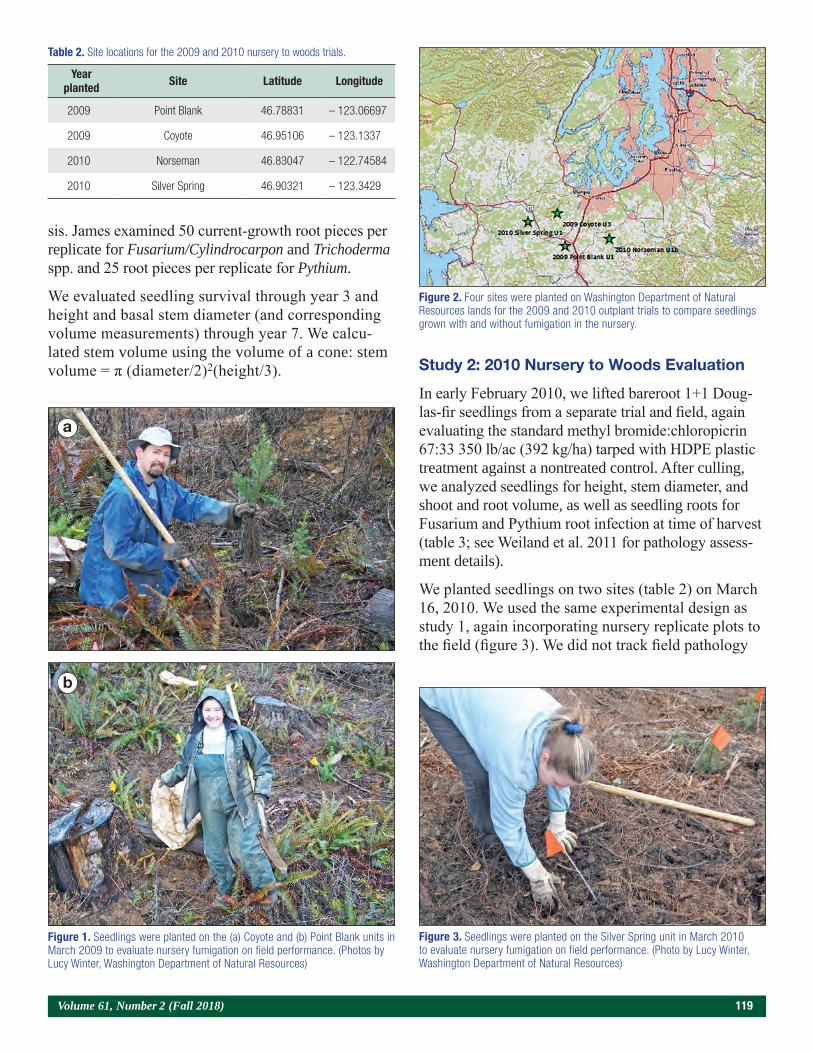
Volume 61, Number 2 (Fall 2018) 119
sis. James examined 50 current-growth root pieces per replicate for Fusarium/Cylindrocarpon and Trichoderma spp. and 25 root pieces per replicate for Pythium.
We evaluated seedling survival through year 3 and height and basal stem diameter (and corresponding volume measurements) through year 7. We calcu-lated stem volume using the volume of a cone: stem volume = π (diameter/2)2(height/3). Study 2: 2010 Nursery to Woods Evaluation
In early February 2010, we lifted bareroot 1+1 Doug-las-fir seedlings from a separate trial and field, again evaluating the standard methyl bromide:chloropicrin 67:33 350 lb/ac (392 kg/ha) tarped with HDPE plastic treatment against a nontreated control. After culling, we analyzed seedlings for height, stem diameter, and shoot and root volume, as well as seedling roots for Fusarium and Pythium root infection at time of harvest (table 3; see Weiland et al. 2011 for pathology assess-ment details).
We planted seedlings on two sites (table 2) on March 16, 2010. We used the same experimental design as study 1, again incorporating nursery replicate plots to the field (figure 3). We did not track field pathology
Year planted Site Latitude Longitude
2009 Point Blank 46.78831 – 123.06697
2009 Coyote 46.95106 – 123.1337
2010 Norseman 46.83047 – 122.74584
2010 Silver Spring 46.90321 – 123.3429
Table 2. Site locations for the 2009 and 2010 nursery to woods trials.
a
b
Figure 1. Seedlings were planted on the (a) Coyote and (b) Point Blank units in March 2009 to evaluate nursery fumigation on field performance. (Photos by Lucy Winter, Washington Department of Natural Resources)
Figure 3. Seedlings were planted on the Silver Spring unit in March 2010 to evaluate nursery fumigation on field performance. (Photo by Lucy Winter, Washington Department of Natural Resources)
Figure 2. Four sites were planted on Washington Department of Natural Resources lands for the 2009 and 2010 outplant trials to compare seedlings grown with and without fumigation in the nursery.
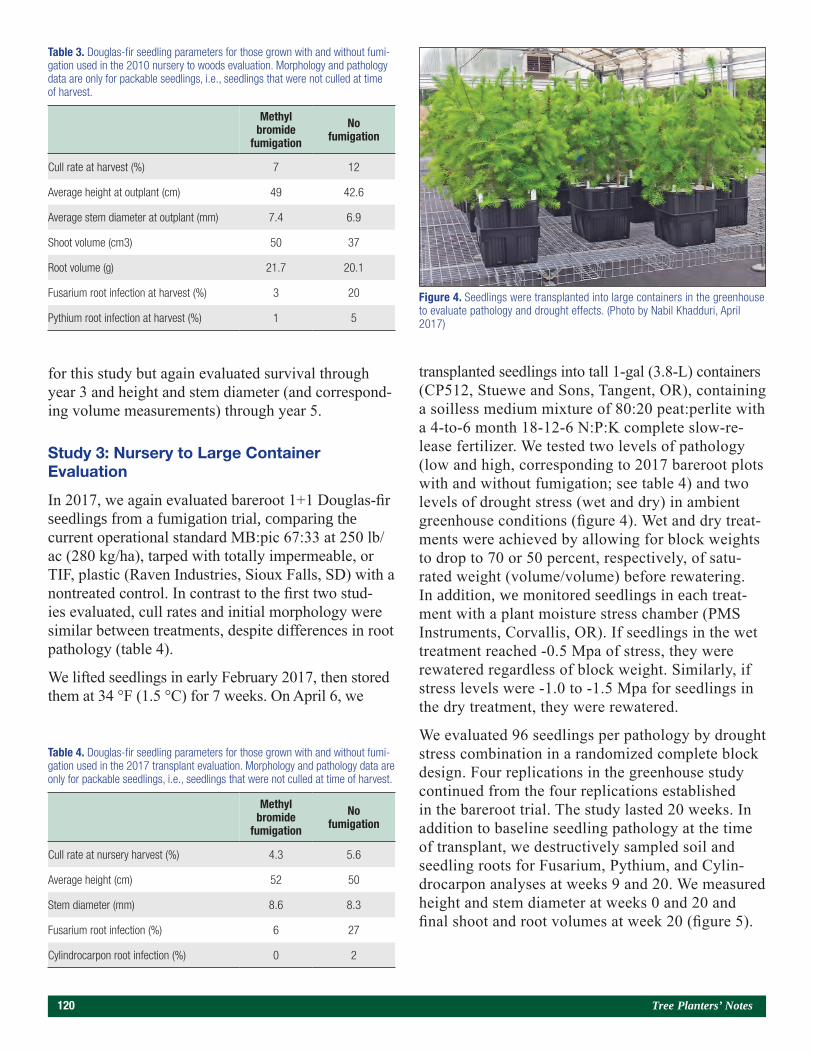
120 Tree Planters’ Notes
for this study but again evaluated survival through year 3 and height and stem diameter (and correspond-ing volume measurements) through year 5.
Study 3: Nursery to Large Container Evaluation
In 2017, we again evaluated bareroot 1+1 Douglas-fir seedlings from a fumigation trial, comparing the current operational standard MB:pic 67:33 at 250 lb/ac (280 kg/ha), tarped with totally impermeable, or TIF, plastic (Raven Industries, Sioux Falls, SD) with a nontreated control. In contrast to the first two stud-ies evaluated, cull rates and initial morphology were similar between treatments, despite differences in root pathology (table 4).
We lifted seedlings in early February 2017, then stored them at 34 °F (1.5 °C) for 7 weeks. On April 6, we
transplanted seedlings into tall 1-gal (3.8-L) containers (CP512, Stuewe and Sons, Tangent, OR), containing a soilless medium mixture of 80:20 peat:perlite with a 4-to-6 month 18-12-6 N:P:K complete slow-re-lease fertilizer. We tested two levels of pathology (low and high, corresponding to 2017 bareroot plots with and without fumigation; see table 4) and two levels of drought stress (wet and dry) in ambient greenhouse conditions (figure 4). Wet and dry treat-ments were achieved by allowing for block weights to drop to 70 or 50 percent, respectively, of satu-rated weight (volume/volume) before rewatering. In addition, we monitored seedlings in each treat-ment with a plant moisture stress chamber (PMS Instruments, Corvallis, OR). If seedlings in the wet treatment reached -0.5 Mpa of stress, they were rewatered regardless of block weight. Similarly, if stress levels were -1.0 to -1.5 Mpa for seedlings in the dry treatment, they were rewatered.
We evaluated 96 seedlings per pathology by drought stress combination in a randomized complete block design. Four replications in the greenhouse study continued from the four replications established in the bareroot trial. The study lasted 20 weeks. In addition to baseline seedling pathology at the time of transplant, we destructively sampled soil and seedling roots for Fusarium, Pythium, and Cylin-drocarpon analyses at weeks 9 and 20. We measured height and stem diameter at weeks 0 and 20 and final shoot and root volumes at week 20 (figure 5).
Methyl bromide
fumigation
No fumigation
Cull rate at harvest (%) 7 12
Average height at outplant (cm) 49 42.6
Average stem diameter at outplant (mm) 7.4 6.9
Shoot volume (cm3) 50 37
Root volume (g) 21.7 20.1
Fusarium root infection at harvest (%) 3 20
Pythium root infection at harvest (%) 1 5
Methyl bromide
fumigation
No fumigation
Cull rate at nursery harvest (%) 4.3 5.6
Average height (cm) 52 50
Stem diameter (mm) 8.6 8.3
Fusarium root infection (%) 6 27
Cylindrocarpon root infection (%) 0 2
Table 3. Douglas-fir seedling parameters for those grown with and without fumi-gation used in the 2010 nursery to woods evaluation. Morphology and pathology data are only for packable seedlings, i.e., seedlings that were not culled at time of harvest.
Table 4. Douglas-fir seedling parameters for those grown with and without fumi-gation used in the 2017 transplant evaluation. Morphology and pathology data are only for packable seedlings, i.e., seedlings that were not culled at time of harvest.
Figure 4. Seedlings were transplanted into large containers in the greenhouse to evaluate pathology and drought effects. (Photo by Nabil Khadduri, April 2017)
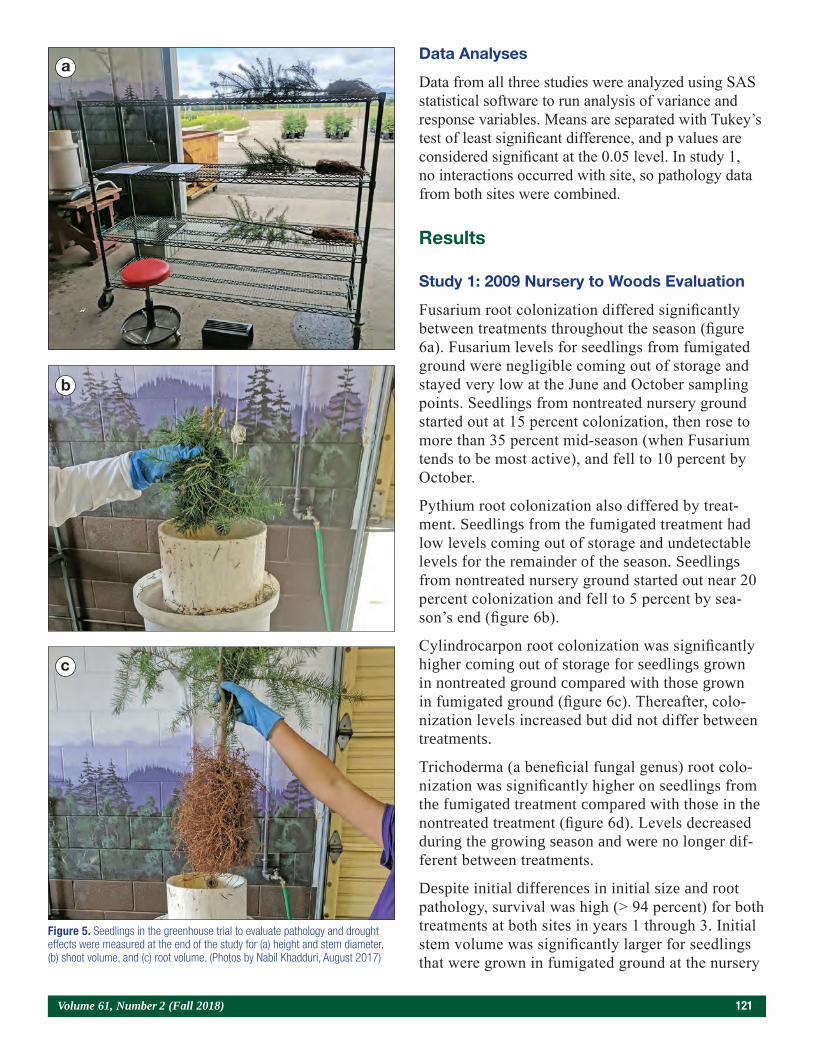
Volume 61, Number 2 (Fall 2018) 121
Data Analyses
Data from all three studies were analyzed using SAS statistical software to run analysis of variance and response variables. Means are separated with Tukey’s test of least significant difference, and p values are considered significant at the 0.05 level. In study 1, no interactions occurred with site, so pathology data from both sites were combined.
Results
Study 1: 2009 Nursery to Woods Evaluation
Fusarium root colonization differed significantly between treatments throughout the season (figure 6a). Fusarium levels for seedlings from fumigated ground were negligible coming out of storage and stayed very low at the June and October sampling points. Seedlings from nontreated nursery ground started out at 15 percent colonization, then rose to more than 35 percent mid-season (when Fusarium tends to be most active), and fell to 10 percent by October.
Pythium root colonization also differed by treat-ment. Seedlings from the fumigated treatment had low levels coming out of storage and undetectable levels for the remainder of the season. Seedlings from nontreated nursery ground started out near 20 percent colonization and fell to 5 percent by sea-son’s end (figure 6b).
Cylindrocarpon root colonization was significantly higher coming out of storage for seedlings grown in nontreated ground compared with those grown in fumigated ground (figure 6c). Thereafter, colo-nization levels increased but did not differ between treatments.
Trichoderma (a beneficial fungal genus) root colo-nization was significantly higher on seedlings from the fumigated treatment compared with those in the nontreated treatment (figure 6d). Levels decreased during the growing season and were no longer dif-ferent between treatments.
Despite initial differences in initial size and root pathology, survival was high (> 94 percent) for both treatments at both sites in years 1 through 3. Initial stem volume was significantly larger for seedlings that were grown in fumigated ground at the nursery
Figure 5. Seedlings in the greenhouse trial to evaluate pathology and drought effects were measured at the end of the study for (a) height and stem diameter, (b) shoot volume, and (c) root volume. (Photos by Nabil Khadduri, August 2017)
a
c
b
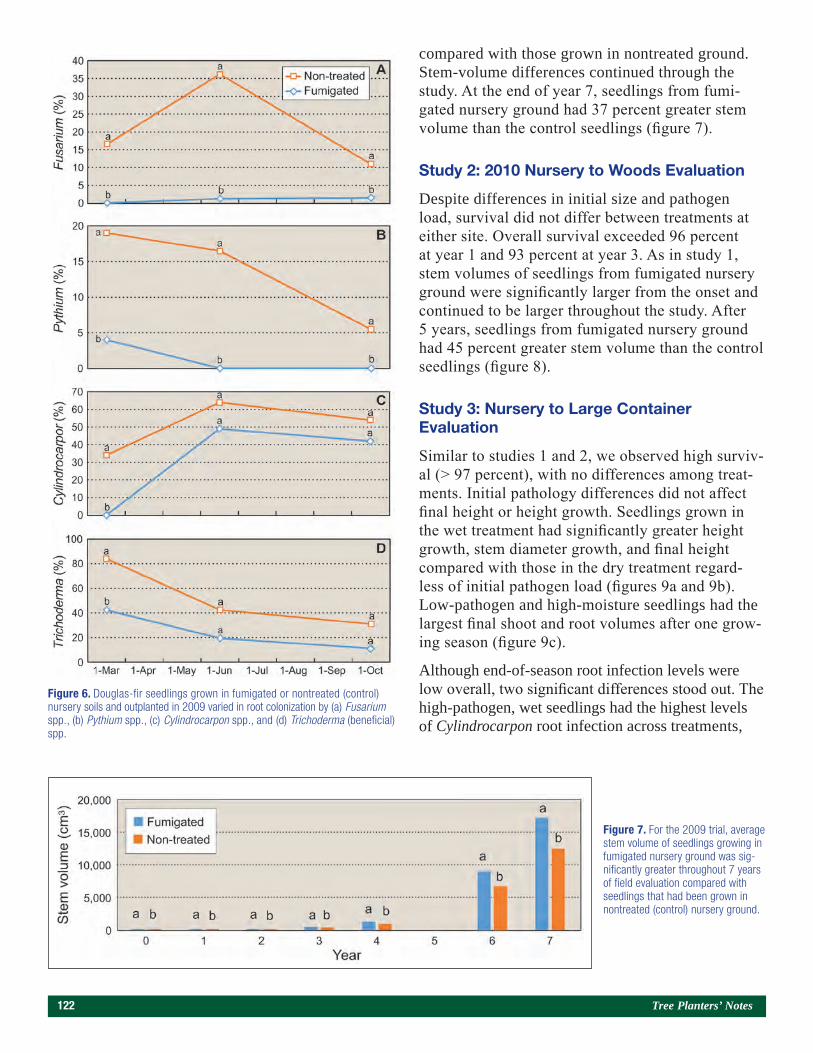
122 Tree Planters’ Notes
compared with those grown in nontreated ground. Stem-volume differences continued through the study. At the end of year 7, seedlings from fumi-gated nursery ground had 37 percent greater stem volume than the control seedlings (figure 7).
Study 2: 2010 Nursery to Woods Evaluation
Despite differences in initial size and pathogen load, survival did not differ between treatments at either site. Overall survival exceeded 96 percent at year 1 and 93 percent at year 3. As in study 1, stem volumes of seedlings from fumigated nursery ground were significantly larger from the onset and continued to be larger throughout the study. After 5 years, seedlings from fumigated nursery ground had 45 percent greater stem volume than the control seedlings (figure 8).
Study 3: Nursery to Large Container Evaluation
Similar to studies 1 and 2, we observed high surviv-al (> 97 percent), with no differences among treat-ments. Initial pathology differences did not affect final height or height growth. Seedlings grown in the wet treatment had significantly greater height growth, stem diameter growth, and final height compared with those in the dry treatment regard-less of initial pathogen load (figures 9a and 9b). Low-pathogen and high-moisture seedlings had the largest final shoot and root volumes after one grow-ing season (figure 9c).
Although end-of-season root infection levels were low overall, two significant differences stood out. The high-pathogen, wet seedlings had the highest levels of Cylindrocarpon root infection across treatments,
Figure 6. Douglas-fir seedlings grown in fumigated or nontreated (control) nursery soils and outplanted in 2009 varied in root colonization by (a) Fusarium spp., (b) Pythium spp., (c) Cylindrocarpon spp., and (d) Trichoderma (beneficial) spp.
Figure 7. For the 2009 trial, average stem volume of seedlings growing in fumigated nursery ground was sig-nificantly greater throughout 7 years of field evaluation compared with seedlings that had been grown in nontreated (control) nursery ground.
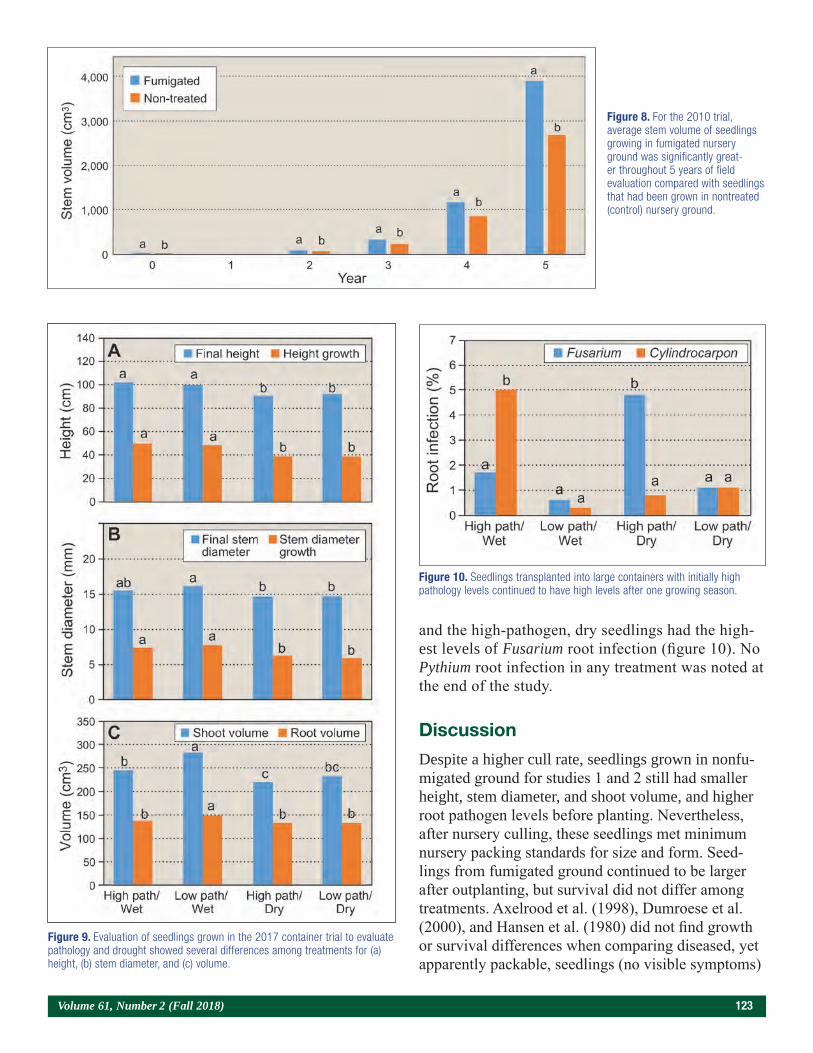
Volume 61, Number 2 (Fall 2018) 123
and the high-pathogen, dry seedlings had the high-est levels of Fusarium root infection (figure 10). No Pythium root infection in any treatment was noted at the end of the study.
Discussion
Despite a higher cull rate, seedlings grown in nonfu-migated ground for studies 1 and 2 still had smaller height, stem diameter, and shoot volume, and higher root pathogen levels before planting. Nevertheless, after nursery culling, these seedlings met minimum nursery packing standards for size and form. Seed-lings from fumigated ground continued to be larger after outplanting, but survival did not differ among treatments. Axelrood et al. (1998), Dumroese et al. (2000), and Hansen et al. (1980) did not find growth or survival differences when comparing diseased, yet apparently packable, seedlings (no visible symptoms)
Figure 8. For the 2010 trial, average stem volume of seedlings growing in fumigated nursery ground was significantly great-er throughout 5 years of field evaluation compared with seedlings that had been grown in nontreated (control) nursery ground.
Figure 9. Evaluation of seedlings grown in the 2017 container trial to evaluate pathology and drought showed several differences among treatments for (a) height, (b) stem diameter, and (c) volume.
Figure 10. Seedlings transplanted into large containers with initially high pathology levels continued to have high levels after one growing season.
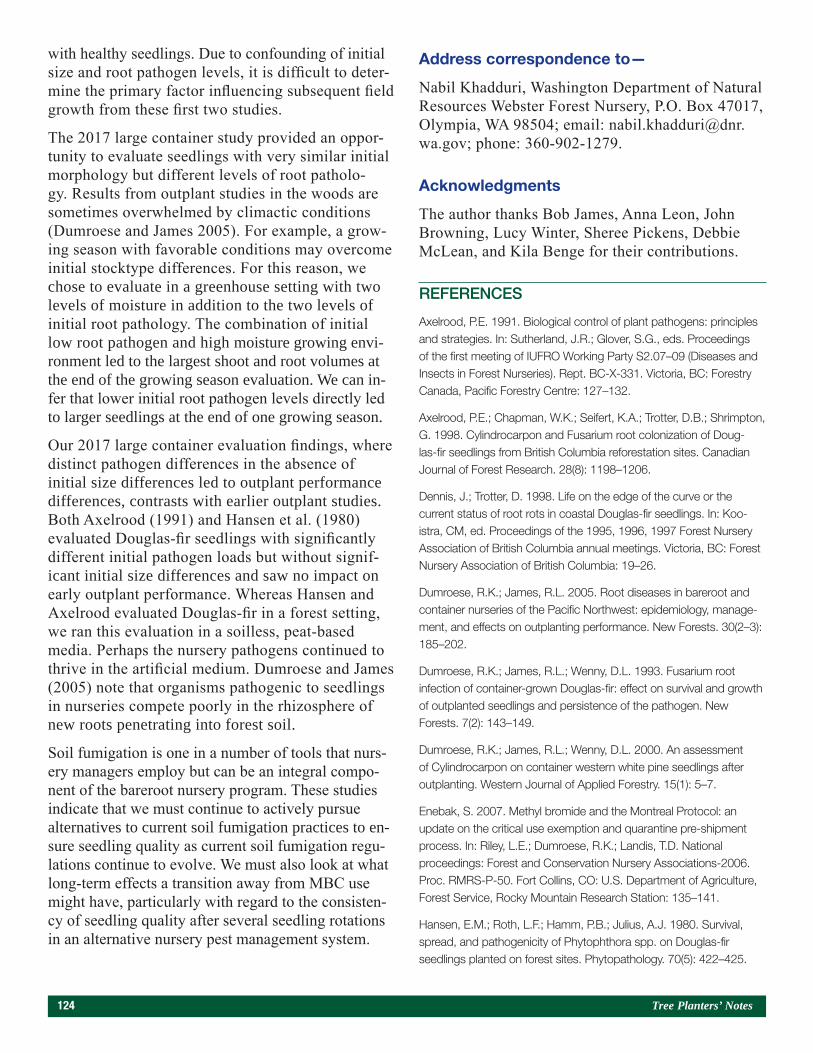
124 Tree Planters’ Notes
with healthy seedlings. Due to confounding of initial size and root pathogen levels, it is difficult to deter-mine the primary factor influencing subsequent field growth from these first two studies.
The 2017 large container study provided an oppor-tunity to evaluate seedlings with very similar initial morphology but different levels of root patholo-gy. Results from outplant studies in the woods are sometimes overwhelmed by climactic conditions (Dumroese and James 2005). For example, a grow-ing season with favorable conditions may overcome initial stocktype differences. For this reason, we chose to evaluate in a greenhouse setting with two levels of moisture in addition to the two levels of initial root pathology. The combination of initial low root pathogen and high moisture growing envi-ronment led to the largest shoot and root volumes at the end of the growing season evaluation. We can in-fer that lower initial root pathogen levels directly led to larger seedlings at the end of one growing season.
Our 2017 large container evaluation findings, where distinct pathogen differences in the absence of initial size differences led to outplant performance differences, contrasts with earlier outplant studies. Both Axelrood (1991) and Hansen et al. (1980) evaluated Douglas-fir seedlings with significantly different initial pathogen loads but without signif-icant initial size differences and saw no impact on early outplant performance. Whereas Hansen and Axelrood evaluated Douglas-fir in a forest setting, we ran this evaluation in a soilless, peat-based media. Perhaps the nursery pathogens continued to thrive in the artificial medium. Dumroese and James (2005) note that organisms pathogenic to seedlings in nurseries compete poorly in the rhizosphere of new roots penetrating into forest soil.
Soil fumigation is one in a number of tools that nurs-ery managers employ but can be an integral compo-nent of the bareroot nursery program. These studies indicate that we must continue to actively pursue alternatives to current soil fumigation practices to en-sure seedling quality as current soil fumigation regu-lations continue to evolve. We must also look at what long-term effects a transition away from MBC use might have, particularly with regard to the consisten-cy of seedling quality after several seedling rotations in an alternative nursery pest management system.
Address correspondence to—
Nabil Khadduri, Washington Department of Natural Resources Webster Forest Nursery, P.O. Box 47017, Olympia, WA 98504; email: [email protected]; phone: 360-902-1279.
Acknowledgments
The author thanks Bob James, Anna Leon, John Browning, Lucy Winter, Sheree Pickens, Debbie McLean, and Kila Benge for their contributions.
REFERENCES
Axelrood, P.E. 1991. Biological control of plant pathogens: principles and strategies. In: Sutherland, J.R.; Glover, S.G., eds. Proceedings of the first meeting of IUFRO Working Party S2.07–09 (Diseases and Insects in Forest Nurseries). Rept. BC-X-331. Victoria, BC: Forestry Canada, Pacific Forestry Centre: 127–132.
Axelrood, P.E.; Chapman, W.K.; Seifert, K.A.; Trotter, D.B.; Shrimpton, G. 1998. Cylindrocarpon and Fusarium root colonization of Doug-las-fir seedlings from British Columbia reforestation sites. Canadian Journal of Forest Research. 28(8): 1198–1206.
Dennis, J.; Trotter, D. 1998. Life on the edge of the curve or the current status of root rots in coastal Douglas-fir seedlings. In: Koo-istra, CM, ed. Proceedings of the 1995, 1996, 1997 Forest Nursery Association of British Columbia annual meetings. Victoria, BC: Forest Nursery Association of British Columbia: 19–26.
Dumroese, R.K.; James, R.L. 2005. Root diseases in bareroot and container nurseries of the Pacific Northwest: epidemiology, manage-ment, and effects on outplanting performance. New Forests. 30(2–3): 185–202.
Dumroese, R.K.; James, R.L.; Wenny, D.L. 1993. Fusarium root infection of container-grown Douglas-fir: effect on survival and growth of outplanted seedlings and persistence of the pathogen. New Forests. 7(2): 143–149.
Dumroese, R.K.; James, R.L.; Wenny, D.L. 2000. An assessment of Cylindrocarpon on container western white pine seedlings after outplanting. Western Journal of Applied Forestry. 15(1): 5–7.
Enebak, S. 2007. Methyl bromide and the Montreal Protocol: an update on the critical use exemption and quarantine pre-shipment process. In: Riley, L.E.; Dumroese, R.K.; Landis, T.D. National proceedings: Forest and Conservation Nursery Associations-2006. Proc. RMRS-P-50. Fort Collins, CO: U.S. Department of Agriculture, Forest Service, Rocky Mountain Research Station: 135–141.
Hansen, E.M.; Roth, L.F.; Hamm, P.B.; Julius, A.J. 1980. Survival, spread, and pathogenicity of Phytophthora spp. on Douglas-fir seedlings planted on forest sites. Phytopathology. 70(5): 422–425.

Volume 61, Number 2 (Fall 2018) 125
Khadduri, N. 2010. Effect of organic amendments on Douglas-Fir transplants grown in fumigated versus non-fumigated soil. In: Riley, L.E.; Pinto, J.R.; Dumroese, R.K., tech. cords. National proceeding: forest and conservation nursery associations-2009. Proc. RMRS-P-62. Fort Collins, CO: U.S. Department of Agriculture, Forest Service, Rocky Mountain Research Station: 46–50.
Khadduri, N.; Leon, A.; Browning, J.; Salamone, A. 2017. Evaluating Dominus® soil biofumigant as a substitute for methyl bromide in Pacific Northwest forest nurseries. Tree Planters’ Notes. 60(2): 111–120.
Masters, C.J. 2005. Methyl bromide use in forest tree nurseries—what happens after January 1, 2005? Tree Planters’ Notes. 51(1): 4–5.
Rose, R.; Atkinson, M.; Gleason, J.; Sabin, T. 1991. Root volume as a grading criterion to improve field performance of Douglas-fir seedlings. New Forests. 5(3): 195–209.
Smith, R.S., Jr. 1967. Decline of Fusarium oxysporum in the roots of Pinus lambertiana seedlings transplanted into forest soils. Phytopa-thology. 57(11): 1265.
U.S. Environmental Protection Agency (EPA). 2017. Regulatory status of fumigants. https://www.epa.gov/soil-fumigants/regulato-ry-sta-tus-fumigants. (March 2017).
Weiland, J.E.; Leon, A.L.; Edmonds, R.L.; Littke, W.R.; Browning, J.E.; Davis, A.; Beck, B.R.; Miller, T.W.; Cherry, M.L.; Rose, R. 2011. The effects of methyl bromide alternatives on soil and seedling patho-gen populations, weeds, and seedling morphology in Oregon and Washington forest nurseries. Canadian Journal of Forest Research. 41(9): 1855–1896.
Weiland, J.E.; Littke, W.R.; Haase, D.L. 2013. Forest nurseries face critical choices with the loss of methyl bromide fumigation. California Agriculture. 67(3): 153–161.
126 Tree Planters’ Notes
Abstract
Many nurseries and reforestation programs have a diffi-cult time with shortages of farm labor and increasing labor costs. In most cases, these increasing costs will be passed on to the customer by increasing seedling prices. This labor shortage could also result in inter-ruptions and delays in the timely lifting and delivery of seedlings. Given the situation, it is imperative that the nursery and customer maintain open and fair com-munication and that they document expectations in the form of a legal contract. This paper was presented at the Joint annual meeting of the Western Forestry and Conservation Nursery Association and the Pacif-ic Northwest Reforestation Council (Corvallis, OR, October 11–12, 2017).
Communication
Cultivating communication between the nursery personnel growing the seedlings and the forester re-sponsible for planting and early stand establishment is critical to successful reforestation (Haase 2014). The forester should start by visiting several nurser-ies to become familiar with nursery site conditions, soil, irrigation, frost protection, and climatic ex-tremes that impact cultural practices, lifting win-dows, and delivery of their seedlings. The forester should look carefully at seedlings throughout the nursery to see if they are uniform in color and size or are highly variable. If a lot of variation exists, it is important to look much closer. Some questions to consider: do some areas have poor drainage, cold air frost pockets, shade, or poor air circulation in a greenhouse? What is the condition of the facilities and equipment? Is the nursery investing in repairs, maintenance, and improvements? The people growing the seedlings are just as important. I have known excellent nursery facilities, but the people
could not grow a quality seedling, and the opposite is true too.
It is also good to visit nurseries during more than one growing season. Every nursery will have years when something happens that can impact seedling quality. How did they respond to the situation? Did they make corrections or shrug it off as “no big deal”? Tree planting contractors who plant seedlings grown at several nurseries are also a good source of information concerning seedling quality. They do not like planting poor quality seedlings, because they can also be implicated when poor survival occurs. After doing due diligence reviewing nurser-ies, the forester can make an informed decision on which nursery to hire.
After the forester decides where he or she wants to grow their seedlings, it is important that the nursery and customer maintain open communication. Most of the time, the customer provides the seed for the nursery to grow. It is a good practice for the nursery to set aside a small sample of the seed to test for any problems with the seed provided. The nursery needs to document, as soon as possible, any prob-lems in seedling quantity or quality, including what has happened and why, then the customer needs to be contacted. The customer should understand that growing seedlings is subject to year-to-year varia-tion in weather, as well as extreme environmental events. When necessary, the customer and nursery may need to make adjustments to culturing practic-es and target specifications. Contracts should clearly state the seedling specifications and what will be done when seedlings do not meet those specifi-cations. If years of problems repeat, the forester should consider taking his or her business elsewhere. Reducing risk is a primary reason why large for-estry organizations grow their seedlings at several different nurseries.
Contracting, Communication, and Pricing Trends for Forest Seedlings
John Trobaugh
Program Manager, Webster Forest Nursery, Washington Department of Natural Resources, Olympia, WA
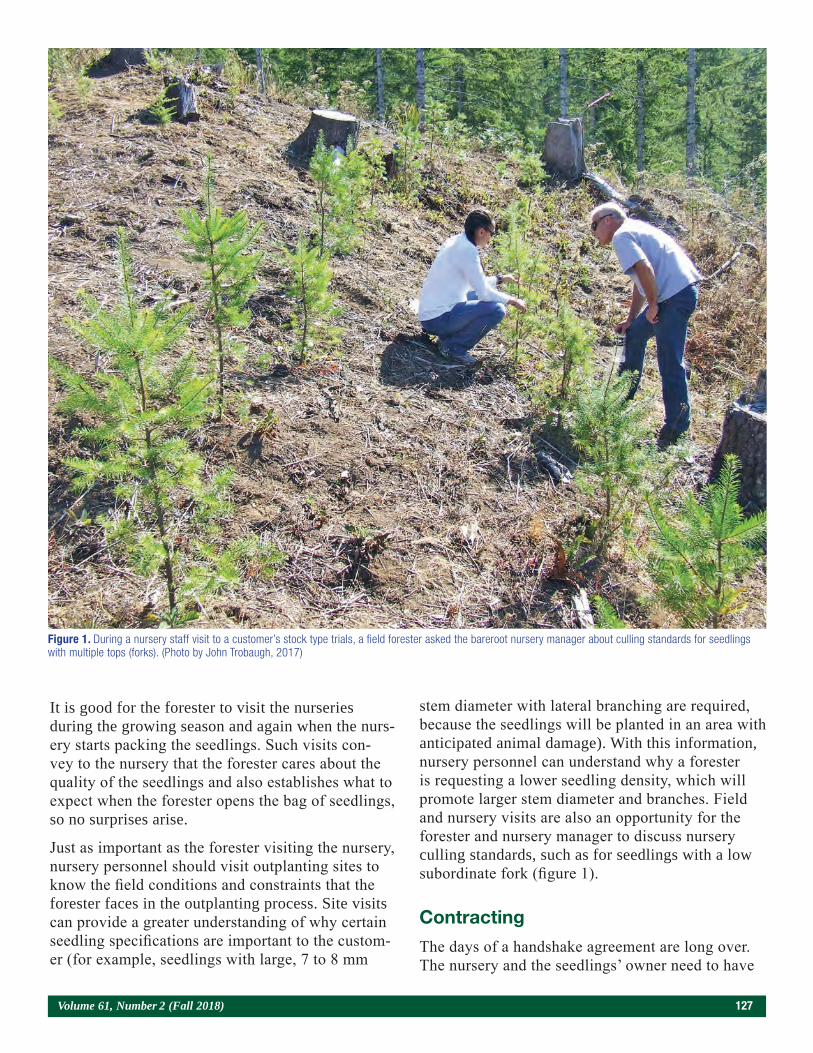
Volume 61, Number 2 (Fall 2018) 127
It is good for the forester to visit the nurseries during the growing season and again when the nurs-ery starts packing the seedlings. Such visits con-vey to the nursery that the forester cares about the quality of the seedlings and also establishes what to expect when the forester opens the bag of seedlings, so no surprises arise.
Just as important as the forester visiting the nursery, nursery personnel should visit outplanting sites to know the field conditions and constraints that the forester faces in the outplanting process. Site visits can provide a greater understanding of why certain seedling specifications are important to the custom-er (for example, seedlings with large, 7 to 8 mm
stem diameter with lateral branching are required, because the seedlings will be planted in an area with anticipated animal damage). With this information, nursery personnel can understand why a forester is requesting a lower seedling density, which will promote larger stem diameter and branches. Field and nursery visits are also an opportunity for the forester and nursery manager to discuss nursery culling standards, such as for seedlings with a low subordinate fork (figure 1).
Contracting
The days of a handshake agreement are long over. The nursery and the seedlings’ owner need to have
Figure 1. During a nursery staff visit to a customer’s stock type trials, a field forester asked the bareroot nursery manager about culling standards for seedlings with multiple tops (forks). (Photo by John Trobaugh, 2017)
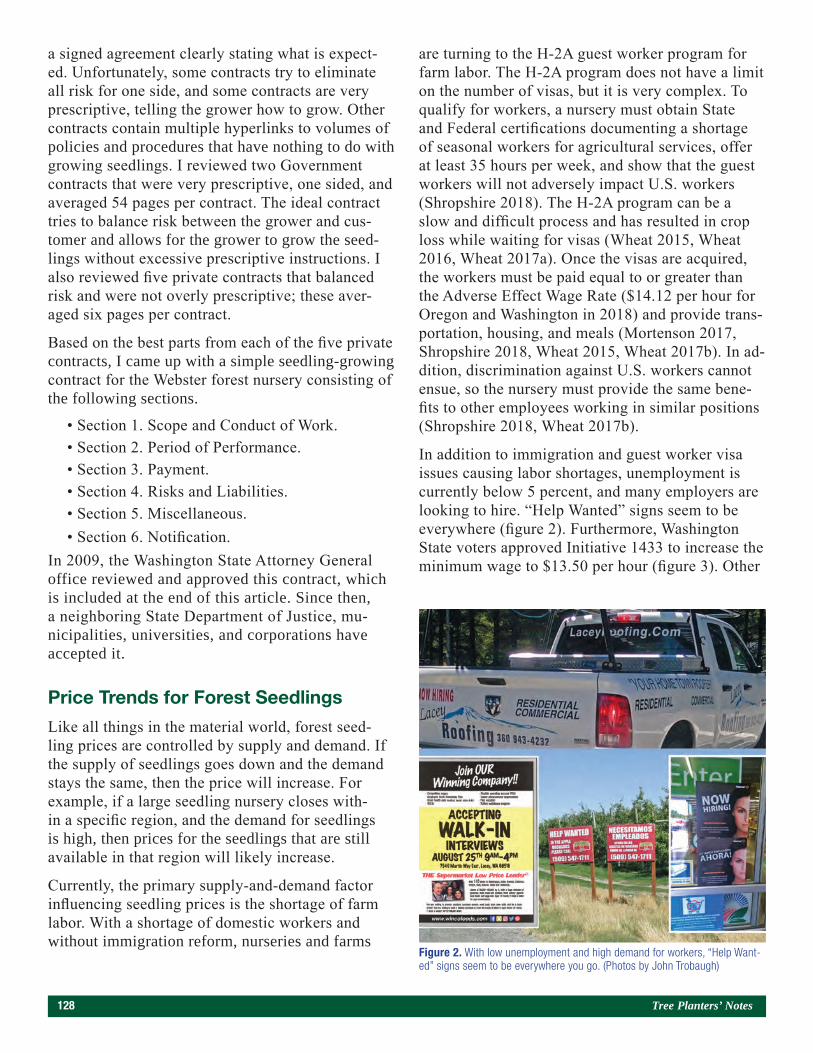
128 Tree Planters’ Notes
a signed agreement clearly stating what is expect-ed. Unfortunately, some contracts try to eliminate all risk for one side, and some contracts are very prescriptive, telling the grower how to grow. Other contracts contain multiple hyperlinks to volumes of policies and procedures that have nothing to do with growing seedlings. I reviewed two Government contracts that were very prescriptive, one sided, and averaged 54 pages per contract. The ideal contract tries to balance risk between the grower and cus-tomer and allows for the grower to grow the seed-lings without excessive prescriptive instructions. I also reviewed five private contracts that balanced risk and were not overly prescriptive; these aver-aged six pages per contract.
Based on the best parts from each of the five private contracts, I came up with a simple seedling-growing contract for the Webster forest nursery consisting of the following sections.
• Section 1. Scope and Conduct of Work.• Section 2. Period of Performance.• Section 3. Payment.• Section 4. Risks and Liabilities.• Section 5. Miscellaneous.• Section 6. Notification.
In 2009, the Washington State Attorney General office reviewed and approved this contract, which is included at the end of this article. Since then, a neighboring State Department of Justice, mu-nicipalities, universities, and corporations have accepted it.
Price Trends for Forest Seedlings
Like all things in the material world, forest seed-ling prices are controlled by supply and demand. If the supply of seedlings goes down and the demand stays the same, then the price will increase. For example, if a large seedling nursery closes with-in a specific region, and the demand for seedlings is high, then prices for the seedlings that are still available in that region will likely increase.
Currently, the primary supply-and-demand factor influencing seedling prices is the shortage of farm labor. With a shortage of domestic workers and without immigration reform, nurseries and farms
are turning to the H-2A guest worker program for farm labor. The H-2A program does not have a limit on the number of visas, but it is very complex. To qualify for workers, a nursery must obtain State and Federal certifications documenting a shortage of seasonal workers for agricultural services, offer at least 35 hours per week, and show that the guest workers will not adversely impact U.S. workers (Shropshire 2018). The H-2A program can be a slow and difficult process and has resulted in crop loss while waiting for visas (Wheat 2015, Wheat 2016, Wheat 2017a). Once the visas are acquired, the workers must be paid equal to or greater than the Adverse Effect Wage Rate ($14.12 per hour for Oregon and Washington in 2018) and provide trans-portation, housing, and meals (Mortenson 2017, Shropshire 2018, Wheat 2015, Wheat 2017b). In ad-dition, discrimination against U.S. workers cannot ensue, so the nursery must provide the same bene-fits to other employees working in similar positions (Shropshire 2018, Wheat 2017b).
In addition to immigration and guest worker visa issues causing labor shortages, unemployment is currently below 5 percent, and many employers are looking to hire. “Help Wanted” signs seem to be everywhere (figure 2). Furthermore, Washington State voters approved Initiative 1433 to increase the minimum wage to $13.50 per hour (figure 3). Other
Figure 2. With low unemployment and high demand for workers, “Help Want-ed” signs seem to be everywhere you go. (Photos by John Trobaugh)
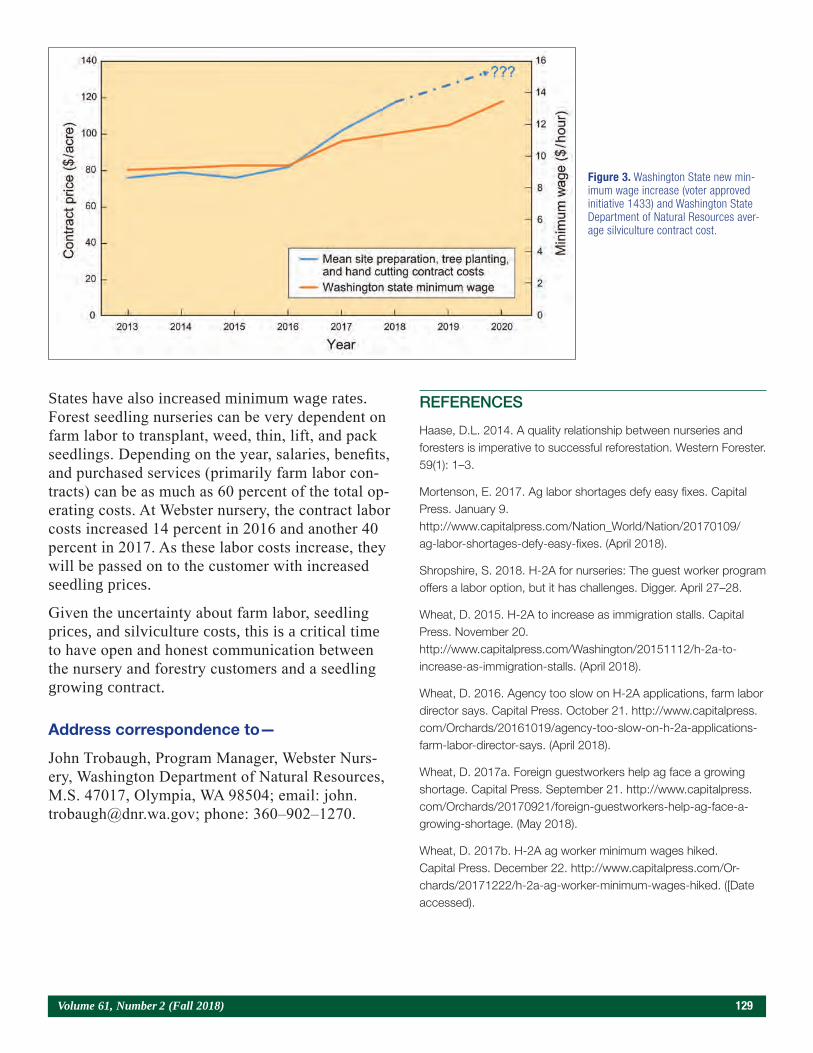
Volume 61, Number 2 (Fall 2018) 129
States have also increased minimum wage rates. Forest seedling nurseries can be very dependent on farm labor to transplant, weed, thin, lift, and pack seedlings. Depending on the year, salaries, benefits, and purchased services (primarily farm labor con-tracts) can be as much as 60 percent of the total op-erating costs. At Webster nursery, the contract labor costs increased 14 percent in 2016 and another 40 percent in 2017. As these labor costs increase, they will be passed on to the customer with increased seedling prices.
Given the uncertainty about farm labor, seedling prices, and silviculture costs, this is a critical time to have open and honest communication between the nursery and forestry customers and a seedling growing contract.
Address correspondence to—
John Trobaugh, Program Manager, Webster Nurs-ery, Washington Department of Natural Resources, M.S. 47017, Olympia, WA 98504; email: [email protected]; phone: 360–902–1270.
REFERENCES
Haase, D.L. 2014. A quality relationship between nurseries and foresters is imperative to successful reforestation. Western Forester. 59(1): 1–3.
Mortenson, E. 2017. Ag labor shortages defy easy fixes. Capital Press. January 9.http://www.capitalpress.com/Nation_World/Nation/20170109/ag-labor-shortages-defy-easy-fixes. (April 2018).
Shropshire, S. 2018. H-2A for nurseries: The guest worker program offers a labor option, but it has challenges. Digger. April 27–28.
Wheat, D. 2015. H-2A to increase as immigration stalls. Capital Press. November 20.http://www.capitalpress.com/Washington/20151112/h-2a-to-increase-as-immigration-stalls. (April 2018).
Wheat, D. 2016. Agency too slow on H-2A applications, farm labor director says. Capital Press. October 21. http://www.capitalpress.com/Orchards/20161019/agency-too-slow-on-h-2a-applications-farm-labor-director-says. (April 2018).
Wheat, D. 2017a. Foreign guestworkers help ag face a growing shortage. Capital Press. September 21. http://www.capitalpress.com/Orchards/20170921/foreign-guestworkers-help-ag-face-a-growing-shortage. (May 2018).
Wheat, D. 2017b. H-2A ag worker minimum wages hiked. Capital Press. December 22. http://www.capitalpress.com/Or-chards/20171222/h-2a-ag-worker-minimum-wages-hiked. ([Date accessed).
Figure 3. Washington State new min-imum wage increase (voter approved initiative 1433) and Washington State Department of Natural Resources aver-age silviculture contract cost.

130 Tree Planters’ Notes
STATE OF WASHINGTONDEPARTMENT OF NATURAL RESOURCES
NURSERY SEEDLING GROWING CONTRACT
Contract No.
This Contract is between the State of Washington Department of Natural Resources (Grower), and (Purchaser). For valuable consideration, the Grower agrees to grow at its nursery facilities seedlings from seed provided by the Purchaser.
The parties mutually agree to the terms below.
TERMS AND CONDITIONS
Section 1. Scope and Conduct of Work.
1. The Grower has suitable bareroot nursery space at its facility, a suitable labor force, technical exper-tise and the needed equipment, materials and supplies to grow seedlings from seed for one year, trans-plant one year old seedlings at approximately 24 seedlings per bed foot, and grow transplanted seedlings for a second year for Purchaser. Seedlings included in this contract for the sow year 2017 are specified in Schedule A, below.
Schedule A –Sow Year 2017
Seedlings Included in this Seedling Growing Contract
The management and procedure governing the work is as follows:
2. The Grower shall furnish all necessary qualified personnel, material, and equipment, and manage and direct the activities to complete in a timely manner the work described in this Contract.
3. Purchaser shall furnish an adequate amount of seed to produce the net quantity of seedlings speci-fied in Schedule A.
4. Grower shall grow the seedlings according to standard nursery practices and with the same care as every other crop in the nursery to achieve the minimum standards set forth in subsection 5 of this Section.
Species PurchaserCode
GrowerCode
SowYear
TransplantMonth
HarvestSeason/
Year
QuantityThousands
(M)
Price$/M
Total$
Douglas-fir 2017 April/May 2018
Winter2018/2019
Total

Volume 61, Number 2 (Fall 2018) 131
5. Grower will single sort Douglas-fir seedlings and cull all seedlings with a caliper of less than six millimeters and height from root collar to terminal bud of less than twelve inches. Seedlings will be free of any visually detectable disease or insects. Seedlings will be free of any forks at the base of the stem. Seedlings will be root pruned to a root length of ten inches (+/- one inch). Seedlings will be packed in Grower’s seedling bags and stored in Grower’s cold storage facilities for not more than fifteen days.
Section 2. Period of Performance.
1. Effective Date: The beginning date of this contract shall be the date the last party has signed the contract and returned a signed copy to the other party. Each project manager shall keep an origi-nal signed copy.
2. Completion Date: This contract shall terminate on June 1, 2019 or when all of its terms and con-ditions have been satisfied, per mutual agreement, whichever is earlier, unless terminated sooner as provided herein.
Section 3. Payment.
1. Payment due to Grower for seedling production services shall be based on the stated price per one thousand seedlings as set forth in Schedule A, plus applicable taxes, if any. Purchaser shall pay Grower 50% of the seedling price specified in Schedule A at the time Grower transplants the seedlings, based on the number of seedlings Purchaser requested and transplanted by Grow-er. Purchaser shall pay the remaining balance based on the net number of seedlings loaded for shipment. Grower will invoice monthly for seedlings shipped that month. All payments are due within 30 days from invoice.
2. Storage costs for the first 15 days following packing is included in the seedling price. If seed-lings remain in Growers coolers beyond 15 days, a $2.00 per bag or box per month storage fee will be added to the invoice, retroactive to the date that the seedlings were packed and placed in storage.
3. The seedlings will be transported by Purchaser. No transportation beyond loading at the loading dock will be provided by Grower.
4. The number of seedlings made available to Purchaser may vary from the ordered number of seed-lings due to potential production of less than or more than the requested quantity. The Grower shall not be responsible for furnishing replacement trees for less than the requested quantity.
5. Purchaser has the first right-of-refusal for any excess seedlings above the requested quantity (overrun) at the contract price as set forth in Schedule A. Any seedlings below the minimum specifications may be purchased by Purchaser or specifications adjusted as negotiated between Purchaser and Grower. If Purchaser declines the overrun and/or seedlings below specifications, they become the property of Grower to sell or otherwise dispose of.
Section 4. Risks and Liabilities
1. The remedies provided in this contract are the sole remedies available to the Purchaser under the contract.
2. No Warranties. The Grower disclaims all warranties, express or implied, including any warranty of merchantability or of fitness for a particular purpose, in connection with the seedling produc-tion services provided by Grower.

132 Tree Planters’ Notes
3. Grower will not be liable to compensate the Purchaser in any manner if Grower is unable to deliver the seedlings or any part thereof by reason of any cause beyond its control such as Acts of God or of the public enemy, wars, insurrection, riot, crop failure, loss of seedlings by fungus or other disease, insects or other pests, fire, flood, strikes or other industrial dispute. If any of the aforementioned events do not cause total destruction of the seedlings, the Grower will deliver and the Purchaser shall accept such portion of the seedlings as have grown and met the Minimum Standards set forth in Section 1, subsection 5 and payments due will be reduced proportionately to the number of seedlings that meet the Minimum Standards.
4. If Purchaser’s seedlings are significantly damaged by the Grower due to acts of negligence, such as misapplication of fertilizers or herbicides, Grower will reimburse the 50% payment made by Purchaser at the time Grower transplanted the one year old seedlings. However, if any such event does not cause total destruction of the seedlings, the Grower will deliver and the Purchaser will accept such portion of the seedlings as have grown and met the Minimum Standards as set forth in Section 1, subsection 5, and the Purchaser will pay to Grower a proportionate amount of the seedling price.
5. Risk of loss or subsequent damage to each shipment of seedlings shall pass to the Purchaser upon completion of the loading of the shipment at Grower’s nursery if transportation is by Purchaser or commercial transportation.
Section 5. Miscellaneous
1. Amendment. The terms of this Agreement, including Schedule A, may be amended only by the written agreement of both parties.
2. Assignment. This contract is not assignable by either party to a third party.
3. Termination. This contract may be terminated by written agreement signed by both parties. If this agreement is terminated after seedlings have been transplanted, the Purchaser gives up all rights to the seedlings and shall continue to be obligated to pay the 50% payment due at transplant time, and if such payment has been made, shall not be entitled to its refund.
4. Dispute Resolution. In the event of any disagreement or dispute between parties under this con-tract, the parties agree to attempt to resolve the dispute through direct negotiation. If the dispute cannot be resolved by direct negotiation, the parties agree to participate in mediation in good faith. The mediator shall be chosen by agreement of the parties. If the parties cannot agree on a mediator, the parties shall use a mediation service that selects the mediator for the parties. The parties agree that mediation shall precede any action in a judicial or quasi-judicial tribunal.
5. Governing Law. This contract shall be construed, interpreted and enforced pursuant to the laws of the State of Washington. Venue shall be in Thurston County. The terms of this contract shall be given their ordinary meaning and shall not be construed in favor of or against either party here-to. If any provision of this contract violates any statute or rule of law of the State of Washington, it is considered modified to conform to that statute or rule of law.
Section 6. Notification
Written notices may be delivered personally, or by FAX, e-mail, U.S. mail or express delivery, to the designated contact persons or their designated replacements. Oral notifications are acceptable if confirmed by written notice within 5 business days.

Volume 61, Number 2 (Fall 2018) 133
Project Manager.
1. The Project Manager for the Purchaser is Telephone Number –
2. The Project Manager for the Grower is John Trobaugh. Telephone Number - 360-902-1270 DNR Webster Forest Nursery.P.O. Box 47017Olympia WA 98504-7017
IN WITNESS WHEREOF, the parties have executed this Agreement.
PURCHASER NAME
Dated: ________________, 20 ___ By: ________________________________
Printed Name: _______________________________
Title: _______________________________
FTIN: ________________________________
UBI Number: _______________________________.
STATE OF WASHINGTONDEPARTMENT OF NATURAL RESOURCES
Dated: __________________, 20 ___ By: ________________________________
Printed Name: ______________________________
Title: ________________________________
134 Tree Planters’ Notes
Abstract
Selecting an appropriate stock type is an important reforestation decision affecting the success and cost of reforestation projects. This study was designed to quantify the effect of three containerized stock types on Douglas-fir seedling survival and growth at two sites in the Central Coastal Range during the initial 8 years of establishment. The stock types tested included styro-8 (S-8), styro-15 (S-15), and styro-60 (S-60). Initial size differences at the time of planting disappeared after 8 years of growth such that tree sizes were similar across stock types. The mortality rate of the S-60 stock type was 15 percent greater than the S-8 and S-15 stock types at both sites. Site conditions affected the growth of seedlings, and, after eight seasons, the more mesic conditions on one of the sites enabled trees to be, on average, 0.6 m taller, with diameters at breast height 0.8 cm larger compared with those growing on the drier site.
Introduction
The survival and growth of planted conifer seedlings is dependent on several factors, including site quality, weather conditions during the establishment period, silvicultural prescriptions (e.g., weed control), and the stock type of the seedlings being planted. Of these factors, stock type selection is one of the first decisions a forest manager can make that will impact establishment efforts.
The Target Plant Concept offers a flexible framework for forest and nursery managers to integrate and im-prove the link between nursery cultural practices and seedling survival and growth on the outplanting site (Dumroese et al. 2016). One of the pillars of the Target
Plant Concept is the idea of “fitness for purpose,” which defines seedling quality by outplanting per-formance rather than nursery performance. Fitness for purpose requires managers to have accurate in-formation on how different stock types produced in the nursery perform under specific field conditions. This information is particularly important consid-ering that seedlings of different stock types also represent different financial investments.
Several studies have examined the impact of stock type selection on Douglas-fir (Pseudotsuga menziesii [Mirb.] Franco) growth, however many of these studies are relatively short term, and results are often conflicting. Van den Driessche (1992) tested the survival and growth of six different Douglas-fir stock types during a 6-year period on a site in south central Vancouver Island. Results demonstrated that smaller seedlings had greater mean relative growth rates compared with larger seedlings. Due to this greater growth rate, differences in the average stem volume of the stock types were no longer observed after six growing seasons despite large initial size differences.
In contrast to van den Driessche (1992), Rose et al. (1997) and Haase et al. (2006) reported that larger planted Douglas-fir seedlings outperformed small-er seedlings. Growing 2-year-old bareroot seedlings operationally and separating the seedlings into small, medium, and large size classes based on root volume produced the different seedling size classes in Rose et al. (1997). This methodology, therefore, did not di-rectly test seedlings of different stock types but rather seedlings of different root volume within a single stock type. Haase et al. (2006) found that seedlings grown in large containers (styro-20) were bigger than seedlings grown in small- or medium-sized containers (styro-8
The Influence of Containerized Stock Type on the Growth and Survival of Douglas-fir Seedlings
Maxwell G. Wightman, Carlos A. Gonzalez-Benecke, and Eric J. Dinger
Faculty Research Assistant, College of Forestry, Oregon State University (OSU), Corvallis, OR; Assistant Professor, College of Forestry, OSU, Corvallis, OR; Forest Inventory and Research Manager,
Roseburg Resources Company, Roseburg, OR
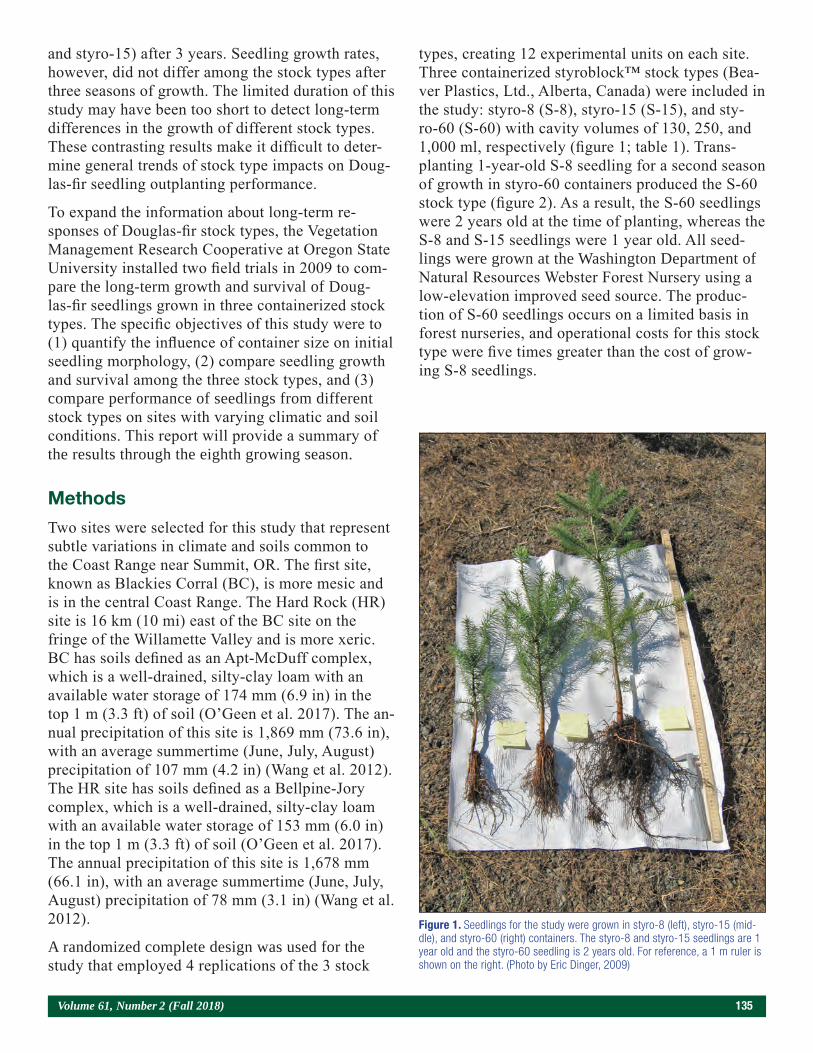
Volume 61, Number 2 (Fall 2018) 135
and styro-15) after 3 years. Seedling growth rates, however, did not differ among the stock types after three seasons of growth. The limited duration of this study may have been too short to detect long-term differences in the growth of different stock types. These contrasting results make it difficult to deter-mine general trends of stock type impacts on Doug-las-fir seedling outplanting performance.
To expand the information about long-term re-sponses of Douglas-fir stock types, the Vegetation Management Research Cooperative at Oregon State University installed two field trials in 2009 to com-pare the long-term growth and survival of Doug-las-fir seedlings grown in three containerized stock types. The specific objectives of this study were to (1) quantify the influence of container size on initial seedling morphology, (2) compare seedling growth and survival among the three stock types, and (3) compare performance of seedlings from different stock types on sites with varying climatic and soil conditions. This report will provide a summary of the results through the eighth growing season.
Methods
Two sites were selected for this study that represent subtle variations in climate and soils common to the Coast Range near Summit, OR. The first site, known as Blackies Corral (BC), is more mesic and is in the central Coast Range. The Hard Rock (HR) site is 16 km (10 mi) east of the BC site on the fringe of the Willamette Valley and is more xeric. BC has soils defined as an Apt-McDuff complex, which is a well-drained, silty-clay loam with an available water storage of 174 mm (6.9 in) in the top 1 m (3.3 ft) of soil (O’Geen et al. 2017). The an-nual precipitation of this site is 1,869 mm (73.6 in), with an average summertime (June, July, August) precipitation of 107 mm (4.2 in) (Wang et al. 2012). The HR site has soils defined as a Bellpine-Jory complex, which is a well-drained, silty-clay loam with an available water storage of 153 mm (6.0 in) in the top 1 m (3.3 ft) of soil (O’Geen et al. 2017). The annual precipitation of this site is 1,678 mm (66.1 in), with an average summertime (June, July, August) precipitation of 78 mm (3.1 in) (Wang et al. 2012).
A randomized complete design was used for the study that employed 4 replications of the 3 stock
types, creating 12 experimental units on each site. Three containerized styroblock™ stock types (Bea-ver Plastics, Ltd., Alberta, Canada) were included in the study: styro-8 (S-8), styro-15 (S-15), and sty-ro-60 (S-60) with cavity volumes of 130, 250, and 1,000 ml, respectively (figure 1; table 1). Trans-planting 1-year-old S-8 seedling for a second season of growth in styro-60 containers produced the S-60 stock type (figure 2). As a result, the S-60 seedlings were 2 years old at the time of planting, whereas the S-8 and S-15 seedlings were 1 year old. All seed-lings were grown at the Washington Department of Natural Resources Webster Forest Nursery using a low-elevation improved seed source. The produc-tion of S-60 seedlings occurs on a limited basis in forest nurseries, and operational costs for this stock type were five times greater than the cost of grow-ing S-8 seedlings.
Figure 1. Seedlings for the study were grown in styro-8 (left), styro-15 (mid-dle), and styro-60 (right) containers. The styro-8 and styro-15 seedlings are 1 year old and the styro-60 seedling is 2 years old. For reference, a 1 m ruler is shown on the right. (Photo by Eric Dinger, 2009)
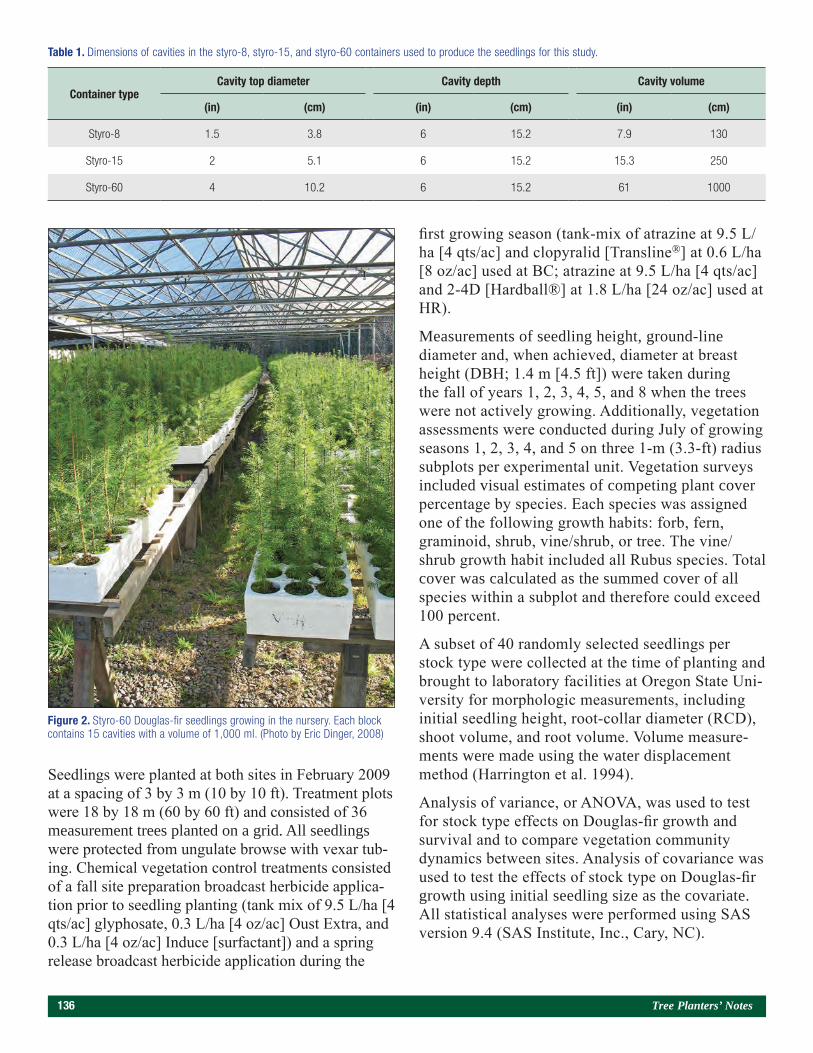
136 Tree Planters’ Notes
Seedlings were planted at both sites in February 2009 at a spacing of 3 by 3 m (10 by 10 ft). Treatment plots were 18 by 18 m (60 by 60 ft) and consisted of 36 measurement trees planted on a grid. All seedlings were protected from ungulate browse with vexar tub-ing. Chemical vegetation control treatments consisted of a fall site preparation broadcast herbicide applica-tion prior to seedling planting (tank mix of 9.5 L/ha [4 qts/ac] glyphosate, 0.3 L/ha [4 oz/ac] Oust Extra, and 0.3 L/ha [4 oz/ac] Induce [surfactant]) and a spring release broadcast herbicide application during the
first growing season (tank-mix of atrazine at 9.5 L/ha [4 qts/ac] and clopyralid [Transline®] at 0.6 L/ha [8 oz/ac] used at BC; atrazine at 9.5 L/ha [4 qts/ac] and 2-4D [Hardball®] at 1.8 L/ha [24 oz/ac] used at HR).
Measurements of seedling height, ground-line diameter and, when achieved, diameter at breast height (DBH; 1.4 m [4.5 ft]) were taken during the fall of years 1, 2, 3, 4, 5, and 8 when the trees were not actively growing. Additionally, vegetation assessments were conducted during July of growing seasons 1, 2, 3, 4, and 5 on three 1-m (3.3-ft) radius subplots per experimental unit. Vegetation surveys included visual estimates of competing plant cover percentage by species. Each species was assigned one of the following growth habits: forb, fern, graminoid, shrub, vine/shrub, or tree. The vine/shrub growth habit included all Rubus species. Total cover was calculated as the summed cover of all species within a subplot and therefore could exceed 100 percent.
A subset of 40 randomly selected seedlings per stock type were collected at the time of planting and brought to laboratory facilities at Oregon State Uni-versity for morphologic measurements, including initial seedling height, root-collar diameter (RCD), shoot volume, and root volume. Volume measure-ments were made using the water displacement method (Harrington et al. 1994).
Analysis of variance, or ANOVA, was used to test for stock type effects on Douglas-fir growth and survival and to compare vegetation community dynamics between sites. Analysis of covariance was used to test the effects of stock type on Douglas-fir growth using initial seedling size as the covariate. All statistical analyses were performed using SAS version 9.4 (SAS Institute, Inc., Cary, NC).
Table 1. Dimensions of cavities in the styro-8, styro-15, and styro-60 containers used to produce the seedlings for this study.
Container typeCavity top diameter Cavity depth Cavity volume
(in) (cm) (in) (cm) (in) (cm)
Styro-8 1.5 3.8 6 15.2 7.9 130
Styro-15 2 5.1 6 15.2 15.3 250
Styro-60 4 10.2 6 15.2 61 1000
Figure 2. Styro-60 Douglas-fir seedlings growing in the nursery. Each block contains 15 cavities with a volume of 1,000 ml. (Photo by Eric Dinger, 2008)
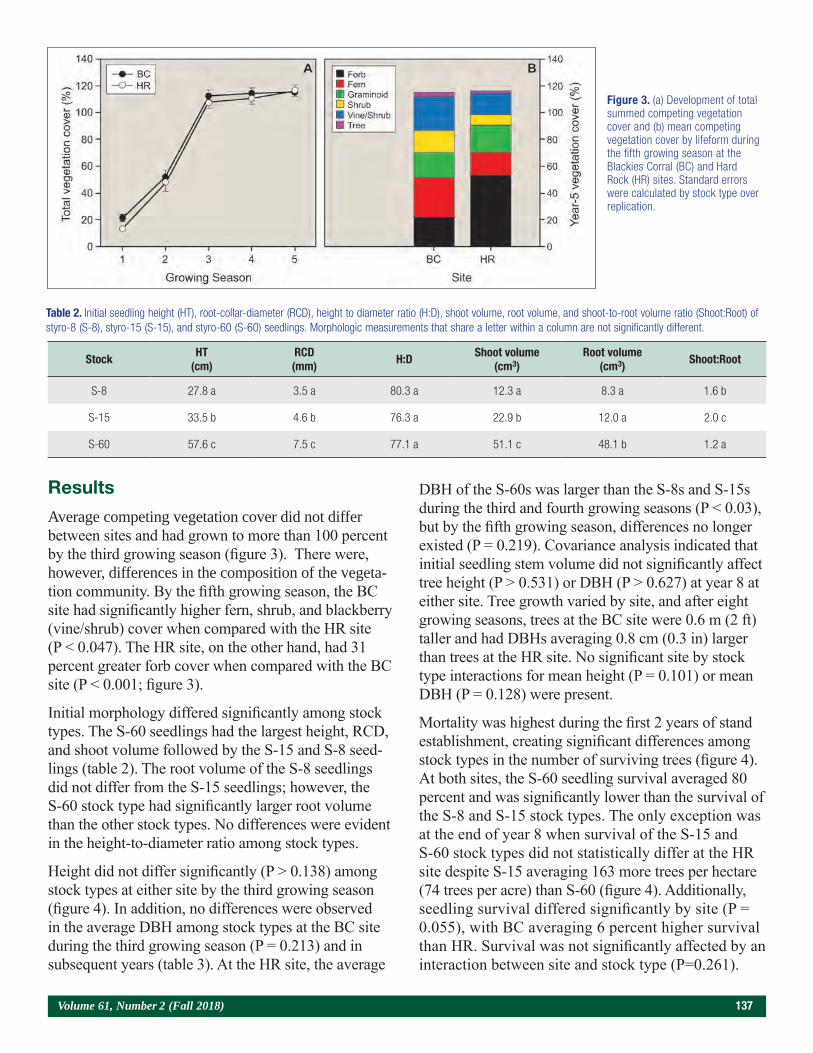
Volume 61, Number 2 (Fall 2018) 137
Table 2. Initial seedling height (HT), root-collar-diameter (RCD), height to diameter ratio (H:D), shoot volume, root volume, and shoot-to-root volume ratio (Shoot:Root) of styro-8 (S-8), styro-15 (S-15), and styro-60 (S-60) seedlings. Morphologic measurements that share a letter within a column are not significantly different.
Stock HT (cm)
RCD (mm) H:D Shoot volume
(cm3)Root volume
(cm3) Shoot:Root
S-8 27.8 a 3.5 a 80.3 a 12.3 a 8.3 a 1.6 b
S-15 33.5 b 4.6 b 76.3 a 22.9 b 12.0 a 2.0 c
S-60 57.6 c 7.5 c 77.1 a 51.1 c 48.1 b 1.2 a
Results
Average competing vegetation cover did not differ between sites and had grown to more than 100 percent by the third growing season (figure 3). There were, however, differences in the composition of the vegeta-tion community. By the fifth growing season, the BC site had significantly higher fern, shrub, and blackberry (vine/shrub) cover when compared with the HR site (P < 0.047). The HR site, on the other hand, had 31 percent greater forb cover when compared with the BC site (P < 0.001; figure 3).
Initial morphology differed significantly among stock types. The S-60 seedlings had the largest height, RCD, and shoot volume followed by the S-15 and S-8 seed-lings (table 2). The root volume of the S-8 seedlings did not differ from the S-15 seedlings; however, the S-60 stock type had significantly larger root volume than the other stock types. No differences were evident in the height-to-diameter ratio among stock types.
Height did not differ significantly (P > 0.138) among stock types at either site by the third growing season (figure 4). In addition, no differences were observed in the average DBH among stock types at the BC site during the third growing season (P = 0.213) and in subsequent years (table 3). At the HR site, the average
DBH of the S-60s was larger than the S-8s and S-15s during the third and fourth growing seasons (P < 0.03), but by the fifth growing season, differences no longer existed (P = 0.219). Covariance analysis indicated that initial seedling stem volume did not significantly affect tree height (P > 0.531) or DBH (P > 0.627) at year 8 at either site. Tree growth varied by site, and after eight growing seasons, trees at the BC site were 0.6 m (2 ft) taller and had DBHs averaging 0.8 cm (0.3 in) larger than trees at the HR site. No significant site by stock type interactions for mean height (P = 0.101) or mean DBH (P = 0.128) were present.
Mortality was highest during the first 2 years of stand establishment, creating significant differences among stock types in the number of surviving trees (figure 4). At both sites, the S-60 seedling survival averaged 80 percent and was significantly lower than the survival of the S-8 and S-15 stock types. The only exception was at the end of year 8 when survival of the S-15 and S-60 stock types did not statistically differ at the HR site despite S-15 averaging 163 more trees per hectare (74 trees per acre) than S-60 (figure 4). Additionally, seedling survival differed significantly by site (P = 0.055), with BC averaging 6 percent higher survival than HR. Survival was not significantly affected by an interaction between site and stock type (P=0.261).
Figure 3. (a) Development of total summed competing vegetation cover and (b) mean competing vegetation cover by lifeform during the fifth growing season at the Blackies Corral (BC) and Hard Rock (HR) sites. Standard errors were calculated by stock type over replication.
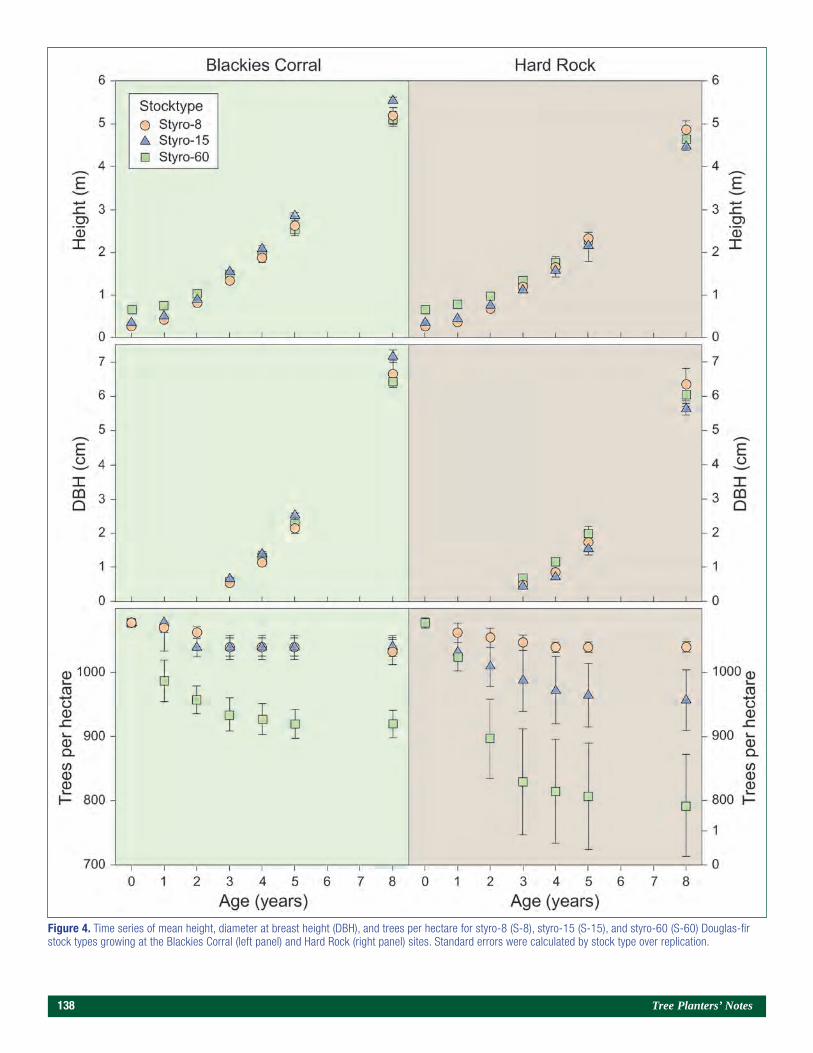
138 Tree Planters’ Notes
Figure 4. Time series of mean height, diameter at breast height (DBH), and trees per hectare for styro-8 (S-8), styro-15 (S-15), and styro-60 (S-60) Douglas-fir stock types growing at the Blackies Corral (left panel) and Hard Rock (right panel) sites. Standard errors were calculated by stock type over replication.
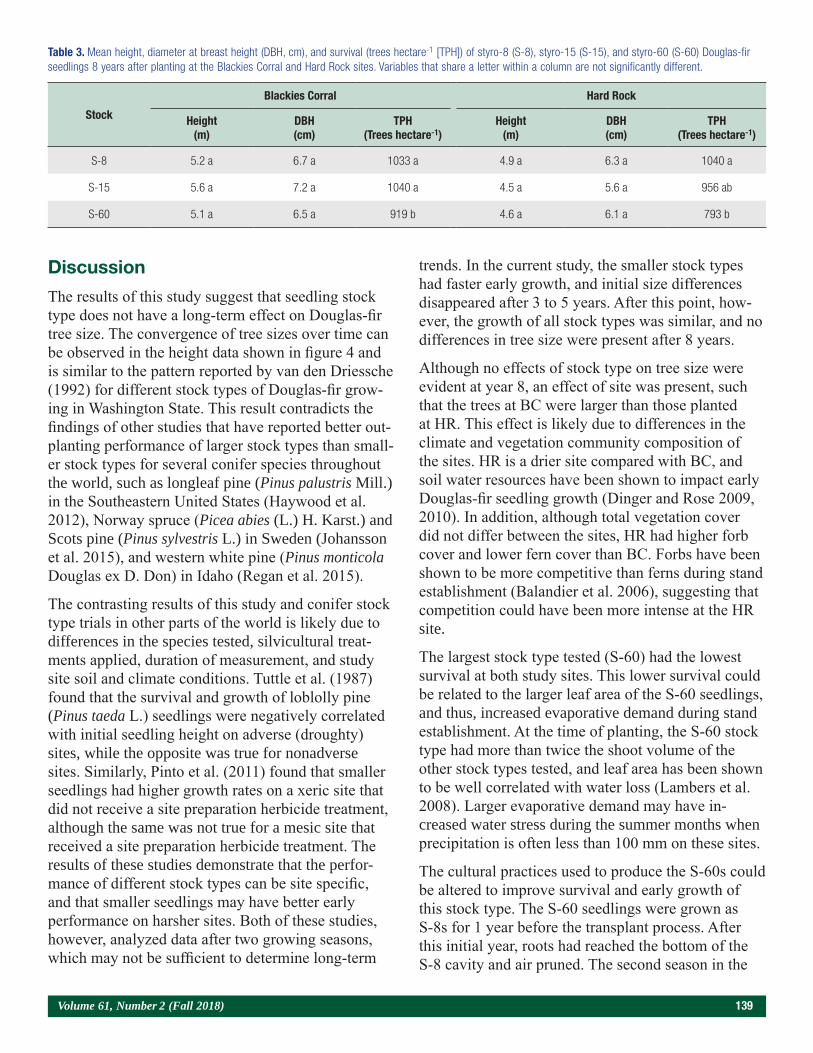
Volume 61, Number 2 (Fall 2018) 139
Discussion
The results of this study suggest that seedling stock type does not have a long-term effect on Douglas-fir tree size. The convergence of tree sizes over time can be observed in the height data shown in figure 4 and is similar to the pattern reported by van den Driessche (1992) for different stock types of Douglas-fir grow-ing in Washington State. This result contradicts the findings of other studies that have reported better out-planting performance of larger stock types than small-er stock types for several conifer species throughout the world, such as longleaf pine (Pinus palustris Mill.) in the Southeastern United States (Haywood et al. 2012), Norway spruce (Picea abies (L.) H. Karst.) and Scots pine (Pinus sylvestris L.) in Sweden (Johansson et al. 2015), and western white pine (Pinus monticola Douglas ex D. Don) in Idaho (Regan et al. 2015).
The contrasting results of this study and conifer stock type trials in other parts of the world is likely due to differences in the species tested, silvicultural treat-ments applied, duration of measurement, and study site soil and climate conditions. Tuttle et al. (1987) found that the survival and growth of loblolly pine (Pinus taeda L.) seedlings were negatively correlated with initial seedling height on adverse (droughty) sites, while the opposite was true for nonadverse sites. Similarly, Pinto et al. (2011) found that smaller seedlings had higher growth rates on a xeric site that did not receive a site preparation herbicide treatment, although the same was not true for a mesic site that received a site preparation herbicide treatment. The results of these studies demonstrate that the perfor-mance of different stock types can be site specific, and that smaller seedlings may have better early performance on harsher sites. Both of these studies, however, analyzed data after two growing seasons, which may not be sufficient to determine long-term
trends. In the current study, the smaller stock types had faster early growth, and initial size differences disappeared after 3 to 5 years. After this point, how-ever, the growth of all stock types was similar, and no differences in tree size were present after 8 years.
Although no effects of stock type on tree size were evident at year 8, an effect of site was present, such that the trees at BC were larger than those planted at HR. This effect is likely due to differences in the climate and vegetation community composition of the sites. HR is a drier site compared with BC, and soil water resources have been shown to impact early Douglas-fir seedling growth (Dinger and Rose 2009, 2010). In addition, although total vegetation cover did not differ between the sites, HR had higher forb cover and lower fern cover than BC. Forbs have been shown to be more competitive than ferns during stand establishment (Balandier et al. 2006), suggesting that competition could have been more intense at the HR site.
The largest stock type tested (S-60) had the lowest survival at both study sites. This lower survival could be related to the larger leaf area of the S-60 seedlings, and thus, increased evaporative demand during stand establishment. At the time of planting, the S-60 stock type had more than twice the shoot volume of the other stock types tested, and leaf area has been shown to be well correlated with water loss (Lambers et al. 2008). Larger evaporative demand may have in-creased water stress during the summer months when precipitation is often less than 100 mm on these sites.
The cultural practices used to produce the S-60s could be altered to improve survival and early growth of this stock type. The S-60 seedlings were grown as S-8s for 1 year before the transplant process. After this initial year, roots had reached the bottom of the S-8 cavity and air pruned. The second season in the
Table 3. Mean height, diameter at breast height (DBH, cm), and survival (trees hectare-1 [TPH]) of styro-8 (S-8), styro-15 (S-15), and styro-60 (S-60) Douglas-fir seedlings 8 years after planting at the Blackies Corral and Hard Rock sites. Variables that share a letter within a column are not significantly different.
Stock
Blackies Corral Hard Rock
Height(m)
DBH(cm)
TPH(Trees hectare-1)
Height(m)
DBH(cm)
TPH(Trees hectare-1)
S-8 5.2 a 6.7 a 1033 a 4.9 a 6.3 a 1040 a
S-15 5.6 a 7.2 a 1040 a 4.5 a 5.6 a 956 ab
S-60 5.1 a 6.5 a 919 b 4.6 a 6.1 a 793 b
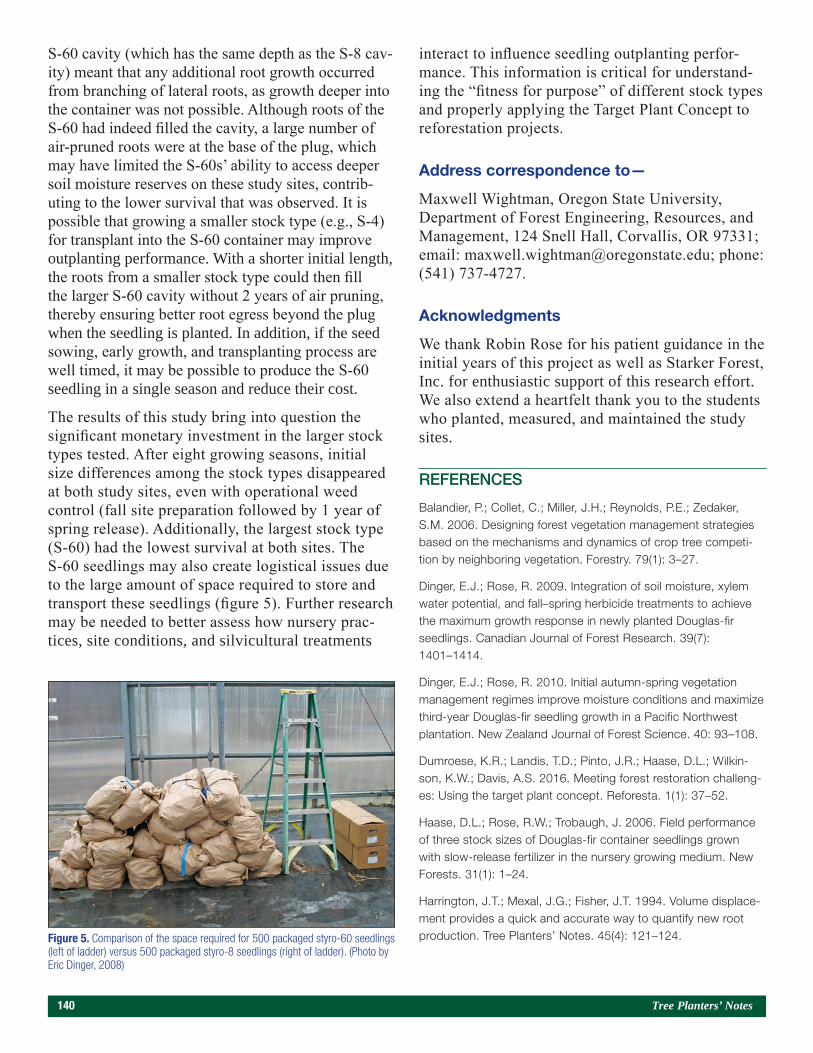
140 Tree Planters’ Notes
S-60 cavity (which has the same depth as the S-8 cav-ity) meant that any additional root growth occurred from branching of lateral roots, as growth deeper into the container was not possible. Although roots of the S-60 had indeed filled the cavity, a large number of air-pruned roots were at the base of the plug, which may have limited the S-60s’ ability to access deeper soil moisture reserves on these study sites, contrib-uting to the lower survival that was observed. It is possible that growing a smaller stock type (e.g., S-4) for transplant into the S-60 container may improve outplanting performance. With a shorter initial length, the roots from a smaller stock type could then fill the larger S-60 cavity without 2 years of air pruning, thereby ensuring better root egress beyond the plug when the seedling is planted. In addition, if the seed sowing, early growth, and transplanting process are well timed, it may be possible to produce the S-60 seedling in a single season and reduce their cost.
The results of this study bring into question the significant monetary investment in the larger stock types tested. After eight growing seasons, initial size differences among the stock types disappeared at both study sites, even with operational weed control (fall site preparation followed by 1 year of spring release). Additionally, the largest stock type (S-60) had the lowest survival at both sites. The S-60 seedlings may also create logistical issues due to the large amount of space required to store and transport these seedlings (figure 5). Further research may be needed to better assess how nursery prac-tices, site conditions, and silvicultural treatments
interact to influence seedling outplanting perfor-mance. This information is critical for understand-ing the “fitness for purpose” of different stock types and properly applying the Target Plant Concept to reforestation projects.
Address correspondence to—
Maxwell Wightman, Oregon State University, Department of Forest Engineering, Resources, and Management, 124 Snell Hall, Corvallis, OR 97331; email: [email protected]; phone: (541) 737-4727.
Acknowledgments
We thank Robin Rose for his patient guidance in the initial years of this project as well as Starker Forest, Inc. for enthusiastic support of this research effort. We also extend a heartfelt thank you to the students who planted, measured, and maintained the study sites.
REFERENCES
Balandier, P.; Collet, C.; Miller, J.H.; Reynolds, P.E.; Zedaker, S.M. 2006. Designing forest vegetation management strategies based on the mechanisms and dynamics of crop tree competi-tion by neighboring vegetation. Forestry. 79(1): 3–27.
Dinger, E.J.; Rose, R. 2009. Integration of soil moisture, xylem water potential, and fall–spring herbicide treatments to achieve the maximum growth response in newly planted Douglas-fir seedlings. Canadian Journal of Forest Research. 39(7): 1401–1414.
Dinger, E.J.; Rose, R. 2010. Initial autumn-spring vegetation management regimes improve moisture conditions and maximize third-year Douglas-fir seedling growth in a Pacific Northwest plantation. New Zealand Journal of Forest Science. 40: 93–108.
Dumroese, K.R.; Landis, T.D.; Pinto, J.R.; Haase, D.L.; Wilkin-son, K.W.; Davis, A.S. 2016. Meeting forest restoration challeng-es: Using the target plant concept. Reforesta. 1(1): 37–52.
Haase, D.L.; Rose, R.W.; Trobaugh, J. 2006. Field performance of three stock sizes of Douglas-fir container seedlings grown with slow-release fertilizer in the nursery growing medium. New Forests. 31(1): 1–24.
Harrington, J.T.; Mexal, J.G.; Fisher, J.T. 1994. Volume displace-ment provides a quick and accurate way to quantify new root production. Tree Planters’ Notes. 45(4): 121–124.Figure 5. Comparison of the space required for 500 packaged styro-60 seedlings
(left of ladder) versus 500 packaged styro-8 seedlings (right of ladder). (Photo by Eric Dinger, 2008)

Volume 61, Number 2 (Fall 2018) 141
Haywood, J.D.; Sung, S.-J. S; Sayer, S.; Anne, M. 2012. Copper root pruning and container cavity size influence longleaf pine growth through five growing seasons. Southern Journal of Applied Forestry. 36(3): 146–151.
Johansson, K.; Hajek, J.; Sjölin, O.; Normark, E. 2015. Early performance of Pinus sylvestris and Picea abies – a comparison between seedling size, species, and geographic location of the planting site. Scandinavian Journal of Forest Research. 30(5): 388–400.
Lambers, H; Chapin, S.F.; Pons, L.P. 2008. Plant physiological ecology. New York: Springer. 605 p.
O’Geen, A.T.; Walkinshaw, M.; Beaudette, D.E. 2017. SoilWeb: a multifaceted interface to soil survey information. Soil Science Society of America Journal. 81(4): 853–862.
Pinto, J.R.; Marshall, J.D.; Dumroese, R.K.; Davis, A.S.; Cobos, D.R. 2011. Establishment and growth of container seedlings for reforestation: A function of stocktype and edaphic conditions. Forest Ecology and Management. 261(11): 1876–1884.
Regan, D.J.; Apostol, K.G.; Davis, A.S. 2015. Stocktype influ-ences western white pine seedling size 6 years after outplanting. Tree Planters’ Notes 58(1): 37–41.
Rose, R.; Haase, D.L.; Kroiher, F.; Sabin, T. 1997. Root volume and growth of ponderosa pine and Douglas-fir seedlings: a summary of eight growing seasons. Western Journal of Applied Forestry. 12(3): 69–73.
Tuttle, C.L.; South, D.B.; Golden, M.S.; Meldahl, R.S. 1987. Relationship between initial seedling height and survival and growth of loblolly pine seedlings planted during a droughty year. Southern Journal of Applied Forestry. 11(3): 139–143.
van den Driessche, R. 1992. Absolute and relative growth of Douglas-fir seedlings of different sizes. Tree Physiology. 10(2): 141–152.
Wang, T.; Hamann, A.; Spittlehouse, D.; Murdock, T.N. 2012. ClimateWNA—high-resolution spatial climate data for western North America. Journal of Applied Meteorology and Climatology. 51(1): 16–29.
142 Tree Planters’ Notes
Abstract
The U.S. Department of Agriculture (USDA), Forest Service, National Technology and Development Pro-gram (NTDP) evaluated the use of satellite telemetry to monitor outplanting sites in remote areas. These areas do not have access to cell service and require hours of drive time to inspect planting sites. Remotely accessible camera and sensor systems provide For-est Service personnel with the capability to inspect sites without leaving the office. This system enables reforestation personnel to plan planting contracts at the optimum time for planting. NTDP evaluated the Nupoint Systems Remote Viewer Satellite Camera System using a Campbell datalogger and air and soil temperature probes. The user receives an image via email that contains the air and soil temperature data. A snow depth gauge in the image provides a refer-ence for determining snow depth. NTDP deployed the system in the fall of 2017, and the system has been transmitting images since February 2018. This paper was presented at the Joint annual meeting of the Western Forestry and Conservation Nursery Associa-tion and the Pacific Northwest Reforestation Council (Corvallis, OR, October 11–12, 2017).
Introduction
The U.S. Department of Agriculture (USDA), For-est Service, National Technology and Development Program (NTDP) provides practical solutions to problems that USDA Forest Service employees and cooperators identified. The solutions help the Forest Service do its work more efficiently and more safely. The program has a history of developing and evalu-ating solutions for monitoring remote site conditions using various forms of telemetry. Two Forest Service reforestation specialists proposed a project to the NTDP to investigate the use of cameras to monitor
outplanting sites in remote areas. Using remote monitoring, reforestation staff can monitor sites in the spring to determine the optimum planting win-dow. The planting window occurs soon after snow melt and before the soil dries out and refers to the period when weather and soil conditions are favor-able for seedling establishment success. The current method to evaluate remote areas requires employees to drive to various sites to assess snow cover and soil temperature. Remote monitoring would save the money and time spent visiting each site, reduce employee travel, and produce a historical record of site-specific monitoring data.
Remote Monitoring System Design
The NTDP project team started this project by evalu-ating the requirements for connectivity, power, data, and physical mounting to aid in the selection of a prototype monitoring system. Many of the sites lack cell service and are too far from standard terrestrial internet services, thereby making satellite connectiv-ity the ideal solution for data transport. The refor-estation specialists requested daily averages of ambi-ent air and soil temperature and an image to evaluate snow depth. NTDP identified Nupoint Systems’ (Delta, BC, Canada) Remote Viewer Satellite Cam-era System as an off-the-shelf product for testing. The tripod mounted camera operates off a battery and saves data to a Campbell datalogger (Campbell Scientific, Inc., Logan, UT). The battery is charged from a solar panel mounted on the north-facing side of the tripod. Air and soil temperature probes are attached to the Campbell datalogger using exist-ing ports contained in the secure system case. The remote viewer system utilizes the Iridium satellite network (McLean, VA) for connectivity. Figure 1 shows the system with its components.
Technology To Remotely Monitor Outplanting SitesEd Messerlie and Tyler Hackney
Portfolio Manager, Technology and Development Program, U.S. Department of Agriculture (USDA), Forest Service, Missoula, MT; Project Leader, Technology and Development Program,
USDA Forest Service, Missoula, MT
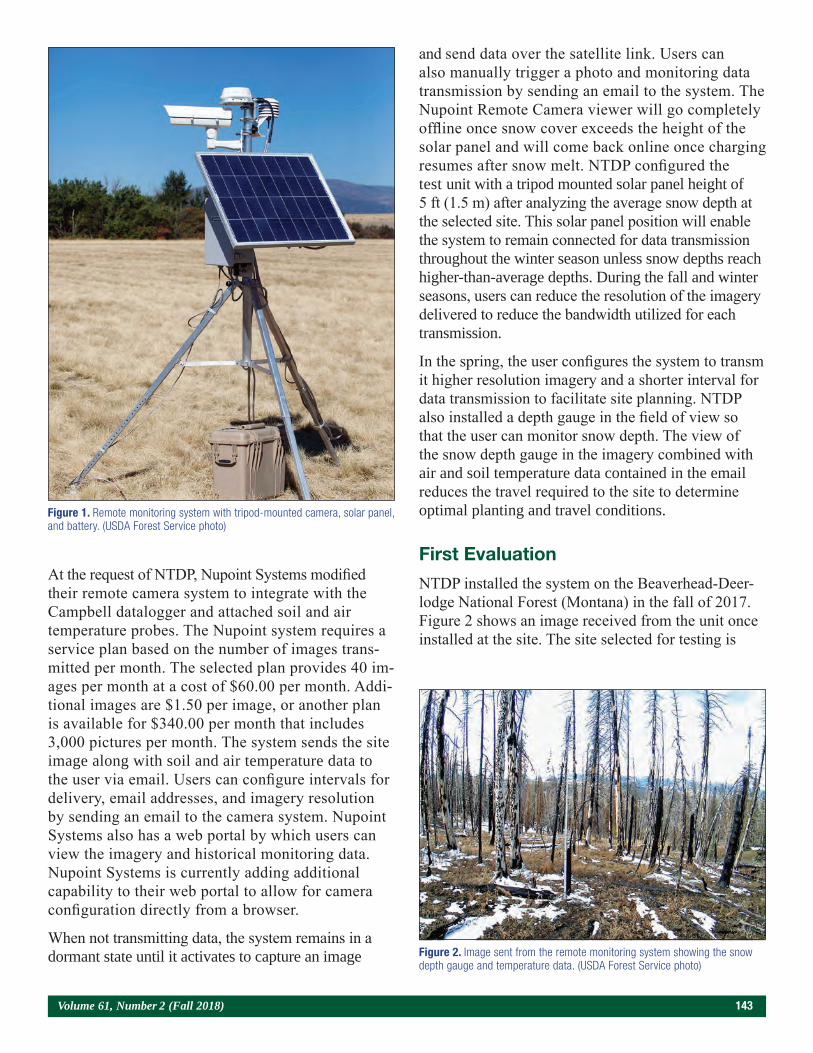
Volume 61, Number 2 (Fall 2018) 143
At the request of NTDP, Nupoint Systems modified their remote camera system to integrate with the Campbell datalogger and attached soil and air temperature probes. The Nupoint system requires a service plan based on the number of images trans-mitted per month. The selected plan provides 40 im-ages per month at a cost of $60.00 per month. Addi-tional images are $1.50 per image, or another plan is available for $340.00 per month that includes 3,000 pictures per month. The system sends the site image along with soil and air temperature data to the user via email. Users can configure intervals for delivery, email addresses, and imagery resolution by sending an email to the camera system. Nupoint Systems also has a web portal by which users can view the imagery and historical monitoring data. Nupoint Systems is currently adding additional capability to their web portal to allow for camera configuration directly from a browser.
When not transmitting data, the system remains in a dormant state until it activates to capture an image
and send data over the satellite link. Users can also manually trigger a photo and monitoring data transmission by sending an email to the system. The Nupoint Remote Camera viewer will go completely offline once snow cover exceeds the height of the solar panel and will come back online once charging resumes after snow melt. NTDP configured the test unit with a tripod mounted solar panel height of 5 ft (1.5 m) after analyzing the average snow depth at the selected site. This solar panel position will enable the system to remain connected for data transmission throughout the winter season unless snow depths reach higher-than-average depths. During the fall and winter seasons, users can reduce the resolution of the imagery delivered to reduce the bandwidth utilized for each transmission.
In the spring, the user configures the system to transm it higher resolution imagery and a shorter interval for data transmission to facilitate site planning. NTDP also installed a depth gauge in the field of view so that the user can monitor snow depth. The view of the snow depth gauge in the imagery combined with air and soil temperature data contained in the email reduces the travel required to the site to determine optimal planting and travel conditions.
First Evaluation
NTDP installed the system on the Beaverhead-Deer-lodge National Forest (Montana) in the fall of 2017. Figure 2 shows an image received from the unit once installed at the site. The site selected for testing is
Figure 1. Remote monitoring system with tripod-mounted camera, solar panel, and battery. (USDA Forest Service photo)
Figure 2. Image sent from the remote monitoring system showing the snow depth gauge and temperature data. (USDA Forest Service photo)

144 Tree Planters’ Notes
within the boundary of the 2013 Eureka Basin Fire. Drive time to the site from the nearest Forest Service office is approximately 2 hours. The elevation at the site is approximately 8,400 ft (2,560 m). The Beaver-head-Deerlodge National Forest plans to plant 50,000 whitebark pine (Pinus albicaulis Engelm.) seedlings across 180 to 200 ac (73 to 81 ha) in the spring of 2018. The seedlings require minimum soil tempera-tures of 40 °F (4.4 °C) at a soil depth of 4 to 6 in (10 to 15 cm). The silviculturist does not expect the plant-ing window to occur until early June.
The Beaverhead-Deerlodge is monitoring the data and imagery and evaluating the effectiveness of the system. The forest silviculturist estimates that the use of the camera will result in annual savings of $2,000. The following is an example of the data displayed in the email.
USFS_13000154_20171003183606.jpg taken at 2017-10-03 18:36:06 UTC
Location: 44.81570, -111.89968
Unit: 13000154 Battery 14.4V
Temperature: 33 F
Trigger: S
Logger: ATMax:54.45,ATMin:37.12,STMax-:62.16,STMin:36.47
Conclusions
To date, the system has worked very well. The depth gauge needs larger numbers so that they are easier to view in the photo. The system currently provides tem-perature data as text in an email. The user would like tabular data so that they can easily record and view trends in the data.
Address correspondence to—
Ed Messerlie, Program Leader, Technology and Development Program, U.S. Department of Agricul-ture, Forest Service, Highway 10 West, Missoula, MT 59808; email: [email protected].

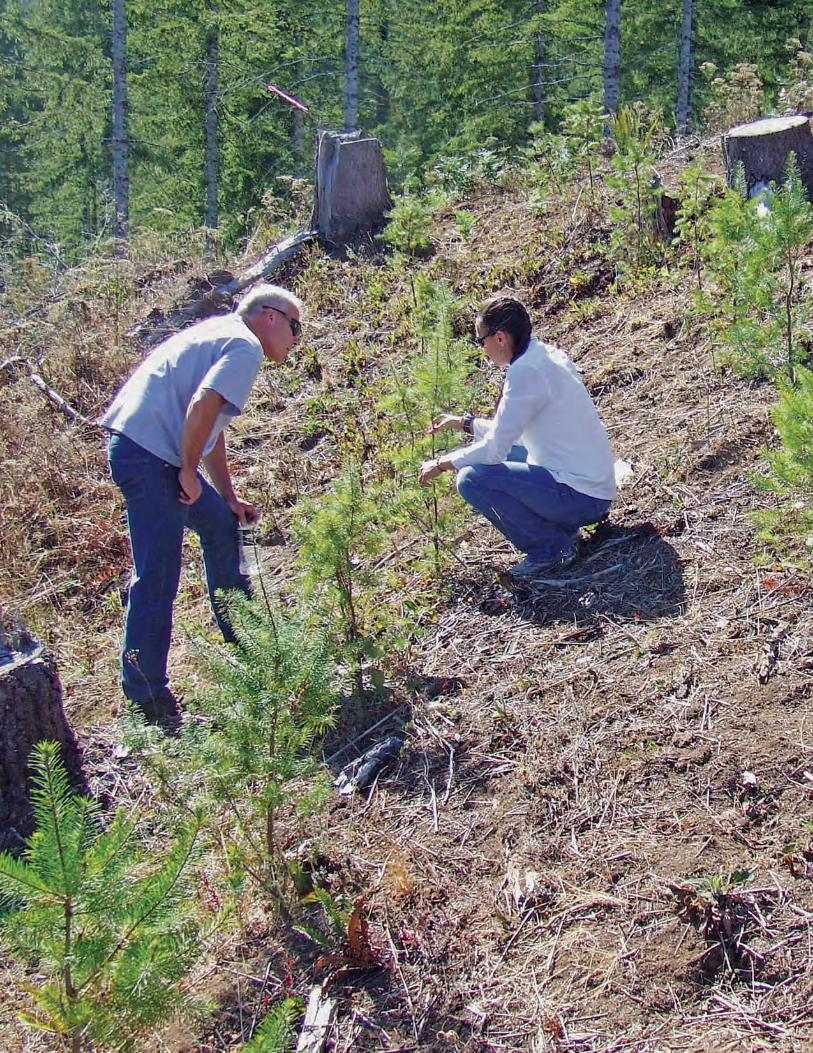
146 Tree Planters’ Notes back cover