transport properties of speek nanocomposite proton conducting membranes: optimization of additives...
TRANSCRIPT
Our reference: JTICE 987 P-authorquery-v9
AUTHOR QUERY FORM
Journal: JTICE Please e-mail or fax your responses and any corrections to:
E-mail: [email protected]
Article Number: 987 Fax: +353 6170 9272
Dear Author,
Please check your proof carefully and mark all corrections at the appropriate place in the proof (e.g., by using on-screenannotation in the PDF file) or compile them in a separate list. Note: if you opt to annotate the file with software other thanAdobe Reader then please also highlight the appropriate place in the PDF file. To ensure fast publication of your paper pleasereturn your corrections within 48 hours.
For correction or revision of any artwork, please consult http://www.elsevier.com/artworkinstructions.
Any queries or remarks that have arisen during the processing of your manuscript are listed below and highlighted by flags inthe proof. Click on the ‘Q’ link to go to the location in the proof.
Location in Query / Remark: click on the Q link to goarticle Please insert your reply or correction at the corresponding line in the proof
Q1 Please confirm that given names and surnames have been identified correctly.Q2 Please supply the name of the city of publication for Refs. [23,51,52].
Please check this box or indicate your approval ifyou have no corrections to make to the PDF file
Thank you for your assistance.
Highlights
Journal of the Taiwan Institute of Chemical Engineers xxx (2014) xxx–xxx
Journal of the Taiwan Institute of Chemical Engineers xxx (2014) xxx–xxxTransport properties of SPEEK nanocomposite protonconducting membranes: Optimization of additivescontent by response surface methodology
H. Ilbeygi a, A. Mayahi a, A.F. Ismail b,*, M.M. Nasef b,c, J. Jaafar b, M. Ghasemi d, T. Matsuura b,e, S.M.J. Zaidi a
a Australian Institute for Bioengineering and Nanotechnology (AIBN), University of Queensland, Brisbane 4072, QLD, Australiab Advanced Membrane Technology Research Centre (AMTEC), Universiti Teknologi Malaysia, 81310 Skudai, Johor, Malaysiac Institute of Hydrogen Economy, International Campus, Universiti Teknologi Malaysia, 54100 Kuala Lumpur, Malaysiad Fuel Cell Institute, University Kebangsaan Malaysia—UKM, 43600 Bangi, Selangor, Malaysiae Industrial Membrane Research Institute, Department of Chemical Engineering, University of Ottawa, Ottawa, ON, Canada K1N 6N5
� Various contents of SPEEK/CC/TAP were successfully prepared.
� Response surface methodology was applied successfully.
� Optimum values were obtained for proton conductivity and methanol permeability.
G Model
JTICE 987r 1
Contents lists available at ScienceDirect
Journal of the Taiwan Institute of Chemical Engineers
jou r nal h o mep age: w ww.els evier . co m/lo c ate / j t i c e
1
2 Transport properties of SPEEK nanocomposite proton conducting3 membranes: Optimization of additives content by response4 surface methodology
5 H. IlbeygiQ1a, A. Mayahi a, A.F. Ismail b,*, M.M. Nasef b,c, J. Jaafar b, M. Ghasemi d,
6 T. Matsuura b,e, S.M.J. Zaidi a
7 a Australian Institute for Bioengineering and Nanotechnology (AIBN), University of Queensland, Brisbane 4072, QLD, Australia
8 b Advanced Membrane Technology Research Centre (AMTEC), Universiti Teknologi Malaysia, 81310 Skudai, Johor, Malaysia
9 c Institute of Hydrogen Economy, International Campus, Universiti Teknologi Malaysia, 54100 Kuala Lumpur, Malaysia
10 d Fuel Cell Institute, University Kebangsaan Malaysia—UKM, 43600 Bangi, Selangor, Malaysia
11 e Industrial Membrane Research Institute, Department of Chemical Engineering, University of Ottawa, Ottawa, ON, Canada K1N 6N5
1213 1. Introduction
14 Direct methanol fuel cells (DMFCs) have great potential for15 generating electricity for portable devices, owing to their high16 efficiency and lightness. However, two major technical limitations17 restrict the commercialization of DMFC, which are the slow18 oxidation kinetics of methanol and the high methanol crossover19 from the anode to the cathode. Nafion1 (DuPont), Flemion1 (Asahi20 Glass Company), Aciplex1 (Asahi Chem.) and Dow XUS (Dow21 Chemical) perfluorinated ionomer (PFI) membranes are commonly22 adopted as electrolytes in DMFC, because of their long-term23 stability under fuel cell operating conditions and excellent proton
24conductivity. However, the high methanol permeation rate across25such membranes represents a serious obstacle to the realization of26DMFCs for practical use [1,2]. To encounter this problem, a number27of alternative membrane materials have been developed in various28research institutes [3,4]. The newly developed materials can be29categorized into three different branches, which are including30modified PFI membranes [5], fluorinate polymer membranes [6,7],31and non-fluorinated polymer membranes [8,9].32Polymer–inorganic nanocomposite materials, herein defined as33inorganic nanofillers dispersed at a nanometer level in a polymer34matrix, have been investigated for DMFCs, and proved to have a35potential to provide a solution to the trade-off problem of36polymeric membranes [10]. For example, many polymer–inorgan-37ic nanocomposite membranes show much lower methanol38permeability when combined with similar or even better proton39conductivities compared to the corresponding pure polymer
Journal of the Taiwan Institute of Chemical Engineers xxx (2014) xxx–xxx
A R T I C L E I N F O
Article history:
Received 17 December 2013
Received in revised form 30 June 2014
Accepted 3 August 2014
Available online xxx
Keywords:
SPEEK nanocomposite
Proton conductivity
Methanol permeability
Response surface methodology
Optimization
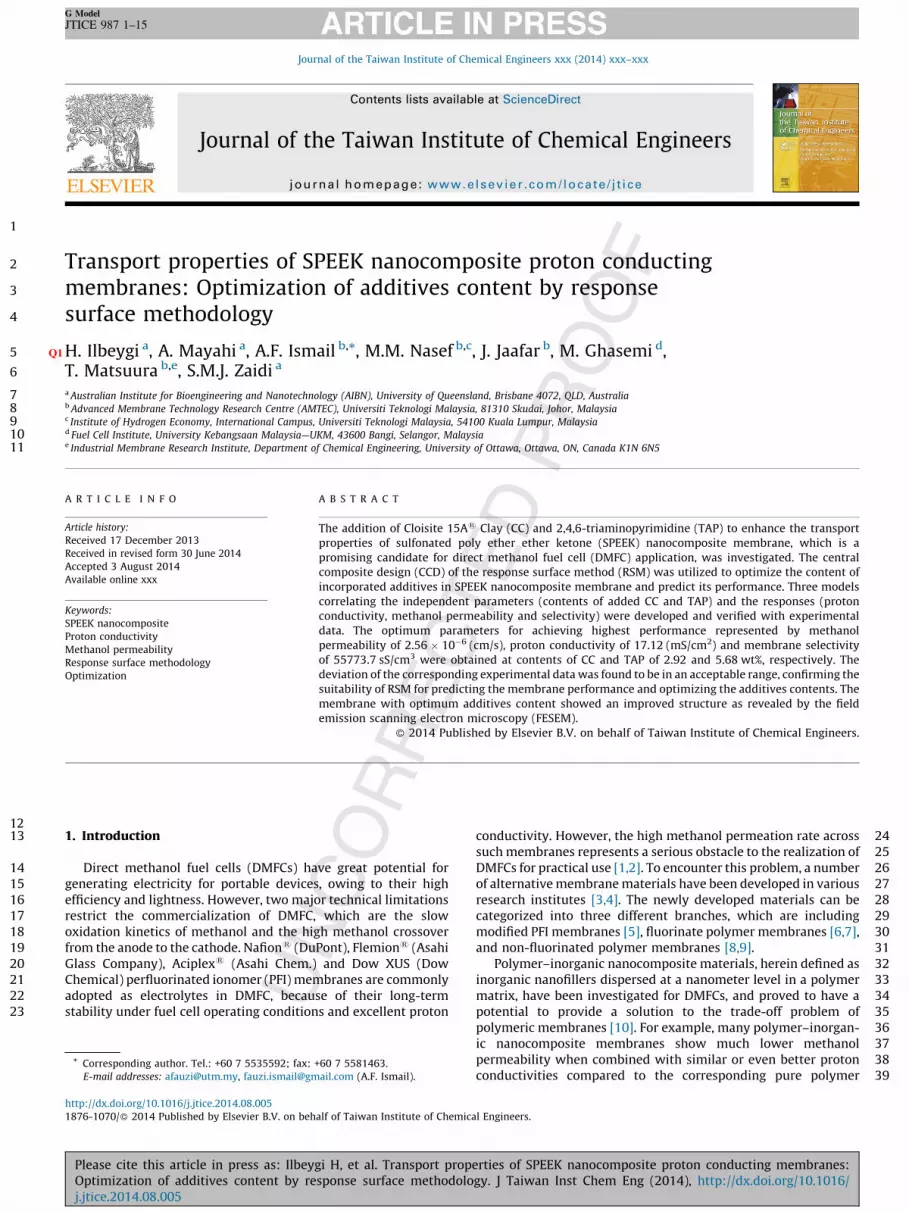
A B S T R A C T
The addition of Cloisite 15A1 Clay (CC) and 2,4,6-triaminopyrimidine (TAP) to enhance the transport
properties of sulfonated poly ether ether ketone (SPEEK) nanocomposite membrane, which is a
promising candidate for direct methanol fuel cell (DMFC) application, was investigated. The central
composite design (CCD) of the response surface method (RSM) was utilized to optimize the content of
incorporated additives in SPEEK nanocomposite membrane and predict its performance. Three models
correlating the independent parameters (contents of added CC and TAP) and the responses (proton
conductivity, methanol permeability and selectivity) were developed and verified with experimental
data. The optimum parameters for achieving highest performance represented by methanol
permeability of 2.56 � 10�6 (cm/s), proton conductivity of 17.12 (mS/cm2) and membrane selectivity
of 55773.7 sS/cm3 were obtained at contents of CC and TAP of 2.92 and 5.68 wt%, respectively. The
deviation of the corresponding experimental data was found to be in an acceptable range, confirming the
suitability of RSM for predicting the membrane performance and optimizing the additives contents. The
membrane with optimum additives content showed an improved structure as revealed by the field
emission scanning electron microscopy (FESEM).
� 2014 Published by Elsevier B.V. on behalf of Taiwan Institute of Chemical Engineers.
* Corresponding author. Tel.: +60 7 5535592; fax: +60 7 5581463.
E-mail addresses: [email protected], [email protected] (A.F. Ismail).
G Model
JTICE 987 1–15
Please cite this article in press as: Ilbeygi H, et al. Transport properties of SPEEK nanocomposite proton conducting membranes:Optimization of additives content by response surface methodology. J Taiwan Inst Chem Eng (2014), http://dx.doi.org/10.1016/j.jtice.2014.08.005
Contents lists available at ScienceDirect
Journal of the Taiwan Institute of Chemical Engineers
jou r nal h o mep age: w ww.els evier . co m/lo c ate / j t i c e
http://dx.doi.org/10.1016/j.jtice.2014.08.005
1876-1070/� 2014 Published by Elsevier B.V. on behalf of Taiwan Institute of Chemical Engineers.
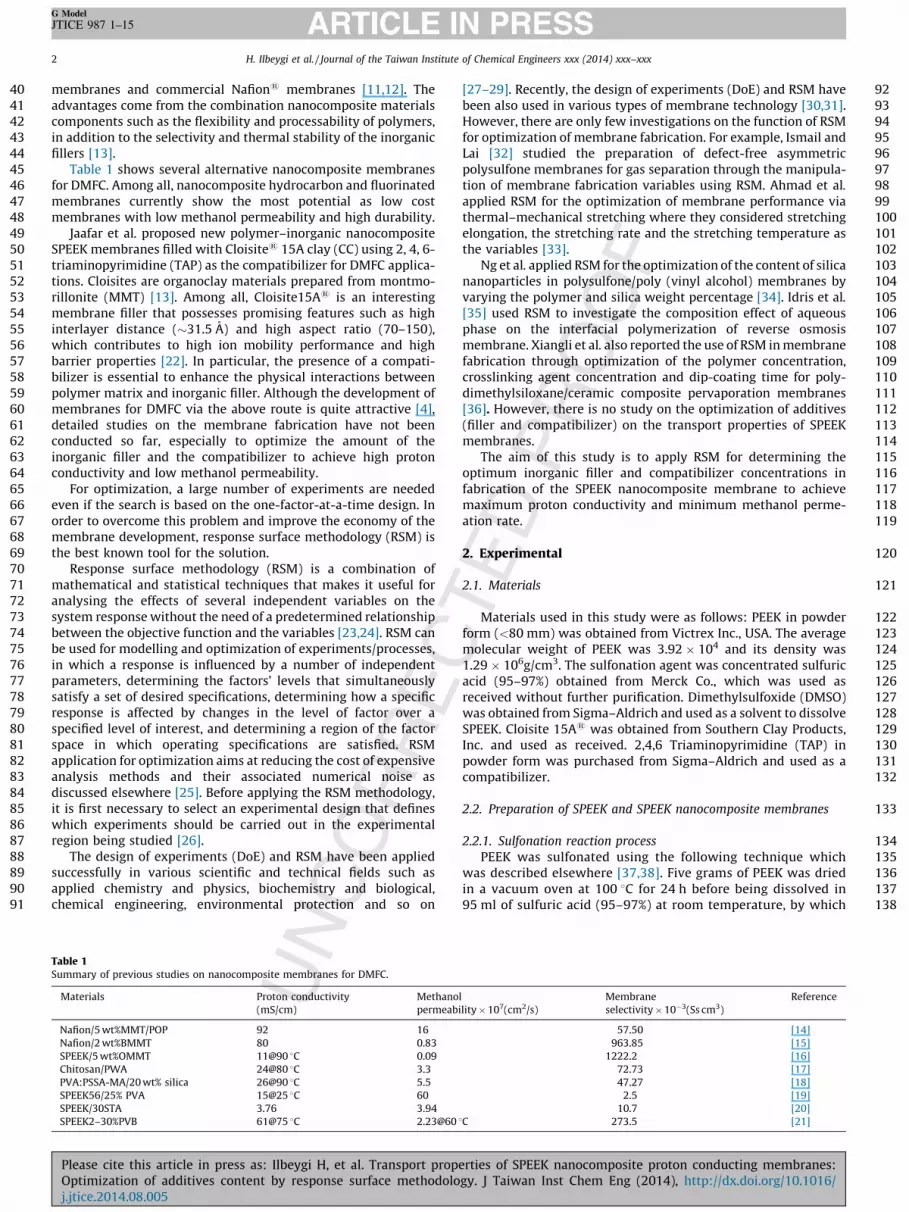
40 membranes and commercial Nafion1 membranes [11,12]. The41 advantages come from the combination nanocomposite materials42 components such as the flexibility and processability of polymers,43 in addition to the selectivity and thermal stability of the inorganic44 fillers [13].45 Table 1 shows several alternative nanocomposite membranes46 for DMFC. Among all, nanocomposite hydrocarbon and fluorinated47 membranes currently show the most potential as low cost48 membranes with low methanol permeability and high durability.49 Jaafar et al. proposed new polymer–inorganic nanocomposite50 SPEEK membranes filled with Cloisite1 15A clay (CC) using 2, 4, 6-51 triaminopyrimidine (TAP) as the compatibilizer for DMFC applica-52 tions. Cloisites are organoclay materials prepared from montmo-53 rillonite (MMT) [13]. Among all, Cloisite15A1 is an interesting54 membrane filler that possesses promising features such as high55 interlayer distance (�31.5 A) and high aspect ratio (70–150),56 which contributes to high ion mobility performance and high57 barrier properties [22]. In particular, the presence of a compati-58 bilizer is essential to enhance the physical interactions between59 polymer matrix and inorganic filler. Although the development of60 membranes for DMFC via the above route is quite attractive [4],61 detailed studies on the membrane fabrication have not been62 conducted so far, especially to optimize the amount of the63 inorganic filler and the compatibilizer to achieve high proton64 conductivity and low methanol permeability.65 For optimization, a large number of experiments are needed66 even if the search is based on the one-factor-at-a-time design. In67 order to overcome this problem and improve the economy of the68 membrane development, response surface methodology (RSM) is69 the best known tool for the solution.70 Response surface methodology (RSM) is a combination of71 mathematical and statistical techniques that makes it useful for72 analysing the effects of several independent variables on the73 system response without the need of a predetermined relationship74 between the objective function and the variables [23,24]. RSM can75 be used for modelling and optimization of experiments/processes,76 in which a response is influenced by a number of independent77 parameters, determining the factors’ levels that simultaneously78 satisfy a set of desired specifications, determining how a specific79 response is affected by changes in the level of factor over a80 specified level of interest, and determining a region of the factor81 space in which operating specifications are satisfied. RSM82 application for optimization aims at reducing the cost of expensive83 analysis methods and their associated numerical noise as84 discussed elsewhere [25]. Before applying the RSM methodology,85 it is first necessary to select an experimental design that defines86 which experiments should be carried out in the experimental87 region being studied [26].88 The design of experiments (DoE) and RSM have been applied89 successfully in various scientific and technical fields such as90 applied chemistry and physics, biochemistry and biological,91 chemical engineering, environmental protection and so on
92[27–29]. Recently, the design of experiments (DoE) and RSM have93been also used in various types of membrane technology [30,31].94However, there are only few investigations on the function of RSM95for optimization of membrane fabrication. For example, Ismail and96Lai [32] studied the preparation of defect-free asymmetric97polysulfone membranes for gas separation through the manipula-98tion of membrane fabrication variables using RSM. Ahmad et al.99applied RSM for the optimization of membrane performance via100thermal–mechanical stretching where they considered stretching101elongation, the stretching rate and the stretching temperature as102the variables [33].103Ng et al. applied RSM for the optimization of the content of silica104nanoparticles in polysulfone/poly (vinyl alcohol) membranes by105varying the polymer and silica weight percentage [34]. Idris et al.106[35] used RSM to investigate the composition effect of aqueous107phase on the interfacial polymerization of reverse osmosis108membrane. Xiangli et al. also reported the use of RSM in membrane109fabrication through optimization of the polymer concentration,110crosslinking agent concentration and dip-coating time for poly-111dimethylsiloxane/ceramic composite pervaporation membranes112[36]. However, there is no study on the optimization of additives113(filler and compatibilizer) on the transport properties of SPEEK114membranes.115The aim of this study is to apply RSM for determining the116optimum inorganic filler and compatibilizer concentrations in117fabrication of the SPEEK nanocomposite membrane to achieve118maximum proton conductivity and minimum methanol perme-119ation rate.
1202. Experimental
1212.1. Materials
122Materials used in this study were as follows: PEEK in powder123form (<80 mm) was obtained from Victrex Inc., USA. The average124molecular weight of PEEK was 3.92 � 104 and its density was1251.29 � 106g/cm3. The sulfonation agent was concentrated sulfuric126acid (95–97%) obtained from Merck Co., which was used as127received without further purification. Dimethylsulfoxide (DMSO)128was obtained from Sigma–Aldrich and used as a solvent to dissolve129SPEEK. Cloisite 15A1 was obtained from Southern Clay Products,130Inc. and used as received. 2,4,6 Triaminopyrimidine (TAP) in131powder form was purchased from Sigma–Aldrich and used as a132compatibilizer.
1332.2. Preparation of SPEEK and SPEEK nanocomposite membranes
1342.2.1. Sulfonation reaction process
135PEEK was sulfonated using the following technique which136was described elsewhere [37,38]. Five grams of PEEK was dried137in a vacuum oven at 100 8C for 24 h before being dissolved in13895 ml of sulfuric acid (95–97%) at room temperature, by which
Table 1Summary of previous studies on nanocomposite membranes for DMFC.
Materials Proton conductivity
(mS/cm)
Methanol
permeability � 107(cm2/s)
Membrane
selectivity � 10�3(Ss cm3)
Reference
Nafion/5 wt%MMT/POP 92 16 57.50 [14]
Nafion/2 wt%BMMT 80 0.83 963.85 [15]
SPEEK/5 wt%OMMT 11@90 8C 0.09 1222.2 [16]
Chitosan/PWA 24@80 8C 3.3 72.73 [17]
PVA:PSSA-MA/20 wt% silica 26@90 8C 5.5 47.27 [18]
SPEEK56/25% PVA 15@25 8C 60 2.5 [19]
SPEEK/30STA 3.76 3.94 10.7 [20]
SPEEK2–30%PVB 61@75 8C 2.23@60 8C 273.5 [21]
H. Ilbeygi et al. / Journal of the Taiwan Institute of Chemical Engineers xxx (2014) xxx–xxx2
G Model
JTICE 987 1–15
Please cite this article in press as: Ilbeygi H, et al. Transport properties of SPEEK nanocomposite proton conducting membranes:Optimization of additives content by response surface methodology. J Taiwan Inst Chem Eng (2014), http://dx.doi.org/10.1016/j.jtice.2014.08.005

139 the heterogeneous sulfonation was suppressed. After completing140 the dissolution of PEEK (about 1 h), the temperature of the141 polymer solution was increased gradually to 60 8C, where it was142 held for 3 h to obtain the desired degree of sulfonation (DS). In143 order to stop the reaction, the obtained solution was poured into144 ice-cold deionized water to precipitate sulfonated polymer145 (SPEEK), followed by filtration and thorough washing of the146 filtrate using deionized water until the pH of water became 6–7.147 The obtained SPEEK was then dried in a vacuum oven at 90 8C for148 24 h.
149 2.2.2. Preparation of nanocomposite polymer dope
150 10 wt% of a SPEEK solution in DMSO was first prepared. Then,151 predetermined amounts of Cloisite15A1 Clay and TAP were152 dispersed in the DMSO in separate containers. Those mixtures153 were stirred for 24 h at room temperature. Subsequently, the154 solutions of Cloisite15A1 and TAP, both dispersed in DMSO, were155 combined and the resultant mixture was stirred for 24 h at a room156 temperature. The combined Cloisite15A1 Clay and TAP mixture157 was then added into the SPEEK solution. The mixture was158 vigorously stirred for 24 h at 60 8C to produce a homogeneous159 solution.
160 2.2.3. Nanocomposite membrane preparation
161 The membrane was fabricated by spreading the polymer dope162 on a glass plate using a casting knife, following the procedure as163 reported by Jaafar et al. [13]. The cast film, together with the164 glass plate was placed in a vacuum oven for 24 h at 60 8C. The165 resultant membrane was peeled off and further dried for 10 h at166 100 8C to ensure complete removal of the trapped solvent, before167 being immersed in water. The water wet membrane was then168 dried in a vacuum oven for 3 days at 80 8C, followed by169 immersion in 1 M sulphuric acid solution for 24 h at room170 temperature. Finally, the membrane was washed acid free using171 a large amount of water to make sure that the sulfonate would be172 in H form. The fabricated nanocomposite membranes were coded173 as SP/CCx/TAPy, where x is CC content (wt%) and y is TAP content174 (wt%).
175 2.3. Morphological analysis
176 A field emission scanning electron microscope (FESEM) (JSM-177 6701F, JEOL USA, INC.) was used to study the morphology of SPEEK178 nanocomposite membrane. The samples were firstly fractured into179 cross sections by freezing them in liquid nitrogen.
180 2.4. Degree of sulfonation of SPEEK
181 The degree of sulfonation of SPEEK was determined via 1H-182 NMR. The H-NMR spectra were recorded on a Varian Unity Inova183 (Brucker Avance 300, USA) spectrometer at a resonance frequency184 of 399.961 MHz at room temperature. For each analysis, 3 wt%185 polymer solution was prepared in deuterated dimethyl sulfoxide186 (DMSO-d6). The degree of sulfonation, x, was determined by187 comparative integration of distinct aromatic signals according to188 the following equation:
n
12 � 2n¼ AH13P
AHint:signal(1)
189190
191 x ¼ n � 100%
192193 where n is number of sulfonated repeat unit/number of entire194 repeat unit, AH13 is area of signal of H13 region, AH is area of195 all other integral signals and x is the degree of sulfonation.
1962.5. Proton conductivity
197Solatron 1260 impedance analyzer (AMETEK, Inc., UK) was used198to measure the proton conductivity of the membrane at a199frequency range of 1–107 Hz and 50–500 mV oscillating voltage.200The membrane sample was soaked in deionized water overnight at201room temperature to achieve equilibrium swelling. The thickness202of the hydrated membrane was determined using a digital203micrometre. The membrane was then placed between two freshly204polished stainless-steel block electrodes quickly hosted in a205conductivity cell made of TEFLON, as illustrated in Fig. 1.206The proton conductivity (s) was calculated using the following207formula:
s ¼ d
RS(2)
208209where d is the thickness of membrane sample, S is the surface area,210and R is membrane resistance that is obtained from the low211intersection of the high frequency semi-circle on a complex with212the Re (z) imaginary axis.
2132.6. Methanol permeability
214Barrier properties of the membrane were determined from the215measurement of methanol permeability. The membrane (with an216effective area of 5 cm2) was soaked in distilled water for 24 h to217achieve full hydration. The membrane was placed between two218compartments of self-made methanol diffusion test cell in a219vertical position, as illustrated in the schematic diagram shown in220Fig. 2. Compartment A was filled with a methanol solution having a221concentration (CA) of 1 M, while compartment B was filled with222deionized water. The volume of solution in compartment B (VB)223was 150 cm3. Each compartment was agitated with a magnetic224stirrer to make the solution uniform.225During the operation, 2 cm3 of the sample solution was taken226from the compartment B every 60 min and analyzed by a gas227chromatograph (Model GC 6890 N, Agilent, USA) at a temperature228range of 100–325 8C and injection sample volume of 5 mL.229The methanol permeability (P) was obtained using Eq. (3) after230introducing a (slope) obtained from the linear plot of CB versus t
231(using a = CB (t)/(t � to)) [40]:
P ¼ a � VB
A� d
CA(3)
232233where VB is the volume of water in compartment B, and CA (1 M) is234the concentration of methanol inside compartment A, which was235assumed to be unchanged throughout the permeation experiment.
Fig. 1. Schematic diagram of the proton conductivity cell [29].
H. Ilbeygi et al. / Journal of the Taiwan Institute of Chemical Engineers xxx (2014) xxx–xxx 3
G Model
JTICE 987 1–15
Please cite this article in press as: Ilbeygi H, et al. Transport properties of SPEEK nanocomposite proton conducting membranes:Optimization of additives content by response surface methodology. J Taiwan Inst Chem Eng (2014), http://dx.doi.org/10.1016/j.jtice.2014.08.005

236 A is the membrane effective area (5.0 cm2) and d is the membrane237 thickness.
238 2.7. Experimental design and optimization
239 In this study, the experimental design was performed using240 Design expert1 (version 8 trial) software, based on the central241 composite model. Full factorial experimental design was used to242 optimize the two independent variables: the content (wt%) of CC243 (denoted as A) and the content (wt%) of TAP (denoted as B). The244 dependent (response) variables were the proton conductivity (s),245 methanol permeability (P) and membrane selectivity (S = s/P).246 Following the central composite design, the responses (proton247 conductivity, methanol permeability and selectivity of the248 membranes) were selected: high (+1) level and low (�1) level249 based on a preliminary number of experiments and using an axial250 spacing (�1.682).251 The experimental design array made from central composite set252 the desired combinations of CC and TAP contents to achieve253 minimum methanol permeability, together with maximum proton254 conductivity and membrane selectivity, as presented in Table 1. To255 analyse the experimental designs in Table 2, Design Expert256 Software (Version 8.0 trial) was utilized, in which the regression257 equations between the additives content and the transport258 properties of the nanocomposite membranes were established.259 The CC and TAP content were considered as dominant parameters260 in the transport properties. Quadratic effects and interactions of261 the two variables on the proton conductivity, methanol perme-262 ability and membrane selectivity of SPEEK nanocomposite263 membrane were then investigated.264 The mathematical model that is found after fitting the function265 to the data may sometimes not satisfactorily explain the266 experimental domain studied. The analysis of variance (ANOVA)267 is a more reliable way to evaluate the quality of the model fitting.268 The central idea of ANOVA aims to compare the variation due to the
269treatment (change in the combination of variable levels) with the270variation due to random errors inherent to the measurements of271the generated responses [41]. In this study, the surface response272models were tested using the ANOVA under 0.05 level of273significance.
2743. Results and discussion
2753.1. Evidence of sulfonation
276Fig. 3 shows the 1H-NMR spectrum of SPEEK. The presence of277the sulfonic acid group in the polymer was detected based on278the intensity signal at H13. When the sulfonic acid functional279group is introduced to the aromatic ring of PEEK, this type of280proton tended to differentiate into three categories; H13 (the281singlet at �7.506 ppm), H14 (the doublet at �7.203 ppm) and282H15 (the doublet at �7.11 ppm). The intensity of the signal at283position H13 assured that the H13 content would be equivalent to284the –SO3H group content, as a large down-field shift occurred for285the hydrogen H13 [42]. The nomenclature of the aromatic286protons for the SPEEK repeating unit is given in Fig. 4. The287calculated degree of sulfonation obtained from (1) for this288membrane was found.
Fig. 2. Methanol permeability testing device.
Table 2Various combinations run according to RSM array.
Run Factor 1 Factor 2 Response 1 Response 2 Response 3
A: Cloisite 15A1 (wt. %) B: TAP (wt%) MeOH permeability �106 (cm2/s) Proton conductivity (mS/cm) Membrane selectivity (sS/cm3)
1 4.25 4.25 4.07 18.47 45364
2 7.5 4.25 7.11 4.46 6278
3 4.25 1 7.81 3.27 4187
4 4.25 4.25 4.07 20.64 50674
5 1.95 1.95 6.46 12.64 19574
6 4.25 7.5 2.39 10.35 43354
7 6.55 1.95 8.51 2.97 3494
8 6.55 6.55 2.70 8.35 30961
9 1.95 6.55 1.88 9.65 51286
10 4.25 4.25 4.13 18.14 43936
11 1 4.25 2.69 14.4 53565
12 4.25 4.25 4.10 18.56 45274
13 4.25 4.25 4.21 19.20 45581
Fig. 3. H NMR spectra of SPEEK.
H. Ilbeygi et al. / Journal of the Taiwan Institute of Chemical Engineers xxx (2014) xxx–xxx4
G Model
JTICE 987 1–15
Please cite this article in press as: Ilbeygi H, et al. Transport properties of SPEEK nanocomposite proton conducting membranes:Optimization of additives content by response surface methodology. J Taiwan Inst Chem Eng (2014), http://dx.doi.org/10.1016/j.jtice.2014.08.005

289 3.2. Field emission scanning electron microscopy (FESEM)
290 Fig. 5(a–c) illustrates the FESEM membrane surface micro-291 graphs of SP/CC2.92/TAP5.68, SP/CC1.95/TAP6.55 and SP/CC6.55/292 TAP1.95 membrane, respectively. It could be clearly seen that SP/293 CC2.92/TAP5.68 nanocomposite membrane had a uniform disper-294 sion of the particles in the SPEEK matrices. The interaction between295 the sulfonic acid groups and amine groups of TAP played a very296 important role in the dispersion of the clay particles in the SPEEK297 matrix. Spherical clay agglomerates embedded in the polymer298 matrix were observed as small circles [43]. The agglomerates299 however emerged above the membrane surface when the TAP/CC300 ratio was changed. For instance, when the TAP concentration was301 increased to 6.55 wt% while CC concentration was decreased to302 1.95 wt%, some rod-shaped and hexagonal foreign matters were303 visible even at low a magnification (Fig. 5b). Apparently, some of304 the TAP particles did not dissolve during dope formulation due to305 the excessive amount of TAP used [44]. On the other hand, when306 the CC concentration was 6.55 wt% while TAP was suppressed to307 1.95 wt%, clay particles was observed aggregating on the308 membrane surface (Fig. 5c).
309 3.3. Model equation
310 The data analysis was performed on a total of thirteen sets of311 experiments, consisting of two factorial points. The response
312variables measured were the proton conductivity, methanol313permeability and membrane selectivity.314Three runs were made for each membrane number and the315average values were recorded for the responses. The Design316expert1 (version 8 trial) software was again used to fit the317responses into linear and quadratic polynomial regression models318with respect to the independent parameter of reaction, as shown in319the following general equation:
yi ¼ bo þ Sbixi þ Sb j jx2i þ SSbi jxix j þ e (4)
320321where y is the response, b is the regression coefficient, x is the322independent parameter and e is the experimental error. An323automatic backward reduction of the insignificant parameters was324met at a significance level of P < 0.05. Finally, the software was325used to perform ANOVA and produce 3D surface plots for the326optimum results space.327As can be seen in Tables 3–5, the F-value, ratio of noise to328response, for proton conductivity, methanol permeability and329membrane selectivity were 53.17, 52.06 and 40.38, respectively,330and this implies that the models were significant. There was a3310.01% chance that a ‘‘model–value’’ of this size could occur due to332the noise. The values of ‘‘Prob > F’’ less than 0.05 indicate that the333model terms are significant.334ANOVA results of the linear model in Table 4 indicated that the335model equation could be used to describe the methanol
Fig. 4. The nomenclature of aromatic protons for the SPEEK repeating unit [32].
Fig. 5. The FESEM images of SPEEK nanocomposite membranes with (a) SP/CC2.92/Tap5.68 and (b) SP/CC1.95/TAP 6.55 (c) SP/CC 6.55/TAP1.95.
H. Ilbeygi et al. / Journal of the Taiwan Institute of Chemical Engineers xxx (2014) xxx–xxx 5
G Model
JTICE 987 1–15
Please cite this article in press as: Ilbeygi H, et al. Transport properties of SPEEK nanocomposite proton conducting membranes:Optimization of additives content by response surface methodology. J Taiwan Inst Chem Eng (2014), http://dx.doi.org/10.1016/j.jtice.2014.08.005
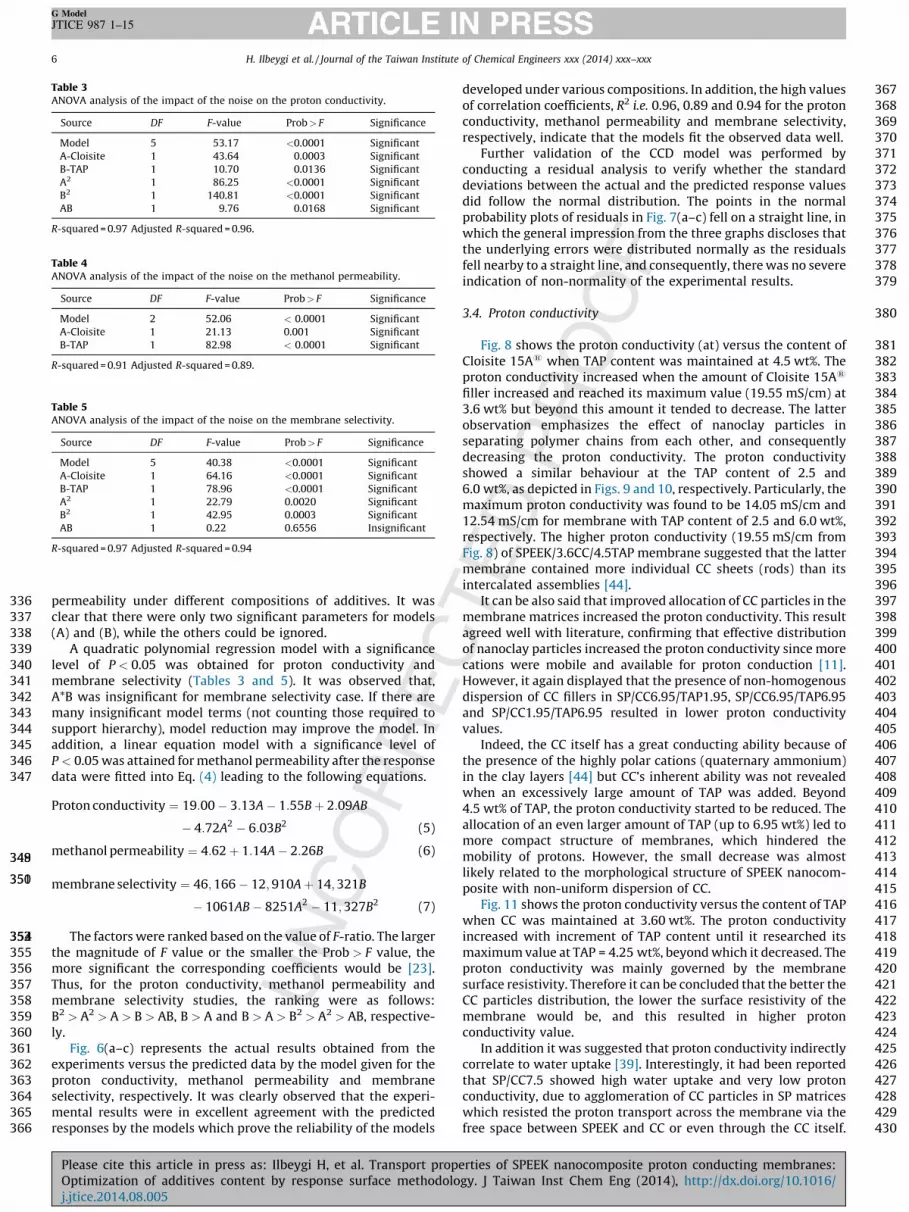
336 permeability under different compositions of additives. It was337 clear that there were only two significant parameters for models338 (A) and (B), while the others could be ignored.339 A quadratic polynomial regression model with a significance340 level of P < 0.05 was obtained for proton conductivity and341 membrane selectivity (Tables 3 and 5). It was observed that,342 A*B was insignificant for membrane selectivity case. If there are343 many insignificant model terms (not counting those required to344 support hierarchy), model reduction may improve the model. In345 addition, a linear equation model with a significance level of346 P < 0.05 was attained for methanol permeability after the response347 data were fitted into Eq. (4) leading to the following equations.
Proton conductivity ¼ 19:00 � 3:13A � 1:55B þ 2:09AB
� 4:72A2 � 6:03B2 (5)
348349methanol permeability ¼ 4:62 þ 1:14A � 2:26B (6)
350351 membrane selectivity ¼ 46; 166 � 12; 910A þ 14; 321B
� 1061AB � 8251A2 � 11; 327B2 (7)
352353354 The factors were ranked based on the value of F-ratio. The larger355 the magnitude of F value or the smaller the Prob > F value, the356 more significant the corresponding coefficients would be [23].357 Thus, for the proton conductivity, methanol permeability and358 membrane selectivity studies, the ranking were as follows:359 B2 > A2 > A > B > AB, B > A and B > A > B2 > A2 > AB, respective-360 ly.361 Fig. 6(a–c) represents the actual results obtained from the362 experiments versus the predicted data by the model given for the363 proton conductivity, methanol permeability and membrane364 selectivity, respectively. It was clearly observed that the experi-365 mental results were in excellent agreement with the predicted366 responses by the models which prove the reliability of the models
367developed under various compositions. In addition, the high values368of correlation coefficients, R2 i.e. 0.96, 0.89 and 0.94 for the proton369conductivity, methanol permeability and membrane selectivity,370respectively, indicate that the models fit the observed data well.371Further validation of the CCD model was performed by372conducting a residual analysis to verify whether the standard373deviations between the actual and the predicted response values374did follow the normal distribution. The points in the normal375probability plots of residuals in Fig. 7(a–c) fell on a straight line, in376which the general impression from the three graphs discloses that377the underlying errors were distributed normally as the residuals378fell nearby to a straight line, and consequently, there was no severe379indication of non-normality of the experimental results.
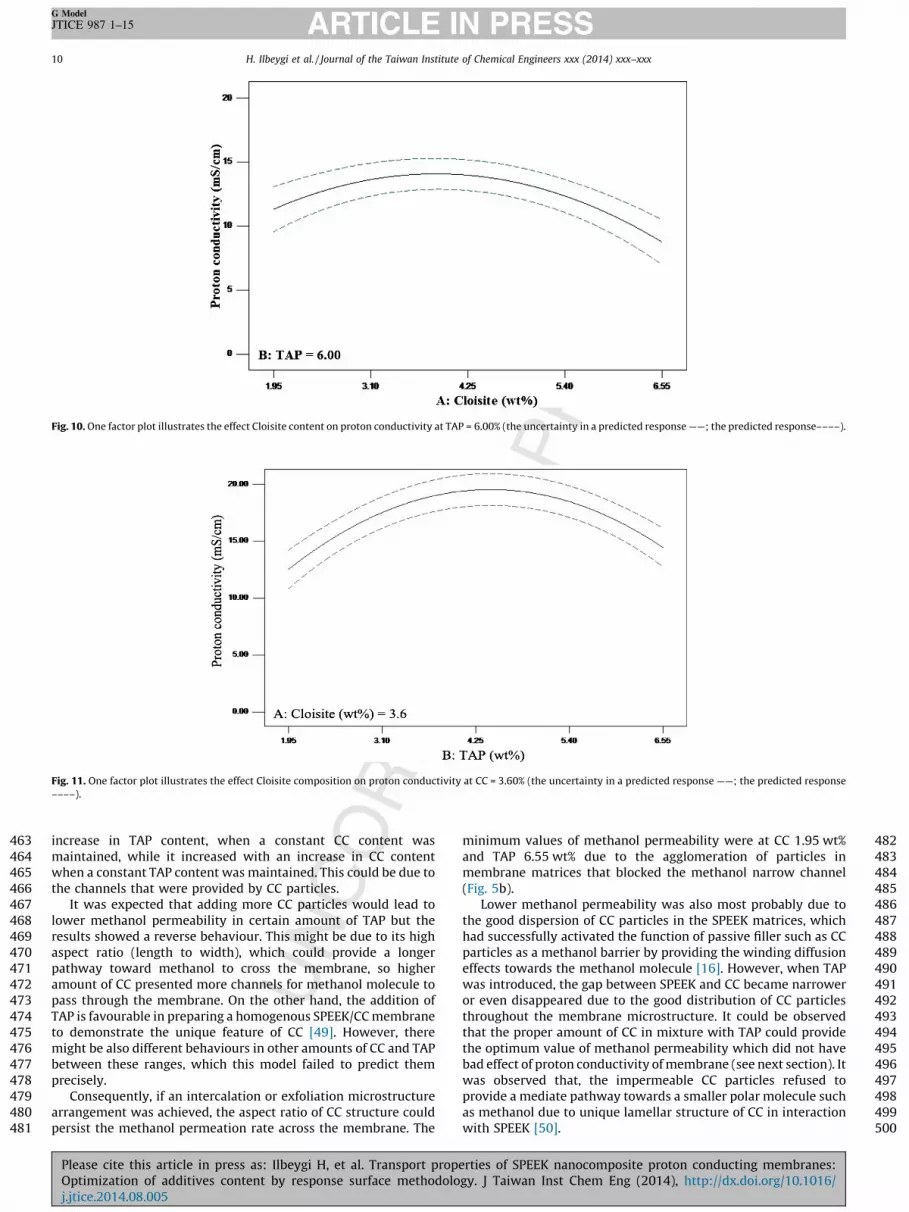
3803.4. Proton conductivity
381Fig. 8 shows the proton conductivity (at) versus the content of382Cloisite 15A1 when TAP content was maintained at 4.5 wt%. The383proton conductivity increased when the amount of Cloisite 15A1
384filler increased and reached its maximum value (19.55 mS/cm) at3853.6 wt% but beyond this amount it tended to decrease. The latter386observation emphasizes the effect of nanoclay particles in387separating polymer chains from each other, and consequently388decreasing the proton conductivity. The proton conductivity389showed a similar behaviour at the TAP content of 2.5 and3906.0 wt%, as depicted in Figs. 9 and 10, respectively. Particularly, the391maximum proton conductivity was found to be 14.05 mS/cm and39212.54 mS/cm for membrane with TAP content of 2.5 and 6.0 wt%,393respectively. The higher proton conductivity (19.55 mS/cm from394Fig. 8) of SPEEK/3.6CC/4.5TAP membrane suggested that the latter395membrane contained more individual CC sheets (rods) than its396intercalated assemblies [44].397It can be also said that improved allocation of CC particles in the398membrane matrices increased the proton conductivity. This result399agreed well with literature, confirming that effective distribution400of nanoclay particles increased the proton conductivity since more401cations were mobile and available for proton conduction [11].402However, it again displayed that the presence of non-homogenous403dispersion of CC fillers in SP/CC6.95/TAP1.95, SP/CC6.95/TAP6.95404and SP/CC1.95/TAP6.95 resulted in lower proton conductivity405values.406Indeed, the CC itself has a great conducting ability because of407the presence of the highly polar cations (quaternary ammonium)408in the clay layers [44] but CC’s inherent ability was not revealed409when an excessively large amount of TAP was added. Beyond4104.5 wt% of TAP, the proton conductivity started to be reduced. The411allocation of an even larger amount of TAP (up to 6.95 wt%) led to412more compact structure of membranes, which hindered the413mobility of protons. However, the small decrease was almost414likely related to the morphological structure of SPEEK nanocom-415posite with non-uniform dispersion of CC.416Fig. 11 shows the proton conductivity versus the content of TAP417when CC was maintained at 3.60 wt%. The proton conductivity418increased with increment of TAP content until it researched its419maximum value at TAP = 4.25 wt%, beyond which it decreased. The420proton conductivity was mainly governed by the membrane421surface resistivity. Therefore it can be concluded that the better the422CC particles distribution, the lower the surface resistivity of the423membrane would be, and this resulted in higher proton424conductivity value.425In addition it was suggested that proton conductivity indirectly426correlate to water uptake [39]. Interestingly, it had been reported427that SP/CC7.5 showed high water uptake and very low proton428conductivity, due to agglomeration of CC particles in SP matrices429which resisted the proton transport across the membrane via the430free space between SPEEK and CC or even through the CC itself.
Table 4ANOVA analysis of the impact of the noise on the methanol permeability.
Source DF F-value Prob > F Significance
Model 2 52.06 < 0.0001 Significant
A-Cloisite 1 21.13 0.001 Significant
B-TAP 1 82.98 < 0.0001 Significant
R-squared = 0.91 Adjusted R-squared = 0.89.
Table 5ANOVA analysis of the impact of the noise on the membrane selectivity.
Source DF F-value Prob > F Significance
Model 5 40.38 <0.0001 Significant
A-Cloisite 1 64.16 <0.0001 Significant
B-TAP 1 78.96 <0.0001 Significant
A2 1 22.79 0.0020 Significant
B2 1 42.95 0.0003 Significant
AB 1 0.22 0.6556 Insignificant
R-squared = 0.97 Adjusted R-squared = 0.94
Table 3ANOVA analysis of the impact of the noise on the proton conductivity.
Source DF F-value Prob > F Significance
Model 5 53.17 <0.0001 Significant
A-Cloisite 1 43.64 0.0003 Significant
B-TAP 1 10.70 0.0136 Significant
A2 1 86.25 <0.0001 Significant
B2 1 140.81 <0.0001 Significant
AB 1 9.76 0.0168 Significant
R-squared = 0.97 Adjusted R-squared = 0.96.
H. Ilbeygi et al. / Journal of the Taiwan Institute of Chemical Engineers xxx (2014) xxx–xxx6
G Model
JTICE 987 1–15
Please cite this article in press as: Ilbeygi H, et al. Transport properties of SPEEK nanocomposite proton conducting membranes:Optimization of additives content by response surface methodology. J Taiwan Inst Chem Eng (2014), http://dx.doi.org/10.1016/j.jtice.2014.08.005
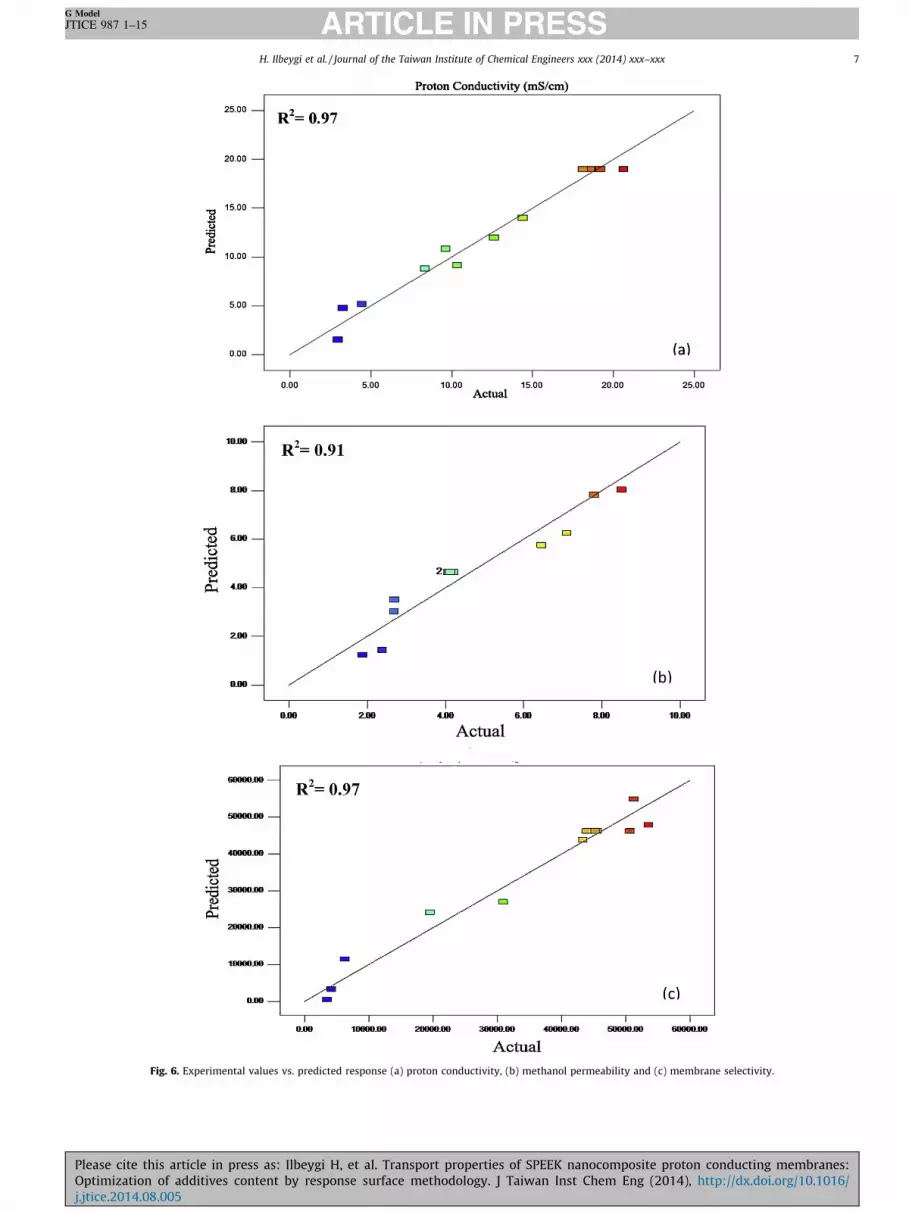
Fig. 6. Experimental values vs. predicted response (a) proton conductivity, (b) methanol permeability and (c) membrane selectivity.
H. Ilbeygi et al. / Journal of the Taiwan Institute of Chemical Engineers xxx (2014) xxx–xxx 7
G Model
JTICE 987 1–15
Please cite this article in press as: Ilbeygi H, et al. Transport properties of SPEEK nanocomposite proton conducting membranes:Optimization of additives content by response surface methodology. J Taiwan Inst Chem Eng (2014), http://dx.doi.org/10.1016/j.jtice.2014.08.005
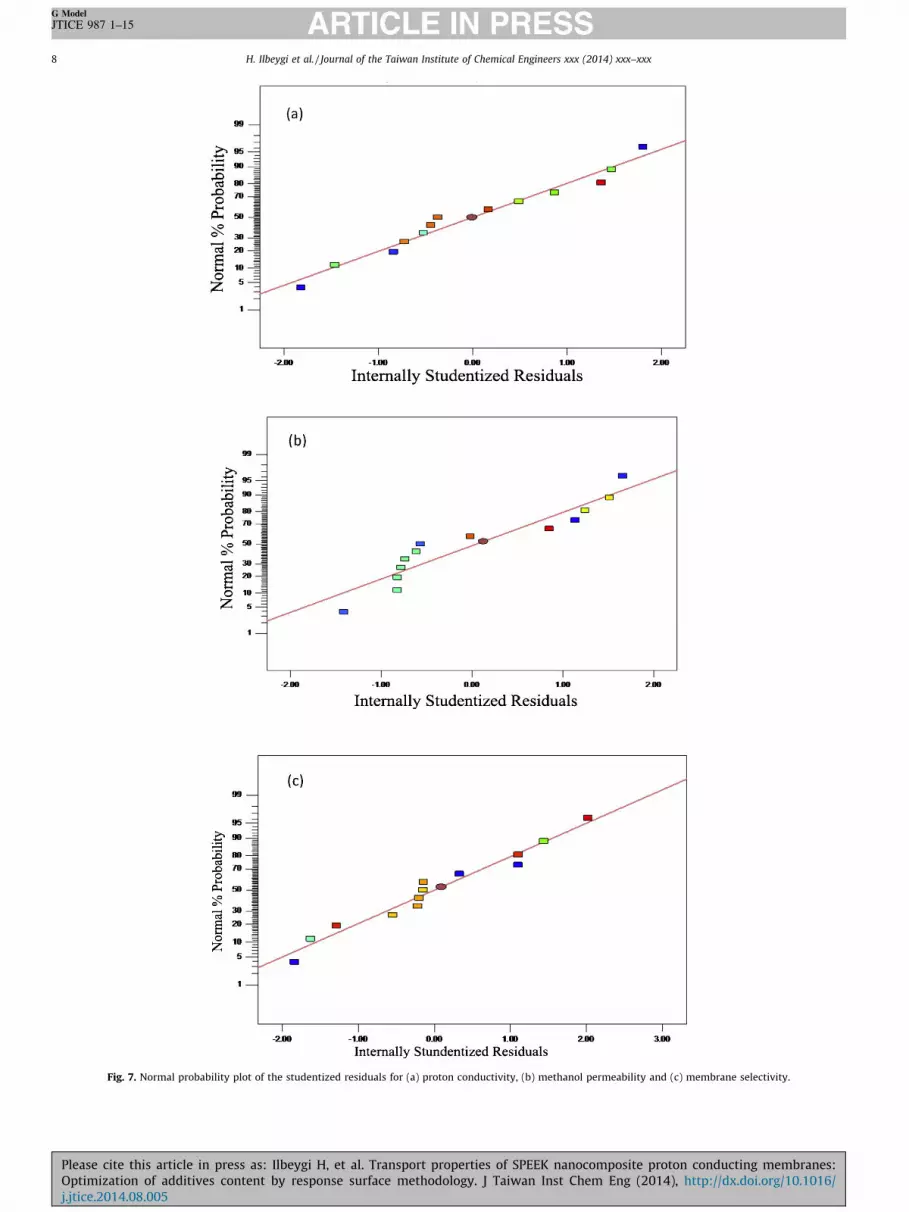
Fig. 7. Normal probability plot of the studentized residuals for (a) proton conductivity, (b) methanol permeability and (c) membrane selectivity.
H. Ilbeygi et al. / Journal of the Taiwan Institute of Chemical Engineers xxx (2014) xxx–xxx8
G Model
JTICE 987 1–15
Please cite this article in press as: Ilbeygi H, et al. Transport properties of SPEEK nanocomposite proton conducting membranes:Optimization of additives content by response surface methodology. J Taiwan Inst Chem Eng (2014), http://dx.doi.org/10.1016/j.jtice.2014.08.005

431 However, water uptake properties of SP nanocomposite membrane432 were improved by adding certain amount of TAP, which led to433 better proton conductivity [45]. It must probably because of434 increment the proton conductivity via water molecules through435 the membrane.436 In general, beside the migration of proton via the interfacial437 space between SP backbone and CC particles, there was another438 significant mechanism related the highly conductive CC particles,439 in which protons are also driven by the presence of water440 molecules absorbed by the CC particles [46].441 Fig. 12 shows contour (a) and 3D surface (b) plots for the442 effects of the CC and TAP content on proton conductivity. Mostly443 it was observed that when the amount of TAP/CC ratio was more444 than one the proton conductivity became higher than the reverse445 ratio. Interestingly, the highest proton conductivity was446 achieved at CC of 3.60 wt% and TAP of 4.50 wt%. On the other447 hand, at CC of 6.55 wt% and TAP of 1.95 wt%, the proton
448conductivity showed the lowest value (2.97 mS/cm), which449might be due to the agglomeration of CC that blocked the cation450pathway.451As mentioned before, the proton conductivity highly depended452on improved dispersion of CC particles in the membranes. As453reported by Wang and Dong [11], a good dispersion of inorganic454fillers is expected to yield the highest ionic conductivity since more455cations are mobile and available for conduction [47]. This456expectation was supported by Kim et al. [48] who found that457smaller size and uniform spreading of ionic clusters cad lead to458better proton conductivity value [48].
4593.5. Methanol permeability
460Fig. 13 shows the dependence of methanol permeability of461SPEEK nanocomposite membranes on the contents of CC and TAP.462As shown in the figure methanol permeability decreased with an
Fig. 8. One factor plot illustrates the effect Cloisite content on proton conductivity at TAP = 4.5% (the uncertainty in a predicted response ——; the predicted response––––).
Fig. 9. One factor plot illustrates the effect of Cloisite content on proton conductivity at TAP = 2.5% (the uncertainty in a predicted response ——; the predicted response––––).
H. Ilbeygi et al. / Journal of the Taiwan Institute of Chemical Engineers xxx (2014) xxx–xxx 9
G Model
JTICE 987 1–15
Please cite this article in press as: Ilbeygi H, et al. Transport properties of SPEEK nanocomposite proton conducting membranes:Optimization of additives content by response surface methodology. J Taiwan Inst Chem Eng (2014), http://dx.doi.org/10.1016/j.jtice.2014.08.005
463 increase in TAP content, when a constant CC content was464 maintained, while it increased with an increase in CC content465 when a constant TAP content was maintained. This could be due to466 the channels that were provided by CC particles.467 It was expected that adding more CC particles would lead to468 lower methanol permeability in certain amount of TAP but the469 results showed a reverse behaviour. This might be due to its high470 aspect ratio (length to width), which could provide a longer471 pathway toward methanol to cross the membrane, so higher472 amount of CC presented more channels for methanol molecule to473 pass through the membrane. On the other hand, the addition of474 TAP is favourable in preparing a homogenous SPEEK/CC membrane475 to demonstrate the unique feature of CC [49]. However, there476 might be also different behaviours in other amounts of CC and TAP477 between these ranges, which this model failed to predict them478 precisely.479 Consequently, if an intercalation or exfoliation microstructure480 arrangement was achieved, the aspect ratio of CC structure could481 persist the methanol permeation rate across the membrane. The
482minimum values of methanol permeability were at CC 1.95 wt%483and TAP 6.55 wt% due to the agglomeration of particles in484membrane matrices that blocked the methanol narrow channel485(Fig. 5b).486Lower methanol permeability was also most probably due to487the good dispersion of CC particles in the SPEEK matrices, which488had successfully activated the function of passive filler such as CC489particles as a methanol barrier by providing the winding diffusion490effects towards the methanol molecule [16]. However, when TAP491was introduced, the gap between SPEEK and CC became narrower492or even disappeared due to the good distribution of CC particles493throughout the membrane microstructure. It could be observed494that the proper amount of CC in mixture with TAP could provide495the optimum value of methanol permeability which did not have496bad effect of proton conductivity of membrane (see next section). It497was observed that, the impermeable CC particles refused to498provide a mediate pathway towards a smaller polar molecule such499as methanol due to unique lamellar structure of CC in interaction500with SPEEK [50].
Fig. 10. One factor plot illustrates the effect Cloisite content on proton conductivity at TAP = 6.00% (the uncertainty in a predicted response ——; the predicted response––––).
Fig. 11. One factor plot illustrates the effect Cloisite composition on proton conductivity at CC = 3.60% (the uncertainty in a predicted response ——; the predicted response
––––).
H. Ilbeygi et al. / Journal of the Taiwan Institute of Chemical Engineers xxx (2014) xxx–xxx10
G Model
JTICE 987 1–15
Please cite this article in press as: Ilbeygi H, et al. Transport properties of SPEEK nanocomposite proton conducting membranes:Optimization of additives content by response surface methodology. J Taiwan Inst Chem Eng (2014), http://dx.doi.org/10.1016/j.jtice.2014.08.005
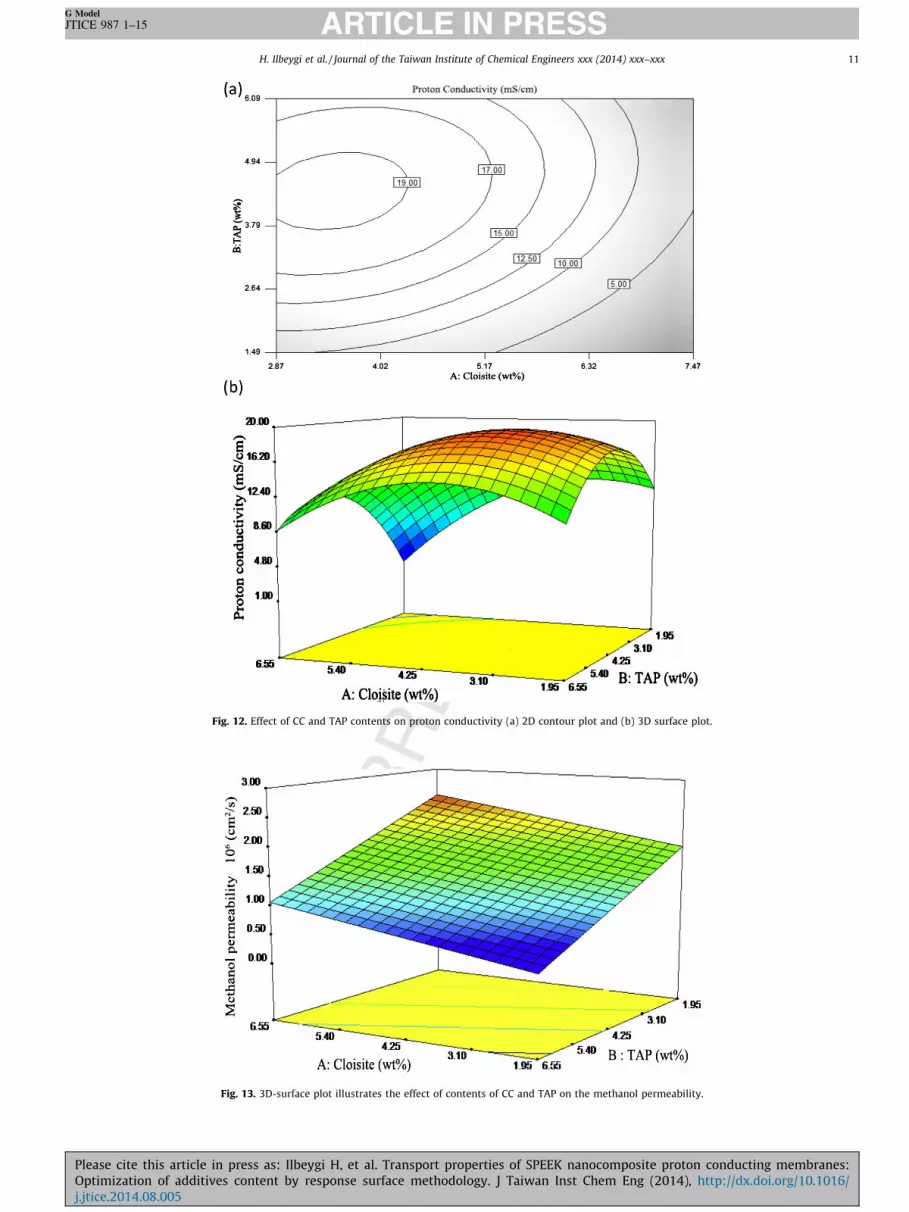
Fig. 12. Effect of CC and TAP contents on proton conductivity (a) 2D contour plot and (b) 3D surface plot.
Fig. 13. 3D-surface plot illustrates the effect of contents of CC and TAP on the methanol permeability.
H. Ilbeygi et al. / Journal of the Taiwan Institute of Chemical Engineers xxx (2014) xxx–xxx 11
G Model
JTICE 987 1–15
Please cite this article in press as: Ilbeygi H, et al. Transport properties of SPEEK nanocomposite proton conducting membranes:Optimization of additives content by response surface methodology. J Taiwan Inst Chem Eng (2014), http://dx.doi.org/10.1016/j.jtice.2014.08.005

Fig. 15. Effect of CC and TAP contents on membrane selectivity (a) 2D contour plot and (b) corresponding 3D surface plot.
Fig. 14. One factor plot illustrates the effect CC content on membrane selectivity at TAP = 5.9% (the uncertainty in a predicted response ——; the predicted response––––)
H. Ilbeygi et al. / Journal of the Taiwan Institute of Chemical Engineers xxx (2014) xxx–xxx12
G Model
JTICE 987 1–15
Please cite this article in press as: Ilbeygi H, et al. Transport properties of SPEEK nanocomposite proton conducting membranes:Optimization of additives content by response surface methodology. J Taiwan Inst Chem Eng (2014), http://dx.doi.org/10.1016/j.jtice.2014.08.005
501 3.6. Membrane selectivity
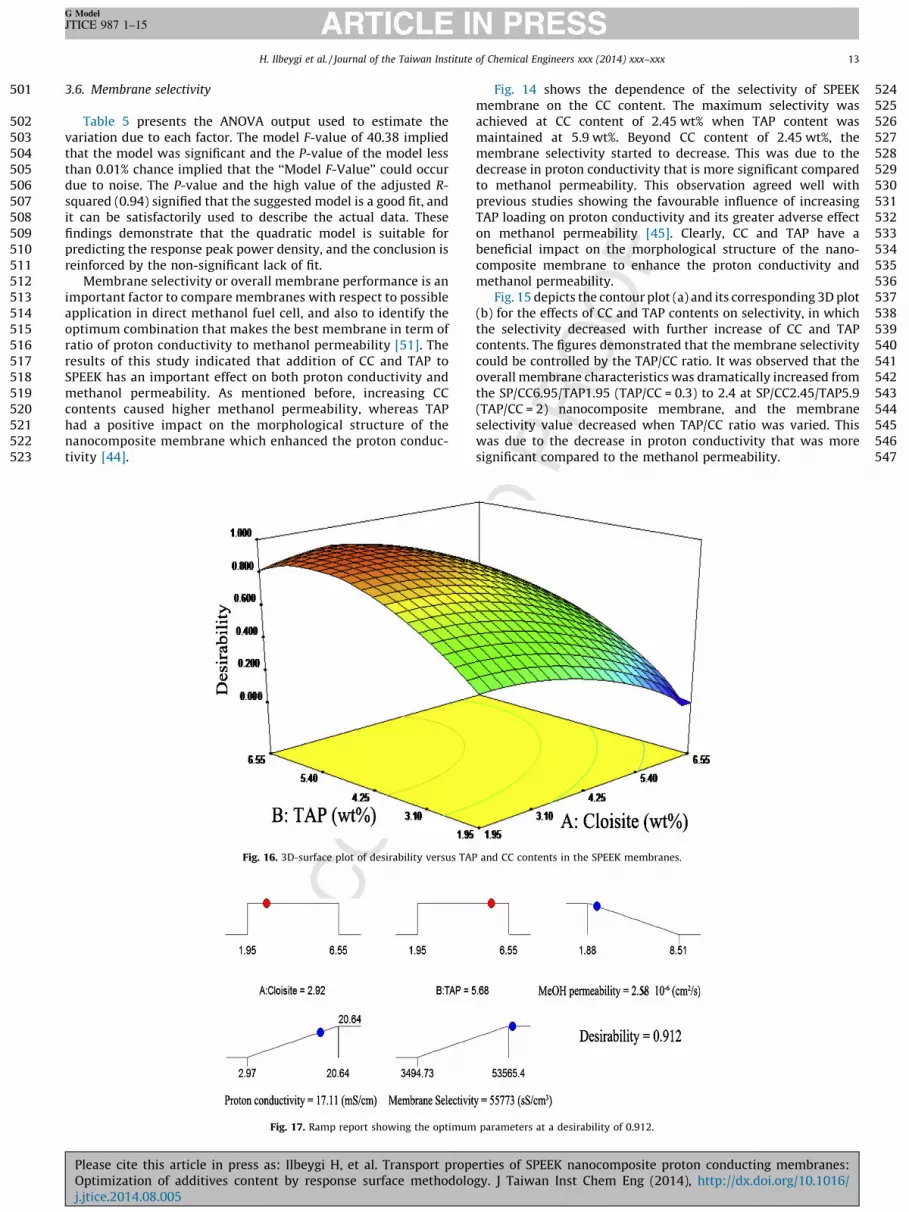
502 Table 5 presents the ANOVA output used to estimate the503 variation due to each factor. The model F-value of 40.38 implied504 that the model was significant and the P-value of the model less505 than 0.01% chance implied that the ‘‘Model F-Value’’ could occur506 due to noise. The P-value and the high value of the adjusted R-507 squared (0.94) signified that the suggested model is a good fit, and508 it can be satisfactorily used to describe the actual data. These509 findings demonstrate that the quadratic model is suitable for510 predicting the response peak power density, and the conclusion is511 reinforced by the non-significant lack of fit.512 Membrane selectivity or overall membrane performance is an513 important factor to compare membranes with respect to possible514 application in direct methanol fuel cell, and also to identify the515 optimum combination that makes the best membrane in term of516 ratio of proton conductivity to methanol permeability [51]. The517 results of this study indicated that addition of CC and TAP to518 SPEEK has an important effect on both proton conductivity and519 methanol permeability. As mentioned before, increasing CC520 contents caused higher methanol permeability, whereas TAP521 had a positive impact on the morphological structure of the522 nanocomposite membrane which enhanced the proton conduc-523 tivity [44].
524Fig. 14 shows the dependence of the selectivity of SPEEK525membrane on the CC content. The maximum selectivity was526achieved at CC content of 2.45 wt% when TAP content was527maintained at 5.9 wt%. Beyond CC content of 2.45 wt%, the528membrane selectivity started to decrease. This was due to the529decrease in proton conductivity that is more significant compared530to methanol permeability. This observation agreed well with531previous studies showing the favourable influence of increasing532TAP loading on proton conductivity and its greater adverse effect533on methanol permeability [45]. Clearly, CC and TAP have a534beneficial impact on the morphological structure of the nano-535composite membrane to enhance the proton conductivity and536methanol permeability.537Fig. 15 depicts the contour plot (a) and its corresponding 3D plot538(b) for the effects of CC and TAP contents on selectivity, in which539the selectivity decreased with further increase of CC and TAP540contents. The figures demonstrated that the membrane selectivity541could be controlled by the TAP/CC ratio. It was observed that the542overall membrane characteristics was dramatically increased from543the SP/CC6.95/TAP1.95 (TAP/CC = 0.3) to 2.4 at SP/CC2.45/TAP5.9544(TAP/CC = 2) nanocomposite membrane, and the membrane545selectivity value decreased when TAP/CC ratio was varied. This546was due to the decrease in proton conductivity that was more547significant compared to the methanol permeability.
Fig. 17. Ramp report showing the optimum parameters at a desirability of 0.912.
Fig. 16. 3D-surface plot of desirability versus TAP and CC contents in the SPEEK membranes.
H. Ilbeygi et al. / Journal of the Taiwan Institute of Chemical Engineers xxx (2014) xxx–xxx 13
G Model
JTICE 987 1–15
Please cite this article in press as: Ilbeygi H, et al. Transport properties of SPEEK nanocomposite proton conducting membranes:Optimization of additives content by response surface methodology. J Taiwan Inst Chem Eng (2014), http://dx.doi.org/10.1016/j.jtice.2014.08.005

548 All two stretching factors were optimized simultaneously549 through a desirability function (D) for three responses according to550 Eq. (8) [33], where N is the number of responses, ri refers to the551 importance of particular response and di denotes the partial552 desirability function for specific responses [52]. The desirability553 function (D) would satisfy all responses with high or low limit of554 requirements to obtain optimum additives content for synthesized555 membrane.
D ¼YNi¼1
drii
" #1=P
ri
(8)
556557558 The ultimate aim was to produce a membrane with maximum559 proton conductivity while maintaining minimum methanol560 permeability. In Fig. 16, the surface response plots clearly shows561 that the desirable stretching conditions tended to shift to lower CC562 content and higher TAP content, which were found to be 2.92 wt%563 and 5.68 wt%, respectively. This optimum membrane synthesis564 condition with 0.91 of desirability value was expected to be able to565 produce a highly proton conduction membrane (17.11 mS/cm)566 with high membrane selectivity (55773 Ss/cm3) and minimal567 methanol permeability (2.58 � 10�6 cm2/s).568 Fig. 17 presents the ramp report of the overall optimum569 parameters, which were investigated to obtain a selectivity of570 55773 Ss/cm3. The optimum combinations of additives content in571 the SPEEK membranes were 2.92 wt% of CC and 5.68 wt% of TAP.572 Table 6 shows a set of membrane formulation and the predicted573 response generated using the Design Expert software. The574 confirmation experiments were conducted at CC 2.92 wt% and575 5.68 wt% to validate the accuracy of the model. The experimental576 values were found to be in good agreement with the values577 predicted from CCD. Errors between the predicted and actual578 values showed that process optimization in CCD was able and579 reliable to produce membrane with desired transport properties580 when the membrane morphology was modified under the581 suggested optimum additives content.
582 4. Conclusions
583 The dependence of transport properties of SPEEK nanocompo-584 site membranes on different contents of additives was investigated585 using RSM central composite design. The relationships between586 the independent parameters TAP and CC content and the response587 (the performance in terms of ionic conductivity, methanol588 permeability and selectivity) had been established and RSM had589 been successfully applied for parameters optimization. Two590 quadratic models for proton conductivity and membrane selectiv-591 ity, together with a linear model for methanol permeability were592 developed. The minimum methanol permeability was obtained at593 CC of 1.95 wt% and TAP of 6.55 wt%. The maximum proton594 conductivity was achieved at CC 3.6 wt% and TAP 4.5 wt%. The595 maximum membrane selectivity was obtained a CC of 2.45 wt%596 and TAP 5.9 wt% TAP content was found to a major factor in597 affecting the membrane selectivity and methanol permeability,598 whereas CC content significantly affected the proton conductivity.599 The composition with the desirability function of 91% (CC600 2.92 wt%, TAP 5.68 wt%) was experimentally validated, where601 the deviations from the predicted values were around 16% for
602methanol permeability, 7.5% for proton conductivity and 8.09% for603membrane selectivity. The results of this work proved that the604addition of CC and TAP (as a compatibilizer) improve the transport605properties of SPEEK nanocomposite membrane making it a606promising membrane for DMFC application. Moreover, the use607of RSM can lead to a reduction in the number of experiments,608which can help to scale up the membrane production. RSM can be609considered as an effective multivariate technique for experimental610design, prediction of the performance and optimization of the611system parameters.
612References
613[1] Zaidi SMJ. Preparation and characterization of composite membranes using614blends of SPEEK/PBI with boron phosphate. Electrochim Acta 2005;50:4771–7.615[2] Norddin MNAM, Ismail AF, Rana D, Matsuura T, Tabe S. The effect of blending616sulfonated poly(ether ether ketone) with various charged surface modifying617macromolecules on proton exchange membrane performance. J Membr Sci6182009;328:148–55.619[3] Lee CH, Min KA, Park HB, Hong YT, Jung BO, Lee YM. Sulfonated poly(arylene620ether sulfone)–silica nanocomposite membrane for direct methanol fuel cell621(DMFC). J Membr Sci 2007;303:258–66.622[4] Yang C-C, Lee Y-J. Preparation of the acidic PVA/MMT nanocomposite polymer623membrane for the direct methanol fuel cell (DMFC). Thin Solid Films6242009;517:4735–40.625[5] Berezina NP, Kononenko NA, Sytcheva AAR, Loza NV, Shkirskaya SA, Hegman626N, et al. Perfluorinated nanocomposite membranes modified by polyaniline:627electrotransport phenomena and morphology. Electrochim Acta6282009;54:2342–52.629[6] Zhang Y, Fang J, Wu Y, Xu H, Chi X, Li W, et al. Novel fluoropolymer anion630exchange membranes for alkaline direct methanol fuel cells. J Colloid Interface631Sci 2012;381:59–66.632[7] Fang J, Zhang Y, Wu Y. Preparation and characterization of fluoropolymer633anion exchange membrane for alkaline direct methanol fuel cells. Energy634Procedia 2012;14:133–6.635[8] Mokrini A, Huneault MA, Shi Z, Xie Z, Holdcroft S. Non-fluorinated proton-636exchange membranes based on melt extruded SEBS/HDPE blends. J Membr Sci6372008;325:749–57.638[9] Fontananova E, Trotta F, Jansen JC, Drioli E. Preparation and characterization of639new non-fluorinated polymeric and composite membranes for PEMFCs. J640Membr Sci 2010;348:326–36.641[10] Peighambardoust SJ, Rowshanzamir S, Amjadi M. Review of the proton ex-642change membranes for fuel cell applications. Int J Hydrogen Energy6432010;35:9349–84.644[11] Wang M, Dong S. Enhanced electrochemical properties of nanocomposite645polymer electrolyte based on copolymer with exfoliated clays. J Power Sources6462007;170:425–32.647[12] Zhang L, Chae S-R, Hendren Z, Park J-S, Wiesner MR. Recent advances in proton648exchange membranes for fuel cell applications. Chem Eng J 2012;20:4–206.64987-97.650[13] Jaafar J, Ismail AF, Matsuura T. Preparation and barrier properties of SPEEK/651Cloisite 15A1/TAP nanocomposite membrane for DMFC application. J Membr652Sci 2009;345:119–27.653[14] Lin Y-F, Yen C-Y, Hung C-H, Hsiao Y-H, Ma C-CM. A novel composite mem-654branes based on sulfonated montmorillonite modified Nafion1 for DMFCs. J655Power Sources 2007;168:162–6.656[15] Hasani-Sadrabadi MM, Dashtimoghadam E, Majedi FS, Kabiri K. Nafion1/bio-657functionalized montmorillonite nanohybrids as novel polyelectrolyte mem-658branes for direct methanol fuel cells. J Power Sources 2009;190:318–21.659[16] Gaowen Z, Zhentao Z. Organic/inorganic composite membranes for applica-660tion in DMFC. J Membr Sci 2005;261:107–13.661[17] Cui Z, Xing W, Liu C, Liao J, Zhang H. Chitosan/heteropolyacid composite662membranes for direct methanol fuel cell. J Power Sources. 2009;188:24–9.663[18] Jin Y, Diniz da Costa JC, Lu GQ. Proton conductive composite membrane of664phosphosilicate and polyvinyl alcohol. Solid State Ionics 2007;178:937–42.665[19] Yang T. Preliminary study of SPEEK/PVA blend membranes for DMFC applica-666tions. Int J Hydrogen EnergyV 33 2008;6772–9.667[20] Mohtar SS, Ismail AF, Matsuura T. Preparation and characterization of SPEEK/668MMT-STA composite membrane for DMFC application. J Membr Sci 2011;669371:10–9.670[21] Molla S, Compan V. Polymer blends of SPEEK for DMFC application at671intermediate temperatures. Int J Hydrogen Energy 2014;39:5121–36.
Table 6Validation experiments using optimum formulation.
CC (wt%) TAP (wt%) Methanol permeability �10�6 (cm2/s) Proton conductivity (mS/cm) Membrane selectivity (sS/cm3) Desirability
Predicted Experiment Error (%) Predicted Experiment Error (%) Predicted Experiment Error (%)
2.92 5.68 2.56 2.94 12.92 17.12 18.51 7.50 55,773.7 60,688.52 8.09 0.912
H. Ilbeygi et al. / Journal of the Taiwan Institute of Chemical Engineers xxx (2014) xxx–xxx14
G Model
JTICE 987 1–15
Please cite this article in press as: Ilbeygi H, et al. Transport properties of SPEEK nanocomposite proton conducting membranes:Optimization of additives content by response surface methodology. J Taiwan Inst Chem Eng (2014), http://dx.doi.org/10.1016/j.jtice.2014.08.005
672 [22] Cervantes-Uc JM, Cauich-Rodrıguez JV, Vazquez-Torres H, Garfias-Mesıas LF,673 Paul DR. Thermal degradation of commercially available organoclays studied674 by TGA–FTIR. Thermochim Acta 2007;457:92–102.675 [23] Myers RH, Montgomery DC, Vining GG, Robinson TJ. References generalized676 linear models. John Wiley & Sons, Inc.; 2010.Q2 p. 484–91.677 [24] Fermoso J, Gil MV, Arias B, Plaza MG, Pevida C, Pis JJ, et al. Application of678 response surface methodology to assess the combined effect of operating679 variables on high-pressure coal gasification for H2-rich gas production. Int J680 Hydrogen Energy. 2010;35:1191–204.681 [25] Myers RH, Montgomery DC, Vining GG, Borror CM, Kowalski SM. Response682 surface methodology: a retrospective and literature survey. J Qual Technol683 2004;36:53–77.684 [26] Hanrahan G, Lu K. Application of factorial and response surface methodology685 in modern experimental design and optimization. Crit Rev Anal Chem686 2006;36:141–51.687 [27] Ravikumar K, Pakshirajan K, Swaminathan T, Balu K. Optimization of batch688 process parameters using response surface methodology for dye removal by a689 novel adsorbent. Chem Eng J. 2005;105:131–8.690 [28] Hamsaveni DR, Prapulla SG, Divakar S. Response surface methodological691 approach for the synthesis of isobutyl isobutyrate. Process Biochem692 2001;36:1103–9.693 [29] Ahmadi M, Vahabzadeh F, Bonakdarpour B, Mofarrah E, Mehranian M. Appli-694 cation of the central composite design and response surface methodology to695 the advanced treatment of olive oil processing wastewater using Fenton’s696 peroxidation. J Hazard Mater 2005;123:187–95.697 [30] Xiarchos I, Jaworska A, Zakrzewska-Trznadel G. Response surface methodolo-698 gy for the modelling of copper removal from aqueous solutions using micellar-699 enhanced ultrafiltration. J Membr Sci 2008;321:222–31.700 [31] Cojocaru C, Zakrzewska-Trznadel G. Response surface modeling and optimi-701 zation of copper removal from aqua solutions using polymer assisted ultrafil-702 tration. J Membr Sci 2007;298:56–70.703 [32] Ismail AF, Lai PY. Development of defect-free asymmetric polysulfone mem-704 branes for gas separation using response surface methodology. Sep Purif705 Technol 2004;40:191–207.706 [33] Ahmad AL, Low SC, Shukor SRA, Ismail A. Optimization of membrane perfor-707 mance by thermal-mechanical stretching process using responses surface708 methodology (RSM). Sep Purif Technol 2009;66:177–86.709 [34] Ng LY, Leo CP, Mohammad AW. Optimizing the incorporation of silica nano-710 particles in polysulfone/poly(vinyl alcohol) membranes with response surface711 methodology. J Appl Polym Sci 2011;121:1804–14.712 [35] Idris A, Kormin F, Noordin MY. Application of response surface methodology in713 describing the performance of thin film composite membrane. Sep Purif714 Technol 2006;49:271–80.715 [36] Xiangli F, Wei W, Chen Y, Jin W, Xu N. Optimization of preparation conditions716 for polydimethylsiloxane (PDMS)/ceramic composite pervaporation mem-717 branes using response surface methodology. J Membr Sci 2008;311:23–33.
718[37] Xing P, Robertson GP, Guiver MD, Mikhailenko SD, Wang K, Kaliaguine S.719Synthesis and characterization of sulfonated poly(ether ether ketone) for720proton exchange membranes. J Membr Sci 2004;229:95–106.721[38] Zaidi SMJ, Mikhailenko SD, Robertson GP, Guiver MD, Kaliaguine S. Proton722conducting composite membranes from polyether ether ketone and hetero-723polyacids for fuel cell applications. J Membr Sci 2000;173:17–34.724[39] Ismail AF, Othman NH, Mustafa A. Sulfonated polyether ether ketone com-725posite membrane using tungstosilicic acid supported on silica–aluminium726oxide for direct methanol fuel cell (DMFC). J Membr Sci 2009;329:18–29.727[40] Mayahi A, Ismail AF, Ilbeygi H, Othman MHD, Ghasemi M, Norddin MNAM,728et al. Effect of operating temperature on the behavior of promising SPEEK/729cSMM electrolyte membrane for DMFCs. Sep Purif Technol 2013;106:72–81.730[41] Bezerra MA, Santelli RE, Oliveira EP, Villar LS, Escaleira LA. Response surface731methodology (RSM) as a tool for optimization in analytical chemistry. Talanta7322008;76:965–77.733[42] Ilbeygi H, Ismail AF, Mayahi A, Nasef MM, Jaafar J, Jalalvandi E. Transport734properties and direct methanol fuel cell performance of sulfonated poly (ether735ether ketone)/Cloisite/triaminopyrimidine nanocomposite polymer electro-736lyte membrane at moderate temperature. Sep Purif Technol. 2013;118:567–73775.738[43] Li X, Liu C, Xu D, Zhao C, Wang Z, Zhang G, et al. Preparation and properties of739sulfonated poly(ether ether ketone)s (SPEEK)/polypyrrole composite mem-740branes for direct methanol fuel cells. J Power Sources. 2006;162:1–8.741[44] Jaafar J, Ismail AF, Matsuura T, Nagai K. Performance of SPEEK based polymer–742nanoclay inorganic membrane for DMFC. J Membr Sci 2011;382:202–11.743[45] Jaafar J, Ismail AF, Matsuura T. Effect of dispersion state of Cloisite15A1 on the744performance of SPEEK/Cloisite15A nanocomposite membrane for DMFC ap-745plication. J Appl Polym Sci. 2012;124:969–77.746[46] Libby B, Smyrl WH, Cussler EL. Polymer-zeolite composite membranes for747direct methanol fuel cells. AlChE J 2003;49:991–1001.748[47] Dang ZM, Wang L, Yin Y, Zhang Q, Lei QQ. Giant dielectric permittivities in749functionalized carbon-nanotube/electroactive-polymer nanocomposites. Adv750Mater 2007;19:852–7.751[48] Kim TK, Kang M, Choi YS, Kim HK, Lee W, Chang H, et al. Preparation of nafion-752sulfonated clay nanocomposite membrane for direct menthol fuel cells via a753film coating process. J Power Sources. 2007;165:1–8.754[49] Thomassin J-M, Pagnoulle C, Caldarella G, Germain A, Jerome R. Contribution755of nanoclays to the barrier properties of a model proton exchange membrane756for fuel cell application. J Membr Sci 2006;270:50–6.757[50] Song M-K, Park S-B, Kim Y-T, Kim K-H, Min S-K, Rhee H-W. Characterization of758polymer-layered silicate nanocomposite membranes for direct methanol fuel759cells. Electrochim Acta 2004;50:639–43.760[51] Ismail A, Norddin MNAM, Jaafar J, Matsuura T. Modification of ulfonated761poly(ether ether ketone) for DMFC application. Membrane modification.762CRC Press; 2012. p. 409–48.763[52] Montgomery DC. Design and analysis of experiments. John Wiley & Sons; 2001 764.
H. Ilbeygi et al. / Journal of the Taiwan Institute of Chemical Engineers xxx (2014) xxx–xxx 15
G Model
JTICE 987 1–15
Please cite this article in press as: Ilbeygi H, et al. Transport properties of SPEEK nanocomposite proton conducting membranes:Optimization of additives content by response surface methodology. J Taiwan Inst Chem Eng (2014), http://dx.doi.org/10.1016/j.jtice.2014.08.005