transient analysis of electrochemical noise for 316 and duplex 2205 stainless steels under pitting...
TRANSCRIPT
Int. J. Electrochem. Sci., 6 (2011) 1785 - 1796
International Journal of
ELECTROCHEMICAL SCIENCE
www.electrochemsci.org
Transient Analysis of Electrochemical Noise for 316 and Duplex
2205 Stainless Steels Under Pitting Corrosion
F.H. Estupiñán-López1, F. Almeraya-Calderón
1,*, R.G. Bautista Margulis.
2, M.A. Baltazar Zamora.
3,
A. Martínez-Villafañe1, J. Uruchurtu Ch.
4, C. Gaona-Tiburcio
1
1 Centro de Investigación en Materiales Avanzados, S.C.
Departamento de Integridad y Diseño de Materiales Compuestos/Grupo Corrosión
Miguel de Cervantes # 120, Complejo Industrial Chihuahua. Chihuahua, Chih., México. 2
Universidad Juárez Autónoma de Tabasco, División Académica de Ciencias Biológicas,
Villahermosa-Tabasco, 86040. México 3
Universidad Veracruzana, Facultad de Ingeniería Civil-Xalapa, Circuito Gonzalo Aguirre Beltrán s/n,
Zona Universitaria 91090, Xalapa, Veracruz, México 4
Universidad Autónoma de Morelos, FCQI-CIICAP. Cuernavaca-Morelos. México *E-mail: [email protected]
Received: 25 March 2011 / Accepted: 9 April 2011 / Published: 1 June 2011
The use of electrochemical noise (EN) technique for the investigation and monitoring of corrosion has
allowed many interesting advances in the corrosion science in recent years. A special advantage of EN
measurements includes the possibility to detect and analyses the early stages of localized corrosion.
However, the understanding of the electrochemical information included in the EN signal is actually
very limited. This work shows the results obtained from EN measurements for different materials that
exhibit pitting corrosion. The obtained transients in potential and current time, correlates with the
scanning electron microscopy (SEM) surface analysis. Electrochemical measurements were made at
different exposure times in order to obtain any correlation. The used materials were austenitic 316
stainless steel and 2205 duplex alloy, immersed in ferric chloride (FeCl3) and sodium chloride (NaCl)
electrolytes. SEM analysis shows that the observed transients in the time series really correspond to the
activity of pit nucleation developed on the surface of the electrodes.
Keywords: Pitting corrosion, electrochemical noise, electrochemical techniques
1. INTRODUCTION
Electrochemical noise technique for corrosion applications has gained popularity in the recent
years and has emerged as a promising technique for corrosion analysis. Electrochemical noise
Int. J. Electrochem. Sci., Vol. 6, 2011
1786
describes the low level spontaneous fluctuations of potential and current that occurs during an
electrochemical process. During a corrosion process, which is predominantly electrochemical in
nature, the cathodic and the anodic reactions can cause small transients in the electrical charges on the
electrode. These transients manifest in the form of potential and current noise, which can be exploited
to map a corrosion event. Electrochemical noise can be measured in potentiostatically-polarized
conditions and in freely corroding systems [1]. The instantaneous response to change in the conditions
of a surface as it begins to corrode enables this method to be a powerful online corrosion-monitoring
tool. High resistance to corrosion of stainless steels (SS) and nickel base alloys, aluminum, titanium,
copper and other metals is mainly attributed to the passive oxide film formed on its surface. However,
the passive film resistance is determined by environmental conditions is exposed to the material and
the alloy composition [2].
The action of aggressive ions, especially chloride ions Cl-, which by increasing its
concentration increases the pitting [3], cause passive films are susceptible to localized breakdown,
resulting in a rapid dissolution of the metal [4] mainly in places where there are heterogeneities,
causing localized corrosion, mainly pitting corrosion as stainless steels. [2 - 5]
Electrochemical Noise is a nondestructive technique [6] to reflect the individual sum of random
events of potential fluctuations and / or current of a material [7 - 12] subject to corrosive conditions
and the value of the Root Mean Square (RMS) of amplitude of these events or standard deviation has
been providing the fingerprint of the amount of dissolved metal, depending on the metal-environment
combination [13]. The fluctuations appear to be linked to variations in the rates of anodic and cathodic
reactions as a result of stochastic processes (breakdown and repassivation of passive film) and
deterministic (formation and propagation of pitting) [14 - 16]. With this technique does not alter the
state of the system under study, since it does not apply any external disturbance for measurement. The
concept of electrochemical noise, it behaves inversely proportional to the frequency range of
oscillations, lower the frequency higher amplitude [17], corrosion processes can be investigated by
observation of electrochemical noise. In the case of pitting, which is a special case of localized
corrosion, there are several methods to analyze noise data, and the most popular are the statistical
methods as the pitting index and power density spectral or spectral analysis. These fluctuations are
usually measured by a system of three electrodes [18].
Thus, the aim of the present work is to correlated the obtained transients of electrochemical
noise in potential and current time series with the photomicrographs obtained by scanning electron
microscopy (SEM) of 316 stainless steel and 2205 Duplex in aqueous solution of 3.5 wt.% NaCl and
6wt.% FeCl3.
2.EXPERIMENTAL PROCEDURE
The chemical composition of type AISI 316 SS and AISI 2205 duplex austenitic – ferritic steel,
used in the present study is given in Table1. The qualitative and quantitative chemical analysis was
performed using the technique of Plasma Emission Spectrometry.
Int. J. Electrochem. Sci., Vol. 6, 2011
1787
Table 1. Chemical composition of materials.
Material Concentration of Elements, wt. %
C Mn Si Cr Mo Ni N Fe
SS 316 0.08 1.47 0.69 16.65 2.094 10.45 *** Balance
Duplex 2205 0.028 1.6 0.44 23.012 2.973 5.876 0.165 Balance
The electrodes were cut from a bar of AISI 316 SS and AISI 2205 duplex of 1.13cm diameter,
joined to a copper wire without insulation on the ends to make electrical contact at the time of the
electrochemical tests and were encapsulated in epoxy resin. The exposure area of the steel samples in
the test solutions was 1cm2. The samples were mechanically polished with grit paper up to grade 600.
The samples were then degreased well with acetone and then rinsed with ethanol. After drying, the
specimens were stored in desiccators for a period of 24h, before electrochemical testing. The
electrolytes used in the study were ferric chloride (6 wt.% FeCl3) and sodium chloride (3.5 wt.%
NaCl); any solution was prepared with reagent grade chemicals and distilled water.
Experiments were performed by immersion in a glass of precipitate to a temperature of 25 C.
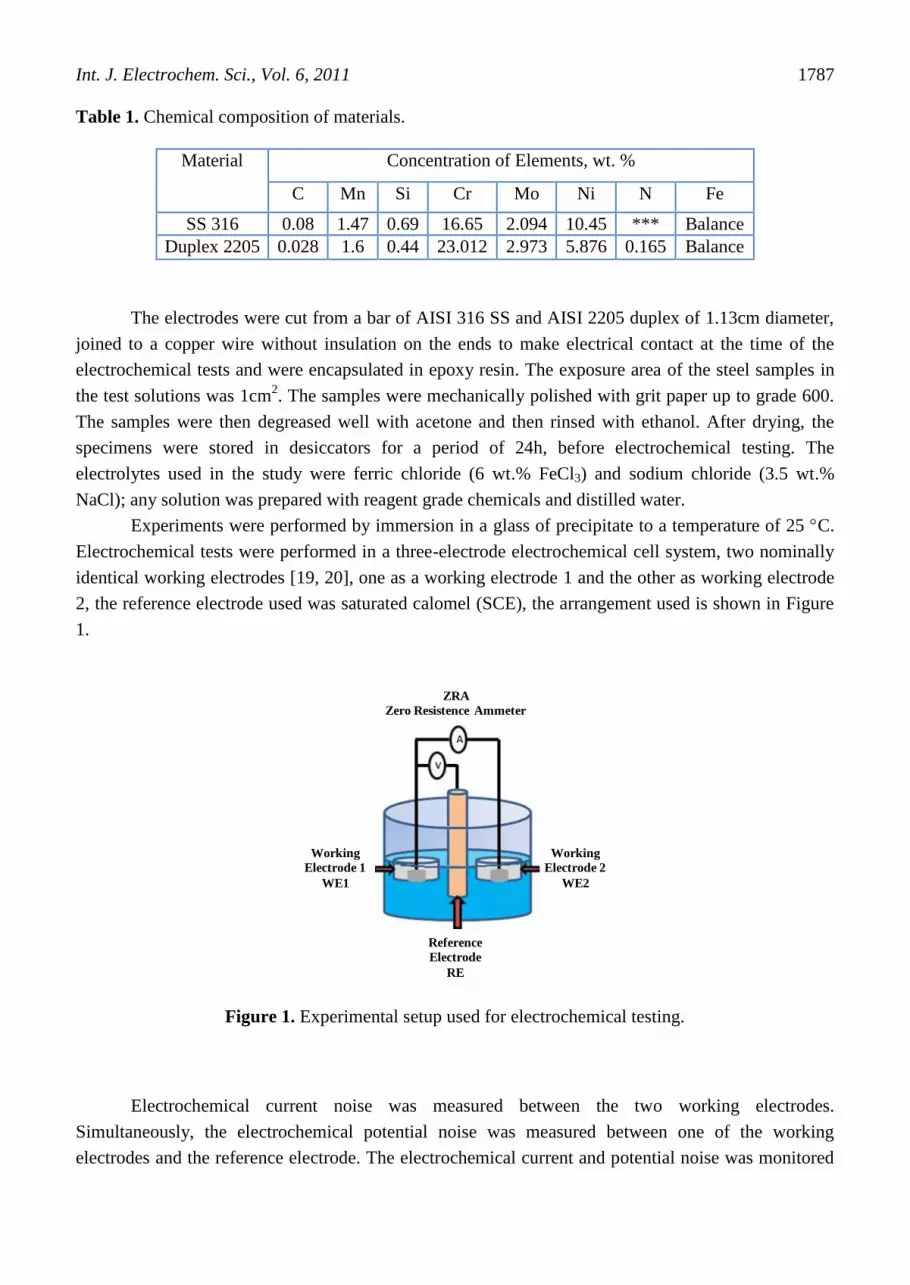
Electrochemical tests were performed in a three-electrode electrochemical cell system, two nominally
identical working electrodes [19, 20], one as a working electrode 1 and the other as working electrode
2, the reference electrode used was saturated calomel (SCE), the arrangement used is shown in Figure
1.
ZRA
Zero Resistence Ammeter
Working
Electrode 1
WE1
Reference
Electrode
RE
Working
Electrode 2
WE2
Figure 1. Experimental setup used for electrochemical testing.
Electrochemical current noise was measured between the two working electrodes.
Simultaneously, the electrochemical potential noise was measured between one of the working
electrodes and the reference electrode. The electrochemical current and potential noise was monitored

Int. J. Electrochem. Sci., Vol. 6, 2011
1788
with respect to time for the particular electrode–electrolyte combination, under open-circuit condition.
The electrochemical potential and current noise series–time records were thus obtained using a
potentiostat / galvanostat / ZRA mark "Solartron 1285" the number of points for each measured block
sample varied and were 500, 1000, 2500 and 4096 points at a rate of 1 point per second. After
electrochemical testing, the samples were dried with alcohol and pressurized hot air and stored in a
desiccator and subsequently making the analysis by scanning electron microscopy (SEM). The SEM
analysis was carried out on the entire sample surface to identify the nucleation or pits.
3. RESULTS AND DISCUSSION
Figure 2 shows the current and potential time series for electrochemical noise measurements
recorded in blocks of 500, 1000, 2500 and 4096 points, each point measurement was made every 1s,
for type 2205 duplex stainless steel in 6 wt.% FeCl3. In the time-series in potential is a trend towards
more noble potentials, and thus the passivation of the material under study. Figure 2b, shows the
electrochemical current time-series, it was observed high frequency fluctuations in a short time period,
such noise signals have also been obtained for uniform, passivation and localized corrosion processes
by Legat and Dolcek [13, 21].
0 500 1000 1500 2000 2500 3000 3500 40000.27
0.28
0.29
0.30
0.31
0.32
0.33
0.34
0.35
0.36
0.37
0.38 a)
4096
2500
1000
500
E (
V v
s E
CS
)
tiempo (s)Time (s) Time (s)
0 500 1000 1500 2000 2500 3000 3500 4000
-1.0x10⁻⁶
0.0
1.0x10⁻⁶
2.0x10⁻⁶
3.0x10⁻⁶
4.0x10⁻⁶
5.0x10⁻⁶
6.0x10⁻⁶
b)
4096 pts
2500 pts
1000 pts
500 pts
Icorr
(A
/cm
2)
tiempo (s)
Figure 2. (a) Potential noise and (b) current noise series obtained for 2205 Duplex steel after several
times of immersion in 6 wt.% FeCl3 solution.
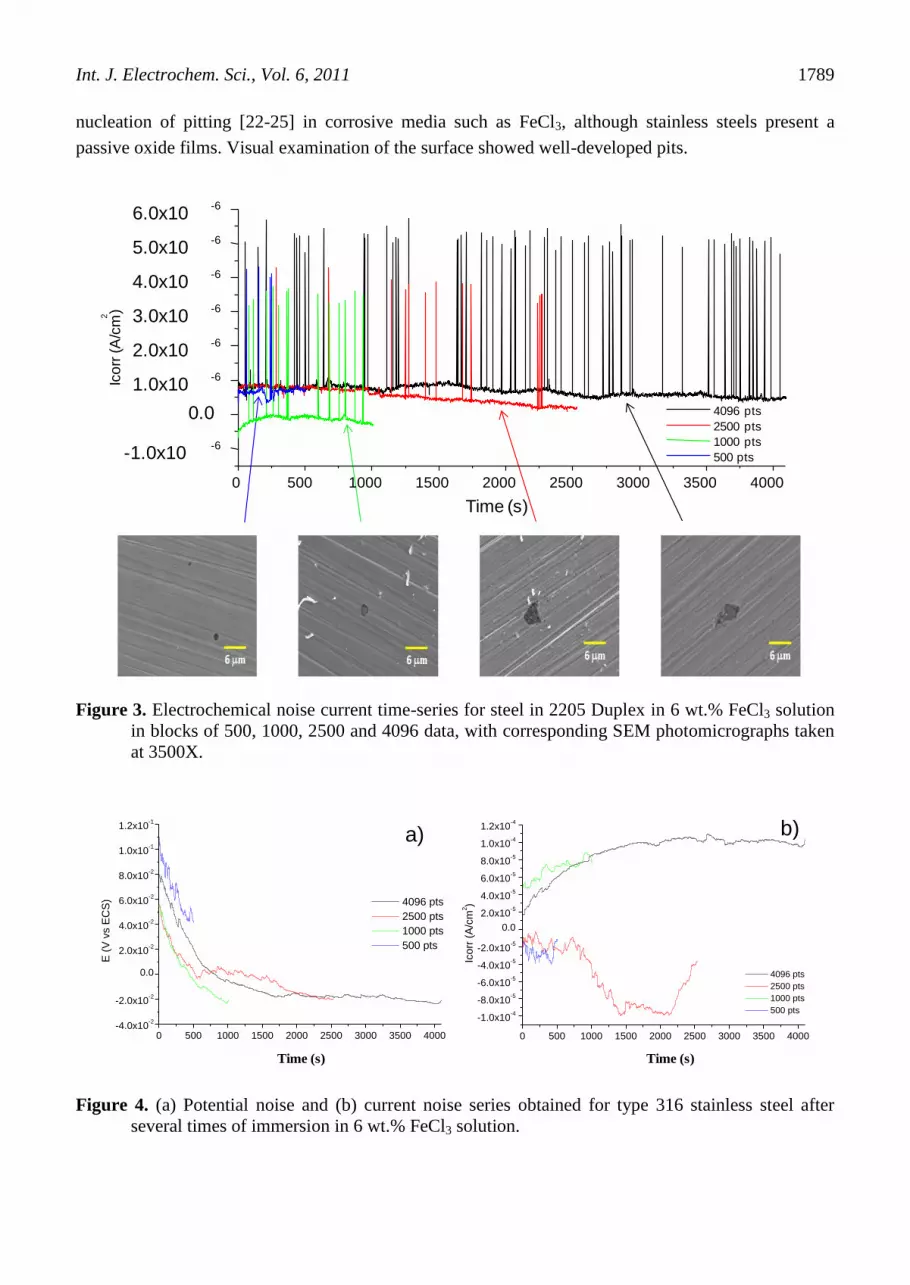
Figure 3 shows the current time series for electrochemical noise measurements recorded in
blocks of 500, 1000, 2500 and 4096 points, and their micrographs respectively for type 2205 duplex
stainless steel in 6 wt.% FeCl3. Regardless the number of measured block data, the trend of the
fluctuations is similar. Also, there are anodic current transients in time-series clearly identify whit high
frequency and very short durations with low intensities of 4 x 10⁻⁶
A/cm2, which is characteristic of the
Int. J. Electrochem. Sci., Vol. 6, 2011
1789
nucleation of pitting [22-25] in corrosive media such as FeCl3, although stainless steels present a
passive oxide films. Visual examination of the surface showed well-developed pits.
0 500 1000 1500 2000 2500 3000 3500 4000
-1.0x10⁻⁶
0.0
1.0x10⁻⁶
2.0x10⁻⁶
3.0x10⁻⁶
4.0x10⁻⁶
5.0x10⁻⁶
6.0x10⁻⁶
4096 pts
2500 pts
1000 pts
500 pts
Ico
rr (
A/c
m2
)
Time (s)
Figure 3. Electrochemical noise current time-series for steel in 2205 Duplex in 6 wt.% FeCl3 solution
in blocks of 500, 1000, 2500 and 4096 data, with corresponding SEM photomicrographs taken
at 3500X.
Time (s)
0 500 1000 1500 2000 2500 3000 3500 4000-4.0x10
-2
-2.0x10⁻²
0.0
2.0x10⁻²
4.0x10⁻²
6.0x10⁻²
8.0x10⁻²
1.0x10⁻¹
1.2x10⁻¹
a)
4096 pts
2500 pts
1000 pts
500 pts
E (
V v
s E
CS
)
tiempo (s)Time (s)
0 500 1000 1500 2000 2500 3000 3500 4000
-1.0x10⁻⁴
-8.0x10⁻⁵
-6.0x10⁻⁵
-4.0x10⁻⁵
-2.0x10⁻⁵
0.0
2.0x10⁻⁵
4.0x10⁻⁵
6.0x10⁻⁵
8.0x10⁻⁵
1.0x10⁻⁴
1.2x10⁻⁴
b)
4096 pts
2500 pts
1000 pts
500 pts
Icorr
(A
/cm
2)
tiempo (s)
Figure 4. (a) Potential noise and (b) current noise series obtained for type 316 stainless steel after
several times of immersion in 6 wt.% FeCl3 solution.

Int. J. Electrochem. Sci., Vol. 6, 2011
1790
Micrographs taken in the scanning electron microscope shows the way that nucleation occurs
and the growing of the pits. In block of 500 s, pits have a size approximately of 1 m. Also, when the
exposure time of the sample increase the size of the pits increases. In block of 4096 s, pits have a size
approximately of 4 m. All those pits were correlated with transients observed in their time-series for
electrochemical noise measurements recorded in blocks of 500, 1000, 2500 and 4096 points.
Figure 4, shows the current and potential time series for electrochemical noise measurements
recorded in blocks of 500, 1000, 2500 and 4096 points, each point measurement was made every 1s,
for type 316 stainless steel in 6 wt.% FeCl3.
Unlike the 2205 duplex steel in the same solution of FeCl3, in this material can not be observed
any transient. Figure 4 (a), shows that ENC fluctuations started in the noble potential values then
decrease to active potential, contrary to the previous case. Regardless of the number of sampled data,
they all follow the same trend. However, fig.4b shows that the reading of 4096 data, for type 316
stainless steel begin to stabilize its potential, which indicates that this material, start passivation. For
electrochemical noise current measurements recorded in blocks of 500, 1000 and 4096 points. Data
shows an increase which corresponds to dissolution of the passive film of stainless steel with a
tendency to repassivation as can be seen in block of 4096 data, where current consumption is not
increasing and tends to stabilize.
0 500 1000 1500 2000 2500 3000 3500 4000
-9.0x10⁻⁵
-6.0x10⁻⁵
-3.0x10⁻⁵
0.0
3.0x10⁻⁵
6.0x10⁻⁵
9.0x10⁻⁵
1.2x10⁻⁴
4096 pts
2500 pts
1000 pts
500 pts
Ico
rr (
A/c
m2
)
Time (s)
Figure 5. Electrochemical noise current time-series for type 316 stainless steel in 6 wt.% FeCl3
solution in blocks of 500, 1000, 2500 and 4096 data, with corresponding SEM
photomicrographs taken at 3500X.
Int. J. Electrochem. Sci., Vol. 6, 2011
1791
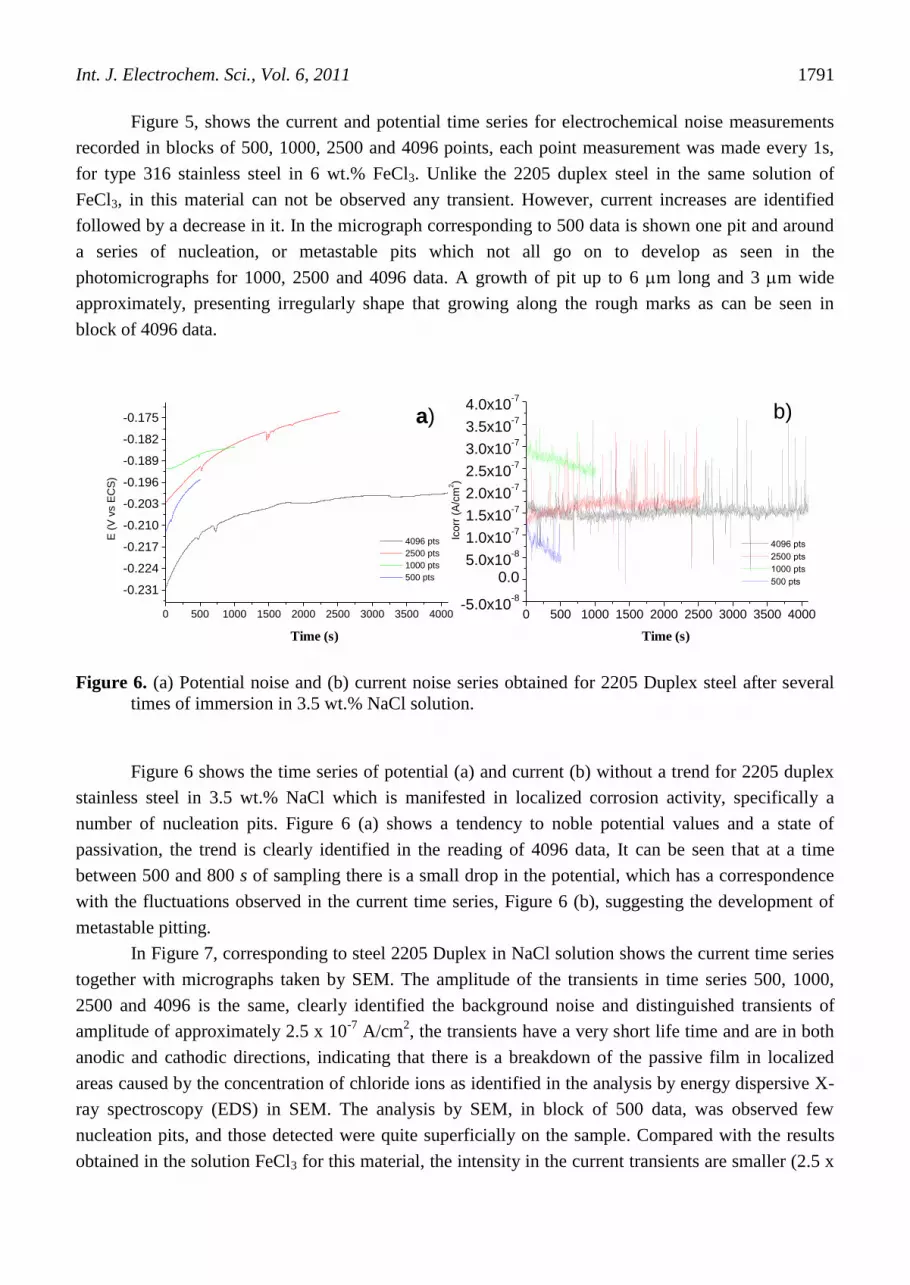
Figure 5, shows the current and potential time series for electrochemical noise measurements
recorded in blocks of 500, 1000, 2500 and 4096 points, each point measurement was made every 1s,
for type 316 stainless steel in 6 wt.% FeCl3. Unlike the 2205 duplex steel in the same solution of
FeCl3, in this material can not be observed any transient. However, current increases are identified
followed by a decrease in it. In the micrograph corresponding to 500 data is shown one pit and around
a series of nucleation, or metastable pits which not all go on to develop as seen in the
photomicrographs for 1000, 2500 and 4096 data. A growth of pit up to 6 m long and 3 m wide
approximately, presenting irregularly shape that growing along the rough marks as can be seen in
block of 4096 data.
Time (s)
0 500 1000 1500 2000 2500 3000 3500 4000
-0.231
-0.224
-0.217
-0.210
-0.203
-0.196
-0.189
-0.182
-0.175 a)
4096 pts
2500 pts
1000 pts
500 pts
E (
V v
s E
CS
)
tiempo (seg) Time (s)
0 500 1000 1500 2000 2500 3000 3500 4000-5.0x10
-8
0.05.0x10
-8
1.0x10⁻⁷
1.5x10⁻⁷
2.0x10⁻⁷
2.5x10⁻⁷
3.0x10⁻⁷
3.5x10⁻⁷
4.0x10⁻⁷
b)
4096 pts
2500 pts
1000 pts
500 pts
Icorr
(A
/cm
2)
tiempo (s)
Figure 6. (a) Potential noise and (b) current noise series obtained for 2205 Duplex steel after several
times of immersion in 3.5 wt.% NaCl solution.
Figure 6 shows the time series of potential (a) and current (b) without a trend for 2205 duplex
stainless steel in 3.5 wt.% NaCl which is manifested in localized corrosion activity, specifically a
number of nucleation pits. Figure 6 (a) shows a tendency to noble potential values and a state of
passivation, the trend is clearly identified in the reading of 4096 data, It can be seen that at a time
between 500 and 800 s of sampling there is a small drop in the potential, which has a correspondence
with the fluctuations observed in the current time series, Figure 6 (b), suggesting the development of
metastable pitting.
In Figure 7, corresponding to steel 2205 Duplex in NaCl solution shows the current time series
together with micrographs taken by SEM. The amplitude of the transients in time series 500, 1000,
2500 and 4096 is the same, clearly identified the background noise and distinguished transients of
amplitude of approximately 2.5 x 10⁻⁷
A/cm2, the transients have a very short life time and are in both
anodic and cathodic directions, indicating that there is a breakdown of the passive film in localized
areas caused by the concentration of chloride ions as identified in the analysis by energy dispersive X-
ray spectroscopy (EDS) in SEM. The analysis by SEM, in block of 500 data, was observed few
nucleation pits, and those detected were quite superficially on the sample. Compared with the results
obtained in the solution FeCl3 for this material, the intensity in the current transients are smaller (2.5 x

Int. J. Electrochem. Sci., Vol. 6, 2011
1792
10-7
A/cm2), which can be verified in the previous micrographs to any number of data, which are
smaller and were superficial ones.
0 500 1000 1500 2000 2500 3000 3500 4000-5.0x10
-8
0.0
5.0x10⁻⁸
1.0x10⁻⁷
1.5x10⁻⁷
2.0x10⁻⁷
2.5x10⁻⁷
3.0x10⁻⁷
3.5x10⁻⁷
4.0x10⁻⁷
4096 pts2500 pts1000 pts500 pts
Ico
rr (
A/c
m2
)
Time (s)
Figure 7. Electrochemical noise current time-series for type 2205 Duplex stainless steel in 3.5 wt.%
NaCl solution in blocks of 500, 1000, 2500 and 4096 data, with corresponding SEM
photomicrographs taken at 3500X.
Time (s)
0 500 1000 1500 2000 2500 3000 3500 4000
-0.150
-0.145
-0.140
-0.135
-0.130
-0.125
-0.120
-0.115
-0.110
-0.105
a)
4096 pts
2500 pts
1000 pts
500 pts
E (
V v
s E
CS
)
tiempo (seg) Time (s)
0 500 1000 1500 2000 2500 3000 3500 4000
0.0
1.0x10⁻⁷
2.0x10⁻⁷
3.0x10⁻⁷
4.0x10⁻⁷
5.0x10⁻⁷
6.0x10⁻⁷
7.0x10⁻⁷
b)
4096 pts
2500 pts
1000 pts
500 pts
Icorr
(A
/cm
2)
tiempo (s)
Figure 8. (a) Potential noise and (b) current noise series obtained for type 316 stainless steel after
several times of immersion in 3.5 wt.% NaCl solution.

Int. J. Electrochem. Sci., Vol. 6, 2011
1793
0 500 1000 1500 2000 2500 3000 3500 4000
0.0
1.0x10⁻⁷
2.0x10⁻⁷
3.0x10⁻⁷
4.0x10⁻⁷
5.0x10⁻⁷
6.0x10⁻⁷
7.0x10⁻⁷
4096 pts
2500 pts
1000 pts
500 pts
Ico
rr (
A/c
m2
)
Time (s)
Figure 9. Electrochemical noise current time-series for type 316 stainless steel in 3.5 wt.% NaCl
solution in blocks of 500, 1000, 2500 and 4096 data, with corresponding SEM
photomicrographs taken at 3500X.
Figure 8, shows the current and potential time series for electrochemical noise measurements
recorded in blocks of 500, 1000, 2500 and 4096 points, each point measurement was made every 1s,
for type 316 stainless steel in 3.5 wt.% NaCl. Figure 8 (a), shows a few drops of potential fluctuations
for any recorded block of sample data. In the same way as in the FeCl3 solution for stainless steel 316,
the trend is to active potential. Identifies some decreases in the course of the experiment to 4096 s,
followed by a recovery potential and its behavior corresponds to the fluctuations present at the current
time series, Figure 8 (b), in which was observed a negligible increase in current.
Figure 9, analyzed together the time-series of current and micrographs, for type 316 stainless
steel in 3.5 wt.% NaCl. Regardless the number of measured block data, the trend of the fluctuations is
similar. It was observed the typical current transients, characterized by a quick rise followed by a slow
recovery, are believed to reflect the metastable pitting process: initiation, growth and repassivation of
metastable pits. The amplitude of the transient characteristic of nucleation has an average of 2.5
A/cm2. However, there are some that can reach amplitude up to 4 A/cm
2, compared with those
observed in the solution of FeCl3 in the current time series analyzed by SEM. There was a lower pit
nucleation density. The nucleation of pits were found superficially in the sample with an irregular
shape of approximately 6 μm long and 2 μm wide for the experiment in block of 4096 s.
Table 2 shows the results of the parameters obtained (resistance to noise, location index,
corrosion current density and corrosion rate) from electrochemical tests, in which confirm those

Int. J. Electrochem. Sci., Vol. 6, 2011
1794
obtained by SEM analysis. To obtain the electrochemical parameters were used to statistical method
least squares, calculated for the experiment to 4096 data.
Table 2. Electrochemical Parameters Calculated from Equations 1-3. [27]*.
Material Solution Electrochemical parameters
Rn (Ω-cm2) Icorr (A/cm
2) IL *Corrosion
Type
Duplex 2205 FeCl3 7965.6 3.26 x 10⁻⁶
0.6017 Localized
NaCl 54768 4.7473 x 10⁻⁷
0.1118 Localized
SS 316 FeCl3 1582 1.64 x 10⁻⁵
0.2855 Localized
NaCl 21307 1.2202 x 10⁻⁶
0.1013 Localized
Calculate the noise resistance (eq. 1) was performed by ratio of the standard deviation of the
measured potential and current noise [22 - 24]:
(1)
Rn data was used to calculate the corrosion rate (eq. 2), in analogy with the equation of Stern -
Geary [25]:
(2)
The location index (eq. 3), which is a parameter that evaluates the variation of current noise
and compares the average value was calculated by the ratio of the current standard deviation and root
mean square current according to [26].
(3)
4.CONCLUSIONS
The transients presented in all time series of potential and current show repeatability and are
characteristic of pitting nucleation or metastable pitting. These transients are independent of the
Int. J. Electrochem. Sci., Vol. 6, 2011
1795
number of sampled data and are reaffirmed by the SEM analysis, which showed a correlation between
the pitting nucleation density and the number of transients in the time series for each experiment.
The amplitude of the transients is related to the size of the nucleation of the pit, for the 2205
duplex steel in the solution of FeCl3 were identified transient with an average size of 4 x 10⁻⁶
A/cm2
and interacting with a 1 micron nucleation. In the austenitic stainless steel in the solution of FeCl3 was
observed amplitudes of 4.3 x 10⁻⁶
cm2 on average with a correspondence in the nucleation size of 1.5
microns. In NaCl solutions for both steels are presented amplitudes with one order of magnitude
smaller than those observed in the solution of FeCl3 and the nucleation of pitting was found on a
sample surface in contrast to those found in solutions of FeCl3 which were deeper in the steel. In the
case of 2205 duplex steel in NaCl solution the average of the amplitudes is 1.5 x 10⁻⁷
cm2 and
corresponds to 1 micron in size for nucleation and Type 316 stainless steel in NaCl solution were also
observed amplitudes of 1.5 x 10⁻⁷
but with size of 1.5 microns.
AISI Type 2205 duplex steel had a higher noise resistance (54768Ω-cm2) in the NaCl solution.
AISI Type 316 SS presented the lowest resistance and it was 1582 Ω-cm2 in the solution of FeCl3. The
location index for duplex stainless steels 316 and 2205 in both FeCl3 and NaCl solutions corresponds
to a type of localized corrosion, showing the highest IL in 2205 duplex FeCl3 solution and the lower
316 stainless steel in NaCl solution.
ACKNOWLEDGEMENTS
The authors thank CONACYT for financial support to carry out doctoral studies with the scholarship
number 160250 and Project 106042. Thanks to A. Borunda-Terrazas, J.M. Lugo-Cuevas, K. Campos
and V.M. Orozco-Carmona for their technical assistance.
References
1. Francois Huet. Chapter 14. Electrochemical Noise Technique. Analytical Methods in Corrosion
Science and Engineering. Book edited by Philippe Marcus and Florian Mansfeld. Published in
2006 by CRC Press. Taylor & Francis Group. 6000 Broken Sound Parkway NW, Suite 300 Boca
Raton, FL 33487-2742
2. Z. Szklarska-Smialowska., Pitting Corrosion of Metals, p. 1, National Association of Corrosion
Engineers, Houston, Texas, (1986).
3. Omar A. Hazzazi, Ayman M. Zaky, Mohammed A. Amin and Sayed S. Abd El Rehim, Int. J.
Electrochem. Sci., 3 (2008): p. 489-508.
4. K. Darowicki, A. Mirakowski, S. Krakowiak, Corrosion Science, 45, (2003): p. 1747-1756.
5. A.Pardoa, M.C. Merinoa, A.E. Coyb, F. Viejob, R. Arrabalb and E. Matykinab, Corrosion Science
50, 6 (2008): p. 1796-180.
6. E. Sarmiento, J. G. González-Rodriguez, J. Uruchurtu, O.Sarmiento, M. Menchaca, Int. J.
Electrochem. Sci., 4, (2009): p. 144 – 155.
7. M. G. Pujar, T. Anita, H. Shaikh, R. K. Dayal and H. S. Khatak, Int. J. Electrochem. Sci., 2,
(2007): p. 301 – 310.
8. U. Bertocci and F. Huet, Corrosion, 51, (1995): p. 131.
9. U. Bertocci, C. Gabrielli. F. Huet, and M. Keddam, J. Electrochem. Soc., 144, (1997): p. 31.
10. P. R. Roberge, Corrosion, 50, (1994): p. 502.
11. G. Gusmano, G. Montespereli, S. Pacetti, A. Petitti, and A. D’Amico, Corrosion, 53, (1997): p.
860

Int. J. Electrochem. Sci., Vol. 6, 2011
1796
12. S. Girija, U. Kamachi Mudali, V.R. Raju, R.K. Dayal, H.S. Khatak, Baldeb Raj., Mat. Sci. and
Eng., 407, (2005): p. 188.
13. A.Legat, V. Dolecek, Corrosion 51 (4) (1995) 295.
14. J. W. Isaac and K. R. Hebert, J. Electrochem. Soc., 146, (1999): p. 502.
15. C. Monticelli, G. Brunoro, A. Frignani, and G. Trabanelli, J. Electrochem. Soc., 139, (1992): p.
706.
16. R. A. Cottis, M. A. Al-Ansari, G. Bagley, and A. Pettiti, Materials Science Forum, 289-292,
(1998), 741.
17. K. Hladki and J.L. Dawson, Corros. Sci., 21, (1981), p. 317.
18. J. Smulko, K. Darowicki, A. Zielinski, Elect. Comm., 4, (2002): p. 388.
19. ASTM International, G 199 – 09, Standard Guide for Electrochemical Noise Measurement, ASTM
International (2009).
20. IE. Castañeda, J.G. Gonzalez-R., G. Dominguez-P., R. Sandoval-J., M.A.Neri-F., J. G. Chacon-N,
A. Martinez-V, Int. J. Electrochem. Sci., 6, (2011): p. 404 – 418.
21. L. Speckert, G.T. Burstein, Corrosion Science, 53, (2011): p. 534-539.
22. F. Barragán, R. Guardián, C. Menchaca, I. Rosales, J. Uruchurtu, Int. J. Electrochem. Sci., 5,
(2010): p. 1799 – 1809.
23. J. R. Kearns, J. R. Scully, P. R. Roberge, D.L. Reichert, J. L. Dawson , Electrochemical Noise
Measurement, for Corrosion Applications, STP1277, ASTM (1996).
24. A.Legat, V. Dolecek, J. Electrochem. Soc. 142 (6) (1995) 1851.
25. Stern. M, Geary. A., Journal Electrochemical Society 104, (1957): p. 56.
26. J.M. Sanchez-Amaya, RA. Cottis and F.J. Botana, Corrosion Science, 47, (2005), p. 3280.
27. Kelly, Inman y Hudson., Electrochemical Noise Measurement for Corrosion Applications, ASTM
STP-1277. ASTM. (1996).
© 2011 by ESG (www.electrochemsci.org)