transformation of vanadium-bearing titanomagnetite ... - mdpi
TRANSCRIPT
minerals
Article
Transformation of Vanadium-BearingTitanomagnetite Concentrate in Additive-FreeRoasting and Alkaline-Pressure Leaching forExtracting Vanadium (V)
Haiyan Zheng 1,* , Weiling Zhang 2,*, Yongchun Guo 1, Qiangjian Gao 1 and Fengman Shen 1
1 School of Metallurgy, Northeastern University, Shenyang 110819, China; [email protected] (Y.G.);[email protected] (Q.G.); [email protected] (F.S.)
2 Baosteel Zhanjiang Iron & Steel Co., Ltd., Zhanjiang 524072, China* Correspondence: [email protected] (H.Z.); [email protected] (W.Z.);
Tel.: +86-24-8369-1266 (H.Z.); +86-759-352-8317 (W.Z.)
Received: 24 February 2019; Accepted: 21 March 2019; Published: 26 March 2019�����������������
Abstract: With a view to satisfying the requirements of environmental protest and efficient usage ofresources, a novel process for efficiently extracting vanadium (V), titanium (Ti), and iron (Fe) fromvanadium-bearing titanomagnetite concentrate was developed. In the new process, vanadium ispre-extracted by additive-free roasting under the air atmosphere and alkaline leaching technologies.In this paper, transformation of vanadium-bearing titanomagnetite concentrate in the roasting isinvestigated based on thermodynamic analyses and experimental discussion. Thermodynamicanalyses show that oxidation of V(III) into V(V) would happen in the roasting experiment over therange of 327–1327 ◦C and vanadium-iron spinel phase (FeV2O4) can be oxidized more easily thanmagnetite (Fe3O4) when the temperature is higher than 861 ◦C. Experimental results show that somecompounds (V2O5, Fe2Al4Si5O18, and Fe2SiO4) with low melting temperature were obtained bysolid reactions at low temperature and melted as a binding phase at elevated temperature. Liquidswere generated due to some chemical reactions or phase transformation reaction (Fe2V2O4(s) →Fe2O3(s) + liquid) at elevated temperature. Main phases of Fe2O3 and Fe2TiO5 are connected andsintered with the binding phases of the compounds with low melting temperature or the mixtureswith low liquidus temperature. In addition, higher roasting temperature leads to higher vanadiumleaching efficiency over the range of 800–1200 ◦C. However, over-burning would happen at 1250 ◦C,some of vanadium oxide was wrapped by silicate network, and the conversion of V(III) into V(V)was prevented from occurring. Therefore, the vanadium leaching efficiency decreased from 59.1%(Troa. = 1200 ◦C) to 57% (Troa. = 1250 ◦C).
Keywords: vanadium-bearing titanomagnetite concentrate; additive-free roasting; vanadium extraction;transformation mechanism; silicate network
1. Introduction
Vanadium-bearing titanomagnetite is a very important mineral resource of vanadium, titaniumand iron. Currently, the major process for smelting vanadium-bearing titanomagnetite involves firstlyextracting iron and then extracting vanadium of slag by sodium salt roasting and water leachingtechnologies [1–8], which causes serious environmental pollution (especially hazardous gases, suchas HCl, SO2, or Cl2) and low recovery ratio of vanadium (total recovery ratio < 45%) and titanium(total recovery ratio < 10%) [8]. In addition, soluble vanadium (V(IV) and V(V)) substances are toxicsubstances and vanadium-rich resources are a potential toxic solid because deleterious health effects
Minerals 2019, 9, 197; doi:10.3390/min9030197 www.mdpi.com/journal/minerals
Minerals 2019, 9, 197 2 of 13
induced by inorganic vanadium compounds have been reported [9,10]. Therefore, more attentionhas been drawn to comprehensive and efficient extraction of valuable elements (V, Ti, and Fe) fromtitanomagnetite deposits with a new environmentally-friendly method.
Regarding the extraction of vanadium from vanadium-bearing resources (such as vanadium-bearingtitanomagnetite, vanadium-rich slag, stone coal) many efforts have been made by researchers [11–27].A calcium roasting method followed by acid or alkaline leaching was an alternative process to extractvanadium with the purpose of avoiding harmful gas generation (such as HCl, SO2, or Cl2), but italways results in low quality vanadium products (V2O5 94% < 98% of high quality) and high acidleaching [11]. Direct acid leaching method without roasting attracted more attention as it has noexhaust gas generation, but it also has the problems of low leaching efficiency (74%) of vanadium andusage of excess leaching agent [12].
Based on the abovementioned background, a novel process for extracting vanadium, titanium, andiron from vanadium-bearing titanomagnetite concentrate was developed. The proposed new processinvolves three parts: (1) pre-extracting vanadium from vanadium-bearing resources by additive-freeroasting under the air atmosphere and alkaline-pressure leaching technologies; (2) reducing thevanadium-free pellets after roasting for producing direct reduction iron (DRI); (3) separating theDRI from titano-rich slag, which can be used as the alternative of raw material for the production oftitanium oxide or titanium smelting process. The advantages of this process are that it is possible toutilize vanadium-bearing resources rationally and recover vanadium, iron, and titanium efficiently;moreover, it is a simple, relatively fast, semi-continuous, easy to scale-up, and environmental-friendlyprocess because it has no additive usage compared with the traditional process. Thus, it is beneficialto achieving sustainable development. This paper focuses on discussing the transformation ofvanadium-bearing titanomagnetite concentrate in the roasting process.
2. Thermodynamic Criteria for Roasting
Usually, V as the form of V(III) solutes into iron oxide in the form of isomorphism instead of Fe(III)in Fe3O4 because the radius of V(III) is close to the radius of Fe(III) (RV(III) = 0.65 Å ≈ RFe(III) = 0.67 Å),vanadium in the ore or slag is therefore considered as the form of vanadium-iron spinel (FeV2O4 orFeO·V2O3) [28,29]. Furthermore, it is noted that the suboxide of vanadium (V(III), V(IV)) is hardlysoluble into acid, neutral or alkaline solutions [30], therefore, it is required to change the suboxide(V(III), V(IV)) into V(V), which is soluble in alkaline solutions, in order to extract vanadium from theore. Therefore, the reactions in the roasting, which are essential to vanadium extraction, are discussedfrom thermodynamic viewpoints.
While discussing the thermodynamic properties of the Fe-Ti-V-O system at elevated temperatures,it is essential to consider the existence of complex oxides, such as FeTixOy, and FeVxOy. The Gibbsenergy changes of the following reactions are not large compared to those of the redox reactions in therelated systems as shown in Figure 1 [31].
FeO (s) + TiO2 (s) = FeTiO3 (s)∆G◦r = −10.987 kJ/mol at 1100 K
(1)
FeO (s) + V2O3 (s) = FeV2O4 (s)∆G◦r = −13.204 kJ/mol at 1100 K
(2)
Furthermore, when the activity of FeOx decreases due to the formation of complex oxides,the activity of TiO2 and V2O3 decreases by almost the same magnitude. In order to facilitate a simplediscussion, FeTixOy and FeVxOy are therefore considered to be the mixtures of TiOx + FeOx andVOx + FeOx respectively and vice versa. In Figure 1, Fe2TiO5 (Fe2O3·TiO2) and Fe2V2O8 (Fe2O3·V2O5)are considered to be the mixtures of TiO2 + Fe2O3 and V2O5 + Fe2O3 respectively.
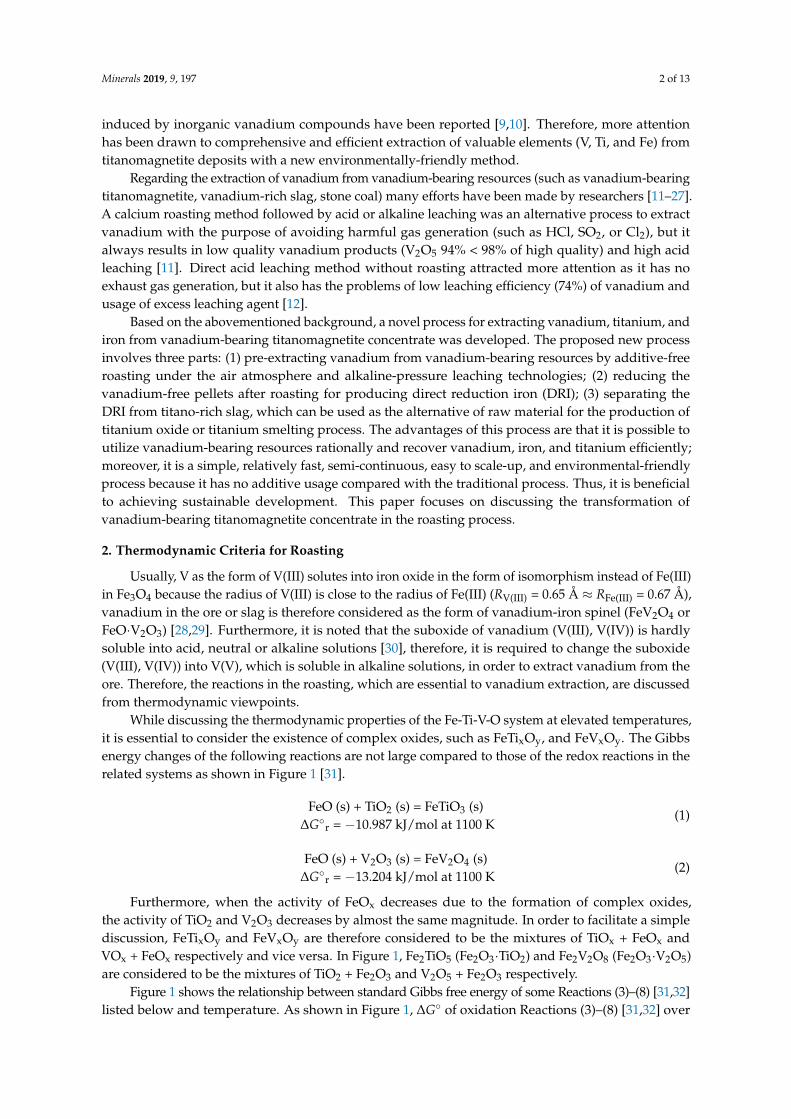
Figure 1 shows the relationship between standard Gibbs free energy of some Reactions (3)–(8) [31,32]listed below and temperature. As shown in Figure 1, ∆G◦ of oxidation Reactions (3)–(8) [31,32] over
Minerals 2019, 9, 197 3 of 13
the range of 327–1327 ◦C (600–1600 K) are lower than zero and the oxidation reactions are spontaneousfrom left to right. When the temperature is higher than 861 ◦C (TCross = 1134 K, the temperature atblack cross point in Figure 1), vanadium-iron spinel phase (FeV2O4) can be oxidized more easily thanmagnetite (Fe3O4) from the view of thermodynamic analysis. Thus, the experiment temperature is setat 800 ◦C or higher in this study in order to ensure all the suboxide of vanadium (mainly V2O3) can beoxidized into V2O5, which can be dissolved easier than V2O3 into alkaline solution.
4Fe3O4 (s) + O2 (g) = 6Fe2O3 (s) (3)
V2O3 (s) + O2 (g) = V2O5 (s), T < 943 K (4)
V2O3 (s) + O2 (g) = V2O5 (l), T > 943 K (5)
2/3FeV2O4 (s) + 2/3FeO (s) + O2 = 2/3Fe2V2O8(s), T < 1113 K (6)
2/3FeV2O4 (s) + 2/3FeO (s) + O2 = 2/3Fe2O3 (s) + 2/3V2O5 (l), T > 1113 K (7)
2FeTiO3(s) + 2FeO(s) + O2(g) = 2Fe2TiO5(s) (8)
Minerals 2019, 9, x FOR PEER REVIEW 3 of 14
[31,32] over the range of 327–1327 °C (600–1600 K) are lower than zero and the oxidation reactions are spontaneous from left to right. When the temperature is higher than 861 °C (TCross = 1134 K, the temperature at black cross point in Figure 1), vanadium-iron spinel phase (FeV2O4) can be oxidized more easily than magnetite (Fe3O4) from the view of thermodynamic analysis. Thus, the experiment temperature is set at 800 °C or higher in this study in order to ensure all the suboxide of vanadium (mainly V2O3) can be oxidized into V2O5, which can be dissolved easier than V2O3 into alkaline solution.
4 Fe3O4 (s) + O2 (g) = 6 Fe2O3 (s) (3)
V2O3 (s) + O2 (g) = V2O5 (s), T < 943 K (4)
V2O3 (s) + O2 (g) = V2O5 (l), T > 943 K (5)
2/3FeV2O4 (s) + 2/3FeO (s) + O2 = 2/3Fe2V2O8(s), T < 1113 K (6)
2/3FeV2O4 (s) + 2/3FeO (s) + O2 = 2/3Fe2O3 (s) + 2/3V2O5 (l), T > 1113 K (7)
2FeTiO3(s) + 2 FeO(s) + O2(g) = 2Fe2TiO5(s) (8)
600 800 1000 1200 1400 1600-400
-300
-200
-100
0327 527 727 927 1127 1327
T (K)
T ( )℃
△G
o (kJ/m
ol)
T (oC)
TCross = 1134 K = 861 oC
TMel., V2O5 = 943 K = 670 oC [31]TDec., Fe2V2O8 = 1113 K = 840 oC [32]
Figure 1. Standard Gibbs free energy diagram of some reactions. Reproduced with permission from [31], Copyright © 1995 VCH Verlagsgesellschaft mbH.
3. Materials and Methods
3.1. Raw Materials
Vanadium-bearing titanomaginetite concentrate used as the raw material in this study is provided from a steel factory of China and its composition by X-ray fluorescence spectrometry analysis (XRF, Rigaku ZSX Primus II) is shown in Table 1. As shown in Table 1, contents of vanadium and calcium in the ore are low. Low CaO is beneficial to the leaching of vanadium because calcium vanadate (xCaO∙V2O5, x = 1, 2, 3) would be generated via the reaction of CaO with V2O5 and it is water-insoluble [30,33] which leads to a reduction in vanadium extraction.
Figure 1. Standard Gibbs free energy diagram of some reactions. Reproduced with permissionfrom [31], Copyright © 1995 VCH Verlagsgesellschaft mbH.
3. Materials and Methods
3.1. Raw Materials
Vanadium-bearing titanomaginetite concentrate used as the raw material in this study is providedfrom a steel factory of China and its composition by X-ray fluorescence spectrometry analysis (XRF,Rigaku ZSX Primus II) is shown in Table 1. As shown in Table 1, contents of vanadium andcalcium in the ore are low. Low CaO is beneficial to the leaching of vanadium because calciumvanadate (xCaO·V2O5, x = 1, 2, 3) would be generated via the reaction of CaO with V2O5 and it iswater-insoluble [30,33] which leads to a reduction in vanadium extraction.
Minerals 2019, 9, 197 4 of 13
Table 1. Composition of vanadium titanomagnetite concentrate used in this study (XRF) *.
Composition Fe2O3 TiO2 Al2O3 SiO2 MgO CaO V2O5 MnO Sum
Content (%) 72.55 12.68 4.66 3.82 3.26 0.96 0.75 0.64 99.51
* Contents of Fe and V in the ore are determined as Fe2O3 and V2O5 respectively by XRF analysis. Contents of V,TFe, and FeO are 0.414%, 57.39%, and 33.76% respectively by chemical analysis. Sodium hydrate (≥96.0%, AR) wasused as leaching agent in this study.
3.2. Experimental
Vanadium-bearing titanomagnetite concentrate from the factory cannot be used directly becauseit is damp. As a result, the ore needs to be dried for a few hours. In a typical experiment, the groundore (−74 µm) without free water was subjected to oxidative roasting in air (partial pressure of oxygenis 0.021 MPa (0.21 atm)) without additives in a muffle furnace over the range of 800–1250 ◦C for 2 h.After roasting, the ore was cooled in the atmosphere and ground into the target particle size (−74 µm)for leaching or related analyses. The leaching conditions are 250 ◦C for 4 h in a sealed reactor withhigh pressure (1.3 MPa) and stirring of 300 r/min, 3:1 of the ratio of liquor to solid, and 100 g/L NaOHas leaching agent. After leaching, the residues are separated from leach liquor with suction device andcleaned with distilled water for three times. Finally, the residues are weighed and subjected to analysis.
Related analyses used in this study are chemical analysis, X-ray fluorescence spectrometry analysis(XRF, Rigaku ZSX Primus II, Rigaku Corporation, Tokyo, Japan), X-ray diffraction (XRD, PANalytical XPertpro, PANalytical B.V., Almelo, The Netherlands), scanning electron microscopy-energy dispersivespectroscopy analysis (SEM-EDS, Shimadzu SSX-550, Shimadzu Corporation, Tokyo Japan), andthermal gravimetry-differential scanning calorimetry analysis (TG-DSC, Netzsch STA449 F3, NetzschGroup, Selb, Germany).
4. Results and Discussion
4.1. Mineral Analysis
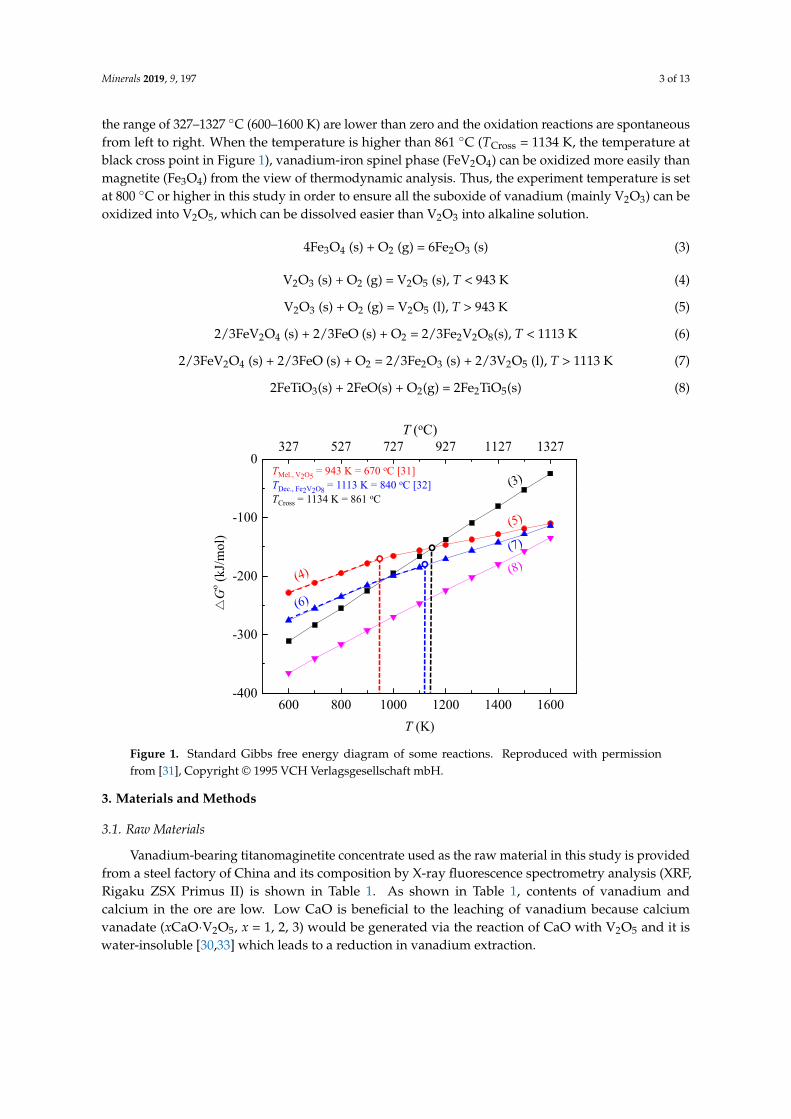
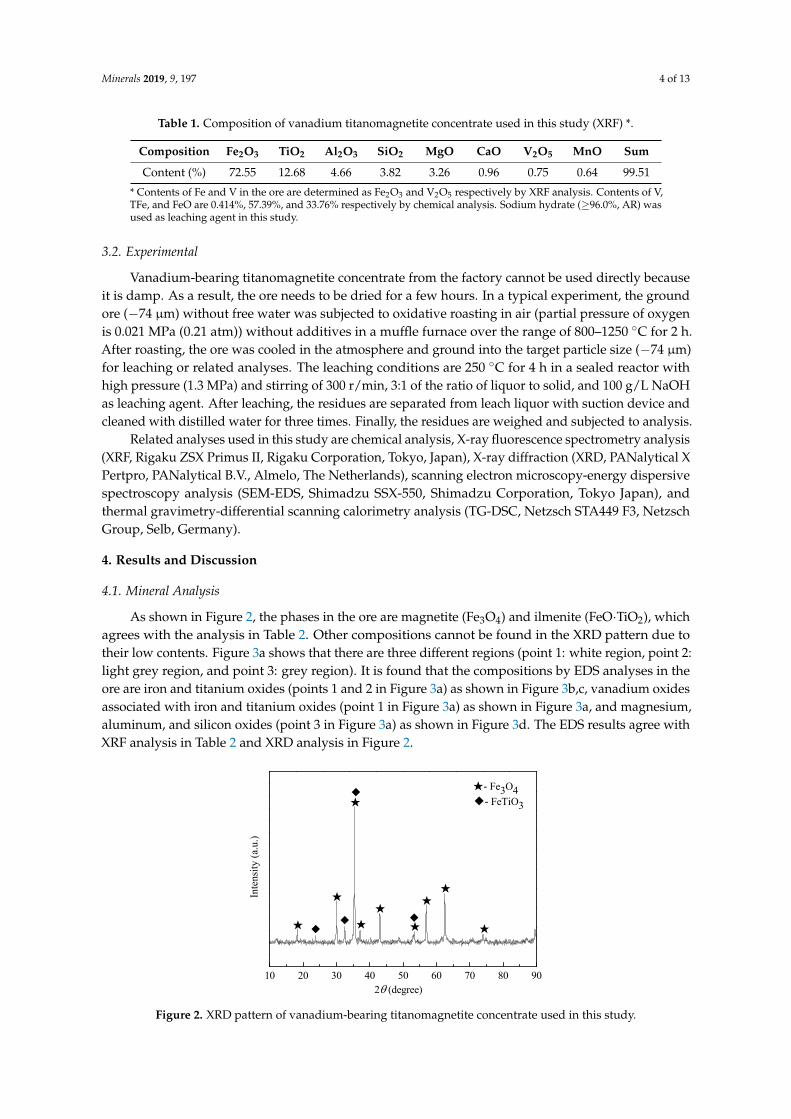
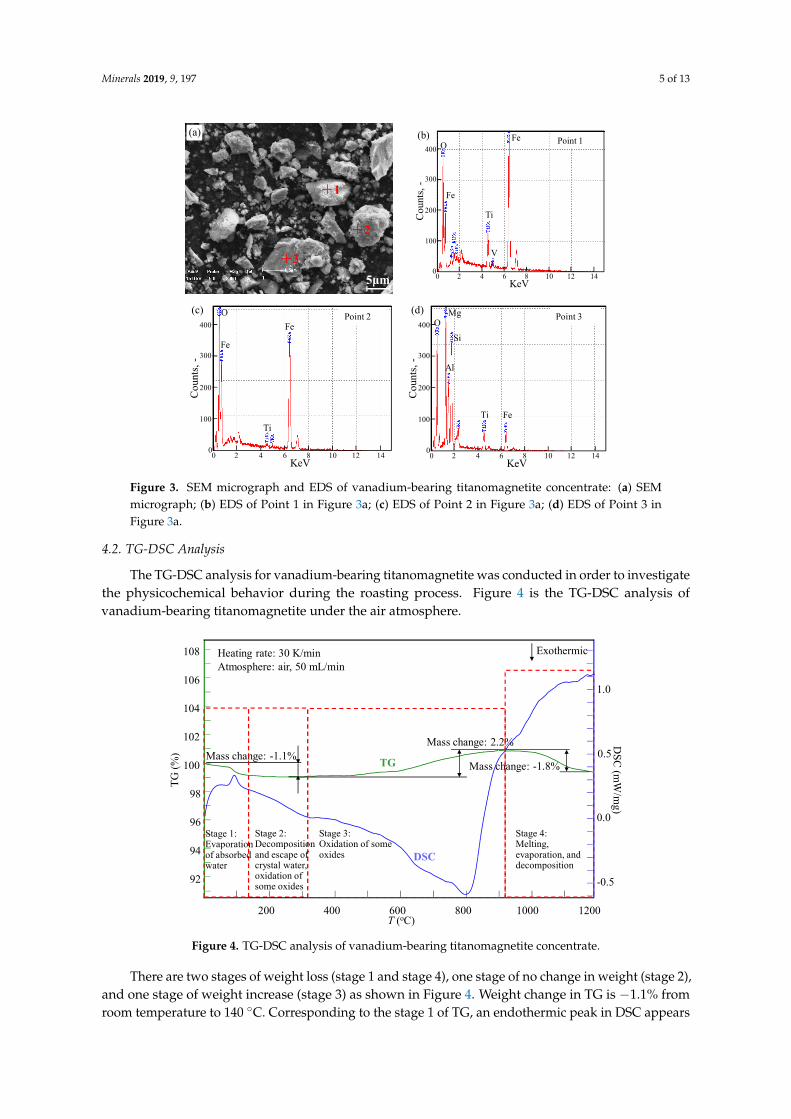
As shown in Figure 2, the phases in the ore are magnetite (Fe3O4) and ilmenite (FeO·TiO2), whichagrees with the analysis in Table 2. Other compositions cannot be found in the XRD pattern due totheir low contents. Figure 3a shows that there are three different regions (point 1: white region, point 2:light grey region, and point 3: grey region). It is found that the compositions by EDS analyses in theore are iron and titanium oxides (points 1 and 2 in Figure 3a) as shown in Figure 3b,c, vanadium oxidesassociated with iron and titanium oxides (point 1 in Figure 3a) as shown in Figure 3a, and magnesium,aluminum, and silicon oxides (point 3 in Figure 3a) as shown in Figure 3d. The EDS results agree withXRF analysis in Table 2 and XRD analysis in Figure 2.
Minerals 2019, 9, x FOR PEER REVIEW 4 of 14
Table 1. Composition of vanadium titanomagnetite concentrate used in this study (XRF) *.
Composition Fe2O3 TiO2 Al2O3 SiO2 MgO CaO V2O5 MnO Sum Content (%) 72.55 12.68 4.66 3.82 3.26 0.96 0.75 0.64 99.51
* Contents of Fe and V in the ore are determined as Fe2O3 and V2O5 respectively by XRF analysis. Contents of V, TFe, and FeO are 0.414%, 57.39%, and 33.76% respectively by chemical analysis. Sodium hydrate (≥96.0%, AR) was used as leaching agent in this study.
3.2. Experimental
Vanadium-bearing titanomagnetite concentrate from the factory cannot be used directly because it is damp. As a result, the ore needs to be dried for a few hours. In a typical experiment, the ground ore (−74 μm) without free water was subjected to oxidative roasting in air (partial pressure of oxygen is 0.021 MPa (0.21 atm)) without additives in a muffle furnace over the range of 800–1250 °C for 2 h. After roasting, the ore was cooled in the atmosphere and ground into the target particle size (−74 μm) for leaching or related analyses. The leaching conditions are 250 °C for 4 h in a sealed reactor with high pressure (1.3 MPa) and stirring of 300 r/min, 3:1 of the ratio of liquor to solid, and 100 g/L NaOH as leaching agent. After leaching, the residues are separated from leach liquor with suction device and cleaned with distilled water for three times. Finally, the residues are weighed and subjected to analysis.
Related analyses used in this study are chemical analysis, X-ray fluorescence spectrometry analysis (XRF, Rigaku ZSX Primus II, Rigaku Corporation, Tokyo, Japan), X-ray diffraction (XRD, PANalytical X Pertpro, PANalytical B.V., Almelo, The Netherlands), scanning electron microscopy-energy dispersive spectroscopy analysis (SEM-EDS, Shimadzu SSX-550, Shimadzu Corporation, Tokyo Japan), and thermal gravimetry-differential scanning calorimetry analysis (TG-DSC, Netzsch STA449 F3, Netzsch Group, Selb, Germany).
4. Results and Discussion
4.1. Mineral Analysis As shown in Figure 2, the phases in the ore are magnetite (Fe3O4) and ilmenite (FeO∙TiO2),
which agrees with the analysis in Table 2. Other compositions cannot be found in the XRD pattern due to their low contents. Figure 3a shows that there are three different regions (point 1: white region, point 2: light grey region, and point 3: grey region). It is found that the compositions by EDS analyses in the ore are iron and titanium oxides (points 1 and 2 in Figure 3a) as shown in Figure 3b,c, vanadium oxides associated with iron and titanium oxides (point 1 in Figure 3a) as shown in Figure 3a, and magnesium, aluminum, and silicon oxides (point 3 in Figure 3a) as shown in Figure 3d. The EDS results agree with XRF analysis in Table 2 and XRD analysis in Figure 2.
10 20 30 40 50 60 70 80 90
Inte
nsity
(a.u
.)
2θ (degree)
◆
◆
◆◆ ★
★- Fe3O4◆- FeTiO3
★★
★★
★
★
★
★
Figure 2. XRD pattern of vanadium-bearing titanomagnetite concentrate used in this study. Figure 2. XRD pattern of vanadium-bearing titanomagnetite concentrate used in this study.
Minerals 2019, 9, 197 5 of 13
Minerals 2019, 9, x FOR PEER REVIEW 5 of 14
+3
+2
+1
5μm
(a)
(b) FeO
Fe
Ti
V
Point 1
KeV
Coun
ts, -
400
300
100
02 4 6 8 10 12 14
200
0
OMg
Al
Si
FeTi
Point 3O
Fe
Ti
FePoint 2(c) (d)
KeV
Coun
ts, -
400
300
100
02 4 6 8 10 12 14
200
KeV
Coun
ts, -
400
300
100
02 4 6 8 10 12 14
200
00
Figure 3. SEM micrograph and EDS of vanadium-bearing titanomagnetite concentrate: (a) SEM micrograph; (b) EDS of Point 1 in Figure 3a; (c) EDS of Point 2 in Figure 3a; (d) EDS of Point 3 in Figure 3a.
4.2. TG-DSC Analysis
The TG-DSC analysis for vanadium-bearing titanomagnetite was conducted in order to investigate the physicochemical behavior during the roasting process. Figure 4 is the TG-DSC analysis of vanadium-bearing titanomagnetite under the air atmosphere.
200 400 600 800 1000 1200
-0.5
0.0
0.5
1.0
DSC (m
W/m
g)
92
94
96
98
100
102
104
106
108
TG (%
)
T (oC)
Exothermic
Mass change: -1.1%Mass change: 2.2%
Mass change: -1.8%
Heating rate: 30 K/minAtmosphere: air, 50 mL/min
TG
DSC
Stage 1:Evaporation of absorbed water
Stage 2: Decomposition and escape of crystal water, oxidation of some oxides
Stage 3: Oxidation of some oxides
Stage 4:Melting, evaporation, and decomposition
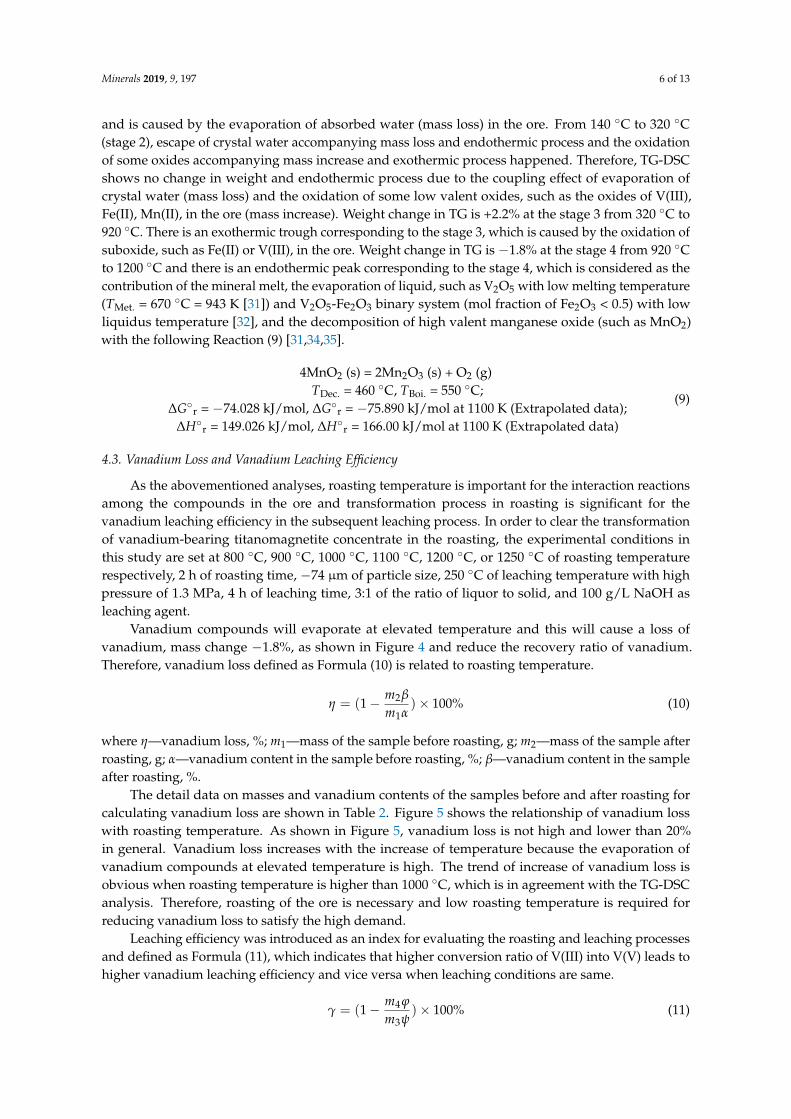
Figure 4. TG-DSC analysis of vanadium-bearing titanomagnetite concentrate.
There are two stages of weight loss (stage 1 and stage 4), one stage of no change in weight (stage 2), and one stage of weight increase (stage 3) as shown in Figure 4. Weight change in TG is −1.1% from room temperature to 140 °C. Corresponding to the stage 1 of TG, an endothermic peak in DSC appears and is caused by the evaporation of absorbed water (mass loss) in the ore. From 140 °C
Figure 3. SEM micrograph and EDS of vanadium-bearing titanomagnetite concentrate: (a) SEMmicrograph; (b) EDS of Point 1 in Figure 3a; (c) EDS of Point 2 in Figure 3a; (d) EDS of Point 3 inFigure 3a.
4.2. TG-DSC Analysis
The TG-DSC analysis for vanadium-bearing titanomagnetite was conducted in order to investigatethe physicochemical behavior during the roasting process. Figure 4 is the TG-DSC analysis ofvanadium-bearing titanomagnetite under the air atmosphere.
Minerals 2019, 9, x FOR PEER REVIEW 5 of 14
+3
+2
+1
5μm
OMg
Al
Si
FeTi
Point 3O
Fe
Ti
FePoint 2
(a)
(c) (d)
(b) FeO
Fe
Ti
V
Point 1
KeV
Coun
ts, -
400
300
100
02 4 6 8 10 12 14
200
KeV
Coun
ts, -
400
300
100
02 4 6 8 10 12 14
200
KeV
Coun
ts, -
400
300
100
02 4 6 8 10 12 14
200
0
0
0
Figure 3. SEM micrograph and EDS of vanadium-bearing titanomagnetite concentrate: (a) SEM micrograph; (b) EDS of Point 1 in Figure 3a; (c) EDS of Point 2 in Figure 3a; (d) EDS of Point 3 in Figure 3a.
4.2. TG-DSC Analysis
The TG-DSC analysis for vanadium-bearing titanomagnetite was conducted in order to investigate the physicochemical behavior during the roasting process. Figure 4 is the TG-DSC analysis of vanadium-bearing titanomagnetite under the air atmosphere.
200 400 600 800 1000 1200
-0.5
0.0
0.5
1.0
DSC (m
W/m
g)
92
94
96
98
100
102
104
106
108
TG (%
)
T (oC)
Exothermic
Mass change: -1.1%Mass change: 2.2%
Mass change: -1.8%
Heating rate: 30 K/minAtmosphere: air, 50 mL/min
TG
DSC
Stage 1:Evaporation of absorbed water
Stage 2: Decomposition and escape of crystal water, oxidation of some oxides
Stage 3: Oxidation of some oxides
Stage 4:Melting, evaporation, and decomposition
Figure 4. TG-DSC analysis of vanadium-bearing titanomagnetite concentrate.
There are two stages of weight loss (stage 1 and stage 4), one stage of no change in weight (stage 2), and one stage of weight increase (stage 3) as shown in Figure 4. Weight change in TG is −1.1% from room temperature to 140 °C. Corresponding to the stage 1 of TG, an endothermic peak in DSC appears and is caused by the evaporation of absorbed water (mass loss) in the ore. From 140 °C
Figure 4. TG-DSC analysis of vanadium-bearing titanomagnetite concentrate.
There are two stages of weight loss (stage 1 and stage 4), one stage of no change in weight (stage 2),and one stage of weight increase (stage 3) as shown in Figure 4. Weight change in TG is −1.1% fromroom temperature to 140 ◦C. Corresponding to the stage 1 of TG, an endothermic peak in DSC appears
Minerals 2019, 9, 197 6 of 13
and is caused by the evaporation of absorbed water (mass loss) in the ore. From 140 ◦C to 320 ◦C(stage 2), escape of crystal water accompanying mass loss and endothermic process and the oxidationof some oxides accompanying mass increase and exothermic process happened. Therefore, TG-DSCshows no change in weight and endothermic process due to the coupling effect of evaporation ofcrystal water (mass loss) and the oxidation of some low valent oxides, such as the oxides of V(III),Fe(II), Mn(II), in the ore (mass increase). Weight change in TG is +2.2% at the stage 3 from 320 ◦C to920 ◦C. There is an exothermic trough corresponding to the stage 3, which is caused by the oxidation ofsuboxide, such as Fe(II) or V(III), in the ore. Weight change in TG is −1.8% at the stage 4 from 920 ◦Cto 1200 ◦C and there is an endothermic peak corresponding to the stage 4, which is considered as thecontribution of the mineral melt, the evaporation of liquid, such as V2O5 with low melting temperature(TMet. = 670 ◦C = 943 K [31]) and V2O5-Fe2O3 binary system (mol fraction of Fe2O3 < 0.5) with lowliquidus temperature [32], and the decomposition of high valent manganese oxide (such as MnO2)with the following Reaction (9) [31,34,35].
4MnO2 (s) = 2Mn2O3 (s) + O2 (g)TDec. = 460 ◦C, TBoi. = 550 ◦C;
∆G◦r = −74.028 kJ/mol, ∆G◦r = −75.890 kJ/mol at 1100 K (Extrapolated data);∆H◦r = 149.026 kJ/mol, ∆H◦r = 166.00 kJ/mol at 1100 K (Extrapolated data)
(9)
4.3. Vanadium Loss and Vanadium Leaching Efficiency
As the abovementioned analyses, roasting temperature is important for the interaction reactionsamong the compounds in the ore and transformation process in roasting is significant for thevanadium leaching efficiency in the subsequent leaching process. In order to clear the transformationof vanadium-bearing titanomagnetite concentrate in the roasting, the experimental conditions inthis study are set at 800 ◦C, 900 ◦C, 1000 ◦C, 1100 ◦C, 1200 ◦C, or 1250 ◦C of roasting temperaturerespectively, 2 h of roasting time, −74 µm of particle size, 250 ◦C of leaching temperature with highpressure of 1.3 MPa, 4 h of leaching time, 3:1 of the ratio of liquor to solid, and 100 g/L NaOH asleaching agent.
Vanadium compounds will evaporate at elevated temperature and this will cause a loss ofvanadium, mass change −1.8%, as shown in Figure 4 and reduce the recovery ratio of vanadium.Therefore, vanadium loss defined as Formula (10) is related to roasting temperature.
η = (1− m2β
m1α)× 100% (10)
where η—vanadium loss, %; m1—mass of the sample before roasting, g; m2—mass of the sample afterroasting, g; α—vanadium content in the sample before roasting, %; β—vanadium content in the sampleafter roasting, %.
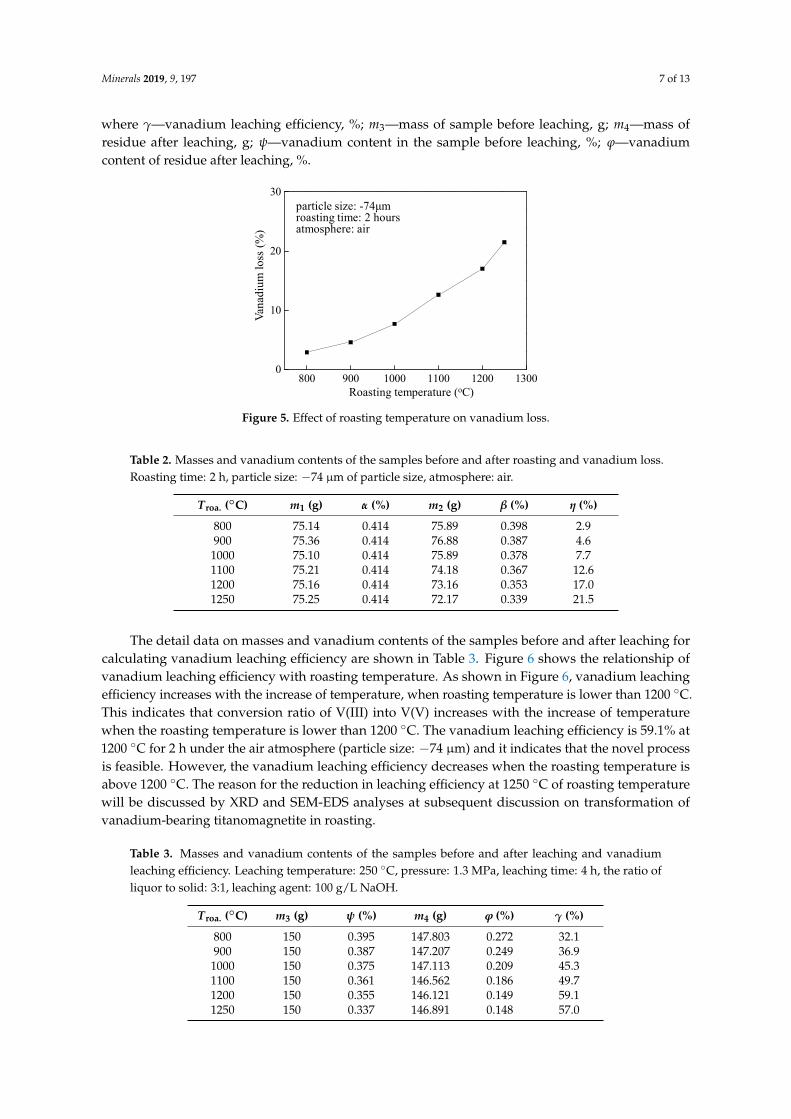
The detail data on masses and vanadium contents of the samples before and after roasting forcalculating vanadium loss are shown in Table 2. Figure 5 shows the relationship of vanadium losswith roasting temperature. As shown in Figure 5, vanadium loss is not high and lower than 20%in general. Vanadium loss increases with the increase of temperature because the evaporation ofvanadium compounds at elevated temperature is high. The trend of increase of vanadium loss isobvious when roasting temperature is higher than 1000 ◦C, which is in agreement with the TG-DSCanalysis. Therefore, roasting of the ore is necessary and low roasting temperature is required forreducing vanadium loss to satisfy the high demand.
Leaching efficiency was introduced as an index for evaluating the roasting and leaching processesand defined as Formula (11), which indicates that higher conversion ratio of V(III) into V(V) leads tohigher vanadium leaching efficiency and vice versa when leaching conditions are same.
γ = (1− m4 ϕ
m3ψ)× 100% (11)
Minerals 2019, 9, 197 7 of 13
where γ—vanadium leaching efficiency, %; m3—mass of sample before leaching, g; m4—mass ofresidue after leaching, g; ψ—vanadium content in the sample before leaching, %; ϕ—vanadiumcontent of residue after leaching, %.
Minerals 2019, 9, x FOR PEER REVIEW 7 of 14
Table 2. Masses and vanadium contents of the samples before and after roasting and vanadium loss. Roasting time: 2 h, particle size: −74 μm of particle size, atmosphere: air.
Troa. (°C) m1 (g) α (%) m2 (g) β (%) η (%) 800 75.14 0.414 75.89 0.398 2.9 900 75.36 0.414 76.88 0.387 4.6
1000 75.10 0.414 75.89 0.378 7.7 1100 75.21 0.414 74.18 0.367 12.6 1200 75.16 0.414 73.16 0.353 17.0 1250 75.25 0.414 72.17 0.339 21.5
800 900 1000 1100 1200 13000
10
20
30
Van
adiu
m lo
ss ra
tio (%
)
Roasting temperature (℃)
particle size: -74μmroasting time: 2 hoursatmosphere: air
Roasting temperature (oC)
Vana
dium
loss
(%)
Figure 5. Effect of roasting temperature on vanadium loss.
Leaching efficiency was introduced as an index for evaluating the roasting and leaching processes and defined as Formula (11), which indicates that higher conversion ratio of V(III) into V(V) leads to higher vanadium leaching efficiency and vice versa when leaching conditions are same.
4
3
(1 ) 100%mm
ϕγψ
×−= (11)
where γ—vanadium leaching efficiency, %; m3—mass of sample before leaching, g; m4—mass of residue after leaching, g; ψ—vanadium content in the sample before leaching, %; φ—vanadium content of residue after leaching, %.
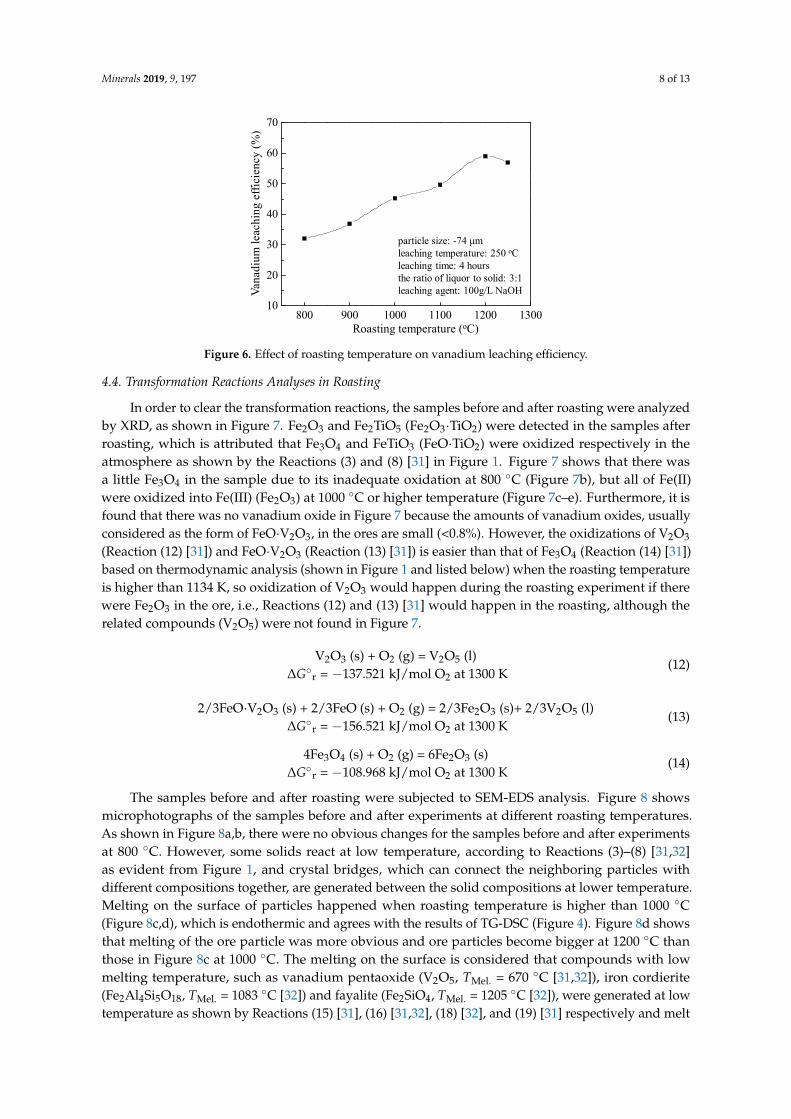
The detail data on masses and vanadium contents of the samples before and after leaching for calculating vanadium leaching efficiency are shown in Table 3. Figure 6 shows the relationship of vanadium leaching efficiency with roasting temperature. As shown in Figure 6, vanadium leaching efficiency increases with the increase of temperature, when roasting temperature is lower than 1200 °C. This indicates that conversion ratio of V(III) into V(V) increases with the increase of temperature when the roasting temperature is lower than 1200 °C. The vanadium leaching efficiency is 59.1% at 1200 °C for 2 h under the air atmosphere (particle size: −74 μm) and it indicates that the novel process is feasible. However, the vanadium leaching efficiency decreases when the roasting temperature is above 1200 °C. The reason for the reduction in leaching efficiency at 1250 °C of roasting temperature will be discussed by XRD and SEM-EDS analyses at subsequent discussion on transformation of vanadium-bearing titanomagnetite in roasting.
Figure 5. Effect of roasting temperature on vanadium loss.
Table 2. Masses and vanadium contents of the samples before and after roasting and vanadium loss.Roasting time: 2 h, particle size: −74 µm of particle size, atmosphere: air.
Troa. (◦C) m1 (g) α (%) m2 (g) β (%) η (%)
800 75.14 0.414 75.89 0.398 2.9900 75.36 0.414 76.88 0.387 4.6
1000 75.10 0.414 75.89 0.378 7.71100 75.21 0.414 74.18 0.367 12.61200 75.16 0.414 73.16 0.353 17.01250 75.25 0.414 72.17 0.339 21.5
The detail data on masses and vanadium contents of the samples before and after leaching forcalculating vanadium leaching efficiency are shown in Table 3. Figure 6 shows the relationship ofvanadium leaching efficiency with roasting temperature. As shown in Figure 6, vanadium leachingefficiency increases with the increase of temperature, when roasting temperature is lower than 1200 ◦C.This indicates that conversion ratio of V(III) into V(V) increases with the increase of temperaturewhen the roasting temperature is lower than 1200 ◦C. The vanadium leaching efficiency is 59.1% at1200 ◦C for 2 h under the air atmosphere (particle size: −74 µm) and it indicates that the novel processis feasible. However, the vanadium leaching efficiency decreases when the roasting temperature isabove 1200 ◦C. The reason for the reduction in leaching efficiency at 1250 ◦C of roasting temperaturewill be discussed by XRD and SEM-EDS analyses at subsequent discussion on transformation ofvanadium-bearing titanomagnetite in roasting.
Table 3. Masses and vanadium contents of the samples before and after leaching and vanadiumleaching efficiency. Leaching temperature: 250 ◦C, pressure: 1.3 MPa, leaching time: 4 h, the ratio ofliquor to solid: 3:1, leaching agent: 100 g/L NaOH.
Troa. (◦C) m3 (g) ψ (%) m4 (g) ϕ (%) γ (%)
800 150 0.395 147.803 0.272 32.1900 150 0.387 147.207 0.249 36.9
1000 150 0.375 147.113 0.209 45.31100 150 0.361 146.562 0.186 49.71200 150 0.355 146.121 0.149 59.11250 150 0.337 146.891 0.148 57.0
Minerals 2019, 9, 197 8 of 13
Minerals 2019, 9, x FOR PEER REVIEW 8 of 14
Table 3. Masses and vanadium contents of the samples before and after leaching and vanadium leaching efficiency. Leaching temperature: 250 °C, pressure: 1.3 MPa, leaching time: 4 h, the ratio of liquor to solid: 3:1, leaching agent: 100 g/L NaOH.
Troa. (°C) m3 (g) ψ (%) m4 (g) φ (%) γ (%) 800 150 0.395 147.803 0.272 32.1 900 150 0.387 147.207 0.249 36.9
1000 150 0.375 147.113 0.209 45.3 1100 150 0.361 146.562 0.186 49.7 1200 150 0.355 146.121 0.149 59.1 1250 150 0.337 146.891 0.148 57.0
800 900 1000 1100 1200 130010
20
30
40
50
60
70
Van
adiu
m le
achi
ng ra
tio (%
)
Roasting temperature (℃)
particle size: -74 μmleaching temperature: 250 oCleaching time: 4 hoursthe ratio of liquor to solid: 3:1leaching agent: 100g/L NaOH
Roasting temperature (oC)
Vana
dium
leac
hing
effi
cien
cy (%
)
Figure 6. Effect of roasting temperature on vanadium leaching efficiency.
4.4. Transformation Reactions Analyses in Roasting
In order to clear the transformation reactions, the samples before and after roasting were analyzed by XRD, as shown in Figure 7. Fe2O3 and Fe2TiO5 (Fe2O3∙TiO2) were detected in the samples after roasting, which is attributed that Fe3O4 and FeTiO3 (FeO∙TiO2) were oxidized respectively in the atmosphere as shown by the Reactions (3) and (8) [31] in Figure 1. Figure 7 shows that there was a little Fe3O4 in the sample due to its inadequate oxidation at 800 °C (Figure 7b), but all of Fe(II) were oxidized into Fe(III) (Fe2O3) at 1000 °C or higher temperature (Figure 7c–e). Furthermore, it is found that there was no vanadium oxide in Figure 7 because the amounts of vanadium oxides, usually considered as the form of FeO∙V2O3, in the ores are small (<0.8%). However, the oxidizations of V2O3 (Reaction (12) [31]) and FeO∙V2O3 (Reaction (13) [31]) is easier than that of Fe3O4 (Reaction (14) [31]) based on thermodynamic analysis (shown in Figure 1 and listed below) when the roasting temperature is higher than 1134 K, so oxidization of V2O3 would happen during the roasting experiment if there were Fe2O3 in the ore, i.e., Reactions (12) and (13) [31] would happen in the roasting, although the related compounds (V2O5) were not found in Figure 7.
V2O3 (s) + O2 (g) = V2O5 (l)
ΔG°r = −137.521 kJ/mol O2 at 1300 K
(12)
2/3FeO∙V2O3 (s) + 2/3FeO (s) + O2 (g) = 2/3Fe2O3 (s)+ 2/3V2O5 (l)
ΔG°r = −156.521 kJ/mol O2 at 1300 K
(13)
4Fe3O4 (s) + O2 (g) = 6Fe2O3 (s)
ΔG°r = −108.968 kJ/mol O2 at 1300 K
(14)
Figure 6. Effect of roasting temperature on vanadium leaching efficiency.
4.4. Transformation Reactions Analyses in Roasting
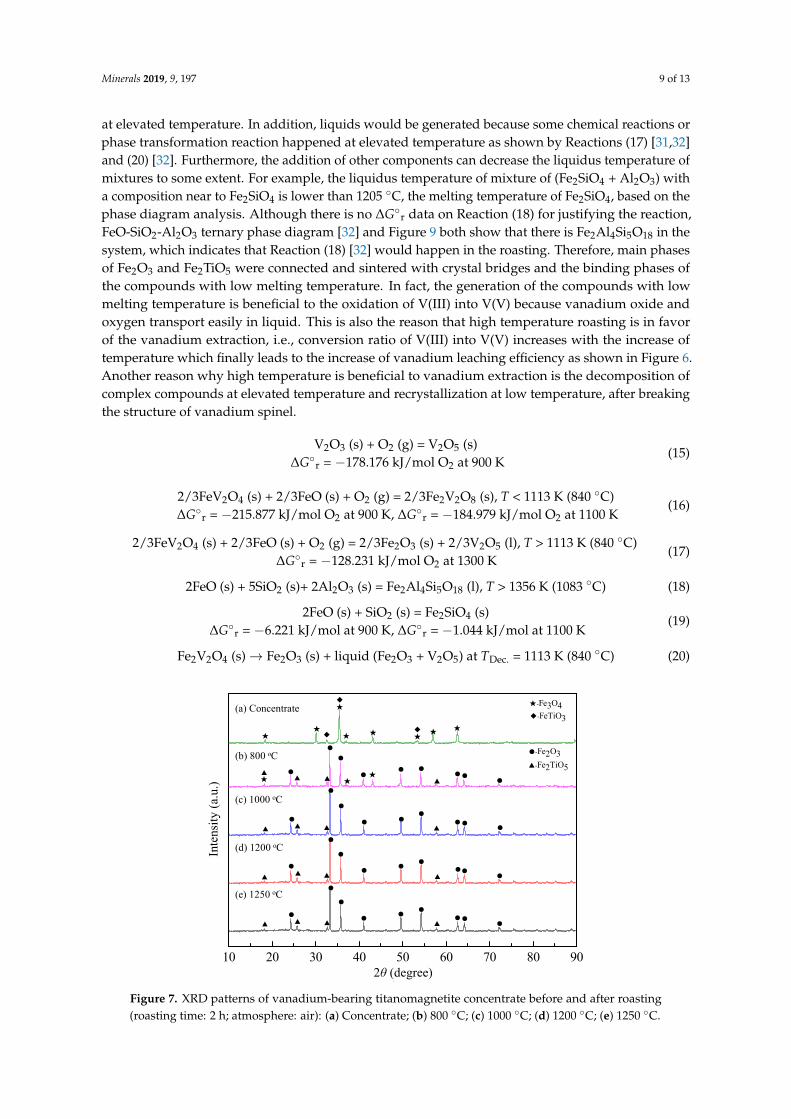
In order to clear the transformation reactions, the samples before and after roasting were analyzedby XRD, as shown in Figure 7. Fe2O3 and Fe2TiO5 (Fe2O3·TiO2) were detected in the samples afterroasting, which is attributed that Fe3O4 and FeTiO3 (FeO·TiO2) were oxidized respectively in theatmosphere as shown by the Reactions (3) and (8) [31] in Figure 1. Figure 7 shows that there wasa little Fe3O4 in the sample due to its inadequate oxidation at 800 ◦C (Figure 7b), but all of Fe(II)were oxidized into Fe(III) (Fe2O3) at 1000 ◦C or higher temperature (Figure 7c–e). Furthermore, it isfound that there was no vanadium oxide in Figure 7 because the amounts of vanadium oxides, usuallyconsidered as the form of FeO·V2O3, in the ores are small (<0.8%). However, the oxidizations of V2O3
(Reaction (12) [31]) and FeO·V2O3 (Reaction (13) [31]) is easier than that of Fe3O4 (Reaction (14) [31])based on thermodynamic analysis (shown in Figure 1 and listed below) when the roasting temperatureis higher than 1134 K, so oxidization of V2O3 would happen during the roasting experiment if therewere Fe2O3 in the ore, i.e., Reactions (12) and (13) [31] would happen in the roasting, although therelated compounds (V2O5) were not found in Figure 7.
V2O3 (s) + O2 (g) = V2O5 (l)∆G◦r = −137.521 kJ/mol O2 at 1300 K
(12)
2/3FeO·V2O3 (s) + 2/3FeO (s) + O2 (g) = 2/3Fe2O3 (s)+ 2/3V2O5 (l)∆G◦r = −156.521 kJ/mol O2 at 1300 K
(13)
4Fe3O4 (s) + O2 (g) = 6Fe2O3 (s)∆G◦r = −108.968 kJ/mol O2 at 1300 K
(14)
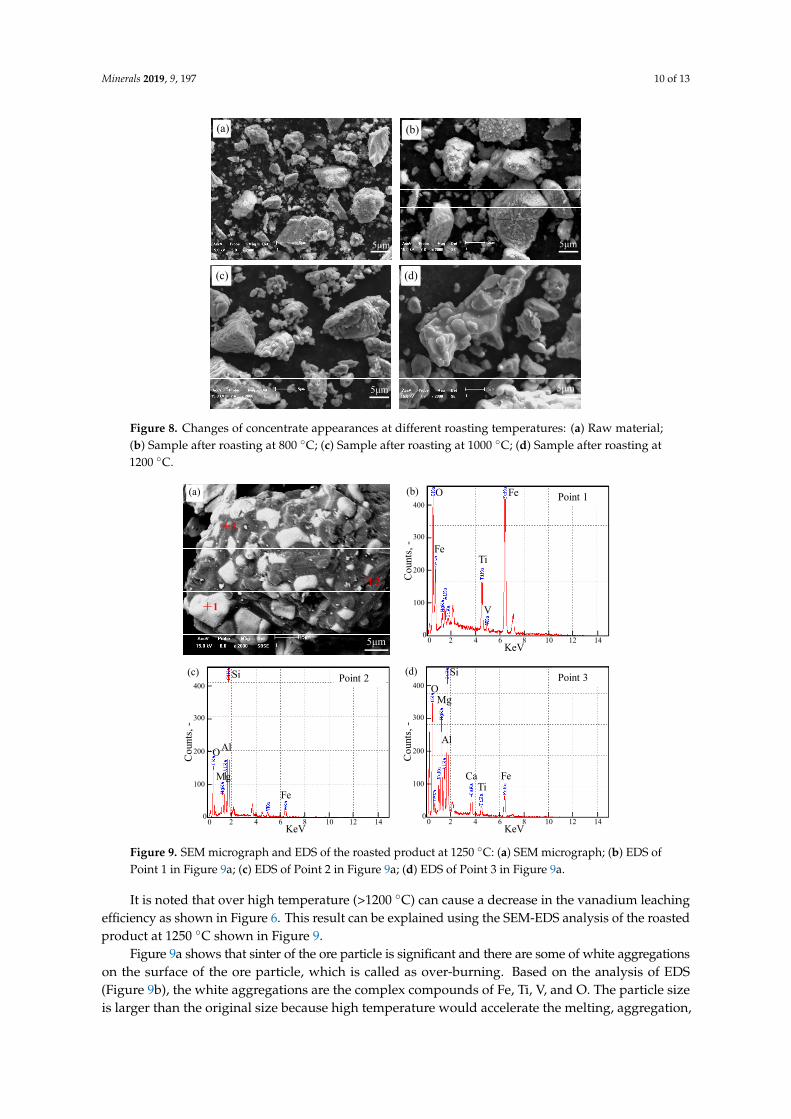
The samples before and after roasting were subjected to SEM-EDS analysis. Figure 8 showsmicrophotographs of the samples before and after experiments at different roasting temperatures.As shown in Figure 8a,b, there were no obvious changes for the samples before and after experimentsat 800 ◦C. However, some solids react at low temperature, according to Reactions (3)–(8) [31,32]as evident from Figure 1, and crystal bridges, which can connect the neighboring particles withdifferent compositions together, are generated between the solid compositions at lower temperature.Melting on the surface of particles happened when roasting temperature is higher than 1000 ◦C(Figure 8c,d), which is endothermic and agrees with the results of TG-DSC (Figure 4). Figure 8d showsthat melting of the ore particle was more obvious and ore particles become bigger at 1200 ◦C thanthose in Figure 8c at 1000 ◦C. The melting on the surface is considered that compounds with lowmelting temperature, such as vanadium pentaoxide (V2O5, TMel. = 670 ◦C [31,32]), iron cordierite(Fe2Al4Si5O18, TMel. = 1083 ◦C [32]) and fayalite (Fe2SiO4, TMel. = 1205 ◦C [32]), were generated at lowtemperature as shown by Reactions (15) [31], (16) [31,32], (18) [32], and (19) [31] respectively and melt
Minerals 2019, 9, 197 9 of 13
at elevated temperature. In addition, liquids would be generated because some chemical reactions orphase transformation reaction happened at elevated temperature as shown by Reactions (17) [31,32]and (20) [32]. Furthermore, the addition of other components can decrease the liquidus temperature ofmixtures to some extent. For example, the liquidus temperature of mixture of (Fe2SiO4 + Al2O3) witha composition near to Fe2SiO4 is lower than 1205 ◦C, the melting temperature of Fe2SiO4, based on thephase diagram analysis. Although there is no ∆G◦r data on Reaction (18) for justifying the reaction,FeO-SiO2-Al2O3 ternary phase diagram [32] and Figure 9 both show that there is Fe2Al4Si5O18 in thesystem, which indicates that Reaction (18) [32] would happen in the roasting. Therefore, main phasesof Fe2O3 and Fe2TiO5 were connected and sintered with crystal bridges and the binding phases ofthe compounds with low melting temperature. In fact, the generation of the compounds with lowmelting temperature is beneficial to the oxidation of V(III) into V(V) because vanadium oxide andoxygen transport easily in liquid. This is also the reason that high temperature roasting is in favorof the vanadium extraction, i.e., conversion ratio of V(III) into V(V) increases with the increase oftemperature which finally leads to the increase of vanadium leaching efficiency as shown in Figure 6.Another reason why high temperature is beneficial to vanadium extraction is the decomposition ofcomplex compounds at elevated temperature and recrystallization at low temperature, after breakingthe structure of vanadium spinel.
V2O3 (s) + O2 (g) = V2O5 (s)∆G◦r = −178.176 kJ/mol O2 at 900 K
(15)
2/3FeV2O4 (s) + 2/3FeO (s) + O2 (g) = 2/3Fe2V2O8 (s), T < 1113 K (840 ◦C)∆G◦r = −215.877 kJ/mol O2 at 900 K, ∆G◦r = −184.979 kJ/mol O2 at 1100 K
(16)
2/3FeV2O4 (s) + 2/3FeO (s) + O2 (g) = 2/3Fe2O3 (s) + 2/3V2O5 (l), T > 1113 K (840 ◦C)∆G◦r = −128.231 kJ/mol O2 at 1300 K
(17)
2FeO (s) + 5SiO2 (s)+ 2Al2O3 (s) = Fe2Al4Si5O18 (l), T > 1356 K (1083 ◦C) (18)
2FeO (s) + SiO2 (s) = Fe2SiO4 (s)∆G◦r = −6.221 kJ/mol at 900 K, ∆G◦r = −1.044 kJ/mol at 1100 K
(19)
Fe2V2O4 (s)→ Fe2O3 (s) + liquid (Fe2O3 + V2O5) at TDec. = 1113 K (840 ◦C) (20)Minerals 2019, 9, x FOR PEER REVIEW 9 of 14
10 20 30 40 50 60 70 80 90
Concentrate
1250℃
1200℃
1000℃
800℃
▲
●
●
●
●
●
●▲
▲
●
●
●
●
●
●
●
●
●
●
▲
▲
▲
▲
●
●
▲
▲
●●●
▲
●●
●
●
●
▲▲●
▲
●●●
▲
●●★●
★
●
●
▲▲●
★★★★
◆★
◆★
★
★-Fe3O4◆-FeTiO3
●-Fe2O3▲-Fe2TiO5
★◆
★
2θ (degree)
Inte
nsity
(a.u
.)
2θ (degree)
Inte
nsity
(a.u
.)
(b) 800 oC
(c) 1000 oC
(d) 1200 oC
(e) 1250 oC
(a) Concentrate
Figure 7. XRD patterns of vanadium-bearing titanomagnetite concentrate before and after roasting (roasting time: 2 h; atmosphere: air): (a) Concentrate; (b) 800 °C; (c) 1000 °C; (d) 1200 °C; (e) 1250 °C.
The samples before and after roasting were subjected to SEM-EDS analysis. Figure 8 shows microphotographs of the samples before and after experiments at different roasting temperatures. As shown in Figure 8a,b, there were no obvious changes for the samples before and after experiments at 800 °C. However, some solids react at low temperature, according to Reactions (3)–(8) [31,32] as evident from Figure 1, and crystal bridges, which can connect the neighboring particles with different compositions together, are generated between the solid compositions at lower temperature. Melting on the surface of particles happened when roasting temperature is higher than 1000 °C (Figure 8c,d), which is endothermic and agrees with the results of TG-DSC (Figure 4). Figure 8d shows that melting of the ore particle was more obvious and ore particles become bigger at 1200 °C than those in Figure 8c at 1000 °C. The melting on the surface is considered that compounds with low melting temperature, such as vanadium pentaoxide (V2O5, TMel. = 670 °C [31,32]), iron cordierite (Fe2Al4Si5O18, TMel. = 1083 °C [32]) and fayalite (Fe2SiO4, TMel. = 1205 °C [32]), were generated at low temperature as shown by Reactions (15) [31], (16) [31,32], (18) [32], and (19) [31] respectively and melt at elevated temperature. In addition, liquids would be generated because some chemical reactions or phase transformation reaction happened at elevated temperature as shown by Reactions (17) [31,32] and (20) [32]. Furthermore, the addition of other components can decrease the liquidus temperature of mixtures to some extent. For example, the liquidus temperature of mixture of (Fe2SiO4 + Al2O3) with a composition near to Fe2SiO4 is lower than 1205 °C, the melting temperature of Fe2SiO4, based on the phase diagram analysis. Although there is no ΔG°r data on Reaction (18) for justifying the reaction, FeO-SiO2-Al2O3 ternary phase diagram [32] and Figure 9 both show that there is Fe2Al4Si5O18 in the system, which indicates that Reaction (18) [32] would happen in the roasting. Therefore, main phases of Fe2O3 and Fe2TiO5 were connected and sintered with crystal bridges and the binding phases of the compounds with low melting temperature. In fact, the generation of the compounds with low melting temperature is beneficial to the oxidation of V(III) into V(V) because vanadium oxide and oxygen transport easily in liquid. This is also the reason that high temperature roasting is in favor of the vanadium extraction, i.e., conversion ratio of V(III) into V(V) increases with the increase of temperature which finally leads to the increase of vanadium leaching efficiency as shown in Figure 6. Another reason why high temperature is beneficial to vanadium extraction is the decomposition of complex compounds at elevated temperature and recrystallization at low temperature, after breaking the structure of vanadium spinel.
Figure 7. XRD patterns of vanadium-bearing titanomagnetite concentrate before and after roasting(roasting time: 2 h; atmosphere: air): (a) Concentrate; (b) 800 ◦C; (c) 1000 ◦C; (d) 1200 ◦C; (e) 1250 ◦C.
Minerals 2019, 9, 197 10 of 13Minerals 2019, 9, x FOR PEER REVIEW 10 of 14
5μm 5μm
5μm 5μm
(a)
(c) (d)
(b)
Figure 8. Changes of concentrate appearances at different roasting temperatures: (a) Raw material; (b) Sample after roasting at 800 °C; (c) Sample after roasting at 1000 °C; (d) Sample after roasting at 1200 °C.
V2O3 (s) + O2 (g) = V2O5 (s)
ΔG°r = −178.176 kJ/mol O2 at 900 K
(15)
2/3FeV2O4 (s) + 2/3FeO (s) + O2 (g) = 2/3Fe2V2O8 (s), T < 1113 K (840 °C)
ΔG°r = −215.877 kJ/mol O2 at 900 K, ΔG°r = −184.979 kJ/mol O2 at 1100 K
(16)
2/3FeV2O4 (s) + 2/3FeO (s) + O2 (g) = 2/3Fe2O3 (s) + 2/3V2O5 (l), T > 1113 K (840 °C)
ΔG°r = −128.231 kJ/mol O2 at 1300 K
(17)
2FeO (s) + 5SiO2 (s)+ 2Al2O3 (s) = Fe2Al4Si5O18 (l), T > 1356 K (1083 °C) (18)
2FeO (s) + SiO2 (s) = Fe2SiO4 (s)
ΔG°r = −6.221 kJ/mol at 900 K, ΔG°r = −1.044 kJ/mol at 1100 K
(19)
Fe2V2O4 (s) → Fe2O3 (s) + liquid (Fe2O3 + V2O5) at TDec. = 1113 K (840 °C) (20)
It is noted that over high temperature (>1200 °C) can cause a decrease in the vanadium leaching efficiency as shown in Figure 6. This result can be explained using the SEM-EDS analysis of the roasted product at 1250 °C shown in Figure 9.
Figure 8. Changes of concentrate appearances at different roasting temperatures: (a) Raw material;(b) Sample after roasting at 800 ◦C; (c) Sample after roasting at 1000 ◦C; (d) Sample after roasting at1200 ◦C.
Minerals 2019, 9, x FOR PEER REVIEW 11 of 14
+1
+3
+2
5μm
(a)
V
O Fe
TiFe
OSi
Mg
CaTi
Fe
Al
Point 1
O
Si
Al
Mg
Fe
Point 2 Point 3
(b)
(c) (d)
KeV
Cou
nts,
-
400
300
100
02 4 6 8 10 12 14
200
Cou
nts,
-
400
300
100
02 4 6 8 10 12 14
200
Cou
nts,
-
400
300
100
02 4 6 8 10 12 14
200
KeVKeV
0
00
Figure 9. SEM micrograph and EDS of the roasted product at 1250 °C: (a) SEM micrograph; (b) EDS of Point 1 in Figure 9a; (c) EDS of Point 2 in Figure 9a; (d) EDS of Point 3 in Figure 9a.
Figure 9a shows that sinter of the ore particle is significant and there are some of white aggregations on the surface of the ore particle, which is called as over-burning. Based on the analysis of EDS (Figure 9b), the white aggregations are the complex compounds of Fe, Ti, V, and O. The particle size is larger than the original size because high temperature would accelerate the melting, aggregation, and sinter of silicate which causes some of the vanadium wrapped by molten silicate, called a silicate network, prevents the conversion of V(III) into V(V), and finally decreases the vanadium leaching efficiency. Figure 9c,d indicate that the complex compounds of Fe, Si, Mg, Al, and O are generated and it agrees with the Reaction (18) and FeO-SiO2-Al2O3 ternary phase diagram [32].
The schematic diagrams of transformation behavior of the samples are shown in Figure 10. Figure 10a is the schematic diagram for Figure 8a in which the outline of the samples before roasting is straight and sharp. Figure 10b is for Figure 8b–d in which the crystal bridges obtained by the reactions among solid compounds and some of binding phases generated connect the neighboring particles and thus the outline become blunt. Figure 10c is the equivalent for Figure 9a.
Based on the abovementioned analyses, the proposed process by additive-free roasting-alkaline leaching is successful. The roasting of the ore is necessary for improving the leaching efficiency and roasting at 1200 °C for 2 h under the air atmosphere is appropriate to minimize vanadium loss and reduce energy consumption by 3.6% compared with roasting at 1250 °C for 2 h (based on laboratory conditions).
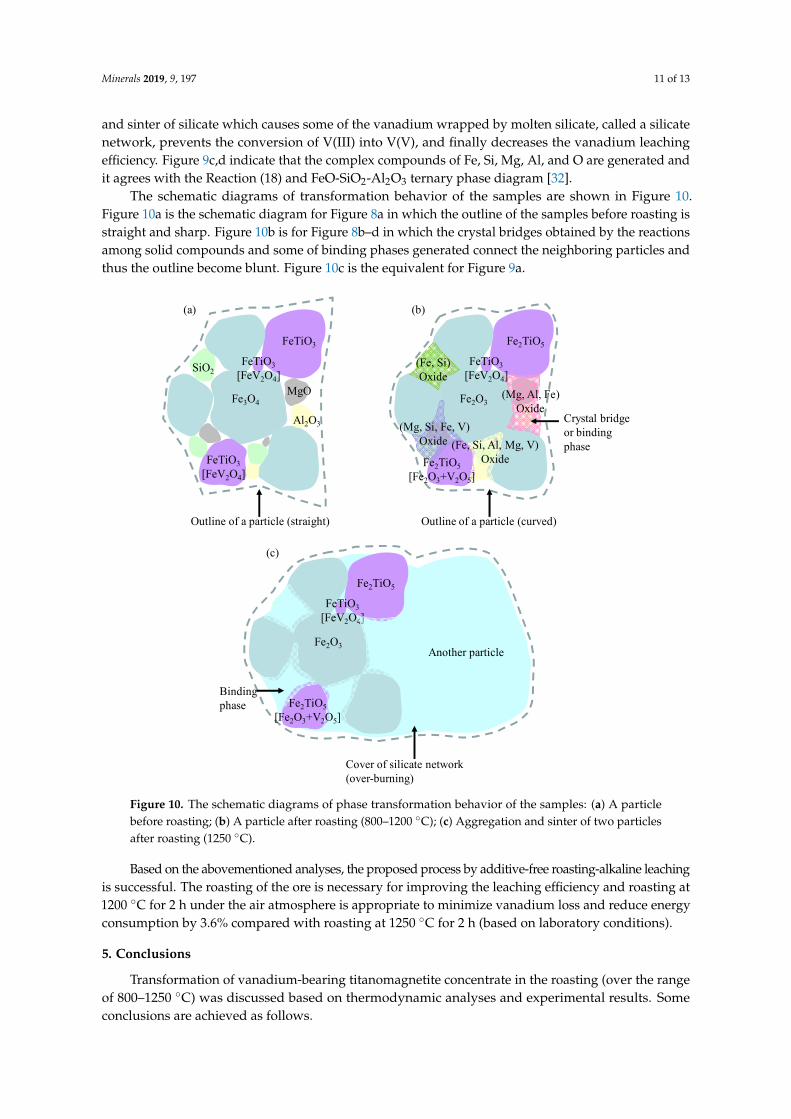
Figure 9. SEM micrograph and EDS of the roasted product at 1250 ◦C: (a) SEM micrograph; (b) EDS ofPoint 1 in Figure 9a; (c) EDS of Point 2 in Figure 9a; (d) EDS of Point 3 in Figure 9a.
It is noted that over high temperature (>1200 ◦C) can cause a decrease in the vanadium leachingefficiency as shown in Figure 6. This result can be explained using the SEM-EDS analysis of the roastedproduct at 1250 ◦C shown in Figure 9.
Figure 9a shows that sinter of the ore particle is significant and there are some of white aggregationson the surface of the ore particle, which is called as over-burning. Based on the analysis of EDS(Figure 9b), the white aggregations are the complex compounds of Fe, Ti, V, and O. The particle sizeis larger than the original size because high temperature would accelerate the melting, aggregation,
Minerals 2019, 9, 197 11 of 13
and sinter of silicate which causes some of the vanadium wrapped by molten silicate, called a silicatenetwork, prevents the conversion of V(III) into V(V), and finally decreases the vanadium leachingefficiency. Figure 9c,d indicate that the complex compounds of Fe, Si, Mg, Al, and O are generated andit agrees with the Reaction (18) and FeO-SiO2-Al2O3 ternary phase diagram [32].
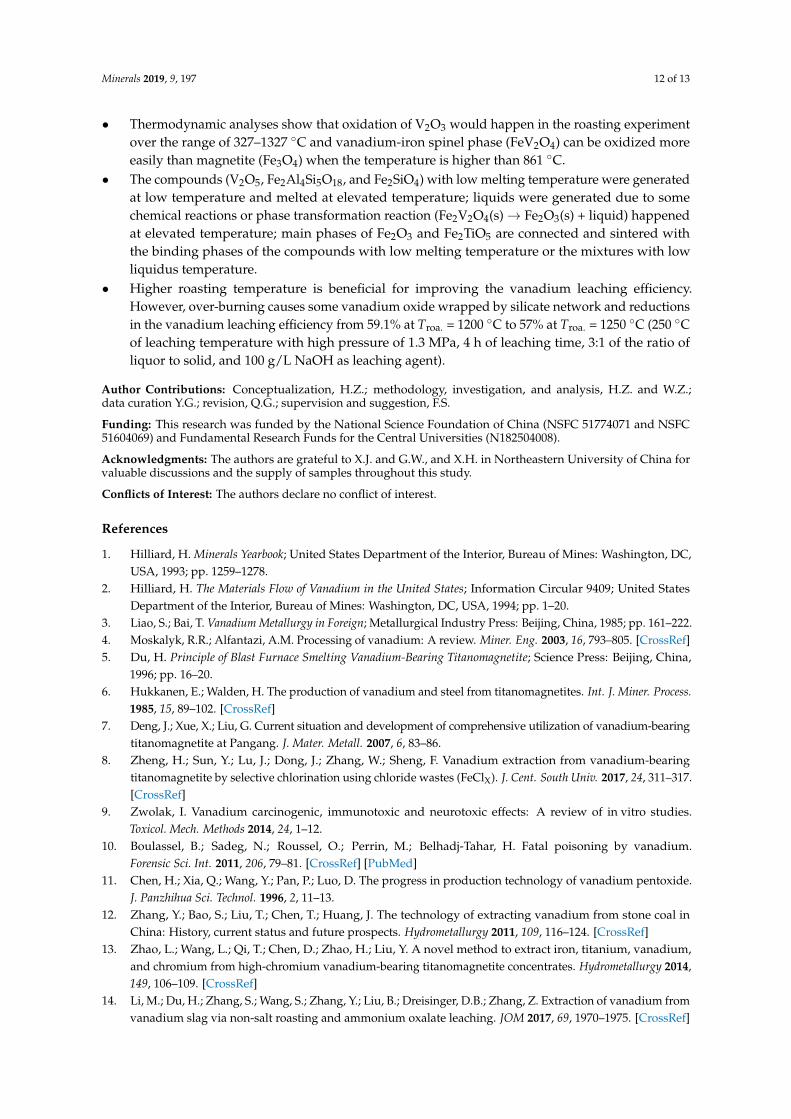
The schematic diagrams of transformation behavior of the samples are shown in Figure 10.Figure 10a is the schematic diagram for Figure 8a in which the outline of the samples before roasting isstraight and sharp. Figure 10b is for Figure 8b–d in which the crystal bridges obtained by the reactionsamong solid compounds and some of binding phases generated connect the neighboring particles andthus the outline become blunt. Figure 10c is the equivalent for Figure 9a.Minerals 2019, 9, x FOR PEER REVIEW 12 of 14
FeTiO3
Fe3O4MgO
SiO2
Al2O3
FeTiO3[FeV2O4]
(a)
Outline of a particle (straight)
FeTiO3[FeV2O4]
Fe2TiO5
Fe2O3
(c)
Cover of silicate network (over-burning)
Another particle
FeTiO3[FeV2O4]
Fe2TiO5[Fe2O3+V2O5]
Binding phase
Fe2TiO5
Fe2O3
(b)
(Mg, Al, Fe)Oxide
(Fe, Si)Oxide
(Mg, Si, Fe, V)Oxide
Outline of a particle (curved)
FeTiO3[FeV2O4]
Crystal bridge or binding phase(Fe, Si, Al, Mg, V)
OxideFe2TiO5[Fe2O3+V2O5]
Figure 10. The schematic diagrams of phase transformation behavior of the samples: (a) A particle before roasting; (b) A particle after roasting (800–1200 °C); (c) Aggregation and sinter of two particles after roasting (1250 °C).
5. Conclusions
Transformation of vanadium-bearing titanomagnetite concentrate in the roasting (over the range of 800–1250 °C) was discussed based on thermodynamic analyses and experimental results. Some conclusions are achieved as follows.
• Thermodynamic analyses show that oxidation of V2O3 would happen in the roasting experiment over the range of 327–1327 °C and vanadium-iron spinel phase (FeV2O4) can be oxidized more easily than magnetite (Fe3O4) when the temperature is higher than 861 °C.
• The compounds (V2O5, Fe2Al4Si5O18, and Fe2SiO4) with low melting temperature were generated at low temperature and melted at elevated temperature; liquids were generated due to some chemical reactions or phase transformation reaction (Fe2V2O4(s) → Fe2O3(s) + liquid) happened at elevated temperature; main phases of Fe2O3 and Fe2TiO5 are connected and sintered with the binding phases of the compounds with low melting temperature or the mixtures with low liquidus temperature.
• Higher roasting temperature is beneficial for improving the vanadium leaching efficiency. However, over-burning causes some vanadium oxide wrapped by silicate network and reductions in the vanadium leaching efficiency from 59.1% at Troa. = 1200 °C to 57% at Troa. = 1250 °C (250 °C of leaching temperature with high pressure of 1.3 MPa, 4 h of leaching time, 3:1 of the ratio of liquor to solid, and 100 g/L NaOH as leaching agent).
Figure 10. The schematic diagrams of phase transformation behavior of the samples: (a) A particlebefore roasting; (b) A particle after roasting (800–1200 ◦C); (c) Aggregation and sinter of two particlesafter roasting (1250 ◦C).
Based on the abovementioned analyses, the proposed process by additive-free roasting-alkaline leachingis successful. The roasting of the ore is necessary for improving the leaching efficiency and roasting at1200 ◦C for 2 h under the air atmosphere is appropriate to minimize vanadium loss and reduce energyconsumption by 3.6% compared with roasting at 1250 ◦C for 2 h (based on laboratory conditions).
5. Conclusions
Transformation of vanadium-bearing titanomagnetite concentrate in the roasting (over the rangeof 800–1250 ◦C) was discussed based on thermodynamic analyses and experimental results. Someconclusions are achieved as follows.
Minerals 2019, 9, 197 12 of 13
• Thermodynamic analyses show that oxidation of V2O3 would happen in the roasting experimentover the range of 327–1327 ◦C and vanadium-iron spinel phase (FeV2O4) can be oxidized moreeasily than magnetite (Fe3O4) when the temperature is higher than 861 ◦C.
• The compounds (V2O5, Fe2Al4Si5O18, and Fe2SiO4) with low melting temperature were generatedat low temperature and melted at elevated temperature; liquids were generated due to somechemical reactions or phase transformation reaction (Fe2V2O4(s)→ Fe2O3(s) + liquid) happenedat elevated temperature; main phases of Fe2O3 and Fe2TiO5 are connected and sintered withthe binding phases of the compounds with low melting temperature or the mixtures with lowliquidus temperature.
• Higher roasting temperature is beneficial for improving the vanadium leaching efficiency.However, over-burning causes some vanadium oxide wrapped by silicate network and reductionsin the vanadium leaching efficiency from 59.1% at Troa. = 1200 ◦C to 57% at Troa. = 1250 ◦C (250 ◦Cof leaching temperature with high pressure of 1.3 MPa, 4 h of leaching time, 3:1 of the ratio ofliquor to solid, and 100 g/L NaOH as leaching agent).
Author Contributions: Conceptualization, H.Z.; methodology, investigation, and analysis, H.Z. and W.Z.;data curation Y.G.; revision, Q.G.; supervision and suggestion, F.S.
Funding: This research was funded by the National Science Foundation of China (NSFC 51774071 and NSFC51604069) and Fundamental Research Funds for the Central Universities (N182504008).
Acknowledgments: The authors are grateful to X.J. and G.W., and X.H. in Northeastern University of China forvaluable discussions and the supply of samples throughout this study.
Conflicts of Interest: The authors declare no conflict of interest.
References
1. Hilliard, H. Minerals Yearbook; United States Department of the Interior, Bureau of Mines: Washington, DC,USA, 1993; pp. 1259–1278.
2. Hilliard, H. The Materials Flow of Vanadium in the United States; Information Circular 9409; United StatesDepartment of the Interior, Bureau of Mines: Washington, DC, USA, 1994; pp. 1–20.
3. Liao, S.; Bai, T. Vanadium Metallurgy in Foreign; Metallurgical Industry Press: Beijing, China, 1985; pp. 161–222.4. Moskalyk, R.R.; Alfantazi, A.M. Processing of vanadium: A review. Miner. Eng. 2003, 16, 793–805. [CrossRef]5. Du, H. Principle of Blast Furnace Smelting Vanadium-Bearing Titanomagnetite; Science Press: Beijing, China,
1996; pp. 16–20.6. Hukkanen, E.; Walden, H. The production of vanadium and steel from titanomagnetites. Int. J. Miner. Process.
1985, 15, 89–102. [CrossRef]7. Deng, J.; Xue, X.; Liu, G. Current situation and development of comprehensive utilization of vanadium-bearing
titanomagnetite at Pangang. J. Mater. Metall. 2007, 6, 83–86.8. Zheng, H.; Sun, Y.; Lu, J.; Dong, J.; Zhang, W.; Sheng, F. Vanadium extraction from vanadium-bearing
titanomagnetite by selective chlorination using chloride wastes (FeClX). J. Cent. South Univ. 2017, 24, 311–317.[CrossRef]
9. Zwolak, I. Vanadium carcinogenic, immunotoxic and neurotoxic effects: A review of in vitro studies.Toxicol. Mech. Methods 2014, 24, 1–12.
10. Boulassel, B.; Sadeg, N.; Roussel, O.; Perrin, M.; Belhadj-Tahar, H. Fatal poisoning by vanadium.Forensic Sci. Int. 2011, 206, 79–81. [CrossRef] [PubMed]
11. Chen, H.; Xia, Q.; Wang, Y.; Pan, P.; Luo, D. The progress in production technology of vanadium pentoxide.J. Panzhihua Sci. Technol. 1996, 2, 11–13.
12. Zhang, Y.; Bao, S.; Liu, T.; Chen, T.; Huang, J. The technology of extracting vanadium from stone coal inChina: History, current status and future prospects. Hydrometallurgy 2011, 109, 116–124. [CrossRef]
13. Zhao, L.; Wang, L.; Qi, T.; Chen, D.; Zhao, H.; Liu, Y. A novel method to extract iron, titanium, vanadium,and chromium from high-chromium vanadium-bearing titanomagnetite concentrates. Hydrometallurgy 2014,149, 106–109. [CrossRef]
14. Li, M.; Du, H.; Zhang, S.; Wang, S.; Zhang, Y.; Liu, B.; Dreisinger, D.B.; Zhang, Z. Extraction of vanadium fromvanadium slag via non-salt roasting and ammonium oxalate leaching. JOM 2017, 69, 1970–1975. [CrossRef]
Minerals 2019, 9, 197 13 of 13
15. Cai, Z.; Zhang, Y.; Liu, T.; Huang, J. Vanadium extraction from refractory stone coal using novel compositeadditive. JOM 2015, 67, 2629–2634. [CrossRef]
16. Li, R.; Liu, T.; Zhang, Y.; Huang, J.; Xu, C. Efficient extraction of vanadium from vanadium-titaniummagnetite concentrate by potassium salt roasting additives. Minerals 2018, 8, 25. [CrossRef]
17. Li, X.; Xie, B.; Wang, G.; Li, X. Oxidation process of low-grade vanadium slag in presence of Na2CO3.Trans. Nonferrous Met. Soc. China 2011, 21, 1860–1867. [CrossRef]
18. Takahashi, H.; Fujiwara, W.; Sun, H.; Yoshida, T.; Matsushima, Y. Extraction of vanadium from ammoniaslag under near-atmospheric conditions. Metals 2018, 8, 414. [CrossRef]
19. Zhu, X.; Li, W.; Guan, X. Vanadium extraction from titano-magnetite by hydrofluoric acid. Int. J.Miner. Process. 2016, 157, 55–59. [CrossRef]
20. Xiang, J.; Huang, Q.; Lv, X.; Bai, C. Extraction of vanadium from converter slag by two-step sulfuric acidleaching process. J. Clean. Prod. 2018, 170, 1089–1101. [CrossRef]
21. Chen, D.; Zhao, H.; Hu, G.; Qi, T.; Yu, H.; Zhang, G.; Wang, L.; Wang, W. An extraction process to recovervanadium from low-grade vanadium-bearing titanomagnetite. J. Hazard. Mater. 2015, 294, 35–40. [CrossRef]
22. Ji, Y.; Shen, S.; Liu, J.; Xue, Y. Cleaner and effective process for extracting vanadium from vanadium slag byusing an innovative three-phase roasting reaction. J. Clean. Prod. 2017, 149, 1068–1078. [CrossRef]
23. Li, H.; Fang, H.; Wang, K.; Zhou, W.; Yang, Z.; Yan, X.; Ge, W.; Li, Q.; Xie, B. Asynchronous extraction ofvanadium and chromium from vanadium slag by stepwise sodium roasting-water leaching. Hydrometallurgy2015, 156, 124–135. [CrossRef]
24. Li, H.; Wang, K.; Hua, W.; Yang, Z.; Zhou, W.; Xie, B. Selective leaching of vanadium in calcification-roastedvanadium slag by ammonium carbonate. Hydrometallurgy 2016, 160, 18–25. [CrossRef]
25. Zhang, Y.; Zhang, T.; David, D.; Lv, G.; Zhang, G.; Zhang, W.; Liu, Y. Extraction of vanadium from direct acidleach solution of converter vanadium slag. Can. Metall. Q. 2017, 56, 281–293. [CrossRef]
26. Luo, X.; Dong, H.; Zhang, S.; Liu, Y. Study on the sodium oxidation properties of low-iron vanadium-titaniummagnetite with high vanadium and titanium. Energy Sources 2018, 40, 1998–2008. [CrossRef]
27. Zhang, Y.; Yi, L.; Wang, L.; Chen, D.; Wang, W.; Liu, Y.; Zhao, H.; Qi, T. A novel process for the recoveryof iron, titanium, and vanadium from vanadium-bearing titanomagnetite: Sodium modification-directreduction coupled process. Int. J. Miner. Metall. Mater. 2017, 24, 504–511. [CrossRef]
28. Bauer, G.; Volker, G.; Hans, H.; Andreas, O.; Oskar, R.; Heinz, R.; Siegfried, S. Vanadium and vanadiumcompounds. In Ullmann’s Encyclopedia of Industrial Chemistry; Wiley-VCH: Weinheim, Germany, 2005;Volume A27, pp. 367–386.
29. Jena, B.C.; Dresler, W.; Reilly, I.G. Extraction of titanium, vanadium and iron from titanomagnetite depositsat pipestone lake, Manitoba, Canada. Miner. Eng. 1995, 8, 159–168. [CrossRef]
30. Chen, J. Handbook of Hydrometallurgy; Metallurgical Industry Press: Beijing, China, 2005; pp. 935–966.31. Barin, I. Thermochemical Data of Pure Substances, 3rd ed.; Wiley-VCH GmbH: Weinheim, Germany, 1995;
pp. 700, 702, 703, 713, 714, 716, 1047, 1505, 1692, 1778, 1780.32. ACerS-NIST Phase Equilibria Diagrams (PC Database Ver. 4.0, NIST Standard Reference Database 31); Figures No.
96-1, 696-A; American Ceramic Society: Westerville, OH, USA; National Institute of Standards andTechnology: Gaithersburg, MD, USA, 2014.
33. Chen, H. Study on extraction of V2O5 from vanadium-bearing slag by lime roasting. Iron Steel Vanadium Titan.1992, 6, 1–9.
34. Wang, X. Ferrous Metallurgy; Metallurgical Industry Press: Beijing, China, 2014; Volume 1, p. 45.35. Huang, X. Principle of Iron and Steel Metallurgy; Metallurgical Industry Press: Beijing, China, 2017; p. 633.
© 2019 by the authors. Licensee MDPI, Basel, Switzerland. This article is an open accessarticle distributed under the terms and conditions of the Creative Commons Attribution(CC BY) license (http://creativecommons.org/licenses/by/4.0/).