trajectories in knowledge economy: empirics from ssa and mena countries
TRANSCRIPT

1
A G D I Working Paper
WP/15/060
Trajectories in Knowledge Economy: Empirics from SSA and MENA
countries
Simplice A. Asongu
African Governance and Development Institute,
P.O. Box 8413, Yaoundé, Cameroon.
E-mail: [email protected]
Antonio R. Andrés
Universidad del Norte
Escuela de Negocios
Departamento de Finanzas y Organizacion
Km 5 via a Puerto Colombia, Barranquilla, Colombia
E-mail:[email protected]

2
2015 African Governance and Development Institute WP/15/060
AGDI Working Paper
Research Department
Trajectories in Knowledge Economy: Empirics from SSA and MENA countries
Simplice A. Asongu & Antonio R. Andrés
December 2015
Abstract
In the first critical assessment of knowledge economy dynamic paths in Africa and the
Middle East, but for a few exceptions, we find overwhelming support for diminishing cross-
country disparities in knowledge-base-economy dimensions. The paper employs all the four
components of the World Bank’s Knowledge Economy Index (KEI): economic incentives,
innovation, education, and information infrastructure. The main finding suggests that sub-
Saharan African (SSA) and the Middle East and North African (MENA) countries with low
levels in KE dynamics and catching-up their counterparts of higher KE levels. We provide the
speeds of integration and time necessary to achieve full (100%) integration. Policy
implications are discussed.
JEL Classification: F42; O10; O38; O57; P00
Keywords: Knowledge economy; Principal component analysis; Panel data; Convergence
1. Introduction
With the recent trend of globalization, it has become abundantly vivid that for any
continent, region or country to be actively involved in the global economy, it must adopt
competition as a benchmark to progress. Competition derives for knowledge economy (KE).
The relevance of KE has emerged as a key theme in the late 1990s in the Organization for

3
Economic Co-operation and Development (OECD) and World Bank reports (World Bank,
2007; Peter, 2008; Weber, 2011; Tchamyou, 2015; Andrés et al., 2015; Amavilah et al., 2014;
Asongu, 2014ab). Knowledge created through innovation and technical progress as a long-run
driver of economic growth has now been well established. The governments of the Newly
Industrialized Economies (Korea, Taiwan, Hong Kong & Singapore), China and Malaysia are
playing quite a substantial role in shifting toward knowledge-based economies, from the
product economies of the post-industrialization period (Chandra & Yokoyama, 2011). The
main idea is that the process of creation and diffusion of knowledge depends on convergence
in certain criteria1 which would lead to more common policies across members of the
convergence club2.
Consistent with recent literature (Tchamyou, 2015; Asongu, 2014c; Nyarko, 2013),
there has been a recent wave of studies on the need to accelerate the move towards KE in
Africa. The growing literature has consisted of inter alia: general surveys on KE (Anyanwu,
2012; Lin, 2006; Rooney, 2005); education (Amavilah, 2009; Chavula, 2010; Ford, 2007;
Wantchekon et al., 2014; Weber, 2011); innovation (Carisle et al., 2013; Oyelaran-Oyeyinka
& Gehl Sampath, 2007); economic incentives and institutional regime (Andrés & Asongu,
2013a ; Andrés et al., 2015; Cogburn, 2003; Nguena & Tsafack, 2014; Saxegaard, 2006;
Letiche, 2006); information and communication technologies (Asongu, 2013a; Butcher, 2011;
Chavula, 2010; African Partnership Forum, 2008); indigenous knowledge systems (Lwoga et
al., 2010; Raseroka, 2008); intellectual capital and economic development (Preece, 2013;
Wagiciengo & Belal, 2012); intellectual property rights (Andrés et al., 2014; Andrés &
Asongu, 2013ab; Asongu, 2013b; Lor & Britz, 2005; Myburgh, 2011; Zerbe, 2005); the
economy of knowledge in space transformation (Maswera et al., 2008; Moodley, 2003);
spatiality in the production of knowledge (Bidwell et al., 2011; Neimark, 2012) and research
and development (African Development Bank, 2007; German & Stroud, 2007; Sumberg,
2005).
The narratives highlighted above emphasise the need of bridging gaps in KE among
countries (Aubert, 2005; AfDB, 2007; Chavula, 2010; Bizri, 2009; Makinda, 2007; Britz et
al., 2006; Lightfoot, 2011). As far as we have reviewed, there is apparently no study that has
tackled the concern of how Sub-Saharan African (SSA) and Middle East and North African
1E.g, convergence in education, information and communication technology (ICT), innovation, and economic
incentives. 2 The European Union’s Lisbon strategy is an eloquent example.

4
(MENA) countries are bridging gaps in KE. This paper seeks to fill this gap and provides
policy measures needed to enhance KE catch-up among countries.
In the light of the above, while some scholarly attention has focused on developed
countries and the emerging economies of Latin America and East Asia, less attention has been
devoted to SSA and MENA countries. A study on the current climate and future prospects in
education, innovation and technology concludes that insofar as the main cultural
underpinnings of KEs are concerned (innovation, education and technology), the Arab
countries may be on arid grounds but not in a total dessert. It further recommends more
scholarly research on KE in the sub-region (Bizri, 2009). The pressing need for KE policy
reform in SSA3 and MENA
4 countries depends much on trajectories in the convergence
process of various KE dynamics. The intuition behind this assertion is that blanket policies are
more likely to succeed across countries depending on the degree of convergence and time
required for full (100%) convergence in KE dynamics5.
Given the growing role of KE in the development process, policy makers are more
likely today to ask the following questions. Are KE dynamics converging within SSA and
MENA countries? If so, then what are the rates and timing of the convergence processes?
Answers to these questions could provide relevant policy orientation to the timing,
enforcement and standardization KE-oriented policies. An additional motivation for this work
also draws from the ‘East Asian Miracle’6. Assessing if SSA and MENA countries with low
levels in KE dynamics and catching-up their counterparts of higher KE levels could be crucial
3Africa remains the world’s poorest inhabited continent in spite of its abundance in minerals and human
resources. Presently, the continent is lagging behind in the Knowledge Economy Index (KEI): a benchmark used
to measure the knowledge infusion in an economy. The global knowledge revolution represents an opportunity
for Africa which has missed the industrial era. Owing the South Korean example, Africa needs the four pillars of
KE more than ever for its development: a sound economic incentive and institutional regime; an educated and
creative population; an efficient innovation system and a dynamic information infrastructure.
Also, see the discussion from Makinda (2007) and Chavula (2010) on the scope and positioning of the paper
below. 4 This need for policy reform draws from the Lightfoot (2011) conclusion that emphasizes the need for deeper
reforms as the way forward to fulfilling the policy aspirations rather than speculating over progress through
technology enriched futures. When applying the framework of knowledge economy (KE) to developing nations
in the Middle East and North African (MENA) region, a report (UNDP Arab Report, 2009) uncovered that they
were not investing in key areas which are fundamental to KEs. “To date, related investments in education,
information infrastructure, research and development (R&D), and innovation have been insufficient or
inappropriate in most MENA countries. Moreover, inadequate economic and institutional frameworks prevent
these investments from yielding desired results” (Aubert & Reiffers, 2003, p.1). 5 Within the framework of this study, convergence will imply the feasibility of common business and
macroeconomic policies while, full (100%) convergence will mean, the enforcements common business and
macroeconomic policies without distinction of nationality and locality. 6 Additional support for the imperative of investigating convergence in KE dynamics is the possibility that, the
level of industrial development could be traced to the common ability of East Asian countries to replicate
existing technology. Some evidence suggest that the ‘East Asian Miracle’ could have originated from these
nations’ capacity to absorb, replicate and duplicate foreign innovations which might have contributed to their
relatively high growth rates.

5
in the formulation of appropriate policy recommendations. In contrast to mainstream research
approach which is based for the most part on one or two dimensions of KE, this paper
employs all the four components of the World Bank’s Knowledge Economy Index (KEI):
economic incentives, innovation, education and information infrastructure.
The rest of this paper is organized as follows. Section 2 examines the intuition and
theoretical underpinnings motivating the study as well as the relevant literature. The data and
methodology are discussed in Section 3. The empirical analysis is covered in Section 4 while
Section 5 concludes.
2. Intuition, literature and scope
2.1 Theoretical issues and Intuition
2.1.1 Theoretical issues
Theories of growth have been classified as either neoclassical or endogenous. With
respect to the neoclassical model (Solow, 1956; Swan, 1956), the convergence process is
premised on the existence of decreasing returns in capital accumulation. Therefore, increases
in capital lead to less than proportional increases in product. This condition elucidates the
existence of a steady-state level for the main magnitudes, such as product per unit of
employment, to which the economy will depend after any transitory shock. Hence, poor
economies will grow at higher rates than rich ones, guaranteeing convergence across all of
them.
Conversely, endogenous growth models incorporate mechanisms that determine the
non-appearance of convergence. At the onset, the fact is not imposing decreasing returns of
capital (Romer, 1990) and mechanisms in which technological growth is a non-decreasing
function of some factors, lead to models of non-steady state or long-run equilibrium. It
follows that increases in output can be sustained in the long-term through knowledge-related
investments that are not subject to diminishing returns at the aggregate level. Such
investments is the source of beneficial external effects which offset the limiting consequences
of increasing capital per worker within a given form. Therefore, whereas investments by
individual firms remain subject to diminishing returns, there is no decline in the overall
marginal product of capital.
New growth theories have shown that new knowledge is an especially valuable factors
of production, on account of the unique non-rival characteristics of information. In particular
its ability to be transferred between users without losing usefulness. Investment in equipment
(encompassing new technological developments) and education, invention and related

6
knowledge enhancing activities are viewed to be key to overcoming the impact of the
diminishing returns that come into play as workers are equipped with more capital.
Technological progress makes it possible to extract greater value from scarce resources and
sustain the economy’s growth over the long-run (Romer, 1990).
Lastly, the new theories maintain that characteristics that make knowledge a highly
valuable and productive commodity also render it difficult to establish an efficient knowledge
market. In other words, a market that provides incentives for both the production of
knowledge and its distribution to all those who can benefit from it (Lamberton, 1996).
2.1.2 Motivation
The motivation of this study typically follows the evidence of income-convergence
across countries that has been investigated in the context of neoclassical growth models,
originally developed by the seminal studies of Baumol (1986), Barro & Sala-i-Martin (1992,
1995) and Mankiw et al. (1992). The theoretical underpinnings of income convergence (as
highlighted in the previous section) are abundant in the empirical growth literature (Solow,
1956; Swan, 1956) and have recently been applied in other fields of development. Whereas
there is a theory and vast empirical studies on per capita income convergence, there is yet not
a theory on convergence in other development branches. However, there is growing
importance of empirical convergence applications to other fields, e.g. applications to financial
systems (Bruno et al., 2012; Narayan et al., 2011; Asongu, 2013a) and KE (Karagiannis,
2007; Asongu, 2015ab). In the light of these recent developments, we are aware of the risks of
‘doing measurement without theory’. Like Constantini & Lupi (2005), we argue that
reporting facts even in the absence of a formal theoretical model is a useful scientific activity.
The intuition underlying convergence in KE is that it is the basis for competitive and
dynamic economies. To understand why convergence in the knowledge-based economy
(KBE) model is so crucial for developing countries, it is important to underline the European
Union’s strategic agenda. According to Karagiannis (2007), the effect that KBE-policies may
have on economic growth was the ultimate objective of the EU’s Lisbon Strategy (LS). Prior
to the LS, the importance of convergence in knowledge as an economic driver had been well
documented (DTI, 1998; Stiglitz, 1999)7. In the current study, convergence will imply the
7 According to the British Department of Trade and Industry (DTI, 1998),“… it is an economy in which the
generation and exploitation of knowledge have come to play the predominant part in the creation of wealth. It’s
not simply about pushing back the frontiers of knowledge; it is also about the more effective use and exploitation
of all types of knowledge in all manner of economic activity…”. Hence, considering the economic consequences
of the knowledge society, understanding the ‘tacit’ nature of knowledge is quite often the basis of competitive

7
feasibility of common business and macroeconomic policies while, full (100%) convergence
will mean, the enforcements common business and macroeconomic policies without
distinction of nationality and locality. Since it is unlikely to find convergence within a very
heterogeneous set of countries, the sample is sub-divided into two homogenous panels based
on regional segmentation.
2.2 Scope and positioning of the paper
The focus of KE economy literature has been on developed countries and the emerging
economies of Latin America and East Asia, particularly on the importance of good
governance on KE development (Dahlan, 2007; Chandra & Yokoyama, 2011) and the
incidence of KE in economic development (Karagiannis, 2007). On the one hand, a clear
relationship between formal institutional quality and knowledge-based economic
infrastructure has been established (Andrés et al., 2015). On the other hand, positive linkages
between KE and economic growth have confirmed (Chavula, 2010). As far as we know, but
for a thin exception (Chavula, 2010), the few SSA and MENA related-papers have been
limited to a few dimensions of KE (Aubert, 2005; Britz et al., 2006; Makinda, 2007; African
Development Bank, AfDB, 2007). In order to clearly position this paper in the light of
existing literature we shall discuss the scope in two strands: policy issues on KE and the KE-
growth nexus.
In the first strand, whereas the need for policy reforms on KE determinants in MENA
countries has already been highlighted in the introduction8, Makinda (2007) provides one of
the most detailed accounts of reforms required in SSA. With respect to Makinda, in order to
rectify this gap between SSA and the Western World, African policy makers need to: (i)
define the type of knowledge their countries require; (ii) establish conditions for nurturing
strategic leaders who will in turn, seek the right forms of knowledge to tackle Africa’s
problems; (iii) build political and legal frameworks that encourage the absorption and
application of scientific innovation and (iv) revamp universities, establish regional research
centers and take capacity building more effectively. Chavula (2010) has also established that
African countries need to direct policy efforts towards restructuring economic incentives that
encourage the acquisition, adaptation and utilization of knowledge into productive use.
Earlier, Britz et al. (2006) had assessed the question of whether Africa is moving towards a
advantage. More so, in order to improve current practices, it is not only important to extend the frontiers of
knowledge, but also to diffuse and exploit the existing ones (Stiglitz, 1999). 8 See Arab Report (2009) and Bizri (2009).

8
knowledge society and found that Africa still has a far way to go down the road and the
journey could be quickened with certain preconditions, inter alia: investment in human
capital, stopping of brain drain, as well as effective development and maintenance of a
physical infrastructure.
In the second strand, the AfDB (2007) has investigated the impact of public
expenditure on the education dimension of KE and found the following. First, in the short-
term, there is a positive relationship between ‘public expenditure on education’ and economic
growth on the one hand, and on the other hand, between knowledge generation and human
capital development. These relationships ultimately, have a potential to positively affect
aggregate labor productivity. Second, in the long-term however, public expenditure is
negatively related to economic growth due to the often lack of capacity to retrain human
capital and subsequent ‘brain drain’. Chavula (2010) has also recently used panel data from
1990 to 2007 to examine the role of KE in economic growth. Findings support the positive
bearing of mobile subscribers, telephone lines, tertiary enrolment and FDI inflows in per
capita economic prosperity. In MENA countries, the United Arab Emirates thanks to Dubai
(an internet and media city with world class standard created from scratch), demonstrates the
best performance (Aubert & Reiffers, 2003). Of the MENA countries which have shown
significant improvements, it is worthwhile articulating that Jordan and Tunisia have heavily
invested in education and developed their ICT and/or electronic sectors. In SSA, South Africa
distinguishes itself quite vividly. Among low-income countries in the sub-region, some
significant progress is noticeable in Uganda, Senegal, Rwanda, and Mauritania (Aubert,
2005).
Europe and North America have fully understood the dynamics of KE and are
inexorably driving developments in the global and international arenas. Other regions like
South America and Asia are responding in calculated steps that underscore the role of KE in
the current pursuit of national, regional and international initiatives. Consequently, the
developed world and the emerging economies of Latin America and East Asia are already
taking KE very seriously. Also, in Africa and the Middle East, KE issues are beginning to
take central stage in discussions on development. It is therefore the interest of this study to
assess pressing policy questions already discussed in the introduction.
9
3. Data and Methodology
3.1 Data
In accordance with previous empirical literature (Chavula, 2010; Weber, 2011), our
dependent variables are from the World Bank´s World Development Indicators (World Bank,
2011). Therefore, the study employs the variables identified under the World Bank’s four KEI
components which include: the economic environment, innovation, education, and
information infrastructure. We estimate a panel of 21 African and Middle East countries over
the years 1996-2010. We concur with the literature (Narayan et al., 2011; Asongu, 2013a) in
asserting that it is unlikely to find convergence within a very heterogeneous set of countries.
Therefore, we divide the data into two subsamples: SSA and MENA countries.
We control for macroeconomic conditions (economic prosperity, financial depth and
inflation), government policy (government expenditure) and the institutional environment
(rule of law). We limit the analysis to only five control variables because of constraints in the
Overidentifying Restrictions (OIR) test for instrument validity. We expect government
expenditure to generally stimulate KE if resources allocated for investment purposes are not
tainted with corrupt practices or poorly managed. From a broad perspective, economic
prosperity should be a natural driver of KE. The effects of financial depth, inflation and rule
of law depend on the dimension of KE. For instance, while inflation could be stimulated by
the demand for credit to compensate for falling purchasing power, it could as well decrease
bank deposits (part for financial depth) and the need for ICT services. While the rule of law is
an incentive to innovation, it could also substantially inhibit knowledge spillovers and hence,
negatively affect the education dimension of KE.
Details about descriptive statistics (with presentation of countries), correlation analysis
(showing the relationships between key variables used in the paper), and variable definitions
are provided in the appendices. The summary statistics (Appendix 1) of the variables used in
the dynamic panel regressions shows that there is quite some variation in the data utilized so
that one should be confident that reasonable estimated linkages should emerge. The purpose
of the correlation analysis (Appendix 2) is to avoid concerns resulting from
overparameterization and multicollinearity. Based on a preliminary assessment of the
correlation matrix, there do not appear to be any serious concerns in terms of the relationships
to be estimated. Appendix 3 discloses definitions and corresponding sources of the variables.

10
3.2 Methodology
3.2.1 Principal Component Analysis (PCA)
Given that each dimension of KE could be correlated with its component variables
individually, one might criticize the redundancy in the information provided for each
dimension of the KEI. Hence, we use principal component analysis (PCA) for treatment of the
variables. The PCA is a common statistical method that is used to reduce a larger set of
correlated variables into a smaller set of uncorrelated variables called principal components
that account for most of variation in the original data set. As shown in Table 1, the first
principal component (PC) accounts for approximately 65% of the variation in all four KE
dimensions. Educatex for example which denotes about 77% of information in the education
dimension of KE is the first PC of primary school enrolment (PSE), secondary school
enrolment (SSE) and tertiary school enrolment (TSE). In the choice of the PCs, the criteria
applied to determine how many common factors to retain are taken from Kaiser (1974) and
Jolliffe (2002). Hence, only PCs with a corresponding eigenvalue greater than one are
retained. It is worth noting that the first PCs are almost equal across dimensions. These results
show that one PC model is appropriate for KE dimensions in our sample.
Table 1: Principal Component Analysis
Knowledge Economy
dimensions
Component Matrix(Loadings) First
P.C
Eigenvalue Indexes
Education
School
enrolment
PSE SSE TSE
Educatex 0.535 0.620 0.574 0.771 2.313
Information &
Infrastructure
ICTs Internet Mobile Telephone
ICTex 0.653 0.661 0.371 0.705 2.115
Economic
Incentive
Trade &
Tariffs
Trade Tariffs
Tradex -0.707 0.707
0.645 1.290
Credit &
IR Spread
Private Credit Interest rate spread
Creditex -0.707 0.707 0.679 1.358
Innovation
Scientific
Journals
Reducing the dimensions of these is impractical owing to low correlation and
conceptual dissimilarity. FDI
Inflows
PSE: Primary School Enrolment. SSE: Secondary School Enrolment. TSE: Tertiary School Enrolment. PC: Principal Component. ICTs: Information and Communication Technologies. IR: Interest Rate. FDI: Foreign Direct Investment.
3.2.2 Estimation technique
The choice of the β-convergence approach is due to constraints in the data set. The use
of cointegration and unit roots estimation strategies are not convenient because of limited

11
degrees of freedom in homogenous panels or convergence clubs. More so, the alternative
strand of convergence (σ-convergence) which is of the view that a group of economies
converge when the cross-section variance of the variable under consideration declines, is also
inappropriate because our data structure is panel. Our estimation procedure typically follows
the evidence of income convergence across economies, which has been investigated in the
context of pioneering works of neoclassical growth models (Baumol, 1986; Barro & Sala-i-
Martin, 1992, 1995; Mankiw et al., 1992). The theoretical underpinnings of income
convergence are well documented in the empirical growth literature (Swan, 1956; Solow,
1956).
The two equations below are the standard approaches in the literature for investigating
conditional convergence if tiW , is taken as strictly exogenous (Fung, 2009).
titititititi WYYY ,,,,, )ln()ln()ln( (1)
tititititi WYY ,,,, )ln()ln( (2)
Where σ = 1+ β, tiY , is the proxy for KE in country i at period t. tiW , is a vector of
determinants of KE, i is a country-specific effect, t is a time-specific constant and ti , the
classical error term. Consistent with the neo-classical growth model, a statistically significant
negative coefficient on in Eq. (1) suggests that countries relatively close to their steady
state of KE growth will experience a slowdown in growth of KE, known as conditional
convergence (Narayan et al., 2011). In the same vein, according to Fung (2009) and recent
African convergence literature (Asongu, 2013a), if 10 in Eq. (2), then tiY , is
dynamically stable around the path with a trend in KE the same as that of tW , and with a
height relative to the level of tW . The variables contained in tiW , and the individual effects
i are measures of the long-term level the KE to which is converging to. Therefore, the
country-specific effect i emphasizes other determinants of a country’s steady state not
captured by tiW , .
Requirements for conditional convergence elucidated above are valid if and only if,
tiW , exhibits strict exogeneity. Unfortunately, this is not the case in the real world because,
while institutional quality, economic prosperity, inflation, financial development and
12
government expenditure (components of tiW , ) influence KE, the reverse effect is also true.
Thus, we are faced here with the issue of endogeneity where control variables ( tiW , ) are
correlated with the error term ( ti , ). Also, country- and time-specific effects could be
correlated with other variables in the model, which is very likely with lagged dependent
variables included in the equations. A way of dealing with the problem of the correlation
between the individual specific-effect and the lagged endogenous variables consists of
eliminating the individual effect by first differencing. Therefore Eq. (2) becomes:
)()()ln(ln)ln()ln( ,,2,,2,,,, titititititititi WWYYYY (3)
However Eq. (3) still presents another issue. Estimation by Ordinary Least Squares
(OLS) is still biased because there remains a correlation between the lagged endogenous
independent variable and the disturbance term. To address this concern, we estimate the
regression in differences jointly with the regression in levels using the Generalized Method of
Moments (GMM) estimation. Arellano and Bond (1991) have suggested an application of the
Generalized Method of Moments (GMM) that exploits all the orthogonality conditions
between the lagged dependent variables and the error term. The procedure uses lagged levels
of the regressors as instruments in the difference equation, and lagged differences of the
regressors as instruments in the levels equation, thus exploiting all the orthogonal conditions
between the lagged dependent variables and the error term. Between the difference GMM
estimator (Arellano & Bond, 1991) and system GMM estimator (Arellano & Bover, 1995;
Blundell & Bond, 1998), the system GMM will be given priority, consistent with Bond et al.
(2001, 3-4)9. This GMM estimation approach has been extensively applied in the convergence
literature. In contrast to Narayan et al. (2011), we shall adopt Fung (2009) owing to software
specificities10
. In model specification, we opt for the second-step GMM because it corrects the
residuals for heteroscedasticity11
. The assumption of no auto-correlation in the residuals is
crucial as lagged variables are to be used as instruments for the dependent variables.
Moreover, the estimation depends on the assumption that the lagged values of the dependent
9 “We also demonstrate that more plausible results can be achieved using a system GMM estimator suggested by
Arellano & Bover (1995) and Blundell & Bond (1998). The system estimator exploits an assumption about the
initial conditions to obtain moment conditions that remain informative even for persistent series, and it has been
shown to perform well in simulations. The necessary restrictions on the initial conditions are potentially
consistent with standard growth frameworks, and appear to be both valid and highly informative in our
empirical application. Hence we recommend this system GMM estimator for consideration in subsequent
empirical growth research”. Bond et al. (2001, pp. 3-4). 10
Whereas, Narayan et al. (2011) have used Eq. (1) in the controlling for fixed effects, this paper applies Eq. (3)
instead; in line with (Fung, 2009). The Fung (2009) has been used in recent African convergence literature
(Asongu, 2013a). The system GMM has been applied in recent KE convergence literature (Karagiannis, 2007). 11
In the first-step, the residuals are assumed to be homoscedastic.

13
variable and other independent variables are valid instruments in the regression. When the
error terms of the level equation are not auto-correlated, the first-order auto-correlation of the
differenced residuals should be significant whereas their second-order auto-correlation should
not be. The validity of the instruments is examined with the Sargan over-identifying
restrictions test (henceforth, OIR). Instruments are highly correlated with the potential
endogenous variable. We need to look at the first stage regression equation and see whether
our instruments are able to capture high variation in our endogenous variables. We should
mention Staiger and Stock and the issue of weak instruments by employing a Fisher test.
In line with Islam (1995, 14), yearly time spans are too short to be appropriate for
studying convergence, as short-run disturbances may loom substantially in such brief time
spans. Therefore, considering the data span of 15 years, we use two-year non-overlapping
intervals12
. This implies in our analysis, τ is set to 2. Hence, we compute the implied rate of
convergence by calculating ‘σ/2’. We divide the estimated coefficient (σ) of the lagged
differenced endogenous variable by 2 because we have used a two year interval to absorb the
short-term disturbances. When the absolute value of the estimated autoregressive coefficient
is greater than zero but less than one ( 10 ), we conclude the existence of convergence.
The broader interpretation suggests that past differences have less proportionate impact on
future differences, denoting the variation on the left hand side of Eq. (3) is decreasing
overtime as the economy is converging to a steady state (Asongu, 2013a).
4. Empirical analysis
4.1 Presentation of results
Before we dive into the presentation of results, it is important at the outset to
understand the economic intuition motivating absolute and conditional convergence in KE.
Absolute convergence in KE occurs when countries share similar fundamental
characteristics with regard to their KE dynamics such that only variations across countries in
initial levels of KE development exist. Absolute convergence therefore results from factors
such as the formulation of monetary unions and adoption of a unique currency, among others
(Asongu, 2013a). The quest for absolute convergence is usually in line with an overall global
strategy in a monetary union. For example the Lisbon Strategy that was launched in 2000 by
12
We have 8 two-year non-overlapping intervals: 1996; 1997-1998; 1999-2000; 2001-2002; 2003-2004; 2005-
2006; 2007-2008; 2009-2010.
14
the European government leaders13
. This strategy is implemented through a combination of
policies aiming at boosting the information society, improving research and development,
accelerating structural reforms for competitiveness and enhancing innovation, while
modernizing the European social model. Simultaneously to the above, a growth-friendly
macroeconomic policy mix is applied14
.
In the same vein, absolute convergence should occur in SSA and MENA countries
because of adjustments common to these countries. For instance since the 1980s, many
countries have undertaken structural reform initiatives engineered by the International
Monetary Fund (IMF) and the World Bank (WB). These reforms have included improving
education, development of ICT, innovation and economic incentives. The degree of internet
penetration, extensive use of mobile phones, increasing literacy rate…etc witnessed in SSA
and MENA countries over the past decade are factors that could facilitate absolute
convergence in KE.
On the other hand, conditional convergence is that which depends on structural and
institutional characteristics. Consistent with the economic growth literature (Barro, 1991),
conditional convergence depicts the kind of convergence whereby one’s own long-term
steady state (equilibrium) depends on structural characteristics and fundamentals of its
economy or market (Nayaran et al., 2011). Therefore, findings are conditional on the macro
economic variables we empirically test (model). Owing to constraints in data availability and
degrees of freedom required for the OIR test, we could not condition the analysis beyond five
macroeconomic variables. This is consistent with the convergence literature in which only
two variables have been used (E.g. see Bruno et al., 2012). For a monetary union, identical
structural characteristics could be reflected in real, fiscal and monetary policy convergence.
This could ultimately lead to KE convergence if simultaneously, growth-friendly
macroeconomic policies-mix are applied by all member states in view of a long-term KE
strategic interest.
4.1.1 Summary of results
This section examines three principal concerns: (i) assessment of the presence of
convergence; (ii) computation of the speed of convergence and (iii) determination of the time
13
The launch of the Lisbon Strategy in 2000 by European governments signaled the initiation of an agenda
aiming at introducing employment and productivity-enhancing reforms in order for Europe to become the most
competitive and dynamic knowledge-based economy in the world capable of sustainable economic growth with
more jobs, better employment facilities and greater social cohesion (Karagiannis, 2007). 14
The implementation period of the mixture of ambitious objectives and policies is from 2000 to 2010.
15
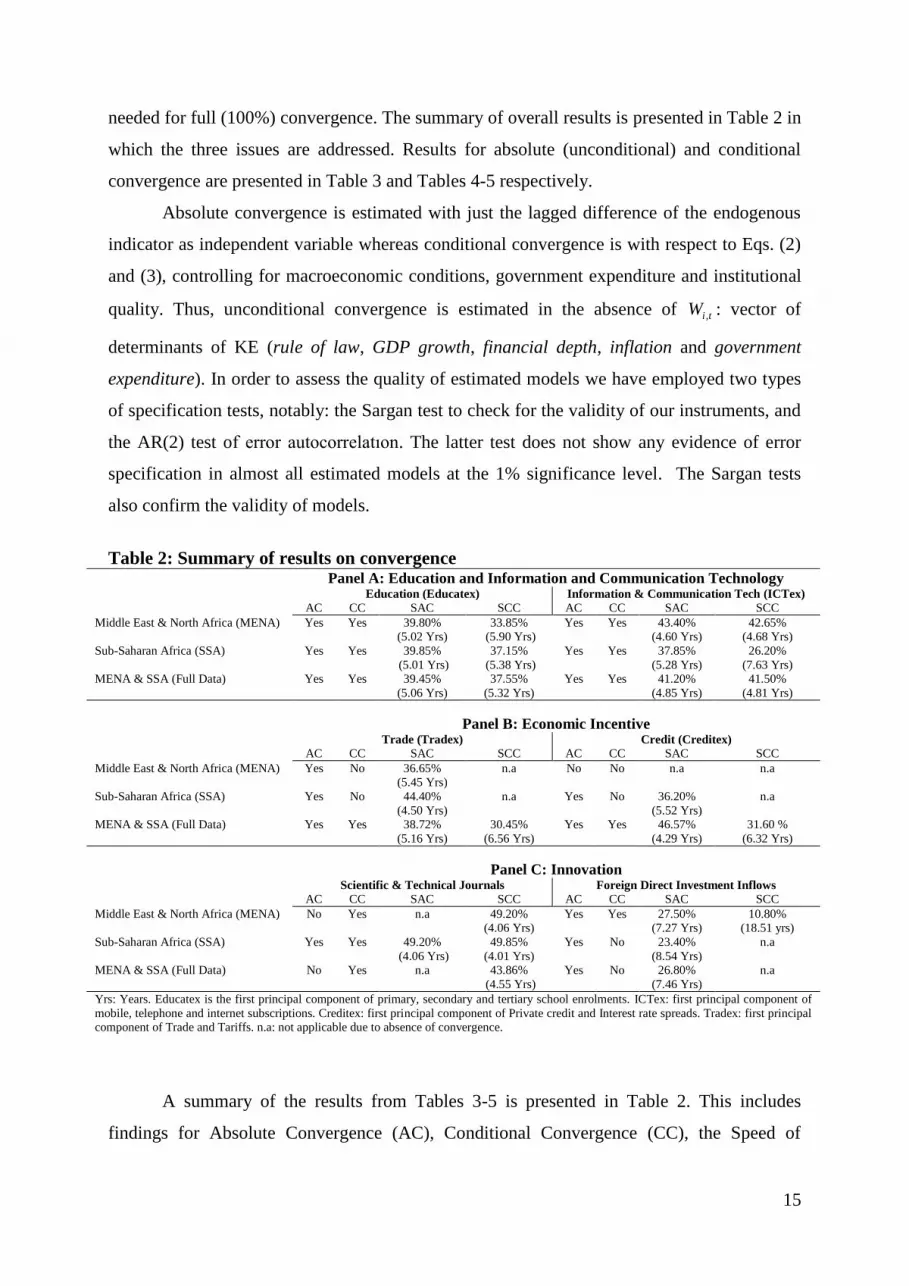
needed for full (100%) convergence. The summary of overall results is presented in Table 2 in
which the three issues are addressed. Results for absolute (unconditional) and conditional
convergence are presented in Table 3 and Tables 4-5 respectively.
Absolute convergence is estimated with just the lagged difference of the endogenous
indicator as independent variable whereas conditional convergence is with respect to Eqs. (2)
and (3), controlling for macroeconomic conditions, government expenditure and institutional
quality. Thus, unconditional convergence is estimated in the absence of tiW , : vector of
determinants of KE (rule of law, GDP growth, financial depth, inflation and government
expenditure). In order to assess the quality of estimated models we have employed two types
of specification tests, notably: the Sargan test to check for the validity of our instruments, and
the AR(2) test of error autocorrelatıon. The latter test does not show any evidence of error
specification in almost all estimated models at the 1% significance level. The Sargan tests
also confirm the validity of models.
Table 2: Summary of results on convergence Panel A: Education and Information and Communication Technology Education (Educatex) Information & Communication Tech (ICTex)
AC CC SAC SCC AC CC SAC SCC
Middle East & North Africa (MENA) Yes Yes 39.80% (5.02 Yrs)
33.85% (5.90 Yrs)
Yes Yes 43.40% (4.60 Yrs)
42.65% (4.68 Yrs)
Sub-Saharan Africa (SSA) Yes Yes 39.85%
(5.01 Yrs)
37.15%
(5.38 Yrs)
Yes Yes 37.85%
(5.28 Yrs)
26.20%
(7.63 Yrs)
MENA & SSA (Full Data) Yes Yes 39.45%
(5.06 Yrs)
37.55%
(5.32 Yrs)
Yes Yes 41.20%
(4.85 Yrs)
41.50%
(4.81 Yrs)
Panel B: Economic Incentive Trade (Tradex) Credit (Creditex)
AC CC SAC SCC AC CC SAC SCC
Middle East & North Africa (MENA) Yes No 36.65% (5.45 Yrs)
n.a No No n.a n.a
Sub-Saharan Africa (SSA) Yes No 44.40%
(4.50 Yrs)
n.a Yes No 36.20%
(5.52 Yrs)
n.a
MENA & SSA (Full Data) Yes Yes 38.72%
(5.16 Yrs)
30.45%
(6.56 Yrs)
Yes Yes 46.57%
(4.29 Yrs)
31.60 %
(6.32 Yrs)
Panel C: Innovation Scientific & Technical Journals Foreign Direct Investment Inflows
AC CC SAC SCC AC CC SAC SCC
Middle East & North Africa (MENA) No Yes n.a 49.20% (4.06 Yrs)
Yes Yes 27.50% (7.27 Yrs)
10.80% (18.51 yrs)
Sub-Saharan Africa (SSA) Yes Yes 49.20%
(4.06 Yrs)
49.85%
(4.01 Yrs)
Yes No 23.40%
(8.54 Yrs)
n.a
MENA & SSA (Full Data) No Yes n.a 43.86%
(4.55 Yrs)
Yes No 26.80%
(7.46 Yrs)
n.a
Yrs: Years. Educatex is the first principal component of primary, secondary and tertiary school enrolments. ICTex: first principal component of
mobile, telephone and internet subscriptions. Creditex: first principal component of Private credit and Interest rate spreads. Tradex: first principal component of Trade and Tariffs. n.a: not applicable due to absence of convergence.
A summary of the results from Tables 3-5 is presented in Table 2. This includes
findings for Absolute Convergence (AC), Conditional Convergence (CC), the Speed of

16
Absolute Convergence (SAC), the Speed of Conditional Convergence (SCC) and the rate
required to achieve full (100%) convergence.
From a general perspective, the following conclusions could be drawn. (i) But for a
few exceptions, there is overwhelming convergence in most KE dynamics. (ii) For the most
part, the convergence rate within SSA is very substantially different from that within MENA.
(iii) Both the lowest and highest rates of convergence are apparent for CC in innovation with
corresponding rates of 10.80% per annum (MENA) and 49.85% per annum (SSA)
respectively. (iv) The hypothesis of convergence is highly significant for education and ICT
(where all hypotheses are valid), followed by innovation (where four hypotheses are invalid)
and lastly by economic incentive (where five hypotheses are invalid).
4.1.2 Absolute convergence (AC)
Table 3 below shows results of AC. Education and ICT findings are presented in Panel
A while, Panel B and Panel C respectively reveal results for economic incentive and
innovation. Though all initial lagged endogenous variables are significant, estimated
coefficients with a value greater than one do not meet the convergence criterion. From Panel
A, it could be observed that almost all the estimated coefficients are quasi-equal across
specifications and KE dimensions. But for MENA in the Creditex regressions, results of Panel
B denote convergence rates that vary from 36.65% per annum to 46.57% per annum (p.a).
MENA and ‘Full data’ findings in the Journals dimension of KE in Panel C do not meet the
convergence criterion.
Table 3: Absolute convergence
Panel A: Education and Information and Communication Technology
Education (Educatex) Information & Communication Tech (ICTex)
MENA SSA Full Data MENA SSA Full Data
Initial 0.796*** 0.797*** 0.789*** 0.868*** 0.757*** 0.824***
(0.000) (0.000) (0.000) (0.000) (0.000) (0.000)
AR(2) -1.182 -1.135 -1.314 -0.814 -0.145 -1.026
(0.237) (0.256) (0.188) (0.415) (0.884) (0.304)
Sargan 6.971 4.043 11.734 13.911 6.267 20.995
(0.994) (0.995) (0.946) (0.974) (1.000) (0.742)
Wald test 7.856*** 407.06*** 164.827*** 988.40*** 216.25*** 903.90***
(0.005) (0.000) (0.000) (0.000) (0.000) (0.000)
Countries 7 5 12 14 7 21
N 25 18 43 95 47 142

17
Panel B: Economic Incentive
Trade (Tradex) Credit (Creditex)
MENA SSA Full Data MENA SSA Full Data
Initial 0.733*** 0.888*** 0.774*** 1.131*** 0.724*** 0.931***
(0.000) (0.000) (0.000) (0.000) (0.000) (0.000)
AR(2) 0.989 -1.476 0.775 -1.303 -0.452 -1.098
(0.322) (0.139) (0.438) (0.192) (0.651) (0.272)
Sargan 9.897 6.010 17.169 7.735 3.892 14.853
(0.955) (0.999) (0.841) (0.999) (1.000) (0.960)
Wald test 11.362*** 66.163*** 45.921*** 465.17*** 11.680*** 539.37***
(0.000) (0.000) (0.000) (0.000) (0.000) (0.000)
Countries 12 7 19 9 6 15
N 40 26 66 44 41 85
Panel C: Innovation
Scientific & Technical Journals Foreign Direct Investment Inflows
MENA SSA Full Data MENA SSA Full Data
Initial 1.034*** 0.984*** 1.024*** 0.536*** 0.468*** 0.550***
(0.000) (0.000) (0.000) (0.000) (0.000) (0.000)
AR(2) 0.316 0.195 0.261 -1.110 1.712* -0.809
(0.751) (0.844) (0.793) (0.267) (0.086) (0.418)
Sargan 13.041 6.909 20.584 13.651 5.699 20.978
(0.836) (0.906) (0.360) (0.977) (1.000) (0.743)
Wald test 20407*** 143.99*** 12190*** 8.808*** 17.500*** 8.754***
(0.000) (0.000) (0.000) (0.003) (0.000) (0.003)
Countries 14 7 21 14 7 21
N 79 35 114 95 49 144
***,**,*: significance levels of 1%, 5% and 10% respectively. AR (2): Second Order Autocorrelation test. Sargan: Overidentifying Restrictions test. N: Number of observations. Initial: lagged endogenous estimated coefficient. SSA: Sub-Saharan Africa. MENA: Middle
East and North Africa. Tech: Technology.
4.1.3 Conditional convergence (CC)
Tables 4-5 below report empirical findings for CC. While Table 4 displays the results
for Educatex, ICTex, Tradex and Creditex, Table 5 reveals results for innovation. Not all
control variables are used in certain equations due to constraints in degrees of freedom.
However, to assess the validity of the results in models without all control variables, the
conditioning information sets are used interchangeably. Results from the various
specifications are not different from those finally reported in the tables.
Most of the control variables are significant with the right signs. (i) In Panel A of
Table 4, government expenditure may either mitigate KE or not, depending on two factors.
On the one hand on how funds allocated for education and communication infrastructure are
managed. On the other hand, how the enforcements of property rights through the rule of law
mechanism (especially in business software piracy) may substantially limit knowledge
spillovers and the smooth development of the ICT sector. (ii) In Table 5, economic prosperity
and low inflation could be strong incentives to FDI inflows.

18
Table 4: Conditional convergence for Education, ICT and Economic Incentive
Panel A: Education and Information and Communication Technology
Education (Educatex) Information & Communication Tech (ICTex)
MENA SSA Full Data MENA SSA Full Data
Initial 0.677*** 0.743*** 0.751*** 0.853*** 0.524** 0.830***
(0.000) (0.000) (0.001) (0.000) (0.022) (0.000)
Intercept 0.265*** -0.034 0.315 0.564 0.305 0.484***
(0.000) (0.743) (0.486) (0.256) (0.343) (0.001)
Gov. Exp. 0.004 0.026** 0.015 -0.004* 0.002 -0.003
(0.272) (0.019) (0.185) (0.058) (0.784) (0.155)
GDP growth --- --- 0.015 0.006 -0.040 0.010
(0.165) (0.541) (0.570) (0.146)
M2 --- --- -0.456 0.031 --- 0.079
(0.261) (0.955) (0.687)
Rule of Law --- --- 0.123 -0.248*** --- -0.227***
(0.389) (0.000) (0.000)
Inflation --- --- -0.011 -0.003 --- -0.011**
(0.575) (0.813) (0.028)
AR(2) -1.291 -1.091 -1.155 -0.173 0.943 -0.717
(0.196) (0.275) (0.247) (0.862) (0.345) (0.473)
Sargan 3.922 1.663 3.563 6.654 2.599 13.973
(0.999) (1.000) (1.000) (1.000) (1.000) (0.973)
Wald test 111.85*** 193.57*** 1704.7*** 1210.93*** 12.205*** 2753.3***
(0.000) (0.000) (0.000) (0.000) (0.006) (0.000)
Countries 7 5 10 12 6 18
N 25 18 39 67 38 105
Panel B: Economic Incentive
Trade (Tradex) Credit (Creditex)
MENA SSA Full Data MENA SSA Full Data
Initial 1.423 1.081 0.609*** 1.305*** 1.092* 0.632*
(0.657) (0.104) (0.001) (0.003) (0.084) (0.092)
Intercept -10.978 0.061 0.391 0.043 -0.835 0.452
(0.582) (0.704) (0.129) (0.782) (0.319) (0.397)
Gov. Exp. 0.010 0.005 -0.005 0.0005 -0.015 -0.004
(0.810) (0.628) (0.170) (0.834) (0.334) (0.410)
GDP growth -0.107 -0.047 -0.026 0.006 0.123 -0.019
(0.731) (0.406) (0.367) (0.721) (0.227) (0.234)
M2 12.879 --- -0.399 --- --- -0.766
(0.571) (0.255) (0.372)
Rule of Law 2.354 --- -0.222 --- --- -0.140
(0.491) (0.207) (0.365)
Inflation 0.045 --- -0.018 --- --- 0.019
(0.872) (0.169) (0.209)
AR(2) t 0.694 -1.200 0.870 -1.397 0.112 -1.230
(0.487) (0.230) (0.384) (0.162) (0.910) (0.218)
Sargan 0.000 1.878 5.763 4.355 1.143 8.448
(1.000) (1.000) (0.998) (1.000) (1.000) (0.999)
Wald 59.356*** 10.195** 480.33*** 87.254*** 10.083** 1380.7***
(0.000) (0.017) (0.000) (0.000) (0.017) (0.000)
Countries 7 5 12 9 5 14
N 27 18 45 43 33 76
***,**,*: significance levels of 1%, 5% and 10% respectively. AR (2) Auto: Second Order Autocorrelation test. Sargan: Overidentifying Restrictions test. N: Number of observatıons. Initial: lagged endogenous estimated coefficient. SSA: Sub-Saharan Africa. MENA: Middle
East and North Africa. Tech: Technology. Gov. Exp: Government Expenditure. M2: Money Supply.

19
Table 5: Conditional convergence for Innovation Innovation
Scientific & Technical Journals Foreign Direct Investment Inflows
MENA SSA Full Data MENA SSA Full Data
Initial 0.877*** 0.997*** 0.984*** 0.114 0.191 0.216*
(0.000) (0.007) (0.000) (0.628) (0.824) (0.078)
Intercept 0.396* 0.003 0.066 -1.613 0.839 -2.230
(0.088) (0.995) (0.420) (0.830) (0.825) (0.399)
Gov. Exp. -0.005* 0.001 -0.0003 -0.0004 0.061 0.031
(0.053) (0.348) (0.817) (0.995) (0.304) (0.457)
GDP growth -0.003 0.010 0.0005 0.138 0.176 0.309*
(0.388) (0.548) (0.878) (0.636) (0.745) (0.067)
M2 0.043 --- 0.007 4.159 --- 3.210
(0.578) (0.908) (0.655) (0.267)
Rule of Law 0.057 --- -0.012 1.916 --- -0.275
(0.331) (0.534) (0.547) (0.847)
Inflation -0.0005 --- -0.001 0.343** --- 0.177***
(0.877) (0.160) (0.041) (0.004)
AR(2) test 0.150 -0.114 0.144 -1.107 0.643 -1.008
(0.880) (0.908) (0.885) (0.268) (0.519) (0.313)
Sargan test 2.158 0.182 9.397 8.994 3.856 15.086
(1.000) (1.000) (0.966) (0.999) (1.000) (0.955)
Wald test 2872.8*** 13.359*** 2599.8*** 21.868*** 29.867*** 37.183***
(0.000) (0.003) (0.000) (0.001) (0.000) (0.000)
Countries 12 6 18 12 6 18
N 55 30 85 67 40 107
***,**,*: significance levels of 1%, 5% and 10% respectively. AR (2): Second Order Autocorrelation test. Sargan: Overidentifying
Restrictions test. N: Number of observations. Initial: lagged endogenous estimated coefficient. SSA: Sub-Saharan Africa. MENA: Middle
and North Africa. Gov. Exp: Government Expenditure. M2: Money Supply.
4.2 Discussion of results, policy implications and caveats
4.2.1 Discussion of results
The progressive build-up of knowledge-based economies in SSA and MENA countries
calls for more capacity building for research, technological development, innovation and
economic incentives. Trajectories of and tendencies in education and ICT are encouraging.
Results of the Education and ICT dimensions of KE demonstrate that, countries with
lower levels of education and ICT are catching-up with their counterparts of higher levels in
the KE dimensions. This interpretation holds for all types of convergences and is valid across
samples. It follows that: (i) the objectives of the United Nations Educational, Scientific and
Cultural Organization (UNESCO) are bearing fruits within Africa and the Middle East15
and
(ii) cross-countries differences in internet penetration, telephone subscriptions and mobile
phone usage are substantially decreasing.
The absence of conditional convergence in the trade and credit aspects of the
economic incentive dimension of KE, point to, the: (i) need for more intra-trade among
15
For further details, see: ‘Towards a convergence of knowledge acquisition and skills development’, a
UNESCO report of education reform (Iwamoto, 2005).

20
sampled countries (in SSA and MENA) and (ii) absence of credit facilities for economic
operators. The low intra-trade in Africa and the Middle East is far from surprising as it has
been substantially documented in the literature (Longo & Sekkat, 2004; Askari et al., 2003).
The absence of convergence in Creditex could be the result of the perennial issue of surplus
liquidity in African formal financial institutions (Saxegaard, 2006).
From the innovation dimension: while, the absence of AC in publication of ‘scientific
and technical journals’ demonstrates the absence of an overall strategy or framework aimed at
improving contribution of knowledge in the scientific domain, lack of conditional
convergence in FDI inflows shows how cross-country differences in structural and
institutional characteristics matter in the attraction foreign capital. Thus, disparities in
macroeconomic policies/conditions and government quality among countries could lead to
this deficiency in conditional convergence.
On a general note, domestic credit and foreign investment inflows have very
heterogeneous initial conditions and are influenced by different fundamental, institutional and
structural characteristics of development. It implies that countries should work towards
adopting common institutional and structural characteristics that favor financial allocation
efficiency. Such institutional characteristics include government-quality dynamics of rule of
law, regulation quality, corruption-control, government effectiveness, political stability (no
violence), democracy, voice and accountability, and press-freedom.
4.2.2 Policy implications: towards more integrated KE strategies
a) Regional integration
Our findings are highly relevant for policy makers in terms of regional integration.
The absence of CC in trade in SSA and MENA countries points to the need for more intra-
regional trade. This brings us to the question of whether policies implemented by African and
Middle East countries to promote intra-regional trade have had any noticeable effects on the
observed convergence patterns. Though from an AC sense, integration may be occurring, it is
not yet noticeable when structural and institutional characteristics are integrated into the
equation. It is thus tempting to conclude that geographical proximity is neither a necessary not
a sufficient condition for trade convergence, which could further suggest that efforts at
promoting trade liberalization may not be so apparent.

21
b) Credit facilities
The absence of CC in economic incentives, especially in Creditex, implies that credit
facilities are not converging contingent on structural and institutional characteristics. This is a
call for more regional investment banks and investment funds which could be instrumental in
addressing cross-country credit facility disparities. Also, given the substantially documented
issues of surplus liquidity in African banks, innovation mechanisms should be developed that
would facilitate the granting of credit to economic operators (Saxegaard, 2006; Asongu &
Tchamyou, 2015).
c) Support for regional research and innovation
The absence of AC in ‘technical and scientific journals’ means that fundamental
characteristics enabling countries with lower levels of publications to catch-up with their
counterparts of higher levels are absent. Thus, there should be encouragement and validation
activities targeting local and regional initiatives to promote development of new innovating
businesses and ‘transfer and exchange’ of best practices as well as the establishment of an
environment more conducive to innovation. The focus should be on:
-trans-regional cooperation to facilitate the development of research and innovation;
-strategies as well as initiation of programs involving local actors and corresponding activities
should be developed in close coordination with inclusive regional policies;
-particular attention should be paid to the participation of sampled countries’ regions, notably
in relation to the transfer of schemes that have proved successful at local and national levels.
The development of research and innovation strategies, as well as inter-regional
technology transfer could greatly benefit sampled countries. This would include, supporting
the development of regional scientific infrastructure. Hence, specific attention should be paid
to the valorization or development of new scientific infrastructure in the regions, in
collaboration and synergy with activities of the regional investment banks (funds). The
example of the EU has shown that modern scientific infrastructure is a key enabler of regional
economic development. For researchers within the regions to be able to cooperate under state-
of-the-art conditions with their counterparts in advanced regions as well as with the rest of the
world, much needs to be considered. For instance, scientific and technical parks for efficient
clustering and cooperation between academia and industry (or high-speed electronic networks
and related facilities for the information economy). A good example is the broadband
electronic interconnection backbone that could link SSA and MENA electronic research and
education networks.

22
Within the context of research training networks and knowledge transfer, fellowships
could be developed to target more and better scientific and technical human resources.
Therefore, more opportunities should be offered to researchers originating from less favored
countries. This will ease the convergence process. Special attention should also be paid to a
number of factors affecting socioeconomic conditions of researchers, notably gender equity,
linguistic balance, and career structure. Ultimately, in view of further reinforcing the human
potential for research in sampled regions, human resource and mobility actions should target,
inter alia: (i) the best and most promising researchers from undeveloped countries, promote
the training of regional researchers abroad and stimulate the return of scientists established
outside Africa and the Middle East; (ii) improving communication between experts and
policymakers through the establishment of joint working and communication platforms
between them at regional levels and (iii) clear statistical indicators that are able to describe the
characteristics, structure and performance of knowledge-based economy should be developed
at national and regional levels.
4. 2. 3 Caveats
Three main caveats have been retained: negative spillovers due to trade convergence, the
absence of a theoretical basis and, draw-backs in the methodology. Firstly, during trade
convergence periods, policy makers should be aware that economies are subject to spillover
effects and a real shock emerging from a certain country/industry might spread quickly to
other countries/industries. Secondly, using econometrics to accomplish more than just testing
theory does not come without risks. The intuitive basis of the study implies that results should
be interpreted with caution as the model is conditioned on the variables we choose and
empirically test, which may not directly reflect implemented policies that drive KE
convergence. Thirdly, as we have already outlined in the first paragraph of Section 3.2.2, the
choice of the convergence approach which is based on constraints in data structure also has its
draw-backs. Consistent with Apergis et al. (2010), skeptics of β-convergence argue that if
countries converge to a common equilibrium with identical internal structures, then the
dispersion of the variable under study should disappear in the long-term as all countries
converge to the same long-run path. If, however, countries converge to ‘convergence clubs’ or
to their own unique equilibrium, the dispersion of this indicator will not near zero (Miller &
Upadhyay, 2002). Moreover, in the latter case of country-specific equilibrium, the movements
of the dispersion are contingent on the initial distribution of the variable under investigation
with regard to their final long-run outcomes. Overall, as sustained by Caporale et al. (2009),

23
the approach may suffer from specific estimation deficiencies associated with the data
structure. Indeed, data on KE dimensions is scarce and these issues can only be overcome
with time.
5. Conclusion
In the first critical assessment of knowledge economy dynamic paths in Africa and the
Middle East, but for a few exceptions, we find overwhelming support for diminishing cross-
country disparities in knowledge-base-economy dimensions. The paper employs all the four
components of the World Bank’s Knowledge Economy Index (KEI): economic incentives,
innovation, education, and information infrastructure. The main finding suggests that sub-
Saharan African (SSA) and the Middle East and North African (MENA) countries with low
levels in KE dynamics and catching-up their counterparts of higher KE levels. We provide the
speeds of integration and time necessary to achieve full (100%) integration. Policy
implications are discussed.
Future inquiries can improve the extant literature by engaging in comparative studies
between SSA and MENA and other countries in the KE frontier.

24
Appendices
Appendix 1: Summary statistics and presentation of countries
Panel A: Summary Statistics
Mean S.D Min Max Obs.
Knowledge
Economy
Educatex (Education) -0.038 1.370 -4.344 1.858 126
ICTex (Information & Infrastructure) 0.028 1.440 -3.750 3.183 310
Tradex (First Economic Incentive) -0.058 1.143 -2.901 2.635 161
Creditex (Second Economic Incentive) 0.118 1.224 -2.296 3.488 193
Scientific and Technical Journals 2.142 0.676 0.518 3.821 284
Foreign Direct Investment Inflows 3.119 3.908 -4.025 33.566 319
Control
variables
Rule of Law -0.063 0.727 -1.606 1.258 264
Inflation 5.585 6.274 -9.797 43.073 296
Government Expenditure 12.318 11.321 -34.88 80.449 295
Economic Prosperity 4.689 3.450 -4.300 26.750 313
Financial Depth 0.523 0.291 0.121 1.279 240
Panel B: Presentation of Countries
MENA: Algeria, Bahrain, Egypt, Jordan, Kuwait, Lebanon, Libya, Morocco, Oman, Qatar, Saudi Arabia,
Tunisia, United Arab Emirates, Yemen.
SSA: Botswana, Cameroon, Kenya, Mauritius, Nigeria, Senegal, Zambia.
S.D: Standard Deviation. Min: Minimum. Max: Maximum. Obs: Observations. MENA: Middle East and North Africa. SSA:
Sub-Saharan Africa.

25
Appendix 2: Correlation Matrix (N = 168)
Knowledge Economy Control Variables
Educatex ICTex Tradex Creditex Journals FDI RL Inflation Gov. Exp. GDPg Fin. Depth
1.000 0.213 -0.310 -0.774 0.172 0.256 0.411 -0.384 0.553 0.142 0.576 Educatex
1.000 -0.212 -0.289 0.390 0.134 -0.007 -0.204 0.109 0.061 0.227 ICTex
1.000 0.382 0.325 -0.418 -0.551 0.002 -0.257 -0.294 -0.277 Tradex
1.000 -0.324 -0.141 -0.600 0.433 -0.295 -0.139 -0.765 Creditex
1.000 0.029 -0.013 -0.188 -0.088 -0.089 0.293 Journals
1.000 0.125 0.063 0.136 0.191 0.215 FDI
1.000 -0.299 0.167 0.157 0.570 RL
1.000 -0.193 0.135 -0.311 Inflation
1.000 0.033 0.175 Gov. Exp.
1.000 0.005 GDPg
1.000 Fin. Depth
Educatex: Education. ICTex: Information and Communication Technology. Tradex: Trade economic incentive. Creditex: Credit economic incentive. Journals: Scientific and
Technical Journals. FDI: Foreign Direct Investment. RL: Rule of Law. Gov. Exp: Government Expenditure. GDPg: GDP growth. Fin. Depth: Financial Depth (M2).

26
Appendix 3: Variable definitions
Variables Variable definitions Data sources
Panel A: Dimensions in Knowledge Economy (KE)
Primary School Enrolment PSE Log of PSE World Bank (WDI)
Secondary School Enrolment SSE Log of SSE World Bank (WDI)
Tertiary School Enrolment TSE Log of TSE World Bank (WDI)
Education in KE Educatex First PC of PSE, SSE & TSE PCA
Internet Users Internet Log of Internet World Bank (WDI)
Mobile Cellular Subscriptions Mobile Log of Mobile World Bank ( WDI)
Telephone lines Tel Log of Tel World Bank (WDI)
Information & Infrastructure in KE ICTex First PC of Internet, Mobile & Tel PCA
Trade Openness Trade Exports plus Imports of Commodities (%
of GDP)
World Bank (WDI)
Tariff Barriers Tariff Tariff rate, most favored nation, weighted
mean, all products (%)
World Bank (WDI)
1st Economic Incentive dimension in KE Tradex First PC of Trade & Tariff PCA
Private domestic credit Credit Private domestic credit (% of GDP) World Bank (WDI)
Interest rate spread Spread Lending rate minus deposit rate (%) World Bank (WDI)
2nd Economic Incentive dimension in KE Creditex First PC of Credit and Spread PCA
1st Innovation dimension in KE Journals Log of Number of Technical & Scientific
Journals
World Bank (WDI)
2nd
Innovation dimension in KE FDI Net Foreign Direct Investment (% of
GDP)
World Bank (WDI)
Panel B: Control variables
Rule of Law R.L Rule of Law (estimate) World Bank (WDI)
Government Expenditure Gov.
Exp.
Government final consumption
expenditure (% of GDP)
World Bank (WDI)
Inflation Infl. Consumer price index (annual %) World Bank (WDI)
Economic Prosperity GDPg GDP growth rate (annual %) World Bank (WDI)
Financial Depth M2 Broad Money Supply (% of GDP) World Bank (FDSD)
WDI: World Bank’s World Development Indicators. FDSD: Financial Development and Structure Database. GDP: Gross Domestic
Product. PC: Principal Component. PCA: Principal Component Analysis. Log: logarithm.

27
References
African Development Bank (2007, December). “Growing knowledge based economy:
Evidence from public expenditure on education in Africa”, Economic Research Working
Paper Series No. 88.
Africa Partnership Forum (2008), “ICT in Africa: Boosting Economic Growth and Poverty
Reduction”, 10th
Meeting of Africa Partnership Forum, Tokyo, Japan (7-8th
April).
Amavilah, V. H., (2009). “Knowledge of African countries: production and value of doctoral
dissertations,” Applied Economics, 41,(7-9), pp. 977-989.
Amavilah, V. H. S., Asongu, S. A., & Andrés, A. R., (2014). “Globalisation, Peace &
Stability, Governance and Knowledge Economy”, African Governance and Development
Institute Working Paper No. 14/012.
Andrés, A. R., & Asongu, S. A., (2013a). “Fighting software piracy: which governance tools
matter in Africa?”, Journal of Business Ethics, 118(3), pp. 667-682.
Andrés, A. R., & Asongu, S. A., (2013b). “Global dynamic timelines for IPRs harmonization
against software piracy”, Economics Bulletin, 33(1), pp. 874-880.
Andrés, A. R., Asongu, S. A., & Amavilah, V. H. S., (2015). “The Impact of Formal
Institutions on Knowledge Economy”, Journal of the Knowledge Economy: 6(4), pp.
1034-1062.
Anyanwu, J. C., (2012). “Developing Knowledge for the Economic Advancement of Africa”,
International Journal of Academic Research in Economics and Management Sciences, 1(2),
pp. 73-111.
Asongu, S. A., (2013a). “On the obituary of scientific knowledge monopoly”, Economics
Bulletin, 33(4), pp. 2718-2731.
Asongu, S. A., (2013b). “Harmonizing IPRs on Software Piracy: Empirics of Trajectories in
Africa”, Journal of Business Ethics, 118(3), pp. 667-682.
Asongu, S. A., (2014a). “Knowledge economy and financial sector competition in African
countries”, African Development Review, 26(2), pp. 333-346.
Asongu, S. A., (2014b). “Software piracy and scientific publication: knowledge economy
evidence from Africa”, African Development Review, 26(4), pp. 572-583.
Asongu, S. A., (2015a). “Knowledge economy gaps, policy syndromes and catch-up
strategies: Fresh South Korean lessons to Africa”, Journal of the Knowledge Economy,
http://link.springer.com/article/10.1007%2Fs13132-015-0321-0
Asongu, S. A., (2015b). “The Comparative Economics of Knowledge Economy in Africa:
Policy Benchmarks, Syndromes, and Implications”, Journal of Knowledge Economy,
http://link.springer.com/article/10.1007%2Fs13132-015-0273-4

28
Asongu, S. A., & Tchamyou, V. S., (2015). “The Comparative African Regional Economics
of Globalization in Financial Allocation Efficiency”, Brussels Economic Review: Revised and
Resubmitted.
Apergis, N., Christou, C., & Miller, S. M., (2010). “Country and industry convergence in
equity markets: International evidence from club convergence and clustering”, Department of
Banking and Financial Management, University of Piraeus, Greece.
Arellano, M., & Bond, S., (1991). “Some tests of specification for panel data: Monte Carlo
evidence and an application to employment equations”. The Review of Economic Studies, 58,
pp. 277-297.
Arellano, M., & Bover, O., (1995). “Another look at the instrumental variable estimation of
error-components models”, Journal of Econometrics, 68, pp. 29-52.
Askari, H., Atie, R., & Khouri, N., (2003, September). “Intra-middle eastern trade: why is it
so low?”, BNL Quarterly Review, No. 226, pp. 1-32.
Asongu, S. A., (2012). “African stock market performance dynamics: A multidimensional
convergence assessment”, Journal of African Business, 14(3), pp. 186-201.
Aubert, J. E., (2005). “Knowledge economies: A global perspective”, In A. Bonfour & L.
Edvinsson (Eds.), Intellectual capital for communities. Elsevier, Oxford.
Aubert, J. E., & Reiffers, J. L., (2003). Knowledge Economies in the Middle East and North
Africa: Toward New Development Strategies. Washington, D. C:The World Bank.
Barro, R. J., (1991). Economic growth in a cross section of countries”, Quarterly Journal of
Economics, 106, 407-443.
Barro, R. J., & Sala-i-Martin, X., (1992). “Convergence”, Journal of Political Economy, 100,
pp. 223-251.
Barro, R. J., & Sala-i-Martin, X., (1995). Economic Growth. The MIT Press, Cambridge, MA.
Baumol, W. J., (1986). “Productivity, growth, convergence and welfare: What the long run
data show?”, American Economic Review, 76, pp. 1072-1085.
Blundell, R., & Bond, S., (1998). “Initial conditions and moment restrictions in dynamic
panel data models”, Journal of Econometrics, 87(1), pp.115-143.
Bidwell, N. J., Winschiers-Theophilus, H., Kapuire, G. K., & Rehm, M., (2011). “Pushing
personhood into place: Situating media in rural knowledge in Africa”, International Journal
of Human-Computer Studies, 69 (10), pp. 618-631.
Bizri, O., (2009). “The Knowledge economy and the Arab Countries: current climate and
future prospects in education, innovation and technology”, Carthage High Level International
Conference on Building Knowledge Economies for job creation, increased competiveness and
balanced development. December, 1-3, 2009.

29
Bond, S., Hoeffler, A., & Tample, J., (2001). “GMM estimation of empirical growth models”,
University of Oxford.
Britz, J. J., Lor, P. J., Coetzee, I. E. M., & Bester, B. C., (2006). “Africa as a knowledge
society: A reality check”, The International Information & Library Review, 38, pp. 25-40.
Bruno, G., De Bonis, R., & Silvestrini, A., (2011). “Do financial systems converge? New
evidence from financial assets in OECD countries”, Journal of Comparative Economics, 40
(1), pp. 141-155.
Butcher, N., (2011). ICT in Africa. A Few Key Challenges, in: ICT, Education, Development,
and the Knowledge Society, Thematic Paper prepared for GeSCI African Leadership in ICT
Program, December 2011, pp. 33-39.
Caporale, G. M., Erdogan, B., & Kuzin, V., (2009). “Testing for convergence in stock
markets: A non-linear factor approach”, Discussion Paper No. 932, Deutsches Institut fur
Wirtschaftsforschung, Berlin.
Carisle, S., Kunc, M., Jones, E., & Tiffin, S., (2013). “Supporting innovation for tourism
development through multi-stakeholder approaches: Experiences from Africa”, Tourism
Management, 35, pp. 59-69.
Chandra, D. S., & Yokoyama, K., (2011).“The role of good governance in the knowledge-
based economic growth of East Asia – A study on Japan, Newly Industrialized Economies,
Malaysia and China”, Graduate School of Economics, Kyushu University.
Chavula, H. K., (2010). “The role of knowledge in economic growth. The African
perspective”, ICT, Science and Technology Division (ISTD), United Nations Economic
Commission for Africa (UNECA).
Cogburn, D., (2003). “Governing global information and communications policy: Emergent
regime formation and the impact on Africa”, Telecommunications Policy, 27, pp. 135-153.
Costantini, M., & Lupi, C., (2005). “Stochastic convergence among European economies”,
Economics Bulletin, 3(38), pp.1-17.
Dahlman, C., (2007). “The challenge of the knowledge economy for Latin America”,
Globalization, Competitiveness and Governability Journal, 1(1), pp. 18-46.
Department of Trade and Industry (1998) “Our Competitive future: Building the knowledge
Driven Economy: Analysis & Background” Cm 4176. The Stationary Office, London.
German, L., & Stroud, A., (2007). “A Framework for the integration of diverse learning
approaches: Operationalizing agricultural research and development (R&D) linkages in
Eastern Africa”, World Development, 35(5), pp. 792-814.
Ford, D. M., (2007). “Technologizing Africa: On the bumpy information highway”,
Computers and Composition, 24, pp. 302-316.

30
Fung, M. K., (2009). “Financial development and economic growth: convergence or
divergence?”, Journal of International Money and Finance, 28, pp. 56-67.
Islam, N., (1995). “Growth empirics: A panel data approach”, The Quarterly Journal of
Economics, 110, (4), pp. 1127-1170.
Iwamoto, W., (2005). “Secondary education reform: Towards a convergence of knowledge
acquisition and skills development”, UNESCO, ED-2005/WS/37.
Jolliffe, I. T., (2002). Principal Component Analysis (2nd
Ed.), New York: Springer.
Kaiser, H. F., (1974). “An index of factorial simplicity”. Psychometrika, 39, pp. 31–36.
Karagiannis, S., (2007, February). “The knowledge-based economy, convergence and
economic growth: Evidence of the European Union”, Center of Planning and Economic
Research. Working Paper No. 91.
Lamberton, D. M., (1996). “The Economics of Communication and Information”.
Cheltenham, U. K: Edward Elgar Editions.
Letiche, J. M., (2006). “Positive economic incentives. New behavioural economics and
successful economic transitions”, Journal of Asian Economics, 17, pp. 775-796.
Lightfoot, M., (2011). “Promoting the Knowledge Economy in the Arab World”, London
Knowledge Lab, Institute of Education.
Lin, B., (2006). “A sustainable perspective on the knowledge economy: A critique of Austrian
and mainstream view”, Ecological Economics, 60(1), pp. 324-332.
Longo, R., & Sekkat, K., (2004). “Economic obstacle in explaining intra-African trade”,
World Development, 32 (8), pp. 1309-1321.
Lor, P. J., & Britz, J., (2005). “Knowledge Production from an African perspective:
International information flows and intellectual property”, The International Information &
Library review, 37, pp. 61-76.
Lwoga, E. T., Ngulube, P., & Stilwell, C., (2010). “Managing indigenous knowledge for
sustainable agricultural development in developing countries: Knowledge management
approaches in the social context”, The International Information & Library Review, 42(3), pp.
172-185.
Makinda, S. M., (2007). “How Africa can benefit from knowledge”, Futures, 39, pp. 973-985.
Mankiw, N. G., Romer, D., & Weil, D. N., (1992). “A contribution to the empirics of
economic growth”, Quarterly Journal of Economics, 107, pp. 407–437.
Maswera, T., Dawson, R., & Edwards, J., (2008). “E-commerce adoption of travel and
tourism organisations in South Africa, Kenya, Zimbabwe and Uganda”, Telematics and
Informatics, 25 (3), pp. 187-200.

31
Moodley, S., (2003). “The Challenge of e-business for the South African apparel sector”,
Technovation, 23, pp. 557-570.
Miller, S. M., & Upadhyay, M. P., (2002). “Total factor productivity and the convergence
hypothesis”, Journal of Macroeconomics, 24, pp. 267-286.
Myburgh, A. F., (2011). “Legal developments in the protection of plant-related traditional
knowledge: An intellectual property lawyer’s perspective of the international and South
African legal framework”, South African Journal of Botany 77, pp. 844-849.
Narayan, P. K., Mishra, S., & Narayan, S., (2011). “Do market capitalization and stocks
traded converge? New global evidence”, Journal of Banking and Finance, 35, pp. 2771-2781.
Neimark, B. D., (2012). “Industrializing nature, knowledge, and labour: The political
economy of bioprospecting in Madagascar”, Geoforum, 43, pp. 980-990.
Nguena, C. L., & Tsafack, N. R., (2014). “On the Sensitivity of Banking Activity Shocks:
Evidence from the CEMAC Sub-region”. Economics Bulletin, 34(1), pp. 354-372.
Nyarko, Y., (2013). “Sustaining High Economic Growth in Sub-Saharan Africa: Knowledge
and the Structure of the Economy”, Journal of African Economies, 22, suppl_1(January), pp: -
i101.
Oyelaran-Oyeyinka, B., & Gehl Sampath, P., (2007). “Innovation in African Development.
Case Studies of Uganda, Tanzania and Kenya”, A World Bank Study.
http://info.worldbank.org/etools/docs/library/239730/InnovationInAfricaFinalPaper.pdf
(Accessed: 21/09/2014).
Preece, J., (2013). “Africa and international policy making for lifelong learning: textual
revelations”, International Journal of Educational Development, 33, pp. 98-105.
Raseroka, K., (2008). “Information transformation Africa: Indigenous knowledge – Securing
space in the knowledge society”, The International Information and Library Review, 40, pp.
243-250.
Romer, P. M., (1990). “Endogenous growth and technical change,” Journal of Political
Economy, 98, pp. 71-102.
Rooney, D., (2005). “Knowledge, economy, technology and society: The politics of
discourse”, Telematics and Informatics, 22, pp. 405-422.
Saxegaard, M., (2006). “Excess liquidity and effectiveness of monetary policy: Evidence from
Sub-Saharan Africa”, IMF Working Paper, No. 06/115.
Solow, R. M., (1956). “A contribution to the theory of economic growth”, Quarterly Journal
of Economics, 70, pp. 65-94.
Stiglitz, J., (1999, January). “Knowledge in the modern economy” Paper Presented at the
“Economics of the Knowledge Driven Economy” conference, organized by DTI & CERP,
London.

32
Sumberg, J., (2005). “Systems of innovation theory and the changing architecture of
agricultural research in Africa”, Food Policy, 30 (1), pp. 21-41.
Swan, T. W., (1956). “Economic growth and capital accumulation”, Economic Record, 32(2),
pp. 334-361.
Tchamyou, S. V., (2015). “The Role of Knowledge Economy in African Business”, African
Governance and Development Institute Working Paper, No. 15/049.
UNDP (2009). Arab Knowledge Report 2009. Towards Productive Intercommunication for
Knowledge. United Nations Development Programme. United Arab Emirates. Dubai.
Wagiciengo, M. M., & Belal, A. R., (2012). “Intellectual capital disclosure by South African
companies: A longitudinal investigation”, Advances in Accounting, 28 (1), pp. 111-119.
Wantchekon, L., Klasnja, M., & Novta, N., (2014). “Education and Human Capital
Externalities: Evidence from Colonial Benin”, Department of Politics, Princeton University.
Weber, A. S., (2011). “The role of education in knowledge economies in developing
countries”, Procedia Social and Behavioral Sciences, 15, pp. 2589-2594.
World Bank, (2007). “Building Knowledge Economies. Advanced Strategies for
Development”, World Bank Institute.
World Bank (2011). World Development Indicators CD-ROM. Washington, DC: The World
Bank.
Zerbe, N., (2005). “Biodiversity, ownership, and indigenous knowledge: exploring legal
frameworks for community, farmers, and intellectual property rights in Africa”, Ecological
Economics, 53, pp. 493-506.